UNITED STATES
SECURITIES AND EXCHANGE COMMISSION
Washington, D.C. 20549
FORM N-CSR
CERTIFIED SHAREHOLDER REPORT OF REGISTERED MANAGEMENT INVESTMENT COMPANIES
Investment Company Act file number 811-05201
Thornburg Investment Trust
(Exact name of registrant as specified in charter)
119 East Marcy Street, Santa Fe, New Mexico 87501
(Address of principal executive offices) (Zip code)
Garrett Thornburg, 119 East Marcy Street, Santa Fe, New Mexico 87501
(Name and address of agent for service)
| Registrant’s | telephone number, including area code: 505-984-0200 |
| Date | of fiscal year end: September 30, 2005 |
| Date | of reporting period: September 30, 2005 |
Item 1. Reports to Stockholders
The following annual reports are attached hereto, in order:
Thornburg Limited Term Municipal Fund
Thornburg Limited Term Municipal Fund Class I
Thornburg California Limited Term Municipal Fund
Thornburg California Limited Term Municipal Fund Class I
Thornburg Intermediate Municipal Fund
Thornburg Intermediate Municipal Fund Class I
Thornburg New Mexico Intermediate Municipal Fund
Thornburg Florida Intermediate Municipal Fund
Thornburg New York Intermediate Municipal Fund
Thornburg Limited Term Income Funds
Thornburg Limited Term Income Funds Class I
Thornburg Value Fund
Thornburg Value Fund Class I
Thornburg International Value Fund
Thornburg International Value Fund Class I
Thornburg Core Growth Fund
Thornburg Core Growth Fund Class I
Thornburg Investment Income Builder Fund
Thornburg Investment Income Builder Fund Class I

Core Strategies for Building Wealth
Thornburg Limited Term Municipal Fund
Annual Report – September 30, 2005
This report is submitted for the general information of shareholders of the Fund. It is not authorized for distribution to prospective investors in the Fund unless preceded or accompanied by an effective prospectus. If you have not received a prospectus, one can be obtained from your financial advisor, online at www.thornburg.com/ download, or by calling 800-847-0200. Carefully consider information in the prospectus regarding the Fund’s investment objectives and policies, risks, sales charges, expenses, experience of its management, marketability of shares, and other information. Read it carefully before you invest or send money. Performance data quoted represents past performance and does not guarantee future results.
Thornburg Limited Term Municipal Fund
Laddering – an All Weather Strategy
The Fund’s investment objective is to obtain as high a level of current income exempt from Federal income taxes as is consistent, in the view of the Fund’s investment advisor, with preservation of capital (may be subject to Alternative Minimum Tax).
This Fund is a laddered portfolio of municipal bonds with an average maturity of five years or less. Laddering involves building a portfolio of bonds with staggered maturities so that a portion of the portfolio matures each year; cash from maturing bonds, if not needed for other purposes, is invested in bonds with longer maturities at the far end of the ladder. The strategy is a good compromise for managing different types of risk.
Thornburg Bond Funds
| • | Thornburg Limited Term Municipal Fund |
| • | Thornburg Intermediate Municipal Fund |
| • | Thornburg California Limited Term Municipal Fund |
| • | Thornburg New Mexico Intermediate Municipal Fund |
| • | Thornburg Florida Intermediate Municipal Fund |
| • | Thornburg New York Intermediate Municipal Fund |
| • | Thornburg Limited Term U.S. Government Fund |
| • | Thornburg Limited Term Income Fund |
Thornburg invests in short- and intermediate-term investment grade bonds. We ladder the maturities of individual bonds in the portfolios to moderate risk. Laddering involves building a portfolio of bonds with staggered maturities so that a portion of the portfolio will mature each year. We apply this disciplined process in all interest rate environments.
Thornburg Equity Funds
| • | Thornburg Value Fund |
| • | Thornburg International Value Fund |
| • | Thornburg Core Growth Fund |
| • | Thornburg Investment Income Builder Fund |
Thornburg’s equity research uses a fundamental, yet comprehensive, analytical approach. We invest when and where we perceive compelling value. Thornburg equity funds focus on a limited number of securities so that each holding can impact performance. The equity team searches for firms believed to have a promising future and seeks to buy shares of those companies at a discount to their intrinsic value.
More information at www.thornburg.com
 | Reduce paper clutter. | |
| Receive your shareholder reports and prospectus online instead of through traditional mail. | ||
| Sign up at | ||
| www.thornburg.com/edelivery |
2 This page is not part of the Annual Report. |
Message
from the Chairman

Garrett Thornburg
Chairman & CEO
November 10, 2005
Dear Fellow Shareholder:
Thornburg Investment Management has a clear mission: to preserve and increase the real wealth of our shareholders. We aspire to accomplish this through a family of laddered bond funds that focus on quality, stability, and minimization of risk over time, and through a range of equity funds that redefine traditional measures of value and growth.
Our bond funds have always been managed using the highly disciplined approach of laddering short and intermediate bond maturities, seeking to provide both an attractive return and stability of principal. All of the bond funds buy only investment-grade securities. We have found this strategy to be the best at managing both interest-rate risk and credit risk, and we believe this strategy has served our shareholders well over time.
The bond funds are managed by portfolio managers who have many years of experience. We are proud of this consistency and experience and look forward to many more successful years with them at the helm.
In years past, there has been news about improper behavior by some mutual fund companies. Many new rules proposed in response to this scandal have called for increased transparency. We welcome increased transparency. Thornburg Investment Management has been a leader in providing information about our stock holdings and bond strategies to our shareholders on our web site, www.thornburg.com.
Unfortunately, some of the new rules will increase the cost to all shareholders in mutual funds. We will do our best to keep these expenses to a minimum. After all, we are shareholders too, and Thornburg employees have over $110 million invested in our own funds.
Thank you for investing with us. We will do our best to continue to earn your trust every day.
Sincerely, |
 |
Garrett Thornburg Chairman & CEO |
| This page is not part of the Annual Report. 3 |

Thornburg Limited Term Municipal Fund
September 30, 2005
| 6 | ||
| 8 | ||
| 9 | ||
| 10 | ||
| 11 | ||
| 14 | ||
| 17 | ||
| 38 | ||
| 39 | ||
| 40 | ||
| 41 | ||
| 44 | ||
This report is certified under the Sarbanes-Oxley Act of 2002, which requires that public companies, including mutual funds, affirm that the information provided in their annual and semiannual shareholder reports fully and fairly represents their financial position.
4 Certified Annual Report |
Important Information
Performance data quoted represents past performance and does not guarantee future results. Investment return and principal value will fluctuate so that upon redemption, investor’s shares may be worth more or less than their original cost. Current performance may be lower or higher than the data quoted. For performance data current to the most recent month end, visit www.thornburg.com.
The maximum sales charge for the Fund’s A shares is 1.50%. C shares include a 0.50% contingent deferred sales charge (CDSC) for the first year only.
Performance data given at net asset value (NAV) does not take into account these sales charges. If the sales charges had been included, the performance would have been lower.
Shares in the Fund carry risks, including possible loss of principal. As with direct bond ownership, Funds that invest in bonds are subject to certain risks including interest-rate risk, credit risk, and inflation risk. The principal value of bond funds will fluctuate relative to changes in interest rates, decreasing when interest rates rise. Unlike bonds, bond funds have ongoing fees and expenses. Shares in the fund are not deposits or obligations of, or guaranteed or endorsed by, any bank, the Federal Deposit Insurance Corporation, the Federal Reserve Board or any government agency.
The information presented on the following pages was current as of September 30, 2005. The manager’s views, portfolio holdings, and sector diversification are historical and subject to change. This material should not be deemed a recommendation to buy or sell any of the securities mentioned.
The matters discussed in this report may constitute forward-looking statements made pursuant to the safe harbor provisions of the Securities Litigation Reform Act of 1995. These include any advisor or portfolio manager prediction, assessment, analysis or outlook for individual securities, industries, investment styles, market sectors and/or markets. These statements involve risks and uncertainties. In addition to the general risks described for each fund in its current prospectus, other factors bearing on these reports include the accuracy of the advisor’s or portfolio manager’s forecasts and predictions, the appropriateness of the investment strategies designed by the advisor or portfolio manager and the ability of the advisor or portfolio manager to implement their strategies efficiently and successfully. Any one or more of these factors, as well as other risks affecting the securities markets generally, could cause the actual results of any fund to differ materially as compared to its benchmarks.
Glossary
The Lehman Brothers Five-Year Municipal Bond Index – A rules-based, market-value-weighted index engineered for the long-term tax-exempt bond market.To be included in the index, bonds must have a minimum credit rating of Baa.The approximate maturity of the municipal bonds in the index is five years. Unless otherwise noted, index returns reflect the reinvestment of income dividends and capital gains, if any, but do not reflect fees, brokerage commissions or other expenses of investing. Investors may not make direct investments into any index.
Duration – The measure of the price sensitivity of a fixed-income security to an interest rate change of 100 basis points. Calculation is based on the weighted average of the present values for all cash flows.
Weighted Average Maturity – A weighted average of all the effective maturities of the bonds in a portfolio. Effective maturity takes into consideration mortgage prepayments, puts, sinking funds, adjustable coupons, and other features of individual bonds and is thus a more accurate measure of interest-rate sensitivity. Longer-maturity funds are generally considered more interest-rate sensitive than their shorter counterparts.
| Certified Annual Report 5 |

George Strickland
Portfolio Manager
October 17, 2005
Dear Fellow Shareholder:
I am pleased to present the Annual Report for the Thornburg Limited Term Municipal Fund. The net asset value (NAV) of the A shares decreased by 24 cents to $13.59 during the twelve months ended September 30, 2005. If you were with us for the entire period, you received dividends of 39.9 cents per share. If you reinvested dividends, you received 40.4 cents per share. Investors who owned C shares received dividends of 36.1 and 36.6 cents per share, respectively.
Over the last twelve months, interest rates on bonds that mature in ten years or less have risen, while interest rates on long-term bonds have fallen. Higher interest rates on short-term bonds have pushed down the price of most of the bonds owned by the Fund, but have allowed us to buy new bonds at higher yields and increase the yield of the portfolio. The A shares of your Fund produced a total return of 1.16% (at NAV) over the twelve month period ended September 30, 2005, compared to a 1.45% return for the Lehman Five Year Municipal Bond Index. The Fund was over-weighted in bonds that mature in less than five years. Since the returns of those short-term bonds lagged the return of the index, the Fund’s return lagged the index slightly.
This has been an eventful year for the bond market and the world. The Federal Reserve has been steadily pushing up the target Fed Funds rate to its current level of 3.75%. Through the end of June, the bond market responded by pushing down yields on long-term bonds, thus flattening the yield curve. A flat yield curve is usually associated with a recession, but the U.S. economy is showing no signs of entering a recession. So, more recently, interest rates have been rising for both short- and long-term bonds, in more of a parallel yield curve shift. We believe that this is a more appropriate response by the market to a tightening Fed, a strong economy, and somewhat elevated levels of inflation.
Your Thornburg Limited Term Municipal Fund is a laddered portfolio of over 640 municipal obligations from 47 states. Today, your Fund’s weighted average maturity is 3.89 years. We ladder the maturity dates of the bonds in your portfolio so that some of the bonds are scheduled to mature during each of the coming years. Laddering bonds accomplishes two goals. First, the staggered bond maturities contained in a ladder defuse interest-rate risk and dampen the Fund’s price volatility. Second, laddering gives the Fund a steady cash flow stream from maturing bonds to reinvest toward the top of the ladder where yields are typically higher. The chart shown here describes the percentages of your Fund’s bond portfolio maturing in each of the coming years.
% of portfolio maturing | Cumulative % maturing | ||||||||||
1 year | = | 13.6 | % | Year 1 | = | 13.6% | |||||
1 to 2 years | = | 10.9 | % | Year 2 | = | 24.5% | |||||
2 to 3 years | = | 15.6 | % | Year 3 | = | 40.1% | |||||
3 to 4 years | = | 13.1 | % | Year 4 | = | 53.2% | |||||
4 to 5 years | = | 11.5 | % | Year 5 | = | 64.7% | |||||
5 to 6 years | = | 11.1 | % | Year 6 | = | 75.8% | |||||
6 to 7 years | = | 8.1 | % | Year 7 | = | 83.9% | |||||
7 to 8 years | = | 7.2 | % | Year 8 | = | 91.1% | |||||
8 to 9 years | = | 5.5 | % | Year 9 | = | 96.6% | |||||
Over 9 years | = | 3.4 | % | Over 9 years | = | 100.0% | |||||
Percentages can and do vary. Data as of 9/30/05.
6 Certified Annual Report |
We have watched along with the rest of the nation the horrific affects of Hurricanes Katrina and Rita, and our hearts and prayers go out to all of those suffering through the devastation of these storms.
We examined Thornburg municipal bond portfolios in the wake of both hurricanes and have found no bonds that we believe are currently threatened with default. Though the Fund has some exposure to municipal issuers in the paths of the storms, many of the bonds have alternate revenue sources such as bond insurance or financial collateral. The few bonds without alternate revenue sources have resources that we believe will see them through this calamity.
Thanks to our policy of broad diversification, issuers affected by Hurricanes Katrina and Rita make up only a small percentage of the Fund. Though the major bond insurers have significant exposure to issuers impacted by the hurricanes, we believe that, as in past disasters, insurance proceeds and government aid will limit or prevent large scale municipal defaults. The human toll and property damage from these storms is far worse than previous natural disasters and the recovery period will take longer. Furthermore, some areas of the gulf coast will never be the same. However, we do believe that most of the cities and towns will survive and have need of schools, hospitals, sewer systems, and other essential services.
Outside of the gulf coast, job growth and a strong economy continue to fill state and local coffers. State tax revenues grew 13.3% in the second quarter of 2005 from the year earlier period. This represents the fastest growth rate recorded by the Nelson Rockefeller Institute of Government since they began monitoring this statistic in 1991. However, many challenges remain. Among them are still-depleted reserve fund balances from the last recession and under funded retirement fund balances in state and local pension funds. To reduce credit risk, we have kept 90% of the portfolio in bonds rated A or above and maintained broad diversification across issuers and market sectors.
Over the years, our practice of laddering a diversified portfolio of short and intermediate maturity municipal bonds has allowed your Fund to perform consistently well in varying interest rate environments. Thank you for investing in Thornburg Limited Term Municipal Fund.
Sincerely, |
 |
George Strickland Portfolio Manager |
| Certified Annual Report 7 |
| STATEMENT OF ASSETS AND LIABILITIES | ||
| Thornburg Limited Term Municipal Fund | September 30, 2005 | |
ASSETS | ||||
Investments at value (cost $1,359,404,909) | $ | 1,383,542,486 | ||
Cash | 649,146 | |||
Receivable for investments sold | 7,791,540 | |||
Receivable for fund shares sold | 2,623,269 | |||
Interest receivable | 18,033,244 | |||
Prepaid expenses and other assets | 25,569 | |||
Total Assets | 1,412,665,254 | |||
LIABILITIES | ||||
Payable for securities purchased | 9,281,373 | |||
Payable for fund shares redeemed | 2,713,913 | |||
Payable to investment advisor and other affiliates (Note 3) | 855,368 | |||
Accounts payable and accrued expenses | 198,145 | |||
Dividends payable | 991,396 | |||
Total Liabilities | 14,040,195 | |||
NET ASSETS | $ | 1,398,625,059 | ||
NET ASSETS CONSIST OF: | ||||
Distribution in excess of net investment income | $ | (2,553 | ) | |
Net unrealized appreciation on investments | 24,135,453 | |||
Accumulated net realized gain (loss) | (6,478,505 | ) | ||
Net capital paid in on shares of beneficial interest | 1,380,970,664 | |||
| $ | 1,398,625,059 | |||
NET ASSET VALUE: | ||||
Class A Shares: | ||||
Net asset value and redemption price per share ($967,649,703 applicable to 71,193,755 shares of beneficial interest outstanding - Note 4) | $ | 13.59 | ||
Maximum sales charge, 1.50% of offering price | 0.21 | |||
Maximum offering price per share | $ | 13.80 | ||
Class C Shares: | ||||
Net asset value and offering price per share* ($140,606,588 applicable to 10,326,146 shares of beneficial interest outstanding - Note 4) | $ | 13.62 | ||
Class I Shares: | ||||
Net asset value, offering and redemption price per share ($290,368,768 applicable to 21,360,741 shares of beneficial interest outstanding - Note 4) | $ | 13.59 | ||
| * | Redemption price per share is equal to net asset value less any applicable contingent deferred sales charge. |
See notes to financial statements.
8 Certified Annual Report |
Thornburg Limited Term Municipal Fund | Year Ended September 30, 2005 |
INVESTMENT INCOME: | ||||
Interest income (net of premium amortized of $15,941,966) | $ | 53,848,175 | ||
EXPENSES: | ||||
Investment advisory fees (Note 3) | 5,743,475 | |||
Administration fees (Note 3) | ||||
Class A Shares | 1,256,590 | |||
Class C Shares | 190,990 | |||
Class I Shares | 128,213 | |||
Distribution and service fees (Note 3) | ||||
Class A Shares | 2,513,180 | |||
Class C Shares | 1,528,014 | |||
Transfer agent fees | ||||
Class A Shares | 473,925 | |||
Class C Shares | 93,435 | |||
Class I Shares | 74,455 | |||
Registration and filing fees | ||||
Class A Shares | 69,049 | |||
Class C Shares | 30,251 | |||
Class I Shares | 52,729 | |||
Custodian fees (Note 3) | 417,614 | |||
Professional fees | 79,518 | |||
Accounting fees | 146,805 | |||
Trustee fees | 20,935 | |||
Other expenses | 273,201 | |||
Total Expenses | 13,092,379 | |||
Less: | ||||
Distribution and service fees waived (Note 3) | (764,803 | ) | ||
Fees paid indirectly (Note 3) | (39,534 | ) | ||
Net Expenses | 12,288,042 | |||
Net Investment Income | 41,560,133 | |||
REALIZED AND UNREALIZED GAIN (LOSS) ON INVESTMENTS | ||||
Net realized gain (loss) on investments sold | (1,895,726 | ) | ||
Increase (decrease) in unrealized appreciation (depreciation) of investments | (23,004,183 | ) | ||
Net Realized and Unrealized Loss on Investments | (24,899,909 | ) | ||
Net Increase in Net Assets Resulting From Operations | $ | 16,660,224 | ||
See notes to financial statements.
| Certified Annual Report 9 |
STATEMENTS OF CHANGES IN NET ASSETS
Thornburg Limited Term Municipal Fund
| Year Ended September 30, 2005 | Three Months Ended September 30, 2004 | Year Ended June 30, 2004 | ||||||||||
INCREASE (DECREASE) IN NET ASSETS FROM: | ||||||||||||
OPERATIONS: | ||||||||||||
Net investment income | $ | 41,560,133 | $ | 9,853,487 | $ | 40,659,597 | ||||||
Net realized gain (loss) on investments sold | (1,895,726 | ) | 74,945 | 1,795,864 | ||||||||
Increase (Decrease) in unrealized appreciation (depreciation) of investments | (23,004,183 | ) | 16,155,302 | (36,334,816 | ) | |||||||
Net Increase (Decrease) in Net Assets Resulting from Operations | 16,660,224 | 26,083,734 | 6,120,645 | |||||||||
DIVIDENDS TO SHAREHOLDERS: | ||||||||||||
From net investment income | ||||||||||||
Class A Shares | (29,220,801 | ) | (7,133,301 | ) | (29,889,249 | ) | ||||||
Class C Shares | (4,017,994 | ) | (958,113 | ) | (3,916,198 | ) | ||||||
Class I Shares | (8,321,340 | ) | (1,762,073 | ) | (6,854,150 | ) | ||||||
FUND SHARE TRANSACTIONS (NOTE 4): | ||||||||||||
Class A Shares | (53,647,281 | ) | (20,348,137 | ) | 74,238,458 | |||||||
Class C Shares | (13,573,272 | ) | (353,019 | ) | 21,587,725 | |||||||
Class I Shares | 56,236,683 | 13,279,935 | 30,607,967 | |||||||||
Net Increase (Decrease) in Net Assets | (35,883,781 | ) | 8,809,026 | 91,895,198 | ||||||||
NET ASSETS: | ||||||||||||
Beginning of period | 1,434,508,840 | 1,425,699,814 | 1,333,804,616 | |||||||||
End of period | $ | 1,398,625,059 | $ | 1,434,508,840 | $ | 1,425,699,814 | ||||||
See notes to financial statements.
10 Certified Annual Report |
| NOTES TO FINANCIAL STATEMENTS | ||
| Thornburg Limited Term Municipal Fund | September 30, 2005 | |
NOTE 1 – ORGANIZATION
Thornburg Limited Term Municipal Fund (the “Fund”) (formerly Thornburg Limited Term Municipal Fund – National Portfolio) is a diversified series of Thornburg Investment Trust (the “Trust”). The Trust is organized as a Massachusetts business trust under a Declaration of Trust dated June 3, 1987 and is registered as a diversified, open-end management investment company under the Investment Company Act of 1940, as amended. The Trust is currently issuing eleven series of shares of beneficial interest in addition to those of the Fund: Thornburg California Limited Term Municipal Fund, Thornburg Florida Intermediate Municipal Fund, Thornburg New York Intermediate Municipal Fund, Thornburg New Mexico Intermediate Municipal Fund, Thornburg Intermediate Municipal Fund, Thornburg Limited Term U.S. Government Fund, Thornburg Limited Term Income Fund, Thornburg Value Fund, Thornburg International Value Fund, Thornburg Core Growth Fund, and Thornburg Investment Income Builder Fund. Each series is considered to be a separate entity for financial reporting and tax purposes and bears expenses directly attributable to it. The Fund’s investment objective is to obtain as high a level of current income exempt from Federal income taxes as is consistent, in the view of the Fund’s investment advisor, with the preservation of capital.
The Fund currently offers three classes of shares of beneficial interest, Class A, Class C, and Institutional Class (Class I) shares. Each class of shares of the Fund represents an interest in the same portfolio of investments, except that (i) Class A shares are sold subject to a front-end sales charge collected at the time the shares are purchased and bear a service fee, (ii) Class C shares are sold at net asset value without a sales charge at the time of purchase, but are subject to a contingent deferred sales charge upon redemption within one year, and bear both a service fee and a distribution fee, (iii) Class I shares are sold at net asset value without a sales charge at the time of purchase, and (iv) the respective classes may have different reinvestment privileges and conversion rights.
Additionally, the Fund may allocate among its classes certain expenses, to the extent applicable to specific classes, including transfer agent fees, government registration fees, certain printing and postage costs, and administrative and legal expenses. Currently, class specific expenses of the Fund are limited to service and distribution fees, administrative fees, and certain registration and transfer agent expenses.
NOTE 2 – SIGNIFICANT ACCOUNTING POLICIES
Significant accounting policies of the Trust are as follows:
Valuation of Investments: In determining the net asset value of investments, the Trust utilizes an independent pricing service approved by the Board of Trustees. Debt investment securities have a primary market over the counter and are valued on the basis of valuations furnished by the pricing service. The pricing service values portfolio securities at quoted bid prices, normally at 4:00 p.m. EST. When quotations are not readily available, securities are valued at evaluated prices as determined by the pricing service using methods which include consideration of yields or prices of municipal obligations of comparable quality, type of issue, coupon, maturity, and rating; indications as to value from dealers and general market conditions. In any case where a price is not available from a pricing service for an investment, the Trust’s valuation and pricing committee determines a fair value for the investment using factors approved by the Trustees. The valuation procedures used by the pricing service and the portfolio valuations received by the Fund are reviewed by the officers of the Trust under the general supervision of the Board of Trustees. Short-term obligations having remaining maturities of 60 days or less are valued at amortized cost, which approximates market value.
Federal Income Taxes: It is the policy of the Trust to comply with the provisions of the Internal Revenue Code applicable to “regulated investment companies” and to distribute all taxable (if any) and tax exempt income of the Fund to the shareholders. Therefore, no provision for Federal income tax is required.
When-Issued and Delayed Delivery Transactions: The Trust may engage in when-issued or delayed delivery transactions. To the extent the Trust engages in such transactions, it will do so for the purpose of acquiring portfolio securities consistent with the Fund’s investment objectives and not for the purpose of investment leverage or to speculate on interest rate and or market changes. At the time the Trust makes a commitment to purchase a security on a when-issued basis, the Fund will record the transaction and reflect the value in determining its net asset value. When effecting such transactions, assets of an amount sufficient to make payment for the portfolio securities to be purchased will be segregated on the Fund’s records on the trade date. Securities purchased on a when-issued or delayed delivery basis do not earn interest until the settlement date.
Dividends: Net investment income of the Fund is declared daily as a dividend on shares for which the Fund has received payment. Dividends are paid monthly and are reinvested in additional shares of the Fund at net asset value per share at the close of business on the dividend payment date or, at the shareholder’s option, paid in cash. Net capital gains, to the extent available, will be distributed at least annually.
General: Securities transactions are accounted for on a trade date basis. Interest income is accrued as earned. Premiums and discounts on securities purchased are amortized to call dates or maturity dates of the respective securities. Realized gains and losses from the sale of securities are recorded on an identified cost basis. Net investment income, other than class specific expenses and realized and unrealized gains and losses, is allocated daily to each class of shares based upon the relative net asset value of outstanding shares (or the value of the
| �� | Certified Annual Report 11 |
| NOTES TO FINANCIAL STATEMENTS, CONTINUED | ||
| Thornburg Limited Term Municipal Fund | September 30, 2005 | |
dividend-eligible shares, as appropriate) of each class of shares at the beginning of the day (after adjusting for the current capital shares activity of the respective class). Expenses common to all funds are allocated among the funds comprising the Trust based upon their relative net asset values or other appropriate allocation methods.
Guarantees and Indemnifications: Under the Trust’s organizational documents, its officers and Trustees are indemnified against certain liability arising out of the performance of their duties to the Fund. Additionally, in the normal course of business the Trust enters into contracts with service providers that contain general indemnification clauses. The Trust’s maximum exposure under these arrangements is unknown. However, based on experience, the Trust expects the risk of loss to be remote.
Use of Estimates: The preparation of financial statements, in conformity with generally accepted accounting principles, requires management to make estimates and assumptions that affect the reported amounts of assets and liabilities and the disclosure of contingent assets and liabilities at the date of the financial statements and the reported amounts of increases and decreases in net assets from operations during the reporting period. Actual results could differ from those estimates.
NOTE 3 – INVESTMENT ADVISORY FEE AND OTHER TRANSACTIONS WITH AFFILIATES
Pursuant to an Investment Advisory Agreement, Thornburg Investment Management, Inc.® (the “Advisor”) serves as the investment advisor and performs services for which the fees are payable at the end of each month. For the year ended September 30, 2005, these fees were payable at annual rates ranging from .50 of 1% to .225 of 1% per annum of the average daily net assets of the Fund. The Trust also has entered into an Administrative Services Agreement with the Advisor, whereby the Advisor will perform certain administrative services for the shareholders of each class of the Fund’s shares, and for which fees will be payable at an annual rate of up to .125 of 1% per annum of the average daily net assets attributable to each class of shares.
The Trust has an underwriting agreement with Thornburg Securities Corporation® (the “Distributor”, an affiliate of the Advisor), which acts as the Distributor of Fund shares. For the year ended September 30, 2005, the Distributor has advised the Fund that it earned commissions aggregating $10,258 from the sale of Class A shares, and collected contingent deferred sales charges aggregating $15,616 from redemptions of Class C shares of the Fund.
Pursuant to a Service Plan under Rule 12b-1 of the Investment Company Act of 1940, the Fund may reimburse to the Advisor amounts not to exceed .25 of 1% per annum of the average daily net assets attributable to each class of shares of the Fund for payments made by the Advisor to securities dealers and other persons for distribution of the Fund’s shares and to obtain various shareholder related services. The Advisor may pay out of its own resources additional expenses for distribution of the Fund’s shares.
The Trust has also adopted a Distribution Plan pursuant to Rule 12b-1, applicable only to the Fund’s Class C shares under which the Fund compensates the Distributor for services in promoting the sale of Class C shares of the Fund at an annual rate of up to .75 of 1% per annum of the average daily net assets attributable to Class C shares. Total fees incurred by each class of shares of the Fund under their respective service and distribution plans and Class C distribution fees waived by the Distributor for the year ended September 30, 2005, are set forth in the Statement of Operations. Distribution fees in the amount of $764,803 were waived for Class C shares.
The Trust has an agreement with the custodian bank to indirectly pay a portion of the custodian’s fees through credits earned by the Fund’s cash on deposit with the bank. This deposit agreement is an alternative to overnight investments. Custodial fees have been adjusted to reflect amounts that would have been paid without this agreement, with a corresponding adjustment reflected as fees paid indirectly in the Statement of Operations. For the year ended September 30, 2005, fees paid indirectly were $39,534.
Certain officers and Trustees of the Trust are also officers and/or Directors of the Advisor and Distributor. The compensation of independent Trustees is borne by the Trust.
12 Certified Annual Report |
| NOTES TO FINANCIAL STATEMENTS, CONTINUED | ||
| Thornburg Limited Term Municipal Fund | September 30, 2005 | |
NOTE 4 – SHARES OF BENEFICIAL INTEREST
At September 30, 2005, there were an unlimited number of shares of beneficial interest authorized. Transactions in shares of beneficial interest were as follows:
Year Ended September 30, 2005 | Three Months Ended September 30, 2004 | Year Ended June 30, 2004 | |||||||||||||||||||
| Shares | Amount | Shares | Amount | Shares | Amount | ||||||||||||||||
Class A Shares | |||||||||||||||||||||
Shares sold | 10,112,925 | $ | 138,664,895 | 2,652,124 | $ | 36,597,200 | 22,343,137 | $ | 310,234,300 | ||||||||||||
Shares issued to shareholders in reinvestment of dividends | 1,429,462 | 19,572,574 | 335,506 | 4,631,084 | 1,399,170 | 19,393,497 | |||||||||||||||
Shares repurchased | (15,463,654 | ) | (211,884,750 | ) | (4,457,299 | ) | (61,576,421 | ) | (18,441,220 | ) | (255,389,339 | ) | |||||||||
Net Increase (Decrease) | (3,921,267 | ) | $ | (53,647,281 | ) | (1,469,669 | ) | $ | (20,348,137 | ) | 5,301,087 | $ | 74,238,458 | ||||||||
Class C Shares | |||||||||||||||||||||
Shares sold | 1,853,494 | $ | 25,470,518 | 506,589 | $ | 7,003,493 | 4,814,111 | $ | 66,984,540 | ||||||||||||
Shares issued to shareholders in reinvestment of dividends | 198,591 | 2,724,023 | 46,675 | 645,678 | 194,692 | 2,704,058 | |||||||||||||||
Shares repurchased | (3,045,634 | ) | (41,767,813 | ) | (578,793 | ) | (8,002,190 | ) | (3,462,370 | ) | (48,100,873 | ) | |||||||||
Net Increase (Decrease) | (993,549 | ) | $ | (13,573,272 | ) | (25,529 | ) | $ | (353,019 | ) | 1,546,433 | $ | 21,587,725 | ||||||||
Class I Shares | |||||||||||||||||||||
Shares sold | 8,961,752 | $ | 122,650,992 | 1,826,487 | $ | 25,227,726 | 8,616,079 | $ | 119,652,434 | ||||||||||||
Shares issued to shareholders in reinvestment of dividends | 501,520 | 6,865,525 | 104,786 | 1,446,479 | 394,435 | 5,468,468 | |||||||||||||||
Shares repurchased | (5,348,315 | ) | (73,279,834 | ) | (970,031 | ) | (13,394,270 | ) | (6,808,603 | ) | (94,512,935 | ) | |||||||||
Net Increase (Decrease) | 4,114,957 | $ | 56,236,683 | 961,242 | $ | 13,279,935 | 2,201,911 | $ | 30,607,967 | ||||||||||||
NOTE 5 – SECURITIES TRANSACTIONS
For the year ended September 30, 2005, the Fund had purchase and sale transactions of investment securities (excluding short-term investments) of $420,714,063 and $381,321,057, respectively.
NOTE 6 – INCOME TAXES
At September 30, 2005, information on the tax components of capital is as follows:
Cost of investments for tax purposes | $ | 1,359,409,800 | ||
Gross unrealized appreciation on a tax basis | $ | 27,475,568 | ||
Gross unrealized depreciation on a tax basis | (3,342,882 | ) | ||
Net unrealized appreciation (depreciation) on investments (tax basis) | $ | 24,132,686 | ||
At September 30, 2005, the Fund did not have any undistributed tax-exempt/ordinary net income or undistributed capital gains.
At September 30, 2005, the Fund had tax basis capital losses, which may be carried over to offset future capital gains. To the extent such carry forwards are used, capital gain distributions may be reduced to the extent provided by regulations.
Such capital loss carryovers expire as follows:
2007 | $ | 1,013,153 | |
2008 | 3,565,103 | ||
2013 | 30,614 | ||
| $ | 4,608,870 | ||
As of September 30, 2005, the Fund had deferred capital losses occurring subsequent to October 31, 2004 of $1,864,744. For tax purposes, such losses will be reflected in the year ending September 30, 2006.
In order to account for permanent book/tax differences, the Fund increased net investment loss by $922 and decreased accumulated net realized investment loss by $922. This reclassification has no impact on the net asset value of the Fund. Reclassifications result primarily from market discount.
All dividends paid by the Fund for the year ended September 30, 2005, period ended September 30, 2004, and the year ended June 30, 2004, represent exempt interest dividends, which are excludable by shareholders from gross income for Federal income tax purposes.
| Certified Annual Report 13 |
Thornburg Limited Term Municipal Fund
| Year Ended Sept. 30, 2005 | 3 Months Sept. 30, | Year Ended June 30, | ||||||||||||||||||||||
| 2004 | 2003 | 2002 | 2001 | |||||||||||||||||||||
Class A Shares: | ||||||||||||||||||||||||
PER SHARE PERFORMANCE | ||||||||||||||||||||||||
(for a share outstanding throughout the period) | ||||||||||||||||||||||||
Net asset value, beginning of period | $ | 13.83 | $ | 13.68 | $ | 14.01 | $ | 13.65 | $ | 13.44 | $ | 13.06 | ||||||||||||
Income from investment operations: | ||||||||||||||||||||||||
Net investment income | 0.40 | 0.09 | 0.40 | 0.45 | 0.52 | 0.58 | ||||||||||||||||||
Net realized and unrealized gain (loss) on investments | (0.24 | ) | 0.15 | (0.33 | ) | 0.36 | 0.21 | 0.38 | ||||||||||||||||
Total from investment operations | 0.16 | 0.24 | 0.07 | 0.81 | 0.73 | 0.96 | ||||||||||||||||||
Less dividends from: | ||||||||||||||||||||||||
Net investment income | (0.40 | ) | (0.09 | ) | (0.40 | ) | (0.45 | ) | (0.52 | ) | (0.58 | ) | ||||||||||||
Change in net asset value | (0.24 | ) | 0.15 | (0.33 | ) | 0.36 | 0.21 | 0.38 | ||||||||||||||||
NET ASSET VALUE, end of period | $ | 13.59 | $ | 13.83 | $ | 13.68 | $ | 14.01 | $ | 13.65 | $ | 13.44 | ||||||||||||
RATIOS/SUPPLEMENTAL DATA | ||||||||||||||||||||||||
Total return(a) | 1.16 | % | 1.78 | % | 0.47 | % | 5.99 | % | 5.54 | % | 7.49 | % | ||||||||||||
Ratios to average net assets: | ||||||||||||||||||||||||
Net investment income | 2.91 | % | 2.69 | %(b) | 2.85 | % | 3.20 | % | 3.83 | % | 4.36 | % | ||||||||||||
Expenses, after expense reductions | 0.90 | % | 0.89 | %(b) | 0.91 | % | 0.93 | % | 0.95 | % | 0.99 | % | ||||||||||||
Expenses, after expense reductions and net of custody credits | 0.90 | % | 0.89 | %(b) | 0.91 | % | 0.93 | % | 0.95 | % | — | |||||||||||||
Expenses, before expense reductions | 0.90 | % | 0.89 | %(b) | 0.91 | % | 0.93 | % | 0.96 | % | 0.99 | % | ||||||||||||
Portfolio turnover rate | 27.80 | % | 4.57 | % | 21.37 | % | 15.81 | % | 19.59 | % | 25.37 | % | ||||||||||||
Net assets at end of period (000) | $ | 967,650 | $ | 1,039,050 | $ | 1,047,482 | $ | 998,878 | $ | 785,145 | $ | 654,157 | ||||||||||||
| (a) | Sales loads are not reflected in computing total return, which is not annualized for periods less than one year. |
| (b) | Annualized. |
| (c) | The Fund’s fiscal year-end changed to September 30. |
14 Certified Annual Report |
FINANCIAL HIGHLIGHTS, CONTINUED
Thornburg Limited Term Municipal Fund
| Year Ended Sept. 30, 2005 | 3 Months Ended Sept. 30, 2004(c) | Year Ended June 30, | ||||||||||||||||||||||
| 2004 | 2003 | 2002 | 2001 | |||||||||||||||||||||
Class C Shares: | ||||||||||||||||||||||||
PER SHARE PERFORMANCE | ||||||||||||||||||||||||
(for a share outstanding throughout the period) | ||||||||||||||||||||||||
Net asset value, beginning of period | $ | 13.86 | $ | 13.70 | $ | 14.04 | $ | 13.67 | $ | 13.46 | $ | 13.08 | ||||||||||||
Income from investment operations: | ||||||||||||||||||||||||
Net investment income | 0.36 | 0.08 | 0.36 | 0.41 | 0.47 | 0.53 | ||||||||||||||||||
Net realized and unrealized gain (loss) on investments | (0.24 | ) | 0.16 | (0.34 | ) | 0.37 | 0.21 | 0.38 | ||||||||||||||||
Total from investment operations | 0.12 | 0.24 | 0.02 | 0.78 | 0.68 | 0.91 | ||||||||||||||||||
Less dividends from: | ||||||||||||||||||||||||
Net investment income | (0.36 | ) | (0.08 | ) | (0.36 | ) | (0.41 | ) | (0.47 | ) | (0.53 | ) | ||||||||||||
Change in net asset value | (0.24 | ) | 0.16 | (0.34 | ) | 0.37 | 0.21 | 0.38 | ||||||||||||||||
NET ASSET VALUE, end of period | $ | 13.62 | $ | 13.86 | $ | 13.70 | $ | 14.04 | $ | 13.67 | $ | 13.46 | ||||||||||||
RATIOS/SUPPLEMENTAL DATA | ||||||||||||||||||||||||
Total return(a) | 0.89 | % | 1.79 | % | 0.12 | % | 5.78 | % | 5.13 | % | 7.07 | % | ||||||||||||
Ratios to average net assets: | ||||||||||||||||||||||||
Net investment income | 2.63 | % | 2.43 | %(b) | 2.56 | % | 2.89 | % | 3.42 | % | 3.96 | % | ||||||||||||
Expenses, after expense reductions | 1.18 | % | 1.15 | %(b) | 1.19 | % | 1.18 | % | 1.33 | % | 1.38 | % | ||||||||||||
Expenses, after expense reductions and net of custody credits | 1.18 | % | 1.15 | %(b) | 1.19 | % | 1.18 | % | 1.33 | % | — | |||||||||||||
Expenses, before expense reductions | 1.68 | % | 1.65 | %(b) | 1.69 | % | 1.68 | % | 1.80 | % | 1.85 | % | ||||||||||||
Portfolio turnover rate | 27.80 | % | 4.57 | % | 21.37 | % | 15.81 | % | 19.59 | % | 25.37 | % | ||||||||||||
Net assets at end of period (000) | $ | 140,606 | $ | 156,870 | $ | 155,458 | $ | 137,559 | $ | 57,258 | $ | 24,773 | ||||||||||||
| (a) | Not annualized for periods less than one year. |
| (b) | Annualized. |
| (c) | The Fund’s fiscal year-end changed to September 30. |
| Certified Annual Report 15 |
FINANCIAL HIGHLIGHTS, CONTINUED
Thornburg Limited Term Municipal Fund
| Year Ended Sept. 30, 2005 | 3 Months Ended Sept. 30, 2004(c) | Year Ended June 30, | ||||||||||||||||||||||
| 2004 | 2003 | 2002 | 2001 | |||||||||||||||||||||
Class I Shares: | ||||||||||||||||||||||||
PER SHARE PERFORMANCE | ||||||||||||||||||||||||
(for a share outstanding throughout the period) | ||||||||||||||||||||||||
Net asset value, beginning of period | $ | 13.83 | $ | 13.68 | $ | 14.01 | $ | 13.65 | $ | 13.44 | $ | 13.06 | ||||||||||||
Income from investment operations: | ||||||||||||||||||||||||
Net investment income | 0.44 | 0.11 | 0.44 | 0.49 | 0.57 | 0.63 | ||||||||||||||||||
Net realized and unrealized gain (loss) on investments | (0.24 | ) | 0.15 | (0.33 | ) | 0.36 | 0.21 | 0.38 | ||||||||||||||||
Total from investment operations | 0.20 | 0.26 | 0.11 | 0.85 | 0.78 | 1.01 | ||||||||||||||||||
Less dividends from: | ||||||||||||||||||||||||
Net investment income | (0.44 | ) | (0.11 | ) | (0.44 | ) | (0.49 | ) | (0.57 | ) | (0.63 | ) | ||||||||||||
Change in net asset value | (0.24 | ) | 0.15 | (0.33 | ) | 0.36 | 0.21 | 0.38 | ||||||||||||||||
NET ASSET VALUE, end of period | $ | 13.59 | $ | 13.83 | $ | 13.68 | $ | 14.01 | $ | 13.65 | $ | 13.44 | ||||||||||||
RATIOS/SUPPLEMENTAL DATA | ||||||||||||||||||||||||
Total return(a) | 1.50 | % | 1.87 | % | 0.80 | % | 6.36 | % | 5.91 | % | 7.91 | % | ||||||||||||
Ratios to average net assets: | ||||||||||||||||||||||||
Net investment income | 3.25 | % | 3.02 | %(b) | 3.18 | % | 3.54 | % | 4.18 | % | 4.75 | % | ||||||||||||
Expenses, after expense reductions | 0.57 | % | 0.55 | %(b) | 0.57 | % | 0.58 | % | 0.60 | % | 0.60 | % | ||||||||||||
Expenses, after expense reductions and net of custody credits | 0.57 | % | 0.55 | %(b) | 0.57 | % | 0.58 | % | 0.60 | % | — | |||||||||||||
Expenses, before expense reductions | 0.57 | % | 0.55 | %(b) | 0.57 | % | 0.58 | % | 0.62 | % | 0.65 | % | ||||||||||||
Portfolio turnover rate | 27.80 | % | 4.57 | % | 21.37 | % | 15.81 | % | 19.59 | % | 25.37 | % | ||||||||||||
Net assets at end of period (000) | $ | 290,369 | $ | 238,589 | $ | 222,760 | $ | 197,367 | $ | 123,652 | $ | 86,160 | ||||||||||||
| (a) | Not annualized for periods less than one year. |
| (b) | Annualized. |
| (c) | The Fund’s fiscal year-end changed to September 30. |
16 Certified Annual Report |
| SCHEDULE OF INVESTMENTS | ||
| Thornburg Limited Term Municipal Fund | September 30, 2005 | |
CUSIPS: CLASS A - 885-215-459, CLASS C - 885-215-442, CLASS I - 885-215-434
NASDAQ SYMBOLS: CLASS A - LTMFX, CLASS C - LTMCX, CLASS I - LTMIX
Issuer-Description | Credit Rating† Moody’s/S&P | Principal Amount | Value | |||||
ARIZONA — 1.07% | ||||||||
Arizona State Transportation Board Grant Anticipation Notes Series A, 5.00% due 7/1/2009 | Aa3/AA- | $ | 2,500,000 | $ | 2,657,825 | |||
Maricopa County Arizona School District 97, 5.50% due 7/1/2008 (Insured: FGIC) | Aaa/NR | 650,000 | 691,002 | |||||
Maricopa County School District 008, 7.50% due 7/1/2008 (Insured: MBIA) | A1/AAA | 1,000,000 | 1,112,510 | |||||
Mohave County Industrial Development Authority Correctional Facilities Contract Revenue Series A, 5.00% due 4/1/2009 (Mohave Prison LLC Project; Insured: XLCA) | NR/AAA | 4,595,000 | 4,845,198 | |||||
Mohave County Industrial Development Authority Series A, 5.00% due 4/1/2014 (Mohave Prison LLC Project; Insured: XLCA) | NR/AAA | 3,135,000 | 3,375,486 | |||||
Pima County Industrial Development Authority Education Revenue Series C, 6.40% due 7/1/2013 (Arizona Charter Schools Project) | Baa3/NR | 1,000,000 | 1,070,180 | |||||
Pima County Industrial Development Authority Industrial Revenue Refunding Lease Obligation A, 7.25% due 7/15/2010 (Insured: FSA) | Aaa/AAA | 570,000 | 585,447 | |||||
Tucson Water Revenue Series D, 9.75% due 7/1/2008 | Aa3/A+ | 500,000 | 585,015 | |||||
ALABAMA — 1.78% | ||||||||
Birmingham Carraway Alabama Special, 6.25% due 8/15/2009 (Insured: Connie Lee) | NR/AAA | 10,000,000 | 10,599,900 | |||||
Huntsville Health Care Authority Series A, 5.00% due 6/1/2013 (Insured: MBIA) | Aaa/AAA | 2,000,000 | 2,142,460 | |||||
Scottsboro Industrial Development Board Refunding, 5.25% due 5/1/2009 (LOC: PNC Bank) | NR/NR | 1,920,000 | 1,933,517 | |||||
West Jefferson Industrial Development, 2.90% due 6/1/2028 put 10/3/2005 (Alabama Power Co. Project) (daily demand notes) | VMIG1/A-1 | 1,200,000 | 1,200,000 | |||||
Wilsonville Industrial Development Board Pollution Control Revenue Refunding, 4.20% due 6/1/2019 put 6/1/2006 (Southern Electric Gaston Project; Insured: AMBAC) | Aaa/AAA | 8,955,000 | 9,014,013 | |||||
ALASKA — 0.53% | ||||||||
Alaska Energy Authority Power Revenue Refunding Third Series, 6.00% due 7/1/2008 (Bradley Lake Project; Insured: FSA) | Aaa/AAA | 2,800,000 | 3,005,632 | |||||
Alaska Student Loan Corp. Revenue Series A, 5.25% due 1/1/2012 (Capital Project; Insured: FSA) | NR/AAA | 3,000,000 | 3,283,560 | |||||
Anchorage Ice Rink Revenue, 6.375% due 1/1/2020 pre-refunded 7/1/2010 | NR/NR | 1,000,000 | 1,122,950 | |||||
ARKANSAS — 0.52% | ||||||||
Conway Electric Revenue Refunding, 5.00% due 8/1/2007 | A2/NR | 2,000,000 | 2,062,420 | |||||
Jefferson County Hospital Revenue Refunding & Improvement, 5.50% due 6/1/2010 (Regional Medical Center Project) | NR/A | 1,000,000 | 1,079,740 | |||||
Jefferson County Hospital Revenue Refunding & Improvement, 5.50% due 6/1/2011 (Regional Medical Center Project) | NR/A | 1,075,000 | 1,168,385 | |||||
Little Rock Hotel & Restaurant Gross Receipts Tax Refunding, 7.125% due 8/1/2009 | A3/NR | 2,645,000 | 2,892,123 | |||||
CALIFORNIA — 2.33% | ||||||||
Bay Area Government Association Rapid Transit, 4.875% due 6/15/2009 (Insured: AMBAC) | Aaa/AAA | 620,000 | 621,023 | |||||
California Health Facilities Financing Authority Revenue Series 83 C, 9.25% due 12/1/2006 (Mercy Health Care Project) (ETM) | Aaa/AAA | 1,600,000 | 1,715,840 | |||||
California Health Facilities Financing Authority Revenue Series B Refunding, 5.25% due 10/1/2013 (Kaiser Permanente Project) (ETM) | A3/AAA | 2,620,000 | 2,793,313 | |||||
California State Department of Water Resources Power Supply Series A, 5.50% due 5/1/2008 | A2/BBB+ | 2,050,000 | 2,163,098 | |||||
California State Department of Water Resources Power Supply Series A, 5.50% due 5/1/2012 | A2/BBB+ | 2,600,000 | 2,869,178 | |||||
California State Department of Water Resources Power Supply Series A, 6.00% due 5/1/2013 | A2/BBB+ | 2,550,000 | 2,896,316 | |||||
California State Series A-3, 2.77% due 5/1/2033 put 10/3/2005 (daily demand notes) | VMIG1/A-1+ | 500,000 | 500,000 | |||||
| Certified Annual Report 17 |
| SCHEDULE OF INVESTMENTS, CONTINUED | ||
| Thornburg Limited Term Municipal Fund | September 30, 2005 | |
Issuer-Description | Credit Rating† Moody’s/S&P | Principal Amount | Value | |||||
California Statewide Community Development Authority Revenue Series D, 4.35% due 11/1/2036 put 3/1/2007 (Kaiser Permanente Project) | VMIG2/A-1 | $ | 2,000,000 | $ | 2,030,420 | |||
Central Valley Financing Authority Revenue, 6.00% due 7/1/2009 (Carson Ice Project) | NR/BBB | 500,000 | 508,950 | |||||
Metropolitan Water District Series B-3, 2.77% due 7/1/2035 put 10/3/2005 (daily demand notes) | VMIG1/A-1+ | 1,500,000 | 1,500,000 | |||||
Northern California Power Agency Public Power Revenue Series A, 5.00% due 7/1/2009 (Geothermal Project Number 3) | Baa2/BBB+ | 6,100,000 | 6,106,893 | |||||
Sacramento County Sanitation District Financing Authority Revenue Series A, 5.875% due 12/1/2027 Crossover refunded 12/1/2005 | Aa3/AA | 2,500,000 | 2,536,800 | |||||
San Jose Financing Authority Lease Revenue Series D, 5.00% due 6/1/2039 mandatory put 6/1/2006 (Civic Center Project; Insured: AMBAC) | Aaa/AAA | 3,000,000 | 3,042,600 | |||||
Santa Clara Valley Transportation Authority Sales Tax Revenue Measure A, 4.00% due 4/1/2036 put 10/2/2006 (Insured: AMBAC) | Aaa/AAA | 1,000,000 | 1,012,830 | |||||
Torrance Hospital Revenue Series A, 7.10% due 12/1/2015 pre-refunded 12/1/2005 (Little Co. of Mary Hospital Project) | NR/AAA | 1,305,000 | 1,314,487 | |||||
Tri City Hospital District Revenue Refunding Series B, 6.00% due 2/15/2006 (Insured: MBIA) | Aaa/AAA | 1,000,000 | 1,011,650 | |||||
COLORADO — 4.08% | ||||||||
Adams County Communication Center Series A, 4.75% due 12/1/2006 | Baa1/NR | 1,025,000 | 1,033,723 | |||||
Adams County Revenue Platte Valley Medical Center, 5.00% due 2/1/2012 (Insured: FHA, MBIA) | NR/AAA | 1,310,000 | 1,407,412 | |||||
Adams County Revenue Platte Valley Medical Center, 5.00% due 8/1/2012 (Insured: FHA, MBIA) | NR/AAA | 1,345,000 | 1,449,950 | |||||
Adams County Revenue Platte Valley Medical Center, 5.00% due 2/1/2013 (Insured: FHA, MBIA) | NR/AAA | 1,380,000 | 1,483,721 | |||||
Adams County Revenue Platte Valley Medical Center, 5.00% due 8/1/2013 (Insured: FHA, MBIA) | NR/AAA | 1,420,000 | 1,529,993 | |||||
Adams County Revenue Platte Valley Medical Center, 5.00% due 2/1/2015 (Insured: FHA, MBIA) | NR/AAA | 1,530,000 | 1,649,019 | |||||
Adams County Revenue Platte Valley Medical Center, 5.00% due 8/1/2015 (Insured: FHA, MBIA) | NR/AAA | 1,565,000 | 1,689,558 | |||||
Adams County School District 012 Series A, 4.375% due 12/15/2007 | Aa3/AA- | 1,000,000 | 1,028,740 | |||||
Central Platte Valley Metropolitan District Refunding Series A, 5.00% due 12/1/2031 put 12/1/2009 (LOC: US Bank) | NR/A-1 | 12,200,000 | 12,820,004 | |||||
Colorado Department of Transport Revenue Anticipation Notes, 6.00% due 6/15/2008 (Insured: AMBAC) | Aaa/AAA | 1,500,000 | 1,611,840 | |||||
Colorado Educational & Cultural Facilities, 4.90% due 4/1/2008 (Nashville Public Radio Project) | NR/BBB+ | 1,000,000 | 1,019,480 | |||||
Colorado Health Facilities Authority, 5.00% due 9/1/2007 (Catholic Health Initiatives Project) | Aa2/AA | 5,705,000 | 5,894,863 | |||||
Colorado Health Facilities Authority Series A, 5.375% due 12/1/2009 (Catholic Health Initiatives Project) | Aa2/AA | 515,000 | 545,658 | |||||
Colorado Housing Finance Authority, 5.25% due 10/1/2007 | A1/AA+ | 80,000 | 80,624 | |||||
Colorado Springs Utilities Revenue Systems Subordinated Lien Refunding & Improvement Series A, 5.00% due 11/15/2005 | Aa2/AA | 2,230,000 | 2,235,976 | |||||
Denver City & County COP Series A, 5.50% due 5/1/2006 (Insured: MBIA) | Aaa/AAA | 500,000 | 507,720 | |||||
Denver Convention Center Senior Series A, 5.00% due 12/1/2011 (Insured: XLCA) | Aaa/AAA | 3,335,000 | 3,588,227 | |||||
El Paso County School District Number 49 Series A, 6.00% due 12/1/2009 (Insured: FSA) | Aaa/AAA | 1,000,000 | 1,084,040 | |||||
Highlands Ranch Metro District 2 GO, 6.50% due 6/15/2012 (Insured: FSA) | Aaa/AAA | 1,000,000 | 1,172,830 | |||||
Highlands Ranch Metropolitan District 3 Refunding Series B, 5.25% due 12/1/2008 (Insured: ACA) | NR/A | 1,760,000 | 1,845,466 | |||||
Highlands Ranch Metropolitan District 3 Series A, 5.25% due 12/1/2008 (Insured: ACA) | NR/A | 1,520,000 | 1,593,811 | |||||
Lakewood COP, 4.40% due 12/1/2008 (Insured: MBIA) | Aaa/AAA | 1,000,000 | 1,035,340 | |||||
Metropolitan Football Stadium District Colorado Sales Tax Revenue Capital Appreciation Series A, 0% due 1/1/2008 (Insured: MBIA) | Aaa/AAA | 1,025,000 | 953,834 | |||||
Pinery West Metropolitan District 3, 4.70% due 12/1/2021 put 12/1/2007 (LOC: Compass Bank) | NR/A-2 | 970,000 | 986,412 | |||||
Plaza Metropolitan District 1 Revenue, 7.60% due 12/1/2016 (Public Improvement Fee/Tax Increment Project) | NR/NR | 6,000,000 | 6,621,120 | |||||
Regional Transportation District of Colorado Series A, 5.00% due 6/1/2009 (Transit Vehicles Project; Insured: AMBAC) | Aaa/AAA | 1,000,000 | 1,059,320 | |||||
Southland Metropolitan District Number 1 unlimited GO, 6.75% due 12/1/2016 | NR/NR | 1,000,000 | 1,095,770 | |||||
CONNECTICUT — 0.12% | ||||||||
Bridgeport GO, 6.00% due 3/1/2006 (Insured: AMBAC) | Aaa/AAA | 1,325,000 | 1,342,397 | |||||
18 Certified Annual Report |
| SCHEDULE OF INVESTMENTS, CONTINUED | ||
| Thornburg Limited Term Municipal Fund | September 30, 2005 | |
Issuer-Description | Credit Rating† Moody’s/S&P | Principal Amount | Value | |||||
Capitol Region Education Council, 6.375% due 10/15/2005 | NR/BBB | $ | 350,000 | $ | 350,378 | |||
DELAWARE — 0.53% | ||||||||
Delaware State Economic Development Authority Revenue, 5.50% due 7/1/2025 put 7/1/2010 (Delmarva Power & Light Project) | Baa1/BBB | 2,045,000 | 2,151,565 | |||||
Delaware State Health Facilities Authority Revenue, 6.25% due 10/1/2006 (ETM) | Aaa/AAA | 845,000 | 848,194 | |||||
Delaware State Health Facilities Authority Revenue Series A, 5.25% due 6/1/2011 (Beebe Medical Center Project) | Baa1/BBB+ | 1,275,000 | 1,359,584 | |||||
Delaware State Health Facilities Authority Revenue Series A, 5.25% due 5/1/2012 (Nanticoke Memorial Hospital Project; Insured: Radian) | NR/AA | 1,370,000 | 1,474,572 | |||||
Delaware State Health Facilities Authority Revenue Series A, 5.25% due 5/1/2013 (Nanticoke Memorial Hospital Project; Insured: Radian) | NR/AA | 1,445,000 | 1,542,595 | |||||
DISTRICT OF COLUMBIA — 2.01% | ||||||||
District of Columbia, 5.50% due 6/1/2008 (Insured: AMBAC) | Aaa/AAA | 1,915,000 | 2,027,602 | |||||
District of Columbia COP, 5.00% due 1/1/2008 (Public Safety & Emergency Project; Insured: AMBAC) | Aaa/AAA | 1,000,000 | 1,039,440 | |||||
District of Columbia COP, 5.25% due 1/1/2013 (Insured: AMBAC) | Aaa/AAA | 5,950,000 | 6,444,980 | |||||
District of Columbia Hospital Revenue, 5.70% due 8/15/2008 (Medlantic Healthcare Project) (ETM) | Aaa/AAA | 4,430,000 | 4,618,674 | |||||
District of Columbia Hospital Revenue Refunding, 5.10% due 8/15/2008 (Medlantic Healthcare Group A Project) (ETM) | Aaa/AAA | 1,500,000 | 1,567,965 | |||||
District of Columbia Revenue, 5.50% due 10/1/2005 (Insured: MBIA) | Aaa/AAA | 500,000 | 500,035 | |||||
District of Columbia Revenue, 6.00% due 1/1/2007 (American Assoc. for Advancement of Science Project; Insured: AMBAC) | Aaa/AAA | 500,000 | 517,780 | |||||
District of Columbia Revenue, 6.00% due 1/1/2009 (American Assoc. for Advancement of Science Project; Insured: AMBAC) | Aaa/AAA | 1,000,000 | 1,082,250 | |||||
District of Columbia Series A, 5.50% due 6/1/2009 (Insured: MBIA) | Aaa/AAA | 4,700,000 | 5,056,072 | |||||
District of Columbia Tax Increment Capital Appreciation, 0% due 7/1/2009 (Mandarin Oriental Project; Insured: FSA) | Aaa/AAA | 2,000,000 | 1,752,580 | |||||
District of Columbia Tax Increment Capital Appreciation, 0% due 7/1/2011 (Mandarin Oriental Project; Insured: FSA) | Aaa/AAA | 1,990,000 | 1,595,303 | |||||
District of Columbia Tax Increment Capital Appreciation, 0% due 7/1/2012 (Mandarin Oriental Project; Insured: FSA) | Aaa/AAA | 1,480,000 | 1,130,439 | |||||
Washington DC Convention Center Authority Dedicated Tax Revenue, 5.00% due 10/1/2006 (Insured: AMBAC) | Aaa/AAA | 750,000 | 765,233 | |||||
FLORIDA — 5.98% | ||||||||
Broward County Resource Recovery Revenue Refunding, 5.375% due 12/1/2009 (Wheelabrator South Project) | A3/AA | 5,000,000 | 5,327,650 | |||||
Capital Projects Finance Authority Student Housing, 5.50% due 10/1/2012 (Capital Projects Student Housing; Insured: MBIA) | Aaa/AAA | 1,000,000 | 1,091,460 | |||||
Crossings at Fleming Island Community Development Refunding Series B, 5.45% due 5/1/2010 (Insured: MBIA) | Aaa/AAA | 2,996,000 | 3,172,345 | |||||
Dade County Solid Waste Systems Special Obligation Revenue Refunding, 6.00% due 10/1/2007 (Insured: AMBAC) | Aaa/AAA | 7,000,000 | 7,398,230 | |||||
Escambia County Health Facilities Revenue Baptist Hospital Baptist Manor, 5.125% due 10/1/2014 | A3/BBB+ | 2,755,000 | 2,842,251 | |||||
Florida Housing Finance Corp. Multifamily Housing Charleston Series I A, 2.75% due 7/1/2031 put 10/3/2005 (daily demand notes) | NR/A-1+ | 1,600,000 | 1,600,000 | |||||
Florida State Refunding, 6.00% due 7/1/2006 (Department of Transportation Right of Way Project) | Aa1/AAA | 1,465,000 | 1,498,944 | |||||
Gulf Breeze Florida Revenue Local Government Series C, 4.00% due 12/1/2015 put 12/1/2007 (Insured: FGIC) | Aaa/AAA | 1,900,000 | 1,915,808 | |||||
| Certified Annual Report 19 |
| SCHEDULE OF INVESTMENTS, CONTINUED | ||
| Thornburg Limited Term Municipal Fund | September 30, 2005 | |
Issuer-Description | Credit Rating† | Principal Amount | Value | |||||
Gulf Breeze Florida Revenue Local Government Series E, 4.00% due 12/1/2020 put 12/1/2007 (Insured: FGIC) | Aaa/AAA | $ | 2,170,000 | $ | 2,188,054 | |||
Hillsborough County Industrial Development Authority, 5.10% due 10/1/2013 (Tampa Electric Co. Project) | Baa2/BBB- | 6,000,000 | 6,318,720 | |||||
Jacksonville Electric St. John’s River Park Systems Revenue Refunding Issue-2 17th Series, 5.25% due 10/1/2012 | Aa2/AA- | 5,000,000 | 5,438,450 | |||||
Miami Dade County School Board COP Series A, 5.00% due 5/1/2006 (Insured: MBIA) | Aaa/AAA | 1,910,000 | 1,933,588 | |||||
Miami Dade County School Board COP Series B, 5.50% due 5/1/2031 put 5/1/2011 (Insured: MBIA) | Aaa/AAA | 1,010,000 | 1,105,920 | |||||
Miami Dade County School Board COP Series C, 5.00% due 8/1/2007 (Insured: MBIA) | Aaa/AAA | 3,390,000 | 3,511,769 | |||||
Miami Dade County Special Housing Revenue Refunding, 5.80% due 10/1/2012 (HUD Section 8) | Baa3/NR | 3,560,000 | 3,448,714 | |||||
Orange County Health Facilities Authority, 5.80% due 11/15/2009 (Adventist Health System Project) | A2/A+ | 1,395,000 | 1,526,995 | |||||
Orange County Health Facilities Authority Revenue Refunding, 6.25% due 11/15/2008 (Adventist Health Systems Project; Insured: AMBAC) | Aaa/AAA | 3,120,000 | 3,194,412 | |||||
Orange County Health Facilities Authority Revenue Unrefunded Balance Series A, 6.25% due 10/1/2007 (Orlando Regional Hospital Project; Insured: MBIA) | Aaa/AAA | 925,000 | 979,677 | |||||
Orange County School Board Series A, 6.00% due 8/1/2008 (Insured: MBIA) | Aaa/NR | 10,000,000 | 10,757,700 | |||||
Palm Beach County Industrial Development Revenue Series 1996, 6.00% due 12/1/2006 (Lourdes-Noreen McKeen Residence Project) (ETM) | NR/A | 940,000 | 970,917 | |||||
Palm Beach County Solid Waste Authority Revenue Refunding Series A, 5.00% due 10/1/2005 | Aa3/AA- | 2,420,000 | 2,420,121 | |||||
Pasco County Housing Finance Authority Multi Family Revenue Refunding Series A, 5.35% due 6/1/2027 put 6/1/2008 (Oak Trail Apts Project; Insured: AXA) | NR/AA- | 1,000,000 | 1,007,810 | |||||
Pelican Marsh Community Development District Refunding Series A, 5.00% due 5/1/2011 (Insured: Radian) | NR/AA | 3,025,000 | 3,093,546 | |||||
St Johns County Florida Industrial Development Authority Series A, 5.50% due 8/1/2014 (Presbyterian Retirement Project) | NR/NR | 1,755,000 | 1,895,628 | |||||
Tampa Solid Waste System Revenue Series A, 4.35% due 10/1/2008 (Insured: AMBAC) | Aaa/AAA | 6,045,000 | 6,223,267 | |||||
University Athletic Association Inc. Florida Athletic Program Revenue Refunding, 2.20% due 10/1/2031 put 10/1/2005 (LOC: Suntrust Bank) | Aa3/NR | 2,835,000 | 2,835,000 | |||||
GEORGIA — 0.60% | ||||||||
Floyd County Sales Tax, 3.50% due 1/1/2006 | Aa3/NR | 1,500,000 | 1,502,655 | |||||
Georgia Municipal Association Inc. COP, 5.00% due 12/1/2006 (Atlanta City Court Project; Insured: AMBAC) | Aaa/AAA | 1,000,000 | 1,024,020 | |||||
Georgia Municipal Electric Power Authority Revenue Series Y, 6.30% due 1/1/2006 | A1/A+ | 730,000 | 736,074 | |||||
Georgia Municipal Electric Power Authority Revenue Unrefunded Balance Series DD, 7.00% due 1/1/2008 (Insured: MBIA) | Aaa/AAA | 1,495,000 | 1,617,425 | |||||
Monroe County Development Authority Pollution Control, 6.75% due 1/1/2010 (Oglethorpe Power Scherer A Refunding; Insured: MBIA) | Aaa/AAA | 2,000,000 | 2,262,240 | |||||
Monroe County Development Authority Pollution Control Revenue Oglethorpe Power Scherer A, 6.80% due 1/1/2012 (Insured: MBIA) | Aaa/AAA | 1,000,000 | 1,175,710 | |||||
HAWAII — 0.30% | ||||||||
Hawaii State Department of Budget & Finance Special Purpose Hawaiian Electric Co., 4.95% due 4/1/2012 (Insured: MBIA) | Aaa/AAA | 2,000,000 | 2,138,540 | |||||
Hawaii State Refunding Series Cb, 5.75% due 1/1/2007 | Aa2/AA- | 1,000,000 | 1,033,760 | |||||
Honolulu City & County Refunding Series A, 7.35% due 7/1/2006 | Aa2/AA- | 1,000,000 | 1,032,430 | |||||
IDAHO — 0.22% | ||||||||
Twin Falls Urban Renewal Agency Refunding Series A, 4.95% due 8/1/2014 | NR/NR | 1,640,000 | 1,633,276 | |||||
Twin Falls Urban Renewal Agency Refunding Series A, 5.15% due 8/1/2017 | NR/NR | 1,455,000 | 1,442,182 | |||||
ILLINOIS — 9.95% | ||||||||
Champaign County Community No 116 Series C, 0% due 1/1/2009 (ETM) | Aaa/AAA | 1,205,000 | 1,080,186 | |||||
20 Certified Annual Report |
SCHEDULE OF INVESTMENTS, CONTINUED
Thornburg Limited Term Municipal Fund
Issuer-Description | Credit Rating† | Principal Amount | Value | |||||
Champaign County Community No 116 Unrefunded Balance Series C, 0% due 1/1/2009 (Insured: FGIC) | Aaa/AAA | $ | 2,140,000 | $ | 1,915,878 | |||
Chicago Board of Education, 6.00% due 12/1/2009 (Insured: FGIC) | Aaa/AAA | 2,000,000 | 2,207,820 | |||||
Chicago Board of Education School Reform, 6.25% due 12/1/2012 (Insured: MBIA) | Aaa/AAA | 750,000 | 871,222 | |||||
Chicago Housing Authority Capital Program Revenue, 5.00% due 7/1/2007 | Aa3/AA | 1,000,000 | 1,028,150 | |||||
Chicago Housing Authority Capital Program Revenue, 5.25% due 7/1/2010 | Aa3/AA | 2,300,000 | 2,457,044 | |||||
Chicago Metropolitan Water Reclamation District, 6.90% due 1/1/2007 | Aaa/AA+ | 2,300,000 | 2,369,069 | |||||
Chicago Midway Airport Revenue Series A, 5.40% due 1/1/2009 (Insured: MBIA) | Aaa/AAA | 1,340,000 | 1,386,538 | |||||
Chicago Midway Airport Revenue Series C, 5.50% due 1/1/2013 (Insured: MBIA) | Aaa/AAA | 1,180,000 | 1,298,201 | |||||
Chicago O’Hare International Airport Revenue, 5.375% due 1/1/2007 (Insured: AMBAC) | Aaa/AAA | 1,000,000 | 1,025,790 | |||||
Chicago O’Hare International Airport Revenue, 5.00% due 1/1/2012 (Insured: MBIA) | Aaa/AAA | 1,105,000 | 1,190,229 | |||||
Chicago O’Hare International Airport Revenue 2nd Lien Series C-1, 5.00% due 1/1/2010 (Insured: MBIA) | Aaa/AAA | 1,000,000 | 1,063,210 | |||||
Chicago O’Hare International Airport Revenue Passenger Facility Series A, 5.625% due 1/1/2014 (Insured: AMBAC) | Aaa/AAA | 3,065,000 | 3,145,609 | |||||
Chicago O’Hare International Airport Revenue Refunding Series A, 4.90% due 1/1/2006 (Insured: MBIA) | Aaa/AAA | 675,000 | 678,037 | |||||
Chicago Park District Parking Facility Revenue, 5.75% due 1/1/2010 (ETM) | Baa1/A | 1,000,000 | 1,094,340 | |||||
Chicago Public Commerce Building Revenue Series C, 5.50% due 2/1/2006 (Insured: FGIC) | Aaa/AAA | 2,000,000 | 2,017,680 | |||||
Chicago Refunding Series A, 5.375% due 1/1/2013 (Insured: MBIA) | Aaa/AAA | 2,000,000 | 2,187,920 | |||||
Chicago Refunding Series A-2, 6.125% due 1/1/2012 (Insured: AMBAC) | Aaa/AAA | 1,000,000 | 1,139,580 | |||||
Chicago Tax Increment Allocation Central Series A, 0% due 12/1/2005 (Insured: AMBAC) | Aaa/AAA | 5,000,000 | 4,976,250 | |||||
Chicago Water Revenue, 6.50% due 11/1/2011 (Insured: FGIC) | Aaa/AAA | 1,810,000 | 2,098,822 | |||||
Cook & Will Counties Township High School District 206 Series C, 0% due 12/1/2005 (Insured: FSA) | Aaa/AAA | 2,545,000 | 2,532,886 | |||||
Cook County Capital Improvement, 5.50% due 11/15/2008 pre-refunded 11/15/2006 | Aaa/AAA | 995,000 | 1,033,089 | |||||
Cook County Community Capital Appreciation, 0% due 12/1/2010 (Insured: FSA) | Aaa/NR | 2,000,000 | 1,660,340 | |||||
Cook County Community School District 97 Series B, 9.00% due 12/1/2013 (Insured: FGIC) | Aaa/NR | 2,250,000 | 3,060,157 | |||||
Cook County School District 99, 9.00% due 12/1/2012 (Insured: FGIC) | Aaa/NR | 1,000,000 | 1,322,620 | |||||
Du Page County Forest Preservation District, 0% due 11/1/2009 | Aaa/AAA | 5,000,000 | 4,349,000 | |||||
Glenview Multi Family Revenue Refunding, 5.20% due 12/1/2027 put 12/1/2007 (Collateralized: FNMA) | NR/AAA | 1,485,000 | 1,526,521 | |||||
Hoffman Estates Illinois Tax Increment Revenue, 0% due 5/15/2006 (Hoffman Estates Economic Dev. Project; Guaranty: Sears) | Ba1/NR | 3,075,000 | 2,998,648 | |||||
Hoffman Estates Illinois Tax Increment Revenue Junior Lien, 0% due 5/15/2007 | Ba1/NR | 1,500,000 | 1,400,700 | |||||
Illinois Development Finance Authority Pollution Control Revenue Refunding, 5.70% due 1/15/2009 (Commonwealth Edison Co. Project; Insured: MBIA) | Aaa/AAA | 3,000,000 | 3,214,740 | |||||
Illinois Development Finance Authority Pollution Series A, 7.375% due 7/1/2021 pre-refunded 7/1/2006 (Illinois Power Co. Project) | Baa1/NR | 5,000,000 | 5,256,150 | |||||
Illinois Development Finance Authority Revenue, 4.00% due 11/15/2005 (Insured: XLCA) | Aaa/AAA | 860,000 | 861,178 | |||||
Illinois Development Finance Authority Revenue, 6.00% due 11/15/2009 (Adventist Health Project; Insured: MBIA) | Aaa/AAA | 3,635,000 | 3,959,206 | |||||
Illinois Development Finance Authority Revenue, 6.00% due 11/15/2010 (Adventist Health Project; Insured: MBIA) | Aaa/AAA | 3,860,000 | 4,264,760 | |||||
Illinois Development Finance Authority Revenue Community Rehab Providers A, 5.00% due 7/1/2006 | NR/BBB | 645,000 | 647,793 | |||||
Illinois Development Finance Authority Revenue Provena Health Series A, 5.50% due 5/15/2011 (Insured: MBIA) | Aaa/AAA | 1,000,000 | 1,060,130 | |||||
Illinois Development Finance Authority Revenue Refunding Community Rehab Providers A, 5.60% due 7/1/2006 | NR/BBB | 1,000,000 | 1,010,270 | |||||
Illinois Development Finance Authority Revenue Refunding Community Rehab Providers Series A, 6.00% due 7/1/2015 | NR/BBB | 4,500,000 | 4,644,585 | |||||
Illinois Development Finance Authority Revenue Series A, 5.75% due 5/15/2014 (Provena Health Project; Insured: MBIA) | Aaa/AAA | 6,035,000 | 6,435,422 | |||||
| Certified Annual Report 21 |
| SCHEDULE OF INVESTMENTS, CONTINUED | ||
| Thornburg Limited Term Municipal Fund | September 30, 2005 | |
Issuer-Description | Credit Rating† | Principal Amount | Value | |||||
Illinois Educational Facilities Authority Revenues Unrefunded Balance Loyola A, 6.00% due 7/1/2009 (Insured: MBIA) | Aaa/AAA | $ | 1,275,000 | $ | 1,388,921 | |||
Illinois Health Facilities Authority Revenue, 5.50% due 11/15/2007 (OSF Healthcare System Project) | A2/A | 915,000 | 953,037 | |||||
Illinois Health Facilities Authority Revenue, 6.50% due 2/15/2008 (Iowa Health System Project) | A1/NR | 1,290,000 | 1,372,392 | |||||
Illinois Health Facilities Authority Revenue, 6.50% due 2/15/2009 (Iowa Health System Project) | A1/NR | 1,375,000 | 1,491,710 | |||||
Illinois Health Facilities Authority Revenue, 6.50% due 2/15/2010 (Iowa Health System Project) | A1/NR | 1,465,000 | 1,617,389 | |||||
Illinois Health Facilities Authority Revenue, 6.00% due 2/15/2011 (Iowa Health System Project; Insured: AMBAC) | Aaa/AAA | 1,560,000 | 1,739,010 | |||||
Illinois Health Facilities Authority Revenue Refunding, 5.00% due 8/15/2007 (University of Chicago Hospital & Health Project; Insured: MBIA) | Aaa/AAA | 1,500,000 | 1,550,505 | |||||
Illinois Health Facilities Authority Revenue Refunding, 5.00% due 8/15/2008 (University of Chicago Hospital & Health Project; Insured: MBIA) | Aaa/AAA | 1,500,000 | 1,570,395 | |||||
Illinois Health Facilities Authority Revenue Refunding, 5.50% due 11/15/2011 (Methodist Medical Center Project; Insured: MBIA) | Aaa/AAA | 3,000,000 | 3,204,330 | |||||
Illinois Health Facilities Authority Revenue University of Chicago, 5.00% due 8/15/2009 (Hospital Systems Project; Insured: MBIA) | Aaa/AAA | 1,000,000 | 1,057,410 | |||||
Illinois Hospital District, 5.50% due 1/1/2010 (Insured: FGIC) | Aaa/AAA | 1,040,000 | 1,123,179 | |||||
Illinois State COP Central Management Department, 5.00% due 7/1/2007 (Insured: AMBAC) | Aaa/AAA | 500,000 | 516,580 | |||||
Illinois State Partners Series A, 6.00% due 7/1/2006 (Insured: AMBAC) | Aaa/AAA | 1,000,000 | 1,022,940 | |||||
Kane County School District Number 129 Aurora West Side Refunding, 5.50% due 2/1/2012 (Insured: FGIC) | Aaa/NR | 1,200,000 | 1,259,736 | |||||
Lake County Community Consolidated School District 73, 9.00% due 1/1/2006 (Insured: FSA) | Aaa/NR | 1,000,000 | 1,014,990 | |||||
Lake County Community High School District 117 Series B, 0% due 12/1/2006 (Insured: FGIC) | Aaa/NR | 2,000,000 | 1,933,340 | |||||
Lake County Community High School District 117 Series B, 0% due 12/1/2011 (Insured: FGIC) | Aaa/NR | 3,235,000 | 2,568,752 | |||||
Lake County Consolidated High School Refunding, 3.25% due 12/1/2005 | NR/AA- | 2,990,000 | 2,992,003 | |||||
McHenry & Kane Counties Community Consolidated School District 158, 0% due 1/1/2010 (Insured: FGIC) | Aaa/AAA | 1,000,000 | 861,370 | |||||
McHenry & Kane Counties II, 0% due 1/1/2012 (Insured: FGIC) | Aaa/AAA | 2,200,000 | 1,733,270 | |||||
Mclean & Woodford Counties School District GO, 7.375% due 12/1/2010 (Insured: FSA) | Aaa/NR | 1,500,000 | 1,773,120 | |||||
Metropolitan Pier & Exposition Authority Dedicated State Tax Revenue Refunding Series A-2002, 6.00% due 6/15/2007 pre-refunded 6/15/2006 (McCormick Place Exposition Project; Insured: AMBAC) | Aaa/AAA | 1,250,000 | 1,301,862 | |||||
Metropolitan Pier & Exposition Authority Dedicated State Tax Revenue Refunding Series A-2002, 6.00% due 6/15/2007 pre-refunded 6/15/2006 (McCormick Place Exposition Project) | Aaa/AAA | 3,750,000 | 3,900,788 | |||||
Naperville City, Du Page & Will Counties Economic Development Revenue, 6.10% due 5/1/2008 (Hospital & Health System Association Project; LOC: American National Bank) | NR/AA- | 1,895,000 | 1,936,368 | |||||
Peoria Public Building Commission School District Facilities Revenue, 0% due 12/1/2007 (Insured: FGIC) | Aaa/NR | 1,100,000 | 1,026,421 | |||||
University of Illinois COP Series A, 5.00% due 8/15/2019 pre-refunded 8/15/2011 (Utility Infrastructure Project) | Aaa/AAA | 5,235,000 | 5,668,772 | |||||
University of Illinois Revenues, 0% due 10/1/2006 (Insured: MBIA) (b) | Aaa/AAA | 6,300,000 | 6,123,159 | |||||
INDIANA — 6.45% | ||||||||
Allen County Economic Development Revenue, 5.00% due 12/30/2012 (Indiana Institute of Technology Project) | NR/NR | 1,370,000 | 1,431,705 | |||||
Allen County Economic Development Revenue First Mortgage, 5.20% due 12/30/2005 (Indiana Institute of Technology Project) | NR/NR | 965,000 | 969,371 | |||||
Allen County Economic Development Revenue First Mortgage, 5.30% due 12/30/2006 (Indiana Institute of Technology Project) | NR/NR | 690,000 | 705,359 | |||||
Allen County Economic Development Revenue First Mortgage, 5.60% due 12/30/2009 (Indiana Institute of Technology Project) | NR/NR | 1,110,000 | 1,172,482 | |||||
22 Certified Annual Report |
| SCHEDULE OF INVESTMENTS, CONTINUED | ||
| Thornburg Limited Term Municipal Fund | September 30, 2005 | |
Issuer-Description | Credit Rating† Moody’s/S&P | Principal Amount | Value | |||||
Allen County Jail Building Corp. First Mortgage, 5.75% due 10/1/2010 | Aa3/NR | $ | 1,115,000 | $ | 1,239,490 | |||
Allen County Jail Building Corp. GO, 5.00% due 10/1/2011 (Insured: XLCA) | Aaa/AAA | 2,390,000 | 2,564,518 | |||||
Allen County Jail Building Corp. GO, 5.00% due 10/1/2012 (Insured: XLCA) | Aaa/AAA | 1,275,000 | �� | 1,372,767 | ||||
Allen County Jail Building Corp. GO, 5.00% due 10/1/2014 (Insured: XLCA) | Aaa/AAA | 1,000,000 | 1,078,110 | |||||
Allen County Jail Building Corp. GO, 5.00% due 10/1/2015 (Insured: XLCA) | Aaa/AAA | 1,480,000 | 1,595,336 | |||||
Allen County Jail Building Corp. GO, 5.00% due 10/1/2016 (Insured: XLCA) | Aaa/AAA | 1,520,000 | 1,637,146 | |||||
Allen County Redevelopment District Tax Series A, 5.00% due 11/15/2016 | A3/NR | 1,000,000 | 1,043,330 | |||||
Ball State University Revenues Student Fee Series K, 5.75% due 7/1/2012 (Insured: FGIC) | Aaa/AAA | 1,000,000 | 1,117,580 | |||||
Boone County Hospital Association Lease Revenue, 5.00% due 1/15/2007 (ETM) | Aaa/AAA | 1,085,000 | 1,112,179 | |||||
Boonville Junior High School Building Corp. Revenue, 0% due 7/1/2010 (State Aid Withholding) | NR/A | 850,000 | 691,806 | |||||
Boonville Junior High School Building Corp. Revenue, 0% due 1/1/2011 (State Aid Withholding) | NR/A | 850,000 | 672,129 | |||||
Boonville Junior High School Building Corp. Revenue Refunding, 0% due 7/1/2011 (State Aid Withholding) | NR/A | 950,000 | 732,954 | |||||
Brownsburg 1999 School Building, 5.00% due 2/1/2011 (Insured: FSA) | Aaa/AAA | 1,720,000 | 1,844,941 | |||||
Brownsburg 1999 School Building, 5.00% due 8/1/2011 (Insured: FSA) | Aaa/AAA | 1,835,000 | 1,976,570 | |||||
Brownsburg 1999 School Building, 5.25% due 2/1/2012 (Insured: FSA) | Aaa/AAA | 1,880,000 | 2,052,810 | |||||
Brownsburg 1999 School Building, 5.25% due 8/1/2012 (Insured: FSA) | Aaa/AAA | 1,755,000 | 1,925,112 | |||||
Center Grove 2000 Building First Mortgage, 5.00% due 7/15/2009 (Insured: AMBAC) | Aaa/AAA | 1,175,000 | 1,249,765 | |||||
Center Grove 2000 Building First Mortgage, 5.00% due 7/15/2010 (Insured: AMBAC) | Aaa/AAA | 1,135,000 | 1,219,716 | |||||
Dekalb County Redevelopment Authority Lease Rental Revenue Refunding, 5.00% due 1/15/2011 (Mini Mill Local Public Improvement Project; Insured: XLCA) | Aaa/AAA | 1,015,000 | 1,080,742 | |||||
Dekalb County Redevelopment Authority Lease Rental Revenue Refunding, 5.00% due 1/15/2012 (Mini Mill Local Public Improvement Project; Insured: XLCA) | Aaa/AAA | 1,000,000 | 1,068,730 | |||||
Dekalb County Redevelopment Authority Lease Rental Revenue Refunding, 5.25% due 1/15/2013 (Mini Mill Local Public Improvement Project; Insured: XLCA) | Aaa/AAA | 1,000,000 | 1,083,450 | |||||
Dekalb County Redevelopment Authority Lease Rental Revenue Refunding, 5.25% due 1/15/2014 (Mini Mill Local Public Improvement Project; Insured: XLCA) | Aaa/AAA | 1,000,000 | 1,077,700 | |||||
Eagle Union Middle School Building Corp., 5.50% due 7/15/2009 (ETM) | Aaa/AAA | 910,000 | 984,029 | |||||
Elberfeld J. H. Castle School Building Corp. Indiana First Mortgage, 0% due 1/15/2006 (State Aid Withholding) | NR/A | 1,860,000 | 1,841,419 | |||||
Elberfeld J. H. Castle School Building Corp. Indiana First Mortgage Refunding, 0% due 7/5/2008 (Insured: MBIA) | NR/AAA | 1,860,000 | 1,699,594 | |||||
Evansville Vanderburgh Refunding, 5.00% due 7/15/2014 (Insured: AMBAC) | Aaa/AAA | 1,000,000 | 1,083,320 | |||||
Evansville Vanderburgh Refunding, 5.00% due 7/15/2015 (Insured: AMBAC) | Aaa/AAA | 1,000,000 | 1,083,590 | |||||
Goshen Multi School Building Corp. First Mortgage, 5.20% due 7/15/2007 (Insured: MBIA) | Aaa/AAA | 965,000 | 1,000,695 | |||||
Hammond Multi-School Building Corp. First Mortgage Refunding Bond Series 1997, 6.00% due 7/15/2008 (Lake County Project; State Aid Withholding) | NR/A | 2,305,000 | 2,422,325 | |||||
Huntington Economic Development Revenue, 6.00% due 11/1/2006 (United Methodist Membership Project) | NR/NR | 295,000 | 301,396 | |||||
Huntington Economic Development Revenue, 6.15% due 11/1/2008 (United Methodist Membership Project) | NR/NR | 700,000 | 738,388 | |||||
Huntington Economic Development Revenue, 6.20% due 11/1/2010 (United Methodist Membership Project) | NR/NR | 790,000 | 830,179 | |||||
Indiana Health Facility Financing Authority Hospital Revenue, 5.75% due 11/1/2005 (Daughters of Charity Project) (ETM) | Aaa/AA+ | 85,000 | 85,214 | |||||
Indiana Health Facility Financing Authority Hospital Revenue Series D, 5.00% due 11/1/2026 pre-refunded 11/1/2007 | Aaa/NR | 1,650,000 | 1,707,024 | |||||
Indiana Municipal Power Supply Systems Revenue Refunding Series B, 5.80% due 1/1/2008 (Insured: MBIA) | Aaa/AAA | 1,000,000 | 1,057,050 | |||||
Indiana State Educational Facilities Authority Revenue, 5.75% due 10/1/2009 (University of Indianapolis Project) | NR/A- | 670,000 | 720,411 | |||||
Indiana University Revenues Refunding, 0% due 8/1/2007 (Insured: AMBAC) | Aaa/AAA | 2,500,000 | 2,359,850 | |||||
Indianapolis Airport Authority Revenue Refunding Series A, 5.35% due 7/1/2007 (Insured: FGIC) | Aaa/AAA | 1,100,000 | 1,139,633 | |||||
Indianapolis Local Public Improvement Bond Bank Transportation Revenue, 0% due 7/1/2006 (ETM) | Aa2/AA- | 1,240,000 | 1,213,055 | |||||
| Certified Annual Report 23 |
| SCHEDULE OF INVESTMENTS, CONTINUED | ||
| Thornburg Limited Term Municipal Fund | September 30, 2005 | |
Issuer-Description | Credit Rating† Moody’s/S&P | Principal Amount | Value | |||||
Indianapolis Resource Recovery Revenue Refunding, 6.75% due 12/1/2006 | Aaa/AAA | $ | 2,000,000 | $ | 2,078,700 | |||
Knox Middle School Building Corp. First Mortgage, 6.00% due 7/15/2008 (Insured: FGIC) | Aaa/AAA | 855,000 | 917,877 | |||||
Knox Middle School Building Corp. First Mortgage, 6.00% due 7/15/2009 (Insured: FGIC) | Aaa/AAA | 455,000 | 497,829 | |||||
Madison Schools Lydia Middleton Building Corp., 5.00% due 7/15/2014 (Insured: FGIC) | Aaa/AAA | 1,200,000 | 1,297,200 | |||||
Madison Schools Lydia Middleton Building Corp., 5.00% due 7/15/2015 (Insured: FGIC) | Aaa/AAA | 1,250,000 | 1,351,325 | |||||
Monroe County Community School Building Corp. Revenue Refunding, 5.00% due 1/15/2007 (Insured: AMBAC) | Aaa/AAA | 625,000 | 638,513 | |||||
Mount Vernon of Hancock County Refunding First Mortgage, 5.00% due 7/15/2013 (Insured: MBIA) | Aaa/AAA | 1,055,000 | 1,138,007 | |||||
Mount Vernon of Hancock County Refunding First Mortgage, 5.00% due 7/15/2014 (Insured: MBIA) | Aaa/AAA | 1,135,000 | 1,226,935 | |||||
Mount Vernon of Hancock County Refunding First Mortgage, 5.00% due 7/15/2015 (Insured: MBIA) | Aaa/AAA | 1,140,000 | 1,232,408 | |||||
Northwestern School Building Corp., 5.00% due 7/15/2011 (State Aid Withholding) | NR/AA | 1,240,000 | 1,325,808 | |||||
Perry Township Multi School Building Refunding, 5.00% due 1/10/2013 (Insured: FSA) | Aaa/NR | 1,225,000 | 1,319,080 | |||||
Perry Township Multi School Building Refunding, 5.25% due 1/15/2013 (Insured: MBIA) | Aaa/AAA | 1,235,000 | 1,353,560 | |||||
Perry Township Multi School Building Refunding, 5.00% due 7/10/2013 (Insured: FSA) | Aaa/NR | 2,025,000 | 2,184,226 | |||||
Perry Township Multi School Building Refunding, 5.25% due 7/15/2013 (Insured: MBIA) | Aaa/AAA | 1,305,000 | 1,434,091 | |||||
Perry Township Multi School Building Refunding, 5.25% due 1/15/2014 (Insured: MBIA) | Aaa/AAA | 1,335,000 | 1,468,313 | |||||
Perry Township Multi School Building Refunding, 5.00% due 7/10/2014 (Insured: FSA) | Aaa/NR | 2,130,000 | 2,302,466 | |||||
Peru Community School Corp. Refunding First Mortgage, 0% due 7/1/2010 (State Aid Withholding) | NR/A | 835,000 | 679,598 | |||||
Rockport Pollution Control Revenue Series C, 2.625% due 4/1/2025 put 10/1/2006 (Indiana Michigan Power Co. Project) | Baa2/BBB | 4,030,000 | 3,983,131 | |||||
Vigo County Elementary School Building Corp. Refunding & Improvement First Mortgage, 4.00% due 1/10/2008 (Insured: FSA) | Aaa/AAA | 1,635,000 | 1,664,463 | |||||
Warren Township Vision 2005 School Building Corp., 3.00% due 1/10/2006 (Insured: FGIC) | Aaa/AAA | 595,000 | 595,208 | |||||
Wawasee Community School Corp. First Mortgage, 5.50% due 7/15/2010 (State Aid Withholding) | NR/AA- | 995,000 | 1,083,316 | |||||
Wawasee Community School Corp. First Mortgage, 5.50% due 7/15/2011 (State Aid Withholding) | NR/AA- | 1,095,000 | 1,203,306 | |||||
West Clark School Building Corp. First Mortgage, 5.75% due 7/15/2011 (Insured: FGIC) | Aaa/AAA | 2,080,000 | 2,320,760 | |||||
Westfield Elementary School Building Corp. First Mortgage Series 1997, 6.80% due 7/15/2007 (ETM) | Aaa/AAA | 1,480,000 | 1,539,777 | |||||
Whitko Indiana Middle School Building Corp. Refunding, 5.35% due 7/15/2007 (Insured: FSA) | Aaa/AAA | 1,305,000 | 1,338,304 | |||||
IOWA — 1.90% | ||||||||
Ankeny Community School District Sales & Services Tax Revenue, 5.00% due 7/1/2010 | NR/A+ | 2,900,000 | 3,070,549 | |||||
Des Moines Limited Obligation Revenue, 6.25% due 12/1/2015 put 12/1/2005 (Des Moines Parking Associates Project; LOC:Wells Fargo Bank) | NR/NR | 3,355,000 | 3,357,684 | |||||
Iowa Finance Authority Commercial Development Revenue Refunding, 5.75% due 4/1/2014 put 4/1/2010 (Governor Square Project; Insured: AXA) | NR/AA- | 6,650,000 | 6,940,406 | |||||
Iowa Finance Authority Hospital Facility Revenue, 6.50% due 2/15/2007 (Iowa Health Services Project) | A1/NR | 435,000 | 452,052 | |||||
Iowa Finance Authority Hospital Facility Revenue, 6.50% due 2/15/2009 (Iowa Health Services Project) | A1/NR | 1,825,000 | 1,979,906 | |||||
Iowa Finance Authority Hospital Facility Revenue, 6.50% due 2/15/2010 (Iowa Health Services Project) | A1/NR | 1,955,000 | 2,159,180 | |||||
Iowa Finance Authority Hospital Facility Revenue, 6.00% due 2/15/2011 pre-refunded 2/15/2010 (Iowa Health Services Project; Insured: AMBAC) | Aaa/AAA | 3,145,000 | 3,508,593 | |||||
Iowa Finance Authority Revenue Trinity Health Series B, 5.75% due 12/1/2007 | Aa3/AA- | 1,430,000 | 1,502,487 | |||||
Iowa Finance Authority Revenue Trinity Health Series B, 5.75% due 12/1/2010 | Aa3/AA- | 3,295,000 | 3,600,117 | |||||
KANSAS — 0.12% | ||||||||
Dodge Unified School District 443 Ford County, 8.25% due 9/1/2006 (Insured: FSA) | Aaa/AAA | 500,000 | 523,790 | |||||
Wichita Water & Sewer Utility Revenue, 5.50% due 10/1/2011 pre-refunded 10/1/2006 (Insured: FGIC) | Aaa/AAA | 1,160,000 | 1,201,099 | |||||
KENTUCKY — 1.40% | ||||||||
Kentucky Economic Development Finance Authority Refunding & Improvement Series A, 5.00% due 2/1/2009 (Ashland Hospital Project; Insured: FSA) | Aaa/AAA | 1,580,000 | 1,663,977 | |||||
Kentucky Economic Development Finance Authority Refunding & Improvement Series A, 5.00% due 2/1/2010 (Ashland Hospital Project; Insured: FSA) | Aaa/AAA | 1,000,000 | 1,062,090 | |||||
24 Certified Annual Report |
| SCHEDULE OF INVESTMENTS, CONTINUED | ||
| Thornburg Limited Term Municipal Fund | September 30, 2005 | |
Issuer-Description | Credit Rating† Moody’s/S&P | Principal Amount | Value | |||||
Kentucky Economic Development Finance Authority Series C, 0% due 10/1/2009 converts to 5.35% 10/1/2005 (Norton Healthcare Project; Insured: MBIA) | Aaa/AAA | $ | 7,400,000 | $ | 7,892,026 | |||
Kentucky Economic Development Finance Authority Series C, 0% due 10/1/2010 converts to 5.40% 10/1/2005 (Norton Healthcare Project; Insured: MBIA) | Aaa/AAA | 7,830,000 | 8,465,169 | |||||
Kentucky State Turnpike Authority Resources Recovery Revenue, 0% due 7/1/2006 (Insured: FGIC) | Aaa/AAA | 390,000 | 381,779 | |||||
Louisville Water Revenue Refunding, 6.00% due 11/15/2006 (ETM) | Aaa/AAA | 150,000 | 154,758 | |||||
LOUISIANA — 2.46% | ||||||||
Jefferson Parish Hospital District 2, 5.25% due 12/1/2015 crossover-refunded 12/1/2005 (Insured: FGIC) | Aaa/AAA | 4,125,000 | 4,139,396 | |||||
Jefferson Sales Tax District Special Sales Tax Revenue Refunding, 5.25% due 12/1/2006 (Insured: AMBAC) | Aaa/AAA | 1,440,000 | 1,474,834 | |||||
Jefferson Sales Tax District Special Sales Tax Revenue Refunding, 5.25% due 12/1/2007 (Insured: AMBAC) | Aaa/AAA | 1,515,000 | 1,578,009 | |||||
Louisiana Local Govt. Environmental Facilities & Community Dev. Auth. Multi Family Revenue Series A, 5.00% due 9/1/2012 (Bellemont Apartments Project) | Baa1/NR | 1,000,000 | 1,006,350 | |||||
Louisiana PFA Revenue, 5.375% due 12/1/2008 (Wynhoven Health Care Center Project; Guaranty: Archdiocese of New Orleans) | NR/NR | 1,850,000 | 1,855,291 | |||||
Louisiana Public Facilities Authority Revenue, 5.75% due 10/1/2008 (Loyola University Project) | A1/A+ | 1,000,000 | 1,041,010 | |||||
Louisiana Public Facilities Authority Revenue Refunding, 4.00% due 4/1/2006 (Loyola University Project) | A1/A+ | 1,085,000 | 1,085,477 | |||||
Louisiana Public Facilities Authority Revenue Refunding, 5.50% due 10/1/2006 (Loyola University Project) | A1/A+ | 1,280,000 | 1,298,432 | |||||
Louisiana State Correctional Facility Lease, 5.00% due 12/15/2008 (Insured: Radian) | NR/AA | 7,135,000 | 7,369,599 | |||||
Louisiana State Offshore Terminal Authority Deepwater Port Revenue, 4.375% due 10/1/2020 put 6/1/2007 (Loop LLC Project) | A3/A | 2,350,000 | 2,369,270 | |||||
Louisiana State Offshore Terminal Refunding Series D, 4.00% due 9/1/2023 put 9/1/2008 (Loop LLC Project) | A3/A | 5,000,000 | 5,006,300 | |||||
New Orleans Parish School Board, 0% due 2/1/2008 (ETM) | NR/AAA | 6,050,000 | 5,228,712 | |||||
New Orleans Refunding, 0% due 9/1/2006 (Insured: AMBAC) | Aaa/AAA | 1,000,000 | 968,740 | |||||
MARYLAND — 0.63% | ||||||||
Baltimore Maryland, 7.00% due 10/15/2009 (Insured: MBIA) | Aaa/AAA | 580,000 | 661,461 | |||||
Howard County Retirement Community Revenue Series A, 7.25% due 5/15/2015 pre-refunded 5/15/2010 | NR/AAA | 1,000,000 | 1,193,160 | |||||
Howard County Retirement Community Revenue Series A, 7.875% due 5/15/2021 pre-refunded 5/15/2010 | NR/AAA | 2,500,000 | 3,044,525 | |||||
Maryland State Health High Educational Facilities Refunding, 6.00% due 7/1/2009 (John Hopkins University Project) | Aa2/AA | 3,605,000 | 3,960,417 | |||||
MASSACHUSETTS — 2.46% | ||||||||
Massachusetts Development Finance Agency Resource Recovery Revenue Series A, 5.50% due 1/1/2011 (Insured: MBIA) | Aaa/AAA | 3,470,000 | 3,781,051 | |||||
Massachusetts Development Finance Agency Resource Recovery Revenue Series B, 5.625% due 1/1/2012 (Insured: MBIA) | Aaa/AAA | 1,240,000 | 1,366,269 | |||||
Massachusetts Industrial Finance Agency Revenue, 8.375% due 2/15/2018 pre-refunded 2/15/2006 (Glenmeadow Retirement Project) | NR/NR | 1,000,000 | 1,038,400 | |||||
Massachusetts State 1999 to 2021 Refunding Series B, 6.50% due 8/1/2008 | Aa2/AA | 2,000,000 | 2,168,960 | |||||
Massachusetts State Health & Educational Berkshire Health Systems Series F, 5.00% due 10/1/2011 (Insured: Assured Guaranty) | NR/AAA | 2,345,000 | 2,512,316 | |||||
Massachusetts State Health & Educational Berkshire Health Systems Series F, 5.00% due 10/1/2012 (Insured: Assured Guaranty) | NR/AAA | 2,330,000 | 2,503,468 | |||||
Massachusetts State Health & Educational Berkshire Health Systems Series F, 5.00% due 10/1/2013 (Insured: Assured Guaranty) | NR/AAA | 3,215,000 | 3,450,402 | |||||
Massachusetts State Health & Educational Series H, 5.375% due 5/15/2012 (New England Medical Center Hospital Project; Insured: FGIC) | Aaa/AAA | 3,415,000 | 3,738,776 | |||||
Massachusetts State Industrial Finance Agency, 5.90% due 7/1/2027 pre-refunded 7/1/2007 (Dana Hall School Project) | Baa2/BBB | 1,220,000 | 1,299,154 | |||||
| Certified Annual Report 25 |
| SCHEDULE OF INVESTMENTS, CONTINUED | ||
| Thornburg Limited Term Municipal Fund | September 30, 2005 | |
Issuer-Description | Credit Rating† Moody’s/S&P | Principal Amount | Value | |||||
Massachusetts State Industrial Finance Agency Capital Appreciation Biomedical A, 0% due 8/1/2010 | Aa3/A+ | $ | 10,000,000 | $ | 8,348,700 | |||
Massachusetts State Refunding GO Series A, 6.00% due 11/1/2008 | Aaa/AAA | 1,000,000 | 1,083,370 | |||||
Massachusetts State Refunding Series A, 5.50% due 1/1/2010 | Aa2/AA | 1,500,000 | 1,627,995 | |||||
Taunton GO, 8.00% due 2/1/2006 (Insured: MBIA) | Aaa/AAA | 1,500,000 | 1,525,515 | |||||
MICHIGAN — 2.39% | ||||||||
Dearborn Economic Development Corp. Oakwood Obligation Group Series A, 5.75% due 11/15/2015 (Insured: FGIC) | Aaa/AAA | 2,450,000 | 2,506,252 | |||||
Detroit Convention Facility, 5.25% due 9/30/2007 | NR/A | 1,000,000 | 1,036,070 | |||||
Detroit Michigan Series A, 6.00% due 4/1/2007 (ETM) | Aaa/AAA | 1,405,000 | 1,466,694 | |||||
Dickinson County Healthcare Systems Hospital Revenue Refunding, 5.50% due 11/1/2013 (Insured: ACA) | NR/A | 2,500,000 | 2,658,325 | |||||
Jackson County Hospital Finance Authority Hospital Revenue Series A, 5.00% due 6/1/2006 (W.A. Foote Memorial Hospital Project; Insured: AMBAC) | Aaa/NR | 1,670,000 | 1,692,495 | |||||
Michigan Hospital Finance Authority Revenue, 5.375% due 7/1/2012 (Insured: FSA) | Aaa/AAA | 2,000,000 | 2,043,680 | |||||
Michigan Hospital Finance Authority Revenue Series A, 5.375% due 11/15/2033 put 11/15/2007 (Ascension Health Project) | Aa2/A-1+ | 10,000,000 | 10,412,900 | |||||
Michigan State Building Authority Revenue Refunding Facilities Program Series I, 5.00% due 10/15/2008 (Insured: FSA) | Aaa/AAA | 4,000,000 | 4,213,920 | |||||
Michigan State Job Development Authority Pollution Control Revenue, 5.55% due 4/1/2009 (General Motors Corp. Project; Guaranty: GM) | Ba2/BB | 1,925,000 | 1,909,099 | |||||
Michigan State Strategic Fund Refunding Detroit Educational, 4.85% due 9/1/2030 put 9/1/2011 (Insured: AMBAC) | Aaa/NR | 1,075,000 | 1,130,803 | |||||
Missouri State Health & Educational Facilities Authority Revenue Series A, 5.00% due 6/1/2011 | NR/AA- | 1,000,000 | 1,066,520 | |||||
Oakland County Economic Development Corp. Limited, 5.50% due 6/1/2014 pre-refunded 6/1/2007 | A1/NR | 1,000,000 | 1,059,230 | |||||
Oxford Area Community School District, 5.00% due 5/1/2012 (Guaranty: School Bond Loan Fund) | Aa2/AA | 800,000 | 863,288 | |||||
Summit Academy North Michigan School District, 8.75% due 7/1/2030 pre-refunded 7/1/2010 | NR/NR | 1,100,000 | 1,342,913 | |||||
MINNESOTA — 0.51% | ||||||||
Minneapolis St. Paul Health Care Systems, 5.25% due 12/1/2012 (Healthpartners Obligation Group Project) | Baa1/BBB+ | 1,000,000 | 1,074,930 | |||||
Minneapolis St. Paul Health Care Systems, 5.25% due 12/1/2013 (Healthpartners Obligation Group Project) | Baa1/BBB+ | 1,500,000 | 1,614,540 | |||||
Osseo Independent School District 279 Crossover Refunding Series B, 5.00% due 2/1/2006 (School District Credit Program) | Aa2/NR | 1,915,000 | 1,928,865 | |||||
Southern Minnesota Municipal Power Agency Revenue Refunding Series A, 5.00% due 1/1/2006 (Insured: AMBAC) | Aaa/AAA | 1,000,000 | 1,005,460 | |||||
University of Minnesota Refunding Series A, 5.50% due 7/1/2006 | Aa2/AA | 1,450,000 | 1,478,463 | |||||
MISSISSIPPI — 1.18% | ||||||||
Gautier Utility District Systems Revenue Refunding, 5.50% due 3/1/2012 (Insured: FGIC) | Aaa/NR | 1,020,000 | 1,123,591 | |||||
Hattiesburg Water & Sewer Revenue Refunding Systems, 5.20% due 8/1/2006 (Insured: AMBAC) | Aaa/AAA | 700,000 | 712,474 | |||||
Mississippi Hospital Equipment & Facilities Authority Revenue, 6.50% due 5/1/2006 (Refunding Mississippi Baptist Medical Center; Insured: MBIA) | Aaa/AAA | 1,000,000 | 1,018,190 | |||||
Mississippi Hospital Equipment & Facilities Baptist Memorial Health B2, 3.00% due 9/1/2018 put 9/1/2006 | NR/AA | 5,000,000 | 4,999,900 | |||||
Mississippi Hospital Equipment & Facilities Baptist Memorial Health B2, 3.50% due 9/1/2022 put 10/1/2006 | NR/AA | 3,500,000 | 3,485,405 | |||||
Mississippi State, 6.20% due 2/1/2008 (ETM) | Aaa/AAA | 3,960,000 | 4,195,937 | |||||
Ridgeland Multi Family Housing Revenue, 4.95% due 10/1/2007 (Collateralized: FNMA) | NR/AAA | 890,000 | 903,039 | |||||
MISSOURI — 0.51% | ||||||||
Missouri Development Finance Board Healthcare Facilities Revenue Series A, 4.80% due 11/1/2012 (Lutheran Home Aged Project; LOC: Commerce Bank) | Aa3/NR | 1,275,000 | 1,311,733 | |||||
26 Certified Annual Report |
| SCHEDULE OF INVESTMENTS, CONTINUED | ||
| Thornburg Limited Term Municipal Fund | September 30, 2005 | |
Issuer-Description | Credit Rating† Moody’s/S&P | Principal Amount | Value | |||||
Missouri State Health & Educational Facilities Revenue Refunding, 2.79% due 6/1/2015 put 10/3/2005 (Cox Health Systems Project) (daily demand notes) | VMIG1/A-1+ | $ | 1,500,000 | $ | 1,500,000 | |||
Springfield COP, 5.20% due 6/1/2006 (Law Enforcement Communication Project) | Aa3/NR | 840,000 | 852,197 | |||||
Springfield COP, 5.25% due 6/1/2007 (Law Enforcement Communication Project) | Aa3/NR | 840,000 | 868,115 | |||||
St. Louis County Refunding, 5.00% due 8/15/2007 (Convention & Sports Facility Project B 1; Insured: AMBAC) | Aaa/AAA | 2,495,000 | 2,583,148 | |||||
MONTANA — 1.16% | ||||||||
Forsyth Pollution Control Revenue Refunding, 5.00% due 10/1/2032 put 12/30/2008 (Insured: AMBAC) | Aaa/AAA | 11,440,000 | 11,987,290 | |||||
Forsyth Pollution Control Revenue Refunding, 5.20% due 5/1/2033 put 5/1/2009 (Portland General Project) | Baa1/BBB+ | 4,000,000 | 4,174,080 | |||||
NEBRASKA — 0.96% | ||||||||
Lancaster County School District 1, 4.00% due 7/15/2007 (Lincoln Public School Project) | Aa2/AAA | 1,995,000 | 2,029,055 | |||||
Madison County Hospital Authority Revenue 1, 5.25% due 7/1/2010 (Faith Regional Health Services Project; Insured: Radian) | NR/AA | 1,455,000 | 1,553,038 | |||||
Madison County Hospital Authority Revenue 1, 5.50% due 7/1/2012 (Faith Regional Health Services Project; Insured: Radian) | NR/AA | 1,625,000 | 1,765,107 | |||||
Omaha Public Power District Nebraska Electric Revenue Refunding Systems B, 5.00% due 2/1/2013 | Aa2/AA | 5,000,000 | 5,412,450 | |||||
Omaha Public Power District Nebraska Electric Revenue Series A, 7.50% due 2/1/2006 (ETM) | NR/AA | 1,090,000 | 1,104,355 | |||||
University of Nebraska Facilities Corp., 5.00% due 7/15/2008 | Aa2/AA- | 1,500,000 | 1,573,455 | |||||
NEVADA — 1.10% | ||||||||
Humboldt County Pollution Control Revenue Refunding, 6.55% due 10/1/2013 (Sierra Pacific Project; Insured: AMBAC) | Aaa/AAA | 5,000,000 | 5,202,400 | |||||
Las Vegas Special Refunding Local Improvement District 707 Series A, 5.125% due 6/1/2011 (Insured: FSA) | Aaa/AAA | 1,705,000 | 1,813,114 | |||||
Nevada Housing Division FNMA Multi Family Certificate A, 4.80% due 4/1/2008 (Collateralized: FNMA) | NR/AAA | 235,000 | 237,799 | |||||
Nevada State GO Colorado River Commission Power Delivery A, 7.00% due 9/15/2008 pre-refunded 9/15/2007 | Aa1/AA | 840,000 | 902,395 | |||||
Sparks Redevelopment Agency Tax Allocation Revenue Refunding Series A, 5.75% due 1/15/2009 (Insured: Radian) | NR/AA | 1,000,000 | 1,065,410 | |||||
Sparks Redevelopment Agency Tax Allocation Revenue Refunding Series A, 5.75% due 1/15/2010 (Insured: Radian) | NR/AA | 1,000,000 | 1,078,140 | |||||
Sparks Redevelopment Agency Tax Allocation Revenue Refunding Series A, 5.75% due 1/15/2011 (Insured: Radian) | NR/AA | 1,285,000 | 1,389,085 | |||||
Washoe County School District, 5.50% due 6/1/2008 (Insured: FSA) | Aaa/AAA | 3,500,000 | 3,708,565 | |||||
NEW HAMPSHIRE — 0.42% | ||||||||
Manchester Housing & Redevelopment Authority Series A, 6.05% due 1/1/2012 (Insured: ACA) | NR/A | 1,500,000 | 1,606,785 | |||||
New Hampshire Industrial Development Authority Revenue, 3.75% due 12/1/2009 (Central Vermont Public Services Project; LOC: Citizens Bank) | Aa2/AA- | 2,880,000 | 2,918,765 | |||||
New Hampshire System Revenue Series A, 7.00% due 11/1/2006 (Insured: FGIC) | Aaa/AAA | 1,290,000 | 1,320,573 | |||||
NEW JERSEY — 1.72% | ||||||||
New Jersey Economic Development Authority Revenue Cigarette Tax, 5.00% due 6/15/2010 (Insured: FSA) | Aaa/AAA | 1,000,000 | 1,066,020 | |||||
New Jersey State Transport Trust Fund Authority Series C, 5.00% due 6/15/2007 (Transportation Systems Project) | A1/AA- | 3,000,000 | 3,092,670 | |||||
New Jersey State Transport Trust Fund Authority Series C, 5.00% due 6/15/2008 (Transportation Systems Project) | A1/AA- | 5,000,000 | 5,224,050 | |||||
New Jersey State Transport Trust Fund Authority Series C, 5.00% due 6/15/2009 (Transportation Systems Project) (b) | A1/AA- | 5,000,000 | 5,278,950 | |||||
| Certified Annual Report 27 |
| SCHEDULE OF INVESTMENTS, CONTINUED | ||
| Thornburg Limited Term Municipal Fund | September 30, 2005 | |
Issuer-Description | Credit Rating† Moody’s/S&P | Principal Amount | Value | |||||
New Jersey State Transport Trust Fund Authority Series C, 5.25% due 6/15/2013 (Transportation Systems Project; Insured: MBIA) | Aaa/AAA | $ | 5,000,000 | $ | 5,498,800 | |||
Newark Housing Authority Port Authority Rental Backed, 3.50% due 1/1/2006 (Newark Marine Terminal Redevelopment Project; Insured: MBIA) | Aaa/AAA | 1,780,000 | 1,782,972 | |||||
Newark Housing Authority Port Authority Rental Backed, 5.00% due 1/1/2010 (Newark Marine Terminal Redevelopment Project; Insured: MBIA) | Aaa/AAA | 1,000,000 | 1,064,850 | |||||
Pequannock River Basin Regional Sewage Authority Refunding Series M, 5.00% due 12/1/2006 (Sewer Revenue Project; Insured: MBIA) | Aaa/NR | 1,090,000 | 1,106,263 | |||||
NEW MEXICO — 2.38% | ||||||||
Farmington Pollution Control Revenue, 2.80% due 9/1/2024 put 10/3/2005 (LOC: Barclays Bank) (daily demand notes) | P1/A-1+ | 3,700,000 | 3,700,000 | |||||
Gallup Pollution Control Revenue Refunding Tri State Generation, 5.00% due 8/15/2012 (Insured: AMBAC) | Aaa/AAA | 3,345,000 | 3,590,523 | |||||
New Mexico Finance Authority State Transportation Refunding Subordinated Lien Series C-3, 2.50% due 6/15/2024 put 10/7/2005 (weekly demand notes) | Aaa/AAA | 8,525,000 | 8,525,000 | |||||
New Mexico Highway Commission Revenue Subordinated Lien Tax Series B, 5.00% due 6/15/2011 (Insured: AMBAC) | Aaa/AAA | 4,865,000 | 5,230,021 | |||||
New Mexico State Hospital Equipment Loan Presbyterian Health Care A, 2.75% due 8/1/2030 put 10/3/2005 (daily demand notes) | VMIG1/A-1+ | 5,000,000 | 5,000,000 | |||||
University of New Mexico Hospital Mortgage Revenue Bonds, 5.00% due 7/1/2009 (Insured: FSA & FHA) | Aaa/AAA | 1,455,000 | 1,537,877 | |||||
University of New Mexico Hospital Mortgage Revenue Bonds, 5.00% due 1/1/2011 (Insured: FSA & FHA) | Aaa/AAA | 1,790,000 | 1,912,400 | |||||
University of New Mexico Hospital Mortgage Revenue Bonds, 5.00% due 7/1/2011 (Insured: FSA & FHA) | Aaa/AAA | 2,065,000 | 2,215,002 | |||||
University of New Mexico Hospital Mortgage Revenue Bonds, 5.00% due 7/1/2012 (Insured: FSA & FHA) | Aaa/AAA | 1,500,000 | 1,615,500 | |||||
NEW YORK — 7.14% | ||||||||
Brookhaven Industrial Development Agency Revenue, 4.375% due 11/1/2031 put 11/1/2006 (Methodist Retirement Community Project; LOC: Northfork Bank) | A1/A- | 1,600,000 | 1,613,360 | |||||
Hempstead Industrial Development Agency Resource Recovery Revenue Refunding, 5.00% due 12/1/2007 (American Ref-Fuel Project; Insured: MBIA) | Aaa/AAA | 1,000,000 | 1,039,590 | |||||
Hempstead Town Industrial Development Agency Refunding, 5.00% due 12/1/2008 (American Fuel Co. Project; Insured: MBIA) | Aaa/AAA | 1,000,000 | 1,039,410 | |||||
Long Island Power Authority Electric Systems Revenue General Series A, 6.00% due 12/1/2007 (Insured: AMBAC) | Aaa/AAA | 1,500,000 | 1,592,565 | |||||
Long Island Power Authority General Series B, 5.00% due 12/1/2006 | A3/A- | 7,000,000 | 7,171,850 | |||||
Metropolitan Transportation Authority New York Revenue Series B, 5.00% due 11/15/2007 | A2/A | 8,000,000 | 8,325,600 | |||||
Metropolitan Transportation Authority New York Service Series B, 5.25% due 7/1/2007 | A2/AA- | 4,535,000 | 4,699,076 | |||||
Monroe County Industrial Development Agency, 5.375% due 6/1/2007 (St. John Fisher College Project; Insured: Radian) | NR/AA | 1,050,000 | 1,086,740 | |||||
New York City, 2.80% due 8/1/2017 put 10/3/2005 (LOC: JPM) (daily demand notes) | VMIG1/A-1+ | 900,000 | 900,000 | |||||
New York City Housing Development Corp. Multi Family Housing Revenue Refunding Series A, 5.50% due 11/1/2009 | Aa2/AA | 185,000 | 185,181 | |||||
New York City Industrial Development Agency Civic Facility Series A, 5.25% due 6/1/2011 (Lycee Francais De New York Project; Insured: ACA) | NR/A | 2,215,000 | 2,365,886 | |||||
New York City Industrial Development Agency Civic Facility Series A, 5.25% due 6/1/2012 (Lycee Francais De New York Project; Insured: ACA) | NR/A | 2,330,000 | 2,496,781 | |||||
New York City Municipal Water Finance Authority Water & Sewer Systems Revenue Series B, 5.75% due 6/15/2026 Crossover refunded 6/15/2006 (Insured: MBIA) | Aaa/AAA | 6,000,000 | 6,173,160 | |||||
New York City Transitional Refunding Future Tax Series A1, 5.00% due 11/1/2012 | Aa1/AAA | 5,000,000 | 5,444,000 | |||||
New York City Transitional Refunding Future Tax Series A1, 5.00% due 11/1/2013 | Aa1/AAA | 10,000,000 | 10,893,800 | |||||
28 Certified Annual Report |
SCHEDULE OF INVESTMENTS, CONTINUED
| Thornburg Limited Term Municipal Fund | September 30, 2005 |
Issuer-Description | Credit Rating† Moody’s/S&P | Principal Amount | Value | |||||
New York Dormitory Authority, 6.00% due 7/1/2007 (Champlain Valley Physicians Project; Insured: Connie Lee) | NR/AAA | $ | 1,040,000 | $ | 1,091,189 | |||
New York Dormitory Authority Revenues Mental Health Services Facilities Improvement B, 5.00% due 8/15/2010 (Insured: MBIA) | Aaa/AAA | 1,600,000 | 1,717,248 | |||||
New York Dormitory Authority Revenues Series B, 5.25% due 11/15/2026 put 5/15/2012 (Insured: AMBAC) | Aaa/AAA | 4,000,000 | 4,363,120 | |||||
New York Series B, 5.50% due 8/1/2011 (Insured: MBIA) | Aaa/AAA | 1,000,000 | 1,106,090 | |||||
New York Series B, 2.80% due 8/15/2018 put 10/3/2005 (daily demand notes) | VMIG1/A-1+ | 1,100,000 | 1,100,000 | |||||
New York State Dormitory Authority Aids Long Term Health Facilities, 5.00% due 11/1/2013 (Insured: SONYMA) | Aa1/NR | 1,600,000 | 1,700,304 | |||||
New York State Dormitory Authority Aids Long Term Health Facilities, 5.00% due 11/1/2014 (Insured: SONYMA) | Aa1/NR | 1,500,000 | 1,594,035 | |||||
New York State Dormitory Authority Revenue Refunding, 5.00% due 2/15/2010 (Wyckoff Heights Project; Insured: AMBAC) | Aaa/AAA | 4,870,000 | 5,123,873 | |||||
New York State Dormitory Authority Revenues, 5.00% due 7/1/2007 (City University Systems Project) | A2/AA- | 3,500,000 | 3,608,815 | |||||
New York State Dormitory Authority Revenues, 5.50% due 7/1/2012 (South Nassau Community Hospital B Project) | Baa1/NR | 1,820,000 | 1,975,555 | |||||
New York State Dormitory Authority Revenues, 5.50% due 7/1/2013 (South Nassau Community Hospital B Project) | Baa1/NR | 1,500,000 | 1,628,310 | |||||
New York State Dormitory Authority Revenues Secured Hospital Interfaith Medical Center Series D, 5.75% due 2/15/2008 | A2/AA- | 2,515,000 | 2,655,714 | |||||
New York State Housing Finance Service Contract Series A, 6.25% due 9/15/2010 pre-refunded 9/15/2007 | A2/AAA | 1,920,000 | 2,018,400 | |||||
New York State Urban Development Corp. Revenue Refunding Facilities A, 6.50% due 1/1/2011 (Correctional Capital Project; Insured: FSA) | Aaa/AAA | 2,500,000 | 2,860,725 | |||||
New York Thruway Authority General Revenue Special Obligation, 0% due 1/1/2006 | NR/A- | 1,320,000 | 1,310,166 | |||||
New York Urban Development Corp. Revenue University Facilities Grants, 6.00% due 1/1/2006 | A2/AA- | 255,000 | 256,918 | |||||
New York Urban Development Corp. Series 7, 6.00% due 1/1/2006 | A2/AA- | 3,425,000 | 3,451,270 | |||||
Oneida County Industrial Development Agency Series C, 6.00% due 1/1/2009 (Civic Facility Faxton Hospital Project; Insured: Radian) | NR/AA | 710,000 | 764,535 | |||||
Port Authority New York & New Jersey Special Obligation, 2.80% due 5/1/2019 put 10/3/2005 (daily demand notes) | VMIG1/A-1+ | 1,100,000 | 1,100,000 | |||||
Tobacco Settlement Financing Corp. Asset Backed Series B-1C, 5.25% due 6/1/2013 | A2/AA- | 2,000,000 | 2,098,780 | |||||
Tobacco Settlement Financing Corp. New York Revenue Asset Backed Series A-1C, 5.25% due 6/1/2012 (Secured: State Contingency Contract) | A2/AA- | 1,190,000 | 1,207,243 | |||||
Tobacco Settlement Financing Corp. New York Revenue Asset Backed Series B-1C, 5.25% due 6/1/2013 (Insured: XLCA) | Aaa/AAA | 2,000,000 | 2,104,540 | |||||
NORTH CAROLINA — 2.13% | ||||||||
Cabarrus County COP Installment Financing Contract, 4.50% due 2/1/2007 (Insured: AMBAC) | Aaa/AAA | 1,100,000 | 1,122,033 | |||||
North Carolina Eastern Municipal Power Agency Power Systems Revenue, 6.125% due 1/1/2009 (Insured: MBIA) | Aaa/AAA | 2,860,000 | 3,111,709 | |||||
North Carolina Eastern Municipal Power Agency Power Systems Revenue Refunding Series D, 5.375% due 1/1/2011 | Baa2/BBB | 3,000,000 | 3,208,140 | |||||
North Carolina Eastern Municipal Power Agency Power Systems Revenue Series C, 5.25% due 1/1/2012 | Baa2/BBB | 650,000 | 694,518 | |||||
North Carolina Eastern Municipal Power Agency Power Systems Series A, 5.50% due 1/1/2012 | Baa2/BBB | 1,000,000 | 1,082,190 | |||||
North Carolina Eastern Municipal Power Agency Power Systems Series C, 5.25% due 1/1/2013 | Baa2/BBB | 1,055,000 | 1,126,972 | |||||
North Carolina Municipal Power Agency 1 Catawba Electric Revenue, 6.00% due 1/1/2010 (Insured: MBIA) | Aaa/AAA | 2,400,000 | 2,650,008 | |||||
North Carolina Municipal Power Agency 1 Catawba Electric Revenue Series A, 5.50% due 1/1/2013 | A3/BBB+ | 2,505,000 | 2,749,288 | |||||
North Carolina Municipal Power Agency 1 Catawba Electric Revenue Series B, 6.375% due 1/1/2013 | A3/BBB+ | 1,000,000 | 1,102,890 | |||||
| Certified Annual Report 29 |
SCHEDULE OF INVESTMENTS, CONTINUED
Thornburg Limited Term Municipal Fund | September 30, 2005 |
Issuer-Description | Credit Rating† Moody’s/S&P | Principal Amount | Value | |||||
North Carolina Municipal Power Agency Series A, 6.00% due 1/1/2007 (Insured: MBIA) | Aaa/AAA | $ | 3,400,000 | $ | 3,525,154 | |||
North Carolina Municipal Power Agency Series A, 6.00% due 1/1/2008 (Insured: MBIA) | Aaa/AAA | 3,900,000 | 4,142,307 | |||||
North Carolina State COP Series B, 5.00% due 6/1/2009 (Repair & Renovation Project) | Aa2/AA+ | 2,000,000 | 2,120,060 | |||||
Raleigh Durham Airport Authority Airport Revenue Series A, 5.50% due 11/1/2006 (Insured: FGIC) | Aaa/NR | 2,000,000 | 2,054,780 | |||||
University of North Carolina Systems Pool Revenue Refunding Series B, 5.00% due 4/1/2012 (Insured: AMBAC) | Aaa/AAA | 1,030,000 | 1,119,785 | |||||
OHIO — 3.45% | ||||||||
Akron COP Refunding, 5.00% due 12/1/2013 (Insured: Assured Guaranty) | Aa1/AAA | 3,000,000 | 3,216,870 | |||||
Akron COP Refunding, 5.00% due 12/1/2014 (Insured: Assured Guaranty) | Aa1/AAA | 2,000,000 | 2,147,860 | |||||
Bellefontaine Hospital Revenue Refunding, 6.00% due 12/1/2013 (Mary Rutan Health Associates Project) | NR/BBB+ | 1,885,000 | 1,891,107 | |||||
Central Ohio Authority Solid Waste Facility Series B, 5.00% due 12/1/2007 | Aa2/AA+ | 2,025,000 | 2,104,299 | |||||
Cleveland Cuyahoga County Port Authority Revenue GO, 6.00% due 11/15/2010 | NR/NR | 3,545,000 | 3,739,975 | |||||
Columbus GO, 12.375% due 2/15/2009 | Aaa/AAA | 1,050,000 | 1,350,289 | |||||
Cuyahoga County Hospital Revenue Refunding, 5.50% due 1/15/2019 (University Health Systems Project B; Insured: MBIA) | Aaa/AAA | 4,000,000 | 4,105,440 | |||||
Cuyahoga County Hospital Revenue Refunding Series A, 4.75% due 2/15/2008 (Metrohealth Systems Project; Insured: MBIA) | Aaa/AAA | 1,000,000 | 1,037,000 | |||||
Cuyahoga County Hospital Revenue Refunding Series B, 6.00% due 1/15/2006 (University Hospital Health Systems Project) | A3/A | 2,705,000 | 2,727,938 | |||||
Hudson City Library Improvement, 6.35% due 12/1/2011 | Aa1/NR | 1,400,000 | 1,599,612 | |||||
Lake County Sewer & Water District Improvement, 5.30% due 12/1/2011 | Aa2/NR | 455,000 | 479,807 | |||||
Lorain County Hospital Revenue Refunding Catholic Healthcare Partners B, 6.00% due 9/1/2008 (Insured: MBIA) | Aaa/AAA | 1,200,000 | 1,281,048 | |||||
Mahoning Valley District Water Refunding, 5.85% due 11/15/2008 (Insured: FSA) | Aaa/AAA | 1,300,000 | 1,404,312 | |||||
Mahoning Valley District Water Refunding, 5.90% due 11/15/2009 (Insured: FSA) | Aaa/AAA | 770,000 | 848,301 | |||||
Montgomery County Revenue, 6.00% due 12/1/2008 (Catholic Health Initiatives Project) | Aa2/AA | 2,250,000 | 2,412,563 | |||||
Montgomery County Revenue, 6.00% due 12/1/2009 (Catholic Health Initiatives Project) | Aa2/AA | 2,385,000 | 2,595,977 | |||||
Montgomery County Revenue, 6.00% due 12/1/2010 (Catholic Health Initiatives Project) | Aa2/AA | 1,530,000 | 1,687,253 | |||||
Montgomery County Solid Waste Revenue, 6.00% due 11/1/2005 (Insured: MBIA) | Aaa/AAA | 1,000,000 | 1,002,720 | |||||
Ohio State Building Authority Refunding Adult Corrections Facilities, 5.00% due 10/1/2006 (Insured: FSA) | Aaa/AAA | 2,000,000 | 2,041,620 | |||||
Ohio State GO, 6.65% due 9/1/2009 (Infrastructure Improvement Project) | Aa1/AA+ | 2,480,000 | 2,669,596 | |||||
Ohio State Unlimited Tax GO Series A, 5.75% due 6/15/2010 pre-refunded 6/15/2009 | Aa1/AA+ | 5,000,000 | 5,442,950 | |||||
Plain Local School District Capital Appreciation, 0% due 12/1/2006 (Insured: FGIC) | Aaa/NR | 680,000 | 657,710 | |||||
Plain Local School District Capital Appreciation, 0% due 12/1/2007 (Insured: FGIC) | Aaa/NR | 845,000 | 790,329 | |||||
Reading Revenue Development, 6.00% due 2/1/2009 (St. Mary’s Educational Institute Project; Insured: Radian) | NR/AA | 975,000 | 1,050,017 | |||||
OKLAHOMA — 2.03% | ||||||||
Claremore Public Works Authority Revenue Refunding, 6.00% due 6/1/2006 (Insured: FSA) | Aaa/NR | 1,235,000 | 1,260,639 | |||||
Claremore Public Works Authority Revenue Refunding, 6.00% due 6/1/2007 (Insured: FSA) | Aaa/NR | 1,340,000 | 1,404,695 | |||||
Comanche County Oklahoma Hospital Authority Revenue Refunding, 4.00% due 7/1/2007 (Insured: Radian) | Aa3/AA | 1,265,000 | 1,277,751 | |||||
Comanche County Oklahoma Hospital Authority Revenue Refunding, 5.00% due 7/1/2011 (Insured: Radian) | Aa3/AA | 1,000,000 | 1,057,720 | |||||
Grand River Dam Authority Revenue, 5.50% due 6/1/2010 | A2/BBB+ | 1,200,000 | 1,300,080 | |||||
Jenks Aquarium Authority Revenue First Mortgage, 5.50% due 7/1/2010 (Insured: MBIA) | Aaa/NR | 500,000 | 528,965 | |||||
Oklahoma Authority Revenue Refunding Health Systems Obligation Group Series A, 5.75% due 8/15/2007 (Insured: MBIA) | Aaa/AAA | 2,380,000 | 2,492,812 | |||||
Oklahoma Development Finance Authority Health Facilities Revenue, 5.75% due 6/1/2011 (Insured: AMBAC) | Aaa/AAA | 740,000 | 821,474 | |||||
30 Certified Annual Report |
SCHEDULE OF INVESTMENTS, CONTINUED
| Thornburg Limited Term Municipal Fund | September 30, 2005 |
Issuer-Description | Credit Rating† Moody’s/S&P | Principal Amount | Value | |||||
Oklahoma Development Finance Authority Hospital Revenue Refunding, 5.00% due 10/1/2012 (Unity Health Center Project) | NR/BBB+ | $ | 1,070,000 | $ | 1,123,125 | |||
Oklahoma Development Finance Authority Hospital Revenue Series A, 5.25% due 12/1/2011 (Duncan Regional Hospital Project) | NR/A- | 1,215,000 | 1,296,697 | |||||
Oklahoma Development Finance Authority Hospital Revenue Series A, 5.25% due 12/1/2012 (Duncan Regional Hospital Project) | NR/A- | 1,330,000 | 1,421,969 | |||||
Oklahoma Development Finance Authority Hospital Revenue Series A, 5.25% due 12/1/2013 (Duncan Regional Hospital Project) | NR/A- | 1,250,000 | 1,334,725 | |||||
Oklahoma Housing Development Authority Revenue Lease Purchase Program Series A, 5.10% due 11/1/2005 | Aa3/NR | 5,000,000 | 5,008,800 | |||||
Oklahoma State Industrial Authority Revenue Health System Obligation A, 6.00% due 8/15/2010 pre-refunded 8/15/2009 | Aaa/AAA | 190,000 | 210,110 | |||||
Oklahoma State Industrial Authority Revenue Unrefunded Balance Health System Series A, 6.00% due 8/15/2010 (Insured: MBIA) | Aaa/AAA | 2,150,000 | 2,366,247 | |||||
Tulsa County Independent School Building, 4.00% due 6/1/2008 | Aa3/NR | 2,750,000 | 2,810,500 | |||||
Tulsa County Independent School District, 4.50% due 8/1/2006 | Aa3/AA- | 2,650,000 | 2,685,484 | |||||
OREGON — 0.37% | ||||||||
Clackamas County Hospital Facility Authority Revenue Refunding, 5.00% due 5/1/2008 (Legacy Health Systems Project) | Aa3/AA | 4,000,000 | 4,164,400 | |||||
Medford Hospital Facilities Authority Revenue Series A, 5.25% due 8/15/2006 (Asante Health Systems Project; Insured: MBIA) | Aaa/AAA | 1,000,000 | 1,019,860 | |||||
PENNSYLVANIA — 2.43% | ||||||||
Allegheny County Hospital Development Health Series B, 6.30% due 5/1/2009 (South Hills Health System Project) | Baa1/NR | 1,505,000 | 1,593,208 | |||||
Allegheny County Hospital Development Refunding, 4.40% due 11/1/2005 (Health Center UPMC Health Systems Project; Insured: MBIA) | Aaa/AAA | 1,000,000 | 1,001,320 | |||||
Chester County School Authority, 5.00% due 4/1/2016 (Intermediate School Project; Insured: AMBAC) (a) | NR/AAA | 1,915,000 | 2,081,471 | |||||
Delaware County Pennsylvania Authority Revenue, 5.50% due 11/15/2007 (Insured: AMBAC) | Aaa/AAA | 1,000,000 | 1,047,160 | |||||
Geisinger Authority Health Systems Revenue, 5.50% due 8/15/2009 | Aa3/AA- | 1,000,000 | 1,062,830 | |||||
Manheim Township School Authority School Revenue Series 1978, 6.625% due 12/1/2007 pre-refunded 12/1/2005 | NR/AAA | 1,025,000 | 1,031,662 | |||||
Montgomery County Pennsylvania Higher Education & Health Authority, 6.25% due 7/1/2006 | Baa3/NR | 730,000 | 739,724 | |||||
Montgomery County Pennsylvania Higher Education & Health Authority, 6.375% due 7/1/2007 | Baa3/NR | 550,000 | 566,775 | |||||
Pennsylvania Higher Educational Facilities Authority Health Services Revenue, 5.50% due 1/1/2009 pre-refunded 1/1/2006 (University of Pennsylvania Health Systems Project) | A3/A | 1,410,000 | 1,433,392 | |||||
Pennsylvania Higher Educational Facilities Series A, 5.00% due 8/15/2008 (University of Pennsylvania Health Systems Project) | A3/A | 1,250,000 | 1,300,112 | |||||
Pennsylvania State Higher Educational Facilities Authority Revenue, 4.00% due 11/1/2032 put 11/1/2005 (LOC: Allied Irish Banks PLC) | VMIG1/NR | 1,500,000 | 1,501,290 | |||||
Pennsylvania State Second Series, 5.25% due 10/1/2008 | Aa2/AA | 900,000 | 954,540 | |||||
Philadelphia Gas Works Revenue Eighteenth Series, 5.00% due 8/1/2009 (Insured: Assured Guaranty) | Aa1/AAA | 1,240,000 | 1,313,619 | |||||
Philadelphia Gas Works Revenue Eighteenth Series, 5.00% due 8/1/2010 (Insured: Assured Guaranty) | Aa1/AAA | 1,305,000 | 1,394,027 | |||||
Philadelphia Hospital & Higher Education Facilities Authority Revenue, 5.50% due 5/15/2006 (Jefferson Health Systems Project) | Aa3/AA- | 1,000,000 | 1,014,770 | |||||
Philadelphia Hospital & Higher Education Health System Series A, 5.25% due 5/15/2007 (Jefferson Health Systems Project; Insured: MBIA) | Aaa/AAA | 2,600,000 | 2,689,076 | |||||
Pittsburgh Series A, 5.00% due 9/1/2012 (Insured: MBIA) | Aaa/AAA | 3,415,000 | 3,690,215 | |||||
Pittsburgh Series A, 5.00% due 9/1/2013 (Insured: MBIA) | Aaa/AAA | 2,000,000 | 2,161,320 | |||||
Pottsville Hospital Authority Revenue Acsension Health Credit Series A, 5.20% due 11/15/2009 (Insured: AMBAC) | Aaa/AAA | 1,000,000 | 1,069,890 | |||||
| Certified Annual Report 31 |
SCHEDULE OF INVESTMENTS, CONTINUED | ||
Thornburg Limited Term Municipal Fund | September 30, 2005 | |
Issuer-Description | Credit Rating† Moody’s/S&P | Principal Amount | Value | |||||
Sayre Pennsylvania Health Care Facilities Authority Series A, 5.00% due 7/1/2008 (Latrobe Area Hospital Project; Insured: AMBAC) | Aaa/AAA | $ | 1,255,000 | $ | 1,313,332 | |||
Sayre Pennsylvania Health Care Facilities Authority Series A, 5.00% due 7/1/2009 (Latrobe Area Hospital Project; Insured: AMBAC) | Aaa/AAA | 1,320,000 | 1,396,613 | |||||
Sayre Pennsylvania Health Care Facilities Authority Series A, 5.25% due 7/1/2011 (Latrobe Area Hospital Project; Insured: AMBAC) | Aaa/AAA | 1,400,000 | 1,522,024 | |||||
Sayre Pennsylvania Health Care Facilities Authority Series A, 5.25% due 7/1/2012 (Latrobe Area Hospital Project; Insured: AMBAC) | Aaa/AAA | 1,000,000 | 1,093,690 | |||||
Scranton Lackawanna Health & Welfare Authority, 7.125% due 1/15/2013 pre-refunded 1/15/2007 (Marian Community Hospital Project) | NR/NR | 1,000,000 | 1,066,220 | |||||
RHODE ISLAND — 1.17% | ||||||||
Providence Public Building Authority Refunding Series B, 5.75% due 12/15/2007 (Insured: FSA) | Aaa/AAA | 1,075,000 | 1,136,759 | |||||
Providence Series C, 5.50% due 1/15/2012 (Insured: FSA) | Aaa/AAA | 1,880,000 | 2,089,225 | |||||
Rhode Island Bond Authority Revenue Refunding Series A, 5.00% due 10/1/2005 (State Public Projects; Insured: AMBAC) | Aaa/AAA | 4,455,000 | 4,455,267 | |||||
Rhode Island Economic Development Corp. Revenue, 5.75% due 7/1/2010 (Providence Place Mall Project; Insured: Radian) | NR/AA | 2,075,000 | 2,218,445 | |||||
Rhode Island State, 5.00% due 10/1/2014 (Providence Plantations Project; Insured MBIA) | Aaa/AAA | 1,000,000 | 1,078,110 | |||||
Rhode Island State COP Refunding, 5.125% due 10/1/2008 (Insured: MBIA) | Aaa/AAA | 1,660,000 | 1,736,426 | |||||
Rhode Island State Health & Education Building, 4.50% due 9/1/2009 (Butler Hospital Project; LOC: Fleet National Bank) | NR/AA | 1,960,000 | 2,031,873 | |||||
Rhode Island State Health & Educational Building Corp. Revenue Hospital Financing, 5.25% due 7/1/2014 (Memorial Hospital Project; LOC: Fleet Bank) | NR/AA | 1,565,000 | 1,670,544 | |||||
SOUTH CAROLINA — 0.90% | ||||||||
Charleston County COP, 6.00% due 12/1/2007 (Insured: MBIA) | Aaa/AAA | 2,050,000 | 2,162,914 | |||||
Charleston County COP Refunding, 5.00% due 6/1/2007 (Charleston Public Facilities Corp. Project; Insured: MBIA) | Aaa/AAA | 1,350,000 | 1,390,189 | |||||
South Carolina Jobs Economic Development Authority Hospital Facilities Revenue Improvement, 7.125% due 12/15/2015 pre-refunded 12/15/2010 (Palmetto Health Alliance Project) | NR/NR | 1,250,000 | 1,490,763 | |||||
South Carolina Jobs Economic Development Authority Hospital Facilities Revenue Improvement Series A, 7.375% due 12/15/2021 pre-refunded 12/15/2010 (Palmetto Health Alliance Project) | NR/NR | 2,600,000 | 3,131,570 | |||||
South Carolina State Public Service Authority Revenue Refunding Series D, 5.00% due 1/1/2006 | Aa2/AA- | 2,000,000 | 2,010,620 | |||||
South Carolina State Public Service Authority Revenue Refunding Series D, 5.00% due 1/1/2007 | Aa2/AA- | 2,315,000 | 2,370,537 | |||||
SOUTH DAKOTA — 0.32% | ||||||||
Rapid City Area School District Refunding Capital Outlay Certificates GO, 5.00% due 1/1/2010 (Insured: FSA) | Aaa/NR | 1,000,000 | 1,066,890 | |||||
South Dakota Health & Educational Facilities Authority Revenue, 5.50% due 9/1/2011 (Rapid City Regional Hospital Project; Insured: MBIA) | Aaa/AAA | 1,100,000 | 1,209,263 | |||||
South Dakota State Health & Educational Facilities Authority Revenue Refunding, 6.25% due 7/1/2009 (McKennan Hospital Project; Insured: MBIA) | Aaa/AAA | 1,000,000 | 1,097,710 | |||||
South Dakota State Health & Educational Facilities Authority Revenue Refunding, 6.00% due 7/1/2014 (McKennan Hospital Project; Insured: MBIA) | Aaa/AAA | 1,000,000 | 1,040,590 | |||||
TENNESSEE — 0.16% | ||||||||
Franklin Industrial Development Multi Family Refunding Housing Series A, 5.75% due 4/1/2010 (Insured: FSA) | Aaa/AAA | 660,000 | 683,331 | |||||
Metro Government Nashville Water & Sewer, 6.50% due 12/1/2014 (ETM) | Aaa/AAA | 1,240,000 | 1,500,623 | |||||
TEXAS — 14.92% | ||||||||
Amarillo Health Facilities Corp. Hospital Revenue, 5.50% due 1/1/2011 (Baptist St. Anthony’s Hospital Corp. Project; Insured: FSA) | Aaa/NR | 1,350,000 | 1,467,639 | |||||
32 Certified Annual Report |
SCHEDULE OF INVESTMENTS, CONTINUED | ||
| Thornburg Limited Term Municipal Fund | September 30, 2005 | |
Issuer-Description | Credit Rating† Moody’s/S&P | Principal Amount | Value | |||||
Austin Texas Refunding, 5.00% due 3/1/2011 | Aa2/AA+ | $ | 1,000,000 | $ | 1,073,440 | |||
Bell County Health Facilities Development Corp. Revenue Series A, 6.25% due 8/15/2010 (Scott & White Memorial Hospital Project; Insured: MBIA) | Aaa/AAA | 1,000,000 | 1,116,740 | |||||
Bexar County Housing Finance Corp. Multi Family Housing Revenue, 5.00% due 1/1/2011 (Insured: MBIA) | Aaa/NR | 1,800,000 | 1,887,894 | |||||
Cedar Hill Independent School District Refunding, 0% due 8/15/2010 (Guaranty: PSF) | NR/AAA | 1,250,000 | 1,027,787 | |||||
Central Regional Mobility Authority Revenue Anticipation Notes, 5.00% due 1/1/2008 | Aa3/AA | 7,000,000 | 7,285,390 | |||||
Clint Independent School District Refunding, 5.50% due 2/15/2011 (Guaranty: PSF) | Aaa/AAA | 1,700,000 | 1,865,461 | |||||
Clint Independent School District Refunding, 5.50% due 2/15/2012 (Guaranty: PSF) | Aaa/AAA | 1,425,000 | 1,559,164 | |||||
Coppell Independent School District Refunding, 0% due 8/15/2007 (Guaranty: PSF) | NR/AAA | 3,300,000 | 3,112,164 | |||||
Corpus Christi Business & Job Development Corp. Sales Tax Revenue, 5.00% due 9/1/2012 (Refunding & Improvement Arena Project; Insured: AMBAC) | Aaa/AAA | 1,025,000 | 1,109,562 | |||||
Corpus Christi Utility Systems Revenue Refunding, 5.50% due 7/15/2006 (Insured: FSA) | Aaa/AAA | 4,070,000 | 4,152,540 | |||||
Corpus Christi Utility Systems Revenue Refunding, 5.50% due 7/15/2008 (Insured: FSA) | Aaa/AAA | 2,000,000 | 2,122,800 | |||||
Corpus Christi Utility Systems Revenue Refunding, 5.50% due 7/15/2009 (Insured: FSA) | Aaa/AAA | 4,780,000 | 5,152,553 | |||||
Cypress Fair Banks Independent School District Refunding GO, 5.00% due 2/15/2022 put 8/15/2010 (Guaranty: PSF) | Aaa/AAA | 2,500,000 | 2,664,100 | |||||
Dallas Tax Increment Financing Reinvestment Zone 2, 5.75% due 8/15/2006 (Insured: Radian) | NR/AA | 450,000 | 459,571 | |||||
Duncanville Independent School District Refunding Series B, 0% due 2/15/2011 (Guaranty: PSF) | Aaa/AAA | 4,945,000 | 4,058,411 | |||||
Duncanville Independent School District Refunding Series B, 0% due 2/15/2012 (Guaranty: PSF) | Aaa/AAA | 1,245,000 | 975,096 | |||||
Fort Worth Water & Sewer Revenue Refunding & Improvement, 5.25% due 2/15/2011 pre-refunded 2/15/2008 | Aa2/AA | 3,800,000 | 3,986,884 | |||||
Fort Worth Water & Sewer Revenue Series 2001, 5.25% due 2/15/2011 (Tarrant & Denton County Project) | Aa2/AA | 1,390,000 | 1,508,400 | |||||
Grapevine Colleyville ISD Capital Appreciation, 0% due 8/15/2011 (Guaranty: PSF) | Aaa/AAA | 7,350,000 | 5,908,738 | |||||
Grapevine Texas, 5.25% due 2/15/2012 (Insured: FGIC) | Aaa/AAA | 2,005,000 | 2,021,662 | |||||
Gulf Coast Waste Disposal Authority Environmental Facilities Revenue Refunding, 4.20% due 11/1/2006 (Occidental Project) | A3/A- | 4,000,000 | 4,029,160 | |||||
Gulf Coast Waste Disposal Authority Texas Revenue Refunding, 5.00% due 10/1/2010 (Bayport Area Systems Project; Insured: AMBAC) | Aaa/AAA | 1,000,000 | 1,068,060 | |||||
Gulf Coast Waste Disposal Authority Texas Revenue Refunding, 5.00% due 10/1/2011 (Bayport Area Systems Project; Insured: AMBAC) | Aaa/AAA | 1,000,000 | 1,073,020 | |||||
Harlingen Consolidated Independent School, 7.50% due 8/15/2006 (Guaranty: PSF) | Aaa/AAA | 1,275,000 | 1,324,342 | |||||
Harlingen Consolidated Independent School, 7.50% due 8/15/2009 (Guaranty: PSF) | Aaa/AAA | 750,000 | 860,422 | |||||
Harris County Health Facilities, 5.00% due 11/15/2015 (Teco Project; Insured: MBIA) | Aaa/AAA | 1,500,000 | 1,595,940 | |||||
Harris County Health Facilities Development Corp. Hospital Revenue Refunding Series A, 6.00% due 6/1/2012 (Memorial Hospital Systems Project; Insured: MBIA) | Aaa/AAA | 500,000 | 569,065 | |||||
Harris County Health Facilities Development Corp.Thermal Utility Revenue, 5.45% due 2/15/2011 (Teco Project; Insured: AMBAC) | Aaa/AAA | 4,085,000 | 4,391,171 | |||||
Harris County Health Facilities Hospital Series A, 6.00% due 6/1/2010 (Memorial Hospital Systems Project; Insured: MBIA) | Aaa/AAA | 3,100,000 | 3,424,694 | |||||
Harris County Hospital District Mortgage Revenue, 7.40% due 2/15/2010 (ETM) | Aaa/AAA | 420,000 | 447,653 | |||||
Harris County Hospital District Mortgage Revenue Unrefunded Balance Refunding, 7.40% due 2/15/2010 (Insured: AMBAC) | Aaa/AAA | 1,925,000 | 2,104,833 | |||||
Harris County Hospital District Revenue Refunding, 5.75% due 2/15/2011 (Insured: MBIA) | Aaa/AAA | 10,000,000 | 10,949,700 | |||||
Harris County Hospital District Revenue Refunding, 5.75% due 2/15/2012 (Insured: MBIA) | Aaa/AAA | 2,000,000 | 2,186,580 | |||||
Harris County Refunding Toll Road Senior Lien Series B-2, 5.00% due 8/15/2021 put 8/15/2009 (Insured: FGIC) | Aaa/AAA | 5,000,000 | 5,308,500 | |||||
Harris County Sports Authority Revenue Senior Lien Series G, 0% due 11/15/2010 (Insured: MBIA) | Aaa/AAA | 3,260,000 | 2,707,006 | |||||
Harris County Texas GO, 0% due 8/1/2008 | Aa1/AA+ | 7,000,000 | 6,386,030 | |||||
Houston Community College Systems Refunding Student Fee, 5.25% due 4/15/2010 (Insured: FSA) | Aaa/AAA | 1,000,000 | 1,078,240 | |||||
Houston Community College Systems Refunding Student Fee, 5.25% due 4/15/2011 (Insured: FSA) | Aaa/AAA | 1,000,000 | 1,087,080 | |||||
Houston Community College Systems Refunding Student Fee, 5.25% due 4/15/2012 (Insured: FSA) | Aaa/AAA | 1,460,000 | 1,597,313 | |||||
Houston Community College Systems Refunding Student Fee, 5.25% due 4/15/2013 (Insured: FSA) | Aaa/AAA | 1,250,000 | 1,371,900 | |||||
| Certified Annual Report 33 |
| SCHEDULE OF INVESTMENTS, CONTINUED | ||
| Thornburg Limited Term Municipal Fund | September 30, 2005 | |
Issuer-Description | Credit Rating† Moody’s/S&P | Principal Amount | Value | |||||
Keller Independent School District Capital Appreciation Refunding, 0% due 8/15/2012 (Guaranty PSF) | Aaa/AAA | $ | 1,250,000 | $ | 957,837 | |||
Laredo Sports Venue Sales Refunding & Improvement, 5.00% due 3/15/2012 (Insured: AMBAC) | Aaa/AAA | 1,660,000 | 1,786,094 | |||||
Laredo Sports Venue Sales Refunding & Improvement, 5.00% due 3/15/2013 (Insured: AMBAC) | Aaa/AAA | 1,745,000 | 1,880,325 | |||||
Laredo Sports Venue Sales Refunding & Improvement, 5.00% due 3/15/2014 (Insured: AMBAC) | Aaa/AAA | 1,835,000 | 1,980,864 | |||||
Laredo Sports Venue Sales Refunding & Improvement, 5.00% due 3/15/2015 (Insured: AMBAC) | Aaa/AAA | 1,930,000 | 2,082,605 | |||||
Lewisville Combination Contract Revenue, 4.125% due 5/1/2031 pre-refunded 11/1/2006 (Special Assessment Castle Hills Project Number 3; LOC:Wells Fargo Bank) | NR/AA | 1,000,000 | 1,012,660 | |||||
Longview Water & Sewer Revenue Refunding, 5.00% due 3/1/2012 (Insured: MBIA) | Aaa/AAA | 1,150,000 | 1,240,356 | |||||
Lower Colorado River Authority Revenue Refunding & Improvement, 8.00% due 5/15/2010 (Transportation Systems Project; Insured: FSA) | Aaa/AAA | 750,000 | 893,198 | |||||
Mesquite Independent School District Refunding, 0% due 8/15/2011 (Guaranty: PSF) | NR/AAA | 3,065,000 | 2,424,630 | |||||
Midlothian Independent School District Refunding, 0% due 2/15/2008 (Guaranty: PSF) | Aaa/NR | 1,415,000 | 1,311,309 | |||||
Midlothian Independent School District Refunding, 0% due 2/15/2009 (Guaranty: PSF) | Aaa/NR | 1,200,000 | 1,071,300 | |||||
Midtown Redevelopment Authority Texas Tax, 6.00% due 1/1/2010 (Insured: Radian) | NR/AA | 700,000 | 761,334 | |||||
Midtown Redevelopment Authority Texas Tax, 6.00% due 1/1/2011 (Insured: Radian) | NR/AA | 740,000 | 814,222 | |||||
Red River Education Finance Corp., 2.10% due 12/1/2034 put 12/1/2007 (Parish Episcopal School Project; LOC: Allied Irish Banks PLC) | VMIG1/NR | 2,500,000 | 2,415,475 | |||||
Sam Rayburn Municipal Power Agency Refunding, 5.50% due 10/1/2012 | Baa2/BBB- | 6,000,000 | 6,416,460 | |||||
San Antonio Hotel Occupancy Revenue Refunding Series B, 5.00% due 8/15/2034 put 8/1/2008 (Insured: AMBAC) | Aaa/AAA | 5,000,000 | 5,242,050 | |||||
Socorro Independent School District Series A, 5.75% due 2/15/2011 (Guaranty: PSF) | NR/AAA | 1,970,000 | 2,078,370 | |||||
Southlake Tax Increment Certificates of Obligation Series B, 0% due 2/15/2007 (Insured: AMBAC) | Aaa/AAA | 965,000 | 901,821 | |||||
Southlake Tax Increment Certificates of Obligation Series B, 0% due 2/15/2008 pre-refunded 2/15/2006 | Aaa/AAA | 1,120,000 | 987,302 | |||||
Southlake Tax Increment Certificates of Obligation Series B, 0% due 2/15/2009 pre-refunded 2/15/2006 | Aaa/AAA | 1,275,000 | 1,057,880 | |||||
Southlake Tax Increment Certificates of Obligation Series B, 0% due 2/15/2010 pre-refunded 2/15/2006 | Aaa/AAA | 1,440,000 | 1,120,205 | |||||
Spring Branch Independent School District, 7.50% due 2/1/2011 (Guaranty: PSF) | Aaa/AAA | 500,000 | 594,270 | |||||
Springhill Courtland Heights Public Facility Corp. MultiFamily Revenue Senior Lien Housing Series A, 5.125% due 12/1/2008 | NR/BBB- | 1,150,000 | 1,163,041 | |||||
Tarrant County Health Facilities, 5.875% due 11/15/2007 (Adventist/Sunbelt Health System Project) | A2/A+ | 580,000 | 612,584 | |||||
Tarrant County Health Facilities, 6.00% due 11/15/2009 (Adventist/Sunbelt Health System Project) | A2/A+ | 650,000 | 716,476 | |||||
Tarrant County Health Facilities, 6.10% due 11/15/2011 pre-refunded 11/15/2010 (Adventist/Sunbelt Health System Project) | A2/A+ | 730,000 | 826,988 | |||||
Tarrant County Health Facilities Development Corp., 5.75% due 2/15/2011 (Texas Health Resources Project; Insured: MBIA) | Aaa/AAA | 1,400,000 | 1,499,246 | |||||
Tarrant County Health Facilities Development Corp. Health Systems Revenue Series A, 5.75% due 2/15/2008 (Texas Health Resources Systems Project; Insured: MBIA) | Aaa/AAA | 3,000,000 | 3,167,850 | |||||
Tarrant County Health Facilities Development Series A, 5.75% due 2/15/2009 (Texas Health Resources Systems Project; Insured: MBIA) | Aaa/AAA | 3,000,000 | 3,199,830 | |||||
Texarkana Health Facilities Development Corp. Hospital Revenue, 5.75% due 10/1/2008 (Insured: MBIA) | Aaa/AAA | 1,500,000 | 1,602,465 | |||||
Texas Affordable Housing Corp. Portfolio A, 4.85% due 9/1/2012 (Insured: MBIA) | Aaa/AAA | 2,000,000 | 2,002,480 | |||||
Texas Affordable Housing Corp. Series A, 4.85% due 9/1/2012 (Insured: MBIA) | Aaa/AAA | 1,945,000 | 1,987,090 | |||||
Texas Public Finance Authority Building Revenue State Preservation Project Series B, 6.00% due 8/1/2011 pre-refunded 8/1/2009 (Insured: FSA) | Aaa/AAA | 1,000,000 | 1,100,010 | |||||
Texas State Tax & Revenue Anticipation Notes, 4.50% due 8/31/2006 | Mig1/SP-1+ | 15,000,000 | 15,200,400 | |||||
Texas State Turnpike Authority Central Texas Turnpike Systems Rev. Bond Anticipation Note 2nd Tier, 5.00% due 6/1/2008 | Aa3/AA | 7,000,000 | 7,324,590 | |||||
Travis County GO, 5.00% due 3/1/2007 | Aaa/AAA | 1,000,000 | 1,026,960 | |||||
Travis County GO, 5.00% due 3/1/2010 pre-refunded 3/1/2008 | Aaa/AAA | 500,000 | 522,360 | |||||
Travis County Health Facilities Development Corp. Revenue Ascension Health Credit Series A, 5.75% due 11/15/2007 (Insured: MBIA) | Aaa/AAA | 1,000,000 | 1,052,260 | |||||
Travis County Health Facilities Development Corp. Revenue Ascension Health Credit Series A, 5.75% due 11/15/2008 (Insured: MBIA) | Aaa/AAA | 2,300,000 | 2,464,151 | |||||
34 Certified Annual Report |
| SCHEDULE OF INVESTMENTS, CONTINUED | ||
| Thornburg Limited Term Municipal Fund | September 30, 2005 | |
Issuer-Description | Credit Rating† Moody’s/S&P | Principal Amount | Value | |||||
Travis County Health Facilities Development Corp. Revenue Series A, 5.75% due 11/15/2009 (Insured: MBIA) | Aaa/AAA | $ | 3,750,000 | $ | 4,077,300 | |||
Travis County Health Facilities Development Series A, 5.75% due 11/15/2010 (Ascension Health Project; Insured: MBIA) | Aaa/AAA | 2,000,000 | 2,186,120 | |||||
Washington County Health Facilities Development Corp. Revenue, 5.35% due 6/1/2009 (Insured: ACA) | NR/A | 1,660,000 | 1,749,408 | |||||
West Harris County Regional Water, 5.25% due 12/15/2010 (Insured: FSA) | Aaa/AAA | 1,700,000 | 1,847,441 | |||||
West Harris County Regional Water, 5.25% due 12/15/2011 (Insured: FSA) | Aaa/AAA | 2,315,000 | 2,532,842 | |||||
West Harris County Regional Water, 5.25% due 12/15/2012 (Insured: FSA) | Aaa/AAA | 2,435,000 | 2,678,695 | |||||
Wylie Independent School District, 5.00% due 8/15/2011 (Guaranty PSF) | NR/AAA | 1,000,000 | 1,077,510 | |||||
UTAH — 0.63% | ||||||||
Intermountain Power Agency Power Supply Revenue Series A, 5.00% due 7/1/2012 (ETM) | Aaa/AAA | 4,355,000 | 4,362,621 | |||||
Intermountain Power Agency Utah Power Supply Series E, 6.25% due 7/1/2009 (Insured: FSA) | Aaa/AAA | 500,000 | 551,630 | |||||
Salt Lake County Municipal Building, 5.50% due 10/1/2009 | Aa1/AA+ | 1,500,000 | 1,625,130 | |||||
Snyderville Basin Sewer Improvement, 5.00% due 11/1/2006 (Insured: AMBAC) | Aaa/AAA | 675,000 | 690,322 | |||||
Utah Board of Regents Auxiliary Systems & Student Fee Revenue Refunding Series A, 5.00% due 5/1/2010 | NR/AA | 510,000 | 544,145 | |||||
Utah State University Hospital Board of Regents Revenue, 5.25% due 8/1/2008 (Insured: MBIA) | Aaa/AAA | 1,000,000 | 1,051,980 | |||||
VIRGINIA — 0.87% | ||||||||
Alexandria Industrial Development Authority Revenue, 5.75% due 10/1/2007 (Insured: AMBAC) | Aaa/AAA | 1,010,000 | 1,063,803 | |||||
Alexandria Industrial Development Authority Revenue, 5.75% due 10/1/2008 (Insured: AMBAC) | Aaa/AAA | 1,070,000 | 1,150,068 | |||||
Alexandria Industrial Development Authority Revenue, 5.75% due 10/1/2009 (Insured: AMBAC) | Aaa/AAA | 1,130,000 | 1,236,118 | |||||
Alexandria Industrial Development Authority Revenue, 5.75% due 10/1/2010 (Insured: AMBAC) | Aaa/AAA | 1,195,000 | 1,328,709 | |||||
Chesterfield County Industrial Development, 5.50% due 10/1/2009 (Vepco Project) | A3/BBB+ | 1,500,000 | 1,551,045 | |||||
Hampton GO Refunding Bond, 5.85% due 3/1/2007 | Aa2/AA | 595,000 | 602,301 | |||||
Hampton Hospital Facilities Revenue Series A, 5.00% due 11/1/2005 | Aa2/AA | 500,000 | 500,865 | |||||
Norton Industrial Development Authority Hospital Revenue Refunding Improvement, 5.75% due 12/1/2012 (Norton Community Hospital Project; Insured: ACA) | NR/A | 1,460,000 | 1,601,167 | |||||
Suffolk Redevelopment Housing Authority Refunding, 4.85% due 7/1/2031 put 7/1/2011 (Windsor at Potomac Project; Collateralized: FNMA) | Aaa/NR | 3,000,000 | 3,155,700 | |||||
WASHINGTON — 3.25% | ||||||||
Conservation & Renewable Energy Systems Revenue Refunding, 5.00% due 10/1/2007 (Washington Conservation Project) | Aaa/AA- | 1,000,000 | 1,037,610 | |||||
Energy Northwest Washington Electric Revenue Refunding Series A, 5.375% due 7/1/2013 (Project Number 1; Insured: FSA) | Aaa/AAA | 2,000,000 | 2,199,700 | |||||
Energy Northwest Washington Revenue Series A, 4.75% due 7/1/2007 (Wind Project) | A3/A- | 1,675,000 | 1,700,795 | |||||
Energy Northwest Washington Revenue Series A, 4.95% due 7/1/2008 (Wind Project) | A3/A- | 1,760,000 | 1,836,683 | |||||
Energy Northwest Washington Revenue Series B, 4.95% due 7/1/2008 (Wind Project) | A3/A- | 705,000 | 722,625 | |||||
Energy Northwest Washington Revenue Series B, 5.20% due 7/1/2010 pre-refunded 1/1/2007 (Wind Project) | A3/A- | 785,000 | 827,523 | |||||
Goat Hill Properties Washington Lease Revenue, 5.00% due 12/1/2012 (Government Office Building Project; Insured: MBIA) | Aaa/AAA | 2,055,000 | 2,227,846 | |||||
Grant County Priest Rapids Hydroelectric, 6.00% due 1/1/2006 (Insured: AMBAC) | Aaa/AAA | 335,000 | 337,640 | |||||
Spokane County School District GO, 0% due 6/1/2014 (Insured: MBIA) | Aaa/AAA | 1,600,000 | 1,455,984 | |||||
Spokane Regional Solid Waste Refunding, 5.00% due 12/1/2005 (Insured: AMBAC) | Aaa/AAA | 1,000,000 | 1,003,340 | |||||
Spokane Regional Solid Waste Refunding, 5.00% due 12/1/2006 (Insured: AMBAC) | Aaa/AAA | 1,000,000 | 1,021,700 | |||||
Spokane Regional Solid Waste Refunding, 5.25% due 12/1/2007 (Insured: AMBAC) | Aaa/AAA | 1,000,000 | 1,042,230 | |||||
Spokane Washington Refunding, 5.00% due 12/15/2009 | A2/AA- | 2,150,000 | 2,221,552 | |||||
Spokane Washington Refunding, 5.00% due 12/15/2010 | A2/AA- | 2,430,000 | 2,505,792 | |||||
University of Washington Alumni Association Lease Revenue Refunding, 5.00% due 8/15/2006 (Medical Center Project; Insured: MBIA) | Aaa/AAA | 1,000,000 | 1,017,280 | |||||
| Certified Annual Report 35 |
| SCHEDULE OF INVESTMENTS, CONTINUED | ||
| Thornburg Limited Term Municipal Fund | September 30, 2005 | |
Issuer-Description | Credit Rating† Moody’s/S&P | Principal Amount | Value | |||||
University of Washington Alumni Association Lease Revenue Refunding, 5.00% due 8/15/2007 (Medical Center Project; Insured: MBIA) | Aaa/AAA | $ | 1,100,000 | $ | 1,137,235 | |||
Washington Health Care Facilities, 5.50% due 12/1/2009 (Providence Services Project; Insured: MBIA) | Aaa/AAA | 1,500,000 | 1,619,595 | |||||
Washington Public Power Supply, 5.40% due 7/1/2012 (Insured: FSA) | Aaa/AAA | 900,000 | 990,063 | |||||
Washington Public Power Supply Refunding Series A, 5.00% due 7/1/2011 (Insured: FSA) | Aaa/AAA | 2,500,000 | 2,653,125 | |||||
Washington Public Power Supply System Refunding Revenue, 0% due 7/1/2008 (Nuclear Project Number 3) | Aaa/AA- | 1,140,000 | 1,039,247 | |||||
Washington Public Power Supply System Series 96-A, 6.00% due 7/1/2006 (Insured: MBIA) | Aaa/AAA | 1,655,000 | 1,693,098 | |||||
Washington Public Power Supply Systems, 6.00% due 7/1/2008 (Nuclear Project Number 1; Insured: AMBAC) | Aaa/AAA | 1,000,000 | 1,073,710 | |||||
Washington Public Power Supply Systems Revenue Refunding Series A, 5.10% due 7/1/2010 (Nuclear Project Number 2; Insured: FSA) | Aaa/AAA | 1,000,000 | 1,051,570 | |||||
Washington Public Power Supply Systems Revenue Refunding Series B, 0% due 7/1/2008 (Nuclear Project Number 3) | Aaa/AA- | 830,000 | 756,645 | |||||
Washington State Public Power Supply Systems Revenue Refunding Series A, 6.00% due 7/1/2007 (Nuclear Project Number 1; Insured: AMBAC) (b) | Aaa/AAA | 5,000,000 | 5,204,900 | |||||
Washington State Series A, 5.00% due 7/1/2008 (Insured: FGIC) | Aaa/AAA | 6,810,000 | 7,143,077 | |||||
WEST VIRGINIA — 0.14% | ||||||||
Harrison County Nursing Facility Revenue Refunding, 5.625% due 9/1/2010 (Salem Health Care Corp. Project; LOC: Fleet Bank) | NR/NR | 390,000 | 401,400 | |||||
Pleasants County Pollution Control Revenue, 4.70% due 11/1/2007 (Monongahela Power Co. Project; Insured: AMBAC) | Aaa/AAA | 1,500,000 | 1,551,060 | |||||
WISCONSIN — 0.96% | ||||||||
Bradley Pollution Control Revenue, 6.75% due 7/1/2009 (Owens Illinois Waste Project) (ETM) | Ba1/BB+ | 1,500,000 | 1,680,030 | |||||
Milwaukee Wisconsin Corp. Series R GO, 5.50% due 9/1/2009 | Aa2/AA | 2,200,000 | 2,379,630 | |||||
Wisconsin State Health & Educational Facilities Authority Revenue, 6.00% due 8/15/2008 (Aurora Health Care Inc. Project; Insured: MBIA) | Aaa/AAA | 2,000,000 | 2,135,500 | |||||
Wisconsin State Health & Educational Facilities Hospital Sisters Services Inc., 4.50% due 12/1/2023 put 12/1/2007 (Insured: FSA) | Aaa/NR | 5,825,000 | 5,964,101 | |||||
Wisconsin State Health & Educational Series A, 5.00% due 2/15/2008 (Gundersen Lutheran Hospital Project; Insured: FSA) | Aaa/AAA | 1,250,000 | 1,300,150 | |||||
WYOMING — 0.28% | ||||||||
West Park Hospital District Revenue, 5.90% due 7/1/2010 (Insured: ACA) | NR/A | 1,615,000 | 1,671,880 | |||||
Wyoming Farm Loan Board Revenue, 0% due 4/1/2009 | NR/AA | 2,500,000 | 2,194,175 | |||||
TOTAL INVESTMENTS — 98.92% (COST $ 1,359,404,909) | $ | 1,383,542,486 | ||||||
OTHER ASSETS LESS LIABILITIES — 1.08% | 15,082,573 | |||||||
NET ASSETS — 100.00% | $ | 1,398,625,059 | ||||||
36 Certified Annual Report |
| SCHEDULE OF INVESTMENTS, CONTINUED | ||
| Thornburg Limited Term Municipal Fund | September 30, 2005 | |
Footnote Legend
See notes to financial statements.
| † | Credit ratings are unaudited. Rating changes may have occurred prior to or subsequent to the reporting period end. |
| (a) | When-issued security. |
| (b) | Segregated as collateral for a when-issued security. |
Portfolio Abbreviations
To simplify the listings of securities, abbreviations are used per the table below:
| ACA | Insured by American Capital Access | |
| AMBAC | Insured by American Municipal Bond Assurance Corp. | |
| COP | Certificates of Participation | |
| ETM | Escrowed to Maturity | |
| FGIC | Insured by Financial Guaranty Insurance Co. | |
| FHA | Insured by Federal Housing Administration | |
| FNMA | Collateralized by Federal National Mortgage Association | |
| FSA | Insured by Financial Security Assurance Co. | |
| GO | General Obligation | |
| MBIA | Insured by Municipal Bond Investors Assurance | |
| PSF | Guaranteed by Permanent School Fund | |
| RADIAN | Insured by Radian Asset Assurance | |
| SONYMA | State of New York Mortgage Authority | |
| XLCA | Insured by XL Capital Assurance |
SUMMARY OF SECURITY CREDIT RATINGS†
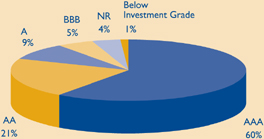
Ratings are a blend of Moody’s and Standard & Poor’s, using the higher rating. Some bonds are rated by only one service.
| Certified Annual Report 37 |
REPORT OF INDEPENDENT REGISTERED PUBLIC ACCOUNTING FIRM
Thornburg Limited Term Municipal Fund
To the Trustees and Shareholders of
Thornburg Limited Term Municipal Fund
In our opinion, the accompanying statement of assets and liabilities, including the schedule of investments, and the related statements of operations and of changes in net assets and the financial highlights present fairly, in all material respects, the financial position of Thornburg Limited Term Municipal Fund (one of the Portfolios constituting Thornburg Investment Trust, hereafter referred to as the “Fund”) at September 30, 2005, the results of its operations for the year then ended, the changes in its net assets and the financial highlights for each of the periods presented, in conformity with accounting principles generally accepted in the United States of America. These financial statements and financial highlights (hereafter referred to as “financial statements”) are the responsibility of the Fund’s management. Our responsibility is to express an opinion on these financial statements based on our audits. We conducted our audits of these financial statements in accordance with the standards of the Public Company Accounting Oversight Board (United States). Those standards require that we plan and perform the audit to obtain reasonable assurance about whether the financial statements are free of material misstatement. An audit includes examining, on a test basis, evidence supporting the amounts and disclosures in the financial statements, assessing the accounting principles used and significant estimates made by management, and evaluating the overall financial statement presentation. We believe that our audits, which included confirmation of securities at September 30, 2005 by correspondence with the custodian and brokers, provide a reasonable basis for our opinion.
PricewaterhouseCoopers LLP
New York, New York
November 16, 2005
38 Certified Annual Report |
| EXPENSE EXAMPLE | ||
| Thornburg Limited Term Municipal Fund | September 30, 2005 (Unaudited) | |
As a shareholder of the Fund, you incur two types of costs:
(1) transaction costs, including
(a) sales charges (loads) on purchase payments, for Class A Shares;
(b) a deferred sales charge on redemptions of any part or all of a purchase of $1 million of Class A shares within 12 months of purchase;
(c) a deferred sales charge on redemptions of Class C shares within 12 months of purchase;
(2) ongoing costs, including management fees; distribution and/or service (12b-1) fees; and other Fund expenses.
This example is intended to help you understand your ongoing costs (in dollars) of investing in the Fund and to compare these costs with the ongoing costs of investing in other mutual funds.
The example is based on an investment of $1,000 invested on March 31, 2005 and held until September 30, 2005.
Actual Expenses
The first line of the table at right provides information about actual account values and actual expenses. You may use the information in this line, together with the amount you invested, to estimate the expenses that you paid over the period. Simply divide your account value by $1,000 (for example, an $8,600 account value divided by $1,000 = 8.6), then multiply the result by the number in the first line under the heading entitled “Expenses Paid During Period” to estimate the expenses you paid on your account during this period.
Hypothetical Example for Comparison Purposes
The second line of the table at right provides information about hypothetical account values and hypothetical expenses based on the Fund’s actual expense ratio and an assumed rate of return of 5% per year before expenses, which is not the Fund’s actual return. The hypothetical account values and expenses may not be used to estimate the actual ending account balance or expenses you paid for the period. You may use this information to compare the ongoing costs of investing in the Fund and other funds. To do so, compare this 5% hypothetical example with the 5% hypothetical examples that appear in the shareholder reports of the other funds.
| Beginning Account Value 3/31/05 | Ending Account Value 9/30/05 | Expenses Paid During Period† 3/31/05-9/30/05 | |||||||
Class A Shares | |||||||||
Actual | $ | 1,000 | $ | 1,014.50 | $ | 4.56 | |||
Hypothetical* | $ | 1,000 | $ | 1,020.54 | $ | 4.57 | |||
Class C Shares | |||||||||
Actual | $ | 1,000 | $ | 1,013.90 | $ | 5.92 | |||
Hypothetical* | $ | 1,000 | $ | 1,019.19 | $ | 5.94 | |||
Class I Shares | |||||||||
Actual | $ | 1,000 | $ | 1,016.20 | $ | 2.85 | |||
Hypothetical* | $ | 1,000 | $ | 1,022.24 | $ | 2.86 | |||
| † | Expenses are equal to the annualized expense ratio for each class (A: 0.90%; C: 1.17%; and I: 0.56%) multiplied by the average account value over the period, multiplied by 183/365 to reflect the one-half year period. |
| * | Hypothetical assumes a rate of return of 5% per year before expenses. |
Please note that the expenses shown in the table are meant to highlight your ongoing costs only and do not reflect any transactional costs, such as sales charges (loads), redemption fees, or exchange fees. Therefore, the second line of the table is useful in comparing ongoing costs only, and will not help you determine the relative total costs of owning different funds. In addition, if these transactional costs were included, your costs would have been higher.
| Certified Annual Report 39 |
| INDEX COMPARISON | ||
| Thornburg Limited Term Municipal Fund | September 30, 2005 (Unaudited) | |
GROWTH OF A HYPOTHETICAL $10,000 INVESTMENT
Thornburg Limited Term Municipal Fund Class A Total Returns versus
Lehman Brothers Five Year Municipal Bond Index and Consumer Price Index
(September 30, 1984 to September 30, 2005)
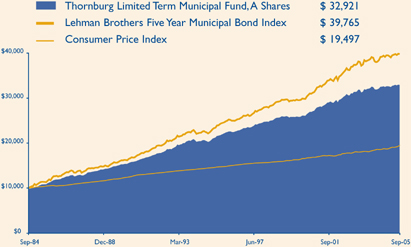
AVERAGE ANNUAL TOTAL RETURNS
For the periods ended September 30, 2005 (with sales charge)
| 1 Yr | 5 Yrs | 10 Yrs | Since Inception | |||||||||
A Shares (Incep: 9/28/84) | (0.35 | )% | 3.79 | % | 3.97 | % | 5.83 | % | ||||
C Shares (Incep: 9/01/94) | 0.39 | % | 3.77 | % | 3.74 | % | 3.90 | % |
FUND ATTRIBUTES
as of September 30, 2005
| Annualized Dist. Rate (@NAV) | SEC Yield | NAV | Maximum Offering Price | |||||||||
A Shares (Incep: 9/28/84) | 3.05 | % | 2.58 | % | $ | 13.59 | $ | 13.80 | ||||
C Shares (Incep: 9/01/94) | 2.77 | % | 2.34 | % | $ | 13.62 | $ | 13.62 | ||||
Performance data reflect past performance, which is no guarantee of future results. The performance data and graph do not reflect the deduction of taxes that a shareholder would pay on distributions or the redemption of Fund shares.
Returns reflect the reinvestment of dividends and capital gains as well as applicable sales charges. Class A Shares are sold with a maximum sales charge of 1.50%. C shares assume deduction of a 0.50% contingent deferred sales charge (CDSC) for the first year only.
The Consumer Price Index (“CPI”) measures prices of a fixed basket of goods bought by a typical consumer, including food, transportation, shelter, utilities, clothing, medical care, entertainment and other items. The CPI, published by the Bureau of Labor Statistics in the Department of Labor, is based at 100 in 1982 and is released monthly. It is widely used as a cost-of-living benchmark to adjust Social Security payments and other payment schedules, union contracts and tax brackets. The CPI is also known as the cost-of-living index.
The Lehman Brothers Five-Year Municipal Bond Index is a rules-based, market-value-weighted index engineered for the long-term tax-exempt bond market. To be included in the index, bonds must have a minimum credit rating of Baa. The approximate maturity of the municipal bonds in the index is five years.
Unless otherwise noted, index returns reflect the reinvestment of income dividends and capital gains, if any, but do not reflect fees, brokerage commissions or other expenses of investing. Investors may not make direct investments into any index.
The SEC Yield is computed in accordance with SEC standards measuring the net investment income per share over a specified 30-day period expressed as a percentage of the maximum offering price of the Fund’s shares at the end of the period.
The distribution rate is calculated by taking the sum of the month’s total distribution factors and dividing this sum by a 30-day period and annualizing to 360-day year. The value is then divided by the ending Net Asset Value (NAV) to arrive at the annualized distribution yield. The yield is calculated on a periodic basis and is subject to change depending on the Funds’ NAV and current distributions.
40 Certified Annual Report |
| Thornburg Limited Term Municipal Fund | September 30, 2005 | (Unaudited) |
Name, Age, Position Held with Fund Year Elected | Principal Occupation(s) During Past Five Years | Other Directorships Held by Trustee | ||
INTERESTED TRUSTEES(1)(2)(4) | ||||
| Garrett Thornburg, 59 Chairman of Trustees, Trustee since 1987(3) | CEO, Chairman and controlling shareholder of Thornburg Investment Management, Inc. (investment advisor) and Thornburg Securities Corporation (securities dealer); Chairman of Thornburg Limited Term Municipal Fund, Inc. (registered investment company) to 2004; CEO and Chairman of Thornburg Mortgage, Inc. (real estate investment trust); Chairman of Thornburg Mortgage Advisory Corporation (investment manager to Thornburg Mortgage, Inc.). | Director of Thornburg Mortgage, Inc. (real estate investment trust) | ||
| Brian J. McMahon, 49 Trustee since 2001, Member of Governance & Nominating Committee, President since 1997(5)(6) | President and Managing Director of Thornburg Investment Management, Inc.; President of Thornburg Limited Term Municipal Fund, Inc. to 2004. | None | ||
INDEPENDENT TRUSTEES(1)(2)(4) | ||||
| David A. Ater, 60 Trustee since 1994, Member of Audit Committee and Governance & Nominating Committee | Principal in Ater & Associates, Santa Fe, NM (developer, planner and broker of residential and commercial real estate); owner developer and broker for various real estate projects. | Director of Thornburg Mortgage, Inc. (real estate investment trust) | ||
| David D. Chase, 64 Chairman of Audit Committee, Trustee since 2000 | Chairman, President, CEO, and Managing Member of Vestor Associates, LLC, the general partner of Vestor Partners, LP, Santa Fe, NM (private equity fund); Chairman and CEO of Vestor Holdings, Inc., Santa Fe, NM (merchant bank). | None | ||
| Eliot R. Cutler, 59 Chairman of Governance & Nominating Committee, Trustee since 2004 | Partner, Akin, Gump, Strauss, Hauer & Feld, LLP, Washington, D.C. (law firm) since November 2000; partner, Cutler & Stanfield, Washington, D.C. (law firm) until November 2000. | Director of Thornburg Mortgage, Inc. (real estate investment trust) | ||
| Susan H. Dubin, 56 Trustee since 2004, Member of Audit Committee | President of Dubin Investments, Ltd., Greenwich, CT (private investment fund); Director and officer of various charitable organizations; and formerly, Vice President of Chemical Bank (predecessor to JP Morgan Chase & Co.), New York, 1974–1996. | None | ||
| Owen D.Van Essen, 51 Trustee since 2004, Member of Governance & Nominating Committee | President of Dirks,Van Essen & Murray, Santa Fe, NM (newspaper mergers and acquisitions). | None | ||
| James W. Weyhrauch, 46 Trustee since 1996, Member of Audit Committee | Director, Executive Vice President to 2002, and President and CEO 2002–2004, Nambé Mills, Inc., Santa Fe, NM (manufacturer); real estate agent, Santa Fe Properties, Santa Fe, NM since 2004. | None | ||
| Certified Annual Report 41 |
TRUSTEES AND OFFICERS, CONTINUED
| Thornburg Limited Term Municipal Fund | September 30, 2005 | (Unaudited) |
Name, Age, Position Held with Fund Year Elected | Principal Occupation(s) During Past Five Years | Other Directorships Held by Trustee | ||
OFFICERS OF THE FUND (WHO ARE NOT TRUSTEES)(1)(6)(7) | ||||
| Dawn B. Fischer, 58 Secretary since 1987 | Secretary and Managing Director, Thornburg Investment Management, Inc.; Secretary, Thornburg Limited Term Municipal Fund, Inc. to 2004; Secretary, Thornburg Securities Corporation; Vice President, Daily Tax Free Income Fund, Inc. (registered investment company). | Not applicable | ||
| Steven J. Bohlin, 46 Vice President since 1987; Treasurer since 1989 | Vice President and Managing Director of Thornburg Investment Management, Inc.; Vice President of Thornburg Limited Term Municipal Fund, Inc. to 2004. | Not applicable | ||
| George T. Strickland, 42 Vice President since 1996 | Vice President and Managing Director of Thornburg Investment Management, Inc.; Vice President (to 2004) and Treasurer (2003–2004) of Thornburg Limited Term Municipal Fund, Inc. | Not applicable | ||
William V. Fries, 66 Vice President since 1995 | Vice President and Managing Director of Thornburg Investment Management, Inc. | Not applicable | ||
| Leigh Moiola, 38 Vice President since 2001 | Vice President and Managing Director of Thornburg Investment Management, Inc.; Vice President of Thornburg Limited Term Municipal Fund, Inc. 1999–2004. | Not applicable | ||
| Kenneth Ziesenheim, 51 Vice President since 1995 | Vice President and Managing Director of Thornburg Investment Management, Inc.; President of Thornburg Securities Corporation; Vice President of Thornburg Limited Term Municipal Fund, Inc. to 2004. | Not applicable | ||
| Alexander Motola, 35 Vice President since 2001 | Vice President and Managing Director of Thornburg Investment Management, Inc. since 2000; Portfolio Manager, Insight Capital Research & Management, Inc., Walnut Creek, California 1995–2000. | Not applicable | ||
Wendy Trevisani, 34 Vice President since 1999 | Associate Portfolio Manager of Thornburg Investment Management, Inc. since 1999, Vice President since 2000 and Managing Director since 2003; Vice President of Thornburg Limited Term Municipal Fund, Inc. 1999–2002. | Not applicable | ||
Joshua Gonze, 42 Vice President since 1999 | Associate Portfolio Manager of Thornburg Investment Management, Inc. since 1999, Vice President since 1999 and Managing Director since 2003; Vice President of Thornburg Limited Term Municipal Fund, Inc. to 2004. | Not applicable | ||
Brad Kinkelaar, 37 Vice President since 1999 | Associate Portfolio Manager of Thornburg Investment Management, Inc. since 1999, Vice President since 2000 and Managing Director since 2003. | Not applicable | ||
| Christopher Ihlefeld, 35 Vice President since 2003 | Associate Portfolio Manager since 1999; Vice President of Thornburg Investment Management, Inc. since 2002; Vice President of Limited Term Municipal Fund, Inc., 2003–2004. | Not applicable | ||
Leon Sandersfeld, 39 Vice President since 2003 | Associate of Thornburg Investment Management, Inc. since 2002; Senior Staff Accountant, Farm Bureau Life Insurance Co. 1998–2002. | Not applicable | ||
42 Certified Annual Report |
TRUSTEES AND OFFICERS, CONTINUED
| Thornburg Limited Term Municipal Fund | September 30, 2005 | (Unaudited) |
Name, Age, Position Held with Fund Year Elected | Principal Occupation(s) During Past Five Years | Other Directorships Held by Trustee | ||
Sasha Wilcoxon, 31 Vice President since 2003 | Associate of Thornburg Investment Management, Inc. since 2000 and Mutual Fund Operations Department Manager since 2002. | Not applicable | ||
| Ed Maran, 47 Vice President since 2004 | Associate Portfolio Manager of Thornburg Investment Management, Inc. since 2002 and Vice President and Managing Director since 2004; Analyst, USAA 2001–2002; Oil Analyst, A.G. Edwards 1997–2000. | Not applicable | ||
Vinson Walden, 35 Vice President since 2004 | Associate Portfolio Manager of Thornburg Investment Management, Inc. since 2002 and Vice President and Managing Director since 2004; Associate Portfolio Manager, Ibis Management 2002–2004; Associate, Lehman Brothers, 1997–2001. | Not applicable | ||
| (1) | Each person’s address is 119 East Marcy Street, Santa Fe, New Mexico 87501. |
| (2) | The Fund is one of twelve separate investment “Funds” or “series” of Thornburg Investment Trust (the “Trust”), which comprises the Thornburg mutual fund complex and is organized as a Massachusetts business trust. The Trust currently has twelve active Funds. Thornburg Investment Management, Inc. is the investment advisor to, and manages, the twelve Funds of the Trust. Each Trustee oversees the twelve Funds in the fund complex. |
| (3) | Mr.Thornburg is considered an “interested” Trustee under the Investment Company Act of 1940 because he is a director and controlling shareholder of Thornburg Investment Management, Inc., the investment advisor to the twelve active Funds of the Trust, and is the sole director and controlling shareholder of Thornburg Securities Corporation, the distributor of shares for the Trust. |
| (4) | Each Trustee serves in office until the election and qualification of a successor. |
| (5) | Mr. McMahon is considered an “interested” Trustee because he is the president of Thornburg Investment Management, Inc. |
| (6) | The Trust’s president, secretary and treasurer each serves a one-year term or until the election and qualification of a successor; each other officer serves at the pleasure of the Trustees. |
| (7) | Assistant vice presidents, assistant secretaries and assistant treasurers are not shown. |
The Statement of Additional Information for each Fund of the Trust includes additional information about the Trustees and is available, without charge and upon request, by calling 1-800-847-0200.
| Certified Annual Report 43 |
| OTHER INFORMATION | |||
| Thornburg Limited Term Municipal Fund | September 30, 2005 | (Unaudited) | |
PORTFOLIO PROXY VOTING
Policies and Procedures:
The Trust has delegated to Thornburg Investment Management, Inc. (the “Advisor”) voting decisions respecting proxies for the Fund’s voting securities. The Advisor makes voting decisions in accordance with its Proxy Voting Policy and Procedures. A description of the Policy and Procedures is available (i) without charge, upon request, by calling the Advisor toll-free at 1-800-847-0200, (ii) on the Thornburg website at www.thornburg.com, and (iii) on the Securities and Exchange Commission’s website at www.sec.gov.
Commencing August 31, 2004, information regarding how proxies were voted is available on or before August 31 of each year for the twelve months ending the preceding June 30. This information is available (i) without charge, upon request by calling the Advisor toll-free at 1-800-847-0200, (ii) on the Thornburg website at www.thornburg.com and (iii) on the Securities and Exchange Commission’s website at www.sec.gov.
TAX INFORMATION
For the fiscal year ended September 30, 2005, 100% of dividends paid by the Fund are tax exempt dividends for Federal Income Tax purposes. The information and distributions reported herein may differ from the information and distributions taxable to the shareholders for the calendar year ending December 31, 2005.
AVAILABILITY OF QUARTERLY PORTFOLIO SCHEDULE
The Fund files with the Securities and Exchange Commission schedules of its portfolio holdings on Form N-Q for the first and third quarters of each fiscal year. The Fund’s Forms N-Q are available on the Commission’s website at www.sec.gov, or may be reviewed and copied at the Commission’s Public Reference Room in Washington, D.C. Information on the operation of the Public Reference Room may be obtained by calling 1-800-SEC-0330. The Fund also makes this information available on its website at www.thornburg.com/download or upon request by calling 1-800-847-0200.
TRUSTEES DELIBERATIONS RESPECTING RENEWAL OF INVESTMENT ADVISORY AGREEMENT
Thornburg Investment Management, Inc. (the “Advisor”) provides investment management services to Thornburg Limited Term Municipal Fund pursuant to an investment advisory agreement. The Trustees consider the renewal of this agreement annually and most recently determined to renew the agreement on September 13, 2005.
In connection with their general supervision of the Advisor, the Trustees receive and consider reports throughout the year from the Advisor respecting the Advisor’s management of the Fund’s investments. These reports include information about the Fund’s purchase and sale of portfolio investments and explanations from the Advisor respecting investment selections, the investment performance of the Fund, general appraisals of industry and economic prospects and factors, and other matters affecting the Fund and relating to the Advisor’s performance of services for the Fund.
In anticipation of their recent consideration of the advisory agreement’s renewal, the independent Trustees met with representatives of the Advisor in May and July 2005 to specify the information the Advisor would present to the Trustees for their review. The independent Trustees thereafter met in independent session to consider various factors respecting the agreement’s renewal, and met in a subsequent session with the Advisor’s chief investment officer to present questions. Following these sessions, the Trustees met on September 13, 2005 to consider a renewal of the advisory agreement.
The Trustees considered various factors in their review of the Advisor’s performance under the investment advisory agreement, including specifically the principles outlined in their February 2005 Statement to Shareholders, a copy of which accompanies this Annual Report to Shareholders. Summarized below are certain of the factors considered by the Trustees, in connection with the determination to renew the advisory agreement. In determining to renew the advisory agreement, the Trustees did not identify any single fact or aspect of the Advisor’s performance as controlling, and this summary does not describe all of the matters considered by the Trustees in making their determination.
Quality of Services; Fund Investment Performance. In reviewing the nature, extent, and quality of services provided by the Advisor and the investment performance of the Fund, the Trustees primarily considered the Advisor’s adherence to the Fund’s stated objectives and policies, the Advisor’s execution of the Fund’s investment strategies in prevailing market conditions, the Fund’s absolute investment performance, the Fund’s investment performance compared to categories of other broadly similar mutual funds and broad based securities indices, the Fund’s investment performance over different periods of time, the Fund’s returns and share price changes in rising and declining markets compared to total returns and price fluctuations and total returns of various categories of mutual funds and securities indices, and related factors. The Trustees noted that bond indices have limited utility in evaluating fixed income mutual funds. Similarly, the Trustees noted in comparing the Fund to other mutual funds that the value of such comparisons may be limited in some degree because the Fund’s investment approach, and in particular its laddered maturity portfolio, differs from other funds. In conducting their review, the Trustees observed that the Advisor had continued to faithfully pursue and to achieve the Fund’s stated objectives, as demonstrated particularly by the Advisor’s selection of investments and investment performance. The Trustees noted in this regard the Fund’s above average or better investment performance over various periods compared to a category of generally similar mutual funds selected by an independent mutual fund analyst firm.
44 Certified Annual Report |
| OTHER INFORMATION, CONTINUED | |||
| Thornburg Limited Term Municipal Fund | September 30, 2005 | (Unaudited) | |
The Trustees also considered a number of other factors in reviewing the quality of the Advisor’s services, including the qualifications and integrity of the Advisor’s senior personnel, the Advisor’s staffing and other resources, the Advisor’s compliance with regulatory requirements, Fund sales performance and perceptions of the Funds in the marketplace, and other factors.
The Trustees concluded, based upon these and other considerations, that the Advisor had actively and competently pursued the Fund’s stated investment objectives in accordance with the Fund’s investment policies stated in its prospectuses. The Trustees further concluded that the investment performance of the Fund was satisfactory in the context of the Fund’s objectives and policies and prevailing market conditions.
Fees and Expenses; Profitability of Advisor. In reviewing the fees charged by the Advisor to the Fund, the Trustees primarily considered the fees charged by the Advisor and the other expenses charged to the Fund in light of the nature and quality of services provided, comparison of the actual Advisor’s fee and Fund expenses to the statement of fees and expenses in the Fund’s prospectuses, comparisons of the Advisor’s fee and other Fund expenses to median and average fees and expenses charged to similar mutual funds, and comparisons of fees and expenses charged to the Fund with fees and expenses charged to other, similar specific mutual funds. In addition, the Trustees considered the profitability of the Advisor compared to other investment management firms, and comparisons of the investment management fee rates charged by the Advisor to the Fund with rates charged to other clients and the differing types of services furnished to the Fund and the other clients. The Trustees observed in their review that the management fee and expenses charged to the Fund were generally comparable to average and median fees and expenses charged to a group of generally similar mutual funds. The Trustees also observed in their review that fee rates charged by the Advisor to other clients of the Advisor were not directly comparable to rates charged to the Fund principally because of the significant differences in the services provided.
The Trustees concluded, based upon these and other considerations, that the fees charged to the Fund by the Advisor were fair and reasonable in view of the following: the services provided, the clear disclosure of these fees and expenses in the Fund’s prospectuses, and prevailing fees and expenses charged to mutual funds generally. The Trustees further concluded that there was no indication that the Advisor’s profitability was unusual, viewed in the context of the services provided, the performance of the Fund, and the fees and profitability of other investment management firms.
Economies of Scale. In reviewing the extent to which economies of scale would be realized by the Fund as it grows and whether fee levels reflect economies of scale, the Trustees considered the breakpoint structure for advisory fees chargeable to the Fund, the demonstrated economies of scale enjoyed by the Fund and other funds of the Trust as they had grown in size, and economies of scale realized by other mutual funds. The Trustees concluded that the Fund has realized and may reasonably be expected to realize further economies of scale for the benefit of its shareholders as it grows in size.
Ancillary Benefits to Advisor. In reviewing benefits enjoyed by the Advisor because of its relationship with the Fund, the Trustees considered an arrangement through which the Advisor received certain research services, favorable publicity received by the Advisor because of the superior investment performance of certain Funds of the Trust, and the benefits to the Fund from the Advisor’s expansion of its staffing and other resources to serve a broader variety of investment clients. The Trustees concluded, based upon these and other considerations, that there was no unusual or unfair benefit enjoyed by the Advisor and that the Fund enjoyed benefits by virtue of the Advisor’s engagement by other investment clients.
| Certified Annual Report 45 |
Trustees’ Statement to Shareholders
Not part of the Certified Annual Report
February 8, 2005
The Trustees are concerned that recent commentaries and opinions reported in the media may confuse investors in general as to the supervisory duties of trustees of mutual funds and, in particular, leave Thornburg Investment Trust shareholders uncertain regarding how we discharge our responsibilities in supervising the Funds’ investment advisor and in reviewing the advisor’s contract for renewal. We decided to spell out clearly three principal guidelines that we follow in supervising the Trust’s investment advisor on your behalf.
We begin with the premise that each shareholder selected his or her Fund because its investments are managed by the investment advisor identified in the prospectus and in accordance with the objective and policies described in the prospectus. We realize, as each of you do, that if you believe that your Fund’s stated objective and policies no longer serve your personal investment goals, you can sell your shares and leave the Fund.
Therefore, we believe that our primary supervisory task - our principal obligation to you - is to assess the nature and quality of the advisor’s services, and to confirm that the advisor actively and competently pursues the Fund’s objective, in accordance with the policies set out in the prospectus. To do this, we meet regularly with management to review your Fund’s portfolio and to discuss the advisor’s specific actions and judgments in pursuing the Fund’s objective. We do not substitute our own judgment for the advisor’s decisions in selecting investments; the advisor is paid to exercise its informed judgment on investment decisions, and we seek to confirm, in reviewing the advisor’s performance, that the advisor is doing just that.
Second, while we are conscious of costs and the effect that costs have on shareholders’ returns, we do not seek the lowest fees or expense ratio as our sole or primary objective. We try to make sure that your Fund’s fees and costs are reasonable in relationship to the services rendered and that they are generally in line with those charged by other expert investment advisors, consistent with our belief that the Fund’s investors searched for and expect that expertise and attention and have decided to pay a reasonable price for it. We do not put the management contract “out to bid” as a matter of course, and we would not do so unless we had concluded that the advisor materially had failed to pursue the Fund’s objectives in accordance with its policies, or for other equally important reasons. We believe that any other approach would be inconsistent with your interests and contrary to your expectations when you bought shares of the Fund in the first place.
Finally, because we believe that most Thornburg Fund shareholders have invested with a long-term perspective, we try not to focus too much on the fashions of the moment and on short-term performance. The market will not favor any specific investment objective or set of policies at all times and under all economic circumstances. A fund will experience periods of both high and low returns relative to other funds and other investments. Even if one of our Funds is not favored by the market at a particular time, we believe that the advisor is nonetheless obliged to remain true to the Fund’s objective and policies, and we watch to see that it does so.
This statement is submitted for the general information of the shareholders of Thornburg Investment Trust. It is not authorized for distribution to prospective investors in the Fund unless preceded or accompanied by an effective prospectus. If you have not received a prospectus, one can be obtained from your financial advisor, online at www.thornburg.com/download, or by calling 800-847-0200. Carefully consider information in the prospectus regarding the Fund’s investment objectives and policies, risks, sales charges, expenses, experience of its management, marketability of shares, and other information. Read it carefully before you invest or send money.
46 This page is not part of the Annual Report. |
Planning Options
Retirement and Education Accounts
Thornburg Investment Management offers retirement and education savings accounts that can help you meet a variety of planning challenges. For account applications or further information on any of the accounts below, please call 1-800-847-0200 or go to www.thornburg.com/ira. Your financial advisor can help you determine which plan is right for you.
Individual Retirement Accounts
Individual Retirement Accounts (IRAs) provide a tax-advantaged means to save money for the future. For a detailed outline of the difference between retirement accounts, see www.thornburg.com/ira. Rollovers are available. Call 1-800-847-0200 for more information.
Traditional IRAs – Contributions to Traditional IRAs are tax deductible for eligible individuals, and withdrawals are taxed as additional ordinary income. You may contribute to an IRA if you receive compensation and are under 701/2, even if you are covered by an employer retirement plan.
Roth IRAs – Under a Roth IRA, there is no tax deduction for contributions, but there is no income tax on qualified withdrawals. For a more detailed comparison of Traditional and Roth IRAs, please see our web site at www.thornburg.com/ira.
SEP IRAs – Simplified Employee Pension (SEP) IRAs are established by employers. The employer is allowed a tax deduction for contributions made to the SEP Plan and makes contributions to each eligible employee’s SEP IRA on a discretionary basis.
SIMPLE IRAs – Savings Incentive Match Plan for Employees of Small Employers (SIMPLE) is designed to give small business owners a simplified method to establish and contribute to a retirement plan for employees. The employer is allowed a tax deduction for contributions and makes either matching or non-elective contributions to each eligible employee’s SIMPLE IRA. Employees may make salary deferral contributions.
403(b)
A special, tax-advantaged savings vehicle available only to employees of 501(c)(3) organizations, such as charitable, educational, scientific and religious organizations. 403(b) plans are also available to employees of public schools and universities.
Coverdell Education Savings Account
These savings accounts are designed to provide a way to save money for higher education expenses. In an Education Savings Account, earnings and interest grow tax free, and qualified withdrawals used to pay for eligible higher-education expenses are tax- and penalty-free.
Funds Available
The following funds are available in the accounts listed above:
| • | Thornburg International Value Fund |
| • | Thornburg Value Fund |
| • | Thornburg Core Growth Fund |
| • | Thornburg Investment Income Builder Fund |
| • | Thornburg Limited Term U.S. Government Fund |
| • | Thornburg Limited Term Income Fund |
| This page is not part of the Annual Report. 47 |
The Firm
Thornburg Investment Management® is a privately held investment management company based in Santa Fe, New Mexico with assets under management of over $16 billion. Founded in 1982, the firm manages four equity funds, eight bond funds, and separate portfolios for select institutions and individuals.
Investment Philosophy
We seek to preserve and increase the real wealth of the Funds’ shareholders after accounting for inflation, taxes, and investment expenses. We’re committed to disciplined investing and controlling risk in all market environments through laddered bond and focused equity portfolios.
Portfolio Holdings Disclosure
We believe you should know about your portfolio. Our web site keeps investors informed of the Funds’ equity holdings. Go to www.thornburg.com/funds for commentary on our equity fund holdings.
Co-Ownership of Funds
We invest side-by-side with the Funds’ shareholders. Our employees have invested over $110 million in Thornburg Funds.
Core Strategies for Building Wealth
We deliver core strategies to help investors meet long-term goals. A core strategy is a consistent, disciplined and proven investment process that represents the foundation of a diversified portfolio.
| Investment Manager: | Distributor: | |
 |  | |
119 East Marcy Street Santa Fe, New Mexico 87501 800.847.0200 | 119 East Marcy Street Santa Fe, New Mexico 87501 800.847.0200 | |

Core Strategies for Building Wealth
Thornburg Limited Term Municipal Fund
I Shares
Annual Report – September 30, 2005
This report is submitted for the general information of shareholders of the Fund. It is not authorized for distribution to prospective investors in the Fund unless preceded or accompanied by an effective prospectus. If you have not received a prospectus, one can be obtained from your financial advisor, online at www.thornburg.com/download, or by calling 800-847-0200. Carefully consider information in the prospectus regarding the Fund’s investment objectives and policies, risks, sales charges, expenses, experience of its management, marketability of shares, and other information. Read it carefully before you invest or send money. Performance data quoted represents past performance and does not guarantee future results.
Thornburg Limited Term Municipal Fund
Laddering – an All Weather Strategy
The Fund’s investment objective is to obtain as high a level of current income exempt from Federal income taxes as is consistent, in the view of the Fund’s investment advisor, with preservation of capital (may be subject to Alternative Minimum Tax).
This Fund is a laddered portfolio of municipal bonds with an average maturity of five years or less. Laddering involves building a portfolio of bonds with staggered maturities so that a portion of the portfolio matures each year; cash from maturing bonds, if not needed for other purposes, is invested in bonds with longer maturities at the far end of the ladder. The strategy is a good compromise for managing different types of risk.
Thornburg Bond Funds
| • | Thornburg Limited Term Municipal Fund |
| • | Thornburg Intermediate Municipal Fund |
| • | Thornburg California Limited Term Municipal Fund |
| • | Thornburg New Mexico Intermediate Municipal Fund |
| • | Thornburg Florida Intermediate Municipal Fund |
| • | Thornburg New York Intermediate Municipal Fund |
| • | Thornburg Limited Term U.S. Government Fund |
| • | Thornburg Limited Term Income Fund |
Thornburg invests in short- and intermediate-term investment grade bonds. We ladder the maturities of individual bonds in the portfolios to moderate risk. Laddering involves building a portfolio of bonds with staggered maturities so that a portion of the portfolio will mature each year. We apply this disciplined process in all interest rate environments.
Thornburg Equity Funds
| • | Thornburg Value Fund |
| • | Thornburg International Value Fund |
| • | Thornburg Core Growth Fund |
| • | Thornburg Investment Income Builder Fund |
Thornburg’s equity research uses a fundamental, yet comprehensive, analytical approach. We invest when and where we perceive compelling value. Thornburg equity funds focus on a limited number of securities so that each holding can impact performance. The equity team searches for firms believed to have a promising future and seeks to buy shares of those companies at a discount to their intrinsic value.
More information at www.thornburg.com
 | Reduce paper clutter. | |
| Receive your shareholder reports and prospectus online instead of through traditional mail. | ||
| Sign up at | ||
| www.thornburg.com/edelivery |
| 2 | This page is not part of the Annual Report. |
Message
from the Chairman
Garrett Thornburg Chairman & CEO | November 10, 2005
Dear Fellow Shareholder:
Thornburg Investment Management has a clear mission: to preserve and increase the real wealth of our shareholders. We aspire to accomplish this through a family of laddered bond funds that focus on quality, stability, and minimization of risk over time, and through a range of equity funds that redefine traditional measures of value and growth.
Our bond funds have always been managed using the highly disciplined approach of laddering short and intermediate bond maturities, seeking to provide both an attractive return and stability of principal. All of the bond funds buy only investment-grade securities. We have found this strategy to be the best at managing both interest-rate risk and credit risk, and we believe this strategy has served our shareholders well over time.
The bond funds are managed by portfolio managers who have many years of experience. We are proud of this consistency and experience and look forward to many more successful years with them at the helm.
In years past, there has been news about improper behavior by some mutual fund companies. Many new rules proposed in response to this scandal have called for increased transparency. We welcome increased transparency. Thornburg Investment Management has been a leader in providing information about our stock holdings and bond strategies to our shareholders on our web site, www.thornburg.com.
Unfortunately, some of the new rules will increase the cost to all shareholders in mutual funds. We will do our best to keep these expenses to a minimum. After all, we are shareholders too, and Thornburg employees have over $110 million invested in our own funds.
Thank you for investing with us. We will do our best to continue to earn your trust every day. | |

Sincerely, |
 |
| Garrett Thornburg |
| Chairman & CEO |
| This page is not part of the Annual Report. | 3 |

Thornburg Limited Term Municipal Fund
I Shares – September 30, 2005
| 6 | ||
| 8 | ||
| 9 | ||
| 10 | ||
| 11 | ||
| 14 | ||
| 15 | ||
| 36 | ||
| 37 | ||
| 38 | ||
| 39 | ||
| 42 | ||
This report is certified under the Sarbanes-Oxley Act of 2002, which requires that public companies, including mutual funds, affirm that the information provided in their annual and semiannual shareholder reports fully and fairly represents their financial position.
| 4 | Certified Annual Report |
Important Information
Performance data quoted represents past performance and does not guarantee future results. Investment return and principal value will fluctuate so that upon redemption, investor’s shares may be worth more or less than their original cost. Current performance may be lower or higher than the data quoted. For performance data current to the most recent month end, visit www.thornburg.com.
Minimum investments for Class I shares are higher than those for other classes. Returns reflect the reinvestment of dividends and capital gains. There is no up front sales charge for this class of shares.
Shares in the Fund carry risks, including possible loss of principal. As with direct bond ownership, Funds that invest in bonds are subject to certain risks including interest-rate risk, credit risk, and inflation risk. The principal value of bond funds will fluctuate relative to changes in interest rates, decreasing when interest rates rise. Unlike bonds, bond funds have ongoing fees and expenses. Shares in the fund are not deposits or obligations of, or guaranteed or endorsed by, any bank, the Federal Deposit Insurance Corporation, the Federal Reserve Board or any government agency.
The information presented on the following pages was current as of September 30, 2005. The manager’s views, portfolio holdings, and sector diversification are historical and subject to change. This material should not be deemed a recommendation to buy or sell any of the securities mentioned.
The matters discussed in this report may constitute forward-looking statements made pursuant to the safe harbor provisions of the Securities Litigation Reform Act of 1995. These include any advisor or portfolio manager prediction, assessment, analysis or outlook for individual securities, industries, investment styles, market sectors and/or markets. These statements involve risks and uncertainties. In addition to the general risks described for each fund in its current prospectus, other factors bearing on these reports include the accuracy of the advisor’s or portfolio manager’s forecasts and predictions, the appropriateness of the investment strategies designed by the advisor or portfolio manager and the ability of the advisor or portfolio manager to implement their strategies efficiently and successfully. Any one or more of these factors, as well as other risks affecting the securities markets generally, could cause the actual results of any fund to differ materially as compared to its benchmarks.
Glossary
The Lehman Brothers Five-Year Municipal Bond Index – A rules-based, market-value-weighted index engineered for the long-term tax-exempt bond market. To be included in the index, bonds must have a minimum credit rating of Baa. The approximate maturity of the municipal bonds in the index is five years. Unless otherwise noted, index returns reflect the reinvestment of income dividends and capital gains, if any, but do not reflect fees, brokerage commissions or other expenses of investing. Investors may not make direct investments into any index.
Duration – The measure of the price sensitivity of a fixed-income security to an interest rate change of 100 basis points. Calculation is based on the weighted average of the present values for all cash flows.
Weighted Average Maturity – A weighted average of all the effective maturities of the bonds in a portfolio. Effective maturity takes into consideration mortgage prepayments, puts, sinking funds, adjustable coupons, and other features of individual bonds and is thus a more accurate measure of interest-rate sensitivity. Longer-maturity funds are generally considered more interest-rate sensitive than their shorter counterparts.
| Certified Annual Report | 5 |
George Strickland Portfolio Manager | October 17, 2005
Dear Fellow Shareholder:
I am pleased to present the Annual Report for the Thornburg Limited Term Municipal Fund. The net asset value of the I shares decreased by 24 cents to $13.59 during the twelve months ended September 30, 2005. If you were with us for the entire period, you received dividends of 44.4 cents per share. If you reinvested dividends, you received 45.1 cents per share.
Over the last twelve months, interest rates on bonds that mature in ten years or less have risen, while interest rates on long-term bonds have fallen. Higher interest rates on short-term bonds have pushed down the price of most of the bonds owned by the Fund, but have allowed us to buy new bonds at higher yields and increase the yield of the portfolio. The I shares of your Fund produced a total return of 1.50% over the twelve month period ended September 30, 2005, which slightly outperformed the 1.45% return for the Lehman Five Year Municipal Bond Index.
This has been an eventful year for the bond market and the world. The Federal Reserve has been steadily pushing up the target Fed Funds rate to its current level of 3.75%. Through the end of June, the bond market responded by pushing down yields on long-term bonds, thus flattening the yield curve. A flat yield curve is usually associated with a recession, but the U.S. economy is showing no signs of entering a recession. So, more recently, interest rates have been rising for both short- and long-term bonds, in more of a parallel yield curve shift. We believe that this is a more appropriate response by the market to a tightening Fed, a strong economy, and somewhat elevated levels of inflation.
Your Thornburg Limited Term Municipal Fund is a laddered portfolio of over 640 municipal obligations from 47 states. Today, your Fund’s weighted average maturity is 3.89 years. We ladder the maturity dates of the bonds in your portfolio so that some of the bonds are scheduled to mature during each of the coming years. Laddering bonds accomplishes two goals. First, the staggered bond maturities contained in a ladder defuse interest-rate risk and dampen the Fund’s price volatility. Second, laddering gives the Fund a steady cash flow stream from maturing bonds to reinvest toward the top of the ladder where yields are typically higher. The chart shown here describes the percentages of your Fund’s bond portfolio maturing in each of the coming years.
We have watched along with the rest of the nation the horrific affects of Hurricanes Katrina and Rita, and our hearts and prayers go out to all of those suffering through the devastation of these storms. | |

% of portfolio | Cumulative % | |||||||||||||
| 1 year | = | 13.6 | % | Year 1 | = | 13.6 | % | |||||||
| 1 to 2 years | = | 10.9 | % | Year 2 | = | 24.5 | % | |||||||
| 2 to 3 years | = | 15.6 | % | Year 3 | = | 40.1 | % | |||||||
| 3 to 4 years | = | 13.1 | % | Year 4 | = | 53.2 | % | |||||||
| 4 to 5 years | = | 11.5 | % | Year 5 | = | 64.7 | % | |||||||
| 5 to 6 years | = | 11.1 | % | Year 6 | = | 75.8 | % | |||||||
| 6 to 7 years | = | 8.1 | % | Year 7 | = | 83.9 | % | |||||||
| 7 to 8 years | = | 7.2 | % | Year 8 | = | 91.1 | % | |||||||
| 8 to 9 years | = | 5.5 | % | Year 9 | = | 96.6 | % | |||||||
| Over 9 years | = | 3.4 | % | Over 9 years | = | 100.0 | % | |||||||
Percentages can and do vary. Data as of 9/30/05.
| 6 | Certified Annual Report |
We examined Thornburg municipal bond portfolios in the wake of both hurricanes and have found no bonds that we believe are currently threatened with default. Though the Fund has some exposure to municipal issuers in the paths of the storms, many of the bonds have alternate revenue sources such as bond insurance or financial collateral. The few bonds without alternate revenue sources have resources that we believe will see them through this calamity.
Thanks to our policy of broad diversification, issuers affected by Hurricane Katrina and Rita make up only a small percentage of the Fund. Though the major bond insurers have significant exposure to issuers impacted by the hurricanes, we believe that, as in past disasters, insurance proceeds and government aid will limit or prevent large scale municipal defaults. The human toll and property damage from these storms is far worse than previous natural disasters and the recovery period will take longer. Furthermore, some areas of the gulf coast will never be the same. However, we do believe that most of the cities and towns will survive and have need of schools, hospitals, sewer systems, and other essential services.
Outside of the gulf coast, job growth and a strong economy continue to fill state and local coffers. State tax revenues grew 13.3% in the second quarter of 2005 from the year earlier period. This represents the fastest growth rate recorded by the Nelson Rockefeller Institute of Government since they began monitoring this statistic in 1991. However, many challenges remain. Among them are still-depleted reserve fund balances from the last recession, and under funded retirement fund balances in state and local pension funds. To reduce credit risk, we have kept 90% of the portfolio in bonds rated A or above and maintained broad diversification across issuers and market sectors.
Over the years, our practice of laddering a diversified portfolio of short and intermediate maturity municipal bonds has allowed your Fund to perform consistently well in varying interest rate environments. Thank you for investing in Thornburg Limited Term Municipal Fund.
Sincerely, |
 |
| George Strickland |
| Portfolio Manager |
| Certified Annual Report | 7 |
STATEMENT OF ASSETS AND LIABILITIES
| Thornburg Limited Term Municipal Fund | September 30, 2005 |
ASSETS | ||||
Investments at value (cost $1,359,404,909) | $ | 1,383,542,486 | ||
Cash | 649,146 | |||
Receivable for investments sold | 7,791,540 | |||
Receivable for fund shares sold | 2,623,269 | |||
Interest receivable | 18,033,244 | |||
Prepaid expenses and other assets | 25,569 | |||
Total Assets | 1,412,665,254 | |||
LIABILITIES | ||||
Payable for securities purchased | 9,281,373 | |||
Payable for fund shares redeemed | 2,713,913 | |||
Payable to investment advisor and other affiliates (Note 3) | 855,368 | |||
Accounts payable and accrued expenses | 198,145 | |||
Dividends payable | 991,396 | |||
Total Liabilities | 14,040,195 | |||
NET ASSETS | $ | 1,398,625,059 | ||
NET ASSETS CONSIST OF: | ||||
Distribution in excess of net investment income | $ | (2,553 | ) | |
Net unrealized appreciation on investments | 24,135,453 | |||
Accumulated net realized gain (loss) | (6,478,505 | ) | ||
Net capital paid in on shares of beneficial interest | 1,380,970,664 | |||
| $ | 1,398,625,059 | |||
NET ASSET VALUE: | ||||
Class A Shares: | ||||
Net asset value and redemption price per share ($967,649,703 applicable to 71,193,755 shares of beneficial interest outstanding - Note 4) | $ | 13.59 | ||
Maximum sales charge, 1.50% of offering price | 0.21 | |||
Maximum offering price per share | $ | 13.80 | ||
Class C Shares: | ||||
Net asset value and offering price per share* ($140,606,588 applicable to 10,326,146 shares of beneficial interest outstanding - Note 4) | $ | 13.62 | ||
Class I Shares: | ||||
Net asset value, offering and redemption price per share ($290,368,768 applicable to 21,360,741 shares of beneficial interest outstanding - Note 4) | $ | 13.59 | ||
| * | Redemption price per share is equal to net asset value less any applicable contingent deferred sales charge. |
See notes to financial statements.
| 8 | Certified Annual Report |
| Thornburg Limited Term Municipal Fund | Year Ended September 30, 2005 |
INVESTMENT INCOME: | ||||
Interest income (net of premium amortized of $15,941,966) | $ | 53,848,175 | ||
EXPENSES: | ||||
Investment advisory fees (Note 3) | 5,743,475 | |||
Administration fees (Note 3) | ||||
Class A Shares | 1,256,590 | |||
Class C Shares | 190,990 | |||
Class I Shares | 128,213 | |||
Distribution and service fees (Note 3) | ||||
Class A Shares | 2,513,180 | |||
Class C Shares | 1,528,014 | |||
Transfer agent fees | ||||
Class A Shares | 473,925 | |||
Class C Shares | 93,435 | |||
Class I Shares | 74,455 | |||
Registration and filing fees | ||||
Class A Shares | 69,049 | |||
Class C Shares | 30,251 | |||
Class I Shares | 52,729 | |||
Custodian fees (Note 3) | 417,614 | |||
Professional fees | 79,518 | |||
Accounting fees | 146,805 | |||
Trustee fees | 20,935 | |||
Other expenses | 273,201 | |||
Total Expenses | 13,092,379 | |||
Less: | ||||
Distribution and service fees waived (Note 3) | (764,803 | ) | ||
Fees paid indirectly (Note 3) | (39,534 | ) | ||
Net Expenses | 12,288,042 | |||
Net Investment Income | 41,560,133 | |||
REALIZED AND UNREALIZED GAIN (LOSS) ON INVESTMENTS | ||||
Net realized gain (loss) on investments sold | (1,895,726 | ) | ||
Increase (decrease) in unrealized appreciation (depreciation) of investments | (23,004,183 | ) | ||
Net Realized and Unrealized Loss on Investments | (24,899,909 | ) | ||
Net Increase in Net Assets Resulting From Operations | $ | 16,660,224 | ||
See notes to financial statements.
| Certified Annual Report | 9 |
STATEMENTS OF CHANGES IN NET ASSETS
Thornburg Limited Term Municipal Fund
| Year Ended September 30, 2005 | Three Months Ended September 30, 2004 | Year Ended June 30, 2004 | ||||||||||
INCREASE (DECREASE) IN NET ASSETS FROM: | ||||||||||||
OPERATIONS: | ||||||||||||
Net investment income | $ | 41,560,133 | $ | 9,853,487 | $ | 40,659,597 | ||||||
Net realized gain (loss) on investments sold | (1,895,726 | ) | 74,945 | 1,795,864 | ||||||||
Increase (Decrease) in unrealized appreciation (depreciation) of investments | (23,004,183 | ) | 16,155,302 | (36,334,816 | ) | |||||||
Net Increase (Decrease) in Net Assets Resulting from Operations | 16,660,224 | 26,083,734 | 6,120,645 | |||||||||
DIVIDENDS TO SHAREHOLDERS: | ||||||||||||
From net investment income | ||||||||||||
Class A Shares | (29,220,801 | ) | (7,133,301 | ) | (29,889,249 | ) | ||||||
Class C Shares | (4,017,994 | ) | (958,113 | ) | (3,916,198 | ) | ||||||
Class I Shares | (8,321,340 | ) | (1,762,073 | ) | (6,854,150 | ) | ||||||
FUND SHARE TRANSACTIONS (NOTE 4): | ||||||||||||
Class A Shares | (53,647,281 | ) | (20,348,137 | ) | 74,238,458 | |||||||
Class C Shares | (13,573,272 | ) | (353,019 | ) | 21,587,725 | |||||||
Class I Shares | 56,236,683 | 13,279,935 | 30,607,967 | |||||||||
Net Increase (Decrease) in Net Assets | (35,883,781 | ) | 8,809,026 | 91,895,198 | ||||||||
NET ASSETS: | ||||||||||||
Beginning of period | 1,434,508,840 | 1,425,699,814 | 1,333,804,616 | |||||||||
End of period | $ | 1,398,625,059 | $ | 1,434,508,840 | $ | 1,425,699,814 | ||||||
See notes to financial statements.
| 10 | Certified Annual Report |
| Thornburg Limited Term Municipal Fund | September 30, 2005 |
NOTE 1 – ORGANIZATION
Thornburg Limited Term Municipal Fund (the “Fund”) (formerly Thornburg Limited Term Municipal Fund – National Portfolio) is a diversified series of Thornburg Investment Trust (the “Trust”). The Trust is organized as a Massachusetts business trust under a Declaration of Trust dated June 3, 1987 and is registered as a diversified, open-end management investment company under the Investment Company Act of 1940, as amended. The Trust is currently issuing eleven series of shares of beneficial interest in addition to those of the Fund: Thornburg California Limited Term Municipal Fund, Thornburg Florida Intermediate Municipal Fund, Thornburg New York Intermediate Municipal Fund, Thornburg New Mexico Intermediate Municipal Fund, Thornburg Intermediate Municipal Fund, Thornburg Limited Term U.S. Government Fund, Thornburg Limited Term Income Fund, Thornburg Value Fund, Thornburg International Value Fund, Thornburg Core Growth Fund, and Thornburg Investment Income Builder Fund. Each series is considered to be a separate entity for financial reporting and tax purposes and bears expenses directly attributable to it. The Fund’s investment objective is to obtain as high a level of current income exempt from Federal income taxes as is consistent, in the view of the Fund’s investment advisor, with the preservation of capital.
The Fund currently offers three classes of shares of beneficial interest, Class A, Class C, and Institutional Class (Class I) shares. Each class of shares of the Fund represents an interest in the same portfolio of investments, except that (i) Class A shares are sold subject to a front-end sales charge collected at the time the shares are purchased and bear a service fee, (ii) Class C shares are sold at net asset value without a sales charge at the time of purchase, but are subject to a contingent deferred sales charge upon redemption within one year, and bear both a service fee and a distribution fee, (iii) Class I shares are sold at net asset value without a sales charge at the time of purchase, and (iv) the respective classes may have different reinvestment privileges and conversion rights. Additionally, the Fund may allocate among its classes certain expenses, to the extent applicable to specific classes, including transfer agent fees, government registration fees, certain printing and postage costs, and administrative and legal expenses. Currently, class specific expenses of the Fund are limited to service and distribution fees, administrative fees, and certain registration and transfer agent expenses.
NOTE 2 – SIGNIFICANT ACCOUNTING POLICIES
Significant accounting policies of the Trust are as follows:
Valuation of Investments: In determining the net asset value of investments, the Trust utilizes an independent pricing service approved by the Board of Trustees. Debt investment securities have a primary market over the counter and are valued on the basis of valuations furnished by the pricing service. The pricing service values portfolio securities at quoted bid prices, normally at 4:00 p.m. EST. When quotations are not readily available, securities are valued at evaluated prices as determined by the pricing service using methods which include consideration of yields or prices of municipal obligations of comparable quality, type of issue, coupon, maturity, and rating; indications as to value from dealers and general market conditions. In any case where a price is not available from a pricing service for an investment, the Trust’s valuation and pricing committee determines a fair value for the investment using factors approved by the Trustees. The valuation procedures used by the pricing service and the portfolio valuations received by the Fund are reviewed by the officers of the Trust under the general supervision of the Board of Trustees. Short-term obligations having remaining maturities of 60 days or less are valued at amortized cost, which approximates market value.
Federal Income Taxes: It is the policy of the Trust to comply with the provisions of the Internal Revenue Code applicable to “regulated investment companies” and to distribute all taxable (if any) and tax exempt income of the Fund to the shareholders. Therefore, no provision for Federal income tax is required.
When-Issued and Delayed Delivery Transactions: The Trust may engage in when-issued or delayed delivery transactions. To the extent the Trust engages in such transactions, it will do so for the purpose of acquiring portfolio securities consistent with the Fund’s investment objectives and not for the purpose of investment leverage or to speculate on interest rate and or market changes. At the time the Trust makes a commitment to purchase a security on a when-issued basis, the Fund will record the transaction and reflect the value in determining its net asset value. When effecting such transactions, assets of an amount sufficient to make payment for the portfolio securities to be purchased will be segregated on the Fund’s records on the trade date. Securities purchased on a when-issued or delayed delivery basis do not earn interest until the settlement date.
Dividends: Net investment income of the Fund is declared daily as a dividend on shares for which the Fund has received payment. Dividends are paid monthly and are reinvested in additional shares of the Fund at net asset value per share at the close of business on the dividend payment date or, at the shareholder’s option, paid in cash. Net capital gains, to the extent available, will be distributed at least annually.
General: Securities transactions are accounted for on a trade date basis. Interest income is accrued as earned. Premiums and discounts on securities purchased are amortized to call dates or maturity dates of the respective securities. Realized gains and losses from the sale of securities are recorded on an identified cost basis. Net investment income, other than class specific expenses and realized and unrealized gains and losses, is allocated daily to each class of shares based upon the relative net asset value of outstanding shares (or the value of the
| Certified Annual Report | 11 |
NOTES TO FINANCIAL STATEMENTS, CONTINUED
| Thornburg Limited Term Municipal Fund | September 30, 2005 |
dividend-eligible shares, as appropriate) of each class of shares at the beginning of the day (after adjusting for the current capital shares activity of the respective class). Expenses common to all funds are allocated among the funds comprising the Trust based upon their relative net asset values or other appropriate allocation methods.
Guarantees and Indemnifications: Under the Trust’s organizational documents, its officers and Trustees are indemnified against certain liability arising out of the performance of their duties to the Fund. Additionally, in the normal course of business the Trust enters into contracts with service providers that contain general indemnification clauses. The Trust’s maximum exposure under these arrangements is unknown. However, based on experience, the Trust expects the risk of loss to be remote.
Use of Estimates: The preparation of financial statements, in conformity with generally accepted accounting principles, requires management to make estimates and assumptions that affect the reported amounts of assets and liabilities and the disclosure of contingent assets and liabilities at the date of the financial statements and the reported amounts of increases and decreases in net assets from operations during the reporting period. Actual results could differ from those estimates.
NOTE 3 – INVESTMENT ADVISORY FEE AND OTHER TRANSACTIONS WITH AFFILIATES
Pursuant to an Investment Advisory Agreement, Thornburg Investment Management, Inc.® (the “Advisor”) serves as the investment advisor and performs services for which the fees are payable at the end of each month. For the year ended September 30, 2005, these fees were payable at annual rates ranging from .50 of 1% to .225 of 1% per annum of the average daily net assets of the Fund. The Trust also has entered into an Administrative Services Agreement with the Advisor, whereby the Advisor will perform certain administrative services for the shareholders of each class of the Fund’s shares, and for which fees will be payable at an annual rate of up to .125 of 1% per annum of the average daily net assets attributable to each class of shares.
The Trust has an underwriting agreement with Thornburg Securities Corporation® (the “Distributor”, an affiliate of the Advisor), which acts as the Distributor of Fund shares. For the year ended September 30, 2005, the Distributor has advised the Fund that it earned commissions aggregating $10,258 from the sale of Class A shares, and collected contingent deferred sales charges aggregating $15,616 from redemptions of Class C shares of the Fund.
Pursuant to a Service Plan under Rule 12b-1 of the Investment Company Act of 1940, the Fund may reimburse to the Advisor amounts not to exceed .25 of 1% per annum of the average daily net assets attributable to each class of shares of the Fund for payments made by the Advisor to securities dealers and other persons for distribution of the Fund’s shares and to obtain various shareholder related services. The Advisor may pay out of its own resources additional expenses for distribution of the Fund’s shares.
The Trust has also adopted a Distribution Plan pursuant to Rule 12b-1, applicable only to the Fund’s Class C shares under which the Fund compensates the Distributor for services in promoting the sale of Class C shares of the Fund at an annual rate of up to .75 of 1% per annum of the average daily net assets attributable to Class C shares. Total fees incurred by each class of shares of the Fund under their respective service and distribution plans and Class C distribution fees waived by the Distributor for the year ended September 30, 2005, are set forth in the Statement of Operations. Distribution fees in the amount of $764,803 were waived for Class C shares.
The Trust has an agreement with the custodian bank to indirectly pay a portion of the custodian’s fees through credits earned by the Fund’s cash on deposit with the bank. This deposit agreement is an alternative to overnight investments. Custodial fees have been adjusted to reflect amounts that would have been paid without this agreement, with a corresponding adjustment reflected as fees paid indirectly in the Statement of Operations. For the year ended September 30, 2005, fees paid indirectly were $39,534.
Certain officers and Trustees of the Trust are also officers and/or Directors of the Advisor and Distributor. The compensation of independent Trustees is borne by the Trust.
12 | Certified Annual Report |
NOTES TO FINANCIAL STATEMENTS, CONTINUED
| Thornburg Limited Term Municipal Fund | September 30, 2005 |
NOTE 4 – SHARES OF BENEFICIAL INTEREST
At September 30, 2005, there were an unlimited number of shares of beneficial interest authorized. Transactions in shares of beneficial interest were as follows:
| Year Ended September 30, 2005 | Three Months Ended September 30, 2004 | Year Ended June 30, 2004 | |||||||||||||||||||
| Shares | Amount | Shares | Amount | Shares | Amount | ||||||||||||||||
Class A Shares | |||||||||||||||||||||
Shares sold | 10,112,925 | $ | 138,664,895 | 2,652,124 | $ | 36,597,200 | 22,343,137 | $ | 310,234,300 | ||||||||||||
Shares issued to shareholders in reinvestment of dividends | 1,429,462 | 19,572,574 | 335,506 | 4,631,084 | 1,399,170 | 19,393,497 | |||||||||||||||
Shares repurchased | (15,463,654 | ) | (211,884,750 | ) | (4,457,299 | ) | (61,576,421 | ) | (18,441,220 | ) | (255,389,339 | ) | |||||||||
Net Increase (Decrease) | (3,921,267 | ) | $ | (53,647,281 | ) | (1,469,669 | ) | $ | (20,348,137 | ) | 5,301,087 | $ | 74,238,458 | ||||||||
Class C Shares | |||||||||||||||||||||
Shares sold | 1,853,494 | $ | 25,470,518 | 506,589 | $ | 7,003,493 | 4,814,111 | $ | 66,984,540 | ||||||||||||
Shares issued to shareholders in reinvestment of dividends | 198,591 | 2,724,023 | 46,675 | 645,678 | 194,692 | 2,704,058 | |||||||||||||||
Shares repurchased | (3,045,634 | ) | (41,767,813 | ) | (578,793 | ) | (8,002,190 | ) | (3,462,370 | ) | (48,100,873 | ) | |||||||||
Net Increase (Decrease) | (993,549 | ) | $ | (13,573,272 | ) | (25,529 | ) | $ | (353,019 | ) | 1,546,433 | $ | 21,587,725 | ||||||||
Class I Shares | |||||||||||||||||||||
Shares sold | 8,961,752 | $ | 122,650,992 | 1,826,487 | $ | 25,227,726 | 8,616,079 | $ | 119,652,434 | ||||||||||||
Shares issued to shareholders in reinvestment of dividends | 501,520 | 6,865,525 | 104,786 | 1,446,479 | 394,435 | 5,468,468 | |||||||||||||||
Shares repurchased | (5,348,315 | ) | (73,279,834 | ) | (970,031 | ) | (13,394,270 | ) | (6,808,603 | ) | (94,512,935 | ) | |||||||||
Net Increase (Decrease) | 4,114,957 | $ | 56,236,683 | 961,242 | $ | 13,279,935 | 2,201,911 | $ | 30,607,967 | ||||||||||||
NOTE 5 – SECURITIES TRANSACTIONS
For the year ended September 30, 2005, the Fund had purchase and sale transactions of investment securities (excluding short-term investments) of $420,714,063 and $381,321,057, respectively.
NOTE 6 – INCOME TAXES
At September 30, 2005, information on the tax components of capital is as follows:
Cost of investments for tax purposes | $ | 1,359,409,800 | ||
Gross unrealized appreciation on a tax basis | $ | 27,475,568 | ||
Gross unrealized depreciation on a tax basis | (3,342,882 | ) | ||
Net unrealized appreciation (depreciation) on investments (tax basis) | $ | 24,132,686 | ||
At September 30, 2005, the Fund did not have any undistributed tax-exempt/ordinary net income or undistributed capital gains.
At September 30, 2005, the Fund had tax basis capital losses, which may be carried over to offset future capital gains. To the extent such carry forwards are used, capital gain distributions may be reduced to the extent provided by regulations.
Such capital loss carryovers expire as follows:
2007 | $ | 1,013,153 | |
2008 | 3,565,103 | ||
2013 | 30,614 | ||
| $ | 4,608,870 | ||
As of September 30, 2005, the Fund had deferred capital losses occurring subsequent to October 31, 2004 of $1,864,744. For tax purposes, such losses will be reflected in the year ending September 30, 2006.
In order to account for permanent book/tax differences, the Fund increased net investment loss by $922 and decreased accumulated net realized investment loss by $922. This reclassification has no impact on the net asset value of the Fund. Reclassifications result primarily from market discount.
All dividends paid by the Fund for the year ended September 30, 2005, period ended September 30, 2004, and the year ended June 30, 2004, represent exempt interest dividends, which are excludable by shareholders from gross income for Federal income tax purposes.
| Certified Annual Report | 13 |
Thornburg Limited Term Municipal Fund
Year 2005 | 3 Months 2004(c) | Year Ended June 30, | ||||||||||||||||||||||
| 2004 | 2003 | 2002 | 2001 | |||||||||||||||||||||
Class I Shares: | ||||||||||||||||||||||||
PER SHARE PERFORMANCE | ||||||||||||||||||||||||
(for a share outstanding throughout the period) | ||||||||||||||||||||||||
Net asset value, beginning of period | $ | 13.83 | $ | 13.68 | $ | 14.01 | $ | 13.65 | $ | 13.44 | $ | 13.06 | ||||||||||||
Income from investment operations: | ||||||||||||||||||||||||
Net investment income | 0.44 | 0.11 | 0.44 | 0.49 | 0.57 | 0.63 | ||||||||||||||||||
Net realized and unrealized gain (loss) on investments | (0.24 | ) | 0.15 | (0.33 | ) | 0.36 | 0.21 | 0.38 | ||||||||||||||||
Total from investment operations | 0.20 | 0.26 | 0.11 | 0.85 | 0.78 | 1.01 | ||||||||||||||||||
Less dividends from: | ||||||||||||||||||||||||
Net investment income | (0.44 | ) | (0.11 | ) | (0.44 | ) | (0.49 | ) | (0.57 | ) | (0.63 | ) | ||||||||||||
Change in net asset value | (0.24 | ) | 0.15 | (0.33 | ) | 0.36 | 0.21 | 0.38 | ||||||||||||||||
NET ASSET VALUE, end of period | $ | 13.59 | $ | 13.83 | $ | 13.68 | $ | 14.01 | $ | 13.65 | $ | 13.44 | ||||||||||||
RATIOS/SUPPLEMENTAL DATA | ||||||||||||||||||||||||
Total return(a) | 1.50 | % | 1.87 | % | 0.80 | % | 6.36 | % | 5.91 | % | 7.91 | % | ||||||||||||
Ratios to average net assets: | ||||||||||||||||||||||||
Net investment income | 3.25 | % | 3.02 | %(b) | 3.18 | % | 3.54 | % | 4.18 | % | 4.75 | % | ||||||||||||
Expenses, after expense reductions | 0.57 | % | 0.55 | %(b) | 0.57 | % | 0.58 | % | 0.60 | % | 0.60 | % | ||||||||||||
Expenses, after expense reductions and net of custody credits | 0.57 | % | 0.55 | %(b) | 0.57 | % | 0.58 | % | 0.60 | % | — | |||||||||||||
Expenses, before expense reductions | 0.57 | % | 0.55 | %(b) | 0.57 | % | 0.58 | % | 0.62 | % | 0.65 | % | ||||||||||||
Portfolio turnover rate | 27.80 | % | 4.57 | % | 21.37 | % | 15.81 | % | 19.59 | % | 25.37 | % | ||||||||||||
Net assets at end of period (000) | $ | 290,369 | $ | 238,589 | $ | 222,760 | $ | 197,367 | $ | 123,652 | $ | 86,160 | ||||||||||||
| (a) | Not annualized for periods less than one year. |
| (b) | Annualized. |
| (c) | The Fund’s fiscal year-end changed to September 30. |
| 14 | Certified Annual Report |
| Thornburg Limited Term Municipal Fund | September 30, 2005 |
CUSIPS: CLASS A - 885-215-459, CLASS C - 885-215-442, CLASS I - 885-215-434 NASDAQ SYMBOLS: CLASS A - LTMFX, CLASS C - LTMCX, CLASS I - LTMIX
Issuer-Description | Credit Rating† | Principal Amount | Value | |||||
ARIZONA — 1.07% | ||||||||
Arizona State Transportation Board Grant Anticipation Notes Series A, 5.00% due 7/1/2009 | Aa3/AA- | $ | 2,500,000 | $ | 2,657,825 | |||
Maricopa County Arizona School District 97, 5.50% due 7/1/2008 (Insured: FGIC) | Aaa/NR | 650,000 | 691,002 | |||||
Maricopa County School District 008, 7.50% due 7/1/2008 (Insured: MBIA) | A1/AAA | 1,000,000 | 1,112,510 | |||||
Mohave County Industrial Development Authority Correctional Facilities Contract Revenue Series A, 5.00% due 4/1/2009 (Mohave Prison LLC Project; Insured: XLCA) | NR/AAA | 4,595,000 | 4,845,198 | |||||
Mohave County Industrial Development Authority Series A, 5.00% due 4/1/2014 (Mohave Prison LLC Project; Insured: XLCA) | NR/AAA | 3,135,000 | 3,375,486 | |||||
Pima County Industrial Development Authority Education Revenue Series C, 6.40% due 7/1/2013 (Arizona Charter Schools Project) | Baa3/NR | 1,000,000 | 1,070,180 | |||||
Pima County Industrial Development Authority Industrial Revenue Refunding Lease Obligation A, 7.25% due 7/15/2010 (Insured: FSA) | Aaa/AAA | 570,000 | 585,447 | |||||
Tucson Water Revenue Series D, 9.75% due 7/1/2008 | Aa3/A+ | 500,000 | 585,015 | |||||
ALABAMA — 1.78% | ||||||||
Birmingham Carraway Alabama Special, 6.25% due 8/15/2009 (Insured: Connie Lee) | NR/AAA | 10,000,000 | 10,599,900 | |||||
Huntsville Health Care Authority Series A, 5.00% due 6/1/2013 (Insured: MBIA) | Aaa/AAA | 2,000,000 | 2,142,460 | |||||
Scottsboro Industrial Development Board Refunding, 5.25% due 5/1/2009 (LOC: PNC Bank) | NR/NR | 1,920,000 | 1,933,517 | |||||
West Jefferson Industrial Development, 2.90% due 6/1/2028 put 10/3/2005 (Alabama Power Co. Project) (daily demand notes) | VMIG1/A-1 | 1,200,000 | 1,200,000 | |||||
Wilsonville Industrial Development Board Pollution Control Revenue Refunding, 4.20% due 6/1/2019 put 6/1/2006 (Southern Electric Gaston Project; Insured: AMBAC) | Aaa/AAA | 8,955,000 | 9,014,013 | |||||
ALASKA — 0.53% | ||||||||
Alaska Energy Authority Power Revenue Refunding Third Series, 6.00% due 7/1/2008 (Bradley Lake Project; Insured: FSA) | Aaa/AAA | 2,800,000 | 3,005,632 | |||||
Alaska Student Loan Corp. Revenue Series A, 5.25% due 1/1/2012 (Capital Project; Insured: FSA) | NR/AAA | 3,000,000 | 3,283,560 | |||||
Anchorage Ice Rink Revenue, 6.375% due 1/1/2020 pre-refunded 7/1/2010 | NR/NR | 1,000,000 | 1,122,950 | |||||
ARKANSAS — 0.52% | ||||||||
Conway Electric Revenue Refunding, 5.00% due 8/1/2007 | A2/NR | 2,000,000 | 2,062,420 | |||||
Jefferson County Hospital Revenue Refunding & Improvement, 5.50% due 6/1/2010 (Regional Medical Center Project) | NR/A | 1,000,000 | 1,079,740 | |||||
Jefferson County Hospital Revenue Refunding & Improvement, 5.50% due 6/1/2011 (Regional Medical Center Project) | NR/A | 1,075,000 | 1,168,385 | |||||
Little Rock Hotel & Restaurant Gross Receipts Tax Refunding, 7.125% due 8/1/2009 | A3/NR | 2,645,000 | 2,892,123 | |||||
CALIFORNIA — 2.33% | ||||||||
Bay Area Government Association Rapid Transit, 4.875% due 6/15/2009 (Insured: AMBAC) | Aaa/AAA | 620,000 | 621,023 | |||||
California Health Facilities Financing Authority Revenue Series 83 C, 9.25% due 12/1/2006 (Mercy Health Care Project) (ETM) | Aaa/AAA | 1,600,000 | 1,715,840 | |||||
California Health Facilities Financing Authority Revenue Series B Refunding, 5.25% due 10/1/2013 (Kaiser Permanente Project) (ETM) | A3/AAA | 2,620,000 | 2,793,313 | |||||
California State Department of Water Resources Power Supply Series A, 5.50% due 5/1/2008 | A2/BBB+ | 2,050,000 | 2,163,098 | |||||
California State Department of Water Resources Power Supply Series A, 5.50% due 5/1/2012 | A2/BBB+ | 2,600,000 | 2,869,178 | |||||
California State Department of Water Resources Power Supply Series A, 6.00% due 5/1/2013 | A2/BBB+ | 2,550,000 | 2,896,316 | |||||
California State Series A-3, 2.77% due 5/1/2033 put 10/3/2005 (daily demand notes) | VMIG1/A-1+ | 500,000 | 500,000 | |||||
| Certified Annual Report | 15 |
SCHEDULE OF INVESTMENTS, CONTINUED
| Thornburg Limited Term Municipal Fund | September 30, 2005 |
Issuer-Description | Credit Rating† | Principal Amount | Value | |||||
California Statewide Community Development Authority Revenue Series D, 4.35% due 11/1/2036 put 3/1/2007 (Kaiser Permanente Project) | VMIG2/A-1 | $ | 2,000,000 | $ | 2,030,420 | |||
Central Valley Financing Authority Revenue, 6.00% due 7/1/2009 (Carson Ice Project) | NR/BBB | 500,000 | 508,950 | |||||
Metropolitan Water District Series B-3, 2.77% due 7/1/2035 put 10/3/2005 (daily demand notes) | VMIG1/A-1+ | 1,500,000 | 1,500,000 | |||||
Northern California Power Agency Public Power Revenue Series A, 5.00% due 7/1/2009 (Geothermal Project Number 3) | Baa2/BBB+ | 6,100,000 | 6,106,893 | |||||
Sacramento County Sanitation District Financing Authority Revenue Series A, 5.875% due 12/1/2027 Crossover refunded 12/1/2005 | Aa3/AA | 2,500,000 | 2,536,800 | |||||
San Jose Financing Authority Lease Revenue Series D, 5.00% due 6/1/2039 mandatory put 6/1/2006 (Civic Center Project; Insured: AMBAC) | Aaa/AAA | 3,000,000 | 3,042,600 | |||||
Santa Clara Valley Transportation Authority Sales Tax Revenue Measure A, 4.00% due 4/1/2036 put 10/2/2006 (Insured: AMBAC) | Aaa/AAA | 1,000,000 | 1,012,830 | |||||
Torrance Hospital Revenue Series A, 7.10% due 12/1/2015 pre-refunded 12/1/2005 (Little Co. of Mary Hospital Project) | NR/AAA | 1,305,000 | 1,314,487 | |||||
Tri City Hospital District Revenue Refunding Series B, 6.00% due 2/15/2006 (Insured: MBIA) | Aaa/AAA | 1,000,000 | 1,011,650 | |||||
COLORADO — 4.08% | ||||||||
Adams County Communication Center Series A, 4.75% due 12/1/2006 | Baa1/NR | 1,025,000 | 1,033,723 | |||||
Adams County Revenue Platte Valley Medical Center, 5.00% due 2/1/2012 (Insured: FHA, MBIA) | NR/AAA | 1,310,000 | 1,407,412 | |||||
Adams County Revenue Platte Valley Medical Center, 5.00% due 8/1/2012 (Insured: FHA, MBIA) | NR/AAA | 1,345,000 | 1,449,950 | |||||
Adams County Revenue Platte Valley Medical Center, 5.00% due 2/1/2013 (Insured: FHA, MBIA) | NR/AAA | 1,380,000 | 1,483,721 | |||||
Adams County Revenue Platte Valley Medical Center, 5.00% due 8/1/2013 (Insured: FHA, MBIA) | NR/AAA | 1,420,000 | 1,529,993 | |||||
Adams County Revenue Platte Valley Medical Center, 5.00% due 2/1/2015 (Insured: FHA, MBIA) | NR/AAA | 1,530,000 | 1,649,019 | |||||
Adams County Revenue Platte Valley Medical Center, 5.00% due 8/1/2015 (Insured: FHA, MBIA) | NR/AAA | 1,565,000 | 1,689,558 | |||||
Adams County School District 012 Series A, 4.375% due 12/15/2007 | Aa3/AA- | 1,000,000 | 1,028,740 | |||||
Central Platte Valley Metropolitan District Refunding Series A, 5.00% due 12/1/2031 put 12/1/2009 (LOC: US Bank) | NR/A-1 | 12,200,000 | 12,820,004 | |||||
Colorado Department of Transport Revenue Anticipation Notes, 6.00% due 6/15/2008 (Insured: AMBAC) | Aaa/AAA | 1,500,000 | 1,611,840 | |||||
Colorado Educational & Cultural Facilities, 4.90% due 4/1/2008 (Nashville Public Radio Project) | NR/BBB+ | 1,000,000 | 1,019,480 | |||||
Colorado Health Facilities Authority, 5.00% due 9/1/2007 (Catholic Health Initiatives Project) | Aa2/AA | 5,705,000 | 5,894,863 | |||||
Colorado Health Facilities Authority Series A, 5.375% due 12/1/2009 (Catholic Health Initiatives Project) | Aa2/AA | 515,000 | 545,658 | |||||
Colorado Housing Finance Authority, 5.25% due 10/1/2007 | A1/AA+ | 80,000 | 80,624 | |||||
Colorado Springs Utilities Revenue Systems Subordinated Lien Refunding & Improvement Series A, 5.00% due 11/15/2005 | Aa2/AA | 2,230,000 | 2,235,976 | |||||
Denver City & County COP Series A, 5.50% due 5/1/2006 (Insured: MBIA) | Aaa/AAA | 500,000 | 507,720 | |||||
Denver Convention Center Senior Series A, 5.00% due 12/1/2011 (Insured: XLCA) | Aaa/AAA | 3,335,000 | 3,588,227 | |||||
El Paso County School District Number 49 Series A, 6.00% due 12/1/2009 (Insured: FSA) | Aaa/AAA | 1,000,000 | 1,084,040 | |||||
Highlands Ranch Metro District 2 GO, 6.50% due 6/15/2012 (Insured: FSA) | Aaa/AAA | 1,000,000 | 1,172,830 | |||||
Highlands Ranch Metropolitan District 3 Refunding Series B, 5.25% due 12/1/2008 (Insured: ACA) | NR/A | 1,760,000 | 1,845,466 | |||||
Highlands Ranch Metropolitan District 3 Series A, 5.25% due 12/1/2008 (Insured: ACA) | NR/A | 1,520,000 | 1,593,811 | |||||
Lakewood COP, 4.40% due 12/1/2008 (Insured: MBIA) | Aaa/AAA | 1,000,000 | 1,035,340 | |||||
Metropolitan Football Stadium District Colorado Sales Tax Revenue Capital Appreciation Series A, 0% due 1/1/2008 (Insured: MBIA) | Aaa/AAA | 1,025,000 | 953,834 | |||||
Pinery West Metropolitan District 3, 4.70% due 12/1/2021 put 12/1/2007 (LOC: Compass Bank) | NR/A-2 | 970,000 | 986,412 | |||||
Plaza Metropolitan District 1 Revenue, 7.60% due 12/1/2016 (Public Improvement Fee/Tax Increment Project) | NR/NR | 6,000,000 | 6,621,120 | |||||
Regional Transportation District of Colorado Series A, 5.00% due 6/1/2009 (Transit Vehicles Project; Insured: AMBAC) | Aaa/AAA | 1,000,000 | 1,059,320 | |||||
Southland Metropolitan District Number 1 unlimited GO, 6.75% due 12/1/2016 | NR/NR | 1,000,000 | 1,095,770 | |||||
CONNECTICUT — 0.12% | ||||||||
Bridgeport GO, 6.00% due 3/1/2006 (Insured: AMBAC) | Aaa/AAA | 1,325,000 | 1,342,397 | |||||
16 | Certified Annual Report |
SCHEDULE OF INVESTMENTS, CONTINUED
| Thornburg Limited Term Municipal Fund | September 30, 2005 |
Issuer-Description | Credit Rating† | Principal Amount | Value | |||||
Capitol Region Education Council, 6.375% due 10/15/2005 | NR/BBB | $ | 350,000 | $ | 350,378 | |||
DELAWARE — 0.53% | ||||||||
Delaware State Economic Development Authority Revenue, 5.50% due 7/1/2025 put 7/1/2010 (Delmarva Power & Light Project) | Baa1/BBB | 2,045,000 | 2,151,565 | |||||
Delaware State Health Facilities Authority Revenue, 6.25% due 10/1/2006 (ETM) | Aaa/AAA | 845,000 | 848,194 | |||||
Delaware State Health Facilities Authority Revenue Series A, 5.25% due 6/1/2011 (Beebe Medical Center Project) | Baa1/BBB+ | 1,275,000 | 1,359,584 | |||||
Delaware State Health Facilities Authority Revenue Series A, 5.25% due 5/1/2012 (Nanticoke Memorial Hospital Project; Insured: Radian) | NR/AA | 1,370,000 | 1,474,572 | |||||
Delaware State Health Facilities Authority Revenue Series A, 5.25% due 5/1/2013 (Nanticoke Memorial Hospital Project; Insured: Radian) | NR/AA | 1,445,000 | 1,542,595 | |||||
DISTRICT OF COLUMBIA — 2.01% | ||||||||
District of Columbia, 5.50% due 6/1/2008 (Insured: AMBAC) | Aaa/AAA | 1,915,000 | 2,027,602 | |||||
District of Columbia COP, 5.00% due 1/1/2008 (Public Safety & Emergency Project; Insured: AMBAC) | Aaa/AAA | 1,000,000 | 1,039,440 | |||||
District of Columbia COP, 5.25% due 1/1/2013 (Insured: AMBAC) | Aaa/AAA | 5,950,000 | 6,444,980 | |||||
District of Columbia Hospital Revenue, 5.70% due 8/15/2008 (Medlantic Healthcare Project) (ETM) | Aaa/AAA | 4,430,000 | 4,618,674 | |||||
District of Columbia Hospital Revenue Refunding, 5.10% due 8/15/2008 (Medlantic Healthcare Group A Project) (ETM) | Aaa/AAA | 1,500,000 | 1,567,965 | |||||
District of Columbia Revenue, 5.50% due 10/1/2005 (Insured: MBIA) | Aaa/AAA | 500,000 | 500,035 | |||||
District of Columbia Revenue, 6.00% due 1/1/2007 (American Assoc. for Advancement of Science Project; Insured: AMBAC) | Aaa/AAA | 500,000 | 517,780 | |||||
District of Columbia Revenue, 6.00% due 1/1/2009 (American Assoc. for Advancement of Science Project; Insured: AMBAC) | Aaa/AAA | 1,000,000 | 1,082,250 | |||||
District of Columbia Series A, 5.50% due 6/1/2009 (Insured: MBIA) | Aaa/AAA | 4,700,000 | 5,056,072 | |||||
District of Columbia Tax Increment Capital Appreciation, 0% due 7/1/2009 (Mandarin Oriental Project; Insured: FSA) | Aaa/AAA | 2,000,000 | 1,752,580 | |||||
District of Columbia Tax Increment Capital Appreciation, 0% due 7/1/2011 (Mandarin Oriental Project; Insured: FSA) | Aaa/AAA | 1,990,000 | 1,595,303 | |||||
District of Columbia Tax Increment Capital Appreciation, 0% due 7/1/2012 (Mandarin Oriental Project; Insured: FSA) | Aaa/AAA | 1,480,000 | 1,130,439 | |||||
Washington DC Convention Center Authority Dedicated Tax Revenue, 5.00% due 10/1/2006 (Insured: AMBAC) | Aaa/AAA | 750,000 | 765,233 | |||||
FLORIDA — 5.98% | ||||||||
Broward County Resource Recovery Revenue Refunding, 5.375% due 12/1/2009 (Wheelabrator South Project) | A3/AA | 5,000,000 | 5,327,650 | |||||
Capital Projects Finance Authority Student Housing, 5.50% due 10/1/2012 (Capital Projects Student Housing; Insured: MBIA) | Aaa/AAA | 1,000,000 | 1,091,460 | |||||
Crossings at Fleming Island Community Development Refunding Series B, 5.45% due 5/1/2010 (Insured: MBIA) | Aaa/AAA | 2,996,000 | 3,172,345 | |||||
Dade County Solid Waste Systems Special Obligation Revenue Refunding, 6.00% due 10/1/2007 (Insured: AMBAC) | Aaa/AAA | 7,000,000 | 7,398,230 | |||||
Escambia County Health Facilities Revenue Baptist Hospital Baptist Manor, 5.125% due 10/1/2014 | A3/BBB+ | 2,755,000 | 2,842,251 | |||||
Florida Housing Finance Corp. Multifamily Housing Charleston Series I A, 2.75% due 7/1/2031 put 10/3/2005 (daily demand notes) | NR/A-1+ | 1,600,000 | 1,600,000 | |||||
Florida State Refunding, 6.00% due 7/1/2006 (Department of Transportation Right of Way Project) | Aa1/AAA | 1,465,000 | 1,498,944 | |||||
Gulf Breeze Florida Revenue Local Government Series C, 4.00% due 12/1/2015 put 12/1/2007 (Insured: FGIC) | Aaa/AAA | 1,900,000 | 1,915,808 | |||||
| Certified Annual Report | 17 |
SCHEDULE OF INVESTMENTS, CONTINUED
| Thornburg Limited Term Municipal Fund | September 30, 2005 |
Issuer-Description | Credit Rating† | Principal Amount | Value | |||||
Gulf Breeze Florida Revenue Local Government Series E, 4.00% due 12/1/2020 put 12/1/2007 (Insured: FGIC) | Aaa/AAA | $ | 2,170,000 | $ | 2,188,054 | |||
Hillsborough County Industrial Development Authority, 5.10% due 10/1/2013 (Tampa Electric Co. Project) | Baa2/BBB- | 6,000,000 | 6,318,720 | |||||
Jacksonville Electric St. John’s River Park Systems Revenue Refunding Issue-2 17th Series, 5.25% due 10/1/2012 | Aa2/AA- | 5,000,000 | 5,438,450 | |||||
Miami Dade County School Board COP Series A, 5.00% due 5/1/2006 (Insured: MBIA) | Aaa/AAA | 1,910,000 | 1,933,588 | |||||
Miami Dade County School Board COP Series B, 5.50% due 5/1/2031 put 5/1/2011 (Insured: MBIA) | Aaa/AAA | 1,010,000 | 1,105,920 | |||||
Miami Dade County School Board COP Series C, 5.00% due 8/1/2007 (Insured: MBIA) | Aaa/AAA | 3,390,000 | 3,511,769 | |||||
Miami Dade County Special Housing Revenue Refunding, 5.80% due 10/1/2012 (HUD Section 8) | Baa3/NR | 3,560,000 | 3,448,714 | |||||
Orange County Health Facilities Authority, 5.80% due 11/15/2009 (Adventist Health System Project) | A2/A+ | 1,395,000 | 1,526,995 | |||||
Orange County Health Facilities Authority Revenue Refunding, 6.25% due 11/15/2008 (Adventist Health Systems Project; Insured: AMBAC) | Aaa/AAA | 3,120,000 | 3,194,412 | |||||
Orange County Health Facilities Authority Revenue Unrefunded Balance Series A, 6.25% due 10/1/2007 (Orlando Regional Hospital Project; Insured: MBIA) | Aaa/AAA | 925,000 | 979,677 | |||||
Orange County School Board Series A, 6.00% due 8/1/2008 (Insured: MBIA) | Aaa/NR | 10,000,000 | 10,757,700 | |||||
Palm Beach County Industrial Development Revenue Series 1996, 6.00% due 12/1/2006 (Lourdes-Noreen McKeen Residence Project) (ETM) | NR/A | 940,000 | 970,917 | |||||
Palm Beach County Solid Waste Authority Revenue Refunding Series A, 5.00% due 10/1/2005 | Aa3/AA- | 2,420,000 | 2,420,121 | |||||
Pasco County Housing Finance Authority Multi Family Revenue Refunding Series A, 5.35% due 6/1/2027 put 6/1/2008 (Oak Trail Apts Project; Insured: AXA) | NR/AA- | 1,000,000 | 1,007,810 | |||||
Pelican Marsh Community Development District Refunding Series A, 5.00% due 5/1/2011 (Insured: Radian) | NR/AA | 3,025,000 | 3,093,546 | |||||
St Johns County Florida Industrial Development Authority Series A, 5.50% due 8/1/2014 (Presbyterian Retirement Project) | NR/NR | 1,755,000 | 1,895,628 | |||||
Tampa Solid Waste System Revenue Series A, 4.35% due 10/1/2008 (Insured: AMBAC) | Aaa/AAA | 6,045,000 | 6,223,267 | |||||
University Athletic Association Inc. Florida Athletic Program Revenue Refunding, 2.20% due 10/1/2031 put 10/1/2005 (LOC: Suntrust Bank) | Aa3/NR | 2,835,000 | 2,835,000 | |||||
GEORGIA — 0.60% | ||||||||
Floyd County Sales Tax, 3.50% due 1/1/2006 | Aa3/NR | 1,500,000 | 1,502,655 | |||||
Georgia Municipal Association Inc. COP, 5.00% due 12/1/2006 (Atlanta City Court Project; Insured: AMBAC) | Aaa/AAA | 1,000,000 | 1,024,020 | |||||
Georgia Municipal Electric Power Authority Revenue Series Y, 6.30% due 1/1/2006 | A1/A+ | 730,000 | 736,074 | |||||
Georgia Municipal Electric Power Authority Revenue Unrefunded Balance Series DD, 7.00% due 1/1/2008 (Insured: MBIA) | Aaa/AAA | 1,495,000 | 1,617,425 | |||||
Monroe County Development Authority Pollution Control, 6.75% due 1/1/2010 (Oglethorpe Power Scherer A Refunding; Insured: MBIA) | Aaa/AAA | 2,000,000 | 2,262,240 | |||||
Monroe County Development Authority Pollution Control Revenue Oglethorpe Power Scherer A, 6.80% due 1/1/2012 (Insured: MBIA) | Aaa/AAA | 1,000,000 | 1,175,710 | |||||
HAWAII — 0.30% | ||||||||
Hawaii State Department of Budget & Finance Special Purpose Hawaiian Electric Co., 4.95% due 4/1/2012 (Insured: MBIA) | Aaa/AAA | 2,000,000 | 2,138,540 | |||||
Hawaii State Refunding Series Cb, 5.75% due 1/1/2007 | Aa2/AA- | 1,000,000 | 1,033,760 | |||||
Honolulu City & County Refunding Series A, 7.35% due 7/1/2006 | Aa2/AA- | 1,000,000 | 1,032,430 | |||||
IDAHO — 0.22% | ||||||||
Twin Falls Urban Renewal Agency Refunding Series A, 4.95% due 8/1/2014 | NR/NR | 1,640,000 | 1,633,276 | |||||
Twin Falls Urban Renewal Agency Refunding Series A, 5.15% due 8/1/2017 | NR/NR | 1,455,000 | 1,442,182 | |||||
ILLINOIS — 9.95% | ||||||||
Champaign County Community No 116 Series C, 0% due 1/1/2009 (ETM) | Aaa/AAA | 1,205,000 | 1,080,186 | |||||
18 | Certified Annual Report |
SCHEDULE OF INVESTMENTS, CONTINUED
| Thornburg Limited Term Municipal Fund |
Issuer-Description | Credit Rating† | Principal Amount | Value | |||||
Champaign County Community No 116 Unrefunded Balance Series C, 0% due 1/1/2009 (Insured: FGIC) | Aaa/AAA | $ | 2,140,000 | $ | 1,915,878 | |||
Chicago Board of Education, 6.00% due 12/1/2009 (Insured: FGIC) | Aaa/AAA | 2,000,000 | 2,207,820 | |||||
Chicago Board of Education School Reform, 6.25% due 12/1/2012 (Insured: MBIA) | Aaa/AAA | 750,000 | 871,222 | |||||
Chicago Housing Authority Capital Program Revenue, 5.00% due 7/1/2007 | Aa3/AA | 1,000,000 | 1,028,150 | |||||
Chicago Housing Authority Capital Program Revenue, 5.25% due 7/1/2010 | Aa3/AA | 2,300,000 | 2,457,044 | |||||
Chicago Metropolitan Water Reclamation District, 6.90% due 1/1/2007 | Aaa/AA+ | 2,300,000 | 2,369,069 | |||||
Chicago Midway Airport Revenue Series A, 5.40% due 1/1/2009 (Insured: MBIA) | Aaa/AAA | 1,340,000 | 1,386,538 | |||||
Chicago Midway Airport Revenue Series C, 5.50% due 1/1/2013 (Insured: MBIA) | Aaa/AAA | 1,180,000 | 1,298,201 | |||||
Chicago O’Hare International Airport Revenue, 5.375% due 1/1/2007 (Insured: AMBAC) | Aaa/AAA | 1,000,000 | 1,025,790 | |||||
Chicago O’Hare International Airport Revenue, 5.00% due 1/1/2012 (Insured: MBIA) | Aaa/AAA | 1,105,000 | 1,190,229 | |||||
Chicago O’Hare International Airport Revenue 2nd Lien Series C-1, 5.00% due 1/1/2010 (Insured: MBIA) | Aaa/AAA | 1,000,000 | 1,063,210 | |||||
Chicago O’Hare International Airport Revenue Passenger Facility Series A, 5.625% due 1/1/2014 (Insured: AMBAC) | Aaa/AAA | 3,065,000 | 3,145,609 | |||||
Chicago O’Hare International Airport Revenue Refunding Series A, 4.90% due 1/1/2006 (Insured: MBIA) | Aaa/AAA | 675,000 | 678,037 | |||||
Chicago Park District Parking Facility Revenue, 5.75% due 1/1/2010 (ETM) | Baa1/A | 1,000,000 | 1,094,340 | |||||
Chicago Public Commerce Building Revenue Series C, 5.50% due 2/1/2006 (Insured: FGIC) | Aaa/AAA | 2,000,000 | 2,017,680 | |||||
Chicago Refunding Series A, 5.375% due 1/1/2013 (Insured: MBIA) | Aaa/AAA | 2,000,000 | 2,187,920 | |||||
Chicago Refunding Series A-2, 6.125% due 1/1/2012 (Insured: AMBAC) | Aaa/AAA | 1,000,000 | 1,139,580 | |||||
Chicago Tax Increment Allocation Central Series A, 0% due 12/1/2005 (Insured: AMBAC) | Aaa/AAA | 5,000,000 | 4,976,250 | |||||
Chicago Water Revenue, 6.50% due 11/1/2011 (Insured: FGIC) | Aaa/AAA | 1,810,000 | 2,098,822 | |||||
Cook & Will Counties Township High School District 206 Series C, 0% due 12/1/2005 (Insured: FSA) | Aaa/AAA | 2,545,000 | 2,532,886 | |||||
Cook County Capital Improvement, 5.50% due 11/15/2008 pre-refunded 11/15/2006 | Aaa/AAA | 995,000 | 1,033,089 | |||||
Cook County Community Capital Appreciation, 0% due 12/1/2010 (Insured: FSA) | Aaa/NR | 2,000,000 | 1,660,340 | |||||
Cook County Community School District 97 Series B, 9.00% due 12/1/2013 (Insured: FGIC) | Aaa/NR | 2,250,000 | 3,060,157 | |||||
Cook County School District 99, 9.00% due 12/1/2012 (Insured: FGIC) | Aaa/NR | 1,000,000 | 1,322,620 | |||||
Du Page County Forest Preservation District, 0% due 11/1/2009 | Aaa/AAA | 5,000,000 | 4,349,000 | |||||
Glenview Multi Family Revenue Refunding, 5.20% due 12/1/2027 put 12/1/2007 (Collateralized: FNMA) | NR/AAA | 1,485,000 | 1,526,521 | |||||
Hoffman Estates Illinois Tax Increment Revenue, 0% due 5/15/2006 (Hoffman Estates Economic Dev. Project; Guaranty: Sears) | Ba1/NR | 3,075,000 | 2,998,648 | |||||
Hoffman Estates Illinois Tax Increment Revenue Junior Lien, 0% due 5/15/2007 | Ba1/NR | 1,500,000 | 1,400,700 | |||||
Illinois Development Finance Authority Pollution Control Revenue Refunding, 5.70% due 1/15/2009 (Commonwealth Edison Co. Project; Insured: MBIA) | Aaa/AAA | 3,000,000 | 3,214,740 | |||||
Illinois Development Finance Authority Pollution Series A, 7.375% due 7/1/2021 pre-refunded 7/1/2006 (Illinois Power Co. Project) | Baa1/NR | 5,000,000 | 5,256,150 | |||||
Illinois Development Finance Authority Revenue, 4.00% due 11/15/2005 (Insured: XLCA) | Aaa/AAA | 860,000 | 861,178 | |||||
Illinois Development Finance Authority Revenue, 6.00% due 11/15/2009 (Adventist Health Project; Insured: MBIA) | Aaa/AAA | 3,635,000 | 3,959,206 | |||||
Illinois Development Finance Authority Revenue, 6.00% due 11/15/2010 (Adventist Health Project; Insured: MBIA) | Aaa/AAA | 3,860,000 | 4,264,760 | |||||
Illinois Development Finance Authority Revenue Community Rehab Providers A, 5.00% due 7/1/2006 | NR/BBB | 645,000 | 647,793 | |||||
Illinois Development Finance Authority Revenue Provena Health Series A, 5.50% due 5/15/2011 (Insured: MBIA) | Aaa/AAA | 1,000,000 | 1,060,130 | |||||
Illinois Development Finance Authority Revenue Refunding Community Rehab Providers A, 5.60% due 7/1/2006 | NR/BBB | 1,000,000 | 1,010,270 | |||||
Illinois Development Finance Authority Revenue Refunding Community Rehab Providers Series A, 6.00% due 7/1/2015 | NR/BBB | 4,500,000 | 4,644,585 | |||||
Illinois Development Finance Authority Revenue Series A, 5.75% due 5/15/2014 (Provena Health Project; Insured: MBIA) | Aaa/AAA | 6,035,000 | 6,435,422 | |||||
| Certified Annual Report | 19 |
SCHEDULE OF INVESTMENTS, CONTINUED
| Thornburg Limited Term Municipal Fund | September 30, 2005 |
Issuer-Description | Credit Rating† | Principal Amount | Value | |||||
Illinois Educational Facilities Authority Revenues Unrefunded Balance Loyola A, 6.00% due 7/1/2009 (Insured: MBIA) | Aaa/AAA | $ | 1,275,000 | $ | 1,388,921 | |||
Illinois Health Facilities Authority Revenue, 5.50% due 11/15/2007 (OSF Healthcare System Project) | A2/A | 915,000 | 953,037 | |||||
Illinois Health Facilities Authority Revenue, 6.50% due 2/15/2008 (Iowa Health System Project) | A1/NR | 1,290,000 | 1,372,392 | |||||
Illinois Health Facilities Authority Revenue, 6.50% due 2/15/2009 (Iowa Health System Project) | A1/NR | 1,375,000 | 1,491,710 | |||||
Illinois Health Facilities Authority Revenue, 6.50% due 2/15/2010 (Iowa Health System Project) | A1/NR | 1,465,000 | 1,617,389 | |||||
Illinois Health Facilities Authority Revenue, 6.00% due 2/15/2011 (Iowa Health System Project; Insured: AMBAC) | Aaa/AAA | 1,560,000 | 1,739,010 | |||||
Illinois Health Facilities Authority Revenue Refunding, 5.00% due 8/15/2007 (University of Chicago Hospital & Health Project; Insured: MBIA) | Aaa/AAA | 1,500,000 | 1,550,505 | |||||
Illinois Health Facilities Authority Revenue Refunding, 5.00% due 8/15/2008 (University of Chicago Hospital & Health Project; Insured: MBIA) | Aaa/AAA | 1,500,000 | 1,570,395 | |||||
Illinois Health Facilities Authority Revenue Refunding, 5.50% due 11/15/2011 (Methodist Medical Center Project; Insured: MBIA) | Aaa/AAA | 3,000,000 | 3,204,330 | |||||
Illinois Health Facilities Authority Revenue University of Chicago, 5.00% due 8/15/2009 (Hospital Systems Project; Insured: MBIA) | Aaa/AAA | 1,000,000 | 1,057,410 | |||||
Illinois Hospital District, 5.50% due 1/1/2010 (Insured: FGIC) | Aaa/AAA | 1,040,000 | 1,123,179 | |||||
Illinois State COP Central Management Department, 5.00% due 7/1/2007 (Insured: AMBAC) | Aaa/AAA | 500,000 | 516,580 | |||||
Illinois State Partners Series A, 6.00% due 7/1/2006 (Insured: AMBAC) | Aaa/AAA | 1,000,000 | 1,022,940 | |||||
Kane County School District Number 129 Aurora West Side Refunding, 5.50% due 2/1/2012 (Insured: FGIC) | Aaa/NR | 1,200,000 | 1,259,736 | |||||
Lake County Community Consolidated School District 73, 9.00% due 1/1/2006 (Insured: FSA) | Aaa/NR | 1,000,000 | 1,014,990 | |||||
Lake County Community High School District 117 Series B, 0% due 12/1/2006 (Insured: FGIC) | Aaa/NR | 2,000,000 | 1,933,340 | |||||
Lake County Community High School District 117 Series B, 0% due 12/1/2011 (Insured: FGIC) | Aaa/NR | 3,235,000 | 2,568,752 | |||||
Lake County Consolidated High School Refunding, 3.25% due 12/1/2005 | NR/AA- | 2,990,000 | 2,992,003 | |||||
McHenry & Kane Counties Community Consolidated School District 158, 0% due 1/1/2010 (Insured: FGIC) | Aaa/AAA | 1,000,000 | 861,370 | |||||
McHenry & Kane Counties II, 0% due 1/1/2012 (Insured: FGIC) | Aaa/AAA | 2,200,000 | 1,733,270 | |||||
Mclean & Woodford Counties School District GO, 7.375% due 12/1/2010 (Insured: FSA) | Aaa/NR | 1,500,000 | 1,773,120 | |||||
Metropolitan Pier & Exposition Authority Dedicated State Tax Revenue Refunding Series A-2002, 6.00% due 6/15/2007 pre-refunded 6/15/2006 (McCormick Place Exposition Project; Insured: AMBAC) | Aaa/AAA | 1,250,000 | 1,301,862 | |||||
Metropolitan Pier & Exposition Authority Dedicated State Tax Revenue Refunding Series A-2002, 6.00% due 6/15/2007 pre-refunded 6/15/2006 (McCormick Place Exposition Project) | Aaa/AAA | 3,750,000 | 3,900,788 | |||||
Naperville City, Du Page & Will Counties Economic Development Revenue, 6.10% due 5/1/2008 (Hospital & Health System Association Project; LOC: American National Bank) | NR/AA- | 1,895,000 | 1,936,368 | |||||
Peoria Public Building Commission School District Facilities Revenue, 0% due 12/1/2007 (Insured: FGIC) | Aaa/NR | 1,100,000 | 1,026,421 | |||||
University of Illinois COP Series A, 5.00% due 8/15/2019 pre-refunded 8/15/2011 (Utility Infrastructure Project) | Aaa/AAA | 5,235,000 | 5,668,772 | |||||
University of Illinois Revenues, 0% due 10/1/2006 (Insured: MBIA) (b) | Aaa/AAA | 6,300,000 | 6,123,159 | |||||
INDIANA — 6.45% | ||||||||
Allen County Economic Development Revenue, 5.00% due 12/30/2012 (Indiana Institute of Technology Project) | NR/NR | 1,370,000 | 1,431,705 | |||||
Allen County Economic Development Revenue First Mortgage, 5.20% due 12/30/2005 (Indiana Institute of Technology Project) | NR/NR | 965,000 | 969,371 | |||||
Allen County Economic Development Revenue First Mortgage, 5.30% due 12/30/2006 (Indiana Institute of Technology Project) | NR/NR | 690,000 | 705,359 | |||||
Allen County Economic Development Revenue First Mortgage, 5.60% due 12/30/2009 (Indiana Institute of Technology Project) | NR/NR | 1,110,000 | 1,172,482 | |||||
20 | Certified Annual Report |
SCHEDULE OF INVESTMENTS, CONTINUED
| Thornburg Limited Term Municipal Fund | September 30, 2005 |
Issuer-Description | Credit Rating† | Principal Amount | Value | |||||
Allen County Jail Building Corp. First Mortgage, 5.75% due 10/1/2010 | Aa3/NR | $ | 1,115,000 | $ | 1,239,490 | |||
Allen County Jail Building Corp. GO, 5.00% due 10/1/2011 (Insured: XLCA) | Aaa/AAA | 2,390,000 | 2,564,518 | |||||
Allen County Jail Building Corp. GO, 5.00% due 10/1/2012 (Insured: XLCA) | Aaa/AAA | 1,275,000 | 1,372,767 | |||||
Allen County Jail Building Corp. GO, 5.00% due 10/1/2014 (Insured: XLCA) | Aaa/AAA | 1,000,000 | 1,078,110 | |||||
Allen County Jail Building Corp. GO, 5.00% due 10/1/2015 (Insured: XLCA) | Aaa/AAA | 1,480,000 | 1,595,336 | |||||
Allen County Jail Building Corp. GO, 5.00% due 10/1/2016 (Insured: XLCA) | Aaa/AAA | 1,520,000 | 1,637,146 | |||||
Allen County Redevelopment District Tax Series A, 5.00% due 11/15/2016 | A3/NR | 1,000,000 | 1,043,330 | |||||
Ball State University Revenues Student Fee Series K, 5.75% due 7/1/2012 (Insured: FGIC) | Aaa/AAA | 1,000,000 | 1,117,580 | |||||
Boone County Hospital Association Lease Revenue, 5.00% due 1/15/2007 (ETM) | Aaa/AAA | 1,085,000 | 1,112,179 | |||||
Boonville Junior High School Building Corp. Revenue, 0% due 7/1/2010 (State Aid Withholding) | NR/A | 850,000 | 691,806 | |||||
Boonville Junior High School Building Corp. Revenue, 0% due 1/1/2011 (State Aid Withholding) | NR/A | 850,000 | 672,129 | |||||
Boonville Junior High School Building Corp. Revenue Refunding, 0% due 7/1/2011 (State Aid Withholding) | NR/A | 950,000 | 732,954 | |||||
Brownsburg 1999 School Building, 5.00% due 2/1/2011 (Insured: FSA) | Aaa/AAA | 1,720,000 | 1,844,941 | |||||
Brownsburg 1999 School Building, 5.00% due 8/1/2011 (Insured: FSA) | Aaa/AAA | 1,835,000 | 1,976,570 | |||||
Brownsburg 1999 School Building, 5.25% due 2/1/2012 (Insured: FSA) | Aaa/AAA | 1,880,000 | 2,052,810 | |||||
Brownsburg 1999 School Building, 5.25% due 8/1/2012 (Insured: FSA) | Aaa/AAA | 1,755,000 | 1,925,112 | |||||
Center Grove 2000 Building First Mortgage, 5.00% due 7/15/2009 (Insured: AMBAC) | Aaa/AAA | 1,175,000 | 1,249,765 | |||||
Center Grove 2000 Building First Mortgage, 5.00% due 7/15/2010 (Insured: AMBAC) | Aaa/AAA | 1,135,000 | 1,219,716 | |||||
Dekalb County Redevelopment Authority Lease Rental Revenue Refunding, 5.00% due 1/15/2011 (Mini Mill Local Public Improvement Project; Insured: XLCA) | Aaa/AAA | 1,015,000 | 1,080,742 | |||||
Dekalb County Redevelopment Authority Lease Rental Revenue Refunding, 5.00% due 1/15/2012 (Mini Mill Local Public Improvement Project; Insured: XLCA) | Aaa/AAA | 1,000,000 | 1,068,730 | |||||
Dekalb County Redevelopment Authority Lease Rental Revenue Refunding, 5.25% due 1/15/2013 (Mini Mill Local Public Improvement Project; Insured: XLCA) | Aaa/AAA | 1,000,000 | 1,083,450 | |||||
Dekalb County Redevelopment Authority Lease Rental Revenue Refunding, 5.25% due 1/15/2014 (Mini Mill Local Public Improvement Project; Insured: XLCA) | Aaa/AAA | 1,000,000 | 1,077,700 | |||||
Eagle Union Middle School Building Corp., 5.50% due 7/15/2009 (ETM) | Aaa/AAA | 910,000 | 984,029 | |||||
Elberfeld J. H. Castle School Building Corp. Indiana First Mortgage, 0% due 1/15/2006 (State Aid Withholding) | NR/A | 1,860,000 | 1,841,419 | |||||
Elberfeld J. H. Castle School Building Corp. Indiana First Mortgage Refunding, 0% due 7/5/2008 (Insured: MBIA) | NR/AAA | 1,860,000 | 1,699,594 | |||||
Evansville Vanderburgh Refunding, 5.00% due 7/15/2014 (Insured: AMBAC) | Aaa/AAA | 1,000,000 | 1,083,320 | |||||
Evansville Vanderburgh Refunding, 5.00% due 7/15/2015 (Insured: AMBAC) | Aaa/AAA | 1,000,000 | 1,083,590 | |||||
Goshen Multi School Building Corp. First Mortgage, 5.20% due 7/15/2007 (Insured: MBIA) | Aaa/AAA | 965,000 | 1,000,695 | |||||
Hammond Multi-School Building Corp. First Mortgage Refunding Bond Series 1997, 6.00% due 7/15/2008 (Lake County Project; State Aid Withholding) | NR/A | 2,305,000 | 2,422,325 | |||||
Huntington Economic Development Revenue, 6.00% due 11/1/2006 (United Methodist Membership Project) | NR/NR | 295,000 | 301,396 | |||||
Huntington Economic Development Revenue, 6.15% due 11/1/2008 (United Methodist Membership Project) | NR/NR | 700,000 | 738,388 | |||||
Huntington Economic Development Revenue, 6.20% due 11/1/2010 (United Methodist Membership Project) | NR/NR | 790,000 | 830,179 | |||||
Indiana Health Facility Financing Authority Hospital Revenue, 5.75% due 11/1/2005 (Daughters of Charity Project) (ETM) | Aaa/AA+ | 85,000 | 85,214 | |||||
Indiana Health Facility Financing Authority Hospital Revenue Series D, 5.00% due 11/1/2026 pre-refunded 11/1/2007 | Aaa/NR | 1,650,000 | 1,707,024 | |||||
Indiana Municipal Power Supply Systems Revenue Refunding Series B, 5.80% due 1/1/2008 (Insured: MBIA) | Aaa/AAA | 1,000,000 | 1,057,050 | |||||
Indiana State Educational Facilities Authority Revenue, 5.75% due 10/1/2009 (University of Indianapolis Project) | NR/A- | 670,000 | 720,411 | |||||
Indiana University Revenues Refunding, 0% due 8/1/2007 (Insured: AMBAC) | Aaa/AAA | 2,500,000 | 2,359,850 | |||||
Indianapolis Airport Authority Revenue Refunding Series A, 5.35% due 7/1/2007 (Insured: FGIC) | Aaa/AAA | 1,100,000 | 1,139,633 | |||||
Indianapolis Local Public Improvement Bond Bank Transportation Revenue, 0% due 7/1/2006 (ETM) | Aa2/AA- | 1,240,000 | 1,213,055 | |||||
| Certified Annual Report | 21 |
SCHEDULE OF INVESTMENTS, CONTINUED
| Thornburg Limited Term Municipal Fund | September 30, 2005 |
Issuer-Description | Credit Rating† | Principal Amount | Value | |||||
Indianapolis Resource Recovery Revenue Refunding, 6.75% due 12/1/2006 (Ogden Martin Systems, Inc. Project; Insured: AMBAC) | Aaa/AAA | $ | 2,000,000 | $ | 2,078,700 | |||
Knox Middle School Building Corp. First Mortgage, 6.00% due 7/15/2008 (Insured: FGIC) | Aaa/AAA | 855,000 | 917,877 | |||||
Knox Middle School Building Corp. First Mortgage, 6.00% due 7/15/2009 (Insured: FGIC) | Aaa/AAA | 455,000 | 497,829 | |||||
Madison Schools Lydia Middleton Building Corp., 5.00% due 7/15/2014 (Insured: FGIC) | Aaa/AAA | 1,200,000 | 1,297,200 | |||||
Madison Schools Lydia Middleton Building Corp., 5.00% due 7/15/2015 (Insured: FGIC) | Aaa/AAA | 1,250,000 | 1,351,325 | |||||
Monroe County Community School Building Corp. Revenue Refunding, 5.00% due 1/15/2007 (Insured: AMBAC) | Aaa/AAA | 625,000 | 638,513 | |||||
Mount Vernon of Hancock County Refunding First Mortgage, 5.00% due 7/15/2013 (Insured: MBIA) | Aaa/AAA | 1,055,000 | 1,138,007 | |||||
Mount Vernon of Hancock County Refunding First Mortgage, 5.00% due 7/15/2014 (Insured: MBIA) | Aaa/AAA | 1,135,000 | 1,226,935 | |||||
Mount Vernon of Hancock County Refunding First Mortgage, 5.00% due 7/15/2015 (Insured: MBIA) | Aaa/AAA | 1,140,000 | 1,232,408 | |||||
Northwestern School Building Corp., 5.00% due 7/15/2011 (State Aid Withholding) | NR/AA | 1,240,000 | 1,325,808 | |||||
Perry Township Multi School Building Refunding, 5.00% due 1/10/2013 (Insured: FSA) | Aaa/NR | 1,225,000 | 1,319,080 | |||||
Perry Township Multi School Building Refunding, 5.25% due 1/15/2013 (Insured: MBIA) | Aaa/AAA | 1,235,000 | 1,353,560 | |||||
Perry Township Multi School Building Refunding, 5.00% due 7/10/2013 (Insured: FSA) | Aaa/NR | 2,025,000 | 2,184,226 | |||||
Perry Township Multi School Building Refunding, 5.25% due 7/15/2013 (Insured: MBIA) | Aaa/AAA | 1,305,000 | 1,434,091 | |||||
Perry Township Multi School Building Refunding, 5.25% due 1/15/2014 (Insured: MBIA) | Aaa/AAA | 1,335,000 | 1,468,313 | |||||
Perry Township Multi School Building Refunding, 5.00% due 7/10/2014 (Insured: FSA) | Aaa/NR | 2,130,000 | 2,302,466 | |||||
Peru Community School Corp. Refunding First Mortgage, 0% due 7/1/2010 (State Aid Withholding) | NR/A | 835,000 | 679,598 | |||||
Rockport Pollution Control Revenue Series C, 2.625% due 4/1/2025 put 10/1/2006 (Indiana Michigan Power Co. Project) | Baa2/BBB | 4,030,000 | 3,983,131 | |||||
Vigo County Elementary School Building Corp. Refunding & Improvement First Mortgage, 4.00% due 1/10/2008 (Insured: FSA) | Aaa/AAA | 1,635,000 | 1,664,463 | |||||
Warren Township Vision 2005 School Building Corp., 3.00% due 1/10/2006 (Insured: FGIC) | Aaa/AAA | 595,000 | 595,208 | |||||
Wawasee Community School Corp. First Mortgage, 5.50% due 7/15/2010 (State Aid Withholding) | NR/AA- | 995,000 | 1,083,316 | |||||
Wawasee Community School Corp. First Mortgage, 5.50% due 7/15/2011 (State Aid Withholding) | NR/AA- | 1,095,000 | 1,203,306 | |||||
West Clark School Building Corp. First Mortgage, 5.75% due 7/15/2011 (Insured: FGIC) | Aaa/AAA | 2,080,000 | 2,320,760 | |||||
Westfield Elementary School Building Corp. First Mortgage Series 1997, 6.80% due 7/15/2007 (ETM) | Aaa/AAA | 1,480,000 | 1,539,777 | |||||
Whitko Indiana Middle School Building Corp. Refunding, 5.35% due 7/15/2007 (Insured: FSA) | Aaa/AAA | 1,305,000 | 1,338,304 | |||||
IOWA — 1.90% | ||||||||
Ankeny Community School District Sales & Services Tax Revenue, 5.00% due 7/1/2010 | NR/A+ | 2,900,000 | 3,070,549 | |||||
Des Moines Limited Obligation Revenue, 6.25% due 12/1/2015 put 12/1/2005 (Des Moines Parking Associates Project; LOC: Wells Fargo Bank) | NR/NR | 3,355,000 | 3,357,684 | |||||
Iowa Finance Authority Commercial Development Revenue Refunding, 5.75% due 4/1/2014 put 4/1/2010 (Governor Square Project; Insured: AXA) | NR/AA- | 6,650,000 | 6,940,406 | |||||
Iowa Finance Authority Hospital Facility Revenue, 6.50% due 2/15/2007 (Iowa Health Services Project) | A1/NR | 435,000 | 452,052 | |||||
Iowa Finance Authority Hospital Facility Revenue, 6.50% due 2/15/2009 (Iowa Health Services Project) | A1/NR | 1,825,000 | 1,979,906 | |||||
Iowa Finance Authority Hospital Facility Revenue, 6.50% due 2/15/2010 (Iowa Health Services Project) | A1/NR | 1,955,000 | 2,159,180 | |||||
Iowa Finance Authority Hospital Facility Revenue, 6.00% due 2/15/2011 pre-refunded 2/15/2010 (Iowa Health Services Project; Insured: AMBAC) | Aaa/AAA | 3,145,000 | 3,508,593 | |||||
Iowa Finance Authority Revenue Trinity Health Series B, 5.75% due 12/1/2007 | Aa3/AA- | 1,430,000 | 1,502,487 | |||||
Iowa Finance Authority Revenue Trinity Health Series B, 5.75% due 12/1/2010 | Aa3/AA- | 3,295,000 | 3,600,117 | |||||
KANSAS — 0.12% | ||||||||
Dodge Unified School District 443 Ford County, 8.25% due 9/1/2006 (Insured: FSA) | Aaa/AAA | 500,000 | 523,790 | |||||
Wichita Water & Sewer Utility Revenue, 5.50% due 10/1/2011 pre-refunded 10/1/2006 (Insured: FGIC) | Aaa/AAA | 1,160,000 | 1,201,099 | |||||
KENTUCKY — 1.40% | ||||||||
Kentucky Economic Development Finance Authority Refunding & Improvement Series A, 5.00% due 2/1/2009 (Ashland Hospital Project; Insured: FSA) | Aaa/AAA | 1,580,000 | 1,663,977 | |||||
Kentucky Economic Development Finance Authority Refunding & Improvement Series A, 5.00% due 2/1/2010 (Ashland Hospital Project; Insured: FSA) | Aaa/AAA | 1,000,000 | 1,062,090 | |||||
22 | Certified Annual Report |
SCHEDULE OF INVESTMENTS, CONTINUED
| Thornburg Limited Term Municipal Fund | September 30, 2005 |
Issuer-Description | Credit Rating† | Principal Amount | Value | |||||
Kentucky Economic Development Finance Authority Series C, 0% due 10/1/2009 converts to 5.35% 10/1/2005 (Norton Healthcare Project; Insured: MBIA) | Aaa/AAA | $ | 7,400,000 | $ | 7,892,026 | |||
Kentucky Economic Development Finance Authority Series C, 0% due 10/1/2010 converts to 5.40% 10/1/2005 (Norton Healthcare Project; Insured: MBIA) | Aaa/AAA | 7,830,000 | 8,465,169 | |||||
Kentucky State Turnpike Authority Resources Recovery Revenue, 0% due 7/1/2006 (Insured: FGIC) | Aaa/AAA | 390,000 | 381,779 | |||||
Louisville Water Revenue Refunding, 6.00% due 11/15/2006 (ETM) | Aaa/AAA | 150,000 | 154,758 | |||||
LOUISIANA — 2.46% | ||||||||
Jefferson Parish Hospital District 2, 5.25% due 12/1/2015 crossover-refunded 12/1/2005 (Insured: FGIC) | Aaa/AAA | 4,125,000 | 4,139,396 | |||||
Jefferson Sales Tax District Special Sales Tax Revenue Refunding, 5.25% due 12/1/2006 (Insured: AMBAC) | Aaa/AAA | 1,440,000 | 1,474,834 | |||||
Jefferson Sales Tax District Special Sales Tax Revenue Refunding, 5.25% due 12/1/2007 (Insured: AMBAC) | Aaa/AAA | 1,515,000 | 1,578,009 | |||||
Louisiana Local Govt. Environmental Facilities & Community Dev. Auth. Multi Family Revenue Series A, 5.00% due 9/1/2012 (Bellemont Apartments Project) | Baa1/NR | 1,000,000 | 1,006,350 | |||||
Louisiana PFA Revenue, 5.375% due 12/1/2008 (Wynhoven Health Care Center Project; Guaranty: Archdiocese of New Orleans) | NR/NR | 1,850,000 | 1,855,291 | |||||
Louisiana Public Facilities Authority Revenue, 5.75% due 10/1/2008 (Loyola University Project) | A1/A+ | 1,000,000 | 1,041,010 | |||||
Louisiana Public Facilities Authority Revenue Refunding, 4.00% due 4/1/2006 (Loyola University Project) | A1/A+ | 1,085,000 | 1,085,477 | |||||
Louisiana Public Facilities Authority Revenue Refunding, 5.50% due 10/1/2006 (Loyola University Project) | A1/A+ | 1,280,000 | 1,298,432 | |||||
Louisiana State Correctional Facility Lease, 5.00% due 12/15/2008 (Insured: Radian) | NR/AA | 7,135,000 | 7,369,599 | |||||
Louisiana State Offshore Terminal Authority Deepwater Port Revenue, 4.375% due 10/1/2020 put 6/1/2007 (Loop LLC Project) | A3/A | 2,350,000 | 2,369,270 | |||||
Louisiana State Offshore Terminal Refunding Series D, 4.00% due 9/1/2023 put 9/1/2008 (Loop LLC Project) | A3/A | 5,000,000 | 5,006,300 | |||||
New Orleans Parish School Board, 0% due 2/1/2008 (ETM) | NR/AAA | 6,050,000 | 5,228,712 | |||||
New Orleans Refunding, 0% due 9/1/2006 (Insured: AMBAC) | Aaa/AAA | 1,000,000 | 968,740 | |||||
MARYLAND — 0.63% | ||||||||
Baltimore Maryland, 7.00% due 10/15/2009 (Insured: MBIA) | Aaa/AAA | 580,000 | 661,461 | |||||
Howard County Retirement Community Revenue Series A, 7.25% due 5/15/2015 pre-refunded 5/15/2010 | NR/AAA | 1,000,000 | 1,193,160 | |||||
Howard County Retirement Community Revenue Series A, 7.875% due 5/15/2021 pre-refunded 5/15/2010 | NR/AAA | 2,500,000 | 3,044,525 | |||||
Maryland State Health High Educational Facilities Refunding, 6.00% due 7/1/2009 (John Hopkins University Project) | Aa2/AA | 3,605,000 | 3,960,417 | |||||
MASSACHUSETTS — 2.46% | ||||||||
Massachusetts Development Finance Agency Resource Recovery Revenue Series A, 5.50% due 1/1/2011 (Insured: MBIA) | Aaa/AAA | 3,470,000 | 3,781,051 | |||||
Massachusetts Development Finance Agency Resource Recovery Revenue Series B, 5.625% due 1/1/2012 (Insured: MBIA) | Aaa/AAA | 1,240,000 | 1,366,269 | |||||
Massachusetts Industrial Finance Agency Revenue, 8.375% due 2/15/2018 pre-refunded 2/15/2006 (Glenmeadow Retirement Project) | NR/NR | 1,000,000 | 1,038,400 | |||||
Massachusetts State 1999 to 2021 Refunding Series B, 6.50% due 8/1/2008 | Aa2/AA | 2,000,000 | 2,168,960 | |||||
Massachusetts State Health & Educational Berkshire Health Systems Series F, 5.00% due 10/1/2011 (Insured: Assured Guaranty) | NR/AAA | 2,345,000 | 2,512,316 | |||||
Massachusetts State Health & Educational Berkshire Health Systems Series F, 5.00% due 10/1/2012 (Insured: Assured Guaranty) | NR/AAA | 2,330,000 | 2,503,468 | |||||
Massachusetts State Health & Educational Berkshire Health Systems Series F, 5.00% due 10/1/2013 (Insured: Assured Guaranty) | NR/AAA | 3,215,000 | 3,450,402 | |||||
Massachusetts State Health & Educational Series H, 5.375% due 5/15/2012 (New England Medical Center Hospital Project; Insured: FGIC) | Aaa/AAA | 3,415,000 | 3,738,776 | |||||
Massachusetts State Industrial Finance Agency, 5.90% due 7/1/2027 pre-refunded 7/1/2007 (Dana Hall School Project) | Baa2/BBB | 1,220,000 | 1,299,154 | |||||
| Certified Annual Report | 23 |
SCHEDULE OF INVESTMENTS, CONTINUED
| Thornburg Limited Term Municipal Fund | September 30, 2005 |
Issuer-Description | Credit Rating† | Principal Amount | Value | |||||
Massachusetts State Industrial Finance Agency Capital Appreciation Biomedical A, 0% due 8/1/2010 | Aa3/A+ | $ | 10,000,000 | $ | 8,348,700 | |||
Massachusetts State Refunding GO Series A, 6.00% due 11/1/2008 | Aaa/AAA | 1,000,000 | 1,083,370 | |||||
Massachusetts State Refunding Series A, 5.50% due 1/1/2010 | Aa2/AA | 1,500,000 | 1,627,995 | |||||
Taunton GO, 8.00% due 2/1/2006 (Insured: MBIA) | Aaa/AAA | 1,500,000 | 1,525,515 | |||||
MICHIGAN — 2.39% | ||||||||
Dearborn Economic Development Corp. Oakwood Obligation Group Series A, 5.75% due 11/15/2015 (Insured: FGIC) | Aaa/AAA | 2,450,000 | 2,506,252 | |||||
Detroit Convention Facility, 5.25% due 9/30/2007 | NR/A | 1,000,000 | 1,036,070 | |||||
Detroit Michigan Series A, 6.00% due 4/1/2007 (ETM) | Aaa/AAA | 1,405,000 | 1,466,694 | |||||
Dickinson County Healthcare Systems Hospital Revenue Refunding, 5.50% due 11/1/2013 (Insured: ACA) | NR/A | 2,500,000 | 2,658,325 | |||||
Jackson County Hospital Finance Authority Hospital Revenue Series A, 5.00% due 6/1/2006 (W.A. Foote Memorial Hospital Project; Insured: AMBAC) | Aaa/NR | 1,670,000 | 1,692,495 | |||||
Michigan Hospital Finance Authority Revenue, 5.375% due 7/1/2012 (Insured: FSA) | Aaa/AAA | 2,000,000 | 2,043,680 | |||||
Michigan Hospital Finance Authority Revenue Series A, 5.375% due 11/15/2033 put 11/15/2007 (Ascension Health Project) | Aa2/A-1+ | 10,000,000 | 10,412,900 | |||||
Michigan State Building Authority Revenue Refunding Facilities Program Series I, 5.00% due 10/15/2008 (Insured: FSA) | Aaa/AAA | 4,000,000 | 4,213,920 | |||||
Michigan State Job Development Authority Pollution Control Revenue, 5.55% due 4/1/2009 (General Motors Corp. Project; Guaranty: GM) | Ba2/BB | 1,925,000 | 1,909,099 | |||||
Michigan State Strategic Fund Refunding Detroit Educational, 4.85% due 9/1/2030 put 9/1/2011 (Insured: AMBAC) | Aaa/NR | 1,075,000 | 1,130,803 | |||||
Missouri State Health & Educational Facilities Authority Revenue Series A, 5.00% due 6/1/2011 | NR/AA- | 1,000,000 | 1,066,520 | |||||
Oakland County Economic Development Corp. Limited, 5.50% due 6/1/2014 pre-refunded 6/1/2007 | A1/NR | 1,000,000 | 1,059,230 | |||||
Oxford Area Community School District, 5.00% due 5/1/2012 (Guaranty: School Bond Loan Fund) | Aa2/AA | 800,000 | 863,288 | |||||
Summit Academy North Michigan School District, 8.75% due 7/1/2030 pre-refunded 7/1/2010 | NR/NR | 1,100,000 | 1,342,913 | |||||
MINNESOTA — 0.51% | ||||||||
Minneapolis St. Paul Health Care Systems, 5.25% due 12/1/2012 (Healthpartners Obligation Group Project) | Baa1/BBB+ | 1,000,000 | 1,074,930 | |||||
Minneapolis St. Paul Health Care Systems, 5.25% due 12/1/2013 (Healthpartners Obligation Group Project) | Baa1/BBB+ | 1,500,000 | 1,614,540 | |||||
Osseo Independent School District 279 Crossover Refunding Series B, 5.00% due 2/1/2006 (School District Credit Program) | Aa2/NR | 1,915,000 | 1,928,865 | |||||
Southern Minnesota Municipal Power Agency Revenue Refunding Series A, 5.00% due 1/1/2006 (Insured: AMBAC) | Aaa/AAA | 1,000,000 | 1,005,460 | |||||
University of Minnesota Refunding Series A, 5.50% due 7/1/2006 | Aa2/AA | 1,450,000 | 1,478,463 | |||||
MISSISSIPPI — 1.18% | ||||||||
Gautier Utility District Systems Revenue Refunding, 5.50% due 3/1/2012 (Insured: FGIC) | Aaa/NR | 1,020,000 | 1,123,591 | |||||
Hattiesburg Water & Sewer Revenue Refunding Systems, 5.20% due 8/1/2006 (Insured: AMBAC) | Aaa/AAA | 700,000 | 712,474 | |||||
Mississippi Hospital Equipment & Facilities Authority Revenue, 6.50% due 5/1/2006 (Refunding Mississippi Baptist Medical Center; Insured: MBIA) | Aaa/AAA | 1,000,000 | 1,018,190 | |||||
Mississippi Hospital Equipment & Facilities Baptist Memorial Health B2, 3.00% due 9/1/2018 put 9/1/2006 | NR/AA | 5,000,000 | 4,999,900 | |||||
Mississippi Hospital Equipment & Facilities Baptist Memorial Health B2, 3.50% due 9/1/2022 put 10/1/2006 | NR/AA | 3,500,000 | 3,485,405 | |||||
Mississippi State, 6.20% due 2/1/2008 (ETM) | Aaa/AAA | 3,960,000 | 4,195,937 | |||||
Ridgeland Multi Family Housing Revenue, 4.95% due 10/1/2007 (Collateralized: FNMA) | NR/AAA | 890,000 | 903,039 | |||||
MISSOURI — 0.51% | ||||||||
Missouri Development Finance Board Healthcare Facilities Revenue Series A, 4.80% due 11/1/2012 (Lutheran Home Aged Project; LOC: Commerce Bank) | Aa3/NR | 1,275,000 | 1,311,733 | |||||
24 | Certified Annual Report |
SCHEDULE OF INVESTMENTS, CONTINUED
| Thornburg Limited Term Municipal Fund | September 30, 2005 |
Issuer-Description | Credit Rating† | Principal Amount | Value | |||||
Missouri State Health & Educational Facilities Revenue Refunding, 2.79% due 6/1/2015 put 10/3/2005 (Cox Health Systems Project) (daily demand notes) | VMIG1/A-1+ | $ | 1,500,000 | $ | 1,500,000 | |||
Springfield COP, 5.20% due 6/1/2006 (Law Enforcement Communication Project) | Aa3/NR | 840,000 | 852,197 | |||||
Springfield COP, 5.25% due 6/1/2007 (Law Enforcement Communication Project) | Aa3/NR | 840,000 | 868,115 | |||||
St. Louis County Refunding, 5.00% due 8/15/2007 (Convention & Sports Facility Project B 1; Insured: AMBAC) | Aaa/AAA | 2,495,000 | 2,583,148 | |||||
MONTANA — 1.16% | ||||||||
Forsyth Pollution Control Revenue Refunding, 5.00% due 10/1/2032 put 12/30/2008 (Insured: AMBAC) | Aaa/AAA | 11,440,000 | 11,987,290 | |||||
Forsyth Pollution Control Revenue Refunding, 5.20% due 5/1/2033 put 5/1/2009 (Portland General Project) | Baa1/BBB+ | 4,000,000 | 4,174,080 | |||||
NEBRASKA — 0.96% | ||||||||
Lancaster County School District 1, 4.00% due 7/15/2007 (Lincoln Public School Project) | Aa2/AAA | 1,995,000 | 2,029,055 | |||||
Madison County Hospital Authority Revenue 1, 5.25% due 7/1/2010 (Faith Regional Health Services Project; Insured: Radian) | NR/AA | 1,455,000 | 1,553,038 | |||||
Madison County Hospital Authority Revenue 1, 5.50% due 7/1/2012 (Faith Regional Health Services Project; Insured: Radian) | NR/AA | 1,625,000 | 1,765,107 | |||||
Omaha Public Power District Nebraska Electric Revenue Refunding Systems B, 5.00% due 2/1/2013 | Aa2/AA | 5,000,000 | 5,412,450 | |||||
Omaha Public Power District Nebraska Electric Revenue Series A, 7.50% due 2/1/2006 (ETM) | NR/AA | 1,090,000 | 1,104,355 | |||||
University of Nebraska Facilities Corp., 5.00% due 7/15/2008 | Aa2/AA- | 1,500,000 | 1,573,455 | |||||
NEVADA — 1.10% | ||||||||
Humboldt County Pollution Control Revenue Refunding, 6.55% due 10/1/2013 (Sierra Pacific Project; Insured: AMBAC) | Aaa/AAA | 5,000,000 | 5,202,400 | |||||
Las Vegas Special Refunding Local Improvement District 707 Series A, 5.125% due 6/1/2011 (Insured: FSA) | Aaa/AAA | 1,705,000 | 1,813,114 | |||||
Nevada Housing Division FNMA Multi Family Certificate A, 4.80% due 4/1/2008 (Collateralized: FNMA) | NR/AAA | 235,000 | 237,799 | |||||
Nevada State GO Colorado River Commission Power Delivery A, 7.00% due 9/15/2008 pre-refunded 9/15/2007 | Aa1/AA | 840,000 | 902,395 | |||||
Sparks Redevelopment Agency Tax Allocation Revenue Refunding Series A, 5.75% due 1/15/2009 (Insured: Radian) | NR/AA | 1,000,000 | 1,065,410 | |||||
Sparks Redevelopment Agency Tax Allocation Revenue Refunding Series A, 5.75% due 1/15/2010 (Insured: Radian) | NR/AA | 1,000,000 | 1,078,140 | |||||
Sparks Redevelopment Agency Tax Allocation Revenue Refunding Series A, 5.75% due 1/15/2011 (Insured: Radian) | NR/AA | 1,285,000 | 1,389,085 | |||||
Washoe County School District, 5.50% due 6/1/2008 (Insured: FSA) | Aaa/AAA | 3,500,000 | 3,708,565 | |||||
NEW HAMPSHIRE — 0.42% | ||||||||
Manchester Housing & Redevelopment Authority Series A, 6.05% due 1/1/2012 (Insured: ACA) | NR/A | 1,500,000 | 1,606,785 | |||||
New Hampshire Industrial Development Authority Revenue, 3.75% due 12/1/2009 (Central Vermont Public Services Project; LOC: Citizens Bank) | Aa2/AA- | 2,880,000 | 2,918,765 | |||||
New Hampshire System Revenue Series A, 7.00% due 11/1/2006 (Insured: FGIC) | Aaa/AAA | 1,290,000 | 1,320,573 | |||||
NEW JERSEY — 1.72% | ||||||||
New Jersey Economic Development Authority Revenue Cigarette Tax, 5.00% due 6/15/2010 (Insured: FSA) | Aaa/AAA | 1,000,000 | 1,066,020 | |||||
New Jersey State Transport Trust Fund Authority Series C, 5.00% due 6/15/2007 (Transportation Systems Project) | A1/AA- | 3,000,000 | 3,092,670 | |||||
New Jersey State Transport Trust Fund Authority Series C, 5.00% due 6/15/2008 (Transportation Systems Project) | A1/AA- | 5,000,000 | 5,224,050 | |||||
New Jersey State Transport Trust Fund Authority Series C, 5.00% due 6/15/2009 (Transportation Systems Project) (b) | A1/AA- | 5,000,000 | 5,278,950 | |||||
| Certified Annual Report | 25 |
SCHEDULE OF INVESTMENTS, CONTINUED
| Thornburg Limited Term Municipal Fund | September 30, 2005 |
Issuer-Description | Credit Rating† | Principal Amount | Value | |||||
New Jersey State Transport Trust Fund Authority Series C, 5.25% due 6/15/2013 (Transportation Systems Project; Insured: MBIA) | Aaa/AAA | $ | 5,000,000 | $ | 5,498,800 | |||
Newark Housing Authority Port Authority Rental Backed, 3.50% due 1/1/2006 (Newark Marine Terminal Redevelopment Project; Insured: MBIA) | Aaa/AAA | 1,780,000 | 1,782,972 | |||||
Newark Housing Authority Port Authority Rental Backed, 5.00% due 1/1/2010 (Newark Marine Terminal Redevelopment Project; Insured: MBIA) | Aaa/AAA | 1,000,000 | 1,064,850 | |||||
Pequannock River Basin Regional Sewage Authority Refunding Series M, 5.00% due 12/1/2006 (Sewer Revenue Project; Insured: MBIA) | Aaa/NR | 1,090,000 | 1,106,263 | |||||
NEW MEXICO — 2.38% | ||||||||
Farmington Pollution Control Revenue, 2.80% due 9/1/2024 put 10/3/2005 (LOC: Barclays Bank) (daily demand notes) | P1/A-1+ | 3,700,000 | 3,700,000 | |||||
Gallup Pollution Control Revenue Refunding Tri State Generation, 5.00% due 8/15/2012 (Insured: AMBAC) | Aaa/AAA | 3,345,000 | 3,590,523 | |||||
New Mexico Finance Authority State Transportation Refunding Subordinated Lien Series C-3, 2.50% due 6/15/2024 put 10/7/2005 (weekly demand notes) | Aaa/AAA | 8,525,000 | 8,525,000 | |||||
New Mexico Highway Commission Revenue Subordinated Lien Tax Series B, 5.00% due 6/15/2011 (Insured: AMBAC) | Aaa/AAA | 4,865,000 | 5,230,021 | |||||
New Mexico State Hospital Equipment Loan Presbyterian Health Care A, 2.75% due 8/1/2030 put 10/3/2005 (daily demand notes) | VMIG1/A-1+ | 5,000,000 | 5,000,000 | |||||
University of New Mexico Hospital Mortgage Revenue Bonds, 5.00% due 7/1/2009 (Insured: FSA & FHA) | Aaa/AAA | 1,455,000 | 1,537,877 | |||||
University of New Mexico Hospital Mortgage Revenue Bonds, 5.00% due 1/1/2011 (Insured: FSA & FHA) | Aaa/AAA | 1,790,000 | 1,912,400 | |||||
University of New Mexico Hospital Mortgage Revenue Bonds, 5.00% due 7/1/2011 (Insured: FSA & FHA) | Aaa/AAA | 2,065,000 | 2,215,002 | |||||
University of New Mexico Hospital Mortgage Revenue Bonds, 5.00% due 7/1/2012 (Insured: FSA & FHA) | Aaa/AAA | 1,500,000 | 1,615,500 | |||||
NEW YORK — 7.14% | ||||||||
Brookhaven Industrial Development Agency Revenue, 4.375% due 11/1/2031 put 11/1/2006 (Methodist Retirement Community Project; LOC: Northfork Bank) | A1/A- | 1,600,000 | 1,613,360 | |||||
Hempstead Industrial Development Agency Resource Recovery Revenue Refunding, 5.00% due 12/1/2007 (American Ref-Fuel Project; Insured: MBIA) | Aaa/AAA | 1,000,000 | 1,039,590 | |||||
Hempstead Town Industrial Development Agency Refunding, 5.00% due 12/1/2008 (American Fuel Co. Project; Insured: MBIA) | Aaa/AAA | 1,000,000 | 1,039,410 | |||||
Long Island Power Authority Electric Systems Revenue General Series A, 6.00% due 12/1/2007 (Insured: AMBAC) | Aaa/AAA | 1,500,000 | 1,592,565 | |||||
Long Island Power Authority General Series B, 5.00% due 12/1/2006 | A3/A- | 7,000,000 | 7,171,850 | |||||
Metropolitan Transportation Authority New York Revenue Series B, 5.00% due 11/15/2007 | A2/A | 8,000,000 | 8,325,600 | |||||
Metropolitan Transportation Authority New York Service Series B, 5.25% due 7/1/2007 | A2/AA- | 4,535,000 | 4,699,076 | |||||
Monroe County Industrial Development Agency, 5.375% due 6/1/2007 (St. John Fisher College Project; Insured: Radian) | NR/AA | 1,050,000 | 1,086,740 | |||||
New York City, 2.80% due 8/1/2017 put 10/3/2005 (LOC: JPM) (daily demand notes) | VMIG1/A-1+ | 900,000 | 900,000 | |||||
New York City Housing Development Corp. Multi Family Housing Revenue Refunding Series A, 5.50% due 11/1/2009 | Aa2/AA | 185,000 | 185,181 | |||||
New York City Industrial Development Agency Civic Facility Series A, 5.25% due 6/1/2011 (Lycee Francais De New York Project; Insured: ACA) | NR/A | 2,215,000 | 2,365,886 | |||||
New York City Industrial Development Agency Civic Facility Series A, 5.25% due 6/1/2012 (Lycee Francais De New York Project; Insured: ACA) | NR/A | 2,330,000 | 2,496,781 | |||||
New York City Municipal Water Finance Authority Water & Sewer Systems Revenue Series B, 5.75% due 6/15/2026 Crossover refunded 6/15/2006 (Insured: MBIA) | Aaa/AAA | 6,000,000 | 6,173,160 | |||||
New York City Transitional Refunding Future Tax Series A1, 5.00% due 11/1/2012 | Aa1/AAA | 5,000,000 | 5,444,000 | |||||
New York City Transitional Refunding Future Tax Series A1, 5.00% due 11/1/2013 | Aa1/AAA | 10,000,000 | 10,893,800 | |||||
26 | Certified Annual Report |
SCHEDULE OF INVESTMENTS, CONTINUED
| Thornburg Limited Term Municipal Fund | September 30, 2005 |
Issuer-Description | Credit Rating† | Principal Amount | Value | |||||
New York Dormitory Authority, 6.00% due 7/1/2007 (Champlain Valley Physicians Project; Insured: Connie Lee) | NR/AAA | $ | 1,040,000 | $ | 1,091,189 | |||
New York Dormitory Authority Revenues Mental Health Services Facilities Improvement B, 5.00% due 8/15/2010 (Insured: MBIA) | Aaa/AAA | 1,600,000 | 1,717,248 | |||||
New York Dormitory Authority Revenues Series B, 5.25% due 11/15/2026 put 5/15/2012 (Insured: AMBAC) | Aaa/AAA | 4,000,000 | 4,363,120 | |||||
New York Series B, 5.50% due 8/1/2011 (Insured: MBIA) | Aaa/AAA | 1,000,000 | 1,106,090 | |||||
New York Series B, 2.80% due 8/15/2018 put 10/3/2005 (daily demand notes) | VMIG1/A-1+ | 1,100,000 | 1,100,000 | |||||
New York State Dormitory Authority Aids Long Term Health Facilities, 5.00% due 11/1/2013 (Insured: SONYMA) | Aa1/NR | 1,600,000 | 1,700,304 | |||||
New York State Dormitory Authority Aids Long Term Health Facilities, 5.00% due 11/1/2014 (Insured: SONYMA) | Aa1/NR | 1,500,000 | 1,594,035 | |||||
New York State Dormitory Authority Revenue Refunding, 5.00% due 2/15/2010 (Wyckoff Heights Project; Insured: AMBAC) | Aaa/AAA | 4,870,000 | 5,123,873 | |||||
New York State Dormitory Authority Revenues, 5.00% due 7/1/2007 (City University Systems Project) | A2/AA- | 3,500,000 | 3,608,815 | |||||
New York State Dormitory Authority Revenues, 5.50% due 7/1/2012 (South Nassau Community Hospital B Project) | Baa1/NR | 1,820,000 | 1,975,555 | |||||
New York State Dormitory Authority Revenues, 5.50% due 7/1/2013 (South Nassau Community Hospital B Project) | Baa1/NR | 1,500,000 | 1,628,310 | |||||
New York State Dormitory Authority Revenues Secured Hospital Interfaith Medical Center Series D, 5.75% due 2/15/2008 | A2/AA- | 2,515,000 | 2,655,714 | |||||
New York State Housing Finance Service Contract Series A, 6.25% due 9/15/2010 pre-refunded 9/15/2007 | A2/AAA | 1,920,000 | 2,018,400 | |||||
New York State Urban Development Corp. Revenue Refunding Facilities A, 6.50% due 1/1/2011 (Correctional Capital Project; Insured: FSA) | Aaa/AAA | 2,500,000 | 2,860,725 | |||||
New York Thruway Authority General Revenue Special Obligation, 0% due 1/1/2006 | NR/A- | 1,320,000 | 1,310,166 | |||||
New York Urban Development Corp. Revenue University Facilities Grants, 6.00% due 1/1/2006 | A2/AA- | 255,000 | 256,918 | |||||
New York Urban Development Corp. Series 7, 6.00% due 1/1/2006 | A2/AA- | 3,425,000 | 3,451,270 | |||||
Oneida County Industrial Development Agency Series C, 6.00% due 1/1/2009 (Civic Facility Faxton Hospital Project; Insured: Radian) | NR/AA | 710,000 | 764,535 | |||||
Port Authority New York & New Jersey Special Obligation, 2.80% due 5/1/2019 put 10/3/2005 (daily demand notes) | VMIG1/A-1+ | 1,100,000 | 1,100,000 | |||||
Tobacco Settlement Financing Corp. Asset Backed Series B-1C, 5.25% due 6/1/2013 | A2/AA- | 2,000,000 | 2,098,780 | |||||
Tobacco Settlement Financing Corp. New York Revenue Asset Backed Series A-1C, 5.25% due 6/1/2012 (Secured: State Contingency Contract) | A2/AA- | 1,190,000 | 1,207,243 | |||||
Tobacco Settlement Financing Corp. New York Revenue Asset Backed Series B-1C, 5.25% due 6/1/2013 (Insured: XLCA) | Aaa/AAA | 2,000,000 | 2,104,540 | |||||
NORTH CAROLINA — 2.13% | ||||||||
Cabarrus County COP Installment Financing Contract, 4.50% due 2/1/2007 (Insured: AMBAC) | Aaa/AAA | 1,100,000 | 1,122,033 | |||||
North Carolina Eastern Municipal Power Agency Power Systems Revenue, 6.125% due 1/1/2009 (Insured: MBIA) | Aaa/AAA | 2,860,000 | 3,111,709 | |||||
North Carolina Eastern Municipal Power Agency Power Systems Revenue Refunding Series D, 5.375% due 1/1/2011 | Baa2/BBB | 3,000,000 | 3,208,140 | |||||
North Carolina Eastern Municipal Power Agency Power Systems Revenue Series C, 5.25% due 1/1/2012 | Baa2/BBB | 650,000 | 694,518 | |||||
North Carolina Eastern Municipal Power Agency Power Systems Series A, 5.50% due 1/1/2012 | Baa2/BBB | 1,000,000 | 1,082,190 | |||||
North Carolina Eastern Municipal Power Agency Power Systems Series C, 5.25% due 1/1/2013 | Baa2/BBB | 1,055,000 | 1,126,972 | |||||
North Carolina Municipal Power Agency 1 Catawba Electric Revenue, 6.00% due 1/1/2010 (Insured: MBIA) | Aaa/AAA | 2,400,000 | 2,650,008 | |||||
North Carolina Municipal Power Agency 1 Catawba Electric Revenue Series A, 5.50% due 1/1/2013 | A3/BBB+ | 2,505,000 | 2,749,288 | |||||
North Carolina Municipal Power Agency 1 Catawba Electric Revenue Series B, 6.375% due 1/1/2013 | A3/BBB+ | 1,000,000 | 1,102,890 | |||||
| Certified Annual Report | 27 |
SCHEDULE OF INVESTMENTS, CONTINUED
| Thornburg Limited Term Municipal Fund | September 30, 2005 |
Issuer-Description | Credit Rating† | Principal Amount | Value | |||||
North Carolina Municipal Power Agency Series A, 6.00% due 1/1/2007 (Insured: MBIA) | Aaa/AAA | $ | 3,400,000 | $ | 3,525,154 | |||
North Carolina Municipal Power Agency Series A, 6.00% due 1/1/2008 (Insured: MBIA) | Aaa/AAA | 3,900,000 | 4,142,307 | |||||
North Carolina State COP Series B, 5.00% due 6/1/2009 (Repair & Renovation Project) | Aa2/AA+ | 2,000,000 | 2,120,060 | |||||
Raleigh Durham Airport Authority Airport Revenue Series A, 5.50% due 11/1/2006 (Insured: FGIC) | Aaa/NR | 2,000,000 | 2,054,780 | |||||
University of North Carolina Systems Pool Revenue Refunding Series B, 5.00% due 4/1/2012 (Insured: AMBAC) | Aaa/AAA | 1,030,000 | 1,119,785 | |||||
OHIO — 3.45% | ||||||||
Akron COP Refunding, 5.00% due 12/1/2013 (Insured: Assured Guaranty) | Aa1/AAA | 3,000,000 | 3,216,870 | |||||
Akron COP Refunding, 5.00% due 12/1/2014 (Insured: Assured Guaranty) | Aa1/AAA | 2,000,000 | 2,147,860 | |||||
Bellefontaine Hospital Revenue Refunding, 6.00% due 12/1/2013 (Mary Rutan Health Associates Project) | NR/BBB+ | 1,885,000 | 1,891,107 | |||||
Central Ohio Authority Solid Waste Facility Series B, 5.00% due 12/1/2007 | Aa2/AA+ | 2,025,000 | 2,104,299 | |||||
Cleveland Cuyahoga County Port Authority Revenue GO, 6.00% due 11/15/2010 | NR/NR | 3,545,000 | 3,739,975 | |||||
Columbus GO, 12.375% due 2/15/2009 | Aaa/AAA | 1,050,000 | 1,350,289 | |||||
Cuyahoga County Hospital Revenue Refunding, 5.50% due 1/15/2019 (University Health Systems Project B; Insured: MBIA) | Aaa/AAA | 4,000,000 | 4,105,440 | |||||
Cuyahoga County Hospital Revenue Refunding Series A, 4.75% due 2/15/2008 (Metrohealth Systems Project; Insured: MBIA) | Aaa/AAA | 1,000,000 | 1,037,000 | |||||
Cuyahoga County Hospital Revenue Refunding Series B, 6.00% due 1/15/2006 (University Hospital Health Systems Project) | A3/A | 2,705,000 | 2,727,938 | |||||
Hudson City Library Improvement, 6.35% due 12/1/2011 | Aa1/NR | 1,400,000 | 1,599,612 | |||||
Lake County Sewer & Water District Improvement, 5.30% due 12/1/2011 | Aa2/NR | 455,000 | 479,807 | |||||
Lorain County Hospital Revenue Refunding Catholic Healthcare Partners B, 6.00% due 9/1/2008 (Insured: MBIA) | Aaa/AAA | 1,200,000 | 1,281,048 | |||||
Mahoning Valley District Water Refunding, 5.85% due 11/15/2008 (Insured: FSA) | Aaa/AAA | 1,300,000 | 1,404,312 | |||||
Mahoning Valley District Water Refunding, 5.90% due 11/15/2009 (Insured: FSA) | Aaa/AAA | 770,000 | 848,301 | |||||
Montgomery County Revenue, 6.00% due 12/1/2008 (Catholic Health Initiatives Project) | Aa2/AA | 2,250,000 | 2,412,563 | |||||
Montgomery County Revenue, 6.00% due 12/1/2009 (Catholic Health Initiatives Project) | Aa2/AA | 2,385,000 | 2,595,977 | |||||
Montgomery County Revenue, 6.00% due 12/1/2010 (Catholic Health Initiatives Project) | Aa2/AA | 1,530,000 | 1,687,253 | |||||
Montgomery County Solid Waste Revenue, 6.00% due 11/1/2005 (Insured: MBIA) | Aaa/AAA | 1,000,000 | 1,002,720 | |||||
Ohio State Building Authority Refunding Adult Corrections Facilities, 5.00% due 10/1/2006 (Insured: FSA) | Aaa/AAA | 2,000,000 | 2,041,620 | |||||
Ohio State GO, 6.65% due 9/1/2009 (Infrastructure Improvement Project) | Aa1/AA+ | 2,480,000 | 2,669,596 | |||||
Ohio State Unlimited Tax GO Series A, 5.75% due 6/15/2010 pre-refunded 6/15/2009 | Aa1/AA+ | 5,000,000 | 5,442,950 | |||||
Plain Local School District Capital Appreciation, 0% due 12/1/2006 (Insured: FGIC) | Aaa/NR | 680,000 | 657,710 | |||||
Plain Local School District Capital Appreciation, 0% due 12/1/2007 (Insured: FGIC) | Aaa/NR | 845,000 | 790,329 | |||||
Reading Revenue Development, 6.00% due 2/1/2009 (St. Mary’s Educational Institute Project; Insured: Radian) | NR/AA | 975,000 | 1,050,017 | |||||
OKLAHOMA — 2.03% | ||||||||
Claremore Public Works Authority Revenue Refunding, 6.00% due 6/1/2006 (Insured: FSA) | Aaa/NR | 1,235,000 | 1,260,639 | |||||
Claremore Public Works Authority Revenue Refunding, 6.00% due 6/1/2007 (Insured: FSA) | Aaa/NR | 1,340,000 | 1,404,695 | |||||
Comanche County Oklahoma Hospital Authority Revenue Refunding, 4.00% due 7/1/2007 (Insured: Radian) | Aa3/AA | 1,265,000 | 1,277,751 | |||||
Comanche County Oklahoma Hospital Authority Revenue Refunding, 5.00% due 7/1/2011 (Insured: Radian) | Aa3/AA | 1,000,000 | 1,057,720 | |||||
Grand River Dam Authority Revenue, 5.50% due 6/1/2010 | A2/BBB+ | 1,200,000 | 1,300,080 | |||||
Jenks Aquarium Authority Revenue First Mortgage, 5.50% due 7/1/2010 (Insured: MBIA) | Aaa/NR | 500,000 | 528,965 | |||||
Oklahoma Authority Revenue Refunding Health Systems Obligation Group Series A, 5.75% due 8/15/2007 (Insured: MBIA) | Aaa/AAA | 2,380,000 | 2,492,812 | |||||
Oklahoma Development Finance Authority Health Facilities Revenue, 5.75% due 6/1/2011 (Insured: AMBAC) | Aaa/AAA | 740,000 | 821,474 | |||||
28 | Certified Annual Report |
SCHEDULE OF INVESTMENTS, CONTINUED
| Thornburg Limited Term Municipal Fund | September 30, 2005 |
Issuer-Description | Credit Rating† | Principal Amount | Value | |||||
Oklahoma Development Finance Authority Hospital Revenue Refunding, 5.00% due 10/1/2012 (Unity Health Center Project) | NR/BBB+ | $ | 1,070,000 | $ | 1,123,125 | |||
Oklahoma Development Finance Authority Hospital Revenue Series A, 5.25% due 12/1/2011 (Duncan Regional Hospital Project) | NR/A- | 1,215,000 | 1,296,697 | |||||
Oklahoma Development Finance Authority Hospital Revenue Series A, 5.25% due 12/1/2012 (Duncan Regional Hospital Project) | NR/A- | 1,330,000 | 1,421,969 | |||||
Oklahoma Development Finance Authority Hospital Revenue Series A, 5.25% due 12/1/2013 (Duncan Regional Hospital Project) | NR/A- | 1,250,000 | 1,334,725 | |||||
Oklahoma Housing Development Authority Revenue Lease Purchase Program Series A, 5.10% due 11/1/2005 | Aa3/NR | 5,000,000 | 5,008,800 | |||||
Oklahoma State Industrial Authority Revenue Health System Obligation A, 6.00% due 8/15/2010 pre-refunded 8/15/2009 | Aaa/AAA | 190,000 | 210,110 | |||||
Oklahoma State Industrial Authority Revenue Unrefunded Balance Health System Series A, 6.00% due 8/15/2010 (Insured: MBIA) | Aaa/AAA | 2,150,000 | 2,366,247 | |||||
Tulsa County Independent School Building, 4.00% due 6/1/2008 | Aa3/NR | 2,750,000 | 2,810,500 | |||||
Tulsa County Independent School District, 4.50% due 8/1/2006 | Aa3/AA- | 2,650,000 | 2,685,484 | |||||
OREGON — 0.37% | ||||||||
Clackamas County Hospital Facility Authority Revenue Refunding, 5.00% due 5/1/2008 (Legacy Health Systems Project) | Aa3/AA | 4,000,000 | 4,164,400 | |||||
Medford Hospital Facilities Authority Revenue Series A, 5.25% due 8/15/2006 (Asante Health Systems Project; Insured: MBIA) | Aaa/AAA | 1,000,000 | 1,019,860 | |||||
PENNSYLVANIA — 2.43% | ||||||||
Allegheny County Hospital Development Health Series B, 6.30% due 5/1/2009 (South Hills Health System Project) | Baa1/NR | 1,505,000 | 1,593,208 | |||||
Allegheny County Hospital Development Refunding, 4.40% due 11/1/2005 (Health Center UPMC Health Systems Project; Insured: MBIA) | Aaa/AAA | 1,000,000 | 1,001,320 | |||||
Chester County School Authority, 5.00% due 4/1/2016 (Intermediate School Project; Insured: AMBAC) (a) | NR/AAA | 1,915,000 | 2,081,471 | |||||
Delaware County Pennsylvania Authority Revenue, 5.50% due 11/15/2007 (Insured: AMBAC) | Aaa/AAA | 1,000,000 | 1,047,160 | |||||
Geisinger Authority Health Systems Revenue, 5.50% due 8/15/2009 | Aa3/AA- | 1,000,000 | 1,062,830 | |||||
Manheim Township School Authority School Revenue Series 1978, 6.625% due 12/1/2007 pre-refunded 12/1/2005 | NR/AAA | 1,025,000 | 1,031,662 | |||||
Montgomery County Pennsylvania Higher Education & Health Authority, 6.25% due 7/1/2006 | Baa3/NR | 730,000 | 739,724 | |||||
Montgomery County Pennsylvania Higher Education & Health Authority, 6.375% due 7/1/2007 | Baa3/NR | 550,000 | 566,775 | |||||
Pennsylvania Higher Educational Facilities Authority Health Services Revenue, 5.50% due 1/1/2009 pre-refunded 1/1/2006 (University of Pennsylvania Health Systems Project) | A3/A | 1,410,000 | 1,433,392 | |||||
Pennsylvania Higher Educational Facilities Series A, 5.00% due 8/15/2008 (University of Pennsylvania Health Systems Project) | A3/A | 1,250,000 | 1,300,112 | |||||
Pennsylvania State Higher Educational Facilities Authority Revenue, 4.00% due 11/1/2032 put 11/1/2005 (LOC: Allied Irish Banks PLC) | VMIG1/NR | 1,500,000 | 1,501,290 | |||||
Pennsylvania State Second Series, 5.25% due 10/1/2008 | Aa2/AA | 900,000 | 954,540 | |||||
Philadelphia Gas Works Revenue Eighteenth Series, 5.00% due 8/1/2009 (Insured: Assured Guaranty) | Aa1/AAA | 1,240,000 | 1,313,619 | |||||
Philadelphia Gas Works Revenue Eighteenth Series, 5.00% due 8/1/2010 (Insured: Assured Guaranty) | Aa1/AAA | 1,305,000 | 1,394,027 | |||||
Philadelphia Hospital & Higher Education Facilities Authority Revenue, 5.50% due 5/15/2006 (Jefferson Health Systems Project) | Aa3/AA- | 1,000,000 | 1,014,770 | |||||
Philadelphia Hospital & Higher Education Health System Series A, 5.25% due 5/15/2007 (Jefferson Health Systems Project; Insured: MBIA) | Aaa/AAA | 2,600,000 | 2,689,076 | |||||
Pittsburgh Series A, 5.00% due 9/1/2012 (Insured: MBIA) | Aaa/AAA | 3,415,000 | 3,690,215 | |||||
Pittsburgh Series A, 5.00% due 9/1/2013 (Insured: MBIA) | Aaa/AAA | 2,000,000 | 2,161,320 | |||||
Pottsville Hospital Authority Revenue Acsension Health Credit Series A, 5.20% due 11/15/2009 (Insured: AMBAC) | Aaa/AAA | 1,000,000 | 1,069,890 | |||||
| Certified Annual Report | 29 |
SCHEDULE OF INVESTMENTS, CONTINUED
| Thornburg Limited Term Municipal Fund | September 30, 2005 |
Issuer-Description | Credit Rating† | Principal Amount | Value | |||||
Sayre Pennsylvania Health Care Facilities Authority Series A, 5.00% due 7/1/2008 (Latrobe Area Hospital Project; Insured: AMBAC) | Aaa/AAA | $ | 1,255,000 | $ | 1,313,332 | |||
Sayre Pennsylvania Health Care Facilities Authority Series A, 5.00% due 7/1/2009 (Latrobe Area Hospital Project; Insured: AMBAC) | Aaa/AAA | 1,320,000 | 1,396,613 | |||||
Sayre Pennsylvania Health Care Facilities Authority Series A, 5.25% due 7/1/2011 (Latrobe Area Hospital Project; Insured: AMBAC) | Aaa/AAA | 1,400,000 | 1,522,024 | |||||
Sayre Pennsylvania Health Care Facilities Authority Series A, 5.25% due 7/1/2012 (Latrobe Area Hospital Project; Insured: AMBAC) | Aaa/AAA | 1,000,000 | 1,093,690 | |||||
Scranton Lackawanna Health & Welfare Authority, 7.125% due 1/15/2013 pre-refunded 1/15/2007 (Marian Community Hospital Project) | NR/NR | 1,000,000 | 1,066,220 | |||||
RHODE ISLAND — 1.17% | ||||||||
Providence Public Building Authority Refunding Series B, 5.75% due 12/15/2007 (Insured: FSA) | Aaa/AAA | 1,075,000 | 1,136,759 | |||||
Providence Series C, 5.50% due 1/15/2012 (Insured: FSA) | Aaa/AAA | 1,880,000 | 2,089,225 | |||||
Rhode Island Bond Authority Revenue Refunding Series A, 5.00% due 10/1/2005 (State Public Projects; Insured: AMBAC) | Aaa/AAA | 4,455,000 | 4,455,267 | |||||
Rhode Island Economic Development Corp. Revenue, 5.75% due 7/1/2010 (Providence Place Mall Project; Insured: Radian) | NR/AA | 2,075,000 | 2,218,445 | |||||
Rhode Island State, 5.00% due 10/1/2014 (Providence Plantations Project; Insured MBIA) | Aaa/AAA | 1,000,000 | 1,078,110 | |||||
Rhode Island State COP Refunding, 5.125% due 10/1/2008 (Insured: MBIA) | Aaa/AAA | 1,660,000 | 1,736,426 | |||||
Rhode Island State Health & Education Building, 4.50% due 9/1/2009 (Butler Hospital Project; LOC: Fleet National Bank) | NR/AA | 1,960,000 | 2,031,873 | |||||
Rhode Island State Health & Educational Building Corp. Revenue Hospital Financing, 5.25% due 7/1/2014 (Memorial Hospital Project; LOC: Fleet Bank) | NR/AA | 1,565,000 | 1,670,544 | |||||
SOUTH CAROLINA — 0.90% | ||||||||
Charleston County COP, 6.00% due 12/1/2007 (Insured: MBIA) | Aaa/AAA | 2,050,000 | 2,162,914 | |||||
Charleston County COP Refunding, 5.00% due 6/1/2007 (Charleston Public Facilities Corp. Project; Insured: MBIA) | Aaa/AAA | 1,350,000 | 1,390,189 | |||||
South Carolina Jobs Economic Development Authority Hospital Facilities Revenue Improvement, 7.125% due 12/15/2015 pre-refunded 12/15/2010 (Palmetto Health Alliance Project) | NR/NR | 1,250,000 | 1,490,763 | |||||
South Carolina Jobs Economic Development Authority Hospital Facilities Revenue Improvement Series A, 7.375% due 12/15/2021 pre-refunded 12/15/2010 (Palmetto Health Alliance Project) | NR/NR | 2,600,000 | 3,131,570 | |||||
South Carolina State Public Service Authority Revenue Refunding Series D, 5.00% due 1/1/2006 | Aa2/AA- | 2,000,000 | 2,010,620 | |||||
South Carolina State Public Service Authority Revenue Refunding Series D, 5.00% due 1/1/2007 | Aa2/AA- | 2,315,000 | 2,370,537 | |||||
SOUTH DAKOTA — 0.32% | ||||||||
Rapid City Area School District Refunding Capital Outlay Certificates GO, 5.00% due 1/1/2010 (Insured: FSA) | Aaa/NR | 1,000,000 | 1,066,890 | |||||
South Dakota Health & Educational Facilities Authority Revenue, 5.50% due 9/1/2011 (Rapid City Regional Hospital Project; Insured: MBIA) | Aaa/AAA | 1,100,000 | 1,209,263 | |||||
South Dakota State Health & Educational Facilities Authority Revenue Refunding, 6.25% due 7/1/2009 (McKennan Hospital Project; Insured: MBIA) | Aaa/AAA | 1,000,000 | 1,097,710 | |||||
South Dakota State Health & Educational Facilities Authority Revenue Refunding, 6.00% due 7/1/2014 (McKennan Hospital Project; Insured: MBIA) | Aaa/AAA | 1,000,000 | 1,040,590 | |||||
TENNESSEE — 0.16% | ||||||||
Franklin Industrial Development Multi Family Refunding Housing Series A, 5.75% due 4/1/2010 (Insured: FSA) | Aaa/AAA | 660,000 | 683,331 | |||||
Metro Government Nashville Water & Sewer, 6.50% due 12/1/2014 (ETM) | Aaa/AAA | 1,240,000 | 1,500,623 | |||||
TEXAS — 14.92% | ||||||||
Amarillo Health Facilities Corp. Hospital Revenue, 5.50% due 1/1/2011 (Baptist St. Anthony’s Hospital Corp. Project; Insured: FSA) | Aaa/NR | 1,350,000 | 1,467,639 | |||||
30 | Certified Annual Report |
SCHEDULE OF INVESTMENTS, CONTINUED
| Thornburg Limited Term Municipal Fund | September 30, 2005 |
Issuer-Description | Credit Rating† | Principal Amount | Value | |||||
Austin Texas Refunding, 5.00% due 3/1/2011 | Aa2/AA+ | $ | 1,000,000 | $ | 1,073,440 | |||
Bell County Health Facilities Development Corp. Revenue Series A, 6.25% due 8/15/2010 (Scott & White Memorial Hospital Project; Insured: MBIA) | Aaa/AAA | 1,000,000 | 1,116,740 | |||||
Bexar County Housing Finance Corp. Multi Family Housing Revenue, 5.00% due 1/1/2011 (Insured: MBIA) | Aaa/NR | 1,800,000 | 1,887,894 | |||||
Cedar Hill Independent School District Refunding, 0% due 8/15/2010 (Guaranty: PSF) | NR/AAA | 1,250,000 | 1,027,787 | |||||
Central Regional Mobility Authority Revenue Anticipation Notes, 5.00% due 1/1/2008 | Aa3/AA | 7,000,000 | 7,285,390 | |||||
Clint Independent School District Refunding, 5.50% due 2/15/2011 (Guaranty: PSF) | Aaa/AAA | 1,700,000 | 1,865,461 | |||||
Clint Independent School District Refunding, 5.50% due 2/15/2012 (Guaranty: PSF) | Aaa/AAA | 1,425,000 | 1,559,164 | |||||
Coppell Independent School District Refunding, 0% due 8/15/2007 (Guaranty: PSF) | NR/AAA | 3,300,000 | 3,112,164 | |||||
Corpus Christi Business & Job Development Corp. Sales Tax Revenue, 5.00% due 9/1/2012 (Refunding & Improvement Arena Project; Insured: AMBAC) | Aaa/AAA | 1,025,000 | 1,109,562 | |||||
Corpus Christi Utility Systems Revenue Refunding, 5.50% due 7/15/2006 (Insured: FSA) | Aaa/AAA | 4,070,000 | 4,152,540 | |||||
Corpus Christi Utility Systems Revenue Refunding, 5.50% due 7/15/2008 (Insured: FSA) | Aaa/AAA | 2,000,000 | 2,122,800 | |||||
Corpus Christi Utility Systems Revenue Refunding, 5.50% due 7/15/2009 (Insured: FSA) | Aaa/AAA | 4,780,000 | 5,152,553 | |||||
Cypress Fair Banks Independent School District Refunding GO, 5.00% due 2/15/2022 put 8/15/2010 (Guaranty: PSF) | Aaa/AAA | 2,500,000 | 2,664,100 | |||||
Dallas Tax Increment Financing Reinvestment Zone 2, 5.75% due 8/15/2006 (Insured: Radian) | NR/AA | 450,000 | 459,571 | |||||
Duncanville Independent School District Refunding Series B, 0% due 2/15/2011 (Guaranty: PSF) | Aaa/AAA | 4,945,000 | 4,058,411 | |||||
Duncanville Independent School District Refunding Series B, 0% due 2/15/2012 (Guaranty: PSF) | Aaa/AAA | 1,245,000 | 975,096 | |||||
Fort Worth Water & Sewer Revenue Refunding & Improvement, 5.25% due 2/15/2011 pre-refunded 2/15/2008 | Aa2/AA | 3,800,000 | 3,986,884 | |||||
Fort Worth Water & Sewer Revenue Series 2001, 5.25% due 2/15/2011 (Tarrant & Denton County Project) | Aa2/AA | 1,390,000 | 1,508,400 | |||||
Grapevine Colleyville ISD Capital Appreciation, 0% due 8/15/2011 (Guaranty: PSF) | Aaa/AAA | 7,350,000 | 5,908,738 | |||||
Grapevine Texas, 5.25% due 2/15/2012 (Insured: FGIC) | Aaa/AAA | 2,005,000 | 2,021,662 | |||||
Gulf Coast Waste Disposal Authority Environmental Facilities Revenue Refunding, 4.20% due 11/1/2006 (Occidental Project) | A3/A- | 4,000,000 | 4,029,160 | |||||
Gulf Coast Waste Disposal Authority Texas Revenue Refunding, 5.00% due 10/1/2010 (Bayport Area Systems Project; Insured: AMBAC) | Aaa/AAA | 1,000,000 | 1,068,060 | |||||
Gulf Coast Waste Disposal Authority Texas Revenue Refunding, 5.00% due 10/1/2011 (Bayport Area Systems Project; Insured: AMBAC) | Aaa/AAA | 1,000,000 | 1,073,020 | |||||
Harlingen Consolidated Independent School, 7.50% due 8/15/2006 (Guaranty: PSF) | Aaa/AAA | 1,275,000 | 1,324,342 | |||||
Harlingen Consolidated Independent School, 7.50% due 8/15/2009 (Guaranty: PSF) | Aaa/AAA | 750,000 | 860,422 | |||||
Harris County Health Facilities, 5.00% due 11/15/2015 (Teco Project; Insured: MBIA) | Aaa/AAA | 1,500,000 | 1,595,940 | |||||
Harris County Health Facilities Development Corp. Hospital Revenue Refunding Series A, 6.00% due 6/1/2012 (Memorial Hospital Systems Project; Insured: MBIA) | Aaa/AAA | 500,000 | 569,065 | |||||
Harris County Health Facilities Development Corp. Thermal Utility Revenue, 5.45% due 2/15/2011 (Teco Project; Insured: AMBAC) | Aaa/AAA | 4,085,000 | 4,391,171 | |||||
Harris County Health Facilities Hospital Series A, 6.00% due 6/1/2010 (Memorial Hospital Systems Project; Insured: MBIA) | Aaa/AAA | 3,100,000 | 3,424,694 | |||||
Harris County Hospital District Mortgage Revenue, 7.40% due 2/15/2010 (ETM) | Aaa/AAA | 420,000 | 447,653 | |||||
Harris County Hospital District Mortgage Revenue Unrefunded Balance Refunding, 7.40% due 2/15/2010 (Insured: AMBAC) | Aaa/AAA | 1,925,000 | 2,104,833 | |||||
Harris County Hospital District Revenue Refunding, 5.75% due 2/15/2011 (Insured: MBIA) | Aaa/AAA | 10,000,000 | 10,949,700 | |||||
Harris County Hospital District Revenue Refunding, 5.75% due 2/15/2012 (Insured: MBIA) | Aaa/AAA | 2,000,000 | 2,186,580 | |||||
Harris County Refunding Toll Road Senior Lien Series B-2, 5.00% due 8/15/2021 put 8/15/2009 (Insured: FGIC) | Aaa/AAA | 5,000,000 | 5,308,500 | |||||
Harris County Sports Authority Revenue Senior Lien Series G, 0% due 11/15/2010 (Insured: MBIA) | Aaa/AAA | 3,260,000 | 2,707,006 | |||||
Harris County Texas GO, 0% due 8/1/2008 | Aa1/AA+ | 7,000,000 | 6,386,030 | |||||
Houston Community College Systems Refunding Student Fee, 5.25% due 4/15/2010 (Insured: FSA) | Aaa/AAA | 1,000,000 | 1,078,240 | |||||
Houston Community College Systems Refunding Student Fee, 5.25% due 4/15/2011 (Insured: FSA) | Aaa/AAA | 1,000,000 | 1,087,080 | |||||
Houston Community College Systems Refunding Student Fee, 5.25% due 4/15/2012 (Insured: FSA) | Aaa/AAA | 1,460,000 | 1,597,313 | |||||
Houston Community College Systems Refunding Student Fee, 5.25% due 4/15/2013 (Insured: FSA) | Aaa/AAA | 1,250,000 | 1,371,900 | |||||
| Certified Annual Report | 31 |
SCHEDULE OF INVESTMENTS, CONTINUED
| Thornburg Limited Term Municipal Fund | September 30, 2005 |
Issuer-Description | Credit Rating† | Principal Amount | Value | |||||
Keller Independent School District Capital Appreciation Refunding, 0% due 8/15/2012 (Guaranty PSF) | Aaa/AAA | $ | 1,250,000 | $ | 957,837 | |||
Laredo Sports Venue Sales Refunding & Improvement, 5.00% due 3/15/2012 (Insured: AMBAC) | Aaa/AAA | 1,660,000 | 1,786,094 | |||||
Laredo Sports Venue Sales Refunding & Improvement, 5.00% due 3/15/2013 (Insured: AMBAC) | Aaa/AAA | 1,745,000 | 1,880,325 | |||||
Laredo Sports Venue Sales Refunding & Improvement, 5.00% due 3/15/2014 (Insured: AMBAC) | Aaa/AAA | 1,835,000 | 1,980,864 | |||||
Laredo Sports Venue Sales Refunding & Improvement, 5.00% due 3/15/2015 (Insured: AMBAC) | Aaa/AAA | 1,930,000 | 2,082,605 | |||||
Lewisville Combination Contract Revenue, 4.125% due 5/1/2031 pre-refunded 11/1/2006 (Special Assessment Castle Hills Project Number 3; LOC: Wells Fargo Bank) | NR/AA | 1,000,000 | 1,012,660 | |||||
Longview Water & Sewer Revenue Refunding, 5.00% due 3/1/2012 (Insured: MBIA) | Aaa/AAA | 1,150,000 | 1,240,356 | |||||
Lower Colorado River Authority Revenue Refunding & Improvement, 8.00% due 5/15/2010 (Transportation Systems Project; Insured: FSA) | Aaa/AAA | 750,000 | 893,198 | |||||
Mesquite Independent School District Refunding, 0% due 8/15/2011 (Guaranty: PSF) | NR/AAA | 3,065,000 | 2,424,630 | |||||
Midlothian Independent School District Refunding, 0% due 2/15/2008 (Guaranty: PSF) | Aaa/NR | 1,415,000 | 1,311,309 | |||||
Midlothian Independent School District Refunding, 0% due 2/15/2009 (Guaranty: PSF) | Aaa/NR | 1,200,000 | 1,071,300 | |||||
Midtown Redevelopment Authority Texas Tax, 6.00% due 1/1/2010 (Insured: Radian) | NR/AA | 700,000 | 761,334 | |||||
Midtown Redevelopment Authority Texas Tax, 6.00% due 1/1/2011 (Insured: Radian) | NR/AA | 740,000 | 814,222 | |||||
Red River Education Finance Corp., 2.10% due 12/1/2034 put 12/1/2007 (Parish Episcopal School Project; LOC: Allied Irish Banks PLC) | VMIG1/NR | 2,500,000 | 2,415,475 | |||||
Sam Rayburn Municipal Power Agency Refunding, 5.50% due 10/1/2012 | Baa2/BBB- | 6,000,000 | 6,416,460 | |||||
San Antonio Hotel Occupancy Revenue Refunding Series B, 5.00% due 8/15/2034 put 8/1/2008 (Insured: AMBAC) | Aaa/AAA | 5,000,000 | 5,242,050 | |||||
Socorro Independent School District Series A, 5.75% due 2/15/2011 (Guaranty: PSF) | NR/AAA | 1,970,000 | 2,078,370 | |||||
Southlake Tax Increment Certificates of Obligation Series B, 0% due 2/15/2007 (Insured: AMBAC) | Aaa/AAA | 965,000 | 901,821 | |||||
Southlake Tax Increment Certificates of Obligation Series B, 0% due 2/15/2008 pre-refunded 2/15/2006 | Aaa/AAA | 1,120,000 | 987,302 | |||||
Southlake Tax Increment Certificates of Obligation Series B, 0% due 2/15/2009 pre-refunded 2/15/2006 | Aaa/AAA | 1,275,000 | 1,057,880 | |||||
Southlake Tax Increment Certificates of Obligation Series B, 0% due 2/15/2010 pre-refunded 2/15/2006 | Aaa/AAA | 1,440,000 | 1,120,205 | |||||
Spring Branch Independent School District, 7.50% due 2/1/2011 (Guaranty: PSF) | Aaa/AAA | 500,000 | 594,270 | |||||
Springhill Courtland Heights Public Facility Corp. MultiFamily Revenue Senior Lien Housing Series A, 5.125% due 12/1/2008 | NR/BBB- | 1,150,000 | 1,163,041 | |||||
Tarrant County Health Facilities, 5.875% due 11/15/2007 (Adventist/Sunbelt Health System Project) | A2/A+ | 580,000 | 612,584 | |||||
Tarrant County Health Facilities, 6.00% due 11/15/2009 (Adventist/Sunbelt Health System Project) | A2/A+ | 650,000 | 716,476 | |||||
Tarrant County Health Facilities, 6.10% due 11/15/2011 pre-refunded 11/15/2010 (Adventist/Sunbelt Health System Project) | A2/A+ | 730,000 | 826,988 | |||||
Tarrant County Health Facilities Development Corp., 5.75% due 2/15/2011 (Texas Health Resources Project; Insured: MBIA) | Aaa/AAA | 1,400,000 | 1,499,246 | |||||
Tarrant County Health Facilities Development Corp. Health Systems Revenue Series A, 5.75% due 2/15/2008 (Texas Health Resources Systems Project; Insured: MBIA) | Aaa/AAA | 3,000,000 | 3,167,850 | |||||
Tarrant County Health Facilities Development Series A, 5.75% due 2/15/2009 (Texas Health Resources Systems Project; Insured: MBIA) | Aaa/AAA | 3,000,000 | 3,199,830 | |||||
Texarkana Health Facilities Development Corp. Hospital Revenue, 5.75% due 10/1/2008 (Insured: MBIA) | Aaa/AAA | 1,500,000 | 1,602,465 | |||||
Texas Affordable Housing Corp. Portfolio A, 4.85% due 9/1/2012 (Insured: MBIA) | Aaa/AAA | 2,000,000 | 2,002,480 | |||||
Texas Affordable Housing Corp. Series A, 4.85% due 9/1/2012 (Insured: MBIA) | Aaa/AAA | 1,945,000 | 1,987,090 | |||||
Texas Public Finance Authority Building Revenue State Preservation Project Series B, 6.00% due 8/1/2011 pre-refunded 8/1/2009 (Insured: FSA) | Aaa/AAA | 1,000,000 | 1,100,010 | |||||
Texas State Tax & Revenue Anticipation Notes, 4.50% due 8/31/2006 | Mig1/SP-1+ | 15,000,000 | 15,200,400 | |||||
Texas State Turnpike Authority Central Texas Turnpike Systems Rev. Bond Anticipation Note 2nd Tier, 5.00% due 6/1/2008 | Aa3/AA | 7,000,000 | 7,324,590 | |||||
Travis County GO, 5.00% due 3/1/2007 | Aaa/AAA | 1,000,000 | 1,026,960 | |||||
Travis County GO, 5.00% due 3/1/2010 pre-refunded 3/1/2008 | Aaa/AAA | 500,000 | 522,360 | |||||
Travis County Health Facilities Development Corp. Revenue Ascension Health Credit Series A, 5.75% due 11/15/2007 (Insured: MBIA) | Aaa/AAA | 1,000,000 | 1,052,260 | |||||
Travis County Health Facilities Development Corp. Revenue Ascension Health Credit Series A, 5.75% due 11/15/2008 (Insured: MBIA) | Aaa/AAA | 2,300,000 | 2,464,151 | |||||
32 | Certified Annual Report |
SCHEDULE OF INVESTMENTS, CONTINUED
| Thornburg Limited Term Municipal Fund | September 30, 2005 |
Issuer-Description | Credit Rating† | Principal Amount | Value | |||||
Travis County Health Facilities Development Corp. Revenue Series A, 5.75% due 11/15/2009 (Insured: MBIA) | Aaa/AAA | $ | 3,750,000 | $ | 4,077,300 | |||
Travis County Health Facilities Development Series A, 5.75% due 11/15/2010 (Ascension Health Project; Insured: MBIA) | Aaa/AAA | 2,000,000 | 2,186,120 | |||||
Washington County Health Facilities Development Corp. Revenue, 5.35% due 6/1/2009 (Insured: ACA) | NR/A | 1,660,000 | 1,749,408 | |||||
West Harris County Regional Water, 5.25% due 12/15/2010 (Insured: FSA) | Aaa/AAA | 1,700,000 | 1,847,441 | |||||
West Harris County Regional Water, 5.25% due 12/15/2011 (Insured: FSA) | Aaa/AAA | 2,315,000 | 2,532,842 | |||||
West Harris County Regional Water, 5.25% due 12/15/2012 (Insured: FSA) | Aaa/AAA | 2,435,000 | 2,678,695 | |||||
Wylie Independent School District, 5.00% due 8/15/2011 (Guaranty PSF) | NR/AAA | 1,000,000 | 1,077,510 | |||||
UTAH — 0.63% | ||||||||
Intermountain Power Agency Power Supply Revenue Series A, 5.00% due 7/1/2012 (ETM) | Aaa/AAA | 4,355,000 | 4,362,621 | |||||
Intermountain Power Agency Utah Power Supply Series E, 6.25% due 7/1/2009 (Insured: FSA) | Aaa/AAA | 500,000 | 551,630 | |||||
Salt Lake County Municipal Building, 5.50% due 10/1/2009 | Aa1/AA+ | 1,500,000 | 1,625,130 | |||||
Snyderville Basin Sewer Improvement, 5.00% due 11/1/2006 (Insured: AMBAC) | Aaa/AAA | 675,000 | 690,322 | |||||
Utah Board of Regents Auxiliary Systems & Student Fee Revenue Refunding Series A, 5.00% due 5/1/2010 | NR/AA | 510,000 | 544,145 | |||||
Utah State University Hospital Board of Regents Revenue, 5.25% due 8/1/2008 (Insured: MBIA) | Aaa/AAA | 1,000,000 | 1,051,980 | |||||
VIRGINIA — 0.87% | ||||||||
Alexandria Industrial Development Authority Revenue, 5.75% due 10/1/2007 (Insured: AMBAC) | Aaa/AAA | 1,010,000 | 1,063,803 | |||||
Alexandria Industrial Development Authority Revenue, 5.75% due 10/1/2008 (Insured: AMBAC) | Aaa/AAA | 1,070,000 | 1,150,068 | |||||
Alexandria Industrial Development Authority Revenue, 5.75% due 10/1/2009 (Insured: AMBAC) | Aaa/AAA | 1,130,000 | 1,236,118 | |||||
Alexandria Industrial Development Authority Revenue, 5.75% due 10/1/2010 (Insured: AMBAC) | Aaa/AAA | 1,195,000 | 1,328,709 | |||||
Chesterfield County Industrial Development, 5.50% due 10/1/2009 (Vepco Project) | A3/BBB+ | 1,500,000 | 1,551,045 | |||||
Hampton GO Refunding Bond, 5.85% due 3/1/2007 | Aa2/AA | 595,000 | 602,301 | |||||
Hampton Hospital Facilities Revenue Series A, 5.00% due 11/1/2005 | Aa2/AA | 500,000 | 500,865 | |||||
Norton Industrial Development Authority Hospital Revenue Refunding Improvement, 5.75% due 12/1/2012 (Norton Community Hospital Project; Insured: ACA) | NR/A | 1,460,000 | 1,601,167 | |||||
Suffolk Redevelopment Housing Authority Refunding, 4.85% due 7/1/2031 put 7/1/2011 (Windsor at Potomac Project; Collateralized: FNMA) | Aaa/NR | 3,000,000 | 3,155,700 | |||||
WASHINGTON — 3.25% | ||||||||
Conservation & Renewable Energy Systems Revenue Refunding, 5.00% due 10/1/2007 (Washington Conservation Project) | Aaa/AA- | 1,000,000 | 1,037,610 | |||||
Energy Northwest Washington Electric Revenue Refunding Series A, 5.375% due 7/1/2013 (Project Number 1; Insured: FSA) | Aaa/AAA | 2,000,000 | 2,199,700 | |||||
Energy Northwest Washington Revenue Series A, 4.75% due 7/1/2007 (Wind Project) | A3/A- | 1,675,000 | 1,700,795 | |||||
Energy Northwest Washington Revenue Series A, 4.95% due 7/1/2008 (Wind Project) | A3/A- | 1,760,000 | 1,836,683 | |||||
Energy Northwest Washington Revenue Series B, 4.95% due 7/1/2008 (Wind Project) | A3/A- | 705,000 | 722,625 | |||||
Energy Northwest Washington Revenue Series B, 5.20% due 7/1/2010 pre-refunded 1/1/2007 (Wind Project) | A3/A- | 785,000 | 827,523 | |||||
Goat Hill Properties Washington Lease Revenue, 5.00% due 12/1/2012 (Government Office Building Project; Insured: MBIA) | Aaa/AAA | 2,055,000 | 2,227,846 | |||||
Grant County Priest Rapids Hydroelectric, 6.00% due 1/1/2006 (Insured: AMBAC) | Aaa/AAA | 335,000 | 337,640 | |||||
Spokane County School District GO, 0% due 6/1/2014 (Insured: MBIA) | Aaa/AAA | 1,600,000 | 1,455,984 | |||||
Spokane Regional Solid Waste Refunding, 5.00% due 12/1/2005 (Insured: AMBAC) | Aaa/AAA | 1,000,000 | 1,003,340 | |||||
Spokane Regional Solid Waste Refunding, 5.00% due 12/1/2006 (Insured: AMBAC) | Aaa/AAA | 1,000,000 | 1,021,700 | |||||
Spokane Regional Solid Waste Refunding, 5.25% due 12/1/2007 (Insured: AMBAC) | Aaa/AAA | 1,000,000 | 1,042,230 | |||||
Spokane Washington Refunding, 5.00% due 12/15/2009 | A2/AA- | 2,150,000 | 2,221,552 | |||||
Spokane Washington Refunding, 5.00% due 12/15/2010 | A2/AA- | 2,430,000 | 2,505,792 | |||||
University of Washington Alumni Association Lease Revenue Refunding, 5.00% due 8/15/2006 (Medical Center Project; Insured: MBIA) | Aaa/AAA | 1,000,000 | 1,017,280 | |||||
| Certified Annual Report | 33 |
SCHEDULE OF INVESTMENTS, CONTINUED
| Thornburg Limited Term Municipal Fund | September 30, 2005 |
Issuer-Description | Credit Rating† | Principal Amount | Value | |||||
University of Washington Alumni Association Lease Revenue Refunding, 5.00% due 8/15/2007 (Medical Center Project; Insured: MBIA) | Aaa/AAA | $ | 1,100,000 | $ | 1,137,235 | |||
Washington Health Care Facilities, 5.50% due 12/1/2009 (Providence Services Project; Insured: MBIA) | Aaa/AAA | 1,500,000 | 1,619,595 | |||||
Washington Public Power Supply, 5.40% due 7/1/2012 (Insured: FSA) | Aaa/AAA | 900,000 | 990,063 | |||||
Washington Public Power Supply Refunding Series A, 5.00% due 7/1/2011 (Insured: FSA) | Aaa/AAA | 2,500,000 | 2,653,125 | |||||
Washington Public Power Supply System Refunding Revenue, 0% due 7/1/2008 (Nuclear Project Number 3) | Aaa/AA- | 1,140,000 | 1,039,247 | |||||
Washington Public Power Supply System Series 96-A, 6.00% due 7/1/2006 (Insured: MBIA) | Aaa/AAA | 1,655,000 | 1,693,098 | |||||
Washington Public Power Supply Systems, 6.00% due 7/1/2008 (Nuclear Project Number 1; Insured: AMBAC) | Aaa/AAA | 1,000,000 | 1,073,710 | |||||
Washington Public Power Supply Systems Revenue Refunding Series A, 5.10% due 7/1/2010 (Nuclear Project Number 2; Insured: FSA) | Aaa/AAA | 1,000,000 | 1,051,570 | |||||
Washington Public Power Supply Systems Revenue Refunding Series B, 0% due 7/1/2008 (Nuclear Project Number 3) | Aaa/AA- | 830,000 | 756,645 | |||||
Washington State Public Power Supply Systems Revenue Refunding Series A, 6.00% due 7/1/2007 (Nuclear Project Number 1; Insured: AMBAC) (b) | Aaa/AAA | 5,000,000 | 5,204,900 | |||||
Washington State Series A, 5.00% due 7/1/2008 (Insured: FGIC) | Aaa/AAA | 6,810,000 | 7,143,077 | |||||
WEST VIRGINIA — 0.14% | ||||||||
Harrison County Nursing Facility Revenue Refunding, 5.625% due 9/1/2010 (Salem Health Care Corp. Project; LOC: Fleet Bank) | NR/NR | 390,000 | 401,400 | |||||
Pleasants County Pollution Control Revenue, 4.70% due 11/1/2007 (Monongahela Power Co. Project; Insured: AMBAC) | Aaa/AAA | 1,500,000 | 1,551,060 | |||||
WISCONSIN — 0.96% | ||||||||
Bradley Pollution Control Revenue, 6.75% due 7/1/2009 (Owens Illinois Waste Project) (ETM) | Ba1/BB+ | 1,500,000 | 1,680,030 | |||||
Milwaukee Wisconsin Corp. Series R GO, 5.50% due 9/1/2009 | Aa2/AA | 2,200,000 | 2,379,630 | |||||
Wisconsin State Health & Educational Facilities Authority Revenue, 6.00% due 8/15/2008 (Aurora Health Care Inc. Project; Insured: MBIA) | Aaa/AAA | 2,000,000 | 2,135,500 | |||||
Wisconsin State Health & Educational Facilities Hospital Sisters Services Inc., 4.50% due 12/1/2023 put 12/1/2007 (Insured: FSA) | Aaa/NR | 5,825,000 | 5,964,101 | |||||
Wisconsin State Health & Educational Series A, 5.00% due 2/15/2008 (Gundersen Lutheran Hospital Project; Insured: FSA) | Aaa/AAA | 1,250,000 | 1,300,150 | |||||
WYOMING — 0.28% | ||||||||
West Park Hospital District Revenue, 5.90% due 7/1/2010 (Insured: ACA) | NR/A | 1,615,000 | 1,671,880 | |||||
Wyoming Farm Loan Board Revenue, 0% due 4/1/2009 | NR/AA | 2,500,000 | 2,194,175 | |||||
TOTAL INVESTMENTS — 98.92% (COST $1,359,404,909) | $ | 1,383,542,486 | ||||||
OTHER ASSETS LESS LIABILITIES — 1.08% | 15,082,573 | |||||||
NET ASSETS — 100.00% | $ | 1,398,625,059 | ||||||
See notes to financial statements.
34 | Certified Annual Report |
SCHEDULE OF INVESTMENTS, CONTINUED
| Thornburg Limited Term Municipal Fund | September 30, 2005 |
Footnote Legend
| † | Credit ratings are unaudited. Rating changes may have occurred prior to or subsequent to the reporting period end. |
| (a) | When-issued security. |
| (b) | Segregated as collateral for a when-issued security. |
Portfolio Abbreviations
To simplify the listings of securities, abbreviations are used per the table below:
| ACA | Insured by American Capital Access | |
| AMBAC | Insured by American Municipal Bond Assurance Corp. | |
| COP | Certificates of Participation | |
| ETM | Escrowed to Maturity | |
| FGIC | Insured by Financial Guaranty Insurance Co. | |
| FHA | Insured by Federal Housing Administration | |
| FNMA | Collateralized by Federal National Mortgage Association | |
| FSA | Insured by Financial Security Assurance Co. | |
| GO | General Obligation | |
| MBIA | Insured by Municipal Bond Investors Assurance | |
| PSF | Guaranteed by Permanent School Fund | |
| RADIAN | Insured by Radian Asset Assurance | |
| SONYMA | State of New York Mortgage Authority | |
| XLCA | Insured by XL Capital Assurance |
SUMMARY OF SECURITY CREDIT RATINGS†
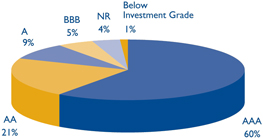
Ratings are a blend of Moody’s and Standard & Poor’s, using the higher rating. Some bonds are rated by only one service.
| Certified Annual Report | 35 |
REPORT OF INDEPENDENT REGISTERED PUBLIC ACCOUNTING FIRM
Thornburg Limited Term Municipal Fund
To the Trustees and Class I Shareholders of
Thornburg Limited Term Municipal Fund
In our opinion, the accompanying statement of assets and liabilities, including the schedule of investments, and the related statements of operations and of changes in net assets and the financial highlights present fairly, in all material respects, the financial position of Thornburg Limited Term Municipal Fund (one of the Portfolios constituting Thornburg Investment Trust, hereafter referred to as the “Fund”) at September 30, 2005, the results of its operations for the year then ended, the changes in its net assets and the financial highlights for the Class I shares for each of the periods presented, in conformity with accounting principles generally accepted in the United States of America. These financial statements and financial highlights (hereafter referred to as “financial statements”) are the responsibility of the Fund’s management. Our responsibility is to express an opinion on these financial statements based on our audits. We conducted our audits of these financial statements in accordance with the standards of the Public Company Accounting Oversight Board (United States). Those standards require that we plan and perform the audit to obtain reasonable assurance about whether the financial statements are free of material misstatement. An audit includes examining, on a test basis, evidence supporting the amounts and disclosures in the financial statements, assessing the accounting principles used and significant estimates made by management, and evaluating the overall financial statement presentation. We believe that our audits, which included confirmation of securities at September 30, 2005 by correspondence with the custodian and brokers, provide a reasonable basis for our opinion.
PricewaterhouseCoopers LLP
New York, New York
November 16, 2005
| 36 | Certified Annual Report |
| Thornburg Limited Term Municipal Fund | September 30, 2005 (Unaudited) |
As a shareholder of the Fund, you incur ongoing costs, including management and administration fees and other Fund expenses.
This example is intended to help you understand your ongoing costs (in dollars) of investing in the Fund and to compare these costs with the ongoing costs of investing in other mutual funds.
The example is based on an investment of $1,000 invested on March 31, 2005 and held until September 30, 2005.
Actual Expenses
The first line of the table at right provides information about actual account values and actual expenses. You may use the information in this line, together with the amount you invested, to estimate the expenses that you paid over the period. Simply divide your account value by $1,000 (for example, an $8,600 account value divided by $1,000 = 8.6), then multiply the result by the number in the first line under the heading entitled “Expenses Paid During Period” to estimate the expenses you paid on your account during this period.
Hypothetical Example for Comparison Purposes
The second line of the table at right provides information about hypothetical account values and hypothetical expenses based on the Fund’s actual expense ratio and an assumed rate of return of 5% per year before expenses, which is not the Fund’s actual return. The hypothetical account values and expenses may not be used to estimate the actual ending account balance or expenses you paid for the period. You may use this information to compare the ongoing costs of investing in the Fund and other funds. To do so, compare this 5% hypothetical example with the 5% hypothetical examples that appear in the shareholder reports of the other funds.
Please note that the expenses shown in the table are meant to highlight your ongoing costs only and do not reflect any transactional costs, such as sales charges (loads), redemption fees, or exchange fees. Therefore, the second line of the table is useful in comparing ongoing costs only, and will not help you determine the relative total costs of owning different funds. In addition, if these transactional costs were included, your costs would have been higher.
| Beginning Account Value 3/31/05 | Ending Account Value 9/30/05 | Expenses Paid During Period† 3/31/05-9/30/05 | |||||||
Class I Shares | |||||||||
Actual | $ | 1,000 | $ | 1,016.20 | $ | 2.85 | |||
Hypothetical* | $ | 1,000 | $ | 1,022.24 | $ | 2.86 | |||
| † | Expenses are equal to the annualized expense ratio for Class I shares (0.56%) multiplied by the average account value over the period, multiplied by 183/365 to reflect the one-half year period. |
| * | Hypothetical assumes a rate of return of 5% per year before expenses. |
| Certified Annual Report | 37 |
| Thornburg Limited Term Municipal Fund | September 30, 2005 (Unaudited) |
GROWTH OF A HYPOTHETICAL $10,000 INVESTMENT
Thornburg Limited Term Municipal Fund Class I Total Returns versus
Lehman Brothers Five Year Municipal Bond Index and Consumer Price Index
(July 30, 1996 to September 30, 2005)
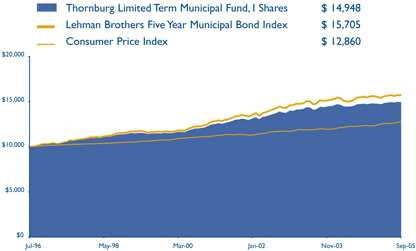
AVERAGE ANNUAL TOTAL RETURNS
For the periods ended September 30, 2005
| 1 Yr | 5 Yrs | 10 Yrs | Since Inception | ||||||||
I Shares (Incep: 7/5/96) | 1.50 | % | 4.45 | % | N/A | 4.58 | % |
FUND ATTRIBUTES
as of September 30, 2005
| Annualized Dist. Rate | SEC Yield | NAV | Maximum Offering Price | |||||||||
I Shares (Incep: 7/5/96) | 3.40 | % | 2.98 | % | $ | 13.59 | $ | 13.59 | ||||
Performance data reflect past performance, which is no guarantee of future results. The performance data and graph do not reflect the deduction of taxes that a shareholder would pay on distributions or the redemption of Fund shares.
Returns reflect the reinvestment of dividends and capital gains. There is no up front sales charge for this class of shares.
The Consumer Price Index (“CPI”) measures prices of a fixed basket of goods bought by a typical consumer, including food, transportation, shelter, utilities, clothing, medical care, entertainment and other items. The CPI, published by the Bureau of Labor Statistics in the Department of Labor, is based at 100 in 1982 and is released monthly. It is widely used as a cost-of-living benchmark to adjust Social Security payments and other payment schedules, union contracts and tax brackets. The CPI is also known as the cost-of-living index.
The Lehman Brothers Five-Year Municipal Bond Index is a rules-based, market-value-weighted index engineered for the long-term tax-exempt bond market. To be included in the index, bonds must have a minimum credit rating of Baa. The approximate maturity of the municipal bonds in the index is five years.
Unless otherwise noted, index returns reflect the reinvestment of income dividends and capital gains, if any, but do not reflect fees, brokerage commissions or other expenses of investing. Investors may not make direct investments into any index.
The SEC Yield is computed in accordance with SEC standards measuring the net investment income per share over a specified 30-day period expressed as a percentage of the maximum offering price of the Fund’s shares at the end of the period.
The distribution rate is calculated by taking the sum of the month’s total distribution factors and dividing this sum by a 30-day period and annualizing to 360-day year. The value is then divided by the ending Net Asset Value (NAV) to arrive at the annualized distribution yield. The yield is calculated on a periodic basis and is subject to change depending on the Funds’ NAV and current distributions.
| 38 | Certified Annual Report |
| Thornburg Limited Term Municipal Fund | September 30, 2005 (Unaudited) |
Name, Age, | Principal Occupation(s) During Past Five Years | Other Directorships | ||
INTERESTED TRUSTEES(1)(2)(4) | ||||
Garrett Thornburg, 59 Chairman of Trustees, Trustee since 1987(3) | CEO, Chairman and controlling shareholder of Thornburg Investment Management, Inc. (investment advisor) and Thornburg Securities Corporation (securities dealer); Chairman of Thornburg Limited Term Municipal Fund, Inc. (registered investment company) to 2004; CEO and Chairman of Thornburg Mortgage, Inc. (real estate investment trust); Chairman of Thornburg Mortgage Advisory Corporation (investment manager to Thornburg Mortgage, Inc.). | Director of Thornburg Mortgage, Inc. (real estate investment trust) | ||
Brian J. McMahon, 49 Trustee since 2001, Member of Governance & Nominating Committee, President since 1997(5)(6) | President and Managing Director of Thornburg Investment Management, Inc.; President of Thornburg Limited Term Municipal Fund, Inc. to 2004. | None | ||
INDEPENDENT TRUSTEES(1)(2)(4) | ||||
David A. Ater, 60 Trustee since 1994, Member of Audit Committee and Governance & Nominating Committee | Principal in Ater & Associates, Santa Fe, NM (developer, planner and broker of residential and commercial real estate); owner developer and broker for various real estate projects. | Director of Thornburg Mortgage, Inc. (real estate investment trust) | ||
David D. Chase, 64 Chairman of Audit Committee, Trustee since 2000 | Chairman, President, CEO, and Managing Member of Vestor Associates, LLC, the general partner of Vestor Partners, LP, Santa Fe, NM (private equity fund); Chairman and CEO of Vestor Holdings, Inc., Santa Fe, NM (merchant bank). | None | ||
Eliot R. Cutler, 59 Chairman of Governance & Nominating Committee, Trustee since 2004 | Partner, Akin, Gump, Strauss, Hauer & Feld, LLP, Washington, D.C. (law firm) since November 2000; partner, Cutler & Stanfield, Washington, D.C. (law firm) until November 2000. | Director of Thornburg Mortgage, Inc. (real estate investment trust) | ||
Susan H. Dubin, 56 Trustee since 2004, Member of Audit Committee | President of Dubin Investments, Ltd., Greenwich, CT (private investment fund); Director and officer of various charitable organizations; and formerly, Vice President of Chemical Bank (predecessor to JP Morgan Chase & Co.), New York, 1974–1996. | None | ||
Owen D. Van Essen, 51 Trustee since 2004, Member of Governance & Nominating Committee | President of Dirks, Van Essen & Murray, Santa Fe, NM (newspaper mergers and acquisitions). | None | ||
James W. Weyhrauch, 46 Trustee since 1996, Member of Audit Committee | Director, Executive Vice President to 2002, and President and CEO 2002–2004, Nambé Mills, Inc., Santa Fe, NM (manufacturer); real estate agent, Santa Fe Properties, Santa Fe, NM since 2004. | None | ||
| Certified Annual Report | 39 |
TRUSTEES AND OFFICERS, CONTINUED
| Thornburg Limited Term Municipal Fund | September 30, 2005 (Unaudited) |
Name, Age, | Principal Occupation(s) During Past Five Years | Other Directorships | ||
OFFICERS OF THE FUND (WHO ARE NOT TRUSTEES)(1)(6)(7) | ||||
Dawn B. Fischer, 58 Secretary since 1987 | Secretary and Managing Director, Thornburg Investment Management, Inc.; Secretary, Thornburg Limited Term Municipal Fund, Inc. to 2004; Secretary, Thornburg Securities Corporation; Vice President, Daily Tax Free Income Fund, Inc. (registered investment company). | Not applicable | ||
Steven J. Bohlin, 46 Vice President since 1987; Treasurer since 1989 | Vice President and Managing Director of Thornburg Investment Management, Inc.; Vice President of Thornburg Limited Term Municipal Fund, Inc. to 2004. | Not applicable | ||
George T. Strickland, 42 Vice President since 1996 | Vice President and Managing Director of Thornburg Investment Management, Inc.; Vice President (to 2004) and Treasurer (2003–2004) of Thornburg Limited Term Municipal Fund, Inc. | Not applicable | ||
William V. Fries, 66 Vice President since 1995 | Vice President and Managing Director of Thornburg Investment Management, Inc. | Not applicable | ||
Leigh Moiola, 38 Vice President since 2001 | Vice President and Managing Director of Thornburg Investment Management, Inc.; Vice President of Thornburg Limited Term Municipal Fund, Inc. 1999–2004. | Not applicable | ||
Kenneth Ziesenheim, 51 Vice President since 1995 | Vice President and Managing Director of Thornburg Investment Management, Inc.; President of Thornburg Securities Corporation; Vice President of Thornburg Limited Term Municipal Fund, Inc. to 2004. | Not applicable | ||
Alexander Motola, 35 Vice President since 2001 | Vice President and Managing Director of Thornburg Investment Management, Inc. since 2000; Portfolio Manager, Insight Capital Research & Management, Inc., Walnut Creek, California 1995–2000. | Not applicable | ||
Wendy Trevisani, 34 Vice President since 1999 | Associate Portfolio Manager of Thornburg Investment Management, Inc. since 1999, Vice President since 2000 and Managing Director since 2003; Vice President of Thornburg Limited Term Municipal Fund, Inc. 1999–2002. | Not applicable | ||
Joshua Gonze, 42 Vice President since 1999 | Associate Portfolio Manager of Thornburg Investment Management, Inc. since 1999, Vice President since 1999 and Managing Director since 2003; Vice President of Thornburg Limited Term Municipal Fund, Inc. to 2004. | Not applicable | ||
Brad Kinkelaar, 37 Vice President since 1999 | Associate Portfolio Manager of Thornburg Investment Management, Inc. since 1999, Vice President since 2000 and Managing Director since 2003. | Not applicable | ||
Christopher Ihlefeld, 35 Vice President since 2003 | Associate Portfolio Manager since 1999; Vice President of Thornburg Investment Management, Inc. since 2002; Vice President of Limited Term Municipal Fund, Inc., 2003–2004. | Not applicable | ||
Leon Sandersfeld, 39 Vice President since 2003 | Associate of Thornburg Investment Management, Inc. since 2002; Senior Staff Accountant, Farm Bureau Life Insurance Co. 1998–2002. | Not applicable | ||
40 | Certified Annual Report |
TRUSTEES AND OFFICERS, CONTINUED
| Thornburg Limited Term Municipal Fund | September 30, 2005 (Unaudited) |
Name, Age, | Principal Occupation(s) During Past Five Years | Other Directorships | ||
Sasha Wilcoxon, 31 Vice President since 2003 | Associate of Thornburg Investment Management, Inc. since 2000 and Mutual Fund Operations Department Manager since 2002. | Not applicable | ||
Ed Maran, 47 Vice President since 2004 | Associate Portfolio Manager of Thornburg Investment Management, Inc. since 2002 and Vice President and Managing Director since 2004; Analyst, USAA 2001–2002; Oil Analyst, A.G. Edwards 1997–2000. | Not applicable | ||
Vinson Walden, 35 Vice President since 2004 | Associate Portfolio Manager of Thornburg Investment Management, Inc. since 2002 and Vice President and Managing Director since 2004; Associate Portfolio Manager, Ibis Management 2002–2004; Associate, Lehman Brothers, 1997–2001. | Not applicable | ||
| (1) | Each person’s address is 119 East Marcy Street, Santa Fe, New Mexico 87501. |
| (2) | The Fund is one of twelve separate investment “Funds” or “series” of Thornburg Investment Trust (the “Trust”), which comprises the Thornburg mutual fund complex and is organized as a Massachusetts business trust. The Trust currently has twelve active Funds. Thornburg Investment Management, Inc. is the investment advisor to, and manages, the twelve Funds of the Trust. Each Trustee oversees the twelve Funds in the fund complex. |
| (3) | Mr. Thornburg is considered an “interested” Trustee under the Investment Company Act of 1940 because he is a director and controlling shareholder of Thornburg Investment Management, Inc., the investment advisor to the twelve active Funds of the Trust, and is the sole director and controlling shareholder of Thornburg Securities Corporation, the distributor of shares for the Trust. |
| (4) | Each Trustee serves in office until the election and qualification of a successor. |
| (5) | Mr. McMahon is considered an “interested” Trustee because he is the president of Thornburg Investment Management, Inc. |
| (6) | The Trust’s president, secretary and treasurer each serves a one-year term or until the election and qualification of a successor; each other officer serves at the pleasure of the Trustees. |
| (7) | Assistant vice presidents, assistant secretaries and assistant treasurers are not shown. |
The Statement of Additional Information for each Fund of the Trust includes additional information about the Trustees and is available, without charge and upon request, by calling 1-800-847-0200.
| Certified Annual Report | 41 |
| Thornburg Limited Term Municipal Fund | September 30, 2005 (Unaudited) |
PORTFOLIO PROXY VOTING
Policies and Procedures:
The Trust has delegated to Thornburg Investment Management, Inc. (the “Advisor”) voting decisions respecting proxies for the Fund’s voting securities. The Advisor makes voting decisions in accordance with its Proxy Voting Policy and Procedures. A description of the Policy and Procedures is available (i) without charge, upon request, by calling the Advisor toll-free at 1-800-847-0200, (ii) on the Thornburg website at www.thornburg.com, and (iii) on the Securities and Exchange Commission’s website at www.sec.gov.
Commencing August 31, 2004, information regarding how proxies were voted is available on or before August 31 of each year for the twelve months ending the preceding June 30. This information is available (i) without charge, upon request by calling the Advisor toll-free at 1-800-847-0200, (ii) on the Thornburg website at www.thornburg.com and (iii) on the Securities and Exchange Commission’s website at www.sec.gov.
TAX INFORMATION
For the fiscal year ended September 30, 2005, 100% of dividends paid by the Fund are tax exempt dividends for Federal Income Tax purposes. The information and distributions reported herein may differ from the information and distributions taxable to the shareholders for the calendar year ending December 31, 2005.
AVAILABILITY OF QUARTERLY PORTFOLIO SCHEDULE
The Fund files with the Securities and Exchange Commission schedules of its portfolio holdings on Form N-Q for the first and third quarters of each fiscal year. The Fund’s Forms N-Q are available on the Commission’s website at www.sec.gov, or may be reviewed and copied at the Commission’s Public Reference Room in Washington, D.C. Information on the operation of the Public Reference Room may be obtained by calling 1-800-SEC-0330. The Fund also makes this information available on its website at www.thornburg.com/download or upon request by calling 1-800-847-0200.
TRUSTEES DELIBERATIONS RESPECTING RENEWAL OF INVESTMENT ADVISORY AGREEMENT
Thornburg Investment Management, Inc. (the “Advisor”) provides investment management services to Thornburg Limited Term Municipal Fund pursuant to an investment advisory agreement. The Trustees consider the renewal of this agreement annually and most recently determined to renew the agreement on September 13, 2005.
In connection with their general supervision of the Advisor, the Trustees receive and consider reports throughout the year from the Advisor respecting the Advisor’s management of the Fund’s investments. These reports include information about the Fund’s purchase and sale of portfolio investments and explanations from the Advisor respecting investment selections, the investment performance of the Fund, general appraisals of industry and economic prospects and factors, and other matters affecting the Fund and relating to the Advisor’s performance of services for the Fund.
In anticipation of their recent consideration of the advisory agreement’s renewal, the independent Trustees met with representatives of the Advisor in May and July 2005 to specify the information the Advisor would present to the Trustees for their review. The independent Trustees thereafter met in independent session to consider various factors respecting the agreement’s renewal, and met in a subsequent session with the Advisor’s chief investment officer to present questions. Following these sessions, the Trustees met on September 13, 2005 to consider a renewal of the advisory agreement.
The Trustees considered various factors in their review of the Advisor’s performance under the investment advisory agreement, including specifically the principles outlined in their February 2005 Statement to Shareholders, a copy of which accompanies this Annual Report to Shareholders. Summarized below are certain of the factors considered by the Trustees, in connection with the determination to renew the advisory agreement. In determining to renew the Advisory agreement, the Trustees did not identify any single fact or aspect of the Advisor’s performance as controlling, and this summary does not describe all of the matters considered by the Trustees in making their determination.
Quality of Services; Fund Investment Performance. In reviewing the nature, extent, and quality of services provided by the Advisor and the investment performance of the Fund, the Trustees primarily considered the Advisor’s adherence to the Fund’s stated objectives and policies, the Advisor’s execution of the Fund’s investment strategies in prevailing market conditions, the Fund’s absolute investment performance, the Fund’s investment performance compared to categories of other broadly similar mutual funds and broad based securities indices, the Fund’s investment performance over different periods of time, the Fund’s returns and share price changes in rising and declining markets compared to total returns and price fluctuations and total returns of various categories of mutual funds and securities indices, and related factors. The Trustees noted that bond indices have limited utility in evaluating fixed income mutual funds. Similarly, the Trustees noted in comparing the Fund to other mutual funds that the value of such comparisons may be limited in some degree because the Fund’s investment approach, and in particular its laddered maturity portfolio, differs from other funds. In conducting their review, the Trustees observed that the Advisor had continued to faithfully pursue and to achieve the Fund’s stated objectives, as demonstrated particularly by the Advisor’s selection of investments and investment performance. The Trustees noted in this regard the Fund’s above average or better investment performance over various
| 42 | Certified Annual Report |
OTHER INFORMATION, CONTINUED
| Thornburg Limited Term Municipal Fund | September 30, 2005 (Unaudited) |
periods compared to a category of generally similar mutual funds selected by an independent mutual fund analyst firm.
The Trustees also considered a number of other factors in reviewing the quality of the Advisor’s services, including the qualifications and integrity of the Advisor’s senior personnel, the Advisor’s staffing and other resources, the Advisor’s compliance with regulatory requirements, Fund sales performance and perceptions of the Funds in the marketplace, and other factors.
The Trustees concluded, based upon these and other considerations, that the Advisor had actively and competently pursued the Fund’s stated investment objectives in accordance with the Fund’s investment policies stated in its prospectuses. The Trustees further concluded that the investment performance of the Fund was satisfactory in the context of the Fund’s objectives and policies and prevailing market conditions.
Fees and Expenses; Profitability of Advisor. In reviewing the fees charged by the Advisor to the Fund, the Trustees primarily considered the fees charged by the Advisor and the other expenses charged to the Fund in light of the nature and quality of services provided, comparison of the actual Advisor’s fee and Fund expenses to the statement of fees and expenses in the Fund’s prospectuses, comparisons of the Advisor’s fee and other Fund expenses to median and average fees and expenses charged to similar mutual funds, and comparisons of fees and expenses charged to the Fund with fees and expenses charged to other, similar specific mutual funds. In addition, the Trustees considered the profitability of the Advisor compared to other investment management firms, and comparisons of the investment management fee rates charged by the Advisor to the Fund with rates charged to other clients and the differing types of services furnished to the Fund and the other clients. The Trustees observed in their review that the management fee and expenses charged to the Fund were generally comparable to average and median fees and expenses charged to a group of generally similar mutual funds. The Trustees also observed in their review that fee rates charged by the Advisor to other clients of the Advisor were not directly comparable to rates charged to the Fund principally because of the significant differences in the services provided.
The Trustees concluded, based upon these and other considerations, that the fees charged to the Fund by the Advisor were fair and reasonable in view of the following: the services provided, the clear disclosure of these fees and expenses in the Fund’s prospectuses, and prevailing fees and expenses charged to mutual funds generally. The Trustees further concluded that there was no indication that the Advisor’s profitability was unusual, viewed in the context of the services provided, the performance of the Fund, and the fees and profitability of other investment management firms.
Economies of Scale. In reviewing the extent to which economies of scale would be realized by the Fund as it grows and whether fee levels reflect economies of scale, the Trustees considered the breakpoint structure for advisory fees chargeable to the Fund, the demonstrated economies of scale enjoyed by the Fund and other funds of the Trust as they had grown in size, and economies of scale realized by other mutual funds. The Trustees concluded that the Fund has realized and may reasonably be expected to realize further economies of scale for the benefit of its shareholders as it grows in size.
Ancillary Benefits to Advisor. In reviewing benefits enjoyed by the Advisor because of its relationship with the Fund, the Trustees considered an arrangement through which the Advisor received certain research services, favorable publicity received by the Advisor because of the superior investment performance of certain Funds of the Trust, and the benefits to the Fund from the Advisor’s expansion of its staffing and other resources to serve a broader variety of investment clients. The Trustees concluded, based upon these and other considerations, that there was no unusual or unfair benefit enjoyed by the Advisor and that the Fund enjoyed benefits by virtue of the Advisor’s engagement by other investment clients.
| Certified Annual Report | 43 |
Trustees’ Statement to Shareholders
Not part of the Certified Annual Report
February 8, 2005
The Trustees are concerned that recent commentaries and opinions reported in the media may confuse investors in general as to the supervisory duties of trustees of mutual funds and, in particular, leave Thornburg Investment Trust shareholders uncertain regarding how we discharge our responsibilities in supervising the Funds’ investment advisor and in reviewing the advisor’s contract for renewal. We decided to spell out clearly three principal guidelines that we follow in supervising the Trust’s investment advisor on your behalf.
We begin with the premise that each shareholder selected his or her Fund because its investments are managed by the investment advisor identified in the prospectus and in accordance with the objective and policies described in the prospectus. We realize, as each of you do, that if you believe that your Fund’s stated objective and policies no longer serve your personal investment goals, you can sell your shares and leave the Fund.
Therefore, we believe that our primary supervisory task – our principal obligation to you – is to assess the nature and quality of the advisor’s services, and to confirm that the advisor actively and competently pursues the Fund’s objective, in accordance with the policies set out in the prospectus. To do this, we meet regularly with management to review your Fund’s portfolio and to discuss the advisor’s specific actions and judgments in pursuing the Fund’s objective. We do not substitute our own judgment for the advisor’s decisions in selecting investments; the advisor is paid to exercise its informed judgment on investment decisions, and we seek to confirm, in reviewing the advisor’s performance, that the advisor is doing just that.
Second, while we are conscious of costs and the effect that costs have on shareholders’ returns, we do not seek the lowest fees or expense ratio as our sole or primary objective. We try to make sure that your Fund’s fees and costs are reasonable in relationship to the services rendered and that they are generally in line with those charged by other expert investment advisors, consistent with our belief that the Fund’s investors searched for and expect that expertise and attention and have decided to pay a reasonable price for it. We do not put the management contract “out to bid” as a matter of course, and we would not do so unless we had concluded that the advisor materially had failed to pursue the Fund’s objectives in accordance with its policies, or for other equally important reasons. We believe that any other approach would be inconsistent with your interests and contrary to your expectations when you bought shares of the Fund in the first place.
Finally, because we believe that most Thornburg Fund shareholders have invested with a long-term perspective, we try not to focus too much on the fashions of the moment and on short-term performance. The market will not favor any specific investment objective or set of policies at all times and under all economic circumstances. A fund will experience periods of both high and low returns relative to other funds and other investments. Even if one of our Funds is not favored by the market at a particular time, we believe that the advisor is nonetheless obliged to remain true to the Fund’s objective and policies, and we watch to see that it does so.
This statement is submitted for the general information of the shareholders of Thornburg Investment Trust. It is not authorized for distribution to prospective investors in the Fund unless preceded or accompanied by an effective prospectus. If you have not received a prospectus, one can be obtained from your financial advisor, online at www.thornburg.com/download, or by calling 800-847-0200. Carefully consider information in the prospectus regarding the Fund’s investment objectives and policies, risks, sales charges, expenses, experience of its management, marketability of shares, and other information. Read it carefully before you invest or send money.
| 44 | This page is not part of the Annual Report. |
This page intentionally left blank.
| This page is not part of the Annual Report. | 45 |
This page intentionally left blank.
| 46 | This page is not part of the Annual Report. |
Planning Options
Retirement and Education Accounts
Thornburg Investment Management offers retirement and education savings accounts that can help you meet a variety of planning challenges. For account applications or further information on any of the accounts below, please call 1-800-847-0200 or go to www.thornburg.com/ira. Your financial advisor can help you determine which plan is right for you.
Individual Retirement Accounts
Individual Retirement Accounts (IRAs) provide a tax-advantaged means to save money for the future. For a detailed outline of the difference between retirement accounts, see www.thornburg.com/ira. Rollovers are available. Call 1-800-847-0200 for more information.
Traditional IRAs – Contributions to Traditional IRAs are tax deductible for eligible individuals, and withdrawals are taxed as additional ordinary income. You may contribute to an IRA if you receive compensation and are under 701/2, even if you are covered by an employer retirement plan.
Roth IRAs – Under a Roth IRA, there is no tax deduction for contributions, but there is no income tax on qualified withdrawals. For a more detailed comparison of Traditional and Roth IRAs, please see our web site at www.thornburg.com/ira.
SEP IRAs – Simplified Employee Pension (SEP) IRAs are established by employers. The employer is allowed a tax deduction for contributions made to the SEP Plan and makes contributions to each eligible employee’s SEP IRA on a discretionary basis.
SIMPLE IRAs – Savings Incentive Match Plan for Employees of Small Employers (SIMPLE) is designed to give small business owners a simplified method to establish and contribute to a retirement plan for employees. The employer is allowed a tax deduction for contributions and makes either matching or non-elective contributions to each eligible employee’s SIMPLE IRA. Employees may make salary deferral contributions.
403(b)
A special, tax-advantaged savings vehicle available only to employees of 501(c)(3) organizations, such as charitable, educational, scientific and religious organizations. 403(b) plans are also available to employees of public schools and universities.
Coverdell Education Savings Account
These savings accounts are designed to provide a way to save money for higher education expenses. In an Education Savings Account, earnings and interest grow tax free, and qualified withdrawals used to pay for eligible higher-education expenses are tax- and penalty-free.
Funds Available
The following funds are available in the accounts listed above:
| • | Thornburg International Value Fund |
| • | Thornburg Value Fund |
| • | Thornburg Core Growth Fund |
| • | Thornburg Investment Income Builder Fund |
| • | Thornburg Limited Term U.S. Government Fund |
| • | Thornburg Limited Term Income Fund |
| This page is not part of the Annual Report. | 47 |
The Firm
Thornburg Investment Management® is a privately held investment management company based in Santa Fe, New Mexico with assets under management of over $16 billion. Founded in 1982, the firm manages four equity funds, eight bond funds, and separate portfolios for select institutions and individuals.
Investment Philosophy
We seek to preserve and increase the real wealth of the Funds’ shareholders after accounting for inflation, taxes, and investment expenses. We’re committed to disciplined investing and controlling risk in all market environments through laddered bond and focused equity portfolios.
Portfolio Holdings Disclosure
We believe you should know about your portfolio. Our web site keeps investors informed of the Funds’ equity holdings. Go to www.thornburg.com/funds for commentary on our equity fund holdings.
Co-Ownership of Funds
We invest side-by-side with the Funds’ shareholders. Our employees have invested over $110 million in Thornburg Funds.
Core Strategies for Building Wealth
We deliver core strategies to help investors meet long-term goals. A core strategy is a consistent, disciplined and proven investment process that represents the foundation of a diversified portfolio.
Investment Manager: | Distributor: | |
 |  | |
119 East Marcy Street | 119 East Marcy Street | |
Santa Fe, New Mexico 87501 | Santa Fe, New Mexico 87501 | |
800.847.0200 | 800.847.0200 | |

Core Strategies for Building Wealth
Thornburg California Limited Term Municipal Fund
Annual Report – September 30, 2005
This report is submitted for the general information of shareholders of the Fund. It is not authorized for distribution to prospective investors in the Fund unless preceded or accompanied by an effective prospectus. If you have not received a prospectus, one can be obtained from your financial advisor, online at www.thornburg.com/ download, or by calling 800-847-0200. Carefully consider information in the prospectus regarding the Fund’s investment objectives and policies, risks, sales charges, expenses, experience of its management, marketability of shares, and other information. Read it carefully before you invest or send money. Performance data quoted represents past performance and does not guarantee future results.
Thornburg California Limited Term Municipal Fund
Laddering – an All Weather Strategy
The Fund will invest primarily in municipal obligations originating in California with the objective of obtaining exemption of interest dividends from any income taxes imposed by California on individuals.
The Fund offers California investors double tax-free yields (may be subject to Alternative Minimum Tax) in a laddered municipal bond portfolio with an average maturity of five years or less. Laddering involves building a portfolio of bonds with staggered maturities so that a portion of the portfolio matures each year; cash from maturing bonds, if not needed for other purposes, is invested in bonds with longer maturities at the far end of the ladder. The strategy is a good compromise for managing different types of risk.
Thornburg Bond Funds
| • | Thornburg Limited Term Municipal Fund |
| • | Thornburg Intermediate Municipal Fund |
| • | Thornburg California Limited Term Municipal Fund |
| • | Thornburg New Mexico Intermediate Municipal Fund |
| • | Thornburg Florida Intermediate Municipal Fund |
| • | Thornburg New York Intermediate Municipal Fund |
| • | Thornburg Limited Term U.S. Government Fund |
| • | Thornburg Limited Term Income Fund |
Thornburg invests in short- and intermediate-term investment grade bonds. We ladder the maturities of individual bonds in the portfolios to moderate risk. Laddering involves building a portfolio of bonds with staggered maturities so that a portion of the portfolio will mature each year. We apply this disciplined process in all interest rate environments.
Thornburg Equity Funds
| • | Thornburg Value Fund |
| • | Thornburg International Value Fund |
| • | Thornburg Core Growth Fund |
| • | Thornburg Investment Income Builder Fund |
Thornburg’s equity research uses a fundamental, yet comprehensive, analytical approach. We invest when and where we perceive compelling value. Thornburg equity funds focus on a limited number of securities so that each holding can impact performance. The equity team searches for firms believed to have a promising future and seeks to buy shares of those companies at a discount to their intrinsic value.
More information at www.thornburg.com
| Reduce paper clutter. Receive your shareholder reports and prospectus online instead of through traditional mail.
Sign up at www.thornburg.com/edelivery |

2 | This page is not part of the Annual Report. |
Message
from the Chairman

Garrett Thornburg
Chairman & CEO
November 10, 2005
Dear Fellow Shareholder:
Thornburg Investment Management has a clear mission: to preserve and increase the real wealth of our shareholders. We aspire to accomplish this through a family of laddered bond funds that focus on quality, stability, and minimization of risk over time, and through a range of equity funds that redefine traditional measures of value and growth.
Our bond funds have always been managed using the highly disciplined approach of laddering short and intermediate bond maturities, seeking to provide both an attractive return and stability of principal. All of the bond funds buy only investment-grade securities. We have found this strategy to be the best at managing both interest-rate risk and credit risk, and we believe this strategy has served our shareholders well over time.
The bond funds are managed by portfolio managers who have many years of experience. We are proud of this consistency and experience and look forward to many more successful years with them at the helm.
In years past, there has been news about improper behavior by some mutual fund companies. Many new rules proposed in response to this scandal have called for increased transparency. We welcome increased transparency. Thornburg Investment Management has been a leader in providing information about our stock holdings and bond strategies to our shareholders on our web site, www.thornburg.com.
Unfortunately, some of the new rules will increase the cost to all shareholders in mutual funds. We will do our best to keep these expenses to a minimum. After all, we are shareholders too, and Thornburg employees have over $110 million invested in our own funds.
Thank you for investing with us. We will do our best to continue to earn your trust every day.
| Sincerely, |
 |
Garrett Thornburg Chairman & CEO |
| This page is not part of the Annual Report. | 3 |

Thornburg California Limited Term Municipal Fund
September 30, 2005
Table of Contents
| 6 | ||
| 8 | ||
| 9 | ||
| 10 | ||
| 11 | ||
| 14 | ||
| 17 | ||
| 22 | ||
| 23 | ||
| 24 | ||
| 25 | ||
| 28 | ||
This report is certified under the Sarbanes-Oxley Act of 2002, which requires that public companies, including mutual funds, affirm that the information provided in their annual and semiannual shareholder reports fully and fairly represents their financial position.
4 | Certified Annual Report |
Important Information
Performance data represent past performance and do not guarantee future results. Investment return and principal value will fluctuate. Upon redemption, shares may be worth more or less than their original cost. Current returns may be lower or higher than those shown. For performance current to the most recent month end, visit www.thornburg.com.
The maximum sales charge for the Fund’s A shares is 1.50%. C shares include a 0.50% contingent deferred sales charge (CDSC) for the first year only.
Performance data given at net asset value (NAV) does not take into account these sales charges. If the sales charges had been included, the performance would have been lower.
Shares in the Fund carry risks, including possible loss of principal. As with direct bond ownership, funds that invest in bonds are subject to certain risks including interest-rate risk, credit risk, and inflation risk. The principal value of bond funds will fluctuate relative to changes in interest rates, decreasing when interest rates rise. Unlike bonds, bond funds have ongoing fees and expenses. Shares in the Fund are not deposits or obligations of, or guaranteed or endorsed by, any bank, the Federal Deposit Insurance Corporation, the Federal Reserve Board or any government agency.
The information presented on the following pages was current as of September 30, 2005. The manager’s views, portfolio holdings, and sector diversification are historical and subject to change. This material should not be deemed a recommendation to buy or sell any of the securities mentioned.
The matters discussed in this report may constitute forward-looking statements made pursuant to the safe harbor provisions of the Securities Litigation Reform Act of 1995. These include any advisor or portfolio manager prediction, assessment, analysis or outlook for individual securities, industries, investment styles, market sectors and/or markets. These statements involve risks and uncertainties. In addition to the general risks described for each fund in its current prospectus, other factors bearing on these reports include the accuracy of the advisor’s or portfolio manager’s forecasts and predictions, the appropriateness of the investment strategies designed by the advisor or portfolio manager and the ability of the advisor or portfolio manager to implement their strategies efficiently and successfully. Any one or more of these factors, as well as other risks affecting the securities markets generally, could cause the actual results of any fund to differ materially as compared to its benchmarks.
Glossary
The Lehman Brothers Five-Year Municipal Bond Index – A rules-based, market-value-weighted index engineered for the long-term tax-exempt bond market.To be included in the index, bonds must have a minimum credit rating of Baa. The approximate maturity of the municipal bonds in the index is five years. Unless otherwise noted, index returns reflect the reinvestment of income dividends and capital gains, if any, but do not reflect fees, brokerage commissions or other expenses of investing. Investors may not make direct investments into any index.
Duration – The measure of the price sensitivity of a fixed-income security to an interest rate change of 100 basis points. Calculation is based on the weighted average of the present values for all cash flows.
Weighted Average Maturity – A weighted average of all the effective maturities of the bonds in a portfolio. Effective maturity takes into consideration mortgage prepayments, puts, sinking funds, adjustable coupons, and other features of individual bonds and is thus a more accurate measure of interest-rate sensitivity. Longer-maturity funds are generally considered more interest-rate sensitive than their shorter counterparts.
| Certified Annual Report | 5 |

George Strickland
Portfolio Manager
October 17, 2005
Dear Fellow Shareholder:
I am pleased to present the Annual Report for the Thornburg California Limited Term Municipal Fund. The net asset value (NAV) of the A shares decreased by 23 cents to $12.79 during the twelve months ended September 30, 2005. If you were with us for the entire period, you received dividends of 35.6 cents per share. If you reinvested your dividends, you received 36.0 cents per share. Investors who owned C shares received dividends of 32.3 and 32.7 cents per share, respectively.
Over the last twelve months, interest rates on bonds that mature in ten years or less have risen, while interest rates on long-term bonds have fallen. Higher interest rates on short-term bonds have pushed down the price of most of the bonds owned by the Fund, but have allowed us to buy new bonds at higher yields and increase the yield of the portfolio. The A shares of your Fund produced a total return of 0.98% (at NAV) over the twelve month period ended September 30, 2005, compared to a 1.45% return for the Lehman Five Year Municipal Bond Index. The Fund was over weighted in bonds that mature in less than five years. Since the returns of those short-term bonds lagged the return of the index, the Fund’s return lagged the index somewhat.
This has been an eventful year for the bond market and the world. The Federal Reserve has been steadily pushing up the target Fed Funds rate to its current level of 3.75%. Through the end of June, the bond market responded by pushing down yields on long-term bonds, thus flattening the yield curve. A flat yield curve is usually associated with a recession, but the U.S. economy is showing no signs of entering a recession. So, more recently, interest rates have been rising for both short and long-term bonds, in more of a parallel yield curve shift. We believe that this is a more appropriate response by the market to a tightening Fed, a strong economy, and somewhat elevated levels of inflation.
Your Thornburg California Limited Term Municipal Fund is a laddered portfolio of over 140 municipal obligations from all over California. Your Fund’s weighted average maturity is 4.49 years. We ladder the maturity dates of the bonds in your portfolio so that some of the bonds are scheduled to mature during each of the coming years. Laddering bonds accomplishes two goals. First, the staggered bond maturities contained in a ladder defuse interest-rate risk and dampen the Fund’s price volatility. Second, laddering gives the Fund a steady cash flow stream from maturing bonds to reinvest toward the top of the ladder where yields are typically higher. The chart shown here describes the percentages of your Fund’s bond portfolio maturing in each of the coming years.
% of portfolio | Cumulative % Maturing | |||||||||||||
1 year | = | 11.4 | % | Year 1 | = | 11.4 | % | |||||||
1 to 2 years | = | 11.2 | % | Year 2 | = | 22.6 | % | |||||||
2 to 3 years | = | 13.9 | % | Year 3 | = | 36.5 | % | |||||||
3 to 4 years | = | 14.0 | % | Year 4 | = | 50.5 | % | |||||||
4 to 5 years | = | 9.1 | % | Year 5 | = | 59.6 | % | |||||||
5 to 6 years | = | 8.0 | % | Year 6 | = | 67.6 | % | |||||||
6 to 7 years | = | 12.5 | % | Year 7 | = | 80.1 | % | |||||||
7 to 8 years | = | 3.6 | % | Year 8 | = | 83.7 | % | |||||||
8 to 9 years | = | 7.3 | % | Year 9 | = | 91.0 | % | |||||||
Over 9 years | = | 9.0 | % | Over 9 years | = | 100.0 | % | |||||||
Percentages can and do vary. Data as of 9/30/05.
6 | Certified Annual Report |
The California economy has performed quite well as of late. Second quarter personal income growth was 6.5% and, through September, California General Fund tax revenues are running $666 million ahead of the budget estimate. However, 2005-06 fiscal year expenditures are expected to increase 10% and State General Fund balance is projected to fall from $7.5 billion to $1.3 billion. Furthermore, the state will have to grapple with a large looming deficit in the 2006-07 fiscal year that is currently expected to total $7 billion. To manage credit risk, we have kept 93% of the portfolio in bonds rated A or above and maintained broad diversification across issuers and market sectors.
Over the years, our practice of laddering a diversified portfolio of short and intermediate maturity municipal bonds has allowed your Fund to perform consistently well in varying interest rate environments. Thank you for investing in Thornburg California Limited Term Municipal Fund.
| Sincerely, |
 |
George Strickland Portfolio Manager |
| Certified Annual Report | 7 |
| STATEMENT OF ASSETS AND LIABILITIES | ||
| Thornburg California Limited Term Municipal Fund | September 30, 2005 | |
ASSETS | ||||
Investments at value (cost $157,860,495) | $ | 159,787,339 | ||
Cash | 165,500 | |||
Receivable for fund shares sold | 276,917 | |||
Interest receivable | 2,170,554 | |||
Total Assets | 162,400,310 | |||
LIABILITIES | ||||
Payable for fund shares redeemed | 146,709 | |||
Payable to investment advisor and other affiliates (Note 3) | 113,436 | |||
Accounts payable and accrued expenses | 50,175 | |||
Dividends payable | 123,832 | |||
Total Liabilities | 434,152 | |||
NET ASSETS | $ | 161,966,158 | ||
NET ASSETS CONSIST OF: | ||||
Net unrealized appreciation on investments | $ | 1,926,844 | ||
Accumulated net realized gain (loss) | (593,743 | ) | ||
Net capital paid in on shares of beneficial interest | 160,633,057 | |||
| $ | 161,966,158 | |||
NET ASSET VALUE: | ||||
Class A Shares: | ||||
Net asset value and redemption price per share | $ | 12.79 | ||
Maximum sales charge, 1.50% of offering price | 0.19 | |||
Maximum offering price per share | $ | 12.98 | ||
Class C Shares: | ||||
Net asset value and offering price per share * | $ | 12.80 | ||
Class I Shares: | ||||
Net asset value, offering and redemption price per share | $ | 12.80 | ||
| * | Redemption price per share is equal to net asset value less any applicable contingent deferred sales charge. |
See notes to financial statements.
8 | Certified Annual Report |
| STATEMENT OF OPERATIONS | ||
| Thornburg California Limited Term Municipal Fund | Year Ended September 30, 2005 | |
INVESTMENT INCOME: | ||||
Interest income (net of premium amortized of $2,594,819) | $ | 6,495,270 | ||
EXPENSES: | ||||
Investment advisory fees (Note 3) | 866,662 | |||
Administration fees (Note 3) | ||||
Class A Shares | 153,957 | |||
Class C Shares | 26,647 | |||
Class I Shares | 14,425 | |||
Distribution and service fees (Note 3) | ||||
Class A Shares | 307,915 | |||
Class C Shares | 213,199 | |||
Transfer agent fees | ||||
Class A Shares | 46,717 | |||
Class C Shares | 19,781 | |||
Class I Shares | 21,014 | |||
Registration and filing fees | ||||
Class A Shares | 472 | |||
Class C Shares | 472 | |||
Class I Shares | 784 | |||
Custodian fees (Note 3) | 78,669 | |||
Professional fees | 29,838 | |||
Accounting fees | 18,205 | |||
Trustee fees | 5,816 | |||
Other expenses | 47,114 | |||
Total Expenses | 1,851,687 | |||
Less: | ||||
Expenses reimbursed by Investment Advisor (Note 3) | (54,992 | ) | ||
Distribution and service fees waived (Note 3) | (106,726 | ) | ||
Fees paid indirectly (Note 3) | (11,884 | ) | ||
Net Expenses | 1,678,085 | |||
Net Investment Income | 4,817,185 | |||
REALIZED AND UNREALIZED GAIN (LOSS) ON INVESTMENTS | ||||
Net realized gain (loss) on investments sold | (139,338 | ) | ||
Increase (Decrease) in unrealized appreciation (depreciation) of investments | (2,988,040 | ) | ||
Net Realized and Unrealized Loss on Investments | (3,127,378 | ) | ||
Net Increase in Net Assets Resulting From Operations | $ | 1,689,807 | ||
See notes to financial statements.
| Certified Annual Report | 9 |
STATEMENTS OF CHANGES IN NET ASSETS
Thornburg California Limited Term Municipal Fund
| Year Ended September 30, 2005 | Three Months Ended September 30, 2004 | Year Ended June 30, 2004 | ||||||||||
INCREASE (DECREASE) IN NET ASSETS FROM: | ||||||||||||
OPERATIONS: | ||||||||||||
Net investment income | $ | 4,817,185 | $ | 1,144,598 | $ | 4,899,573 | ||||||
Net realized loss on investments sold | (139,338 | ) | (33,844 | ) | 302,064 | |||||||
Increase (Decrease) in unrealized appreciation (depreciation) of investments | (2,988,040 | ) | 2,023,841 | (5,077,284 | ) | |||||||
Net Increase (Decrease) in Net Assets Resulting from Operations | 1,689,807 | 3,134,595 | 124,353 | |||||||||
DIVIDENDS TO SHAREHOLDERS: | ||||||||||||
From net investment income | ||||||||||||
Class A Shares | (3,392,991 | ) | (841,492 | ) | (3,715,243 | ) | ||||||
Class C Shares | (533,799 | ) | (127,839 | ) | (544,139 | ) | ||||||
Class I Shares | (890,395 | ) | (175,267 | ) | (640,191 | ) | ||||||
FUND SHARE TRANSACTIONS (NOTE 4): | ||||||||||||
Class A Shares | (21,261,597 | ) | 1,954,371 | (14,508,762 | ) | |||||||
Class C Shares | (1,532,552 | ) | (674,119 | ) | 441,058 | |||||||
Class I Shares | 5,630,725 | 2,536,234 | 2,945,765 | |||||||||
Net Increase (Decrease) in Net Assets | (20,290,802 | ) | 5,806,483 | (15,897,159 | ) | |||||||
NET ASSETS: | ||||||||||||
Beginning of period | 182,256,960 | 176,450,477 | 192,347,636 | |||||||||
End of period | $ | 161,966,158 | $ | 182,256,960 | $ | 176,450,477 | ||||||
See notes to financial statements.
10 | Certified Annual Report |
| NOTES TO FINANCIAL STATEMENTS | ||
| Thornburg California Limited Term Municipal Fund | September 30, 2005 | |
NOTE 1 – ORGANIZATION
Thornburg California Limited Term Municipal Fund (the “Fund”) (formerly Thornburg Limited Term Municipal Fund – California Portfolio) is a diversified series of Thornburg Investment Trust (the “Trust”). The Trust is organized as a Massachusetts business trust under a Declaration of Trust dated June 3, 1987 and is registered as a diversified, open-end management investment company under the Investment Company Act of 1940, as amended. The Trust is currently issuing eleven series of shares of beneficial interest in addition to those of the Fund: Thornburg Limited Term Municipal Fund, Thornburg Florida Intermediate Municipal Fund, Thornburg New York Intermediate Municipal Fund, Thornburg New Mexico Intermediate Municipal Fund, Thornburg Intermediate Municipal Fund, Thornburg Limited Term U.S. Government Fund, Thornburg Limited Term Income Fund, Thornburg Value Fund, Thornburg International Value Fund, Thornburg Core Growth Fund, and Thornburg Investment Income Builder Fund. Each series is considered to be a separate entity for financial reporting and tax purposes and bears expenses directly attributable to it. The Fund’s investment objective is to obtain as high a level of current income exempt from Federal income tax as is consistent, in the view of the Fund’s investment advisor, with the preservation of capital. In addition, the Fund will invest primarily in Municipal Obligations originating in California with the objective of obtaining exemption of interest dividends from any income taxes imposed by California on individuals.
The Fund currently offers three classes of shares of beneficial interest, Class A, Class C, and Institutional Class (Class I) shares. Each class of shares of the Fund represents an interest in the same portfolio of investments, except that (i) Class A shares are sold subject to a front-end sales charge collected at the time the shares are purchased and bear a service fee, (ii) Class C shares are sold at net asset value without a sales charge at the time of purchase, but are subject to a contingent deferred sales charge upon redemption within one year, and bear both a service fee and a distribution fee, (iii) Class I shares are sold at net asset value without a sales charge at the time of purchase, and (iv) the respective classes may have different reinvestment privileges and conversion rights. Additionally, the Fund may allocate among its classes certain expenses, to the extent applicable to specific classes, including transfer agent fees, government registration fees, certain printing and postage costs, and administrative and legal expenses. Currently, class specific expenses of the Fund are limited to service and distribution fees, administrative fees, and certain registration and transfer agent expenses.
NOTE 2 – SIGNIFICANT ACCOUNTING POLICIES
Significant accounting policies of the Trust are as follows:
Valuation of Investments: In determining the net asset value of investments, the Trust utilizes an independent pricing service approved by the Board of Trustees. Debt investment securities have a primary market over the counter and are valued on the basis of valuations furnished by the pricing service. The pricing service values portfolio securities at quoted bid prices, normally at 4:00 p.m. EST. When quotations are not readily available, securities are valued at evaluated prices as determined by the pricing service using methods which include consideration of yields or prices of municipal obligations of comparable quality, type of issue, coupon, maturity, and rating; indications as to value from dealers and general market conditions. In any case where a price is not available from a pricing service for an investment, the Trust’s valuation and pricing committee determines a fair value for the investment using factors approved by the Trustees. The valuation procedures used by the pricing service and the portfolio valuations received by the Fund are reviewed by the officers of the Trust under the general supervision of the Board of Trustees. Short-term obligations having remaining maturities of 60 days or less are valued at amortized cost, which approximates market value.
Federal Income Taxes: It is the policy of the Trust to comply with the provisions of the Internal Revenue Code applicable to “regulated investment companies” and to distribute all taxable (if any) and tax exempt income, of the Fund to the shareholders. Therefore, no provision for Federal income tax is required.
When-Issued and Delayed Delivery Transactions: The Trust may engage in when-issued or delayed delivery transactions. To the extent the Trust engages in such transactions, it will do so for the purpose of acquiring portfolio securities consistent with the Fund’s investment objectives and not for the purpose of investment leverage or to speculate on interest rate and/or market changes. At the time the Trust makes a commitment to purchase a security on a when-issued basis, the Fund will record the transaction and reflect the value in determining its net asset value. When effecting such transactions, assets of an amount sufficient to make payment for the portfolio securities to be purchased will be segregated on the Fund’s records on the trade date. Securities purchased on a when-issued or delayed delivery basis do not earn interest until the settlement date.
Dividends: Net investment income of the Fund is declared daily as a dividend on shares for which the Fund has received payment. Dividends are paid monthly and are reinvested in additional shares of the Fund at net asset value per share at the close of business on the dividend payment date or, at the shareholder’s option, paid in cash. Net capital gains, to the extent available, will be distributed at least annually.
General: Securities transactions are accounted for on a trade date basis. Interest income is accrued as earned. Premiums and discounts on securities purchased are amortized to call dates or maturity dates of the respective securities. Realized gains and losses from the sale of securities are recorded on an
| Certified Annual Report | 11 |
| NOTES TO FINANCIAL STATEMENTS, CONTINUED | ||
| Thornburg California Limited Term Municipal Fund | September 30, 2005 | |
identified cost basis. Net investment income, other than class specific expenses and realized and unrealized gains and losses, is allocated daily to each class of shares based upon the relative net asset value of outstanding shares (or the value of the dividend-eligible shares, as appropriate) of each class of shares at the beginning of the day (after adjusting for the current capital shares activity of the respective class). Expenses common to all funds are allocated among the funds comprising the Trust based upon their relative net asset values or other appropriate allocation methods.
Guarantees and Indemnifications: Under the Trust’s organizational documents, its officers and Trustees are indemnified against certain liability arising out of the performance of their duties to the Fund. Additionally, in the normal course of business the Trust enters into contracts with service providers that contain general indemnification clauses. The Trust’s maximum exposure under these arrangements is unknown. However, based on experience, the Trust expects the risk of loss to be remote.
Use of Estimates: The preparation of financial statements, in conformity with generally accepted accounting principles, requires management to make estimates and assumptions that affect the reported amounts of assets and liabilities and the disclosure of contingent assets and liabilities at the date of the financial statements and the reported amounts of increases and decreases in net assets from operations during the reporting period. Actual results could differ from those estimates.
NOTE 3 – INVESTMENT ADVISORY FEE AND OTHER TRANSACTIONS WITH AFFILIATES
Pursuant to an Investment Advisory Agreement, Thornburg Investment Management, Inc.® (the “Advisor”) serves as the investment advisor and performs services for which the fees are payable at the end of each month. For the year ended September 30, 2005, these fees were payable at annual rates ranging from .50 of 1% to .225 of 1% per annum of the average daily net assets of the Fund. The Trust also has entered into an Administrative Services Agreement with the Advisor, whereby the Advisor will perform certain administrative services for the shareholders of each class of the Fund’s shares, and for which fees will be payable at an annual rate of up to .125 of 1% per annum of the average daily net assets attributable to each class of shares. For the year ended September 30, 2005, the Advisor voluntarily reimbursed certain class specific expenses and administrative fees of $24,467 for Class A shares, $15,491 for Class C shares, and $15,034 for Class I shares.
The Trust has an underwriting agreement with Thornburg Securities Corporation® (the “Distributor”, an affiliate of the Advisor), which acts as the distributor of Fund shares. For the year ended September 30, 2005, the Distributor has advised the Fund that it earned commissions aggregating $1,060 from the sale of Class A shares, and collected contingent deferred sales charges aggregating $2,859 from redemptions of Class C shares of the Fund.
Pursuant to a Service Plan under Rule 12b-1 of the Investment Company Act of 1940, the Fund may reimburse to the Advisor amounts not to exceed .25 of 1% per annum of the average daily net assets attributable to each class of shares of the Fund for payments made by the Advisor to securities dealers and other persons for distribution of the Fund’s shares and to obtain various shareholder related services. The Advisor may pay out of its own resources additional expenses for distribution of the Fund’s shares.
The Trust also has adopted a Distribution Plan pursuant to Rule 12b-1, applicable only to the Fund’s Class C shares, under which the Fund compensates the Distributor for services in promoting the sale of Class C shares of the Fund at an annual rate of up to .75 of 1% per annum of the average daily net assets attributable to Class C shares. Total fees incurred by each class of shares of the Fund under their respective service and distribution plans and Class C distribution fees waived by the Distributor for the year ended September 30, 2005, are set forth in the Statement of Operations. Distribution fees in the amount of $106,726 were waived for Class C shares.
The Trust has an agreement with the custodian bank to indirectly pay a portion of the custodian’s fees through credits earned by the Fund’s cash on deposit with the bank. This deposit agreement is an alternative to overnight investments. Custodial fees have been adjusted to reflect amounts that would have been paid without this agreement, with a corresponding adjustment reflected as fees paid indirectly in the Statement of Operations. For the year ended September 30, 2005, fees paid indirectly were $11,884.
Certain officers and Trustees of the Trust are also officers and/or Directors of the Advisor and Distributor. The compensation of independent Trustees is borne by the Trust.
12 | Certified Annual Report |
| NOTES TO FINANCIAL STATEMENTS, CONTINUED | ||
| Thornburg California Limited Term Municipal Fund | September 30, 2005 | |
NOTE 4 – SHARES OF BENEFICIAL INTEREST
At September 30, 2005, there were an unlimited number of shares of beneficial interest authorized. Transactions in shares of beneficial interest were as follows:
Year Ended September 30, 2005 | Three Months Ended September 30, 2004 | Year Ended June 30, 2004 | |||||||||||||||||||
| Shares | Amount | Shares | Amount | Shares | Amount | ||||||||||||||||
Class A Shares | |||||||||||||||||||||
Shares sold | 851,431 | $ | 10,982,577 | 502,652 | $ | 6,531,022 | 1,775,040 | $ | 23,232,846 | ||||||||||||
Shares issued to shareholders in reinvestment of dividends | 174,031 | 2,241,423 | 41,636 | 541,263 | 188,208 | 2,457,459 | |||||||||||||||
Shares repurchased | (2,675,964 | ) | (34,485,597 | ) | (394,425 | ) | (5,117,914 | ) | (3,079,256 | ) | (40,199,067 | ) | |||||||||
Net Increase (Decrease) | (1,650,502 | ) | $ | (21,261,597 | ) | 149,863 | $ | 1,954,371 | (1,116,008 | ) | $ | (14,508,762 | ) | ||||||||
Class C Shares | |||||||||||||||||||||
Shares sold | 306,700 | $ | 3,962,605 | 81,630 | $ | 1,061,877 | 530,253 | $ | 6,927,987 | ||||||||||||
Shares issued to shareholders in reinvestment of dividends | 27,743 | 357,622 | 6,991 | 90,936 | 30,099 | 393,331 | |||||||||||||||
Shares repurchased | (454,085 | ) | (5,852,779 | ) | (140,412 | ) | (1,826,932 | ) | (526,102 | ) | (6,880,260 | ) | |||||||||
Net Increase (Decrease) | (119,642 | ) | $ | (1,532,552 | ) | (51,791 | ) | $ | (674,119 | ) | 34,250 | $ | 441,058 | ||||||||
Class I Shares | |||||||||||||||||||||
Shares sold | 1,134,747 | $ | 14,661,908 | 296,419 | $ | 3,855,573 | 935,797 | $ | 12,251,009 | ||||||||||||
Shares issued to shareholders in reinvestment of dividends | 54,521 | 702,734 | 11,020 | 143,387 | 38,885 | 508,066 | |||||||||||||||
Shares repurchased | (754,043 | ) | (9,733,917 | ) | (112,491 | ) | (1,462,726 | ) | (753,140 | ) | (9,813,310 | ) | |||||||||
Net Increase (Decrease) | 435,225 | $ | 5,630,725 | 194,948 | $ | 2,536,234 | 221,542 | $ | 2,945,765 | ||||||||||||
NOTE 5 – SECURITIES TRANSACTIONS
For the year ended September 30, 2005, the Fund had purchase and sale transactions of investment securities (excluding short-term investments) of $44,457,569 and $49,918,273, respectively.
NOTE 6 – INCOME TAXES
At September 30, 2005, information on the tax components of capital is as follows:
Cost of investments for tax purpose | $ | 157,860,495 | ||
Gross unrealized appreciation on a tax basis | $ | 2,567,681 | ||
Gross unrealized depreciation on a tax basis | (640,837 | ) | ||
Net unrealized appreciation (depreciation) on investments (tax basis) | $ | 1,926,844 | ||
At September 30, 2005, the Fund did not have any undistributed tax-exempt/ordinary net income or undistributed capital gains.
At September 30, 2005, the Fund had tax basis capital losses, which may be carried over to offset future capital gains. To the extent such carry forwards are used, capital gain distributions may be reduced to the extent provided by regulations.
Such capital loss carryovers expire as follows:
2007 | $ | 205,990 | |
2008 | 214,571 | ||
2012 | 33,844 | ||
| $ | 454,405 | ||
At September 30, 2005, the Fund had deferred capital losses occurring subsequent to October 31, 2004 of $139,338. For tax purposes, such losses will be reflected in the year ending September 30, 2006.
All dividends paid by the Fund for the year ended September 30, 2005, the three months ended September 30, 2004, and the year ended June 30, 2004, represent exempt interest dividends, which are excludable by shareholders from gross income for Federal income tax purposes.
| Certified Annual Report | 13 |
Thornburg California Limited Term Municipal Fund
Year Ended 2005 | 3 Months 2004(c) | Year Ended June 30, | ||||||||||||||||||||||
| 2004 | 2003 | 2002 | 2001 | |||||||||||||||||||||
Class A Shares: | ||||||||||||||||||||||||
PER SHARE PERFORMANCE | ||||||||||||||||||||||||
(for a share outstanding throughout the period) | ||||||||||||||||||||||||
Net asset value, beginning of period | $ | 13.02 | $ | 12.87 | $ | 13.20 | $ | 12.96 | $ | 12.79 | $ | 12.59 | ||||||||||||
Income from investment operations: | ||||||||||||||||||||||||
Net investment income | 0.36 | 0.08 | 0.35 | 0.38 | 0.46 | 0.54 | ||||||||||||||||||
Net realized and unrealized gain (loss) on investments | (0.23 | ) | 0.15 | (0.33 | ) | 0.24 | 0.17 | 0.20 | ||||||||||||||||
Total from investment operations | 0.13 | 0.23 | 0.02 | 0.62 | 0.63 | 0.74 | ||||||||||||||||||
Less dividends from: | ||||||||||||||||||||||||
Net investment income | (0.36 | ) | (0.08 | ) | (0.35 | ) | (0.38 | ) | (0.46 | ) | (0.54 | ) | ||||||||||||
Change in net asset value | (0.23 | ) | 0.15 | (0.33 | ) | 0.24 | 0.17 | 0.20 | ||||||||||||||||
NET ASSET VALUE, end of period | $ | 12.79 | $ | 13.02 | $ | 12.87 | $ | 13.20 | $ | 12.96 | $ | 12.79 | ||||||||||||
RATIOS/SUPPLEMENTAL DATA | ||||||||||||||||||||||||
Total return(a) | 0.98 | % | 1.81 | % | 0.13 | % | 4.83 | % | 5.03 | % | 6.00 | % | ||||||||||||
Ratios to average net assets: | ||||||||||||||||||||||||
Net investment income | 2.75 | % | 2.53 | %(b) | 2.66 | % | 2.87 | % | 3.58 | % | 4.26 | % | ||||||||||||
Expenses, after expense reductions | 1.00 | % | 0.99 | %(b) | 0.99 | % | 0.99 | % | 1.00 | % | 0.99 | % | ||||||||||||
Expenses, after expense reductions and net of custody credits | 0.99 | % | 0.99 | %(b) | 0.99 | % | 0.99 | % | 0.99 | % | — | |||||||||||||
Expenses, before expense reductions | 1.02 | % | 1.05 | %(b) | 1.04 | % | 1.02 | % | 1.01 | % | 1.05 | % | ||||||||||||
Portfolio turnover rate | 26.33 | % | 4.18 | % | 23.80 | % | 26.03 | % | 25.16 | % | 15.45 | % | ||||||||||||
Net assets at end of period (000) | $ | 111,102 | $ | 134,588 | $ | 131,158 | $ | 149,269 | $ | 115,237 | $ | 89,967 | ||||||||||||
| (a) | Sales loads are not reflected in computing total return, which is not annualized for periods less than one year. |
| (b) | Annualized. |
| (c) | The Fund’s fiscal year-end changed to September 30. |
14 | Certified Annual Report |
FINANCIAL HIGHLIGHTS, CONTINUED
Thornburg California Limited Term Municipal Fund
Year 2005 | 3 Months 2004(c) | Year Ended June 30, | ||||||||||||||||||||||
| 2004 | 2003 | 2002 | 2001 | |||||||||||||||||||||
Class C Shares: | ||||||||||||||||||||||||
PER SHARE PERFORMANCE | ||||||||||||||||||||||||
(for a share outstanding throughout the period) | ||||||||||||||||||||||||
Net asset value, beginning of period | $ | 13.03 | $ | 12.88 | $ | 13.21 | $ | 12.97 | $ | 12.80 | $ | 12.61 | ||||||||||||
Income from investment operations: | ||||||||||||||||||||||||
Net investment income | 0.32 | 0.07 | 0.32 | 0.34 | 0.41 | 0.49 | ||||||||||||||||||
Net realized and unrealized gain (loss) on investments | (0.23 | ) | 0.15 | (0.33 | ) | 0.24 | 0.17 | 0.19 | ||||||||||||||||
Total from investment operations | 0.09 | 0.22 | (0.01 | ) | 0.58 | 0.58 | 0.68 | |||||||||||||||||
Less dividends from: | ||||||||||||||||||||||||
Net investment income | (0.32 | ) | (0.07 | ) | (0.32 | ) | (0.34 | ) | (0.41 | ) | (0.49 | ) | ||||||||||||
Change in net asset value | (0.23 | ) | 0.15 | (0.33 | ) | 0.24 | 0.17 | 0.19 | ||||||||||||||||
NET ASSET VALUE, end of period | $ | 12.80 | $ | 13.03 | $ | 12.88 | $ | 13.21 | $ | 12.97 | $ | 12.80 | ||||||||||||
RATIOS/SUPPLEMENTAL DATA | ||||||||||||||||||||||||
Total return(a) | 0.73 | % | 1.75 | % | (0.12 | )% | 4.51 | % | 4.60 | % | 5.49 | % | ||||||||||||
Ratios to average net assets: | ||||||||||||||||||||||||
Net investment income | 2.50 | % | 2.28 | %(b) | 2.41 | % | 2.56 | % | 3.15 | % | 3.86 | % | ||||||||||||
Expenses, after expense reductions | 1.25 | % | 1.24 | %(b) | 1.24 | % | 1.30 | % | 1.38 | % | 1.40 | % | ||||||||||||
Expenses, after expense reductions and net of custody credits | 1.24 | % | 1.24 | %(b) | 1.24 | % | 1.30 | % | 1.37 | % | — | |||||||||||||
Expenses, before expense reductions | 1.82 | % | 1.87 | %(b) | 1.86 | % | 1.80 | % | 1.86 | % | 2.01 | % | ||||||||||||
Portfolio turnover rate | 26.33 | % | 4.18 | % | 23.80 | % | 26.03 | % | 25.16 | % | 15.45 | % | ||||||||||||
Net assets at end of period (000) | $ | 20,021 | $ | 21,941 | $ | 22,363 | $ | 22,487 | $ | 16,081 | $ | 6,392 | ||||||||||||
| (a) | Not annualized for periods less than one year. |
| (b) | Annualized. |
| (c) | The Fund’s fiscal year-end changed to September 30. |
| Certified Annual Report | 15 |
FINANCIAL HIGHLIGHTS, CONTINUED
Thornburg California Limited Term Municipal Fund
Year 2005 | 3 Months 2004(c) | Year Ended June 30, | ||||||||||||||||||||||
| 2004 | 2003 | 2002 | 2001 | |||||||||||||||||||||
Class I Shares: | ||||||||||||||||||||||||
PER SHARE PERFORMANCE | ||||||||||||||||||||||||
(for a share outstanding throughout the period) | ||||||||||||||||||||||||
Net asset value, beginning of period | $ | 13.03 | $ | 12.89 | $ | 13.22 | $ | 12.97 | $ | 12.79 | $ | 12.60 | ||||||||||||
Income from investment operations: | ||||||||||||||||||||||||
Net investment income | 0.40 | 0.09 | 0.39 | 0.42 | 0.51 | 0.59 | ||||||||||||||||||
Net realized and unrealized gain (loss) on investments | (0.23 | ) | 0.14 | (0.33 | ) | 0.25 | 0.18 | 0.19 | ||||||||||||||||
Total from investment operations | 0.17 | 0.23 | 0.06 | 0.67 | 0.69 | 0.78 | ||||||||||||||||||
Less dividends from: | ||||||||||||||||||||||||
Net investment income | (0.40 | ) | (0.09 | ) | (0.39 | ) | (0.42 | ) | (0.51 | ) | (0.59 | ) | ||||||||||||
Change in net asset value | (0.23 | ) | 0.14 | (0.33 | ) | 0.25 | 0.18 | 0.19 | ||||||||||||||||
NET ASSET VALUE, end of period | $ | 12.80 | $ | 13.03 | $ | 12.89 | $ | 13.22 | $ | 12.97 | $ | 12.79 | ||||||||||||
| RATIOS/SUPPLEMENTAL DATA | ||||||||||||||||||||||||
Total return(a) | 1.31 | % | 1.81 | % | 0.46 | % | 5.27 | % | 5.48 | % | 6.28 | % | ||||||||||||
Ratios to average net assets: | ||||||||||||||||||||||||
Net investment income | 3.09 | % | 2.85 | %(b) | 2.99 | % | 3.20 | % | 3.92 | % | 4.60 | % | ||||||||||||
Expenses, after expense reductions | 0.68 | % | 0.67 | %(b) | 0.67 | % | 0.65 | % | 0.66 | % | 0.65 | % | ||||||||||||
Expenses, after expense reductions and net of custody credits | 0.67 | % | 0.67 | %(b) | 0.67 | % | 0.65 | % | 0.65 | % | — | |||||||||||||
Expenses, before expense reductions | 0.73 | % | 0.77 | %(b) | 0.78 | % | 0.75 | % | 0.84 | % | 0.98 | % | ||||||||||||
Portfolio turnover rate | 26.33 | % | 4.18 | % | 23.80 | % | 26.03 | % | 25.16 | % | 15.45 | % | ||||||||||||
Net assets at end of period (000) | $ | 30,843 | $ | 25,728 | $ | 22,929 | $ | 20,592 | $ | 10,133 | $ | 5,520 | ||||||||||||
| (a) | Not annualized for periods less than one year. |
| (b) | Annualized. |
| (c) | The Fund’s fiscal year-end changed to September 30. |
16 | Certified Annual Report |
| ||
| Thornburg California Limited Term Municipal Fund | September 30, 2005 |
CUSIPS: CLASS A - 885-215-426, CLASS C - 885-215-418, CLASS I - 885-215-392 NASDAQ SYMBOLS: CLASS A - LTCAX, CLASS C - LTCCX, CLASS I - LTCIX
Issuer-Description | Credit Rating† Moody’s/S&P | Principal Amount | Value | |||||
ABAG Finance Authority, 4.75% due 10/1/2011 (California School of Mechanical Arts Project) | A3/NR | $ | 435,000 | $ | 459,147 | |||
ABAG Finance Authority, 4.75% due 10/1/2012 (California School of Mechanical Arts Project) | A3/NR | 455,000 | 479,925 | |||||
Alameda COP, 4.60% due 5/1/2011 | NR/A+ | 425,000 | 447,576 | |||||
Alum Rock Union Elementary School District GO Refunding Bonds, 8.00% due 9/1/2006 (Insured: FGIC) | Aaa/AAA | 295,000 | 308,797 | |||||
Alum Rock Union Elementary School District GO Refunding Bonds, 8.00% due 9/1/2007 (Insured: FGIC) | Aaa/AAA | 380,000 | 415,667 | |||||
Bay Area Government Associates Lease Series 2002, 4.00% due 7/1/2006 (Insured:AMBAC) | Aaa/AAA | 765,000 | 772,053 | |||||
Bay Area Government Association Rapid Transit, 4.875% due 6/15/2009 (Insured:AMBAC) | Aaa/AAA | 215,000 | 215,355 | |||||
Bonita Unified School District COP Refunding, 4.50% due 5/1/2010 (Insured: MBIA) | Aaa/AAA | 700,000 | 737,289 | |||||
California Health Facilities Financing, 5.50% due 10/1/2006 (Sisters of Providence Project) | Aa3/AA | 1,235,000 | 1,265,517 | |||||
California Health Facilities Financing Authority Revenue Series B Refunding, 5.25% due 10/1/2013 (Kaiser Permanente Project) (ETM) | A3/AAA | 2,000,000 | 2,132,300 | |||||
California Health Facilities Financing Revenue, 6.40% due 10/1/2005 (Sisters of Providence Project) | Aa3/AA | 700,000 | 700,063 | |||||
California Housing Finance Authority Revenue Series 1985-B, 9.875% due 2/1/2017 | Aa2/AA- | 670,000 | 682,187 | |||||
California Infrastructure & Economic Development Bank Revenue, 5.00% due 7/1/2010 (Bay Area Toll Bridges Project; Insured: FSA) | Aaa/AAA | 1,000,000 | 1,080,100 | |||||
California Mobile Home Park Financing Series A, 4.75% due 11/15/2010 (Rancho Vallecitos Project; Insured:ACA) | NR/A | 500,000 | 520,490 | |||||
California Mobile Home Park Financing Series A, 5.00% due 11/15/2013 (Rancho Vallecitos Project; Insured:ACA) | NR/A | 570,000 | 599,406 | |||||
California Pollution Control Solid Waste Authority, 6.75% due 7/1/2011 (ETM) | Aaa/NR | 2,650,000 | 2,872,573 | |||||
California Rural HMFA Single Family Mortgage Revenue, 5.25% due 6/1/2010 (Collateralized: GNMA/FNMA) | NR/AAA | 25,000 | 25,060 | |||||
California Rural HMFA Single Family Mortgage Revenue, 5.65% due 6/1/2010 (Collateralized: GNMA/FNMA) | NR/AAA | 10,000 | 10,030 | |||||
California State, 6.40% due 2/1/2006 (Insured: MBIA) | Aaa/AAA | 500,000 | 505,965 | |||||
California State, 7.50% due 10/1/2007 (Insured: MBIA) | Aaa/AAA | 2,000,000 | 2,175,300 | |||||
California State, 6.60% due 2/1/2010 (Insured: MBIA) | Aaa/AAA | 560,000 | 635,225 | |||||
California State, 6.50% due 9/1/2010 (Insured:AMBAC) | Aaa/AAA | 1,250,000 | 1,431,200 | |||||
California State, 5.50% due 3/1/2012 (Insured: FGIC) | Aaa/AAA | 230,000 | 232,431 | |||||
California State Department of Water Resources Power Series A, 5.50% due 5/1/2011 (Insured: MBIA) | Aaa/AAA | 2,000,000 | 2,215,960 | |||||
California State Department of Water Resources Power Supply Series A, 5.50% due 5/1/2008 | A2/BBB+ | 2,580,000 | 2,722,339 | |||||
California State Department of Water Resources Power Supply Series A, 5.25% due 5/1/2009 (Insured: MBIA) | Aaa/AAA | 800,000 | 858,016 | |||||
California State Economic Recovery Series A, 5.00% due 1/1/2008 | Aa3/AA- | 1,000,000 | 1,042,320 | |||||
California State Economic Recovery Series C-3, 2.77% due 7/1/2023 put 10/3/2005 (Guaranty: Landesbank) (daily demand notes) | VMIG1/A-1+ | 200,000 | 200,000 | |||||
California State Public Works Board Lease Revenue, 5.50% due 6/1/2010 (Various Universities Project) | Aa2/AA- | 530,000 | 575,299 | |||||
California State Public Works Board Lease Revenue, 5.00% due 11/1/2015 | Aa2/AA- | 1,000,000 | 1,078,130 | |||||
California State Public Works Lease Series A, 5.50% due 1/1/2017 (Department of Corrections Project; Insured:AMBAC) | Aaa/AAA | 3,285,000 | 3,370,738 | |||||
California State Refunding, 5.75% due 10/1/2010 (Insured: FSA) | Aaa/AAA | 1,000,000 | 1,115,060 | |||||
California State Series A-3, 2.77% due 5/1/2033 put 10/3/2005 (daily demand notes) | VMIG1/A-1+ | 800,000 | 800,000 | |||||
California State Veterans Bonds, 9.50% due 2/1/2010 (Insured: MBIA) | Aaa/AAA | 1,000,000 | 1,248,270 | |||||
California Statewide Community Development Authority COP, 5.25% due 7/1/2010 (St Joseph Health Systems Project) | Aa3/AA- | 560,000 | 594,054 | |||||
California Statewide Community Development Authority COP, 5.30% due 12/1/2015 (ETM) | Aaa/AAA | 2,600,000 | 2,697,188 | |||||
| Certified Annual Report | 17 |
SCHEDULE OF INVESTMENTS, CONTINUED
| ||
| Thornburg California Limited Term Municipal Fund | September 30, 2005 |
Issuer-Description | Credit Rating† Moody’s/S&P | Principal Amount | Value | |||||
California Statewide Community Development Authority Revenue, 5.125% due 6/1/2008 (Louisiana Orthopedic Hospital Foundation Project; Insured:AMBAC) | Aaa/AAA | $ | 595,000 | $ | 620,680 | |||
California Statewide Community Development Authority Revenue COP, 6.50% due 8/1/2012 (Cedars Sinai Center Hospital Project; Insured: MBIA) | Aaa/AAA | 860,000 | 948,133 | |||||
California Statewide Community Development Authority Revenue Series B, 5.00% due 6/1/2008 (Hospital Monterey Peninsula Project; Insured: FSA) | NR/AAA | 1,110,000 | 1,165,333 | |||||
California Statewide Community Development Authority Revenue Series B, 5.00% due 6/1/2009 (Hospital Monterey Peninsula Project; Insured: FSA) | NR/AAA | 1,180,000 | 1,254,069 | |||||
California Statewide Community Development Authority Revenue Series D, 4.35% due 11/1/2036 put 3/1/2007 (Kaiser Permanente Project) | VMIG2/A-1 | 1,000,000 | 1,015,210 | |||||
California Statewide Community Development Authority Series E, 3.875% due 4/1/2032 put 4/1/2010 (Kaiser Permanente Project) | NR/A-1 | 1,000,000 | 1,004,930 | |||||
California Statewide Community Development Authority Solid Waste Revenue, 2.90% due 4/1/2011 put 4/1/2007 (Waste Management Inc. Project) | NR/BBB | 1,000,000 | 988,120 | |||||
California Statewide Community Development Series E, 4.70% due 11/1/2036 put 6/1/2009 (Kaiser Permanente Project) | VMIG2/A-1 | 2,000,000 | 2,082,880 | |||||
Capistrano Unified School District 92-1 Community Facilities District Special Tax, 7.10% due 9/1/2021 pre-refunded 9/1/2007 | NR/NR | 890,000 | 965,321 | |||||
Castaic Lake Water Agency COP Refunding Series A, 7.25% due 8/1/2007 (Water Systems Improvement Project; Insured: MBIA) | Aaa/AAA | 1,000,000 | 1,075,470 | |||||
Central Union High School District Imperial County Refunding, 5.00% due 8/1/2011 (Insured: FGIC) | Aaa/AAA | 780,000 | 848,757 | |||||
Central Union High School District Imperial County Refunding, 5.00% due 8/1/2012 (Insured: FGIC) | Aaa/AAA | 830,000 | 907,447 | |||||
Central Valley Financing Authority Revenue, 6.00% due 7/1/2009 (Carson Ice Project) | NR/BBB | 165,000 | 167,953 | |||||
Central Valley School Districts Financing Authority, 0% due 2/1/2007 (Insured: MBIA) | Aaa/AAA | 205,000 | 196,933 | |||||
Coachella Valley California Unified School District COP Refunding, 5.00% due 9/1/2012 (Insured: MBIA) | Aaa/AAA | 800,000 | 869,568 | |||||
East Palo Alto Public Financing University Circle Gateway/101 Series A, 5.00% due 10/1/2014 (Insured: RADIAN) | NR/AA | 670,000 | 720,237 | |||||
East Palo Alto Public Financing University Circle Gateway/101 Series A, 5.00% due 10/1/2016 (Insured: RADIAN) | NR/AA | 735,000 | 789,735 | |||||
East Side Union High School District Santa Clara County Series B, 6.625% due 8/1/2006 (Insured: MBIA) | Aaa/AAA | 700,000 | 722,015 | |||||
East Side Union High School District Santa Clara County Series B, 6.625% due 8/1/2007 (Insured: MBIA) | Aaa/AAA | 840,000 | 895,516 | |||||
El Monte COP Senior Department Public Services Facility Phase II, 5.00% due 1/1/2009 (Insured:AMBAC) | Aaa/AAA | 2,730,000 | 2,852,659 | |||||
Emeryville Public Financing Authority Revenue Series A, 5.00% due 9/1/2012 (Emeryville Redevelopment Project; Insured:AMBAC) | Aaa/AAA | 2,295,000 | 2,510,776 | |||||
Escondido Joint Powers Financing Authority Lease Revenue Refunding, 0% due 9/1/2013 (California Center For The Arts Project; Insured:AMBAC) | Aaa/AAA | 500,000 | 310,270 | |||||
Escondido Multi Family Housing Revenue Refunding Bond Series 1997-A, 5.40% due 1/1/2027 put 7/1/2007 (Terrace Gardens Project; Collateralized: FNMA) | NR/AAA | 3,015,000 | 3,065,350 | |||||
Fresno County Housing Authority Multi Family Revenue Refunding Series A, 4.90%due 11/1/2027 mandatory put 11/1/2007 (Housing Creek Park Apartments Project; Collateralized: FNMA) | NR/AAA | 400,000 | 408,468 | |||||
Fresno Unified School District Series D, 5.00% due 8/1/2009 (ETM) | Aaa/AAA | 545,000 | 565,018 | |||||
Hawaiian Gardens Redevelopment Agency Refunding, 5.50% due 12/1/2008 | NR/BBB+ | 575,000 | 609,488 | |||||
Julian Union High School District, 4.875% due 11/1/2005 (Insured: MBIA) | Aaa/AAA | 155,000 | 155,273 | |||||
Kern High School District, 7.00% due 8/1/2010 (ETM) | Aaa/NR | 165,000 | 192,393 | |||||
Kern High School District Refunding Series A, 6.30% due 8/1/2011 (Insured: MBIA) | Aaa/AAA | 500,000 | 571,850 | |||||
18 | Certified Annual Report |
SCHEDULE OF INVESTMENTS, CONTINUED
| ||
| Thornburg California Limited Term Municipal Fund | September 30, 2005 |
Issuer-Description | Credit Rating† Moody’s/S&P | Principal Amount | Value | |||||
Kern High School District Series B, 9.00% due 8/1/2006 (ETM) | Aaa/AAA | $ | 680,000 | $ | 714,048 | |||
Los Angeles Community Redevelopment Agency, 5.00% due 7/1/2009 (Cinerama Dome Public Parking Project; Insured:ACA) | NR/A | 835,000 | 872,066 | |||||
Los Angeles Community Redevelopment Agency, 5.75% due 7/1/2010 (Cinerama Dome Public Parking Project; Insured:ACA) | NR/A | 435,000 | 470,948 | |||||
Los Angeles Community Redevelopment Agency, 5.00% due 9/1/2012 (Insured:AMBAC) | Aaa/NR | 1,810,000 | 1,959,325 | |||||
Los Angeles Convention & Exhibition Center, 9.00% due 12/1/2020 pre-refunded 12/1/2005 | Aaa/AAA | 5,000 | 5,052 | |||||
Los Angeles COP, 5.00% due 2/1/2012 (Insured: MBIA) | Aaa/AAA | 1,400,000 | 1,515,458 | |||||
Los Angeles County Capital Asset, 5.00% due 4/1/2008 (Insured:AMBAC) | Aaa/AAA | 2,000,000 | 2,096,740 | |||||
Los Angeles County Public Works Refunding Series A, 5.00% due 12/1/2008 (Master Refunding Project; Insured: MBIA) | Aaa/AAA | 2,000,000 | 2,119,560 | |||||
Los Angeles Department of Water & Power Revenue Refunding Series A Subseries A-1, 5.00% due 7/1/2008 (Power Systems Project) | Aa3/AA- | 1,000,000 | 1,053,500 | |||||
Los Angeles Department of Water & Power Revenue Series A, 5.25% due 7/1/2011 (Insured: MBIA) | Aaa/AAA | 3,000,000 | 3,295,830 | |||||
Los Angeles Multi Family Revenue, 5.85% due 12/1/2027 put 12/01/2007 (Collateralized: FNMA) | NR/AAA | 1,925,000 | 1,969,352 | |||||
Los Angeles Regional Airport Lease Refunding, 5.25% due 1/1/2009 (Facilities Laxfuel Corp. LA International Project; Insured:AMBAC) | Aaa/AAA | 1,590,000 | 1,664,285 | |||||
Los Angeles Unified School District Series E, 5.50% due 7/1/2012 (Insured: MBIA) | Aaa/AAA | 2,500,000 | 2,806,225 | |||||
Milpitas California Agency Tax Allocation Redevelopment Project Area No 1, 5.00% due 9/1/2015 (Insured: MBIA) | Aaa/AAA | 2,000,000 | 2,152,400 | |||||
Moorpark Mobile Home Park Revenue Series A, 5.80% due 5/15/2010 (Villa Delaware Arroyo Project; Insured:ACA) | NR/A | 1,205,000 | 1,225,449 | |||||
New Haven Unified School District Refunding, 12.00% due 8/1/2006 (Insured: FSA) | Aaa/AAA | 1,400,000 | 1,502,732 | |||||
New Haven Unified School District Refunding, 12.00% due 8/1/2008 (Insured: FSA) | Aaa/AAA | 1,000,000 | 1,234,620 | |||||
Northern California Power Agency Public Power Revenue, 5.65% due 7/1/2007 (Geothermal Project 3-A) (ETM) | Baa2/BBB+ | 360,000 | 376,783 | |||||
Northern California Power Agency Public Power Revenue, 5.65% due 7/1/2007 | Baa2/BBB+ | 340,000 | 353,280 | |||||
Northern California Power Agency Public Power Revenue Series A, 5.00% due 7/1/2009 (Geothermal Project Number 3) | Baa2/BBB+ | 4,000,000 | 4,004,520 | |||||
Oakland Redevelopment Agency, 7.40% due 5/1/2007 (Insured:AMBAC) | Aaa/AAA | 40,000 | 40,150 | |||||
Ontario Montclair School District COP Refunding, 3.80% due 9/1/2028 put 8/31/2007 (School Facility Bridge Funding Project; Insured: FSA) | VMIG1/A-1 | 1,680,000 | 1,680,739 | |||||
Orange County Airport Revenue Bond, 6.00% due 7/1/2007 (Insured: MBIA) | Aaa/AAA | 1,000,000 | 1,047,130 | |||||
Orange County Local Transportation Authority Sales Tax Revenue, 6.00% due 2/15/2006 | Aa2/AA+ | 510,000 | 515,941 | |||||
Orange County Recovery COP Series A, 6.00% due 7/1/2006 (Insured: MBIA) | Aaa/AAA | 600,000 | 614,130 | |||||
Oxnard Financing Authority Solid Refunding, 5.00% due 5/1/2013 (Insured:AMBAC) | Aaa/AAA | 2,115,000 | 2,245,453 | |||||
Oxnard HBR District Revenue Refunding, 5.65% due 8/1/2014 (Insured:ACA) | NR/A | 1,520,000 | 1,589,859 | |||||
Piedmont Unified School District Series B, 0% due 8/1/2013 pre-refunded 8/1/2007 | Aa3/NR | 1,000,000 | 656,020 | |||||
Pittsburg California Redevelopment Agency Tax Allocation Refunding, 5.25% due 8/1/2012 (Los Medanos Community Development Project A; Insured: MBIA) | Aaa/AAA | 3,350,000 | 3,698,165 | |||||
Pomona Unified School District Refunding Series A, 6.10% due 2/1/2010 (Insured: MBIA) | Aaa/AAA | 320,000 | 357,235 | |||||
Porterville COP, 6.10% due 10/1/2005 (Water Systems Refunding Project; Insured:AMBAC) | Aaa/AAA | 295,000 | 295,027 | |||||
Puerto Rico Commonwealth Highway & Transportation Authority, 5.50% due 7/1/2009 (Insured: FSA) | Aaa/AAA | 1,000,000 | 1,082,510 | |||||
Puerto Rico Commonwealth Highway & Transportation Authority Highway Revenue Refunding Series A, 5.00% due 7/1/2008 (Insured: FGIC) | Aaa/AAA | 1,000,000 | 1,051,340 | |||||
Puerto Rico Municipal Finance Agency Series A, 6.00% due 7/1/2011 (Insured: FSA) | Aaa/AAA | 600,000 | 682,530 | |||||
Richmond Joint Powers Financing Authority Refunding Lease & Gas Tax Series A, 5.25% due 5/15/2013 | NR/NR | 2,000,000 | 2,046,080 | |||||
Sacramento County Sanitation District Financing Authority Revenue Series A, 5.75% due 12/1/2009 | Aa3/AA | 560,000 | 614,678 | |||||
Sacramento County Sanitation District Financing Authority Revenue Series A, 5.875% due 12/1/2027 Crossover refunded 12/1/2005 | Aa3/AA | 2,500,000 | 2,536,800 | |||||
Sacramento Municipal Utility District Electric Revenue Refunding Series C, 5.75% due 11/15/2007 (ETM) | Aaa/AAA | 330,000 | 330,406 | |||||
| Certified Annual Report | 19 |
SCHEDULE OF INVESTMENTS, CONTINUED
| ||
| Thornburg California Limited Term Municipal Fund | September 30, 2005 |
Issuer-Description | Credit Rating† Moody’s/S&P | Principal Amount | Value | |||||
Sacramento Municipal Utility District Refunding Series L, 5.10% due 7/1/2014 (Insured:AMBAC) | Aaa/AAA | $ | 1,000,000 | $ | 1,052,980 | |||
Sacramento Power Authority Revenue, 5.875% due 7/1/2015 pre-refunded 7/1/2006 (Cogeneration Project; Insured: MBIA) | Aaa/AAA | 2,500,000 | 2,606,100 | |||||
Salinas Redevelopment Agency Tax Allocation Series A, 0% due 11/1/2022 (Insured: FSA) | Aaa/AAA | 1,450,000 | 577,840 | |||||
San Bernardino County Multi Family Housing Revenue Refunding Series A, 4.75% due 12/15/2031 put 12/15/2011 (Collateralized: FNMA) | Aaa/NR | 3,000,000 | 3,144,630 | |||||
San Bernardino County Special Taxes Community Facilities District 2002-1, 5.10% due 9/1/2011 | NR/NR | 190,000 | 196,458 | |||||
San Bernardino County Special Taxes Community Facilities District 2002-1, 5.20% due 9/1/2012 | NR/NR | 205,000 | 212,456 | |||||
San Bernardino County Special Taxes Community Facilities District 2002-1, 5.30% due 9/1/2013 | NR/NR | 300,000 | 311,775 | |||||
San Bernardino County Transportation Authority Sales Tax Revenue Series A, 6.00% due 3/1/2010 (ETM) | Aaa/AAA | 175,000 | 187,324 | |||||
San Diego County Regional Transportation Commission Sales Tax Revenue Series A, 6.00% due 4/1/2008 (ETM) | Aaa/AA- | 590,000 | 619,642 | |||||
San Diego Public Facilities Financing Authority Lease Revenue, 7.00% due 4/1/2006 (Insured: MBIA) | Aaa/AAA | 455,000 | 464,428 | |||||
San Diego Public Facilities Financing Authority Lease Revenue, 7.00% due 4/1/2007 (Insured: MBIA) | Aaa/AAA | 425,000 | 450,249 | |||||
San Francisco Bay Area Transit Bridge Toll Notes, 5.625% due 8/1/2006 (Insured:ACA) | NR/A | 1,400,000 | 1,428,658 | |||||
San Francisco City & County Capital Appreciation George R Moscone, 0% due 7/1/2010 | A1/AA- | 1,380,000 | 1,149,098 | |||||
San Francisco International Airport Revenue AMT Special Facilities Lease, 5.25% due 1/1/2019 (Insured:AMBAC) | Aaa/AAA | 1,000,000 | 1,041,910 | |||||
San Francisco International Airport Revenue Series Issue 13B, 8.00% due 5/1/2007 (Insured: MBIA) | Aaa/AAA | 1,100,000 | 1,141,030 | |||||
San Francisco Laguna Honda Hospital Series I, 5.00% due 6/15/2014 (Insured: FSA) | Aaa/AAA | 2,320,000 | 2,525,320 | |||||
San Jose Evergreen Community College District Series C, 0% due 9/1/2011 crossover refunded 9/1/2010 (Insured:AMBAC) | Aaa/AAA | 2,200,000 | 1,730,146 | |||||
San Jose Financing Authority Lease Revenue Series D, 5.00% due 6/1/2039 mandatory put 6/1/2006 (Civic Center Project; Insured:AMBAC) | Aaa/AAA | 2,700,000 | 2,738,340 | |||||
San Marcos Public Facilities Authority Revenue Community Facilities District 88-1, 0% due 3/1/2008 (ETM) | Aaa/NR | 1,900,000 | 1,759,229 | |||||
Santa Clara Valley Transportation Authority Sales Tax Revenue Measure A, 5.50% due 4/1/2036 put 10/2/2006 (Insured:AMBAC) | Aaa/AAA | 1,810,000 | 1,859,974 | |||||
Seal Beach Redevelopment Agency Mobile Home Park Revenue Series A, 5.20% due 12/15/2013 (Insured:ACA) | NR/A | 575,000 | 612,605 | |||||
South Orange County Public Financing Authority Special Tax Revenue Series C, 8.00% due 8/15/2008 (Foothill Area Project; Insured: FGIC) | Aaa/AAA | 1,500,000 | 1,699,710 | |||||
Southeast Resources Recovery Facilities Authority Lease Revenue Refunding Series B, 5.375% due 12/1/2013 (Insured:AMBAC) | Aaa/AAA | 1,060,000 | 1,152,803 | |||||
Southern California Revenue, 5.15% due 7/1/2015 (Public Power Project; Insured:AMBAC) | Aaa/AAA | 350,000 | 383,404 | |||||
Southern California Revenue, 5.15% due 7/1/2015 (Public Power Project; Insured:AMBAC) | Aaa/AAA | 250,000 | 273,860 | |||||
Stanton Multi Family Housing Revenue Bond Series 1997, 5.625% due 8/1/2029 put 8/1/2009 (Continental Gardens Project; Collateralized: FNMA) | NR/AAA | 3,200,000 | 3,350,368 | |||||
Ukiah Unified School District COP, 5.00% due 9/1/2008 (Insured: MBIA) | Aaa/AAA | 1,000,000 | 1,054,820 | |||||
Val Verde Unified School District COP, 5.00% due 1/1/2014 (Insured: FGIC) | NR/AAA | 445,000 | 486,790 | |||||
Val Verde Unified School District Series B, 5.00% due 1/1/2013 (Refunding Project; Insured: FGIC) | NR/AAA | 360,000 | 388,562 | |||||
Val Verde Unified School District Series B, 5.00% due 1/1/2014 (Refunding Project; Insured: FGIC) | NR/AAA | 430,000 | 464,968 | |||||
Ventura County Community College Series A, 5.00% due 8/1/2012 (Insured: MBIA) | Aaa/AAA | 500,000 | 546,655 | |||||
Victorville Redevelopment Agency Tax Allocation Bear Valley Road Special Escrow Fund A, 5.00% due 12/1/2014 (Insured: FSA) | Aaa/AAA | 455,000 | 456,652 | |||||
Walnut Valley Unified School District, 9.00% due 8/1/2006 (ETM) | Aaa/AAA | 800,000 | 840,056 | |||||
Walnut Valley Unified School District, 8.75% due 8/1/2010 (ETM) | Aaa/AAA | 1,000,000 | 1,242,860 | |||||
Walnut Valley Unified School District Series A, 6.80% due 2/1/2007 (Insured: MBIA) | Aaa/AAA | 250,000 | 262,810 | |||||
Walnut Valley Unified School District Series A, 6.90% due 2/1/2008 (Insured: MBIA) | Aaa/AAA | 250,000 | 272,020 | |||||
Walnut Valley Unified School District Series A, 7.00% due 8/1/2008 (Insured: MBIA) | Aaa/AAA | 100,000 | 110,743 | |||||
Washington Township Health Care District Revenue, 5.00% due 7/1/2009 | A2/NR | 450,000 | 469,818 | |||||
20 | Certified Annual Report |
| SCHEDULE OF INVESTMENTS, CONTINUED | ||
| Thornburg California Limited Term Municipal Fund | September 30, 2005 | |
Issuer-Description | Credit Rating† Moody’s/S&P | Principal Amount | Value | |||||
West Contra Costa Unified School District Series A, 7.00% due 8/1/2006 (Insured: MBIA) | Aaa/AAA | $ | 595,000 | $ | 615,563 | |||
West Contra Costa Unified School District Series A, 7.00% due 8/1/2008 (Insured: MBIA) | Aaa/AAA | 655,000 | 725,367 | |||||
Whittier Solid Waste Revenue Refunding Series A, 5.375% due 8/1/2014 (Insured:AMBAC) | Aaa/AAA | 1,000,000 | 1,002,070 | |||||
TOTAL INVESTMENTS — 98.65% (Cost $ 157,860,495) | $ | 159,787,339 | ||||||
OTHER ASSETS LESS LIABILITIES — 1.35% | 2,178,819 | |||||||
NET ASSETS — 100.00% | $ | 161,966,158 | ||||||
Footnote Legend
See notes to financial statements.
| † | Credit ratings are unaudited. Rating changes may have occurred prior to or subsequent to the reporting period end. |
Portfolio Abbreviations
To simplify the listings of securities, abbreviations are used per the table below:
| ACA | Insured by American Capital Access | |
| AMBAC | Insured by American Municipal Bond Assurance Corp. | |
| AMT | Alternative Minimum Tax | |
| COP | Certificates of Participation | |
| ETM | Escrowed to Maturity | |
| FGIC | Insured by Financial Guaranty Insurance Co. | |
| FNMA | Collateralized by Federal National Mortgage Association | |
| FSA | Insured by Financial Security Assurance Co. | |
| GNMA | Insured by Government National Mortgage Co. | |
| GO | General Obligation | |
| MBIA | Insured by Municipal Bond Investors Assurance | |
| RADIAN | Insured by Radian Asset Assurance |
SUMMARY OF SECURITY CREDIT RATINGS†
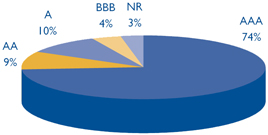
Ratings are a blend of Moody’s and Standard & Poor’s, using the higher rating. Some bonds are rated by only one service.
| Certified Annual Report | 21 |
REPORT OF INDEPENDENT REGISTERED PUBLIC ACCOUNTING FIRM
Thornburg California Limited Term Municipal Fund
To the Trustees and Shareholders of
Thornburg California Limited Term Municipal Fund
In our opinion, the accompanying statement of assets and liabilities, including the schedule of investments, and the related statements of operations and of changes in net assets and the financial highlights present fairly, in all material respects, the financial position of Thornburg California Limited Term Municipal Fund (one of the Portfolios constituting Thornburg Investment Trust, hereafter referred to as the “Fund”) at September 30, 2005, the results of its operations for the year then ended, the changes in its net assets and the financial highlights for each of the periods presented, in conformity with accounting principles generally accepted in the United States of America. These financial statements and financial highlights (hereafter referred to as “financial statements”) are the responsibility of the Fund’s management. Our responsibility is to express an opinion on these financial statements based on our audits. We conducted our audits of these financial statements in accordance with the standards of the Public Company Accounting Oversight Board (United States). Those standards require that we plan and perform the audit to obtain reasonable assurance about whether the financial statements are free of material misstatement. An audit includes examining, on a test basis, evidence supporting the amounts and disclosures in the financial statements, assessing the accounting principles used and significant estimates made by management, and evaluating the overall financial statement presentation. We believe that our audits, which included confirmation of securities at September 30, 2005 by correspondence with the custodian and brokers, provide a reasonable basis for our opinion.
PricewaterhouseCoopers LLP
New York, New York
November 16, 2005
22 | Certified Annual Report |
| EXPENSE EXAMPLE | ||
| Thornburg California Limited Term Municipal Fund | September 30, 2005 (Unaudited) | |
As a shareholder of the Fund, you incur two types of costs:
(1) transaction costs, including
(a) sales charges (loads) on purchase payments, for Class A Shares;
(b) a deferred sales charge on redemptions of any part or all of a purchase of $1 million of Class A shares within 12 months of purchase;
(c) a deferred sales charge on redemptions of Class C shares within 12 months of purchase;
(2) ongoing costs, including management fees; distribution and/or service (12b-1) fees; and other Fund expenses.
This example is intended to help you understand your ongoing costs (in dollars) of investing in the Fund and to compare these costs with the ongoing costs of investing in other mutual funds.
The example is based on an investment of $1,000 invested on March 31, 2005 and held until September 30, 2005.
Actual Expenses
The first line of the table at right provides information about actual account values and actual expenses. You may use the information in this line, together with the amount you invested, to estimate the expenses that you paid over the period. Simply divide your account value by $1,000 (for example, an $8,600 account value divided by $1,000 = 8.6), then multiply the result by the number in the first line under the heading entitled “Expenses Paid During Period” to estimate the expenses you paid on your account during this period.
Hypothetical Example for Comparison Purposes
The second line of the table at right provides information about hypothetical account values and hypothetical expenses based on the Fund’s actual expense ratio and an assumed rate of return of 5% per year before expenses, which is not the Fund’s actual return. The hypothetical account values and expenses may not be used to estimate the actual ending account balance or expenses you paid for the period. You may use this information to compare the ongoing costs of investing in the Fund and other funds. To do so, compare this 5% hypothetical example with the 5% hypothetical examples that appear in the shareholder reports of the other funds.
Beginning Account Value 3/31/05 | Ending Account Value 9/30/05 | Expenses Paid During Period† 3/31/05-9/30/05 | |||||||
Class A Shares | |||||||||
Actual | $ | 1,000 | $ | 1,012.80 | $ | 4.98 | |||
Hypothetical* | $ | 1,000 | $ | 1,020.12 | $ | 5.00 | |||
Class C Shares | |||||||||
Actual | $ | 1,000 | $ | 1,011.50 | $ | 6.27 | |||
Hypothetical* | $ | 1,000 | $ | 1,018.83 | $ | 6.29 | |||
Class I Shares | |||||||||
Actual | $ | 1,000 | $ | 1,014.40 | $ | 3.38 | |||
Hypothetical* | $ | 1,000 | $ | 1,021.71 | $ | 3.39 | |||
| † | Expenses are equal to the annualized expense ratio for each class (A: 0.99%; C: 1.24%; and I: 0.67%) multiplied by the average account value over the period, multiplied by 183/365 to reflect the one-half year period. |
| * | Hypothetical assumes a rate of return of 5% per year before expenses. |
Please note that the expenses shown in the table are meant to highlight your ongoing costs only and do not reflect any transactional costs, such as sales charges (loads), redemption fees, or exchange fees. Therefore, the second line of the table is useful in comparing ongoing costs only, and will not help you determine the relative total costs of owning different funds. In addition, if these transactional costs were included, your costs would have been higher.
| Certified Annual Report | 23 |
| INDEX COMPARISON | ||
| Thornburg California Limited Term Municipal Fund | September 30, 2005 (Unaudited) | |
GROWTH OF A HYPOTHETICAL $10,000 INVESTMENT
Thornburg California Limited Term Municipal Fund Class A Total Returns versus Lehman
Brothers Five-Year Municipal Bond Index and Consumer Price Index
(February 28, 1987 to September 30, 2005)
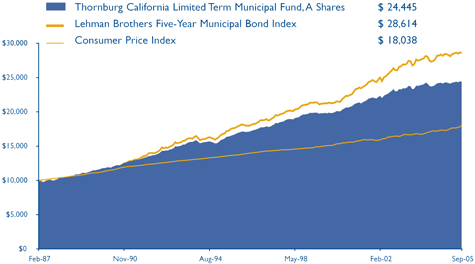
AVERAGE ANNUAL TOTAL RETURNS
For the periods ended September 30, 2005 (with sales charge)
| 1 Yr | 5 Yrs | 10 Yrs | Since Inception | |||||||||
A Shares (Incep: 2/19/87) | (0.55 | )% | 3.14 | % | 3.73 | % | 4.92 | % | ||||
C Shares (Incep: 9/1/94) | 0.22 | % | 3.12 | % | 3.52 | % | 3.67 | % |
FUND ATTRIBUTES
as of September 30, 2005
| Annualized Dist. Rate (@NAV) | SEC Yield | NAV | Maximum Offering Price | |||||||||
A Shares (Incep: 2/19/87) | 2.98 | % | 2.49 | % | $ | 12.79 | $ | 12.98 | ||||
C Shares (Incep: 9/1/94) | 2.72 | % | 2.25 | % | $ | 12.80 | $ | 12.80 | ||||
Performance data reflect past performance, which is no guarantee of future results. The performance data and graph do not reflect the deduction of taxes that a shareholder would pay on distributions or the redemption of Fund shares.
Returns reflect the reinvestment of dividends and capital gains as well as applicable sales charges. Class A Shares are sold with a maximum sales charge of 1.50%. C shares assume deduction of a 0.50% contingent deferred sales charge (CDSC) for the first year only.
The Consumer Price Index (“CPI”) measures prices of a fixed basket of goods bought by a typical consumer, including food, transportation, shelter, utilities, clothing, medical care, entertainment and other items. The CPI, published by the Bureau of Labor Statistics in the Department of Labor, is based at 100 in 1982 and is released monthly. It is widely used as a cost-of-living benchmark to adjust Social Security payments and other payment schedules, union contracts and tax brackets. The CPI is also known as the cost-of-living index.
The Lehman Brothers Five-Year Municipal Bond Index is a rules-based, market-value-weighted index engineered for the long-term tax-exempt bond market. To be included in the index, bonds must have a minimum credit rating of Baa. The approximate maturity of the municipal bonds in the index is five years.
Unless otherwise noted, index returns reflect the reinvestment of income dividends and capital gains, if any, but do not reflect fees, brokerage commissions or other expenses of investing. Investors may not make direct investments into any index.
The SEC Yield is computed in accordance with SEC standards measuring the net investment income per share over a specified 30-day period expressed as a percentage of the maximum offering price of the Fund’s shares at the end of the period.
The distribution rate is calculated by taking the sum of the month’s total distribution factors and dividing this sum by a 30-day period and annualizing to 360-day year. The value is then divided by the ending Net Asset Value (NAV) to arrive at the annualized distribution yield. The yield is calculated on a periodic basis and is subject to change depending on the Fund’s NAV and current distributions.
24 | Certified Annual Report |
| TRUSTEES AND OFFICERS | ||
| Thornburg California Limited Term Municipal Fund | September 30, 2005 (Unaudited) | |
Name, Age, Year Elected | Principal Occupation(s) During Past Five Years | Other Directorships Held by Trustee | ||
INTERESTED TRUSTEES (1)(2)(4) | ||||
Garrett Thornburg, 59 Chairman of Trustees, Trustee since 1987(3) | CEO, Chairman and controlling shareholder of Thornburg Investment Management, Inc. (investment advisor) and Thornburg Securities Corporation (securities dealer); Chairman of Thornburg Limited Term Municipal Fund, Inc. (registered investment company) to 2004; CEO and Chairman of Thornburg Mortgage, Inc. (real estate investment trust); Chairman of Thornburg Mortgage Advisory Corporation (investment manager to Thornburg Mortgage, Inc.). | Director of Thornburg Mortgage, Inc. (real estate investment trust) | ||
Brian J. McMahon, 49 Trustee since 2001, Member of Governance & Nominating Committee, President since 1997(5)(6) | President and Managing Director of Thornburg Investment Management, Inc.; President of Thornburg Limited Term Municipal Fund, Inc. to 2004. | None | ||
INDEPENDENT TRUSTEES (1)(2)(4) | ||||
David A.Ater, 60 Trustee since 1994, Member of Audit Committee and Governance & Nominating Committee | Principal in Ater & Associates, Santa Fe, NM (developer, planner and broker of residential and commercial real estate); owner developer and broker for various real estate projects. | Director of Thornburg Mortgage, Inc. (real estate investment trust) | ||
David D. Chase, 64 Chairman of Audit Committee, Trustee since 2000 | Chairman, President, CEO, and Managing Member of Vestor Associates, LLC, the general partner of Vestor Partners, LP, Santa Fe, NM (private equity fund); Chairman and CEO of Vestor Holdings, Inc., Santa Fe, NM (merchant bank). | None | ||
Eliot R. Cutler, 59 Chairman of Governance & Nominating Committee, Trustee since 2004 | Partner,Akin, Gump, Strauss, Hauer & Feld, LLP,Washington, D.C. (law firm) since November 2000; partner, Cutler & Stanfield,Washington, D.C. (law firm) until November 2000. | Director of Thornburg Mortgage, Inc. (real estate investment trust) | ||
Susan H. Dubin, 56 Trustee since 2004, Member of Audit Committee | President of Dubin Investments, Ltd., Greenwich, CT (private investment fund); Director and officer of various charitable organizations; and formerly, Vice President of Chemical Bank (predecessor to JP Morgan Chase & Co.), New York, 1974–1996. | None | ||
Owen D.Van Essen, 51 Trustee since 2004, Member of Governance & Nominating Committee | President of Dirks,Van Essen & Murray, Santa Fe, NM (newspaper mergers and acquisitions). | None | ||
James W. Weyhrauch, 46 Trustee since 1996, Member of Audit Committee | Director, Executive Vice President to 2002, and President and CEO 2002–2004, Nambé Mills, Inc., Santa Fe, NM (manufacturer); real estate agent, Santa Fe Properties, Santa Fe, NM since 2004. | None | ||
| Certified Annual Report | 25 |
| TRUSTEES AND OFFICERS, CONTINUED | ||
| Thornburg California Limited Term Municipal Fund | September 30, 2005 (Unaudited) | |
Name, Age, Position Held with Fund Year Elected | Principal Occupation(s) During Past Five Years | Other Directorships Held by Trustee | ||
OFFICERS OF THE FUND (WHO ARE NOT TRUSTEES)(1)(6)(7) | ||||
Dawn B. Fischer, 58 Secretary since 1987 | Secretary and Managing Director,Thornburg Investment Management, Inc.; Secretary,Thornburg Limited Term Municipal Fund, Inc. to 2004; Secretary, Thornburg Securities Corporation; Vice President, Daily Tax Free Income Fund, Inc. (registered investment company). | Not applicable | ||
Steven J. Bohlin, 46 Vice President since 1987; Treasurer since 1989 | Vice President and Managing Director of Thornburg Investment Management, Inc.; Vice President of Thornburg Limited Term Municipal Fund, Inc. to 2004. | Not applicable | ||
George T. Strickland, 42 Vice President since 1996 | Vice President and Managing Director of Thornburg Investment Management, Inc.; Vice President (to 2004) and Treasurer (2003–2004) of Thornburg Limited Term Municipal Fund, Inc. | Not applicable | ||
William V. Fries, 66 Vice President since 1995 | Vice President and Managing Director of Thornburg Investment Management, Inc. | Not applicable | ||
Leigh Moiola, 38 Vice President since 2001 | Vice President and Managing Director of Thornburg Investment Management, Inc.; Vice President of Thornburg Limited Term Municipal Fund, Inc. 1999–2004. | Not applicable | ||
Kenneth Ziesenheim, 51 Vice President since 1995 | Vice President and Managing Director of Thornburg Investment Management, Inc.; President of Thornburg Securities Corporation; Vice President of Thornburg Limited Term Municipal Fund, Inc. to 2004. | Not applicable | ||
Alexander Motola, 35 Vice President since 2001 | Vice President and Managing Director of Thornburg Investment Management, Inc. since 2000; Portfolio Manager, Insight Capital Research & Management, Inc., Walnut Creek, California 1995–2000. | Not applicable | ||
Wendy Trevisani, 34 Vice President since 1999 | Associate Portfolio Manager of Thornburg Investment Management, Inc. since 1999, Vice President since 2000 and Managing Director since 2003; Vice President of Thornburg Limited Term Municipal Fund, Inc. 1999–2002. | Not applicable | ||
Joshua Gonze, 42 Vice President since 1999 | Associate Portfolio Manager of Thornburg Investment Management, Inc. since 1999, Vice President since 1999 and Managing Director since 2003; Vice President of Thornburg Limited Term Municipal Fund, Inc. to 2004. | Not applicable | ||
Brad Kinkelaar, 37 Vice President since 1999 | Associate Portfolio Manager of Thornburg Investment Management, Inc. since 1999, Vice President since 2000 and Managing Director since 2003. | Not applicable | ||
Christopher Ihlefeld, 35 Vice President since 2003 | Associate Portfolio Manager since 1999; Vice President of Thornburg Investment Management, Inc. since 2002; Vice President of Limited Term Municipal Fund, Inc., 2003–2004. | Not applicable | ||
Leon Sandersfeld, 39 Vice President since 2003 | Associate of Thornburg Investment Management, Inc. since 2002; Senior Staff Accountant, Farm Bureau Life Insurance Co. 1998–2002. | Not applicable | ||
26 | Certified Annual Report |
| TRUSTEES AND OFFICERS, CONTINUED | ||
| Thornburg California Limited Term Municipal Fund | September 30, 2005 (Unaudited) | |
Name, Age, Position Held with Fund Year Elected | Principal Occupation(s) During Past Five Years | Other Directorships Held by Trustee | ||
Sasha Wilcoxon, 31 Vice President since 2003 | Associate of Thornburg Investment Management, Inc. since 2000 and Mutual Fund Operations Department Manager since 2002. | Not applicable | ||
Ed Maran, 47 Vice President since 2004 | Associate Portfolio Manager of Thornburg Investment Management, Inc. since 2002 and Vice President and Managing Director since 2004; Analyst, USAA 2001–2002; Oil Analyst, A.G. Edwards 1997–2000. | Not applicable | ||
Vinson Walden, 35 Vice President since 2004 | Associate Portfolio Manager of Thornburg Investment Management, Inc. since 2002 and Vice President and Managing Director since 2004; Associate Portfolio Manager, Ibis Management 2002–2004; Associate, Lehman Brothers, 1997–2001. | Not applicable | ||
| (1) | Each person’s address is 119 East Marcy Street, Santa Fe, New Mexico 87501. |
| (2) | The Fund is one of twelve separate investment “Funds” or “series” of Thornburg Investment Trust (the “Trust”), which comprises the Thornburg mutual fund complex and is organized as a Massachusetts business trust. The Trust currently has twelve active Funds. Thornburg Investment Management, Inc. is the investment advisor to, and manages, the twelve Funds of the Trust. Each Trustee oversees the twelve Funds in the fund complex. |
| (3) | Mr.Thornburg is considered an “interested” Trustee under the Investment Company Act of 1940 because he is a director and controlling shareholder of Thornburg Investment Management, Inc., the investment advisor to the twelve active Funds of the Trust, and is the sole director and controlling shareholder of Thornburg Securities Corporation, the distributor of shares for the Trust. |
| (4) | Each Trustee serves in office until the election and qualification of a successor. |
| (5) | Mr. McMahon is considered an “interested” Trustee because he is the president of Thornburg Investment Management, Inc. |
| (6) | The Trust’s president, secretary and treasurer each serves a one-year term or until the election and qualification of a successor; each other officer serves at the pleasure of the Trustees. |
| (7) | Assistant vice presidents, assistant secretaries and assistant treasurers are not shown. |
The Statement of Additional Information for each Fund of the Trust includes additional information about the Trustees and is available, without charge and upon request, by calling 1-800-847-0200.
| Certified Annual Report | 27 |
| OTHER INFORMATION | ||
| Thornburg California Limited Term Municipal Fund | September 30, 2005 (Unaudited) | |
PORTFOLIO PROXY VOTING
Policies and Procedures:
The Trust has delegated to Thornburg Investment Management, Inc. (the “Advisor”) voting decisions respecting proxies for the Fund’s voting securities. The Advisor makes voting decisions in accordance with its Proxy Voting Policy and Procedures. A description of the Policy and Procedures is available (i) without charge, upon request, by calling the Advisor toll-free at 1-800-847-0200, (ii) on the Thornburg website at www.thornburg.com, and (iii) on the Securities and Exchange Commission’s website at www.sec.gov.
Commencing August 31, 2004, information regarding how proxies were voted is available on or before August 31 of each year for the twelve months ending the preceding June 30. This information is available (i) without charge, upon request by calling the Advisor toll-free at 1-800-847-0200, (ii) on the Thornburg website at www.thornburg.com, and (iii) on the Securities and Exchange Commission’s website at www.sec.gov.
TAX INFORMATION
For the fiscal year ended September 30, 2005, 100% of dividends paid by the Fund are tax exempt dividends for Federal Income Tax purposes. The information and distributions reported herein may differ from the information and distributions taxable to the shareholders for the calendar year ending December 31, 2005.
AVAILABILITY OF QUARTERLY PORTFOLIO SCHEDULE
The Fund files with the Securities and Exchange Commission schedules of its portfolio holdings on Form N-Q for the first and third quarters of each fiscal year. The Fund’s Forms N-Q are available on the Commission’s website at www.sec.gov, or may be reviewed and copied at the Commission’s Public Reference Room in Washington, D.C. Information on the operation of the Public Reference Room may be obtained by calling 1-800-SEC-0330. The Fund also makes this information available on its website at www.thornburg.com/download or upon request by calling 1-800-847-0200.
TRUSTEES DELIBERATIONS RESPECTING RENEWAL OF INVESTMENT ADVISORY AGREEMENT
Thornburg Investment Management, Inc. (the “Advisor”) provides investment management services to Thornburg California Limited Term Municipal Fund pursuant to an investment advisory agreement. The Trustees consider the renewal of this agreement annually and most recently determined to renew the agreement on September 13, 2005.
In connection with their general supervision of the Advisor, the Trustees receive and consider reports throughout the year from the Advisor respecting the Advisor’s management of the Fund’s investments. These reports include information about the Fund’s purchase and sale of portfolio investments and explanations from the Advisor respecting investment selections, the investment performance of the Fund, general appraisals of industry and economic prospects and factors, and other matters affecting the Fund and relating to the Advisor’s performance of services for the Fund.
In anticipation of their recent consideration of the advisory agreement’s renewal, the independent Trustees met with representatives of the Advisor in May and July 2005 to specify the information the Advisor would present to the Trustees for their review. The independent Trustees thereafter met in independent session to consider various factors respecting the agreement’s renewal, and met in a subsequent session with the Advisor’s chief investment officer to present questions. Following these sessions, the Trustees met on September 13, 2005 to consider a renewal of the advisory agreement.
The Trustees considered various factors in their review of the Advisor’s performance under the investment advisory agreement, including specifically the principles outlined in their February 2005 Statement to Shareholders, a copy of which accompanies this Annual Report to Shareholders. Summarized below are certain of the factors considered by the Trustees in connection with the determination to renew the advisory agreement. In determining to renew the advisory agreement, the Trustees did not identify any single fact or aspect of the Advisor’s performance as controlling, and this summary does not describe all of the matters considered by the Trustees in making their determination.
Quality of Services; Fund Investment Performance. In reviewing the nature, extent, and quality of services provided by the Advisor and the investment performance of the Fund, the Trustees primarily considered the Advisor’s adherence to the Fund’s stated objectives and policies, the Advisor’s execution of the Fund’s investment strategies in prevailing market conditions, the Fund’s absolute investment performance, the Fund’s investment performance compared to categories of other broadly similar mutual funds and broad based securities indices, the Fund’s investment performance over different periods of time, the Fund’s total returns in rising and declining markets compared to total returns of a category of generally similar mutual funds and a broad based securities index, measures of portfolio risk and share price volatility, and related factors. The Trustees noted that bond indices have limited utility in evaluating fixed income mutual funds. Similarly, the Trustees noted in comparing the Fund to other mutual funds that the value of such comparisons may be limited in some degree because the Fund’s investment approach, and in particular its laddered maturity portfolio, differs from other funds. In conducting their review, the Trustees observed that the Advisor had continued to faithfully pursue and to achieve the Fund’s stated objectives, as demonstrated particularly by the Advisor’s selection of investments in a challenging single state environment and the Fund’s investment performance in the context of
28 | Certified Annual Report |
| OTHER INFORMATION, CONTINUED | ||
| Thornburg California Limited Term Municipal Fund | September 30, 2005 (Unaudited) | |
that environment and the Fund’s investment policies. The Trustees noted in this regard that the Fund’s investment performance fell within the middle range of a category of generally similar California fixed income mutual funds selected by an independent analyst firm, and that the Fund’s share price volatility was lower than a category of longer term California funds selected by an independent analyst firm.
The Trustees also considered a number of other factors in reviewing the quality of the Advisor’s services, including the qualifications and integrity of the Advisor’s senior personnel, the Advisor’s staffing and other resources, the Advisor’s compliance with regulatory requirements, Fund sales performance and perceptions of the Funds in the marketplace, and other factors.
The Trustees concluded, based upon these and other considerations, that the Advisor had actively and competently pursued the Fund’s stated investment objectives in accordance with the Fund’s investment policies stated in its prospectuses. The Trustees further concluded that the investment performance of the Fund was satisfactory in the context of the Fund’s objectives and policies and prevailing market conditions.
Fees and Expenses; Profitability of Advisor. In reviewing the fees charged by the Advisor to the Fund, the Trustees primarily considered the fees charged by the Advisor and the other expenses charged to the Fund in light of the nature and quality of services provided, comparison of the actual Advisor’s fee and Fund expenses to the statement of fees and expenses in the Fund’s prospectuses, comparisons of the Advisor’s fee and other Fund expenses to median and average fees and expenses charged to similar mutual funds, and comparisons of fees and expenses charged to the Fund with fees and expenses charged to other, similar specific mutual funds. In addition, the Trustees considered the profitability of the Advisor compared to other investment management firms, and comparisons of the investment management fee rates charged by the Advisor to the Fund with rates charged to other clients of the Advisor and the differing types of services furnished to the Fund and the other clients. The Trustees observed that the management fee charged to the Fund was comparable to the average and median rates charged to a group of similar mutual funds. The Trustees also observed that the overall expenses for the Fund were somewhat higher than the average and median expenses for the same group of funds, but that the difference was not notable in view of the size of the Fund, and the other factors considered. The Trustees also determined in their review that fee rates charged by the Advisor to other clients of the Advisor were not directly comparable to rates charged to the Fund principally because of the significant differences in the services provided.
The Trustees concluded, based upon these and other considerations, that the fees charged to the Fund by the Advisor were fair and reasonable in view of the following: the services provided, the clear disclosure of these fees and expenses in the Fund’s prospectuses, and prevailing fees and expenses charged to mutual funds generally. The Trustees further concluded that there was no indication that the Advisor’s profitability was unusual, viewed in the context of the services provided, the performance of the Fund, and the fees and profitability of other investment management firms.
Economies of Scale. In reviewing the extent to which economies of scale would be realized by the Fund as it grows and whether fee levels reflect economies of scale, the Trustees considered the breakpoint structure for advisory fees chargeable to the Fund, the demonstrated economies of scale enjoyed by other Funds of the Trust as they had grown in size, and economies of scale realized by other mutual funds. The Trustees concluded that the Fund may reasonably be expected to realize economies of scale for the benefit of its shareholders as it grows in size.
Ancillary Benefits to Advisor. In reviewing benefits enjoyed by the Advisor because of its relationship with the Fund, the Trustees considered an arrangement through which the Advisor received certain research services, favorable publicity received by the Advisor because of the superior investment performance of certain Funds of the Trust, and the benefits to the Fund from the Advisor’s expansion of its staffing and other resources to serve a broader variety of investment clients. The Trustees concluded, based upon these and other considerations, that there was no unusual or unfair benefit enjoyed by the Advisor and that the Fund enjoyed benefits by virtue of the Advisor’s engagement by other investment clients.
| Certified Annual Report | 29 |
Trustees’ Statement to Shareholders
Not part of the Certified Annual Report
February 8, 2005
The Trustees are concerned that recent commentaries and opinions reported in the media may confuse investors in general as to the supervisory duties of trustees of mutual funds and, in particular, leave Thornburg Investment Trust shareholders uncertain regarding how we discharge our responsibilities in supervising the Funds’ investment advisor and in reviewing the advisor’s contract for renewal. We decided to spell out clearly three principal guidelines that we follow in supervising the Trust’s investment advisor on your behalf.
We begin with the premise that each shareholder selected his or her Fund because its investments are managed by the investment advisor identified in the prospectus and in accordance with the objective and policies described in the prospectus. We realize, as each of you do, that if you believe that your Fund’s stated objective and policies no longer serve your personal investment goals, you can sell your shares and leave the Fund.
Therefore, we believe that our primary supervisory task – our principal obligation to you – is to assess the nature and quality of the advisor’s services, and to confirm that the advisor actively and competently pursues the Fund’s objective, in accordance with the policies set out in the prospectus. To do this, we meet regularly with management to review your Fund’s portfolio and to discuss the advisor’s specific actions and judgments in pursuing the Fund’s objective. We do not substitute our own judgment for the advisor’s decisions in selecting investments; the advisor is paid to exercise its informed judgment on investment decisions, and we seek to confirm, in reviewing the advisor’s performance, that the advisor is doing just that.
Second, while we are conscious of costs and the effect that costs have on shareholders’ returns, we do not seek the lowest fees or expense ratio as our sole or primary objective. We try to make sure that your Fund’s fees and costs are reasonable in relationship to the services rendered and that they are generally in line with those charged by other expert investment advisors, consistent with our belief that the Fund’s investors searched for and expect that expertise and attention and have decided to pay a reasonable price for it. We do not put the management contract “out to bid” as a matter of course, and we would not do so unless we had concluded that the advisor materially had failed to pursue the Fund’s objectives in accordance with its policies, or for other equally important reasons. We believe that any other approach would be inconsistent with your interests and contrary to your expectations when you bought shares of the Fund in the first place.
Finally, because we believe that most Thornburg Fund shareholders have invested with a long-term perspective, we try not to focus too much on the fashions of the moment and on short-term performance. The market will not favor any specific investment objective or set of policies at all times and under all economic circumstances. A fund will experience periods of both high and low returns relative to other funds and other investments. Even if one of our Funds is not favored by the market at a particular time, we believe that the advisor is nonetheless obliged to remain true to the Fund’s objective and policies, and we watch to see that it does so.
This statement is submitted for the general information of the shareholders of Thornburg Investment Trust. It is not authorized for distribution to prospective investors in the Fund unless preceded or accompanied by an effective prospectus. If you have not received a prospectus, one can be obtained from your financial advisor, online at www.thornburg.com/download, or by calling 800-847-0200. Carefully consider information in the prospectus regarding the Fund’s investment objectives and policies, risks, sales charges, expenses, experience of its management, marketability of shares, and other information. Read it carefully before you invest or send money.
30 | This page is not part of the Annual Report. |
Planning Options
Retirement and Education Accounts
Thornburg Investment Management offers retirement and education savings accounts that can help you meet a variety of planning challenges. For account applications or further information on any of the accounts below, please call 1-800-847-0200 or go to www.thornburg.com/ira. Your financial advisor can help you determine which plan is right for you.
Individual Retirement Accounts
Individual Retirement Accounts (IRAs) provide a tax-advantaged means to save money for the future. For a detailed outline of the difference between retirement accounts, see www.thornburg.com/ira. Rollovers are available. Call 1-800-847-0200 for more information.
Traditional IRAs – Contributions to Traditional IRAs are tax deductible for eligible individuals, and withdrawals are taxed as additional ordinary income. You may contribute to an IRA if you receive compensation and are under 701/2, even if you are covered by an employer retirement plan.
Roth IRAs – Under a Roth IRA, there is no tax deduction for contributions, but there is no income tax on qualified withdrawals. For a more detailed comparison of Traditional and Roth IRAs, please see our web site at www.thornburg.com/ira.
SEP IRAs – Simplified Employee Pension (SEP) IRAs are established by employers. The employer is allowed a tax deduction for contributions made to the SEP Plan and makes contributions to each eligible employee’s SEP IRA on a discretionary basis.
SIMPLE IRAs – Savings Incentive Match Plan for Employees of Small Employers (SIMPLE) is designed to give small business owners a simplified method to establish and contribute to a retirement plan for employees. The employer is allowed a tax deduction for contributions and makes either matching or non-elective contributions to each eligible employee’s SIMPLE IRA. Employees may make salary deferral contributions.
403(b)
A special, tax-advantaged savings vehicle available only to employees of 501(c)(3) organizations, such as charitable, educational, scientific and religious organizations. 403(b) plans are also available to employees of public schools and universities.
Coverdell Education Savings Account
These savings accounts are designed to provide a way to save money for higher education expenses. In an Education Savings Account, earnings and interest grow tax free, and qualified withdrawals used to pay for eligible higher-education expenses are tax- and penalty-free.
Funds Available
The following funds are available in the accounts listed above:
| • | Thornburg International Value Fund |
| • | Thornburg Value Fund |
| • | Thornburg Core Growth Fund |
| • | Thornburg Investment Income Builder Fund |
| • | Thornburg Limited Term U.S. Government Fund |
| • | Thornburg Limited Term Income Fund |
| This page is not part of the Annual Report. | 31 |
The Firm
Thornburg Investment Management® is a privately held investment management company based in Santa Fe, New Mexico with assets under management of over $16 billion. Founded in 1982, the firm manages four equity funds, eight bond funds, and separate portfolios for select institutions and individuals.
Investment Philosophy
We seek to preserve and increase the real wealth of the Funds’ shareholders after accounting for inflation, taxes, and investment expenses. We’re committed to disciplined investing and controlling risk in all market environments through laddered bond and focused equity portfolios.
Portfolio Holdings Disclosure
We believe you should know about your portfolio. Our web site keeps investors informed of the Funds’ equity holdings. Go to www.thornburg.com/funds for commentary on our equity fund holdings.
Co-Ownership of Funds
We invest side-by-side with the Funds’ shareholders. Our employees have invested over $110 million in Thornburg Funds.
Core Strategies for Building Wealth
We deliver core strategies to help investors meet long-term goals. A core strategy is a consistent, disciplined and proven investment process that represents the foundation of a diversified portfolio.
INVESTMENT MANAGER:
Thornburg Investment Management®
119 East Marcy Street
Santa Fe, New Mexico 87501
800.847.0200
DISTRIBUTOR:
Thornburg SecuritiesTM
119 East Marcy Street
Santa Fe, New Mexico 87501
800.847.0200

Core Strategies for Building Wealth
Thornburg California Limited Term Municipal Fund
I Shares
Annual Report – September 30, 2005
This report is submitted for the general information of shareholders of the Fund. It is not authorized for distribution to prospective investors in the Fund unless preceded or accompanied by an effective prospectus. If you have not received a prospectus, one can be obtained from your financial advisor, online at www.thornburg.com/ download, or by calling 800-847-0200. Carefully consider information in the prospectus regarding the Fund’s investment objectives and policies, risks, sales charges, expenses, experience of its management, marketability of shares, and other information. Read it carefully before you invest or send money. Performance data quoted represents past performance and does not guarantee future results.
Thornburg California Limited Term Municipal Fund
Laddering – an All Weather Strategy
The Fund will invest primarily in municipal obligations originating in California with the objective of obtaining exemption of interest dividends from any income taxes imposed by California on individuals.
The Fund offers California investors double tax-free yields (may be subject to Alternative Minimum Tax) in a laddered municipal bond portfolio with an average maturity of five years or less. Laddering involves building a portfolio of bonds with staggered maturities so that a portion of the portfolio matures each year; cash from maturing bonds, if not needed for other purposes, is invested in bonds with longer maturities at the far end of the ladder. The strategy is a good compromise for managing different types of risk.
Thornburg Bond Funds
| • | Thornburg Limited Term Municipal Fund |
| • | Thornburg Intermediate Municipal Fund |
| • | Thornburg California Limited Term Municipal Fund |
| • | Thornburg New Mexico Intermediate Municipal Fund |
| • | Thornburg Florida Intermediate Municipal Fund |
| • | Thornburg New York Intermediate Municipal Fund |
| • | Thornburg Limited Term U.S. Government Fund |
| • | Thornburg Limited Term Income Fund |
Thornburg invests in short- and intermediate-term investment grade bonds. We ladder the maturities of individual bonds in the portfolios to moderate risk. Laddering involves building a portfolio of bonds with staggered maturities so that a portion of the portfolio will mature each year. We apply this disciplined process in all interest rate environments.
Thornburg Equity Funds
| • | Thornburg Value Fund |
| • | Thornburg International Value Fund |
| • | Thornburg Core Growth Fund |
| • | Thornburg Investment Income Builder Fund |
Thornburg’s equity research uses a fundamental, yet comprehensive, analytical approach. We invest when and where we perceive the most compelling value. Thornburg equity funds focus on a limited number of securities so that each holding can have a material impact on performance. The equity team searches for firms believed to have a promising future and seeks to buy shares of those companies at a discount to their intrinsic value.
More information at www.thornburg.com
 | Reduce paper clutter. | |
| Receive your shareholder reports and prospectus online instead of through traditional mail. | ||
Sign up at | ||
| www.thornburg.com/edelivery |
2 This page is not part of the Annual Report.
Message
from the Chairman

Garrett Thornburg
Chairman & CEO
November 10, 2005
Dear Fellow Shareholder:
Thornburg Investment Management has a clear mission: to preserve and increase the real wealth of our shareholders. We aspire to accomplish this through a family of laddered bond funds that focus on quality, stability, and minimization of risk over time, and through a range of equity funds that redefine traditional measures of value and growth.
Our bond funds have always been managed using the highly disciplined approach of laddering short and intermediate bond maturities, seeking to provide both an attractive return and stability of principal. All of the bond funds buy only investment-grade securities. We have found this strategy to be the best at managing both interest-rate risk and credit risk, and we believe this strategy has served our shareholders well over time.
The bond funds are managed by portfolio managers who have many years of experience. We are proud of this consistency and experience and look forward to many more successful years with them at the helm.
In years past, there has been news about improper behavior by some mutual fund companies. Many new rules proposed in response to this scandal have called for increased transparency. We welcome increased transparency. Thornburg Investment Management has been a leader in providing information about our stock holdings and bond strategies to our shareholders on our web site, www.thornburg.com.
Unfortunately, some of the new rules will increase the cost to all shareholders in mutual funds. We will do our best to keep these expenses to a minimum. After all, we are shareholders too, and Thornburg employees have over $110 million invested in our own funds.
Thank you for investing with us. We will do our best to continue to earn your trust every day.
| Sincerely, |
 |
| Garrett Thornburg |
| Chairman & CEO |
This page is not part of the Annual Report. 3

Thornburg California Limited Term Municipal Fund
I Shares – September 30, 2005
Table of Contents | ||
| 6 | ||
| 8 | ||
| 9 | ||
| 10 | ||
| 11 | ||
| 14 | ||
| 15 | ||
| 20 | ||
| 21 | ||
| 22 | ||
| 23 | ||
| 26 | ||
This report is certified under the Sarbanes-Oxley Act of 2002, which requires that public companies, including mutual funds, affirm that the information provided in their annual and semiannual shareholder reports fully and fairly represents their financial position.
4 Certified Annual Report
Important Information
Performance data represent past performance and do not guarantee future results. Investment return and principal value will fluctuate. Upon redemption, shares may be worth more or less than their original cost. Current returns may be lower or higher than those shown. For performance current to the most recent month end, visit www.thornburg.com.
Minimum investments for Class I shares are higher than those for other classes. Returns reflect the reinvestment of dividends and capital gains. There is no up front sales charge for this class of shares.
Shares in the Fund carry risks, including possible loss of principal. As with direct bond ownership, funds that invest in bonds are subject to certain risks including interest-rate risk, credit risk, and inflation risk. The principal value of bond funds will fluctuate relative to changes in interest rates, decreasing when interest rates rise. Unlike bonds, bond funds have ongoing fees and expenses. Shares in the Fund are not deposits or obligations of, or guaranteed or endorsed by, any bank, the Federal Deposit Insurance Corporation, the Federal Reserve Board or any government agency.
The information presented on the following pages was current as of September 30, 2005. The manager’s views, portfolio holdings, and sector diversification are historical and subject to change. This material should not be deemed a recommendation to buy or sell any of the securities mentioned.
The matters discussed in this report may constitute forward-looking statements made pursuant to the safe harbor provisions of the Securities Litigation Reform Act of 1995. These include any advisor or portfolio manager prediction, assessment, analysis or outlook for individual securities, industries, investment styles, market sectors and/or markets. These statements involve risks and uncertainties. In addition to the general risks described for each fund in its current prospectus, other factors bearing on these reports include the accuracy of the advisor’s or portfolio manager’s forecasts and predictions, the appropriateness of the investment strategies designed by the advisor or portfolio manager and the ability of the advisor or portfolio manager to implement their strategies efficiently and successfully. Any one or more of these factors, as well as other risks affecting the securities markets generally, could cause the actual results of any fund to differ materially as compared to its benchmarks.
Glossary
The Lehman Brothers Five-Year Municipal Bond Index – A rules-based, market-value-weighted index engineered for the long-term tax-exempt bond market. To be included in the index, bonds must have a minimum credit rating of Baa. The approximate maturity of the municipal bonds in the index is five years. Unless otherwise noted, index returns reflect the reinvestment of income dividends and capital gains, if any, but do not reflect fees, brokerage commissions or other expenses of investing. Investors may not make direct investments into any index.
Duration – The measure of the price sensitivity of a fixed-income security to an interest rate change of 100 basis points. Calculation is based on the weighted average of the present values for all cash flows.
Weighted Average Maturity – A weighted average of all the effective maturities of the bonds in a portfolio. Effective maturity takes into consideration mortgage prepayments, puts, sinking funds, adjustable coupons, and other features of individual bonds and is thus a more accurate measure of interest-rate sensitivity. Longer-maturity funds are generally considered more interest-rate sensitive than their shorter counterparts.
Certified Annual Report 5

George Strickland
Portfolio Manager
October 17, 2005
Dear Fellow Shareholder:
I am pleased to present the Annual Report for the Thornburg California Limited Term Municipal Fund. The net asset value (NAV) of the I shares decreased by 23 cents to $12.80 during the twelve months ended September 30, 2005. If you were with us for the entire period, you received dividends of 39.8 cents per share. If you reinvested your dividends, you received 40.3 cents per share.
Over the last twelve months, interest rates on bonds that mature in ten years or less have risen, while interest rates on long-term bonds have fallen. Higher interest rates on short-term bonds have pushed down the price of most of the bonds owned by the Fund, but have allowed us to buy new bonds at higher yields and increase the yield of the portfolio. The I shares of your Fund produced a total return of 1.31% over the twelve month period ended September 30, 2005, compared to a 1.45% return for the Lehman Five Year Municipal Bond Index. The Fund was over weighted in bonds that mature in less than five years. Since the returns of those short-term bonds lagged the return of the index, the Fund’s return lagged the index slightly.
This has been an eventful year for the bond market and the world. The Federal Reserve has been steadily pushing up the target Fed Funds rate to its current level of 3.75%. Through the end of June, the bond market responded by pushing down yields on long-term bonds, thus flattening the yield curve. A flat yield curve is usually associated with a recession, but the U.S. economy is showing no signs of entering a recession. So, more recently, interest rates have been rising for both short and long-term bonds, in more of a parallel yield curve shift. We believe that this is a more appropriate response by the market to a tightening Fed, a strong economy, and somewhat elevated levels of inflation.
Your Thornburg California Limited Term Municipal Fund is a laddered portfolio of over 140 municipal obligations from all over California. Your Fund’s weighted average maturity is 4.49 years. We ladder the maturity dates of the bonds in your portfolio so that some of the bonds are scheduled to mature during each of the coming years. Laddering bonds accomplishes two goals. First, the staggered bond maturities contained in a ladder defuse interest-rate risk and dampen the Fund’s price volatility. Second, laddering gives the Fund a steady cash flow stream from maturing bonds to reinvest toward the top of the ladder where yields are typically higher. The chart shown here describes the percentages of your Fund’s bond portfolio maturing in each of the coming years.
% of portfolio maturing | Cumulative % maturing | ||
1 year = 11.4% | Year 1 = 11.4 | % | |
1 to 2 years = 11.2% | Year 2 = 22.6 | % | |
2 to 3 years = 13.9% | Year 3 = 36.5 | % | |
3 to 4 years = 14.0% | Year 4 = 50.5 | % | |
4 to 5 years = 9.1% | Year 5 = 59.6 | % | |
5 to 6 years = 8.0% | Year 6 = 67.6 | % | |
6 to 7 years = 12.5% | Year 7 = 80.1 | % | |
7 to 8 years = 3.6% | Year 8 = 83.7 | % | |
8 to 9 years = 7.3% | Year 9 = 91.0 | % | |
Over 9 years = 9.0% | Over 9 years = 100.0 | % |
Percentages can and do vary. Data as of 9/30/05.
6 Certified Annual Report
The California economy has performed quite well as of late. Second quarter personal income growth was 6.5% and, through September, California General Fund tax revenues are running $666 million ahead of the budget estimate. However, 2005-06 fiscal year expenditures are expected to increase 10% and State General Fund balance is projected to fall from $7.5 billion to $1.3 billion. Furthermore, the state will have to grapple with a large looming deficit in the 2006-07 fiscal year that is currently expected to total $7 billion. To manage credit risk, we have kept 93% of the portfolio in bonds rated A or above and maintained broad diversification across issuers and market sectors.
Over the years, our practice of laddering a diversified portfolio of short and intermediate maturity municipal bonds has allowed your Fund to perform consistently well in varying interest rate environments. Thank you for investing in Thornburg California Limited Term Municipal Fund.
| Sincerely, |
 |
George Strickland |
Portfolio Manager |
Certified Annual Report 7
STATEMENT OF ASSETS AND LIABILITIES
| Thornburg California Limited Term Municipal Fund | September 30, 2005 |
ASSETS | ||||
Investments at value (cost $157,860,495) | $ | 159,787,339 | ||
Cash | 165,500 | |||
Receivable for fund shares sold | 276,917 | |||
Interest receivable | 2,170,554 | |||
Total Assets | 162,400,310 | |||
LIABILITIES | ||||
Payable for fund shares redeemed | 146,709 | |||
Payable to investment advisor and other affiliates (Note 3) | 113,436 | |||
Accounts payable and accrued expenses | 50,175 | |||
Dividends payable | 123,832 | |||
Total Liabilities | 434,152 | |||
NET ASSETS | $ | 161,966,158 | ||
NET ASSETS CONSIST OF: | ||||
Net unrealized appreciation on investments | $ | 1,926,844 | ||
Accumulated net realized gain (loss) | (593,743 | ) | ||
Net capital paid in on shares of beneficial interest | 160,633,057 | |||
| $ | 161,966,158 | |||
NET ASSET VALUE: | ||||
Class A Shares: | ||||
Net asset value and redemption price per share ($111,101,658 applicable to 8,688,184 shares of beneficial interest outstanding - Note 4) | $ | 12.79 | ||
Maximum sales charge, 1.50% of offering price | 0.19 | |||
Maximum offering price per share | $ | 12.98 | ||
Class C Shares: | ||||
Net asset value and offering price per share* ($20,021,198 applicable to 1,564,457 shares of beneficial interest outstanding - Note 4) | $ | 12.80 | ||
Class I Shares: | ||||
Net asset value, offering and redemption price per share ($30,843,302 applicable to 2,409,667 shares of beneficial interest outstanding - Note 4) | $ | 12.80 | ||
| * | Redemption price per share is equal to net asset value less any applicable contingent deferred sales charge. |
See notes to financial statements.
8 Certified Annual Report
Thornburg California Limited Term Municipal Fund | Year Ended September 30, 2005 |
INVESTMENT INCOME: | ||||
Interest income (net of premium amortized of $2,594,819) | $ | 6,495,270 | ||
EXPENSES: | ||||
Investment advisory fees (Note 3) | 866,662 | |||
Administration fees (Note 3) | ||||
Class A Shares | 153,957 | |||
Class C Shares | 26,647 | |||
Class I Shares | 14,425 | |||
Distribution and service fees (Note 3) | ||||
Class A Shares | 307,915 | |||
Class C Shares | 213,199 | |||
Transfer agent fees | ||||
Class A Shares | 46,717 | |||
Class C Shares | 19,781 | |||
Class I Shares | 21,014 | |||
Registration and filing fees | ||||
Class A Shares | 472 | |||
Class C Shares | 472 | |||
Class I Shares | 784 | |||
Custodian fees (Note 3) | 78,669 | |||
Professional fees | 29,838 | |||
Accounting fees | 18,205 | |||
Trustee fees | 5,816 | |||
Other expenses | 47,114 | |||
Total Expenses | 1,851,687 | |||
Less: | ||||
Expenses reimbursed by Investment Advisor (Note 3) | (54,992 | ) | ||
Distribution and service fees waived (Note 3) | (106,726 | ) | ||
Fees paid indirectly (Note 3) | (11,884 | ) | ||
Net Expenses | 1,678,085 | |||
Net Investment Income | 4,817,185 | |||
REALIZED AND UNREALIZED GAIN (LOSS) ON INVESTMENTS | ||||
Net realized gain (loss) on investments sold | (139,338 | ) | ||
Increase (Decrease) in unrealized appreciation (depreciation) of investments | (2,988,040 | ) | ||
Net Realized and Unrealized Loss on Investments | (3,127,378 | ) | ||
Net Increase in Net Assets Resulting From Operations | $ | 1,689,807 | ||
See notes to financial statements.
Certified Annual Report 9
STATEMENTS OF CHANGES IN NET ASSETS
Thornburg California Limited Term Municipal Fund
| Year Ended September 30, 2005 | Three Months Ended September 30, 2004 | Year Ended June 30, 2004 | ||||||||||
INCREASE (DECREASE) IN NET ASSETS FROM: | ||||||||||||
OPERATIONS: | ||||||||||||
Net investment income | $ | 4,817,185 | $ | 1,144,598 | $ | 4,899,573 | ||||||
Net realized loss on investments sold | (139,338 | ) | (33,844 | ) | 302,064 | |||||||
Increase (Decrease) in unrealized appreciation (depreciation) of investments | (2,988,040 | ) | 2,023,841 | (5,077,284 | ) | |||||||
Net Increase (Decrease) in Net Assets Resulting from Operations | 1,689,807 | 3,134,595 | 124,353 | |||||||||
DIVIDENDS TO SHAREHOLDERS: | ||||||||||||
From net investment income | ||||||||||||
Class A Shares | (3,392,991 | ) | (841,492 | ) | (3,715,243 | ) | ||||||
Class C Shares | (533,799 | ) | (127,839 | ) | (544,139 | ) | ||||||
Class I Shares | (890,395 | ) | (175,267 | ) | (640,191 | ) | ||||||
FUND SHARE TRANSACTIONS (NOTE 4): | ||||||||||||
Class A Shares | (21,261,597 | ) | 1,954,371 | (14,508,762 | ) | |||||||
Class C Shares | (1,532,552 | ) | (674,119 | ) | 441,058 | |||||||
Class I Shares | 5,630,725 | 2,536,234 | 2,945,765 | |||||||||
Net Increase (Decrease) in Net Assets | (20,290,802 | ) | 5,806,483 | (15,897,159 | ) | |||||||
NET ASSETS: | ||||||||||||
Beginning of period | 182,256,960 | 176,450,477 | 192,347,636 | |||||||||
End of period | $ | 161,966,158 | $ | 182,256,960 | $ | 176,450,477 | ||||||
See notes to financial statements.
10 Certified Annual Report
| Thornburg California Limited Term Municipal Fund | September 30, 2005 |
NOTE 1 – ORGANIZATION
Thornburg California Limited Term Municipal Fund (the “Fund”) (formerly Thornburg Limited Term Municipal Fund – California Portfolio) is a diversified series of Thornburg Investment Trust (the “Trust”). The Trust is organized as a Massachusetts business trust under a Declaration of Trust dated June 3, 1987 and is registered as a diversified, open-end management investment company under the Investment Company Act of 1940, as amended. The Trust is currently issuing eleven series of shares of beneficial interest in addition to those of the Fund: Thornburg Limited Term Municipal Fund, Thornburg Florida Intermediate Municipal Fund, Thornburg New York Intermediate Municipal Fund, Thornburg New Mexico Intermediate Municipal Fund, Thornburg Intermediate Municipal Fund, Thornburg Limited Term U.S. Government Fund, Thornburg Limited Term Income Fund, Thornburg Value Fund, Thornburg International Value Fund, Thornburg Core Growth Fund, and Thornburg Investment Income Builder Fund. Each series is considered to be a separate entity for financial reporting and tax purposes and bears expenses directly attributable to it. The Fund’s investment objective is to obtain as high a level of current income exempt from Federal income tax as is consistent, in the view of the Fund’s investment advisor, with the preservation of capital. In addition, the Fund will invest primarily in Municipal Obligations originating in California with the objective of obtaining exemption of interest dividends from any income taxes imposed by California on individuals.
The Fund currently offers three classes of shares of beneficial interest, Class A, Class C, and Institutional Class (Class I) shares. Each class of shares of the Fund represents an interest in the same portfolio of investments, except that (i) Class A shares are sold subject to a front-end sales charge collected at the time the shares are purchased and bear a service fee, (ii) Class C shares are sold at net asset value without a sales charge at the time of purchase, but are subject to a contingent deferred sales charge upon redemption within one year, and bear both a service fee and a distribution fee, (iii) Class I shares are sold at net asset value without a sales charge at the time of purchase, and (iv) the respective classes may have different reinvestment privileges and conversion rights. Additionally, the Fund may allocate among its classes certain expenses, to the extent applicable to specific classes, including transfer agent fees, government registration fees, certain printing and postage costs, and administrative and legal expenses. Currently, class specific expenses of the Fund are limited to service and distribution fees, administrative fees, and certain registration and transfer agent expenses.
NOTE 2 – SIGNIFICANT ACCOUNTING POLICIES
Significant accounting policies of the Trust are as follows:
Valuation of Investments: In determining the net asset value of investments, the Trust utilizes an independent pricing service approved by the Board of Trustees. Debt investment securities have a primary market over the counter and are valued on the basis of valuations furnished by the pricing service. The pricing service values portfolio securities at quoted bid prices, normally at 4:00 p.m. EST. When quotations are not readily available, securities are valued at evaluated prices as determined by the pricing service using methods which include consideration of yields or prices of municipal obligations of comparable quality, type of issue, coupon, maturity, and rating; indications as to value from dealers and general market conditions. In any case where a price is not available from a pricing service for an investment, the Trust’s valuation and pricing committee determines a fair value for the investment using factors approved by the Trustees. The valuation procedures used by the pricing service and the portfolio valuations received by the Fund are reviewed by the officers of the Trust under the general supervision of the Board of Trustees. Short-term obligations having remaining maturities of 60 days or less are valued at amortized cost, which approximates market value.
Federal Income Taxes: It is the policy of the Trust to comply with the provisions of the Internal Revenue Code applicable to “regulated investment companies” and to distribute all taxable (if any) and tax exempt income, of the Fund to the shareholders. Therefore, no provision for Federal income tax is required.
When-Issued and Delayed Delivery Transactions: The Trust may engage in when-issued or delayed delivery transactions. To the extent the Trust engages in such transactions, it will do so for the purpose of acquiring portfolio securities consistent with the Fund’s investment objectives and not for the purpose of investment leverage or to speculate on interest rate and/or market changes. At the time the Trust makes a commitment to purchase a security on a when-issued basis, the Fund will record the transaction and reflect the value in determining its net asset value. When effecting such transactions, assets of an amount sufficient to make payment for the portfolio securities to be purchased will be segregated on the Fund’s records on the trade date. Securities purchased on a when-issued or delayed delivery basis do not earn interest until the settlement date.
Dividends: Net investment income of the Fund is declared daily as a dividend on shares for which the Fund has received payment. Dividends are paid monthly and are reinvested in additional shares of the Fund at net asset value per share at the close of business on the dividend payment date or, at the shareholder’s option, paid in cash. Net capital gains, to the extent available, will be distributed at least annually.
General: Securities transactions are accounted for on a trade date basis. Interest income is accrued as earned. Premiums and discounts on securities purchased are amortized to call dates or maturity dates of the respective securities. Realized gains and losses from the sale of securities are recorded on an
Certified Annual Report 11
NOTES TO FINANCIAL STATEMENTS, CONTINUED
| Thornburg California Limited Term Municipal Fund | September 30, 2005 |
identified cost basis. Net investment income, other than class specific expenses and realized and unrealized gains and losses, is allocated daily to each class of shares based upon the relative net asset value of outstanding shares (or the value of the dividend-eligible shares, as appropriate) of each class of shares at the beginning of the day (after adjusting for the current capital shares activity of the respective class). Expenses common to all funds are allocated among the funds comprising the Trust based upon their relative net asset values or other appropriate allocation methods.
Guarantees and Indemnifications: Under the Trust’s organizational documents, its officers and Trustees are indemnified against certain liability arising out of the performance of their duties to the Fund. Additionally, in the normal course of business the Trust enters into contracts with service providers that contain general indemnification clauses. The Trust’s maximum exposure under these arrangements is unknown. However, based on experience, the Trust expects the risk of loss to be remote.
Use of Estimates: The preparation of financial statements, in conformity with generally accepted accounting principles, requires management to make estimates and assumptions that affect the reported amounts of assets and liabilities and the disclosure of contingent assets and liabilities at the date of the financial statements and the reported amounts of increases and decreases in net assets from operations during the reporting period. Actual results could differ from those estimates.
NOTE 3 – INVESTMENT ADVISORY FEE AND OTHER TRANSACTIONS WITH AFFILIATES
Pursuant to an Investment Advisory Agreement, Thornburg Investment Management, Inc.® (the “Advisor”) serves as the investment advisor and performs services for which the fees are payable at the end of each month. For the year ended September 30, 2005, these fees were payable at annual rates ranging from .50 of 1% to .225 of 1% per annum of the average daily net assets of the Fund. The Trust also has entered into an Administrative Services Agreement with the Advisor, whereby the Advisor will perform certain administrative services for the shareholders of each class of the Fund’s shares, and for which fees will be payable at an annual rate of up to .125 of 1% per annum of the average daily net assets attributable to each class of shares. For the year ended September 30, 2005, the Advisor voluntarily reimbursed certain class specific expenses and administrative fees of $24,467 for Class A shares, $15,491 for Class C shares, and $15,034 for Class I shares.
The Trust has an underwriting agreement with Thornburg Securities Corporation® (the “Distributor”, an affiliate of the Advisor), which acts as the distributor of Fund shares. For the year ended September 30, 2005, the Distributor has advised the Fund that it earned commissions aggregating $1,060 from the sale of Class A shares, and collected contingent deferred sales charges aggregating $2,859 from redemptions of Class C shares of the Fund.
Pursuant to a Service Plan under Rule 12b-1 of the Investment Company Act of 1940, the Fund may reimburse to the Advisor amounts not to exceed .25 of 1% per annum of the average daily net assets attributable to each class of shares of the Fund for payments made by the Advisor to securities dealers and other persons for distribution of the Fund’s shares and to obtain various shareholder related services. The Advisor may pay out of its own resources additional expenses for distribution of the Fund’s shares.
The Trust also has adopted a Distribution Plan pursuant to Rule 12b-1, applicable only to the Fund’s Class C shares, under which the Fund compensates the Distributor for services in promoting the sale of Class C shares of the Fund at an annual rate of up to .75 of 1% per annum of the average daily net assets attributable to Class C shares. Total fees incurred by each class of shares of the Fund under their respective service and distribution plans and Class C distribution fees waived by the Distributor for the year ended September 30, 2005, are set forth in the Statement of Operations. Distribution fees in the amount of $106,726 were waived for Class C shares.
The Trust has an agreement with the custodian bank to indirectly pay a portion of the custodian’s fees through credits earned by the Fund’s cash on deposit with the bank. This deposit agreement is an alternative to overnight investments. Custodial fees have been adjusted to reflect amounts that would have been paid without this agreement, with a corresponding adjustment reflected as fees paid indirectly in the Statement of Operations. For the year ended September 30, 2005, fees paid indirectly were $11,884.
Certain officers and Trustees of the Trust are also officers and/or Directors of the Advisor and Distributor. The compensation of independent Trustees is borne by the Trust.
12 Certified Annual Report
NOTES TO FINANCIAL STATEMENTS, CONTINUED
| Thornburg California Limited Term Municipal Fund | September 30, 2005 |
NOTE 4 – SHARES OF BENEFICIAL INTEREST
At September 30, 2005, there were an unlimited number of shares of beneficial interest authorized. Transactions in shares of beneficial interest were as follows:
| Year Ended September 30, 2005 | Three Months Ended September 30, 2004 | Year Ended June 30, 2004 | |||||||||||||||||||
| Shares | Amount | Shares | Amount | Shares | Amount | ||||||||||||||||
Class A Shares | |||||||||||||||||||||
Shares sold | 851,431 | $ | 10,982,577 | 502,652 | $ | 6,531,022 | 1,775,040 | $ | 23,232,846 | ||||||||||||
Shares issued to shareholders in reinvestment of dividends | 174,031 | 2,241,423 | 41,636 | 541,263 | 188,208 | 2,457,459 | |||||||||||||||
Shares repurchased | (2,675,964 | ) | (34,485,597 | ) | (394,425 | ) | (5,117,914 | ) | (3,079,256 | ) | (40,199,067 | ) | |||||||||
Net Increase (Decrease) | (1,650,502 | ) | $ | (21,261,597 | ) | 149,863 | $ | 1,954,371 | (1,116,008 | ) | $ | (14,508,762 | ) | ||||||||
Class C Shares | |||||||||||||||||||||
Shares sold | 306,700 | $ | 3,962,605 | 81,630 | $ | 1,061,877 | 530,253 | $ | 6,927,987 | ||||||||||||
Shares issued to shareholders in reinvestment of dividends | 27,743 | 357,622 | 6,991 | 90,936 | 30,099 | 393,331 | |||||||||||||||
Shares repurchased | (454,085 | ) | (5,852,779 | ) | (140,412 | ) | (1,826,932 | ) | (526,102 | ) | (6,880,260 | ) | |||||||||
Net Increase (Decrease) | (119,642 | ) | $ | (1,532,552 | ) | (51,791 | ) | $ | (674,119 | ) | 34,250 | $ | 441,058 | ||||||||
Class I Shares | |||||||||||||||||||||
Shares sold | 1,134,747 | $ | 14,661,908 | 296,419 | $ | 3,855,573 | 935,797 | $ | 12,251,009 | ||||||||||||
Shares issued to shareholders in reinvestment of dividends | 54,521 | 702,734 | 11,020 | 143,387 | 38,885 | 508,066 | |||||||||||||||
Shares repurchased | (754,043 | ) | (9,733,917 | ) | (112,491 | ) | (1,462,726 | ) | (753,140 | ) | (9,813,310 | ) | |||||||||
Net Increase (Decrease) | 435,225 | $ | 5,630,725 | 194,948 | $ | 2,536,234 | 221,542 | $ | 2,945,765 | ||||||||||||
NOTE 5 – SECURITIES TRANSACTIONS
For the year ended September 30, 2005, the Fund had purchase and sale transactions of investment securities (excluding short-term investments) of $44,457,569 and $49,918,273, respectively.
NOTE 6 – INCOME TAXES
At September 30, 2005, information on the tax components of capital is as follows:
Cost of investments for tax purpose | $ | 157,860,495 | ||
Gross unrealized appreciation on a tax basis | $ | 2,567,681 | ||
Gross unrealized depreciation on a tax basis | (640,837 | ) | ||
Net unrealized appreciation (depreciation) on investments (tax basis) | $ | 1,926,844 | ||
At September 30, 2005, the Fund did not have any undistributed tax-exempt/ordinary net income or undistributed capital gains.
At September 30, 2005, the Fund had tax basis capital losses, which may be carried over to offset future capital gains. To the extent such carry forwards are used, capital gain distributions may be reduced to the extent provided by regulations.
Such capital loss carryovers expire as follows:
2007 | $ | 205,990 | |
2008 | 214,571 | ||
2012 | 33,844 | ||
| $ | 454,405 | ||
At September 30, 2005, the Fund had deferred capital losses occurring subsequent to October 31, 2004 of $139,338. For tax purposes, such losses will be reflected in the year ending September 30, 2006.
All dividends paid by the Fund for the year ended September 30, 2005, the three months ended September 30, 2004, and the year ended June 30, 2004, represent exempt interest dividends, which are excludable by shareholders from gross income for Federal income tax purposes.
Certified Annual Report 13
Thornburg California Limited Term Municipal Fund
| Year Ended Sept. 30, 2005 | 3 Months Ended Sept. 30, 2004(c) | Year Ended June 30, | ||||||||||||||||||||||
| 2004 | 2003 | 2002 | 2001 | |||||||||||||||||||||
Class I Shares: | ||||||||||||||||||||||||
PER SHARE PERFORMANCE | ||||||||||||||||||||||||
(for a share outstanding throughout the period) | ||||||||||||||||||||||||
Net asset value, beginning of period | $ | 13.03 | $ | 12.89 | $ | 13.22 | $ | 12.97 | $ | 12.79 | $ | 12.60 | ||||||||||||
Income from investment operations: | ||||||||||||||||||||||||
Net investment income | 0.40 | 0.09 | 0.39 | 0.42 | 0.51 | 0.59 | ||||||||||||||||||
Net realized and unrealized gain (loss) on investments | (0.23 | ) | 0.14 | (0.33 | ) | 0.25 | 0.18 | 0.19 | ||||||||||||||||
Total from investment operations | 0.17 | 0.23 | 0.06 | 0.67 | 0.69 | 0.78 | ||||||||||||||||||
Less dividends from: | ||||||||||||||||||||||||
Net investment income | (0.40 | ) | (0.09 | ) | (0.39 | ) | (0.42 | ) | (0.51 | ) | (0.59 | ) | ||||||||||||
Change in net asset value | (0.23 | ) | 0.14 | (0.33 | ) | 0.25 | 0.18 | 0.19 | ||||||||||||||||
NET ASSET VALUE, end of period | $ | 12.80 | $ | 13.03 | $ | 12.89 | $ | 13.22 | $ | 12.97 | $ | 12.79 | ||||||||||||
RATIOS/SUPPLEMENTAL DATA | ||||||||||||||||||||||||
Total return(a) | 1.31 | % | 1.81 | % | 0.46 | % | 5.27 | % | 5.48 | % | 6.28 | % | ||||||||||||
Ratios to average net assets: | ||||||||||||||||||||||||
Net investment income | 3.09 | % | 2.85 | %(b) | 2.99 | % | 3.20 | % | 3.92 | % | 4.60 | % | ||||||||||||
Expenses, after expense reductions | 0.68 | % | 0.67 | %(b) | 0.67 | % | 0.65 | % | 0.66 | % | 0.65 | % | ||||||||||||
Expenses, after expense reductions and net of custody credits | 0.67 | % | 0.67 | %(b) | 0.67 | % | 0.65 | % | 0.65 | % | — | |||||||||||||
Expenses, before expense reductions | 0.73 | % | 0.77 | %(b) | 0.78 | % | 0.75 | % | 0.84 | % | 0.98 | % | ||||||||||||
Portfolio turnover rate | 26.33 | % | 4.18 | % | 23.80 | % | 26.03 | % | 25.16 | % | 15.45 | % | ||||||||||||
Net assets at end of period (000) | $ | 30,843 | $ | 25,728 | $ | 22,929 | $ | 20,592 | $ | 10,133 | $ | 5,520 | ||||||||||||
| (a) | Not annualized for periods less than one year. |
| (b) | Annualized. |
| (c) | The Fund’s fiscal year-end changed to September 30. |
14 Certified Annual Report
| Thornburg California Limited Term Municipal Fund | September 30, 2005 |
CUSIPS: CLASS A - 885-215-426, CLASS C - 885-215-418, CLASS I - 885-215-392
NASDAQ SYMBOLS: CLASS A - LTCAX, CLASS C - LTCCX, CLASS I - LTCIX
| Credit Rating† | Principal | |||||||
Issuer-Description | Moody’s/S&P | Amount | Value | |||||
ABAG Finance Authority, 4.75% due 10/1/2011 | A3/NR | $ | 435,000 | $ | 459,147 | |||
ABAG Finance Authority, 4.75% due 10/1/2012 | A3/NR | 455,000 | 479,925 | |||||
Alameda COP, 4.60% due 5/1/2011 | NR/A+ | 425,000 | 447,576 | |||||
Alum Rock Union Elementary School District GO Refunding Bonds, 8.00% due 9/1/2006 (Insured: FGIC) | Aaa/AAA | 295,000 | 308,797 | |||||
Alum Rock Union Elementary School District GO Refunding Bonds, 8.00% due 9/1/2007 (Insured: FGIC) | Aaa/AAA | 380,000 | 415,667 | |||||
Bay Area Government Associates Lease Series 2002, 4.00% due 7/1/2006 | Aaa/AAA | 765,000 | 772,053 | |||||
Bay Area Government Association Rapid Transit, 4.875% due 6/15/2009 | Aaa/AAA | 215,000 | 215,355 | |||||
Bonita Unified School District COP Refunding, 4.50% due 5/1/2010 (Insured: MBIA) | Aaa/AAA | 700,000 | 737,289 | |||||
California Health Facilities Financing, 5.50% due 10/1/2006 | Aa3/AA | 1,235,000 | 1,265,517 | |||||
California Health Facilities Financing Authority Revenue Series B Refunding, 5.25% due 10/1/2013 (Kaiser Permanente Project) (ETM) | A3/AAA | 2,000,000 | 2,132,300 | |||||
California Health Facilities Financing Revenue, 6.40% due 10/1/2005 | Aa3/AA | 700,000 | 700,063 | |||||
California Housing Finance Authority Revenue Series 1985-B, 9.875% due 2/1/2017 | Aa2/AA- | 670,000 | 682,187 | |||||
California Infrastructure & Economic Development Bank Revenue, 5.00% due 7/1/2010 (Bay Area Toll Bridges Project; Insured: FSA) | Aaa/AAA | 1,000,000 | 1,080,100 | |||||
California Mobile Home Park Financing Series A, 4.75% due 11/15/2010 | NR/A | 500,000 | 520,490 | |||||
California Mobile Home Park Financing Series A, 5.00% due 11/15/2013 | NR/A | 570,000 | 599,406 | |||||
California Pollution Control Solid Waste Authority, 6.75% due 7/1/2011 (ETM) | Aaa/NR | 2,650,000 | 2,872,573 | |||||
California Rural HMFA Single Family Mortgage Revenue, 5.25% due 6/1/2010 (Collateralized: GNMA/FNMA) | NR/AAA | 25,000 | 25,060 | |||||
California Rural HMFA Single Family Mortgage Revenue, 5.65% due 6/1/2010 (Collateralized: GNMA/FNMA) | NR/AAA | 10,000 | 10,030 | |||||
California State, 6.40% due 2/1/2006 (Insured: MBIA) | Aaa/AAA | 500,000 | 505,965 | |||||
California State, 7.50% due 10/1/2007 (Insured: MBIA) | Aaa/AAA | 2,000,000 | 2,175,300 | |||||
California State, 6.60% due 2/1/2010 (Insured: MBIA) | Aaa/AAA | 560,000 | 635,225 | |||||
California State, 6.50% due 9/1/2010 (Insured: AMBAC) | Aaa/AAA | 1,250,000 | 1,431,200 | |||||
California State, 5.50% due 3/1/2012 (Insured: FGIC) | Aaa/AAA | 230,000 | 232,431 | |||||
California State Department of Water Resources Power Series A, 5.50% due 5/1/2011 (Insured: MBIA) | Aaa/AAA | 2,000,000 | 2,215,960 | |||||
California State Department of Water Resources Power Supply Series A, 5.50% due 5/1/2008 | A2/BBB+ | 2,580,000 | 2,722,339 | |||||
California State Department of Water Resources Power Supply Series A, 5.25% due 5/1/2009 (Insured: MBIA) | Aaa/AAA | 800,000 | 858,016 | |||||
California State Economic Recovery Series A, 5.00% due 1/1/2008 | Aa3/AA- | 1,000,000 | 1,042,320 | |||||
California State Economic Recovery Series C-3, 2.77% due 7/1/2023 put 10/3/2005 (Guaranty: Landesbank) (daily demand notes) | VMIG1/A-1+ | 200,000 | 200,000 | |||||
California State Public Works Board Lease Revenue, 5.50% due 6/1/2010 | Aa2/AA- | 530,000 | 575,299 | |||||
California State Public Works Board Lease Revenue, 5.00% due 11/1/2015 | Aa2/AA- | 1,000,000 | 1,078,130 | |||||
California State Public Works Lease Series A, 5.50% due 1/1/2017 | Aaa/AAA | 3,285,000 | 3,370,738 | |||||
California State Refunding, 5.75% due 10/1/2010 (Insured: FSA) | Aaa/AAA | 1,000,000 | 1,115,060 | |||||
California State Series A-3, 2.77% due 5/1/2033 put 10/3/2005 (daily demand notes) | VMIG1/A-1+ | 800,000 | 800,000 | |||||
California State Veterans Bonds, 9.50% due 2/1/2010 (Insured: MBIA) | Aaa/AAA | 1,000,000 | 1,248,270 | |||||
California Statewide Community Development Authority COP, 5.25% due 7/1/2010 | Aa3/AA- | 560,000 | 594,054 | |||||
California Statewide Community Development Authority COP, 5.30% due 12/1/2015 (ETM) | Aaa/AAA | 2,600,000 | 2,697,188 | |||||
Certified Annual Report 15
SCHEDULE OF INVESTMENTS, CONTINUED
| Thornburg California Limited Term Municipal Fund | September 30, 2005 |
Issuer-Description | Credit Rating† Moody’s/S&P | Principal Amount | Value | |||||
California Statewide Community Development Authority Revenue, 5.125% due 6/1/2008 (Louisiana Orthopedic Hospital Foundation Project; Insured: AMBAC) | Aaa/AAA | $ | 595,000 | $ | 620,680 | |||
California Statewide Community Development Authority Revenue COP, 6.50% due 8/1/2012 (Cedars Sinai Center Hospital Project; Insured: MBIA) | Aaa/AAA | 860,000 | 948,133 | |||||
California Statewide Community Development Authority Revenue Series B, 5.00% due 6/1/2008 (Hospital Monterey Peninsula Project; Insured: FSA) | NR/AAA | 1,110,000 | 1,165,333 | |||||
California Statewide Community Development Authority Revenue Series B, 5.00% due 6/1/2009 (Hospital Monterey Peninsula Project; Insured: FSA) | NR/AAA | 1,180,000 | 1,254,069 | |||||
California Statewide Community Development Authority Revenue Series D, 4.35% due 11/1/2036 put 3/1/2007 (Kaiser Permanente Project) | VMIG2/A-1 | 1,000,000 | 1,015,210 | |||||
California Statewide Community Development Authority Series E, 3.875% due 4/1/2032 put 4/1/2010 (Kaiser Permanente Project) | NR/A-1 | 1,000,000 | 1,004,930 | |||||
California Statewide Community Development Authority Solid Waste Revenue, 2.90% due 4/1/2011 put 4/1/2007 (Waste Management Inc. Project) | NR/BBB | 1,000,000 | 988,120 | |||||
California Statewide Community Development Series E, 4.70% due 11/1/2036 put 6/1/2009 (Kaiser Permanente Project) | VMIG2/A-1 | 2,000,000 | 2,082,880 | |||||
Capistrano Unified School District 92-1 Community Facilities District Special Tax, 7.10% due 9/1/2021 pre-refunded 9/1/2007 | NR/NR | 890,000 | 965,321 | |||||
Castaic Lake Water Agency COP Refunding Series A, 7.25% due 8/1/2007 (Water Systems Improvement Project; Insured: MBIA) | Aaa/AAA | 1,000,000 | 1,075,470 | |||||
Central Union High School District Imperial County Refunding, 5.00% due 8/1/2011 (Insured: FGIC) | Aaa/AAA | 780,000 | 848,757 | |||||
Central Union High School District Imperial County Refunding, 5.00% due 8/1/2012 (Insured: FGIC) | Aaa/AAA | 830,000 | 907,447 | |||||
Central Valley Financing Authority Revenue, 6.00% due 7/1/2009 (Carson Ice Project) | NR/BBB | 165,000 | 167,953 | |||||
Central Valley School Districts Financing Authority, 0% due 2/1/2007 (Insured: MBIA) | Aaa/AAA | 205,000 | 196,933 | |||||
Coachella Valley California Unified School District COP Refunding, 5.00% due 9/1/2012 (Insured: MBIA) | Aaa/AAA | 800,000 | 869,568 | |||||
East Palo Alto Public Financing University Circle Gateway/101 Series A, 5.00% due 10/1/2014 (Insured: RADIAN) | NR/AA | 670,000 | 720,237 | |||||
East Palo Alto Public Financing University Circle Gateway/101 Series A, 5.00% due 10/1/2016 (Insured: RADIAN) | NR/AA | 735,000 | 789,735 | |||||
East Side Union High School District Santa Clara County Series B, 6.625% due 8/1/2006 (Insured: MBIA) | Aaa/AAA | 700,000 | 722,015 | |||||
East Side Union High School District Santa Clara County Series B, 6.625% due 8/1/2007 (Insured: MBIA) | Aaa/AAA | 840,000 | 895,516 | |||||
El Monte COP Senior Department Public Services Facility Phase II, 5.00% due 1/1/2009 (Insured: AMBAC) | Aaa/AAA | 2,730,000 | 2,852,659 | |||||
Emeryville Public Financing Authority Revenue Series A, 5.00% due 9/1/2012 (Emeryville Redevelopment Project; Insured: AMBAC) | Aaa/AAA | 2,295,000 | 2,510,776 | |||||
Escondido Joint Powers Financing Authority Lease Revenue Refunding, 0% due 9/1/2013 (California Center For The Arts Project; Insured:AMBAC) | Aaa/AAA | 500,000 | 310,270 | |||||
Escondido Multi Family Housing Revenue Refunding Bond Series 1997-A, 5.40% due 1/1/2027 put 7/1/2007 (Terrace Gardens Project; Collateralized: FNMA) | NR/AAA | 3,015,000 | 3,065,350 | |||||
Fresno County Housing Authority Multi Family Revenue Refunding Series A, 4.90% due 11/1/2027 mandatory put 11/1/2007 (Housing Creek Park Apartments Project; Collateralized: FNMA) | NR/AAA | 400,000 | 408,468 | |||||
Fresno Unified School District Series D, 5.00% due 8/1/2009 (ETM) | Aaa/AAA | 545,000 | 565,018 | |||||
Hawaiian Gardens Redevelopment Agency Refunding, 5.50% due 12/1/2008 | NR/BBB+ | 575,000 | 609,488 | |||||
Julian Union High School District, 4.875% due 11/1/2005 (Insured: MBIA) | Aaa/AAA | 155,000 | 155,273 | |||||
Kern High School District, 7.00% due 8/1/2010 (ETM) | Aaa/NR | 165,000 | 192,393 | |||||
Kern High School District Refunding Series A, 6.30% due 8/1/2011 (Insured: MBIA) | Aaa/AAA | 500,000 | 571,850 | |||||
16 Certified Annual Report
SCHEDULE OF INVESTMENTS, CONTINUED
| Thornburg California Limited Term Municipal Fund | September 30, 2005 |
| Credit Rating† | Principal | |||||||
Issuer-Description | Moody’s/S&P | Amount | Value | |||||
Kern High School District Series B, 9.00% due 8/1/2006 (ETM) | Aaa/AAA | $ | 680,000 | $ | 714,048 | |||
Los Angeles Community Redevelopment Agency, 5.00% due 7/1/2009 (Cinerama Dome Public Parking Project; Insured: ACA) | NR/A | 835,000 | 872,066 | |||||
Los Angeles Community Redevelopment Agency, 5.75% due 7/1/2010 (Cinerama Dome Public Parking Project; Insured: ACA) | NR/A | 435,000 | 470,948 | |||||
Los Angeles Community Redevelopment Agency, 5.00% due 9/1/2012 (Insured: AMBAC) | Aaa/NR | 1,810,000 | 1,959,325 | |||||
Los Angeles Convention & Exhibition Center, 9.00% due 12/1/2020 pre-refunded 12/1/2005 | Aaa/AAA | 5,000 | 5,052 | |||||
Los Angeles COP, 5.00% due 2/1/2012 (Insured: MBIA) | Aaa/AAA | 1,400,000 | 1,515,458 | |||||
Los Angeles County Capital Asset, 5.00% due 4/1/2008 (Insured: AMBAC) | Aaa/AAA | 2,000,000 | 2,096,740 | |||||
Los Angeles County Public Works Refunding Series A, 5.00% due 12/1/2008 | Aaa/AAA | 2,000,000 | 2,119,560 | |||||
Los Angeles Department of Water & Power Revenue Refunding Series A Subseries A-1, 5.00% due 7/1/2008 (Power Systems Project) | Aa3/AA- | 1,000,000 | 1,053,500 | |||||
Los Angeles Department of Water & Power Revenue Series A, 5.25% due 7/1/2011 (Insured: MBIA) | Aaa/AAA | 3,000,000 | 3,295,830 | |||||
Los Angeles Multi Family Revenue, 5.85% due 12/1/2027 put 12/01/2007 | NR/AAA | 1,925,000 | 1,969,352 | |||||
Los Angeles Regional Airport Lease Refunding, 5.25% due 1/1/2009 | Aaa/AAA | 1,590,000 | 1,664,285 | |||||
Los Angeles Unified School District Series E, 5.50% due 7/1/2012 (Insured: MBIA) | Aaa/AAA | 2,500,000 | 2,806,225 | |||||
Milpitas California Agency Tax Allocation Redevelopment Project Area No 1, 5.00% due 9/1/2015 (Insured: MBIA) | Aaa/AAA | 2,000,000 | 2,152,400 | |||||
Moorpark Mobile Home Park Revenue Series A, 5.80% due 5/15/2010 | NR/A | 1,205,000 | 1,225,449 | |||||
New Haven Unified School District Refunding, 12.00% due 8/1/2006 (Insured: FSA) | Aaa/AAA | 1,400,000 | 1,502,732 | |||||
New Haven Unified School District Refunding, 12.00% due 8/1/2008 (Insured: FSA) | Aaa/AAA | 1,000,000 | 1,234,620 | |||||
Northern California Power Agency Public Power Revenue, 5.65% due 7/1/2007 (Geothermal Project 3-A) (ETM) | Baa2/BBB+ | 360,000 | 376,783 | |||||
Northern California Power Agency Public Power Revenue, 5.65% due 7/1/2007 | Baa2/BBB+ | 340,000 | 353,280 | |||||
Northern California Power Agency Public Power Revenue Series A, 5.00% due 7/1/2009 (Geothermal Project Number 3) | Baa2/BBB+ | 4,000,000 | 4,004,520 | |||||
Oakland Redevelopment Agency, 7.40% due 5/1/2007 (Insured: AMBAC) | Aaa/AAA | 40,000 | 40,150 | |||||
Ontario Montclair School District COP Refunding, 3.80% due 9/1/2028 put 8/31/2007 (School Facility Bridge Funding Project; Insured: FSA) | VMIG1/A-1 | 1,680,000 | 1,680,739 | |||||
Orange County Airport Revenue Bond, 6.00% due 7/1/2007 (Insured: MBIA) | Aaa/AAA | 1,000,000 | 1,047,130 | |||||
Orange County Local Transportation Authority Sales Tax Revenue, 6.00% due 2/15/2006 | Aa2/AA+ | 510,000 | 515,941 | |||||
Orange County Recovery COP Series A, 6.00% due 7/1/2006 (Insured: MBIA) | Aaa/AAA | 600,000 | 614,130 | |||||
Oxnard Financing Authority Solid Refunding, 5.00% due 5/1/2013 (Insured: AMBAC) | Aaa/AAA | 2,115,000 | 2,245,453 | |||||
Oxnard HBR District Revenue Refunding, 5.65% due 8/1/2014 (Insured: ACA) | NR/A | 1,520,000 | 1,589,859 | |||||
Piedmont Unified School District Series B, 0% due 8/1/2013 pre-refunded 8/1/2007 | Aa3/NR | 1,000,000 | 656,020 | |||||
Pittsburg California Redevelopment Agency Tax Allocation Refunding, 5.25% due 8/1/2012 (Los Medanos Community Development Project A; Insured: MBIA) | Aaa/AAA | 3,350,000 | 3,698,165 | |||||
Pomona Unified School District Refunding Series A, 6.10% due 2/1/2010 (Insured: MBIA) | Aaa/AAA | 320,000 | 357,235 | |||||
Porterville COP, 6.10% due 10/1/2005 (Water Systems Refunding Project; Insured: AMBAC) | Aaa/AAA | 295,000 | 295,027 | |||||
Puerto Rico Commonwealth Highway & Transportation Authority, 5.50% due 7/1/2009 (Insured: FSA) | Aaa/AAA | 1,000,000 | 1,082,510 | |||||
Puerto Rico Commonwealth Highway & Transportation Authority Highway Revenue Refunding Series A, 5.00% due 7/1/2008 (Insured: FGIC) | Aaa/AAA | 1,000,000 | 1,051,340 | |||||
Puerto Rico Municipal Finance Agency Series A, 6.00% due 7/1/2011 (Insured: FSA) | Aaa/AAA | 600,000 | 682,530 | |||||
Richmond Joint Powers Financing Authority Refunding Lease & Gas Tax Series A, 5.25% due 5/15/2013 | NR/NR | 2,000,000 | 2,046,080 | |||||
Sacramento County Sanitation District Financing Authority Revenue Series A, 5.75% due 12/1/2009 | Aa3/AA | 560,000 | 614,678 | |||||
Sacramento County Sanitation District Financing Authority Revenue Series A, 5.875% due 12/1/2027 Crossover refunded 12/1/2005 | Aa3/AA | 2,500,000 | 2,536,800 | |||||
Sacramento Municipal Utility District Electric Revenue Refunding Series C, 5.75% due 11/15/2007 (ETM) | Aaa/AAA | 330,000 | 330,406 | |||||
Certified Annual Report 17
SCHEDULE OF INVESTMENTS, CONTINUED
| Thornburg California Limited Term Municipal Fund | September 30, 2005 |
| Credit Rating† | Principal | |||||||
Issuer-Description | Moody’s/S&P | Amount | Value | |||||
Sacramento Municipal Utility District Refunding Series L, 5.10% due 7/1/2014 (Insured: AMBAC) | Aaa/AAA | $ | 1,000,000 | $ | 1,052,980 | |||
Sacramento Power Authority Revenue, 5.875% due 7/1/2015 pre-refunded 7/1/2006 (Cogeneration Project; Insured: MBIA) | Aaa/AAA | 2,500,000 | 2,606,100 | |||||
Salinas Redevelopment Agency Tax Allocation Series A, 0% due 11/1/2022 (Insured: FSA) | Aaa/AAA | 1,450,000 | 577,840 | |||||
San Bernardino County Multi Family Housing Revenue Refunding Series A, 4.75% due 12/15/2031 put 12/15/2011 (Collateralized: FNMA) | Aaa/NR | 3,000,000 | 3,144,630 | |||||
San Bernardino County Special Taxes Community Facilities District 2002-1, 5.10% due 9/1/2011 | NR/NR | 190,000 | 196,458 | |||||
San Bernardino County Special Taxes Community Facilities District 2002-1, 5.20% due 9/1/2012 | NR/NR | 205,000 | 212,456 | |||||
San Bernardino County Special Taxes Community Facilities District 2002-1, 5.30% due 9/1/2013 | NR/NR | 300,000 | 311,775 | |||||
San Bernardino County Transportation Authority Sales Tax Revenue Series A, 6.00% due 3/1/2010 (ETM) | Aaa/AAA | 175,000 | 187,324 | |||||
San Diego County Regional Transportation Commission Sales Tax Revenue Series A, 6.00% due 4/1/2008 (ETM) | Aaa/AA- | 590,000 | 619,642 | |||||
San Diego Public Facilities Financing Authority Lease Revenue, 7.00% due 4/1/2006 (Insured: MBIA) | Aaa/AAA | 455,000 | 464,428 | |||||
San Diego Public Facilities Financing Authority Lease Revenue, 7.00% due 4/1/2007 (Insured: MBIA) | Aaa/AAA | 425,000 | 450,249 | |||||
San Francisco Bay Area Transit Bridge Toll Notes, 5.625% due 8/1/2006 (Insured: ACA) | NR/A | 1,400,000 | 1,428,658 | |||||
San Francisco City & County Capital Appreciation George R Moscone, 0% due 7/1/2010 | A1/AA- | 1,380,000 | 1,149,098 | |||||
San Francisco International Airport Revenue AMT Special Facilities Lease, 5.25% due 1/1/2019 (Insured: AMBAC) | Aaa/AAA | 1,000,000 | 1,041,910 | |||||
San Francisco International Airport Revenue Series Issue 13B, 8.00% due 5/1/2007 (Insured: MBIA) | Aaa/AAA | 1,100,000 | 1,141,030 | |||||
San Francisco Laguna Honda Hospital Series I, 5.00% due 6/15/2014 (Insured: FSA) | Aaa/AAA | 2,320,000 | 2,525,320 | |||||
San Jose Evergreen Community College District Series C, 0% due 9/1/2011 crossover refunded 9/1/2010 (Insured: AMBAC) | Aaa/AAA | 2,200,000 | 1,730,146 | |||||
San Jose Financing Authority Lease Revenue Series D, 5.00% due 6/1/2039 mandatory put 6/1/2006 (Civic Center Project; Insured: AMBAC) | Aaa/AAA | 2,700,000 | 2,738,340 | |||||
San Marcos Public Facilities Authority Revenue Community Facilities District 88-1, 0% due 3/1/2008 (ETM) | Aaa/NR | 1,900,000 | 1,759,229 | |||||
Santa Clara Valley Transportation Authority Sales Tax Revenue Measure A, 5.50% due 4/1/2036 put 10/2/2006 (Insured: AMBAC) | Aaa/AAA | 1,810,000 | 1,859,974 | |||||
Seal Beach Redevelopment Agency Mobile Home Park Revenue Series A, 5.20% due 12/15/2013 (Insured: ACA) | NR/A | 575,000 | 612,605 | |||||
South Orange County Public Financing Authority Special Tax Revenue Series C, 8.00% due 8/15/2008 (Foothill Area Project; Insured: FGIC) | Aaa/AAA | 1,500,000 | 1,699,710 | |||||
Southeast Resources Recovery Facilities Authority Lease Revenue Refunding Series B, 5.375% due 12/1/2013 (Insured: AMBAC) | Aaa/AAA | 1,060,000 | 1,152,803 | |||||
Southern California Revenue, 5.15% due 7/1/2015 (Public Power Project; Insured: AMBAC) | Aaa/AAA | 350,000 | 383,404 | |||||
Southern California Revenue, 5.15% due 7/1/2015 (Public Power Project; Insured: AMBAC) | Aaa/AAA | 250,000 | 273,860 | |||||
Stanton Multi Family Housing Revenue Bond Series 1997, 5.625% due 8/1/2029 put 8/1/2009 (Continental Gardens Project; Collateralized: FNMA) | NR/AAA | 3,200,000 | 3,350,368 | |||||
Ukiah Unified School District COP, 5.00% due 9/1/2008 (Insured: MBIA) | Aaa/AAA | 1,000,000 | 1,054,820 | |||||
Val Verde Unified School District COP, 5.00% due 1/1/2014 (Insured: FGIC) | NR/AAA | 445,000 | 486,790 | |||||
Val Verde Unified School District Series B, 5.00% due 1/1/2013 (Refunding Project; Insured: FGIC) | NR/AAA | 360,000 | 388,562 | |||||
Val Verde Unified School District Series B, 5.00% due 1/1/2014 (Refunding Project; Insured: FGIC) | NR/AAA | 430,000 | 464,968 | |||||
Ventura County Community College Series A, 5.00% due 8/1/2012 (Insured: MBIA) | Aaa/AAA | 500,000 | 546,655 | |||||
Victorville Redevelopment Agency Tax Allocation Bear Valley Road Special Escrow Fund A, 5.00% due 12/1/2014 (Insured: FSA) | Aaa/AAA | 455,000 | 456,652 | |||||
Walnut Valley Unified School District, 9.00% due 8/1/2006 (ETM) | Aaa/AAA | 800,000 | 840,056 | |||||
Walnut Valley Unified School District, 8.75% due 8/1/2010 (ETM) | Aaa/AAA | 1,000,000 | 1,242,860 | |||||
Walnut Valley Unified School District Series A, 6.80% due 2/1/2007 (Insured: MBIA) | Aaa/AAA | 250,000 | 262,810 | |||||
Walnut Valley Unified School District Series A, 6.90% due 2/1/2008 (Insured: MBIA) | Aaa/AAA | 250,000 | 272,020 | |||||
Walnut Valley Unified School District Series A, 7.00% due 8/1/2008 (Insured: MBIA) | Aaa/AAA | 100,000 | 110,743 | |||||
Washington Township Health Care District Revenue, 5.00% due 7/1/2009 | A2/NR | 450,000 | 469,818 | |||||
18 Certified Annual Report
SCHEDULE OF INVESTMENTS, CONTINUED
| Thornburg California Limited Term Municipal Fund | September 30, 2005 |
Issuer-Description | Credit Rating† Moody’s/S&P | Principal Amount | Value | |||||
West Contra Costa Unified School District Series A, 7.00% due 8/1/2006 (Insured: MBIA) | Aaa/AAA | $ | 595,000 | $ | 615,563 | |||
West Contra Costa Unified School District Series A, 7.00% due 8/1/2008 (Insured: MBIA) | Aaa/AAA | 655,000 | 725,367 | |||||
Whittier Solid Waste Revenue Refunding Series A, 5.375% due 8/1/2014 (Insured:AMBAC) | Aaa/AAA | 1,000,000 | 1,002,070 | |||||
TOTAL INVESTMENTS — 98.65% (Cost $ 157,860,495 ) | $ | 159,787,339 | ||||||
OTHER ASSETS LESS LIABILITIES — 1.35% | 2,178,819 | |||||||
NET ASSETS — 100.00% | $ | 161,966,158 | ||||||
Footnote Legend
See notes to financial statements.
| † | Credit ratings are unaudited. Rating changes may have occurred prior to or subsequent to the reporting period end. |
Portfolio Abbreviations
To simplify the listings of securities, abbreviations are used per the table below:
| ACA | Insured by American Capital Access | |
| AMBAC | Insured by American Municipal Bond Assurance Corp. | |
| AMT | Alternative Minimum Tax | |
| COP | Certificates of Participation | |
| ETM | Escrowed to Maturity | |
| FGIC | Insured by Financial Guaranty Insurance Co. | |
| FNMA | Collateralized by Federal National Mortgage Association | |
| FSA | Insured by Financial Security Assurance Co. | |
| GNMA | Insured by Government National Mortgage Co. | |
| GO | General Obligation | |
| MBIA | Insured by Municipal Bond Investors Assurance | |
| RADIAN | Insured by Radian Asset Assurance |
SUMMARY OF SECURITY CREDIT RATINGS†
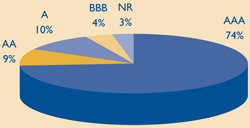
Ratings are a blend of Moody’s and Standard & Poor���s, using the higher rating. Some bonds are rated by only one service.
Certified Annual Report 19
REPORT OF INDEPENDENT REGISTERED PUBLIC ACCOUNTING FIRM
Thornburg California Limited Term Municipal Fund
To the Trustees and Class I Shareholders of
Thornburg California Limited Term Municipal Fund
In our opinion, the accompanying statement of assets and liabilities, including the schedule of investments, and the related statements of operations and of changes in net assets and the financial highlights present fairly, in all material respects, the financial position of Thornburg California Limited Term Municipal Fund (one of the Portfolios constituting Thornburg Investment Trust, hereafter referred to as the “Fund”) at September 30, 2005, the results of its operations for the year then ended, the changes in its net assets and the financial highlights for the Class I shares for each of the periods presented, in conformity with accounting principles generally accepted in the United States of America. These financial statements and financial highlights (hereafter referred to as “financial statements”) are the responsibility of the Fund’s management. Our responsibility is to express an opinion on these financial statements based on our audits. We conducted our audits of these financial statements in accordance with the standards of the Public Company Accounting Oversight Board (United States). Those standards require that we plan and perform the audit to obtain reasonable assurance about whether the financial statements are free of material misstatement. An audit includes examining, on a test basis, evidence supporting the amounts and disclosures in the financial statements, assessing the accounting principles used and significant estimates made by management, and evaluating the overall financial statement presentation. We believe that our audits, which included confirmation of securities at September 30, 2005 by correspondence with the custodian and brokers, provide a reasonable basis for our opinion.
PricewaterhouseCoopers LLP
New York, New York
November 16, 2005
20 Certified Annual Report
| Thornburg California Limited Term Municipal Fund | September 30, 2005 (Unaudited) |
As a shareholder of the Fund, you incur ongoing costs, including management and administration fees and other Fund expenses.
This example is intended to help you understand your ongoing costs (in dollars) of investing in the Fund and to compare these costs with the ongoing costs of investing in other mutual funds.
The example is based on an investment of $1,000 invested on March 31, 2005 and held until September 30, 2005.
Actual Expenses
The first line of the table at right provides information about actual account values and actual expenses. You may use the information in this line, together with the amount you invested, to estimate the expenses that you paid over the period. Simply divide your account value by $1,000 (for example, an $8,600 account value divided by $1,000 = 8.6), then multiply the result by the number in the first line under the heading entitled “Expenses Paid During Period” to estimate the expenses you paid on your account during this period.
Hypothetical Example for Comparison Purposes
The second line of the table at right provides information about hypothetical account values and hypothetical expenses based on the Fund’s actual expense ratio and an assumed rate of return of 5% per year before expenses, which is not the Fund’s actual return. The hypothetical account values and expenses may not be used to estimate the actual ending account balance or expenses you paid for the period. You may use this information to compare the ongoing costs of investing in the Fund and other funds. To do so, compare this 5% hypothetical example with the 5% hypothetical examples that appear in the shareholder reports of the other funds.
Please note that the expenses shown in the table are meant to highlight your ongoing costs only and do not reflect any transactional costs, such as sales charges (loads), redemption fees, or exchange fees. Therefore, the second line of the table is useful in comparing ongoing costs only, and will not help you determine the relative total costs of owning different funds. In addition, if these transactional costs were included, your costs would have been higher.
| Beginning Account Value 3/31/05 | Ending Account Value 9/30/05 | Expenses Paid During Period† 3/31/05-9/30/05 | |||||||
Class I Shares | |||||||||
Actual | $ | 1,000 | $ | 1,014.40 | $ | 3.38 | |||
Hypothetical* | $ | 1,000 | $ | 1,021.71 | $ | 3.39 | |||
| † | Expenses are equal to the annualized expense ratio for Class I shares (0.67%) multiplied by the average account value over the period, multiplied by 183/365 to reflect the one-half year period. |
| * | Hypothetical assumes a rate of return of 5% per year before expenses. |
Certified Annual Report 21
| Thornburg California Limited Term Municipal Fund | September 30, 2005 (Unaudited) |
GROWTH OF A HYPOTHETICAL $10,000 INVESTMENT
Thornburg California Limited Term Municipal Fund Class I Total Returns versus Lehman
Brothers Five-Year Municipal Bond Index and Consumer Price Index
(April 1, 1997 to September 30, 2005)
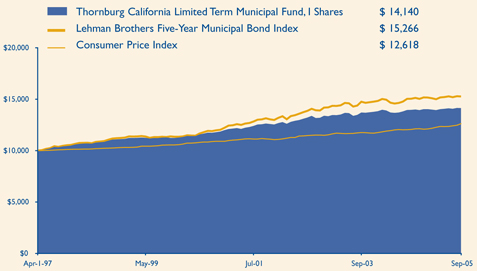
AVERAGE ANNUAL TOTAL RETURNS
For the periods ended September 30, 2005
| 1 Yr | 5 Yrs | 10 Yrs | Since Inception | ||||||||
I Shares (Incep: 4/1/97) | 1.31 | % | 3.81 | % | N/A | 4.16 | % |
FUND ATTRIBUTES
as of September 30, 2005
| Annualized Dist. Rate | SEC Yield | NAV | Maximum Offering Price | |||||||||
I Shares (Incep: 4/1/97) | 3.28 | % | 2.83 | % | $ | 12.80 | $ | 12.80 | ||||
Performance data reflect past performance, which is no guarantee of future results. The performance data and graph do not reflect the deduction of taxes that a shareholder would pay on distributions or the redemption of Fund shares.
Returns reflect the reinvestment of dividends and capital gains. There is no up front sales charge for this class of shares.
The Consumer Price Index (“CPI”) measures prices of a fixed basket of goods bought by a typical consumer, including food, transportation, shelter, utilities, clothing, medical care, entertainment and other items. The CPI, published by the Bureau of Labor Statistics in the Department of Labor, is based at 100 in 1982 and is released monthly. It is widely used as a cost-of-living benchmark to adjust Social Security payments and other payment schedules, union contracts and tax brackets. The CPI is also known as the cost-of-living index.
The Lehman Brothers Five-Year Municipal Bond Index is a rules-based, market-value-weighted index engineered for the long-term tax-exempt bond market. To be included in the index, bonds must have a minimum credit rating of Baa. The approximate maturity of the municipal bonds in the index is five years.
Unless otherwise noted, index returns reflect the reinvestment of income dividends and capital gains, if any, but do not reflect fees, brokerage commissions or other expenses of investing. Investors may not make direct investments into any index.
The SEC Yield is computed in accordance with SEC standards measuring the net investment income per share over a specified 30-day period expressed as a percentage of the maximum offering price of the Fund’s shares at the end of the period.
The distribution rate is calculated by taking the sum of the month’s total distribution factors and dividing this sum by a 30-day period and annualizing to 360-day year. The value is then divided by the ending Net Asset Value (NAV) to arrive at the annualized distribution yield. The yield is calculated on a periodic basis and is subject to change depending on the Fund’s NAV and current distributions.
22 Certified Annual Report
| Thornburg California Limited Term Municipal Fund | September 30, 2005 (Unaudited) |
Name, Age,(1) Year Elected(4)(6) | Principal Occupation(s) During Past Five Years | Other Directorships | ||
INTERESTED TRUSTEES(1)(2)(4) | ||||
| Garrett Thornburg, 59 Chairman of Trustees, Trustee since 1987(3) | CEO, Chairman and controlling shareholder of Thornburg Investment Management, Inc. (investment advisor) and Thornburg Securities Corporation (securities dealer); Chairman of Thornburg Limited Term Municipal Fund, Inc. (registered investment company) to 2004; CEO and Chairman of Thornburg Mortgage, Inc. (real estate investment trust); Chairman of Thornburg Mortgage Advisory Corporation (investment manager to Thornburg Mortgage, Inc.). | Director of Thornburg Mortgage, Inc. (real estate investment trust) | ||
| Brian J. McMahon, 49 Trustee since 2001, Member of Governance & Nominating Committee, President since 1997(5)(6) | President and Managing Director of Thornburg Investment Management, Inc.; President of Thornburg Limited Term Municipal Fund, Inc. to 2004. | None | ||
INDEPENDENT TRUSTEES(1)(2)(4) | ||||
David A. Ater, 60 Trustee since 1994, Member of Audit Committee and Governance & Nominating Committee | Principal in Ater & Associates, Santa Fe, NM (developer, planner and broker of residential and commercial real estate); owner developer and broker for various real estate projects. | Director of Thornburg Mortgage, Inc. (real estate investment trust) | ||
David D. Chase, 64 Chairman of Audit Committee, Trustee since 2000 | Chairman, President, CEO, and Managing Member of Vestor Associates, LLC, the general partner of Vestor Partners, LP, Santa Fe, NM (private equity fund); Chairman and CEO of Vestor Holdings, Inc., Santa Fe, NM (merchant bank). | None | ||
Eliot R. Cutler, 59 Chairman of Governance & Nominating Committee, Trustee since 2004 | Partner, Akin, Gump, Strauss, Hauer & Feld, LLP,Washington, D.C. (law firm) since November 2000; partner, Cutler & Stanfield,Washington, D.C. (law firm) until November 2000. | Director of Thornburg Mortgage, Inc. (real estate investment trust) | ||
Susan H. Dubin, 56 Trustee since 2004, Member of Audit Committee | President of Dubin Investments, Ltd., Greenwich, CT (private investment fund); Director and officer of various charitable organizations; and formerly, Vice President of Chemical Bank (predecessor to JP Morgan Chase & Co.), New York, 1974–1996. | None | ||
Owen D. Van Essen, 51 Trustee since 2004, Member of Governance & Nominating Committee | President of Dirks, Van Essen & Murray, Santa Fe, NM (newspaper mergers and acquisitions). | None | ||
James W. Weyhrauch, 46 Trustee since 1996, Member of Audit Committee | Director, Executive Vice President to 2002, and President and CEO 2002–2004, Nambé Mills, Inc., Santa Fe, NM (manufacturer); real estate agent, Santa Fe Properties, Santa Fe, NM since 2004. | None | ||
Certified Annual Report 23
TRUSTEES AND OFFICERS, CONTINUED
| Thornburg California Limited Term Municipal Fund | September 30, 2005 (Unaudited) |
Name, Age,(1) Year Elected(4)(6) | Principal Occupation(s) During Past Five Years | Other Directorships | ||
| OFFICERS OF THE FUND (WHO ARE NOT TRUSTEES)(1)(6)(7) | ||||
| Dawn B. Fischer, 58 Secretary since 1987 | Secretary and Managing Director, Thornburg Investment Management, Inc.; Secretary, Thornburg Limited Term Municipal Fund, Inc. to 2004; Secretary, Thornburg Securities Corporation; Vice President, Daily Tax Free Income Fund, Inc. (registered investment company). | Not applicable | ||
| Steven J. Bohlin, 46 Vice President since 1987; Treasurer since 1989 | Vice President and Managing Director of Thornburg Investment Management, Inc.; Vice President of Thornburg Limited Term Municipal Fund, Inc. to 2004. | Not applicable | ||
| George T. Strickland, 42 Vice President since 1996 | Vice President and Managing Director of Thornburg Investment Management, Inc.; Vice President (to 2004) and Treasurer (2003–2004) of Thornburg Limited Term Municipal Fund, Inc. | Not applicable | ||
| William V. Fries, 66 Vice President since 1995 | Vice President and Managing Director of Thornburg Investment Management, Inc. | Not applicable | ||
| Leigh Moiola, 38 Vice President since 2001 | Vice President and Managing Director of Thornburg Investment Management, Inc.; Vice President of Thornburg Limited Term Municipal Fund, Inc. 1999–2004. | Not applicable | ||
| Kenneth Ziesenheim, 51 Vice President since 1995 | Vice President and Managing Director of Thornburg Investment Management, Inc.; President of Thornburg Securities Corporation; Vice President of Thornburg Limited Term Municipal Fund, Inc. to 2004. | Not applicable | ||
| Alexander Motola, 35 Vice President since 2001 | Vice President and Managing Director of Thornburg Investment Management, Inc. since 2000; Portfolio Manager, Insight Capital Research & Management, Inc., Walnut Creek, California 1995–2000. | Not applicable | ||
| Wendy Trevisani, 34 Vice President since 1999 | Associate Portfolio Manager of Thornburg Investment Management, Inc. since 1999, Vice President since 2000 and Managing Director since 2003; Vice President of Thornburg Limited Term Municipal Fund, Inc. 1999–2002. | Not applicable | ||
| Joshua Gonze, 42 Vice President since 1999 | Associate Portfolio Manager of Thornburg Investment Management, Inc. since 1999, Vice President since 1999 and Managing Director since 2003; Vice President of Thornburg Limited Term Municipal Fund, Inc. to 2004. | Not applicable | ||
| Brad Kinkelaar, 37 Vice President since 1999 | Associate Portfolio Manager of Thornburg Investment Management, Inc. since 1999, Vice President since 2000 and Managing Director since 2003. | Not applicable | ||
| Christopher Ihlefeld, 35 Vice President since 2003 | Associate Portfolio Manager since 1999; Vice President of Thornburg Investment Management, Inc. since 2002; Vice President of Limited Term Municipal Fund, Inc., 2003–2004. | Not applicable | ||
| Leon Sandersfeld, 39 Vice President since 2003 | Associate of Thornburg Investment Management, Inc. since 2002; Senior Staff Accountant, Farm Bureau Life Insurance Co. 1998–2002. | Not applicable | ||
24 Certified Annual Report
TRUSTEES AND OFFICERS, CONTINUED
| Thornburg California Limited Term Municipal Fund | September 30, 2005 (Unaudited) |
Name, Age,(1) Year Elected(4)(6) | Principal Occupation(s) During Past Five Years | Other Directorships | ||
Sasha Wilcoxon, 31 Vice President since 2003 | Associate of Thornburg Investment Management, Inc. since 2000 and Mutual Fund Operations Department Manager since 2002. | Not applicable | ||
Ed Maran, 47 Vice President since 2004 | Associate Portfolio Manager of Thornburg Investment Management, Inc. since 2002 and Vice President and Managing Director since 2004; Analyst, USAA 2001–2002; Oil Analyst, A.G. Edwards 1997–2000. | Not applicable | ||
Vinson Walden, 35 Vice President since 2004 | Associate Portfolio Manager of Thornburg Investment Management, Inc. since 2002 and Vice President and Managing Director since 2004; Associate Portfolio Manager, Ibis Management 2002–2004; Associate, Lehman Brothers, 1997–2001. | Not applicable | ||
| (1) | Each person’s address is 119 East Marcy Street, Santa Fe, New Mexico 87501. |
| (2) | The Fund is one of twelve separate investment “Funds” or “series” of Thornburg Investment Trust (the “Trust”), which comprises the Thornburg mutual fund complex and is organized as a Massachusetts business trust. The Trust currently has twelve active Funds. Thornburg Investment Management, Inc. is the investment advisor to, and manages, the twelve Funds of the Trust. Each Trustee oversees the twelve Funds in the fund complex. |
| (3) | Mr. Thornburg is considered an “interested” Trustee under the Investment Company Act of 1940 because he is a director and controlling shareholder of Thornburg Investment Management, Inc., the investment advisor to the twelve active Funds of the Trust, and is the sole director and controlling shareholder of Thornburg Securities Corporation, the distributor of shares for the Trust. |
| (4) | Each Trustee serves in office until the election and qualification of a successor. |
| (5) | Mr. McMahon is considered an “interested” Trustee because he is the president of Thornburg Investment Management, Inc. |
| (6) | The Trust’s president, secretary and treasurer each serves a one-year term or until the election and qualification of a successor; each other officer serves at the pleasure of the Trustees. |
| (7) | Assistant vice presidents, assistant secretaries and assistant treasurers are not shown. |
The Statement of Additional Information for each Fund of the Trust includes additional information about the Trustees and is available, without charge and upon request, by calling 1-800-847-0200.
Certified Annual Report 25
| Thornburg California Limited Term Municipal Fund | September 30, 2005 (Unaudited) |
PORTFOLIO PROXY VOTING
Policies and Procedures:
The Trust has delegated to Thornburg Investment Management, Inc. (the “Advisor”) voting decisions respecting proxies for the Fund’s voting securities. The Advisor makes voting decisions in accordance with its Proxy Voting Policy and Procedures. A description of the Policy and Procedures is available (i) without charge, upon request, by calling the Advisor toll-free at 1-800-847-0200, (ii) on the Thornburg website at www.thornburg.com, and (iii) on the Securities and Exchange Commission’s website at www.sec.gov.
Commencing August 31, 2004, information regarding how proxies were voted is available on or before August 31 of each year for the twelve months ending the preceding June 30. This information is available (i) without charge, upon request by calling the Advisor toll-free at 1-800-847-0200, (ii) on the Thornburg website at www.thornburg.com, and (iii) on the Securities and Exchange Commission’s website at www.sec.gov.
TAX INFORMATION
For the fiscal year ended September 30, 2005, 100% of dividends paid by the Fund are tax exempt dividends for Federal Income Tax purposes. The information and distributions reported herein may differ from the information and distributions taxable to the shareholders for the calendar year ending December 31, 2005.
AVAILABILITY OF QUARTERLY PORTFOLIO SCHEDULE
The Fund files with the Securities and Exchange Commission schedules of its portfolio holdings on Form N-Q for the first and third quarters of each fiscal year. The Fund’s Forms N-Q are available on the Commission’s website at www.sec.gov, or may be reviewed and copied at the Commission’s Public Reference Room in Washington, D.C. Information on the operation of the Public Reference Room may be obtained by calling 1-800-SEC-0330. The Fund also makes this information available on its website at www.thornburg.com/download or upon request by calling 1-800-847-0200.
TRUSTEES DELIBERATIONS RESPECTING RENEWAL OF INVESTMENT ADVISORY AGREEMENT
Thornburg Investment Management, Inc. (the “Advisor”) provides investment management services to Thornburg California Limited Term Municipal Fund pursuant to an investment advisory agreement. The Trustees consider the renewal of this agreement annually and most recently determined to renew the agreement on September 13, 2005.
In connection with their general supervision of the Advisor, the Trustees receive and consider reports throughout the year from the Advisor respecting the Advisor’s management of the Fund’s investments. These reports include information about the Fund’s purchase and sale of portfolio investments and explanations from the Advisor respecting investment selections, the investment performance of the Fund, general appraisals of industry and economic prospects and factors, and other matters affecting the Fund and relating to the Advisor’s performance of services for the Fund.
In anticipation of their recent consideration of the advisory agreement’s renewal, the independent Trustees met with representatives of the Advisor in May and July 2005 to specify the information the Advisor would present to the Trustees for their review. The independent Trustees thereafter met in independent session to consider various factors respecting the agreement’s renewal, and met in a subsequent session with the Advisor’s chief investment officer to present questions. Following these sessions, the Trustees met on September 13, 2005 to consider a renewal of the advisory agreement.
The Trustees considered various factors in their review of the Advisor’s performance under the investment advisory agreement, including specifically the principles outlined in their February 2005 Statement to Shareholders, a copy of which accompanies this Annual Report to Shareholders. Summarized below are certain of the factors considered by the Trustees in connection with the determination to renew the advisory agreement. In determining to renew the advisory agreement, the Trustees did not identify any single fact or aspect of the Advisor’s performance as controlling, and this summary does not describe all of the matters considered by the Trustees in making their determination.
Quality of Services; Fund Investment Performance. In reviewing the nature, extent, and quality of services provided by the Advisor and the investment performance of the Fund, the Trustees primarily considered the Advisor’s adherence to the Fund’s stated objectives and policies, the Advisor’s execution of the Fund’s investment strategies in prevailing market conditions, the Fund’s absolute investment performance, the Fund’s investment performance compared to categories of other broadly similar mutual funds and broad based securities indices, the Fund’s investment performance over different periods of time, the Fund’s total returns in rising and declining markets compared to total returns of a category of generally similar mutual funds and a broad based securities index, measures of portfolio risk and share price volatility, and related factors. The Trustees noted that bond indices have limited utility in evaluating fixed income mutual funds. Similarly, the Trustees noted in comparing the Fund to other mutual funds that the value of such comparisons may be limited in some degree because the Fund’s investment approach, and in particular its laddered maturity portfolio, differs from other funds. In conducting their review, the Trustees observed that the Advisor had continued to faithfully pursue and to achieve the Fund’s stated objectives, as demonstrated particularly by the Advisor’s selection of investments in a challenging single state environment and the Fund’s investment performance in the context of
26 Certified Annual Report
OTHER INFORMATION, CONTINUED
| Thornburg California Limited Term Municipal Fund | September 30, 2005 (Unaudited) |
that environment and the Fund’s investment policies. The Trustees noted in this regard that the Fund’s investment performance fell within the middle range of a category of generally similar California fixed income mutual funds selected by an independent analyst firm, and that the Fund’s share price volatility was lower than a category of longer term California funds selected by an independent analyst firm.
The Trustees also considered a number of other factors in reviewing the quality of the Advisor’s services, including the qualifications and integrity of the Advisor’s senior personnel, the Advisor’s staffing and other resources, the Advisor’s compliance with regulatory requirements, Fund sales performance and perceptions of the Funds in the marketplace, and other factors.
The Trustees concluded, based upon these and other considerations, that the Advisor had actively and competently pursued the Fund’s stated investment objectives in accordance with the Fund’s investment policies stated in its prospectuses. The Trustees further concluded that the investment performance of the Fund was satisfactory in the context of the Fund’s objectives and policies and prevailing market conditions.
Fees and Expenses; Profitability of Advisor. In reviewing the fees charged by the Advisor to the Fund, the Trustees primarily considered the fees charged by the Advisor and the other expenses charged to the Fund in light of the nature and quality of services provided, comparison of the actual Advisor’s fee and Fund expenses to the statement of fees and expenses in the Fund’s prospectuses, comparisons of the Advisor’s fee and other Fund expenses to median and average fees and expenses charged to similar mutual funds, and comparisons of fees and expenses charged to the Fund with fees and expenses charged to other, similar specific mutual funds. In addition, the Trustees considered the profitability of the Advisor compared to other investment management firms, and comparisons of the investment management fee rates charged by the Advisor to the Fund with rates charged to other clients of the Advisor and the differing types of services furnished to the Fund and the other clients. The Trustees observed that the management fee charged to the Fund was comparable to the average and median rates charged to a group of similar mutual funds. The Trustees also observed that the overall expenses for the Fund were somewhat higher than the average and median expenses for the same group of funds, but that the difference was not notable in view of the size of the Fund, and the other factors considered. The Trustees also determined in their review that fee rates charged by the Advisor to other clients of the Advisor were not directly comparable to rates charged to the Fund principally because of the significant differences in the services provided.
The Trustees concluded, based upon these and other considerations, that the fees charged to the Fund by the Advisor were fair and reasonable in view of the following: the services provided, the clear disclosure of these fees and expenses in the Fund’s prospectuses, and prevailing fees and expenses charged to mutual funds generally. The Trustees further concluded that there was no indication that the Advisor’s profitability was unusual, viewed in the context of the services provided, the performance of the Fund, and the fees and profitability of other investment management firms.
Economies of Scale. In reviewing the extent to which economies of scale would be realized by the Fund as it grows and whether fee levels reflect economies of scale, the Trustees considered the breakpoint structure for advisory fees chargeable to the Fund, the demonstrated economies of scale enjoyed by other Funds of the Trust as they had grown in size, and economies of scale realized by other mutual funds. The Trustees concluded that the Fund may reasonably be expected to realize economies of scale for the benefit of its shareholders as it grows in size.
Ancillary Benefits to Advisor. In reviewing benefits enjoyed by the Advisor because of its relationship with the Fund, the Trustees considered an arrangement through which the Advisor received certain research services, favorable publicity received by the Advisor because of the superior investment performance of certain Funds of the Trust, and the benefits to the Fund from the Advisor’s expansion of its staffing and other resources to serve a broader variety of investment clients. The Trustees concluded, based upon these and other considerations, that there was no unusual or unfair benefit enjoyed by the Advisor and that the Fund enjoyed benefits by virtue of the Advisor’s engagement by other investment clients.
Certified Annual Report 27
Trustees’ Statement to Shareholders
Not part of the Certified Annual Report
February 8, 2005
The Trustees are concerned that recent commentaries and opinions reported in the media may confuse investors in general as to the supervisory duties of trustees of mutual funds and, in particular, leave Thornburg Investment Trust shareholders uncertain regarding how we discharge our responsibilities in supervising the Funds’ investment advisor and in reviewing the advisor’s contract for renewal. We decided to spell out clearly three principal guidelines that we follow in supervising the Trust’s investment advisor on your behalf.
We begin with the premise that each shareholder selected his or her Fund because its investments are managed by the investment advisor identified in the prospectus and in accordance with the objective and policies described in the prospectus. We realize, as each of you do, that if you believe that your Fund’s stated objective and policies no longer serve your personal investment goals, you can sell your shares and leave the Fund.
Therefore, we believe that our primary supervisory task – our principal obligation to you – is to assess the nature and quality of the advisor’s services, and to confirm that the advisor actively and competently pursues the Fund’s objective, in accordance with the policies set out in the prospectus. To do this, we meet regularly with management to review your Fund’s portfolio and to discuss the advisor’s specific actions and judgments in pursuing the Fund’s objective. We do not substitute our own judgment for the advisor’s decisions in selecting investments; the advisor is paid to exercise its informed judgment on investment decisions, and we seek to confirm, in reviewing the advisor’s performance, that the advisor is doing just that.
Second, while we are conscious of costs and the effect that costs have on shareholders’ returns, we do not seek the lowest fees or expense ratio as our sole or primary objective. We try to make sure that your Fund’s fees and costs are reasonable in relationship to the services rendered and that they are generally in line with those charged by other expert investment advisors, consistent with our belief that the Fund’s investors searched for and expect that expertise and attention and have decided to pay a reasonable price for it. We do not put the management contract “out to bid” as a matter of course, and we would not do so unless we had concluded that the advisor materially had failed to pursue the Fund’s objectives in accordance with its policies, or for other equally important reasons. We believe that any other approach would be inconsistent with your interests and contrary to your expectations when you bought shares of the Fund in the first place.
Finally, because we believe that most Thornburg Fund shareholders have invested with a long-term perspective, we try not to focus too much on the fashions of the moment and on short-term performance. The market will not favor any specific investment objective or set of policies at all times and under all economic circumstances. A fund will experience periods of both high and low returns relative to other funds and other investments. Even if one of our Funds is not favored by the market at a particular time, we believe that the advisor is nonetheless obliged to remain true to the Fund’s objective and policies, and we watch to see that it does so.
This statement is submitted for the general information of the shareholders of Thornburg Investment Trust. It is not authorized for distribution to prospective investors in the Fund unless preceded or accompanied by an effective prospectus. If you have not received a prospectus, one can be obtained from your financial advisor, online at www.thornburg.com/download, or by calling 800-847-0200. Carefully consider information in the prospectus regarding the Fund’s investment objectives and policies, risks, sales charges, expenses, experience of its management, marketability of shares, and other information. Read it carefully before you invest or send money.
28 This page is not part of the Annual Report.
This page intentionally left blank.
This page is not part of the Annual Report. 29
This page intentionally left blank.
30 This page is not part of the Annual Report.
Planning Options
Retirement and Education Accounts
Thornburg Investment Management offers retirement and education savings accounts that can help you meet a variety of planning challenges. For account applications or further information on any of the accounts below, please call 1-800-847-0200 or go to www.thornburg.com/ira. Your financial advisor can help you determine which plan is right for you.
Individual Retirement Accounts
Individual Retirement Accounts (IRAs) provide a tax-advantaged means to save money for the future. For a detailed outline of the difference between retirement accounts, see www.thornburg.com/ira. Rollovers are available. Call 1-800-847-0200 for more information.
Traditional IRAs – Contributions to Traditional IRAs are tax deductible for eligible individuals, and withdrawals are taxed as additional ordinary income. You may contribute to an IRA if you receive compensation and are under 701/2, even if you are covered by an employer retirement plan.
Roth IRAs – Under a Roth IRA, there is no tax deduction for contributions, but there is no income tax on qualified withdrawals. For a more detailed comparison of Traditional and Roth IRAs, please see our web site at www.thornburg.com/ira.
SEP IRAs – Simplified Employee Pension (SEP) IRAs are established by employers. The employer is allowed a tax deduction for contributions made to the SEP Plan and makes contributions to each eligible employee’s SEP IRA on a discretionary basis.
SIMPLE IRAs – Savings Incentive Match Plan for Employees of Small Employers (SIMPLE) is designed to give small business owners a simplified method to establish and contribute to a retirement plan for employees. The employer is allowed a tax deduction for contributions and makes either matching or non-elective contributions to each eligible employee’s SIMPLE IRA. Employees may make salary deferral contributions.
403(b)
A special, tax-advantaged savings vehicle available only to employees of 501(c)(3) organizations, such as charitable, educational, scientific and religious organizations. 403(b) plans are also available to employees of public schools and universities.
Coverdell Education Savings Account
These savings accounts are designed to provide a way to save money for higher education expenses. In an Education Savings Account, earnings and interest grow tax free, and qualified withdrawals used to pay for eligible higher-education expenses are tax- and penalty-free.
Funds Available
The following funds are available in the accounts listed above:
| • | Thornburg International Value Fund |
| • | Thornburg Value Fund |
| • | Thornburg Core Growth Fund |
| • | Thornburg Investment Income Builder Fund |
| • | Thornburg Limited Term U.S. Government Fund |
| • | Thornburg Limited Term Income Fund |
This page is not part of the Annual Report. 31
The Firm
Thornburg Investment Management® is a privately held investment management company based in Santa Fe, New Mexico with assets under management of over $16 billion. Founded in 1982, the firm manages four equity funds, eight bond funds, and separate portfolios for select institutions and individuals.
Investment Philosophy
We seek to preserve and increase the real wealth of the Funds’ shareholders after accounting for inflation, taxes, and investment expenses. We’re committed to disciplined investing and controlling risk in all market environments through laddered bond and focused equity portfolios.
Portfolio Holdings Disclosure
We believe you should know about your portfolio. Our web site keeps investors informed of the Funds’ equity holdings. Go to www.thornburg.com/funds for commentary on our equity fund holdings.
Co-Ownership of Funds
We invest side-by-side with the Funds’ shareholders. Our employees have invested over $110 million in Thornburg Funds.
Core Strategies for Building Wealth
We deliver core strategies to help investors meet long-term goals. A core strategy is a consistent, disciplined and proven investment process that represents the foundation of a diversified portfolio.
Investment Manager:
Thornburg Investment Management®
119 East Marcy Street
Santa Fe, New Mexico 87501
800.847.0200
Distributor:
Thornburg Securities™
119 East Marcy Street
Santa Fe, New Mexico 87501
800.847.0200

Core Strategies for Building Wealth
Thornburg Intermediate Municipal Fund
Annual Report – September 30, 2005
This report is submitted for the general information of shareholders of the Fund. It is not authorized for distribution to prospective investors in the Fund unless preceded or accompanied by an effective prospectus. If you have not received a prospectus, one can be obtained from your financial advisor, online at www.thornburg.com/download, or by calling 800-847-0200. Carefully consider information in the prospectus regarding the Fund’s investment objectives and policies, risks, sales charges, expenses, experience of its management, marketability of shares, and other information. Read it carefully before you invest or send money. Performance data quoted represents past performance and does not guarantee future results.
Thornburg Intermediate Municipal Fund
Laddering – an All Weather Strategy
The Fund’s investment objective is to obtain as high a level of current income exempt from Federal income taxes as is consistent with preservation of capital (may be subject to Alternative Minimum Tax).
This Fund is a laddered portfolio of municipal bonds with an average maturity of ten years or less. Laddering involves building a portfolio of bonds with staggered maturities so that a portion of the portfolio matures each year; cash from maturing bonds, if not needed for other purposes, is invested in bonds with longer maturities at the far end of the ladder. We regard the strategy as a good compromise for managing different types of risk.
Thornburg Bond Funds
| • | Thornburg Limited Term Municipal Fund |
| • | Thornburg Intermediate Municipal Fund |
| • | Thornburg California Limited Term Municipal Fund |
| • | Thornburg New Mexico Intermediate Municipal Fund |
| • | Thornburg Florida Intermediate Municipal Fund |
| • | Thornburg New York Intermediate Municipal Fund |
| • | Thornburg Limited Term U.S. Government Fund |
| • | Thornburg Limited Term Income Fund |
Thornburg invests in short- and intermediate-term investment grade bonds. We ladder the maturities of individual bonds in the portfolios to moderate risk. Laddering involves building a portfolio of bonds with staggered maturities so that a portion of the portfolio will mature each year. We apply this disciplined process in all interest rate environments.
Thornburg Equity Funds
| • | Thornburg Value Fund |
| • | Thornburg International Value Fund |
| • | Thornburg Core Growth Fund |
| • | Thornburg Investment Income Builder Fund |
Thornburg’s equity research uses a fundamental, yet comprehensive, analytical approach. We invest when and where we perceive compelling value. Thornburg equity funds focus on a limited number of securities so that each holding can impact performance. The equity team searches for firms believed to have a promising future and seeks to buy shares of those companies at a discount to their intrinsic value.
More information at www.thornburg.com
 | Reduce paper clutter. Receive your shareholder reports and prospectus online instead of through traditional mail.
Sign up at www.thornburg.com/edelivery |
2 This page is not a part of the Annual Report.
Message
from the Chairman

Garrett Thornburg
Chairman & CEO
November 10, 2005
Dear Fellow Shareholder:
Thornburg Investment Management has a clear mission: to preserve and increase the real wealth of our shareholders. We aspire to accomplish this through a family of laddered bond funds that focus on quality, stability, and minimization of risk over time, and through a range of equity funds that redefine traditional measures of value and growth.
Our bond funds have always been managed using the highly disciplined approach of laddering short and intermediate bond maturities, seeking to provide both an attractive return and stability of principal. All of the bond funds buy only investment-grade securities. We have found this strategy to be the best at managing both interest-rate risk and credit risk, and we believe this strategy has served our shareholders well over time.
The bond funds are managed by portfolio managers who have many years of experience. We are proud of this consistency and experience and look forward to many more successful years with them at the helm.
In years past, there has been news about improper behavior by some mutual fund companies. Many new rules proposed in response to this scandal have called for increased transparency. We welcome increased transparency. Thornburg Investment Management has been a leader in providing information about our stock holdings and bond strategies to our shareholders on our web site, www.thornburg.com.
Unfortunately, some of the new rules will increase the cost to all shareholders in mutual funds. We will do our best to keep these expenses to a minimum. After all, we are shareholders too, and Thornburg employees have over $110 million invested in our own funds.
Thank you for investing with us. We will do our best to continue to earn your trust every day.
Sincerely, |
 |
| Garrett Thornburg |
| Chairman & CEO |
This page is not part of the Annual Report. 3

Thornburg Intermediate Municipal Fund
September 30, 2005
| 6 | ||
| 8 | ||
| 9 | ||
| 10 | ||
| 11 | ||
| 14 | ||
| 17 | ||
| 29 | ||
| 30 | ||
| 31 | ||
| 32 | ||
| 35 | ||
This report is certified under the Sarbanes-Oxley Act of 2002, which requires that public companies, including mutual funds, affirm that the information provided in their annual and semiannual shareholder reports fully and fairly represents their financial position.
4 Certified Annual Report
Important Information
Performance data quoted represents past performance and does not guarantee future results. Investment return and principal value will fluctuate so that upon redemption, investor’s shares may be worth more or less than their original cost. Current performance may be lower or higher than the data quoted. For performance data current to the most recent month end, visit www.thornburg.com.
The maximum sales charge for Class A Shares is 2.00%. C shares assume deduction of a 0.60% contingent deferred sales charge (CDSC) for the first year only.
Performance data given at net asset value (NAV) does not take into account these sales charges. If the sales charges had been included, the performance would have been lower.
Shares in the Fund carry risks, including possible loss of principal. As with direct bond ownership, funds that invest in bonds are subject to certain risks including interest-rate risk, credit risk, and inflation risk. The principal value of bond funds will fluctuate relative to changes in interest rates, decreasing when interest rates rise. Unlike bonds, bond funds have ongoing fees and expenses. Shares in the Fund are not deposits or obligations of, or guaranteed or endorsed by, any bank, the Federal Deposit Insurance Corporation, the Federal Reserve Board or any government agency.
The information presented on the following pages was current as of September 30, 2005. The manager’s views, portfolio holdings, and sector diversification are historical and subject to change. This material should not be deemed a recommendation to buy or sell any of the securities mentioned.
The matters discussed in this report may constitute forward-looking statements made pursuant to the safe harbor provisions of the Securities Litigation Reform Act of 1995. These include any advisor or portfolio manager prediction, assessment, analysis or outlook for individual securities, industries, investment styles, market sectors and/or markets. These statements involve risks and uncertainties. In addition to the general risks described for each Fund in its current prospectus, other factors bearing on these reports include the accuracy of the advisor’s or portfolio manager’s forecasts and predictions, the appropriateness of the investment strategies designed by the advisor or portfolio manager and the ability of the advisor or portfolio manager to implement their strategies efficiently and successfully. Any one or more of these factors, as well as other risks affecting the securities markets generally, could cause the actual results of any fund to differ materially as compared to its benchmarks.
Glossary
The Merrill Lynch 7-12 Year Municipal Bond Index – A widely-accepted unmanaged market-weighted index comprised of fixed-rate, coupon bearing bonds issued within five years of the most recent month-end with greater than $50 million principal amount having a Moody’s investment grade rating and maturities of seven to twelve years.
Duration – The measure of the price sensitivity of a fixed-income security to an interest rate change of 100 basis points. Calculation is based on the weighted average of the present values for all cash flows.
Weighted Average Maturity – A weighted average of all the effective maturities of the bonds in a portfolio. Effective maturity takes into consideration mortgage prepayments, puts, sinking funds, adjustable coupons, and other features of individual bonds and is thus a more accurate measure of interest-rate sensitivity. Longer-maturity funds are generally considered more interest-rate sensitive than their shorter counterparts.
Certified Annual Report 5

George Strickland
Portfolio Manager
October 15, 2005
Dear Fellow Shareholder:
I am pleased to present the Annual Report for the Thornburg Intermediate Municipal Fund. The net asset value (NAV) of the A shares decreased by 15 cents to $13.33 during the twelve months ended September 30, 2005. If you were with us for the entire period, you received dividends of 49.1 cents per share. If you reinvested dividends, you received 50.0 cents per share. Investors who owned C shares received dividends of 45.8 and 46.5 cents per share, respectively.
Over the last twelve months, interest rates on bonds that mature in ten years or less have risen, while interest rates on long-term bonds have fallen. Higher interest rates on short-term bonds have pushed down the price of many of the bonds owned by the Fund, but have allowed us to buy new bonds at higher yields. The A shares of your Fund produced a total return of 2.57% (at NAV) over the twelve month period ended September 30, 2005, compared to a 2.92% return for the Merrill Lynch 7-12 Year Municipal Bond Index. The Fund was over weighted in bonds that mature in less than eight years. Since the returns of those short-term bonds lagged the return of the index, the Fund’s return lagged the index slightly.
This has been an eventful year for the bond market and the world. The Federal Reserve has been steadily pushing up the target Fed Funds rate to its current level of 3.75%. Through the end of June, the bond market responded by pushing down yields on long-term bonds, thus flattening the yield curve. A flat yield curve is usually associated with a recession, but the U.S. economy is showing no signs of entering a recession. So, more recently, interest rates have been rising for both short and long-term bonds, in more of a parallel yield curve shift. We believe that this is a more appropriate response by the market to a tightening Fed, a strong economy, and somewhat elevated levels of inflation.
Your Thornburg Intermediate Municipal Fund is a laddered portfolio of over 300 municipal obligations from 45 states. Today, your Fund’s weighted average maturity is 7.42 years. We ladder the maturity dates of the bonds in your portfolio so that some of the bonds are scheduled to mature during each of the coming years. Laddering intermediate bonds accomplishes two goals. First, the staggered bond maturities contained in a ladder defuse interest-rate risk and dampen the Fund’s price volatility. Second, laddering gives the Fund a steady cash flow stream from maturing bonds to reinvest toward the top of the ladder where yields are typically higher. The chart shown here describes the percentages of your Fund’s bond portfolio maturing in each of the coming years.
% of portfolio maturing | Cumulative % maturing | ||||||||||||
| 2 years | = | 12.1% | Year 2 | = | 12.1 | % | |||||||
| 2 to 4 years | = | 13.4% | Year 4 | = | 25.5 | % | |||||||
| 4 to 6 years | = | 16.8% | Year 6 | = | 42.3 | % | |||||||
| 6 to 8 years | = | 13.6% | Year 8 | = | 55.9 | % | |||||||
| 8 to 10 years | = | 9.2% | Year 10 | = | 65.1 | % | |||||||
| 10 to 12 years | = | 12.3% | Year 12 | = | 77.4 | % | |||||||
| 12 to 14 years | = | 12.7% | Year 14 | = | 90.1 | % | |||||||
| 14 to 16 years | = | 6.4% | Year 16 | = | 96.5 | % | |||||||
| 16 to 18 years | = | 1.2% | Year 18 | = | 97.7 | % | |||||||
| Over 18 years | = | 2.3% | Over 18 years | = | 100.0 | % | |||||||
Percentages can and do vary. Data as of 9/30/05.
6 Certified Annual Report
We have watched along with the rest of the nation the horrific affects of Hurricanes Katrina and Rita, and our hearts and prayers go out to all of those suffering through the devastation of these storms.
We examined Thornburg municipal bond portfolios in the wake of both hurricanes and have found no bonds that we believe are currently threatened with default. Though the Fund has some exposure to municipal issuers in the paths of the storms, many of the bonds have alternate revenue sources such as bond insurance or financial collateral. The few bonds without alternate revenue sources have resources that we believe will see them through this calamity.
Thanks to our policy of broad diversification, issuers affected by Hurricanes Katrina and Rita make up only a small percentage of the Fund. Though the major bond insurers have significant exposure to issuers impacted by the hurricanes, we believe that, as in past disasters, insurance proceeds and government aid will limit or prevent large scale municipal defaults. The human toll and property damage from these storms is far worse than previous natural disasters and the recovery period will take longer. Furthermore, some areas of the gulf coast will never be the same. However, we do believe that most of the cities and towns will survive and have need of schools, hospitals, sewer systems, and other essential services.
Outside of the gulf coast, job growth and a strong economy continue to fill state and local coffers. State tax revenues grew 13.3% in the second quarter of 2005 from the year earlier period. This represents the fastest growth rate recorded by the Nelson Rockefeller Institute of Government since they began monitoring this statistic in 1991. However, many challenges remain. Among them are still-depleted reserve fund balances from the last recession, and under funded retirement fund balances in state and local pension funds. To reduce credit risk, we have kept 87% of the portfolio in bonds rated A or above and maintained broad diversification across issuers and market sectors.
Over the years, our practice of laddering a diversified portfolio of short and intermediate maturity municipal bonds has allowed your Fund to perform consistently well in varying interest rate environments. Thank you for investing in Thornburg Intermediate Municipal Fund.
Sincerely, |
 |
| George Strickland |
| Portfolio Manager |
Certified Annual Report 7
| STATEMENT OF ASSETS AND LIABILITIES | ||||
Thornburg Intermediate Municipal Fund | September 30, 2005 | |||
ASSETS | ||||
Investments at value (cost $448,492,869) | $ | 467,714,840 | ||
Cash | 1,288,461 | |||
Receivable for investments sold | 486,485 | |||
Receivable for fund shares sold | 1,034,386 | |||
Interest receivable | 6,373,119 | |||
Prepaid expenses and other assets | 29,197 | |||
Total Assets | 476,926,488 | |||
LIABILITIES | ||||
Payable for securities purchased | 4,980,125 | |||
Payable for fund shares redeemed | 745,210 | |||
Payable to investment advisor and other affiliates (Note 3) | 330,464 | |||
Accounts payable and accrued expenses | 88,108 | |||
Dividends payable | 580,025 | |||
Total Liabilities | 6,723,932 | |||
NET ASSETS | $ | 470,202,556 | ||
NET ASSETS CONSIST OF: | ||||
Distribution in excess of net investment income | $ | (2,806 | ) | |
Net unrealized appreciation on investments | 19,221,971 | |||
Accumulated net realized gain (loss) | (8,799,597 | ) | ||
Net capital paid in on shares of beneficial interest | 459,782,988 | |||
| $ | 470,202,556 | |||
NET ASSET VALUE: | ||||
Class A Shares: | ||||
Net asset value and redemption price per share ($362,783,213 applicable to 27,220,773 shares of beneficial interest outstanding - Note 4) | $ | 13.33 | ||
Maximum sales charge, 2.00% of offering price | 0.27 | |||
Maximum offering price per share | $ | 13.60 | ||
Class C Shares: | ||||
Net asset value and offering price per share * ($55,382,122 applicable to 4,150,349 shares of beneficial interest outstanding - Note 4) | $ | 13.34 | ||
Class I Shares: | ||||
Net asset value, offering and redemption price per share ($52,037,221 applicable to 3,910,218 shares of beneficial interest outstanding - Note 4) | $ | 13.31 | ||
| * | Redemption price per share is equal to net asset value less any applicable contingent deferred sales charge. |
See notes to financial statements.
8 Certified Annual Report
| STATEMENT OF OPERATIONS | ||||
Thornburg Intermediate Municipal Fund | Year Ended September 30, 2005 | |||
INVESTMENT INCOME: | ||||
Interest income (net of premium amortized of $2,610,706) | $ | 21,441,900 | ||
EXPENSES: | ||||
Investment advisory fees (Note 3) | 2,304,795 | |||
Administration fees (Note 3) | ||||
Class A Shares | 451,683 | |||
Class C Shares | 70,959 | |||
Class I Shares | 21,422 | |||
Distribution and service fees (Note 3) | ||||
Class A Shares | 903,366 | |||
Class C Shares | 567,732 | |||
Transfer agent fees | ||||
Class A Shares | 177,005 | |||
Class C Shares | 36,378 | |||
Class I Shares | 47,400 | |||
Registration and filing fees | ||||
Class A Shares | 47,967 | |||
Class C Shares | 21,230 | |||
Class I Shares | 18,203 | |||
Custodian fees (Note 3) | 151,880 | |||
Professional fees | 48,825 | |||
Accounting fees | 39,710 | |||
Trustee fees | 9,110 | |||
Other expenses | 75,905 | |||
Total Expenses | 4,993,570 | |||
Less: | ||||
Expenses reimbursed by Investment Advisor (Note 3) | (179,684 | ) | ||
Distribution and service fees waived (Note 3) | (225,215 | ) | ||
Fees paid indirectly (Note 3) | (17,170 | ) | ||
Net Expenses | 4,571,501 | |||
Net Investment Income | 16,870,399 | |||
REALIZED AND UNREALIZED GAIN (LOSS) | ||||
Net realized gain (loss) on investments sold | 1,423,283 | |||
Increase (decrease) in unrealized appreciation (depreciation) of investments | (6,895,981 | ) | ||
Net Realized and Unrealized Loss on Investments | (5,472,698 | ) | ||
Net Increase in Net Assets Resulting From Operations | $ | 11,397,701 | ||
See notes to financial statements.
Certified Annual Report 9
STATEMENTS OF CHANGES IN NET ASSETS
Thornburg Intermediate Municipal Fund
| Year Ended September 30, 2005 | Year Ended September 30, 2004 | |||||||
INCREASE (DECREASE) IN NET ASSETS FROM: | ||||||||
OPERATIONS: | ||||||||
Net investment income | $ | 16,870,399 | $ | 17,327,406 | ||||
Net realized gain (loss) on investments sold | 1,423,283 | (454,070 | ) | |||||
Increase (Decrease) in unrealized appreciation (depreciation) of investments | (6,895,981 | ) | (2,505,819 | ) | ||||
Net Increase (Decrease) in Net Assets Resulting from Operations | 11,397,701 | 14,367,517 | ||||||
DIVIDENDS TO SHAREHOLDERS: | ||||||||
From net investment income | ||||||||
Class A Shares | (13,228,266 | ) | (14,280,020 | ) | ||||
Class C Shares | (1,934,404 | ) | (2,139,590 | ) | ||||
Class I Shares | (1,707,729 | ) | (907,796 | ) | ||||
FUND SHARE TRANSACTIONS (NOTE 4): | ||||||||
Class A Shares | (3,168,323 | ) | (17,365,422 | ) | ||||
Class C Shares | (1,924,468 | ) | (2,267,561 | ) | ||||
Class I Shares | 19,483,987 | 13,757,994 | ||||||
Net Increase (Decrease) in Net Assets | 8,918,498 | (8,834,878 | ) | |||||
NET ASSETS: | ||||||||
Beginning of year | 461,284,058 | 470,118,936 | ||||||
End of year | $ | 470,202,556 | $ | 461,284,058 | ||||
See notes to financial statements.
10 Certified Annual Report
Thornburg Intermediate Municipal Fund | September 30, 2005 |
NOTE 1 – ORGANIZATION
Thornburg Intermediate Municipal Fund (the “Fund”) is a diversified series of Thornburg Investment Trust (the “Trust”). The Trust is organized as a Massachusetts business trust under a Declaration of Trust dated June 3, 1987 and is registered as a diversified, open-end management investment company under the Investment Company Act of 1940, as amended. The Trust is currently issuing eleven series of shares of beneficial interest in addition to those of the Fund: Thornburg Limited Term Municipal Fund, Thornburg California Limited Term Municipal Fund, Thornburg Florida Intermediate Municipal Fund, Thornburg New York Intermediate Fund, Thornburg New Mexico Intermediate Municipal Fund, Thornburg Limited Term U.S. Government Fund, Thornburg Limited Term Income Fund, Thornburg Value Fund, Thornburg International Value Fund, Thornburg Core Growth Fund, and Thornburg Investment Income Builder Fund. Each series is considered to be a separate entity for financial reporting and tax purposes and bears expenses directly attributable to it. The Fund’s investment objective is to obtain as high a level of current income exempt from Federal income taxes as is consistent with the preservation of capital.
The Fund currently offers three classes of shares of beneficial interest, Class A, Class C, and Institutional Class (Class I) shares. Each class of shares of the Fund represents an interest in the same portfolio of investments of the Fund, except that (i) Class A shares are sold subject to a front-end sales charge collected at the time the shares are purchased and bear a service fee, (ii) Class C shares are sold at net asset value without a sales charge at the time of purchase, but are subject to a contingent deferred sales charge upon redemption within one year, and bear a service fee and a distribution fee, (iii) Class I shares are sold at net asset value without a sales charge at the time of purchase, and (iv) the respective classes may have different reinvestment privileges and conversion rights.
Additionally, the Fund may allocate among its classes certain expenses, to the extent allowable to specific classes, including transfer agent fees, government registration fees, certain printing and postage costs, and administrative and legal expenses. Currently, class specific expenses of the Fund are limited to service and distribution fees, administration fees, and certain registration and transfer agent expenses.
NOTE 2 – SIGNIFICANT ACCOUNTING POLICIES
Significant accounting policies of the Trust are as follows:
Valuation of Investments: In determining the net asset value of Investments, the Trust utilizes an independent pricing service approved by the Board of Trustees. Debt investment securities have a primary market over the counter and are valued on the basis of valuations furnished by the pricing service. The pricing service values portfolio securities at quoted bid prices, normally at 4:00 p.m. EST. When quotations are not readily available, securities are valued at evaluated prices as determined by the pricing service using methods which include consideration of yields or prices of municipal obligations of comparable quality, type of issue, coupon, maturity and rating; indications as to value from dealers and general market conditions. In any case where a price is not available from a pricing service for an investment, the Trust’s valuation and pricing committee determines a fair value for the investment using factors approved by the Trustees. The valuation procedures used by the pricing service and the portfolio valuations received by the Fund are reviewed by the officers of the Trust under the general supervision of the Board of Trustees. Short-term obligations having remaining maturities of 60 days or less are valued at amortized cost, which approximates market value.
Federal Income Taxes: It is the policy of the Trust to comply with the provisions of the Internal Revenue Code applicable to “regulated investment companies” and to distribute all taxable (if any) and tax exempt income of the Fund to the shareholders. Therefore, no provision for Federal income tax is required.
When-Issued and Delayed Delivery Transactions: The Trust may engage in when-issued or delayed delivery transactions. To the extent the Trust engages in such transactions, it will do so for the purpose of acquiring portfolio securities consistent with the Fund’s investment objectives and not for the purpose of investment leverage or to speculate on interest rate and or market changes. At the time the Trust makes a commitment to purchase a security on a when-issued basis, the Fund will record the transaction and reflect the value in determining its net asset value. When effecting such transactions, assets of an amount sufficient to make payment for the portfolio securities to be purchased will be segregated on the Fund’s records on the trade date. Securities purchased on a when-issued or delayed delivery basis do not earn interest until the settlement date.
Dividends: Net investment income of the Fund is declared daily as a dividend on shares for which the Fund has received payment. Dividends are paid monthly and are reinvested in additional shares of the Fund at net asset value per share at the close of business on the dividend payment date or, at the shareholder’s option, paid in cash. Net capital gains, to the extent available, will be distributed at least annually.
General: Securities transactions are accounted for on a trade date basis. Interest income is accrued as earned. Premiums and discounts on securities purchased are amortized to call dates or maturity dates of the respective securities. Realized gains and losses from the sale of securities are recorded on an identified cost basis. Net investment income, other than class specific expenses and realized and unrealized gains and losses, is allocated daily to each class of shares based upon the relative net asset value of outstanding shares (or the value of the dividend-eligible shares, as appropriate) of each class of shares at the beginning of the day (after adjusting for the current capital shares activity of the respective class). Expenses common to all funds are allocated among the funds comprising the
Certified Annual Report 11
NOTES TO FINANCIAL STATEMENTS, CONTINUED
Thornburg Intermediate Municipal Fund | September 30, 2005 |
Trust based upon their relative net asset values or other appropriate allocation methods.
Guarantees and Indemnifications: Under the Trust’s organizational documents, its officers and Trustees are indemnified against certain liability arising out of the performance of their duties to the Fund. Additionally, in the normal course of business the Trust enters into contracts with service providers that contain general indemnification clauses. The Trust’s maximum exposure under these arrangements is unknown. However, based on experience, the Trust expects the risk of loss to be remote.
Use of Estimates: The preparation of financial statements, in conformity with generally accepted accounting principles, requires management to make estimates and assumptions that affect the reported amounts of assets and liabilities and the disclosure of contingent assets and liabilities at the date of the financial statements and the reported amounts of increases and decreases in net assets from operations during the reporting period. Actual results could differ from those estimates.
NOTE 3 – INVESTMENT ADVISORY FEE AND OTHER TRANSACTIONS WITH AFFILIATES
Pursuant to an investment advisory agreement, Thornburg Investment Management, Inc.® (the “Advisor”) serves as the investment advisor and performs services for which the fees are payable at the end of each month. For the year ended September 30, 2005, these fees were payable at annual rates ranging from .50 of 1% to .275 of 1% per annum of the average daily net assets of the Fund. The Fund also has an administrative services agreement with the Advisor, whereby the Advisor will perform certain administrative services for the shareholders of each class of the Fund’s shares, and for which fees will be payable at an annual rate of up to .125 of 1% per annum of the average daily net assets attributable to each class of shares. For the year ended September 30, 2005, the Advisor voluntarily reimbursed certain class specific expenses and administrative fees of $50,368 for Class A shares, $86,844 for Class C shares, and $42,472 for Class I shares.
The Trust has an underwriting agreement with Thornburg Securities Corporation® (the “Distributor”, an affiliate of the Advisor), which acts as the Distributor of the Fund shares. For the year ended September 30, 2005, the Distributor has advised the Fund that it earned net commissions aggregating $3,153 from the sale of Class A shares and collected contingent deferred sales charges aggregating $2,406 from redemptions of Class C shares of the Fund.
Pursuant to a service plan, under Rule 12b-1 of the Investment Company Act of 1940, the Fund may reimburse to the Advisor an amount not to exceed .25 of 1% per annum of the average daily net assets attributable to each class of shares of the Fund for payments made by the Advisor to securities dealers and other financial institutions to obtain various shareholder related services. The Advisor may pay out of its own resources additional expenses for distribution of the Fund’s shares.
The Trust has also adopted a distribution plan pursuant to Rule 12b-1, applicable only to the Fund’s Class C shares under which the Fund compensates the Distributor for services in promoting the sale of Class C shares of the Fund at an annual rate of up to .75% of the average daily net assets attributable to Class C shares. Total fees incurred by each class of shares of the Fund under their respective Service and Distribution Plans for the year ended September 30, 2005, are set forth in the Statement of Operations. Distribution fees in the amount of $225,215 were waived for Class C shares.
The Trust has an agreement with the custodian bank to indirectly pay a portion of the custodian’s fees through credits earned by the Fund’s cash on deposit with the bank. This deposit agreement is an alternative to overnight investments. Custodial fees have been adjusted to reflect amounts that would have been paid without this agreement, with a corresponding adjustment reflected as fees paid indirectly in the Statement of Operations. For the year ended September 30, 2005, fees paid indirectly were $17,170.
Certain officers and Trustees of the Trust are also officers and/or Directors of the Advisor and Distributor. The compensation of independent Trustees is borne by the Trust.
12 Certified Annual Report
NOTES TO FINANCIAL STATEMENTS, CONTINUED
Thornburg Intermediate Municipal Fund | September 30, 2005 |
NOTE 4 – SHARES OF BENEFICIAL INTEREST
At September 30, 2005, there were an unlimited number of shares of beneficial interest authorized. Transactions in shares of beneficial interest were as follows:
Year Ended September 30, 2005 | Year Ended September 30, 2004 | |||||||||||||
| Shares | Amount | Shares | Amount | |||||||||||
Class A Shares | ||||||||||||||
Shares sold | 3,998,362 | $ | 53,659,687 | 4,635,509 | $ | 62,513,224 | ||||||||
Shares issued to shareholders in reinvestment of dividends | 548,300 | 7,352,541 | 621,472 | 8,358,310 | ||||||||||
Shares repurchased | (4,780,870 | ) | (64,180,551 | ) | (6,560,558 | ) | (88,236,956 | ) | ||||||
Net Increase (Decrease) | (234,208 | ) | $ | (3,168,323 | ) | (1,303,577 | ) | $ | (17,365,422 | ) | ||||
Class C Shares | ||||||||||||||
Shares sold | 715,681 | $ | 9,615,224 | 946,921 | $ | 12,804,296 | ||||||||
Shares issued to shareholders in reinvestment of dividends | 93,895 | 1,260,710 | 111,651 | 1,503,248 | ||||||||||
Shares repurchased | (953,413 | ) | (12,800,402 | ) | (1,234,469 | ) | (16,575,105 | ) | ||||||
Net Increase (Decrease) | (143,837 | ) | $ | (1,924,468 | ) | (175,897 | ) | $ | (2,267,561 | ) | ||||
Class I Shares | ||||||||||||||
Shares sold | 2,292,723 | $ | 30,718,233 | 1,489,564 | $ | 19,943,017 | ||||||||
Shares issued to shareholders in, reinvestment of dividends | 64,408 | 862,041 | 46,460 | 623,829 | ||||||||||
Shares repurchased | (903,624 | ) | (12,096,287 | ) | (506,745 | ) | (6,808,852 | ) | ||||||
Net Increase (Decrease) | 1,453,507 | $ | 19,483,987 | 1,029,279 | $ | 13,757,994 | ||||||||
NOTE 5 – SECURITIES TRANSACTIONS
For the year ended September 30, 2005, the Fund had purchase and sale transactions of investment securities (excluding short-term investments) of $125,319,713 and $88,875,804, respectively.
NOTE 6 – INCOME TAXES
At September 30, 2005, information on the tax components of capital is as follows:
Cost of investments for tax purpose | $ | 448,491,820 | ||
Gross unrealized appreciation on a tax basis | $ | 19,904,515 | ||
Gross unrealized depreciation on a tax basis | (681,495 | ) | ||
Net unrealized appreciation (depreciation) on investments (tax basis) | $ | 19,223,020 | ||
At September 30, 2005, the Fund did not have any undistributed tax-exempt/ordinary net income or undistributed capital gains.
At September 30, 2005, the Fund had tax basis capital losses, which may be carried over to offset future capital gains. To the extent such carry forwards are used, capital gain distributions may be reduced to the extent provided by regulations.
Capital loss carryovers expiring in: | |||
2008 | $ | 2,116,559 | |
2009 | 2,374,508 | ||
2011 | 11,597 | ||
2012 | 4,297,982 | ||
| $ | 8,800,646 | ||
The Fund utilized $680,909 of its capital loss carry forward during the year ended September 30, 2005.
In order to account for book/tax differences, the Fund decreased accumulated net realized loss by $538 and increased over-distributed net investment income by $538. Reclassifications result primarily from market discount.
All dividends paid by the Fund for the year ended September 30, 2005 and September 30, 2004 represent tax exempt interest dividends, which are excludable by shareholders from gross income for Federal income tax purposes.
Certified Annual Report 13
Thornburg Intermediate Municipal Fund
| Year Ended September 30, | ||||||||||||||||||||
| 2005 | 2004 | 2003 | 2002 | 2001 | ||||||||||||||||
Class A Shares: | ||||||||||||||||||||
PER SHARE PERFORMANCE (for a share outstanding throughout the year) | ||||||||||||||||||||
Net asset value, beginning of year | $ | 13.48 | $ | 13.56 | $ | 13.67 | $ | 13.28 | $ | 12.78 | ||||||||||
Income from investment operations: | ||||||||||||||||||||
Net investment income | 0.49 | 0.52 | 0.52 | 0.56 | 0.62 | |||||||||||||||
Net realized and unrealized gain (loss) on investments | (0.15 | ) | (0.08 | ) | (0.11 | ) | 0.39 | 0.50 | ||||||||||||
Total from investment operations | 0.34 | 0.44 | 0.41 | 0.95 | 1.12 | |||||||||||||||
Less dividends from: | ||||||||||||||||||||
Net investment income | (0.49 | ) | (0.52 | ) | (0.52 | ) | (0.56 | ) | (0.62 | ) | ||||||||||
Change in net asset value | (0.15 | ) | (0.08 | ) | (0.11 | ) | 0.39 | 0.50 | ||||||||||||
NET ASSET VALUE, end of year | $ | 13.33 | $ | 13.48 | $ | 13.56 | $ | 13.67 | $ | 13.28 | ||||||||||
RATIOS/SUPPLEMENTAL DATA | ||||||||||||||||||||
Total return(a) | 2.57 | % | 3.29 | % | 3.11 | % | 7.39 | % | 8.94 | % | ||||||||||
Ratios to average net assets: | ||||||||||||||||||||
Net investment income | 3.66 | % | 3.83 | % | 3.87 | % | 4.23 | % | 4.73 | % | ||||||||||
Expenses, after expense reductions | 0.99 | % | 0.98 | % | 0.99 | % | 0.92 | % | 0.82 | % | ||||||||||
Expenses, after expense reductions and net of custody credits | 0.99 | % | 0.98 | % | 0.99 | % | 0.92 | % | — | |||||||||||
Expenses, before expense reductions | 1.01 | % | 0.98 | % | 1.00 | % | 1.00 | % | 1.02 | % | ||||||||||
Portfolio turnover rate | 20.06 | % | 11.81 | % | 15.13 | % | 16.36 | % | 18.24 | % | ||||||||||
Net assets at end of year (000) | $ | 362,783 | $ | 370,227 | $ | 390,080 | $ | 414,150 | $ | 338,931 | ||||||||||
| (a) | Sales loads are not reflected in computing total return. |
14 Certified Annual Report
FINANCIAL HIGHLIGHTS, CONTINUED
Thornburg Intermediate Municipal Fund
| Year Ended September 30, | ||||||||||||||||||||
| 2005 | 2004 | 2003 | 2002 | 2001 | ||||||||||||||||
Class C Shares: | ||||||||||||||||||||
PER SHARE PERFORMANCE (for a share outstanding throughout the year) | ||||||||||||||||||||
Net asset value, beginning of year | $ | 13.50 | $ | 13.58 | $ | 13.69 | $ | 13.30 | $ | 12.79 | ||||||||||
Income from investment operations: | ||||||||||||||||||||
Net investment income | 0.46 | 0.48 | 0.47 | 0.51 | 0.57 | |||||||||||||||
Net realized and unrealized gain (loss) on investments | (0.16 | ) | (0.08 | ) | (0.11 | ) | 0.39 | 0.51 | ||||||||||||
Total from investment operations | 0.30 | 0.40 | 0.36 | 0.90 | 1.08 | |||||||||||||||
Less dividends from: | ||||||||||||||||||||
Net investment income | (0.46 | ) | (0.48 | ) | (0.47 | ) | (0.51 | ) | (0.57 | ) | ||||||||||
Change in net asset value | (0.16 | ) | (0.08 | ) | (0.11 | ) | 0.39 | 0.51 | ||||||||||||
NET ASSET VALUE, end of year | $ | 13.34 | $ | 13.50 | $ | 13.58 | $ | 13.69 | $ | 13.30 | ||||||||||
RATIOS/SUPPLEMENTAL DATA | ||||||||||||||||||||
Total return | 2.24 | % | 3.02 | % | 2.73 | % | 6.97 | % | 8.59 | % | ||||||||||
Ratios to average net assets: | ||||||||||||||||||||
Net investment income | 3.41 | % | 3.57 | % | 3.50 | % | 3.84 | % | 4.33 | % | ||||||||||
Expenses, after expense reductions | 1.25 | % | 1.24 | % | 1.35 | % | 1.30 | % | 1.21 | % | ||||||||||
Expenses, after expense reductions and net of custody credits | 1.24 | % | 1.24 | % | 1.35 | % | 1.30 | % | — | |||||||||||
Expenses, before expense reductions | 1.80 | % | 1.78 | % | 1.80 | % | 1.80 | % | 1.83 | % | ||||||||||
Portfolio turnover rate | 20.06 | % | 11.81 | % | 15.13 | % | 16.36 | % | 18.24 | % | ||||||||||
Net assets at end of year (000) | $ | 55,382 | $ | 57,979 | $ | 60,707 | $ | 47,155 | $ | 40,002 | ||||||||||
Certified Annual Report 15
FINANCIAL HIGHLIGHTS, CONTINUED
Thornburg Intermediate Municipal Fund
| Year Ended September 30, | ||||||||||||||||||||
| 2005 | 2004 | 2003 | 2002 | 2001 | ||||||||||||||||
Class I Shares: | ||||||||||||||||||||
PER SHARE PERFORMANCE | ||||||||||||||||||||
(for a share outstanding throughout the year) | ||||||||||||||||||||
Net asset value, beginning of year | $ | 13.46 | $ | 13.54 | $ | 13.65 | $ | 13.26 | $ | 12.76 | ||||||||||
Income from investment operations: | ||||||||||||||||||||
Net investment income | 0.53 | 0.56 | 0.57 | 0.61 | 0.65 | |||||||||||||||
Net realized and unrealized gain (loss) on investments | (0.15 | ) | (0.08 | ) | (0.11 | ) | 0.39 | 0.50 | ||||||||||||
Total from investment operations | 0.38 | 0.48 | 0.46 | 1.00 | 1.15 | |||||||||||||||
Less dividends from: | ||||||||||||||||||||
Net investment income | (0.53 | ) | (0.56 | ) | (0.57 | ) | (0.61 | ) | (0.65 | ) | ||||||||||
Change in net asset value | (0.15 | ) | (0.08 | ) | (0.11 | ) | 0.39 | 0.50 | ||||||||||||
NET ASSET VALUE, end of year | $ | 13.31 | $ | 13.46 | $ | 13.54 | $ | 13.65 | $ | 13.26 | ||||||||||
RATIOS/SUPPLEMENTAL DATA | ||||||||||||||||||||
Total return | 2.90 | % | 3.61 | % | 3.49 | % | 7.75 | % | 9.23 | % | ||||||||||
Ratios to average net assets: | ||||||||||||||||||||
Net investment income | 3.98 | % | 4.12 | % | 4.23 | % | 4.57 | % | 4.99 | % | ||||||||||
Expenses, after expense reductions | 0.67 | % | 0.67 | % | 0.62 | % | 0.58 | % | 0.55 | % | ||||||||||
Expenses, after expense reductions and net of custody credits | 0.67 | % | 0.67 | % | 0.62 | % | 0.58 | % | — | |||||||||||
Expenses, before expense reductions | 0.77 | % | 0.75 | % | 0.80 | % | 0.79 | % | 0.79 | % | ||||||||||
Portfolio turnover rate | 20.06 | % | 11.81 | % | 15.13 | % | 16.36 | % | 18.24 | % | ||||||||||
Net assets at end of year (000) | $ | 52,037 | $ | 33,079 | $ | 19,333 | $ | 18,330 | $ | 17,258 | ||||||||||
16 Certified Annual Report
Thornburg Intermediate Municipal Fund | September 30, 2005 |
CUSIPS: CLASS A - 885-215-202, CLASS C - 885-215-780, CLASS I - 885-215-673
NASDAQ SYMBOLS: CLASS A - THIMX, CLASS C - THMCX, CLASS I - THMIX
Issuer-Description | Credit Rating† Moody’s/S&P | Principal Amount | Value | |||||
ALABAMA — 1.33% | ||||||||
Alabama Docks Revenue, 6.00% due 10/1/2008 (Insured: MBIA) | Aaa/AAA | $ | 800,000 | $ | 864,120 | |||
Birmingham Carraway Alabama Special, 6.25% due 8/15/2009 (Insured: Connie Lee) | NR/AAA | 2,000,000 | 2,119,980 | |||||
East Alabama Health Care Authority Tax Anticipation Series A, 4.00% due 9/1/2006 (Insured: MBIA) | Aaa/AAA | 1,515,000 | 1,528,014 | |||||
Lauderdale County & Florence Health Group Series A, 5.75% due 7/1/2013 (Insured: MBIA) | Aaa/AAA | 1,600,000 | 1,737,168 | |||||
ALASKA — 0.91% | ||||||||
Alaska Energy Authority Power Revenue Refunding Bradley Lake Fourth Series, 6.00% due 7/1/2011 (Insured: FSA) | Aaa/AAA | 955,000 | 1,075,721 | |||||
Alaska Municipal Bond Bank Series A, 5.00% due 10/1/2017 (Insured: FGIC) | Aaa/AAA | 2,470,000 | 2,651,545 | |||||
Anchorage School Refunding, 6.00% due 10/1/2012 (Insured: FGIC) | Aaa/AAA | 500,000 | 564,030 | |||||
ARIZONA — 2.07% | ||||||||
Mohave County Industrial Development Authority Prison Project Series A, 5.00% due 4/1/2013 (Insured: XLCA) | NR/AAA | 4,200,000 | 4,516,386 | |||||
Phoenix Street & Highway User Revenue, 6.50% due 7/1/2009 (ETM) | Aa3/AAA | 1,000,000 | 1,081,530 | |||||
Pima County Industrial Development Authority Series C, 6.70% due 7/1/2021 (Arizona Charter Schools Project) | Baa3/NR | 2,715,000 | 2,876,244 | |||||
Tucson GO Series D, 9.75% due 7/1/2012 (ETM) | NR/AA | 400,000 | 543,764 | |||||
Tucson GO Series D, 9.75% due 7/1/2013 (ETM) | NR/AA | 500,000 | 699,045 | |||||
ARKANSAS — 0.54% | ||||||||
Jefferson County Hospital Revenue Refunding & Improvement, 5.75% due 6/1/2012 (Regional Medical Center Project) | NR/A | 1,135,000 | 1,241,111 | |||||
Jefferson County Hospital Revenue Refunding & Improvement, 5.75% due 6/1/2013 (Regional Medical Center Project) | NR/A | 1,200,000 | 1,304,112 | |||||
CALIFORNIA — 4.00% | ||||||||
California Department of Water Resources Power Series A, 5.75% due 5/1/2017 | A2/BBB+ | 3,000,000 | 3,333,540 | |||||
California Housing Finance Authority Revenue Series 1985-B, 9.875% due 2/1/2017 | Aa2/AA- | 675,000 | 687,278 | |||||
California State Economic Recovery Series C-3, 2.77% due 7/1/2023 put 10/3/2005 (Guaranty: Landesbank) (daily demand notes) | VMIG1/A-1+ | 1,400,000 | 1,400,000 | |||||
California Statewide Community Development Authority COP, 5.50% due 10/1/2007 (Unihealth America Project) (ETM) (b) | Aaa/AAA | 4,500,000 | 4,722,480 | |||||
Camino Hospital District Revenue Series A, 6.25% due 8/15/2017 (ETM) | Aaa/AAA | 1,000,000 | 1,165,510 | |||||
East Palo Alto Public Financing Series A, 5.00% due 10/1/2017 (University Circle Gateway 101 Project) (Insured:RADIAN) | NR/AA | 770,000 | 824,970 | |||||
Escondido Joint Powers Financing Authority Lease Revenue, 0% due 9/1/2007 (Center for the Arts Project; Insured:AMBAC) | Aaa/AAA | 1,740,000 | 1,602,279 | |||||
Golden West Schools Financing Authority Capital Appreciation, 0% due 8/1/2018 (Insured: MBIA) | Aaa/AAA | 2,140,000 | 1,091,058 | |||||
Los Angeles County Multi Family Variable Rate 1984 Issue A, 2.48% due 7/1/2014 put 10/7/2005 (weekly demand notes) | NR/NR | 500,000 | 500,000 | |||||
Metropolitan Water District Series B-3, 2.77% due 7/1/2035 put 10/3/2005 (daily demand notes) | VMIG1/A-1+ | 1,400,000 | 1,400,000 | |||||
San Diego County Water Authority Revenue & Refunding Series 1993-A, 8.79% due 4/25/2007 (Insured: FGIC) | Aaa/AAA | 500,000 | 541,820 | |||||
Stanton Multi Family Housing Revenue Bond Series 1997, 5.625% due 8/1/2029 put 8/1/2009 (Continental Gardens Project; Collateralized: FNMA) | NR/AAA | 1,460,000 | 1,528,605 | |||||
Certified Annual Report 17
SCHEDULE OF INVESTMENTS, CONTINUED
Thornburg Intermediate Municipal Fund | September 30, 2005 |
Issuer-Description | Credit Rating† Moody’s/S&P | Principal Amount | Value | |||||
COLORADO — 5.93% | ||||||||
Adams County Communication Center Series A, 5.75% due 12/1/2016 | Baa1/NR | $ | 1,265,000 | $ | 1,341,014 | |||
Adams County Revenue Platte Valley Medical Center, 5.00% due 2/1/2014 (Insured: FHA) | NR/AAA | 1,455,000 | 1,567,573 | |||||
Adams County Revenue Platte Valley Medical Center, 5.00% due 8/1/2014 (Insured: FHA) | NR/AAA | 1,000,000 | 1,079,720 | |||||
Arvada Industrial Development Revenue, 5.25% due 12/1/2007 (Wanco Inc. Project; LOC: US Bank, N.A.) | NR/NR | 65,000 | 65,109 | |||||
Arvada Industrial Development Revenue, 5.60% due 12/1/2012 (Wanco Inc. Project; LOC: US Bank, N.A.) | NR/NR | 450,000 | 460,539 | |||||
Central Platte Valley Metropolitan District, 5.15% due 12/1/2013 pre-refunded 12/1/2009 | NR/AAA | 1,000,000 | 1,083,160 | |||||
Central Platte Valley Metropolitan District Refunding Series A, 5.00% due 12/1/2031 put 12/1/2009 (LOC: US Bank) | NR/A-1 | 4,000,000 | 4,203,280 | |||||
Colorado Educational & Cultural Facilities Refunding, 6.00% due 4/1/2021 (Charter School Cherry Creek Project) | Baa2/NR | 500,000 | 527,725 | |||||
Colorado Educational & Cultural Facilities Refunding & Improvement, 5.25% due 8/15/2019 (Charter School Project; Insured: XLCA) | Aaa/AAA | 1,475,000 | 1,588,678 | |||||
Colorado Housing Finance Authority Single Family Program Subordinated Series C, 5.75% due 10/1/2007 | A1/A+ | 15,000 | 15,154 | |||||
Colorado Student Obligation Bond Student Loan Senior Subordinated Series B, 6.20% due 12/1/2008 | A2/NR | 1,570,000 | 1,604,870 | |||||
Denver City & County COP Series B, 5.00% due 12/1/2011 | Aa2/AA | 2,465,000 | 2,654,978 | |||||
El Paso County School District 11, 7.10% due 12/1/2013 | Aa3/AA- | 500,000 | 617,130 | |||||
Glendale COP, 5.40% due 8/15/2008 (Education Center Project) | NR/BBB | 675,000 | 675,925 | |||||
Interstate South Metropolitan District Refunding, 6.00% due 12/1/2020 (LOC: BNP Paribas) (b) | NR/AA | 2,395,000 | 2,402,161 | |||||
Larimer County GO, 8.45% due 12/15/2005 (Poudre School District Project) | Aa3/NR | 2,830,000 | 2,862,262 | |||||
Northwest Parkway Public Highway Authority Capital Appreciation Senior Convertible C, 0% due 6/15/2014 (Insured: FSA) | Aaa/AAA | 1,005,000 | 834,160 | |||||
Plaza Metropolitan District 1 Colorado Revenue Public Improvement Fee/Tax Increment, 7.70% due 12/1/2017 | NR/NR | 2,500,000 | 2,766,525 | |||||
Southlands Metropolitan District Number 1 GO, 7.00% due 12/1/2024 | NR/NR | 1,370,000 | 1,499,780 | |||||
Thornton County SFMR Series 1992-A, 8.05% due 8/1/2009 | A2/NR | 25,000 | 25,016 | |||||
CONNECTICUT — 0.11% | ||||||||
Eastern Resource Recovery Authority Series A, 5.25% due 1/1/2006 (Wheelabrator Lisbon Project) | NR/BBB | 500,000 | 500,740 | |||||
DELAWARE — 0.34% | ||||||||
Delaware State Health Facilities Authority Revenue Series A, 5.25% due 5/1/2016 (Nanticoke Memorial Hospital Project; Insured: Radian) | NR/AA | 1,500,000 | 1,580,040 | |||||
DISTRICT OF COLUMBIA — 0.88% | ||||||||
District of Columbia Hospital Revenue, 5.375% due 8/15/2015 (ETM) | Aaa/AAA | 600,000 | 633,720 | |||||
District of Columbia Refunding Series B, 6.00% due 6/1/2015 (Insured: MBIA) | Aaa/AAA | 3,000,000 | 3,498,780 | |||||
FLORIDA — 4.32% | ||||||||
Broward County Resource Recovery Revenue, 5.00% due 12/1/2007 | A3/AA | 1,500,000 | 1,554,585 | |||||
Deltona Utility Systems Revenue, 5.25% due 10/1/2015 (Insured: MBIA) | Aaa/AAA | 1,000,000 | 1,098,530 | |||||
Duval County Multi Family Housing Revenue Refunding, 5.90% due 9/1/2016 (St. Augustine Apartments Project) | NR/AA- | 1,000,000 | 1,024,110 | |||||
Enterprise Community Development District Assessment Bonds, 6.00% due 5/1/2010 (Insured: MBIA) | Aaa/AAA | 1,375,000 | 1,378,506 | |||||
Escambia County Health Facility Series C, 5.00% due 11/1/2028 pre-refunded 11/1/2010 (Charity Obligation Group Project) | Aaa/NR | 2,500,000 | 2,645,500 | |||||
18 Certified Annual Report
SCHEDULE OF INVESTMENTS, CONTINUED
Thornburg Intermediate Municipal Fund | September 30, 2005 |
Issuer-Description | Credit Rating† Moody’s/S&P | Principal Amount | Value | |||||
Florida Board of Education Capital Outlay Refunding Public Education Series D, 5.75% due 6/1/2018 | Aa1/AAA | $ | 1,460,000 | $ | 1,610,730 | |||
Highlands County Health Facility Refunded Hospital Adventist Health A, 5.00% due 11/15/2019 (a) | A2/A+ | 1,100,000 | 1,152,492 | |||||
Jacksonville District Water & Sewer COP, 5.00% due 10/1/2020 pre-refunded 10/1/2008 | Aaa/AAA | 1,000,000 | 1,037,500 | |||||
Orange County School Board Series A, 6.00% due 8/1/2008 (Insured: MBIA) | Aaa/NR | 1,580,000 | 1,699,717 | |||||
Pasco County Housing Finance Authority MFHR, 5.50% due 6/1/2027 put 6/1/2008 (Cypress Trail Apartments Project; Guaranty: Axa Reinsurance) | NR/AA- | 2,000,000 | 2,024,480 | |||||
Port Everglades Authority Port Improvement Revenue Refunding Series A, 5.00% due 9/1/2016 (Insured: FSA) | Aaa/AAA | 3,635,000 | 3,651,103 | |||||
Sarasota County Public Hospital Series A, 2.95% due 7/1/2037 put 10/3/2005 (Sarosota Memorial Hospital Project; Insured: AMBAC) (daily demand notes) | VMIG1/NR | 400,000 | 400,000 | |||||
Turtle Run Community Development District Refunding Water Management Benefit Special Assessment, 5.00% due 5/1/2011 (Insured: MBIA) | Aaa/AAA | 1,000,000 | 1,057,900 | |||||
GEORGIA — 0.06% | ||||||||
Georgia Municipal Electric Authority Power Revenue Unrefunded Balance 2005 Series Y, 10.00% due 1/1/2010 | A1/A+ | 230,000 | 288,471 | |||||
HAWAII — 0.50% | �� | |||||||
Hawaii Department of Budget & Finance, 6.40% due 7/1/2013 (Insured: MBIA) | Aaa/AAA | 2,000,000 | 2,344,740 | |||||
IDAHO — 0.43% | ||||||||
Boise City Idaho Industrial Development Corp. Western Trailer Co. Project, 5.00% due 5/15/2020 (LOC: Wells Fargo) | Aaa/NR | 2,000,000 | 2,021,600 | |||||
ILLINOIS — 9.92% | ||||||||
Champaign County Community Unit Series C, 0% due 1/1/2011 pre-refunded 1/1/2010 | Aaa/AAA | 800,000 | 652,656 | |||||
Chicago Housing Authority Capital, 5.00% due 7/1/2008 | Aa3/AA | 3,020,000 | 3,140,951 | |||||
Chicago Midway Airport Revenue Refunding Second Lien Series A, 5.00% due 1/1/2019 (Insured: AMBAC) | Aaa/AAA | 1,210,000 | 1,261,812 | |||||
Chicago Tax Increment Allocation Lincoln Belmont A, 5.30% due 1/1/2014 (Insured: ACA) | NR/A | 2,285,000 | 2,370,093 | |||||
Chicago Wastewater Transmission Revenue Refunding Second Lien, 5.50% due 1/1/2013 (Insured: MBIA) | Aaa/AAA | 650,000 | 722,917 | |||||
Cook County Capital Improvement, 5.50% due 11/15/2008 (Insured: FGIC) | Aaa/AAA | 500,000 | 518,400 | |||||
Cook County School District Class A, 0% due 12/1/2022 | NR/NR | 2,000,000 | 829,800 | |||||
Du Page County School District Capital Appreciation, 0% due 2/1/2010 (Insured: FGIC) | Aaa/NR | 655,000 | 561,184 | |||||
Freeport Illinois GO, 5.375% due 1/1/2018 (Insured: MBIA) | Aaa/AAA | 1,500,000 | 1,636,530 | |||||
Illinois Development Finance Authority Revenue, 6.00% due 11/15/2012 (Insured: MBIA) | Aaa/AAA | 2,860,000 | 3,200,740 | |||||
Illinois Development Finance Authority Revenue Refunding Community Rehab Providers A, 5.90% due 7/1/2009 | NR/BBB | 820,000 | 846,437 | |||||
Illinois Development Financing Authority Debt Restructuring Revenue Series 1994, 7.25% due 11/15/2009 (East St. Louis Project) | NR/A | 820,000 | 839,090 | |||||
Illinois Educational Facilities Authority Revenues Adjusted, 4.75% due 11/1/2036 put 11/1/2016 (Field Museum Project) | A2/A | 1,160,000 | 1,187,086 | |||||
Illinois Educational Facilities Authority Revenues Capital Appreciation, 0% due 7/1/2014 pre-refunded 7/1/2009 | Aaa/AAA | 475,000 | 234,294 | |||||
Illinois Educational Facilities Authority Revenues Loyola University A, 6.00% due 7/1/2012 (Insured: MBIA) (ETM) | Aaa/AAA | 230,000 | 262,370 | |||||
Illinois Educational Facilities Authority Revenues Midwestern University B, 5.50% due 5/15/2018 (Insured: ACA) | NR/A | 1,500,000 | 1,550,760 | |||||
Illinois Educational Facilities Authority Revenues Unrefunded Balance Loyola A, 5.00% due 7/1/2006 (Insured: MBIA) | Aaa/AAA | 1,540,000 | 1,562,684 | |||||
Certified Annual Report 19
SCHEDULE OF INVESTMENTS, CONTINUED
Thornburg Intermediate Municipal Fund | September 30, 2005 |
Issuer-Description | Credit Rating† Moody’s/S&P | Principal Amount | Value | |||||
Illinois Educational Facilities Authority Revenues Unrefunded Balance Loyola A, 6.00% due 7/1/2011 (ETM) | Aaa/AAA | $ | 770,000 | $ | 868,190 | |||
Illinois Educational Facilities Authority Revenues Unrefunded Balance Loyola A, 6.00% due 7/1/2012 (ETM) | Aaa/AAA | 1,080,000 | 1,223,705 | |||||
Illinois Health Facilities Authority Revenue, 5.50% due 10/1/2009 (Decatur Memorial Hospital Project) | A2/A | 1,055,000 | 1,123,638 | |||||
Illinois Health Facilities Authority Revenue, 5.70% due 2/20/2021 (Midwest Care Center Project; Collateralized: GNMA) | Aaa/NR | 990,000 | 1,066,854 | |||||
Illinois Health Facilities Authority Revenue Healthcare Systems, 6.25% due 11/15/2019 pre-refunded 11/15/2009 (OSF Healthcare Project) | A2/A | 1,250,000 | 1,343,313 | |||||
Illinois Health Facilities Authority Revenue Series A, 5.75% due 8/15/2013 pre-refunded 8/15/2009 Children’s Memorial Hospital Project) | Aaa/AAA | 1,900,000 | 2,086,865 | |||||
Illinois University Revenues, 5.25% due 1/15/2018 (UIC South Campus Development Project; Insured: FGIC) | Aaa/AAA | 1,205,000 | 1,312,992 | |||||
Jackson & Williamson Counties, Illinois, 7.50% due 12/1/2009 (Insured: AMBAC) | Aaa/AAA | 680,000 | 787,338 | |||||
Marion Refunding, 5.00% due 9/15/2012 (Insured: FGIC) | Aaa/AAA | 755,000 | 816,812 | |||||
McHenry County School District Woodstock GO, 6.80% due 1/1/2006 (Insured: FSA) | Aaa/AAA | 710,000 | 716,873 | |||||
Melrose Park Tax Increment Series B, 6.50% due 12/15/2015 (Insured: FSA) | Aaa/AAA | 1,015,000 | 1,162,408 | |||||
Sangamon County Property Tax Lease Receipts, 7.45% due 11/15/2006 | Aa3/NR | 560,000 | 575,557 | |||||
Sangamon County School District Series A, 5.875% due 8/15/2018 (Hay Edwards Project; Insured: ACA) | NR/A | 2,400,000 | 2,585,784 | |||||
Sherman Revenue Refunding Mortgage, 6.10% due 10/1/2014 (Collateralized: GNMA) | NR/AAA | 1,170,000 | 1,261,038 | |||||
Sherman Revenue Refunding Mortgage, 6.20% due 10/1/2019 (Collateralized: GNMA) | NR/AAA | 1,600,000 | 1,723,328 | |||||
Southern Illinois University Revenues, 0% due 4/1/2014 (Insured: MBIA) | Aaa/AAA | 1,425,000 | 1,002,416 | |||||
University of Illinois Revenue Capital Appreciation, 0% due 4/1/2014 (Insured: MBIA) | Aaa/AAA | 1,590,000 | 1,119,424 | |||||
West Chicago Industrial Development Revenue, 6.90% due 9/1/2024 (Leggett & Platt Inc. Project) | NR/A+ | 1,000,000 | 1,012,810 | |||||
Will & Kendall Counties Community Series B, 5.125% due 1/1/2014 (Insured: FSA) | Aaa/AAA | 1,000,000 | 1,073,820 | |||||
Will County Community School 365-U Capital Appreciation, 0% due 11/1/2011 (Insured: FSA) | Aaa/AAA | 3,000,000 | 2,390,460 | |||||
INDIANA — 7.46% | ||||||||
Allen County Economic Development, 5.80% due 12/30/2012 (Indiana Institute of Technology Project) | NR/NR | 895,000 | 942,721 | |||||
Allen County Economic Development, 5.75% due 12/30/2015 (Indiana Institute of Technology Project) | NR/NR | 1,355,000 | 1,464,132 | |||||
Allen County Jail Building Corp. GO, 5.00% due 4/1/2018 (Insured: XLCA) | Aaa/AAA | 2,495,000 | 2,665,284 | |||||
Allen County Redevelopment District Tax Series A, 5.00% due 11/15/2018 | A3/NR | 1,560,000 | 1,644,380 | |||||
Allen County War Memorial Series A, 5.25% due 11/1/2013 (Insured: AMBAC) | Aaa/NR | 1,000,000 | 1,083,780 | |||||
Boone County Hospital Association, 5.625% due 1/15/2015 pre-refunded 7/15/2011 (Insured: FGIC) | Aaa/AAA | 1,000,000 | 1,110,860 | |||||
Brownsburg 1999 School Building, 5.00% due 2/1/2010 (Insured: FSA) | Aaa/AAA | 1,260,000 | 1,341,887 | |||||
Dyer Redevelopment Authority, 6.40% due 7/15/2015 pre-refunded 7/15/2009 | NR/A- | 1,515,000 | 1,697,088 | |||||
Dyer Redevelopment Authority, 6.50% due 7/15/2016 pre-refunded 7/15/2009 | NR/A- | 1,910,000 | 2,146,324 | |||||
East Chicago Elementary School Building First Mortgage Series A, 6.25% due 7/5/2008 (State Aid Withholding) | NR/A | 350,000 | 371,094 | |||||
Fishers Redevelopment Authority, 5.25% due 2/1/2018 (Insured: XLCA) | Aaa/AAA | 1,500,000 | 1,646,715 | |||||
Fishers Redevelopment Authority, 5.25% due 2/1/2020 (Insured: XLCA) | Aaa/AAA | 1,025,000 | 1,118,931 | |||||
Gary Building Corp. - Lake County First Mortgage Series 1994-B, 8.25% due 7/1/2010 (Sears Building Project) | NR/NR | 865,000 | 882,387 | |||||
Goshen Chandler School Building Capital Appreciation Refunding, 0% due 1/15/2011 (Insured: MBIA) | Aaa/AAA | 1,020,000 | 837,818 | |||||
Hamilton Southeastern Indiana, 6.25% due 7/15/2006 (North Delaware School Building Project; Insured: AMBAC) | Aaa/AAA | 1,340,000 | 1,375,202 | |||||
20 Certified Annual Report
SCHEDULE OF INVESTMENTS, CONTINUED
Thornburg Intermediate Municipal Fund | September 30, 2005 |
Issuer-Description | Credit Rating† Moody’s/S&P | Principal Amount | Value | |||||
Huntington Economic Development Revenue, 6.40% due 5/1/2015 (United Methodist Memorial Project) | NR/NR | $ | 1,000,000 | $ | 1,051,180 | |||
Indiana Bond Bank Special Program Hendrick’s Redevelopment Series B, 6.20% due 2/1/2023 pre-refunded 2/1/2007 | NR/NR | 1,500,000 | 1,590,960 | |||||
Indiana Health Facility Hospital Revenue, 5.75% due 9/1/2015 (ETM) | NR/AA- | 575,000 | 588,518 | |||||
Indiana Health Facility Hospital Revenue, 5.40% due 2/15/2016 (Clarian Health Obligation Group Project; Insured: MBIA) | Aaa/AAA | 1,000,000 | 1,086,840 | |||||
Indiana State Educational Facilities Authority Revenue, 5.65% due 10/1/2015 (University of Indianapolis Project) | NR/A- | 1,065,000 | 1,142,575 | |||||
Indiana State Educational Facilities Authority Revenue, 5.70% due 10/1/2016 (University of Indianapolis Project) | NR/A- | 1,025,000 | 1,101,547 | |||||
Indianapolis Economic Development Revenue, 5.50% due 6/1/2014 pre-refunded 6/1/2009 | Aa3/NR | 500,000 | 543,165 | |||||
Indianapolis Local Public Improvement Bond Bank, 0% due 7/1/2009 (ETM) | Aa2/AA- | 740,000 | 651,333 | |||||
Portage Township Multi School Building, 5.50% due 7/15/2015 (Insured: FGIC) | Aaa/AAA | 500,000 | 553,270 | |||||
Rockport Pollution Control Revenue Series A, 4.90% due 6/1/2025 put 6/1/2007 (Indiana Michigan Power Co. Project) | Baa2/BBB | 3,165,000 | 3,234,598 | |||||
Wawasee Community School Corp. First Mortgage, 5.50% due 7/15/2012 pre-refunded 1/15/2012 | NR/AA- | 1,200,000 | 1,328,376 | |||||
West Clark School Building Corp. First Mortgage, 5.75% due 7/15/2017 (Insured: FGIC) | Aaa/AAA | 1,685,000 | 1,895,002 | |||||
IOWA — 1.47% | ||||||||
Iowa Finance Authority Health Care Facilities, 6.00% due 7/1/2013 (Genesis Medical Center Project) | A1/NR | 1,000,000 | 1,080,770 | |||||
Iowa Finance Authority Hospital Facility Revenue, 6.00% due 7/1/2012 (Trinity Regional Hospital Project; Insured: FSA) | Aaa/AAA | 1,000,000 | 1,116,780 | |||||
Iowa Finance Authority Hospital Facility Revenue, 6.75% due 2/15/2016 pre-refunded 2/15/2010 | A1/NR | 1,000,000 | 1,145,890 | |||||
Iowa Finance Authority Revenue, 6.00% due 12/1/2018 (Catholic Health Initiatives Project) | Aa2/AA | 2,000,000 | 2,194,300 | |||||
Iowa Finance Authority Revenue Refunding Trinity Health Series B, 5.75% due 12/1/2015 | Aa3/AA- | 1,250,000 | 1,360,137 | |||||
KANSAS — 0.99% | ||||||||
Wichita Hospital Revenue Refunding Improvement Series XI, 6.75% due 11/15/2019 (Christi Health System Project) | NR/A+ | 4,200,000 | 4,648,644 | |||||
KENTUCKY — 1.10% | ||||||||
Kentucky Economic Development Finance Authority Series C, 5.85% due 10/1/2015 (Norton Healthcare Project; Insured: MBIA) | Aaa/AAA | 4,000,000 | 4,479,960 | |||||
Wilmore Housing Facilities Revenue, 5.55% due 7/1/2013 (LOC: Allied Irish Bank PLC) | NR/NR | 665,000 | 695,756 | |||||
LOUISIANA — 2.25% | ||||||||
Jefferson Sales Tax District Revenue Series B, 5.50% due 12/1/2008 (Insured: AMBAC) | Aaa/AAA | 1,595,000 | 1,695,884 | |||||
Louisiana Local Govt. Environment Series A, 4.10% due 9/1/2007 (Housing Bellemont Apts. Project) | Baa1/NR | 340,000 | 341,737 | |||||
Louisiana State Offshore Terminal Refunding Series D, 4.00% due 9/1/2023 put 9/1/2008 (Loop LLC Project) | A3/A | 3,250,000 | 3,254,095 | |||||
Morehouse Parish Pollution Revenue Refunding Series A, 5.25% due 11/15/2013 (International Paper Co. Project) | Baa2/BBB | 3,000,000 | 3,196,710 | |||||
New Orleans Sewer Service Revenue, 5.50% due 6/1/2017 (Insured: FGIC) | Aaa/AAA | 1,000,000 | 1,059,720 | |||||
Orleans Levee District Trust Receipts Series A, 5.95% due 11/1/2007 (Insured: FSA) | Aaa/AAA | 1,000,000 | 1,034,250 | |||||
MAINE — 0.23% | ||||||||
Jay Solid Waste Disposal Revenue Series B, 6.20% due 9/1/2019 (International Paper Co. Project) | Baa2/BBB | 1,000,000 | 1,077,480 | |||||
Certified Annual Report 21
SCHEDULE OF INVESTMENTS, CONTINUED
Thornburg Intermediate Municipal Fund | September 30, 2005 |
Issuer-Description | Credit Rating† Moody’s/S&P | Principal Amount | Value | |||||
MASSACHUSETTS — 0.44% | ||||||||
Massachusetts HFA AMT Housing Development Series A, 5.05% due 6/1/2010 (Insured: MBIA) | Aaa/AAA | $ | 935,000 | $ | 948,380 | |||
Massachusetts HFA Refunding Series A, 6.125% due 12/1/2011 pre-refunded 12/1/2006 | Aaa/AAA | 150,000 | 157,470 | |||||
Massachusetts HFA Unrefunded Refunding Series A, 6.125% due 12/1/2011 (Insured: MBIA) | Aaa/AAA | 950,000 | 953,078 | |||||
MICHIGAN — 1.27% | ||||||||
Kalamazoo Hospital Finance Authority Revenue Series 1994-A, 6.25% due 6/1/2014 (Borgess Medical Center Project) (ETM) | Aaa/AAA | 650,000 | 764,705 | |||||
Kent Hospital Finance Authority Michigan Hospital, 7.25% due 1/15/2013 (Insured: MBIA) | Aaa/AAA | 1,000,000 | 1,162,340 | |||||
Michigan State Building Authority Revenue Refunding Facilities Program Series I, 5.25% due 10/15/2017 (Insured: FSA) | Aaa/AAA | 2,450,000 | 2,681,697 | |||||
Southfield Economic Development Corp. Refunding Revenue N.W. 12 Limited Partnership, 7.25% due 12/1/2010 | NR/NR | 1,355,000 | 1,355,081 | |||||
MINNESOTA — 0.39% | ||||||||
Minneapolis St. Paul Health, 6.00% due 12/1/2018 (Healthpartners Obligation Group Project) | Baa1/BBB+ | 1,000,000 | 1,105,120 | |||||
Southern Minnesota Municipal Power Agency Supply, Series A, 5.75% due 1/1/2018 pre-refunded to various dates (Insured: MBIA) | Aaa/AAA | 700,000 | 744,219 | |||||
MISSISSIPPI — 0.32% | ||||||||
Mississippi Higher Educational Authority Series C, 7.50% due 9/1/2009 | A2/NR | 1,500,000 | 1,503,495 | |||||
MISSOURI — 0.94% | ||||||||
Missouri Development Finance Board Healthcare Series A, 5.40% due 11/1/2018 (Lutheran Home Aged Project; LOC: Commerce Bank) | Aa3/NR | 2,025,000 | 2,099,621 | |||||
Missouri State Health & Education Facility Revenue, 2.25% due 6/1/2031 put 10/3/2005 (daily demand notes) | Aaa/AAA | 1,000,000 | 1,000,000 | |||||
Platte County COP, 4.00% due 9/1/2006 | NR/AA- | 1,310,000 | 1,321,974 | |||||
NEBRASKA — 0.19% | ||||||||
Madison County Hospital Authority 1 Hospital Revenue, 5.50% due 7/1/2014 (Faith Regional Health Services Project; Insured: Radian) | NR/AA | 845,000 | 906,719 | |||||
NEVADA — 1.38% | ||||||||
Clark County Pollution Control Revenue Series B, 6.60% due 6/1/2019 (Nevada Power Co. Project; Insured: FGIC) | Aaa/AAA | 640,000 | 646,106 | |||||
Las Vegas Special Improvement District Refunding Senior Local Improvement Series A, 5.375% due 6/1/2013 (Insured: FSA) | Aaa/AAA | 1,175,000 | 1,253,513 | |||||
Washoe County Capital Appreciation Reno Sparks Series B, 0% due 7/1/2011 (Insured: FSA) | Aaa/AAA | 2,600,000 | 2,094,924 | |||||
Washoe County School District Refunding Series B, 5.00% due 6/1/2010 (Insured: FGIC) | Aaa/AAA | 2,350,000 | 2,515,699 | |||||
NEW HAMPSHIRE — 1.32% | ||||||||
Manchester Housing & Redevelopment Authority Capital Appreciation Series B, 0% due 1/1/2016 (Insured: Radian) | NR/A | 4,990,000 | 3,020,148 | |||||
New Hampshire Pollution Refunding Central Maine Power Co., 5.375% due 5/1/2014 | A3/BBB+ | 3,000,000 | 3,190,170 | |||||
NEW JERSEY — 1.00% | ||||||||
New Jersey Economic Development Authority School Facilities Construction Series O, 5.00% due 3/1/2019 (a) | A1/AA- | 1,280,000 | 1,353,830 | |||||
22 Certified Annual Report
SCHEDULE OF INVESTMENTS, CONTINUED
Thornburg Intermediate Municipal Fund | September 30, 2005 |
Issuer-Description | Credit Rating† Moody’s/S&P | Principal Amount | Value | |||||
New Jersey EDA Refunding Revenue, 7.50% due 12/1/2019 (Spectrum for Living Development Project; LOC: PNC Bank) | A3/A | $ | 240,000 | $ | 240,826 | |||
New Jersey State Transit Corp., 5.00% due 10/1/2009 (Insured: FSA) | Aaa/AAA | 1,700,000 | 1,802,952 | |||||
New Jersey State Transit Corp. Federal Transportation Administration Grants Series B, 5.50% due 9/15/2010 (Insured: AMBAC) | Aaa/AAA | 1,200,000 | 1,311,096 | |||||
NEW MEXICO — 1.36% | ||||||||
Albuquerque Airport Revenue Refunding, 5.00% due 7/1/2008 (Insured: AMBAC) | Aaa/AAA | 2,380,000 | 2,484,887 | |||||
New Mexico Finance Authority State Transportation Refunding Subordinated Lien Series C-3, 2.50% due 6/15/2024 put 10/7/2005 (weekly demand notes) | Aaa/AAA | 1,800,000 | 1,800,000 | |||||
University of New Mexico Hospital Mortgage Revenue Bonds, 5.00% due 1/1/2018 (Insured: FSA & FHA) | Aaa/AAA | 2,000,000 | 2,119,060 | |||||
NEW YORK — 3.98% | ||||||||
Long Island Power Authority General Series B, 5.00% due 12/1/2006 | A3/A- | 2,000,000 | 2,049,100 | |||||
Metro Transportation Authority New York Service Control Series B, 5.25% due 7/1/2006 | A2/AA- | 1,080,000 | 1,098,144 | |||||
Nassau Health Care Corp., 6.00% due 8/1/2011 pre-refunded 8/1/2009 | Aaa/AAA | 1,000,000 | 1,121,190 | |||||
New York City, 2.80% due 8/1/2017 put 10/3/2005 (LOC: JPM) (daily demand notes) | VMIG1/A-1+ | 1,100,000 | 1,100,000 | |||||
New York City Industrial Development Agency Series A, 5.00% due 6/1/2010 (Lycee Francais De New York Project; Insured: ACA) | NR/A | 1,175,000 | 1,235,618 | |||||
New York City Municipal Water Finance Authority, 2.80% due 6/15/2023 put 10/3/2005 (daily demand notes) | VMIG1/A-1+ | 500,000 | 500,000 | |||||
New York City Trust Cultural Resources, 5.75% due 7/1/2015 (Museum of American Folk Art Project; Insured: ACA) | NR/A | 875,000 | 938,044 | |||||
New York Housing Finance Service Series A, 6.375% due 9/15/2015 pre-refunded 9/15/2007 | A2/AAA | 220,000 | 233,757 | |||||
New York New York Sub Series A-8, 2.80% due 8/1/2018 put 10/3/2005 (daily demand notes) | VMIG1/A-1+ | 1,600,000 | 1,600,000 | |||||
New York Series E, 6.00% due 8/1/2008 pre-refunded 8/1/2006 | Aaa/AAA | 910,000 | 947,064 | |||||
New York Series E, 6.00% due 8/1/2008 pre-refunded 8/1/2006 (Insured: FGIC) | Aaa/AAA | 1,025,000 | 1,063,868 | |||||
New York State Dormitory Authority School Districts Financing Program Series E, 9.00% due 10/1/2007 (Insured: MBIA) | Aaa/AAA | 1,000,000 | 1,112,890 | |||||
New York State Thruway Authority General Revenue Series F, 5.00% due 1/1/2018 (Insured: AMBAC) | Aaa/AAA | 3,000,000 | 3,222,720 | |||||
Port Authority New York & New Jersey Special Obligation, 6.25% due 12/1/2011 (JFK International Air Terminal 6 Project; Insured: MBIA) | Aaa/AAA | 2,200,000 | 2,471,568 | |||||
NORTH CAROLINA — 0.56% | ||||||||
North Carolina Eastern Municipal Power Refunding Series A, 5.70% due 1/1/2013 (Insured: MBIA) | Aaa/AAA | 1,200,000 | 1,260,612 | |||||
North Carolina Housing Finance Agency Single Family Revenue Bond Series BB, 6.50% due 9/1/2026 | Aa2/AA | 1,360,000 | 1,388,832 | |||||
NORTH DAKOTA — 0.34% | ||||||||
Grand Forks Health Care System Revenue Bonds Series 1997, 6.25% due 8/15/2006 (Altra Health Systems Obligated Group Project; Insured: MBIA) | Aaa/AAA | 365,000 | 374,979 | |||||
North Dakota State Housing Finance Agency Refunding Housing Finance Program Home Mortgage Series A, 5.70% due 7/1/2030 | Aa1/NR | 1,210,000 | 1,230,800 | |||||
OHIO — 3.78% | ||||||||
Butler County Transportation Improvement, 6.00% due 4/1/2010 (Insured: FSA) | Aaa/AAA | 1,000,000 | 1,083,280 | |||||
Central Ohio Solid Waste Authority Series B, 5.00% due 12/1/2008 | Aa2/AA+ | 2,530,000 | 2,662,446 | |||||
Cleveland Cuyahoga County Development Bond Fund A, 6.25% due 5/15/2016 (LOC: Fifth Third Bank) | NR/NR | 1,485,000 | 1,552,924 | |||||
Certified Annual Report 23
SCHEDULE OF INVESTMENTS, CONTINUED
Thornburg Intermediate Municipal Fund | September 30, 2005 |
Issuer-Description | Credit Rating† Moody’s/S&P | Principal Amount | Value | |||||
Cuyahoga County Hospital Revenue Refunding, 5.50% due 1/15/2019 (University Health Systems Project B; Insured: MBIA) | Aaa/AAA | $ | 3,545,000 | $ | 3,638,446 | |||
Franklin County Health Care Revenue Series 1995-A, 6.00% due 11/1/2010 (Heinzerling Foundation Project; LOC: Banc One) | Aa2/NR | 1,100,000 | 1,123,969 | |||||
Franklin County Hospital, 5.80% due 12/1/2005 (Doctors Project) (ETM) | NR/NR | 500,000 | 502,495 | |||||
Hamilton Wastewater Systems Revenue Refunding, 5.25% due 10/1/2017 (Insured: FSA) | Aaa/AAA | 1,500,000 | 1,662,465 | |||||
Marysville School District COP, 5.25% due 12/1/2017 (School Facilities Project; Insured: MBIA) | Aaa/AAA | 2,000,000 | 2,203,800 | |||||
North Ridgeville Economic Development, 0% due 2/1/2015 (Collateralized: FHA) | NR/A | 475,000 | 220,918 | |||||
Ohio State Higher Educational Facility Revenue, 5.05% due 7/1/2037 put 7/1/2016 (Kenyon College Project) | A2/A | 2,200,000 | 2,330,988 | |||||
Reynoldsburg Health Care Facilities Revenue Bonds Series 1997, 5.70% due 10/20/2012 (Collateralized: GNMA) | Aa3/NR | 760,000 | 802,689 | |||||
OKLAHOMA — 3.34% | ||||||||
Alva Hospital Authority Hospital Revenue Sales Tax, 5.25% due 6/1/2025 | Aa3/AA | 1,505,000 | 1,587,775 | |||||
Oklahoma City Municipal Improvement Authority, 0% due 7/1/2008 (Insured: AMBAC) | Aaa/AAA | 1,020,000 | 934,391 | |||||
Oklahoma City Municipal Water & Sewer Capital Appreciation Series C, 0% due 7/1/2006 (Insured: AMBAC) | Aaa/AAA | 500,000 | 489,680 | |||||
Oklahoma City Municipal Water & Sewer Series C, 0% due 7/1/2011 (Insured: AMBAC) | Aaa/AAA | 1,125,000 | 910,564 | |||||
Oklahoma City Municipal Water & Sewer Series C, 0% due 7/1/2013 (Insured: AMBAC) | Aaa/AAA | 1,485,000 | 1,090,732 | |||||
Oklahoma Development Finance Authority Hospital Association Pooled Hospital A, 5.40% due 6/1/2013 (Insured: AMBAC) | Aaa/AAA | 825,000 | 900,884 | |||||
Oklahoma Industrial Authority Revenue Refunding, 6.00% due 8/15/2010 (Integris Baptist Project; Insured: AMBAC) | Aaa/AAA | 750,000 | 833,085 | |||||
Tulsa County Independent School District Combined Purpose, 4.50% due 8/1/2007 | Aa3/AA- | 2,800,000 | 2,874,228 | |||||
Tulsa Industrial Authority Hospital Revenue Refunding, 5.375% due 2/15/2017 (St. John Medical Center Project) | Aa3/AA | 4,000,000 | 4,065,520 | |||||
Tulsa Industrial Development Authority Hospital Revenue, 6.10% due 2/15/2009 pre-refunded 2/15/2006 (St. John Medical Center Project) | Aa3/AA | 1,485,000 | 1,502,731 | |||||
Tulsa Public Facilities Authority Solid Waste Revenue, 5.65% due 11/1/2006 (Ogden Martin Project; Insured: AMBAC) | Aaa/AAA | 500,000 | 513,265 | |||||
OREGON — 0.27% | ||||||||
Albany Hospital Facility Authority Gross Revenue & Refunding Series 1994, 7.00% due 10/1/2005 (Mennonite Home Project) | NR/NR | 365,000 | 365,018 | |||||
Forest Grove Campus Improvement & Refunding Pacific University, 6.00% due 5/1/2015 pre-refunded 5/1/2010 (Insured: Radian) | NR/AA | 800,000 | 891,816 | |||||
PENNSYLVANIA — 2.68% | ||||||||
Allegheny County Hospital Development Health Series B, 6.50% due 5/1/2012 (South Hills Health Systems Project) | Baa1/NR | 1,400,000 | 1,495,074 | |||||
Carbon County Industrial Development Authority Refunding, 6.65% due 5/1/2010 (Panther Creek Partners Project) | NR/BBB- | 1,580,000 | 1,707,933 | |||||
Chester County School Authority, 5.00% due 4/1/2020 (Intermediate Unit Project; Insured: AMBAC) (a) | NR/AAA | 2,310,000 | 2,469,413 | |||||
Lancaster County Capital Appreciation Series B, 0% due 5/1/2014 (Insured: FGIC) | Aaa/NR | 795,000 | 556,993 | |||||
Lancaster County Capital Appreciation Series B, 0% due 5/1/2015 (Insured: FGIC) | Aaa/NR | 800,000 | 527,208 | |||||
Lehigh County General Purpose Shepard Rehab. Hospital, 6.00% due 11/15/2007 (Insured: AMBAC) | Aaa/AAA | 785,000 | 830,852 | |||||
Pennsylvania Convention Center Revenue Refunding Series A, 6.70% due 9/1/2014 (Insured: MBIA IBC) | Aaa/AAA | 220,000 | 222,893 | |||||
Pennsylvania Higher Education University Series 14, 0% due 7/1/2020 (Insured: AMBAC) | Aaa/AAA | 2,032,839 | 686,124 | |||||
Pennsylvania State Higher Educational Facility Allegheny Delaware Valley Obligation A, 5.60% due 11/15/2009 (Insured: MBIA) | Aaa/AAA | 500,000 | 538,390 | |||||
24 Certified Annual Report
SCHEDULE OF INVESTMENTS, CONTINUED
Thornburg Intermediate Municipal Fund | September 30, 2005 |
Issuer-Description | Credit Rating† Moody’s/S&P | Principal Amount | Value | |||||
Pennsylvania State Higher Educational Facility Allegheny Delaware Valley Obligation A, 5.60% due 11/15/2010 (Insured: MBIA) | Aaa/AAA | $ | 480,000 | $ | 523,320 | |||
Philadelphia Hospital & High Education Health Systems, 5.25% due 5/15/2006 (Jefferson Health Systems A Project; Insured: MBIA) | Aaa/AAA | 3,025,000 | 3,068,136 | |||||
PUERTO RICO — 0.38% | ||||||||
Puerto Rico Commonwealth Refunding Series B, 2.50% due 7/1/2029 put 10/3/2005 (Insured: FGIC) (daily demand notes) | Aaa/AAA | 1,800,000 | 1,800,000 | |||||
RHODE ISLAND — 0.77% | ||||||||
Rhode Island Health & Education Building Hospital Financing, 5.25% due 7/1/2015 (Memorial Hospital Project; LOC: Fleet Bank) | NR/AA | 1,325,000 | 1,408,051 | |||||
Rhode Island Health & Education Building Refunding, 6.00% due 8/1/2014 (Credit Support: FHA) | NR/AA | 1,000,000 | 1,082,490 | |||||
Rhode Island Health & Education Building Refunding Higher Education State University, 5.00% due 3/15/2014 (Insured: Radian) | NR/AA | 1,065,000 | 1,127,207 | |||||
SOUTH CAROLINA — 0.68% | ||||||||
Darlington County Industrial Development, 6.00% due 4/1/2026 (Sonoco Products Co. Project) | A3/A- | 3,100,000 | 3,184,909 | |||||
SOUTH DAKOTA — 0.22% | ||||||||
South Dakota Housing Development Authority Homeownership Series B, 4.85% due 5/1/2009 | Aa1/AAA | 1,000,000 | 1,040,780 | |||||
TENNESSEE — 0.44% | ||||||||
Knox County Health, 4.90% due 6/1/2031 put 6/1/2011 (Collateralized: FNMA) | NR/AAA | 2,000,000 | 2,050,480 | |||||
TEXAS — 17.19% | ||||||||
Bexar County Health Facilities Development Corp., 6.125% due 7/1/2022 (Army Retirement Residence Project) | NR/BBB- | 1,250,000 | 1,340,075 | |||||
Bexar County Housing Finance Corp., 5.50% due 1/1/2016 (Insured: MBIA) | Aaa/NR | 600,000 | 634,074 | |||||
Bexar County Housing Finance Corp., 5.70% due 1/1/2021 (Insured: MBIA) | Aaa/NR | 1,035,000 | 1,094,512 | |||||
Bexar County Housing Finance Corp., 6.50% due 12/1/2021 | Baa1/NR | 2,000,000 | 2,019,940 | |||||
Bexar County Housing Finance Corp. Multi Family Housing, 5.40% due 8/1/2012 (Dymaxion & Marrach Park Apts. A Project; Insured: MBIA) | Aaa/NR | 1,005,000 | 1,049,300 | |||||
Bexar County Housing Finance Corp. Multi Family Housing, 5.95% due 8/1/2020 (Dymaxion & Marrach Park Apts. A Project; Insured: MBIA) | Aaa/NR | 1,270,000 | 1,357,592 | |||||
Bexar County Housing Finance Corp. Series A, 5.875% due 4/1/2014 (Honey Creek Apartments Project; Insured: MBIA) | Aaa/NR | 975,000 | 1,027,114 | |||||
Bexar County Housing Finance Corp. Series A, 6.125% due 4/1/2020 (Honey Creek Apartments Project; Insured: MBIA) | Aaa/NR | 800,000 | 834,792 | |||||
Birdville Independent School District Refunding, 0% due 2/15/2012 (Guaranty: PSF) | Aaa/AAA | 2,800,000 | 2,192,988 | |||||
Brazos River Authority TXU Energy Pollution Control Revenue, 5.05% due 6/1/2030 put 6/19/2006 | Baa2/BBB- | 2,040,000 | 2,059,482 | |||||
Carroll Independent School District Capital Appreciation Refunding, 0% due 2/15/2011 (Guaranty: PSF) | Aaa/AAA | 1,130,000 | 898,779 | |||||
Central Regional Mobility Authority Revenue Anticipation Notes, 5.00% due 1/1/2008 | Aa3/AA | 1,100,000 | 1,144,847 | |||||
Coppell Independent School District Capital Appreciation Refunding, 0% due 8/15/2013 (Guaranty: PSF) | NR/AAA | 5,000,000 | 3,455,000 | |||||
De Soto Independent School District Refunding, 5.125% due 8/15/2017 (Guaranty: PSF) | NR/AAA | 1,100,000 | 1,101,573 | |||||
Donna Independent School District Refunding, 5.00% due 2/15/2015 (Guaranty: PSF) | Aaa/AAA | 980,000 | 1,061,124 | |||||
Duncanville Independent School District Capital Appreciation Refunding Series B, 0% due 2/15/2016 (Guaranty: PSF) | Aaa/AAA | 3,000,000 | 1,803,180 | |||||
Certified Annual Report 25
SCHEDULE OF INVESTMENTS, CONTINUED
Thornburg Intermediate Municipal Fund | September 30, 2005 |
Issuer-Description | Credit Rating† Moody’s/S&P | Principal Amount | Value | |||||
El Paso Independent School District Capital Appreciation Refunding, 0% due 8/15/2010 (Guaranty: PSF) | Aaa/AAA | $ | 3,750,000 | $ | 3,050,325 | |||
El Paso Independent School District Capital Appreciation Refunding, 0% due 8/15/2011 (Guaranty: PSF) | Aaa/AAA | 2,500,000 | 1,915,125 | |||||
Ennis Independent School District Refunding, 0% due 8/15/2012 (Guaranty: PSF) | Aaa/NR | 2,460,000 | 1,839,367 | |||||
Ennis Independent School District Refunding, 0% due 8/15/2013 (Guaranty: PSF) | Aaa/NR | 2,490,000 | 1,754,628 | |||||
Ennis Independent School District Refunding, 0% due 8/15/2014 (Guaranty: PSF) | Aaa/NR | 2,525,000 | 1,668,242 | |||||
Fort Worth Water & Sewer Revenue, 5.25% due 2/15/2009 | Aa2/AA | 1,000,000 | 1,063,240 | |||||
Gulf Coast Center Revenue, 6.75% due 9/1/2020 (Mental Health Retardation Center Project) | NR/BBB | 1,320,000 | 1,423,686 | |||||
Hays Consolidated Independent School District Capital Appreciation, 0% due 8/15/2013 pre-refunded 8/15/2011 (Guaranty: PSF) | Aaa/AAA | 6,245,000 | 4,513,699 | |||||
Irving Hospital Authority Series B, 5.80% due 7/1/2009 (Irving Healthcare Systems Project; Insured: FSA) | Aaa/AAA | 470,000 | 471,058 | |||||
Irving Waterworks & Sewer Revenue Refunding & Improvement, 5.375% due 8/15/2014 | Aa2/AA | 1,500,000 | 1,625,475 | |||||
Laredo Sports Venue Sales Refunding & Improvement, 5.00% due 3/15/2018 (Insured: AMBAC) | Aaa/AAA | 2,040,000 | 2,171,192 | |||||
Mesquite Independent School District Refunding, 0% due 8/15/2012 (Guaranty: PSF) | NR/AAA | 1,420,000 | 1,057,914 | |||||
Midlothian Independent School District Capital Appreciation Refunding, 0% due 2/15/2012 (Guaranty: PSF) | Aaa/NR | 1,000,000 | 783,210 | |||||
Midtown Redevelopment Authority Tax, 6.00% due 1/1/2012 (Insured: Radian) | NR/AA | 735,000 | 804,333 | |||||
Midtown Redevelopment Authority Tax, 6.00% due 1/1/2013 (Insured: Radian) | NR/AA | 500,000 | 544,450 | |||||
Pharr San Juan Alamo Independent Building, 5.75% due 2/1/2013 (Guaranty: PSF) | Aaa/AAA | 1,000,000 | 1,089,910 | |||||
Port Arthur Refunding, 5.00% due 2/15/2019 (Insured: MBIA) | Aaa/AAA | 1,000,000 | 1,055,860 | |||||
Sabine River Authority Texas Pollution Refunding Series A, 5.80% due 7/1/2022 (TXU Energy Co. Project) | Baa2/BBB- | 1,000,000 | 1,072,180 | |||||
Sam Rayburn Municipal Power Agency Refunding, 6.00% due 10/1/2016 | Baa2/BBB- | 3,000,000 | 3,224,880 | |||||
Sam Rayburn Municipal Power Agency Refunding Series A, 6.00% due 10/1/2021 | Baa2/BBB- | 675,000 | 714,879 | |||||
San Antonio Hotel Occupancy Revenue Refunding Series B, 5.00% due 8/15/2034 put 8/1/2008 (Insured: AMBAC) | Aaa/AAA | 1,350,000 | 1,415,354 | |||||
Stafford Economic Development, 6.00% due 9/1/2017 (Insured: FGIC) | Aaa/AAA | 1,775,000 | 2,069,597 | |||||
Tarrant County Health Facilities, 6.625% due 11/15/2020 pre-refunded 11/15/2010 (Adventist/Sunbelt Project) | A2/A+ | 3,500,000 | 4,050,690 | |||||
Texarkana Health Facilities Hospital Refunding Series A, 5.75% due 10/1/2009 (Wadley Regional Medical Center Project; Insured: MBIA) | Aaa/AAA | 500,000 | 542,265 | |||||
Texarkana Health Facilities Hospital Refunding Series A, 5.75% due 10/1/2011 (Insured: MBIA) | Aaa/AAA | 2,500,000 | 2,781,425 | |||||
Texas State Tax & Revenue Anticipation Notes, 4.50% due 8/31/2006 | Mig1/SP-1+ | 5,000,000 | 5,066,800 | |||||
Travis County GO, 5.25% due 3/1/2021 | Aaa/AAA | 1,000,000 | 1,099,200 | |||||
Travis County Health Facilities Development Series A, 5.75% due 11/15/2010 (Ascension Health Project; Insured: MBIA) | Aaa/AAA | 2,000,000 | 2,186,120 | |||||
Travis County Health Facilities Development Series A, 6.25% due 11/15/2014 pre-refunded 11/15/2009 (Ascension Health Project; Insured: MBIA) | Aaa/AAA | 3,000,000 | 3,367,860 | |||||
Upper Trinity Regional Water District Regional Treated Water Supply Systems Series A, 7.125% due 8/1/2008 (Insured: FGIC) | Aaa/AAA | 600,000 | 652,248 | |||||
Waco Health Facilities Development Corp. Series A, 6.00% due 11/15/2015 pre-refunded 11/15/2009 (Ascension Health Project) | Aa2/AA | 870,000 | 970,137 | |||||
Waco Health Facilities Development Corp. Series A, 6.00% due 11/15/2016 pre-refunded 11/15/2009 (Ascension Health Project) | Aa2/AA | 1,050,000 | 1,170,855 | |||||
West Harris County Municipal Utility Refunding, 6.00% due 3/1/2017 (Insured: Radian) | NR/AA | 500,000 | 527,310 | |||||
UTAH — 0.95% | ||||||||
Salt Lake City Municipal Building Series B, 5.30% due 10/15/2012 pre-refunded 10/15/2009 (Insured: AMBAC) | Aaa/AAA | 1,085,000 | 1,179,319 | |||||
Utah Board of Regents Auxiliary Refunding Series A, 5.25% due 5/1/2013 | NR/AA | 595,000 | 645,664 | |||||
26 Certified Annual Report
SCHEDULE OF INVESTMENTS, CONTINUED
Thornburg Intermediate Municipal Fund | September 30, 2005 |
Issuer-Description | Credit Rating† Moody’s/S&P | Principal Amount | Value | |||||
Utah County Municipal Building Authority, 5.50% due 11/1/2016 pre-refunded 11/1/2011 (Insured: AMBAC) | Aaa/NR | $ | 1,000,000 | $ | 1,102,410 | |||
Utah Housing Finance Agency, 6.05% due 7/1/2016 (Credit Support: FHA) | NR/AAA | 405,000 | 419,827 | |||||
Utah Housing Finance Agency SFMR D-2 Class I, 5.85% due 7/1/2015 | Aa2/AA | 90,000 | 90,381 | |||||
Utah Water Finance Agency Revenue Pooled Loan Financing Program Series A, 5.00% due 10/1/2012 (Insured: AMBAC) | Aaa/NR | 940,000 | 1,018,697 | |||||
VIRGINIA — 2.69% | ||||||||
Alexandria Industrial Development Authority, 5.90% due 10/1/2020 (Insured: AMBAC) | Aaa/AAA | 2,000,000 | 2,227,360 | |||||
Alexandria Industrial Development Authority Institute For Defense Analysis Series A, 6.00% due 10/1/2014 (Insured: AMBAC) | Aaa/AAA | 1,500,000 | 1,686,060 | |||||
Alexandria Industrial Development Authority Institute For Defense Analysis Series A, 6.00% due 10/1/2015 (Insured: AMBAC) | Aaa/AAA | 1,590,000 | 1,795,269 | |||||
Fauquier County Industrial Development Authority, 5.50% due 10/1/2016 (Insured: Radian) | NR/AA | 1,000,000 | 1,088,020 | |||||
Hanover County Industrial Development Authority Medical Facilities Revenue, 6.00% due 10/1/2021 (ETM) | Aaa/AAA | 795,000 | 795,127 | |||||
Norfolk Industrial Development Authority Lease, 5.625% due 9/15/2017 pre-refunded 9/15/2006 (Norfolk Public Health Center Project) | Aa1/AA+ | 1,000,000 | 1,044,870 | |||||
Norton Industrial Development Authority Hospital Refunding, 6.00% due 12/1/2014 (Norton Community Hospital Project; Insured: ACA) | NR/A | 1,635,000 | 1,795,001 | |||||
Spotsylvania County Industrial Development, 6.00% due 9/1/2019 put 9/1/2008 (Walter Grinders Project; LOC: Deutsche Bank) | NR/NR | 2,210,000 | 2,238,797 | |||||
WASHINGTON — 6.42% | ||||||||
Benton County Public Utility District Refunding Series A, 5.625% due 11/1/2012 (Insured: FSA) | Aaa/AAA | 1,500,000 | 1,664,805 | |||||
Energy Northwest Washington Series A, 5.60% due 7/1/2015 pre-refunded 1/1/2007 (Wind Project) | A3/A- | 1,000,000 | 1,059,040 | |||||
Energy Northwest Washington Series B, 5.10% due 7/1/2009 pre-refunded 1/1/2007 (Wind Project) | A3/A- | 745,000 | 784,448 | |||||
Grant County Public Utility District-2 Wanapum Hydro Electric Revenue Series C, 6.00% due 1/1/2006 (Insured: AMBAC) | Aaa/AAA | 145,000 | 146,143 | |||||
Port Longview Industrial Development Corp. Solid Waste Disposal Revenue, 6.875% due 10/1/2008 | NR/BBB | 1,500,000 | 1,628,175 | |||||
Snohomish County Public Utility 001 Systems Notes, 5.00% due 12/1/2005 | A1/SP-1+ | 500,000 | 501,750 | |||||
Spokane County School District GO, 0% due 6/1/2019 (Insured: MBIA) | Aaa/AAA | 1,240,000 | 1,115,405 | |||||
Tacoma Electric Systems Revenue Series A, 5.50% due 1/1/2012 (Insured: FSA) | Aaa/AAA | 750,000 | 824,955 | |||||
University of Washington Revenue Refunding, 5.25% due 8/15/2009 (University of Washington Medical Center Project; Insured: MBIA) | Aaa/AAA | 1,350,000 | 1,440,153 | |||||
Vancouver Downtown Redevelopment Senior Series A, 5.50% due 1/1/2018 (Conference Center Project; Insured: ACA) | NR/A | 3,500,000 | 3,726,380 | |||||
Washington Health Care Facilities, 5.50% due 12/1/2010 (Insured: MBIA) | Aaa/AAA | 2,690,000 | 2,919,618 | |||||
Washington Health Care Facilities, 6.00% due 12/1/2014 (Insured: MBIA) | Aaa/AAA | 1,735,000 | 1,928,747 | |||||
Washington Health Care Facilities, 6.00% due 12/1/2015 (Insured: MBIA) | Aaa/AAA | 1,945,000 | 2,161,226 | |||||
Washington Health Care Facilities Refunding, 6.375% due 10/1/2010 (Insured: FGIC) | Aaa/AAA | 1,500,000 | 1,693,770 | |||||
Washington Health Care Facilities Sea Mar Community Health Center, 5.60% due 1/1/2018 (LOC: U.S. Bancorp) | Aa1/NR | 1,025,000 | 1,097,262 | |||||
Washington Nonprofit Housing, 5.60% due 7/1/2011 (Kline Galland Center Project; Insured: Radian) | NR/AA | 500,000 | 534,785 | |||||
Washington Nonprofit Housing, 5.875% due 7/1/2019 (Kline Galland Center Project; Insured: Radian) | NR/AA | 1,000,000 | 1,079,090 | |||||
Washington Public Power Supply Capital Appreciation Refunding Series B, 0% due 7/1/2011 | Aaa/AA- | 1,000,000 | 800,300 | |||||
Washington Public Power Supply Refunding Series A, 5.00% due 7/1/2011 (Insured: FSA) (b) | Aaa/AAA | 3,030,000 | 3,215,587 | |||||
Washington Public Power Supply System, 0% due 7/1/2010 (Project 3) | Aaa/AA- | 960,000 | 804,605 | |||||
Washington State Multi Family Mortgage Revenue, 6.30% due 1/1/2021 put 1/1/2011 (LOC: US Bank N.A.) | NR/AA- | 1,000,000 | 1,068,350 | |||||
Certified Annual Report 27
SCHEDULE OF INVESTMENTS, CONTINUED
Thornburg Intermediate Municipal Fund | September 30, 2005 |
Issuer-Description | Credit Rating† Moody’s/S&P | Principal Amount | Value | |||||
WISCONSIN — 1.33% | ||||||||
Wisconsin Health & Educational Facilities, 5.75% due 8/15/2020 | NR/AA | $ | 1,000,000 | $ | 1,081,310 | |||
Wisconsin Housing & Economic Development Housing Series A, 5.875% due 11/1/2016 (Insured: AMBAC) | Aaa/AAA | 1,980,000 | 2,084,128 | |||||
Wisconsin State Health & Educational Facilities Hospital Sisters Services Inc., 4.50% due 12/1/2023 put 12/1/2007 (Insured: FSA) | Aaa/NR | 3,000,000 | 3,071,640 | |||||
TOTAL INVESTMENTS — 99.47% (COST $448,492,869) | $ | 467,714,840 | ||||||
OTHER ASSETS LESS LIABILITIES — 0.53% | 2,487,716 | |||||||
NET ASSETS — 100.00% | $ | 470,202,556 | ||||||
Footnote Legend
See notes to financial statements.
| † | Credit ratings are unaudited. Rating changes may have occurred prior to or subsequent to the reporting period end. |
| (a) | When-issued security. |
| (b) | Segregated as collateral for a when-issued security. |
Portfolio Abbreviations
To simplify the listings of securities, abbreviations are used per the table below:
| ACA | Insured by American Capital Access |
| AMBAC | Insured by American Municipal Bond Assurance Corp. |
| AMT | Alternative Minimum Tax |
| COP | Certificates of Participation |
| ETM | Escrowed to Maturity |
| FGIC | Insured by Financial Guaranty Insurance Co. |
| FHA | Insured by Federal Housing Administration |
| FNMA | Collateralized by Federal National Mortgage Association |
| FSA | Insured by Financial Security Assurance Co. |
| GNMA | Insured by Government National Mortgage Co. |
| GO | General Obligation |
| IBC | Insured Bond Certificate |
| MBIA | Insured by Municipal Bond Investors Assurance |
| PSF | Guaranteed by Permanent School Fund |
| RADIAN | Insured by Radian Asset Assurance |
| SFMR | Single Family Mortgage Revenue Bond |
| XLCA | Insured by XL Capital Assurance |
SUMMARY OF SECURITY CREDIT RATINGS†
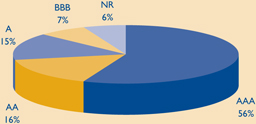
Ratings are a blend of Moody’s and Standard & Poor’s, using the higher rating. Some bonds are rated by only one service.
28 Certified Annual Report
REPORT OF INDEPENDENT REGISTERED PUBLIC ACCOUNTING FIRM
Thornburg Intermediate Municipal Fund
To the Trustees and Shareholders of
Thornburg Intermediate Municipal Fund
In our opinion, the accompanying statement of assets and liabilities, including the schedule of investments, and the related statements of operations and of changes in net assets and the financial highlights present fairly, in all material respects, the financial position of Thornburg Intermediate Municipal Fund (one of the Portfolios constituting Thornburg Investment Trust, hereafter referred to as the “Fund”) at September 30, 2005, the results of its operations for the year then ended, the changes in its net assets for each of the two years in the period then ended and the financial highlights for each of the periods presented, in conformity with accounting principles generally accepted in the United States of America. These financial statements and financial highlights (hereafter referred to as “financial statements”) are the responsibility of the Fund’s management. Our responsibility is to express an opinion on these financial statements based on our audits. We conducted our audits of these financial statements in accordance with the standards of the Public Company Accounting Oversight Board (United States). Those standards require that we plan and perform the audit to obtain reasonable assurance about whether the financial statements are free of material misstatement. An audit includes examining, on a test basis, evidence supporting the amounts and disclosures in the financial statements, assessing the accounting principles used and significant estimates made by management, and evaluating the overall financial statement presentation. We believe that our audits, which included confirmation of securities at September 30, 2005 by correspondence with the custodian and brokers, provide a reasonable basis for our opinion.
PricewaterhouseCoopers LLP
New York, New York
November 16, 2005
Certified Annual Report 29
Thornburg Intermediate Municipal Fund | September 30, 2005 (Unaudited) |
As a shareholder of the Fund, you incur two types of costs:
(1) transaction costs, including
(a) sales charges (loads) on purchase payments, for Class A Shares,
(b) a deferred sales charge on redemptions of any part or all of a purchase of $1 million of Class A shares within 12 months of purchase;
(c) a deferred sales charge on redemptions of Class C shares within 12 months of purchase;
(2) ongoing costs, including management fees; distribution and/or service (12b-1) fees; and other Fund expenses
This example is intended to help you understand your ongoing costs (in dollars) of investing in the Fund and to compare these costs with the ongoing costs of investing in other mutual funds.
The example is based on an investment of $1,000 invested on March 31, 2005 and held until September 30, 2005.
Actual Expenses
The first line of the table at right provides information about actual account values and actual expenses. You may use the information in this line, together with the amount you invested, to estimate the expenses that you paid over the period. Simply divide your account value by $1,000 (for example, an $8,600 account value divided by $1,000 = 8.6), then multiply the result by the number in the first line under the heading entitled “Expenses Paid During Period” to estimate the expenses you paid on your account during this period.
Hypothetical Example for Comparison Purposes
The second line of the table at right provides information about hypothetical account values and hypothetical expenses based on the Fund’s actual expense ratio and an assumed rate of return of 5% per year before expenses, which is not the Fund’s actual return. The hypothetical account values and expenses may not be used to estimate the actual ending account balance or expenses you paid for the period. You may use this information to compare the ongoing costs of investing in the Fund and other funds. To do so, compare this 5% hypothetical example with the 5% hypothetical examples that appear in the shareholder reports of the other funds.
| Beginning Account Value 3/31/05 | Ending Account Value 9/30/05 | Expenses Paid During Period† 3/31/05-9/30/05 | |||||||
Class A Shares | |||||||||
Actual | $ | 1,000 | $ | 1,022.40 | $ | 5.00 | |||
Hypothetical* | $ | 1,000 | $ | 1,020.12 | $ | 5.00 | |||
Class C Shares | |||||||||
Actual | $ | 1,000 | $ | 1,020.30 | $ | 6.29 | |||
Hypothetical* | $ | 1,000 | $ | 1,018.84 | $ | 6.29 | |||
Class I Shares | |||||||||
Actual | $ | 1,000 | $ | 1,024.00 | $ | 3.39 | |||
Hypothetical* | $ | 1,000 | $ | 1,021.71 | $ | 3.39 | |||
| † | Expenses are equal to the annualized expense ratio for each class (A: 0.99%; C: 1.24%; and I: 0.67%) multiplied by the average account value over the period, multiplied by 183/365 to reflect the one-half year period. |
| * | Hypothetical assumes a rate of return of 5% per year before expenses. |
Please note that the expenses shown in the table are meant to highlight your ongoing costs only and do not reflect any transactional costs, such as sales charges (loads), redemption fees, or exchange fees. Therefore, the second line of the table is useful in comparing ongoing costs only, and will not help you determine the relative total costs of owning different funds. In addition, if these transactional costs were included, your costs would have been higher.
30 Certified Annual Report
Thornburg Intermediate Municipal Fund | September 30, 2005 (Unaudited) |
GROWTH OF A HYPOTHETICAL $10,000 INVESTMENT
Thornburg Intermediate Municipal Fund Class A Total Returns, versus
Merrill Lynch 7-12 Year Municipal Bond Index and Consumer Price Index
(July 31, 1991 to September 30, 2005)
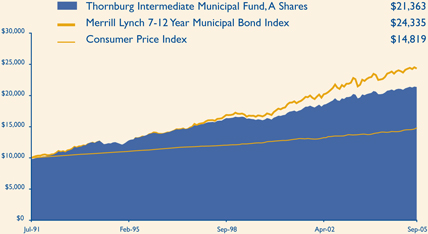
AVERAGE ANNUAL TOTAL RETURNS
For the periods ended September 30, 2005 (with sales charge)
| 1 Yr | 5 Yrs | 10 Yrs | Since Inception | |||||||||||
A Shares (Incep: 7/22/91) | 0.48 | % | 4.60 | % | 4.46 | % | 5.51 | % | ||||||
C Shares (Incep: 9/1/94) | 1.62 | % | 4.68 | % | 4.27 | % | 4.53 | % | ||||||
| FUND ATTRIBUTES | ||||||||||||||
| as of September 30, 2005 | ||||||||||||||
| Annualized Dist. Rate (@NAV) | SEC Yield | NAV | Maximum Offering Price | |||||||||||
A Shares (Incep: 7/22/91) | 3.66 | % | 2.83 | % | $ | 13.33 | $ | 13.60 | ||||||
C Shares (Incep: 9/1/94) | 3.40 | % | 2.63 | % | $ | 13.34 | $ | 13.34 | ||||||
Performance data reflect past performance, which is no guarantee of future results. The performance data and graph do not reflect the deduction of taxes that a shareholder would pay on distributions or the redemption of Fund shares.
Returns reflect the reinvestment of dividends and capital gains, as well as applicable sales charges. Class A Shares are sold with a maximum sales charge of 2.00%. C shares assume deduction of a 0.60% contingent deferred sales charge (CDSC) for the first year only.
The Consumer Price Index (“CPI”) measures prices of a fixed basket of goods bought by a typical consumer, including food, transportation, shelter, utilities, clothing, medical care, entertainment and other items. The CPI, published by the Bureau of Labor Statistics in the Department of Labor, is based at 100 in 1982 and is released monthly. It is widely used as a cost-of-living benchmark to adjust Social Security payments and other payment schedules, union contracts and tax brackets. The CPI is also known as the cost-of-living index.
The Merrill Lynch 7-12 Year Municipal Bond Index represents a broad measure of market performance. It is a model portfolio of municipal obligations throughout the U.S., with an average maturity which ranges from seven to twelve years.
Unless otherwise noted, index returns reflect the reinvestment of income dividends and capital gains, if any, but do not reflect fees, brokerage commissions or other expenses of investing. Investors may not make direct investments into any index.
The SEC Yield is computed in accordance with SEC standards measuring the net investment income per share over a specified 30-day period expressed as a percentage of the maximum offering price of the Funds’ shares at the end of the period.
The distribution rate is calculated by taking the sum of the month’s total distribution factors and dividing this sum by a 30-day period and annualizing to 360-day year. The value is then divided by the ending Net Asset Value (NAV) to arrive at the annualized distribution yield. The yield is calculated on a periodic basis and is subject to change depending on the Fund’s NAV and current distributions.
Certified Annual Report 31
Thornburg Intermediate Municipal Fund | September 30, 2005 (Unaudited) |
Name, Age, | Principal Occupation(s) | Other Directorships | ||
INTERESTED TRUSTEES(1)(2)(4) | ||||
| Garrett Thornburg, 59 Chairman of Trustees, Trustee since 1987(3) | CEO, Chairman and controlling shareholder of Thornburg Investment Management, Inc. (investment advisor) and Thornburg Securities Corporation (securities dealer); Chairman of Thornburg Limited Term Municipal Fund, Inc. (registered investment company) to 2004; CEO and Chairman of Thornburg Mortgage, Inc. (real estate investment trust); Chairman of Thornburg Mortgage Advisory Corporation (investment manager to Thornburg Mortgage, Inc.). | Director of Thornburg Mortgage, Inc. (real estate investment trust) | ||
| Brian J. McMahon, 49 Trustee since 2001, Member of Governance & Nominating Committee, President since 1997(5)(6) | President and Managing Director of Thornburg Investment Management, Inc.; None President of Thornburg Limited Term Municipal Fund, Inc. to 2004. | None | ||
INDEPENDENT TRUSTEES(1)(2)(4) | ||||
| David A. Ater, 60 Trustee since 1994, Member of Audit Committee and Governance & Nominating Committee | Principal in Ater & Associates, Santa Fe, NM (developer, planner and broker of residential and commercial real estate); owner developer and broker for various real estate projects. | Director of Thornburg Mortgage, Inc. (real estate investment trust) | ||
| David D. Chase, 64 Chairman of Audit Committee, Trustee since 2000 | Chairman, President, CEO, and Managing Member of Vestor Associates, LLC, the general partner of Vestor Partners, LP, Santa Fe, NM (private equity fund); Chairman and CEO of Vestor Holdings, Inc., Santa Fe, NM (merchant bank). | None | ||
| Eliot R. Cutler, 59 Chairman of Governance & Nominating Committee, Trustee since 2004 | Partner, Akin, Gump, Strauss, Hauer & Feld, LLP, Washington, D.C. (law firm) since November 2000; partner, Cutler & Stanfield, Washington, D.C. (law firm) until November 2000. | Director of Thornburg Mortgage, Inc. (real estate investment trust) | ||
| Susan H. Dubin, 56 Trustee since 2004, Member of Audit Committee | President of Dubin Investments, Ltd., Greenwich, CT (private investment fund); Director and officer of various charitable organizations; and formerly, Vice President of Chemical Bank (predecessor to JP Morgan Chase & Co.), New York, 1974–1996. | None | ||
| Owen D. Van Essen, 51 Trustee since 2004, Member of Governance & Nominating Committee | President of Dirks, Van Essen & Murray, Santa Fe, NM (newspaper mergers and acquisitions). | None | ||
| James W. Weyhrauch, 46 Trustee since 1996, Member of Audit Committee | Director, Executive Vice President to 2002, and President and CEO 2002–2004, Nambé Mills, Inc., Santa Fe, NM (manufacturer); real estate agent, Santa Fe Properties, Santa Fe, NM since 2004. | None | ||
32 Certified Annual Report
TRUSTEES AND OFFICERS, CONTINUED
Thornburg Intermediate Municipal Fund | September 30, 2005 (Unaudited) |
Name, Age, | Principal Occupation(s) | Other Directorships | ||
OFFICERS OF THE FUND (WHO ARE NOT TRUSTEES)(1)(6)(7) | ||||
| Dawn B. Fischer, 58 Secretary since 1987 | Secretary and Managing Director, Thornburg Investment Management, Inc.; Secretary, Thornburg Limited Term Municipal Fund, Inc. to 2004; Secretary, Thornburg Securities Corporation; Vice President, Daily Tax Free Income Fund, Inc. (registered investment company). | Not applicable | ||
| Steven J. Bohlin, 46 Vice President since 1987; Treasurer since 1989 | Vice President and Managing Director of Thornburg Investment Management, Inc.; Vice President of Thornburg Limited Term Municipal Fund, Inc. to 2004. | Not applicable | ||
| George T. Strickland, 42 Vice President since 1996 | Vice President and Managing Director of Thornburg Investment Management, Inc.; Vice President (to 2004) and Treasurer (2003–2004) of Thornburg Limited Term Municipal Fund, Inc. | Not applicable | ||
| William V. Fries, 66 Vice President since 1995 | Vice President and Managing Director of Thornburg Investment Management, Inc. | Not applicable | ||
| Leigh Moiola, 38 Vice President since 2001 | Vice President and Managing Director of Thornburg Investment Management, Inc.; Vice President of Thornburg Limited Term Municipal Fund, Inc. 1999–2004. | Not applicable | ||
| Kenneth Ziesenheim, 51 Vice President since 1995 | Vice President and Managing Director of Thornburg Investment Management, Inc.; President of Thornburg Securities Corporation; Vice President of Thornburg Limited Term Municipal Fund, Inc. to 2004. | Not applicable | ||
| Alexander Motola, 35 Vice President since 2001 | Vice President and Managing Director of Thornburg Investment Management, Inc. since 2000; Portfolio Manager, Insight Capital Research & Management, Inc., Walnut Creek, California 1995–2000. | Not applicable | ||
| Wendy Trevisani, 34 Vice President since 1999 | Associate Portfolio Manager of Thornburg Investment Management, Inc. since 1999, Vice President since 2000 and Managing Director since 2003; Vice President of Thornburg Limited Term Municipal Fund, Inc. 1999–2002. | Not applicable | ||
| Joshua Gonze, 42 Vice President since 1999 | Associate Portfolio Manager of Thornburg Investment Management, Inc. since 1999, Vice President since 1999 and Managing Director since 2003; Vice President of Thornburg Limited Term Municipal Fund, Inc. to 2004. | Not applicable | ||
| Brad Kinkelaar, 37 Vice President since 1999 | Associate Portfolio Manager of Thornburg Investment Management, Inc. since 1999, Vice President since 2000 and Managing Director since 2003. | Not applicable | ||
| Christopher Ihlefeld, 35 Vice President since 2003 | Associate Portfolio Manager since 1999; Vice President of Thornburg Investment Management, Inc. since 2002; Vice President of Limited Term Municipal Fund, Inc., 2003–2004. | Not applicable | ||
| Leon Sandersfeld, 39 Vice President since 2003 | Associate of Thornburg Investment Management, Inc. since 2002; Senior Staff Accountant, Farm Bureau Life Insurance Co. 1998–2002. | Not applicable | ||
Certified Annual Report 33
TRUSTEES AND OFFICERS, CONTINUED
Thornburg Intermediate Municipal Fund | September 30, 2005 (Unaudited) |
Name, Age, | Principal Occupation(s) | Other Directorships Held by Trustee | ||
Sasha Wilcoxon, 31 Vice President since 2003 | Associate of Thornburg Investment Management, Inc. since 2000 and Mutual Fund Operations Department Manager since 2002. | Not applicable | ||
Ed Maran, 47 Vice President since 2004 | Associate Portfolio Manager of Thornburg Investment Management, Inc. since 2002 and Vice President and Managing Director since 2004; Analyst, USAA, 2001–2002; Oil Analyst, A.G. Edwards 1997–2000. | Not applicable | ||
Vinson Walden, 35 Vice President since 2004 | Associate Portfolio Manager of Thornburg Investment Management, Inc. since 2002 and Vice President and Managing Director since 2004; Associate Portfolio Manager, Ibis Management 2002–2004; Associate, Lehman Brothers, 1997–2001. | Not applicable | ||
| (1) | Each person’s address is 119 East Marcy Street, Santa Fe, New Mexico 87501. |
| (2) | The Fund is one of twelve separate investment “Funds” or “series” of Thornburg Investment Trust (the “Trust”), which comprises the Thornburg mutual fund complex and is organized as a Massachusetts business trust. The Trust currently has twelve active Funds. Thornburg Investment Management, Inc. is the investment advisor to, and manages, the twelve Funds of the Trust. Each Trustee oversees the twelve Funds in the fund complex. |
| (3) | Mr. Thornburg is considered an “interested” Trustee under the Investment Company Act of 1940 because he is a director and controlling shareholder of Thornburg Investment Management, Inc., the investment advisor to the twelve active Funds of the Trust, and is the sole director and controlling shareholder of Thornburg Securities Corporation, the distributor of shares for the Trust. |
| (4) | Each Trustee serves in office until the election and qualification of a successor. |
| (5) | Mr. McMahon is considered an “interested” Trustee because he is the president of Thornburg Investment Management, Inc. |
| (6) | The Trust’s president, secretary and treasurer each serves a one-year term or until the election and qualification of a successor; each other officer serves at the pleasure of the Trustees. |
| (7) | Assistant vice presidents, assistant secretaries and assistant treasurers are not shown. |
The Statement of Additional Information for each Fund of the Trust includes additional information about the Trustees and is available, without charge and upon request, by calling 1-800-847-0200.
34 Certified Annual Report
Thornburg Intermediate Municipal Fund | September 30, 2005 (Unaudited) |
PORTFOLIO PROXY VOTING
Policies and Procedures:
The Trust has delegated to Thornburg Investment Management, Inc. (the “Advisor”) voting decisions respecting proxies for the Fund’s voting securities. The Advisor makes voting decisions in accordance with its Proxy Voting Policy and Procedures. A description of the Policy and Procedures is available (i) without charge, upon request, by calling the Advisor toll-free at 1-800-847-0200, (ii) on the Thornburg website at www.thornburg.com, and (iii) on the Securities and Exchange Commission’s website at www.sec.gov.
Commencing August 31, 2004, information regarding how proxies were voted is available on or before August 31 of each year for the twelve months ending the preceding June 30. This information is available (i) without charge, upon request by calling the Advisor toll-free at 1-800-847-0200, (ii) on the Thornburg website at www.thornburg.com, and (iii) on the Securities and Exchange Commission’s website at www.sec.gov.
TAX INFORMATION
For the fiscal year ended September 30, 2005, 100% of dividends paid by the Fund are tax exempt dividends for Federal Income Tax purposes. The information and distributions reported herein may differ from the information and distributions taxable to the shareholders for the calendar year ending December 31, 2005.
AVAILABILITY OF QUARTERLY PORTFOLIO SCHEDULE
The Fund files with the Securities and Exchange Commission schedules of its portfolio holdings on Form N-Q for the first and third quarters of each fiscal year. The Fund’s Forms N-Q are available on the Commission’s website at www.sec.gov, or may be reviewed and copied at the Commission’s Public Reference Room in Washington, D.C. Information on the operation of the Public Reference Room may be obtained by calling 1-800-SEC-0330. The Fund also makes this information available on its website at www.thornburg.com/download or upon request by calling 1-800-847-0200.
TRUSTEES DELIBERATIONS RESPECTING RENEWAL OF INVESTMENT ADVISORY AGREEMENT
Thornburg Investment Management, Inc. (the “Advisor”) provides investment management services to Thornburg Intermediate Municipal Fund pursuant to an investment advisory agreement. The Trustees consider the renewal of this agreement annually and most recently determined to renew the agreement on September 13, 2005.
In connection with their general supervision of the Advisor, the Trustees receive and consider reports throughout the year from the Advisor respecting the Advisor’s management of the Fund’s investments. These reports include information about the Fund’s purchase and sale of portfolio investments and explanations from the Advisor respecting investment selections, the investment performance of the Fund, general appraisals of industry and economic prospects and factors, and other matters affecting the Fund and relating to the Advisor’s performance of services for the Fund.
In anticipation of their recent consideration of the advisory agreement’s renewal, the independent Trustees met with representatives of the Advisor in May and July 2005 to specify the information the Advisor would present to the Trustees for their review. The independent Trustees thereafter met in independent session to consider various factors respecting the agreement’s renewal, and met in a subsequent session with the Advisor’s chief investment officer to present questions. Following these sessions, the Trustees met on September 13, 2005 to consider a renewal of the advisory agreement.
The Trustees considered various factors in their review of the Advisor’s performance under the investment advisory agreement, including specifically the principles outlined in their February 2005 Statement to Shareholders, a copy of which accompanies this Annual Report to Shareholders. Summarized below are certain of the factors considered by the Trustees, in connection with the determination to renew the advisory agreement. In determining to renew the advisory agreement, the Trustees did not identify any single fact or aspect of the Advisor’s performance as controlling, and this summary does not describe all of the matters considered by the Trustees in making their determination.
Quality of Services; Fund Investment Performance. In reviewing the nature, extent, and quality of services provided by the Advisor and the investment performance of the Fund, the Trustees primarily considered the Advisor’s adherence to the Fund’s stated objectives and policies, the Advisor’s execution of the Fund’s investment strategies in prevailing market conditions, the Fund’s absolute investment performance, the Fund’s investment performance compared to categories of other broadly similar mutual funds, the Fund’s investment performance over different periods of time, the Fund’s total returns in rising and declining markets compared to total returns of a category of generally similar mutual funds and a broad based securities index, comparative measures of portfolio risk and share price volatility, and related factors. The Trustees noted that bond indices have limited utility in evaluating fixed income mutual funds. Similarly, the Trustees noted in comparing the Fund to other mutual funds that the value of such comparisons may be limited in some degree because the Fund’s investment approach, and in particular its laddered maturity portfolio, differs from other funds. In conducting their review, the Trustees observed that the Advisor had continued to faithfully pursue and to achieve the Fund’s stated objectives, as demonstrated particularly by the Advisor’s selection of investments and the Fund’s investment performance. The Trustees noted in this regard the Fund’s above average or better investment performance
Certified Annual Report 35
OTHER INFORMATION, CONTINUED
Thornburg Intermediate Municipal Fund | September 30, 2005 (Unaudited) |
as compared to two categories of generally similar mutual funds assembled by independent mutual fund analyst firms.
The Trustees also considered a number of other factors in reviewing the quality of the Advisor’s services, including the qualifications and integrity of the Advisor’s senior personnel, the Advisor’s staffing and other resources, the Advisor’s compliance with regulatory requirements, Fund sales performance and perceptions of the Funds in the marketplace, and other factors.
The Trustees concluded, based upon these and other considerations, that the Advisor had actively and competently pursued the Fund’s stated investment objectives in accordance with the Fund’s investment policies stated in its prospectuses. The Trustees further concluded that the investment performance of the Fund was satisfactory in the context of the Fund’s objectives and policies and prevailing market conditions.
Fees and Expenses; Profitability of Advisor. In reviewing the fees charged by the Advisor to the Fund, the Trustees primarily considered the fees charged by the Advisor and the other expenses charged to the Fund in light of the nature and quality of services provided, comparison of the actual Advisor’s fee and Fund expenses to the statement of fees and expenses in the Fund’s prospectuses, comparisons of the Advisor’s fee and other Fund expenses to median and average fees and expenses charged to similar mutual funds, and comparisons of fees and expenses charged to the Fund with fees and expenses charged to other, similar specific mutual funds. In addition, the Trustees considered the profitability of the Advisor compared to other investment management firms, and comparisons of the investment management fee rates charged by the Advisor to the Fund with rates charged to other clients of the Advisor and the differing types of services furnished to the Fund and the other clients. The Trustees noted that the overall expenses for the Fund were somewhat higher than average and median expenses for a group of similar mutual funds, and that the management fee was somewhat higher than the median for the same group of funds but that the differences were not significant in view of the investment performance of the Fund and the other factors considered. The Trustees further noted in this regard that the management fee charged to the Fund was comparable to the average management fees for the same group of mutual funds. The Trustees observed in their review that fee rates charged by the Advisor to other clients of the Advisor were not directly comparable to rates charged to the Fund principally because of the significant differences in the services provided.
The Trustees concluded, based upon these and other considerations, that the fees charged to the Fund by the Advisor were fair and reasonable in view of the following: the services provided, the clear disclosure of these fees and expenses in the Fund’s prospectuses, and prevailing fees and expenses charged to mutual funds generally. The Trustees further concluded that there was no indication that the Advisor’s profitability was unusual, viewed in the context of the services provided, the performance of the Fund, and the fees and profitability of other investment management firms.
Economies of Scale. In reviewing the extent to which economies of scale would be realized by the Fund as it grows and whether fee levels reflect economies of scale, the Trustees considered the breakpoint structure for advisory fees chargeable to the Fund, the demonstrated economies of scale enjoyed by other Funds of the Trust as they had grown in size, and economies of scale realized by other mutual funds. The Trustees concluded that the Fund may reasonably be expected to realize economies of scale for the benefit of its shareholders as it grows in size.
Ancillary Benefits to Advisor. In reviewing benefits enjoyed by the Advisor because of its relationship with the Fund, the Trustees considered an arrangement through which the Advisor received certain research services, favorable publicity received by the Advisor because of the superior investment performance of certain Funds of the Trust, and the benefits to the Fund from the Advisor’s expansion of its staffing and other resources to serve a broader variety of investment clients. The Trustees concluded, based upon these and other considerations, that there was no unusual or unfair benefit enjoyed by the Advisor and that the Fund enjoyed benefits by virtue of the Advisor’s engagement by other investment clients.
36 Certified Annual Report
Trustees’ Statement to Shareholders
Not part of the Certified Annual Report
February 8, 2005
The Trustees are concerned that recent commentaries and opinions reported in the media may confuse investors in general as to the supervisory duties of trustees of mutual funds and, in particular, leave Thornburg Investment Trust shareholders uncertain regarding how we discharge our responsibilities in supervising the Funds’ investment advisor and in reviewing the advisor’s contract for renewal. We decided to spell out clearly three principal guidelines that we follow in supervising the Trust’s investment advisor on your behalf.
We begin with the premise that each shareholder selected his or her Fund because its investments are managed by the investment advisor identified in the prospectus and in accordance with the objective and policies described in the prospectus. We realize, as each of you do, that if you believe that your Fund’s stated objective and policies no longer serve your personal investment goals, you can sell your shares and leave the Fund.
Therefore, we believe that our primary supervisory task – our principal obligation to you – is to assess the nature and quality of the advisor’s services, and to confirm that the advisor actively and competently pursues the Fund’s objective, in accordance with the policies set out in the prospectus. To do this, we meet regularly with management to review your Fund’s portfolio and to discuss the advisor’s specific actions and judgments in pursuing the Fund’s objective. We do not substitute our own judgment for the advisor’s decisions in selecting investments; the advisor is paid to exercise its informed judgment on investment decisions, and we seek to confirm, in reviewing the advisor’s performance, that the advisor is doing just that.
Second, while we are conscious of costs and the effect that costs have on shareholders’ returns, we do not seek the lowest fees or expense ratio as our sole or primary objective. We try to make sure that your Fund’s fees and costs are reasonable in relationship to the services rendered and that they are generally in line with those charged by other expert investment advisors, consistent with our belief that the Fund’s investors searched for and expect that expertise and attention and have decided to pay a reasonable price for it. We do not put the management contract “out to bid” as a matter of course, and we would not do so unless we had concluded that the advisor materially had failed to pursue the Fund’s objectives in accordance with its policies, or for other equally important reasons. We believe that any other approach would be inconsistent with your interests and contrary to your expectations when you bought shares of the Fund in the first place.
Finally, because we believe that most Thornburg Fund shareholders have invested with a long-term perspective, we try not to focus too much on the fashions of the moment and on short-term performance. The market will not favor any specific investment objective or set of policies at all times and under all economic circumstances. A fund will experience periods of both high and low returns relative to other funds and other investments. Even if one of our Funds is not favored by the market at a particular time, we believe that the advisor is nonetheless obliged to remain true to the Fund’s objective and policies, and we watch to see that it does so.
This statement is submitted for the general information of the shareholders of Thornburg Investment Trust. It is not authorized for distribution to prospective investors in the Fund unless preceded or accompanied by an effective prospectus. If you have not received a prospectus, one can be obtained from your financial advisor, online at www.thornburg.com/download, or by calling 800-847-0200. Carefully consider information in the prospectus regarding the Fund’s investment objectives and policies, risks, sales charges, expenses, experience of its management, marketability of shares, and other information. Read it carefully before you invest or send money.
This page is not part of the Annual Report. 37
This page intentionally left blank.
38 This page is not part of the Annual Report.
Planning Options
Retirement and Education Accounts
Thornburg Investment Management offers retirement and education savings accounts that can help you meet a variety of planning challenges. For account applications or further information on any of the accounts below, please call 1-800-847-0200 or go to www.thornburg.com/ira. Your financial advisor can help you determine which plan is right for you.
Individual Retirement Accounts
Individual Retirement Accounts (IRAs) provide a tax-advantaged means to save money for the future. For a detailed outline of the difference between retirement accounts, see www.thornburg.com/ira. Rollovers are available. Call 1-800-847-0200 for more information.
Traditional IRAs – Contributions to Traditional IRAs are tax deductible for eligible individuals, and withdrawals are taxed as additional ordinary income. You may contribute to an IRA if you receive compensation and are under 70 1/2, even if you are covered by an employer retirement plan.
Roth IRAs – Under a Roth IRA, there is no tax deduction for contributions, but there is no income tax on qualified withdrawals. For a more detailed comparison of Traditional and Roth IRAs, please see our web site at www.thornburg.com/ira.
SEP IRAs – Simplified Employee Pension (SEP) IRAs are established by employers. The employer is allowed a tax deduction for contributions made to the SEP Plan and makes contributions to each eligible employee’s SEP IRA on a discretionary basis.
SIMPLE IRAs – Savings Incentive Match Plan for Employees of Small Employers (SIMPLE) is designed to give small business owners a simplified method to establish and contribute to a retirement plan for employees. The employer is allowed a tax deduction for contributions and makes either matching or non-elective contributions to each eligible employee’s SIMPLE IRA. Employees may make salary deferral contributions.
403(b)
A special, tax-advantaged savings vehicle available only to employees of 501(c)(3) organizations, such as charitable, educational, scientific and religious organizations. 403(b) plans are also available to employees of public schools and universities.
Coverdell Education Savings Account
These savings accounts are designed to provide a way to save money for higher education expenses. In an Education Savings Account, earnings and interest grow tax free, and qualified withdrawals used to pay for eligible higher-education expenses are tax- and penalty-free.
Funds Available
The following funds are available in the accounts listed above:
| • | Thornburg International Value Fund |
| • | Thornburg Value Fund |
| • | Thornburg Core Growth Fund |
| • | Thornburg Investment Income Builder Fund |
| • | Thornburg Limited Term U.S. Government Fund |
| • | Thornburg Limited Term Income Fund |
This page is not part of the Annual Report. 39
The Firm
Thornburg Investment Management® is a privately held investment management company based in Santa Fe, New Mexico with assets under management of over $16 billion. Founded in 1982, the firm manages four equity funds, eight bond funds, and separate portfolios for select institutions and individuals.
Investment Philosophy
We seek to preserve and increase the real wealth of the Funds’ shareholders after accounting for inflation, taxes, and investment expenses. We’re committed to disciplined investing and controlling risk in all market environments through laddered bond and focused equity portfolios.
Portfolio Holdings Disclosure
We believe you should know about your portfolio. Our web site keeps investors informed of the Funds’ equity holdings. Go to www.thornburg.com/funds for commentary on our equity fund holdings.
Co-Ownership of Funds
We invest side-by-side with the Funds’ shareholders. Our employees have invested over $110 million in Thornburg Funds.
Core Strategies for Building Wealth
We deliver core strategies to help investors meet long-term goals. A core strategy is a consistent, disciplined and proven investment process that represents the foundation of a diversified portfolio.
| Investment Manager: | Distributor: | |
 |  | |
119 East Marcy Street Santa Fe, New Mexico 87501 800.847.0200 | 119 East Marcy Street Santa Fe, New Mexico 87501 800.847.0200 | |

Core Strategies for Building Wealth
Thornburg Intermediate Municipal Fund
I Shares
Annual Report – September 30, 2005
This report is submitted for the general information of shareholders of the Fund. It is not authorized for distribution to prospective investors in the Fund unless preceded or accompanied by an effective prospectus. If you have not received a prospectus, one can be obtained from your financial advisor, online at www.thornburg.com/ download, or by calling 800-847-0200. Carefully consider information in the prospectus regarding the Fund’s investment objectives and policies, risks, sales charges, expenses, experience of its management, marketability of shares, and other information. Read it carefully before you invest or send money. Performance data quoted represents past performance and does not guarantee future results.
Thornburg Intermediate Municipal Fund
Laddering – an All Weather Strategy
The Fund’s investment objective is to obtain as high a level of current income exempt from Federal income taxes as is consistent with preservation of capital (may be subject to Alternative Minimum Tax).
This Fund is a laddered portfolio of municipal bonds with an average maturity of ten years or less. Laddering involves building a portfolio of bonds with staggered maturities so that a portion of the portfolio matures each year; cash from maturing bonds, if not needed for other purposes, is invested in bonds with longer maturities at the far end of the ladder. We regard the strategy as a good compromise for managing different types of risk.
Thornburg Bond Funds
| • | Thornburg Limited Term Municipal Fund |
| • | Thornburg Intermediate Municipal Fund |
| • | Thornburg California Limited Term Municipal Fund |
| • | Thornburg New Mexico Intermediate Municipal Fund |
| • | Thornburg Florida Intermediate Municipal Fund |
| • | Thornburg New York Intermediate Municipal Fund |
| • | Thornburg Limited Term U.S. Government Fund |
| • | Thornburg Limited Term Income Fund |
Thornburg invests in short- and intermediate-term investment grade bonds. We ladder the maturities of individual bonds in the portfolios to moderate risk. Laddering involves building a portfolio of bonds with staggered maturities so that a portion of the portfolio will mature each year. We apply this disciplined process in all interest rate environments.
Thornburg Equity Funds
| • | Thornburg Value Fund |
| • | Thornburg International Value Fund |
| • | Thornburg Core Growth Fund |
| • | Thornburg Investment Income Builder Fund |
Thornburg’s equity research uses a fundamental, yet comprehensive, analytical approach. We invest when and where we perceive compelling value. Thornburg equity funds focus on a limited number of securities so that each holding can impact performance. The equity team searches for firms believed to have a promising future and seeks to buy shares of those companies at a discount to their intrinsic value.
More information at www.thornburg.com
 | Reduce paper clutter. | |
| Receive your shareholder reports and prospectus online instead of through traditional mail. | ||
| Sign up at | ||
| www.thornburg.com/edelivery |
| 2 | This page is not part of the Annual Report. |
Message
from the Chairman
Garrett Thornburg Chairman & CEO | November 10, 2005
Dear Fellow Shareholder:
Thornburg Investment Management has a clear mission: to preserve and increase the real wealth of our shareholders. We aspire to accomplish this through a family of laddered bond funds that focus on quality, stability, and minimization of risk over time, and through a range of equity funds that redefine traditional measures of value and growth.
Our bond funds have always been managed using the highly disciplined approach of laddering short and intermediate bond maturities, seeking to provide both an attractive return and stability of principal. All of the bond funds buy only investment-grade securities. We have found this strategy to be the best at managing both interest-rate risk and credit risk, and we believe this strategy has served our shareholders well over time.
The bond funds are managed by portfolio managers who have many years of experience. We are proud of this consistency and experience and look forward to many more successful years with them at the helm.
In years past, there has been news about improper behavior by some mutual fund companies. Many new rules proposed in response to this scandal have called for increased transparency. We welcome increased transparency. Thornburg Investment Management has been a leader in providing information about our stock holdings and bond strategies to our shareholders on our web site, www.thornburg.com.
Unfortunately, some of the new rules will increase the cost to all shareholders in mutual funds. We will do our best to keep these expenses to a minimum. After all, we are shareholders too, and Thornburg employees have over $110 million invested in our own funds.
Thank you for investing with us. We will do our best to continue to earn your trust every day. | |

| Sincerely, |
 |
| Garrett Thornburg |
| Chairman & CEO |
| This page is not part of the Annual Report. | 3 |

Thornburg Intermediate Municipal Fund
I Shares – September 30, 2005
| Table of Contents | ||
| 6 | ||
| 8 | ||
| 9 | ||
| 10 | ||
| 11 | ||
| 14 | ||
| 15 | ||
| 27 | ||
| 28 | ||
| 29 | ||
| 30 | ||
| 33 | ||
This report is certified under the Sarbanes-Oxley Act of 2002, which requires that public companies, including mutual funds, affirm that the information provided in their annual and semiannual shareholder reports fully and fairly represents their financial position.
4 | Certified Annual Report |
Important Information
Performance data quoted represents past performance and does not guarantee future results. Investment return and principal value will fluctuate so that upon redemption, investor’s shares may be worth more or less than their original cost. Current performance may be lower or higher than the data quoted. For performance data current to the most recent month end, visit www.thornburg.com.
Minimum investments for Class I shares are higher than those for other classes. Returns reflect the reinvestment of dividends and capital gains. There is no up front sales charge for this class of shares.
Shares in the Fund carry risks, including possible loss of principal. As with direct bond ownership, funds that invest in bonds are subject to certain risks including interest-rate risk, credit risk, and inflation risk. The principal value of bond funds will fluctuate relative to changes in interest rates, decreasing when interest rates rise. Unlike bonds, bond funds have ongoing fees and expenses. Shares in the Fund are not deposits or obligations of, or guaranteed or endorsed by, any bank, the Federal Deposit Insurance Corporation, the Federal Reserve Board or any government agency.
The information presented on the following pages was current as of September 30, 2005. The manager’s views, portfolio holdings, and sector diversification are historical and subject to change. This material should not be deemed a recommendation to buy or sell any of the securities mentioned.
The matters discussed in this report may constitute forward-looking statements made pursuant to the safe harbor provisions of the Securities Litigation Reform Act of 1995. These include any advisor or portfolio manager prediction, assessment, analysis or outlook for individual securities, industries, investment styles, market sectors and/or markets. These statements involve risks and uncertainties. In addition to the general risks described for each Fund in its current prospectus, other factors bearing on these reports include the accuracy of the advisor’s or portfolio manager’s forecasts and predictions, the appropriateness of the investment strategies designed by the advisor or portfolio manager and the ability of the advisor or portfolio manager to implement their strategies efficiently and successfully. Any one or more of these factors, as well as other risks affecting the securities markets generally, could cause the actual results of any fund to differ materially as compared to its benchmarks.
Glossary
The Merrill Lynch 7-12 Year Municipal Bond Index – A widely-accepted unmanaged market-weighted index comprised of fixed-rate, coupon bearing bonds issued within five years of the most recent month-end with greater than $50 million principal amount having a Moody’s investment grade rating and maturities of seven to twelve years.
Duration – The measure of the price sensitivity of a fixed-income security to an interest rate change of 100 basis points. Calculation is based on the weighted average of the present values for all cash flows.
Weighted Average Maturity – A weighted average of all the effective maturities of the bonds in a portfolio. Effective maturity takes into consideration mortgage prepayments, puts, sinking funds, adjustable coupons, and other features of individual bonds and is thus a more accurate measure of interest-rate sensitivity. Longer-maturity funds are generally considered more interest-rate sensitive than their shorter counterparts.
| Certified Annual Report | 5 |
George Strickland Portfolio Manager | October 15, 2005
Dear Fellow Shareholder:
I am pleased to present the Annual Report for the Thornburg Intermediate Municipal Fund. The net asset value of the I shares decreased by 15 cents to $13.31 during the twelve months ended September 30, 2005. If you were with us for the entire period, you received dividends of 53.4 cents per share. If you reinvested dividends, you received 54.3 cents per share.
Over the last twelve months, interest rates on bonds that mature in ten years or less have risen, while interest rates on long-term bonds have fallen. Higher interest rates on short-terms bonds have pushed down the price of many of the bonds owned by the Fund, but have allowed us to buy new bonds at higher yields. The I shares of your Fund produced a total return of 2.90% over the twelve month period ended September 30, 2005, compared to a 2.92% return for the Merrill Lynch 7-12 Year Municipal Bond Index. The Fund was over weighted in bonds that mature in less than eight years. Since the returns of those short-term bonds lagged the return of the index, the Fund’s return lagged the index slightly.
This has been an eventful year for the bond market and the world. The Federal Reserve has been steadily pushing up the target Fed Funds rate to its current level of 3.75%. Through the end of June, the bond market responded by pushing down yields on long-term bonds, thus flattening the yield curve. A flat yield curve is usually associated with a recession, but the U.S. economy is showing no signs of entering a recession. So, more recently, interest rates have been rising for both short and long-term bonds, in more of a parallel yield curve shift. We believe that this is a more appropriate response by the market to a tightening Fed, a strong economy, and somewhat elevated levels of inflation.
Your Thornburg Intermediate Municipal Fund is a laddered portfolio of over 300 municipal obligations from 45 states. Today, your Fund’s weighted average maturity is 7.42 years. We ladder the maturity dates of the bonds in your portfolio so that some of the bonds are scheduled to mature during each of the coming years. Laddering intermediate bonds accomplishes two goals. First, the staggered bond maturities contained in a ladder defuse interest-rate risk and dampen the Fund’s price volatility. Second, laddering gives the Fund a steady cash flow stream from maturing bonds to reinvest toward the top of the ladder where yields are typically higher The chart shown here describes the percentages of your Fund’s bond portfolio maturing in each of the coming years.
We have watched along with the rest of the nation the horrific affects of Hurricanes Katrina and Rita, and our hearts and prayers go out to all of those suffering through the devastation of these storms. | |

% of portfolio | Cumulative | |
| 2 years = 12.1% | Year 2 = 12.1% | |
| 2 to 4 years = 13.4% | Year 4 = 25.5% | |
| 4 to 6 years = 16.8% | Year 6 = 42.3% | |
| 6 to 8 years = 13.6% | Year 8 = 55.9% | |
| 8 to 10 years = 9.2% | Year 10 = 65.1% | |
| 10 to 12 years = 12.3% | Year 12 = 77.4% | |
| 12 to 14 years = 12.7% | Year 14 = 90.1% | |
| 14 to 16 years = 6.4% | Year 16 = 96.5% | |
| 16 to 18 years = 1.2% | Year 18 = 97.7% | |
| Over 18 years = 2.3% | Over 18 years = 100.0% |
Percentages can and do vary. Data as of 9/30/05.
6 | Certified Annual Report |
We examined Thornburg municipal bond portfolios in the wake of both hurricanes and have found no bonds that we believe are currently threatened with default. Though the Fund has some exposure to municipal issuers in the paths of the storms, many of the bonds have alternate revenue sources such as bond insurance or financial collateral. The few bonds without alternate revenue sources have resources that we believe will see them through this calamity.
Thanks to our policy of broad diversification, issuers affected by Hurricanes Katrina and Rita make up only a small percentage of the Fund. Though the major bond insurers have significant exposure to issuers impacted by the hurricanes, we believe that, as in past disasters, insurance proceeds and government aid will limit or prevent large scale municipal defaults. The human toll and property damage from these storms is far worse than previous natural disasters and the recovery period will take longer. Furthermore, some areas of the gulf coast will never be the same. However, we do believe that most of the cities and towns will survive and have need of schools, hospitals, sewer systems, and other essential services.
Outside of the gulf coast, job growth and a strong economy continue to fill state and local coffers. State tax revenues grew 13.3% in the second quarter of 2005 from the year earlier period. This represents the fastest growth rate recorded by the Nelson Rockefeller Institute of Government since they began monitoring this statistic in 1991. However, many challenges remain. Among them are still-depleted reserve fund balances from the last recession, and under funded retirement fund balances in state and local pension funds. To reduce credit risk, we have kept 87% of the portfolio in bonds rated A or above and maintained broad diversification across issuers and market sectors.
Over the years, our practice of laddering a diversified portfolio of short and intermediate maturity municipal bonds has allowed your Fund to perform consistently well in varying interest rate environments. Thank you for investing in Thornburg Intermediate Municipal Fund.
Sincerely, |
 |
| George Strickland |
| Portfolio Manager |
| Certified Annual Report | 7 |
STATEMENT OF ASSETS AND LIABILITIES
| Thornburg Intermediate Municipal Fund | September 30, 2005 |
ASSETS | ||||
Investments at value (cost $448,492,869) | $ | 467,714,840 | ||
Cash | 1,288,461 | |||
Receivable for investments sold | 486,485 | |||
Receivable for fund shares sold | 1,034,386 | |||
Interest receivable | 6,373,119 | |||
Prepaid expenses and other assets | 29,197 | |||
Total Assets | 476,926,488 | |||
LIABILITIES | ||||
Payable for securities purchased | 4,980,125 | |||
Payable for fund shares redeemed | 745,210 | |||
Payable to investment advisor and other affiliates (Note 3) | 330,464 | |||
Accounts payable and accrued expenses | 88,108 | |||
Dividends payable | 580,025 | |||
Total Liabilities | 6,723,932 | |||
NET ASSETS | $ | 470,202,556 | ||
NET ASSETS CONSIST OF: | ||||
Distribution in excess of net investment income | $ | (2,806 | ) | |
Net unrealized appreciation on investments | 19,221,971 | |||
Accumulated net realized gain (loss) | (8,799,597 | ) | ||
Net capital paid in on shares of beneficial interest | 459,782,988 | |||
| $ | 470,202,556 | |||
NET ASSET VALUE: | ||||
Class A Shares: | ||||
Net asset value and redemption price per share ($362,783,213 applicable to 27,220,773 shares of beneficial interest outstanding - Note 4) | $ | 13.33 | ||
Maximum sales charge, 2.00% of offering price | 0.27 | |||
Maximum offering price per share | $ | 13.60 | ||
Class C Shares: | ||||
Net asset value and offering price per share * ($55,382,122 applicable to 4,150,349 shares of beneficial interest outstanding - Note 4) | $ | 13.34 | ||
Class I Shares: | ||||
Net asset value, offering and redemption price per share ($52,037,221 applicable to 3,910,218 shares of beneficial interest outstanding - Note 4) | $ | 13.31 | ||
| * | Redemption price per share is equal to net asset value less any applicable contingent deferred sales charge. |
See notes to financial statements.
8 | Certified Annual Report |
STATEMENT OF OPERATIONS
| Thornburg Intermediate Municipal Fund | Year Ended September 30, 2005 |
INVESTMENT INCOME: | ||||
Interest income (net of premium amortized of $2,610,706) | $ | 21,441,900 | ||
EXPENSES: | ||||
Investment advisory fees (Note 3) | 2,304,795 | |||
Administration fees (Note 3) | ||||
Class A Shares | 451,683 | |||
Class C Shares | 70,959 | |||
Class I Shares | 21,422 | |||
Distribution and service fees (Note 3) | ||||
Class A Shares | 903,366 | |||
Class C Shares | 567,732 | |||
Transfer agent fees | ||||
Class A Shares | 177,005 | |||
Class C Shares | 36,378 | |||
Class I Shares | 47,400 | |||
Registration and filing fees | ||||
Class A Shares | 47,967 | |||
Class C Shares | 21,230 | |||
Class I Shares | 18,203 | |||
Custodian fees (Note 3) | 151,880 | |||
Professional fees | 48,825 | |||
Accounting fees | 39,710 | |||
Trustee fees | 9,110 | |||
Other expenses | 75,905 | |||
Total Expenses | 4,993,570 | |||
Less: | ||||
Expenses reimbursed by Investment Advisor (Note 3) | (179,684 | ) | ||
Distribution and service fees waived (Note 3) | (225,215 | ) | ||
Fees paid indirectly (Note 3) | (17,170 | ) | ||
Net Expenses | 4,571,501 | |||
Net Investment Income | 16,870,399 | |||
REALIZED AND UNREALIZED GAIN (LOSS) | ||||
Net realized gain (loss) on investments sold | 1,423,283 | |||
Increase (decrease) in unrealized appreciation (depreciation) of investments | (6,895,981 | ) | ||
Net Realized and Unrealized Loss on Investments | (5,472,698 | ) | ||
Net Increase in Net Assets Resulting From Operations | $ | 11,397,701 | ||
See notes to financial statements.
| Certified Annual Report | 9 |
STATEMENTS OF CHANGES IN NET ASSETS
| Thornburg Intermediate Municipal Fund | ||
| Year Ended September 30, 2005 | Year Ended September 30, 2004 | |||||||
INCREASE (DECREASE) IN NET ASSETS FROM: | ||||||||
OPERATIONS: | ||||||||
Net investment income | $ | 16,870,399 | $ | 17,327,406 | ||||
Net realized gain (loss) on investments sold | 1,423,283 | (454,070 | ) | |||||
Increase (Decrease) in unrealized appreciation (depreciation) of investments | (6,895,981 | ) | (2,505,819 | ) | ||||
Net Increase (Decrease) in Net Assets Resulting from Operations | 11,397,701 | 14,367,517 | ||||||
DIVIDENDS TO SHAREHOLDERS: | ||||||||
From net investment income | ||||||||
Class A Shares | (13,228,266 | ) | (14,280,020 | ) | ||||
Class C Shares | (1,934,404 | ) | (2,139,590 | ) | ||||
Class I Shares | (1,707,729 | ) | (907,796 | ) | ||||
FUND SHARE TRANSACTIONS (NOTE 4): | ||||||||
Class A Shares | (3,168,323 | ) | (17,365,422 | ) | ||||
Class C Shares | (1,924,468 | ) | (2,267,561 | ) | ||||
Class I Shares | 19,483,987 | 13,757,994 | ||||||
Net Increase (Decrease) in Net Assets | 8,918,498 | (8,834,878 | ) | |||||
NET ASSETS: | ||||||||
Beginning of year | 461,284,058 | 470,118,936 | ||||||
End of year | $ | 470,202,556 | $ | 461,284,058 | ||||
See notes to financial statements.
10 | Certified Annual Report |
| Thornburg Intermediate Municipal Fund | September 30, 2005 |
NOTE 1 – ORGANIZATION
Thornburg Intermediate Municipal Fund (the “Fund”) is a diversified series of Thornburg Investment Trust (the “Trust”). The Trust is organized as a Massachusetts business trust under a Declaration of Trust dated June 3, 1987 and is registered as a diversified, open-end management investment company under the Investment Company Act of 1940, as amended. The Trust is currently issuing eleven series of shares of beneficial interest in addition to those of the Fund: Thornburg Limited Term Municipal Fund, Thornburg California Limited Term Municipal Fund, Thornburg Florida Intermediate Municipal Fund, Thornburg New York Intermediate Fund, Thornburg New Mexico Intermediate Municipal Fund, Thornburg Limited Term U.S. Government Fund, Thornburg Limited Term Income Fund, Thornburg Value Fund, Thornburg International Value Fund, Thornburg Core Growth Fund, and Thornburg Investment Income Builder Fund. Each series is considered to be a separate entity for financial reporting and tax purposes and bears expenses directly attributable to it. The Fund’s investment objective is to obtain as high a level of current income exempt from Federal income taxes as is consistent with the preservation of capital.
The Fund currently offers three classes of shares of beneficial interest, Class A, Class C, and Institutional Class (Class I) shares. Each class of shares of the Fund represents an interest in the same portfolio of investments of the Fund, except that (i) Class A shares are sold subject to a front-end sales charge collected at the time the shares are purchased and bear a service fee, (ii) Class C shares are sold at net asset value without a sales charge at the time of purchase, but are subject to a contingent deferred sales charge upon redemption within one year, and bear a service fee and a distribution fee, (iii) Class I shares are sold at net asset value without a sales charge at the time of purchase, and (iv) the respective classes may have different reinvestment privileges and conversion rights. Additionally, the Fund may allocate among its classes certain expenses, to the extent allowable to specific classes, including transfer agent fees, government registration fees, certain printing and postage costs, and administrative and legal expenses. Currently, class specific expenses of the Fund are limited to service and distribution fees, administration fees, and certain registration and transfer agent expenses.
NOTE 2 – SIGNIFICANT ACCOUNTING POLICIES
Significant accounting policies of the Trust are as follows:
Valuation of Investments: In determining the net asset value of Investments, the Trust utilizes an independent pricing service approved by the Board of Trustees. Debt investment securities have a primary market over the counter and are valued on the basis of valuations furnished by the pricing service. The pricing service values portfolio securities at quoted bid prices, normally at 4:00 p.m. EST. When quotations are not readily available, securities are valued at evaluated prices as determined by the pricing service using methods which include consideration of yields or prices of municipal obligations of comparable quality, type of issue, coupon, maturity and rating; indications as to value from dealers and general market conditions. In any case where a price is not available from a pricing service for an investment, the Trust’s valuation and pricing committee determines a fair value for the investment using factors approved by the Trustees. The valuation procedures used by the pricing service and the portfolio valuations received by the Fund are reviewed by the officers of the Trust under the general supervision of the Board of Trustees. Short-term obligations having remaining maturities of 60 days or less are valued at amortized cost, which approximates market value.
Federal Income Taxes: It is the policy of the Trust to comply with the provisions of the Internal Revenue Code applicable to “regulated investment companies” and to distribute all taxable (if any) and tax exempt income of the Fund to the shareholders. Therefore, no provision for Federal income tax is required.
When-Issued and Delayed Delivery Transactions: The Trust may engage in when-issued or delayed delivery transactions. To the extent the Trust engages in such transactions, it will do so for the purpose of acquiring portfolio securities consistent with the Fund’s investment objectives and not for the purpose of investment leverage or to speculate on interest rate and or market changes. At the time the Trust makes a commitment to purchase a security on a when-issued basis, the Fund will record the transaction and reflect the value in determining its net asset value. When effecting such transactions, assets of an amount sufficient to make payment for the portfolio securities to be purchased will be segregated on the Fund’s records on the trade date. Securities purchased on a when-issued or delayed delivery basis do not earn interest until the settlement date.
Dividends: Net investment income of the Fund is declared daily as a dividend on shares for which the Fund has received payment. Dividends are paid monthly and are reinvested in additional shares of the Fund at net asset value per share at the close of business on the dividend payment date or, at the shareholder’s option, paid in cash. Net capital gains, to the extent available, will be distributed at least annually.
General: Securities transactions are accounted for on a trade date basis. Interest income is accrued as earned. Premiums and discounts on securities purchased are amortized to call dates or maturity dates of the respective securities. Realized gains and losses from the sale of securities are recorded on an identified cost basis. Net investment income, other than class specific expenses and realized and unrealized gains and losses, is allocated daily to each class of shares based upon the relative net asset value of outstanding shares (or the value of the dividend-eligible shares, as appropriate) of each class of shares at the beginning of the day (after adjusting for the current capital shares activity of the respective class). Expenses common to all funds are allocated among the funds comprising the
| Certified Annual Report | 11 |
NOTES TO FINANCIAL STATEMENTS, CONTINUED
| Thornburg Intermediate Municipal Fund | September 30, 2005 |
Trust based upon their relative net asset values or other appropriate allocation methods.
Guarantees and Indemnifications: Under the Trust’s organizational documents, its officers and Trustees are indemnified against certain liability arising out of the performance of their duties to the Fund. Additionally, in the normal course of business the Trust enters into contracts with service providers that contain general indemnification clauses. The Trust’s maximum exposure under these arrangements is unknown. However, based on experience, the Trust expects the risk of loss to be remote.
Use of Estimates: The preparation of financial statements, in conformity with generally accepted accounting principles, requires management to make estimates and assumptions that affect the reported amounts of assets and liabilities and the disclosure of contingent assets and liabilities at the date of the financial statements and the reported amounts of increases and decreases in net assets from operations during the reporting period. Actual results could differ from those estimates.
NOTE 3 – INVESTMENT ADVISORY FEE AND OTHER TRANSACTIONS WITH AFFILIATES
Pursuant to an investment advisory agreement, Thornburg Investment Management, Inc.® (the “Advisor”) serves as the investment advisor and performs services for which the fees are payable at the end of each month. For the year ended September 30, 2005, these fees were payable at annual rates ranging from .50 of 1% to .275 of 1% per annum of the average daily net assets of the Fund. The Fund also has an administrative services agreement with the Advisor, whereby the Advisor will perform certain administrative services for the shareholders of each class of the Fund’s shares, and for which fees will be payable at an annual rate of up to .125 of 1% per annum of the average daily net assets attributable to each class of shares. For the year ended September 30, 2005, the Advisor voluntarily reimbursed certain class specific expenses and administrative fees of $50,368 for Class A shares, $86,844 for Class C shares, and $42,472 for Class I shares.
The Trust has an underwriting agreement with Thornburg Securities Corporation® (the “Distributor”, an affiliate of the Advisor), which acts as the Distributor of the Fund shares. For the year ended September 30, 2005, the Distributor has advised the Fund that it earned net commissions aggregating $3,153 from the sale of Class A shares and collected contingent deferred sales charges aggregating $2,406 from redemptions of Class C shares of the Fund.
Pursuant to a service plan, under Rule 12b-1 of the Investment Company Act of 1940, the Fund may reimburse to the Advisor an amount not to exceed .25 of 1% per annum of the average daily net assets attributable to each class of shares of the Fund for payments made by the Advisor to securities dealers and other financial institutions to obtain various shareholder related services. The Advisor may pay out of its own resources additional expenses for distribution of the Fund’s shares.
The Trust has also adopted a distribution plan pursuant to Rule 12b-1, applicable only to the Fund’s Class C shares under which the Fund compensates the Distributor for services in promoting the sale of Class C shares of the Fund at an annual rate of up to .75% of the average daily net assets attributable to Class C shares. Total fees incurred by each class of shares of the Fund under their respective Service and Distribution Plans for the year ended September 30, 2005, are set forth in the Statement of Operations. Distribution fees in the amount of $225,215 were waived for Class C shares.
The Trust has an agreement with the custodian bank to indirectly pay a portion of the custodian’s fees through credits earned by the Fund’s cash on deposit with the bank. This deposit agreement is an alternative to overnight investments. Custodial fees have been adjusted to reflect amounts that would have been paid without this agreement, with a corresponding adjustment reflected as fees paid indirectly in the Statement of Operations. For the year ended September 30, 2005, fees paid indirectly were $17,170.
Certain officers and Trustees of the Trust are also officers and/or Directors of the Advisor and Distributor. The compensation of independent Trustees is borne by the Trust.
12 | Certified Annual Report |
NOTES TO FINANCIAL STATEMENTS, CONTINUED
| Thornburg Intermediate Municipal Fund | September 30, 2005 |
NOTE 4 – SHARES OF BENEFICIAL INTEREST
At September 30, 2005, there were an unlimited number of shares of beneficial interest authorized. Transactions in shares of beneficial interest were as follows:
| Year Ended September 30, 2005 | Year Ended September 30, 2004 | |||||||||||||
| Shares | Amount | Shares | Amount | |||||||||||
Class A Shares | ||||||||||||||
Shares sold | 3,998,362 | $ | 53,659,687 | 4,635,509 | $ | 62,513,224 | ||||||||
Shares issued to shareholders in reinvestment of dividends | 548,300 | 7,352,541 | 621,472 | 8,358,310 | ||||||||||
Shares repurchased | (4,780,870 | ) | (64,180,551 | ) | (6,560,558 | ) | (88,236,956 | ) | ||||||
Net Increase (Decrease) | (234,208 | ) | $ | (3,168,323 | ) | (1,303,577 | ) | $ | (17,365,422 | ) | ||||
Class C Shares | ||||||||||||||
Shares sold | 715,681 | $ | 9,615,224 | 946,921 | $ | 12,804,296 | ||||||||
Shares issued to shareholders in reinvestment of dividends | 93,895 | 1,260,710 | 111,651 | 1,503,248 | ||||||||||
Shares repurchased | (953,413 | ) | (12,800,402 | ) | (1,234,469 | ) | (16,575,105 | ) | ||||||
Net Increase (Decrease) | (143,837 | ) | $ | (1,924,468 | ) | (175,897 | ) | $ | (2,267,561 | ) | ||||
Class I Shares | ||||||||||||||
Shares sold | 2,292,723 | $ | 30,718,233 | 1,489,564 | $ | 19,943,017 | ||||||||
Shares issued to shareholders in, reinvestment of dividends | 64,408 | 862,041 | 46,460 | 623,829 | ||||||||||
Shares repurchased | (903,624 | ) | (12,096,287 | ) | (506,745 | ) | (6,808,852 | ) | ||||||
Net Increase (Decrease) | 1,453,507 | $ | 19,483,987 | 1,029,279 | $ | 13,757,994 | ||||||||
NOTE 5 – SECURITIES TRANSACTIONS
For the year ended September 30, 2005, the Fund had purchase and sale transactions of investment securities (excluding short-term investments) of $125,319,713 and $88,875,804, respectively.
NOTE 6 – INCOME TAXES
At September 30, 2005, information on the tax components of capital is as follows:
Cost of investments for tax purpose | $ | 448,491,820 | ||
Gross unrealized appreciation on a tax basis | $ | 19,904,515 | ||
Gross unrealized depreciation on a tax basis | (681,495 | ) | ||
Net unrealized appreciation (depreciation) | $ | 19,223,020 | ||
At September 30, 2005, the Fund did not have any undistributed tax-exempt/ordinary net income or undistributed capital gains.
At September 30, 2005, the Fund had tax basis capital losses, which may be carried over to offset future capital gains. To the extent such carry forwards are used, capital gain distributions may be reduced to the extent provided by regulations.
| Capital loss carryovers expiring in: | |||
| 2008 | $2,116,559 | ||
| 2009 | 2,374,508 | ||
| 2011 | 11,597 | ||
| 2012 | 4,297,982 | ||
| $ | 8,800,646 | ||
The Fund utilized $680,909 of its capital loss carry forward during the year ended September 30, 2005.
In order to account for book/tax differences, the Fund decreased accumulated net realized loss by $538 and increased over-distributed net investment income by $538. Reclassifications result primarily from market discount.
All dividends paid by the Fund for the year ended September 30, 2005 and September 30, 2004 represent tax exempt interest dividends, which are excludable by shareholders from gross income for Federal income tax purposes.
| Certified Annual Report | 13 |
FINANCIAL HIGHLIGHTS
| Thornburg Intermediate Municipal Fund |
| Year Ended September 30, | ||||||||||||||||||||
| 2005 | 2004 | 2003 | 2002 | 2001 | ||||||||||||||||
Class I Shares: | ||||||||||||||||||||
PER SHARE PERFORMANCE | ||||||||||||||||||||
(for a share outstanding throughout the year) | ||||||||||||||||||||
Net asset value, beginning of year | $ | 13.46 | $ | 13.54 | $ | 13.65 | $ | 13.26 | $ | 12.76 | ||||||||||
Income from investment operations: | ||||||||||||||||||||
Net investment income | 0.53 | 0.56 | 0.57 | 0.61 | 0.65 | |||||||||||||||
Net realized and unrealized gain (loss) on investments | (0.15 | ) | (0.08 | ) | (0.11 | ) | 0.39 | 0.50 | ||||||||||||
Total from investment operations | 0.38 | 0.48 | 0.46 | 1.00 | 1.15 | |||||||||||||||
Less dividends from: | ||||||||||||||||||||
Net investment income | (0.53 | ) | (0.56 | ) | (0.57 | ) | (0.61 | ) | (0.65 | ) | ||||||||||
Change in net asset value | (0.15 | ) | (0.08 | ) | (0.11 | ) | 0.39 | 0.50 | ||||||||||||
NET ASSET VALUE, end of year | $ | 13.31 | $ | 13.46 | $ | 13.54 | $ | 13.65 | $ | 13.26 | ||||||||||
RATIOS/SUPPLEMENTAL DATA | ||||||||||||||||||||
Total return | 2.90 | % | 3.61 | % | 3.49 | % | 7.75 | % | 9.23 | % | ||||||||||
Ratios to average net assets: | ||||||||||||||||||||
Net investment income | 3.98 | % | 4.12 | % | 4.23 | % | 4.57 | % | 4.99 | % | ||||||||||
Expenses, after expense reductions | 0.67 | % | 0.67 | % | 0.62 | % | 0.58 | % | 0.55 | % | ||||||||||
Expenses, after expense reductions | 0.67 | % | 0.67 | % | 0.62 | % | 0.58 | % | — | |||||||||||
Expenses, before expense reductions | 0.77 | % | 0.75 | % | 0.80 | % | 0.79 | % | 0.79 | % | ||||||||||
Portfolio turnover rate | 20.06 | % | 11.81 | % | 15.13 | % | 16.36 | % | 18.24 | % | ||||||||||
Net assets at end of year (000) | $ | 52,037 | $ | 33,079 | $ | 19,333 | $ | 18,330 | $ | 17,258 | ||||||||||
14 | Certified Annual Report |
| SCHEDULE OF INVESTMENTS | ||
| Thornburg Intermediate Municipal Fund | September 30, 2005 | |
CUSIPS: CLASS A - 885-215-202, CLASS C - 885-215-780, CLASS I - 885-215-673
NASDAQ SYMBOLS: CLASS A - THIMX, CLASS C - THMCX, CLASS I - THMIX
Issuer-Description | Credit Rating† Moody’s/S&P | Principal Amount | Value | |||||
ALABAMA — 1.33% | ||||||||
Alabama Docks Revenue, 6.00% due 10/1/2008 (Insured: MBIA) | Aaa/AAA | $ | 800,000 | $ | 864,120 | |||
Birmingham Carraway Alabama Special, 6.25% due 8/15/2009 (Insured: Connie Lee) | NR/AAA | 2,000,000 | 2,119,980 | |||||
East Alabama Health Care Authority Tax Anticipation Series A, 4.00% due 9/1/2006 (Insured: MBIA) | Aaa/AAA | 1,515,000 | 1,528,014 | |||||
Lauderdale County & Florence Health Group Series A, 5.75% due 7/1/2013 (Insured: MBIA) | Aaa/AAA | 1,600,000 | 1,737,168 | |||||
ALASKA — 0.91% | ||||||||
Alaska Energy Authority Power Revenue Refunding Bradley Lake Fourth Series, | Aaa/AAA | 955,000 | 1,075,721 | |||||
Alaska Municipal Bond Bank Series A, 5.00% due 10/1/2017 (Insured: FGIC) | Aaa/AAA | 2,470,000 | 2,651,545 | |||||
Anchorage School Refunding, 6.00% due 10/1/2012 (Insured: FGIC) | Aaa/AAA | 500,000 | 564,030 | |||||
ARIZONA — 2.07% | ||||||||
Mohave County Industrial Development Authority Prison Project Series A, | NR/AAA | 4,200,000 | 4,516,386 | |||||
Phoenix Street & Highway User Revenue, 6.50% due 7/1/2009 (ETM) | Aa3/AAA | 1,000,000 | 1,081,530 | |||||
Pima County Industrial Development Authority Series C, 6.70% due 7/1/2021 (Arizona Charter Schools Project) | Baa3/NR | 2,715,000 | 2,876,244 | |||||
Tucson GO Series D, 9.75% due 7/1/2012 (ETM) | NR/AA | 400,000 | 543,764 | |||||
Tucson GO Series D, 9.75% due 7/1/2013 (ETM) | NR/AA | 500,000 | 699,045 | |||||
ARKANSAS — 0.54% | ||||||||
Jefferson County Hospital Revenue Refunding & Improvement, 5.75% due 6/1/2012 (Regional Medical Center Project) | NR/A | 1,135,000 | 1,241,111 | |||||
Jefferson County Hospital Revenue Refunding & Improvement, 5.75% due 6/1/2013 (Regional Medical Center Project) | NR/A | 1,200,000 | 1,304,112 | |||||
CALIFORNIA — 4.00% | ||||||||
California Department of Water Resources Power Series A, 5.75% due 5/1/2017 | A2/BBB+ | 3,000,000 | 3,333,540 | |||||
California Housing Finance Authority Revenue Series 1985-B, 9.875% due 2/1/2017 | Aa2/AA- | 675,000 | 687,278 | |||||
California State Economic Recovery Series C-3, 2.77% due 7/1/2023 put 10/3/2005 (Guaranty: Landesbank) (daily demand notes) | VMIG1/A-1+ | 1,400,000 | 1,400,000 | |||||
California Statewide Community Development Authority COP, 5.50% due 10/1/2007 (Unihealth America Project) (ETM) (b) | Aaa/AAA | 4,500,000 | 4,722,480 | |||||
Camino Hospital District Revenue Series A, 6.25% due 8/15/2017 (ETM) | Aaa/AAA | 1,000,000 | 1,165,510 | |||||
East Palo Alto Public Financing Series A, 5.00% due 10/1/2017 (University Circle Gateway 101 Project) (Insured: RADIAN) | NR/AA | 770,000 | 824,970 | |||||
Escondido Joint Powers Financing Authority Lease Revenue, 0% due 9/1/2007 (Center for the Arts Project; Insured: AMBAC) | Aaa/AAA | 1,740,000 | 1,602,279 | |||||
Golden West Schools Financing Authority Capital Appreciation, 0% due 8/1/2018 (Insured: MBIA) | Aaa/AAA | 2,140,000 | 1,091,058 | |||||
Los Angeles County Multi Family Variable Rate 1984 Issue A, 2.48% due 7/1/2014 put 10/7/2005 (weekly demand notes) | NR/NR | 500,000 | 500,000 | |||||
Metropolitan Water District Series B-3, 2.77% due 7/1/2035 put 10/3/2005 (daily demand notes) | VMIG1/A-1+ | 1,400,000 | 1,400,000 | |||||
San Diego County Water Authority Revenue & Refunding Series 1993-A, 8.79% due 4/25/2007 (Insured: FGIC) | Aaa/AAA | 500,000 | 541,820 | |||||
Stanton Multi Family Housing Revenue Bond Series 1997, 5.625% due 8/1/2029 put 8/1/2009 (Continental Gardens Project; Collateralized: FNMA) | NR/AAA | 1,460,000 | 1,528,605 | |||||
| Certified Annual Report | 15 |
SCHEDULE OF INVESTMENTS, CONTINUED
| Thornburg Intermediate Municipal Fund | September 30, 2005 |
Issuer-Description | Credit Rating† Moody’s/S&P | Principal Amount | Value | |||||
COLORADO — 5.93% | ||||||||
Adams County Communication Center Series A, 5.75% due 12/1/2016 | Baa1/NR | $ | 1,265,000 | $ | 1,341,014 | |||
Adams County Revenue Platte Valley Medical Center, 5.00% due 2/1/2014 (Insured: FHA) | NR/AAA | 1,455,000 | 1,567,573 | |||||
Adams County Revenue Platte Valley Medical Center, 5.00% due 8/1/2014 (Insured: FHA) | NR/AAA | 1,000,000 | 1,079,720 | |||||
Arvada Industrial Development Revenue, 5.25% due 12/1/2007 (Wanco Inc. Project; LOC: US Bank, N.A.) | NR/NR | 65,000 | 65,109 | |||||
Arvada Industrial Development Revenue, 5.60% due 12/1/2012 (Wanco Inc. Project; LOC: US Bank, N.A.) | NR/NR | 450,000 | 460,539 | |||||
Central Platte Valley Metropolitan District, 5.15% due 12/1/2013 pre-refunded 12/1/2009 | NR/AAA | 1,000,000 | 1,083,160 | |||||
Central Platte Valley Metropolitan District Refunding Series A, 5.00% due 12/1/2031 put 12/1/2009 (LOC: US Bank) | NR/A-1 | 4,000,000 | 4,203,280 | |||||
Colorado Educational & Cultural Facilities Refunding, 6.00% due 4/1/2021 (Charter School Cherry Creek Project) | Baa2/NR | 500,000 | 527,725 | |||||
Colorado Educational & Cultural Facilities Refunding & Improvement, 5.25% due 8/15/2019 (Charter School Project; Insured: XLCA) | Aaa/AAA | 1,475,000 | 1,588,678 | |||||
Colorado Housing Finance Authority Single Family Program Subordinated Series C, 5.75% due 10/1/2007 | A1/A+ | 15,000 | 15,154 | |||||
Colorado Student Obligation Bond Student Loan Senior Subordinated Series B, 6.20% due 12/1/2008 | A2/NR | 1,570,000 | 1,604,870 | |||||
Denver City & County COP Series B, 5.00% due 12/1/2011 | Aa2/AA | 2,465,000 | 2,654,978 | |||||
El Paso County School District 11, 7.10% due 12/1/2013 | Aa3/AA- | 500,000 | 617,130 | |||||
Glendale COP, 5.40% due 8/15/2008 (Education Center Project) | NR/BBB | 675,000 | 675,925 | |||||
Interstate South Metropolitan District Refunding, 6.00% due 12/1/2020 (LOC: BNP Paribas) (b) | NR/AA | 2,395,000 | 2,402,161 | |||||
Larimer County GO, 8.45% due 12/15/2005 (Poudre School District Project) | Aa3/NR | 2,830,000 | 2,862,262 | |||||
Northwest Parkway Public Highway Authority Capital Appreciation Senior Convertible C, 0% due 6/15/2014 (Insured: FSA) | Aaa/AAA | 1,005,000 | 834,160 | |||||
Plaza Metropolitan District 1 Colorado Revenue Public Improvement Fee/Tax Increment, 7.70% due 12/1/2017 | NR/NR | 2,500,000 | 2,766,525 | |||||
Southlands Metropolitan District Number 1 GO, 7.00% due 12/1/2024 | NR/NR | 1,370,000 | 1,499,780 | |||||
Thornton County SFMR Series 1992-A, 8.05% due 8/1/2009 | A2/NR | 25,000 | 25,016 | |||||
CONNECTICUT — 0.11% | ||||||||
Eastern Resource Recovery Authority Series A, 5.25% due 1/1/2006 (Wheelabrator Lisbon Project) | NR/BBB | 500,000 | 500,740 | |||||
DELAWARE — 0.34% | �� | |||||||
Delaware State Health Facilities Authority Revenue Series A, 5.25% due 5/1/2016 (Nanticoke Memorial Hospital Project; Insured: Radian) | NR/AA | 1,500,000 | 1,580,040 | |||||
DISTRICT OF COLUMBIA — 0.88% | ||||||||
District of Columbia Hospital Revenue, 5.375% due 8/15/2015 (ETM) | Aaa/AAA | 600,000 | 633,720 | |||||
District of Columbia Refunding Series B, 6.00% due 6/1/2015 (Insured: MBIA) | Aaa/AAA | 3,000,000 | 3,498,780 | |||||
FLORIDA — 4.32% | ||||||||
Broward County Resource Recovery Revenue, 5.00% due 12/1/2007 | A3/AA | 1,500,000 | 1,554,585 | |||||
Deltona Utility Systems Revenue, 5.25% due 10/1/2015 (Insured: MBIA) | Aaa/AAA | 1,000,000 | 1,098,530 | |||||
Duval County Multi Family Housing Revenue Refunding, 5.90% due 9/1/2016 (St. Augustine Apartments Project) | NR/AA- | 1,000,000 | 1,024,110 | |||||
Enterprise Community Development District Assessment Bonds, 6.00% due 5/1/2010 (Insured: MBIA) | Aaa/AAA | 1,375,000 | 1,378,506 | |||||
Escambia County Health Facility Series C, 5.00% due 11/1/2028 pre-refunded 11/1/2010 (Charity Obligation Group Project) | Aaa/NR | 2,500,000 | 2,645,500 | |||||
16 | Certified Annual Report |
SCHEDULE OF INVESTMENTS, CONTINUED
| Thornburg Intermediate Municipal Fund | September 30, 2005 |
Issuer-Description | Credit Rating† Moody’s/S&P | Principal Amount | Value | |||||
Florida Board of Education Capital Outlay Refunding Public Education Series D, 5.75% due 6/1/2018 | Aa1/AAA | $ | 1,460,000 | $ | 1,610,730 | |||
Highlands County Health Facility Refunded Hospital Adventist Health A, 5.00% due 11/15/2019 (a) | A2/A+ | 1,100,000 | 1,152,492 | |||||
Jacksonville District Water & Sewer COP, 5.00% due 10/1/2020 pre-refunded 10/1/2008 | Aaa/AAA | 1,000,000 | 1,037,500 | |||||
Orange County School Board Series A, 6.00% due 8/1/2008 (Insured: MBIA) | Aaa/NR | 1,580,000 | 1,699,717 | |||||
Pasco County Housing Finance Authority MFHR, 5.50% due 6/1/2027 put 6/1/2008 (Cypress Trail Apartments Project; Guaranty:Axa Reinsurance) | NR/AA- | 2,000,000 | 2,024,480 | |||||
Port Everglades Authority Port Improvement Revenue Refunding Series A, 5.00% due 9/1/2016 (Insured: FSA) | Aaa/AAA | 3,635,000 | 3,651,103 | |||||
Sarasota County Public Hospital Series A, 2.95% due 7/1/2037 put 10/3/2005 (Sarosota Memorial Hospital Project; Insured: AMBAC) (daily demand notes) | VMIG1/NR | 400,000 | 400,000 | |||||
Turtle Run Community Development District Refunding Water Management Benefit Special Assessment, 5.00% due 5/1/2011 (Insured: MBIA) | Aaa/AAA | 1,000,000 | 1,057,900 | |||||
GEORGIA — 0.06% | ||||||||
Georgia Municipal Electric Authority Power Revenue Unrefunded Balance 2005 Series Y, 10.00% due 1/1/2010 | A1/A+ | 230,000 | 288,471 | |||||
HAWAII — 0.50% | ||||||||
Hawaii Department of Budget & Finance, 6.40% due 7/1/2013 (Insured: MBIA) | Aaa/AAA | 2,000,000 | 2,344,740 | |||||
IDAHO — 0.43% | ||||||||
Boise City Idaho Industrial Development Corp. Western Trailer Co. Project, 5.00% due 5/15/2020 (LOC: Wells Fargo) | Aaa/NR | 2,000,000 | 2,021,600 | |||||
ILLINOIS — 9.92% | ||||||||
Champaign County Community Unit Series C, 0% due 1/1/2011 pre-refunded 1/1/2010 | Aaa/AAA | 800,000 | 652,656 | |||||
Chicago Housing Authority Capital, 5.00% due 7/1/2008 | Aa3/AA | 3,020,000 | 3,140,951 | |||||
Chicago Midway Airport Revenue Refunding Second Lien Series A, 5.00% due 1/1/2019 (Insured: AMBAC) | Aaa/AAA | 1,210,000 | 1,261,812 | |||||
Chicago Tax Increment Allocation Lincoln Belmont A, 5.30% due 1/1/2014 (Insured: ACA) | NR/A | 2,285,000 | 2,370,093 | |||||
Chicago Wastewater Transmission Revenue Refunding Second Lien, 5.50% due 1/1/2013 (Insured: MBIA) | Aaa/AAA | 650,000 | 722,917 | |||||
Cook County Capital Improvement, 5.50% due 11/15/2008 (Insured: FGIC) | Aaa/AAA | 500,000 | 518,400 | |||||
Cook County School District Class A, 0% due 12/1/2022 | NR/NR | 2,000,000 | 829,800 | |||||
Du Page County School District Capital Appreciation, 0% due 2/1/2010 (Insured: FGIC) | Aaa/NR | 655,000 | 561,184 | |||||
Freeport Illinois GO, 5.375% due 1/1/2018 (Insured: MBIA) | Aaa/AAA | 1,500,000 | 1,636,530 | |||||
Illinois Development Finance Authority Revenue, 6.00% due 11/15/2012 (Insured: MBIA) | Aaa/AAA | 2,860,000 | 3,200,740 | |||||
Illinois Development Finance Authority Revenue Refunding Community Rehab Providers A, 5.90% due 7/1/2009 | NR/BBB | 820,000 | 846,437 | |||||
Illinois Development Financing Authority Debt Restructuring Revenue Series 1994, 7.25% due 11/15/2009 (East St. Louis Project) | NR/A | 820,000 | 839,090 | |||||
Illinois Educational Facilities Authority Revenues Adjusted, 4.75% due 11/1/2036 put 11/1/2016 (Field Museum Project) | A2/A | 1,160,000 | 1,187,086 | |||||
Illinois Educational Facilities Authority Revenues Capital Appreciation, 0% due 7/1/2014 pre-refunded 7/1/2009 | Aaa/AAA | 475,000 | 234,294 | |||||
Illinois Educational Facilities Authority Revenues Loyola University A, 6.00% due 7/1/2012 (Insured: MBIA) (ETM) | Aaa/AAA | 230,000 | 262,370 | |||||
Illinois Educational Facilities Authority Revenues Midwestern University B, 5.50% due 5/15/2018 (Insured: ACA) | NR/A | 1,500,000 | 1,550,760 | |||||
Illinois Educational Facilities Authority Revenues Unrefunded Balance Loyola A, 5.00% due 7/1/2006 (Insured: MBIA) | Aaa/AAA | 1,540,000 | 1,562,684 | |||||
| Certified Annual Report | 17 |
SCHEDULE OF INVESTMENTS, CONTINUED
| Thornburg Intermediate Municipal Fund | September 30, 2005 |
Issuer-Description | Credit Rating† Moody’s/S&P | Principal Amount | Value | |||||
Illinois Educational Facilities Authority Revenues Unrefunded Balance Loyola A, | Aaa/AAA | $ | 770,000 | $ | 868,190 | |||
Illinois Educational Facilities Authority Revenues Unrefunded Balance Loyola A, | Aaa/AAA | 1,080,000 | 1,223,705 | |||||
Illinois Health Facilities Authority Revenue, 5.50% due 10/1/2009 | A2/A | 1,055,000 | 1,123,638 | |||||
Illinois Health Facilities Authority Revenue, 5.70% due 2/20/2021 | Aaa/ NR | 990,000 | 1,066,854 | |||||
Illinois Health Facilities Authority Revenue Healthcare Systems, 6.25% due 11/15/2019 pre-refunded 11/15/2009 (OSF Healthcare Project) | A2/A | 1,250,000 | 1,343,313 | |||||
Illinois Health Facilities Authority Revenue Series A, 5.75% due 8/15/2013 pre-refunded 8/15/2009 Children’s Memorial Hospital Project) | Aaa/AAA | 1,900,000 | 2,086,865 | |||||
Illinois University Revenues, 5.25% due 1/15/2018 | Aaa/AAA | 1,205,000 | 1,312,992 | |||||
Jackson & Williamson Counties, Illinois, 7.50% due 12/1/2009 (Insured: AMBAC) | Aaa/AAA | 680,000 | 787,338 | |||||
Marion Refunding, 5.00% due 9/15/2012 (Insured: FGIC) | Aaa/AAA | 755,000 | 816,812 | |||||
McHenry County School District Woodstock GO, 6.80% due 1/1/2006 (Insured: FSA) | Aaa/AAA | 710,000 | 716,873 | |||||
Melrose Park Tax Increment Series B, 6.50% due 12/15/2015 (Insured: FSA) | Aaa/AAA | 1,015,000 | 1,162,408 | |||||
Sangamon County Property Tax Lease Receipts, 7.45% due 11/15/2006 | Aa3/NR | 560,000 | 575,557 | |||||
Sangamon County School District Series A, 5.875% due 8/15/2018 | NR/A | 2,400,000 | 2,585,784 | |||||
Sherman Revenue Refunding Mortgage, 6.10% due 10/1/2014 (Collateralized: GNMA) | NR/AAA | 1,170,000 | 1,261,038 | |||||
Sherman Revenue Refunding Mortgage, 6.20% due 10/1/2019 (Collateralized: GNMA) | NR/AAA | 1,600,000 | 1,723,328 | |||||
Southern Illinois University Revenues, 0% due 4/1/2014 (Insured: MBIA) | Aaa/AAA | 1,425,000 | 1,002,416 | |||||
University of Illinois Revenue Capital Appreciation, 0% due 4/1/2014 (Insured: MBIA) | Aaa/AAA | 1,590,000 | 1,119,424 | |||||
West Chicago Industrial Development Revenue, 6.90% due 9/1/2024 | NR/A+ | 1,000,000 | 1,012,810 | |||||
Will & Kendall Counties Community Series B, 5.125% due 1/1/2014 (Insured: FSA) | Aaa/AAA | 1,000,000 | 1,073,820 | |||||
Will County Community School 365-U Capital Appreciation, 0% due 11/1/2011 | Aaa/AAA | 3,000,000 | 2,390,460 | |||||
INDIANA — 7.46% | ||||||||
Allen County Economic Development, 5.80% due 12/30/2012 | NR/NR | 895,000 | 942,721 | |||||
Allen County Economic Development, 5.75% due 12/30/2015 | NR/NR | 1,355,000 | 1,464,132 | |||||
Allen County Jail Building Corp. GO, 5.00% due 4/1/2018 (Insured: XLCA) | Aaa/AAA | 2,495,000 | 2,665,284 | |||||
Allen County Redevelopment District Tax Series A, 5.00% due 11/15/2018 | A3/NR | 1,560,000 | 1,644,380 | |||||
Allen County War Memorial Series A, 5.25% due 11/1/2013 (Insured: AMBAC) | Aaa/NR | 1,000,000 | 1,083,780 | |||||
Boone County Hospital Association, 5.625% due 1/15/2015 pre-refunded 7/15/2011 | Aaa/AAA | 1,000,000 | 1,110,860 | |||||
Brownsburg 1999 School Building, 5.00% due 2/1/2010 (Insured: FSA) | Aaa/AAA | 1,260,000 | 1,341,887 | |||||
Dyer Redevelopment Authority, 6.40% due 7/15/2015 pre-refunded 7/15/2009 | NR/A- | 1,515,000 | 1,697,088 | |||||
Dyer Redevelopment Authority, 6.50% due 7/15/2016 pre-refunded 7/15/2009 | NR/A- | 1,910,000 | 2,146,324 | |||||
East Chicago Elementary School Building First Mortgage Series A, 6.25% due 7/5/2008 (State Aid Withholding) | NR/A | 350,000 | 371,094 | |||||
Fishers Redevelopment Authority, 5.25% due 2/1/2018 (Insured: XLCA) | Aaa/AAA | 1,500,000 | 1,646,715 | |||||
Fishers Redevelopment Authority, 5.25% due 2/1/2020 (Insured: XLCA) | Aaa/AAA | 1,025,000 | 1,118,931 | |||||
Gary Building Corp.- Lake County First Mortgage Series 1994-B, 8.25% due 7/1/2010 (Sears Building Project) | NR/NR | 865,000 | 882,387 | |||||
Goshen Chandler School Building Capital Appreciation Refunding, 0% due 1/15/2011 (Insured: MBIA) | Aaa/AAA | 1,020,000 | 837,818 | |||||
Hamilton Southeastern Indiana, 6.25% due 7/15/2006 | Aaa/AAA | 1,340,000 | 1,375,202 | |||||
18 | Certified Annual Report |
SCHEDULE OF INVESTMENTS, CONTINUED
| Thornburg Intermediate Municipal Fund | September 30, 2005 |
Issuer-Description | Credit Rating† | Principal Amount | Value | |||||
Huntington Economic Development Revenue, 6.40% due 5/1/2015 (United Methodist Memorial Project) | NR/NR | $ | 1,000,000 | $ | 1,051,180 | |||
Indiana Bond Bank Special Program Hendrick’s Redevelopment Series B, 6.20% due 2/1/2023 pre-refunded 2/1/2007 | NR/NR | 1,500,000 | 1,590,960 | |||||
Indiana Health Facility Hospital Revenue, 5.75% due 9/1/2015 (ETM) | NR/AA- | 575,000 | 588,518 | |||||
Indiana Health Facility Hospital Revenue, 5.40% due 2/15/2016 (Clarian Health Obligation Group Project; Insured: MBIA) | Aaa/AAA | 1,000,000 | 1,086,840 | |||||
Indiana State Educational Facilities Authority Revenue, 5.65% due 10/1/2015 (University of Indianapolis Project) | NR/A- | 1,065,000 | 1,142,575 | |||||
Indiana State Educational Facilities Authority Revenue, 5.70% due 10/1/2016 (University of Indianapolis Project) | NR/A- | 1,025,000 | 1,101,547 | |||||
Indianapolis Economic Development Revenue, 5.50% due 6/1/2014 pre-refunded 6/1/2009 | Aa3/NR | 500,000 | 543,165 | |||||
Indianapolis Local Public Improvement Bond Bank, 0% due 7/1/2009 (ETM) | Aa2/AA- | 740,000 | 651,333 | |||||
Portage Township Multi School Building, 5.50% due 7/15/2015 (Insured: FGIC) | Aaa/AAA | 500,000 | 553,270 | |||||
Rockport Pollution Control Revenue Series A, 4.90% due 6/1/2025 put 6/1/2007 (Indiana Michigan Power Co. Project) | Baa2/BBB | 3,165,000 | 3,234,598 | |||||
Wawasee Community School Corp. First Mortgage, 5.50% due 7/15/2012 pre-refunded 1/15/2012 | NR/AA- | 1,200,000 | 1,328,376 | |||||
West Clark School Building Corp. First Mortgage, 5.75% due 7/15/2017 (Insured: FGIC) | Aaa/AAA | 1,685,000 | 1,895,002 | |||||
IOWA — 1.47% | ||||||||
Iowa Finance Authority Health Care Facilities, 6.00% due 7/1/2013 (Genesis Medical Center Project) | A1/NR | 1,000,000 | 1,080,770 | |||||
Iowa Finance Authority Hospital Facility Revenue, 6.00% due 7/1/2012 (Trinity Regional Hospital Project; Insured: FSA) | Aaa/AAA | 1,000,000 | 1,116,780 | |||||
Iowa Finance Authority Hospital Facility Revenue, 6.75% due 2/15/2016 pre-refunded 2/15/2010 | A1/NR | 1,000,000 | 1,145,890 | |||||
Iowa Finance Authority Revenue, 6.00% due 12/1/2018 (Catholic Health Initiatives Project) | Aa2/AA | 2,000,000 | 2,194,300 | |||||
Iowa Finance Authority Revenue Refunding Trinity Health Series B, 5.75% due 12/1/2015 | Aa3/AA- | 1,250,000 | 1,360,137 | |||||
KANSAS — 0.99% | ||||||||
Wichita Hospital Revenue Refunding Improvement Series XI, 6.75% due 11/15/2019 (Christi Health System Project) | NR/A+ | 4,200,000 | 4,648,644 | |||||
KENTUCKY — 1.10% | ||||||||
Kentucky Economic Development Finance Authority Series C, 5.85% due 10/1/2015 (Norton Healthcare Project; Insured: MBIA) | Aaa/AAA | 4,000,000 | 4,479,960 | |||||
Wilmore Housing Facilities Revenue, 5.55% due 7/1/2013 (LOC: Allied Irish Bank PLC) | NR/NR | 665,000 | 695,756 | |||||
LOUISIANA — 2.25% | ||||||||
Jefferson Sales Tax District Revenue Series B, 5.50% due 12/1/2008 (Insured: AMBAC) | Aaa/AAA | 1,595,000 | 1,695,884 | |||||
Louisiana Local Govt. Environment Series A, 4.10% due 9/1/2007 (Housing Bellemont Apts. Project) | Baa1/NR | 340,000 | 341,737 | |||||
Louisiana State Offshore Terminal Refunding Series D, 4.00% due 9/1/2023 put 9/1/2008 (Loop LLC Project) | A3/A | 3,250,000 | 3,254,095 | |||||
Morehouse Parish Pollution Revenue Refunding Series A, 5.25% due 11/15/2013 (International Paper Co. Project) | Baa2/BBB | 3,000,000 | 3,196,710 | |||||
New Orleans Sewer Service Revenue, 5.50% due 6/1/2017 (Insured: FGIC) | Aaa/AAA | 1,000,000 | 1,059,720 | |||||
Orleans Levee District Trust Receipts Series A, 5.95% due 11/1/2007 (Insured: FSA) | Aaa/AAA | 1,000,000 | 1,034,250 | |||||
MAINE — 0.23% | ||||||||
Jay Solid Waste Disposal Revenue Series B, 6.20% due 9/1/2019 (International Paper Co. Project) | Baa2/BBB | 1,000,000 | 1,077,480 | |||||
| Certified Annual Report | 19 |
SCHEDULE OF INVESTMENTS, CONTINUED
| Thornburg Intermediate Municipal Fund | September 30, 2005 |
Issuer-Description | Credit Rating† | Principal Amount | Value | |||||
MASSACHUSETTS — 0.44% | ||||||||
Massachusetts HFA AMT Housing Development Series A, 5.05% due 6/1/2010 (Insured: MBIA) | Aaa/AAA | $ | 935,000 | $ | 948,380 | |||
Massachusetts HFA Refunding Series A, 6.125% due 12/1/2011 pre-refunded 12/1/2006 | Aaa/AAA | 150,000 | 157,470 | |||||
Massachusetts HFA Unrefunded Refunding Series A, 6.125% due 12/1/2011 (Insured: MBIA) | Aaa/AAA | 950,000 | 953,078 | |||||
MICHIGAN — 1.27% | ||||||||
Kalamazoo Hospital Finance Authority Revenue Series 1994-A, 6.25% due 6/1/2014 (Borgess Medical Center Project) (ETM) | Aaa/AAA | 650,000 | 764,705 | |||||
Kent Hospital Finance Authority Michigan Hospital, 7.25% due 1/15/2013 (Insured: MBIA) | Aaa/AAA | 1,000,000 | 1,162,340 | |||||
Michigan State Building Authority Revenue Refunding Facilities Program Series I, 5.25% due 10/15/2017 (Insured: FSA) | Aaa/AAA | 2,450,000 | 2,681,697 | |||||
Southfield Economic Development Corp. Refunding Revenue N.W. 12 Limited Partnership, 7.25% due 12/1/2010 | NR/NR | 1,355,000 | 1,355,081 | |||||
MINNESOTA — 0.39% | ||||||||
Minneapolis St. Paul Health, 6.00% due 12/1/2018 (Healthpartners Obligation Group Project) | Baa1/BBB+ | 1,000,000 | 1,105,120 | |||||
Southern Minnesota Municipal Power Agency Supply, Series A, 5.75% due 1/1/2018 pre-refunded to various dates (Insured: MBIA) | Aaa/AAA | 700,000 | 744,219 | |||||
MISSISSIPPI — 0.32% | ||||||||
Mississippi Higher Educational Authority Series C, 7.50% due 9/1/2009 | A2/NR | 1,500,000 | 1,503,495 | |||||
MISSOURI — 0.94% | ||||||||
Missouri Development Finance Board Healthcare Series A, 5.40% due 11/1/2018 (Lutheran Home Aged Project; LOC: Commerce Bank) | Aa3/NR | 2,025,000 | 2,099,621 | |||||
Missouri State Health & Education Facility Revenue, 2.25% due 6/1/2031 put 10/3/2005 (daily demand notes) | Aaa/AAA | 1,000,000 | 1,000,000 | |||||
Platte County COP, 4.00% due 9/1/2006 | NR/AA- | 1,310,000 | 1,321,974 | |||||
NEBRASKA — 0.19% | ||||||||
Madison County Hospital Authority 1 Hospital Revenue, 5.50% due 7/1/2014 (Faith Regional Health Services Project; Insured: Radian) | NR/AA | 845,000 | 906,719 | |||||
NEVADA — 1.38% | ||||||||
Clark County Pollution Control Revenue Series B, 6.60% due 6/1/2019 (Nevada Power Co. Project; Insured: FGIC) | Aaa/AAA | 640,000 | 646,106 | |||||
Las Vegas Special Improvement District Refunding Senior Local Improvement Series A, 5.375% due 6/1/2013 (Insured: FSA) | Aaa/AAA | 1,175,000 | 1,253,513 | |||||
Washoe County Capital Appreciation Reno Sparks Series B, 0% due 7/1/2011 (Insured: FSA) | Aaa/AAA | 2,600,000 | 2,094,924 | |||||
Washoe County School District Refunding Series B, 5.00% due 6/1/2010 (Insured: FGIC) | Aaa/AAA | 2,350,000 | 2,515,699 | |||||
NEW HAMPSHIRE — 1.32% | ||||||||
Manchester Housing & Redevelopment Authority Capital Appreciation Series B, 0% due 1/1/2016 (Insured: Radian) | NR/A | 4,990,000 | 3,020,148 | |||||
New Hampshire Pollution Refunding Central Maine Power Co., 5.375% due 5/1/2014 | A3/BBB+ | 3,000,000 | 3,190,170 | |||||
NEW JERSEY — 1.00% | ||||||||
New Jersey Economic Development Authority School Facilities Construction Series O, 5.00% due 3/1/2019 (a) | A1/AA- | 1,280,000 | 1,353,830 | |||||
20 | Certified Annual Report |
SCHEDULE OF INVESTMENTS, CONTINUED
| Thornburg Intermediate Municipal Fund | September 30, 2005 |
Issuer-Description | Credit Rating† | Principal Amount | Value | |||||
New Jersey EDA Refunding Revenue, 7.50% due 12/1/2019 (Spectrum for Living Development Project; LOC: PNC Bank) | A3/A | $ | 240,000 | $ | 240,826 | |||
New Jersey State Transit Corp., 5.00% due 10/1/2009 (Insured: FSA) | Aaa/AAA | 1,700,000 | 1,802,952 | |||||
New Jersey State Transit Corp. Federal Transportation Administration Grants Series B, 5.50% due 9/15/2010 (Insured: AMBAC) | Aaa/AAA | 1,200,000 | 1,311,096 | |||||
NEW MEXICO — 1.36% | ||||||||
Albuquerque Airport Revenue Refunding, 5.00% due 7/1/2008 (Insured: AMBAC) | Aaa/AAA | 2,380,000 | 2,484,887 | |||||
New Mexico Finance Authority State Transportation Refunding Subordinated Lien Series C-3, 2.50% due 6/15/2024 put 10/7/2005 (weekly demand notes) | Aaa/AAA | 1,800,000 | 1,800,000 | |||||
University of New Mexico Hospital Mortgage Revenue Bonds, 5.00% due 1/1/2018 (Insured: FSA & FHA) | Aaa/AAA | 2,000,000 | 2,119,060 | |||||
NEW YORK — 3.98% | ||||||||
Long Island Power Authority General Series B, 5.00% due 12/1/2006 | A3/A- | 2,000,000 | 2,049,100 | |||||
Metro Transportation Authority New York Service Control Series B, 5.25% due 7/1/2006 | A2/AA- | 1,080,000 | 1,098,144 | |||||
Nassau Health Care Corp., 6.00% due 8/1/2011 pre-refunded 8/1/2009 | Aaa/AAA | 1,000,000 | 1,121,190 | |||||
New York City, 2.80% due 8/1/2017 put 10/3/2005 (LOC: JPM) (daily demand notes) | VMIG1/A-1+ | 1,100,000 | 1,100,000 | |||||
New York City Industrial Development Agency Series A, 5.00% due 6/1/2010 (Lycee Francais De New York Project; Insured: ACA) | NR/A | 1,175,000 | 1,235,618 | |||||
New York City Municipal Water Finance Authority, 2.80% due 6/15/2023 put 10/3/2005 (daily demand notes) | VMIG1/A-1+ | 500,000 | 500,000 | |||||
New York City Trust Cultural Resources, 5.75% due 7/1/2015 (Museum of American Folk Art Project; Insured: ACA) | NR/A | 875,000 | 938,044 | |||||
New York Housing Finance Service Series A, 6.375% due 9/15/2015 pre-refunded 9/15/2007 | A2/AAA | 220,000 | 233,757 | |||||
New York New York Sub Series A-8, 2.80% due 8/1/2018 put 10/3/2005 (daily demand notes) | VMIG1/A-1+ | 1,600,000 | 1,600,000 | |||||
New York Series E, 6.00% due 8/1/2008 pre-refunded 8/1/2006 | Aaa/AAA | 910,000 | 947,064 | |||||
New York Series E, 6.00% due 8/1/2008 pre-refunded 8/1/2006 (Insured: FGIC) | Aaa/AAA | 1,025,000 | 1,063,868 | |||||
New York State Dormitory Authority School Districts Financing Program Series E, 9.00% due 10/1/2007 (Insured: MBIA) | Aaa/AAA | 1,000,000 | 1,112,890 | |||||
New York State Thruway Authority General Revenue Series F, 5.00% due 1/1/2018 (Insured: AMBAC) | Aaa/AAA | 3,000,000 | 3,222,720 | |||||
Port Authority New York & New Jersey Special Obligation, 6.25% due 12/1/2011 (JFK International Air Terminal 6 Project; Insured: MBIA) | Aaa/AAA | 2,200,000 | 2,471,568 | |||||
NORTH CAROLINA — 0.56% | ||||||||
North Carolina Eastern Municipal Power Refunding Series A, 5.70% due 1/1/2013 (Insured: MBIA) | Aaa/AAA | 1,200,000 | 1,260,612 | |||||
North Carolina Housing Finance Agency Single Family Revenue Bond Series BB, 6.50% due 9/1/2026 | Aa2/AA | 1,360,000 | 1,388,832 | |||||
NORTH DAKOTA — 0.34% | ||||||||
Grand Forks Health Care System Revenue Bonds Series 1997, 6.25% due 8/15/2006 (Altra Health Systems Obligated Group Project; Insured: MBIA) | Aaa/AAA | 365,000 | 374,979 | |||||
North Dakota State Housing Finance Agency Refunding Housing Finance Program Home Mortgage Series A, 5.70% due 7/1/2030 | Aa1/NR | 1,210,000 | 1,230,800 | |||||
OHIO — 3.78% | ||||||||
Butler County Transportation Improvement, 6.00% due 4/1/2010 (Insured: FSA) | Aaa/AAA | 1,000,000 | 1,083,280 | |||||
Central Ohio Solid Waste Authority Series B, 5.00% due 12/1/2008 | Aa2/AA+ | 2,530,000 | 2,662,446 | |||||
Cleveland Cuyahoga County Development Bond Fund A, 6.25% due 5/15/2016 (LOC: FifthThird Bank) | NR/NR | 1,485,000 | 1,552,924 | |||||
| Certified Annual Report | 21 |
SCHEDULE OF INVESTMENTS, CONTINUED
| Thornburg Intermediate Municipal Fund | September 30, 2005 |
Issuer-Description | Credit Rating† Moody’s/S&P | Principal Amount | Value | |||||
Cuyahoga County Hospital Revenue Refunding, 5.50% due 1/15/2019 (University Health Systems Project B; Insured: MBIA) | Aaa/AAA | $ | 3,545,000 | $ | 3,638,446 | |||
Franklin County Health Care Revenue Series 1995-A, 6.00% due 11/1/2010 (Heinzerling Foundation Project; LOC: Banc One) | Aa2/NR | 1,100,000 | 1,123,969 | |||||
Franklin County Hospital, 5.80% due 12/1/2005 (Doctors Project) (ETM) | NR/NR | 500,000 | 502,495 | |||||
Hamilton Wastewater Systems Revenue Refunding, 5.25% due 10/1/2017 (Insured: FSA) | Aaa/AAA | 1,500,000 | 1,662,465 | |||||
Marysville School District COP, 5.25% due 12/1/2017 (School Facilities Project; Insured: MBIA) | Aaa/AAA | 2,000,000 | 2,203,800 | |||||
North Ridgeville Economic Development, 0% due 2/1/2015 (Collateralized: FHA) | NR/A | 475,000 | 220,918 | |||||
Ohio State Higher Educational Facility Revenue, 5.05% due 7/1/2037 put 7/1/2016 (Kenyon College Project) | A2/A | 2,200,000 | 2,330,988 | |||||
Reynoldsburg Health Care Facilities Revenue Bonds Series 1997, 5.70% due 10/20/2012 (Collateralized: GNMA) | Aa3/NR | 760,000 | 802,689 | |||||
OKLAHOMA — 3.34% | ||||||||
Alva Hospital Authority Hospital Revenue Sales Tax, 5.25% due 6/1/2025 | Aa3/AA | 1,505,000 | 1,587,775 | |||||
Oklahoma City Municipal Improvement Authority, 0% due 7/1/2008 (Insured: AMBAC) | Aaa/AAA | 1,020,000 | 934,391 | |||||
Oklahoma City Municipal Water & Sewer Capital Appreciation Series C, 0% due 7/1/2006 (Insured: AMBAC) | Aaa/AAA | 500,000 | 489,680 | |||||
Oklahoma City Municipal Water & Sewer Series C, 0% due 7/1/2011 (Insured: AMBAC) | Aaa/AAA | 1,125,000 | 910,564 | |||||
Oklahoma City Municipal Water & Sewer Series C, 0% due 7/1/2013 (Insured: AMBAC) | Aaa/AAA | 1,485,000 | 1,090,732 | |||||
Oklahoma Development Finance Authority Hospital Association Pooled Hospital A, 5.40% due 6/1/2013 (Insured: AMBAC) | Aaa/AAA | 825,000 | 900,884 | |||||
Oklahoma Industrial Authority Revenue Refunding, 6.00% due 8/15/2010 (Integris Baptist Project; Insured: AMBAC) | Aaa/AAA | 750,000 | 833,085 | |||||
Tulsa County Independent School District Combined Purpose, 4.50% due 8/1/2007 | Aa3/AA- | 2,800,000 | 2,874,228 | |||||
Tulsa Industrial Authority Hospital Revenue Refunding, 5.375% due 2/15/2017 (St. John Medical Center Project) | Aa3/AA | 4,000,000 | 4,065,520 | |||||
Tulsa Industrial Development Authority Hospital Revenue, 6.10% due 2/15/2009 pre-refunded 2/15/2006 (St. John Medical Center Project) | Aa3/AA | 1,485,000 | 1,502,731 | |||||
Tulsa Public Facilities Authority Solid Waste Revenue, 5.65% due 11/1/2006 (Ogden Martin Project; Insured: AMBAC) | Aaa/AAA | 500,000 | 513,265 | |||||
OREGON — 0.27% | ||||||||
Albany Hospital Facility Authority Gross Revenue & Refunding Series 1994, 7.00% due 10/1/2005 (Mennonite Home Project) | NR/NR | 365,000 | 365,018 | |||||
Forest Grove Campus Improvement & Refunding Pacific University, 6.00% due 5/1/2015 pre-refunded 5/1/2010 (Insured: Radian) | NR/AA | 800,000 | 891,816 | |||||
PENNSYLVANIA — 2.68% | ||||||||
Allegheny County Hospital Development Health Series B, 6.50% due 5/1/2012 (South Hills Health Systems Project) | Baa1/NR | 1,400,000 | 1,495,074 | |||||
Carbon County Industrial Development Authority Refunding, 6.65% due 5/1/2010 (Panther Creek Partners Project) | NR/BBB- | 1,580,000 | 1,707,933 | |||||
Chester County School Authority, 5.00% due 4/1/2020 (Intermediate Unit Project; Insured: AMBAC) (a) | NR/AAA | 2,310,000 | 2,469,413 | |||||
Lancaster County Capital Appreciation Series B, 0% due 5/1/2014 (Insured: FGIC) | Aaa/NR | 795,000 | 556,993 | |||||
Lancaster County Capital Appreciation Series B, 0% due 5/1/2015 (Insured: FGIC) | Aaa/NR | 800,000 | 527,208 | |||||
Lehigh County General Purpose Shepard Rehab. Hospital, 6.00% due 11/15/2007 (Insured: AMBAC) | Aaa/AAA | 785,000 | 830,852 | |||||
Pennsylvania Convention Center Revenue Refunding Series A, 6.70% due 9/1/2014 (Insured: MBIA IBC) | Aaa/AAA | 220,000 | 222,893 | |||||
Pennsylvania Higher Education University Series 14, 0% due 7/1/2020 (Insured: AMBAC) | Aaa/AAA | 2,032,839 | 686,124 | |||||
Pennsylvania State Higher Educational Facility Allegheny Delaware Valley Obligation A, 5.60% due 11/15/2009 (Insured: MBIA) | Aaa/AAA | 500,000 | 538,390 | |||||
22 | Certified Annual Report |
SCHEDULE OF INVESTMENTS, CONTINUED
| Thornburg Intermediate Municipal Fund | September 30, 2005 |
Issuer-Description | Credit Rating† Moody’s/S&P | Principal Amount | Value | |||||
Pennsylvania State Higher Educational Facility Allegheny Delaware Valley Obligation A, 5.60% due 11/15/2010 (Insured: MBIA) | Aaa/AAA | $ | 480,000 | $ | 523,320 | |||
Philadelphia Hospital & High Education Health Systems, 5.25% due 5/15/2006 (Jefferson Health Systems A Project; Insured: MBIA) | Aaa/AAA | 3,025,000 | 3,068,136 | |||||
PUERTO RICO — 0.38% | ||||||||
Puerto Rico Commonwealth Refunding Series B, 2.50% due 7/1/2029 put 10/3/2005 (Insured: FGIC) (daily demand notes) | Aaa/AAA | 1,800,000 | 1,800,000 | |||||
RHODE ISLAND — 0.77% | ||||||||
Rhode Island Health & Education Building Hospital Financing, 5.25% due 7/1/2015 (Memorial Hospital Project; LOC: Fleet Bank) | NR/AA | 1,325,000 | 1,408,051 | |||||
Rhode Island Health & Education Building Refunding, 6.00% due 8/1/2014 (Credit Support: FHA) | NR/AA | 1,000,000 | 1,082,490 | |||||
Rhode Island Health & Education Building Refunding Higher Education State University, 5.00% due 3/15/2014 (Insured: Radian) | NR/AA | 1,065,000 | 1,127,207 | |||||
SOUTH CAROLINA — 0.68% | ||||||||
Darlington County Industrial Development, 6.00% due 4/1/2026 (Sonoco Products Co. Project) | A3/A- | 3,100,000 | 3,184,909 | |||||
SOUTH DAKOTA — 0.22% | ||||||||
South Dakota Housing Development Authority Homeownership Series B, 4.85% due 5/1/2009 | Aa1/AAA | 1,000,000 | 1,040,780 | |||||
TENNESSEE — 0.44% | ||||||||
Knox County Health, 4.90% due 6/1/2031 put 6/1/2011 (Collateralized: FNMA) | NR/AAA | 2,000,000 | 2,050,480 | |||||
TEXAS — 17.19% | ||||||||
Bexar County Health Facilities Development Corp., 6.125% due 7/1/2022 (Army Retirement Residence Project) | NR/BBB- | 1,250,000 | 1,340,075 | |||||
Bexar County Housing Finance Corp., 5.50% due 1/1/2016 (Insured: MBIA) | Aaa/NR | 600,000 | 634,074 | |||||
Bexar County Housing Finance Corp., 5.70% due 1/1/2021 (Insured: MBIA) | Aaa/NR | 1,035,000 | 1,094,512 | |||||
Bexar County Housing Finance Corp., 6.50% due 12/1/2021 | Baa1/NR | 2,000,000 | 2,019,940 | |||||
Bexar County Housing Finance Corp. Multi Family Housing, 5.40% due 8/1/2012 (Dymaxion & Marrach Park Apts. A Project; Insured: MBIA) | Aaa/NR | 1,005,000 | 1,049,300 | |||||
Bexar County Housing Finance Corp. Multi Family Housing, 5.95% due 8/1/2020 (Dymaxion & Marrach Park Apts. A Project; Insured: MBIA) | Aaa/NR | 1,270,000 | 1,357,592 | |||||
Bexar County Housing Finance Corp. Series A, 5.875% due 4/1/2014 (Honey Creek Apartments Project; Insured: MBIA) | Aaa/NR | 975,000 | 1,027,114 | |||||
Bexar County Housing Finance Corp. Series A, 6.125% due 4/1/2020 (Honey Creek Apartments Project; Insured: MBIA) | Aaa/NR | 800,000 | 834,792 | |||||
Birdville Independent School District Refunding, 0% due 2/15/2012 (Guaranty: PSF) | Aaa/AAA | 2,800,000 | 2,192,988 | |||||
Brazos River Authority TXU Energy Pollution Control Revenue, 5.05% due 6/1/2030 put 6/19/2006 | Baa2/BBB- | 2,040,000 | 2,059,482 | |||||
Carroll Independent School District Capital Appreciation Refunding, 0% due 2/15/2011 (Guaranty: PSF) | Aaa/AAA | 1,130,000 | 898,779 | |||||
Central Regional Mobility Authority Revenue Anticipation Notes, 5.00% due 1/1/2008 | Aa3/AA | 1,100,000 | 1,144,847 | |||||
Coppell Independent School District Capital Appreciation Refunding, 0% due 8/15/2013 (Guaranty: PSF) | NR/AAA | 5,000,000 | 3,455,000 | |||||
De Soto Independent School District Refunding, 5.125% due 8/15/2017 (Guaranty: PSF) | NR/AAA | 1,100,000 | 1,101,573 | |||||
Donna Independent School District Refunding, 5.00% due 2/15/2015 (Guaranty: PSF) | Aaa/AAA | 980,000 | 1,061,124 | |||||
Duncanville Independent School District Capital Appreciation Refunding Series B, 0% due 2/15/2016 (Guaranty: PSF) | Aaa/AAA | 3,000,000 | 1,803,180 | |||||
| Certified Annual Report | 23 |
SCHEDULE OF INVESTMENTS, CONTINUED
| Thornburg Intermediate Municipal Fund | September 30, 2005 |
Issuer-Description | Credit Rating† Moody’s/S&P | Principal Amount | Value | |||||
El Paso Independent School District Capital Appreciation Refunding, 0% due 8/15/2010 (Guaranty: PSF) | Aaa/AAA | $ | 3,750,000 | $ | 3,050,325 | |||
El Paso Independent School District Capital Appreciation Refunding, 0% due 8/15/2011 (Guaranty: PSF) | Aaa/AAA | 2,500,000 | 1,915,125 | |||||
Ennis Independent School District Refunding, 0% due 8/15/2012 (Guaranty: PSF) | Aaa/NR | 2,460,000 | 1,839,367 | |||||
Ennis Independent School District Refunding, 0% due 8/15/2013 (Guaranty: PSF) | Aaa/NR | 2,490,000 | 1,754,628 | |||||
Ennis Independent School District Refunding, 0% due 8/15/2014 (Guaranty: PSF) | Aaa/NR | 2,525,000 | 1,668,242 | |||||
Fort Worth Water & Sewer Revenue, 5.25% due 2/15/2009 | Aa2/AA | 1,000,000 | 1,063,240 | |||||
Gulf Coast Center Revenue, 6.75% due 9/1/2020 (Mental Health Retardation Center Project) | NR/BBB | 1,320,000 | 1,423,686 | |||||
Hays Consolidated Independent School District Capital Appreciation, 0% due 8/15/2013 pre-refunded 8/15/2011 (Guaranty: PSF) | Aaa/AAA | 6,245,000 | 4,513,699 | |||||
Irving Hospital Authority Series B, 5.80% due 7/1/2009 (Irving Healthcare Systems Project; Insured: FSA) | Aaa/AAA | 470,000 | 471,058 | |||||
Irving Waterworks & Sewer Revenue Refunding & Improvement, 5.375% due 8/15/2014 | Aa2/AA | 1,500,000 | 1,625,475 | |||||
Laredo Sports Venue Sales Refunding & Improvement, 5.00% due 3/15/2018 (Insured: AMBAC) | Aaa/AAA | 2,040,000 | 2,171,192 | |||||
Mesquite Independent School District Refunding, 0% due 8/15/2012 (Guaranty: PSF) | NR/AAA | 1,420,000 | 1,057,914 | |||||
Midlothian Independent School District Capital Appreciation Refunding, 0% due 2/15/2012 (Guaranty: PSF) | Aaa/NR | 1,000,000 | 783,210 | |||||
Midtown Redevelopment Authority Tax, 6.00% due 1/1/2012 (Insured: Radian) | NR/AA | 735,000 | 804,333 | |||||
Midtown Redevelopment Authority Tax, 6.00% due 1/1/2013 (Insured: Radian) | NR/AA | 500,000 | 544,450 | |||||
Pharr San Juan Alamo Independent Building, 5.75% due 2/1/2013 (Guaranty: PSF) | Aaa/AAA | 1,000,000 | 1,089,910 | |||||
Port Arthur Refunding, 5.00% due 2/15/2019 (Insured: MBIA) | Aaa/AAA | 1,000,000 | 1,055,860 | |||||
Sabine River Authority Texas Pollution Refunding Series A, 5.80% due 7/1/2022 (TXU Energy Co. Project) | Baa2/BBB- | 1,000,000 | 1,072,180 | |||||
Sam Rayburn Municipal Power Agency Refunding, 6.00% due 10/1/2016 | Baa2/BBB- | 3,000,000 | 3,224,880 | |||||
Sam Rayburn Municipal Power Agency Refunding Series A, 6.00% due 10/1/2021 | Baa2/BBB- | 675,000 | 714,879 | |||||
San Antonio Hotel Occupancy Revenue Refunding Series B, 5.00% due 8/15/2034 put 8/1/2008 (Insured: AMBAC) | Aaa/AAA | 1,350,000 | 1,415,354 | |||||
Stafford Economic Development, 6.00% due 9/1/2017 (Insured: FGIC) | Aaa/AAA | 1,775,000 | 2,069,597 | |||||
Tarrant County Health Facilities, 6.625% due 11/15/2020 pre-refunded 11/15/2010 (Adventist/Sunbelt Project) | A2/A+ | 3,500,000 | 4,050,690 | |||||
Texarkana Health Facilities Hospital Refunding Series A, 5.75% due 10/1/2009 (Wadley Regional Medical Center Project; Insured: MBIA) | Aaa/AAA | 500,000 | 542,265 | |||||
Texarkana Health Facilities Hospital Refunding Series A, 5.75% due 10/1/2011 (Insured: MBIA) | Aaa/AAA | 2,500,000 | 2,781,425 | |||||
Texas State Tax & Revenue Anticipation Notes, 4.50% due 8/31/2006 | Mig1/SP-1+ | 5,000,000 | 5,066,800 | |||||
Travis County GO, 5.25% due 3/1/2021 | Aaa/AAA | 1,000,000 | 1,099,200 | |||||
Travis County Health Facilities Development Series A, 5.75% due 11/15/2010 (Ascension Health Project; Insured: MBIA) | Aaa/AAA | 2,000,000 | 2,186,120 | |||||
Travis County Health Facilities Development Series A, 6.25% due 11/15/2014 pre-refunded 11/15/2009 (Ascension Health Project; Insured: MBIA) | Aaa/AAA | 3,000,000 | 3,367,860 | |||||
Upper Trinity Regional Water District Regional Treated Water Supply Systems Series A, 7.125% due 8/1/2008 (Insured: FGIC) | Aaa/AAA | 600,000 | 652,248 | |||||
Waco Health Facilities Development Corp. Series A, 6.00% due 11/15/2015 pre-refunded 11/15/2009 (Ascension Health Project) | Aa2/AA | 870,000 | 970,137 | |||||
Waco Health Facilities Development Corp. Series A, 6.00% due 11/15/2016 pre-refunded 11/15/2009 (Ascension Health Project) | Aa2/AA | 1,050,000 | 1,170,855 | |||||
West Harris County Municipal Utility Refunding, 6.00% due 3/1/2017 (Insured: Radian) | NR/AA | 500,000 | 527,310 | |||||
UTAH — 0.95% | ||||||||
Salt Lake City Municipal Building Series B, 5.30% due 10/15/2012 pre-refunded 10/15/2009 (Insured: AMBAC) | Aaa/AAA | 1,085,000 | 1,179,319 | |||||
Utah Board of Regents Auxiliary Refunding Series A, 5.25% due 5/1/2013 | NR/AA | 595,000 | 645,664 | |||||
24 | Certified Annual Report |
SCHEDULE OF INVESTMENTS, CONTINUED
| Thornburg Intermediate Municipal Fund | September 30, 2005 |
Issuer-Description | Credit Rating† | Principal Amount | Value | |||||
Utah County Municipal Building Authority, 5.50% due 11/1/2016 pre-refunded 11/1/2011 (Insured: AMBAC) | Aaa/NR | $ | 1,000,000 | $ | 1,102,410 | |||
Utah Housing Finance Agency, 6.05% due 7/1/2016 (Credit Support: FHA) | NR/AAA | 405,000 | 419,827 | |||||
Utah Housing Finance Agency SFMR D-2 Class I, 5.85% due 7/1/2015 | Aa2/AA | 90,000 | 90,381 | |||||
Utah Water Finance Agency Revenue Pooled Loan Financing Program Series A, 5.00% due 10/1/2012 (Insured: AMBAC) | Aaa/NR | 940,000 | 1,018,697 | |||||
VIRGINIA — 2.69% | ||||||||
Alexandria Industrial Development Authority, 5.90% due 10/1/2020 (Insured: AMBAC) | Aaa/AAA | 2,000,000 | 2,227,360 | |||||
Alexandria Industrial Development Authority Institute For Defense Analysis Series A, 6.00% due 10/1/2014 (Insured: AMBAC) | Aaa/AAA | 1,500,000 | 1,686,060 | |||||
Alexandria Industrial Development Authority Institute For Defense Analysis Series A, 6.00% due 10/1/2015 (Insured: AMBAC) | Aaa/AAA | 1,590,000 | 1,795,269 | |||||
Fauquier County Industrial Development Authority, 5.50% due 10/1/2016 (Insured: Radian) | NR/AA | 1,000,000 | 1,088,020 | |||||
Hanover County Industrial Development Authority Medical Facilities Revenue, 6.00% due 10/1/2021 (ETM) | Aaa/AAA | 795,000 | 795,127 | |||||
Norfolk Industrial Development Authority Lease, 5.625% due 9/15/2017 pre-refunded 9/15/2006 (Norfolk Public Health Center Project) | Aa1/AA+ | 1,000,000 | 1,044,870 | |||||
Norton Industrial Development Authority Hospital Refunding, 6.00% due 12/1/2014 (Norton Community Hospital Project; Insured: ACA) | NR/A | 1,635,000 | 1,795,001 | |||||
Spotsylvania County Industrial Development, 6.00% due 9/1/2019 put 9/1/2008 (Walter Grinders Project; LOC: Deutsche Bank) | NR/NR | 2,210,000 | 2,238,797 | |||||
WASHINGTON — 6.42% | ||||||||
Benton County Public Utility District Refunding Series A, 5.625% due 11/1/2012 (Insured: FSA) | Aaa/AAA | 1,500,000 | 1,664,805 | |||||
Energy Northwest Washington Series A, 5.60% due 7/1/2015 pre-refunded 1/1/2007 (Wind Project) | A3/A- | 1,000,000 | 1,059,040 | |||||
Energy Northwest Washington Series B, 5.10% due 7/1/2009 pre-refunded 1/1/2007 (Wind Project) | A3/A- | 745,000 | 784,448 | |||||
Grant County Public Utility District-2 Wanapum Hydro Electric Revenue Series C, 6.00% due 1/1/2006 (Insured: AMBAC) | Aaa/AAA | 145,000 | 146,143 | |||||
Port Longview Industrial Development Corp. Solid Waste Disposal Revenue, 6.875% due 10/1/2008 | NR/BBB | 1,500,000 | 1,628,175 | |||||
Snohomish County Public Utility 001 Systems Notes, 5.00% due 12/1/2005 | A1/SP-1+ | 500,000 | 501,750 | |||||
Spokane County School District GO, 0% due 6/1/2019 (Insured: MBIA) | Aaa/AAA | 1,240,000 | 1,115,405 | |||||
Tacoma Electric Systems Revenue Series A, 5.50% due 1/1/2012 (Insured: FSA) | Aaa/AAA | 750,000 | 824,955 | |||||
University of Washington Revenue Refunding, 5.25% due 8/15/2009 (University of Washington Medical Center Project; Insured: MBIA) | Aaa/AAA | 1,350,000 | 1,440,153 | |||||
Vancouver Downtown Redevelopment Senior Series A, 5.50% due 1/1/2018 (Conference Center Project; Insured: ACA) | NR/A | 3,500,000 | 3,726,380 | |||||
Washington Health Care Facilities, 5.50% due 12/1/2010 (Insured: MBIA) | Aaa/AAA | 2,690,000 | 2,919,618 | |||||
Washington Health Care Facilities, 6.00% due 12/1/2014 (Insured: MBIA) | Aaa/AAA | 1,735,000 | 1,928,747 | |||||
Washington Health Care Facilities, 6.00% due 12/1/2015 (Insured: MBIA) | Aaa/AAA | 1,945,000 | 2,161,226 | |||||
Washington Health Care Facilities Refunding, 6.375% due 10/1/2010 (Insured: FGIC) | Aaa/AAA | 1,500,000 | 1,693,770 | |||||
Washington Health Care Facilities Sea Mar Community Health Center, 5.60% due 1/1/2018 (LOC: U.S. Bancorp) | Aa1/NR | 1,025,000 | 1,097,262 | |||||
Washington Nonprofit Housing, 5.60% due 7/1/2011 (Kline Galland Center Project; Insured: Radian) | NR/AA | 500,000 | 534,785 | |||||
Washington Nonprofit Housing, 5.875% due 7/1/2019 (Kline Galland Center Project; Insured: Radian) | NR/AA | 1,000,000 | 1,079,090 | |||||
Washington Public Power Supply Capital Appreciation Refunding Series B, 0% due 7/1/2011 | Aaa/AA- | 1,000,000 | 800,300 | |||||
Washington Public Power Supply Refunding Series A, 5.00% due 7/1/2011 (Insured: FSA) (b) | Aaa/AAA | 3,030,000 | 3,215,587 | |||||
Washington Public Power Supply System, 0% due 7/1/2010 (Project 3) | Aaa/AA- | 960,000 | 804,605 | |||||
Washington State Multi Family Mortgage Revenue, 6.30% due 1/1/2021 put 1/1/2011 (LOC: US Bank N.A.) | NR/AA- | 1,000,000 | 1,068,350 | |||||
| Certified Annual Report | 25 |
SCHEDULE OF INVESTMENTS, CONTINUED
| Thornburg Intermediate Municipal Fund | September 30, 2005 |
Issuer-Description | Credit Rating† | Principal Amount | Value | |||||
WISCONSIN — 1.33% | ||||||||
Wisconsin Health & Educational Facilities, 5.75% due 8/15/2020 (Eagle River Memorial Hospital Inc. Project; Insured: Radian) | NR/AA | $ | 1,000,000 | $ | 1,081,310 | |||
Wisconsin Housing & Economic Development Housing Series A, 5.875% due 11/1/2016 (Insured: AMBAC) | Aaa/AAA | 1,980,000 | 2,084,128 | |||||
Wisconsin State Health & Educational Facilities Hospital Sisters Services Inc., 4.50% due 12/1/2023 put 12/1/2007 (Insured: FSA) | Aaa/NR | 3,000,000 | 3,071,640 | |||||
TOTAL INVESTMENTS — 99.47% (COST $448,492,869) | $ | 467,714,840 | ||||||
OTHER ASSETS LESS LIABILITIES — 0.53% | 2,487,716 | |||||||
NET ASSETS — 100.00% | $ | 470,202,556 | ||||||
See notes to financial statements.
Footnote Legend
| † | Credit ratings are unaudited. Rating changes may have occurred prior to or subsequent to the reporting period end. |
| (a) | When-issued security. |
| (b) | Segregated as collateral for a when-issued security. |
Portfolio Abbreviations
To simplify the listings of securities, abbreviations are used per the table below:
| ACA | Insured by American Capital Access |
| AMBAC | Insured by American Municipal Bond Assurance Corp. |
| AMT | Alternative Minimum Tax |
| COP | Certificates of Participation |
| ETM | Escrowed to Maturity |
| FGIC | Insured by Financial Guaranty Insurance Co. |
| FHA | Insured by Federal Housing Administration |
| FNMA | Collateralized by Federal National Mortgage Association |
| FSA | Insured by Financial Security Assurance Co. |
| GNMA | Insured by Government National Mortgage Co. |
| GO | General Obligation |
| IBC | Insured Bond Certificate |
| MBIA | Insured by Municipal Bond Investors Assurance |
| PSF | Guaranteed by Permanent School Fund |
| RADIAN | Insured by Radian Asset Assurance |
| SFMR | Single Family Mortgage Revenue Bond |
| XLCA | Insured by XL Capital Assurance |
SUMMARY OF SECURITY CREDIT RATINGS†
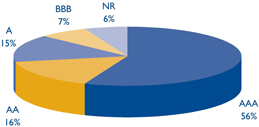
Ratings are a blend of Moody’s and Standard & Poor’s, using the higher rating. Some bonds are rated by only one service.
26 | Certified Annual Report |
REPORT OF INDEPENDENT REGISTERED PUBLIC ACCOUNTING FIRM
Thornburg Intermediate Municipal Fund
To the Trustees and Class I Shareholders of Thornburg Intermediate Municipal Fund
In our opinion, the accompanying statement of assets and liabilities, including the schedule of investments, and the related statements of operations and of changes in net assets and the financial highlights present fairly, in all material respects, the financial position of Thornburg Intermediate Municipal Fund (one of the Portfolios constituting Thornburg Investment Trust, hereafter referred to as the “Fund”) at September 30, 2005, the results of its operations for the year then ended, the changes in its net assets for each of the two years in the period then ended and the financial highlights for the Class I shares for each of the periods presented, in conformity with accounting principles generally accepted in the United States of America. These financial statements and financial highlights (hereafter referred to as “financial statements”) are the responsibility of the Fund’s management. Our responsibility is to express an opinion on these financial statements based on our audits. We conducted our audits of these financial statements in accordance with the standards of the Public Company Accounting Oversight Board (United States). Those standards require that we plan and perform the audit to obtain reasonable assurance about whether the financial statements are free of material misstatement. An audit includes examining, on a test basis, evidence supporting the amounts and disclosures in the financial statements, assessing the accounting principles used and significant estimates made by management, and evaluating the overall financial statement presentation. We believe that our audits, which included confirmation of securities at September 30, 2005 by correspondence with the custodian and brokers, provide a reasonable basis for our opinion.
PricewaterhouseCoopers LLP
New York, New York
November 16, 2005
| Certified Annual Report | 27 |
| Thornburg Intermediate Municipal Fund | September 30, 2005 (Unaudited) |
As a shareholder of the Fund, you incur ongoing costs, including management and administration fees and other Fund expenses.
This example is intended to help you understand your ongoing costs (in dollars) of investing in the Fund and to compare these costs with the ongoing costs of investing in other mutual funds.
The example is based on an investment of $1,000 invested on March 31, 2005 and held until September 30, 2005.
Actual Expenses
The first line of the table at right provides information about actual account values and actual expenses. You may use the information in this line, together with the amount you invested, to estimate the expenses that you paid over the period. Simply divide your account value by $1,000 (for example, an $8,600 account value divided by $1,000 = 8.6), then multiply the result by the number in the first line under the heading entitled “Expenses Paid During Period” to estimate the expenses you paid on your account during this period.
Hypothetical Example for Comparison Purposes
The second line of the table at right provides information about hypothetical account values and hypothetical expenses based on the Fund’s actual expense ratio and an assumed rate of return 5% per year before expenses, which is not the Fund’s actual return. The hypothetical account values and expenses may not be used to estimate the actual ending account balance or expenses you paid for the period. You may use this information to compare the ongoing costs of investing in the Fund and other funds. To do so, compare this 5% hypothetical example with the 5% hypothetical examples that appear in the shareholder reports of the other funds.
Please note that the expenses shown in the table are meant to highlight your ongoing costs only and do not reflect any transactional costs, such as sales charges (loads), redemption fees, or change fees. Therefore, the second line of the table is useful in comparing ongoing costs only, and will not help you determine the relative total costs of owning different funds. In addition, if these transactional costs were included, your costs would have been higher.
| Beginning Account Value 3/31/05 | Ending Account Value 9/30/05 | Expenses Paid During Period† 3/31/05-9/30/05 | |||||||
Class I Shares | |||||||||
Actual | $ | 1,000 | $ | 1,024.00 | $ | 3.39 | |||
Hypothetical* | $ | 1,000 | $ | 1,021.71 | $ | 3.39 | |||
| † | Expenses are equal to the annualized expense ratio for Class I shares (0.67%) multiplied by the average account value over the period, multiplied by 183/365 to reflect the one-half year period. |
| * | Hypothetical assumes a rate of return of 5% per year before expenses. |
28 | Certified Annual Report |
| Thornburg Intermediate Municipal Fund | September 30, 2005 (Unaudited) |
GROWTH OF A HYPOTHETICAL $10,000 INVESTMENT
Thornburg Intermediate Municipal Fund Class I Total Returns, versus
Merrill Lynch 7-12 Year Municipal Bond Index and Consumer Price Index
(July 30, 1996 to September 30, 2005)
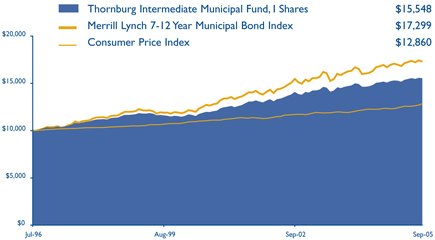
AVERAGE ANNUAL TOTAL RETURNS
For the periods ended September 30, 2005
| 1 Yr | 5 Yrs | 10 Yrs | Since Inception | |||||
I Shares (Incep: 7/5/96) | 2.90% | 5.37% | N/A | 5.07% |
FUND ATTRIBUTES
as of September 30, 2005
| Annualized Dist. Rate | SEC Yield | NAV | Maximum Offering Price | |||||
I Shares (Incep: 7/5/96) | 3.97% | 3.21% | $13.31 | $13.31 |
Performance data reflect past performance, which is no guarantee of future results. The performance data and graph do not reflect the deduction of taxes that a shareholder would pay on distributions or the redemption of Fund shares.
Returns reflect the reinvestment of dividends and capital gains. There is no up front sales charge for this class of shares.
The Consumer Price Index (“CPI”) measures prices of a fixed basket of goods bought by a typical consumer, including food, transportation, shelter, utilities, clothing, medical care, entertainment and other items. The CPI, published by the Bureau of Labor Statistics in the Department of Labor, is based at 100 in 1982 and is released monthly. It is widely used as a cost-of-living benchmark to adjust Social Security payments and other payment schedules, union contracts and tax brackets. The CPI is also known as the cost-of-living index.
The Merrill Lynch 7-12 Year Municipal Bond Index represents a broad measure of market performance. It is a model portfolio of municipal obligations throughout the U.S., with an average maturity which ranges from seven to twelve years.
Unless otherwise noted, index returns reflect the reinvestment of income dividends and capital gains, if any, but do not reflect fees, brokerage commissions or other expenses of investing. Investors may not make direct investments into any index.
The SEC Yield is computed in accordance with SEC standards measuring the net investment income per share over a specified 30-day period expressed as a percentage of the maximum offering price of the Funds’ shares at the end of the period.
The distribution rate is calculated by taking the sum of the month’s total distribution factors and dividing this sum by a 30-day period and annualizing to 360-day year. The value is then divided by the ending Net Asset Value (NAV) to arrive at the annualized distribution yield. The yield is calculated on a periodic basis and is subject to change depending on the Fund’s NAV and current distributions.
| Certified Annual Report | 29 |
| Thornburg Intermediate Municipal Fund | September 30, 2005 (Unaudited) |
Name, Age, (1) Position Held with Fund(2) Year Elected(4)(6) | Principal Occupation(s) During Past Five Years | Other Directorships Held by Trustee | ||
INTERESTED TRUSTEES(1)(2)(4) | ||||
Garrett Thornburg, 59 Chairman of Trustees, Trustee since 1987(3) | CEO, Chairman and controlling shareholder of Thornburg Investment Management, Inc. (investment advisor) and Thornburg Securities Corporation (securities dealer); Chairman of Thornburg Limited Term Municipal Fund, Inc. (registered investment company) to 2004; CEO and Chairman of Thornburg Mortgage, Inc. (real estate investment trust); Chairman of Thornburg Mortgage Advisory Corporation (investment manager to Thornburg Mortgage, Inc.). | Director of Thornburg Mortgage, Inc. (real estate investment trust) | ||
Brian J. McMahon, 49 Trustee since 2001, Member of Governance & Nominating Committee, President since 1997(5)(6) | President and Managing Director of Thornburg Investment Management, Inc.; President of Thornburg Limited Term Municipal Fund, Inc. to 2004. | None | ||
INDEPENDENT TRUSTEES(1)(2)(4) | ||||
David A.Ater, 60 Trustee since 1994, Member of Audit Committee and Governance & Nominating Committee | Principal in Ater & Associates, Santa Fe, NM (developer, planner and broker of residential and commercial real estate); owner developer and broker for various real estate projects. | Director of Thornburg Mortgage, Inc. (real estate investment trust) | ||
David D. Chase, 64 Chairman of Audit Committee, Trustee since 2000 | Chairman, President, CEO, and Managing Member of Vestor Associates, LLC, the general partner of Vestor Partners, LP, Santa Fe, NM (private equity fund); Chairman and CEO of Vestor Holdings, Inc., Santa Fe, NM (merchant bank). | None | ||
Eliot R. Cutler, 59 Chairman of Governance & Nominating Committee, Trustee since 2004 | Partner,Akin, Gump, Strauss, Hauer & Feld, LLP,Washington, D.C. (law firm) since November 2000; partner, Cutler & Stanfield,Washington, D.C. (law firm) until November 2000. | Director of Thornburg Mortgage, Inc. (real estate investment trust) | ||
Susan H. Dubin, 56 Trustee since 2004, Member of Audit Committee | President of Dubin Investments, Ltd., Greenwich, CT (private investment fund); Director and officer of various charitable organizations; and formerly, Vice President of Chemical Bank (predecessor to JP Morgan Chase & Co.), New York, 1974–1996. | None | ||
Owen D.Van Essen, 51 Trustee since 2004, Member of Governance & Nominating Committee | President of Dirks,Van Essen & Murray, Santa Fe, NM (newspaper mergers and acquisitions). | None | ||
James W. Weyhrauch, 46 Trustee since 1996, Member of Audit Committee | Director, Executive Vice President to 2002, and President and CEO 2002–2004, Nambé Mills, Inc., Santa Fe, NM (manufacturer); real estate agent, Santa Fe Properties, Santa Fe, NM since 2004. | None | ||
30 | Certified Annual Report |
TRUSTEES AND OFFICERS, CONTINUED
| Thornburg Intermediate Municipal Fund | September 30, 2005 (Unaudited) |
Name, Age, | Principal Occupation(s) During Past Five Years | Other Directorships | ||
OFFICERS OF THE FUND (WHO ARE NOT TRUSTEES)(1)(6)(7) | ||||
Dawn B. Fischer, 58 Secretary since 1987 | Secretary and Managing Director, Thornburg Investment Management, Inc.; Secretary, Thornburg Limited Term Municipal Fund, Inc. to 2004; Secretary, Thornburg Securities Corporation; Vice President, Daily Tax Free Income Fund, Inc. (registered investment company). | Not applicable | ||
Steven J. Bohlin, 46 Vice President since 1987; Treasurer since 1989 | Vice President and Managing Director of Thornburg Investment Management, Inc.; Vice President of Thornburg Limited Term Municipal Fund, Inc. to 2004. | Not applicable | ||
George T. Strickland, 42 Vice President since 1996 | Vice President and Managing Director of Thornburg Investment Management, Inc.; Vice President (to 2004) and Treasurer (2003–2004) of Thornburg Limited Term Municipal Fund, Inc. | Not applicable | ||
William V. Fries, 66 Vice President since 1995 | Vice President and Managing Director of Thornburg Investment Management, Inc. | Not applicable | ||
Leigh Moiola, 38 Vice President since 2001 | Vice President and Managing Director of Thornburg Investment Management, Inc.; Vice President of Thornburg Limited Term Municipal Fund, Inc. 1999–2004. | Not applicable | ||
Kenneth Ziesenheim, 51 Vice President since 1995 | Vice President and Managing Director of Thornburg Investment Management, Inc.; President of Thornburg Securities Corporation; Vice President of Thornburg Limited Term Municipal Fund, Inc. to 2004. | Not applicable | ||
Alexander Motola, 35 Vice President since 2001 | Vice President and Managing Director of Thornburg Investment Management, Inc. since 2000; Portfolio Manager, Insight Capital Research & Management, Inc., Walnut Creek, California 1995–2000. | Not applicable | ||
Wendy Trevisani, 34 Vice President since 1999 | Associate Portfolio Manager of Thornburg Investment Management, Inc. since 1999, Vice President since 2000 and Managing Director since 2003; Vice President of Thornburg Limited Term Municipal Fund, Inc. 1999–2002. | Not applicable | ||
Joshua Gonze, 42 Vice President since 1999 | Associate Portfolio Manager of Thornburg Investment Management, Inc. since 1999, Vice President since 1999 and Managing Director since 2003; Vice President of Thornburg Limited Term Municipal Fund, Inc. to 2004. | Not applicable | ||
Brad Kinkelaar, 37 Vice President since 1999 | Associate Portfolio Manager of Thornburg Investment Management, Inc. since 1999, Vice President since 2000 and Managing Director since 2003. | Not applicable | ||
Christopher Ihlefeld, 35 Vice President since 2003 | Associate Portfolio Manager since 1999; Vice President of Thornburg Investment Management, Inc. since 2002; Vice President of Limited Term Municipal Fund, Inc., 2003–2004. | Not applicable | ||
Leon Sandersfeld, 39 Vice President since 2003 | Associate of Thornburg Investment Management, Inc. since 2002; Senior Staff Accountant, Farm Bureau Life Insurance Co. 1998–2002. | Not applicable | ||
| Certified Annual Report | 31 |
TRUSTEES AND OFFICERS, CONTINUED
| Thornburg Intermediate Municipal Fund | September 30, 2005 (Unaudited) |
Name, Age, | Principal Occupation(s) During Past Five Years | Other Directorships | ||
Sasha Wilcoxon, 31 Vice President since 2003 | Associate of Thornburg Investment Management, Inc. since 2000 and Mutual Fund Operations Department Manager since 2002. | Not applicable | ||
Ed Maran, 47 Vice President since 2004 | Associate Portfolio Manager of Thornburg Investment Management, Inc. since 2002 and Vice President and Managing Director since 2004; Analyst, USAA 2001–2002; Oil Analyst, A.G. Edwards 1997–2000. | Not applicable | ||
Vinson Walden, 35 Vice President since 2004 | Associate Portfolio Manager of Thornburg Investment Management, Inc. since 2002 and Vice President and Managing Director since 2004; Associate Portfolio Manager, Ibis Management 2002–2004; Associate, Lehman Brothers, 1997–2001. | Not applicable | ||
| (1) | Each person’s address is 119 East Marcy Street, Santa Fe, New Mexico 87501. |
| (2) | The Fund is one of twelve separate investment “Funds” or “series” of Thornburg Investment Trust (the “Trust”), which comprises the Thornburg mutual fund complex and is organized as a Massachusetts business trust. The Trust currently has twelve active Funds. Thornburg Investment Management, Inc. is the investment advisor to, and manages, the twelve Funds of the Trust. Each Trustee oversees the twelve Funds in the fund complex. |
| (3) | Mr.Thornburg is considered an “interested” Trustee under the Investment Company Act of 1940 because he is a director and controlling shareholder of Thornburg Investment Management, Inc., the investment advisor to the twelve active Funds of the Trust, and is the sole director and controlling shareholder of Thornburg Securities Corporation, the distributor of shares for the Trust. |
| (4) | Each Trustee serves in office until the election and qualification of a successor. |
| (5) | Mr. McMahon is considered an “interested” Trustee because he is the president of Thornburg Investment Management, Inc. |
| (6) | The Trust’s president, secretary and treasurer each serves a one-year term or until the election and qualification of a successor; each other officer serves at the pleasure of the Trustees. |
| (7) | Assistant vice presidents, assistant secretaries and assistant treasurers are not shown. |
The Statement of Additional Information for each Fund of the Trust includes additional information about the Trustees and is available, without charge and upon request, by calling 1-800-847-0200.
32 | Certified Annual Report |
| Thornburg Intermediate Municipal Fund | September 30, 2005 (Unaudited) |
PORTFOLIO PROXY VOTING
Policies and Procedures:
The Trust has delegated to Thornburg Investment Management, Inc. (the “Advisor”) voting decisions respecting proxies for the Fund’s voting securities. The Advisor makes voting decisions in accordance with its Proxy Voting Policy and Procedures. A description of the Policy and Procedures is available (i) without charge, upon request, by calling the Advisor toll-free at 1-800-847-0200, (ii) on the Thornburg website at www.thornburg.com, and (iii) on the Securities and Exchange Commission’s website at www.sec.gov.
Commencing August 31, 2004, information regarding how proxies were voted is available on or before August 31 of each year for the twelve months ending the preceding June 30. This information is available (i) without charge, upon request by calling the Advisor toll-free at 1-800-847-0200, (ii) on the Thornburg website at www.thornburg.com, and (iii) on the Securities and Exchange Commission’s website at www.sec.gov.
TAX INFORMATION
For the fiscal year ended September 30, 2005, 100% of dividends paid by the Fund are tax exempt dividends for Federal Income Tax purposes. The information and distributions reported herein may differ from the information and distributions taxable to the shareholders for the calendar year ending December 31, 2005.
AVAILABILITY OF QUARTERLY PORTFOLIO SCHEDULE
The Fund files with the Securities and Exchange Commission schedules of its portfolio holdings on Form N-Q for the first and third quarters of each fiscal year. The Fund’s Forms N-Q are available on the Commission’s website at www.sec.gov, or may be reviewed and copied at the Commission’s Public Reference Room in Washington, D.C. Information on the operation of the Public Reference Room may be obtained by calling 1-800-SEC-0330. The Fund also makes this information available on its website at www.thornburg.com/download or upon request by calling 1-800-847-0200.
TRUSTEES DELIBERATIONS RESPECTING RENEWAL OF INVESTMENT ADVISORY AGREEMENT
Thornburg Investment Management, Inc. (the “Advisor”) provides investment management services to Thornburg Intermediate Municipal Fund pursuant to an investment advisory agreement. The Trustees consider the renewal of this agreement annually and most recently determined to renew the agreement on September 13, 2005.
In connection with their general supervision of the Advisor, the Trustees receive and consider reports throughout the year from the Advisor respecting the Advisor’s management of the Fund’s investments. These reports include information about the Fund’s purchase and sale of portfolio investments and explanations from the Advisor respecting investment selections, the investment performance of the Fund, general appraisals of industry and economic prospects and factors, and other matters affecting the Fund and relating to the Advisor’s performance of services for the Fund.
In anticipation of their recent consideration of the advisory agreement’s renewal, the independent Trustees met with representatives of the Advisor in May and July 2005 to specify the information the Advisor would present to the Trustees for their review. The independent Trustees thereafter met in independent session to consider various factors respecting the agreement’s renewal, and met in a subsequent session with the Advisor’s chief investment officer to present questions. Following these sessions, the Trustees met on September 13, 2005 to consider a renewal of the advisory agreement.
The Trustees considered various factors in their review of the Advisor’s performance under the investment advisory agreement, including specifically the principles outlined in their February 2005 Statement to Shareholders, a copy of which accompanies this Annual Report to Shareholders. Summarized below are certain of the factors considered by the Trustees, in connection with the determination to renew the advisory agreement. In determining to renew the advisory agreement, the Trustees did not identify any single fact or aspect of the Advisor’s performance as controlling, and this summary does not describe all of the matters considered by the Trustees in making their determination.
Quality of Services; Fund Investment Performance. In reviewing the nature, extent, and quality of services provided by the Advisor and the investment performance of the Fund, the Trustees primarily considered the Advisor’s adherence to the Fund’s stated objectives and policies, the Advisor’s execution of the Fund’s investment strategies in prevailing market conditions, the Fund’s absolute investment performance, the Fund’s investment performance compared to categories of other broadly similar mutual funds, the Fund’s investment performance over different periods of time, the Fund’s total returns in rising and declining markets compared to total returns of a category of generally similar mutual funds and a broad based securities index, comparative measures of portfolio risk and share price volatility, and related factors. The Trustees noted that bond indices have limited utility in evaluating fixed income mutual funds. Similarly, the Trustees noted in comparing the Fund to other mutual funds that the value of such comparisons may be limited in some degree because the Fund’s investment approach, and in particular its laddered maturity portfolio, differs from other funds. In conducting their review, the Trustees observed that the Advisor had continued to faithfully pursue and to achieve the Fund’s stated objectives, as demonstrated particularly by the Advisor’s selection of investments and the Fund’s investment performance. The Trustees noted in this regard the Fund’s above average or better investment performance
| Certified Annual Report | 33 |
OTHER INFORMATION, CONTINUED
| Thornburg Intermediate Municipal Fund | September 30, 2005 (Unaudited) |
as compared to two categories of generally similar mutual funds assembled by independent mutual fund analyst firms.
The Trustees also considered a number of other factors in reviewing the quality of the Advisor’s services, including the qualifications and integrity of the Advisor’s senior personnel, the Advisor’s staffing and other resources, the Advisor’s compliance with regulatory requirements, Fund sales performance and perceptions of the Funds in the marketplace, and other factors.
The Trustees concluded, based upon these and other considerations, that the Advisor had actively and competently pursued the Fund’s stated investment objectives in accordance with the Fund’s investment policies stated in its prospectuses. The Trustees further concluded that the investment performance of the Fund was satisfactory in the context of the Fund’s objectives and policies and prevailing market conditions.
Fees and Expenses; Profitability of Advisor. In reviewing the fees charged by the Advisor to the Fund, the Trustees primarily considered the fees charged by the Advisor and the other expenses charged to the Fund in light of the nature and quality of services provided, comparison of the actual Advisor’s fee and Fund expenses to the statement of fees and expenses in the Fund’s prospectuses, comparisons of the Advisor’s fee and other Fund expenses to median and average fees and expenses charged to similar mutual funds, and comparisons of fees and expenses charged to the Fund with fees and expenses charged to other, similar specific mutual funds. In addition, the Trustees considered the profitability of the Advisor compared to other investment management firms, and comparisons of the investment management fee rates charged by the Advisor to the Fund with rates charged to other clients of the Advisor and the differing types of services furnished to the Fund and the other clients. The Trustees noted that the overall expenses for the Fund were somewhat higher than average and median expenses for a group of similar mutual funds, and that the management fee was somewhat higher than the median for the same group of funds but that the differences were not significant in view of the investment performance of the Fund and the other factors considered. The Trustees further noted in this regard that the management fee charged to the Fund was comparable to the average management fees for the same group of mutual funds. The Trustees observed in their review that fee rates charged by the Advisor to other clients of the Advisor were not directly comparable to rates charged to the Fund principally because of the significant differences in the services provided.
The Trustees concluded, based upon these and other considerations, that the fees charged to the Fund by the Advisor were fair and reasonable in view of the following: the services provided, the clear disclosure of these fees and expenses in the Fund’s prospectuses, and prevailing fees and expenses charged to mutual funds generally. The Trustees further concluded that there was no indication that the Advisor’s profitability was unusual, viewed in the context of the services provided, the performance of the Fund, and the fees and profitability of other investment management firms.
Economies of Scale. In reviewing the extent to which economies of scale would be realized by the Fund as it grows and whether fee levels reflect economies of scale, the Trustees considered the breakpoint structure for advisory fees chargeable to the Fund, the demonstrated economies of scale enjoyed by other Funds of the Trust as they had grown in size, and economies of scale realized by other mutual funds. The Trustees concluded that the Fund may reasonably be expected to realize economies of scale for the benefit of its shareholders as it grows in size.
Ancillary Benefits to Advisor. In reviewing benefits enjoyed by the Advisor because of its relationship with the Fund, the Trustees considered an arrangement through which the Advisor received certain research services, favorable publicity received by the Advisor because of the superior investment performance of certain Funds of the Trust, and the benefits to the Fund from the Advisor’s expansion of its staffing and other resources to serve a broader variety of investment clients. The Trustees concluded, based upon these and other considerations, that there was no unusual or unfair benefit enjoyed by the Advisor and that the Fund enjoyed benefits by virtue of the Advisor’s engagement by other investment clients.
34 | Certified Annual Report |
Trustees’ Statement to Shareholders
Not part of the Certified Annual Report
February 8, 2005
The Trustees are concerned that recent commentaries and opinions reported in the media may confuse investors in general as to the supervisory duties of trustees of mutual funds and, in particular, leave Thornburg Investment Trust shareholders uncertain regarding how we discharge our responsibilities in supervising the Funds’ investment advisor and in reviewing the advisor’s contract for renewal. We decided to spell out clearly three principal guidelines that we follow in supervising the Trust’s investment advisor on your behalf.
We begin with the premise that each shareholder selected his or her Fund because its investments are managed by the investment advisor identified in the prospectus and in accordance with the objective and policies described in the prospectus. We realize, as each of you do, that if you believe that your Fund’s stated objective and policies no longer serve your personal investment goals, you can sell your shares and leave the Fund.
Therefore, we believe that our primary supervisory task – our principal obligation to you – is to assess the nature and quality of the advisor’s services, and to confirm that the advisor actively and competently pursues the Fund’s objective, in accordance with the policies set out in the prospectus. To do this, we meet regularly with management to review your Fund’s portfolio and to discuss the advisor’s specific actions and judgments in pursuing the Fund’s objective. We do not substitute our own judgment for the advisor’s decisions in selecting investments; the advisor is paid to exercise its informed judgment on investment decisions, and we seek to confirm, in reviewing the advisor’s performance, that the advisor is doing just that.
Second, while we are conscious of costs and the effect that costs have on shareholders’ returns, we do not seek the lowest fees or expense ratio as our sole or primary objective. We try to make sure that your Fund’s fees and costs are reasonable in relationship to the services rendered and that they are generally in line with those charged by other expert investment advisors, consistent with our belief that the Fund’s investors searched for and expect that expertise and attention and have decided to pay a reasonable price for it. We do not put the management contract “out to bid” as a matter of course, and we would not do so unless we had concluded that the advisor materially had failed to pursue the Fund’s objectives in accordance with its policies, or for other equally important reasons. We believe that any other approach would be inconsistent with your interests and contrary to your expectations when you bought shares of the Fund in the first place.
Finally, because we believe that most Thornburg Fund shareholders have invested with a long-term perspective, we try not to focus too much on the fashions of the moment and on short-term performance. The market will not favor any specific investment objective or set of policies at all times and under all economic circumstances. A fund will experience periods of both high and low returns relative to other funds and other investments. Even if one of our Funds is not favored by the market at a particular time, we believe that the advisor is nonetheless obliged to remain true to the Fund’s objective and policies, and we watch to see that it does so.
This statement is submitted for the general information of the shareholders of Thornburg Investment Trust. It is not authorized for distribution to prospective investors in the Fund unless preceded or accompanied by an effective prospectus. If you have not received a prospectus, one can be obtained from your financial advisor, online at www.thornburg.com/download, or by calling 800-847-0200. Carefully consider information in the prospectus regarding the Fund’s investment objectives and policies, risks, sales charges, expenses, experience of its management, marketability of shares, and other information. Read it carefully before you invest or send money.
| This page is not part of the Annual Report. | 35 |
This page intentionally left blank.
36 | This page is not part of the Annual Report. |
This page intentionally left blank.
| This page is not part of the Annual Report. | 37 |
This page intentionally left blank.
38 | This page is not part of the Annual Report. |
Planning Options
Retirement and Education Accounts
Thornburg Investment Management offers retirement and education savings accounts that can help you meet a variety of planning challenges. For account applications or further information on any of the accounts below, please call 1-800-847-0200 or go to www.thornburg.com/ira. Your financial advisor can help you determine which plan is right for you.
Individual Retirement Accounts
Individual Retirement Accounts (IRAs) provide a tax-advantaged means to save money for the future. For a detailed outline of the difference between retirement accounts, see www.thornburg.com/ira. Rollovers are available. Call 1-800-847-0200 for more information.
Traditional IRAs – Contributions to Traditional IRAs are tax deductible for eligible individuals, and withdrawals are taxed as additional ordinary income. You may contribute to an IRA if you receive compensation and are under 70 1/2, even if you are covered by an employer retirement plan.
Roth IRAs – Under a Roth IRA, there is no tax deduction for contributions, but there is no income tax on qualified withdrawals. For a more detailed comparison of Traditional and Roth IRAs, please see our web site at www.thornburg.com/ira.
SEP IRAs – Simplified Employee Pension (SEP) IRAs are established by employers. The employer is allowed a tax deduction for contributions made to the SEP Plan and makes contributions to each eligible employee’s SEP IRA on a discretionary basis.
SIMPLE IRAs – Savings Incentive Match Plan for Employees of Small Employers (SIMPLE) is designed to give small business owners a simplified method to establish and contribute to a retirement plan for employees. The employer is allowed a tax deduction for contributions and makes either matching or non-elective contributions to each eligible employee’s SIMPLE IRA. Employees may make salary deferral contributions.
403(b)
A special, tax-advantaged savings vehicle available only to employees of 501(c)(3) organizations, such as charitable, educational, scientific and religious organizations. 403(b) plans are also available to employees of public schools and universities.
Coverdell Education Savings Account
These savings accounts are designed to provide a way to save money for higher education expenses. In an Education Savings Account, earnings and interest grow tax free, and qualified withdrawals used to pay for eligible higher-education expenses are tax- and penalty-free.
Funds Available
The following funds are available in the accounts listed above:
| • | Thornburg International Value Fund |
| • | Thornburg Value Fund |
| • | Thornburg Core Growth Fund |
| • | Thornburg Investment Income Builder Fund |
| • | Thornburg Limited Term U.S. Government Fund |
| • | Thornburg Limited Term Income Fund |
| This page is not part of the Annual Report. | 39 |
The Firm
Thornburg Investment Management® is a privately held investment management company based in Santa Fe, New Mexico with assets under management of over $16 billion. Founded in 1982, the firm manages four equity funds, eight bond funds, and separate portfolios for select institutions and individuals.
Investment Philosophy
We seek to preserve and increase the real wealth of the Funds’ shareholders after accounting for inflation, taxes, and investment expenses. We’re committed to disciplined investing and controlling risk in all market environments through laddered bond and focused equity portfolios.
Portfolio Holdings Disclosure
We believe you should know about your portfolio. Our web site keeps investors informed of the Funds’ equity holdings. Go to www.thornburg.com/funds for commentary on our equity fund holdings.
Co-Ownership of Funds
We invest side-by-side with the Funds’ shareholders. Our employees have invested over $110 million in Thornburg Funds.
Core Strategies for Building Wealth
We deliver core strategies to help investors meet long-term goals. A core strategy is a consistent, disciplined and proven investment process that represents the foundation of a diversified portfolio.
Investment Manager: | Distributor: | |
|
| |
119 East Marcy Street | 119 East Marcy Street | |
Santa Fe, New Mexico 87501 | Santa Fe, New Mexico 87501 | |
800.847.0200 | 800.847.0200 | |


Core Strategies for Building Wealth
Thornburg New Mexico Intermediate Municipal Fund
Annual Report – September 30, 2005
This report is submitted for the general information of shareholders of the Fund. It is not authorized for distribution to prospective investors in the Fund unless preceded or accompanied by an effective prospectus. If you have not received a prospectus, one can be obtained from your financial advisor, online at www.thornburg.com/ download, or by calling 800-847-0200. Carefully consider information in the prospectus regarding the Fund’s investment objectives and policies, risks, sales charges, expenses, experience of its management, marketability of shares, and other information. Read it carefully before you invest or send money. Performance data quoted represents past performance and does not guarantee future results.
Thornburg New Mexico Intermediate Municipal Fund
Laddering – an All Weather Strategy
The Fund’s investment objective is to obtain as high a level of current income exempt from Federal income tax as is consistent with preservation of capital.
This Fund offers New Mexico investors double tax-free yields (may be subject to Alternative Minimum Tax) in a laddered municipal bond portfolio with an average maturity of ten years or less. Laddering involves building a portfolio of bonds with staggered maturities so that a portion of the portfolio matures each year; cash from maturing bonds, if not needed for other purposes, is invested in bonds with longer maturities at the far end of the ladder. The strategy is a good compromise for managing different types of risk.
Thornburg Bond Funds
| • | Thornburg Limited Term Municipal Fund |
| • | Thornburg Intermediate Municipal Fund |
| • | Thornburg California Limited Term Municipal Fund |
| • | Thornburg New Mexico Intermediate Municipal Fund |
| • | Thornburg Florida Intermediate Municipal Fund |
| • | Thornburg New York Intermediate Municipal Fund |
| • | Thornburg Limited Term U.S. Government Fund |
| • | Thornburg Limited Term Income Fund |
Thornburg invests in short- and intermediate-term investment grade bonds. We ladder the maturities of individual bonds in the portfolios to moderate risk. Laddering involves building a portfolio of bonds with staggered maturities so that a portion of the portfolio will mature each year. We apply this disciplined process in all interest rate environments.
Thornburg Equity Funds
| • | Thornburg Value Fund |
| • | Thornburg International Value Fund |
| • | Thornburg Core Growth Fund |
| • | Thornburg Investment Income Builder Fund |
Thornburg’s equity research uses a fundamental, yet comprehensive, analytical approach. We invest when and where we perceive compelling value. Thornburg equity funds focus on a limited number of securities so that each holding can impact performance. The equity team searches for firms believed to have a promising future and seeks to buy shares of those companies at a discount to their intrinsic value.
More information at www.thornburg.com
 | ||
| Reduce paper clutter. | ||
| Receive your shareholder reports and prospectus online instead of through traditional mail. | ||
| Sign up at | ||
| www.thornburg.com/edelivery | ||
2 | This page is not part of the Annual Report. |
Message
from the Chairman

Garrett Thornburg
Chairman & CEO
November 10, 2005
Dear Fellow Shareholder:
Thornburg Investment Management has a clear mission: to preserve and increase the real wealth of our shareholders. We aspire to accomplish this through a family of laddered bond funds that focus on quality, stability, and minimization of risk over time, and through a range of equity funds that redefine traditional measures of value and growth.
Our bond funds have always been managed using the highly disciplined approach of laddering short and intermediate bond maturities, seeking to provide both an attractive return and stability of principal. All of the bond funds buy only investment-grade securities. We have found this strategy to be the best at managing both interest-rate risk and credit risk, and we believe this strategy has served our shareholders well over time.
The bond funds are managed by portfolio managers who have many years of experience. We are proud of this consistency and experience and look forward to many more successful years with them at the helm.
In years past, there has been news about improper behavior by some mutual fund companies. Many new rules proposed in response to this scandal have called for increased transparency. We welcome increased transparency. Thornburg Investment Management has been a leader in providing information about our stock holdings and bond strategies to our shareholders on our web site, www.thornburg.com.
Unfortunately, some of the new rules will increase the cost to all shareholders in mutual funds. We will do our best to keep these expenses to a minimum. After all, we are shareholders too, and Thornburg employees have over $110 million invested in our own funds.
Thank you for investing with us. We will do our best to continue to earn your trust every day.
Sincerely, |
 |
| Garrett Thornburg |
| Chairman & CEO |
| This page is not part of the Annual Report. | 3 |

Thornburg New Mexico Intermediate Municipal Fund
September 30, 2005
| 6 | ||
| 8 | ||
| 9 | ||
| 10 | ||
| 11 | ||
| 14 | ||
| 16 | ||
| 21 | ||
| 22 | ||
| 23 | ||
| 24 | ||
| 27 | ||
This report is certified under the Sarbanes-Oxley Act of 2002, which requires that public companies, including mutual funds, affirm that the information provided in their annual and semiannual shareholder reports fully and fairly represents their financial position.
4 | Certified Annual Report |
Important Information
Performance data quoted represents past performance and does not guarantee future results. Investment return and principal value will fluctuate so that upon redemption, investor’s shares may be worth more or less than their original cost. Current performance may be lower or higher than the data quoted. For performance data current to the most recent month end, visit www.thornburg.com.
The maximum sales charge for Class A Shares is 2.00%. There is no up front sales charge for Class D Shares and no contingent deferred sales charge (CDSC).
Performance data given at net asset value (NAV) does not take into account these sales charges. If the sales charges had been included, the performance would have been lower.
Shares in the Fund carry risks, including possible loss of principal. As with direct bond ownership, funds that invest in bonds are subject to certain risks including interest-rate risk, credit risk, and inflation risk. The principal value of bond funds will fluctuate relative to changes in interest rates, decreasing when interest rates rise. Unlike bonds, bond funds have ongoing fees and expenses. Shares in the Fund are not deposits or obligations of, or guaranteed or endorsed by, any bank, the Federal Deposit Insurance Corporation, the Federal Reserve Board or any government agency.
The information presented on the following pages was current as of September 30, 2005. The manager’s views, portfolio holdings, and sector diversification are historical and subject to change. This material should not be deemed a recommendation to buy or sell any of the securities mentioned.
The matters discussed in this report may constitute forward-looking statements made pursuant to the safe harbor provisions of the Securities Litigation Reform Act of 1995. These include any advisor or portfolio manager prediction, assessment, analysis or outlook for individual securities, industries, investment styles, market sectors and/or markets. These statements involve risks and uncertainties. In addition to the general risks described for each fund in its current prospectus, other factors bearing on these reports include the accuracy of the advisor’s or portfolio manager’s forecasts and predictions, the appropriateness of the investment strategies designed by the advisor or portfolio manager and the ability of the advisor or portfolio manager to implement their strategies efficiently and successfully. Any one or more of these factors, as well as other risks affecting the securities markets generally, could cause the actual results of any fund to differ materially as compared to its benchmarks.
Glossary
The Merrill Lynch 7-12 Year Municipal Bond Index – A widely-accepted unmanaged market-weighted index comprised of fixed-rate, coupon bearing bonds issued within five years of the most recent month-end with greater than $50 million principal amount having a Moody’s investment grade rating and maturities of seven to twelve years.
Duration – The measure of the price sensitivity of a fixed-income security to an interest rate change of 100 basis points. Calculation is based on the weighted average of the present values for all cash flows.
Weighted Average Maturity – A weighted average of all the effective maturities of the bonds in a portfolio. Effective maturity takes into consideration mortgage prepayments, puts, sinking funds, adjustable coupons, and other features of individual bonds and is thus a more accurate measure of interest-rate sensitivity. Longer-maturity funds are generally considered more interest-rate sensitive than their shorter counterparts.
| Certified Annual Report | 5 |

George Strickland
Portfolio Manager
October 15, 2005
Dear Fellow Shareholder:
I am pleased to present the Annual Report for the Thornburg New Mexico Intermediate Municipal Fund. The net asset value (NAV) of the A shares decreased by 18 cents to $13.22 during the twelve months ending September 30, 2005. If you were with us for the entire period, you received dividends of 42.9 cents per share. If you reinvested dividends, you received 43.5 cents per share. Investors who owned D shares received dividends of 39.4 and 39.9 cents per share, respectively.
Over the last twelve months, interest rates on bonds that mature in ten years or less have risen, while interest rates on long-term bonds have fallen. Higher interest rates on short-term bonds have pushed down the price of many of the bonds owned by the Fund, but have allowed us to buy new bonds at higher yields. The A shares of your Fund produced a total return of 1.88% (at NAV) over the twelve month period ending September 30, 2005, compared to a 2.92% return for the Merrill Lynch 7-12 Year Municipal Bond Index. The Fund was over weighted in bonds that mature in less than eight years. Since the returns of those short-term bonds lagged the return of the index, the Fund’s return lagged the index somewhat.
This has been an eventful year for the bond market and the world. The Federal Reserve has been steadily pushing up the target Fed Funds rate to its current level of 3.75%. Through the end of June, the bond market responded by pushing down yields on long-term bonds, thus flattening the yield curve. A flat yield curve is usually associated with a recession, but the U.S. economy is showing no signs of entering a recession. So, more recently, interest rates have been rising for both short and long-term bonds, in more of a parallel yield curve shift. We believe that this is a more appropriate response by the market to a tightening Fed, a strong economy, and somewhat elevated levels of inflation.
Your Thornburg New Mexico Intermediate Municipal Fund is a laddered portfolio of over 160 municipal obligations from all over New Mexico. Today, your Fund’s weighted average maturity is 7.38 years. We ladder the maturity dates of the bonds in your portfolio so that some of the bonds are scheduled to mature during each of the coming years. Laddering intermediate bonds accomplishes two goals. First, the staggered bond maturities contained in a ladder defuse interest-rate risk and dampen the Fund’s price volatility. Second, laddering gives the Fund a steady cash flow stream from maturing bonds to reinvest toward the top of the ladder where yields are typically higher.
% of portfolio maturing | Cumulative % maturing | |
2 years = 14.5% | Year 2 = 14.5% | |
2 to 4 years = 14.1% | Year 4 = 28.6% | |
4 to 6 years = 19.3% | Year 6 = 47.9% | |
6 to 8 years = 12.2% | Year 8 = 60.1% | |
8 to 10 years = 10.6% | Year 10 = 70.7% | |
10 to 12 years = 10.5% | Year 12 = 81.2% | |
12 to 14 years = 8.3% | Year 14 = 89.5% | |
14 to 16 years = 5.7% | Year 16 = 95.2% | |
16 to 18 years = 1.3% | Year 18 = 96.5% | |
Over 18 years = 3.5% | Over 18 years = 100.0% |
Percentages can and do vary. Data as of 9/30/05.
6 | Certified Annual Report |
The chart shown on page 6 describes the percentages of your Fund’s bond portfolio maturing in each of the coming years.
Thus far in 2005, New Mexico continues to benefit from a strong job market and elevated commodity prices. State revenues are on track to increase an astounding 16.1%. Much of the increase can be attributed to high oil and gas prices, but other areas of the economy are also showing considerable strength. The continued implementation of income tax cuts and the current plan for gas tax relief will likely cut into the current surplus, and the recent indictment of the State Treasurer and his predecessor remind us that risks often show up in places where they are not expected. To reduce credit risk, we have kept 90% of the portfolio in bonds rated A or above and maintained broad diversification across issuers and market sectors.
Over the years, our practice of laddering a diversified portfolio of short and intermediate maturity municipal bonds has allowed your Fund to perform consistently well in varying interest rate environments. Thank you for investing in Thornburg New Mexico Intermediate Municipal Fund.
Sincerely, |
 |
| George Strickland |
| Portfolio Manager |
| Certified Annual Report | 7 |
| STATEMENT OF ASSETS AND LIABILITIES | ||
| Thornburg New Mexico Intermediate Municipal Fund | September 30, 2005 | |
ASSETS | ||||
Investments at value (cost $222,342,578) | $ | 228,517,204 | ||
Cash | 854,457 | |||
Receivable for fund shares sold | 300,531 | |||
Interest receivable | 2,933,767 | |||
Prepaid expenses and other assets | 685 | |||
Total Assets | 232,606,644 | |||
LIABILITIES | ||||
Payable for securities purchased | 1,066,525 | |||
Payable for fund shares redeemed | 166,105 | |||
Payable to investment advisor and other affiliates (Note 3) | 168,474 | |||
Accounts payable and accrued expenses | 52,825 | |||
Dividends payable | 240,433 | |||
Total Liabilities | 1,694,362 | |||
NET ASSETS | $ | 230,912,282 | ||
NET ASSETS CONSIST OF: | ||||
Distribution in excess of net investment income | $ | (9,545 | ) | |
Net unrealized appreciation on investments | 6,174,626 | |||
Accumulated net realized gain (loss) | (1,142,434 | ) | ||
Net capital paid in on shares of beneficial interest | 225,889,635 | |||
| $ | 230,912,282 | |||
NET ASSET VALUE: | ||||
Class A Shares: | ||||
Net asset value and redemption price per share ($212,334,944 applicable to 16,061,527 shares of beneficial interest outstanding - Note 4) | $ | 13.22 | ||
Maximum sales charge, 2.00% of offering price | 0.27 | |||
Maximum offering price per share | $ | 13.49 | ||
Class D Shares: | ||||
Net asset value, offering and redemption price per share ($18,577,338 applicable to 1,404,529 shares of beneficial interest outstanding - Note 4) | $ | 13.23 | ||
See notes to financial statements.
8 | Certified Annual Report |
| STATEMENT OF OPERATIONS | ||
| Thornburg New Mexico Intermediate Municipal Fund | Year Ended September 30, 2005 | |
INVESTMENT INCOME: | ||||
Interest income (net of premium amortized of $1,424,906) | $ | 9,625,899 | ||
EXPENSES: | ||||
Investment advisory fees (Note 3) | 1,146,018 | |||
Administration fees (Note 3) | ||||
Class A Shares | 265,558 | |||
Class D Shares | 20,946 | |||
Distribution and service fees (Note 3) | ||||
Class A Shares | 531,117 | |||
Class D Shares | 167,549 | |||
Transfer agent fees | ||||
Class A Shares | 84,740 | |||
Class D Shares | 20,378 | |||
Registration and filing fees | ||||
Class A Shares | 608 | |||
Class D Shares | 617 | |||
Custodian fees (Note 3) | 83,269 | |||
Professional fees | 29,970 | |||
Accounting fees | 19,519 | |||
Trustee fees | 4,817 | |||
Other expenses | 44,827 | |||
Total Expenses | 2,419,933 | |||
Less: | ||||
Expenses reimbursed by Investment Advisor (Note 3) | (24,505 | ) | ||
Distribution and service fees waived (Note 3) | (83,497 | ) | ||
Fees paid indirectly (Note 3) | (22,343 | ) | ||
Net Expenses | 2,289,588 | |||
Net Investment Income | 7,336,311 | |||
REALIZED AND UNREALIZED GAIN (LOSS) ON INVESTMENTS | ||||
Net realized gain (loss) on investments | (38,616 | ) | ||
Increase (Decrease) in unrealized appreciation (depreciation) of investments | (3,097,649 | ) | ||
Net Realized and Unrealized Loss on Investments | (3,136,265 | ) | ||
Net Increase in Net Assets Resulting From Operations | $ | 4,200,046 | ||
See notes to financial statements.
| Certified Annual Report | 9 |
STATEMENTS OF CHANGES IN NET ASSETS
Thornburg New Mexico Intermediate Municipal Fund
| Year Ended September 30, 2005 | Year Ended September 30, 2004 | |||||||
INCREASE (DECREASE) IN NET ASSETS FROM: | ||||||||
OPERATIONS: | ||||||||
Net investment income | $ | 7,336,311 | $ | 7,737,512 | ||||
Net realized gain (loss) on investments | (38,616 | ) | 75,537 | |||||
Increase (Decrease) in unrealized appreciation (depreciation) of investments | (3,097,649 | ) | (1,318,602 | ) | ||||
Net Increase (Decrease) in Net Assets | ||||||||
Resulting from Operations | 4,200,046 | 6,494,447 | ||||||
DIVIDENDS TO SHAREHOLDERS: | ||||||||
From net investment income | ||||||||
Class A Shares | (6,841,095 | ) | (7,294,556 | ) | ||||
Class D Shares | (495,216 | ) | (442,956 | ) | ||||
FUND SHARE TRANSACTIONS (NOTE 4) | ||||||||
Class A Shares | 6,800,512 | (7,201,734 | ) | |||||
Class D Shares | 4,761,448 | (492,776 | ) | |||||
Net Increase (Decrease) in Net Assets | 8,425,695 | (8,937,575 | ) | |||||
NET ASSETS: | ||||||||
Beginning of year | 222,486,587 | 231,424,162 | ||||||
End of year | $ | 230,912,282 | $ | 222,486,587 | ||||
See notes to financial statements.
10 | Certified Annual Report |
| N OTES TO FINANCIAL STATEMENTS | ||
| Thornburg New Mexico Intermediate Municipal Fund | September 30, 2005 | |
NOTE 1 – ORGANIZATION
Thornburg New Mexico Intermediate Municipal Fund (the “Fund”) is a non-diversified series of Thornburg Investment Trust (the “Trust”). The Trust is organized as a Massachusetts business trust under a Declaration of Trust dated June 3, 1987 and is registered as a diversified, open-end management investment company under the Investment Company Act of 1940, as amended. The Trust is currently issuing eleven series of shares of beneficial interest in addition to those of the Fund: Thornburg Limited Term Municipal Fund, Thornburg California Limited Term Municipal Fund, Thornburg Florida Intermediate Municipal Fund, Thornburg New York Intermediate Municipal Fund, Thornburg Intermediate Municipal Fund, Thornburg Limited Term U.S. Government Fund, Thornburg Limited Term Income Fund, Thornburg Value Fund, Thornburg International Value Fund, Thornburg Core Growth Fund, and Thornburg Investment Income Builder Fund. Each series is considered to be a separate entity for financial reporting and tax purposes and bears expenses directly attributable to it. The Fund’s investment objective is to obtain as high a level of current income exempt from Federal income tax as is consistent, in the view of the Fund’s investment advisor, with the preservation of capital.
The Fund currently offers two classes of shares of beneficial interest, Class A and Class D shares. Each class of shares of the Fund represents an interest in the same portfolio of investments, except that (i) Class A shares are sold subject to a front-end sales charge collected at the time the shares are purchased and bear a service fee, (ii) Class D shares are sold at net asset value without a sales charge at the time of purchase or redemption, and bear both a service fee and a distribution fee, and (iii) the respective classes may have different reinvestment privileges and conversion rights. Additionally, the Fund may allocate among its classes certain expenses, to the extent applicable to specific classes, including transfer agent fees, government registration fees, certain printing and postage costs, and administrative and legal expenses. Currently, class specific expenses of the Fund are limited to service and distribution fees, administration fees, and certain registration and transfer agent expenses.
NOTE 2 – SIGNIFICANT ACCOUNTING POLICIES
Significant accounting policies of the Trust are as follows:
Valuation of Investments: In determining the net asset value of investments, the Trust utilizes an independent pricing service approved by the Board of Trustees. Debt investment securities have a primary market over the counter and are valued on the basis of valuations furnished by the pricing service. The pricing service values portfolio securities at quoted bid prices, normally at 4:00 p.m. EST. When quotations are not readily available, securities are valued at evaluated prices as determined by the pricing service using methods which include consideration of yields or prices of municipal obligations of comparable quality, type of issue, coupon, maturity, and rating; indications as to value from dealers and general market conditions. In any case where a price is not available from a pricing service for an investment, the Trust’s valuation and pricing committee determines a fair value for the investment using factors approved by the Trustees. The valuation procedures used by the pricing service and the portfolio valuations received by the Fund are reviewed by the officers of the Trust under the general supervision of the Board of Trustees. Short-term obligations having remaining maturities of 60 days or less are valued at amortized cost, which approximates market value.
Federal Income Taxes: It is the policy of the Trust to comply with the provisions of the Internal Revenue Code applicable to “regulated investment companies” and to distribute all taxable (if any) and tax exempt income, of the Fund to the shareholders. Therefore, no provision for Federal income tax is required.
When-Issued and Delayed Delivery Transactions: The Trust may engage in when-issued or delayed delivery transactions. To the extent the Trust engages in such transactions, it will do so for the purpose of acquiring portfolio securities consistent with the Fund’s investment objectives and not for the purpose of investment leverage or to speculate on interest rate and/or market changes. At the time the Trust makes a commitment to purchase a security on a when-issued basis, the Fund will record the transaction and reflect the value in determining its net asset value. When effecting such transactions, assets of an amount sufficient to make payment for the portfolio securities to be purchased will be segregated on the Fund’s records on the trade date. Securities purchased on a when-issued or delayed delivery basis do not earn interest until the settlement date.
Dividends: Net investment income of the Fund is declared daily as a dividend on shares for which the Fund has received payment. Dividends are paid monthly and are reinvested in additional shares of the Fund at net asset value per share at the close of business on the dividend payment date or, at the shareholder’s option, paid in cash. Net capital gains, to the extent available, will be distributed at least annually.
General: Securities transactions are accounted for on a trade date basis. Interest income is accrued as earned. Premiums and discounts on securities purchased are amortized to call dates or maturity dates of the respective securities. Realized gains and losses from the sale of securities are recorded on an identified cost basis. Net investment income, other than class specific expenses and realized and unrealized gains and losses, is allocated daily to each class of shares based upon the relative net asset value of outstanding shares (or the value of the dividend-eligible shares, as appropriate) of each class of shares at the beginning of the day (after adjusting for the current capital shares activity of the respective class). Expenses common to all funds are allocated among the funds comprising the
| Certified Annual Report | 11 |
| NOTES TO FINANCIAL STATEMENTS, CONTINUED | ||
| Thornburg New Mexico Intermediate Municipal Fund | September 30, 2005 | |
Trust based upon their relative net asset values or other appropriate allocation methods.
Guarantees and Indemnifications: Under the Trust’s organizational documents, its officers and Trustees are indemnified against certain liability arising out of the performance of their duties to the Fund. Additionally, in the normal course of business the Trust enters into contracts with service providers that contain general indemnification clauses. The Trust’s maximum exposure under these arrangements is unknown. However, based on experience, the Trust expects the risk of loss to be remote.
Use of Estimates: The preparation of financial statements, in conformity with generally accepted accounting principles, requires management to make estimates and assumptions that affect the reported amounts of assets and liabilities and the disclosure of contingent assets and liabilities at the date of the financial statements and the reported amounts of increases and decreases in net assets from operations during the reporting period. Actual results could differ from those estimates.
NOTE 3 – INVESTMENT ADVISORY FEE AND OTHER TRANSACTIONS WITH AFFILIATES
Pursuant to an investment advisory agreement, Thornburg Investment Management, Inc.® (the “Advisor”) serves as the investment advisor and performs services for which the fees are payable at the end of each month. For the year ended September 30, 2005, these fees were payable at annual rates ranging from .50 of 1% to .275 of 1% per annum of the average daily net assets of the Fund. The Trust also has an administrative services agreement with the Advisor, whereby the Advisor will perform certain administrative services for the shareholders of each class of the Fund’s shares, and for which fees will be payable at an annual rate of up to ..125 of 1% per annum of the average daily net assets attributable to each class of shares. For the year ended September 30, 2005, the Advisor voluntarily reimbursed certain class specific expenses and administrative fees of $11,769 for Class A and $12,736 for Class D shares.
The Trust has an underwriting agreement with Thornburg Securities Corporation® (the “Distributor”, an affiliate of the Advisor), which acts as the Distributor of Fund shares. For the year ended September 30, 2005, the Distributor has advised the Fund that it earned no commissions from the sale of Class A shares.
Pursuant to a service plan, under Rule 12b-1 of the Investment Company Act of 1940, the Fund may reimburse to the Advisor an amount not to exceed .25 of 1% per annum of the average daily net assets attributable to each class of shares of the Fund for payments made by the Advisor to securities dealers and other financial institutions to obtain various shareholder related services. The Advisor may pay out of its own resources additional expenses for distribution of the Fund’s shares.
The Trust has also adopted a distribution plan pursuant to Rule 12b-1, applicable only to the Fund’s Class D shares under which the Fund compensates the Distributor for services in promoting the sale of Class D shares of the Fund at an annual rate of up to .75% per annum of the average daily net assets attributable to Class D shares. Total fees incurred by each class of shares of the Fund under their respective service and distribution plans for the year ended September 30, 2005, are set forth in the Statement of Operations. Distribution fees in the amount of $83,497 were waived for Class D shares.
The Trust has an agreement with the custodian bank to indirectly pay a portion of the custodian’s fees through credits earned by the Fund’s cash on deposit with the bank. This deposit agreement is an alternative to overnight investments. Custodial fees have been adjusted to reflect amounts that would have been paid without this agreement, with a corresponding adjustment reflected as fees paid indirectly in the Statement of Operations. For the year ended September 30, 2005, fees paid indirectly were $22,343.
Certain officers and Trustees of the Trust are also officers and/or Directors of the Advisor and Distributor. The compensation of independent Trustees is borne by the Trust.
12 | Certified Annual Report |
| NOTES TO FINANCIAL STATEMENTS, CONTINUED | ||
| Thornburg New Mexico Intermediate Municipal Fund | September 30, 2005 | |
NOTE 4 – SHARES OF BENEFICIAL INTEREST
At September 30, 2005, there were an unlimited number of shares of beneficial interest authorized. Transactions in shares of beneficial interest were as follows:
| Year Ended September 30, 2005 | Year Ended September 30, 2004 | |||||||||||||
| Shares | Amount | Shares | Amount | |||||||||||
Class A Shares | ||||||||||||||
Shares sold | 2,916,830 | $ | 38,880,406 | 4,003,342 | $ | 53,491,206 | ||||||||
Shares issued to shareholders in reinvestment of dividends | 306,539 | 4,079,149 | 325,601 | 4,347,760 | ||||||||||
Shares repurchased | (2,715,515 | ) | (36,159,043 | ) | (4,879,544 | ) | (65,040,700 | ) | ||||||
Net Increase (Decrease) | 507,854 | $ | 6,800,512 | (550,601 | ) | $ | (7,201,734 | ) | ||||||
Class D Shares | ||||||||||||||
Shares sold | 599,941 | $ | 8,004,279 | 486,049 | $ | 6,512,327 | ||||||||
Shares issued to shareholders in reinvestment of dividends | 27,198 | 362,058 | 26,023 | 347,627 | ||||||||||
Shares repurchased | (270,603 | ) | (3,604,889 | ) | (552,559 | ) | (7,352,730 | ) | ||||||
Net Increase (Decrease) | 356,536 | $ | 4,761,448 | (40,487 | ) | $ | (492,776 | ) | ||||||
NOTE 5 – SECURITIES TRANSACTIONS
For the year ended September 30, 2005, the Fund had purchase and sale transactions of investment securities (excluding short-term investments) of $55,151,682 and $36,614,486, respectively.
NOTE 6 – INCOME TAXES
At September 30, 2005, information on the tax components of capital is as follows:
Cost of investments for tax purpose | $ | 222,342,342 | ||
Gross unrealized appreciation on a tax basis | $ | 6,581,402 | ||
Gross unrealized depreciation on a tax basis | (406,540 | ) | ||
Net unrealized appreciation (depreciation) on investments (tax basis) | $ | 6,174,862 | ||
At September 30, 2005, the Fund did not have any undistributed tax-exempt/ordinary net income or undistributed capital gains.
At September 30, 2005, the Fund had tax basis capital losses, which may be carried over to offset future capital gains. To the extent such carry forwards are used, capital gains distributions may be reduced to the extent provided by regulations.
Such losses expire as follows:
2006 | $ | 7,178 | |
2007 | 33,677 | ||
2008 | 595,638 | ||
2009 | 320,666 | ||
2011 | 145,437 | ||
2013 | 255 | ||
| $ | 1,102,851 | ||
In order to account for book/tax differences, the Fund increased accumulated net realized gain (loss) by $111, decreased over-distributed net investment income (loss) by $4,828 and increased net paid in capital paid in on shares of beneficial interest by $4,717. Reclassifications result primarily from taxable market discount.
At September 30, 2005, the Fund had deferred capital losses occurring subsequent to October 31, 2004 of $39,819. For tax purposes, such losses will be reflected in the year ending September 30, 2006.
All dividends paid by the Fund for the years ended September 30, 2005 and September 30, 2004, represent tax exempt interest dividends, which are excludable by shareholders from gross income for Federal income tax purposes.
| Certified Annual Report | 13 |
Thornburg New Mexico Intermediate Municipal Fund
| Year Ended September 30, | ||||||||||||||||||||
| 2005 | 2004 | 2003 | 2002 | 2001 | ||||||||||||||||
Class A Shares: | ||||||||||||||||||||
PER SHARE PERFORMANCE | ||||||||||||||||||||
(for a share outstanding throughout the year) | ||||||||||||||||||||
Net asset value, beginning of year | $ | 13.40 | $ | 13.46 | $ | 13.42 | $ | 13.16 | $ | 12.85 | ||||||||||
Income from investment operations: | ||||||||||||||||||||
Net investment income | 0.43 | 0.45 | 0.48 | 0.53 | 0.59 | |||||||||||||||
Net realized and unrealized gain (loss) on investments | (0.18 | ) | (0.06 | ) | 0.04 | 0.26 | 0.31 | |||||||||||||
Total from investment operations | 0.25 | 0.39 | 0.52 | 0.79 | 0.90 | |||||||||||||||
Less dividends from: | ||||||||||||||||||||
Net investment income | (0.43 | ) | (0.45 | ) | (0.48 | ) | (0.53 | ) | (0.59 | ) | ||||||||||
Change in net asset value | (0.18 | ) | (0.06 | ) | 0.04 | 0.26 | 0.31 | |||||||||||||
NET ASSET VALUE, end of year | $ | 13.22 | $ | 13.40 | $ | 13.46 | $ | 13.42 | $ | 13.16 | ||||||||||
RATIOS/SUPPLEMENTAL DATA | ||||||||||||||||||||
Total return(a) | 1.88 | % | 3.00 | % | 3.93 | % | 6.16 | % | 7.12 | % | ||||||||||
Ratios to average net assets: | ||||||||||||||||||||
Net investment income | 3.22 | % | 3.40 | % | 3.55 | % | 4.01 | % | 4.49 | % | ||||||||||
Expenses, after expense reductions | 0.99 | % | 0.96 | % | 0.97 | % | 0.98 | % | 1.01 | % | ||||||||||
Expenses, after expense reductions and net of custody credits | 0.98 | % | 0.96 | % | 0.97 | % | 0.98 | % | — | |||||||||||
Expenses, before expense reductions | 0.99 | % | 0.96 | % | 0.97 | % | 1.00 | % | 1.01 | % | ||||||||||
Portfolio turnover rate | 16.63 | % | 14.66 | % | 16.53 | % | 21.35 | % | 18.77 | % | ||||||||||
Net assets at end of year (000) | $ | 212,335 | $ | 208,435 | $ | 216,766 | $ | 192,749 | $ | 158,645 | ||||||||||
| (a) | Sales loads are not reflected in computing total return. |
14 | Certified Annual Report |
| FINANCIAL HIGHLIGHTS, CONTINUED | ||
| Thornburg New Mexico Intermediate Municipal Fund | ||
| Year Ended September 30, | ||||||||||||||||||||
| 2005 | 2004 | 2003 | 2002 | 2001 | ||||||||||||||||
Class D Shares: | ||||||||||||||||||||
PER SHARE PERFORMANCE | ||||||||||||||||||||
(for a share outstanding throughout the year) | ||||||||||||||||||||
Net asset value, beginning of year | $ | 13.41 | $ | 13.47 | $ | 13.43 | $ | 13.16 | $ | 12.85 | ||||||||||
Income from investment operations: | ||||||||||||||||||||
Net investment income | 0.39 | 0.42 | 0.44 | 0.49 | 0.55 | |||||||||||||||
Net realized and unrealized gain (loss) on investments | (0.18 | ) | (0.06 | ) | 0.04 | 0.27 | 0.31 | |||||||||||||
Total from investment operations | 0.21 | 0.36 | 0.48 | 0.76 | 0.86 | |||||||||||||||
Less dividends from: | ||||||||||||||||||||
Net investment income | (0.39 | ) | (0.42 | ) | (0.44 | ) | (0.49 | ) | (0.55 | ) | ||||||||||
Change in net asset value | (0.18 | ) | (0.06 | ) | 0.04 | 0.27 | 0.31 | |||||||||||||
NET ASSET VALUE, end of year | $ | 13.23 | $ | 13.41 | $ | 13.47 | $ | 13.43 | $ | 13.16 | ||||||||||
RATIOS/SUPPLEMENTAL DATA | ||||||||||||||||||||
Total return | 1.62 | % | 2.70 | % | 3.63 | % | 5.94 | % | 6.84 | % | ||||||||||
Ratios to average net assets: | ||||||||||||||||||||
Net investment income | 2.96 | % | 3.11 | % | 3.24 | % | 3.64 | % | 4.23 | % | ||||||||||
Expenses, after expense reductions | 1.25 | % | 1.25 | % | 1.25 | % | 1.25 | % | 1.27 | % | ||||||||||
Expenses, after expense reductions and net of custody credits | 1.24 | % | 1.24 | % | 1.25 | % | 1.25 | % | — | |||||||||||
Expenses, before expense reductions | 1.83 | % | 1.83 | % | 1.88 | % | 2.00 | % | 2.40 | % | ||||||||||
Portfolio turnover rate | 16.63 | % | 14.66 | % | 16.53 | % | 21.35 | % | 18.77 | % | ||||||||||
Net assets at end of year (000) | $ | 18,577 | $ | 14,051 | $ | 14,658 | $ | 9,719 | $ | 2,831 | ||||||||||
| Certified Annual Report | 15 |
| SCHEDULE OF INVESTMENTS | ||
| Thornburg New Mexico Intermediate Municipal Fund | September 30, 2005 | |
CUSIPS: CLASS A - 885-215-301, CLASS D - 885-215-624
NASDAQ SYMBOLS: CLASS A - THNMX, CLASS D - THNDX
Issuer-Description | Credit Rating† Moody’s/S&P | Principal Amount | Value | |||||
Alamogordo Hospital Revenue, 5.30% due 1/1/2013 (Insured: Radian) | NR/AA | $ | 3,000,000 | $ | 3,082,380 | |||
Albuquerque Airport Revenue, 5.00% due 7/1/2007 (Insured:AMBAC) | Aaa/AAA | 1,000,000 | 1,031,780 | |||||
Albuquerque Airport Revenue Adjustment Refunding, 2.73% due 7/1/2014 put 10/7/2005 (Insured:AMBAC) (weekly demand notes) | VMIG1/A-1 | 1,600,000 | 1,600,000 | |||||
Albuquerque Airport Revenue Refunding, 4.20% due 7/1/2009 (Insured:AMBAC) | Aaa/AAA | 610,000 | 626,812 | |||||
Albuquerque Airport Revenue Senior Lien Improvement Series B, 5.00% due 7/1/2012 (Insured: MBIA) | Aaa/AAA | 1,670,000 | 1,787,251 | |||||
Albuquerque Gross Receipts & Lodgers Tax, 2.75% due 7/1/2023 put 10/7/2005 (weekly demand notes) | VMIG1/A-1+ | 400,000 | 400,000 | |||||
Albuquerque Gross Receipts Series B, 0% due 7/1/2012 pre-refunded 7/1/2011 | Aaa/AAA | 1,775,000 | 1,381,394 | |||||
Albuquerque Gross Receipts Unrefunded Balance Series B, 0% due 7/1/2012 (Insured: FSA) | Aaa/AAA | 225,000 | 173,626 | |||||
Albuquerque Industrial Revenue Refunding, 5.15% due 4/1/2016 (MCT Industries Inc. Project; LOC: Bank of the West) | Aa3/NR | 1,170,000 | 1,219,713 | |||||
Albuquerque Industrial Revenue Refunding, 5.25% due 4/1/2017 (MCT Industries Inc. Project; LOC: Bank of the West) | Aa3/NR | 2,140,000 | 2,241,243 | |||||
Albuquerque Joint Water & Sewage Revenue Series A, 0% due 7/1/2008 (Insured: FGIC) | Aaa/AAA | 1,600,000 | 1,463,728 | |||||
Albuquerque Joint Water & Sewage Systems Revenue, 6.00% due 7/1/2006 | Aa3/AA | 1,500,000 | 1,534,860 | |||||
Albuquerque Joint Water & Sewage Systems Revenue, 4.75% due 7/1/2008 | Aa3/AA | 100,000 | 100,145 | |||||
Albuquerque Joint Water & Sewage Systems Revenue Refunding & Improvement Series A, 5.25% due 7/1/2011 | Aa3/AA | 1,135,000 | 1,243,200 | |||||
Albuquerque Municipal School District Number 12 Refunding, 5.00% due 8/1/2009 | Aa2/AA | 2,240,000 | 2,383,786 | |||||
Albuquerque Municipal School District Number 12 Refunding, 5.10% due 8/1/2014 | Aa2/AA | 760,000 | 796,564 | |||||
Albuquerque Municipal School District Number 12 Refunding, 5.00% due 8/1/2015 | Aa2/AA | 1,175,000 | 1,250,576 | |||||
Albuquerque Refuse Removal & Disposal Revenue Refunding Series B, 5.00% due 7/1/2010 (Insured: FSA) | Aaa/AAA | 415,000 | 445,212 | |||||
Albuquerque Refuse Removal & Disposal Revenue Refunding Series B, 5.00% due 7/1/2011 (Insured: FSA) | Aaa/AAA | 1,000,000 | 1,080,200 | |||||
Albuquerque Series B, 5.00% due 7/1/2006 | Aa3/AA | 2,200,000 | 2,235,376 | |||||
Artesia Hospital District, 4.50% due 8/1/2008 (Insured:AMBAC) | Aaa/NR | 810,000 | 839,128 | |||||
Belen Consolidated School District No 2 Ref Series A, 4.00% due 8/1/2007 (Insured: MBIA) | Aaa/NR | 1,000,000 | 1,017,650 | |||||
Belen Consolidated School District No 2 Ref Series A, 4.00% due 8/1/2008 (Insured: MBIA) | Aaa/NR | 1,000,000 | 1,023,320 | |||||
Belen Gasoline Tax Revenue Refunding & Improvement, 5.40% due 1/1/2011 | NR/NR | 585,000 | 604,878 | |||||
Bernalillo County GO, 7.00% due 2/1/2006 | Aa1/AA+ | 400,000 | 405,532 | |||||
Bernalillo County GO, 7.00% due 2/1/2007 | Aa1/AA+ | 410,000 | 431,410 | |||||
Bernalillo County Gross Receipts, 5.10% due 10/1/2010 | Aa3/AA | 525,000 | 559,456 | |||||
Bernalillo County Gross Receipts Series B, 5.00% due 4/1/2021 (Insured: MBIA) | Aaa/AAA | 3,000,000 | 3,289,410 | |||||
Bernalillo County Gross Receipts Tax Revenue, 5.50% due 10/1/2011 | Aa3/AA | 495,000 | 533,788 | |||||
Bernalillo County Gross Receipts Tax Revenue, 5.25% due 10/1/2012 | Aa3/AA | 1,000,000 | 1,104,260 | |||||
Bernalillo County Gross Receipts Tax Revenue, 5.75% due 10/1/2015 | Aa3/AA | 2,000,000 | 2,175,280 | |||||
Bernalillo County Multi Family Housing Revenue Series 1988, 4.60% due 11/1/2025 put 11/1/2006 (Sunchase Apartments Project; Insured:AXA Reinsurance Co.) | NR/AA- | 2,300,000 | 2,302,875 | |||||
Chaves County Gross Receipts Tax Revenue, 5.00% due 7/1/2017 (Insured: FGIC) | Aaa/NR | 1,000,000 | 1,061,500 | |||||
Chaves County Gross Receipts Tax Revenue, 5.05% due 7/1/2019 (Insured: FGIC) | Aaa/NR | 1,030,000 | 1,095,580 | |||||
Chaves County Gross Receipts Tax Revenue, 5.00% due 7/1/2021 (Insured; FGIC) | Aaa/NR | 1,410,000 | 1,481,924 | |||||
Cibola County Gross Receipts Tax Revenue, 5.875% due 11/1/2008 (Insured:AMBAC) | Aaa/AAA | 495,000 | 533,857 | |||||
Cibola County Gross Receipts Tax Revenue, 6.00% due 11/1/2010 (Insured:AMBAC) | Aaa/AAA | 555,000 | 621,583 | |||||
Eastern New Mexico University Revenues Refunding & Improvement, 4.95% due 4/1/2006 (Insured:AMBAC) | Aaa/AAA | 500,000 | 500,845 | |||||
Farmington Hospital Revenue Series A, 5.125% due 6/1/2018 (San Juan Regional Medical Center Project) | A3/NR | 570,000 | 596,140 | |||||
Farmington Hospital Revenue Series A, 5.125% due 6/1/2019 (San Juan Regional Medical Center Project) | A3/NR | 645,000 | 672,225 | |||||
16 | Certified Annual Report |
| SCHEDULE OF INVESTMENTS, CONTINUED | ||
| Thornburg New Mexico Intermediate Municipal Fund | September 30, 2005 | |
Issuer-Description | Credit Rating† Moody’s/S&P | Principal Amount | Value | |||||
Farmington Municipal School District 5 Refunding, 5.00% due 9/1/2011 (Insured: FSA) | Aaa/NR | $ | 1,000,000 | $ | 1,046,550 | |||
Farmington Pollution Control Revenue, 2.80% due 9/1/2024 put 10/3/2005 (LOC: Barclays Bank) (daily demand notes) | P1/A-1+ | 3,630,000 | 3,630,000 | |||||
Farmington Pollution Control Revenue Refunding (El Paso Electric), 4.00% due 6/1/2032 put 8/1/2012 (Insured: FGIC) | Aaa/AAA | 1,000,000 | 1,007,040 | |||||
Farmington Pollution Control Revenue Refunding (Southern Cal. Edison) Series A, 3.55% due 4/1/2029 put 4/1/2010 (Insured: FGIC) | Aaa/AAA | 1,000,000 | 1,001,860 | |||||
Farmington Utility Systems Revenue Refunding Series A, 5.00% due 5/15/2011 (Insured: FSA) | Aaa/AAA | 3,000,000 | 3,240,240 | |||||
Farmington Utility Systems Revenue Refunding Series A, 5.00% due 5/15/2012 (Insured: FSA) | Aaa/AAA | 6,095,000 | 6,546,639 | |||||
Gallup Pollution Control Revenue Refunding Tri-State Generation, 5.00% due 8/15/2013 (Insured: AMBAC) | Aaa/AAA | 2,060,000 | 2,209,824 | |||||
Gallup Pollution Control Revenue Refunding Tri-State Generation, 5.00% due 8/15/2017 (Insured: AMBAC) | Aaa/AAA | 3,540,000 | 3,760,931 | |||||
Grant County Hospital Facility Revenue, 5.50% due 8/1/2009 (Gila Regional Medical Center Project; Insured: Radian) | NR/AA | 1,310,000 | 1,397,888 | |||||
Grant County Hospital Facility Revenue, 5.50% due 8/1/2010 (Gila Regional Medical Center Project; Insured: Radian) | NR/AA | 1,385,000 | 1,495,343 | |||||
Las Cruces Gross Receipts Tax Revenue Refunding & Improvement, 5.00% due 6/1/2009 (Insured: MBIA) | Aaa/NR | 1,115,000 | 1,183,126 | |||||
Las Cruces Joint Utility Refunding & Improvement Revenue, 6.50% due 7/1/2007 (ETM) | A1/NR | 225,000 | 225,742 | |||||
Las Cruces School District 2, 5.50% due 8/1/2010 | Aa3/NR | 1,000,000 | 1,077,980 | |||||
Las Cruces School District 2 Refunding, 4.00% due 8/1/2007 | Aa3/NR | 2,600,000 | 2,645,890 | |||||
New Mexico Educational Assistance Foundation Revenue (Guaranteed Student Loans), 6.65% due 3/1/2007 | Aaa/NR | 975,000 | 988,611 | |||||
New Mexico Educational Assistance Foundation Series A 3 (Guaranteed Student Loans), 4.95% due 3/1/2009 | Aaa/NR | 2,000,000 | 2,083,460 | |||||
New Mexico Educational Assistance Student Loan Series 2-B (Guaranteed Student Loans), 5.75% due 12/1/2008 | NR/NR | 50,000 | 50,474 | |||||
New Mexico Finance Authority Revenue Court Facilities Fee, 5.00% due 6/15/2014 pre-refunded 6/15/2011 (Insured: MBIA) | Aaa/AAA | 1,295,000 | 1,395,634 | |||||
New Mexico Finance Authority Revenue Court Facilities Fee Revenue Series A, 5.50% due 6/15/2020 pre-refunded 6/15/2011 (Insured: MBIA) | Aaa/AAA | 2,000,000 | 2,206,760 | |||||
New Mexico Finance Authority Revenue Public Project, 5.00% due 6/15/2019 (Insured: MBIA) | Aaa/NR | 1,215,000 | 1,299,771 | |||||
New Mexico Finance Authority Revenue Refunding, 5.00% due 6/1/2014 (Public Project Revolving Fund B; Insured: MBIA) | Aaa/AAA | 2,660,000 | 2,869,209 | |||||
New Mexico Finance Authority Revenue Refunding, 5.00% due 6/15/2018 (Public Project Revolving Fund C; Insured: AMBAC) | Aaa/NR | 2,915,000 | 3,130,448 | |||||
New Mexico Finance Authority Revenue Series A, 4.00% due 4/1/2010 (Cigarette Tax UNM Health Project; Insured: MBIA) | Aaa/AAA | 2,300,000 | 2,361,525 | |||||
New Mexico Finance Authority Revenue Series B-1, 5.25% due 6/1/2015 (Public Project; Insured: AMBAC) | Aaa/AAA | 1,000,000 | 1,098,680 | |||||
New Mexico Finance Authority Revenue Series C, 5.15% due 6/1/2012 pre-refunded 6/1/2009 (Insured: MBIA) | Aaa/AAA | 255,000 | 270,415 | |||||
New Mexico Finance Authority Revenue Series C, 5.25% due 6/1/2013 pre-refunded 6/1/2009 (Insured: MBIA) | Aaa/AAA | 130,000 | 138,303 | |||||
New Mexico Finance Authority Revenue Series C, 5.35% due 6/1/2014 pre-refunded 6/1/2009 (Insured: MBIA) | Aaa/AAA | 130,000 | 138,748 | |||||
New Mexico Finance Authority Revenue Series C, 5.45% due 6/1/2015 pre-refunded 6/1/2009 (Insured: MBIA) | Aaa/AAA | 145,000 | 155,176 | |||||
New Mexico Finance Authority Revenue State Office Building Tax Series A, 5.00% due 6/1/2012 | Aa1/AAA | 1,725,000 | 1,856,290 | |||||
New Mexico Finance Authority Revenue State Office Building Tax Series A, 5.00% due 6/1/2013 | Aa1/AAA | 1,325,000 | 1,423,593 | |||||
| Certified Annual Report | 17 |
| SCHEDULE OF INVESTMENTS, CONTINUED | ||
| Thornburg New Mexico Intermediate Municipal Fund | September 30, 2005 | |
Issuer-Description | Credit Rating† Moody’s/S&P | Principal Amount | Value | |||||
New Mexico Finance Authority Revenue State Office Building Tax Series A, 5.00% due 6/1/2014 | Aa1/AAA | $ | 1,875,000 | $ | 2,009,531 | |||
New Mexico Finance Authority State Transportation Series A, 5.00% due 6/15/2014 (Insured: MBIA) | Aaa/AAA | 2,100,000 | 2,296,959 | |||||
New Mexico Financial Authority Revenue Refunding Series C, 5.00% due 6/15/2013 (Insured: AMBAC) | Aaa/NR | 2,280,000 | 2,472,934 | |||||
New Mexico Financial Authority Revenue Refunding Series C, 5.00% due 6/15/2015 (Insured: AMBAC) | Aaa/NR | 2,360,000 | 2,568,412 | |||||
New Mexico Highway Commission Revenue Senior Subordinated Lien Tax Series A, 5.50% due 6/15/2013 pre-refunded 6/15/2011 | Aa2/AA+ | 2,000,000 | 2,201,320 | |||||
New Mexico Highway Commission Revenue Senior Subordinated Lien Tax Series A, 5.50% due 6/15/2014 | Aa2/AA+ | 2,000,000 | 2,197,420 | |||||
New Mexico Highway Commission Tax Revenue, 5.125% due 6/15/2010 | Aa2/AA+ | 4,355,000 | 4,559,554 | |||||
New Mexico Highway Commission Tax Senior Subordinated Lien, 6.00% due 6/15/2011 pre-refunded 6/15/2009 | Aa2/AA+ | 5,000,000 | 5,486,350 | |||||
New Mexico Hospital Equipment Loan, 5.20% due 12/1/2010 pre-refunded 12/1/2007 (Catholic Health Initiatives Project) | NR/AA | 1,140,000 | 1,201,138 | |||||
New Mexico Hospital Equipment Loan Series A, 5.75% due 8/1/2016 pre-refunded 8/1/2011 (Presbyterian Healthcare Project) | Aa3/AA- | 5,205,000 | 5,861,455 | |||||
New Mexico Housing Authority Region III Multi Family Housing Revenue Series A, 5.30% due 12/1/2022 (Senior El Paseo Apartments Project; Insured: AMBAC) | Aaa/AAA | 1,160,000 | 1,203,871 | |||||
New Mexico MFA Forward Mortgage Series C, 6.50% due 7/1/2025 (Collateralized: FNMA/GNMA) | NR/NR | 315,000 | 317,000 | |||||
New Mexico MFA General, 5.80% due 9/1/2019 pre-refunded 9/1/2009 | NR/AAA | 775,000 | 809,046 | |||||
New Mexico MFA SFMR, 5.70% due 9/1/2014 (Collateralized: FNMA/GNMA) | NR/AAA | 115,000 | 117,001 | |||||
New Mexico MFA SFMR, 5.75% due 3/1/2017 (Collateralized: FNMA/GNMA) | NR/AAA | 305,000 | 310,444 | |||||
New Mexico MFA SFMR, 0% due 9/1/2019 (GIC: Bayerisch Landesbank) | NR/AAA | 385,000 | 301,751 | |||||
New Mexico MFA SFMR Series A3, 6.15% due 9/1/2017 (Collateralized: FNMA/GNMA) | NR/AAA | 110,000 | 110,983 | |||||
New Mexico MFA SFMR Series B2, 5.80% due 1/1/2009 (Collateralized: FNMA/GNMA) | NR/AAA | 40,000 | 40,297 | |||||
New Mexico MFA SFMR Series B2, 5.80% due 7/1/2009 (Collateralized: FNMA/GNMA) | NR/AAA | 25,000 | 25,208 | |||||
New Mexico MFA SFMR Series B3, 5.80% due 9/1/2016 (Collateralized: FNMA/GNMA) | NR/AAA | 285,000 | 300,481 | |||||
New Mexico MFA SFMR Series C2, 6.05% due 9/1/2021 (Collateralized: FNMA/GNMA) | NR/AAA | 430,000 | 448,838 | |||||
New Mexico MFA SFMR Series D2, 5.875% due 9/1/2021 (Collateralized: FNMA/GNMA) | NR/AAA | 640,000 | 652,141 | |||||
New Mexico MFA SFMR Series H, 5.45% due 1/1/2006 (Collateralized: FNMA/GNMA) | NR/AAA | 170,000 | 170,833 | |||||
New Mexico MFA SFMR Series H, 5.45% due 7/1/2006 (Collateralized: FNMA/GNMA) | NR/AAA | 175,000 | 177,492 | |||||
New Mexico MFA Single Family Series E2, 5.875% due 9/1/2020 | NR/AAA | 385,000 | 410,726 | |||||
New Mexico Mortgage Finance Multi Family Refunding Series B, 5.00% due 7/1/2031 put 7/1/2011 (Sombra Del Oso Apartments Project; Collateralized: FNMA) | Aaa/NR | 1,000,000 | 1,040,700 | |||||
New Mexico Mortgage Finance Multi Family Refunding Series C, 5.00% due 7/1/2031 put 7/1/2011 (Riverwalk Apartments Project; Collateralized: FNMA) | Aaa/NR | 1,910,000 | 1,987,737 | |||||
New Mexico Mortgage Finance Multi Family Refunding Series D, 5.00% due 7/1/2031 put 7/1/2011 (Tierra Pointe I Apartments Project; Collateralized: FNMA) | Aaa/NR | 2,785,000 | 2,898,350 | |||||
New Mexico Mortgage Finance Multi Family Series A, 6.05% due 7/1/2028 (Sandpiper Apartments Project; Insured: FHA) | NR/AAA | 2,335,000 | 2,510,242 | |||||
New Mexico State Highway Commission Revenue Infrastructure Senior Subordinated Lien C, 5.00% due 6/15/2012 | Aa2/AA+ | 1,000,000 | 1,078,030 | |||||
New Mexico State Highway Commission Tax Revenue Senior Subordinated Lien, 5.75% due 6/15/2009 | Aa2/AA+ | 1,095,000 | 1,192,006 | |||||
New Mexico State Highway Commission Tax Series A, 5.00% due 6/15/2010 (ETM) | Aa2/AA+ | 255,000 | 273,771 | |||||
New Mexico State Highway Commission Tax Series A, 5.00% due 6/15/2010 | Aa2/AA+ | 245,000 | 262,716 | |||||
New Mexico State Hospital Equipment Loan Council Hospital Revenue Series A, 4.80% due 8/1/2010 (Presbyterian Healthcare Project) | Aa3/AA- | 500,000 | 523,290 | |||||
New Mexico State Severance Tax, 5.00% due 7/1/2007 | Aa2/AA | 1,475,000 | 1,525,194 | |||||
New Mexico State Severance Tax Refunding Series A, 5.00% due 7/1/2007 | Aa2/AA | 1,645,000 | 1,700,979 | |||||
New Mexico State Severance Tax Refunding Series A, 5.00% due 7/1/2008 | Aa2/AA | 675,000 | 697,154 | |||||
18 | Certified Annual Report |
| SCHEDULE OF INVESTMENTS, CONTINUED | ||
| Thornburg New Mexico Intermediate Municipal Fund | September 30, 2005 | |
Issuer-Description | Credit Rating† Moody’s/S&P | Principal Amount | Value | |||||
New Mexico State Severance Tax Refunding Series A, 5.00% due 7/1/2009 | Aa2/AA | $ | 2,500,000 | $ | 2,656,000 | |||
New Mexico State Supplemental Severance Series A, 5.00% due 7/1/2011 pre-refunded 7/1/2007 | Aa3/A+ | 1,000,000 | 1,033,510 | |||||
New Mexico State University Revenues Refunding & Improvement, 4.00% due 4/1/2006 (Insured: FSA) | Aaa/AAA | 1,260,000 | 1,267,308 | |||||
New Mexico State University Revenues Refunding & Improvement, 5.00% due 4/1/2013 (Insured: FSA) | Aaa/AAA | 1,000,000 | 1,087,220 | |||||
New Mexico Supplemental Severance Series A, 5.00% due 7/1/2008 | Aa3/A+ | 5,000,000 | 5,155,450 | |||||
Puerto Rico Public Buildings Authority Revenue Refunding Government Facilities Series F, 5.25% due 7/1/2019 (Insured: XLCA) | Aaa/AAA | 1,000,000 | 1,121,030 | |||||
Rio Rancho Gross Receipts Tax, 5.00% due 6/1/2014 (Insured: FGIC) | Aaa/AAA | 955,000 | 1,038,410 | |||||
Rio Rancho Gross Receipts Tax, 5.00% due 6/1/2016 (Insured: FGIC) | Aaa/AAA | 555,000 | 601,431 | |||||
Rio Rancho Gross Receipts Tax, 5.00% due 6/1/2017 (Insured: FGIC) | Aaa/AAA | 1,110,000 | 1,197,302 | |||||
Rio Rancho Gross Receipts Tax, 5.00% due 6/1/2022 (Insured: FGIC) | Aaa/AAA | 1,000,000 | 1,058,900 | |||||
Rio Rancho Water & Wastewater System, 6.50% due 5/15/2006 (Insured: FSA) | Aaa/AAA | 1,000,000 | 1,022,280 | |||||
Rio Rancho Water & Wastewater System, 5.25% due 5/15/2007 (Insured:AMBAC) | NR/AAA | 1,695,000 | 1,755,257 | |||||
Ruidoso Municipal School District 3, 6.35% due 8/1/2006 (Insured: FSA) | Aaa/AAA | 250,000 | 257,230 | |||||
San Juan County Gasoline Tax/Motor Vehicle Revenue Refunding & Improvement, 5.25% due 5/15/2014 | A1/NR | 400,000 | 433,728 | |||||
San Juan County Gasoline Tax/Motor Vehicle Revenue Refunding & Improvement, 5.25% due 5/15/2022 | A1/NR | 1,725,000 | 1,833,951 | |||||
San Juan County Gross Receipts, 5.30% due 9/15/2009 | A1/NR | 410,000 | 428,876 | |||||
San Juan County Gross Receipts Refunding, 5.00% due 6/15/2014 (Insured: MBIA) | Aaa/AAA | 1,225,000 | 1,327,569 | |||||
San Juan County Gross Receipts Refunding, 5.00% due 6/15/2017 (Insured: MBIA) | Aaa/AAA | 1,370,000 | 1,471,257 | |||||
San Juan County Gross Receipts Tax Revenue Senior Series B, 5.50% due 9/15/2016 (Insured:AMBAC) | Aaa/AAA | 1,180,000 | 1,308,467 | |||||
San Juan County Gross Receipts Tax Revenue Subordinated Series A, 5.75% due 9/15/2021 (Insured:AMBAC) | Aaa/AAA | 1,000,000 | 1,119,020 | |||||
Sandoval County Incentive Payment, 4.25% due 12/1/2006 | NR/NR | 2,600,000 | 2,640,586 | |||||
Sandoval County Incentive Payment, 5.00% due 6/1/2020 | NR/A+ | 1,390,000 | 1,457,262 | |||||
Sandoval County Landfill Revenue Refunding & Improvement, 5.50% due 8/15/2015 | Baa2/NR | 1,420,000 | 1,488,771 | |||||
Sandoval County Landfill Revenue Refunding & Improvement, 5.75% due 8/15/2018 | Baa2/NR | 1,335,000 | 1,411,856 | |||||
Sandoval County Revenue Refunding Series B, 5.75% due 2/1/2010 (Intel Project) | NR/NR | 840,000 | 853,784 | |||||
Santa Fe County, 5.00% due 7/1/2007 (Insured: MBIA) | Aaa/NR | 640,000 | 649,523 | |||||
Santa Fe County, 5.00% due 7/1/2008 (Insured: MBIA) | Aaa/NR | 785,000 | 796,681 | |||||
Santa Fe County, 7.25% due 7/1/2029 (Rancho Viejo Improvement District Project) | NR/NR | 1,845,000 | 1,952,047 | |||||
Santa Fe County Correctional Systems Revenue, 5.20% due 2/1/2012 (Insured: FSA) | Aaa/AAA | 515,000 | 561,803 | |||||
Santa Fe County Correctional Systems Revenue, 5.00% due 2/1/2018 (Insured: FSA) | Aaa/AAA | 1,000,000 | 1,084,380 | |||||
Santa Fe County Revenue Series 1990, 9.00% due 1/1/2008 (Office & Training Facilities Project) (ETM) | NR/NR | 626,000 | 704,838 | |||||
Santa Fe County Revenue Series A, 5.50% due 5/15/2015 (El Castillo Retirement Project) | NR/BBB- | 1,250,000 | 1,268,900 | |||||
Santa Fe County Revenue Series A, 5.80% due 5/15/2018 (El Castillo Retirement Project) | NR/BBB- | 1,835,000 | 1,835,587 | |||||
Santa Fe Educational Facilities Revenue, 5.00% due 3/1/2007 (St. John’s College Project) | NR/BBB- | 200,000 | 203,286 | |||||
Santa Fe Educational Facilities Revenue, 5.10% due 3/1/2008 (St. John’s College Project) | NR/BBB- | 210,000 | 215,416 | |||||
Santa Fe Educational Facilities Revenue, 5.40% due 3/1/2017 (St. John’s College Project) | NR/BBB- | 1,215,000 | 1,228,098 | |||||
Santa Fe SFMR, 5.25% due 11/1/2005 (Collateralized: FNMA/GNMA) | Aaa/NR | 20,000 | 20,033 | |||||
Santa Fe SFMR, 6.00% due 11/1/2010 (Collateralized: FNMA/GNMA) | Aaa/NR | 85,000 | 87,712 | |||||
Santa Fe SFMR, 6.10% due 11/1/2011 (Collateralized: FNMA/GNMA) | Aaa/NR | 140,000 | 142,951 | |||||
Santa Fe SFMR, 6.20% due 11/1/2016 (Collateralized: FNMA/GNMA) | Aaa/NR | 140,000 | 140,238 | |||||
Santa Fe Solid Waste Management Agency Facility Revenue, 6.00% due 6/1/2006 | NR/NR | 775,000 | 788,888 | |||||
Santa Fe Solid Waste Management Agency Facility Revenue, 6.10% due 6/1/2007 | NR/NR | 875,000 | 912,441 | |||||
Santa Fe Utility Revenue Refunding Series A, 5.35% due 6/1/2011 (Insured:AMBAC) | Aaa/AAA | 1,230,000 | 1,261,107 | |||||
Taos County Gross Receipts County Education Improvement, 4.75% due 10/1/2012 | Baa1/NR | 1,500,000 | 1,514,235 | |||||
Taos Municipal School District 1 Refunding, 5.00% due 9/1/2008 (Insured: FSA) | Aaa/NR | 450,000 | 474,876 | |||||
University of New Mexico Hospital Mortgage Revenue Bonds, 5.00% due 1/1/2010 (Insured: FSA & FHA) | Aaa/AAA | 500,000 | 530,590 | |||||
| Certified Annual Report | 19 |
| SCHEDULE OF INVESTMENTS, CONTINUED | ||
| Thornburg New Mexico Intermediate Municipal Fund | September 30, 2005 | |
Issuer-Description | Credit Rating† Moody’s/S&P | Principal Amount | Value | |||||
University of New Mexico Hospital Mortgage Revenue Bonds, 5.00% due 7/1/2010 (Insured: FSA & FHA) | Aaa/AAA | $ | 1,855,000 | $ | 1,978,265 | |||
University of New Mexico Hospital Mortgage Revenue Bonds, 5.00% due 1/1/2012 (Insured: FSA & FHA) | Aaa/AAA | 500,000 | 536,540 | |||||
University of New Mexico Hospital Mortgage Revenue Bonds, 5.00% due 1/1/2020 (Insured: FSA & FHA) | Aaa/AAA | 2,310,000 | 2,435,387 | |||||
University of New Mexico Hospital Revenue Bonds, 5.00% due 1/1/2016 (Insured: FSA & FHA) | Aaa/AAA | 2,920,000 | 3,115,903 | |||||
University of New Mexico Revenue Hospital Mortgage, 5.00% due 1/1/2019 (Insured: FSA & FHA) | Aaa/AAA | 3,000,000 | 3,169,560 | |||||
University of New Mexico Revenue Refunding & Improvement Subordinated Lien Systems Series A, 5.25% due 6/1/2017 | Aa3/AA | 1,730,000 | 1,881,790 | |||||
University of New Mexico Revenue Refunding & Improvement Subordinated Lien Systems Series A, 5.25% due 6/1/2021 | Aa3/AA | 1,000,000 | 1,079,770 | |||||
University of New Mexico Revenue Refunding & Systems Improvement Subordinated Lien, 5.00% due 6/1/2015 (Insured:AMBAC) | Aaa/AAA | 1,590,000 | 1,730,079 | |||||
University of New Mexico Revenue Refunding Subordinated Lien, 5.25% due 6/1/2016 | Aa3/AA | 645,000 | 702,386 | |||||
University of New Mexico Revenue Refunding Subordinated Lien A, 5.25% due 6/1/2018 | Aa3/AA | 1,825,000 | 1,985,126 | |||||
University of New Mexico Revenue Refunding Subordinated Lien Systems Series A, 5.25% due 6/1/2015 | Aa3/AA | 1,195,000 | 1,308,453 | |||||
University of New Mexico Revenue Refunding Subordinated Lien Systems Series A, 5.25% due 6/1/2018 | Aa3/AA | 1,200,000 | 1,309,752 | |||||
University of New Mexico Revenue Series A, 5.25% due 6/1/2013 | Aa3/AA | 665,000 | 726,253 | |||||
University of New Mexico Revenue Series A, 5.25% due 6/1/2014 | Aa3/AA | 335,000 | 365,857 | |||||
University of New Mexico Revenue Series A, 6.00% due 6/1/2021 | Aa3/AA | 610,000 | 720,142 | |||||
Ventana West Public Improvement District Special Tax, 6.625% due 8/1/2023 | NR/NR | 2,000,000 | 2,121,140 | |||||
Villa Hermosa Multi Family Housing Revenue, 5.85% due 11/20/2016 (Collateralized: GNMA) | NR/AAA | 1,105,000 | 1,144,725 | |||||
TOTAL INVESTMENTS — 98.96% (Cost $ 222,342,578) | $ | 228,517,204 | ||||||
OTHER ASSETS LESS LIABILITIES — 1.04% | 2,395,078 | |||||||
NET ASSETS — 100.00% | $ | 230,912,282 | ||||||
Footnote Legend
See notes to financial statements.
| † | Credit ratings are unaudited. Rating changes may have occurred prior to or subsequent to the reporting period end. |
Portfolio Abbreviations
To simplify the listings of securities, abbreviations are used per the table below:
AMBAC | Insured by American Municipal Bond Assurance Corp. | |
ETM | Escrowed to Maturity | |
FGIC | Insured by Financial Guaranty Insurance Co. | |
FHA | Insured by Federal Housing Administration | |
FNMA | Collateralized by Federal National Mortgage Association | |
FSA | Insured by Financial Security Assurance Co. | |
GNMA | Insured by Government National Mortgage Co. | |
GO | General Obligation | |
MBIA | Insured by Municipal Bond Investors Assurance | |
MFA | Mortgage Finance Authority | |
RADIAN | Insured by Radian Asset Assurance | |
SFMR | Single Family Mortgage Revenue Bond | |
XLCA | Insured by XL Capital Assurance |
SUMMARY OF SECURITY CREDIT RATINGS†
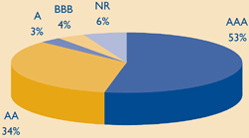
Ratings are a blend of Moody’s and Standard & Poor’s, using the higher rating. Some bonds are rated by only one service.
20 | Certified Annual Report |
REPORT OF INDEPENDENT REGISTERED PUBLIC ACCOUNTING FIRM
Thornburg New Mexico Intermediate Municipal Fund
To the Trustees and Shareholders of
Thornburg New Mexico Intermediate Municipal Fund
In our opinion, the accompanying statement of assets and liabilities, including the schedule of investments, and the related statements of operations and of changes in net assets and the financial highlights present fairly, in all material respects, the financial position of Thornburg New Mexico Intermediate Municipal Fund (one of the Portfolios constituting Thornburg Investment Trust, hereafter referred to as the “Fund”) at September 30, 2005, the results of its operations for the year then ended, the changes in its net assets for each of the two years in the period then ended and the financial highlights for each of the periods presented, in conformity with accounting principles generally accepted in the United States of America. These financial statements and financial highlights (hereafter referred to as “financial statements”) are the responsibility of the Fund’s management. Our responsibility is to express an opinion on these financial statements based on our audits. We conducted our audits of these financial statements in accordance with the standards of the Public Company Accounting Oversight Board (United States). Those standards require that we plan and perform the audit to obtain reasonable assurance about whether the financial statements are free of material misstatement. An audit includes examining, on a test basis, evidence supporting the amounts and disclosures in the financial statements, assessing the accounting principles used and significant estimates made by management, and evaluating the overall financial statement presentation. We believe that our audits, which included confirmation of securities at September 30, 2005 by correspondence with the custodian and brokers, provide a reasonable basis for our opinion.
PricewaterhouseCoopers LLP
New York, New York
November 16, 2005
| Certified Annual Report | 21 |
| EXPENSE EXAMPLE | ||
| Thornburg New Mexico Intermediate Municipal Fund | September 30, 2005 (Unaudited) | |
As a shareholder of the Fund, you incur two types of costs:
(1) transaction costs, including
(a) sales charges (loads) on purchase payments, for Class A Shares;
(b) a deferred sales charge on redemptions of any part or all of a purchase of $1 million of Class A shares within 12 months of purchase;
(2) ongoing costs, including management fees; distribution and/or service (12b-1) fees; and other Fund expenses.
This example is intended to help you understand your ongoing costs (in dollars) of investing in the Fund and to compare these costs with the ongoing costs of investing in other mutual funds.
The example is based on an investment of $1,000 invested on March 31, 2005 and held until September 30, 2005.
Actual Expenses
The first line of the table at right provides information about actual account values and actual expenses. You may use the information in this line, together with the amount you invested, to estimate the expenses that you paid over the period. Simply divide your account value by $1,000 (for example, an $8,600 account value divided by $1,000 = 8.6), then multiply the result by the number in the first line under the heading entitled “Expenses Paid During Period” to estimate the expenses you paid on your account during this period.
Hypothetical Example for Comparison Purposes
The second line of the table at right provides information about hypothetical account values and hypothetical expenses based on the Fund’s actual expense ratio and an assumed rate of return of 5% per year before expenses, which is not the Fund’s actual return. The hypothetical account values and expenses may not be used to estimate the actual ending account balance or expenses you paid for the period. You may use this information to compare the ongoing costs of investing in the Fund and other funds. To do so, compare this 5% hypothetical example with the 5% hypothetical examples that appear in the shareholder reports of the other funds.
Please note that the expenses shown in the table are meant to highlight your ongoing costs only and do not reflect any transactional costs, such as sales charges (loads), redemption fees, or exchange fees. Therefore, the second line of the table is useful in comparing ongoing costs only, and will not help you determine the relative total costs of owning different funds. In addition, if these transactional costs were included, your costs would have been higher.
| Beginning Account Value 3/31/05 | Ending Account Value 9/30/05 | Expenses Paid During Period† 3/31/05-9/30/05 | |||||||
Class A Shares | |||||||||
Actual | $ | 1,000 | $ | 1,019.40 | $ | 4.90 | |||
Hypothetical* | $ | 1,000 | $ | 1,020.22 | $ | 4.90 | |||
Class D Shares | |||||||||
Actual | $ | 1,000 | $ | 1,018.80 | $ | 6.29 | |||
Hypothetical* | $ | 1,000 | $ | 1,018.84 | $ | 6.29 | |||
| † | Expenses are equal to the annualized expense ratio for each class (A: 0.97% and D: 1.24%) multiplied by the average account value over the period, multiplied by 183/365 to reflect the one-half year period. |
| * | Hypothetical assumes a rate of return of 5% per year before expenses. |
22 | Certified Annual Report |
| INDEX COMPARISON | ||
| Thornburg New Mexico Intermediate Municipal Fund | September 30, 2005 (Unaudited) | |
GROWTH OF A HYPOTHETICAL $10,000 INVESTMENT
Thornburg New Mexico Intermediate Municipal Fund Class A Total Returns, versus
Merrill Lynch 7-12 Year Municipal Bond Index and Consumer Price Index
(June 30, 1991 to September 30, 2005)
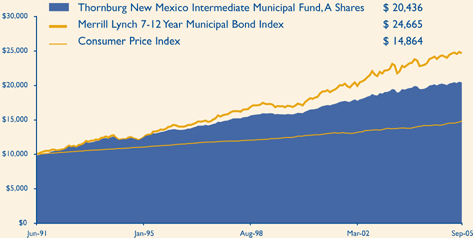
AVERAGE ANNUAL TOTAL RETURNS
For the periods ended September 30, 2005 (with sales charge)
| 1 Yr | 5 Yrs | 10 Yrs | Since Inception | |||||||||
A Shares (Incep: 6/18/91) | (0.13 | )% | 3.98 | % | 4.19 | % | 5.14 | % | ||||
D Shares (Incep: 6/1/99) | 1.62 | % | 4.13 | % | N/A | 3.78 | % |
FUND ATTRIBUTES
as of September 30, 2005
| Annualized Dist. Rate (@NAV) | SEC Yield | NAV | Maximum Offering Price | |||||||||
A Shares (Incep: 6/18/91) | 3.26 | % | 2.73 | % | $ | 13.22 | $ | 13.49 | ||||
D Shares (Incep: 6/1/99) | 2.99 | % | 2.51 | % | $ | 13.23 | $ | 13.23 | ||||
Performance data reflect past performance, which is no guarantee of future results. The performance data and graph do not reflect the deduction of taxes that a shareholder would pay on distributions or the redemption of Fund shares.
Returns reflect the reinvestment of dividends and capital gains, as well as applicable sales charges. Class A Shares are sold with a maximum sales charge of 2.00%. There is no up front sales charge for Class D Shares and no contingent deferred sales charge (CDSC).
The Consumer Price Index (“CPI”) measures prices of a fixed basket of goods bought by a typical consumer, including food, transportation, shelter, utilities, clothing, medical care, entertainment and other items. The CPI, published by the Bureau of Labor Statistics in the Department of Labor, is based at 100 in 1982 and is released monthly. It is widely used as a cost-of-living benchmark to adjust Social Security payments and other payment schedules, union contracts and tax brackets. The CPI is also known as the cost-of-living index.
The Merrill Lynch 7-12 Year Municipal Bond Index represents a broad measure of market performance. It is a model portfolio of municipal obligations throughout the U.S., with an average maturity which ranges from seven to twelve years.
Unless otherwise noted, index returns reflect the reinvestment of income dividends and capital gains, if any, but do not reflect fees, brokerage commissions or other expenses of investing. Investors may not make direct investments into any index.
The SEC Yield is computed in accordance with SEC standards measuring the net investment income per share over a specified 30-day period expressed as a percentage of the maximum offering price of the Funds’ shares at the end of the period.
The distribution rate is calculated by taking the sum of the month’s total distribution factors and dividing this sum by a 30-day period and annualizing to 360-day year. The value is then divided by the ending Net Asset Value (NAV) to arrive at the annualized distribution yield. The yield is calculated on a periodic basis and is subject to change depending on the Fund’s NAV and current distributions.
| Certified Annual Report | 23 |
| TRUSTEES AND OFFICERS | ||
| Thornburg New Mexico Intermediate Municipal Fund | September 30, 2005 (Unaudited) | |
Name, Age, Position Held with Fund Year Elected | Principal Occupation(s) During Past Five Years | Other Directorships Held by Trustee | ||
| INTERESTED TRUSTEES(1)(2)(4) | ||||
| Garrett Thornburg, 59 Chairman of Trustees, Trustee since 1987(3) | CEO, Chairman and controlling shareholder of Thornburg Investment Management, Inc. (investment advisor) and Thornburg Securities Corporation (securities dealer); Chairman of Thornburg Limited Term Municipal Fund, Inc. (registered investment company) to 2004; CEO and Chairman of Thornburg Mortgage, Inc. (real estate investment trust); Chairman of Thornburg Mortgage Advisory Corporation (investment manager to Thornburg Mortgage, Inc.). | Director of Thornburg Mortgage, Inc. (real estate investment trust) | ||
| Brian J. McMahon, 49 Trustee since 2001, Member of Governance & Nominating Committee, President since 1997(5)(6) | President and Managing Director of Thornburg Investment Management, Inc.; President of Thornburg Limited Term Municipal Fund, Inc. to 2004. | None | ||
| INDEPENDENT TRUSTEES(1)(2)(4) | ||||
David A. Ater, 60 Trustee since 1994, Member of Audit Committee and Governance & Nominating Committee | Principal in Ater & Associates, Santa Fe, NM (developer, planner and broker of residential and commercial real estate); owner developer and broker for various real estate projects. | Director of Thornburg Mortgage, Inc. (real estate investment trust) | ||
| David D. Chase, 64 Chairman of Audit Committee, Trustee since 2000 | Chairman, President, CEO, and Managing Member of Vestor Associates, LLC, the general partner of Vestor Partners, LP, Santa Fe, NM (private equity fund); Chairman and CEO of Vestor Holdings, Inc., Santa Fe, NM (merchant bank). | None | ||
Eliot R. Cutler, 59 Chairman of Governance & Nominating Committee, Trustee since 2004 | Partner, Akin, Gump, Strauss, Hauer & Feld, LLP, Washington, D.C. (law firm) since November 2000; partner, Cutler & Stanfield, Washington, D.C. (law firm) until November 2000. | Director of Thornburg Mortgage, Inc. (real estate investment trust) | ||
Susan H. Dubin, 56 Trustee since 2004, Member of Audit Committee | President of Dubin Investments, Ltd., Greenwich, CT (private investment fund); Director and officer of various charitable organizations; and formerly, Vice President of Chemical Bank (predecessor to JP Morgan Chase & Co.), New York, 1974–1996. | None | ||
Owen D. Van Essen, 51 Trustee since 2004, Member of Governance & Nominating Committee | President of Dirks, Van Essen & Murray, Santa Fe, NM (newspaper mergers and acquisitions). | None | ||
James W. Weyhrauch, 46 Trustee since 1996, Member of Audit Committee | Director, Executive Vice President to 2002, and President and CEO 2002–2004, Nambé Mills, Inc., Santa Fe, NM (manufacturer); real estate agent, Santa Fe Properties, Santa Fe, NM since 2004. | None | ||
24 | Certified Annual Report |
| TRUSTEES AND OFFICERS, CONTINUED | ||
| Thornburg New Mexico Intermediate Municipal Fund | September 30, 2005 (Unaudited) | |
Name, Age, Position Held with Fund Year Elected | Principal Occupation(s) During Past Five Years | Other Directorships Held by Trustee | ||
| OFFICERS OF THE FUND (WHO ARE NOT TRUSTEES)(1)(6)(7) | ||||
Dawn B. Fischer, 58 Secretary since 1987 | Secretary and Managing Director, Thornburg Investment Management, Inc.; Secretary, Thonburg Limited Term Municipal Fund, Inc. to 2004; Secretary, Thornburg Securities Corporation; Vice President, Daily Tax Free Income Fund, Inc. (registered investment company). | Not applicable | ||
Steven J. Bohlin, 46 Vice President since 1987; Treasurer since 1989 | Vice President and Managing Director of Thornburg Investment Management, Inc.; Vice President of Thornburg Limited Term Municipal Fund, Inc. to 2004. | Not applicable | ||
George T. Strickland, 42 Vice President since 1996 | Vice President and Managing Director of Thornburg Investment Management, Inc.; Vice President (to 2004) and Treasurer (2003–2004) of Thornburg Limited Term Municipal Fund, Inc. | Not applicable | ||
William V. Fries, 66 Vice President since 1995 | Vice President and Managing Director of Thornburg Investment Management, Inc. | Not applicable | ||
Leigh Moiola, 38 Vice President since 2001 | Vice President and Managing Director of Thornburg Investment Management, Inc.; Vice President of Thornburg Limited Term Municipal Fund, Inc. 1999–2004. | Not applicable | ||
Kenneth Ziesenheim, 51 Vice President since 1995 | Vice President and Managing Director of Thornburg Investment Management, Inc.; President of Thornburg Securities Corporation; Vice President of Thornburg Limited Term Municipal Fund, Inc. to 2004. | Not applicable | ||
Alexander Motola, 35 Vice President since 2001 | Vice President and Managing Director of Thornburg Investment Management, Inc. since 2000; Portfolio Manager, Insight Capital Research & Management, Inc., Walnut Creek, California 1995–2000. | Not applicable | ||
Wendy Trevisani, 34 Vice President since 1999 | Associate Portfolio Manager of Thornburg Investment Management, Inc. since 1999, Vice President since 2000 and Managing Director since 2003; Vice President of Thornburg Limited Term Municipal Fund, Inc. 1999–2002. | Not applicable | ||
Joshua Gonze, 42 Vice President since 1999 | Associate Portfolio Manager of Thornburg Investment Management, Inc. since 1999, Vice President since 1999 and Managing Director since 2003; Vice President of Thornburg Limited Term Municipal Fund, Inc. to 2004. | Not applicable | ||
Brad Kinkelaar, 37 Vice President since 1999 | Associate Portfolio Manager of Thornburg Investment Management, Inc. since 1999, Vice President since 2000 and Managing Director since 2003. | Not applicable | ||
Christopher Ihlefeld, 35 Vice President since 2003 | Associate Portfolio Manager since 1999; Vice President of Thornburg Investment Management, Inc. since 2002; Vice President of Limited Term Municipal Fund, Inc., 2003–2004. | Not applicable | ||
Leon Sandersfeld, 39 Vice President since 2003 | Associate of Thornburg Investment Management, Inc. since 2002; Senior Staff Accountant, Farm Bureau Life Insurance Co. 1998–2002. | Not applicable | ||
| Certified Annual Report | 25 |
| TRUSTEES AND OFFICERS, CONTINUED | ||
| Thornburg New Mexico Intermediate Municipal Fund | September 30, 2005 (Unaudited) | |
Name, Age, Position Held with Fund Year Elected | Principal Occupation(s) During Past Five Years | Other Directorships Held by Trustee | ||
Sasha Wilcoxon, 31 Vice President since 2003 | Associate of Thornburg Investment Management, Inc. since 2000 and Mutual Fund Operations Department Manager since 2002. | Not applicable | ||
Ed Maran, 47 Vice President since 2004 | Associate Portfolio Manager of Thornburg Investment Management, Inc. since 2002 and Vice President and Managing Director since 2004; Analyst, USAA 2001–2002; Oil Analyst, A.G. Edwards 1997–2000. | Not applicable | ||
Vinson Walden, 35 Vice President since 2004 | Associate Portfolio Manager of Thornburg Investment Management, Inc. since 2002 and Vice President and Managing Director since 2004; Associate Portfolio Manager, Ibis Management 2002–2004; Associate, Lehman Brothers, 1997–2001. | Not applicable | ||
| (1) | Each person’s address is 119 East Marcy Street, Santa Fe, New Mexico 87501. |
| (2) | The Fund is one of twelve separate investment “Funds” or “series” of Thornburg Investment Trust (the “Trust”), which comprises the Thornburg mutual fund complex and is organized as a Massachusetts business trust. The Trust currently has twelve active Funds. Thornburg Investment Management, Inc. is the investment advisor to, and manages, the twelve Funds of the Trust. Each Trustee oversees the twelve Funds in the fund complex. |
| (3) | Mr. Thornburg is considered an “interested” Trustee under the Investment Company Act of 1940 because he is a director and controlling shareholder of Thornburg Investment Management, Inc., the investment advisor to the twelve active Funds of the Trust, and is the sole director and controlling shareholder of Thornburg Securities Corporation, the distributor of shares for the Trust. |
| (4) | Each Trustee serves in office until the election and qualification of a successor. |
| (5) | Mr. McMahon is considered an “interested” Trustee because he is the president of Thornburg Investment Management, Inc. |
| (6) | The Trust’s president, secretary and treasurer each serves a one-year term or until the election and qualification of a successor; each other officer serves at the pleasure of the Trustees. |
| (7) | Assistant vice presidents, assistant secretaries and assistant treasurers are not shown. |
The Statement of Additional Information for each Fund of the Trust includes additional information about the Trustees and is available, without charge and upon request, by calling 1-800-847-0200.
26 | Certified Annual Report |
| OTHER INFORMATION | ||
| Thornburg New Mexico Intermediate Municipal Fund | September 30, 2005 (Unaudited) | |
PORTFOLIO PROXY VOTING
Policies and Procedures:
The Trust has delegated to Thornburg Investment Management, Inc. (the “Advisor”) voting decisions respecting proxies for the Fund’s voting securities. The Advisor makes voting decisions in accordance with its Proxy Voting Policy and Procedures. A description of the Policy and Procedures is available (i) without charge, upon request, by calling the Advisor toll-free at 1-800-847-0200, (ii) on the Thornburg website at www.thornburg.com, and (iii) on the Securities and Exchange Commission’s website at www.sec.gov.
Commencing August 31, 2004, information regarding how proxies were voted is available on or before August 31 of each year for the twelve months ending the preceding June 30. This information is available (i) without charge, upon request by calling the Advisor toll-free at 1-800-847-0200, (ii) on the Thornburg website at www.thornburg.com, and (iii) on the Securities and Exchange Commission’s website at www.sec.gov.
TAX INFORMATION
For the fiscal year ended September 30, 2005, 100% of dividends paid by the Fund are tax exempt dividends for Federal Income Tax purposes. The information and distributions reported herein may differ from the information and distributions taxable to the shareholders for the calendar year ending December 31, 2005.
AVAILABILITY OF QUARTERLY PORTFOLIO SCHEDULE
The Fund files with the Securities and Exchange Commission schedules of its portfolio holdings on Form N-Q for the first and third quarters of each fiscal year. The Fund’s Forms N-Q are available on the Commission’s website at www.sec.gov, or may be reviewed and copied at the Commission’s Public Reference Room in Washington, D.C. Information on the operation of the Public Reference Room may be obtained by calling 1-800-SEC-0330. The Fund also makes this information available on its website at www.thornburg.com/download or upon request by calling 1-800-847-0200.
TRUSTEES DELIBERATIONS RESPECTING RENEWAL OF INVESTMENT ADVISORY AGREEMENT
Thornburg Investment Management, Inc. (the “Advisor”) provides investment management services to Thornburg New Mexico Intermediate Municipal Fund pursuant to an investment advisory agreement. The Trustees consider the renewal of this agreement annually and most recently determined to renew the agreement on September 13, 2005.
In connection with their general supervision of the Advisor, the Trustees receive and consider reports throughout the year from the Advisor respecting the Advisor’s management of the Fund’s investments. These reports include information about the Fund’s purchase and sale of portfolio investments and explanations from the Advisor respecting investment selections, the investment performance of the Fund, general appraisals of industry and economic prospects and factors, and other matters affecting the Fund and relating to the Advisor’s performance of services for the Fund.
In anticipation of their recent consideration of the advisory agreement’s renewal, the independent Trustees met with representatives of the Advisor in May and July 2005 to specify the information the Advisor would present to the Trustees for their review. The independent Trustees thereafter met in independent session to consider various factors respecting the agreement’s renewal, and met in a subsequent session with the Advisor’s chief investment officer to present questions. Following these sessions, the Trustees met on September 13, 2005 to consider a renewal of the advisory agreement.
The Trustees considered various factors in their review of the Advisor’s performance under the investment advisory agreement, including specifically the principles outlined in their February 2005 Statement to Shareholders, a copy of which accompanies this Annual Report to Shareholders. Summarized below are certain of the factors considered by the Trustees, in connection with the determination to renew the advisory agreement. In determining to renew the advisory agreement, the Trustees did not identify any single fact or aspect of the Advisor’s performance as controlling, and this summary does not describe all of the matters considered by the Trustees in making their determination.
Quality of Services; Fund Investment Performance. In reviewing the nature, extent, and quality of services provided by the Advisor and the investment performance of the Fund, the Trustees primarily considered the Advisor’s adherence to the Fund’s stated objectives and policies, the Advisor’s execution of the Fund’s investment strategies in prevailing market conditions, the Fund’s absolute investment performance, the Fund’s investment performance compared to categories of other single state fixed income mutual funds, the Fund’s investment performance over different periods of time, the Fund’s total returns in rising and declining markets compared to total returns of a category of generally similar mutual funds and a broad based securities index, comparative measures of portfolio risk and share price volatility, and related factors. The Trustees noted that bond indices have limited utility in evaluating fixed income mutual funds. In conducting their review, the Trustees observed that the Advisor had continued to faithfully pursue and to achieve the Fund’s stated objectives, as demonstrated particularly by the Advisor’s selection of investments in a small single state market with unusual characteristics and the Fund’s investment performance. The Trustees noted in this regard the Fund’s average or better investment performance and lower share price volatility as compared to a category of single state mutual funds assembled by an independent mutual fund analyst firm. The Trustees also noted that categories of single state fixed income mutual funds selected from a variety
| Certified Annual Report | 27 |
| OTHER INFORMATION, CONTINUED | ||
| Thornburg New Mexico Intermediate Municipal Fund | September 30, 2005 (Unaudited) | |
of states are only roughly comparable to the Fund due to the Fund’s laddered portfolio and investments in a relatively small and unique market.
The Trustees also considered a number of other factors in reviewing the quality of the Advisor’s services, including the qualifications and integrity of the Advisor’s senior personnel, the Advisor’s staffing and other resources, the Advisor’s compliance with regulatory requirements, Fund sales performance and perceptions of the Funds in the marketplace, and other factors.
The Trustees concluded, based upon these and other considerations, that the Advisor had actively and competently pursued the Fund’s stated investment objectives in accordance with the Fund’s investment policies stated in its prospectuses. The Trustees further concluded that the investment performance of the Fund was satisfactory in the context of the Fund’s objectives and policies and prevailing market conditions.
Fees and Expenses; Profitability of Advisor. In reviewing the fees charged by the Advisor to the Fund, the Trustees primarily considered the fees charged by the Advisor and the other expenses charged to the Fund in light of the nature and quality of services provided, comparison of the actual Advisor’s fee and Fund expenses to the statement of fees and expenses in the Fund’s prospectuses, comparisons of the Advisor’s fee and other Fund expenses to median and average fees and expenses charged to similar mutual funds, and comparisons of fees and expenses charged to the Fund with fees and expenses charged to other, similar specific mutual funds. In addition, the Trustees considered the profitability of the Advisor compared to other investment management firms, and compared the investment management fee rates charged by the Advisor to the Fund with rates charged to other clients of the Advisor and the differing types of services furnished to the Fund and the other clients. The Trustees noted that the overall expenses for the Fund were somewhat higher than average and median expenses for a group of single state fixed income mutual funds, and that the management fee was somewhat higher than the median fee for the same group of funds, but that the differences were not notable in view of the size of the Fund and the other factors considered. The Trustees further noted in this regard that the management fee charged to the Fund was comparable to the average management fees for the same group of single state mutual funds. The Trustees observed in their review that fee rates charged by the Advisor to other clients of the Advisor were not directly comparable to rates charged to the Fund principally because of the significant differences in the services provided.
The Trustees concluded, based upon these and other considerations, that the fees charged to the Fund by the Advisor were fair and reasonable in view of the following: the services provided, the clear disclosure of these fees and expenses in the Fund’s prospectuses, and prevailing fees and expenses charged to mutual funds generally. The Trustees further concluded that there was no indication that the Advisor’s profitability was unusual, viewed in the context of the services provided, the performance of the Fund, and the fees and profitability of other investment management firms.
Economies of Scale. In reviewing the extent to which economies of scale would be realized by the Fund as it grows and whether fee levels reflect economies of scale, the Trustees considered the breakpoint structure for advisory fees chargeable to the Fund, the demonstrated economies of scale enjoyed by other Funds of the Trust as they had grown in size, and economies of scale realized by other mutual funds. The Trustees concluded that the Fund may reasonably be expected to realize economies of scale for the benefit of its shareholders as it grows in size.
Ancillary Benefits to Advisor. In reviewing benefits enjoyed by the Advisor because of its relationship with the Fund, the Trustees considered an arrangement through which the Advisor received certain research services, favorable publicity received by the Advisor because of the superior investment performance of certain Funds of the Trust, and the benefits to the Fund from the Advisor’s expansion of its staffing and other resources to serve a broader variety of investment clients. The Trustees concluded, based upon these and other considerations, that there was no unusual or unfair benefit enjoyed by the Advisor, and that the Fund enjoyed benefits by virtue of the Advisor’s engagement by other investment clients.
28 | Certified Annual Report |
Trustees’ Statement to Shareholders
Not part of the Certified Annual Report
February 8, 2005
The Trustees are concerned that recent commentaries and opinions reported in the media may confuse investors in general as to the supervisory duties of trustees of mutual funds and, in particular, leave Thornburg Investment Trust shareholders uncertain regarding how we discharge our responsibilities in supervising the Funds’ investment advisor and in reviewing the advisor’s contract for renewal. We decided to spell out clearly three principal guidelines that we follow in supervising the Trust’s investment advisor on your behalf.
We begin with the premise that each shareholder selected his or her Fund because its investments are managed by the investment advisor identified in the prospectus and in accordance with the objective and policies described in the prospectus. We realize, as each of you do, that if you believe that your Fund’s stated objective and policies no longer serve your personal investment goals, you can sell your shares and leave the Fund.
Therefore, we believe that our primary supervisory task – our principal obligation to you – is to assess the nature and quality of the advisor’s services, and to confirm that the advisor actively and competently pursues the Fund’s objective, in accordance with the policies set out in the prospectus. To do this, we meet regularly with management to review your Fund’s portfolio and to discuss the advisor’s specific actions and judgments in pursuing the Fund’s objective. We do not substitute our own judgment for the advisor’s decisions in selecting investments; the advisor is paid to exercise its informed judgment on investment decisions, and we seek to confirm, in reviewing the advisor’s performance, that the advisor is doing just that.
Second, while we are conscious of costs and the effect that costs have on shareholders’ returns, we do not seek the lowest fees or expense ratio as our sole or primary objective. We try to make sure that your Fund’s fees and costs are reasonable in relationship to the services rendered and that they are generally in line with those charged by other expert investment advisors, consistent with our belief that the Fund’s investors searched for and expect that expertise and attention and have decided to pay a reasonable price for it. We do not put the management contract “out to bid” as a matter of course, and we would not do so unless we had concluded that the advisor materially had failed to pursue the Fund’s objectives in accordance with its policies, or for other equally important reasons. We believe that any other approach would be inconsistent with your interests and contrary to your expectations when you bought shares of the Fund in the first place.
Finally, because we believe that most Thornburg Fund shareholders have invested with a long-term perspective, we try not to focus too much on the fashions of the moment and on short-term performance. The market will not favor any specific investment objective or set of policies at all times and under all economic circumstances. A fund will experience periods of both high and low returns relative to other funds and other investments. Even if one of our Funds is not favored by the market at a particular time, we believe that the advisor is nonetheless obliged to remain true to the Fund’s objective and policies, and we watch to see that it does so.
This statement is submitted for the general information of the shareholders of Thornburg Investment Trust. It is not authorized for distribution to prospective investors in the Fund unless preceded or accompanied by an effective prospectus. If you have not received a prospectus, one can be obtained from your financial advisor, online at www.thornburg.com/download, or by calling 800-847-0200. Carefully consider information in the prospectus regarding the Fund’s investment objectives and policies, risks, sales charges, expenses, experience of its management, marketability of shares, and other information. Read it carefully before you invest or send money.
| This page is not part of the Annual Report. | 29 |
This page intentionally left blank.
30 | This page is not part of the Annual Report. |
Planning Options
Retirement and Education Accounts
Thornburg Investment Management offers retirement and education savings accounts that can help you meet a variety of planning challenges. For account applications or further information on any of the accounts below, please call 1-800-847-0200 or go to www.thornburg.com/ira. Your financial advisor can help you determine which plan is right for you.
Individual Retirement Accounts
Individual Retirement Accounts (IRAs) provide a tax-advantaged means to save money for the future. For a detailed outline of the difference between retirement accounts, see www.thornburg.com/ira. Rollovers are available. Call 1-800-847-0200 for more information.
Traditional IRAs – Contributions to Traditional IRAs are tax deductible for eligible individuals, and withdrawals are taxed as additional ordinary income. You may contribute to an IRA if you receive compensation and are under 701/2, even if you are covered by an employer retirement plan.
Roth IRAs – Under a Roth IRA, there is no tax deduction for contributions, but there is no income tax on qualified withdrawals. For a more detailed comparison of Traditional and Roth IRAs, please see our web site at www.thornburg.com/ira.
SEP IRAs – Simplified Employee Pension (SEP) IRAs are established by employers. The employer is allowed a tax deduction for contributions made to the SEP Plan and makes contributions to each eligible employee’s SEP IRA on a discretionary basis.
SIMPLE IRAs – Savings Incentive Match Plan for Employees of Small Employers (SIMPLE) is designed to give small business owners a simplified method to establish and contribute to a retirement plan for employees. The employer is allowed a tax deduction for contributions and makes either matching or non-elective contributions to each eligible employee’s SIMPLE IRA. Employees may make salary deferral contributions.
403(b)
A special, tax-advantaged savings vehicle available only to employees of 501(c)(3) organizations, such as charitable, educational, scientific and religious organizations. 403(b) plans are also available to employees of public schools and universities.
Coverdell Education Savings Account
These savings accounts are designed to provide a way to save money for higher education expenses. In an Education Savings Account, earnings and interest grow tax free, and qualified withdrawals used to pay for eligible higher-education expenses are tax- and penalty-free.
Funds Available
The following funds are available in the accounts listed above:
| • | Thornburg International Value Fund |
| • | Thornburg Value Fund |
| • | Thornburg Core Growth Fund |
| • | Thornburg Investment Income Builder Fund |
| • | Thornburg Limited Term U.S. Government Fund |
| • | Thornburg Limited Term Income Fund |
| This page is not part of the Annual Report. | 31 |
The Firm
Thornburg Investment Management® is a privately held investment management company based in Santa Fe, New Mexico with assets under management of over $16 billion. Founded in 1982, the firm manages four equity funds, eight bond funds, and separate portfolios for select institutions and individuals.
Investment Philosophy
We seek to preserve and increase the real wealth of the Funds’ shareholders after accounting for inflation, taxes, and investment expenses. We’re committed to disciplined investing and controlling risk in all market environments through laddered bond and focused equity portfolios.
Portfolio Holdings Disclosure
We believe you should know about your portfolio. Our web site keeps investors informed of the Funds’ equity holdings. Go to www.thornburg.com/funds for commentary on our equity fund holdings.
Co-Ownership of Funds
We invest side-by-side with the Funds’ shareholders. Our employees have invested over $110 million in Thornburg Funds.
Core Strategies for Building Wealth
We deliver core strategies to help investors meet long-term goals. A core strategy is a consistent, disciplined and proven investment process that represents the foundation of a diversified portfolio.
| Investment Manager: | Distributor: | |||||
 |  | |||||
| 119 East Marcy Street | 119 East Marcy Street | |||||
| Santa Fe, New Mexico 87501 | Santa Fe, New Mexico 87501 | |||||
| 800.847.0200 | 800.847.0200 | |||||

Core Strategies for Building Wealth
Thornburg Florida Intermediate Municipal Fund
Annual Report – September 30, 2005
This report is submitted for the general information of shareholders of the Fund. It is not authorized for distribution to prospective investors in the Fund unless preceded or accompanied by an effective prospectus. If you have not received a prospectus, one can be obtained from your financial advisor, online at www.thornburg.com/download, or by calling 800-847-0200. Carefully consider information in the prospectus regarding the Fund’s investment objectives and policies, risks, sales charges, expenses, experience of its management, market ability of shares, and other information. Read it carefully before you invest or send money. Performance data quoted represents past performance and does not guarantee future results.
Thornburg Florida Intermediate Municipal Fund
Laddering – an All Weather Strategy
The Fund’s investment objective is to obtain as high a level of current income exempt from Federal income tax as is consistent with preservation of capital.
The Fund offers Florida investors double tax-free yields (may be subject to Alternative Minimum Tax) in a laddered municipal bond portfolio with an average maturity of ten years or less. Laddering involves building a portfolio of bonds with staggered maturities so that a portion of the portfolio matures each year; cash from maturing bonds, if not needed for other purposes, is invested in bonds with longer maturities at the far end of the ladder. The strategy is a good compromise for managing different types of risk.
Thornburg Bond Funds
| • | Thornburg Limited Term Municipal Fund |
| • | Thornburg Intermediate Municipal Fund |
| • | Thornburg California Limited Term Municipal Fund |
| • | Thornburg New Mexico Intermediate Municipal Fund |
| • | Thornburg Florida Intermediate Municipal Fund |
| • | Thornburg New York Intermediate Municipal Fund |
| • | Thornburg Limited Term U.S. Government Fund |
| • | Thornburg Limited Term Income Fund |
Thornburg invests in short- and intermediate-term investment grade bonds. We ladder the maturities of individual bonds in the portfolios to moderate risk. Laddering involves building a portfolio of bonds with staggered maturities so that a portion of the portfolio will mature each year. We apply this disciplined process in all interest rate environments.
Thornburg Equity Funds
| • | Thornburg Value Fund |
| • | Thornburg International Value Fund |
| • | Thornburg Core Growth Fund |
| • | Thornburg Investment Income Builder Fund |
Thornburg’s equity research uses a fundamental, yet comprehensive, analytical approach. We invest when and where we perceive compelling value. Thornburg equity funds focus on a limited number of securities so that each holding can impact performance. The equity team searches for firms believed to have a promising future and seeks to buy shares of those companies at a discount to their intrinsic value.
More information at www.thornburg.com
 | Reduce paper clutter. | |
| Receive your shareholder reports and prospectus online instead of through traditional mail. | ||
Sign up at | ||
| www.thornburg.com/edelivery |
2 This page is not part of the Annual Report. |
Message
from the Chairman

Garrett Thornburg
Chairman & CEO
November 10, 2005
Dear Fellow Shareholder:
Thornburg Investment Management has a clear mission: to preserve and increase the real wealth of our shareholders. We aspire to accomplish this through a family of laddered bond funds that focus on quality, stability, and minimization of risk over time, and through a range of equity funds that redefine traditional measures of value and growth.
Our bond funds have always been managed using the highly disciplined approach of laddering short and intermediate bond maturities, seeking to provide both an attractive return and stability of principal. All of the bond funds buy only investment-grade securities. We have found this strategy to be the best at managing both interest-rate risk and credit risk, and we believe this strategy has served our shareholders well over time.
The bond funds are managed by portfolio managers who have many years of experience. We are proud of this consistency and experience and look forward to many more successful years with them at the helm.
In years past, there has been news about improper behavior by some mutual fund companies. Many new rules proposed in response to this scandal have called for increased transparency. We welcome increased transparency. Thornburg Investment Management has been a leader in providing information about our stock holdings and bond strategies to our shareholders on our web site, www.thornburg.com.
Unfortunately, some of the new rules will increase the cost to all shareholders in mutual funds. We will do our best to keep these expenses to a minimum. After all, we are shareholders too, and Thornburg employees have over $110 million invested in our own funds.
Thank you for investing with us. We will do our best to continue to earn your trust everyday.
Sincerely, |
 |
| Garrett Thornburg |
| Chairman & CEO |
| This page is not part of the Annual Report. 3 |

Thornburg Florida Intermediate Municipal Fund
September 30, 2005
| 6 | ||
| 8 | ||
| 9 | ||
| 10 | ||
| 11 | ||
| 14 | ||
| 15 | ||
| 18 | ||
| 19 | ||
| 20 | ||
| 21 | ||
| 24 | ||
This report is certified under the Sarbanes-Oxley Act of 2002 , which requires that public companies, including mutual funds, affirm that the information provided in their annual and semiannual shareholder reports fully and fairly represents their financial position.
4 Certified Annual Report |
Important Information
Performance data quoted represents past performance and does not guarantee future results. Investment return and principal value will fluctuate so that upon redemption, investor’s shares may be worth more or less than their original cost. Current performance may be lower or higher than the data quoted. For performance data current to the most recent month end, visit www.thornburg.com.
The maximum sales charge for Class A Shares is 2.00%.
Performance data given at net asset value (NAV) does not take into account these sales charges. If the sales charges had been included, the performance would have been lower.
Shares in the Fund carry risks, including possible loss of principal. As with direct bond ownership, funds that invest in bonds are subject to certain risks including interest-rate risk, credit risk, and inflation risk. The principal value of bond funds will fluctuate relative to changes in interest rates, decreasing when interest rates rise. Unlike bonds, bond funds have ongoing fees and expenses. Shares in the Fund are not deposits or obligations of, or guaranteed or endorsed by, any bank, the Federal Deposit Insurance Corporation, the Federal Reserve Board or any government agency.
The information presented on the following pages was current as of September 30, 2005. The manager’s views, port-folio holdings, and sector diversification are historical and subject to change. This material should not be deemed a recommendation to buy or sell any of the securities mentioned.
The matters discussed in this report may constitute forward-looking statements made pursuant to the safe harbor provisions of the Securities Litigation Reform Act of 1995. These include any advisor or portfolio manager prediction, assessment, analysis or outlook for individual securities, industries, investment styles, market sectors and/or markets. These statements involve risks and uncertainties. In addition to the general risks described for each Fund in its current prospectus, other factors bearing on these reports include the accuracy of the advisor’s or portfolio manager’s forecasts and predictions, the appropriateness of the investment strategies designed by the advisor or portfolio manager and the ability of the advisor or portfolio manager to implement their strategies efficiently and successfully. Anyone or more of these factors, as well as other risks affecting the securities markets generally, could cause the actual results of any fund to differ materially as compared to its benchmarks.
Glossary
The Merrill Lynch 7-12 Year Municipal Bond Index – A widely-accepted unmanaged market-weighted index comprised of fixed- rate, coupon bearing bonds issued within five years of the most recent month-end with greater than $50 million principal amount having a Moody’s investment grade rating and maturities of seven to twelve years.
Duration – The measure of the price sensitivity of a fixed-income security to an interest rate change of 100 basis points. Calculation is based on the weighted average of the present values for all cash flows.
Weighted Average Maturity – A weighted average of all the effective maturities of the bonds in a portfolio. Effective maturity takes into consideration mortgage prepayments, puts, sinking funds, adjustable coupons, and other features of individual bonds and is thus a more accurate measure of interest-rate sensitivity. Longer-maturity funds are generally considered more interest-rate sensitive than their shorter counterparts.
| Certified Annual Report 5 |

George Strickland
Portfolio Manager
October 18, 2005
Dear Fellow Shareholder:
I am pleased to present the Annual Report for the Thornburg Florida Intermediate Municipal Fund. The net asset value (NAV) of the A shares decreased by 16 cents to $12.24 during the twelve months ended September 30, 2005. If you were with us for the entire period, you received dividends of 39.5 cents per share. If you reinvested dividends, you received 40.1 cents per share.
Over the last twelve months, interest rates on bonds that mature in ten years or less have risen, while interest rates on long-term bonds have fallen. Higher interest rates on short-term bonds have pushed down the price of many of the bonds owned by the Fund, but have allowed us to buy new bonds at higher yields. The A shares of your Fund produced a total return of 1.92% (at NAV) over the twelve month period ended September 30, 2005, compared to a 2.92% return for the Merrill Lynch 7-12 Year Municipal Bond Index. The Fund was over weighted in bonds that mature in less than eight years. Since the returns of those short-term bonds lagged the return of the index, the Fund’s return lagged the index slightly.
This has been an eventful year for the bond market and the world. The Federal Reserve has been steadily pushing up the target Fed Funds rate to its current level of 3.75%. Through the end of June, the bond market responded by pushing down yields on long-term bonds, thus flattening the yield curve. A flat yield curve is usually associated with a recession, but the U.S. economy is showing no signs of entering a recession. So, more recently, interest rates have been rising for both short and long-term bonds, in more of a parallel yield curve shift. We believe that this is a more appropriate response by the market to a tightening Fed, a strong economy, and somewhat elevated levels of inflation.
Your Thornburg Florida Intermediate Municipal Fund is a laddered portfolio of over 60 municipal obligations from all over Florida. Today, your Fund’s weighted average maturity is 6.8 years. We ladder the maturity dates of the bonds in your portfolio so that some of the bonds are scheduled to mature during each of the coming years. Laddering intermediate bonds accomplishes two goals. First, the staggered bond maturities contained in a ladder defuse interest-rate risk and dampen the Fund’s price volatility. Second, laddering gives the Fund a steady cash flow stream from maturing bonds to reinvest toward the top of the ladder where yields are typically higher. The chart shown here describes the percentages of your Fund’s bond portfolio maturing in each of the coming years.
Thus far in 2005, Florida continues to benefit from a booming job market and a rapidly growing economy. Private sector employment growth through August, 2005 was 3.5%, the 7th fastest rate among the 50 states. State General Fund revenues were $320 million above estimates in the recently completed fiscal year. Both Moody’s and Standard and Poor’s have upgraded the state’s debt ratings in 2005. However, Florida’s debt burden has risen steadily and the health care and education needs of a rapidly growing and aging population are considerable. To reduce credit risk, we have kept 87% of the portfolio in bonds rated A or above and maintained broad diversification across issuers and market sectors.
% of portfolio maturing | Cumulative % maturing | ||||||||||||
2 years | = | 7.8 | % | Year 2 | = | 7.8% | |||||||
2 to 4 years | = | 10.7 | % | Year 4 | = | 18.5% | |||||||
4 to 6 years | = | 20.8 | % | Year 6 | = | 39.3% | |||||||
6 to 8 years | = | 14.2 | % | Year 8 | = | 53.5% | |||||||
8 to 10 years | = | 22.1 | % | Year 10 | = | 75.6% | |||||||
10 to 12 years | = | 17.3 | % | Year 12 | = | 92.9% | |||||||
12 to 14 years | = | 2.7 | % | Year 14 | = | 95.6% | |||||||
14 to 16 years | = | 3.3 | % | Year 16 | = | 98.9% | |||||||
16 to 18 years | = | 0.0 | % | Year 18 | = | 98.9% | |||||||
Over 18 years | = | 1.1 | % | Over 18 years | = | 100.0% | |||||||
Percentages can and do vary. Data as of 9/30/05.
6 Certified Annual Report |
Over the years, our practice of laddering a diversified portfolio of short and intermediate maturity municipal bonds has allowed your Fund to perform consistently well in varying interest rate environments. Thank you for investing in Thornburg Florida Intermediate Municipal Fund.
Sincerely,
 |
| George Strickland |
| Portfolio Manager |
| Certified Annual Report 7 |
STATEMENT OF ASSETS AND LIABILITIES
| Thornburg Florida Intermediate Municipal Fund | September 30, 2005 |
ASSETS | ||||
Investments at value (cost $48,956,360) | $ | 50,187,876 | ||
Cash | 437,235 | |||
Receivable for investments sold | 215,000 | |||
Receivable for fund shares sold | 71,562 | |||
Interest receivable | 855,731 | |||
Total Assets | 51,767,404 | |||
LIABILITIES | ||||
Payable for securities purchased | 1,052,530 | |||
Payable for fund shares redeemed | 4,270 | |||
Payable to investment advisor and other affiliates (Note 3) | 36,818 | |||
Accounts payable and accrued expenses | 29,541 | |||
Dividends payable | 85,268 | |||
Total Liabilities | 1,208,427 | |||
NET ASSETS | $ | 50,558,977 | ||
NET ASSETS CONSIST OF: | ||||
Distribution in excess of net investment income | $ | (719 | ) | |
Net unrealized appreciation on investments | 1,231,516 | |||
Accumulated net realized gain (loss) | (627,085 | ) | ||
Net capital paid in on shares of beneficial interest | 49,955,265 | |||
| $ | 50,558,977 | |||
NET ASSET VALUE: | ||||
Class A Shares: | ||||
Net asset value and redemption price per share ($50,558,977 applicable to 4,130,283 shares of beneficial interest outstanding - Note 4) | $ | 12.24 | ||
Maximum sales charge, 2.00% of offering price | 0.25 | |||
Maximum offering price per share | $ | 12.49 | ||
See notes to financial statements.
8 Certified Annual Report |
| Thornburg Florida Intermediate Municipal Fund | Year Ended September 30, 2005 |
INVESTMENT INCOME: | ||||
Interest income (net of premium amortized of $482,870) | $ | 2,297,797 | ||
EXPENSES: | ||||
Investment advisory fees (Note 3) | 274,542 | |||
Administration fees (Note 3) | 68,636 | |||
Distribution and service fees (Note 3) | 137,271 | |||
Transfer agent fees | 25,269 | |||
Custodian fees (Note 3) | 32,051 | |||
Professional fees | 22,886 | |||
Accounting fees | 4,709 | |||
Trustee fees | 2,187 | |||
Other expenses | 21,349 | |||
Total Expenses | 588,900 | |||
Less: | ||||
Management fees waived by investment advisor (Note 3) | (40,386 | ) | ||
Fees paid indirectly (Note 3) | (5,311 | ) | ||
Net Expenses | 543,203 | |||
Net Investment Income | 1,754,594 | |||
REALIZED AND UNREALIZED GAIN (LOSS) ON INVESTMENTS | ||||
Net realized gain (loss) on investments sold | (114,586 | ) | ||
Increase (Decrease) in unrealized appreciation (depreciation) of investments | (627,001 | ) | ||
Net Realized and Unrealized Loss on Investments | (741,587 | ) | ||
Net Increase in Net Assets Resulting From Operations | $ | 1,013,007 | ||
See notes to financial statements.
| Certified Annual Report 9 |
STATEMENTS OF CHANGES IN NET ASSETS
Thornburg Florida Intermediate Municipal Fund
| Year Ended September 30, 2005 | Year Ended September 30, 2004 | |||||||
INCREASE (DECREASE) IN NET ASSETS FROM: | ||||||||
OPERATIONS: | ||||||||
Net investment income | $ | 1,754,594 | $ | 1,834,787 | ||||
Net realized gain (loss) on investments sold | (114,586 | ) | 154,900 | |||||
Increase (Decrease) in unrealized appreciation (depreciation) of investments | (627,001 | ) | (446,787 | ) | ||||
Net Increase (Decrease) in Net Assets Resulting from Operations | 1,013,007 | 1,542,900 | ||||||
DIVIDENDS TO SHAREHOLDERS: | ||||||||
From net investment income | ||||||||
Class A Shares | (1,754,594 | ) | (1,834,787 | ) | ||||
FUND SHARE TRANSACTIONS (NOTE 4): | ||||||||
Class A Shares | (6,389,026 | ) | 4,069,773 | |||||
Net Increase (Decrease) in Net Assets | (7,130,613 | ) | 3,777,886 | |||||
NET ASSETS: | ||||||||
Beginning of year | 57,689,590 | 53,911,704 | ||||||
End of year | $ | 50,558,977 | $ | 57,689,590 | ||||
See notes to financial statements.
10 Certified Annual Report |
| Thornburg Florida Intermediate Municipal Fund | September 30, 2005 |
NOTE 1 – ORGANIZATION
Thornburg Florida Intermediate Municipal Fund (the “Fund”) is a non-diversified series of Thornburg Investment Trust (the “Trust”). The Trust is organized as a Massachusetts business trust under a Declaration of Trust dated June 3, 1987 and is registered as a diversified, open-end management investment company under the Investment Company Act of 1940, as amended. The Trust is currently issuing eleven series of shares of beneficial interest in addition to those of the Fund: Thornburg California Limited Term Municipal Fund, Thornburg Limited Term Municipal Fund, Thornburg New Mexico Intermediate Municipal Fund, Thornburg New York Intermediate Municipal Fund, Thornburg Intermediate Municipal Fund, Thornburg Limited Term U.S. Government Fund, Thornburg Limited Term Income Fund, Thornburg Value Fund, Thornburg International Value Fund, Thornburg Core Growth Fund, and Thornburg Investment Income Builder Fund. Each series is considered to be a separate entity for financial reporting and tax purposes and bears expenses directly attributable to it. The Fund’s investment objective is to obtain as high a level of current income exempt from Federal income tax as is consistent, in the view of the Fund’s investment advisor, with the preservation of capital. The Fund will also invest primarily in municipal obligations within the state of Florida, with the objective of having interest dividends paid to its shareholders exempt from any individual income taxes. The Fund currently offers only one class of shares of beneficial interest, Class A shares.
NOTE 2 – SIGNIFICANT ACCOUNTING POLICIES
Significant accounting policies of the Trust are as follows:
Valuation of Investments: In determining the net asset value of investments, the Trust utilizes an independent pricing service approved by the Board of Trustees. Debt investment securities have a primary market over the counter and are valued on the basis of valuations furnished by the pricing service. The pricing service values portfolio securities at quoted bid prices, normally at 4:00 p.m. EST. When quotations are not readily available, securities are valued at evaluated prices as determined by the pricing service using methods which include consideration of yields or prices of municipal obligations of comparable quality, type of issue, coupon, maturity, and rating; indications as to value from dealers and general market conditions. In any case where a price is not available from a pricing service for an investment, the Trust’s valuation and pricing committee determines a fair value for the investment using factors approved by the Trustees. The valuation procedures used by the pricing service and the portfolio valuations received by the Fund are reviewed by the officers of the Trust under the general supervision of the Board of Trustees. Short-term obligations having remaining maturities of 60 days or less are valued at amortized cost, which approximates market value.
Federal Income Taxes: It is the policy of the Trust to comply with the provisions of the Internal Revenue Code applicable to “regulated investment companies” and to distribute all taxable (if any) and tax exempt income, of the Fund to the shareholders. Therefore, no provision for Federal income tax is required.
When-Issued and Delayed Delivery Transactions: The Trust may engage in when-issued or delayed delivery transactions. To the extent the Trust engages in such transactions, it will do so for the purpose of acquiring portfolio securities consistent with the Fund’s investment objectives and not for the purpose of investment leverage or to speculate on interest rate and/or market changes. At the time the Trust makes a commitment to purchase a security on a when-issued basis, the Fund will record the transaction and reflect the value in determining its net asset value. When effecting such transactions, assets of an amount sufficient to make payment for the portfolio securities to be purchased will be segregated on the Fund’s records on the trade date. Securities purchased on a when-issued or delayed delivery basis do not earn interest until the settlement date.
Dividends: Net investment income of the Fund is declared daily as a dividend on shares for which the Fund has received payment. Dividends are paid monthly and are reinvested in additional shares of the Fund at net asset value per share at the close of business on the dividend payment date or, at the shareholder’s option, paid in cash. Net capital gains, to the extent available, will be distributed at least annually.
General: Securities transactions are accounted for on a trade date basis. Interest income is accrued as earned. Premiums and discounts on securities purchased are amortized to call dates or maturity dates of the respective securities. Realized gains and losses from the sale of securities are recorded on an identified cost basis. Expenses common to all funds are allocated among the funds comprising the Trust based upon their relative net asset values or other appropriate allocation methods.
Guarantees and Indemnifications: Under the Trust’s organizational documents, its officers and Trustees are indemnified against certain liability arising out of the performance of their duties to the Fund. Additionally, in the normal course of business the Trust enters into contracts with service providers that contain general indemnification clauses. The Trust’s maximum exposure under these arrangements is unknown. However, based on experience, the Trust expects the risk of loss to be remote.
Use of Estimates: The preparation of financial statements, in conformity with generally accepted accounting principles, requires management to make estimates and assumptions that affect the reported amounts of assets and liabilities and the disclosure of contingent assets and liabilities at the date of the
| Certified Annual Report 11 |
NOTES TO FINANCIAL STATEMENTS, CONTINUED
| Thornburg Florida Intermediate Municipal Fund | September 30, 2005 |
financial statements and the reported amounts of increases and decreases in net assets from operations during the reporting period. Actual results could differ from those estimates.
NOTE 3 – INVESTMENT ADVISORY FEE AND OTHER TRANSACTIONS WITH AFFILIATES
Pursuant to an investment advisory agreement, Thornburg Investment Management, Inc.® (the “Advisor”) serves as the investment advisor and performs services for which the fees are payable at the end of each month. For the year ended September 30, 2005, these fees were payable at annual rates ranging from .50 of 1% to .275 of 1% per annum of the average daily net assets of the Fund. For the year ended September 30, 2005, the Advisor voluntarily waived investment advisory fees of $40,386. The Fund entered into an administrative services agreement with the Advisor, whereby the Advisor will perform certain administrative services for the shareholders of each class of the Fund’s shares, and for which fees will be payable at an annual rate of up to .125 of 1% per annum of the average daily net assets attributable to each class of shares.
The Trust has an underwriting agreement with Thornburg Securities Corporation® (the “Distributor”, an affiliate of the Advisor), which acts as the Distributor of Fund shares. For the year ended September 30, 2005, the Distributor has advised the Fund that it earned net commissions aggregating $65 from the sale of Class A shares.
Pursuant to a service plan, under Rule 12b-1 of the Investment Company Act of 1940, the Fund may reimburse to the Advisor an amount not to exceed .25 of 1% per annum of the average daily net assets attributable to each class of shares of the Fund for payments made by the Advisor to securities dealers and other financial institutions to obtain various shareholder related services. The Advisor may pay out of its own resources additional expenses for distribution of the Fund’s shares.
The Trust has an agreement with the custodian bank to indirectly pay a portion of the custodian’s fees through credits earned by the Fund’s cash on deposit with the bank. This deposit agreement is an alternative to overnight investments. Custodial fees have been adjusted to reflect amounts that would have been paid without this agreement, with a corresponding adjustment reflected as fees paid indirectly in the Statement of Operations. For the year ended September 30, 2005, fees paid indirectly were $5,311.
Certain officers and Trustees of the Trust are also officers and/or Directors of the Advisor and Distributor. The compensation of independent Trustees is borne by the Trust.
NOTE 4 – SHARES OF BENEFICIAL INTEREST
At September 30, 2005, there were an unlimited number of shares of beneficial interest authorized. Transactions in shares of beneficial interest were as follows:
Year Ended September 30, 2005 | Year Ended September 30, 2004 | |||||||||||||
| Shares | Amount | Shares | Amount | |||||||||||
Class A Shares | ||||||||||||||
Shares sold | 1,188,263 | $ | 14,686,495 | 2,536,845 | $ | 31,559,903 | ||||||||
Shares issued to shareholders in reinvestment of dividends | 56,858 | 700,091 | 61,460 | 761,112 | ||||||||||
Shares repurchased | (1,766,341 | ) | (21,775,612 | ) | (2,273,113 | ) | (28,251,242 | ) | ||||||
Net Increase (Decrease) | (521,220 | ) | $ | (6,389,026 | ) | 325,192 | $ | 4,069,773 | ||||||
NOTE 5 – SECURITIES TRANSACTIONS
For the year ended September 30, 2005, the Fund had purchase and sale transactions of investment securities (excluding short term investments) of $14,737,082 and $17,372,330, respectively.
NOTE 6 – INCOME TAXES
At September 30, 2005, information on the tax components of capital is as follows:
Cost of investments for tax purpose | $ | 48,955,641 | ||
Gross unrealized appreciation on a tax basis | $ | 1,355,325 | ||
Gross unrealized depreciation on a tax basis | (123,090 | ) | ||
Net unrealized appreciation (depreciation) on investments (tax basis) | $ | 1,232,235 |
At September 30, 2005, the Fund did not have any undistributed tax-exempt/ordinary net income or undistributed capital gains.
At September 30, 2005, the Fund had tax basis capital losses, which may be carried over to offset future capital gains. To the extent such carry forwards are used, capital gain distributions may be reduced to the extent provided by regulations. Such losses expire as follows:
2008 | $ | 223,600 | |
2009 | 282,018 | ||
| $ | 505,618 | ||
12 Certified Annual Report |
NOTES TO FINANCIAL STATEMENTS, CONTINUED
Thornburg Florida Intermediate Municipal Fund | September 30, 2005 |
At September 30, 2005 the Fund had deferred capital losses occurring subsequent to October 31, 2004 of $122,186. For tax purposes, such losses will be reflected in the year ending September 30, 2006.
In order to account for permanent book/tax differences, the Fund increased over-distributed net investment income (loss) by $331 and decreased accumulated net realized investment loss by $331. This reclassification results primarily due to the difference in tax treatment of market discounts and has no impact on the net asset value of the Fund.
All dividends paid by the Fund for the year ended September 30, 2005 and September 30, 2004, represent exempt interest dividends, which are excludable by shareholders from gross income for Federal income tax purposes.
| Certified Annual Report 13 |
Thornburg Florida Intermediate Municipal Fund
| Year Ended September 30, | ||||||||||||||||||||
Class A Shares: | 2005 | 2004 | 2003 | 2002 | 2001 | |||||||||||||||
PER SHARE PERFORMANCE | ||||||||||||||||||||
(for a share outstanding throughout the year) | ||||||||||||||||||||
Net asset value, beginning of year | $ | 12.40 | $ | 12.46 | $ | 12.57 | $ | 12.24 | $ | 11.73 | ||||||||||
Income from investment operations: | ||||||||||||||||||||
Net investment income | 0.39 | 0.40 | 0.45 | 0.52 | 0.55 | |||||||||||||||
Net realized and unrealized gain (loss) on investments | (0.16 | ) | (0.06 | ) | (0.1 1 | ) | 0.33 | 0.51 | ||||||||||||
Total from investment operations | 0.23 | 0.34 | 0.34 | 0.85 | 1.06 | |||||||||||||||
Less dividends from: | ||||||||||||||||||||
Net investment income | (0.39 | ) | (0.40 | ) | (0.45 | ) | (0.52 | ) | (0.55 | ) | ||||||||||
Change in net asset value | (0.16 | ) | (0.06 | ) | (0.1 1 | ) | 0.33 | 0.51 | ||||||||||||
NET ASSET VALUE, end of year | $ | 12.24 | $ | 12.40 | $ | 12.46 | $ | 12.57 | $ | 12.24 | ||||||||||
RATIOS/SUPPLEMENTAL DATA | ||||||||||||||||||||
Total return(a) | 1.92 | % | 2.76 | % | 2.77 | % | 7.10 | % | 9.20 | % | ||||||||||
Ratios to average net assets: | ||||||||||||||||||||
Net investment income | 3.20 | % | 3.20 | % | 3.60 | % | 4.18 | % | 4.55 | % | ||||||||||
Expenses, after expense reductions | 1.00 | % | 0.89 | % | 0.91 | % | 0.85 | % | 0.89 | % | ||||||||||
Expenses, after expense reductions and net of custody credits | 0.99 | % | 0.89 | % | 0.91 | % | 0.84 | % | ||||||||||||
Expenses, before expense reductions | 1.07 | % | 1.03 | % | 1.06 | % | 1.06 | % | 1.10 | % | ||||||||||
Portfolio turnover rate | 27.67 | % | 36.69 | % | 30.98 | % | 30.28 | % | 22.99 | % | ||||||||||
Net assets at end of year (000) | $ | 50,559 | $ | 57,690 | $ | 53,912 | $ | 41,860 | $ | 28,934 | ||||||||||
| (a) | Sales loads are not reflected in computing total return. |
14 Certified Annual Report |
Thornburg Florida Intermediate Municipal Fund | September 30, 2005 |
CUSIPS: CLASS A - 885-215-707
NASDAQ SYMBOLS: CLASS A -THFLX
Issuer-Description | Credit Rating† Moody’s/S&P | Principal Amount | Value | |||||
Broward County Multi Family Housing, 5.40% due 10/1/2011 (Pembroke Park Apts Project; Guaranty: Florida Housing Finance Corp.) | NR/NR | $ | 680,000 | $ | 704,065 | |||
Broward County Resource Recovery Revenue Refunding, 5.375% due 12/1/2009 (Wheelabrator South Project) | A3/AA | 1,240,000 | 1,321,257 | |||||
Capital Projects Finance Authority Student Housing, 5.50% due 10/1/2012 (Capital Projects Student Housing; Insured: MBIA) | Aaa/AAA | 820,000 | 894,997 | |||||
Capital Trust Agency Multi Family Housing Revenue Series A, 5.15% due 11/1/2030 put 1 1/1/2010 (Shadow Run Project; Collateralized: FNMA) | Aaa/NR | 1,000,000 | 1,053,500 | |||||
Collier County Housing Finance Authority Multi Family Revenue A-1, 4.90% due 2/15/2032 put 2/15/2012 (Goodlette Arms Project; Collateralized: FNMA) | Aaa/NR | 800,000 | 816,816 | |||||
Cooper City Utility Systems Capital Appreciation Refunding Series A, 0% due 10/1 /2013 (Insured: AMBAC) | Aaa/AAA | 3,000,000 | 1,792,140 | |||||
Crossings at Fleming Island Community Development Refunding Series A, 5.60% due 5/1/2012 (Insured: MBIA) | Aaa/AAA | 350,000 | 385,539 | |||||
Crossings at Fleming Island Community Development Refunding Series B, 5.45% due 5/1/2010 (Insured: MBIA) | Aaa/AAA | 714,000 | 756,026 | |||||
Dade County Seaport Revenue Refunding Series E, 8.00% due 10/1/2008 (Insured: MBIA) | Aaa/AAA | 655,000 | 744,132 | |||||
Deltona Utility Systems Revenue, 5.25% due 10/1/2015 (Insured: MBIA) | Aaa/AAA | 1,185,000 | 1,301,758 | |||||
Duval County HFA Multi Family Housing Revenue Series 1996,5.35% due 9/1/2006 (St. Augustine Apartments Project) | NR/AA- | 260,000 | 263,523 | |||||
Duval County Multi Family Housing Revenue Refunding, 5.90% due 9/1/2016 (St. Augustine Apartments Project) | NR/AA- | 700,000 | 716,877 | |||||
Enterprise Community Development District Florida Water & Sewer Revenue, 6.125% due 5/1/2024 (Insured: MBIA) | Aaa/AAA | 230,000 | 230,568 | |||||
Escambia County Health Facilities Revenue Baptist Hospital Baptist Manor, 5.125% due 10/1/2014 | A3/BBB+ | 1,000,000 | 1,031,670 | |||||
Escambia County Health Facility Revenue, 5.95% due 7/1/2020 (Florida Health Care Facility Loan Project; Insured: AMBAC) | Aaa/NR | 560,000 | 599,486 | |||||
First Florida Govt. Financing Commission Revenue Refunding Series B, 5.50% due 7/1/2016 (Insured: AMBAC) | Aaa/NR | 300,000 | 340,398 | |||||
Florida Board of Education Capital Outlay, 9.125% due 6/1/2014 | Aa1/AAA | 905,000 | 1,175,821 | |||||
Florida Board of Education Capital Outlay Public Education Series C, 5.50% due 6/1/2013 (Insured: FGIC) | Aaa/AAA | 1,000,000 | 1,111,350 | |||||
Florida Finance Corp. Revenue Homeowner Mortgage Series 1,4.80% due 1/1/2016 | Aa2/AA | 540,000 | 551,961 | |||||
Florida Housing Finance Agency, 4.00% due 12/1/2007 (Multi Family Guaranteed Mortgage; LOC: Wachovia Bank) | NR/NR | 1,000,000 | 1,002,310 | |||||
Florida Housing Finance Corp. Revenue Housing D 1, 5.10% due 10/1/2011 (Augustine Club Apartments Project; Insured: MBIA) | Aaa/NR | 200,000 | 206,560 | |||||
Florida Housing Finance Corp. Revenue Housing D 1, 5.40% due 4/1/2014 (Augustine Club Apartments Project; Insured: MBIA) | Aaa/NR | 415,000 | 429,363 | |||||
Florida State Board of Education Series C,6.00% due 5/1/2007 (ETM) | NR/NR | 300,000 | 300,999 | |||||
Florida State Board of Education Series D, 6.20% due 5/1/2007 (ETM) | Aaa/AAA | 220,000 | 220,785 | |||||
Florida State Department of Environmental Protection Revenue Series A, 5.00% due 7/1/2017 (Florida Forever Project; Insured: FGIC) | Aaa/AAA | 1,000,000 | 1,076,160 | |||||
Grand Haven Community Development District Florida Special Assessment Series A, 6.90% due 5/1/2019 | NR/NR | 275,000 | 278,597 | |||||
Gulf Breeze Revenue, 4.50% due 12/1/2015 put 12/1/2007 (Insured: FGIC) | Aaa/AAA | 250,000 | 255,033 | |||||
Gulf Breeze Revenue, 4.70% due 12/1/2015 put 12/1/2010 (Insured: FGIC) | Aaa/AAA | 375,000 | 391,020 | |||||
Highlands County Health Facilities Refunding Series B (Adventist Health Hospital Project), 5.00% due 11/15/2019 put 11/15/2015 (a) | A2/A+ | 1,000,000 | 1,047,720 | |||||
Hillsborough County Aviation Authority Revenue Tampa International Airport Series A, 5.25% due 10/1/2009 (Insured: MBIA) | Aaa/AAA | 1,000,000 | 1,065,990 | |||||
| Certified Annual Report 15 |
| SCHEDULE OF INVESTMENTS, CONTINUED | ||
| Thornburg Florida Intermediate Municipal Fund | September 30, 2005 | |
Issuer-Description | Credit Rating† Moody’s/S&P | Principal Amount | Value | |||||
Hillsborough County Industrial Development Authority, 5.10% due 10/1/2013 (Tampa Electric Co. Project) | Baa2/BBB- | $ | 1,000,000 | $ | 1,053,120 | |||
Jacksonville Electric St. John’s River Park Systems Revenue Refunding Issue-2 17th Series, 5.25% due 10/1/2012 | Aa2/AA- | 1,000,000 | 1,087,690 | |||||
Jacksonville Health Facilities Authority Hospital Revenue, 5.75% due 8/15/2014 pre-refunded 8/15/201 1 | Aa2/NR | 1,000,000 | 1,095,290 | |||||
Lee County COP, 4.90% due 10/1/2006 (Master Lease Project; Insured: AMBAC) | Aaa/AAA | 500,000 | 500,815 | |||||
Miami Dade County School Board Series B, 5.00% due 5/1/2031 put 5/1/201 1 (Insured: MBIA) | Aaa/AAA | 1,000,000 | 1,069,880 | |||||
Miami Dade County Special Housing Revenue Refunding, 5.80% due 10/1/2012 (HUD Section 8) | Baa3/NR | 925,000 | 896,085 | |||||
Miami Dade County Special Obligation Capital Asset Acquisition Series A-2, 5.00% due 4/1/2011 (Insured: AMBAC) | Aaa/AAA | 825,000 | 890,522 | |||||
Miami Refunding, 5.375% due 9/1/2015 (Insured: MBIA) | Aaa/AAA | 1,000,000 | 1,100,760 | |||||
North Miami Health Facilities Authority Revenue, 6.00% due 8/15/2024 (Catholic Health Services Obligation Group Project; LOC: Suntrust Bank) | Aa3/NR | 300,000 | 310,704 | |||||
Okeechobee County Florida Solid Waste Revenue, 4.20% due 7/1/2039 put 7/1/2009 (Waste Management Landfill A Project) | NR/A-2 | 1,000,000 | 1,007,200 | |||||
Orange County Health Facilities Authority Revenue Refunding, 6.25% due 1 1/15/2008 (Adventist Health Systems Project; Insured: AMBAC) | Aaa/AAA | 1,000,000 | 1,023,850 | |||||
Orange County Health Facilities Authority Revenue Refunding, 5.125% due 6/1/2014 (Mayflower Retirement Project; Insured: Radian) | NR/AA | 1,000,000 | 1,042,210 | |||||
Orange County Health Facilities Authority Revenue Refunding, 6.375% due 11/15/2020 (Adventist Health Systems Project) pre-refunded 11/15/2010 | A2/A+ | 1,000,000 | 1,145,690 | |||||
Orange County Health Facilities Authority Revenue Unrefunded Balance Series A, 6.25% due 10/1/2013 (Orlando Regional Hospital Project; Insured: MBIA) | Aaa/AAA | 440,000 | 512,305 | |||||
Orange County Health Facilities Authority Revenue Unrefunded Balance Series A, 6.25% due 10/1/2016 (Insured: MBIA) | Aaa/AAA | 300,000 | 355,377 | |||||
Orange County Housing Finance Authority, 6.10% due 10/1/2005 (Collateralized: FNMA/GNMA) | NR/AAA | 20,000 | 20,001 | |||||
Orange County Housing Finance Authority Multi Family, 5. 50% due 7/1/2010 (Insured: MBIA) | Aaa/NR | 425,000 | 444,635 | |||||
Orange County School Board COP Series A, 5.50% due 8/1/2017 (Insured: MBIA) | Aaa/AAA | 735,000 | 810,029 | |||||
Orange County Solid Waste Facility Revenue Refunding, 5.00% due 10/1/201 1 (Insured: MBIA) | Aaa/AAA | 500,000 | 536,510 | |||||
Orlando & Orange County Expressway Revenue, 8.25% due 7/1/2014 (Insured: FGIC) | Aaa/AAA | 500,000 | 666,165 | |||||
Palm Beach County Industrial Development Revenue Series 1996,6.10% due 12/1/2007 pre-refunded 12/1/2006 (Lourdes-Noreen McKeen-Geriatric Care Project; LOC: Allied Irish Bank) | NR/A | 515,000 | 543,320 | |||||
Palm Beach County Industrial Development Revenue Series 1996,6.20% due 12/1/2008 pre-refunded 12/1/2006 (Lourdes-Noreen McKeen-Geriatric Care Project; LOC: Allied Irish Bank) | NR/A | 270,000 | 285,155 | |||||
Palm Beach County School Board COP Series D, 5.00% due 8/1/2012 (Insured: FSA) | Aaa/AAA | 400,000 | 434,028 | |||||
Palm Beach County Solid Waste Revenue Refunding Series A, 6.00% due 10/1/2010 put 7/1/2010 (Insured: AMBAC) | Aaa/AAA | 1,000,000 | 1,114,320 | |||||
Pasco County Housing Finance Authority MFHR, 5.50% due 6/1/2027 put 6/1/2008 (Cypress Trail Apartments Project; Guaranty: Axa Reinsurance) | NR/AA- | 1,020,000 | 1,032,485 | |||||
Pensacola Airport Revenue, 6.25% due 10/1/2005 (Insured: MBIA) | Aaa/AAA | 690,000 | 690,062 | |||||
Pensacola Airport Revenue Series B, 5.40% due 10/1/2007 (Insured: MBIA) | Aaa/AAA | 275,000 | 281,267 | |||||
Pinellas County Educational Facility Authority Revenue, 8.00% due 2/1/2011 pre-refunded 2/1/2006 (Clearwater Christian College Project) | NR/NR | 515,000 | 532,685 | |||||
Port Everglades Authority Port Improvement Revenue Refunding Series A, 5.00% due 9/1/2016 (Insured: FSA) (b) | Aaa/AAA | 2,000,000 | 2,008,860 | |||||
Sarasota County Public Hospital Series A, 2.95% due 7/1/2037 put 10/3/2005 (Sarosota Memorial Hospital Project; Insured: AMBAC) (daily demand notes) | VMIG1/NR | 830,000 | 830,000 | |||||
St Johns County Florida Industrial Development Authority Series A, 5.50% due 8/1/2014 (Presbyterian Retirement Project) | NR/NR | 1,000,000 | 1,080,130 | |||||
Tampa Revenue, 5.50% due 11/15/2013 (Insured: MBIA) | Aaa/AAA | 1,050,000 | 1,171,244 | |||||
Tohopekaliga Water Authority Utility Series A, 5.25% due 10/1/2016 (Insured: FSA) | Aaa/AAA | 1,345,000 | 1,476,541 | |||||
USF Financing Corp. COP Master Lease Program Series A, 5.00% due 7/1/2018 (Insured: AMBAC) | Aaa/AAA | $ | 1,000,000 | $ | 1,072,520 | |||
TOTAL INVESTMENTS — 99.27% (Cost $ 48,956,360) | $ | 50,187,876 | ||||||
OTHER ASSETS LESS LIABILITIES — 0.73% | �� | 371,101 | ||||||
NET ASSETS — 100.00% | $ | 50,558,977 | ||||||
16 Certified Annual Report |
| SCHEDULE OF INVESTMENTS, CONTINUED | ||
| Thornburg Florida Intermediate Municipal Fund | September 30, 2005 | |
Footnote Legend
See notes to financial statements.
| † | Credit ratings are unaudited. Rating changes may have occurred prior to or subsequent to the reporting period end. |
| (a) | When-issued security. |
| (b) | Segregated as collateral for a when-issued security. |
Portfolio Abbreviations
To simplify the listings of securities, abbreviations are used per the table below:
AMBAC | Insured by American Municipal Bond Assurance Corp. | |
COP | Certificates of Participation | |
ETM | Escrowed to Maturity | |
FGIC | Insured by Financial Guaranty Insurance Co. | |
FNMA | Collateralized by Federal National Mortgage Association | |
FSA | Insured by Financial Security Assurance Co. | |
GNMA | Insured by Government National Mortgage Co. | |
MBIA | Insured by Municipal Bond Investors Assurance | |
RADIAN | Insured by Radian Asset Assurance |
SUMMARY OF SECURITY CREDIT RATINGS†
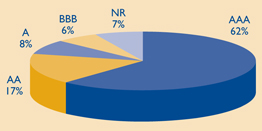
Ratings are a blend of Moody’s and Standard & Poor’s, using the higher rating. Some bonds are rated by only one service.
| Certified Annual Report 17 |
REPORT OF INDEPENDENT REGISTERED PUBLIC ACCOUNTING FIRM
Thornburg Florida Intermediate Municipal Fund
To the Trustees and Shareholders of
Thornburg Florida Intermediate Municipal Fund
In our opinion, the accompanying statement of assets and liabilities, including the schedule of investments, and the related statements of operations and of changes in net assets and the financial highlights present fairly, in all material respects, the financial position of Thornburg Florida Intermediate Municipal Fund (one of the Portfolios constituting Thornburg Investment Trust, hereafter referred to as the “Fund”) at September 30, 2005, the results of its operations for the year then ended, the changes in its net assets for each of the two years in the period then ended and the financial highlights for each of the periods presented, in conformity with accounting principles generally accepted in the United States of America. These financial statements and financial highlights (hereafter referred to as “financial statements”) are the responsibility of the Fund’s management. Our responsibility is to express an opinion on these financial statements based on our audits. We conducted our audits of these financial statements in accordance with the standards of the Public Company Accounting Oversight Board (United States). Those standards require that we plan and perform the audit to obtain reasonable assurance about whether the financial statements are free of material misstatement. An audit includes examining, on a test basis, evidence supporting the amounts and disclosures in the financial statements, assessing the accounting principles used and significant estimates made by management, and evaluating the overall financial statement presentation. We believe that our audits, which included confirmation of securities at September 30, 2005 by correspondence with the custodian and brokers, provide a reasonable basis for our opinion.
PricewaterhouseCoopers LLP
New York, New York
November 16, 2005
18 Certified Annual Report |
| EXPENSE EXAMPLE | ||
| Thornburg Florida Intermediate Municipal Fund | September 30, 2005 (Unaudited) | |
As a shareholder of the Fund, you incur two types of costs:
(1) transaction costs, including
(a) sales charges (loads) on purchase payments, for Class A Shares;
(b) a deferred sales charge on redemptions of any part or all of a purchase of $1 million of Class A shares within 12 months of purchase;
(2) ongoing costs, including management fees; distribution and/or service (12b-1) fees; and other Fund expenses.
This example is intended to help you understand your ongoing costs (in dollars) of investing in the Fund and to compare these costs with the ongoing costs of investing in other mutual funds.
The example is based on an investment of $1,000 invested on March 31,2005 and held until September 30, 2005.
| Beginning Account Value 3/31/05 | Ending Account Value 9/30/05 | Expenses Paid During Period† 3/31/05-9/30/05 | |||||||
Class A Shares | |||||||||
Actual | $ | 1,000 | $ | 1,021.00 | $ | 5.01 | |||
Hypothetical* | $ | 1,000 | $ | 1,020.11 | $ | 5.01 | |||
| † | Expenses are equal to the annualized expense ratio for Class A shares (0.99%) multiplied by the average account value over the period, multiplied by 183/365 to reflect the one-half year period. |
| * | Hypothetical assumes a rate of return of 5% per year before expenses. |
Actual Expenses
The first line of the table at right provides information about actual account values and actual expenses. You may use the information in this line, together with the amount you invested, to estimate the expenses that you paid over the period. Simply divide your account value by $1,000 (for example, an $8,600 account value divided by $1,000 = 8.6), then multiply the result by the number in the first line under the heading entitled “Expenses Paid During Period” to estimate the expenses you paid on your account during this period.
Hypothetical Example for Comparison Purposes
The second line of the table at right provides information about hypothetical account values and hypothetical expenses based on the Fund’s actual expense ratio and an assumed rate of return of 5% per year before expenses, which is not the Fund’s actual return. The hypothetical account values and expenses may not be used to estimate the actual ending account balance or expenses you paid for the period. You may use this information to compare the ongoing costs of investing in the Fund and other funds. To do so, compare this 5% hypothetical example with the 5% hypothetical examples that appear in the shareholder reports of the other funds.
Please note that the expenses shown in the table are meant to highlight your ongoing costs only and do not reflect any transactional costs, such as sales charges (loads), redemption fees, or exchange fees. Therefore, the second line of the table is useful in comparing ongoing costs only, and will not help you determine the relative total costs of owning different funds. In addition, if these transactional costs were included, your costs would have been higher.
| Certified Annual Report 19 |
| INDEX COMPARISON | ||
| Thornburg Florida Intermediate Municipal Fund | September 30, 2005 (Unaudited) | |
GROWTH OF A HYPOTHETICAL $10,000 INVESTMENT
Thornburg Florida Intermediate Municipal Fund Class A Total Returns, versus
Merrill Lynch 7-12 Year Municipal Bond Index and Consumer Price Index
(February 1, 1994 to September 30, 2005)
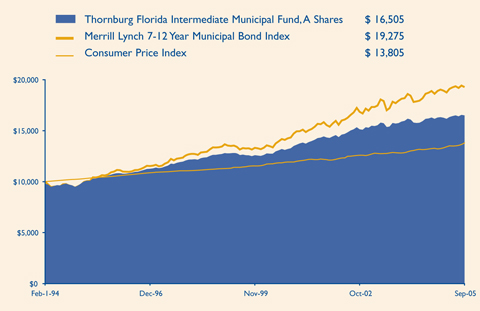
AVERAGE ANNUAL TOTAL RETURNS
For the periods ended September 30, 2005 (with sales charge)
| 1 Yr | 5 Yrs | 10 Yrs | Since Inception | |||||||||
A Shares (Incep: 2/1/94) | (0.09 | )% | 4.29 | % | 4.42 | % | 4.39 | % |
FUND ATTRIBUTES
as of September 30, 2005
| Annualized Dist. Rate (@NAV) | SEC Yield | NAV | Maximum Offering Price | |||||||||
A Shares (Incep:2/1/94) | 3.45 | % | 2.93 | % | $ | 12.24 | $ | 12.49 | ||||
Performance data reflect past performance, which is no guarantee of future results. The performance data and graph do not reflect the deduction of taxes that a shareholder would pay on distributions or the redemption of Fund shares.
Returns reflect the reinvestment of dividends and capital gains, as well as applicable sales charges. Class A Shares are sold with a maximum sales charge of 2.00%.
The Consumer Price Index (“CPI”) measures prices of a fixed basket of goods bought by a typical consumer, including food, transportation, shelter, utilities, clothing, medical care, entertainment and other items. The CPI, published by the Bureau of Labor Statistics in the Department of Labor, is based at 100 in 1982 and is released monthly. It is widely used as a cost-of-living benchmark to adjust Social Security payments and other payment schedules, union contracts and tax brackets. The CPI is also known as the cost-of-living index.
The Merrill Lynch 7-12 Year Municipal Bond Index represents a broad measure of market performance. It is a model portfolio of municipal obligations throughout the U.S., with an average maturity which ranges from seven to twelve years.
Unless otherwise noted, index returns reflect the reinvestment of income dividends and capital gains, if any, but do not reflect fees, brokerage commissions or other expenses of investing. Investors may not make direct investments into any index.
The SEC Yield is computed in accordance with SEC standards measuring the net investment income per share over a specified 30-day period expressed as a percentage of the maximum offering price of the Funds’ shares at the end of the period.
The distribution rate is calculated by taking the sum of the month’s total distribution factors and dividing this sum by a 30-day period and annualizing to 360-day year. The value is then divided by the ending Net Asset Value (NAV) to arrive at the annualized distribution yield. The yield is calculated on a periodic basis and is subject to change depending on the Fund’s NAV and current distributions.
20 Certified Annual Report |
| TRUSTEES AND OFFICERS | ||
| Thornburg Florida Intermediate Municipal Fund | September 30, 2005 (Unaudited) | |
Name, Age, | Principal Occupation(s) During Past Five Years | Other Directorships | ||
INTERESTED TRUSTEES(1)(2)(4) | ||||
Garrett Thornburg, 59 Chairman of Trustees, Trustee since 1987(3) | CEO, Chairman and controlling shareholder of Thornburg Investment Management, Inc. (investment advisor) and Thornburg Securities Corporation (securities dealer); Chairman of Thornburg Limited Term Municipal Fund, Inc. (registered investment company) to 2004; CEO and Chairman of Thornburg Mortgage, Inc. (real estate investment trust); Chairman of Thornburg Mortgage Advisory Corporation (investment manager to Thornburg Mortgage, Inc.). | Director of Thornburg Mortgage, Inc. (real estate investment trust) | ||
Brian J. McMahon, 49 Trustee since 2001, Member of Governance & Nominating Committee, President since 1997(5)(6) | President and Managing Director of Thornburg Investment Management, Inc.; President of Thornburg Limited Term Municipal Fund, Inc. to 2004. | None | ||
INDEPENDENT TRUSTEES(1)(2)(4) | ||||
David A. Ater, 60 Trustee since 1994, Member of Audit Committee and Governance & Nominating Committee | Principal in Ater & Associates, Santa Fe, NM (developer, planner and broker of residential and commercial real estate); owner developer and broker for various real estate projects. | Director of Thornburg Mortgage, Inc. (real estate investment trust) | ||
David D. Chase, 64 Chairman of Audit Committee, Trustee since 2000 | Chairman, President, CEO, and Managing Member of Vestor Associates, LLC, the general partner of Vestor Partners, LP, Santa Fe, NM (private equity fund); Chairman and CEO of Vestor Holdings, Inc., Santa Fe, NM (merchant bank). | None | ||
Eliot R. Cutler, 59 Chairman of Governance & Nominating Committee, Trustee since 2004 | Partner, Akin, Gump, Strauss, Hauer & Feld, LLP, Washington, D.C. (law firm) since November 2000; partner, Cutler & Stanfield, Washington, D.C. (law firm) until November 2000. | Director of Thornburg Mortgage, Inc. (real estate investment trust) | ||
Susan H. Dubin, 56 Trustee since 2004, Member of Audit Committee | President of Dubin Investments, Ltd., Greenwich, CT (private investment fund); Director and officer of various charitable organizations; and formerly, Vice President of Chemical Bank (predecessor to JP Morgan Chase & Co.), New York, 1974-1996. | None | ||
Owen D. Van Essen, 51 Trustee since 2004, Member of Governance & Nominating Committee | President of Dirks, Van Essen & Murray, Santa Fe, NM (newspaper mergers and acquisitions). | None | ||
James W. Weyhrauch, 46 Trustee since 1996, Member of Audit Committee | Director, Executive Vice President to 2002, and President and CEO 2002-2004, Nambé Mills, Inc., Santa Fe, NM (manufacturer); real estate agent, Santa Fe Properties, Santa Fe, NM since 2004. | None | ||
| Certified Annual Report 21 |
TRUSTEES AND OFFICERS, CONTINUED
Thornburg Florida Intermediate Municipal Fund | September 30, 2005 (Unaudited) |
Name, Age, Position Held with Fund Year Elected | Principal Occupation(s) During Past Five Years | Other Directorships | ||
OFFICERS OF THE FUND (WHO ARE NOTTRUSTEES)(1)(6)(7) | ||||
Dawn B. Fischer, 58 Secretary since 1987 | Secretary and Managing Director, Thornburg Investment Management, Inc.; Secretary, Thornburg Limited Term Municipal Fund, Inc. to 2004; Secretary, Thornburg Securities Corporation; Vice President, Daily Tax Free Income Fund, Inc. (registered investment company). | Not applicable | ||
Steven J. Bohlin, 46 Vice President since 1987; Treasurer since 1989 | Vice President and Managing Director of Thornburg Investment Management, Inc.; Vice President of Thornburg Limited Term Municipal Fund, Inc. to 2004. | Not applicable | ||
George T. Strickland, 42 Vice President since 1996 | Vice President and Managing Director of Thornburg Investment Management, Inc.; Vice President (to 2004) and Treasurer (2003-2004) of Thornburg Limited Term Municipal Fund, Inc. | Not applicable | ||
William V. Fries, 66 Vice President since 1995 | Vice President and Managing Director of Thornburg Investment Management, Inc. | Not applicable | ||
Leigh Moiola, 38 Vice President since 2001 | Vice President and Managing Director of Thornburg Investment Management, Inc.; Vice President of Thornburg Limited Term Municipal Fund, Inc. 1999-2004. | Not applicable | ||
Kenneth Ziesenheim, 51 Vice President since 1995 | Vice President and Managing Director of Thornburg Investment Management, Inc.; President of Thornburg Securities Corporation; Vice President of Thornburg Limited Term Municipal Fund, Inc. to 2004. | Not applicable | ||
Alexander Motola, 35 Vice President since 2001 | Vice President and Managing Director of Thornburg Investment Management, Inc. since 2000; Portfolio Manager, Insight Capital Research & Management, Inc., Walnut Creek, California 1995-2000. | Not applicable | ||
Wendy Trevisani, 34 Vice President since 1999 | Associate Portfolio Manager of Thornburg Investment Management, Inc. since 1999, Vice President since 2000 and Managing Director since 2003; Vice President of Thornburg Limited Term Municipal Fund, Inc. 1999-2002. | Not applicable | ||
Joshua Gonze, 42 Vice President since 1999 | Associate Portfolio Manager of Thornburg Investment Management, Inc. since 1999, Vice President since 1999 and Managing Director since 2003; Vice President of Thornburg Limited Term Municipal Fund, Inc. to 2004. | Not applicable | ||
Brad Kinkelaar, 37 Vice President since 1999 | Associate Portfolio Manager of Thornburg Investment Management, Inc. since 1999, Vice President since 2000 and Managing Director since 2003. | Not applicable | ||
Christopher Ihlefeld, 35 Vice President since 2003 | Associate Portfolio Manager since 1999; Vice President of Thornburg Investment Management, Inc. since 2002; Vice President of Limited Term Municipal Fund, Inc., 2003-2004. | Not applicable | ||
22 Certified Annual Report |
TRUSTEES AND OFFICERS, CONTINUED
Thornburg Florida Intermediate Municipal Fund | September 30, 2005 (Unaudited) |
Name, Age, Position Held with Fund Year Elected | Principal Occupation(s) During Past Five Years | Other Directorships Held by Trustee | ||
Leon Sandersfeld, 39 Vice President since 2003 | Associate of Thornburg Investment Management, Inc. since 2002; Senior Staff Accountant, Farm Bureau Life Insurance Co. 1998–2002. | Not applicable | ||
Sasha Wilcoxon, 31 Vice President since 2003 | Associate of Thornburg Investment Management, Inc. since 2000 and Mutual Fund Operations Department Manager since 2002. | Not applicable | ||
Ed Maran, 47 Vice President since 2004 | Associate Portfolio Manager of Thornburg Investment Management, Inc. since 2002 and Vice President and Managing Director since 2004; Analyst, USAA 2001-2002; Oil Analyst, A.G. Edwards 1997–2000. | Not applicable | ||
Vinson Walden, 35 Vice President since 2004 | Associate Portfolio Manager of Thornburg Investment Management, Inc. since 2002 and Vice President and Managing Director since 2004; Associate Portfolio Manager, Ibis Management 2002-2004; Associate, Lehman Brothers, 1997–2001. | Not applicable | ||
| (1) | Each person’s address is 119 East Marcy Street, Santa Fe, New Mexico 87501. |
| (2) | The Fund is one of twelve separate investment “Funds” or “series” of Thornburg Investment Trust (the “Trust”), which comprises the Thornburg mutual fund complex and is organized as a Massachusetts business trust. The Trust currently has twelve active Funds. Thornburg Investment Management, Inc. is the investment advisor to, and manages, the twelve Funds of the Trust. Each Trustee oversees the twelve Funds in the fund complex. |
| (3) | Mr.Thornburg is considered an “interested” Trustee under the Investment Company Act of 1940 because he is a director and controlling shareholder of Thornburg Investment Management, Inc., the investment advisor to the twelve active Funds of the Trust, and is the sole director and controlling shareholder of Thornburg Securities Corporation, the distributor of shares for the Trust. |
| (4) | Each Trustee serves in office until the election and qualification of a successor. |
| (5) | Mr. McMahon is considered an “interested” Trustee because he is the president of Thornburg Investment Management, Inc. |
| (6) | The Trust’s president, secretary and treasurer each serves a one-year term or until the election and qualification of a successor; each other officer serves at the pleasure of the Trustees. |
| (7) | Assistant vice presidents, assistant secretaries and assistant treasurers are not shown. |
The Statement of Additional Information for each Fund of the Trust includes additional information about the Trustees and is available, without charge and upon request, by calling 1-800-847-0200.
| Certified Annual Report 23 |
Thornburg Florida Intermediate Municipal Fund | September 30, 2005 (Unaudited) |
PORTFOLIO PROXY VOTING
Policies and Procedures:
The Trust has delegated to Thornburg Investment Management, Inc. (the “Advisor”) voting decisions respecting proxies for the Fund’s voting securities. The Advisor makes voting decisions in accordance with its Proxy Voting Policy and Procedures. A description of the Policy and Procedures is available (i) without charge, upon request, by calling the Advisor toll-free at 1-800-847-0200, (ii) on the Thornburg website at www.thornburg.com, and (iii) on the Securities and Exchange Commission’s website at www.sec.gov.
Commencing August 31, 2004, information regarding how proxies were voted is available on or before August 31 of each year for the twelve months ending the preceding June 30. This information is available (i) without charge, upon request by calling the Advisor toll-free at 1-800-847-0200, (ii) on the Thornburg website at www.thornburg.com, and (iii) on the Securities and Exchange Commission’s website at www.sec.gov.
TAX INFORMATION
For the fiscal year ended September 30, 2005, 100% of dividends paid by the Fund are tax exempt dividends for Federal Income Tax purposes. The information and distributions reported herein may differ from the information and distributions taxable to the shareholders for the calendar year ending December 31, 2005.
AVAILABILITY OF QUARTERLY PORTFOLIO SCHEDULE
The Fund files with the Securities and Exchange Commission schedules of its portfolio holdings on Form N-Q for the first and third quarters of each fiscal year. The Fund’s Forms N-Q are available on the Commission’s website at www.sec.gov, or may be reviewed and copied at the Commission’s Public Reference Room in Washington, D.C. Information on the operation of the Public Reference Room may be obtained by calling 1-800-SEC-0330. The Fund also makes this information available on its website at www.thornburg.com/download or upon request by calling 1-800-847-0200.
TRUSTEES DELIBERATIONS RESPECTING RENEWAL OF INVESTMENT ADVISORY AGREEMENT
Thornburg Investment Management, Inc. (the “Advisor”) provides investment management services to Thornburg Florida Intermediate Municipal Fund pursuant to an investment advisory agreement. The Trustees consider the renewal of this agreement annually and most recently determined to renew the agreement on September 13, 2005.
In connection with their general supervision of the Advisor, the Trustees receive and consider reports throughout the year from the Advisor respecting the Advisor’s management of the Fund’s investments. These reports include information about the Fund’s purchase and sale of portfolio investments and explanations from the Advisor respecting investment selections, the investment performance of the Fund, general appraisals of industry and economic prospects and factors, and other matters affecting the Fund and relating to the Advisor’s performance of services for the Fund.
In anticipation of their recent consideration of the advisory agreement’s renewal, the independent Trustees met with representatives of the Advisor in May and July 2005 to specify the information the Advisor would present to the Trustees for their review. The independent Trustees thereafter met in independent session to consider various factors respecting the agreement’s renewal, and met in a subsequent session with the Advisor’s chief investment officer to present questions. Following these sessions, the Trustees met on September 13, 2005 to consider a renewal of the advisory agreement.
The Trustees considered various factors in their review of the Advisor’s performance under the investment advisory agreement, including specifically the principles outlined in their February 2005 Statement to Shareholders, a copy of which accompanies this Annual Report to Shareholders. Summarized below are certain of the factors considered by the Trustees, in connection with the determination to renew the advisory agreement. In determining to renew the advisory agreement, the Trustees did not identify any single fact or aspect of the Advisor’s performance as controlling, and this summary does not describe all of the matters considered by the Trustees in making their determination.
Quality of Services; Fund Investment Performance. In reviewing the nature, extent, and quality of services provided by the Advisor and the investment performance of the Fund, the Trustees primarily considered the Advisor’s adherence to the Fund’s stated objectives and policies, the Advisor’s execution of the Fund’s investment strategies in prevailing market conditions, the Fund’s absolute investment performance, the Fund’s investment performance compared to categories of other single state fixed income mutual funds, the Fund’s investment performance over different periods of time, the Fund’s total returns in rising and declining markets compared to total returns of a category of generally similar mutual funds and a broad based securities index, comparative measures of portfolio risk and share price volatility, and related factors. The Trustees noted that bond indices have limited utility in evaluating fixed income mutual funds. Similarly, the Trustees noted in comparing the Fund to other mutual funds that the value of such comparisons may be limited in some degree because the Fund’s investment approach, and in particular its laddered maturity portfolio, differs from other funds. In conducting their review, the Trustees observed that the Advisor had continued to faithfully pursue and to achieve the Fund’s stated objectives, as demonstrated particularly by the Advisor’s selection of investments in a single state environment and its investment performance. The Trustees noted in this regard that the Fund’s performance was comparable to the average of a category of
24 Certified Annual Report |
OTHER INFORMATION, CONTINUED | ||
Thornburg Florida Intermediate Municipal Fund | September 30, 2005 (Unaudited) | |
generally similar Florida fixed income funds selected by an independent analyst firm, and that the Fund’s share price volatility was lower than a category of longer term single state funds selected by an independent analyst firm.
The Trustees also considered a number of other factors in reviewing the quality of the Advisor’s services, including the qualifications and integrity of the Advisor’s senior personnel, the Advisor’s staffing and other resources, the Advisor’s compliance with regulatory requirements, Fund sales performance and perceptions of the Funds in the marketplace, and other factors.
The Trustees concluded, based upon these and other considerations, that the Advisor had actively and competently pursued the Fund’s stated investment objectives in accordance with the Fund’s investment policies stated in its prospectuses. The Trustees further concluded that the investment performance of the Fund was satisfactory in the context of the Fund’s objectives and policies and prevailing market conditions.
Fees and Expenses; Profitability of Advisor. In reviewing the fees charged by the Advisor to the Fund, the Trustees primarily considered the fees charged by the Advisor and the other expenses charged to the Fund in light of the nature and quality of services provided, comparison of the actual Advisor’s fee and Fund expenses to the statement of fees and expenses in the Fund’s prospectuses, the Advisor’s waivers of fees, comparisons of the Advisor’s fee, and other Fund expenses to median and average fees and expenses charged to similar mutual funds, and comparisons of fees and expenses charged to the Fund with fees and expenses charged to other, similar specific mutual funds. In addition, the Trustees considered the profitability of the Advisor compared to other investment management firms, and compared the investment management fee rates charged by the Advisor to the Fund with rates charged to other clients of the Advisor and the differing types of services furnished to the Fund and the other clients. The Trustees noted that the overall expenses for the Fund were somewhat lower than average and comparable to median expenses for a group of similar mutual funds. The Trustees further noted in this regard that the stated management fee chargeable to the Fund was comparable to the average and median management fees for other Florida fixed income mutual funds in the group, but that the actual fee was lower due to the Advisor’s waiver of fees. The Trustees also observed in their review that fee rates charged by the Advisor to other clients of the Advisor were not directly comparable to rates charged to the Fund principally because of the significant differences in the services provided.
The Trustees concluded, based upon these and other considerations, that the fees charged to the Fund by the Advisor were fair and reasonable in view of the following: the services provided, the clear disclosure of these fees and expenses in the Fund’s prospectuses, and prevailing fees and expenses charged to mutual funds generally. The Trustees further concluded that there was no indication that the Advisor’s profitability was unusual, viewed in the context of the services provided, the performance of the Fund, and the fees and profitability of other investment management firms.
Economies of Scale. In reviewing the extent to which economies of scale would be realized by the Fund as it grows and whether fee levels reflect economies of scale, the Trustees considered the breakpoint structure for advisory fees chargeable to the Fund, the demonstrated economies of scale enjoyed by other Funds of the Trust as they had grown in size, and economies of scale realized by other mutual funds. The Trustees concluded that the Fund may reasonably be expected to realize economies of scale for the benefit of its shareholders as it grows in size.
Ancillary Benefits to Advisor. In reviewing benefits enjoyed by the Advisor because of its relationship with the Fund, the Trustees considered an arrangement through which the Advisor received certain research services, favorable publicity received by the Advisor because of the superior investment performance of certain Funds of the Trust, and the benefits to the Fund from the Advisor’s expansion of its staffing and other resources to serve a broader variety of investment clients. The Trustees concluded, based upon these and other considerations, that there was no unusual or unfair benefit enjoyed by the Advisor and that the Fund enjoyed benefits by virtue of the Advisor’s engagement by other investment clients.
| Certified Annual Report 25 |
Trustees’ Statement to Shareholders
Not part of the Certified Annual Report
February 8, 2005
The Trustees are concerned that recent commentaries and opinions reported in the media may confuse investors in general as to the supervisory duties of trustees of mutual funds and, in particular, leave Thornburg Investment Trust shareholders uncertain regarding how we discharge our responsibilities in supervising the Funds’ investment advisor and in reviewing the advisor’s contract for renewal. We decided to spell out clearly three principal guidelines that we follow in supervising the Trust’s investment advisor on your behalf.
We begin with the premise that each shareholder selected his or her Fund because its investments are managed by the investment advisor identified in the prospectus and in accordance with the objective and policies described in the prospectus. We realize, as each of you do, that if you believe that your Fund’s stated objective and policies no longer serve your personal investment goals, you can sell your shares and leave the Fund.
Therefore, we believe that our primary supervisory task – our principal obligation to you – is to assess the nature and quality of the advisor’s services, and to confirm that the advisor actively and competently pursues the Fund’s objective, in accordance with the policies set out in the prospectus. To do this, we meet regularly with management to review your Fund’s portfolio and to discuss the advisor’s specific actions and judgments in pursuing the Fund’s objective. We do not substitute our own judgment for the advisor’s decisions in selecting investments; the advisor is paid to exercise its informed judgment on investment decisions, and we seek to confirm, in reviewing the advisor’s performance, that the advisor is doing just that.
Second, while we are conscious of costs and the effect that costs have on shareholders’ returns, we do not seek the lowest fees or expense ratio as our sole or primary objective. We try to make sure that your Fund’s fees and costs are reasonable in relationship to the services rendered and that they are generally in line with those charged by other expert investment advisors, consistent with our belief that the Fund’s investors searched for and expect that expertise and attention and have decided to pay a reasonable price for it. We do not put the management contract “out to bid” as a matter of course, and we would not do so unless we had concluded that the advisor materially had failed to pursue the Fund’s objectives in accordance with its policies, or for other equally important reasons. We believe that any other approach would be inconsistent with your interests and contrary to your expectations when you bought shares of the Fund in the first place.
Finally, because we believe that most Thornburg Fund shareholders have invested with a long-term perspective, we try not to focus too much on the fashions of the moment and on short-term performance. The market will not favor any specific investment objective or set of policies at all times and under all economic circumstances. A fund will experience periods of both high and low returns relative to other funds and other investments. Even if one of our Funds is not favored by the market at a particular time, we believe that the advisor is nonetheless obliged to remain true to the Fund’s objective and policies, and we watch to see that it does so.
This statement is submitted for the general information of the shareholders of Thornburg Investment Trust. It is not authorized for distribution to prospective investors in the Fund unless preceded or accompanied by an effective prospectus. If you have not received a prospectus, one can be obtained from your financial advisor, online at www.thornburg.com/download, or by calling 800-847-0200. Carefully consider information in the prospectus regarding the Fund’s investment objectives and policies, risks, sales charges, expenses, experience of its management, marketability of shares, and other information. Read it carefully before you invest or send money.
26 This page is not part of the Annual Report. |
Planning Options
Retirement and Education Accounts
Thornburg Investment Management offers retirement and education savings accounts that can help you meet a variety of planning challenges. For account applications or further information on any of the accounts below, please call 1-800-847-0200 or go to www.thornburg.com/ira. Your financial advisor can help you determine which plan is right for you.
Individual Retirement Accounts
Individual Retirement Accounts (IRAs) provide a tax-advantaged means to save money for the future. For a detailed outline of the difference between retirement accounts, see www.thornburg.com/ira. Rollovers are available. Call 1-800-847-0200 for more information.
Traditional IRAs – Contributions to Traditional IRAs are tax deductible for eligible individuals, and withdrawals are taxed as additional ordinary income. You may contribute to an IRA if you receive compensation and are under 70 1/2, even if you are covered by an employer retirement plan.
Roth IRAs – Under a Roth IRA, there is no tax deduction for contributions, but there is no income tax on qualified withdrawals. For a more detailed comparison of Traditional and Roth IRAs, please see our web site at www.thornburg.com/ira.
SEP IRAs – Simplified Employee Pension (SEP) IRAs are established by employers. The employer is allowed a tax deduction for contributions made to the SEP Plan and makes contributions to each eligible employee’s SEP IRA on a discretionary basis.
SIMPLE IRAs – Savings Incentive Match Plan for Employees of Small Employers (SIMPLE) is designed to give small business owners a simplified method to establish and contribute to a retirement plan for employees. The employer is allowed a tax deduction for contributions and makes either matching or non-elective contributions to each eligible employee’s SIMPLE IRA. Employees may make salary deferral contributions.
403(b)
A special, tax-advantaged savings vehicle available only to employees of 501(c)(3) organizations, such as charitable, educational, scientific and religious organizations. 403(b) plans are also available to employees of public schools and universities.
Coverdell Education Savings Account
These savings accounts are designed to provide a way to save money for higher education expenses. In an Education Savings Account, earnings and interest grow tax free, and qualified withdrawals used to pay for eligible higher-education expenses are tax- and penalty-free.
Funds Available
The following funds are available in the accounts listed above:
| • | Thornburg International Value Fund |
| • | Thornburg Value Fund |
| • | Thornburg Core Growth Fund |
| • | Thornburg Investment Income Builder Fund |
| • | Thornburg Limited Term U.S. Government Fund |
| • | Thornburg Limited Term Income Fund |
| This page is not part of the Annual Report. 27 |
The Firm
Thornburg Investment Management® is a privately held investment management company based in Santa Fe, New Mexico with assets under management of over $16 billion. Founded in 1982, the firm manages four equity funds, eight bond funds, and separate portfolios for select institutions and individuals.
Investment Philosophy
We seek to preserve and increase the real wealth of the Funds’ shareholders after accounting for inflation, taxes, and investment expenses. We’re committed to disciplined investing and controlling risk in all market environments through laddered bond and focused equity portfolios.
Portfolio Holdings Disclosure
We believe you should know about your portfolio. Our web site keeps investors informed of the Funds’ equity holdings. Go to www.thornburg.com/funds for commentary on our equity fund holdings.
Co-Ownership of Funds
We invest side-by-side with the Funds’ shareholders. Our employees have invested over $110 million in Thornburg Funds.
Core Strategies for Building Wealth
We deliver core strategies to help investors meet long-term goals. A core strategy is a consistent, disciplined and proven investment process that represents the foundation of a diversified portfolio.
Investment Manager: | Distributor: | |
 |  | |
119 East Marcy Street Santa Fe, New Mexico 87501 800.847.0200 | 119 East Marcy Street Santa Fe, New Mexico 87501 800.847.0200 | |

Core Strategies for Building Wealth
Thornburg New York Intermediate Municipal Fund
Annual Report – September 30, 2005
This report is submitted for the general information of shareholders of the Fund. It is not authorized for distribution to prospective investors in the Fund unless preceded or accompanied by an effective prospectus. If you have not received a prospectus, one can be obtained from your financial advisor, online at www.thornburg.com/ download, or by calling 800-847-0200. Carefully consider information in the prospectus regarding the Fund’s investment objectives and policies, risks, sales charges, expenses, experience of its management, marketability of shares, and other information. Read it carefully before you invest or send money. Performance data quoted represents past performance and does not guarantee future results.
Thornburg New York Intermediate Municipal Fund
Laddering – an All Weather Strategy
The Fund’s investment objective is to obtain as high a level of current income exempt from Federal, New York State and New York City individual income taxes as is consistent with preservation of capital.
The Fund offers New York investors double (or for New York City residents triple) tax-free yields (may be subject to Alternative Minimum Tax) from a laddered portfolio with an average maturity of ten years or less. Laddering involves building a portfolio of bonds with staggered maturities so that a portion of the portfolio matures each year; cash from maturing bonds, if not needed for other purposes, is invested in bonds with longer maturities at the far end of the ladder.The strategy is a good compromise for managing different types of risk.
Thornburg Bond Funds
| • | Thornburg Limited Term Municipal Fund |
| • | Thornburg Intermediate Municipal Fund |
| • | Thornburg California Limited Term Municipal Fund |
| • | Thornburg New Mexico Intermediate Municipal Fund |
| • | Thornburg Florida Intermediate Municipal Fund |
| • | Thornburg New York Intermediate Municipal Fund |
| • | Thornburg Limited Term U.S. Government Fund |
| • | Thornburg Limited Term Income Fund |
Thornburg invests in short- and intermediate-term investment grade bonds. We ladder the maturities of individual bonds in the portfolios to moderate risk. Laddering involves building a portfolio of bonds with staggered maturities so that a portion of the portfolio will mature each year. We apply this disciplined process in all interest rate environments.
Thornburg Equity Funds
| • | Thornburg Value Fund |
| • | Thornburg International Value Fund |
| • | Thornburg Core Growth Fund |
| • | Thornburg Investment Income Builder Fund |
Thornburg’s equity research uses a fundamental, yet comprehensive, analytical approach. We invest when and where we perceive compelling value. Thornburg equity funds focus on a limited number of securities so that each holding can impact performance. The equity team searches for firms believed to have a promising future and seeks to buy shares of those companies at a discount to their intrinsic value.
More information at www.thornburg.com
 | Reduce paper clutter. | |
| Receive your shareholder reports and prospectus online | ||
| instead of through traditional mail. | ||
| Sign up at | ||
| www.thornburg.com/edelivery | ||
2 | This page is not part of the Annual Report |
Message
from the Chairman

Garrett Thornburg
Chairman & CEO
November 10, 2005
Dear Fellow Shareholder:
Thornburg Investment Management has a clear mission: to preserve and increase the real wealth of our shareholders. We aspire to accomplish this through a family of laddered bond funds that focus on quality, stability, and minimization of risk over time, and through a range of equity funds that redefine traditional measures of value and growth.
Our bond funds have always been managed using the highly disciplined approach of laddering short and intermediate bond maturities, seeking to provide both an attractive return and stability of principal. All of the bond funds buy only investment-grade securities. We have found this strategy to be the best at managing both interest-rate risk and credit risk, and we believe this strategy has served our shareholders well over time.
The bond funds are managed by portfolio managers who have many years of experience. We are proud of this consistency and experience and look forward to many more successful years with them at the helm.
In years past, there has been news about improper behavior by some mutual fund companies. Many new rules proposed in response to this scandal have called for increased transparency. We welcome increased transparency. Thornburg Investment Management has been a leader in providing information about our stock holdings and bond strategies to our shareholders on our web site, www.thornburg.com.
Unfortunately, some of the new rules will increase the cost to all shareholders in mutual funds. We will do our best to keep these expenses to a minimum. After all, we are shareholders too, and Thornburg employees have over $110 million invested in our own funds.
Thank you for investing with us. We will do our best to continue to earn your trust every day.
Sincerely, |
 |
Garrett Thornburg Chairman & CEO |
| This page is not part of the Annual Report. | 3 |

Thornburg New York Intermediate Municipal Fund
September 30, 2005
| 6 | ||
| 8 | ||
| 9 | ||
| 10 | ||
| 11 | ||
| 14 | ||
| 15 | ||
| 17 | ||
| 18 | ||
| 19 | ||
| 20 | ||
| 23 | ||
This report is certified under the Sarbanes-Oxley Act of 2002, which requires that public companies, including mutual funds, affirm that the information provided in their annual and semiannual shareholder reports fully and fairly represents their financial position.
4 | Certified Annual Report |
Important Information
Performance data quoted represents past performance and does not guarantee future results. Investment return and principal value will fluctuate so that upon redemption, investor’s shares may be worth more or less than their original cost. Current performance may be lower or higher than the data quoted. For performance data current to the most recent month end, visit www.thornburg.com.
The maximum sales charge for Class A Shares is 2.00%.
Performance data given at net asset value (NAV) does not take into account these sales charges. If the sales charges had been included, the performance would have been lower.
Shares in the Fund carry risks, including possible loss of principal. As with direct bond ownership, funds that invest in bonds are subject to certain risks including interest-rate risk, credit risk, and inflation risk. The principal value of bond funds will fluctuate relative to changes in interest rates, decreasing when interest rates rise. Unlike bonds, bond funds have ongoing fees and expenses. Shares in the Fund are not deposits or obligations of, or guaranteed or endorsed by, any bank, the Federal Deposit Insurance Corporation, the Federal Reserve Board or any government agency.
The information presented on the following pages was current as of September 30, 2005. The manager’s views, portfolio holdings, and sector diversification are historical and subject to change. This material should not be deemed a recommendation to buy or sell any of the securities mentioned.
The matters discussed in this report may constitute forward-looking statements made pursuant to the safe harbor provisions of the Securities Litigation Reform Act of 1995. These include any advisor or portfolio manager prediction, assessment, analysis or outlook for individual securities, industries, investment styles, market sectors and/or markets. These statements involve risks and uncertainties. In addition to the general risks described for each Fund in its current prospectus, other factors bearing on these reports include the accuracy of the advisor’s or portfolio manager’s forecasts and predictions, the appropriateness of the investment strategies designed by the advisor or portfolio manager and the ability of the advisor or portfolio manager to implement their strategies efficiently and successfully. Any one or more of these factors, as well as other risks affecting the securities markets generally, could cause the actual results of any fund to differ materially as compared to its benchmarks.
Glossary
The Merrill Lynch 7-12 Year Municipal Bond Index – A widely-accepted unmanaged market-weighted index comprised of fixed-rate, coupon bearing bonds issued within five years of the most recent month-end with greater than $50 million principal amount having a Moody’s investment grade rating and maturities of seven to twelve years.
Duration – The measure of the price sensitivity of a fixed-income security to an interest rate change of 100 basis points. Calculation is based on the weighted average of the present values for all cash flows.
Weighted Average Maturity – A weighted average of all the effective maturities of the bonds in a portfolio. Effective maturity takes into consideration mortgage prepayments, puts, sinking funds, adjustable coupons, and other features of individual bonds and is thus a more accurate measure of interest-rate sensitivity. Longer-maturity funds are generally considered more interest-rate sensitive than their shorter counterparts.
| Certified Annual Report | 5 |

George Strickland
Portfolio Manager
October 19, 2005
Dear Fellow Shareholder:
I am pleased to present the Annual Report for the Thornburg New York Intermediate Municipal Fund. The net asset value (NAV) of the A shares decreased by 20 cents to $12.44 during the twelve months ended September 30, 2005. If you were with us for the entire period, you received dividends of 41.5 cents per share. If you reinvested dividends, you received 42.2 cents per share.
Over the last twelve months, interest rates on bonds that mature in ten years or less have risen, while interest rates on long-term bonds have fallen. Higher interest rates on short-term bonds have pushed down the price of many of the bonds owned by the Fund, but have allowed us to buy new bonds at higher yields. The A shares of your Fund produced a total return of 1.73% (at NAV) over the twelve month period ended September 30, 2005, compared to a 2.92% return for the Merrill Lynch 7-12 Year Municipal Bond Index. The Fund was over weighted in bonds that mature in less than eight years. Since the returns of those short-term bonds lagged the return of the index, the Fund’s return lagged the index somewhat.
This has been an eventful year for the bond market and the world. The Federal Reserve has been steadily pushing up the target Fed Funds rate to its current level of 3.75%. Through the end of June, the bond market responded by pushing down yields on long-term bonds, thus flattening the yield curve. A flat yield curve is usually associated with a recession, but the U.S. economy is showing no signs of entering a recession. So, more recently, interest rates have been rising for both short and long-term bonds, in more of a parallel yield curve shift. We believe that this is a more appropriate response by the market to a tightening Fed, a strong economy, and somewhat elevated levels of inflation.
Your Thornburg New York Intermediate Municipal Fund is a laddered portfolio of 50 municipal obligations from all over New York. Your Fund’s weighted average maturity is 6.31 years. We ladder the maturity dates of the bonds in your portfolio so that some of the bonds are scheduled to mature during each of the coming years. Laddering intermediate bonds accomplishes two goals. First, the staggered bond maturities contained in a ladder defuse interest-rate risk and dampen the Fund’s price volatility. Second, laddering gives the Fund a steady cash flow stream from maturing bonds to reinvest toward the top of the ladder where yields are typically higher. The chart shown here describes the percentages of your Fund’s bond portfolio maturing in each of the coming years.
| % of portfolio maturing | Cumulative % maturing | |||||
| 2 years | = 17.1% | Year 2 | = 17.1% | |||
| 2 to 4 years | = 12.8% | Year 4 | = 29.9% | |||
| 4 to 6 years | = 15.7% | Year 6 | = 45.6% | |||
| 6 to 8 years | = 17.8% | Year 8 | = 63.4% | |||
| 8 to 10 years | = 14.5% | Year 10 | = 77.9% | |||
| 10 to 12 years | = 5.7% | Year 12 | = 83.6% | |||
| 12 to 14 years | = 11.6% | Year 14 | = 95.2% | |||
| 14 to 16 years | = 1.2% | Year 16 | = 96.4% | |||
| 16 to 18 years | = 0.0% | Year 18 | = 96.4% | |||
| Over 18 years | = 3.6% | Over 18 years | = 100.0% | |||
Percentages can and do vary. Data as of 9/30/05.
6 | Certified Annual Report |
Thus far in 2005, New York continues to benefit from a strong job market and robust financial markets. Since the end of the state’s recent recession in August 2003, New York has added more than 147,000 private sector jobs and the unemployment rate has dipped to 4.7%. State receipts through August 2005 are running 11.4% ahead of last year and $698 million above the Financial Plan Estimate. However, the state and local economy is tied closely to the financial services industry which has proven to be quite volatile in the past. Furthermore, state and local debt levels are significantly above national averages. To reduce credit risk, we have kept 92% of the portfolio in bonds rated A or above and maintained broad diversification across issuers and market sectors.
Over the years, our practice of laddering a diversified portfolio of short and intermediate maturity municipal bonds has allowed your Fund to perform consistently well in varying interest rate environments. Thank you for investing in Thornburg New York Intermediate Municipal Fund.
Sincerely, |
 |
George Strickland Portfolio Manager |
| Certified Annual Report | 7 |
| Thornburg New York Intermediate Municipal Fund | September 30, 2005 | |
ASSETS | ||||
Investments at value (cost $39,909,718) | $ | 41,081,439 | ||
Cash | 420,883 | |||
Receivable for fund shares sold | 15,972 | |||
Interest receivable | 508,290 | |||
Prepaid expenses and other assets | 1,199 | |||
Total Assets | 42,027,783 | |||
LIABILITIES | ||||
Payable for securities purchased | 542,925 | |||
Payable for fund shares redeemed | 8,176 | |||
Payable to investment advisor and other affiliates (Note 3) | 28,866 | |||
Accounts payable and accrued expenses | 30,447 | |||
Dividends payable | 41,895 | |||
Total Liabilities | 652,309 | |||
NET ASSETS | $ | 41,375,474 | ||
NET ASSETS CONSIST OF: | ||||
Distribution in excess of net investment income | $ | (8,584 | ) | |
Net unrealized appreciation on investments | 1,171,721 | |||
Accumulated net realized gain (loss) | (69,725 | ) | ||
Net capital paid in on shares of beneficial interest | 40,282,062 | |||
| $ | 41,375,474 | |||
NET ASSET VALUE: | ||||
Class A Shares: | ||||
Net asset value and redemption price per share ($41,375,474 applicable to 3,327,132 shares of beneficial interest outstanding - Note 4) | $ | 12.44 | ||
Maximum sales charge, 2.00% of offering price | 0.25 | |||
Maximum offering price per share | $ | 12.69 | ||
See notes to financial statements.
8 | Certified Annual Report |
| Thornburg New York Intermediate Municipal Fund | Year Ended September 30, 2005 | |
INVESTMENT INCOME: | ||||
Interest income (net of premium amortized of $361,723) | $ | 1,881,778 | ||
EXPENSES: | ||||
Investment advisory fees (Note 3) | 219,024 | |||
Administration fees (Note 3) | 54,756 | |||
Distribution and service fees (Note 3) | 109,512 | |||
Transfer agent fees | 33,824 | |||
Registration and filing fees | 298 | |||
Custodian fees (Note 3) | 27,549 | |||
Professional fees | 21,610 | |||
Accounting fees | 6,001 | |||
Trustee fees | 1,266 | |||
Other expenses | 21,708 | |||
Total Expenses | 495,548 | |||
Less: | ||||
Management fees waived by investment advisor (Note 3) | (55,668 | ) | ||
Fees paid indirectly (Note 3) | (6,212 | ) | ||
Net Expenses | 433,668 | |||
Net Investment Income | 1,448,110 | |||
REALIZED AND UNREALIZED GAIN (LOSS) | ||||
Net realized gain (loss) on investments sold | (50,108 | ) | ||
Increase (decrease) in unrealized appreciation (depreciation) of investments | (668,668 | ) | ||
Net Realized and Unrealized Loss on Investments | (718,776 | ) | ||
Net Increase in Net Assets Resulting From Operations | $ | 729,334 | ||
See notes to financial statements.
| Certified Annual Report | 9 |
STATEMENTS OF CHANGES IN NET ASSETS
Thornburg New York Intermediate Municipal Fund
| Year Ended September 30, 2005 | Three Months Ended September 30, 2004 | Year Ended June 30, 2004 | ||||||||||
INCREASE (DECREASE) IN NET ASSETS FROM: | ||||||||||||
OPERATIONS: | ||||||||||||
Net investment income | $ | 1,448,110 | $ | 356,933 | $ | 1,460,526 | ||||||
Net realized gain (loss) on investments sold | (50,108 | ) | 11,068 | 7,282 | ||||||||
Increase (Decrease) in unrealized appreciation (depreciation) of investments | (668,668 | ) | 629,517 | (1,325,587 | ) | |||||||
Net Increase (Decrease) in Net Assets Resulting from Operations | 729,334 | 997,518 | 142,221 | |||||||||
DIVIDENDS TO SHAREHOLDERS: | ||||||||||||
From net investment income Class A Shares | (1,448,110 | ) | (356,933 | ) | (1,460,846 | ) | ||||||
FUND SHARE TRANSACTIONS (NOTE 4): | ||||||||||||
Class A Shares | (3,448,315 | ) | 2,350,704 | 4,106,329 | ||||||||
Net Increase (Decrease) in Net Assets | (4,167,091 | ) | 2,991,289 | 2,787,704 | ||||||||
NET ASSETS: | ||||||||||||
Beginning of period | 45,542,565 | 42,551,276 | 39,763,572 | |||||||||
End of period | $ | 41,375,474 | $ | 45,542,565 | $ | 42,551,276 | ||||||
See notes to financial statements.
10 | Certified Annual Report |
| Thornburg New York Intermediate Municipal Fund | September 30, 2005 | |
NOTE 1 – ORGANIZATION
Thornburg New York Intermediate Municipal Fund (the “Fund”) is a non-diversified series of Thornburg Investment Trust (the “Trust”). The Trust is organized as a Massachusetts business trust under a Declaration of Trust dated June 3, 1987 and is registered as a diversified, open-end management investment company under the Investment Company Act of 1940, as amended. The Trust is currently issuing eleven series of shares of beneficial interest in addition to those of the Fund: Thornburg California Limited Term Municipal Fund, Thornburg Limited Term Municipal Fund, Thornburg Florida Intermediate Municipal Fund, Thornburg New Mexico Intermediate Municipal Fund, Thornburg Intermediate Municipal Fund, Thornburg Limited Term U.S. Government Fund, Thornburg Limited Term Income Fund, Thornburg Value Fund, Thornburg International Value Fund, Thornburg Core Growth Fund, and Thornburg Investment Income Builder Fund. Each series is considered to be a separate entity for financial reporting and tax purposes and bears expenses directly attributable to it. The Fund’s investment objective is to obtain as high a level of current income exempt from Federal income tax as is consistent, in the view of the Fund’s investment advisor, with the preservation of capital. The Fund will also invest primarily in municipal obligations within the state of New York, with the objective of having interest dividends paid to its shareholders exempt from any individual income taxes. Additionally, the Fund will seek to have dividends paid to its individual shareholders exempt from New York City income taxes. The Fund currently offers only one class of shares of beneficial interest, Class A shares.
NOTE 2 – SIGNIFICANT ACCOUNTING POLICIES
Significant accounting policies of the Trust are as follows:
Valuation of Investments: In determining the net asset value of investments, the Trust utilizes an independent pricing service approved by the Board of Trustees. Debt investment securities have a primary market over the counter and are valued on the basis of valuations furnished by the pricing service. The pricing service values portfolio securities at quoted bid prices, normally at 4:00 p.m. EST. When quotations are not readily available, securities are valued at evaluated prices as determined by the pricing service using methods which include consideration of yields or prices of municipal obligations of comparable quality, type of issue, coupon, maturity, and rating; indications as to value from dealers and general market conditions. In any case where a price is not available from a pricing service for an investment, the Trust’s valuation and pricing committee determines a fair value for the investment using factors approved by the Trustees. The valuation procedures used by the pricing service and the portfolio valuations received by the Fund are reviewed by the officers of the Trust under the general supervision of the Board of Trustees. Short-term obligations having remaining maturities of 60 days or less are valued at amortized cost, which approximates market value.
Federal Income Taxes: It is the policy of the Trust to comply with the provisions of the Internal Revenue Code applicable to “regulated investment companies” and to distribute all taxable (if any) and tax exempt income of the Fund to the shareholders. Therefore, no provision for Federal income tax is required.
When-Issued and Delayed Delivery Transactions: The Trust may engage in when-issued or delayed delivery transactions. To the extent the Trust engages in such transactions, it will do so for the purpose of acquiring portfolio securities consistent with the Fund’s investment objectives and not for the purpose of investment leverage or to speculate on interest rate and/or market changes. At the time the Trust makes a commitment to purchase a security on a when-issued basis, the Fund will record the transaction and reflect the value in determining its net asset value. When effecting such transactions, assets of an amount sufficient to make payment for the portfolio securities to be purchased will be segregated on the Fund’s records on the trade date. Securities purchased on a when-issued or delayed delivery basis do not earn interest until the settlement date.
Dividends: Net investment income of the Fund is declared daily as a dividend on shares for which the Fund has received payment. Dividends are paid monthly and are reinvested in additional shares of the Fund at net asset value per share at the close of business on the dividend payment date or, at the shareholder’s option, paid in cash. Net capital gains, to the extent available, will be distributed at least annually.
General: Securities transactions are accounted for on a trade date basis. Interest income is accrued as earned. Premiums and discounts on securities purchased are amortized to call dates or maturity dates of the respective securities. Realized gains and losses from the sale of securities are recorded on an identified cost basis. Expenses common to all Funds are allocated among the Funds comprising the Trust based upon their relative net asset values or other appropriate allocation methods.
Guarantees and Indemnifications: Under the Trust’s organizational documents, its officers and Trustees are indemnified against certain liability arising out of the performance of their duties to the Fund. Additionally, in the normal course of business the Trust enters into contracts with service providers that contain general indemnification clauses. The Trust’s maximum exposure under these arrangements is unknown. However, based on experience, the Trust expects the risk of loss to be remote.
Use of Estimates: The preparation of financial statements, in conformity with generally accepted accounting principles, requires management to make estimates and assumptions that affect the reported amounts of assets and liabilities and the disclosure of contingent assets and liabilities at the date of the financial statements and the reported amounts of increases
| Certified Annual Report | 11 |
| NOTES TO FINANCIAL STATEMENTS, CONTINUED | ||
| Thornburg New York Intermediate Municipal Fund | September 30, 2005 | |
and decreases in net assets from operations during the reporting period. Actual results could differ from those estimates.
NOTE 3 – INVESTMENT ADVISORY FEE AND OTHER TRANSACTIONS WITH AFFILIATES
Pursuant to an investment advisory agreement, Thornburg Investment Management, Inc.® (the “Advisor”) serves as the investment advisor and performs services for which the fees are payable at the end of each month. For the year ended September 30, 2005, these fees were payable at annual rates ranging from .50 of 1% to .275 of 1% per annum of the average daily net assets of the Fund. For the year ended September 30, 2005, the Advisor voluntarily waived investment advisory fees of $55,668. The Trust entered into an Administrative Services Agreement with the Advisor, whereby the Advisor will perform certain administrative services for the shareholders and for which fees will be payable at an annual rate of up to .125 of 1% per annum of the average daily net assets.
The Trust has an underwriting agreement with Thornburg Securities Corporation® (the “Distributor”, an affiliate of the Advisor), which acts as the distributor of Fund shares. For the year ended September 30, 2005, the Distributor has advised the Fund that it earned net commissions aggregating $74 from the sale of Class A shares.
Pursuant to a Service Plan, under Rule 12b-1 of the Investment Company Act of 1940, the Trust may reimburse to the Advisor an amount not to exceed .25 of 1% per annum of the Fund’s average daily net assets for payments made by the Advisor to securities dealers and other persons for distribution of the Fund’s shares and to obtain various shareholder related services. The Advisor may pay out of its own resources additional expenses for distribution of the Fund’s shares.
The Trust has an agreement with the custodian bank to indirectly pay a portion of the custodian’s fees through credits earned by the Fund’s cash on deposit with the bank. This deposit agreement is an alternative to overnight investments. Custodial fees have been adjusted to reflect amounts that would have been paid without this agreement, with a corresponding adjustment reflected as fees paid indirectly in the Statement of Operations. For the year ended September 30, 2005, fees paid indirectly were $6,212.
Certain officers and Trustees of the Trust are also officers and/or Directors of the Advisor and Distributor. The compensation of independent Trustees is borne by the Trust.
NOTE 4 – SHARES OF BENEFICIAL INTEREST
At September 30, 2005, there were an unlimited number of shares of beneficial interest authorized. Transactions in shares of beneficial interest were as follows:
Year Ended September 30, 2005 | Three Months Ended September 30, 2004 | Year Ended June 30, 2004 | |||||||||||||||||||
| Shares | Amount | Shares | Amount | Shares | Amount | ||||||||||||||||
Class A Shares | |||||||||||||||||||||
Shares sold | 413,556 | $ | 5,190,988 | 289,811 | $ | 3,647,279 | 940,980 | $ | 11,918,550 | ||||||||||||
Shares issued to shareholders in reinvestment of dividends | 73,108 | 916,743 | 18,199 | 229,327 | 73,809 | 933,594 | |||||||||||||||
Shares repurchased | (762,664 | ) | (9,556,046 | ) | (121,053 | ) | (1,525,902 | ) | (690,958 | ) | (8,745,815 | ) | |||||||||
Net Increase (Decrease) | (276,000 | ) | $ | (3,448,315 | ) | 186,957 | $ | 2,350,704 | 323,831 | $ | 4,106,329 | ||||||||||
12 | Certified Annual Report |
| NOTES TO FINANCIAL STATEMENTS, CONTINUED | ||
| Thornburg New York Intermediate Municipal Fund | September 30, 2005 | |
NOTE 5 – SECURITIES TRANSACTIONS
For the year ended September 30, 2005, the Fund had purchase and sale transactions of investment securities (excluding short-term investments) of $12,077,364 and $13,644,984, respectively.
NOTE 6 – INCOME TAXES
At September 30, 2005, information on the tax components of capital is as follows:
Cost of investments for tax purposes | $ | 39,909,203 | ||
Gross unrealized appreciation on a tax basis | $ | 1,180,948 | ||
Gross unrealized depreciation on a tax basis | (8,712 | ) | ||
Net unrealized appreciation (depreciation) on investments (tax basis) | $ | 1,172,236 | ||
At September 30, 2005, the Fund did not have any undistributed tax-exempt/ordinary net income or undistributed capital gains.
At September 30, 2005, the Fund had tax basis capital losses of $20,132, which may be carried over to offset future capital gains. Such capital loss carryovers expire September 30, 2011.
The Fund utilized $252 of its loss carry forward during the year ended September 30, 2005. To the extent such carry forwards are used, capital gain distributions may be reduced to the extent provided by regulations.
At September 30, 2005, the Fund deferred capital losses occurring subsequent to October 31, 2004 of $50,108. For tax purposes, such losses will be reflected in the year ending September 30, 2006.
The tax character of distributions paid by the Fund for the year ended September 30, 2005, three months ended September 30, 2004, and year ended June 30, 2004 was as follows:
| 9/30/05 | 9/30/04 | 6/30/04 | |||||||
Tax-exempt income | $ | 1,448,110 | $ | 356,933 | $ | 1,460,846 | |||
| Certified Annual Report | 13 |
Thornburg New York Intermediate Municipal Fund
Year 2005 | 3 Months 2004(c) | Year Ended June 30, | ||||||||||||||||||||||
| 2004 | 2003 | 2002 | 2001 | |||||||||||||||||||||
Class A Shares: | ||||||||||||||||||||||||
PER SHARE PERFORMANCE | ||||||||||||||||||||||||
(for a share outstanding throughout the period) | ||||||||||||||||||||||||
Net asset value, beginning of period | $ | 12.64 | $ | 12.46 | $ | 12.86 | $ | 12.63 | $ | 12.55 | $ | 12.16 | ||||||||||||
Income from investment operations: | ||||||||||||||||||||||||
Net investment income | 0.42 | 0.10 | 0.45 | 0.51 | 0.54 | 0.62 | ||||||||||||||||||
Net realized and unrealized gain (loss) on investments | (0.20 | ) | 0.18 | (0.40 | ) | 0.25 | 0.08 | 0.39 | ||||||||||||||||
Total from investment operations | 0.22 | 0.28 | 0.05 | 0.76 | 0.62 | 1.01 | ||||||||||||||||||
Less dividends from: | ||||||||||||||||||||||||
Net investment income | (0.42 | ) | (0.10 | ) | (0.45 | ) | (0.51 | ) | (0.54 | ) | (0.62 | ) | ||||||||||||
Realized capital gains | — | — | — | (0.02 | ) | — | — | |||||||||||||||||
Total distributions | (0.42 | ) | (0.10 | ) | (0.45 | ) | (0.53 | ) | (0.54 | ) | (0.62 | ) | ||||||||||||
Change in net asset value | (0.20 | ) | 0.18 | (0.40 | ) | 0.23 | 0.08 | 0.39 | ||||||||||||||||
NET ASSET VALUE, end of period | $ | 12.44 | $ | 12.64 | $ | 12.46 | $ | 12.86 | $ | 12.63 | $ | 12.55 | ||||||||||||
RATIOS/SUPPLEMENTAL DATA | ||||||||||||||||||||||||
Total return(a) | 1.73 | % | 2.26 | % | 0.36 | % | 6.16 | % | 5.05 | % | 8.44 | % | ||||||||||||
Ratios to average net assets: | ||||||||||||||||||||||||
Net investment income | 3.31 | % | 3.19 | %(b) | 3.51 | % | 4.02 | % | 4.29 | % | 4.95 | % | ||||||||||||
Expenses, after expense reductions | 1.00 | % | 0.99 | %(b) | 0.99 | % | 0.93 | % | 0.87 | % | 0.87 | % | ||||||||||||
Expenses, after expense reductions and net of custody credits | 0.99 | % | 0.99 | %(b) | 0.99 | % | 0.93 | % | 0.87 | % | — | |||||||||||||
Expenses, before expense reductions | 1.12 | % | 1.18 | %(b) | 1.11 | % | 1.10 | % | 1.09 | % | 1.13 | % | ||||||||||||
Portfolio turnover rate | 28.70 | % | 4.27 | % | 13.46 | % | 15.57 | % | 17.66 | % | 21.96 | % | ||||||||||||
Net assets at end of period (000) | $ | 41,375 | $ | 45,543 | $ | 42,551 | $ | 39,764 | $ | 32,076 | $ | 25,855 | ||||||||||||
| (a) | Sales loads are not reflected in computing total return, which is not annualized for periods less than one year. |
| (b) | Annualized. |
| (c) | The Fund’s fiscal year-end changed to September 30. |
14 | Certified Annual Report |
Thornburg New York Intermediate Municipal Fund | September 30, 2005 |
CUSIPS: CLASS A - 885-215-665
NASDAQ SYMBOLS: CLASS A - THNYX
Issuer-Description | Credit Rating† Moody’s/S&P | Principal Amount | Value | |||||
Amherst Industrial Development Agency Civic Facility Revenue, 5.75% due 4/1/2015 (Insured: ACA) | NR/A | $ | 465,000 | $ | 500,712 | |||
Bethlehem Central School District GO, 7.10% due 11/1/2006 (Insured: AMBAC) | Aaa/AAA | 700,000 | 730,758 | |||||
Brookhaven Industrial Development Agency Revenue, 4.375% due 11/1/2031 put 11/1/2006 (Methodist Retirement Community Project; LOC: Northfork Bank) | A1/A- | 1,060,000 | 1,068,851 | |||||
Canastota Central School District GO, 7.10% due 6/15/2007 (ETM) | A2/NR | 215,000 | 229,764 | |||||
Canastota Central School District GO, 7.10% due 6/15/2008 (ETM) | A2/NR | 205,000 | 226,605 | |||||
Hempstead Industrial Development Agency Resource Recovery Revenue, 5.00% due 12/1/2010 put 6/1/2010 (American Ref-Fuel Project) | Ba1/BB+ | 1,000,000 | 1,043,240 | |||||
Long Island Power Authority Electric Systems Revenue General Series A, 6.00% due 12/1/2007 (Insured: AMBAC) | Aaa/AAA | 785,000 | 833,442 | |||||
Long Island Power Authority General Series B, 5.00% due 12/1/2006 | A3/A- | 1,000,000 | 1,024,550 | |||||
Monroe County Industrial Development Agency Revenue, 6.45% due 2/1/2014 (Civic Facility - DePaul Community Facility Project; Insured: Sonyma) | Aa1/NR | 880,000 | 889,469 | |||||
Nassau Health Care Corp., 6.00% due 8/1/2011 pre-refunded 8/1/2009 | Aaa/AAA | 530,000 | 594,231 | |||||
New York City Industrial Development Agency Civic Facility Revenue Refunding, 6.00% due 8/1/2006 (YMCA Greater New York Project) | Baa1/NR | 580,000 | 594,100 | |||||
New York City Municipal Water Finance Authority Series B, 5.75% due 6/15/2013 (ETM) | Aaa/AAA | 1,000,000 | 1,056,760 | |||||
New York City Municipal Water Finance Authority Water & Sewer Systems Revenue Series C, 2.80% due 6/15/2022 put 10/3/2005 (daily demand notes) | VMIG1/A-1+ | 1,000,000 | 1,000,000 | |||||
New York City Transitional Refunding Future Tax Secured C, 5.25% due 8/1/2016 (Insured: AMBAC) | Aaa/AAA | 1,365,000 | 1,492,559 | |||||
New York City Trust Cultural Resources Revenue, 5.75% due 7/1/2014 (Museum of American Folk Art Project; Insured: ACA) | NR/A | 920,000 | 989,994 | |||||
New York Dormitory Authority Lease Revenue Series A, 5.25% due 8/15/2013 (Insured: FSA) | Aaa/AAA | 1,000,000 | 1,079,870 | |||||
New York Dormitory Authority Revenue, 5.25% due 7/1/2010 (Insured: Radian) | NR/AA | 350,000 | 376,586 | |||||
New York Dormitory Authority Revenue, 5.25% due 7/1/2011 (Insured: Radian) | NR/AA | 370,000 | 400,847 | |||||
New York Dormitory Authority Revenue AIDS Long Term Health Care Facility, 5.00% due 11/1/2012 | Aa1/NR | 2,000,000 | 2,125,380 | |||||
New York Dormitory Authority Revenue Mental Health Services A, 5.50% due 2/15/2019 pre-refunded 8/15/2011 (Insured: MBIA) | Aaa/AAA | 1,085,000 | 1,209,656 | |||||
New York Dormitory Authority Revenue Mental Health Services Facilities Improvement A, 5.00% due 2/15/2015 (Insured: AMBAC) | Aaa/AAA | 1,900,000 | 2,068,169 | |||||
New York Dormitory Authority Revenue Refunding, 6.10% due 7/1/2019 (Ryan Clinton Community Health Center Project; Insured: Sonyma) | Aa1/NR | 1,000,000 | 1,105,880 | |||||
New York Dormitory Authority Revenue Unrefunded Mental Health Services A, 5.50% due 2/15/2019 (Insured: MBIA) | Aaa/AAA | 30,000 | 32,893 | |||||
New York Dormitory Authority School District Bond Financing Program Series A, 5.50% due 7/1/2009 (State Aid Withholding) | NR/A+ | 575,000 | 619,488 | |||||
New York Environmental Facilities Corp. PCR Water Series E, 6.875% due 6/15/2014 (State Revolving Fund) | Aaa/AAA | 400,000 | 404,300 | |||||
New York Housing Finance Service Series A, 6.375% due 9/15/2015 pre-refunded 9/15/2007 | A2/AAA | 665,000 | 706,582 | |||||
New York Medical Care Facilities Finance Agency Revenue, 6.125% due 2/15/2014 (Insured: FHA) | Aa2/AA | 5,000 | 5,059 | |||||
New York Mortgage Agency Revenue, 5.85% due 10/1/2017 | Aaa/NR | 125,000 | 129,841 | |||||
New York Refunded Series G, 6.75% due 2/1/2009 (ETM) | Aaa/AAA | 50,000 | 55,767 | |||||
New York Refunding Series A, 5.50% due 8/1/2014 (Insured: FSA) | Aaa/AAA | 1,000,000 | 1,112,010 | |||||
New York Refunding Series H, 5.00% due 8/1/2018 | A1/A+ | 1,000,000 | 1,053,960 | |||||
New York Series F, 5.50% due 8/1/2006 (ETM) | Aaa/AAA | 5,000 | 5,111 | |||||
New York Series H 4, 2.79% due 3/1/2034 put 10/3/2005 (LOC: BONY) (daily demand notes) | VMIG1/A-1+ | 500,000 | 500,000 | |||||
New York State Dormitory Authority Revenue Personal Income Tax, 5.50% due 3/15/2012 | A1/AA | 1,000,000 | 1,106,540 | |||||
New York State Dormitory Authority Revenue Refunding, 5.00% due 2/15/2010 (Wyckoff Heights Project; Insured: AMBAC) | Aaa/AAA | 1,000,000 | 1,052,130 | |||||
| Certified Annual Report | 15 |
SCHEDULE OF INVESTMENTS, CONTINUED | ||
| Thornburg New York Intermediate Municipal Fund | September 30, 2005 | |
Issuer-Description | Credit Rating† Moody’s/S&P | Principal Amount | Value | ||||
New York State GO, 9.875% due 11/15/2005 | A1/AA | $500,000 | $ | 504,175 | |||
New York State Mortgage Agency Revenue Series 70, 5.375% due 10/1/2017 | Aa1/NR | 300,000 | 310,563 | ||||
New York State Thruway Authority General Revenue Series F, 5.00% due 1/1/2018 (Insured: AMBAC) | Aaa/AAA | 2,000,000 | 2,148,480 | ||||
New York State Thruway Authority Service Contract Revenue Refunding, 5.50% due 4/1/2013 (Local Highway & Bridge Project; Insured: XLCA) | Aaa/AAA | 1,000,000 | 1,099,250 | ||||
New York State Urban Development Corp. Revenue Refunding Facilities A, 6.50% due 1/1/2011 (Correctional Capital Project; Insured: FSA) | Aaa/AAA | 1,000,000 | 1,144,290 | ||||
New York Unrefunded Series G, 6.75% due 2/1/2009 (Insured: MBIA-IBC) | Aaa/AAA | 950,000 | 1,055,440 | ||||
New York Urban Development Corp. Correctional Facilities Revenue, 0% due 1/1/2008 | A2/AA- | 2,000,000 | 1,852,900 | ||||
Newark Wayne Community Hospital Revenue Series B, 5.875% due 1/15/2033 (Insured: AMBAC) | Aaa/AAA | 1,480,000 | 1,483,389 | ||||
Oneida County Industrial Development Agency Revenue, 6.00% due 1/1/2010 (Insured: Radian) | NR/AA | 375,000 | 410,482 | ||||
Oneida County Industrial Development Agency Revenue, 6.10% due 6/1/2020 (Civic Facility Presbyterian Home Project; LOC: HSBC Bank USA) | Aa2/NR | 450,000 | 487,197 | ||||
Port Chester Industrial Development Agency Refunding, 4.75% due 7/1/2031 put 7/1/2011 (American Foundation Project; Collateralized: FNMA) | NR/AAA | 750,000 | 788,647 | ||||
Puerto Rico Electric Power Authority Power Revenue Refunding Series J, 5.375% due 7/1/2017 (Insured: XLCA) | Aaa/AAA | 545,000 | 614,684 | ||||
Tobacco Settlement Financing Corp. New York Revenue Asset Backed Series A-1C, 5.00% due 6/1/2012 (Secured: State Contingency Contract) | A2/AA- | 850,000 | 860,923 | ||||
Utica Industrial Development Agency Civic Facility Revenue, 5.25% due 7/15/2016 (Munson Williams Proctor Institute Project) | A1/NR | 210,000 | 228,852 | ||||
Valley Central School District Montgomery, 7.15% due 6/15/2007 (Insured: AMBAC) | Aaa/AAA | 625,000 | 667,063 | ||||
TOTAL INVESTMENTS — 99.29% (Cost $39,909,718) | $ | 41,081,439 | |||||
OTHER ASSETS LESS LIABILITIES — 0.71% | 294,035 | ||||||
NET ASSETS — 100.00% | $ | 41,375,474 | |||||
Footnote Legend
See notes to financial statements.
| † | Credit ratings are unaudited. Rating changes may have occurred prior to or subsequent to the reporting period end. |
Portfolio Abbreviations
To simplify the listings of securities, abbreviations are used per the table below:
ACA | Insured by American Capital Access | |
AMBAC | Insured by American Municipal Bond Assurance Corp. | |
BONY | Letter of Credit from Bank of New York | |
ETM | Escrowed to Maturity | |
FHA | Insured by Federal Housing Administration | |
FNMA | Collateralized by Federal National Mortgage Association | |
FSA | Insured by Financial Security Assurance Co. | |
GO | General Obligation | |
MBIA | Insured by Municipal Bond Investors Assurance | |
MBIA-IBC | Insured by Municipal Bond Investors Assurance - Insured Bond Certificates | |
RADIAN | Insured by Radian Asset Assurance | |
SONYMA | State of New York Mortgage Authority | |
XLCA | Insured by XL Capital Assurance | |
SUMMARY OF SECURITY CREDIT RATINGS†
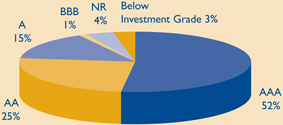
Ratings are a blend of Moody’s and Standard & Poor’s, using the higher rating. Some bonds are rated by only one service.
16 | Certified Annual Report |
REPORT OF INDEPENDENT REGISTERED PUBLIC ACCOUNTING FIRM
Thornburg New York Intermediate Municipal Fund
To the Trustees and Shareholders of
Thornburg New York Intermediate Municipal Fund
In our opinion, the accompanying statement of assets and liabilities, including the schedule of investments, and the related statements of operations and of changes in net assets and the financial highlights present fairly, in all material respects, the financial position of Thornburg New York Intermediate Municipal Fund (one of the Portfolios constituting Thornburg Investment Trust, hereafter referred to as the “Fund”) at September 30, 2005, the results of its operations for the year then ended, the changes in its net assets and the financial highlights for each of the periods presented, in conformity with accounting principles generally accepted in the United States of America. These financial statements and financial highlights (hereafter referred to as “financial statements”) are the responsibility of the Fund’s management. Our responsibility is to express an opinion on these financial statements based on our audits. We conducted our audits of these financial statements in accordance with the standards of the Public Company Accounting Oversight Board (United States). Those standards require that we plan and perform the audit to obtain reasonable assurance about whether the financial statements are free of material misstatement. An audit includes examining, on a test basis, evidence supporting the amounts and disclosures in the financial statements, assessing the accounting principles used and significant estimates made by management, and evaluating the overall financial statement presentation. We believe that our audits, which included confirmation of securities at September 30, 2005 by correspondence with the custodian and brokers, provide a reasonable basis for our opinion.
PricewaterhouseCoopers LLP
New York, New York
November 16, 2005
| Certified Annual Report | 17 |
| Thornburg New York Intermediate Municipal Fund | September 30, 2005 (Unaudited) | |
As a shareholder of the Fund, you incur two types of costs:
(1) transaction costs, including
(a) sales charges (loads) on purchase payments, for Class A Shares;
(b) a deferred sales charge on redemptions of any part or all of a purchase of $1 million of Class A shares within 12 months of purchase;
(2) ongoing costs, including management fees; distribution and/or service (12b-1) fees; and other Fund expenses.
This example is intended to help you understand your ongoing costs (in dollars) of investing in the Fund and to compare these costs with the ongoing costs of investing in other mutual funds.
The example is based on an investment of $1,000 invested on March 31, 2005 and held until September 30, 2005.
Actual Expenses
The first line of the table at right provides information about actual account values and actual expenses. You may use the information in this line, together with the amount you invested, to estimate the expenses that you paid over the period. Simply divide your account value by $1,000 (for example, an $8,600 account value divided by $1,000 = 8.6), then multiply the result by the number in the first line under the heading entitled “Expenses Paid During Period” to estimate the expenses you paid on your account during this period.
Hypothetical Example for Comparison Purposes
The second line of the table at right provides information about hypothetical account values and hypothetical expenses based on the Fund’s actual expense ratio and an assumed rate of return of 5% per year before expenses, which is not the Fund’s actual return. The hypothetical account values and expenses may not be used to estimate the actual ending account balance or expenses you paid for the period. You may use this information to compare the ongoing costs of investing in the Fund and other funds. To do so, compare this 5% hypothetical example with the 5% hypothetical examples that appear in the shareholder reports of the other funds.
| Beginning Account Value 3/31/05 | Ending Account Value 9/30/05 | Expenses Paid During Period† 3/31/05-9/30/05 | |||||||
Class A Shares | |||||||||
Actual | $ | 1,000 | $ | 1,018.20 | $ | 5.01 | |||
Hypothetical* | $ | 1,000 | $ | 1,020.11 | $ | 5.01 | |||
| † | Expenses are equal to the annualized expense ratio for class A shares (0.99%) multiplied by the average account value over the period, multiplied by 183/366 to reflect the one-half year period. |
| * | Hypothetical assumes a rate of return of 5% per year before expenses. |
Please note that the expenses shown in the table are meant to highlight your ongoing costs only and do not reflect any transactional costs, such as sales charges (loads), redemption fees, or exchange fees. Therefore, the second line of the table is useful in comparing ongoing costs only, and will not help you determine the relative total costs of owning different funds. In addition, if these transactional costs were included, your costs would have been higher.
18 | Certified Annual Report |
Thornburg New York Intermediate Municipal Fund | September 30, 2005 (Unaudited) | |
GROWTH OF A HYPOTHETICAL $10,000 INVESTMENT
Thornburg New York Intermediate Municipal Fund Class A Total Returns, versus
Merrill Lynch 7-12 Year Municipal Bond Index and Consumer Price Index
(September 30, 1997 to September 30, 2005)
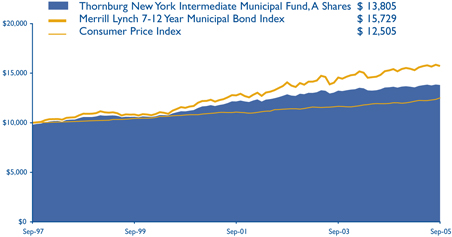
AVERAGE ANNUAL TOTAL RETURNS
For the periods ended September 30, 2005 (with sales charge)
| 1 Yr | 5 Yrs | 10 Yrs | Since Inception | ||||||||
A Shares (Incep: 9/5/97) | (0.32 | )% | 3.96 | % | N/A | 4.16 | % |
FUND ATTRIBUTES
as of September 30, 2005
| Annualized Dist. Rate (@NAV) | SEC Yield | NAV | Maximum Offering Price | |||||||||
A Shares (Incep: 9/5/97) | 3.48 | % | 2.61 | % | $ | 12.44 | $ | 12.69 | ||||
Performance data reflect past performance, which is no guarantee of future results. The performance data and graph do not reflect the deduction of taxes that a shareholder would pay on distributions or the redemption of Fund shares.
Returns reflect the reinvestment of dividends and capital gains, as well as applicable sales charge. Class A Shares are sold with a maximum sales charge of 2.00%
The Consumer Price Index (“CPI”) measures prices of a fixed basket of goods bought by a typical consumer, including food, transportation, shelter, utilities, clothing, medical care, entertainment and other items. The CPI, published by the Bureau of Labor Statistics in the Department of Labor, is based at 100 in 1982 and is released monthly. It is widely used as a cost-of-living benchmark to adjust Social Security payments and other payment schedules, union contracts and tax brackets. The CPI is also known as the cost-of-living index.
The Merrill Lynch 7-12 Year Municipal Bond Index represents a broad measure of market performance. It is a model portfolio of municipal obligations throughout the U.S., with an average maturity which ranges from seven to twelve years.
Unless otherwise noted, index returns reflect the reinvestment of income dividends and capital gains, if any, but do not reflect fees, brokerage commissions or other expenses of investing. Investors may not make direct investments into any index.
The SEC Yield is computed in accordance with SEC standards measuring the net investment income per share over a specified 30-day period expressed as a percentage of the maximum offering price of the Funds’ shares at the end of the period.
The distribution rate is calculated by taking the sum of the month’s total distribution factors and dividing this sum by a 30-day period and annualizing to 360-day year. The value is then divided by the ending Net Asset Value (NAV) to arrive at the annualized distribution yield. The yield is calculated on a periodic basis and is subject to change depending on the Funds’ NAV and current distributions.
| Certified Annual Report | 19 |
Thornburg New York Intermediate Municipal Fund | September 30, 2005 (Unaudited) | |
Name, Age, Position Held with Fund Year Elected | Principal Occupation(s) During Past Five Years | Other Directorships Held by Trustee | ||
INTERESTED TRUSTEES(1)(2)(4) | ||||
Garrett Thornburg, 59 Chairman of Trustees, Trustee since 1987(3) | CEO, Chairman and controlling shareholder of Thornburg Investment Management, Inc. (investment advisor) and Thornburg Securities Corporation (securities dealer); Chairman of Thornburg Limited Term Municipal Fund, Inc. (registered investment company) to 2004; CEO and Chairman of Thornburg Mortgage, Inc. (real estate investment trust); Chairman of Thornburg Mortgage Advisory Corporation (investment manager to Thornburg Mortgage, Inc.). | Director of Thornburg Mortgage, Inc. (real estate investment trust) | ||
Brian J. McMahon, 49 Trustee since 2001, Member of Governance & Nominating Committee, President since 1997(5)(6) | President and Managing Director of Thornburg Investment Management, Inc.; President of Thornburg Limited Term Municipal Fund, Inc. to 2004. | None | ||
INDEPENDENT TRUSTEES(1)(2)(4) | ||||
David A. Ater, 60 Trustee since 1994, Member of Audit Committee and Governance & Nominating Committee | Principal in Ater & Associates, Santa Fe, NM (developer, planner and broker of residential and commercial real estate); owner developer and broker for various real estate projects. | Director of Thornburg Mortgage, Inc. (real estate investment trust) | ||
David D. Chase, 64 Chairman of Audit Committee, Trustee since 2000 | Chairman, President, CEO, and Managing Member of Vestor Associates, LLC, the general partner of Vestor Partners, LP, Santa Fe, NM (private equity fund); Chairman and CEO of Vestor Holdings, Inc., Santa Fe, NM (merchant bank). | None | ||
Eliot R. Cutler, 59 Chairman of Governance & Nominating Committee, Trustee since 2004 | Partner, Akin, Gump, Strauss, Hauer & Feld, LLP, Washington, D.C. (law firm) since November 2000; partner, Cutler & Stanfield, Washington, D.C. (law firm) until November 2000. | Director of Thornburg Mortgage, Inc. (real estate investment trust) | ||
Susan H. Dubin, 56 Trustee since 2004, Member of Audit Committee | President of Dubin Investments, Ltd., Greenwich, CT (private investment fund); Director and officer of various charitable organizations; and formerly, Vice President of Chemical Bank (predecessor to JP Morgan Chase & Co.), New York, 1974–1996. | None | ||
Owen D. Van Essen, 51 Trustee since 2004, Member of Governance & Nominating Committee | President of Dirks, Van Essen & Murray, Santa Fe, NM (newspaper mergers and acquisitions). | None | ||
James W. Weyhrauch, 46 Trustee since 1996, Member of Audit Committee | Director, Executive Vice President to 2002, and President and CEO 2002–2004, Nambé Mills, Inc., Santa Fe, NM (manufacturer); real estate agent, Santa Fe Properties, Santa Fe, NM since 2004. | None | ||
20 | Certified Annual Report |
| TRUSTEES AND OFFICERS, CONTINUED | ||
| Thornburg New York Intermediate Municipal Fund | September 30, 2005 (Unaudited) | |
Name, Age, Position Held with Fund Year Elected | Principal Occupation(s) During Past Five Years | Other Directorships Held by Trustee | ||
OFFICERS OF THE FUND (WHO ARE NOT TRUSTEES)(1)(6)(7) | ||||
Dawn B. Fischer, 58 Secretary since 1987 | Secretary and Managing Director, Thornburg Investment Management, Inc.; Secretary, Thornburg Limited Term Municipal Fund, Inc. to 2004; Secretary, Thornburg Securities Corporation; Vice President, Daily Tax Free Income Fund, Inc. (registered investment company). | Not applicable | ||
Steven J. Bohlin, 46 Vice President since 1987; Treasurer since 1989 | Vice President and Managing Director of Thornburg Investment Management, Inc.; Vice President of Thornburg Limited Term Municipal Fund, Inc. to 2004. | Not applicable | ||
George T. Strickland, 42 Vice President since 1996 | Vice President and Managing Director of Thornburg Investment Management, Inc.; Vice President (to 2004) and Treasurer (2003–2004) of Thornburg Limited Term Municipal Fund, Inc. | Not applicable | ||
William V. Fries, 66 Vice President since 1995 | Vice President and Managing Director of Thornburg Investment Management, Inc. | Not applicable | ||
Leigh Moiola, 38 Vice President since 2001 | Vice President and Managing Director of Thornburg Investment Management, Inc.; Vice President of Thornburg Limited Term Municipal Fund, Inc. 1999–2004. | Not applicable | ||
Kenneth Ziesenheim, 51 Vice President since 1995 | Vice President and Managing Director of Thornburg Investment Management, Inc.; President of Thornburg Securities Corporation; Vice President of Thornburg Limited Term Municipal Fund, Inc. to 2004. | Not applicable | ||
Alexander Motola, 35 Vice President since 2001 | Vice President and Managing Director of Thornburg Investment Management, Inc. since 2000; Portfolio Manager, Insight Capital Research & Management, Inc., Walnut Creek, California 1995–2000. | Not applicable | ||
Wendy Trevisani, 34 Vice President since 1999 | Associate Portfolio Manager of Thornburg Investment Management, Inc. since 1999, Vice President since 2000 and Managing Director since 2003; Vice President of Thornburg Limited Term Municipal Fund, Inc. 1999–2002. | Not applicable | ||
Joshua Gonze, 42 Vice President since 1999 | Associate Portfolio Manager of Thornburg Investment Management, Inc. since 1999, Vice President since 1999 and Managing Director since 2003; Vice President of Thornburg Limited Term Municipal Fund, Inc. to 2004. | Not applicable | ||
Brad Kinkelaar, 37 Vice President since 1999 | Associate Portfolio Manager of Thornburg Investment Management, Inc. since 1999, Vice President since 2000 and Managing Director since 2003. | Not applicable | ||
Christopher Ihlefeld, 35 Vice President since 2003 | Associate Portfolio Manager since 1999; Vice President of Thornburg Investment Management, Inc. since 2002; Vice President of Limited Term Municipal Fund, Inc., 2003–2004. | Not applicable | ||
Leon Sandersfeld, 39 Vice President since 2003 | Associate of Thornburg Investment Management, Inc. since 2002; Senior Staff Accountant, Farm Bureau Life Insurance Co. 1998–2002. | Not applicable | ||
| Certified Annual Report | 21 |
| TRUSTEES AND OFFICERS, CONTINUED | ||
| Thornburg New York Intermediate Municipal Fund | September 30, 2005 (Unaudited) | |
Name, Age, Position Held with Fund Year | Principal Occupation(s) During Past Five Years | Other Directorships Held by Trustee | ||
Sasha Wilcoxon, 31 Vice President since 2003 | Associate of Thornburg Investment Management, Inc. since 2000 and Mutual Fund Operations Department Manager since 2002. | Not applicable | ||
Ed Maran, 47 Vice President since 2004 | Associate Portfolio Manager of Thornburg Investment Management, Inc. since 2002 and Vice President and Managing Director since 2004; Analyst, USAA 2001–2002; Oil Analyst, A.G. Edwards 1997–2000. | Not applicable | ||
Vinson Walden, 35 Vice President since 2004 | Associate Portfolio Manager of Thornburg Investment Management, Inc. since 2002 and Vice President and Managing Director since 2004; Associate Portfolio Manager, Ibis Management 2002–2004; Associate, Lehman Brothers, 1997–2001. | Not applicable | ||
| (1) | Each person’s address is 119 East Marcy Street, Santa Fe, New Mexico 87501. |
| (2) | The Fund is one of twelve separate investment “Funds” or “series” of Thornburg Investment Trust (the “Trust”), which comprises the Thornburg mutual fund complex and is organized as a Massachusetts business trust. The Trust currently has twelve active Funds.Thornburg Investment Management, Inc. is the investment advisor to, and manages, the twelve Funds of the Trust. Each Trustee oversees the twelve Funds in the fund complex. |
| (3) | Mr.Thornburg is considered an “interested” Trustee under the Investment Company Act of 1940 because he is a director and controlling shareholder of Thornburg Investment Management, Inc., the investment advisor to the twelve active Funds of the Trust, and is the sole director and controlling shareholder of Thornburg Securities Corporation, the distributor of shares for the Trust. |
| (4) | Each Trustee serves in office until the election and qualification of a successor. |
| (5) | Mr. McMahon is considered an “interested” Trustee because he is the president of Thornburg Investment Management, Inc. |
| (6) | The Trust’s president, secretary and treasurer each serves a one-year term or until the election and qualification of a successor; each other officer serves at the pleasure of the Trustees. |
| (7) | Assistant vice presidents, assistant secretaries and assistant treasurers are not shown. |
The Statement of Additional Information for each Fund of the Trust includes additional information about the Trustees and is available, without charge and upon request, by calling 1-800-847-0200.
22 | Certified Annual Report |
| Thornburg New York Intermediate Municipal Fund | September 30, 2005 (Unaudited) | |
PORTFOLIO PROXY VOTING
Policies and Procedures:
The Trust has delegated to Thornburg Investment Management, Inc. (the “Advisor”) voting decisions respecting proxies for the Fund’s voting securities. The Advisor makes voting decisions in accordance with its Proxy Voting Policy and Procedures. A description of the Policy and Procedures is available (i) without charge, upon request, by calling the Advisor toll-free at 1-800-847-0200, (ii) on the Thornburg website at www.thornburg.com, and (iii) on the Securities and Exchange Commission’s website at www.sec.gov.
Commencing August 31, 2004, information regarding how proxies were voted is available on or before August 31 of each year for the twelve months ending the preceding June 30. This information is available (i) without charge, upon request by calling the Advisor toll-free at 1-800-847-0200, (ii) on the Thornburg website at www.thornburg.com, and (iii) on the Securities and Exchange Commission’s website at www.sec.gov.
TAX INFORMATION
For the fiscal year ended September 30, 2005, 100% of dividends paid by the Fund are tax exempt dividends for Federal Income Tax purposes. The information and distributions reported herein may differ from the information and distributions taxable to the shareholders for the calendar year ending December 31, 2005.
AVAILABILITY OF QUARTERLY PORTFOLIO SCHEDULE
The Fund files with the Securities and Exchange Commission schedules of its portfolio holdings on Form N-Q for the first and third quarters of each fiscal year. The Fund’s Forms N-Q are available on the Commission’s website at www.sec.gov, or may be reviewed and copied at the Commission’s Public Reference Room in Washington, D.C. Information on the operation of the Public Reference Room may be obtained by calling 1-800-SEC-0330. The Fund also makes this information available on its website at www.thornburg.com/download or upon request by calling 1-800-847-0200.
TRUSTEES DELIBERATIONS RESPECTING RENEWAL OF INVESTMENT ADVISORY AGREEMENT
Thornburg Investment Management, Inc. (the “Advisor”) provides investment management services to Thornburg New York Intermediate Municipal Fund pursuant to an investment advisory agreement. The Trustees consider the renewal of this agreement annually and most recently determined to renew the agreement on September 13, 2005.
In connection with their general supervision of the Advisor, the Trustees receive and consider reports throughout the year from the Advisor respecting the Advisor’s management of the Fund’s investments. These reports include information about the Fund’s purchase and sale of portfolio investments and explanations from the Advisor respecting investment selections, the investment performance of the Fund, general appraisals of industry and economic prospects and factors, and other matters affecting the Fund and relating to the Advisor’s performance of services for the Fund.
In anticipation of their recent consideration of the advisory agreement’s renewal, the independent Trustees met with representatives of the Advisor in May and July 2005 to specify the information the Advisor would present to the Trustees for their review. The independent Trustees thereafter met in independent session to consider various factors respecting the agreement’s renewal, and met in a subsequent session with the Advisor’s chief investment officer to present questions. Following these sessions, the Trustees met on September 13, 2005 to consider a renewal of the advisory agreement.
The Trustees considered various factors in their review of the Advisor’s performance under the investment advisory agreement, including specifically the principles outlined in their February 2005 Statement to Shareholders, a copy of which accompanies this Annual Report to Shareholders. Summarized below are certain of the factors considered by the Trustees, in connection with the determination to renew the advisory agreement. In determining to renew the advisory agreement, the Trustees did not identify any single fact or aspect of the Advisor’s performance as controlling, and this summary does not describe all of the matters considered by the Trustees in making their determination.
Quality of Services; Fund Investment Performance. In reviewing the nature, extent, and quality of services provided by the Advisor and the investment performance of the Fund, the Trustees primarily considered the Advisor’s adherence to the Fund’s stated objectives and policies, the Advisor’s execution of the Fund’s investment strategies in prevailing market conditions, the Fund’s absolute investment performance, the Fund’s investment performance compared to categories of other broadly similar mutual funds and broad based securities indices, the Fund’s investment performance over different periods of time, the Fund’s total returns in rising and declining markets compared to total returns of a category of generally similar mutual funds and a broad based securities index, comparative measures of portfolio risk and share price volatility, and related factors. The Trustees noted that bond indices have limited utility in evaluating fixed income mutual funds.
Similarly, the Trustees noted in comparing the Fund to other mutual funds that the value of such comparisons may be limited in some degree because the Fund’s investment approach, and in particular its laddered maturity portfolio, differs from other funds. In conducting their review, the Trustees observed that the Advisor had continued to faithfully pursue and to achieve the Fund’s stated objectives, as demonstrated particularly by the Advisor’s selection of investments in a single state environment and the Fund’s investment performance. The Trustees noted in this regard that the Fund’s investment
| Certified Annual Report | 23 |
| OTHER INFORMATION, CONTINUED | ||
| Thornburg New York Intermediate Municipal Fund | September 30, 2005 (Unaudited) | |
performance was generally comparable to (but slightly lower than) the average of a category of New York fixed income funds selected by an independent analyst firm which were generally similar to the Fund, but which typically invested lesser proportions of their portfolios in investment grade securities. The Trustees also noted that the Fund’s share price volatility was lower than a category of longer term New York funds selected by an independent analyst firm.
The Trustees also considered a number of other factors in reviewing the quality of the Advisor’s services, including the qualifications and integrity of the Advisor’s senior personnel, the Advisor’s staffing and other resources, the Advisor’s compliance with regulatory requirements, Fund sales performance and perceptions of the Funds in the marketplace, and other factors.
The Trustees concluded, based upon these and other considerations, that the Advisor had actively and competently pursued the Fund’s stated investment objectives in accordance with the Fund’s investment policies stated in its prospectuses. The Trustees further concluded that the investment performance of the Fund was satisfactory in the context of the Fund’s objectives and policies and prevailing market conditions.
Fees and Expenses; Profitability of Advisor. In reviewing the fees charged by the Advisor to the Fund, the Trustees primarily considered the fees charged by the Advisor and the other expenses charged to the Fund in light of the nature and quality of services provided, comparison of the actual Advisor’s fee and Fund expenses to the statement of fees and expenses in the Fund’s prospectuses, the Advisor’s waiver of fees, comparisons of the Advisor’s fee, and other Fund expenses to median and average fees and expenses charged to similar mutual funds, and comparisons of fees and expenses charged to the Fund with fees and expenses charged to other, similar specific mutual funds. In addition, the Trustees considered the profitability of the Advisor compared to other investment management firms, and compared the investment management fee rates charged by the Advisor to the Fund with rates charged to other clients of the Advisor and the differing types of services furnished to the Fund and the other clients. The Trustees noted that the overall expenses for the Fund were somewhat lower than average and comparable to median expenses for a group of similar mutual funds. The Trustees further noted in this regard that the management fee chargeable to the Fund was comparable to the average and median management fees for the same group of New York fixed income mutual funds, but that the actual fee was lower due to the Advisor’s waiver of fees. The Trustees also observed in their review that fee rates charged by the Advisor to other clients of the Advisor were not directly comparable to rates charged to the Fund principally because of the significant differences in the services provided.
The Trustees concluded, based upon these and other considerations, that the fees charged to the Fund by the Advisor were fair and reasonable in view of the following: the services provided, the clear disclosure of these fees and expenses in the Fund’s prospectuses, and prevailing fees and expenses charged to mutual funds generally. The Trustees further concluded that there was no indication that the Advisor’s profitability was unusual, viewed in the context of the services provided, the performance of the Fund, and the fees and profitability of other investment management firms.
Economies of Scale. In reviewing the extent to which economies of scale would be realized by the Fund as it grows and whether fee levels reflect economies of scale, the Trustees considered the breakpoint structure for advisory fees chargeable to the Fund, the demonstrated economies of scale enjoyed by other Funds of the Trust as they had grown in size, and economies of scale realized by other mutual funds. The Trustees concluded that the Fund may reasonably be expected to realize economies of scale for the benefit of its shareholders as it grows in size.
Ancillary Benefits to Advisor. In reviewing benefits enjoyed by the Advisor because of its relationship with the Fund, the Trustees considered an arrangement through which the Advisor received certain research services, favorable publicity received by the Advisor because of the superior investment performance of certain Funds of the Trust, and the benefits to the Fund from the Advisor’s expansion of its staffing and other resources to serve a broader variety of investment clients. The Trustees concluded, based upon these and other considerations, that there was no unusual or unfair benefit enjoyed by the Advisor and that the Fund enjoyed benefits by virtue of the Advisor’s engagement by other investment clients.
24 | Certified Annual Report |
Trustees’ Statement to Shareholders
Not part of the Certified Annual Report
February 8, 2005
The Trustees are concerned that recent commentaries and opinions reported in the media may confuse investors in general as to the supervisory duties of trustees of mutual funds and, in particular, leave Thornburg Investment Trust shareholders uncertain regarding how we discharge our responsibilities in supervising the Funds’ investment advisor and in reviewing the advisor’s contract for renewal. We decided to spell out clearly three principal guidelines that we follow in supervising the Trust’s investment advisor on your behalf.
We begin with the premise that each shareholder selected his or her Fund because its investments are managed by the investment advisor identified in the prospectus and in accordance with the objective and policies described in the prospectus. We realize, as each of you do, that if you believe that your Fund’s stated objective and policies no longer serve your personal investment goals, you can sell your shares and leave the Fund.
Therefore, we believe that our primary supervisory task – our principal obligation to you – is to assess the nature and quality of the advisor’s services, and to confirm that the advisor actively and competently pursues the Fund’s objective, in accordance with the policies set out in the prospectus. To do this, we meet regularly with management to review your Fund’s portfolio and to discuss the advisor’s specific actions and judgments in pursuing the Fund’s objective. We do not substitute our own judgment for the advisor’s decisions in selecting investments; the advisor is paid to exercise its informed judgment on investment decisions, and we seek to confirm, in reviewing the advisor’s performance, that the advisor is doing just that.
Second, while we are conscious of costs and the effect that costs have on shareholders’ returns, we do not seek the lowest fees or expense ratio as our sole or primary objective. We try to make sure that your Fund’s fees and costs are reasonable in relationship to the services rendered and that they are generally in line with those charged by other expert investment advisors, consistent with our belief that the Fund’s investors searched for and expect that expertise and attention and have decided to pay a reasonable price for it. We do not put the management contract “out to bid” as a matter of course, and we would not do so unless we had concluded that the advisor materially had failed to pursue the Fund’s objectives in accordance with its policies, or for other equally important reasons. We believe that any other approach would be inconsistent with your interests and contrary to your expectations when you bought shares of the Fund in the first place.
Finally, because we believe that most Thornburg Fund shareholders have invested with a long-term perspective, we try not to focus too much on the fashions of the moment and on short-term performance. The market will not favor any specific investment objective or set of policies at all times and under all economic circumstances. A fund will experience periods of both high and low returns relative to other funds and other investments. Even if one of our Funds is not favored by the market at a particular time, we believe that the advisor is nonetheless obliged to remain true to the Fund’s objective and policies, and we watch to see that it does so.
This statement is submitted for the general information of the shareholders of Thornburg Investment Trust. It is not authorized for distribution to prospective investors in the Fund unless preceded or accompanied by an effective prospectus. If you have not received a prospectus, one can be obtained from your financial advisor, online at www.thornburg.com/download, or by calling 800-847-0200. Carefully consider information in the prospectus regarding the Fund’s investment objectives and policies, risks, sales charges, expenses, experience of its management, marketability of shares, and other information. Read it carefully before you invest or send money.
| This page is not part of the Annual Report | 25 |
This page intentionally left blank.
26 | This page is not part of the Annual Report |
Planning Options
Retirement and Education Accounts
Thornburg Investment Management offers retirement and education savings accounts that can help you meet a variety of planning challenges. For account applications or further information on any of the accounts below, please call 1-800-847-0200 or go to www.thornburg.com/ira. Your financial advisor can help you determine which plan is right for you.
Individual Retirement Accounts
Individual Retirement Accounts (IRAs) provide a tax-advantaged means to save money for the future. For a detailed outline of the difference between retirement accounts, see www.thornburg.com/ira. Rollovers are available. Call 1-800-847-0200 for more information.
Traditional IRAs – Contributions to Traditional IRAs are tax deductible for eligible individuals, and withdrawals are taxed as additional ordinary income. You may contribute to an IRA if you receive compensation and are under 701/2, even if you are covered by an employer retirement plan.
Roth IRAs – Under a Roth IRA, there is no tax deduction for contributions, but there is no income tax on qualified withdrawals. For a more detailed comparison of Traditional and Roth IRAs, please see our web site at www.thornburg.com/ira.
SEP IRAs – Simplified Employee Pension (SEP) IRAs are established by employers. The employer is allowed a tax deduction for contributions made to the SEP Plan and makes contributions to each eligible employee’s SEP IRA on a discretionary basis.
SIMPLE IRAs – Savings Incentive Match Plan for Employees of Small Employers (SIMPLE) is designed to give small business owners a simplified method to establish and contribute to a retirement plan for employees. The employer is allowed a tax deduction for contributions and makes either matching or non-elective contributions to each eligible employee’s SIMPLE IRA. Employees may make salary deferral contributions.
403(b)
A special, tax-advantaged savings vehicle available only to employees of 501(c)(3) organizations, such as charitable, educational, scientific and religious organizations. 403(b) plans are also available to employees of public schools and universities.
Coverdell Education Savings Account
These savings accounts are designed to provide a way to save money for higher education expenses. In an Education Savings Account, earnings and interest grow tax free, and qualified withdrawals used to pay for eligible higher-education expenses are tax- and penalty-free.
Funds Available
The following funds are available in the accounts listed above:
| • | Thornburg International Value Fund |
| • | Thornburg Value Fund |
| • | Thornburg Core Growth Fund |
| • | Thornburg Investment Income Builder Fund |
| • | Thornburg Limited Term U.S. Government Fund |
| • | Thornburg Limited Term Income Fund |
| This page is not part of the Annual Report | 27 |
The Firm
Thornburg Investment Management® is a privately held investment management company based in Santa Fe, New Mexico with assets under management of over $16 billion. Founded in 1982, the firm manages four equity funds, eight bond funds, and separate portfolios for select institutions and individuals.
Investment Philosophy
We seek to preserve and increase the real wealth of the Funds’ shareholders after accounting for inflation, taxes, and investment expenses. We’re committed to disciplined investing and controlling risk in all market environments through laddered bond and focused equity portfolios.
Portfolio Holdings Disclosure
We believe you should know about your portfolio. Our web site keeps investors informed of the Funds’ equity holdings. Go to www.thornburg.com/funds for commentary on our equity fund holdings.
Co-Ownership of Funds
We invest side-by-side with the Funds’ shareholders. Our employees have invested over $110 million in Thornburg Funds.
Core Strategies for Building Wealth
We deliver core strategies to help investors meet long-term goals. A core strategy is a consistent, disciplined and proven investment process that represents the foundation of a diversified portfolio.
| Investment Manager: | Distributor: | |||||
 |  | |||||
119 East Marcy Street Santa Fe, New Mexico 87501 800.847.0200 | 119 East Marcy Street Santa Fe, New Mexico 87501 800.847.0200 | |||||

Core Strategies for Building Wealth
Thornburg Limited Term Income Funds
Annual Report – September 30, 2005
This report is submitted for the general information of shareholders of the Fund. It is not authorized for distribution to prospective investors in the Fund unless preceded or accompanied by an effective prospectus. If you have not received a prospectus, one can be obtained from your financial advisor, online at www.thornburg.com/download, or by calling 800-847-0200. Carefully consider information in the prospectus regarding the Fund’s investment objectives and policies, risks, sales charges, expenses, experience of its management, marketability of shares, and other information. Read it carefully before you invest or send money. Performance data quoted represents past performance and does not guarantee future results.
Thornburg Limited Term Income Funds
Laddering – an All Weather Strategy
The Funds’ objectives are to obtain as high a level of current income as is consistent with the preservation of capital.
Thornburg Limited Term U.S. Government Fund – This Fund is a laddered portfolio of short/intermediate obligations issued by the U.S. Government, its agencies or instrumentalities with an average maturity of five years or less.
Thornburg Limited Term Income Fund – This Fund is a laddered portfolio of short/intermediate investment grade obligations with an average maturity of five years or less.
Laddering involves building a portfolio of bonds with staggered maturities so that a portion of the portfolio matures each year; cash from maturing bonds, if not needed for other purposes, is invested in bonds with longer maturities at the far end of the ladder. The strategy is a good compromise for managing different types of risk.
Thornburg Bond Funds
| • | Thornburg Limited Term Municipal Fund |
| • | Thornburg Intermediate Municipal Fund |
| • | Thornburg California Limited Term Municipal Fund |
| • | Thornburg New Mexico Intermediate Municipal Fund |
| • | Thornburg Florida Intermediate Municipal Fund |
| • | Thornburg New York Intermediate Municipal Fund |
| • | Thornburg Limited Term U.S. Government Fund |
| • | Thornburg Limited Term Income Fund |
Thornburg invests in short- and intermediate-term investment grade bonds. We ladder the maturities of individual bonds in the portfolios to moderate risk. Laddering involves building a portfolio of bonds with staggered maturities so that a portion of the portfolio will mature each year. We apply this disciplined process in all interest rate environments.
Thornburg Equity Funds
| • | Thornburg Value Fund |
| • | Thornburg International Value Fund |
| • | Thornburg Core Growth Fund |
| • | Thornburg Investment Income Builder Fund |
Thornburg’s equity research uses a fundamental, yet comprehensive, analytical approach. We invest when and where we perceive compelling value. Thornburg equity funds focus on a limited number of securities so that each holding can impact performance. The equity team searches for firms believed to have a promising future and seeks to buy shares of those companies at a discount to their intrinsic value.
More information at www.thornburg.com
| Reduce paper clutter. | |
| Receive your shareholder reports and prospectus online instead of through traditional mail. | ||
| Sign up at | ||
| www.thornburg.com/edelivery | ||

2 | This page is not part of the Annual Report. |
Message
from the Chairman

Garrett Thornburg
Chairman & CEO
November 10, 2005
Dear Fellow Shareholder:
Thornburg Investment Management has a clear mission: to preserve and increase the real wealth of our shareholders. We aspire to accomplish this through a family of laddered bond funds that focus on quality, stability, and minimization of risk over time, and through a range of equity funds that redefine traditional measures of value and growth.
Our bond funds have always been managed using the highly disciplined approach of laddering short and intermediate bond maturities, seeking to provide both an attractive return and stability of principal. All of the bond funds buy only investment-grade securities. We have found this strategy to be the best at managing both interest-rate risk and credit risk, and we believe this strategy has served our shareholders well over time.
The bond funds are managed by portfolio managers who have many years of experience. We are proud of this consistency and experience and look forward to many more successful years with them at the helm.
In years past, there has been news about improper behavior by some mutual fund companies. Many new rules proposed in response to this scandal have called for increased transparency. We welcome increased transparency. Thornburg Investment Management has been a leader in providing information about our stock holdings and bond strategies to our shareholders on our web site, www.thornburg.com.
Unfortunately, some of the new rules will increase the cost to all shareholders in mutual funds. We will do our best to keep these expenses to a minimum. After all, we are shareholders too, and Thornburg employees have over $110 million invested in our own funds.
Thank you for investing with us. We will do our best to continue to earn your trust everyday.
Sincerely,
|
Garrett Thornburg |
Chairman & CEO |

| This page is not part of the Annual Report. | 3 |

Thornburg Limited Term Income Funds
September 30, 2005
Table of Contents | ||
| 6 | ||
| 8 | ||
| 10 | ||
| 12 | ||
| 13 | ||
| 14 | ||
| 19 | ||
| 24 | ||
| 28 | ||
| 32 | ||
| 42 | ||
| 43 | ||
| 44 | ||
| 45 | ||
| 46 | ||
| 49 | ||
This report is certified under the Sarbanes-Oxley Act of 2002, which requires that public companies, including mutual funds, affirm that the information provided in their annual and semiannual shareholder reports fully and fairly represents their financial position.
4 | Certified Annual Report |
Important Information
Performance data quoted represents past performance and does not guarantee future results. Investment return and principal value will fluctuate so that upon redemption, investor’s shares may be worth more or less than their original cost. Current performance may be lower or higher than the data quoted. For performance data current to the most recent month end, visit www.thornburg.com.
The maximum sales charge for Class A Shares is 1.50%. Class B shares are sold with a contingent deferred sales charge (CDSC) that declines from 5.00% to 0% depending upon the period of time the shares are held. Class B shares will automatically convert to Class A shares on a quarterly basis approximately eight years after purchase. C shares include a 0.50% CDSC for the first year only. There is no up-front sales charge for R1 shares.
Performance data given at net asset value (NAV) does not take into account these sales charges. If the sales charges had been included, the performance would have been lower.
Shares in the Fund carry risks, including possible loss of principal. As with direct bond ownership, funds that invest in bonds are subject to certain risks including interest-rate risk, credit risk, and inflation risk. The principal value of bond funds will fluctuate relative to changes in interest rates, decreasing when interest rates rise. Unlike bonds, bond funds have ongoing fees and expenses. Shares in the Funds are not deposits or obligations of, or guaranteed or endorsed by, any bank, the Federal Deposit Insurance Corporation, the Federal Reserve Board or any government agency.
The information presented on the following pages was current as of September 30, 2005. The manager’s views, portfolio holdings, and sector diversification are historical and subject to change. This material should not be deemed a recommendation to buy or sell any of the securities mentioned.
The matters discussed in this report may constitute forward-looking statements made pursuant to the safe harbor provisions of the Securities Litigation Reform Act of 1995. These include any advisor or portfolio manager prediction, assessment, analysis or outlook for individual securities, industries, investment styles, market sectors and/or markets. These statements involve risks and uncertainties. In addition to the general risks described for each Fund in its current prospectus, other factors bearing on these reports include the accuracy of the advisor’s or portfolio manager’s forecasts and predictions, the appropriateness of the investment strategies designed by the advisor or portfolio manager and the ability of the advisor or portfolio manager to implement their strategies efficiently and successfully. Any one or more of these factors, as well as other risks affecting the securities markets generally, could cause the actual results of any fund to differ materially as compared to its benchmarks.
Glossary
The Lehman Brothers Intermediate Government/Credit Bond Index – An unmanaged, market-weighted index generally representative of intermediate government and investment-grade corporate debt securities having maturities of up to ten years.
The Lehman Brothers Intermediate Government Bond Index – An unmanaged, market-weighted index generally representative of all public obligations of the U.S. Government, its agencies and instrumentalities having maturities of up to ten years.
Unless otherwise noted, index returns reflect the reinvestment of income dividends and capital gains, if any, but do not reflect fees, brokerage commissions or other expenses of investing. Investors may not make direct investments into any index.
Duration – The measure of the price sensitivity of a fixed-income security to an interest rate change of 100 basis points. Calculation is based on the weighted average of the present values for all cash flows.
Basis Point – A unit for measuring a bond yield that is equal to 1/100th of a 1% yield. A 1% change =100 basis points (bps)
Consumer Price Index (CPI) – Measures prices of a fixed basket of goods bought by a typical consumer, including food, transportation, shelter, utilities, clothing, medical care, entertainment and other items. The CPI, published by the Bureau of Labor Statistics in the Department of Labor, is based at 100 in 1982 and is released monthly. It is widely used as a cost-of-living benchmark to adjust Social Security payments and other payment schedules, union contracts and tax brackets. The CPI is also known as the cost-of-living index.
| Certified Annual Report | 5 |

Steve Bohlin
Portfolio Manager
October 15, 2005
Dear Fellow Shareholder:
I am pleased to present the Annual Report for the Thornburg Limited Term Income Fund and the Thornburg Limited Term U.S. Government Fund for the twelve months ended September 30, 2005. The net asset value (NAV) of an A share of the Thornburg Limited Term Income Fund ended the period at $12.51. If you were invested for the entire period, you received dividends of 47.2 cents per share. If you reinvested your dividends, you received 48.0 cents per share. Investors who owned C shares received 44.0 and 44.7 cents per share, respectively. The NAV of an A share of the Thornburg Limited Term U.S. Government Fund ended the period at $12.76. If you were invested for the entire period, you received dividends of 33.4 cents per share. If you reinvested your dividends, you received 33.8 cents per share. Investors who owned C shares received 30.3 and 30.6 cents per share, respectively. Please read the accompanying exhibits for more detailed information and history.
Interest rates on U.S. Treasuries generally rose during the last year. The five-year Treasury yield rose from 3.38% to end the period at 4.19%. However, the market fluctuated widely in the interim. For example, the yield on a five-year U.S. Treasury ranged between a high of 4.33% and a low of 3.25% over the period. Interest rates mostly rose through March before starting a downward trend through June. Market yields rose rapidly through July before starting a downward trend in August before rising again in September. There was also a flattening of the yield curve as shorter term interest rates rose more than longer term rates. Quality spreads (the additional yield on a corporate bond) contracted through March, widened through the first part of June, contracted until the middle of August and widened again through the end of the period. When all is said and done, credit spreads are about the same for A – AAA (S&P) rated credits and a little wider for the lowest investment grade (BBB S&P rated) credits compared to a year ago.
Putting income and the change in price together, the A shares of the Thornburg Limited Term Income Fund produced a total return of 1.44% over the year, assuming a beginning-of-the-period investment at the net asset value. The Lehman Intermediate Government/Credit Index produced a 1.50% total return over the same time period. The A shares of the Thornburg Limited Term U.S. Government Fund produced a total return of 0.66% over the year, assuming a beginning-of-the-period investment at the net asset value. The Lehman Intermediate Government Index produced a 1.31% total return over the same time period. The Funds kept their maturities concentrated in the front years of the ladder. The Limited Term U.S. Governement Fund had a shorter average maturity than the Limited Term Income Fund. The flattening of the yield curve caused shorter term bonds to underperform longer term bonds. For example, the yield on a one-year Treasury rose 191 basis points while the yield on a ten-year Treasury rose only 20 basis points. We have kept our durations shorter than the indices thus far in 2005, because we believe doing so will improve the Funds’ return relative to the indices if interest rates continue to rise.
Longer-term interest rates are lower today than when the Federal Reserve Board Open Market Committee started raising rates in June of 2004. In the face of 275 basis points of rate increases, this seems astounding. This seems especially astounding if one considers that GDP growth has continued at or above trend for the last two years and that the year-over-year increase in CPI is tracking 4.7%. Today, the real yield on the ten-year Treasury note is negative: the CPI inflation rate is higher than the yield on a ten-year Treasury note. This last happened in 1980, when inflation was in the 12% to 13% range. Inflation today is less than half of that, but so is the yield on a ten-year Treasury note.
6 | Certified Annual Report |
Most market participants believe that the overall inflation rate is overstated because of the rise in oil and that the “core” rate should be used as a guide instead. However, inflation is not just about the “core”. The reason the “core” rate is a relevant measure is that if food or energy are temporarily boosted because of non-monetary events, the market does not have to react to a temporary change. However, higher energy prices are clearly not a temporary event. Thus far this year, the energy component of the CPI is up 42.5% at an annual rate, which follows a 16.5% increase in 2004, which in turn came on the heels of increases of 7.0% and 11.0% in 2003 and 2002, respectively. Higher energy prices are here and are not temporary. The U.S. economy was well positioned for this increase in energy prices – we have had steady jobs growth and strong GDP growth and U.S. corporations have been running very lean.
The question becomes whether the U.S. consumer and U.S. corporations slow down their expenditures in the face of this latest increase in energy prices, causing inflation and the U.S. economy to lower. The economy seems well positioned to weather any but the most severe slowdown. However, the current negative real yields in the bond market are still a conundrum. In partial explanation of the low level of interest rates, the Federal Reserve Board recently published a paper* suggesting that the huge influx of foreign investments has, in part, been a major factor in keeping rates low. According to this Fed paper, these foreign investments have kept interest rates perhaps as much as 100 basis points lower than usual, as capital inflows now equal 7% of GDP. Japan and China together now own over 20% of the U.S. bond market – Treasuries, Agencies, and Corporate bonds.
No matter what the reason, an investor is paying the U.S. Treasury to borrow their money, because the U.S. Treasury can pay the loan back with inflated dollars. And, an investor currently cannot venture further out the Treasury yield curve to reach a level that pays more than the rate of CPI inflation.
It appears evident that the Fed will maintain their “measured pace”. The worries of cost-push inflation from the most recent energy spike pretty much insure that. Eventually, the Fed Funds Rate needs to be at a neutral level, which would be somewhere above the rate of inflation. Any marked increase in the pace of “core” inflation data will cause the Fed to accelerate their “pace”. Unless inflation slows remarkably, the current level of the ten-year Treasury is not justified. We are cognizant of this as we invest these portfolios.
The Thornburg Limited Term Income Fund and the Thornburg Limited Term U.S. Government Fund are laddered portfolios of short-to-intermediate bonds. We keep the portfolios laddered over a time period ranging from one day to approximately ten years, with the average maturity of the portfolios always no more than five years. Some of the bonds are always coming close to maturity, but never too many at one time. We feel a laddered maturity portfolio of short-to-intermediate bonds is a sensible strategy over time. Intermediate bonds have proven to be a sensible part of a portfolio. They can provide stability to the underlying principal and they can provide income for the portfolio.
Thank you for investing in our Funds. We feel the Thornburg Limited Term U.S. Government Fund and the Thornburg Limited Term Income Fund are appropriate investments for investors who want a short-to-intermediate bond portfolio. While future performance cannot be guaranteed, we feel that we are well positioned, and we will maintain a steady course.
Sincerely,
 |
| Steven J. Bohlin |
| Portfolio Manager |
| * | Warnick, F. and Cacdac Warnock, V. “2005 International Capital Flows and U.S. Interest Rates.” International Finance Discussion Papers, Number 840, September 2005. Board of Governors of the Federal Reserve System. |
| Certified Annual Report | 7 |
| STATEMENTS OF ASSETS AND LIABILITIES | ||
| Thornburg Limited Term Income Funds | September 30, 2005 | |
| Limited Term U.S. Government Fund | Limited Term Income Fund | |||||||
ASSETS | ||||||||
Investments at value (cost $193,449,059 and $369,934,333, respectively) | $ | 189,838,211 | $ | 369,895,639 | ||||
Cash | 711,167 | 1,058,473 | ||||||
Receivable for investments sold | 0 | 200,000 | ||||||
Principal receivable | 57,332 | 0 | ||||||
Receivable for fund shares sold | 220,355 | 464,249 | ||||||
Interest receivable | 1,919,061 | 3,411,996 | ||||||
Prepaid expenses and other assets | 26,010 | 35,050 | ||||||
Total Assets | 192,772,136 | 375,065,407 | ||||||
LIABILITIES | ||||||||
Payable for fund shares redeemed | 281,877 | 644,935 | ||||||
Payable to investment advisor and other affiliates (Note 3) | 113,760 | 211,296 | ||||||
Accounts payable and accrued expenses | 76,114 | 150,752 | ||||||
Dividends payable | 99,505 | 255,739 | ||||||
Total Liabilities | 571,256 | 1,262,722 | ||||||
NET ASSETS | $ | 192,200,880 | $ | 373,802,685 | ||||
NET ASSETS CONSIST OF: | ||||||||
Undistributed net investment income | $ | 52,033 | $ | 70,784 | ||||
Net unrealized depreciation on investments | (3,610,848 | ) | (38,694 | ) | ||||
Accumulated net realized gain (loss) | (688,484 | ) | (3,689,902 | ) | ||||
Net capital paid in on shares of beneficial interest | 196,448,179 | 377,460,497 | ||||||
| $ | 192,200,880 | $ | 373,802,685 | |||||
NET ASSET VALUE: | ||||||||
Class A Shares: | ||||||||
Net asset value and redemption price per share | $ | 12.76 | $ | 12.51 | ||||
Maximum sales charge, 1.50% of offering price | 0.19 | 0.19 | ||||||
Maximum offering price per share | $ | 12.95 | $ | 12.70 | ||||
Class B Shares: | ||||||||
Net asset value and offering price per share * | $ | 12.73 | $ | — | ||||
Class C Shares: | ||||||||
Net asset value and offering price per share * | $ | 12.84 | $ | 12.49 | ||||
8 | Certified Annual Report |
| STATEMENTS OF ASSETS AND LIABILITIES, CONTINUED | ||
| Thornburg Limited Term Income Funds | September 30, 2005 | |
| Limited Term U.S. Government Fund | Limited Term Income Fund | |||||
Class I Shares: | ||||||
Net asset value, offering and redemption price per share | $ | 12.76 | $ | 12.51 | ||
Class R1 Shares: | ||||||
Net asset value, offering and redemption price per share | $ | 12.77 | $ | 12.52 | ||
| * | Redemption price per share is equal to net asset value less any applicable contingent deferred sales charge. |
See notes to financial statements.
| Certified Annual Report | 9 |
| STATEMENTS OF OPERATIONS | ||
| Thornburg Limited Term Income Funds | Year Ended September 30, 2005 | |
| Limited Term U.S. Government Fund | Limited Term Income Fund | |||||||
INVESTMENT INCOME: | ||||||||
Interest income (net of premium amortized of $1,908,912 and $1,178,774, respectively) | $ | 7,294,879 | $ | 17,524,165 | ||||
EXPENSES: | ||||||||
Investment advisory fees (Note 3) | 785,728 | 1,939,301 | ||||||
Administration fees (Note 3) | ||||||||
Class A Shares | 190,521 | 287,276 | ||||||
Class B Shares | 2,805 | 0 | ||||||
Class C Shares | 48,204 | 79,048 | ||||||
Class I Shares | 7,659 | 46,767 | ||||||
Class R1 Shares | 1,233 | 1,584 | ||||||
Distribution and service fees (Note 3) | ||||||||
Class A Shares | 381,043 | 574,552 | ||||||
Class B Shares | 22,388 | 0 | ||||||
Class C Shares | 385,648 | 632,392 | ||||||
Class R1 Shares | 4,994 | 6,365 | ||||||
Transfer agent fees | ||||||||
Class A Shares | 189,755 | 262,520 | ||||||
Class B Shares | 16,712 | 0 | ||||||
Class C Shares | 50,620 | 82,285 | ||||||
Class I Shares | 25,103 | 62,655 | ||||||
Class R1 Shares | 3,602 | 4,325 | ||||||
Registration and filing fees | ||||||||
Class A Shares | 27,439 | 40,059 | ||||||
Class B Shares | 11,753 | 0 | ||||||
Class C Shares | 23,038 | 25,903 | ||||||
Class I Shares | 18,739 | 22,877 | ||||||
Class R1 Shares | 20,639 | 20,301 | ||||||
Custodian fees (Note 3) | 89,651 | 133,082 | ||||||
Professional fees | 38,187 | 50,690 | ||||||
Accounting fees | 19,510 | 38,900 | ||||||
Trustee fees | 6,556 | 7,831 | ||||||
Other expenses | 62,257 | 97,426 | ||||||
Total Expenses | 2,433,784 | 4,416,139 | ||||||
Less: | ||||||||
Expenses reimbursed by Investment Advisor (Note 3) | (82,484 | ) | (367,593 | ) | ||||
Distribution and service fees waived (Note 3) | (193,397 | ) | (316,489 | ) | ||||
Fees paid indirectly (Note 3) | (17,211 | ) | (22,722 | ) | ||||
Net Expenses | 2,140,692 | 3,709,335 | ||||||
Net Investment Income | $ | 5,154,187 | $ | 13,814,830 | ||||
10 | Certified Annual Report |
| STATEMENTS OF OPERATIONS, CONTINUED | ||
| Thornburg Limited Term Income Funds | Year Ended September 30, 2005 | |
| Limited Term U.S. Government Fund | Limited Term Income Fund | |||||||
REALIZED AND UNREALIZED GAIN (LOSS) | ||||||||
Net realized gain (loss) on: | ||||||||
Investments | $ | 120,345 | $ | (26,961 | ) | |||
Foreign currency transactions | 0 | 60,220 | ||||||
| 120,345 | 33,259 | |||||||
Net change in unrealized appreciation (depreciation) on: | ||||||||
Investments | (4,003,893 | ) | (8,194,449 | ) | ||||
Net Realized and Unrealized Loss on Investments | (3,883,548 | ) | (8,161,190 | ) | ||||
Net Increase in Net Assets Resulting From Operations | $ | 1,270,639 | $ | 5,653,640 | ||||
See notes to financial statements.
| Certified Annual Report | 11 |
| STATEMENTS OF CHANGES IN NET ASSETS |
| Thornburg Limited Term U.S. Government Fund |
| Year Ended September 30, 2005 | Year Ended September 30, 2004 | |||||||
| INCREASE (DECREASE) IN NET ASSETS FROM: | ||||||||
| OPERATIONS: | ||||||||
Net investment income | $ | 5,154,187 | $ | 6,108,467 | ||||
Net realized gain on investments sold | 120,345 | 2,572,794 | ||||||
Increase (Decrease) in unrealized appreciation (depreciation) of investments | (4,003,893 | ) | (6,634,413 | ) | ||||
Net Increase (Decrease) in Net Assets Resulting from Operations | 1,270,639 | 2,046,848 | ||||||
DIVIDENDS TO SHAREHOLDERS: | ||||||||
From net investment income | ||||||||
Class A Shares | (3,952,925 | ) | (4,505,818 | ) | ||||
Class B Shares | (25,128 | ) | (42,140 | ) | ||||
Class C Shares | (900,979 | ) | (1,193,563 | ) | ||||
Class I Shares | (443,663 | ) | (363,591 | ) | ||||
Class R1 Shares | (26,599 | ) | (3,340 | ) | ||||
FUND SHARE TRANSACTIONS (NOTE 4): | ||||||||
Class A Shares | (22,152,201 | ) | (10,449,346 | ) | ||||
Class B Shares | (476,721 | ) | (628,485 | ) | ||||
Class C Shares | (9,829,652 | ) | (11,845,239 | ) | ||||
Class I Shares | 3,482,340 | 19,693 | ||||||
Class R1 Shares | 2,598,892 | 421,885 | ||||||
Net Decrease in Net Assets | (30,455,997 | ) | (26,543,096 | ) | ||||
NET ASSETS: | ||||||||
Beginning of year | 222,656,877 | 249,199,973 | ||||||
End of year | $ | 192,200,880 | $ | 222,656,877 | ||||
See notes to financial statements.
12 | Certified Annual Report |
| STATEMENTS OF CHANGES IN NET ASSETS |
| Thornburg Limited Term Income Fund |
| Year Ended September 30, 2005 | Year Ended September 30, 2004 | |||||||
| INCREASE (DECREASE) IN NET ASSETS FROM: | ||||||||
| OPERATIONS: | ||||||||
Net investment income | $ | 13,814,830 | $ | 11,970,046 | ||||
Net realized gain on investments | 33,259 | (1,197,633 | ) | |||||
Increase (Decrease) in unrealized appreciation (depreciation) of investments | (8,194,449 | ) | (3,681,220 | ) | ||||
Net Increase (Decrease) in Net Assets Resulting from Operations | 5,653,640 | 7,091,193 | ||||||
DIVIDENDS TO SHAREHOLDERS: | ||||||||
From net investment income | ||||||||
Class A Shares | (8,546,058 | ) | (7,103,088 | ) | ||||
Class C Shares | (2,192,018 | ) | (1,897,482 | ) | ||||
Class I Shares | (3,797,631 | ) | (3,012,694 | ) | ||||
Class R1 Shares | (48,598 | ) | (8,104 | ) | ||||
FUND SHARE TRANSACTIONS (NOTE 4): | ||||||||
Class A Shares | (12,086,746 | ) | 48,582,688 | |||||
Class C Shares | (4,598,144 | ) | 11,375,293 | |||||
Class I Shares | 11,548,065 | 31,761,582 | ||||||
Class R1 Shares | 1,280,382 | 903,829 | ||||||
Net Increase (Decrease) in Net Assets | (12,787,108 | ) | 87,693,217 | |||||
NET ASSETS: | ||||||||
Beginning of year | 386,589,793 | 298,896,576 | ||||||
End of year | $ | 373,802,685 | $ | 386,589,793 | ||||
See notes to financial statements.
| Certified Annual Report | 13 |
| NOTES TO FINANCIAL STATEMENTS | ||
| Thornburg Limited Term Income Funds | September 30, 2005 | |
NOTE 1 – ORGANIZATION
Thornburg Limited Term U.S. Government Fund (the “Government Fund”) and Thornburg Limited Term Income Fund (the “Income Fund”), hereafter referred to collectively as the “Funds”, are diversified series of Thornburg Investment Trust (the “Trust”). The Trust is organized as a Massachusetts business trust under a Declaration of Trust dated June 3, 1987 and is registered as a diversified, open-end management investment company under the Investment Company Act of 1940, as amended. The Trust is currently issuing ten series of shares of beneficial interest in addition to those of the Funds: Thornburg Limited Term Municipal Fund, Thornburg California Limited Term Municipal Fund, Thornburg Florida Intermediate Municipal Fund, Thornburg New York Intermediate Municipal Fund, Thornburg New Mexico Intermediate Municipal Fund, Thornburg Intermediate Municipal Fund, Thornburg Value Fund, Thornburg International Value Fund, Thornburg Core Growth Fund, and Thornburg Investment Income Builder Fund. Each series is considered to be a separate entity for financial reporting and tax purposes and bears expenses directly attributable to it. The Funds’ objectives are to obtain as high a level of current income as is consistent, in the view of the Funds’ investment advisor, with the preservation of capital.
The Government Fund currently offers five classes of shares of beneficial interest, Class A, Class B, Class C, Institutional Class (Class I), and Retirement Class (Class R1) shares. The Income Fund currently offers four classes of shares of beneficial interest, Class A, Class C, Institutional Class (Class I), and Retirement Class (Class R1) shares. Each class of shares of a Fund represents an interest in the same portfolio of investments, except that (i) Class A shares are sold subject to a front-end sales charge collected at the time the shares are purchased and bear a service fee, (ii) Class B shares are sold at net asset value without a sales charge at the time of purchase, but are subject to a contingent deferred sales charge upon redemption and bear both a service fee and distribution fee, (iii) Class C shares are sold at net asset value without a sales charge at the time of purchase, but are subject to a contingent deferred sales charge upon redemption within one year and bear both a service fee and a distribution fee, (iv) Class I shares are sold at net asset value without a sales charge at the time of purchase, (v) Class R1 shares are sold at net asset value without a sales charge, but bear both a service fee and a distribution fee, and (vi) the respective classes may have different reinvestment privileges and conversion rights. Additionally, each Fund may allocate among its classes certain expenses, to the extent applicable to specific classes, including transfer agent fees, government registration fees, certain printing and postage costs, and administrative and legal expenses. Currently, class specific expenses of the Funds are limited to service and distribution fees, administrative fees, and certain registration and transfer agent expenses. Class B shares of the Government Fund out-standing for eight years will convert to Class A shares of the Government Fund.
NOTE 2 – SIGNIFICANT ACCOUNTING POLICIES
Significant accounting policies of the Trust are as follows:
Valuation of Investments: In determining the net asset value of investments, the Trust utilizes an independent pricing service approved by the Board of Trustees. Debt investment securities have a primary market over the counter and are valued on the basis of valuations furnished by the pricing service. The pricing service values portfolio securities at quoted bid prices, normally at 4:00 p.m. EST. When quotations are not readily available, securities are valued at evaluated prices as determined by the pricing service using methods which include consideration of yields or prices of obligations of comparable quality, type of issue, coupon, maturity, and rating; indications as to value from dealers and general market conditions. In any case where a price is not available from a pricing service for an investment, the Trust’s valuation and pricing committee determines a fair value for the investment using factors approved by the Trustees. The valuation procedures used by the pricing service and the portfolio valuations received by the Funds are reviewed by the officers of the Trust under the general supervision of the Board of Trustees. Short-term instruments having a maturity of 60 days or less are valued at amortized cost, which approximates market value.
Federal Income Taxes: It is the policy of the Trust to comply with the provisions of the Internal Revenue Code applicable to “regulated investment companies” and to distribute all taxable income, including any net realized gain on investments of the Funds to the shareholders. Therefore, no provision for Federal income taxes is required.
When-Issued and Delayed Delivery Transactions: The Trust may engage in when-issued or delayed delivery transactions. To the extent the Trust engages in such transactions, it will do so for the purpose of acquiring portfolio securities consistent with the Funds’ investment objectives and not for the purpose of investment leverage or to speculate on interest rate and/or market changes. At the time the Trust makes a commitment to purchase a security on a when-issued basis, the Funds will record the transaction and reflect the value in determining each Fund’s net asset value. When effecting such transactions, assets of an amount sufficient to make payment for the portfolio securities to be purchased will be segregated on each Fund’s records at the trade date. Securities purchased on a when-issued or delayed delivery basis do not earn interest until the settlement date.
Dividends: Net investment incomes of the Funds are declared daily as a dividend on shares for which the Funds have received payment. Dividends are paid monthly and are reinvested in additional shares of the Funds at net asset value per share at the close of business on the dividend payment date or, at the shareholder’s option, paid in cash. Net capital gains, to the extent available, will be distributed at least annually.
14 | Certified Annual Report |
| NOTES TO FINANCIAL STATEMENTS, CONTINUED | ||
| Thornburg Limited Term Income Funds | September 30, 2005 | |
General: Securities transactions are accounted for on a trade date basis. Interest income is accrued as earned. Premiums and discounts on securities purchased are amortized over the life of the respective securities. Realized gains and losses from the sale of securities are recorded on an identified cost basis. The Funds invest in various mortgage-backed securities. Such securities pay interest and a portion of principal each month, which is then available for investment in securities at prevailing prices. Net investment income, other than class specific expenses and realized and unrealized gains and losses, is allocated daily to each class of shares based upon the relative net asset value of outstanding shares (or the value of the dividend-eligible shares, as appropriate) of each class of shares at the beginning of the day (after adjusting for the current share activity of the respective class). Expenses common to all funds are allocated among the funds comprising the Trust based upon their relative net asset values or other appropriate allocation methods.
Foreign Currency Transactions: With respect to the Income Fund, portfolio securities and other assets and liabilities denominated in foreign currencies are translated into U.S. dollars based on the rate of exchange of such currencies against U.S. dollars on the date of valuation. Purchases and sales of portfolio securities and interest denominated in foreign currencies are translated into U.S. dollar amounts on the respective dates of such transactions.
The Income Fund does not isolate that portion of the results of operations resulting from changes in foreign exchange rates on investments from the fluctuations arising from changes in market prices of securities held. Such fluctuations are included with the net realized and unrealized gain or loss from investments.
Reported net realized foreign exchange gains or losses arise from sales of foreign currencies, currency gains or losses realized between the trade and settlement dates on securities transactions, and the difference between the amount of interest recorded on the Income Fund’s books and the U.S. dollar equivalent of the amounts actually received or paid.
Guarantees and Indemnifications: Under the Trust’s organizational documents, its officers and Trustees are indemnified against certain liability arising out of the performance of their duties to the Funds. Additionally, in the normal course of business the Trust enters into contracts with service providers that contain general indemnification clauses. The Trust’s maximum exposure under these arrangements is unknown. However, based on experience, the Trust expects the risk of loss to be remote.
Use of Estimates: The preparation of financial statements, in conformity with generally accepted accounting principles, requires management to make estimates and assumptions that affect the reported amounts of assets and liabilities and the disclosure of contingent assets and liabilities at the date of the financial statements and the reported amounts of increases and decreases in net assets from operations during the reporting period. Actual results could differ from those estimates.
NOTE 3 – INVESTMENT ADVISORY FEE AND OTHER TRANSACTIONS WITH AFFILIATES
Pursuant to an investment advisory agreement, Thornburg Investment Management, Inc.® (the “Advisor”) serves as the investment advisor and performs services to the Funds for which the fees are payable at the end of each month. For the year ended September 30, 2005, these fees were payable at annual rates ranging from .375 of 1% to .275 of 1% per annum of the average daily net assets of the Government Fund and .50 of 1% to .275 of 1% per annum of the average daily net assets of the Income Fund depending on each Fund’s asset size. The Trust also has an Administrative Services Agreement with the Advisor, whereby the Advisor will perform certain administrative services for the shareholders of each class of each Fund’s shares, and for which fees will be payable at an annual rate of up to .125 of 1% per annum of the average daily net assets attributable to Class A, Class B, Class C, and Class R1 shares, and up to .05 of 1% per annum of the average daily net assets attributable to Class I shares. For the year ended September 30,2005, the Advisor voluntarily reimbursed certain class specific expenses and administrative fees of $8,654, $9,197, $17,936, $20,778, and $25,919 for the Class A, B, C, I, and R1 shares, respectively, of the Government Fund and $210,311, $82,832, $47,166, and $27,284 for the Class A, C, I, and R1 shares, respectively, of the Income Fund.
The Trust has an underwriting agreement with Thornburg Securities Corporation® (the “Distributor”, an affiliate of the Advisor), which acts as the distributor of each Fund’s shares. For the year ended September 30, 2005, the Distributor has advised the Funds that they earned net commissions aggregating $561 and refunded $575 from the sales of Class A shares of the Government Fund and Income Fund, respectively, and collected contingent deferred sales charges aggregating $5,855and $12,011 from redemptions of Class C shares of the Government Fund and Income Fund, respectively.
Pursuant to a service plan under Rule 12b-1 of the Investment Company Act of 1940, the Funds may reimburse to the Advisor an amount not to exceed .25 of 1% per annum of its average daily net assets attributable to the Class A, Class B, Class C, and Class R1 shares of the Funds for payments made by the Advisor to securities dealers and other financial institutions to obtain various shareholder related services. The Advisor may pay out of its own resources additional expenses for distribution of each Fund’s shares.
The Trust has also adopted Distribution Plans pursuant to Rule 12b-1, applicable to each Fund’s Class B, Class C, and Class R1 shares under which the Funds compensate the Distributor for services in promoting the sale of Class B, C, and R1 shares of the Funds at an annual rate of up to .75 of 1%��per annum of
| Certified Annual Report | 15 |
| NOTES TO FINANCIAL STATEMENTS, CONTINUED | ||
| Thornburg Limited Term Income Funds | September 30, 2005 | |
the average daily net assets attributable to these classes. Total fees incurred by each class of shares of the Funds under their respective service and distribution plans for the year ended September 30, 2005, are set forth in the Statements of Operations. Distribution fees of $193,397 and $316,489, respectively, for Class C shares of the Government Fund and Income Fund were waived.
The Trust has an agreement with the custodian bank to indirectly pay a portion of the custodian’s fees through credits earned by each Fund’s cash on deposit with the bank. This deposit agreement is an alternative to overnight investments. Custodial fees have been adjusted to reflect amounts that would have been paid without this agreement, with a corresponding adjustment reflected as fees paid indirectly in the Statement of Operations. For the year ended September 30,2005, fees paid indirectly were $17,211 for the Government Fund and $22,722 for the Income Fund.
Certain officers and Trustees of the Trust are also officers and/or Directors of the Advisor and Distributor. The compensation of independent Trustees is borne by the Trust.
NOTE 4 – SHARES OF BENEFICIAL INTEREST
At September 30, 2005, there were an unlimited number of shares of beneficial interest authorized. Transactions in shares of beneficial interest were as follows:
GOVERNMENT FUND
Year Ended September 30, 2005 | Year Ended September 30, 2004 | |||||||||||||
| Shares | Amount | Shares | Amount | |||||||||||
Class A Shares | ||||||||||||||
Shares sold | 2,243,592 | $ | 28,913,349 | 3,221,701 | $ | 42,079,302 | ||||||||
Shares issued to shareholders in reinvestment of dividends | 230,485 | 2,966,058 | 258,973 | 3,377,519 | ||||||||||
Shares repurchased | (4,195,950 | ) | (54,031,608 | ) | (4,285,525 | ) | (55,906,167 | ) | ||||||
Net Increase (Decrease) | (1,721,873 | ) | $ | (22,152,201 | ) | (804,851 | ) | $ | (10,449,346 | ) | ||||
Class B Shares | ||||||||||||||
Shares sold | 36,434 | $ | 470,166 | 78,261 | $ | 1,011,694 | ||||||||
Shares issued to shareholders in reinvestment of dividends | 1,423 | 18,270 | 1,992 | 25,958 | ||||||||||
Shares repurchased | (75,180 | ) | (965,157 | ) | (128,014 | ) | (1,666,137 | ) | ||||||
Net Increase (Decrease) | (37,323 | ) | $ | (476,721 | ) | (47,761 | ) | $ | (628,485 | ) | ||||
Class C Shares | ||||||||||||||
Shares sold | 353,641 | $ | 4,581,667 | 728,926 | $ | 9,584,018 | ||||||||
Shares issued to shareholders in reinvestment of dividends | 51,902 | 671,957 | 67,056 | 880,006 | ||||||||||
Shares repurchased | (1,165,115 | ) | (15,083,276 | ) | (1,700,988 | ) | (22,309,263 | ) | ||||||
Net Increase (Decrease) | (759,572 | ) | $ | (9,829,652 | ) | (905,006 | ) | $ | (11,845,239 | ) | ||||
Class I Shares | ||||||||||||||
Shares sold | 560,384 | $ | 7,250,216 | 415,995 | $ | 5,417,464 | ||||||||
Shares issued to shareholders in reinvestment of dividends | 30,104 | 387,218 | 23,453 | 305,738 | ||||||||||
Shares repurchased | (322,906 | ) | (4,155,094 | ) | (436,875 | ) | (5,703,509 | ) | ||||||
Net Increase (Decrease) | 267,582 | $ | 3,482,340 | 2,573 | $ | 19,693 | ||||||||
Class R1 Shares | ||||||||||||||
Shares sold | 225,835 | $ | 2,890,863 | 33,177 | $ | 432,173 | ||||||||
Shares issued to shareholders in reinvestment of dividends | 1,901 | 24,425 | 186 | 2,416 | ||||||||||
Shares repurchased | (24,563 | ) | (316,396 | ) | (972 | ) | (12,704 | ) | ||||||
Net Increase (Decrease) | 203,173 | $ | 2,598,892 | 32,391 | $ | 421,885 | ||||||||
16 | Certified Annual Report |
| NOTES TO FINANCIAL STATEMENTS, CONTINUED | ||
| Thornburg Limited Term Income Funds | September 30, 2005 | |
INCOME FUND
Year Ended September 30, 2005 | Year Ended September 30, 2004 | |||||||||||||
| Shares | Amount | Shares | Amount | |||||||||||
Class A Shares | ||||||||||||||
Shares sold | 4,512,773 | $ | 57,228,284 | 7,793,807 | $ | 99,954,867 | ||||||||
Shares issued to shareholders in reinvestment of dividends | 493,348 | 6,244,437 | 403,134 | 5,160,648 | ||||||||||
Shares repurchased | (5,976,128 | ) | (75,559,467 | ) | (4,413,893 | ) | (56,532,827 | ) | ||||||
Net Increase (Decrease) | (970,007 | ) | $ | (12,086,746 | ) | 3,783,048 | $ | 48,582,688 | ||||||
Class C Shares | ||||||||||||||
Shares sold | 996,231 | $ | 12,608,384 | 2,147,268 | $ | 27,537,572 | ||||||||
Shares issued to shareholders in reinvestment of dividends | 119,269 | 1,507,204 | 100,334 | 1,282,321 | ||||||||||
Shares repurchased | (1,480,457 | ) | (18,713,732 | ) | (1,365,887 | ) | (17,444,600 | ) | ||||||
Net Increase (Decrease) | (364,957 | ) | $ | (4,598,144 | ) | 881,715 | $ | 11,375,293 | ||||||
Class I Shares | ||||||||||||||
Shares sold | 2,722,997 | $ | 34,485,958 | 4,876,662 | $ | 62,615,919 | ||||||||
Shares issued to shareholders in reinvestment of dividends | 272,125 | 3,443,839 | 214,441 | 2,744,433 | ||||||||||
Shares repurchased | (2,083,269 | ) | (26,381,732 | ) | (2,637,669 | ) | (33,598,770 | ) | ||||||
Net Increase (Decrease) | 911,853 | $ | 11,548,065 | 2,453,434 | $ | 31,761,582 | ||||||||
Class R1 Shares | ||||||||||||||
Shares sold | 117,357 | $ | 1,481,761 | 71,754 | $ | 911,924 | ||||||||
Shares issued to shareholders in reinvestment of dividends | 2,363 | 29,836 | 223 | 2,855 | ||||||||||
Shares repurchased | (18,214 | ) | (231,215 | ) | (863 | ) | (10,950 | ) | ||||||
Net Increase (Decrease) | 101,506 | $ | 1,280,382 | 71,114 | $ | 903,829 | ||||||||
| Certified Annual Report | 17 |
| NOTES TO FINANCIAL STATEMENTS, CONTINUED | ||
| Thornburg Limited Term Income Funds | September 30, 2005 | |
NOTE 5 – SECURITIES TRANSACTIONS
For the year ended September 30, 2005, The Government Fund had purchase and sale transactions of investment securities(excluding short-term investments) of $50,821,343 and $35,041,005, respectively, and the Income Fund had purchase and sale transactions of investment securities (excluding short-term investments and U.S. government obligations) of $72,488,122 and $69,890,222, respectively.
NOTE 6 – INCOME TAXES
At September 30, 2005, information on the tax components of capital is as follows:
Government Fund | Income Fund | |||||||
Cost of investments for tax purpose | $ | 193,449,059 | $ | 369,941,132 | ||||
Gross unrealized appreciation on a tax basis | 454,761 | 3,433,412 | ||||||
Gross unrealized depreciation on a tax basis | (4,065,609 | ) | (3,478,905 | ) | ||||
Net unrealized appreciation (depreciation) on investments (tax basis) | $ | (3,610,848 | ) | $ | (45,493 | ) | ||
Distributable earnings ordinary income | $ | 52,033 | $ | 70,784 | ||||
At September 30, 2005, the Government Fund had tax basis capital losses, which may be carried over to offset future capital gains. Such losses expire as follows:
2009 | $ | 674,873 | |
2010 | 13,611 | ||
| $ | 688,484 | ||
At September 30, 2005, the Income Fund had tax basis capital losses, which may be carried over to offset future capital gains. Such losses expire as follows:
2008 | $ | 497,824 | |
2009 | 650,941 | ||
2010 | 308,333 | ||
2013 | 1,625,980 | ||
| $ | 3,083,078 | ||
The Government Fund utilized $54,462 of capital loss carry forwards for the year ended September 30, 2005. Unutilized tax basis capital losses may be carried forward to offset realized gains in future years. To the extent such carry forwards are used, capital gains distributions may be reduced to the extent provided by regulations.
As of September 30, 2005, the Income Fund had deferred capital losses occurring subsequent to October 31, 2004 of $600,025. For tax purposes, such losses will be reflected in the year ending September 30, 2006.
In order to account for book/tax differences, the Government Fund increased undistributed net investment income (loss) by $65,883 and decreased accumulated net realized (loss) by $65,883. The Income Fund increased undistributed net investment income (loss) by $644,970 and decreased accumulated net realized (loss) by $644,970. This reclass has no impact on the net asset value of the Fund. Reclassifications result primarily from foreign currency and paydowns.
For tax purposes, distributions for the year ended September 30, 2005 and September 30, 2004, were paid from ordinary income.
18 | Certified Annual Report |
| FINANCIAL HIGHLIGHTS |
| Thornburg Limited Term U.S. Government Fund |
| Year Ended September 30, | ||||||||||||||||||||
| 2005 | 2004 | 2003 | 2002 | 2001 | ||||||||||||||||
Class A Shares: | ||||||||||||||||||||
PER SHARE PERFORMANCE | ||||||||||||||||||||
(for a share outstanding throughout the year) | ||||||||||||||||||||
Net asset value, beginning of year | $ | 13.01 | $ | 13.23 | $ | 13.27 | $ | 12.77 | $ | 12.03 | ||||||||||
Income from investment operations: | ||||||||||||||||||||
Net investment income | 0.32 | 0.35 | 0.47 | 0.58 | 0.67 | |||||||||||||||
Net realized and unrealized gain (loss) on investments | (0.24 | ) | (0.22 | ) | (0.04 | ) | 0.50 | 0.74 | ||||||||||||
Total from investment operations | 0.08 | 0.13 | 0.43 | 1.08 | 1.41 | |||||||||||||||
Less dividends from: | ||||||||||||||||||||
Net investment income | (0.33 | ) | (0.35 | ) | (0.47 | ) | (0.58 | ) | (0.67 | ) | ||||||||||
Change in net asset value | (0.25 | ) | (0.22 | ) | (0.04 | ) | 0.50 | 0.74 | ||||||||||||
NET ASSET VALUE, end of year | $ | 12.76 | $ | 13.01 | $ | 13.23 | $ | 13.27 | $ | 12.77 | ||||||||||
RATIOS/SUPPLEMENTAL DATA | ||||||||||||||||||||
Total return(a) | 0.66 | % | 1.04 | % | 3.29 | % | 8.75 | % | 12.02 | % | ||||||||||
Ratios to average net assets: | ||||||||||||||||||||
Net investment income | 2.50 | % | 2.72 | % | 3.53 | % | 4.53 | % | 5.39 | % | ||||||||||
Expenses, after expense reductions | 0.99 | % | 0.92 | % | 0.92 | % | 0.93 | % | 0.99 | % | ||||||||||
Expenses, after expense reductions and net of custody credits | 0.98 | % | 0.91 | % | 0.90 | % | 0.92 | % | — | |||||||||||
Expenses, before expense reductions | 0.99 | % | 0.92 | % | 0.92 | % | 0.93 | % | 0.99 | % | ||||||||||
Portfolio turnover rate | 18.00 | % | 12.39 | % | 35.06 | % | 4.34 | % | 15.23 | % | ||||||||||
Net assets at end of year (000) | $ | 138,422 | $ | 163,530 | $ | 176,876 | $ | 155,864 | $ | 105,348 | ||||||||||
| (a) | Sales loads are not reflected in computing total return. |
| Certified Annual Report | 19 |
| FINANCIAL HIGHLIGHTS, CONTINUED |
| Thornburg Limited Term U.S. Government Fund |
Year Ended September 30, | Period Ended September 30, | |||||||||||
| 2005 | 2004 | 2003(c) | ||||||||||
Class B Shares: | ||||||||||||
PER SHARE PERFORMANCE | ||||||||||||
(for a share outstanding throughout the period) | ||||||||||||
Net asset value, beginning of period | $ | 12.98 | $ | 13.22 | $ | 13.12 | ||||||
Income from investment operations | ||||||||||||
Net investment income | 0.13 | 0.21 | 0.37 | |||||||||
Net realized and unrealized gain (loss) on investments | (0.24 | ) | (0.24 | ) | 0.10 | |||||||
Total from investment operations | (0.11 | ) | (0.03 | ) | 0.47 | |||||||
Less dividends from: | ||||||||||||
Net investment income | (0.14 | ) | (0.21 | ) | (0.37 | ) | ||||||
Change in net asset value | (0.25 | ) | (0.24 | ) | 0.10 | |||||||
NET ASSET VALUE, end of period | $ | 12.73 | $ | 12.98 | $ | 13.22 | ||||||
RATIOS/SUPPLEMENTAL DATA | ||||||||||||
Total return(a) | (0.82 | )% | (0.24 | )% | 3.60 | % | ||||||
Ratios to average net assets: | ||||||||||||
Net investment income | 1.03 | % | 1.65 | % | 2.93 | %(b) | ||||||
Expenses, after expense reductions | 2.46 | % | 1.99 | % | 1.35 | %(b) | ||||||
Expenses, after expense reductions and net of custody credits | 2.45 | % | 1.99 | % | 1.33 | %(b) | ||||||
Expenses, before expense reductions | 2.86 | % | 2.74 | % | 3.32 | %(b) | ||||||
Portfolio turnover rate | 18.00 | % | 12.39 | % | 35.06 | % | ||||||
Net assets at end of period (000) | $ | 1,875 | $ | 2,396 | $ | 3,073 | ||||||
| (a) | Not annualized for periods less than one year. |
| (b) | Annualized. |
| (c) | Effective date of Class B Shares was November 1, 2002. |
20 | Certified Annual Report |
| FINANCIAL HIGHLIGHTS, CONTINUED |
| Thornburg Limited Term U.S. Government Fund |
| Year Ended September 30, | ||||||||||||||||||||
| 2005 | 2004 | 2003 | 2002 | 2001 | ||||||||||||||||
Class C Shares: | ||||||||||||||||||||
PER SHARE PERFORMANCE | ||||||||||||||||||||
(for a share outstanding throughout the year) | ||||||||||||||||||||
Net asset value, beginning of year | $ | 13.09 | $ | 13.31 | $ | 13.35 | $ | 12.85 | $ | 12.10 | ||||||||||
Income from investment operations: | ||||||||||||||||||||
Net investment income | 0.29 | 0.31 | 0.43 | 0.54 | 0.62 | |||||||||||||||
Net realized and unrealized gain (loss) on investments | (0.24 | ) | (0.22 | ) | (0.04 | ) | 0.50 | 0.75 | ||||||||||||
| �� | ||||||||||||||||||||
Total from investment operations | 0.05 | 0.09 | 0.39 | 1.04 | 1.37 | |||||||||||||||
Less dividends from: | ||||||||||||||||||||
Net investment income | (0.30 | ) | (0.31 | ) | (0.43 | ) | (0.54 | ) | (0.62 | ) | ||||||||||
Change in net asset value | (0.25 | ) | (0.22 | ) | (0.04 | ) | 0.50 | 0.75 | ||||||||||||
NET ASSET VALUE, end of year | $ | 12.84 | $ | 13.09 | $ | 13.31 | $ | 13.35 | $ | 12.85 | ||||||||||
RATIOS/SUPPLEMENTAL DATA | ||||||||||||||||||||
Total return | 0.41 | % | 0.73 | % | 2.96 | % | 8.33 | % | 11.60 | % | ||||||||||
Ratios to average net assets: | ||||||||||||||||||||
Net investment income | 2.24 | % | 2.40 | % | 3.14 | % | 4.13 | % | 4.89 | % | ||||||||||
Expenses, after expense reductions | 1.25 | % | 1.24 | % | 1.24 | % | 1.28 | % | 1.41 | % | ||||||||||
Expenses, after expense reductions and net of custody credits | 1.24 | % | 1.24 | % | 1.22 | % | 1.27 | % | — | |||||||||||
Expenses, before expense reductions | 1.79 | % | 1.76 | % | 1.76 | % | 1.78 | % | 2.01 | % | ||||||||||
Portfolio turnover rate | 18.00 | % | 12.39 | % | 35.06 | % | 4.34 | % | 15.23 | % | ||||||||||
Net assets at end of year (000) | $ | 32,821 | $ | 43,404 | $ | 56,166 | $ | 30,587 | $ | 12,704 | ||||||||||
| Certified Annual Report | 21 |
| FINANCIAL HIGHLIGHTS, CONTINUED |
| Thornburg Limited Term U.S. Government Fund |
| Year Ended September 30, | ||||||||||||||||||||
| 2005 | 2004 | 2003 | 2002 | 2001 | ||||||||||||||||
Class I Shares: | ||||||||||||||||||||
PER SHARE PERFORMANCE | ||||||||||||||||||||
(for a share outstanding throughout the year) | ||||||||||||||||||||
Net asset value, beginning of year | $ | 13.01 | $ | 13.22 | $ | 13.27 | $ | 12.77 | $ | 12.03 | ||||||||||
Income from investment operations: | ||||||||||||||||||||
Net investment income | 0.36 | 0.39 | 0.51 | 0.62 | 0.72 | |||||||||||||||
Net realized and unrealized gain (loss) on investments | (0.24 | ) | (0.21 | ) | (0.05 | ) | 0.50 | 0.74 | ||||||||||||
Total from investment operations | 0.12 | 0.18 | 0.46 | 1.12 | 1.46 | |||||||||||||||
Less dividends from: | ||||||||||||||||||||
Net investment income | (0.37 | ) | (0.39 | ) | (0.51 | ) | (0.62 | ) | (0.72 | ) | ||||||||||
Change in net asset value | (0.25 | ) | (0.21 | ) | (0.05 | ) | 0.50 | 0.74 | ||||||||||||
NET ASSET VALUE, end of year | $ | 12.76 | $ | 13.01 | $ | 13.22 | $ | 13.27 | $ | 12.77 | ||||||||||
RATIOS/SUPPLEMENTAL DATA | ||||||||||||||||||||
Total return | 0.95 | % | 1.37 | % | 3.51 | % | 9.11 | % | 12.45 | % | ||||||||||
Ratios to average net assets: | ||||||||||||||||||||
Net investment income | 2.82 | % | 2.95 | % | 3.77 | % | 4.86 | % | 5.79 | % | ||||||||||
Expenses, after expense reductions | 0.68 | % | 0.67 | % | 0.64 | % | 0.61 | % | 0.61 | % | ||||||||||
Expenses, after expense reductions and net of custody credits | 0.67 | % | 0.67 | % | 0.62 | % | 0.60 | % | — | |||||||||||
Expenses, before expense reductions | 0.80 | % | 0.77 | % | 0.82 | % | 1.04 | % | 1.21 | % | ||||||||||
Portfolio turnover rate | 18.00 | % | 12.39 | % | 35.06 | % | 4.34 | % | 15.23 | % | ||||||||||
Net assets at end of year (000) | $ | 16,075 | $ | 12,905 | $ | 13,085 | $ | 6,960 | $ | 3,992 | ||||||||||
22 | Certified Annual Report |
| FINANCIAL HIGHLIGHTS, CONTINUED |
| Thornburg Limited Term U.S. Government Fund |
| Year Ended September 30, | Period Ended 2003(c) | |||||||||||
| 2005 | 2004 | |||||||||||
Class R1 Shares: | ||||||||||||
PER SHARE PERFORMANCE | ||||||||||||
(for a share outstanding throughout the period) | ||||||||||||
Net asset value, beginning of period | $ | 13.02 | $ | 13.23 | $ | 13.38 | ||||||
Income from investment operations | ||||||||||||
Net investment income | 0.34 | 0.37 | 0.17 | |||||||||
Net realized and unrealized gain (loss) on investments | (0.25 | ) | (0.21 | ) | (0.15 | ) | ||||||
Total from investment operations | 0.09 | 0.16 | 0.02 | |||||||||
Less dividends from: | ||||||||||||
Net investment income | (0.34 | ) | (0.37 | ) | (0.17 | ) | ||||||
Change in net asset value | (0.25 | ) | (0.21 | ) | (0.15 | ) | ||||||
NET ASSET VALUE, end of period | $ | 12.77 | $ | 13.02 | $ | 13.23 | ||||||
RATIOS/SUPPLEMENTAL DATA | ||||||||||||
Total return(a) | 0.72 | % | 1.26 | % | 0.19 | % | ||||||
Ratios to average net assets: | ||||||||||||
Net investment income | 2.66 | % | 2.62 | % | 5.07 | %(b) | ||||||
Expenses, after expense reductions | 0.93 | % | 0.91 | % | 1.15 | %(b) | ||||||
Expenses, after expense reductions and net of custody credits | 0.91 | % | 0.91 | % | 1.15 | %(b) | ||||||
Expenses, before expense reductions | 3.55 | % | 13.56 | % | 41,652.81 | %(b)* | ||||||
Portfolio turnover rate | 18.00 | % | 12.39 | % | 35.06 | % | ||||||
Net assets at end of period (000) | $ | 3,008 | $ | 422 | $ | — | (d) | |||||
| (a) | Not annualized for periods less than one year. |
| (b) | Annualized. |
| (c) | Effective date of Class R1 Shares was July 1, 2003. |
| (d) | Net assets at end of period were less than $1,000. |
| * | Due to the size of net assets and fixed expenses, ratios may appear disproportionate. |
| Certified Annual Report | 23 |
| FINANCIAL HIGHLIGHTS |
| Thornburg Limited Term Income Fund |
| Year Ended September 30, | ||||||||||||||||||||
| 2005 | 2004 | 2003 | 2002 | 2001 | ||||||||||||||||
Class A Shares: | ||||||||||||||||||||
PER SHARE PERFORMANCE | ||||||||||||||||||||
(for a share outstanding throughout the year) | ||||||||||||||||||||
Net asset value, beginning of year | $ | 12.80 | $ | 12.99 | $ | 12.79 | $ | 12.55 | $ | 11.89 | ||||||||||
Income from investment operations: | ||||||||||||||||||||
Net investment income | 0.46 | 0.43 | 0.51 | 0.61 | 0.73 | |||||||||||||||
Net realized and unrealized gain (loss) on investments | (0.28 | ) | (0.19 | ) | 0.20 | 0.24 | 0.66 | |||||||||||||
Total from investment operations | 0.18 | 0.24 | 0.71 | 0.85 | 1.39 | |||||||||||||||
Less dividends from: | ||||||||||||||||||||
Net investment income | (0.47 | ) | (0.43 | ) | (0.51 | ) | (0.61 | ) | (0.73 | ) | ||||||||||
Change in net asset value | (0.29 | ) | (0.19 | ) | 0.20 | 0.24 | 0.66 | |||||||||||||
NET ASSET VALUE, end of year | $ | 12.51 | $ | 12.80 | $ | 12.99 | $ | 12.79 | $ | 12.55 | ||||||||||
RATIOS/SUPPLEMENTAL DATA | ||||||||||||||||||||
Total return(a) | 1.44 | % | 1.96 | % | 5.56 | % | 7.05 | % | 12.05 | % | ||||||||||
Ratios to average net assets: | ||||||||||||||||||||
Net investment income | 3.52 | % | 3.33 | % | 3.91 | % | 4.88 | % | 5.94 | % | ||||||||||
Expenses, after expense reductions | 1.00 | % | 0.99 | % | 0.99 | % | 0.99 | % | 1.00 | % | ||||||||||
Expenses, after expense reductions and net of custody credits | 0.99 | % | 0.99 | % | 0.99 | % | 0.99 | % | — | |||||||||||
Expenses, before expense reductions | 1.09 | % | 1.07 | % | 1.04 | % | 1.10 | % | 1.16 | % | ||||||||||
Portfolio turnover rate | 23.16 | % | 22.73 | % | 18.86 | % | 21.63 | % | 20.54 | % | ||||||||||
Net assets at end of year (000) | $ | 212,881 | $ | 230,256 | $ | 184,497 | $ | 104,710 | $ | 56,036 | ||||||||||
| (a) | Sales loads are not reflected in computing total return. |
24 | Certified Annual Report |
| FINANCIAL HIGHLIGHTS, CONTINUED |
| Thornburg Limited Term Income Fund |
| Year Ended September 30, | ||||||||||||||||||||
| 2005 | 2004 | 2003 | 2002 | 2001 | ||||||||||||||||
Class C Shares: | ||||||||||||||||||||
PER SHARE PERFORMANCE | ||||||||||||||||||||
(for a share outstanding throughout the year) | ||||||||||||||||||||
Net asset value, beginning of year | $ | 12.78 | $ | 12.97 | $ | 12.77 | $ | 12.53 | $ | 11.87 | ||||||||||
Income from investment operations: | ||||||||||||||||||||
Net investment income | 0.43 | 0.40 | 0.46 | 0.56 | 0.68 | |||||||||||||||
Net realized and unrealized gain (loss) on investments | (0.28 | ) | (0.19 | ) | 0.20 | 0.24 | 0.66 | |||||||||||||
Total from investment operations | 0.15 | 0.21 | 0.66 | 0.80 | 1.34 | |||||||||||||||
Less dividends from: | ||||||||||||||||||||
Net investment income | (0.44 | ) | (0.40 | ) | (0.46 | ) | (0.56 | ) | (0.68 | ) | ||||||||||
Change in net asset value | (0.29 | ) | (0.19 | ) | 0.20 | 0.24 | 0.66 | |||||||||||||
NET ASSET VALUE, end of year | $ | 12.49 | $ | 12.78 | $ | 12.97 | $ | 12.77 | $ | 12.53 | ||||||||||
RATIOS/SUPPLEMENTAL DATA | ||||||||||||||||||||
Total return | 1.19 | % | 1.70 | % | 5.20 | % | 6.63 | % | 11.61 | % | ||||||||||
Ratios to average net assets: | ||||||||||||||||||||
Net investment income | 3.27 | % | 3.07 | % | 3.56 | % | 4.45 | % | 5.52 | % | ||||||||||
Expenses, after expense reductions | 1.25 | % | 1.25 | % | 1.33 | % | 1.39 | % | 1.41 | % | ||||||||||
Expenses, after expense reductions and net of custody credits | 1.24 | % | 1.24 | % | 1.33 | % | 1.39 | % | — | |||||||||||
Expenses, before expense reductions | 1.88 | % | 1.87 | % | 1.92 | % | 1.93 | % | 2.13 | % | ||||||||||
Portfolio turnover rate | 23.16 | % | 22.73 | % | 18.86 | % | 21.63 | % | 20.54 | % | ||||||||||
Net assets at end of year (000) | $ | 59,355 | $ | 65,398 | $ | 54,926 | $ | 30,258 | $ | 15,219 | ||||||||||
| Certified Annual Report | 25 |
FINANCIAL HIGHLIGHTS, CONTINUED
Thornburg Limited Term Income Fund
| Year Ended September 30, | ||||||||||||||||||||
| 2005 | 2004 | 2003 | 2002 | 2001 | ||||||||||||||||
Class I Shares: | ||||||||||||||||||||
PER SHARE PERFORMANCE | ||||||||||||||||||||
(for a share outstanding throughout the year) | ||||||||||||||||||||
Net asset value, beginning of year | $ | 12.80 | $ | 12.99 | $ | 12.79 | $ | 12.55 | $ | 11.90 | ||||||||||
Income from investment operations: | ||||||||||||||||||||
Net investment income | 0.51 | 0.47 | 0.55 | 0.65 | 0.77 | |||||||||||||||
Net realized and unrealized gain (loss) on investments | (0.29 | ) | (0.19 | ) | 0.20 | 0.24 | 0.65 | |||||||||||||
Total from investment operations | 0.22 | 0.28 | 0.75 | 0.89 | 1.42 | |||||||||||||||
Less dividends from: | ||||||||||||||||||||
Net investment income | (0.51 | ) | (0.47 | ) | (0.55 | ) | (0.65 | ) | (0.77 | ) | ||||||||||
Change in net asset value | (0.29 | ) | (0.19 | ) | 0.20 | 0.24 | 0.65 | |||||||||||||
NET ASSET VALUE, end of year | $ | 12.51 | $ | 12.80 | $ | 12.99 | $ | 12.79 | $ | 12.55 | ||||||||||
RATIOS/SUPPLEMENTAL DATA | ||||||||||||||||||||
Total return | 1.77 | % | 2.29 | % | 5.89 | % | 7.38 | % | 12.29 | % | ||||||||||
Ratios to average net assets: | ||||||||||||||||||||
Net investment income | 3.85 | % | 3.64 | % | 4.23 | % | 5.19 | % | 6.24 | % | ||||||||||
Expenses, after expense reductions | 0.67 | % | 0.67 | % | 0.69 | % | 0.69 | % | 0.70 | % | ||||||||||
Expenses, after expense reductions and net of custody credits | 0.67 | % | 0.67 | % | 0.69 | % | 0.69 | % | — | |||||||||||
Expenses, before expense reductions | 0.72 | % | 0.72 | % | 0.76 | % | 0.78 | % | 0.89 | % | ||||||||||
Portfolio turnover rate | 23.16 | % | 22.73 | % | 18.86 | % | 21.63 | % | 20.54 | % | ||||||||||
Net assets at end of year (000) | $ | 99,396 | $ | 90,025 | $ | 59,473 | $ | 39,281 | $ | 24,298 | ||||||||||
26 | Certified Annual Report |
FINANCIAL HIGHLIGHTS, CONTINUED
Thornburg Limited Term Income Fund
| Year Ended September 30, | Period Ended 2003(c) | |||||||||||
| 2005 | 2004 | |||||||||||
Class R1 Shares: | ||||||||||||
PER SHARE PERFORMANCE | ||||||||||||
(for a share outstanding throughout the period) | ||||||||||||
Net asset value, beginning of period | $ | 12.81 | $ | 12.99 | $ | 13.10 | ||||||
Income from investment operations | ||||||||||||
Net investment income | 0.48 | 0.45 | 0.17 | |||||||||
Net realized and unrealized gain (loss) on investments | (0.30 | ) | (0.18 | ) | (0.11 | ) | ||||||
Total from investment operations | 0.18 | 0.27 | 0.06 | |||||||||
Less dividends from: | ||||||||||||
Net investment income | (0.47 | ) | (0.45 | ) | (0.17 | ) | ||||||
Change in net asset value | (0.29 | ) | (0.18 | ) | (0.11 | ) | ||||||
NET ASSET VALUE, end of period | $ | 12.52 | $ | 12.81 | $ | 12.99 | ||||||
RATIOS/SUPPLEMENTAL DATA | ||||||||||||
Total return(a) | 1.43 | % | 2.14 | % | 0.48 | % | ||||||
Ratios to average net assets: | ||||||||||||
Net investment income | 3.57 | % | 3.41 | % | 5.19 | %(b) | ||||||
Expenses, after expense reductions | 1.00 | % | 0.98 | % | 1.25 | %(b) | ||||||
Expenses, after expense reductions and net of custody credits | 0.99 | % | 0.98 | % | 1.25 | %(b) | ||||||
Expenses, before expense reductions | 3.15 | % | 7.63 | % | 41,534.94 | %(b)* | ||||||
Portfolio turnover rate | 23.16 | % | 22.73 | % | 18.86 | % | ||||||
Net assets at end of period (000) | $ | 2,162 | $ | 911 | $ | — | (d) | |||||
| (a) | Not annualized for periods less than one year. |
| (b) | Annualized. |
| (c) | Effective date of Class R1 Shares was July 1, 2003. |
| (d) | Net assets at end of period were less than $1,000. |
| * | Due to the size of net assets and fixed expenses, ratios may appear disproportionate. |
| Certified Annual Report | 27 |
| SCHEDULE OF INVESTMENTS | ||
| Thornburg Limited Term U.S. Government Fund | September 30, 2005 | |
CUSIPS: Class A - 885-215-103, CLASS B - 885-215-848, CLASS C - 885-215-830, CLASS I - 885-215-699, CLASS RI - 885-215-491 NASDAQ SYMBOLS: CLASS A - LTUSX, CLASS B - LTUBX, CLASS C - LTUCX, CLASS I - LTUIX, CLASS RI - LTURX
Issuer-Description | Principal Amount | Value | ||||
U.S.Treasury Securities — 47.25% | ||||||
United States Treasury Notes, 5.75% due 11/15/2005 | $ | 7,000,000 | $ | 7,017,500 | ||
United States Treasury Notes, 5.625% due 2/15/2006 | 3,000,000 | 3,018,750 | ||||
United States Treasury Notes, 4.625% due 5/15/2006 | 5,500,000 | 5,519,336 | ||||
United States Treasury Notes, 7.00% due 7/15/2006 | 2,000,000 | 2,043,750 | ||||
United States Treasury Notes, 2.375% due 8/15/2006 | 2,890,000 | 2,847,779 | ||||
United States Treasury Notes, 4.375% due 5/15/2007 | 9,000,000 | 9,029,531 | ||||
United States Treasury Notes, 6.125% due 8/15/2007 | 4,000,000 | 4,140,000 | ||||
United States Treasury Notes, 2.625% due 5/15/2008 | 10,000,000 | 9,617,969 | ||||
United States Treasury Notes, 5.50% due 5/15/2009 | 10,000,000 | 10,445,312 | ||||
United States Treasury Notes, 6.50% due 2/15/2010 | 15,000,000 | 16,346,484 | ||||
United States Treasury Notes, 5.75% due 8/15/2010 | 6,000,000 | 6,398,437 | ||||
United States Treasury Notes, 3.625% due 5/15/2013 | 15,000,000 | 14,390,625 | ||||
TOTAL U.S.TREASURY SECURITIES (Cost $93,651,803) | 90,815,473 | |||||
U.S. Government Agencies — 48.40% | ||||||
Federal Agricultural Mtg Corp., 5.86% due 3/3/2006 | 900,000 | 907,081 | ||||
Federal Agricultural Mtg Corp., 8.07% due 7/17/2006 | 1,000,000 | 1,029,688 | ||||
Federal Agricultural Mtg Corp., 6.71% due 7/28/2014 | 200,000 | 227,609 | ||||
Federal Farm Credit Bank, 1.875% due 1/16/2007 | 4,650,000 | 4,505,567 | ||||
Federal Farm Credit Bank, 6.75% due 7/7/2009 | 350,000 | 375,958 | ||||
Federal Farm Credit Bank Consolidated MTN, 5.875% due 7/28/2008 | 1,900,000 | 1,967,202 | ||||
Federal Farm Credit Bank Consolidated MTN, 5.87% due 9/2/2008 | 1,300,000 | 1,346,780 | ||||
Federal Farm Credit Bank Consolidated MTN, 5.35% due 12/11/2008 | 200,000 | 204,702 | ||||
Federal Farm Credit Bank Consolidated MTN, 5.80% due 3/19/2009 | 300,000 | 311,728 | ||||
Federal Farm Credit Bank Consolidated MTN, 6.06% due 5/28/2013 | 240,000 | 259,378 | ||||
Federal Home Loan Bank, 6.345% due 11/1/2005 | 100,000 | 100,219 | ||||
Federal Home Loan Bank, 5.24% due 12/7/2005 | 225,000 | 225,643 | ||||
Federal Home Loan Bank, 5.37% due 1/20/2006 | 100,000 | 100,435 | ||||
Federal Home Loan Bank, 2.25% due 5/15/2006 | 3,000,000 | 2,964,478 | ||||
Federal Home Loan Bank, 3.05% due 10/12/2006 | 3,975,000 | 3,925,009 | ||||
Federal Home Loan Bank, 7.76% due 11/21/2006 | 200,000 | 207,457 | ||||
Federal Home Loan Bank, 3.72% due 2/22/2007 | 5,000,000 | 4,994,365 | ||||
Federal Home Loan Bank, 7.00% due 2/15/2008 | 150,000 | 158,219 | ||||
Federal Home Loan Bank, 5.48% due 1/8/2009 | 1,250,000 | 1,283,532 | ||||
Federal Home Loan Bank, 5.985% due 4/9/2009 | 1,000,000 | 1,044,785 | ||||
Federal Home Loan Bank, 5.79% due 4/27/2009 | 200,000 | 207,787 | ||||
Federal Home Loan Bank, 3.00% due 4/29/2009 | 1,750,000 | 1,735,854 | ||||
Federal Home Loan Bank, 3.40% due 11/12/2010 | 2,750,000 | 2,687,806 | ||||
Federal Home Loan Mtg Corp., 5.98% due 12/8/2005 | 75,000 | 75,323 | ||||
Federal Home Loan Mtg Corp., 6.80% due 3/19/2007 | 300,000 | 310,152 | ||||
Federal Home Loan Mtg Corp., 4.37% due 6/2/2009 | 5,000,000 | 4,998,555 | ||||
Federal Home Loan Mtg Corp. CMO Series 1616 Class E, 6.50% due 11/15/2008 | 2,044,928 | 2,082,698 | ||||
Federal Home Loan Mtg Corp. CMO Series 2137 Class TM, 6.50% due 1/15/2028 | 2,053 | 2,049 | ||||
Federal Home Loan Mtg Corp. CMO Series 2592 Class PD, 5.00% due 7/15/2014 | 1,000,000 | 1,000,181 | ||||
Federal Home Loan Mtg Corp. CMO Series 2814 Class GB, 5.00% due 6/15/2019 | 1,677,528 | 1,665,291 | ||||
Federal Home Loan Mtg Corp. CMO Series 2821 Class YI, 5.50% due 9/15/2014 | 2,759,492 | 2,789,677 | ||||
Federal Home Loan Mtg Corp., Pool # 141016, 9.25% due 11/1/2016 | 70,091 | 77,804 | ||||
28 | Certified Annual Report |
| SCHEDULE OF INVESTMENTS, CONTINUED | ||
| Thornburg Limited Term U.S. Government Fund | September 30, 2005 | |
Issuer-Description | Principal Amount | Value | ||||
Federal Home Loan Mtg Corp., Pool # 141412, 8.50% due 4/1/2017 | $ | 151,769 | $ | 163,631 | ||
Federal Home Loan Mtg Corp., Pool # 160043, 8.75% due 4/1/2008 | 11,908 | 12,194 | ||||
Federal Home Loan Mtg Corp., Pool # 181730, 8.50% due 5/1/2008 | 11,649 | 11,893 | ||||
Federal Home Loan Mtg Corp., Pool # 252986, 10.75% due 4/1/2010 | 37,313 | 40,442 | ||||
Federal Home Loan Mtg Corp., Pool # 256764, 8.75% due 10/1/2014 | 7,244 | 7,385 | ||||
Federal Home Loan Mtg Corp., Pool # 273822, 8.50% due 4/1/2009 | 33,965 | 34,334 | ||||
Federal Home Loan Mtg Corp., Pool # 291880, 8.25% due 5/1/2017 | 1,032 | 1,040 | ||||
Federal Home Loan Mtg Corp., Pool # 294817, 9.75% due 1/1/2017 | 27,440 | 30,743 | ||||
Federal Home Loan Mtg Corp., Pool # 298107, 10.25% due 8/1/2017 | 27,638 | 31,721 | ||||
Federal Home Loan Mtg Corp., Pool # C90041, 6.50% due 11/1/2013 | �� | 54,904 | 56,421 | |||
Federal Home Loan Mtg Corp., Pool # D06908, 9.50% due 9/1/2017 | 7,784 | 8,191 | ||||
Federal Home Loan Mtg Corp., Pool # D37120, 7.00% due 7/1/2023 | 57,249 | 60,366 | ||||
Federal Home Loan Mtg Corp., Pool # E00170, 8.00% due 7/1/2007 | 37,561 | 38,405 | ||||
Federal Home Loan Mtg Corp., Pool # E49074, 6.50% due 7/1/2008 | 26,254 | 27,157 | ||||
Federal Home Loan Mtg Corp., Pool # E61778, 6.50% due 4/1/2008 | 37,586 | 38,878 | ||||
Federal Home Loan Mtg Corp., Pool # E65962, 7.00% due 5/1/2008 | 1,811 | 1,817 | ||||
Federal National Mtg Assoc, 2.15% due 7/21/2006 | 750,000 | 737,783 | ||||
Federal National Mtg Assoc, 2.62% due 12/5/2007 | 1,000,000 | 997,030 | ||||
Federal National Mtg Assoc, 3.125% due 12/8/2008 | 3,665,000 | 3,629,011 | ||||
Federal National Mtg Assoc, 4.15% due 1/23/2009 | 2,000,000 | 1,999,812 | ||||
Federal National Mtg Assoc, 3.25% due 6/16/2009 | 4,000,000 | 3,970,523 | ||||
Federal National Mtg Assoc, 4.25% due 6/29/2012 | 3,250,000 | 3,220,746 | ||||
Federal National Mtg Assoc CMO Series 1992-22 Class HC, 7.00% due 3/25/2007 | 97,597 | 98,546 | ||||
Federal National Mtg Assoc CMO Series 1993-101 Class PJ, 7.00% due 6/25/2008 | 503,638 | 510,168 | ||||
Federal National Mtg Assoc CMO Series 1993-122 Class D, 6.50% due 6/25/2023 | 156,073 | 158,147 | ||||
Federal National Mtg Assoc CMO Series 1993-32 Class H, 6.00% due 3/25/2023 | 175,967 | 178,747 | ||||
Federal National Mtg Assoc CMO Series G1993-35 Class JD, 6.50% due 11/25/2006 | 446,605 | 446,448 | ||||
Federal National Mtg Assoc CPI Floating Rate Note, 3.67% due 2/17/2009 | 3,000,000 | 2,988,690 | ||||
Federal National Mtg Assoc, Pool # 008307, 8.00% due 5/1/2008 | 62,242 | 63,763 | ||||
Federal National Mtg Assoc, Pool # 019535, 10.25% due 7/1/2008 | 8,222 | 8,607 | ||||
Federal National Mtg Assoc, Pool # 033356, 9.25% due 8/1/2016 | 78,544 | 85,494 | ||||
Federal National Mtg Assoc, Pool # 040526, 9.25% due 1/1/2017 | 4,122 | 4,218 | ||||
Federal National Mtg Assoc, Pool # 044003, 8.00% due 6/1/2017 | 67,142 | 71,780 | ||||
Federal National Mtg Assoc, Pool # 050811, 7.50% due 12/1/2012 | 52,507 | 54,573 | ||||
Federal National Mtg Assoc, Pool # 050832, 7.50% due 6/1/2013 | 75,785 | 78,686 | ||||
Federal National Mtg Assoc, Pool # 076388, 9.25% due 9/1/2018 | 77,932 | 85,922 | ||||
Federal National Mtg Assoc, Pool # 077725, 9.75% due 10/1/2018 | 37,406 | 39,463 | ||||
Federal National Mtg Assoc, Pool # 100286, 7.50% due 8/1/2009 | 150,383 | 154,004 | ||||
Federal National Mtg Assoc, Pool # 112067, 9.50% due 10/1/2016 | 55,700 | 61,865 | ||||
Federal National Mtg Assoc, Pool # 156156, 8.50% due 4/1/2021 | 56,234 | 58,913 | ||||
Federal National Mtg Assoc, Pool # 190555, 7.00% due 1/1/2014 | 45,008 | 46,532 | ||||
Federal National Mtg Assoc, Pool # 190703, 7.00% due 3/1/2009 | 35,428 | 36,211 | ||||
Federal National Mtg Assoc, Pool # 190836, 7.00% due 6/1/2009 | 88,452 | 90,530 | ||||
Federal National Mtg Assoc, Pool # 250387, 7.00% due 11/1/2010 | 70,534 | 73,772 | ||||
Federal National Mtg Assoc, Pool # 250481, 6.50% due 11/1/2015 | 6,648 | 6,816 | ||||
Federal National Mtg Assoc, Pool # 251258, 7.00% due 9/1/2007 | 32,216 | 32,763 | ||||
Federal National Mtg Assoc, Pool # 251759, 6.00% due 5/1/2013 | 108,855 | 112,065 | ||||
Federal National Mtg Assoc, Pool # 252648, 6.50% due 5/1/2022 | 270,575 | 280,056 | ||||
Federal National Mtg Assoc, Pool # 252787, 7.00% due 8/1/2006 | 10,651 | 10,743 | ||||
Federal National Mtg Assoc, Pool # 303383, 7.00% due 12/1/2009 | 61,740 | 62,954 | ||||
Federal National Mtg Assoc, Pool # 312663, 7.50% due 6/1/2010 | 89,253 | 93,848 | ||||
Federal National Mtg Assoc, Pool # 323706, 7.00% due 2/1/2009 | 107,954 | 110,128 | ||||
Federal National Mtg Assoc, Pool # 323735, 5.50% due 5/1/2006 | 1,271,734 | 1,272,421 | ||||
| Certified Annual Report | 29 |
| SCHEDULE OF INVESTMENTS, CONTINUED | ||
| Thornburg Limited Term U.S. Government Fund | September 30, 2005 | |
Issuer-Description | Principal Amount | Value | ||||
Federal National Mtg Assoc, Pool # 334996, 7.00% due 2/1/2011 | $ | 75,121 | $ | 78,569 | ||
Federal National Mtg Assoc, Pool # 342947, 7.25% due 4/1/2024 | 558,018 | 592,534 | ||||
Federal National Mtg Assoc, Pool # 345775, 8.50% due 12/1/2024 | 45,840 | 47,854 | ||||
Federal National Mtg Assoc, Pool # 373942, 6.50% due 12/1/2008 | 49,947 | 51,757 | ||||
Federal National Mtg Assoc, Pool # 382889, 7.35% due 12/1/2010 | 302,671 | 321,508 | ||||
Federal National Mtg Assoc, Pool # 382926, 7.37% due 12/1/2010 | 336,685 | 357,834 | ||||
Federal National Mtg Assoc, Pool # 384243, 6.10% due 10/1/2011 | 617,123 | 638,744 | ||||
Federal National Mtg Assoc, Pool # 384746, 5.86% due 2/1/2009 | 1,056,054 | 1,090,790 | ||||
Federal National Mtg Assoc, Pool # 385714, 4.70% due 1/1/2010 | 3,175,155 | 3,160,308 | ||||
Federal National Mtg Assoc, Pool # 406384, 8.25% due 12/1/2024 | 226,775 | 242,584 | ||||
Federal National Mtg Assoc, Pool # 443909, 6.50% due 9/1/2018 | 208,214 | 214,361 | ||||
Federal National Mtg Assoc, Pool # 460568, 5.20% due 12/1/2006 | 3,500,000 | 3,504,765 | ||||
Federal National Mtg Assoc, Pool # 516363, 5.00% due 3/1/2014 | 268,017 | 268,153 | ||||
Federal National Mtg Assoc, Pool # 555207, 7.00% due 11/1/2017 | 128,363 | 134,255 | ||||
Government National Mtg Assoc CMO Series 2001-65 Class PG, 6.00% due 7/20/2028 | 1,271,134 | 1,275,420 | ||||
Government National Mtg Assoc CMO Series 2002-67 Class VA, 6.00% due 3/20/2013 | 426,293 | 430,719 | ||||
Government National Mtg Assoc, Pool # 000623, 8.00% due 9/20/2016 | 70,968 | 75,608 | ||||
Government National Mtg Assoc, Pool # 016944, 7.50% due 5/15/2007 | 51,035 | 54,242 | ||||
Government National Mtg Assoc, Pool # 306636, 8.25% due 12/15/2006 | 19,035 | 19,342 | ||||
Government National Mtg Assoc, Pool # 369693, 7.00% due 1/15/2009 | 110,324 | 116,009 | ||||
Government National Mtg Assoc, Pool # 409921, 7.50% due 8/15/2010 | 64,218 | 67,524 | ||||
Government National Mtg Assoc, Pool # 410240, 7.00% due 12/15/2010 | 49,685 | 52,214 | ||||
Government National Mtg Assoc, Pool # 410271, 7.50% due 8/15/2010 | 42,370 | 44,552 | ||||
Government National Mtg Assoc, Pool # 410846, 7.00% due 12/15/2010 | 76,752 | 80,659 | ||||
Government National Mtg Assoc, Pool # 430150, 7.25% due 12/15/2026 | 72,221 | 76,932 | ||||
Government National Mtg Assoc, Pool # 447040, 7.75% due 5/15/2027 | 52,403 | 56,289 | ||||
Government National Mtg Assoc, Pool # 453928, 7.00% due 7/15/2017 | 95,691 | 101,325 | ||||
Government National Mtg Assoc, Pool # 780063, 7.00% due 9/15/2008 | 25,460 | 26,771 | ||||
Government National Mtg Assoc, Pool # 780448, 6.50% due 8/15/2011 | 149,458 | 155,903 | ||||
Overseas Private Investment Corp., 4.10% due 11/15/2014 | 2,376,000 | 2,312,466 | ||||
Private Export Funding Corp., 4.974% due 8/15/2013 | 2,700,000 | 2,761,633 | ||||
Private Export Funding Corp. Series P, 5.685% due 5/15/2012 | 5,000,000 | 5,313,140 | ||||
Tennessee Valley Authority, 4.75% due 8/1/2013 | 3,000,000 | 3,031,516 | ||||
TOTAL U.S. GOVERNMENT AGENCIES (Cost $93,800,205) | 93,025,688 | |||||
Short Term Investments — 3.12% | ||||||
Federal Home Loan Bank Discount Notes, 3.54% due 10/6/2005 | 6,000,000 | 5,997,050 | ||||
TOTAL SHORT TERM INVESTMENTS (Cost $5,997,050) | 5,997,050 | |||||
TOTAL INVESTMENTS — 98.77% (Cost $193,449,059) | $ | 189,838,211 | ||||
OTHER ASSETS LESS LIABILITIES — 1.23% | 2,362,669 | |||||
NET ASSETS — 100.00% | $ | 192,200,880 | ||||
30 | Certified Annual Report |
| SCHEDULE OF INVESTMENTS, CONTINUED | ||
| Thornburg Limited Term U.S. Government Fund | September 30, 2005 | |
Footnote Legend
See notes to financial statements.
Portfolio Abbreviations
To simplify the listings of securities, abbreviations are used per the table below:
MTN Medium-Term Note
SUMMARY OF TYPES OF HOLDINGS
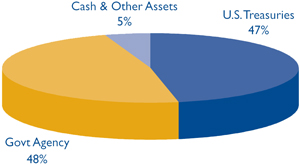
| Certified Annual Report | 31 |
| SCHEDULE OF INVESTMENTS | ||
| Thornburg Limited Term Income Fund | September 30, 2005 | |
CUSIPS: Class A - 885-215-509, CLASS C - 885-215-764, CLASS I - 885-215-681, CLASS RI - 885-215-483 NASDAQ SYMBOLS: CLASS A - THIFX, CLASS C - THICX, CLASS I - THIIX, CLASS RI - THIRX
Issuer-Description | Credit Rating† Moody’s/S&P | Principal Amount | Value | |||||
U.S.Treasury Securities — 4.65% | ||||||||
United States Treasury Notes, 4.625% due 5/15/2006 | Aaa/AAA | $ | 4,500,000 | $ | 4,515,820 | |||
United States Treasury Notes, 3.00% due 2/15/2008 | Aaa/AAA | 4,000,000 | 3,895,625 | |||||
United States Treasury Notes, 4.75% due 11/15/2008 | Aaa/AAA | 1,500,000 | 1,524,375 | |||||
United States Treasury Notes, 5.75% due 8/15/2010 | Aaa/AAA | 2,500,000 | 2,666,016 | |||||
United States Treasury Notes, 3.625% due 5/15/2013 | Aaa/AAA | 5,000,000 | 4,796,875 | |||||
TOTAL U.S.TREASURY SECURITIES (Cost $17,518,496) | 17,398,711 | |||||||
U.S. Government Agencies — 9.44% | ||||||||
Federal Home Loan Bank, 2.25% due 5/15/2006 | Aaa/AAA | 2,000,000 | 1,976,319 | |||||
Federal Home Loan Bank, 3.72% due 2/22/2007 | Aaa/AAA | 1,370,000 | 1,368,456 | |||||
Federal Home Loan Bank, 4.875% due 5/15/2007 | Aaa/AAA | 150,000 | 150,987 | |||||
Federal Home Loan Bank, 3.95% due 9/24/2007 | Aaa/AAA | 1,000,000 | 989,323 | |||||
Federal Home Loan Bank, 5.833% due 1/23/2008 | Aaa/AAA | 500,000 | 514,077 | |||||
Federal Home Loan Bank, 5.785% due 4/14/2008 | Aaa/AAA | 75,000 | 77,212 | |||||
Federal Home Loan Bank, 5.835% due 7/15/2008 | Aaa/AAA | 300,000 | 310,022 | |||||
Federal Home Loan Bank, 5.085% due 10/7/2008 | Aaa/AAA | 250,000 | 253,629 | |||||
Federal Home Loan Bank, 5.038% due 10/14/2008 | Aaa/AAA | 200,000 | 202,652 | |||||
Federal Home Loan Bank, 5.365% due 12/11/2008 | Aaa/AAA | 75,000 | 76,751 | |||||
Federal Home Loan Bank, 3.00% due 12/15/2008 | Aaa/AAA | 3,000,000 | 2,984,949 | |||||
Federal Home Loan Bank, 5.985% due 4/9/2009 | Aaa/AAA | 85,000 | 88,807 | |||||
Federal Home Loan Bank, 3.00% due 9/22/2009 | Aaa/AAA | 1,500,000 | 1,490,741 | |||||
Federal Home Loan Mtg Corp., 9.00% due 10/1/2005 | Aaa/AAA | 294 | 296 | |||||
Federal Home Loan Mtg Corp., 4.37% due 6/2/2009 | Aaa/AAA | 5,000,000 | 4,998,555 | |||||
Federal Home Loan Mtg Corp. CMO Series 2160 Class PG, 6.50% due 11/15/2027 | Aaa/AAA | 769,693 | 768,637 | |||||
Federal Home Loan Mtg Corp. CMO Series 2814 Class GB, 5.00% due 6/15/2019 | Aaa/AAA | 1,677,528 | 1,665,291 | |||||
Federal Home Loan Mtg Corp. CMO Series 2821 Class YI, 5.50% due 9/15/2014 | Aaa/AAA | 2,760,403 | 2,790,598 | |||||
Federal National Mtg Assoc, 3.25% due 3/29/2007 | Aaa/AAA | 4,550,000 | 4,476,170 | |||||
Federal National Mtg Assoc, 5.185% due 11/1/2008 | Aaa/AAA | 462,680 | 467,198 | |||||
Federal National Mtg Assoc, 6.00% due 12/1/2008 | Aaa/AAA | 82,672 | 85,071 | |||||
Federal National Mtg Assoc, 8.00% due 12/1/2009 | Aaa/AAA | 31,131 | 32,359 | |||||
Federal National Mtg Assoc, 7.00% due 3/1/2011 | Aaa/AAA | 46,806 | 48,955 | |||||
Federal National Mtg Assoc, 6.42% due 4/1/2011 | Aaa/AAA | 2,381,281 | 2,464,156 | |||||
Federal National Mtg Assoc, 5.095% due 12/1/2011 | Aaa/AAA | 126,796 | 128,573 | |||||
Federal National Mtg Assoc, 7.491% due 8/1/2014 | Aaa/AAA | 37,042 | 37,875 | |||||
Federal National Mtg Assoc CMO Series 2003-64 Class EC, 5.50% due 5/25/2030 | Aaa/AAA | 987,376 | 991,356 | |||||
Federal National Mtg Assoc CPI Floating Rate Note, 3.67% due 2/17/2009 | Aaa/AAA | 5,000,000 | 4,981,150 | |||||
Federal National Mtg Assoc, Pool # 460568, 5.20% due 12/1/2006 | Aaa/AAA | 800,000 | 801,089 | |||||
Government National Mtg Assoc, Pool # 003007, 8.50% due 11/20/2015 | Aaa/AAA | 28,255 | 29,963 | |||||
Government National Mtg Assoc, Pool # 827148, 3.375% due 2/20/2024 | Aaa/AAA | 40,436 | 40,931 | |||||
TOTAL U.S. GOVERNMENT AGENCIES (Cost $35,421,095) | 35,292,148 | |||||||
Asset Back Securities — 4.02% | ||||||||
Associates Manufactured Housing Trust 1996-1 A5, 7.60% due 3/15/2027 | Aaa/AAA | 312,016 | 317,456 | |||||
GSR Mtg Loan Trust Series 2004-3F Class 2-A10, 7.343% due 2/25/2034 | NA/AAA | 939,843 | 930,142 | |||||
Small Business Administration, 4.638% due 2/10/2015 | NR/NR | 3,294,763 | 3,294,643 | |||||
Washington Mutual Series 02-AR10, Class-A6, 4.816% due 10/25/2032 | Aaa/AAA | 49,847 | 49,726 | |||||
Washington Mutual Series 03-AR10, Class-A4, 4.071% due 10/25/2033 | Aaa/AAA | 2,000,000 | 1,980,027 | |||||
32 | Certified Annual Report |
| SCHEDULE OF INVESTMENTS, CONTINUED | ||
| Thornburg Limited Term Income Fund | September 30, 2005 | |
Issuer-Description | Credit Rating† Moody’s/S&P | Principal Amount | Value | |||||
Washington Mutual Series 03-AR12, Class-A4, 3.743% due 2/25/2034 | Aaa/AAA | $ | 2,000,000 | $ | 1,965,588 | |||
Washington Mutual Series 03-AR5, Class-A6, 3.695% due 6/25/2033 | Aaa/AAA | 3,200,000 | 3,106,564 | |||||
Washington Mutual Series 05-AR4, Class-A4b, 4.68% due 4/25/2035 | Aaa/AAA | 500,000 | 492,265 | |||||
Wells Fargo Mtg Backed Secs Series 2005-3 Class-A10, 5.50% due 5/25/2035 | Aaa/NA | 2,880,489 | 2,879,950 | |||||
TOTAL ASSET BACK SECURITIES (Cost $15,190,856) | 15,016,361 | |||||||
Corporate Bonds — 66.77% | ||||||||
BANKS — 3.03% | ||||||||
COMMERCIAL BANKS — 3.03% | ||||||||
Bank of America Corp., 4.375% due 12/1/2010 | Aa2/AA- | 1,675,000 | 1,644,199 | |||||
Capital One Bank, 6.70% due 5/15/2008 | Baa2/BBB | 1,665,000 | 1,739,983 | |||||
Fifth Third Bank, Cincinnati Ohio, 3.375% due 8/15/2008 | Aa1/AA- | 2,500,000 | 2,418,025 | |||||
HSBC USA Inc., 8.375% due 2/15/2007 | A1/A+ | 700,000 | 732,571 | |||||
National Westminster Bank, 7.375% due 10/1/2009 | Aa2/AA- | 715,000 | 785,455 | |||||
Nations Bank Corp., 7.23% due 8/15/2012 | Aa2/AA- | 250,000 | 277,790 | |||||
Northern Trust Co., 6.25% due 6/2/2008 | A1/A+ | 500,000 | 523,420 | |||||
PNC Funding Corp., 6.875% due 7/15/2007 | A3/BBB+ | 95,000 | 98,645 | |||||
Suntrust Bank Atlanta Georgia, 2.50% due 5/4/2006 | Aa2/AA- | 2,200,000 | 2,172,395 | |||||
Union Planters Corp., 6.75% due 11/1/2005 | A2/A- | 120,000 | 120,225 | |||||
US Bank, 5.625% due 11/30/2005 | Aa1/AA- | 385,000 | 385,898 | |||||
US Bank, 6.30% due 7/15/2008 | Aa2/A+ | 400,000 | 417,826 | |||||
| 11,316,432 | ||||||||
CAPITAL GOODS — 4.76% | ||||||||
MACHINERY — 4.76% | ||||||||
Caterpillar Financial Services Corp., 6.40% due 2/15/2008 | A2/A | 250,000 | 256,497 | |||||
Emerson Electric Co., 5.75% due 11/1/2011 | A2/A | 800,000 | 842,884 | |||||
General American Railcar Corp., 6.69% due 9/20/2016 | A3/AA- | 214,524 | 214,127 | |||||
Hubbell Inc., 6.375% due 5/15/2012 | A3/A+ | 1,000,000 | 1,081,503 | |||||
Illinois Tool Works Inc., 5.75% due 3/1/2009 | Aa3/AA | 4,595,000 | 4,767,409 | |||||
John Deere Capital Corp., 5.125% due 10/19/2006 | A3/A- | 450,000 | 452,832 | |||||
John Deere Capital Corp. Floating Rate Note, 3.959% due 6/10/2008 | A3/A- | 4,415,000 | 4,413,967 | |||||
Johnson Controls Inc., 5.00% due 11/15/2006 | A2/A | 1,000,000 | 1,002,840 | |||||
Pentair Inc., 7.85% due 10/15/2009 | Baa3/BBB | 1,000,000 | 1,099,732 | |||||
Pitney Bowes Inc., 5.875% due 5/1/2006 | Aa3/A+ | 900,000 | 905,764 | |||||
Pitney Bowes Inc., 4.625% due 10/1/2012 | Aa3/A+ | 900,000 | 888,627 | |||||
Pitney Bowes Inc., 3.875% due 6/15/2013 | Aa3/A+ | 2,000,000 | 1,875,244 | |||||
| 17,801,426 | ||||||||
COMMERCIAL SERVICES & SUPPLIES — 1.68% | ||||||||
COMMERCIAL SERVICES & SUPPLIES — 1.68% | ||||||||
Aramark Services Inc., 7.00% due 7/15/2006 | Baa3/BBB- | 250,000 | 253,352 | |||||
Science Applications International Corp., 6.75% due 2/1/2008 | A3/A- | 250,000 | 261,223 | |||||
Science Applications International Corp., 6.25% due 7/1/2012 | A3/A- | 1,000,000 | 1,058,514 | |||||
Valassis Communications, 6.625% due 1/15/2009 | Baa3/BBB- | 1,700,000 | 1,763,837 | |||||
Waste Management Inc., 6.875% due 5/15/2009 | Baa3/BBB | 725,000 | 771,382 | |||||
Waste Management Inc., 7.375% due 8/1/2010 | Baa3/BBB | 500,000 | 549,828 | |||||
| Certified Annual Report | 33 |
| SCHEDULE OF INVESTMENTS, CONTINUED | ||
| Thornburg Limited Term Income Fund | September 30, 2005 | |
Issuer-Description | Credit Rating† Moody’s/S&P | Principal Amount | Value | |||||
Waste Management Inc., 6.50% due 11/15/2008 | Baa3/BBB | $ | 1,000,000 | $ | 1,045,578 | |||
WMX Technologies Inc., 7.00% due 10/15/2006 | Baa3/BBB | 550,000 | 561,979 | |||||
| 6,265,693 | ||||||||
DIVERSIFIED FINANCIALS — 25.75% | ||||||||
CAPITAL MARKETS — 8.52% | ||||||||
Bear Stearns Co. Inc., 4.50% due 10/28/2010 | A1/A | 1,500,000 | 1,476,999 | |||||
Jefferies Group Inc. Senior Note Series B, 7.50% due 8/15/2007 | Baa1/BBB | 2,600,000 | 2,723,443 | |||||
Legg Mason Mtg Capital Corp., 5.29% due 6/1/2009 | NR/NR | 1,714,286 | 1,712,757 | |||||
Lehman Brothers Holdings Inc., 3.50% due 8/7/2008 | A1/A | 700,000 | 678,875 | |||||
Lehman Brothers Holdings Inc. CPI Floating Rate Note, 4.53% due 5/12/2014 | A1/A | 5,190,000 | 5,140,124 | |||||
Merrill Lynch & Co., CPI Floating Rate Note, 3.33% due 3/12/2007 | Aa3/A+ | 5,000,000 | 4,985,950 | |||||
Merrill Lynch & Co., CPI Floating Rate Note, 3.03% due 4/5/2006 | Aa3/A+ | 5,376,000 | 5,356,163 | |||||
Merrill Lynch & Co., CPI Floating Rate Note, 5.22% due 5/5/2014 | Aa3/A+ | 1,000,000 | 989,710 | |||||
Merrill Lynch & Co., CPI Floating Rate Note, 3.69% due 3/2/2009 | Aa3/A+ | 3,000,000 | 2,970,330 | |||||
Morgan Stanley Group, Inc., 3.734% due 1/18/2008 | Aa3/A+ | 5,000,000 | 5,002,870 | |||||
Schwab Charles Corp., 6.30% due 4/28/2006 | A2/A- | 800,000 | 808,151 | |||||
CONSUMER FINANCE — 4.57% | ||||||||
SLM Corp. CPI Floating Rate Note, 4.65% due 1/31/2014 | A2/A | 9,500,000 | 9,451,455 | |||||
SLM Corp. CPI Floating Rate Note, 3.73% due 3/2/2009 | A2/A | 3,000,000 | 2,962,740 | |||||
SLM Corp. Floating Rate Note, 3.86% due 7/25/2008 | A2/A | 3,000,000 | 3,009,465 | |||||
SLM Corp. Floating Rate Note, 4.118% due 9/15/2008 | A2/A | 1,675,000 | 1,675,968 | |||||
DIVERSIFIED FINANCIAL SERVICES — 12.66% | ||||||||
American General Finance Corp., 4.625% due 9/1/2010 | A1/A+ | 200,000 | 197,225 | |||||
Berkshire Hathaway Finance Corp. Senior Note, 4.625% due 10/15/2013 | Aaa/AAA | 1,000,000 | 981,237 | |||||
Dun & Bradstreet Corp., 6.625% due 3/15/2006 | NR/A- | 75,000 | 75,683 | |||||
General Electric Capital Corp., 7.75% due 6/9/2009 | Aaa/AAA | 200,000 | 219,217 | |||||
General Electric Capital Corp., Floating Rate Note, 4.175% due 5/30/2008 | Aaa/AAA | 494,000 | 493,018 | |||||
General Electric Capital Corp., 4.25% due 12/1/2010 | Aaa/AAA | 2,000,000 | 1,961,622 | |||||
General Electric Capital Corp., Floating Rate Note, 3.573% due 3/2/2009 | Aaa/AAA | 5,000,000 | 4,868,750 | |||||
General Electric Capital Corp., 4.375% due 11/21/2011 | Aaa/AAA | 1,500,000 | 1,468,773 | |||||
General Electric Capital Corp., 7.375% due 1/19/2010 | Aaa/AAA | 400,000 | 441,414 | |||||
General Electric Capital Corp., 5.00% due 2/15/2007 | Aaa/AAA | 2,900,000 | 2,920,961 | |||||
General Electric Capital Corp. Floating Rate Note, 3.99% due 12/15/2009 | Aaa/AAA | 1,000,000 | 1,001,705 | |||||
Household Finance Corp., 7.20% due 7/15/2006 | A1/A | 550,000 | 561,052 | |||||
Household Finance Corp., 5.75% due 1/30/2007 | A1/A | 400,000 | 406,204 | |||||
Household Finance Corp., 5.90% due 5/15/2006 | A1/A | 100,000 | 100,416 | |||||
Household Finance Corp., 6.40% due 9/15/2009 | A1/A | 400,000 | 410,898 | |||||
Household Finance Corp. CPI Floating Rate Note, 4.54% due 8/10/2009 | A1/A | 5,000,000 | 4,898,850 | |||||
International Lease Finance Corp., 5.00% due 9/15/2012 | A1/AA- | 4,000,000 | 3,947,168 | |||||
International Lease Finance Corp., 4.55% due 10/15/2009 | A1/AA- | 2,500,000 | 2,487,540 | |||||
International Lease Finance Corp. Floating Rate Note, 3.999% due 1/15/2010 | A1/AA- | 4,050,000 | 4,065,451 | |||||
JP Morgan Chase Co., 4.50% due 11/15/2010 | Aa3/A+ | 1,465,000 | 1,444,893 | |||||
JP Morgan Chase Co. CPI Floating Rate Note, 4.90% due 6/28/2009 | Aa3/A+ | 5,000,000 | 5,042,050 | |||||
Principal Financial Group Australia, 8.20% due 8/15/2009 | A2/A | 700,000 | 776,150 | |||||
Toyota Motor Credit Corp., 2.875% due 8/1/2008 | Aaa/AAA | 800,000 | 765,198 | |||||
Toyota Motor Credit Corp., 4.35% due 12/15/2010 | Aaa/AAA | 800,000 | 794,570 | |||||
Toyota Motor Credit Corp., 4.25% due 3/15/2010 | Aaa/AAA | 3,450,000 | 3,411,674 | |||||
Toyota Motor Credit Corp., 2.70% due 1/30/2007 | Aaa/AAA | 3,300,000 | 3,217,757 | |||||
US Central Credit Union, 2.75% due 5/30/2008 | Aa1/AAA | 375,000 | 358,733 | |||||
| 96,263,209 | ||||||||
34 | Certified Annual Report |
| SCHEDULE OF INVESTMENTS, CONTINUED | ||
| Thornburg Limited Term Income Fund | September 30, 2005 | |
Issuer-Description | Credit Rating† Moody’s/S&P | Principal Amount | Value | |||||
ENERGY — 3.33% | ||||||||
ENERGY EQUIPMENT & SERVICES — 3.08% | ||||||||
Amerenenergy Generating Co., 7.75% due 11/1/2005 | A3/A- | $ | 850,000 | $ | 852,340 | |||
BJ Services Co. Note Series B, 7.00% due 2/1/2006 | Baa2/BBB+ | 75,000 | 75,491 | |||||
Central Power & Light Co., 7.125% due 2/1/2008 | Baa1/BBB | 2,000,000 | 2,101,656 | |||||
Commonwealth Edison Co., 4.74% due 8/15/2010 | A3/A- | 975,000 | 958,188 | |||||
El Paso Corp., 7.00% due 5/15/2011 | Caa1/B- | 700,000 | 698,250 | |||||
Enterprise Products Participating LP, 7.50% due 2/1/2011 | Baa3/BB+ | 250,000 | 273,452 | |||||
EOG Resources Inc., 6.00% due 12/15/2008 | Baa1/BBB+ | 450,000 | 463,573 | |||||
Louis Dreyfus Natural Gas Corp., 6.875% due 12/1/2007 | A3/BBB+ | 290,000 | 301,936 | |||||
Murphy Oil Corp., 6.375% due 5/1/2012 | Baa1/A- | 750,000 | 805,246 | |||||
Panenergy Corp., 7.00% due 10/15/2006 | Baa3/BBB- | 1,100,000 | 1,118,105 | |||||
Phillips Petroleum Co., 9.375% due 2/15/2011 | A3/A- | 900,000 | 1,087,069 | |||||
Phillips Petroleum Co., 8.75% due 5/25/2010 | A3/A- | 250,000 | 292,306 | |||||
Questar Pipeline Co., 6.05% due 12/1/2008 | A2/A- | 425,000 | 438,926 | |||||
Rio Tinto Finance, 5.75% due 7/3/2006 | Aa3/A+ | 925,000 | 934,640 | |||||
Smith International Inc. Senior Note, 7.00% due 9/15/2007 | Baa1/BBB+ | 600,000 | 622,399 | |||||
Sonat Inc., 7.625% due 7/15/2011 | Caa1/B- | 500,000 | 507,500 | |||||
OIL, GAS & CONSUMABLE FUELS — 0.25% | ||||||||
Occidental Petroleum Corp., 10.125% due 9/15/2009 | A3/A- | 315,000 | 378,331 | |||||
Occidental Petroleum Corp., 7.375% due 11/15/2008 | A3/A- | 300,000 | 324,146 | |||||
Union Oil Co. California, 7.90% due 4/18/2008 | A1/BBB+ | 200,000 | 213,331 | |||||
| 12,446,885 | ||||||||
FOOD & DRUG RETAILING — 0.08% | ||||||||
FOOD & STAPLES RETAILING — 0.08% | ||||||||
General Mills, 5.50% due 1/12/2009 | Baa2/BBB+ | 300,000 | 306,334 | |||||
| 306,334 | ||||||||
FOOD BEVERAGE & TOBACCO — 1.77% | ||||||||
BEVERAGES — 0.94% | ||||||||
Anheuser Busch Co. Inc., 4.375% due 1/15/2013 | A1/A+ | 2,000,000 | 1,957,224 | |||||
Anheuser Busch Co. Inc., 5.625% due 10/1/2010 | A1/A+ | 1,150,000 | 1,198,357 | |||||
Coca Cola Co., 5.75% due 3/15/2011 | Aa3/A+ | 200,000 | 209,410 | |||||
Conagra Inc., 7.875% due 9/15/2010 | Baa1/BBB+ | 150,000 | 167,844 | |||||
FOOD PRODUCTS — 0.83% | ||||||||
Diageo Finance BV, 3.00% due 12/15/2006 | A2/A- | 925,000 | 907,283 | |||||
Kellogg Co., 4.875% due 10/15/2005 | Baa1/BBB+ | 186,000 | 186,042 | |||||
Sara Lee Corp., 6.00% due 1/15/2008 | A3/BBB+ | 900,000 | 919,929 | |||||
Sysco International Co., 6.10% due 6/1/2012 | A1/A+ | 1,000,000 | 1,073,625 | |||||
| 6,619,714 | ||||||||
HEALTH CARE EQUIPMENT & SERVICES — 0.13% | ||||||||
HEALTH CARE EQUIPMENT & SUPPLIES — 0.13% | ||||||||
Baxter International Inc., 5.25% due 5/1/2007 | Baa1/A- | 500,000 | 504,102 | |||||
| 504,102 | ||||||||
| Certified Annual Report | 35 |
SCHEDULE OF INVESTMENTS, CONTINUED
| ||
| Thornburg Limited Term Income Fund | September 30, 2005 |
Issuer-Description | Credit Rating† Moody’s/S&P | Principal Amount | Value | |||||
HOTELS RESTAURANTS & LEISURE — 0.13% | ||||||||
HOTELS RESTAURANTS & LEISURE — 0.13% | ||||||||
Wendy’s International Inc., 6.35% due 12/15/2005 | Baa2/BBB+ | $ | 500,000 | $ | 501,669 | |||
| 501,669 | ||||||||
HOUSEHOLD & PERSONAL PRODUCTS — 0.87% | ||||||||
PERSONAL PRODUCTS — 0.87% | ||||||||
Nike Inc., 5.50% due 8/15/2006 | A2/A+ | 900,000 | 908,035 | |||||
Procter & Gamble Co., 4.75% due 6/15/2007 | Aa3/AA- | 350,000 | 351,490 | |||||
Procter & Gamble Co., 4.30% due 8/15/2008 | Aa3/AA- | 2,000,000 | 1,989,008 | |||||
| 3,248,533 | ||||||||
INSURANCE — 8.45% | ||||||||
INSURANCE — 8.45% | ||||||||
AIG Sunamerica Global Financing, 5.10% due 1/17/2007 | Aa2/AA+ | 800,000 | 805,371 | |||||
Allstate Corp., 5.375% due 12/1/2006 | A1/A+ | 900,000 | 907,375 | |||||
Allstate Life Global Funding, 4.50% due 4/2/2007 | Aa2/AA | 5,000,000 | 4,986,800 | |||||
Hartford Financial Services Group Inc. Senior Note, 4.625% due 7/15/2013 | A3/A- | 1,000,000 | 968,129 | |||||
Hartford Life Inc., 7.10% due 6/15/2007 | A3/A- | 300,000 | 311,754 | |||||
Liberty Mutual Group Inc., 5.75% due 3/15/2014 | Baa3/BBB | 1,000,000 | 977,124 | |||||
Lincoln National Corp., 4.75% due 2/15/2014 | A3/A- | 1,000,000 | 974,277 | |||||
Metlife Inc., 5.25% due 12/1/2006 | A2/A | 450,000 | 451,750 | |||||
Old Republic International Corp., 7.00% due 6/15/2007 | Aa3/A+ | 1,800,000 | 1,860,867 | |||||
Pacific Life Global Funding CPI Floating Rate Note, 4.71% due 2/6/2016 | Aa3/AA | 8,000,000 | 7,958,000 | |||||
Principal Life Global Funding, 4.40% due 10/1/2010 | Aa2/AA | 4,000,000 | 3,921,028 | |||||
Principal Life Income Funding Floating Rate Note, 4.41% due 4/1/2016 | Aa2/AA | 5,000,000 | 4,858,550 | |||||
Unumprovident Corp., 7.625% due 3/1/2011 | Ba1/BB+ | 2,450,000 | 2,591,522 | |||||
| 31,572,547 | ||||||||
MATERIALS — 1.27% | ||||||||
CHEMICALS — 1.27% | ||||||||
Chevron Phillips Chemical, 7.00% due 3/15/2011 | Baa1/BBB+ | 500,000 | 542,226 | |||||
Chevron Phillips Chemical, 5.375% due 6/15/2007 | Baa1/BBB+ | 75,000 | 75,628 | |||||
Chevrontexaco Capital Co., 3.50% due 9/17/2007 | Aa2/AA | 1,400,000 | 1,375,224 | |||||
Dow Chemical Co., 5.75% due 12/15/2008 | A3/A- | 350,000 | 361,979 | |||||
E.I. du Pont de Nemours & Co., 8.25% due 9/15/2006 | Aa3/AA- | 200,000 | 205,998 | |||||
E.I. du Pont de Nemours & Co., 4.75% due 11/15/2012 | Aa3/AA- | 1,000,000 | 997,783 | |||||
E.I. du Pont de Nemours & Co., 4.125% due 3/6/2013 | Aa3/AA- | 325,000 | 312,382 | |||||
Hoechst Celanese Corp., 7.125% due 3/15/2009 | B2/NR | 200,000 | 205,414 | |||||
Lubrizol Corp. Senior Note, 5.875% due 12/1/2008 | Baa3/BBB- | 635,000 | 651,782 | |||||
| 4,728,416 | ||||||||
MEDIA — 1.24% | ||||||||
MEDIA — 1.24% | ||||||||
AOL Time Warner Inc., 6.75% due 4/15/2011 | Baa1/BBB+ | 750,000 | 805,439 | |||||
E W Scripps Co. Ohio, 5.75% due 7/15/2012 | A2/A | 80,000 | 83,120 | |||||
36 | Certified Annual Report |
SCHEDULE OF INVESTMENTS, CONTINUED
| ||
| Thornburg Limited Term Income Fund | September 30, 2005 |
Issuer-Description | Credit Rating† Moody’s/S&P | Principal Amount | Value | |||||
New York Times Co., 4.625% due 6/25/2007 | A2/A+ | $ | 300,000 | $ | 299,925 | |||
Scholastic Corp., 5.75% due 1/15/2007 | Baa3/BBB- | 255,000 | 257,475 | |||||
Thomson Corp., 4.25% due 8/15/2009 | A3/A- | 2,900,000 | 2,839,848 | |||||
Time Warner Inc., 8.05% due 1/15/2016 | Baa1/BBB+ | 200,000 | 234,821 | |||||
Tribune Co., 6.875% due 11/1/2006 | A3/A- | 125,000 | 127,610 | |||||
| 4,648,238 | ||||||||
MISCELLANEOUS — 0.48% | ||||||||
MISCELLANEOUS — 0.14% | ||||||||
Stanford University, 5.85% due 3/15/2009 | NA/AAA | 500,000 | 520,446 | |||||
YANKEE — 0.34% | ||||||||
Kreditanstalt Fur Wiederaufbau, 3.25% due 7/16/2007 | Aaa/AAA | 435,000 | 426,357 | |||||
Nova Scotia Province Canada, 5.75% due 2/27/2012 | A2/A | 500,000 | 526,762 | |||||
Ontario Province Canada, 3.282% due 3/28/2008 | Aa2/AA | 335,000 | 324,743 | |||||
| 1,798,308 | ||||||||
PHARMACEUTICALS & BIOTECHNOLOGY — 2.85% | ||||||||
BIOTECHNOLOGY — 2.31% | ||||||||
Abbott Labs, 6.40% due 12/1/2006 | A1/AA | 1,000,000 | 1,021,780 | |||||
Abbott Labs, 3.75% due 3/15/2011 | A1/AA | 500,000 | 476,984 | |||||
Eli Lilly & Co., 5.50% due 7/15/2006 | Aa3/AA | 1,850,000 | 1,865,714 | |||||
Tiers Inflation Linked Trust Series Wyeth 2004 21 Trust Certificate CPI Floating Rate Note, 4.653% due 2/1/2014 | Baa1/A | 5,450,000 | 5,286,881 | |||||
PHARMACEUTICALS — 0.54% | ||||||||
Pharmacia Corp., 5.75% due 12/1/2005 | Aaa/AAA | 2,000,000 | 2,005,502 | |||||
| 10,656,861 | ||||||||
RETAILING — 2.15% | ||||||||
DISTRIBUTORS — 0.03% | ||||||||
Dayton Hudson Corp., 9.625% due 2/1/2008 | A2/A+ | 100,000 | 110,163 | |||||
MULTILINE RETAIL — 1.55% | ||||||||
Costco Wholesale Corp., 5.50% due 3/15/2007 | A2/A | 500,000 | 506,050 | |||||
Dillard’s Inc., 7.375% due 6/1/2006 | B2/BB | 150,000 | 152,625 | |||||
Wal-Mart Stores Inc., 6.875% due 8/10/2009 | Aa2/AA | 900,000 | 969,348 | |||||
Wal-Mart Stores Inc., 4.125% due 2/15/2011 | Aa2/AA | 3,735,000 | 3,633,087 | |||||
Wal-Mart Stores Inc., 8.57% due 1/2/2010 | Aa2/AA | 345,489 | 368,005 | |||||
Wal-Mart Stores Inc., 1992-A1 Pass Through Certificate, 7.49% due 6/21/2007 | Aa2/AA | 165,231 | 170,991 | |||||
SPECIALTY RETAIL — 0.57% | ||||||||
Home Depot, Inc., 4.625% due 8/15/2010 | Aa3/AA | 2,135,000 | 2,134,408 | |||||
| 8,044,677 | ||||||||
| Certified Annual Report | 37 |
SCHEDULE OF INVESTMENTS, CONTINUED
| ||
| Thornburg Limited Term Income Fund | September 30, 2005 |
Issuer-Description | Credit Rating† Moody’s/S&P | Principal Amount | Value | |||||
SOFTWARE & SERVICES — 1.21% | ||||||||
INTERNET SOFTWARE & SERVICES — 1.21% | ||||||||
Electronic Data Systems Corp., 7.125% due 10/15/2009 | Ba1/BBB- | $ | 2,500,000 | $ | 2,677,492 | |||
Electronic Data Systems Corp., 6.50% due 8/1/2013 | Ba1/BBB- | 1,000,000 | 1,024,368 | |||||
Reynolds & Reynolds, 7.00% due 12/15/2006 | Baa2/BBB | 800,000 | 803,234 | |||||
| 4,505,094 | ||||||||
TECHNOLOGY HARDWARE & EQUIPMENT — 2.88% | ||||||||
COMPUTERS & PERIPHERALS — 2.88% | ||||||||
Computer Sciences Corp., 6.25% due 3/15/2009 | A3/A | 300,000 | 311,693 | |||||
Computer Sciences Corp., 7.375% due 6/15/2011 | A3/A | 1,317,000 | 1,468,263 | |||||
Computer Sciences Corp., 3.50% due 4/15/2008 | A3/A | 2,000,000 | 1,941,774 | |||||
First Data Corp., 5.625% due 11/1/2011 | A1/A+ | 900,000 | 936,114 | |||||
First Data Corp., 6.375% due 12/15/2007 | A1/A+ | 110,000 | 113,854 | |||||
International Business Machines, 4.875% due 10/1/2006 | A1/A+ | 500,000 | 502,179 | |||||
International Business Machines, 4.25% due 9/15/2009 | A1/A+ | 1,000,000 | 988,871 | |||||
International Business Machines, 2.375% due 11/1/2006 | A1/A+ | 2,825,000 | 2,764,585 | |||||
Jabil Circuit Inc., 5.875% due 7/15/2010 | Baa3/BBB- | 500,000 | 512,160 | |||||
Oracle Corp., 6.91% due 2/15/2007 | A3/A- | 1,200,000 | 1,235,293 | |||||
| 10,774,786 | ||||||||
TELECOMMUNICATION SERVICES — 1.06% | ||||||||
DIVERSIFIED TELECOMMUNICATION SERVICES — 1.06% | ||||||||
Cingular Wireless, 5.625% due 12/15/2006 | Baa2/A | 900,000 | 910,901 | |||||
GTE Hawaiian Telephone Inc., 7.375% due 9/1/2006 (Insured: MBIA) | Aaa/AAA | 1,500,000 | 1,521,952 | |||||
Verizon Wireless Capital LLC, 5.375% due 12/15/2006 | A3/A+ | 1,500,000 | 1,514,558 | |||||
| 3,947,411 | ||||||||
TRANSPORTATION — 0.59% | ||||||||
AIRLINES — 0.53% | ||||||||
Continental Airlines Pass Through Certificate Series 1997 4 Class-4A, 6.90% due 1/2/2018 | Baa3/BBB+ | 200,742 | 196,203 | |||||
Delta Air Lines Inc. EETC Series 2001-1 Class-A, 6.619% due 3/18/2011 | Ba2/BB+ | 279,327 | 261,255 | |||||
Northwest Airlines 1999-2 Class-A, 7.575% due 3/1/2019 | Ba2/BBB- | 124,273 | 124,279 | |||||
Southwest Airlines Co., 7.875% due 9/1/2007 | Baa1/A | 1,012,000 | 1,066,175 | |||||
Southwest Airlines Co., 5.10% due 5/1/2006 | Aa2/AA+ | 307,975 | 308,563 | |||||
ROAD & RAIL — 0.06% | ||||||||
CSX Corp., 7.45% due 5/1/2007 | Baa2/BBB | 225,000 | 234,157 | |||||
| 2,190,632 | ||||||||
UTILITIES — 3.06% | ||||||||
ELECTRIC UTILITIES — 2.23% | ||||||||
Appalachian Power Co., 6.60% due 5/1/2009 (Insured: MBIA) | Aaa/AAA | 175,000 | 185,550 | |||||
Gulf Power Co., 4.35% due 7/15/2013 | A2/A | 925,000 | 890,742 | |||||
Minnesota Power & Light Co., 7.00% due 2/15/2007 | Baa1/A | 900,000 | 926,505 | |||||
Northern Border Pipeline Co., 6.25% due 5/1/2007 | A3/BBB+ | 120,000 | 122,618 | |||||
Northern States Power Co., 4.75% due 8/1/2010 | A2/A- | 2,825,000 | 2,813,516 | |||||
38 | Certified Annual Report |
SCHEDULE OF INVESTMENTS, CONTINUED
| ||
| Thornburg Limited Term Income Fund | September 30, 2005 |
Issuer-Description | Credit Rating† Moody’s/S&P | Principal Amount | Value | |||||
Pennsylvania Power & Light Co., 6.55% due 3/1/2006 (Insured: MBIA) | Aaa/AAA | $ | 210,000 | $ | 211,831 | |||
PSI Energy Inc., 7.85% due 10/15/2007 | Baa1/BBB | 500,000 | 529,271 | |||||
PSI Energy Inc., 6.65% due 6/15/2006 | A3/A- | 245,000 | 248,566 | |||||
Public Service Electric & Gas Co., 6.75% due 3/1/2006 (Insured: MBIA) | Aaa/AAA | 275,000 | 277,561 | |||||
Texas Eastern Transmission Corp. Senior Note, 5.25% due 7/15/2007 | Baa2/BBB | 525,000 | 529,296 | |||||
Wisconsin Energy Corp., 5.50% due 12/1/2008 | A3/BBB+ | 350,000 | 358,316 | |||||
Wisconsin Public Service Corp., 6.125% due 8/1/2011 | Aa2/A+ | 1,150,000 | 1,223,868 | |||||
GAS UTILITIES — 0.57% | ||||||||
Southern California Gas Co., 4.375% due 1/15/2011 | A1/A+ | 225,000 | 221,665 | |||||
Texas Municipal Gas Corp., 2.60% due 7/1/2007 (Insured: FSA) | Aaa/AAA | 1,950,000 | 1,920,379 | |||||
MULTI-UTILITIES — 0.26% | ||||||||
Madison Gas & Electric Co., 6.02% due 9/15/2008 | Aa3/AA- | 950,000 | 979,298 | |||||
| 11,438,982 | ||||||||
TOTAL CORPORATE BONDS (Cost $249,395,358) | 249,579,949 | |||||||
Taxable Municipal Bonds — 11.93% | ||||||||
American Campus Properties Student Housing, 7.38% due 9/1/2012 (Insured: MBIA) | Aaa/AAA | 3,885,000 | 4,254,425 | |||||
American Fork City Utah Sales, 4.89% due 3/1/2012 (Insured: FSA) | Aaa/AAA | 300,000 | 300,480 | |||||
American Fork City Utah Sales, 5.07% due 3/1/2013 (Insured: FSA) | Aaa/AAA | 120,000 | 121,512 | |||||
Arkansas Electric Coop Corp., 7.33% due 6/30/2008 | A2/AA- | 116,000 | 119,921 | |||||
Bessemer Alabama Water Revenue Taxable Warrants Series B, 7.375% due 7/1/2008 (Insured: FSA) | Aaa/AAA | 670,000 | 692,579 | |||||
Brockton MA Taxable Economic Development Series A, 6.45% due 5/1/2017 (Insured: FGIC) | Aaa/AAA | 150,000 | 164,161 | |||||
Burbank California Waste Disposal Revenue, 5.29% due 5/1/2007 (Insured: FSA) | Aaa/AAA | 370,000 | 373,171 | |||||
Burbank California Waste Disposal Revenue, 5.48% due 5/1/2008 (Insured: FSA) | Aaa/AAA | 310,000 | 316,036 | |||||
Chicago Illinois Taxable Neighborhoods Alive Series B, 5.20% due 1/1/2006 (Insured: FGIC) | Aaa/AAA | 200,000 | 201,448 | |||||
Cleveland Cuyahoga County Ohio, 6.10% due 5/15/2013 | NR/BBB+ | 1,945,000 | 1,899,312 | |||||
Connecticut State Housing Finance Authority, 3.10% due 6/15/2032 put 12/1/2005 (Insured:AMBAC) | Aaa/AAA | 1,870,000 | 1,866,017 | |||||
Cook County Illinois Community College District 508, 6.90% due 5/1/2010 (Insured:AMBAC) | Aaa/AAA | 600,000 | 620,538 | |||||
Cook County Illinois School District 083, 4.625% due 12/1/2010 (Insured: FSA) | Aaa/NR | 250,000 | 247,642 | |||||
Cook County Illinois School District 083, 4.875% due 12/1/2011 (Insured: FSA) | Aaa/NR | 150,000 | 149,880 | |||||
Denver City & County Special Facilities Taxable Refunding & Improvement Series B, 7.15% due 1/1/2008 (Insured: MBIA) | Aaa/AAA | 900,000 | 948,096 | |||||
Elkhart Indiana Redevelopment District Revenue, 4.80% due 6/15/2011 | NR/NR | 240,000 | 230,314 | |||||
Elkhart Indiana Redevelopment District Revenue, 4.80% due 12/15/2011 | NR/NR | 245,000 | 234,325 | |||||
Elkhart Indiana Redevelopment District Revenue, 5.05% due 12/15/2012 | NR/NR | 515,000 | 495,100 | |||||
Elkhart Indiana Redevelopment District Revenue, 5.25% due 12/15/2013 | NR/NR | 540,000 | 518,762 | |||||
Green Bay Wisconsin Series B, 4.875% due 4/1/2011 (Insured: MBIA) | Aaa/NR | 365,000 | 365,748 | |||||
Hancock County Mississippi, 4.20% due 8/1/2008 (Insured: MBIA) | Aaa/NR | 305,000 | 300,620 | |||||
Hancock County Mississippi, 4.80% due 8/1/2010 (Insured: MBIA) | Aaa/NR | 245,000 | 244,588 | |||||
Hancock County Mississippi, 4.90% due 8/1/2011 (Insured: MBIA) | Aaa/NR | 315,000 | 315,331 | |||||
Hanover Pennsylvania Area School District Taxable Notes Series B, 4.47% due 3/15/2013 (Insured: FSA) | Aaa/AAA | 1,385,000 | 1,359,835 | |||||
Jefferson County Texas Navigation Taxable Refunding, 5.50% due 5/1/2010 (Insured: FSA) | Aaa/NR | 500,000 | 509,695 | |||||
Jefferson Franklin, Etc. Counties Illinois Community College District 521, 3.00% due 1/1/2006 (Insured: FSA) | Aaa/NR | 200,000 | 199,480 | |||||
Jefferson Franklin, Etc. Counties Illinois Community College District 521, 3.625% due 1/1/2007 (Insured: FSA) | Aaa/NR | 300,000 | 296,964 | |||||
Jersey City New Jersey Municipal Utilities Authority, 3.72% due 5/15/2009 (Insured: MBIA) | Aaa/AAA | 575,000 | 556,525 | |||||
Kendall Kane County Illinois School 308, 5.50% due 10/1/2011 (Insured: FGIC) | Aaa/NR | 365,000 | 378,439 | |||||
| Certified Annual Report | 39 |
SCHEDULE OF INVESTMENTS, CONTINUED
| ||
| Thornburg Limited Term Income Fund | September 30, 2005 |
Issuer-Description | Credit Rating† Moody’s/S&P | Principal Amount | Value | |||||
King County Washington GO, 7.55% due 12/1/2005 | Aa1/AA+ | $ | 405,000 | $ | 407,543 | |||
Los Angeles County California Metropolitan Transport, 4.56% due 7/1/2010 (Insured:AMBAC) | Aaa/AAA | 2,775,000 | 2,753,771 | |||||
Maryland State Economic Development Corp., 7.25% due 6/1/2008 (Maryland Tech Development Center Project) | NR/NR | 280,000 | 288,963 | |||||
McKeesport Pennsylvania Taxable Series B, 6.60% due 3/1/2006 (Insured: MBIA) | Aaa/AAA | 240,000 | 242,395 | |||||
Mississippi State Taxable Business Series V, 7.125% due 9/1/2006 | NR/AA | 140,000 | 143,198 | |||||
Montgomery County Maryland Revenue Authority, 5.00% due 2/15/2012 | Aa2/AA+ | 100,000 | 100,482 | |||||
Multnomah County Oregon School District 1J Refunding Taxable, 4.191% due 6/15/2008 | A2/A- | 650,000 | 638,853 | |||||
New Jersey Health Care Facilities Financing, 10.75% due 7/1/2010 (ETM) | NR/NR | 365,000 | 425,126 | |||||
New Jersey Health Care Facilities Financing, 7.70% due 7/1/2011 (Insured: Connie Lee) | NR/AAA | 130,000 | 139,198 | |||||
New Rochelle New York Industrial Development Agency, 7.15% due 10/1/2014 | Aa2/A+ | 150,000 | 159,180 | |||||
New York Environmental Facilities, 5.85% due 3/15/2011 | NR/AA- | 3,500,000 | 3,686,200 | |||||
New York State Housing Finance , 4.46% due 8/15/2009 | Aa1/NR | 455,000 | 448,407 | |||||
New York State Thruway Authority Service Contract, 2.59% due 3/15/2006 | A2/AA- | 1,000,000 | 992,790 | |||||
New York State Urban Development Corp., 4.75% due 12/15/2011 | NR/AA | 1,400,000 | 1,404,382 | |||||
Newark New Jersey, 4.70% due 4/1/2011 (Insured: MBIA) | Aaa/NR | 845,000 | 839,668 | |||||
Newark New Jersey, 4.90% due 4/1/2012 (Insured: MBIA) | Aaa/NR | 1,225,000 | 1,224,326 | |||||
Niagara Falls New York Public Water, 4.30% due 7/15/2010 (Insured: MBIA) | Aaa/AAA | 360,000 | 354,031 | |||||
Northwest Open Access Network Washington Revenue, 6.18% due 12/1/2008 (Insured:AMBAC) | Aaa/AAA | 1,600,000 | 1,667,424 | |||||
Ohio State Petroleum Underground Storage, 6.75% due 8/15/2008 (Insured: MBIA) | Aaa/AAA | 660,000 | 661,320 | |||||
Pima County Arizona Industrial Development Authority Series E, 9.05% due 7/1/2008 | Baa3/NR | 70,000 | 71,216 | |||||
Port Walla Walla Revenue, 5.30% due 12/1/2009 | NR/NR | 235,000 | 231,964 | |||||
Providence Rhode Island, 5.59% due 1/15/2008 (Insured: FGIC) | Aaa/AAA | 340,000 | 348,048 | |||||
Short Pump Town Center Community Development, 6.26% due 2/1/2009 | NR/NR | 1,000,000 | 1,021,780 | |||||
Sisters Providence Obligation Group Direct Obligation Notes Series 1997, 7.47% due 10/1/2007 | Aa3/AA | 1,805,000 | 1,889,799 | |||||
Tazewell County Illinois Community High School, 5.20% due 12/1/2011 (Insured: FSA) | Aaa/NR | 355,000 | 362,689 | |||||
Tennessee State Taxable Series B, 6.00% due 2/1/2013 | Aa2/AA | 500,000 | 528,995 | |||||
Texas State Public Finance Authority Revenue, 3.125% due 6/15/2007 | Aa2/AA | 400,000 | 391,196 | |||||
Texas Tech University Revenue, 6.00% due 8/15/2011 (Insured: MBIA) | Aaa/AAA | 245,000 | 260,060 | |||||
University Illinois Revenue, 6.35% due 4/1/2011 (Insured: FGIC) | Aaa/AAA | 1,000,000 | 1,075,080 | |||||
Victor New York, 9.20% due 5/1/2014 | NR/NR | 1,250,000 | 1,315,838 | |||||
Virginia Housing Development Authority Taxable Rental Housing Series I, 7.30% due 2/1/2008 | Aa1/AA+ | 505,000 | 530,715 | |||||
West Valley City Utah Municipal Building Lease Refunding Taxable, 7.67% due 5/1/2006 | Aa2/NR | 1,500,000 | 1,526,670 | |||||
Wisconsin State General Revenue, 4.80% due 5/1/2013 (Insured: FSA) | Aaa/AAA | 200,000 | 199,992 | |||||
TOTAL TAXABLE MUNICIPAL BONDS (Cost $44,412,301) | 44,612,243 | |||||||
Short Term Investments — 2.14% | ||||||||
Citigroup, 3.78% due 10/7/2005 | Prim1/A-1+ | 5,000,000 | 4,996,850 | |||||
UBS Finance, 3.74% due 10/3/2005 | Prim1/A-1+ | 3,000,000 | 2,999,377 | |||||
TOTAL SHORT TERM INVESTMENTS (Cost $7,996,227) | 7,996,227 | |||||||
TOTAL INVESTMENTS — 98.95% (Cost $369,934,333) | $ | 369,895,639 | ||||||
OTHER ASSETS LESS LIABILITIES — 1.05% | 3,907,046 | |||||||
NET ASSETS — 100.00% | $ | 373,802,685 | ||||||
40 | Certified Annual Report |
SCHEDULE OF INVESTMENTS, CONTINUED
| ||
| Thornburg Limited Term Income Fund | September 30, 2005 |
Footnote Legend
| † | Credit ratings are unaudited. Rating changes may have occurred prior to or subsequent to the reporting period end. |
See notes to financial statements.
Portfolio Abbreviations
To simplify the listings of securities, abbreviations are used per the table below:
AMBAC | Insured by American Municipal Bond Assurance Corp. | |
ETM | Escrowed to Maturity | |
FGIC | Insured by Financial Guaranty Insurance Co. | |
FSA | Insured by Financial Security Assurance Co. | |
GO | General Obligation | |
MBIA | Insured by Municipal Bond Investors Assurance |
SUMMARY OF SECURITY CREDIT RATINGS†
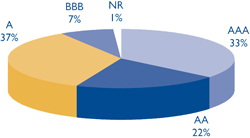
Ratings are a blend of Moody’s and Standard & Poor’s, using the higher rating. Some bonds are rated by only one service.
| Certified Annual Report | 41 |
REPORT OF INDEPENDENT REGISTERED PUBLIC ACCOUNTING FIRM
Thornburg Limited Term Income Funds
To the Trustees and Shareholders of
Thornburg Limited Term U.S. Government Fund
Thornburg Limited Term Income Fund
In our opinion, the accompanying statements of assets and liabilities, including the schedules of investments, and the related statements of operations and of changes in net assets and the financial highlights present fairly, in all material respects, the financial position of Thornburg Limited Term U.S. Government Fund and Thornburg Limited Term Income Fund (separate portfolios of Thornburg Investment Trust, hereafter referred to as the “Funds”) at September 30, 2005, the results of each of their operations for the year then ended, the changes in each of their net assets for each of the two years in the period then ended and the financial highlights for each of the periods presented, in conformity with accounting principles generally accepted in the United States of America. These financial statements and financial highlights (hereafter referred to as “financial statements”) are the responsibility of the Funds’ management. Our responsibility is to express an opinion on these financial statements based on our audits. We conducted our audits of these financial statements in accordance with the standards of the Public Company Accounting Oversight Board (United States). Those standards require that we plan and perform the audit to obtain reasonable assurance about whether the financial statements are free of material misstatement. An audit includes examining, on a test basis, evidence supporting the amounts and disclosures in the financial statements, assessing the accounting principles used and significant estimates made by management, and evaluating the overall financial statement presentation. We believe that our audits, which included confirmation of securities at September 30, 2005 by correspondence with the custodian and brokers, provide a reasonable basis for our opinion.
PricewaterhouseCoopers LLP
New York, New York
November 16, 2005
42 | Certified Annual Report |
| ||
| Thornburg Limited Term Income Funds | September 30, 2005 (Unaudited) |
As a shareholder of the Fund, you incur two types of costs:
(1) transaction costs, including
(a) sales charges (loads) on purchase payments, for Class A Shares;
(b) a deferred sales charge on redemptions of any part or all of a purchase of $1 million of Class A shares within 12 months of purchase;
(c) a deferred sales charge on redemptions of Class C shares within 12 months of purchase;
(2) ongoing costs, including management fees; distribution and/or service (12b-1) fees; and other Fund expenses.
This example is intended to help you understand your ongoing costs (in dollars) of investing in the Fund and to compare these costs with the ongoing costs of investing in other mutual funds.
The example is based on an investment of $1,000 invested on March 31, 2005 and held until September 30, 2005.
Actual Expenses
The first line of the table at right provides information about actual account values and actual expenses. You may use the information in this line, together with the amount you invested, to estimate the expenses that you paid over the period. Simply divide your account value by $1,000 (for example, an $8,600 account value divided by $1,000 = 8.6), then multiply the result by the number in the first line under the heading entitled “Expenses Paid During Period” to estimate the expenses you paid on your account during this period.
Hypothetical Example for Comparison Purposes
The second line of the table at right provides information about hypothetical account values and hypothetical expenses based on the Fund’s actual expense ratio and an assumed rate of return of 5% per year before expenses, which is not the Fund’s actual return. The hypothetical account values and expenses may not be used to estimate the actual ending account balance or expenses you paid for the period. You may use this information to compare the ongoing costs of investing in the Fund and other funds. To do so, compare this 5% hypothetical example with the 5% hypothetical examples that appear in the shareholder reports of the other funds.
| Beginning Account Value 3/31/05 | Ending Account Value 9/30/05 | Expenses Paid During Period† | |||||||
U.S. Government Fund | |||||||||
Class A Shares | |||||||||
Actual | $ | 1,000 | $ | 1,011.70 | $ | 4.92 | |||
Hypothetical* | $ | 1,000 | $ | 1,020.18 | $ | 4.94 | |||
Class B Shares | |||||||||
Actual | $ | 1,000 | $ | 1,004.00 | $ | 12.54 | |||
Hypothetical* | $ | 1,000 | $ | 1,012.55 | $ | 12.60 | |||
Class C Shares | |||||||||
Actual | $ | 1,000 | $ | 1,011.10 | $ | 6.22 | |||
Hypothetical* | $ | 1,000 | $ | 1,018.88 | $ | 6.24 | |||
Class I Shares | |||||||||
Actual | $ | 1,000 | $ | 1,014.00 | $ | 3.38 | |||
Hypothetical* | $ | 1,000 | $ | 1,021.71 | $ | 3.39 | |||
Class R1 Shares | |||||||||
Actual | $ | 1,000 | $ | 1,012.80 | $ | 4.60 | |||
Hypothetical* | $ | 1,000 | $ | 1,020.50 | $ | 4.61 | |||
Income Fund | |||||||||
Class A Shares | |||||||||
Actual | $ | 1,000 | $ | 1,014.10 | $ | 5.02 | |||
Hypothetical* | $ | 1,000 | $ | 1,020.08 | $ | 5.03 | |||
Class C Shares | |||||||||
Actual | $ | 1,000 | $ | 1,012.90 | $ | 6.28 | |||
Hypothetical* | $ | 1,000 | $ | 1,018.83 | $ | 6.30 | |||
Class I Shares | |||||||||
Actual | $ | 1,000 | $ | 1,015.80 | $ | 3.38 | |||
Hypothetical* | $ | 1,000 | $ | 1,021.71 | $ | 3.39 | |||
Class R1 Shares | |||||||||
Actual | $ | 1,000 | $ | 1,014.20 | $ | 5.00 | |||
Hypothetical* | $ | 1,000 | $ | 1,020.10 | $ | 5.02 | |||
| † | Thornburg Limited Term U.S. Government Fund expenses are equal to the annualized expense ratio for each class (A: 0.97%; B: 2.50%; C: 1.23%; I: 0.67%; and R1: 0.91%) multiplied by the average account value over the period, multiplied by 183/365 to reflect the one-half year period. Thornburg Limited Term Income Fund expenses are equal to the annualized expense ratio for each class (A: 0.99%; C: 1.24%; I: 0.67%; and R1: 0.99%) multiplied by the average account value over the period, multiplied by 183/365 to reflect the one-half year period. |
| * | Hypothetical assumes a rate of return of 5% per year before expenses. |
Please note that the expenses shown in the table are meant to highlight your ongoing costs only and do not reflect any transactional costs, such as sales charges (loads), redemption fees, or exchange fees. Therefore, the second line of the table is useful in comparing ongoing costs only, and will not help you determine the relative total costs of owning different funds. In addition, if these transactional costs were included, your costs would have been higher.
| Certified Annual Report | 43 |
| INDEX COMPARISON | ||
| Thornburg Limited Term U.S. Government Fund | September 30, 2005 (Unaudited) | |
GROWTH OF A HYPOTHETICAL $10,000 INVESTMENT
Thornburg Limited Term U.S. Government Fund Class A Total Returns, versus
Lehman Brothers Intermediate Government Bond Index and Consumer Price Index
(November 30, 1987 to September 30, 2005)
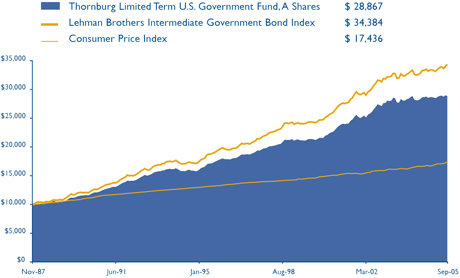
AVERAGE ANNUAL TOTAL RETURNS For the periods ended September 30, 2005 (with sales charge) |
| |||||||||||||
| 1 Yr | 5 Yrs | 10 Yrs | Since Inception | |||||||||||
A Shares (Incep: 11/16/87) | (0.87 | )% | 4.75 | % | 5.01 | % | 6.14 | % | ||||||
B Shares (Incep: 11/1/02) | (5.78 | )% | N/A | N/A | (0.60 | )% | ||||||||
C Shares (Incep: 9/1/94) | (0.09 | )% | 4.71 | % | 4.79 | % | 5.08 | % | ||||||
R1 Shares (Incep: 7/1/03) | 0.72 | % | N/A | N/A | 0.96 | % | ||||||||
FUND ATTRIBUTES as of September 30, 2005 |
| |||||||||||||
Annualized Dist. Rate (@NAV) | SEC Yield | NAV | Maximum Offering Price | |||||||||||
A Shares (Incep: 11/16/87) | 2.67 | % | 3.00 | % | $ | 12.76 | $ | 12.95 | ||||||
B Shares (Incep: 11/1/02) | 1.18 | % | 1.53 | % | $ | 12.73 | $ | 12.73 | ||||||
C Shares (Incep: 9/1/94) | 2.47 | % | 2.81 | % | $ | 12.84 | $ | 12.84 | ||||||
R1 Shares (Incep: 7/1/03) | 2.77 | % | 3.17 | % | $ | 12.77 | $ | 12.77 | ||||||
Performance data reflect past performance, which is no guarantee of future results. The performance data and graph do not reflect the deduction of taxes that a shareholder would pay on distributions or the redemption of Fund shares.
For the U.S. Government Fund, returns reflect the reinvestment of dividends and capital gains as well as applicable sales charges. Class A Shares are sold with a maximum sales charge of 1.50%. Class B shares are sold with a contingent deferred sales charge (CDSC) that declines from 5.00% to 0% depending upon the period of time the shares are held. Class B shares will automatically convert to Class A shares on a quarterly basis approximately eight years after purchase. C shares include a 0.50% CDSC for the first year only. There is no up front sales charge for R1 shares.
The Lehman Brothers Intermediate Government Bond Index is an unmanaged market-weighted index generally representative of all public obligations of the U.S. Government, its agencies and instrumentalities having maturities of up to ten years.
The SEC Yield is computed in accordance with SEC standards measuring the net investment income per share over a specified 30-day period expressed as a percentage of the maximum offering price of the Funds’ shares at the end of the period.
The distribution rate is calculated by taking the sum of the month’s total distribution factors and dividing this sum by a 30-day period and annualizing to 360-day year. The value is then divided by the ending Net Asset Value (NAV) to arrive at the annualized distribution yield. The yield is calculated on a periodic basis and is subject to change depending on the Funds’ NAV and current distributions.
Shares are not guaranteed by the U.S. Government.
44 | Certified Annual Report |
| INDEX COMPARISON | ||
| Thornburg Limited Term Income Fund | September 30, 2005 (Unaudited) | |
GROWTH OF A HYPOTHETICAL $10,000 INVESTMENT
Thornburg Limited Term Income Fund Class A Total Returns versus
Lehman Brothers Intermediate Government/Credit Index and Consumer Price Index
(October 1, 1992 to September 30, 2005)
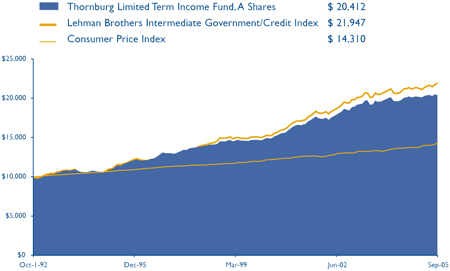
AVERAGE ANNUAL TOTAL RETURNS For the periods ended September 30, 2005 (with sales charge) |
| |||||||||||||
| 1 Yr | 5 Yrs | 10 Yrs | Since Inception | |||||||||||
A Shares (Incep: 10/1/92) | (0.08 | )% | 5.23 | % | 5.52 | % | 5.64 | % | ||||||
C Shares (Incep: 9/1/94) | 0.68 | % | 5.20 | % | 5.30 | % | 5.51 | % | ||||||
R1 Shares (Incep: 7/1/03) | 1.43 | % | N/A | N/A | 1.80 | % | ||||||||
FUND ATTRIBUTES as of September 30, 2005 |
| |||||||||||||
Annualized Dist. Rate (@NAV) | SEC Yield | NAV | Maximum Offering Price | |||||||||||
A Shares (Incep: 10/1/92) | 3.91 | % | 3.59 | % | $ | 12.51 | $ | 12.70 | ||||||
C Shares (Incep: 9/1/94) | 3.66 | % | 3.39 | % | $ | 12.49 | $ | 12.49 | ||||||
R1 Shares (Incep: 7/1/03) | 3.91 | % | 3.65 | % | $ | 12.52 | $ | 12.52 | ||||||
Performance data reflect past performance, which is no guarantee of future results. The performance data and graph do not reflect the deduction of taxes that a shareholder would pay on distributions or the redemption of Fund shares.
For the Limited Term Income Fund, returns reflect the reinvestment of dividends and capital gains as well as applicable sales charges. Class A Shares is 1.50%. C shares include a 0.50% contingent deferred sales charge (CDSC) for the first year only. There is no up front sales charge for R1 shares.
The Lehman Brothers Intermediate Government/Credit Bond Index is an unmanaged, market-weighted index generally representative of intermediate government and investment grade corporate debt securities having maturities of up to ten years.
The Consumer Price Index (“CPI”) measures prices of a fixed basket of goods bought by a typical consumer, including food, transportation, shelter, utilities, clothing, medical care, entertainment and other items. The CPI, published by the Bureau of Labor Statistics in the Department of Labor, is based at 100 in 1982 and is released monthly. It is widely used as a cost-of-living benchmark to adjust Social Security payments and other payment schedules, union contracts and tax brackets. The CPI is also known as the cost-of-living index.
Unless otherwise noted, index returns reflect the reinvestment of income dividends and capital gains, if any, but do not reflect fees, brokerage commissions or other expenses of investing. Investors may not make direct investments into any index.
| Certified Annual Report | 45 |
| TRUSTEES AND OFFICERS | ||
| Thornburg Limited Term Income Funds | September 30, 2005 (Unaudited) | |
Name, Age, Position Held with Fund Year Elected | Principal Occupation(s) During Past Five Years | Other Directorships Held by Trustee | ||
INTERESTED TRUSTEES (1)(2)(4) | ||||
Garrett Thornburg, 59 Chairman of Trustees, Trustee since 1987(3) | CEO, Chairman and controlling shareholder of Thornburg Investment Management, Inc. (investment advisor) and Thornburg Securities Corporation (securities dealer); Chairman of Thornburg Limited Term Municipal Fund, Inc. (registered investment company) to 2004; CEO and Chairman of Thornburg Mortgage, Inc. (real estate investment trust); Chairman of Thornburg Mortgage Advisory Corporation (investment manager to Thornburg Mortgage, Inc.). | Director of Thornburg Mortgage, Inc. (real estate investment trust) | ||
Brian J. McMahon, 49 Trustee since 2001, Member of Governance & Nominating Committee, President since 1997(5)(6) | President and Managing Director of Thornburg Investment Management, Inc.; President of Thornburg Limited Term Municipal Fund, Inc. to 2004. | None | ||
| INDEPENDENT TRUSTEES (1)(2)(4) | ||||
David A. Ater, 60 Trustee since 1994, Member of Audit Committee and Governance & Nominating Committee | Principal in Ater & Associates, Santa Fe, NM (developer, planner and broker of residential and commercial real estate); owner developer and broker for various real estate projects. | Director of Thornburg Mortgage, Inc. (real estate investment trust) | ||
David D. Chase, 64 Chairman of Audit Committee, Trustee since 2000 | Chairman, President, CEO, and Managing Member of Vestor Associates, LLC, the general partner of Vestor Partners, LP, Santa Fe, NM (private equity fund); Chairman and CEO of Vestor Holdings, Inc., Santa Fe, NM (merchant bank). | None | ||
Eliot R. Cutler, 59 Chairman of Governance & Nominating Committee, Trustee since 2004 | Partner, Akin, Gump, Strauss, Hauer & Feld, LLP, Washington, D.C. (law firm) since November 2000; partner, Cutler & Stanfield, Washington, D.C. (law firm) until November 2000. | Director of Thornburg Mortgage, Inc. (real estate investment trust) | ||
Susan H. Dubin, 56 Trustee since 2004, Member of Audit Committee | President of Dubin Investments, Ltd., Greenwich, CT (private investment fund); Director and officer of various charitable organizations; and formerly, Vice President of Chemical Bank (predecessor to JP Morgan Chase & Co.), New York, 1974–1996. | None | ||
Owen D.Van Essen, 51 Trustee since 2004, Member of Governance & Nominating Committee | President of Dirks, Van Essen & Murray, Santa Fe, NM (newspaper mergers and acquisitions). | None | ||
James W. Weyhrauch, 46 Trustee since 1996, Member of Audit Committee | Director, Executive Vice President to 2002, and President and CEO 2002–2004, Nambé Mills, Inc., Santa Fe, NM (manufacturer); real estate agent, Santa Fe Properties, Santa Fe, NM since 2004. | None | ||
46 | Certified Annual Report |
| TRUSTEES AND OFFICERS, CONTINUED | ||
| Thornburg Limited Term Income Funds | September 30, 2005 (Unaudited) | |
Name, Age, Position Held with Fund Year Elected | Principal Occupation(s) During Past Five Years | Other Directorships Held by Trustee | ||
| OFFICERS OF THE FUND (WHO ARE NOT TRUSTEES)(1)(6)(7) | ||||
Dawn B. Fischer, 58 Secretary since 1987 | Secretary and Managing Director, Thornburg Investment Management, Inc.; Secretary, Thornburg Limited Term Municipal Fund, Inc. to 2004; Secretary, Thornburg Securities Corporation; Vice President, Daily Tax Free Income Fund, Inc. (registered investment company). | Not applicable | ||
Steven J. Bohlin, 46 Vice President since 1987; Treasurer since 1989 | Vice President and Managing Director of Thornburg Investment Management, Inc.; Vice President of Thornburg Limited Term Municipal Fund, Inc. to 2004. | Not applicable | ||
George T. Strickland, 42 Vice President since 1996 | Vice President and Managing Director of Thornburg Investment Management, Inc.; Vice President (to 2004) and Treasurer (2003–2004) of Thornburg Limited Term Municipal Fund, Inc. | Not applicable | ||
William V. Fries, 66 Vice President since 1995 | Vice President and Managing Director of Thornburg Investment Management, Inc. | Not applicable | ||
Leigh Moiola, 38 Vice President since 2001 | Vice President and Managing Director of Thornburg Investment Management, Inc.; Vice President of Thornburg Limited Term Municipal Fund, Inc. 1999–2004. | Not applicable | ||
Kenneth Ziesenheim, 51 Vice President since 1995 | Vice President and Managing Director of Thornburg Investment Management, Inc.; President of Thornburg Securities Corporation; Vice President of Thornburg Limited Term Municipal Fund, Inc. to 2004. | Not applicable | ||
Alexander Motola, 35 Vice President since 2001 | Vice President and Managing Director of Thornburg Investment Management, Inc. since 2000; Portfolio Manager, Insight Capital Research & Management, Inc., Walnut Creek, California 1995–2000. | Not applicable | ||
Wendy Trevisani, 34 Vice President since 1999 | Associate Portfolio Manager of Thornburg Investment Management, Inc. since 1999, Vice President since 2000 and Managing Director since 2003; Vice President of Thornburg Limited Term Municipal Fund, Inc. 1999–2002. | Not applicable | ||
Joshua Gonze, 42 Vice President since 1999 | Associate Portfolio Manager of Thornburg Investment Management, Inc. since 1999, Vice President since 1999 and Managing Director since 2003; Vice President of Thornburg Limited Term Municipal Fund, Inc. to 2004. | Not applicable | ||
Brad Kinkelaar, 37 Vice President since 1999 | Associate Portfolio Manager of Thornburg Investment Management, Inc. since 1999, Vice President since 2000 and Managing Director since 2003. | Not applicable | ||
Christopher Ihlefeld, 35 Vice President since 2003 | Associate Portfolio Manager since 1999; Vice President of Thornburg Investment Management, Inc. since 2002; Vice President of Limited Term Municipal Fund, Inc., 2003–2004. | Not applicable | ||
Leon Sandersfeld, 39 Vice President since 2003 | Associate of Thornburg Investment Management, Inc. since 2002; Senior Staff Accountant, Farm Bureau Life Insurance Co. 1998–2002. | Not applicable | ||
| Certified Annual Report | 47 |
| TRUSTEES AND OFFICERS, CONTINUED | ||
Thornburg Limited Term Income Funds | September 30, 2005 (Unaudited) | |
Name, Age, Position Held with Fund Year Elected | Principal Occupation(s) During Past Five Years | Other Directorships Held by Trustee | ||
Sasha Wilcoxon, 31 Vice President since 2003 | Associate of Thornburg Investment Management, Inc. since 2000 and Mutual Fund Operations Department Manager since 2002. | Not applicable | ||
Ed Maran, 47 Vice President since 2004 | Associate Portfolio Manager of Thornburg Investment Management, Inc. since 2002 and Vice President and Managing Director since 2004; Analyst, USAA 2001–2002; Oil Analyst, A.G. Edwards 1997–2000. | Not applicable | ||
Vinson Walden, 35 Vice President since 2004 | Associate Portfolio Manager of Thornburg Investment Management, Inc. since 2002 and Vice President and Managing Director since 2004; Associate Portfolio Manager, Ibis Management 2002–2004; Associate, Lehman Brothers, 1997–2001. | Not applicable | ||
| (1) | Each person’s address is 119 East Marcy Street, Santa Fe, New Mexico 87501. |
| (2) | The Fund is one of twelve separate investment “Funds” or “series” of Thornburg Investment Trust (the “Trust”), which comprises the Thornburg mutual fund complex and is organized as a Massachusetts business trust. The Trust currently has twelve active Funds. Thornburg Investment Management, Inc. is the investment advisor to, and manages, the twelve Funds of the Trust. Each Trustee oversees the twelve Funds in the fund complex. |
| (3) | Mr. Thornburg is considered an “interested” Trustee under the Investment Company Act of 1940 because he is a director and controlling shareholder of Thornburg Investment Management, Inc., the investment advisor to the twelve active Funds of the Trust, and is the sole director and controlling shareholder of Thornburg Securities Corporation, the distributor of shares for the Trust. |
| (4) | Each Trustee serves in office until the election and qualification of a successor. |
| (5) | Mr. McMahon is considered an “interested” Trustee because he is the president of Thornburg Investment Management, Inc. |
| (6) | The Trust’s president, secretary and treasurer each serves a one-year term or until the election and qualification of a successor; each other officer serves at the pleasure of the Trustees. |
| (7) | Assistant vice presidents, assistant secretaries and assistant treasurers are not shown. |
The Statement of Additional Information for each Fund of the Trust includes additional information about the Trustees and is available, without charge and upon request, by calling 1-800-847-0200.
48 | Certified Annual Report |
| OTHER INFORMATION | ||
| Thornburg Limited Term Income Funds | September 30, 2005 (Unaudited) | |
PORTFOLIO PROXY VOTING
Policies and Procedures:
The Trust has delegated to Thornburg Investment Management, Inc. (the “Advisor”) voting decisions respecting proxies for the Fund’s voting securities. The Advisor makes voting decisions in accordance with its Proxy Voting Policy and Procedures. A description of the Policy and Procedures is available (i) without charge, upon request, by calling the Advisor toll-free at 1-800-847-0200, (ii) on the Thornburg website at www.thornburg.com, and (iii) on the Securities and Exchange Commission’s website at www.sec.gov.
Commencing August 31, 2004, information regarding how proxies were voted is available on or before August 31 of each year for the twelve months ending the preceding June 30. This information is available (i) without charge, upon request by calling the Advisor toll-free at 1-800-847-0200, (ii) on the Thornburg website at www.thornburg.com, and (iii) on the Securities and Exchange Commission’s website at www.sec.gov.
AVAILABILITY OF QUARTERLY PORTFOLIO SCHEDULE
The Fund files with the Securities and Exchange Commission schedules of its portfolio holdings on Form N-Q for the first and third quarters of each fiscal year. The Fund’s Forms N-Q are available on the Commission’s website at www.sec.gov, or may be reviewed and copied at the Commission’s Public Reference Room in Washington, D.C. Information on the operation of the Public Reference Room may be obtained by calling 1-800-SEC-0330. The Fund also makes this information available on its website at www.thornburg.com/download or upon request by calling 1-800-847-0200.
TRUSTEES DELIBERATIONS RESPECTING RENEWAL OF INVESTMENT ADVISORY AGREEMENT FOR THE THORNBURG LIMITED TERM U.S. GOVERNMENT FUND
Thornburg Investment Management, Inc. (the “Advisor”) provides investment management services to Thornburg Limited Term U.S. Government Fund pursuant to an investment advisory agreement. The Trustees consider the renewal of this agreement annually and most recently determined to renew the agreement on September 13, 2005.
In connection with their general supervision of the Advisor, the Trustees receive and consider reports throughout the year from the Advisor respecting the Advisor’s management of the Fund’s investments. These reports include information about the Fund’s purchase and sale of portfolio investments and explanations from the Advisor respecting investment selections, the investment performance of the Fund, general appraisals of industry and economic prospects and factors, and other matters affecting the Fund and relating to the Advisor’s performance of services for the Fund.
In anticipation of their recent consideration of the advisory agreement’s renewal, the independent Trustees met with representatives of the Advisor in May and July 2005 to specify the information the Advisor would present to the Trustees for their review. The independent Trustees thereafter met in independent session to consider various factors respecting the agreement’s renewal, and met in a subsequent session with the Advisor’s chief investment officer to present questions. Following these sessions, the Trustees met on September 13, 2005 to consider a renewal of the advisory agreement.
The Trustees considered various factors in their review of the Advisor’s performance under the investment advisory agreement, including specifically the principles outlined in their February 2005 Statement to Shareholders, a copy of which accompanies this Annual Report to Shareholders. Summarized below are certain of the factors considered by the Trustees, in connection with the determination to renew the advisory agreement. In determining to renew the advisory agreement, the Trustees did not identify any single fact or aspect of the Advisor’s performance as controlling, and this summary does not describe all of the matters considered by the Trustees in making their determination.
Quality of Services; Fund Investment Performance. In reviewing the nature, extent, and quality of services provided by the Advisor and the investment performance of the Fund, the Trustees primarily considered the Advisor’s adherence to the Fund’s stated objectives and policies, the Advisor’s execution of the Fund’s investment strategies in prevailing market conditions, the Fund’s absolute investment performance, the Fund’s investment performance compared to categories of other broadly similar mutual funds, the Fund’s investment performance over different periods of time, the Fund’s total returns in rising and declining markets compared to total returns of a category of generally similar mutual funds and a securities index, comparative measures of portfolio risk and share price volatility, and related factors. The Trustees noted that bond indices have limited utility in evaluating fixed income mutual funds. Similarly, the Trustees noted in comparing the Fund to other mutual funds that the value of such comparisons may be limited in some degree because the Fund’s investment approach, and in particular its laddered maturity portfolio, differs from other funds. In conducting their review, the Trustees observed that the Advisor had continued to faithfully pursue and to achieve the Fund’s stated objectives, as demonstrated particularly by the Advisor’s selection of investments in a challenging interest rate environment and the Fund’s investment performance. The Trustees noted in this regard the Fund’s average or better performance over different periods compared to a category of generally similar mutual funds selected by an independent analyst firm, and the Fund’s lower share price volatility than a category of longer term U.S. Government income funds selected by an independent analyst firm.
| Certified Annual Report | 49 |
| OTHER INFORMATION, CONTINUED | |||
| Thornburg Limited Term Income Funds | September 30, 2005 | (Unaudited) | |
The Trustees also considered a number of other factors in reviewing the quality of the Advisor’s services, including the qualifications and integrity of the Advisor’s senior personnel, the Advisor’s staffing and other resources, the Advisor’s compliance with regulatory requirements, Fund sales performance and perceptions of the funds in the marketplace, and other factors.
The Trustees concluded, based upon these and other considerations, that the Advisor had actively and competently pursued the Fund’s stated investment objectives in accordance with the Fund’s investment policies stated in its prospectuses. The Trustees further concluded that the investment performance of the Fund was satisfactory in the context of the Fund’s objectives and policies and prevailing market conditions.
Fees and Expenses; Profitability of Advisor. In reviewing the fees charged by the Advisor to the Fund, the Trustees primarily considered the fees charged by the Advisor and the other expenses charged to the Fund in light of the nature and quality of services provided, comparison of the actual Advisor’s fee and Fund expenses to the statement of fees and expenses in the Fund’s prospectuses, comparisons of the Advisor’s fee and other Fund expenses to median and average fees and expenses charged to similar mutual funds, and comparisons of fees and expenses charged to the Fund with fees and expenses charged to other, similar specific mutual funds. In addition, the Trustees considered the profitability of the Advisor compared to other investment management firms, and comparisons of the investment management fee rates charged by the Advisor to the Fund with rates charged to other clients and the differing types of services furnished to the Fund and the other clients. The Trustees noted that the management fee for the Fund was lower than average and median fees for a group of similar mutual funds. The Trustees further noted in this regard that the overall expenses charged to the Fund were somewhat lower than the average and median management fees for the same group of mutual funds. The Trustees also observed in their review that fee rates charged by the Advisor to other clients of the Advisor were not directly comparable to rates charged to the Fund principally because of the significant differences in the services provided.
The Trustees concluded, based upon these and other considerations, that the fees charged to the Fund by the Advisor were fair and reasonable in view of the following: the services provided, the clear disclosure of these fees and expenses in the Fund’s prospectuses, and prevailing fees and expenses charged to generally similar mutual funds. The Trustees further concluded that there was no indication that the Advisor’s profitability was unusual, viewed in the context of the services provided, the performance of the Fund, and the fees and profitability of other investment management firms.
Economies of Scale. In reviewing the extent to which economies of scale would be realized by the Fund as it grows and whether fee levels reflect economies of scale, the Trustees considered the breakpoint structure for advisory fees chargeable to the Fund, the demonstrated economies of scale enjoyed by other funds of the Trust as they had grown in size, and economies of scale realized by other mutual funds. The Trustees concluded that the Fund may reasonably be expected to realize economies of scale for the benefit of its shareholders as it grows in size.
Ancillary Benefits to Advisor. In reviewing benefits enjoyed by the Advisor because of its relationship with the Fund, the Trustees considered an arrangement through which the Advisor received certain research services, favorable publicity received by the Advisor because of the superior investment performance of certain Funds of the Trust, and the benefits to the Fund from the Advisor’s expansion of its staffing and other resources to serve a broader variety of investment clients. The Trustees concluded, based upon these and other considerations, that there was no unusual or unfair benefit enjoyed by the Advisor and that the Fund enjoyed benefits by virtue of the Advisor’s engagement by other investment clients.
TRUSTEES DELIBERATIONS RESPECTING RENEWAL OF INVESTMENT ADVISORY AGREEMENT FOR THE THORNBURG LIMITED TERM INCOME FUND
Thornburg Investment Management, Inc. (the “Advisor”) provides investment management services to Thornburg Limited Term Income Fund pursuant to an investment advisory agreement. The Trustees consider the renewal of this agreement annually and most recently determined to renew the agreement on September 13, 2005.
In connection with their general supervision of the Advisor, the Trustees receive and consider reports throughout the year from the Advisor respecting the Advisor’s management of the Fund’s investments. These reports include information about the Fund’s purchase and sale of portfolio investments and explanations from the Advisor respecting investment selections, the investment performance of the Fund, general appraisals of industry and economic prospects and factors, and other matters affecting the Fund and relating to the Advisor’s performance of services for the Fund.
In anticipation of their recent consideration of the advisory agreement’s renewal, the independent Trustees met with representatives of the Advisor in May and July 2005 to specify the information the Advisor would present to the Trustees for their review. The independent Trustees thereafter met in independent session to consider various factors respecting the agreement’s renewal, and met in a subsequent session with the Advisor’s chief investment officer to present questions. Following these sessions, the Trustees met on September 13, 2005 to consider a renewal of the advisory agreement.
50 | Certified Annual Report |
| OTHER INFORMATION, CONTINUED | |||
| Thornburg Limited Term Income Funds | September 30, 2005 | (Unaudited) | |
The Trustees considered various factors in their review of the Advisor’s performance under the investment advisory agreement, including specifically the principles outlined in their February 2005 Statement to Shareholders, a copy of which accompanies this Annual Report to Shareholders. Summarized below are certain of the factors considered by the Trustees, in connection with the determination to renew the advisory agreement. In determining to renew the advisory agreement, the Trustees did not identify any single fact or aspect of the Advisor’s performance as controlling, and this summary does not describe all of the matters considered by the Trustees in making their determination.
Quality of Services; Fund Investment Performance. In reviewing the nature, extent, and quality of services provided by the Advisor and the investment performance of the Fund, the Trustees primarily considered the Advisor’s adherence to the Fund’s stated objectives and policies, the Advisor’s execution of the Fund’s investment strategies in prevailing market conditions, the Fund’s absolute investment performance, the Fund’s investment performance compared to categories of other broadly similar mutual funds and broad based securities indices, the Fund’s investment performance over different periods of time, the Fund’s total returns in rising and declining markets compared to total returns of a category of generally similar mutual funds and a broad based securities index, comparative measures of portfolio risk and share price volatility, and related factors. The Trustees noted that bond indices have limited utility in evaluating fixed income mutual funds. Similarly, the Trustees noted in comparing the Fund to other mutual funds that the value of such comparisons may be limited in some degree because the Fund’s investment approach, and in particular its laddered maturity portfolio, differs from other funds. In conducting their review, the Trustees observed that the Advisor had continued to faithfully pursue and to achieve the Fund’s stated objectives, as demonstrated particularly by the Advisor’s selection of investments in a challenging interest rate environment and the Fund’s investment performance. The Trustees also noted in this regard the Fund’s above average investment performance over various periods compared to a category of generally similar fixed income mutual funds selected by an independent mutual fund analyst firm, and the Fund’s lower share price volatility compared to a category of funds having longer term portfolios.
The Trustees also considered a number of other factors in reviewing the quality of the Advisor’s services, including the qualifications and integrity of the Advisor’s senior personnel, the Advisor’s staffing and other resources, the Advisor’s compliance with regulatory requirements, Fund sales performance and perceptions of the funds in the marketplace, and other factors.
The Trustees concluded, based upon these and other considerations, that the Advisor had actively and competently pursued the Fund’s stated investment objectives in accordance with the Fund’s investment policies stated in its prospectuses. The Trustees further concluded that the investment performance of the Fund was satisfactory in the context of the Fund’s objectives and policies and prevailing market conditions.
Fees and Expenses; Profitability of Advisor. In reviewing the fees charged by the Advisor to the Fund, the Trustees primarily considered the fees charged by the Advisor and the other expenses charged to the Fund in light of the nature and quality of services provided, comparison of the actual Advisor’s fee and Fund expenses to the statement of fees and expenses in the Fund’s prospectuses, comparisons of the Advisor’s fee and other Fund expenses to median and average fees and expenses charged to similar mutual funds, and comparisons of fees and expenses charged to the Fund with fees and expenses charged to other, similar specific mutual funds. In addition, the Trustees considered the profitability of the Advisor compared to other investment management firms, and comparisons of the investment management fee rates charged by the Advisor to the Fund with rates charged to other clients of the Advisor and the differing types of services furnished to the Fund and the other clients. The Trustees noted that the management fee and overall expenses for the Fund were comparable to average and median management fees and expenses for a group of generally similar mutual funds. The Trustees also observed in their review that fee rates charged by the Advisor to other clients of the Advisor were not directly comparable to rates charged to the Fund principally because of the significant differences in the services provided.
The Trustees concluded, based upon these and other considerations, that the fees charged to the Fund by the Advisor were fair and reasonable in view of the following: the services provided, the clear disclosure of these fees and expenses in the Fund’s prospectuses, and prevailing fees and expenses charged to mutual funds generally. The Trustees further concluded that there was no indication that the Advisor’s profitability was unusual, viewed in the context of the services provided, the performance of the Fund, and the fees and profitability of other investment management firms.
Economies of Scale. In reviewing the extent to which economies of scale would be realized by the Fund as it grows and whether fee levels reflect economies of scale, the Trustees considered the breakpoint structure for advisory fees chargeable to the Fund, the demonstrated economies of scale enjoyed by other funds of the Trust as they had grown in size, and economies of scale realized by other mutual funds. The Trustees concluded that the Fund may reasonably be expected to realize economies of scale for the benefit of its shareholders as it grows in size.
Ancillary Benefits to Advisor. In reviewing benefits enjoyed by the Advisor because of its relationship with the Fund, the Trustees considered an arrangement through which the Advisor received certain research services, favorable publicity
| Certified Annual Report | 51 |
| OTHER INFORMATION, CONTINUED | |||
| Thornburg Limited Term Income Funds | September 30, 2005 | (Unaudited) | |
received by the Advisor because of the superior investment performance of certain Funds of the Trust, and the benefits to the Fund from the Advisor’s expansion of its staffing and other resources to serve a broader variety of investment clients. The Trustees concluded, based upon these and other considerations, that there was no unusual or unfair benefit enjoyed by the Advisor and that the Fund enjoyed benefits by virtue of the Advisor’s engagement by other investment clients.
52 | Certified Annual Report |
Trustees’ Statement to Shareholders
Not part of the Certified Annual Report
February 8, 2005
The Trustees are concerned that recent commentaries and opinions reported in the media may confuse investors in general as to the supervisory duties of trustees of mutual funds and, in particular, leave Thornburg Investment Trust shareholders uncertain regarding how we discharge our responsibilities in supervising the Funds’ investment advisor and in reviewing the advisor’s contract for renewal. We decided to spell out clearly three principal guidelines that we follow in supervising the Trust’s investment advisor on your behalf.
We begin with the premise that each shareholder selected his or her Fund because its investments are managed by the investment advisor identified in the prospectus and in accordance with the objective and policies described in the prospectus. We realize, as each of you do, that if you believe that your Fund’s stated objective and policies no longer serve your personal investment goals, you can sell your shares and leave the Fund.
Therefore, we believe that our primary supervisory task – our principal obligation to you – is to assess the nature and quality of the advisor’s services, and to confirm that the advisor actively and competently pursues the Fund’s objective, in accordance with the policies set out in the prospectus. To do this, we meet regularly with management to review your Fund’s portfolio and to discuss the advisor’s specific actions and judgments in pursuing the Fund’s objective. We do not substitute our own judgment for the advisor’s decisions in selecting investments; the advisor is paid to exercise its informed judgment on investment decisions, and we seek to confirm, in reviewing the advisor’s performance, that the advisor is doing just that.
Second, while we are conscious of costs and the effect that costs have on shareholders’ returns, we do not seek the lowest fees or expense ratio as our sole or primary objective. We try to make sure that your Fund’s fees and costs are reasonable in relationship to the services rendered and that they are generally in line with those charged by other expert investment advisors, consistent with our belief that the Fund’s investors searched for and expect that expertise and attention and have decided to pay a reasonable price for it. We do not put the management contract “out to bid” as a matter of course, and we would not do so unless we had concluded that the advisor materially had failed to pursue the Fund’s objectives in accordance with its policies, or for other equally important reasons. We believe that any other approach would be inconsistent with your interests and contrary to your expectations when you bought shares of the Fund in the first place.
Finally, because we believe that most Thornburg Fund shareholders have invested with a long-term perspective, we try not to focus too much on the fashions of the moment and on short-term performance. The market will not favor any specific investment objective or set of policies at all times and under all economic circumstances. A fund will experience periods of both high and low returns relative to other funds and other investments. Even if one of our Funds is not favored by the market at a particular time, we believe that the advisor is nonetheless obliged to remain true to the Fund’s objective and policies, and we watch to see that it does so.
This statement is submitted for the general information of the shareholders of Thornburg Investment Trust. It is not authorized for distribution to prospective investors in the Fund unless preceded or accompanied by an effective prospectus. If you have not received a prospectus, one can be obtained from your financial advisor, online at www.thornburg.com/download, or by calling 800-847-0200. Carefully consider information in the prospectus regarding the Fund’s investment objectives and policies, risks, sales charges, expenses, experience of its management, marketability of shares, and other information. Read it carefully before you invest or send money.
| This page is not part of the Annual Report. | 53 |
This page intentionally left blank.
54 | This page is not part of the Annual Report. |
Planning Options
Retirement and Education Accounts
Thornburg Investment Management offers retirement and education savings accounts that can help you meet a variety of planning challenges. For account applications or further information on any of the accounts below, please call 1-800-847-0200 or go to www.thornburg.com/ira. Your financial advisor can help you determine which plan is right for you.
Individual Retirement Accounts
Individual Retirement Accounts (IRAs) provide a tax-advantaged means to save money for the future. For a detailed outline of the difference between retirement accounts, see www.thornburg.com/ira. Rollovers are available. Call 1-800-847-0200 for more information.
Traditional IRAs – Contributions to Traditional IRAs are tax deductible for eligible individuals, and withdrawals are taxed as additional ordinary income. You may contribute to an IRA if you receive compensation and are under 70 1/2, even if you are covered by an employer retirement plan.
Roth IRAs – Under a Roth IRA, there is no tax deduction for contributions, but there is no income tax on qualified withdrawals. For a more detailed comparison of Traditional and Roth IRAs, please see our web site at www.thornburg.com/ira.
SEP IRAs – Simplified Employee Pension (SEP) IRAs are established by employers. The employer is allowed a tax deduction for contributions made to the SEP Plan and makes contributions to each eligible employee’s SEP IRA on a discretionary basis.
SIMPLE IRAs – Savings Incentive Match Plan for Employees of Small Employers (SIMPLE) is designed to give small business owners a simplified method to establish and contribute to a retirement plan for employees. The employer is allowed a tax deduction for contributions and makes either matching or non-elective contributions to each eligible employee’s SIMPLE IRA. Employees may make salary deferral contributions.
403(b)
A special, tax-advantaged savings vehicle available only to employees of 501(c)(3) organizations, such as charitable, educational, scientific and religious organizations. 403(b) plans are also available to employees of public schools and universities.
Coverdell Education Savings Account
These savings accounts are designed to provide a way to save money for higher education expenses. In an Education Savings Account, earnings and interest grow tax free, and qualified withdrawals used to pay for eligible higher-education expenses are tax- and penalty-free.
Funds Available
The following funds are available in the accounts listed above:
| • | Thornburg International Value Fund |
| • | Thornburg Value Fund |
| • | Thornburg Core Growth Fund |
| • | Thornburg Investment Income Builder Fund |
| • | Thornburg Limited Term U.S. Government Fund |
| • | Thornburg Limited Term Income Fund |
| This page is not part of the Annual Report. | 55 |
The Firm
Thornburg Investment Management® is a privately held investment management company based in Santa Fe, New Mexico with assets under management of over $16 billion. Founded in 1982, the firm manages four equity funds, eight bond funds, and separate portfolios for select institutions and individuals.
Investment Philosophy
We seek to preserve and increase the real wealth of the Funds’ shareholders after accounting for inflation, taxes, and investment expenses. We’re committed to disciplined investing and controlling risk in all market environments through laddered bond and focused equity portfolios.
Portfolio Holdings Disclosure
We believe you should know about your portfolio. Our web site keeps investors informed of the Funds’ equity holdings. Go to www.thornburg.com/funds for commentary on our equity fund holdings.
Co-Ownership of Funds
We invest side-by-side with the Funds’ shareholders. Our employees have invested over $110 million in Thornburg Funds.
Core Strategies for Building Wealth
We deliver core strategies to help investors meet long-term goals. A core strategy is a consistent, disciplined and proven investment process that represents the foundation of a diversified portfolio.
Investment Manager:
Thornburg Investment Management®
119 East Marcy Street
Santa Fe, New Mexico 87501
800.847.0200
Distributor:
Thornburg SecuritiesTM
119 East Marcy Street
Santa Fe, New Mexico 87501
800.847.0200

Core Strategies for Building Wealth
Thornburg Limited Term Income Funds
I Shares
Annual Report – September 30, 2005
This report is submitted for the general information of shareholders of the Fund. It is not authorized for distribution to prospective investors in the Fund unless preceded or accompanied by an effective prospectus. If you have not received a prospectus, one can be obtained from your financial advisor, online at www.thornburg.com/ download, or by calling 800-847-0200. Carefully consider information in the prospectus regarding the Fund’s investment objectives and policies, risks, sales charges, expenses, experience of its management, marketability of shares, and other information. Read it carefully before you invest or send money. Performance data quoted represents past performance and does not guarantee future results.
Thornburg Limited Term Income Funds
Laddering – an All Weather Strategy
The Funds’ objectives are to obtain as high a level of current income as is consistent with the preservation of capital.
Thornburg Limited Term U.S. Government Fund – This Fund is a laddered portfolio of short/ intermediate obligations issued by the U.S. Government, its agencies or instrumentalities with an average maturity of five years or less.
Thornburg Limited Term Income Fund – This Fund is a laddered portfolio of short/intermediate investment grade obligations with an average maturity of five years or less.
Laddering involves building a portfolio of bonds with staggered maturities so that a portion of the portfolio matures each year; cash from maturing bonds, if not needed for other purposes, is invested in bonds with longer maturities at the far end of the ladder. The strategy is a good compromise for managing different types of risk.
Thornburg Bond Funds
| • | Thornburg Limited Term Municipal Fund |
| • | Thornburg Intermediate Municipal Fund |
| • | Thornburg California Limited Term Municipal Fund |
| • | Thornburg New Mexico Intermediate Municipal Fund |
| • | Thornburg Florida Intermediate Municipal Fund |
| • | Thornburg New York Intermediate Municipal Fund |
| • | Thornburg Limited Term U.S. Government Fund |
| • | Thornburg Limited Term Income Fund |
Thornburg invests in short- and intermediate-term investment grade bonds. We ladder the maturities of individual bonds in the portfolios to moderate risk. Laddering involves building a portfolio of bonds with staggered maturities so that a portion of the portfolio will mature each year. We apply this disciplined process in all interest rate environments.
Thornburg Equity Funds
| • | Thornburg Value Fund |
| • | Thornburg International Value Fund |
| • | Thornburg Core Growth Fund |
| • | Thornburg Investment Income Builder Fund |
Thornburg’s equity research uses a fundamental, yet comprehensive, analytical approach. We invest when and where we perceive compelling value. Thornburg equity funds focus on a limited number of securities so that each holding can impact performance. The equity team searches for firms believed to have a promising future and seeks to buy shares of those companies at a discount to their intrinsic value.
More information at www.thornburg.com
 | Reduce paper clutter. Receive your shareholder reports and prospectus online instead of through traditional mail.
Sign up at www.thornburg.com/edelivery |
2 | This page is not part of the Annual Report. |
Message
from the Chairman

Garrett Thornburg
Chairman & CEO
November 10, 2005
Dear Fellow Shareholder:
Thornburg Investment Management has a clear mission: to preserve and increase the real wealth of our shareholders. We aspire to accomplish this through a family of laddered bond funds that focus on quality, stability, and minimization of risk over time, and through a range of equity funds that redefine traditional measures of value and growth.
Our bond funds have always been managed using the highly disciplined approach of laddering short and intermediate bond maturities, seeking to provide both an attractive return and stability of principal. All of the bond funds buy only investment-grade securities. We have found this strategy to be the best at managing both interest-rate risk and credit risk, and we believe this strategy has served our shareholders well over time.
The bond funds are managed by portfolio managers who have many years of experience. We are proud of this consistency and experience and look forward to many more successful years with them at the helm.
In years past, there has been news about improper behavior by some mutual fund companies. Many new rules proposed in response to this scandal have called for increased transparency. We welcome increased transparency. Thornburg Investment Management has been a leader in providing information about our stock holdings and bond strategies to our shareholders on our web site, www.thornburg.com.
Unfortunately, some of the new rules will increase the cost to all shareholders in mutual funds. We will do our best to keep these expenses to a minimum. After all, we are shareholders too, and Thornburg employees have over $110 million invested in our own funds.
Thank you for investing with us. We will do our best to continue to earn your trust every day.
| Sincerely, |
 |
Garrett Thornburg Chairman & CEO |
| This page is not part of the Annual Report. | 3 |

Thornburg Limited Term Income Funds
I Shares - September 30, 2005
| 6 | ||
| 8 | ||
| 10 | ||
| 12 | ||
| 13 | ||
| 14 | ||
| 19 | ||
| 20 | ||
| 21 | ||
| 25 | ||
| 35 | ||
| 36 | ||
| 37 | ||
| 38 | ||
| 39 | ||
| 42 | ||
This report is certified under the Sarbanes-Oxley Act of 2002, which requires that public companies, including mutual funds, affirm that the information provided in their annual and semiannual shareholder reports fully and fairly represents their financial position.
4 | Certified Annual Report |
Important Information
Performance data quoted represents past performance and does not guarantee future results. Investment return and principal value will fluctuate so that upon redemption, investor’s shares may be worth more or less than their original cost. Current performance may be lower or higher than the data quoted. For performance data current to the most recent month end, visit www.thornburg.com.
Minimum investments for Class I shares are higher than those for other classes.
Returns reflect the reinvestment of dividends and capital gains. There is no up-front sales charge for I shares.
Shares in the Fund carry risks, including possible loss of principal. As with direct bond ownership, funds that invest in bonds are subject to certain risks including interest-rate risk, credit risk, and inflation risk. The principal value of bond funds will fluctuate relative to changes in interest rates, decreasing when interest rates rise. Unlike bonds, bond funds have ongoing fees and expenses. Shares in the Funds are not deposits or obligations of, or guaranteed or endorsed by, any bank, the Federal Deposit Insurance Corporation, the Federal Reserve Board or any government agency.
The information presented on the following pages was current as of September 30, 2005. The manager’s views, portfolio holdings, and sector diversification are historical and subject to change. This material should not be deemed a recommendation to buy or sell any of the securities mentioned.
The matters discussed in this report may constitute forward-looking statements made pursuant to the safe harbor provisions of the Securities Litigation Reform Act of 1995. These include any advisor or portfolio manager prediction, assessment, analysis or outlook for individual securities, industries, investment styles, market sectors and/or markets. These statements involve risks and uncertainties. In addition to the general risks described for each Fund in its current prospectus, other factors bearing on these reports include the accuracy of the advisor’s or portfolio manager’s forecasts and predictions, the appropriateness of the investment strategies designed by the advisor or portfolio manager and the ability of the advisor or portfolio manager to implement their strategies efficiently and successfully. Any one or more of these factors, as well as other risks affecting the securities markets generally, could cause the actual results of any fund to differ materially as compared to its benchmarks.
Glossary
The Lehman Brothers Intermediate Government/Credit Bond Index – An unmanaged, market-weighted index generally representative of intermediate government and investment-grade corporate debt securities having maturities of up to ten years.
The Lehman Brothers Intermediate Government Bond Index – An unmanaged, market-weighted index generally representative of all public obligations of the U.S. Government, its agencies and instrumentalities having maturities of up to ten years.
Unless otherwise noted, index returns reflect the reinvestment of income dividends and capital gains, if any, but do not reflect fees, brokerage commissions or other expenses of investing. Investors may not make direct investments into any index.
Duration – The measure of the price sensitivity of a fixed-income security to an interest rate change of 100 basis points. Calculation is based on the weighted average of the present values for all cash flows.
Basis Point – A unit for measuring a bond yield that is equal to 1/100th of a 1% yield. A 1% change =100 basis points (bps)
Consumer Price Index (CPI) – Measures prices of a fixed basket of goods bought by a typical consumer, including food, transportation, shelter, utilities, clothing, medical care, entertainment and other items. The CPI, published by the Bureau of Labor Statistics in the Department of Labor, is based at 100 in 1982 and is released monthly. It is widely used as a cost-of-living benchmark to adjust Social Security payments and other payment schedules, union contracts and tax brackets. The CPI is also known as the cost-of-living index.
| Certified Annual Report | 5 |

Steve Bohlin
Portfolio Manager
October 15, 2005
Dear Fellow Shareholder:
I am pleased to present the Annual Report for the Thornburg Limited Term Income Fund and the Thornburg Limited Term U.S. Government Fund for the twelve months ended September 30, 2005. The net asset value of an I share of the Thornburg Limited Term Income Fund ended the period at $12.51. If you were invested for the entire period, you received dividends of 51.3 cents per share. If you reinvested your dividends, you received 52.2 cents per share. The net asset value of an I share of the Thornburg Limited Term U.S. Government Fund ended the period at $12.76. If you were invested for the entire period, you received dividends of 37.2 cents per share. If you reinvested your dividends, you received 37.7 cents per share. Please read the accompanying exhibits for more detailed information and history.
Interest rates on U.S. Treasuries generally rose during the last year. The five-year Treasury yield rose from 3.38% to end the period at 4.19%. However, the market fluctuated widely in the interim. For example, the yield on a five-year U.S. Treasury ranged between a high of 4.33% and a low of 3.25% over the period. Interest rates mostly rose through March before starting a downward trend through June. Market yields rose rapidly through July before starting a downward trend in August before rising again in September. There was also a flattening of the yield curve as shorter term interest rates rose more than longer term rates. Quality spreads (the additional yield on a corporate bond) contracted through March, widened through the first part of June, contracted until the middle of August and widened again through the end of the period. When all is said and done, credit spreads are about the same for A – AAA (S&P) rated credits and a little wider for the lowest investment grade (BBB S&P rated) credits compared to a year ago.
Putting income and the change in price together, the I shares of the Thornburg Limited Term Income Fund produced a total return of 1.77% over the year, assuming a beginning-of-the-period investment at the net asset value. The Lehman Intermediate Government/Credit Index produced a 1.50% total return over the same time period. The I shares of the Thornburg Limited Term U.S. Government Fund produced a total return of 0.95% over the year, assuming a beginning-of-the-period investment at the net asset value. The Lehman Intermediate Government Index produced a 1.31% total return over the same time period. The Funds kept their maturities concentrated in the front years of the ladder. The Limited Term U.S. Governement Fund had a shorter average maturity than the Limited Term Income Fund. The flattening of the yield curve caused shorter term bonds to underperform longer term bonds. For example, the yield on a one-year Treasury rose 191 basis points while the yield on a ten-year Treasury rose only 20 basis points. We have kept our durations shorter than the indices thus far in 2005, because we believe doing so will improve the Funds’ return relative to the indices if interest rates continue to rise.
Longer-term interest rates are lower today than when the Federal Reserve Board Open Market Committee started raising rates in June of 2004. In the face of 275 basis points of rate increases, this seems astounding. This seems especially astounding if one considers that GDP growth has continued at or above trend for the last two years and that the year-over-year increase in CPI is tracking 4.7%. Today, the real yield on the ten-year Treasury note is negative: the CPI inflation rate is higher than the yield on a ten-year Treasury note. This last happened in 1980, when inflation was in the 12% to 13% range. Inflation today is less than half of that, but so is the yield on a ten-year Treasury note.
Most market participants believe that the overall inflation rate is overstated because of the rise in oil and that the “core” rate should be used as a guide instead. However, inflation is not just about the “core”. The reason the “core” rate is a relevant measure is that if food or energy are temporarily boosted because of non-monetary
6 | Certified Annual Report |
events, the market does not have to react to a temporary change. However, higher energy prices are clearly not a temporary event. Thus far this year, the energy component of the CPI is up 42.5% at an annual rate, which follows a 16.5% increase in 2004, which in turn came on the heels of increases of 7.0% and 11.0% in 2003 and 2002, respectively. Higher energy prices are here and are not temporary. The U.S. economy was well positioned for this increase in energy prices – we have had steady jobs growth and strong GDP growth and U.S. corporations have been running very lean.
The question becomes whether the U.S. consumer and U.S. corporations slow down their expenditures in the face of this latest increase in energy prices, causing inflation and the U.S. economy to lower. The economy seems well positioned to weather any but the most severe slowdown. However, the current negative real yields in the bond market are still a conundrum. In partial explanation of the low level of interest rates, the Federal Reserve Board recently published a paper* suggesting that the huge influx of foreign investments has, in part, been a major factor in keeping rates low. According to this Fed paper, these foreign investments have kept interest rates perhaps as much as 100 basis points lower than usual, as capital inflows now equal 7% of GDP. Japan and China together now own over 20% of the U.S. bond market – Treasuries, Agencies, and Corporate bonds.
No matter what the reason, an investor is paying the U.S. Treasury to borrow their money, because the U.S. Treasury can pay the loan back with inflated dollars. And, an investor currently cannot venture further out the Treasury yield curve to reach a level that pays more than the rate of CPI inflation.
It appears evident that the Fed will maintain their “measured pace”. The worries of cost-push inflation from the most recent energy spike pretty much insure that. Eventually, the Fed Funds Rate needs to be at a neutral level, which would be somewhere above the rate of inflation. Any marked increase in the pace of “core” inflation data will cause the Fed to accelerate their “pace”. Unless inflation slows remarkably, the current level of the ten-year Treasury is not justified. We are cognizant of this as we invest these portfolios.
The Thornburg Limited Term Income Fund and the Thornburg Limited Term U.S. Government Fund are laddered portfolios of short-to-intermediate bonds. We keep the portfolios laddered over a time period ranging from one day to approximately ten years, with the average maturity of the portfolios always no more than five years. Some of the bonds are always coming close to maturity, but never too many at one time. We feel a laddered maturity portfolio of short-to-intermediate bonds is a sensible strategy over time. Intermediate bonds have proven to be a sensible part of a portfolio. They can provide stability to the underlying principal and they can provide income for the portfolio.
Thank you for investing in our Funds. We feel the Thornburg Limited Term U.S. Government Fund and the Thornburg Limited Term Income Fund are appropriate investments for investors who want a short-to-intermediate bond portfolio. While future performance cannot be guaranteed, we feel that we are well positioned, and we will maintain a steady course.
| Sincerely, |
 |
Steven J. Bohlin Portfolio Manager |
| * | Warnick, F. and Cacdac Warnock,V.“ 2005 International Capital Flows and U.S. Interest Rates.” International Finance Discussion Papers, Number 840, September 2005. Board of Governors of the Federal Reserve System. |
| Certified Annual Report | 7 |
| STATEMENTS OF ASSETS AND LIABILITIES | ||
| Thornburg Limited Term Income Funds | September 30, 2005 | |
Limited Term U.S. Government Fund | Limited Term Income Fund | |||||||
ASSETS | ||||||||
Investments at value (cost $193,449,059 and $369,934,333, respectively) | $ | 189,838,211 | $ | 369,895,639 | ||||
Cash | 711,167 | 1,058,473 | ||||||
Receivable for investments sold | 0 | 200,000 | ||||||
Principal receivable | 57,332 | 0 | ||||||
Receivable for fund shares sold | 220,355 | 464,249 | ||||||
Interest receivable | 1,919,061 | 3,411,996 | ||||||
Prepaid expenses and other assets | 26,010 | 35,050 | ||||||
Total Assets | 192,772,136 | 375,065,407 | ||||||
LIABILITIES | ||||||||
Payable for fund shares redeemed | 281,877 | 644,935 | ||||||
Payable to investment advisor and other affiliates (Note 3) | 113,760 | 211,296 | ||||||
Accounts payable and accrued expenses | 76,114 | 150,752 | ||||||
Dividends payable | 99,505 | 255,739 | ||||||
Total Liabilities | 571,256 | 1,262,722 | ||||||
NET ASSETS | $ | 192,200,880 | $ | 373,802,685 | ||||
NET ASSETS CONSIST OF: | ||||||||
Undistributed net investment income | $ | 52,033 | $ | 70,784 | ||||
Net unrealized depreciation on investments | (3,610,848 | ) | (38,694 | ) | ||||
Accumulated net realized gain (loss) | (688,484 | ) | (3,689,902 | ) | ||||
Net capital paid in on shares of beneficial interest | 196,448,179 | 377,460,497 | ||||||
| $ | 192,200,880 | $ | 373,802,685 | |||||
NET ASSET VALUE: | ||||||||
Class A Shares: | ||||||||
Net asset value and redemption price per share | $ | 12.76 | $ | 12.51 | ||||
Maximum sales charge, 1.50% of offering price | 0.19 | 0.19 | ||||||
Maximum offering price per share | $ | 12.95 | $ | 12.70 | ||||
Class B Shares: | ||||||||
Net asset value and offering price per share * | $ | 12.73 | $ | — | ||||
Class C Shares: | ||||||||
Net asset value and offering price per share * | $ | 12.84 | $ | 12.49 | ||||
8 | Certified Annual Report |
| STATEMENTS OF ASSETS AND LIABILITIES, CONTINUED | ||
| Thornburg Limited Term Income Funds | September 30, 2005 | |
Limited Term U.S. Government Fund | Limited Term Income Fund | |||||
Class I Shares: | ||||||
Net asset value, offering and redemption price per share | $ | 12.76 | $ | 12.51 | ||
Class R1 Shares: | ||||||
Net asset value, offering and redemption price per share | $ | 12.77 | $ | 12.52 | ||
| * | Redemption price per share is equal to net asset value less any applicable contingent deferred sales charge. |
See notes to financial statements.
| Certified Annual Report | 9 |
| STATEMENTS OF OPERATIONS | ||
| Thornburg Limited Term Income Funds | Year Ended September 30, 2005 | |
Limited Term U.S. Government Fund | Limited Term Income Fund | |||||||
INVESTMENT INCOME: | ||||||||
Interest income (net of premium amortized of $1,908,912 and $1,178,774, respectively) | $ | 7,294,879 | $ | 17,524,165 | ||||
EXPENSES: | ||||||||
Investment advisory fees (Note 3) | 785,728 | 1,939,301 | ||||||
Administration fees (Note 3) | ||||||||
Class A Shares | 190,521 | 287,276 | ||||||
Class B Shares | 2,805 | 0 | ||||||
Class C Shares | 48,204 | 79,048 | ||||||
Class I Shares | 7,659 | 46,767 | ||||||
Class R1 Shares | 1,233 | 1,584 | ||||||
Distribution and service fees (Note 3) | ||||||||
Class A Shares | 381,043 | 574,552 | ||||||
Class B Shares | 22,388 | 0 | ||||||
Class C Shares | 385,648 | 632,392 | ||||||
Class R1 Shares | 4,994 | 6,365 | ||||||
Transfer agent fees | ||||||||
Class A Shares | 189,755 | 262,520 | ||||||
Class B Shares | 16,712 | 0 | ||||||
Class C Shares | 50,620 | 82,285 | ||||||
Class I Shares | 25,103 | 62,655 | ||||||
Class R1 Shares | 3,602 | 4,325 | ||||||
Registration and filing fees | ||||||||
Class A Shares | 27,439 | 40,059 | ||||||
Class B Shares | 11,753 | 0 | ||||||
Class C Shares | 23,038 | 25,903 | ||||||
Class I Shares | 18,739 | 22,877 | ||||||
Class R1 Shares | 20,639 | 20,301 | ||||||
Custodian fees (Note 3) | 89,651 | 133,082 | ||||||
Professional fees | 38,187 | 50,690 | ||||||
Accounting fees | 19,510 | 38,900 | ||||||
Trustee fees | 6,556 | 7,831 | ||||||
Other expenses | 62,257 | 97,426 | ||||||
Total Expenses | 2,433,784 | 4,416,139 | ||||||
Less: | ||||||||
Expenses reimbursed by Investment Advisor (Note 3) | (82,484 | ) | (367,593 | ) | ||||
Distribution and service fees waived (Note 3) | (193,397 | ) | (316,489 | ) | ||||
Fees paid indirectly (Note 3) | (17,211 | ) | (22,722 | ) | ||||
Net Expenses | 2,140,692 | 3,709,335 | ||||||
Net Investment Income | $ | 5,154,187 | $ | 13,814,830 | ||||
10 | Certified Annual Report |
| STATEMENTS OF OPERATIONS, CONTINUED | ||
| Thornburg Limited Term Income Funds | Year Ended September 30, 2005 | |
| Limited Term U.S. Government Fund | Limited Term Income Fund | |||||||
REALIZED AND UNREALIZED GAIN (LOSS) | ||||||||
Net realized gain (loss) on: | ||||||||
Investments | $ | 120,345 | $ | (26,961 | ) | |||
Foreign currency transactions | 0 | 60,220 | ||||||
| 120,345 | 33,259 | |||||||
Net change in unrealized appreciation (depreciation) on: | ||||||||
Investments | (4,003,893 | ) | (8,194,449 | ) | ||||
Net Realized and Unrealized Loss on Investments | (3,883,548 | ) | (8,161,190 | ) | ||||
Net Increase in Net Assets Resulting From Operations | $ | 1,270,639 | $ | 5,653,640 | ||||
See notes to financial statements.
| Certified Annual Report | 11 |
STATEMENTS OF CHANGES IN NET ASSETS
Thornburg Limited Term U.S. Government Fund
| Year Ended September 30, 2005 | Year Ended September 30, 2004 | |||||||
INCREASE (DECREASE) IN NET ASSETS FROM: | ||||||||
OPERATIONS: | ||||||||
Net investment income | $ | 5,154,187 | $ | 6,108,467 | ||||
Net realized gain on investments sold | 120,345 | 2,572,794 | ||||||
Increase (Decrease) in unrealized appreciation (depreciation) of investments | (4,003,893 | ) | (6,634,413 | ) | ||||
Net Increase (Decrease) in Net Assets Resulting from Operations | 1,270,639 | 2,046,848 | ||||||
DIVIDENDS TO SHAREHOLDERS: | ||||||||
From net investment income | ||||||||
Class A Shares | (3,952,925 | ) | (4,505,818 | ) | ||||
Class B Shares | (25,128 | ) | (42,140 | ) | ||||
Class C Shares | (900,979 | ) | (1,193,563 | ) | ||||
Class I Shares | (443,663 | ) | (363,591 | ) | ||||
Class R1 Shares | (26,599 | ) | (3,340 | ) | ||||
FUND SHARE TRANSACTIONS (NOTE 4): | ||||||||
Class A Shares | (22,152,201 | ) | (10,449,346 | ) | ||||
Class B Shares | (476,721 | ) | (628,485 | ) | ||||
Class C Shares | (9,829,652 | ) | (11,845,239 | ) | ||||
Class I Shares | 3,482,340 | 19,693 | ||||||
Class R1 Shares | 2,598,892 | 421,885 | ||||||
Net Decrease in Net Assets | (30,455,997 | ) | (26,543,096 | ) | ||||
NET ASSETS: | ||||||||
Beginning of year | 222,656,877 | 249,199,973 | ||||||
End of year | $ | 192,200,880 | $ | 222,656,877 | ||||
See notes to financial statements.
12 | Certified Annual Report |
STATEMENTS OF CHANGES IN NET ASSETS
Thornburg Limited Term Income Fund
| Year Ended September 30, 2005 | Year Ended September 30, 2004 | |||||||
INCREASE (DECREASE) IN NET ASSETS FROM: | ||||||||
OPERATIONS: | ||||||||
Net investment income | $ | 13,814,830 | $ | 11,970,046 | ||||
Net realized gain on investments | 33,259 | (1,197,633 | ) | |||||
Increase (Decrease) in unrealized appreciation (depreciation) of investments | (8,194,449 | ) | (3,681,220 | ) | ||||
Net Increase (Decrease) in Net Assets Resulting from Operations | 5,653,640 | 7,091,193 | ||||||
DIVIDENDS TO SHAREHOLDERS: | ||||||||
From net investment income | ||||||||
Class A Shares | (8,546,058 | ) | (7,103,088 | ) | ||||
Class C Shares | (2,192,018 | ) | (1,897,482 | ) | ||||
Class I Shares | (3,797,631 | ) | (3,012,694 | ) | ||||
Class R1 Shares | (48,598 | ) | (8,104 | ) | ||||
FUND SHARE TRANSACTIONS (NOTE 4): | ||||||||
Class A Shares | (12,086,746 | ) | 48,582,688 | |||||
Class C Shares | (4,598,144 | ) | 11,375,293 | |||||
Class I Shares | 11,548,065 | 31,761,582 | ||||||
Class R1 Shares | 1,280,382 | 903,829 | ||||||
Net Increase (Decrease) in Net Assets | (12,787,108 | ) | 87,693,217 | |||||
NET ASSETS: | ||||||||
Beginning of year | 386,589,793 | 298,896,576 | ||||||
End of year | $ | 373,802,685 | $ | 386,589,793 | ||||
See notes to financial statements.
| Certified Annual Report | 13 |
| NOTES TO FINANCIAL STATEMENTS | ||
| Thornburg Limited Term Income Funds | September 30, 2005 | |
NOTE 1 – ORGANIZATION
Thornburg Limited Term U.S. Government Fund (the “Government Fund”) and Thornburg Limited Term Income Fund (the “Income Fund”), hereafter referred to collectively as the “Funds”, are diversified series of Thornburg Investment Trust (the “Trust”). The Trust is organized as a Massachusetts business trust under a Declaration of Trust dated June 3, 1987 and is registered as a diversified, open-end management investment company under the Investment Company Act of 1940, as amended. The Trust is currently issuing ten series of shares of beneficial interest in addition to those of the Funds: Thornburg Limited Term Municipal Fund, Thornburg California Limited Term Municipal Fund, Thornburg Florida Intermediate Municipal Fund, Thornburg New York Intermediate Municipal Fund, Thornburg New Mexico Intermediate Municipal Fund, Thornburg Intermediate Municipal Fund, Thornburg Value Fund, Thornburg International Value Fund, Thornburg Core Growth Fund, and Thornburg Investment Income Builder Fund. Each series is considered to be a separate entity for financial reporting and tax purposes and bears expenses directly attributable to it. The Funds’ objectives are to obtain as high a level of current income as is consistent, in the view of the Funds’ investment advisor, with the preservation of capital.
The Government Fund currently offers five classes of shares of beneficial interest, Class A, Class B, Class C, Institutional Class (Class I), and Retirement Class (Class R1) shares. The Income Fund currently offers four classes of shares of beneficial interest, Class A, Class C, Institutional Class (Class I), and Retirement Class (Class R1) shares. Each class of shares of a Fund represents an interest in the same portfolio of investments, except that (i) Class A shares are sold subject to a front-end sales charge collected at the time the shares are purchased and bear a service fee, (ii) Class B shares are sold at net asset value without a sales charge at the time of purchase, but are subject to a contingent deferred sales charge upon redemption and bear both a service fee and distribution fee, (iii) Class C shares are sold at net asset value without a sales charge at the time of purchase, but are subject to a contingent deferred sales charge upon redemption within one year and bear both a service fee and a distribution fee, (iv) Class I shares are sold at net asset value without a sales charge at the time of purchase, (v) Class R1 shares are sold at net asset value without a sales charge, but bear both a service fee and a distribution fee, and (vi) the respective classes may have different reinvestment privileges and conversion rights. Additionally, each Fund may allocate among its classes certain expenses, to the extent applicable to specific classes, including transfer agent fees, government registration fees, certain printing and postage costs, and administrative and legal expenses. Currently, class specific expenses of the Funds are limited to service and distribution fees, administrative fees, and certain registration and transfer agent expenses. Class B shares of the Government Fund outstanding for eight years will convert to Class A shares of the Government Fund.
NOTE 2 – SIGNIFICANT ACCOUNTING POLICIES
Significant accounting policies of the Trust are as follows:
Valuation of Investments: In determining the net asset value of investments, the Trust utilizes an independent pricing service approved by the Board of Trustees. Debt investment securities have a primary market over the counter and are valued on the basis of valuations furnished by the pricing service. The pricing service values portfolio securities at quoted bid prices, normally at 4:00 p.m. EST. When quotations are not readily available, securities are valued at evaluated prices as determined by the pricing service using methods which include consideration of yields or prices of obligations of comparable quality, type of issue, coupon, maturity, and rating; indications as to value from dealers and general market conditions. In any case where a price is not available from a pricing service for an investment, the Trust’s valuation and pricing committee determines a fair value for the investment using factors approved by the Trustees. The valuation procedures used by the pricing service and the portfolio valuations received by the Funds are reviewed by the officers of the Trust under the general supervision of the Board of Trustees. Short-term instruments having a maturity of 60 days or less are valued at amortized cost, which approximates market value.
Federal Income Taxes: It is the policy of the Trust to comply with the provisions of the Internal Revenue Code applicable to “regulated investment companies” and to distribute all taxable income, including any net realized gain on investments of the Funds to the shareholders. Therefore, no provision for Federal income taxes is required.
When-Issued and Delayed Delivery Transactions: The Trust may engage in when-issued or delayed delivery transactions. To the extent the Trust engages in such transactions, it will do so for the purpose of acquiring portfolio securities consistent with the Funds’ investment objectives and not for the purpose of investment leverage or to speculate on interest rate and/or market changes. At the time the Trust makes a commitment to purchase a security on a when-issued basis, the Funds will record the transaction and reflect the value in determining each Fund’s net asset value. When effecting such transactions, assets of an amount sufficient to make payment for the portfolio securities to be purchased will be segregated on each Fund’s records at the trade date. Securities purchased on a when-issued or delayed delivery basis do not earn interest until the settlement date.
Dividends: Net investment incomes of the Funds are declared daily as a dividend on shares for which the Funds have received payment. Dividends are paid monthly and are reinvested in additional shares of the Funds at net asset value per share at the close of business on the dividend payment date or, at the shareholder’s option, paid in cash. Net capital gains, to the extent available, will be distributed at least annually.
14 | Certified Annual Report |
| NOTES TO FINANCIAL STATEMENTS, CONTINUED | ||
| Thornburg Limited Term Income Funds | September 30, 2005 | |
General: Securities transactions are accounted for on a trade date basis. Interest income is accrued as earned. Premiums and discounts on securities purchased are amortized over the life of the respective securities. Realized gains and losses from the sale of securities are recorded on an identified cost basis. The Funds invest in various mortgage-backed securities. Such securities pay interest and a portion of principal each month, which is then available for investment in securities at prevailing prices. Net investment income, other than class specific expenses and realized and unrealized gains and losses, is allocated daily to each class of shares based upon the relative net asset value of outstanding shares (or the value of the dividend-eligible shares, as appropriate) of each class of shares at the beginning of the day (after adjusting for the current share activity of the respective class). Expenses common to all funds are allocated among the funds comprising the Trust based upon their relative net asset values or other appropriate allocation methods.
Foreign Currency Transactions: With respect to the Income Fund, portfolio securities and other assets and liabilities denominated in foreign currencies are translated into U.S. dollars based on the rate of exchange of such currencies against U.S. dollars on the date of valuation. Purchases and sales of portfolio securities and interest denominated in foreign currencies are translated into U.S. dollar amounts on the respective dates of such transactions.
The Income Fund does not isolate that portion of the results of operations resulting from changes in foreign exchange rates on investments from the fluctuations arising from changes in market prices of securities held. Such fluctuations are included with the net realized and unrealized gain or loss from investments.
Reported net realized foreign exchange gains or losses arise from sales of foreign currencies, currency gains or losses realized between the trade and settlement dates on securities transactions, and the difference between the amount of interest recorded on the Income Fund’s books and the U.S. dollar equivalent of the amounts actually received or paid.
Guarantees and Indemnifications: Under the Trust’s organizational documents, its officers and Trustees are indemnified against certain liability arising out of the performance of their duties to the Funds. Additionally, in the normal course of business the Trust enters into contracts with service providers that contain general indemnification clauses. The Trust’s maximum exposure under these arrangements is unknown. However, based on experience, the Trust expects the risk of loss to be remote.
Use of Estimates: The preparation of financial statements, in conformity with generally accepted accounting principles, requires management to make estimates and assumptions that affect the reported amounts of assets and liabilities and the disclosure of contingent assets and liabilities at the date of the financial statements and the reported amounts of increases and decreases in net assets from operations during the reporting period. Actual results could differ from those estimates.
NOTE 3 – INVESTMENT ADVISORY FEE AND OTHER TRANSACTIONS WITH AFFILIATES
Pursuant to an investment advisory agreement, Thornburg Investment Management, Inc.® (the “Advisor”) serves as the investment advisor and performs services to the Funds for which the fees are payable at the end of each month. For the year ended September 30, 2005, these fees were payable at annual rates ranging from .375 of 1% to .275 of 1% per annum of the average daily net assets of the Government Fund and .50 of 1% to .275 of 1% per annum of the average daily net assets of the Income Fund depending on each Fund’s asset size. The Trust also has an Administrative Services Agreement with the Advisor, whereby the Advisor will perform certain administrative services for the shareholders of each class of each Fund’s shares, and for which fees will be payable at an annual rate of up to .125 of 1% per annum of the average daily net assets attributable to Class A, Class B, Class C, and Class R1 shares, and up to .05 of 1% per annum of the average daily net assets attributable to Class I shares. For the year ended September 30, 2005, the Advisor voluntarily reimbursed certain class specific expenses and administrative fees of $8,654, $9,197, $17,936, $20,778, and $25,919 for the Class A, B, C, I, and R1 shares, respectively, of the Government Fund and $210,311, $82,832, $47,166, and $27,284 for the Class A, C, I, and R1 shares, respectively, of the Income Fund.
The Trust has an underwriting agreement with Thornburg Securities Corporation® (the “Distributor”, an affiliate of the Advisor), which acts as the distributor of each Fund’s shares. For the year ended September 30, 2005, the Distributor has advised the Funds that they earned net commissions aggregating $561 and refunded $575 from the sales of Class A shares of the Government Fund and Income Fund, respectively, and collected contingent deferred sales charges aggregating $5,855 and $12,011 from redemptions of Class C shares of the Government Fund and Income Fund, respectively.
Pursuant to a service plan under Rule 12b-1 of the Investment Company Act of 1940, the Funds may reimburse to the Advisor an amount not to exceed .25 of 1% per annum of its average daily net assets attributable to the Class A, Class B, Class C, and Class R1 shares of the Funds for payments made by the Advisor to securities dealers and other financial institutions to obtain various shareholder related services. The Advisor may pay out of its own resources additional expenses for distribution of each Fund’s shares.
The Trust has also adopted Distribution Plans pursuant to Rule 12b-1, applicable to each Fund’s Class B, Class C, and Class R1 shares under which the Funds compensate the Distributor for services in promoting the sale of Class B, C, and R1 shares of the Funds at an annual rate of up to .75 of 1% per annum of
| Certified Annual Report | 15 |
| NOTES TO FINANCIAL STATEMENTS, CONTINUED | ||
| Thornburg Limited Term Income Funds | September 30, 2005 | |
the average daily net assets attributable to these classes. Total fees incurred by each class of shares of the Funds under their respective service and distribution plans for the year ended September 30, 2005, are set forth in the Statements of Operations. Distribution fees of $193,397 and $316,489, respectively, for Class C shares of the Government Fund and Income Fund were waived.
The Trust has an agreement with the custodian bank to indirectly pay a portion of the custodian’s fees through credits earned by each Fund’s cash on deposit with the bank. This deposit agreement is an alternative to overnight investments. Custodial fees have been adjusted to reflect amounts that would have been paid without this agreement, with a corresponding adjustment reflected as fees paid indirectly in the Statement of Operations. For the year ended September 30, 2005, fees paid indirectly were $17,211 for the Government Fund and $22,722 for the Income Fund.
Certain officers and Trustees of the Trust are also officers and/or Directors of the Advisor and Distributor. The compensation of independent Trustees is borne by the Trust.
NOTE 4 – SHARES OF BENEFICIAL INTEREST
At September 30, 2005, there were an unlimited number of shares of beneficial interest authorized. Transactions in shares of beneficial interest were as follows:
GOVERNMENT FUND | Year Ended September 30, 2005 | Year Ended September 30, 2004 | ||||||||||||
| Shares | Amount | Shares | Amount | |||||||||||
Class A Shares | ||||||||||||||
Shares sold | 2,243,592 | $ | 28,913,349 | 3,221,701 | $ | 42,079,302 | ||||||||
Shares issued to shareholders in reinvestment of dividends | 230,485 | 2,966,058 | 258,973 | 3,377,519 | ||||||||||
Shares repurchased | (4,195,950 | ) | (54,031,608 | ) | (4,285,525 | ) | (55,906,167 | ) | ||||||
Net Increase (Decrease) | (1,721,873 | ) | $ | (22,152,201 | ) | (804,851 | ) | $ | (10,449,346 | ) | ||||
Class B Shares | ||||||||||||||
Shares sold | 36,434 | $ | 470,166 | 78,261 | $ | 1,011,694 | ||||||||
Shares issued to shareholders in reinvestment of dividends | 1,423 | 18,270 | 1,992 | 25,958 | ||||||||||
Shares repurchased | (75,180 | ) | (965,157 | ) | (128,014 | ) | (1,666,137 | ) | ||||||
Net Increase (Decrease) | (37,323 | ) | $ | (476,721 | ) | (47,761 | ) | $ | (628,485 | ) | ||||
Class C Shares | ||||||||||||||
Shares sold | 353,641 | $ | 4,581,667 | 728,926 | $ | 9,584,018 | ||||||||
Shares issued to shareholders in reinvestment of dividends | 51,902 | 671,957 | 67,056 | 880,006 | ||||||||||
Shares repurchased | (1,165,115 | ) | (15,083,276 | ) | (1,700,988 | ) | (22,309,263 | ) | ||||||
Net Increase (Decrease) | (759,572 | ) | $ | (9,829,652 | ) | (905,006 | ) | $ | (11,845,239 | ) | ||||
Class I Shares | ||||||||||||||
Shares sold | 560,384 | $ | 7,250,216 | 415,995 | $ | 5,417,464 | ||||||||
Shares issued to shareholders in reinvestment of dividends | 30,104 | 387,218 | 23,453 | 305,738 | ||||||||||
Shares repurchased | (322,906 | ) | (4,155,094 | ) | (436,875 | ) | (5,703,509 | ) | ||||||
Net Increase (Decrease) | 267,582 | $ | 3,482,340 | 2,573 | $ | 19,693 | ||||||||
Class R1 Shares | ||||||||||||||
Shares sold | 225,835 | $ | 2,890,863 | 33,177 | $ | 432,173 | ||||||||
Shares issued to shareholders in reinvestment of dividends | 1,901 | 24,425 | 186 | 2,416 | ||||||||||
Shares repurchased | (24,563 | ) | (316,396 | ) | (972 | ) | (12,704 | ) | ||||||
Net Increase (Decrease) | 203,173 | $ | 2,598,892 | 32,391 | $ | 421,885 | ||||||||
16 | Certified Annual Report |
| NOTES TO FINANCIAL STATEMENTS, CONTINUED | ||
| Thornburg Limited Term Income Funds | September 30, 2005 | |
INCOME FUND | Year Ended September 30, 2005 | Year Ended September 30, 2004 | ||||||||||||
| Shares | Amount | Shares | Amount | |||||||||||
Class A Shares | ||||||||||||||
Shares sold | 4,512,773 | $ | 57,228,284 | 7,793,807 | $ | 99,954,867 | ||||||||
Shares issued to shareholders in reinvestment of dividends | 493,348 | 6,244,437 | 403,134 | 5,160,648 | ||||||||||
Shares repurchased | (5,976,128 | ) | (75,559,467 | ) | (4,413,893 | ) | (56,532,827 | ) | ||||||
Net Increase (Decrease) | (970,007 | ) | $ | (12,086,746 | ) | 3,783,048 | $ | 48,582,688 | ||||||
Class C Shares | ||||||||||||||
Shares sold | 996,231 | $ | 12,608,384 | 2,147,268 | $ | 27,537,572 | ||||||||
Shares issued to shareholders in reinvestment of dividends | 119,269 | 1,507,204 | 100,334 | 1,282,321 | ||||||||||
Shares repurchased | (1,480,457 | ) | (18,713,732 | ) | (1,365,887 | ) | (17,444,600 | ) | ||||||
Net Increase (Decrease) | (364,957 | ) | $ | (4,598,144 | ) | 881,715 | $ | 11,375,293 | ||||||
Class I Shares | ||||||||||||||
Shares sold | 2,722,997 | $ | 34,485,958 | 4,876,662 | $ | 62,615,919 | ||||||||
Shares issued to shareholders in reinvestment of dividends | 272,125 | 3,443,839 | 214,441 | 2,744,433 | ||||||||||
Shares repurchased | (2,083,269 | ) | (26,381,732 | ) | (2,637,669 | ) | (33,598,770 | ) | ||||||
Net Increase (Decrease) | 911,853 | $ | 11,548,065 | 2,453,434 | $ | 31,761,582 | ||||||||
Class R1 Shares | ||||||||||||||
Shares sold | 117,357 | $ | 1,481,761 | 71,754 | $ | 911,924 | ||||||||
Shares issued to shareholders in reinvestment of dividends | 2,363 | 29,836 | 223 | 2,855 | ||||||||||
Shares repurchased | (18,214 | ) | (231,215 | ) | (863 | ) | (10,950 | ) | ||||||
Net Increase (Decrease) | 101,506 | $ | 1,280,382 | 71,114 | $ | 903,829 | ||||||||
| Certified Annual Report | 17 |
| NOTES TO FINANCIAL STATEMENTS, CONTINUED | ||
| Thornburg Limited Term Income Funds | September 30, 2005 | |
NOTE 5 – SECURITIES TRANSACTIONS
For the year ended September 30, 2005, The Government Fund had purchase and sale transactions of investment securities (excluding short-term investments) of $50,821,343 and $35,041,005, respectively, and the Income Fund had purchase and sale transactions of investment securities (excluding short-term investments and U.S. government obligations) of $72,488,122 and $69,890,222, respectively.
NOTE 6 – INCOME TAXES
At September 30, 2005, information on the tax components of capital is as follows:
| Government Fund | Income Fund | |||||||
Cost of investments for tax purpose | $ | 193,449,059 | $ | 369,941,132 | ||||
Gross unrealized appreciation on a tax basis | 454,761 | 3,433,412 | ||||||
Gross unrealized depreciation on a tax basis | (4,065,609 | ) | (3,478,905 | ) | ||||
Net unrealized appreciation (depreciation) on investments (tax basis) | $ | (3,610,848 | ) | $ | (45,493 | ) | ||
Distributable earnings ordinary income | $ | 52,033 | $ | 70,784 | ||||
At September 30, 2005, the Government Fund had tax basis capital losses, which may be carried over to offset future capital gains. Such losses expire as follows:
2009 | $ | 674,873 | |
2010 | 13,611 | ||
| $ | 688,484 | ||
At September 30, 2005, the Income Fund had tax basis capital losses, which may be carried over to offset future capital gains. Such losses expire as follows:
2008 | $ | 497,824 | |
2009 | 650,941 | ||
2010 | 308,333 | ||
2013 | 1,625,980 | ||
| $ | 3,083,078 | ||
The Government Fund utilized $54,462 of capital loss carry forwards for the year ended September 30, 2005. Unutilized tax basis capital losses may be carried forward to offset realized gains in future years. To the extent such carry forwards are used, capital gains distributions may be reduced to the extent provided by regulations.
As of September 30, 2005, the Income Fund had deferred capital losses occurring subsequent to October 31, 2004 of $600,025. For tax purposes, such losses will be reflected in the year ending September 30, 2006.
In order to account for book/tax differences, the Government Fund increased undistributed net investment income (loss) by $65,883 and decreased accumulated net realized (loss) by $65,883. The Income Fund increased undistributed net investment income (loss) by $644,970 and decreased accumulated net realized (loss) by $644,970. This reclass has no impact on the net asset value of the Fund. Reclassifications result primarily from foreign currency and paydowns.
For tax purposes, distributions for the year ended September 30, 2005 and September 30, 2004, were paid from ordinary income.
18 | Certified Annual Report |
Thornburg Limited Term U.S. Government Fund
| Year Ended September 30, | ||||||||||||||||||||
| 2005 | 2004 | 2003 | 2002 | 2001 | ||||||||||||||||
Class I Shares: | ||||||||||||||||||||
PER SHARE PERFORMANCE | ||||||||||||||||||||
(for a share outstanding throughout the year) | ||||||||||||||||||||
Net asset value, beginning of year | $ | 13.01 | $ | 13.22 | $ | 13.27 | $ | 12.77 | $ | 12.03 | ||||||||||
Income from investment operations: | ||||||||||||||||||||
Net investment income | 0.36 | 0.39 | 0.51 | 0.62 | 0.72 | |||||||||||||||
Net realized and unrealized gain (loss) on investments | (0.24 | ) | (0.21 | ) | (0.05 | ) | 0.50 | 0.74 | ||||||||||||
Total from investment operations | 0.12 | 0.18 | 0.46 | 1.12 | 1.46 | |||||||||||||||
Less dividends from: | ||||||||||||||||||||
Net investment income | (0.37 | ) | (0.39 | ) | (0.51 | ) | (0.62 | ) | (0.72 | ) | ||||||||||
Change in net asset value | (0.25 | ) | (0.21 | ) | (0.05 | ) | 0.50 | 0.74 | ||||||||||||
NET ASSET VALUE, end of year | $ | 12.76 | $ | 13.01 | $ | 13.22 | $ | 13.27 | $ | 12.77 | ||||||||||
RATIOS/SUPPLEMENTAL DATA | ||||||||||||||||||||
Total return | 0.95 | % | 1.37 | % | 3.51 | % | 9.11 | % | 12.45 | % | ||||||||||
Ratios to average net assets: | ||||||||||||||||||||
Net investment income | 2.82 | % | 2.95 | % | 3.77 | % | 4.86 | % | 5.79 | % | ||||||||||
Expenses, after expense reductions | 0.68 | % | 0.67 | % | 0.64 | % | 0.61 | % | 0.61 | % | ||||||||||
Expenses, after expense reductions and net of custody credits | 0.67 | % | 0.67 | % | 0.62 | % | 0.60 | % | — | |||||||||||
Expenses, before expense reductions | 0.80 | % | 0.77 | % | 0.82 | % | 1.04 | % | 1.21 | % | ||||||||||
Portfolio turnover rate | 18.00 | % | 12.39 | % | 35.06 | % | 4.34 | % | 15.23 | % | ||||||||||
Net assets at end of year (000) | $ | 16,075 | $ | 12,905 | $ | 13,085 | $ | 6,960 | $ | 3,992 | ||||||||||
| Certified Annual Report | 19 |
Thornburg Limited Term Income Fund
| Year Ended September 30, | ||||||||||||||||||||
| 2005 | 2004 | 2003 | 2002 | 2001 | ||||||||||||||||
Class I Shares: | ||||||||||||||||||||
PER SHARE PERFORMANCE | ||||||||||||||||||||
(for a share outstanding throughout the year) | ||||||||||||||||||||
Net asset value, beginning of year | $ | 12.80 | $ | 12.99 | $ | 12.79 | $ | 12.55 | $ | 11.90 | ||||||||||
Income from investment operations: | ||||||||||||||||||||
Net investment income | 0.51 | 0.47 | 0.55 | 0.65 | 0.77 | |||||||||||||||
Net realized and unrealized gain (loss) on investments | (0.29 | ) | (0.19 | ) | 0.20 | 0.24 | 0.65 | |||||||||||||
Total from investment operations | 0.22 | 0.28 | 0.75 | 0.89 | 1.42 | |||||||||||||||
Less dividends from: | ||||||||||||||||||||
Net investment income | (0.51 | ) | (0.47 | ) | (0.55 | ) | (0.65 | ) | (0.77 | ) | ||||||||||
Change in net asset value | (0.29 | ) | (0.19 | ) | 0.20 | 0.24 | 0.65 | |||||||||||||
NET ASSET VALUE, end of year | $ | 12.51 | $ | 12.80 | $ | 12.99 | $ | 12.79 | $ | 12.55 | ||||||||||
RATIOS/SUPPLEMENTAL DATA | ||||||||||||||||||||
Total return | 1.77 | % | 2.29 | % | 5.89 | % | 7.38 | % | 12.29 | % | ||||||||||
Ratios to average net assets: | ||||||||||||||||||||
Net investment income | 3.85 | % | 3.64 | % | 4.23 | % | 5.19 | % | 6.24 | % | ||||||||||
Expenses, after expense reductions | 0.67 | % | 0.67 | % | 0.69 | % | 0.69 | % | 0.70 | % | ||||||||||
Expenses, after expense reductions and net of custody credits | 0.67 | % | 0.67 | % | 0.69 | % | 0.69 | % | — | |||||||||||
Expenses, before expense reductions | 0.72 | % | 0.72 | % | 0.76 | % | 0.78 | % | 0.89 | % | ||||||||||
Portfolio turnover rate | 23.16 | % | 22.73 | % | 18.86 | % | 21.63 | % | 20.54 | % | ||||||||||
Net assets at end of year (000) | $ | 99,396 | $ | 90,025 | $ | 59,473 | $ | 39,281 | $ | 24,298 | ||||||||||
20 | Certified Annual Report |
| SCHEDULE OF INVESTMENTS | ||
| Thornburg Limited Term U.S. Government Fund | September 30, 2005 | |
CUSIPS: Class A - 885-215-103, CLASS B - 885-215-848, CLASS C - 885-215-830, CLASS I - 885-215-699, CLASS RI - 885-215-491 NASDAQ SYMBOLS: CLASS A - LTUSX, CLASS B - LTUBX, CLASS C - LTUCX, CLASS I - LTUIX, CLASS RI - LTURX
Issuer-Description | Principal Amount | Value | ||||
U.S.Treasury Securities — 47.25% | ||||||
United States Treasury Notes, 5.75% due 11/15/2005 | $ | 7,000,000 | $ | 7,017,500 | ||
United States Treasury Notes, 5.625% due 2/15/2006 | 3,000,000 | 3,018,750 | ||||
United States Treasury Notes, 4.625% due 5/15/2006 | 5,500,000 | 5,519,336 | ||||
United States Treasury Notes, 7.00% due 7/15/2006 | 2,000,000 | 2,043,750 | ||||
United States Treasury Notes, 2.375% due 8/15/2006 | 2,890,000 | 2,847,779 | ||||
United States Treasury Notes, 4.375% due 5/15/2007 | 9,000,000 | 9,029,531 | ||||
United States Treasury Notes, 6.125% due 8/15/2007 | 4,000,000 | 4,140,000 | ||||
United States Treasury Notes, 2.625% due 5/15/2008 | 10,000,000 | 9,617,969 | ||||
United States Treasury Notes, 5.50% due 5/15/2009 | 10,000,000 | 10,445,312 | ||||
United States Treasury Notes, 6.50% due 2/15/2010 | 15,000,000 | 16,346,484 | ||||
United States Treasury Notes, 5.75% due 8/15/2010 | 6,000,000 | 6,398,437 | ||||
United States Treasury Notes, 3.625% due 5/15/2013 | 15,000,000 | 14,390,625 | ||||
TOTAL U.S.TREASURY SECURITIES (Cost $93,651,803) | 90,815,473 | |||||
U.S. Government Agencies — 48.40% | ||||||
Federal Agricultural Mtg Corp., 5.86% due 3/3/2006 | 900,000 | 907,081 | ||||
Federal Agricultural Mtg Corp., 8.07% due 7/17/2006 | 1,000,000 | 1,029,688 | ||||
Federal Agricultural Mtg Corp., 6.71% due 7/28/2014 | 200,000 | 227,609 | ||||
Federal Farm Credit Bank, 1.875% due 1/16/2007 | 4,650,000 | 4,505,567 | ||||
Federal Farm Credit Bank, 6.75% due 7/7/2009 | 350,000 | 375,958 | ||||
Federal Farm Credit Bank Consolidated MTN, 5.875% due 7/28/2008 | 1,900,000 | 1,967,202 | ||||
Federal Farm Credit Bank Consolidated MTN, 5.87% due 9/2/2008 | 1,300,000 | 1,346,780 | ||||
Federal Farm Credit Bank Consolidated MTN, 5.35% due 12/11/2008 | 200,000 | 204,702 | ||||
Federal Farm Credit Bank Consolidated MTN, 5.80% due 3/19/2009 | 300,000 | 311,728 | ||||
Federal Farm Credit Bank Consolidated MTN, 6.06% due 5/28/2013 | 240,000 | 259,378 | ||||
Federal Home Loan Bank, 6.345% due 11/1/2005 | 100,000 | 100,219 | ||||
Federal Home Loan Bank, 5.24% due 12/7/2005 | 225,000 | 225,643 | ||||
Federal Home Loan Bank, 5.37% due 1/20/2006 | 100,000 | 100,435 | ||||
Federal Home Loan Bank, 2.25% due 5/15/2006 | 3,000,000 | 2,964,478 | ||||
Federal Home Loan Bank, 3.05% due 10/12/2006 | 3,975,000 | 3,925,009 | ||||
Federal Home Loan Bank, 7.76% due 11/21/2006 | 200,000 | 207,457 | ||||
Federal Home Loan Bank, 3.72% due 2/22/2007 | 5,000,000 | 4,994,365 | ||||
Federal Home Loan Bank, 7.00% due 2/15/2008 | 150,000 | 158,219 | ||||
Federal Home Loan Bank, 5.48% due 1/8/2009 | 1,250,000 | 1,283,532 | ||||
Federal Home Loan Bank, 5.985% due 4/9/2009 | 1,000,000 | 1,044,785 | ||||
Federal Home Loan Bank, 5.79% due 4/27/2009 | 200,000 | 207,787 | ||||
Federal Home Loan Bank, 3.00% due 4/29/2009 | 1,750,000 | 1,735,854 | ||||
Federal Home Loan Bank, 3.40% due 11/12/2010 | 2,750,000 | 2,687,806 | ||||
Federal Home Loan Mtg Corp., 5.98% due 12/8/2005 | 75,000 | 75,323 | ||||
Federal Home Loan Mtg Corp., 6.80% due 3/19/2007 | 300,000 | 310,152 | ||||
Federal Home Loan Mtg Corp., 4.37% due 6/2/2009 | 5,000,000 | 4,998,555 | ||||
Federal Home Loan Mtg Corp. CMO Series 1616 Class E, 6.50% due 11/15/2008 | 2,044,928 | 2,082,698 | ||||
Federal Home Loan Mtg Corp. CMO Series 2137 Class TM, 6.50% due 1/15/2028 | 2,053 | 2,049 | ||||
Federal Home Loan Mtg Corp. CMO Series 2592 Class PD, 5.00% due 7/15/2014 | 1,000,000 | 1,000,181 | ||||
Federal Home Loan Mtg Corp. CMO Series 2814 Class GB, 5.00% due 6/15/2019 | 1,677,528 | 1,665,291 | ||||
Federal Home Loan Mtg Corp. CMO Series 2821 Class YI, 5.50% due 9/15/2014 | 2,759,492 | 2,789,677 | ||||
Federal Home Loan Mtg Corp., Pool # 141016, 9.25% due 11/1/2016 | 70,091 | 77,804 | ||||
| Certified Annual Report | 21 |
| SCHEDULE OF INVESTMENTS, CONTINUED | ||
| Thornburg Limited Term U.S. Government Fund | September 30, 2005 | |
Issuer-Description | Principal Amount | Value | ||||
Federal Home Loan Mtg Corp., Pool # 141412, 8.50% due 4/1/2017 | $ | 151,769 | $ | 163,631 | ||
Federal Home Loan Mtg Corp., Pool # 160043, 8.75% due 4/1/2008 | 11,908 | 12,194 | ||||
Federal Home Loan Mtg Corp., Pool # 181730, 8.50% due 5/1/2008 | 11,649 | 11,893 | ||||
Federal Home Loan Mtg Corp., Pool # 252986, 10.75% due 4/1/2010 | 37,313 | 40,442 | ||||
Federal Home Loan Mtg Corp., Pool # 256764, 8.75% due 10/1/2014 | 7,244 | 7,385 | ||||
Federal Home Loan Mtg Corp., Pool # 273822, 8.50% due 4/1/2009 | 33,965 | 34,334 | ||||
Federal Home Loan Mtg Corp., Pool # 291880, 8.25% due 5/1/2017 | 1,032 | 1,040 | ||||
Federal Home Loan Mtg Corp., Pool # 294817, 9.75% due 1/1/2017 | 27,440 | 30,743 | ||||
Federal Home Loan Mtg Corp., Pool # 298107, 10.25% due 8/1/2017 | 27,638 | 31,721 | ||||
Federal Home Loan Mtg Corp., Pool # C90041, 6.50% due 11/1/2013 | 54,904 | 56,421 | ||||
Federal Home Loan Mtg Corp., Pool # D06908, 9.50% due 9/1/2017 | 7,784 | 8,191 | ||||
Federal Home Loan Mtg Corp., Pool # D37120, 7.00% due 7/1/2023 | 57,249 | 60,366 | ||||
Federal Home Loan Mtg Corp., Pool # E00170, 8.00% due 7/1/2007 | 37,561 | 38,405 | ||||
Federal Home Loan Mtg Corp., Pool # E49074, 6.50% due 7/1/2008 | 26,254 | 27,157 | ||||
Federal Home Loan Mtg Corp., Pool # E61778, 6.50% due 4/1/2008 | 37,586 | 38,878 | ||||
Federal Home Loan Mtg Corp., Pool # E65962, 7.00% due 5/1/2008 | 1,811 | 1,817 | ||||
Federal National Mtg Assoc, 2.15% due 7/21/2006 | 750,000 | 737,783 | ||||
Federal National Mtg Assoc, 2.62% due 12/5/2007 | 1,000,000 | 997,030 | ||||
Federal National Mtg Assoc, 3.125% due 12/8/2008 | 3,665,000 | 3,629,011 | ||||
Federal National Mtg Assoc, 4.15% due 1/23/2009 | 2,000,000 | 1,999,812 | ||||
Federal National Mtg Assoc, 3.25% due 6/16/2009 | 4,000,000 | 3,970,523 | ||||
Federal National Mtg Assoc, 4.25% due 6/29/2012 | 3,250,000 | 3,220,746 | ||||
Federal National Mtg Assoc CMO Series 1992-22 Class HC, 7.00% due 3/25/2007 | 97,597 | 98,546 | ||||
Federal National Mtg Assoc CMO Series 1993-101 Class PJ, 7.00% due 6/25/2008 | 503,638 | 510,168 | ||||
Federal National Mtg Assoc CMO Series 1993-122 Class D, 6.50% due 6/25/2023 | 156,073 | 158,147 | ||||
Federal National Mtg Assoc CMO Series 1993-32 Class H, 6.00% due 3/25/2023 | 175,967 | 178,747 | ||||
Federal National Mtg Assoc CMO Series G1993-35 Class JD, 6.50% due 11/25/2006 | 446,605 | 446,448 | ||||
Federal National Mtg Assoc CPI Floating Rate Note, 3.67% due 2/17/2009 | 3,000,000 | 2,988,690 | ||||
Federal National Mtg Assoc, Pool # 008307, 8.00% due 5/1/2008 | 62,242 | 63,763 | ||||
Federal National Mtg Assoc, Pool # 019535, 10.25% due 7/1/2008 | 8,222 | 8,607 | ||||
Federal National Mtg Assoc, Pool # 033356, 9.25% due 8/1/2016 | 78,544 | 85,494 | ||||
Federal National Mtg Assoc, Pool # 040526, 9.25% due 1/1/2017 | 4,122 | 4,218 | ||||
Federal National Mtg Assoc, Pool # 044003, 8.00% due 6/1/2017 | 67,142 | 71,780 | ||||
Federal National Mtg Assoc, Pool # 050811, 7.50% due 12/1/2012 | 52,507 | 54,573 | ||||
Federal National Mtg Assoc, Pool # 050832, 7.50% due 6/1/2013 | 75,785 | 78,686 | ||||
Federal National Mtg Assoc, Pool # 076388, 9.25% due 9/1/2018 | 77,932 | 85,922 | ||||
Federal National Mtg Assoc, Pool # 077725, 9.75% due 10/1/2018 | 37,406 | 39,463 | ||||
Federal National Mtg Assoc, Pool # 100286, 7.50% due 8/1/2009 | 150,383 | 154,004 | ||||
Federal National Mtg Assoc, Pool # 112067, 9.50% due 10/1/2016 | 55,700 | 61,865 | ||||
Federal National Mtg Assoc, Pool # 156156, 8.50% due 4/1/2021 | 56,234 | �� | 58,913 | |||
Federal National Mtg Assoc, Pool # 190555, 7.00% due 1/1/2014 | 45,008 | 46,532 | ||||
Federal National Mtg Assoc, Pool # 190703, 7.00% due 3/1/2009 | 35,428 | 36,211 | ||||
Federal National Mtg Assoc, Pool # 190836, 7.00% due 6/1/2009 | 88,452 | 90,530 | ||||
Federal National Mtg Assoc, Pool # 250387, 7.00% due 11/1/2010 | 70,534 | 73,772 | ||||
Federal National Mtg Assoc, Pool # 250481, 6.50% due 11/1/2015 | 6,648 | 6,816 | ||||
Federal National Mtg Assoc, Pool # 251258, 7.00% due 9/1/2007 | 32,216 | 32,763 | ||||
Federal National Mtg Assoc, Pool # 251759, 6.00% due 5/1/2013 | 108,855 | 112,065 | ||||
Federal National Mtg Assoc, Pool # 252648, 6.50% due 5/1/2022 | 270,575 | 280,056 | ||||
Federal National Mtg Assoc, Pool # 252787, 7.00% due 8/1/2006 | 10,651 | 10,743 | ||||
Federal National Mtg Assoc, Pool # 303383, 7.00% due 12/1/2009 | 61,740 | 62,954 | ||||
Federal National Mtg Assoc, Pool # 312663, 7.50% due 6/1/2010 | 89,253 | 93,848 | ||||
Federal National Mtg Assoc, Pool # 323706, 7.00% due 2/1/2009 | 107,954 | 110,128 | ||||
Federal National Mtg Assoc, Pool # 323735, 5.50% due 5/1/2006 | 1,271,734 | 1,272,421 | ||||
22 | Certified Annual Report |
| SCHEDULE OF INVESTMENTS, CONTINUED | ||
| Thornburg Limited Term U.S. Government Fund | September 30, 2005 | |
Issuer-Description | Principal Amount | Value | ||||
Federal National Mtg Assoc, Pool # 334996, 7.00% due 2/1/2011 | $ | 75,121 | $ | 78,569 | ||
Federal National Mtg Assoc, Pool # 342947, 7.25% due 4/1/2024 | 558,018 | 592,534 | ||||
Federal National Mtg Assoc, Pool # 345775, 8.50% due 12/1/2024 | 45,840 | 47,854 | ||||
Federal National Mtg Assoc, Pool # 373942, 6.50% due 12/1/2008 | 49,947 | 51,757 | ||||
Federal National Mtg Assoc, Pool # 382889, 7.35% due 12/1/2010 | 302,671 | 321,508 | ||||
Federal National Mtg Assoc, Pool # 382926, 7.37% due 12/1/2010 | 336,685 | 357,834 | ||||
Federal National Mtg Assoc, Pool # 384243, 6.10% due 10/1/2011 | 617,123 | 638,744 | ||||
Federal National Mtg Assoc, Pool # 384746, 5.86% due 2/1/2009 | 1,056,054 | 1,090,790 | ||||
Federal National Mtg Assoc, Pool # 385714, 4.70% due 1/1/2010 | 3,175,155 | 3,160,308 | ||||
Federal National Mtg Assoc, Pool # 406384, 8.25% due 12/1/2024 | 226,775 | 242,584 | ||||
Federal National Mtg Assoc, Pool # 443909, 6.50% due 9/1/2018 | 208,214 | 214,361 | ||||
Federal National Mtg Assoc, Pool # 460568, 5.20% due 12/1/2006 | 3,500,000 | 3,504,765 | ||||
Federal National Mtg Assoc, Pool # 516363, 5.00% due 3/1/2014 | 268,017 | 268,153 | ||||
Federal National Mtg Assoc, Pool # 555207, 7.00% due 11/1/2017 | 128,363 | 134,255 | ||||
Government National Mtg Assoc CMO Series 2001-65 Class PG, 6.00% due 7/20/2028 | 1,271,134 | 1,275,420 | ||||
Government National Mtg Assoc CMO Series 2002-67 Class VA, 6.00% due 3/20/2013 | 426,293 | 430,719 | ||||
Government National Mtg Assoc, Pool # 000623, 8.00% due 9/20/2016 | 70,968 | 75,608 | ||||
Government National Mtg Assoc, Pool # 016944, 7.50% due 5/15/2007 | 51,035 | 54,242 | ||||
Government National Mtg Assoc, Pool # 306636, 8.25% due 12/15/2006 | 19,035 | 19,342 | ||||
Government National Mtg Assoc, Pool # 369693, 7.00% due 1/15/2009 | 110,324 | 116,009 | ||||
Government National Mtg Assoc, Pool # 409921, 7.50% due 8/15/2010 | 64,218 | 67,524 | ||||
Government National Mtg Assoc, Pool # 410240, 7.00% due 12/15/2010 | 49,685 | 52,214 | ||||
Government National Mtg Assoc, Pool # 410271, 7.50% due 8/15/2010 | 42,370 | 44,552 | ||||
Government National Mtg Assoc, Pool # 410846, 7.00% due 12/15/2010 | 76,752 | 80,659 | ||||
Government National Mtg Assoc, Pool # 430150, 7.25% due 12/15/2026 | 72,221 | 76,932 | ||||
Government National Mtg Assoc, Pool # 447040, 7.75% due 5/15/2027 | 52,403 | 56,289 | ||||
Government National Mtg Assoc, Pool # 453928, 7.00% due 7/15/2017 | 95,691 | 101,325 | ||||
Government National Mtg Assoc, Pool # 780063, 7.00% due 9/15/2008 | 25,460 | 26,771 | ||||
Government National Mtg Assoc, Pool # 780448, 6.50% due 8/15/2011 | 149,458 | 155,903 | ||||
Overseas Private Investment Corp., 4.10% due 11/15/2014 | 2,376,000 | 2,312,466 | ||||
Private Export Funding Corp., 4.974% due 8/15/2013 | 2,700,000 | 2,761,633 | ||||
Private Export Funding Corp. Series P, 5.685% due 5/15/2012 | 5,000,000 | 5,313,140 | ||||
Tennessee Valley Authority, 4.75% due 8/1/2013 | 3,000,000 | 3,031,516 | ||||
TOTAL U.S. GOVERNMENT AGENCIES (Cost $93,800,205) | 93,025,688 | |||||
Short Term Investments — 3.12% | ||||||
Federal Home Loan Bank Discount Notes, 3.54% due 10/6/2005 | 6,000,000 | 5,997,050 | ||||
TOTAL SHORT TERM INVESTMENTS (Cost $5,997,050) | 5,997,050 | |||||
TOTAL INVESTMENTS — 98.77% (Cost $193,449,059) | $ | 189,838,211 | ||||
OTHER ASSETS LESS LIABILITIES — 1.23% | 2,362,669 | |||||
NET ASSETS — 100.00% | $ | 192,200,880 | ||||
| Certified Annual Report | 23 |
| SCHEDULE OF INVESTMENTS, CONTINUED | ||
| Thornburg Limited Term U.S. Government Fund | September 30, 2005 | |
Footnote Legend
See notes to financial statements.
Portfolio Abbreviations
To simplify the listings of securities, abbreviations are used per the table below:
| MTN | Medium-Term Note |
SUMMARY OF TYPES OF HOLDINGS
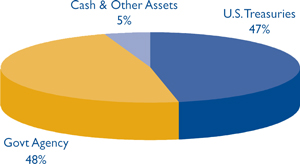
24 | Certified Annual Report |
| SCHEDULE OF INVESTMENTS | ||
| Thornburg Limited Term Income Fund | September 30, 2005 | |
CUSIPS: Class A - 885-215-509, CLASS C - 885-215-764, CLASS I - 885-215-681, CLASS RI - 885-215-483 NASDAQ SYMBOLS: CLASS A - THIFX, CLASS C - THICX, CLASS I - THIIX, CLASS RI - THIRX
Issuer-Description | Credit Rating† Moody’s/S&P | Principal Amount | Value | |||||
U.S.Treasury Securities — 4.65% | ||||||||
United States Treasury Notes, 4.625% due 5/15/2006 | Aaa/AAA | $ | 4,500,000 | $ | 4,515,820 | |||
United States Treasury Notes, 3.00% due 2/15/2008 | Aaa/AAA | 4,000,000 | 3,895,625 | |||||
United States Treasury Notes, 4.75% due 11/15/2008 | Aaa/AAA | 1,500,000 | 1,524,375 | |||||
United States Treasury Notes, 5.75% due 8/15/2010 | Aaa/AAA | 2,500,000 | 2,666,016 | |||||
United States Treasury Notes, 3.625% due 5/15/2013 | Aaa/AAA | 5,000,000 | 4,796,875 | |||||
TOTAL U.S.TREASURY SECURITIES (Cost $17,518,496) | 17,398,711 | |||||||
U.S. Government Agencies — 9.44% | ||||||||
Federal Home Loan Bank, 2.25% due 5/15/2006 | Aaa/AAA | 2,000,000 | 1,976,319 | |||||
Federal Home Loan Bank, 3.72% due 2/22/2007 | Aaa/AAA | 1,370,000 | 1,368,456 | |||||
Federal Home Loan Bank, 4.875% due 5/15/2007 | Aaa/AAA | 150,000 | 150,987 | |||||
Federal Home Loan Bank, 3.95% due 9/24/2007 | Aaa/AAA | 1,000,000 | 989,323 | |||||
Federal Home Loan Bank, 5.833% due 1/23/2008 | Aaa/AAA | 500,000 | 514,077 | |||||
Federal Home Loan Bank, 5.785% due 4/14/2008 | Aaa/AAA | 75,000 | 77,212 | |||||
Federal Home Loan Bank, 5.835% due 7/15/2008 | Aaa/AAA | 300,000 | 310,022 | |||||
Federal Home Loan Bank, 5.085% due 10/7/2008 | Aaa/AAA | 250,000 | 253,629 | |||||
Federal Home Loan Bank, 5.038% due 10/14/2008 | Aaa/AAA | 200,000 | 202,652 | |||||
Federal Home Loan Bank, 5.365% due 12/11/2008 | Aaa/AAA | 75,000 | 76,751 | |||||
Federal Home Loan Bank, 3.00% due 12/15/2008 | Aaa/AAA | 3,000,000 | 2,984,949 | |||||
Federal Home Loan Bank, 5.985% due 4/9/2009 | Aaa/AAA | 85,000 | 88,807 | |||||
Federal Home Loan Bank, 3.00% due 9/22/2009 | Aaa/AAA | 1,500,000 | 1,490,741 | |||||
Federal Home Loan Mtg Corp., 9.00% due 10/1/2005 | Aaa/AAA | 294 | 296 | |||||
Federal Home Loan Mtg Corp., 4.37% due 6/2/2009 | Aaa/AAA | 5,000,000 | 4,998,555 | |||||
Federal Home Loan Mtg Corp. CMO Series 2160 Class PG, 6.50% due 11/15/2027 | Aaa/AAA | 769,693 | 768,637 | |||||
Federal Home Loan Mtg Corp. CMO Series 2814 Class GB, 5.00% due 6/15/2019 | Aaa/AAA | 1,677,528 | 1,665,291 | |||||
Federal Home Loan Mtg Corp. CMO Series 2821 Class YI, 5.50% due 9/15/2014 | Aaa/AAA | 2,760,403 | 2,790,598 | |||||
Federal National Mtg Assoc, 3.25% due 3/29/2007 | Aaa/AAA | 4,550,000 | 4,476,170 | |||||
Federal National Mtg Assoc, 5.185% due 11/1/2008 | Aaa/AAA | 462,680 | 467,198 | |||||
Federal National Mtg Assoc, 6.00% due 12/1/2008 | Aaa/AAA | 82,672 | 85,071 | |||||
Federal National Mtg Assoc, 8.00% due 12/1/2009 | Aaa/AAA | 31,131 | 32,359 | |||||
Federal National Mtg Assoc, 7.00% due 3/1/2011 | Aaa/AAA | 46,806 | 48,955 | |||||
Federal National Mtg Assoc, 6.42% due 4/1/2011 | Aaa/AAA | 2,381,281 | 2,464,156 | |||||
Federal National Mtg Assoc, 5.095% due 12/1/2011 | Aaa/AAA | 126,796 | 128,573 | |||||
Federal National Mtg Assoc, 7.491% due 8/1/2014 | Aaa/AAA | 37,042 | 37,875 | |||||
Federal National Mtg Assoc CMO Series 2003-64 Class EC, 5.50% due 5/25/2030 | Aaa/AAA | 987,376 | 991,356 | |||||
Federal National Mtg Assoc CPI Floating Rate Note, 3.67% due 2/17/2009 | Aaa/AAA | 5,000,000 | 4,981,150 | |||||
Federal National Mtg Assoc, Pool # 460568, 5.20% due 12/1/2006 | Aaa/AAA | 800,000 | 801,089 | |||||
Government National Mtg Assoc, Pool # 003007, 8.50% due 11/20/2015 | Aaa/AAA | 28,255 | 29,963 | |||||
Government National Mtg Assoc, Pool # 827148, 3.375% due 2/20/2024 | Aaa/AAA | 40,436 | 40,931 | |||||
TOTAL U.S. GOVERNMENT AGENCIES (Cost $35,421,095) | 35,292,148 | |||||||
Asset Back Securities — 4.02% | ||||||||
Associates Manufactured Housing Trust 1996-1 A5, 7.60% due 3/15/2027 | Aaa/AAA | 312,016 | 317,456 | |||||
GSR Mtg Loan Trust Series 2004-3F Class 2-A10, 7.343% due 2/25/2034 | NA/AAA | 939,843 | 930,142 | |||||
Small Business Administration, 4.638% due 2/10/2015 | NR/NR | 3,294,763 | 3,294,643 | |||||
Washington Mutual Series 02-AR10, Class-A6, 4.816% due 10/25/2032 | Aaa/AAA | 49,847 | 49,726 | |||||
Washington Mutual Series 03-AR10, Class-A4, 4.071% due 10/25/2033 | Aaa/AAA | 2,000,000 | 1,980,027 | |||||
| Certified Annual Report | 25 |
| SCHEDULE OF INVESTMENTS, CONTINUED | ||
| Thornburg Limited Term Income Fund | September 30, 2005 | |
Issuer-Description | Credit Rating† Moody’s/S&P | Principal Amount | Value | |||||
Washington Mutual Series 03-AR12, Class-A4, 3.743% due 2/25/2034 | Aaa/AAA | $ | 2,000,000 | $ | 1,965,588 | |||
Washington Mutual Series 03-AR5, Class-A6, 3.695% due 6/25/2033 | Aaa/AAA | 3,200,000 | 3,106,564 | |||||
Washington Mutual Series 05-AR4, Class-A4b, 4.68% due 4/25/2035 | Aaa/AAA | 500,000 | 492,265 | |||||
Wells Fargo Mtg Backed Secs Series 2005-3 Class-A10, 5.50% due 5/25/2035 | Aaa/NA | 2,880,489 | 2,879,950 | |||||
TOTAL ASSET BACK SECURITIES (Cost $15,190,856) | 15,016,361 | |||||||
Corporate Bonds — 66.77% | ||||||||
BANKS — 3.03% | ||||||||
COMMERCIAL BANKS — 3.03% | ||||||||
Bank of America Corp., 4.375% due 12/1/2010 | Aa2/AA- | 1,675,000 | 1,644,199 | |||||
Capital One Bank, 6.70% due 5/15/2008 | Baa2/BBB | 1,665,000 | 1,739,983 | |||||
Fifth Third Bank, Cincinnati Ohio, 3.375% due 8/15/2008 | Aa1/AA- | 2,500,000 | 2,418,025 | |||||
HSBC USA Inc., 8.375% due 2/15/2007 | A1/A+ | 700,000 | 732,571 | |||||
National Westminster Bank, 7.375% due 10/1/2009 | Aa2/AA- | 715,000 | 785,455 | |||||
Nations Bank Corp., 7.23% due 8/15/2012 | Aa2/AA- | 250,000 | 277,790 | |||||
Northern Trust Co., 6.25% due 6/2/2008 | A1/A+ | 500,000 | 523,420 | |||||
PNC Funding Corp., 6.875% due 7/15/2007 | A3/BBB+ | 95,000 | 98,645 | |||||
Suntrust Bank Atlanta Georgia, 2.50% due 5/4/2006 | Aa2/AA- | 2,200,000 | 2,172,395 | |||||
Union Planters Corp., 6.75% due 11/1/2005 | A2/A- | 120,000 | 120,225 | |||||
US Bank, 5.625% due 11/30/2005 | Aa1/AA- | 385,000 | 385,898 | |||||
US Bank, 6.30% due 7/15/2008 | Aa2/A+ | 400,000 | 417,826 | |||||
| 11,316,432 | ||||||||
CAPITAL GOODS — 4.76% | ||||||||
MACHINERY — 4.76% | ||||||||
Caterpillar Financial Services Corp., 6.40% due 2/15/2008 | A2/A | 250,000 | 256,497 | |||||
Emerson Electric Co., 5.75% due 11/1/2011 | A2/A | 800,000 | 842,884 | |||||
General American Railcar Corp., 6.69% due 9/20/2016 | A3/AA- | 214,524 | 214,127 | |||||
Hubbell Inc., 6.375% due 5/15/2012 | A3/A+ | 1,000,000 | 1,081,503 | |||||
Illinois Tool Works Inc., 5.75% due 3/1/2009 | Aa3/AA | 4,595,000 | 4,767,409 | |||||
John Deere Capital Corp., 5.125% due 10/19/2006 | A3/A- | 450,000 | 452,832 | |||||
John Deere Capital Corp. Floating Rate Note, 3.959% due 6/10/2008 | A3/A- | 4,415,000 | 4,413,967 | |||||
Johnson Controls Inc., 5.00% due 11/15/2006 | A2/A | 1,000,000 | 1,002,840 | |||||
Pentair Inc., 7.85% due 10/15/2009 | Baa3/BBB | 1,000,000 | 1,099,732 | |||||
Pitney Bowes Inc., 5.875% due 5/1/2006 | Aa3/A+ | 900,000 | 905,764 | |||||
Pitney Bowes Inc., 4.625% due 10/1/2012 | Aa3/A+ | 900,000 | 888,627 | |||||
Pitney Bowes Inc., 3.875% due 6/15/2013 | Aa3/A+ | 2,000,000 | 1,875,244 | |||||
| 17,801,426 | ||||||||
COMMERCIAL SERVICES & SUPPLIES — 1.68% | ||||||||
COMMERCIAL SERVICES & SUPPLIES — 1.68% | ||||||||
Aramark Services Inc., 7.00% due 7/15/2006 | Baa3/BBB- | 250,000 | 253,352 | |||||
Science Applications International Corp., 6.75% due 2/1/2008 | A3/A- | 250,000 | 261,223 | |||||
Science Applications International Corp., 6.25% due 7/1/2012 | A3/A- | 1,000,000 | 1,058,514 | |||||
Valassis Communications, 6.625% due 1/15/2009 | Baa3/BBB- | 1,700,000 | 1,763,837 | |||||
Waste Management Inc., 6.875% due 5/15/2009 | Baa3/BBB | 725,000 | 771,382 | |||||
Waste Management Inc., 7.375% due 8/1/2010 | Baa3/BBB | 500,000 | 549,828 | |||||
26 | Certified Annual Report |
| SCHEDULE OF INVESTMENTS, CONTINUED | ||
| Thornburg Limited Term Income Fund | September 30, 2005 | |
Issuer-Description | Credit Rating† Moody’s/S&P | Principal Amount | Value | |||||
Waste Management Inc., 6.50% due 11/15/2008 | Baa3/BBB | $ | 1,000,000 | $ | 1,045,578 | |||
WMX Technologies Inc., 7.00% due 10/15/2006 | Baa3/BBB | 550,000 | 561,979 | |||||
| 6,265,693 | ||||||||
DIVERSIFIED FINANCIALS — 25.75% | ||||||||
CAPITAL MARKETS — 8.52% | ||||||||
Bear Stearns Co. Inc., 4.50% due 10/28/2010 | A1/A | 1,500,000 | 1,476,999 | |||||
Jefferies Group Inc. Senior Note Series B, 7.50% due 8/15/2007 | Baa1/BBB | 2,600,000 | 2,723,443 | |||||
Legg Mason Mtg Capital Corp., 5.29% due 6/1/2009 | NR/NR | 1,714,286 | 1,712,757 | |||||
Lehman Brothers Holdings Inc., 3.50% due 8/7/2008 | A1/A | 700,000 | 678,875 | |||||
Lehman Brothers Holdings Inc. CPI Floating Rate Note, 4.53% due 5/12/2014 | A1/A | 5,190,000 | 5,140,124 | |||||
Merrill Lynch & Co., CPI Floating Rate Note, 3.33% due 3/12/2007 | Aa3/A+ | 5,000,000 | 4,985,950 | |||||
Merrill Lynch & Co., CPI Floating Rate Note, 3.03% due 4/5/2006 | Aa3/A+ | 5,376,000 | 5,356,163 | |||||
Merrill Lynch & Co., CPI Floating Rate Note, 5.22% due 5/5/2014 | Aa3/A+ | 1,000,000 | 989,710 | |||||
Merrill Lynch & Co., CPI Floating Rate Note, 3.69% due 3/2/2009 | Aa3/A+ | 3,000,000 | 2,970,330 | |||||
Morgan Stanley Group, Inc., 3.734% due 1/18/2008 | Aa3/A+ | 5,000,000 | 5,002,870 | |||||
Schwab Charles Corp., 6.30% due 4/28/2006 | A2/A- | 800,000 | 808,151 | |||||
CONSUMER FINANCE — 4.57% | ||||||||
SLM Corp. CPI Floating Rate Note, 4.65% due 1/31/2014 | A2/A | 9,500,000 | 9,451,455 | |||||
SLM Corp. CPI Floating Rate Note, 3.73% due 3/2/2009 | A2/A | 3,000,000 | 2,962,740 | |||||
SLM Corp. Floating Rate Note, 3.86% due 7/25/2008 | A2/A | 3,000,000 | 3,009,465 | |||||
SLM Corp. Floating Rate Note, 4.118% due 9/15/2008 | A2/A | 1,675,000 | 1,675,968 | |||||
DIVERSIFIED FINANCIAL SERVICES — 12.66% | ||||||||
American General Finance Corp., 4.625% due 9/1/2010 | A1/A+ | 200,000 | 197,225 | |||||
Berkshire Hathaway Finance Corp. Senior Note, 4.625% due 10/15/2013 | Aaa/AAA | 1,000,000 | 981,237 | |||||
Dun & Bradstreet Corp., 6.625% due 3/15/2006 | NR/A- | 75,000 | 75,683 | |||||
General Electric Capital Corp., 7.75% due 6/9/2009 | Aaa/AAA | 200,000 | 219,217 | |||||
General Electric Capital Corp., Floating Rate Note,4.175% due 5/30/2008 | Aaa/AAA | 494,000 | 493,018 | |||||
General Electric Capital Corp., 4.25% due 12/1/2010 | Aaa/AAA | 2,000,000 | 1,961,622 | |||||
General Electric Capital Corp., Floating Rate Note, 3.573% due 3/2/2009 | Aaa/AAA | 5,000,000 | 4,868,750 | |||||
General Electric Capital Corp., 4.375% due 11/21/2011 | Aaa/AAA | 1,500,000 | 1,468,773 | |||||
General Electric Capital Corp., 7.375% due 1/19/2010 | Aaa/AAA | 400,000 | 441,414 | |||||
General Electric Capital Corp., 5.00% due 2/15/2007 | Aaa/AAA | 2,900,000 | 2,920,961 | |||||
General Electric Capital Corp. Floating Rate Note, 3.99% due 12/15/2009 | Aaa/AAA | 1,000,000 | 1,001,705 | |||||
Household Finance Corp., 7.20% due 7/15/2006 | A1/A | 550,000 | 561,052 | |||||
Household Finance Corp., 5.75% due 1/30/2007 | A1/A | 400,000 | 406,204 | |||||
Household Finance Corp., 5.90% due 5/15/2006 | A1/A | 100,000 | 100,416 | |||||
Household Finance Corp., 6.40% due 9/15/2009 | A1/A | 400,000 | 410,898 | |||||
Household Finance Corp. CPI Floating Rate Note, 4.54% due 8/10/2009 | A1/A | 5,000,000 | 4,898,850 | |||||
International Lease Finance Corp., 5.00% due 9/15/2012 | A1/AA- | 4,000,000 | 3,947,168 | |||||
International Lease Finance Corp., 4.55% due 10/15/2009 | A1/AA- | 2,500,000 | 2,487,540 | |||||
International Lease Finance Corp. Floating Rate Note, 3.999% due 1/15/2010 | A1/AA- | 4,050,000 | 4,065,451 | |||||
JP Morgan Chase Co., 4.50% due 11/15/2010 | Aa3/A+ | 1,465,000 | 1,444,893 | |||||
JP Morgan Chase Co. CPI Floating Rate Note, 4.90% due 6/28/2009 | Aa3/A+ | 5,000,000 | 5,042,050 | |||||
Principal Financial Group Australia, 8.20% due 8/15/2009 | A2/A | 700,000 | 776,150 | |||||
Toyota Motor Credit Corp., 2.875% due 8/1/2008 | Aaa/AAA | 800,000 | 765,198 | |||||
Toyota Motor Credit Corp., 4.35% due 12/15/2010 | Aaa/AAA | 800,000 | 794,570 | |||||
Toyota Motor Credit Corp., 4.25% due 3/15/2010 | Aaa/AAA | 3,450,000 | 3,411,674 | |||||
Toyota Motor Credit Corp., 2.70% due 1/30/2007 | Aaa/AAA | 3,300,000 | 3,217,757 | |||||
US Central Credit Union, 2.75% due 5/30/2008 | Aa1/AAA | 375,000 | 358,733 | |||||
| 96,263,209 | ||||||||
| Certified Annual Report | 27 |
| SCHEDULE OF INVESTMENTS, CONTINUED | ||
| Thornburg Limited Term Income Fund | September 30, 2005 | |
Issuer-Description | Credit Rating† Moody’s/S&P | Principal Amount | Value | |||||
ENERGY — 3.33% | ||||||||
ENERGY EQUIPMENT & SERVICES — 3.08% | ||||||||
Amerenenergy Generating Co., 7.75% due 11/1/2005 | A3/A- | $ | 850,000 | $ | 852,340 | |||
BJ Services Co. Note Series B, 7.00% due 2/1/2006 | Baa2/BBB+ | 75,000 | 75,491 | |||||
Central Power & Light Co., 7.125% due 2/1/2008 | Baa1/BBB | 2,000,000 | 2,101,656 | |||||
Commonwealth Edison Co., 4.74% due 8/15/2010 | A3/A- | 975,000 | 958,188 | |||||
El Paso Corp., 7.00% due 5/15/2011 | Caa1/B- | 700,000 | 698,250 | |||||
Enterprise Products Participating LP, 7.50% due 2/1/2011 | Baa3/BB+ | 250,000 | 273,452 | |||||
EOG Resources Inc., 6.00% due 12/15/2008 | Baa1/BBB+ | 450,000 | 463,573 | |||||
Louis Dreyfus Natural Gas Corp., 6.875% due 12/1/2007 | A3/BBB+ | 290,000 | 301,936 | |||||
Murphy Oil Corp., 6.375% due 5/1/2012 | Baa1/A- | 750,000 | 805,246 | |||||
Panenergy Corp., 7.00% due 10/15/2006 | Baa3/BBB- | 1,100,000 | 1,118,105 | |||||
Phillips Petroleum Co., 9.375% due 2/15/2011 | A3/A- | 900,000 | 1,087,069 | |||||
Phillips Petroleum Co., 8.75% due 5/25/2010 | A3/A- | 250,000 | 292,306 | |||||
Questar Pipeline Co., 6.05% due 12/1/2008 | A2/A- | 425,000 | 438,926 | |||||
Rio Tinto Finance, 5.75% due 7/3/2006 | Aa3/A+ | 925,000 | 934,640 | |||||
Smith International Inc. Senior Note, 7.00% due 9/15/2007 | Baa1/BBB+ | 600,000 | 622,399 | |||||
Sonat Inc., 7.625% due 7/15/2011 | Caa1/B- | 500,000 | 507,500 | |||||
OIL, GAS & CONSUMABLE FUELS — 0.25% | ||||||||
Occidental Petroleum Corp., 10.125% due 9/15/2009 | A3/A- | 315,000 | 378,331 | |||||
Occidental Petroleum Corp., 7.375% due 11/15/2008 | A3/A- | 300,000 | 324,146 | |||||
Union Oil Co. California, 7.90% due 4/18/2008 | A1/BBB+ | 200,000 | 213,331 | |||||
| 12,446,885 | ||||||||
FOOD & DRUG RETAILING — 0.08% | ||||||||
FOOD & STAPLES RETAILING — 0.08% | ||||||||
General Mills, 5.50% due 1/12/2009 | Baa2/BBB+ | 300,000 | 306,334 | |||||
| 306,334 | ||||||||
FOOD BEVERAGE & TOBACCO — 1.77% | ||||||||
BEVERAGES — 0.94% | ||||||||
Anheuser Busch Co. Inc., 4.375% due 1/15/2013 | A1/A+ | 2,000,000 | 1,957,224 | |||||
Anheuser Busch Co. Inc., 5.625% due 10/1/2010 | A1/A+ | 1,150,000 | 1,198,357 | |||||
Coca Cola Co., 5.75% due 3/15/2011 | Aa3/A+ | 200,000 | 209,410 | |||||
Conagra Inc., 7.875% due 9/15/2010 | Baa1/BBB+ | 150,000 | 167,844 | |||||
FOOD PRODUCTS — 0.83% | ||||||||
Diageo Finance BV, 3.00% due 12/15/2006 | A2/A- | 925,000 | 907,283 | |||||
Kellogg Co., 4.875% due 10/15/2005 | Baa1/BBB+ | 186,000 | 186,042 | |||||
Sara Lee Corp., 6.00% due 1/15/2008 | A3/BBB+ | 900,000 | 919,929 | |||||
Sysco International Co., 6.10% due 6/1/2012 | A1/A+ | 1,000,000 | 1,073,625 | |||||
| 6,619,714 | ||||||||
HEALTH CARE EQUIPMENT & SERVICES — 0.13% | ||||||||
HEALTH CARE EQUIPMENT & SUPPLIES — 0.13% | ||||||||
Baxter International Inc., 5.25% due 5/1/2007 | Baa1/A- | 500,000 | 504,102 | |||||
| 504,102 | ||||||||
28 | Certified Annual Report |
| SCHEDULE OF INVESTMENTS, CONTINUED | ||
| Thornburg Limited Term Income Fund | September 30, 2005 | |
Issuer-Description | Credit Rating† Moody’s/S&P | Principal Amount | Value | |||||
HOTELS RESTAURANTS & LEISURE — 0.13% | ||||||||
HOTELS RESTAURANTS & LEISURE — 0.13% | ||||||||
Wendy’s International Inc., 6.35% due 12/15/2005 | Baa2/BBB+ | $ | 500,000 | $ | 501,669 | |||
| 501,669 | ||||||||
HOUSEHOLD & PERSONAL PRODUCTS — 0.87% | ||||||||
PERSONAL PRODUCTS — 0.87% | ||||||||
Nike Inc., 5.50% due 8/15/2006 | A2/A+ | 900,000 | 908,035 | |||||
Procter & Gamble Co., 4.75% due 6/15/2007 | Aa3/AA- | 350,000 | 351,490 | |||||
Procter & Gamble Co., 4.30% due 8/15/2008 | Aa3/AA- | 2,000,000 | 1,989,008 | |||||
| 3,248,533 | ||||||||
INSURANCE — 8.45% | ||||||||
INSURANCE — 8.45% | ||||||||
AIG Sunamerica Global Financing, 5.10% due 1/17/2007 | Aa2/AA+ | 800,000 | 805,371 | |||||
Allstate Corp., 5.375% due 12/1/2006 | A1/A+ | 900,000 | 907,375 | |||||
Allstate Life Global Funding, 4.50% due 4/2/2007 | Aa2/AA | 5,000,000 | 4,986,800 | |||||
Hartford Financial Services Group Inc. Senior Note, 4.625% due 7/15/2013 | A3/A- | 1,000,000 | 968,129 | |||||
Hartford Life Inc., 7.10% due 6/15/2007 | A3/A- | 300,000 | 311,754 | |||||
Liberty Mutual Group Inc., 5.75% due 3/15/2014 | Baa3/BBB | 1,000,000 | 977,124 | |||||
Lincoln National Corp., 4.75% due 2/15/2014 | A3/A- | 1,000,000 | 974,277 | |||||
Metlife Inc., 5.25% due 12/1/2006 | A2/A | 450,000 | 451,750 | |||||
Old Republic International Corp., 7.00% due 6/15/2007 | Aa3/A+ | 1,800,000 | 1,860,867 | |||||
Pacific Life Global Funding CPI Floating Rate Note, 4.71% due 2/6/2016 | Aa3/AA | 8,000,000 | 7,958,000 | |||||
Principal Life Global Funding, 4.40% due 10/1/2010 | Aa2/AA | 4,000,000 | 3,921,028 | |||||
Principal Life Income Funding Floating Rate Note, 4.41% due 4/1/2016 | Aa2/AA | 5,000,000 | 4,858,550 | |||||
Unumprovident Corp., 7.625% due 3/1/2011 | Ba1/BB+ | 2,450,000 | 2,591,522 | |||||
| 31,572,547 | ||||||||
MATERIALS — 1.27% | ||||||||
CHEMICALS — 1.27% | ||||||||
Chevron Phillips Chemical, 7.00% due 3/15/2011 | Baa1/BBB+ | 500,000 | 542,226 | |||||
Chevron Phillips Chemical, 5.375% due 6/15/2007 | Baa1/BBB+ | 75,000 | 75,628 | |||||
Chevrontexaco Capital Co., 3.50% due 9/17/2007 | Aa2/AA | 1,400,000 | 1,375,224 | |||||
Dow Chemical Co., 5.75% due 12/15/2008 | A3/A- | 350,000 | 361,979 | |||||
E.I. du Pont de Nemours & Co., 8.25% due 9/15/2006 | Aa3/AA- | 200,000 | 205,998 | |||||
E.I. du Pont de Nemours & Co., 4.75% due 11/15/2012 | Aa3/AA- | 1,000,000 | 997,783 | |||||
E.I. du Pont de Nemours & Co., 4.125% due 3/6/2013 | Aa3/AA- | 325,000 | 312,382 | |||||
Hoechst Celanese Corp., 7.125% due 3/15/2009 | B2/NR | 200,000 | 205,414 | |||||
Lubrizol Corp. Senior Note, 5.875% due 12/1/2008 | Baa3/BBB- | 635,000 | 651,782 | |||||
| 4,728,416 | ||||||||
MEDIA — 1.24% | ||||||||
MEDIA — 1.24% | ||||||||
AOL Time Warner Inc., 6.75% due 4/15/2011 | Baa1/BBB+ | 750,000 | 805,439 | |||||
E W Scripps Co. Ohio, 5.75% due 7/15/2012 | A2/A | 80,000 | 83,120 | |||||
| Certified Annual Report | 29 |
| SCHEDULE OF INVESTMENTS, CONTINUED | ||
| Thornburg Limited Term Income Fund | September 30, 2005 | |
Issuer-Description | Credit Rating† Moody’s/S&P | Principal Amount | Value | |||||
New York Times Co., 4.625% due 6/25/2007 | A2/A+ | $ | 300,000 | $ | 299,925 | |||
Scholastic Corp., 5.75% due 1/15/2007 | Baa3/BBB- | 255,000 | 257,475 | |||||
Thomson Corp., 4.25% due 8/15/2009 | A3/A- | 2,900,000 | 2,839,848 | |||||
Time Warner Inc., 8.05% due 1/15/2016 | Baa1/BBB+ | 200,000 | 234,821 | |||||
Tribune Co., 6.875% due 11/1/2006 | A3/A- | 125,000 | 127,610 | |||||
| 4,648,238 | ||||||||
MISCELLANEOUS — 0.48% | ||||||||
MISCELLANEOUS — 0.14% | ||||||||
Stanford University, 5.85% due 3/15/2009 | NA/AAA | 500,000 | 520,446 | |||||
YANKEE — 0.34% | ||||||||
Kreditanstalt Fur Wiederaufbau, 3.25% due 7/16/2007 | Aaa/AAA | 435,000 | 426,357 | |||||
Nova Scotia Province Canada, 5.75% due 2/27/2012 | A2/A | 500,000 | 526,762 | |||||
Ontario Province Canada, 3.282% due 3/28/2008 | Aa2/AA | 335,000 | 324,743 | |||||
| 1,798,308 | ||||||||
PHARMACEUTICALS & BIOTECHNOLOGY — 2.85% | ||||||||
BIOTECHNOLOGY — 2.31% | ||||||||
Abbott Labs, 6.40% due 12/1/2006 | A1/AA | 1,000,000 | 1,021,780 | |||||
Abbott Labs, 3.75% due 3/15/2011 | A1/AA | 500,000 | 476,984 | |||||
Eli Lilly & Co., 5.50% due 7/15/2006 | Aa3/AA | 1,850,000 | 1,865,714 | |||||
Tiers Inflation Linked Trust Series Wyeth 2004 21 Trust Certificate CPI Floating Rate Note, 4.653% due 2/1/2014 | Baa1/A | 5,450,000 | 5,286,881 | |||||
PHARMACEUTICALS — 0.54% | ||||||||
Pharmacia Corp., 5.75% due 12/1/2005 | Aaa/AAA | 2,000,000 | 2,005,502 | |||||
| 10,656,861 | ||||||||
RETAILING — 2.15% | ||||||||
DISTRIBUTORS — 0.03% | ||||||||
Dayton Hudson Corp., 9.625% due 2/1/2008 | A2/A+ | 100,000 | 110,163 | |||||
MULTILINE RETAIL — 1.55% | ||||||||
Costco Wholesale Corp., 5.50% due 3/15/2007 | A2/A | 500,000 | 506,050 | |||||
Dillard’s Inc., 7.375% due 6/1/2006 | B2/BB | 150,000 | 152,625 | |||||
Wal-Mart Stores Inc., 6.875% due 8/10/2009 | Aa2/AA | 900,000 | 969,348 | |||||
Wal-Mart Stores Inc., 4.125% due 2/15/2011 | Aa2/AA | 3,735,000 | 3,633,087 | |||||
Wal-Mart Stores Inc., 8.57% due 1/2/2010 | Aa2/AA | 345,489 | 368,005 | |||||
Wal-Mart Stores Inc., 1992-A1 Pass Through Certificate, 7.49% due 6/21/2007 | Aa2/AA | 165,231 | 170,991 | |||||
SPECIALTY RETAIL — 0.57% | ||||||||
Home Depot, Inc., 4.625% due 8/15/2010 | Aa3/AA | 2,135,000 | 2,134,408 | |||||
| 8,044,677 | ||||||||
30 | Certified Annual Report |
| SCHEDULE OF INVESTMENTS, CONTINUED | ||
| Thornburg Limited Term Income Fund | September 30, 2005 | |
Issuer-Description | Credit Rating† Moody’s/S&P | Principal Amount | Value | |||||
SOFTWARE & SERVICES — 1.21% | ||||||||
INTERNET SOFTWARE & SERVICES — 1.21% | ||||||||
Electronic Data Systems Corp., 7.125% due 10/15/2009 | Ba1/BBB- | $ | 2,500,000 | $ | 2,677,492 | |||
Electronic Data Systems Corp., 6.50% due 8/1/2013 | Ba1/BBB- | 1,000,000 | 1,024,368 | |||||
Reynolds & Reynolds, 7.00% due 12/15/2006 | Baa2/BBB | 800,000 | 803,234 | |||||
| 4,505,094 | ||||||||
TECHNOLOGY HARDWARE & EQUIPMENT — 2.88% | ||||||||
COMPUTERS & PERIPHERALS — 2.88% | ||||||||
Computer Sciences Corp., 6.25% due 3/15/2009 | A3/A | 300,000 | 311,693 | |||||
Computer Sciences Corp., 7.375% due 6/15/2011 | A3/A | 1,317,000 | 1,468,263 | |||||
Computer Sciences Corp., 3.50% due 4/15/2008 | A3/A | 2,000,000 | 1,941,774 | |||||
First Data Corp., 5.625% due 11/1/2011 | A1/A+ | 900,000 | 936,114 | |||||
First Data Corp., 6.375% due 12/15/2007 | A1/A+ | 110,000 | 113,854 | |||||
International Business Machines, 4.875% due 10/1/2006 | A1/A+ | 500,000 | 502,179 | |||||
International Business Machines, 4.25% due 9/15/2009 | A1/A+ | 1,000,000 | 988,871 | |||||
International Business Machines, 2.375% due 11/1/2006 | A1/A+ | 2,825,000 | 2,764,585 | |||||
Jabil Circuit Inc., 5.875% due 7/15/2010 | Baa3/BBB- | 500,000 | 512,160 | |||||
Oracle Corp., 6.91% due 2/15/2007 | A3/A- | 1,200,000 | 1,235,293 | |||||
| 10,774,786 | ||||||||
TELECOMMUNICATION SERVICES — 1.06% | ||||||||
DIVERSIFIED TELECOMMUNICATION SERVICES — 1.06% | ||||||||
Cingular Wireless, 5.625% due 12/15/2006 | Baa2/A | 900,000 | 910,901 | |||||
GTE Hawaiian Telephone Inc., 7.375% due 9/1/2006 (Insured: MBIA) | Aaa/AAA | 1,500,000 | 1,521,952 | |||||
Verizon Wireless Capital LLC, 5.375% due 12/15/2006 | A3/A+ | 1,500,000 | 1,514,558 | |||||
| 3,947,411 | ||||||||
TRANSPORTATION — 0.59% | ||||||||
AIRLINES — 0.53% | ||||||||
Continental Airlines Pass Through Certificate Series 1997 4 Class-4A, 6.90% due 1/2/2018 | Baa3/BBB+ | 200,742 | 196,203 | |||||
Delta Air Lines Inc. EETC Series 2001-1 Class-A, 6.619% due 3/18/2011 | Ba2/BB+ | 279,327 | 261,255 | |||||
Northwest Airlines 1999-2 Class-A, 7.575% due 3/1/2019 | Ba2/BBB- | 124,273 | 124,279 | |||||
Southwest Airlines Co., 7.875% due 9/1/2007 | Baa1/A | 1,012,000 | 1,066,175 | |||||
Southwest Airlines Co., 5.10% due 5/1/2006 | Aa2/AA+ | 307,975 | 308,563 | |||||
ROAD & RAIL — 0.06% | ||||||||
CSX Corp., 7.45% due 5/1/2007 | Baa2/BBB | 225,000 | 234,157 | |||||
| 2,190,632 | ||||||||
UTILITIES — 3.06% | ||||||||
ELECTRIC UTILITIES — 2.23% | ||||||||
Appalachian Power Co., 6.60% due 5/1/2009 (Insured: MBIA) | Aaa/AAA | 175,000 | 185,550 | |||||
Gulf Power Co., 4.35% due 7/15/2013 | A2/A | 925,000 | 890,742 | |||||
Minnesota Power & Light Co., 7.00% due 2/15/2007 | Baa1/A | 900,000 | 926,505 | |||||
Northern Border Pipeline Co., 6.25% due 5/1/2007 | A3/BBB+ | 120,000 | 122,618 | |||||
Northern States Power Co., 4.75% due 8/1/2010 | A2/A- | 2,825,000 | 2,813,516 | |||||
| Certified Annual Report | 31 |
| SCHEDULE OF INVESTMENTS, CONTINUED | ||
| Thornburg Limited Term Income Fund | September 30, 2005 | |
Issuer-Description | Credit Rating† Moody’s/S&P | Principal Amount | Value | |||||
Pennsylvania Power & Light Co., 6.55% due 3/1/2006 (Insured: MBIA) | Aaa/AAA | $ | 210,000 | $ | 211,831 | |||
PSI Energy Inc., 7.85% due 10/15/2007 | Baa1/BBB | 500,000 | 529,271 | |||||
PSI Energy Inc., 6.65% due 6/15/2006 | A3/A- | 245,000 | 248,566 | |||||
Public Service Electric & Gas Co., 6.75% due 3/1/2006 (Insured: MBIA) | Aaa/AAA | 275,000 | 277,561 | |||||
Texas Eastern Transmission Corp. Senior Note, 5.25% due 7/15/2007 | Baa2/BBB | 525,000 | 529,296 | |||||
Wisconsin Energy Corp., 5.50% due 12/1/2008 | A3/BBB+ | 350,000 | 358,316 | |||||
Wisconsin Public Service Corp., 6.125% due 8/1/2011 | Aa2/A+ | 1,150,000 | 1,223,868 | |||||
GAS UTILITIES — 0.57% | ||||||||
Southern California Gas Co., 4.375% due 1/15/2011 | A1/A+ | 225,000 | 221,665 | |||||
Texas Municipal Gas Corp., 2.60% due 7/1/2007 (Insured: FSA) | Aaa/AAA | 1,950,000 | 1,920,379 | |||||
MULTI-UTILITIES — 0.26% | ||||||||
Madison Gas & Electric Co., 6.02% due 9/15/2008 | Aa3/AA- | 950,000 | 979,298 | |||||
| 11,438,982 | ||||||||
TOTAL CORPORATE BONDS (Cost $249,395,358) | 249,579,949 | |||||||
Taxable Municipal Bonds — 11.93% | ||||||||
American Campus Properties Student Housing, 7.38% due 9/1/2012 (Insured: MBIA) | Aaa/AAA | 3,885,000 | 4,254,425 | |||||
American Fork City Utah Sales, 4.89% due 3/1/2012 (Insured: FSA) | Aaa/AAA | 300,000 | 300,480 | |||||
American Fork City Utah Sales, 5.07% due 3/1/2013 (Insured: FSA) | Aaa/AAA | 120,000 | 121,512 | |||||
Arkansas Electric Coop Corp., 7.33% due 6/30/2008 | A2/AA- | 116,000 | 119,921 | |||||
Bessemer Alabama Water Revenue Taxable Warrants Series B, 7.375% due 7/1/2008 (Insured: FSA) | Aaa/AAA | 670,000 | 692,579 | |||||
Brockton MA Taxable Economic Development Series A, 6.45% due 5/1/2017 (Insured: FGIC) | Aaa/AAA | 150,000 | 164,161 | |||||
Burbank California Waste Disposal Revenue, 5.29% due 5/1/2007 (Insured: FSA) | Aaa/AAA | 370,000 | 373,171 | |||||
Burbank California Waste Disposal Revenue, 5.48% due 5/1/2008 (Insured: FSA) | Aaa/AAA | 310,000 | 316,036 | |||||
Chicago Illinois Taxable Neighborhoods Alive Series B, 5.20% due 1/1/2006 (Insured: FGIC) | Aaa/AAA | 200,000 | 201,448 | |||||
Cleveland Cuyahoga County Ohio, 6.10% due 5/15/2013 | NR/BBB+ | 1,945,000 | 1,899,312 | |||||
Connecticut State Housing Finance Authority, 3.10% due 6/15/2032 put 12/1/2005 (Insured:AMBAC) | Aaa/AAA | 1,870,000 | 1,866,017 | |||||
Cook County Illinois Community College District 508, 6.90% due 5/1/2010 (Insured:AMBAC) | Aaa/AAA | 600,000 | 620,538 | |||||
Cook County Illinois School District 083, 4.625% due 12/1/2010 (Insured: FSA) | Aaa/NR | 250,000 | 247,642 | |||||
Cook County Illinois School District 083, 4.875% due 12/1/2011 (Insured: FSA) | Aaa/NR | 150,000 | 149,880 | |||||
Denver City & County Special Facilities Taxable Refunding & Improvement Series B, 7.15% due 1/1/2008 (Insured: MBIA) | Aaa/AAA | 900,000 | 948,096 | |||||
Elkhart Indiana Redevelopment District Revenue, 4.80% due 6/15/2011 | NR/NR | 240,000 | 230,314 | |||||
Elkhart Indiana Redevelopment District Revenue, 4.80% due 12/15/2011 | NR/NR | 245,000 | 234,325 | |||||
Elkhart Indiana Redevelopment District Revenue, 5.05% due 12/15/2012 | NR/NR | 515,000 | 495,100 | |||||
Elkhart Indiana Redevelopment District Revenue, 5.25% due 12/15/2013 | NR/NR | 540,000 | 518,762 | |||||
Green Bay Wisconsin Series B, 4.875% due 4/1/2011 (Insured: MBIA) | Aaa/NR | 365,000 | 365,748 | |||||
Hancock County Mississippi, 4.20% due 8/1/2008 (Insured: MBIA) | Aaa/NR | 305,000 | 300,620 | |||||
Hancock County Mississippi, 4.80% due 8/1/2010 (Insured: MBIA) | Aaa/NR | 245,000 | 244,588 | |||||
Hancock County Mississippi, 4.90% due 8/1/2011 (Insured: MBIA) | Aaa/NR | 315,000 | 315,331 | |||||
Hanover Pennsylvania Area School District Taxable Notes Series B, 4.47% due 3/15/2013 (Insured: FSA) | Aaa/AAA | 1,385,000 | 1,359,835 | |||||
Jefferson County Texas Navigation Taxable Refunding, 5.50% due 5/1/2010 (Insured: FSA) | Aaa/NR | 500,000 | 509,695 | |||||
Jefferson Franklin, Etc. Counties Illinois Community College District 521, 3.00% due 1/1/2006 (Insured: FSA) | Aaa/NR | 200,000 | 199,480 | |||||
Jefferson Franklin, Etc. Counties Illinois Community College District 521, 3.625% due 1/1/2007 (Insured: FSA) | Aaa/NR | 300,000 | 296,964 | |||||
Jersey City New Jersey Municipal Utilities Authority, 3.72% due 5/15/2009 (Insured: MBIA) | Aaa/AAA | 575,000 | 556,525 | |||||
Kendall Kane County Illinois School 308, 5.50% due 10/1/2011 (Insured: FGIC) | Aaa/NR | 365,000 | 378,439 | |||||
32 | Certified Annual Report |
| SCHEDULE OF INVESTMENTS, CONTINUED | ||
| Thornburg Limited Term Income Fund | September 30, 2005 | |
Issuer-Description | Credit Rating† Moody’s/S&P | Principal Amount | Value | |||||
King County Washington GO, 7.55% due 12/1/2005 | Aa1/AA+ | $ | 405,000 | $ | 407,543 | |||
Los Angeles County California Metropolitan Transport, 4.56% due 7/1/2010 (Insured:AMBAC) | Aaa/AAA | 2,775,000 | 2,753,771 | |||||
Maryland State Economic Development Corp., 7.25% due 6/1/2008 | ||||||||
(Maryland Tech Development Center Project) | NR/NR | 280,000 | 288,963 | |||||
McKeesport Pennsylvania Taxable Series B, 6.60% due 3/1/2006 (Insured: MBIA) | Aaa/AAA | 240,000 | 242,395 | |||||
Mississippi State Taxable Business Series V, 7.125% due 9/1/2006 | NR/AA | 140,000 | 143,198 | |||||
Montgomery County Maryland Revenue Authority, 5.00% due 2/15/2012 | Aa2/AA+ | 100,000 | 100,482 | |||||
Multnomah County Oregon School District 1J Refunding Taxable, 4.191% due 6/15/2008 | A2/A- | 650,000 | 638,853 | |||||
New Jersey Health Care Facilities Financing, 10.75% due 7/1/2010 (ETM) | NR/NR | 365,000 | 425,126 | |||||
New Jersey Health Care Facilities Financing, 7.70% due 7/1/2011 (Insured: Connie Lee) | NR/AAA | 130,000 | 139,198 | |||||
New Rochelle New York Industrial Development Agency, 7.15% due 10/1/2014 | Aa2/A+ | 150,000 | 159,180 | |||||
New York Environmental Facilities, 5.85% due 3/15/2011 | NR/AA- | 3,500,000 | 3,686,200 | |||||
New York State Housing Finance, 4.46% due 8/15/2009 | Aa1/NR | 455,000 | 448,407 | |||||
New York State Thruway Authority Service Contract, 2.59% due 3/15/2006 | A2/AA- | 1,000,000 | 992,790 | |||||
New York State Urban Development Corp., 4.75% due 12/15/2011 | NR/AA | 1,400,000 | 1,404,382 | |||||
Newark New Jersey, 4.70% due 4/1/2011 (Insured: MBIA) | Aaa/NR | 845,000 | 839,668 | |||||
Newark New Jersey, 4.90% due 4/1/2012 (Insured: MBIA) | Aaa/NR | 1,225,000 | 1,224,326 | |||||
Niagara Falls New York Public Water, 4.30% due 7/15/2010 (Insured: MBIA) | Aaa/AAA | 360,000 | 354,031 | |||||
Northwest Open Access Network Washington Revenue, 6.18% due 12/1/2008 (Insured:AMBAC) | Aaa/AAA | 1,600,000 | 1,667,424 | |||||
Ohio State Petroleum Underground Storage, 6.75% due 8/15/2008 (Insured: MBIA) | Aaa/AAA | 660,000 | 661,320 | |||||
Pima County Arizona Industrial Development Authority Series E, 9.05% due 7/1/2008 | Baa3/NR | 70,000 | 71,216 | |||||
Port Walla Walla Revenue, 5.30% due 12/1/2009 | NR/NR | 235,000 | 231,964 | |||||
Providence Rhode Island, 5.59% due 1/15/2008 (Insured: FGIC) | Aaa/AAA | 340,000 | 348,048 | |||||
Short Pump Town Center Community Development, 6.26% due 2/1/2009 | NR/NR | 1,000,000 | 1,021,780 | |||||
Sisters Providence Obligation Group Direct Obligation Notes Series 1997, 7.47% due 10/1/2007 | Aa3/AA | 1,805,000 | 1,889,799 | |||||
Tazewell County Illinois Community High School, 5.20% due 12/1/2011 (Insured: FSA) | Aaa/NR | 355,000 | 362,689 | |||||
Tennessee State Taxable Series B, 6.00% due 2/1/2013 | Aa2/AA | 500,000 | 528,995 | |||||
Texas State Public Finance Authority Revenue, 3.125% due 6/15/2007 | Aa2/AA | 400,000 | 391,196 | |||||
Texas Tech University Revenue, 6.00% due 8/15/2011 (Insured: MBIA) | Aaa/AAA | 245,000 | 260,060 | |||||
University Illinois Revenue, 6.35% due 4/1/2011 (Insured: FGIC) | Aaa/AAA | 1,000,000 | 1,075,080 | |||||
Victor New York, 9.20% due 5/1/2014 | NR/NR | 1,250,000 | 1,315,838 | |||||
Virginia Housing Development Authority Taxable Rental Housing Series I, 7.30% due 2/1/2008 | Aa1/AA+ | 505,000 | 530,715 | |||||
West Valley City Utah Municipal Building Lease Refunding Taxable, 7.67% due 5/1/2006 | Aa2/NR | 1,500,000 | 1,526,670 | |||||
Wisconsin State General Revenue, 4.80% due 5/1/2013 (Insured: FSA) | Aaa/AAA | 200,000 | 199,992 | |||||
TOTAL TAXABLE MUNICIPAL BONDS (Cost $44,412,301) | 44,612,243 | |||||||
Short Term Investments — 2.14% | ||||||||
Citigroup, 3.78% due 10/7/2005 | Prim1/A-1+ | 5,000,000 | 4,996,850 | |||||
UBS Finance, 3.74% due 10/3/2005 | Prim1/A-1+ | 3,000,000 | 2,999,377 | |||||
TOTAL SHORT TERM INVESTMENTS (Cost $7,996,227) | 7,996,227 | |||||||
TOTAL INVESTMENTS — 98.95% (Cost $369,934,333) | $ | 369,895,639 | ||||||
OTHER ASSETS LESS LIABILITIES — 1.05% | 3,907,046 | |||||||
NET ASSETS — 100.00% | $ | 373,802,685 | ||||||
| Certified Annual Report | 33 |
| SCHEDULE OF INVESTMENTS, CONTINUED | ||
| Thornburg Limited Term Income Fund | September 30, 2005 | |
Footnote Legend
| † | Credit ratings are unaudited. Rating changes may have occurred prior to or subsequent to the reporting period end. |
See notes to financial statements.
Portfolio Abbreviations
To simplify the listings of securities, abbreviations are used per the table below:
| AMBAC | Insured by American Municipal Bond Assurance Corp. | |
| ETM | Escrowed to Maturity | |
| FGIC | Insured by Financial Guaranty Insurance Co. | |
| FSA | Insured by Financial Security Assurance Co. | |
| GO | General Obligation | |
| MBIA | Insured by Municipal Bond Investors Assurance |
SUMMARY OF SECURITY CREDIT RATINGS†

Ratings are a blend of Moody’s and Standard & Poor’s, using the higher rating. Some bonds are rated by only one service.
34 | Certified Annual Report |
REPORT OF INDEPENDENT REGISTERED PUBLIC ACCOUNTING FIRM
Thornburg Limited Term Income Funds
To the Trustees and Class I Shareholders of
Thornburg Limited Term U.S. Government Fund
Thornburg Limited Term Income Fund
In our opinion, the accompanying statements of assets and liabilities, including the schedules of investments, and the related statements of operations and of changes in net assets and the financial highlights present fairly, in all material respects, the financial position of Thornburg Limited Term U.S. Government Fund and Thornburg Limited Term Income Fund (separate portfolios of Thornburg Investment Trust, hereafter referred to as the “Funds”) at September 30, 2005, the results of each of their operations for the year then ended, the changes in each of their net assets for each of the two years in the period then ended and the financial highlights for the class I shares for each of the periods presented, in conformity with accounting principles generally accepted in the United States of America. These financial statements and financial highlights (hereafter referred to as “financial statements”) are the responsibility of the Fund’s management. Our responsibility is to express an opinion on these financial statements based on our audits. We conducted our audits of these financial statements in accordance with the standards of the Public Company Accounting Oversight Board (United States). Those standards require that we plan and perform the audit to obtain reasonable assurance about whether the financial statements are free of material misstatement. An audit includes examining, on a test basis, evidence supporting the amounts and disclosures in the financial statements, assessing the accounting principles used and significant estimates made by management, and evaluating the overall financial statement presentation. We believe that our audits, which included confirmation of securities at September 30, 2005 by correspondence with the custodian and brokers, provide a reasonable basis for our opinion.
PricewaterhouseCoopers LLP
New York, New York
November 16, 2005
| Certified Annual Report | 35 |
| EXPENSE EXAMPLE | ||
| Thornburg Limited Term Income Funds | September 30, 2005 (Unaudited) | |
As a shareholder of the Fund, you incur ongoing costs, including management and administrative fees and other Fund expenses.
This example is intended to help you understand your ongoing costs (in dollars) of investing in the Fund and to compare these costs with the ongoing costs of investing in other mutual funds.
The example is based on an investment of $1,000 invested on March 31, 2005 and held until September 30, 2005.
Actual Expenses
The first line of the table at right provides information about actual account values and actual expenses. You may use the information in this line, together with the amount you invested, to estimate the expenses that you paid over the period. Simply divide your account value by $1,000 (for example, an $8,600 account value divided by $1,000 = 8.6), then multiply the result by the number in the first line under the heading entitled “Expenses Paid During Period” to estimate the expenses you paid on your account during this period.
Hypothetical Example for Comparison Purposes
The second line of the table at right provides information about hypothetical account values and hypothetical expenses based on the Fund’s actual expense ratio and an assumed rate of return of 5% per year before expenses, which is not the Fund’s actual return. The hypothetical account values and expenses may not be used to estimate the actual ending account balance or expenses you paid for the period. You may use this information to compare the ongoing costs of investing in the Fund and other funds. To do so, compare this 5% hypothetical example with the 5% hypothetical examples that appear in the shareholder reports of the other funds.
Please note that the expenses shown in the table are meant to highlight your ongoing costs only and do not reflect any transactional costs, such as sales charges (loads), redemption fees, or exchange fees. Therefore, the second line of the table is useful in comparing ongoing costs only, and will not help you determine the relative total costs of owning different funds. In addition, if these transactional costs were included, your costs would have been higher.
Beginning Account Value 3/31/05 | Ending Account Value 9/30/05 | Expenses Paid During Period† 3/31/05–9/30/05 | |||||||
U.S. Government Fund | |||||||||
Class I Shares | |||||||||
Actual | $ | 1,000 | $ | 1,014.00 | $ | 3.38 | |||
Hypothetical* | $ | 1,000 | $ | 1,021.71 | $ | 3.39 | |||
Income Fund | |||||||||
Class I Shares | |||||||||
Actual | $ | 1,000 | $ | 1,015.80 | $ | 3.38 | |||
Hypothetical* | $ | 1,000 | $ | 1,021.71 | $ | 3.39 | |||
| † | Thornburg Limited Term U.S. Government Fund expenses are equal to the annualized expense ratio for class I shares (0.67%) multiplied by the average account value over the period, multiplied by 183/365 to reflect the one-half year period. Thornburg Limited Term Income Fund expenses are equal to the annualized expense ratio for class I shares (0.67%) multiplied by the average account value over the period, multiplied by 183/365 to reflect the one-half year period. |
| * | Hypothetical assumes a rate of return of 5% per year before expenses. |
36 | Certified Annual Report |
| INDEX COMPARISON | ||
| Thornburg Limited Term U.S. Government Fund | September 30, 2005 (Unaudited) | |
GROWTH OF A HYPOTHETICAL $10,000 INVESTMENT
Thornburg Limited Term U.S. Government Fund Class I Total Returns, versus
Lehman Brothers Intermediate Government Bond Index and Consumer Price Index
(July 30, 1996 to September 30, 2005)

AVERAGE ANNUAL TOTAL RETURNS
For the periods ended September 30, 2005
| 1 Yr | 5 Yrs | 10 Yrs | Since Inception | ||||||||
I Shares (Incep: 7/5/96) | 0.95 | % | 5.38 | % | N/A | 5.67 | % |
FUND ATTRIBUTES
as of September 30, 2005
| Annualized Dist. Rate | SEC Yield | NAV | Maximum Offering Price | |||||||||
I Shares (Incep: 7/5/96) | 2.99 | % | 3.37 | % | $ | 12.76 | $ | 12.76 | ||||
Performance data reflect past performance, which is no guarantee of future results. The performance data and graph do not reflect the deduction of taxes that a shareholder would pay on distributions or the redemption of Fund shares.
For the U.S. Government Fund, returns reflect the reinvestment of dividends and capital gains. There is no up front sales charge for I shares.
The Lehman Brothers Intermediate Government Bond Index is an unmanaged market-weighted index generally representative of all public obligations of the U.S. Government, its agencies and instrumentalities having maturities of up to ten years.
The SEC Yield is computed in accordance with SEC standards measuring the net investment income per share over a specified 30-day period expressed as a percentage of the maximum offering price of the Funds’ shares at the end of the period.
The distribution rate is calculated by taking the sum of the month’s total distribution factors and dividing this sum by a 30-day period and annualizing to 360-day year. The value is then divided by the ending Net Asset Value (NAV) to arrive at the annualized distribution yield. The yield is calculated on a periodic basis and is subject to change depending on the Funds’ NAV and current distributions.
Shares are not guaranteed by the U.S. Government.
| Certified Annual Report | 37 |
| INDEX COMPARISON | ||
| Thornburg Limited Term Income Fund | September 30, 2005 (Unaudited) | |
GROWTH OF A HYPOTHETICAL $10,000 INVESTMENT
Thornburg Limited Term Income Fund Class I Total Returns versus
Lehman Brothers Intermediate Government/Credit Index and Consumer Price Index
(July 30, 1996 to September 30, 2005)
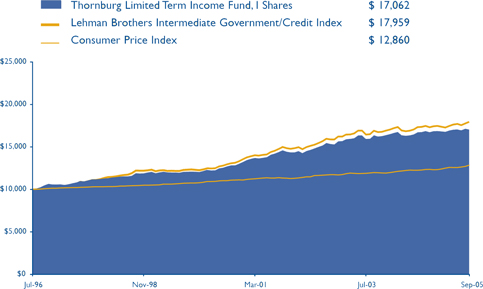
AVERAGE ANNUAL TOTAL RETURNS
For the periods ended September 30, 2005
| 1 Yr | 5 Yrs | 10 Yrs | Since Inception | ||||||||
I Shares (Incep: 7/5/96) | 1.77 | % | 5.86 | % | N/A | 6.09 | % |
FUND ATTRIBUTES
as of September 30, 2005
| Annualized Dist. Rate | SEC Yield | NAV | Maximum Offering Price | |||||||||
I Shares (Incep: 7/5/96) | 4.23 | % | 3.97 | % | $ | 12.51 | $ | 12.51 | ||||
Performance data reflect past performance, which is no guarantee of future results. The performance data and graph do not reflect the deduction of taxes that a shareholder would pay on distributions or the redemption of Fund shares.
For the Limited Term Income Fund, returns reflect the reinvestment of dividends and capital gains. There is no up front sales charge for I shares.
The Lehman Brothers Intermediate Government/Credit Bond Index is an unmanaged, market-weighted index generally representative of intermediate government and investment grade corporate debt securities having maturities of up to ten years.
The Consumer Price Index (“CPI”) measures prices of a fixed basket of goods bought by a typical consumer, including food, transportation, shelter, utilities, clothing, medical care, entertainment and other items. The CPI, published by the Bureau of Labor Statistics in the Department of Labor, is based at 100 in 1982 and is released monthly. It is widely used as a cost-of-living benchmark to adjust Social Security payments and other payment schedules, union contracts and tax brackets. The CPI is also known as the cost-of-living index.
Unless otherwise noted, index returns reflect the reinvestment of income dividends and capital gains, if any, but do not reflect fees, brokerage commissions or other expenses of investing. Investors may not make direct investments into any index.
38 | Certified Annual Report |
| TRUSTEES AND OFFICERS | ||
| Thornburg Limited Term Income Funds | September 30, 2005 (Unaudited) | |
Name, Age, Position Held with Fund Year Elected | Principal Occupation(s) During Past Five Years | Other Directorships Held by Trustee | ||
INTERESTED TRUSTEES(1)(2)(4) | ||||
Garrett Thornburg, 59 Chairman of Trustees, Trustee since 1987(3) | CEO, Chairman and controlling shareholder of Thornburg Investment Management, Inc. (investment advisor) and Thornburg Securities Corporation (securities dealer); Chairman of Thornburg Limited Term Municipal Fund, Inc. (registered investment company) to 2004; CEO and Chairman of Thornburg Mortgage, Inc. (real estate investment trust); Chairman of Thornburg Mortgage Advisory Corporation (investment manager to Thornburg Mortgage, Inc.). | Director of Thornburg Mortgage, Inc. (real estate investment trust) | ||
Brian J. McMahon, 49 Trustee since 2001, Member of Governance & Nominating Committee, President since 1997(5)(6) | President and Managing Director of Thornburg Investment Management, Inc.; President of Thornburg Limited Term Municipal Fund, Inc. to 2004. | None | ||
| INDEPENDENT TRUSTEES(1)(2)(4) | ||||
David A. Ater, 60 Trustee since 1994, Member of Audit Committee and Governance & Nominating Committee | Principal in Ater & Associates, Santa Fe, NM (developer, planner and broker of residential and commercial real estate); owner developer and broker for various real estate projects. | Director of Thornburg Mortgage, Inc. (real estate investment trust) | ||
David D. Chase, 64 Chairman of Audit Committee, Trustee since 2000 | Chairman, President, CEO, and Managing Member of Vestor Associates, LLC, the general partner of Vestor Partners, LP, Santa Fe, NM (private equity fund); Chairman and CEO of Vestor Holdings, Inc., Santa Fe, NM (merchant bank). | None | ||
Eliot R. Cutler, 59 Chairman of Governance & Nominating Committee, Trustee since 2004 | Partner, Akin, Gump, Strauss, Hauer & Feld, LLP, Washington, D.C. (law firm) since November 2000; partner, Cutler & Stanfield, Washington, D.C. (law firm) until November 2000. | Director of Thornburg Mortgage, Inc. (real estate investment trust) | ||
Susan H. Dubin, 56 Trustee since 2004, Member of Audit Committee | President of Dubin Investments, Ltd., Greenwich, CT (private investment fund); Director and officer of various charitable organizations; and formerly, Vice President of Chemical Bank (predecessor to JP Morgan Chase & Co.), New York, 1974–1996. | None | ||
Owen D.Van Essen, 51 Trustee since 2004, Member of Governance & Nominating Committee | President of Dirks, Van Essen & Murray, Santa Fe, NM (newspaper mergers and acquisitions). | None | ||
James W. Weyhrauch, 46 Trustee since 1996, Member of Audit Committee | Director, Executive Vice President to 2002, and President and CEO 2002–2004, Nambé Mills, Inc., Santa Fe, NM (manufacturer); real estate agent, Santa Fe Properties, Santa Fe, NM since 2004. | None | ||
| Certified Annual Report | 39 |
| TRUSTEES AND OFFICERS, CONTINUED | ||
| Thornburg Limited Term Income Funds | September 30, 2005 (Unaudited) | |
Name, Age, Position Held with Fund Year Elected | Principal Occupation(s) During Past Five Years | Other Directorships Held by Trustee | ||
OFFICERS OF THE FUND (WHO ARE NOT TRUSTEES)(1)(6)(7) | ||||
Dawn B. Fischer, 58 Secretary since 1987 | Secretary and Managing Director, Thornburg Investment Management, Inc.; Secretary, Thornburg Limited Term Municipal Fund, Inc. to 2004; Secretary, Thornburg Securities Corporation; Vice President, Daily Tax Free Income Fund, Inc. (registered investment company). | Not applicable | ||
Steven J. Bohlin, 46 Vice President since 1987; Treasurer since 1989 | Vice President and Managing Director of Thornburg Investment Management, Inc.; Vice President of Thornburg Limited Term Municipal Fund, Inc. to 2004. | Not applicable | ||
George T. Strickland, 42 Vice President since 1996 | Vice President and Managing Director of Thornburg Investment Management, Inc.; Vice President (to 2004) and Treasurer (2003–2004) of Thornburg Limited Term Municipal Fund, Inc. | Not applicable | ||
William V. Fries, 66 Vice President since 1995 | Vice President and Managing Director of Thornburg Investment Management, Inc. | Not applicable | ||
Leigh Moiola, 38 Vice President since 2001 | Vice President and Managing Director of Thornburg Investment Management, Inc.; Vice President of Thornburg Limited Term Municipal Fund, Inc. 1999–2004. | Not applicable | ||
Kenneth Ziesenheim, 51 Vice President since 1995 | Vice President and Managing Director of Thornburg Investment Management, Inc.; President of Thornburg Securities Corporation; Vice President of Thornburg Limited Term Municipal Fund, Inc. to 2004. | Not applicable | ||
Alexander Motola, 35 Vice President since 2001 | Vice President and Managing Director of Thornburg Investment Management, Inc. since 2000; Portfolio Manager, Insight Capital Research & Management, Inc., Walnut Creek, California 1995–2000. | Not applicable | ||
Wendy Trevisani, 34 Vice President since 1999 | Associate Portfolio Manager of Thornburg Investment Management, Inc. since 1999, Vice President since 2000 and Managing Director since 2003; Vice President of Thornburg Limited Term Municipal Fund, Inc. 1999–2002. | Not applicable | ||
Joshua Gonze, 42 Vice President since 1999 | Associate Portfolio Manager of Thornburg Investment Management, Inc. since 1999,Vice President since 1999 and Managing Director since 2003; Vice President of Thornburg Limited Term Municipal Fund, Inc. to 2004. | Not applicable | ||
Brad Kinkelaar, 37 Vice President since 1999 | Associate Portfolio Manager of Thornburg Investment Management, Inc. since 1999, Vice President since 2000 and Managing Director since 2003. | Not applicable | ||
Christopher Ihlefeld, 35 Vice President since 2003 | Associate Portfolio Manager since 1999; Vice President of Thornburg Investment Management, Inc. since 2002; Vice President of Limited Term Municipal Fund, Inc., 2003–2004. | Not applicable | ||
Leon Sandersfeld, 39 Vice President since 2003 | Associate of Thornburg Investment Management, Inc. since 2002; Senior Staff Accountant, Farm Bureau Life Insurance Co. 1998–2002. | Not applicable | ||
40 | Certified Annual Report |
| TRUSTEES AND OFFICERS, CONTINUED | ||
| Thornburg Limited Term Income Funds | September 30, 2005 (Unaudited) | |
Name, Age, Position Held with Fund Year Elected | Principal Occupation(s) During Past Five Years | Other Directorships | ||
Sasha Wilcoxon, 31 Vice President since 2003 | Associate of Thornburg Investment Management, Inc. since 2000 and Mutual Fund Operations Department Manager since 2002. | Not applicable | ||
Ed Maran, 47 Vice President since 2004 | Associate Portfolio Manager of Thornburg Investment Management, Inc. since 2002 and Vice President and Managing Director since 2004; Analyst, USAA 2001–2002; Oil Analyst, A.G. Edwards 1997–2000. | Not applicable | ||
Vinson Walden, 35 Vice President since 2004 | Associate Portfolio Manager of Thornburg Investment Management, Inc. since 2002 and Vice President and Managing Director since 2004; Associate Portfolio Manager, Ibis Management 2002–2004; Associate, Lehman Brothers, 1997–2001. | Not applicable | ||
| (1) | Each person’s address is 119 East Marcy Street, Santa Fe, New Mexico 87501. |
| (2) | The Fund is one of twelve separate investment “Funds” or “series” of Thornburg Investment Trust (the “Trust”), which comprises the Thornburg mutual fund complex and is organized as a Massachusetts business trust. The Trust currently has twelve active Funds. Thornburg Investment Management, Inc. is the investment advisor to, and manages, the twelve Funds of the Trust. Each Trustee oversees the twelve Funds in the fund complex. |
| (3) | Mr. Thornburg is considered an “interested” Trustee under the Investment Company Act of 1940 because he is a director and controlling shareholder of Thornburg Investment Management, Inc., the investment advisor to the twelve active Funds of the Trust, and is the sole director and controlling shareholder of Thornburg Securities Corporation, the distributor of shares for the Trust. |
| (4) | Each Trustee serves in office until the election and qualification of a successor. |
| (5) | Mr. McMahon is considered an “interested” Trustee because he is the president of Thornburg Investment Management, Inc. |
| (6) | The Trust’s president, secretary and treasurer each serves a one-year term or until the election and qualification of a successor; each other officer serves at the pleasure of the Trustees. |
| (7) | Assistant vice presidents, assistant secretaries and assistant treasurers are not shown. |
The Statement of Additional Information for each Fund of the Trust includes additional information about the Trustees and is available, without charge and upon request, by calling 1-800-847-0200.
| Certified Annual Report | 41 |
| OTHER INFORMATION | ||
| Thornburg Limited Term Income Funds | September 30, 2005 (Unaudited) | |
PORTFOLIO PROXY VOTING
Policies and Procedures:
The Trust has delegated to Thornburg Investment Management, Inc. (the “Advisor”) voting decisions respecting proxies for the Fund’s voting securities. The Advisor makes voting decisions in accordance with its Proxy Voting Policy and Procedures. A description of the Policy and Procedures is available (i) without charge, upon request, by calling the Advisor toll-free at 1-800-847-0200, (ii) on the Thornburg website at www.thornburg.com, and (iii) on the Securities and Exchange Commission’s website at www.sec.gov.
Commencing August 31, 2004, information regarding how proxies were voted is available on or before August 31 of each year for the twelve months ending the preceding June 30. This information is available (i) without charge, upon request by calling the Advisor toll-free at 1-800-847-0200, (ii) on the Thornburg website at www.thornburg.com, and (iii) on the Securities and Exchange Commission’s website at www.sec.gov.
AVAILABILITY OF QUARTERLY PORTFOLIO SCHEDULE
The Fund files with the Securities and Exchange Commission schedules of its portfolio holdings on Form N-Q for the first and third quarters of each fiscal year. The Fund’s Forms N-Q are available on the Commission’s website at www.sec.gov, or may be reviewed and copied at the Commission’s Public Reference Room in Washington, D.C. Information on the operation of the Public Reference Room may be obtained by calling 1-800-SEC-0330. The Fund also makes this information available on its website at www.thornburg.com/download or upon request by calling 1-800-847-0200.
TRUSTEES DELIBERATIONS RESPECTING RENEWAL OF INVESTMENT ADVISORY AGREEMENT FOR THE THORNBURG LIMITED TERM U.S. GOVERNMENT FUND
Thornburg Investment Management, Inc. (the “Advisor”) provides investment management services to Thornburg Limited Term U.S. Government Fund pursuant to an investment advisory agreement. The Trustees consider the renewal of this agreement annually and most recently determined to renew the agreement on September 13, 2005.
In connection with their general supervision of the Advisor, the Trustees receive and consider reports throughout the year from the Advisor respecting the Advisor’s management of the Fund’s investments. These reports include information about the Fund’s purchase and sale of portfolio investments and explanations from the Advisor respecting investment selections, the investment performance of the Fund, general appraisals of industry and economic prospects and factors, and other matters affecting the Fund and relating to the Advisor’s performance of services for the Fund.
In anticipation of their recent consideration of the advisory agreement’s renewal, the independent Trustees met with representatives of the Advisor in May and July 2005 to specify the information the Advisor would present to the Trustees for their review. The independent Trustees thereafter met in independent session to consider various factors respecting the agreement’s renewal, and met in a subsequent session with the Advisor’s chief investment officer to present questions.
Following these sessions, the Trustees met on September 13, 2005 to consider a renewal of the advisory agreement.
The Trustees considered various factors in their review of the Advisor’s performance under the investment advisory agreement, including specifically the principles outlined in their February 2005 Statement to Shareholders, a copy of which accompanies this Annual Report to Shareholders. Summarized below are certain of the factors considered by the Trustees, in connection with the determination to renew the advisory agreement. In determining to renew the advisory agreement, the Trustees did not identify any single fact or aspect of the Advisor’s performance as controlling, and this summary does not describe all of the matters considered by the Trustees in making their determination.
Quality of Services; Fund Investment Performance. In reviewing the nature, extent, and quality of services provided by the Advisor and the investment performance of the Fund, the Trustees primarily considered the Advisor’s adherence to the Fund’s stated objectives and policies, the Advisor’s execution of the Fund’s investment strategies in prevailing market conditions, the Fund’s absolute investment performance, the Fund’s investment performance compared to categories of other broadly similar mutual funds, the Fund’s investment performance over different periods of time, the Fund’s total returns in rising and declining markets compared to total returns of a category of generally similar mutual funds and a securities index, comparative measures of portfolio risk and share price volatility, and related factors. The Trustees noted that bond indices have limited utility in evaluating fixed income mutual funds. Similarly, the Trustees noted in comparing the Fund to other mutual funds that the value of such comparisons may be limited in some degree because the Fund’s investment approach, and in particular its laddered maturity portfolio, differs from other funds. In conducting their review, the Trustees observed that the Advisor had continued to faithfully pursue and to achieve the Fund’s stated objectives, as demonstrated particularly by the Advisor’s selection of investments in a challenging interest rate environment and the Fund’s investment performance. The Trustees noted in this regard the Fund’s average or better performance over different periods compared to a category of generally similar mutual funds selected by an independent analyst firm, and the Fund’s lower share price volatility than a category of longer term U.S. Government income funds selected by an independent analyst firm.
42 | Certified Annual Report |
| OTHER INFORMATION, CONTINUED | ||
| Thornburg Limited Term Income Funds | September 30, 2005 (Unaudited) | |
The Trustees also considered a number of other factors in reviewing the quality of the Advisor’s services, including the qualifications and integrity of the Advisor’s senior personnel, the Advisor’s staffing and other resources, the Advisor’s compliance with regulatory requirements, Fund sales performance and perceptions of the funds in the marketplace, and other factors.
The Trustees concluded, based upon these and other considerations, that the Advisor had actively and competently pursued the Fund’s stated investment objectives in accordance with the Fund’s investment policies stated in its prospectuses. The Trustees further concluded that the investment performance of the Fund was satisfactory in the context of the Fund’s objectives and policies and prevailing market conditions.
Fees and Expenses; Profitability of Advisor. In reviewing the fees charged by the Advisor to the Fund, the Trustees primarily considered the fees charged by the Advisor and the other expenses charged to the Fund in light of the nature and quality of services provided, comparison of the actual Advisor’s fee and Fund expenses to the statement of fees and expenses in the Fund’s prospectuses, comparisons of the Advisor’s fee and other Fund expenses to median and average fees and expenses charged to similar mutual funds, and comparisons of fees and expenses charged to the Fund with fees and expenses charged to other, similar specific mutual funds. In addition, the Trustees considered the profitability of the Advisor compared to other investment management firms, and comparisons of the investment management fee rates charged by the Advisor to the Fund with rates charged to other clients and the differing types of services furnished to the Fund and the other clients. The Trustees noted that the management fee for the Fund was lower than average and median fees for a group of similar mutual funds. The Trustees further noted in this regard that the overall expenses charged to the Fund were somewhat lower than the average and median management fees for the same group of mutual funds. The Trustees also observed in their review that fee rates charged by the Advisor to other clients of the Advisor were not directly comparable to rates charged to the Fund principally because of the significant differences in the services provided.
The Trustees concluded, based upon these and other considerations, that the fees charged to the Fund by the Advisor were fair and reasonable in view of the services provided, the clear disclosure of these fees and expenses is in the Fund’s prospectuses, as well as prevailing fees and expenses charged to generally similar mutual funds. The Trustees further concluded that there was no indication that the Advisor’s profitability was unusual, viewed in the context of the services provided, the performance of the Fund, and the fees and profitability of other investment management firms.
Economies of Scale. In reviewing the extent to which economies of scale would be realized by the Fund as it grows and whether fee levels reflect economies of scale, the Trustees considered the breakpoint structure for advisory fees chargeable to the Fund, the demonstrated economies of scale enjoyed by other funds of the Trust as they had grown in size, and economies of scale realized by other mutual funds. The Trustees concluded that the Fund may reasonably be expected to realize economies of scale for the benefit of its shareholders as it grows in size.
Ancillary Benefits to Advisor. In reviewing benefits enjoyed by the Advisor because of its relationship with the Fund, the Trustees considered an arrangement through which the Advisor received certain research services, favorable publicity received by the Advisor because of the superior investment performance of certain Funds of the Trust, and the benefits to the Fund from the Advisor’s expansion of its staffing and other resources to serve a broader variety of investment clients. The Trustees concluded, based upon these and other considerations, that there was no unusual or unfair benefit enjoyed by the Advisor and that the Fund enjoyed benefits by virtue of the Advisor’s engagement by other investment clients.
TRUSTEES DELIBERATIONS RESPECTING RENEWAL OF INVESTMENT ADVISORY AGREEMENT FOR THE THORNBURG LIMITED TERM INCOME FUND
Thornburg Investment Management, Inc. (the “Advisor”) provides investment management services to Thornburg Limited Term Income Fund pursuant to an investment advisory agreement. The Trustees consider the renewal of this agreement annually and most recently determined to renew the agreement on September 13, 2005.
In connection with their general supervision of the Advisor, the Trustees receive and consider reports throughout the year from the Advisor respecting the Advisor’s management of the Fund’s investments. These reports include information about the Fund’s purchase and sale of portfolio investments and explanations from the Advisor respecting investment selections, the investment performance of the Fund, general appraisals of industry and economic prospects and factors, and other matters affecting the Fund and relating to the Advisor’s performance of services for the Fund.
In anticipation of their recent consideration of the advisory agreement’s renewal, the independent Trustees met with representatives of the Advisor in May and July 2005 to specify the information the Advisor would present to the Trustees for their review. The independent Trustees thereafter met in independent session to consider various factors respecting the agreement’s renewal, and met in a subsequent session with the Advisor’s chief investment officer to present questions.
Following these sessions, the Trustees met on September 13, 2005 to consider a renewal of the advisory agreement.
| Certified Annual Report | 43 |
| OTHER INFORMATION, CONTINUED | ||
| Thornburg Limited Term Income Funds | September 30, 2005 (Unaudited) | |
The Trustees considered various factors in their review of the Advisor’s performance under the investment advisory agreement, including specifically the principles outlined in their February 2005 Statement to Shareholders, a copy of which accompanies this Annual Report to Shareholders. Summarized below are certain of the factors considered by the Trustees, in connection with the determination to renew the advisory agreement. In determining to renew the advisory agreement, the Trustees did not identify any single fact or aspect of the Advisor’s performance as controlling, and this summary does not describe all of the matters considered by the Trustees in making their determination.
Quality of Services; Fund Investment Performance. In reviewing the nature, extent, and quality of services provided by the Advisor and the investment performance of the Fund, the Trustees primarily considered the Advisor’s adherence to the Fund’s stated objectives and policies, the Advisor’s execution of the Fund’s investment strategies in prevailing market conditions, the Fund’s absolute investment performance, the Fund’s investment performance compared to categories of other broadly similar mutual funds and broad based securities indices, the Fund’s investment performance over different periods of time, the Fund’s total returns in rising and declining markets compared to total returns of a category of generally similar mutual funds and a broad based securities index, comparative measures of portfolio risk and share price volatility, and related factors. The Trustees noted that bond indices have limited utility in evaluating fixed income mutual funds. Similarly, the Trustees noted in comparing the Fund to other mutual funds that the value of such comparisons may be limited in some degree because the Fund’s investment approach, and in particular its laddered maturity portfolio, differs from other funds. In conducting their review, the Trustees observed that the Advisor had continued to faithfully pursue and to achieve the Fund’s stated objectives, as demonstrated particularly by the Advisor’s selection of investments in a challenging interest rate environment and the Fund’s investment performance. The Trustees also noted in this regard the Fund’s above average investment performance over various periods compared to a category of generally similar fixed income mutual funds selected by an independent mutual fund analyst firm, and the Fund’s lower share price volatility compared to a category of funds having longer term portfolios.
The Trustees also considered a number of other factors in reviewing the quality of the Advisor’s services, including the qualifications and integrity of the Advisor’s senior personnel, the Advisor’s staffing and other resources, the Advisor’s compliance with regulatory requirements, Fund sales performance and perceptions of the funds in the marketplace, and other factors.
The Trustees concluded, based upon these and other considerations, that the Advisor had actively and competently pursued the Fund’s stated investment objectives in accordance with the Fund’s investment policies stated in its prospectuses. The Trustees further concluded that the investment performance of the Fund was satisfactory in the context of the Fund’s objectives and policies and prevailing market conditions.
Fees and Expenses; Profitability of Advisor. In reviewing the fees charged by the Advisor to the Fund, the Trustees primarily considered the fees charged by the Advisor and the other expenses charged to the Fund in light of the nature and quality of services provided, comparison of the actual Advisor’s fee and Fund expenses to the statement of fees and expenses in the Fund’s prospectuses, comparisons of the Advisor’s fee and other Fund expenses to median and average fees and expenses charged to similar mutual funds, and comparisons of fees and expenses charged to the Fund with fees and expenses charged to other, similar specific mutual funds. In addition, the Trustees considered the profitability of the Advisor compared to other investment management firms, and comparisons of the investment management fee rates charged by the Advisor to the Fund with rates charged to other clients of the Advisor and the differing types of services furnished to the Fund and the other clients. The Trustees noted that the management fee and overall expenses for the Fund were comparable to average and median management fees and expenses for a group of generally similar mutual funds. The Trustees also observed in their review that fee rates charged by the Advisor to other clients of the Advisor were not directly comparable to rates charged to the Fund principally because of the significant differences in the services provided.
The Trustees concluded, based upon these and other considerations, that the fees charged to the Fund by the Advisor were fair and reasonable in view of the services provided, the clear disclosure of these fees and expenses is in the Fund’s prospectuses, as well as prevailing fees and expenses charged to mutual funds generally. The Trustees further concluded that there was no indication that the Advisor’s profitability was unusual, viewed in the context of the services provided, the performance of the Fund, and the fees and profitability of other investment management firms.
Economies of Scale. In reviewing the extent to which economies of scale would be realized by the Fund as it grows and whether fee levels reflect economies of scale, the Trustees considered the breakpoint structure for advisory fees chargeable to the Fund, the demonstrated economies of scale enjoyed by other funds of the Trust as they had grown in size, and economies of scale realized by other mutual funds. The Trustees concluded that the Fund may reasonably be expected to realize economies of scale for the benefit of its shareholders as it grows in size.
Ancillary Benefits to Advisor. In reviewing benefits enjoyed by the Advisor because of its relationship with the Fund, the Trustees considered an arrangement through which the Advisor received certain research services, favorable publicity
44 | Certified Annual Report |
| OTHER INFORMATION, CONTINUED | ||
| Thornburg Limited Term Income Funds | September 30, 2005 (Unaudited) | |
received by the Advisor because of the superior investment performance of certain Funds of the Trust, and the benefits to the Fund from the Advisor’s expansion of its staffing and other resources to serve a broader variety of investment clients. The Trustees concluded, based upon these and other considerations, that there was no unusual or unfair benefit enjoyed by the Advisor and that the Fund enjoyed benefits by virtue of the Advisor’s engagement by other investment clients.
| Certified Annual Report | 45 |
Trustees’ Statement to Shareholders
Not part of the Certified Annual Report
February 8, 2005
The Trustees are concerned that recent commentaries and opinions reported in the media may confuse investors in general as to the supervisory duties of trustees of mutual funds and, in particular, leave Thornburg Investment Trust shareholders uncertain regarding how we discharge our responsibilities in supervising the Funds’ investment advisor and in reviewing the advisor’s contract for renewal. We decided to spell out clearly three principal guidelines that we follow in supervising the Trust’s investment advisor on your behalf.
We begin with the premise that each shareholder selected his or her Fund because its investments are managed by the investment advisor identified in the prospectus and in accordance with the objective and policies described in the prospectus. We realize, as each of you do, that if you believe that your Fund’s stated objective and policies no longer serve your personal investment goals, you can sell your shares and leave the Fund.
Therefore, we believe that our primary supervisory task – our principal obligation to you – is to assess the nature and quality of the advisor’s services, and to confirm that the advisor actively and competently pursues the Fund’s objective, in accordance with the policies set out in the prospectus. To do this, we meet regularly with management to review your Fund’s portfolio and to discuss the advisor’s specific actions and judgments in pursuing the Fund’s objective. We do not substitute our own judgment for the advisor’s decisions in selecting investments; the advisor is paid to exercise its informed judgment on investment decisions, and we seek to confirm, in reviewing the advisor’s performance, that the advisor is doing just that.
Second, while we are conscious of costs and the effect that costs have on shareholders’ returns, we do not seek the lowest fees or expense ratio as our sole or primary objective. We try to make sure that your Fund’s fees and costs are reasonable in relationship to the services rendered and that they are generally in line with those charged by other expert investment advisors, consistent with our belief that the Fund’s investors searched for and expect that expertise and attention and have decided to pay a reasonable price for it. We do not put the management contract “out to bid” as a matter of course, and we would not do so unless we had concluded that the advisor materially had failed to pursue the Fund’s objectives in accordance with its policies, or for other equally important reasons. We believe that any other approach would be inconsistent with your interests and contrary to your expectations when you bought shares of the Fund in the first place.
Finally, because we believe that most Thornburg Fund shareholders have invested with a long-term perspective, we try not to focus too much on the fashions of the moment and on short-term performance. The market will not favor any specific investment objective or set of policies at all times and under all economic circumstances. A fund will experience periods of both high and low returns relative to other funds and other investments. Even if one of our Funds is not favored by the market at a particular time, we believe that the advisor is nonetheless obliged to remain true to the Fund’s objective and policies, and we watch to see that it does so.
This statement is submitted for the general information of the shareholders of Thornburg Investment Trust. It is not authorized for distribution to prospective investors in the Fund unless preceded or accompanied by an effective prospectus. If you have not received a prospectus, one can be obtained from your financial advisor, online at www.thornburg.com/download, or by calling 800-847-0200. Carefully consider information in the prospectus regarding the Fund’s investment objectives and policies, risks, sales charges, expenses, experience of its management, marketability of shares, and other information. Read it carefully before you invest or send money.
46 | This page is not part of the Annual Report. |
Planning Options
Retirement and Education Accounts
Thornburg Investment Management offers retirement and education savings accounts that can help you meet a variety of planning challenges. For account applications or further information on any of the accounts below, please call 1-800-847-0200 or go to www.thornburg.com/ira. Your financial advisor can help you determine which plan is right for you.
Individual Retirement Accounts
Individual Retirement Accounts (IRAs) provide a tax-advantaged means to save money for the future. For a detailed outline of the difference between retirement accounts, see www.thornburg.com/ira. Rollovers are available. Call 1-800-847-0200 for more information.
Traditional IRAs – Contributions to Traditional IRAs are tax deductible for eligible individuals, and withdrawals are taxed as additional ordinary income. You may contribute to an IRA if you receive compensation and are under 701/2, even if you are covered by an employer retirement plan.
Roth IRAs – Under a Roth IRA, there is no tax deduction for contributions, but there is no income tax on qualified withdrawals. For a more detailed comparison of Traditional and Roth IRAs, please see our web site at www.thornburg.com/ira.
SEP IRAs – Simplified Employee Pension (SEP) IRAs are established by employers. The employer is allowed a tax deduction for contributions made to the SEP Plan and makes contributions to each eligible employee’s SEP IRA on a discretionary basis.
SIMPLE IRAs – Savings Incentive Match Plan for Employees of Small Employers (SIMPLE) is designed to give small business owners a simplified method to establish and contribute to a retirement plan for employees. The employer is allowed a tax deduction for contributions and makes either matching or non-elective contributions to each eligible employee’s SIMPLE IRA. Employees may make salary deferral contributions.
403(b)
A special, tax-advantaged savings vehicle available only to employees of 501(c)(3) organizations, such as charitable, educational, scientific and religious organizations. 403(b) plans are also available to employees of public schools and universities.
Coverdell Education Savings Account
These savings accounts are designed to provide a way to save money for higher education expenses. In an Education Savings Account, earnings and interest grow tax free, and qualified withdrawals used to pay for eligible higher-education expenses are tax- and penalty-free.
Funds Available
The following funds are available in the accounts listed above:
| • | Thornburg International Value Fund |
| • | Thornburg Value Fund |
| • | Thornburg Core Growth Fund |
| • | Thornburg Investment Income Builder Fund |
| • | Thornburg Limited Term U.S. Government Fund |
| • | Thornburg Limited Term Income Fund |
| This page is not part of the Annual Report. | 47 |
The Firm
Thornburg Investment Management® is a privately held investment management company based in Santa Fe, New Mexico with assets under management of over $16 billion. Founded in 1982, the firm manages four equity funds, eight bond funds, and separate portfolios for select institutions and individuals.
Investment Philosophy
We seek to preserve and increase the real wealth of the Funds’ shareholders after accounting for inflation, taxes, and investment expenses. We’re committed to disciplined investing and controlling risk in all market environments through laddered bond and focused equity portfolios.
Portfolio Holdings Disclosure
We believe you should know about your portfolio. Our web site keeps investors informed of the Funds’ equity holdings. Go to www.thornburg.com/funds for commentary on our equity fund holdings.
Co-Ownership of Funds
We invest side-by-side with the Funds’ shareholders. Our employees have invested over $110 million in Thornburg Funds.
Core Strategies for Building Wealth
We deliver core strategies to help investors meet long-term goals. A core strategy is a consistent, disciplined and proven investment process that represents the foundation of a diversified portfolio.
INVESTMENT MANAGER:
Thornburg Investment Management®
119 East Marcy Street
Santa Fe, New Mexico 87501
800.847.0200
DISTRIBUTOR:
Thornburg Securities™
119 East Marcy Street
Santa Fe, New Mexico 87501
800.847.0200

Core Strategies for Building Wealth
Thornburg Value Fund
Informational Brochure and Annual Report – September 30, 2005
The Value of Experience
This report and the accompanying brochure are submitted for the general information of shareholders of the Fund. It is not authorized for distribution to prospective investors in the Fund unless preceded or accompanied by an effective prospectus. If you have not received a prospectus, one can be obtained from your financial advisor, online at www.thornburg.com/ download, or by calling 800-847-0200. Carefully consider information in the prospectus regarding the Fund’s investment objectives and policies, risks, sales charges, expenses, experience of its management, marketability of shares, and other information. Read it carefully before you invest or send money. Performance data quoted represents past performance and does not guarantee future results.
Thornburg Value Fund
The Value of Experience
The Fund seeks long-term capital appreciation by investing in a portfolio of a limited number of holdings selected on a value basis using fundamental research. As a secondary consideration, the Fund also seeks some current income.
The portfolio is diversified to include basic value stocks, but also includes stocks of companies with consistent earnings characteristics and those of emerging franchises, when, in our opinion, these issues are value priced.
Thornburg Bond Funds
| • | Thornburg Limited Term Municipal Fund |
| • | Thornburg Intermediate Municipal Fund |
| • | Thornburg California Limited Term Municipal Fund |
| • | Thornburg New Mexico Intermediate Municipal Fund |
| • | Thornburg Florida Intermediate Municipal Fund |
| • | Thornburg New York Intermediate Municipal Fund |
| • | Thornburg Limited Term U.S. Government Fund |
| • | Thornburg Limited Term Income Fund |
Thornburg invests in short- and intermediate-term investment grade bonds. We ladder the maturities of individual bonds in the portfolios to moderate risk. Laddering involves building a portfolio of bonds with staggered maturities so that a portion of the portfolio will mature each year. We apply this disciplined process in all interest rate environments.
Thornburg Equity Funds
| • | Thornburg Value Fund |
| • | Thornburg International Value Fund |
| • | Thornburg Core Growth Fund |
| • | Thornburg Investment Income Builder Fund |
Thornburg’s equity research uses a fundamental, yet comprehensive, analytical approach. We invest when and where we perceive compelling value. Thornburg equity funds focus on a limited number of securities so that each holding can impact performance. The equity team searches for firms believed to have a promising future and seeks to buy shares of those companies at a discount to their intrinsic value.
More information at www.thornburg.com
 | Reduce paper clutter.
Receive your shareholder reports and prospectus online instead of through traditional mail.
Sign up at www.thornburg.com/edelivery |
2 | This page is not part of the Annual Report. |
Message
from the Chairman

Garrett Thornburg
Chairman & CEO
November 9, 2005
Dear Fellow Shareholder:
Thornburg Investment Management has a clear mission: to preserve and increase the real wealth of our shareholders. We seek to accomplish this through a range of equity funds that redefine traditional measures of value and growth and through a family of laddered bond funds that focus on quality, stability and minimizing risk over time.
Confirming our strategy, all Thornburg equity funds have ranked well within their respective categories.
The Thornburg equity funds employ a comprehensive approach which is more inclusive than the traditional deep value or high growth approach to stock selection. Within the Thornburg Value Fund and the Thornburg International Value Fund, the portfolios’ securities are classified into three baskets: basic value stocks, stocks of companies with consistent earnings, and stocks of emerging franchises. Thornburg Core Growth Fund’s holdings are classified into similar baskets: growth industry leaders, consistent growth companies, and emerging growth companies. After being identified through bottom-up screening from a worldwide universe, all stocks are subject to a rigorous selection process that must satisfy the Thornburg investment team’s two fundamental criteria: in the opinion of the portfolio manager, the companies must be selling at attractive discounts to intrinsic value and have compelling prospects for long-term growth. You can read much more about the stocks in your Fund’s portfolio at our web site, www.thornburg.com/funds.
During this decade, the average dividend yield paid by equity and hybrid mutual funds has dipped well below 1%. We established Thornburg Investment Income Builder Fund in late 2002 to be clearly different from other equity/hybrid funds by paying attractive dividends today, with a further goal of increasing these in the future. Our record to date shows clear success in achieving each aspect of this mission.
On the bond side, we have always had a highly disciplined approach of laddering short- and intermediate-bond maturities seeking to provide both an attractive return and relative stability of principal.
Recently, there has been a lot of news about improper behavior by some mutual fund companies. Many of the proposed new rules in response to this scandal have called for increased transparency. We welcome increased transparency. Thornburg Investment Management has been a leader in providing information about our stock holdings to our shareholders on our web site, www.thornburg.com.
Unfortunately, some of those new rules will increase the cost to all shareholders in mutual funds. We will do our best to keep these expenses to a minimal amount. After all, we are shareholders too! Thornburg employees have over $110 million invested in our own funds.
Thank you for investing with us. We will do our best to continue to earn your trust every day.
| Sincerely, |
 |
| Garrett Thornburg |
| Chairman & CEO |
| This page is not part of the Annual Report. | 3 |
Important Information
The information presented on the following pages was current as of September 30, 2005. The manager’s views, portfolio holdings, and sector diversification are historical and subject to change. This material should not be deemed a recommendation to buy or sell any of the securities mentioned.
Shares in the Fund carry risks including possible loss of principal. There are special risks associated with international investing, including currency fluctuations, government regulation, political developments, and differences in liquidity. Additionally, the Fund invests a portion of the assets in small capitalization companies which may increase the risk of greater price fluctuations. Shares in the Fund are not deposits or obligations of, or guaranteed or endorsed by, any bank, the Federal Deposit Insurance Corporation, the Federal Reserve Board, or any government agency.
Performance data given at net asset value (NAV) does not take into account the applicable sales charges. If the sales charges had been included, the performance would have been lower.
Glossary
Standard & Poor’s 500 Stock Index (S&P 500) – An unmanaged index generally representative of the U.S. stock market, without regard to company size. Unless otherwise noted, index returns do not reflect fees, brokerage commissions or other expenses of investing. Investors may not make direct investments into any index.
Beta – A measure of market-related risk. Less than one means the portfolio is less volatile than the index, while greater than one indicates more volatility than the index.
Median Market Capitalization – Market capitalization (market cap) is the total value of a company’s stock, calculated by multiplying the number of outstanding common shares by the current share price. The company whose market cap is in the middle of the portfolio is the median market cap. Half the companies in the portfolio have values greater than the median and half have values that are less. If there is an even number of companies, then the median is the average of the two companies in the middle.
Price to Book Value (P/B) – A ratio used to compare a stock’s market value to its book value. It is calculated by dividing the current closing price of the stock by the latest quarter’s book value (book value is simply assets minus liabilities).
Price to Cash Flow Ratio – A measure of the market’s expectations of a firm’s future financial health. It is calculated by dividing the price per share by cash flow per share.
Price to Earnings Ratio (P/E) – A valuation ratio of a company’s current share price compared to its per-share earnings. P/E equals a company’s market value per share divided by earnings per share.
4 | This page is not part of the Annual Report. |
This page intentionally left blank.
| This page is not part of the Annual Report. | 5 |
Portfolio Overview
Thornburg Value Fund
IMPORTANT PERFORMANCE
INFORMATION
Performance data quoted represents past performance and does not guarantee future results. Investment return and principal value will fluctuate so that upon redemption, investor’s shares may be worth more or less than their original cost. Current performance may be lower or higher than the data quoted. For performance data current to the most recent month end, visit www.thornburg.com.
The maximum sales charge for Class A shares is 4.50%. A shares are subject to a 1% 90-day redemption fee.
MANAGEMENT TEAM

Front row, L to R: Wendy Trevisani, Bill Fries, Brad
Kinkelaar, and Brian McMahon. Back row, L to R:
Lei Wang, Connor Browne, Ed Maran, Vin Walden,
Thomas Garcia, and Lewis Kaufman.
KEY PORTFOLIO ATTRIBUTES
Portfolio P/E* | 19.0x | ||
Portfolio Price to Cash Flow* | 8.8 | ||
Portfolio Price to Book Value* | 2.7 | ||
Median Market Cap* | $ | 23.85 B | |
3-Year Beta (Thornburg vs. S&P 500)** | 0.99 | ||
Holdings | 49 | ||
| * | Source: Thomson Portfolio Analytics |
| ** | Source: Morningstar Principia Pro |
For the fiscal year ended September 30, 2005, the Class A shares of the Thornburg Value Fund provided a positive return of 17.70% at NAV, compared to 12.25% for the S&P 500 Index. The Fund’s out performance was primarily attributable to contributions from stock selection.
Positive portfolio performance was driven by telecommunication services, financial, and energy holdings. This was somewhat different than the index which was driven by health care, information technology, as well as energy stocks. As is usually the case, the sector exposure of the Fund was secondary and a product of the bottom-up research process which focuses on owning promising companies at a discount to their intrinsic value.
October 2nd marked the Fund’s tenth anniversary. Given the litany of current adversity in the world, it might be constructive to reflect on the past investment environment for stocks, and the challenges companies now face. Our cumulative total return since inception on October 2, 1995 has been 241% or the equivalent of an annual compound rate in excess of 13%. That’s over 3% per annum better than the return of the S&P 500 Index over the same period. Of course, we are pleased with the result; there were some very satisfying years over the period. We were aware then, as we are now, that success is not necessarily permanent. There were also a number of quarters when stocks were down significantly and the outlook was dismal – the fall of 1998 and the summer of 2002 come to mind. In both cases we maintained the integrity of the portfolio, setting up excellent returns in following periods. Also worth mentioning is our performance in the period after the market peak in 2000. When the market declined, our out performance of the S&P 500 was material (for the calendar year ended 2000, the Fund’s A shares had a positive total
AVERAGE ANNUAL TOTAL RETURNS*
FOR PERIODS ENDED SEPTEMBER 30, 2005
| 3Q ‘05 | 1 Yr | 3 Yrs | 5 Yrs | Since Inception | |||||||||||
A Shares (Incep: 10/2/95) | |||||||||||||||
Without Sales Charge | 5.69 | % | 17.70 | % | 17.17 | % | 0.59 | % | 13.06 | % | |||||
With Sales Charge | 0.95 | % | 12.42 | % | 15.38 | % | (0.33 | )% | 12.55 | % | |||||
S&P 500 Index (Since: 10/2/95) | 3.60 | % | 12.25 | % | 16.69 | % | (1.49 | )% | 9.54 | % | |||||
| * | Periods under one year are not annualized. |
6 | This page is not part of the Annual Report. |
return of 3.96% at NAV while the S&P 500 Index returned negative 9.10%). Some credit goes to a target price discipline that worked.
No doubt the next ten years will be different from the past decade. In the first few years of the Value Fund’s existence, markets were robust. Equity valuations rose and technology boomed on the back of the personal computer and the embrace of the Internet. Since 2000, markets have been roiled by events such as 9/11, corporate scandal, the war in Iraq, and higher oil prices, just to mention a few. Other than the lift-off from the psychological bottom in the summer of 2002 and the post-presidential election rally in 2004, U.S. markets have generally been range-bound. The current concerns, in addition to the lingering effects of those above, are inflation, interest rates, consumer spending, deficits, and even bird flu. Through it all, corporate America has performed well from a profit generation standpoint.
The process and philosophy employed during the Fund’s ten-year history remains unchanged and is a very important factor in the Fund’s consistent out performance of benchmarks and peers over the long-term. We will continue to maintain a diversified portfolio of the stocks we identify through our research process. Our goal remains to provide competitive, long-term investment returns to our shareholders.
PERFORMANCE IMPACT FOR YEAR ENDED 9/30/05
Top Contributors | Top Detractors | |
NII Holdings Inc. | Ditech Communications Corp. | |
WellPoint Inc. | Boston Scientific Corp. | |
Unocal Corp. | AON Corp. | |
Petroleo Brasileiro | Pfizer Inc. | |
Chicago Mercantile Exchange Holdings Inc. | DIRECTV Group | |
Source: Thomson Portfolio Analytics
MARKET CAPITALIZATION EXPOSURE
As of 9/30/05
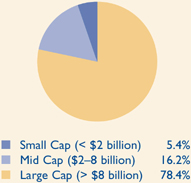
TOP TEN EQUITY HOLDINGS
As of 9/30/05
NII Holdings Inc. | 3.9 | % | |
Chevron Corp. | 3.7 | % | |
ExxonMobil Corp. | 3.1 | % | |
Goldman Sachs Group Inc. | 3.0 | % | |
Citigroup Inc. | 2.7 | % | |
Lloyds TSB Group | 2.7 | % | |
Union Pacific Corp. | 2.6 | % | |
General Electric Co. | 2.6 | % | |
Comcast Corp. | 2.6 | % | |
WellPoint Inc. | 2.5 | % | |
TOP TEN INDUSTRIES
As of 9/30/05
Diversified Financials | 13.6 | % | |
Telecommunication Services | 13.4 | % | |
Health Care Equip. & Services | 10.2 | % | |
Energy | 9.7 | % | |
Media | 6.5 | % | |
Software & Services | 6.2 | % | |
Pharmaceuticals & Biotech | 5.9 | % | |
Banks | 5.1 | % | |
Transportation | 4.7 | % | |
Tech Hardware & Equipment | 4.7 | % | |
| This page is not part of the Annual Report. | 7 |
This page intentionally left blank.
8 | This page is not part of the Annual Report. |

Thornburg Value Fund
September 30, 2005
| 10 | ||
| 12 | ||
| 14 | ||
| 16 | ||
| 17 | ||
| 21 | ||
| 27 | ||
| 32 | ||
| 33 | ||
| 34 | ||
| 35 | ||
| 38 | ||
This report is certified under the Sarbanes-Oxley Act of 2002, which requires that public companies, including mutual funds, affirm that the information provided in their annual and semiannual shareholder reports fully and fairly represents their financial position.
| Certified Annual Report | 9 |

William V. Fries, CFA
Portfolio Manager
October 17, 2005
Dear Fellow Shareholder:
The fiscal year ended September 30, 2005 was a good year for our Fund. The net asset value (NAV) of the Class A shares on September 30, 2005 was $32.79. One year ago on September 30, 2004, the net asset value was $28.11. Total return of the Fund for the period was 17.70% at NAV, compared with 12.25% for the S&P 500 Index. Good performance was broadly based with holdings in telecommunications, financial services, energy, health care services, and technology having favorable impact. For details on performance by share class please refer to the performance summary on page 34.
Telecommunication services stocks held during the year provided some of the return that enabled the Fund to outperform the S&P 500 Index. NII Holdings Inc. performed particularly well. Located in Reston, Virginia, NII Holdings enjoyed continued growth of its digital wireless communication services in Latin America. Also in telecommunications, the performance of Crown Castle International Corp. was noteworthy. Crown Castle owns and operates wireless communications towers.
Financial stocks consistently made up the largest sector weighting in the portfolio over the trailing twelve months and also contributed to positive performance. The Fund’s exposure to financial stocks was diverse and included banks, insurance companies, and diversified financial institutions. Chicago Mercantile Exchange Holdings, Inc., which operates the leading derivatives exchange in the U.S., was the best-performing financial stock in the portfolio, thanks to healthy futures trading volume and creative product initiatives. St. Paul Travelers Inc. also provided significant positive performance.
With oil prices steadily appreciating during the year, it is not surprising to find energy positions among the better-performing stocks in the portfolio. Unocal Corp., Petroleo Brasileiro, and Exxon Mobil Corp. were the best-performing energy holdings in the Fund.
United Healthcare Corp. and WellPoint Inc. were the most positive contributors to performance in the health care area. Their performance offset disappointing results in pharmaceuticals and health care equipment holdings.
The information technology sector represented the largest source of underperformance relative to the S&P 500 Index. This in part reflected modest exposure to the sector. The semiconductor industry was a bright spot, as Samsung Electronics Co. Ltd. and Texas Instruments Inc. both performed very well. The biggest negative for the Fund came from Ditech Communications Corp., which provides voice processing products to wire-line and mobile operators. Ditech was sold after experiencing an unexpected shortfall in sales.
Ultimately, earnings drive stock prices and there are many companies reporting improved results. Earnings recorded by the companies in the S&P 500 are at record levels and corporate
10 | Certified Annual Report |
liquidity is in great shape. This is a point of optimism that should not be overlooked. Energy, health care services, financial services, and even some technology-related companies are demonstrating resilient business models. The outlook remains encouraging. However, consumer spending may contract in the period ahead as budgets are adjusted to reflect higher energy costs. As in the past, there will be companies that do well and stocks that represent solid value, even when some macro-considerations for equities are discouraging. For equity investors, the period ahead may well be one of opportunity.
We will be as diligent as ever in our quest to generate capital appreciation in the period ahead. We thank you for your past trust and confidence. We will continue to work toward sustaining both in the future.
Sincerely, |
 |
| William V. Fries,CFA |
| Portfolio Manager |
The matters discussed in this report may constitute forward-looking statements made pursuant to the safe harbor provisions of the Securities Litigation Reform Act of 1995. These include any advisor or portfolio manager prediction, assessment, analysis or outlook for individual securities, industries, investment styles, market sectors and/or markets. These statements involve risks and uncertainties. In addition to the general risks described for each fund in its current prospectus, other factors bearing on these reports include the accuracy of the advisor’s or portfolio manager’s forecasts and predictions, the appropriateness of the investment strategies designed by the advisor or portfolio manager, and the ability of the advisor or portfolio manager to implement their strategies efficiently and successfully. Any one or more of these factors, as well as other risks affecting the securities markets generally, could cause the actual results of any fund to differ materially as compared to its benchmarks.
| Certified Annual Report | 11 |
STATEMENT OF ASSETS AND LIABILITIES
Thornburg Value Fund | September 30, 2005 |
ASSETS | ||||
Investments at value (cost $1,800,021,076) | $ | 1,978,030,674 | ||
Cash | 1,595,940 | |||
Receivable for investments sold | 4,425,971 | |||
Receivable for fund shares sold | 1,772,806 | |||
Dividends receivable | 3,865,582 | |||
Interest receivable | 772,113 | |||
Prepaid expenses and other assets | 46,558 | |||
Total Assets | 1,990,509,644 | |||
LIABILITIES | ||||
Payable for securities purchased | 3,462,504 | |||
Payable for fund shares redeemed | 2,718,960 | |||
Payable to investment advisor and other affiliates (Note 3) | 2,157,353 | |||
Accounts payable and accrued expenses | 802,530 | |||
Dividends payable | 432,956 | |||
Total Liabilities | 9,574,303 | |||
NET ASSETS | $ | 1,980,935,341 | ||
NET ASSETS CONSIST OF: | ||||
Undistributed net investment income | $ | 1,516,251 | ||
Net unrealized appreciation on investments | 177,994,326 | |||
Accumulated net realized gain (loss) | (17,073,501 | ) | ||
Net capital paid in on shares of beneficial interest | 1,818,498,265 | |||
| $ | 1,980,935,341 | |||
12 | Certified Annual Report |
| STATEMENT OF ASSETS AND LIABILITIES, CONTINUED | ||
Thornburg Value Fund | September 30, 2005 | |
NET ASSET VALUE: | |||
Class A Shares: | |||
Net asset value and redemption price per share | $ | 32.79 | |
Maximum sales charge, 4.50% of offering price | 1.55 | ||
Maximum offering price per share | $ | 34.34 | |
Class B Shares: | |||
Net asset value and offering price per share * | $ | 31.60 | |
Class C Shares: | |||
Net asset value and offering price per share * | $ | 31.92 | |
Class I Shares: | |||
Net asset value, offering and redemption price per share | $ | 33.23 | |
Class R1 Shares: | |||
Net asset value, offering and redemption price per share | $ | 32.68 | |
Class R5 Shares: | |||
Net asset value, offering and redemption price per share | $ | 33.22 | |
| * | Redemption price per share is equal to net asset value less any applicable contingent deferred sales charge. |
See notes to financial statements.
| Certified Annual Report | 13 |
Thornburg Value Fund | Year Ended September 30, 2005 |
INVESTMENT INCOME: | ||||
Dividend income (net of foreign taxes withheld of $426,216) | $ | 37,196,206 | ||
Interest income | 13,057,223 | |||
Total Income | 50,253,429 | |||
EXPENSES: | ||||
Investment advisory fees (Note 3) | 16,399,121 | |||
Administration fees (Note 3) | ||||
Class A Shares | 1,352,343 | |||
Class B Shares | 116,611 | |||
Class C Shares | 574,219 | |||
Class I Shares | 208,908 | |||
Class R1 Shares | 8,875 | |||
Class R5 Shares | 9 | |||
Distribution and service fees (Note 3) | ||||
Class A Shares | 2,702,757 | |||
Class B Shares | 931,869 | |||
Class C Shares | 4,588,168 | |||
Class R1 Shares | 35,557 | |||
Transfer agent fees | ||||
Class A Shares | 1,668,090 | |||
Class B Shares | 164,765 | |||
Class C Shares | 683,740 | |||
Class I Shares | 306,430 | |||
Class R1 Shares | 11,634 | |||
Class R5 Shares | 7,795 | |||
Registration and filing fees | ||||
Class A Shares | 68,222 | |||
Class B Shares | 7,495 | |||
Class C Shares | 17,351 | |||
Class I Shares | 65,205 | |||
Class R1 Shares | 20,812 | |||
Class R5 Shares | 14,003 | |||
Custodian fees (Note 3) | 460,438 | |||
Professional fees | 115,730 | |||
Accounting fees | 201,896 | |||
Trustee fees | 42,165 | |||
Other expenses | 538,135 | |||
Total Expenses | 31,312,343 | |||
Less: | ||||
Expenses reimbursed by Investment Advisor (Note 3) | (123,513 | ) | ||
Fees paid indirectly (Note 3) | (30,118 | ) | ||
Net Expenses | 31,158,712 | |||
Net Investment Income | $ | 19,094,717 | ||
14 | Certified Annual Report |
| STATEMENT OF OPERATIONS, CONTINUED | ||
Thornburg Value Fund | Year Ended September 30, 2005 | |
REALIZED AND UNREALIZED GAIN (LOSS) | ||||
Net realized gain (loss) on: | ||||
Investments | $ | 256,147,139 | ||
Foreign currency transactions | (502,454 | ) | ||
| 255,644,685 | ||||
Net change in unrealized appreciation (depreciation) on: | ||||
Investments | 57,937,038 | |||
Foreign currency translation | (15,271 | ) | ||
| 57,921,767 | ||||
Net Realized and Unrealized Gain | 313,566,452 | |||
Net Increase in Net Assets Resulting From Operations | $ | 332,661,169 | ||
See notes to financial statements.
| Certified Annual Report | 15 |
STATEMENTS OF CHANGES IN NET ASSETS
Thornburg Value Fund
| Year Ended September 30, 2005 | Year Ended September 30, 2004 | |||||||
INCREASE (DECREASE) IN NET ASSETS FROM: | ||||||||
OPERATIONS: | ||||||||
Net investment income gain | $ | 19,094,717 | $ | 10,860,838 | ||||
Net realized gain on investments and foreign currency transactions | 255,644,685 | 143,972,530 | ||||||
Increase (Decrease) in unrealized appreciation (depreciation) on investments and foreign currency translation | 57,921,767 | (29,911,224 | ) | |||||
Net Increase (Decrease) in Net Assets Resulting from Operations | 332,661,169 | 124,922,144 | ||||||
DIVIDENDS TO SHAREHOLDERS: | ||||||||
From net investment income | ||||||||
Class A Shares | (9,628,160 | ) | (7,240,069 | ) | ||||
Class B Shares | (253,266 | ) | (165,223 | ) | ||||
Class C Shares | (1,270,882 | ) | (881,785 | ) | ||||
Class I Shares | (5,577,033 | ) | (3,723,901 | ) | ||||
Class R1 Shares | (76,812 | ) | (41,476 | ) | ||||
Class R5 Shares | (246 | ) | 0 | |||||
FUND SHARE TRANSACTIONS (NOTE 4): | ||||||||
Class A Shares | (280,665,531 | ) | 28,336,374 | |||||
Class B Shares | (15,317,740 | ) | (1,996,877 | ) | ||||
Class C Shares | (99,126,047 | ) | 6,280,617 | |||||
Class I Shares | 16,018,891 | 102,430,454 | ||||||
Class R1 Shares | 4,801,953 | 5,988,945 | ||||||
Class R5 Shares | 29,098 | 0 | ||||||
Net Increase (Decrease) in Net Assets | (58,404,606 | ) | 253,909,203 | |||||
NET ASSETS: | ||||||||
Beginning of year | 2,039,339,947 | 1,785,430,744 | ||||||
End of year | $ | 1,980,935,341 | $ | 2,039,339,947 | ||||
See notes to financial statements.
16 | Certified Annual Report |
Thornburg Value Fund | September 30, 2005 |
NOTE 1 – ORGANIZATION
Thornburg Value Fund, hereinafter referred to as the “Fund,” is a diversified series of Thornburg Investment Trust (the “Trust”). The Trust is organized as a Massachusetts business trust under a Declaration of Trust dated June 3, 1987 and is registered as a diversified, open-end management investment company under the Investment Company Act of 1940, as amended. The Trust is currently issuing eleven series of shares of beneficial interest in addition to those of the Fund: Thornburg Limited Term Municipal Fund, Thornburg California Limited Term Municipal Fund, Thornburg Limited Term U.S. Government Fund, Thornburg New Mexico Intermediate Municipal Fund, Thornburg Intermediate Municipal Fund, Thornburg Limited Term Income Fund, Thornburg Florida Intermediate Municipal Fund, Thornburg International Value Fund, Thornburg Core Growth Fund, Thornburg New York Intermediate Municipal Fund, and Thornburg Investment Income Builder Fund. Each series is considered to be a separate entity for financial reporting and tax purposes and bears expenses directly attributable to it. The Fund seeks long-term capital appreciation by investing primarily in domestic equity securities selected on a value basis.
The Fund currently offers six classes of shares of beneficial interest, Class A, Class B, Class C, Institutional Class (Class I), and Retirement Class (Class R1 and Class R5) shares. Each class of shares of a Fund represents an interest in the same portfolio of investments of the Fund, except that (i) Class A shares are sold subject to a front-end sales charge collected at the time the shares are purchased and bear a service fee, (ii) Class B shares are sold at net asset value without a sales charge at the time of purchase, but are subject to a contingent deferred sales charge upon redemption and bear both a service fee and distribution fee, (iii) Class C shares are sold at net asset value without a sales charge at the time of purchase, but are subject to a contingent deferred sales charge upon redemption within one year, and bear a service fee and a distribution fee, (iv) Class I shares are sold at net asset value without a sales charge at the time of purchase, (v) Class R1 shares are sold at net asset value without a sales charge at the time of purchase, but bear both a service fee and distribution fee, (vi) Class R5 shares are sold at net asset value without a sales charge at the time of purchase, and (vii) the respective classes may have different reinvestment privileges and conversion rights. Additionally, the Fund may allocate among its classes certain expenses, to the extent allowable to specific classes, including transfer agent fees, government registration fees, certain printing and postage costs, and administrative and legal expenses. Currently, class specific expenses of the Fund are limited to service and distribution fees, administration fees, and certain registration and transfer agent expenses. Class B shares of the Fund outstanding for eight years will convert to Class A shares of the Fund.
NOTE 2 – SIGNIFICANT ACCOUNTING POLICIES
Significant accounting policies of the Trust are as follows:
Valuation of Securities: In determining the net asset value of investments, investments are stated at value based on latest sales prices, normally at 4:00 pm EST reported on securities exchanges on the last business day of the period. Investments for which no sale is reported are valued at the mean between bid and asked prices or in accordance with such other method as the Trustees may authorize. In any case where a market quotation is not readily available, the Trust’s valuation and pricing committee determines a fair value for the investment using factors approved by the Trustees. Short term obligations having remaining maturities of 60 days or less are valued at amortized cost, which approximates market value.
Foreign Currency Translation: Portfolio securities and other assets and liabilities denominated in foreign currencies are translated into U.S. dollars based on the exchange rate of such currencies against the U.S. dollar on the date of valuation. Purchases and sales of securities and income items denominated in foreign currencies are translated into U.S. dollars at the exchange rate in effect on the translation date. When the Fund purchases or sells foreign securities it will customarily enter into a foreign exchange contract to minimize foreign exchange risk from the trade date to the settlement date of such transactions.
The Fund does not separately report the effect of changes in foreign exchange rates from changes in market prices on securities held. Such changes are included in net realized and unrealized gain or loss from investments.
Reported net realized foreign exchange gains or losses arise from sales of foreign currencies, currency gains or losses realized between the trade and settlement dates on securities transactions and the difference between the amount of interest recorded on the Fund’s books, and the U.S. dollar equivalent of the amounts actually received or paid.
Federal Income Taxes: It is the policy of the Trust to comply with the provisions of the Internal Revenue Code applicable to “regulated investment companies” and to distribute all taxable income, including any net realized gain on investments of the Fund to the shareholders. Therefore, no provision for Federal income taxes is required.
When-Issued and Delayed Delivery Transactions: The Trust may engage in when-issued or delayed delivery transactions. To the extent the Trust engages in such transactions, it will do so for the purpose of acquiring portfolio securities consistent with the Fund’s investment objectives and not for the purpose of investment leverage or to speculate on interest rate and/or
| Certified Annual Report | 17 |
NOTES TO FINANCIAL STATEMENTS, CONTINUED | ||
Thornburg Value Fund | September 30, 2005 | |
market changes. At the time the Trust makes a commitment to purchase a security on a when-issued basis, the Fund will record the transaction and reflect the value in determining its net asset value. When effecting such transactions, assets of an amount sufficient to make payment for the portfolio securities to be purchased will be segregated on the Fund’s records on the trade date. Securities purchased on a when-issued or delayed delivery basis do not earn interest until the settlement date.
Dividends: Dividends to shareholders are generally paid quarterly and are reinvested in additional shares of the Fund at net asset value per share at the close of business on the dividend payment date or, at the shareholder’s option, paid in cash. Net realized capital gains, to the extent available, will be distributed at least annually. Distributions to shareholders are based on income tax regulations and therefore, their characteristics may differ for financial statement and tax purposes.
General: Securities transactions are accounted for on a trade date basis. Interest income is accrued as earned and dividend income is recorded on the ex-dividend date. Certain income from foreign securities is recognized as soon as information is available to the Fund. Realized gains and losses from the sale of securities are recorded on an identified cost basis. Net investment income, other than class specific expenses and realized and unrealized gains and losses, is allocated daily to each class of shares based upon the relative net asset value of outstanding shares of each class of shares at the beginning of the day (after adjusting for the current share activity of the respective class). Expenses common to all funds are allocated among the funds comprising the Trust based upon their relative net asset values or other appropriate allocation methods.
Guarantees and Indemnifications: Under the Trust’s organizational documents, its officers and Trustees are indemnified against certain liability arising out of the performance of their duties to the Fund. Additionally, in the normal course of business the Trust enters into contracts with service providers that contain general indemnification clauses. The Trust’s maximum exposure under these arrangements is unknown. However, based on experience, the Trust expects the risk of loss to be remote.
Use of Estimates: The preparation of financial statements, in conformity with generally accepted accounting principles, requires management to make estimates and assumptions that affect the reported amounts of assets and liabilities and the disclosure of contingent assets and liabilities at the date of the financial statements and the reported amounts of increases and decreases in net assets from operations during the reporting period. Actual results could differ from those estimates.
NOTE 3 – INVESTMENT ADVISORY FEE AND OTHER TRANSACTIONS WITH AFFILIATES
Pursuant to an investment advisory agreement, Thornburg Investment Management, Inc.® (the “Advisor”) serves as the investment advisor and performs services to the Fund for which the fees are payable at the end of each month. For the year ended September 30, 2005, these fees were payable at annual rates ranging from .875 of 1% to .675 of 1% per annum of the average daily net assets of the Fund depending on the Fund’s asset size. The Fund also has an administrative services agreement with the Advisor, whereby the Advisor will perform certain administrative services for the shareholders of each class of the Fund’s shares, and for which fees will be payable at an annual rate of up to .125 of 1% per annum of the average daily net assets attributable to each class of shares. For the year ended September 30, 2005, the Advisor voluntarily reimbursed certain class specific expenses, administrative fees, and distribution fees of $59,825 for Class I shares, $41,907 for Class R1 shares, and $21,781 for Class R5 shares.
The Trust has an underwriting agreement with Thornburg Securities Corporation® (the “Distributor”, an affiliate of the Advisor), which acts as the distributor of the Fund’s shares. For the year ended September 30, 2005, the Distributor has advised the Fund that it earned net commissions aggregating $52,178 from the sale of Class A shares of the Fund and collected contingent deferred sales charges aggregating $24,837 from redemptions of Class C shares of the Fund.
Pursuant to a service plan under Rule 12b-1 of the Investment Company Act of 1940, the Fund may reimburse to the Advisor an amount not to exceed .25 of 1% per annum of its average daily net assets attributable to each class of shares of the Fund for payments made by the Advisor to securities dealers and other financial institutions to obtain various shareholder related services. The Advisor may pay out of its own resources additional expenses for distribution of the Fund’s shares.
The Trust has also adopted distribution plans pursuant to Rule 12b-1, applicable only to the Fund’s Class B, Class C, and Class R1 shares under which the Fund compensates the Distributor for services in promoting the sale of Class B, Class C, and Class R1 shares of the Fund at an annual rate of up to .75 of 1% per annum of the average daily net assets attributable to Class B, Class C, and Class R1 shares. Total fees incurred by the Distributor for each class of shares of the Fund under its respective service and distribution plans for the year ended September 30, 2005, are set forth in the Statement of Operations.
The Trust has an agreement with the custodian bank to indirectly pay a portion of the custodian’s fees through credits earned by the Fund’s cash on deposit with the bank. This
18 | Certified Annual Report |
| NOTES TO FINANCIAL STATEMENTS, CONTINUED | ||
Thornburg Value Fund | September 30, 2005 | |
deposit agreement is an alternative to overnight investments. Custodial fees have been adjusted to reflect amounts that would have been paid without this agreement, with a corresponding adjustment reflected as fees paid indirectly in the Statement of Operations. For the year ended September 30, 2005, fees paid indirectly were $30,118.
Certain officers and Trustees of the Trust are also officers and/or Directors of the Advisor and Distributor. The compensation of independent Trustees is borne by the Trust.
NOTE 4 – SHARES OF BENEFICIAL INTEREST
At September 30, 2005, there were an unlimited number of shares of beneficial interest authorized. Sale of Class R5 shares commenced February 1, 2005. Transactions in shares of beneficial interest were as follows:
Year Ended September 30, 2005 | Year Ended September 30, 2004 | |||||||||||||
| Shares | Amount | Shares | Amount | |||||||||||
Class A Shares | ||||||||||||||
Shares sold | 5,556,737 | $ | 169,738,087 | 11,405,873 | $ | 327,555,712 | ||||||||
Shares issued to shareholders in reinvestment of dividends | 279,894 | 8,715,714 | 228,437 | 6,559,600 | ||||||||||
Shares repurchased ** | (14,823,032 | ) | (459,119,332 | ) | (10,795,871 | ) | (305,778,938 | ) | ||||||
Net Increase (Decrease) | (8,986,401 | ) | $ | (280,665,531 | ) | 838,439 | $ | 28,336,374 | ||||||
** The Fund charges a redemption fee of 1% of the Class A shares exchanged within 90 days of purchase. For the year ended September 30, 2005 and year ended September 30, 2004, $51,849 and $63,006, respectively, were netted in the amount reported for shares repurchased. |
| |||||||||||||
Class B Shares | ||||||||||||||
Shares sold | 77,850 | $ | 2,288,707 | 380,476 | $ | 10,548,934 | ||||||||
Shares issued to shareholders in reinvestment of dividends | 7,536 | 224,646 | 5,415 | 146,992 | ||||||||||
Shares repurchased | (607,159 | ) | (17,831,093 | ) | (460,576 | ) | (12,692,803 | ) | ||||||
Net Increase (Decrease) | (521,773 | ) | $ | (15,317,740 | ) | (74,685 | ) | $ | (1,996,877 | ) | ||||
Class C Shares | ||||||||||||||
Shares sold | 915,021 | $ | 27,095,236 | 3,239,399 | $ | 90,745,058 | ||||||||
Shares issued to shareholders in reinvestment of dividends | 35,972 | 1,085,438 | 27,090 | 746,516 | ||||||||||
Shares repurchased | (4,307,157 | ) | (127,306,721 | ) | (3,079,437 | ) | (85,210,957 | ) | ||||||
Net Increase (Decrease) | (3,356,164 | ) | $ | (99,126,047 | ) | 187,052 | $ | 6,280,617 | ||||||
Class I Shares | ||||||||||||||
Shares sold | 3,589,202 | $ | 111,238,406 | 5,766,851 | $ | 167,750,890 | ||||||||
Shares issued to shareholders in reinvestment of dividends | 147,185 | 4,664,983 | 106,031 | 3,088,228 | ||||||||||
Shares repurchased ** | (3,238,887 | ) | (99,884,498 | ) | (2,376,801 | ) | (68,408,664 | ) | ||||||
Net Increase (Decrease) | 497,500 | $ | 16,018,891 | 3,496,081 | $ | 102,430,454 | ||||||||
| ** | The Fund charges a redemption fee of 1% of the Class I shares exchanged within 90 days of purchase. For the year ended September 30, 2005 and year ended September 30, 2004, $15,714 and $12,511, respectively, were netted in the amount reported for shares repurchased. |
| Certified Annual Report | 19 |
| NOTES TO FINANCIAL STATEMENTS, CONTINUED | ||
Thornburg Value Fund | September 30, 2005 | |
Class R1 Shares | ||||||||||||||
Shares sold | 239,052 | $ | 7,454,820 | 218,435 | $ | 6,370,169 | ||||||||
Shares issued to shareholders in reinvestment of dividends | 2,115 | 66,501 | 1,357 | 38,681 | ||||||||||
Shares repurchased | (89,436 | ) | (2,719,368 | ) | (14,704 | ) | (419,905 | ) | ||||||
Net Increase (Decrease) | 151,731 | $ | 4,801,953 | 205,088 | $ | 5,988,945 | ||||||||
Class R5 Shares* | ||||||||||||||
Shares sold | 927 | $ | 28,852 | — | $ | — | ||||||||
Shares issued to shareholders in reinvestment of dividends | 8 | 246 | — | — | ||||||||||
Shares repurchased | (— | ) | (— | ) | — | — | ||||||||
Net Increase (Decrease) | 935 | $ | 29,098 | — | $ | — | ||||||||
| * | Effective date of Class R5 shares was February 1, 2005. |
NOTE 5 – SECURITIES TRANSACTIONS
For the year ended September 30, 2005, the Fund had purchase and sale transactions of investment securities (excluding short-term investments) of $1,192,122,249 and $1,601,701,387, respectively.
NOTE 6 – INCOME TAXES
At September 30, 2005, information on the tax components of capital is as follows:
Cost of investments for tax purpose | $ | 1,799,632,460 | ||
Gross unrealized appreciation on a tax basis | $ | 259,646,889 | ||
Gross unrealized depreciation on a tax basis | (81,248,675 | ) | ||
Net unrealized appreciation (depreciation) on investments (tax basis) | $ | 178,398,214 | ||
Distributable earnings – ordinary income | $ | 1,604,286 | ||
At September 30, 2005, the Fund did not have any undistributed capital gains.
At September 30, 2005, the Fund had deferred tax basis currency losses occurring subsequent to October 31, 2004 of $476,651. For tax purposes, such losses will be reflected in the year ending September 30, 2006.
At September 30, 2005, the Fund had tax basis capital losses of $17,073,501, which may be carried over to offset future capital gains. To the extent such carry forwards are used, capital gain distributions may be reduced to the extent provided by regulations. Such losses expire September 30, 2011.
The Fund utilized $256,147,139 of its capital loss carry forward during the year ended September 30, 2005.
In order to account for permanent book/tax differences, the Fund decreased undistributed net investment income by $897,294 and decreased accumulated net realized investment loss by $897,294. This reclassification has no impact on the net asset value of the Fund. Reclassifications result primarily from investments in REIT’s and currency losses.
The tax character of distributions paid during the year ended September 30, 2005, and September 30, 2004, was as follows:
| 2005 | 2004 | |||||
Distributions from: | ||||||
Ordinary income | $ | 16,806,399 | $ | 12,052,454 | ||
NOTE 7 – FINANCIAL INSTRUMENTS WITH OFF-BALANCE SHEET RISK AND FOREIGN INVESTMENT RISK
There are special risks associated with international investing, including currency fluctuations, government regulation, political developments, and differences in liquidity.
20 | Certified Annual Report |
Thornburg Value Fund
| Year Ended September 30, | ||||||||||||||||||||
| 2005 | 2004 | 2003 | 2002 | 2001 | ||||||||||||||||
Class A Shares: | ||||||||||||||||||||
PER SHARE PERFORMANCE | ||||||||||||||||||||
(for a share outstanding throughout the year)+ | ||||||||||||||||||||
Net asset value, beginning of year | $ | 28.11 | $ | 26.29 | $ | 20.73 | $ | 26.04 | $ | 32.98 | ||||||||||
Income from investment operations: | ||||||||||||||||||||
Net investment income (loss) | 0.32 | 0.20 | 0.15 | — | (C) | 0.02 | ||||||||||||||
Net realized and unrealized gain (loss) on investments | 4.64 | 1.81 | 5.45 | (5.31 | ) | (6.38 | ) | |||||||||||||
Total from investment operations | 4.96 | 2.01 | 5.60 | (5.31 | ) | (6.36 | ) | |||||||||||||
Less dividends from: | ||||||||||||||||||||
Net investment income | (0.28 | ) | (0.19 | ) | (0.02 | ) | — | (0.25 | ) | |||||||||||
Net realized gains | — | — | — | — | (0.25 | ) | ||||||||||||||
Return of capital | — | — | (0.02 | ) | — | (0.08 | ) | |||||||||||||
Total dividends | (0.28 | ) | (0.19 | ) | (0.04 | ) | — | (0.58 | ) | |||||||||||
Change in net asset value | 4.68 | 1.82 | 5.56 | (5.31 | ) | (6.94 | ) | |||||||||||||
NET ASSET VALUE, end of year | $ | 32.79 | $ | 28.11 | $ | 26.29 | $ | 20.73 | $ | 26.04 | ||||||||||
RATIOS/SUPPLEMENTAL DATA | ||||||||||||||||||||
Total return(a) | 17.70 | % | 7.61 | % | 27.02 | % | (20.39 | )% | (19.59 | )% | ||||||||||
Ratios to average net assets: | ||||||||||||||||||||
Net investment income (loss) | 1.05 | % | 0.69 | % | 0.66 | % | — | (b) | 0.07 | % | ||||||||||
Expenses, after expense reductions | 1.40 | % | 1.37 | % | 1.43 | % | 1.40 | % | 1.37 | % | ||||||||||
Expenses, after expense reductions and net of custody credits | 1.40 | % | 1.37 | % | 1.43 | % | 1.40 | % | — | |||||||||||
Expenses, before expense reductions | 1.40 | % | 1.37 | % | 1.43 | % | 1.40 | % | 1.38 | % | ||||||||||
Portfolio turnover rate | 58.90 | % | 68.74 | % | 82.89 | % | 76.37 | % | 71.81 | % | ||||||||||
Net assets at end of year (000) | $ | 972,478 | $ | 1,086,448 | $ | 994,043 | $ | 809,229 | $ | 1,078,582 | ||||||||||
| (a) | Sales loads are not reflected in computing total return. |
| (b) | The ratio of net investment loss to average net assets is less than 0.01%. |
| (c) | Net investment loss per share is less than $0.01. |
| + | Based on weighted average shares outstanding. |
| Certified Annual Report | 21 |
| FINANCIAL HIGHLIGHTS, CONTINUED | ||
Thornburg Value Fund | ||
| Year Ended September 30, | ||||||||||||||||||||
| 2005 | 2004 | 2003 | 2002 | 2001 | ||||||||||||||||
Class B Shares: | ||||||||||||||||||||
PER SHARE PERFORMANCE | ||||||||||||||||||||
(for a share outstanding throughout the year)+ | ||||||||||||||||||||
Net asset value, beginning of year | $ | 27.13 | $ | 25.47 | $ | 20.22 | $ | 25.61 | $ | 32.63 | ||||||||||
Income from investment operations: | ||||||||||||||||||||
Net investment income (loss) | 0.08 | (0.03 | ) | (0.05 | ) | (0.22 | ) | (0.24 | ) | |||||||||||
Net realized and unrealized gain (loss) on investments | 4.47 | 1.74 | 5.30 | (5.17 | ) | (6.31 | ) | |||||||||||||
Total from investment operations | 4.55 | 1.71 | 5.25 | (5.39 | ) | (6.55 | ) | |||||||||||||
Less dividends from: | ||||||||||||||||||||
Net investment income | (0.08 | ) | (0.05 | ) | — | — | (0.19 | ) | ||||||||||||
Net realized gains | — | — | — | — | (0.25 | ) | ||||||||||||||
Return of capital | — | — | — | — | (0.03 | ) | ||||||||||||||
Total dividends | (0.08 | ) | (0.05 | ) | — | — | (0.47 | ) | ||||||||||||
Change in net asset value | 4.47 | 1.66 | 5.25 | (5.39 | ) | (7.02 | ) | |||||||||||||
NET ASSET VALUE, end of year | $ | 31.60 | $ | 27.13 | $ | 25.47 | $ | 20.22 | $ | 25.61 | ||||||||||
| RATIOS/SUPPLEMENTAL DATA | ||||||||||||||||||||
Total return | 16.78 | % | 6.71 | % | 25.96 | % | (21.05 | )% | (20.35 | )% | ||||||||||
Ratios to average net assets: | ||||||||||||||||||||
Net investment income (loss) | 0.27 | % | (0.12 | )% | (0.22 | )% | (0.85 | )% | (0.83 | )% | ||||||||||
Expenses, after expense reductions | 2.17 | % | 2.18 | % | 2.31 | % | 2.25 | % | 2.27 | % | ||||||||||
Expenses, after expense reductions and net of custody credits | 2.17 | % | 2.18 | % | 2.31 | % | 2.25 | % | — | |||||||||||
Expenses, before expense reductions | 2.17 | % | 2.20 | % | 2.32 | % | 2.25 | % | 2.30 | % | ||||||||||
Portfolio turnover rate | 58.90 | % | 68.74 | % | 82.89 | % | 76.37 | % | 71.81 | % | ||||||||||
Net assets at end of year (000) | $ | 92,410 | $ | 93,508 | $ | 89,661 | $ | 70,682 | $ | 68,740 | ||||||||||
| + | Based on weighted average shares outstanding. |
22 | Certified Annual Report |
| FINANCIAL HIGHLIGHTS, CONTINUED | ||
Thornburg Value Fund | ||
| Year Ended September 30, | ||||||||||||||||||||
| 2005 | 2004 | 2003 | 2002 | 2001 | ||||||||||||||||
Class C Shares: | ||||||||||||||||||||
PER SHARE PERFORMANCE | ||||||||||||||||||||
(for a share outstanding throughout the year)+ | ||||||||||||||||||||
Net asset value, beginning of year | $ | 27.40 | $ | 25.70 | $ | 20.40 | $ | 25.82 | $ | 32.80 | ||||||||||
Income from investment operations: | ||||||||||||||||||||
Net investment income (loss) | 0.09 | (0.02 | ) | (0.04 | ) | (0.20 | ) | (0.22 | ) | |||||||||||
Net realized and unrealized gain (loss) on investments | 4.51 | 1.77 | 5.34 | (5.22 | ) | (6.34 | ) | |||||||||||||
Total from investment operations | 4.60 | 1.75 | 5.30 | (5.42 | ) | (6.56 | ) | |||||||||||||
Less dividends from: | ||||||||||||||||||||
Net investment income | (0.08 | ) | (0.05 | ) | — | — | (0.16 | ) | ||||||||||||
Net realized gains | — | — | — | — | (0.25 | ) | ||||||||||||||
Return of capital | — | — | — | — | (0.01 | ) | ||||||||||||||
Total dividends | (0.08 | ) | (0.05 | ) | — | — | (0.42 | ) | ||||||||||||
Change in net asset value | 4.52 | 1.70 | 5.30 | (5.42 | ) | (6.98 | ) | |||||||||||||
NET ASSET VALUE, end of year | $ | 31.92 | $ | 27.40 | $ | 25.70 | $ | 20.40 | $ | 25.82 | ||||||||||
| RATIOS/SUPPLEMENTAL DATA | ||||||||||||||||||||
Total return | 16.80 | % | 6.81 | % | 25.98 | % | (20.99 | )% | (20.24 | )% | ||||||||||
Ratios to average net assets: | ||||||||||||||||||||
Net investment income (loss) | 0.31 | % | (0.07 | )% | (0.16 | )% | (0.77 | )% | (0.74 | )% | ||||||||||
Expenses, after expense reductions | 2.14 | % | 2.14 | % | 2.25 | % | 2.17 | % | 2.18 | % | ||||||||||
Expenses, after expense reductions and net of custody credits | 2.14 | % | 2.14 | % | 2.25 | % | 2.17 | % | — | |||||||||||
Expenses, before expense reductions | 2.14 | % | 2.15 | % | 2.25 | % | 2.17 | % | 2.19 | % | ||||||||||
Portfolio turnover rate | 58.90 | % | 68.74 | % | 82.89 | % | 76.37 | % | 71.81 | % | ||||||||||
Net assets at end of year (000) | $ | 446,567 | $ | 475,296 | $ | 441,103 | $ | 368,038 | $ | 437,199 | ||||||||||
| + | Based on weighted average shares outstanding. |
| Certified Annual Report | 23 |
| FINANCIAL HIGHLIGHTS, CONTINUED | ||
Thornburg Value Fund | ||
| Year Ended September 30, | ||||||||||||||||||||
| 2005 | 2004 | 2003 | 2002 | 2001 | ||||||||||||||||
Class I Shares: | ||||||||||||||||||||
PER SHARE PERFORMANCE | ||||||||||||||||||||
(for a share outstanding throughout the year)+ | ||||||||||||||||||||
Net asset value, beginning of year | $ | 28.49 | $ | 26.64 | $ | 20.95 | $ | 26.18 | $ | 33.09 | ||||||||||
Income from investment operations: | ||||||||||||||||||||
Net investment income (loss) | 0.45 | 0.31 | 0.26 | 0.11 | 0.14 | |||||||||||||||
Net realized and unrealized gain (loss) on investments | 4.70 | 1.84 | 5.51 | (5.34 | ) | (6.42 | ) | |||||||||||||
Total from investment operations | 5.15 | 2.15 | 5.77 | (5.23 | ) | (6.28 | ) | |||||||||||||
Less dividends from: | ||||||||||||||||||||
Net investment income | (0.41 | ) | (0.30 | ) | (0.03 | ) | — | (0.28 | ) | |||||||||||
Net realized gains | — | — | — | — | (0.25 | ) | ||||||||||||||
Return of capital | — | — | (0.05 | ) | — | (0.10 | ) | |||||||||||||
Total dividends | (0.41 | ) | (0.30 | ) | (0.08 | ) | — | (0.63 | ) | |||||||||||
Change in net asset value | 4.74 | 1.85 | 5.69 | (5.23 | ) | (6.91 | ) | |||||||||||||
NET ASSET VALUE, end of year | $ | 33.23 | $ | 28.49 | $ | 26.64 | $ | 20.95 | $ | 26.18 | ||||||||||
| RATIOS/SUPPLEMENTAL DATA | ||||||||||||||||||||
Total return | 18.16 | % | 8.04 | % | 27.55 | % | (19.98 | )% | (19.29 | )% | ||||||||||
Ratios to average net assets: | ||||||||||||||||||||
Net investment income (loss) | 1.44 | % | 1.07 | % | 1.10 | % | 0.42 | % | 0.45 | % | ||||||||||
Expenses, after expense reductions | 0.99 | % | 0.99 | % | 0.99 | % | 0.98 | % | 0.99 | % | ||||||||||
Expenses, after expense reductions and net of custody credits | 0.98 | % | 0.99 | % | 0.99 | % | 0.98 | % | — | |||||||||||
Expenses, before expense reductions | 1.00 | % | 0.99 | % | 1.03 | % | 0.99 | % | 1.01 | % | ||||||||||
Portfolio turnover rate | 58.90 | % | 68.74 | % | 82.89 | % | 76.37 | % | 71.81 | % | ||||||||||
Net assets at end of year (000) | $ | 457,788 | $ | 378,334 | $ | 260,624 | $ | 207,613 | $ | 293,784 | ||||||||||
| + | Based on weighted average shares outstanding. |
24 | Certified Annual Report |
| FINANCIAL HIGHLIGHTS, CONTINUED | ||
Thornburg Value Fund | ||
| Year Ended September 30, | Period Ended September 30, | |||||||||||
| 2005 | 2004 | 2003(c) | ||||||||||
Class R1 Shares: | ||||||||||||
PER SHARE PERFORMANCE | ||||||||||||
(for a share outstanding throughout the period)+ | ||||||||||||
Net asset value, beginning of period | $ | 28.06 | $ | 26.27 | $ | 25.83 | ||||||
Income from investment operations: | ||||||||||||
Net investment income (loss) | 0.33 | 0.17 | 0.03 | |||||||||
Net realized and unrealized gain (loss) on investments | 4.60 | 1.85 | 0.41 | |||||||||
Total from investment operations | 4.93 | 2.02 | 0.44 | |||||||||
Less dividends from: | ||||||||||||
Net investment income | (0.31 | ) | (0.23 | ) | — | |||||||
Change in net asset value | 4.62 | 1.79 | 0.44 | |||||||||
NET ASSET VALUE, end of period | $ | 32.68 | $ | 28.06 | $ | 26.27 | ||||||
RATIOS/SUPPLEMENTAL DATA | ||||||||||||
Total return(a) | 17.64 | % | 7.68 | % | 1.70 | % | ||||||
Ratios to average net assets: | ||||||||||||
Net investment income (loss) | 1.07 | % | 0.61 | % | 0.48 | %(b) | ||||||
Expenses, after expense reductions | 1.35 | % | 1.34 | % | 1.45 | %(b) | ||||||
Expenses, after expense reductions and net of custody credits | 1.35 | % | 1.34 | % | 1.45 | %(b) | ||||||
Expenses, before expense reductions | 1.94 | % | 2.22 | % | 44,445.63 | %(b)† | ||||||
Portfolio turnover rate | 58.90 | % | 68.74 | % | 82.89 | % | ||||||
Net assets at end of period (000) | $ | 11,661 | $ | 5,754 | $ | 0 | (d) | |||||
| (a) | Not annualized for periods less than one year. |
| (b) | Annualized. |
| (c) | Effective date of Class R1 Shares was July 1, 2003. |
| (d) | Net assets at end of period were less than $1,000. |
| † | Due to the size of net assets and fixed expenses, ratios may appear disproportionate. |
| + | Based on weighted average shares outstanding. |
| Certified Annual Report | 25 |
| FINANCIAL HIGHLIGHTS, CONTINUED | ||
Thornburg Value Fund | ||
| Year Ended September 30, 2005(c) | ||||
Class R5 Shares: | ||||
PER SHARE PERFORMANCE | ||||
(for a share outstanding throughout the period)+ | ||||
Net asset value, beginning of period | $ | 30.75 | ||
Income from investment operations: | ||||
Net investment income | 0.28 | |||
Net realized and unrealized gain (loss) on investments | 2.45 | |||
Total from investment operations | 2.73 | |||
Less dividends from: | ||||
Net investment income | (0.26 | ) | ||
Change in net asset value | 2.47 | |||
NET ASSET VALUE, end of period | $ | 33.22 | ||
RATIOS/SUPPLEMENTAL DATA | ||||
Total return(a) | 8.93 | % | ||
Ratios to average net assets: | ||||
Net investment income | 1.31 | %(b) | ||
Expenses, after expense reductions | 1.00 | %(b) | ||
Expenses, after expense reductions and net of custody credits | 0.99 | %(b) | ||
Expenses, before expense reductions | 127.30 | %(b)† | ||
Portfolio turnover rate | 58.90 | % | ||
Net assets at end of period (000) | $ | 31 | ||
| (a) | Not annualized for periods less than one year. |
| (b) | Annualized. |
| (c) | Effective date of Class R5 Shares was February 1, 2005. |
| † | Due to the size of net assets and fixed expenses, ratios may appear disproportionate. |
| + | Based on weighted average shares outstanding. |
26 | Certified Annual Report |
Thornburg Value Fund | September 30, 2005 |
CUSIPS: CLASS A - 885-215-731, CLASS B - 885-215-590, CLASS C - 885-215-715, CLASS I - 885-215-632,
CLASS R1 - 885-215-533, CLASS R5 - 885-215-376
NASDAQ SYMBOLS: CLASS A - TVAFX, CLASS B - TVBFX, CLASS C - TVCFX, CLASS I - TVIFX,
CLASS R1 - TVRFX, CLASS R5 - TVRRX
| Shares/ Principal Amount | Value | ||||
COMMON STOCK — 93.88% | |||||
BANKS — 5.13% | |||||
COMMERCIAL BANKS — 5.13% | |||||
Bank of America Corp. | 1,158,900 | $ | 48,789,690 | ||
Lloyds TSB Group plc | 6,383,200 | 52,745,038 | |||
| 101,534,728 | |||||
CAPITAL GOODS — 4.63% | |||||
INDUSTRIAL CONGLOMERATES — 4.63% | |||||
General Electric Co. | 1,503,200 | 50,612,744 | |||
Tyco International Ltd. | 1,472,300 | 41,003,555 | |||
| 91,616,299 | |||||
COMMERCIAL SERVICES & SUPPLIES — 0.55% | |||||
COMMERCIAL SERVICES & SUPPLIES — 0.55% | |||||
FTI Consulting Inc.+ | 428,712 | 10,829,265 | |||
| 10,829,265 | |||||
CONSUMER DURABLES & APPAREL — 2.13% | |||||
HOUSEHOLD DURABLES — 2.13% | |||||
American Greetings Corp. | 1,540,100 | 42,198,740 | |||
| 42,198,740 | |||||
DIVERSIFIED FINANCIALS — 13.58% | |||||
CAPITAL MARKETS — 7.62% | |||||
Charles Schwab Corp. | 3,061,100 | 44,171,673 | |||
Goldman Sachs Group Inc. | 493,500 | 59,999,730 | |||
The Bank of New York Co. Inc. | 1,593,200 | 46,856,012 | |||
DIVERSIFIED FINANCIAL SERVICES — 5.96% | |||||
Alliance Capital Management Holdings LP | 313,400 | 14,996,190 | |||
Chicago Mercantile Exchange Co. | 144,080 | 48,598,184 | |||
Citigroup Inc. | 1,194,100 | 54,355,432 | |||
| 268,977,221 | |||||
| Certified Annual Report | 27 |
| SCHEDULE OF INVESTMENTS, CONTINUED | ||
Thornburg Value Fund | September 30, 2005 | |
| Shares/ Principal Amount | Value | ||||
ENERGY — 9.67% | |||||
ENERGY EQUIPMENT & SERVICES — 1.84% | |||||
Schlumberger Ltd. | 432,350 | $ | 36,481,693 | ||
OIL, GAS & CONSUMABLE FUELS — 7.83% | |||||
Canadian Natural Resources Ltd. | 468,000 | 21,163,702 | |||
ChevronTexaco Corp. | 1,132,100 | 73,280,833 | |||
Exxon Mobil Corp. | 955,200 | 60,693,408 | |||
| 191,619,636 | |||||
HEALTH CARE EQUIPMENT & SERVICES — 10.19% | |||||
HEALTH CARE EQUIPMENT & SUPPLIES — 2.06% | |||||
Fisher Scientific International, Inc.+ | 657,000 | 40,766,850 | |||
HEALTH CARE PROVIDERS & SERVICES — 8.13% | |||||
Caremark Rx Inc.+ | 908,000 | 45,336,440 | |||
Eclipsys Corp.+ | 1,639,540 | 29,249,394 | |||
Health Management Associates | 1,549,855 | 36,375,097 | |||
WellPoint Inc.+ | 661,200 | 50,132,184 | |||
| 201,859,965 | |||||
HOUSEHOLD & PERSONAL PRODUCTS — 2.10% | |||||
HOUSEHOLD PRODUCTS — 2.10% | |||||
Colgate Palmolive Co. | 789,300 | 41,667,147 | |||
| 41,667,147 | |||||
INSURANCE — 2.10% | |||||
INSURANCE — 2.10% | |||||
MBIA, Inc. | 685,000 | 41,524,700 | |||
| 41,524,700 | |||||
MATERIALS — 1.82% | |||||
CHEMICALS — 1.82% | |||||
Dow Chemical Co. | 867,500 | 36,148,725 | |||
| 36,148,725 | |||||
MEDIA — 6.48% | |||||
MEDIA — 6.48% | |||||
Comcast Corp.+ | 1,754,600 | 50,497,388 | |||
DIRECTV Group Inc.+ | 3,097,685 | 46,403,321 | |||
Sirius Satellite Radio Inc.+ | 1,681,355 | 11,012,875 | |||
XM Satellite Radio Holdings Inc.+ | 571,605 | 20,526,336 | |||
| 128,439,920 | |||||
28 | Certified Annual Report |
| SCHEDULE OF INVESTMENTS, CONTINUED | ||
Thornburg Value Fund | September 30, 2005 | |
| Shares/ Principal Amount | Value | ||||
PHARMACEUTICALS & BIOTECHNOLOGY — 5.91% | |||||
PHARMACEUTICALS — 5.91% | |||||
Johnson & Johnson | 384,700 | $ | 24,343,816 | ||
Pfizer Inc. | 1,989,300 | 49,672,821 | |||
Sanofi-Aventis | 518,400 | 42,974,708 | |||
| 116,991,345 | |||||
RETAILING — 3.94% | |||||
MULTILINE RETAIL — 1.89% | |||||
Target Corp. | 720,000 | 37,389,600 | |||
SPECIALTY RETAIL — 2.05% | |||||
Linens N Things Inc.+ | 1,526,077 | 40,746,256 | |||
| 78,135,856 | |||||
SOFTWARE & SERVICES — 6.24% | |||||
INTERNET SOFTWARE & SERVICES — 1.46% | |||||
Google Inc.+ | 91,620 | 28,994,065 | |||
IT SERVICES — 0.97% | |||||
Bearingpoint, Inc. Co.+ | 2,523,500 | 19,153,365 | |||
SOFTWARE — 3.81% | |||||
Microsoft Corp. | 1,788,900 | 46,028,397 | |||
Oracle Corp.+ | 2,381,000 | 29,500,590 | |||
| 123,676,417 | |||||
TECHNOLOGY HARDWARE & EQUIPMENT — 4.74% | |||||
COMMUNICATIONS EQUIPMENT — 4.74% | |||||
Cisco Systems Inc.+ | 2,481,700 | 44,496,881 | |||
Motorola, Inc. | 2,232,300 | 49,311,507 | |||
| 93,808,388 | |||||
TELECOMMUNICATION SERVICES — 9.93% | |||||
DIVERSIFIED TELECOMMUNICATION SERVICES — 2.49% | |||||
Alltel Corp. | 756,500 | 49,255,715 | |||
WIRELESS TELECOMMUNICATION SERVICES — 7.44% | |||||
Crown Castle International Corp.+ | 1,310,100 | 32,267,763 | |||
Leap Wireless International, Inc.+ | 1,075,900 | 37,871,680 | |||
NII Holdings Inc.+ | 915,804 | 77,339,648 | |||
| 196,734,806 | |||||
| Certified Annual Report | 29 |
| SCHEDULE OF INVESTMENTS, CONTINUED | ||
Thornburg Value Fund | September 30, 2005 | |
| Shares/ Principal Amount | Value | |||||
TRANSPORTATION — 4.74% | ||||||
AIRLINES — 2.13% | ||||||
Southwest Airlines Co. | 2,837,553 | $ | 42,137,662 | |||
ROAD & RAIL — 2.61% | ||||||
Union Pacific Corp. | 721,200 | 51,710,040 | ||||
| 93,847,702 | ||||||
TOTAL COMMON STOCKS (Cost $ 1,667,666,033) | 1,859,610,860 | |||||
CORPORATE BONDS — 0.53% | ||||||
TELECOMMUNICATION SERVICES — 0.53% | ||||||
DIVERSIFIED TELECOMMUNICATION SERVICES — 0.53% | ||||||
Level 3 Communications Inc., 9.125%, 5/1/2008 | $ | 7,000,000 | 5,705,000 | |||
Level 3 Communications Inc., 10.50%, 12/1/2008 | 5,900,000 | 4,838,000 | ||||
| 10,543,000 | ||||||
TOTAL CORPORATE BONDS (Cost $ 10,205,847) | 10,543,000 | |||||
CONVERTIBLE BONDS — 2.92% | ||||||
TELECOMMUNICATION SERVICES — 2.92% | ||||||
DIVERSIFIED TELECOMMUNICATION SERVICES — 2.92% | ||||||
Level 3 Communications Inc., 6.00%, 9/15/2009 | 20,700,000 | 10,841,625 | ||||
Level 3 Communications Inc., 6.00%, 3/15/2010 | 91,600,000 | 47,059,500 | ||||
| 57,901,125 | ||||||
TOTAL CONVERTIBLE BONDS (Cost $ 72,173,507) | 57,901,125 | |||||
SHORT TERM INVESTMENTS — 2.52% | ||||||
Lasalle Bank Corp., 3.71%, 10/7/2005 | 20,000,000 | 19,987,634 | ||||
Toyota Credit de Puerto Rico, 3.73%, 10/4/2005 | 6,000,000 | 5,998,135 | ||||
UBS Finance, 3.78%, 10/5/2005 | 24,000,000 | 23,989,920 | ||||
TOTAL SHORT TERM INVESTMENTS (Cost $ 49,975,689) | 49,975,689 | |||||
TOTAL INVESTMENTS — 99.85% (COST $ 1,800,021,076) | $ | 1,978,030,674 | ||||
OTHER ASSETS LESS LIABILITIES — 0.15% | 2,904,667 | |||||
NET ASSETS — 100.00% | $ | 1,980,935,341 | ||||
Footnote Legend
See notes to financial statements.
| + | Non-income producing |
30 | Certified Annual Report |
SCHEDULE OF INVESTMENTS, CONTINUED | ||
Thornburg Value Fund | September 30, 2005 | |
SUMMARY OF INDUSTRY EXPOSURE
As of 9/30/05
Diversified Financials | 13.6 | % | |
Telecommunication Services | 13.4 | % | |
Health Care Equipment & Services | 10.2 | % | |
Energy | 9.7 | % | |
Media | 6.5 | % | |
Software & Services | 6.2 | % | |
Pharmaceuticals & Biotechnology | 5.9 | % | |
Banks | 5.1 | % | |
Transportation | 4.7 | % | |
Technology Hardware & Equipment | 4.7 | % | |
Capital Goods | 4.6 | % | |
Retailing | 3.9 | % | |
Consumer Durables & Apparel | 2.1 | % | |
Household & Personal Products | 2.1 | % | |
Insurance | 2.1 | % | |
Materials | 1.8 | % | |
Commercial Services & Supplies | 0.6 | % | |
Other Assets and Cash Equivalents | 2.8 | % | |
| Certified Annual Report | 31 |
REPORT OF INDEPENDENT REGISTERED PUBLIC ACCOUNTING FIRM
Thornburg Value Fund
To the Trustees and Shareholders of
Thornburg Value Fund
In our opinion, the accompanying statement of assets and liabilities, including the schedule of investments, and the related statements of operations and of changes in net assets and the financial highlights present fairly, in all material respects, the financial position of Thornburg Value Fund (one of the portfolios constituting Thornburg Investment Trust, hereafter referred to as the “Fund”) at September 30, 2005, the results of its operations for the year then ended, the changes in its net assets for each of the two years in the period then ended and the financial highlights for each of the periods presented, in conformity with accounting principles generally accepted in the United States of America. These financial statements and financial highlights (hereafter referred to as “financial statements”) are the responsibility of the Fund’s management. Our responsibility is to express an opinion on these financial statements based on our audits. We conducted our audits of these financial statements in accordance with the standards of the Public Company Accounting Oversight Board (United States). Those standards require that we plan and perform the audit to obtain reasonable assurance about whether the financial statements are free of material misstatement. An audit includes examining, on a test basis, evidence supporting the amounts and disclosures in the financial statements, assessing the accounting principles used and significant estimates made by management, and evaluating the overall financial statement presentation. We believe that our audits, which included confirmation of securities at September 30, 2005 by correspondence with the custodian and brokers, provide a reasonable basis for our opinion.
PricewaterhouseCoopers LLP
New York, New York
November 16, 2005
32 | Certified Annual Report |
Thornburg Value Fund | September 30, 2005 (Unaudited) |
As a shareholder of the Fund, you incur two types of costs:
(1) transaction costs, including
(a) sales charges (loads) on purchase payments for Class A Shares;
(b) a deferred sales charge on redemptions of any part or all of a purchase of $1 million of Class A shares within 12 months of purchase;
(c) a deferred sales charge on redemptions of Class C shares within 12 months of purchase;
(d) a 90-day redemption fee on Class A and Class I shares;
(2) ongoing costs, including management fees; distribution and/or service (12b-1) fees; and other Fund expenses.
This example is intended to help you understand your ongoing costs (in dollars) of investing in the Fund and to compare these costs with the ongoing costs of investing in other mutual funds.
The example is based on an investment of $1,000 invested on March 31, 2005 and held until September 30, 2005.
Actual Expenses
The first line of the table at right provides information about actual account values and actual expenses. You may use the information in this line, together with the amount you invested, to estimate the expenses that you paid over the period. Simply divide your account value by $1,000 (for example, an $8,600 account value divided by $1,000 = 8.6), then multiply the result by the number in the first line under the heading entitled “Expenses Paid During Period” to estimate the expenses you paid on your account during this period.
Hypothetical Example for Comparison Purposes
The second line of the table at right provides information about hypothetical account values and hypothetical expenses based on the Fund’s actual expense ratio and an assumed rate of return of 5% per year before expenses, which is not the Fund’s actual return. The hypothetical account values and expenses may not be used to estimate the actual ending account balance or expenses you paid for the period. You may use this information to compare the ongoing costs of investing in the Fund and other funds. To do so, compare this 5% hypothetical example with the 5% hypothetical examples that appear in the shareholder reports of the other funds.
| Beginning Account Value 3/31/05 | Ending Account Value 9/30/05 | Expenses Paid 3/31/05–9/30/05 | |||||||
Class A Shares | |||||||||
Actual | $ | 1,000.00 | $ | 1,085.20 | $ | 7.23 | |||
Hypothetical* | $ | 1,000.00 | $ | 1,018.13 | $ | 7.00 | |||
Class B Shares | |||||||||
Actual | $ | 1,000.00 | $ | 1,080.80 | $ | 11.33 | |||
Hypothetical* | $ | 1,000.00 | $ | 1,014.18 | $ | 10.96 | |||
Class C Shares | |||||||||
Actual | $ | 1,000.00 | $ | 1,081.20 | $ | 11.06 | |||
Hypothetical* | $ | 1,000.00 | $ | 1,014.44 | $ | 10.70 | |||
Class I Shares | |||||||||
Actual | $ | 1,000.00 | $ | 1,087.20 | $ | 5.13 | |||
Hypothetical* | $ | 1,000.00 | $ | 1,020.15 | $ | 4.97 | |||
Class R1 Shares | |||||||||
Actual | $ | 1,000.00 | $ | 1,084.90 | $ | 7.06 | |||
Hypothetical* | $ | 1,000.00 | $ | 1,018.30 | $ | 6.83 | |||
Class R5 Shares | |||||||||
Actual | $ | 1,000.00 | $ | 1,086.90 | $ | 5.21 | |||
Hypothetical* | $ | 1,000.00 | $ | 1,020.08 | $ | 5.04 | |||
| † | Expenses are equal to the annualized expense ratio for each class (A: 1.38%; B: 2.17%; C: 2.12%; I: 0.98%; R1: 1.35%; and R5: 1.00%) multiplied by the average account value over the period, multiplied by 183/365 to reflect the one-half year period. |
| * | Hypothetical assumes a rate of return of 5% per year before expenses. |
Please note that the expenses shown in the table are meant to highlight your ongoing costs only and do not reflect any transactional costs, such as sales charges (loads), redemption fees, or exchange fees. Therefore, the second line of the table is useful in comparing ongoing costs only, and will not help you determine the relative total costs of owning different funds. In addition, if these transactional costs were included, your costs would have been higher.
| Certified Annual Report | 33 |
Thornburg Value Fund | September 30, 2005 (Unaudited) |
GROWTH OF A HYPOTHETICAL $10,000 INVESTMENT
Thornburg Value Fund versus S&P 500 Index (October 2, 1995 to September 30, 2005)
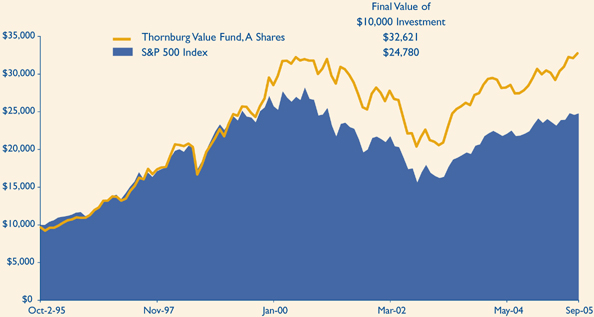
AVERAGE ANNUAL TOTAL RETURNS
For periods ended September 30, 2005 (with sales charge)
| 1Yr | 5Yrs | Since Inception | |||||||
A Shares (Incep: 10/02/95) | 12.42 | % | (0.33 | )% | 12.55 | % | |||
B Shares (Incep: 4/03/00) | 11.49 | % | (0.66 | )% | (0.56 | )% | |||
C Shares (Incep: 10/02/95) | 15.80 | % | (0.19 | )% | 12.19 | % | |||
R1 Shares (Incep: 7/01/03) | 17.64 | % | — | 11.91 | % | ||||
R5 Shares (Incep: 2/01/05) | — | — | 8.93 | % | |||||
S&P 500 (Since: 10/02/95) | 12.25 | % | (1.49 | )% | 9.54 | % |
Performance data reflects past performance, which is no guarantee of future results. The performance data and graph do not reflect the deduction of taxes that a shareholder would pay on distributions or the redemption of Fund shares.
Returns reflect the reinvestment of dividends and capital gains as well as applicable sales charges. Class A shares are sold with a maximum sales charge of 4.50%. Class B shares are sold with a contingent deferred sales charge (CDSC) that declines from 5.00% to 0% depending upon the period of time the shares are held. Class B shares will automatically convert to Class A shares on a quarterly basis approximately eight years after purchase. Class C shares are subject to a 1% CDSC for the first year only. There is no up-front sales charge for Class R1 and R5 shares. Class R1 and R5 shares are available only to certain qualified investors. Class A shares are subject to a 1% 90-day redemption fee.
The Standard & Poor’s 500 Stock Index (S&P 500) is an unmanaged index generally representative of the U.S. stock market, without regard to company size. Unless otherwise noted, index returns do not reflect fees, brokerage commissions or other expenses of investing. Investors may not make direct investments into any index.
34 | Certified Annual Report |
Thornburg Value Fund | September 30, 2005 (Unaudited) |
Name, Age, Position Held with Fund Year Elected | Principal Occupation(s) During Past Five Years | Other Directorships Held by Trustee | ||
INTERESTED TRUSTEES(1)(2)(4) | ||||
Garrett Thornburg, 59 Chairman of Trustees, Trustee since 1987(3) | CEO, Chairman and controlling shareholder of Thornburg Investment Management, Inc. (investment advisor) and Thornburg Securities Corporation (securities dealer); Chairman of Thornburg Limited Term Municipal Fund, Inc. (registered investment company) to 2004; CEO and Chairman of Thornburg Mortgage, Inc. (real estate investment trust); Chairman of Thornburg Mortgage Advisory Corporation (investment manager to Thornburg Mortgage, Inc.). | Director of Thornburg Mortgage, Inc. (real estate investment trust) | ||
Brian J. McMahon, 49 Trustee since 2001, Member of Governance & Nominating Committee, President since 1997(5)(6) | President and Managing Director of Thornburg Investment Management, Inc.; President of Thornburg Limited Term Municipal Fund, Inc. to 2004. | None | ||
INDEPENDENT TRUSTEES(1)(2)(4) | ||||
David A. Ater, 60 Trustee since 1994, Member of Audit Committee and Governance & Nominating Committee | Principal in Ater & Associates, Santa Fe, NM (developer, planner and broker of residential and commercial real estate); owner developer and broker for various real estate projects. | Director of Thornburg Mortgage, Inc. (real estate investment trust) | ||
David D. Chase, 64 Chairman of Audit Committee, Trustee since 2000 | Chairman, President, CEO, and Managing Member of Vestor Associates, LLC, the general partner of Vestor Partners, LP, Santa Fe, NM (private equity fund); Chairman and CEO of Vestor Holdings, Inc., Santa Fe, NM (merchant bank). | None | ||
Eliot R. Cutler, 59 Chairman of Governance & Nominating Committee, Trustee since 2004 | Partner, Akin, Gump, Strauss, Hauer & Feld, LLP, Washington, D.C. (law firm) since November 2000; partner, Cutler & Stanfield, Washington, D.C. (law firm) until November 2000. | Director of Thornburg Mortgage, Inc. (real estate investment trust) | ||
Susan H. Dubin, 56 Trustee since 2004, Member of Audit Committee | President of Dubin Investments, Ltd., Greenwich, CT (private investment fund); Director and officer of various charitable organizations; and formerly, Vice President of Chemical Bank (predecessor to JP Morgan Chase & Co.), New York, 1974–1996. | None | ||
Owen D. Van Essen, 51 Trustee since 2004, Member of Governance & Nominating Committee | President of Dirks, Van Essen & Murray, Santa Fe, NM (newspaper mergers and acquisitions). | None | ||
James W. Weyhrauch, 46 Trustee since 1996, Member of Audit Committee | Director, Executive Vice President to 2002, and President and CEO 2002–2004, Nambé Mills, Inc., Santa Fe, NM (manufacturer); real estate agent, Santa Fe Properties, Santa Fe, NM since 2004. | None | ||
| Certified Annual Report | 35 |
| TRUSTEES AND OFFICERS, CONTINUED | ||
Thornburg Value Fund | September 30, 2005 (Unaudited) | |
Name, Age, Position Held with Fund Year | Principal Occupation(s) During Past Five Years | Other Directorships Held by Trustee | ||
OFFICERS OF THE FUND (WHO ARE NOT TRUSTEES)(1)(6)(7) | ||||
Dawn B. Fischer, 58 Secretary since 1987 | Secretary and Managing Director, Thornburg Investment Management, Inc.; Secretary, Thornburg Limited Term Municipal Fund, Inc. to 2004; Secretary, Thornburg Securities Corporation; Vice President, Daily Tax Free Income Fund, Inc. (registered investment company). | Not applicable | ||
Steven J. Bohlin, 46 Vice President since 1987; Treasurer since 1989 | Vice President and Managing Director of Thornburg Investment Management, Inc.; Vice President of Thornburg Limited Term Municipal Fund, Inc. to 2004. | Not applicable | ||
George T. Strickland, 42 Vice President since 1996 | Vice President and Managing Director of Thornburg Investment Management, Inc.; Vice President (to 2004) and Treasurer (2003–2004) of Thornburg Limited Term Municipal Fund, Inc. | Not applicable | ||
William V. Fries, 66 Vice President since 1995 | Vice President and Managing Director of Thornburg Investment Management, Inc. | Not applicable | ||
Leigh Moiola, 38 Vice President since 2001 | Vice President and Managing Director of Thornburg Investment Management, Inc.; Vice President of Thornburg Limited Term Municipal Fund, Inc. 1999–2004. | Not applicable | ||
Kenneth Ziesenheim, 51 Vice President since 1995 | Vice President and Managing Director of Thornburg Investment Management, Inc.; President of Thornburg Securities Corporation; Vice President of Thornburg Limited Term Municipal Fund, Inc. to 2004. | Not applicable | ||
Alexander Motola, 35 Vice President since 2001 | Vice President and Managing Director of Thornburg Investment Management, Inc. since 2000; Portfolio Manager, Insight Capital Research & Management, Inc., Walnut Creek, California 1995–2000. | Not applicable | ||
Wendy Trevisani, 34 Vice President since 1999 | Associate Portfolio Manager of Thornburg Investment Management, Inc. since 1999, Vice President since 2000 and Managing Director since 2003; Vice President of Thornburg Limited Term Municipal Fund, Inc. 1999–2002. | Not applicable | ||
Joshua Gonze, 42 Vice President since 1999 | Associate Portfolio Manager of Thornburg Investment Management, Inc. since 1999, Vice President since 1999 and Managing Director since 2003; Vice President of Thornburg Limited Term Municipal Fund, Inc. to 2004. | Not applicable | ||
Brad Kinkelaar, 37 Vice President since 1999 | Associate Portfolio Manager of Thornburg Investment Management, Inc. since 1999, Vice President since 2000 and Managing Director since 2003. | Not applicable | ||
Christopher Ihlefeld, 35 Vice President since 2003 | Associate Portfolio Manager since 1999; Vice President of Thornburg Investment Management, Inc. since 2002; Vice President of Limited Term Municipal Fund, Inc., 2003–2004. | Not applicable | ||
Leon Sandersfeld, 39 Vice President since 2003 | Associate of Thornburg Investment Management, Inc. since 2002; Senior Staff Accountant, Farm Bureau Life Insurance Co. 1998–2002. | Not applicable | ||
36 | Certified Annual Report |
| TRUSTEES AND OFFICERS, CONTINUED | ||
Thornburg Value Fund | September 30, 2005 (unaudited) | |
Name, Age, Position Held with Fund Year | Principal Occupation(s) During Past Five Years | Other Directorships Held by Trustee | ||
Sasha Wilcoxon, 31 Vice President since 2003 | Associate of Thornburg Investment Management, Inc. since 2000 and Mutual Fund Operations Department Manager since 2002. | Not applicable | ||
Ed Maran, 47 Vice President since 2004 | Associate Portfolio Manager of Thornburg Investment Management, Inc. since 2002 and Vice President and Managing Director since 2004; Analyst, USAA 2001–2002; Oil Analyst, A.G. Edwards 1997–2000. | Not applicable | ||
Vinson Walden, 35 Vice President since 2004 | Associate Portfolio Manager of Thornburg Investment Management, Inc. since 2002 and Vice President and Managing Director since 2004; Associate Portfolio Manager, Ibis Management 2002–2004; Associate, Lehman Brothers, 1997–2001. | Not applicable | ||
| (1) | Each person’s address is 119 East Marcy Street, Santa Fe, New Mexico 87501. |
| (2) | The Fund is one of twelve separate investment “Funds” or “series” of Thornburg Investment Trust (the “Trust”), which comprises the Thornburg mutual fund complex and is organized as a Massachusetts business trust. The Trust currently has twelve active Funds. Thornburg Investment Management, Inc. is the investment advisor to, and manages, the twelve Funds of the Trust. Each Trustee oversees the twelve Funds in the fund complex. |
| (3) | Mr. Thornburg is considered an “interested” Trustee under the Investment Company Act of 1940 because he is a director and controlling shareholder of Thornburg Investment Management, Inc., the investment advisor to the twelve active Funds of the Trust, and is the sole director and controlling shareholder of Thornburg Securities Corporation, the distributor of shares for the Trust. |
| (4) | Each Trustee serves in office until the election and qualification of a successor. |
| (5) | Mr. McMahon is considered an “interested” Trustee because he is the president of Thornburg Investment Management, Inc. |
| (6) | The Trust’s president, secretary and treasurer each serves a one-year term or until the election and qualification of a successor; each other officer serves at the pleasure of the Trustees. |
| (7) | Assistant vice presidents, assistant secretaries and assistant treasurers are not shown. |
The Statement of Additional Information for each Fund of the Trust includes additional information about the Trustees and is available, without charge and upon request, by calling 1-800-847-0200.
| Certified Annual Report | 37 |
Thornburg Value Fund | September 30, 2005 (Unaudited) |
PORTFOLIO PROXY VOTING
Policies and Procedures:
The Trust has delegated to Thornburg Investment Management, Inc. (the “Advisor”) voting decisions respecting proxies for the Fund’s voting securities. The Advisor makes voting decisions in accordance with its Proxy Voting Policy and Procedures. A description of the Policy and Procedures is available (i) without charge, upon request, by calling the Advisor toll-free at 1-800-847-0200, (ii) on the Thornburg website at www.thornburg.com, and (iii) on the Securities and Exchange Commission’s website at www.sec.gov.
Commencing August 31, 2004, information regarding how proxies were voted is available on or before August 31 of each year for the twelve months ending the preceding June 30. This information is available (i) without charge, upon request by calling the Advisor toll-free at 1-800-847-0200, (ii) on the Thornburg website at www.thornburg.com, and (iii) on the Securities and Exchange Commission’s website at www.sec.gov.
TAX INFORMATION
For the tax year ended September 30, 2005, the Thornburg Value Fund designates 100% of the dividends paid from tax basis net ordinary income as qualifying for the reduced rate under the Jobs and Growth Tax Relief and Reconciliation Act of 2003.
100% of the ordinary income distributions paid by the Fund (or the maximum amount allowed) for the year ended September 30, 2005 qualified for the corporate dividends received deduction.
The information and distributions reported herein may differ from the information and distributions taxable to the shareholders for the calendar year ending December 31, 2005. Complete information will be computed and reported in conjunction with your 2005 Form 1099-DIV.
AVAILABILITY OF QUARTERLY PORTFOLIO SCHEDULE
The Fund files with the Securities and Exchange Commission schedules of its portfolio holdings on Form N-Q for the first and third quarters of each fiscal year. The Fund’s Forms N-Q are available on the Commission’s website at www.sec.gov, or may be reviewed and copied at the Commission’s Public Reference Room in Washington, D.C. Information on the operation of the Public Reference Room may be obtained by calling 1-800-SEC-0330. The Fund also makes this information available on its website at www.thornburg.com/download or upon request by calling 1-800-847-0200.
TRUSTEES DELIBERATIONS RESPECTING RENEWAL OF INVESTMENT ADVISORY AGREEMENT
Thornburg Investment Management, Inc. (the “Advisor”) provides investment management services to Thornburg Value Fund pursuant to an investment advisory agreement. The Trustees consider the renewal of this agreement annually and most recently determined to renew the agreement on September 13, 2005.
In connection with their general supervision of the Advisor, the Trustees receive and consider reports throughout the year from the Advisor respecting the Advisor’s management of the Fund’s investments. These reports include information about the Fund’s purchase and sale of portfolio investments and explanations from the Advisor respecting investment selections, the investment performance of the Fund, general appraisals of industry and economic prospects and factors, and other matters affecting the Fund and relating to the Advisor’s performance of services for the Fund.
In anticipation of their recent consideration of the advisory agreement’s renewal, the independent Trustees met with representatives of the Advisor in July 2005 to specify the information the Advisor would present to the Trustees for their review. The independent Trustees thereafter met in independent session to consider various factors respecting the agreement’s renewal, and met in a subsequent session with the Advisor’s chief investment officer to present questions. Following these sessions, the Trustees met on September 13, 2005 to consider a renewal of the advisory agreement.
The Trustees considered various factors in their review of the Advisor’s performance under the investment advisory agreement, including specifically the principles outlined in their February 2005 Statement to Shareholders, a copy of which accompanies this Annual Report to Shareholders. Summarized below are certain of the factors considered by the Trustees in connection with the determination to renew the advisory agreement. In determining to renew the advisory agreement, the Trustees did not identify any single fact or aspect of the Advisor’s performance as controlling, and this summary does not describe all of the matters considered by the Trustees in making their determination.
Quality of Services; Fund Investment Performance. In reviewing the nature, extent, and quality of services provided by the Advisor and the investment performance of the Fund, the Trustees primarily considered the Advisor’s adherence to the Fund’s stated objectives and policies, the Advisor’s execution of the Fund’s investment strategies in prevailing market conditions, the Fund’s absolute investment performance, the Fund’s investment performance compared to categories of other broadly similar mutual funds and a broad based securities index, the Fund’s investment performance over different periods of time, the Fund’s total returns in rising and declining markets compared to total returns of a broad based securities index, measures of relative portfolio risk, and related factors. The Trustees noted in comparing the Fund to other mutual funds and to indices that the value of such comparisons may be limited because the Fund’s investment approach, and the selection of its portfolio securities, are unique or differ in
38 | Certified Annual Report |
| OTHER INFORMATION, CONTINUED | ||
Thornburg Value Fund | September 30, 2005 (Unaudited) | |
considerable degree from the characteristics of other funds and indices. In conducting their review, the Trustees observed that the Advisor had continued to faithfully pursue and to achieve the Fund’s stated objectives, as demonstrated particularly by the Advisor’s selection of investments and the Fund’s investment performance. The Trustees also noted in this regard the Fund’s above average investment performance in most periods as compared to broad based securities indices and categories of equity mutual funds selected by independent mutual fund analyst firms.
The Trustees also considered a number of other factors in reviewing the quality of the Advisor’s services, including the qualifications and integrity of the Advisor’s senior personnel, the Advisor’s staffing and other resources, the Advisor’s compliance with regulatory requirements, Fund sales performance and perceptions of the Funds in the marketplace, and other factors.
The Trustees concluded, based upon these and other considerations, that the Advisor had actively and competently pursued the Fund’s stated investment objectives in accordance with the Fund’s investment policies stated in its prospectuses. The Trustees further concluded that the investment performance of the Fund was satisfactory in the context of the Fund’s objectives and policies and prevailing market conditions.
Fees and Expenses; Profitability of Advisor. In reviewing the fees charged by the Advisor to the Fund, the Trustees primarily considered the fees charged by the Advisor and the other expenses charged to the Fund in light of the nature and quality of services provided, comparison of the actual Advisor’s fee and Fund expenses to the statement of fees and expenses in the Fund’s prospectuses, comparisons of the Advisor’s fee and other Fund expenses to median and average fees and expenses charged to similar mutual funds, and comparisons of fees and expenses charged to the Fund with fees and expenses charged to other, similar specific mutual funds. In addition, the Trustees considered the profitability of the Advisor compared to other investment management firms, and comparisons of the investment management fee rates charged by the Advisor to the Fund with rates charged to other clients of the Advisor and the differing types of services furnished to the Fund and the other clients. The Trustees noted that the management fee charged to the Fund was higher than the average and median fee rates charged to a group of multi-cap core funds assembled by an independent mutual fund analyst firm, but that the overall expense ratio was comparable to the average and median expense ratios for the same fund group. The Trustees further noted in this regard the investment performance of the Fund. The Trustees also observed in their review that fee rates charged by the Advisor to other clients of the Advisor were not directly comparable to rates charged to the Fund principally because of the significant differences in the services provided.
The Trustees concluded, based upon these and other considerations, that the fees charged to the Fund by the Advisor were fair and reasonable in view of the following: the services provided, the clear disclosure of these fees and expenses in the Fund’s prospectuses, and prevailing fees and expenses charged to mutual funds generally. The Trustees further concluded that there was no indication that the Advisor’s profitability was unusual, viewed in the context of the services provided, the performance of the Fund, and the fees and profitability of other investment management firms.
Economies of Scale. In reviewing the extent to which economies of scale would be realized by the Fund as it grows and whether fee levels reflect economies of scale, the Trustees considered the breakpoint structure for advisory fees chargeable to the Fund, the demonstrated economies of scale enjoyed by the Fund and other Funds of the Trust as they had grown in size, and economies of scale realized by other mutual funds. The Trustees concluded that the Fund has realized and may reasonably be expected to realize further economies of scale for the benefit of its shareholders as it grows in size.
Ancillary Benefits to Advisor. In reviewing benefits enjoyed by the Advisor because of its relationship with the Fund, the Trustees considered an arrangement through which the Advisor received certain research services, favorable publicity received by the Advisor because of the superior investment performance of certain funds of the Trust, and the benefits to the Fund from the Advisor’s expansion of its staffing and other resources to serve a broader variety of investment clients. The Trustees concluded, based upon these and other considerations, that there was no unusual or unfair benefit enjoyed by the Advisor and that the Fund enjoyed benefits by virtue of the Advisor’s engagement by other investment clients.
| Certified Annual Report | 39 |
Trustees’ Statement to Shareholders
Not part of the Certified Annual Report
February 8, 2005
The Trustees are concerned that recent commentaries and opinions reported in the media may confuse investors in general as to the supervisory duties of trustees of mutual funds and, in particular, leave Thornburg Investment Trust shareholders uncertain regarding how we discharge our responsibilities in supervising the Funds’ investment advisor and in reviewing the advisor’s contract for renewal. We decided to spell out clearly three principal guidelines that we follow in supervising the Trust’s investment advisor on your behalf.
We begin with the premise that each shareholder selected his or her Fund because its investments are managed by the investment advisor identified in the prospectus and in accordance with the objective and policies described in the prospectus. We realize, as each of you do, that if you believe that your Fund’s stated objective and policies no longer serve your personal investment goals, you can sell your shares and leave the Fund.
Therefore, we believe that our primary supervisory task – our principal obligation to you – is to assess the nature and quality of the advisor’s services, and to confirm that the advisor actively and competently pursues the Fund’s objective, in accordance with the policies set out in the prospectus. To do this, we meet regularly with management to review your Fund’s portfolio and to discuss the advisor’s specific actions and judgments in pursuing the Fund’s objective. We do not substitute our own judgment for the advisor’s decisions in selecting investments; the advisor is paid to exercise its informed judgment on investment decisions, and we seek to confirm, in reviewing the advisor’s performance, that the advisor is doing just that.
Second, while we are conscious of costs and the effect that costs have on shareholders’ returns, we do not seek the lowest fees or expense ratio as our sole or primary objective. We try to make sure that your Fund’s fees and costs are reasonable in relationship to the services rendered and that they are generally in line with those charged by other expert investment advisors, consistent with our belief that the Fund’s investors searched for and expect that expertise and attention and have decided to pay a reasonable price for it. We do not put the management contract “out to bid” as a matter of course, and we would not do so unless we had concluded that the advisor materially had failed to pursue the Fund’s objectives in accordance with its policies, or for other equally important reasons. We believe that any other approach would be inconsistent with your interests and contrary to your expectations when you bought shares of the Fund in the first place.
Finally, because we believe that most Thornburg Fund shareholders have invested with a long-term perspective, we try not to focus too much on the fashions of the moment and on short-term performance. The market will not favor any specific investment objective or set of policies at all times and under all economic circumstances. A fund will experience periods of both high and low returns relative to other funds and other investments. Even if one of our Funds is not favored by the market at a particular time, we believe that the advisor is nonetheless obliged to remain true to the Fund’s objective and policies, and we watch to see that it does so.
This statement is submitted for the general information of the shareholders of Thornburg Investment Trust. It is not authorized for distribution to prospective investors in the Fund unless preceded or accompanied by an effective prospectus. If you have not received a prospectus, one can be obtained from your financial advisor, online at www.thornburg.com/download, or by calling 800-847-0200. Carefully consider information in the prospectus regarding the Fund’s investment objectives and policies, risks, sales charges, expenses, experience of its management, marketability of shares, and other information. Read it carefully before you invest or send money.
40 | This page is not part of the Annual Report. |
This page intentionally left blank.
| This page is not part of the Annual Report. | 41 |
This page intentionally left blank.
42 | This page is not part of the Annual Report. |
Planning Options
Retirement and Education Accounts
Thornburg Investment Management offers retirement and education savings accounts that can help you meet a variety of planning challenges. For account applications or further information on any of the accounts below, please call 1-800-847-0200 or go to www.thornburg.com/ira. Your financial advisor can help you determine which plan is right for you.
Individual Retirement Accounts
Individual Retirement Accounts (IRAs) provide a tax-advantaged means to save money for the future. For a detailed outline of the difference between retirement accounts, see www.thornburg.com/ira. Rollovers are available. Call 1-800-847-0200 for more information.
Traditional IRAs – Contributions to Traditional IRAs are tax deductible for eligible individuals, and withdrawals are taxed as additional ordinary income. You may contribute to an IRA if you receive compensation and are under 701/2, even if you are covered by an employer retirement plan.
Roth IRAs – Under a Roth IRA, there is no tax deduction for contributions, but there is no income tax on qualified withdrawals. For a more detailed comparison of Traditional and Roth IRAs, please see our web site at www.thornburg.com/ira.
SEP IRAs – Simplified Employee Pension (SEP) IRAs are established by employers. The employer is allowed a tax deduction for contributions made to the SEP Plan and makes contributions to each eligible employee’s SEP IRA on a discretionary basis.
SIMPLE IRAs – Savings Incentive Match Plan for Employees of Small Employers (SIMPLE) is designed to give small business owners a simplified method to establish and contribute to a retirement plan for employees. The employer is allowed a tax deduction for contributions and makes either matching or non-elective contributions to each eligible employee’s SIMPLE IRA. Employees may make salary deferral contributions.
403(b)
A special, tax-advantaged savings vehicle available only to employees of 501(c)(3) organizations, such as charitable, educational, scientific and religious organizations. 403(b) plans are also available to employees of public schools and universities.
Coverdell Education Savings Account
These savings accounts are designed to provide a way to save money for higher education expenses. In an Education Savings Account, earnings and interest grow tax free, and qualified withdrawals used to pay for eligible higher-education expenses are tax- and penalty-free.
Funds Available
The following funds are available in the accounts listed above:
| • | Thornburg International Value Fund |
| • | Thornburg Value Fund |
| • | Thornburg Core Growth Fund |
| • | Thornburg Investment Income Builder Fund |
| • | Thornburg Limited Term U.S. Government Fund |
| • | Thornburg Limited Term Income Fund |
| This page is not part of the Annual Report. | 43 |
The Firm
Thornburg Investment Management® is a privately held investment management company based in Santa Fe, New Mexico with assets under management of over $16 billion. Founded in 1982, the firm manages four equity funds, eight bond funds, and separate portfolios for select institutions and individuals.
Investment Philosophy
We seek to preserve and increase the real wealth of the Funds’ shareholders after accounting for inflation, taxes, and investment expenses. We’re committed to disciplined investing and controlling risk in all market environments through laddered bond and focused equity portfolios.
Portfolio Holdings Disclosure
We believe you should know about your portfolio. Our web site keeps investors informed of the Funds’ equity holdings. Go to www.thornburg.com/funds for commentary on our equity fund holdings.
Co-Ownership of Funds
We invest side-by-side with the Funds’ shareholders. Our employees have invested over $110 million in Thornburg Funds.
Core Strategies for Building Wealth
We deliver core strategies to help investors meet long-term goals. A core strategy is a consistent, disciplined and proven investment process that represents the foundation of a diversified portfolio.
| Investment Manager: | Distributor: | |
 |  | |
119 East Marcy Street | 119 East Marcy Street | |
Santa Fe, New Mexico 87501 | Santa Fe, New Mexico 87501 | |
800.847.0200 | 800.847.0200 | |


Core Strategies for Building Wealth
Thornburg Value Fund
I Shares
Informational Brochure and
Annual Report – September 30, 2005
The Value of Experience
This report and the accompanying brochure are submitted for the general information of shareholders of the Fund. It is not authorized for distribution to prospective investors in the Fund unless preceded or accompanied by an effective prospectus. If you have not received a prospectus, one can be obtained from your financial advisor, online at www.thornburg.com/ download, or by calling 800-847-0200. Carefully consider information in the prospectus regarding the Fund’s investment objectives and policies, risks, sales charges, expenses, experience of its management, marketability of shares, and other information. Read it carefully before you invest or send money. Performance data quoted represents past performance and does not guarantee future results.
Thornburg Value Fund
The Value of Experience
The Fund seeks long-term capital appreciation by investing in a portfolio of a limited number of holdings selected on a value basis using fundamental research. As a secondary consideration, the Fund also seeks some current income.
The portfolio is diversified to include basic value stocks, but also includes stocks of companies with consistent earnings characteristics and those of emerging franchises, when, in our opinion, these issues are value priced.
Thornburg Bond Funds
| • | Thornburg Limited Term Municipal Fund |
| • | Thornburg Intermediate Municipal Fund |
| • | Thornburg California Limited Term Municipal Fund |
| • | Thornburg New Mexico Intermediate Municipal Fund |
| • | Thornburg Florida Intermediate Municipal Fund |
| • | Thornburg New York Intermediate Municipal Fund |
| • | Thornburg Limited Term U.S. Government Fund |
| • | Thornburg Limited Term Income Fund |
Thornburg invests in short- and intermediate-term investment grade bonds. We ladder the maturities of individual bonds in the portfolios to moderate risk. Laddering involves building a portfolio of bonds with staggered maturities so that a portion of the portfolio will mature each year. We apply this disciplined process in all interest rate environments.
Thornburg Equity Funds
| • | Thornburg Value Fund |
| • | Thornburg International Value Fund |
| • | Thornburg Core Growth Fund |
| • | Thornburg Investment Income Builder Fund |
Thornburg’s equity research uses a fundamental, yet comprehensive, analytical approach. We invest when and where we perceive compelling value. Thornburg equity funds focus on a limited number of securities so that each holding can impact performance. The equity team searches for firms believed to have a promising future and seeks to buy shares of those companies at a discount to their intrinsic value.
More information at www.thornburg.com
 | Reduce paper clutter. | |
| Receive your shareholder reports and prospectus online instead of through traditional mail. | ||
Sign up at | ||
| www.thornburg.com/edelivery |
2 | This page is not part of the Annual Report. |
Message
from the Chairman

Garrett Thornburg
Chairman & CEO
November 9, 2005
Dear Fellow Shareholder:
Thornburg Investment Management has a clear mission: to preserve and increase the real wealth of our shareholders. We seek to accomplish this through a range of equity funds that redefine traditional measures of value and growth and through a family of laddered bond funds that focus on quality, stability and minimizing risk over time.
Confirming our strategy, all Thornburg equity funds have ranked well within their respective categories.
The Thornburg equity funds employ a comprehensive approach which is more inclusive than the traditional deep value or high growth approach to stock selection. Within the Thornburg Value Fund and the Thornburg International Value Fund, the portfolios’ securities are classified into three baskets: basic value stocks, stocks of companies with consistent earnings, and stocks of emerging franchises. Thornburg Core Growth Fund’s holdings are classified into similar baskets: growth industry leaders, consistent growth companies, and emerging growth companies. After being identified through bottom-up screening from a worldwide universe, all stocks are subject to a rigorous selection process that must satisfy the Thornburg investment team’s two fundamental criteria: in the opinion of the portfolio manager, the companies must be selling at attractive discounts to intrinsic value and have compelling prospects for long-term growth. You can read much more about the stocks in your Fund’s portfolio at our web site, www.thornburg.com/funds.
During this decade, the average dividend yield paid by equity and hybrid mutual funds has dipped well below 1%. We established Thornburg Investment Income Builder Fund in late 2002 to be clearly different from other equity/hybrid funds by paying attractive dividends today, with a further goal of increasing these in the future. Our record to date shows clear success in achieving each aspect of this mission.
On the bond side, we have always had a highly disciplined approach of laddering short- and intermediate-bond maturities seeking to provide both an attractive return and relative stability of principal.
Recently, there has been a lot of news about improper behavior by some mutual fund companies. Many of the proposed new rules in response to this scandal have called for increased transparency. We welcome increased transparency. Thornburg Investment Management has been a leader in providing information about our stock holdings to our shareholders on our web site, www.thornburg.com.
Unfortunately, some of those new rules will increase the cost to all shareholders in mutual funds. We will do our best to keep these expenses to a minimal amount. After all, we are shareholders too! Thornburg employees have over $110 million invested in our own funds.
Thank you for investing with us. We will do our best to continue to earn your trust every day.
| Sincerely, |
 |
| Garrett Thornburg |
| Chairman & CEO |
| This page is not part of the Annual Report. | 3 |
Important Information
The information presented on the following pages was current as of September 30, 2005. The manager’s views, portfolio holdings, and sector diversification are historical and subject to change. This material should not be deemed a recommendation to buy or sell any of the securities mentioned.
Shares in the Fund carry risks including possible loss of principal. There are special risks associated with international investing, including currency fluctuations, government regulation, political developments, and differences in liquidity. Additionally, the Fund invests a portion of the assets in small capitalization companies which may increase the risk of greater price fluctuations. Shares in the Fund are not deposits or obligations of, or guaranteed or endorsed by, any bank, the Federal Deposit Insurance Corporation, the Federal Reserve Board, or any government agency.
Minimum investments for Class I shares are higher than those for other classes.
Glossary
Standard & Poor’s 500 Stock Index (S&P 500) – An unmanaged index generally representative of the U.S. stock market, without regard to company size. Unless otherwise noted, index returns do not reflect fees, brokerage commissions or other expenses of investing. Investors may not make direct investments into any index.
Beta – A measure of market-related risk. Less than one means the portfolio is less volatile than the index, while greater than one indicates more volatility than the index.
Median Market Capitalization – Market capitalization (market cap) is the total value of a company’s stock, calculated by multiplying the number of outstanding common shares by the current share price. The company whose market cap is in the middle of the portfolio is the median market cap. Half the companies in the portfolio have values greater than the median and half have values that are less. If there is an even number of companies, then the median is the average of the two companies in the middle.
Price to Book Value (P/B) – A ratio used to compare a stock’s market value to its book value. It is calculated by dividing the current closing price of the stock by the latest quarter’s book value (book value is simply assets minus liabilities).
Price to Cash Flow Ratio – A measure of the market’s expectations of a firm’s future financial health. It is calculated by dividing the price per share by cash flow per share.
Price to Earnings Ratio (P/E) – A valuation ratio of a company’s current share price compared to its per-share earnings. P/E equals a company’s market value per share divided by earnings per share.
4 | This page is not part of the Annual Report. |
This page intentionally left blank.
| This page is not part of the Annual Report. | 5 |
Portfolio Overview
Thornburg Value Fund
IMPORTANT PERFORMANCE
INFORMATION
Performance data quoted represents past performance and does not guarantee future results. Investment return and principal value will fluctuate so that upon redemption, investor’s shares may be worth more or less than their original cost. Current performance may be lower or higher than the data quoted. For performance data current to the most recent month end, visit www.thornburg.com.
There is no up-front sales charge for Class I shares. I shares are subject to a 1% 90-day redemption fee.
MANAGEMENT TEAM

Front row, L to R: Wendy Trevisani, Bill Fries, Brad Kinkelaar, and Brian McMahon. Back row, L to R: Lei Wang, Connor Browne, Ed Maran,Vin Walden, Thomas Garcia, and Lewis Kaufman.
KEY PORTFOLIO ATTRIBUTES
Portfolio P/E* | 19.0x | ||
Portfolio Price to Cash Flow* | 8.8 | ||
Portfolio Price to Book Value* | 2.7 | ||
Median Market Cap* | $ | 23.85 B | |
3-Year Beta (Thornburg vs. S&P 500)** | 0.99 | ||
Holdings | 49 |
| * | Source:Thomson Portfolio Analytics |
| ** | Source: Morningstar Principia Pro |
For the fiscal year ended September 30, 2005, the Class I shares of the Thornburg Value Fund provided a positive return of 18.16%, compared to 12.25% for the S&P 500 Index. The Fund’s outperformance was primarily attributable to contributions from stock selection.
Positive portfolio performance was driven by telecommunication services, financial, and energy holdings. This was somewhat different than the index which was driven by health care, information technology, as well as energy stocks. As is usually the case, the sector exposure of the Fund was secondary and a product of the bottom-up research process which focuses on owning promising companies at a discount to their intrinsic value.
October 2nd marked the Fund’s tenth anniversary. Given the litany of current adversity in the world, it might be constructive to reflect on the past investment environment for stocks, and the challenges companies now face. Our cumulative total return since inception on October 2, 1995 has been 241% or the equivalent of an annual compound rate in excess of 13%. That’s over 3% per annum better than the return of the S&P 500 Index over the same period. Of course, we are pleased with the result; there were some very satisfying years over the period. We were aware then, as we are now, that success is not necessarily permanent. There were also a number of quarters when stocks were down significantly and the outlook was dismal – the fall of 1998 and the summer of 2002 come to mind. In both cases we maintained the integrity of the portfolio, setting up excellent returns in following periods. Also worth mentioning is our performance in the period after the market peak in 2000. When the market declined, our outperformance of the S&P 500 was material (for the calendar year ended 2000, the Fund’s I shares had a positive total return of 4.33% while the S&P 500 Index returned negative 9.10%). Some credit goes to a target price discipline that worked.
AVERAGE ANNUAL TOTAL RETURNS*
FOR PERIODS ENDED SEPTEMBER 30, 2005
| 3Q ‘05 | 1Yr | 3Yrs | 5Yrs | Since Inception | |||||||||||
I Shares (Incep: 11/2/98) | 5.81 | % | 18.16 | % | 17.65 | % | 1.01 | % | 7.81 | % | |||||
S&P 500 Index (Since: 11/2/98) | 3.60 | % | 12.25 | % | 16.69 | % | (1.49 | )% | 3.18 | % |
| * | Periods under one year are not annualized. |
6 | This page is not part of the Annual Report. |
No doubt the next ten years will be different from the past decade. In the first few years of the Value Fund’s existence, markets were robust. Equity valuations rose and technology boomed on the back of the personal computer and the embrace of the Internet. Since 2000, markets have been roiled by events such as 9/11, corporate scandal, the war in Iraq, and higher oil prices, just to mention a few. Other than the lift-off from the psychological bottom in the summer of 2002 and the post-presidential election rally in 2004, U.S. markets have generally been range-bound. The current concerns, in addition to the lingering effects of those above, are inflation, interest rates, consumer spending, deficits, and even bird flu. Through it all, corporate America has performed well from a profit generation standpoint.
The process and philosophy employed during the Fund’s ten-year history remains unchanged and is a very important factor in the Fund’s consistent outperformance of benchmarks and peers over the long-term. We will continue to maintain a diversified portfolio of the stocks we identify through our research process. Our goal remains to provide competitive, long-term investment returns to our shareholders.
PERFORMANCE IMPACT FOR YEAR ENDED 9/30/05
Top Contributors | Top Detractors | |
NII Holdings Inc. | Ditech Communications Corp. | |
WellPoint Inc. | Boston Scientific Corp. | |
Unocal Corp. | AON Corp. | |
Petroleo Brasileiro | Pfizer Inc. | |
Chicago Mercantile Exchange Holdings Inc. | DIRECTV Group |
Source: Thomson Portfolio Analytics
MARKET CAPITALIZATION EXPOSURE
As of 9/30/05
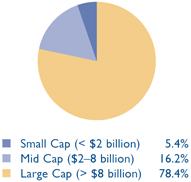
TOP TEN EQUITY HOLDINGS
As of 9/30/05
NII Holdings Inc. | 3.9 | % | |
Chevron Corp. | 3.7 | % | |
ExxonMobil Corp. | 3.1 | % | |
Goldman Sachs Group Inc. | 3.0 | % | |
Citigroup Inc. | 2.7 | % | |
Lloyds TSB Group | 2.7 | % | |
Union Pacific Corp. | 2.6 | % | |
General Electric Co. | 2.6 | % | |
Comcast Corp. | 2.6 | % | |
WellPoint Inc. | 2.5 | % |
TOP TEN INDUSTRIES
As of 9/30/05
Diversified Financials | 13.6 | % | |
Telecommunication Services | 13.4 | % | |
Health Care Equip. & Services | 10.2 | % | |
Energy | 9.7 | % | |
Media | 6.5 | % | |
Software & Services | 6.2 | % | |
Pharmaceuticals & Biotech | 5.9 | % | |
Banks | 5.1 | % | |
Transportation | 4.7 | % | |
Tech Hardware & Equipment | 4.7 | % |
| This page is not part of the Annual Report. | 7 |
This page intentionally left blank.
8 | This page is not part of the Annual Report. |

Thornburg Value Fund
I Shares – September 30, 2005
| 10 | ||
| 12 | ||
| 14 | ||
| 16 | ||
| 17 | ||
| 21 | ||
| 22 | ||
| 27 | ||
| 28 | ||
| 29 | ||
| 30 | ||
| 33 | ||
This report is certified under the Sarbanes-Oxley Act of 2002, which requires that public companies, including mutual funds, affirm that the information provided in their annual and semiannual shareholder reports fully and fairly represents their financial position.
| Certified Annual Report | 9 |

William V. Fries,CFA
Portfolio Manager
October 17, 2005
Dear Fellow Shareholder:
The fiscal year ended September 30, 2005 was a good year for our Fund. The net asset value of the Class I shares on September 30, 2005 was $33.23. One year ago on September 30, 2004, the net asset value was $28.49. Total return of the Fund for the period was 18.16%, compared with 12.25% for the S&P 500 Index. Good performance was broadly based with holdings in telecommunications, financial services, energy, health care services, and technology having favorable impact. For details on performance by share class please refer to the performance summary on page 29.
Telecommunication services stocks held during the year provided some of the return that enabled the Fund to outperform the S&P 500 Index. NII Holdings Inc. performed particularly well. Located in Reston, Virginia, NII Holdings enjoyed continued growth of its digital wireless communication services in Latin America. Also in telecommunications, the performance of Crown Castle International Corp. was noteworthy. Crown Castle owns and operates wireless communications towers.
Financial stocks consistently made up the largest sector weighting in the portfolio over the trailing twelve months and also contributed to positive performance. The Fund’s exposure to financial stocks was diverse and included banks, insurance companies, and diversified financial institutions. Chicago Mercantile Exchange Holdings, Inc., which operates the leading derivatives exchange in the U.S., was the best-performing financial stock in the portfolio, thanks to healthy futures trading volume and creative product initiatives. St. Paul Travelers Inc. also provided significant positive performance.
With oil prices steadily appreciating during the year, it is not surprising to find energy positions among the better-performing stocks in the portfolio. Unocal Corp., Petroleo Brasileiro, and Exxon Mobil Corp. were the best-performing energy holdings in the Fund.
United Healthcare Corp. and WellPoint Inc. were the most positive contributors to performance in the health care area. Their performance offset disappointing results in pharmaceuticals and health care equipment holdings.
The information technology sector represented the largest source of underperformance relative to the S&P 500 Index. This in part reflected modest exposure to the sector. The semiconductor industry was a bright spot, as Samsung Electronics Co. Ltd. and Texas Instruments Inc. both performed very well. The biggest negative for the Fund came from Ditech Communications Corp., which provides voice processing products to wire-line and mobile operators. Ditech was sold after experiencing an unexpected shortfall in sales.
Ultimately, earnings drive stock prices and there are many companies reporting improved results. Earnings recorded by the companies in the S&P 500 are at record levels and corporate
10 | Certified Annual Report |
liquidity is in great shape. This is a point of optimism that should not be overlooked. Energy, health care services, financial services, and even some technology-related companies are demonstrating resilient models. The outlook remains encouraging. However, consumer spending may contract in the period ahead as budgets are adjusted to reflect higher energy costs. As in the past, there will be companies that do well and stocks that represent solid value, even when some macro-considerations for equities are discouraging. For equity investors, the period ahead may well be one of opportunity.
We will be as diligent as ever in our quest to generate capital appreciation in the period ahead. We thank for your past trust and confidence. We will continue to work toward sustaining both in the future.
| Sincerely, |
 |
William V. Fries, CFA Portfolio Manager |
The matters discussed in this report may constitute forward-looking statements made pursuant to the safe harbor provisions of the Securities Litigation Reform Act of 1995. These include any advisor or portfolio manager prediction, assessment, analysis or outlook for individual securities, industries, investment styles, market sectors and/or markets. These statements involve risks and uncertainties. In addition to the general risks described for each fund in its current prospectus, other factors bearing on these reports include the accuracy of the advisor’s or portfolio manager’s forecasts and predictions, the appropriateness of the investment strategies designed by the advisor or portfolio manager, and the ability of the advisor or portfolio manager to implement their strategies efficiently and successfully. Any one or more of these factors, as well as other risks affecting the securities markets generally, could cause the actual results of any fund to differ materially as compared to its benchmarks.
| Certified Annual Report | 11 |
| STATEMENT OF ASSETS AND LIABILITIES | ||
| Thornburg Value Fund | September 30, 2005 | |
| ASSETS | ||||
Investments at value (cost $1,800,021,076) | $ | 1,978,030,674 | ||
Cash | 1,595,940 | |||
Receivable for investments sold | 4,425,971 | |||
Receivable for fund shares sold | 1,772,806 | |||
Dividends receivable | 3,865,582 | |||
Interest receivable | 772,113 | |||
Prepaid expenses and other assets | 46,558 | |||
Total Assets | 1,990,509,644 | |||
| LIABILITIES | ||||
Payable for securities purchased | 3,462,504 | |||
Payable for fund shares redeemed | 2,718,960 | |||
Payable to investment advisor and other affiliates (Note 3) | 2,157,353 | |||
Accounts payable and accrued expenses | 802,530 | |||
Dividends payable | 432,956 | |||
Total Liabilities | 9,574,303 | |||
| NET ASSETS | $ | 1,980,935,341 | ||
| NET ASSETS CONSIST OF: | ||||
Undistributed net investment income | $ | 1,516,251 | ||
Net unrealized appreciation on investments | 177,994,326 | |||
Accumulated net realized gain (loss) | (17,073,501 | ) | ||
Net capital paid in on shares of beneficial interest | 1,818,498,265 | |||
| $ | 1,980,935,341 | |||
12 | Certified Annual Report |
| STATEMENT OF ASSETS AND LIABILITIES, CONTINUED | ||
| Thornburg Value Fund | September 30, 2005 | |
| NET ASSET VALUE: | |||
| Class A Shares: | |||
Net asset value and redemption price per share | $ | 32.79 | |
Maximum sales charge, 4.50% of offering price | 1.55 | ||
Maximum offering price per share | $ | 34.34 | |
| Class B Shares: | |||
Net asset value and offering price per share * | $ | 31.60 | |
| Class C Shares: | |||
Net asset value and offering price per share * | $ | 31.92 | |
| Class I Shares: | |||
Net asset value, offering and redemption price per share | $ | 33.23 | |
| Class R1 Shares: | |||
Net asset value, offering and redemption price per share | $ | 32.68 | |
| Class R5 Shares: | |||
Net asset value, offering and redemption price per share | $ | 33.22 | |
| * | Redemption price per share is equal to net asset value less any applicable contingent deferred sales charge. |
See notes to financial statements.
| Certified Annual Report | 13 |
| STATEMENT OF OPERATIONS | ||
| Thornburg Value Fund | Year Ended September 30, 2005 | |
| INVESTMENT INCOME: | ||||
Dividend income (net of foreign taxes withheld of $426,216) | $ | 37,196,206 | ||
Interest income | 13,057,223 | |||
Total Income | 50,253,429 | |||
| EXPENSES: | ||||
Investment advisory fees (Note 3) | 16,399,121 | |||
Administration fees (Note 3) | ||||
Class A Shares | 1,352,343 | |||
Class B Shares | 116,611 | |||
Class C Shares | 574,219 | |||
Class I Shares | 208,908 | |||
Class R1 Shares | 8,875 | |||
Class R5 Shares | 9 | |||
| Distribution and service fees (Note 3) | ||||
Class A Shares | 2,702,757 | |||
Class B Shares | 931,869 | |||
Class C Shares | 4,588,168 | |||
Class R1 Shares | 35,557 | |||
| Transfer agent fees | ||||
Class A Shares | 1,668,090 | |||
Class B Shares | 164,765 | |||
Class C Shares | 683,740 | |||
Class I Shares | 306,430 | |||
Class R1 Shares | 11,634 | |||
Class R5 Shares | 7,795 | |||
| Registration and filing fees | ||||
Class A Shares | 68,222 | |||
Class B Shares | 7,495 | |||
Class C Shares | 17,351 | |||
Class I Shares | 65,205 | |||
Class R1 Shares | 20,812 | |||
Class R5 Shares | 14,003 | |||
Custodian fees (Note 3) | 460,438 | |||
Professional fees | 115,730 | |||
Accounting fees | 201,896 | |||
Trustee fees | 42,165 | |||
Other expenses | 538,135 | |||
Total Expenses | 31,312,343 | |||
Less: | ||||
Expenses reimbursed by Investment Advisor (Note 3) | (123,513 | ) | ||
Fees paid indirectly (Note 3) | (30,118 | ) | ||
Net Expenses | 31,158,712 | |||
Net Investment Income | $ | 19,094,717 | ||
14 | Certified Annual Report |
| STATEMENT OF OPERATIONS, CONTINUED | ||
| Thornburg Value Fund | Year Ended September 30, 2005 | |
| REALIZED AND UNREALIZED GAIN (LOSS) | ||||
Net realized gain (loss) on: | ||||
Investments | $ | 256,147,139 | ||
Foreign currency transactions | (502,454 | ) | ||
| 255,644,685 | ||||
Net change in unrealized appreciation (depreciation) on: | ||||
Investments | 57,937,038 | |||
Foreign currency translation | (15,271 | ) | ||
| 57,921,767 | ||||
Net Realized and Unrealized Gain | 313,566,452 | |||
Net Increase in Net Assets Resulting From Operations | $ | 332,661,169 | ||
See notes to financial statements.
| Certified Annual Report | 15 |
STATEMENTS OF CHANGES IN NET ASSETS
Thornburg Value Fund
Year Ended September 30, 2005 | Year Ended September 30, 2004 | |||||||
INCREASE (DECREASE) IN NET ASSETS FROM: | ||||||||
OPERATIONS: | ||||||||
Net investment income gain | $ | 19,094,717 | $ | 10,860,838 | ||||
Net realized gain on investments and foreign currency transactions | 255,644,685 | 143,972,530 | ||||||
Increase (Decrease) in unrealized appreciation (depreciation) on investments and foreign currency translation | 57,921,767 | (29,911,224 | ) | |||||
Net Increase (Decrease) in Net Assets Resulting from Operations | 332,661,169 | 124,922,144 | ||||||
DIVIDENDS TO SHAREHOLDERS: | ||||||||
From net investment income | ||||||||
Class A Shares | (9,628,160 | ) | (7,240,069 | ) | ||||
Class B Shares | (253,266 | ) | (165,223 | ) | ||||
Class C Shares | (1,270,882 | ) | (881,785 | ) | ||||
Class I Shares | (5,577,033 | ) | (3,723,901 | ) | ||||
Class R1 Shares | (76,812 | ) | (41,476 | ) | ||||
Class R5 Shares | (246 | ) | 0 | |||||
FUND SHARE TRANSACTIONS (NOTE 4): | ||||||||
Class A Shares | (280,665,531 | ) | 28,336,374 | |||||
Class B Shares | (15,317,740 | ) | (1,996,877 | ) | ||||
Class C Shares | (99,126,047 | ) | 6,280,617 | |||||
Class I Shares | 16,018,891 | 102,430,454 | ||||||
Class R1 Shares | 4,801,953 | 5,988,945 | ||||||
Class R5 Shares | 29,098 | 0 | ||||||
Net Increase (Decrease) in Net Assets | (58,404,606 | ) | 253,909,203 | |||||
NET ASSETS: | ||||||||
Beginning of year | 2,039,339,947 | 1,785,430,744 | ||||||
End of year | $ | 1,980,935,341 | $ | 2,039,339,947 | ||||
See notes to financial statements.
16 | Certified Annual Report |
| NOTES TO FINANCIAL STATEMENTS | ||
| Thornburg Value Fund | September 30, 2005 | |
NOTE 1 – ORGANIZATION
Thornburg Value Fund, hereinafter referred to as the “Fund,” is a diversified series of Thornburg Investment Trust (the “Trust”). The Trust is organized as a Massachusetts business trust under a Declaration of Trust dated June 3, 1987 and is registered as a diversified, open-end management investment company under the Investment Company Act of 1940, as amended. The Trust is currently issuing eleven series of shares of beneficial interest in addition to those of the Fund: Thornburg Limited Term Municipal Fund, Thornburg California Limited Term Municipal Fund, Thornburg Limited Term U.S. Government Fund, Thornburg New Mexico Intermediate Municipal Fund, Thornburg Intermediate Municipal Fund, Thornburg Limited Term Income Fund, Thornburg Florida Intermediate Municipal Fund, Thornburg International Value Fund, Thornburg Core Growth Fund, Thornburg New York Intermediate Municipal Fund, and Thornburg Investment Income Builder Fund. Each series is considered to be a separate entity for financial reporting and tax purposes and bears expenses directly attributable to it. The Fund seeks long-term capital appreciation by investing primarily in domestic equity securities selected on a value basis.
The Fund currently offers six classes of shares of beneficial interest, Class A, Class B, Class C, Institutional Class (Class I), and Retirement Class (Class R1 and Class R5) shares. Each class of shares of a Fund represents an interest in the same portfolio of investments of the Fund, except that (i) Class A shares are sold subject to a front-end sales charge collected at the time the shares are purchased and bear a service fee, (ii) Class B shares are sold at net asset value without a sales charge at the time of purchase, but are subject to a contingent deferred sales charge upon redemption and bear both a service fee and distribution fee, (iii) Class C shares are sold at net asset value without a sales charge at the time of purchase, but are subject to a contingent deferred sales charge upon redemption within one year, and bear a service fee and a distribution fee, (iv) Class I shares are sold at net asset value without a sales charge at the time of purchase, (v) Class R1 shares are sold at net asset value without a sales charge at the time of purchase, but bear both a service fee and distribution fee, (vi) Class R5 shares are sold at net asset value without a sales charge at the time of purchase, and (vii) the respective classes may have different reinvestment privileges and conversion rights. Additionally, the Fund may allocate among its classes certain expenses, to the extent allowable to specific classes, including transfer agent fees, government registration fees, certain printing and postage costs, and administrative and legal expenses. Currently, class specific expenses of the Fund are limited to service and distribution fees, administration fees, and certain registration and transfer agent expenses. Class B shares of the Fund outstanding for eight years will convert to Class A shares of the Fund.
NOTE 2 – SIGNIFICANT ACCOUNTING POLICIES
Significant accounting policies of the Trust are as follows:
Valuation of Securities: In determining the net asset value of investments, investments are stated at value based on latest sales prices, normally at 4:00 pm EST reported on securities exchanges on the last business day of the period. Investments for which no sale is reported are valued at the mean between bid and asked prices or in accordance with such other method as the Trustees may authorize. In any case where a market quotation is not readily available, the Trust’s valuation and pricing committee determines a fair value for the investment using factors approved by the Trustees. Short term obligations having remaining maturities of 60 days or less are valued at amortized cost, which approximates market value.
Foreign Currency Translation: Portfolio securities and other assets and liabilities denominated in foreign currencies are translated into U.S. dollars based on the exchange rate of such currencies against the U.S. dollar on the date of valuation. Purchases and sales of securities and income items denominated in foreign currencies are translated into U.S. dollars at the exchange rate in effect on the translation date. When the Fund purchases or sells foreign securities it will customarily enter into a foreign exchange contract to minimize foreign exchange risk from the trade date to the settlement date of such transactions.
The Fund does not separately report the effect of changes in foreign exchange rates from changes in market prices on securities held. Such changes are included in net realized and unrealized gain or loss from investments.
Reported net realized foreign exchange gains or losses arise from sales of foreign currencies, currency gains or losses realized between the trade and settlement dates on securities transactions and the difference between the amount of interest recorded on the Fund’s books, and the U.S. dollar equivalent of the amounts actually received or paid.
Federal Income Taxes: It is the policy of the Trust to comply with the provisions of the Internal Revenue Code applicable to “regulated investment companies” and to distribute all taxable income, including any net realized gain on investments of the Fund to the shareholders. Therefore, no provision for Federal income taxes is required.
When-Issued and Delayed Delivery Transactions: The Trust may engage in when-issued or delayed delivery transactions. To the extent the Trust engages in such transactions, it will do so for the purpose of acquiring portfolio securities consistent with the Fund’s investment objectives and not for the purpose of investment leverage or to speculate on interest rate and/or
| Certified Annual Report | 17 |
| NOTES TO FINANCIAL STATEMENTS, CONTINUED | ||
| Thornburg Value Fund | September 30, 2005 | |
market changes. At the time the Trust makes a commitment to purchase a security on a when-issued basis, the Fund will record the transaction and reflect the value in determining its net asset value. When effecting such transactions, assets of an amount sufficient to make payment for the portfolio securities to be purchased will be segregated on the Fund’s records on the trade date. Securities purchased on a when-issued or delayed delivery basis do not earn interest until the settlement date.
Dividends: Dividends to shareholders are generally paid quarterly and are reinvested in additional shares of the Fund at net asset value per share at the close of business on the dividend payment date or, at the shareholder’s option, paid in cash. Net realized capital gains, to the extent available, will be distributed at least annually. Distributions to shareholders are based on income tax regulations and therefore, their characteristics may differ for financial statement and tax purposes.
General: Securities transactions are accounted for on a trade date basis. Interest income is accrued as earned and dividend income is recorded on the ex-dividend date. Certain income from foreign securities is recognized as soon as information is available to the Fund. Realized gains and losses from the sale of securities are recorded on an identified cost basis. Net investment income, other than class specific expenses and realized and unrealized gains and losses, is allocated daily to each class of shares based upon the relative net asset value of outstanding shares of each class of shares at the beginning of the day (after adjusting for the current share activity of the respective class). Expenses common to all funds are allocated among the funds comprising the Trust based upon their relative net asset values or other appropriate allocation methods.
Guarantees and Indemnifications: Under the Trust’s organizational documents, its officers and Trustees are indemnified against certain liability arising out of the performance of their duties to the Fund. Additionally, in the normal course of business the Trust enters into contracts with service providers that contain general indemnification clauses. The Trust’s maximum exposure under these arrangements is unknown. However, based on experience, the Trust expects the risk of loss to be remote.
Use of Estimates: The preparation of financial statements, in conformity with generally accepted accounting principles, requires management to make estimates and assumptions that affect the reported amounts of assets and liabilities and the disclosure of contingent assets and liabilities at the date of the financial statements and the reported amounts of increases and decreases in net assets from operations during the reporting period. Actual results could differ from those estimates.
NOTE 3 – INVESTMENT ADVISORY FEE AND OTHER TRANSACTIONS WITH AFFILIATES
Pursuant to an investment advisory agreement, Thornburg Investment Management, Inc.® (the “Advisor”) serves as the investment advisor and performs services to the Fund for which the fees are payable at the end of each month. For the year ended September 30, 2005, these fees were payable at annual rates ranging from .875 of 1% to .675 of 1% per annum of the average daily net assets of the Fund depending on the Fund’s asset size. The Fund also has an administrative services agreement with the Advisor, whereby the Advisor will perform certain administrative services for the shareholders of each class of the Fund’s shares, and for which fees will be payable at an annual rate of up to .125 of 1% per annum of the average daily net assets attributable to each class of shares. For the year ended September 30, 2005, the Advisor voluntarily reimbursed certain class specific expenses, administrative fees, and distribution fees of $59,825 for Class I shares, $41,907 for Class R1 shares, and $21,781 for Class R5 shares.
The Trust has an underwriting agreement with Thornburg Securities Corporation® (the “Distributor”, an affiliate of the Advisor), which acts as the distributor of the Fund’s shares. For the year ended September 30, 2005, the Distributor has advised the Fund that it earned net commissions aggregating $52,178 from the sale of Class A shares of the Fund and collected contingent deferred sales charges aggregating $24,837 from redemptions of Class C shares of the Fund.
Pursuant to a service plan under Rule 12b-1 of the Investment Company Act of 1940, the Fund may reimburse to the Advisor an amount not to exceed .25 of 1% per annum of its average daily net assets attributable to each class of shares of the Fund for payments made by the Advisor to securities dealers and other financial institutions to obtain various shareholder related services. The Advisor may pay out of its own resources additional expenses for distribution of the Fund’s shares.
The Trust has also adopted distribution plans pursuant to Rule 12b-1, applicable only to the Fund’s Class B, Class C, and Class R1 shares under which the Fund compensates the Distributor for services in promoting the sale of Class B, Class C, and Class R1 shares of the Fund at an annual rate of up to .75 of 1% per annum of the average daily net assets attributable to Class B, Class C, and Class R1 shares. Total fees incurred by the Distributor for each class of shares of the Fund under its respective service and distribution plans for the year ended September 30, 2005, are set forth in the Statement of Operations.
The Trust has an agreement with the custodian bank to indirectly pay a portion of the custodian’s fees through credits earned by the Fund’s cash on deposit with the bank. This
18 | Certified Annual Report |
| NOTES TO FINANCIAL STATEMENTS, CONTINUED | ||
| Thornburg Value Fund | September 30, 2005 | |
deposit agreement is an alternative to overnight investments. Custodial fees have been adjusted to reflect amounts that would have been paid without this agreement, with a corresponding adjustment reflected as fees paid indirectly in the Statement of Operations. For the year ended September 30, 2005, fees paid indirectly were $30,118.
Certain officers and Trustees of the Trust are also officers and/or Directors of the Advisor and Distributor. The compensation of independent Trustees is borne by the Trust.
NOTE 4 – SHARES OF BENEFICIAL INTEREST
At September 30, 2005, there were an unlimited number of shares of beneficial interest authorized. Sale of Class R5 shares commenced February 1, 2005. Transactions in shares of beneficial interest were as follows:
Year Ended September 30, 2005 | Year Ended September 30, 2004 | |||||||||||||
| Shares | Amount | Shares | Amount | |||||||||||
Class A Shares | ||||||||||||||
Shares sold | 5,556,737 | $ | 169,738,087 | 11,405,873 | $ | 327,555,712 | ||||||||
Shares issued to shareholders in reinvestment of dividends | 279,894 | 8,715,714 | 228,437 | 6,559,600 | ||||||||||
Shares repurchased ** | (14,823,032 | ) | (459,119,332 | ) | (10,795,871 | ) | (305,778,938 | ) | ||||||
Net Increase (Decrease) | (8,986,401 | ) | $ | (280,665,531 | ) | 838,439 | $ | 28,336,374 | ||||||
** The Fund charges a redemption fee of 1% of the Class A shares exchanged within 90 days of purchase. For the year ended September 30, 2005 and year ended September 30, 2004, $51,849 and $63,006, respectively, were netted in the amount reported for shares repurchased. |
| |||||||||||||
Class B Shares | ||||||||||||||
Shares sold | 77,850 | $ | 2,288,707 | 380,476 | $ | 10,548,934 | ||||||||
Shares issued to shareholders in reinvestment of dividends | 7,536 | 224,646 | 5,415 | 146,992 | ||||||||||
Shares repurchased | (607,159 | ) | (17,831,093 | ) | (460,576 | ) | (12,692,803 | ) | ||||||
Net Increase (Decrease) | (521,773 | ) | $ | (15,317,740 | ) | (74,685 | ) | $ | (1,996,877 | ) | ||||
Class C Shares | ||||||||||||||
Shares sold | 915,021 | $ | 27,095,236 | 3,239,399 | $ | 90,745,058 | ||||||||
Shares issued to shareholders in reinvestment of dividends | 35,972 | 1,085,438 | 27,090 | 746,516 | ||||||||||
Shares repurchased | (4,307,157 | ) | (127,306,721 | ) | (3,079,437 | ) | (85,210,957 | ) | ||||||
Net Increase (Decrease) | (3,356,164 | ) | $ | (99,126,047 | ) | 187,052 | $ | 6,280,617 | ||||||
Class I Shares | ||||||||||||||
Shares sold | 3,589,202 | $ | 111,238,406 | 5,766,851 | $ | 167,750,890 | ||||||||
Shares issued to shareholders in reinvestment of dividends | 147,185 | 4,664,983 | 106,031 | 3,088,228 | ||||||||||
Shares repurchased ** | (3,238,887 | ) | (99,884,498 | ) | (2,376,801 | ) | (68,408,664 | ) | ||||||
Net Increase (Decrease) | 497,500 | $ | 16,018,891 | 3,496,081 | $ | 102,430,454 | ||||||||
** The Fund charges a redemption fee of 1% of the Class I shares exchanged within 90 days of purchase. For the year ended September 30, 2005 and year ended September 30, 2004, $15,714 and $12,511, respectively, were netted in the amount reported for shares repurchased. |
| |||||||||||||
| Certified Annual Report | 19 |
| NOTES TO FINANCIAL STATEMENTS, CONTINUED | ||
| Thornburg Value Fund | September 30, 2005 | |
Class R1 Shares | ||||||||||||||
Shares sold | 239,052 | $ | 7,454,820 | 218,435 | $ | 6,370,169 | ||||||||
Shares issued to shareholders in reinvestment of dividends | 2,115 | 66,501 | 1,357 | 38,681 | ||||||||||
Shares repurchased | (89,436 | ) | (2,719,368 | ) | (14,704 | ) | (419,905 | ) | ||||||
Net Increase (Decrease) | 151,731 | $ | 4,801,953 | 205,088 | $ | 5,988,945 | ||||||||
Class R5 Shares* | ||||||||||||||
Shares sold | 927 | $ | 28,852 | — | $ | — | ||||||||
Shares issued to shareholders in reinvestment of dividends | 8 | 246 | — | — | ||||||||||
Shares repurchased | (— | ) | (— | ) | — | — | ||||||||
Net Increase (Decrease) | 935 | $ | 29,098 | — | $ | — | ||||||||
| * | Effective date of Class R5 shares was February 1, 2005. |
NOTE 5 – SECURITIES TRANSACTIONS
For the year ended September 30, 2005, the Fund had purchase and sale transactions of investment securities (excluding short-term investments) of $1,192,122,249 and $1,601,701,387, respectively.
NOTE 6 – INCOME TAXES
At September 30, 2005, information on the tax components of capital is as follows:
Cost of investments for tax purpose | $ | 1,799,632,460 | ||
Gross unrealized appreciation on a tax basis | $ | 259,646,889 | ||
Gross unrealized depreciation on a tax basis | (81,248,675 | ) | ||
Net unrealized appreciation (depreciation) on investments (tax basis) | $ | 178,398,214 | ||
Distributable earnings – ordinary income | $ | 1,604,286 | ||
At September 30, 2005, the Fund did not have any undistributed capital gains.
At September 30, 2005, the Fund had deferred tax basis currency losses occurring subsequent to October 31, 2004 of $476,651. For tax purposes, such losses will be reflected in the year ending September 30, 2006.
At September 30, 2005, the Fund had tax basis capital losses of $17,073,501, which may be carried over to offset future capital gains. To the extent such carry forwards are used, capital gain distributions may be reduced to the extent provided by regulations. Such losses expire September 30, 2011.
The Fund utilized $256,147,139 of its capital loss carry forward during the year ended September 30, 2005.
In order to account for permanent book/tax differences, the Fund decreased undistributed net investment income by $897,294 and decreased accumulated net realized investment loss by $897,294. This reclassification has no impact on the net asset value of the Fund. Reclassifications result primarily from investments in REIT’s and currency losses.
The tax character of distributions paid during the year ended September 30, 2005, and September 30, 2004, was as follows:
| 2005 | 2004 | |||||
Distributions from: Ordinary income | $ | 16,806,399 | $ | 12,052,454 | ||
NOTE 7 – FINANCIAL INSTRUMENTS WITH OFF-BALANCE SHEET RISK AND FOREIGN INVESTMENT RISK
There are special risks associated with international investing, including currency fluctuations, government regulation, political developments, and differences in liquidity.
20 | Certified Annual Report |
Thornburg Value Fund
| Year Ended September 30, | ||||||||||||||||||||
| 2005 | 2004 | 2003 | 2002 | 2001 | ||||||||||||||||
| Class I Shares: | ||||||||||||||||||||
| PER SHARE PERFORMANCE | ||||||||||||||||||||
| (for a share outstanding throughout the year)+ | ||||||||||||||||||||
Net asset value, beginning of year | $ | 28.49 | $ | 26.64 | $ | 20.95 | $ | 26.18 | $ | 33.09 | ||||||||||
Income from investment operations: | ||||||||||||||||||||
Net investment income (loss) | 0.45 | 0.31 | 0.26 | 0.11 | 0.14 | |||||||||||||||
Net realized and unrealized gain (loss) on investments | 4.70 | 1.84 | 5.51 | (5.34 | ) | (6.42 | ) | |||||||||||||
Total from investment operations | 5.15 | 2.15 | 5.77 | (5.23 | ) | (6.28 | ) | |||||||||||||
Less dividends from: | ||||||||||||||||||||
Net investment income | (0.41 | ) | (0.30 | ) | (0.03 | ) | — | (0.28 | ) | |||||||||||
Net realized gains | — | — | — | — | (0.25 | ) | ||||||||||||||
Return of capital | — | — | (0.05 | ) | — | (0.10 | ) | |||||||||||||
Total dividends | (0.41 | ) | (0.30 | ) | (0.08 | ) | — | (0.63 | ) | |||||||||||
Change in net asset value | 4.74 | 1.85 | 5.69 | (5.23 | ) | (6.91 | ) | |||||||||||||
NET ASSET VALUE, end of year | $ | 33.23 | $ | 28.49 | $ | 26.64 | $ | 20.95 | $ | 26.18 | ||||||||||
| RATIOS/SUPPLEMENTAL DATA | ||||||||||||||||||||
Total return | 18.16 | % | 8.04 | % | 27.55 | % | (19.98 | )% | (19.29 | )% | ||||||||||
Ratios to average net assets: | ||||||||||||||||||||
Net investment income (loss) | 1.44 | % | 1.07 | % | 1.10 | % | 0.42 | % | 0.45 | % | ||||||||||
Expenses, after expense reductions | 0.99 | % | 0.99 | % | 0.99 | % | 0.98 | % | 0.99 | % | ||||||||||
Expenses, after expense reductions and net of custody credits | 0.98 | % | 0.99 | % | 0.99 | % | 0.98 | % | — | |||||||||||
Expenses, before expense reductions | 1.00 | % | 0.99 | % | 1.03 | % | 0.99 | % | 1.01 | % | ||||||||||
Portfolio turnover rate | 58.90 | % | 68.74 | % | 82.89 | % | 76.37 | % | 71.81 | % | ||||||||||
Net assets at end of year (000) | $ | 457,788 | $ | 378,334 | $ | 260,624 | $ | 207,613 | $ | 293,784 | ||||||||||
| + | Based on weighted average shares outstanding. |
| Certified Annual Report | 21 |
| SCHEDULE OF INVESTMENTS | ||
| Thornburg Value Fund | September 30, 2005 | |
CUSIPS: CLASS A - 885-215-731, CLASS B - 885-215-590, CLASS C - 885-215-715, CLASS I - 885-215-632, CLASS R1 - 885-215-533, CLASS R5 - 885-215-376
NASDAQ SYMBOLS: CLASS A - TVAFX, CLASS B - TVBFX, CLASS C - TVCFX, CLASS I - TVIFX, CLASS R1 - TVRFX, CLASS R5 - TVRRX
Shares/ Amount | Value | ||||
COMMON STOCK — 93.88% | |||||
BANKS — 5.13% | |||||
COMMERCIAL BANKS — 5.13% | |||||
Bank of America Corp. | 1,158,900 | $ | 48,789,690 | ||
TLloyds TSB Group plc | 6,383,200 | 52,745,038 | |||
| 101,534,728 | |||||
CAPITAL GOODS — 4.63% | |||||
INDUSTRIAL CONGLOMERATES — 4.63% | |||||
General Electric Co. | 1,503,200 | 50,612,744 | |||
Tyco International Ltd. | 1,472,300 | 41,003,555 | |||
| 91,616,299 | |||||
COMMERCIAL SERVICES & SUPPLIES — 0.55% | |||||
COMMERCIAL SERVICES & SUPPLIES — 0.55% | |||||
FTI Consulting Inc.+ | 428,712 | 10,829,265 | |||
| 10,829,265 | |||||
CONSUMER DURABLES & APPAREL — 2.13% | |||||
HOUSEHOLD DURABLES — 2.13% | |||||
American Greetings Corp. | 1,540,100 | 42,198,740 | |||
| 42,198,740 | |||||
DIVERSIFIED FINANCIALS — 13.58% | |||||
CAPITAL MARKETS — 7.62% | |||||
Charles Schwab Corp. | 3,061,100 | 44,171,673 | |||
Goldman Sachs Group Inc. | 493,500 | 59,999,730 | |||
The Bank of New York Co. Inc. | 1,593,200 | 46,856,012 | |||
DIVERSIFIED FINANCIAL SERVICES — 5.96% | |||||
Alliance Capital Management Holdings LP | 313,400 | 14,996,190 | |||
Chicago Mercantile Exchange Co. | 144,080 | 48,598,184 | |||
Citigroup Inc. | 1,194,100 | 54,355,432 | |||
| 268,977,221 | |||||
22 | Certified Annual Report |
| SCHEDULE OF INVESTMENTS, CONTINUED | ||
| Thornburg Value Fund | September 30, 2005 | |
Shares/ Amount | Value | ||||
ENERGY — 9.67% | |||||
ENERGY EQUIPMENT & SERVICES — 1.84% | |||||
Schlumberger Ltd. | 432,350 | $ | 36,481,693 | ||
OIL, GAS & CONSUMABLE FUELS — 7.83% | |||||
Canadian Natural Resources Ltd. | 468,000 | 21,163,702 | |||
ChevronTexaco Corp. | 1,132,100 | 73,280,833 | |||
Exxon Mobil Corp. | 955,200 | 60,693,408 | |||
| 191,619,636 | |||||
HEALTH CARE EQUIPMENT & SERVICES — 10.19% | |||||
HEALTH CARE EQUIPMENT & SUPPLIES — 2.06% | |||||
Fisher Scientific International, Inc.+ | 657,000 | 40,766,850 | |||
HEALTH CARE PROVIDERS & SERVICES — 8.13% | |||||
Caremark Rx Inc.+ | 908,000 | 45,336,440 | |||
Eclipsys Corp.+ | 1,639,540 | 29,249,394 | |||
Health Management Associates | 1,549,855 | 36,375,097 | |||
WellPoint Inc.+ | 661,200 | 50,132,184 | |||
| 201,859,965 | |||||
HOUSEHOLD & PERSONAL PRODUCTS — 2.10% | |||||
HOUSEHOLD PRODUCTS — 2.10% | |||||
Colgate Palmolive Co. | 789,300 | 41,667,147 | |||
| 41,667,147 | |||||
INSURANCE — 2.10% | |||||
INSURANCE — 2.10% | |||||
MBIA, Inc. | 685,000 | 41,524,700 | |||
| 41,524,700 | |||||
MATERIALS — 1.82% | |||||
CHEMICALS — 1.82% | |||||
Dow Chemical Co. | 867,500 | 36,148,725 | |||
| 36,148,725 | |||||
MEDIA — 6.48% | |||||
MEDIA — 6.48% | |||||
Comcast Corp.+ | 1,754,600 | 50,497,388 | |||
DIRECTV Group Inc.+ | 3,097,685 | 46,403,321 | |||
Sirius Satellite Radio Inc.+ | 1,681,355 | 11,012,875 | |||
XM Satellite Radio Holdings Inc.+ | 571,605 | 20,526,336 | |||
| 128,439,920 | |||||
| Certified Annual Report | 23 |
| SCHEDULE OF INVESTMENTS, CONTINUED | ||
| Thornburg Value Fund | September 30, 2005 | |
Shares/ Amount | Value | ||||
PHARMACEUTICALS & BIOTECHNOLOGY — 5.91% | |||||
PHARMACEUTICALS — 5.91% | |||||
Johnson & Johnson | 384,700 | $ | 24,343,816 | ||
Pfizer Inc. | 1,989,300 | 49,672,821 | |||
Sanofi-Aventis | 518,400 | 42,974,708 | |||
| 116,991,345 | |||||
RETAILING — 3.94% | |||||
MULTILINE RETAIL — 1.89% | |||||
Target Corp. | 720,000 | 37,389,600 | |||
SPECIALTY RETAIL — 2.05% | |||||
Linens N Things Inc.+ | 1,526,077 | 40,746,256 | |||
| �� | |||||
| 78,135,856 | |||||
SOFTWARE & SERVICES — 6.24% | |||||
INTERNET SOFTWARE & SERVICES — 1.46% | |||||
Google Inc.+ | 91,620 | 28,994,065 | |||
IT SERVICES — 0.97% | |||||
Bearingpoint, Inc. Co.+ | 2,523,500 | 19,153,365 | |||
SOFTWARE — 3.81% | |||||
Microsoft Corp. | 1,788,900 | 46,028,397 | |||
Oracle Corp.+ | 2,381,000 | 29,500,590 | |||
| 123,676,417 | |||||
TECHNOLOGY HARDWARE & EQUIPMENT — 4.74% | |||||
COMMUNICATIONS EQUIPMENT — 4.74% | |||||
Cisco Systems Inc.+ | 2,481,700 | 44,496,881 | |||
Motorola, Inc. | 2,232,300 | 49,311,507 | |||
| 93,808,388 | |||||
TELECOMMUNICATION SERVICES — 9.93% | |||||
DIVERSIFIED TELECOMMUNICATION SERVICES — 2.49% | |||||
Alltel Corp. | 756,500 | 49,255,715 | |||
WIRELESS TELECOMMUNICATION SERVICES — 7.44% | |||||
Crown Castle International Corp.+ | 1,310,100 | 32,267,763 | |||
Leap Wireless International, Inc.+ | 1,075,900 | 37,871,680 | |||
NII Holdings Inc.+ | 915,804 | 77,339,648 | |||
| 196,734,806 | |||||
24 | Certified Annual Report |
| SCHEDULE OF INVESTMENTS, CONTINUED | ||
| Thornburg Value Fund | September 30, 2005 | |
Shares/ Amount | Value | |||||
TRANSPORTATION — 4.74% | ||||||
AIRLINES — 2.13% | ||||||
Southwest Airlines Co. | 2,837,553 | $ | 42,137,662 | |||
ROAD & RAIL — 2.61% | ||||||
Union Pacific Corp. | 721,200 | 51,710,040 | ||||
| 93,847,702 | ||||||
TOTAL COMMON STOCKS (Cost $1,667,666,033) | 1,859,610,860 | |||||
CORPORATE BONDS — 0.53% | ||||||
TELECOMMUNICATION SERVICES — 0.53% | ||||||
DIVERSIFIED TELECOMMUNICATION SERVICES — 0.53% | ||||||
Level 3 Communications Inc., 9.125%, 5/1/2008 | $ | 7,000,000 | 5,705,000 | |||
Level 3 Communications Inc., 10.50%, 12/1/2008 | 5,900,000 | 4,838,000 | ||||
| 10,543,000 | ||||||
TOTAL CORPORATE BONDS (Cost $10,205,847) | 10,543,000 | |||||
CONVERTIBLE BONDS — 2.92% | ||||||
TELECOMMUNICATION SERVICES — 2.92% | ||||||
DIVERSIFIED TELECOMMUNICATION SERVICES — 2.92% | ||||||
Level 3 Communications Inc., 6.00%, 9/15/2009 | 20,700,000 | 10,841,625 | ||||
Level 3 Communications Inc., 6.00%, 3/15/2010 | 91,600,000 | 47,059,500 | ||||
| 57,901,125 | ||||||
TOTAL CONVERTIBLE BONDS (Cost $72,173,507) | 57,901,125 | |||||
SHORT TERM INVESTMENTS — 2.52% | ||||||
Lasalle Bank Corp., 3.71%, 10/7/2005 | 20,000,000 | 19,987,634 | ||||
Toyota Credit de Puerto Rico, 3.73%, 10/4/2005 | 6,000,000 | 5,998,135 | ||||
UBS Finance, 3.78%, 10/5/2005 | 24,000,000 | 23,989,920 | ||||
TOTAL SHORT TERM INVESTMENTS (Cost $49,975,689) | 49,975,689 | |||||
TOTAL INVESTMENTS — 99.85% (COST $1,800,021,076) | $ | 1,978,030,674 | ||||
OTHER ASSETS LESS LIABILITIES — 0.15% | 2,904,667 | |||||
NET ASSETS — 100.00% | $ | 1,980,935,341 | ||||
| Footnote Legend | ||||||
| See notes to financial statements. | ||||||
+ Non-income producing | ||||||
| Certified Annual Report | 25 |
| SCHEDULE OF INVESTMENTS, CONTINUED | ||
| Thornburg Value Fund | September 30, 2005 | |
SUMMARY OF INDUSTRY EXPOSURE
As of 9/30/05
Diversified Financials | 13.6 | % | |
Telecommunication Services | 13.4 | % | |
Health Care Equipment & Services | 10.2 | % | |
Energy | 9.7 | % | |
Media | 6.5 | % | |
Software & Services | 6.2 | % | |
Pharmaceuticals & Biotechnology | 5.9 | % | |
Banks | 5.1 | % | |
Transportation | 4.7 | % | |
Technology Hardware & Equipment | 4.7 | % | |
Capital Goods | 4.6 | % | |
Retailing | 3.9 | % | |
Consumer Durables & Apparel | 2.1 | % | |
Household & Personal Products | 2.1 | % | |
Insurance | 2.1 | % | |
Materials | 1.8 | % | |
Commercial Services & Supplies | 0.6 | % | |
Other Assets and Cash Equivalents | 2.8 | % |
26 | Certified Annual Report |
REPORT OF INDEPENDENT REGISTERED PUBLIC ACCOUNTING FIRM
Thornburg Value Fund
To the Trustees and Class I Shareholders of
Thornburg Value Fund
In our opinion, the accompanying statement of assets and liabilities, including the schedule of investments, and the related statements of operations and of changes in net assets and the financial highlights present fairly, in all material respects, the financial position of Thornburg Value Fund (one of the portfolios constituting Thornburg Investment Trust, hereafter referred to as the “Fund”) at September 30, 2005, the results of its operations for the year then ended, the changes in its net assets for each of the two years in the period then ended and the financial highlights for Class I shares for each of the periods presented, in conformity with accounting principles generally accepted in the United States of America. These financial statements and financial highlights (hereafter referred to as “financial statements”) are the responsibility of the Fund’s management. Our responsibility is to express an opinion on these financial statements based on our audits. We conducted our audits of these financial statements in accordance with the standards of the Public Company Accounting Oversight Board (United States). Those standards require that we plan and perform the audit to obtain reasonable assurance about whether the financial statements are free of material misstatement. An audit includes examining, on a test basis, evidence supporting the amounts and disclosures in the financial statements, assessing the accounting principles used and significant estimates made by management, and evaluating the overall financial statement presentation. We believe that our audits, which included confirmation of securities at September 30, 2005 by correspondence with the custodian and brokers, provide a reasonable basis for our opinion.
PricewaterhouseCoopers LLP
New York, New York
November 16, 2005
| Certified Annual Report | 27 |
| EXPENSE EXAMPLE | ||
| Thornburg Value Fund | September 30, 2005 (Unaudited) | |
As a shareholder of the Fund, you incur two types of costs:
(1) transaction costs, including a 90-day redemption fee on Class I shares;
(2) ongoing costs, including management and administrative fees and other Fund expenses.
This example is intended to help you understand your ongoing costs (in dollars) of investing in the Fund and to compare these costs with the ongoing costs of investing in other mutual funds.
The example is based on an investment of $1,000 invested on March 31, 2005 and held until September 30, 2005.
Actual Expenses
The first line of the table at right provides information about actual account values and actual expenses. You may use the information in this line, together with the amount you invested, to estimate the expenses that you paid over the period. Simply divide your account value by $1,000 (for example, an $8,600 account value divided by $1,000 = 8.6), then multiply the result by the number in the first line under the heading entitled “Expenses Paid During Period” to estimate the expenses you paid on your account during this period.
Hypothetical Example for Comparison Purposes
The second line of the table at right provides information about hypothetical account values and hypothetical expenses based on the Fund’s actual expense ratio and an assumed rate of return of 5% per year before expenses, which is not the Fund’s actual return. The hypothetical account values and expenses may not be used to estimate the actual ending account balance or expenses you paid for the period. You may use this information to compare the ongoing costs of investing in the Fund and other funds. To do so, compare this 5% hypothetical example with the 5% hypothetical examples that appear in the shareholder reports of the other funds.
Please note that the expenses shown in the table are meant to highlight your ongoing costs only and do not reflect any transactional costs, such as sales charges (loads), redemption fees, or exchange fees. Therefore, the second line of the table is useful in comparing ongoing costs only, and will not help you determine the relative total costs of owning different funds. In addition, if these transactional costs were included, your costs would have been higher.
Beginning Account Value 3/31/05 | Ending Account Value 9/30/05 | Expenses Paid During 3/31/05–9/30/05 | |||||||
Class I Shares | |||||||||
Actual | $ | 1,000.00 | $ | 1,087.20 | $ | 5.13 | |||
Hypothetical* | $ | 1,000.00 | $ | 1,020.15 | $ | 4.97 | |||
| † | Expenses are equal to the annualized expense ratio for Class I shares (0.98%) multiplied by the average account value over the period, multiplied by 183/365 to reflect the one-half year period. |
| * | Hypothetical assumes a rate of return of 5% per year before expenses. |
28 | Certified Annual Report |
| INDEX COMPARISON | ||
| Thornburg Value Fund | September 30, 2005 (Unaudited) | |
GROWTH OF A HYPOTHETICAL $10,000 INVESTMENT
Thornburg Value Fund versus S&P 500 Index (November 2, 1998 to September 30, 2005)
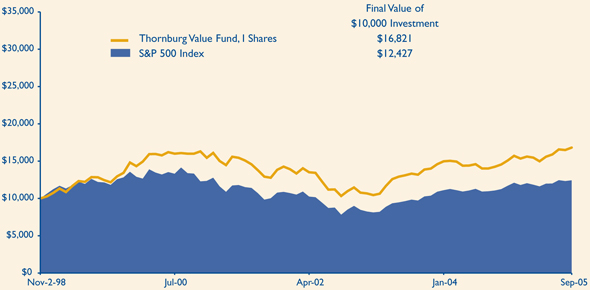
AVERAGE ANNUAL TOTAL RETURNS
For periods ended September 30, 2005
| 1 Yr | 5 Yrs | Since Inception | |||||||
I Shares (Incep: 11/2/98) | 18.16 | % | 1.01 | % | 7.81 | % | |||
S&P 500 (Since: 11/2/98) | 12.25 | % | (1.49 | )% | 3.18 | % |
Performance data reflects past performance, which is no guarantee of future results. The performance data and graph do not reflect the deduction of taxes that a shareholder would pay on distributions or the redemption of Fund shares.
Returns reflect the reinvestment of dividends and capital gains. There is no up-front sales charge for Class I shares. Class I shares are subject to a 1% 90-day redemption fee.
The Standard & Poor’s 500 Stock Index (S&P 500) is an unmanaged index generally representative of the U.S. stock market, without regard to company size. Unless otherwise noted, index returns do not reflect fees, brokerage commissions or other expenses of investing. Investors may not make direct investments into any index.
| Certified Annual Report | 29 |
| TRUSTEES AND OFFICERS | ||
| Thornburg Value Fund | September 30, 2005 (Unaudited) | |
Name, Age, Position Held with Fund Year Elected | Principal Occupation(s) During Past Five Years | Other Directorships Held by Trustee | ||
INTERESTED TRUSTEES(1)(2)(4) | ||||
Garrett Thornburg, 59 Chairman of Trustees, Trustee since 1987(3) | CEO, Chairman and controlling shareholder of Thornburg Investment Management, Inc. (investment advisor) and Thornburg Securities Corporation (securities dealer); Chairman of Thornburg Limited Term Municipal Fund, Inc. (registered investment company) to 2004; CEO and Chairman of Thornburg Mortgage, Inc. (real estate investment trust); Chairman of Thornburg Mortgage Advisory Corporation (investment manager to Thornburg Mortgage, Inc.). | Director of Thornburg Mortgage, Inc. (real estate investment trust) | ||
Brian J. McMahon, 49 Trustee since 2001, Member of Governance & Nominating Committee, President since 1997(5)(6) | President and Managing Director of Thornburg Investment Management, Inc.; President of Thornburg Limited Term Municipal Fund, Inc. to 2004. | None | ||
INDEPENDENT TRUSTEES(1)(2)(4) | ||||
David A. Ater, 60 Trustee since 1994, Member of Audit Committee and Governance & Nominating Committee | Principal in Ater & Associates, Santa Fe, NM (developer, planner and broker of residential and commercial real estate); owner developer and broker for various real estate projects. | Director of Thornburg Mortgage, Inc. (real estate investment trust) | ||
David D. Chase, 64 Chairman of Audit Committee, Trustee since 2000 | Chairman, President, CEO, and Managing Member of Vestor Associates, LLC, the general partner of Vestor Partners, LP, Santa Fe, NM (private equity fund); Chairman and CEO of Vestor Holdings, Inc., Santa Fe, NM (merchant bank). | None | ||
Eliot R. Cutler, 59 Chairman of Governance & Nominating Committee, Trustee since 2004 | Partner, Akin, Gump, Strauss, Hauer & Feld, LLP,Washington, D.C. (law firm) since November 2000; partner, Cutler & Stanfield,Washington, D.C. (law firm) until November 2000. | Director of Thornburg Mortgage, Inc. (real estate investment trust) | ||
Susan H. Dubin, 56 Trustee since 2004, Member of Audit Committee | President of Dubin Investments, Ltd., Greenwich, CT (private investment fund); Director and officer of various charitable organizations; and formerly, Vice President of Chemical Bank (predecessor to JP Morgan Chase & Co.), New York, 1974–1996. | None | ||
Owen D.Van Essen, 51 Trustee since 2004, Member of Governance & Nominating Committee | President of Dirks,Van Essen & Murray, Santa Fe, NM (newspaper mergers and acquisitions). | None | ||
James W. Weyhrauch, 46 Trustee since 1996, Member of Audit Committee | Director, Executive Vice President to 2002, and President and CEO 2002–2004, Nambé Mills, Inc., Santa Fe, NM (manufacturer); real estate agent, Santa Fe Properties, Santa Fe, NM since 2004. | None | ||
30 | Certified Annual Report |
| TRUSTEES AND OFFICERS, CONTINUED | ||
| Thornburg Value Fund | September 30, 2005 (Unaudited) | |
Name, Age, Position Held with Fund Year Elected | Principal Occupation(s) During Past Five Years | Other Directorships Held by Trustee | ||
| OFFICERS OF THE FUND (WHO ARE NOT TRUSTEES)(1)(6)(7) | ||||
Dawn B. Fischer, 58 Secretary since 1987 | Secretary and Managing Director, Thornburg Investment Management, Inc.; Secretary, Thornburg Limited Term Municipal Fund, Inc. to 2004; Secretary, Thornburg Securities Corporation; Vice President, Daily Tax Free Income Fund, Inc. (registered investment company). | Not applicable | ||
Steven J. Bohlin, 46 Vice President since 1987; Treasurer since 1989 | Vice President and Managing Director of Thornburg Investment Management, Inc.; Vice President of Thornburg Limited Term Municipal Fund, Inc. to 2004. | Not applicable | ||
| George T. Strickland, 42 Vice President since 1996 | Vice President and Managing Director of Thornburg Investment Management, Inc.; Vice President (to 2004) and Treasurer (2003–2004) of Thornburg Limited Term Municipal Fund, Inc. | Not applicable | ||
| William V. Fries, 66 Vice President since 1995 | Vice President and Managing Director of Thornburg Investment Management, Inc. | Not applicable | ||
Leigh Moiola, 38 Vice President since 2001 | Vice President and Managing Director of Thornburg Investment Management, Inc.; Vice President of Thornburg Limited Term Municipal Fund, Inc. 1999–2004. | Not applicable | ||
| Kenneth Ziesenheim, 51 Vice President since 1995 | Vice President and Managing Director of Thornburg Investment Management, Inc.; President of Thornburg Securities Corporation; Vice President of Thornburg Limited Term Municipal Fund, Inc. to 2004. | Not applicable | ||
| Alexander Motola, 35 Vice President since 2001 | Vice President and Managing Director of Thornburg Investment Management, Inc. since 2000; Portfolio Manager, Insight Capital Research & Management, Inc., Walnut Creek, California 1995–2000. | Not applicable | ||
| Wendy Trevisani, 34 Vice President since 1999 | Associate Portfolio Manager of Thornburg Investment Management, Inc. since 1999, Vice President since 2000 and Managing Director since 2003; Vice President of Thornburg Limited Term Municipal Fund, Inc. 1999–2002. | Not applicable | ||
Joshua Gonze, 42 Vice President since 1999 | Associate Portfolio Manager of Thornburg Investment Management, Inc. since 1999, Vice President since 1999 and Managing Director since 2003; Vice President of Thornburg Limited Term Municipal Fund, Inc. to 2004. | Not applicable | ||
Brad Kinkelaar, 37 Vice President since 1999 | Associate Portfolio Manager of Thornburg Investment Management, Inc. since 1999, Vice President since 2000 and Managing Director since 2003. | Not applicable | ||
Christopher Ihlefeld, 35 Vice President since 2003 | Associate Portfolio Manager since 1999; Vice President of Thornburg Investment Management, Inc. since 2002; Vice President of Limited Term Municipal Fund, Inc., 2003–2004. | Not applicable | ||
Leon Sandersfeld, 39 Vice President since 2003 | Associate of Thornburg Investment Management, Inc. since 2002; Senior Staff Accountant, Farm Bureau Life Insurance Co. 1998–2002. | Not applicable | ||
| Certified Annual Report | 31 |
| TRUSTEES AND OFFICERS, CONTINUED | ||
| Thornburg Value Fund | September 30, 2005 (Unaudited) | |
Name, Age, Position Held with Fund Year Elected | Principal Occupation(s) During Past Five Years | Other Directorships Held by Trustee | ||
Sasha Wilcoxon, 31 Vice President since 2003 | Associate of Thornburg Investment Management, Inc. since 2000 and Mutual Fund Operations Department Manager since 2002. | Not applicable | ||
Ed Maran, 47 Vice President since 2004 | Associate Portfolio Manager of Thornburg Investment Management, Inc. since 2002 and Vice President and Managing Director since 2004; Analyst, USAA 2001–2002; Oil Analyst, A.G. Edwards 1997–2000. | Not applicable | ||
Vinson Walden, 35 Vice President since 2004 | Associate Portfolio Manager of Thornburg Investment Management, Inc. since 2002 and Vice President and Managing Director since 2004; Associate Portfolio Manager, Ibis Management 2002–2004; Associate, Lehman Brothers, 1997–2001. | Not applicable | ||
| (1) | Each person’s address is 119 East Marcy Street, Santa Fe, New Mexico 87501. |
| (2) | The Fund is one of twelve separate investment “Funds” or “series” of Thornburg Investment Trust (the “Trust”), which comprises the Thornburg mutual fund complex and is organized as a Massachusetts business trust. The Trust currently has twelve active Funds. Thornburg Investment Management, Inc. is the investment advisor to, and manages, the twelve Funds of the Trust. Each Trustee oversees the twelve Funds in the fund complex. |
| (3) | Mr.Thornburg is considered an “interested” Trustee under the Investment Company Act of 1940 because he is a director and controlling shareholder of Thornburg Investment Management, Inc., the investment advisor to the twelve active Funds of the Trust, and is the sole director and controlling shareholder of Thornburg Securities Corporation, the distributor of shares for the Trust. |
| (4) | Each Trustee serves in office until the election and qualification of a successor. |
| (5) | Mr. McMahon is considered an “interested” Trustee because he is the president of Thornburg Investment Management, Inc. |
| (6) | The Trust’s president, secretary and treasurer each serves a one-year term or until the election and qualification of a successor; each other officer serves at the pleasure of the Trustees. |
| (7) | Assistant vice presidents, assistant secretaries and assistant treasurers are not shown. |
The Statement of Additional Information for each Fund of the Trust includes additional information about the Trustees and is available, without charge and upon request, by calling 1-800-847-0200.
32 | Certified Annual Report |
| OTHER INFORMATION | ||
| Thornburg Value Fund | September 30, 2005 (Unaudited) | |
PORTFOLIO PROXY VOTING
Policies and Procedures:
The Trust has delegated to Thornburg Investment Management, Inc. (the “Advisor”) voting decisions respecting proxies for the Fund’s voting securities. The Advisor makes voting decisions in accordance with its Proxy Voting Policy and Procedures. A description of the Policy and Procedures is available (i) without charge, upon request, by calling the Advisor toll-free at 1-800-847-0200, (ii) on the Thornburg website at www.thornburg.com, and (iii) on the Securities and Exchange Commission’s website at www.sec.gov.
Commencing August 31, 2004, information regarding how proxies were voted is available on or before August 31 of each year for the twelve months ending the preceding June 30. This information is available (i) without charge, upon request by calling the Advisor toll-free at 1-800-847-0200, (ii) on the Thornburg website at www.thornburg.com, and (iii) on the Securities and Exchange Commission’s website at www.sec.gov.
TAX INFORMATION
For the tax year ended September 30, 2005, the Thornburg Value Fund designates 100% of the dividends paid from tax basis net ordinary income as qualifying for the reduced rate under the Jobs and Growth Tax Relief and Reconciliation Act of 2003.
100% of the ordinary income distributions paid by the Fund (or the maximum amount allowed) for the year ended September 30, 2005 qualified for the corporate dividends received deduction.
The information and distributions reported herein may differ from the information and distributions taxable to the shareholders for the calendar year ending December 31, 2005. Complete information will be computed and reported in conjunction with your 2005 Form 1099-DIV.
AVAILABILITY OF QUARTERLY PORTFOLIO SCHEDULE
The Fund files with the Securities and Exchange Commission schedules of its portfolio holdings on Form N-Q for the first and third quarters of each fiscal year. The Fund’s Forms N-Q are available on the Commission’s website at www.sec.gov, or may be reviewed and copied at the Commission’s Public Reference Room in Washington, D.C. Information on the operation of the Public Reference Room may be obtained by calling 1-800-SEC-0330. The Fund also makes this information available on its website at www.thornburg.com/download or upon request by calling 1-800-847-0200.
TRUSTEES DELIBERATIONS RESPECTING RENEWAL OF INVESTMENT ADVISORY AGREEMENT
Thornburg Investment Management, Inc. (the “Advisor”) provides investment management services to Thornburg Value Fund pursuant to an investment advisory agreement. The Trustees consider the renewal of this agreement annually and most recently determined to renew the agreement on September 13, 2005.
In connection with their general supervision of the Advisor, the Trustees receive and consider reports throughout the year from the Advisor respecting the Advisor’s management of the Fund’s investments. These reports include information about the Fund’s purchase and sale of portfolio investments and explanations from the Advisor respecting investment selections, the investment performance of the Fund, general appraisals of industry and economic prospects and factors, and other matters affecting the Fund and relating to the Advisor’s performance of services for the Fund.
In anticipation of their recent consideration of the advisory agreement’s renewal, the independent Trustees met with representatives of the Advisor in July 2005 to specify the information the Advisor would present to the Trustees for their review. The independent Trustees thereafter met in independent session to consider various factors respecting the agreement’s renewal, and met in a subsequent session with the Advisor’s chief investment officer to present questions. Following these sessions, the Trustees met on September 13, 2005 to consider a renewal of the advisory agreement.
The Trustees considered various factors in their review of the Advisor’s performance under the investment advisory agreement, including specifically the principles outlined in their February 2005 Statement to Shareholders, a copy of which accompanies this Annual Report to Shareholders. Summarized below are certain of the factors considered by the Trustees in connection with the determination to renew the advisory agreement. In determining to renew the advisory agreement, the Trustees did not identify any single fact or aspect of the Advisor’s performance as controlling, and this summary does not describe all of the matters considered by the Trustees in making their determination.
Quality of Services; Fund Investment Performance. In reviewing the nature, extent, and quality of services provided by the Advisor and the investment performance of the Fund, the Trustees primarily considered the Advisor’s adherence to the Fund’s stated objectives and policies, the Advisor’s execution of the Fund’s investment strategies in prevailing market conditions, the Fund’s absolute investment performance, the Fund’s investment performance compared to categories of other broadly similar mutual funds and a broad based securities index, the Fund’s investment performance over different periods of time, the Fund’s total returns in rising and declining markets compared to total returns of a broad based securities index, measures of relative portfolio risk, and related factors. The Trustees noted in comparing the Fund to other mutual funds and to indices that the value of such comparisons may be limited because the Fund’s investment approach, and the selection of its portfolio securities, are unique or differ in con-
| Certified Annual Report | 33 |
| OTHER INFORMATION, CONTINUED | ||
| Thornburg Value Fund | September 30, 2005 (Unaudited) | |
siderable degree from the characteristics of other funds and indices. In conducting their review, the Trustees observed that the Advisor had continued to faithfully pursue and to achieve the Fund’s stated objectives, as demonstrated particularly by the Advisor’s selection of investments and the Fund’s investment performance. The Trustees also noted in this regard the Fund’s above average investment performance in most periods as compared to broad based securities indices and categories of equity mutual funds selected by independent mutual fund analyst firms.
The Trustees also considered a number of other factors in reviewing the quality of the Advisor’s services, including the qualifications and integrity of the Advisor’s senior personnel, the Advisor’s staffing and other resources, the Advisor’s compliance with regulatory requirements, Fund sales performance and perceptions of the Funds in the marketplace, and other factors.
The Trustees concluded, based upon these and other considerations, that the Advisor had actively and competently pursued the Fund’s stated investment objectives in accordance with the Fund’s investment policies stated in its prospectuses. The Trustees further concluded that the investment performance of the Fund was satisfactory in the context of the Fund’s objectives and policies and prevailing market conditions.
Fees and Expenses; Profitability of Advisor. In reviewing the fees charged by the Advisor to the Fund, the Trustees primarily considered the fees charged by the Advisor and the other expenses charged to the Fund in light of the nature and quality of services provided, comparison of the actual Advisor’s fee and Fund expenses to the statement of fees and expenses in the Fund’s prospectuses, comparisons of the Advisor’s fee and other Fund expenses to median and average fees and expenses charged to similar mutual funds, and comparisons of fees and expenses charged to the Fund with fees and expenses charged to other, similar specific mutual funds. In addition, the Trustees considered the profitability of the Advisor compared to other investment management firms, and comparisons of the investment management fee rates charged by the Advisor to the Fund with rates charged to other clients of the Advisor and the differing types of services furnished to the Fund and the other clients. The Trustees noted that the management fee charged to the Fund was higher than the average and median fee rates charged to a group of multi-cap core funds assembled by an independent mutual fund analyst firm, but that the overall expense ratio was comparable to the average and median expense ratios for the same fund group. The Trustees further noted in this regard the investment performance of the Fund. The Trustees also observed in their review that fee rates charged by the Advisor to other clients of the Advisor were not directly comparable to rates charged to the Fund principally because of the significant differences in the services provided.
The Trustees concluded, based upon these and other considerations, that the fees charged to the Fund by the Advisor were fair and reasonable in view of the following: the services provided, the clear disclosure of these fees and expenses in the Fund’s prospectuses, and prevailing fees and expenses charged to mutual funds generally. The Trustees further concluded that there was no indication that the Advisor’s profitability was unusual, viewed in the context of the services provided, the performance of the Fund, and the fees and profitability of other investment management firms.
Economies of Scale. In reviewing the extent to which economies of scale would be realized by the Fund as it grows and whether fee levels reflect economies of scale, the Trustees considered the breakpoint structure for advisory fees chargeable to the Fund, the demonstrated economies of scale enjoyed by the Fund and other Funds of the Trust as they had grown in size, and economies of scale realized by other mutual funds. The Trustees concluded that the Fund has realized and may reasonably be expected to realize further economies of scale for the benefit of its shareholders as it grows in size.
Ancillary Benefits to Advisor. In reviewing benefits enjoyed by the Advisor because of its relationship with the Fund, the Trustees considered an arrangement through which the Advisor received certain research services, favorable publicity received by the Advisor because of the superior investment performance of certain funds of the Trust, and the benefits to the Fund from the Advisor’s expansion of its staffing and other resources to serve a broader variety of investment clients. The Trustees concluded, based upon these and other considerations, that there was no unusual or unfair benefit enjoyed by the Advisor and that the Fund enjoyed benefits by virtue of the Advisor’s engagement by other investment clients.
34 | Certified Annual Report |
Trustees’ Statement to Shareholders
Not part of the Certified Annual Report
February 8, 2005
The Trustees are concerned that recent commentaries and opinions reported in the media may confuse investors in general as to the supervisory duties of trustees of mutual funds and, in particular, leave Thornburg Investment Trust shareholders uncertain regarding how we discharge our responsibilities in supervising the Funds’ investment advisor and in reviewing the advisor’s contract for renewal. We decided to spell out clearly three principal guidelines that we follow in supervising the Trust’s investment advisor on your behalf.
We begin with the premise that each shareholder selected his or her Fund because its investments are managed by the investment advisor identified in the prospectus and in accordance with the objective and policies described in the prospectus. We realize, as each of you do, that if you believe that your Fund’s stated objective and policies no longer serve your personal investment goals, you can sell your shares and leave the Fund.
Therefore, we believe that our primary supervisory task – our principal obligation to you – is to assess the nature and quality of the advisor’s services, and to confirm that the advisor actively and competently pursues the Fund’s objective, in accordance with the policies set out in the prospectus. To do this, we meet regularly with management to review your Fund’s portfolio and to discuss the advisor’s specific actions and judgments in pursuing the Fund’s objective. We do not substitute our own judgment for the advisor’s decisions in selecting investments; the advisor is paid to exercise its informed judgment on investment decisions, and we seek to confirm, in reviewing the advisor’s performance, that the advisor is doing just that.
Second, while we are conscious of costs and the effect that costs have on shareholders’ returns, we do not seek the lowest fees or expense ratio as our sole or primary objective. We try to make sure that your Fund’s fees and costs are reasonable in relationship to the services rendered and that they are generally in line with those charged by other expert investment advisors, consistent with our belief that the Fund’s investors searched for and expect that expertise and attention and have decided to pay a reasonable price for it. We do not put the management contract “out to bid” as a matter of course, and we would not do so unless we had concluded that the advisor materially had failed to pursue the Fund’s objectives in accordance with its policies, or for other equally important reasons. We believe that any other approach would be inconsistent with your interests and contrary to your expectations when you bought shares of the Fund in the first place.
Finally, because we believe that most Thornburg Fund shareholders have invested with a long-term perspective, we try not to focus too much on the fashions of the moment and on short-term performance. The market will not favor any specific investment objective or set of policies at all times and under all economic circumstances. A fund will experience periods of both high and low returns relative to other funds and other investments. Even if one of our Funds is not favored by the market at a particular time, we believe that the advisor is nonetheless obliged to remain true to the Fund’s objective and policies, and we watch to see that it does so.
This statement is submitted for the general information of the shareholders of Thornburg Investment Trust. It is not authorized for distribution to prospective investors in the Fund unless preceded or accompanied by an effective prospectus. If you have not received a prospectus, one can be obtained from your financial advisor, online at www.thornburg.com/download, or by calling 800-847-0200. Carefully consider information in the prospectus regarding the Fund’s investment objectives and policies, risks, sales charges, expenses, experience of its management, marketability of shares, and other information. Read it carefully before you invest or send money.
| This page is not part of the Annual Report. | 35 |
This page intentionally left blank.
36 | This page is not part of the Annual Report. |
This page intentionally left blank.
| This page is not part of the Annual Report. | 37 |
This page intentionally left blank.
38 | This page is not part of the Annual Report. |
Planning Options
Retirement and Education Accounts
Thornburg Investment Management offers retirement and education savings accounts that can help you meet a variety of planning challenges. For account applications or further information on any of the accounts below, please call 1-800-847-0200 or go to www.thornburg.com/ira. Your financial advisor can help you determine which plan is right for you.
Individual Retirement Accounts
Individual Retirement Accounts (IRAs) provide a tax-advantaged means to save money for the future. For a detailed outline of the difference between retirement accounts, see www.thornburg.com/ira. Rollovers are available. Call 1-800-847-0200 for more information.
Traditional IRAs – Contributions to Traditional IRAs are tax deductible for eligible individuals, and withdrawals are taxed as additional ordinary income. You may contribute to an IRA if you receive compensation and are under 70 1/2, even if you are covered by an employer retirement plan.
Roth IRAs – Under a Roth IRA, there is no tax deduction for contributions, but there is no income tax on qualified withdrawals. For a more detailed comparison of Traditional and Roth IRAs, please see our web site at www.thornburg.com/ira.
SEP IRAs – Simplified Employee Pension (SEP) IRAs are established by employers. The employer is allowed a tax deduction for contributions made to the SEP Plan and makes contributions to each eligible employee’s SEP IRA on a discretionary basis.
SIMPLE IRAs – Savings Incentive Match Plan for Employees of Small Employers (SIMPLE) is designed to give small business owners a simplified method to establish and contribute to a retirement plan for employees. The employer is allowed a tax deduction for contributions and makes either matching or non-elective contributions to each eligible employee’s SIMPLE IRA. Employees may make salary deferral contributions.
403(b)
A special, tax-advantaged savings vehicle available only to employees of 501(c)(3) organizations, such as charitable, educational, scientific and religious organizations. 403(b) plans are also available to employees of public schools and universities.
Coverdell Education Savings Account
These savings accounts are designed to provide a way to save money for higher education expenses. In an Education Savings Account, earnings and interest grow tax free, and qualified withdrawals used to pay for eligible higher-education expenses are tax- and penalty-free.
Funds Available
The following funds are available in the accounts listed above:
| • | Thornburg International Value Fund |
| • | Thornburg Value Fund |
| • | Thornburg Core Growth Fund |
| • | Thornburg Investment Income Builder Fund |
| • | Thornburg Limited Term U.S. Government Fund |
| • | Thornburg Limited Term Income Fund |
| This page is not part of the Annual Report. | 39 |
The Firm
Thornburg Investment Management® is a privately held investment management company based in Santa Fe, New Mexico with assets under management of over $16 billion. Founded in 1982, the firm manages four equity funds, eight bond funds, and separate portfolios for select institutions and individuals.
Investment Philosophy
We seek to preserve and increase the real wealth of the Funds’ shareholders after accounting for inflation, taxes, and investment expenses. We’re committed to disciplined investing and controlling risk in all market environments through laddered bond and focused equity portfolios.
Portfolio Holdings Disclosure
We believe you should know about your portfolio. Our web site keeps investors informed of the Funds’ equity holdings. Go to www.thornburg.com/funds for commentary on our equity fund holdings.
Co-Ownership of Funds
We invest side-by-side with the Funds’ shareholders. Our employees have invested over $110 million in Thornburg Funds.
Core Strategies for Building Wealth
We deliver core strategies to help investors meet long-term goals. A core strategy is a consistent, disciplined and proven investment process that represents the foundation of a diversified portfolio.
INVESTMENT MANAGER:
Thornburg Investment Management®
119 East Marcy Street
Santa Fe, New Mexico 87501
800.847.0200
DISTRIBUTOR:
Thornburg Securities™
119 East Marcy Street
Santa Fe, New Mexico 87501
800.847.0200

Core Strategies for Building Wealth
Thornburg International Value Fund
Informational Brochure and Annual Report – September 30, 2005
Value knows no boundaries
This report and the accompanying brochure are submitted for the general information of shareholders of the Fund. It is not authorized for distribution to prospective investors in the Fund unless preceded or accompanied by an effective prospectus. If you have not received a prospectus, one can be obtained from your financial advisor, online at www.thornburg.com/ download, or by calling 800-847-0200. Carefully consider information in the prospectus regarding the Fund’s investment objectives and policies, risks, sales charges, expenses, experience of its management, marketability of shares, and other information. Read it carefully before you invest or send money. Performance data quoted represents past performance and does not guarantee future results.
Thornburg International Value Fund
Value Knows No Boundaries
The Fund seeks long-term capital appreciation by investing in a portfolio of a limited number of holdings selected on a value basis using fundamental research. As a secondary consideration, the Fund also seeks some current income.
The portfolio is diversified to include basic value stocks, but also includes stocks of companies with consistent earnings characteristics and those of emerging franchises, when, in our opinion, these issues are value priced.
Thornburg Bond Funds
| • | Thornburg Limited Term Municipal Fund |
| • | Thornburg Intermediate Municipal Fund |
| • | Thornburg California Limited Term Municipal Fund |
| • | Thornburg New Mexico Intermediate Municipal Fund |
| • | Thornburg Florida Intermediate Municipal Fund |
| • | Thornburg New York Intermediate Municipal Fund |
| • | Thornburg Limited Term U.S. Government Fund |
| • | Thornburg Limited Term Income Fund |
Thornburg invests in short- and intermediate-term investment grade bonds. We ladder the maturities of individual bonds in the portfolios to moderate risk. Laddering involves building a portfolio of bonds with staggered maturities so that a portion of the portfolio will mature each year. We apply this disciplined process in all interest rate environments.
Thornburg Equity Funds
| • | Thornburg Value Fund |
| • | Thornburg International Value Fund |
| • | Thornburg Core Growth Fund |
| • | Thornburg Investment Income Builder Fund |
Thornburg’s equity research uses a fundamental, yet comprehensive, analytical approach. We invest when and where we perceive compelling value. Thornburg equity funds focus on a limited number of securities so that each holding can impact performance. The equity team searches for firms believed to have a promising future and seeks to buy shares of those companies at a discount to their intrinsic value.
More information at www.thornburg.com
 | Reduce paper clutter. | |
| Receive your shareholder reports and prospectus online instead of through traditional mail. | ||
| Sign up at | ||
| www.thornburg.com/edelivery | ||
| 2 | This page is not part of the Annual Report. |
Message
from the Chairman

Garrett Thornburg
Chairman & CEO
November 9, 2005
Dear Fellow Shareholder:
Thornburg Investment Management has a clear mission: to preserve and increase the real wealth of our shareholders. We seek to accomplish this through a range of equity funds that redefine traditional measures of value and growth and through a family of laddered bond funds that focus on quality, stability and minimizing risk over time.
Confirming our strategy, all Thornburg equity funds have ranked well within their respective categories.
The Thornburg equity funds employ a comprehensive approach which is more inclusive than the traditional deep value or high growth approach to stock selection. Within the Thornburg Value Fund and the Thornburg International Value Fund, the portfolios’ securities are classified into three baskets: basic value stocks, stocks of companies with consistent earnings, and stocks of emerging franchises. Thornburg Core Growth Fund’s holdings are classified into similar baskets: growth industry leaders, consistent growth companies, and emerging growth companies. After being identified through bottom-up screening from a worldwide universe, all stocks are subject to a rigorous selection process that must satisfy the Thornburg investment team’s two fundamental criteria: in the opinion of the portfolio manager, the companies must be selling at attractive discounts to intrinsic value and have compelling prospects for long-term growth. You can read much more about the stocks in your Fund’s portfolio at our web site, www.thornburg.com/funds.
During this decade, the average dividend yield paid by equity and hybrid mutual funds has dipped well below 1%. We established Thornburg Investment Income Builder Fund in late 2002 to be clearly different from other equity/hybrid funds by paying attractive dividends today, with a further goal of increasing these in the future. Our record to date shows clear success in achieving each aspect of this mission.
On the bond side, we have always had a highly disciplined approach of laddering short- and intermediate-bond maturities seeking to provide both an attractive return and relative stability of principal.
Recently, there has been a lot of news about improper behavior by some mutual fund companies. Many of the proposed new rules in response to this scandal have called for increased transparency. We welcome increased transparency. Thornburg Investment Management has been a leader in providing information about our stock holdings to our shareholders on our web site, www.thornburg.com.
Unfortunately, some of those new rules will increase the cost to all shareholders in mutual funds. We will do our best to keep these expenses to a minimal amount. After all, we are shareholders too! Thornburg employees have over $110 million invested in our own funds.
Thank you for investing with us. We will do our best to continue to earn your trust every day.
Sincerely,
 |
| Garrett Thornburg |
| Chairman & CEO |
| This page is not part of the Annual Report. | 3 |
Important Information
The information presented on the following pages was current as of September 30, 2005. The manager’s views, portfolio holdings, and sector diversification are historical and subject to change. This material should not be deemed a recommendation to buy or sell any of the securities mentioned.
Shares in the Fund carry risks including possible loss of principal. There are special risks associated with international investing, including currency fluctuations, government regulation, political developments, and differences in liquidity. Risks may be associated with investments in emerging markets including illiquidity and volatility. Additionally, the Fund invests a portion of the assets in small capitalization companies which may increase the risk of greater price fluctuations. Funds invested in a limited number of holdings may expose an investor to greater volatility. Shares in the Fund are not deposits or obligations of, or guaranteed or endorsed by, any bank, the Federal Deposit Insurance Corporation, the Federal Reserve Board, or any government agency.
Performance data given at net asset value (NAV) does not take into account the applicable sales charges. If the sales charges had been included, the performance would have been lower.
Morningstar Award
Established in 1988, the Morningstar Fund Manager of the Year Award recognizes portfolio managers who demonstrate excellent investment skill and the courage to differ from the consensus. To qualify for the award, managers must have not only a great year, but also must have a record of delivering outstanding long-term performance and of aligning their interests with shareholders’. The Fund Manager of the Year Award winners are chosen based upon Morningstar’s proprietary research and in-depth evaluation by its senior analysts.
Glossary
The Morgan Stanley Capital International (MSCI) Europe,Australasia, Far East Index (EAFE) – The MSCI EAFE is an unmanaged index. It is a generally accepted benchmark for major overseas markets. Index weightings represent the relative capitalizations of the major overseas markets included in the index on a U.S. dollar adjusted basis. The index is calculated with gross dividends reinvested in U.S. dollars. Unless otherwise noted, index returns do not reflect fees, brokerage commissions or other expenses of investing. Investors may not make direct investments into any index.
Beta – A measure of market-related risk. Less than one means the portfolio is less volatile than the index, while greater than one indicates more volatility than the index.
Median Market Capitalization – Market capitalization (market cap) is the total value of a company’s stock, calculated by multiplying the number of outstanding common shares by the current share price. The company whose market cap is in the middle of the portfolio is the median market cap. Half the companies in the portfolio have values greater than the median, and half have values that are less. If there is an even number of companies, then the median is the average of the two companies in the middle.
Price to Book Value (P/B) – A ratio used to compare a stock’s market value to its book value. It is calculated by dividing the current closing price of the stock by the latest quarter’s book value (book value is simply assets minus liabilities).
Price to Cash Flow Ratio – A measure of the market’s expectations of a firm’s future financial health. It is calculated by dividing the price per share by cash flow per share.
Price to Earnings Ratio (P/E) – A valuation ratio of a company’s current share price compared to its per-share earnings. P/E equals a company’s market value per share divided by earnings per share.
| 4 | This page is not part of the Annual Report. |
Thornburg International Value Fund
Value Knows No Boundaries
Investing is an art. It is also a science. It requires vision and precision – the vision to recognize opportunity and the precision to use that opportunity to achieve a specific goal.
The greatest success comes to those who strike a balance between the two.
Thornburg International Value Fund strikes such a balance.
The Fund seeks to find bargains in overseas markets. It differs from other international equity funds in two key ways. First, it focuses on a limited number of stocks; and second, it takes a more comprehensive approach to value investing. This unique strategy has provided shareholders with positive returns since the Fund’s inception in 1998, and earned portfolio manager Bill Fries the distinction of Morningstar’s 2003 International Fund Manager of the Year.
Fries’ unassuming and quiet demeanor belies his fierce determination to recognize value and harness it for his shareholders. He brings more than thirty years of investment experience to the process. He also brings a commitment to fundamental, hands-on research. He and his team of associate portfolio managers are dedicated to a collaborative approach in identifying and analyzing investment ideas. They scour the globe to find the world’s most promising companies. The investment committee is, in Fries’ words, “in continuous session.” Everybody’s idea is important. “Combining promise and discount valuation” is the team’s mantra.
In managing the Thornburg International Value Fund, Fries takes a conservative, bottom-up approach to stock selection. The Fund is not predisposed to a geographical region or industry. And, it recognizes no “false gods.” Fries and his associates use a combination of traditional value screens, financial analysis, collaborative research, and on-site company visits to gauge the intrinsic value of a company and to estimate its potential for significant future earnings growth. Their current goal is to maintain a portfolio of 45–60 companies diversified by sector, country, region, and economic sensitivity, with no one industry accounting for more than 25% of the Fund’s portfolio, and no one stock comprising more than 5.0%.
Because of the limited number of stocks in the portfolio, every holding counts. Once a company has survived the team’s initial screens, the managers then expand their analysis of what is behind its revenue and cash-generating model. And they take the time to get to know the company, its people and its corporate culture. At the time of purchase, the managers set 12–18 month price targets for each stock. They review those targets as the fundamentals of the stocks change during the course of ownership.
The bottom line? By engendering a wide-open, collegial environment, Fries ensures that information flows freely and that the Fund benefits from the best of the team’s thinking. And because the Fund’s advisor, Thornburg Investment Management®, is located in Santa Fe, New Mexico, the portfolio team avoids the tendency to be trapped by Wall Street’s “pack” instinct. While they have access to the best of Wall Street’s analysis, they are not ruled by it. Their distance from the herd serves to fortify independent and objective thinking.
Foreign markets now account for 49% of world market capitalization. These markets do not all move in sync. When one is up, often another is down. Losses in one may be offset by gains in another. Limiting the number of companies in the portfolio and employing a rigorous sell discipline has enabled the Thornburg team to strike a balance between risk and reward and allow shareholders in Thornburg International Value Fund to enjoy reasonable rates of growth and still sleep at night.
| This page is not part of the Annual Report. | 5 |
Portfolio Overview
Thornburg International Value Fund
IMPORTANT PERFORMANCE
INFORMATION
Performance data quoted represents past performance and does not guarantee future results. Investment return and principal value will fluctuate so that upon redemption, investor’s shares may be worth more or less than their original cost. Current performance may be lower or higher than the data quoted. For performance data current to the most recent month end, visit www.thornburg.com.
The maximum sales charge for Class A shares is 4.50%. A shares are subject to a 1% 90-day redemption fee.
MANAGEMENT TEAM

Front row, L to R: Wendy Trevisani, Bill Fries, Brad Kinkelaar, and Brian McMahon. Back row, L to R: Thomas Garcia, Ed Maran, Lei Wang, Lewis Kaufman, and Vin Walden.
KEY PORTFOLIO ATTRIBUTES
Portfolio P/E* | 18.9x | |||
Portfolio Price to Cash Flow* | 13.9 | |||
Portfolio Price to Book Value* | 2.5 | |||
Median Market Cap* | $ | 16.66 B | ||
3-Year Beta (Thornburg vs. MSCI EAFE)** | 0.96 | |||
Holdings | 58 | |||
Emerging Markets Exposure | 24.6 | % |
| * | Source: Thomson Portfolio Analytics |
| ** | Source: Morningstar Principia Pro |
During the fiscal twelve-month period ended September 30, 2005, the Class A shares of the Thornburg International Value Fund posted a positive return of 26.51% at NAV compared to 25.79% for the MSCI EAFE Index. During the period, individual stock selection had the largest positive impact on the performance of the portfolio.
The Fund found the most success in financial, telecommunication services, and information technology stocks. This differed from the benchmark where the telecommunication services and information technology sectors were the two worst performing sectors in the index. Both sectors were positive contributors to performance for the International Value Fund where the focus of the research team is on the merit of the individual companies.
Exposure to financial stocks consistently represented the largest sector weighting in the Fund during the fiscal year and provided the greatest amount of relative and absolute positive performance. Strong performance was contributed by a diverse group of individual holdings including South Korean banks Kookmin Bank and Shinhan Financial Group Co. Ltd. Deutsche Börse AG and Euronext NV, which operate European financial exchanges, both posted positive returns as their businesses continued to flourish. Bank holdings in the United Kingdom, Japan, and India also contributed to the positive performance of the Fund.
Telecommunication services holdings were a good example of stock selection driving portfolio performance. In general, performance of the sector was lackluster, but the stocks held in the Fund performed very well. America Movil S.A. de C.V. was the biggest standout. America Movil is a cellular provider in Mexico and has been able to capitalize on rapidly increasing mobile phone penetration in that country.
AVERAGE ANNUAL TOTAL RETURNS*
FOR PERIODS ENDED SEPTEMBER 30, 2005
| 3Q ‘05 | 1 Yr | 3 Yrs | 5 Yrs | Since Inception | |||||||||||
A Shares (Incep: 5/28/98) | |||||||||||||||
Without Sales Charge | 10.72 | % | 26.51 | % | 24.63 | % | 7.91 | % | 11.07 | % | |||||
With Sales Charge | 5.72 | % | 20.80 | % | 22.73 | % | 6.93 | % | 10.38 | % | |||||
MSCI EAFE Index (Since: 5/28/98) | 10.38 | % | 25.79 | % | 24.61 | % | 3.16 | % | 4.25 | % |
| * | Periods under one year are not annualized. |
| 6 | This page is not part of the Annual Report. |
Within the information technology sector, a broad range of stocks contributed to positive performance. Amdocs Ltd., a customer care and billing company serving the telecommunications industry, performed well. Samsung Electronics Co. Ltd. also provided positive performance to the Fund during the year.
Energy stocks provided a positive boost to the portfolio. The most significant holdings were Petroleo Brasileiro of Brazil and Lukoil Oil Company of Russia. Energy stocks represented a source of both relative and absolute outperformance during the year.
The most significant drag on the portfolio came from the materials and utilities sectors. The Fund had very little exposure to stocks in these sectors, which were strong performing components of the index. Health care stocks were also an area of weakness. The most notable negative contributor was Novo Nordisk A/S, a specialty pharmaceutical company focusing on the treatment of diabetes.
The process and philosophy of the Fund remains unchanged. The Fund is concentrated and diversified with 58 holdings and exposure to 19 countries and 19 industries. Market cap exposure is spread across small, mid, and large cap stocks with a bias towards large cap (stocks with market caps above $8 billion). Emerging market exposure is currently 24.6%. We will continue to maintain a diversified portfolio of stocks we identify through our bottom-up research process. Our goal remains to provide competitive long-term returns to our shareholders.
PERFORMANCE IMPACT FOR YEAR ENDED 9/30/05
Top Contributors | Top Detractors | |
| America Movil S.A. de C.V. ADR | Kingfisher plc | |
| Deutsche Börse AG | Novo Nordisk A/S | |
| Rogers Communications Inc. | Singapore Telecommunications Ltd. | |
| Petroleo Brasileiro S.A. ADR | Carrefour SA | |
| Euronext NV | Puma AG | |
| Source:Thomson Portfolio Analytics | ||
TOP TEN EQUITY HOLDINGS
As of 9/30/05
BP Amoco ADR | 3.4 | % | |
Sanofi-Aventis | 2.8 | % | |
America Movil S.A. de C.V. ADR | 2.7 | % | |
GlaxoSmithKline plc | 2.5 | % | |
Rogers Communications Inc. | 2.3 | % | |
Teva Pharmaceutical Industries Ltd. ADR | 2.2 | % | |
Schlumberger Ltd. | 2.2 | % | |
Cadbury Schweppes plc | 2.1 | % | |
Deutsche Börse AG | 2.1 | % | |
Vodafone Group plc ADR | 2.1 | % | |
| TOP TEN COUNTRIES | |||
| As of 9/30/05 | |||
United Kingdom | 21.2 | % | |
Japan | 11.7 | % | |
Switzerland | 8.2 | % | |
Germany | 7.0 | % | |
France | 6.2 | % | |
South Korea | 5.7 | % | |
Canada | 5.5 | % | |
China | 5.4 | % | |
Mexico | 4.4 | % | |
Denmark | 3.7 | % | |
| TOP TEN INDUSTRIES | |||
| As of 9/30/05 | |||
Pharmaceuticals & Biotechnology | 13.0 | % | |
Energy | 12.0 | % | |
Banks | 11.8 | % | |
Telecommunication Services | 8.5 | % | |
Diversified Financials | 7.4 | % | |
Food & Staples Retailing | 6.6 | % | |
Media | 6.4 | % | |
Automobiles & Components | 6.0 | % | |
Tech. Hardware & Equipment | 4.5 | % | |
Insurance | 3.9 | % | |
| This page is not part of the Annual Report. | 7 |
This page intentionally left blank.
| 8 | This page is not part of the Annual Report. |

Thornburg International Value Fund
September 30, 2005
This report is certified under the Sarbanes-Oxley Act of 2002, which requires that public companies, including mutual funds, affirm that the information provided in their annual and semiannual shareholder reports fully and fairly represents their financial position.
| Certified Annual Report | 9 |

William V. Fries, CFA
Portfolio Manager
October 17, 2005
Dear Fellow Shareholder:
The fiscal year ended September 30 was a good year for our Fund. The net asset value (NAV) of the Class A shares on September 30, 2005 was $22.80. One year ago on September 30, 2004, the net asset value was $18.18. Total return of the Fund’s A shares for the period was 26.51% at NAV compared with 25.79% for the MSCI EAFE benchmark index. Generally speaking, international markets performed well during the fiscal year with particular strength in telecommunications, banking, securities exchanges, and energy. Our best performing telecom-related stocks were based in our North American neighbors Mexico and Canada. Banking strength was in Korea and Japan, and the security exchanges in Europe were standout performers. Energy holdings performance came mostly from integrated companies with resources as geographically diverse as Brazil, China, Russia, and the United States. Technology-related holdings also contributed to performance, including recent addition Logitech International. For details on performance by share class, please refer to the performance summary on page 35.
Interest in investing internationally continues to grow. This, in part, reflects the dollar’s retreat from an esteemed status over the past couple of years, but it also reflects increased recognition that some individual stock opportunities in a global economy may be new and different from those of the past. Diversification of dollar-based assets may be a rational reason to invest overseas and was a prime motivation in 2004. It is not the only reason. I believe a look at our portfolio holdings supports this assertion. A number of our holdings are truly distinct companies with no U.S. equivalent. For example, our airport holding Fraport AG and port holding China Merchants Holdings International Co. Ltd., would be equivalent to owning shares in Chicago’s O’Hare International Airport and California’s Port of Long Beach, neither of which is likely to be offered anytime soon. In the pharmaceutical area, the European-based companies are doing better than their U.S. counterparts. Each of our health care holdings has a unique set of products, distribution, and potentially productive research. The distinct positive of Roche Holdings AG’s affiliation with Genentech is a compelling example of a unique and productive arrangement. Competitive leadership in industries that are global is another attractive attribute of a few of our holdings; Toyota Motor Corp. and Schlumberger Ltd. are illustrative. Both are market share-gainers currently, and are likely to remain so.
The opportunity in emerging markets is worthy of comment. Economic growth in the Far East outside Japan continues at a pace not possible in more developed markets. It appears sustainable, barring a dramatic downturn in developed economies. Companies that support and serve this growth, especially where businesses are positioned as local leaders, will likely benefit from home market development. Our Korean banks, Kookmin Bank and Shinhan Financial Group Co., as well as Chinese coal company Shenhua Energy and Indian motorcycle company Hero Honda Motors Ltd. are each good examples of premiere local companies with essential or desirable products and services. Our web site has descriptive summaries of these and our other holdings as well as links to company web sites at www.thornburg.com/funds. A visit to this web site might help you understand our enthusiasm for the Thornburg International Value Fund.
It might be considered overly optimistic to assume that the performance of the last twelve months in overseas markets will be repeated in the year ahead. Yet markets remain buoyant, even with slow economies in Western Europe and the United Kingdom. There are reasons to remain constructive. Strength in the dollar this year has eased the European worry about their export economy, while high energy prices remain a concern for U.S. consumers. In Europe, where energy is heavily taxed already, consumer spending is less likely to be affected. A healthy Japanese economy for the first time in years and continued improvement in living standards in emerging markets are also supportive of global equity markets. It may seem a stretch at this time, but consider market psychology
| 10 | Certified Annual Report |
if oil prices peak sometime soon, violence in Iraq diminishes, the Chinese let their currency float higher, the U.S. economy stays healthy, and global inflation is contained. Granted, all of this together is unlikely, but in an environment of rising corporate earnings and reasonable valuation, any of these developments would support equity markets. Even in a challenging market environment, there will be companies that succeed and stocks that represent good values. We will remain focused on companies we believe have the promise and valuation to provide an opportunity for capital appreciation.
We thank you for your past trust and confidence. We will continue to work toward sustaining both in the future.
Sincerely,
 |
William V. Fries, CFA Portfolio Manager |
The matters discussed in this report may constitute forward-looking statements made pursuant to the safe harbor provisions of the Securities Litigation Reform Act of 1995. These include any advisor or portfolio manager prediction, assessment, analysis or outlook for individual securities, industries, investment styles, market sectors and/or markets. These statements involve risks and uncertainties. In addition to the general risks described for each fund in its current prospectus, other factors bearing on these reports include the accuracy of the advisor’s or portfolio manager’s forecasts and predictions, the appropriateness of the investment strategies designed by the advisor or portfolio manager, and the ability of the advisor or portfolio manager to implement their strategies efficiently and successfully. Any one or more of these factors, as well as other risks affecting the securities markets generally, could cause the actual results of any fund to differ materially as compared to its benchmarks.
| Certified Annual Report | 11 |
STATEMENT OF ASSETS AND LIABILITIES
Thornburg International Value Fund | September 30, 2005 |
ASSETS | ||||
Investments at value (cost $ 3,401,314,606) | $ | 4,004,371,401 | ||
Cash | 6,002,551 | |||
Receivable for investments sold | 15,653,109 | |||
Receivable for fund shares sold | 42,855,427 | |||
Unrealized gain on forward exchange contracts (Note 7) | 12,079,515 | |||
Dividends receivable | 11,360,072 | |||
Prepaid expenses and other assets | 58,165 | |||
Total Assets | 4,092,380,240 | |||
LIABILITIES | ||||
Payable for securities purchased | 126,747,229 | |||
Payable for fund shares redeemed | 6,857,669 | |||
Unrealized loss on forward exchange contracts (Note 7) | 33,051,583 | |||
Payable to investment advisor and other affiliates (Note 3) | 3,557,098 | |||
Deferred tax payable | 749,810 | |||
Accounts payable and accrued expenses | 1,410,243 | |||
Dividends payable | 5,833,429 | |||
Total Liabilities | 178,207,061 | |||
NET ASSETS | $ | 3,914,173,179 | ||
NET ASSETS CONSIST OF: | ||||
Distribution in excess of net investment income | $ | (1,940,997 | ) | |
Net unrealized appreciation on investments | 581,099,906 | |||
Accumulated net realized gain (loss) | 95,139,946 | |||
Net capital paid in on shares of beneficial interest | 3,239,874,324 | |||
| $ | 3,914,173,179 | |||
| 12 | Certified Annual Report |
| STATEMENT OF ASSETS AND LIABILITIES, CONTINUED | ||
Thornburg International Value Fund | September 30, 2005 | |
NET ASSET VALUE: | |||
Class A Shares: | |||
Net asset value and redemption price per share | |||
($2,205,924,392 applicable to 96,730,208 shares of beneficial interest outstanding - Note 4) | $ | 22.80 | |
Maximum sales charge, 4.50% of offering price | 1.07 | ||
Maximum offering price per share | $ | 23.87 | |
Class B Shares: | |||
Net asset value and offering price per share * | |||
($47,305,854 applicable to 2,168,349 shares of beneficial interest outstanding - Note 4) | $ | 21.82 | |
Class C Shares: | |||
Net asset value and offering price per share * | |||
($635,832,781 applicable to 29,050,420 shares of beneficial interest outstanding - Note 4) | $ | 21.89 | |
Class I Shares: | |||
Net asset value, offering and redemption price per share | |||
($892,216,330 applicable to 38,474,708 shares of beneficial interest outstanding - Note 4) | $ | 23.19 | |
Class R1 Shares: | |||
Net asset value, offering and redemption price per share | |||
($118,436,032 applicable to 5,175,383 shares of beneficial interest outstanding - Note 4) | $ | 22.88 | |
Class R5 Shares: | |||
Net asset value, offering and redemption price per share | |||
($14,457,790 applicable to 623,657 shares of beneficial interest outstanding - Note 4) | $ | 23.18 | |
| * | Redemption price per share is equal to net asset value less any applicable contingent deferred sales charge. |
See notes to financial statements.
| Certified Annual Report | 13 |
Thornburg International Value Fund | Year Ended September 30, 2005 |
INVESTMENT INCOME: | ||||
Dividend income (net of foreign taxes withheld of $ 4,116,928) | $ | 57,019,613 | ||
Interest income | 3,394,474 | |||
Total Income | 60,414,087 | |||
EXPENSES: | ||||
Investment advisory fees (Note 3) | 20,117,121 | |||
Administration fees (Note 3) | ||||
Class A Shares | 1,930,603 | |||
Class B Shares | 43,024 | |||
Class C Shares | 530,513 | |||
Class I Shares | 276,894 | |||
Class R1 Shares | 68,997 | |||
Class R5 Shares | 895 | |||
Distribution and service fees (Note 3) | ||||
Class A Shares | 3,872,178 | |||
Class B Shares | 344,884 | |||
Class C Shares | 4,254,766 | |||
Class R1 Shares | 277,203 | |||
Transfer agent fees | ||||
Class A Shares | 2,663,010 | |||
Class B Shares | 68,557 | |||
Class C Shares | 563,265 | |||
Class I Shares | 361,300 | |||
Class R1 Shares | 96,115 | |||
Class R5 Shares | 7,302 | |||
Registration and filing fees | ||||
Class A Shares | 123,286 | |||
Class B Shares | 19,571 | |||
Class C Shares | 45,916 | |||
Class I Shares | 109,686 | |||
Class R1 Shares | 21,233 | |||
Class R5 Shares | 14,337 | |||
Custodian fees (Note 3) | 1,858,551 | |||
Professional fees | 141,160 | |||
Accounting fees | 210,470 | |||
Trustee fees | 57,760 | |||
Other expenses | 774,271 | |||
Total Expenses | 38,852,868 | |||
Less: | ||||
Expenses reimbursed by Investment Advisor (Note 3) | (325,980 | ) | ||
Fees paid indirectly (Note 3) | (72,001 | ) | ||
Net Expenses | 38,454,887 | |||
Net Investment Income | $ | 21,959,200 | ||
| 14 | Certified Annual Report |
| STATEMENT OF OPERATIONS, CONTINUED | ||
Thornburg International Value Fund | Year Ended September 30, 2005 | |
REALIZED AND UNREALIZED GAIN (LOSS) | ||||
Net realized gain (loss) on: | ||||
Investments | $ | 83,008,194 | ||
Foreign currency transactions | 12,552,565 | |||
| 95,560,759 | ||||
Net change in unrealized appreciation (depreciation) on: | ||||
Investments (net of change in deferred taxes payable of $ 254,092) | 509,336,265 | |||
Foreign currency translation | (17,929,681 | ) | ||
| 491,406,584 | ||||
Net Realized and Unrealized Gain | 586,967,343 | |||
Net Increase in Net Assets Resulting From Operations | $ | 608,926,543 | ||
See notes to financial statements.
| Certified Annual Report | 15 |
STATEMENTS OF CHANGES IN NET ASSETS
Thornburg International Value Fund
| Year Ended September 30, 2005 | Year Ended September 30, 2004 | ||||||
INCREASE (DECREASE) IN NET ASSETS FROM: | |||||||
OPERATIONS: | |||||||
Net investment income | $ | 21,959,200 | $ | 6,816,361 | |||
Net realized gain on investments and foreign currency transactions | 95,560,759 | 21,723,437 | |||||
Increase (Decrease) in unrealized appreciation (depreciation) on investments, foreign currency translation, and deferred taxes | 491,406,584 | 61,424,573 | |||||
Net Increase in Net Assets Resulting from Operations | 608,926,543 | 89,964,371 | |||||
DIVIDENDS TO SHAREHOLDERS: | |||||||
From net investment income | |||||||
Class A Shares | (15,978,639 | ) | 0 | ||||
Class B Shares | (42,865 | ) | 0 | ||||
Class C Shares | (1,295,932 | ) | 0 | ||||
Class I Shares | (9,263,083 | ) | 0 | ||||
Class R1 Shares | (831,509 | ) | 0 | ||||
Class R5 Shares | (63,095 | ) | 0 | ||||
FUND SHARE TRANSACTIONS (NOTE 4): | |||||||
Class A Shares | 914,862,678 | 797,028,763 | |||||
Class B Shares | 17,432,995 | 14,140,582 | |||||
Class C Shares | 296,865,675 | 172,158,420 | |||||
Class I Shares | 475,565,309 | 242,069,929 | |||||
Class R1 Shares | 94,648,632 | 10,904,969 | |||||
Class R5 Shares | 13,789,338 | 0 | |||||
Net Increase in Net Assets | 2,394,616,047 | 1,326,267,034 | |||||
NET ASSETS: | |||||||
Beginning of year | 1,519,557,132 | 193,290,098 | |||||
End of year | $ | 3,914,173,179 | $ | 1,519,557,132 | |||
See notes to financial statements.
| 16 | Certified Annual Report |
| NOTES TO FINANCIAL STATEMENTS | ||
Thornburg International Value Fund | September 30, 2005 | |
NOTE 1 – ORGANIZATION
Thornburg International Value Fund, hereinafter referred to as the “Fund,” is a diversified series of Thornburg Investment Trust (the “Trust”). The Trust was organized as a Massachusetts business trust under a Declaration of Trust dated June 3, 1987 and is registered as a diversified, open-end management investment company under the Investment Company Act of 1940, as amended. The Trust is currently issuing eleven series of shares of beneficial interest in addition to those of the Fund: Thornburg Limited Term Municipal Fund, Thornburg California Limited Term Municipal Fund, Thornburg Limited Term U.S. Government Fund, Thornburg New Mexico Intermediate Municipal Fund, Thornburg Intermediate Municipal Fund, Thornburg Limited Term Income Fund, Thornburg Florida Intermediate Municipal Fund, Thornburg Value Fund, Thornburg Core Growth Fund, Thornburg New York Intermediate Municipal Fund, and Thornburg Investment Income Builder Fund. Each series is considered to be a separate entity for financial reporting and tax purposes and bears expenses directly attributable to it. The Fund seeks long-term capital appreciation by investing primarily in both foreign and domestic equity securities selected on a value basis.
The Fund currently offers six classes of shares of beneficial interest, Class A, Class B, Class C, Institutional Class (Class I), and Retirement Class (Class R1 and Class R5) shares. Each class of shares of a Fund represents an interest in the same portfolio of investments of the Fund, except that (i) Class A shares are sold subject to a front-end sales charge collected at the time the shares are purchased and bear a service fee, (ii) Class B shares are sold at net asset value without a sales charge at the time of purchase, but are subject to a contingent deferred sales charge upon redemption and bear both a service fee and distribution fee, (iii) Class C shares are sold at net asset value without a sales charge at the time of purchase, but are subject to a contingent deferred sales charge upon redemption within one year, and bear a service fee and a distribution fee, (iv) Class I shares are sold at net asset value without a sales charge at the time of purchase, (v) Class R1 shares are sold at net asset value without a sales charge at the time of purchase, but bear both a service fee and distribution fee, (vi) Class R5 shares are sold at net asset value without a sales charge at the time of purchase, and (vii) the respective classes may have different reinvestment privileges and conversion rights. Additionally, the Fund may allocate among its classes certain expenses, to the extent allowable to specific classes, including transfer agent fees, government registration fees, certain printing and postage costs, and administrative and legal expenses. Currently, class specific expenses of the Fund are limited to service and distribution fees, administration fees, and certain registration and transfer agent expenses. Class B shares of the Fund outstanding for eight years will convert to Class A shares of the Fund.
NOTE 2 – SIGNIFICANT ACCOUNTING POLICIES
Significant accounting policies of the Trust are as follows:
Valuation of Securities: In determining the net asset value of investments, investments are stated at value based on latest sales prices, normally at 4:00 pm EST reported on securities exchanges on the last business day of the period. Investments for which no sale is reported are valued at the mean between bid and asked prices or in accordance with such other method as the Trustees may authorize. In any case where a market quotation is not readily available, the Trust’s valuation and pricing committee determines a fair value for the investment using factors approved by the Trustees. Short term obligations having remaining maturities of 60 days or less are valued at amortized cost, which approximates market value.
Foreign Currency Translation: Portfolio securities and other assets and liabilities denominated in foreign currencies are translated into U.S. dollars based on the exchange rate of such currencies against the U.S. dollar on the date of valuation. Purchases and sales of securities and income items denominated in foreign currencies are translated into U.S. dollars at the exchange rate in effect on the translation date. When the Fund purchases or sells foreign securities it will customarily enter into a foreign exchange contract to minimize foreign exchange risk from the trade date to the settlement date of such transactions.
The Fund does not separately report the effect of changes in foreign exchange rates from changes in market prices on securities held. Such changes are included in net realized and unrealized gain or loss from investments.
Reported net realized foreign exchange gains or losses arise from sales of foreign currencies, currency gains or losses realized between the trade and settlement dates on securities transactions and the difference between the amount of interest recorded on the Fund’s books, and the U.S. dollar equivalent of the amounts actually received or paid.
Deferred Taxes: The Fund is subject to a tax imposed on net realized gains of securities of certain foreign countries. The Fund records an estimated deferred tax liability for net unrealized gains on these securities as reflected in the accompanying financial statements.
Federal Income Taxes: It is the policy of the Trust to comply with the provisions of the Internal Revenue Code applicable to “regulated investment companies” and to distribute all taxable income, including any net realized gain on investments of the Fund to the shareholders. Therefore, no provision for Federal income taxes is required.
When-Issued and Delayed Delivery Transactions: The Trust may engage in when-issued or delayed delivery transactions. To the extent the Trust engages in such transactions, it will do so for the purpose of acquiring portfolio securities consistent with the Fund’s investment objectives and not for the purpose of investment leverage or to speculate on interest rate and/or market changes. At the time the Trust makes a commitment to purchase a security on a when-issued basis, the Fund will record the transaction and reflect the value in determining its net asset value. When effecting such transactions, assets of an amount
| Certified Annual Report | 17 |
| NOTES TO FINANCIAL STATEMENTS, CONTINUED | ||
Thornburg International Value Fund | September 30, 2005 | |
sufficient to make payment for the portfolio securities to be purchased will be segregated on the Fund’s records on the trade date. Securities purchased on a when-issued or delayed delivery basis do not earn interest until the settlement date.
Dividends: Dividends to shareholders are generally paid quarterly and are reinvested in additional shares of the Fund at net asset value per share at the close of business on the dividend payment date or, at the shareholder’s option, paid in cash. Net realized capital gains, to the extent available, will be distributed at least annually. Distributions to shareholders are based on income tax regulations and, therefore, their characteristics may differ for financial statement and tax purposes.
General: Securities transactions are accounted for on a trade date basis. Interest income is accrued as earned and dividend income is recorded on the ex-dividend date. Certain income from foreign securities is recognized as soon as information is available to the Fund. Realized gains and losses from the sale of securities are recorded on an identified cost basis. Net investment income, other than class specific expenses and realized and unrealized gains and losses, is allocated daily to each class of shares based upon the relative net asset value of outstanding shares of each class of shares at the beginning of the day (after adjusting for the current share activity of the respective class). Expenses common to all funds are allocated among the funds comprising the Trust based upon their relative net asset values or other appropriate allocation methods.
Guarantees and Indemnifications: Under the Trust’s organizational documents, its officers and Trustees are indemnified against certain liability arising out of the performance of their duties to the Fund. Additionally, in the normal course of business, the Trust enters into contracts with service providers that contain general indemnification clauses. The Trust’s maximum exposure under these arrangements is unknown. However, based on experience, the Trust expects the risk of loss to be remote.
Use of Estimates: The preparation of financial statements, in conformity with generally accepted accounting principles, requires management to make estimates and assumptions that affect the reported amounts of assets and liabilities and the disclosure of contingent assets and liabilities at the date of the financial statements and the reported amounts of increases and decreases in net assets from operations during the reporting period. Actual results could differ from those estimates.
NOTE 3 – INVESTMENT ADVISORY FEE AND OTHER TRANSACTIONS WITH AFFILIATES
Pursuant to an investment advisory agreement, Thornburg Investment Management, Inc.® (the “Advisor”) serves as the investment advisor and performs services to the Fund for which the fees are payable at the end of each month. For the year ended September 30, 2005, these fees were payable at annual rates ranging from .875 of 1% to .675 of 1% per annum of the average daily net assets of the Fund depending on the Fund’s asset size. The Fund also has an administrative services agreement with the Advisor, whereby the Advisor will perform certain administrative services for the shareholders of each class of the Fund’s shares, and for which fees will be payable at an annual rate of up to .125 of 1% per annum of the average daily net assets attributable to each class of shares. For the year ended September 30, 2005, the Advisor voluntarily reimbursed certain class specific expenses and administrative fees of $4,496 for Class B shares, $154,331 for Class I shares, $146,888 for Class R1 shares, and $20,265 for Class R5 shares.
The Trust has an underwriting agreement with Thornburg Securities Corporation® (the “Distributor”, an affiliate of the Advisor), which acts as the Distributor of the Fund’s shares. For the year ended September 30, 2005, the Distributor has advised the Fund that it earned net commissions aggregating $355,292 from the sale of Class A shares of the Fund and collected contingent deferred sales charges aggregating $67,027 from redemptions of Class C shares of the Fund.
Pursuant to a service plan under Rule 12b-1 of the Investment Company Act of 1940, the Fund may reimburse to the Advisor an amount not to exceed .25 of 1% per annum of its average daily net assets attributable to each class of shares of the Fund for payments made by the Advisor to securities dealers and other financial institutions to obtain various shareholder related services. The Advisor may pay out of its own resources additional expenses for distribution of the Fund’s shares.
The Trust has also adopted distribution plans pursuant to Rule 12b-1, applicable only to the Fund’s Class B, Class C, and Class R1 shares, under which the Fund compensates the Distributor for services in promoting the sale of Class B, Class C, and Class R1 shares of the Fund at an annual rate of up to .75 of 1% per annum of the average daily net assets attributable to Class B, Class C, and Class R1 shares. Total fees incurred by the Distributor for each class of shares of the Fund under their respective service and distribution plans for the year ended September 30, 2005, are set forth in the Statement of Operations.
The Trust has an agreement with the custodian bank to indirectly pay a portion of the custodian’s fees through credits earned by the Fund’s cash on deposit with the bank. This deposit agreement is an alternative to overnight investments. Custodial fees have been adjusted to reflect amounts that would have been paid without this agreement, with a corresponding adjustment reflected as fees paid indirectly in the Statement of Operations. For the year ended September 30, 2005, fees paid indirectly were $72,001.
Certain officers and Trustees of the Trust are also officers and/or Directors of the Advisor and Distributor. The compensation of independent Trustees is borne by the Trust.
| 18 | Certified Annual Report |
| NOTES TO FINANCIAL STATEMENTS, CONTINUED | ||
Thornburg International Value Fund | September 30, 2005 | |
NOTE 4 – SHARES OF BENEFICIAL INTEREST
At September 30, 2005, there were an unlimited number of shares of beneficial interest authorized. Sale of Class R5 shares commenced February 1, 2005. Transactions in shares of beneficial interest were as follows:
Year Ended September 30, 2005 | Year Ended September 30, 2004 | |||||||||||||
| Shares | Amount | Shares | Amount | |||||||||||
Class A Shares | ||||||||||||||
Shares sold | 60,454,538 | $ | 1,242,916,897 | 51,167,423 | $ | 894,268,597 | ||||||||
Shares issued to shareholders in reinvestment of dividends | 516,124 | 11,403,851 | — | — | ||||||||||
Shares repurchased** | (16,431,651 | ) | (339,458,070 | ) | (5,531,059 | ) | (97,239,834 | ) | ||||||
Net Increase (Decrease) | 44,539,011 | $ | 914,862,678 | 45,636,364 | $ | 797,028,763 | ||||||||
** The Fund charges a redemption fee of 1% of the Class A shares exchanged within 90 days of purchase. For the year ended September 30, 2005 and year ended September 30, 2004, $94,738 and $51,074, respectively, were netted in the amount reported for shares repurchased. |
| |||||||||||||
Class B Shares | ||||||||||||||
Shares sold | 984,619 | $ | 19,222,274 | 897,624 | $ | 15,193,868 | ||||||||
Shares issued to shareholders in reinvestment of dividends | 1,513 | 33,010 | — | — | ||||||||||
Shares repurchased | (92,953 | ) | (1,822,289 | ) | (62,324 | ) | (1,053,286 | ) | ||||||
Net Increase (Decrease) | 893,179 | $ | 17,432,995 | 835,300 | $ | 14,140,582 | ||||||||
Class C Shares | ||||||||||||||
Shares sold | 16,705,254 | $ | 329,116,035 | 10,858,583 | $ | 184,217,626 | ||||||||
Shares issued to shareholders in reinvestment of dividends | 34,263 | 741,499 | — | — | ||||||||||
Shares repurchased | (1,663,255 | ) | (32,991,859 | ) | (716,792 | ) | (12,059,206 | ) | ||||||
Net Increase (Decrease) | 15,076,262 | $ | 296,865,675 | 10,141,791 | $ | 172,158,420 | ||||||||
Class I Shares | ||||||||||||||
Shares sold | 25,541,204 | $ | 537,358,303 | 14,591,120 | $ | 258,463,205 | ||||||||
Shares issued to shareholders in reinvestment of dividends | 305,722 | 6,870,416 | — | — | ||||||||||
Shares repurchased** | (3,256,726 | ) | (68,663,410 | ) | (921,861 | ) | (16,393,276 | ) | ||||||
Net Increase (Decrease) | 22,590,200 | $ | 475,565,309 | 13,669,259 | $ | 242,069,929 | ||||||||
| ** | The Fund charges a redemption fee of 1% of the Class I shares exchanged within 90 days of purchase. For the year ended September 30, 2005 and year ended September 30, 2004, $28,336 and $18,249, respectively, were netted in the amount reported for shares repurchased. |
| Certified Annual Report | 19 |
| NOTES TO FINANCIAL STATEMENTS, CONTINUED | ||
Thornburg International Value Fund | September 30, 2005 | |
Year Ended September 30, 2005 | Year Ended September 30, 2004 | |||||||||||||
Class R1 Shares | ||||||||||||||
Shares sold | 5,096,497 | $ | 105,840,553 | 686,300 | $ | 12,209,648 | ||||||||
Shares issued to shareholders in reinvestment of dividends | 24,709 | 559,227 | — | — | ||||||||||
Shares repurchased | (558,900 | ) | (11,751,148 | ) | (73,228 | ) | (1,304,679 | ) | ||||||
Net Increase (Decrease) | 4,562,306 | $ | 94,648,632 | 613,072 | $ | 10,904,969 | ||||||||
Class R5 Shares* | ||||||||||||||
Shares sold | 620,945 | $ | 13,726,467 | — | $ | — | ||||||||
Shares issued to shareholders in reinvestment of dividends | 2,722 | 63,095 | — | — | ||||||||||
Shares repurchased | (10 | ) | (224 | ) | — | — | ||||||||
Net Increase (Decrease) | 623,657 | $ | 13,789,338 | — | $ | — | ||||||||
| * | Effective date of Class R5 shares was February 1, 2005. |
NOTE 5 – SECURITIES TRANSACTIONS
For the year ended September 30, 2005, the Fund had purchase and sale transactions of investment securities (excluding short-term investments) of $2,725,185,254 and $854,633,399, respectively.
NOTE 6 – INCOME TAXES
At September 30, 2005, information on the tax components of capital is as follows:
Cost of investments for tax purpose | $ | 3,413,834,078 | ||
Gross unrealized appreciation on a tax basis | $ | 623,983,770 | ||
Gross unrealized depreciation on a tax basis | (33,446,447 | ) | ||
Net unrealized appreciation (depreciation) on investments (tax basis) | $ | 590,537,323 | ||
Distributable earnings - ordinary income | $ | 28,534,716 | ||
Distributable Capital Gains | $ | 59,147,989 |
The Fund utilized $7,110,004 of its capital loss carry forward during the year ended September 30, 2005.
At September 30, 2005, the Fund had deferred tax basis currency losses occurring subsequent to October 31, 2004 of $1,612,785. For tax purposes, such losses will be reflected in the year ending September 30, 2006.
In order to account for permanent book/tax differences, the Fund decreased undistributed net investment income (loss) by $2,842,585 and increased accumulated net realized gain by $2,842,585. This reclassification has no impact on the net asset value of the Fund. Reclassifications result primarily from foreign currency losses and realized foreign capital gains taxes.
The tax character of distributions paid by the Fund for the year ended September 30, 2005 was $27,475,123 from the distribution of ordinary income.
NOTE 7 – FINANCIAL INSTRUMENTS WITH OFF-BALANCE SHEET RISK AND FOREIGN INVESTMENT RISK
During the year ended September 30, 2005, the Fund was a party to financial instruments with off-balance sheet risks, primarily currency forward exchange contracts. A forward exchange contract is an agreement between two parties to exchange different currencies at a specified rate at an agreed upon future date. These contracts are purchased in order to minimize the risk to the Fund with respect to its foreign stock transactions from adverse changes in the relationship between the U.S. dollar and foreign currencies. In each case these contracts have been initiated in conjunction with foreign stock transactions. These instruments may involve market risks in excess of the amount recognized on the Statement of Assets and Liabilities. Such risks would arise from the possible inability of counterparties to meet the terms of their contracts, future movement in currency value and interest rates and contract positions that are not exact offsets. These contracts are reported in the financial statements at the Fund’s net equity, as measured by the difference between the forward exchange rates at the reporting date and the forward exchange rates at the dates of entry into the contract. There are special risks associated with international investing, including currency fluctuations, government regulation, political developments, and differences in liquidity.
| 20 | Certified Annual Report |
| NOTES TO FINANCIAL STATEMENTS, CONTINUED | ||
Thornburg International Value Fund | September 30, 2005 | |
CONTRACTS TO SELL:
| Contracts | Contract Value Date | Market Value | ||||||
| 155,000,000 | Euro Dollar for 187,709,650 USD | January 10, 2006 | $ | (195,172 | ) | |||
| 85,000,000 | Euro Dollar for 102,450,500 USD | January 11, 2006 | (600,163 | ) | ||||
| 120,000,000 | Greater British Pound for 208,344,000 USD | January 10, 2006 | (3,748,098 | ) | ||||
| 85,000,000 | Greater British Pound for 147,738,500 USD | January 11, 2006 | (2,493,429 | ) | ||||
| 1,400,000,000 | Indian Rupee for 31,638,418 USD | October 07, 2005 | (198,553 | ) | ||||
| 3,300,000,000 | Indian Rupee for 74,024,226 USD | April 04, 2006 | (749,373 | ) | ||||
| 450,000,000 | Mexican Peso for 38,818,201 USD | October 07, 2005 | (2,833,474 | ) | ||||
| 680,000,000 | Mexican Peso for 60,687,193 USD | December 14, 2005 | (1,614,282 | ) | ||||
| 70,000,000 | Mexican Peso for 6,252,791 USD | January 11, 2006 | (137,951 | ) | ||||
| Unrealized loss from forward Sell contracts: | (12,570,495 | ) | ||||||
| 147,500,000 | Swiss Franc for 118,874,919 USD | February 10, 2006 | 3,041,630 | |||||
| 58,500,000 | Euro Dollar for 76,289,850 USD | October 05, 2005 | 5,733,753 | |||||
| 98,600,000 | Euro Dollar for 122,212,728 USD | December 02, 2005 | 2,938,345 | |||||
| 390,000,000 | Mexican Peso for 35,691,407 USD | February 10, 2006 | 219,161 | |||||
| 710,000,000 | Mexican Peso for 64,247,579 USD | April 04, 2006 | 91,721 | |||||
| Unrealized gain from forward Sell contracts: | 12,024,610 | |||||||
| Net unrealized gain (loss) from forward Sell contracts: | $ | (545,885 | ) | |||||
| CONTRACTS TO BUY: | ||||||||
| Contracts | Contract Value Date | Market Value | ||||||
| 147,500,000 | Swiss Franc for 120,750,207 USD | February 10, 2006 | $ | (4,916,917 | ) | |||
| 58,500,000 | Euro Dollar for 72,978,165 USD | October 05, 2005 | (2,422,068 | ) | ||||
| 98,600,000 | Euro Dollar for 123,336,768 USD | December 02, 2005 | (4,062,385 | ) | ||||
| 120,000,000 | Greater British Pound for 221,089,200 USD | January 10, 2006 | (8,997,102 | ) | ||||
| 450,000,000 | Mexican Peso for 41,734,292 USD | October 07, 2005 | (82,616 | ) | ||||
| Unrealized loss from forward Buy contracts: | (20,481,088 | ) | ||||||
| 1,400,000,000 | Indian Rupee for 31,782,066 USD | October 07, 2005 | 54,905 | |||||
| Unrealized gain from forward Buy contracts: | 54,905 | |||||||
| Net unrealized gain (loss) from forward Buy contracts: | $ | (20,426,183 | ) | |||||
| Net unrealized gain (loss) from forward Exchange contracts: | $ | (20,972,068 | ) | |||||
| Certified Annual Report | 21 |
Thornburg International Value Fund
| Year Ended September 30, | ||||||||||||||||||||
| 2005 | 2004 | 2003 | 2002 | 2001 | ||||||||||||||||
Class A Shares: | ||||||||||||||||||||
PER SHARE PERFORMANCE | ||||||||||||||||||||
(for a share outstanding throughout the year)+ | ||||||||||||||||||||
Net asset value, beginning of year | $ | 18.18 | $ | 14.95 | $ | 11.88 | $ | 12.37 | $ | 16.64 | ||||||||||
Income from investment operations: | ||||||||||||||||||||
Net investment income (loss) | 0.18 | 0.15 | 0.06 | 0.03 | 0.03 | |||||||||||||||
Net realized and unrealized gain (loss) on investments | 4.63 | 3.08 | 3.00 | (0.54 | ) | (3.39 | ) | |||||||||||||
Total from investment operations | 4.81 | 3.23 | 3.06 | (0.51 | ) | (3.36 | ) | |||||||||||||
Redemption fees added to paid in capital | — | — | 0.01 | 0.02 | — | |||||||||||||||
Less dividends from: | ||||||||||||||||||||
Net investment income | (0.19 | ) | — | — | — | (0.86 | ) | |||||||||||||
Return of capital | — | — | — | — | (0.05 | ) | ||||||||||||||
Total dividends | (0.19 | ) | — | — | — | (0.91 | ) | |||||||||||||
Change in net asset value | 4.62 | 3.23 | 3.07 | (0.49 | ) | (4.27 | ) | |||||||||||||
NET ASSET VALUE, end of year | $ | 22.80 | $ | 18.18 | $ | 14.95 | $ | 11.88 | $ | 12.37 | ||||||||||
RATIOS/SUPPLEMENTAL DATA | ||||||||||||||||||||
Total return(a) | 26.51 | % | 21.61 | % | 25.84 | % | (3.96 | )% | (21.28 | )% | ||||||||||
Ratios to average net assets: | ||||||||||||||||||||
Net investment income (loss) | 0.87 | % | 0.88 | % | 0.44 | % | 0.19 | % | 0.22 | % | ||||||||||
Expenses, after expense reductions | 1.44 | % | 1.49 | % | 1.59 | % | 1.57 | % | 1.54 | % | ||||||||||
Expenses, after expense reductions and net of custody credits | 1.44 | % | 1.49 | % | 1.59 | % | 1.57 | % | — | |||||||||||
Expenses, before expense reductions | 1.44 | % | 1.51 | % | 1.67 | % | 1.60 | % | 1.56 | % | ||||||||||
Portfolio turnover rate | 34.17 | % | 35.84 | % | 58.35 | % | 28.39 | % | 61.05 | % | ||||||||||
Net assets at end of year (000) | $ | 2,205,924 | $ | 948,631 | $ | 97,991 | $ | 69,490 | $ | 56,507 | ||||||||||
| (a) | Sales loads are not reflected in computing total return. |
| + | Based on weighted average shares outstanding. |
| 22 | Certified Annual Report |
| FINANCIAL HIGHLIGHTS, CONTINUED | ||
Thornburg International Value Fund | ||
| Year Ended September 30, | ||||||||||||||||||||
| 2005 | 2004 | 2003 | 2002 | 2001 | ||||||||||||||||
Class B Shares: | ||||||||||||||||||||
PER SHARE PERFORMANCE | ||||||||||||||||||||
(for a share outstanding throughout the year)+ | ||||||||||||||||||||
Net asset value, beginning of year | $ | 17.39 | $ | 14.43 | $ | 11.57 | $ | 12.16 | $ | 16.44 | ||||||||||
Income from investment operations: | ||||||||||||||||||||
Net investment income (loss) | 0.01 | (0.02 | ) | (0.04 | ) | (0.08 | ) | (0.06 | ) | |||||||||||
Net realized and unrealized gain (loss) on investments | 4.44 | 2.98 | 2.90 | (0.51 | ) | (3.36 | ) | |||||||||||||
Total from investment operations | 4.45 | 2.96 | 2.86 | (0.59 | ) | (3.42 | ) | |||||||||||||
Less dividends from: | ||||||||||||||||||||
Net investment income | (0.02 | ) | — | — | — | (0.82 | ) | |||||||||||||
Return of capital | — | — | — | — | (0.04 | ) | ||||||||||||||
Total dividends | (0.02 | ) | — | — | — | (0.86 | ) | |||||||||||||
Change in net asset value | 4.43 | 2.96 | 2.86 | (0.59 | ) | (4.28 | ) | |||||||||||||
NET ASSET VALUE, end of year | $ | 21.82 | $ | 17.39 | $ | 14.43 | $ | 11.57 | $ | 12.16 | ||||||||||
RATIOS/SUPPLEMENTAL DATA | ||||||||||||||||||||
Total return | 25.59 | % | 20.51 | % | 24.72 | % | (4.85 | )% | (21.86 | )% | ||||||||||
Ratios to average net assets: | ||||||||||||||||||||
Net investment income (loss) | 0.04 | % | (0.12 | )% | (0.32 | )% | (0.58 | )% | (0.39 | )% | ||||||||||
Expenses, after expense reductions | 2.26 | % | 2.36 | % | 2.38 | % | 2.39 | % | 2.40 | % | ||||||||||
Expenses, after expense reductions and net of custody credits | 2.25 | % | 2.36 | % | 2.38 | % | 2.39 | % | — | |||||||||||
Expenses, before expense reductions | 2.27 | % | 2.42 | % | 2.84 | % | 2.88 | % | 3.62 | % | ||||||||||
Portfolio turnover rate | 34.17 | % | 35.84 | % | 58.35 | % | 28.39 | % | 61.05 | % | ||||||||||
Net assets at end of year (000) | $ | 47,306 | $ | 22,181 | $ | 6,346 | $ | 4,672 | $ | 2,570 | ||||||||||
| + | Based on weighted average shares outstanding. |
| Certified Annual Report | 23 |
| FINANCIAL HIGHLIGHTS, CONTINUED | ||
Thornburg International Value Fund | ||
| Year Ended September 30, | ||||||||||||||||||||
| 2005 | 2004 | 2003 | 2002 | 2001 | ||||||||||||||||
Class C Shares: | ||||||||||||||||||||
PER SHARE PERFORMANCE | ||||||||||||||||||||
(for a share outstanding throughout the year)+ | ||||||||||||||||||||
Net asset value, beginning of year | $ | 17.46 | $ | 14.47 | $ | 11.60 | $ | 12.19 | $ | 16.49 | ||||||||||
Income from investment operations: | ||||||||||||||||||||
Net investment income (loss) | 0.03 | 0.01 | (0.04 | ) | (0.08 | ) | (0.08 | ) | ||||||||||||
Net realized and unrealized gain (loss) on investments | 4.45 | 2.98 | 2.91 | (0.51 | ) | (3.37 | ) | |||||||||||||
Total from investment operations | 4.48 | 2.99 | 2.87 | (0.59 | ) | (3.45 | ) | |||||||||||||
Less dividends from: | ||||||||||||||||||||
Net investment income | (0.05 | ) | — | — | — | (0.81 | ) | |||||||||||||
Return of capital | — | — | — | — | (0.04 | ) | ||||||||||||||
Total dividends | (0.05 | ) | — | — | — | (0.85 | ) | |||||||||||||
Change in net asset value | 4.43 | 2.99 | 2.87 | (0.59 | ) | (4.30 | ) | |||||||||||||
NET ASSET VALUE, end of year | $ | 21.89 | $ | 17.46 | $ | 14.47 | $ | 11.60 | $ | 12.19 | ||||||||||
RATIOS/SUPPLEMENTAL DATA | ||||||||||||||||||||
Total return | 25.65 | % | 20.66 | % | 24.74 | % | (4.84 | )% | (21.96 | )% | ||||||||||
Ratios to average net assets: | ||||||||||||||||||||
Net investment income (loss) | 0.16 | % | 0.04 | % | (0.31 | )% | (0.62 | )% | (0.51 | )% | ||||||||||
Expenses, after expense reductions | 2.16 | % | 2.26 | % | 2.37 | % | 2.36 | % | 2.37 | % | ||||||||||
Expenses, after expense reductions and net of custody credits | 2.15 | % | 2.26 | % | 2.37 | % | 2.36 | % | — | |||||||||||
Expenses, before expense reductions | 2.16 | % | 2.26 | % | 2.45 | % | 2.36 | % | 2.39 | % | ||||||||||
Portfolio turnover rate | 34.17 | % | 35.84 | % | 58.35 | % | 28.39 | % | 61.05 | % | ||||||||||
Net assets at end of year (000) | $ | 635,833 | $ | 243,955 | $ | 55,443 | $ | 39,995 | $ | 26,426 | ||||||||||
| + | Based on weighted average shares outstanding. |
| 24 | Certified Annual Report |
| FINANCIAL HIGHLIGHTS, CONTINUED | ||
Thornburg International Value Fund | ||
| Year Ended September 30, | Period Ended 2001(b) | |||||||||||||||||||
| 2005 | 2004 | 2003 | 2002 | |||||||||||||||||
Class I Shares: | ||||||||||||||||||||
PER SHARE PERFORMANCE | ||||||||||||||||||||
(for a share outstanding throughout the period)+ | ||||||||||||||||||||
Net asset value, beginning of period | $ | 18.48 | $ | 15.13 | $ | 11.96 | $ | 12.40 | $ | 14.63 | ||||||||||
Income from investment operations: | ||||||||||||||||||||
Net investment income (loss) | 0.28 | 0.24 | 0.14 | 0.10 | 0.11 | |||||||||||||||
Net realized and unrealized gain (loss) on investments | 4.72 | 3.11 | 3.03 | (0.54 | ) | (2.21 | ) | |||||||||||||
Total from investment operations | 5.00 | 3.35 | 3.17 | (0.44 | ) | (2.10 | ) | |||||||||||||
Less dividends from: | ||||||||||||||||||||
Net investment income | (0.29 | ) | — | — | — | (0.08 | ) | |||||||||||||
Return of capital | — | — | — | — | (0.05 | ) | ||||||||||||||
Total dividends | (0.29 | ) | — | — | — | (0.13 | ) | |||||||||||||
Change in net asset value | 4.71 | 3.35 | 3.17 | (0.44 | ) | (2.23 | ) | |||||||||||||
NET ASSET VALUE, end of period | $ | 23.19 | $ | 18.48 | $ | 15.13 | $ | 11.96 | $ | 12.40 | ||||||||||
RATIOS/SUPPLEMENTAL DATA | ||||||||||||||||||||
Total return(c) | 27.15 | % | 22.14 | % | 26.51 | % | (3.55 | )% | (14.50 | )% | ||||||||||
Ratios to average net assets: | ||||||||||||||||||||
Net investment income (loss) | 1.32 | % | 1.35 | % | 1.07 | % | 0.71 | % | 1.57 | %(a) | ||||||||||
Expenses, after expense reductions | 0.99 | % | 0.99 | % | 0.99 | % | 0.99 | % | 0.97 | %(a) | ||||||||||
Expenses, after expense reductions and net of custody credits | 0.99 | % | 0.99 | % | 0.99 | % | 0.99 | % | — | |||||||||||
Expenses, before expense reductions | 1.02 | % | 1.11 | % | 1.25 | % | 1.28 | % | 1.38 | %(a) | ||||||||||
Portfolio turnover rate | 34.17 | % | 35.84 | % | 58.35 | % | 28.39 | % | 61.05 | % | ||||||||||
Net assets at end of period (000) | $ | 892,216 | $ | 293,583 | $ | 33,511 | $ | 19,187 | $ | 11,249 | ||||||||||
| (a) | Annualized. |
| (b) | Effective date of Class I Shares was March 30, 2001. |
| (c) | Not annualized for periods less than one year. |
| + | Based on weighted average shares outstanding. |
| Certified Annual Report | 25 |
| FINANCIAL HIGHLIGHTS, CONTINUED | ||
Thornburg International Value Fund | ||
| Year Ended September 30, | Period Ended 2003(c) | |||||||||||
| 2005 | 2004 | |||||||||||
Class R1 Shares: | ||||||||||||
PER SHARE PERFORMANCE | ||||||||||||
(for a share outstanding throughout the period)+ | ||||||||||||
Net asset value, beginning of period | $ | 18.28 | $ | 15.01 | $ | 13.59 | ||||||
Income from investment operations: | ||||||||||||
Net investment income (loss) | 0.21 | 0.19 | 0.02 | |||||||||
Net realized and unrealized gain (loss) on investments | 4.63 | 3.08 | 1.40 | |||||||||
Total from investment operations | 4.84 | 3.27 | 1.42 | |||||||||
Less dividends from: | ||||||||||||
Net investment income | (0.24 | ) | — | — | ||||||||
Change in net asset value | 4.60 | 3.27 | 1.42 | |||||||||
NET ASSET VALUE, end of period | $ | 22.88 | $ | 18.28 | $ | 15.01 | ||||||
RATIOS/SUPPLEMENTAL DATA | ||||||||||||
Total return(a) | 26.54 | % | 21.79 | % | 10.45 | % | ||||||
Ratios to average net assets: | ||||||||||||
Net investment income (loss) | 0.99 | % | 1.08 | % | 0.65 | %(b) | ||||||
Expenses, after expense reductions | 1.45 | % | 1.45 | % | 1.60 | %(b) | ||||||
Expenses, after expense reductions and net of custody credits | 1.45 | % | 1.45 | % | 1.60 | %(b) | ||||||
Expenses, before expense reductions | 1.72 | % | 2.42 | % | 30,451.98 | %(b)† | ||||||
Portfolio turnover rate | 34.17 | % | 35.84 | % | 58.35 | % | ||||||
Net assets at end of period (000) | $ | 118,436 | $ | 11,207 | $ | — | (d) | |||||
| (a) | Not annualized for periods less than one year. |
| (b) | Annualized. |
| (c) | Effective date of Class R1 Shares was July 1, 2003. |
| (d) | Net assets at end of year were less than $1,000. |
| † | Due to the size of net assets and fixed expenses, ratios may appear disproportionate. |
| + | Based on weighted average shares outstanding. |
| 26 | Certified Annual Report |
| FINANCIAL HIGHLIGHTS, CONTINUED | ||
Thornburg International Value Fund | ||
| Period Ended September 30, 2005(c) | ||||
Class R5 Shares: | ||||
PER SHARE PERFORMANCE | ||||
(for a share outstanding throughout the period)+ | ||||
Net asset value, beginning of period | $ | 20.37 | ||
Income from investment operations: | ||||
Net investment income | 0.16 | |||
Net realized and unrealized gain (loss) on investments | 2.84 | |||
Total from investment operations | 3.00 | |||
Less dividends from: | ||||
Net investment income | (0.19 | ) | ||
Change in net asset value | 2.81 | |||
NET ASSET VALUE, end of period | $ | 23.18 | ||
RATIOS/SUPPLEMENTAL DATA | ||||
Total return(a) | 14.72 | % | ||
Ratios to average net assets: | ||||
Net investment income | 1.10 | %(b) | ||
Expenses, after expense reductions | 1.00 | %(b) | ||
Expenses, after expense reductions and net of custody credits | 0.99 | %(b) | ||
Expenses, before expense reductions | 2.13 | %(b) | ||
Portfolio turnover rate | 34.17 | % | ||
Net assets at end of period (000) | $ | 14,458 | ||
| (a) | Not annualized for periods less than one year. |
| (b) | Annualized. |
| (c) | Effective date of Class R5 Shares was February 1, 2005. |
| + | Based on weighted average shares outstanding. |
| Certified Annual Report | 27 |
| SCHEDULE OF INVESTMENTS | ||
Thornburg International Value Fund | September 30, 2005 | |
CUSIPS: CLASS A - 885-215-657, CLASS B - 885-215-616, CLASS C - 885-215-640, CLASS I - 885-215-566,
CLASS R1 - 885-215-525, CLASS R5 - 885-215-368
NASDAQ SYMBOLS: CLASS A - TGVAX, CLASS B - THGBX, CLASS C - THGCX, CLASS I - TGVIX,
CLASS R1 - TGVRX, CLASS R5 - TIVRX
| Shares/ Principal Amount | Value | ||||
COMMON STOCK — 98.19% | |||||
AUTOMOBILES & COMPONENTS — 6.00% | |||||
AUTOMOBILES — 6.00% | |||||
Bayerische Motoren Werke AG | 1,134,276 | $ | 53,422,748 | ||
Hero Honda Motors Ltd. | 2,311,127 | 39,005,032 | |||
Hyundai Motor Co. | 788,900 | 61,674,197 | |||
Toyota Motor Corp. | 1,762,600 | 80,899,598 | |||
| 235,001,575 | |||||
BANKS — 11.78% | |||||
COMMERCIAL BANKS — 11.78% | |||||
Bank of Fukuoka Ltd. | 8,584,300 | 61,979,411 | |||
Bank of Yokohama | 2,050,700 | 15,656,962 | |||
Barclays plc | 7,884,400 | 79,937,314 | |||
ICICI Bank Ltd. | 832,737 | 11,371,174 | |||
ICICI Bank Ltd. Sponsored ADR | 905,000 | 25,566,250 | |||
Kookmin Bank | 1,090,800 | 64,349,352 | |||
Lloyds TSB Group plc | 9,097,700 | 75,175,231 | |||
Royal Bank of Scotland Group plc | 2,356,100 | 67,077,372 | |||
Shinhan Financial Group Co. | 1,721,200 | 59,932,432 | |||
| 461,045,498 | |||||
CAPITAL GOODS — 1.96% | |||||
AEROSPACE & DEFENSE — 1.96% | |||||
Embraer Brasileira de Aeronaut ADR | 1,992,128 | 76,896,141 | |||
| 76,896,141 | |||||
COMMERCIAL SERVICES & SUPPLIES — 1.63% | |||||
COMMERCIAL SERVICES & SUPPLIES — 1.63% | |||||
Secom Co. | 1,320,600 | 63,643,373 | |||
| 63,643,373 | |||||
CONSUMER DURABLES & APPAREL — 3.21% | |||||
TEXTILES,APPAREL & LUXURY GOODS — 3.21% | |||||
Adidas-Salomon AG | 371,821 | 64,821,247 | |||
Burberry Group plc | 7,951,946 | 60,783,184 | |||
| 125,604,431 | |||||
| 28 | Certified Annual Report |
| SCHEDULE OF INVESTMENTS, CONTINUED | ||
Thornburg International Value Fund | September 30, 2005 | |
| Shares/ Principal Amount | Value | ||||
DIVERSIFIED FINANCIALS — 7.42% | |||||
CAPITAL MARKETS — 1.85% | |||||
UBS AG | 848,580 | $ | 72,415,671 | ||
DIVERSIFIED FINANCIAL SERVICES — 5.57% | |||||
Deutsche Börse AG | 858,109 | 82,259,266 | |||
Euronext NV | 1,743,897 | 77,004,200 | |||
Hong Kong Exchanges & Clearing Ltd. | 17,097,400 | 58,630,111 | |||
| 290,309,248 | |||||
ENERGY — 12.01% | |||||
ENERGY EQUIPMENT & SERVICES — 2.20% | |||||
Schlumberger Ltd. | 1,018,400 | 85,932,592 | |||
OIL, GAS & CONSUMABLE FUELS — 9.81% | |||||
BP Amoco ADR | 1,876,700 | 132,964,195 | |||
Canadian Natural Resources Ltd. | 1,494,500 | 67,583,660 | |||
China Petroleum & Chemical Corp. | 145,812,000 | 66,731,460 | |||
China Shenhua Energy+ | 40,000,000 | 46,925,660 | |||
Lukoil Oil Co. Sponsored ADR | 1,209,400 | 69,927,508 | |||
| 470,065,075 | |||||
FOOD & STAPLES RETAILING — 6.64% | |||||
FOOD & STAPLES RETAILING — 6.64% | |||||
Carrefour SA | 1,206,200 | 55,675,804 | |||
FamilyMart Co. Ltd. | 2,019,100 | 60,771,711 | |||
Tesco plc | 14,018,053 | 76,767,011 | |||
Wal-Mart de México | 13,113,400 | 66,528,473 | |||
| 259,742,999 | |||||
FOOD BEVERAGE & TOBACCO — 2.13% | |||||
FOOD PRODUCTS — 2.13% | |||||
Cadbury Schweppes plc | 8,247,541 | 83,473,148 | |||
| 83,473,148 | |||||
INSURANCE — 3.93% | |||||
INSURANCE — 3.93% | |||||
Millea Holdings, Inc. | 5,027 | 80,755,020 | |||
Willis Group Holdings Ltd. | 1,947,788 | 73,139,439 | |||
| 153,894,459 | |||||
MATERIALS — 2.36% | |||||
CHEMICALS — 1.37% | |||||
Givaudan AG | 83,560 | 53,740,295 | |||
| Certified Annual Report | 29 |
| SCHEDULE OF INVESTMENTS, CONTINUED | ||
Thornburg International Value Fund | September 30, 2005 | |
| Shares/ Principal Amount | Value | ||||
METALS & MINING — 0.99% | |||||
Tokyo Steel Mfg. | 2,476,700 | $ | 38,584,011 | ||
| 92,324,306 | |||||
MEDIA — 6.37% | |||||
MEDIA — 6.37% | |||||
Promotora de Informaciones SA | 2,308,300 | 44,672,734 | |||
Rogers Communications Inc.+ | 2,238,900 | 88,248,472 | |||
Shaw Communications | 2,817,900 | 58,981,843 | |||
Sogecable SA+ | 1,467,000 | 57,454,146 | |||
| 249,357,195 | |||||
PHARMACEUTICALS & BIOTECHNOLOGY — 12.97% | |||||
PHARMACEUTICALS — 12.97% | |||||
GlaxoSmithKline plc | 3,889,835 | 99,248,218 | |||
Novartis AG ADR | 1,168,600 | 59,598,600 | |||
Novo Nordisk A/S | 1,499,600 | 74,385,161 | |||
Roche Holdings AG | 548,200 | 76,467,308 | |||
Sanofi-Aventis | 1,342,600 | 111,299,852 | |||
Teva Pharmaceutical Industries Ltd. ADR | 2,593,000 | 86,658,060 | |||
| 507,657,199 | |||||
SEMICONDUCTORS & SEMICONDUCTOR EQUIPMENT — 0.90% | |||||
SEMICONDUCTORS & SEMICONDUCTOR EQUIPMENT — 0.90% | |||||
Samsung Electronics Co. Ltd. | 62,300 | 35,138,993 | |||
| 35,138,993 | |||||
SOFTWARE & SERVICES — 2.44% | |||||
SOFTWARE — 2.44% | |||||
Amdocs Ltd.+ | 1,684,400 | 46,708,412 | |||
Check Point Software Technologies Ltd.+ | 2,010,000 | 48,883,200 | |||
| 95,591,612 | |||||
TECHNOLOGY HARDWARE & EQUIPMENT — 4.45% | |||||
COMMUNICATIONS EQUIPMENT — 1.57% | |||||
Tandberg ASA | 4,596,000 | 61,515,281 | |||
COMPUTERS & PERIPHERALS — 1.45% | |||||
Logitech International+ | 1,397,656 | 56,762,833 | |||
OFFICE ELECTRONICS — 1.43% | |||||
Canon Inc. | 1,036,800 | 56,097,657 | |||
| 174,375,771 | |||||
| 30 | Certified Annual Report |
| SCHEDULE OF INVESTMENTS, CONTINUED | ||
Thornburg International Value Fund | September 30, 2005 | |
| Shares/ Principal Amount | Value | ||||||
TELECOMMUNICATION SERVICES — 8.49% | |||||||
DIVERSIFIED TELECOMMUNICATION SERVICES — 3.65% | |||||||
Singapore Telecommunications Ltd. | 48,964,000 | $ | 70,972,815 | ||||
TDC A/S | 1,333,800 | 71,979,641 | |||||
WIRELESS TELECOMMUNICATION SERVICES — 4.84% | |||||||
America Movil S.A. de C.V. | 4,073,544 | 107,215,678 | |||||
Vodafone Group plc ADR | 3,160,900 | 82,088,573 | |||||
| 332,256,707 | |||||||
TRANSPORTATION — 3.50% | |||||||
TRANSPORTATION INFRASTRUCTURE — 3.50% | |||||||
China Merchants Hldgs International Co. Ltd. | 27,867,000 | 62,150,601 | |||||
Fraport AG | 1,443,731 | 74,908,805 | |||||
| 137,059,406 | |||||||
TOTAL COMMON STOCK (Cost $ 3,241,844,839) | 3,843,437,136 | ||||||
OTHER SECURITIES — 0.87% | |||||||
iShares FTSE/Xinhua China 25 Index Fund+ | 529,300 | 33,991,646 | |||||
TOTAL OTHER SECURITIES (Cost $ 32,527,148) | 33,991,646 | ||||||
SHORT TERM INVESTMENTS — 3.24% | |||||||
American General, 3.77%, 10/3/2005 | $ | 29,000,000 | 28,993,926 | ||||
American General, 3.77%, 10/4/2005 | 26,000,000 | 25,991,831 | |||||
American General, 3.81%, 10/5/2005 | 13,000,000 | 12,994,497 | |||||
American General, 3.82%, 10/6/2005 | 33,000,000 | 32,982,492 | |||||
Citigroup Funding, Inc., 3.76%, 10/5/2005 | 15,000,000 | 14,993,733 | |||||
Citigroup Funding, Inc., 3.78%, 10/13/2005 | 11,000,000 | 10,986,140 | |||||
TOTAL SHORT TERM INVESTMENTS (Cost $ 126,942,619) | 126,942,619 | ||||||
TOTAL INVESTMENTS — 102.30% (COST $ 3,401,314,606) | $ | 4,004,371,401 | |||||
LIABILITIES NET OF OTHER ASSETS — (2.30)% | (90,198,222 | ) | |||||
NET ASSETS — 100.00% | $ | 3,914,173,179 | |||||
Footnote Legend
See notes to financial statements.
| + | Non-income producing |
Portfolio Abbreviations
To simplify the listings of securities, abbreviations are used per the table below:
ADR American Depository Receipt
| Certified Annual Report | 31 |
| SCHEDULE OF INVESTMENTS, CONTINUED | ||
Thornburg International Value Fund | September 30, 2005 | |
SUMMARY OF INDUSTRY EXPOSURE
As of 9/30/05
Pharmaceuticals & Biotechnology | 13.0 | % | |
Energy | 12.0 | % | |
Banks | 11.8 | % | |
Telecommunication Services | 8.5 | % | |
Diversified Financials | 7.4 | % | |
Food & Staples Retailing | 6.6 | % | |
Media | 6.4 | % | |
Automobiles & Components | 6.0 | % | |
Technology Hardware & Equipment | 4.5 | % | |
Insurance | 3.9 | % | |
Transportation | 3.5 | % | |
Consumer Durables & Apparel | 3.2 | % | |
Software & Services | 2.4 | % | |
Materials | 2.4 | % | |
Food, Beverage & Tobacco | 2.1 | % | |
Capital Goods | 2.0 | % | |
Commercial Services & Supplies | 1.6 | % | |
Semiconductors & Semiconductor Equip. | 0.9 | % | |
Other Securities | 0.9 | % | |
Other Assets & Cash Equivalents | 0.9 | % | |
SUMMARY OF COUNTRY EXPOSURE
As of 9/30/05
United Kingdom | 21.2 | % | |
Japan | 11.7 | % | |
Switzerland | 8.2 | % | |
Germany | 7.0 | % | |
France | 6.2 | % | |
South Korea | 5.7 | % | |
Canada | 5.5 | % | |
China | 5.4 | % | |
Mexico | 4.4 | % | |
Denmark | 3.7 | % | |
Israel | 3.5 | % | |
U.S. | 3.4 | % | |
Spain | 2.6 | % | |
Brazil | 2.0 | % | |
India | 1.9 | % | |
Singapore | 1.8 | % | |
Russia | 1.8 | % | |
Norway | 1.6 | % | |
Hong Kong | 1.5 | % | |
| 32 | Certified Annual Report |
| REPORT OF INDEPENDENT REGISTERED PUBLIC ACCOUNTING FIRM | ||
Thornburg International Value Fund | ||
To the Trustees and Shareholders of
Thornburg International Value Fund
In our opinion, the accompanying statement of assets and liabilities, including the schedule of investments, and the related statements of operations and of changes in net assets and the financial highlights present fairly, in all material respects, the financial position of Thornburg International Value Fund (one of the portfolios constituting Thornburg Investment Trust, hereafter referred to as the “Fund”) at September 30, 2005, the results of its operations for the year then ended, the changes in its net assets for each of the two years in the period then ended and the financial highlights for each of the periods presented, in conformity with accounting principles generally accepted in the United States of America. These financial statements and financial highlights (hereafter referred to as “financial statements”) are the responsibility of the Fund’s management. Our responsibility is to express an opinion on these financial statements based on our audits. We conducted our audits of these financial statements in accordance with the standards of the Public Company Accounting Oversight Board (United States). Those standards require that we plan and perform the audit to obtain reasonable assurance about whether the financial statements are free of material misstatement. An audit includes examining, on a test basis, evidence supporting the amounts and disclosures in the financial statements, assessing the accounting principles used and significant estimates made by management, and evaluating the overall financial statement presentation. We believe that our audits, which included confirmation of securities at September 30, 2005 by correspondence with the custodian and brokers, provide a reasonable basis for our opinion.
PricewaterhouseCoopers LLP
New York, New York
November 16, 2005
| Certified Annual Report | 33 |
| EXPENSE EXAMPLE | ||
Thornburg International Value Fund | September 30, 2005 (Unaudited) | |
As a shareholder of the Fund, you incur two types of costs:
(1) transaction costs, including
(a) sales charges (loads) on purchase payments, for Class A Shares;
(b) a deferred sales charge on redemptions of any part or all of a purchase of $1 million of Class A shares within 12 months of purchase;
(c) a deferred sales charge on redemptions of Class C shares within 12 months of purchase;
(d) a 90-day redemption fee on Class A and Class I shares;
(2) ongoing costs, including management fees; distribution and/or service (12b-1) fees; and other Fund expenses.
This example is intended to help you understand your ongoing costs (in dollars) of investing in the Fund and to compare these costs with the ongoing costs of investing in other mutual funds.
The example is based on an investment of $1,000 invested on March 31, 2005 and held until September 30, 2005.
Actual Expenses
The first line of the table at right provides information about actual account values and actual expenses. You may use the information in this line, together with the amount you invested, to estimate the expenses that you paid over the period. Simply divide your account value by $1,000 (for example, an $8,600 account value divided by $1,000 = 8.6), then multiply the result by the number in the first line under the heading entitled “Expenses Paid During Period” to estimate the expenses you paid on your account during this period.
Hypothetical Example for Comparison Purposes
The second line of the table at right provides information about hypothetical account values and hypothetical expenses based on the Fund’s actual expense ratio and an assumed rate of return of 5% per year before expenses, which is not the Fund’s actual return. The hypothetical account values and expenses may not be used to estimate the actual ending account balance or expenses you paid for the period. You may use this information to compare the ongoing costs of investing in the Fund and other funds. To do so, compare this 5% hypothetical example with the 5% hypothetical examples that appear in the shareholder reports of the other funds.
| Beginning Account Value 3/31/05 | Ending Account Value 9/30/05 | Expenses Paid During Period† 3/31/05–9/30/05 | |||||||
Class A Shares | |||||||||
Actual | $ | 1,000.00 | $ | 1,123.50 | $ | 7.73 | |||
Hypothetical* | $ | 1,000.00 | $ | 1,017.79 | $ | 7.34 | |||
Class B Shares | |||||||||
Actual | $ | 1,000.00 | $ | 1,120.00 | $ | 11.90 | |||
Hypothetical* | $ | 1,000.00 | $ | 1,013.84 | $ | 11.30 | |||
Class C Shares | |||||||||
Actual | $ | 1,000.00 | $ | 1,120.00 | $ | 11.39 | |||
Hypothetical* | $ | 1,000.00 | $ | 1,014.32 | $ | 10.83 | |||
Class I Shares | |||||||||
Actual | $ | 1,000.00 | $ | 1,126.90 | $ | 5.28 | |||
Hypothetical* | $ | 1,000.00 | $ | 1,020.11 | $ | 5.01 | |||
Class R1 Shares | |||||||||
Actual | $ | 1,000.00 | $ | 1,123.90 | $ | 7.72 | |||
Hypothetical* | $ | 1,000.00 | $ | 1,017.80 | $ | 7.33 | |||
Class R5 Shares | |||||||||
Actual | $ | 1,000.00 | $ | 1,126.70 | $ | 5.28 | |||
Hypothetical* | $ | 1,000.00 | $ | 1,020.10 | $ | 5.01 | |||
| † | Expenses are equal to the annualized expense ratio for each class (A: 1.45%; B: 2.24%; C: 2.14%; I: 0.99%; R1: 1.45%; and R5: 0.99%) multiplied by the average account value over the period, multiplied by 183/365 to reflect the one-half year period. |
| * | Hypothetical assumes a rate of return of 5% per year before expenses. |
Please note that the expenses shown in the table are meant to highlight your ongoing costs only and do not reflect any transactional costs, such as sales charges (loads), redemption fees, or exchange fees. Therefore, the second line of the table is useful in comparing ongoing costs only, and will not help you determine the relative total costs of owning different funds. In addition, if these transactional costs were included, your costs would have been higher.
| 34 | Certified Annual Report |
| INDEX COMPARISON | ||
Thornburg International Value Fund | September 30, 2005 (Unaudited) | |
GROWTH OF A HYPOTHETICAL $10,000 INVESTMENT
Thornburg International Value Fund versus MSCI EAFE Index (May 28, 1998 to September 30, 2005)
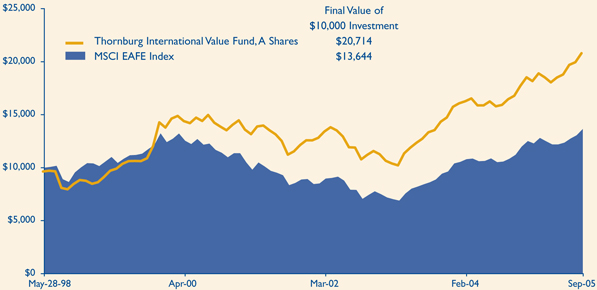
AVERAGE ANNUAL TOTAL RETURNS
For periods ended September 30, 2005 (with sales charge)
| 1Yr | 5Yrs | Since Inception | |||||||
A Shares (Incep: 05/28/98) | 20.80 | % | 6.93 | % | 10.38 | % | |||
B Shares (Incep: 4/03/00) | 20.59 | % | 6.71 | % | 5.34 | % | |||
C Shares (Incep: 5/28/98) | 24.65 | % | 7.03 | % | 10.12 | % | |||
R1 Shares (Incep: 7/01/03) | 26.54 | % | — | 26.64 | % | ||||
R5 Shares (Incep: 2/01/05) | — | — | 14.72 | % | |||||
MSCI EAFE Index (Since: 05/28/98) | 25.79 | % | 3.16 | % | 4.25 | % |
Performance data reflects past performance, which is no guarantee of future results. The performance data and graph do not reflect the deduction of taxes that a shareholder would pay on distributions or the redemption of Fund shares.
Returns reflect the reinvestment of dividends and capital gains as well as applicable sales charges. Class A shares are sold with a maximum sales charge of 4.50%. Class B shares are sold with a contingent deferred sales charge (CDSC) that declines from 5.00% to 0% depending upon the period of time the shares are held. Class B shares will automatically convert to Class A shares on a quarterly basis approximately eight years after purchase. Class C shares are subject to a 1% CDSC for the first year only. There is no up-front sales charge for Class R1 and R5 shares. Class R1 and R5 shares are available only to certain qualified investors. Class A shares are subject to a 1% 90-day redemption fee.
The Morgan Stanley Capital International (MSCI) Europe, Australasia, Far East Index (EAFE) is an unmanaged index. It is a generally accepted benchmark for major overseas markets. Index weightings represent the relative capitalizations of the major overseas markets included in the index on a U.S. dollar adjusted basis. The index is calculated with gross dividends reinvested in U.S. dollars. Unless otherwise noted, index returns do not reflect fees, brokerage commissions or other expenses of investing. Investors may not make direct investments into any index.
| Certified Annual Report | 35 |
| TRUSTEES AND OFFICERS | ||
Thornburg International Value Fund | September 30, 2005 (Unaudited) | |
Name, Age, | Principal Occupation(s) During Past Five Years | Other Directorships | ||
| INTERESTED TRUSTEES(1)(2)(4) | ||||
Garrett Thornburg, 59 Chairman of Trustees, Trustee since 1987(3) | CEO, Chairman and controlling shareholder of Thornburg Investment Management, Inc. (investment advisor) and Thornburg Securities Corporation (securities dealer); Chairman of Thornburg Limited Term Municipal Fund, Inc. (registered investment company) to 2004; CEO and Chairman of Thornburg Mortgage, Inc. (real estate investment trust); Chairman of Thornburg Mortgage Advisory Corporation (investment manager to Thornburg Mortgage, Inc.). | Director of Thornburg Mortgage, Inc. (real estate investment trust) | ||
Brian J. McMahon, 49 Trustee since 2001, Member of Governance & Nominating Committee, President since 1997(5)(6) | President and Managing Director of Thornburg Investment Management, Inc.; President of Thornburg Limited Term Municipal Fund, Inc. to 2004. | None | ||
| INDEPENDENT TRUSTEES(1)(2)(4) | ||||
David A.Ater, 60 Trustee since 1994, Member of Audit Committee and Governance & Nominating Committee | Principal in Ater & Associates, Santa Fe, NM (developer, planner and broker of residential and commercial real estate); owner developer and broker for various real estate projects. | Director of Thornburg Mortgage, Inc. (real estate investment trust) | ||
David D. Chase, 64 Chairman of Audit Committee, Trustee since 2000 | Chairman, President, CEO, and Managing Member of Vestor Associates, LLC, the general partner of Vestor Partners, LP, Santa Fe, NM (private equity fund); Chairman and CEO of Vestor Holdings, Inc., Santa Fe, NM (merchant bank). | None | ||
Eliot R. Cutler, 59 Chairman of Governance & Nominating Committee, Trustee since 2004 | Partner, Akin, Gump, Strauss, Hauer & Feld, LLP, Washington, D.C. (law firm) since November 2000; partner, Cutler & Stanfield, Washington, D.C. (law firm) until November 2000. | Director of Thornburg Mortgage, Inc. (real estate investment trust) | ||
Susan H. Dubin, 56 Trustee since 2004, Member of Audit Committee | President of Dubin Investments, Ltd., Greenwich, CT (private investment fund); Director and officer of various charitable organizations; and formerly, Vice President of Chemical Bank (predecessor to JP Morgan Chase & Co.), New York, 1974–1996. | None | ||
Owen D.Van Essen, 51 Trustee since 2004, Member of Governance & Nominating Committee | President of Dirks, Van Essen & Murray, Santa Fe, NM (newspaper mergers and acquisitions). | None | ||
James W. Weyhrauch, 46 Trustee since 1996, Member of Audit Committee | Director, Executive Vice President to 2002, and President and CEO 2002–2004, Nambé Mills, Inc., Santa Fe, NM (manufacturer); real estate agent, Santa Fe Properties, Santa Fe, NM since 2004. | None | ||
| 36 | Certified Annual Report |
| TRUSTEES AND OFFICERS, CONTINUED | ||
Thornburg International Value Fund | September 30, 2005 (Unaudited) | |
Name, Age, Position Held with Fund Year | Principal Occupation(s) During Past Five Years | Other Directorships Held by | ||
| OFFICERS OF THE FUND (WHO ARE NOT TRUSTEES) (1)(6)(7) | ||||
Dawn B. Fischer, 58 Secretary since 1987 | Secretary and Managing Director, Thornburg Investment Management, Inc.; Secretary, Thornburg Limited Term Municipal Fund, Inc. to 2004; Secretary, Thornburg Securities Corporation; Vice President, Daily Tax Free Income Fund, Inc. (registered investment company). | Not applicable | ||
Steven J. Bohlin, 46 Vice President since 1987; Treasurer since 1989 | Vice President and Managing Director of Thornburg Investment Management, Inc.; Vice President of Thornburg Limited Term Municipal Fund, Inc. to 2004. | Not applicable | ||
George T. Strickland, 42 Vice President since 1996 | Vice President and Managing Director of Thornburg Investment Management, Inc.; Vice President (to 2004) and Treasurer (2003–2004) of Thornburg Limited Term Municipal Fund, Inc. | Not applicable | ||
William V. Fries, 66 Vice President since 1995 | Vice President and Managing Director of Thornburg Investment Management, Inc. | Not applicable | ||
Leigh Moiola, 38 Vice President since 2001 | Vice President and Managing Director of Thornburg Investment Management, Inc.; Vice President of Thornburg Limited Term Municipal Fund, Inc. 1999–2004. | Not applicable | ||
Kenneth Ziesenheim, 51 Vice President since 1995 | Vice President and Managing Director of Thornburg Investment Management, Inc.; President of Thornburg Securities Corporation; Vice President of Thornburg Limited Term Municipal Fund, Inc. to 2004. | Not applicable | ||
Alexander Motola, 35 Vice President since 2001 | Vice President and Managing Director of Thornburg Investment Management, Inc. since 2000; Portfolio Manager, Insight Capital Research & Management, Inc., Walnut Creek, California 1995–2000. | Not applicable | ||
Wendy Trevisani, 34 Vice President since 1999 | Associate Portfolio Manager of Thornburg Investment Management, Inc. since 1999, Vice President since 2000 and Managing Director since 2003; Vice President of Thornburg Limited Term Municipal Fund, Inc. 1999–2002. | Not applicable | ||
Joshua Gonze, 42 Vice President since 1999 | Associate Portfolio Manager of Thornburg Investment Management, Inc. since 1999, Vice President since 1999 and Managing Director since 2003; Vice President of Thornburg Limited Term Municipal Fund, Inc. to 2004. | Not applicable | ||
Brad Kinkelaar, 37 Vice President since 1999 | Associate Portfolio Manager of Thornburg Investment Management, Inc. since 1999, Vice President since 2000 and Managing Director since 2003. | Not applicable | ||
Christopher Ihlefeld, 35 Vice President since 2003 | Associate Portfolio Manager since 1999; Vice President of Thornburg Investment Management, Inc. since 2002; Vice President of Limited Term Municipal Fund, Inc., 2003–2004. | Not applicable | ||
Leon Sandersfeld, 39 Vice President since 2003 | Associate of Thornburg Investment Management, Inc. since 2002; Senior Staff Accountant, Farm Bureau Life Insurance Co. 1998–2002. | Not applicable | ||
| Certified Annual Report | 37 |
| TRUSTEES AND OFFICERS, CONTINUED | ||
Thornburg International Value Fund | September 30, 2005 (Unaudited) | |
Name, Age, Position Held with Fund Year Elected | Principal Occupation(s) During Past Five Years | Other Directorships Held by Trustee | ||
| Sasha Wilcoxon, 31 Vice President since 2003 | Associate of Thornburg Investment Management, Inc. since 2000 and Mutual Fund Operations Department Manager since 2002. | Not applicable | ||
| Ed Maran, 47 Vice President since 2004 | Associate Portfolio Manager of Thornburg Investment Management, Inc. since 2002 and Vice President and Managing Director since 2004; Analyst, USAA 2001–2002; Oil Analyst, A.G. Edwards 1997–2000. | Not applicable | ||
| Vinson Walden, 35 Vice President since 2004 | Associate Portfolio Manager of Thornburg Investment Management, Inc. since 2002 and Vice President and Managing Director since 2004; Associate Portfolio Manager, Ibis Management 2002–2004; Associate, Lehman Brothers, 1997–2001. | Not applicable | ||
| (1) | Each person’s address is 119 East Marcy Street, Santa Fe, New Mexico 87501. |
| (2) | The Fund is one of twelve separate investment “Funds” or “series” of Thornburg Investment Trust (the “Trust”), which comprises the Thornburg mutual fund complex and is organized as a Massachusetts business trust. The Trust currently has twelve active Funds. Thornburg Investment Management, Inc. is the investment advisor to, and manages, the twelve Funds of the Trust. Each Trustee oversees the twelve Funds in the fund complex. |
| (3) | Mr. Thornburg is considered an “interested” Trustee under the Investment Company Act of 1940 because he is a director and controlling shareholder of Thornburg Investment Management, Inc., the investment advisor to the twelve active Funds of the Trust, and is the sole director and controlling shareholder of Thornburg Securities Corporation, the distributor of shares for the Trust. |
| (4) | Each Trustee serves in office until the election and qualification of a successor. |
| (5) | Mr. McMahon is considered an “interested” Trustee because he is the president of Thornburg Investment Management, Inc. |
| (6) | The Trust’s president, secretary and treasurer each serves a one-year term or until the election and qualification of a successor; each other officer serves at the pleasure of the Trustees. |
| (7) | Assistant vice presidents, assistant secretaries and assistant treasurers are not shown. |
The Statement of Additional Information for each Fund of the Trust includes additional information about the Trustees and is available, without charge and upon request, by calling 1-800-847-0200.
| 38 | Certified Annual Report |
Thornburg International Value Fund | September 30, 2005 (Unaudited) |
PORTFOLIO PROXY VOTING
Policies and Procedures:
The Trust has delegated to Thornburg Investment Management, Inc. (the “Advisor”) voting decisions respecting proxies for the Fund’s voting securities. The Advisor makes voting decisions in accordance with its Proxy Voting Policy and Procedures. A description of the Policy and Procedures is available (i) without charge, upon request, by calling the Advisor toll-free at 1-800-847-0200, (ii) on the Thornburg website at www.thornburg.com, and (iii) on the Securities and Exchange Commission’s website at www.sec.gov.
Commencing August 31, 2004, information regarding how proxies were voted is available on or before August 31 of each year for the twelve months ending the preceding June 30. This information is available (i) without charge, upon request by calling the advisor toll-free at 1-800-847-0200, (ii) on the Thornburg website at www.thornburg.com, and (iii) on the Securities and Exchange Commission’s website at www.sec.gov.
TAX INFORMATION
For the tax year ended September 30, 2005, the Thornburg International Value Fund designates 100% of the dividends paid from tax basis net ordinary income as qualifying for the reduced rate under the Jobs and Growth Tax Relief and Reconciliation Act of 2003.
The information and distributions reported herein may differ from the information and distributions taxable to the shareholders for the calendar year ending December 31, 2005. Complete information will be computed and reported in conjunction with your 2005 Form 1099-DIV.
0.11% of the ordinary income distributions paid by the Fund for the year ended September 30, 2005 qualified for the corporate dividends received deduction.
For the year ended September 30, 2004, foreign taxes paid and foreign source income were $1,669,313 and $6,417,510, respectively. Additionally, for the year ended September 30, 2005, foreign taxes paid and foreign source income is $4,032,102 and $36,328,566, respectively.
Please note that the above information is provided to satisfy Internal Revenue Code notification requirements. Foreign tax information will be provided with your 2005 1099-DIV.
AVAILABILITY OF QUARTERLY PORTFOLIO SCHEDULE
The Fund files with the Securities and Exchange Commission schedules of its portfolio holdings on Form N-Q for the first and third quarters of each fiscal year. The Fund’s Forms N-Q are available on the Commission’s website at www.sec.gov, or may be reviewed and copied at the Commission’s Public Reference Room in Washington, D.C. Information on the operation of the Public Reference Room may be obtained by calling 1-800-SEC-0330. The Fund also makes this information available on its website at www.thornburg.com/download or upon request by calling 1-800-847-0200.
TRUSTEES DELIBERATIONS RESPECTING RENEWAL OF INVESTMENT ADVISORY AGREEMENT
Thornburg Investment Management, Inc. (the “Advisor”) provides investment management services to Thornburg International Value Fund pursuant to an investment advisory agreement. The Trustees consider the renewal of this agreement annually and most recently determined to renew the agreement on September 13, 2005.
In connection with their general supervision of the Advisor, the Trustees receive and consider reports throughout the year from the Advisor respecting the Advisor’s management of the Fund’s investments. These reports include information about the Fund’s purchase and sale of portfolio investments and explanations from the Advisor respecting investment selections, the investment performance of the Fund, general appraisals of industry and economic prospects and factors, and other matters affecting the Fund and relating to the Advisor’s performance of services for the Fund.
In anticipation of their recent consideration of the advisory agreement’s renewal, the independent Trustees met with representatives of the Advisor in July 2005 to specify the information the Advisor would present to the Trustees for their review. The independent Trustees thereafter met in independent session to consider various factors respecting the agreement’s renewal, and met in a subsequent session with the Advisor’s chief investment officer to present questions. Following these sessions, the Trustees met on September 13, 2005 to consider a renewal of the advisory agreement.
The Trustees considered various factors in their review of the Advisor’s performance under the investment advisory agreement, including specifically the principles outlined in their February 2005 Statement to Shareholders, a copy of which accompanies this Annual Report to Shareholders. Summarized below are certain of the factors considered by the Trustees, in connection with the determination to renew the advisory agreement. In determining to renew the advisory agreement, the Trustees did not identify any single fact or aspect of the Advisor’s performance as controlling, and this summary does not describe all of the matters considered by the Trustees in making their determination.
Quality of Services; Fund Investment Performance. In reviewing the nature, extent, and quality of services provided by the Advisor and the investment performance of the Fund, the Trustees primarily considered the Advisor’s adherence to the Fund’s stated objectives and policies, the Advisor’s execution of the Fund’s investment strategies in prevailing market
| Certified Annual Report | 39 |
| OTHER INFORMATION, CONTINUED | ||
Thornburg International Value Fund | September 30, 2005 (Unaudited) | |
conditions, the Fund’s absolute investment performance, the Fund’s investment performance compared to categories of other broadly similar mutual funds and broad based securities indices, the Fund’s investment performance over different periods of time, the Fund’s total returns in rising and declining markets compared to total returns of a broad based securities index, measures of relative portfolio risk, and related factors. The Trustees noted in comparing the Fund to other mutual funds and to indices that the value of such comparisons may be limited because the Fund’s investment approach, and the selection of its portfolio securities, are unique or differ in considerable degree from the characteristics of other funds and indices. In conducting their review, the Trustees observed that the Advisor had continued to faithfully pursue and to achieve the Fund’s stated objectives, as demonstrated particularly by the Advisor’s selection of investments and the Fund’s investment performance. The Trustees also noted in this regard the Fund’s superior investment performance in most periods as compared to broad based securities indices and categories of mutual funds selected by independent mutual fund analyst firms.
The Trustees also considered a number of other factors in reviewing the quality of the Advisor’s services, including the qualifications and integrity of the Advisor’s senior personnel, the Advisor’s staffing and other resources, the Advisor’s compliance with regulatory requirements, Fund sales performance and perceptions of the Funds in the marketplace, and other factors.
The Trustees concluded, based upon these and other considerations, that the Advisor had actively and competently pursued the Fund’s stated investment objectives in accordance with the Fund’s investment policies stated in its prospectuses. The Trustees further concluded that the investment performance of the Fund was satisfactory in the context of the Fund’s objectives and policies and prevailing market conditions.
Fees and Expenses; Profitability of Advisor. In reviewing the fees charged by the Advisor to the Fund, the Trustees primarily considered the fees charged by the Advisor and the other expenses charged to the Fund in light of the nature and quality of services provided, comparison of the actual Advisor’s fee and Fund expenses to the statement of fees and expenses in the Fund’s prospectuses, comparisons of the Advisor’s fee and other Fund expenses to median and average fees and expenses charged to similar mutual funds, and comparisons of fees and expenses charged to the Fund with fees and expenses charged to other, similar specific mutual funds. In addition, the Trustees considered the profitability of the Advisor compared to other investment management firms, and comparisons of the investment management fee rates charged by the Advisor to the Fund with rates charged to other clients of the Advisor and the differing types of services furnished to the Fund and the other clients. The Trustees noted that the Fund’s management fee and overall expense ratio were lower than the average and median fee rates and expense ratios for a group of international equity mutual funds assembled by an independent mutual fund analyst firm. The Trustees also observed in their review that fee rates charged by the Advisor to other clients of the Advisor were not directly comparable to rates charged to the Fund principally because of the significant differences in the services provided.
The Trustees concluded, based upon these and other considerations, that the fees charged to the Fund by the Advisor were fair and reasonable in view of the following: the services provided, the clear disclosure of these fees and expenses in the Fund’s prospectuses, and prevailing fees and expenses charged to mutual funds generally. The Trustees further concluded that there was no indication that the Advisor’s profitability was unusual, viewed in the context of the services provided, the performance of the Fund, and the fees and profitability of other investment management firms.
Economies of Scale. In reviewing the extent to which economies of scale would be realized by the Fund as it grows and whether fee levels reflect economies of scale, the Trustees considered the breakpoint structure for advisory fees chargeable to the Fund, the demonstrated economies of scale enjoyed by the Fund and other Funds of the Trust as they had grown in size, and economies of scale realized by other mutual funds. The Trustees concluded that the Fund has realized and may reasonably be expected to realize further economies of scale for the benefit of its shareholders as it grows in size.
Ancillary Benefits to Advisor. In reviewing benefits enjoyed by the Advisor because of its relationship with the Fund, the Trustees considered an arrangement through which the Advisor received certain research services, favorable publicity received by the Advisor because of the superior investment performance of certain Funds of the Trust, and the benefits to the Fund from the Advisor’s expansion of its staffing and other resources to serve a broader variety of investment clients. The Trustees concluded, based upon these and other considerations, that there was no unusual or unfair benefit enjoyed by the Advisor and that the Fund enjoyed benefits by virtue of the Advisor’s engagement by other investment clients.
| 40 | Certified Annual Report |
Trustees’ Statement to Shareholders
Not part of the Certified Annual Report
February 8, 2005
The Trustees are concerned that recent commentaries and opinions reported in the media may confuse investors in general as to the supervisory duties of trustees of mutual funds and, in particular, leave Thornburg Investment Trust shareholders uncertain regarding how we discharge our responsibilities in supervising the Funds’ investment advisor and in reviewing the advisor’s contract for renewal. We decided to spell out clearly three principal guidelines that we follow in supervising the Trust’s investment advisor on your behalf.
We begin with the premise that each shareholder selected his or her Fund because its investments are managed by the investment advisor identified in the prospectus and in accordance with the objective and policies described in the prospectus. We realize, as each of you do, that if you believe that your Fund’s stated objective and policies no longer serve your personal investment goals, you can sell your shares and leave the Fund.
Therefore, we believe that our primary supervisory task – our principal obligation to you – is to assess the nature and quality of the advisor’s services, and to confirm that the advisor actively and competently pursues the Fund’s objective, in accordance with the policies set out in the prospectus. To do this, we meet regularly with management to review your Fund’s portfolio and to discuss the advisor’s specific actions and judgments in pursuing the Fund’s objective. We do not substitute our own judgment for the advisor’s decisions in selecting investments; the advisor is paid to exercise its informed judgment on investment decisions, and we seek to confirm, in reviewing the advisor’s performance, that the advisor is doing just that.
Second, while we are conscious of costs and the effect that costs have on shareholders’ returns, we do not seek the lowest fees or expense ratio as our sole or primary objective. We try to make sure that your Fund’s fees and costs are reasonable in relationship to the services rendered and that they are generally in line with those charged by other expert investment advisors, consistent with our belief that the Fund’s investors searched for and expect that expertise and attention and have decided to pay a reasonable price for it. We do not put the management contract “out to bid” as a matter of course, and we would not do so unless we had concluded that the advisor materially had failed to pursue the Fund’s objectives in accordance with its policies, or for other equally important reasons. We believe that any other approach would be inconsistent with your interests and contrary to your expectations when you bought shares of the Fund in the first place.
Finally, because we believe that most Thornburg Fund shareholders have invested with a long-term perspective, we try not to focus too much on the fashions of the moment and on short-term performance. The market will not favor any specific investment objective or set of policies at all times and under all economic circumstances. A fund will experience periods of both high and low returns relative to other funds and other investments. Even if one of our Funds is not favored by the market at a particular time, we believe that the advisor is nonetheless obliged to remain true to the Fund’s objective and policies, and we watch to see that it does so.
This statement is submitted for the general information of the shareholders of Thornburg Investment Trust. It is not authorized for distribution to prospective investors in the Fund unless preceded or accompanied by an effective prospectus. If you have not received a prospectus, one can be obtained from your financial advisor, online at www.thornburg.com/download, or by calling 800-847-0200. Carefully consider information in the prospectus regarding the Fund’s investment objectives and policies, risks, sales charges, expenses, experience of its management, marketability of shares, and other information. Read it carefully before you invest or send money.
| This page is not part of the Annual Report. | 41 |
This page intentionally left blank.
| 42 | This page is not part of the Annual Report. |
Planning Options
Retirement and Education Accounts
Thornburg Investment Management offers retirement and education savings accounts that can help you meet a variety of planning challenges. For account applications or further information on any of the accounts below, please call 1-800-847-0200 or go to www.thornburg.com/ira. Your financial advisor can help you determine which plan is right for you.
Individual Retirement Accounts
Individual Retirement Accounts (IRAs) provide a tax-advantaged means to save money for the future. For a detailed outline of the difference between retirement accounts, see www.thornburg.com/ira. Rollovers are available. Call 1-800-847-0200 for more information.
Traditional IRAs – Contributions to Traditional IRAs are tax deductible for eligible individuals, and withdrawals are taxed as additional ordinary income. You may contribute to an IRA if you receive compensation and are under 701/2, even if you are covered by an employer retirement plan.
Roth IRAs – Under a Roth IRA, there is no tax deduction for contributions, but there is no income tax on qualified withdrawals. For a more detailed comparison of Traditional and Roth IRAs, please see our web site at www.thornburg.com/ira.
SEP IRAs – Simplified Employee Pension (SEP) IRAs are established by employers. The employer is allowed a tax deduction for contributions made to the SEP Plan and makes contributions to each eligible employee’s SEP IRA on a discretionary basis.
SIMPLE IRAs – Savings Incentive Match Plan for Employees of Small Employers (SIMPLE) is designed to give small business owners a simplified method to establish and contribute to a retirement plan for employees. The employer is allowed a tax deduction for contributions and makes either matching or non-elective contributions to each eligible employee’s SIMPLE IRA. Employees may make salary deferral contributions.
403(b)
A special, tax-advantaged savings vehicle available only to employees of 501(c)(3) organizations, such as charitable, educational, scientific and religious organizations. 403(b) plans are also available to employees of public schools and universities.
Coverdell Education Savings Account
These savings accounts are designed to provide a way to save money for higher education expenses. In an Education Savings Account, earnings and interest grow tax free, and qualified withdrawals used to pay for eligible higher-education expenses are tax- and penalty-free.
Funds Available
The following funds are available in the accounts listed above:
| • | Thornburg International Value Fund |
| • | Thornburg Value Fund |
| • | Thornburg Core Growth Fund |
| • | Thornburg Investment Income Builder Fund |
| • | Thornburg Limited Term U.S. Government Fund |
| • | Thornburg Limited Term Income Fund |
| This page is not part of the Annual Report. | 43 |
The Firm
Thornburg Investment Management® is a privately held investment management company based in Santa Fe, New Mexico with assets under management of over $16 billion. Founded in 1982, the firm manages four equity funds, eight bond funds, and separate portfolios for select institutions and individuals.
Investment Philosophy
We seek to preserve and increase the real wealth of the Funds’ shareholders after accounting for inflation, taxes, and investment expenses. We’re committed to disciplined investing and controlling risk in all market environments through laddered bond and focused equity portfolios.
Portfolio Holdings Disclosure
We believe you should know about your portfolio. Our web site keeps investors informed of the Funds’ equity holdings. Go to www.thornburg.com/funds for commentary on our equity fund holdings.
Co-Ownership of Funds
We invest side-by-side with the Funds’ shareholders. Our employees have invested over $110 million in Thornburg Funds.
Core Strategies for Building Wealth
We deliver core strategies to help investors meet long-term goals. A core strategy is a consistent, disciplined and proven investment process that represents the foundation of a diversified portfolio.
| Investment Manager: | Distributor: | |||||
 |  | |||||
| 119 East Marcy Street | 119 East Marcy Street | |||||
| Santa Fe, New Mexico 87501 | Santa Fe, New Mexico 87501 | |||||
| 800.847.0200 | 800.847.0200 | |||||

Core Strategies for Building Wealth
Thornburg International Value Fund
I Shares
Informational Brochure and
Annual Report – September 30, 2005
Value knows no boundaries
This report and the accompanying brochure are submitted for the general information of shareholders of the Fund. It is not authorized for distribution to prospective investors in the Fund unless preceded or accompanied by an effective prospectus. If you have not received a prospectus, one can be obtained from your financial advisor, online at www.thornburg.com/ download, or by calling 800-847-0200. Carefully consider information in the prospectus regarding the Fund’s investment objectives and policies, risks, sales charges, expenses, experience of its management, marketability of shares, and other information. Read it carefully before you invest or send money. Performance data quoted represents past performance and does not guarantee future results.
Thornburg International Value Fund
Value Knows No Boundaries
The Fund seeks long-term capital appreciation by investing in a portfolio of a limited number of holdings selected on a value basis using fundamental research. As a secondary consideration, the Fund also seeks some current income.
The portfolio is diversified to include basic value stocks, but also includes stocks of companies with consistent earnings characteristics and those of emerging franchises, when, in our opinion, these issues are value priced.
Thornburg Bond Funds
| • | Thornburg Limited Term Municipal Fund |
| • | Thornburg Intermediate Municipal Fund |
| • | Thornburg California Limited Term Municipal Fund |
| • | Thornburg New Mexico Intermediate Municipal Fund |
| • | Thornburg Florida Intermediate Municipal Fund |
| • | Thornburg New York Intermediate Municipal Fund |
| • | Thornburg Limited Term U.S. Government Fund |
| • | Thornburg Limited Term Income Fund |
Thornburg invests in short- and intermediate-term investment grade bonds. We ladder the maturities of individual bonds in the portfolios to moderate risk. Laddering involves building a portfolio of bonds with staggered maturities so that a portion of the portfolio will mature each year. We apply this disciplined process in all interest rate environments.
Thornburg Equity Funds
| • | Thornburg Value Fund |
| • | Thornburg International Value Fund |
| • | Thornburg Core Growth Fund |
| • | Thornburg Investment Income Builder Fund |
Thornburg’s equity research uses a fundamental, yet comprehensive, analytical approach. We invest when and where we perceive compelling value. Thornburg equity funds focus on a limited number of securities so that each holding can impact performance. The equity team searches for firms believed to have a promising future and seeks to buy shares of those companies at a discount to their intrinsic value.
More information at www.thornburg.com
 | Reduce paper clutter. Receive your shareholder reports and prospectus online instead of through traditional mail. | |
Sign up at | ||
| www.thornburg.com/edelivery |
| 2 | This page is not part of the Annual Report. |
Message
from the Chairman

Garrett Thornburg
Chairman & CEO
November 9, 2005
Dear Fellow Shareholder:
Thornburg Investment Management has a clear mission: to preserve and increase the real wealth of our shareholders. We seek to accomplish this through a range of equity funds that redefine traditional measures of value and growth and through a family of laddered bond funds that focus on quality, stability and minimizing risk over time.
Confirming our strategy, all Thornburg equity funds have ranked well within their respective categories.
The Thornburg equity funds employ a comprehensive approach which is more inclusive than the traditional deep value or high growth approach to stock selection. Within the Thornburg Value Fund and the Thornburg International Value Fund, the portfolios’ securities are classified into three baskets: basic value stocks, stocks of companies with consistent earnings, and stocks of emerging franchises. Thornburg Core Growth Fund’s holdings are classified into similar baskets: growth industry leaders, consistent growth companies, and emerging growth companies. After being identified through bottom-up screening from a worldwide universe, all stocks are subject to a rigorous selection process that must satisfy the Thornburg investment team’s two fundamental criteria: in the opinion of the portfolio manager, the companies must be selling at attractive discounts to intrinsic value and have compelling prospects for long-term growth. You can read much more about the stocks in your Fund’s portfolio at our web site, www.thornburg.com/funds.
During this decade, the average dividend yield paid by equity and hybrid mutual funds has dipped well below 1%. We established Thornburg Investment Income Builder Fund in late 2002 to be clearly different from other equity/hybrid funds by paying attractive dividends today, with a further goal of increasing these in the future. Our record to date shows clear success in achieving each aspect of this mission.
On the bond side, we have always had a highly disciplined approach of laddering short- and intermediate-bond maturities seeking to provide both an attractive return and relative stability of principal.
Recently, there has been a lot of news about improper behavior by some mutual fund companies. Many of the proposed new rules in response to this scandal have called for increased transparency. We welcome increased transparency. Thornburg Investment Management has been a leader in providing information about our stock holdings to our shareholders on our web site, www.thornburg.com.
Unfortunately, some of those new rules will increase the cost to all shareholders in mutual funds. We will do our best to keep these expenses to a minimal amount. After all, we are shareholders too! Thornburg employees have over $110 million invested in our own funds.
Thank you for investing with us. We will do our best to continue to earn your trust every day.
| Sincerely, |
 |
| Garrett Thornburg |
| Chairman & CEO |
| This page is not part of the Annual Report. | 3 |
Important Information
The information presented on the following pages was current as of September 30, 2005. The manager’s views, portfolio holdings, and sector diversification are historical and subject to change. This material should not be deemed a recommendation to buy or sell any of the securities mentioned.
Shares in the Fund carry risks including possible loss of principal. There are special risks associated with international investing, including currency fluctuations, government regulation, political developments, and differences in liquidity. Risks may be associated with investments in emerging markets including illiquidity and volatility. Additionally, the Fund invests a portion of the assets in small capitalization companies which may increase the risk of greater price fluctuations. Funds invested in a limited number of holdings may expose an investor to greater volatility. Shares in the Fund are not deposits or obligations of, or guaranteed or endorsed by, any bank, the Federal Deposit Insurance Corporation, the Federal Reserve Board, or any government agency. Minimum investments for Class I shares are higher than those for other classes.
Morningstar Award
Established in 1988, the Morningstar Fund Manager of the Year Award recognizes portfolio managers who demonstrate excellent investment skill and the courage to differ from the consensus. To qualify for the award, managers must have not only a great year, but also must have a record of delivering outstanding long-term performance and of aligning their interests with shareholders’. The Fund Manager of the Year Award winners are chosen based upon Morningstar’s proprietary research and in-depth evaluation by its senior analysts.
Glossary
The Morgan Stanley Capital International (MSCI) Europe, Australasia, Far East Index (EAFE) – The MSCI EAFE is an unmanaged index. It is a generally accepted benchmark for major overseas markets. Index weightings represent the relative capitalizations of the major overseas markets included in the index on a U.S. dollar adjusted basis. The index is calculated with gross dividends reinvested in U.S. dollars. Unless otherwise noted, index returns do not reflect fees, brokerage commissions or other expenses of investing. Investors may not make direct investments into any index.
Beta – A measure of market-related risk. Less than one means the portfolio is less volatile than the index, while greater than one indicates more volatility than the index.
Median Market Capitalization – Market capitalization (market cap) is the total value of a company’s stock, calculated by multiplying the number of outstanding common shares by the current share price. The company whose market cap is in the middle of the portfolio is the median market cap. Half the companies in the portfolio have values greater than the median, and half have values that are less. If there is an even number of companies, then the median is the average of the two companies in the middle.
Price to Book Value (P/B) – A ratio used to compare a stock’s market value to its book value. It is calculated by dividing the current closing price of the stock by the latest quarter’s book value (book value is simply assets minus liabilities).
Price to Cash Flow Ratio – A measure of the market’s expectations of a firm’s future financial health. It is calculated by dividing the price per share by cash flow per share.
Price to Earnings Ratio (P/E) – A valuation ratio of a company’s current share price compared to its per-share earnings. P/E equals a company’s market value per share divided by earnings per share.
| 4 | This page is not part of the Annual Report. |
Thornburg International Value Fund
Value Knows No Boundaries
Investing is an art. It is also a science. It requires vision and precision – the vision to recognize opportunity and the precision to use that opportunity to achieve a specific goal.
The greatest success comes to those who strike a balance between the two.
Thornburg International Value Fund strikes such a balance.
The Fund seeks to find bargains in overseas markets. It differs from other international equity funds in two key ways. First, it focuses on a limited number of stocks; and second, it takes a more comprehensive approach to value investing. This unique strategy has provided shareholders with positive returns since the Fund’s inception in 1998, and earned portfolio manager Bill Fries the distinction of Morningstar’s 2003 International Fund Manager of the Year.
Fries’ unassuming and quiet demeanor belies his fierce determination to recognize value and harness it for his shareholders. He brings more than thirty years of investment experience to the process. He also brings a commitment to fundamental, hands-on research. He and his team of associate portfolio managers are dedicated to a collaborative approach in identifying and analyzing investment ideas. They scour the globe to find the world’s most promising companies. The investment committee is, in Fries’ words, “in continuous session.” Everybody’s idea is important. “Combining promise and discount valuation” is the team’s mantra.
In managing the Thornburg International Value Fund, Fries takes a conservative, bottom-up approach to stock selection. The Fund is not predisposed to a geographical region or industry. And, it recognizes no “false gods.” Fries and his associates use a combination of traditional value screens, financial analysis, collaborative research, and on-site company visits to gauge the intrinsic value of a company and to estimate its potential for significant future earnings growth. Their current goal is to maintain a portfolio of 45–60 companies diversified by sector, country, region, and economic sensitivity, with no one industry accounting for more than 25% of the Fund’s portfolio, and no one stock comprising more than 5.0%.
Because of the limited number of stocks in the portfolio, every holding counts. Once a company has survived the team’s initial screens, the managers then expand their analysis of what is behind its revenue and cash-generating model. And they take the time to get to know the company, its people and its corporate culture. At the time of purchase, the managers set 12–18 month price targets for each stock. They review those targets as the fundamentals of the stocks change during the course of ownership.
The bottom line? By engendering a wide-open, collegial environment, Fries ensures that information flows freely and that the Fund benefits from the best of the team’s thinking. And because the Fund’s advisor, Thornburg Investment Management®, is located in Santa Fe, New Mexico, the portfolio team avoids the tendency to be trapped by Wall Street’s “pack” instinct. While they have access to the best of Wall Street’s analysis, they are not ruled by it. Their distance from the herd serves to fortify independent and objective thinking.
Foreign markets now account for 49% of world market capitalization. These markets do not all move in sync. When one is up, often another is down. Losses in one may be offset by gains in another. Limiting the number of companies in the portfolio and employing a rigorous sell discipline has enabled the Thornburg team to strike a balance between risk and reward and allow shareholders in Thornburg International Value Fund to enjoy reasonable rates of growth and still sleep at night.
| This page is not part of the Annual Report. | 5 |
Portfolio Overview
Thornburg International Value Fund
IMPORTANT PERFORMANCE
INFORMATION
Performance data quoted represents past performance and does not guarantee future results. Investment return and principal value will fluctuate so that upon redemption, investor’s shares may be worth more or less than their original cost. Current performance may be lower or higher than the data quoted. For performance data current to the most recent month end, visit www.thornburg.com. There is no up-front sales charge for Class I shares. I shares are subject to a 1% 90-day redemption fee.
MANAGEMENT TEAM

Front row, L to R: Wendy Trevisani, Bill Fries, Brad Kinkelaar, and Brian McMahon. Back row, L to R: Thomas Garcia, Ed Maran, Lei Wang, Lewis Kaufman, and Vin Walden.
KEY PORTFOLIO ATTRIBUTES
Portfolio P/E* | 18.9 | x | ||
Portfolio Price to Cash Flow* | 13.9 | |||
Portfolio Price to Book Value* | 2.5 | |||
Median Market Cap* | $ | 16.66 | B | |
3-Year Beta (Thornburg vs. MSCI EAFE)** | 0.96 | |||
Holdings | 58 | |||
Emerging Markets Exposure | 24.6 | % |
| * | Source: Thomson Portfolio Analytics |
| ** | Source: Morningstar Principia Pro |
During the fiscal twelve-month period ended September 30, 2005, the Class I shares of the Thornburg International Value Fund posted a positive return of 27.15% compared to 25.79% for the MSCI EAFE Index. During the period, individual stock selection had the largest positive impact on the performance of the portfolio.
The Fund found the most success in financial, telecommunication services, and information technology stocks. This differed from the benchmark where the telecommunication services and information technology sectors were the two worst performing sectors in the index. Both sectors were positive contributors to performance for the International Value Fund where the focus of the research team is on the merit of the individual companies.
Exposure to financial stocks consistently represented the largest sector weighting in the Fund during the fiscal year and provided the greatest amount of relative and absolute positive performance. Strong performance was contributed by a diverse group of individual holdings including South Korean banks Kookmin Bank and Shinhan Financial Group Co. Ltd. Deutsche Börse AG and Euronext NV, which operate European financial exchanges, both posted positive returns as their businesses continued to flourish. Bank holdings in the United Kingdom, Japan, and India also contributed to the positive performance of the Fund.
Telecommunication services holdings were a good example of stock selection driving portfolio performance. In general, performance of the sector was lackluster, but the stocks held in the Fund performed very well. America Movil S.A. de C.V. was the biggest standout. America Movil is a cellular provider in Mexico and has been able to capitalize on rapidly increasing mobile phone penetration in that country.
AVERAGE ANNUAL TOTAL RETURNS*
FOR PERIODS ENDED SEPTEMBER 30, 2005
| 3Q ‘05 | 1 Yr | 3 Yrs | Since Inception | |||||||||
I Shares (Incep: 3/30/01) | 10.87 | % | 27.15 | % | 25.25 | % | 11.30 | % | ||||
MSCI EAFE Index (Since: 3/30/01) | 10.38 | % | 25.79 | % | 24.61 | % | 7.60 | % |
| * | Periods under one year are not annualized. |
| 6 | This page is not part of the Annual Report. |
Within the information technology sector, a broad range of stocks contributed to positive performance. Amdocs Ltd., a customer care and billing company serving the telecommunications industry, performed well. Samsung Electronics Co. Ltd. also provided positive performance to the Fund during the year.
Energy stocks provided a positive boost to the portfolio. The most significant holdings were Petroleo Brasileiro of Brazil and Lukoil Oil Company of Russia. Energy stocks represented a source of both relative and absolute outperformance during the year.
The most significant drag on the portfolio came from the materials and utilities sectors. The Fund had very little exposure to stocks in these sectors, which were strong performing components of the index. Health care stocks were also an area of weakness. The most notable negative contributor was Novo Nordisk A/S, a specialty pharmaceutical company focusing on the treatment of diabetes.
The process and philosophy of the Fund remains unchanged. The Fund is concentrated and diversified with 58 holdings and exposure to 19 countries and 19 industries. Market cap exposure is spread across small, mid, and large cap stocks with a bias towards large cap (stocks with market caps above $8 billion). Emerging market exposure is currently 24.6%. We will continue to maintain a diversified portfolio of stocks we identify through our bottom-up research process. Our goal remains to provide competitive long-term returns to our shareholders.
PERFORMANCE IMPACT FOR YEAR ENDED 9/30/05
Top Contributors | Top Detractors | |
America Movil S.A. de C.V. ADR | Kingfisher plc | |
Deutsche Börse AG | Novo Nordisk A/S | |
Rogers Communications Inc. | Singapore Telecommunications Ltd. | |
Petroleo Brasileiro S.A. ADR | Carrefour SA | |
Euronext NV | Puma AG | |
Source: Thomson Portfolio Analytics
| TOP TEN EQUITY HOLDINGS | ||
| As of 9/30/05 |
BP Amoco ADR | 3.4 | % | |
Sanofi-Aventis | 2.8 | % | |
America Movil S.A. de C.V. ADR | 2.7 | % | |
GlaxoSmithKline plc | 2.5 | % | |
Rogers Communications Inc. | 2.3 | % | |
Teva Pharmaceutical Industries Ltd. ADR | 2.2 | % | |
Schlumberger Ltd. | 2.2 | % | |
Cadbury Schweppes plc | 2.1 | % | |
Deutsche Börse AG | 2.1 | % | |
Vodafone Group plc ADR | 2.1 | % | |
| TOP TEN COUNTRIES | ||
| As of 9/30/05 | ||
United Kingdom | 21.2 | % | |
Japan | 11.7 | % | |
Switzerland | 8.2 | % | |
Germany | 7.0 | % | |
France | 6.2 | % | |
South Korea | 5.7 | % | |
Canada | 5.5 | % | |
China | 5.4 | % | |
Mexico | 4.4 | % | |
Denmark | 3.7 | % | |
| TOP TEN INDUSTRIES | ||
| As of 9/30/05 | ||
Pharmaceuticals & Biotechnology | 13.0 | % | |
Energy | 12.0 | % | |
Banks | 11.8 | % | |
Telecommunication Services | 8.5 | % | |
Diversified Financials | 7.4 | % | |
Food & Staples Retailing | 6.6 | % | |
Media | 6.4 | % | |
Automobiles & Components | 6.0 | % | |
Tech. Hardware & Equipment | 4.5 | % | |
Insurance | 3.9 | % | |
| This page is not part of the Annual Report. | 7 |
This page intentionally left blank.
| 8 | This page is not part of the Annual Report. |

Thornburg International Value Fund
I Shares – September 30, 2005
| 10 | ||
| 12 | ||
| 14 | ||
| 16 | ||
| 17 | ||
| 22 | ||
| 23 | ||
| 28 | ||
| 29 | ||
| 30 | ||
| 31 | ||
| 34 | ||
This report is certified under the Sarbanes-Oxley Act of 2002, which requires that public companies, including mutual funds, affirm that the information provided in their annual and semiannual shareholder reports fully and fairly represents their financial position.
| Certified Annual Report | 9 |

William V. Fries,CFA
Portfolio Manager
October 17, 2005
Dear Fellow Shareholder:
The fiscal year ended September 30 was a good year for our Fund. The net asset value of Class I shares on September 30, 2005 was $23.19. One year ago on September 30, 2004, the net asset value was $18.48. Total return of the Fund for the period was 27.15% compared with 25.79% for the MSCI EAFE benchmark index. Generally speaking, international markets performed well during the fiscal year with particular strength in telecommunications, banking, securities exchanges, and energy. Our best performing telecom-related stocks were based in our North American neighbors Mexico and Canada. Banking strength was in Korea and Japan, and the security exchanges in Europe were standout performers. Energy holdings performance came mostly from integrated companies with resources as geographically diverse as Brazil, China, Russia, and the United States. Technology-related holdings also contributed to performance, including recent addition Logitech International. For details on performance by share class, please refer to the performance summary on page 30.
Interest in investing internationally continues to grow. This, in part, reflects the dollar’s retreat from an esteemed status over the past couple of years, but it also reflects increased recognition that some individual stock opportunities in a global economy may be new and different from those of the past. Diversification of dollar-based assets may be a rational reason to invest overseas and was a prime motivation in 2004. It is not the only reason. I believe a look at our portfolio holdings supports this assertion. A number of our holdings are truly distinct companies with no U.S. equivalent. For example, our airport holding Fraport AG and port holding China Merchants Holdings International Co. Ltd., would be equivalent to owning shares in Chicago’s O’Hare International Airport and California’s Port of Long Beach, neither of which is likely to be offered anytime soon. In the pharmaceutical area, the European-based companies are doing better than their U.S. counterparts. Each of our health care holdings has a unique set of products, distribution, and potentially productive research. The distinct positive of Roche Holdings AG’s affiliation with Genentech is a compelling example of a unique and productive arrangement. Competitive leadership in industries that are global is another attractive attribute of a few of our holdings; Toyota Motor Corp. and Schlumberger Ltd. are illustrative. Both are market share-gainers currently, and are likely to remain so.
The opportunity in emerging markets is worthy of comment. Economic growth in the Far East outside Japan continues at a pace not possible in more developed markets. It appears sustainable, barring a dramatic downturn in developed economies. Companies that support and serve this growth, especially where businesses are positioned as local leaders, will likely benefit from home market development. Our Korean banks, Kookmin Bank and Shinhan Financial Group Co., as well as Chinese coal company Shenhua Energy and Indian motorcycle company Hero Honda Motors Ltd. are each good examples of premiere local companies with essential or desirable products and services. Our web site has descriptive summaries of these and our other holdings as well as links to company web sites at www.thornburg.com/funds. A visit to this web site might help you understand our enthusiasm for the Thornburg International Value Fund.
It might be considered overly optimistic to assume that the performance of the last twelve months in overseas markets will be repeated in the year ahead. Yet markets remain buoyant, even with slow economies in Western Europe and the United Kingdom. There are reasons to remain constructive. Strength in the dollar this year has eased the European worry about their export economy, while high energy prices remain a concern for U.S. consumers. In Europe, where energy is heavily taxed already, consumer spending is less likely to be affected. A healthy Japanese economy for the first time in years and continued improvement in living standards in emerging markets are also supportive of global equity markets. It may seem a stretch at this time, but consider market
| 10 | Certified Annual Report |
psychology if oil prices peak sometime soon, violence in Iraq diminishes, the Chinese let their currency float higher, the U.S. economy stays healthy, and global inflation is contained. Granted, all of this together is unlikely, but in an environment of rising corporate earnings and reasonable valuation, any of these developments would support equity markets. Even in a challenging market environment, there will be companies that succeed and stocks that represent good values. We will remain focused on companies we believe have the promise and valuation to provide an opportunity for capital appreciation.
We thank you for your past trust and confidence. We will continue to work toward sustaining both in the future.
Sincerely, |
 |
| William V. Fries,CFA |
| Portfolio Manager |
The matters discussed in this report may constitute forward-looking statements made pursuant to the safe harbor provisions of the Securities Litigation Reform Act of 1995. These include any advisor or portfolio manager prediction, assessment, analysis or outlook for individual securities, industries, investment styles, market sectors and/or markets. These statements involve risks and uncertainties. In addition to the general risks described for each fund in its current prospectus, other factors bearing on these reports include the accuracy of the advisor’s or portfolio manager’s forecasts and predictions, the appropriateness of the investment strategies designed by the advisor or portfolio manager, and the ability of the advisor or portfolio manager to implement their strategies efficiently and successfully. Any one or more of these factors, as well as other risks affecting the securities markets generally, could cause the actual results of any fund to differ materially as compared to its benchmarks.
| Certified Annual Report | 11 |
STATEMENT OF ASSETS AND LIABILITIES
Thornburg International Value Fund | September 30, 2005 |
ASSETS | ||||
Investments at value (cost $3,401,314,606) | $ | 4,004,371,401 | ||
Cash | 6,002,551 | |||
Receivable for investments sold | 15,653,109 | |||
Receivable for fund shares sold | 42,855,427 | |||
Unrealized gain on forward exchange contracts (Note 7) | 12,079,515 | |||
Dividends receivable | 11,360,072 | |||
Prepaid expenses and other assets | 58,165 | |||
Total Assets | 4,092,380,240 | |||
LIABILITIES | ||||
Payable for securities purchased | 126,747,229 | |||
Payable for fund shares redeemed | 6,857,669 | |||
Unrealized loss on forward exchange contracts (Note 7) | 33,051,583 | |||
Payable to investment advisor and other affiliates (Note 3) | 3,557,098 | |||
Deferred tax payable | 749,810 | |||
Accounts payable and accrued expenses | 1,410,243 | |||
Dividends payable | 5,833,429 | |||
Total Liabilities | 178,207,061 | |||
NET ASSETS | $ | 3,914,173,179 | ||
NET ASSETS CONSIST OF: | ||||
Distribution in excess of net investment income | $ | (1,940,997 | ) | |
Net unrealized appreciation on investments | 581,099,906 | |||
Accumulated net realized gain (loss) | 95,139,946 | |||
Net capital paid in on shares of beneficial interest | 3,239,874,324 | |||
| $ | 3,914,173,179 | |||
| 12 | Certified Annual Report |
| STATEMENT OF ASSETS AND LIABILITIES, CONTINUED | ||
Thornburg International Value Fund | September 30, 2005 | |
NET ASSET VALUE: | |||
Class A Shares: | |||
Net asset value and redemption price per share ($2,205,924,392 applicable to 96,730,208 shares of beneficial interest outstanding - Note 4) | $ | 22.80 | |
Maximum sales charge, 4.50% of offering price | 1.07 | ||
Maximum offering price per share | $ | 23.87 | |
Class B Shares: | |||
Net asset value and offering price per share * ($47,305,854 applicable to 2,168,349 shares of beneficial interest outstanding - Note 4) | $ | 21.82 | |
Class C Shares: | |||
Net asset value and offering price per share * ($635,832,781 applicable to 29,050,420 shares of beneficial interest outstanding - Note 4) | $ | 21.89 | |
Class I Shares: | |||
Net asset value, offering and redemption price per share ($892,216,330 applicable to 38,474,708 shares of beneficial interest outstanding - Note 4) | $ | 23.19 | |
Class R1 Shares: | |||
Net asset value, offering and redemption price per share ($118,436,032 applicable to 5,175,383 shares of beneficial interest outstanding - Note 4) | $ | 22.88 | |
Class R5 Shares: | |||
Net asset value, offering and redemption price per share ($14,457,790 applicable to 623,657 shares of beneficial interest outstanding - Note 4) | $ | 23.18 | |
| * | Redemption price per share is equal to net asset value less any applicable contingent deferred sales charge. |
See notes to financial statements.
| Certified Annual Report | 13 |
| STATEMENT OF OPERATIONS | ||
Thornburg International Value Fund | Year Ended September 30, 2005 | |
INVESTMENT INCOME: | ||||
Dividend income (net of foreign taxes withheld of $4,116,928) | $ | 57,019,613 | ||
Interest income | 3,394,474 | |||
Total Income | 60,414,087 | |||
EXPENSES: | ||||
Investment advisory fees (Note 3) | 20,117,121 | |||
Administration fees (Note 3) | ||||
Class A Shares | 1,930,603 | |||
Class B Shares | 43,024 | |||
Class C Shares | 530,513 | |||
Class I Shares | 276,894 | |||
Class R1 Shares | 68,997 | |||
Class R5 Shares | 895 | |||
Distribution and service fees (Note 3) | ||||
Class A Shares | 3,872,178 | |||
Class B Shares | 344,884 | |||
Class C Shares | 4,254,766 | |||
Class R1 Shares | 277,203 | |||
Transfer agent fees | ||||
Class A Shares | 2,663,010 | |||
Class B Shares | 68,557 | |||
Class C Shares | 563,265 | |||
Class I Shares | 361,300 | |||
Class R1 Shares | 96,115 | |||
Class R5 Shares | 7,302 | |||
Registration and filing fees | ||||
Class A Shares | 123,286 | |||
Class B Shares | 19,571 | |||
Class C Shares | 45,916 | |||
Class I Shares | 109,686 | |||
Class R1 Shares | 21,233 | |||
Class R5 Shares | 14,337 | |||
Custodian fees (Note 3) | 1,858,551 | |||
Professional fees | 141,160 | |||
Accounting fees | 210,470 | |||
Trustee fees | 57,760 | |||
Other expenses | 774,271 | |||
Total Expenses | 38,852,868 | |||
Less: | ||||
Expenses reimbursed by Investment Advisor (Note 3) | (325,980 | ) | ||
Fees paid indirectly (Note 3) | (72,001 | ) | ||
Net Expenses | 38,454,887 | |||
Net Investment Income | $ | 21,959,200 | ||
| 14 | Certified Annual Report |
| STATEMENT OF OPERATIONS, CONTINUED | ||
Thornburg International Value Fund | Year Ended September 30, 2005 | |
REALIZED AND UNREALIZED GAIN (LOSS) | ||||
Net realized gain (loss) on: | ||||
Investments | $ | 83,008,194 | ||
Foreign currency transactions | 12,552,565 | |||
| 95,560,759 | ||||
Net change in unrealized appreciation (depreciation) on: | ||||
Investments (net of change in deferred taxes payable of $254,092) | 509,336,265 | |||
Foreign currency translation | (17,929,681 | ) | ||
| 491,406,584 | ||||
Net Realized and Unrealized Gain | 586,967,343 | |||
Net Increase in Net Assets Resulting From Operations | $ | 608,926,543 | ||
See notes to financial statements.
| Certified Annual Report | 15 |
STATEMENTS OF CHANGES IN NET ASSETS
Thornburg International Value Fund
| Year Ended September 30, 2005 | Year Ended September 30, 2004 | ||||||
INCREASE (DECREASE) IN NET ASSETS FROM: | |||||||
OPERATIONS: | |||||||
Net investment income | $ | 21,959,200 | $ | 6,816,361 | |||
Net realized gain on investments and foreign currency transactions | 95,560,759 | 21,723,437 | |||||
Increase (Decrease) in unrealized appreciation (depreciation) on investments, foreign currency translation, and deferred taxes | 491,406,584 | 61,424,573 | |||||
Net Increase in Net Assets Resulting from Operations | 608,926,543 | 89,964,371 | |||||
DIVIDENDS TO SHAREHOLDERS: | |||||||
From net investment income | |||||||
Class A Shares | (15,978,639 | ) | 0 | ||||
Class B Shares | (42,865 | ) | 0 | ||||
Class C Shares | (1,295,932 | ) | 0 | ||||
Class I Shares | (9,263,083 | ) | 0 | ||||
Class R1 Shares | (831,509 | ) | 0 | ||||
Class R5 Shares | (63,095 | ) | 0 | ||||
FUND SHARE TRANSACTIONS (NOTE 4): | |||||||
Class A Shares | 914,862,678 | 797,028,763 | |||||
Class B Shares | 17,432,995 | 14,140,582 | |||||
Class C Shares | 296,865,675 | 172,158,420 | |||||
Class I Shares | 475,565,309 | 242,069,929 | |||||
Class R1 Shares | 94,648,632 | 10,904,969 | |||||
Class R5 Shares | 13,789,338 | 0 | |||||
Net Increase in Net Assets | 2,394,616,047 | 1,326,267,034 | |||||
NET ASSETS: | |||||||
Beginning of year | 1,519,557,132 | 193,290,098 | |||||
End of year | $ | 3,914,173,179 | $ | 1,519,557,132 | |||
See notes to financial statements.
| 16 | Certified Annual Report |
| NOTES TO FINANCIAL STATEMENTS | ||
Thornburg International Value Fund | September 30, 2005 | |
NOTE 1 – ORGANIZATION
Thornburg International Value Fund, hereinafter referred to as the “Fund,” is a diversified series of Thornburg Investment Trust (the “Trust”). The Trust was organized as a Massachusetts business trust under a Declaration of Trust dated June 3, 1987 and is registered as a diversified, open-end management investment company under the Investment Company Act of 1940, as amended. The Trust is currently issuing eleven series of shares of beneficial interest in addition to those of the Fund: Thornburg Limited Term Municipal Fund, Thornburg California Limited Term Municipal Fund, Thornburg Limited Term U.S. Government Fund, Thornburg New Mexico Intermediate Municipal Fund, Thornburg Intermediate Municipal Fund, Thornburg Limited Term Income Fund, Thornburg Florida Intermediate Municipal Fund, Thornburg Value Fund, Thornburg Core Growth Fund, Thornburg New York Intermediate Municipal Fund, and Thornburg Investment Income Builder Fund. Each series is considered to be a separate entity for financial reporting and tax purposes and bears expenses directly attributable to it. The Fund seeks long-term capital appreciation by investing primarily in both foreign and domestic equity securities selected on a value basis.
The Fund currently offers six classes of shares of beneficial interest, Class A, Class B, Class C, Institutional Class (Class I), and Retirement Class (Class R1 and Class R5) shares. Each class of shares of a Fund represents an interest in the same portfolio of investments of the Fund, except that (i) Class A shares are sold subject to a front-end sales charge collected at the time the shares are purchased and bear a service fee, (ii) Class B shares are sold at net asset value without a sales charge at the time of purchase, but are subject to a contingent deferred sales charge upon redemption and bear both a service fee and distribution fee, (iii) Class C shares are sold at net asset value without a sales charge at the time of purchase, but are subject to a contingent deferred sales charge upon redemption within one year, and bear a service fee and a distribution fee, (iv) Class I shares are sold at net asset value without a sales charge at the time of purchase, (v) Class R1 shares are sold at net asset value without a sales charge at the time of purchase, but bear both a service fee and distribution fee, (vi) Class R5 shares are sold at net asset value without a sales charge at the time of purchase, and (vii) the respective classes may have different reinvestment privileges and conversion rights. Additionally, the Fund may allocate among its classes certain expenses, to the extent allowable to specific classes, including transfer agent fees, government registration fees, certain printing and postage costs, and administrative and legal expenses. Currently, class specific expenses of the Fund are limited to service and distribution fees, administration fees, and certain registration and transfer agent expenses. Class B shares of the Fund outstanding for eight years will convert to Class A shares of the Fund.
NOTE 2 – SIGNIFICANT ACCOUNTING POLICIES
Significant accounting policies of the Trust are as follows:
Valuation of Securities: In determining the net asset value of investments, investments are stated at value based on latest sales prices, normally at 4:00 pm EST reported on securities exchanges on the last business day of the period. Investments for which no sale is reported are valued at the mean between bid and asked prices or in accordance with such other method as the Trustees may authorize. In any case where a market quotation is not readily available, the Trust’s valuation and pricing committee determines a fair value for the investment using factors approved by the Trustees. Short term obligations having remaining maturities of 60 days or less are valued at amortized cost, which approximates market value.
Foreign Currency Translation: Portfolio securities and other assets and liabilities denominated in foreign currencies are translated into U.S. dollars based on the exchange rate of such currencies against the U.S. dollar on the date of valuation. Purchases and sales of securities and income items denominated in foreign currencies are translated into U.S. dollars at the exchange rate in effect on the translation date. When the Fund purchases or sells foreign securities it will customarily enter into a foreign exchange contract to minimize foreign exchange risk from the trade date to the settlement date of such transactions.
The Fund does not separately report the effect of changes in foreign exchange rates from changes in market prices on securities held. Such changes are included in net realized and unrealized gain or loss from investments.
Reported net realized foreign exchange gains or losses arise from sales of foreign currencies, currency gains or losses realized between the trade and settlement dates on securities transactions and the difference between the amount of interest recorded on the Fund’s books, and the U.S. dollar equivalent of the amounts actually received or paid.
Deferred Taxes: The Fund is subject to a tax imposed on net realized gains of securities of certain foreign countries. The Fund records an estimated deferred tax liability for net unrealized gains on these securities as reflected in the accompanying financial statements.
Federal Income Taxes: It is the policy of the Trust to comply with the provisions of the Internal Revenue Code applicable to “regulated investment companies” and to distribute all taxable income, including any net realized gain on investments of the Fund to the shareholders. Therefore, no provision for Federal income taxes is required.
When-Issued and Delayed Delivery Transactions: The Trust may engage in when-issued or delayed delivery transactions. To the extent the Trust engages in such transactions, it will do so for the purpose of acquiring portfolio securities consistent with the Fund’s investment objectives and not for the purpose of investment leverage or to speculate on interest rate and/or market changes. At the time the Trust makes a commitment to purchase a security on a when-issued basis, the Fund will record the transaction and reflect the value in determining its net asset value. When effecting such transactions, assets of an amount
| Certified Annual Report | 17 |
| NOTES TO FINANCIAL STATEMENTS, CONTINUED | ||
Thornburg International Value Fund | September 30, 2005 | |
sufficient to make payment for the portfolio securities to be purchased will be segregated on the Fund’s records on the trade date. Securities purchased on a when-issued or delayed delivery basis do not earn interest until the settlement date.
Dividends: Dividends to shareholders are generally paid quarterly and are reinvested in additional shares of the Fund at net asset value per share at the close of business on the dividend payment date or, at the shareholder’s option, paid in cash. Net realized capital gains, to the extent available, will be distributed at least annually. Distributions to shareholders are based on income tax regulations and, therefore, their characteristics may differ for financial statement and tax purposes.
General: Securities transactions are accounted for on a trade date basis. Interest income is accrued as earned and dividend income is recorded on the ex-dividend date. Certain income from foreign securities is recognized as soon as information is available to the Fund. Realized gains and losses from the sale of securities are recorded on an identified cost basis. Net investment income, other than class specific expenses and realized and unrealized gains and losses, is allocated daily to each class of shares based upon the relative net asset value of outstanding shares of each class of shares at the beginning of the day (after adjusting for the current share activity of the respective class). Expenses common to all funds are allocated among the funds comprising the Trust based upon their relative net asset values or other appropriate allocation methods.
Guarantees and Indemnifications: Under the Trust’s organizational documents, its officers and Trustees are indemnified against certain liability arising out of the performance of their duties to the Fund. Additionally, in the normal course of business, the Trust enters into contracts with service providers that contain general indemnification clauses. The Trust’s maximum exposure under these arrangements is unknown. However, based on experience, the Trust expects the risk of loss to be remote.
Use of Estimates: The preparation of financial statements, in conformity with generally accepted accounting principles, requires management to make estimates and assumptions that affect the reported amounts of assets and liabilities and the disclosure of contingent assets and liabilities at the date of the financial statements and the reported amounts of increases and decreases in net assets from operations during the reporting period. Actual results could differ from those estimates.
NOTE 3 – INVESTMENT ADVISORY FEE AND OTHER TRANSACTIONS WITH AFFILIATES
Pursuant to an investment advisory agreement, Thornburg Investment Management, Inc.® (the “Advisor”) serves as the investment advisor and performs services to the Fund for which the fees are payable at the end of each month. For the year ended September 30, 2005, these fees were payable at annual rates ranging from .875 of 1% to .675 of 1% per annum of the average daily net assets of the Fund depending on the Fund’s asset size.
The Fund also has an administrative services agreement with the Advisor, whereby the Advisor will perform certain administrative services for the shareholders of each class of the Fund’s shares, and for which fees will be payable at an annual rate of up to .125 of 1% per annum of the average daily net assets attributable to each class of shares. For the year ended September 30, 2005, the Advisor voluntarily reimbursed certain class specific expenses and administrative fees of $4,496 for Class B shares, $154,331 for Class I shares, $146,888 for Class R1 shares, and $20,265 for Class R5 shares.
The Trust has an underwriting agreement with Thornburg Securities Corporation® (the “Distributor”, an affiliate of the Advisor), which acts as the Distributor of the Fund’s shares. For the year ended September 30, 2005, the Distributor has advised the Fund that it earned net commissions aggregating $355,292 from the sale of Class A shares of the Fund and collected contingent deferred sales charges aggregating $67,027 from redemptions of Class C shares of the Fund.
Pursuant to a service plan under Rule 12b-1 of the Investment Company Act of 1940, the Fund may reimburse to the Advisor an amount not to exceed .25 of 1% per annum of its average daily net assets attributable to each class of shares of the Fund for payments made by the Advisor to securities dealers and other financial institutions to obtain various shareholder related services. The Advisor may pay out of its own resources additional expenses for distribution of the Fund’s shares.
The Trust has also adopted distribution plans pursuant to Rule 12b-1, applicable only to the Fund’s Class B, Class C, and Class R1 shares, under which the Fund compensates the Distributor for services in promoting the sale of Class B, Class C, and Class R1 shares of the Fund at an annual rate of up to .75 of 1% per annum of the average daily net assets attributable to Class B, Class C, and Class R1 shares. Total fees incurred by the Distributor for each class of shares of the Fund under their respective service and distribution plans for the year ended September 30, 2005, are set forth in the Statement of Operations.
The Trust has an agreement with the custodian bank to indirectly pay a portion of the custodian’s fees through credits earned by the Fund’s cash on deposit with the bank. This deposit agreement is an alternative to overnight investments. Custodial fees have been adjusted to reflect amounts that would have been paid without this agreement, with a corresponding adjustment reflected as fees paid indirectly in the Statement of Operations. For the year ended September 30, 2005, fees paid indirectly were $72,001.
Certain officers and Trustees of the Trust are also officers and/or Directors of the Advisor and Distributor. The compensation of independent Trustees is borne by the Trust.
| 18 | Certified Annual Report |
| NOTES TO FINANCIAL STATEMENTS, CONTINUED | ||
Thornburg International Value Fund | September 30, 2005 | |
NOTE 4 – SHARES OF BENEFICIAL INTEREST
At September 30, 2005, there were an unlimited number of shares of beneficial interest authorized. Sale of Class R5 shares commenced February 1, 2005. Transactions in shares of beneficial interest were as follows:
Year Ended September 30, 2005 | Year Ended September 30, 2004 | |||||||||||||
| Shares | Amount | Shares | Amount | |||||||||||
Class A Shares | ||||||||||||||
Shares sold | 60,454,538 | $ | 1,242,916,897 | 51,167,423 | $ | 894,268,597 | ||||||||
Shares issued to shareholders in reinvestment of dividends | 516,124 | 11,403,851 | — | — | ||||||||||
Shares repurchased** | (16,431,651 | ) | (339,458,070 | ) | (5,531,059 | ) | (97,239,834 | ) | ||||||
Net Increase (Decrease) | 44,539,011 | $ | 914,862,678 | 45,636,364 | $ | 797,028,763 | ||||||||
** The Fund charges a redemption fee of 1% of the Class A shares exchanged within 90 days of purchase. For the year ended September 30, 2005 and year ended September 30, 2004, $94,738 and $51,074, respectively, were netted in the amount reported for shares repurchased. |
| |||||||||||||
Class B Shares | ||||||||||||||
Shares sold | 984,619 | $ | 19,222,274 | 897,624 | $ | 15,193,868 | ||||||||
Shares issued to shareholders in reinvestment of dividends | 1,513 | 33,010 | — | — | ||||||||||
Shares repurchased | (92,953 | ) | (1,822,289 | ) | (62,324 | ) | (1,053,286 | ) | ||||||
Net Increase (Decrease) | 893,179 | $ | 17,432,995 | 835,300 | $ | 14,140,582 | ||||||||
Class C Shares | ||||||||||||||
Shares sold | 16,705,254 | $ | 329,116,035 | 10,858,583 | $ | 184,217,626 | ||||||||
Shares issued to shareholders in reinvestment of dividends | 34,263 | 741,499 | — | — | ||||||||||
Shares repurchased | (1,663,255 | ) | (32,991,859 | ) | (716,792 | ) | (12,059,206 | ) | ||||||
Net Increase (Decrease) | 15,076,262 | $ | 296,865,675 | 10,141,791 | $ | 172,158,420 | ||||||||
Class I Shares | ||||||||||||||
Shares sold | 25,541,204 | $ | 537,358,303 | 14,591,120 | $ | 258,463,205 | ||||||||
Shares issued to shareholders in reinvestment of dividends | 305,722 | 6,870,416 | — | — | ||||||||||
Shares repurchased** | (3,256,726 | ) | (68,663,410 | ) | (921,861 | ) | (16,393,276 | ) | ||||||
Net Increase (Decrease) | 22,590,200 | $ | 475,565,309 | 13,669,259 | $ | 242,069,929 | ||||||||
** The Fund charges a redemption fee of 1% of the Class I shares exchanged within 90 days of purchase. For the year ended September 30, 2005 and year ended September 30, 2004, $28,336 and $18,249, respectively, were netted in the amount reported for shares repurchased. |
| |||||||||||||
| Certified Annual Report | 19 |
| NOTES TO FINANCIAL STATEMENTS, CONTINUED | ||
Thornburg International Value Fund | September 30, 2005 | |
Year Ended September 30, 2005 | Year Ended September 30, 2004 | |||||||||||||
Class R1 Shares | ||||||||||||||
Shares sold | 5,096,497 | $ | 105,840,553 | 686,300 | $ | 12,209,648 | ||||||||
Shares issued to shareholders in reinvestment of dividends | 24,709 | 559,227 | — | — | ||||||||||
Shares repurchased | (558,900 | ) | (11,751,148 | ) | (73,228 | ) | (1,304,679 | ) | ||||||
Net Increase (Decrease) | 4,562,306 | $ | 94,648,632 | 613,072 | $ | 10,904,969 | ||||||||
Class R5 Shares* | ||||||||||||||
Shares sold | 620,945 | $ | 13,726,467 | — | $ | — | ||||||||
Shares issued to shareholders in reinvestment of dividends | 2,722 | 63,095 | — | — | ||||||||||
Shares repurchased | (10 | ) | (224 | ) | — | — | ||||||||
Net Increase (Decrease) | 623,657 | $ | 13,789,338 | — | $ | — | ||||||||
| * | Effective date of Class R5 shares was February 1, 2005. |
NOTE 5 – SECURITIES TRANSACTIONS
For the year ended September 30, 2005, the Fund had purchase and sale transactions of investment securities (excluding short-term investments) of $2,725,185,254 and $854,633,399, respectively.
NOTE 6 – INCOME TAXES
At September 30, 2005, information on the tax components of capital is as follows:
Cost of investments for tax purpose | $ | 3,413,834,078 | ||
Gross unrealized appreciation on a tax basis | $ | 623,983,770 | ||
Gross unrealized depreciation on a tax basis | (33,446,447 | ) | ||
Net unrealized appreciation (depreciation) on investments (tax basis) | $ | 590,537,323 | ||
Distributable earnings - ordinary income | $ | 28,534,716 | ||
Distributable Capital Gains | $ | 59,147,989 |
The Fund utilized $7,110,004 of its capital loss carry forward during the year ended September 30, 2005.
At September 30, 2005, the Fund had deferred tax basis currency losses occurring subsequent to October 31, 2004 of $1,612,785. For tax purposes, such losses will be reflected in the year ending September 30, 2006.
In order to account for permanent book/tax differences, the Fund decreased undistributed net investment income (loss) by $2,842,585 and increased accumulated net realized gain by $2,842,585. This reclassification has no impact on the net asset value of the Fund. Reclassifications result primarily from foreign currency losses and realized foreign capital gains taxes.
The tax character of distributions paid by the Fund for the year ended September 30, 2005 was $27,475,123 from the distribution of ordinary income.
NOTE 7 – FINANCIAL INSTRUMENTS WITH OFF-BALANCE SHEET RISK AND FOREIGN INVESTMENT RISK
During the year ended September 30, 2005, the Fund was a party to financial instruments with off-balance sheet risks, primarily currency forward exchange contracts. A forward exchange contract is an agreement between two parties to exchange different currencies at a specified rate at an agreed upon future date. These contracts are purchased in order to minimize the risk to the Fund with respect to its foreign stock transactions from adverse changes in the relationship between the U.S. dollar and foreign currencies. In each case these contracts have been initiated in conjunction with foreign stock transactions. These instruments may involve market risks in excess of the amount recognized on the Statement of Assets and Liabilities. Such risks would arise from the possible inability of counterparties to meet the terms of their contracts, future movement in currency value and interest rates and contract positions that are not exact offsets. These contracts are reported in the financial statements at the Fund’s net equity, as measured by the difference between the forward exchange rates at the reporting date and the forward exchange rates at the dates of entry into the contract. There are special risks associated with international investing, including currency fluctuations, government regulation, political developments, and differences in liquidity.
| 20 | Certified Annual Report |
| NOTES TO FINANCIAL STATEMENTS, CONTINUED | ||
Thornburg International Value Fund | September 30, 2005 | |
| CONTRACTS TO SELL:
| ||||||||
| Contracts | Contract Value Date | Market Value | ||||||
| 155,000,000 | Euro Dollar for 187,709,650 USD | January 10, 2006 | $ | (195,172 | ) | |||
| 85,000,000 | Euro Dollar for 102,450,500 USD | January 11, 2006 | (600,163 | ) | ||||
| 120,000,000 | Greater British Pound for 208,344,000 USD | January 10, 2006 | (3,748,098 | ) | ||||
| 85,000,000 | Greater British Pound for 147,738,500 USD | January 11, 2006 | (2,493,429 | ) | ||||
| 1,400,000,000 | Indian Rupee for 31,638,418 USD | October 07, 2005 | (198,553 | ) | ||||
| 3,300,000,000 | Indian Rupee for 74,024,226 USD | April 04, 2006 | (749,373 | ) | ||||
| 450,000,000 | Mexican Peso for 38,818,201 USD | October 07, 2005 | (2,833,474 | ) | ||||
| 680,000,000 | Mexican Peso for 60,687,193 USD | December 14, 2005 | (1,614,282 | ) | ||||
| 70,000,000 | Mexican Peso for 6,252,791 USD | January 11, 2006 | (137,951 | ) | ||||
| Unrealized loss from forward Sell contracts: | (12,570,495 | ) | ||||||
| 147,500,000 | Swiss Franc for 118,874,919 USD | February 10, 2006 | 3,041,630 | |||||
| 58,500,000 | Euro Dollar for 76,289,850 USD | October 05, 2005 | 5,733,753 | |||||
| 98,600,000 | Euro Dollar for 122,212,728 USD | December 02, 2005 | 2,938,345 | |||||
| 390,000,000 | Mexican Peso for 35,691,407 USD | February 10, 2006 | 219,161 | |||||
| 710,000,000 | Mexican Peso for 64,247,579 USD | April 04, 2006 | 91,721 | |||||
| Unrealized gain from forward Sell contracts: | 12,024,610 | |||||||
| Net unrealized gain (loss) from forward Sell contracts: | $ | (545,885 | ) | |||||
| CONTRACTS TO BUY: | ||||||||
| Contracts | Contract Value Date | Market Value | ||||||
| 147,500,000 | Swiss Franc for 120,750,207 USD | February 10, 2006 | $ | (4,916,917 | ) | |||
| 58,500,000 | Euro Dollar for 72,978,165 USD | October 05, 2005 | (2,422,068 | ) | ||||
| 98,600,000 | Euro Dollar for 123,336,768 USD | December 02, 2005 | (4,062,385 | ) | ||||
| 120,000,000 | Greater British Pound for 221,089,200 USD | January 10, 2006 | (8,997,102 | ) | ||||
| 450,000,000 | Mexican Peso for 41,734,292 USD | October 07, 2005 | (82,616 | ) | ||||
| Unrealized loss from forward Buy contracts: | (20,481,088 | ) | ||||||
| 1,400,000,000 | Indian Rupee for 31,782,066 USD | October 07, 2005 | 54,905 | |||||
| Unrealized gain from forward Buy contracts: | 54,905 | |||||||
| Net unrealized gain (loss) from forward Buy contracts: | $ | (20,426,183 | ) | |||||
| Net unrealized gain (loss) from forward Exchange contracts: | $ | (20,972,068 | ) | |||||
| Certified Annual Report | 21 |
Thornburg International Value Fund
| Year Ended September 30, | Period Ended Sept. 30, | |||||||||||||||||||
| 2005 | 2004 | 2003 | 2002 | 2001(b) | ||||||||||||||||
Class I Shares: | ||||||||||||||||||||
PER SHARE PERFORMANCE | ||||||||||||||||||||
(for a share outstanding throughout the period)+ | ||||||||||||||||||||
Net asset value, beginning of period | $ | 18.48 | $ | 15.13 | $ | 11.96 | $ | 12.40 | $ | 14.63 | ||||||||||
Income from investment operations: | ||||||||||||||||||||
Net investment income (loss) | 0.28 | 0.24 | 0.14 | 0.10 | 0.11 | |||||||||||||||
Net realized and unrealized gain (loss) on investments | 4.72 | 3.11 | 3.03 | (0.54 | ) | (2.21 | ) | |||||||||||||
Total from investment operations | 5.00 | 3.35 | 3.17 | (0.44 | ) | (2.10 | ) | |||||||||||||
Less dividends from: | ||||||||||||||||||||
Net investment income | (0.29 | ) | — | — | — | (0.08 | ) | |||||||||||||
Return of capital | — | — | — | — | (0.05 | ) | ||||||||||||||
Total dividends | (0.29 | ) | — | — | — | (0.13 | ) | |||||||||||||
Change in net asset value | 4.71 | 3.35 | 3.17 | (0.44 | ) | (2.23 | ) | |||||||||||||
NET ASSET VALUE, end of period | $ | 23.19 | $ | 18.48 | $ | 15.13 | $ | 11.96 | $ | 12.40 | ||||||||||
RATIOS/SUPPLEMENTAL DATA | ||||||||||||||||||||
Total return(c) | 27.15 | % | 22.14 | % | 26.51 | % | (3.55 | )% | (14.50 | )% | ||||||||||
Ratios to average net assets: | ||||||||||||||||||||
Net investment income (loss) | 1.32 | % | 1.35 | % | 1.07 | % | 0.71 | % | 1.57 | %(a) | ||||||||||
Expenses, after expense reductions | 0.99 | % | 0.99 | % | 0.99 | % | 0.99 | % | 0.97 | %(a) | ||||||||||
Expenses, after expense reductions and net of custody credits | 0.99 | % | 0.99 | % | 0.99 | % | 0.99 | % | — | |||||||||||
Expenses, before expense reductions | 1.02 | % | 1.11 | % | 1.25 | % | 1.28 | % | 1.38 | %(a) | ||||||||||
Portfolio turnover rate | 34.17 | % | 35.84 | % | 58.35 | % | 28.39 | % | 61.05 | % | ||||||||||
Net assets at end of period (000) | $ | 892,216 | $ | 293,583 | $ | 33,511 | $ | 19,187 | $ | 11,249 | ||||||||||
| (a) | Annualized. |
| (b) | Effective date of Class I Shares was March 30, 2001. |
| (c) | Not annualized for periods less than one year. |
| + | Based on weighted average shares outstanding. |
| 22 | Certified Annual Report |
Thornburg International Value Fund | September 30, 2005 |
CUSIPS: CLASS A - 885-215-657, CLASS B - 885-215-616, CLASS C - 885-215-640, CLASS I - 885-215-566, CLASS R1 - 885-215-525, CLASS R5 - 885-215-368
NASDAQ SYMBOLS: CLASS A - TGVAX, CLASS B - THGBX, CLASS C - THGCX, CLASS I - TGVIX, CLASS R1 - TGVRX, CLASS R5 - TIVRX
| Shares/ Principal Amount | Value | ||||
COMMON STOCK — 98.19% | |||||
AUTOMOBILES & COMPONENTS — 6.00% | |||||
AUTOMOBILES — 6.00% | |||||
Bayerische Motoren Werke AG | 1,134,276 | $ | 53,422,748 | ||
Hero Honda Motors Ltd. | 2,311,127 | 39,005,032 | |||
Hyundai Motor Co. | 788,900 | 61,674,197 | |||
Toyota Motor Corp. | 1,762,600 | 80,899,598 | |||
| 235,001,575 | |||||
BANKS — 11.78% | |||||
COMMERCIAL BANKS — 11.78% | |||||
Bank of Fukuoka Ltd. | 8,584,300 | 61,979,411 | |||
Bank of Yokohama | 2,050,700 | 15,656,962 | |||
Barclays plc | 7,884,400 | 79,937,314 | |||
ICICI Bank Ltd. | 832,737 | 11,371,174 | |||
ICICI Bank Ltd. Sponsored ADR | 905,000 | 25,566,250 | |||
Kookmin Bank | 1,090,800 | 64,349,352 | |||
Lloyds TSB Group plc | 9,097,700 | 75,175,231 | |||
Royal Bank of Scotland Group plc | 2,356,100 | 67,077,372 | |||
Shinhan Financial Group Co. | 1,721,200 | 59,932,432 | |||
| 461,045,498 | |||||
CAPITAL GOODS — 1.96% | |||||
AEROSPACE & DEFENSE — 1.96% | |||||
Embraer Brasileira de Aeronaut ADR | 1,992,128 | 76,896,141 | |||
| 76,896,141 | |||||
COMMERCIAL SERVICES & SUPPLIES — 1.63% | |||||
COMMERCIAL SERVICES & SUPPLIES — 1.63% | |||||
Secom Co. | 1,320,600 | 63,643,373 | |||
| 63,643,373 | |||||
CONSUMER DURABLES & APPAREL — 3.21% | |||||
TEXTILES, APPAREL & LUXURY GOODS — 3.21% | |||||
Adidas-Salomon AG | 371,821 | 64,821,247 | |||
Burberry Group plc | 7,951,946 | 60,783,184 | |||
| 125,604,431 | |||||
| Certified Annual Report | 23 |
| SCHEDULE OF INVESTMENTS, CONTINUED | ||
Thornburg International Value Fund | September 30, 2005 | |
| Shares/ Principal Amount | Value | ||||
DIVERSIFIED FINANCIALS — 7.42% | |||||
CAPITAL MARKETS — 1.85% | |||||
UBS AG | 848,580 | $ | 72,415,671 | ||
DIVERSIFIED FINANCIAL SERVICES — 5.57% | |||||
Deutsche Börse AG | 858,109 | 82,259,266 | |||
Euronext NV | 1,743,897 | 77,004,200 | |||
Hong Kong Exchanges & Clearing Ltd. | 17,097,400 | 58,630,111 | |||
| 290,309,248 | |||||
ENERGY — 12.01% | |||||
ENERGY EQUIPMENT & SERVICES — 2.20% | |||||
Schlumberger Ltd. | 1,018,400 | 85,932,592 | |||
OIL, GAS & CONSUMABLE FUELS — 9.81% | |||||
BP Amoco ADR | 1,876,700 | 132,964,195 | |||
Canadian Natural Resources Ltd. | 1,494,500 | 67,583,660 | |||
China Petroleum & Chemical Corp. | 145,812,000 | 66,731,460 | |||
China Shenhua Energy+ | 40,000,000 | 46,925,660 | |||
Lukoil Oil Co. Sponsored ADR | 1,209,400 | 69,927,508 | |||
| 470,065,075 | |||||
FOOD & STAPLES RETAILING — 6.64% | |||||
FOOD & STAPLES RETAILING — 6.64% | |||||
Carrefour SA | 1,206,200 | 55,675,804 | |||
FamilyMart Co. Ltd. | 2,019,100 | 60,771,711 | |||
Tesco plc | 14,018,053 | 76,767,011 | |||
Wal-Mart de México | 13,113,400 | 66,528,473 | |||
| 259,742,999 | |||||
FOOD BEVERAGE & TOBACCO — 2.13% | |||||
FOOD PRODUCTS — 2.13% | |||||
Cadbury Schweppes plc | 8,247,541 | 83,473,148 | |||
| 83,473,148 | |||||
INSURANCE — 3.93% | |||||
INSURANCE — 3.93% | |||||
Millea Holdings, Inc. | 5,027 | 80,755,020 | |||
Willis Group Holdings Ltd. | 1,947,788 | 73,139,439 | |||
| 153,894,459 | |||||
MATERIALS — 2.36% | |||||
CHEMICALS — 1.37% | |||||
Givaudan AG | 83,560 | 53,740,295 | |||
| 24 | Certified Annual Report |
| SCHEDULE OF INVESTMENTS, CONTINUED | ||
Thornburg International Value Fund | September 30, 2005 | |
| Shares/ Principal Amount | Value | ||||
METALS & MINING — 0.99% | |||||
Tokyo Steel Mfg. | 2,476,700 | $ | 38,584,011 | ||
| 92,324,306 | |||||
MEDIA — 6.37% | |||||
MEDIA — 6.37% | |||||
Promotora de Informaciones SA | 2,308,300 | 44,672,734 | |||
Rogers Communications Inc.+ | 2,238,900 | 88,248,472 | |||
Shaw Communications | 2,817,900 | 58,981,843 | |||
Sogecable SA+ | 1,467,000 | 57,454,146 | |||
| 249,357,195 | |||||
PHARMACEUTICALS & BIOTECHNOLOGY — 12.97% | |||||
PHARMACEUTICALS — 12.97% | |||||
GlaxoSmithKline plc | 3,889,835 | 99,248,218 | |||
Novartis AG ADR | 1,168,600 | 59,598,600 | |||
Novo Nordisk A/S | 1,499,600 | 74,385,161 | |||
Roche Holdings AG | 548,200 | 76,467,308 | |||
Sanofi-Aventis | 1,342,600 | 111,299,852 | |||
Teva Pharmaceutical Industries Ltd. ADR | 2,593,000 | 86,658,060 | |||
| 507,657,199 | |||||
SEMICONDUCTORS & SEMICONDUCTOR EQUIPMENT — 0.90% | |||||
SEMICONDUCTORS & SEMICONDUCTOR EQUIPMENT — 0.90% | |||||
Samsung Electronics Co. Ltd. | 62,300 | 35,138,993 | |||
| 35,138,993 | |||||
SOFTWARE & SERVICES — 2.44% | |||||
SOFTWARE — 2.44% | |||||
Amdocs Ltd.+ | 1,684,400 | 46,708,412 | |||
Check Point Software Technologies Ltd.+ | 2,010,000 | 48,883,200 | |||
| 95,591,612 | |||||
TECHNOLOGY HARDWARE & EQUIPMENT — 4.45% | |||||
COMMUNICATIONS EQUIPMENT — 1.57% | |||||
Tandberg ASA | 4,596,000 | 61,515,281 | |||
COMPUTERS & PERIPHERALS — 1.45% | |||||
Logitech International+ | 1,397,656 | 56,762,833 | |||
OFFICE ELECTRONICS — 1.43% | |||||
Canon Inc. | 1,036,800 | 56,097,657 | |||
| 174,375,771 | |||||
| Certified Annual Report | 25 |
| SCHEDULE OF INVESTMENTS, CONTINUED | ||
Thornburg International Value Fund | September 30, 2005 | |
| Shares/ Principal Amount | Value | ||||||
TELECOMMUNICATION SERVICES — 8.49% | |||||||
DIVERSIFIED TELECOMMUNICATION SERVICES — 3.65% | |||||||
Singapore Telecommunications Ltd. | 48,964,000 | $ | 70,972,815 | ||||
TDC A/S | 1,333,800 | 71,979,641 | |||||
WIRELESS TELECOMMUNICATION SERVICES — 4.84% | |||||||
America Movil S.A. de C.V. | 4,073,544 | 107,215,678 | |||||
Vodafone Group plc ADR | 3,160,900 | 82,088,573 | |||||
| 332,256,707 | |||||||
TRANSPORTATION — 3.50% | |||||||
TRANSPORTATION INFRASTRUCTURE — 3.50% | |||||||
China Merchants Hldgs International Co. Ltd. | 27,867,000 | 62,150,601 | |||||
Fraport AG | 1,443,731 | 74,908,805 | |||||
| 137,059,406 | |||||||
TOTAL COMMON STOCK (Cost $3,241,844,839) | 3,843,437,136 | ||||||
OTHER SECURITIES — 0.87% | |||||||
iShares FTSE/Xinhua China 25 Index Fund+ | 529,300 | 33,991,646 | |||||
TOTAL OTHER SECURITIES (Cost $ 32,527,148) | 33,991,646 | ||||||
SHORT TERM INVESTMENTS — 3.24% | |||||||
American General, 3.77%, 10/3/2005 | $ | 29,000,000 | 28,993,926 | ||||
American General, 3.77%, 10/4/2005 | 26,000,000 | 25,991,831 | |||||
American General, 3.81%, 10/5/2005 | 13,000,000 | 12,994,497 | |||||
American General, 3.82%, 10/6/2005 | 33,000,000 | 32,982,492 | |||||
Citigroup Funding, Inc., 3.76%, 10/5/2005 | 15,000,000 | 14,993,733 | |||||
Citigroup Funding, Inc., 3.78%, 10/13/2005 | 11,000,000 | 10,986,140 | |||||
TOTAL SHORT TERM INVESTMENTS (Cost $126,942,619) | 126,942,619 | ||||||
TOTAL INVESTMENTS — 102.30% (COST $3,401,314,606) | $ | 4,004,371,401 | |||||
LIABILITIES NET OF OTHER ASSETS — (2.30)% | (90,198,222 | ) | |||||
NET ASSETS — 100.00% | $ | 3,914,173,179 | |||||
Footnote Legend
See notes to financial statements.
| + | Non-income producing |
Portfolio Abbreviations
To simplify the listings of securities, abbreviations are used per the table below:
| ADR | American Depository Receipt |
| 26 | Certified Annual Report |
| SCHEDULE OF INVESTMENTS, CONTINUED | ||
Thornburg International Value Fund | September 30, 2005 | |
SUMMARY OF INDUSTRY EXPOSURE
As of 9/30/05
Pharmaceuticals & Biotechnology | 13.0 | % | |
Energy | 12.0 | % | |
Banks | 11.8 | % | |
Telecommunication Services | 8.5 | % | |
Diversified Financials | 7.4 | % | |
Food & Staples Retailing | 6.6 | % | |
Media | 6.4 | % | |
Automobiles & Components | 6.0 | % | |
Technology Hardware & Equipment | 4.5 | % | |
Insurance | 3.9 | % | |
Transportation | 3.5 | % | |
Consumer Durables & Apparel | 3.2 | % | |
Software & Services | 2.4 | % | |
Materials | 2.4 | % | |
Food, Beverage & Tobacco | 2.1 | % | |
Capital Goods | 2.0 | % | |
Commercial Services & Supplies | 1.6 | % | |
Semiconductors & Semiconductor Equip. | 0.9 | % | |
Other Securities | 0.9 | % | |
Other Assets & Cash Equivalents | 0.9 | % |
SUMMARY OF COUNTRY EXPOSURE
As of 9/30/05
United Kingdom | 21.2 | % | |
Japan | 11.7 | % | |
Switzerland | 8.2 | % | |
Germany | 7.0 | % | |
France | 6.2 | % | |
South Korea | 5.7 | % | |
Canada | 5.5 | % | |
China | 5.4 | % | |
Mexico | 4.4 | % | |
Denmark | 3.7 | % | |
Israel | 3.5 | % | |
U.S. | 3.4 | % | |
Spain | 2.6 | % | |
Brazil | 2.0 | % | |
India | 1.9 | % | |
Singapore | 1.8 | % | |
Russia | 1.8 | % | |
Norway | 1.6 | % | |
Hong Kong | 1.5 | % |
| Certified Annual Report | 27 |
REPORT OF INDEPENDENT REGISTERED PUBLIC ACCOUNTING FIRM
Thornburg International Value Fund
To the Trustees and Class I Shareholders of
Thornburg International Value Fund
In our opinion, the accompanying statement of assets and liabilities, including the schedule of investments, and the related statements of operations and of changes in net assets and the financial highlights present fairly, in all material respects, the financial position of Thornburg International Value Fund (one of the portfolios constituting Thornburg Investment Trust, hereafter referred to as the “Fund”) at September 30, 2005, the results of its operations for the year then ended, the changes in its net assets for each of the two years in the period then ended and the financial highlights for Class I shares for each of the periods presented, in conformity with accounting principles generally accepted in the United States of America. These financial statements and financial highlights (hereafter referred to as “financial statements”) are the responsibility of the Fund’s management. Our responsibility is to express an opinion on these financial statements based on our audits. We conducted our audits of these financial statements in accordance with the standards of the Public Company Accounting Oversight Board (United States). Those standards require that we plan and perform the audit to obtain reasonable assurance about whether the financial statements are free of material misstatement. An audit includes examining, on a test basis, evidence supporting the amounts and disclosures in the financial statements, assessing the accounting principles used and significant estimates made by management, and evaluating the overall financial statement presentation. We believe that our audits, which included confirmation of securities at September 30, 2005 by correspondence with the custodian and brokers, provide a reasonable basis for our opinion.
PricewaterhouseCoopers LLP
New York, New York
November 16, 2005
| 28 | Certified Annual Report |
| EXPENSE EXAMPLE | |||
Thornburg International Value Fund | September 30, 2005 | (Unaudited) | |
As a shareholder of the Fund, you incur two types of costs:
(1) transaction costs, including a 90-day redemption fee on Class I shares; and
(2) ongoing costs, including management and administrative fees and other Fund expenses.
This example is intended to help you understand your ongoing costs (in dollars) of investing in the Fund and to compare these costs with the ongoing costs of investing in other mutual funds.
The example is based on an investment of $1,000 invested on March 31, 2005 and held until September 30, 2005.
Actual Expenses
The first line of the table at right provides information about actual account values and actual expenses. You may use the information in this line, together with the amount you invested, to estimate the expenses that you paid over the period. Simply divide your account value by $1,000 (for example, an $8,600 account value divided by $1,000 = 8.6), then multiply the result by the number in the first line under the heading entitled “Expenses Paid During Period” to estimate the expenses you paid on your account during this period.
Hypothetical Example for Comparison Purposes
The second line of the table at right provides information about hypothetical account values and hypothetical expenses based on the Fund’s actual expense ratio and an assumed rate of return of 5% per year before expenses, which is not the Fund’s actual return. The hypothetical account values and expenses may not be used to estimate the actual ending account balance or expenses you paid for the period. You may use this information to compare the ongoing costs of investing in the Fund and other funds. To do so, compare this 5% hypothetical example with the 5% hypothetical examples that appear in the shareholder reports of the other funds.
Please note that the expenses shown in the table are meant to highlight your ongoing costs only and do not reflect any transactional costs, such as sales charges (loads), redemption fees, or exchange fees. Therefore, the second line of the table is useful in comparing ongoing costs only, and will not help you determine the relative total costs of owning different funds. In addition, if these transactional costs were included, your costs would have been higher.
| Beginning Account Value 3/31/05 | Ending Account Value 9/30/05 | Expenses Paid During Period† 3/31/05–9/30/05 | |||||||
Class I Shares | |||||||||
Actual | $ | 1,000.00 | $ | 1,126.90 | $ | 5.28 | |||
Hypothetical* | $ | 1,000.00 | $ | 1,020.11 | $ | 5.01 | |||
| † | Expenses are equal to the annualized expense ratio for Class I shares (0.99%) multiplied by the average account value over the period, multiplied by 183/365 to reflect the one-half year period. |
| * | Hypothetical assumes a rate of return of 5% per year before expenses. |
| Certified Annual Report | 29 |
| INDEX COMPARISON | ||
Thornburg International Value Fund | September 30, 2005 (Unaudited) | |
GROWTH OF A HYPOTHETICAL $10,000 INVESTMENT
Thornburg International Value Fund versus MSCI EAFE Index (March 30, 2001 to September 30, 2005)
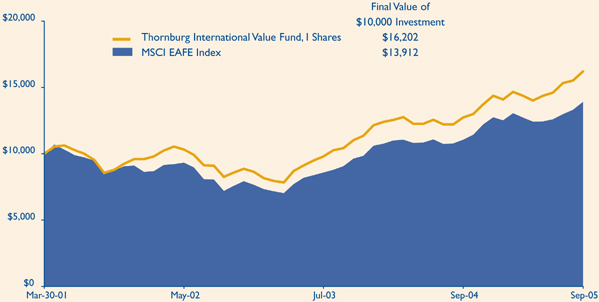
AVERAGE ANNUAL TOTAL RETURNS
For periods ended September 30, 2005
| 1 Yr | 3 Yrs | Since Inception | |||||||
I Shares (Incep: 03/30/01) | 27.15 | % | 25.25 | % | 11.30 | % | |||
MSCI EAFE Index (Since: 03/30/01) | 25.79 | % | 24.61 | % | 7.60 | % |
Performance data reflects past performance, which is no guarantee of future results. The performance data and graph do not reflect the deduction of taxes that a shareholder would pay on distributions or the redemption of Fund shares.
Returns reflect the reinvestment of dividends and capital gains. There is no up-front sales charge for Class I shares. Class I shares are subject to a 1% 90-day redemption fee.
The Morgan Stanley Capital International (MSCI) Europe, Australasia, Far East Index (EAFE) is an unmanaged index. It is a generally accepted benchmark for major overseas markets. Index weightings represent the relative capitalizations of the major overseas markets included in the index on a U.S. dollar adjusted basis. The index is calculated with gross dividends reinvested in U.S. dollars. Unless otherwise noted, index returns do not reflect fees, brokerage commissions or other expenses of investing. Investors may not make direct investments into any index.
| 30 | Certified Annual Report |
| TRUSTEES AND OFFICERS | ||
Thornburg International Value Fund | September 30, 2005 (Unaudited) | |
Name, Age, Position Held with Fund Year Elected | Principal Occupation(s) During Past Five Years | Other Directorships Held by Trustee | ||
INTERESTED TRUSTEES(1)(2)(4) | ||||
Garrett Thornburg, 59 Chairman of Trustees, Trustee since 1987(3) | CEO, Chairman and controlling shareholder of Thornburg Investment Management, Inc. (investment advisor) and Thornburg Securities Corporation (securities dealer); Chairman of Thornburg Limited Term Municipal Fund, Inc. (registered investment company) to 2004; CEO and Chairman of Thornburg Mortgage, Inc. (real estate investment trust); Chairman of Thornburg Mortgage Advisory Corporation (investment manager to Thornburg Mortgage, Inc.). | Director of Thornburg Mortgage, Inc. (real estate investment trust) | ||
Brian J. McMahon, 49 Trustee since 2001, Member of Governance & Nominating Committee, President since 1997(5)(6) | President and Managing Director of Thornburg Investment Management, Inc.; President of Thornburg Limited Term Municipal Fund, Inc. to 2004. | None | ||
INDEPENDENT TRUSTEES(1)(2)(4) | ||||
David A. Ater, 60 Trustee since 1994, Member of Audit Committee and Governance & Nominating Committee | Principal in Ater & Associates, Santa Fe, NM (developer, planner and broker of residential and commercial real estate); owner developer and broker for various real estate projects. | Director of Thornburg Mortgage, Inc. (real estate investment trust) | ||
David D. Chase, 64 Chairman of Audit Committee, Trustee since 2000 | Chairman, President, CEO, and Managing Member of Vestor Associates, LLC, the general partner of Vestor Partners, LP, Santa Fe, NM (private equity fund); Chairman and CEO of Vestor Holdings, Inc., Santa Fe, NM (merchant bank). | None | ||
Eliot R. Cutler, 59 Chairman of Governance & Nominating Committee, Trustee since 2004 | Partner, Akin, Gump, Strauss, Hauer & Feld, LLP, Washington, D.C. (law firm) since November 2000; partner, Cutler & Stanfield, Washington, D.C. (law firm) until November 2000. | Director of Thornburg Mortgage, Inc. (real estate investment trust) | ||
Susan H. Dubin, 56 Trustee since 2004, Member of Audit Committee | President of Dubin Investments, Ltd., Greenwich, CT (private investment fund); Director and officer of various charitable organizations; and formerly, Vice President of Chemical Bank (predecessor to JP Morgan Chase & Co.), New York, 1974–1996. | None | ||
Owen D.Van Essen, 51 Trustee since 2004, Member of Governance & Nominating Committee | President of Dirks,Van Essen & Murray, Santa Fe, NM (newspaper mergers and acquisitions). | None | ||
James W. Weyhrauch, 46 Trustee since 1996, Member of Audit Committee | Director, Executive Vice President to 2002, and President and CEO 2002–2004, Nambé Mills, Inc., Santa Fe, NM (manufacturer); real estate agent, Santa Fe Properties, Santa Fe, NM since 2004. | None | ||
| Certified Annual Report | 31 |
| TRUSTEES AND OFFICERS, CONTINUED | ||
Thornburg International Value Fund | September 30, 2005 (Unaudited) | |
Name, Age, Position Held with Fund Year Elected | Principal Occupation(s) During Past Five Years | Other Directorships Held by Trustee | ||
OFFICERS OF THE FUND (WHO ARE NOT TRUSTEES)(1)(6)(7) | ||||
Dawn B. Fischer, 58 Secretary since 1987 | Secretary and Managing Director, Thornburg Investment Management, Inc.; Secretary, Thornburg Limited Term Municipal Fund, Inc. to 2004; Secretary, Thornburg Securities Corporation; Vice President, Daily Tax Free Income Fund, Inc. (registered investment company). | Not applicable | ||
Steven J. Bohlin, 46 Vice President since 1987; Treasurer since 1989 | Vice President and Managing Director of Thornburg Investment Management, Inc.; Vice President of Thornburg Limited Term Municipal Fund, Inc. to 2004. | Not applicable | ||
George T. Strickland, 42 Vice President since 1996 | Vice President and Managing Director of Thornburg Investment Management, Inc.; Vice President (to 2004) and Treasurer (2003–2004) of Thornburg Limited Term Municipal Fund, Inc. | Not applicable | ||
William V. Fries, 66 Vice President since 1995 | Vice President and Managing Director of Thornburg Investment Management, Inc. | Not applicable | ||
Leigh Moiola, 38 Vice President since 2001 | Vice President and Managing Director of Thornburg Investment Management, Inc.; Vice President of Thornburg Limited Term Municipal Fund, Inc. 1999–2004. | Not applicable | ||
Kenneth Ziesenheim, 51 Vice President since 1995 | Vice President and Managing Director of Thornburg Investment Management, Inc.; President of Thornburg Securities Corporation; Vice President of Thornburg Limited Term Municipal Fund, Inc. to 2004. | Not applicable | ||
Alexander Motola, 35 Vice President since 2001 | Vice President and Managing Director of Thornburg Investment Management, Inc. since 2000; Portfolio Manager, Insight Capital Research & Management, Inc., Walnut Creek, California 1995–2000. | Not applicable | ||
Wendy Trevisani, 34 Vice President since 1999 | Associate Portfolio Manager of Thornburg Investment Management, Inc. since 1999, Vice President since 2000 and Managing Director since 2003; Vice President of Thornburg Limited Term Municipal Fund, Inc. 1999–2002. | Not applicable | ||
Joshua Gonze, 42 Vice President since 1999 | Associate Portfolio Manager of Thornburg Investment Management, Inc. since 1999, Vice President since 1999 and Managing Director since 2003; Vice President of Thornburg Limited Term Municipal Fund, Inc. to 2004. | Not applicable | ||
Brad Kinkelaar, 37 Vice President since 1999 | Associate Portfolio Manager of Thornburg Investment Management, Inc. since 1999, Vice President since 2000 and Managing Director since 2003. | Not applicable | ||
Christopher Ihlefeld, 35 Vice President since 2003 | Associate Portfolio Manager since 1999; Vice President of Thornburg Investment Management, Inc. since 2002; Vice President of Limited Term Municipal Fund, Inc., 2003–2004. | Not applicable | ||
Leon Sandersfeld, 39 Vice President since 2003 | Associate of Thornburg Investment Management, Inc. since 2002; Senior Staff Accountant, Farm Bureau Life Insurance Co. 1998–2002. | Not applicable | ||
| 32 | Certified Annual Report |
| TRUSTEES AND OFFICERS, CONTINUED | ||
Thornburg International Value Fund | September 30, 2005 (Unaudited) | |
Name, Age, Position Held with Fund Year Elected | Principal Occupation(s) During Past Five Years | Other Directorships Held by Trustee | ||
Sasha Wilcoxon, 31 Vice President since 2003 | Associate of Thornburg Investment Management, Inc. since 2000 and Mutual Fund Operations Department Manager since 2002. | Not applicable | ||
Ed Maran, 47 Vice President since 2004 | Associate Portfolio Manager of Thornburg Investment Management, Inc. since 2002 and Vice President and Managing Director since 2004; Analyst, USAA 2001–2002; Oil Analyst, A.G. Edwards 1997–2000. | Not applicable | ||
Vinson Walden, 35 Vice President since 2004 | Associate Portfolio Manager of Thornburg Investment Management, Inc. since 2002 and Vice President and Managing Director since 2004; Associate Portfolio Manager, Ibis Management 2002–2004; Associate, Lehman Brothers, 1997–2001. | Not applicable | ||
| (1) | Each person’s address is 119 East Marcy Street, Santa Fe, New Mexico 87501. |
| (2) | The Fund is one of twelve separate investment “Funds” or “series” of Thornburg Investment Trust (the “Trust”), which comprises the Thornburg mutual fund complex and is organized as a Massachusetts business trust. The Trust currently has twelve active Funds.Thornburg Investment Management, Inc. is the investment advisor to, and manages, the twelve Funds of the Trust. Each Trustee oversees the twelve Funds in the fund complex. |
| (3) | Mr. Thornburg is considered an “interested” Trustee under the Investment Company Act of 1940 because he is a director and controlling shareholder of Thornburg Investment Management, Inc., the investment advisor to the twelve active Funds of the Trust, and is the sole director and controlling shareholder of Thornburg Securities Corporation, the distributor of shares for the Trust. |
| (4) | Each Trustee serves in office until the election and qualification of a successor. |
| (5) | Mr. McMahon is considered an “interested” Trustee because he is the president of Thornburg Investment Management, Inc. |
| (6) | The Trust’s president, secretary and treasurer each serves a one-year term or until the election and qualification of a successor; each other officer serves at the pleasure of the Trustees. |
| (7) | Assistant vice presidents, assistant secretaries and assistant treasurers are not shown. |
The Statement of Additional Information for each Fund of the Trust includes additional information about the Trustees and is available, without charge and upon request, by calling 1-800-847-0200.
| Certified Annual Report | 33 |
| OTHER INFORMATION | ||
Thornburg International Value Fund | September 30, 2005 (Unaudited) | |
PORTFOLIO PROXY VOTING
Policies and Procedures:
The Trust has delegated to Thornburg Investment Management, Inc. (the “Advisor”) voting decisions respecting proxies for the Fund’s voting securities. The Advisor makes voting decisions in accordance with its Proxy Voting Policy and Procedures. A description of the Policy and Procedures is available (i) without charge, upon request, by calling the Advisor toll-free at 1-800-847-0200, (ii) on the Thornburg website at www.thornburg.com, and (iii) on the Securities and Exchange Commission’s website at www.sec.gov.
Commencing August 31, 2004, information regarding how proxies were voted is available on or before August 31 of each year for the twelve months ending the preceding June 30. This information is available (i) without charge, upon request by calling the advisor toll-free at 1-800-847-0200, (ii) on the Thornburg website at www.thornburg.com, and (iii) on the Securities and Exchange Commission’s website at www.sec.gov.
TAX INFORMATION
For the tax year ended September 30, 2005, the Thornburg International Value Fund designates 100% of the dividends paid from tax basis net ordinary income as qualifying for the reduced rate under the Jobs and Growth Tax Relief and Reconciliation Act of 2003.
The information and distributions reported herein may differ from the information and distributions taxable to the shareholders for the calendar year ending December 31, 2005. Complete information will be computed and reported in conjunction with your 2005 Form 1099-DIV.
0.11% of the ordinary income distributions paid by the Fund for the year ended September 30, 2005 qualified for the corporate dividends received deduction.
For the year ended September 30, 2004, foreign taxes paid and foreign source income were $1,669,313 and $6,417,510, respectively. Additionally, for the year ended September 30, 2005, foreign taxes paid and foreign source income is $4,032,102 and $36,328,566, respectively.
Please note that the above information is provided to satisfy Internal Revenue Code notification requirements. Foreign tax information will be provided with your 2005 1099-DIV.
AVAILABILITY OF QUARTERLY PORTFOLIO SCHEDULE
The Fund files with the Securities and Exchange Commission schedules of its portfolio holdings on Form N-Q for the first and third quarters of each fiscal year. The Fund’s Forms N-Q are available on the Commission’s website at www.sec.gov, or may be reviewed and copied at the Commission’s Public Reference Room in Washington, D.C. Information on the operation of the Public Reference Room may be obtained by calling 1-800-SEC-0330. The Fund also makes this information available on its website at www.thornburg.com/download or upon request by calling 1-800-847-0200.
TRUSTEES DELIBERATIONS RESPECTING RENEWAL OF INVESTMENT ADVISORY AGREEMENT
Thornburg Investment Management, Inc. (the “Advisor”) provides investment management services to Thornburg International Value Fund pursuant to an investment advisory agreement. The Trustees consider the renewal of this agreement annually and most recently determined to renew the agreement on September 13, 2005.
In connection with their general supervision of the Advisor, the Trustees receive and consider reports throughout the year from the Advisor respecting the Advisor’s management of the Fund’s investments. These reports include information about the Fund’s purchase and sale of portfolio investments and explanations from the Advisor respecting investment selections, the investment performance of the Fund, general appraisals of industry and economic prospects and factors, and other matters affecting the Fund and relating to the Advisor’s performance of services for the Fund.
In anticipation of their recent consideration of the advisory agreement’s renewal, the independent Trustees met with representatives of the Advisor in July 2005 to specify the information the Advisor would present to the Trustees for their review. The independent Trustees thereafter met in independent session to consider various factors respecting the agreement’s renewal, and met in a subsequent session with the Advisor’s chief investment officer to present questions. Following these sessions, the Trustees met on September 13, 2005 to consider a renewal of the advisory agreement.
The Trustees considered various factors in their review of the Advisor’s performance under the investment advisory agreement, including specifically the principles outlined in their February 2005 Statement to Shareholders, a copy of which accompanies this Annual Report to Shareholders. Summarized below are certain of the factors considered by the Trustees, in connection with the determination to renew the advisory agreement. In determining to renew the advisory agreement, the Trustees did not identify any single fact or aspect of the Advisor’s performance as controlling, and this summary does not describe all of the matters considered by the Trustees in making their determination.
Quality of Services; Fund Investment Performance. In reviewing the nature, extent, and quality of services provided by the Advisor and the investment performance of the Fund, the Trustees primarily considered the Advisor’s adherence to the Fund’s stated objectives and policies, the Advisor’s execution of the Fund’s investment strategies in prevailing market
| 34 | Certified Annual Report |
OTHER INFORMATION, CONTINUED | ||
Thornburg International Value Fund | September 30, 2005 | |
conditions, the Fund’s absolute investment performance, the Fund’s investment performance compared to categories of other broadly similar mutual funds and broad based securities indices, the Fund’s investment performance over different periods of time, the Fund’s total returns in rising and declining markets compared to total returns of a broad based securities index, measures of relative portfolio risk, and related factors. The Trustees noted in comparing the Fund to other mutual funds and to indices that the value of such comparisons may be limited because the Fund’s investment approach, and the selection of its portfolio securities, are unique or differ in considerable degree from the characteristics of other funds and indices. In conducting their review, the Trustees observed that the Advisor had continued to faithfully pursue and to achieve the Fund’s stated objectives, as demonstrated particularly by the Advisor’s selection of investments and the Fund’s investment performance. The Trustees also noted in this regard the Fund’s superior investment performance in most periods as compared to broad based securities indices and categories of mutual funds selected by independent mutual fund analyst firms.
The Trustees also considered a number of other factors in reviewing the quality of the Advisor’s services, including the qualifications and integrity of the Advisor’s senior personnel, the Advisor’s staffing and other resources, the Advisor’s compliance with regulatory requirements, Fund sales performance and perceptions of the Funds in the marketplace, and other factors.
The Trustees concluded, based upon these and other considerations, that the Advisor had actively and competently pursued the Fund’s stated investment objectives in accordance with the Fund’s investment policies stated in its prospectuses. The Trustees further concluded that the investment performance of the Fund was satisfactory in the context of the Fund’s objectives and policies and prevailing market conditions.
Fees and Expenses; Profitability of Advisor. In reviewing the fees charged by the Advisor to the Fund, the Trustees primarily considered the fees charged by the Advisor and the other expenses charged to the Fund in light of the nature and quality of services provided, comparison of the actual Advisor’s fee and Fund expenses to the statement of fees and expenses in the Fund’s prospectuses, comparisons of the Advisor’s fee and other Fund expenses to median and average fees and expenses charged to similar mutual funds, and comparisons of fees and expenses charged to the Fund with fees and expenses charged to other, similar specific mutual funds. In addition, the Trustees considered the profitability of the Advisor compared to other investment management firms, and comparisons of the investment management fee rates charged by the Advisor to the Fund with rates charged to other clients of the Advisor and the differing types of services furnished to the Fund and the other clients. The Trustees noted that the Fund’s management fee and overall expense ratio were lower than the average and median fee rates and expense ratios for a group of international equity mutual funds assembled by an independent mutual fund analyst firm. The Trustees also observed in their review that fee rates charged by the Advisor to other clients of the Advisor were not directly comparable to rates charged to the Fund principally because of the significant differences in the services provided.
The Trustees concluded, based upon these and other considerations, that the fees charged to the Fund by the Advisor were fair and reasonable in view of the following: the services provided, the clear disclosure of these fees and expenses in the Fund’s prospectuses, and prevailing fees and expenses charged to mutual funds generally. The Trustees further concluded that there was no indication that the Advisor’s profitability was unusual, viewed in the context of the services provided, the performance of the Fund, and the fees and profitability of other investment management firms.
Economies of Scale. In reviewing the extent to which economies of scale would be realized by the Fund as it grows and whether fee levels reflect economies of scale, the Trustees considered the breakpoint structure for advisory fees chargeable to the Fund, the demonstrated economies of scale enjoyed by the Fund and other Funds of the Trust as they had grown in size, and economies of scale realized by other mutual funds. The Trustees concluded that the Fund has realized and may reasonably be expected to realize further economies of scale for the benefit of its shareholders as it grows in size.
Ancillary Benefits to Advisor. In reviewing benefits enjoyed by the Advisor because of its relationship with the Fund, the Trustees considered an arrangement through which the Advisor received certain research services, favorable publicity received by the Advisor because of the superior investment performance of certain Funds of the Trust, and the benefits to the Fund from the Advisor’s expansion of its staffing and other resources to serve a broader variety of investment clients. The Trustees concluded, based upon these and other considerations, that there was no unusual or unfair benefit enjoyed by the Advisor and that the Fund enjoyed benefits by virtue of the Advisor’s engagement by other investment clients.
| Certified Annual Report | 35 |
Trustees’ Statement to Shareholders
Not part of the Certified Annual Report
February 8, 2005
The Trustees are concerned that recent commentaries and opinions reported in the media may confuse investors in general as to the supervisory duties of trustees of mutual funds and, in particular, leave Thornburg Investment Trust shareholders uncertain regarding how we discharge our responsibilities in supervising the Funds’ investment advisor and in reviewing the advisor’s contract for renewal. We decided to spell out clearly three principal guidelines that we follow in supervising the Trust’s investment advisor on your behalf.
We begin with the premise that each shareholder selected his or her Fund because its investments are managed by the investment advisor identified in the prospectus and in accordance with the objective and policies described in the prospectus. We realize, as each of you do, that if you believe that your Fund’s stated objective and policies no longer serve your personal investment goals, you can sell your shares and leave the Fund.
Therefore, we believe that our primary supervisory task – our principal obligation to you – is to assess the nature and quality of the advisor’s services, and to confirm that the advisor actively and competently pursues the Fund’s objective, in accordance with the policies set out in the prospectus. To do this, we meet regularly with management to review your Fund’s portfolio and to discuss the advisor’s specific actions and judgments in pursuing the Fund’s objective. We do not substitute our own judgment for the advisor’s decisions in selecting investments; the advisor is paid to exercise its informed judgment on investment decisions, and we seek to confirm, in reviewing the advisor’s performance, that the advisor is doing just that.
Second, while we are conscious of costs and the effect that costs have on shareholders’ returns, we do not seek the lowest fees or expense ratio as our sole or primary objective. We try to make sure that your Fund’s fees and costs are reasonable in relationship to the services rendered and that they are generally in line with those charged by other expert investment advisors, consistent with our belief that the Fund’s investors searched for and expect that expertise and attention and have decided to pay a reasonable price for it. We do not put the management contract “out to bid” as a matter of course, and we would not do so unless we had concluded that the advisor materially had failed to pursue the Fund’s objectives in accordance with its policies, or for other equally important reasons. We believe that any other approach would be inconsistent with your interests and contrary to your expectations when you bought shares of the Fund in the first place.
Finally, because we believe that most Thornburg Fund shareholders have invested with a long-term perspective, we try not to focus too much on the fashions of the moment and on short-term performance. The market will not favor any specific investment objective or set of policies at all times and under all economic circumstances. A fund will experience periods of both high and low returns relative to other funds and other investments. Even if one of our Funds is not favored by the market at a particular time, we believe that the advisor is nonetheless obliged to remain true to the Fund’s objective and policies, and we watch to see that it does so.
This statement is submitted for the general information of the shareholders of Thornburg Investment Trust. It is not authorized for distribution to prospective investors in the Fund unless preceded or accompanied by an effective prospectus. If you have not received a prospectus, one can be obtained from your financial advisor, online at www.thornburg.com/download, or by calling 800-847-0200. Carefully consider information in the prospectus regarding the Fund’s investment objectives and policies, risks, sales charges, expenses, experience of its management, marketability of shares, and other information. Read it carefully before you invest or send money.
| 36 | This page is not part of the Annual Report. |
This page intentionally left blank.
| This page is not part of the Annual Report. | 37 |
This page intentionally left blank.
| 38 | This page is not part of the Annual Report. |
Planning Options
Retirement and Education Accounts
Thornburg Investment Management offers retirement and education savings accounts that can help you meet a variety of planning challenges. For account applications or further information on any of the accounts below, please call 1-800-847-0200 or go to www.thornburg.com/ira. Your financial advisor can help you determine which plan is right for you.
Individual Retirement Accounts
Individual Retirement Accounts (IRAs) provide a tax-advantaged means to save money for the future. For a detailed outline of the difference between retirement accounts, see www.thornburg.com/ira. Rollovers are available. Call 1-800-847-0200 for more information.
Traditional IRAs – Contributions to Traditional IRAs are tax deductible for eligible individuals, and withdrawals are taxed as additional ordinary income. You may contribute to an IRA if you receive compensation and are under 701/2, even if you are covered by an employer retirement plan.
Roth IRAs – Under a Roth IRA, there is no tax deduction for contributions, but there is no income tax on qualified withdrawals. For a more detailed comparison of Traditional and Roth IRAs, please see our web site at www.thornburg.com/ira.
SEP IRAs – Simplified Employee Pension (SEP) IRAs are established by employers. The employer is allowed a tax deduction for contributions made to the SEP Plan and makes contributions to each eligible employee’s SEP IRA on a discretionary basis.
SIMPLE IRAs – Savings Incentive Match Plan for Employees of Small Employers (SIMPLE) is designed to give small business owners a simplified method to establish and contribute to a retirement plan for employees. The employer is allowed a tax deduction for contributions and makes either matching or non-elective contributions to each eligible employee’s SIMPLE IRA. Employees may make salary deferral contributions.
403(b)
A special, tax-advantaged savings vehicle available only to employees of 501(c)(3) organizations, such as charitable, educational, scientific and religious organizations. 403(b) plans are also available to employees of public schools and universities.
Coverdell Education Savings Account
These savings accounts are designed to provide a way to save money for higher education expenses. In an Education Savings Account, earnings and interest grow tax free, and qualified withdrawals used to pay for eligible higher-education expenses are tax- and penalty-free.
Funds Available
The following funds are available in the accounts listed above:
| • | Thornburg International Value Fund |
| • | Thornburg Value Fund |
| • | Thornburg Core Growth Fund |
| • | Thornburg Investment Income Builder Fund |
| • | Thornburg Limited Term U.S. Government Fund |
| • | Thornburg Limited Term Income Fund |
| This page is not part of the Annual Report. | 39 |
The Firm
Thornburg Investment Management® is a privately held investment management company based in Santa Fe, New Mexico with assets under management of over $16 billion. Founded in 1982, the firm manages four equity funds, eight bond funds, and separate portfolios for select institutions and individuals.
Investment Philosophy
We seek to preserve and increase the real wealth of the Funds’ shareholders after accounting for inflation, taxes, and investment expenses. We’re committed to disciplined investing and controlling risk in all market environments through laddered bond and focused equity portfolios.
Portfolio Holdings Disclosure
We believe you should know about your portfolio. Our web site keeps investors informed of the Funds’ equity holdings. Go to www.thornburg.com/funds for commentary on our equity fund holdings.
Co-Ownership of Funds
We invest side-by-side with the Funds’ shareholders. Our employees have invested over $110 million in Thornburg Funds.
Core Strategies for Building Wealth
We deliver core strategies to help investors meet long-term goals. A core strategy is a consistent, disciplined and proven investment process that represents the foundation of a diversified portfolio.
| Investment Manager: | Distributor: | |
 |  | |
119 East Marcy Street | 119 East Marcy Street | |
Santa Fe, New Mexico 87501 | Santa Fe, New Mexico 87501 | |
800.847.0200 | 800.847.0200 | |

Core Strategies for Building Wealth
Thornburg Core Growth Fund
Informational Brochure and
Annual Report – September 30, 2005
Overall Morningstar Rating™
Overall rating among 664 funds in the Mid-Cap Growth category covering the three-year period ended October 31, 2005, based on risk-adjusted returns.
Star Quality
This report and the accompanying brochure are submitted for the general information of shareholders of the Fund. It is not authorized for distribution to prospective investors in the Fund unless preceded or accompanied by an effective prospectus. If you have not received a prospectus, one can be obtained from your financial advisor, online at www.thornburg.com/ download, or by calling 800-847-0200. Carefully consider information in the prospectus regarding the Fund’s investment objectives and policies, risks, sales charges, expenses, experience of its management, marketability of shares, and other information. Read it carefully before you invest or send money. Performance data quoted represents past performance and does not guarantee future results.
Thornburg Core Growth Fund
The Fund seeks long-term growth of capital by investing in a selection of quality growth stocks that management believes will have growing revenues and earnings.
The Fund can invest in companies of any size, from large, well-established firms to small, emerging growth franchises. Management uses traditional fundamental research to evaluate securities and make buy/sell decisions.
Thornburg Bond Funds
| • | Thornburg Limited Term Municipal Fund |
| • | Thornburg Intermediate Municipal Fund |
| • | Thornburg California Limited Term Municipal Fund |
| • | Thornburg New Mexico Intermediate Municipal Fund |
| • | Thornburg Florida Intermediate Municipal Fund |
| • | Thornburg New York Intermediate Municipal Fund |
| • | Thornburg Limited Term U.S. Government Fund |
| • | Thornburg Limited Term Income Fund |
Thornburg invests in short- and intermediate-term investment grade bonds. We ladder the maturities of individual bonds in the portfolios to moderate risk. Laddering involves building a portfolio of bonds with staggered maturities so that a portion of the portfolio will mature each year. We apply this disciplined process in all interest rate environments.
Thornburg Equity Funds
| • | Thornburg Value Fund |
| • | Thornburg International Value Fund |
| • | Thornburg Core Growth Fund |
| • | Thornburg Investment Income Builder Fund |
Thornburg’s equity research uses a fundamental, yet comprehensive, analytical approach. We invest when and where we perceive compelling value. Thornburg equity funds focus on a limited number of securities so that each holding can impact performance. The equity team searches for firms believed to have a promising future and seeks to buy shares of those companies at a discount to their intrinsic value.
More information at www.thornburg.com
 | Reduce paper clutter.
Receive your shareholder reports and prospectus online instead of through traditional mail.
Sign up at www.thornburg.com/edelivery |
2 | This page is not part of the Annual Report. |
Message
from the Chairman

Garrett Thornburg
Chairman & CEO
November 9, 2005
Dear Fellow Shareholder:
Thornburg Investment Management has a clear mission: to preserve and increase the real wealth of our shareholders. We seek to accomplish this through a range of equity funds that redefine traditional measures of value and growth and through a family of laddered bond funds that focus on quality, stability and minimizing risk over time.
Confirming our strategy, all Thornburg equity funds have ranked well within their respective categories.
The Thornburg equity funds employ a comprehensive approach which is more inclusive than the traditional deep value or high growth approach to stock selection. Within the Thornburg Value Fund and the Thornburg International Value Fund, the portfolios’ securities are classified into three baskets: basic value stocks, stocks of companies with consistent earnings, and stocks of emerging franchises. Thornburg Core Growth Fund’s holdings are classified into similar baskets: growth industry leaders, consistent growth companies, and emerging growth companies. After being identified through bottom-up screening from a worldwide universe, all stocks are subject to a rigorous selection process that must satisfy the Thornburg investment team’s two fundamental criteria: in the opinion of the portfolio manager, the companies must be selling at attractive discounts to intrinsic value and have compelling prospects for long-term growth. You can read much more about the stocks in your Fund’s portfolio at our web site, www.thornburg.com/funds.
During this decade, the average dividend yield paid by equity and hybrid mutual funds has dipped well below 1%. We established Thornburg Investment Income Builder Fund in late 2002 to be clearly different from other equity/hybrid funds by paying attractive dividends today, with a further goal of increasing these in the future. Our record to date shows clear success in achieving each aspect of this mission.
On the bond side, we have always had a highly disciplined approach of laddering short- and intermediate-bond maturities seeking to provide both an attractive return and relative stability of principal.
Recently, there has been a lot of news about improper behavior by some mutual fund companies. Many of the proposed new rules in response to this scandal have called for increased transparency. We welcome increased transparency. Thornburg Investment Management has been a leader in providing information about our stock holdings to our shareholders on our web site, www.thornburg.com.
Unfortunately, some of those new rules will increase the cost to all shareholders in mutual funds. We will do our best to keep these expenses to a minimal amount. After all, we are shareholders too! Thornburg employees have over $110 million invested in our own funds.
Thank you for investing with us. We will do our best to continue to earn your trust every day.
| Sincerely, |
 |
Garrett Thornburg Chairman & CEO |
| This page is not part of the Annual Report. | 3 |
Important Information
The information presented on the following pages was current as of September 30, 2005. The manager’s views, portfolio holdings, and sector diversification are historical and subject to change. This material should not be deemed a recommendation to buy or sell any of the securities mentioned.
Shares in the Fund carry risks including possible loss of principal. There are special risks associated with international investing, including currency fluctuations, government regulation, political developments, and differences in liquidity. Additionally, the Fund invests a portion of the assets in small capitalization companies which may increase the risk of greater price fluctuations. Funds invested in a limited number of holdings may expose an investor to greater volatility. Shares in the Fund are not deposits or obligations of, or guaranteed or endorsed by, any bank, the Federal Deposit Insurance Corporation, the Federal Reserve Board or any government agency.
Performance data given at net asset value (NAV) does not take into account the applicable sales charges. If the sales charges had been included, the performance would have been lower.
From time to time the Fund may invest in shares of companies through initial public offerings (IPOs). IPOs have the potential to produce substantial gains. There is no assurance that the Fund will have continued access to profitable IPOs and as the Fund’s assets grow, the impact of an IPO investment may decline. Therefore investors should not rely on these past gains as an indication of future performance.
The Morningstar Risk-Adjusted Rating (commonly called the star rating) brings both performance and risk together into one evaluation. To determine a fund’s star rating for a given period (three, five, or ten years), the fund’s Morningstar Risk score is subtracted from its Morningstar Return score. The resulting number is plotted along a bell curve to determine the fund’s rating for each time period: If the fund scores in the top 10% of its broad investment class (domestic stock, international stock, taxable bond, or municipal bond), it receives 5 stars (Highest); if it falls in the next 22.5%, it receives 4 stars (Above Average); a place in the middle 35% earns it 3 stars (Average); those in the next 22.5% receive 2 stars (Below Average); and the bottom 10% get 1 star (Lowest). The star ratings are recalculated monthly. Thornburg Core Growth Fund received 5 stars for the three-year period ended September 30, 2005, among 655 funds in the Mid-Cap Growth category.
Glossary
NASDAQ Composite Index – The NASDAQ Composite Index is a market-value weighted, technology-oriented index comprised of approximately 5,000 domestic and non-U.S.-based securities.
Russell 1000 Growth Index – Russell 1000 Growth Index measures the performance of those Russell 1000 companies with higher price-to-book ratios and higher forecasted growth values.
Standard & Poor’s 500 Stock Index (S&P 500) – An unmanaged index generally representative of the U.S. stock market, without regard to company size. Unless otherwise noted, index returns do not reflect fees, brokerage commissions or other expenses of investing. Investors may not make direct investments into any index.
Unless otherwise noted, index returns reflect the reinvestment of income dividends and capital gains, if any, but do not reflect fees, brokerage commissions or other expenses of investing. Investors may not make direct investments into any index. The performance of any index is not indicative of the performance of any particular investment.
Beta – Beta is a measure of market-related risk. Less than one means the portfolio is less volatile than the index, while greater than one indicates more volatility than the index.
Median Market Capitalization – Market capitalization (market cap) is the total value of a company’s stock, calculated by multiplying the number of outstanding common shares by the current share price. The company whose market cap is in the middle of the portfolio is the median market cap. Half the companies in the portfolio have values greater than the median, and half have values that are less. If there is an even number of companies, then the median is the average of the two companies in the middle.
Price to Book Value (P/B) – A ratio used to compare a stock’s market value to its book value. It is calculated by dividing the current closing price of the stock by the latest quarter’s book value (book value is simply assets minus liabilities).
Price to Cash Flow Ratio – A measure of the market’s expectations of a firm’s future financial health. It is calculated by dividing the price per share by cash flow per share.
Price to Earnings Ratio (P/E) – A valuation ratio of a company’s current share price compared to its per-share earnings. P/E equals a company’s market value per share divided by earnings per share.
4 | This page is not part of the Annual Report. |
Thornburg Core Growth Fund
Continually Evaluating the Risk Equation
Growth stocks are often referred to as “glamour” stocks . . . and it is easy to understand why. Growth stocks generate excitement. These are stocks where rapid earnings growth is expected to be followed by rapid price appreciation. Growth stocks capture the imagination, and investing in them can offer considerable opportunities for reward.
But growth stocks can also be volatile. Identifying which companies will succeed takes work. It takes digging down to the nuts and bolts of companies. The managers of Thornburg Core Growth Fund understand this. They know that it is grit, not glamour, that creates a successful growth fund.
Portfolio Manager Alex Motola and his team apply a rigorous stock selection process to investments for Thornburg Core Growth Fund. This is a portfolio run on common sense, not on abstract theory. Motola’s overarching philosophy is to create a fund that generates good performance over the long term, while reducing volatility in the interim. Intensive, hands-on, independent research is the central theme. While other growth funds rely on broad portfolio diversification to temper volatility, Thornburg Core Growth Fund concentrates on a limited number of stocks and diversifies those investments among three segments of the growth fund universe: consistent growth companies, growth industry leaders, and emerging growth companies. By limiting the number of securities, Thornburg’s managers can cover each stock in greater depth. Diversifying among three growth baskets further mitigates risk because each of these segments reacts differently than the equity markets as a whole.
How does the stock selection process work? Before adding a stock to the Fund’s portfolio, Motola and his team drill down into the company and its business. Their research goes well beyond the standard Wall Street analysis, and eschews today’s common growth investing mantra of buy growth at any price. Instead, the Thornburg team zeros in on the risk equation.
Companies are initially screened using a variety of quantitative measures and parameters. Most are rejected and logged onto a screening rejection spreadsheet. Only those with the most appealing opportunities to expand margins and grow earnings move on to the next step – the construction of a company-specific model. The goal is to cut to the quick and get at the underlying business. The team uses SEC filings to construct proprietary income statement, balance sheet and cash flow statement models for each remaining company. From these they analyze historical data, monitor current conditions, identify red-flags and estimate future growth potential.
Motola, a former historian who has been at the Fund’s helm since its inception, is not one to go along with the crowd. He and his team are not tied to “mainstream thinking.” While they have access to the best of Wall Street’s analysis, they are not ruled by it.
They test the strength of a company’s underlying business model against a variety of what-if screens. They conduct site visits and interview company management. And they complete the picture by checking in with a company’s major customers, suppliers, and distributors. Revenue and cost of goods sold are given particular attention, with each broken down in as many ways as the data will allow.
With growth stocks beginning to return to favor, this team is positioned to demonstrate the strength of its grit over glamour strategy . . . and eager to continue providing its shareholders with steady, consistent performance through a variety of market cycles.
| This page is not part of the Annual Report. | 5 |
Portfolio Overview
Thornburg Core Growth Fund
IMPORTANT PERFORMANCE INFORMATION
Performance data quoted represents past performance and does not guarantee future results. Investment return and principal value will fluctuate so that upon redemption, investor’s shares may be worth more or less than their original cost. Current performance may be lower or higher than the data quoted. For performance data current to the most recent month end, visit www.thornburg.com.
The maximum sales charge for Class A shares is 4.50%. A shares are subject to a 1% 90-day redemption fee.
MANAGEMENT TEAM

Left to Right: Connor Browne, Brian Summers, Alex Motola, and Lei Wang
KEY PORTFOLIO ATTRIBUTES
Portfolio P/E* | 23.12 | x | ||
Portfolio Price to Cash Flow* | 28.9 | |||
Portfolio Price to Book Value* | 4.3 | |||
Median Market Cap* | $ | 4.20 B | ||
3-Year Beta (Thornburg vs. NASDAQ)** | 0.74 | |||
Holdings | 35 |
| * | Source: Thomson Portfolio Analytics |
| ** | Source: Morningstar Principia Pro |
The Class A shares of the Thornburg Core Growth Fund posted a positive return of 30.73% at NAV for the twelve-month period ended September 30, 2005. The Fund outperformed both the Russell 1000 Growth Index, which returned 11.60% during the period, and the NASDAQ Composite Index, which returned 14.19%. Once again, stock selection was the primary driver of the Fund’s relative outperformance, as individual stocks from a variety of sectors and industries were the top performers in the Fund.
Consumer discretionary stocks had the most notable impact on the Fund’s outperformance of the benchmarks and represented a diverse and eclectic mix of holdings. Among the strong performers were Imax Corp., known for its large format theatres and patented 70mm film format, retailer CJ Home Shopping Co. Ltd., a South Korean home shopping company, and Life Time Fitness Inc., which operates super fitness centers.
Information technology represented the largest weight in the portfolio during the year and had a significant impact on the relative outperformance of the Fund. Significant holdings with good performance included Google Inc., which was one of the larger weighted holdings in the Fund for a majority of the year. Apple Computer Inc. contributed significant returns in addition to less recognizable names such as Datatrak International Inc., which provides software and services that enable the collection and transfer of clinical trial data electronically, and Netease.com Inc., a Chinese online gaming company. Technology related holdings represented a broad range of companies, which is characteristic of the flexible nature of the Fund.
AVERAGE ANNUAL TOTAL RETURNS*
FOR PERIODS ENDED SEPTEMBER 30, 2005
| 3Q ‘05 | 1 Yr | 3 Yrs | Since Inception | |||||||||
A Shares (Incep: 12/27/00) | ||||||||||||
Without Sales Charge | 8.64 | % | 30.73 | % | 30.12 | % | 3.72 | % | ||||
With Sales Charge | 3.72 | % | 24.87 | % | 28.16 | % | 2.73 | % | ||||
NASDAQ (Since: 12/27/00) | 4.78 | % | 14.19 | % | 23.09 | % | (2.96 | )% | ||||
Russell 1000 Growth (Since:12/27/00) | 4.01 | % | 11.60 | % | 14.74 | % | (4.45 | )% |
| * | Periods under one year are not annualized. |
6 | This page is not part of the Annual Report. |
Additional performance was garnered from a number of areas. One of the best performing stocks was financial holding Chicago Mercantile Exchange Holdings Inc., which operates the leading derivatives exchange in the U.S. Telecommunications stock NII Holdings Inc. performed well as it benefited from growing demand for digital wireless communication services in Latin America. Health care company WellPoint Inc. merged with Anthem to become the largest health benefits company in the U.S. Energy holding ATP Oil and Gas Corp. also provided a boost, as the offshore oil and gas company benefited from rising energy prices.
Although the Fund outperformed by a significant margin during the year, there were some holdings that did not work out. The most significant was Boston Scientific Corp., a long time holding that had a number of disappointing business developments and was sold based on those deteriorating fundamentals. Another poor performer was Ditech Communications, which provides voice processing products to mobile and wire-line operators. Ditech was sold off after experiencing an unexpected sales shortfall and is no longer held in the Fund.
Overall, the performance of the Fund was very good. The team’s comprehensive approach to growth and breadth of research were evident in the wide variety of companies held in the portfolio that contributed to positive returns during the year. As the Fund approaches its five-year anniversary, this flexible and opportunistic approach has enabled the Fund to fully benefit from the rigorous fundamental research conducted by the team and realize its goal of maximizing long-term after tax returns while controlling risk.
PERFORMANCE IMPACT FOR YEAR ENDED 9/30/05
Top Contributors | Top Detractors | |
Chicago Mercantile Exchange Co. | Boston Scientific Corp. | |
WellPoint Inc. | Ditech Communications | |
Google Inc. | PartyGaming plc | |
CJ Home Shopping Co. Ltd. | Pfizer Inc. | |
NII Holdings Inc. | DIRECTV Group Inc. | |
Source: Thomson Portfolio Analytics | ||
MARKET CAPITALIZATION EXPOSURE
As of 9/30/05
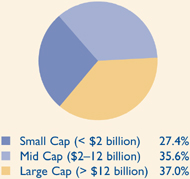
TOP TEN EQUITY HOLDINGS
As of 9/30/05
Google Inc. | 4.9 | % | |
Microsoft Corp. | 4.6 | % | |
Apple Computer Inc. | 4.1 | % | |
Amdocs Ltd. | 3.8 | % | |
Gilead Sciences Inc. | 3.7 | % | |
Sanofi-Aventis | 3.5 | % | |
Check Point Software | 3.4 | % | |
Cytyc Corp. | 3.4 | % | |
UnitedHealth Group Inc. | 3.3 | % | |
Chicago Mercantile Exchange Co. | 3.3 | % |
TOP TEN INDUSTRIES
As of 9/30/05
Software & Services | 19.5 | % | |
Health Care Equip & Services | 17.2 | % | |
Media | 10.6 | % | |
Pharmaceuticals & Biotech | 9.6 | % | |
Energy | 8.4 | % | |
Diversified Financials | 5.8 | % | |
Telecommunication Services | 5.2 | % | |
Semiconductors & Semi. Equipment | 4.7 | % | |
Technology Hardware & Equip | 4.1 | % | |
Retailing | 3.0 | % |
| This page is not part of the Annual Report. 7 |
This page intentionally left blank.
8 This page is not part of the Annual Report. |

Thornburg Core Growth Fund
September 30, 2005
| 10 | ||
| 12 | ||
| 14 | ||
| 16 | ||
| 17 | ||
| 22 | ||
| 26 | ||
| 30 | ||
| 31 | ||
| 32 | ||
| 33 | ||
| 36 | ||
This report is certified under the Sarbanes-Oxley Act of 2002, which requires that public companies, including mutual funds, affirm that the information provided in their annual and semiannual shareholder reports fully and fairly represents their financial position.
| Certified Annual Report 9 |

Alexander M.V.
Motola, CFA
Portfolio Manager
October 17, 2005
Dear Fellow Shareholder:
Over the past twelve months, the Thornburg Core Growth Fund has participated in the rising equity market. On September 30, 2004, the net asset value (NAV) for the Class A shares was $10.87. Twelve months later, the Fund’s NAV was $14.21. The Fund’s Class A shares outperformed its benchmarks with a total return of 30.73% at NAV during the past twelve months. The NASDAQ Composite Index returned 14.19% and the Russell 1000 Growth returned 11.60% over the twelve-month period.
Our health care sector exposure has declined over the past twelve months, from 34% of the portfolio to 27%. The sector remains a fertile area for investment ideas, and we continue to scour the landscape for promising opportunities. Our technology exposure appears to have remained constant, when comparing the start of the fiscal year to the finish, but actually it was not static throughout the year. Finally, our exposure to the consumer has continued to decline; a development we are very comfortable with when considering the twin risks of rising commodity prices and rising interest rates.
We finished the fiscal year slightly overweight in our Emerging Growth Companies basket, with 37% of our assets in that category. Consistent Growers represented 27% of assets, and Growth Industry Leaders made up 33% of the portfolio. Stocks with market capitalizations in excess of $12 billion represented 37% of the portfolio, our largest cap weighting.
Our biggest contributor to the Fund’s performance was the Chicago Mercantile Exchange Co. Although we did not participate in the initial public offering, our global exchange holdings (in other Thornburg funds) and the uniqueness of Chicago Mercantile’s business led us to believe it was a compelling opportunity. Google Inc. and Apple Computer Inc. were also large contributors to the Fund’s total return.
The situation with Apple is an interesting one, and was again highlighted in the aftermath of their recently released third quarter earnings. Many people have focused on the success and momentum surrounding the now ubiquitous iPod family of devices. However, the success of Apple’s stock depends largely on the company’s ability to design and sell elegant and easy-to-use personal computers. iPod revenues have certainly become more meaningful to the company, but it is the tendency of iPod users to buy Apple’s PC offerings that is most important.
Google has become a verb. The company has revolutionized an already innovative industry, and Google continues to benefit from the relentless and inevitable move of advertising and content from the printed world to the digital world. The universe of domestic companies with market capitalizations greater than $50 billion, and that are growing revenues in excess of 80%, is small. In fact, besides Google, which grew revenues 98% year over year in the second quarter, only one other 50 billion+ domestic market cap grew revenues even 50% – Goldman Sachs. In Goldman’s case, the 15 acquisitions they’ve made over the last year have helped ramp up their revenue growth. Google is a unique franchise in advertising in both the online world and in the investing world, and we feel that the stock will eventually reflect the full value of that opportunity.
What didn’t work? No central theme united the worst performers: PartyGaming plc, Boston Scientific, Jamdat Mobile Inc., and DIRECTV Group Inc. We purchased PartyGaming plc after it went public in the United Kingdom, and raised funds for the purchase by selling our modestly successful investment in Sportingbet plc. Our rationale was to participate more directly in online poker (PartyGaming plc is a pure play on that industry), versus being diluted by Sportingbet’s more diverse interests. We also felt that PartyGaming had a big advantage in that they had the most players, and hence the most interesting tournaments (and pots!). This “liquidity pool” of poker players did not prove to be as much of a competitive advantage as we had hoped, and the company has needed to spend ever-increasing amounts to attract and retain players. Jamdat Mobile suffered through a quarter where organic growth slowed faster than our expectations. One of Jamdat’s major wireless carrier customers, Cingular Wireless, decided to increase their inventory of games from Jamdat competitors and as a result Jamdat titles saw less sell through. Secondly, internal resource constraints at Jamdat pushed back the release of new game titles as the company worked through the integration of a previous acquisition. In addition to the issues specific to the second quarter for Jamdat, we sold Jamdat based on our expectation that, in the long run, the business model may not be able to leverage sales growth into a much higher margin structure and competitive forces may suppress intermediate-term revenue potential.
Boston Scientific has been a long time holding in the Thornburg Core Growth Fund. While we correctly identified the opportunity in the drug eluting stent market prior to Boston Scientific’s Taxus launch, we did a poor job of identifying what be-
10 Certified Annual Report |
came unsustainable market share expectations. Released data on the Taxus stent this year has been weaker than data for Johnson & Johnson’s competitive product, the Cypher, and sales have begun to reflect that reality. Furthermore, a number of management missteps have given us less confidence in our long term investment thesis. While Boston’s pipeline continues to look strong, we have sold the position given the uncertainty surrounding the company’s largest product.
At DIRECTV, investors continue to focus on increasing costs to acquire new subscribers. As new technologies, like Personal Video Recorders (i.e. Tivo-like functionality) and High Definition signals, are introduced, the cost of each box is higher. But, we believe that the returns on the increased investment in these new subscribers will be much higher than DIRECTV’s cost of capital. With the advanced functionality, subscribers tend to pay a higher monthly fee and keep the service longer. Further, the acquisition costs are magnified as DIRECTV is growing much faster than its competitors. As new subscribers decrease as a percentage of total subscribers, the strong cash flow generation characteristics of the company should become clearer.
It is important to understand our focus on risk control. Although we hope our statistical risk is low (standard deviation of returns), our focus is on appropriate diversification and stock-specific risk control. “Knowing what you own” is our mantra. Our approach is a balance between diversifying our portfolio and maximizing the impact of individual stock selections.
We seek to control risk by consciously diversifying our portfolio by capitalization range, by sector and within sectors, and by basket (Growth Industry Leaders, Consistent Growth Companies, and Emerging Growth Companies). Moreover, since we focus our research efforts on identifying stock specific risks – knowing the business model, the accounting issues, the competitive, regulatory, and legal risks, and the quality of earnings being generated – we feel we are controlling our risks at the most basic and important place, the individual security level.
Although the outlook for the consumer is discouraging, many other aspects of the market and the economy are encouraging. The consensus forecast is for the S&P 500 Index to grow earnings by 10% this year and 6% next year. In spite of this strong expected business performance, that index is only up 2.76% for the year. Interest rates have increased, but remain low by historical standards. Over the life of the Fund (inception was December of 2000), the returns on Growth Equity asset classes (small, mid-cap, and large) have been negative. History suggests that, at some future point, growth stocks will outperform value stocks. After five years of value outperformance, it is likely that the shift will occur sooner rather than later.
Initial public offerings contributed 2.5% of total return to the Fund during the Fund’s fiscal year. This includes holdings that we continue to own with expectations of generating long-term profits as our investment cases play out.
Our motto is “Core strategies for building wealth.” We believe the Thornburg Core Growth Fund continues to fulfill its mandate as a growth-oriented investment vehicle that can form part of the nucleus of an asset allocation strategy. Our focus is on maximizing long term after-tax returns while controlling risk. We encourage you to learn more about your portfolio. Descriptions of each holding and links to company web sites can be found by pointing your Internet browser to www.thornburg.com/funds. Thank you for investing in the Thornburg Core Growth Fund.
Regards, |
 |
Alexander M.V. Motola, CFA Portfolio Manager |
The matters discussed in this report may constitute forward-looking statements made pursuant to the safe harbor provisions of the Securities Litigation Reform Act of 1995. These include any advisor or portfolio manager prediction, assessment, analysis or outlook for individual securities, industries, investment styles, market sectors and/or markets. These statements involve risks and uncertainties. In addition to the general risks described for each fund in its current prospectus, other factors bearing on these reports include the accuracy of the advisor’s or portfolio manager’s forecasts and predictions, the appropriateness of the investment strategies designed by the advisor or portfolio manager, and the ability of the advisor or portfolio manager to implement their strategies efficiently and successfully. Any one or more of these factors, as well as other risks affecting the securities markets generally, could cause the actual results of any fund to differ materially as compared to its benchmarks.
| Certified Annual Report 11 |
| STATEMENT OF ASSETS AND LIABILITIES | ||
| Thornburg Core Growth Fund | September 30, 2005 | |
ASSETS | ||||
Investments at value (cost $180,310,584) | $ | 212,656,012 | ||
Cash | 1,969,280 | |||
Receivable for fund shares sold | 3,986,533 | |||
Unrealized gain on forward exchange contracts (Note 7) | 221,391 | |||
Dividends receivable | 4,160 | |||
Prepaid expenses and other assets | 33,230 | |||
Total Assets | 218,870,606 | |||
LIABILITIES | ||||
Payable for securities purchased | 9,384,395 | |||
Payable for fund shares redeemed | 105,395 | |||
Unrealized loss on forward exchange contracts (Note 7) | 197,859 | |||
Payable to investment advisor and other affiliates (Note 3) | 192,890 | |||
Deferred tax payable | 15,264 | |||
Accounts payable and accrued expenses | 80,948 | |||
Total Liabilities | 9,976,751 | |||
NET ASSETS | $ | 208,893,855 | ||
NET ASSETS CONSIST OF: | ||||
Distribution in excess of net investment income | $ | (58,129 | ) | |
Net unrealized appreciation on investments | 32,353,737 | |||
Accumulated net realized gain (loss) | 4,423,999 | |||
Net capital paid in on shares of beneficial interest | 172,174,248 | |||
| $ | 208,893,855 | |||
12 Certified Annual Report |
| STATEMENT OF ASSETS AND LIABILITIES, CONTINUED | ||
Thornburg Core Growth Fund | September 30, 2005 | |
NET ASSET VALUE: | |||
Class A Shares: | |||
Net asset value and redemption price per share | |||
($110,836,478 applicable to 7,800,318 shares of beneficial interest outstanding - Note 4) | $ | 14.21 | |
Maximum sales charge, 4.50% of offering price | 0.67 | ||
Maximum offering price per share | $ | 14.88 | |
Class C Shares: | |||
Net asset value and offering price per share * | |||
($41,737,264 applicable to 3,061,623 shares of beneficial interest outstanding - Note 4) | $ | 13.63 | |
Class I Shares: | |||
Net asset value, offering and redemption price per share | |||
($49,975,244 applicable to 3,476,945 shares of beneficial interest outstanding - Note 4) | $ | 14.37 | |
Class R1 Shares: | |||
Net asset value, offering and redemption price per share | |||
($6,344,869 applicable to 445,040 shares of beneficial interest outstanding - Note 4) | $ | 14.26 | |
| * | Redemption price per share is equal to net asset value less any applicable contingent deferred sales charge. |
See notes to financial statements.
| Certified Annual Report 13 |
| STATEMENT OF OPERATIONS | ||
Thornburg Core Growth Fund | Year Ended September 30, 2005 | |
INVESTMENT INCOME: | ||||
Dividend income (net of foreign taxes withheld of $10,045) | $ | 210,827 | ||
Interest income | 276,693 | |||
Total Income | 487,520 | |||
EXPENSES: | ||||
Investment advisory fees (Note 3) | 983,586 | |||
Administration fees (Note 3) | ||||
Class A Shares | 76,182 | |||
Class C Shares | 27,000 | |||
Class I Shares | 14,271 | |||
Class R1 Shares | 1,663 | |||
Distribution and service fees (Note 3) | ||||
Class A Shares | 152,723 | |||
Class C Shares | 216,567 | |||
Class R1 Shares | 6,750 | |||
Transfer agent fees | ||||
Class A Shares | 103,795 | |||
Class C Shares | 33,985 | |||
Class I Shares | 18,014 | |||
Class R1 Shares | 2,767 | |||
Registration and filing fees | ||||
Class A Shares | 24,535 | |||
Class C Shares | 16,814 | |||
Class I Shares | 8,527 | |||
Class R1 Shares | 22,979 | |||
Custodian fees (Note 3) | 74,670 | |||
Professional fees | 33,864 | |||
Accounting fees | 9,975 | |||
Trustee fees | 2,244 | |||
Other expenses | 61,956 | |||
Total Expenses | 1,892,867 | |||
Less: | ||||
Expenses reimbursed by Investment Advisor (Note 3) | (71,218 | ) | ||
Distribution and Service fees waived (Note 3) | (100 | ) | ||
Management fees waived by investment Advisor (Note 3) | (24,743 | ) | ||
Fees paid indirectly (Note 3) | (30,230 | ) | ||
Net Expenses | 1,766,576 | |||
Net Investment Loss | $ | (1,279,056 | ) | |
14 Certified Annual Report |
| STATEMENT OF OPERATIONS, CONTINUED | ||
Thornburg Core Growth Fund | Year Ended September 30, 2005 | |
REALIZED AND UNREALIZED GAIN (LOSS) | ||||
Net realized gain (loss) on: | ||||
Investments | $ | 6,703,838 | ||
Foreign currency transactions | (58,157 | ) | ||
| 6,645,681 | ||||
Net change in unrealized appreciation (depreciation) on: | ||||
Investments (net of change in deferred taxes payable of $15,264) | 25,124,172 | |||
Foreign currency translation | 23,533 | |||
| 25,147,705 | ||||
Net Realized and Unrealized Gain on Investments | 31,793,386 | |||
Net Increase in Net Assets Resulting From Operations | $ | 30,514,330 | ||
See notes to financial statements.
| Certified Annual Report 15 |
STATEMENTS OF CHANGES IN NET ASSETS
Thornburg Core Growth Fund
| Year Ended September 30, 2005 | Year Ended September 30, 2004 | |||||||
INCREASE (DECREASE) IN NET ASSETS FROM: | ||||||||
OPERATIONS: | ||||||||
Net investment income (loss) | $ | (1,279,056 | ) | $ | (907,261 | ) | ||
Net realized gain (loss) on investments and foreign currency transactions | 6,645,681 | (69,166 | ) | |||||
Increase (Decrease) in unrealized appreciation (depreciation) on investments, foreign currency translation, and deferred taxes | 25,147,705 | 3,816,240 | ||||||
Net Increase (Decrease) in Net Assets Resulting from Operations | 30,514,330 | 2,839,813 | ||||||
FUND SHARE TRANSACTIONS (NOTE 4): | ||||||||
Class A Shares | 53,496,950 | 2,225,643 | ||||||
Class C Shares | 21,351,328 | 7,120,528 | ||||||
Class I Shares | 20,375,442 | 21,612,285 | ||||||
Class R1 Shares | 5,969,887 | 14,604 | ||||||
Net Increase in Net Assets | 131,707,937 | 33,812,873 | ||||||
NET ASSETS: | ||||||||
Beginning of year | 77,185,918 | 43,373,045 | ||||||
End of year | $ | 208,893,855 | $ | 77,185,918 | ||||
See notes to financial statements.
16 Certified Annual Report |
Thornburg Core Growth Fund | September 30, 2005 |
NOTE 1 – ORGANIZATION
Thornburg Core Growth Fund, hereinafter referred to as the “Fund,” is a diversified series of Thornburg Investment Trust (the “Trust”). The Fund commenced operations on December 27, 2000. The Trust was organized as a Massachusetts business trust under a Declaration of Trust dated June 3, 1987 and is registered as a diversified, open-end management investment company under the Investment Company Act of 1940, as amended. The Trust is currently issuing eleven series of shares of beneficial interest in addition to those of the Fund: Thornburg Limited Term Municipal Fund, Thornburg California Limited Term Municipal Fund, Thornburg Limited Term U.S. Government Fund, Thornburg New Mexico Intermediate Municipal Fund, Thornburg Intermediate Municipal Fund, Thornburg Limited Term Income Fund, Thornburg Value Fund, Thornburg International Value Fund, Thornburg Florida Intermediate Municipal Fund, Thornburg New York Intermediate Municipal Fund, and Thornburg Investment Income Builder Fund. Each series is considered to be a separate entity for financial reporting and tax purposes and bears expenses directly attributable to it. The Fund seeks long-term capital appreciation by investing primarily in domestic equity securities selected for their growth potential.
The Fund currently offers four classes of shares of beneficial interest, Class A, Class C, Institutional Class (Class I), and Retirement Class (Class R1) shares. Each class of shares of the Fund represents an interest in the same portfolio of investments of the Fund, except that (i) Class A shares are sold subject to a front-end sales charge collected at the time the shares are purchased and bear a service fee, (ii) Class C shares are sold at net asset value without a sales charge at the time of purchase, but are subject to a contingent deferred sales charge upon redemption within one year, and bear both a service fee and a distribution fee, (iii) Class I shares are sold at net asset value without a sales charge at the time of purchase, (iv) Class R1 shares are sold at net asset value without a sales charge at the time of purchase but bear both a service fee and a distribution fee, and (iv) the respective classes may have different reinvestment privileges and conversion rights. Additionally, the Fund may allocate among its classes certain expenses, to the extent allowable, to specific classes including transfer agent fees, government registration fees, certain printing and postage costs, and administration and legal expenses. Currently, class specific expenses of the Fund are limited to service and distribution fees, administration fees, and certain registration and transfer agent expenses.
NOTE 2 – SIGNIFICANT ACCOUNTING POLICIES
Significant accounting policies of the Trust are as follows:
Valuation of Securities: In determining the net asset value of investments, investments are stated at value based on latest sales prices, normally at 4:00 pm EST reported on securities exchanges on the last business day of the period. Investments for which no sale is reported are valued at the mean between bid and asked prices or in accordance with such other method as the Trustees may authorize. In any case where a market quotation is not readily available, the Trust’s valuation and pricing committee determines a fair value for the investment using factors approved by the Trustees. Short term obligations having remaining maturities of 60 days or less are valued at amortized cost, which approximates market value.
Options Transactions: The Fund may buy or write put and call options through listed exchanges and the over-the-counter market. The buyer has the right to purchase (in the case of a call option) or sell (in the case of a put option) a specified quantity of a specific security or other underlying asset at a specified price prior to or on a specified expiration date. The writer of an option is exposed to the risk of loss if the market price of the underlying asset declines (in the case of a put option) or increases (in the case of a call option). The writer of an option can never profit by more than the premium paid by the buyer but can lose an unlimited amount. The writer also has the additional risk of not being able to enter into a closing transaction if a liquid secondary market does not exist.
Premiums received/paid from writing/purchasing options are recorded as liabilities/assets on the Statement of Assets and Liabilities, and are subsequently adjusted to current values. The difference between the current value of an option and the premium received/paid is treated as an unrealized gain or loss.
When a purchased option expires on its stipulated expiration date or when a closing transaction is entered into, the premium paid on the purchase of the option is treated by the Fund as a realized loss. When a written option expires on its stipulated expiration date or when a closing transaction is entered into, the related liability is extinguished and the Fund realizes a gain (loss if the cost of the closing transaction exceeds the premium received when the option was written).
Foreign Currency Translation: Portfolio securities and other assets and liabilities denominated in foreign currencies are translated into U.S. dollars based on the exchange rate of such currencies against the U.S. dollar on the date of valuation. Purchases and sales of securities and income items denominated in foreign currencies are translated into U.S. dollars at the exchange rate in effect on the translation date. When the Fund purchases or sells foreign securities it will customarily enter into a foreign exchange contract to minimize foreign exchange risk from the trade date to the settlement date of such transactions.
The Fund does not separately report the effect of changes in foreign exchange rates from changes in market prices on securities held. Such changes are included in net realized and unrealized gain or loss from investments.
Reported net realized foreign exchange gains or losses arise from sales of foreign currencies, currency gains or losses realized
| Certified Annual Report 17 |
NOTES TO FINANCIAL STATEMENTS, CONTINUED
Thornburg Core Growth Fund | September 30, 2005 |
between the trade and settlement dates on securities transactions and the difference between the amount of interest recorded on the Fund’s books, and the U.S. dollar equivalent of the amounts actually received or paid.
Federal Income Taxes: It is the policy of the Trust to comply with the provisions of the Internal Revenue Code applicable to “regulated investment companies” and to distribute all taxable income, including any net realized gain on investments, of the Fund to the shareholders. Therefore, no provision for Federal income taxes is required.
Dividends: Dividends to shareholders are generally paid quarterly and are reinvested in additional shares of the Fund at net asset value per share at the close of business on the dividend payment date or, at the shareholder’s option, paid in cash. Net realized capital gains, to the extent available, will be distributed at least annually. Distributions to shareholders are based on income tax regulations and therefore, their characteristics may differ for financial statement and tax purposes.
General: Securities transactions are accounted for on a trade date basis. Interest income is accrued as earned and dividend income is recorded on the ex-dividend date. Certain income from foreign securities is recognized as soon as information is available to the Fund. Realized gains and losses from the sale of securities are recorded on an identified cost basis. Net investment income, other than class specific expenses and realized and unrealized gains and losses, is allocated daily to each class of shares based upon the relative net asset value of outstanding shares of each class of shares at the beginning of the day (after adjusting for the current share activity of the respective class). Expenses common to all funds are allocated among the funds comprising the Trust based upon their relative net asset values or other appropriate allocation methods.
Guarantees and Indemnifications: Under the Trust’s organizational documents, its officers and Trustees are indemnified against certain liability arising out of the performance of their duties to the Fund. Additionally, in the normal course of business the Trust enters into contracts with service providers that contain general indemnification clauses. The Trust’s maximum exposure under these arrangements is unknown. However, based on experience, the Trust expects the risk of loss to be remote.
Use of Estimates: The preparation of financial statements, in conformity with generally accepted accounting principles, requires management to make estimates and assumptions that affect the reported amounts of assets and liabilities and the disclosure of contingent assets and liabilities at the date of the financial statements and the reported amounts of increases and decreases in net assets from operations during the reporting period. Actual results could differ from those estimates.
NOTE 3 – INVESTMENT ADVISORY FEE AND OTHER TRANSACTIONS WITH AFFILIATES
Pursuant to an investment advisory agreement, Thornburg Investment Management, Inc.® (the “Advisor”) serves as the investment advisor and performs services to the Fund for which the fees are payable at the end of each month. For the year ended September 30, 2005, these fees were payable at annual rates ranging from .875 of 1% to .675 of 1% per annum of the average daily net assets of the Fund depending on the Fund’s asset size. For the year ended September 30, 2005, the Advisor voluntarily waived investment advisory fees of $24,743. The Fund also has an administrative services agreement with the Advisor, whereby the Advisor will perform certain administrative services for the shareholders of each class of the Fund’s shares, and for which fees will be payable at an annual rate of up to .125 of 1% per annum of the average daily net assets attributable to each class of shares. For the year ended September 30, 2005, the Advisor voluntarily reimbursed certain class specific expenses and administrative fees and distribution fees of $1,015 for Class A shares, $2,252 for Class C shares, $40,812 for Class I shares, and $27,139 for Class R1 shares.
The Trust has an underwriting agreement with Thornburg Securities Corporation® (the “Distributor”, an affiliate of the Advisor), which acts as the Distributor of the Fund’s shares. For the year ended September 30, 2005, the Distributor has advised the Fund that it earned net commissions aggregating $63,900 from the sale of Class A shares of the Fund and collected contingent deferred sales charges aggregating $4,236 from redemptions of Class C shares of the Fund.
Pursuant to a service plan under Rule 12b-1 of the Investment Company Act of 1940, the Fund may reimburse to the Advisor an amount not to exceed .25 of 1% per annum of its average daily net assets attributable to each class of shares of the Fund for payments made by the Advisor to securities dealers and other financial institutions to obtain various shareholder related services. The Advisor may pay out of its own resources additional expenses for distribution of the Fund’s shares.
The Trust has also adopted distribution plans pursuant to Rule 12b-1, applicable only to the Fund’s Class C and Class R1 shares, under which the Fund compensates the Distributor for services in promoting the sale of Class C and Class R1 shares of the Fund at an annual rate of up to .75 of 1% of the average daily net assets attributable to Class C and Class R1 shares. Total fees incurred by each class of shares of the Fund under its respective service and distribution plans are set forth in the Statement of Operations.
The Trust has an agreement with the custodian bank to indirectly pay a portion of the custodian’s fees through credits earned by the Fund’s cash on deposit with the bank. This deposit agreement is an alternative to overnight investments. Custodial fees have been adjusted to reflect amounts that
18 Certified Annual Report |
NOTES TO FINANCIAL STATEMENTS, CONTINUED
| Thornburg Core Growth Fund | September 30, 2005 |
would have been paid without this agreement, with a corresponding adjustment reflected as fees paid indirectly in the Statement of Operations. For the year ended September 30, 2005, fees paid indirectly were $30,230.
Certain officers and Trustees of the Trust are also officers and/or Directors of the Advisor and Distributor. The compensation of independent Trustees is borne by the Trust.
NOTE 4 – SHARES OF BENEFICIAL INTEREST
At September 30, 2005, there were an unlimited number of shares of beneficial interest authorized. Transactions in shares of beneficial interest were as follows:
Year Ended September 30, 2005 | Year Ended September 30, 2004 | |||||||||||||
| Shares | Amount | Shares | Amount | |||||||||||
Class A Shares | ||||||||||||||
Shares sold | 4,753,098 | $ | 62,419,689 | 2,600,930 | $ | 28,184,218 | ||||||||
Shares repurchased** | (714,886 | ) | (8,922,739 | ) | (2,423,327 | ) | (25,958,575 | ) | ||||||
Net Increase (Decrease) | 4,038,212 | $ | 53,496,950 | 177,603 | $ | 2,225,643 | ||||||||
** The Fund charges a redemption fee of 1% of the Class A shares exchanged within 90 days of purchase. For the year ended September 30, 2005 and year ended September 30, 2004, $3,423 and $19,941, respectively, were netted in the amount reported for shares repurchased.
|
| |||||||||||||
Class C Shares | ||||||||||||||
Shares sold | 1,892,754 | $ | 24,074,650 | 872,281 | $ | 9,164,316 | ||||||||
Shares repurchased | (228,812 | ) | (2,723,322 | ) | (199,986 | ) | (2,043,788 | ) | ||||||
Net Increase (Decrease) | 1,663,942 | $ | 21,351,328 | 672,295 | $ | 7,120,528 | ||||||||
Class I Shares* | ||||||||||||||
Shares sold | 1,588,545 | $ | 21,467,761 | 2,027,702 | $ | 22,189,316 | ||||||||
Shares repurchased ** | (85,287 | ) | (1,092,319 | ) | (54,015 | ) | (577,031 | ) | ||||||
Net Increase (Decrease) | 1,503,258 | $ | 20,375,442 | 1,973,687 | $ | 21,612,285 | ||||||||
* Effective date of Class I shares was November 1, 2003.
** The Fund charges a redemption fee of 1% of the Class I shares exchanged within 90 days of purchase. For the year ended September 30, 2005 and the year ended September 30, 2004, $344 and $474, respectively, were netted in the amount reported for shares repurchased.
|
| |||||||||||||
Class R1 Shares | ||||||||||||||
Shares sold | 490,525 | $ | 6,601,537 | 1,444 | $ | 14,629 | ||||||||
Shares repurchased | (46,935 | ) | (631,650 | ) | (2 | ) | (25 | ) | ||||||
Net Increase (Decrease) | 443,590 | $ | 5,969,887 | 1,442 | $ | 14,604 | ||||||||
| Certified Annual Report 19 |
NOTES TO FINANCIAL STATEMENTS, CONTINUED
| Thornburg Core Growth Fund | September 30, 2005 |
NOTE 5 – SECURITIES TRANSACTIONS
For the year ended September 30, 2005, the Fund had purchase and sale transactions of investment securities (excluding short-term investments) of $221,651,351 and $127,016,852, respectively.
NOTE 6 – INCOME TAXES
At September 30, 2005, information on the tax components of capital is as follows:
Cost of investments for tax purpose | $ | 180,335,944 | ||
Gross unrealized appreciation on a tax basis | $ | 33,022,463 | ||
Gross unrealized depreciation on a tax basis | (843,871 | ) | ||
Net unrealized appreciation | ||||
(depreciation) on investments (tax basis) | $ | 32,320,068 | ||
Distributable earnings – capital gains | $ | 4,423,505 |
At September 30, 2005, the Fund did not have any undistributed ordinary net income.
At September 30, 2005, the Fund had deferred tax basis currency losses occurring subsequent to October 31, 2004 of $58,129. For tax purposes, such losses will be reflected in the year ending September 30, 2006.
The Fund utilized $1,343,924 of its capital loss carry forward during the year ended September 30, 2005.
In order to account for permanent book/tax differences, the Fund decreased net capital paid in on shares of beneficial interest by $1,294,709, increased accumulated net realized investment gain by $66,236, and decreased over distribution of net investment income (loss) by $1,228,473. This reclassification has no impact on the net asset value of the Fund. Reclassifications result primarily from net operating loss and currency gains.
NOTE 7 – FINANCIAL INSTRUMENTS WITH OFF-BALANCE SHEET RISK AND FOREIGN INVESTMENT RISK
During the year ended September 30, 2005, the Fund was a party to financial instruments with off-balance sheet risks, primarily currency forward exchange contracts. A forward exchange contract is an agreement between two parties to exchange different currencies at a specified rate at an agreed upon future date. These contracts are purchased in order to minimize the risk to the Fund with respect to its foreign stock transactions from adverse changes in the relationship between the U.S. dollar and foreign currencies. In each case these contracts have been initiated in conjunction with foreign stock transactions. These instruments may involve market risks in excess of the amount recognized on the Statement of Assets and Liabilities. Such risks would arise from the possible inability of counterparties to meet the terms of their contracts, future movement in currency value and interest rates and contract positions that are not exact offsets. These contracts are reported in the financial statements at the Fund’s net equity, as measured by the difference between the forward exchange rates at the reporting date and the forward exchange rates at the dates of entry into the contract. There are special risks associated with international investing, including currency fluctuations, government regulation, political developments, and differences in liquidity.
20 Certified Annual Report |
NOTES TO FINANCIAL STATEMENTS, CONTINUED
Thornburg Core Growth Fund | September 30, 2005 |
CONTRACTS TO SELL: | ||||||
| Contract Value Date | Market Value | |||||
Contracts | ||||||
2,200,000 Pound Sterling for 3,861,389 USD | January 18, 2006 | $ | (26,971 | ) | ||
Unrealized loss from forward exchange contracts: | (26,971 | ) | ||||
2,570,000 Swiss Franc for 2,024,260 USD | January 18, 2006 | 10,393 | ||||
3,175,000 Euro Dollar for 3,873,024 USD | January 18, 2006 | 22,187 | ||||
4,285,000 Euro Dollar for 5,333,771 USD | January 18, 2006 | 136,657 | ||||
5,700,000,000 Korean Won for 5,520,581 USD | January 18, 2006 | 49,386 | ||||
Unrealized gain from forward exchange contracts: | 218,623 | |||||
Net unrealized gain (loss) from forward | ||||||
Sell contracts: | $ | 191,652 | ||||
CONTRACTS TO BUY: | ||||||
| Contract Value Date | Market Value | |||||
Contracts | ||||||
750,000 Euro Dollar for 916,275 USD | January 18, 2006 | $ | (6,629 | ) | ||
2,200,000 Pound Sterling for 4,052,620 USD | January 18, 2006 | (164,259 | ) | |||
Unrealized loss from forward exchange contracts: | (170,888 | ) | ||||
860,000 Euro Dollar for 1,040,293 USD | January 18, 2006 | 2,768 | ||||
Unrealized gain from forward exchange contracts: | 2,768 | |||||
Net unrealized gain (loss) from forward | ||||||
Buy contracts: | $ | (168,120 | ) | |||
Net unrealized gain (loss) from forward | ||||||
Exchange contracts: | $ | 23,532 | ||||
| Certified Annual Report 21 |
| FINANCIAL HIGHLIGHTS | ||
Thornburg Core Growth Fund | ||
| Year Ended September 30, | Period Ended September 30, | |||||||||||||||||||
| 2005 | 2004 | 2003 | 2002 | 2001(c) | ||||||||||||||||
Class A Shares: | ||||||||||||||||||||
PER SHARE PERFORMANCE | ||||||||||||||||||||
(for a share outstanding throughout the period)+ | ||||||||||||||||||||
Net asset value, beginning of period | $ | 10.87 | $ | 10.11 | $ | 6.45 | $ | 7.80 | $ | 11.94 | ||||||||||
Income from investment operations: | ||||||||||||||||||||
Net investment income (loss) | (0.14 | ) | (0.15 | ) | (0.13 | ) | (0.12 | ) | (0.08 | ) | ||||||||||
Net realized and unrealized gain (loss) on investments | 3.48 | 0.90 | 3.77 | (1.23 | ) | (4.06 | ) | |||||||||||||
Total from investment operations | 3.34 | 0.75 | 3.64 | (1.35 | ) | (4.14 | ) | |||||||||||||
Redemption fees added to paid in capital | — | 0.01 | 0.02 | — | — | |||||||||||||||
Change in net asset value | 3.34 | 0.76 | 3.66 | (1.35 | ) | (4.14 | ) | |||||||||||||
NET ASSET VALUE, end of period | $ | 14.21 | $ | 10.87 | $ | 10.11 | $ | 6.45 | $ | 7.80 | ||||||||||
RATIOS/SUPPLEMENTAL DATA | ||||||||||||||||||||
Total return(a) | 30.73 | % | 7.52 | % | 56.74 | % | (17.31 | )% | (34.67 | )% | ||||||||||
Ratios to average net assets: | ||||||||||||||||||||
Net investment income (loss) | (1.14 | )% | (1.37 | )% | (1.43 | )% | (1.44 | )% | (1.02 | )%(b) | ||||||||||
Expenses, after expense reductions | 1.60 | % | 1.62 | % | 1.65 | % | 1.64 | % | 1.71 | %(b) | ||||||||||
Expenses, after expense reductions and net of custody credits | 1.57 | % | 1.61 | % | 1.63 | % | 1.63 | % | — | |||||||||||
Expenses, before expense reductions | 1.60 | % | 1.70 | % | 2.03 | % | 2.39 | % | 2.80 | %(b) | ||||||||||
Portfolio turnover rate | 115.37 | % | 108.50 | % | 102.91 | % | 212.17 | % | 126.15 | % | ||||||||||
Net assets at end of period (000) | $ | 110,836 | $ | 40,899 | $ | 36,247 | $ | 5,685 | $ | 6,337 | ||||||||||
| (a) | Sales loads are not reflected in computing total return, which is not annualized for periods less than one year. |
| (b) | Annualized. |
| (c) | Fund commenced operations on December 27, 2000. |
| + | Based on weighted average shares outstanding. |
22 Certified Annual Report |
FINANCIAL HIGHLIGHTS, CONTINUED
Thornburg Core Growth Fund |
| Year Ended September 30, | Period Ended September 30, | |||||||||||||||||||
| 2005 | 2004 | 2003 | 2002 | 2001(c) | ||||||||||||||||
Class C Shares: | ||||||||||||||||||||
PER SHARE PERFORMANCE | ||||||||||||||||||||
(for a share outstanding throughout the period)+ | ||||||||||||||||||||
Net asset value, beginning of period | $ | 10.51 | $ | 9.85 | $ | 6.38 | $ | 7.76 | $ | 11.94 | ||||||||||
Income from investment operations: | ||||||||||||||||||||
Net investment income (loss) | (0.23 | ) | (0.22 | ) | (0.18 | ) | (0.18 | ) | (0.13 | ) | ||||||||||
Net realized and unrealized gain (loss) on investments | 3.35 | 0.88 | 3.65 | (1.20 | ) | (4.05 | ) | |||||||||||||
Total from investment operations | 3.12 | 0.66 | 3.47 | (1.38 | ) | (4.18 | ) | |||||||||||||
Change in net asset value | 3.12 | 0.66 | 3.47 | (1.38 | ) | (4.18 | ) | |||||||||||||
NET ASSET VALUE, end of period | $ | 13.63 | $ | 10.51 | $ | 9.85 | $ | 6.38 | $ | 7.76 | ||||||||||
RATIOS/SUPPLEMENTAL DATA | ||||||||||||||||||||
Total return(a) | 29.69 | % | 6.70 | % | 54.39 | % | (17.78 | )% | (35.01 | )% | ||||||||||
Ratios to average net assets: | ||||||||||||||||||||
Net investment income (loss) | (1.91 | )% | (2.13 | )% | (2.19 | )% | (2.19 | )% | (1.78 | )%(b) | ||||||||||
Expenses, after expense reductions | 2.37 | % | 2.38 | % | 2.40 | % | 2.39 | % | 2.49 | %(b) | ||||||||||
Expenses, after expense reductions and net of custody credits | 2.34 | % | 2.37 | % | 2.38 | % | 2.38 | % | — | |||||||||||
Expenses, before expense reductions | 2.37 | % | 2.52 | % | 3.35 | % | 3.45 | % | 4.43 | %(b) | ||||||||||
Portfolio turnover rate | 115.37 | % | 108.50 | % | 102.91 | % | 212.17 | % | 126.15 | % | ||||||||||
Net assets at end of period (000) | $ | 41,737 | $ | 14,693 | $ | 7,146 | $ | 1,892 | $ | 2,216 | ||||||||||
| (a) | Not annualized for periods less than one year. |
| (b) | Annualized. |
| (c) | Fund commenced operations on December 27, 2000. |
| + | Based on weighted average shares outstanding. |
| Certified Annual Report 23 |
FINANCIAL HIGHLIGHTS, CONTINUED
Thornburg Core Growth Fund |
| Year Ended September 30, 2005 | Period Ended September 30, 2004(c) | |||||||
Class I Shares: | ||||||||
PER SHARE PERFORMANCE | ||||||||
(for a share outstanding throughout the period)+ | ||||||||
Net asset value, beginning of period | $ | 10.93 | $ | 10.87 | ||||
Income from investment operations: | ||||||||
Net investment income (loss) | (0.07 | ) | (0.08 | ) | ||||
Net realized and unrealized gain (loss) on investments | 3.51 | 0.14 | ||||||
Total from investment operations | 3.44 | 0.06 | ||||||
Change in net asset value | 3.44 | 0.06 | ||||||
NET ASSET VALUE, end of period | $ | 14.37 | $ | 10.93 | ||||
RATIOS/SUPPLEMENTAL DATA | ||||||||
Total return(a) | 31.47 | % | 0.55 | % | ||||
Ratios to average net assets: | ||||||||
Net investment income (loss) | (0.55 | )% | (0.74 | )%(b) | ||||
Expenses, after expense reductions | 1.02 | % | 1.00 | %(b) | ||||
Expenses, after expense reductions and net of custody credits | 0.99 | % | 0.99 | %(b) | ||||
Expenses, before expense reductions | 1.15 | % | 1.31 | %(b) | ||||
Portfolio turnover rate | 115.37 | % | 108.50 | % | ||||
Net assets at end of period (000) | $ | 49,975 | $ | 21,578 | ||||
| (a) | Not annualized for periods less than one year. |
| (b) | Annualized. |
| (c) | Effective date of Class I Shares was November 1, 2003. |
| + | Based on weighted average shares outstanding. |
24 Certified Annual Report |
FINANCIAL HIGHLIGHTS, CONTINUED
Thornburg Core Growth Fund
Year Ended September 30, | Period Ended September 30, | |||||||||||
| 2005 | 2004 | 2003(c) | ||||||||||
Class R1 Shares: | ||||||||||||
PER SHARE PERFORMANCE | ||||||||||||
(for a share outstanding throughout the period)+ | ||||||||||||
Net asset value, beginning of period | $ | 10.90 | $ | 10.11 | $ | 9.59 | ||||||
Income from investment operations: | ||||||||||||
Net investment income (loss) | (0.14 | ) | (0.12 | ) | (0.03 | ) | ||||||
Net realized and unrealized gain (loss) on investments | 3.50 | 0.91 | 0.55 | |||||||||
Total from investment operations | 3.36 | 0.79 | 0.52 | |||||||||
Change in net asset value | 3.36 | 0.79 | 0.52 | |||||||||
NET ASSET VALUE, end of period | $ | 14.26 | $ | 10.90 | $ | 10.11 | ||||||
RATIOS/SUPPLEMENTAL DATA | ||||||||||||
Total return(a) | 30.83 | % | 7.81 | % | 5.42 | % | ||||||
Ratios to average net assets: | ||||||||||||
Net investment income (loss) | (1.08 | )% | (1.17 | )% | (1.06 | )%(b) | ||||||
Expenses, after expense reductions | 1.52 | % | 1.50 | % | 1.65 | % (b) | ||||||
Expenses, after expense reductions and net of custody credits | 1.49 | % | 1.49 | % | 1.65 | % (b) | ||||||
Expenses, before expense reductions | 3.56 | % | 722.79 | %† | 22,219.77 | % (b)† | ||||||
Portfolio turnover rate | 115.37 | % | 108.50 | % | 102.91 | % | ||||||
Net assets at end of period (000) | $ | 6,345 | $ | 16 | $ | — | (d) | |||||
| (a) | Not annualized for periods less than one year. |
| (b) | Annualized. |
| (c) | Effective date of Class R1 Shares was July 1, 2003. |
| (d) | Net assets at end of year were less than $1,000. |
| † | Due to the size of net assets and fixed expenses, ratios may appear disproportionate. |
| + | Based on weighted average shares outstanding. |
| Certified Annual Report 25 |
| SCHEDULE OF INVESTMENTS | ||
| Thornburg Core Growth Fund | September 30, 2005 | |
CUSIPS: CLASS A - 885-215-582, CLASS C - 885-215-574, CLASS I - 885-215-475, CLASS R1 - 885-215-517 NASDAQ SYMBOLS: CLASS A - THCGX, CLASS C - TCGCX, CLASS I - THIGX, CLASS R1 - THCRX
Shares/ Principal Amount | Value | ||||
COMMON STOCK — 97.01% | |||||
CONSUMER DURABLES & APPAREL — 1.65% | |||||
TEXTILES, APPAREL & LUXURY GOODS — 1.65% | |||||
Coach, Inc.+ | 109,700 | $ | 3,440,192 | ||
| 3,440,192 | |||||
CONSUMER SERVICES — 1.66% | |||||
HOTELS RESTAURANTS & LEISURE — 1.66% | |||||
Life Time Fitness Inc.+ | 104,900 | 3,476,386 | |||
| 3,476,386 | |||||
DIVERSIFIED FINANCIALS — 5.79% | |||||
CAPITAL MARKETS — 2.45% | |||||
Affiliated Managers Group Inc.+ | 70,775 | 5,125,525 | |||
DIVERSIFIED FINANCIAL SERVICES — 3.34% | |||||
Chicago Mercantile Exchange Co. | 20,672 | 6,972,666 | |||
| 12,098,191 | |||||
ENERGY — 8.43% | |||||
ENERGY EQUIPMENT & SERVICES — 2.77% | |||||
Patterson Uti Energy, Inc. | 160,400 | 5,787,232 | |||
OIL, GAS & CONSUMABLE FUELS — 5.66% | |||||
ATP Oil & Gas Corp.+ | 169,500 | 5,566,380 | |||
Cimarex Energy Co.+ | 138,000 | 6,255,540 | |||
| 17,609,152 | |||||
FOOD & STAPLES RETAILING — 2.31% | |||||
FOOD & STAPLES RETAILING — 2.31% | |||||
FuJi Food & Catering | 4,259,000 | 4,831,693 | |||
| 4,831,693 | |||||
HEALTH CARE EQUIPMENT & SERVICES — 17.19% | |||||
HEALTH CARE EQUIPMENT & SUPPLIES — 7.35% | |||||
Cytyc Corp.+ | 264,600 | 7,104,510 | |||
Kyphon, Inc.+ | 103,200 | 4,534,608 | |||
Lifecell Corp.+ | 172,200 | 3,724,686 | |||
26 Certified Annual Report |
| SCHEDULE OF INVESTMENTS, CONTINUED | ||
| Thornburg Core Growth Fund | September 30, 2005 | |
| Shares/ Principal Amount | Value | ||||
HEALTH CARE PROVIDERS & SERVICES — 9.84% | |||||
Caremark Rx Inc.+ | 134,671 | $ | 6,724,123 | ||
UnitedHealth Group Inc. | 124,150 | 6,977,230 | |||
WellPoint Inc.+ | 90,400 | 6,854,128 | |||
| 35,919,285 | |||||
MEDIA — 10.64% | |||||
MEDIA — 10.64% | |||||
DIRECTV Group Inc.+ | 392,100 | 5,873,658 | |||
Focus Media Holdings Ltd.ADR+ | 166,800 | 4,460,232 | |||
Getty Images, Inc.+ | 68,730 | 5,913,529 | |||
Imax Corp.+ | 574,167 | 5,988,562 | |||
| 22,235,981 | |||||
PHARMACEUTICALS & BIOTECHNOLOGY — 9.63% | |||||
BIOTECHNOLOGY — 3.69% | |||||
Gilead Sciences Inc.+ | 158,050 | 7,706,518 | |||
PHARMACEUTICALS — 5.94% | |||||
Johnson & Johnson | 81,325 | 5,146,246 | |||
Sanofi-Aventis | 87,500 | 7,253,640 | |||
| 20,106,404 | |||||
RETAILING — 2.96% | |||||
INTERNET & CATALOG RETAIL — 2.96% | |||||
CJ Home Shopping Co. Ltd. | 68,900 | 6,179,520 | |||
| 6,179,520 | |||||
SEMICONDUCTORS & SEMICONDUCTOR EQUIPMENT — 4.72% | |||||
SEMICONDUCTORS & SEMICONDUCTOR EQUIPMENT — 4.72% | |||||
Austriamicrosystems AG+ | 52,000 | 2,418,464 | |||
Cymer Inc.+ | 87,700 | 2,746,764 | |||
Microtune, Inc.+ | 753,138 | 4,692,050 | |||
| 9,857,278 | |||||
SOFTWARE & SERVICES — 19.45% | |||||
INTERNET SOFTWARE & SERVICES — 4.90% | |||||
Google Inc.+ | 32,350 | 10,237,481 | |||
IT SERVICES — 2.69% | |||||
Satyam Computer | 441,500 | 5,624,067 | |||
| Certified Annual Report 27 |
| SCHEDULE OF INVESTMENTS, CONTINUED | ||
| Thornburg Core Growth Fund | September 30, 2005 | |
Shares/ Principal Amount | Value | ||||
SOFTWARE — 11.86% | |||||
Amdocs Ltd.+ | 286,025 | $ | 7,931,473 | ||
Check Point Software Technologies Ltd.+ | 295,700 | 7,191,424 | |||
Microsoft Corp. | 375,100 | 9,651,323 | |||
| 40,635,768 | |||||
TECHNOLOGY HARDWARE & EQUIPMENT — 4.06% | |||||
COMPUTERS & PERIPHERALS — 4.06% | |||||
Apple Computer, Inc.+ | 158,100 | 8,475,741 | |||
| 8,475,741 | |||||
TELECOMMUNICATION SERVICES — 5.19% | |||||
WIRELESS TELECOMMUNICATION SERVICES — 5.19% | |||||
Leap Wireless International, Inc.+ | 149,400 | 5,258,880 | |||
NII Holdings Inc.+ | 66,110 | 5,582,989 | |||
| 10,841,869 | |||||
TRANSPORTATION — 1.59% | |||||
TRANSPORTATION INFRASTRUCTURE — 1.59% | |||||
Shenzhen Chiwan Wharf Holdings Ltd. | 2,114,916 | 3,323,578 | |||
| 3,323,578 | |||||
UTILITIES — 1.74% | |||||
INDUSTRIAL POWER PRODUCTION / ENERGY TRADING — 1.74% | |||||
Ormat Technologies Inc. | 163,900 | 3,627,107 | |||
| 3,627,107 | |||||
TOTAL COMMON STOCK (Cost $170,312,718) | 202,658,145 | ||||
28 Certified Annual Report |
| SCHEDULE OF INVESTMENTS, CONTINUED | ||
| Thornburg Core Growth Fund | September 30, 2005 | |
Shares/ Principal Amount | Value | ||||||
SHORT TERM INVESTMENTS — 4.79% | |||||||
UBS Finance, 3.84%, 10/3/2005 | $ | 10,000,000 | $ | 9,997,866 | |||
TOTAL SHORT TERM INVESTMENTS (Cost $9,997,866) | 9,997,866 | ||||||
TOTAL INVESTMENTS — 101.80% (COST $180,310,584) | $ | 212,656,012 | |||||
LIABILITIES NET OF OTHER ASSETS — (1.80)% | (3,762,157 | ) | |||||
NET ASSETS — 100.00% | $ | 208,893,855 | |||||
Footnote Legend
| See | notes to financial statements. |
| + | Non-income producing |
Portfolio Abbreviations
To simplify the listings of securities, abbreviations are used per the table below:
ADR American Depository Receipt
SUMMARY OF INDUSTRY EXPOSURE
As of 9/30/05
Software & Services | 19.5 | % | Technology Hardware & Equipment | 4.1 | % | |||
Health Care Equipment & Services | 17.2 | % | Retailing | 3.0 | % | |||
Media | 10.6 | % | Food & Staples Retail | 2.3 | % | |||
Pharmaceutical & Biotechnology | 9.6 | % | Utilities | 1.7 | % | |||
Energy | 8.4 | % | Consumer Services | 1.7 | % | |||
Diversified Financials | 5.8 | % | Consumer Durables & Apparel | 1.6 | % | |||
Telecommunication Services | 5.2 | % | Transportation | 1.6 | % | |||
Semiconductors and Semiconductor Equip | 4.7 | % | Other Assets & Cash Equivalents | 3.0 | % |
| Certified Annual Report 29 |
REPORT OF INDEPENDENT REGISTERED PUBLIC ACCOUNTING FIRM
Thornburg Core Growth Fund
To the Trustees and Shareholders of
Thornburg Core Growth Fund
In our opinion, the accompanying statement of assets and liabilities, including the schedule of investments, and the related statements of operations and of changes in net assets and the financial highlights present fairly, in all material respects, the financial position of Thornburg Core Growth Fund (one of the portfolios constituting Thornburg Investment Trust, hereafter referred to as the “Fund”) at September 30, 2005, the results of its operations for the year then ended, the changes in its net assets for each of the two years in the period then ended and the financial highlights for each of the periods presented, in conformity with accounting principles generally accepted in the United States of America. These financial statements and financial highlights (hereafter referred to as “financial statements”) are the responsibility of the Fund’s management. Our responsibility is to express an opinion on these financial statements based on our audits. We conducted our audits of these financial statements in accordance with the standards of the Public Company Accounting Oversight Board (United States). Those standards require that we plan and perform the audit to obtain reasonable assurance about whether the financial statements are free of material misstatement. An audit includes examining, on a test basis, evidence supporting the amounts and disclosures in the financial statements, assessing the accounting principles used and significant estimates made by management, and evaluating the overall financial statement presentation. We believe that our audits, which included confirmation of securities at September 30, 2005 by correspondence with the custodian and brokers, provide a reasonable basis for our opinion.
PricewaterhouseCoopers LLP
New York, New York
November 16, 2005
30 Certified Annual Report |
Thornburg Core Growth Fund | September 30, 2005 (Unaudited) |
As a shareholder of the Fund, you incur two types of costs:
(1) transaction costs, including
(a) sales charges (loads) on purchase payments, for Class A Shares;
(b) a deferred sales charge on redemptions of any part or all of a purchase of $1 million of Class A shares within 12 months of purchase;
(c) a deferred sales charge on redemptions of Class C shares within 12 months of purchase;
(d) a 90-day redemption fee on Class A and Class I shares;
(2) ongoing costs, including management fees; distribution and/or service (12b-1) fees; and other Fund expenses.
This example is intended to help you understand your ongoing costs (in dollars) of investing in the Fund and to compare these costs with the ongoing costs of investing in other mutual funds.
The example is based on an investment of $1,000 invested on March 31, 2005 and held until September 30, 2005.
Actual Expenses
The first line of the table at right provides information about actual account values and actual expenses. You may use the information in this line, together with the amount you invested, to estimate the expenses that you paid over the period. Simply divide your account value by $1,000 (for example, an $8,600 account value divided by $1,000 = 8.6), then multiply the result by the number in the first line under the heading entitled “Expenses Paid During Period” to estimate the expenses you paid on your account during this period.
Hypothetical Example for Comparison Purposes
The second line of the table at right provides information about hypothetical account values and hypothetical expenses based on the Fund’s actual expense ratio and an assumed rate of return of 5% per year before expenses, which is not the Fund’s actual return. The hypothetical account values and expenses may not be used to estimate the actual ending account balance or expenses you paid for the period. You may use this information to compare the ongoing costs of investing in the Fund and other funds. To do so, compare this 5% hypothetical example with the 5% hypothetical examples that appear in the shareholder reports of the other funds.
| Beginning Account Value 3/31/05 | Ending Account Value 9/30/05 | Expenses Paid During Period† 3/31/05–9/30/05 | |||||||
Class A Shares | |||||||||
Actual | $ | 1,000.00 | $ | 1,163.80 | $ | 8.54 | |||
Hypothetical* | $ | 1,000.00 | $ | 1,017.18 | $ | 7.96 | |||
Class C Shares | |||||||||
Actual | $ | 1,000.00 | $ | 1,159.00 | $ | 12.58 | |||
Hypothetical* | $ | 1,000.00 | $ | 1,013.41 | $ | 11.74 | |||
Class I Shares | |||||||||
Actual | $ | 1,000.00 | $ | 1,166.40 | $ | 5.38 | |||
Hypothetical* | $ | 1,000.00 | $ | 1,020.11 | $ | 5.01 | |||
Class R1 Shares | |||||||||
Actual | $ | 1,000.00 | $ | 1,164.10 | $ | 8.08 | |||
Hypothetical* | $ | 1,000.00 | $ | 1,017.61 | $ | 7.53 | |||
| † | Expenses are equal to the annualized expense ratio for each class (A: 1.57%; C: 2.33%; I: 0.99%; and R1: 1.49%) multiplied by the average account value over the period, multiplied by 183/365 to reflect the one-half year period. |
| * | Hypothetical assumes a rate of return of 5% per year before expenses. |
Please note that the expenses shown in the table are meant to highlight your ongoing costs only and do not reflect any transactional costs, such as sales charges (loads), redemption fees, or exchange fees. Therefore, the second line of the table is useful in comparing ongoing costs only, and will not help you determine the relative total costs of owning different funds. In addition, if these transactional costs were included, your costs would have been higher.
| Certified Annual Report 31 |
Thornburg Core Growth Fund | September 30, 2005 (Unaudited) |
GROWTH OF A HYPOTHETICAL $10,000 INVESTMENT
Thornburg Core Growth Fund versus NASDAQ Composite Index (December 27, 2000 to September 30, 2005)
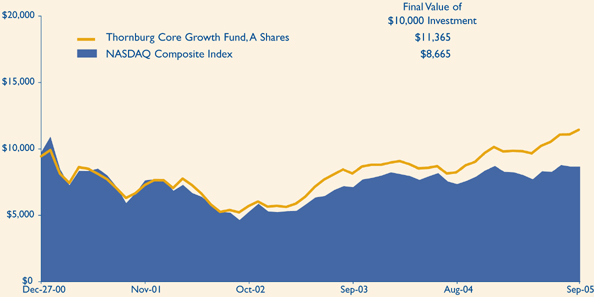
AVERAGE ANNUAL TOTAL RETURNS
For periods ended September 30, 2005 (with sales charge)
| 1 Yr | 3 Yrs | Since Inception | |||||||
A Shares (Incep: 12/27/00) | 24.87 | % | 28.16 | % | 2.73 | % | |||
C Shares (Incep: 12/27/00) | 28.69 | % | 28.79 | % | 2.82 | % | |||
R1 Shares (Incep: 7/01/03) | 30.83 | % | — | 19.26 | % | ||||
NASDAQ Composite Index (Since: 12/27/00) | 14.19 | % | 23.09 | % | (2.96 | )% |
Performance data reflects past performance, which is no guarantee of future results. The performance data and graph do not reflect the deduction of taxes that a shareholder would pay on distributions or the redemption of Fund shares.
Returns reflect the reinvestment of dividends and capital gains as well as applicable sales charges. Class A shares are sold with a maximum sales charge of 4.50%. Class C shares are subject to a 1% contingent deferred sales charge (CDSC) for the first year only. There is no up-front sales charge for Class R1 shares. Class R1 shares are available only to certain qualified investors. Class A shares are subject to a 1% 90-day redemption fee.
The NASDAQ Composite Index is a market value-weighted, technology-oriented index comprised of approximately 5,000 domestic and non-US-based securities. Unless otherwise noted, index returns reflect the reinvestment of income dividends and capital gains, if any, but do not reflect fees, brokerage commissions or other expenses of investing. Investors may not make direct investments into any index. The performance of any index is not indicative of the performance of any particular investment.
32 Certified Annual Report |
Thornburg Core Growth Fund | September 30, 2005 (Unaudited) |
Name, Age, Position Held with Fund Year Elected | Principal Occupation(s) During Past Five Years | Other Directorships | ||
INTERESTED TRUSTEES(1)(2)(4) | ||||
Garrett Thornburg, 59 Chairman of Trustees, Trustee since 1987(3) | CEO, Chairman and controlling shareholder of Thornburg Investment Management, Inc. (investment advisor) and Thornburg Securities Corporation (securities dealer); Chairman of Thornburg Limited Term Municipal Fund, Inc. (registered investment company) to 2004; CEO and Chairman of Thornburg Mortgage, Inc. (real estate investment trust); Chairman of Thornburg Mortgage Advisory Corporation (investment manager to Thornburg Mortgage, Inc.). | Director of Thornburg Mortgage, Inc. (real estate investment trust) | ||
Brian J. McMahon, 49 Trustee since 2001, Member of Governance & Nominating Committee, President since 1997(5)(6) | President and Managing Director of Thornburg Investment Management, Inc.; President of Thornburg Limited Term Municipal Fund, Inc. to 2004. | None | ||
INDEPENDENT TRUSTEES (1)(2)(4) | ||||
David A. Ater, 60 Trustee since 1994, Member of Audit Committee and Governance & Nominating Committee | Principal in Ater & Associates, Santa Fe, NM (developer, planner and broker of residential and commercial real estate); owner developer and broker for various real estate projects. | Director of Thornburg Mortgage, Inc. (real estate investment trust) | ||
David D. Chase, 64 Chairman of Audit Committee, Trustee since 2000 | Chairman, President, CEO, and Managing Member of Vestor Associates, LLC, the general partner of Vestor Partners, LP, Santa Fe, NM (private equity fund); Chairman and CEO of Vestor Holdings, Inc., Santa Fe, NM (merchant bank). | None | ||
Eliot R. Cutler, 59 Chairman of Governance & Nominating Committee, Trustee since 2004 | Partner, Akin, Gump, Strauss, Hauer & Feld, LLP, Washington, D.C. (law firm) since November 2000; partner, Cutler & Stanfield, Washington, D.C. (law firm) until November 2000. | Director of Thornburg Mortgage, Inc. (real estate investment trust) | ||
Susan H. Dubin, 56 Trustee since 2004, Member of Audit Committee | President of Dubin Investments, Ltd., Greenwich, CT (private investment fund); Director and officer of various charitable organizations; and formerly, Vice President of Chemical Bank (predecessor to JP Morgan Chase & Co.), New York, 1974–1996. | None | ||
Owen D.Van Essen, 51 Trustee since 2004, Member of Governance & Nominating Committee | President of Dirks, Van Essen & Murray, Santa Fe, NM (newspaper mergers and acquisitions). | None | ||
James W. Weyhrauch, 46 Trustee since 1996, Member of Audit Committee | Director, Executive Vice President to 2002, and President and CEO 2002–2004, Nambé Mills, Inc., Santa Fe, NM (manufacturer); real estate agent, Santa Fe Properties, Santa Fe, NM since 2004. | None | ||
| Certified Annual Report 33 |
TRUSTEES AND OFFICERS, CONTINUED
| Thornburg Core Growth Fund | September 30, 2005 | (Unaudited) |
Name, Age, Position Held with Fund Year Elected | Principal Occupation(s) During Past Five Years | Other Directorships Held by Trustee | ||
OFFICERS OF THE FUND (WHO ARE NOT TRUSTEES)(1)(6)(7) | ||||
| Dawn B. Fischer, 58 Secretary since 1987 | Secretary and Managing Director, Thornburg Investment Management, Inc.; Secretary, Thornburg Limited Term Municipal Fund, Inc. to 2004; Secretary, Thornburg Securities Corporation; Vice President, Daily Tax Free Income Fund, Inc. (registered investment company). | Not applicable | ||
Steven J. Bohlin, 46 Vice President since 1987; Treasurer since 1989 | Vice President and Managing Director of Thornburg Investment Management, Inc.; Vice President of Thornburg Limited Term Municipal Fund, Inc. to 2004. | Not applicable | ||
| George T. Strickland, 42 Vice President since 1996 | Vice President and Managing Director of Thornburg Investment Management, Inc.; Vice President (to 2004) and Treasurer (2003–2004) of Thornburg Limited Term Municipal Fund, Inc. | Not applicable | ||
William V. Fries, 66 Vice President since 1995 | Vice President and Managing Director of Thornburg Investment Management, Inc. | Not applicable | ||
Leigh Moiola, 38 Vice President since 2001 | Vice President and Managing Director of Thornburg Investment Management, Inc.; Vice President of Thornburg Limited Term Municipal Fund, Inc. 1999–2004. | Not applicable | ||
| Kenneth Ziesenheim, 51 Vice President since 1995 | Vice President and Managing Director of Thornburg Investment Management, Inc.; President of Thornburg Securities Corporation; Vice President of Thornburg Limited Term Municipal Fund, Inc. to 2004. | Not applicable | ||
| Alexander Motola, 35 Vice President since 2001 | Vice President and Managing Director of Thornburg Investment Management, Inc. since 2000; Portfolio Manager, Insight Capital Research & Management, Inc., Walnut Creek, California 1995–2000. | Not applicable | ||
Wendy Trevisani, 34 Vice President since 1999 | Associate Portfolio Manager of Thornburg Investment Management, Inc. since 1999, Vice President since 2000 and Managing Director since 2003; Vice President of Thornburg Limited Term Municipal Fund, Inc. 1999–2002. | Not applicable | ||
Joshua Gonze, 42 Vice President since 1999 | Associate Portfolio Manager of Thornburg Investment Management, Inc. since 1999, Vice President since 1999 and Managing Director since 2003; Vice President of Thornburg Limited Term Municipal Fund, Inc. to 2004. | Not applicable | ||
Brad Kinkelaar, 37 Vice President since 1999 | Associate Portfolio Manager of Thornburg Investment Management, Inc. since 1999, Vice President since 2000 and Managing Director since 2003. | Not applicable | ||
| Christopher Ihlefeld, 35 Vice President since 2003 | Associate Portfolio Manager since 1999; Vice President of Thornburg Investment Management, Inc. since 2002; Vice President of Limited Term Municipal Fund, Inc., 2003–2004. | Not applicable | ||
Leon Sandersfeld, 39 Vice President since 2003 | Associate of Thornburg Investment Management, Inc. since 2002; Senior Staff Accountant, Farm Bureau Life Insurance Co. 1998–2002. | Not applicable | ||
34 Certified Annual Report |
TRUSTEES AND OFFICERS, CONTINUED
Thornburg Core Growth Fund | September 30, 2005 | (Unaudited) |
Name, Age, Position Held with Fund Year Elected | Principal Occupation(s) During Past Five Years | Other Directorships Held by Trustee | ||
| Sasha Wilcoxon, 31 Vice President since 2003 | Associate of Thornburg Investment Management, Inc. since 2000 and Mutual Fund Operations Department Manager since 2002. | Not applicable | ||
Ed Maran, 47 Vice President since 2004 | Associate Portfolio Manager of Thornburg Investment Management, Inc. since 2002 and Vice President and Managing Director since 2004; Analyst, USAA 2001–2002; Oil Analyst, A.G. Edwards 1997–2000. | Not applicable | ||
Vinson Walden, 35 Vice President since 2004 | Associate Portfolio Manager of Thornburg Investment Management, Inc. since 2002 and Vice President and Managing Director since 2004; Associate Portfolio Manager, Ibis Management 2002–2004; Associate, Lehman Brothers, 1997–2001. | Not applicable | ||
| (1) | Each person’s address is 119 East Marcy Street, Santa Fe, New Mexico 87501. |
| (2) | The Fund is one of twelve separate investment “Funds” or “series” of Thornburg Investment Trust (the “Trust”), which comprises the Thornburg mutual fund complex and is organized as a Massachusetts business trust. The Trust currently has twelve active Funds. Thornburg Investment Management, Inc. is the investment advisor to, and manages, the twelve Funds of the Trust. Each Trustee oversees the twelve Funds in the fund complex. |
| (3) | Mr. Thornburg is considered an “interested” Trustee under the Investment Company Act of 1940 because he is a director and controlling shareholder of Thornburg Investment Management, Inc., the investment advisor to the twelve active Funds of the Trust, and is the sole director and controlling shareholder of Thornburg Securities Corporation, the distributor of shares for the Trust. |
| (4) | Each Trustee serves in office until the election and qualification of a successor. |
| (5) | Mr. McMahon is considered an “interested” Trustee because he is the president of Thornburg Investment Management, Inc. |
| (6) | The Trust’s president, secretary and treasurer each serves a one-year term or until the election and qualification of a successor; each other officer serves at the pleasure of the Trustees. |
| (7) | Assistant vice presidents, assistant secretaries and assistant treasurers are not shown. |
The Statement of Additional Information for each Fund of the Trust includes additional information about the Trustees and is available, without charge and upon request, by calling 1-800-847-0200.
| Certified Annual Report 35 |
| Thornburg Core Growth Fund | September 30, 2005 | (Unaudited) |
PORTFOLIO PROXY VOTING
Policies and Procedures:
The Trust has delegated to Thornburg Investment Management, Inc. (the “Advisor”) voting decisions respecting proxies for the Fund’s voting securities. The Advisor makes voting decisions in accordance with its Proxy Voting Policy and Procedures. A description of the Policy and Procedures is available (i) without charge, upon request, by calling the Advisor toll-free at 1-800-847-0200, (ii) on the Thornburg website at www.thornburg.com, and (iii) on the Securities and Exchange Commission’s website at www.sec.gov.
Commencing August 31, 2004, information regarding how proxies were voted is available on or before August 31 of each year for the twelve months ending the preceding June 30. This information is available (i) without charge, upon request by calling the Advisor toll-free at 1-800-847-0200, (ii) on the Thornburg website at www.thornburg.com, and (iii) on the Securities and Exchange Commission’s website at www.sec.gov.
AVAILABILITY OF QUARTERLY PORTFOLIO SCHEDULE
The Fund files with the Securities and Exchange Commission schedules of its portfolio holdings on Form N-Q for the first and third quarters of each fiscal year. The Fund’s Forms N-Q are available on the Commission’s website at www.sec.gov, or may be reviewed and copied at the Commission’s Public Reference Room in Washington, D.C. Information on the operation of the Public Reference Room may be obtained by calling 1-800-SEC-0330. The Fund also makes this information available on its website at www.thornburg.com/download or upon request by calling 1-800-847-0200.
TRUSTEES DELIBERATIONS RESPECTING RENEWAL OF INVESTMENT ADVISORY AGREEMENT
Thornburg Investment Management, Inc. (the “Advisor”) provides investment management services to Thornburg Core Growth Fund pursuant to an investment advisory agreement. The Trustees consider the renewal of this agreement annually and most recently determined to renew the agreement on September 13, 2005.
In connection with their general supervision of the Advisor, the Trustees receive and consider reports throughout the year from the Advisor respecting the Advisor’s management of the Fund’s investments. These reports include information about the Fund’s purchase and sale of portfolio investments and explanations from the Advisor respecting investment selections, the investment performance of the Fund, general appraisals of industry and economic prospects and factors, and other matters affecting the Fund and relating to the Advisor’s performance of services for the Fund.
In anticipation of their recent consideration of the advisory agreement’s renewal, the independent Trustees met with representatives of the Advisor in July 2005 to specify the information the Advisor would present to the Trustees for their review. The independent Trustees thereafter met in independent session to consider various factors respecting the agreement’s renewal, and met in a subsequent session with the Advisor’s chief investment officer to present questions. Following these sessions, the Trustees met on September 13, 2005 to consider a renewal of the advisory agreement.
The Trustees considered various factors in their review of the Advisor’s performance under the investment advisory agreement, including specifically the principles outlined in their February 2005 Statement to Shareholders, a copy of which accompanies this Annual Report to Shareholders. Summarized below are certain of the factors considered by the Trustees, in connection with the determination to renew the advisory agreement. In determining to renew the advisory agreement, the Trustees did not identify any single fact or aspect of the Advisor’s performance as controlling, and this summary does not describe all of the matters considered by the Trustees in making their determination.
Quality of Services; Fund Investment Performance. In reviewing the nature, extent, and quality of services provided by the Advisor and the investment performance of the Fund, the Trustees primarily considered the Advisor’s adherence to the Fund’s stated objectives and policies, the Advisor’s execution of the Fund’s investment strategies in prevailing market conditions, the Fund’s absolute investment performance, the Fund’s investment performance compared to categories of other broadly similar mutual funds and broad based securities indices, the Fund’s investment performance over different periods of time, the Fund’s total returns in rising and declining markets compared to total returns of a broad based securities index, measures of relative portfolio risk, and related factors. The Trustees noted in comparing the Fund with other mutual funds and to indices that the value of such comparisons may be limited because the Fund’s investment approach, and the selection of its portfolio securities, are unique or differ in considerable degree from the characteristics of other funds and indices. In conducting their review, the Trustees observed that the Advisor had continued to faithfully pursue and to achieve the Fund’s stated objectives, as demonstrated particularly by the Advisor’s selection of investments and the Fund’s investment performance. The Trustees noted in this regard the Fund’s exceptional investment performance in most periods as compared to broad based securities indices and categories of mutual funds selected by independent mutual fund analyst firms.
The Trustees also considered a number of other factors in reviewing the quality of the Advisor’s services, including the qualifications and integrity of the Advisor’s senior personnel, the Advisor’s staffing and other resources, the Advisor’s compliance with regulatory requirements, Fund sales performance and perceptions of the Funds in the marketplace, and other factors.
36 Certified Annual Report |
OTHER INFORMATION, CONTINUED
Thornburg Core Growth Fund | September 30, 2005 (Unaudited) |
The Trustees concluded, based upon these and other considerations, that the Advisor had actively and competently pursued the Fund’s stated investment objectives in accordance with the Fund’s investment policies stated in its prospectuses. The Trustees further concluded that the investment performance of the Fund was satisfactory in the context of the Fund’s objectives and policies and prevailing market conditions.
Fees and Expenses; Profitability of Advisor. In reviewing the fees charged by the Advisor to the Fund, the Trustees primarily considered the fees charged by the Advisor and the other expenses charged to the Fund in light of the nature and quality of services provided, comparison of the actual Advisor’s fee and Fund expenses to the statement of fees and expenses in the Fund’s prospectuses, the Advisor’s waiver of a portion of its fee, comparisons of the Advisor’s fee and other Fund expenses to median and average fees and expenses charged to similar mutual funds, and comparisons of fees and expenses charged to the Fund with fees and expenses charged to other, similar specific mutual funds. In addition, the Trustees considered the profitability of the Advisor compared to other investment management firms, and comparisons of the investment management fee rates charged by the Advisor to the Fund with rates charged to other clients of the Advisor and the differing types of services furnished to the Fund and the other clients. The Trustees noted that the Fund’s management fee was somewhat higher than the average and median fee rates for a group of multi-cap growth equity funds selected by an independent analyst firm, but that the overall expense ratio of the Fund was comparable to the average and median expense ratios for the same group of mutual funds. The Trustees also observed in their review that fee rates charged by the Advisor to other clients of the Advisor were not directly comparable to rates charged to the Fund principally because of the significant differences in the services provided.
The Trustees concluded, based upon these and other considerations, that the fees charged to the Fund by the Advisor were fair and reasonable in view of the following: the services provided, the clear disclosure of these fees and expenses in the Fund’s prospectuses, and prevailing fees and expenses charged to mutual funds generally. The Trustees further concluded that there was no indication that the Advisor’s profitability was unusual, viewed in the context of the services provided, the performance of the Fund, and the fees and profitability of other investment management firms.
Economies of Scale. In reviewing the extent to which economies of scale would be realized by the Fund as it grows and whether fee levels reflect economies of scale, the Trustees considered the breakpoint structure for advisory fees chargeable to the Fund, the demonstrated economies of scale enjoyed by other funds of the Trust as they had grown in size, and economies of scale realized by other mutual funds. The Trustees concluded that the Fund may reasonably be expected to realize economies of scale for the benefit of its shareholders as it grows in size.
Ancillary Benefits to Advisor. In reviewing benefits enjoyed by the Advisor because of its relationship with the Fund, the Trustees considered an arrangement through which the Advisor received certain research services, favorable publicity received by the Advisor because of the superior investment performance of certain Funds of the Trust, and the benefits to the Fund from the Advisor’s expansion of its staffing and other resources to serve a broader variety of investment clients. The Trustees concluded, based upon these and other considerations, that there was no unusual or unfair benefit enjoyed by the Advisor, and that the Fund enjoyed benefits by virtue of the Advisor’s engagement by other investment clients.
Certified Annual Report 37
Trustees’ Statement to Shareholders
Not part of the Certified Annual Report
February 8, 2005
The Trustees are concerned that recent commentaries and opinions reported in the media may confuse investors in general as to the supervisory duties of trustees of mutual funds and, in particular, leave Thornburg Investment Trust shareholders uncertain regarding how we discharge our responsibilities in supervising the Funds’ investment advisor and in reviewing the advisor’s contract for renewal. We decided to spell out clearly three principal guidelines that we follow in supervising the Trust’s investment advisor on your behalf.
We begin with the premise that each shareholder selected his or her Fund because its investments are managed by the investment advisor identified in the prospectus and in accordance with the objective and policies described in the prospectus. We realize, as each of you do, that if you believe that your Fund’s stated objective and policies no longer serve your personal investment goals, you can sell your shares and leave the Fund.
Therefore, we believe that our primary supervisory task – our principal obligation to you – is to assess the nature and quality of the advisor’s services, and to confirm that the advisor actively and competently pursues the Fund’s objective, in accordance with the policies set out in the prospectus. To do this, we meet regularly with management to review your Fund’s portfolio and to discuss the advisor’s specific actions and judgments in pursuing the Fund’s objective. We do not substitute our own judgment for the advisor’s decisions in selecting investments; the advisor is paid to exercise its informed judgment on investment decisions, and we seek to confirm, in reviewing the advisor’s performance, that the advisor is doing just that.
Second, while we are conscious of costs and the effect that costs have on shareholders’ returns, we do not seek the lowest fees or expense ratio as our sole or primary objective. We try to make sure that your Fund’s fees and costs are reasonable in relationship to the services rendered and that they are generally in line with those charged by other expert investment advisors, consistent with our belief that the Fund’s investors searched for and expect that expertise and attention and have decided to pay a reasonable price for it. We do not put the management contract “out to bid” as a matter of course, and we would not do so unless we had concluded that the advisor materially had failed to pursue the Fund’s objectives in accordance with its policies, or for other equally important reasons. We believe that any other approach would be inconsistent with your interests and contrary to your expectations when you bought shares of the Fund in the first place.
Finally, because we believe that most Thornburg Fund shareholders have invested with a long-term perspective, we try not to focus too much on the fashions of the moment and on short-term performance. The market will not favor any specific investment objective or set of policies at all times and under all economic circumstances. A fund will experience periods of both high and low returns relative to other funds and other investments. Even if one of our Funds is not favored by the market at a particular time, we believe that the advisor is nonetheless obliged to remain true to the Fund’s objective and policies, and we watch to see that it does so.
This statement is submitted for the general information of the shareholders of Thornburg Investment Trust. It is not authorized for distribution to prospective investors in the Fund unless preceded or accompanied by an effective prospectus. If you have not received a prospectus, one can be obtained from your financial advisor, online at www.thornburg.com/download, or by calling 800-847-0200. Carefully consider information in the prospectus regarding the Fund’s investment objectives and policies, risks, sales charges, expenses, experience of its management, marketability of shares, and other information. Read it carefully before you invest or send money.
38 This page is not part of the Annual Report. |
Planning Options
Retirement and Education Accounts
Thornburg Investment Management offers retirement and education savings accounts that can help you meet a variety of planning challenges. For account applications or further information on any of the accounts below, please call 1-800-847-0200 or go to www.thornburg.com/ira. Your financial advisor can help you determine which plan is right for you.
Individual Retirement Accounts
Individual Retirement Accounts (IRAs) provide a tax-advantaged means to save money for the future. For a detailed outline of the difference between retirement accounts, see www.thornburg.com/ira. Rollovers are available. Call 1-800-847-0200 for more information.
Traditional IRAs – Contributions to Traditional IRAs are tax deductible for eligible individuals, and withdrawals are taxed as additional ordinary income. You may contribute to an IRA if you receive compensation and are under 70 1/2, even if you are covered by an employer retirement plan.
Roth IRAs – Under a Roth IRA, there is no tax deduction for contributions, but there is no income tax on qualified withdrawals. For a more detailed comparison of Traditional and Roth IRAs, please see our web site at www.thornburg.com/ira.
SEP IRAs – Simplified Employee Pension (SEP) IRAs are established by employers. The employer is allowed a tax deduction for contributions made to the SEP Plan and makes contributions to each eligible employee’s SEP IRA on a discretionary basis.
SIMPLE IRAs – Savings Incentive Match Plan for Employees of Small Employers (SIMPLE) is designed to give small business owners a simplified method to establish and contribute to a retirement plan for employees. The employer is allowed a tax deduction for contributions and makes either matching or non-elective contributions to each eligible employee’s SIMPLE IRA. Employees may make salary deferral contributions.
405(b)
A special, tax-advantaged savings vehicle available only to employees of 501(c)(3) organizations, such as charitable, educational, scientific and religious organizations. 403(b) plans are also available to employees of public schools and universities.
Coverdell Education Savings Account
These savings accounts are designed to provide a way to save money for higher education expenses. In an Education Savings Account, earnings and interest grow tax free, and qualified withdrawals used to pay for eligible higher-education expenses are tax- and penalty-free.
Funds Available
The following funds are available in the accounts listed above:
| • | Thornburg International Value Fund |
| • | Thornburg Value Fund |
| • | Thornburg Core Growth Fund |
| • | Thornburg Investment Income Builder Fund |
| • | Thornburg Limited Term U.S. Government Fund |
| • | Thornburg Limited Term Income Fund |
| This page is not part of the Annual Report. 39 |
The Firm
Thornburg Investment Management® is a privately held investment management company based in Santa Fe, New Mexico with assets under management of over $16 billion. Founded in 1982, the firm manages four equity funds, eight bond funds, and separate portfolios for select institutions and individuals.
Investment Philosophy
We seek to preserve and increase the real wealth of the Funds’ shareholders after accounting for inflation, taxes, and investment expenses. We’re committed to disciplined investing and controlling risk in all market environments through laddered bond and focused equity portfolios.
Portfolio Holdings Disclosure
We believe you should know about your portfolio. Our web site keeps investors informed of the Funds’ equity holdings. Go to www.thornburg.com/funds for commentary on our equity fund holdings.
Co-Ownership of Funds
We invest side-by-side with the Funds’ shareholders. Our employees have invested over $110 million in Thornburg Funds.
Core Strategies for Building Wealth
We deliver core strategies to help investors meet long-term goals. A core strategy is a consistent, disciplined and proven investment process that represents the foundation of a diversified portfolio.
| Investment Manager: | Distributor | |
 |  | |
119 East Marcy Street Santa Fe, New Mexico 87501 800.847.0200 | 119 East Marcy Street Santa Fe, New Mexico 87501 800.847.0200 | |

Core Strategies for Building Wealth
Thornburg Core Growth Fund
I Shares
Informational Brochure and
Annual Report – September 30, 2005
Overall Morningstar Rating™
Overall rating among 664 funds in the Mid-Cap Growth category covering the three-year period ended October 31, 2005, based on risk-adjusted returns.
Star Quality
This report and the accompanying brochure are submitted for the general information of shareholders of the Fund. It is not authorized for distribution to prospective investors in the Fund unless preceded or accompanied by an effective prospectus. If you have not received a prospectus, one can be obtained from your financial advisor, online at www.thornburg.com/ download, or by calling 800-847-0200. Carefully consider information in the prospectus regarding the Fund’s investment objectives and policies, risks, sales charges, expenses, experience of its management, marketability of shares, and other information. Read it carefully before you invest or send money. Performance data quoted represents past performance and does not guarantee future results.
Thornburg Core Growth Fund
The Fund seeks long-term growth of capital by investing in a selection of quality growth stocks that management believes will have growing revenues and earnings.
The Fund can invest in companies of any size, from large, well-established firms to small, emerging growth franchises. Management uses traditional fundamental research to evaluate securities and make buy/sell decisions.
Thornburg Bond Funds
| • | Thornburg Limited Term Municipal Fund |
| • | Thornburg Intermediate Municipal Fund |
| • | Thornburg California Limited Term Municipal Fund |
| • | Thornburg New Mexico Intermediate Municipal Fund |
| • | Thornburg Florida Intermediate Municipal Fund |
| • | Thornburg New York Intermediate Municipal Fund |
| • | Thornburg Limited Term U.S. Government Fund |
| • | Thornburg Limited Term Income Fund |
Thornburg invests in short- and intermediate-term investment grade bonds. We ladder the maturities of individual bonds in the portfolios to moderate risk. Laddering involves building a portfolio of bonds with staggered maturities so that a portion of the portfolio will mature each year. We apply this disciplined process in all interest rate environments.
Thornburg Equity Funds
| • | Thornburg Value Fund |
| • | Thornburg International Value Fund |
| • | Thornburg Core Growth Fund |
| • | Thornburg Investment Income Builder Fund |
Thornburg’s equity research uses a fundamental, yet comprehensive, analytical approach. We invest when and where we perceive compelling value. Thornburg equity funds focus on a limited number of securities so that each holding can impact performance. The equity team searches for firms believed to have a promising future and seeks to buy shares of those companies at a discount to their intrinsic value.
More information at www.thornburg.com
 | Reduce paper clutter. | |
| Receive your shareholder reports and prospectus online instead of through traditional mail. | ||
| Sign up at | ||
| www.thornburg.com/edelivery | ||
2 | This page is not part of the Annual Report. |
Message
from the Chairman

Garrett Thornburg
Chairman & CEO
November 9, 2005
Dear Fellow Shareholder:
Thornburg Investment Management has a clear mission: to preserve and increase the real wealth of our shareholders. We seek to accomplish this through a range of equity funds that redefine traditional measures of value and growth and through a family of laddered bond funds that focus on quality, stability and minimizing risk over time.
Confirming our strategy, all Thornburg equity funds have ranked well within their respective categories.
The Thornburg equity funds employ a comprehensive approach which is more inclusive than the traditional deep value or high growth approach to stock selection. Within the Thornburg Value Fund and the Thornburg International Value Fund, the portfolios’ securities are classified into three baskets: basic value stocks, stocks of companies with consistent earnings, and stocks of emerging franchises. Thornburg Core Growth Fund’s holdings are classified into similar baskets: growth industry leaders, consistent growth companies, and emerging growth companies. After being identified through bottom-up screening from a worldwide universe, all stocks are subject to a rigorous selection process that must satisfy the Thornburg investment team’s two fundamental criteria: in the opinion of the portfolio manager, the companies must be selling at attractive discounts to intrinsic value and have compelling prospects for long-term growth. You can read much more about the stocks in your Fund’s portfolio at our web site, www.thornburg.com/funds.
During this decade, the average dividend yield paid by equity and hybrid mutual funds has dipped well below 1%. We established Thornburg Investment Income Builder Fund in late 2002 to be clearly different from other equity/hybrid funds by paying attractive dividends today, with a further goal of increasing these in the future. Our record to date shows clear success in achieving each aspect of this mission.
On the bond side, we have always had a highly disciplined approach of laddering short- and intermediate-bond maturities seeking to provide both an attractive return and relative stability of principal.
Recently, there has been a lot of news about improper behavior by some mutual fund companies. Many of the proposed new rules in response to this scandal have called for increased transparency. We welcome increased transparency. Thornburg Investment Management has been a leader in providing information about our stock holdings to our shareholders on our web site, www.thornburg.com.
Unfortunately, some of those new rules will increase the cost to all shareholders in mutual funds. We will do our best to keep these expenses to a minimal amount. After all, we are shareholders too! Thornburg employees have over $110 million invested in our own funds.
Thank you for investing with us. We will do our best to continue to earn your trust every day.
Sincerely, |
 |
Garrett Thornburg Chairman & CEO |
| This page is not part of the Annual Report. | 3 |
Important Information
The information presented on the following pages was current as of September 30, 2005. The manager’s views, portfolio holdings, and sector diversification are historical and subject to change. This material should not be deemed a recommendation to buy or sell any of the securities mentioned.
Shares in the Fund carry risks including possible loss of principal. There are special risks associated with international investing, including currency fluctuations, government regulation, political developments, and differences in liquidity. Additionally, the Fund invests a portion of the assets in small capitalization companies which may increase the risk of greater price fluctuations. Funds invested in a limited number of holdings may expose an investor to greater volatility. Shares in the Fund are not deposits or obligations of, or guaranteed or endorsed by, any bank, the Federal Deposit Insurance Corporation, the Federal Reserve Board or any government agency.
From time to time the Fund may invest in shares of companies through initial public offerings (IPOs). IPOs have the potential to produce substantial gains. There is no assurance that the Fund will have continued access to profitable IPOs and as the Fund’s assets grow, the impact of an IPO investment may decline. Therefore investors should not rely on these past gains as an indication of future performance.
Minimum investments for Class I shares are higher than those for other classes.
The Morningstar Risk-Adjusted Rating (commonly called the star rating) brings both performance and risk together into one evaluation. To determine a fund’s star rating for a given period (three, five, or ten years), the fund’s Morningstar Risk score is subtracted from its Morningstar Return score. The resulting number is plotted along a bell curve to determine the fund’s rating for each time period: If the fund scores in the top 10% of its broad investment class (domestic stock, international stock, taxable bond, or municipal bond), it receives 5 stars (Highest); if it falls in the next 22.5%, it receives 4 stars (Above Average); a place in the middle 35% earns it 3 stars (Average); those in the next 22.5% receive 2 stars (Below Average); and the bottom 10% get 1 star (Lowest). The star ratings are recalculated monthly. Thornburg Core Growth Fund received 5 stars for the three-year period ended September 30, 2005, among 655 funds in the Mid-Cap Growth category.
Glossary
NASDAQ Composite Index – The NASDAQ Composite Index is a market-value weighted, technology-oriented index comprised of approximately 5,000 domestic and non-U.S.-based securities.
Russell 1000 Growth Index – Russell 1000 Growth Index measures the performance of those Russell 1000 companies with higher price-to-book ratios and higher forecasted growth values.
Standard & Poor’s 500 Stock Index (S&P 500) – An unmanaged index generally representative of the U.S. stock market, without regard to company size. Unless otherwise noted, index returns do not reflect fees, brokerage commissions or other expenses of investing. Investors may not make direct investments into any index.
Unless otherwise noted, index returns reflect the reinvestment of income dividends and capital gains, if any, but do not reflect fees, brokerage commissions or other expenses of investing. Investors may not make direct investments into any index. The performance of any index is not indicative of the performance of any particular investment.
Beta – Beta is a measure of market-related risk. Less than one means the portfolio is less volatile than the index, while greater than one indicates more volatility than the index.
Median Market Capitalization – Market capitalization (market cap) is the total value of a company’s stock, calculated by multiplying the number of outstanding common shares by the current share price. The company whose market cap is in the middle of the portfolio is the median market cap. Half the companies in the portfolio have values greater than the median, and half have values that are less. If there is an even number of companies, then the median is the average of the two companies in the middle.
Price to Book Value (P/B) – A ratio used to compare a stock’s market value to its book value. It is calculated by dividing the current closing price of the stock by the latest quarter’s book value (book value is simply assets minus liabilities).
Price to Cash Flow Ratio – A measure of the market’s expectations of a firm’s future financial health. It is calculated by dividing the price per share by cash flow per share.
Price to Earnings Ratio (P/E) – A valuation ratio of a company’s current share price compared to its per-share earnings. P/E equals a company’s market value per share divided by earnings per share.
4 | This page is not part of the Annual Report. |
Thornburg Core Growth Fund
Continually Evaluating the Risk Equation
Growth stocks are often referred to as “glamour” stocks . . . and it is easy to understand why. Growth stocks generate excitement. These are stocks where rapid earnings growth is expected to be followed by rapid price appreciation. Growth stocks capture the imagination, and investing in them can offer considerable opportunities for reward.
But growth stocks can also be volatile. Identifying which companies will succeed takes work. It takes digging down to the nuts and bolts of companies. The managers of Thornburg Core Growth Fund understand this. They know that it is grit, not glamour, that creates a successful growth fund.
Portfolio Manager Alex Motola and his team apply a rigorous stock selection process to investments for Thornburg Core Growth Fund. This is a portfolio run on common sense, not on abstract theory. Motola’s overarching philosophy is to create a fund that generates good performance over the long term, while reducing volatility in the interim. Intensive, hands-on, independent research is the central theme. While other growth funds rely on broad portfolio diversification to temper volatility, Thornburg Core Growth Fund concentrates on a limited number of stocks and diversifies those investments among three segments of the growth fund universe: consistent growth companies, growth industry leaders, and emerging growth companies. By limiting the number of securities, Thornburg’s managers can cover each stock in greater depth. Diversifying among three growth baskets further mitigates risk because each of these segments reacts differently than the equity markets as a whole.
How does the stock selection process work? Before adding a stock to the Fund’s portfolio, Motola and his team drill down into the company and its business. Their research goes well beyond the standard Wall Street analysis, and eschews today’s common growth investing mantra of buy growth at any price. Instead, the Thornburg team zeros in on the risk equation.
Companies are initially screened using a variety of quantitative measures and parameters. Most are rejected and logged onto a screening rejection spreadsheet. Only those with the most appealing opportunities to expand margins and grow earnings move on to the next step – the construction of a company-specific model. The goal is to cut to the quick and get at the underlying business. The team uses SEC filings to construct proprietary income statement, balance sheet and cash flow statement models for each remaining company. From these they analyze historical data, monitor current conditions, identify red-flags and estimate future growth potential.
Motola, a former historian who has been at the Fund’s helm since its inception, is not one to go along with the crowd. He and his team are not tied to “mainstream thinking.” While they have access to the best of Wall Street’s analysis, they are not ruled by it.
They test the strength of a company’s underlying business model against a variety of what-if screens. They conduct site visits and interview company management. And they complete the picture by checking in with a company’s major customers, suppliers, and distributors. Revenue and cost of goods sold are given particular attention, with each broken down in as many ways as the data will allow.
With growth stocks beginning to return to favor, this team is positioned to demonstrate the strength of its grit over glamour strategy . . . and eager to continue providing its shareholders with steady, consistent performance through a variety of market cycles.
| This page is not part of the Annual Report. | 5 |
Portfolio Overview
Thornburg Core Growth Fund
IMPORTANT PERFORMANCE INFORMATION
Performance data quoted represents past performance and does not guarantee future results. Investment return and principal value will fluctuate so that upon redemption, investor’s shares may be worth more or less than their original cost. Current performance may be lower or higher than the data quoted. For performance data current to the most recent month end, visit www.thornburg.com.
There is no up-front sales charge for Class I shares. I shares are subject to a 1% 90-day redemption fee.
MANAGEMENT TEAM

Left to Right: Connor Browne, Brian Summers, Alex Motola, and Lei Wang
KEY PORTFOLIO ATTRIBUTES
Portfolio P/E* | 23.12 | x | ||
Portfolio Price to Cash Flow* | 28.9 | |||
Portfolio Price to Book Value* | 4.3 | |||
Median Market Cap* | $ | 4.20 B | ||
3-Year Beta (Thornburg vs. NASDAQ)** | 0.74 | |||
Holdings | 35 |
| * | Source: Thomson Portfolio Analytics |
| ** | Source: Morningstar Principia Pro |
The Class I shares of the Thornburg Core Growth Fund posted a positive return of 31.47% for the twelve-month period ended September 30, 2005. The Fund outperformed both the Russell 1000 Growth Index, which returned 11.60% during the period, and the NASDAQ Composite Index, which returned 14.19%. Once again, stock selection was the primary driver of the Fund’s relative outperformance, as individual stocks from a variety of sectors and industries were the top performers in the Fund.
Consumer discretionary stocks had the most notable impact on the Fund’s outperformance of the benchmarks and represented a diverse and eclectic mix of holdings. Among the strong performers were Imax Corp., known for its large format theatres and patented 70mm film format, retailer CJ Home Shopping Co. Ltd., a South Korean home shopping company, and Life Time Fitness Inc., which operates super fitness centers.
Information technology represented the largest weight in the portfolio during the year and had a significant impact on the relative outperformance of the Fund. Significant holdings with good performance included Google Inc., which was one of the larger weighted holdings in the Fund for a majority of the year. Apple Computer Inc. contributed significant returns in addition to less recognizable names such as Datatrak International Inc., which provides software and services that enable the collection and transfer of clinical trial data electronically, and Netease.com Inc., a Chinese online gaming company. Technology related holdings represented a broad range of companies, which is characteristic of the flexible nature of the Fund.
AVERAGE ANNUAL TOTAL RETURNS*
FOR PERIODS ENDED SEPTEMBER 30, 2005
| 3Q ‘05 | 1 Yr | Since Inception | |||||||
I Shares (Incep: 11/3/03) | 8.70 | % | 31.47 | % | 15.74 | % | |||
NASDAQ (Since: 11/3/03) | 4.78 | % | 14.19 | % | 6.38 | % | |||
Russell 1000 Growth (Since: 11/3/03) | 4.01 | % | 11.60 | % | 6.90 | % |
| * | Periods under one year are not annualized. |
6 | This page is not part of the Annual Report. | . |
Additional performance was garnered from a number of areas. One of the best performing stocks was financial holding Chicago Mercantile Exchange Holdings Inc., which operates the leading derivatives exchange in the U.S. Telecommunications stock NII Holdings Inc. performed well as it benefited from growing demand for digital wireless communication services in Latin America. Health care company WellPoint Inc. merged with Anthem to become the largest health benefits company in the U.S. Energy holding ATP Oil and Gas Corp. also provided a boost, as the offshore oil and gas company benefited from rising energy prices.
Although the Fund outperformed by a significant margin during the year, there were some holdings that did not work out. The most significant was Boston Scientific Corp., a long time holding that had a number of disappointing business developments and was sold based on those deteriorating fundamentals. Another poor performer was Ditech Communications, which provides voice processing products to mobile and wire-line operators. Ditech was sold off after experiencing an unexpected sales shortfall and is no longer held in the Fund.
Overall, the performance of the Fund was very good. The team’s comprehensive approach to growth and breadth of research were evident in the wide variety of companies held in the portfolio that contributed to positive returns during the year. As the Fund approaches its five-year anniversary, this flexible and opportunistic approach has enabled the Fund to fully benefit from the rigorous fundamental research conducted by the team and realize its goal of maximizing long-term after tax returns while controlling risk.
PERFORMANCE IMPACT FOR YEAR ENDED 9/30/05
Top Contributors | Top Detractors | |
| Chicago Mercantile Exchange Co. | Boston Scientific Corp. | |
| WellPoint Inc. | Ditech Communications | |
| Google Inc. | PartyGaming plc | |
| CJ Home Shopping Co. Ltd. | Pfizer Inc. | |
| NII Holdings Inc. | DIRECTV Group Inc. | |
Source: Thomson Portfolio Analytics
MARKET CAPITALIZATION EXPOSURE
As of 9/30/05

TOP TEN EQUITY HOLDINGS
As of 9/30/05
Google Inc. | 4.9 | % | |
Microsoft Corp. | 4.6 | % | |
Apple Computer Inc. | 4.1 | % | |
Amdocs Ltd. | 3.8 | % | |
Gilead Sciences Inc. | 3.7 | % | |
Sanofi-Aventis | 3.5 | % | |
Check Point Software | 3.4 | % | |
Cytyc Corp. | 3.4 | % | |
UnitedHealth Group Inc. | 3.3 | % | |
Chicago Mercantile Exchange Co. | 3.3 | % |
TOP TEN INDUSTRIES
As of 9/30/05
Software & Services | 19.5 | % | |
Health Care Equip & Services | 17.2 | % | |
Media | 10.6 | % | |
Pharmaceuticals & Biotech | 9.6 | % | |
Energy | 8.4 | % | |
Diversified Financials | 5.8 | % | |
Telecommunication Services | 5.2 | % | |
Semiconductors & Semi. Equipment | 4.7 | % | |
Technology Hardware & Equip | 4.1 | % | |
Retailing | 3.0 | % |
| This page is not part of the Annual Report. | 7 |
This page intentionally left blank.
8 | This page is not part of the Annual Report. |

Thornburg Core Growth Fund
I Shares – September 30, 2005
| 10 | ||
| 12 | ||
| 14 | ||
| 16 | ||
| 17 | ||
| 22 | ||
| 23 | ||
| 27 | ||
| 28 | ||
| 29 | ||
| 30 | ||
| 33 | ||
This report is certified under the Sarbanes-Oxley Act of 2002, which requires that public companies, including mutual funds, affirm that the information provided in their annual and semiannual shareholder reports fully and fairly represents their financial position.
| Certified Annual Report | 9 |

Alexander M.V. Motola,CFA
Portfolio Manager
October 17, 2005
Dear Fellow Shareholder:
Over the past twelve months, the Thornburg Core Growth Fund has participated in the rising equity market. On September 30, 2004, the net asset value (NAV) for the Class I shares was $10.93. Twelve months later, the Fund’s NAV was $14.37. The Fund’s Class I shares outperformed its benchmarks with a total return of 31.47% during the past twelve months. The NASDAQ Composite Index returned 14.19% and the Russell 1000 Growth returned 11.60% over the twelve-month period.
Our health care sector exposure has declined over the past twelve months, from 34% of the portfolio to 27%. The sector remains a fertile area for investment ideas, and we continue to scour the landscape for promising opportunities. Our technology exposure appears to have remained constant, when comparing the start of the fiscal year to the finish, but actually it was not static throughout the year. Finally, our exposure to the consumer has continued to decline; a development we are very comfortable with when considering the twin risks of rising commodity prices and rising interest rates.
We finished the fiscal year slightly overweight in our Emerging Growth Companies basket, with 37% of our assets in that category. Consistent Growers represented 27% of assets, and Growth Industry Leaders made up 33% of the portfolio. Stocks with market capitalizations in excess of $12 billion represented 37% of the portfolio, our largest cap weighting.
Our biggest contributor to the Fund’s performance was the Chicago Mercantile Exchange Co. Although we did not participate in the initial public offering, our global exchange holdings (in other Thornburg funds) and the uniqueness of Chicago Mercantile’s business led us to believe it was a compelling opportunity. Google Inc. and Apple Computer Inc. were also large contributors to the Fund’s total return.
The situation with Apple is an interesting one, and was again highlighted in the aftermath of their recently released third quarter earnings. Many people have focused on the success and momentum surrounding the now ubiquitous iPod family of devices. However, the success of Apple’s stock depends largely on the company’s ability to design and sell elegant and easy-to-use personal computers. iPod revenues have certainly become more meaningful to the company, but it is the tendency of iPod users to buy Apple’s PC offerings that is most important.
Google has become a verb. The company has revolutionized an already innovative industry, and Google continues to benefit from the relentless and inevitable move of advertising and content from the printed world to the digital world. The universe of domestic companies with market capitalizations greater than $50 billion, and that are growing revenues in excess of 80%, is small. In fact, besides Google, which grew revenues 98% year over year in the second quarter, only one other 50 billion+ domestic market cap grew revenues even 50% – Goldman Sachs. In Goldman’s case, the 15 acquisitions they’ve made over the last year have helped ramp up their revenue growth. Google is a unique franchise in advertising in both the online world and in the investing world, and we feel that the stock will eventually reflect the full value of that opportunity.
What didn’t work? No central theme united the worst performers: PartyGaming plc, Boston Scientific, Jamdat Mobile Inc., and DIRECTV Group Inc. We purchased PartyGaming plc after it went public in the United Kingdom, and raised funds for the purchase by selling our modestly successful investment in Sportingbet plc. Our rationale was to participate more directly in online poker (PartyGaming plc is a pure play on that industry), versus being diluted by Sportingbet’s more diverse interests. We also felt that Partygaming had a big advantage in that they had the most players, and hence the most interesting tournaments (and pots!). This “liquidity pool” of poker players did not prove to be as much of a competitive advantage as we had hoped, and the company has needed to spend ever-increasing amounts to attract and retain players. Jamdat Mobile suffered through a quarter where organic growth slowed faster than our expectations. One of Jamdat’s major wireless carrier customers, Cingular Wireless, decided to increase their inventory of games from Jamdat competitors and as a result Jamdat titles saw less sell through. Secondly, internal resource constraints at Jamdat pushed back the release of new game titles as the company worked through the integration of a previous acquisition. In addition to the issues specific to the second quarter for Jamdat, we sold Jamdat based on our expectation that, in the long run, the business model may not be able to leverage sales growth into a much higher margin structure and competitive forces may suppress intermediate-term revenue potential.
Boston Scientific has been a long time holding in the Thornburg Core Growth Fund. While we correctly identified the opportunity in the drug eluting stent market prior to Boston Scientific’s Taxus launch, we did a poor job of identifying what
10 | Certified Annual Report | . |
became unsustainable market share expectations. Released data on the Taxus stent this year has been weaker than data for Johnson & Johnson’s competitive product, the Cypher, and sales have begun to reflect that reality. Furthermore, a number of management missteps have given us less confidence in our long term investment thesis. While Boston’s pipeline continues to look strong, we have sold the position given the uncertainty surrounding the company’s largest product.
At DIRECTV, investors continue to focus on increasing costs to acquire new subscribers. As new technologies, like Personal Video Recorders (i.e. Tivo-like functionality) and High Definition signals, are introduced, the cost of each box is higher. But, we believe that the returns on the increased investment in these new subscribers will be much higher than DIRECTV’s cost of capital. With the advanced functionality, subscribers tend to pay a higher monthly fee and keep the service longer. Further, the acquisition costs are magnified as DIRECTV is growing much faster than its competitors. As new subscribers decrease as a percentage of total subscribers, the strong cash flow generation characteristics of the company should become clearer.
It is important to understand our focus on risk control. Although we hope our statistical risk is low (standard deviation of returns), our focus is on appropriate diversification and stock-specific risk control. “Knowing what you own” is our mantra. Our approach is a balance between diversifying our portfolio and maximizing the impact of individual stock selections.
We seek to control risk by consciously diversifying our portfolio by capitalization range, by sector and within sectors, and by basket (Growth Industry Leaders, Consistent Growth Companies, and Emerging Growth Companies). Moreover, since we focus our research efforts on identifying stock specific risks – knowing the business model, the accounting issues, the competitive, regulatory, and legal risks, and the quality of earnings being generated – we feel we are controlling our risks at the most basic and important place, the individual security level.
Although the outlook for the consumer is discouraging, many other aspects of the market and the economy are encouraging. The consensus forecast is for the S&P 500 Index to grow earnings by 10% this year and 6% next year. In spite of this strong expected business performance, that index is only up 2.76% for the year. Interest rates have increased, but remain low by historical standards. Over the life of the Fund (inception was December of 2000), the returns on Growth Equity asset classes (small, mid-cap, and large) have been negative. History suggests that, at some future point, growth stocks will outperform value stocks. After five years of value outperformance, it is likely that the shift will occur sooner rather than later.
Initial public offerings contributed 2.5% of total return to the Fund during the Fund’s fiscal year. This includes holdings that we continue to own with expectations of generating long-term profits as our investment cases play out.
Our motto is “Core strategies for building wealth.” We believe the Thornburg Core Growth Fund continues to fulfill its mandate as a growth-oriented investment vehicle that can form part of the nucleus of an asset allocation strategy. Our focus is on maximizing long term after-tax returns while controlling risk. We encourage you to learn more about your portfolio. Descriptions of each holding and links to company web sites can be found by pointing your Internet browser to www.thornburg.com/funds. Thank you for investing in the Thornburg Core Growth Fund.
Regards,
 |
| Alexander M.V. Motola,CFA |
| Portfolio Manager |
The matters discussed in this report may constitute forward-looking statements made pursuant to the safe harbor provisions of the Securities Litigation Reform Act of 1995. These include any advisor or portfolio manager prediction, assessment, analysis or outlook for individual securities, industries, investment styles, market sectors and/or markets. These statements involve risks and uncertainties. In addition to the general risks described for each fund in its current prospectus, other factors bearing on these reports include the accuracy of the advisor’s or portfolio manager’s forecasts and predictions, the appropriateness of the investment strategies designed by the advisor or portfolio manager, and the ability of the advisor or portfolio manager to implement their strategies efficiently and successfully. Any one or more of these factors, as well as other risks affecting the securities markets generally, could cause the actual results of any fund to differ materially as compared to its benchmarks.
| Certified Annual Report | 11 |
STATEMENT OF ASSETS AND LIABILITIES
Thornburg Core Growth Fund | September 30, 2005 |
ASSETS | ||||
Investments at value (cost $180,310,584) | $ | 212,656,012 | ||
Cash | 1,969,280 | |||
Receivable for fund shares sold | 3,986,533 | |||
Unrealized gain on forward exchange contracts (Note 7) | 221,391 | |||
Dividends receivable | 4,160 | |||
Prepaid expenses and other assets | 33,230 | |||
Total Assets | 218,870,606 | |||
LIABILITIES | ||||
Payable for securities purchased | 9,384,395 | |||
Payable for fund shares redeemed | 105,395 | |||
Unrealized loss on forward exchange contracts (Note 7) | 197,859 | |||
Payable to investment advisor and other affiliates (Note 3) | 192,890 | |||
Deferred tax payable | 15,264 | |||
Accounts payable and accrued expenses | 80,948 | |||
Total Liabilities | 9,976,751 | |||
NET ASSETS | $ | 208,893,855 | ||
NET ASSETS CONSIST OF: | ||||
Distribution in excess of net investment income | $ | (58,129 | ) | |
Net unrealized appreciation on investments | 32,353,737 | |||
Accumulated net realized gain (loss) | 4,423,999 | |||
Net capital paid in on shares of beneficial interest | 172,174,248 | |||
| $ | 208,893,855 | |||
12 | Certified Annual Report |
| STATEMENT OF ASSETS AND LIABILITIES, CONTINUED | ||
Thornburg Core Growth Fund | September 30, 2005 | |
NET ASSET VALUE: | |||
Class A Shares: | |||
Net asset value and redemption price per share ($110,836,478 applicable to 7,800,318 shares of beneficial interest outstanding - Note 4) | $ | 14.21 | |
Maximum sales charge, 4.50% of offering price | 0.67 | ||
Maximum offering price per share | $ | 14.88 | |
Class C Shares: | |||
Net asset value and offering price per share * ($41,737,264 applicable to 3,061,623 shares of beneficial interest outstanding - Note 4) | $ | 13.63 | |
Class I Shares: | |||
Net asset value, offering and redemption price per share ($49,975,244 applicable to 3,476,945 shares of beneficial interest outstanding - Note 4) | $ | 14.37 | |
Class R1 Shares: | |||
Net asset value, offering and redemption price per share ($6,344,869 applicable to 445,040 shares of beneficial interest outstanding - Note 4) | $ | 14.26 | |
| * | Redemption price per share is equal to net asset value less any applicable contingent deferred sales charge. |
See notes to financial statements.
| Certified Annual Report | 13 |
| STATEMENT OF OPERATIONS | ||
Thornburg Core Growth Fund | Year Ended September 30, 2005 | |
INVESTMENT INCOME: | ||||
Dividend income (net of foreign taxes withheld of $ 10,045) | $ | 210,827 | ||
Interest income | 276,693 | |||
Total Income | 487,520 | |||
EXPENSES: | ||||
Investment advisory fees (Note 3) | 983,586 | |||
Administration fees (Note 3) | ||||
Class A Shares | 76,182 | |||
Class C Shares | 27,000 | |||
Class I Shares | 14,271 | |||
Class R1 Shares | 1,663 | |||
Distribution and service fees (Note 3) | ||||
Class A Shares | 152,723 | |||
Class C Shares | 216,567 | |||
Class R1 Shares | 6,750 | |||
Transfer agent fees | ||||
Class A Shares | 103,795 | |||
Class C Shares | 33,985 | |||
Class I Shares | 18,014 | |||
Class R1 Shares | 2,767 | |||
Registration and filing fees | ||||
Class A Shares | 24,535 | |||
Class C Shares | 16,814 | |||
Class I Shares | 8,527 | |||
Class R1 Shares | 22,979 | |||
Custodian fees (Note 3) | 74,670 | |||
Professional fees | 33,864 | |||
Accounting fees | 9,975 | |||
Trustee fees | 2,244 | |||
Other expenses | 61,956 | |||
Total Expenses | 1,892,867 | |||
Less: | ||||
Expenses reimbursed by Investment Advisor (Note 3) | (71,218 | ) | ||
Distribution and Service fees waived (Note 3) | (100 | ) | ||
Management fees waived by investment Advisor (Note 3) | (24,743 | ) | ||
Fees paid indirectly (Note 3) | (30,230 | ) | ||
Net Expenses | 1,766,576 | |||
Net Investment Loss | $ | (1,279,056 | ) | |
14 | Certified Annual Report |
| STATEMENT OF OPERATIONS, CONTINUED | ||
Thornburg Core Growth Fund | Year Ended September 30, 2005 | |
REALIZED AND UNREALIZED GAIN (LOSS) | ||||
Net realized gain (loss) on: | ||||
Investments | $ | 6,703,838 | ||
Foreign currency transactions | (58,157 | ) | ||
| 6,645,681 | ||||
Net change in unrealized appreciation (depreciation) on: | ||||
Investments (net of change in deferred taxes payable of $ 15,264) | 25,124,172 | |||
Foreign currency translation | 23,533 | |||
| 25,147,705 | ||||
Net Realized and Unrealized Gain on Investments | 31,793,386 | |||
Net Increase in Net Assets Resulting From Operations | $ | 30,514,330 | ||
See notes to financial statements.
| Certified Annual Report | 15 |
| STATEMENTS OF CHANGES IN NET ASSETS | ||
Thornburg Core Growth Fund | ||
| Year Ended September 30, 2005 | Year Ended September 30, 2004 | |||||||
INCREASE (DECREASE) IN NET ASSETS FROM: | ||||||||
OPERATIONS: | ||||||||
Net investment income (loss) | $ | (1,279,056 | ) | $ | (907,261 | ) | ||
Net realized gain (loss) on investments and foreign currency transactions | 6,645,681 | (69,166 | ) | |||||
Increase (Decrease) in unrealized appreciation (depreciation) on investments, foreign currency translation, and deferred taxes | 25,147,705 | 3,816,240 | ||||||
Net Increase (Decrease) in Net Assets Resulting from Operations | 30,514,330 | 2,839,813 | ||||||
FUND SHARE TRANSACTIONS (NOTE 4): | ||||||||
Class A Shares | 53,496,950 | 2,225,643 | ||||||
Class C Shares | 21,351,328 | 7,120,528 | ||||||
Class I Shares | 20,375,442 | 21,612,285 | ||||||
Class R1 Shares | 5,969,887 | 14,604 | ||||||
Net Increase in Net Assets | 131,707,937 | 33,812,873 | ||||||
NET ASSETS: | ||||||||
Beginning of year | 77,185,918 | 43,373,045 | ||||||
End of year | $ | 208,893,855 | $ | 77,185,918 | ||||
See notes to financial statements.
16 | Certified Annual Report |
| NOTES TO FINANCIAL STATEMENTS | ||
Thornburg Core Growth Fund | September 30, 2005 | |
NOTE 1 – ORGANIZATION
Thornburg Core Growth Fund, hereinafter referred to as the “Fund,” is a diversified series of Thornburg Investment Trust (the “Trust”). The Fund commenced operations on December 27, 2000. The Trust was organized as a Massachusetts business trust under a Declaration of Trust dated June 3, 1987 and is registered as a diversified, open-end management investment company under the Investment Company Act of 1940, as amended. The Trust is currently issuing eleven series of shares of beneficial interest in addition to those of the Fund: Thornburg Limited Term Municipal Fund, Thornburg California Limited Term Municipal Fund, Thornburg Limited Term U.S. Government Fund, Thornburg New Mexico Intermediate Municipal Fund, Thornburg Intermediate Municipal Fund, Thornburg Limited Term Income Fund, Thornburg Value Fund, Thornburg International Value Fund, Thornburg Florida Intermediate Municipal Fund, Thornburg New York Intermediate Municipal Fund, and Thornburg Investment Income Builder Fund. Each series is considered to be a separate entity for financial reporting and tax purposes and bears expenses directly attributable to it. The Fund seeks long-term capital appreciation by investing primarily in domestic equity securities selected for their growth potential.
The Fund currently offers four classes of shares of beneficial interest, Class A, Class C, Institutional Class (Class I), and Retirement Class (Class R1) shares. Each class of shares of the Fund represents an interest in the same portfolio of investments of the Fund, except that (i) Class A shares are sold subject to a front-end sales charge collected at the time the shares are purchased and bear a service fee, (ii) Class C shares are sold at net asset value without a sales charge at the time of purchase, but are subject to a contingent deferred sales charge upon redemption within one year, and bear both a service fee and a distribution fee, (iii) Class I shares are sold at net asset value without a sales charge at the time of purchase, (iv) Class R1 shares are sold at net asset value without a sales charge at the time of purchase but bear both a service fee and a distribution fee, and (iv) the respective classes may have different reinvestment privileges and conversion rights. Additionally, the Fund may allocate among its classes certain expenses, to the extent allowable, to specific classes including transfer agent fees, government registration fees, certain printing and postage costs, and administration and legal expenses. Currently, class specific expenses of the Fund are limited to service and distribution fees, administration fees, and certain registration and transfer agent expenses.
NOTE 2 – SIGNIFICANT ACCOUNTING POLICIES
Significant accounting policies of the Trust are as follows:
Valuation of Securities: In determining the net asset value of investments, investments are stated at value based on latest sales prices, normally at 4:00 pm EST reported on securities exchanges on the last business day of the period. Investments for which no sale is reported are valued at the mean between bid and asked prices or in accordance with such other method as the Trustees may authorize. In any case where a market quotation is not readily available, the Trust’s valuation and pricing committee determines a fair value for the investment using factors approved by the Trustees. Short term obligations having remaining maturities of 60 days or less are valued at amortized cost, which approximates market value.
Options Transactions: The Fund may buy or write put and call options through listed exchanges and the over-the-counter market. The buyer has the right to purchase (in the case of a call option) or sell (in the case of a put option) a specified quantity of a specific security or other underlying asset at a specified price prior to or on a specified expiration date. The writer of an option is exposed to the risk of loss if the market price of the underlying asset declines (in the case of a put option) or increases (in the case of a call option). The writer of an option can never profit by more than the premium paid by the buyer but can lose an unlimited amount. The writer also has the additional risk of not being able to enter into a closing transaction if a liquid secondary market does not exist.
Premiums received/paid from writing/purchasing options are recorded as liabilities/assets on the Statement of Assets and Liabilities, and are subsequently adjusted to current values. The difference between the current value of an option and the premium received/paid is treated as an unrealized gain or loss.
When a purchased option expires on its stipulated expiration date or when a closing transaction is entered into, the premium paid on the purchase of the option is treated by the Fund as a realized loss. When a written option expires on its stipulated expiration date or when a closing transaction is entered into, the related liability is extinguished and the Fund realizes a gain (loss if the cost of the closing transaction exceeds the premium received when the option was written).
Foreign Currency Translation: Portfolio securities and other assets and liabilities denominated in foreign currencies are translated into U.S. dollars based on the exchange rate of such currencies against the U.S. dollar on the date of valuation. Purchases and sales of securities and income items denominated in foreign currencies are translated into U.S. dollars at the exchange rate in effect on the translation date. When the Fund purchases or sells foreign securities it will customarily enter into a foreign exchange contract to minimize foreign exchange risk from the trade date to the settlement date of such transactions.
The Fund does not separately report the effect of changes in foreign exchange rates from changes in market prices on securities held. Such changes are included in net realized and unrealized gain or loss from investments.
Reported net realized foreign exchange gains or losses arise from sales of foreign currencies, currency gains or losses
| Certified Annual Report | 17 |
| NOTES TO FINANCIAL STATEMENTS, CONTINUED | ||
Thornburg Core Growth Fund | September 30, 2005 | |
realized between the trade and settlement dates on securities transactions and the difference between the amount of interest recorded on the Fund’s books, and the U.S. dollar equivalent of the amounts actually received or paid.
Federal Income Taxes: It is the policy of the Trust to comply with the provisions of the Internal Revenue Code applicable to “regulated investment companies” and to distribute all taxable income, including any net realized gain on investments, of the Fund to the shareholders. Therefore, no provision for Federal income taxes is required.
Dividends: Dividends to shareholders are generally paid quarterly and are reinvested in additional shares of the Fund at net asset value per share at the close of business on the dividend payment date or, at the shareholder’s option, paid in cash. Net realized capital gains, to the extent available, will be distributed at least annually. Distributions to shareholders are based on income tax regulations and therefore, their characteristics may differ for financial statement and tax purposes.
General: Securities transactions are accounted for on a trade date basis. Interest income is accrued as earned and dividend income is recorded on the ex-dividend date. Certain income from foreign securities is recognized as soon as information is available to the Fund. Realized gains and losses from the sale of securities are recorded on an identified cost basis. Net investment income, other than class specific expenses and realized and unrealized gains and losses, is allocated daily to each class of shares based upon the relative net asset value of outstanding shares of each class of shares at the beginning of the day (after adjusting for the current share activity of the respective class). Expenses common to all funds are allocated among the funds comprising the Trust based upon their relative net asset values or other appropriate allocation methods.
Guarantees and Indemnifications: Under the Trust’s organizational documents, its officers and Trustees are indemnified against certain liability arising out of the performance of their duties to the Fund. Additionally, in the normal course of business the Trust enters into contracts with service providers that contain general indemnification clauses. The Trust’s maximum exposure under these arrangements is unknown. However, based on experience, the Trust expects the risk of loss to be remote.
Use of Estimates: The preparation of financial statements, in conformity with generally accepted accounting principles, requires management to make estimates and assumptions that affect the reported amounts of assets and liabilities and the disclosure of contingent assets and liabilities at the date of the financial statements and the reported amounts of increases and decreases in net assets from operations during the reporting period. Actual results could differ from those estimates.
NOTE 3 – INVESTMENT ADVISORY FEE AND OTHER TRANSACTIONS WITH AFFILIATES
Pursuant to an investment advisory agreement, Thornburg Investment Management, Inc.® (the “Advisor”) serves as the investment advisor and performs services to the Fund for which the fees are payable at the end of each month. For the year ended September 30, 2005, these fees were payable at annual rates ranging from .875 of 1% to .675 of 1% per annum of the average daily net assets of the Fund depending on the Fund’s asset size. For the year ended September 30, 2005, the Advisor voluntarily waived investment advisory fees of $24,743. The Fund also has an administrative services agreement with the Advisor, whereby the Advisor will perform certain administrative services for the shareholders of each class of the Fund’s shares, and for which fees will be payable at an annual rate of up to .125 of 1% per annum of the average daily net assets attributable to each class of shares. For the year ended September 30, 2005, the Advisor voluntarily reimbursed certain class specific expenses and administrative fees and distribution fees of $1,015 for Class A shares, $2,252 for Class C shares, $40,812 for Class I shares, and $27,139 for Class R1 shares.
The Trust has an underwriting agreement with Thornburg Securities Corporation® (the “Distributor”, an affiliate of the Advisor), which acts as the Distributor of the Fund’s shares. For the year ended September 30, 2005, the Distributor has advised the Fund that it earned commissions aggregating $63,900 from the sale of Class A shares of the Fund and collected contingent deferred sales charges aggregating $4,236 from redemptions of Class C shares of the Fund.
Pursuant to a service plan under Rule 12b-1 of the Investment Company Act of 1940, the Fund may reimburse to the Advisor an amount not to exceed .25 of 1% per annum of its average daily net assets attributable to each class of shares of the Fund for payments made by the Advisor to securities dealers and other financial institutions to obtain various shareholder related services. The Advisor may pay out of its own resources additional expenses for distribution of the Fund’s shares.
The Trust has also adopted distribution plans pursuant to Rule 12b-1, applicable only to the Fund’s Class C and Class R1 shares, under which the Fund compensates the Distributor for services in promoting the sale of Class C and Class R1 shares of the Fund at an annual rate of up to .75 of 1% of the average daily net assets attributable to Class C and Class R1 shares. Total fees incurred by each class of shares of the Fund under its respective service and distribution plans are set forth in the Statement of Operations.
The Trust has an agreement with the custodian bank to indirectly pay a portion of the custodian’s fees through credits earned by the Fund’s cash on deposit with the bank. This deposit agreement is an alternative to overnight investments. Custodial fees have been adjusted to reflect amounts that
18 | Certified Annual Report |
| NOTES TO FINANCIAL STATEMENTS, CONTINUED | ||
Thornburg Core Growth Fund | September 30, 2005 | |
would have been paid without this agreement, with a corresponding adjustment reflected as fees paid indirectly in the Statement of Operations. For the year ended September 30, 2005, fees paid indirectly were $30,230.
Certain officers and Trustees of the Trust are also officers and/or Directors of the Advisor and Distributor. The compensation of independent Trustees is borne by the Trust.
NOTE 4 – SHARES OF BENEFICIAL INTEREST
At September 30, 2005, there were an unlimited number of shares of beneficial interest authorized. Transactions in shares of beneficial interest were as follows:
Year Ended September 30, 2005 | Year Ended September 30, 2004 | |||||||||||||
| Shares | Amount | Shares | Amount | |||||||||||
Class A Shares | ||||||||||||||
Shares sold | 4,753,098 | $ | 62,419,689 | 2,600,930 | $ | 28,184,218 | ||||||||
Shares repurchased** | (714,886 | ) | (8,922,739 | ) | (2,423,327 | ) | (25,958,575 | ) | ||||||
Net Increase (Decrease) | 4,038,212 | $ | 53,496,950 | 177,603 | $ | 2,225,643 | ||||||||
** The Fund charges a redemption fee of 1% of the Class A shares exchanged within 90 days of purchase. For the year ended September 30, 2005 and year ended September 30, 2004, $3,423 and $19,941, respectively, were netted in the amount reported for shares repurchased. |
| |||||||||||||
Class C Shares | ||||||||||||||
Shares sold | 1,892,754 | $ | 24,074,650 | 872,281 | $ | 9,164,316 | ||||||||
Shares repurchased | (228,812 | ) | (2,723,322 | ) | (199,986 | ) | (2,043,788 | ) | ||||||
Net Increase (Decrease) | 1,663,942 | $ | 21,351,328 | 672,295 | $ | 7,120,528 | ||||||||
Class I Shares* | ||||||||||||||
Shares sold | 1,588,545 | $ | 21,467,761 | 2,027,702 | $ | 22,189,316 | ||||||||
Shares repurchased ** | (85,287 | ) | (1,092,319 | ) | (54,015 | ) | (577,031 | ) | ||||||
Net Increase (Decrease) | 1,503,258 | $ | 20,375,442 | 1,973,687 | $ | 21,612,285 | ||||||||
* Effective date of Class I shares was November 1, 2003.
** The Fund charges a redemption fee of 1% of the Class I shares exchanged within 90 days of purchase. For the year ended September 30, 2005 and the year ended September 30, 2004, $344 and $474, respectively, were netted in the amount reported for shares repurchased. |
| |||||||||||||
Class R1 Shares | ||||||||||||||
Shares sold | 490,525 | $ | 6,601,537 | 1,444 | $ | 14,629 | ||||||||
Shares repurchased | (46,935 | ) | (631,650 | ) | (2 | ) | (25 | ) | ||||||
Net Increase (Decrease) | 443,590 | $ | 5,969,887 | 1,442 | $ | 14,604 | ||||||||
| Certified Annual Report | 19 |
| NOTES TO FINANCIAL STATEMENTS, CONTINUED | ||
Thornburg Core Growth Fund | September 30, 2005 | |
NOTE 5 – SECURITIES TRANSACTIONS
For the year ended September 30, 2005, the Fund had purchase and sale transactions of investment securities (excluding short-term investments) of $221,651,351 and $127,016,852, respectively.
NOTE 6 – INCOME TAXES
At September 30, 2005, information on the tax components of capital is as follows:
Cost of investments for tax purpose | $ | 180,335,944 | ||
Gross unrealized appreciation on a tax basis | $ | 33,022,463 | ||
Gross unrealized depreciation on a tax basis | (843,871 | ) | ||
Net unrealized appreciation (depreciation) on investments (tax basis) | $ | 32,320,068 | ||
Distributable earnings – capital gains | $ | 4,423,505 |
At September 30, 2005, the Fund did not have any undistributed ordinary net income.
At September 30, 2005, the Fund had deferred tax basis currency losses occurring subsequent to October 31, 2004 of $58,129. For tax purposes, such losses will be reflected in the year ending September 30, 2006.
The Fund utilized $1,343,924 of its capital loss carry forward during the year ended September 30, 2005.
In order to account for permanent book/tax differences, the Fund decreased net capital paid in on shares of beneficial interest by $1,294,709, increased accumulated net realized investment gain by $66,236, and decreased overdistribution of net investment income (loss) by $1,228,473. This reclassification has no impact on the net asset value of the Fund. Reclassifications result primarily from net operating loss and currency gains.
NOTE 7 – FINANCIAL INSTRUMENTS WITH OFF-BALANCE SHEET RISK AND FOREIGN INVESTMENT RISK
During the year ended September 30, 2005, the Fund was a party to financial instruments with off-balance sheet risks, primarily currency forward exchange contracts. A forward exchange contract is an agreement between two parties to exchange different currencies at a specified rate at an agreed upon future date. These contracts are purchased in order to minimize the risk to the Fund with respect to its foreign stock transactions from adverse changes in the relationship between the U.S. dollar and foreign currencies. In each case these contracts have been initiated in conjunction with foreign stock transactions. These instruments may involve market risks in excess of the amount recognized on the Statement of Assets and Liabilities. Such risks would arise from the possible inability of counterparties to meet the terms of their contracts, future movement in currency value and interest rates and contract positions that are not exact offsets. These contracts are reported in the financial statements at the Fund’s net equity, as measured by the difference between the forward exchange rates at the reporting date and the forward exchange rates at the dates of entry into the contract. There are special risks associated with international investing, including currency fluctuations, government regulation, political developments, and differences in liquidity.
20 | Certified Annual Report |
| NOTES TO FINANCIAL STATEMENTS, CONTINUED | ||
Thornburg Core Growth Fund | September 30, 2005 | |
CONTRACTS TO SELL:
| Contracts | Contract Value Date | Market Value | ||||||
| 2,200,000 | Pound Sterling for 3,861,389 USD | January 18, 2006 | $ | (26,971 | ) | |||
| Unrealized loss from forward exchange contracts: | (26,971 | ) | ||||||
| 2,570,000 | Swiss Franc for 2,024,260 USD | January 18, 2006 | 10,393 | |||||
| 3,175,000 | Euro Dollar for 3,873,024 USD | January 18, 2006 | 22,187 | |||||
| 4,285,000 | Euro Dollar for 5,333,771 USD | January 18, 2006 | 136,657 | |||||
| 5,700,000,000 | Korean Won for 5,520,581 USD | January 18, 2006 | 49,386 | |||||
| Unrealized gain from forward exchange contracts: | 218,623 | |||||||
| Net unrealized gain (loss) from forward Sell contracts: | $ | 191,652 | ||||||
| CONTRACTS TO BUY: | ||||||||
| Contracts | Contract Value Date | Market Value | ||||||
| 750,000 | Euro Dollar for 916,275 USD | January 18, 2006 | $ | (6,629 | ) | |||
| 2,200,000 | Pound Sterling for 4,052,620 USD | January 18, 2006 | (164,259 | ) | ||||
| Unrealized loss from forward exchange contracts: | (170,888 | ) | ||||||
| 860,000 | Euro Dollar for 1,040,293 USD | January 18, 2006 | 2,768 | |||||
| Unrealized gain from forward exchange contracts: | 2,768 | |||||||
| Net unrealized gain (loss) from forward Buy contracts: | $ | (168,120 | ) | |||||
| Net unrealized gain (loss) from forward Exchange contracts: | $ | 23,532 | ||||||
| Certified Annual Report | 21 |
Thornburg Core Growth Fund
| Year Ended September 30, 2005 | Period Ended September 30, 2004(c) | |||||||
Class I Shares: | ||||||||
PER SHARE PERFORMANCE | ||||||||
(for a share outstanding throughout the period)+ | ||||||||
Net asset value, beginning of period | $ | 10.93 | $ | 10.87 | ||||
Income from investment operations: | ||||||||
Net investment income (loss) | (0.07 | ) | (0.08 | ) | ||||
Net realized and unrealized gain (loss) on investments | 3.51 | 0.14 | ||||||
Total from investment operations | 3.44 | 0.06 | ||||||
Change in net asset value | 3.44 | 0.06 | ||||||
NET ASSET VALUE, end of period | $ | 14.37 | $ | 10.93 | ||||
RATIOS/SUPPLEMENTAL DATA | ||||||||
Total return (a) | 31.47 | % | 0.55 | % | ||||
Ratios to average net assets: | ||||||||
Net investment income (loss) | (0.55 | )% | (0.74 | )%(b) | ||||
Expenses, after expense reductions | 1.02 | % | 1.00 | %(b) | ||||
Expenses, after expense reductions and net of custody credits | 0.99 | % | 0.99 | %(b) | ||||
Expenses, before expense reductions | 1.15 | % | 1.31 | %(b) | ||||
Portfolio turnover rate | 115.37 | % | 108.50 | % | ||||
Net assets at end of period (000) | $ | 49,975 | $ | 21,578 | ||||
| (a) | Not annualized for periods less than one year. |
| (b) | Annualized. |
| (c) | Effective date of Class I Shares was November 1, 2003. |
| + | Based on weighted average shares outstanding. |
22 | Certified Annual Report |
Thornburg Core Growth Fund | September 30, 2005 |
CUSIPS: CLASS A - 885-215-582, CLASS C - 885-215-574, CLASS I - 885-215-475, CLASS R1 - 885-215-517
NASDAQ SYMBOLS: CLASS A - THCGX, CLASS C - TCGCX, CLASS I - THIGX, CLASS R1 - THCRX
| Shares/ Principal Amount | Value | ||||
COMMON STOCK — 97.01% | |||||
CONSUMER DURABLES & APPAREL — 1.65% | |||||
TEXTILES, APPAREL & LUXURY GOODS — 1.65% | |||||
Coach, Inc.+ | 109,700 | $ | 3,440,192 | ||
| 3,440,192 | |||||
CONSUMER SERVICES — 1.66% | |||||
HOTELS RESTAURANTS & LEISURE — 1.66% | |||||
Life Time Fitness Inc.+ | 104,900 | 3,476,386 | |||
| 3,476,386 | |||||
DIVERSIFIED FINANCIALS — 5.79% | |||||
CAPITAL MARKETS — 2.45% | |||||
Affiliated Managers Group Inc.+ | 70,775 | 5,125,525 | |||
DIVERSIFIED FINANCIAL SERVICES — 3.34% | |||||
Chicago Mercantile Exchange Co. | 20,672 | 6,972,666 | |||
| 12,098,191 | |||||
ENERGY — 8.43% | |||||
ENERGY EQUIPMENT & SERVICES — 2.77% | |||||
Patterson Uti Energy, Inc. | 160,400 | 5,787,232 | |||
OIL, GAS & CONSUMABLE FUELS — 5.66% | |||||
ATP Oil & Gas Corp.+ | 169,500 | 5,566,380 | |||
Cimarex Energy Co.+ | 138,000 | 6,255,540 | |||
| 17,609,152 | |||||
FOOD & STAPLES RETAILING — 2.31% | |||||
FOOD & STAPLES RETAILING — 2.31% | |||||
FuJi Food & Catering | 4,259,000 | 4,831,693 | |||
| 4,831,693 | |||||
HEALTH CARE EQUIPMENT & SERVICES — 17.19% | |||||
HEALTH CARE EQUIPMENT & SUPPLIES — 7.35% | |||||
Cytyc Corp.+ | 264,600 | 7,104,510 | |||
Kyphon, Inc.+ | 103,200 | 4,534,608 | |||
Lifecell Corp.+ | 172,200 | 3,724,686 | |||
| Certified Annual Report | 23 |
| SCHEDULE OF INVESTMENTS, CONTINUED | ||
Thornburg Core Growth Fund | September 30, 2005 | |
| Shares/ Principal Amount | Value | ||||
HEALTH CARE PROVIDERS & SERVICES — 9.84% | |||||
Caremark Rx Inc.+ | 134,671 | $ | 6,724,123 | ||
UnitedHealth Group Inc. | 124,150 | 6,977,230 | |||
WellPoint Inc.+ | 90,400 | 6,854,128 | |||
| 35,919,285 | |||||
MEDIA — 10.64% | |||||
MEDIA — 10.64% | |||||
DIRECTV Group Inc.+ | 392,100 | 5,873,658 | |||
Focus Media Holdings Ltd.ADR+ | 166,800 | 4,460,232 | |||
Getty Images, Inc.+ | 68,730 | 5,913,529 | |||
Imax Corp.+ | 574,167 | 5,988,562 | |||
| 22,235,981 | |||||
PHARMACEUTICALS & BIOTECHNOLOGY — 9.63% | |||||
BIOTECHNOLOGY — 3.69% | |||||
Gilead Sciences Inc.+ | 158,050 | 7,706,518 | |||
PHARMACEUTICALS — 5.94% | |||||
Johnson & Johnson | 81,325 | 5,146,246 | |||
Sanofi-Aventis | 87,500 | 7,253,640 | |||
| 20,106,404 | |||||
RETAILING — 2.96% | |||||
INTERNET & CATALOG RETAIL — 2.96% | |||||
CJ Home Shopping Co. Ltd. | 68,900 | 6,179,520 | |||
| 6,179,520 | |||||
SEMICONDUCTORS & SEMICONDUCTOR EQUIPMENT — 4.72% | |||||
SEMICONDUCTORS & SEMICONDUCTOR EQUIPMENT — 4.72% | |||||
Austriamicrosystems AG+ | 52,000 | 2,418,464 | |||
Cymer Inc.+ | 87,700 | 2,746,764 | |||
Microtune, Inc.+ | 753,138 | 4,692,050 | |||
| 9,857,278 | |||||
SOFTWARE & SERVICES — 19.45% | |||||
INTERNET SOFTWARE & SERVICES — 4.90% | |||||
Google Inc.+ | 32,350 | 10,237,481 | |||
IT SERVICES — 2.69% | |||||
Satyam Computer | 441,500 | 5,624,067 | |||
24 | Certified Annual Report |
| SCHEDULE OF INVESTMENTS, CONTINUED | ||
Thornburg Core Growth Fund | September 30, 2005 | |
| Shares/ Principal Amount | Value | ||||
SOFTWARE — 11.86% | |||||
Amdocs Ltd.+ | 286,025 | $ | 7,931,473 | ||
Check Point Software Technologies Ltd.+ | 295,700 | 7,191,424 | |||
Microsoft Corp. | 375,100 | 9,651,323 | |||
| 40,635,768 | |||||
TECHNOLOGY HARDWARE & EQUIPMENT — 4.06% | |||||
COMPUTERS & PERIPHERALS — 4.06% | |||||
Apple Computer, Inc.+ | 158,100 | 8,475,741 | |||
| 8,475,741 | |||||
TELECOMMUNICATION SERVICES — 5.19% | |||||
WIRELESS TELECOMMUNICATION SERVICES — 5.19% | |||||
Leap Wireless International, Inc.+ | 149,400 | 5,258,880 | |||
NII Holdings Inc.+ | 66,110 | 5,582,989 | |||
| 10,841,869 | |||||
TRANSPORTATION — 1.59% | |||||
TRANSPORTATION INFRASTRUCTURE — 1.59% | |||||
Shenzhen Chiwan Wharf Holdings Ltd. | 2,114,916 | 3,323,578 | |||
| 3,323,578 | |||||
UTILITIES — 1.74% | |||||
INDUSTRIAL POWER PRODUCTION / ENERGY TRADING — 1.74% | |||||
Ormat Technologies Inc. | 163,900 | 3,627,107 | |||
| 3,627,107 | |||||
TOTAL COMMON STOCK (Cost $170,312,718) | 202,658,145 | ||||
| Certified Annual Report | 25 |
| SCHEDULE OF INVESTMENTS, CONTINUED | ||
Thornburg Core Growth Fund | September 30, 2005 | |
| Shares/ Principal Amount | Value | ||||||
SHORT TERM INVESTMENTS — 4.79% | |||||||
UBS Finance, 3.84%, 10/3/2005 | $ | 10,000,000 | $ | 9,997,866 | |||
TOTAL SHORT TERM INVESTMENTS (Cost $ 9,997,866) | 9,997,866 | ||||||
TOTAL INVESTMENTS — 101.80% (COST $ 180,310,584) | $ | 212,656,012 | |||||
LIABILITIES NET OF OTHER ASSETS — (1.80)% | (3,762,157 | ) | |||||
NET ASSETS — 100.00% | $ | 208,893,855 | |||||
Footnote Legend
See notes to financial statements.
| + | Non-income producing |
Portfolio Abbreviations
To simplify the listings of securities, abbreviations are used per the table below:
ADR American Depository Receipt
SUMMARY OF INDUSTRY EXPOSURE
As of 9/30/05
Software & Services | 19.5 | % | |
Health Care Equipment & Services | 17.2 | % | |
Media | 10.6 | % | |
Pharmaceutical & Biotechnology | 9.6 | % | |
Energy | 8.4 | % | |
Diversified Financials | 5.8 | % | |
Telecommunication Services | 5.2 | % | |
Semiconductors and Semiconductor Equip | 4.7 | % | |
Technology Hardware & Equipment | 4.1 | % | |
Retailing | 3.0 | % | |
Food & Staples Retail | 2.3 | % | |
Utilities | 1.7 | % | |
Consumer Services | 1.7 | % | |
Consumer Durables & Apparel | 1.6 | % | |
Transportation | 1.6 | % | |
Other Assets & Cash Equivalents | 3.0 | % |
26 | Certified Annual Report |
REPORT OF INDEPENDENT REGISTERED PUBLIC ACCOUNTING FIRM
Thornburg Core Growth Fund
To the Trustees and Class I Shareholders of
Thornburg Core Growth Fund
In our opinion, the accompanying statement of assets and liabilities, including the schedule of investments, and the related statements of operations and of changes in net assets and the financial highlights present fairly, in all material respects, the financial position of Thornburg Core Growth Fund (one of the portfolios constituting Thornburg Investment Trust, hereafter referred to as the “Fund”) at September 30, 2005, the results of its operations for the year then ended, the changes in its net assets for each of the two years in the period then ended and the financial highlights for Class I shares for each of the periods presented, in conformity with accounting principles generally accepted in the United States of America. These financial statements and financial highlights (hereafter referred to as “financial statements”) are the responsibility of the Fund’s management. Our responsibility is to express an opinion on these financial statements based on our audits. We conducted our audits of these financial statements in accordance with the standards of the Public Company Accounting Oversight Board (United States). Those standards require that we plan and perform the audit to obtain reasonable assurance about whether the financial statements are free of material misstatement. An audit includes examining, on a test basis, evidence supporting the amounts and disclosures in the financial statements, assessing the accounting principles used and significant estimates made by management, and evaluating the overall financial statement presentation. We believe that our audits, which included confirmation of securities at September 30, 2005 by correspondence with the custodian and brokers, provide a reasonable basis for our opinion.
PricewaterhouseCoopers LLP
New York, New York
November 16, 2005
| Certified Annual Report | 27 |
Thornburg Core Growth Fund | September 30, 2005 (Unaudited) |
As a shareholder of the Fund, you incur two types of costs:
(1) transaction costs, including a 90-day redemption fee on Class I shares;
(2) ongoing costs, including management and administrative fees and other Fund expenses.
This example is intended to help you understand your ongoing costs (in dollars) of investing in the Fund and to compare these costs with the ongoing costs of investing in other mutual funds.
The example is based on an investment of $1,000 invested on March 31, 2005 and held until September 30, 2005.
Actual Expenses
The first line of the table at right provides information about actual account values and actual expenses. You may use the information in this line, together with the amount you invested, to estimate the expenses that you paid over the period. Simply divide your account value by $1,000 (for example, an $8,600 account value divided by $1,000 = 8.6), then multiply the result by the number in the first line under the heading entitled “Expenses Paid During Period” to estimate the expenses you paid on your account during this period.
Hypothetical Example for Comparison Purposes
The second line of the table at right provides information about hypothetical account values and hypothetical expenses based on the Fund’s actual expense ratio and an assumed rate of return of 5% per year before expenses, which is not the Fund's actual return. The hypothetical account values and expenses may not be used to estimate the actual ending account balance or expenses you paid for the period. You may use this information to compare the ongoing costs of investing in the Fund and other funds. To do so, compare this 5% hypothetical example with the 5% hypothetical examples that appear in the shareholder reports of the other funds.
Please note that the expenses shown in the table are meant to highlight your ongoing costs only and do not reflect any transactional costs, such as sales charges (loads), redemption fees, or exchange fees. Therefore, the second line of the table is useful in comparing ongoing costs only, and will not help you determine the relative total costs of owning different funds. In addition, if these transactional costs were included, your costs would have been higher.
| Beginning Account Value 3/31/05 | Ending Account Value 9/30/05 | Expenses Paid 3/31/05–9/30/05 | |||||||
Class I Shares | |||||||||
Actual | $ | 1,000.00 | $ | 1,166.40 | $ | 5.38 | |||
Hypothetical* | $ | 1,000.00 | $ | 1,020.11 | $ | 5.01 | |||
| † | Expenses are equal to the annualized expense ratio for Class I shares (0.99%) multiplied by the average account value over the period, multiplied by 183/365 to reflect the one-half year period. |
| * | Hypothetical assumes a rate of return of 5% per year before expenses. |
28 | Certified Annual Report |
Thornburg Core Growth Fund | September 30, 2005 (Unaudited) |
GROWTH OF A HYPOTHETICAL $10,000 INVESTMENT
Thornburg Core Growth Fund versus NASDAQ Composite Index (November 3, 2003 to September 30, 2005)
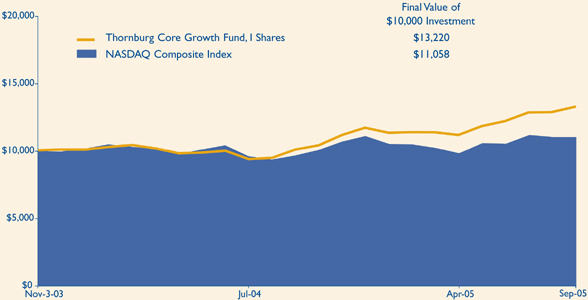
AVERAGE ANNUAL TOTAL RETURNS
For periods ended September 30, 2005
| 1 Yr | Since Inception | |||||
I Shares (Incep: 11/3/03) | 31.47 | % | 15.74 | % | ||
NASDAQ Composite Index | ||||||
(Since: 11/3/03) | 14.19 | % | 6.38 | % |
Performance data reflects past performance, which is no guarantee of future results. The performance data and graph do not reflect the deduction of taxes that a shareholder would pay on distributions or the redemption of Fund shares.
Returns reflect the reinvestment of dividends and capital gains. There is no up-front sales charge for Class I shares. Class I shares are subject to a 1% 90-day redemption fee.
The NASDAQ Composite Index is a market value-weighted, technology-oriented index comprised of approximately 5,000 domestic and non-US-based securities. Unless otherwise noted, index returns reflect the reinvestment of income dividends and capital gains, if any, but do not reflect fees, brokerage commissions or other expenses of investing. Investors may not make direct investments into any index. The performance of any index is not indicative of the performance of any particular investment.
| Certified Annual Report | 29 |
| TRUSTEES AND OFFICERS | ||
Thornburg Core Growth Fund | September 30, 2005 (Unaudited) | |
Name, Age, Position Held with Fund Year Elected | Principal Occupation(s) During Past Five Years | Other Directorships Held by Trustee | ||
INTERESTED TRUSTEES(1)(2)(4) | ||||
| Garrett Thornburg, 59 Chairman of Trustees, Trustee since 1987(3) | CEO, Chairman and controlling shareholder of Thornburg Investment Management, Inc. (investment advisor) and Thornburg Securities Corporation (securities dealer); Chairman of Thornburg Limited Term Municipal Fund, Inc. (registered investment company) to 2004; CEO and Chairman of Thornburg Mortgage, Inc. (real estate investment trust); Chairman of Thornburg Mortgage Advisory Corporation (investment manager to Thornburg Mortgage, Inc.). | Director of Thornburg Mortgage, Inc. (real estate investment trust) | ||
| Brian J. McMahon, 49 Trustee since 2001, Member of Governance & Nominating Committee, President since 1997(5)(6) | President and Managing Director of Thornburg Investment Management, Inc.; President of Thornburg Limited Term Municipal Fund, Inc. to 2004. | None | ||
INDEPENDENT TRUSTEES(1)(2)(4) | ||||
| David A.Ater, 60 Trustee since 1994, Member of Audit Committee and Governance & Nominating Committee | Principal in Ater & Associates, Santa Fe, NM (developer, planner and broker of residential and commercial real estate); owner developer and broker for various real estate projects. | Director of Thornburg Mortgage, Inc. (real estate investment trust) | ||
| David D. Chase, 64 Chairman of Audit Committee, Trustee since 2000 | Chairman, President, CEO, and Managing Member of Vestor Associates, LLC, the general partner of Vestor Partners, LP, Santa Fe, NM (private equity fund); Chairman and CEO of Vestor Holdings, Inc., Santa Fe, NM (merchant bank). | None | ||
| Eliot R. Cutler, 59 Chairman of Governance & Nominating Committee, Trustee since 2004 | Partner, Akin, Gump, Strauss, Hauer & Feld, LLP, Washington, D.C. (law firm) since November 2000; partner, Cutler & Stanfield, Washington, D.C. (law firm) until November 2000. | Director of Thornburg Mortgage, Inc. (real estate investment trust) | ||
| Susan H. Dubin, 56 Trustee since 2004, Member of Audit Committee | President of Dubin Investments, Ltd., Greenwich, CT (private investment fund); Director and officer of various charitable organizations; and formerly, Vice President of Chemical Bank (predecessor to JP Morgan Chase & Co.), New York, 1974–1996. | None | ||
| Owen D.Van Essen, 51 Trustee since 2004, Member of Governance & Nominating Committee | President of Dirks, Van Essen & Murray, Santa Fe, NM (newspaper mergers and acquisitions). | None | ||
| James W. Weyhrauch, 46 Trustee since 1996, Member of Audit Committee | Director, Executive Vice President to 2002, and President and CEO 2002–2004, Nambé Mills, Inc., Santa Fe, NM (manufacturer); real estate agent, Santa Fe Properties, Santa Fe, NM since 2004. | None | ||
30 | Certified Annual Report |
| TRUSTEES AND OFFICERS, CONTINUED | ||
Thornburg Core Growth Fund | September 30, 2005 (Unaudited) | |
Name, Age, Position Held with Fund Year Elected | Principal Occupation(s) During Past Five Years | Other Directorships Held by Trustee | ||
OFFICERS OF THE FUND (WHO ARE NOT TRUSTEES)(1)(6)(7) | ||||
Dawn B. Fischer, 58 Secretary since 1987 | Secretary and Managing Director, Thornburg Investment Management, Inc.; Secretary, Thornburg Limited Term Municipal Fund, Inc. to 2004; Secretary, Thornburg Securities Corporation; Vice President, Daily Tax Free Income Fund, Inc. (registered investment company). | Not applicable | ||
Steven J. Bohlin, 46 Vice President since 1987; Treasurer since 1989 | Vice President and Managing Director of Thornburg Investment Management, Inc.; Vice President of Thornburg Limited Term Municipal Fund, Inc. to 2004. | Not applicable | ||
George T. Strickland, 42 Vice President since 1996 | Vice President and Managing Director of Thornburg Investment Management, Inc.; Vice President (to 2004) and Treasurer (2003–2004) of Thornburg Limited Term Municipal Fund, Inc. | Not applicable | ||
William V. Fries, 66 Vice President since 1995 | Vice President and Managing Director of Thornburg Investment Management, Inc. | Not applicable | ||
Leigh Moiola, 38 Vice President since 2001 | Vice President and Managing Director of Thornburg Investment Management, Inc.; Vice President of Thornburg Limited Term Municipal Fund, Inc. 1999–2004. | Not applicable | ||
Kenneth Ziesenheim, 51 Vice President since 1995 | Vice President and Managing Director of Thornburg Investment Management, Inc.; President of Thornburg Securities Corporation; Vice President of Thornburg Limited Term Municipal Fund, Inc. to 2004. | Not applicable | ||
Alexander Motola, 35 Vice President since 2001 | Vice President and Managing Director of Thornburg Investment Management, Inc. since 2000; Portfolio Manager, Insight Capital Research & Management, Inc., Walnut Creek, California 1995–2000. | Not applicable | ||
Wendy Trevisani, 34 Vice President since 1999 | Associate Portfolio Manager of Thornburg Investment Management, Inc. since 1999, Vice President since 2000 and Managing Director since 2003; Vice President of Thornburg Limited Term Municipal Fund, Inc. 1999–2002. | Not applicable | ||
Joshua Gonze, 42 Vice President since 1999 | Associate Portfolio Manager of Thornburg Investment Management, Inc. since 1999, Vice President since 1999 and Managing Director since 2003; Vice President of Thornburg Limited Term Municipal Fund, Inc. to 2004. | Not applicable | ||
Brad Kinkelaar, 37 Vice President since 1999 | Associate Portfolio Manager of Thornburg Investment Management, Inc. since 1999, Vice President since 2000 and Managing Director since 2003. | Not applicable | ||
Christopher Ihlefeld, 35 Vice President since 2003 | Associate Portfolio Manager since 1999; Vice President of Thornburg Investment Management, Inc. since 2002; Vice President of Limited Term Municipal Fund, Inc., 2003–2004. | Not applicable | ||
Leon Sandersfeld, 39 Vice President since 2003 | Associate of Thornburg Investment Management, Inc. since 2002; Senior Staff Accountant, Farm Bureau Life Insurance Co. 1998–2002. | Not applicable | ||
| Certified Annual Report | 31 |
| TRUSTEES AND OFFICERS, CONTINUED | ||
Thornburg Core Growth Fund | September 30, 2005 (Unaudited) | |
Name, Age, Position Held with Fund Year Elected | Principal Occupation(s) During Past Five Years | Other Directorships Held by Trustee | ||
Sasha Wilcoxon, 31 Vice President since 2003 | Associate of Thornburg Investment Management, Inc. since 2000 and Mutual Fund Operations Department Manager since 2002. | Not applicable | ||
Ed Maran, 47 Vice President since 2004 | Associate Portfolio Manager of Thornburg Investment Management, Inc. since 2002 and Vice President and Managing Director since 2004; Analyst, USAA 2001–2002; Oil Analyst, A.G. Edwards 1997–2000. | Not applicable | ||
Vinson Walden, 35 Vice President since 2004 | Associate Portfolio Manager of Thornburg Investment Management, Inc. since 2002 and Vice President and Managing Director since 2004; Associate Portfolio Manager, Ibis Management 2002–2004; Associate, Lehman Brothers, 1997–2001. | Not applicable | ||
| (1) | Each person’s address is 119 East Marcy Street, Santa Fe, New Mexico 87501. |
| (2) | The Fund is one of twelve separate investment “Funds” or “series” of Thornburg Investment Trust (the “Trust”), which comprises the Thornburg mutual fund complex and is organized as a Massachusetts business trust. The Trust currently has twelve active Funds. Thornburg Investment Management, Inc. is the investment advisor to, and manages, the twelve Funds of the Trust. Each Trustee oversees the twelve Funds in the fund complex. |
| (3) | Mr. Thornburg is considered an “interested” Trustee under the Investment Company Act of 1940 because he is a director and controlling shareholder of Thornburg Investment Management, Inc., the investment advisor to the twelve active Funds of the Trust, and is the sole director and controlling shareholder of Thornburg Securities Corporation, the distributor of shares for the Trust. |
| (4) | Each Trustee serves in office until the election and qualification of a successor. |
| (5) | Mr. McMahon is considered an “interested” Trustee because he is the president of Thornburg Investment Management, Inc. |
| (6) | The Trust’s president, secretary and treasurer each serves a one-year term or until the election and qualification of a successor; each other officer serves at the pleasure of the Trustees. |
| (7) | Assistant vice presidents, assistant secretaries and assistant treasurers are not shown. |
The Statement of Additional Information for each Fund of the Trust includes additional information about the Trustees and is available, without charge and upon request, by calling 1-800-847-0200.
32 | Certified Annual Report |
| OTHER INFORMATION | ||
Thornburg Core Growth Fund | September 30, 2005 (Unaudited) | |
PORTFOLIO PROXY VOTING
Policies and Procedures:
The Trust has delegated to Thornburg Investment Management, Inc. (the “Advisor”) voting decisions respecting proxies for the Fund’s voting securities. The Advisor makes voting decisions in accordance with its Proxy Voting Policy and Procedures. A description of the Policy and Procedures is available (i) without charge, upon request, by calling the Advisor toll-free at 1-800-847-0200, (ii) on the Thornburg website at www.thornburg.com, and (iii) on the Securities and Exchange Commission’s website at www.sec.gov.
Commencing August 31, 2004, information regarding how proxies were voted is available on or before August 31 of each year for the twelve months ending the preceding June 30. This information is available (i) without charge, upon request by calling the Advisor toll-free at 1-800-847-0200, (ii) on the Thornburg website at www.thornburg.com, and (iii) on the Securities and Exchange Commission’s website at www.sec.gov.
AVAILABILITY OF QUARTERLY PORTFOLIO SCHEDULE
The Fund files with the Securities and Exchange Commission schedules of its portfolio holdings on Form N-Q for the first and third quarters of each fiscal year. The Fund’s Forms N-Q are available on the Commission’s website at www.sec.gov, or may be reviewed and copied at the Commission’s Public Reference Room in Washington, D.C. Information on the operation of the Public Reference Room may be obtained by calling 1-800-SEC-0330. The Fund also makes this information available on its website at www.thornburg.com/download or upon request by calling 1-800-847-0200.
TRUSTEES DELIBERATIONS RESPECTING RENEWAL OF INVESTMENT ADVISORY AGREEMENT
Thornburg Investment Management, Inc. (the “Advisor”) provides investment management services to Thornburg Core Growth Fund pursuant to an investment advisory agreement. The Trustees consider the renewal of this agreement annually and most recently determined to renew the agreement on September 13, 2005.
In connection with their general supervision of the Advisor, the Trustees receive and consider reports throughout the year from the Advisor respecting the Advisor’s management of the Fund’s investments. These reports include information about the Fund’s purchase and sale of portfolio investments and explanations from the Advisor respecting investment selections, the investment performance of the Fund, general appraisals of industry and economic prospects and factors, and other matters affecting the Fund and relating to the Advisor’s performance of services for the Fund.
In anticipation of their recent consideration of the advisory agreement’s renewal, the independent Trustees met with representatives of the Advisor in July 2005 to specify the information the Advisor would present to the Trustees for their review. The independent Trustees thereafter met in independent session to consider various factors respecting the agreement’s renewal, and met in a subsequent session with the Advisor’s chief investment officer to present questions. Following these sessions, the Trustees met on September 13, 2005 to consider a renewal of the advisory agreement.
The Trustees considered various factors in their review of the Advisor’s performance under the investment advisory agreement, including specifically the principles outlined in their February 2005 Statement to Shareholders, a copy of which accompanies this Annual Report to Shareholders. Summarized below are certain of the factors considered by the Trustees, in connection with the determination to renew the advisory agreement. In determining to renew the advisory agreement, the Trustees did not identify any single fact or aspect of the Advisor’s performance as controlling, and this summary does not describe all of the matters considered by the Trustees in making their determination.
Quality of Services; Fund Investment Performance. In reviewing the nature, extent, and quality of services provided by the Advisor and the investment performance of the Fund, the Trustees primarily considered the Advisor’s adherence to the Fund’s stated objectives and policies, the Advisor’s execution of the Fund’s investment strategies in prevailing market conditions, the Fund’s absolute investment performance, the Fund’s investment performance compared to categories of other broadly similar mutual funds and broad based securities indices, the Fund’s investment performance over different periods of time, the Fund’s total returns in rising and declining markets compared to total returns of a broad based securities index, measures of relative portfolio risk, and related factors. The Trustees noted in comparing the Fund with other mutual funds and to indices that the value of such comparisons may be limited because the Fund’s investment approach, and the selection of its portfolio securities, are unique or differ in considerable degree from the characteristics of other funds and indices. In conducting their review, the Trustees observed that the Advisor had continued to faithfully pursue and to achieve the Fund’s stated objectives, as demonstrated particularly by the Advisor’s selection of investments and the Fund’s investment performance. The Trustees noted in this regard the Fund’s exceptional investment performance in most periods as compared to broad based securities indices and categories of mutual funds selected by independent mutual fund analyst firms.
The Trustees also considered a number of other factors in reviewing the quality of the Advisor’s services, including the qualifications and integrity of the Advisor’s senior personnel, the Advisor’s staffing and other resources, the Advisor’s compliance with regulatory requirements, Fund sales performance
| Certified Annual Report | 33 |
| OTHER INFORMATION, CONTINUED | ||
Thornburg Core Growth Fund | September 30, 2005 (Unaudited) | |
and perceptions of the Funds in the marketplace, and other factors.
The Trustees concluded, based upon these and other considerations, that the Advisor had actively and competently pursued the Fund’s stated investment objectives in accordance with the Fund’s investment policies stated in its prospectuses. The Trustees further concluded that the investment performance of the Fund was satisfactory in the context of the Fund’s objectives and policies and prevailing market conditions.
Fees and Expenses; Profitability of Advisor. In reviewing the fees charged by the Advisor to the Fund, the Trustees primarily considered the fees charged by the Advisor and the other expenses charged to the Fund in light of the nature and quality of services provided, comparison of the actual Advisor’s fee and Fund expenses to the statement of fees and expenses in the Fund’s prospectuses, the Advisor’s waiver of a portion of its fee, comparisons of the Advisor’s fee and other Fund expenses to median and average fees and expenses charged to similar mutual funds, and comparisons of fees and expenses charged to the Fund with fees and expenses charged to other, similar specific mutual funds. In addition, the Trustees considered the profitability of the Advisor compared to other investment management firms, and comparisons of the investment management fee rates charged by the Advisor to the Fund with rates charged to other clients of the Advisor and the differing types of services furnished to the Fund and the other clients. The Trustees noted that the Fund’s management fee was somewhat higher than the average and median fee rates for a group of multi-cap growth equity funds selected by an independent analyst firm, but that the overall expense ratio of the Fund was comparable to the average and median expense ratios for the same group of mutual funds. The Trustees also observed in their review that fee rates charged by the Advisor to other clients of the Advisor were not directly comparable to rates charged to the Fund principally because of the significant differences in the services provided.
The Trustees concluded, based upon these and other considerations, that the fees charged to the Fund by the Advisor were fair and reasonable in view of the following: the services provided, the clear disclosure of these fees and expenses in the Fund’s prospectuses, and prevailing fees and expenses charged to mutual funds generally. The Trustees further concluded that there was no indication that the Advisor’s profitability was unusual, viewed in the context of the services provided, the performance of the Fund, and the fees and profitability of other investment management firms.
Economies of Scale. In reviewing the extent to which economies of scale would be realized by the Fund as it grows and whether fee levels reflect economies of scale, the Trustees considered the breakpoint structure for advisory fees chargeable to the Fund, the demonstrated economies of scale enjoyed by other funds of the Trust as they had grown in size, and economies of scale realized by other mutual funds. The Trustees concluded that the Fund may reasonably be expected to realize economies of scale for the benefit of its shareholders as it grows in size.
Ancillary Benefits to Advisor. In reviewing benefits enjoyed by the Advisor because of its relationship with the Fund, the Trustees considered an arrangement through which the Advisor received certain research services, favorable publicity received by the Advisor because of the superior investment performance of certain Funds of the Trust, and the benefits to the Fund from the Advisor’s expansion of its staffing and other resources to serve a broader variety of investment clients. The Trustees concluded, based upon these and other considerations, that there was no unusual or unfair benefit enjoyed by the Advisor, and that the Fund enjoyed benefits by virtue of the Advisor’s engagement by other investment clients.
34 | Certified Annual Report |
Trustees’ Statement to Shareholders
Not part of the Certified Annual Report
February 8, 2005
The Trustees are concerned that recent commentaries and opinions reported in the media may confuse investors in general as to the supervisory duties of trustees of mutual funds and, in particular, leave Thornburg Investment Trust shareholders uncertain regarding how we discharge our responsibilities in supervising the Funds’ investment advisor and in reviewing the advisor’s contract for renewal. We decided to spell out clearly three principal guidelines that we follow in supervising the Trust’s investment advisor on your behalf.
We begin with the premise that each shareholder selected his or her Fund because its investments are managed by the investment advisor identified in the prospectus and in accordance with the objective and policies described in the prospectus. We realize, as each of you do, that if you believe that your Fund’s stated objective and policies no longer serve your personal investment goals, you can sell your shares and leave the Fund.
Therefore, we believe that our primary supervisory task – our principal obligation to you – is to assess the nature and quality of the advisor’s services, and to confirm that the advisor actively and competently pursues the Fund’s objective, in accordance with the policies set out in the prospectus. To do this, we meet regularly with management to review your Fund’s portfolio and to discuss the advisor’s specific actions and judgments in pursuing the Fund’s objective. We do not substitute our own judgment for the advisor’s decisions in selecting investments; the advisor is paid to exercise its informed judgment on investment decisions, and we seek to confirm, in reviewing the advisor’s performance, that the advisor is doing just that.
Second, while we are conscious of costs and the effect that costs have on shareholders’ returns, we do not seek the lowest fees or expense ratio as our sole or primary objective. We try to make sure that your Fund’s fees and costs are reasonable in relationship to the services rendered and that they are generally in line with those charged by other expert investment advisors, consistent with our belief that the Fund’s investors searched for and expect that expertise and attention and have decided to pay a reasonable price for it. We do not put the management contract “out to bid” as a matter of course, and we would not do so unless we had concluded that the advisor materially had failed to pursue the Fund’s objectives in accordance with its policies, or for other equally important reasons. We believe that any other approach would be inconsistent with your interests and contrary to your expectations when you bought shares of the Fund in the first place.
Finally, because we believe that most Thornburg Fund shareholders have invested with a long-term perspective, we try not to focus too much on the fashions of the moment and on short-term performance. The market will not favor any specific investment objective or set of policies at all times and under all economic circumstances. A fund will experience periods of both high and low returns relative to other funds and other investments. Even if one of our Funds is not favored by the market at a particular time, we believe that the advisor is nonetheless obliged to remain true to the Fund’s objective and policies, and we watch to see that it does so.
This statement is submitted for the general information of the shareholders of Thornburg Investment Trust. It is not authorized for distribution to prospective investors in the Fund unless preceded or accompanied by an effective prospectus. If you have not received a prospectus, one can be obtained from your financial advisor, online at www.thornburg.com/download, or by calling 800-847-0200. Carefully consider information in the prospectus regarding the Fund’s investment objectives and policies, risks, sales charges, expenses, experience of its management, marketability of shares, and other information. Read it carefully before you invest or send money.
| This page is not part of the Annual Report. | 35 |
This page intentionally left blank.
36 | This page is not part of the Annual Report. |
This page intentionally left blank.
| This page is not part of the Annual Report. | 37 |
This page intentionally left blank.
38 | This page is not part of the Annual Report. |
Planning Options
Retirement and Education Accounts
Thornburg Investment Management offers retirement and education savings accounts that can help you meet a variety of planning challenges. For account applications or further information on any of the accounts below, please call 1-800-847-0200 or go to www.thornburg.com/ira. Your financial advisor can help you determine which plan is right for you.
Individual Retirement Accounts
Individual Retirement Accounts (IRAs) provide a tax-advantaged means to save money for the future. For a detailed outline of the difference between retirement accounts, see www.thornburg.com/ira. Rollovers are available. Call 1-800-847-0200 for more information.
Traditional IRAs – Contributions to Traditional IRAs are tax deductible for eligible individuals, and withdrawals are taxed as additional ordinary income. You may contribute to an IRA if you receive compensation and are under 70 1/2, even if you are covered by an employer retirement plan.
Roth IRAs – Under a Roth IRA, there is no tax deduction for contributions, but there is no income tax on qualified withdrawals. For a more detailed comparison of Traditional and Roth IRAs, please see our web site at www.thornburg.com/ira.
SEP IRAs – Simplified Employee Pension (SEP) IRAs are established by employers. The employer is allowed a tax deduction for contributions made to the SEP Plan and makes contributions to each eligible employee’s SEP IRA on a discretionary basis.
SIMPLE IRAs – Savings Incentive Match Plan for Employees of Small Employers (SIMPLE) is designed to give small business owners a simplified method to establish and contribute to a retirement plan for employees. The employer is allowed a tax deduction for contributions and makes either matching or non-elective contributions to each eligible employee’s SIMPLE IRA. Employees may make salary deferral contributions.
403(b)
A special, tax-advantaged savings vehicle available only to employees of 501(c)(3) organizations, such as charitable, educational, scientific and religious organizations. 403(b) plans are also available to employees of public schools and universities.
Coverdell Education Savings Account
These savings accounts are designed to provide a way to save money for higher education expenses. In an Education Savings Account, earnings and interest grow tax free, and qualified withdrawals used to pay for eligible higher-education expenses are tax- and penalty-free.
Funds Available
The following funds are available in the accounts listed above:
| • | Thornburg International Value Fund |
| • | Thornburg Value Fund |
| • | Thornburg Core Growth Fund |
| • | Thornburg Investment Income Builder Fund |
| • | Thornburg Limited Term U.S. Government Fund |
| • | Thornburg Limited Term Income Fund |
| This page is not part of the Annual Report. | 39 |
The Firm
Thornburg Investment Management® is a privately held investment management company based in Santa Fe, New Mexico with assets under management of over $16 billion. Founded in 1982, the firm manages four equity funds, eight bond funds, and separate portfolios for select institutions and individuals.
Investment Philosophy
We seek to preserve and increase the real wealth of the Funds’ shareholders after accounting for inflation, taxes, and investment expenses. We’re committed to disciplined investing and controlling risk in all market environments through laddered bond and focused equity portfolios.
Portfolio Holdings Disclosure
We believe you should know about your portfolio. Our web site keeps investors informed of the Funds’ equity holdings. Go to www.thornburg.com/funds for commentary on our equity fund holdings.
Co-Ownership of Funds
We invest side-by-side with the Funds’ shareholders. Our employees have invested over $110 million in Thornburg Funds.
Core Strategies for Building Wealth
We deliver core strategies to help investors meet long-term goals. A core strategy is a consistent, disciplined and proven investment process that represents the foundation of a diversified portfolio.
Investment Manager: | Distributor: | |
 |  | |
119 East Marcy Street | 119 East Marcy Street | |
Santa Fe, New Mexico 87501 | Santa Fe, New Mexico 87501 | |
800.847.0200 | 800.847.0200 | |

Core Strategies for Building Wealth
Thornburg Investment Income Builder Fund
Informational Brochure and Annual Report – September 30, 2005
Current stream of income plus potential for growth.
This report and the accompanying brochure are submitted for the general information of shareholders of the Fund. It is not authorized for distribution to prospective investors in the Fund unless preceded or accompanied by an effective prospectus. If you have not received a prospectus, one can be obtained from your financial advisor, online at www.thornburg.com/ download, or by calling 800-847-0200. Carefully consider information in the prospectus regarding the Fund’s investment objectives and policies, risks, sales charges, expenses, experience of its management, marketability of shares, and other information. Read it carefully before you invest or send money. Performance data quoted represents past performance and does not guarantee future results.
Thornburg Investment Income Builder Fund
Current Stream of Income Plus Potential for Growth
The Fund seeks to provide a level of current income which exceeds the average yield on U.S. stocks generally, and which will generally grow, subject to periodic fluctuations, over the years on a per share basis. The Fund’s secondary investment objective is long-term capital appreciation.
The Fund invests primarily in companies (both in the U.S. and abroad) that pay dividends and, in the opinion of Thornburg Investment Management, that show the capacity to increase them. To provide additional income, the Fund also invests in bonds and hybrid securities.
Thornburg Bond Funds
| • | Thornburg Limited Term Municipal Fund |
| • | Thornburg Intermediate Municipal Fund |
| • | Thornburg California Limited Term Municipal Fund |
| • | Thornburg New Mexico Intermediate Municipal Fund |
| • | Thornburg Florida Intermediate Municipal Fund |
| • | Thornburg New York Intermediate Municipal Fund |
| • | Thornburg Limited Term U.S. Government Fund |
| • | Thornburg Limited Term Income Fund |
Thornburg invests in short- and intermediate-term investment grade bonds. We ladder the maturities of individual bonds in the portfolios to moderate risk. Laddering involves building a portfolio of bonds with staggered maturities so that a portion of the portfolio will mature each year. We apply this disciplined process in all interest rate environments.
Thornburg Equity Funds
| • | Thornburg Value Fund |
| • | Thornburg International Value Fund |
| • | Thornburg Core Growth Fund |
| • | Thornburg Investment Income Builder Fund |
Thornburg’s equity research uses a fundamental, yet comprehensive, analytical approach. We invest when and where we perceive compelling value. Thornburg equity funds focus on a limited number of securities so that each holding can impact performance. The equity team searches for firms believed to have a promising future and seeks to buy shares of those companies at a discount to their intrinsic value.
More information at www.thornburg.com
 | Reduce paper clutter.
Receive your shareholder reports and prospectus online instead of through traditional mail.
Sign up at
www.thornburg.com/edelivery |
| 2 This page is not part of the Annual Report. | ||||||
Message
from the Chairman

Garrett Thornburg
Chairman & CEO
November 9, 2005
Dear Fellow Shareholder:
Thornburg Investment Management has a clear mission: to preserve and increase the real wealth of our shareholders. We seek to accomplish this through a range of equity funds that redefine traditional measures of value and growth and through a family of laddered bond funds that focus on quality, stability and minimizing risk over time.
Confirming our strategy, all Thornburg equity funds have ranked well within their respective categories.
The Thornburg equity funds employ a comprehensive approach which is more inclusive than the traditional deep value or high growth approach to stock selection. Within the Thornburg Value Fund and the Thornburg International Value Fund, the portfolios’ securities are classified into three baskets: basic value stocks, stocks of companies with consistent earnings, and stocks of emerging franchises. Thornburg Core Growth Fund’s holdings are classified into similar baskets: growth industry leaders, consistent growth companies, and emerging growth companies. After being identified through bottom-up screening from a worldwide universe, all stocks are subject to a rigorous selection process that must satisfy the Thornburg investment team’s two fundamental criteria: in the opinion of the portfolio manager, the companies must be selling at attractive discounts to intrinsic value and have compelling prospects for long-term growth. You can read much more about the stocks in your Fund’s portfolio at our web site, www.thornburg.com/funds.
During this decade, the average dividend yield paid by equity and hybrid mutual funds has dipped well below 1%. We established Thornburg Investment Income Builder Fund in late 2002 to be clearly different from other equity/hybrid funds by paying attractive dividends today, with a further goal of increasing these in the future. Our record to date shows clear success in achieving each aspect of this mission.
On the bond side, we have always had a highly disciplined approach of laddering short- and intermediate-bond maturities seeking to provide both an attractive return and relative stability of principal.
Recently, there has been a lot of news about improper behavior by some mutual fund companies. Many of the proposed new rules in response to this scandal have called for increased transparency. We welcome increased transparency. Thornburg Investment Management has been a leader in providing information about our stock holdings to our shareholders on our web site, www.thornburg.com.
Unfortunately, some of those new rules will increase the cost to all shareholders in mutual funds. We will do our best to keep these expenses to a minimal amount. After all, we are shareholders too! Thornburg employees have over $110 million invested in our own funds.
Thank you for investing with us. We will do our best to continue to earn your trust every day.
| Sincerely, |
 |
Garrett Thornburg Chairman & CEO |
| This page is not part of the Annual Report. 3 | ||||||
The Dividend Landscape
To appreciate the investment environment that Thornburg Investment Income Builder Fund operates in, you may wish to review these highlights of the “dividend landscape.”
The S&P 500 Index Payout Ratio – A Historical Perspective
S&P 500 Index Payout Ratio (January 1940 to October 2005)
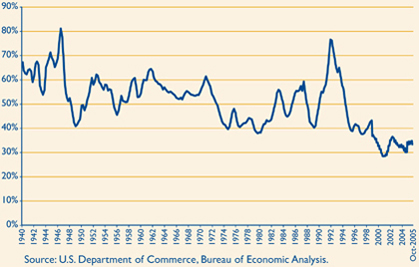
The dividend payout ratio is a fraction that expresses dividend payments as a percentage of per-share earnings. By long-term historical standards, the dividend payout ratio of the S&P 500 Index is relatively low at this time.
Corporate Willingness to Pay Dividends is Improving
Percentage of Companies Paying Dividends
in Russell 1000 Index (December 1979 to December 2004)
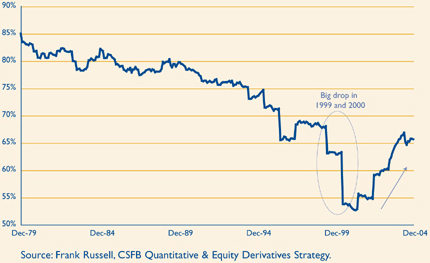
The Russell 1000 Index includes 1000 public companies that are supposed to be generally representative of corporate America. Between 1980 and 1993, at least 75% of these firms paid some dividend. Between 1994 and 2001, the percentage of Russell 1000 companies paying dividends sank to just over 50%, indicating investor and management preference for reinvesting retained earnings in growth initiatives. Now the pendulum appears to be swinging back, and the percentage of dividend payers is increasing. Long-term academic studies have shown that subsequent earnings-per-share growth of dividend-paying firms actually exceeds that of non-payers.
| 4 This page is not part of the Annual Report. | ||||||
Rising Dividend Payments Despite Decreasing Dividend Yields
Over time, the dollar dividend per unit of the S&P 500 Index has increased. Because the price of the index itself has increased even more, the yield on the S&P 500 Index, as a percentage of the current index price, has generally decreased in recent decades. You should note, however, that the yield on the original investment made at a fixed point in time (say, 1970 or 1989) has increased, even without reinvestment of dividends.
Hypothetical chart is for illustration purposes only and is not indicative of an investment in any particular security. Investors may not invest directly in an index.
S&P 500 Index Average Yield vs. Annual Dividends from a One-
Time $10,000 Investment in the Index (Dividends not Reinvested)
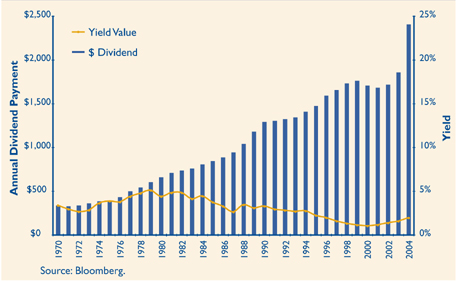
A Truly Diversified Dividend-Paying Portfolio Must Look Beyond the Obvious High Yield Stocks!
In the (large cap) Russell 1000 Index, 73% of the top 100 dividend payers are either real estate investment trusts (REITs) or utilities. In the (small cap) Russell 2000 Index, 78% of the top 100 dividend-yielding stocks are either REITs or utilities. In order to construct a diversified portfolio of attractive yielding stocks, one must look beyond these two sectors. We do!
The Top 100 Dividend Yields
| Russell 1000 Index | Russell 2000 Index | |||||
REITs | 45 | % | 69 | % | ||
Utilities | 28 | % | 9 | % | ||
Banks | 7 | % | 1 | % | ||
Other Financials | 4 | % | 5 | % | ||
Consumer Staples | 5 | % | 3 | % | ||
Telecommunications | 4 | % | 0 | % | ||
Materials | 2 | % | 5 | % | ||
Health Care | 1 | % | 1 | % | ||
Consumer Discretionary | 4 | % | 6 | % | ||
Industrials | 0 | % | 0 | % | ||
Energy | 0 | % | 1 | % | ||
Technology | 0 | % | 0 | % |
Source: Baseline, as of December 31, 2004; (Numbers may not add to 100% due to rounding.)
| This page is not part of the Annual Report. 5 | ||||||
The Dividend Landscape
Continued
Global Diversification Can Improve the Portfolio Yield
Average Dividend Yields and Payout Ratios
of Markets Around the Globe
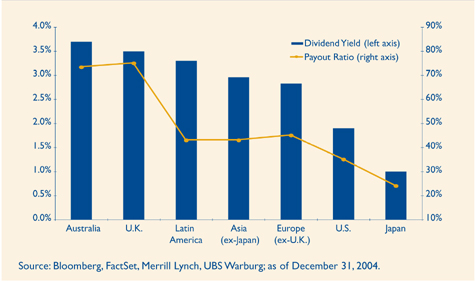
Since firms outside the U.S. tend to pay higher dividends than U.S. firms, particularly outside the REIT and utility sectors, we diversify the Thornburg Investment Income Builder Fund into some foreign dividend-paying stocks to try to take advantage of these opportunities.
| 6 This page is not part of the Annual Report. | ||||||
Important Information
The information presented on the following pages was current as of September 30, 2005. The manager’s views, portfolio holdings, and sector diversification are historical and subject to change. This material should not be deemed a recommendation to buy or sell any of the securities mentioned.
Shares in the Fund carry risks including possible loss of principal. There are special risks associated with international investing, including currency fluctuations, government regulation, political developments, and differences in liquidity. Additionally, the Fund invests a portion of the assets in small capitalization companies which may increase the risk of greater price fluctuations.
As with direct bond ownership, funds that invest in bonds are subject to certain risks including interest-rate risk, credit risk, and inflation risk. The value of a bond will fluctuate relative to changes in interest rates; as interest rates rise, the overall price of bonds fall. Shares in the Fund are not deposits or obligations of, or guaranteed or endorsed by, any bank, the Federal Deposit Insurance Corporation, the Federal Reserve Board or any government agency.
Performance data given at net asset value (NAV) does not take into account the applicable sales charges. If the sales charges had been included, the performance would have been lower.
Glossary
Blended Index – The blended index is comprised of 25% Lehman Brothers Aggregate Bond Index and 75% MSCI World Equity Index. The Lehman Brothers Aggregate Bond Index is composed of approximately 6,000 publicly traded bonds including U.S. government, mortgage-backed, corporate and Yankee bonds with an average maturity of approximately 10 years. The index is weighted by the market value of the bonds included in the index. The Morgan Stanley Capital International World Equity Index is a total return index, reported in U.S. dollars, based on share prices and reinvested gross dividends of approximately 1,600 companies from 22 countries: Australia, Austria, Belgium, Canada, Denmark, Finland, France, Germany, Hong Kong, Ireland, Italy, Japan, Malaysia, Netherlands, New Zealand, Norway, Singapore, Spain, Sweden, Switzerland, the United Kingdom, and the United States.
Russell 1000 Index – Consists of the 1,000 largest securities in the Russell 3000 Index, which represents approximately 90% of the total market capitalization of the Russell 3000 Index. It is a large-cap, market-oriented index and is highly correlated with the S&P 500 Index.
Russell 2000 Index – An unmanaged index generally representative of the 2,000 smallest companies in the Russell 3000 Index, representing approximately 10% of the total market capitalization of the Russell 3000 Index.
Standard & Poor’s 500 Stock Index (S&P 500) – An unmanaged index generally representative of the U.S. stock market, without regard to company size.
Unless otherwise noted, index returns reflect the reinvestment of income dividends and capital gains, if any, but do not reflect fees, brokerage commissions or other expenses of investing. Investors may not make direct investments into any index. The performance of any index is not indicative of the performance of any particular investment.
Median Market Capitalization – Market capitalization (market cap) is the total value of a company’s stock, calculated by multiplying the number of outstanding common shares by the current share price. The company whose market cap is in the middle of the portfolio is the median market cap. Half the companies in the portfolio have values greater than the median, and half have values that are less. If there is an even number of companies, then the median is the average of the two companies in the middle.
Price to Book Value (P/B) – A ratio used to compare a stock’s market value to its book value. It is calculated by dividing the current closing price of the stock by the latest quarter’s book value (book value is simply assets minus liabilities).
Price to Cash Flow Ratio – A measure of the market’s expectations of a firm’s future financial health. It is calculated by dividing the price per share by cash flow per share.
Price to Earnings Ratio (P/E) – A valuation ratio of a company’s current share price compared to its per-share earnings. P/E equals a company’s market value per share divided by earnings per share.
Weighted Average Coupon – Coupon refers to the rate of interest paid on a bond, usually expressed as a percent of its par value. A fund’s weighted average coupon is calculated by weighting each bond’s coupon by its relative size in the portfolio and taking the average.
| This page is not part of the Annual Report. | 7 |
Portfolio Overview
Thornburg Investment Income Builder Fund
IMPORTANT PERFORMANCE INFORMATION
Performance data quoted represents past performance and does not guarantee future results. Investment return and principal value will fluctuate so that upon redemption, investor’s shares may be worth more or less than their original cost. Current performance may be lower or higher than the data quoted. For performance data current to the most recent month end, visit www.thornburg.com.
The maximum sales charge for Class A shares is 4.50%. A shares are subject to a 1% 90-day redemption fee.
MANAGEMENT TEAM

Front row, L to R: Steven Bohlin, Brad Kinkelaar, and Brian McMahon. Back row, L to R: Wendy Trevisani, Lewis Kaufman, Ed Maran, Vin Walden, and Lei Wang.
PORTFOLIO COMPOSITION
As of 9/30/05
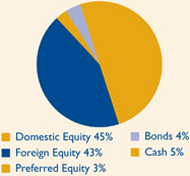
We do not expect each sequential quarter’s dividend to increase over that of the prior quarter, since dividend payments outside the U.S. tend to be seasonal. Rather, the Fund aspires to increase the dividend paid on an annual basis.
100% of 2004 and 2003’s dividend payments qualified for the lower 15% tax rate on stock dividends. (There is no guarantee that this will be the case for future dividends.)
QUARTERLY DIVIDEND HISTORY
| Q1 | Q2 | Q3 | Q4 | Total | |||||||||||
Class A Shares | |||||||||||||||
2005 | 11.0 | ¢ | 13.6 | ¢ | 17.4 | ¢ | N/A | N/A | |||||||
2004 | 10.2 | ¢ | 12.5 | ¢ | 15.0 | ¢ | 21.8 | ¢ | 59.5 | ¢ | |||||
2003 | 9.2 | ¢ | 11.2 | ¢ | 12.4 | ¢ | 17.5 | ¢ | 50.3 | ¢ | |||||
Class C Shares | |||||||||||||||
2005 | 9.1 | ¢ | 11.7 | ¢ | 15.6 | ¢ | N/A | N/A | |||||||
2004 | 8.4 | ¢ | 10.9 | ¢ | 13.7 | ¢ | 20.2 | ¢ | 53.2 | ¢ | |||||
2003 | 8.3 | ¢ | 9.5 | ¢ | 10.4 | ¢ | 15.9 | ¢ | 44.1 | ¢ |
KEY PORTFOLIO ATTRIBUTES
Equity Statistics | ||||
Equity Portfolio P/E | 13.4 | x | ||
Median Market Cap | $ | 17.9 | B | |
Equity Holdings | 54 | |||
Fixed Income Statistics | ||||
Weighted Average Coupon | 5.07 | % | ||
Average Credit Quality | A- | |||
Average Maturity | 3.2 yrs | |||
Duration | 1.2 yrs | |||
Bond Holdings | 31 | |||
| TOP TEN HOLDINGS | ||||
General Electric Co. | 3.4 | % | ||
Dominion Resources Inc. | 3.2 | % | ||
Pfizer Inc. | 3.2 | % | ||
Altria Group Inc. | 3.2 | % | ||
Canadian Oil Sands Trust | 3.1 | % | ||
Host Marriott Corp. | 3.1 | % | ||
ENI S.p.A. | 3.0 | % | ||
GlaxoSmithKline plc | 3.0 | % | ||
Vodafone Group plc | 2.9 | % | ||
BP Amoco ADR | 2.9 | % | ||
AVERAGE ANNUAL TOTAL RETURNS*
For periods ending September 30, 2005
| 3Q ’05 | 1 Yr | Since Inception | |||||||
A Shares (Incep: 12/24/02) | |||||||||
Without Sales Charge | 3.93 | % | 19.21 | % | 19.94 | % | |||
With Sales Charge | (0.75 | )% | 13.81 | % | 17.97 | % | |||
Blended Index** (Since: 12/31/02) | 4.94 | % | 14.70 | % | 15.25 | % |
| * | Periods under one year are not annualized. |
| ** | Blended Index: 75% MSCI World/25% Lehman Brothers Aggregate |
| 8 This page is not part of the Annual Report. | ||||||
The investment objective of Thornburg Investment Income Builder Fund is to provide a level of current income which exceeds the average yield on U.S. stocks, and which will grow, subject to periodic fluctuations, over the years. This objective remains constant over time. However, the specific investments we have used to try to reach our objective have changed over time. There is no guarantee the Fund will meet its investment objectives.
Business conditions for various industries and operating effectiveness at individual firms, change over time. Investor preferences, expressed as both absolute and relative prices, also change over time. In the view of your portfolio management team, “some doors close and others open.” As shown in the tables below, the percentage industry allocations of your Fund evolve to reflect these changing conditions.
TOP TEN INDUSTRIES
As of 9/30/05
Energy | 15.6 | % | |
Diversified Financials | 13.7 | % | |
Banks | 9.4 | % | |
Utilities | 8.7 | % | |
Telecommunication Services | 8.5 | % | |
Pharmaceuticals & Biotechnology | 7.4 | % | |
Real Estate | 5.8 | % | |
Transportation | 4.5 | % | |
Food Beverage & Tobacco | 4.2 | % | |
Capital Goods | 3.4 | % | |
TOP TEN INDUSTRIES As of 6/30/05 | |||
Diversified Financials | 14.6 | % | |
Energy | 14.5 | % | |
Banks | 10.6 | % | |
Telecommunication Services | 9.7 | % | |
Utilities | 8.4 | % | |
Pharmaceuticals & Biotechnology | 6.2 | % | |
Transportation | 5.4 | % | |
Materials | 5.1 | % | |
Real Estate | 4.4 | % | |
Food Beverage & Tobacco | 2.9 | % | |
TOP TEN INDUSTRIES As of 3/31/05 | |||
| 14.8 | % | ||
Banks | 14.8 | % | |
Energy | 11.8 | % | |
Telecommunication Services | 9.0 | % | |
Utilities | 7.8 | % | |
Pharmaceuticals & Biotechnology | 7.1 | % | |
Transportation | 5.8 | % | |
Food & Staples Retailing | 4.8 | % | |
Materials | 3.8 | % | |
Food Beverage & Tobacco | 3.4 | % | |
TOP TEN INDUSTRIES As of 12/31/04 | |||
Banks | 15.0 | % | |
Diversified Financials | 11.6 | % | |
Pharmaceuticals & Biotechnology | 8.9 | % | |
Energy | 7.3 | % | |
Transportation | 7.0 | % | |
Telecommunication Services | 6.5 | % | |
Food Beverage & Tobacco | 6.1 | % | |
Utilities | 5.6 | % | |
Insurance | 4.5 | % | |
Food & Staples Retailing | 3.9 | % | |
| This page is not part of the Annual Report. 9 | ||||||
This page intentionally left blank.
| 10 This page is not part of the Annual Report. | ||||||

Thornburg Investment Income Builder Fund
September 30, 2005
| 12 | ||
| 14 | ||
| 16 | ||
| 18 | ||
| 19 | ||
| 23 | ||
| 27 | ||
| 34 | ||
| 35 | ||
| 36 | ||
| 37 | ||
| 40 |
This report is certified under the Sarbanes-Oxley Act of 2002, which requires that public companies, including mutual funds, affirm that the information provided in their annual and semiannual shareholder reports fully and fairly represents their financial position.
| Certified Annual Report 11 | ||||||
October 17, 2005
Dear Fellow Shareholder:
Recall that the objective of Thornburg Investment Income Builder Fund is to pay attractive, growing dividends to shareholders. As a byproduct of achieving this, we also aim to generate capital appreciation of the share price over time. (There is no guarantee that these objectives will be met.) Following are the quarterly dividends paid by your Fund in the fiscal year that ended on September 30, 2005:
| Dec. 04 Qtr. | March 05 Qtr. | June 05 Qtr. | Sept. 05 Qtr. | Fiscal Year 05 Total | |||||||||||
A Shares | 21.8 | ¢ | 11.0 | ¢ | 13.6 | ¢ | 17.4 | ¢ | 63.8 | ¢ | |||||
C Shares | 20.2 | ¢ | 9.1 | ¢ | 11.7 | ¢ | 15.6 | ¢ | 56.7 | ¢ |
Dividends paid to both A and C shares during the fiscal year increased by more than 15% over prior year levels. We expect that at least 85% of the regular quarterly dividends paid by your Fund this year will qualify for the 15% tax rate for individual taxpayers on “qualifying dividends.” We also expect to pay a capital gains dividend (1% to 2% of net asset value) in November 2005. The net asset values (NAV) of the A and C shares ended the fiscal period at $17.93 and $17.95, respectively, having increased by $2.33 each since September 30, 2004. On September 30, 2005, your Fund owned 54 stocks, comprising 90% of your portfolio. You also held 30 different bonds and cash equivalents with a weighted average duration of 1.2 years.
Firms in a broad range of industries contributed to the solid return of your Fund in the last six months, but three of our top five performers were oil & gas businesses. Integrated oil & gas producers Marathon Oil Corp., ChevronTexaco Corp., and ENI S.p.A. were joined by Dominion Resources Inc. (utility, with significant gas production) and Hong Kong Exchanges & Clearing Ltd. (equity exchange) as the top five performers for the period. The performance of these stocks is not surprising, given that the price of crude oil averaged almost $58/barrel over the last six months. Hong Kong Exchanges benefited from good equity trading volumes and new listings.
PPG Industries Inc. (chemicals), Dow Chemical Co. (chemicals), Telecom Italia Mobile (telecommunication services), Kingfisher plc (home improvement retailer, mostly United Kingdom and France), and Tesco plc (food & general merchandise retailer, mostly United Kingdom) were our weakest portfolio performers. The underlying businesses of each of these except Tesco exhibited weakness, relative to expectations. For the chemicals businesses, high energy input costs could not be fully offset. Most consumer- dependent businesses in the United Kingdom have shown weakness due to high housing costs, rising interest rates, and rising energy costs – perhaps a preview of what is in store for similar businesses in the United States in the coming year. On average, your portfolio companies have increased their earnings and dividends over the last year by around 12% and 11%, respectively.
Our exposure to foreign currencies via the non-U.S. stocks in your portfolio was a small negative during the fiscal year. The fact that we hedged this risk by buying dollars for future delivery mitigated the currency risk in euros and British pounds. Your Fund’s most significant industry exposures as of September 30, 2005 are listed on page 33. Banking and diversified financial services firms continue to be important weightings in your portfolio, though we reduced these weightings during the year. Here, we have tried to focus on dividend paying beneficiaries of rising interest rates. Senior oil company executives have told us that their assumed oil prices when evaluating new projects remain in the $20-$30 per barrel range (less than 50% of today’s price). This indicates continuing under-investment in energy exploration & development, which should help sustain generally higher energy prices than we observed prior to 2004. We are conscious of the fact that energy use may stall in an environment of higher prices and slower economic growth. Increasing energy consumption in emerging economies may offset demand destruction in more mature economies. We continued to own selected
| 12 Certified Annual Report | ||||||
firms in the growing, cash-generative mobile telecommunication services sector, and we expect rising hotel room rates to lead to significant dividend increases from the hotel REITs in your portfolio.
We remain optimistic about the backdrop for success of our investment program, due to ongoing improvements in corporate ability and willingness to pay dividends. The 15% tax rate on dividend income is important icing on the cake. Ability to pay is determined by revenues, earnings, and cash flows after expenses of operating the business. Looking at the broad U.S. market, year-over-year revenue growth of public companies (as represented by the S&P 1500 Index) increased at 12%, and operating earnings per share grew 11%, according to the corporate data service Baseline. Net profit margins have reached historic highs, though there are increasing signs that these will fall in coming quarters. In general, firms outside the U.S. show similar trends. Balance sheets have generally improved, as indicated by Moody’s report of declines in the default rate of below-investment-grade bond issues. We doubt that company revenues and earnings can continue to increase at such high multiples of GDP growth. Costs are increasing for most firms, and many of these have limited ability to pass higher costs through while maintaining unit sales volumes.
Willingness to pay, determined by the behavior of corporate executives and boards, also seems to be improving, but progress is slow. The dividend per unit of the S&P 500 Index increased from $3.14 in 1970 to an expected level of around $22 in 2005. We believe the period of stupid acquisitions, dishonest accounting, and blind pursuit of profitless revenue growth has yielded (for a while) to a more constructive mindset, focusing on profitability. There is considerable room for further dividend improvement. The ratio of dividend payments (around $22) to earnings (around $74) for the S&P 500 Index portfolio is below 30%. Many firms should be able to pay out 50% of earnings, or more, to shareholders. Financial discipline is at least as constructive for CEOs as it is for teenagers, and paying good dividends reinforces capital discipline in a company.
Your Fund’s investments are reported to you in the latter pages of this report. You can read more about the equity investments in your Fund by going to our web site, www.thornburg.com/funds. (If you do not have internet access, please call us at 800-847-0200. We will print and mail you a copy of this). Thank you for your support, and best wishes.
Sincerely,
 |  |  | ||
| Brian McMahon | Brad Kinkelaar | Steven J. Bohlin | ||
| President & Chief Investment Officer | Managing Director | Managing Director |
| * | 75% MSCI World and 25% Lehman Brothers Aggregate, see page 36 for complete description of index. |
The matters discussed in this report may constitute forward-looking statements made pursuant to the safe harbor provisions of the Securities Litigation Reform Act of 1995. These include any advisor or portfolio manager prediction, assessment, analysis or outlook for individual securities, industries, investment styles, market sectors and/or markets. These statements involve risks and uncertainties. In addition to the general risks described for each fund in its current prospectus, other factors bearing on these reports include the accuracy of the advisor’s or portfolio manager’s forecasts and predictions, the appropriateness of the investment strategies designed by the advisor or portfolio manager, and the ability of the advisor or portfolio manager to implement their strategies efficiently and successfully. Any one or more of these factors, as well as other risks affecting the securities markets generally, could cause the actual results of any fund to differ materially as compared to its benchmarks.
| Certified Annual Report 13 | ||||||
STATEMENT OF ASSETS AND LIABILITIES
| Thornburg Investment Income Builder Fund | September 30, 2005 |
ASSETS | |||
Investments at value (cost $886,105,687) | $ | 966,889,083 | |
Cash | 1,019,008 | ||
Receivable for investments sold | 35,461,645 | ||
Receivable for fund shares sold | 9,236,502 | ||
Unrealized gain on forward exchange contracts (Note 7) | 2,210,570 | ||
Dividends receivable | 4,949,133 | ||
Interest receivable | 705,216 | ||
Prepaid expenses and other assets | 21,049 | ||
Total Assets | 1,020,492,206 | ||
LIABILITIES | |||
Payable for securities purchased | 32,321,353 | ||
Payable for fund shares redeemed | 753,745 | ||
Unrealized loss on forward exchange contracts (Note 7) | 917,380 | ||
Payable to investment advisor and other affiliates (Note 3) | 968,346 | ||
Deferred tax payable | 306,966 | ||
Accounts payable and accrued expenses | 309,199 | ||
Dividends payable | 2,121,867 | ||
Total Liabilities | 37,698,856 | ||
NET ASSETS | $ | 982,793,350 | |
NET ASSETS CONSIST OF: | |||
Undistributed net investment income | $ | 6,877,895 | |
Net unrealized appreciation on investments | 81,699,931 | ||
Accumulated net realized gain (loss) | 16,739,017 | ||
Net capital paid in on shares of beneficial interest | 877,476,507 | ||
| $ | 982,793,350 | ||
| 14 Certified Annual Report | ||||||
| STATEMENT OF ASSETS AND LIABILITIES, CONTINUED | ||
| Thornburg Investment Income Builder Fund | September 30, 2005 | |
NET ASSET VALUE: | |||
Class A Shares: | |||
Net asset value and redemption price per share ($515,914,934 applicable to 28,766,763 shares of beneficial interest outstanding - Note 4) | $ | 17.93 | |
Maximum sales charge, 4.50% of offering price | 0.84 | ||
Maximum offering price per share | $ | 18.77 | |
Class C Shares: | |||
Net asset value and offering price per share* ($337,488,577 applicable to 18,802,005 shares of beneficial interest outstanding - Note 4) | $ | 17.95 | |
Class I Shares: | |||
Net asset value, offering and redemption price per share ($129,110,166 applicable to 7,158,934 shares of beneficial interest outstanding - Note 4) | $ | 18.03 | |
Class R1 Shares: | |||
Net asset value, offering and redemption price per share ($279,673 applicable to 15,594 shares of beneficial interest outstanding - Note 4) | $ | 17.93 | |
| * | Redemption price per share is equal to net asset value less any applicable contingent deferred sales charge. |
See notes to financial statements.
| Certified Annual Report 15 | ||||||
| Thornburg Investment Income Builder Fund | Year Ended September 30, 2005 | |
INVESTMENT INCOME: | ||||
Dividend income (net of foreign taxes withheld of $1,611,046) | $ | 33,859,526 | ||
Interest income | 4,170,400 | |||
Total Income | 38,029,926 | |||
EXPENSES: | ||||
Investment advisory fees (Note 3) | 5,707,419 | |||
Administration fees (Note 3) | ||||
Class A Shares | 448,565 | |||
Class C Shares | 286,400 | |||
Class I Shares | 37,132 | |||
Class R1 Shares | 95 | |||
Distribution and service fees (Note 3) | ||||
Class A Shares | 904,397 | |||
Class C Shares | 2,312,023 | |||
Class R1 Shares | 388 | |||
Transfer agent fees | ||||
Class A Shares | 368,300 | |||
Class C Shares | 248,065 | |||
Class I Shares | 41,351 | |||
Class R1 Shares | 7,451 | |||
Registration and filing fees | ||||
Class A Shares | 87,951 | |||
Class C Shares | 50,860 | |||
Class I Shares | 15,389 | |||
Class R1 Shares | 13,446 | |||
Custodian fees (Note 3) | 361,112 | |||
Professional fees | 64,571 | |||
Accounting fees | 54,370 | |||
Trustee fees | 14,720 | |||
Other expenses | 202,556 | |||
Total Expenses | 11,226,561 | |||
Less: | ||||
Expenses reimbursed by Investment Advisor (Note 3) | (856,138 | ) | ||
Fees paid indirectly (Note 3) | (35,262 | ) | ||
Net Expenses | 10,335,161 | |||
Net Investment Income | $ | 27,694,765 | ||
| 16 Certified Annual Report | ||||||
| STATEMENT OF OPERATIONS, CONTINUED | ||
| Thornburg Investment Income Builder Fund | Year Ended September 30, 2005 | |
REALIZED AND UNREALIZED GAIN (LOSS) | |||
Net realized gain (loss) on: | |||
Investments | $ | 16,634,596 | |
Foreign currency transactions | 2,574,289 | ||
| 19,208,885 | |||
Net change in unrealized appreciation (depreciation) on: | |||
Investments (net of change in deferred taxes payable of $256,669) | 54,638,518 | ||
Foreign currency translations | 2,174,174 | ||
| 56,812,692 | |||
Net Realized and Unrealized Gain | 76,021,577 | ||
Net Increase in Net Assets Resulting From Operations | $ | 103,716,342 | |
See notes to financial statements.
| Certified Annual Report 17 | ||||||
STATEMENTS OF CHANGES IN NET ASSETS
Thornburg Investment Income Builder Fund
| Year Ended September 30, 2005 | Year Ended September 30, 2004 | |||||||
INCREASE (DECREASE) IN NET ASSETS FROM: | ||||||||
OPERATIONS: | ||||||||
Net investment income | $ | 27,694,765 | $ | 12,099,404 | ||||
Net realized gain (loss) on investments and foreign currency | 19,208,885 | (3,417,913 | ) | |||||
Increase (Decrease) in unrealized appreciation (depreciation) on investments, foreign currency translation, and deferred taxes | 56,812,692 | 21,451,937 | ||||||
Net Increase (Decrease) in Net Assets Resulting from Operations | 103,716,342 | 30,133,428 | ||||||
DIVIDENDS TO SHAREHOLDERS: | ||||||||
From net investment income | ||||||||
Class A Shares | (13,160,919 | ) | (5,486,221 | ) | ||||
Class C Shares | (7,462,307 | ) | (2,936,820 | ) | ||||
Class I Shares | (2,791,906 | ) | (641,652 | ) | ||||
Class R1 Shares | (2,854 | ) | 0 | |||||
From realized gains | ||||||||
Class A Shares | (11,306 | ) | 0 | |||||
Class C Shares | (7,266 | ) | 0 | |||||
Class I Shares | (1,756 | ) | 0 | |||||
FUND SHARE TRANSACTIONS (NOTE 4): | ||||||||
Class A Shares | 247,700,405 | 138,687,397 | ||||||
Class C Shares | 166,392,249 | 96,221,064 | ||||||
Class I Shares | 87,260,594 | 32,217,399 | ||||||
Class R1 Shares | 271,714 | 0 | ||||||
Net Increase in Net Assets | 581,902,990 | 288,194,595 | ||||||
NET ASSETS: | ||||||||
Beginning of year | 400,890,360 | 112,695,765 | ||||||
End of year | $ | 982,793,350 | $ | 400,890,360 | ||||
See notes to financial statements.
| 18 Certified Annual Report | ||||||
Thornburg Investment Income Builder Fund | September 30, 2005 |
NOTE 1 – ORGANIZATION
Thornburg Investment Income Builder Fund, hereinafter referred to as the “Fund,” is a diversified series of Thornburg Investment Trust (the “Trust”). The Fund commenced operations on December 24, 2002. The Trust was organized as a Massachusetts business trust under a Declaration of Trust dated June 3, 1987 and is registered as a diversified, open-end management investment company under the Investment Company Act of 1940, as amended. The Trust is currently issuing eleven series of shares of beneficial interest in addition to those of the Fund: Thornburg Limited Term Municipal Fund, Thornburg California Limited Term Municipal Fund, Thornburg Limited Term U.S. Government Fund, Thornburg New Mexico Intermediate Municipal Fund, Thornburg Intermediate Municipal Fund, Thornburg Limited Term Income Fund, Thornburg Florida Intermediate Municipal Fund, Thornburg Value Fund, Thornburg International Value Fund, Thornburg New York Intermediate Municipal Fund and Thornburg Core Growth Fund. Each series is considered to be a separate entity for financial reporting and tax purposes and bears expenses directly attributable to it. The Fund pursues its investment objectives by investing in a broad range of income producing securities, primarily stocks and bonds.
The Fund currently offers four classes of shares of beneficial interest, Class A, Class C, Institutional Class (Class I) and Retirement Class (Class R1) shares. Each class of shares of the Fund represents an interest in the same portfolio of investments of the Fund, except that (i) Class A shares are sold subject to a front-end sales charge collected at the time the shares are purchased and bear a service fee, (ii) Class C shares are sold at net asset value without a sales charge at the time of purchase, but are subject to a contingent deferred sales charge upon redemption within one year, and bear both a service fee and a distribution fee, (iii) Class I shares are sold at net asset value without a sales charge at the time of purchase, (iv) Class R1 shares are sold at net asset value without a sales charge at the time of purchase, but bear both a service fee and distribution fee, and (v) the respective classes may have different reinvestment privileges and conversion rights. Additionally, the Fund may allocate among its classes certain expenses, to the extent allowable, to specific classes including transfer agent fees, government registration fees, certain printing and postage costs, and administration and legal expenses. Currently, class specific expenses of the Fund are limited to service and distribution fees, administration fees, and certain registration and transfer agent expenses.
NOTE 2 – SIGNIFICANT ACCOUNTING POLICIES
Significant accounting policies of the Trust are as follows:
Valuation of Securities: In determining the net asset value of investments, investments are stated at value based on latest sales prices, normally at 4:00 pm EST reported on securities exchanges on the last business day of the period. Investments for which no sale is reported are valued at the mean between bid and asked prices or in accordance with such other method as the Trustees may authorize. In any case where a market quotation is not readily available, the Trust’s valuation and pricing committee determines a fair value for the investment using factors approved by the Trustees. Short term obligations having remaining maturities of 60 days or less are valued at amortized cost, which approximates market value.
Foreign Currency Translation: Portfolio securities and other assets and liabilities denominated in foreign currencies are translated into U.S. dollars based on the exchange rate of such currencies against the U.S. dollar on the date of valuation. Purchases and sales of securities and income items denominated in foreign currencies are translated into U.S. dollars at the exchange rate in effect on the translation date. When the Fund purchases or sells foreign securities it will customarily enter into a foreign exchange contract to minimize foreign exchange risk from the trade date to the settlement date of such transactions.
The Fund does not separately report the effect of changes in foreign exchange rates from changes in market prices on securities held. Such changes are included in net realized and unrealized gain or loss from investments.
Reported net realized foreign exchange gains or losses arise from sales of foreign currencies, currency gains or losses realized between the trade and settlement dates on securities transactions, and the difference between the amount of interest recorded on the Fund’s books and the U.S. dollar equivalent of the amounts actually received or paid.
Deferred Taxes: The Fund is subject to a tax imposed on net realized gains of securities of certain foreign countries. The Fund records an estimated deferred tax liability for net unrealized gains on these securities as reflected in the accompanying financial statements.
Federal Income Taxes: It is the policy of the Trust to comply with the provisions of the Internal Revenue Code applicable to “regulated investment companies” and to distribute all taxable income, including any net realized gain on investments, of the Fund to the shareholders. Therefore, no provision for Federal income taxes is required.
When-Issued and Delayed Delivery Transactions: The Trust may engage in when-issued or delayed delivery transactions. To the extent the Trust engages in such transactions, it will do so for the purpose of acquiring portfolio securities consistent with the Fund’s investment objectives and not for the purpose of investment leverage or to speculate on interest rate and or market changes. At the time the Trust makes a commitment to purchase a security on a when-issued basis, the Fund will record the transaction and reflect the value in determining its net asset value. When effecting such transactions, assets of an amount sufficient to make payment for the portfolio securities to be purchased will be segregated on the Fund’s records on the trade date. Securities purchased on a when-issued or delayed delivery basis do not earn interest until the settlement date.
| Certified Annual Report | 19 |
| NOTES TO FINANCIAL STATEMENTS, CONTINUED | ||
| Thornburg Investment Income Builder Fund | September 30, 2005 | |
Dividends: Net investment income of the Fund is declared daily as a dividend on shares for which the Fund has received payment. Dividends are paid quarterly and are reinvested in additional shares of the Fund at net asset value per share at the close of business on the dividend payment date or, at the shareholder’s option, paid in cash. Net capital gains, to the extent available, will be distributed at least annually. Distributions to shareholders are based on income tax regulations and, therefore, their characteristics may differ for financial statement and tax purposes.
General: Securities transactions are accounted for on a trade date basis. Interest income is accrued as earned and dividend income is recorded on the ex-dividend date. Certain income from foreign securities is recognized as soon as information is available to the Fund. Realized gains and losses from the sale of securities are recorded on an identified cost basis. Distributions received on securities that represent a return of capital or capital gain are recorded as a reduction of cost of investments and/or as a realized gain. The Fund estimates the components of distributions received that may be considered return of capital distributions or capital gain distributions. Net investment income, other than class specific expenses and realized and unrealized gains and losses, is allocated daily to each class of shares based upon the relative net asset value of outstanding shares of each class of shares at the beginning of the day (after adjusting for the current share activity of the respective class). Expenses common to all funds are allocated among the funds comprising the Trust based upon their relative net asset values or other appropriate allocation methods.
Guarantees and Indemnifications: Under the Trust’s organizational documents, its officers and Trustees are indemnified against certain liability arising out of the performance of their duties to the Fund. Additionally, in the normal course of business the Trust enters into contracts with service providers that contain general indemnification clauses. The Trust’s maximum exposure under these arrangements is unknown. However, based on experience, the Trust expects the risk of loss to be remote.
Use of Estimates: The preparation of financial statements, in conformity with generally accepted accounting principles, requires management to make estimates and assumptions that affect the reported amounts of assets and liabilities and the disclosure of contingent assets and liabilities at the date of the financial statements and the reported amounts of increases and decreases in net assets from operations during the reporting period. Actual results could differ from those estimates.
NOTE 3 – INVESTMENT ADVISORY FEE AND OTHER TRANSACTIONS WITH AFFILIATES
Pursuant to an investment advisory agreement, Thornburg Investment Management, Inc.® (the “Advisor”) serves as the investment advisor and performs services to the Fund for which the fees are payable at the end of each month. For the year ended September 30, 2005, these fees were payable at annual rates ranging from .875 of 1% to .675 of 1% per annum of the average daily net assets of the Fund depending on the Fund’s asset size. The Fund also has an administrative services agreement with the Advisor, whereby the Advisor will perform certain administrative services for the shareholders of each class of the Fund’s shares, and for which fees will be payable at an annual rate of up to .125 of 1% per annum of the average daily net assets attributable to each class of shares. For the year ended September 30, 2005, the Advisor voluntarily reimbursed certain class specific expenses, administrative fees, and distribution fees of $762,635 for Class C shares, $72,530 for Class I shares, and $20,973 for Class R1 shares.
The Trust has an underwriting agreement with Thornburg Securities Corporation® (the “Distributor”, an affiliate of the Advisor), which acts as the Distributor of the Fund’s shares. For the year ended September 30, 2005, the Distributor has advised the Fund that it earned commissions aggregating $414,982 from the sale of Class A shares of the Fund and collected contingent deferred sales charges aggregating $28,778 from redemptions of Class C shares of the Fund.
Pursuant to a service plan under Rule 12b-1 of the Investment Company Act of 1940, the Fund may reimburse to the Advisor an amount not to exceed .25 of 1% per annum of its average daily net assets attributable to each class of shares of the Fund for payments made by the Advisor to securities dealers and other financial institutions to obtain various shareholder related services. The Advisor may pay out of its own resources additional expenses for distribution of the Fund’s shares.
The Trust has also adopted distribution plans pursuant to Rule 12b-1, applicable only to the Fund’s Class C and Class R1 shares, under which the Fund compensates the Distributor for services in promoting the sale of Class C and Class R1 shares of the Fund at an annual rate of up to .75 of 1% of the average daily net assets attributable to Class C and Class R1 shares. Total fees incurred by each class of shares of the Fund under its respective Service and Distribution Plans are set forth in the Statement of Operations.
The Trust has an agreement with the custodian bank to indirectly pay a portion of the custodian’s fees through credits earned by the Fund’s cash on deposit with the bank. This deposit agreement is an alternative to overnight investments. Custodial fees have been adjusted to reflect amounts that would have been paid without this agreement, with a corresponding adjustment reflected as fees paid indirectly in the Statement of Operations. For the year ended September 30, 2005, fees paid indirectly were $35,262.
Certain officers and Trustees of the Trust are also officers and/or Directors of the Advisor and Distributor. The compensation of independent Trustees is borne by the Trust.
| 20 Certified Annual Report | ||||||
| NOTES TO FINANCIAL STATEMENTS, CONTINUED | ||
| Thornburg Investment Income Builder Fund | September 30, 2005 | |
NOTE 4 – SHARES OF BENEFICIAL INTEREST
At September 30, 2005, there were an unlimited number of shares of beneficial interest authorized. Sales of Class R1 shares commenced February 1, 2005. Transactions in shares of beneficial interest were as follows:
| Year Ended September 30, 2005 | Year Ended September 30, 2004 | |||||||||||||
| Shares | Amount | Shares | Amount | |||||||||||
Class A Shares | ||||||||||||||
Shares sold | 15,824,625 | $ | 272,463,968 | 10,579,300 | $ | 160,956,212 | ||||||||
Shares issued to shareholders in reinvestment of dividends | 582,139 | 10,174,628 | 283,535 | 4,388,856 | ||||||||||
Shares repurchased** | (2,029,458 | ) | (34,938,191 | ) | (1,780,207 | ) | (26,657,671 | ) | ||||||
Net Increase (Decrease) | 14,377,306 | $ | 247,700,405 | 9,082,628 | $ | 138,687,397 | ||||||||
** The Fund charges a redemption fee of 1% of the Class A shares exchanged within 90 days of purchase. For the year ended September 30, 2005 and year ended September 30, 2004, $25,676 and $33,971, respectively, were netted in the amount reported for shares repurchased.
|
| |||||||||||||
Class C Shares | ||||||||||||||
Shares sold | 10,240,222 | $ | 176,652,670 | 6,542,027 | $ | 100,023,227 | ||||||||
Shares issued to shareholders in reinvestment of dividends | 278,319 | 4,873,053 | 120,816 | 1,873,063 | ||||||||||
Shares repurchased | (878,803 | ) | (15,133,474 | ) | (372,748 | ) | (5,675,226 | ) | ||||||
Net Increase (Decrease) | 9,639,738 | $ | 166,392,249 | 6,290,095 | $ | 96,221,064 | ||||||||
Class I Shares | ||||||||||||||
Shares sold | 5,095,258 | $ | 88,334,328 | 2,128,882 | $ | 32,252,605 | ||||||||
Shares issued to shareholders in reinvestment of dividends | 133,505 | 2,350,289 | 36,925 | 573,313 | ||||||||||
Shares repurchased ** | (195,879 | ) | (3,424,023 | ) | (39,757 | ) | (608,519 | ) | ||||||
Net Increase (Decrease) | 5,032,884 | $ | 87,260,594 | 2,126,050 | $ | 32,217,399 | ||||||||
** The Fund charges a redemption fee of 1% of the Class I shares exchanged within 90 days of purchase. For the year ended September 30, 2005 and year ended September 30, 2004, $4,932 and $1,717, respectively, were netted in the amount reported for shares repurchased.
|
| |||||||||||||
Class R1 Shares* | ||||||||||||||
Shares sold | 15,475 | $ | 269,569 | — | $ | — | ||||||||
Shares issued to shareholders in reinvestment of dividends | 159 | 2,832 | — | — | ||||||||||
Shares repurchased | (40 | ) | (687 | ) | — | — | ||||||||
Net Increase (Decrease) | 15,594 | $ | 271,714 | — | $ | — | ||||||||
| * | Effective date of Class R1 shares was February 1, 2005. |
| Certified Annual Report 21 | ||||||
| NOTES TO FINANCIAL STATEMENTS, CONTINUED | ||
| Thornburg Investment Income Builder Fund | September 30, 2005 | |
NOTE 5 – SECURITIES TRANSACTIONS
For the year ended September 30, 2005, the Fund had purchase and sale transactions of investment securities (excluding short-term investments) of $1,000,751,622 and $497,543,249, respectively.
NOTE 6 – INCOME TAXES
At September 30, 2005, information on the tax components of capital is as follows:
Cost of investments for tax purpose | $ | 890,454,430 | ||
Gross unrealized appreciation on a tax basis | $ | 86,292,475 | ||
Gross unrealized depreciation on a tax basis | (9,857,822 | ) | ||
Net unrealized appreciation (depreciation) on investments (tax basis) | $ | 76,434,653 | ||
Distributable earnings – ordinary income | $ | 12,989,103 | ||
Distributable earnings – capital gains | $ | 16,386,212 |
At September 30, 2005, the Fund had deferred tax basis currency losses occurring subsequent to October 31, 2004 of $143,354. For tax purposes, such losses will be reflected in the year ending September 30, 2006.
In order to account for permanent book/tax differences, the Fund decreased undistributed net investment income by $437,174 and increased accumulated net realized gain by $437,174. This reclassification has no impact on the net asset value of the Fund. Reclassifications result primarily from foreign currency transactions, investments in REITs, and partnerships.
The tax character of distributions paid during the year ended September 30, 2005, and September 30, 2004, was as follows:
| 2005 | 2004 | |||||
Distributions from: | ||||||
Ordinary income | $ | 23,435,475 | $ | 9,064,693 | ||
Distributable capital gains | 2,839 | — | ||||
Total | $ | 23,438,314 | $ | 9,064,693 | ||
NOTE 7 – FINANCIAL INSTRUMENTS WITH OFF-BALANCE SHEET RISK AND FOREIGN INVESTMENT RISK
During the year ended September 30, 2005, the Fund was a party to financial instruments with off-balance sheet risks, primarily currency forward exchange contracts. A forward exchange contract is an agreement between two parties to exchange different currencies at a specified rate at an agreed upon future date. These contracts are purchased in order to minimize the risk to the Fund with respect to its foreign stock transactions from adverse changes in the relationship between the U.S. dollar and foreign currencies. In each case these contracts have been initiated in conjunction with foreign stock transactions. These instruments may involve market risks in excess of the amount recognized on the Statement of Assets and Liabilities. Such risks would arise from the possible inability of counterparties to meet the terms of their contracts, future movement in currency value and interest rates and contract positions that are not exact offsets. These contracts are reported in the financial statements at the Fund’s net equity, as measured by the difference between the forward exchange rates at the reporting date and the forward exchange rates at the dates of entry into the contract. There are special risks associated with international investing, including currency fluctuations, government regulation, political developments, and differences in liquidity.
CONTRACTS TO SELL:
Contracts | Contract Value Date | Market Value | ||||||
25,000,000 | Euro Dollar for 30,125,000 USD | January 11, 2006 | $ | (184,018 | ) | |||
25,000,000 | Greater British Pound for 43,452,500 USD | January 11, 2006 | (733,362 | ) | ||||
Unrealized loss from forward exchange contracts: | (917,380 | ) | ||||||
16,700,000 | Euro Dollar for 21,540,495 USD | November 14, 2005 | 1,358,552 | |||||
16,000,000 | Euro Dollar for 20,204,800 USD | November 30, 2005 | 852,018 | |||||
Unrealized gain from forward exchange contracts: | 2,210,570 | |||||||
Net unrealized gain (loss) from forward Exchange contracts | $ | 1,293,190 | ||||||
| 22 Certified Annual Report | ||||||
Thornburg Investment Income Builder Fund
| Year Ended September 30, | Period Ended September 30, | |||||||||||
| 2005 | 2004 | 2003(c) | ||||||||||
Class A Shares: | ||||||||||||
PER SHARE PERFORMANCE | ||||||||||||
(for a share outstanding throughout the period)+ | ||||||||||||
Net asset value, beginning of period | $ | 15.60 | $ | 13.77 | $ | 11.94 | ||||||
Income from investment operations: | ||||||||||||
Net investment income | 0.73 | 0.72 | 0.56 | |||||||||
Net realized and unrealized gain (loss) on investments | 2.24 | 1.66 | 1.60 | |||||||||
Total from investment operations | 2.97 | 2.38 | 2.16 | |||||||||
Less dividends from: | ||||||||||||
Net investment income | (0.64 | ) | (0.55 | ) | (0.33 | ) | ||||||
Change in net asset value | 2.33 | 1.83 | 1.83 | |||||||||
NET ASSET VALUE, end of period | $ | 17.93 | $ | 15.60 | $ | 13.77 | ||||||
RATIOS/SUPPLEMENTAL DATA | ||||||||||||
Total return(a) | 19.21 | % | 17.40 | % | 18.25 | % | ||||||
Ratios to average net assets: | ||||||||||||
Net investment income | 4.26 | % | 4.72 | % | 5.65 | %(b) | ||||||
Expenses, after expense reductions | 1.47 | % | 1.50 | % | 1.61 | %(b) | ||||||
Expenses, after expense reductions and net of custody credits | 1.47 | % | 1.49 | % | 1.60 | %(b) | ||||||
Expenses, before expense reductions | 1.47 | % | 1.50 | % | 1.74 | %(b) | ||||||
Portfolio turnover rate | 76.76 | % | 109.21 | % | 52.10 | % | ||||||
Net assets at end of period (000) | $ | 515,915 | $ | 224,522 | $ | 73,083 | ||||||
| (a) | Sales loads are not reflected in computing total return, which is not annualized for periods less than one year. |
| (b) | Annualized. |
| (c) | Fund commenced operations on December 24, 2002. |
| + | Based on weighted average shares outstanding. |
| Certified Annual Report 23 | ||||||
| FINANCIAL HIGHLIGHTS, CONTINUED | ||
| Thornburg Investment Income Builder Fund | ||
| Year Ended September 30, | Period Ended 2003(c) | |||||||||||
| 2005 | 2004 | |||||||||||
Class C Shares: | ||||||||||||
PER SHARE PERFORMANCE | ||||||||||||
(for a share outstanding throughout the period)+ | ||||||||||||
Net asset value, beginning of period | $ | 15.62 | $ | 13.79 | $ | 11.94 | ||||||
Income from investment operations: | ||||||||||||
Net investment income | 0.66 | 0.66 | 0.51 | |||||||||
Net realized and unrealized gain (loss) on investments | 2.24 | 1.66 | 1.62 | |||||||||
Total from investment operations | 2.90 | 2.32 | 2.13 | |||||||||
Less dividends from: | ||||||||||||
Net investment income | (0.57 | ) | (0.49 | ) | (0.28 | ) | ||||||
Change in net asset value | 2.33 | 1.83 | 1.85 | |||||||||
NET ASSET VALUE, end of period | $ | 17.95 | $ | 15.62 | $ | 13.79 | ||||||
RATIOS/SUPPLEMENTAL DATA | ||||||||||||
Total return(a) | 18.70 | % | 16.89 | % | 18.01 | % | ||||||
Ratios to average net assets: | ||||||||||||
Net investment income | 3.84 | % | 4.33 | % | 5.10 | %(b) | ||||||
Expenses, after expense reductions | 1.90 | % | 1.89 | % | 1.91 | %(b) | ||||||
Expenses, after expense reductions and net of custody credits | 1.89 | % | 1.89 | % | 1.90 | %(b) | ||||||
Expenses, before expense reductions | 2.23 | % | 2.25 | % | 2.55 | %(b) | ||||||
Portfolio turnover rate | 76.76 | % | 109.21 | % | 52.10 | % | ||||||
Net assets at end of period (000) | $ | 337,489 | $ | 143,122 | $ | 39,613 | ||||||
| (a) | Not annualized for periods less than one year. |
| (b) | Annualized. |
| (c) | Fund commenced operations on December 24, 2002. |
| + | Based on weighted average shares outstanding. |
| 24 Certified Annual Report | ||||||
| FINANCIAL HIGHLIGHTS, CONTINUED | ||
| Thornburg Investment Income Builder Fund | ||
| Year Ended September 30, 2005 | Period Ended September 30, 2004(c) | |||||||
Class I Shares: | ||||||||
PER SHARE PERFORMANCE | ||||||||
(for a share outstanding throughout the period)+ | ||||||||
Net asset value, beginning of period | $ | 15.64 | $ | 14.45 | ||||
Income from investment operations: | ||||||||
Net investment income (loss) | 0.84 | 0.74 | ||||||
Net realized and unrealized gain (loss) on investments | 2.22 | 1.01 | ||||||
Total from investment operations | 3.06 | 1.75 | ||||||
Less dividends from: | ||||||||
Net investment income | (0.67 | ) | (0.56 | ) | ||||
Change in net asset value | 2.39 | 1.19 | ||||||
NET ASSET VALUE, end of period | $ | 18.03 | $ | 15.64 | ||||
RATIOS/SUPPLEMENTAL DATA | ||||||||
Total return(a) | 19.73 | % | 12.19 | % | ||||
Ratios to average net assets: | ||||||||
Net investment income (loss) | 4.86 | % | 5.33 | %(b) | ||||
Expenses, after expense reductions | 1.00 | % | 0.99 | %(b) | ||||
Expenses, after expense reductions and net of custody credits | 0.99 | % | 0.99 | %(b) | ||||
Expenses, before expense reductions | 1.09 | % | 1.21 | %(b) | ||||
Portfolio turnover rate | 76.76 | % | 109.21 | % | ||||
Net assets at end of period (000) | $ | 129,110 | $ | 33,247 | ||||
| (a) | Not annualized for periods less than one year. |
| (b) | Annualized. |
| (c) | Effective date of Class I Shares was November 1, 2003. |
| + | Based on weighted average shares outstanding. |
| Certified Annual Report 25 | ||||||
| FINANCIAL HIGHLIGHTS, CONTINUED | ||
| Thornburg Investment Income Builder Fund | ||
| Period Ended September 30, 2005(c) | ||||
Class R1 Shares: | ||||
PER SHARE PERFORMANCE | ||||
(for a share outstanding throughout the period)+ | ||||
Net asset value, beginning of period | $ | 16.98 | ||
Income from investment operations: | ||||
Net investment income | 0.50 | |||
Net realized and unrealized gain (loss) on investments | 0.79 | |||
Total from investment operations | 1.29 | |||
Less dividends from: | ||||
Net investment income | (0.34 | ) | ||
Change in net asset value | 0.95 | |||
NET ASSET VALUE, end of period | $ | 17.93 | ||
RATIOS/SUPPLEMENTAL DATA | ||||
Total return(a) | 7.67 | % | ||
Ratios to average net assets: | ||||
Net investment income | 4.27 | %(b) | ||
Expenses, after expense reductions | 1.50 | %(b) | ||
Expenses, after expense reductions and net of custody credits | 1.49 | %(b) | ||
Expenses, before expense reductions | 28.93 | %(b)† | ||
Portfolio turnover rate | 76.76 | % | ||
Net assets at end of period (000) | $ | 280 | ||
| (a) | Not annualized for periods less than one year. |
| (b) | Annualized. |
| (c) | Effective date of Class R1 Shares was February 1, 2005. |
| † | Due to the size of net assets and fixed expenses, ratios may appear disproportionate. |
| + | Based on weighted average shares outstanding. |
| 26 Certified Annual Report | ||||||
| Thornburg Investment Income Builder Fund | September 30, 2005 |
CUSIPS: CLASS A - 885-215-558, CLASS C - 885-215-541, CLASS I - 885-215-467, CLASS R1 - 885-215-384 NASDAQ SYMBOLS: CLASS A - TIBAX, CLASS C - TIBCX, CLASS I - TIBIX, CLASS R1 - TIBRX
| Shares/ Principal Amount | Value | ||||
COMMON STOCK — 88.02% | |||||
AUTOMOBILES & COMPONENTS — 0.86% | |||||
AUTOMOBILES — 0.86% | |||||
Hero Honda Motors Ltd. | 500,000 | $ | 8,438,531 | ||
| 8,438,531 | |||||
BANKS — 8.18% | |||||
COMMERCIAL BANKS — 8.18% | |||||
Bank of America Corp. | 420,000 | 17,682,000 | |||
Bank of Ireland Group | 378,527 | 5,979,204 | |||
Barclays plc | 2,600,000 | 26,360,537 | |||
Liechtenstein Landesbank | 20,000 | 11,636,928 | |||
Lloyds TSB Group plc | 1,825,000 | 15,080,163 | |||
Royal Bank of Scotland Group plc | 128,615 | 3,661,625 | |||
| 80,400,457 | |||||
CAPITAL GOODS — 3.43% | |||||
INDUSTRIAL CONGLOMERATES — 3.43% | |||||
General Electric Co. | 1,000,000 | 33,670,000 | |||
| 33,670,000 | |||||
COMMERCIAL SERVICES & SUPPLIES — 2.83% | |||||
COMMERCIAL SERVICES & SUPPLIES — 2.83% | |||||
Synagro Technologies, Inc. | 5,924,455 | 27,844,938 | |||
| 27,844,938 | |||||
CONSUMER SERVICES — 0.76% | |||||
HOTELS RESTAURANTS & LEISURE — 0.76% | |||||
Berjaya Sports | 7,000,000 | 7,429,026 | |||
| 7,429,026 | |||||
DIVERSIFIED FINANCIALS — 11.64% | |||||
CAPITAL MARKETS — 2.53% | |||||
The Bank of New York Co. Inc. | 400,000 | 11,764,000 | |||
WP Stewart & Co. Ltd. | 584,200 | 13,039,344 | |||
| Certified Annual Report 27 | ||||||
| SCHEDULE OF INVESTMENTS, CONTINUED | ||
| Thornburg Investment Income Builder Fund | September 30, 2005 | |
| Shares/ Principal Amount | Value | ||||
DIVERSIFIED FINANCIAL SERVICES — 9.11% | |||||
Alliance Capital Management Holdings LP | 350,000 | $ | 16,747,500 | ||
Citigroup Inc. | 575,000 | 26,174,000 | |||
Hong Kong Exchanges & Clearing Ltd. | 4,500,000 | 15,431,323 | |||
JPMorgan Chase & Co. | 700,000 | 23,751,000 | |||
Singapore Exchange Ltd. | 5,000,000 | 7,454,518 | |||
| 114,361,685 | |||||
ENERGY — 15.62% | |||||
OIL, GAS & CONSUMABLE FUELS — 15.62% | |||||
BP Amoco ADR | 400,000 | 28,340,000 | |||
Canadian Oil Sands Trust | 275,000 | 30,426,590 | |||
ChevronTexaco Corp. | 400,000 | 25,892,000 | |||
Eni S.p.A. | 1,000,000 | 29,795,316 | |||
Marathon Oil Corp. | 300,000 | 20,679,000 | |||
Petrochina Co. Ltd.ADR | 220,000 | 18,341,400 | |||
| 153,474,306 | |||||
FOOD & STAPLES RETAILING — 2.68% | |||||
FOOD & STAPLES RETAILING — 2.68% | |||||
Tesco plc | 4,800,000 | 26,286,222 | |||
| 26,286,222 | |||||
FOOD BEVERAGE & TOBACCO — 4.23% | |||||
FOOD PRODUCTS — 1.04% | |||||
Reddy Ice Holdings, Inc. | 500,000 | 10,255,000 | |||
TOBACCO — 3.19% | |||||
Altria Group Inc. | 425,000 | 31,326,750 | |||
| 41,581,750 | |||||
HOUSEHOLD & PERSONAL PRODUCTS — 0.87% | |||||
HOUSEHOLD PRODUCTS — 0.87% | |||||
Kimberly Clark de Mexico | 2,280,000 | 8,577,663 | |||
| 8,577,663 | |||||
MATERIALS — 2.66% | |||||
CHEMICALS — 2.66% | |||||
Dow Chemical Co. | 500,000 | 20,835,000 | |||
PPG Industries Inc. | 90,200 | 5,338,938 | |||
| 26,173,938 | |||||
| 28 Certified Annual Report | ||||||
| SCHEDULE OF INVESTMENTS, CONTINUED | ||
| Thornburg Investment Income Builder Fund | September 30, 2005 | |
| Shares/ Principal Amount | Value | ||||
MEDIA — 0.58% | |||||
MEDIA — 0.58% | |||||
APN News & Media | 1,500,000 | $ | 5,732,249 | ||
| 5,732,249 | |||||
PHARMACEUTICALS & BIOTECHNOLOGY — 6.90% | �� | ||||
PHARMACEUTICALS — 6.90% | |||||
GlaxoSmithKline plc | 1,150,000 | 29,341,978 | |||
Pfizer Inc. | 1,275,000 | 31,836,750 | |||
Sanofi-Aventis | 80,000 | 6,631,899 | |||
| 67,810,627 | |||||
REAL ESTATE — 5.65% | |||||
REAL ESTATE — 5.65% | |||||
Boston Properties Inc. | 130,000 | 9,217,000 | |||
Equity Inns Inc. | 400,000 | 5,400,000 | |||
Highland Hospitality Corp. | 1,025,000 | 10,516,500 | |||
Host Marriott Corp. | 1,800,000 | 30,420,000 | |||
| 55,553,500 | |||||
SEMICONDUCTORS & SEMICONDUCTOR EQUIPMENT — 1.15% | |||||
SEMICONDUCTORS & SEMICONDUCTOR EQUIPMENT — 1.15% | |||||
Samsung Electronics Co. Ltd. | 20,000 | 11,280,576 | |||
| 11,280,576 | |||||
TELECOMMUNICATION SERVICES — 6.95% | |||||
DIVERSIFIED TELECOMMUNICATION SERVICES — 4.03% | |||||
Alltel Corp. | 315,000 | 20,509,650 | |||
Chunghwa Telecom Co. Ltd. ADR | 450,000 | 8,329,500 | |||
TDC A/S | 200,000 | 10,793,169 | |||
WIRELESS TELECOMMUNICATION SERVICES — 2.92% | |||||
Vodafone Group plc | 11,000,000 | 28,708,532 | |||
| 68,340,851 | |||||
TRANSPORTATION — 4.47% | |||||
TRANSPORTATION INFRASTRUCTURE — 4.47% | |||||
China Merchants Hldgs International Co. Ltd. | 4,500,000 | 10,036,161 | |||
Hopewell Highway | 12,000,000 | 8,508,499 | |||
Macquarie Infrastructure Co. | 600,000 | 16,920,000 | |||
Shenzhen Chiwan Wharf Holdings Ltd. | 5,410,060 | 8,501,877 | |||
| 43,966,537 | |||||
| Certified Annual Report 29 | ||||||
| SCHEDULE OF INVESTMENTS, CONTINUED | ||
| Thornburg Investment Income Builder Fund | September 30, 2005 | |
| Shares/ Principal Amount | Value | |||||
UTILITIES — 8.56% | ||||||
ELECTRIC UTILITIES — 4.28% | ||||||
Companhia Energetica de Minas Gerais | 250,000 | $ | 9,520,000 | |||
Enel S.p.A. | 2,140,000 | 18,501,552 | ||||
Iberdrola S.A. | 500,000 | 14,017,424 | ||||
GAS UTILITIES — 1.04% | ||||||
Snam Rete Gas S.p.A. | 1,750,000 | 10,234,227 | ||||
MULTI-UTILITIES — 3.24% | ||||||
Dominion Resources, Inc. | 370,000 | 31,871,800 | ||||
| 84,145,003 | ||||||
TOTAL COMMON STOCK (Cost $784,030,336) | 865,067,859 | |||||
PREFERRED STOCK — 2.62% | ||||||
BANKS — 1.22% | ||||||
COMMERCIAL BANKS — 1.22% | ||||||
First Tennessee Bank | 12,000 | 12,006,750 | ||||
| 12,006,750 | ||||||
DIVERSIFIED FINANCIALS — 1.40% | ||||||
DIVERSIFIED FINANCIAL SERVICES — 1.40% | ||||||
Lehman Brothers Holdings Inc. | 140,000 | 3,540,600 | ||||
Merrill Lynch & Co. Inc. | 420,000 | 10,185,000 | ||||
| 13,725,600 | ||||||
TOTAL PREFERRED STOCK (Cost $26,008,250) | 25,732,350 | |||||
CORPORATE BONDS — 2.98% | ||||||
COMMERCIAL SERVICES & SUPPLIES — 0.07% | ||||||
COMMERCIAL SERVICES & SUPPLIES — 0.07% | ||||||
Allied Waste North America Inc., 6.375%, 4/15/2011 | $ | 500,000 | 478,750 | |||
Waste Management Inc., 7.375%, 8/1/2010 | 175,000 | 192,440 | ||||
| 671,190 | ||||||
DIVERSIFIED FINANCIALS — 0.64% | ||||||
DIVERSIFIED FINANCIAL SERVICES — 0.64% | ||||||
Capital One Bank, 6.70%, 5/15/2008 | 655,000 | 684,498 | ||||
Capital One Bank, 6.50%, 6/13/2013 | 1,500,000 | 1,609,090 | ||||
SLM Corp. CPI Floating Rate Note, 4.65%, 1/31/2014 | 2,000,000 | 1,989,780 | ||||
SLM Corp. CPI Floating Rate Note, 3.73%, 3/2/2009 | 2,000,000 | 1,975,160 | ||||
| 6,258,528 | ||||||
| 30 Certified Annual Report | ||||||
| SCHEDULE OF INVESTMENTS, CONTINUED | ||
| Thornburg Investment Income Builder Fund | September 30, 2005 | |
| Shares/ Principal Amount | Value | |||||
INSURANCE — 0.49% | ||||||
INSURANCE — 0.49% | ||||||
AAG Holding Co. Inc., 6.875%, 6/1/2008 | $ | 335,000 | $ | 343,148 | ||
Hartford Life Inc., 7.10%, 6/15/2007 | 400,000 | 415,672 | ||||
Liberty Mutual Group Inc., 5.75%, 3/15/2014 | 1,000,000 | 977,124 | ||||
Old Republic International Corp., 7.00%, 6/15/2007 | 1,000,000 | 1,033,815 | ||||
Pacific Life Global Funding CPI Floating Rate Note, 5.35%, 2/6/2016 | 2,000,000 | 1,989,500 | ||||
| 4,759,259 | ||||||
MEDIA — 0.12% | ||||||
MEDIA — 0.12% | ||||||
AOL Time Warner Inc., 6.875%, 5/1/2012 | 425,000 | 464,476 | ||||
Independent News & Media plc, 5.75%, 5/17/2009 | 600,000 | 736,141 | ||||
| 1,200,617 | ||||||
PHARMACEUTICALS & BIOTECHNOLOGY — 0.49% | ||||||
BIOTECHNOLOGY — 0.49% | ||||||
Tiers Inflation Linked Trust Series Wyeth 2004 21 Trust Certificate CPI Floating Rate Note, 4.653%, 2/1/2014 | 5,000,000 | 4,850,350 | ||||
| 4,850,350 | ||||||
REAL ESTATE — 0.16% | ||||||
REAL ESTATE — 0.16% | ||||||
MDC Holdings Inc., 7.00%, 12/1/2012 | 1,500,000 | 1,613,258 | ||||
| 1,613,258 | ||||||
TECHNOLOGY HARDWARE & EQUIPMENT — 0.05% | ||||||
COMPUTERS & PERIPHERALS — 0.05% | ||||||
Jabil Circuit Inc., 5.875%, 7/15/2010 | 500,000 | 512,160 | ||||
| 512,160 | ||||||
TELECOMMUNICATION SERVICES — 0.81% | ||||||
DIVERSIFIED TELECOMMUNICATION SERVICES — 0.81% | ||||||
Level 3 Communications Inc., 9.125%, 5/1/2008 | 2,500,000 | 2,037,500 | ||||
Level 3 Communications Inc., 10.50%, 12/1/2008 | 4,000,000 | 3,280,000 | ||||
TCI Communications Inc., 7.875%, 8/1/2013 | 2,285,000 | 2,641,928 | ||||
| 7,959,428 | ||||||
| Certified Annual Report 31 | ||||||
| SCHEDULE OF INVESTMENTS, CONTINUED | ||
| Thornburg Investment Income Builder Fund | September 30, 2005 | |
| Shares/ Principal Amount | Value | |||||
UTILITIES — 0.15% | ||||||
GAS UTILITIES — 0.15% | ||||||
Sonat Inc., 7.625%, 7/15/2011 | $ | 1,400,000 | $ | 1,421,000 | ||
| 1,421,000 | ||||||
TOTAL CORPORATE BONDS (Cost $28,744,625) | 29,245,790 | |||||
CONVERTIBLE BONDS — 0.81% | ||||||
DIVERSIFIED FINANCIALS — 0.01% | ||||||
CAPITAL MARKETS — 0.01% | ||||||
E-Trade Financial Corp., 6.00%, 2/1/2007 | 132,000 | 133,485 | ||||
| 133,485 | ||||||
TELECOMMUNICATION SERVICES — 0.80% | ||||||
DIVERSIFIED TELECOMMUNICATION SERVICES — 0.80% | ||||||
Level 3 Communications Inc., 6.00%, 9/15/2009 | 250,000 | 130,937 | ||||
Level 3 Communications Inc., 6.00%, 3/15/2010 | 15,025,000 | 7,719,094 | ||||
| 7,850,031 | ||||||
TOTAL CONVERTIBLE BONDS (Cost $8,975,231) | 7,983,516 | |||||
TAXABLE MUNICIPAL BONDS — 0.60% | ||||||
Short Pump Town Center Community Development, 6.26%, 2/1/2009 | 2,000,000 | 2,043,560 | ||||
Victor New York, 9.05%, 5/1/2008 | 1,690,000 | 1,727,755 | ||||
Victor New York, 9.20%, 5/1/2014 | 2,000,000 | 2,105,340 | ||||
TOTAL TAXABLE MUNICIPAL BONDS (Cost $5,888,475) | 5,876,655 | |||||
U.S. GOVERNMENT AGENCIES — 0.20% | ||||||
Federal National Mtg Assoc CPI Floating Rate Note, 3.67%, 2/17/2009 | 2,000,000 | 1,992,460 | ||||
TOTAL U.S. GOVERNMENT AGENCIES (Cost $2,000,000) | 1,992,460 | |||||
SHORT TERM INVESTMENTS — 3.15% | ||||||
American Express Credit Corp., 3.68%, 10/5/2005 | 15,000,000 | 14,993,866 | ||||
UBS Finance, 3.84%, 10/3/2005 | 16,000,000 | 15,996,587 | ||||
TOTAL SHORT TERM INVESTMENTS (Cost $30,990,453) | 30,990,453 | |||||
TOTAL INVESTMENTS — 98.38% (Cost $886,105,687) | $ | 966,889,083 | ||||
OTHER ASSETS LESS LIABILITIES — 1.62% | 15,904,267 | |||||
NET ASSETS — 100.00% | $ | 982,793,350 | ||||
Footnote Legend
See notes to financial statements.
Portfolio Abbreviations
To simplify the listings of securities, abbreviations are used per the table below:
ADR American Depository Receipt
| 32 Certified Annual Report | ||||||
| SCHEDULE OF INVESTMENTS, CONTINUED | ||
| Thornburg Investment Income Builder Fund | September 30, 2005 | |
SUMMARY OF INDUSTRY EXPOSURE
As of 9/30/05
Energy | 15.6 | % | |
Diversified Financials | 13.7 | % | |
Banks | 9.4 | % | |
Utilities | 8.7 | % | |
Telecommunication Services | 8.5 | % | |
Pharmaceuticals & Biotechnology | 7.4 | % | |
Real Estate | 5.8 | % | |
Transportation | 4.5 | % | |
Food Beverage & Tobacco | 4.2 | % | |
Capital Goods | 3.4 | % | |
Commercial Service & Supply | 2.9 | % | |
Food Staples Retailing | 2.7 | % | |
Materials | 2.7 | % | |
Semiconductors & Semiconductor Equip. | 1.1 | % | |
Household & Personal Products | 0.9 | % | |
Automobiles & Components | 0.8 | % | |
Consumer Services | 0.8 | % | |
Media | 0.7 | % | |
Insurance | 0.5 | % | |
Technology Hardware & Equipment | 0.1 | % | |
Municipal Bonds | 0.6 | % | |
U.S. Government Agencies | 0.2 | % | |
Other Assets & Cash Equivalents | 4.8 | % |
SUMMARY OF COUNTRY EXPOSURE
As of 9/30/05
U.S. | 52.1 | % | |
U.K. | 16.0 | % | |
Italy | 6.0 | % | |
China | 4.6 | % | |
Canada | 3.1 | % | |
Hong Kong | 1.6 | % | |
Spain | 1.4 | % | |
Switzerland | 1.2 | % | |
South Korea | 1.1 | % | |
Denmark | 1.1 | % | |
Brazil | 1.0 | % | |
Mexico | 0.9 | % | |
India | 0.9 | % | |
Taiwan | 0.8 | % | |
Singapore | 0.7 | % | |
Malaysia | 0.7 | % | |
Ireland | 0.7 | % | |
France | 0.7 | % | |
Australia | 0.6 | % | |
Other Assets and Cash Equivalents | 4.8 | % |
| Certified Annual Report 33 | ||||||
REPORT OF INDEPENDENT REGISTERED PUBLIC ACCOUNTING FIRM
Thornburg Investment Income Builder Fund
To the Trustees and Shareholders of
Thornburg Investment Income Builder Fund
In our opinion, the accompanying statement of assets and liabilities, including the schedule of investments, and the related statements of operations and of changes in net assets and the financial highlights present fairly, in all material respects, the financial position of Thornburg Investment Income Builder Fund (one of the portfolios constituting Thornburg Investment Trust, hereafter referred to as the “Fund”) at September 30, 2005, the results of its operations for the year then ended, the changes in its net assets for each of the two years in the period then ended and the financial highlights for each of the periods presented, in conformity with accounting principles generally accepted in the United States of America. These financial statements and financial highlights (hereafter referred to as “financial statements”) are the responsibility of the Fund’s management. Our responsibility is to express an opinion on these financial statements based on our audits. We conducted our audits of these financial statements in accordance with the standards of the Public Company Accounting Oversight Board (United States). Those standards require that we plan and perform the audit to obtain reasonable assurance about whether the financial statements are free of material misstatement. An audit includes examining, on a test basis, evidence supporting the amounts and disclosures in the financial statements, assessing the accounting principles used and significant estimates made by management, and evaluating the overall financial statement presentation. We believe that our audits, which included confirmation of securities at September 30, 2005 by correspondence with the custodian and brokers, provide a reasonable basis for our opinion.
PricewaterhouseCoopers LLP
New York, New York
November 16, 2005
| 34 Certified Annual Report | ||||||
Thornburg Investment Income Builder Fund | September 30, 2005 (Unaudited) |
As a shareholder of the Fund, you incur two types of costs:
(1) transaction costs, including
(a) sales charges (loads) on purchase payments, for Class A Shares;
(b) a deferred sales charge on redemptions of any part or all of a purchase of $1 million of Class A shares within 12 months of purchase;
(c) a deferred sales charge on redemptions of Class C shares within 12 months of purchase;
(d) a 90-day redemption fee on Class A and Class I shares;
(2) ongoing costs, including management fees; distribution and/or service (12b-1) fees; and other Fund expenses.
This example is intended to help you understand your ongoing costs (in dollars) of investing in the Fund and to compare these costs with the ongoing costs of investing in other mutual funds.
The example is based on an investment of $1,000 invested on March 31, 2005 and held until September 30, 2005.
Actual Expenses
The first line of the table at right provides information about actual account values and actual expenses. You may use the information in this line, together with the amount you invested, to estimate the expenses that you paid over the period. Simply divide your account value by $1,000 (for example, an $8,600 account value divided by $1,000 = 8.6), then multiply the result by the number in the first line under the heading entitled “Expenses Paid During Period” to estimate the expenses you paid on your account during this period.
Hypothetical Example for Comparison Purposes
The second line of the table at right provides information about hypothetical account values and hypothetical expenses based on the Fund’s actual expense ratio and an assumed rate of return of 5% per year before expenses, which is not the Fund’s actual return. The hypothetical account values and expenses may not be used to estimate the actual ending account balance or expenses you paid for the period. You may use this information to compare the ongoing costs of investing in the Fund and other funds. To do so, compare this 5% hypothetical example with the 5% hypothetical examples that appear in the shareholder reports of the other funds.
| Beginning Account Value 3/31/05 | Ending Account Value 9/30/05 | Expenses Paid During Period† 3/31/05–9/30/05 | |||||||
Class A Shares | |||||||||
Actual | $ | 1,000.00 | $ | 1,059.50 | $ | 7.58 | |||
Hypothetical* | $ | 1,000.00 | $ | 1,017.71 | $ | 7.42 | |||
Class C Shares | |||||||||
Actual | $ | 1,000.00 | $ | 1,057.30 | $ | 9.73 | |||
Hypothetical* | $ | 1,000.00 | $ | 1,015.61 | $ | 9.53 | |||
Class I Shares | |||||||||
Actual | $ | 1,000.00 | $ | 1,061.80 | $ | 5.12 | |||
Hypothetical* | $ | 1,000.00 | $ | 1,020.10 | $ | 5.01 | |||
Class R1 Shares | |||||||||
Actual | $ | 1,000.00 | $ | 1,058.70 | $ | 7.74 | |||
Hypothetical* | $ | 1,000.00 | $ | 1,017.55 | $ | 7.58 | |||
| † | Expenses are equal to the annualized expense ratio for each class (A: 1.47%; C: 1.89%; I: 0.99%; and R1: 1.50%) multiplied by the average account value over the period, multiplied by 183/365 to reflect the one-half year period. |
| * | Hypothetical assumes a rate of return of 5% per year before expenses. |
Please note that the expenses shown in the table are meant to highlight your ongoing costs only and do not reflect any transactional costs, such as sales charges (loads), redemption fees, or exchange fees. Therefore, the second line of the table is useful in comparing ongoing costs only, and will not help you determine the relative total costs of owning different funds. In addition, if these transactional costs were included, your costs would have been higher.
| Certified Annual Report 35 | ||||||
Thornburg Investment Income Builder Fund | September 30, 2005 | (Unaudited) | |
GROWTH OF A HYPOTHETICAL $10,000 INVESTMENT
Thornburg Investment Income Builder Fund versus Blended Index (December 31, 2002 to September 30, 2005)
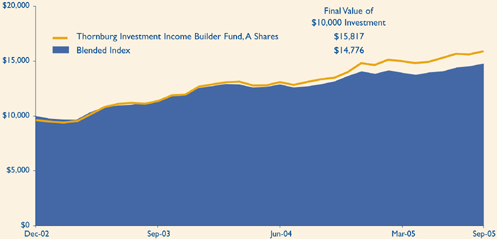
AVERAGE ANNUAL TOTAL RETURNS
For periods ended September 30, 2005 (with sales charge)
| 1 Yr | Since Inception | |||||
A Shares (Incep: 12/24/02) | 13.81 | % | 17.97 | % | ||
C Shares (Incep: 12/24/02) | 17.70 | % | 19.49 | % | ||
R1 Shares (Incep: 2/01/05) | — | 7.67 | % | |||
Blended Index (Since: 12/31/02) | 14.70 | % | 15.25 | % |
Performance data reflects past performance, which is no guarantee of future results. The performance data and graph do not reflect the deduction of taxes that a shareholder would pay on distributions or the redemption of Fund shares.
Returns reflect the reinvestment of dividends and capital gains as well as applicable sales charges. Class A shares are sold with a maximum sales charge of 4.50%. Class C shares are subject to a 1% contingent deferred sales charge (CDSC) for the first year only. There is no up-front sales charge for Class R1 shares. Class R1 shares are available only to certain qualified investors. Class A shares are subject to a 1% 90-day redemption fee.
The blended index is comprised of 25% Lehman Brothers Aggregate Bond Index and 75% MSCI World Equity Index. The Lehman Brothers Aggregate Bond Index is composed of approximately 6,000 publicly traded bonds including U.S. government, mortgage-backed, corporate and Yankee bonds with an average maturity of approximately 10 years. The index is weighted by the market value of the bonds included in the index. The Morgan Stanley Capital International World Equity Index is a total return index, reported in U.S. dollars, based on share prices and reinvested gross dividends. Unless otherwise noted, index returns reflect the reinvestment of income dividends and capital gains, if any, but do not reflect fees, brokerage commissions or other expenses of investing. Investors may not make direct investments into any index. The performance of any index is not indicative of the performance of any particular investment.
| 36 Certified Annual Report | ||||||
| TRUSTEES AND OFFICERS | |||
Thornburg Investment Income Builder Fund | September 30, 2005 | (Unaudited) |
Name, Age, Position Held with Fund Year Elected | Principal Occupation(s) During Past Five Years | Other Directorships Held by Trustee | ||
INTERESTED TRUSTEES(1)(2)(4) | ||||
Garrett Thornburg, 59 Chairman of Trustees, Trustee since 1987(3) | CEO, Chairman and controlling shareholder of Thornburg Investment Management, Inc. (investment advisor) and Thornburg Securities Corporation (securities dealer); Chairman of Thornburg Limited Term Municipal Fund, Inc. (registered investment company) to 2004; CEO and Chairman of Thornburg Mortgage, Inc. (real estate investment trust); Chairman of Thornburg Mortgage Advisory Corporation (investment manager to Thornburg Mortgage, Inc.). | Director of Thornburg Mortgage, Inc. (real estate investment trust) | ||
Brian J. McMahon, 49 Trustee since 2001, Member of Governance & Nominating Committee, President since 1997(5)(6) | President and Managing Director of Thornburg Investment Management, Inc.; President of Thornburg Limited Term Municipal Fund, Inc. to 2004. | None | ||
INDEPENDENT TRUSTEES(1)(2)(4) | ||||
David A.Ater, 60 Trustee since 1994, Member of Audit Committee and Governance & Nominating Committee | Principal in Ater & Associates, Santa Fe, NM (developer, planner and broker of residential and commercial real estate); owner developer and broker for various real estate projects. | Director of Thornburg Mortgage, Inc. (real estate investment trust) | ||
David D. Chase, 64 Chairman of Audit Committee, Trustee since 2000 | Chairman, President, CEO, and Managing Member of Vestor Associates, LLC, the general partner of Vestor Partners, LP, Santa Fe, NM (private equity fund); Chairman and CEO of Vestor Holdings, Inc., Santa Fe, NM (merchant bank). | None | ||
Eliot R. Cutler, 59 Chairman of Governance & Nominating Committee, Trustee since 2004 | Partner,Akin, Gump, Strauss, Hauer & Feld, LLP,Washington, D.C. (law firm) since November 2000; partner, Cutler & Stanfield,Washington, D.C. (law firm) until November 2000. | Director of Thornburg Mortgage, Inc. (real estate investment trust) | ||
Susan H. Dubin, 56 Trustee since 2004, Member of Audit Committee | President of Dubin Investments, Ltd., Greenwich, CT (private investment fund); Director and officer of various charitable organizations; and formerly, Vice President of Chemical Bank (predecessor to JP Morgan Chase & Co.), New York, 1974–1996. | None | ||
Owen D.Van Essen, 51 Trustee since 2004, Member of Governance & Nominating Committee | President of Dirks,Van Essen & Murray, Santa Fe, NM (newspaper mergers and acquisitions). | None | ||
James W. Weyhrauch, 46 Trustee since 1996, Member of Audit Committee | Director, Executive Vice President to 2002, and President and CEO 2002–2004, Nambé Mills, Inc., Santa Fe, NM (manufacturer); real estate agent, Santa Fe Properties, Santa Fe, NM since 2004. | None | ||
| Certified Annual Report 37 | ||||||
| TRUSTEES AND OFFICERS, CONTINUED | |||
| Thornburg Investment Income Builder Fund | September 30, 2005 | (Unaudited) | |
Name, Age, Position Held with Fund Year Elected | Principal Occupation(s) During Past Five Years | Other Directorships Held by Trustee | ||
OFFICERS OF THE FUND (WHO ARE NOT TRUSTEES)(1)(6)(7) | ||||
Dawn B. Fischer, 58 Secretary since 1987 | Secretary and Managing Director, Thornburg Investment Management, Inc.; Secretary,Thornburg Limited Term Municipal Fund, Inc. to 2004; Secretary, Thornburg Securities Corporation; Vice President, Daily Tax Free Income Fund, Inc. (registered investment company). | Not applicable | ||
Steven J. Bohlin, 46 Vice President since 1987; Treasurer since 1989 | Vice President and Managing Director of Thornburg Investment Management, Inc.; Vice President of Thornburg Limited Term Municipal Fund, Inc. to 2004. | Not applicable | ||
George T. Strickland, 42 Vice President since 1996 | Vice President and Managing Director of Thornburg Investment Management, Inc.; Vice President (to 2004) and Treasurer (2003–2004) of Thornburg Limited Term Municipal Fund, Inc. | Not applicable | ||
William V. Fries, 66 Vice President since 1995 | Vice President and Managing Director of Thornburg Investment Management, Inc. | Not applicable | ||
Leigh Moiola, 38 Vice President since 2001 | Vice President and Managing Director of Thornburg Investment Management, Inc.; Vice President of Thornburg Limited Term Municipal Fund, Inc. 1999–2004. | Not applicable | ||
Kenneth Ziesenheim, 51 Vice President since 1995 | Vice President and Managing Director of Thornburg Investment Management, Inc.; President of Thornburg Securities Corporation; Vice President of Thornburg | Not applicable | ||
| Limited Term Municipal Fund, Inc. to 2004. | ||||
Alexander Motola, 35 Vice President since 2001 | Vice President and Managing Director of Thornburg Investment Management, Inc. since 2000; Portfolio Manager, Insight Capital Research & Management, Inc., Walnut Creek, California 1995–2000. | Not applicable | ||
Wendy Trevisani, 34 Vice President since 1999 | Associate Portfolio Manager of Thornburg Investment Management, Inc. since 1999, Vice President since 2000 and Managing Director since 2003; Vice President of Thornburg Limited Term Municipal Fund, Inc. 1999–2002. | Not applicable | ||
Joshua Gonze, 42 Vice President since 1999 | Associate Portfolio Manager of Thornburg Investment Management, Inc. since 1999, Vice President since 1999 and Managing Director since 2003; Vice President of Thornburg Limited Term Municipal Fund, Inc. to 2004. | Not applicable | ||
Brad Kinkelaar, 37 Vice President since 1999 | Associate Portfolio Manager of Thornburg Investment Management, Inc. since 1999, Vice President since 2000 and Managing Director since 2003. | Not applicable | ||
Christopher Ihlefeld, 35 Vice President since 2003 | Associate Portfolio Manager since 1999; Vice President of Thornburg Investment Management, Inc. since 2002; Vice President of Limited Term Municipal Fund, Inc., 2003–2004. | Not applicable | ||
Leon Sandersfeld, 39 Vice President since 2003 | Associate of Thornburg Investment Management, Inc. since 2002; Senior Staff Accountant, Farm Bureau Life Insurance Co. 1998–2002. | Not applicable | ||
| 38 Certified Annual Report | ||||||
| TRUSTEES AND OFFICERS, CONTINUED | |||
| Thornburg Investment Income Builder Fund | September 30, 2005 | (Unaudited) | |
Name, Age, | Principal Occupation(s) During Past Five Years | Other Directorships Held by Trustee | ||
Sasha Wilcoxon, 31 Vice President since 2003 | Associate of Thornburg Investment Management, Inc. since 2000 and Mutual Fund Operations Department Manager since 2002. | Not applicable | ||
Ed Maran, 47 Vice President since 2004 | Associate Portfolio Manager of Thornburg Investment Management, Inc. since 2002 and Vice President and Managing Director since 2004; Analyst, USAA 2001–2002; Oil Analyst, A.G. Edwards 1997–2000. | Not applicable | ||
Vinson Walden, 35 Vice President since 2004 | Associate Portfolio Manager of Thornburg Investment Management, Inc. since 2002 and Vice President and Managing Director since 2004; Associate Portfolio Manager, Ibis Management 2002–2004; Associate, Lehman Brothers, 1997–2001. | Not applicable | ||
| (1) | Each person’s address is 119 East Marcy Street, Santa Fe, New Mexico 87501. |
| (2) | The Fund is one of twelve separate investment “Funds” or “series” of Thornburg Investment Trust (the “Trust”), which comprises the Thornburg mutual fund complex and is organized as a Massachusetts business trust. The Trust currently has twelve active Funds. Thornburg Investment Management, Inc. is the investment advisor to, and manages, the twelve Funds of the Trust. Each Trustee oversees the twelve Funds in the fund complex. |
| (3) | Mr.Thornburg is considered an “interested” Trustee under the Investment Company Act of 1940 because he is a director and controlling shareholder of Thornburg Investment Management, Inc., the investment advisor to the twelve active Funds of the Trust, and is the sole director and controlling shareholder of Thornburg Securities Corporation, the distributor of shares for the Trust. |
| (4) | Each Trustee serves in office until the election and qualification of a successor. |
| (5) | Mr. McMahon is considered an “interested” Trustee because he is the president of Thornburg Investment Management, Inc. |
| (6) | The Trust’s president, secretary and treasurer each serves a one-year term or until the election and qualification of a successor; each other officer serves at the pleasure of the Trustees. |
| (7) | Assistant vice presidents, assistant secretaries and assistant treasurers are not shown. |
The Statement of Additional Information for each Fund of the Trust includes additional information about the Trustees and is available, without charge and upon request, by calling 1-800-847-0200.
| Certified Annual Report 39 | ||||||
| Thornburg Investment Income Builder Fund | September 30, 2005 (Unaudited) |
PORTFOLIO PROXY VOTING
Policies and Procedures:
The Trust has delegated to Thornburg Investment Management, Inc. (the “Advisor”) voting decisions respecting proxies for the Fund’s voting securities. The Advisor makes voting decisions in accordance with its Proxy Voting Policy and Procedures. A description of the Policy and Procedures is available (i) without charge, upon request, by calling the Advisor toll-free at 1-800-847-0200, (ii) on the Thornburg website at www.thornburg.com, and (iii) on the Securities and Exchange Commission’s website at www.sec.gov.
Commencing August 31, 2004, information regarding how proxies were voted is available on or before August 31 of each year for the twelve months ending the preceding June 30. This information is available (i) without charge, upon request by calling the Advisor toll-free at 1-800-847-0200, (ii) on the Thornburg website at www.thornburg.com, and (iii) on the Securities and Exchange Commission’s website at www.sec.gov.
TAX INFORMATION
For the fiscal year ended September 30, 2005, the Fund designates long-term capital gain dividends of $2,839.
For the tax year ended September 30, 2005, the Thornburg Investment Income Builder Fund designates 89.92% of the dividends paid from tax basis net ordinary income as qualifying for the reduced rate under the Jobs and Growth Tax Relief and Reconciliation Act of 2003.
31.01% of the ordinary income distributions paid by the Fund for the year ended September 30, 2005 qualified for the corporate dividends received deduction.
The information and distributions reported herein may differ from the information and distributions taxable to the shareholders for the calendar year ending December 31, 2005. Complete information will be computed and reported in conjunction with your 2005 Form 1099-DIV.
AVAILABILITY OF QUARTERLY PORTFOLIO SCHEDULE
The Fund files with the Securities and Exchange Commission schedules of its portfolio holdings on Form N-Q for the first and third quarters of each fiscal year. The Fund’s Forms N-Q are available on the Commission’s website at www.sec.gov, or may be reviewed and copied at the Commission’s Public Reference Room in Washington, D.C. Information on the operation of the Public Reference Room may be obtained by calling 1-800-SEC-0330. The Fund also makes this information available on its website at www.thornburg.com/download or upon request by calling 1-800-847-0200.
TRUSTEES DELIBERATIONS RESPECTING RENEWAL OF INVESTMENT ADVISORY AGREEMENT
Thornburg Investment Management, Inc. (the “Advisor”) provides investment management services to Thornburg Investment Income Builder Fund pursuant to an investment advisory agreement. The Trustees consider the renewal of this agreement annually and most recently determined to renew the agreement on September 13, 2005.
In connection with their general supervision of the Advisor, the Trustees receive and consider reports throughout the year from the Advisor respecting the Advisor’s management of the Fund’s investments. These reports include information about the Fund’s purchase and sale of portfolio investments and explanations from the Advisor respecting investment selections, the investment performance of the Fund, general appraisals of industry and economic prospects and factors, and other matters affecting the Fund and relating to the Advisor’s performance of services for the Fund.
In anticipation of their recent consideration of the advisory agreement’s renewal, the independent Trustees met with representatives of the Advisor in May and July 2005 to specify the information the Advisor would present to the Trustees for their review. The independent Trustees thereafter met in independent session to consider various factors respecting the agreement’s renewal, and met in a subsequent session with the Advisor’s chief investment officer to present questions. Following these sessions, the Trustees met on September 13, 2005 to consider a renewal of the advisory agreement.
The Trustees considered various factors in their review of the Advisor’s performance under the investment advisory agreement, including specifically the principles outlined in their February 2005 Statement to Shareholders, a copy of which accompanies this Annual Report to Shareholders. Summarized below are certain of the factors considered by the Trustees, in connection with the determination to renew the advisory agreement. In determining to renew the advisory agreement, the Trustees did not identify any single fact or aspect of the Advisor’s performance as controlling, and this summary does not describe all of the matters considered by the Trustees in making their determination.
Quality of Services; Fund Investment Performance. In reviewing the nature, extent, and quality of services provided by the Advisor and the investment performance of the Fund, the Trustees primarily considered the Advisor’s adherence to the Fund’s stated objectives and policies, the Advisor’s execution of the Fund’s investment strategies in prevailing market conditions, the Fund’s absolute investment performance, the Fund’s investment performance compared to categories of other mutual funds and a blended securities index, the Fund’s investment performance over different periods of time, the Fund’s returns in rising and declining markets compared to total
| 40 Certified Annual Report | ||||||
| OTHER INFORMATION, CONTINUED | ||
| Thornburg Investment Income Builder Fund | September 30, 2005 (Unaudited) | |
returns of a blended securities index, measures of relative portfolio risk, and related factors. The Trustees noted in comparing the Fund to other mutual funds and to indices that the value of such comparisons may be limited because the Fund’s investment objectives and approach, and the selection of its portfolio securities, are unique or differ in considerable degree from the characteristics of other funds and indices. In conducting their review, the Trustees observed that the Advisor had continued to faithfully pursue and to achieve the Fund’s stated objectives, as demonstrated particularly by the Advisor’s selection of investments and the Fund’s investment performance. The Trustees also noted in this regard the Fund’s exceptional investment performance as compared to a blended benchmark consisting of two broad based securities indices, and as compared to categories of mutual funds selected by independent mutual fund analyst firms.
The Trustees also considered a number of other factors in reviewing the quality of the Advisor’s services, including the qualifications and integrity of the Advisor’s senior personnel, the Advisor’s staffing and other resources, the Advisor’s compliance with regulatory requirements, Fund sales performance and perceptions of the Funds in the marketplace, and other factors.
The Trustees concluded, based upon these and other considerations, that the Advisor had actively and competently pursued the Fund’s stated investment objectives in accordance with the Fund’s investment policies stated in its prospectuses. The Trustees further concluded that the investment performance of the Fund was satisfactory in the context of the Fund’s objectives and policies and prevailing market conditions.
Fees and Expenses; Profitability of Advisor. In reviewing the fees charged by the Advisor to the Fund, the Trustees primarily considered the fees charged by the Advisor and the other expenses charged to the Fund in light of the nature and quality of services provided, comparison of the actual Advisor’s fee and Fund expenses to the statement of fees and expenses in the Fund’s prospectuses, comparisons of the Advisor’s fee and other Fund expenses to median and average fees and expenses charged to similar mutual funds, and comparisons of fees and expenses charged to the Fund with fees and expenses charged to other, similar specific mutual funds. In addition, the Trustees considered the profitability of the Advisor compared to other investment management firms, and comparisons of the investment management fee rates charged by the Advisor to the Fund with rates charged to other clients and the differing types of services furnished to the Fund and the other clients. The Trustees also noted that the Fund’s management fee was higher than the average and median fee rates for a group of equity income mutual funds selected by an independent analyst firm, and that the overall expense ratio of the Fund was somewhat higher than the average and median expense ratios for the same group of mutual funds. The Trustees recognized the unique nature of the Fund and the limited utility of the category in assessing the reasonableness of the fees charged to the Fund, the greater significance of equity investments to the Fund, and the higher management fee rates typically charged by equity fund managers. The Trustees noted in this regard the superior performance of the Fund, the comparability of the overall expense ratio, the size of the Fund, the specific services of the Advisor and other factors. The Trustees also observed in their review that fee rates charged by the Advisor to other clients of the Advisor were not directly comparable to rates charged to the Fund principally because of the significant differences in the services provided.
The Trustees concluded, based upon these and other considerations, that the fees charged to the Fund by the Advisor were fair and reasonable in view of the following: the services provided, the clear disclosure of these fees and expenses in the Fund’s prospectuses, and prevailing fees and expenses charged to mutual funds generally. The Trustees further concluded that there was no indication that the Advisor’s profitability was unusual, viewed in the context of the services provided, the performance of the Fund, and the fees and profitability of other investment management firms.
Economies of Scale. In reviewing the extent to which economies of scale would be realized by the Fund as it grows and whether fee levels reflect economies of scale, the Trustees considered the breakpoint structure for advisory fees chargeable to the Fund, the demonstrated economies of scale enjoyed by the Fund and other funds of the Trust as they had grown in size, and economies of scale realized by other mutual funds. The Trustees concluded that the Fund has realized and may reasonably be expected to realize further economies of scale for the benefit of its shareholders as it grows in size.
Ancillary Benefits to Advisor. In reviewing benefits enjoyed by the Advisor because of its relationship with the Fund, the Trustees considered an arrangement through which the Advisor received certain research services, favorable publicity received by the Advisor because of the superior investment performance of certain Funds of the Trust, and the benefits to the Fund from the Advisor’s expansion of its staffing and other resources to serve a broader variety of investment clients. The Trustees concluded, based upon these and other considerations, that there was no unusual or unfair benefit enjoyed by the Advisor and that the Fund enjoyed benefits by virtue of the Advisor’s engagement by other investment clients.
| Certified Annual Report 41 | ||||||
Trustees’ Statement to Shareholders
Not part of the Certified Annual Report
February 8, 2005
The Trustees are concerned that recent commentaries and opinions reported in the media may confuse investors in general as to the supervisory duties of trustees of mutual funds and, in particular, leave Thornburg Investment Trust shareholders uncertain regarding how we discharge our responsibilities in supervising the Funds’ investment advisor and in reviewing the advisor’s contract for renewal. We decided to spell out clearly three principal guidelines that we follow in supervising the Trust’s investment advisor on your behalf.
We begin with the premise that each shareholder selected his or her Fund because its investments are managed by the investment advisor identified in the prospectus and in accordance with the objective and policies described in the prospectus. We realize, as each of you do, that if you believe that your Fund’s stated objective and policies no longer serve your personal investment goals, you can sell your shares and leave the Fund.
Therefore, we believe that our primary supervisory task – our principal obligation to you – is to assess the nature and quality of the advisor’s services, and to confirm that the advisor actively and competently pursues the Fund’s objective, in accordance with the policies set out in the prospectus. To do this, we meet regularly with management to review your Fund’s portfolio and to discuss the advisor’s specific actions and judgments in pursuing the Fund’s objective. We do not substitute our own judgment for the advisor’s decisions in selecting investments; the advisor is paid to exercise its informed judgment on investment decisions, and we seek to confirm, in reviewing the advisor’s performance, that the advisor is doing just that.
Second, while we are conscious of costs and the effect that costs have on shareholders’ returns, we do not seek the lowest fees or expense ratio as our sole or primary objective. We try to make sure that your Fund’s fees and costs are reasonable in relationship to the services rendered and that they are generally in line with those charged by other expert investment advisors, consistent with our belief that the Fund’s investors searched for and expect that expertise and attention and have decided to pay a reasonable price for it. We do not put the management contract “out to bid” as a matter of course, and we would not do so unless we had concluded that the advisor materially had failed to pursue the Fund’s objectives in accordance with its policies, or for other equally important reasons. We believe that any other approach would be inconsistent with your interests and contrary to your expectations when you bought shares of the Fund in the first place.
Finally, because we believe that most Thornburg Fund shareholders have invested with a long-term perspective, we try not to focus too much on the fashions of the moment and on short-term performance. The market will not favor any specific investment objective or set of policies at all times and under all economic circumstances. A fund will experience periods of both high and low returns relative to other funds and other investments. Even if one of our Funds is not favored by the market at a particular time, we believe that the advisor is nonetheless obliged to remain true to the Fund’s objective and policies, and we watch to see that it does so.
This statement is submitted for the general information of the shareholders of Thornburg Investment Trust. It is not authorized for distribution to prospective investors in the Fund unless preceded or accompanied by an effective prospectus. If you have not received a prospectus, one can be obtained from your financial advisor, online at www.thornburg.com/download, or by calling 800-847-0200. Carefully consider information in the prospectus regarding the Fund’s investment objectives and policies, risks, sales charges, expenses, experience of its management, marketability of shares, and other information. Read it carefully before you invest or send money.
| 42 This page is not part of the Annual Report. | ||||||
Planning Options
Retirement and Education Accounts
Thornburg Investment Management offers retirement and education savings accounts that can help you meet a variety of planning challenges. For account applications or further information on any of the accounts below, please call 1-800-847-0200 or go to www.thornburg.com/ira. Your financial advisor can help you determine which plan is right for you.
Individual Retirement Accounts
Individual Retirement Accounts (IRAs) provide a tax-advantaged means to save money for the future. For a detailed outline of the difference between retirement accounts, see www.thornburg.com/ira. Rollovers are available. Call 1-800-847-0200 for more information.
Traditional IRAs – Contributions to Traditional IRAs are tax deductible for eligible individuals, and withdrawals are taxed as additional ordinary income. You may contribute to an IRA if you receive compensation and are under 701/2, even if you are covered by an employer retirement plan.
Roth IRAs – Under a Roth IRA, there is no tax deduction for contributions, but there is no income tax on qualified withdrawals. For a more detailed comparison of Traditional and Roth IRAs, please see our web site at www.thornburg.com/ira.
SEP IRAs – Simplified Employee Pension (SEP) IRAs are established by employers. The employer is allowed a tax deduction for contributions made to the SEP Plan and makes contributions to each eligible employee’s SEP IRA on a discretionary basis.
SIMPLE IRAs – Savings Incentive Match Plan for Employees of Small Employers (SIMPLE) is designed to give small business owners a simplified method to establish and contribute to a retirement plan for employees. The employer is allowed a tax deduction for contributions and makes either matching or non-elective contributions to each eligible employee’s SIMPLE IRA. Employees may make salary deferral contributions.
403(b)
A special, tax-advantaged savings vehicle available only to employees of 501(c)(3) organizations, such as charitable, educational, scientific and religious organizations. 403(b) plans are also available to employees of public schools and universities.
Coverdell Education Savings Account
These savings accounts are designed to provide a way to save money for higher education expenses. In an Education Savings Account, earnings and interest grow tax free, and qualified withdrawals used to pay for eligible higher-education expenses are tax- and penalty-free.
Funds Available
The following funds are available in the accounts listed above:
| • | Thornburg International Value Fund |
| • | Thornburg Value Fund |
| • | Thornburg Core Growth Fund |
| • | Thornburg Investment Income Builder Fund |
| • | Thornburg Limited Term U.S. Government Fund |
| • | Thornburg Limited Term Income Fund |
| This page is not part of the Annual Report. 43 | ||||||
The Firm
Thornburg Investment Management® is a privately held investment management company based in Santa Fe, New Mexico with assets under management of over $16 billion. Founded in 1982, the firm manages four equity funds, eight bond funds, and separate portfolios for select institutions and individuals.
Investment Philosophy
We seek to preserve and increase the real wealth of the Funds’ shareholders after accounting for inflation, taxes, and investment expenses. We’re committed to disciplined investing and controlling risk in all market environments through laddered bond and focused equity portfolios.
Portfolio Holdings Disclosure
We believe you should know about your portfolio. Our web site keeps investors informed of the Funds’ equity holdings. Go to www.thornburg.com/funds for commentary on our equity fund holdings.
Co-Ownership of Funds
We invest side-by-side with the Funds’ shareholders. Our employees have invested over $110 million in Thornburg Funds.
Core Strategies for Building Wealth
We deliver core strategies to help investors meet long-term goals. A core strategy is a consistent, disciplined and proven investment process that represents the foundation of a diversified portfolio.
Investment Manager:
| Distributor:
| |
119 East Marcy Street Santa Fe, New Mexico 87501 800.847.0200 |
119 East Marcy Street Santa Fe, New Mexico 87501 800.847.0200 |


Core Strategies for Building Wealth
Thornburg Investment Income Builder Fund
I Shares
Informational Brochure and Annual Report – September 30, 2005
Current stream of income plus potential for growth.
This report and the accompanying brochure are submitted for the general information of shareholders of the Fund. It is not authorized for distribution to prospective investors in the Fund unless preceded or accompanied by an effective prospectus. If you have not received a prospectus, one can be obtained from your financial advisor, online at www.thornburg.com/ download, or by calling 800-847-0200. Carefully consider information in the prospectus regarding the Fund’s investment objectives and policies, risks, sales charges, expenses, experience of its management, marketability of shares, and other information. Read it carefully before you invest or send money. Performance data quoted represents past performance and does not guarantee future results.
Thornburg Investment Income Builder Fund
Current Stream of Income Plus Potential for Growth
The Fund seeks to provide a level of current income which exceeds the average yield on U.S. stocks generally, and which will generally grow, subject to periodic fluctuations, over the years on a per share basis. The Fund’s secondary investment objective is long-term capital appreciation.
The Fund invests primarily in companies (both in the U.S. and abroad) that pay dividends and, in the opinion of Thornburg Investment Management, that show the capacity to increase them. To provide additional income, the Fund also invests in bonds and hybrid securities.
Thornburg Bond Funds
| • | Thornburg Limited Term Municipal Fund |
| • | Thornburg Intermediate Municipal Fund |
| • | Thornburg California Limited Term Municipal Fund |
| • | Thornburg New Mexico Intermediate Municipal Fund |
| • | Thornburg Florida Intermediate Municipal Fund |
| • | Thornburg New York Intermediate Municipal Fund |
| • | Thornburg Limited Term U.S. Government Fund |
| • | Thornburg Limited Term Income Fund |
Thornburg invests in short- and intermediate-term investment grade bonds. We ladder the maturities of individual bonds in the portfolios to moderate risk. Laddering involves building a portfolio of bonds with staggered maturities so that a portion of the portfolio will mature each year. We apply this disciplined process in all interest rate environments.
Thornburg Equity Funds
| • | Thornburg Value Fund |
| • | Thornburg International Value Fund |
| • | Thornburg Core Growth Fund |
| • | Thornburg Investment Income Builder Fund |
Thornburg’s equity research uses a fundamental, yet comprehensive, analytical approach. We invest when and where we perceive compelling value. Thornburg equity funds focus on a limited number of securities so that each holding can impact performance. The equity team searches for firms believed to have a promising future and seeks to buy shares of those companies at a discount to their intrinsic value.
More information at www.thornburg.com
 | Reduce paper clutter.
Receive your shareholder reports and prospectus online instead of through traditional mail.
Sign up at
www.thornburg.com/edelivery |
2 This page is not part of the Annual Report. |
Message
from the Chairman

Garrett Thornburg
Chairman & CEO
November 9, 2005
Dear Fellow Shareholder:
Thornburg Investment Management has a clear mission: to preserve and increase the real wealth of our shareholders. We seek to accomplish this through a range of equity funds that redefine traditional measures of value and growth and through a family of laddered bond funds that focus on quality, stability and minimizing risk over time.
Confirming our strategy, all Thornburg equity funds have ranked well within their respective categories.
The Thornburg equity funds employ a comprehensive approach which is more inclusive than the traditional deep value or high growth approach to stock selection. Within the Thornburg Value Fund and the Thornburg International Value Fund, the portfolios’ securities are classified into three baskets: basic value stocks, stocks of companies with consistent earnings, and stocks of emerging franchises. Thornburg Core Growth Fund’s holdings are classified into similar baskets: growth industry leaders, consistent growth companies, and emerging growth companies. After being identified through bottom-up screening from a worldwide universe, all stocks are subject to a rigorous selection process that must satisfy the Thornburg investment team’s two fundamental criteria: in the opinion of the portfolio manager, the companies must be selling at attractive discounts to intrinsic value and have compelling prospects for long-term growth. You can read much more about the stocks in your Fund’s portfolio at our web site, www.thornburg.com/funds.
During this decade, the average dividend yield paid by equity and hybrid mutual funds has dipped well below 1%. We established Thornburg Investment Income Builder Fund in late 2002 to be clearly different from other equity/hybrid funds by paying attractive dividends today, with a further goal of increasing these in the future. Our record to date shows clear success in achieving each aspect of this mission.
On the bond side, we have always had a highly disciplined approach of laddering short- and intermediate-bond maturities seeking to provide both an attractive return and relative stability of principal.
Recently, there has been a lot of news about improper behavior by some mutual fund companies. Many of the proposed new rules in response to this scandal have called for increased transparency. We welcome increased transparency. Thornburg Investment Management has been a leader in providing information about our stock holdings to our shareholders on our web site, www.thornburg.com.
Unfortunately, some of those new rules will increase the cost to all shareholders in mutual funds. We will do our best to keep these expenses to a minimal amount. After all, we are shareholders too! Thornburg employees have over $110 million invested in our own funds.
Thank you for investing with us. We will do our best to continue to earn your trust every day.
Sincerely, |
 |
| Garrett Thornburg |
| Chairman & CEO |
| This page is not part of the Annual Report. 3 |
The Dividend Landscape
To appreciate the investment environment that Thornburg Investment Income Builder Fund operates in, you may wish to review these highlights of the “dividend landscape.”
The S&P 500 Index Payout Ratio – A Historical Perspective
S&P 500 Index Payout Ratio (January 1940 to October 2005)
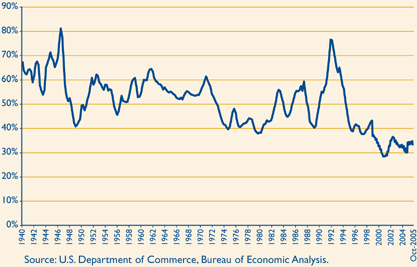
The dividend payout ratio is a fraction that expresses dividend payments as a percentage of per-share earnings. By long-term historical standards, the dividend payout ratio of the S&P 500 Index is relatively low at this time.
Corporate Willingness to Pay Dividends is Improving
Percentage of Companies Paying Dividends
in Russell 1000 Index (December 1979 to December 2004)
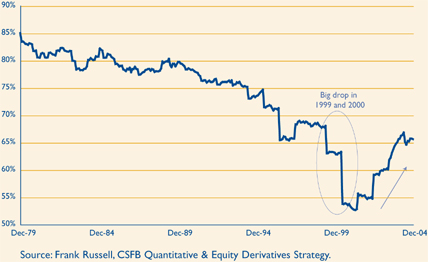
The Russell 1000 Index includes 1000 public companies that are supposed to be generally representative of corporate America. Between 1980 and 1993, at least 75% of these firms paid some dividend. Between 1994 and 2001, the percentage of Russell 1000 companies paying dividends sank to just over 50%, indicating investor and management preference for reinvesting retained earnings in growth initiatives. Now the pendulum appears to be swinging back, and the percentage of dividend payers is increasing. Long-term academic studies have shown that subsequent earnings-per-share growth of dividend-paying firms actually exceeds that of non-payers.
4 This page is not part of the Annual Report. |
Rising Dividend Payments Despite Decreasing Dividend Yields
Over time, the dollar dividend per unit of the S&P 500 Index has increased. Because the price of the index itself has increased even more, the yield on the S&P 500 Index, as a percentage of the current index price, has generally decreased in recent decades. You should note, however, that the yield on the original investment made at a fixed point in time (say, 1970 or 1989) has increased, even without reinvestment of dividends.
Hypothetical chart is for illustration purposes only and is not indicative of an investment in any particular security. Investors may not invest directly in an index.
S&P 500 Index Average Yield vs. Annual Dividends from a One-
Time $10,000 Investment in the Index (Dividends not Reinvested)
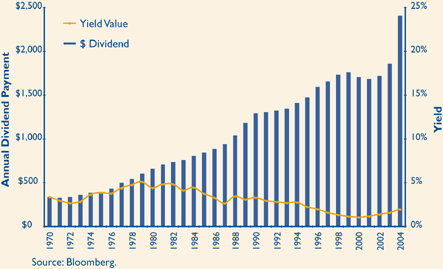
A Truly Diversified Dividend-Paying Portfolio Must Look Beyond the Obvious High Yield Stocks!
In the (large cap) Russell 1000 Index, 73% of the top 100 dividend payers are either real estate investment trusts (REITs) or utilities. In the (small cap) Russell 2000 Index, 78% of the top 100 dividend-yielding stocks are either REITs or utilities. In order to construct a diversified portfolio of attractive yielding stocks, one must look beyond these two sectors. We do!
| The Top 100 Dividend Yields | ||||||
| Russell 1000 Index | Russell 2000 Index | |||||
REITs | 45 | % | 69 | % | ||
Utilities | 28 | % | 9 | % | ||
Banks | 7 | % | 1 | % | ||
Other Financials | 4 | % | 5 | % | ||
Consumer Staples | 5 | % | 3 | % | ||
Telecommunications | 4 | % | 0 | % | ||
Materials | 2 | % | 5 | % | ||
Health Care | 1 | % | 1 | % | ||
Consumer Discretionary | 4 | % | 6 | % | ||
Industrials | 0 | % | 0 | % | ||
Energy | 0 | % | 1 | % | ||
Technology | 0 | % | 0 | % | ||
Source: Baseline, as of December 31, 2004; (Numbers may not add to 100% due to rounding.)
| This page is not part of the Annual Report. 5 |
The Dividend Landscape
Continued
Global Diversification Can Improve the Portfolio Yield
Average Dividend Yields and Payout Ratios
of Markets Around the Globe
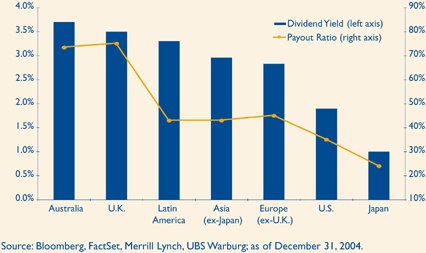
Source: Bloomberg, FactSet, Merrill Lynch, UBS Warburg; as of December 31, 2004.
Since firms outside the U.S. tend to pay higher dividends than U.S. firms, particularly outside the REIT and utility sectors, we diversify the Thornburg Investment Income Builder Fund into some foreign dividend-paying stocks to try to take advantage of these opportunities.
6 This page is not part of the Annual Report. |
Important Information
The information presented on the following pages was current as of September 30, 2005. The manager’s views, portfolio holdings, and sector diversification are historical and subject to change. This material should not be deemed a recommendation to buy or sell any of the securities mentioned.
Shares in the Fund carry risks including possible loss of principal. There are special risks associated with international investing, including currency fluctuations, government regulation, political developments, and differences in liquidity. Additionally, the Fund invests a portion of the assets in small capitalization companies which may increase the risk of greater price fluctuations.
As with direct bond ownership, funds that invest in bonds are subject to certain risks including interest-rate risk, credit risk, and inflation risk. The value of a bond will fluctuate relative to changes in interest rates; as interest rates rise, the overall price of bonds fall. Shares in the Fund are not deposits or obligations of, or guaranteed or endorsed by, any bank, the Federal Deposit Insurance Corporation, the Federal Reserve Board or any government agency.
Minimum investments for Class I shares are higher than those for other classes.
Glossary
Blended Index – The blended index is comprised of 25% Lehman Brothers Aggregate Bond Index and 75% MSCI World Equity Index. The Lehman Brothers Aggregate Bond Index is composed of approximately 6,000 publicly traded bonds including U.S. government, mortgage-backed, corporate and Yankee bonds with an average maturity of approximately 10 years. The index is weighted by the market value of the bonds included in the index. The Morgan Stanley Capital International World Equity Index is a total return index, reported in U.S. dollars, based on share prices and reinvested gross dividends of approximately 1,600 companies from 22 countries: Australia, Austria, Belgium, Canada, Denmark, Finland, France, Germany, Hong Kong, Ireland, Italy, Japan, Malaysia, Netherlands, New Zealand, Norway, Singapore, Spain, Sweden, Switzerland, the United Kingdom, and the United States.
Russell 1000 Index – Consists of the 1,000 largest securities in the Russell 3000 Index, which represents approximately 90% of the total market capitalization of the Russell 3000 Index. It is a large-cap, market-oriented index and is highly correlated with the S&P 500 Index.
Russell 2000 Index – An unmanaged index generally representative of the 2,000 smallest companies in the Russell 3000 Index, representing approximately 10% of the total market capitalization of the Russell 3000 Index.
Standard & Poor’s 500 Stock Index (S&P 500) – An unmanaged index generally representative of the U.S. stock market, without regard to company size.
Unless otherwise noted, index returns reflect the reinvestment of income dividends and capital gains, if any, but do not reflect fees, brokerage commissions or other expenses of investing. Investors may not make direct investments into any index. The performance of any index is not indicative of the performance of any particular investment.
Median Market Capitalization – Market capitalization (market cap) is the total value of a company’s stock, calculated by multiplying the number of outstanding common shares by the current share price. The company whose market cap is in the middle of the portfolio is the median market cap. Half the companies in the portfolio have values greater than the median, and half have values that are less. If there is an even number of companies, then the median is the average of the two companies in the middle.
Price to Book Value (P/B) – A ratio used to compare a stock’s market value to its book value. It is calculated by dividing the current closing price of the stock by the latest quarter’s book value (book value is simply assets minus liabilities).
Price to Cash Flow Ratio – A measure of the market’s expectations of a firm’s future financial health. It is calculated by dividing the price per share by cash flow per share.
Price to Earnings Ratio (P/E) – A valuation ratio of a company’s current share price compared to its per-share earnings. P/E equals a company’s market value per share divided by earnings per share.
Weighted Average Coupon – Coupon refers to the rate of interest paid on a bond, usually expressed as a percent of its par value. A fund’s weighted average coupon is calculated by weighting each bond’s coupon by its relative size in the portfolio and taking the average.
| This page is not part of the Annual Report. 7 |
Portfolio Overview
Thornburg Investment Income Builder Fund
IMPORTANT PERFORMANCE
INFORMATION
Performance data quoted represents past performance and does not guarantee future results. Investment return and principal value will fluctuate so that upon redemption, investor’s shares may be worth more or less than their original cost. Current performance may be lower or higher than the data quoted. For performance data current to the most recent month end, visit www.thornburg.com.
There is no up-front sales charge for Class I shares. I shares are subject to a 1% 90-day redemption fee.
MANAGEMENT TEAM

Front row, L to R: Steven Bohlin, Brad Kinkelaar, and Brian McMahon. Back row, L to R: Wendy Trevisani, Lewis Kaufman, Ed Maran,Vin Walden, and Lei Wang.
PORTFOLIO COMPOSITION
As of 9/30/05
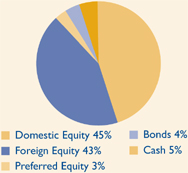
We do not expect each sequential quarter’s dividend to increase over that of the prior quarter, since dividend payments outside the U.S. tend to be seasonal. Rather, the Fund aspires to increase the dividend paid on an annual basis.
100% of 2004 and 2003’s dividend payments qualified for the lower 15% tax rate on stock dividends. (There is no guarantee that this will be the case for future dividends.)
QUARTERLY DIVIDEND HISTORY
| Q1 | Q2 | Q3 | Q4 | Total | |||||||||||
Class I Shares | |||||||||||||||
2005 | 11.6 | ¢ | 14.2 | ¢ | 18.0 | ¢ | N/A | N/A | |||||||
2004 | 11.7 | ¢ | 13.6 | ¢ | 16.0 | ¢ | 22.7 | ¢ | 64.0 | ¢ |
KEY PORTFOLIO ATTRIBUTES
Equity Statistics | ||||
Equity Portfolio P/E | 13.4 | x | ||
Median Market Cap | $ | 17.9B | ||
Equity Holdings | 54 | |||
Fixed Income Statistics | ||||
Weighted Average Coupon | 5.07 | % | ||
Average Credit Quality | A- | |||
Average Maturity | 3.2 yrs | |||
Duration | 1.2 yrs | |||
Bond Holdings | 31 |
TOP TEN HOLDINGS
General Electric Co. | 3.4 | % | |
Dominion Resources Inc. | 3.2 | % | |
Pfizer Inc. | 3.2 | % | |
Altria Group Inc. | 3.2 | % | |
Canadian Oil Sands Trust | 3.1 | % | |
Host Marriott Corp. | 3.1 | % | |
ENI S.p.A. | 3.0 | % | |
GlaxoSmithKline plc | 3.0 | % | |
Vodafone Group plc | 2.9 | % | |
BP Amoco ADR | 2.9 | % |
AVERAGE ANNUAL TOTAL RETURNS*
For periods ending September 30, 2005
| 3Q ‘05 | 1 Yr | Since Inception | |||||||
I Shares (Incep: 11/3/03) | 4.06 | % | 19.73 | % | 16.71 | % | |||
Blended Index** (Since: 11/3/03) | 4.94 | % | 14.70 | % | 12.41 | % |
| * | Periods under one year are not annualized. |
| ** | Blended Index: 75% MSCI World/25% Lehman Brothers Aggregate |
8 This page is not part of the Annual Report. |
The investment objective of Thornburg Investment Income Builder Fund is to provide a level of current income which exceeds the average yield on U.S. stocks, and which will grow, subject to periodic fluctuations, over the years. This objective remains constant over time. However, the specific investments we have used to try to reach our objective have changed over time. There is no guarantee the Fund will meet its investment objectives.
Business conditions for various industries and operating effectiveness at individual firms, change over time. Investor preferences, expressed as both absolute and relative prices, also change over time. In the view of your portfolio management team, “some doors close and others open.” As shown in the tables below, the percentage industry allocations of your Fund evolve to reflect these changing conditions.
TOP TEN INDUSTRIES
As of 9/30/05
Energy | 15.6 | % | |
Diversified Financials | 13.7 | % | |
Banks | 9.4 | % | |
Utilities | 8.7 | % | |
Telecommunication Services | 8.5 | % | |
Pharmaceuticals & Biotechnology | 7.4 | % | |
Real Estate | 5.8 | % | |
Transportation | 4.5 | % | |
Food Beverage & Tobacco | 4.2 | % | |
Capital Goods | 3.4 | % |
TOP TEN INDUSTRIES
As of 6/30/05
Diversified Financials | 14.6 | % | |
Energy | 14.5 | % | |
Banks | 10.6 | % | |
Telecommunication Services | 9.7 | % | |
Utilities | 8.4 | % | |
Pharmaceuticals & Biotechnology | 6.2 | % | |
Transportation | 5.4 | % | |
Materials | �� | 5.1 | % |
Real Estate | 4.4 | % | |
Food Beverage & Tobacco | 2.9 | % |
TOP TEN INDUSTRIES
As of 3/31/05
Diversified Financials | 14.8 | % | |
Banks | 14.8 | % | |
Energy | 11.8 | % | |
Telecommunication Services | 9.0 | % | |
Utilities | 7.8 | % | |
Pharmaceuticals & Biotechnology | 7.1 | % | |
Transportation | 5.8 | % | |
Food & Staples Retailing | 4.8 | % | |
Materials | 3.8 | % | |
Food Beverage & Tobacco | 3.4 | % |
TOP TEN INDUSTRIES
As of 12/31/04
Banks | 15.0 | % | |
Diversified Financials | 11.6 | % | |
Pharmaceuticals & Biotechnology | 8.9 | % | |
Energy | 7.3 | % | |
Transportation | 7.0 | % | |
Telecommunication Services | 6.5 | % | |
Food Beverage & Tobacco | 6.1 | % | |
Utilities | 5.6 | % | |
Insurance | 4.5 | % | |
Food & Staples Retailing | 3.9 | % |
| This page is not part of the Annual Report. 9 |
This page intentionally left blank.
10 This page is not part of the Annual Report. |

Thornburg Investment Income Builder Fund
I Shares – September 30, 2005
| 12 | ||
| 14 | ||
| 16 | ||
| 18 | ||
| 19 | ||
| 23 | ||
| 24 | ||
| 31 | ||
| 32 | ||
| 33 | ||
| 34 | ||
| 37 | ||
This report is certified under the Sarbanes-Oxley Act of 2002, which requires that public companies, including mutual funds, affirm that the information provided in their annual and semiannual shareholder reports fully and fairly represents their financial position.
| Certified Annual Report 11 |
October 17, 2005
Dear Fellow Shareholder:
Recall that the objective of Thornburg Investment Income Builder Fund is to pay attractive, growing dividends to shareholders. As a byproduct of achieving this, we also aim to generate capital appreciation of the share price over time. (There is no guarantee that these objectives will be met.) Following are the quarterly dividends paid by your Fund in the fiscal year that ended on September 30, 2005:
| Dec. 04 Qtr. | March 05 Qtr. | June 05 Qtr. | Sept. 05 Qtr. | Fiscal Year 05 Total | |||||||||||
I Shares | 22.7 | ¢ | 11.6 | ¢ | 14.2 | ¢ | 18.0 | ¢ | 66.5 | ¢ |
We expect that at least 85% of the regular quarterly dividends paid by your Fund this year will qualify for the 15% tax rate for individual taxpayers on “qualifying dividends.” We also expect to pay a capital gains dividend (1% to 2% of net asset value) in November 2005. The net asset value (NAV) of the I shares ended the fiscal period at $18.03, having increased by $2.39 since September 30, 2004. On September 30, 2005, your Fund owned 54 stocks, comprising 90% of your portfolio. You also held 30 different bonds and cash equivalents with a weighted average duration of 1.2 years.
Firms in a broad range of industries contributed to the solid return of your Fund in the last six months, but three of our top five performers were oil & gas businesses. Integrated oil & gas producers Marathon Oil Corp., ChevronTexaco Corp., and ENI S.p.A. were joined by Dominion Resources Inc. (utility, with significant gas production) and Hong Kong Exchanges & Clearing Ltd. (equity exchange) as the top five performers for the period. The performance of these stocks is not surprising, given that the price of crude oil averaged almost $58/barrel over the last six months. Hong Kong Exchanges benefited from good equity trading volumes and new listings.
PPG Industries Inc. (chemicals), Dow Chemical Co. (chemicals), Telecom Italia Mobile (telecommunication services), Kingfisher plc (home improvement retailer, mostly United Kingdom and France), and Tesco plc (food & general merchandise retailer, mostly United Kingdom) were our weakest portfolio performers. The underlying businesses of each of these except Tesco exhibited weakness, relative to expectations. For the chemicals businesses, high energy input costs could not be fully offset. Most consumer- dependent businesses in the United Kingdom have shown weakness due to high housing costs, rising interest rates, and rising energy costs – perhaps a preview of what is in store for similar businesses in the United States in the coming year. On average, your portfolio companies have increased their earnings and dividends over the last year by around 12% and 11%, respectively.
Our exposure to foreign currencies via the non-U.S. stocks in your portfolio was a small negative during the fiscal year. The fact that we hedged this risk by buying dollars for future delivery mitigated the currency risk in euros and British pounds. Your Fund’s most significant industry exposures as of September 30, 2005 are listed on page 30 . Banking and diversified financial services firms continue to be important weightings in your portfolio, though we reduced these weightings during the year. Here, we have tried to focus on dividend paying beneficiaries of rising interest rates. Senior oil company executives have told us that their assumed oil prices when evaluating new projects remain in the $20-$30 per barrel range (less than 50% of today’s price). This indicates continuing under-investment in energy exploration & development, which should help sustain generally higher energy prices than we observed prior to 2004. We are conscious of the fact that energy use may stall in an environment of higher prices and slower economic growth. Increasing energy consumption in emerging economies may offset demand destruction in more mature economies. We continued to own selected firms in the growing, cash-generative mobile telecommunication services sector, and we expect rising hotel room rates to lead to significant dividend increases from the hotel REITs in your portfolio.
12 Certified Annual Report |
We remain optimistic about the backdrop for success of our investment program, due to ongoing improvements in corporate ability and willingness to pay dividends. The 15% tax rate on dividend income is important icing on the cake. Ability to pay is determined by revenues, earnings, and cash flows after expenses of operating the business. Looking at the broad U.S. market, year-over-year revenue growth of public companies (as represented by the S&P 1500 Index) increased at 12%, and operating earnings per share grew 11%, according to the corporate data service Baseline. Net profit margins have reached historic highs, though there are increasing signs that these will fall in coming quarters. In general, firms outside the U.S. show similar trends. Balance sheets have generally improved, as indicated by Moody’s report of declines in the default rate of below-investment-grade bond issues. We doubt that company revenues and earnings can continue to increase at such high multiples of GDP growth. Costs are increasing for most firms, and many of these have limited ability to pass higher costs through while maintaining unit sales volumes.
Willingness to pay, determined by the behavior of corporate executives and boards, also seems to be improving, but progress is slow. The dividend per unit of the S&P 500 Index increased from $3.14 in 1970 to an expected level of around $22 in 2005. We believe the period of stupid acquisitions, dishonest accounting, and blind pursuit of profitless revenue growth has yielded (for a while) to a more constructive mindset, focusing on profitability. There is considerable room for further dividend improvement. The ratio of dividend payments (around $22) to earnings (around $74) for the S&P 500 Index portfolio is below 30%. Many firms should be able to pay out 50% of earnings, or more, to shareholders. Financial discipline is at least as constructive for CEOs as it is for teenagers, and paying good dividends reinforces capital discipline in a company.
Your Fund’s investments are reported to you in the latter pages of this report. You can read more about the equity investments in your Fund by going to our web site, www.thornburg.com/funds. (If you do not have inter-net access, please call us at 800-847-0200. We will print and mail you a copy of this). Thank you for your support, and best wishes.
Sincerely, | ||||
 |  |  | ||
| Brian McMahon | Brad Kinkelaar | Steven J. Bohlin | ||
| President & Chief Investment Officer | Managing Director | Managing Director | ||
| * | 75% MSCI World and 25% Lehman Brothers Aggregate, see page 33 for complete description of index. |
The matters discussed in this report may constitute forward-looking statements made pursuant to the safe harbor provisions of the Securities Litigation Reform Act of 1995. These include any advisor or portfolio manager prediction, assessment, analysis or outlook for individual securities, industries, investment styles, market sectors and/or markets. These statements involve risks and uncertainties. In addition to the general risks described for each fund in its current prospectus, other factors bearing on these reports include the accuracy of the advisor’s or portfolio manager’s forecasts and predictions, the appropriateness of the investment strategies designed by the advisor or portfolio manager, and the ability of the advisor or portfolio manager to implement their strategies efficiently and successfully. Any one or more of these factors, as well as other risks affecting the securities markets generally, could cause the actual results of any fund to differ materially as compared to its benchmarks.
| Certified Annual Report 13 |
STATEMENT OF ASSETS AND LIABILITIES
Thornburg Investment Income Builder Fund | September 30, 2005 |
ASSETS | |||
Investments at value (cost $886,105,687) | $ | 966,889,083 | |
Cash | 1,019,008 | ||
Receivable for investments sold | 35,461,645 | ||
Receivable for fund shares sold | 9,236,502 | ||
Unrealized gain on forward exchange contracts (Note 7) | 2,210,570 | ||
Dividends receivable | 4,949,133 | ||
Interest receivable | 705,216 | ||
Prepaid expenses and other assets | 21,049 | ||
Total Assets | 1,020,492,206 | ||
LIABILITIES | |||
Payable for securities purchased | 32,321,353 | ||
Payable for fund shares redeemed | 753,745 | ||
Unrealized loss on forward exchange contracts (Note 7) | 917,380 | ||
Payable to investment advisor and other affiliates (Note 3) | 968,346 | ||
Deferred tax payable | 306,966 | ||
Accounts payable and accrued expenses | 309,199 | ||
Dividends payable | 2,121,867 | ||
Total Liabilities | 37,698,856 | ||
NET ASSETS | $ | 982,793,350 | |
NET ASSETS CONSIST OF: | |||
Undistributed net investment income | $ | 6,877,895 | |
Net unrealized appreciation on investments | 81,699,931 | ||
Accumulated net realized gain (loss) | 16,739,017 | ||
Net capital paid in on shares of beneficial interest | 877,476,507 | ||
| $ | 982,793,350 | ||
14 Certified Annual Report |
STATEMENT OF ASSETS AND LIABILITIES, CONTINUED
Thornburg Investment Income Builder Fund | September 30, 2005 |
NET ASSET VALUE: | |||
Class A Shares: | |||
Net asset value and redemption price per share ($515,914,934 applicable to 28,766,763 shares of beneficial interest outstanding - Note 4) | $ | 17.93 | |
Maximum sales charge, 4.50% of offering price | 0.84 | ||
Maximum offering price per share | $ | 18.77 | |
Class C Shares: | |||
Net asset value and offering price per share* ($337,488,577 applicable to 18,802,005 shares of beneficial interest outstanding - Note 4) | $ | 17.95 | |
Class I Shares: | |||
Net asset value, offering and redemption price per share ($129,110,166 applicable to 7,158,934 shares of beneficial interest outstanding - Note 4) | $ | 18.03 | |
Class R1 Shares: | |||
Net asset value, offering and redemption price per share ($279,673 applicable to 15,594 shares of beneficial interest outstanding - Note 4) | $ | 17.93 | |
| * | Redemption price per share is equal to net asset value less any applicable contingent deferred sales charge. |
See notes to financial statements.
| Certified Annual Report 15 |
Thornburg Investment Income Builder Fund | Year Ended September 30, 2005 |
INVESTMENT INCOME: | ||||
Dividend income (net of foreign taxes withheld of $1,611,046) | $ | 33,859,526 | ||
Interest income | 4,170,400 | |||
Total Income | 38,029,926 | |||
EXPENSES: | ||||
Investment advisory fees (Note 3) | 5,707,419 | |||
Administration fees (Note 3) | ||||
Class A Shares | 448,565 | |||
Class C Shares | 286,400 | |||
Class I Shares | 37,132 | |||
Class R1 Shares | 95 | |||
Distribution and service fees (Note 3) | ||||
Class A Shares | 904,397 | |||
Class C Shares | 2,312,023 | |||
Class R1 Shares | 388 | |||
Transfer agent fees | ||||
Class A Shares | 368,300 | |||
Class C Shares | 248,065 | |||
Class I Shares | 41,351 | |||
Class R1 Shares | 7,451 | |||
Registration and filing fees | ||||
Class A Shares | 87,951 | |||
Class C Shares | 50,860 | |||
Class I Shares | 15,389 | |||
Class R1 Shares | 13,446 | |||
Custodian fees (Note 3) | 361,112 | |||
Professional fees | 64,571 | |||
Accounting fees | 54,370 | |||
Trustee fees | 14,720 | |||
Other expenses | 202,556 | |||
Total Expenses | 11,226,561 | |||
Less: | ||||
Expenses reimbursed by Investment Advisor (Note 3) | (856,138 | ) | ||
Fees paid indirectly (Note 3) | (35,262 | ) | ||
Net Expenses | 10,335,161 | |||
Net Investment Income | $ | 27,694,765 | ||
16 Certified Annual Report |
| STATEMENT OF OPERATIONS, CONTINUED | ||
Thornburg Investment Income Builder Fund | Year Ended September 30, 2005 | |
REALIZED AND UNREALIZED GAIN (LOSS) | |||
Net realized gain (loss) on: | |||
Investments | $ | 16,634,596 | |
Foreign currency transactions | 2,574,289 | ||
| 19,208,885 | |||
Net change in unrealized appreciation (depreciation) on: | |||
Investments (net of change in deferred taxes payable of $256,669) | 54,638,518 | ||
Foreign currency translations | 2,174,174 | ||
| 56,812,692 | |||
Net Realized and Unrealized Gain | 76,021,577 | ||
Net Increase in Net Assets Resulting From Operations | $ | 103,716,342 | |
See notes to financial statements.
| Certified Annual Report 17 |
| STATEMENTS OF CHANGES IN NET ASSETS | ||
Thornburg Investment Income Builder Fund | ||
| Year Ended September 30, 2005 | Year Ended September 30, 2004 | |||||||
INCREASE (DECREASE) IN NET ASSETS FROM: | ||||||||
OPERATIONS: | ||||||||
Net investment income | $ | 27,694,765 | $ | 12,099,404 | ||||
Net realized gain (loss) on investments and foreign currency | 19,208,885 | (3,417,913 | ) | |||||
Increase (Decrease) in unrealized appreciation (depreciation) on investments, foreign currency translation, and deferred taxes | 56,812,692 | 21,451,937 | ||||||
Net Increase (Decrease) in Net Assets Resulting from Operations | 103,716,342 | 30,133,428 | ||||||
DIVIDENDS TO SHAREHOLDERS: | ||||||||
From net investment income | ||||||||
Class A Shares | (13,160,919 | ) | (5,486,221 | ) | ||||
Class C Shares | (7,462,307 | ) | (2,936,820 | ) | ||||
Class I Shares | (2,791,906 | ) | (641,652 | ) | ||||
Class R1 Shares | (2,854 | ) | 0 | |||||
From realized gains | ||||||||
Class A Shares | (11,306 | ) | 0 | |||||
Class C Shares | (7,266 | ) | 0 | |||||
Class I Shares | (1,756 | ) | 0 | |||||
FUND SHARE TRANSACTIONS (NOTE 4): | ||||||||
Class A Shares | 247,700,405 | 138,687,397 | ||||||
Class C Shares | 166,392,249 | 96,221,064 | ||||||
Class I Shares | 87,260,594 | 32,217,399 | ||||||
Class R1 Shares | 271,714 | 0 | ||||||
Net Increase in Net Assets | 581,902,990 | 288,194,595 | ||||||
NET ASSETS: | ||||||||
Beginning of year | 400,890,360 | 112,695,765 | ||||||
End of year | $ | 982,793,350 | $ | 400,890,360 | ||||
See notes to financial statements.
18 Certified Annual Report |
| NOTES TO FINANCIAL STATEMENTS | ||
Thornburg Investment Income Builder Fund | September 30, 2005 | |
NOTE 1 – ORGANIZATION
Thornburg Investment Income Builder Fund, hereinafter referred to as the “Fund,” is a diversified series of Thornburg Investment Trust (the “Trust”). The Fund commenced operations on December 24, 2002. The Trust was organized as a Massachusetts business trust under a Declaration of Trust dated June 3, 1987 and is registered as a diversified, open-end management investment company under the Investment Company Act of 1940, as amended. The Trust is currently issuing eleven series of shares of beneficial interest in addition to those of the Fund: Thornburg Limited Term Municipal Fund, Thornburg California Limited Term Municipal Fund, Thornburg Limited Term U.S. Government Fund, Thornburg New Mexico Intermediate Municipal Fund, Thornburg Intermediate Municipal Fund, Thornburg Limited Term Income Fund, Thornburg Florida Intermediate Municipal Fund, Thornburg Value Fund, Thornburg International Value Fund, Thornburg New York Intermediate Municipal Fund and Thornburg Core Growth Fund. Each series is considered to be a separate entity for financial reporting and tax purposes and bears expenses directly attributable to it. The Fund pursues its investment objectives by investing in a broad range of income producing securities, primarily stocks and bonds.
The Fund currently offers four classes of shares of beneficial interest, Class A, Class C, Institutional Class (Class I) and Retirement Class (Class R1) shares. Each class of shares of the Fund represents an interest in the same portfolio of investments of the Fund, except that (i) Class A shares are sold subject to a front-end sales charge collected at the time the shares are purchased and bear a service fee, (ii) Class C shares are sold at net asset value without a sales charge at the time of purchase, but are subject to a contingent deferred sales charge upon redemption within one year, and bear both a service fee and a distribution fee, (iii) Class I shares are sold at net asset value without a sales charge at the time of purchase, (iv) Class R1 shares are sold at net asset value without a sales charge at the time of purchase, but bear both a service fee and distribution fee, and (v) the respective classes may have different reinvestment privileges and conversion rights. Additionally, the Fund may allocate among its classes certain expenses, to the extent allowable, to specific classes including transfer agent fees, government registration fees, certain printing and postage costs, and administration and legal expenses. Currently, class specific expenses of the Fund are limited to service and distribution fees, administration fees, and certain registration and transfer agent expenses.
NOTE 2 – SIGNIFICANT ACCOUNTING POLICIES
Significant accounting policies of the Trust are as follows:
Valuation of Securities: In determining the net asset value of investments, investments are stated at value based on latest sales prices, normally at 4:00 pm EST reported on securities exchanges on the last business day of the period. Investments for which no sale is reported are valued at the mean between bid and asked prices or in accordance with such other method as the Trustees may authorize. In any case where a market quotation is not readily available, the Trust’s valuation and pricing committee determines a fair value for the investment using factors approved by the Trustees. Short term obligations having remaining maturities of 60 days or less are valued at amortized cost, which approximates market value.
Foreign Currency Translation: Portfolio securities and other assets and liabilities denominated in foreign currencies are translated into U.S. dollars based on the exchange rate of such currencies against the U.S. dollar on the date of valuation. Purchases and sales of securities and income items denominated in foreign currencies are translated into U.S. dollars at the exchange rate in effect on the translation date. When the Fund purchases or sells foreign securities it will customarily enter into a foreign exchange contract to minimize foreign exchange risk from the trade date to the settlement date of such transactions.
The Fund does not separately report the effect of changes in foreign exchange rates from changes in market prices on securities held. Such changes are included in net realized and unrealized gain or loss from investments.
Reported net realized foreign exchange gains or losses arise from sales of foreign currencies, currency gains or losses realized between the trade and settlement dates on securities transactions, and the difference between the amount of interest recorded on the Fund’s books and the U.S. dollar equivalent of the amounts actually received or paid.
Deferred Taxes: The Fund is subject to a tax imposed on net realized gains of securities of certain foreign countries. The Fund records an estimated deferred tax liability for net unrealized gains on these securities as reflected in the accompanying financial statements.
Federal Income Taxes: It is the policy of the Trust to comply with the provisions of the Internal Revenue Code applicable to “regulated investment companies” and to distribute all taxable income, including any net realized gain on investments, of the Fund to the shareholders. Therefore, no provision for Federal income taxes is required.
When-Issued and Delayed Delivery Transactions: The Trust may engage in when-issued or delayed delivery transactions. To the extent the Trust engages in such transactions, it will do so for the purpose of acquiring portfolio securities consistent with the Fund’s investment objectives and not for the purpose of investment leverage or to speculate on interest rate and or market changes. At the time the Trust makes a commitment to purchase a security on a when-issued basis, the Fund will record the transaction and reflect the value in determining its net asset value. When effecting such transactions, assets of an amount sufficient to make payment for the portfolio securities to be purchased will be segregated on the Fund’s records on the trade date. Securities purchased on a when-issued or delayed delivery basis do not earn interest until the settlement date.
| Certified Annual Report 19 |
NOTES TO FINANCIAL STATEMENTS, CONTINUED
Thornburg Investment Income Builder Fund | September 30, 2005 | |
Dividends: Net investment income of the Fund is declared daily as a dividend on shares for which the Fund has received payment. Dividends are paid quarterly and are reinvested in additional shares of the Fund at net asset value per share at the close of business on the dividend payment date or, at the shareholder’s option, paid in cash. Net capital gains, to the extent available, will be distributed at least annually. Distributions to shareholders are based on income tax regulations and, therefore, their characteristics may differ for financial statement and tax purposes.
General: Securities transactions are accounted for on a trade date basis. Interest income is accrued as earned and dividend income is recorded on the ex-dividend date. Certain income from foreign securities is recognized as soon as information is available to the Fund. Realized gains and losses from the sale of securities are recorded on an identified cost basis. Distributions received on securities that represent a return of capital or capital gain are recorded as a reduction of cost of investments and/or as a realized gain. The Fund estimates the components of distributions received that may be considered return of capital distributions or capital gain distributions. Net investment income, other than class specific expenses and realized and unrealized gains and losses, is allocated daily to each class of shares based upon the relative net asset value of outstanding shares of each class of shares at the beginning of the day (after adjusting for the current share activity of the respective class). Expenses common to all funds are allocated among the funds comprising the Trust based upon their relative net asset values or other appropriate allocation methods.
Guarantees and Indemnifications: Under the Trust’s organizational documents, its officers and Trustees are indemnified against certain liability arising out of the performance of their duties to the Fund. Additionally, in the normal course of business the Trust enters into contracts with service providers that contain general indemnification clauses. The Trust’s maximum exposure under these arrangements is unknown. However, based on experience, the Trust expects the risk of loss to be remote.
Use of Estimates: The preparation of financial statements, in conformity with generally accepted accounting principles, requires management to make estimates and assumptions that affect the reported amounts of assets and liabilities and the disclosure of contingent assets and liabilities at the date of the financial statements and the reported amounts of increases and decreases in net assets from operations during the reporting period. Actual results could differ from those estimates.
NOTE 3 – INVESTMENT ADVISORY FEE AND OTHER TRANSACTIONS WITH AFFILIATES
Pursuant to an investment advisory agreement, Thornburg Investment Management, Inc.® (the “Advisor”) serves as the investment advisor and performs services to the Fund for which the fees are payable at the end of each month. For the year ended September 30, 2005, these fees were payable at annual rates ranging from .875 of 1% to .675 of 1% per annum of the average daily net assets of the Fund depending on the Fund’s asset size. The Fund also has an administrative services agreement with the Advisor, whereby the Advisor will perform certain administrative services for the shareholders of each class of the Fund’s shares, and for which fees will be payable at an annual rate of up to .125 of 1% per annum of the average daily net assets attributable to each class of shares. For the year ended September 30, 2005, the Advisor voluntarily reimbursed certain class specific expenses, administrative fees, and distribution fees of $762,635 for Class C shares, $72,530 for Class I shares, and $20,973 for Class R1 shares.
The Trust has an underwriting agreement with Thornburg Securities Corporation® (the “Distributor”, an affiliate of the Advisor), which acts as the Distributor of the Fund’s shares. For the year ended September 30, 2005, the Distributor has advised the Fund that it earned commissions aggregating $414,982 from the sale of Class A shares of the Fund and collected contingent deferred sales charges aggregating $28,778 from redemptions of Class C shares of the Fund.
Pursuant to a service plan under Rule 12b-1 of the Investment Company Act of 1940, the Fund may reimburse to the Advisor an amount not to exceed .25 of 1% per annum of its average daily net assets attributable to each class of shares of the Fund for payments made by the Advisor to securities dealers and other financial institutions to obtain various shareholder related services. The Advisor may pay out of its own resources additional expenses for distribution of the Fund’s shares.
The Trust has also adopted distribution plans pursuant to Rule 12b-1, applicable only to the Fund’s Class C and Class R1 shares, under which the Fund compensates the Distributor for services in promoting the sale of Class C and Class R1 shares of the Fund at an annual rate of up to .75 of 1% of the average daily net assets attributable to Class C and Class R1 shares. Total fees incurred by each class of shares of the Fund under its respective Service and Distribution Plans are set forth in the Statement of Operations.
The Trust has an agreement with the custodian bank to indirectly pay a portion of the custodian’s fees through credits earned by the Fund’s cash on deposit with the bank. This deposit agreement is an alternative to overnight investments. Custodial fees have been adjusted to reflect amounts that would have been paid without this agreement, with a corresponding adjustment reflected as fees paid indirectly in the Statement of Operations. For the year ended September 30, 2005, fees paid indirectly were $35,262.
Certain officers and Trustees of the Trust are also officers and/or Directors of the Advisor and Distributor. The compensation of independent Trustees is borne by the Trust.
20 Certified Annual Report |
NOTES TO FINANCIAL STATEMENTS, CONTINUED
Thornburg Investment Income Builder Fund | September 30, 2005 | |
NOTE 4 – SHARES OF BENEFICIAL INTEREST
At September 30, 2005, there were an unlimited number of shares of beneficial interest authorized. Sales of Class R1 shares commenced February 1, 2005. Transactions in shares of beneficial interest were as follows:
Year Ended September 30, 2005 | Year Ended September 30, 2004 | |||||||||||||
| Shares | Amount | Shares | Amount | |||||||||||
Class A Shares | ||||||||||||||
Shares sold | 15,824,625 | $ | 272,463,968 | 10,579,300 | $ | 160,956,212 | ||||||||
Shares issued to shareholders in reinvestment of dividends | 582,139 | 10,174,628 | 283,535 | 4,388,856 | ||||||||||
Shares repurchased** | (2,029,458 | ) | (34,938,191 | ) | (1,780,207 | ) | (26,657,671 | ) | ||||||
Net Increase (Decrease) | 14,377,306 | $ | 247,700,405 | 9,082,628 | $ | 138,687,397 | ||||||||
** The Fund charges a redemption fee of 1% of the Class A shares exchanged within 90 days of purchase. For the year ended September 30, 2005 and year ended September 30, 2004, $25,676 and $33,971, respectively, were netted in the amount reported for shares repurchased. |
| |||||||||||||
Class C Shares | ||||||||||||||
Shares sold | 10,240,222 | $ | 176,652,670 | 6,542,027 | $ | 100,023,227 | ||||||||
Shares issued to shareholders in reinvestment of dividends | 278,319 | 4,873,053 | 120,816 | 1,873,063 | ||||||||||
Shares repurchased | (878,803 | ) | (15,133,474 | ) | (372,748 | ) | (5,675,226 | ) | ||||||
Net Increase (Decrease) | 9,639,738 | $ | 166,392,249 | 6,290,095 | $ | 96,221,064 | ||||||||
Class I Shares | ||||||||||||||
Shares sold | 5,095,258 | $ | 88,334,328 | 2,128,882 | $ | 32,252,605 | ||||||||
Shares issued to shareholders in reinvestment of dividends | 133,505 | 2,350,289 | 36,925 | 573,313 | ||||||||||
Shares repurchased ** | (195,879 | ) | (3,424,023 | ) | (39,757 | ) | (608,519 | ) | ||||||
Net Increase (Decrease) | 5,032,884 | $ | 87,260,594 | 2,126,050 | $ | 32,217,399 | ||||||||
** The Fund charges a redemption fee of 1% of the Class I shares exchanged within 90 days of purchase. For the year ended September 30, 2005 and year ended September 30, 2004, $4,932 and $1,717, respectively, were netted in the amount reported for shares repurchased. |
| |||||||||||||
Class R1 Shares* | ||||||||||||||
Shares sold | 15,475 | $ | 269,569 | — | $ | — | ||||||||
Shares issued to shareholders in reinvestment of dividends | 159 | 2,832 | — | — | ||||||||||
Shares repurchased | (40 | ) | (687 | ) | — | — | ||||||||
Net Increase (Decrease) | 15,594 | $ | 271,714 | — | $ | — | ||||||||
| * | Effective date of Class R1 shares was February 1, 2005. |
| Certified Annual Report 21 |
NOTES TO FINANCIAL STATEMENTS, CONTINUED
Thornburg Investment Income Builder Fund | September 30, 2005 | |
NOTE 5 – SECURITIES TRANSACTIONS
For the year ended September 30, 2005, the Fund had purchase and sale transactions of investment securities (excluding short-term investments) of $1,000,751,622 and $497,543,249, respectively.
NOTE 6 – INCOME TAXES
At September 30, 2005, information on the tax components of capital is as follows:
Cost of investments for tax purpose | $ | 890,454,430 | ||
Gross unrealized appreciation on a tax basis | $ | 86,292,475 | ||
Gross unrealized depreciation on a tax basis | (9,857,822 | ) | ||
Net unrealized appreciation (depreciation) on investments (tax basis) | $ | 76,434,653 | ||
Distributable earnings – ordinary income | $ | 12,989,103 | ||
Distributable earnings – capital gains | $ | 16,386,212 |
At September 30, 2005, the Fund had deferred tax basis currency losses occurring subsequent to October 31, 2004 of $143,354. For tax purposes, such losses will be reflected in the year ending September 30, 2006.
In order to account for permanent book/tax differences, the Fund decreased undistributed net investment income by $437,174 and increased accumulated net realized gain by $437,174. This reclassification has no impact on the net asset value of the Fund. Reclassifications result primarily from foreign currency transactions, investments in REITs, and partnerships.
The tax character of distributions paid during the year ended September 30, 2005, and September 30, 2004, was as follows:
| 2005 | 2004 | |||||
Distributions from: | ||||||
Ordinary income | $ | 23,435,475 | $ | 9,064,693 | ||
Distributable capital gains | 2,839 | — | ||||
Total | $ | 23,438,314 | $ | 9,064,693 | ||
NOTE 7 – FINANCIAL INSTRUMENTS WITH OFF-BALANCE SHEET RISK AND FOREIGN INVESTMENT RISK
During the year ended September 30, 2005, the Fund was a party to financial instruments with off-balance sheet risks, primarily currency forward exchange contracts. A forward exchange contract is an agreement between two parties to exchange different currencies at a specified rate at an agreed upon future date. These contracts are purchased in order to minimize the risk to the Fund with respect to its foreign stock transactions from adverse changes in the relationship between the U.S. dollar and foreign currencies. In each case these contracts have been initiated in conjunction with foreign stock transactions. These instruments may involve market risks in excess of the amount recognized on the Statement of Assets and Liabilities. Such risks would arise from the possible inability of counterparties to meet the terms of their contracts, future movement in currency value and interest rates and contract positions that are not exact offsets. These contracts are reported in the financial statements at the Fund’s net equity, as measured by the difference between the forward exchange rates at the reporting date and the forward exchange rates at the dates of entry into the contract. There are special risks associated with international investing, including currency fluctuations, government regulation, political developments, and differences in liquidity.
CONTRACTS TO SELL:
Contracts | Contract Value Date | Market Value | ||||||
25,000,000 | Euro Dollar for 30,125,000 USD | January 11, 2006 | $ | (184,018 | ) | |||
25,000,000 | Greater British Pound for 43,452,500 USD | January 11, 2006 | (733,362 | ) | ||||
Unrealized loss from forward exchange contracts: | (917,380 | ) | ||||||
16,700,000 | Euro Dollar for 21,540,495 USD | November 14, 2005 | 1,358,552 | |||||
16,000,000 | Euro Dollar for 20,204,800 USD | November 30, 2005 | 852,018 | |||||
Unrealized gain from forward exchange contracts: | 2,210,570 | |||||||
Net unrealized gain (loss) from forward Exchange contracts | $ | 1,293,190 | ||||||
22 Certified Annual Report |
Thornburg Investment Income Builder Fund |
| Year Ended September 30, 2005 | Period Ended September 30, 2004(c) | |||||||
Class I Shares: | ||||||||
PER SHARE PERFORMANCE | ||||||||
(for a share outstanding throughout the period)+ | ||||||||
Net asset value, beginning of period | $ | 15.64 | $ | 14.45 | ||||
Income from investment operations: | ||||||||
Net investment income (loss) | 0.84 | 0.74 | ||||||
Net realized and unrealized gain (loss) on investments | 2.22 | 1.01 | ||||||
Total from investment operations | 3.06 | 1.75 | ||||||
Less dividends from: | ||||||||
Net investment income | (0.67 | ) | (0.56 | ) | ||||
Change in net asset value | 2.39 | 1.19 | ||||||
NET ASSET VALUE, end of period | $ | 18.03 | $ | 15.64 | ||||
RATIOS/SUPPLEMENTAL DATA | ||||||||
Total return(a) | 19.73 | % | 12.19 | % | ||||
Ratios to average net assets: | ||||||||
Net investment income (loss) | 4.86 | % | 5.33 | %(b) | ||||
Expenses, after expense reductions | 1.00 | % | 0.99 | %(b) | ||||
Expenses, after expense reductions and net of custody credits | 0.99 | % | 0.99 | %(b) | ||||
Expenses, before expense reductions | 1.09 | % | 1.21 | %(b) | ||||
Portfolio turnover rate | 76.76 | % | 109.21 | % | ||||
Net assets at end of period (000) | $ | 129,110 | $ | 33,247 | ||||
| (a) | Not annualized for periods less than one year. |
| (b) | Annualized. |
| (c) | Effective date of Class I Shares was November 1, 2003. |
| + | Based on weighted average shares outstanding. |
| Certified Annual Report 23 |
Thornburg Investment Income Builder Fund | September 30, 2005 |
CUSIPS: CLASS A - 885-215-558, CLASS C - 885-215-541, CLASS I - 885-215-467, CLASS R1 - 885-215-384
NASDAQ SYMBOLS: CLASS A - TIBAX, CLASS C - TIBCX, CLASS I - TIBIX, CLASS R1 - TIBRX
| Shares/ Principal Amount | Value | ||||
COMMON STOCK — 88.02% | |||||
AUTOMOBILES & COMPONENTS — 0.86% | |||||
AUTOMOBILES — 0.86% | |||||
Hero Honda Motors Ltd. | 500,000 | $ | 8,438,531 | ||
| 8,438,531 | |||||
BANKS — 8.18% | |||||
COMMERCIAL BANKS — 8.18% | |||||
Bank of America Corp. | 420,000 | 17,682,000 | |||
Bank of Ireland Group | 378,527 | 5,979,204 | |||
Barclays plc | 2,600,000 | 26,360,537 | |||
Liechtenstein Landesbank | 20,000 | 11,636,928 | |||
Lloyds TSB Group plc | 1,825,000 | 15,080,163 | |||
Royal Bank of Scotland Group plc | 128,615 | 3,661,625 | |||
| 80,400,457 | |||||
CAPITAL GOODS — 3.43% | |||||
INDUSTRIAL CONGLOMERATES — 3.43% | |||||
General Electric Co. | 1,000,000 | 33,670,000 | |||
| 33,670,000 | |||||
COMMERCIAL SERVICES & SUPPLIES — 2.83% | |||||
COMMERCIAL SERVICES & SUPPLIES — 2.83% | |||||
Synagro Technologies, Inc. | 5,924,455 | 27,844,938 | |||
| 27,844,938 | |||||
CONSUMER SERVICES — 0.76% | |||||
HOTELS RESTAURANTS & LEISURE — 0.76% | |||||
Berjaya Sports | 7,000,000 | 7,429,026 | |||
| 7,429,026 | |||||
DIVERSIFIED FINANCIALS — 11.64% | |||||
CAPITAL MARKETS — 2.53% | |||||
The Bank of New York Co. Inc. | 400,000 | 11,764,000 | |||
WP Stewart & Co. Ltd. | 584,200 | 13,039,344 | |||
24 Certified Annual Report |
SCHEDULE OF INVESTMENTS, CONTINUED
Thornburg Investment Income Builder Fund | September 30, 2005 |
| Shares/ Principal Amount | Value | ||||
DIVERSIFIED FINANCIAL SERVICES — 9.11% | |||||
Alliance Capital Management Holdings LP | 350,000 | $ | 16,747,500 | ||
Citigroup Inc. | 575,000 | 26,174,000 | |||
Hong Kong Exchanges & Clearing Ltd. | 4,500,000 | 15,431,323 | |||
JPMorgan Chase & Co. | 700,000 | 23,751,000 | |||
Singapore Exchange Ltd. | 5,000,000 | 7,454,518 | |||
| 114,361,685 | |||||
ENERGY — 15.62% | |||||
OIL, GAS & CONSUMABLE FUELS — 15.62% | |||||
BP Amoco ADR | 400,000 | 28,340,000 | |||
Canadian Oil Sands Trust | 275,000 | 30,426,590 | |||
ChevronTexaco Corp. | 400,000 | 25,892,000 | |||
Eni S.p.A. | 1,000,000 | 29,795,316 | |||
Marathon Oil Corp. | 300,000 | 20,679,000 | |||
Petrochina Co. Ltd. ADR | 220,000 | 18,341,400 | |||
| 153,474,306 | |||||
FOOD & STAPLES RETAILING — 2.68% | |||||
FOOD & STAPLES RETAILING — 2.68% | |||||
Tesco plc | 4,800,000 | 26,286,222 | |||
| 26,286,222 | |||||
FOOD BEVERAGE & TOBACCO — 4.23% | |||||
FOOD PRODUCTS — 1.04% | |||||
Reddy Ice Holdings, Inc. | 500,000 | 10,255,000 | |||
TOBACCO — 3.19% | |||||
Altria Group Inc. | 425,000 | 31,326,750 | |||
| 41,581,750 | |||||
HOUSEHOLD & PERSONAL PRODUCTS — 0.87% | |||||
HOUSEHOLD PRODUCTS — 0.87% | |||||
Kimberly Clark de Mexico | 2,280,000 | 8,577,663 | |||
| 8,577,663 | |||||
MATERIALS — 2.66% | |||||
CHEMICALS — 2.66% | |||||
Dow Chemical Co. | 500,000 | 20,835,000 | |||
PPG Industries Inc. | 90,200 | 5,338,938 | |||
| 26,173,938 | |||||
| Certified Annual Report 25 |
| SCHEDULE OF INVESTMENTS, CONTINUED | ||
Thornburg Investment Income Builder Fund | September 30, 2005 | |
| Shares/ Principal Amount | Value | ||||
MEDIA — 0.58% | |||||
MEDIA — 0.58% | |||||
APN News & Media | 1,500,000 | $ | 5,732,249 | ||
| 5,732,249 | |||||
PHARMACEUTICALS & BIOTECHNOLOGY — 6.90% | |||||
PHARMACEUTICALS — 6.90% | |||||
GlaxoSmithKline plc | 1,150,000 | 29,341,978 | |||
Pfizer Inc. | 1,275,000 | 31,836,750 | |||
Sanofi-Aventis | 80,000 | 6,631,899 | |||
| 67,810,627 | |||||
REAL ESTATE — 5.65% | |||||
REAL ESTATE — 5.65% | |||||
Boston Properties Inc. | 130,000 | 9,217,000 | |||
Equity Inns Inc. | 400,000 | 5,400,000 | |||
Highland Hospitality Corp. | 1,025,000 | 10,516,500 | |||
Host Marriott Corp. | 1,800,000 | 30,420,000 | |||
| 55,553,500 | |||||
SEMICONDUCTORS & SEMICONDUCTOR EQUIPMENT — 1.15% | |||||
SEMICONDUCTORS & SEMICONDUCTOR EQUIPMENT — 1.15% | |||||
Samsung Electronics Co. Ltd. | 20,000 | 11,280,576 | |||
| 11,280,576 | |||||
TELECOMMUNICATION SERVICES — 6.95% | |||||
DIVERSIFIED TELECOMMUNICATION SERVICES — 4.03% | |||||
Alltel Corp. | 315,000 | 20,509,650 | |||
Chunghwa Telecom Co. Ltd. ADR | 450,000 | 8,329,500 | |||
TDC A/S | 200,000 | 10,793,169 | |||
WIRELESS TELECOMMUNICATION SERVICES — 2.92% | |||||
Vodafone Group plc | 11,000,000 | 28,708,532 | |||
| 68,340,851 | |||||
TRANSPORTATION — 4.47% | |||||
TRANSPORTATION INFRASTRUCTURE — 4.47% | |||||
China Merchants Hldgs International Co. Ltd. | 4,500,000 | 10,036,161 | |||
Hopewell Highway | 12,000,000 | 8,508,499 | |||
Macquarie Infrastructure Co. | 600,000 | 16,920,000 | |||
Shenzhen Chiwan Wharf Holdings Ltd. | 5,410,060 | 8,501,877 | |||
| 43,966,537 | |||||
26 Certified Annual Report |
| SCHEDULE OF INVESTMENTS, CONTINUED | ||
Thornburg Investment Income Builder Fund | September 30, 2005 | |
| Shares/ Principal Amount | Value | |||||
UTILITIES — 8.56% | ||||||
ELECTRIC UTILITIES — 4.28% | ||||||
Companhia Energetica de Minas Gerais | 250,000 | $ | 9,520,000 | |||
Enel S.p.A. | 2,140,000 | 18,501,552 | ||||
Iberdrola S.A. | 500,000 | 14,017,424 | ||||
GAS UTILITIES — 1.04% | ||||||
Snam Rete Gas S.p.A. | 1,750,000 | 10,234,227 | ||||
MULTI-UTILITIES — 3.24% | ||||||
Dominion Resources, Inc. | 370,000 | 31,871,800 | ||||
| 84,145,003 | ||||||
TOTAL COMMON STOCK (Cost $784,030,336) | 865,067,859 | |||||
PREFERRED STOCK — 2.62% | ||||||
BANKS — 1.22% | ||||||
COMMERCIAL BANKS — 1.22% | ||||||
First Tennessee Bank | 12,000 | 12,006,750 | ||||
| 12,006,750 | ||||||
DIVERSIFIED FINANCIALS — 1.40% | ||||||
DIVERSIFIED FINANCIAL SERVICES — 1.40% | ||||||
Lehman Brothers Holdings Inc. | 140,000 | 3,540,600 | ||||
Merrill Lynch & Co. Inc. | 420,000 | 10,185,000 | ||||
| 13,725,600 | ||||||
TOTAL PREFERRED STOCK (Cost $26,008,250) | 25,732,350 | |||||
CORPORATE BONDS — 2.98% | ||||||
COMMERCIAL SERVICES & SUPPLIES — 0.07% | ||||||
COMMERCIAL SERVICES & SUPPLIES — 0.07% | ||||||
Allied Waste North America Inc., 6.375%, 4/15/2011 | $ | 500,000 | 478,750 | |||
Waste Management Inc., 7.375%, 8/1/2010 | 175,000 | 192,440 | ||||
| 671,190 | ||||||
DIVERSIFIED FINANCIALS — 0.64% | ||||||
DIVERSIFIED FINANCIAL SERVICES — 0.64% | ||||||
Capital One Bank, 6.70%, 5/15/2008 | 655,000 | 684,498 | ||||
Capital One Bank, 6.50%, 6/13/2013 | 1,500,000 | 1,609,090 | ||||
SLM Corp. CPI Floating Rate Note, 4.65%, 1/31/2014 | 2,000,000 | 1,989,780 | ||||
SLM Corp. CPI Floating Rate Note, 3.73%, 3/2/2009 | 2,000,000 | 1,975,160 | ||||
| 6,258,528 | ||||||
| Certified Annual Report 27 |
| SCHEDULE OF INVESTMENTS, CONTINUED | ||
Thornburg Investment Income Builder Fund | September 30, 2005 | |
| Shares/ Principal Amount | Value | |||||
INSURANCE — 0.49% | ||||||
INSURANCE — 0.49% | ||||||
AAG Holding Co. Inc., 6.875%, 6/1/2008 | $ | 335,000 | $ | 343,148 | ||
Hartford Life Inc., 7.10%, 6/15/2007 | 400,000 | 415,672 | ||||
Liberty Mutual Group Inc., 5.75%, 3/15/2014 | 1,000,000 | 977,124 | ||||
Old Republic International Corp., 7.00%, 6/15/2007 | 1,000,000 | 1,033,815 | ||||
Pacific Life Global Funding CPI Floating Rate Note, 5.35%, 2/6/2016 | 2,000,000 | 1,989,500 | ||||
| 4,759,259 | ||||||
MEDIA — 0.12% | ||||||
MEDIA — 0.12% | ||||||
AOL Time Warner Inc., 6.875%, 5/1/2012 | 425,000 | 464,476 | ||||
Independent News & Media plc, 5.75%, 5/17/2009 | 600,000 | 736,141 | ||||
| 1,200,617 | ||||||
PHARMACEUTICALS & BIOTECHNOLOGY — 0.49% | ||||||
BIOTECHNOLOGY — 0.49% | ||||||
Tiers Inflation Linked Trust Series Wyeth 2004 21 Trust Certificate | ||||||
CPI Floating Rate Note, 4.653%, 2/1/2014 | 5,000,000 | 4,850,350 | ||||
| 4,850,350 | ||||||
REAL ESTATE — 0.16% | ||||||
REAL ESTATE — 0.16% | ||||||
MDC Holdings Inc., 7.00%, 12/1/2012 | 1,500,000 | 1,613,258 | ||||
| 1,613,258 | ||||||
TECHNOLOGY HARDWARE & EQUIPMENT — 0.05% | ||||||
COMPUTERS & PERIPHERALS — 0.05% | ||||||
Jabil Circuit Inc., 5.875%, 7/15/2010 | 500,000 | 512,160 | ||||
| 512,160 | ||||||
TELECOMMUNICATION SERVICES — 0.81% | ||||||
DIVERSIFIED TELECOMMUNICATION SERVICES — 0.81% | ||||||
Level 3 Communications Inc., 9.125%, 5/1/2008 | 2,500,000 | 2,037,500 | ||||
Level 3 Communications Inc., 10.50%, 12/1/2008 | 4,000,000 | 3,280,000 | ||||
TCI Communications Inc., 7.875%, 8/1/2013 | 2,285,000 | 2,641,928 | ||||
| 7,959,428 | ||||||
28 Certified Annual Report |
SCHEDULE OF INVESTMENTS, CONTINUED
Thornburg Investment Income Builder Fund | September 30, 2005 |
| Shares/ Principal Amount | Value | |||||
UTILITIES — 0.15% | ||||||
GAS UTILITIES — 0.15% | ||||||
Sonat Inc., 7.625%, 7/15/2011 | $ | 1,400,000 | $ | 1,421,000 | ||
| 1,421,000 | ||||||
TOTAL CORPORATE BONDS (Cost $28,744,625) | 29,245,790 | |||||
CONVERTIBLE BONDS — 0.81% | ||||||
DIVERSIFIED FINANCIALS — 0.01% | ||||||
CAPITAL MARKETS — 0.01% | ||||||
E-Trade Financial Corp., 6.00%, 2/1/2007 | 132,000 | 133,485 | ||||
| 133,485 | ||||||
TELECOMMUNICATION SERVICES — 0.80% | ||||||
DIVERSIFIED TELECOMMUNICATION SERVICES — 0.80% | ||||||
Level 3 Communications Inc., 6.00%, 9/15/2009 | 250,000 | 130,937 | ||||
Level 3 Communications Inc., 6.00%, 3/15/2010 | 15,025,000 | 7,719,094 | ||||
| 7,850,031 | ||||||
TOTAL CONVERTIBLE BONDS (Cost $8,975,231) | 7,983,516 | |||||
TAXABLE MUNICIPAL BONDS — 0.60% | ||||||
Short Pump Town Center Community Development, 6.26%, 2/1/2009 | 2,000,000 | 2,043,560 | ||||
Victor New York, 9.05%, 5/1/2008 | 1,690,000 | 1,727,755 | ||||
Victor New York, 9.20%, 5/1/2014 | 2,000,000 | 2,105,340 | ||||
TOTAL TAXABLE MUNICIPAL BONDS (Cost $5,888,475) | 5,876,655 | |||||
U.S. GOVERNMENT AGENCIES — 0.20% | ||||||
Federal National Mtg Assoc CPI Floating Rate Note, 3.67%, 2/17/2009 | 2,000,000 | 1,992,460 | ||||
TOTAL U.S. GOVERNMENT AGENCIES (Cost $2,000,000) | 1,992,460 | |||||
SHORT TERM INVESTMENTS — 3.15% | ||||||
American Express Credit Corp., 3.68%, 10/5/2005 | 15,000,000 | 14,993,866 | ||||
UBS Finance, 3.84%, 10/3/2005 | 16,000,000 | 15,996,587 | ||||
TOTAL SHORT TERM INVESTMENTS (Cost $30,990,453) | 30,990,453 | |||||
| Certified Annual Report 29 |
SCHEDULE OF INVESTMENTS, CONTINUED
Thornburg Investment Income Builder Fund | September 30, 2005 |
| Shares/ Principal Amount | Value | ||||
TOTAL INVESTMENTS — 98.38% (COST $886,105,687) | $ | 966,889,083 | |||
OTHER ASSETS LESS LIABILITIES — 1.62% | 15,904,267 | ||||
NET ASSETS — 100.00% | $ | 982,793,350 | |||
Footnote Legend
See notes to financial statements.
Portfolio Abbreviations
To simplify the listings of securities, abbreviations are used per the table below:
ADR American Depository Receipt
SUMMARY OF INDUSTRY EXPOSURE
As of 9/30/05
Energy | 15.6 | % | |
Diversified Financials | 13.7 | % | |
Banks | 9.4 | % | |
Utilities | 8.7 | % | |
Telecommunication Services | 8.5 | % | |
Pharmaceuticals & Biotechnology | 7.4 | % | |
Real Estate | 5.8 | % | |
Transportation | 4.5 | % | |
Food Beverage & Tobacco | 4.2 | % | |
Capital Goods | 3.4 | % | |
Commercial Service & Supply | 2.9 | % | |
Food Staples Retailing | 2.7 | % | |
Materials | 2.7 | % | |
Semiconductors & Semiconductor Equip. | 1.1 | % | |
Household & Personal Products | 0.9 | % | |
Automobiles & Components | 0.8 | % | |
Consumer Services | 0.8 | % | |
Media | 0.7 | % | |
Insurance | 0.5 | % | |
Technology Hardware & Equipment | 0.1 | % | |
Municipal Bonds | 0.6 | % | |
U.S. Government Agencies | 0.2 | % | |
Other Assets & Cash Equivalents | 4.8 | % |
SUMMARY OF COUNTRY EXPOSURE
As of 9/30/05
U.S. | 52.1 | % | |
U.K. | 16.0 | % | |
Italy | 6.0 | % | |
China | 4.6 | % | |
Canada | 3.1 | % | |
Hong Kong | 1.6 | % | |
Spain | 1.4 | % | |
Switzerland | 1.2 | % | |
South Korea | 1.1 | % | |
Denmark | 1.1 | % | |
Brazil | 1.0 | % | |
Mexico | 0.9 | % | |
India | 0.9 | % | |
Taiwan | 0.8 | % | |
Singapore | 0.7 | % | |
Malaysia | 0.7 | % | |
Ireland | 0.7 | % | |
France | 0.7 | % | |
Australia | 0.6 | % | |
Other Assets and Cash Equivalents | 4.8 | % |
30 Certified Annual Report |
REPORT OF INDEPENDENT REGISTERED PUBLIC ACCOUNTING FIRM
Thornburg Investment Income Builder Fund
To the Trustees and Class I Shareholders of Thornburg Investment Income Builder Fund
In our opinion, the accompanying statement of assets and liabilities, including the schedule of investments, and the related statements of operations and of changes in net assets and the financial highlights present fairly, in all material respects, the financial position of Thornburg Investment Income Builder Fund (one of the portfolios constituting Thornburg Investment Trust, hereafter referred to as the “Fund”) at September 30, 2005, the results of its operations for the year then ended, the changes in its net assets for each of the two years in the period then ended and the financial highlights for Class I shares for each of the periods presented, in conformity with accounting principles generally accepted in the United States of America. These financial statements and financial highlights (hereafter referred to as “financial statements”) are the responsibility of the Fund’s management. Our responsibility is to express an opinion on these financial statements based on our audits. We conducted our audits of these financial statements in accordance with the standards of the Public Company Accounting Oversight Board (United States). Those standards require that we plan and perform the audit to obtain reasonable assurance about whether the financial statements are free of material misstatement. An audit includes examining, on a test basis, evidence supporting the amounts and disclosures in the financial statements, assessing the accounting principles used and significant estimates made by management, and evaluating the overall financial statement presentation. We believe that our audits, which included confirmation of securities at September 30, 2005 by correspondence with the custodian and brokers, provide a reasonable basis for our opinion.
PricewaterhouseCoopers LLP
New York, New York
November 16, 2005
| Certified Annual Report 31 |
Thornburg Investment Income Builder Fund | September 30, 2005 | (Unaudited) | |
As a shareholder of the Fund, you incur two types of costs:
(1) transaction costs, including a 90-day redemption fee on Class I shares and
(2) ongoing costs, including management and administrative fees and other Fund expenses.
This example is intended to help you understand your ongoing costs (in dollars) of investing in the Fund and to compare these costs with the ongoing costs of investing in other mutual funds.
The example is based on an investment of $1,000 invested on March 31, 2005 and held until September 30, 2005.
Actual Expenses
The first line of the table at right provides information about actual account values and actual expenses. You may use the information in this line, together with the amount you invested, to estimate the expenses that you paid over the period. Simply divide your account value by $1,000 (for example, an $8,600 account value divided by $1,000 = 8.6), then multiply the result by the number in the first line under the heading entitled “Expenses Paid During Period” to estimate the expenses you paid on your account during this period.
Hypothetical Example for Comparison Purposes
The second line of the table at right provides information about hypothetical account values and hypothetical expenses based on the Fund’s actual expense ratio and an assumed rate of return of 5% per year before expenses, which is not the Fund’s actual return. The hypothetical account values and expenses may not be used to estimate the actual ending account balance or expenses you paid for the period. You may use this information to compare the ongoing costs of investing in the Fund and other funds. To do so, compare this 5% hypothetical example with the 5% hypothetical examples that appear in the shareholder reports of the other funds.
Please note that the expenses shown in the table are meant to highlight your ongoing costs only and do not reflect any transactional costs, such as sales charges (loads), redemption fees, or exchange fees. Therefore, the second line of the table is useful in comparing ongoing costs only, and will not help you determine the relative total costs of owning different funds. In addition, if these transactional costs were included, your costs would have been higher.
| Beginning Account Value 3/31/05 | Ending Account Value 9/30/05 | Expenses Paid During Period† 3/31/05–9/30/05 | |||||||
Class I Shares | |||||||||
Actual | $ | 1,000.00 | $ | 1,061.80 | $ | 5.12 | |||
Hypothetical* | $ | 1,000.00 | $ | 1,020.10 | $ | 5.01 | |||
| † | Expenses are equal to the annualized expense ratio for Class I shares (0.99%) multiplied by the average account value over the period, multiplied by 183/365 to reflect the one-half year period. |
| * | Hypothetical assumes a rate of return of 5% per year before expenses. |
32 Certified Annual Report |
Thornburg Investment Income Builder Fund | September 30, 2005 | (Unaudited) | |
GROWTH OF A HYPOTHETICAL $10,000 INVESTMENT
Thornburg Investment Income Builder Fund versus Blended Index (November 3, 2003 to September 30, 2005)
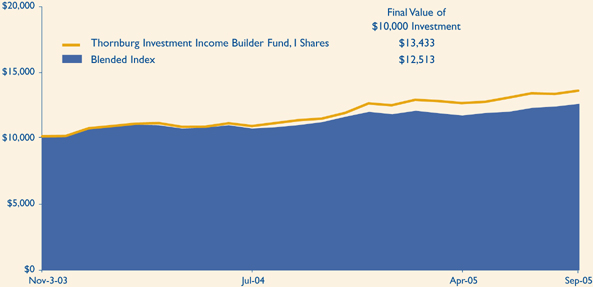
AVERAGE ANNUAL TOTAL RETURNS
For periods ended September 30, 2005
| 1Yr | Since Inception | |||||
I Shares (Incep: 11/3/03) | 19.73 | % | 16.71 | % | ||
Blended Index (Since: 11/3/03) | 14.70 | % | 12.41 | % |
Performance data reflects past performance, which is no guarantee of future results. The performance data and graph do not reflect the deduction of taxes that a shareholder would pay on distributions or the redemption of Fund shares.
Returns reflect the reinvestment of dividends and capital gains. There is no up-front sales charge for Class I shares. Class I shares are subject to a 1% 90-day redemption fee.
The blended index is comprised of 25% Lehman Brothers Aggregate Bond Index and 75% MSCI World Equity Index. The Lehman Brothers Aggregate Bond Index is composed of approximately 6,000 publicly traded bonds including U.S. government, mortgage-backed, corporate and Yankee bonds with an average maturity of approximately 10 years. The index is weighted by the market value of the bond included in the index. This index represents asset types which are subject to risk, including loss of principal. The Morgan Stanley Capital International World Equity Index is a total return index, reported in U.S. dollars, based on share prices and reinvested gross dividends. The securities represented in this index may experience loss of invested principal and are subject to investment risk. In exchange for greater growth potential, investments in foreign securities can have added risks. These include changes in currency rates, economic and monetary policy, differences in auditing standards and risks related to political and economic developments. Unless otherwise noted, index returns reflect the reinvestment of income dividends and capital gains, if any, but do not reflect fees, brokerage commissions or other expenses of investing. Investors may not make direct investments into any index. The performance of any index is not indicative of the performance of any particular investment.
| Certified Annual Report 33 |
Thornburg Investment Income Builder Fund | September 30, 2005 | (Unaudited) | |
Name, Age, Position Held with Fund Year Elected | Principal Occupation(s) During Past Five Years | Other Directorships Held | ||
INTERESTED TRUSTEES(1)(2)(4) | ||||
Garrett Thornburg, 59 Chairman of Trustees, Trustee since 1987(3) | CEO, Chairman and controlling shareholder of Thornburg Investment Management, Inc. (investment advisor) and Thornburg Securities Corporation (securities dealer); Chairman of Thornburg Limited Term Municipal Fund, Inc. (registered investment company) to 2004; CEO and Chairman of Thornburg Mortgage, Inc. (real estate investment trust); Chairman of Thornburg Mortgage Advisory Corporation (investment manager to Thornburg Mortgage, Inc.). | Director of Thornburg Mortgage, Inc. (real estate investment trust) | ||
Brian J. McMahon, 49 Trustee since 2001, Member of Governance & Nominating Committee, President since 1997(5)(6) | President and Managing Director of Thornburg Investment Management, Inc.; President of Thornburg Limited Term Municipal Fund, Inc. to 2004. | None | ||
INDEPENDENT TRUSTEES(1)(2)(4) | ||||
David A.Ater, 60 Trustee since 1994, Member of Audit Committee and Governance & Nominating Committee | Principal in Ater & Associates, Santa Fe, NM (developer, planner and broker of residential and commercial real estate); owner developer and broker for various real estate projects. | Director of Thornburg Mortgage, Inc. (real estate investment trust) | ||
David D. Chase, 64 Chairman of Audit Committee, Trustee since 2000 | Chairman, President, CEO, and Managing Member of Vestor Associates, LLC, the general partner of Vestor Partners, LP, Santa Fe, NM (private equity fund); Chairman and CEO of Vestor Holdings, Inc., Santa Fe, NM (merchant bank). | None | ||
Eliot R. Cutler, 59 Chairman of Governance & Nominating Committee, Trustee since 2004 | Partner, Akin, Gump, Strauss, Hauer & Feld, LLP, Washington, D.C. (law firm) since November 2000; partner, Cutler & Stanfield, Washington, D.C. (law firm) until November 2000. | Director of Thornburg Mortgage, Inc. (real estate investment trust) | ||
Susan H. Dubin, 56 Trustee since 2004, Member of Audit Committee | President of Dubin Investments, Ltd., Greenwich, CT (private investment fund); Director and officer of various charitable organizations; and formerly, Vice President of Chemical Bank (predecessor to JP Morgan Chase & Co.), New York, 1974–1996. | None | ||
Owen D.Van Essen, 51 Trustee since 2004, Member of Governance & Nominating Committee | President of Dirks, Van Essen & Murray, Santa Fe, NM (newspaper mergers and acquisitions). | None | ||
James W. Weyhrauch, 46 Trustee since 1996, Member of Audit Committee | Director, Executive Vice President to 2002, and President and CEO 2002–2004, Nambé Mills, Inc., Santa Fe, NM (manufacturer); real estate agent, Santa Fe Properties, Santa Fe, NM since 2004. | None | ||
34 Certified Annual Report |
TRUSTEES AND OFFICERS, CONTINUED
Thornburg Investment Income Builder Fund | September 30, 2005 | (Unaudited) |
Name, Age, Position Held with Fund Year Elected | Principal Occupation(s) During Past Five Years | Other Directorships Held by Trustee | ||
OFFICERS OF THE FUND (WHO ARE NOT TRUSTEES)(1)(6)(7) | ||||
| Dawn B. Fischer, 58 Secretary since 1987 | Secretary and Managing Director, Thornburg Investment Management, Inc.; Secretary, Thornburg Limited Term Municipal Fund, Inc. to 2004; Secretary, Thornburg Securities Corporation; Vice President, Daily Tax Free Income Fund, Inc. (registered investment company). | Not applicable | ||
Steven J. Bohlin, 46 Vice President since 1987; Treasurer since 1989 | Vice President and Managing Director of Thornburg Investment Management, Inc.; Vice President of Thornburg Limited Term Municipal Fund, Inc. to 2004. | Not applicable | ||
George T. Strickland, 42 Vice President since 1996 | Vice President and Managing Director of Thornburg Investment Management, Inc.; Vice President (to 2004) and Treasurer (2003–2004) of Thornburg Limited Term Municipal Fund, Inc. | Not applicable | ||
William V. Fries, 66 Vice President since 1995 | Vice President and Managing Director of Thornburg Investment Management, Inc. | Not applicable | ||
Leigh Moiola, 38 Vice President since 2001 | Vice President and Managing Director of Thornburg Investment Management, Inc.; Vice President of Thornburg Limited Term Municipal Fund, Inc. 1999–2004. | Not applicable | ||
| Kenneth Ziesenheim, 51 Vice President since 1995 | Vice President and Managing Director of Thornburg Investment Management, Inc.; President of Thornburg Securities Corporation; Vice President of Thornburg Limited Term Municipal Fund, Inc. to 2004. | Not applicable | ||
Alexander Motola, 35 Vice President since 2001 | Vice President and Managing Director of Thornburg Investment Management, Inc. since 2000; Portfolio Manager, Insight Capital Research & Management, Inc., Walnut Creek, California 1995–2000. | Not applicable | ||
Wendy Trevisani, 34 Vice President since 1999 | Associate Portfolio Manager of Thornburg Investment Management, Inc. since 1999, Vice President since 2000 and Managing Director since 2003; Vice President of Thornburg Limited Term Municipal Fund, Inc. 1999–2002. | Not applicable | ||
Joshua Gonze, 42 Vice President since 1999 | Associate Portfolio Manager of Thornburg Investment Management, Inc. since 1999, Vice President since 1999 and Managing Director since 2003; Vice President of Thornburg Limited Term Municipal Fund, Inc. to 2004. | Not applicable | ||
Brad Kinkelaar, 37 Vice President since 1999 | Associate Portfolio Manager of Thornburg Investment Management, Inc. since 1999, Vice President since 2000 and Managing Director since 2003. | Not applicable | ||
Christopher Ihlefeld, 35 Vice President since 2003 | Associate Portfolio Manager since 1999; Vice President of Thornburg Investment Management, Inc. since 2002; Vice President of Limited Term Municipal Fund, Inc., 2003–2004. | Not applicable | ||
Leon Sandersfeld, 39 Vice President since 2003 | Associate of Thornburg Investment Management, Inc. since 2002; Senior Staff Accountant, Farm Bureau Life Insurance Co. 1998–2002. | Not applicable | ||
| Certified Annual Report 35 |
TRUSTEES AND OFFICERS, CONTINUED
Thornburg Investment Income Builder Fund | September 30, 2005 | (Unaudited) |
Name, Age, Position Held | Principal Occupation(s) During Past Five Years | Other Directorships Held by Trustee | ||
| Sasha Wilcoxon, 31 Vice President since 2003 | Associate of Thornburg Investment Management, Inc. since 2000 and Mutual Fund Operations Department Manager since 2002. | Not applicable | ||
Ed Maran, 47 Vice President since 2004 | Associate Portfolio Manager of Thornburg Investment Management, Inc. since 2002 and Vice President and Managing Director since 2004; Analyst, USAA 2001–2002; Oil Analyst, A.G. Edwards 1997–2000. | Not applicable | ||
Vinson Walden, 35 Vice President since 2004 | Associate Portfolio Manager of Thornburg Investment Management, Inc. since 2002 and Vice President and Managing Director since 2004; Associate Portfolio Manager, Ibis Management 2002–2004; Associate, Lehman Brothers, 1997–2001. | Not applicable | ||
| (1) | Each person’s address is 119 East Marcy Street, Santa Fe, New Mexico 87501. |
| (2) | The Fund is one of twelve separate investment “Funds” or “series” of Thornburg Investment Trust (the “Trust”), which comprises the Thornburg mutual fund complex and is organized as a Massachusetts business trust. The Trust currently has twelve active Funds. Thornburg Investment Management, Inc. is the investment advisor to, and manages, the twelve Funds of the Trust. Each Trustee oversees the twelve Funds in the fund complex. |
| (3) | Mr. Thornburg is considered an “interested” Trustee under the Investment Company Act of 1940 because he is a director and controlling shareholder of Thornburg Investment Management, Inc., the investment advisor to the twelve active Funds of the Trust, and is the sole director and controlling shareholder of Thornburg Securities Corporation, the distributor of shares for the Trust. |
| (4) | Each Trustee serves in office until the election and qualification of a successor. |
| (5) | Mr. McMahon is considered an “interested” Trustee because he is the president of Thornburg Investment Management, Inc. |
| (6) | The Trust’s president, secretary and treasurer each serves a one-year term or until the election and qualification of a successor; each other officer serves at the pleasure of the Trustees. |
| (7) | Assistant vice presidents, assistant secretaries and assistant treasurers are not shown. |
The Statement of Additional Information for each Fund of the Trust includes additional information about the Trustees and is available, without charge and upon request, by calling 1-800-847-0200.
36 Certified Annual Report |
Thornburg Investment Income Builder Fund | September 30, 2005 | (Unaudited) |
PORTFOLIO PROXY VOTING
Policies and Procedures:
The Trust has delegated to Thornburg Investment Management, Inc. (the “Advisor”) voting decisions respecting proxies for the Fund’s voting securities. The Advisor makes voting decisions in accordance with its Proxy Voting Policy and Procedures. A description of the Policy and Procedures is available (i) without charge, upon request, by calling the Advisor toll-free at 1-800-847-0200, (ii) on the Thornburg website at www.thornburg.com, and (iii) on the Securities and Exchange Commission’s website at www.sec.gov.
Commencing August 31, 2004, information regarding how proxies were voted is available on or before August 31 of each year for the twelve months ending the preceding June 30. This information is available (i) without charge, upon request by calling the Advisor toll-free at 1-800-847-0200, (ii) on the Thornburg website at www.thornburg.com, and (iii) on the Securities and Exchange Commission’s website at www.sec.gov.
TAX INFORMATION
For the fiscal year ended September 30, 2005, the Fund designates long-term capital gain dividends of $2,839.
For the tax year ended September 30, 2005, the Thornburg Investment Income Builder Fund designates 89.92% of the dividends paid from tax basis net ordinary income as qualifying for the reduced rate under the Jobs and Growth Tax Relief and Reconciliation Act of 2003.
31.01% of the ordinary income distributions paid by the Fund for the year ended September 30, 2005 qualified for the corporate dividends received deduction.
The information and distributions reported herein may differ from the information and distributions taxable to the shareholders for the calendar year ending December 31, 2005. Complete information will be computed and reported in conjunction with your 2005 Form 1099-DIV.
AVAILABILITY OF QUARTERLY PORTFOLIO SCHEDULE
The Fund files with the Securities and Exchange Commission schedules of its portfolio holdings on Form N-Q for the first and third quarters of each fiscal year. The Fund’s Forms N-Q are available on the Commission’s website at www.sec.gov, or may be reviewed and copied at the Commission’s Public Reference Room in Washington, D.C. Information on the operation of the Public Reference Room may be obtained by calling 1-800-SEC-0330. The Fund also makes this information available on its website at www.thornburg.com/download or upon request by calling 1-800-847-0200.
TRUSTEES DELIBERATIONS RESPECTING RENEWAL OF INVESTMENT ADVISORY AGREEMENT
Thornburg Investment Management, Inc. (the “Advisor”) provides investment management services to Thornburg Investment Income Builder Fund pursuant to an investment advisory agreement. The Trustees consider the renewal of this agreement annually and most recently determined to renew the agreement on September 13, 2005.
In connection with their general supervision of the Advisor, the Trustees receive and consider reports throughout the year from the Advisor respecting the Advisor’s management of the Fund’s investments. These reports include information about the Fund’s purchase and sale of portfolio investments and explanations from the Advisor respecting investment selections, the investment performance of the Fund, general appraisals of industry and economic prospects and factors, and other matters affecting the Fund and relating to the Advisor’s performance of services for the Fund.
In anticipation of their recent consideration of the advisory agreement’s renewal, the independent Trustees met with representatives of the Advisor in May and July 2005 to specify the information the Advisor would present to the Trustees for their review. The independent Trustees thereafter met in independent session to consider various factors respecting the agreement’s renewal, and met in a subsequent session with the Advisor’s chief investment officer to present questions. Following these sessions, the Trustees met on September 13, 2005 to consider a renewal of the advisory agreement.
The Trustees considered various factors in their review of the Advisor’s performance under the investment advisory agreement, including specifically the principles outlined in their February 2005 Statement to Shareholders, a copy of which accompanies this Annual Report to Shareholders. Summarized below are certain of the factors considered by the Trustees, in connection with the determination to renew the advisory agreement. In determining to renew the advisory agreement, the Trustees did not identify any single fact or aspect of the Advisor’s performance as controlling, and this summary does not describe all of the matters considered by the Trustees in making their determination.
Quality of Services; Fund Investment Performance. In reviewing the nature, extent, and quality of services provided by the Advisor and the investment performance of the Fund, the Trustees primarily considered the Advisor’s adherence to the Fund’s stated objectives and policies, the Advisor’s execution of the Fund’s investment strategies in prevailing market conditions, the Fund’s absolute investment performance, the Fund’s investment performance compared to categories of other mutual funds and a blended securities index, the Fund’s investment performance over different periods of time, the Fund’s returns in rising and declining markets compared to total
| Certified Annual Report 37 |
| OTHER INFORMATION, CONTINUED | ||
Thornburg Investment Income Builder Fund | September 30, 2005 (Unaudited) | |
returns of a blended securities index, measures of relative portfolio risk, and related factors. The Trustees noted in comparing the Fund to other mutual funds and to indices that the value of such comparisons may be limited because the Fund’s investment objectives and approach, and the selection of its portfolio securities, are unique or differ in considerable degree from the characteristics of other funds and indices. In conducting their review, the Trustees observed that the Advisor had continued to faithfully pursue and to achieve the Fund’s stated objectives, as demonstrated particularly by the Advisor’s selection of investments and the Fund’s investment performance. The Trustees also noted in this regard the Fund’s exceptional investment performance as compared to a blended benchmark consisting of two broad based securities indices, and as compared to categories of mutual funds selected by independent mutual fund analyst firms.
The Trustees also considered a number of other factors in reviewing the quality of the Advisor’s services, including the qualifications and integrity of the Advisor’s senior personnel, the Advisor’s staffing and other resources, the Advisor’s compliance with regulatory requirements, Fund sales performance and perceptions of the Funds in the marketplace, and other factors.
The Trustees concluded, based upon these and other considerations, that the Advisor had actively and competently pursued the Fund’s stated investment objectives in accordance with the Fund’s investment policies stated in its prospectuses. The Trustees further concluded that the investment performance of the Fund was satisfactory in the context of the Fund’s objectives and policies and prevailing market conditions.
Fees and Expenses; Profitability of Advisor. In reviewing the fees charged by the Advisor to the Fund, the Trustees primarily considered the fees charged by the Advisor and the other expenses charged to the Fund in light of the nature and quality of services provided, comparison of the actual Advisor’s fee and Fund expenses to the statement of fees and expenses in the Fund’s prospectuses, comparisons of the Advisor’s fee and other Fund expenses to median and average fees and expenses charged to similar mutual funds, and comparisons of fees and expenses charged to the Fund with fees and expenses charged to other, similar specific mutual funds. In addition, the Trustees considered the profitability of the Advisor compared to other investment management firms, and comparisons of the investment management fee rates charged by the Advisor to the Fund with rates charged to other clients and the differing types of services furnished to the Fund and the other clients. The Trustees also noted that the Fund’s management fee was higher than the average and median fee rates for a group of equity income mutual funds selected by an independent analyst firm, and that the overall expense ratio of the Fund was somewhat higher than the average and median expense ratios for the same group of mutual funds. The Trustees recognized the unique nature of the Fund and the limited utility of the category in assessing the reasonableness of the fees charged to the Fund, the greater significance of equity investments to the Fund, and the higher management fee rates typically charged by equity fund managers. The Trustees noted in this regard the superior performance of the Fund, the comparability of the overall expense ratio, the size of the Fund, the specific services of the Advisor and other factors. The Trustees also observed in their review that fee rates charged by the Advisor to other clients of the Advisor were not directly comparable to rates charged to the Fund principally because of the significant differences in the services provided.
The Trustees concluded, based upon these and other considerations, that the fees charged to the Fund by the Advisor were fair and reasonable in view of the following: the services provided, the clear disclosure of these fees and expenses in the Fund’s prospectuses, and prevailing fees and expenses charged to mutual funds generally. The Trustees further concluded that there was no indication that the Advisor’s profitability was unusual, viewed in the context of the services provided, the performance of the Fund, and the fees and profitability of other investment management firms.
Economies of Scale. In reviewing the extent to which economies of scale would be realized by the Fund as it grows and whether fee levels reflect economies of scale, the Trustees considered the breakpoint structure for advisory fees chargeable to the Fund, the demonstrated economies of scale enjoyed by the Fund and other funds of the Trust as they had grown in size, and economies of scale realized by other mutual funds. The Trustees concluded that the Fund has realized and may reasonably be expected to realize further economies of scale for the benefit of its shareholders as it grows in size.
Ancillary Benefits to Advisor. In reviewing benefits enjoyed by the Advisor because of its relationship with the Fund, the Trustees considered an arrangement through which the Advisor received certain research services, favorable publicity received by the Advisor because of the superior investment performance of certain Funds of the Trust, and the benefits to the Fund from the Advisor’s expansion of its staffing and other resources to serve a broader variety of investment clients. The Trustees concluded, based upon these and other considerations, that there was no unusual or unfair benefit enjoyed by the Advisor and that the Fund enjoyed benefits by virtue of the Advisor’s engagement by other investment clients.
38 Certified Annual Report
Trustees’ Statement to Shareholders
Not part of the Certified Annual Report
February 8, 2005
The Trustees are concerned that recent commentaries and opinions reported in the media may confuse investors in general as to the supervisory duties of trustees of mutual funds and, in particular, leave Thornburg Investment Trust shareholders uncertain regarding how we discharge our responsibilities in supervising the Funds’ investment advisor and in reviewing the advisor’s contract for renewal. We decided to spell out clearly three principal guidelines that we follow in supervising the Trust’s investment advisor on your behalf.
We begin with the premise that each shareholder selected his or her Fund because its investments are managed by the investment advisor identified in the prospectus and in accordance with the objective and policies described in the prospectus. We realize, as each of you do, that if you believe that your Fund’s stated objective and policies no longer serve your personal investment goals, you can sell your shares and leave the Fund.
Therefore, we believe that our primary supervisory task – our principal obligation to you – is to assess the nature and quality of the advisor’s services, and to confirm that the advisor actively and competently pursues the Fund’s objective, in accordance with the policies set out in the prospectus. To do this, we meet regularly with management to review your Fund’s portfolio and to discuss the advisor’s specific actions and judgments in pursuing the Fund’s objective. We do not substitute our own judgment for the advisor’s decisions in selecting investments; the advisor is paid to exercise its informed judgment on investment decisions, and we seek to confirm, in reviewing the advisor’s performance, that the advisor is doing just that.
Second, while we are conscious of costs and the effect that costs have on shareholders’ returns, we do not seek the lowest fees or expense ratio as our sole or primary objective. We try to make sure that your Fund’s fees and costs are reasonable in relationship to the services rendered and that they are generally in line with those charged by other expert investment advisors, consistent with our belief that the Fund’s investors searched for and expect that expertise and attention and have decided to pay a reasonable price for it. We do not put the management contract “out to bid” as a matter of course, and we would not do so unless we had concluded that the advisor materially had failed to pursue the Fund’s objectives in accordance with its policies, or for other equally important reasons. We believe that any other approach would be inconsistent with your interests and contrary to your expectations when you bought shares of the Fund in the first place.
Finally, because we believe that most Thornburg Fund shareholders have invested with a long-term perspective, we try not to focus too much on the fashions of the moment and on short-term performance. The market will not favor any specific investment objective or set of policies at all times and under all economic circumstances. A fund will experience periods of both high and low returns relative to other funds and other investments. Even if one of our Funds is not favored by the market at a particular time, we believe that the advisor is nonetheless obliged to remain true to the Fund’s objective and policies, and we watch to see that it does so.
This statement is submitted for the general information of the shareholders of Thornburg Investment Trust. It is not authorized for distribution to prospective investors in the Fund unless preceded or accompanied by an effective prospectus. If you have not received a prospectus, one can be obtained from your financial advisor, online at www.thornburg.com/download, or by calling 800-847-0200. Carefully consider information in the prospectus regarding the Fund’s investment objectives and policies, risks, sales charges, expenses, experience of its management, marketability of shares, and other information. Read it carefully before you invest or send money.
| This page is not part of the Annual Report. 39 |
This page intentionally left blank.
40 This page is not part of the Annual Report. |
This page intentionally left blank.
| This page is not part of the Annual Report. 41 |
This page intentionally left blank.
42 This page is not part of the Annual Report. |
Planning Options
Retirement and Education Accounts
Thornburg Investment Management offers retirement and education savings accounts that can help you meet a variety of planning challenges. For account applications or further information on any of the accounts below, please call 1-800-847-0200 or go to www.thornburg.com/ira. Your financial advisor can help you determine which plan is right for you.
Individual Retirement Accounts
Individual Retirement Accounts (IRAs) provide a tax-advantaged means to save money for the future. For a detailed outline of the difference between retirement accounts, see www.thornburg.com/ira. Rollovers are available. Call 1-800-847-0200 for more information.
Traditional IRAs – Contributions to Traditional IRAs are tax deductible for eligible individuals, and withdrawals are taxed as additional ordinary income. You may contribute to an IRA if you receive compensation and are under 70 1/2, even if you are covered by an employer retirement plan.
Roth IRAs – Under a Roth IRA, there is no tax deduction for contributions, but there is no income tax on qualified withdrawals. For a more detailed comparison of Traditional and Roth IRAs, please see our web site at www.thornburg.com/ira.
SEP IRAs – Simplified Employee Pension (SEP) IRAs are established by employers. The employer is allowed a tax deduction for contributions made to the SEP Plan and makes contributions to each eligible employee’s SEP IRA on a discretionary basis.
SIMPLE IRAs – Savings Incentive Match Plan for Employees of Small Employers (SIMPLE) is designed to give small business owners a simplified method to establish and contribute to a retirement plan for employees. The employer is allowed a tax deduction for contributions and makes either matching or non-elective contributions to each eligible employee’s SIMPLE IRA. Employees may make salary deferral contributions.
403(b)
A special, tax-advantaged savings vehicle available only to employees of 501(c)(3) organizations, such as charitable, educational, scientific and religious organizations. 403(b) plans are also available to employees of public schools and universities.
Coverdell Education Savings Account
These savings accounts are designed to provide a way to save money for higher education expenses. In an Education Savings Account, earnings and interest grow tax free, and qualified withdrawals used to pay for eligible higher-education expenses are tax- and penalty-free.
Funds Available
The following funds are available in the accounts listed above:
| • | Thornburg International Value Fund |
| • | Thornburg Value Fund |
| • | Thornburg Core Growth Fund |
| • | Thornburg Investment Income Builder Fund |
| • | Thornburg Limited Term U.S. Government Fund |
| • | Thornburg Limited Term Income Fund |
| This page is not part of the Annual Report. 43 |
The Firm
Thornburg Investment Management® is a privately held investment management company based in Santa Fe, New Mexico with assets under management of over $16 billion. Founded in 1982, the firm manages four equity funds, eight bond funds, and separate portfolios for select institutions and individuals.
Investment Philosophy
We seek to preserve and increase the real wealth of the Funds’ shareholders after accounting for inflation, taxes, and investment expenses. We’re committed to disciplined investing and controlling risk in all market environments through laddered bond and focused equity portfolios.
Portfolio Holdings Disclosure
We believe you should know about your portfolio. Our web site keeps investors informed of the Funds’ equity holdings. Go to www.thornburg.com/funds for commentary on our equity fund holdings.
Co-Ownership of Funds
We invest side-by-side with the Funds’ shareholders. Our employees have invested over $110 million in Thornburg Funds.
Core Strategies for Building Wealth
We deliver core strategies to help investors meet long-term goals. A core strategy is a consistent, disciplined and proven investment process that represents the foundation of a diversified portfolio.
Investment Manager: | Distributor: | |
|
| |
119 East Marcy Street | 119 East Marcy Street | |
Santa Fe, New Mexico 87501 | Santa Fe, New Mexico 87501 | |
800.847.0200 | 800.847.0200 |


Item 2. Code of Ethics
Thornburg Investment Trust (the “Trust”) has adopted a code of ethics described in Item 2 of Form N-CSR. The code was amended effective July 20, 2005 to address conduct which could represent a conflict, as more fully described in the code. A copy of the code of ethics is filed as an exhibit to this Form N-CSR.
Item 3. Audit Committee Financial Expert
The Trustees of Thornburg Investment Trust have determined that two members of the Trust’s audit committee, David A. Ater and David D. Chase, are each audit committee financial experts as defined in Item 3 of Form N-CSR. Mr. Ater and Mr. Chase are each independent for purposes of Item 3 of Form N-CSR. The Trustees’ determinations in this regard were based upon their current understandings of the definition of “audit committee financial expert” and current interpretations of the definition. The Trustees call attention to the lack of clarity in the definition, and that shareholders and prospective investors may wish to evaluate independently this definition and the qualifications of the Trust’s audit committee. The definition of “audit committee financial expert,” together with comments on the definition, are set forth in the Securities and Exchange Commission’s website (www.sec.gov).
Item 4. Principal Accountant Fees and Services
Audit Fees
The aggregate fees billed to Thornburg Investment Trust in each of the last two fiscal years ended September 30, 2004 and September 30, 2005, for the audit of the Trust’s financial statements and for services that are normally provided by PricewaterhouseCoopers LLP, registered independent public accounting firm (“PWC”) in connection with statutory and regulatory filings or requirements for those fiscal years are set out below. In addition, the narrative below the table describes the aggregate fees billed to Thornburg Limited Term Municipal Fund, Inc. (the “Company”) for the audit of the Company’s financial statements and services described in the preceding sentence for the Company’s last fiscal period ended June 21, 2004. On June 21, 2004, the Company’s two series were reorganized as Funds of Thornburg Investment Trust.
Year Ended September 30, | Year Ended September 30, 2005 | |||||
Thornburg Investment Trust | $ | 491,300 | $ | 49,000 | ||
On June 21, 2004, the two series of the Company were reorganized as Funds of Thornburg Investment Trust. Audit fees billed to the Company’s two series in the Company’s last fiscal period July 1, 2003 to June 21, 2004 were $65,210. Following the reorganization, the two reorganized Funds and a third Fund of the Trust changed their fiscal year end from June 30 to September 30. The figure of $491,300 for Thornburg Investment Trust billed in the year ended September 30, 2004 reflects audit fees relating to audits for the year ended June 30, 2004 for the three Funds which previously had a June 30 year end, and a portion of the fees for the audits for all 12 Funds of the Trust for the year ended September 30, 2004. The difference in the relative sizes of the figures shown above for the two years also reflects the fact that the figures show fees as billed to the Trust in the periods shown, in accordance with regulatory requirements, and a given fee may not be shown for the year or period to which it relates (and be shown in a different year) depending upon the date the Trust is billed. Fees reflected in the Funds’ financial statements are accounted for on an accrual basis.
Audit-Related Fees
The fees billed to Thornburg Investment Trust by PWC in each of the last two fiscal years for assurance and related services that are reasonably related to the audit or review of the Trust’s financial statements are set out below. In addition, the narrative below the table describes the aggregate fees billed to the Company for the same category of services for its last fiscal period ended June 21, 2004.
| Year Ended September 30, 2004 | Year Ended September 30, 2005 | |||||
Thornburg Investment Trust | $ | 10,230 | $ | 3,550 | ||
The audit-related fees billed to the Trust in the year ended September 30, 2004 related to advice on distribution computations, and preparation for and attendance at audit committee meetings. The audit-related fees billed to the Trust in the year ended September 30, 2005 related to preparation for and attendance at audit committee meetings. Audit-related fees billed to the Company’s two series in its last fiscal period ended June 21, 2004 were $7,835. The audit-related fees billed to the Company related to advice on financial reporting issues and issuance of consents respecting filings in connection with the reorganization of the Company’s two series as Funds of the Trust.
Tax Fees
The fees billed to Thornburg Investment Trust by PWC in each of the last two fiscal years ended September 30, 2004 and September 30, 2005 for professional services rendered by PWC for tax compliance, tax advice or tax planning are set out below. In addition, the narrative below the table describes the fees billed to the Company for the same category of services for its last fiscal period ended June 21, 2004.
| Year Ended September 30, 2004 | Year Ended September 30, 2005 | |||||
Thornburg Investment Trust | $ | 3,000 | $ | 103,900 | ||
The tax fees billed to the Trust in each of the last two fiscal years were primarily for tax return preparation. The difference in the relative sizes of the figures shown for the two years is due principally to the fact that the figures reflect fees and costs as invoiced to the Trust in the periods shown, in accordance with regulatory requirements, and a given fee or cost may not be shown for the year to which it relates (and be shown in a different year) depending upon the date the Trust receives an invoice. Fees and costs reflected in the Funds’ financial statements are accounted for on an accrual basis. The fees billed to the Company’s two
series in its last fiscal period ended June 21, 2004 were $7,000. The tax fees billed to the Company in that period were primarily for tax return preparation.
All Other Fees
The fees billed to Thornburg Investment Trust by PWC in each of the last two fiscal years ended September 30, 2004 and September 30, 2005 for all other fees rendered by PWC are set out below.
| Year Ended September 30, 2004 | Year Ended September 30, 2005 | |||||
Thornburg Investment Trust | $ | -0- | $ | 9,954 | ||
The figure shown for the year ended September 30, 2005 pertains to a tax-related training class that was provided to the Trust’s accounting staff in Santa Fe, New Mexico, and includes the fee for the class and the materials prepared by PWC staff members. PWC performs no services for the investment adviser, the Funds’ principal underwriter or any other person controlling, controlled by, or under common control with the investment adviser which provides ongoing services to the Funds, except that PWC has provided to the investment adviser, Thornburg Investment Management, Inc. attestation of its investment performance presentations. The fees billed by PWC for these services were $-0- and $27,000 for the fiscal years ended September 30, 2004 and September 30, 2005, respectively.
The Audit Committee has determined that PWC’s performance of the described services for the investment adviser is compatible with PWC’s independence in its audit of the Funds.
Audit Committee Pre-Approval Policies and Procedures
As of September 30, 2005, the Trust’s Audit Committee has not adopted pre-approval policies and procedures. Accordingly, all services provided by PWC to the Funds must be approved beforehand by the Audit Committee.
Item 5. Audit Committee of Listed Registrants
Not applicable.
Item 6. Schedule of Investments
Not applicable.
Item 7. Disclosure of Proxy Voting Policies and Procedures for Closed-End Management Investment Companies
Not applicable.
Item 8. Portfolio Managers of Closed End Management Investment Companies
Not applicable.
Item 9. Purchases of Equity Securities by Closed-End Management Investment Companies and Affiliated Purchasers.
Not applicable.
Item 10. Submission of Matters to a Vote of Security Holders
The authority to consider candidates recommended by the shareholders in accordance with the Trust’s Procedure for Shareholder Communications is committed to the Governance and Nominating Committee.
Item 11. Controls and Procedures
(a) The principal executive officer and the principal financial officer have concluded that Thornburg Investment Trust disclosure controls and procedures provide reasonable assurance that material information relating to Thornburg Investment Trust is made known to them by the appropriate persons, based on their evaluation of these controls and procedures as of a date within 90 days prior to the filing date of this report.
(b) There was no change in Thornburg Investment Trust’s internal control over financial reporting that occurred during the registrant’s second fiscal quarter of the period covered by this report (that is, the registrant’s fourth fiscal quarter) that has materially affected, or is reasonably likely to materially affect, the registrant’s internal control over financial reporting.
Item 12. Exhibits
| (a) | (1) Code of Business Conduct and Ethics attached hereto as Exhibit 99.CODE ETH. |
| (a) | (2) Certifications pursuant to Rule 30a-2(a) under the Investment Company Act of 1940 (17 CFR 70.30a-2(a)) attached hereto as Exhibit 99.CERT. |
| (a) | (3) Not Applicable |
| (b) | Certification pursuant to Section 906 of the Sarbanes-Oxley Act of 2002 and Rule 30a-2(b) under the Investment Company Act of 1940 (17 CFR 70.30a-2(b)) attached hereto as Exhibit 99.906CERT. |
SIGNATURES
Pursuant to the requirements of the Securities Exchange Act of 1934 and the Investment Company Act of 1940, the registrant has duly caused this report to be signed on its behalf by the undersigned, thereunto duly authorized.
Thornburg Investment Trust, in respect of Thornburg Limited Term Municipal Fund, Thornburg California Limited Term Municipal Fund, Thornburg Intermediate Municipal Fund, Thornburg New Mexico Intermediate Municipal Fund, Thornburg Florida Intermediate Municipal Fund, Thornburg New York Intermediate Municipal Fund, Thornburg Limited Term U.S. Government Fund, Thornburg Limited Term Income Fund, Thornburg Value Fund, Thornburg International Value Fund, Thornburg Core Growth Fund, and Thornburg Investment Income Builder Fund (herein referred to as the “Funds”).
| By: | /s/ Brian J. McMahon |
Brian J. McMahon
President and principal executive officer
| Date: November | 21, 2005 |
Pursuant to the requirements of the Securities Exchange Act of 1934 and the Investment Company Act of 1940, this report has been signed below by the following persons on behalf of the registrant and in the capacities and on the dates indicated.
| By: | /s/ Brian J. McMahon |
Brian J. McMahon
President and principal executive officer
| Date: November | 21, 2005 |
| By: | /s/ Steven J. Bohlin |
Steven J. Bohlin
Treasurer and principal financial officer
| Date: November | 21, 2005 |