Washington, D.C. 20549
Nuveen California Municipal Value Fund, Inc.
Kevin J. McCarthy
Form N-CSR is to be used by management investment companies to file reports with the Commission not later than 10 days after the transmission to stockholders of any report that is required to be transmitted to stockholders under Rule 30e-1 under the Investment Company Act of 1940 (17 CFR 270.30e-1). The Commission may use the information provided on Form N-CSR in its regulatory, disclosure review, inspection, and policymaking roles.
A registrant is required to disclose the information specified by Form N-CSR, and the Commission will make this information public. A registrant is not required to respond to the collection of information contained in Form N-CSR unless the Form displays a currently valid Office of Management and Budget (“OMB”) control number. Please direct comments concerning the accuracy of the information collection burden estimate and any suggestions for reducing the burden to Secretary, Securities and Exchange Commission, 450 Fifth Street, NW, Washington, DC 20549-0609. The OMB has reviewed this collection of information under the clearance requirements of 44 U.S.C. ss. 3507.
ITEM 1. REPORTS TO STOCKHOLDERS.
LIFE IS COMPLEX.
Nuveen makes things e-simple.
It only takes a minute to sign up for e-Reports. Once enrolled, you’ll receive an e-mail as soon as your Nuveen Fund information is ready. No more waiting for delivery by regular mail. Just click on the link within the e-mail to see the report and save it on your computer if you wish.
Free e-Reports right to your e-mail!
www.investordelivery.com
If you receive your Nuveen Fund distributions and statements from your financial advisor or brokerage account.
OR
www.nuveen.com/accountaccess
If you receive your Nuveen Fund distributions and statements directly from Nuveen.
Table of Contents
| Chairman’s Letter to Shareholders | 4 |
| | |
| Portfolio Manager’s Comments | 5 |
| | |
| Fund Leverage | 12 |
| | |
| Common Share Information | 14 |
| | |
| Risk Considerations | 16 |
| | |
| Performance Overview and Holding Summaries | 17 |
| | |
| Shareholder Meeting Report | 24 |
| | |
| Report of Independent Registered Public Accounting Firm | 26 |
| | |
| Portfolios of Investments | 27 |
| | |
| Statement of Assets and Liabilities | 71 |
| | |
| Statement of Operations | 73 |
| | |
| Statement of Changes in Net Assets | 75 |
| | |
| Statement of Cash Flows | 78 |
| | |
| Financial Highlights | 80 |
| | |
| Notes to Financial Statements | 90 |
| | |
| Board Members & Officers | 102 |
| | |
| Reinvest Automatically, Easily and Conveniently | 107 |
| | |
| Glossary of Terms Used in this Report | 109 |
| | |
| Additional Fund Information | 111 |
Chairman’s
Letter to Shareholders
Dear Shareholders,
Despite the global economy’s ability to muddle through the many economic headwinds of recent years, investors continue to have good reason to remain cautious. The European Central Bank’s commitment to “do what it takes” to support sovereign debt markets has stabilized the broader euro area financial markets. The larger member states of the European Union (EU) are working diligently to strengthen the framework for a tighter financial and banking union and meaningful progress has been made by agreeing to centralize large bank regulation under the European Central Bank. However, economic conditions in the southern tier members are not improving and the pressures on their political leadership remain intense. The jury is out on whether the respective populations will support the continuing austerity measures that are required to meet the EU fiscal targets.
In the U.S., the Fed’s commitment to low interest rates through Quantitative Easing is the subject of increasing debate in its policy making deliberations and many independent economists are expressing concern about the economic distortions resulting from negative real interest rates. There are encouraging signs in Congress that both political parties are working toward compromises on previously irreconcilable social issues. It is too early to tell whether those efforts will produce meaningful results or pave the way for cooperation on the major fiscal issues that potentially loom ahead. Over the longer term, there are some positive trends for the U.S. economy: house prices are clearly recovering, banks and corporations continue to strengthen their financial positions and incentives for capital investment in the U.S. by domestic and foreign corporations are increasing due to more competitive energy and labor costs.
During the last eighteen months, U.S. investors have benefited from strong returns in the domestic equity markets and steady total returns in many fixed income markets. However, many macroeconomic risks remain unresolved, including negotiating through the many U.S. fiscal issues, managing the risks of another year of abnormally low U.S. interest rates, achieving a better balance between fiscal discipline and encouraging economic growth in the euro area and reducing the potential economic impact of geopolitical issues, particularly in the Middle East and East Asia. In the face of these uncertainties, the experienced investment professionals at Nuveen Investments seek out investments in companies that are enjoying positive economic conditions. At the same time they are always on the alert for risks in markets subject to excessive optimism. Monitoring this process is a critical function for the Fund Board as it oversees your Nuveen Fund on your behalf.
As always, I encourage you to communicate with your financial consultant if you have any questions about your investment in a Nuveen Fund. On behalf of the other members of your Fund Board, we look forward to continuing to earn your trust in the months and years ahead.
Sincerely,
Robert P. Bremner
Chairman of the Board
April 22, 2013
Portfolio Manager’s Comments
Nuveen California Municipal Value Fund, Inc. (NCA)
Nuveen California Municipal Value Fund 2 (NCB)
Nuveen California Performance Plus Municipal Fund, Inc. (NCP)
Nuveen California Municipal Market Opportunity Fund, Inc. (NCO)
Nuveen California Investment Quality Municipal Fund, Inc. (NQC)
Nuveen California Select Quality Municipal Fund, Inc. (NVC)
Nuveen California Quality Income Municipal Fund, Inc. (NUC)
Portfolio manager Scott Romans reviews economic and municipal market conditions at both the national and state levels, key investment strategies and the twelve-month performance of these Nuveen California Municipal Funds. Scott has managed NCA, NCP, NCO, NQC, NVC and NUC since 2003 and NCB since its inception in 2009.
What factors affected the U.S. economic and municipal market environments during the twelve-month reporting period ended February 28, 2013?
During this reporting period, the U.S. economy’s progress toward recovery from recession continued at a moderate pace. The Federal Reserve (Fed) maintained its efforts to improve the overall economic environment by holding the benchmark fed funds rate at the record low level of zero to 0.25% that it established in December 2008. At its March 2013 meeting (following the end of this reporting period), the central bank stated it expected that its “highly accommodative stance of monetary policy” would keep the fed funds rate in “this exceptionally low range” as long as the unemployment rate remained above 6.5% and the outlook for inflation was no higher than 2.5%. The Fed also decided to continue purchasing $40 billion of mortgage-backed securities and $45 billion of longer-term Treasury securities each month in an open-ended effort to bolster growth. Taken together, the goals of these actions are to put downward pressure on longer-term interest rates, make broader financial conditions more accommodative and support a stronger economic recovery as well as continued progress toward the Fed’s mandates of maximum employment and price stability.
In the fourth quarter of 2012, the U.S. economy, as measured by the U.S. gross domestic product (GDP), grew at an annualized rate of 0.4%, bringing GDP growth for the calendar year 2012 to 2.2%, compared with 1.8% in 2011. The Consumer Price Index (CPI) rose 2.0% year-over-year as of February 2013, while the core CPI (which excludes food and energy) increased 2.0% during the period, staying within the Fed’s unofficial objective of 2.0% or lower for this inflation measure. Labor market conditions continued to show signs of improvement. As of February 2013, the national unemployment rate was 7.7%, the lowest level since December 2008, down from 8.3% in February 2012. The housing
Certain statements in this report are forward-looking statements. Discussions of specific investments are for illustration only and are not intended as recommendations of individual investments. The forward-looking statements and other views expressed herein are those of the portfolio manager as of the date of this report. Actual future results or occurrences may differ significantly from those anticipated in any forward-looking statements, and the views expressed herein are subject to change at any time, due to numerous market and other factors. The Funds disclaim any obligation to update publicly or revise any forward-looking statements or views expressed herein.
Ratings shown are the highest rating given by one of the following national rating agencies: Standard & Poor’s Group, Moody’s Investors Service, Inc. or Fitch, Inc. Credit ratings are subject to change. AAA, AA, A and BBB are investment grade ratings; BB, B, CCC, CC, C and D are below investment grade ratings. Certain bonds backed by U.S. Government or agency securities are regarded as having an implied rating equal to the rating of such securities. Holdings designated N/R are not rated by these national rating agencies.
market, long a major weak spot in the economic recovery, also delivered some good news, as the average home price in the S&P/Case-Shiller Index of 20 major metropolitan areas rose 8.1% for the twelve months ended January 2013 (most recent data available at the time this report was prepared). This marked the largest twelve-month percentage gain for the index since the pre-recession summer of 2006, although housing prices continued to be off approximately 30% from their mid-2006 peak.
During this period, the outlook for the U.S. economy continued to be clouded by uncertainty about global financial markets and the outcome of the “fiscal cliff.” The tax consequences of the fiscal cliff situation which were scheduled to become effective in January 2013 were averted through a last-minute deal that raised payroll taxes but left in place a number of tax breaks, including the tax exemption on municipal bond interest. However, lawmakers postponed and then failed to reach a resolution on $1.2 trillion in spending cuts, the “sequestration”, intended to address the federal budget deficit. As a result, automatic spending cuts affecting both defense and non-defense programs (excluding Social Security and Medicaid) took effect March 1, 2013, with potential implications for economic growth over the next decade.
Municipal bond prices generally rallied during this period, as strong demand and tight supply combined to create favorable market conditions for municipal bonds. Although the total volume of tax-exempt supply improved over that of the same period a year earlier, the issuance pattern remained light compared with long-term historical trends and new money issuance was relatively flat. This supply/demand dynamic served as a key driver of performance. Concurrent with rising prices, yields continued to decline across most maturities, especially at the longer end of the municipal yield curve and the long end of the curve continued to flatten. In addition to the lingering effects of the Build America Bonds (BAB) program, which expired at the end of 2010 but impacted issuance well into 2012, the low level of municipal issuance reflected the current political distaste for additional borrowing by state and local governments facing fiscal constraints and the prevalent atmosphere of municipal budget austerity. During this reporting period, we continued to see borrowers come to market seeking to take advantage of the low rate environment through refunding activity, with approximately two-thirds of municipal paper issued by borrowers that were calling existing debt and refinancing at lower rates.
Over the twelve months ended February 28, 2013, municipal bond issuance nationwide totaled $379.6 billion, an increase of 16% over the issuance for the twelve-month period ended February 29, 2012. As previously discussed, the majority of this supply was attributable to refunding issues, rather than new money issuance. During this period, demand for municipal bonds remained consistently strong, especially from individual investors, but also from mutual funds, banks and crossover buyers such as hedge funds.
How were the economic and market environments in California during this reporting period?
California’s economic recovery has broadened, driven by consumer and tourism spending and expanding technology services. This, along with the stabilization of the previously shrinking construction and education sectors, helped to drive down the state’s jobless numbers. As of February 2013, California’s unemployment rate was 9.6%, its lowest level since late 2008, down from 10.8% in February 2012. Although this number has improved substantially from its all-time high of 12.4% in 2010, California’s 9.6% remains the highest jobless rate in the nation (tied with Mississippi and Nevada). Recent improvements were expected to transform housing into a positive driver of the California economy. According to the S&P/Case-Shiller Index, home prices in San Diego, Los Angeles, and San Francisco rose 9.8%, 12.1%, and 17.5%, respectively, over the twelve months ended January 2013 (most recent data available at the time this report was prepared). This growth outpaced the average increase of 8.1% nationally for the same period. Recovering housing-related industries, including construction, should help employment numbers continue to improve.
On the fiscal front, the fiscal 2012 general fund budget totaled $91.3 billion and closed a projected two-year budget gap of $15.7 billion in part through spending reductions aimed at welfare and child care for the poor. Overall, continued budget problems, including persistent deficits and spending that outpaced revenues, posed the largest threat to the state’s economic recovery over the near and long term. This risk was averted when voters approved temporary sales and personal income tax increases (Proposition 30) in November 2012. Proposition 30 raised the state sales tax rate from 7.25% to 7.50% through 2016 and increased the top marginal income tax rate to 13.3% through 2018. These increases eliminated the need for $6 billion in cuts that would have affected K-12 and higher education spending. In addition, the new state sales tax rate combined with the new highest federal tax bracket of 39.6% has stimulated demand for municipal California tax-exempt paper. For fiscal 2013-2014, the proposed general fund budget is expected to be structurally balanced, with general fund expenditures estimated at $97.7 billion, a 5% increase over the revised fiscal 2013 estimates. Tempering the positive financial news at the state level was the number of local municipalities, including San Bernardino and Stockton, which filed for bankruptcy, as cities were increasingly squeezed by budget problems resulting from declines in property valuations and rising pension costs. In January 2013, S&P upgraded the rating on California general obligation (GO) debt to A from A-, while Moody’s and Fitch maintained their ratings of A1 and A-, respectively, as of February 2013. All three rating agencies listed their outlooks for California as stable. For the twelve months ended February 28, 2013, municipal issuance in California totaled $44.0 billion, an increase of 3% over the previous twelve months. For this period, California was the second largest state issuer in the nation (behind New York), representing approximately 11.6% of total issuance nationwide for the period.
How did the Funds perform during the twelve-month reporting period ending February 28, 2013? What strategies were used to manage the Funds during the reporting period and how did these strategies influence performance?
The tables in each Fund’s Performance Overview and Holding Summaries section of this report provide total returns for the Funds for the one-year, five-year, ten-year and/or since inception period ended February 28, 2013. Each Fund’s total returns are compared with the performance of a corresponding market index and Lipper classification average.
For the twelve months ended February 28, 2013, the total returns on common share net asset value (NAV) for all of these California Funds exceeded the returns for the S&P Municipal Bond California Index and the S&P Municipal Bond Index. For this same period, NCO, NQC and NVC outperformed the average return for the Lipper California Municipal Debt Funds Classification Average, while NUC lagged the Lipper average by a small margin, and NCA, NCB and NCP underperformed the Lipper average.
Key management factors that influenced the Funds’ returns during this period included duration and yield curve positioning, credit exposure and sector allocation. The use of regulatory leverage also was an important positive factor in performance during this period. The primary reason that the returns of NCA and NCB trailed those of the other Funds for this twelve-month period was that these two Funds do not use regulatory leverage. Leverage is discussed in more detail later in this report.
In an environment of declining rates and a flattening yield curve, municipal bonds with longer maturities generally outperformed those with shorter maturities. Overall, credits at the longest end of the municipal yield curve posted the strongest returns, while bonds at the shortest end produced the weakest results. Duration and yield curve positioning was a net positive contributor to the performance of these Funds. On the whole, NVC was the most advantageously positioned in terms of duration and yield curve exposure, being overweight in the long intermediate part of the yield curve and an underweight to the shortest end. NCO, NQC, NUC and NCP also tended to have durations longer than their targets to varying degrees, and their returns benefited in proportion to their allocations along the outperforming longer end of the curve. In terms of duration and yield curve, NCA was less advantageously positioned than NCB, with a shorter effective duration, which detracted from NCA’s performance. In addition, the Funds were generally helped by their allocations of long duration bonds, many of which were zero coupon bonds, which generally outperformed the market as a whole during this period.
Credit exposure was another important factor in the Funds’ performance during these twelve months, as lower quality bonds generally outperformed higher quality bonds. This outperformance was due in part to the greater demand for lower rated bonds as investors looked for investment vehicles offering higher yields. As investors became more comfortable taking on additional investment risk, credit spreads, or the difference in yield spreads between U.S. Treasury securities and comparable investments such as municipal bonds, narrowed through a variety of rating categories. As a result of this spread compression, the Funds generally benefited from their holdings of lower rated credits. Among these Funds, NCB, NCO, NVC and NUC had the largest allocations of
bonds rated BBB, and NVC was also helped by overweightings in sub-investment grade bonds and an underweighting in bonds rated AAA and AA. Although NCP’s contribution from credit exposure was positive, the Fund was underweighted in sub-investment grade bonds, which detracted from its performance.
During this period, revenue bonds as a whole outperformed the general municipal market. Holdings that generally made positive contributions to the Funds’ returns included industrial development revenue (IDR) credits, health care (together with hospitals), education, transportation and housing bonds. All of these Funds were overweight in health care, which boosted their performance. Tobacco credits backed by the 1998 master tobacco settlement agreement were the top performing market sector in 2012, helped by their longer effective durations and the increased demand for higher yielding investments by investors who had become less risk-averse. In addition, based on recent data showing that cigarette sales had fallen less steeply than anticipated, the 46 states participating in the agreement, including California, stand to receive increased payments from the tobacco companies. During this period, as tobacco bonds rallied, all of these Funds benefited from their holdings of tobacco credits, with NVC having the heaviest weighting of tobacco bonds and NUC the smallest.
In contrast, pre-refunded bonds, which are often backed by U.S. Treasury securities, were among the poorest performing market segments during this period. The underperformance of these bonds can be attributed primarily to their shorter effective maturities and higher credit quality. As of February 28, 2013, NCA and NUC had the heaviest weightings in pre-refunded bonds, which hampered their performance, while NCB held a negligible amount of pre-refunded bonds. Also lagging the performance of the general municipal market for this period were GO bonds and electric utilities credits. All of these Funds were underweighted to varying degrees in the tax-supported sector, especially California state GOs, relative to the California market, which lessened the negative impact of these holdings. This underweighting was due to the fact that California state GOs comprise such a large portion of the tax-supported sector in California that it would be very difficult to match the market weighting in our portfolios.
In light of recent events in the municipal marketplace, shareholders also should be aware of an issue involving the holdings of some of the Funds, i.e., the downgrade of Puerto Rico bonds. In December 2012, Moody’s downgraded Puerto Rico GO bonds to Baa3 from Baa1 based on Puerto Rico’s ongoing economic problems, unfunded pension liabilities, elevated debt levels and structural budget gaps. Earlier in the year (July 2012), bonds issued by the Puerto Rico Sales Tax Financing Corporation (COFINA) also were downgraded by Moody’s to Aa3 from Aa2. Shareholders of the California Funds should note that NCA, NQC and NVC have limited exposure to Puerto Rico GO bonds, while NCB, NCP, NCO and NUC do not have any Puerto Rico holdings. NCA also has a small position in Puerto Rico cogeneration facilities bonds and NVC holds Puerto Rico appropriation credits. The Puerto Rico bonds were generally purchased in the past to help keep the Funds fully invested and to provide higher yields, added diversification and triple exemption (i.e., exemption from federal, state and local taxes). During this period, no additional Puerto Rico bonds were purchased by these Funds. For the reporting
period ended February 28, 2013, Puerto Rico paper generally underperformed the market as whole. The impact on performance differed by Fund in line with the type and amount of its holdings.
As previously discussed, municipal bond prices generally rallied nationally during this period, driven by strong demand and tight supply of new issuance. At the same time, yields continued to be relatively low. California municipal paper also performed well, due in part to demand triggered by recent changes in the state tax code as well as improving economic conditions in the state. In this environment, we continued to take a bottom-up approach to discovering sectors that appeared undervalued as well as individual credits that had the potential to perform well over the long term and helped us keep our Funds fully invested.
Much of our investment activity during this period was opportunistic, with purchases driven by the timing of cash flows from called or maturing bonds. To find attractive opportunities for the Funds, we were focused largely on the secondary market, rather than new issuance, which remained below historical levels. In particular, we looked for bonds with calls dates between 2019 and 2021, a structure that we believed offered value, specifically, attractive pricing and yields relative to the bonds’ call dates. In addition, if these bonds are not called in 2019 to 2021, we potentially stand to receive a higher yield by holding the bonds until they mature or are called. This type of bond is sometimes referred to as a “kicker bond” because of the additional yield, or “kick” to maturity, once the bond passes its initial call date.
We also continued to add exposure to redevelopment agency (RDA) bonds in the secondary market. In 2011, as part of cost-saving measures to close gaps in the California state budget, all 400 RDAs in the state were ordered to dissolve by February 1, 2012, and successor agencies and oversight boards were created to manage obligations that were in place prior to the dissolution and take title to the RDAs’ housing and other assets. The uncertainty surrounding the fate of the state’s RDAs caused spreads on RDA bonds to widen substantially and prompted RDAs to issue their remaining capacity of bonds prior to the 2012 termination date, resulting in heavy issuance of these bonds offering attractive prices, higher coupons, and very attractive structures, including 10-year call provisions. During this period, as the market became more comfortable with these bonds, their spreads began to narrow, and we found fewer deals that we regarded as attractive as the period progressed. We continued to be very selective in our purchases in this sector, performing the underlying credit work and evaluating issuers on a case-by-case basis.
During this period, we also took advantage of short-term market opportunities created by supply/demand dynamics in the municipal market. While demand for tax-exempt paper remained consistently strong throughout the period, supply fluctuated widely. We found that periods of substantial supply provided good short-term buying opportunities not only because of the increased number of issues available, but also because some investors became more hesitant in their buying as supply grew, causing spreads to widen temporarily. At times when supply was more plentiful, we focused on anticipating cash flows from bond calls and maturing bonds and closely monitored opportunities for reinvestment.
Cash for new purchases during this period was generated primarily by the proceeds from the increased number of bond calls resulting from the growth in refinancings. The elevated number of bond calls provided a meaningful source of liquidity, which drove much of our activity during this period as we worked to redeploy these proceeds, as well as those from maturing bonds, to keep the Funds fully invested and support their income streams. In addition, we sold selected bonds with short effective maturities on the occasions when we needed additional cash to take advantage of attractive opportunities.
As of February 28, 2013, all of these Funds continued to use inverse floating rate securities. We employ inverse floaters for a variety of reasons, including duration management, income enhancement and total return enhancement. As part of our duration management strategies, NCB also used forward interest rate swaps to reduce price volatility risk to movements in U.S. interest rates relative to the Fund’s benchmarks. During this period, these derivatives added mildly to performance and we continued to use forward interest rate swaps to reduce NCB’s duration as of period end.
Fund Leverage
IMPACT OF THE FUNDS’ LEVERAGE STRATEGIES ON PERFORMANCE
One important factor impacting the return of the Funds relative to their benchmarks was the Funds’ use of leverage. As mentioned previously, NCA and NCB do not use regulatory leverage. The Funds use leverage because their managers believe that, over time, leveraging provides opportunities for additional income and total return for common shareholders. However, use of leverage also can expose common shareholders to additional volatility. For example, as the prices of securities held by a Fund decline, the negative impact of these valuation changes on common share net asset value and common shareholder total return is magnified by the use of leverage. Conversely, leverage may enhance common share returns during periods when the prices of securities held by a Fund generally are rising. Leverage had a positive impact on the performance of the Funds over this reporting period.
THE FUND’S REGULATORY LEVERAGE
As of February 28, 2013, the Funds’ percentages of effective and regulatory leverage are shown in the accompanying table:
| | Effective | | Regulatory | |
| Fund | Leverage* | | Leverage* | |
| NCA | 1.67% | | 0.00% | |
| NCB | 9.39% | | 0.00% | |
| NCP | 36.33% | | 30.37% | |
| NCO | 34.21% | | 26.97% | |
| NQC | 36.30% | | 32.42% | |
| NVC | 35.36% | | 29.07% | |
| NUC | 36.86% | | 30.03% | |
| * | Effective Leverage is a Fund’s effective economic leverage, and includes both regulatory leverage and the leverage effects of certain derivative and other investments in a Fund’s portfolio that increase the Fund’s investment exposure. Currently, the leverage effects of Tender Option Bond (TOB) inverse floater holdings are included in effective leverage values, in addition to any regulatory leverage. Regulatory leverage consists of preferred shares issued or borrowings of a Fund. Both of these are part of a Fund’s capital structure. Regulatory leverage is sometimes referred to as “‘40 Act Leverage” and is subject to asset coverage limits set forth in the Investment Company Act of 1940. |
As of February 28, 2013, the following Funds have issued and outstanding Variable Rate Demand Preferred (VRDP) Shares as shown in the accompanying table. As mentioned previously, NCA and NCB do not use regulatory leverage.
VRDP Shares
| Fund | VRDP Shares Issued at Liquidation Value | |
| NCP | | $ | 91,000,000 | |
| NCO | | $ | 49,800,000 | |
| NQC | | $ | 105,600,000 | |
| NVC | | $ | 158,900,000 | |
| NUC | | $ | 158,100,000 | |
During the twelve month reporting period NCP issued an additional $10,000,000 VRDP Shares at liquidation value through a private negotiated offering. Also during the reporting period NQC exchanged all 956 Series 1 VRDP Shares for 956 Series 2 VRDP Shares and issued an additional $10,000,000 Series 2 VRDP Shares at liquidation value through a private negotiated offering.
Refer to Notes to Financial Statements, Footnote 1 – General Information and Significant Accounting Policies for further details on VRDP Shares.
Common Share Information
COMMON SHARE DIVIDENDS
During the twelve-month reporting period ended February 28, 2013, the Funds’ monthly dividends to common shareholders were as shown in the accompanying table.
| | | Per Common Share Amounts | |
| | | NCA | ** | | NCB | ** | | NCP | | NCO | | NQC | | NVC | | NUC | |
| March | | $0.0390 | | | $0.0665 | | | $0.0815 | | $0.0800 | | $0.0830 | | $0.0860 | | $0.0875 | |
| April | | 0.0390 | | | 0.0665 | | | 0.0815 | | 0.0800 | | 0.0830 | | 0.0860 | | 0.0875 | |
| May | | 0.0390 | | | 0.0665 | | | 0.0815 | | 0.0800 | | 0.0830 | | 0.0860 | | 0.0875 | |
| June | | 0.0390 | | | 0.0665 | | | 0.0815 | | 0.0800 | | 0.0830 | | 0.0860 | | 0.0875 | |
| July | | 0.0390 | | | 0.0665 | | | 0.0815 | | 0.0800 | | 0.0830 | | 0.0860 | | 0.0875 | |
| August | | 0.0390 | | | 0.0665 | | | 0.0815 | | 0.0800 | | 0.0830 | | 0.0860 | | 0.0875 | |
| September | | 0.0390 | | | 0.0665 | | | 0.0815 | | 0.0800 | | 0.0830 | | 0.0860 | | 0.0875 | |
| October | | 0.0390 | | | 0.0665 | | | 0.0815 | | 0.0800 | | 0.0830 | | 0.0860 | | 0.0875 | |
| November | | 0.0390 | | | 0.0665 | | | 0.0815 | | 0.0800 | | 0.0830 | | 0.0860 | | 0.0875 | |
| December | | 0.0390 | | | 0.0650 | | | 0.0790 | | 0.0800 | | 0.0770 | | 0.0830 | | 0.0850 | |
| January | | 0.0390 | | | 0.0650 | | | 0.0790 | | 0.0800 | | 0.0770 | | 0.0830 | | 0.0850 | |
| February | | 0.0390 | | | 0.0650 | | | 0.0790 | | 0.0800 | | 0.0770 | | 0.0830 | | 0.0850 | |
| | | | | | | | | | | | | | | | | | |
| Market Yield*** | | 4.48% | | | 4.63% | | | 5.89% | | 5.73% | | 5.73% | | 5.73% | | 5.94% | |
| Taxable-Equivalent Yield*** | | 6.86% | | | 7.09% | | | 9.02% | | 8.77% | | 8.77% | | 8.77% | | 9.10% | |
| ** | NCA paid shareholders an ordinary income distribution in December 2012 of $0.0020 per share. NCB paid shareholders a capital gain and ordinary income distribution in December 2012 of $0.0133 and $0.0051, respectively. |
| ** | Market Yield is based on the Fund’s current annualized monthly dividend divided by the Fund’s current market price as of the end of the reporting period. Taxable-Equivalent Yield represents the yield that must be earned on a fully taxable investment in order to equal the yield of the Fund on an after-tax basis. It is based on a combined federal and state income tax rate of 34.7%. When comparing a Fund to investments that generate qualified dividend income, the Taxable-Equivalent Yield is lower. |
All of the Funds in this report seek to pay stable dividends at rates that reflect each Fund’s past results and projected future performance. During certain periods, each Fund may pay dividends at a rate that may be more or less than the amount of net investment income actually earned by the Fund during the period. If a Fund has cumulatively earned more than it has paid in dividends, it holds the excess in reserve as undistributed net investment income (UNII) as part of the Fund’s NAV. Conversely, if a Fund has cumulatively paid dividends in excess of its earnings, the excess constitutes negative UNII that is likewise reflected in the Fund’s NAV. Each Fund will, over time, pay all of its net investment income as dividends to shareholders. As of February 28, 2013, all of the Funds in this report had positive UNII balances for tax and financial reporting purposes.
COMMON SHARE REPURCHASES
During November 2012, the Nuveen Funds’ Board of Directors/Trustees reauthorized the Funds’ open-market share repurchase program, allowing each Fund to repurchase an aggregate of up to approximately 10% of its outstanding common shares.
As of February 28, 2013, and since the inception of the Funds’ repurchase programs, the Funds have cumulatively repurchased and retired their common shares as shown in the accompanying table. Since the inception of the Funds’ repurchase programs, NCA, NCB and NQC have not repurchased any of their outstanding common shares.
| | Common Shares | | % of Common Shares | |
| Funds | Repurchased and Retired | | Authorized for Repurchase | |
| NCA | — | | — | |
| NCB | — | | — | |
| NCP | 28,300 | | 2.2% | |
| NCO | 24,900 | | 3.1% | |
| NQC | — | | — | |
| NVC | 41,400 | | 1.9% | |
| NUC | 40,000 | | 1.7% | |
During the twelve-month reporting period, the Funds did not repurchase any of their outstanding common shares.
SHELF EQUITY PROGRAMS
The following Funds filed a preliminary prospectus with the SEC for an equity shelf offering, which are not yet effective, pursuant to which the Funds may issue additional common shares as shown in the accompanying table.
| | Additional | |
| Fund | Common Shares | |
| NCA | 2,500,000 | |
| NCP | 1,200,000 | |
| NQC | 1,300,000 | |
| NVC | 2,300,000 | |
| NUC | 2,200,000 | |
Refer to Notes to Financial Statements, Footnote 1 - General Information and Significant Accounting Policies for further details on the Funds’ Shelf Equity Programs.
COMMON SHARE OTHER INFORMATION
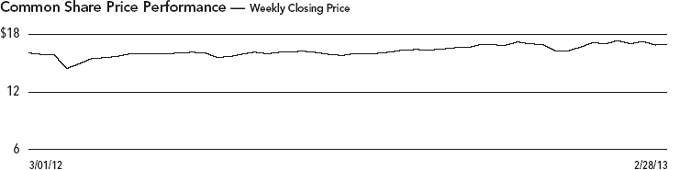
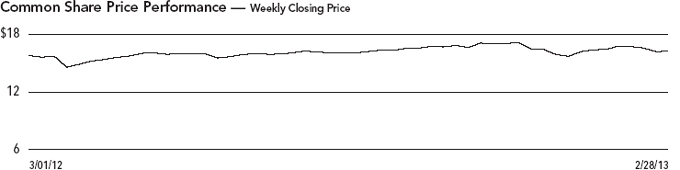
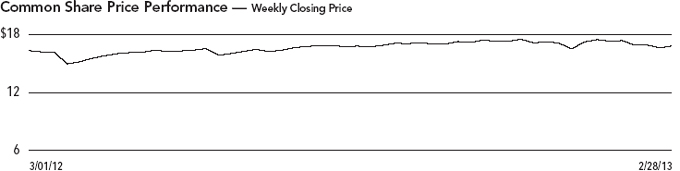
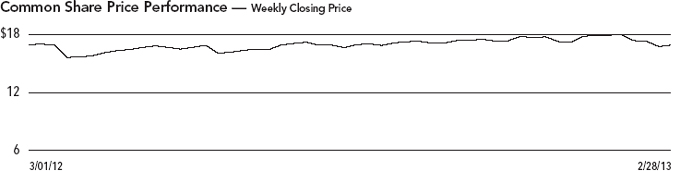
As of February 28, 2013, and during the twelve-month reporting period, the Funds were trading at a premium/(discount) to their common share net asset value (NAV) as shown in the accompanying table.
| | | | NCA | | | NCB | | | NCP | | | NCO | | | NQC | | | NVC | | | NUC | |
| Common Share NAV | | $ | 10.45 | | $ | 17.57 | | $ | 16.04 | | $ | 16.51 | | $ | 16.13 | | $ | 16.65 | | $ | 16.65 | |
| Common Share Price | | $ | 10.45 | | $ | 16.86 | | $ | 16.10 | | $ | 16.74 | | $ | 16.13 | | $ | 16.88 | | $ | 17.16 | |
| Premium/(Discount) | | | | | | | | | | | | | | | | | | | | | | |
| to NAV | | | 0.00 | % | | (4.04 | )% | | 0.37 | % | | 1.39 | % | | 0.00 | % | | 1.38 | % | | 3.06 | % |
| 12-Month Average | | | | | | | | | | | | | | | | | | | | | | |
| Premium/(Discount) | | | | | | | | | | | | | | | | | | | | | | |
| to NAV | | | 0.01 | % | | (3.59 | )% | | 1.19 | % | | 0.95 | % | | 1.91 | % | | 2.38 | % | | 3.38 | % |
Risk Considerations
Fund shares are not guaranteed or endorsed by any bank or other insured depository institution, and are not federally insured by the Federal Deposit Insurance Corporation. Past performance is no guarantee of future results. Fund common shares are subject to a variety of risks, including:
Investment, Price and Market Risk. An investment in common shares is subject to investment risk, including the possible loss of the entire principal amount that you invest. Your investment in common shares represents an indirect investment in the municipal securities owned by the Fund, which generally trade in the over-the-counter markets. Shares of closed-end investment companies like these Funds frequently trade at a discount to their net asset value (NAV). Your common shares at any point in time may be worth less than your original investment, even after taking into account the reinvestment of Fund dividends and distributions.
Leverage Risk. Each Fund’s use of leverage creates the possibility of higher volatility for the Fund’s per share NAV, market price, distributions and returns. There is no assurance that a Fund’s leveraging strategy will be successful.
Tax Risk. The tax treatment of Fund distributions may be affected by new IRS interpretations of the Internal Revenue Code and future changes in tax laws and regulations.
Issuer Credit Risk. This is the risk that a security in a Fund’s portfolio will fail to make dividend or interest payments when due.
Interest Rate Risk. Fixed-income securities such as bonds, preferred, convertible and other debt securities will decline in value if market interest rates rise.
Reinvestment Risk. If market interest rates decline, income earned from a Fund’s portfolio may be reinvested at rates below that of the original bond that generated the income.
Call Risk or Prepayment Risk. Issuers may exercise their option to prepay principal earlier than scheduled, forcing a Fund to reinvest in lower-yielding securities.
Inverse Floater Risk. The Funds invest in inverse floaters. Due to their leveraged nature, these investments can greatly increase a Fund’s exposure to interest rate risk and credit risk. In addition, investments in inverse floaters involve the risk that the Fund could lose more than its original principal investment.
Nuveen California Municipal Value Fund, Inc. (NCA)
Performance Overview and Holding Summaries as of February 28, 2013
Average Annual Total Returns as of February 28, 2013
| | | | Average Annual | |
| | | | 1-Year | | 5-Year | | 10-Year |
| NCA at Common Share NAV | | | 8.48 | % | | 7.28 | % | | 5.41 | % |
| NCA at Common Share Price | | | 7.99 | % | | 7.94 | % | | 6.03 | % |
| S&P Municipal Bond California Index | | | 6.77 | % | | 7.22 | % | | 5.38 | % |
| S&P Municipal Bond Index | | | 5.69 | % | | 6.81 | % | | 5.19 | % |
| Lipper California Municipal Debt Funds Classification Average | | | 11.55 | % | | 9.29 | % | | 6.20 | % |
Past performance is not predictive of future results. Current performance may be higher or lower than the data shown. Returns do not reflect the deduction of taxes that shareholders may have to pay on Fund distributions or upon the sale of Fund shares. Comparative index and Lipper return information is provided for the Fund’s shares at NAV only. Indexes and Lipper averages are not available for direct investment.
Portfolio Composition2 | |
| (as a % of total investments) | |
| Tax Obligation/Limited | 20.0% |
| Health Care | 16.3% |
| U.S. Guaranteed | 15.7% |
| Tax Obligation/General | 14.7% |
| Water and Sewer | 10.1% |
| Utilities | 7.7% |
| Consumer Staples | 4.6% |
| Other | 10.9% |
| Credit Quality | |
(as a % of total investment exposure)1,2,3 | |
| AAA/U.S. Guaranteed | 14% |
| AA | 23% |
| A | 31% |
| BBB | 15% |
| BB or Lower | 7% |
| N/R | 10% |
Refer to the Glossary of Terms Used in this Report for further definition of the terms used within this Fund’s Performance Overview and Holding Summaries page.
| 1 | Ratings shown are the highest rating given by one of the following national rating agencies: Standard & Poor’s Group, Moody’s Investors Service, Inc. or Fitch, Inc. Credit ratings are subject to change. AAA, AA, A, and BBB are investment grade ratings; BB, B, CCC, CC, C and D are below-investment grade ratings. Certain bonds backed by U.S. Government or agency securities are regarded as having an implied rating equal to the rating of such securities. Holdings designated N/R are not rated by these national rating agencies. |
| 2 | Holdings are subject to change. |
| 3 | Percentages may not add to 100% due to the exclusion of Other Assets Less Liabilities from the table. |
Nuveen California Municipal Value Fund 2 (NCB)
Performance Overview and Holding Summaries as of February 28, 2013
Average Annual Total Returns as of February 28, 2013
| | | Average Annual |
| | | | | | Since |
| | | 1-Year | | | Inception |
| NCB at Common Share NAV | | 10.54% | | | 10.92% |
| NCB at Common Share Price | | 8.39% | | | 8.72% |
| S&P Municipal Bond California Index | | 6.77% | | | 7.81% |
| S&P Municipal Bond Index | | 5.69% | | | 7.15% |
| Lipper California Municipal Debt Funds Classification Average | | 11.55% | | | 6.57% |
Past performance is not predictive of future results. Current performance may be higher or lower than the data shown. Returns do not reflect the deduction of taxes that shareholders may have to pay on Fund distributions or upon the sale of Fund shares. Comparative index and Lipper return information is provided for the Fund’s shares at NAV only. Indexes and Lipper averages are not available for direct investment.
Portfolio Composition2,3 | |
| (as a % of total investments) | |
| Health Care | 24.5% |
| Tax Obligation/Limited | 18.2% |
| Utilities | 14.4% |
| Water and Sewer | 9.2% |
| Tax Obligation/General | 9.2% |
| Education and Civic Organizations | 7.2% |
| Housing/Single Family | 6.3% |
| Consumer Staples | 5.5% |
| Other | 5.5% |
| Credit Quality | |
(as a % of total investment exposure)1,2,3,4 | |
| AAA/U.S. Guaranteed | 15% |
| AA | 17% |
| A | 37% |
| BBB | 27% |
| BB or Lower | 1% |
| N/R | 1% |
Refer to the Glossary of Terms Used in this Report for further definition of the terms used within this Fund’s Performance Overview and Holding Summaries page.
| 1 | Ratings shown are the highest rating given by one of the following national rating agencies: Standard & Poor’s Group, Moody’s Investors Service, Inc. or Fitch, Inc. Credit ratings are subject to change. AAA, AA, A, and BBB are investment grade ratings; BB, B, CCC, CC, C and D are below-investment grade ratings. Certain bonds backed by U.S. Government or agency securities are regarded as having an implied rating equal to the rating of such securities. Holdings designated N/R are not rated by these national rating agencies. |
| 2 | Holdings are subject to change. |
| 3 | Excluding investments in derivatives. |
| 4 | Percentages may not add to 100% due to the exclusion of Other Assets Less Liabilities from the table. |
Nuveen California Performance Plus Municipal Fund, Inc. (NCP)
Performance Overview and Holding Summaries as of February 28, 2013
Average Annual Total Returns as of February 28, 2013
| | | Average Annual | |
| | | 1-Year | | 5-Year | | 10-Year | |
| NCP at Common Share NAV | | 10.67% | | 9.88% | | 6.60% | |
| NCP at Common Share Price | | 8.75% | | 11.82% | | 7.88% | |
| S&P Municipal Bond California Index | | 6.77% | | 7.22% | | 5.38% | |
| S&P Municipal Bond Index | | 5.69% | | 6.81% | | 5.19% | |
| Lipper California Municipal Debt Funds Classification Average | | 11.55% | | 9.29% | | 6.20% | |
Past performance is not predictive of future results. Current performance may be higher or lower than the data shown. Returns do not reflect the deduction of taxes that shareholders may have to pay on Fund distributions or upon the sale of Fund shares. Comparative index and Lipper return information is provided for the Fund’s shares at NAV only. Indexes and Lipper averages are not available for direct investment.
Portfolio Composition2 | |
| (as a % of total investments) | |
| Tax Obligation/Limited | 31.8% |
| Health Care | 19.5% |
| Tax Obligation/General | 15.4% |
| U.S. Guaranteed | 7.4% |
| Water and Sewer | 7.0% |
| Transportation | 5.5% |
| Other | 13.4% |
| Credit Quality | |
(as a % of total investment exposure)1,2,3 | |
| AAA/U.S. Guaranteed | 11% |
| AA | 27% |
| A | 35% |
| BBB | 14% |
| BB or Lower | 5% |
| N/R | 7% |
Refer to the Glossary of Terms Used in this Report for further definition of the terms used within this Fund’s Performance Overview and Holding Summaries page.
| 1 | Ratings shown are the highest rating given by one of the following national rating agencies: Standard & Poor’s Group, Moody’s Investors Service, Inc. or Fitch, Inc. Credit ratings are subject to change. AAA, AA, A, and BBB are investment grade ratings; BB, B, CCC, CC, C and D are below-investment grade ratings. Certain bonds backed by U.S. Government or agency securities are regarded as having an implied rating equal to the rating of such securities. Holdings designated N/R are not rated by these national rating agencies. |
| 2 | Holdings are subject to change. |
| 3 | Percentages may not add to 100% due to the exclusion of Other Assets Less Liabilities from the table. |
Nuveen California Municipal Market Opportunity Fund, Inc. (NCO)
Performance Overview and Holding Summaries as of February 28, 2013
Average Annual Total Returns as of February 28, 2013
| | | Average Annual |
| | | 1-Year | | 5-Year | | 10-Year |
| NCO at Common Share NAV | | 12.22% | | 10.43% | | 6.81% |
| NCO at Common Share Price | | 12.20% | | 12.59% | | 8.19% |
| S&P Municipal Bond California Index | | 6.77% | | 7.22% | | 5.38% |
| S&P Municipal Bond Index | | 5.69% | | 6.81% | | 5.19% |
| Lipper California Municipal Debt Funds Classification Average | | 11.55% | | 9.29% | | 6.20% |
Past performance is not predictive of future results. Current performance may be higher or lower than the data shown. Returns do not reflect the deduction of taxes that shareholders may have to pay on Fund distributions or upon the sale of Fund shares. Comparative index and Lipper return information is provided for the Fund’s shares at NAV only. Indexes and Lipper averages are not available for direct investment.
Portfolio Composition2 | |
| (as a % of total investments) | |
| Tax Obligation/Limited | 22.6% |
| Health Care | 19.0% |
| Tax Obligation/General | 18.0% |
| Water and Sewer | 12.9% |
| U.S. Guaranteed | 7.3% |
| Consumer Staples | 5.2% |
| Other | 15.0% |
| Credit Quality | |
(as a % of total investment exposure)1,2,3 | |
| AAA/U.S. Guaranteed | 13% |
| AA | 34% |
| A | 18% |
| BBB | 20% |
| BB or Lower | 6% |
| N/R | 9% |
Refer to the Glossary of Terms Used in this Report for further definition of the terms used within this Fund’s Performance Overview and Holding Summaries page.
| 1 | Ratings shown are the highest rating given by one of the following national rating agencies: Standard & Poor’s Group, Moody’s Investors Service, Inc. or Fitch, Inc. Credit ratings are subject to change. AAA, AA, A, and BBB are investment grade ratings; BB, B, CCC, CC, C and D are below-investment grade ratings. Certain bonds backed by U.S. Government or agency securities are regarded as having an implied rating equal to the rating of such securities. Holdings designated N/R are not rated by these national rating agencies. |
| 2 | Holdings are subject to change. |
| 3 | Percentages may not add to 100% due to the exclusion of Other Assets Less Liabilities from the table. |
Nuveen California Investment Quality Municipal Fund, Inc. (NQC)
Performance Overview and Holding Summaries as of February 28, 2013
Average Annual Total Returns as of February 28, 2013
| | | Average Annual | |
| | | 1-Year | | | 5-Year | | | 10-Year | |
| NQC at Common Share NAV | | 12.17% | | | 10.03% | | | 6.58% | |
| NQC at Common Share Price | | 8.22% | | | 12.23% | | | 7.87% | |
| S&P Municipal Bond California Index | | 6.77% | | | 7.22% | | | 5.38% | |
| S&P Municipal Bond Index | | 5.69% | | | 6.81% | | | 5.19% | |
| Lipper California Municipal Debt Funds Classification Average | | 11.55% | | | 9.29% | | | 6.20% | |
Past performance is not predictive of future results. Current performance may be higher or lower than the data shown. Returns do not reflect the deduction of taxes that shareholders may have to pay on Fund distributions or upon the sale of Fund shares. Comparative index and Lipper return information is provided for the Fund’s shares at NAV only. Indexes and Lipper averages are not available for direct investment.
Portfolio Composition2 | |
| (as a % of total investments) | |
| Tax Obligation/Limited | 29.7% |
| Tax Obligation/General | 21.8% |
| Health Care | 16.3% |
| Education and Civic Organizations | 8.2% |
| Water and Sewer | 7.5% |
| Consumer Staples | 4.5% |
| Other | 12.0% |
| Credit Quality | |
(as a % of total investment exposure)1,2,3 | |
| AAA/U.S. Guaranteed | 4% |
| AA | 32% |
| A | 35% |
| BBB | 16% |
| BB or Lower | 5% |
| N/R | 6% |
Refer to the Glossary of Terms Used in this Report for further definition of the terms used within this Fund’s Performance Overview and Holding Summaries page.
| 1 | Ratings shown are the highest rating given by one of the following national rating agencies: Standard & Poor’s Group, Moody’s Investors Service, Inc. or Fitch, Inc. Credit ratings are subject to change. AAA, AA, A, and BBB are investment grade ratings; BB, B, CCC, CC, C and D are below-investment grade ratings. Certain bonds backed by U.S. Government or agency securities are regarded as having an implied rating equal to the rating of such securities. Holdings designated N/R are not rated by these national rating agencies. |
| 2 | Holdings are subject to change. |
| 3 | Percentages may not add to 100% due to the exclusion of Other Assets Less Liabilities from the table. |
Nuveen California Select Quality Municipal Fund, Inc. (NVC)
Performance Overview and Holding Summaries as of February 28, 2013
Average Annual Total Returns as of February 28, 2013
| | | Average Annual | |
| | | 1-Year | | 5-Year | | 10-Year | |
| NVC at Common Share NAV | | 12.89% | | 11.06% | | 7.26% | |
| NVC at Common Share Price | | 9.70% | | 13.51% | | 8.35% | |
| S&P Municipal Bond California Index | | 6.77% | | 7.22% | | 5.38% | |
| S&P Municipal Bond Index | | 5.69% | | 6.81% | | 5.19% | |
| Lipper California Municipal Debt Funds Classification Average | | 11.55% | | 9.29% | | 6.20% | |
Past performance is not predictive of future results. Current performance may be higher or lower than the data shown. Returns do not reflect the deduction of taxes that shareholders may have to pay on Fund distributions or upon the sale of Fund shares. Comparative index and Lipper return information is provided for the Fund’s shares at NAV only. Indexes and Lipper averages are not available for direct investment.
Portfolio Composition2 | |
| (as a % of total investments) | |
| Tax Obligation/General | 22.8% |
| Tax Obligation/Limited | 22.2% |
| Health Care | 20.2% |
| Water and Sewer | 8.6% |
| Utilities | 5.9% |
| Consumer Staples | 5.6% |
| Other | 14.7% |
| Credit Quality | |
(as a % of total investment exposure)1,2,3 | |
| AAA/U.S. Guaranteed | 6% |
| AA | 31% |
| A | 34% |
| BBB | 18% |
| BB or Lower | 5% |
| N/R | 5% |
Refer to the Glossary of Terms Used in this Report for further definition of the terms used within this Fund’s Performance Overview and Holding Summaries page.
| 1 | Ratings shown are the highest rating given by one of the following national rating agencies: Standard & Poor’s Group, Moody’s Investors Service, Inc. or Fitch, Inc. Credit ratings are subject to change. AAA, AA, A, and BBB are investment grade ratings; BB, B, CCC, CC, C and D are below-investment grade ratings. Certain bonds backed by U.S. Government or agency securities are regarded as having an implied rating equal to the rating of such securities. Holdings designated N/R are not rated by these national rating agencies. |
| 2 | Holdings are subject to change. |
| 3 | Percentages may not add to 100% due to the exclusion of Other Assets Less Liabilities from the table. |
Nuveen California Quality Income Municipal Fund, Inc. (NUC)
Performance Overview and Holding Summaries as of February 28, 2013
Average Annual Total Returns as of February 28, 2013
| | | Average Annual | |
| | | 1-Year | | 5-Year | | 10-Year | |
| NUC at Common Share NAV | | 11.21% | | 10.36% | | 7.15% | |
| NUC at Common Share Price | | 8.54% | | 12.83% | | 7.92% | |
| S&P Municipal Bond California Index | | 6.77% | | 7.22% | | 5.38% | |
| S&P Municipal Bond Index | | 5.69% | | 6.81% | | 5.19% | |
| Lipper California Municipal Debt Funds Classification Average | | 11.55% | | 9.29% | | 6.20% | |
Past performance is not predictive of future results. Current performance may be higher or lower than the data shown. Returns do not reflect the deduction of taxes that shareholders may have to pay on Fund distributions or upon the sale of Fund shares. Comparative index and Lipper return information is provided for the Fund’s shares at NAV only. Indexes and Lipper averages are not available for direct investment.
Portfolio Composition2 | |
| (as a % of total investments) | |
| Tax Obligation/Limited | 25.4% |
| Health Care | 22.6% |
| Tax Obligation/General | 14.6% |
| U.S. Guaranteed | 10.6% |
| Water and Sewer | 7.3% |
| Education and Civic Organizations | 5.1% |
| Other | 14.4% |
| Credit Quality | |
(as a % of total investment exposure)1,2,3 | |
| AAA/U.S. Guaranteed | 14% |
| AA | 30% |
| A | 26% |
| BBB | 25% |
| BB or Lower | 1% |
| N/R | 4% |
Refer to the Glossary of Terms Used in this Report for further definition of the terms used within this Fund’s Performance Overview and Holding Summaries page.
| 1 | Ratings shown are the highest rating given by one of the following national rating agencies: Standard & Poor’s Group, Moody’s Investors Service, Inc. or Fitch, Inc. Credit ratings are subject to change. AAA, AA, A, and BBB are investment grade ratings; BB, B, CCC, CC, C and D are below-investment grade ratings. Certain bonds backed by U.S. Government or agency securities are regarded as having an implied rating equal to the rating of such securities. Holdings designated N/R are not rated by these national rating agencies. |
| 2 | Holdings are subject to change. |
| 3 | Percentages may not add to 100% due to the exclusion of Other Assets Less Liabilities from the table. |
| NCA | | Shareholder Meeting Report |
NCB NCP | | The annual meeting of shareholders was held in the offices of Nuveen Investments on November 14, 2012; at this meeting the shareholders were asked to vote on the election of Board Members. |
| NCO | |
| | | | NCA | | | NCB | | | NCP | | | NCO | |
| | | | Common Shares | | | Common Shares | | | Common and Preferred shares voting together as a class | | | Preferred shares | | | Common and Preferred shares voting together as a class | | | Preferred shares | |
| Approval of the Board Members was reached as follows: | | | | | | | | | | | | | | | | |
| John P. Amboian | | | | | | | | | | | | | | | | | | | |
| For | | | — | | | — | | | 11,476,898 | | | — | | | 7,167,774 | | | — | |
| Withhold | | | — | | | — | | | 245,994 | | | — | | | 129,461 | | | — | |
| Total | | | — | | | — | | | 11,722,892 | | | — | | | 7,297,235 | | | — | |
| Robert P. Bremner | | | | | | | | | | | | | | | | | | | |
| For | | | 22,452,327 | | | 3,062,141 | | | 11,474,917 | | | — | | | 7,165,168 | | | — | |
| Withhold | | | 526,167 | | | 50,461 | | | 247,975 | | | — | | | 132,067 | | | — | |
| Total | | | 22,978,494 | | | 3,112,602 | | | 11,722,892 | | | — | | | 7,297,235 | | | — | |
| Jack B. Evans | | | | | | | | | | | | | | | | | | | |
| For | | | 22,462,077 | | | 3,062,141 | | | 11,477,898 | | | — | | | 7,167,774 | | | — | |
| Withhold | | | 516,417 | | | 50,461 | | | 244,994 | | | — | | | 129,461 | | | — | |
| Total | | | 22,978,494 | | | 3,112,602 | | | 11,722,892 | | | — | | | 7,297,235 | | | — | |
| William C. Hunter | | | | | | | | | | | | | | | | | | | |
| For | | | — | | | — | | | — | | | 782 | | | — | | | 498 | |
| Withhold | | | — | | | — | | | — | | | 28 | | | — | | | — | |
| Total | | | — | | | — | | | — | | | 810 | | | — | | | 498 | |
| David J. Kundert | | | | | | | | | | | | | | | | | | | |
| For | | | — | | | — | | | 11,460,245 | | | — | | | 7,167,774 | | | — | |
| Withhold | | | — | | | — | | | 262,647 | | | — | | | 129,461 | | | — | |
| Total | | | — | | | — | | | 11,722,892 | | | — | | | 7,297,235 | | | — | |
| William J. Schneider | | | | | | | | | | | | | | | | | | | |
| For | | | 22,454,311 | | | 3,062,141 | | | — | | | 782 | | | — | | | 498 | |
| Withhold | | | 524,183 | | | 50,461 | | | — | | | 28 | | | — | | | — | |
| Total | | | 22,978,494 | | | 3,112,602 | | | — | | | 810 | | | — | | | 498 | |
| Judith M. Stockdale | | | | | | | | | | | | | | | | | | | |
| For | | | — | | | — | | | 11,436,502 | | | — | | | 7,139,358 | | | — | |
| Withhold | | | — | | | — | | | 286,390 | | | — | | | 157,877 | | | — | |
| Total | | | — | | | — | | | 11,722,892 | | | — | | | 7,297,235 | | | — | |
| Carole E. Stone | | | | | | | | | | | | | | | | | | | |
| For | | | — | | | — | | | 11,459,790 | | | — | | | 7,144,804 | | | — | |
| Withhold | | | — | | | — | | | 263,102 | | | — | | | 152,431 | | | — | |
| Total | | | — | | | — | | | 11,722,892 | | | — | | | 7,297,235 | | | — | |
| Virginia L. Stringer | | | | | | | | | | | | | | | | | | | |
| For | | | — | | | — | | | 11,452,889 | | | — | | | 7,167,774 | | | — | |
| Withhold | | | — | | | — | | | 270,003 | | | — | | | 129,461 | | | — | |
| Total | | | — | | | — | | | 11,722,892 | | | — | | | 7,297,235 | | | — | |
| Terence J. Toth | | | | | | | | | | | | | | | | | | | |
| For | | | — | | | — | | | 11,483,031 | | | — | | | 7,165,874 | | | — | |
| Withhold | | | — | | | — | | | 239,861 | | | — | | | 131,361 | | | — | |
| Total | | | — | | | — | | | 11,722,892 | | | — | | | 7,297,235 | | | — | |
| | | | NQC | | | NVC | | | NUC | |
| | | | Common and Preferred shares voting together as a class | | | Preferred Shares | | | Common and Preferred shares voting together as a class | | | Preferred shares | | | Common and Preferred shares voting together as a class | | | Preferred shares | |
| Approval of the Board Members was reached as follows: | | | | | | | | | | | | | |
| John P. Amboian | | | | | | | | | | | | | | | | | | | |
| For | | | 11,810,964 | | | — | | | 19,756,354 | | | — | | | 19,459,194 | | | — | |
| Withhold | | | 494,883 | | | — | | | 764,173 | | | — | | | 422,679 | | | — | |
| Total | | | 12,305,847 | | | — | | | 20,520,527 | | | — | | | 19,881,873 | | | — | |
| Robert P. Bremner | | | | | | | | | | | | | | | | | | | |
| For | | | 11,818,085 | | | — | | | 19,742,469 | | | — | | | 19,482,343 | | | — | |
| Withhold | | | 487,762 | | | — | | | 778,058 | | | — | | | 399,530 | | | — | |
| Total | | | 12,305,847 | | | — | | | 20,520,527 | | | — | | | 19,881,873 | | | — | |
| Jack B. Evans | | | | | | | | | | | | | | | | | | | |
| For | | | 11,816,668 | | | — | | | 19,766,234 | | | — | | | 19,491,356 | | | — | |
| Withhold | | | 489,179 | | | — | | | 754,293 | | | — | | | 390,517 | | | — | |
| Total | | | 12,305,847 | | | — | | | 20,520,527 | | | — | | | 19,881,873 | | | — | |
| William C. Hunter | | | | | | | | | | | | | | | | | | | |
| For | | | — | | | 922 | | | — | | | 1,546 | | | — | | | 1,553 | |
| Withhold | | | — | | | 34 | | | — | | | 43 | | | — | | | 28 | |
| Total | | | — | | | 956 | | | — | | | 1,589 | | | — | | | 1,581 | |
| David J. Kundert | | | | | | | | | | | | | | | | | | | |
| For | | | 11,810,964 | | | — | | | 19,749,266 | | | — | | | 19,483,336 | | | — | |
| Withhold | | | 494,883 | | | — | | | 771,261 | | | — | | | 398,537 | | | — | |
| Total | | | 12,305,847 | | | — | | | 20,520,527 | | | — | | | 19,881,873 | | | — | |
| William J. Schneider | | | | | | | | | | | | | | | | | | | |
| For | | | — | | | 922 | | | — | | | 1,546 | | | — | | | 1,553 | |
| Withhold | | | — | | | 34 | | | — | | | 43 | | | — | | | 28 | |
| Total | | | — | | | 956 | | | — | | | 1,589 | | | — | | | 1,581 | |
| Judith M. Stockdale | | | | | | | | | | | | | | | | | | | |
| For | | | 11,849,655 | | | — | | | 19,662,114 | | | — | | | 19,411,028 | | | — | |
| Withhold | | | 456,192 | | | — | | | 858,413 | | | — | | | 470,845 | | | — | |
| Total | | | 12,305,847 | | | — | | | 20,520,527 | | | — | | | 19,881,873 | | | — | |
| Carole E. Stone | | | | | | | | | | | | | | | | | | | |
| For | | | 11,862,628 | | | — | | | 19,698,082 | | | — | | | 19,414,835 | | | — | |
| Withhold | | | 443,219 | | | — | | | 822,445 | | | — | | | 467,038 | | | — | |
| Total | | | 12,305,847 | | | — | | | 20,520,527 | | | — | | | 19,881,873 | | | — | |
| Virginia L. Stringer | | | | | | | | | | | | | | | | | | | |
| For | | | 11,882,159 | | | — | | | 19,777,168 | | | — | | | 19,472,391 | | | — | |
| Withhold | | | 423,688 | | | — | | | 743,359 | | | — | | | 409,482 | | | — | |
| Total | | | 12,305,847 | | | — | | | 20,520,527 | | | — | | | 19,881,873 | | | — | |
| Terence J. Toth | | | | | | | | | | | | | | | | | | | |
| For | | | 11,810,964 | | | — | | | 19,767,723 | | | — | | | 19,474,644 | | | — | |
| Withhold | | | 494,883 | | | — | | | 752,804 | | | — | | | 407,229 | | | — | |
| Total | | | 12,305,847 | | | — | | | 20,520,527 | | | — | | | 19,881,873 | | | — | |
Report of Independent
Registered Public Accounting Firm
The Board of Directors/Trustees and Shareholders
Nuveen California Municipal Value Fund, Inc.
Nuveen California Municipal Value Fund 2
Nuveen California Performance Plus Municipal Fund, Inc.
Nuveen California Municipal Market Opportunity Fund, Inc.
Nuveen California Investment Quality Municipal Fund, Inc.
Nuveen California Select Quality Municipal Fund, Inc.
Nuveen California Quality Income Municipal Fund, Inc.
We have audited the accompanying statements of assets and liabilities, including the portfolios of investments, of Nuveen California Municipal Value Fund, Inc., Nuveen California Municipal Value Fund 2, Nuveen California Performance Plus Municipal Fund, Inc., Nuveen California Municipal Market Opportunity Fund, Inc., Nuveen California Investment Quality Municipal Fund, Inc., Nuveen California Select Quality Municipal Fund, Inc., and Nuveen California Quality Income Municipal Fund, Inc. (the “Funds”) as of February 28, 2013, and the related statements of operations and cash flows (Nuveen California Performance Plus Municipal Fund, Inc., Nuveen California Municipal Market Opportunity Fund, Inc., Nuveen California Investment Quality Municipal Fund, Inc., Nuveen California Select Quality Municipal Fund, Inc., and Nuveen California Quality Income Municipal Fund, Inc. only) for the year then ended, the statements of changes in net assets for each of the two years in the period then ended, and the financial highlights for each of the periods indicated therein. These financial statements and financial highlights are the responsibility of the Funds’ management. Our responsibility is to express an opinion on these financial statements and financial highlights based on our audits.
We conducted our audits in accordance with the standards of the Public Company Accounting Oversight Board (United States). Those standards require that we plan and perform the audits to obtain reasonable assurance about whether the financial statements and financial highlights are free of material misstatement. We were not engaged to perform an audit of the Funds’ internal control over financial reporting. Our audits included consideration of internal control over financial reporting as a basis for designing audit procedures that are appropriate in the circumstances, but not for the purpose of expressing an opinion on the effectiveness of the Funds’ internal control over financial reporting. Accordingly, we express no such opinion. An audit also includes examining, on a test basis, evidence supporting the amounts and disclosures in the financial statements and financial highlights, assessing the accounting principles used and significant estimates made by management, and evaluating the overall financial statement presentation. Our procedures included confirmation of securities owned as of February 28, 2013, by correspondence with the custodian and brokers or by other appropriate auditing procedures where replies from brokers were not received. We believe that our audits provide a reasonable basis for our opinion.
In our opinion, the financial statements and financial highlights referred to above present fairly, in all material respects, the financial positions of Nuveen California Municipal Value Fund, Inc., Nuveen California Municipal Value Fund 2, Nuveen California Performance Plus Municipal Fund, Inc., Nuveen California Municipal Market Opportunity Fund, Inc., Nuveen California Investment Quality Municipal Fund, Inc., Nuveen California Select Quality Municipal Fund, Inc., and Nuveen California Quality Income Municipal Fund, Inc. at February 28, 2013, and the results of their operations and their cash flows (Nuveen California Performance Plus Municipal Fund, Inc., Nuveen California Municipal Market Opportunity Fund, Inc., Nuveen California Investment Quality Municipal Fund, Inc., Nuveen California Select Quality Municipal Fund, Inc., and Nuveen California Quality Income Municipal Fund, Inc. only) for the year then ended, the changes in their net assets for each of the two years in the period then ended, and the financial highlights for each of the periods indicated therein, in conformity with U.S. generally accepted accounting principles.

Chicago, Illinois
April 25, 2013
| | | Nuveen California Municipal Value Fund, Inc. |
| NCA | | Portfolio of Investments |
| | | February 28, 2013 |
| | Principal | | | | Optional Call | | | | |
| | Amount (000) | | Description (1) | | Provisions (2) | Ratings (3) | | Value | |
| | | | Consumer Staples – 4.6% (4.6% of Total Investments) | | | | | | |
| $ | 385 | | California County Tobacco Securitization Agency, Tobacco Settlement Asset-Backed Bonds, Sonoma County Tobacco Securitization Corporation, Series 2005, 4.250%, 6/01/21 | | 6/15 at 100.00 | BB+ | $ | 374,774 | |
| | | | Golden State Tobacco Securitization Corporation, California, Tobacco Settlement Asset-Backed Bonds, Series 2007A-1: | | | | | | |
| | 5,940 | | 5.750%, 6/01/47 | | 6/17 at 100.00 | B | | 5,569,403 | |
| | 3,500 | | 5.125%, 6/01/47 | | 6/17 at 100.00 | B | | 2,972,060 | |
| | 3,570 | | Golden State Tobacco Securitization Corporation, California, Tobacco Settlement Asset-Backed Bonds, Series 2007A-2, 5.300%, 6/01/37 | | 6/22 at 100.00 | B | | 3,256,661 | |
| | 13,395 | | Total Consumer Staples | | | | | 12,172,898 | |
| | | | Education and Civic Organizations – 0.5% (0.4% of Total Investments) | | | | | | |
| | 140 | | California Educational Facilities Authority, Revenue Bonds, University of Redlands, Series 2005A, 5.000%, 10/01/35 | | 10/15 at 100.00 | A3 | | 145,667 | |
| | | | California Educational Facilities Authority, Revenue Bonds, University of the Pacific, Series 2006: | | | | | | |
| | 95 | | 5.000%, 11/01/21 | | 11/15 at 100.00 | A2 | | 103,155 | |
| | 125 | | 5.000%, 11/01/25 | | 11/15 at 100.00 | A2 | | 134,829 | |
| | 700 | | California Statewide Communities Development Authority, School Facility Revenue Bonds, Alliance College-Ready Public Schools, Series 2011A, 7.000%, 7/01/46 | | 7/21 at 100.00 | BBB | | 797,034 | |
| | 1,060 | | Total Education and Civic Organizations | | | | | 1,180,685 | |
| | | | Health Care – 16.4% (16.3% of Total Investments) | | | | | | |
| | | | California Health Facilities Financing Authority, Revenue Bonds, Rady Children’s Hospital – San Diego, Series 2011: | | | | | | |
| | 560 | | 5.000%, 8/15/31 | | 8/21 at 100.00 | A+ | | 620,850 | |
| | 670 | | 5.250%, 8/15/41 | | 8/21 at 100.00 | A+ | | 742,045 | |
| | 5,365 | | California Health Facilities Financing Authority, Revenue Bonds, Sutter Health, Series 2007A, 5.250%, 11/15/46 (UB) | | 11/16 at 100.00 | AA– | | 5,857,668 | |
| | 1,000 | | California Health Facilities Financing Authority, Revenue Bonds, Sutter Health, Series 2011B, 6.000%, 8/15/42 | | 8/20 at 100.00 | AA– | | 1,226,490 | |
| | 3,870 | | California Municipal Financing Authority, Certificates of Participation, Community Hospitals of Central California, Series 2007, 5.250%, 2/01/27 | | 2/17 at 100.00 | BBB | | 4,125,768 | |
| | 3,000 | | California Statewide Communities Development Authority, Insured Health Facility Revenue Bonds, Catholic Healthcare West, Series 2008K, 5.500%, 7/01/41 – AGC Insured | | 7/17 at 100.00 | AA– | | 3,336,510 | |
| | 560 | | California Statewide Communities Development Authority, Revenue Bonds, Adventist Health System West, Series 2005A, 5.000%, 3/01/35 | | 3/15 at 100.00 | A | | 595,090 | |
| | 1,460 | | California Statewide Communities Development Authority, Revenue Bonds, Kaiser Permanente System, Series 2001C, 5.250%, 8/01/31 | | 8/16 at 100.00 | A+ | | 1,637,054 | |
| | 2,500 | | California Statewide Communities Development Authority, Revenue Bonds, Kaiser Permanente System, Series 2007A, 4.750%, 4/01/33 | | 4/17 at 100.00 | A+ | | 2,684,275 | |
| | 2,710 | | California Statewide Communities Development Authority, Revenue Bonds, Sherman Oaks Health System, Series 1998A, 5.000%, 8/01/22 – AMBAC Insured | | No Opt. Call | A1 | | 3,000,377 | |
| | 1,890 | | California Statewide Communities Development Authority, Revenue Bonds, Sutter Health, Series 2005A, 5.000%, 11/15/43 | | 11/15 at 100.00 | AA– | | 2,031,145 | |
| | 1,000 | | California Statewide Communities Development Authority, Revenue Bonds, ValleyCare Health System, Series 2007A, 5.125%, 7/15/31 | | 7/17 at 100.00 | N/R | | 1,034,110 | |
| | 1,615 | | Loma Linda, California, Hospital Revenue Bonds, Loma Linda University Medical Center, Series 2005A, 5.000%, 12/01/22 | | 12/15 at 100.00 | BBB | | 1,657,620 | |
| | 1,525 | | Loma Linda, California, Hospital Revenue Bonds, Loma Linda University Medical Center, Series 2008A, 8.250%, 12/01/38 | | 12/17 at 100.00 | BBB | | 1,776,930 | |
| | | Nuveen California Municipal Value Fund, Inc. (continued) |
| NCA | | Portfolio of Investments |
| | | February 28, 2013 |
| | Principal | | | | Optional Call | | | | |
| | Amount (000) | | Description (1) | | Provisions (2) | Ratings (3) | | Value | |
| | | | Health Care (continued) | | | | | | |
| $ | 2,940 | | Palomar Pomerado Health Care District, California, Certificates of Participation, Series 2009, 6.750%, 11/01/39 | | 11/19 at 100.00 | Baa3 | $ | 3,327,463 | |
| | 2,900 | | Palomar Pomerado Health Care District, California, Certificates of Participation, Series 2010, 6.000%, 11/01/41 | | 11/20 at 100.00 | Baa3 | | 3,156,882 | |
| | 1,750 | | San Buenaventura, California, Revenue Bonds, Community Memorial Health System, Series 2011, 7.500%, 12/01/41 | | 12/21 at 100.00 | BB | | 2,139,900 | |
| | 3,000 | | Santa Clara County Financing Authority, California, Insured Revenue Bonds, El Camino Hospital, Series 2007A, 5.750%, 2/01/41 – AMBAC Insured | | 8/17 at 100.00 | A+ | | 3,317,790 | |
| | 1,000 | | Sierra View Local Health Care District, California, Revenue Bonds, Series 2007, 5.250%, 7/01/37 | | 9/17 at 100.00 | A | | 1,038,200 | |
| | 39,315 | | Total Health Care | | | | | 43,306,167 | |
| | | | Housing/Multifamily – 2.2% (2.2% of Total Investments) | | | | | | |
| | 1,035 | | California Municipal Finance Authority, Mobile Home Park Revenue Bonds, Caritas Projects Series 2010A, 6.400%, 8/15/45 | | 8/20 at 100.00 | BBB | | 1,145,352 | |
| | 1,060 | | California Municipal Finance Authority, Mobile Home Park Revenue Bonds, Caritas Projects Series 2012A, 5.500%, 8/15/47 | | 8/22 at 100.00 | BBB | | 1,131,677 | |
| | 2,355 | | California Statewide Community Development Authority, Multifamily Housing Revenue Bonds, Harbor City Lights, Series 1999Y, 6.650%, 7/01/39 (Alternative Minimum Tax) | | 5/13 at 100.00 | N/R | | 2,356,248 | |
| | 1,265 | | San Dimas Housing Authority, California, Mobile Home Park Revenue Bonds, Charter Oak Mobile Home Estates Acquisition Project, Series 1998A, 5.700%, 7/01/28 | | 5/13 at 100.00 | N/R | | 1,266,151 | |
| | 5,715 | | Total Housing/Multifamily | | | | | 5,899,428 | |
| | | | Housing/Single Family – 0.9% (0.9% of Total Investments) | | | | | | |
| | 2,125 | | California Department of Veteran Affairs, Home Purchase Revenue Bonds, Series 2007, 5.000%, 12/01/42 (Alternative Minimum Tax) | | 12/16 at 100.00 | AA | | 2,180,059 | |
| | 125 | | California Housing Finance Agency, Home Mortgage Revenue Bonds, Series 2006H, 5.750%, 8/01/30 – FGIC Insured (Alternative Minimum Tax) | | 2/16 at 100.00 | BBB | | 130,844 | |
| | 2,250 | | Total Housing/Single Family | | | | | 2,310,903 | |
| | | | Long-Term Care – 3.8% (3.7% of Total Investments) | | | | | | |
| | | | ABAG Finance Authority for Non-Profit Corporations, California, Cal-Mortgage Revenue Bonds, Elder Care Alliance of Union City, Series 2004: | | | | | | |
| | 1,850 | | 5.400%, 8/15/24 | | 8/14 at 100.00 | A | | 1,917,155 | |
| | 2,130 | | 5.600%, 8/15/34 | | 8/14 at 100.00 | A | | 2,201,611 | |
| | 4,000 | | ABAG Finance Authority for Non-Profit Corporations, California, Health Facility Revenue Bonds, The Institute on Aging, Series 2008A, 5.650%, 8/15/38 | | 8/18 at 100.00 | A | | 4,393,600 | |
| | 1,470 | | California Statewide Community Development Authority, Certificates of Participation, Internext Group, Series 1999, 5.375%, 4/01/17 | | 5/13 at 100.00 | BBB | | 1,474,778 | |
| | 9,450 | | Total Long-Term Care | | | | | 9,987,144 | |
| | | | Tax Obligation/General – 14.8% (14.7% of Total Investments) | | | | | | |
| | 415 | | California State, General Obligation Bonds, Series 2004, 5.000%, 2/01/20 | | 2/14 at 100.00 | A1 | | 433,231 | |
| | | | California State, General Obligation Bonds, Various Purpose Series 2009: | | | | | | |
| | 2,500 | | 6.000%, 4/01/38 | | 4/19 at 100.00 | A1 | | 3,022,125 | |
| | 1,000 | | 6.000%, 11/01/39 | | 11/19 at 100.00 | A1 | | 1,223,890 | |
| | 2,000 | | California State, General Obligation Bonds, Various Purpose Series 2010, 5.500%, 3/01/40 | | 3/20 at 100.00 | A1 | | 2,368,700 | |
| | | | California State, General Obligation Bonds, Various Purpose Series 2011: | | | | | | |
| | 3,520 | | 5.000%, 9/01/41 | | 9/21 at 100.00 | A1 | | 3,951,024 | |
| | 2,625 | | 5.000%, 10/01/41 | | 10/21 at 100.00 | A1 | | 2,949,083 | |
| | | | California State, General Obligation Bonds, Various Purpose Series 2012: | | | | | | |
| | 1,000 | | 5.250%, 2/01/28 | | 2/22 at 100.00 | A1 | | 1,205,870 | |
| | 2,500 | | 5.000%, 4/01/42 | | 4/22 at 100.00 | A1 | | 2,821,975 | |
| | 1,500 | | Los Angeles Unified School District, California, General Obligation Bonds, Series 2006F, 5.000%, 7/01/24 – FGIC Insured | | 7/16 at 100.00 | Aa2 | | 1,687,770 | |
| | | | | | | | | | |
| | Principal | | | | Optional Call | | | | |
| | Amount (000) | | Description (1) | | Provisions (2) | Ratings (3) | | Value | |
| | | | Tax Obligation/General (continued) | | | | | | |
| $ | 2,000 | | Puerto Rico, General Obligation and Public Improvement Bonds, Series 2002A, 5.500%, 7/01/20 – NPFG Insured | | No Opt. Call | BBB+ | $ | 2,189,780 | |
| | 270 | | Roseville Joint Union High School District, Placer County, California, General Obligation Bonds, Series 2006B, 5.000%, 8/01/27 – FGIC Insured | | 8/15 at 100.00 | AA | | 294,835 | |
| | 11,875 | | San Mateo Union High School District, San Mateo County, California, General Obligation Bonds, Election 2010 Series 2011A, 0.000%, 9/01/41 | | 9/36 at 100.00 | Aa1 | | 6,427,580 | |
| | 1,320 | | Tahoe Forest Hospital District, Placer and Nevada Counties, California, General Obligation Bonds, Series 2010B, 5.500%, 8/01/35 | | 8/18 at 100.00 | Aa3 | | 1,517,102 | |
| | 20,860 | | Yosemite Community College District, California, General Obligation Bonds, Capital Appreciation, Election 2004, Series 2010D, 0.000%, 8/01/42 | | No Opt. Call | Aa2 | | 9,002,966 | |
| | 53,385 | | Total Tax Obligation/General | | | | | 39,095,931 | |
| | | | Tax Obligation/Limited – 20.1% (20.0% of Total Investments) | | | | | | |
| | 1,000 | | Artesia Redevelopment Agency, California, Tax Allocation Revenue Bonds, Artesia Redevelopment Project Area, Series 2007, 5.375%, 6/01/27 | | 6/15 at 100.00 | BBB+ | | 1,011,880 | |
| | | | Bell Community Redevelopment Agency, California, Tax Allocation Bonds, Bell Project Area, Series 2003: | | | | | | |
| | 3,000 | | 5.500%, 10/01/23 – RAAI Insured | | 10/13 at 100.00 | N/R | | 3,000,180 | |
| | 1,000 | | 5.625%, 10/01/33 – RAAI Insured | | 10/13 at 100.00 | N/R | | 955,370 | |
| | 2,400 | | Calexico Community Redevelopment Agency, California, Tax Allocation Bonds, Merged Central | | 8/13 at 102.00 | A– | | 2,446,800 | |
| | | | Business and Residential District Project, Series 2003C, 5.000%, 8/01/28 – AMBAC Insured | | | | | | |
| | 1,000 | | California State Public Works Board, Lease Revenue Bonds, Various Capital Projects, Series 2009G-1, 5.750%, 10/01/30 | | 10/19 at 100.00 | A2 | | 1,179,380 | |
| | 2,000 | | California State Public Works Board, Lease Revenue Bonds, Various Capital Projects, Series 2009-I, 6.375%, 11/01/34 | | 11/19 at 100.00 | A2 | | 2,464,660 | |
| | 340 | | Capistrano Unified School District, Orange County, California, Special Tax Bonds, Community Facilities District, Series 2005, 5.000%, 9/01/24 – FGIC Insured | | 9/15 at 100.00 | BBB– | | 351,237 | |
| | 1,005 | | Chino Redevelopment Agency, California, Merged Chino Redevelopment Project Area Tax Allocation Bonds, Series 2006, 5.000%, 9/01/38 – AMBAC Insured | | 9/16 at 101.00 | A– | | 1,020,990 | |
| | 1,000 | | Folsom Public Financing Authority, California, Special Tax Revenue Bonds, Refunding Series 2007A, 5.000%, 9/01/23 – AMBAC Insured | | 9/17 at 100.00 | N/R | | 1,048,020 | |
| | 750 | | Fontana Redevelopment Agency, California, Jurupa Hills Redevelopment Project, Tax Allocation Refunding Bonds, 1997 Series A, 5.500%, 10/01/27 | | 4/13 at 100.00 | A– | | 750,968 | |
| | 675 | | Inglewood Redevelopment Agency, California, Tax Allocation Bonds, Merged Redevelopment Project, Subordinate Lien Series 2007A-1, 5.000%, 5/01/25 – AMBAC Insured | | 5/17 at 100.00 | BBB+ | | 692,584 | |
| | | | Irvine, California, Unified School District, Community Facilities District Special Tax Bonds, Series 2006A: | | | | | | |
| | 150 | | 5.000%, 9/01/26 | | 9/16 at 100.00 | N/R | | 155,219 | |
| | 355 | | 5.125%, 9/01/36 | | 9/16 at 100.00 | N/R | | 363,513 | |
| | 2,500 | | Kern County Board of Education, California, Certificates of Participation, Series 2006A, 5.000%, 6/01/31 – NPFG Insured | | 6/16 at 100.00 | A | | 2,564,375 | |
| | 750 | | Lancaster Redevelopment Agency, California, Tax Allocation Bonds, Combined Redevelopment Project Areas Housing Programs, Series 2009, 6.000%, 8/01/24 | | 8/19 at 100.00 | BBB | | 844,620 | |
| | 615 | | Los Angeles Community Redevelopment Agency, California, Lease Revenue Bonds, Manchester Social Services Project, Series 2005, 5.000%, 9/01/37 – AMBAC Insured | | 9/15 at 100.00 | A1 | | 640,498 | |
| | 795 | | Milpitas, California, Local Improvement District 20 Limited Obligation Bonds, Series 1998A, 5.650%, 9/02/13 | | 3/13 at 103.00 | N/R | | 809,223 | |
| | | | Modesto Schools Infrastructure Financing Agency, Stanislaus County, California, Special Tax Revenue Bonds, Series 2004: | | | | | | |
| | 1,045 | | 5.250%, 9/01/22 – AMBAC Insured | | 9/14 at 100.00 | N/R | | 1,073,497 | |
| | 1,145 | | 5.250%, 9/01/23 – AMBAC Insured | | 9/14 at 100.00 | N/R | | 1,174,186 | |
| | 1,255 | | 5.250%, 9/01/24 – AMBAC Insured | | 9/14 at 100.00 | N/R | | 1,279,761 | |
| | 370 | | National City Community Development Commission, California, Tax Allocation Bonds, National City Redevelopment Project, Series 2011, 6.500%, 8/01/24 | | 8/21 at 100.00 | A– | | 462,700 | |
| | | Nuveen California Municipal Value Fund, Inc. (continued) |
| NCA | | Portfolio of Investments |
| | | February 28, 2013 |
| | Principal | | | | Optional Call | | | | |
| | Amount (000) | | Description (1) | | Provisions (2) | Ratings (3) | | Value | |
| | | | Tax Obligation/Limited (continued) | | | | | | |
| $ | 140 | | Novato Redevelopment Agency, California, Tax Allocation Bonds, Hamilton Field Redevelopment Project, Series 2011, 6.750%, 9/01/40 | | 9/21 at 100.00 | BBB+ | $ | 164,224 | |
| | 420 | | Oakland Redevelopment Agency, California, Subordinate Lien Tax Allocation Bonds, Central District Redevelopment Project, Series 2003, 5.500%, 9/01/18 – FGIC Insured | | 5/13 at 100.00 | A– | | 421,273 | |
| | 5,910 | | Palmdale Elementary School District, Los Angeles County, California, Special Tax Bonds, Community Facilities District 90-1, Series 1999, 5.800%, 8/01/29 | | 5/13 at 100.00 | AA– | | 5,923,593 | |
| | | | Perris Union High School District Financing Authority, Riverside County, California, Revenue Bonds, Series 2011: | | | | | | |
| | 125 | | 6.000%, 9/01/33 | | 9/13 at 100.00 | N/R | | 129,495 | |
| | 275 | | 6.125%, 9/01/41 | | 9/13 at 100.00 | N/R | | 284,719 | |
| | 1,130 | | Pittsburg Redevelopment Agency, California, Tax Allocation Bonds, Los Medanos Community Development Project, Refunding Series 2008A, 6.500%, 9/01/28 | | 9/18 at 100.00 | BBB– | | 1,238,017 | |
| | 440 | | Rancho Santa Fe CSD Financing Authority, California, Revenue Bonds, Superior Lien Series 2011A, 5.750%, 9/01/30 | | 9/21 at 100.00 | BBB+ | | 508,103 | |
| | 290 | | Rialto Redevelopment Agency, California, Tax Allocation Bonds, Merged Project Area, Series 2005A, 5.000%, 9/01/35 – SYNCORA GTY Insured | | 9/15 at 100.00 | A– | | 293,437 | |
| | 80 | | Riverside County Redevelopment Agency, California, Tax Allocation Bonds, Jurupa Valley Project Area, Series 2011B, 6.500%, 10/01/25 | | 10/21 at 100.00 | A– | | 91,477 | |
| | 5,000 | | Riverside County Redevelopment Agency, California, Tax Allocation Housing Bonds, Series 2004A, 5.000%, 10/01/37 – SYNCORA GTY Insured | | 10/14 at 100.00 | A– | | 5,010,750 | |
| | 360 | | Roseville, California, Certificates of Participation, Public Facilities, Series 2003A, 5.000%, 8/01/25 – AMBAC Insured | | 8/13 at 100.00 | AA– | | 365,389 | |
| | 1,000 | | San Diego County Regional Transportation Commission, California, Sales Tax Revenue Bonds, Series 2012A, 5.000%, 4/01/42 | | 4/22 at 100.00 | AAA | | 1,148,220 | |
| | 65 | | San Francisco Redevelopment Finance Authority, California, Tax Allocation Revenue Bonds, Mission Bay North Redevelopment Project, Series 2011C, 6.750%, 8/01/41 | | 2/21 at 100.00 | A– | | 78,285 | |
| | | | San Francisco Redevelopment Financing Authority, California, Tax Allocation Revenue Bonds, Mission Bay South Redevelopment Project, Series 2011D: | | | | | | |
| | 65 | | 7.000%, 8/01/33 | | 2/21 at 100.00 | BBB | | 76,411 | |
| | 80 | | 7.000%, 8/01/41 | | 2/21 at 100.00 | BBB | | 92,800 | |
| | 2,750 | | San Jose Financing Authority, California, Lease Revenue Refunding Bonds, Convention Center Project, Series 2001F, 5.000%, 9/01/20 – NPFG Insured | | 5/13 at 100.00 | AA | | 2,761,853 | |
| | | | San Jose Redevelopment Agency, California, Tax Allocation Bonds, Merged Area Redevelopment Project, Series 2006C: | | | | | | |
| | 400 | | 5.000%, 8/01/24 – NPFG Insured | | 8/17 at 100.00 | BBB | | 417,876 | |
| | 590 | | 5.000%, 8/01/25 – NPFG Insured | | 8/17 at 100.00 | BBB | | 614,910 | |
| | 780 | | San Jose Redevelopment Agency, California, Tax Allocation Bonds, Merged Area Redevelopment Project, Series 2006D, 5.000%, 8/01/23 – AMBAC Insured | | 8/17 at 100.00 | BBB | | 802,082 | |
| | 910 | | Santa Clara Valley Transportation Authority, California, Sales Tax Revenue Bonds, Series 2007A, 5.000%, 4/01/36 – AMBAC Insured | | 4/17 at 100.00 | AA+ | | 1,030,129 | |
| | 110 | | Signal Hill Redevelopment Agency, California, Project 1 Tax Allocation Bonds, Series 2011, 7.000%, 10/01/26 | | 4/21 at 100.00 | N/R | | 122,782 | |
| | 1,000 | | Simi Valley, California, Certificates of Participation, Series 2004, 5.000%, 9/01/24 – AMBAC Insured | | 9/14 at 100.00 | A+ | | 1,050,640 | |
| | 1,420 | | Tehachapi Redevelopment Agency, California, Tax Allocation Bonds, Series 2007, 5.250%, 12/01/37 – RAAI Insured | | 12/17 at 100.00 | BBB– | | 1,398,601 | |
| | 1,925 | | Travis Unified School District, Solano County, California, Certificates of Participation, Series 2006, 5.000%, 9/01/26 – FGIC Insured | | 9/16 at 100.00 | N/R | | 1,973,491 | |
| | 875 | | Vista Joint Powers Financing Authority, California, Special Tax Lease Revenue Refunding Bonds, Community Facilities District 90-2, Series 1997A, 5.875%, 9/01/20 | | 5/13 at 100.00 | N/R | | 875,945 | |
| | 1,730 | | West Contra Costa Healthcare District, California, Certificates of Participation, Series 2004, 5.375%, 7/01/21 – AMBAC Insured | | 7/14 at 100.00 | A– | | 1,800,411 | |
| | 190 | | Yorba Linda Redevelopment Agency, Orange County, California, Tax Allocation Revenue Bonds, Yorba Linda Redevelopment Project, Subordinate Lien Series 2011A, 6.500%, 9/01/32 | | 9/21 at 100.00 | A– | | 225,401 | |
| | 51,210 | | Total Tax Obligation/Limited | | | | | 53,189,975 | |
| | Principal | | | | Optional Call | | | | |
| | Amount (000) | | Description (1) | | Provisions (2) | Ratings (3) | | Value | |
| | | | Transportation – 3.8% (3.7% of Total Investments) | | | | | | |
| $ | 2,500 | | Bay Area Toll Authority, California, Revenue Bonds, San Francisco Bay Area Toll Bridge, Series 2006F, 5.000%, 4/01/31 (UB) | | 4/16 at 100.00 | AA | $ | 2,850,500 | |
| | 5,500 | | Foothill/Eastern Transportation Corridor Agency, California, Toll Road Revenue Refunding Bonds, Series 1999, 5.875%, 1/15/27 | | 1/14 at 101.00 | BBB– | | 5,664,175 | |
| | 1,250 | | Fresno, California, Airport Revenue Bonds, Series 2000A, 5.500%, 7/01/30 – AGM Insured | | 5/13 at 100.00 | AA– | | 1,252,375 | |
| | 215 | | Palm Springs Financing Authority, California, Palm Springs International Airport Revenue Bonds, Series 2006, 5.550%, 7/01/28 (Alternative Minimum Tax) | | 7/14 at 102.00 | N/R | | 215,899 | |
| | 9,465 | | Total Transportation | | | | | 9,982,949 | |
| | | | U.S. Guaranteed – 15.8% (15.7% of Total Investments) (4) | | | | | | |
| | 5,010 | | Burbank Redevelopment Agency, California, Tax Allocation Bonds, Golden State Redevelopment Project, Series 2003, 5.750%, 12/01/33 (Pre-refunded 12/01/13) – FGIC Insured | | 12/13 at 100.00 | N/R (4) | | 5,211,051 | |
| | 1,480 | | California Department of Water Resources, Water System Revenue Bonds, Central Valley Project, Series 2005AD, 5.000%, 12/01/22 (Pre-refunded 6/01/15) – AGM Insured | | 6/15 at 100.00 | AAA | | 1,634,305 | |
| | | | California State, General Obligation Bonds, Series 2004: | | | | | | |
| | 85 | | 5.000%, 2/01/20 (Pre-refunded 2/01/14) | | 2/14 at 100.00 | Aaa | | 88,771 | |
| | 2,845 | | 5.250%, 4/01/34 (Pre-refunded 4/01/14) | | 4/14 at 100.00 | AAA | | 3,002,243 | |
| | 2,065 | | Contra Costa County, California, GNMA Mortgage-Backed Securities Program Home Mortgage Revenue Bonds, Series 1988, 8.250%, 6/01/21 (Alternative Minimum Tax) (ETM) | | No Opt. Call | Aaa | | 2,793,119 | |
| | 1,265 | | Golden State Tobacco Securitization Corporation, California, Tobacco Settlement Asset-Backed Bonds, Series 2003A-1, 6.250%, 6/01/33 (Pre-refunded 6/01/13) | | 6/13 at 100.00 | Aaa | | 1,284,873 | |
| | 2,750 | | Los Angeles County Schools, California, Certificates of Participation, Pooled Financing Program, Regionalized Business Services Corporation, Series 2003A, 5.000%, 9/01/28 (Pre-refunded 9/01/13) – AGM Insured | | 9/13 at 100.00 | AA– (4) | | 2,815,863 | |
| | 2,000 | | Orange County Sanitation District, California, Certificates of Participation, Series 2003, 5.250%, 2/01/27 (Pre-refunded 8/01/13) – FGIC Insured | | 8/13 at 100.00 | AAA | | 2,043,340 | |
| | 8,565 | | Palmdale, California, GNMA Mortgage-Backed Securities Program Single Family Mortgage Revenue Bonds, Series 1988A, 0.000%, 3/01/17 (ETM) | | No Opt. Call | AAA | | 8,281,669 | |
| | 20,415 | | San Bernardino County, California, GNMA Mortgage-Backed Securities Program Single Family Home Mortgage Revenue Bonds, Series 1988A, 0.000%, 9/01/21 (Alternative Minimum Tax) (ETM) | | No Opt. Call | AA+ (4) | | 13,816,050 | |
| | 625 | | San Mateo Union High School District, San Mateo County, California, Certificates of Participation, Phase 1, Series 2007A, 5.000%, 12/15/30 (Pre-refunded 12/15/17) – AMBAC Insured | | 12/17 at 100.00 | AA– (4) | | 750,581 | |
| | 47,105 | | Total U.S. Guaranteed | | | | | 41,721,865 | |
| | | | Utilities – 7.8% (7.7% of Total Investments) | | | | | | |
| | 2,445 | | California Statewide Community Development Authority, Certificates of Participation Refunding, Rio Bravo Fresno Project, Series 1999A, 6.500%, 12/01/18 | | 5/13 at 100.00 | N/R | | 2,404,169 | |
| | 1,800 | | Long Beach Bond Finance Authority, California, Natural Gas Purchase Revenue Bonds, Series 2007A, 5.500%, 11/15/37 | | No Opt. Call | A | | 2,191,950 | |
| | 21,500 | | Merced Irrigation District, California, Certificates of Participation, Water and Hydroelectric Series 2008B, 0.000%, 9/01/23 | | 9/16 at 64.56 | A | | 11,945,399 | |
| | 605 | | Merced Irrigation District, California, Electric System Revenue Bonds, Series 2005, 5.125%, 9/01/31 – SYNCORA GTY Insured | | 9/15 at 100.00 | N/R | | 623,277 | |
| | 3,470 | | Puerto Rico Industrial, Tourist, Educational, Medical and Environmental Control Facilities Financing Authority, Co-Generation Facility Revenue Bonds, Series 2000A, 6.625%, 6/01/26 (Alternative Minimum Tax) | | 5/13 at 100.00 | Ba1 | | 3,469,792 | |
| | 29,820 | | Total Utilities | | | | | 20,634,587 | |
| | | | Water and Sewer – 10.2% (10.1% of Total Investments) | | | | | | |
| | | | California Pollution Control Financing Authority, Water Furnishing Revenue Bonds, Poseidon Resources Channelside Desalination Project, Series 2012: | | | | | | |
| | 1,375 | | 5.000%, 7/01/37 (Alternative Minimum Tax) | | No Opt. Call | Baa3 | | 1,436,490 | |
| | 2,675 | | 5.000%, 11/21/45 (Alternative Minimum Tax) | | No Opt. Call | Baa3 | | 2,773,868 | |
| | 1,500 | | Castaic Lake Water Agency, California, Certificates of Participation, Series 2006C, 5.000%, 8/01/36 – NPFG Insured | | 8/16 at 100.00 | AA– | | 1,648,275 | |
| | | Nuveen California Municipal Value Fund, Inc. (continued) |
| NCA | | Portfolio of Investments |
| | | February 28, 2013 |
| | Principal | | | | Optional Call | | | | |
| | Amount (000) | | Description (1) | | Provisions (2) | Ratings (3) | | Value | |
| | | | Water and Sewer (continued) | | | | | | |
| $ | 410 | | Healdsburg Public Financing Authority, California, Wastewater Revenue Bonds, Series 2006, 5.000%, 4/01/36 – NPFG Insured | | 4/16 at 100.00 | AA– | $ | 450,160 | |
| | 500 | | Los Angeles County Sanitation Districts Financing Authority, California, Senior Revenue Bonds, Capital Projects, Series 2003A, 5.000%, 10/01/23 – AGM Insured | | 10/13 at 100.00 | AA+ | | 513,990 | |
| | 5,000 | | Los Angeles Department of Water and Power, California, Waterworks Revenue Bonds, Series 2007A-2, 5.000%, 7/01/44 – AMBAC Insured | | 7/17 at 100.00 | AA | | 5,632,650 | |
| | | | Madera Irrigation District. California, Water Revenue Refunding Bonds, Series 2008: | | | | | | |
| | 1,850 | | 5.500%, 1/01/33 | | 1/18 at 100.00 | A– | | 2,049,338 | |
| | 3,000 | | 5.500%, 1/01/38 | | 1/18 at 100.00 | A– | | 3,264,240 | |
| | 5,000 | | Metropolitan Water District of Southern California, Water Revenue Bonds, 2006 Authorization Series 2007A, 5.000%, 7/01/37 | | 7/17 at 100.00 | AAA | | 5,711,300 | |
| | 3,500 | | Woodbridge Irrigation District, California, Certificates of Participation, Water Systems Project, Series 2003, 5.625%, 7/01/43 | | 7/13 at 100.00 | A+ | | 3,516,590 | |
| | 24,810 | | Total Water and Sewer | | | | | 26,996,901 | |
| $ | 286,980 | | Total Investments (cost $239,923,290) – 100.9% | | | | | 266,479,433 | |
| | | | Floating Rate Obligations– (1.7)% | | | | | (4,490,000 | ) |
| | | | Other Assets Less Liabilities – 0.8% | | | | | 2,104,186 | |
| | | | Net Assets – 100% | | | | $ | 264,093,619 | |
| (1) | | All percentages in the Portfolio of Investments are based on net assets applicable to Common shares unless otherwise noted. |
| (2) | | Optional Call Provisions (not covered by the report of independent registered public accounting firm): Dates (month and year) and prices of the earliest optional call or redemption. There may be other call provisions at varying prices at later dates. Certain mortgage-backed securities may be subject to periodic principal paydowns. |
| (3) | | Ratings (not covered by the report of independent registered public accounting firm): Using the highest of Standard & Poor’s Group (“Standard & Poor’s”), Moody’s Investors Service, Inc. (“Moody’s”) or Fitch, Inc. (“Fitch”) rating. Ratings below BBB by Standard & Poor’s, Baa by Moody’s or BBB by Fitch are considered to be below investment grade. Holdings designated N/R are not rated by any of these national rating agencies. |
| (4) | | Backed by an escrow or trust containing sufficient U.S. Government or U.S. Government agency securities, which ensure the timely payment of principal and interest. Certain bonds backed by U.S. Government or agency securities are regarded as having an implied rating equal to the rating of such securities. |
| N/R | | Not rated. |
| (ETM) | | Escrowed to maturity. |
| (UB) | | Underlying bond of an inverse floating rate trust reflected as a financing transaction. See Notes to Financial Statements, Footnote 1 – General Information and Significant Accounting Policies, Inverse Floating Rate Securities for more information. |
See accompanying notes to financial statements.
| | | Nuveen California Municipal Value Fund 2 |
| NCB | | Portfolio of Investments |
| | | February 28, 2013 |
| | Principal | | | | Optional Call | | | | |
| | Amount (000) | | Description (1) | | Provisions (2) | Ratings (3) | | Value | |
| | | | Consumer Staples – 5.4% (5.5% of Total Investments) | | | | | | |
| $ | 3,500 | | Tobacco Securitization Authority of Northern California, Tobacco Settlement Asset-Backed Bonds, Series 2005A-1, 5.500%, 6/01/45 | | 6/15 at 100.00 | B– | $ | 3,115,280 | |
| | | | Education and Civic Organizations – 7.1% (7.2% of Total Investments) | | | | | | |
| | 500 | | California Educational Facilities Authority, Revenue Bonds, University of Redlands, Series 2005A, 5.000%, 10/01/25 | | 10/15 at 100.00 | A3 | | 539,035 | |
| | 920 | | California Educational Facilities Authority, Revenue Bonds, University of the Pacific, Series 2009, 5.500%, 11/01/39 | | 11/19 at 100.00 | A2 | | 1,029,508 | |
| | 1,965 | | California State Public Works Board, Lease Revenue Bonds, University of California Department of Education Riverside Campus Project, Series 2009B, 5.750%, 4/01/23 | | 4/19 at 100.00 | A2 | | 2,357,882 | |
| | 150 | | California Statewide Communities Development Authority, School Facility Revenue Bonds, Alliance College-Ready Public Schools, Series 2011A, 7.000%, 7/01/46 | | 7/21 at 100.00 | BBB | | 170,793 | |
| | 3,535 | | Total Education and Civic Organizations | | | | | 4,097,218 | |
| | | | Health Care – 24.0% (24.5% of Total Investments) | | | | | | |
| | 1,000 | | ABAG Finance Authority for Non-Profit Corporations, California, Cal-Mortgage Insured Health Facility Revenue Bonds, Saint Rose Hospital, Series 2009A, 6.000%, 5/15/29 | | 5/19 at 100.00 | A | | 1,151,420 | |
| | 1,900 | | California Health Facilities Financing Authority, Revenue Bonds, Catholic Healthcare West, Series 2009A, 6.000%, 7/01/39 | | 7/19 at 100.00 | A | | 2,260,069 | |
| | 1,000 | | California Health Facilities Financing Authority, Revenue Bonds, Childrens Hospital of Orange County, Series 2009A, 6.500%, 11/01/38 | | 11/19 at 100.00 | A | | 1,230,980 | |
| | 850 | | California Municipal Financing Authority, Certificates of Participation, Community Hospitals of Central California, Series 2007, 5.250%, 2/01/27 | | 2/17 at 100.00 | BBB | | 906,177 | |
| | 700 | | California Statewide Communities Development Authority, Revenue Bonds, Adventist Health System West, Series 2007B, 5.000%, 3/01/37 – AGC Insured | | 3/18 at 100.00 | AA– | | 757,288 | |
| | | | California Statewide Communities Development Authority, Revenue Bonds, Kaiser Permanante System, Series 2006: | | | | | | |
| | 625 | | 5.000%, 3/01/41 | | 3/16 at 100.00 | A+ | | 669,744 | |
| | 2,000 | | 5.250%, 3/01/45 | | 3/16 at 100.00 | A+ | | 2,147,900 | |
| | 1,500 | | California Statewide Communities Development Authority, Revenue Bonds, Sutter Health, Series 2004D, 5.050%, 8/15/38 – AGM Insured | | 8/18 at 100.00 | AA | | 1,690,125 | |
| | 800 | | Delaware County Hospital Authority, Indiana, Hospital Revenue Bonds, Cardinal Health System, Series 2006, 5.000%, 8/01/24 | | 8/16 at 100.00 | Baa2 | | 860,880 | |
| | 850 | | Illinois Finance Authority, Revenue Bonds, Sherman Health Systems, Series 2007A, 5.500%, 8/01/37 | | 8/17 at 100.00 | BBB | | 930,963 | |
| | 725 | | Palomar Pomerado Health Care District, California, Certificates of Participation, Series 2010, 6.000%, 11/01/41 | | 11/20 at 100.00 | Baa3 | | 789,221 | |
| | 380 | | San Buenaventura, California, Revenue Bonds, Community Memorial Health System, Series 2011, 7.500%, 12/01/41 | | 12/21 at 100.00 | BB | | 464,664 | |
| | 12,330 | | Total Health Care | | | | | 13,859,431 | |
| | | | Housing/Multifamily – 1.0% (1.0% of Total Investments) | | | | | | |
| | 230 | | California Municipal Finance Authority, Mobile Home Park Revenue Bonds, Caritas Projects Series 2010A, 6.400%, 8/15/45 | | 8/20 at 100.00 | BBB | | 254,523 | |
| | 70 | | California Municipal Finance Authority, Mobile Home Park Revenue Bonds, Caritas Projects Series 2012A, 5.500%, 8/15/47 | | 8/22 at 100.00 | BBB | | 74,733 | |
| | 250 | | California Municipal Finance Authority, Mobile Home Park Revenue Bonds, Caritas Projects Series 2012B, 7.250%, 8/15/47 | | 8/22 at 100.00 | A1 | | 264,448 | |
| | 550 | | Total Housing/Multifamily | | | | | 593,704 | |
| | | Nuveen California Municipal Value Fund 2 (continued) |
| NCB | | Portfolio of Investments |
| | | February 28, 2013 |
| | Principal | | | | Optional Call | | | | |
| | Amount (000) | | Description (1) | | Provisions (2) | Ratings (3) | | Value | |
| | | | Housing/Single Family – 6.2% (6.3% of Total Investments) | | | | | | |
| $ | 1,055 | | California Housing Finance Agency, California, Home Mortgage Revenue Bonds, Series 2008L, 5.500%, 8/01/38 | | 2/18 at 100.00 | BBB | $ | 1,081,618 | |
| | 2,500 | | California Housing Finance Agency, Home Mortgage Revenue Bonds, Series 2006K, 4.625%, 8/01/26 (Alternative Minimum Tax) | | 2/16 at 100.00 | BBB | | 2,487,550 | |
| | 3,555 | | Total Housing/Single Family | | | | | 3,569,168 | |
| | | | Long-Term Care – 2.1% (2.2% of Total Investments) | | | | | | |
| | 1,000 | | California Health Facilities Financing Authority, Insured Revenue Bonds, Community Program for Persons with Developmental Disabilities, Series 2011A, 6.250%, 2/01/26 | | 2/21 at 100.00 | A | | 1,240,600 | |
| | | | Materials – 1.1% (1.1% of Total Investments) | | | | | | |
| | 585 | | Courtland Industrial Development Board, Alabama, Solid Waste Revenue Bonds, International Paper Company Project, Series 2005A, 5.200%, 6/01/25 (Alternative Minimum Tax) | | 6/15 at 100.00 | BBB | | 610,787 | |
| | | | Tax Obligation/General – 9.0% (9.2% of Total Investments) | | | | | | |
| | 2,000 | | California State, General Obligation Bonds, Various Purpose Series 2007, 5.000%, 6/01/37 – NPFG Insured | | 6/17 at 100.00 | A1 | | 2,198,580 | |
| | 2,100 | | Carlsbad Unified School District, San Diego County, California, General Obligation Bonds, Series 2009B, 0.000%, 5/01/34 | | 5/24 at 100.00 | AA | | 1,732,059 | |
| | 1,120 | | Oakland, California, General Obligation Bonds, Measure DD Series 2009B, 5.250%, 1/15/29 | | 1/19 at 100.00 | Aa2 | | 1,255,856 | |
| | 5,220 | | Total Tax Obligation/General | | | | | 5,186,495 | |
| | | | Tax Obligation/Limited – 17.8% (18.2% of Total Investments) | | | | | | |
| | 500 | | California State Public Works Board, Lease Revenue Bonds, Various Capital Projects, Series 2010A-1, 6.000%, 3/01/35 | | 3/20 at 100.00 | A2 | | 612,945 | |
| | 160 | | Fontana Redevelopment Agency, California, Jurupa Hills Redevelopment Project, Tax Allocation Refunding Bonds, 1997 Series A, 5.500%, 10/01/27 | | 4/13 at 100.00 | A– | | 160,206 | |
| | 145 | | Inglewood Redevelopment Agency, California, Tax Allocation Bonds, Merged Redevelopment Project, Subordinate Lien Series 2007A-1, 5.000%, 5/01/25 – AMBAC Insured | | 5/17 at 100.00 | BBB+ | | 148,777 | |
| | 1,000 | | Lancaster Redevelopment Agency, California, Tax Allocation Bonds, Combined Redevelopment Project Areas Housing Programs, Series 2009, 6.875%, 8/01/39 | | 8/19 at 100.00 | BBB | | 1,151,290 | |
| | | | National City Community Development Commission, California, Tax Allocation Bonds, National City Redevelopment Project, Series 2011: | | | | | | |
| | 1,135 | | 5.000%, 8/01/16 | | No Opt. Call | A– | | 1,257,058 | |
| | 80 | | 6.500%, 8/01/24 | | 8/21 at 100.00 | A– | | 100,043 | |
| | 30 | | Novato Redevelopment Agency, California, Tax Allocation Bonds, Hamilton Field Redevelopment Project, Series 2011, 6.750%, 9/01/40 | | 9/21 at 100.00 | BBB+ | | 35,191 | |
| | | | Perris Union High School District Financing Authority, Riverside County, California, Revenue Bonds, Series 2011: | | | | | | |
| | 30 | | 6.000%, 9/01/33 | | No Opt. Call | N/R | | 31,079 | |
| | 60 | | 6.125%, 9/01/41 | | No Opt. Call | N/R | | 62,120 | |
| | 240 | | Pittsburg Redevelopment Agency, California, Tax Allocation Bonds, Los Medanos Community Development Project, Refunding Series 2008A, 6.500%, 9/01/28 | | 9/18 at 100.00 | BBB– | | 262,942 | |
| | 95 | | Rancho Santa Fe CSD Financing Authority, California, Revenue Bonds, Superior Lien Series 2011A, 5.750%, 9/01/30 | | 9/21 at 100.00 | BBB+ | | 109,704 | |
| | 15 | | Riverside County Redevelopment Agency, California, Tax Allocation Bonds, Jurupa Valley Project Area, Series 2011B, 6.500%, 10/01/25 | | 10/21 at 100.00 | A– | | 17,152 | |
| | 1,000 | | San Francisco City and County Redevelopment Financing Authority, California, Tax Allocation Revenue Bonds, San Francisco Redevelopment Projects, Series 2009B, 6.625%, 8/01/39 | | 8/19 at 100.00 | A | | 1,166,180 | |
| | 1,500 | | San Francisco City and County, California, Certificates of Participation, Multiple Capital Improvement Projects, Series 2009A, 5.250%, 4/01/31 | | 4/19 at 100.00 | AA– | | 1,687,920 | |
| | 15 | | San Francisco Redevelopment Finance Authority, California, Tax Allocation Revenue Bonds, Mission Bay North Redevelopment Project, Series 2011C, 6.750%, 8/01/41 | | 2/21 at 100.00 | A– | | 18,066 | |
| | Principal | | | | Optional Call | | | | |
| | Amount (000) | | Description (1) | | Provisions (2) | Ratings (3) | | Value | |
| | | | Tax Obligation/Limited (continued) | | | | | | |
| | | | San Francisco Redevelopment Financing Authority, California, Tax Allocation Revenue Bonds, Mission Bay South Redevelopment Project, Series 2011D: | | | | | | |
| $ | 15 | | 7.000%, 8/01/33 | | 2/21 at 100.00 | BBB | $ | 17,633 | |
| | 15 | | 7.000%, 8/01/41 | | 2/21 at 100.00 | BBB | | 17,400 | |
| | 125 | | San Jose Redevelopment Agency, California, Tax Allocation Bonds, Merged Area Redevelopment Project, Series 2006C, 5.000%, 8/01/25 – NPFG Insured | | 8/17 at 100.00 | BBB | | 130,278 | |
| | 585 | | San Jose Redevelopment Agency, California, Tax Allocation Bonds, Merged Area Redevelopment Project, Series 2006D, 5.000%, 8/01/22 – AMBAC Insured | | 8/17 at 100.00 | BBB | | 604,656 | |
| | 25 | | Signal Hill Redevelopment Agency, California, Project 1 Tax Allocation Bonds, Series 2011, 7.000%, 10/01/26 | | 4/21 at 100.00 | N/R | | 27,905 | |
| | 500 | | Val Verde Unified School District Financing Authority, California, Special Tax Revenue, Junior Lien Refunding Series 2003, 6.250%, 10/01/28 | | 10/13 at 102.00 | N/R | | 513,670 | |
| | 2,000 | | Westlake Village, California, Certificates of Participation, Financing Project, Series 2009, 5.000%, 6/01/39 | | 6/16 at 100.00 | AA+ | | 2,123,520 | |
| | 40 | | Yorba Linda Redevelopment Agency, Orange County, California, Tax Allocation Revenue Bonds, Yorba Linda Redevelopment Project, Subordinate Lien Series 2011A, 6.000%, 9/01/26 | | 9/21 at 100.00 | A– | | 46,606 | |
| | 9,310 | | Total Tax Obligation/Limited | | | | | 10,302,341 | |
| | | | Transportation – 1.0% (1.0% of Total Investments) | | | | | | |
| | 500 | | San Francisco Airports Commission, California, Revenue Bonds, San Francisco International Airport, Second Series 2002, Issue 32G, 5.000%, 5/01/24 – FGIC Insured | | 5/16 at 100.00 | A+ | | 556,340 | |
| | | | U.S. Guaranteed – 0.2% (0.2% of Total Investments) (4) | | | | | | |
| | 80 | | California Educational Facilities Authority, Revenue Bonds, University of the Pacific, Series 2009, 5.500%, 11/01/39 (Pre-refunded 11/01/19) | | 11/19 at 100.00 | A2 (4) | | 100,471 | |
| | | | Utilities – 14.1% (14.4% of Total Investments) | | | | | | |
| | 1,000 | | M-S-R Energy Authority, California, Gas Revenue Bonds, Series 2009C, 6.500%, 11/01/39 | | No Opt. Call | A | | 1,409,550 | |
| | 2,495 | | Roseville Natural Gas Financing Authority, California, Gas Revenue Bonds, Series 2007, 5.000%, 2/15/17 | | No Opt. Call | A | | 2,786,142 | |
| | 2,400 | | Southern California Public Power Authority, Natural Gas Project 1 Revenue Bonds, Series 2007A, 5.250%, 11/01/24 | | No Opt. Call | Baa1 | | 2,817,480 | |
| | 1,000 | | Tuolumne Wind Project Authority, California, Revenue Bonds, Tuolumne Company Project, Series 2009A, 5.625%, 1/01/29 | | 1/19 at 100.00 | A+ | | 1,161,160 | |
| | 6,895 | | Total Utilities | | | | | 8,174,332 | |
| | | | Water and Sewer – 9.0% (9.2% of Total Investments) | | | | | | |
| | 575 | | California Pollution Control Financing Authority, Water Furnishing Revenue Bonds, Poseidon | | No Opt. Call | Baa3 | | 596,252 | |
| | | | Resources Channelside Desalination Project, Series 2012, 5.000%, 11/21/45 (Alternative Minimum Tax) | | | | | | |
| | 2,000 | | Orange County Sanitation District, California, Certificates of Participation, Tender Option Bond Trust 3020, 17.942%, 2/01/35 (IF) (5) | | 2/19 at 100.00 | AAA | | 3,114,960 | |
| | 800 | | San Francisco City and County Public Utilities Commission, California, Water Revenue Bonds, Series 2011A, 5.000%, 11/01/41 | | No Opt. Call | AA– | | 925,016 | |
| | 500 | | Western Riverside Water & Wastewater Financing Authority, California, Revenue Bonds, Western Municipal Water District, Series 2009, 5.625%, 9/01/39 – AGC Insured | | 8/19 at 100.00 | AA | | 568,051 | |
| | 3,875 | | Total Water and Sewer | | | | | 5,204,279 | |
| $ | 50,935 | | Total Investments (cost $46,119,389) – 98.0% | | | | | 56,610,446 | |
| | | | Other Assets Less Liabilities – 2.0% (6) | | | | | 1,158,879 | |
| | | | Net Assets Applicable to Common Shares – 100% | | | | $ | 57,769,325 | |
| | | Nuveen California Municipal Value Fund 2 (continued) |
| NCB | | Portfolio of Investments |
| | | February 28, 2013 |
Investments in Derivatives at February 28, 2013:
Swaps outstanding:
| | | | | Fund | | | | | | | Fixed Rate | | | | | | Unrealized | |
| | | Notional | | Pay/Receive | | Floating Rate | | Fixed Rate | | | Payment | | Effective | | Termination | | Appreciation | |
| Counterparty | | Amount | | Floating Rate | | Index | | (Annualized | ) | | Frequency | | Date (7 | ) | Date | | (Depreciation) (6 | ) |
| Barclays Bank PLC | | $1,000,000 | | Receive | | 3-Month USD-LIBOR | | 3.190% | | | Semi-Annually | | 4/30/14 | | 4/30/34 | | $(32,496 | ) |
| (1) | | All percentages shown in the Portfolio of Investments are based on net assets applicable to Common shares unless otherwise noted. |
| (2) | | Optional Call Provisions (not covered by the report of independent registered public accounting firm): Dates (month and year) and prices of the earliest optional call or redemption. There may be other call provisions at varying prices at later dates. Certain mortgage-backed securities may be subject to periodic principal paydowns. |
| (3) | | Ratings (not covered by the report of independent registered public accounting firm): Using the highest of Standard & Poor’s Group (“Standard & Poor’s”), Moody’s Investors Service, Inc. (“Moody’s”) or Fitch, Inc. (“Fitch”) rating. Ratings below BBB by Standard & Poor’s, Baa by Moody’s or BBB by Fitch are considered to be below investment grade. Holdings designated N/R are not rated by any of these national rating agencies. |
| (4) | | Backed by an escrow or trust containing sufficient U.S. Government or U.S. Government agency securities, which ensure the timely payment of principal and interest. Certain bonds backed by U.S. Government or agency securities are regarded as having an implied rating equal to the rating of such securities. |
| (5) | | Investment, or portion of investment, has been pledged to collateralize the net payment obligations for investments in inverse floating rate transactions. |
| (6) | | Other Assets Less Liabilities includes the Unrealized Appreciation (Depreciation) of derivative investments as noted within Investments in Derivatives as of the end of the reporting period. |
| (7) | | Effective date represents the date on which both the Fund and Counterparty commence interest payment accruals on each forward swap contract. |
| N/R | | Not rated. |
| (IF) | | Inverse floating rate investment. |
| USD-LIBOR | | United States Dollar-London Interbank Offered Rate. |
See accompanying notes to financial statements.
| | | Nuveen California Performance Plus Municipal Fund, Inc. |
| NCP | | Portfolio of Investments |
| | | February 28, 2013 |
| | Principal | | | | Optional Call | | | | |
| | Amount (000) | | Description (1) | | Provisions (2) | Ratings (3) | | Value | |
| | | | Consumer Staples – 6.9% (4.8% of Total Investments) | | | | | | |
| $ | 455 | | California County Tobacco Securitization Agency, Tobacco Settlement Asset-Backed Bonds, Sonoma County Tobacco Securitization Corporation, Series 2005, 4.250%, 6/01/21 | | 6/15 at 100.00 | BB+ | $ | 442,915 | |
| | 3,000 | | Golden State Tobacco Securitization Corporation, California, Tobacco Settlement Asset-Backed Bonds, Series 2007A-1, 5.750%, 6/01/47 | | 6/17 at 100.00 | B | | 2,812,830 | |
| | 12,135 | | Golden State Tobacco Securitization Corporation, California, Tobacco Settlement Asset-Backed Bonds, Series 2007A-2, 5.300%, 6/01/37 | | 6/22 at 100.00 | B | | 11,069,908 | |
| | 15,590 | | Total Consumer Staples | | | | | 14,325,653 | |
| | | | Education and Civic Organizations – 2.5% (1.8% of Total Investments) | | | | | | |
| | 160 | | California Educational Facilities Authority, Revenue Bonds, University of Redlands, Series 2005A, 5.000%, 10/01/35 | | 10/15 at 100.00 | A3 | | 166,477 | |
| | | | California Educational Facilities Authority, Revenue Bonds, University of the Pacific, Series 2006: | | | | | | |
| | 110 | | 5.000%, 11/01/21 | | 11/15 at 100.00 | A2 | | 119,442 | |
| | 150 | | 5.000%, 11/01/25 | | 11/15 at 100.00 | A2 | | 161,795 | |
| | 2,645 | | California State Public Works Board, Lease Revenue Bonds, University of California Regents, Tender Option Bond Trust 1065, 9.376%, 3/01/33 (IF) | | 3/18 at 100.00 | Aa2 | | 3,251,022 | |
| | 1,585 | | University of California, Revenue Bonds, Multi-Purpose Projects, Series 2003A, 5.125%, 5/15/17 – AMBAC Insured | | 5/13 at 100.00 | Aa1 | | 1,601,579 | |
| | 4,650 | | Total Education and Civic Organizations | | | | | 5,300,315 | |
| | | | Health Care – 28.2% (19.5% of Total Investments) | | | | | | |
| | 1,000 | | California Health Facilities Financing Authority, Revenue Bonds, Cedars-Sinai Medical Center, Series 2009, 5.000%, 8/15/39 | | 8/19 at 100.00 | A+ | | 1,103,420 | |
| | 7,885 | | California Health Facilities Financing Authority, Revenue Bonds, Childrens Hospital Los Angeles, Series 2010A, 5.250%, 7/01/38 – AGC Insured | | 7/20 at 100.00 | AA– | | 8,514,065 | |
| | 810 | | California Health Facilities Financing Authority, Revenue Bonds, Rady Children’s Hospital – San Diego, Series 2011, 5.250%, 8/15/41 | | 8/21 at 100.00 | A+ | | 897,099 | |
| | 2,320 | | California Health Facilities Financing Authority, Revenue Bonds, Sutter Health, Series 2007A, 5.250%, 11/15/46 (UB) | | 11/16 at 100.00 | AA– | | 2,533,046 | |
| | 1,200 | | California Health Facilities Financing Authority, Revenue Bonds, Sutter Health, Series 2011B, 6.000%, 8/15/42 | | 8/20 at 100.00 | AA– | | 1,471,788 | |
| | 1,375 | | California Municipal Finance Authority, Revenue Bonds, Eisenhower Medical Center, Series 2010A, 5.750%, 7/01/40 | | 7/20 at 100.00 | Baa2 | | 1,522,551 | |
| | 1,650 | | California Municipal Financing Authority, Certificates of Participation, Community Hospitals of Central California, Series 2007, 5.250%, 2/01/46 | | 2/17 at 100.00 | BBB | | 1,731,213 | |
| | 4,000 | | California Statewide Communities Development Authority, Revenue Bonds, Adventist Health System West, Series 2005A, 5.000%, 3/01/35 | | 3/15 at 100.00 | A | | 4,250,640 | |
| | 1,440 | | California Statewide Communities Development Authority, Revenue Bonds, Childrens Hospital of Los Angeles, Series 2007, 5.000%, 8/15/47 | | 8/17 at 100.00 | BBB+ | | 1,506,398 | |
| | 1,000 | | California Statewide Communities Development Authority, Revenue Bonds, Cottage Health System Obligated Group, Series 2010, 5.000%, 11/01/40 | | 11/20 at 100.00 | AA– | | 1,107,600 | |
| | | | California Statewide Communities Development Authority, Revenue Bonds, Daughters of Charity Health System, Series 2005A: | | | | | | |
| | 4,000 | | 5.250%, 7/01/24 | | 7/15 at 100.00 | BBB | | 4,289,200 | |
| | 1,000 | | 5.250%, 7/01/30 | | 7/15 at 100.00 | BBB | | 1,055,000 | |
| | 1,755 | | California Statewide Communities Development Authority, Revenue Bonds, Kaiser Permanente System, Series 2001C, 5.250%, 8/01/31 | | 8/16 at 100.00 | A+ | | 1,967,829 | |
| | 1,250 | | California Statewide Communities Development Authority, Revenue Bonds, Kaiser Permanente System, Series 2007A, 4.750%, 4/01/33 | | 4/17 at 100.00 | A+ | | 1,342,138 | |
| | | Nuveen California Performance Plus Municipal Fund, Inc. (continued) |
| NCP | | Portfolio of Investments |
| | | February 28, 2013 |
| | Principal | | | | Optional Call | | | | |
| | Amount (000) | | Description (1) | | Provisions (2) | Ratings (3) | | Value | |
| | | | Health Care (continued) | | | | | | |
| $ | 895 | | California Statewide Communities Development Authority, Revenue Bonds, Saint Joseph Health System, Tender Option Bond Trust 2554, 18.398%, 7/01/47 – AGM Insured (IF) | | 7/18 at 100.00 | AA– | $ | 1,349,767 | |
| | 1,355 | | California Statewide Communities Development Authority, Revenue Bonds, Sherman Oaks Health System, Series 1998A, 5.000%, 8/01/22 – AMBAC Insured | | No Opt. Call | A1 | | 1,500,188 | |
| | 1,000 | | California Statewide Communities Development Authority, Revenue Bonds, Sutter Health, Series 2005A, 5.000%, 11/15/43 | | 11/15 at 100.00 | AA– | | 1,074,680 | |
| | 4,045 | | California Statewide Communities Development Authority, Revenue Bonds, Sutter Health, Series 2005A, 5.000%, 11/15/43 (UB) (4) | | 11/15 at 100.00 | AA– | | 4,347,081 | |
| | 1,000 | | Loma Linda, California, Hospital Revenue Bonds, Loma Linda University Medical Center, Series 2005A, 5.000%, 12/01/23 | | 12/15 at 100.00 | BBB | | 1,022,840 | |
| | 1,750 | | Loma Linda, California, Hospital Revenue Bonds, Loma Linda University Medical Center, Series 2008A, 8.250%, 12/01/38 | | 12/17 at 100.00 | BBB | | 2,039,100 | |
| | 5,000 | | Marysville, California, Revenue Bonds, The Fremont-Rideout Health Group, Series 2011, 5.250%, 1/01/42 | | 1/21 at 100.00 | A | | 5,503,450 | |
| | 2,900 | | Palomar Pomerado Health Care District, California, Certificates of Participation, Series 2010, 6.000%, 11/01/41 | | 11/20 at 100.00 | Baa3 | | 3,156,882 | |
| | 1,000 | | Rancho Mirage Joint Powers Financing Authority, California, Revenue Bonds, Eisenhower Medical Center, Series 2007A, 5.000%, 7/01/47 | | 7/17 at 100.00 | Baa2 | | 1,024,410 | |
| | 1,600 | | The Regents of the University of California, Medical Center Pooled Revenue Bonds, Series 2009E, 5.000%, 5/15/38 | | 5/17 at 101.00 | Aa2 | | 1,718,416 | |
| | 2,350 | | Upland, California, Certificates of Participation, San Antonio Community Hospital, Series 2011, 6.500%, 1/01/41 | | 1/21 at 100.00 | A | | 2,819,859 | |
| | 53,580 | | Total Health Care | | | | | 58,848,660 | |
| | | | Housing/Multifamily – 1.2% (0.8% of Total Investments) | | | | | | |
| | 1,145 | | California Municipal Finance Authority, Mobile Home Park Revenue Bonds, Caritas Projects Series 2010A, 6.400%, 8/15/45 | | 8/20 at 100.00 | BBB | | 1,267,080 | |
| | 1,160 | | California Municipal Finance Authority, Mobile Home Park Revenue Bonds, Caritas Projects Series 2012A, 5.500%, 8/15/47 | | 8/22 at 100.00 | BBB | | 1,238,439 | |
| | 2,305 | | Total Housing/Multifamily | | | | | 2,505,519 | |
| | | | Housing/Single Family – 0.1% (0.1% of Total Investments) | | | | | | |
| | 150 | | California Housing Finance Agency, Home Mortgage Revenue Bonds, Series 2006H, 5.750%, 8/01/30 – FGIC Insured (Alternative Minimum Tax) | | 2/16 at 100.00 | BBB | | 157,013 | |
| | | | Long-Term Care – 1.6% (1.1% of Total Investments) | | | | | | |
| | 3,000 | | ABAG Finance Authority for Non-Profit Corporations, California, Cal-Mortgage Insured Revenue Bonds, Channing House, Series 2010, 6.125%, 5/15/40 | | 5/20 at 100.00 | A | | 3,408,930 | |
| | | | Tax Obligation/General – 22.2% (15.4% of Total Investments) | | | | | | |
| | 500 | | California State, General Obligation Bonds, Series 2004, 5.000%, 2/01/23 | | 2/14 at 100.00 | A1 | | 521,490 | |
| | 3,200 | | California State, General Obligation Bonds, Various Purpose Series 2008, 5.125%, 4/01/33 | | 4/18 at 100.00 | A1 | | 3,627,840 | |
| | 5,750 | | California State, General Obligation Bonds, Various Purpose Series 2009, 6.000%, 11/01/39 | | 11/19 at 100.00 | A1 | | 7,037,368 | |
| | | | California State, General Obligation Bonds, Various Purpose Series 2010: | | | | | | |
| | 3,000 | | 6.000%, 3/01/33 | | 3/20 at 100.00 | A1 | | 3,726,750 | |
| | 2,000 | | 5.250%, 11/01/40 | | 11/20 at 100.00 | A1 | | 2,350,560 | |
| | 1,450 | | California State, General Obligation Bonds, Various Purpose Series 2011, 5.000%, 10/01/41 | | 10/21 at 100.00 | A1 | | 1,629,017 | |
| | 3,500 | | California State, General Obligation Bonds, Various Purpose Series 2012, 5.000%, 4/01/42 | | 4/22 at 100.00 | A1 | | 3,950,765 | |
| | 3,550 | | Centinela Valley Union High School District, Los Angeles County, California, General Obligation Bonds, Series 2002A, 5.250%, 2/01/26 – NPFG Insured | | No Opt. Call | AA– | | 4,217,045 | |
| | 1,400 | | Los Rios Community College District, Sacramento, El Dorado and Yolo Counties, California, General Obligation Bonds, Series 2006C, 5.000%, 8/01/24 – AGM Insured (UB) | | 8/14 at 102.00 | Aa2 | | 1,523,284 | |
| | Principal | | | | Optional Call | | | | |
| | Amount (000) | | Description (1) | | Provisions (2) | Ratings (3) | | Value | |
| | | | Tax Obligation/General (continued) | | | | | | |
| $ | 4,765 | | North Orange County Community College District, California, General Obligation Bonds, Series 2003B, 0.000%, 8/01/27 – FGIC Insured | | No Opt. Call | Aa1 | $ | 2,739,208 | |
| | 2,575 | | Oxnard School District, Ventura County, California, General Obligation Refunding Bonds, Series 2001A, 5.750%, 8/01/30 – NPFG Insured | | 2/22 at 103.00 | A+ | | 3,027,659 | |
| | | | Riverside Community College District, California, General Obligation Bonds, Series 2004A: | | | | | | |
| | 15 | | 5.250%, 8/01/25 – NPFG Insured | | 8/14 at 100.00 | AA | | 15,974 | |
| | 20 | | 5.250%, 8/01/26 – NPFG Insured | | 8/14 at 100.00 | AA | | 21,263 | |
| | 325 | | Roseville Joint Union High School District, Placer County, California, General Obligation Bonds, Series 2006B, 5.000%, 8/01/27 – FGIC Insured | | 8/15 at 100.00 | AA | | 354,894 | |
| | 1,850 | | San Juan Capistano, California, General Obligation Bonds, Open Space Program, Tender Option Bond Trust 3646, 18.111%, 8/01/17 (IF) | | No Opt. Call | AAA | | 2,859,286 | |
| | 4,000 | | San Diego Unified School District, San Diego County, California, General Obligation Bonds, Series 2003E, 5.250%, 7/01/22 – AGM Insured | | 7/13 at 101.00 | Aa2 | | 4,104,760 | |
| | 2,200 | | Santa Maria Joint Union High School District, Santa Barbara and San Luis Obispo Counties, | | No Opt. Call | Aa3 | | 2,971,540 | |
| | | | California, General Obligation Bonds, Series 2003B, 5.625%, 8/01/24 – AGM Insured | | | | | | |
| | 1,440 | | Southwestern Community College District, San Diego County, California, General Obligation Bonds, Series 2005, 5.000%, 8/01/24 – NPFG Insured | | 8/15 at 102.00 | AA– | | 1,616,342 | |
| | 41,540 | | Total Tax Obligation/General | | | | | 46,295,045 | |
| | | | Tax Obligation/Limited – 45.9% (31.8% of Total Investments) | | | | | | |
| | 5,045 | | California State Public Works Board, Lease Revenue Bonds, Department of Corrections, Series 2002A, 5.250%, 3/01/22 – AMBAC Insured | | 5/13 at 100.00 | A2 | | 5,062,960 | |
| | 1,575 | | California State Public Works Board, Lease Revenue Bonds, Department of General Services, Series 2003D, 5.500%, 6/01/20 | | 12/13 at 100.00 | A2 | | 1,628,534 | |
| | 3,010 | | California State Public Works Board, Lease Revenue Bonds, Department of Mental Health, Coalinga State Hospital, Series 2004A, 5.500%, 6/01/19 | | 6/14 at 100.00 | A2 | | 3,186,175 | |
| | 3,000 | | California State Public Works Board, Lease Revenue Bonds, Various Capital Projects, Series 2009G-1, 5.750%, 10/01/30 | | 10/19 at 100.00 | A2 | | 3,538,140 | |
| | 6,000 | | California State Public Works Board, Lease Revenue Bonds, Various Capital Projects, Series 2012G, 5.000%, 11/01/31 | | No Opt. Call | A2 | | 6,868,080 | |
| | 1,295 | | California State, Economic Recovery Revenue Bonds, Series 2004A, 5.000%, 7/01/15 | | 7/14 at 100.00 | Aa3 | | 1,379,058 | |
| | 400 | | Capistrano Unified School District, Orange County, California, Special Tax Bonds, Community Facilities District, Series 2005, 5.000%, 9/01/24 – FGIC Insured | | 9/15 at 100.00 | N/R | | 413,220 | |
| | 1,210 | | Chino Redevelopment Agency, California, Merged Chino Redevelopment Project Area Tax Allocation Bonds, Series 2006, 5.000%, 9/01/38 – AMBAC Insured | | 9/16 at 101.00 | A– | | 1,229,251 | |
| | 2,000 | | Coachella Valley Unified School District, Riverside County, California, Certificates of Participation, Series 2007, 5.000%, 9/01/31 – AMBAC Insured | | 9/16 at 100.00 | N/R | | 2,037,300 | |
| | 2,500 | | Corona Public Financing Authority, California, Superior Lien Revenue Bonds, Series 1999A, 5.000%, 9/01/20 – AGM Insured | | 5/13 at 100.00 | AA– | | 2,557,475 | |
| | 585 | | Dinuba Redevelopment Agency, California, Tax Allocation Bonds, Merged City of Dinuba | | 5/13 at 100.00 | BBB+ | | 587,252 | |
| | | | Redevelopment Project and Dinuba Redevelopment Project 2, As Amended, Refunding Series 2001,5.000%, 9/01/31 – NPFG Insured | | | | | | |
| | 810 | | Fontana Redevelopment Agency, California Jurupa Hills Redevelopment Project, Tax Allocation Refunding Bonds, 1997 Series A, 5.500%, 10/01/27 | | 4/13 at 100.00 | A– | | 811,045 | |
| | 1,045 | | Hawthorne Community Redevelopment Agency, California, Project Area 2 Tax Allocation Bonds, Series 2006, 5.250%, 9/01/36 – SYNCORA GTY Insured | | 9/16 at 100.00 | N/R | | 1,080,269 | |
| | 1,750 | | Hesperia Community Redevelopment Agency, California, Tax Allocation Bonds, Series 2005A, 5.000%, 9/01/25 – SYNCORA GTY Insured | | 9/15 at 100.00 | BB+ | | 1,767,640 | |
| | | | Inglewood Redevelopment Agency, California, Tax Allocation Bonds, Merged Redevelopment Project, Subordinate Lien Series 2007A-1: | | | | | | |
| | 400 | | 5.000%, 5/01/24 – AMBAC Insured | | 5/17 at 100.00 | BBB+ | | 411,804 | |
| | 330 | | 5.000%, 5/01/25 – AMBAC Insured | | 5/17 at 100.00 | BBB+ | | 338,597 | |
| | | Nuveen California Performance Plus Municipal Fund, Inc. (continued) |
| NCP | | Portfolio of Investments |
| | | February 28, 2013 |
| | Principal | | | | Optional Call | | | | |
| | Amount (000) | | Description (1) | | Provisions (2) | Ratings (3) | | Value | |
| | | | Tax Obligation/Limited (continued) | | | | | | |
| | | | Irvine, California, Unified School District, Community Facilities District Special Tax Bonds, Series 2006A: | | | | | | |
| $ | 185 | | 5.000%, 9/01/26 | | 9/16 at 100.00 | N/R | $ | 191,436 | |
| | 425 | | 5.125%, 9/01/36 | | 9/16 at 100.00 | N/R | | 435,192 | |
| | 730 | | Los Angeles Community Redevelopment Agency, California, Lease Revenue Bonds, Manchester Social Services Project, Series 2005, 5.000%, 9/01/37 – AMBAC Insured | | 9/15 at 100.00 | A1 | | 760,266 | |
| | 10,000 | | Los Angeles County Public Works Financing Authority, California, Lease Revenue Bonds, Series 2006B, 5.000%, 9/01/31 – FGIC Insured | | 9/16 at 100.00 | N/R | | 10,628,700 | |
| | 4,000 | | Los Angeles Municipal Improvement Corporation, California, Lease Revenue Bonds, Police Headquarters, Series 2006A, 4.750%, 1/01/31 – FGIC Insured | | 1/17 at 100.00 | A+ | | 4,186,160 | |
| | 1,625 | | Lynwood Redevelopment Agency, California, Project A Revenue Bonds, Subordinate Lien Series 2011A, 6.750%, 9/01/26 | | 9/21 at 100.00 | A– | | 1,936,838 | |
| | 1,395 | | Moreno Valley Unified School District, Riverside County, California, Certificates of Participation, Series 2005, 5.000%, 3/01/22 – AGM Insured | | 3/14 at 100.00 | AA– | | 1,456,059 | |
| | 3,500 | | Murrieta Redevelopment Agency, California, Tax Allocation Bonds, Series 2007A, 5.000%, 8/01/37 – NPFG Insured | | 8/17 at 100.00 | A– | | 3,568,670 | |
| | 400 | | National City Community Development Commission, California, Tax Allocation Bonds, National City Redevelopment Project, Series 2011, 6.500%, 8/01/24 | | 8/21 at 100.00 | A– | | 500,216 | |
| | 1,000 | | Norco Redevelopment Agency, California, Tax Allocation Bonds, Project Area 1, Refunding, School District Pass-Through, Series 2004, 5.000%, 3/01/32 – RAAI Insured | | 3/14 at 100.00 | N/R | | 1,003,600 | |
| | 2,500 | | Norco Redevelopment Agency, California, Tax Allocation Refunding Bonds, Project Area 1, Refunding Series 2010, 5.875%, 3/01/32 | | 3/20 at 100.00 | A | | 2,751,950 | |
| | 150 | | Novato Redevelopment Agency, California, Tax Allocation Bonds, Hamilton Field Redevelopment Project, Series 2011, 6.750%, 9/01/40 | | 9/21 at 100.00 | BBB+ | | 175,955 | |
| | 1,000 | | Paramount Redevelopment Agency, California, Tax Allocation Bonds, Redevelopment Project Area 1, Series 2003, 5.000%, 8/01/23 – NPFG Insured | | 8/13 at 100.00 | A– | | 1,015,620 | |
| | | | Perris Union High School District Financing Authority, Riverside County, California, Revenue Bonds, Series 2011: | | | | | | |
| | 135 | | 6.000%, 9/01/33 | | 9/13 at 100.00 | N/R | | 139,855 | |
| | 300 | | 6.125%, 9/01/41 | | 9/13 at 100.00 | N/R | | 310,602 | |
| | 2,370 | | Pittsburg Redevelopment Agency, California, Tax Allocation Bonds, Los Medanos Community Development Project, Refunding Series 2008A, 6.500%, 9/01/28 | | 9/18 at 100.00 | BBB– | | 2,596,548 | |
| | 480 | | Rancho Santa Fe CSD Financing Authority, California, Revenue Bonds, Superior Lien Series 2011A, 5.750%, 9/01/30 | | 9/21 at 100.00 | BBB+ | | 554,294 | |
| | 350 | | Rialto Redevelopment Agency, California, Tax Allocation Bonds, Merged Project Area, Series 2005A, 5.000%, 9/01/35 – SYNCORA GTY Insured | | 9/15 at 100.00 | A– | | 354,148 | |
| | 1,500 | | Riverside County Public Financing Authority, California, Tax Allocation Bonds, Multiple Projects, Series 2005A, 5.000%, 10/01/37 – SYNCORA GTY Insured | | 10/15 at 100.00 | BBB | | 1,479,045 | |
| | 85 | | Riverside County Redevelopment Agency, California, Tax Allocation Bonds, Jurupa Valley Project Area, Series 2011B, 6.500%, 10/01/25 | | 10/21 at 100.00 | A– | | 97,194 | |
| | 1,445 | | Riverside County Redevelopment Agency, California, Tax Allocation Housing Bonds, Series 2010A, 6.000%, 10/01/39 | | 10/20 at 100.00 | A– | | 1,593,271 | |
| | 710 | | Rohnert Park Community Development Commission, California, Redevelopment Project Tax Allocation Bonds, Series 2007R, 5.000%, 8/01/37 – FGIC Insured | | 8/17 at 100.00 | A– | | 723,930 | |
| | 435 | | Roseville, California, Certificates of Participation, Public Facilities, Series 2003A, 5.000%, 8/01/25 – AMBAC Insured | | 8/13 at 100.00 | AA– | | 441,512 | |
| | 1,000 | | Sacramento City Financing Authority, California, Lease Revenue Refunding Bonds, Series 1993A, 5.400%, 11/01/20 – NPFG Insured | | No Opt. Call | A | | 1,152,960 | |
| | 1,000 | | San Diego County Regional Transportation Commission, California, Sales Tax Revenue Bonds, Series 2012A, 5.000%, 4/01/42 | | 4/22 at 100.00 | AAA | | 1,148,220 | |
| | Principal | | | | Optional Call | | | | |
| | Amount (000) | | Description (1) | | Provisions (2) | Ratings (3) | | Value | |
| | | | Tax Obligation/Limited (continued) | | | | | | |
| $ | 4,000 | | San Diego County, California, Certificates of Participation, Burnham Institute, Series 2006, 5.000%, 9/01/34 | | 9/15 at 102.00 | Baa2 | $ | 4,120,240 | |
| | 500 | | San Francisco Redevelopment Finance Authority, California, Tax Allocation Revenue Bonds, Mission Bay North Redevelopment Project, Series 2009C, 6.500%, 8/01/39 | | 8/19 at 100.00 | A– | | 579,545 | |
| | 70 | | San Francisco Redevelopment Finance Authority, California, Tax Allocation Revenue Bonds, Mission Bay North Redevelopment Project, Series 2011C, 6.750%, 8/01/41 | | 2/21 at 100.00 | A– | | 84,307 | |
| | | | San Francisco Redevelopment Financing Authority, California, Tax Allocation Revenue Bonds, Mission Bay South Redevelopment Project, Series 2011D: | | | | | | |
| | 70 | | 7.000%, 8/01/33 | | 2/21 at 100.00 | BBB | | 82,289 | |
| | 85 | | 7.000%, 8/01/41 | | 2/21 at 100.00 | BBB | | 98,600 | |
| | 125 | | San Francisco, California, Community Facilities District 6, Mission Bay South Public Improvements, Special Tax Refunding Bonds, Series 2013A, 5.000%, 8/01/33 | | 8/22 at 100.00 | N/R | | 133,920 | |
| | 370 | | San Jose Redevelopment Agency, California, Tax Allocation Bonds, Merged Area Redevelopment Project, Series 2004A, 4.360%, 8/01/16 – NPFG Insured | | 8/14 at 100.00 | BBB | | 371,521 | |
| | 655 | | San Jose Redevelopment Agency, California, Tax Allocation Bonds, Merged Area Redevelopment Project, Series 2006C, 5.000%, 8/01/25 – NPFG Insured | | 8/17 at 100.00 | BBB | | 682,654 | |
| | | | San Jose Redevelopment Agency, California, Tax Allocation Bonds, Merged Area Redevelopment Project, Series 2006D: | | | | | | |
| | 335 | | 5.000%, 8/01/19 – AMBAC Insured | | 8/17 at 100.00 | BBB | | 342,179 | |
| | 835 | | 5.000%, 8/01/23 – AMBAC Insured | | 8/17 at 100.00 | BBB | | 858,639 | |
| | 5,000 | | San Marcos Public Facilities Authority, California, Tax Allocation Bonds, Project Areas 2 and 3, Series 2005C, 5.000%, 8/01/35 – AMBAC Insured | | 8/15 at 100.00 | A– | | 5,091,750 | |
| | | | Santa Clara Redevelopment Agency, California, Tax Allocation Bonds, Bayshore North Project, Series 2003: | | | | | | |
| | 2,695 | | 5.000%, 6/01/20 – NPFG Insured | | 6/13 at 100.00 | A | | 2,723,351 | |
| | 1,500 | | 5.000%, 6/01/21 – NPFG Insured | | 6/13 at 100.00 | A | | 1,515,780 | |
| | 120 | | Signal Hill Redevelopment Agency, California, Project 1 Tax Allocation Bonds, Series 2011, 7.000%, 10/01/26 | | 4/21 at 100.00 | N/R | | 133,944 | |
| | | | Sweetwater Union High School District, San Diego County, California, Certificates of Participation, Series 2002: | | | | | | |
| | 2,000 | | 5.000%, 9/01/23 – AGM Insured | | 9/13 at 101.00 | AA– | | 2,044,120 | |
| | 4,015 | | 5.000%, 9/01/24 – AGM Insured | | 9/14 at 100.00 | AA– | | 4,102,888 | |
| | 400 | | Union City Community Redevelopment Agency, California, Tax Allocation Revenue Bonds, Redevelopment Project, Subordinate Lien Series 2011, 6.875%, 12/01/33 | | 12/21 at 100.00 | A | | 490,708 | |
| | 205 | | Yorba Linda Redevelopment Agency, Orange County, California, Tax Allocation Revenue Bonds, Yorba Linda Redevelopment Project, Subordinate Lien Series 2011A, 6.000%, 9/01/26 | | 9/21 at 100.00 | A– | | 238,854 | |
| | 90,655 | | Total Tax Obligation/Limited | | | | | 95,794,330 | |
| | | | Transportation – 8.0% (5.5% of Total Investments) | | | | | | |
| | 1,430 | | Bay Area Toll Authority, California, Revenue Bonds, San Francisco Bay Area Toll Bridge, Series 2006F, 5.000%, 4/01/31 (UB) | | 4/16 at 100.00 | AA | | 1,630,486 | |
| | 1,890 | | Bay Area Toll Authority, California, Revenue Bonds, San Francisco Bay Area Toll Bridge, Series 2008, Tender Option Bond Trust 3211, 13.640%, 10/01/32 (IF) | | 4/18 at 100.00 | AA | | 2,754,543 | |
| | 6,500 | | Foothill/Eastern Transportation Corridor Agency, California, Toll Road Revenue Refunding Bonds, Series 1999, 5.875%, 1/15/29 | | 1/14 at 101.00 | BBB– | | 6,661,720 | |
| | | | San Diego County Regional Airport Authority, California, Airport Revenue Bonds, Senior Series 2013B: | | | | | | |
| | 1,300 | | 5.000%, 7/01/25 (Alternative Minimum Tax) | | 7/23 at 100.00 | A+ | | 1,548,131 | |
| | 1,670 | | 5.000%, 7/01/26 (Alternative Minimum Tax) | | 7/23 at 100.00 | A+ | | 1,973,172 | |
| | 1,805 | | 5.000%, 7/01/27 (Alternative Minimum Tax) | | 7/23 at 100.00 | A+ | | 2,114,233 | |
| | 14,595 | | Total Transportation | | | | | 16,682,285 | |
| | | Nuveen California Performance Plus Municipal Fund, Inc. (continued) |
| NCP | | Portfolio of Investments |
| | | February 28, 2013 |
| | Principal | | | | Optional Call | | | | |
| | Amount (000) | | Description (1) | | Provisions (2) | Ratings (3) | | Value | |
| | | | U.S. Guaranteed – 10.8% (7.4% of Total Investments) (5) | | | | | | |
| $ | 5,360 | | California Infrastructure and Economic Development Bank, First Lien Revenue Bonds, San Francisco Bay Area Toll Bridge, Series 2003A, 5.000%, 7/01/23 – AGM Insured (ETM) | | No Opt. Call | Aaa | $ | 6,936,590 | |
| | 400 | | California State, Economic Recovery Revenue Bonds, Series 2004A, 5.000%, 7/01/15 (Pre-refunded 7/01/14) | | 7/14 at 100.00 | Aaa | | 425,684 | |
| | 4,000 | | Contra Costa County, California, GNMA Mortgage-Backed Securities Program Home Mortgage Revenue Bonds, Series 1988, 8.250%, 6/01/21 (Alternative Minimum Tax) (ETM) | | No Opt. Call | Aaa | | 5,410,400 | |
| | 3,000 | | Golden State Tobacco Securitization Corporation, California, Tobacco Settlement Asset-Backed Bonds, Series 2003A-1, 6.750%, 6/01/39 (Pre-refunded 6/01/13) | | 6/13 at 100.00 | Aaa | | 3,051,000 | |
| | 4,770 | | Los Angeles Department of Water and Power, California, Waterworks Revenue Bonds, Series 2004C, 5.250%, 7/01/20 (Pre-refunded 7/01/14) – NPFG Insured | | 7/14 at 100.00 | AA (5) | | 5,093,597 | |
| | 290 | | Rohnert Park Community Development Commission, California, Redevelopment Project Tax Allocation Bonds, Series 2007R, 5.000%, 8/01/37 – FGIC Insured (ETM) | | 8/17 at 100.00 | N/R (5) | | 324,536 | |
| | 750 | | San Mateo Union High School District, San Mateo County, California, Certificates of Participation, Phase 1, Series 2007A, 5.000%, 12/15/30 (Pre-refunded 12/15/17) – AMBAC Insured | | 12/17 at 100.00 | AA– (5) | | 900,698 | |
| | | | University of California, Revenue Bonds, Multi-Purpose Projects, Series 2003A: | | | | | | |
| | 345 | | 5.125%, 5/15/17 (Pre-refunded 5/15/13) – AMBAC Insured | | 5/13 at 100.00 | Aa1 (5) | | 348,623 | |
| | 70 | | 5.125%, 5/15/17 (Pre-refunded 5/15/13) – AMBAC Insured | | 5/13 at 100.00 | Aa1 (5) | | 70,748 | |
| | 18,985 | | Total U.S. Guaranteed | | | | | 22,561,876 | |
| | | | Utilities – 6.9% (4.8% of Total Investments) | | | | | | |
| | 4,210 | | California Statewide Community Development Authority, Certificates of Participation Refunding, Rio Bravo Fresno Project, Series 1999A, 6.500%, 12/01/18 | | 6/13 at 100.00 | N/R | | 4,139,693 | |
| | 2,140 | | Long Beach Bond Finance Authority, California, Natural Gas Purchase Revenue Bonds, Series 2007A, 5.500%, 11/15/37 | | No Opt. Call | A | | 2,605,985 | |
| | 725 | | Los Angeles Department of Water and Power, California, Power System Revenue Bonds, Series 2003A-2, 5.000%, 7/01/21 – NPFG Insured | | 7/13 at 100.00 | AA– | | 737,021 | |
| | 500 | | Los Angeles Department of Water and Power, California, Power System Revenue Bonds, Series 2005A-1, 5.000%, 7/01/31 – AGM Insured (UB) | | 7/15 at 100.00 | AA– | | 545,315 | |
| | 715 | | Merced Irrigation District, California, Electric System Revenue Bonds, Series 2005, 5.125%, 9/01/31 – SYNCORA GTY Insured | | 9/15 at 100.00 | N/R | | 736,600 | |
| | 5,365 | | Orange County Public Financing Authority, California, Waste Management System Revenue Refunding Bonds, Series 1997, 5.250%, 12/01/13 – AMBAC Insured (Alternative Minimum Tax) | | No Opt. Call | A1 | | 5,562,164 | |
| | 13,655 | | Total Utilities | | | | | 14,326,778 | |
| | | | Water and Sewer – 10.1% (7.0% of Total Investments) | | | | | | |
| | 4,475 | | California Pollution Control Financing Authority, Water Furnishing Revenue Bonds, Poseidon Resources Channelside Desalination Project, Series 2012, 5.000%, 11/21/45 (Alternative Minimum Tax) | | No Opt. Call | Baa3 | | 4,640,396 | |
| | 1,000 | | California Statewide Community Development Authority, Water and Wastewater Revenue Bonds, Pooled Financing Program, Series 2003A, 5.250%, 10/01/23 – AGM Insured | | 10/13 at 100.00 | AA– | | 1,025,640 | |
| | 2,500 | | Central Basin Municipal Water District, California, Certificates of Participation, Tender Option Bond Trust 3152, 18.153%, 8/01/33 – AGM Insured (IF) | | 2/20 at 100.00 | AA | | 3,580,400 | |
| | 1,950 | | East Valley Water District Financing Authority, California, Refunding Revenue Bonds, Series 2010, 5.000%, 10/01/40 | | 10/20 at 100.00 | AA– | | 2,157,851 | |
| | 2,500 | | El Centro Financing Authority, California, Water Revenue Bonds, Series 2006A, 4.750%, 10/01/31 – AGM Insured | | 10/16 at 100.00 | AA– | | | |
| | 2,000 | | Metropolitan Water District of Southern California, Water Revenue Bonds, 2006 Authorization Series 2007A, 5.000%, 7/01/37 | | 7/17 at 100.00 | AAA | | 2,284,520 | |
| | Principal | | | | Optional Call | | | | |
| | Amount (000) | | Description (1) | | Provisions (2) | Ratings (3) | | Value | |
| | | | Water and Sewer (continued) | | | | | | |
| $ | 2,500 | | Pajaro Valley Water Management Agency, California, Revenue Certificates of Participation, Series 1999A, 5.750%, 3/01/29 – AMBAC Insured | | 5/13 at 100.00 | BBB+ | $ | 2,501,900 | |
| | 1,000 | | San Francisco City and County Public Utilities Commission, California, Water Revenue Bonds, Series 2011A, 5.000%, 11/01/28 | | No Opt. Call | AA– | | 1,216,040 | |
| | 945 | | Woodbridge Irrigation District, California, Certificates of Participation, Water Systems Project, Series 2003, 5.625%, 7/01/43 | | 7/13 at 100.00 | A+ | | 949,479 | |
| | 18,870 | | Total Water and Sewer | | | | | 21,092,301 | |
| $ | 277,575 | | Total Investments (cost $277,471,639) – 144.4% | | | | | 301,298,705 | |
| | | | Floating Rate Obligations – (3.0)% | | | | | (6,180,000 | ) |
| | | | Variable Rate Demand Preferred Shares, at Liquidation Value – (43.6)% (6) | | | | | (91,000,000 | ) |
| | | | Other Assets Less Liabilities – 2.2% | | | | | 4,568,137 | |
| | | | Net Assets Applicable to Common Shares – 100% | | | | $ | 208,686,842 | |
| (1) | | All percentages shown in the Portfolio of Investments are based on net assets applicable to Common shares unless otherwise noted. |
| (2) | | Optional Call Provisions (not covered by the report of independent registered public accounting firm): Dates (month and year) and prices of the earliest optional call or redemption. There may be other call provisions at varying prices at later dates. Certain mortgage-backed securities may be subject to periodic principal paydowns. |
| (3) | | Ratings (not covered by the report of independent registered public accounting firm): Using the highest of Standard & Poor’s Group (“Standard & Poor’s”), Moody’s Investors Service, Inc. (“Moody’s”) or Fitch, Inc. (“Fitch”) rating. Ratings below BBB by Standard & Poor’s, Baa by Moody’s or BBB by Fitch are considered to be below investment grade. Holdings designated N/R are not rated by any of these national rating agencies. |
| (4) | | Investment, or portion of investment, has been pledged to collateralize the net payment obligations for inverse floating rate transactions. |
| (5) | | Backed by an escrow or trust containing sufficient U.S. Government or U.S. Government agency securities, which ensure the timely payment of principal and interest. Certain bonds backed by U.S. Government or agency securities are regarded as having an implied rating equal to the rating of such securities. |
| (6) | | Variable Rate Demand Preferred Shares, at Liquidation Value as a percentage of Total Investments is 30.2%. |
| N/R | | Not rated. |
| (ETM) | | Escrowed to maturity. |
| (IF) | | Inverse floating rate investment. |
| (UB) | | Underlying bond of an inverse floating rate trust reflected as a financing transaction. See Notes to Financial Statements, Footnote 1 – General Information and Significant Accounting Policies, Inverse Floating Rate Securities for more information. |
See accompanying notes to financial statements.
| | | Nuveen California Municipal Market Opportunity Fund, Inc. |
| NCO | | Portfolio of Investments |
| | | February 28, 2013 |
| | Principal | | | | Optional Call | | | | |
| | Amount (000) | | Description (1) | | Provisions (2) | Ratings (3) | | Value | |
| | | | Consumer Staples – 7.3% (5.2% of Total Investments) | | | | | | |
| $ | 3,650 | | California County Tobacco Securitization Agency, Tobacco Settlement Asset-Backed Bonds, Los Angeles County Securitization Corporation, Series 2006A, 5.600%, 6/01/36 | | 12/18 at 100.00 | BB– | $ | 3,489,838 | |
| | 295 | | California County Tobacco Securitization Agency, Tobacco Settlement Asset-Backed Bonds, Sonoma County Tobacco Securitization Corporation, Series 2005, 4.250%, 6/01/21 | | 6/15 at 100.00 | BB+ | | 287,165 | |
| | 6,440 | | Golden State Tobacco Securitization Corporation, California, Tobacco Settlement Asset-Backed Bonds, Series 2007A-1, 5.750%, 6/01/47 | | 6/17 at 100.00 | B | | 6,038,208 | |
| | 10,385 | | Total Consumer Staples | | | | | 9,815,211 | |
| | | | Education and Civic Organizations – 3.2% (2.3% of Total Investments) | | | | | | |
| | 100 | | California Educational Facilities Authority, Revenue Bonds, University of Redlands, Series 2005A, 5.000%, 10/01/35 | | 10/15 at 100.00 | A3 | | 104,048 | |
| | | | California Educational Facilities Authority, Revenue Bonds, University of the Pacific, Series 2006: | | | | | | |
| | 70 | | 5.000%, 11/01/21 | | 11/15 at 100.00 | A2 | | 76,009 | |
| | 95 | | 5.000%, 11/01/25 | | 11/15 at 100.00 | A2 | | 102,470 | |
| | 1,000 | | California Infrastructure and Economic Development Bond Bank, Revenue Bonds, Scripps Research Institute, Series 2005A, 5.000%, 7/01/24 | | 7/15 at 100.00 | Aa3 | | 1,089,660 | |
| | 1,680 | | California State Public Works Board, Lease Revenue Bonds, University of California Regents, Tender Option Bond Trust 1065, 9.376%, 3/01/33 (IF) | | 3/18 at 100.00 | Aa2 | | 2,064,922 | |
| | 450 | | California Statewide Communities Development Authority, School Facility Revenue Bonds, Alliance College-Ready Public Schools, Series 2011A, 7.000%, 7/01/46 | | 7/21 at 100.00 | BBB | | 512,379 | |
| | 260 | | California Statewide Communities Development Authority, Charter School Revenue Bonds, Rocketship 4 – Mosaic Elementary Charter School, Series 2011A, 8.500%, 12/01/41 | | 12/21 at 100.00 | N/R | | 301,051 | |
| | 3,655 | | Total Education and Civic Organizations | | | | | 4,250,539 | |
| | | | Health Care – 26.4% (19.0% of Total Investments) | | | | | | |
| | 5,260 | | California Health Facilities Financing Authority, Revenue Bonds, Childrens Hospital Los Angeles, Series 2010A, 5.250%, 7/01/38 – AGC Insured | | 7/20 at 100.00 | AA– | | 5,679,643 | |
| | 515 | | California Health Facilities Financing Authority, Revenue Bonds, Rady Children’s Hospital – San Diego, Series 2011, 5.250%, 8/15/41 | | 8/21 at 100.00 | A+ | | 570,378 | |
| | 5,305 | | California Health Facilities Financing Authority, Revenue Bonds, Sutter Health, Series 2007A, 5.250%, 11/15/46 (UB) | | 11/16 at 100.00 | AA– | | 5,792,158 | |
| | 1,060 | | California Municipal Financing Authority, Certificates of Participation, Community Hospitals of Central California, Series 2007, 5.250%, 2/01/46 | | 2/17 at 100.00 | BBB | | 1,112,173 | |
| | 2,000 | | California Statewide Communities Development Authority, Revenue Bonds, Adventist Health System West, Series 2005A, 5.000%, 3/01/35 | | 3/15 at 100.00 | A | | 2,125,320 | |
| | | | California Statewide Communities Development Authority, Revenue Bonds, Daughters of Charity Health System, Series 2005A: | | | | | | |
| | 1,500 | | 5.250%, 7/01/24 | | 7/15 at 100.00 | BBB | | 1,608,450 | |
| | 1,000 | | 5.250%, 7/01/30 | | 7/15 at 100.00 | BBB | | 1,055,000 | |
| | 135 | | California Statewide Communities Development Authority, Revenue Bonds, Kaiser Permanente System, Series 2001C, 5.250%, 8/01/31 | | 8/16 at 100.00 | A+ | | 151,371 | |
| | 569 | | California Statewide Communities Development Authority, Revenue Bonds, Saint Joseph Health System, Tender Option Bond Trust 2554, 18.398%, 7/01/47 – AGM Insured (IF) | | 7/18 at 100.00 | AA– | | 858,120 | |
| | 675 | | California Statewide Communities Development Authority, Revenue Bonds, Sherman Oaks Health System, Series 1998A, 5.000%, 8/01/22 – AMBAC Insured | | No Opt. Call | A1 | | 747,326 | |
| | 2,585 | | California Statewide Communities Development Authority, Revenue Bonds, Sutter Health, Series 2005A, 5.000%, 11/15/43 | | 11/15 at 100.00 | AA– | | 2,778,048 | |
| | 200 | | California Statewide Communities Development Authority, Revenue Bonds, Sutter Health, Series 2007C, 5.000%, 8/15/38 – AMBAC Insured | | 8/17 at 100.00 | AA– | | 223,756 | |
| | Principal | | | | Optional Call | | | | |
| | Amount (000) | | Description (1) | | Provisions (2) | Ratings (3) | | Value | |
| | | | Health Care (continued) | | | | | | |
| $ | 1,160 | | California Statewide Communities Development Authority, Revenue Bonds, ValleyCare Health System, Series 2007A, 5.125%, 7/15/31 | | 7/17 at 100.00 | N/R | $ | 1,199,568 | |
| | 1,000 | | Loma Linda, California, Hospital Revenue Bonds, Loma Linda University Medical Center, Series 2005A, 5.000%, 12/01/23 | | 12/15 at 100.00 | BBB | | 1,022,840 | |
| | 1,150 | | Loma Linda, California, Hospital Revenue Bonds, Loma Linda University Medical Center, Series 2008A, 8.250%, 12/01/38 | | 12/17 at 100.00 | BBB | | 1,339,980 | |
| | 2,205 | | Madera County, California, Certificates of Participation, Children’s Hospital Central California, Series 2010, 5.375%, 3/15/36 | | 3/20 at 100.00 | A+ | | 2,454,650 | |
| | 1,800 | | Palomar Pomerado Health Care District, California, Certificates of Participation, Series 2010, 6.000%, 11/01/41 | | 11/20 at 100.00 | Baa3 | | 1,959,444 | |
| | 1,000 | | Rancho Mirage Joint Powers Financing Authority, California, Revenue Bonds, Eisenhower Medical Center, Series 2007A, 5.000%, 7/01/38 | | 7/17 at 100.00 | Baa2 | | 1,025,610 | |
| | 1,200 | | San Buenaventura, California, Revenue Bonds, Community Memorial Health System, Series 2011, 7.500%, 12/01/41 | | 12/21 at 100.00 | BB | | 1,467,360 | |
| | 1,250 | | Santa Clara County Financing Authority, California, Insured Revenue Bonds, El Camino Hospital, Series 2007A, 5.750%, 2/01/41 – AMBAC Insured | | 8/17 at 100.00 | A+ | | 1,382,413 | |
| | 1,000 | | The Regents of the University of California, Medical Center Pooled Revenue Bonds, Series 2009E, 5.000%, 5/15/38 | | 5/17 at 101.00 | Aa2 | | 1,074,010 | |
| | 32,569 | | Total Health Care | | | | | 35,627,618 | |
| | | | Housing/Multifamily – 2.9% (2.0% of Total Investments) | | | | | | |
| | 695 | | California Municipal Finance Authority, Mobile Home Park Revenue Bonds, Caritas Projects Series 2010A, 6.400%, 8/15/45 | | 8/20 at 100.00 | BBB | | 769,101 | |
| | 1,665 | | California Municipal Finance Authority, Mobile Home Park Revenue Bonds, Caritas Projects Series 2012A, 5.125%, 8/15/32 | | 8/22 at 100.00 | BBB | | 1,777,521 | |
| | 1,230 | | Independent Cities Finance Authority, California, Mobile Home Park Revenue Bonds, Augusta Communities Mobile Home Park, Series 2012A, 5.000%, 5/15/39 | | 5/22 at 100.00 | A– | | 1,291,992 | |
| | 3,590 | | Total Housing/Multifamily | | | | | 3,838,614 | |
| | | | Housing/Single Family – 0.1% (0.1% of Total Investments) | | | | | | |
| | 100 | | California Housing Finance Agency, Home Mortgage Revenue Bonds, Series 2006H, 5.750%, 8/01/30 – FGIC Insured (Alternative Minimum Tax) | | 2/16 at 100.00 | BBB | | 104,675 | |
| | | | Long-Term Care – 3.4% (2.4% of Total Investments) | | | | | | |
| | 4,000 | | ABAG Finance Authority for Non-Profit Corporations, California, Cal-Mortgage Insured Revenue Bonds, Channing House, Series 2010, 6.125%, 5/15/40 | | 5/20 at 100.00 | A | | 4,545,240 | |
| | | | Tax Obligation/General – 25.0% (18.0% of Total Investments) | | | | | | |
| | 4,125 | | Alameda Unified School District, Alameda County, California, General Obligation Bonds, Series 2004A, 0.000%, 8/01/25 – AGM Insured | | No Opt. Call | Aa2 | | 2,640,743 | |
| | 2,000 | | California State, General Obligation Bonds, Various Purpose Series 2009, 6.000%, 11/01/39 | | 11/19 at 100.00 | A1 | | 2,447,780 | |
| | 6,040 | | California State, General Obligation Bonds, Various Purpose Series 2012, 5.000%, 4/01/42 | | 4/22 at 100.00 | A1 | | 6,817,892 | |
| | 1,350 | | Coachella Valley Unified School District, Riverside County, California, General Obligation Bonds, Series 2005A, 5.000%, 8/01/30 – FGIC Insured | | 8/15 at 100.00 | A1 | | 1,463,549 | |
| | 2,150 | | Los Rios Community College District, Sacramento, El Dorado and Yolo Counties, California, General Obligation Bonds, Series 2006C, 5.000%, 8/01/24 – AGM Insured (UB) | | 8/14 at 102.00 | Aa2 | | 2,339,329 | |
| | 4,100 | | Monrovia Unified School District, Los Angeles County, California, General Obligation Bonds, Series 2001B, 0.000%, 8/01/27 – FGIC Insured | | No Opt. Call | Aa3 | | 2,227,366 | |
| | 2,500 | | Oakland Unified School District, Alameda County, California, General Obligation Bonds, Series 2002, 5.250%, 8/01/21 – FGIC Insured | | 5/13 at 100.00 | N/R | | 2,510,275 | |
| | 25 | | Riverside Community College District, California, General Obligation Bonds, Series 2004A, 5.250%, 8/01/24 – NPFG Insured | | 8/14 at 100.00 | AA | | 26,623 | |
| | | Nuveen California Municipal Market Opportunity Fund, Inc. (continued) |
| NCO | | Portfolio of Investments |
| | | February 28, 2013 |
| | Principal | | | | Optional Call | | | | |
| | Amount (000) | | Description (1) | | Provisions (2) | Ratings (3) | | Value | |
| | | | Tax Obligation/General (continued) | | | | | | |
| $ | 210 | | Roseville Joint Union High School District, Placer County, California, General Obligation Bonds, Series 2006B, 5.000%, 8/01/27 – FGIC Insured | | 8/15 at 100.00 | AA | $ | 229,316 | |
| | 4,970 | | San Rafael City High School District, Marin County, California, General Obligation Bonds, Series 2004B, 0.000%, 8/01/27 – FGIC Insured | | No Opt. Call | AA+ | | 2,889,608 | |
| | 4,175 | | Southwestern Community College District, San Diego County, California, General Obligation Bonds, Series 2004, 0.000%, 8/01/25 – FGIC Insured | | No Opt. Call | Aa2 | | 2,643,568 | |
| | 9,850 | | Sylvan Union School District, Stanislaus County, California, General Obligation Bonds, Election of 2006, Series 2010, 0.000%, 8/01/49 – AGM Insured | | No Opt. Call | AA– | | 3,895,872 | |
| | 5,750 | | Yosemite Community College District, California, General Obligation Bonds, Capital Appreciation, Election 2004, Series 2010D, 0.000%, 8/01/42 | | No Opt. Call | Aa2 | | 2,481,643 | |
| | 1,000 | | Yuba Community College District, California, General Obligation Bonds, Election 2006 Series 2011C, 5.250%, 8/01/47 | | 8/21 at 100.00 | Aa2 | | 1,130,680 | |
| | 48,245 | | Total Tax Obligation/General | | | | | 33,744,244 | |
| | | | Tax Obligation/Limited – 31.4% (22.6% of Total Investments) | | | | | | |
| | 2,000 | | California State Public Works Board, Lease Revenue Bonds, Department of Mental Health, Coalinga State Hospital, Series 2004A, 5.500%, 6/01/19 | | 6/14 at 100.00 | A2 | | 2,117,060 | |
| | 260 | | Capistrano Unified School District, Orange County, California, Special Tax Bonds, Community Facilities District, Series 2005, 5.000%, 9/01/24 – FGIC Insured | | 9/15 at 100.00 | N/R | | 268,593 | |
| | 770 | | Chino Redevelopment Agency, California, Merged Chino Redevelopment Project Area Tax Allocation Bonds, Series 2006, 5.000%, 9/01/38 – AMBAC Insured | | 9/16 at 101.00 | A– | | 782,251 | |
| | 375 | | Dinuba Redevelopment Agency, California, Tax Allocation Bonds, Merged City of Dinuba Redevelopment Project and Dinuba Redevelopment Project 2, As Amended, Refunding Series 2001, 5.000%, 9/01/31 – NPFG Insured | | 5/13 at 101.00 | BBB+ | | 376,444 | |
| | 510 | | Fontana Redevelopment Agency, California, Jurupa Hills Redevelopment Project, Tax Allocation Refunding Bonds, 1997 Series A, 5.500%, 10/01/27 | | 4/13 at 100.00 | A– | | 510,658 | |
| | 1,035 | | Hawthorne Community Redevelopment Agency, California, Project Area 2 Tax Allocation Bonds, Series 2006, 5.250%, 9/01/36 – SYNCORA GTY Insured | | 9/16 at 100.00 | N/R | | 1,069,931 | |
| | 460 | | Inglewood Redevelopment Agency, California, Tax Allocation Bonds, Merged Redevelopment Project, Subordinate Lien Series 2007A-1, 5.000%, 5/01/25 – AMBAC Insured | | 5/17 at 100.00 | BBB+ | | 471,983 | |
| | | | Irvine, California, Unified School District, Community Facilities District Special Tax Bonds, Series 2006A: | | | | | | |
| | 120 | | 5.000%, 9/01/26 | | 9/16 at 100.00 | N/R | | 124,175 | |
| | 275 | | 5.125%, 9/01/36 | | 9/16 at 100.00 | N/R | | 281,595 | |
| | 470 | | Los Angeles Community Redevelopment Agency, California, Lease Revenue Bonds, Manchester Social Services Project, Series 2005, 5.000%, 9/01/37 – AMBAC Insured | | 9/15 at 100.00 | A1 | | 489,486 | |
| | | | Modesto Schools Infrastructure Financing Agency, Stanislaus County, California, Special Tax Revenue Bonds, Series 2004: | | | | | | |
| | 1,375 | | 5.250%, 9/01/25 – AMBAC Insured | | 9/14 at 100.00 | N/R | | 1,400,314 | |
| | 1,500 | | 5.250%, 9/01/26 – AMBAC Insured | | 9/14 at 100.00 | N/R | | 1,525,860 | |
| | 245 | | National City Community Development Commission, California, Tax Allocation Bonds, National City Redevelopment Project, Series 2011, 6.500%, 8/01/24 | | 8/21 at 100.00 | A– | | 306,382 | |
| | 90 | | Novato Redevelopment Agency, California, Tax Allocation Bonds, Hamilton Field Redevelopment Project, Series 2011, 6.750%, 9/01/40 | | 9/21 at 100.00 | BBB+ | | 105,573 | |
| | 10,900 | | Ontario Redevelopment Financing Authority, San Bernardino County, California, Revenue Refunding Bonds, Redevelopment Project 1, Series 1995, 7.400%, 8/01/25 – NPFG Insured | | No Opt. Call | Baa2 | | 13,403,835 | |
| | 1,000 | | Ontario, California, Special Tax Bonds, Community Facilities District 5, Freeway Interchange Project, Series 1997, 6.375%, 9/01/17 | | 3/13 at 100.00 | N/R | | 1,019,450 | |
| | 1,065 | | Panama-Buena Vista Union School District, California, Certificates of Participation, School Construction Project, Series 2006, 5.000%, 9/01/22 – NPFG Insured | | 9/16 at 100.00 | A1 | | 1,157,825 | |
| | Principal | | | | Optional Call | | | | |
| | Amount (000) | | Description (1) | | Provisions (2) | Ratings (3) | | Value | |
| | | | Tax Obligation/Limited (continued) | | | | | | |
| | | | Perris Union High School District Financing Authority, Riverside County, California, Revenue Bonds, Series 2011: | | | | | | |
| $ | 90 | | 6.000%, 9/01/33 | | 9/13 at 100.00 | N/R | $ | 93,236 | |
| | 195 | | 6.125%, 9/01/41 | | 9/13 at 100.00 | N/R | | 201,891 | |
| | 770 | | Pittsburg Redevelopment Agency, California, Tax Allocation Bonds, Los Medanos Community Development Project, Refunding Series 2008A, 6.500%, 9/01/28 | | 9/18 at 100.00 | BBB– | | 843,604 | |
| | 295 | | Rancho Santa Fe CSD Financing Authority, California, Revenue Bonds, Superior Lien Series 2011A, 5.750%, 9/01/30 | | 9/21 at 100.00 | BBB+ | | 340,660 | |
| | 225 | | Rialto Redevelopment Agency, California, Tax Allocation Bonds, Merged Project Area, Series 2005A, 5.000%, 9/01/35 – SYNCORA GTY Insured | | 9/15 at 100.00 | A– | | 227,666 | |
| | 55 | | Riverside County Redevelopment Agency, California, Tax Allocation Bonds, Jurupa Valley Project Area, Series 2011B, 6.500%, 10/01/25 | | 10/21 at 100.00 | A– | | 62,890 | |
| | 1,440 | | Riverside County Redevelopment Agency, California, Tax Allocation Housing Bonds, Series 2010A, 6.000%, 10/01/39 | | 10/20 at 100.00 | A– | | 1,587,758 | |
| | 280 | | Roseville, California, Certificates of Participation, Public Facilities, Series 2003A, 5.000%, 8/01/25 – AMBAC Insured | | 8/13 at 100.00 | AA– | | 284,192 | |
| | 2,500 | | Sacramento City Financing Authority, California, Lease Revenue Refunding Bonds, Series 1993A, 5.400%, 11/01/20 – AMBAC Insured | | No Opt. Call | A | | 2,882,400 | |
| | 2,000 | | San Diego County, California, Certificates of Participation, Burnham Institute, Series 2006, 5.000%, 9/01/34 | | 9/15 at 102.00 | Baa2 | | 2,060,120 | |
| | 45 | | San Francisco Redevelopment Finance Authority, California, Tax Allocation Revenue Bonds, Mission Bay North Redevelopment Project, Series 2011C, 6.750%, 8/01/41 | | 2/21 at 100.00 | A– | | 54,197 | |
| | | | San Francisco Redevelopment Financing Authority, California, Tax Allocation Revenue Bonds, Mission Bay South Redevelopment Project, Series 2011D: | | | | | | |
| | 45 | | 7.000%, 8/01/33 | | 2/21 at 100.00 | BBB | | 52,900 | |
| | 55 | | 7.000%, 8/01/41 | | 2/21 at 100.00 | BBB | | 63,800 | |
| | 1,200 | | San Jose Financing Authority, California, Lease Revenue Refunding Bonds, Convention Center Project, Series 2001F, 5.000%, 9/01/20 – NPFG Insured | | 5/13 at 100.00 | AA | | 1,205,172 | |
| | 410 | | San Jose Redevelopment Agency, California, Tax Allocation Bonds, Merged Area Redevelopment Project, Series 2006C, 5.000%, 8/01/25 – NPFG Insured | | 8/17 at 100.00 | BBB | | 427,310 | |
| | | | San Jose Redevelopment Agency, California, Tax Allocation Bonds, Merged Area Redevelopment Project, Series 2006D: | | | | | | |
| | 360 | | 5.000%, 8/01/19 – AMBAC Insured | | 8/17 at 100.00 | BBB | | 367,715 | |
| | 910 | | 5.000%, 8/01/21 – AMBAC Insured | | 8/17 at 100.00 | BBB | | 947,665 | |
| | 530 | | 5.000%, 8/01/23 – AMBAC Insured | | 8/17 at 100.00 | BBB | | 545,004 | |
| | 70 | | Signal Hill Redevelopment Agency, California, Project 1 Tax Allocation Bonds, Series 2011, 7.000%, 10/01/26 | | 4/21 at 100.00 | N/R | | 78,134 | |
| | 1,585 | | Temecula Public Financing Authority, California, Special Tax Bonds, Community Facilities District 03-01 Crowne Hill, Series 2012, 5.000%, 9/01/33 | | 9/22 at 100.00 | BBB+ | | 1,657,609 | |
| | 1,350 | | Temecula Valley Unified School District, Riverside County, California, Community Facilities District 2002-1 Improvement Area 1 Special Tax, Series 2012, 5.000%, 9/01/33 | | 9/22 at 100.00 | N/R | | 1,393,308 | |
| | 1,300 | | Ventura County Public Financing Authority, California, Lease Revenue Bonds Series 2013A, 5.000%, 11/01/38 (WI/DD, Settling 3/07/13) | | 11/22 at 100.00 | AA | | 1,462,786 | |
| | 125 | | Yorba Linda Redevelopment Agency, Orange County, California, Tax Allocation Revenue Bonds, Yorba Linda Redevelopment Project, Subordinate Lien Series 2011A, 6.000%, 9/01/26 | | 9/21 at 100.00 | A– | | 145,643 | |
| | 38,285 | | Total Tax Obligation/Limited | | | | | 42,397,075 | |
| | | Nuveen California Municipal Market Opportunity Fund, Inc. (continued) |
| NCO | | Portfolio of Investments |
| | | February 28, 2013 |
| | Principal | | | | Optional Call | | | | |
| | Amount (000) | | Description (1) | | Provisions (2) | Ratings (3) | | Value | |
| | | | Transportation – 6.3% (4.6% of Total Investments) | | | | | | |
| $ | 1,355 | | Bay Area Toll Authority, California, Revenue Bonds, San Francisco Bay Area Toll Bridge, Series 2008, Tender Option Bond Trust 3211, 13.640%, 10/01/32 (IF) | | 4/18 at 100.00 | AA | $ | 1,974,818 | |
| | 4,000 | | Foothill/Eastern Transportation Corridor Agency, California, Toll Road Revenue Refunding Bonds, Series 1999, 5.875%, 1/15/29 | | 1/14 at 101.00 | BBB– | | 4,099,520 | |
| | 2,465 | | San Francisco Airports Commission, California, Special Facilities Lease Revenue Bonds, San Francisco International Airport, SFO Fuel Company LLC, Series 2000A, 6.125%, 1/01/27 – AGM Insured (Alternative Minimum Tax) | | 5/13 at 100.00 | AA– | | 2,475,673 | |
| | 7,820 | | Total Transportation | | | | | 8,550,011 | |
| | | | U.S. Guaranteed – 10.2% (7.3% of Total Investments) (4) | | | | | | |
| | 10 | | California Department of Water Resources, Water System Revenue Bonds, Central Valley Project, Series 2002X, 5.500%, 12/01/17 – FGIC Insured (ETM) | | No Opt. Call | AAA | | 12,281 | |
| | 2,100 | | California State, General Obligation Bonds, Series 2004, 5.250%, 4/01/34 (Pre-refunded 4/01/14) | | 4/14 at 100.00 | AAA | | 2,216,067 | |
| | 1,010 | | Golden State Tobacco Securitization Corporation, California, Tobacco Settlement Asset-Backed Bonds, Series 2003A-1, 6.250%, 6/01/33 (Pre-refunded 6/01/13) | | 6/13 at 100.00 | Aaa | | 1,025,867 | |
| | 875 | | Orange County Water District, California, Revenue Certificates of Participation, Series 2003B, 5.000%, 8/15/34 – NPFG Insured (ETM) | | 8/13 at 100.00 | AAA | | 1,171,940 | |
| | 3,495 | | Pomona, California, GNMA/FHLMC Collateralized Single Family Mortgage Revenue Refunding Bonds, Series 1990B, 7.500%, 8/01/23 (ETM) | | No Opt. Call | Aaa | | 4,654,711 | |
| | 1,875 | | Riverside Community College District, California, General Obligation Bonds, Series 2004A, 5.250%, 8/01/24 (Pre-refunded 8/01/14) – NPFG Insured | | 8/14 at 100.00 | AA (4) | | 2,009,944 | |
| | 2,000 | | San Francisco City and County Public Utilities Commission, California, Clean Water Revenue Refunding Bonds, Series 2003A, 5.250%, 10/01/20 (Pre-refunded 4/01/13) – NPFG Insured | | 4/13 at 100.00 | AA– (4) | | 2,009,360 | |
| | 485 | | San Mateo Union High School District, San Mateo County, California, Certificates of Participation, Phase 1, Series 2007A, 5.000%, 12/15/30 (Pre-refunded 12/15/17) – AMBAC Insured | | 12/17 at 100.00 | AA– (4) | | 582,451 | |
| | 11,850 | | Total U.S. Guaranteed | | | | | 13,682,621 | |
| | | | Utilities – 4.9% (3.6% of Total Investments) | | | | | | |
| | 2,815 | | California Statewide Community Development Authority, Certificates of Participation Refunding, Rio Bravo Fresno Project, Series 1999A, 6.500%, 12/01/18 | | 5/13 at 100.00 | N/R | | 2,767,990 | |
| | 1,365 | | Long Beach Bond Finance Authority, California, Natural Gas Purchase Revenue Bonds, Series 2007A, 5.500%, 11/15/37 | | No Opt. Call | A | | 1,662,229 | |
| | 455 | | Merced Irrigation District, California, Electric System Revenue Bonds, Series 2005, 5.125%, 9/01/31 – SYNCORA GTY Insured | | 9/15 at 100.00 | N/R | | 468,746 | |
| | 1,500 | | Southern California Public Power Authority, California, Milford Wind Corridor Phase I Revenue Bonds, Series 2010-1, 5.000%, 7/01/28 | | 1/20 at 100.00 | AA– | | 1,765,890 | |
| | 6,135 | | Total Utilities | | | | | 6,664,855 | |
| | | | Water and Sewer – 17.9% (12.9% of Total Investments) | | | | | | |
| | 1,020 | | California Department of Water Resources, Water System Revenue Bonds, Central Valley Project, Series 2002X, 5.500%, 12/01/17 – FGIC Insured | | No Opt. Call | AAA | | 1,252,162 | |
| | 2,870 | | California Pollution Control Financing Authority, Water Furnishing Revenue Bonds, Poseidon Resources Channelside Desalination Project, Series 2012, 5.000%, 11/21/45 (Alternative Minimum Tax) | | No Opt. Call | Baa3 | | 2,976,075 | |
| | 2,500 | | El Centro Financing Authority, California, Water Revenue Bonds, Series 2006A, 4.750%, 10/01/31 – AGM Insured | | 10/16 at 100.00 | AA– | | 2,736,075 | |
| | 750 | | Fortuna Public Finance Authority, California, Water Revenue Bonds, Series 2006, 5.000%, 10/01/36 – AGM Insured | | 10/16 at 100.00 | AA– | | 785,955 | |
| | Principal | | | | Optional Call | | | | |
| | Amount (000) | | Description (1) | | Provisions (2) | Ratings (3) | | Value | |
| | | | Water and Sewer (continued) | | | | | | |
| $ | 2,540 | | Los Angeles Department of Water and Power, California, Waterworks Revenue Bonds, Series 2011A, 5.250%, 7/01/39 | | 1/21 at 100.00 | AA | $ | 2,966,542 | |
| | 1,000 | | Metropolitan Water District of Southern California, Water Revenue Bonds, 2006 Authorization Series 2007A, 5.000%, 7/01/37 | | 7/17 at 100.00 | AAA | | 1,142,260 | |
| | 3,380 | | Orange County Sanitation District, California, Certificates of Participation, Tender Option Bond Trust 11738, 18.067%, 8/01/29 (IF) | | 2/19 at 100.00 | AAA | | 5,264,215 | |
| | 3,500 | | Placerville Public Financing Authority, California, Wastewater System Refinancing and Improvement Project Revenue Bonds, Series 2006, 5.000%, 9/01/34 – SYNCORA GTY Insured | | 9/16 at 100.00 | N/R | | 3,526,845 | |
| | 350 | | Sacramento County Sanitation District Financing Authority, California, Revenue Bonds, Series 2006, 5.000%, 12/01/31 – FGIC Insured | | 6/16 at 100.00 | AA | | 390,310 | |
| | 2,630 | | San Diego Public Facilities Financing Authority, California, Sewerage Revenue Bonds, Refunding Series 2010A, 5.250%, 5/15/27 | | 5/20 at 100.00 | AA | | 3,146,401 | |
| | 20,540 | | Total Water and Sewer | | | | | 24,186,840 | |
| $ | 187,174 | | Total Investments (cost $166,124,796) – 139.0% | | | | | 187,407,543 | |
| | | | Floating Rate Obligations – (3.2)% | | | | | (4,285,000 | ) |
| | | | Variable Rate Demand Preferred Shares, at Liquidation Value – (36.9)% (5) | | | | | (49,800,000 | ) |
| | | | Other Assets Less Liabilities – 1.1% | | | | | 1,497,579 | |
| | | | Net Assets Applicable to Common Shares – 100% | | | | $ | 134,820,122 | |
| (1) | | All percentages shown in the Portfolio of Investments are based on net assets applicable to Common shares unless otherwise noted. |
| (2) | | Optional Call Provisions (not covered by the report of independent registered public accounting firm): Dates (month and year) and prices of the earliest optional call or redemption. There may be other call provisions at varying prices at later dates. Certain mortgage-backed securities may be subject to periodic principal paydowns. |
| (3) | | Ratings (not covered by the report of independent registered public accounting firm): Using the highest of Standard & Poor’s Group (“Standard & Poor’s”), Moody’s Investors Service, Inc. (“Moody’s”) or Fitch, Inc. (“Fitch”) rating. Ratings below BBB by Standard & Poor’s, Baa by Moody’s or BBB by Fitch are considered to be below investment grade. Holdings designated N/R are not rated by any of these national rating agencies. |
| (4) | | Backed by an escrow or trust containing sufficient U.S. Government or U.S. Government agency securities, which ensure the timely payment of principal and interest. Certain bonds backed by U.S. Government or agency securities are regarded as having an implied rating equal to the rating of such securities. |
| (5) | | Variable Rate Demand Preferred Shares, at Liquidation Value as a percentage of Total Investments is 26.6%. |
| N/R | | Not rated. |
| WI/DD | | Investment, or portion of investment, purchased on a when-issued or delayed delivery basis. |
| (ETM) | | Escrowed to maturity. |
| (IF) | | Inverse floating rate investment. |
| (UB) | | Underlying bond of an inverse floating rate trust reflected as a financing transaction. See Notes to Financial Statements, Footnote 1 – General Information and Significant Accounting Policies, Inverse Floating Rate Securities for more information. |
See accompanying notes to financial statements.
| | | Nuveen California Investment Quality Municipal Fund, Inc. |
| NQC | | Portfolio of Investments |
| | | February 28, 2013 |
| | Principal | | | | Optional Call | | | | |
| | Amount (000) | | Description (1) | | Provisions (2) | Ratings (3) | | Value | |
| | | | Consumer Staples – 6.7% (4.5% of Total Investments) | | | | | | |
| | | | California County Tobacco Securitization Agency, Tobacco Settlement Asset-Backed Bonds, Sonoma County Tobacco Securitization Corporation, Series 2005: | | | | | | |
| $ | 485 | | 4.250%, 6/01/21 | | 6/15 at 100.00 | BB+ | $ | 472,118 | |
| | 3,500 | | 5.250%, 6/01/45 | | 6/15 at 100.00 | B– | | 3,086,615 | |
| | 2,150 | | Golden State Tobacco Securitization Corporation, California, Tobacco Settlement Asset-Backed Bonds, Series 2007A-1, 5.750%, 6/01/47 | | 6/17 at 100.00 | B | | 2,015,862 | |
| | 6,740 | | Golden State Tobacco Securitization Corporation, California, Tobacco Settlement Asset-Backed Bonds, Series 2007A-2, 5.300%, 6/01/37 | | 6/22 at 100.00 | B | | 6,148,430 | |
| | 3,500 | | Tobacco Securitization Authority of Northern California, Tobacco Settlement Asset-Backed Bonds, Series 2005A-1, 5.375%, 6/01/38 | | 6/15 at 100.00 | B– | | 3,093,020 | |
| | 16,375 | | Total Consumer Staples | | | | | 14,816,045 | |
| | | | Education and Civic Organizations – 12.2% (8.2% of Total Investments) | | | | | | |
| | 3,000 | | California Educational Facilities Authority, Revenue Bonds, Dominican University, Series 2006, 5.000%, 12/01/36 | | 12/16 at 100.00 | Baa3 | | 3,116,280 | |
| | 2,000 | | California Educational Facilities Authority, Revenue Bonds, Occidental College, Series 2005A, 5.000%, 10/01/27 – NPFG Insured | | 10/15 at 100.00 | Aa3 | | 2,135,840 | |
| | 1,575 | | California Educational Facilities Authority, Revenue Bonds, Santa Clara University, Series 2010, 5.000%, 2/01/40 | | 2/20 at 100.00 | Aa3 | | 1,757,574 | |
| | 170 | | California Educational Facilities Authority, Revenue Bonds, University of Redlands, Series 2005A, 5.000%, 10/01/35 | | 10/15 at 100.00 | A3 | | 176,882 | |
| | | | California Educational Facilities Authority, Revenue Bonds, University of the Pacific, Series 2006: | | | | | | |
| | 120 | | 5.000%, 11/01/21 | | 11/15 at 100.00 | A2 | | 130,301 | |
| | 160 | | 5.000%, 11/01/25 | | 11/15 at 100.00 | A2 | | 172,581 | |
| | 6,000 | | California State Public Works Board, Lease Revenue Bonds, California State University Projects, Series 1997C, 5.400%, 10/01/22 | | 5/13 at 100.00 | Aa3 | | 6,022,140 | |
| | 2,798 | | California State Public Works Board, Lease Revenue Bonds, University of California Regents, Tender Option Bond Trust 1065, 9.376%, 3/01/33 (IF) | | 3/18 at 100.00 | Aa2 | | 3,439,078 | |
| | | | University of California, Revenue Bonds, Multi-Purpose Projects, Series 2003A: | | | | | | |
| | 3,425 | | 5.125%, 5/15/16 – AMBAC Insured | | 5/13 at 100.00 | Aa1 | | 3,461,065 | |
| | 2,375 | | 5.125%, 5/15/17 – AMBAC Insured | | 5/13 at 100.00 | Aa1 | | 2,399,843 | |
| | 1,060 | | 5.000%, 5/15/24 – AMBAC Insured | | 5/13 at 100.00 | Aa1 | | 1,070,462 | |
| | 3,000 | | 5.000%, 5/15/33 – AMBAC Insured | | 5/13 at 100.00 | Aa1 | | 3,028,560 | |
| | 25,683 | | Total Education and Civic Organizations | | | | | 26,910,606 | |
| | | | Health Care – 24.2% (16.3% of Total Investments) | | | | | | |
| | 3,000 | | California Health Facilities Financing Authority, Revenue Bonds, Catholic Healthcare West, Series 2004G, 5.250%, 7/01/23 | | 7/14 at 100.00 | A | | 3,160,770 | |
| | 3,260 | | California Health Facilities Financing Authority, Revenue Bonds, Childrens Hospital Los Angeles, Series 2010A, 5.250%, 7/01/38 – AGC Insured | | 7/20 at 100.00 | AA– | | 3,520,083 | |
| | 1,250 | | California Health Facilities Financing Authority, Revenue Bonds, Memorial Health Services, Series 2012A, 5.000%, 10/01/33 | | No Opt. Call | AA– | | 1,438,438 | |
| | 840 | | California Health Facilities Financing Authority, Revenue Bonds, Rady Children’s Hospital – San Diego, Series 2011, 5.250%, 8/15/41 | | 8/21 at 100.00 | A+ | | 930,325 | |
| | 7,765 | | California Health Facilities Financing Authority, Revenue Bonds, Sutter Health, Series 2007A, 5.250%, 11/15/46 (UB) | | 11/16 at 100.00 | AA– | | 8,478,060 | |
| | 1,270 | | California Health Facilities Financing Authority, Revenue Bonds, Sutter Health, Series 2011B, 6.000%, 8/15/42 | | 8/20 at 100.00 | AA– | | 1,557,642 | |
| | Principal | | | | Optional Call | | | | |
| | Amount (000) | | Description (1) | | Provisions (2) | Ratings (3) | | Value | |
| | | | Health Care (continued) | | | | | | |
| | | | California Municipal Financing Authority, Certificates of Participation, Community Hospitals of Central California, Series 2007: | | | | | | |
| $ | 2,950 | | 5.250%, 2/01/27 | | 2/17 at 100.00 | BBB | $ | 3,144,966 | |
| | 1,750 | | 5.250%, 2/01/46 | | 2/17 at 100.00 | BBB | | 1,836,135 | |
| | 5,000 | | California Statewide Communities Development Authority, Revenue Bonds, Adventist Health System West, Series 2005A, 5.000%, 3/01/35 | | 3/15 at 100.00 | A | | 5,313,300 | |
| | 3,000 | | California Statewide Communities Development Authority, Revenue Bonds, Daughters of Charity Health System, Series 2005A, 5.250%, 7/01/24 | | 7/15 at 100.00 | BBB | | 3,216,900 | |
| | 2,355 | | California Statewide Communities Development Authority, Revenue Bonds, Kaiser Permanante System, Series 2006, 5.250%, 3/01/45 | | 3/16 at 100.00 | A+ | | 2,529,152 | |
| | 1,840 | | California Statewide Communities Development Authority, Revenue Bonds, Kaiser Permanente System, Series 2001C, 5.250%, 8/01/31 | | 8/16 at 100.00 | A+ | | 2,063,137 | |
| | 948 | | California Statewide Communities Development Authority, Revenue Bonds, Saint Joseph Health System, Tender Option Bond Trust 2554, 18.398%, 7/01/47 – AGM Insured (IF) | | 7/18 at 100.00 | AA– | | 1,428,944 | |
| | 770 | | California Statewide Communities Development Authority, Revenue Bonds, Sutter Health, Series 2005A, 5.000%, 11/15/43 | | 11/15 at 100.00 | AA– | | 827,504 | |
| | 1,000 | | Loma Linda, California, Hospital Revenue Bonds, Loma Linda University Medical Center, Series 2005A, 5.000%, 12/01/23 | | 12/15 at 100.00 | BBB | | 1,022,840 | |
| | 1,785 | | Loma Linda, California, Hospital Revenue Bonds, Loma Linda University Medical Center, Series 2008A, 8.250%, 12/01/38 | | 12/17 at 100.00 | BBB | | 2,079,882 | |
| | 2,400 | | Marysville, California, Revenue Bonds, The Fremont-Rideout Health Group, Series 2011, 5.250%, 1/01/42 | | 1/21 at 100.00 | A | | 2,641,656 | |
| | 3,250 | | Palomar Pomerado Health Care District, California, Certificates of Participation, Series 2010, 6.000%, 11/01/41 | | 11/20 at 100.00 | Baa3 | | 3,537,885 | |
| | 1,250 | | Santa Clara County Financing Authority, California, Insured Revenue Bonds, El Camino Hospital, Series 2007A, 5.750%, 2/01/41 – AMBAC Insured | | 8/17 at 100.00 | A+ | | 1,382,413 | |
| | 2,575 | | Upland, California, Certificates of Participation, San Antonio Community Hospital, Series 2011, 6.500%, 1/01/41 | | 1/21 at 100.00 | A | | 3,089,846 | |
| | 48,258 | | Total Health Care | | | | | 53,199,878 | |
| | | | Housing/Multifamily – 1.2% (0.8% of Total Investments) | | | | | | |
| | 1,240 | | California Municipal Finance Authority, Mobile Home Park Revenue Bonds, Caritas Projects Series 2010A, 6.400%, 8/15/45 | | 8/20 at 100.00 | BBB | | 1,372,209 | |
| | 1,255 | | California Municipal Finance Authority, Mobile Home Park Revenue Bonds, Caritas Projects Series 2012A, 5.500%, 8/15/47 | | 8/22 at 100.00 | BBB | | 1,339,863 | |
| | 2,495 | | Total Housing/Multifamily | | | | | 2,712,072 | |
| | | | Housing/Single Family – 1.3% (0.9% of Total Investments) | | | | | | |
| | 1,890 | | California Housing Finance Agency, California, Home Mortgage Revenue Bonds, Series 2007G, 5.050%, 2/01/29 (Alternative Minimum Tax) | | 2/17 at 100.00 | BBB | | 1,882,553 | |
| | 155 | | California Housing Finance Agency, Home Mortgage Revenue Bonds, Series 2006H, 5.750%, 8/01/30 – FGIC Insured (Alternative Minimum Tax) | | 2/16 at 100.00 | BBB | | 162,246 | |
| | 765 | | California Housing Finance Agency, Home Mortgage Revenue Bonds, Series 2006K, 5.500%, 2/01/42 (Alternative Minimum Tax) | | 2/16 at 100.00 | BBB | | 792,907 | |
| | 2,810 | | Total Housing/Single Family | | | | | 2,837,706 | |
| | | Nuveen California Investment Quality Municipal Fund, Inc. (continued) |
| NQC | | Portfolio of Investments |
| | | February 28, 2013 |
| | Principal | | | | Optional Call | | | | |
| | Amount (000) | | Description (1) | | Provisions (2) | Ratings (3) | | Value | |
| | | | Long-Term Care – 0.7% (0.5% of Total Investments) | | | | | | |
| $ | 1,440 | | California Statewide Community Development Authority, Certificates of Participation, Internext Group, Series 1999, 5.375%, 4/01/17 | | 5/13 at 100.00 | BBB | $ | 1,444,680 | |
| | | | Tax Obligation/General – 32.4% (21.8% of Total Investments) | | | | | | |
| | | | California State, General Obligation Bonds, Various Purpose Series 2009: | | | | | | |
| | 15,445 | | 6.000%, 11/01/39 | | 11/19 at 100.00 | A1 | | 18,902,978 | |
| | 1,505 | | 5.500%, 11/01/39 | | 11/19 at 100.00 | A1 | | 1,772,318 | |
| | 5,100 | | California State, General Obligation Bonds, Various Purpose Series 2010, 5.500%, 3/01/40 | | 3/20 at 100.00 | A1 | | 6,040,185 | |
| | | | California State, General Obligation Bonds, Various Purpose Series 2011: | | | | | | |
| | 2,315 | | 5.000%, 9/01/41 | | 9/21 at 100.00 | A1 | | 2,598,472 | |
| | 1,300 | | 5.000%, 10/01/41 | | 10/21 at 100.00 | A1 | | 1,460,498 | |
| | 7,000 | | California State, General Obligation Bonds, Various Purpose Series 2012, 5.000%, 4/01/42 | | 4/22 at 100.00 | A1 | | 7,901,529 | |
| | 3,250 | | Puerto Rico, General Obligation and Public Improvement Bonds, Series 2002A, 5.500%, 7/01/20 – NPFG Insured | | No Opt. Call | BBB+ | | 3,558,393 | |
| | 20 | | Riverside Community College District, California, General Obligation Bonds, Series 2004A, 5.250%, 8/01/21 – NPFG Insured | | 8/14 at 100.00 | AA | | 21,423 | |
| | 345 | | Roseville Joint Union High School District, Placer County, California, General Obligation Bonds, Series 2006B, 5.000%, 8/01/27 – FGIC Insured | | 8/15 at 100.00 | AA | | 376,733 | |
| | 2,500 | | San Diego Community College District, California, General Obligation Bonds, Refunding Series 2011, 5.000%, 8/01/41 | | 8/21 at 100.00 | AA+ | | 2,878,775 | |
| | 2,000 | | San Diego Unified School District, San Diego County, California, General Obligation Bonds, Series 2003E, 5.250%, 7/01/24 – AGM Insured | | 7/13 at 101.00 | Aa2 | | 2,052,380 | |
| | 5,000 | | San Francisco Bay Area Rapid Transit District, California, General Obligation Bonds, Election of 2004 Series 2007B, 5.000%, 8/01/32 | | 8/17 at 100.00 | AAA | | 5,735,600 | |
| | 41,725 | | Yosemite Community College District, California, General Obligation Bonds, Capital Appreciation, Election 2004, Series 2010D, 0.000%, 8/01/42 | | No Opt. Call | Aa2 | | 18,008,092 | |
| | 87,505 | | Total Tax Obligation/General | | | | | 71,307,376 | |
| | | | Tax Obligation/Limited – 44.1% (29.7% of Total Investments) | | | | | | |
| | 3,000 | | California State Public Works Board, Lease Revenue Bonds, Department of Mental Health, Coalinga State Hospital, Series 2004A, 5.500%, 6/01/20 | | 6/14 at 100.00 | A2 | | 3,172,080 | |
| | 3,000 | | California State Public Works Board, Lease Revenue Bonds, Department of Mental Health, Hospital Addition, Series 2001A, 5.000%, 12/01/21 – AMBAC Insured | | 5/13 at 100.00 | A2 | | 3,040,260 | |
| | 1,000 | | California State Public Works Board, Lease Revenue Bonds, Various Capital Projects, Series 2009G-1, 5.750%, 10/01/30 | | 10/19 at 100.00 | A2 | | 1,179,380 | |
| | 3,000 | | California State Public Works Board, Lease Revenue Bonds, Various Capital Projects, Series 2012G, 5.000%, 11/01/31 | | No Opt. Call | A2 | | 3,434,040 | |
| | 1,390 | | California State, Economic Recovery Revenue Bonds, Series 2004A, 5.000%, 7/01/15 | | 7/14 at 100.00 | Aa3 | | 1,480,225 | |
| | 425 | | Capistrano Unified School District, Orange County, California, Special Tax Bonds, Community Facilities District, Series 2005, 5.000%, 9/01/24 – FGIC Insured | | 9/15 at 100.00 | N/R | | 439,046 | |
| | 970 | | Chula Vista, California, Special Tax Bonds, Community Facilities District 12-1 McMillin Otay Ranch Village Seven, Series 2005, 5.250%, 9/01/30 | | No Opt. Call | N/R | | 985,442 | |
| | 645 | | Dinuba Redevelopment Agency, California, Tax Allocation Bonds, Merged City of Dinuba Redevelopment Project and Dinuba Redevelopment Project 2, As Amended, Refunding Series 2001, 5.000%, 9/01/31 – NPFG Insured | | 5/13 at 101.00 | BBB+ | | 647,483 | |
| | 1,595 | | Fontana Public Financing Authority, California, Tax Allocation Revenue Bonds, North Fontana Redevelopment Project, Series 2003A, 5.375%, 9/01/25 – AMBAC Insured | | 5/13 at 100.00 | A+ | | 1,598,254 | |
| | 885 | | Fontana Redevelopment Agency, California, Jurupa Hills Redevelopment Project, Tax Allocation Refunding Bonds, 1997 Series A, 5.500%, 10/01/27 | | 4/13 at 100.00 | A– | | 886,142 | |
| | 6,000 | | Golden State Tobacco Securitization Corporation, California, Enhanced Tobacco Settlement Asset-Backed Revenue Bonds, Series 2005A, 5.000%, 6/01/45 – AGC Insured | | 6/15 at 100.00 | AA– | | 6,295,440 | |
| | Principal | | | | Optional Call | | | | |
| | Amount (000) | | Description (1) | | Provisions (2) | Ratings (3) | | Value | |
| | | | Tax Obligation/Limited (continued) | | | | | | |
| | | | Golden State Tobacco Securitization Corporation, California, Enhanced Tobacco Settlement Asset-Backed Revenue Bonds, Tender Option Bonds Trust 2215: | | | | | | |
| $ | 1,175 | | 13.920%, 6/01/45 – FGIC Insured (IF) | | 6/15 at 100.00 | A2 | $ | 1,394,819 | |
| | 825 | | 13.920%, 6/01/45 – FGIC Insured (IF) | | 6/15 at 100.00 | A2 | | 972,708 | |
| | 1,770 | | Hawthorne Community Redevelopment Agency, California, Project Area 2 Tax Allocation Bonds, Series 2006, 5.000%, 9/01/26 – SYNCORA GTY Insured | | 9/16 at 100.00 | N/R | | 1,829,861 | |
| | 3,840 | | Hesperia Community Redevelopment Agency, California, Tax Allocation Bonds, Series 2005A, 5.000%, 9/01/35 – SYNCORA GTY Insured | | 9/15 at 100.00 | BB+ | | 3,748,762 | |
| | 810 | | Inglewood Redevelopment Agency, California, Tax Allocation Bonds, Merged Redevelopment Project, Subordinate Lien Series 2007A-1, 5.000%, 5/01/24 – AMBAC Insured | | 5/17 at 100.00 | BBB+ | | 833,903 | |
| | | | Irvine, California, Unified School District, Community Facilities District Special Tax Bonds, Series 2006A: | | | | | | |
| | 195 | | 5.000%, 9/01/26 | | 9/16 at 100.00 | N/R | | 201,784 | |
| | 445 | | 5.125%, 9/01/36 | | 9/16 at 100.00 | N/R | | 455,671 | |
| | 770 | | Los Angeles Community Redevelopment Agency, California, Lease Revenue Bonds, Manchester Social Services Project, Series 2005, 5.000%, 9/01/37 – AMBAC Insured | | 9/15 at 100.00 | A1 | | 801,924 | |
| | 10,000 | | Los Angeles County Public Works Financing Authority, California, Lease Revenue Bonds, Series 2006B, 5.000%, 9/01/31 – FGIC Insured | | 9/16 at 100.00 | N/R | | 10,628,699 | |
| | 440 | | National City Community Development Commission, California, Tax Allocation Bonds, National City Redevelopment Project, Series 2011, 6.500%, 8/01/24 | | 8/21 at 100.00 | A– | | 550,238 | |
| | | | Norco Redevelopment Agency, California, Tax Allocation Refunding Bonds, Project Area 1, Refunding Series 2010: | | | | | | |
| | 1,000 | | 5.875%, 3/01/32 | | 3/20 at 100.00 | A | | 1,100,780 | |
| | 1,500 | | 6.000%, 3/01/36 | | 3/20 at 100.00 | A | | 1,688,115 | |
| | 160 | | Novato Redevelopment Agency, California, Tax Allocation Bonds, Hamilton Field Redevelopment Project, Series 2011, 6.750%, 9/01/40 | | 9/21 at 100.00 | BBB+ | | 187,685 | |
| | 3,600 | | Ontario Redevelopment Financing Authority, San Bernardino County, California, Revenue Refunding Bonds, Redevelopment Project 1, Series 1995, 7.400%, 8/01/25 – NPFG Insured | | No Opt. Call | Baa2 | | 4,426,956 | |
| | 1,685 | | Ontario, California, Special Tax Bonds, Community Facilities District 5, Freeway Interchange Project, Series 1997, 6.375%, 9/01/17 | | 9/13 at 100.00 | N/R | | 1,717,773 | |
| | 1,500 | | Orange County, California, Special Tax Bonds, Community Facilities District 03-1 of Ladera Ranch, Series 2004A, 5.625%, 8/15/34 | | 8/13 at 100.00 | N/R | | 1,509,090 | |
| | 1,000 | | Paramount Redevelopment Agency, California, Tax Allocation Bonds, Redevelopment Project Area 1, Series 2003, 5.000%, 8/01/23 – NPFG Insured | | 8/13 at 100.00 | A– | | 1,015,620 | |
| | | | Perris Union High School District Financing Authority, Riverside County, California, Revenue Bonds, Series 2011: | | | | | | |
| | 150 | | 6.000%, 9/01/33 | | 9/13 at 100.00 | N/R | | 155,394 | |
| | 330 | | 6.125%, 9/01/41 | | 9/13 at 100.00 | N/R | | 341,662 | |
| | 2,630 | | Pittsburg Redevelopment Agency, California, Tax Allocation Bonds, Los Medanos Community Development Project, Refunding Series 2008A, 6.500%, 9/01/28 | | 9/18 at 100.00 | BBB– | | 2,881,402 | |
| | 1,000 | | Pittsburg Redevelopment Agency, California, Tax Allocation Refunding Bonds, Los Medanos Community Development Project, Series 2003A, 5.000%, 8/01/14 – NPFG Insured | | 8/13 at 100.00 | A | | 1,020,990 | |
| | 525 | | Rancho Santa Fe CSD Financing Authority, California, Revenue Bonds, Superior Lien Series 2011A, 5.750%, 9/01/30 | | 9/21 at 100.00 | BBB+ | | 606,260 | |
| | 370 | | Rialto Redevelopment Agency, California, Tax Allocation Bonds, Merged Project Area, Series 2005A, 5.000%, 9/01/35 – SYNCORA GTY Insured | | 9/15 at 100.00 | A– | | 374,385 | |
| | 95 | | Riverside County Redevelopment Agency, California, Tax Allocation Bonds, Jurupa Valley Project Area, Series 2011B, 6.500%, 10/01/25 | | 10/21 at 100.00 | A– | | 108,629 | |
| | | Nuveen California Investment Quality Municipal Fund, Inc. (continued) |
| NQC | | Portfolio of Investments |
| | | February 28, 2013 |
| | Principal | | | | Optional Call | | | | |
| | Amount (000) | | Description (1) | | Provisions (2) | Ratings (3) | | Value | |
| | | | Tax Obligation/Limited (continued) | | | | | | |
| | | | Riverside County, California, Community Facilities District 05-8, Scott Road, Special Tax Bonds Series 2013: | | | | | | |
| $ | 555 | | 5.000%, 9/01/30 | | 9/22 at 100.00 | N/R | $ | 573,237 | |
| | 710 | | 5.000%, 9/01/42 | | 9/22 at 100.00 | N/R | | 714,267 | |
| | 1,415 | | Rohnert Park Community Development Commission, California, Redevelopment Project Tax Allocation Bonds, Series 2007R, 5.000%, 8/01/37 – FGIC Insured | | 8/17 at 100.00 | A– | | 1,442,762 | |
| | 460 | | Roseville, California, Certificates of Participation, Public Facilities, Series 2003A, 5.000%, 8/01/25 – AMBAC Insured | | 8/13 at 100.00 | AA– | | 466,886 | |
| | 4,000 | | Sacramento City Financing Authority, California, Lease Revenue Refunding Bonds, Series 1993A, 5.400%, 11/01/20 – AMBAC Insured | | No Opt. Call | A | | 4,611,840 | |
| | 4,250 | | Sacramento City Financing Authority, California, Tax Allocation Revenue Bonds, Merged Downtown Sacramento and Oak Park Projects, Series 2005A, 0.000%, 12/01/31 – FGIC Insured | | No Opt. Call | A– | | 1,646,663 | |
| | 625 | | San Diego, California, Community Facilities District 3 Liberty Station Special Tax Refunding Bonds Series 2013, 5.000%, 9/01/36 | | 9/23 at 100.00 | N/R | | 662,763 | |
| | 500 | | San Francisco Redevelopment Finance Authority, California, Tax Allocation Revenue Bonds, Mission Bay North Redevelopment Project, Series 2009C, 6.500%, 8/01/39 | | 8/19 at 100.00 | A– | | 579,545 | |
| | 80 | | San Francisco Redevelopment Finance Authority, California, Tax Allocation Revenue Bonds, Mission Bay North Redevelopment Project, Series 2011C, 6.750%, 8/01/41 | | 2/21 at 100.00 | A– | | 96,350 | |
| | | | San Francisco Redevelopment Financing Authority, California, Tax Allocation Revenue Bonds, Mission Bay South Redevelopment Project, Series 2011D: | | | | | | |
| | 75 | | 7.000%, 8/01/33 | | 2/21 at 100.00 | BBB | | 88,166 | |
| | 95 | | 7.000%, 8/01/41 | | 2/21 at 100.00 | BBB | | 110,200 | |
| | 130 | | San Francisco, California, Community Facilities District 6, Mission Bay South Public Improvements, Special Tax Refunding Bonds, Series 2013A, 5.000%, 8/01/33 | | 8/22 at 100.00 | N/R | | 139,277 | |
| | 2,000 | | San Jose Financing Authority, California, Lease Revenue Refunding Bonds, Civic Center Project, Series 2002B, 5.250%, 6/01/19 – AMBAC Insured | | 5/13 at 100.00 | AA | | 2,009,060 | |
| | 3,535 | | San Jose Financing Authority, California, Lease Revenue Refunding Bonds, Convention Center Project, Series 2001F, 5.000%, 9/01/20 – NPFG Insured | | 5/13 at 100.00 | AA | | 3,550,236 | |
| | 1,725 | | San Jose Redevelopment Agency, California, Tax Allocation Bonds, Merged Area Redevelopment Project, Series 2008B, 6.250%, 8/01/20 | | 8/18 at 100.00 | BBB | | 1,894,895 | |
| | 6,000 | | San Ramon Public Financing Authority, California, Tax Allocation Revenue Bonds, Series 2006A, 5.000%, 2/01/38 – AMBAC Insured | | 2/16 at 100.00 | A– | | 6,077,040 | |
| | 2,840 | | Santa Clara Redevelopment Agency, California, Tax Allocation Bonds, Bayshore North Project, Series 2003, 5.000%, 6/01/23 – NPFG Insured | | 6/13 at 100.00 | A | | 2,869,877 | |
| | 5,250 | | Santa Cruz County Redevelopment Agency, California, Tax Allocation Bonds, Live Oak-Soquel Community Improvement Projects, Subordinate Lien Series 2000, 5.250%, 9/01/25 – AMBAC Insured | | 9/13 at 100.00 | A | | 5,350,748 | |
| | 130 | | Signal Hill Redevelopment Agency, California, Project 1 Tax Allocation Bonds, Series 2011, 7.000%, 10/01/26 | | 4/21 at 100.00 | N/R | | 145,106 | |
| | 600 | | Union City Community Redevelopment Agency, California, Tax Allocation Revenue Bonds, Redevelopment Project, Subordinate Lien Series 2011, 6.875%, 12/01/33 | | 12/21 at 100.00 | A | | 736,062 | |
| | 1,265 | | Washington Unified School District, Yolo County, California, Certificates of Participation, Series 2007, 5.125%, 8/01/37 – AMBAC Insured | | 8/17 at 100.00 | A | | 1,339,774 | |
| | 225 | | Yorba Linda Redevelopment Agency, Orange County, California, Tax Allocation Revenue Bonds, Yorba Linda Redevelopment Project, Subordinate Lien Series 2011A, 6.500%, 9/01/32 | | 9/21 at 100.00 | A– | | 266,922 | |
| | 94,190 | | Total Tax Obligation/Limited | | | | | 97,082,578 | |
| | Principal | | | | Optional Call | | | | |
| | Amount (000) | | Description (1) | | Provisions (2) | Ratings (3) | | Value | |
| | | | Transportation – 6.5% (4.4% of Total Investments) | | | | | | |
| $ | 2,080 | | Bay Area Toll Authority, California, Revenue Bonds, San Francisco Bay Area Toll Bridge, Series 2006F, 5.000%, 4/01/31 (UB) | | 4/16 at 100.00 | AA | $ | 2,371,616 | |
| | 1,325 | | Bay Area Toll Authority, California, Revenue Bonds, San Francisco Bay Area Toll Bridge, Series 2008, Tender Option Bond Trust 3211, 13.640%, 10/01/32 (IF) | | 4/18 at 100.00 | AA | | 1,931,095 | |
| | 6,500 | | Foothill/Eastern Transportation Corridor Agency, California, Toll Road Revenue Refunding Bonds, Series 1999, 5.875%, 1/15/29 | | 1/14 at 101.00 | BBB– | | 6,661,720 | |
| | 2,975 | | Los Angeles Department of Airports, California, Revenue Bonds, Los Angeles International Airport, Senior Lien Series 2010D, 5.000%, 5/15/40 | �� | 5/20 at 100.00 | AA | | 3,382,010 | |
| | 12,880 | | Total Transportation | | | | | 14,346,441 | |
| | | | U.S. Guaranteed – 4.8% (3.3% of Total Investments) (4) | | | | | | |
| | 960 | | California State, Economic Recovery Revenue Bonds, Series 2004A, 5.000%, 7/01/15 (Pre-refunded 7/01/14) | | 7/14 at 100.00 | Aaa | | 1,021,642 | |
| | 3,145 | | California State, General Obligation Bonds, Series 2004, 5.250%, 4/01/34 (Pre-refunded 4/01/14) | | 4/14 at 100.00 | AAA | | 3,318,824 | |
| | 1,500 | | Daly City Housing Development Finance Agency, California, Mobile Home Park Revenue Bonds, Franciscan Mobile Home Park Project, Series 2002A, 5.850%, 12/15/32 (Pre-refunded 12/15/13) | | 12/13 at 102.00 | A (4) | | 1,596,255 | |
| | 1,500 | | Los Angeles Department of Water and Power, California, Waterworks Revenue Bonds, Series 2004C, 5.250%, 7/01/19 (Pre-refunded 7/01/14) – NPFG Insured | | 7/14 at 100.00 | AA (4) | | 1,601,760 | |
| | 2,285 | | Moreno Valley Unified School District, Riverside County, California, General Obligation Bonds, Series 2004A, 5.250%, 8/01/24 (Pre-refunded 8/01/14) – AGM Insured | | 8/14 at 100.00 | AA– (4) | | 2,449,451 | |
| | 585 | | Rohnert Park Community Development Commission, California, Redevelopment Project Tax Allocation Bonds, Series 2007R, 5.000%, 8/01/37 – FGIC Insured (ETM) | | 8/17 at 100.00 | N/R (4) | | 654,668 | |
| | 9,975 | | Total U.S. Guaranteed | | | | | 10,642,600 | |
| | | | Utilities – 3.1% (2.1% of Total Investments) | | | | | | |
| | 2,250 | | Long Beach Bond Finance Authority, California, Natural Gas Purchase Revenue Bonds, Series 2007A, 5.500%, 11/15/37 | | No Opt. Call | A | | 2,739,938 | |
| | 740 | | Merced Irrigation District, California, Electric System Revenue Bonds, Series 2005, 5.125%, 9/01/31 – SYNCORA GTY Insured | | 9/15 at 100.00 | N/R | | 762,355 | |
| | 3,210 | | Turlock Irrigation District, California, Electric Revenue Bonds, Series 2003A, 5.000%, 1/01/16 – NPFG Insured | | 5/13 at 100.00 | A+ | | 3,222,712 | |
| | 6,200 | | Total Utilities | | | | | 6,725,005 | |
| | | | Water and Sewer – 11.2% (7.5% of Total Investments) | | | | | | |
| | 4,900 | | California Pollution Control Financing Authority, Water Furnishing Revenue Bonds, Poseidon Resources Channelside Desalination Project, Series 2012, 5.000%, 11/21/45 (Alternative Minimum Tax) | | No Opt. Call | Baa3 | | 5,081,104 | |
| | 520 | | Healdsburg Public Financing Authority, California, Wastewater Revenue Bonds, Series 2006, 5.000%, 4/01/36 – NPFG Insured | | 4/16 at 100.00 | AA– | | 570,934 | |
| | 6,250 | | Los Angeles Department of Water and Power, California, Waterworks Revenue Bonds, Series 2011A, 5.250%, 7/01/39 | | 1/21 at 100.00 | AA | | 7,299,563 | |
| | | Nuveen California Investment Quality Municipal Fund, Inc. (continued) |
| NQC | | Portfolio of Investments |
| | | February 28, 2013 |
| | Principal | | | | Optional Call | | | | |
| | Amount (000) | | Description (1) | | Provisions (2) | Ratings (3) | | Value | |
| | | | Water and Sewer (continued) | | | | | | |
| $ | 3,015 | | Oxnard Financing Authority, California, Wastewater Revenue Bonds, Series 2003, 5.000%, 6/01/17 – FGIC Insured | | 6/13 at 100.00 | BBB | $ | 3,048,316 | |
| | 7,170 | | San Diego Public Facilities Financing Authority, California, Sewerage Revenue Bonds, Refunding Series 2010A, 5.250%, 5/15/28 | | 5/20 at 100.00 | AA | | 8,529,001 | |
| | 21,855 | | Total Water and Sewer | | | | | 24,528,918 | |
| $ | 329,666 | | Total Investments (cost $297,949,029) – 148.4% | | | | | 326,553,905 | |
| | | | Floating Rate Obligations – (2.6)% | | | | | (5,735,000 | ) |
| | | | Variable Rate Demand Preferred Shares, at Liquidation Value – (48.0)% (5) | | | | | (105,600,000 | ) |
| | | | Other Assets Less Liabilities – 2.2% | | | | | 4,887,976 | |
| | | | Net Assets Applicable to Common Shares – 100% | | | | $ | 220,106,881 | |
| (1) | | All percentages shown in the Portfolio of Investments are based on net assets applicable to Common shares unless otherwise noted. |
| (2) | | Optional Call Provisions (not covered by the report of independent registered public accounting firm): Dates (month and year) and prices of the earliest optional call or redemption. There may be other call provisions at varying prices at later dates. Certain mortgage-backed securities may be subject to periodic principal paydowns. |
| (3) | | Ratings (not covered by the report of independent registered public accounting firm): Using the highest of Standard & Poor’s Group (“Standard & Poor’s”), Moody’s Investors Services, Inc. (“Moody’s”) or Fitch, Inc. (“Fitch”) rating. Ratings below BBB by Standard & Poor’s, Baa by Moody’s or BBB by Fitch are considered to be below investment grade. Holdings designated N/R are not rated by any of these national rating agencies. |
| (4) | | Backed by an escrow or trust containing sufficient U.S. Government or U.S. Government agency securities, which ensure the timely payment of principal and interest. Certain bonds backed by U.S. Government or agency securities are regarded as having an implied rating equal to the rating of such securities. |
| (5) | | Variable Rate Demand Preferred Shares, at Liquidation Value as a percentage of Total Investments is 32.3%. |
| N/R | | Not rated. |
| (ETM) | | Escrowed to maturity. |
| (IF) | | Inverse floating rate investment. |
| (UB) | | Underlying bond of an inverse floating rate trust reflected as a financing transaction. See Notes to Financial Statements, Footnote 1 – General Information and Significant Accounting Policies, Inverse Floating Rate Securities for more information. |
See accompanying notes to financial statements.
| | | Nuveen California Select Quality Municipal Fund, Inc. |
| NVC | | Portfolio of Investments |
| | | February 28, 2013 |
| | Principal | | | | Optional Call | | | | |
| | Amount (000) | | Description (1) | | Provisions (2) | Ratings (3) | | Value | |
| | | | Consumer Staples – 8.0% (5.6% of Total Investments) | | | | | | |
| $ | 820 | | California County Tobacco Securitization Agency, Tobacco Settlement Asset-Backed Bonds, Sonoma County Tobacco Securitization Corporation, Series 2005, 4.250%, 6/01/21 | | 6/15 at 100.00 | BB+ | $ | 798,221 | |
| | 3,630 | | California County Tobacco Securitization Agency, Tobacco Settlement Asset-Backed Bonds, Stanislaus County Tobacco Funding Corporation, Series 2002A, 5.500%, 6/01/33 | | 5/13 at 100.00 | Baa1 | | 3,644,883 | |
| | | | Golden State Tobacco Securitization Corporation, California, Tobacco Settlement Asset-Backed Bonds, Series 2007A-1: | | | | | | |
| | 16,515 | | 5.750%, 6/01/47 | | 6/17 at 100.00 | B | | 15,484,629 | |
| | 2,180 | | 5.125%, 6/01/47 | | 6/17 at 100.00 | B | | 1,851,169 | |
| | 10,220 | | Golden State Tobacco Securitization Corporation, California, Tobacco Settlement Asset-Backed Bonds, Series 2007A-2, 5.300%, 6/01/37 | | 6/22 at 100.00 | B | | 9,322,991 | |
| | 33,365 | | Total Consumer Staples | | | | | 31,101,893 | |
| | | | Education and Civic Organizations – 5.8% (4.1% of Total Investments) | | | | | | |
| | 290 | | California Educational Facilities Authority, Revenue Bonds, University of Redlands, Series 2005A, 5.000%, 10/01/35 | | 10/15 at 100.00 | A3 | | 301,739 | |
| | 2,165 | | California Educational Facilities Authority, Revenue Bonds, University of San Francisco, Series 2011, 6.125%, 10/01/36 | | 10/21 at 100.00 | A3 | | 2,690,142 | |
| | 535 | | California Educational Facilities Authority, Revenue Bonds, University of Southern California, Tender Option Bond Trust 09-11B, 18.456%, 10/01/38 (IF) (4) | | 10/18 at 100.00 | Aa1 | | 875,003 | |
| | | | California Educational Facilities Authority, Revenue Bonds, University of the Pacific, Series 2006: | | | | | | |
| | 200 | | 5.000%, 11/01/21 | | 11/15 at 100.00 | A2 | | 217,168 | |
| | 270 | | 5.000%, 11/01/25 | | 11/15 at 100.00 | A2 | | 291,230 | |
| | 1,500 | | 5.000%, 11/01/30 | | 11/15 at 100.00 | A2 | | 1,571,970 | |
| | 1,740 | | California Infrastructure and Economic Development Bond Bank, Revenue Bonds, Scripps Research Institute, Series 2005A, 5.000%, 7/01/24 | | 7/15 at 100.00 | Aa3 | | 1,896,008 | |
| | 4,787 | | California State Public Works Board, Lease Revenue Bonds, University of California Regents, Tender Option Bond Trust 1065, 9.376%, 3/01/33 (IF) | | 3/18 at 100.00 | Aa2 | | 5,883,797 | |
| | 1,385 | | California State University, Systemwide Revenue Bonds, Series 2005C, 5.000%, 11/01/27 – NPFG Insured | | 11/15 at 100.00 | Aa2 | | 1,528,569 | |
| | 770 | | California Statewide Communities Development Authority, Charter School Revenue Bonds, Rocketship 4 – Mosaic Elementary Charter School, Series 2011A, 8.500%, 12/01/41 | | 12/21 at 100.00 | N/R | | 891,575 | |
| | 1,300 | | California Statewide Communities Development Authority, School Facility Revenue Bonds, Alliance College-Ready Public Schools, Series 2011A, 7.000%, 7/01/46 | | 7/21 at 100.00 | BBB | | 1,480,206 | |
| | 5,000 | | University of California, Revenue Bonds, Multi-Purpose Projects, Series 2003A, 5.000%, 5/15/33 – AMBAC Insured | | 5/13 at 100.00 | Aa1 | | 5,047,600 | |
| | 19,942 | | Total Education and Civic Organizations | | | | | 22,675,007 | |
| | | | Health Care – 29.0% (20.2% of Total Investments) | | | | | | |
| | 1,750 | | ABAG Finance Authority for Non-Profit Corporations, California, Cal-Mortgage Insured Revenue Bonds, Sansum-Santa Barbara Medical Foundation Clinic, Series 2002A, 5.500%, 4/01/21 | | 5/13 at 100.00 | A | | 1,755,985 | |
| | 1,455 | | California Health Facilities Financing Authority, Revenue Bonds, Rady Children’s Hospital – San Diego, Series 2011, 5.250%, 8/15/41 | | 8/21 at 100.00 | A+ | | 1,611,456 | |
| | 10,145 | | California Health Facilities Financing Authority, Revenue Bonds, Sutter Health, Series 2007A, 5.250%, 11/15/46 (UB) | | 11/16 at 100.00 | AA– | | 11,076,615 | |
| | 4,200 | | California Statewide Communities Development Authority, Revenue Bonds, Adventist Health System West, Series 2005A, 5.000%, 3/01/35 | | 3/15 at 100.00 | A | | 4,463,172 | |
| | | | California Statewide Communities Development Authority, Revenue Bonds, Daughters of Charity Health System, Series 2005A: | | | | | | |
| | 1,500 | | 5.250%, 7/01/24 | | 7/15 at 100.00 | BBB | | 1,608,450 | |
| | 10,000 | | 5.000%, 7/01/39 | | 7/15 at 100.00 | BBB | | 10,399,100 | |
| | 5,190 | | California Statewide Communities Development Authority, Revenue Bonds, Kaiser Permanente System, Series 2001C, 5.250%, 8/01/31 | | 8/16 at 100.00 | A+ | | 5,819,391 | |
| | 1,355 | | California Statewide Communities Development Authority, Revenue Bonds, Sherman Oaks Health System, Series 1998A, 5.000%, 8/01/22 – AMBAC Insured | | No Opt. Call | A1 | | 1,500,188 | |
| | | Nuveen California Select Quality Municipal Fund, Inc. (continued) |
| NVC | | Portfolio of Investments |
| | | February 28, 2013 |
| | Principal | | | | Optional Call | | | | |
| | Amount (000) | | Description (1) | | Provisions (2) | Ratings (3) | | Value | |
| | | | Health Care (continued) | | | | | | |
| $ | 1,621 | | California Statewide Communities Development Authority, Revenue Bonds, Saint Joseph Health System, Tender Option Bond Trust 2554, 18.398%, 7/01/47 – AGM Insured (IF) | | 7/18 at 100.00 | AA– | $ | 2,444,663 | |
| | 12,125 | | California Statewide Communities Development Authority, Revenue Bonds, Sutter Health, Series 2011A, 6.000%, 8/15/42 | | 8/20 at 100.00 | AA– | | 14,871,191 | |
| | 4,565 | | California Statewide Communities Development Authority, Revenue Bonds, Sutter Health, Tender Option Bond Trust 3102, 18.959%, 11/15/46 (IF) (4) | | 11/16 at 100.00 | AA– | | 6,241,177 | |
| | 3,475 | | California Statewide Communities Development Authority, Revenue Bonds, ValleyCare Health System, Series 2007A, 5.125%, 7/15/31 | | 7/17 at 100.00 | N/R | | 3,593,532 | |
| | 1,000 | | Loma Linda, California, Hospital Revenue Bonds, Loma Linda University Medical Center, Series 2005A, 5.000%, 12/01/23 | | 12/15 at 100.00 | BBB | | 1,022,840 | |
| | 3,100 | | Loma Linda, California, Hospital Revenue Bonds, Loma Linda University Medical Center, Series 2008A, 8.250%, 12/01/38 | | 12/17 at 100.00 | BBB | | 3,612,120 | |
| | | | Madera County, California, Certificates of Participation, Children’s Hospital Central California, Series 2010: | | | | | | |
| | 1,195 | | 5.500%, 3/15/36 | | 3/15 at 100.00 | A+ | | 1,285,151 | |
| | 3,410 | | 5.375%, 3/15/36 | | 3/20 at 100.00 | A+ | | 3,796,080 | |
| | 6,200 | | Madera County, California, Certificates of Participation, Valley Children’s Hospital Project, Series 1995, 5.750%, 3/15/28 – NPFG Insured | | 5/13 at 100.00 | A3 | | 6,213,082 | |
| | 1,770 | | Newport Beach, California, Revenue Bonds, Hoag Memorial Hospital Presbyterian, Series 2011A, 6.000%, 12/01/40 | | 12/21 at 100.00 | AA | | 2,170,870 | |
| | 5,885 | | Palomar Pomerado Health Care District, California, Certificates of Participation, Series 2009, 6.750%, 11/01/39 | | 11/19 at 100.00 | Baa3 | | 6,660,584 | |
| | 5,800 | | Palomar Pomerado Health Care District, California, Certificates of Participation, Series 2010, 6.000%, 11/01/41 | | 11/20 at 100.00 | Baa3 | | 6,313,764 | |
| | 9,655 | | Rancho Mirage Joint Powers Financing Authority, California, Revenue Bonds, Eisenhower Medical Center, Series 2007A, 5.000%, 7/01/38 | | 7/17 at 100.00 | Baa2 | | 9,902,265 | |
| | 3,550 | | San Buenaventura, California, Revenue Bonds, Community Memorial Health System, Series 2011, 7.500%, 12/01/41 | | 12/21 at 100.00 | BB | | 4,340,940 | |
| | 1,500 | | Upland, California, Certificates of Participation, San Antonio Community Hospital, Series 2011, 6.500%, 1/01/41 | | 1/21 at 100.00 | A | | 1,799,910 | |
| | 100,446 | | Total Health Care | | | | | 112,502,526 | |
| | | | Housing/Multifamily – 1.5% (1.0% of Total Investments) | | | | | | |
| | 2,085 | | California Municipal Finance Authority, Mobile Home Park Revenue Bonds, Caritas Projects Series 2010A, 6.400%, 8/15/45 | | 8/20 at 100.00 | BBB | | 2,307,303 | |
| | | | California Municipal Finance Authority, Mobile Home Park Revenue Bonds, Caritas Projects Series 2012A: | | | | | | |
| | 275 | | 5.125%, 8/15/32 | | 8/22 at 100.00 | BBB | | 293,585 | |
| | 525 | | 5.500%, 8/15/47 | | 8/22 at 100.00 | BBB | | 560,501 | |
| | 1,500 | | California Municipal Finance Authority, Mobile Home Park Revenue Bonds, Caritas Projects Series 2012B, 7.250%, 8/15/47 | | 8/22 at 100.00 | A1 | | 1,586,685 | |
| | 1,000 | | Independent Cities Lease Finance Authority, California, Revenue Bonds, Morgan Hill, Hacienda Valley Mobile Home Park, Series 2004A, 5.950%, 11/15/39 | | 11/14 at 100.00 | N/R | | 1,016,810 | |
| | 5,385 | | Total Housing/Multifamily | | | | | 5,764,884 | |
| | | | Housing/Single Family – 0.5% (0.3% of Total Investments) | | | | | | |
| | 1,590 | | California Housing Finance Agency, California, Home Mortgage Revenue Bonds, Series 2007G, 5.050%, 2/01/29 (Alternative Minimum Tax) | | 2/17 at 100.00 | BBB | | 1,583,735 | |
| | 270 | | California Housing Finance Agency, Home Mortgage Revenue Bonds, Series 2006H, 5.750%, 8/01/30 – FGIC Insured (Alternative Minimum Tax) | | 2/16 at 100.00 | BBB | | 282,623 | |
| | 1,860 | | Total Housing/Single Family | | | | | 1,866,358 | |
| | | | Industrials – 1.2% (0.8% of Total Investments) | | | | | | |
| | 4,055 | | California Pollution Control Financing Authority, Solid Waste Disposal Revenue Bonds, Republic Services Inc., Series 2002C, 5.250%, 6/01/23 (Mandatory put 12/01/17) (Alternative Minimum Tax) | | No Opt. Call | BBB | | 4,591,112 | |
| | Principal | | | | Optional Call | | | | |
| | Amount (000) | | Description (1) | | Provisions (2) | Ratings (3) | | Value | |
| | | | Tax Obligation/General – 32.8% (22.8% of Total Investments) | | | | | | |
| $ | 4,010 | | California State, General Obligation Bonds, Series 2003, 5.250%, 2/01/22 | | 8/13 at 100.00 | A1 | $ | 4,092,125 | |
| | 250 | | California State, General Obligation Bonds, Various Purpose Series 2000, 5.625%, 5/01/22 – FGIC Insured | | 5/13 at 100.00 | A1 | | 251,153 | |
| | | | California State, General Obligation Bonds, Various Purpose Series 2009: | | | | | | |
| | 15,000 | | 6.000%, 11/01/39 | | 11/19 at 100.00 | A1 | | 18,358,346 | |
| | 3,500 | | 5.500%, 11/01/39 | | 11/19 at 100.00 | A1 | | 4,121,670 | |
| | | | California State, General Obligation Bonds, Various Purpose Series 2010: | | | | | | |
| | 2,000 | | 6.000%, 3/01/33 | | 3/20 at 100.00 | A1 | | 2,484,500 | |
| | 7,605 | | 5.250%, 11/01/40 | | 11/20 at 100.00 | A1 | | 8,938,004 | |
| | | | California State, General Obligation Bonds, Various Purpose Series 2011: | | | | | | |
| | 13,000 | | 5.000%, 9/01/41 | | 9/21 at 100.00 | A1 | | 14,591,850 | |
| | 9,135 | | 5.000%, 10/01/41 | | 10/21 at 100.00 | A1 | | 10,262,807 | |
| | | | California State, General Obligation Bonds, Various Purpose Series 2012: | | | | | | |
| | 3,000 | | 5.250%, 2/01/28 | | 2/22 at 100.00 | A1 | | 3,617,610 | |
| | 2,215 | | 5.250%, 2/01/29 | | 2/22 at 100.00 | A1 | | 2,655,408 | |
| | 3,000 | | 5.000%, 4/01/42 | | 4/22 at 100.00 | A1 | | 3,386,370 | |
| | 3,850 | | Coachella Valley Unified School District, Riverside County, California, General Obligation Bonds, Series 2005A, 5.000%, 8/01/30 – FGIC Insured | | 8/15 at 100.00 | A1 | | 4,173,824 | |
| | 2,000 | | Coast Community College District, Orange County, California, General Obligation Bonds, Series 2006C, 0.000%, 8/01/31 – AGM Insured | | 8/18 at 100.00 | Aa1 | | 2,063,860 | |
| | 1,030 | | Folsom Cordova Unified School District, Sacramento County, California, General Obligation Bonds, School Facilities Improvement District 2, Series 2004B, 5.000%, 10/01/25 – AGM Insured | | 10/14 at 100.00 | AA– | | 1,100,225 | |
| | | | Fontana Unified School District, San Bernardino County, California, General Obligation Bonds, Refunding Series 2004: | | | | | | |
| | 1,470 | | 5.250%, 5/01/19 – NPFG Insured | | 5/14 at 100.00 | Aa3 | | 1,546,190 | |
| | 1,040 | | 5.250%, 5/01/20 – NPFG Insured | | 5/14 at 100.00 | Aa3 | | 1,093,903 | |
| | 4,000 | | Long Beach Community College District, California, General Obligation Bonds, Series 2005B, 5.000%, 5/01/30 – FGIC Insured | | 5/15 at 100.00 | Aa2 | | 4,309,600 | |
| | 3,915 | | Los Angeles Unified School District, California, General Obligation Bonds, Series 2005A-2, 5.000%, 7/01/24 – NPFG Insured | | 7/15 at 100.00 | Aa2 | | 4,296,634 | |
| | | | Los Rios Community College District, Sacramento, El Dorado and Yolo Counties, California, General Obligation Bonds, Series 2008: | | | | | | |
| | 2,710 | | 5.000%, 8/01/25 – AGM Insured (UB) | | 8/14 at 102.00 | Aa2 | | 2,948,643 | |
| | 3,875 | | 5.000%, 8/01/26 – AGM Insured (UB) | | 8/14 at 102.00 | Aa2 | | 4,216,233 | |
| | 6,000 | | North Orange County Community College District, California, General Obligation Bonds, Series 2003B, 0.000%, 8/01/27 – FGIC Insured | | No Opt. Call | Aa1 | | 3,449,160 | |
| | 5,000 | | Puerto Rico, General Obligation and Public Improvement Bonds, Series 2002A, 5.500%, 7/01/20 – NPFG Insured | | No Opt. Call | BBB– | | 5,474,450 | |
| | 585 | | Roseville Joint Union High School District, Placer County, California, General Obligation Bonds, Series 2006B, 5.000%, 8/01/27 – FGIC Insured | | 8/15 at 100.00 | AA | | 638,808 | |
| | 3,245 | | Southwestern Community College District, San Diego County, California, General Obligation Bonds, Election of 2008, Series 2011C, 5.250%, 8/01/36 | | 8/21 at 100.00 | Aa2 | | 3,788,862 | |
| | 16,150 | | Sylvan Union School District, Stanislaus County, California, General Obligation Bonds, Election of 2006, Series 2010, 0.000%, 8/01/49 – AGM Insured | | No Opt. Call | AA– | | 6,387,648 | |
| | 20,860 | | Yosemite Community College District, California, General Obligation Bonds, Capital Appreciation, Election 2004, Series 2010D, 0.000%, 8/01/42 | | No Opt. Call | Aa2 | | 9,002,967 | |
| | 138,445 | | Total Tax Obligation/General | | | | | 127,250,850 | |
| | | | Tax Obligation/Limited – 31.8% (22.2% of Total Investments) | | | | | | |
| | 3,370 | | Bell Community Redevelopment Agency, California, Tax Allocation Bonds, Bell Project Area, Series 2003, 5.500%, 10/01/23 – RAAI Insured | | 10/13 at 100.00 | N/R | | 3,370,202 | |
| | | | California State Public Works Board, Lease Revenue Bonds, Department of Mental Health, Coalinga State Hospital, Series 2004A: | | | | | | |
| | 4,000 | | 5.500%, 6/01/21 | | 6/14 at 100.00 | A2 | | 4,224,240 | |
| | 2,000 | | 5.500%, 6/01/23 | | 6/14 at 100.00 | A2 | | 2,106,940 | |
| | | Nuveen California Select Quality Municipal Fund, Inc. (continued) |
| NVC | | Portfolio of Investments |
| | | February 28, 2013 |
| | Principal | | | | Optional Call | | | | |
| | Amount (000) | | Description (1) | | Provisions (2) | Ratings (3) | | Value | |
| | | | Tax Obligation/Limited (continued) | | | | | | |
| $ | 2,000 | | California State Public Works Board, Lease Revenue Bonds, Various Capital Projects, Series 2009G-1, 5.750%, 10/01/30 | | 10/19 at 100.00 | A2 | $ | 2,358,760 | |
| | 4,860 | | California State Public Works Board, Lease Revenue Bonds, Various Capital Projects, Series 2009-I, 6.375%, 11/01/34 | | 11/19 at 100.00 | A2 | | 5,989,124 | |
| | 2,415 | | California State Public Works Board, Lease Revenue Bonds, Various Capital Projects, Series 2012G, 5.000%, 11/01/31 | | No Opt. Call | A2 | | 2,764,402 | |
| | 730 | | Capistrano Unified School District, Orange County, California, Special Tax Bonds, Community Facilities District, Series 2005, 5.000%, 9/01/24 – FGIC Insured | | 9/15 at 100.00 | N/R | | 754,127 | |
| | 1,000 | | Coachella Valley Unified School District, Riverside County, California, Certificates of Participation, Series 2007, 5.000%, 9/01/31 – AMBAC Insured | | 9/16 at 100.00 | N/R | | 1,018,650 | |
| | 1,500 | | Commerce Joint Power Financing Authority, California, Tax Allocation Bonds, Redevelopment Projects 2 and 3, Refunding Series 2003A, 5.000%, 8/01/28 – RAAI Insured | | 8/13 at 100.00 | BBB | | 1,504,785 | |
| | 3,000 | | Coronado Community Development Agency, California, Tax Allocation Bonds, Community Development Project, Series 2005, 5.000%, 9/01/30 – AMBAC Insured | | 9/15 at 100.00 | AA– | | 3,123,630 | |
| | 1,115 | | Dinuba Redevelopment Agency, California, Tax Allocation Bonds, Merged City of Dinuba Redevelopment Project and Dinuba Redevelopment Project 2, As Amended, Series 2003, 5.000%, 9/01/33 – NPFG Insured | | 9/13 at 102.00 | BBB+ | | 1,134,301 | |
| | 1,530 | | Fontana Redevelopment Agency, California, Jurupa Hills Redevelopment Project, Tax Allocation Refunding Bonds, 1997 Series A, 5.500%, 10/01/27 | | 4/13 at 100.00 | A– | | 1,531,974 | |
| | 2,500 | | Gilroy School Facilities Financing Authority, Santa Clara County, California, Revenue Bonds, Series 2013A, 5.000%, 8/01/46 (WI/DD, Settling 3/13/13) | | 8/23 at 100.00 | A+ | | 2,699,575 | |
| | | | Golden State Tobacco Securitization Corporation, California, Enhanced Tobacco Settlement Asset-Backed Revenue Bonds, Tender Option Bonds Trust 2215: | | | | | | |
| | 1,940 | | 13.920%, 6/01/45 – FGIC Insured (IF) | | 6/15 at 100.00 | A2 | | 2,302,935 | |
| | 1,355 | | 13.920%, 6/01/45 – FGIC Insured (IF) | | 6/15 at 100.00 | A2 | | 1,597,599 | |
| | 1,785 | | Hawthorne Community Redevelopment Agency, California, Project Area 2 Tax Allocation Bonds, Series 2006, 5.250%, 9/01/36 – SYNCORA GTY Insured | | 9/16 at 100.00 | N/R | | 1,845,244 | |
| | 1,500 | | Hesperia Unified School District, San Bernardino County, California, Certificates of Participation, Capital Improvement, Series 2007, 5.000%, 2/01/41 – AMBAC Insured | | 2/17 at 100.00 | A– | | 1,528,500 | |
| | 435 | | Indian Wells Redevelopment Agency, California, Tax Allocation Bonds, Consolidated Whitewater Project Area, Series 2003A, 5.000%, 9/01/20 – AMBAC Insured | | 9/13 at 100.00 | BBB– | | 438,502 | |
| | 1,345 | | Inglewood Redevelopment Agency, California, Tax Allocation Bonds, Merged Redevelopment Project, Subordinate Lien Series 2007A-1, 5.000%, 5/01/23 – AMBAC Insured | | 5/17 at 100.00 | BBB+ | | 1,393,030 | |
| | | | Irvine, California, Unified School District, Community Facilities District Special Tax Bonds, Series 2006A: | | | | | | |
| | 330 | | 5.000%, 9/01/26 | | 9/16 at 100.00 | N/R | | 341,481 | |
| | 760 | | 5.125%, 9/01/36 | | 9/16 at 100.00 | N/R | | 778,225 | |
| | 3,000 | | La Quinta Redevelopment Agency, California, Tax Allocation Bonds, Redevelopment Project Area 1, Series 2001, 5.000%, 9/01/21 – AMBAC Insured | | 5/13 at 100.00 | A+ | | 3,037,590 | |
| | 4,315 | | Los Angeles Community Redevelopment Agency, California, Lease Revenue Bonds, Manchester Social Services Project, Series 2005, 5.000%, 9/01/37 – AMBAC Insured | | 9/15 at 100.00 | A1 | | 4,493,900 | |
| | 8,175 | | Los Angeles Municipal Improvement Corporation, California, Lease Revenue Bonds, Police Headquarters, Series 2006A, 4.750%, 1/01/31 – FGIC Insured | | 1/17 at 100.00 | A+ | | 8,555,465 | |
| | 1,895 | | Murrieta, California, Special Tax Bonds, Community Facilities District 2000-2, The Oaks Improvement Area A, Series 2004A, 5.900%, 9/01/27 | | 9/14 at 100.00 | N/R | | 1,929,944 | |
| | 735 | | National City Community Development Commission, California, Tax Allocation Bonds, National City Redevelopment Project, Series 2011, 6.500%, 8/01/24 | | 8/21 at 100.00 | A– | | 919,147 | |
| | 275 | | Novato Redevelopment Agency, California, Tax Allocation Bonds, Hamilton Field Redevelopment Project, Series 2011, 6.750%, 9/01/40 | | 9/21 at 100.00 | BBB+ | | 322,583 | |
| | 2,580 | | Oakland Redevelopment Agency, California, Subordinate Lien Tax Allocation Bonds, Central District Redevelopment Project, Series 2003, 5.500%, 9/01/18 – FGIC Insured | | 5/13 at 100.00 | A– | | 2,587,817 | |
| | 3,605 | | Oakland State Building Authority, California, Lease Revenue Bonds, Elihu M. Harris State Office Building, Series 1998A, 5.000%, 4/01/23 – AMBAC Insured | | 5/13 at 100.00 | A2 | | 3,609,867 | |
| | 695 | | Ontario Redevelopment Financing Authority, California, Lease Revenue Bonds, Capital Projects, Series 2001, 5.250%, 8/01/18 – AMBAC Insured | | 8/13 at 100.00 | AA– | | 701,415 | |
| | Principal | | | | Optional Call | | | | |
| | Amount (000) | | Description (1) | | Provisions (2) | Ratings (3) | | Value | |
| | | | Tax Obligation/Limited (continued) | | | | | | |
| $ | 1,000 | | Orange County, California, Special Tax Bonds, Community Facilities District 03-1 of Ladera Ranch, Series 2004A, 5.500%, 8/15/24 | | 8/13 at 100.00 | N/R | $ | 1,007,850 | |
| | 5,000 | | Palm Springs Financing Authority, California, Lease Revenue Bonds, Convention Center Project, Refunding Series 2004A, 5.500%, 11/01/35 – NPFG Insured | | 11/14 at 102.00 | A | | 5,236,550 | |
| | 1,120 | | Panama-Buena Vista Union School District, California, Certificates of Participation, School Construction Project, Series 2006, 5.000%, 9/01/23 – NPFG Insured | | 9/16 at 100.00 | A1 | | 1,213,296 | |
| | | | Perris Union High School District Financing Authority, Riverside County, California, Revenue Bonds, Series 2011: | | | | | | |
| | 225 | | 6.000%, 9/01/33 | | 9/13 at 100.00 | N/R | | 233,091 | |
| | 530 | | 6.125%, 9/01/41 | | 9/13 at 100.00 | N/R | | 548,730 | |
| | 2,000 | | Pico Rivera Water Authority, California, Revenue Bonds, Series 2001A, 6.250%, 12/01/32 | | 5/13 at 101.00 | N/R | | 2,020,720 | |
| | 4,930 | | Pittsburg Redevelopment Agency, California, Tax Allocation Bonds, Los Medanos Community Development Project, Refunding Series 2008A, 6.500%, 9/01/28 | | 9/18 at 100.00 | BBB– | | 5,401,259 | |
| | 8,750 | | Pittsburg Redevelopment Agency, California, Tax Allocation Bonds, Los Medanos Community Development Project, Series 1999, 0.000%, 8/01/23 – AMBAC Insured | | No Opt. Call | A | | 5,640,163 | |
| | 890 | | Rancho Santa Fe CSD Financing Authority, California, Revenue Bonds, Superior Lien Series 2011A, 5.750%, 9/01/30 | | 9/21 at 100.00 | BBB+ | | 1,027,754 | |
| | 635 | | Rialto Redevelopment Agency, California, Tax Allocation Bonds, Merged Project Area, Series 2005A, 5.000%, 9/01/35 – SYNCORA GTY Insured | | 9/15 at 100.00 | A– | | 642,525 | |
| | 160 | | Riverside County Redevelopment Agency, California, Tax Allocation Bonds, Jurupa Valley Project Area, Series 2011B, 6.500%, 10/01/25 | | 10/21 at 100.00 | A– | | 182,954 | |
| | 55 | | Riverside Public Financing Authority, California, Revenue Bonds, Multiple Project Loans, Series 1991A, 8.000%, 2/01/18 | | 8/13 at 100.00 | N/R | | 55,888 | |
| | 820 | | Roseville, California, Certificates of Participation, Public Facilities, Series 2003A, 5.000%, 8/01/25 – AMBAC Insured | | 8/13 at 100.00 | AA– | | 832,275 | |
| | 1,135 | | San Diego County Regional Transportation Commission, California, Sales Tax Revenue Bonds, Series 2012A, 5.000%, 4/01/42 | | 4/22 at 100.00 | AAA | | 1,303,230 | |
| | 130 | | San Francisco Redevelopment Finance Authority, California, Tax Allocation Revenue Bonds, Mission Bay North Redevelopment Project, Series 2011C, 6.750%, 8/01/41 | | 2/21 at 100.00 | A– | | 156,569 | |
| | | | San Francisco Redevelopment Financing Authority, California, Tax Allocation Revenue Bonds, Mission Bay South Redevelopment Project, Series 2011D: | | | | | | |
| | 130 | | 7.000%, 8/01/33 | | 2/21 at 100.00 | BBB | | 152,822 | |
| | 165 | | 7.000%, 8/01/41 | | 2/21 at 100.00 | BBB | | 191,400 | |
| | 2,200 | | San Jose Financing Authority, California, Lease Revenue Refunding Bonds, Convention Center Project, Series 2001F, 5.000%, 9/01/20 – NPFG Insured | | 5/13 at 100.00 | AA | | 2,209,482 | |
| | 875 | | San Jose Redevelopment Agency, California, Housing Set-Aside Tax Allocation Bonds, Merged Area Redevelopment Project, Series 2010A-1, 5.500%, 8/01/35 | | 8/20 at 100.00 | A | | 961,511 | |
| | 1,260 | | San Jose Redevelopment Agency, California, Tax Allocation Bonds, Merged Area Redevelopment Project, Series 2003, 4.900%, 8/01/33 – FGIC Insured | | 8/13 at 100.00 | BBB | | 1,260,718 | |
| | | | San Jose Redevelopment Agency, California, Tax Allocation Bonds, Merged Area Redevelopment Project, Series 2006C: | | | | | | |
| | 1,100 | | 5.000%, 8/01/24 – NPFG Insured | | 8/17 at 100.00 | BBB | | 1,149,159 | |
| | 1,215 | | 5.000%, 8/01/25 – NPFG Insured | | 8/17 at 100.00 | BBB | | 1,266,297 | |
| | 2,860 | | Santa Ana Community Redevelopment Agency, California, Tax Allocation Bonds, Merged Project Area, Series 2011A, 6.750%, 9/01/28 | | 3/21 at 100.00 | A+ | | 3,510,993 | |
| | 4,625 | | Santa Clara Redevelopment Agency, California, Tax Allocation Bonds, Bayshore North Project, Series 2003, 5.000%, 6/01/17 – NPFG Insured | | 6/13 at 100.00 | A | | 4,673,655 | |
| | 220 | | Signal Hill Redevelopment Agency, California, Project 1 Tax Allocation Bonds, Series 2011, 7.000%, 10/01/26 | | 4/21 at 100.00 | N/R | | 245,564 | |
| | 3,250 | | Ventura County Public Financing Authority, California, Lease Revenue Bonds Series 2013A, 5.000%, 11/01/38 (WI/DD, Settling 3/07/13) | | 11/22 at 100.00 | AA | | 3,656,965 | |
| | 6,870 | | Vernon Redevelopment Agency, California, Tax Allocation Bonds, Industrial Redevelopment Project, Series 2005, 5.000%, 9/01/35 – NPFG Insured | | 9/15 at 100.00 | Baa2 | | 6,942,479 | |
| | 2,175 | | Washington Unified School District, Yolo County, California, Certificates of Participation, Series 2007, 5.125%, 8/01/37 – AMBAC Insured | | 8/17 at 100.00 | A | | 2,303,564 | |
| | | Nuveen California Select Quality Municipal Fund, Inc. (continued) |
| NVC | | Portfolio of Investments |
| | | February 28, 2013 |
| | Principal | | | | Optional Call | | | | |
| | Amount (000) | | Description (1) | | Provisions (2) | Ratings (3) | | Value | |
| | | | Tax Obligation/Limited (continued) | | | | | | |
| $ | 385 | | Yorba Linda Redevelopment Agency, Orange County, California, Tax Allocation Revenue Bonds, Yorba Linda Redevelopment Project, Subordinate Lien Series 2011A, 6.000%, 9/01/26 | | 9/21 at 100.00 | A– | $ | 448,579 | |
| | 119,455 | | Total Tax Obligation/Limited | | | | | 123,439,996 | |
| | | | Transportation – 5.6% (3.9% of Total Investments) | | | | | | |
| | 2,210 | | Bay Area Toll Authority, California, Revenue Bonds, San Francisco Bay Area Toll Bridge, Series 2006F, 5.000%, 4/01/31 (UB) | | 4/16 at 100.00 | AA | | 2,519,842 | |
| | 8,300 | | Foothill/Eastern Transportation Corridor Agency, California, Toll Road Revenue Bonds, Series 1995A, 5.000%, 1/01/35 – NPFG Insured | | 5/13 at 100.00 | Baa2 | | 8,299,502 | |
| | 10,500 | | Foothill/Eastern Transportation Corridor Agency, California, Toll Road Revenue Refunding Bonds, Series 1999, 5.875%, 1/15/29 | | 1/14 at 101.00 | BBB– | | 10,761,240 | |
| | 21,010 | | Total Transportation | | | | | 21,580,584 | |
| | | | U.S. Guaranteed – 6.7% (4.6% of Total Investments) (5) | | | | | | |
| | 2,610 | | California Pollution Control Financing Authority, Solid Waste Disposal Revenue Bonds, North County Recycling Center, Series 1991A, 6.750%, 7/01/17 (ETM) | | 5/13 at 100.00 | Aaa | | 2,933,431 | |
| | 990 | | California State, General Obligation Bonds, Series 2003, 5.250%, 2/01/22 (Pre-refunded 8/01/13) – AGM Insured | | 8/13 at 100.00 | AAA | | 1,011,453 | |
| | 3,000 | | Golden State Tobacco Securitization Corporation, California, Tobacco Settlement Asset-Backed Bonds, Series 2003A-1, 6.750%, 6/01/39 (Pre-refunded 6/01/13) | | 6/13 at 100.00 | Aaa | | 3,051,000 | |
| | 4,000 | | Imperial Irrigation District, California, Certificates of Participation, Electric System Revenue Bonds, Series 2003, 5.250%, 11/01/23 (Pre-refunded 11/01/13) – AGM Insured | | 11/13 at 100.00 | AA- (5) | | 4,136,520 | |
| | 1,025 | | Los Angeles, California, Sanitation Equipment Charge Revenue Bonds, Series 2004A, 5.000%, 2/01/22 (Pre-refunded 2/01/14) – AMBAC Insured | | 2/14 at 100.00 | AA (5) | | 1,070,182 | |
| | 3,750 | | Metropolitan Water District of Southern California, Water Revenue Bonds, Series 2004B-3, 5.000%, 10/01/29 (Pre-refunded 10/01/14) – NPFG Insured | | 10/14 at 100.00 | AAA | | 4,032,750 | |
| | 2,000 | | Puerto Rico Public Finance Corporation, Commonwealth Appropriation Bonds, Series 2002E, 6.000%, 8/01/26 – AGC Insured | | No Opt. Call | AA+ (5) | | 2,867,700 | |
| | | | San Francisco City and County Public Utilities Commission, California, Clean Water Revenue Refunding Bonds, Series 2003A: | | | | | | |
| | 2,120 | | 5.250%, 10/01/19 (Pre-refunded 4/01/13) – NPFG Insured | | 4/13 at 100.00 | AA- (5) | | 2,129,922 | |
| | 2,960 | | 5.250%, 10/01/20 (Pre-refunded 4/01/13) – NPFG Insured | | 4/13 at 100.00 | AA- (5) | | 2,973,853 | |
| | 1,365 | | San Mateo Union High School District, San Mateo County, California, Certificates of Participation, Phase 1, Series 2007A, 5.000%, 12/15/30 (Pre-refunded 12/15/17) – AMBAC Insured | | 12/17 at 100.00 | AA- (5) | | 1,639,269 | |
| | 23,820 | | Total U.S. Guaranteed | | | | | 25,846,080 | |
| | | | Utilities – 8.5% (5.9% of Total Investments) | | | | | | |
| | 2,000 | | Anaheim Public Finance Authority, California, Revenue Refunding Bonds, Electric Generating System, Series 2002B, 5.250%, 10/01/18 – AGM Insured | | 5/13 at 100.00 | AA– | | 2,008,540 | |
| | 1,810 | | Anaheim Public Finance Authority, California, Second Lien Electric Distribution Revenue Bonds, Series 2004, 5.250%, 10/01/21 – NPFG Insured | | 10/14 at 100.00 | AA– | | 1,924,410 | |
| | 10,350 | | California Pollution Control Financing Authority, Revenue Bonds, San Diego Gas and Electric Company, Series 1991A, 6.800%, 6/01/15 (Alternative Minimum Tax) | | No Opt. Call | Aa3 | | 11,449,688 | |
| | 1,855 | | Long Beach Bond Finance Authority, California, Natural Gas Purchase Revenue Bonds, Series 2007A, 5.500%, 11/15/37 | | No Opt. Call | A | | 2,258,926 | |
| | 5,000 | | Los Angeles Department of Water and Power, California, Power System Revenue Bonds, Series 2005A-1, 5.000%, 7/01/31 – AGM Insured (UB) | | 7/15 at 100.00 | AA– | | 5,453,150 | |
| | | | Merced Irrigation District, California, Electric System Revenue Bonds, Series 2005: | | | | | | |
| | 4,000 | | 5.000%, 9/01/26 – SYNCORA GTY Insured | | 9/15 at 100.00 | N/R | | 4,144,840 | |
| | 1,260 | | 5.125%, 9/01/31 – SYNCORA GTY Insured | | 9/15 at 100.00 | N/R | | 1,298,065 | |
| | 2,800 | | 5.250%, 9/01/36 – SYNCORA GTY Insured | | 9/15 at 100.00 | N/R | | 2,880,724 | |
| | 1,305 | | Southern California Public Power Authority, California, Milford Wind Corridor Phase I Revenue Bonds, Series 2010-1, 5.000%, 7/01/28 | | 1/20 at 100.00 | AA– | | 1,536,324 | |
| | 30,380 | | Total Utilities | | | | | 32,954,667 | |
| | Principal | | | | Optional Call | | | | |
| | Amount (000) | | Description (1) | | Provisions (2) | Ratings (3) | | Value | |
| | | | Water and Sewer – 12.4% (8.6% of Total Investments) | | | | | | |
| $ | 1,185 | | Burbank, California, Wastewater System Revenue Bonds, Series 2004A, 5.000%, 6/01/24 – AMBAC Insured | | 6/14 at 100.00 | AA+ | $ | 1,250,590 | |
| | 8,380 | | California Pollution Control Financing Authority, Water Furnishing Revenue Bonds, Poseidon Resources Channelside Desalination Project, Series 2012, 5.000%, 11/21/45 (Alternative Minimum Tax) | | No Opt. Call | Baa3 | | 8,689,725 | |
| | 890 | | Healdsburg Public Financing Authority, California, Wastewater Revenue Bonds, Series 2006, 5.000%, 4/01/36 – NPFG Insured | | 4/16 at 100.00 | AA– | | 977,176 | |
| | 1,250 | | Indio Water Authority, California, Water Revenue Bonds, Series 2006, 5.000%, 4/01/31 – AMBAC Insured | | 4/16 at 100.00 | A | | 1,376,888 | |
| | 4,685 | | Los Angeles Department of Water and Power, California, Waterworks Revenue Bonds, Series 2011A, 5.250%, 7/01/39 | | 1/21 at 100.00 | AA | | 5,471,752 | |
| | 4,705 | | Madera Irrigation District. California, Water Revenue Refunding Bonds, Series 2008, 5.500%, 1/01/38 | | 1/18 at 100.00 | A– | | 5,119,416 | |
| | 3,000 | | Metropolitan Water District of Southern California, Water Revenue Bonds, 2006 Authorization Series 2007A, 5.000%, 7/01/37 | | 7/17 at 100.00 | AAA | | 3,426,780 | |
| | 1,510 | | Orange County Sanitation District, California, Certificates of Participation, Tender Option Bond Trust 3020, 17.942%, 2/01/35 (IF) (4) | | 2/19 at 100.00 | AAA | | 2,351,795 | |
| | 2,525 | | Sacramento County Sanitation District Financing Authority, California, Revenue Refunding Bonds, Series 2001, 5.500%, 12/01/20 – AMBAC Insured | | No Opt. Call | AA | | 3,265,685 | |
| | 11,320 | | San Diego Public Facilities Financing Authority, California, Sewerage Revenue Bonds, Refunding Series 2010A, 5.250%, 5/15/25 | | 5/20 at 100.00 | AA | | 13,703,539 | |
| | 2,000 | | West Basin Municipal Water District, California, Certificates of Participation, Refunding Series 2008B, 5.000%, 8/01/28 – AGC Insured | | 8/18 at 100.00 | AA– | | 2,296,000 | |
| | 41,450 | | Total Water and Sewer | | | | | 47,929,346 | |
| $ | 539,613 | | Total Investments (cost $496,379,519) – 143.8% | | | | | 557,503,303 | |
| | | | Floating Rate Obligations – (3.6)% | | | | | (13,810,000 | ) |
| | | | Variable Rate Demand Preferred Shares, at Liquidation Value – (41.0)% (6) | | | | | (158,900,000 | ) |
| | | | Other Assets Less Liabilities – 0.8% | | | | | 2,954,276 | |
| | | | Net Assets Applicable to Common Shares – 100% | | | | $ | 387,747,579 | |
| (1) | | All percentages shown in the Portfolio of Investments are based on net assets applicable to Common shares unless otherwise noted. |
| (2) | | Optional Call Provisions (not covered by the report of independent registered public accounting firm): Dates (month and year) and prices of the earliest optional call or redemption. There may be other call provisions at varying prices at later dates. Certain mortgage-backed securities may be subject to periodic principal paydowns. |
| (3) | | Ratings (not covered by the report of independent registered public accounting firm): Using the highest of Standard & Poor’s Group (“Standard & Poor’s”), Moody’s Investors Service, Inc. (“Moody’s”) or Fitch, Inc. (“Fitch”) rating. Ratings below BBB by Standard & Poor’s, Baa by Moody’s or BBB by Fitch are considered to be below investment grade. Holdings designated N/R are not rated by any of these national rating agencies. |
| (4) | | Investment, or portion of investment, has been pledged to collateralize the net payment obligations for investments in inverse floating rate transactions. |
| (5) | | Backed by an escrow or trust containing sufficient U.S. Government or U.S. Government agency securities, which ensure the timely payment of principal and interest. Certain bonds backed by U.S. Government or agency securities are regarded as having an implied rating equal to the rating of such securities. |
| (6) | | Variable Rate Demand Preferred Shares, at Liquidation Value as a percentage of Total Investments is 28.5% |
| N/R | | Not rated. |
| WI/DD | | Investment, or portion of investment, purchased on a when-issued or delayed delivery basis. |
| (ETM) | | Escrowed to maturity. |
| (IF) | | Inverse floating rate investment. |
| (UB) | | Underlying bond of an inverse floating rate trust reflected as a financing transaction. See Notes to Financial Statements, Footnote 1 – General Information and Significant Accounting Policies, Inverse Floating Rate Securities for more information. |
See accompanying notes to financial statements.
| | | Nuveen California Quality Income Municipal Fund, Inc. |
| NUC | | Portfolio of Investments |
| | | February 28, 2013 |
| | Principal | | | | Optional Call | | | | |
| | Amount (000) | | Description (1) | | Provisions (2) | Ratings (3) | | Value | |
| | | | Consumer Staples – 5.3% (3.6% of Total Investments) | | | | | | |
| $ | 5,000 | | California County Tobacco Securitization Agency, Tobacco Settlement Asset-Backed Bonds, Alameda County Tobacco Asset Securitization Corporation, Series 2002, 5.750%, 6/01/29 | | 5/13 at 100.00 | BBB+ | $ | 5,137,400 | |
| | 790 | | California County Tobacco Securitization Agency, Tobacco Settlement Asset-Backed Bonds, Sonoma County Tobacco Securitization Corporation, Series 2005, 4.250%, 6/01/21 | | 6/15 at 100.00 | BB+ | | 769,018 | |
| | 3,635 | | California County Tobacco Securitization Agency, Tobacco Settlement Asset-Backed Bonds, Stanislaus County Tobacco Funding Corporation, Series 2002A, 5.500%, 6/01/33 | | 5/13 at 100.00 | Baa1 | | 3,649,904 | |
| | 7,025 | | California Statewide Financing Authority, Tobacco Settlement Asset-Backed Bonds, Pooled Tobacco Securitization Program, Series 2002A, 5.625%, 5/01/29 | | 5/13 at 100.00 | BBB | | 6,910,914 | |
| | 1,230 | | Golden State Tobacco Securitization Corporation, California, Tobacco Settlement Asset-Backed Bonds, Series 2007A-1, 5.750%, 6/01/47 | | 6/17 at 100.00 | B | | 1,153,260 | |
| | 2,165 | | Golden State Tobacco Securitization Corporation, California, Tobacco Settlement Asset-Backed Bonds, Series 2007A-2, 5.300%, 6/01/37 | | 6/22 at 100.00 | B | | 1,974,978 | |
| | 19,845 | | Total Consumer Staples | | | | | 19,595,474 | |
| | | | Education and Civic Organizations – 7.6% (5.1% of Total Investments) | | | | | | |
| | 2,225 | | ABAG Finance Authority for Non-Profit Corporations, California, Revenue Bonds, The Jackson Laboratory, Series 2012, 5.000%, 7/01/37 | | 7/22 at 100.00 | A1 | | 2,491,711 | |
| | 280 | | California Educational Facilities Authority, Revenue Bonds, University of Redlands, Series 2005A, 5.000%, 10/01/35 | | 10/15 at 100.00 | A3 | | 291,334 | |
| | 1,935 | | California Educational Facilities Authority, Revenue Bonds, University of Southern California, Tender Option Bond Trust 09-11B, 18.456%, 10/01/38 (IF) (4) | | 10/18 at 100.00 | Aa1 | | 3,164,731 | |
| | | | California Educational Facilities Authority, Revenue Bonds, University of the Pacific, Series 2006: | | | | | | |
| | 195 | | 5.000%, 11/01/21 | | 11/15 at 100.00 | A2 | | 211,739 | |
| | 260 | | 5.000%, 11/01/25 | | 11/15 at 100.00 | A2 | | 280,444 | |
| | 2,450 | | 5.000%, 11/01/30 | | 11/15 at 100.00 | A2 | | 2,567,551 | |
| | 2,500 | | California Municipal Finance Authority, Revenue Bonds, University of La Verne, Series 2010A, 6.250%, 6/01/40 | | 6/20 at 100.00 | BBB+ | | 2,886,025 | |
| | 4,640 | | California State Public Works Board, Lease Revenue Bonds, University of California Regents, Tender Option Bond Trust 1065, 9.376%, 3/01/33 (IF) | | 3/18 at 100.00 | Aa2 | | 5,703,117 | |
| | 4,000 | | California State Public Works Board, Lease Revenue Refunding Bonds, Community Colleges Projects, Series 1996B, 5.625%, 3/01/19 – AMBAC Insured | | 5/13 at 100.00 | A2 | | 4,016,680 | |
| | 1,225 | | California State Public Works Board, Revenue Bonds, University of California – Davis Medical Center, Series 2004II-A, 5.000%, 11/01/23 – NPFG Insured | | 11/14 at 100.00 | Aa2 | | 1,316,165 | |
| | 1,300 | | California Statewide Communities Development Authority, School Facility Revenue Bonds, Alliance College-Ready Public Schools, Series 2011A, 7.000%, 7/01/46 | | 7/21 at 100.00 | BBB | | 1,480,206 | |
| | 785 | | California Statewide Communities Development Authority, Charter School Revenue Bonds, | | 12/21 at 100.00 | N/R | | 908,944 | |
| | | | Rocketship 4 – Mosaic Elementary Charter School, Series 2011A, 8.500%, 12/01/41 | | | | | | |
| | 2,500 | | University of California, Revenue Bonds, Multi-Purpose Projects, Series 2003A, 5.000%, 5/15/33 – AMBAC Insured | | 5/13 at 100.00 | Aa1 | | 2,523,800 | |
| | 24,295 | | Total Education and Civic Organizations | | | | | 27,842,447 | |
| | | | Health Care – 33.4% (22.6% of Total Investments) | | | | | | |
| | 1,750 | | ABAG Finance Authority for Non-Profit Corporations, California, Cal-Mortgage Insured Revenue Bonds, Sansum-Santa Barbara Medical Foundation Clinic, Series 2002A, 5.500%, 4/01/21 | | 5/13 at 100.00 | A | | 1,755,985 | |
| | 1,380 | | California Health Facilities Financing Authority, Revenue Bonds, Rady Children’s Hospital – San Diego, Series 2011, 5.250%, 8/15/41 | | 8/21 at 100.00 | A+ | | 1,528,391 | |
| | 3,000 | | California Health Facilities Financing Authority, Revenue Bonds, St. Joseph Health System, Series 2009A, 5.750%, 7/01/39 | | 7/19 at 100.00 | AA– | | 3,559,710 | |
| | 1,455 | | California Health Facilities Financing Authority, Revenue Bonds, Sutter Health, Series 2007A, 5.250%, 11/15/46 | | 11/16 at 100.00 | AA– | | 1,588,613 | |
| | 14,550 | | California Health Facilities Financing Authority, Revenue Bonds, Sutter Health, Series 2007A, 5.250%, 11/15/46 (UB) | | 11/16 at 100.00 | AA– | | 15,886,127 | |
| | 2,015 | | California Municipal Finance Authority, Revenue Bonds, Eisenhower Medical Center, Series 2010A, 5.750%, 7/01/40 | | 7/20 at 100.00 | Baa2 | | 2,231,230 | |
| | Principal | | | | Optional Call | | | | |
| | Amount (000) | | Description (1) | | Provisions (2) | Ratings (3) | | Value | |
| | | | Health Care (continued) | | | | | | |
| | | | California Municipal Financing Authority, Certificates of Participation, Community Hospitals of Central California, Series 2007: | | | | | | |
| $ | 4,200 | | 5.250%, 2/01/27 | | 2/17 at 100.00 | BBB | $ | 4,477,578 | |
| | 2,855 | | 5.250%, 2/01/46 | | 2/17 at 100.00 | BBB | | 2,995,523 | |
| | | | California Statewide Communities Development Authority, Revenue Bonds, Daughters of Charity Health System, Series 2005A: | | | | | | |
| | 3,425 | | 5.250%, 7/01/24 | | 7/15 at 100.00 | BBB | | 3,672,628 | |
| | 1,500 | | 5.250%, 7/01/30 | | 7/15 at 100.00 | BBB | | 1,582,500 | |
| | 3,015 | | California Statewide Communities Development Authority, Revenue Bonds, Kaiser Permanente System, Series 2001C, 5.250%, 8/01/31 | | 8/16 at 100.00 | A+ | | 3,380,629 | |
| | 8,045 | | California Statewide Communities Development Authority, Revenue Bonds, Kaiser Permanante System, Series 2006, 5.000%, 3/01/41 | | 3/16 at 100.00 | A+ | | 8,620,942 | |
| | 1,571 | | California Statewide Communities Development Authority, Revenue Bonds, Saint Joseph Health System, Tender Option Bond Trust 2554, 18.398%, 7/01/47 – AGM Insured (IF) | | 7/18 at 100.00 | AA– | | 2,369,257 | |
| | 17,470 | | California Statewide Communities Development Authority, Revenue Bonds, Sutter Health, Series 2003A, 5.000%, 8/15/38 – AMBAC Insured (UB) (4) | | 8/17 at 100.00 | AA– | | 19,545,087 | |
| | 5,500 | | California Statewide Communities Development Authority, Revenue Bonds, Sutter Health, Series 2011A, 6.000%, 8/15/42 | | 8/20 at 100.00 | AA– | | 6,745,695 | |
| | 3,400 | | California Statewide Communities Development Authority, Revenue Bonds, ValleyCare Health System, Series 2007A, 5.125%, 7/15/31 | | 7/17 at 100.00 | N/R | | 3,515,974 | |
| | | | Loma Linda, California, Hospital Revenue Bonds, Loma Linda University Medical Center, Series 2005A: | | | | | | |
| | 3,000 | | 5.000%, 12/01/22 | | 12/15 at 100.00 | BBB | | 3,079,170 | |
| | 1,000 | | 5.000%, 12/01/23 | | 12/15 at 100.00 | BBB | | 1,022,840 | |
| | 3,025 | | Loma Linda, California, Hospital Revenue Bonds, Loma Linda University Medical Center, Series 2008A, 8.250%, 12/01/38 | | 12/17 at 100.00 | BBB | | 3,524,730 | |
| | 2,000 | | Madera County, California, Certificates of Participation, Children’s Hospital Central California, Series 2010, 5.375%, 3/15/36 | | 3/20 at 100.00 | A+ | | 2,226,440 | |
| | 4,000 | | Marysville, California, Revenue Bonds, The Fremont-Rideout Health Group, Series 2011, 5.250%, 1/01/42 | | 1/21 at 100.00 | A | | 4,402,760 | |
| | 1,675 | | Newport Beach, California, Revenue Bonds, Hoag Memorial Hospital Presbyterian, Series 2011A, 6.000%, 12/01/40 | | 12/21 at 100.00 | AA | | 2,054,354 | |
| | 1,000 | | Palomar Pomerado Health Care District, California, Certificates of Participation, Series 2009, 6.750%, 11/01/39 | | 11/19 at 100.00 | Baa3 | | 1,131,790 | |
| | 7,835 | | Palomar Pomerado Health Care District, California, Certificates of Participation, Series 2010, 6.000%, 11/01/41 | | 11/20 at 100.00 | Baa3 | | 8,529,024 | |
| | 4,000 | | Rancho Mirage Joint Powers Financing Authority, California, Revenue Bonds, Eisenhower Medical Center, Series 2007A, 5.000%, 7/01/38 | | 7/17 at 100.00 | Baa2 | | 4,102,440 | |
| | 3,500 | | San Buenaventura, California, Revenue Bonds, Community Memorial Health System, Series 2011, 7.500%, 12/01/41 | | 12/21 at 100.00 | BB | | 4,279,800 | |
| | 4,275 | | Upland, California, Certificates of Participation, San Antonio Community Hospital, Series 2011, 6.500%, 1/01/41 | | 1/21 at 100.00 | A | | 5,129,744 | |
| | 110,441 | | Total Health Care | | | | | 122,938,961 | |
| | | | Housing/Multifamily – 2.1% (1.4% of Total Investments) | | | | | | |
| | 2,055 | | California Municipal Finance Authority, Mobile Home Park Revenue Bonds, Caritas Projects Series 2010A, 6.400%, 8/15/45 | | 8/20 at 100.00 | BBB | | 2,274,104 | |
| | 640 | | California Municipal Finance Authority, Mobile Home Park Revenue Bonds, Caritas Projects Series 2012A, 5.500%, 8/15/47 | | 8/22 at 100.00 | BBB | | 683,277 | |
| | 1,480 | | California Municipal Finance Authority, Mobile Home Park Revenue Bonds, Caritas Projects Series 2012B, 7.250%, 8/15/47 | | 8/22 at 100.00 | A1 | | 1,565,529 | |
| | 1,000 | | Independent Cities Lease Finance Authority, California, Revenue Bonds, Morgan Hill, Hacienda Valley Mobile Home Park, Series 2004A, 5.950%, 11/15/39 | | 11/14 at 100.00 | N/R | | 1,016,810 | |
| | 1,905 | | Oceanside, California, Mobile Home Park Revenue Bonds, Laguna Vista Mobile Estates Acquisition Project, Series 1998, 5.800%, 3/01/28 | | 5/13 at 100.00 | N/R | | 1,906,657 | |
| | | Nuveen California Quality Income Municipal Fund, Inc. (continued) |
| NUC | | Portfolio of Investments |
| | | February 28, 2013 |
| | Principal | | | | Optional Call | | | | |
| | Amount (000) | | Description (1) | | Provisions (2) | Ratings (3) | | Value | |
| | | | Housing/Multifamily (continued) | | | | | | |
| $ | 400 | | Yolo County Housing Authority, California, Revenue Refunding Bonds, Russell Park Apartments, Series 1992A, 7.000%, 11/01/14 | | 5/13 at 100.00 | A3 | $ | 401,960 | |
| | 7,480 | | Total Housing/Multifamily | | | | | 7,848,337 | |
| | | | Housing/Single Family – 5.3% (3.6% of Total Investments) | | | | | | |
| | 1,390 | | California Housing Finance Agency, California, Home Mortgage Revenue Bonds, Series 2007G, 5.050%, 2/01/29 (Alternative Minimum Tax) | | 2/17 at 100.00 | BBB | | 1,384,523 | |
| | 260 | | California Housing Finance Agency, Home Mortgage Revenue Bonds, Series 2006H, 5.750%, 8/01/30 – FGIC Insured (Alternative Minimum Tax) | | 2/16 at 100.00 | BBB | | 272,155 | |
| | 17,700 | | California Housing Finance Agency, Home Mortgage Revenue Bonds, Series 2006M, 4.625%, 8/01/26 (Alternative Minimum Tax) | | 2/16 at 100.00 | BBB | | 17,699,468 | |
| | 19,350 | | Total Housing/Single Family | | | | | 19,356,146 | |
| | | | Tax Obligation/General – 21.6% (14.6% of Total Investments) | | | | | | |
| | 10,000 | | Alvord Unified School District, Riverside County, California, General Obligation Bonds, 2007 Election Series 2011B, 0.000%, 8/01/41 – AGM Insured | | No Opt. Call | AA– | | 2,456,000 | |
| | 16,000 | | California State, General Obligation Bonds, Various Purpose Series 2009, 6.000%, 11/01/39 | | 11/19 at 100.00 | A1 | | 19,582,235 | |
| | 4,000 | | California State, General Obligation Bonds, Various Purpose Series 2010, 6.000%, 3/01/33 | | 3/20 at 100.00 | A1 | | 4,969,000 | |
| | 4,340 | | California State, General Obligation Bonds, Various Purpose Series 2011, 5.000%, 9/01/41 | | 9/21 at 100.00 | A1 | | 4,871,433 | |
| | | | California State, General Obligation Bonds, Various Purpose Series 2012: | | | | | | |
| | 3,000 | | 5.250%, 2/01/28 | | 2/22 at 100.00 | A1 | | 3,617,610 | |
| | 6,000 | | 5.000%, 4/01/42 | | 4/22 at 100.00 | A1 | | 6,772,740 | |
| | 30 | | California, General Obligation Bonds, Series 2000, 5.500%, 6/01/25 | | 5/13 at 100.00 | A1 | | 30,134 | |
| | 3,610 | | Hartnell Community College District, California, General Obligation Bonds, Series 2006B, 5.000%, 6/01/29 – AGM Insured (UB) | | 6/16 at 100.00 | Aa2 | | 3,878,259 | |
| | 2,645 | | Long Beach Community College District, California, General Obligation Bonds, Series 2005B, 5.000%, 5/01/30 – FGIC Insured | | 5/15 at 100.00 | Aa2 | | 2,849,723 | |
| | 11,800 | | New Haven Unified School District, Alameda County, California, General Obligation Bonds, Series 2004A, 0.000%, 8/01/27 – NPFG Insured | | No Opt. Call | Aa3 | | 5,809,258 | |
| | 565 | | Roseville Joint Union High School District, Placer County, California, General Obligation Bonds, Series 2006B, 5.000%, 8/01/27 – FGIC Insured | | 8/15 at 100.00 | AA | | 616,969 | |
| | 1,500 | | Sacramento City Unified School District, Sacramento County, California, General Obligation Bonds, Series 2005, 5.000%, 7/01/27 – NPFG Insured | | 7/15 at 100.00 | AA– | | 1,629,750 | |
| | 515 | | San Joaquin Delta Community College District, California, General Obligation Bonds, Series 2005A, 5.000%, 8/01/29 – AGM Insured | | 8/15 at 100.00 | Aa2 | | 542,800 | |
| | 2,000 | | Southwestern Community College District, San Diego County, California, General Obligation Bonds, Election of 2008, Series 2011C, 5.250%, 8/01/36 | | 8/21 at 100.00 | Aa2 | | 2,335,200 | |
| | 41,725 | | Yosemite Community College District, California, General Obligation Bonds, Capital Appreciation, Election 2004, Series 2010D, 0.000%, 8/01/42 | | No Opt. Call | Aa2 | | 18,008,092 | |
| | 1,400 | | Yuba Community College District, California, General Obligation Bonds, Election 2006 Series 2011C, 5.250%, 8/01/47 | | 8/21 at 100.00 | Aa2 | | 1,582,952 | |
| | 109,130 | | Total Tax Obligation/General | | | | | 79,552,155 | |
| | | | Tax Obligation/Limited – 37.6% (25.4% of Total Investments) | | | | | | |
| | 1,655 | | Bell Community Housing Authority, California, Lease Revenue Bonds, Series 2005, 5.000%, 10/01/36 – AMBAC Insured | | 5/13 at 100.00 | N/R | | 1,253,629 | |
| | 1,200 | | Burbank Public Financing Authority, California, Revenue Bonds, West Olive Redevelopment Project, Series 2002, 5.125%, 12/01/22 – AMBAC Insured | | 5/13 at 100.00 | BBB+ | | 1,201,176 | |
| | 3,070 | | California State Public Works Board, Lease Revenue Bonds, Department of General Services, Capital East End Project, Series 2002A, 5.250%, 12/01/16 – AMBAC Insured | | 5/13 at 100.00 | A2 | | 3,082,618 | |
| | 2,030 | | California State Public Works Board, Lease Revenue Bonds, Department of General Services, Series 2002C, 5.250%, 3/01/21 – AMBAC Insured | | 3/21 at 100.00 | A2 | | 2,037,410 | |
| | 5,115 | | California State Public Works Board, Lease Revenue Bonds, Department of Mental Health, Coalinga State Hospital, Series 2004A, 5.500%, 6/01/20 | | 6/14 at 100.00 | A2 | | 5,408,396 | |
| | 3,650 | | California State Public Works Board, Lease Revenue Bonds, Various Capital Projects, Series 2009G-1, 5.750%, 10/01/30 | | 10/19 at 100.00 | A2 | | 4,304,737 | |
| | Principal | | | | Optional Call | | | | |
| | Amount (000) | | Description (1) | | Provisions (2) | Ratings (3) | | Value | |
| | | | Tax Obligation/Limited (continued) | | | | | | |
| $ | 5,000 | | California State Public Works Board, Lease Revenue Bonds, Various Capital Projects, Series 2012G, 5.000%, 11/01/31 | | No Opt. Call | A2 | $ | 5,723,400 | |
| | 690 | | Capistrano Unified School District, Orange County, California, Special Tax Bonds, Community Facilities District, Series 2005, 5.000%, 9/01/24 – FGIC Insured | | 9/15 at 100.00 | N/R | | 712,805 | |
| | 3,000 | | Coachella Valley Unified School District, Riverside County, California, Certificates of Participation, Series 2007, 5.000%, 9/01/31 – AMBAC Insured | | 9/16 at 100.00 | N/R | | 3,055,950 | |
| | | | Commerce Community Development Commission, California, Tax Allocation Refunding Bonds, Merged Area Development Projects 2 and 3, Series 1998A: | | | | | | |
| | 880 | | 5.650%, 8/01/18 | | 5/13 at 100.00 | N/R | | 881,258 | |
| | 2,765 | | 5.700%, 8/01/28 | | 5/13 at 100.00 | N/R | | 2,765,608 | |
| | 1,500 | | Commerce Joint Power Financing Authority, California, Tax Allocation Bonds, Redevelopment Projects 2 and 3, Refunding Series 2003A, 5.000%, 8/01/28 – RAAI Insured | | 8/13 at 100.00 | BBB | | 1,504,785 | |
| | 1,250 | | Coronado Community Development Agency, California, Tax Allocation Bonds, Community Development Project, Series 2005, 5.000%, 9/01/30 – AMBAC Insured | | 9/15 at 100.00 | AA– | | 1,301,513 | |
| | 3,065 | | Corona-Norco Unified School District, Riverside County, California, Special Tax Bonds, Community Facilities District 98-1, Series 2003, 5.500%, 9/01/33 – NPFG Insured | | 9/13 at 100.00 | Baa2 | | 3,083,175 | |
| | 1,085 | | Dinuba Redevelopment Agency, California, Tax Allocation Bonds, Merged City of Dinuba Redevelopment Project and Dinuba Redevelopment Project 2, As Amended, Refunding Series 2001,5.000%, 9/01/31 – NPFG Insured | | 5/13 at 101.00 | BBB+ | | 1,089,177 | |
| | 5 | | Dinuba Redevelopment Agency, California, Tax Allocation Bonds, Merged City of Dinuba Redevelopment Project and Dinuba Redevelopment Project 2, As Amended, Series 2003, 5.000%, 9/01/33 – NPFG Insured | | 9/13 at 102.00 | BBB+ | | 5,087 | |
| | 1,490 | | Fontana Redevelopment Agency, California, Jurupa Hills Redevelopment Project, Tax Allocation Refunding Bonds, 1997 Series A, 5.500%, 10/01/27 | | 4/13 at 100.00 | A– | | 1,491,922 | |
| | 1,000 | | Fremont, California, Special Tax Bonds, Community Facilities District 1, Pacific Commons, Series 2005, 6.300%, 9/01/31 | | 9/13 at 100.00 | N/R | | 1,007,840 | |
| | | | Golden State Tobacco Securitization Corporation, California, Enhanced Tobacco Settlement Asset-Backed Revenue Bonds, Series 2005A: | | | | | | |
| | 8,435 | | 5.000%, 6/01/35 – FGIC Insured | | 6/15 at 100.00 | AA– | | 8,871,174 | |
| | 1,750 | | 5.000%, 6/01/45 – AGC Insured | | 6/15 at 100.00 | AA– | | 1,836,170 | |
| | | | Golden State Tobacco Securitization Corporation, California, Enhanced Tobacco Settlement Asset-Backed Revenue Bonds, Tender Option Bonds Trust 2215: | | | | | | |
| | 1,885 | | 13.920%, 6/01/45 – FGIC Insured (IF) | | 6/15 at 100.00 | A2 | | 2,237,646 | |
| | 1,320 | | 13.920%, 6/01/45 – FGIC Insured (IF) | | 6/15 at 100.00 | A2 | | 1,556,333 | |
| | | | Inglewood Redevelopment Agency, California, Tax Allocation Bonds, Merged Redevelopment Project, Subordinate Lien Series 2007A-1: | | | | | | |
| | 115 | | 5.000%, 5/01/23 – AMBAC Insured | | 5/17 at 100.00 | BBB+ | | 119,107 | |
| | 1,225 | | 5.000%, 5/01/24 – AMBAC Insured | | 5/17 at 100.00 | BBB+ | | 1,261,150 | |
| | | | Irvine, California, Unified School District, Community Facilities District Special Tax Bonds, Series 2006A: | | | | | | |
| | 320 | | 5.000%, 9/01/26 | | 9/16 at 100.00 | N/R | | 331,133 | |
| | 735 | | 5.125%, 9/01/36 | | 9/16 at 100.00 | N/R | | 752,625 | |
| | 3,245 | | Los Angeles Community Redevelopment Agency, California, Lease Revenue Bonds, Manchester Social Services Project, Series 2005, 5.000%, 9/01/37 – AMBAC Insured | | 9/15 at 100.00 | A1 | | 3,379,538 | |
| | 1,350 | | Los Angeles Community Redevelopment Agency, California, Subordinate Lien Tax Allocation Bonds,Bunker Hill Redevelopment Project, Series 2004L, 5.100%, 3/01/19 | | 9/13 at 100.00 | BBB– | | 1,362,893 | |
| | 735 | | National City Community Development Commission, California, Tax Allocation Bonds, National City Redevelopment Project, Series 2011, 6.500%, 8/01/24 | | 8/21 at 100.00 | A– | | 919,147 | |
| | 275 | | Novato Redevelopment Agency, California, Tax Allocation Bonds, Hamilton Field Redevelopment Project, Series 2011, 6.750%, 9/01/40 | | 9/21 at 100.00 | BBB+ | | 322,583 | |
| | 15,300 | | Ontario Redevelopment Financing Authority, San Bernardino County, California, Revenue Refunding Bonds, Redevelopment Project 1, Series 1995, 7.400%, 8/01/25 – NPFG Insured | | No Opt. Call | Baa2 | | 18,814,562 | |
| | 2,000 | | Palm Springs Financing Authority, California, Lease Revenue Bonds, Convention Center Project, Refunding Series 2004A, 5.500%, 11/01/35 – NPFG Insured | | 11/14 at 102.00 | A | | 2,094,620 | |
| | 1,170 | | Panama-Buena Vista Union School District, California, Certificates of Participation, School Construction Project, Series 2006, 5.000%, 9/01/24 – NPFG Insured | | 9/16 at 100.00 | A1 | | 1,259,704 | |
| | | Nuveen California Quality Income Municipal Fund, Inc. (continued) |
| NUC | | Portfolio of Investments |
| | | February 28, 2013 |
| | Principal | | | | Optional Call | | | | |
| | Amount (000) | | Description (1) | | Provisions (2) | Ratings (3) | | Value | |
| | | | Tax Obligation/Limited (continued) | | | | | | |
| | | | Perris Union High School District Financing Authority, Riverside County, California, Revenue Bonds, Series 2011: | | | | | | |
| $ | 255 | | 6.000%, 9/01/33 | | 9/13 at 100.00 | N/R | $ | 264,170 | |
| | 555 | | 6.125%, 9/01/41 | | 9/13 at 100.00 | N/R | | 574,614 | |
| | 2,240 | | Pittsburg Redevelopment Agency, California, Tax Allocation Bonds, Los Medanos Community Development Project, Refunding Series 2008A, 6.500%, 9/01/28 | | 9/18 at 100.00 | BBB– | | 2,454,122 | |
| | 885 | | Rancho Santa Fe CSD Financing Authority, California, Revenue Bonds, Superior Lien Series 2011A, 5.750%, 9/01/30 | | 9/21 at 100.00 | BBB+ | | 1,021,980 | |
| | | | Redding Redevelopment Agency, California, Tax Allocation Bonds, Canby-Hilltop-Cypress Area Project, Series 2003A: | | | | | | |
| | 1,500 | | 5.000%, 9/01/17 – NPFG Insured | | 9/13 at 100.00 | A | | 1,533,465 | |
| | 1,500 | | 5.000%, 9/01/20 – NPFG Insured | | 9/13 at 100.00 | A | | 1,531,140 | |
| | 600 | | Rialto Redevelopment Agency, California, Tax Allocation Bonds, Merged Project Area, Series 2005A, 5.000%, 9/01/35 – SYNCORA GTY Insured | | 9/15 at 100.00 | A– | | 607,110 | |
| | 4,320 | | Richmond Joint Powers Financing Authority, California, Tax Allocation Bonds, Series 2003A, 5.250%, 9/01/22 – NPFG Insured | | 9/13 at 100.00 | A | | 4,406,227 | |
| | 3,375 | | Riverside County Redevelopment Agency, California, Interstate 215 Corridor Redevelopment Project Area Tax Allocation Bonds, Series 2010E, 6.500%, 10/01/40 | | 10/20 at 100.00 | A– | | 3,804,840 | |
| | 160 | | Riverside County Redevelopment Agency, California, Tax Allocation Bonds, Jurupa Valley Project Area, Series 2011B, 6.500%, 10/01/25 | | 10/21 at 100.00 | A– | | 182,954 | |
| | 1,415 | | Rohnert Park Community Development Commission, California, Redevelopment Project Tax Allocation Bonds, Series 2007R, 5.000%, 8/01/37 – FGIC Insured | | 8/17 at 100.00 | A– | | 1,442,762 | |
| | 745 | | Roseville, California, Certificates of Participation, Public Facilities, Series 2003A, 5.000%, 8/01/25 – AMBAC Insured | | 8/13 at 100.00 | AA– | | 756,153 | |
| | 8,625 | | Sacramento City Financing Authority, California, Capital Improvement Revenue Bonds, 300 Richards Boulevard Building Acquisition, Series 2006C, 5.000%, 12/01/36 – AMBAC Insured | | 12/16 at 100.00 | A | | 8,985,353 | |
| | 3,000 | | San Diego County, California, Certificates of Participation, Burnham Institute, Series 2006, 5.000%, 9/01/34 | | 9/15 at 102.00 | Baa2 | | 3,090,180 | |
| | 6,760 | | San Diego Unified School District, San Diego County, California, General Obligation Bonds, Series 2003E, 5.250%, 7/01/21 – AGM Insured | | 7/13 at 101.00 | Aa2 (5) | | 6,937,044 | |
| | 130 | | San Francisco Redevelopment Finance Authority, California, Tax Allocation Revenue Bonds, Mission Bay North Redevelopment Project, Series 2011C, 6.750%, 8/01/41 | | 2/21 at 100.00 | A– | | 156,569 | |
| | | | San Francisco Redevelopment Financing Authority, California, Tax Allocation Revenue Bonds, Mission Bay South Redevelopment Project, Series 2011D: | | | | | | |
| | 130 | | 7.000%, 8/01/33 | | 2/21 at 100.00 | BBB | | 152,822 | |
| | 160 | | 7.000%, 8/01/41 | | 2/21 at 100.00 | BBB | | 185,600 | |
| | 2,500 | | San Jose Financing Authority, California, Lease Revenue Refunding Bonds, Convention Center Project, Series 2001F, 5.000%, 9/01/20 – NPFG Insured | | 5/13 at 100.00 | AA | | 2,510,775 | |
| | 875 | | San Jose Redevelopment Agency, California, Housing Set-Aside Tax Allocation Bonds, Merged Area Redevelopment Project, Series 2010A-1, 5.500%, 8/01/35 | | 8/20 at 100.00 | A | | 961,511 | |
| | 1,260 | | San Jose Redevelopment Agency, California, Tax Allocation Bonds, Merged Area Redevelopment Project, Series 2003, 4.900%, 8/01/33 – FGIC Insured | | 8/13 at 100.00 | BBB | | 1,260,718 | |
| | 700 | | San Jose Redevelopment Agency, California, Tax Allocation Bonds, Merged Area Redevelopment Project, Series 2004A, 4.440%, 8/01/17 – NPFG Insured | | 8/14 at 100.00 | BBB | | 701,568 | |
| | 1,195 | | San Jose Redevelopment Agency, California, Tax Allocation Bonds, Merged Area Redevelopment Project, Series 2006C, 5.000%, 8/01/25 – NPFG Insured | | 8/17 at 100.00 | BBB | | 1,245,453 | |
| | 2,770 | | Santa Ana Community Redevelopment Agency, Orange County, California, Tax Allocation Refunding Bonds, South Main Street Redevelopment, Series 2003B, 5.000%, 9/01/19 – FGIC Insured | | 9/13 at 100.00 | A | | 2,798,393 | |
| | 215 | | Signal Hill Redevelopment Agency, California, Project 1 Tax Allocation Bonds, Series 2011, 7.000%, 10/01/26 | | 4/21 at 100.00 | N/R | | 239,983 | |
| | 1,250 | | Solana Beach School District Public Financing Authority, California, Special Tax Revenue Bonds, Series 2012, 5.000%, 9/01/42 | | 9/22 at 100.00 | BBB | | 1,303,313 | |
| | 1,310 | | Temecula Redevelopment Agency, California, Redevelopment Project 1 Tax Allocation Housing Bonds Series 2011A, 7.000%, 8/01/39 | | 8/21 at 100.00 | A | | 1,588,165 | |
| | Principal | | | | Optional Call | | | | |
| | Amount (000) | | Description (1) | | Provisions (2) | Ratings (3) | | Value | |
| | | | Tax Obligation/Limited (continued) | | | | | | |
| $ | 2,090 | | Washington Unified School District, Yolo County, California, Certificates of Participation, Series 2007, 5.125%, 8/01/37 – AMBAC Insured | | 8/17 at 100.00 | A | $ | 2,213,540 | |
| | 375 | | Yorba Linda Redevelopment Agency, Orange County, California, Tax Allocation Revenue Bonds, Yorba Linda Redevelopment Project, Subordinate Lien Series 2011A, 6.500%, 9/01/32 | | 9/21 at 100.00 | A– | | 444,870 | |
| | 129,205 | | Total Tax Obligation/Limited | | | | | 138,384,265 | |
| | | | Transportation – 5.2% (3.5% of Total Investments) | | | | | | |
| | 3,950 | | Bay Area Toll Authority, California, Revenue Bonds, San Francisco Bay Area Toll Bridge, Series 2006F, 5.000%, 4/01/31 (UB) | | 4/16 at 100.00 | AA | | 4,503,790 | |
| | 970 | | Bay Area Toll Authority, California, Revenue Bonds, San Francisco Bay Area Toll Bridge, Series 2008, Tender Option Bond Trust 3211, 13.640%, 10/01/32 (IF) | | 4/18 at 100.00 | AA | | 1,413,707 | |
| | 11,000 | | Foothill/Eastern Transportation Corridor Agency, California, Toll Road Revenue Refunding Bonds, Series 1999, 5.875%, 1/15/29 | | 1/14 at 101.00 | BBB– | | 11,273,680 | |
| | 2,000 | | Orange County Transportation Authority, California, Toll Road Revenue Bonds, 91 Express Lanes Project, Series 2003A, 5.000%, 8/15/20 – AMBAC Insured | | 8/13 at 100.00 | A1 | | 2,036,940 | |
| | 17,920 | | Total Transportation | | | | | 19,228,117 | |
| | | | U.S. Guaranteed – 15.7% (10.6% of Total Investments) (5) | | | | | | |
| | 6,960 | | California Pollution Control Financing Authority, Solid Waste Disposal Revenue Bonds, North County Recycling Center, Series 1991A, 6.750%, 7/01/17 (ETM) | | 5/13 at 100.00 | Aaa | | 7,822,483 | |
| | 1,110 | | California State, Economic Recovery Revenue Bonds, Series 2004A, 5.000%, 7/01/15 (Pre-refunded 7/01/14) | | 7/14 at 100.00 | Aaa | | 1,181,273 | |
| | 2,500 | | California State, General Obligation Bonds, Series 2004, 5.125%, 2/01/27 (Pre-refunded 2/01/14) | | 2/14 at 100.00 | AAA | | 2,614,275 | |
| | 1,515 | | California Statewide Community Development Authority, Water and Wastewater Revenue Bonds, Pooled Financing Program, Series 2004A, 5.250%, 10/01/24 (Pre-refunded 10/01/13) – AGM Insured | | 10/13 at 101.00 | AA- (5) | | 1,575,948 | |
| | 4,440 | | Coast Community College District, Orange County, California, General Obligation Refunding Bonds, Series 2003A, 5.000%, 8/01/22 (Pre-refunded 8/01/13) – NPFG Insured | | 8/13 at 100.00 | AA- (5) | | 4,530,931 | |
| | 1,615 | | Compton Unified School District, Los Angeles County, California, General Obligation Bonds, Series 2003A, 5.375%, 9/01/19 (Pre-refunded 9/01/13) – NPFG Insured | | 9/13 at 100.00 | N/R (5) | | 1,657,846 | |
| | 12,805 | | Contra Costa County, California, GNMA Mortgage-Backed Securities Program Home Mortgage Revenue Bonds, Series 1988, 8.250%, 6/01/21 (Alternative Minimum Tax) (ETM) | | No Opt. Call | Aaa | | 17,320,042 | |
| | 3,000 | | Daly City Housing Development Finance Agency, California, Mobile Home Park Revenue Bonds, Franciscan Mobile Home Park Project, Series 2002A, 5.850%, 12/15/32 (Pre-refunded 12/15/13) | | 12/13 at 102.00 | A (5) | | 3,192,510 | |
| | | | Goleta Water District, California, Certificates of Participation Revenue Bonds, Series 2003: | | | | | | |
| | 520 | | 5.250%, 12/01/20 (Pre-refunded 12/01/13) | | 12/13 at 100.00 | Baa2 (5) | | 539,921 | |
| | 745 | | 5.250%, 12/01/21 (Pre-refunded 12/01/13) | | 12/13 at 100.00 | Baa2 (5) | | 773,541 | |
| | 4,850 | | Los Angeles County Metropolitan Transportation Authority, California, Proposition A First Tier Senior Sales Tax Revenue Bonds, Series 2003A, 5.000%, 7/01/16 (Pre-refunded 7/01/13) – AGM Insured | | 7/13 at 100.00 | AAA | | 4,929,055 | |
| | 2,375 | | Moreno Valley Unified School District, Riverside County, California, General Obligation Bonds, Series 2004A, 5.250%, 8/01/24 (Pre-refunded 8/01/14) – AGM Insured | | 8/14 at 100.00 | AA- (5) | | 2,545,929 | |
| | 585 | | Rohnert Park Community Development Commission, California, Redevelopment Project Tax Allocation Bonds, Series 2007R, 5.000%, 8/01/37 – FGIC Insured (ETM) | | 8/17 at 100.00 | N/R (5) | | 654,668 | |
| | 4,845 | | San Bernardino County, California, GNMA Mortgage-Backed Securities Program Single Family Home Mortgage Revenue Bonds, Series 1989A, 7.750%, 11/01/14 (Alternative Minimum Tax) (ETM) | | No Opt. Call | Aaa | | 5,153,094 | |
| | | | Turlock Public Finance Authority, California, Sewer Revenue Bonds, Series 2003A: | | | | | | |
| | 1,565 | | 5.000%, 9/15/19 (Pre-refunded 9/15/13) – FGIC Insured | | 9/13 at 100.00 | AA (5) | | 1,605,768 | |
| | 1,650 | | 5.000%, 9/15/20 (Pre-refunded 9/15/13) – FGIC Insured | | 9/13 at 100.00 | AA (5) | | 1,692,983 | |
| | 51,080 | | Total U.S. Guaranteed | | | | | 57,790,267 | |
| | | | Utilities – 3.4% (2.3% of Total Investments) | | | | | | |
| | 3,695 | | Long Beach Bond Finance Authority, California, Natural Gas Purchase Revenue Bonds, Series 2007A, 5.000%, 11/15/35 | | No Opt. Call | A | | 4,243,227 | |
| | 500 | | Los Angeles Department of Water and Power, California, Power System Revenue Bonds, Series 2005A-1, 5.000%, 7/01/31 – AGM Insured (UB) | | 7/15 at 100.00 | AA– | | 545,315 | |
| | | Nuveen California Quality Income Municipal Fund, Inc. (continued) |
| NUC | | Portfolio of Investments |
| | | February 28, 2013 |
| | Principal | | | | Optional Call | | | | |
| | Amount (000) | | Description (1) | | Provisions (2) | Ratings (3) | | Value | |
| | | | Utilities (continued) | | | | | | |
| | | | Merced Irrigation District, California, Electric System Revenue Bonds, Series 2005: | | | | | | |
| $ | 1,235 | | 5.125%, 9/01/31 – SYNCORA GTY Insured | | 9/15 at 100.00 | N/R | $ | 1,272,309 | |
| | 1,500 | | 5.250%, 9/01/36 – SYNCORA GTY Insured | | 9/15 at 100.00 | N/R | | 1,543,245 | |
| | 5,000 | | Merced Irrigation District, California, Revenue Certificates of Participation, Electric System Project, Series 2003, 5.700%, 9/01/36 | | 9/13 at 102.00 | Baa2 | | 5,095,700 | |
| | 11,930 | | Total Utilities | | | | | 12,699,796 | |
| | | | Water and Sewer – 10.7% (7.3% of Total Investments) | | | | | | |
| | | | California Pollution Control Financing Authority, Water Furnishing Revenue Bonds, Poseidon Resources Channelside Desalination Project, Series 2012: | | | | | | |
| | 2,660 | | 5.000%, 7/01/37 (Alternative Minimum Tax) | | No Opt. Call | Baa3 | | 2,778,955 | |
| | 5,320 | | 5.000%, 11/21/45 (Alternative Minimum Tax) | | No Opt. Call | Baa3 | | 5,516,627 | |
| | 5,525 | | California Statewide Community Development Authority, Water and Wastewater Revenue Bonds, Pooled Financing Program, Series 2004A, 5.250%, 10/01/24 – AGM Insured | | 10/13 at 101.00 | AA– | | 5,718,265 | |
| | 1,600 | | Eastern Municipal Water District, California, Water and Sewerage System Revenue Certificates of Participation, Tender Option Bond Trust 3220, 14.790%, 7/01/28 (IF) | | 7/18 at 100.00 | AA+ | | 2,491,616 | |
| | | | Goleta Water District, California, Certificates of Participation Revenue Bonds, Series 2003: | | | | | | |
| | 480 | | 5.250%, 12/01/20 | | 12/13 at 100.00 | A | | 495,408 | |
| | 695 | | 5.250%, 12/01/21 | | 12/13 at 100.00 | A | | 716,774 | |
| | 1,205 | | 5.250%, 12/01/22 – NPFG Insured | | 12/13 at 100.00 | A | | 1,246,488 | |
| | 850 | | Healdsburg Public Financing Authority, California, Wastewater Revenue Bonds, Series 2006, 5.000%, 4/01/36 – NPFG Insured | | 4/16 at 100.00 | AA– | | 933,258 | |
| | 1,250 | | Indio Water Authority, California, Water Revenue Bonds, Series 2006, 5.000%, 4/01/31 – AMBAC Insured | | 4/16 at 100.00 | A | | 1,376,888 | |
| | 670 | | Metropolitan Water District of Southern California, Waterworks Revenue Bonds, Tender Option Bond Trust 09-8B, 18.355%, 7/01/35 (IF) (4) | | 7/19 at 100.00 | AAA | | 1,097,889 | |
| | 9,370 | | San Diego Public Facilities Financing Authority, California, Sewerage Revenue Bonds, Refunding Series 2010A, 5.250%, 5/15/27 | | 5/20 at 100.00 | AA | | 11,209,800 | |
| | 5,230 | | San Francisco City and County Public Utilities Commission, California, Water Revenue Bonds, Series 2012A, 5.000%, 11/01/43 | | 5/22 at 100.00 | AA– | | 5,993,319 | |
| | 34,855 | | Total Water and Sewer | | | | | 39,575,287 | |
| $ | 535,531 | | Total Investments (cost $486,276,679) – 147.9% | | | | | 544,811,252 | |
| | | | Floating Rate Obligations – (6.8)% | | | | | (25,130,000) | |
| | | | Variable Rate Demand Preferred Shares, at Liquidation Value – (42.9)% (6) | | | | | (158,100,000) | |
| | | | Other Assets Less Liabilities – 1.8% | | | | | 6,716,333 | |
| | | | Net Assets Applicable to Common Shares – 100% | | | | $ | 368,297,585 | |
| (1) | | All percentages shown in the Portfolio of Investments are based on net assets applicable to Common shares unless otherwise noted. |
| (2) | | Optional Call Provisions (not covered by the report of independent registered public accounting firm): Dates (month and year) and prices of the earliest optional call or redemption. There may be other call provisions at varying prices at later dates. Certain mortgage-backed securities may be subject to periodic principal paydowns. |
| (3) | | Ratings (not covered by the report of independent registered public accounting firm): Using the highest of Standard & Poor’s Group (“Standard & Poor’s”), Moody’s Investors Service, Inc. (“Moody’s”) or Fitch, Inc. (“Fitch”) rating. Ratings below BBB by Standard & Poor’s, Baa by Moody’s or BBB by Fitch are considered to be below investment grade. Holdings designated N/R are not rated by any of these national rating agencies. |
| (4) | | Investment, or portion of investment, has been pledged to collateralize the net payment obligations for investments in inverse floating rate transactions. |
| (5) | | Backed by an escrow or trust containing sufficient U.S. Government or U.S. Government agency securities, which ensure the timely payment of principal and interest. Certain bonds backed by U.S. Government or agency securities are regarded as having an implied rating equal to the rating of such securities. |
| (6) | | Variable Rate Demand Preferred Shares, at Liquidation Value as a percentage of Total Investments is 29.0% |
| N/R | | Not rated. |
| (ETM) | | Escrowed to maturity. |
| (IF) | | Inverse floating rate investment. |
| (UB) | | Underlying bond of an inverse floating rate trust reflected as a financing transaction. See Notes to Financial Statements, Footnote 1 – General Information and Significant Accounting Policies, Inverse Floating Rate Securities for more information. |
See accompanying notes to financial statements.
| | | Statement of |
| | | Assets & Liabilities |
| | | February 28, 2013 |
| | | | California Value (NCA | ) | | California Value 2 (NCB | ) | | California Performance Plus (NCP | ) | | California Opportunity (NCO | ) |
| Assets | | | | | | | | | | | | | |
| Investments, at value (cost $239,923,290, $46,119,389, $277,471,639 and $166,124,796, respectively) | | $ | 266,479,433 | | $ | 56,610,446 | | $ | 301,298,705 | | $ | 187,407,543 | |
| Cash | | | 359,814 | | | 801,110 | | | 1,971,269 | | | 662,745 | |
| Receivables: | | | | | | | | | | | | | |
| Interest | | | 2,867,934 | | | 642,865 | | | 4,288,056 | | | 2,312,777 | |
| Investments sold | | | — | | | — | | | — | | | — | |
| Deferred offering costs | | | — | | | — | | | 839,225 | | | 682,130 | |
| Other assets | | | 23,973 | | | 824 | | | 101,551 | | | 45,133 | |
| Total assets | | | 269,731,154 | | | 58,055,245 | | | 308,498,806 | | | 191,110,328 | |
| Liabilities | | | | | | | | | | | | | |
| Floating rate obligations | | | 4,490,000 | | | — | | | 6,180,000 | | | 4,285,000 | |
| Unrealized depreciation on swaps | | | — | | | 32,496 | | | — | | | — | |
| Payables: | | | | | | | | | | | | | |
| Common share dividends | | | 908,968 | | | 194,287 | | | 905,654 | | | 584,576 | |
| Investments purchased | | | — | | | — | | | 1,105,979 | | | 1,455,077 | |
| Offering costs | | | — | | | — | | | 357,452 | | | — | |
| Variable Rate Demand Preferred (VRDP) Shares, at liquidation value | | | — | | | — | | | 91,000,000 | | | 49,800,000 | |
| Accrued expenses: | | | | | | | | | | | | | |
| Management fees | | | 109,032 | | | 27,681 | | | 147,248 | | | 91,422 | |
| Directors/Trustees fees | | | 23,847 | | | 221 | | | 35,741 | | | 710 | |
| Other | | | 105,688 | | | 31,235 | | | 79,890 | | | 73,421 | |
| Total liabilities | | | 5,637,535 | | | 285,920 | | | 99,811,964 | | | 56,290,206 | |
| Net assets applicable to Common shares | | $ | 264,093,619 | | $ | 57,769,325 | | $ | 208,686,842 | | $ | 134,820,122 | |
| Common shares outstanding | | | 25,279,781 | | | 3,287,900 | | | 13,009,942 | | | 8,166,362 | |
| Net asset value per Common share outstanding (net assets applicable to Common shares, divided by Common shares outstanding) | | $ | 10.45 | | $ | 17.57 | | $ | 16.04 | | $ | 16.51 | |
| Net assets applicable to Common shares consist of: | | | | | | | | | | | | | |
| Common shares, $.01 par value per share | | $ | 252,798 | | $ | 32,879 | | $ | 130,099 | | $ | 81,664 | |
| Paid-in surplus | | | 237,988,834 | | | 46,967,862 | | | 182,149,712 | | | 113,932,281 | |
| Undistributed (Over-distribution of) net investment income | | | 1,401,825 | | | 409,568 | | | 3,039,905 | | | 1,753,950 | |
| Accumulated net realized gain (loss) | | | (2,105,981 | ) | | (99,545 | ) | | (459,940 | ) | | (2,230,520 | ) |
| Net unrealized appreciation (depreciation) | | | 26,556,143 | | | 10,458,561 | | | 23,827,066 | | | 21,282,747 | |
| Net assets applicable to Common shares | | $ | 264,093,619 | | $ | 57,769,325 | | $ | 208,686,842 | | $ | 134,820,122 | |
| Authorized shares: | | | | | | | | | | | | | |
| Common | | | 250,000,000 | | | Unlimited | | | 200,000,000 | | | 200,000,000 | |
| Preferred | | | N/A | | | N/A | | | 1,000,000 | | | 1,000,000 | |
N/A – Fund is not authorized to issue Preferred shares.
See accompanying notes to financial statements.
| | | Statement of |
| | | Assets & Liabilities (continued) |
| | | February 28, 2013 |
| | | | California Investment Quality (NQC | ) | | California Select Quality (NVC | ) | | California Quality Income (NUC | ) |
| Assets | | | | | | | | | | |
| Investments, at value (cost $297,949,029, $496,379,519 and $486,276,679, respectively) | | $ | 326,553,905 | | $ | 557,503,303 | | $ | 544,811,252 | |
| Cash | | | 597,729 | | | 1,396,361 | | | 547,820 | |
| Receivables: | | | | | | | | | | |
| Interest | | | 4,583,562 | | | 7,769,986 | | | 7,210,125 | |
| Investments sold | | | 4,160,600 | | | 1,360,000 | | | 75,000 | |
| Deferred offering costs | | | 382,501 | | | 826,399 | | | 821,946 | |
| Other assets | | | 127,270 | | | 173,016 | | | 170,576 | |
| Total assets | | | 336,405,567 | | | 569,029,065 | | | 553,636,719 | |
| Liabilities | | | | | | | | | | |
| Floating rate obligations | | | 5,735,000 | | | 13,810,000 | | | 25,130,000 | |
| Unrealized depreciation on swaps | | | — | | | — | | | — | |
| Payables: | | | | | | | | | | |
| Common share dividends | | | 911,341 | | | 1,774,158 | | | 1,667,061 | |
| Investments purchased | | | 3,422,268 | | | 6,337,268 | | | — | |
| Offering costs | | | 329,020 | | | — | | | — | |
| Variable Rate Demand Preferred (VRDP) Shares, at liquidation value | | | 105,600,000 | | | 158,900,000 | | | 158,100,000 | |
| Accrued expenses: | | | | | | | | | | |
| Management fees | | | 159,047 | | | 263,804 | | | 254,429 | |
| Directors/Trustees fees | | | 38,072 | | | 65,197 | | | 63,239 | |
| Other | | | 103,938 | | | 131,059 | | | 124,405 | |
| Total liabilities | | | 116,298,686 | | | 181,281,486 | | | 185,339,134 | |
| Net assets applicable to Common shares | | $ | 220,106,881 | | $ | 387,747,579 | | $ | 368,297,585 | |
| Common shares outstanding | | | 13,648,103 | | | 23,286,027 | | | 22,125,726 | |
| Net asset value per Common share outstanding (net assets applicable to Common shares, divided by Common shares outstanding) | | $ | 16.13 | | $ | 16.65 | | $ | 16.65 | |
| Net assets applicable to Common shares consist of: | | | | | | | | | | |
| Common shares, $.01 par value per share | | $ | 136,481 | | $ | 232,860 | | $ | 221,257 | |
| Paid-in surplus | | | 190,358,770 | | | 325,470,980 | | | 308,908,446 | |
| Undistributed (Over-distribution of) net investment income | | | 2,432,990 | | | 4,682,225 | | | 5,507,582 | |
| Accumulated net realized gain (loss) | | | (1,426,236 | ) | | (3,762,270 | ) | | (4,874,273 | ) |
| Net unrealized appreciation (depreciation) | | | 28,604,876 | | | 61,123,784 | | | 58,534,573 | |
| Net assets applicable to Common shares | | $ | 220,106,881 | | $ | 387,747,579 | | $ | 368,297,585 | |
| Authorized shares: | | | | | | | | | | |
| Common | | | 200,000,000 | | | 200,000,000 | | | 200,000,000 | |
| Preferred | | | 1,000,000 | | | 1,000,000 | | | 1,000,000 | |
See accompanying notes to financial statements.
Year Ended February 28, 2013
| | | | California Value (NCA | ) | | California Value 2 (NCB | ) | | California Performance Plus (NCP | ) | | California Opportunity (NCO | ) |
| Investment Income | | $ | 13,516,721 | | $ | 3,132,492 | | $ | 14,931,048 | | $ | 9,710,068 | |
| Expenses | | | | | | | | | | | | | |
| Management fees | | | 1,387,726 | | | 355,844 | | | 1,851,378 | | | 1,177,987 | |
| Shareholder servicing agent fees and expenses | | | 24,990 | | | 662 | | | 14,468 | | | 8,849 | |
| Interest expense and amortization of offering costs | | | 28,133 | | | — | | | 281,076 | | | 194,687 | |
| Liquidity fees | | | — | | | — | | | 634,971 | | | 514,257 | |
| Remarketing fees | | | — | | | — | | | 83,125 | | | 50,492 | |
| Custodian fees and expenses | | | 43,838 | | | 15,150 | | | 47,570 | | | 32,250 | |
| Directors/Trustees fees and expenses | | | 7,169 | | | 1,689 | | | 7,887 | | | 5,049 | |
| Professional fees | | | 25,934 | | | 16,722 | | | 89,341 | | | 55,545 | |
| Shareholder reporting expenses | | | 90,470 | | | 13,680 | | | 53,055 | | | 64,025 | |
| Stock exchange listing fees | | | 8,354 | | | 423 | | | 8,354 | | | 8,354 | |
| Investor relations expenses | | | 29,835 | | | 5,397 | | | 24,260 | | | 15,794 | |
| Other expenses | | | 16,266 | | | 6,314 | | | 45,883 | | | 41,342 | |
| Total expenses | | | 1,662,715 | | | 415,881 | | | 3,141,368 | | | 2,168,631 | |
| Net investment income (loss) | | | 11,854,006 | | | 2,716,611 | | | 11,789,680 | | | 7,541,437 | |
| Realized and Unrealized Gain (Loss) | | | | | | | | | | | | | |
| Net realized gain (loss) from: | | | | | | | | | | | | | |
| Investments | | | 442,672 | | | 559,938 | | | 678,773 | | | (247,880 | ) |
| Swaps | | | — | | | (661,714 | ) | | — | | | — | |
| Change in net unrealized appreciation (depreciation) of: | | | | | | | | | | | | | |
| Investments | | | 8,841,717 | | | 2,350,407 | | | 8,312,464 | | | 7,906,514 | |
| Swaps | | | — | | | 701,797 | | | — | | | — | |
| Net realized and unrealized gain (loss) | | | 9,284,389 | | | 2,950,428 | | | 8,991,237 | | | 7,658,634 | |
| Net increase (decrease) in net assets applicable to Common shares from operations | | $ | 21,138,395 | | $ | 5,667,039 | | $ | 20,780,917 | | $ | 15,200,071 | |
See accompanying notes to financial statements.
| | | Statement of |
| | | Operations (continued) |
Year Ended February 28, 2013
| | | | California Investment Quality (NQC | ) | | California Select Quality (NVC | ) | | California Quality Income (NUC | ) |
| Investment Income | | $ | 15,654,355 | | $ | 28,103,949 | | $ | 27,714,316 | |
| Expenses | | | | | | | | | | |
| Management fees | | | 2,012,118 | | | 3,402,899 | | | 3,298,198 | |
| Shareholder servicing agent fees and expenses | | | 13,097 | | | 17,753 | | | 16,608 | |
| Interest expense and amortization of offering costs | | | 870,564 | | | 534,112 | | | 622,868 | |
| Liquidity fees | | | 787,291 | | | 1,230,656 | | | 1,224,461 | |
| Remarketing fees | | | 98,900 | | | 161,107 | | | 160,296 | |
| Custodian fees and expenses | | | 53,240 | | | 79,586 | | | 83,882 | |
| Directors/Trustees fees and expenses | | | 8,748 | | | 15,762 | | | 15,265 | |
| Professional fees | | | 233,754 | | | 67,268 | | | 66,479 | |
| Shareholder reporting expenses | | | 56,712 | | | 77,084 | | | 77,388 | |
| Stock exchange listing fees | | | 8,354 | | | 8,365 | | | 8,354 | |
| Investor relations expenses | | | 26,681 | | | 42,411 | | | 42,036 | |
| Other expenses | | | 47,054 | | | 53,584 | | | 53,844 | |
| Total expenses | | | 4,216,513 | | | 5,690,587 | | | 5,669,679 | |
| Net investment income (loss) | | | 11,437,842 | | | 22,413,362 | | | 22,044,637 | |
| Realized and Unrealized Gain (Loss) | | | | | | | | | | |
| Net realized gain (loss) from: | | | | | | | | | | |
| Investments | | | 1,742,907 | | | 1,245,325 | | | 728,051 | |
| Swaps | | | — | | | — | | | — | |
| Change in net unrealized appreciation (depreciation) of: | | | | | | | | | | |
| Investments | | | 11,494,394 | | | 22,266,999 | | | 15,640,505 | |
| Swaps | | | — | | | — | | | — | |
| Net realized and unrealized gain (loss) | | | 13,237,301 | | | 23,512,324 | | | 16,368,556 | |
| Net increase (decrease) in net assets applicable to Common shares from operations | | $ | 24,675,143 | | $ | 45,925,686 | | $ | 38,413,193 | |
See accompanying notes to financial statements.
| | | Statement of |
| | | Changes in Net Assets |
| | | | California Value (NCA) | | | California Value 2 (NCB) | | | California Performance Plus (NCP) | |
| | | | Year Ended 2/28/13 | | | Year Ended 2/29/12 | | | Year Ended 2/28/13 | | | Year Ended 2/29/12 | | | Year Ended 2/28/13 | | | Year Ended 2/29/12 | |
| Operations | | | | | | | | | | | | | | | | | | | |
| Net investment income (loss) | | $ | 11,854,006 | | $ | 12,011,232 | | $ | 2,716,611 | | $ | 2,777,225 | | $ | 11,789,680 | | $ | 12,268,454 | |
| Net realized gain (loss) from: | | | | | | | | | | | | | | | | | | | |
| Investments | | | 442,672 | | | (384,295 | ) | | 559,938 | | | 78,340 | | | 678,773 | | | (72,956 | ) |
| Swaps | | | — | | | — | | | (661,714 | ) | | — | | | — | | | — | |
| Change in net unrealized appreciation (depreciation) of: | | | | | | | | | | | | | | | | | | | |
| Investments | | | 8,841,717 | | | 25,578,700 | | | 2,350,407 | | | 6,344,258 | | | 8,312,464 | | | 30,885,709 | |
| Swaps | | | — | | | — | | | 701,797 | | | (663,331 | ) | | — | | | — | |
| Net increase (decrease) in net assets applicable to Common shares from operations | | | 21,138,395 | | | 37,205,637 | | | 5,667,039 | | | 8,536,492 | | | 20,780,917 | | | 43,081,207 | |
| Distributions to Common Shareholders | | | | | | | | | | | | | | | | | | | |
| From net investment income | | | (11,876,200 | ) | | (11,591,440 | ) | | (2,625,717 | ) | | (2,623,744 | ) | | (12,598,891 | ) | | (12,306,148 | ) |
| From accumulated net realized gains | | | — | | | — | | | (43,729 | ) | | (76,937 | ) | | — | | | — | |
| Decrease in net assets applicable to Common shares from distributions to Common shareholders | | | (11,876,200 | ) | | (11,591,440 | ) | | (2,669,446 | ) | | (2,700,681 | ) | | (12,598,891 | ) | | (12,306,148 | ) |
| Capital Share Transactions | | | | | | | | | | | | | | | | | | | |
| Common shares: | | | | | | | | | | | | | | | | | | | |
| Net proceeds from shares issued to shareholders due to reinvestment of distributions | | | 268,867 | | | — | | | — | | | — | | | 895,810 | | | 233,843 | |
| Net increase (decrease) in net assets applicable to Common shares from capital share transactions | | | 268,867 | | | — | | | — | | | — | | | 895,810 | | | 233,843 | |
| Net increase (decrease) in net assets applicable to Common shares | | | 9,531,062 | | | 25,614,197 | | | 2,997,593 | | | 5,835,811 | | | 9,077,836 | | | 31,008,902 | |
| Net assets applicable to Common shares at the beginning of period | | | 254,562,557 | | | 228,948,360 | | | 54,771,732 | | | 48,935,921 | | | 199,609,006 | | | 168,600,104 | |
| Net assets applicable to Common shares at the end of period | | $ | 264,093,619 | | $ | 254,562,557 | | $ | 57,769,325 | | $ | 54,771,732 | | $ | 208,686,842 | | $ | 199,609,006 | |
| Undistributed (Over-distribution of)net investment income at the end of period | | $ | 1,401,825 | | $ | 1,463,192 | | $ | 409,568 | | $ | 320,997 | | $ | 3,039,905 | | $ | 3,933,426 | |
See accompanying notes to financial statements.
| | | Statement of |
| | | Changes in Net Assets (continued) |
| | | | California Opportunity (NCO) | | | California Investment Quality (NQC) | | | California Select Quality (NVC) | |
| | | | Year Ended 2/28/13 | | | Year Ended 2/29/12 | | | Year Ended 2/28/13 | | | Year Ended 2/29/12 | | | Year Ended 2/28/13 | | | Year Ended 2/29/12 | |
| Operations | | | | | | | | | | | | | | | | | | | |
| Net investment income (loss) | | $ | 7,541,437 | | $ | 7,777,433 | | $ | 11,437,842 | | $ | 12,944,340 | | $ | 22,413,362 | | $ | 23,200,646 | |
| Net realized gain (loss) from: | | | | | | | | | | | | | | | | | | | |
| Investments | | | (247,880 | ) | | (1,160,190 | ) | | 1,742,907 | | | 168,328 | | | 1,245,325 | | | (2,404,426 | ) |
| Swaps | | | — | | | (181,029 | ) | | — | | | — | | | — | | | — | |
| Change in net unrealized appreciation (depreciation) of: | | | | | | | | | | | | | | | | | | | |
| Investments | | | 7,906,514 | | | 24,427,814 | | | 11,494,394 | | | 30,176,191 | | | 22,266,999 | | | 62,856,798 | |
| Swaps | | | — | | | 8,281 | | | — | | | — | | | — | | | — | |
| Net increase (decrease) in net assets applicable to Common shares from operations | | | 15,200,071 | | | 30,872,309 | | | 24,675,143 | | | 43,288,859 | | | 45,925,686 | | | 83,653,018 | |
| Distributions to Common Shareholders | | | | | | | | | | | | | | | | | | | |
| From net investment income | | | (7,830,103 | ) | | (7,720,394 | ) | | (13,320,076 | ) | | (13,079,292 | ) | | (23,760,759 | ) | | (23,196,324 | ) |
| From accumulated net realized gains | | | — | | | — | | | — | | | — | | | — | | | — | |
| Decrease in net assets applicable to Common shares from distributions to Common shareholders | | | (7,830,103 | ) | | (7,720,394 | ) | | (13,320,076 | ) | | (13,079,292 | ) | | (23,760,759 | ) | | (23,196,324 | ) |
| Capital Share Transactions | | | | | | | | | | | | | | | | | | | |
| Common shares: | | | | | | | | | | | | | | | | | | | |
| Net proceeds from shares issued to shareholders due to reinvestment of distributions | | | 338,291 | | | 29,879 | | | 936,643 | | | 131,300 | | | 1,749,591 | | | 828,467 | |
| Net increase (decrease) in net assets applicable to Common shares from capital share transactions | | | 338,291 | | | 29,879 | | | 936,643 | | | 131,300 | | | 1,749,591 | | | 828,467 | |
| Net increase (decrease) in net assets applicable to Common shares | | | 7,708,259 | | | 23,181,794 | | | 12,291,710 | | | 30,340,867 | | | 23,914,518 | | | 61,285,161 | |
| Net assets applicable to Common shares at the beginning of period | | | 127,111,863 | | | 103,930,069 | | | 207,815,171 | | | 177,474,304 | | | 363,833,061 | | | 302,547,900 | |
| Net assets applicable to Common shares at the end of period | | $ | 134,820,122 | | $ | 127,111,863 | | $ | 220,106,881 | | $ | 207,815,171 | | $ | 387,747,579 | | $ | 363,833,061 | |
| Undistributed (Over-distribution of) net investment income at the end of period | | $ | 1,753,950 | | $ | 2,020,626 | | $ | 2,432,990 | | $ | 3,877,813 | | $ | 4,682,225 | | $ | 6,087,003 | |
See accompanying notes to financial statements.
| | | | California Quality Income (NUC) | |
| | | | Year Ended 2/28/13 | | | Year Ended 2/29/12 | |
| Operations | | | | | | | |
| Net investment income (loss) | | $ | 22,044,637 | | $ | 22,787,139 | |
| Net realized gain (loss) from: | | | | | | | |
| Investments | | | 728,051 | | | (606,380 | ) |
| Swaps | | | — | | | — | |
| Change in net unrealized appreciation | | | | | | | |
| (depreciation) of: | | | | | | | |
| Investments | | | 15,640,505 | | | 51,578,780 | |
| Swaps | | | — | | | — | |
| Net increase (decrease) in net assets | | | | | | | |
| applicable to Common shares | | | | | | | |
| from operations | | | 38,413,193 | | | 73,759,539 | |
| Distributions to Common Shareholders | | | | | | | |
| From net investment income | | | (23,014,225 | ) | | (22,452,537 | ) |
| From accumulated net realized gains | | | — | | | — | |
| Decrease in net assets applicable | | | | | | | |
| to Common shares from | | | | | | | |
| distributions to Common | | | | | | | |
| shareholders | | | (23,014,225 | ) | | (22,452,537 | ) |
| Capital Share Transactions | | | | | | | |
| Common shares: | | | | | | | |
| Net proceeds from shares | | | | | | | |
| issued to shareholders due to | | | | | | | |
| reinvestment of distributions | | | 1,521,587 | | | 461,527 | |
| Net increase (decrease) in net assets | | | | | | | |
| applicable to Common shares from | | | | | | | |
| capital share transactions | | | 1,521,587 | | | 461,527 | |
| Net increase (decrease) in net assets | | | | | | | |
| applicable to Common shares | | | 16,920,555 | | | 51,768,529 | |
| Net assets applicable to Common | | | | | | | |
| shares at the beginning of period | | | 351,377,030 | | | 299,608,501 | |
| Net assets applicable to Common | | | | | | | |
| shares at the end of period | | $ | 368,297,585 | | $ | 351,377,030 | |
| Undistributed (Over-distribution of) | | | | | | | |
| net investment income at the end | | | | | | | |
| of period | | $ | 5,507,582 | | $ | 6,462,195 | |
See accompanying notes to financial statements.
Year Ended February 28, 2013
| | | | California Performance Plus (NCP | ) | | California Opportunity (NCO | ) | | California Investment Quality (NQC | ) |
| Cash Flows from Operating Activities: | | | | | | | | | | |
| Net Increase (Decrease) in Net Assets Applicable to Common Shares from Operations | | $ | 20,780,917 | | $ | 15,200,071 | | $ | 24,675,143 | |
| Adjustments to reconcile the net increase (decrease) in net assets applicable to Common shares from operations to net cash provided by (used in) operating activities: | | | | | | | | | | |
| Purchases of investments | | | (43,037,094 | ) | | (24,490,715 | ) | | (59,716,353 | ) |
| Proceeds from sales and maturities of investments | | | 35,461,674 | | | 24,123,422 | | | 56,741,439 | |
| Amortization (Accretion) of premiums and discounts, net | | | (181,217 | ) | | (509,554 | ) | | (713,571 | ) |
| (Increase) Decrease in: | | | | | | | | | | |
| Receivable for interest | | | (247,410 | ) | | (196,017 | ) | | (118,746 | ) |
| Receivable for investments sold | | | 1,195,340 | | | 2,221,236 | | | (2,837,500 | ) |
| Other assets | | | (9,836 | ) | | (420 | ) | | (24,079 | ) |
| Increase (Decrease) in: | | | | | | | | | | |
| Payable for investments purchased | | | (42,421 | ) | | (1,385,417 | ) | | 2,179,818 | |
| Accrued management fees | | | 2,836 | | | (71 | ) | | 3,671 | |
| Accrued Directors/Trustees fees | | | 61 | | | (1,118 | ) | | 256 | |
| Accrued other expenses | | | 1,930 | | | 15,078 | | | 17,400 | |
| Net realized (gain) loss from investments | | | (678,773 | ) | | 247,880 | | | (1,742,907 | ) |
| Change in net unrealized (appreciation) depreciation of investments | | | (8,312,464 | ) | | (7,906,514 | ) | | (11,494,394 | ) |
| Taxes paid on undistributed capital gains | | | (349 | ) | | (322 | ) | | — | |
| Net cash provided by (used in) operating activities | | | 4,933,194 | | | 7,317,539 | | | 6,970,177 | |
| Cash Flows from Financing Activities: | | | | | | | | | | |
| (Increase) Decrease in deferred offering costs | | | (253,806 | ) | | 186,348 | | | 241,308 | |
| Increase (Decrease) in: | | | | | | | | | | |
| Floating rate obligations | | | (1,500,000 | ) | | — | | | (8,495,000 | ) |
| Payable for offering costs | | | 240,306 | | | (177,672 | ) | | 231,216 | |
| VRDP Shares, at liquidation value | | | 10,000,000 | | | — | | | 10,000,000 | |
| Cash distributions paid to Common shareholders | | | (11,724,086 | ) | | (7,506,188 | ) | | (12,489,655 | ) |
| Net cash provided by (used in) financing activities | | | (3,237,586 | ) | | (7,497,512 | ) | | (10,512,132 | ) |
| Net Increase (Decrease) in Cash | | | 1,695,608 | | | (179,973 | ) | | (3,541,955 | ) |
| Cash at the beginning of period | | | 275,661 | | | 842,718 | | | 4,139,684 | |
| Cash at the End of Period | | $ | 1,971,269 | | $ | 662,745 | | $ | 597,729 | |
Supplemental Disclosure of Cash Flow Information
Non-cash financing activities not included herein consist of reinvestments of Common share distributions as follows:
| | | | California Performance Plus (NCP | ) | | California Opportunity (NCO | ) | | California Investment Quality (NQC | ) |
| | | $ | 895,810 | | $ | 338,291 | | $ | 936,643 | |
Cash paid for interest (excluding amortization of offering costs) was as follows:
| | | | California Performance Plus (NCP | ) | | California Opportunity (NCO | ) | | California Investment Quality (NQC | ) |
| | | $ | 260,998 | | $ | 166,597 | | $ | 305,477 | |
See accompanying notes to financial statements.
| | | | California Select Quality (NVC | ) | | California Quality Income (NUC | ) |
| Cash Flows from Operating Activities: | | | | | | | |
| Net Increase (Decrease) in Net Assets Applicable to Common Shares from Operations | | $ | 45,925,686 | | $ | 38,413,193 | |
| Adjustments to reconcile the net increase (decrease) in net assets applicable to Common shares from operations to net cash provided by (used in) operating activities: | | | | | | | |
| Purchases of investments | | | (62,701,960 | ) | | (77,446,934 | ) |
| Proceeds from sales and maturities of investments | | | 53,347,817 | | | 78,843,662 | |
| Amortization (Accretion) of premiums and discounts, net | | | (698,595 | ) | | (103,199 | ) |
| (Increase) Decrease in: | | | | | | | |
| Receivable for interest | | | (271,259 | ) | | 11,620 | |
| Receivable for investments sold | | | 10,198,330 | | | (5,000 | ) |
| Other assets | | | (6,590 | ) | | (6,392 | ) |
| Increase (Decrease) in: | | | | | | | |
| Payable for investments purchased | | | 4,045,268 | | | (2,113,600 | ) |
| Accrued management fees | | | (90 | ) | | (3,151 | ) |
| Accrued Directors/Trustees fees | | | 673 | | | 535 | |
| Accrued other expenses | | | 7,970 | | | 9,275 | |
| Net realized (gain) loss from investments | | | (1,245,325 | ) | | (728,051 | ) |
| Change in net unrealized (appreciation) depreciation of investments | | | (22,266,999 | ) | | (15,640,505 | ) |
| Taxes paid on undistributed capital gains | | | (6,837 | ) | | — | |
| Net cash provided by (used in) operating activities | | | 26,328,089 | | | 21,231,453 | |
| Cash Flows from Financing Activities: | | | | | | | |
| (Increase) Decrease in deferred offering costs | | | (32,000 | ) | | (29,446 | ) |
| Increase (Decrease) in: | | | | | | | |
| Floating rate obligations | | | (3,750,000 | ) | | (1,875,000 | ) |
| Payable for offering costs | | | (1,821 | ) | | (4,186 | ) |
| VRDP Shares, at liquidation value | | | — | | | — | |
| Cash distributions paid to Common shareholders | | | (22,051,674 | ) | | (21,582,458 | ) |
| Net cash provided by (used in) financing activities | | | (25,835,495 | ) | | (23,491,090 | ) |
| Net Increase (Decrease) in Cash | | | 492,594 | | | (2,259,637 | ) |
| Cash at the beginning of period | | | 903,767 | | | 2,807,457 | |
| Cash at the End of Period | | $ | 1,396,361 | | $ | 547,820 | |
Supplemental Disclosure of Cash Flow Information
Non-cash financing activities not included herein consist of reinvestments of Common share distributions as follows:
| | | | California Select Quality (NVC) | | | California Quality Income (NUC) | |
| | | $ | 1,749,591 | | $ | 1,521,587 | |
Cash paid for interest (excluding amortization of offering costs) was as follows:
| | | | California Select Quality (NVC) | | | California Quality Income (NUC) | |
| | | $ | 505,091 | | $ | 593,962 | |
See accompanying notes to financial statements.
| | | Financial |
| | | Highlights |
| | | |
| | | Selected data for a Common share outstanding throughout each period: |
| | | | | | | Investment Operations | | | Less Distributions | | | | | | | | | | | | | |
| | | | Beginning Common Share Net Asset Value | | | Net Investment Income (Loss) | | | Net Realized/ Unrealized Gain (Loss) | | | Total | | | From Net Investment Income to Common Shareholders | | | From Accumulated Net Realized Gains to Common Shareholders | | | Total | | | Discount from Common Shares Repurchased and Retired | | | Initial Offering Costs | | | Ending Common Share Net Asset Value | | | Ending Market Value | |
| California Value (NCA) | | | | | | | | | | | | | | | | | | | | | | | | | | | | | | | |
| Year Ended 2/28–2/29: | | | | | | | | | | | | | | | | | | | | | | | | | | | | | | | |
| 2013 | | $ | 10.08 | | $ | .47 | | $ | .37 | | $ | .84 | | $ | (.47 | ) | $ | — | | $ | (.47 | ) | $ | — | | $ | — | | $ | 10.45 | | $ | 10.45 | |
| 2012 | | | 9.07 | | | .48 | | | .99 | | | 1.47 | | | (.46 | ) | | — | | | (.46 | ) | | — | | | — | | | 10.08 | | | 10.13 | |
| 2011 | | | 9.53 | | | .47 | | | (.47 | ) | | — | | | (.46 | ) | | — | | | (.46 | ) | | — | | | — | | | 9.07 | | | 8.36 | |
| 2010 | | | 8.87 | | | .47 | | | .65 | | | 1.12 | | | (.46 | ) | | — | | | (.46 | ) | | — | | | — | | | 9.53 | | | 9.00 | |
| 2009(b) | | | 9.70 | | | .23 | | | (.70 | ) | | (.47 | ) | | (.23 | ) | | (.13 | ) | | (.36 | ) | | — | | | — | | | 8.87 | | | 8.39 | |
| Year Ended 8/31: | | | | | | | | | | | | | | | | | | | | | | | | | | | | | | | | | | |
| 2008 | | | 9.87 | | | .47 | | | (.18 | ) | | .29 | | | (.44 | ) | | (.02 | ) | | (.46 | ) | | — | | | — | | | 9.70 | | | 9.63 | |
| | | | | | | | | | | | | | | | | | | | | | | | | | | | | | | | | | | |
| California Value 2 (NCB) | | | | | | | | | | | | | | | | | | | | | | | | | | | | | | | |
| Year Ended 2/28–2/29: | | | | | | | | | | | | | | | | | | | | | | | | | | | | | | | |
| 2013 | | | 16.66 | | | .83 | | | .89 | | | 1.72 | | | (.80 | ) | | (.01 | ) | | (.81 | ) | | — | | | — | | | 17.57 | | | 16.86 | |
| 2012 | | | 14.88 | | | .84 | | | 1.76 | | | 2.60 | | | (.80 | ) | | (.02 | ) | | (.82 | ) | | — | | | — | | | 16.66 | | | 16.33 | |
| 2011 | | | 15.71 | | | .84 | | | (.84 | ) | | — | | | (.82 | ) | | (.01 | ) | | (.83 | ) | | — | | | — | | | 14.88 | | | 13.65 | |
| 2010(c) | | | 14.33 | | | .65 | | | 1.40 | | | 2.05 | | | (.62 | ) | | (.02 | ) | | (.64 | ) | | — | | | (.03 | ) | | 15.71 | | | 14.61 | |
| (a) | Total Return Based on Market Value is the combination of changes in the market price per share and the effect of reinvested dividend income and reinvested capital gains distributions, if any, at the average price paid per share at the time of reinvestment. The last dividend declared in the period, which is typically paid on the first business day of the following month, is assumed to be reinvested at the ending market price. The actual reinvestment for the last dividend declared in the period may take place over several days, and in some instances may not be based on the market price, so the actual reinvestment price may be different from the price used in the calculation. Total returns are not annualized. |
| | Total Return Based on Common Share Net Asset Value is the combination of changes in Common share net asset value, reinvested dividend income at net asset value and reinvested capital gains distributions at net asset value, if any. The last dividend declared in the period, which is typically paid on the first business day of the following month, is assumed to be reinvested at the ending net asset value. The actual reinvest price for the last dividend declared in the period may often be based on the Fund’s market price (and not its net asset value), and therefore may be different from the price used in the calculation. Total returns are not annualized. |
| | | | Ratios/Supplemental Data | |
| Total Returns | | | | | | Ratios to Average Net Assets Applicable to Common Shares | | | | |
Based on Market Value | (a) | | Based on Common Share Net Asset Value | (a) | | Ending Net Assets Applicable to Common Shares (000) | | | Expenses | (d) | | Net Investment Income (Loss) | | | Portfolio Turnover Rate | |
| | | | | | | | | | | | | | | | | |
| | | | | | | | | | | | | | | | | |
| 7.99 | % | | 8.48 | % | $ | 264,094 | | | .64 | % | | 4.55 | % | | 16 | % |
| 27.44 | | | 16.58 | | | 254,563 | | | .65 | | | 4.98 | | | 8 | |
| (2.32 | ) | | (.13 | ) | | 228,948 | | | .65 | | | 4.92 | | | 14 | |
| 12.83 | | | 12.85 | | | 240,598 | | | .68 | | | 5.03 | | | 6 | |
| (9.08 | ) | | (4.73 | ) | | 223,949 | | | .72 | * | | 5.30 | * | | 12 | |
| | | | | | | | | | | | | | | | | |
| 4.70 | | | 2.94 | | | 244,985 | | | .69 | | | 4.71 | | | 22 | |
| | | | | | | | | | | | | | | | | |
| | | | | | | | | | | | | | | | | |
| 8.39 | | | 10.54 | | | 57,769 | | | .74 | | | 4.81 | | | 7 | |
| 26.50 | | | 17.97 | | | 54,772 | | | .77 | | | 5.41 | | | 4 | |
| (1.25 | ) | | (.17 | ) | | 48,936 | | | .72 | | | 5.35 | | | 5 | |
| 1.80 | | | 14.34 | | | 51,661 | | | .77 | * | | 5.13 | * | | 10 | |
| (b) | For the six months ended February 28, 2009. |
| (c) | For the period April 28, 2009 (commencement of operations) through February 28, 2010. |
| (d) | The expense ratios reflect, among other things, the interest expense deemed to have been paid by the Fund on the floating rate certificates issued by the special purpose trusts for the self-deposited inverse floaters held by the Fund, where applicable, as described in Footnote 1 – General Information and Significant Accounting Policies, Inverse Floating Rate Securities, as follows: |
| | | | |
| Year Ended 2/28–2/29: | | | | |
| 2013 | | | .01 | % |
| 2012 | | | .01 | |
| 2011 | | | .01 | |
| 2010 | | | .01 | |
| 2009(b) | | | .02 | * |
| Year Ended 8/31: | | | | |
| 2008 | | | .04 | |
| California Value 2 (NCB) | | | | |
| Year Ended 2/28–2/29: | | | | |
| 2013 | | | — | % |
| 2012 | | | — | |
| 2011 | | | — | |
| 2010(c) | | | — | |
See accompanying notes to financial statements.
| | | Financial |
| | | Highlights (continued) |
| | | |
| | | Selected data for a Common share outstanding throughout each period: |
| | | | | | | Investment Operations | | | Less Distributions | | | | | | | | | | |
| | | | Beginning Common Share Net Asset Value | | | Net Investment Income (Loss) | | | Net Realized/ Unrealized Gain (Loss) | | | Distributions from Net Investment Income to Auction Rate Preferred Shareholders | (a) | | Distributions from Accumulated Net Realized Gains to Auction Rate Preferred Shareholders | (a) | | Total | | | From Net Investment Income to Common Shareholders | | | From Accumulated Net Realized Gains to Common Shareholders | | | Total | | | Discount from Common Shares Repurchased and Retired | | | Ending Common Share Net Asset Value | | | Ending Market Value | |
| California Performance Plus (NCP) | | | | | | | | | | | | | | | | | | | | | | | | | | | | | | | |
| Year Ended 2/28–2/29: | | | | | | | | | | | | | | | | | | | | | | | | | | | | | | | | | |
| 2013 | | $ | 15.41 | | $ | .91 | | $ | .69 | | $ | — | | $ | — | | $ | 1.60 | | $ | (.97 | ) | $ | — | | $ | (.97 | ) | $ | — | | $ | 16.04 | | $ | 16.10 | |
| 2012 | | | 13.03 | | | .95 | | | 2.38 | | | — | | | — | | | 3.33 | | | (.95 | ) | | — | | | (.95 | ) | | — | | | 15.41 | | | 15.74 | |
| 2011 | | | 14.07 | | | 1.00 | | | (1.12 | ) | | (.02 | ) | | — | | | (.14 | ) | | (.90 | ) | | — | | | (.90 | ) | | — | | | 13.03 | | | 12.43 | |
| 2010 | | | 12.63 | | | 1.02 | | | 1.26 | | | (.03 | ) | | (.01 | ) | | 2.24 | | | (.80 | ) | | — | | | (.80 | ) | | — | ** | | 14.07 | | | 12.59 | |
| 2009(d) | | | 14.19 | | | .48 | | | (1.45 | ) | | (.12 | ) | | (.03 | ) | | (1.12 | ) | | (.35 | ) | | (.09 | ) | | (.44 | ) | | — | ** | | 12.63 | | | 10.87 | |
| Year Ended 8/31: | | | | | | | | | | | | | | | | | | | | | | | | | | | | | | | | | | | | | |
| 2008 | | | 14.77 | | | .98 | | | (.52 | ) | | (.25 | ) | | (.03 | ) | | .18 | | | (.69 | ) | | (.07 | ) | | (.76 | ) | | — | | | 14.19 | | | 12.70 | |
| | | | | | | | | | | | | | | | | | | | | | | | | | | | | | | | | | | | | | |
| California Opportunity (NCO) | | | | | | | | | | | | | | | | | | | | | | | | | | | | | | | | | | |
| Year Ended 2/28–2/29: | | | | | | | | | | | | | | | | | | | | | | | | | | | | | | | | | |
| 2013 | | | 15.61 | | | .92 | | | .94 | | | — | | | — | | | 1.86 | | | (.96 | ) | | — | | | (.96 | ) | | — | | | 16.51 | | | 16.74 | |
| 2012 | | | 12.76 | | | .95 | | | 2.85 | | | — | | | — | | | 3.80 | | | (.95 | ) | | — | | | (.95 | ) | | — | | | 15.61 | | | 15.83 | |
| 2011 | | | 14.13 | | | .95 | | | (1.39 | ) | | —** | | | — | | | (.44 | ) | | (.93 | ) | | — | | | (.93 | ) | | — | | | 12.76 | | | 12.42 | |
| 2010 | | | 12.92 | | | 1.03 | | | 1.05 | | | (.03 | ) | | — | | | 2.05 | | | (.84 | ) | | — | | | (.84 | ) | | — | ** | | 14.13 | | | 12.94 | |
| 2009(d) | | | 14.32 | | | .50 | | | (1.36 | ) | | (.12 | ) | | (.02 | ) | | (1.00 | ) | | (.35 | ) | | (.05 | ) | | (.40 | ) | | — | ** | | 12.92 | | | 10.77 | |
| Year Ended 8/31: | | | | | | | | | | | | | | | | | | | | | | | | | | | | | | | | | | | | | |
| 2008 | | | 14.90 | | | 1.01 | | | (.52 | ) | | (.26 | ) | | (.03 | ) | | .20 | | | (.71 | ) | | (.07 | ) | | (.78 | ) | | — | | | 14.32 | | | 12.85 | |
| (a) | The amounts shown are based on Common share equivalents. |
| (b) | Total Return Based on Market Value is the combination of changes in the market price per share and the effect of reinvested dividend income and reinvested capital gains distributions, if any, at the average price paid per share at the time of reinvestment. The last dividend declared in the period, which is typically paid on the first business day of the following month, is assumed to be reinvested at the ending market price. The actual reinvestment for the last dividend declared in the period may take place over several days, and in some instances may not be based on the market price, so the actual reinvestment price may be different from the price used in the calculation. Total returns are not annualized. |
| | Total Return Based on Common Share Net Asset Value is the combination of changes in Common share net asset value, reinvested dividend income at net asset value and reinvested capital gains distributions at net asset value, if any. The last dividend declared in the period, which is typically paid on the first business day of the following month, is assumed to be reinvested at the ending net asset value. The actual reinvest price for the last dividend declared in the period may often be based on the Fund’s market price (and not its net asset value), and therefore may be different from the price used in the calculation. Total returns are not annualized. |
| | | | | | | Ratios/Supplemental Data | |
| Total Returns | | | | | | | | | Ratios to Average Net Assets Applicable to Common Shares(c) | | | | |
Based
on
Market
Value | (b) | | Based on
Common
Share Net
Asset Value | (b) | | Ending
Net Assets
Applicable
to Common
Shares (000) | | | Expenses | (e) | | Net
Investment
Income (Loss) | | | Portfolio
Turnover
Rate | |
| | | | | | | | | | | | | | | | | |
| 8.75 | % | | 10.67 | % | $ | 208,687 | | | 1.54 | % | | 5.77 | % | | 12 | % |
| 35.63 | | | 26.45 | | | 199,609 | | | 1.63 | | | 6.73 | | | 10 | |
| 5.61 | | | (1.26 | ) | | 168,600 | | | 1.31 | | | 7.11 | | | 15 | |
| 23.76 | | | 18.20 | | | 182,060 | | | 1.25 | | | 7.58 | | | 3 | |
| (10.58 | ) | | (7.75 | ) | | 163,623 | | | 1.40 | * | | 7.72 | * | | 6 | |
| (4.41 | ) | | 1.23 | | | 183,943 | | | 1.33 | | | 6.73 | | | 11 | |
| | | | | | | | | | | | | | | | | |
| | | | | | | | | | | | | | | | | |
| 12.20 | | | 12.22 | | | 134,820 | | | 1.65 | | | 5.74 | | | 13 | |
| 36.49 | | | 30.81 | | | 127,112 | | | 1.77 | | | 6.80 | | | 12 | |
| 2.82 | | | (3.51 | ) | | 103,930 | | | 1.77 | | | 6.77 | | | 18 | |
| 28.54 | | | 16.25 | | | 115,069 | | | 1.26 | | | 7.59 | | | 5 | |
| (12.83 | ) | | (6.85 | ) | | 105,482 | | | 1.48 | * | | 8.00 | * | | 4 | |
| (5.15 | ) | | 1.35 | | | 116,964 | | | 1.36 | | | 6.84 | | | 8 | |
| (c) | Ratios do not reflect the effect of dividend payments to Auction Rate Preferred shareholders, where applicable; Net Investment Income (Loss) ratios reflect income earned and expenses incurred on assets attributable to Auction Rate Preferred Shares (“ARPS”) and/or VRDP Shares, where applicable. |
| (d) | For the six months ended February 28, 2009. |
| (e) | The expense ratios reflect, among other things, all interest expense and other costs related to VRDP Shares and/or the interest expense deemed to have been paid by the Fund on the floating rate certificates issued by the special purpose trusts for the self-deposited inverse floaters held by the Fund, where applicable, both as described in Footnote 1 – General Information and Significant Accounting Policies, Variable Rate Demand Preferred Shares and Inverse Floating Rate Securities, respectively, as follows: |
| California Performance Plus (NCP) | | | | |
| Year Ended 2/28–2/29: | | | | |
| 2013 | | | .49 | % |
| 2012 | | | .57 | |
| 2011 | | | .17 | |
| 2010 | | | .03 | |
| 2009(d) | | | .06 | * |
| Year Ended 8/31: | | | | |
| 2008 | | | .07 | |
| * | Annualized. |
| ** | Rounds to less than $.01 per share. |
| California Opportunity (NCO) | | | | |
| Year Ended 2/28–2/29: | | | | |
| 2013 | | | .58 | % |
| 2012 | | | .68 | |
| 2011 | | | .69 | |
| 2010 | | | .04 | |
| 2009(d) | | | .04 | * |
| Year Ended 8/31: | | | | |
| 2008 | | | .08 | |
See accompanying notes to financial statements.
| | | Financial |
| | | Highlights (continued) |
| | | |
| | | Selected data for a Common share outstanding throughout each period: |
| | | | | | | Investment Operations | | | Less Distributions | | | | | | | | | | |
| | | | Beginning Common Share Net Asset Value | | | Net Investment Income (Loss) | | | Net Realized/ Unrealized Gain (Loss) | | | Distributions from Net Investment Income to Auction Rate Preferred Shareholders | (a) | | Distributions from Accumulated Net Realized Gains to Auction Rate Preferred Share- holders | (a) | | Total | | | From Net Investment Income to Common Shareholders | | | From Accumulated Net Realized Gains to Common Shareholders | | | Total | | | Discount from Common Shares Repurchased and Retired | | | Ending Common Share Net Asset Value | | | Ending Market Value | |
| California Investment Quality (NQC) | | | | | | | | | | | | | | | | | | | | | | | | | | | | | | | |
| Year Ended 2/28–2/29: | | | | | | | | | | | | | | | | | | | | | | | | | | | | | | | | | | |
| 2013 | | $ | 15.29 | | $ | .84 | | $ | .98 | | $ | — | | $ | — | | $ | 1.82 | | $ | (.98 | ) | $ | — | | $ | (.98 | ) | $ | — | | $ | 16.13 | | $ | 16.13 | |
| 2012 | | | 13.07 | | | .95 | | | 2.23 | | | — | | | — | | | 3.18 | | | (.96 | ) | | — | | | (.96 | ) | | — | | | 15.29 | | | 15.85 | |
| 2011 | | | 14.06 | | | 1.01 | | | (1.06 | ) | | (.03 | ) | | — | | | (.08 | ) | | (.91 | ) | | — | | | (.91 | ) | | — | | | 13.07 | | | 12.41 | |
| 2010 | | | 12.65 | | | 1.04 | | | 1.24 | | | (.02 | ) | | (.02 | ) | | 2.24 | | | (.83 | ) | | — | | | (.83 | ) | | — | | | 14.06 | | | 12.84 | |
| 2009(d) | | | 14.34 | | | .49 | | | (1.50 | ) | | (.11 | ) | | (.02 | ) | | (1.14 | ) | | (.36 | ) | | (.19 | ) | | (.55 | ) | | — | | | 12.65 | | | 11.09 | |
| Year Ended 8/31: | | | | | | | | | | | | | | | | | | | | | | | | | | | | | | | | | | | | | |
| 2008 | | | 14.81 | | | 1.00 | | | (.47 | ) | | (.27 | ) | | — | ** | | .26 | | | (.72 | ) | | (.01 | ) | | (.73 | ) | | — | | | 14.34 | | | 13.08 | |
| | | | | | | | | | | | | | | | | | | | | | | | | | | | | | | | | | | | | | |
| California Select Quality (NVC) | | | | | | | | | | | | | | | | | | | | | | | | | | | | | | | |
| Year Ended 2/28–2/29: | | | | | | | | | | | | | | | | | | | | | | | | | | | | | | | | | | |
| 2013 | | | 15.70 | | | .96 | | | 1.01 | | | — | | | — | | | 1.97 | | | (1.02 | ) | | — | | | (1.02 | ) | | — | | | 16.65 | | | 16.88 | |
| 2012 | | | 13.09 | | | 1.00 | | | 2.61 | | | — | | | — | | | 3.61 | | | (1.00 | ) | | — | | | (1.00 | ) | | — | | | 15.70 | | | 16.38 | |
| 2011 | | | 14.27 | | | 1.02 | | | (1.21 | ) | | (.02 | ) | | — | | | (.21 | ) | | (.97 | ) | | — | | | (.97 | ) | | — | | | 13.09 | | | 12.65 | |
| 2010 | | | 12.72 | | | 1.07 | | | 1.40 | | | (.02 | ) | | (.02 | ) | | 2.43 | | | (.88 | ) | | — | | | (.88 | ) | | — | ** | | 14.27 | | | 13.61 | |
| 2009(d) | | | 14.31 | | | .50 | | | (1.41 | ) | | (.11 | ) | | (.03 | ) | | (1.05 | ) | | (.36 | ) | | (.18 | ) | | (.54 | ) | | — | ** | | 12.72 | | | 10.78 | |
| Year Ended 8/31: | | | | | | | | | | | | | | | | | | | | | | | | | | | | | | | | | | | | | |
| 2008 | | | 14.75 | | | 1.01 | | | (.42 | ) | | (.26 | ) | | (.02 | ) | | .31 | | | (.70 | ) | | (.05 | ) | | (.75 | ) | | — | | | 14.31 | | | 12.88 | |
| (a) | The amounts shown are based on Common share equivalents. |
| (b) | Total Return Based on Market Value is the combination of changes in the market price per share and the effect of reinvested dividend income and reinvested capital gains distributions, if any, at the average price paid per share at the time of reinvestment. The last dividend declared in the period, which is typically paid on the first business day of the following month, is assumed to be reinvested at the ending market price. The actual reinvestment for the last dividend declared in the period may take place over several days, and in some instances may not be based on the market price, so the actual reinvestment price may be different from the price used in the calculation. Total returns are not annualized. |
| | Total Return Based on Common Share Net Asset Value is the combination of changes in Common share net asset value, reinvested dividend income at net asset value and reinvested capital gains distributions at net asset value, if any. The last dividend declared in the period, which is typically paid on the first business day of the following month, is assumed to be reinvested at the ending net asset value. The actual reinvest price for the last dividend declared in the period may often be based on the Fund’s market price (and not its net asset value), and therefore may be different from the price used in the calculation. Total returns are not annualized. |
| | | | | | | Ratios/Supplemental Data | |
| Total Returns | | | | | | Ratios to Average Net Assets Applicable to Common Shares(c) | | | | |
Based
on
Market
Value | (b) | | Based on
Common
Share
Net Asset
Value | (b) | | Ending
Net Assets
Applicable to
Common
Shares (000) | | | Expenses | (e) | | Net
Investment
Income (Loss) | | | Portfolio
Turnover Rate | |
| | | | | | | | | | | | | | | | | |
| 8.22 | % | | 12.17 | % | $ | 220,107 | | | 1.96 | % | | 5.30 | % | | 18 | % |
| 36.87 | | | 25.20 | | | 207,815 | | | 1.74 | | | 6.77 | | | 11 | |
| 3.41 | | | (.84 | ) | | 177,474 | | | 1.36 | | | 7.15 | | | 16 | |
| 23.89 | | | 18.21 | | | 190,883 | | | 1.29 | | | 7.72 | | | 11 | |
| (10.59 | ) | | (7.70 | ) | | 171,836 | | | 1.47 | * | | 7.87 | * | | 6 | |
| .53 | | | 1.78 | | | 194,772 | | | 1.39 | | | 6.77 | | | 15 | |
| | | | | | | | | | | | | | | | | |
| | | | | | | | | | | | | | | | | |
| 9.70 | | | 12.89 | | | 387,748 | | | 1.51 | | | 5.94 | | | 10 | |
| 38.89 | | | 28.60 | | | 363,833 | | | 1.64 | | | 7.03 | | | 16 | |
| (.41 | ) | | (1.82 | ) | | 302,548 | | | 1.50 | | | 7.18 | | | 17 | |
| 35.21 | | | 19.60 | | | 329,544 | | | 1.24 | | | 7.91 | | | 10 | |
| (11.80 | ) | | (7.09 | ) | | 294,019 | | | 1.39 | * | | 8.08 | * | | 6 | |
| (2.52 | ) | | 2.07 | | | 330,915 | | | 1.32 | | | 6.90 | | | 13 | |
| (c) | Ratios do not reflect the effect of dividend payments to Auction Rate Preferred shareholders, where applicable; Net Investment Income (Loss) ratios reflect income earned and expenses incurred on assets attributable to ARPS and/or VRDP Shares, where applicable. |
| (d) | For the six months ended February 28, 2009. |
| (e) | The expense ratios reflect, among other things, all interest expense and other costs related to VRDP Shares and/or the interest expense deemed to have been paid by the Fund on the floating rate certificates issued by the special purpose trusts for the self-deposited inverse floaters held by the Fund, where applicable, both as described in Footnote 1 – General Information and Significant Accounting Policies, Variable Rate Demand Preferred Shares and Inverse Floating Rate Securities, respectively, as follows: |
| California Investment Quality (NQC) | | | | |
| Year Ended 2/28–2/29: | | | | |
| 2013 | | | .81 | % |
| 2012 | | | .65 | |
| 2011 | | | .20 | |
| 2010 | | | .06 | |
| 2009(d) | | | .17 | * |
| Year Ended 8/31: | | | | |
| 2008 | | | .15 | |
| * | Annualized. |
| ** | Rounds to less than $.01 per share. |
| | | | | |
| California Select Quality (NVC) | | | | |
| Year Ended 2/28–2/29: | | | | |
| 2013 | | | .51 | % |
| 2012 | | | .62 | |
| 2011 | | | .41 | |
| 2010 | | | .05 | |
| 2009(d) | | | .11 | * |
| Year Ended 8/31: | | | | |
| 2008 | | | .10 | |
See accompanying notes to financial statements.
| | | Financial |
| | | Highlights (continued) |
| | | |
| | | Selected data for a Common share outstanding throughout each period: |
| | | | | | | Investment Operations | | | Less Distributions | | | | | | | | | | |
| | | | Beginning Common Share Net Asset Value | | | Net Investment Income (Loss) | | | Net Realized/ Unrealized Gain (Loss) | | | Distributions from Net Investment Income to Auction Rate Preferred Shareholders | (a) | | Distributions from Accumulated Net Realized Gains to Auction Rate Preferred Shareholders | (a) | | Total | | | From Net Investment Income to Common Shareholders | | | From Accumulated Net Realized Gains to Common Shareholders | | | Total | | | Discount from Common Shares Repurchased and Retired | | | Ending Common Share Net Asset Value | | | Ending Market Value | |
| California Quality Income (NUC) | | | | | | | | | | | | | | | | | | | | | | | | | | | | | | | |
| Year Ended 2/28–2/29: | | | | | | | | | | | | | | | | | | | | | | | | | | | | | | | |
| 2013 | | $ | 15.95 | | $ | 1.00 | | $ | .74 | | $ | — | | $ | — | | $ | 1.74 | | $ | (1.04 | ) | $ | — | | $ | (1.04 | ) | $ | — | | $ | 16.65 | | $ | 17.16 | |
| 2012 | | | 13.62 | | | 1.03 | | | 2.32 | | | — | | | — | | | 3.35 | | | (1.02 | ) | | — | | | (1.02 | ) | | — | | | 15.95 | | | 16.84 | |
| 2011 | | | 14.58 | | | 1.04 | | | (1.01 | ) | | (.02 | ) | | — | | | .01 | | | (.97 | ) | | — | | | (.97 | ) | | — | | | 13.62 | | | 12.92 | |
| 2010 | | | 13.29 | | | 1.10 | | | 1.13 | | | (.03 | ) | | (.02 | ) | | 2.18 | | | (.89 | ) | | — | | | (.89 | ) | | — | ** | | 14.58 | | | 13.64 | |
| 2009(d) | | | 14.73 | | | .52 | | | (1.28 | ) | | (.12 | ) | | (.03 | ) | | (.91 | ) | | (.37 | ) | | (.16 | ) | | (.53 | ) | | — | ** | | 13.29 | | | 11.21 | |
| Year Ended 8/31: | | | | | | | | | | | | | | | | | | | | | | | | | | | | | | | | | | | | | |
| 2008 | | | 14.93 | | | 1.04 | | | (.23 | ) | | (.29 | ) | | — | | | .52 | | | (.72 | ) | | — | | | (.72 | ) | | — | | | 14.73 | | | 13.08 | |
| (a) | The amounts shown are based on Common share equivalents. |
| (b) | Total Return Based on Market Value is the combination of changes in the market price per share and the effect of reinvested dividend income and reinvested capital gains distributions, if any, at the average price paid per share at the time of reinvestment. The last dividend declared in the period, which is typically paid on the first business day of the following month, is assumed to be reinvested at the ending market price. The actual reinvestment for the last dividend declared in the period may take place over several days, and in some instances may not be based on the market price, so the actual reinvestment price may be different from the price used in the calculation. Total returns are not annualized. |
| | Total Return Based on Common Share Net Asset Value is the combination of changes in Common share net asset value, reinvested dividend income at net asset value and reinvested capital gains distributions at net asset value, if any. The last dividend declared in the period, which is typically paid on the first business day of the following month, is assumed to be reinvested at the ending net asset value. The actual reinvest price for the last dividend declared in the period may often be based on the Fund’s market price (and not its net asset value), and therefore may be different from the price used in the calculation. Total returns are not annualized. |
| | | | | | | Ratios/Supplemental Data | |
| Total Returns | | | | | | Ratios to Average Net Assets Applicable to Common Shares(c) | | | | |
Based on Market Value | (b) | | Based on Common Share Net Asset Value | (b) | | Ending Net Assets Applicable to Common Shares (000) | | | Expenses | (e) | | Net Investment Income (Loss) | | | Portfolio Turnover Rate | |
| | | | | | | | | | | | | | | | | |
| 8.54 | % | | 11.21 | % | $ | 368,298 | | | 1.57 | % | | 6.10 | % | | 14 | % |
| 39.70 | | | 25.46 | | | 351,377 | | | 1.71 | | | 7.05 | | | 11 | |
| 1.41 | | | (.17 | ) | | 299,609 | | | 1.55 | | | 7.12 | | | 16 | |
| 30.22 | | | 16.84 | | | 320,561 | | | 1.26 | | | 7.85 | | | 11 | |
| (9.94 | ) | | (5.94 | ) | | 292,373 | | | 1.37 | * | | 8.00 | * | | 6 | |
| | | | | | | | | | | | | | | | | |
| (2.12 | ) | | 3.51 | | | 324,354 | | | 1.33 | | | 6.93 | | | 10 | |
| (c) | Ratios do not reflect the effect of dividend payments to Auction Rate Preferred shareholders, where applicable; Net Investment Income (Loss) ratios reflect income earned and expenses incurred on assets attributable to ARPS and/or VRDP Shares, where applicable. |
| (d) | For the six months ended February 28, 2009. |
| (e) | The expense ratios reflect, among other things, all interest expense and other costs related to VRDP Shares and/or the interest expense deemed to have been paid by the Fund on the floating rate certificates issued by the special purpose trusts for the self-deposited inverse floaters held by the Fund, where applicable, both as described in Footnote 1 – General Information and Significant Accounting Policies, Variable Rate Demand Preferred Shares and Inverse Floating Rate Securities, respectively, as follows: |
| California Quality Income (NUC) | | | | |
| Year Ended 2/28–2/29: | | | | |
| 2013 | | | .53 | % |
| 2012 | | | .66 | |
| 2011 | | | .44 | |
| 2010 | | | .06 | |
| 2009(d) | | | .10 | * |
| Year Ended 8/31: | | | | |
| 2008 | | | .10 | |
| * | Annualized. |
| ** | Rounds to less than $.01 per share. |
See accompanying notes to financial statements.
| | | Financial |
| | | Highlights (continued) |
| | | | ARPS at the End of Period | | | VRDP Shares at the End of Period | |
| | | | Aggregate
Amount
Outstanding
(000 | ) | | Asset
Coverage
Per $25,000
Share | | | Aggregate
Amount
Outstanding
(000) | | | Asset
Coverage Per $100,000 Share | |
| California Performance Plus (NCP) | | | | | | | | | | | | | |
| Year Ended 2/28–2/29: | | | | | | | | | | | | | |
| 2013 | | $ | — | | $ | — | | $ | 91,000 | | $ | 329,326 | |
| 2012 | | | — | | | — | | | 81,000 | | | 346,431 | |
| 2011 | | | — | | | — | | | 81,000 | | | 308,148 | |
| 2010 | | | 91,175 | | | 74,920 | | | — | | | — | |
| 2009(d) | | | 91,175 | | | 69,865 | | | — | | | — | |
| Year Ended 8/31: | | | | | | | | | | | | | |
| 2008 | | | 105,075 | | | 68,765 | | | — | | | — | |
| | | | | | | | | | | | | | |
| California Opportunity (NCO) | | | | | | | | | | | | | |
| Year Ended 2/28–2/29: | | | | | | | | | | | | | |
| 2013 | | | — | | | — | | | 49,800 | | | 370,723 | |
| 2012 | | | — | | | — | | | 49,800 | | | 355,245 | |
| 2011 | | | — | | | — | | | 49,800 | | | 308,695 | |
| 2010 | | | 48,775 | | | 83,979 | | | — | | | — | |
| 2009(d) | | | 58,900 | | | 69,771 | | | — | | | — | |
| Year Ended 8/31: | | | | | | | | | | | | | |
| 2008 | | | 68,000 | | | 68,002 | | | — | | | — | |
| | | | | | | | | | | | | | |
| California Investment Quality (NQC) | | | | | | | | | | | | | |
| Year Ended 2/28–2/29: | | | | | | | | | | | | | |
| 2013 | | | — | | | — | | | 105,600 | | | 308,435 | |
| 2012 | | | — | | | — | | | 95,600 | | | 317,380 | |
| 2011 | | | — | | | — | | | 95,600 | | | 285,643 | |
| 2010 | | | 94,925 | | | 75,272 | | | — | | | — | |
| 2009(d) | | | 94,925 | | | 70,256 | | | — | | | — | |
| Year Ended 8/31: | | | | | | | | | | | | | |
| 2008 | | | 108,650 | | | 69,816 | | | — | | | — | |
| | | | | | | | | | | | | | |
| California Select Quality (NVC) | | | | | | | | | | | | | |
| Year Ended 2/28–2/29: | | | | | | | | | | | | | |
| 2013 | | | — | | | — | | | 158,900 | | | 344,020 | |
| 2012 | | | — | | | — | | | 158,900 | | | 328,970 | |
| 2011 | | | — | | | — | | | 158,900 | | | 290,401 | |
| 2010 | | | 158,025 | | | 77,135 | | | — | | | — | |
| 2009(d) | | | 164,150 | | | 69,779 | | | — | | | — | |
| Year Ended 8/31: | | | | | | | | | | | | | |
| 2008 | | | 176,375 | | | 71,905 | | | — | | | — | |
| | | | ARPS at the End of Period | | | VRDP Shares at the End of Period | |
| | | | Aggregate
Amount
Outstanding
(000 | ) | | Asset
Coverage
Per $25,000
Share | | | Aggregate
Amount
Outstanding
(000) | | | Asset
Coverage
Per $100,000
Share | |
| California Quality Income (NUC) | | | | | | | | | | | | | |
| Year Ended 2/28–2/29: | | | | | | | | | | | | | |
| 2013 | | $ | — | | $ | — | | $ | 158,100 | | $ | 332,952 | |
| 2012 | | | — | | | — | | | 158,100 | | | 322,250 | |
| 2011 | | | — | | | — | | | 158,100 | | | 289,506 | |
| 2010 | | | 157,225 | | | 75,972 | | | — | | | — | |
| 2009(d) | | | 165,025 | | | 69,292 | | | — | | | — | |
| Year Ended 8/31: | | | | | | | | | | | | | |
| 2008 | | | 176,900 | | | 70,839 | | | — | | | — | |
| (d) | For the six months ended February 28, 2009. |
See accompanying notes to financial statements.
| | | Notes to |
| | | Financial Statements |
1. General Information and Significant Accounting Policies
General Information
The funds covered in this report and their corresponding Common share stock exchange symbols are Nuveen California Municipal Value Fund, Inc. (NCA), Nuveen California Municipal Value Fund 2 (NCB), Nuveen California Performance Plus Municipal Fund, Inc. (NCP), Nuveen California Municipal Market Opportunity Fund, Inc. (NCO), Nuveen California Investment Quality Municipal Fund, Inc. (NQC), Nuveen California Select Quality Municipal Fund, Inc. (NVC) and Nuveen California Quality Income Municipal Fund, Inc. (NUC) (each a “Fund” and collectively, the “Funds”). Common shares of California Value (NCA), California Performance Plus (NCP), California Opportunity (NCO), California Investment Quality (NQC), California Select Quality (NVC) and California Quality Income (NUC) are traded on the New York Stock Exchange (“NYSE”) while Common shares of California Value 2 (NCB) are traded on the NYSE MKT. The Funds are registered under the Investment Company Act of 1940, as amended, as diversified (non-diversified for California Municipal Value 2 (NCB)) closed-end registered investment companies.
On December 31, 2012, the Funds’ investment adviser converted from a Delaware corporation to a Delaware limited liability company. As a result, Nuveen Fund Advisors, Inc., a wholly-owned subsidiary of Nuveen Investments, Inc. (“Nuveen”), changed its name to Nuveen Fund Advisors, LLC (the “Adviser”). There were no changes to the identities or roles of any personnel as a result of the change.
Each Fund seeks to provide current income exempt from both regular federal and California state income taxes by investing primarily in a portfolio of municipal obligations issued by state and local government authorities within the state of California or certain U.S. territories.
Significant Accounting Policies
The following is a summary of significant accounting policies followed by the Funds in the preparation of their financial statements in accordance with U.S. generally accepted accounting principles (“U.S. GAAP”).
Investment Valuation
Prices of municipal bonds and swap contracts are provided by a pricing service approved by the Funds’ Board of Directors/Trustees. These securities are generally classified as Level 2 for fair value measurement purposes. The pricing service establishes a security’s fair value using methods that may include consideration of the following: yields or prices of investments of comparable quality, type of issue, coupon, maturity and rating, market quotes or indications of value from security dealers, evaluations of anticipated cash flows or collateral, general market conditions and other information and analysis, including the obligor’s credit characteristics considered relevant. In pricing certain securities, particularly less liquid and lower quality securities, the pricing service may consider information about a security, its issuer, or market activity, provided by the Adviser. These securities are generally classified as Level 2 or Level 3 depending on the priority of the significant inputs.
Certain securities may not be able to be priced by the pre-established pricing methods as described above. Such securities may be valued by the Funds’ Board of Directors/Trustees or its designee at fair value. These securities generally include, but are not limited to, restricted securities (securities which may not be publicly sold without registration under the Securities Act of 1933, as amended) for which a pricing service is unable to provide a market price; securities whose trading has been formally suspended; debt securities that have gone into default and for which there is no current market quotation; a security whose market price is not available from a pre-established pricing source; a security with respect to which an event has occurred that is likely to materially affect the value of the security after the market has closed but before the calculation of a Fund’s net asset value (as may be the case in non-U.S. markets on which the security is primarily traded) or make it difficult or impossible to obtain a reliable market quotation; and a security whose price, as provided by the pricing service, is not deemed to reflect the security’s fair value. As a general principle, the fair value of a security would appear to be the amount that the owner might reasonably expect to receive for it in a current sale. A variety of factors may be considered in determining the fair value of such securities, which may include consideration of the following: yields or prices of investments of comparable quality, type of issue, coupon, maturity and rating, market quotes or indications of value from security dealers, evaluations of anticipated cash flows or collateral, general market conditions and other information and analysis, including the obligor’s credit characteristics considered relevant. These securities are generally classified as Level 2 or Level 3 depending on the priority of the significant inputs. Regardless of the method employed to value a particular security, all valuations are subject to review by the Funds’ Board of Directors/Trustees or its designee.
Refer to Footnote 2 – Fair Value Measurements for further details on the leveling of securities held by the Funds as of the end of the reporting period.
Investment Transactions
Investment transactions are recorded on a trade date basis. Realized gains and losses from transactions are determined on the specific identification method, which is the same basis used for federal income tax purposes. Investments purchased on a when-issued/delayed delivery basis may have extended settlement periods. Any investments so purchased are subject to market fluctuation during this period. The Funds have instructed the custodian to earmark securities in the Funds’ portfolios with a current value at least equal to the amount of the when-issued/delayed delivery purchase commitments. As of February 28, 2013, California Opportunity (NCO) and California Select Quality (NVC) had outstanding when-issued/delayed delivery purchase commitments of $1,455,077 and $6,337,268, respectively. There where no such outstanding purchase commitments in any of the other Funds.
Investment Income
Interest income, which reflects the amortization of premiums and includes accretion of discounts for financial reporting purposes, is recorded on an accrual basis. Investment income also reflects paydown gains and losses, if any.
Professional Fees
Professional fees presented on the Statement of Operations consist of legal fees incurred in the normal course of operations, audit fees, tax consulting fees and, in some cases, workout expenditures. Workout expenditures are incurred in an attempt to protect or enhance an investment, or to pursue other claims or legal actions on behalf of Fund shareholders. Legal fee refund presented on the Statement of Operations reflects a refund of workout expenditures paid in a prior reporting period, when applicable.
Income Taxes
Each Fund is a separate taxpayer for federal income tax purposes. Each Fund intends to distribute substantially all of its net investment income and net capital gains to shareholders and to otherwise comply with the requirements of Subchapter M of the Internal Revenue Code applicable to regulated investment companies. Therefore, no federal income tax provision is required. Furthermore, each Fund intends to satisfy conditions that will enable interest from municipal securities, which is exempt from regular federal and California state income taxes, to retain such tax-exempt status when distributed to shareholders of the Funds. Net realized capital gains and ordinary income distributions paid by the Funds are subject to federal taxation.
For all open tax years and all major taxing jurisdictions, management of the Funds has concluded that there are no significant uncertain tax positions that would require recognition in the financial statements. Open tax years are those that are open for examination by taxing authorities (i.e., generally the last four tax year ends and the interim tax period since then). Furthermore, management of the Funds is also not aware of any tax positions for which it is reasonably possible that the total amounts of unrecognized tax benefits will significantly change in the next twelve months.
Dividends and Distributions to Common Shareholders
Dividends from net investment income are declared monthly. Net realized capital gains and/or market discount from investment transactions, if any, are distributed to shareholders at least annually. Furthermore, capital gains are distributed only to the extent they exceed available capital loss carryforwards.
Distributions to Common shareholders of net investment income, net realized capital gains and/or market discount, if any, are recorded on the ex-dividend date. The amount and timing of distributions are determined in accordance with federal income tax regulations, which may differ from U.S. GAAP.
Auction Rate Preferred Shares
Each Fund, except California Value (NCA) and California Value 2 (NCB), is authorized to issue Auction Rate Preferred Shares (“ARPS”). As of February 28, 2011, the Funds redeemed all of their outstanding ARPS, at liquidation value.
Variable Rate Demand Preferred Shares
The following Funds have issued and outstanding Variable Rate Demand Preferred (“VRDP”) Shares, with a $100,000 liquidation value per share. California Performance Plus (NCP), California Opportunity (NCO), California Investment Quality (NQC), California Select Quality (NVC) and California Quality Income (NUC) issued their VRDP Shares in a privately negotiated offering. The VRDP Shares were offered to qualified institutional buyers pursuant to Rule 144A under the Securities Act of 1933.
California Performance Plus (NCP) issued an additional 100 VRDP Shares through a private negotiated offering during the fiscal year ended February 28, 2013. California Investment Quality (NQC) exchanged all 956 Series 1 VRDP Shares for 956 Series 2 VRDP Shares and issued an additional 100 Series 2 VRDP Shares through a private negotiated offering during the fiscal year ended February 28, 2013. In conjunction with California Investment Quality’s (NQC) exchange of VRDP Shares, the remaining deferred offering costs of $545,804 for Series 1 VRDP Shares were fully expensed during the fiscal year ended February 28, 2013 as the exchange was deemed an extinguishment of debt. Offering costs of $385,000 were incurred with the issue of Series 2 VRDP Shares, which are being amortized over the life of the shares.
| | | Notes to |
| | | Financial Statements (continued) |
As of February 28, 2013, the number of VRDP Shares outstanding and maturity date for each Fund are as follows:
| | | California
Performance
Plus (NCP | ) | California
Opportunity
(NCO | ) | California
Investment
Quality (NQC | ) | California
Select Quality
(NVC | ) | California
Quality
Income (NUC | ) |
| Series | | 1 | | 1 | | 2 | | 1 | | 1 | |
| VRDP Shares outstanding | | 910 | | 498 | | 1,056 | | 1,589 | | 1,581 | |
| Maturity | | December 1, 2040 | | March 1, 2040 | | December 1, 2042 | | August 1, 2040 | | August 1, 2040 | |
VRDP Shares include a liquidity feature that allows VRDP shareholders to have their shares purchased by a liquidity provider with whom each Fund has contracted in the event that purchase orders for VRDP Shares in a remarketing are not sufficient in number to be matched with the sale orders in that remarketing. Each Fund is required to redeem any VRDP Shares that are still owned by the liquidity provider after six months of continuous, unsuccessful remarketing. Each Fund pays an annual remarketing fee of .10% on the aggregate principal amount of all VRDP Shares outstanding. Each Fund’s VRDP Shares have successfully remarketed since issuance.
Dividends on the VRDP Shares (which are treated as interest payments for financial reporting purposes) are set weekly at a rate established by a remarketing agent; therefore, the market value of the VRDP Shares is expected to approximate its liquidation value. If remarketings for VRDP Shares are continuously unsuccessful for six months, the maximum rate is designed to escalate according to a specified schedule in order to enhance the remarketing agent’s ability to successfully remarket the VRDP Shares.
Subject to certain conditions, VRDP Shares may be redeemed, in whole or in part, at any time at the option of each Fund. Each Fund may also redeem certain of the VRDP Shares if the Fund fails to maintain certain asset coverage requirements and such failures are not cured by the applicable cure date. The redemption price per share is equal to the sum of the liquidation value per share plus any accumulated but unpaid dividends.
The average liquidation value of VRDP Shares outstanding and annualized dividend rate of VRDP Shares for each Fund during the fiscal year ended February 28, 2013, were as follows:
| | | California
Performance
Plus (NCP | ) | California
Opportunity
(NCO | ) | California
Investment
Quality (NQC | ) | California
Select
Quality (NVC | ) | California Quality Income (NUC | ) |
| Average liquidation value of VRDP Shares outstanding | | $81,986,301 | | $49,800,000 | | $97,545,205 | | $158,900,000 | | $158,100,000 | |
| Annualized dividend rate | | 0.26% | | 0.29% | | 0.27% | | 0.27% | | 0.27% | |
For financial reporting purposes only, the liquidation value of VRDP Shares is recognized as a liability on the Statement of Assets and Liabilities. Unpaid dividends on VRDP Shares are recognized as a component of “Interest payable” on the Statement of Assets and Liabilities, when applicable. Costs incurred by the Funds in connection with their offerings of VRDP Shares were recorded as a deferred charge, which are amortized over the life of the shares and are recognized as a component of “Deferred offering costs” on the Statement of Assets and Liabilities and “Interest expense and amortization of offerings costs” on the Statement of Operations. California Performance Plus (NCP) and California Investment Quality (NQC) incurred $360,000 and $930,804 of offering costs, respectively, in conjunction with their shares issued during the fiscal year ended February 28, 2013. Dividends paid on the VRDP Shares are recognized as a component of “Interest expense and amortization of offering costs” on the Statement of Operations. In addition to interest expense, each Fund also pays a per annum liquidity fee to the liquidity provider as well as a remarketing fee, which are recognized as “Liquidity fees” and “Remarketing fees”, respectively, on the Statement of Operations.
Inverse Floating Rate Securities
Each Fund is authorized to invest in inverse floating rate securities. An inverse floating rate security is created by depositing a municipal bond, typically with a fixed interest rate, into a special purpose trust created by a broker-dealer. In turn, this trust (a) issues floating rate certificates, in face amounts equal to some fraction of the deposited bond’s par amount or market value, that typically pay short-term tax-exempt interest rates to third parties, and (b) issues to a long-term investor (such as one of the Funds) an inverse floating rate certificate (sometimes referred to as an “inverse floater”) that represents all remaining or residual interest in the trust. The income received by the inverse floater holder varies inversely with the short-term rate paid to the floating rate certificates’ holders, and in most circumstances the inverse floater holder bears substantially all of the underlying bond’s downside investment risk and also benefits disproportionately from any potential appreciation of the underlying bond’s value. The price of an inverse floating rate security will be more volatile than that of the underlying bond because the interest rate is dependent on not only the fixed coupon rate of the underlying bond but also on the short-term interest paid on the floating rate certificates, and because the inverse floating rate security essentially bears the risk of loss of the greater face value of the underlying bond.
A Fund may purchase an inverse floating rate security in a secondary market transaction without first owning the underlying bond (referred to as an “externally-deposited inverse floater”), or instead by first selling a fixed-rate bond to a broker-dealer for deposit into the special purpose trust and receiving in turn the residual interest in the trust (referred to as a “self-deposited inverse floater”). The inverse floater held by a Fund gives the Fund the
right (a) to cause the holders of the floating rate certificates to tender their notes at par, and (b) to have the broker transfer the fixed-rate bond held by the trust to the Fund, thereby collapsing the trust. An investment in an externally-deposited inverse floater is identified in the Portfolio of Investments as “(IF) – Inverse floating rate investment.” An investment in a self-deposited inverse floater is accounted for as a financing transaction. In such instances, a fixed-rate bond deposited into a special purpose trust is identified in the Portfolio of Investments as “(UB) – Underlying bond of an inverse floating rate trust reflected as a financing transaction,” with the Fund accounting for the short-term floating rate certificates issued by the trust as “Floating rate obligations” on the Statement of Assets and Liabilities. In addition, the Fund reflects in “Investment Income” the entire earnings of the underlying bond and the related interest paid to the holders of the short-term floating rate certificates as a component of “Interest expense and amortization of offering costs” on the Statement of Operations.
During the fiscal year ended February 28, 2013, each Fund invested in externally-deposited inverse floaters and/or self-deposited inverse floaters. Each Fund may also enter into shortfall and forbearance agreements (sometimes referred to as a “recourse trust” or “credit recovery swap”) (such agreements referred to herein as “Recourse Trusts”) with a broker-dealer by which a Fund agrees to reimburse the broker-dealer, in certain circumstances, for the difference between the liquidation value of the fixed-rate bond held by the trust and the liquidation value of the floating rate certificates issued by the trust plus any shortfalls in interest cash flows. Under these agreements, a Fund’s potential exposure to losses related to or on inverse floaters may increase beyond the value of a Fund’s inverse floater investments as a Fund may potentially be liable to fulfill all amounts owed to holders of the floating rate certificates. At period end, any such shortfall is recognized as “Unrealized depreciation on Recourse Trusts” on the Statement of Assets and Liabilities.
At February 28, 2013, each Fund’s maximum exposure to externally-deposited Recourse Trusts was as follows:
| | | | | | | | | | California | | | | | | California | | | California | | | California | |
| | | | California | | | California | | | Performance | | | California | | | Investment | | | Select | | | Quality | |
| | | | Value | | | Value 2 | | | Plus | | | Opportunity | | | Quality | | | Quality | | | Income | |
| | | | (NCA | ) | | (NCB | ) | | (NCP | ) | | (NCO | ) | | (NQC | ) | | (NVC | ) | | (NUC | ) |
| Maximum exposure to Recourse Trusts | | | $ — | | | $ — | | | $7,500,000 | | | $ — | | | $ — | | | $15,295,000 | | | $7,815,000 | |
The average floating rate obligations outstanding and average annual interest rate and fees related to self-deposited inverse floaters for the following Funds during the fiscal year ended February 28, 2013, were as follows:
| | | | California
Value (NCA | ) | | California Performance
Plus (NCP | ) | | California Opportunity
(NCO | ) | | California
Investment Quality (NQC | ) | | California Select Quality (NVC | ) | | California Quality Income (NUC | ) |
| Average floating rate obligations outstanding | | $ | 4,490,000 | | $ | 6,492,329 | | $ | 4,285,000 | | $ | 7,503,822 | | $ | 14,590,822 | | $ | 25,520,411 | |
| Average annual interest rate and fees | | | 0.63% | | | 0.68% | | | 0.57% | | | 0.61% | | | 0.57% | | | 0.68% | |
Swap Contracts
Each Fund is authorized to enter into interest rate swap and forward interest rate swap contracts (“swap contracts”) consistent with their investment objectives and policies to reduce, increase or otherwise alter its risk profile or to alter its portfolio characteristics (i.e. duration, yield curve positioning and credit quality). Each Fund is subject to interest rate risk in the normal course of pursuing its investment. Each Fund’s use of swap contracts is intended to help the Fund manage its overall interest rate sensitivity, either shorter or longer, generally to more closely align the Fund’s interest rate sensitivity with that of the broader market.
Interest rate swap contracts involve each Fund’s agreement with the counterparty to pay or receive a fixed rate payment in exchange for the counterparty receiving or paying a variable rate payment. Forward interest rate swap transactions involve a Fund’s agreement with a counterparty to pay, in the future, a fixed or variable rate payment in exchange for the counterparty paying a Fund a variable or fixed rate payment, the accruals for which would begin at a specified date in the future (the “effective date”). Accordingly, the risk of loss with respect to the swap counterparty on such transactions is limited to the net amount of interest payments that each Fund is to receive. The payment obligation is based on the notional amount of the swap contract and the termination date of the swap (which is akin to a bond’s maturity). The value of a Fund’s swap contract would increase or decrease based primarily on the extent to which long-term interest rates for bonds having a maturity of the swap contract’s termination date increase or decrease. Swap contracts are valued daily. Upon entering into an interest rate swap (and beginning on the effective date for a forward interest rate swap), each Fund accrues the fixed rate payment expected to be paid or received and the variable rate payment expected to be received or paid on a daily basis, and recognizes the daily change in the market value of the Fund’s contractual rights and obligations under the contracts. The net amount recorded for these transactions for each counterparty is recognized on the Statement of Assets and Liabilities as a component of “Unrealized appreciation or depreciation on swaps (,net)” with the change during the fiscal period recognized on the Statement of Operations as a component of “Change in net unrealized appreciation (depreciation) of swaps.” Income received or paid by each Fund is recognized as a component of “Net realized gain (loss) from swaps” on the Statement of Operations, in addition to the net realized gains or losses recognized upon the termination of an interest
| | | Notes to |
| | | Financial Statements (continued) |
rate swap contract, and are equal to the difference between the Fund’s basis in the interest rate swap and the proceeds from (or cost of) the closing transaction. Payments received or made at the beginning of the measurement period are recognized as a component of “Swap premiums paid and/or received” on the Statement of Assets and Liabilities, when applicable. For tax purposes, periodic payments are treated as ordinary income or expense.
Each Fund may terminate a swap contract prior to the effective date, at which point a realized gain or loss is recognized. When a swap contract is terminated, it ordinarily does not involve the delivery of securities or other underlying assets or principal, but rather is settled in cash on a net basis. Once periodic payments are settled in cash, they are combined with the net realized gain or loss recorded upon the termination of the swap contracts.
During the fiscal year ended February 28, 2013, California Value 2 (NCB) continued to use swap contracts to manage the duration of the Fund’s portfolio and to reduce sensitivity to movements in U.S. interest rates. During the fiscal year ended February 28, 2013, swap contracts were utilized to shorten the duration of the Fund’s portfolio. The average notional amount of swap contracts outstanding during the fiscal year ended February 28, 2013, was as follows:
| | | | California Value 2 (NCB | ) |
| Average notional amount of swap contracts outstanding* | | $ | 1,200,000 | |
| * | The average notional amount is calculated based on the outstanding notional at the beginning of the fiscal year and at the end of each fiscal quarter within the current fiscal year. |
Refer to Footnote 3 – Derivative Instruments and Hedging Activities for further details on swap contract activity.
Market and Counterparty Credit Risk
In the normal course of business each Fund may invest in financial instruments and enter into financial transactions where risk of potential loss exists due to changes in the market (market risk) or failure of the other party to the transaction to perform (counterparty credit risk). The potential loss could exceed the value of the financial assets recorded on the financial statements. Financial assets, which potentially expose each Fund to counterparty credit risk, consist principally of cash due from counterparties on forward, option and swap transactions, when applicable. The extent of each Fund’s exposure to counterparty credit risk in respect to these financial assets approximates their carrying value as recorded on the Statement of Assets and Liabilities. Futures contracts, when applicable, expose a Fund to minimal counterparty credit risk as they are exchange traded and the exchange’s clearinghouse, which is counterparty to all exchange traded futures, guarantees the futures contracts against default.
Each Fund helps manage counterparty credit risk by entering into agreements only with counterparties the Adviser believes have the financial resources to honor their obligations and by having the Adviser monitor the financial stability of the counterparties. Additionally, counterparties may be required to pledge collateral daily (based on the daily valuation of the financial asset) on behalf of each Fund with a value approximately equal to the amount of any unrealized gain above a pre-determined threshold. Reciprocally, when each Fund has an unrealized loss, the Funds have instructed the custodian to pledge assets of the Funds as collateral with a value approximately equal to the amount of the unrealized loss above a pre-determined threshold. Collateral pledges are monitored and subsequently adjusted if and when the valuations fluctuate, either up or down, by at least the pre-determined threshold amount.
Zero Coupon Securities
Each Fund is authorized to invest in zero coupon securities. A zero coupon security does not pay a regular interest coupon to its holders during the life of the security. Income to the holder of the security comes from accretion of the difference between the original purchase price of the security at issuance and the par value of the security at maturity and is effectively paid at maturity. The market prices of zero coupon securities generally are more volatile than the market prices of securities that pay interest periodically.
Common Shares Shelf Offering and Shelf Offering Costs
During the current reporting period, the following Funds each filed initial registration statements with the Securities and Exchange Commission (“SEC”) authorizing the Funds to issue additional Common shares through equity shelf programs (“Shelf Offerings”), which are not yet effective.
Additional Common shares to be issued through each Fund’s Shelf Offering are as follows:
| | Additional |
| Fund | Common Shares |
| California Value (NCA) | 2,500,000 |
| California Performance Plus (NCP) | 1,200,000 |
| California Investment Quality (NQC) | 1,300,000 |
| California Select Quality (NVC) | 2,300,000 |
| California Quality Income (NUC) | 2,200,000 |
Under these Shelf Offerings, the Funds, subject to market conditions, may raise additional equity capital from time to time in varying amounts and offering methods at a net price at or above each Fund’s net asset value (“NAV”) per Common share.
Costs incurred by the Funds in connection with their initial Shelf Offerings are recorded as a deferred charge, which will be amortized over the period such additional Common shares are sold not to exceed the one-year life of the Shelf Offering period. Ongoing Shelf Offering costs, and any additional costs the Funds may incur in connection with the Shelf Offerings, are expensed as incurred.
Indemnifications
Under the Funds’ organizational documents, their officers and directors/trustees are indemnified against certain liabilities arising out of the performance of their duties to the Funds. In addition, in the normal course of business, the Funds enter into contracts that provide general indemnifications to other parties. The Funds’ maximum exposure under these arrangements is unknown as this would involve future claims that may be made against the Funds that have not yet occurred. However, the Funds have not had prior claims or losses pursuant to these contracts and expect the risk of loss to be remote.
Use of Estimates
The preparation of financial statements in conformity with U.S. GAAP requires management to make estimates and assumptions that affect the reported amounts of assets and liabilities at the date of the financial statements and the reported amounts of increases and decreases in net assets applicable to Common shares from operations during the reporting period. Actual results may differ from those estimates.
2. Fair Value Measurements
Fair value is defined as the price that the Funds would receive upon selling an investment or transferring a liability in an orderly transaction to an independent buyer in the principal or most advantageous market for the investment. A three-tier hierarchy is used to maximize the use of observable market data and minimize the use of unobservable inputs and to establish classification of fair value measurements for disclosure purposes. Observable inputs reflect the assumptions market participants would use in pricing the asset or liability. Observable inputs are based on market data obtained from sources independent of the reporting entity. Unobservable inputs reflect the reporting entity’s own assumptions about the assumptions market participants would use in pricing the asset or liability. Unobservable inputs are based on the best information available in the circumstances. The following is a summary of the three-tiered hierarchy of valuation input levels.
| | |
| Level 1 – | Inputs are unadjusted and prices are determined using quoted prices in active markets for identical securities. |
| Level 2 – | Prices are determined using other significant observable inputs (including quoted prices for similar securities, interest rates, prepayment speeds, credit risk, etc.). |
| Level 3 – | Prices are determined using significant unobservable inputs (including management’s assumptions in determining the fair value of investments). |
The inputs or methodologies used for valuing securities are not an indication of the risk associated with investing in those securities. The following is a summary of each Fund’s fair value measurements as of the end of the reporting period:
| | | | | | | | | | | | | | |
| California Value (NCA) | | | Level 1 | | | Level 2 | | | Level 3 | | | Total | |
| Long-Term Investments*: | | | | | | | | | | | | | |
| Municipal Bonds | | $ | — | | $ | 266,479,433 | | $ | — | | $ | 266,479,433 | |
| California Value 2 (NCB) | | | Level 1 | | | Level 2 | | | Level 3 | | | Total | |
| Long-Term Investments*: | | | | | | | | | | | | | |
| Municipal Bonds | | $ | — | | $ | 56,610,446 | | $ | — | | $ | 56,610,446 | |
| Derivatives: | | | | | | | | | | | | | |
| Swaps ** | | | — | | | (32,496 | ) | | — | | | (32,496 | ) |
| Total | | $ | — | | $ | 56,577,950 | | $ | — | | $ | 56,577,950 | |
| California Performance Plus (NCP) | | | Level 1 | | | Level 2 | | | Level 3 | | | Total | |
| Long-Term Investments*: | | | | | | | | | | | | | |
| Municipal Bonds | | $ | — | | $ | 301,298,705 | | $ | — | | $ | 301,298,705 | |
| California Opportunity (NCO) | | | Level 1 | | | Level 2 | | | Level 3 | | | Total | |
| Long-Term Investments*: | | | | | | | | | | | | | |
| Municipal Bonds | | $ | — | | $ | 187,407,543 | | $ | — | | $ | 187,407,543 | |
| California Investment Quality (NQC) | | | Level 1 | | | Level 2 | | | Level 3 | | | Total | |
| Long-Term Investments*: | | | | | | | | | | | | | |
| Municipal Bonds | | $ | — | | $ | 326,553,905 | | $ | — | | $ | 326,553,905 | |
| California Select Quality (NVC) | | | Level 1 | | | Level 2 | | | Level 3 | | | Total | |
| Long-Term Investments*: | | | | | | | | | | | | | |
| Municipal Bonds | | $ | — | | $ | 557,503,303 | | $ | — | | $ | 557,503,303 | |
| California Quality Income (NUC) | | | Level 1 | | | Level 2 | | | Level 3 | | | Total | |
| Long-Term Investments*: | | | | | | | | | | | | | |
| Municipal Bonds | | $ | — | | $ | 544,811,252 | | $ | — | | $ | 544,811,252 | |
| * | Refer to the Fund’s Portfolio of Investments for industry classifications. |
| ** | Represents net unrealized appreciation (depreciation) as reported in the Fund’s Portfolio of Investments. |
| | | Notes to |
| | | Financial Statements (continued) |
The Nuveen funds’ Board of Directors/Trustees is responsible for the valuation process and has delegated the oversight of the daily valuation process to the Adviser’s Valuation Committee. The Valuation Committee, pursuant to the valuation policies and procedures adopted by the Board of Directors/Trustees, is responsible for making fair value determinations, evaluating the effectiveness of the funds’ pricing policies, and reporting to the Board of Directors/Trustees. The Valuation Committee is aided in its efforts by the Adviser’s dedicated Securities Valuation Team, which is responsible for administering the daily valuation process and applying fair value methodologies as approved by the Valuation Committee. When determining the reliability of independent pricing services for investments owned by the funds, the Valuation Committee, among other things, conducts due diligence reviews of the pricing services and monitors the quality of security prices received through various testing reports conducted by the Securities Valuation Team.
The Valuation Committee will consider pricing methodologies it deems relevant and appropriate when making fair value determinations. Examples of possible methodologies include, but are not limited to, multiple of earnings; discount from market of a similar freely traded security; discounted cash-flow analysis; book value or a multiple thereof; risk premium/yield analysis; yield to maturity; and/or fundamental investment analysis. The Valuation Committee will also consider factors it deems relevant and appropriate in light of the facts and circumstances. Examples of possible factors include, but are not limited to, the type of security; the issuer’s financial statements; the purchase price of the security; the discount from market value of unrestricted securities of the same class at the time of purchase; analysts’ research and observations from financial institutions; information regarding any transactions or offers with respect to the security; the existence of merger proposals or tender offers affecting the security; the price and extent of public trading in similar securities of the issuer or comparable companies; and the existence of a shelf registration for restricted securities.
For each portfolio security that has been fair valued pursuant to the policies adopted by the Board of Directors/Trustees, the fair value price is compared against the last available and next available market quotations. The Valuation Committee reviews the results of such testing and fair valuation occurrences are reported to the Board of Directors/Trustees.
3. Derivative Instruments and Hedging Activities
The Funds record derivative instruments at fair value with changes in fair value recognized on the Statement of Operations, when applicable. Even though the Funds’ investments in derivatives may represent economic hedges, they are not considered to be hedge transactions for financial reporting purposes. For additional information on the derivative instruments in which each Fund was invested during and at the end of the reporting period, refer to the Portfolios of Investments, Financial Statements and Footnote 1 – General Information and Significant Accounting Policies.
The following table presents the fair value of all derivative instruments held by the Funds as of February 28, 2013, the location of these instruments on the Statement of Assets and Liabilities and the primary underlying risk exposure.
California Value 2 (NCB)
| | | | | Location on the Statement of Assets and Liabilities | |
| Underlying | | Derivative | | Asset Derivatives | | Liability Derivatives | |
| Risk Exposure | | Instrument | | Location | | Value | | Location | | Value | |
| Interest Rate | | Swaps | | | | | | Unrealized depreciation | | | |
| | | | | — | | $ — | | on swaps | | $(32,496 | ) |
The following tables present the amount of net realized gain (loss) and change in net unrealized appreciation (depreciation) recognized for the fiscal year ended February 28, 2013, on derivative instruments, as well as the primary risk exposure associated with each.
| | | | | |
| | | | California | |
| | | | Value 2 | |
| Net Realized Gain (Loss) from Swaps | | | (NCB | ) |
| Risk Exposure | | | | |
| Interest Rate | | $ | (661,714 | ) |
| | | | California | |
| | | | Value 2 | |
| Change in Net Unrealized Appreciation (Depreciation) of Swaps | | | (NCB | ) |
| Risk Exposure | | | | |
| Interest Rate | | $ | 701,797 | |
4. Fund Shares
Common Shares
The Funds have not repurchased any of their outstanding Common shares during the fiscal years ended February 28, 2013 and February 29, 2012.
Transactions in Common shares were as follows:
| | | | California Value (NCA) | | | California Value 2 (NCB) | |
| | | | Year | | | Year | | | Year | | | Year | |
| | | | Ended | | | Ended | | | Ended | | | Ended | |
| | | | 2/28/13 | | | 2/29/12 | | | 2/28/13 | | | 2/29/12 | |
| Common shares: | | | | | | | | | | | | | |
| Issued to shareholders due to reinvestment of distributions | | | 26,100 | | | — | | | — | | | — | |
| | | | California Performance Plus (NCP) | | | California Opportunity (NCO) | |
| | | | Year | | | Year | | | Year | | | Year | |
| | | | Ended | | | Ended | | | Ended | | | Ended | |
| | | | 2/28/13 | | | 2/29/12 | | | 2/28/13 | | | 2/29/12 | |
| Common shares: | | | | | | | | | | | | | |
| Issued to shareholders due to reinvestment of distributions | | | 56,706 | | | 15,794 | | | 20,931 | | | 2,083 | |
| | | | California Investment Quality (NQC) | | | California Select Quality (NVC) | |
| | | | Year | | | Year | | | Year | | | Year | |
| | | | Ended | | | Ended | | | Ended | | | Ended | |
| | | | 2/28/13 | | | 2/29/12 | | | 2/28/13 | | | 2/29/12 | |
| Common shares: | | | | | | | | | | | | | |
| Issued to shareholders due to reinvestment of distributions | | | 58,996 | | | 8,875 | | | 106,787 | | | 58,608 | |
| | | | California Quality Income (NUC) | |
| | | | Year | | | Year | |
| | | | Ended | | | Ended | |
| | | | 2/28/13 | | | 2/29/12 | |
| Common shares: | | | | | | | |
| Issued to shareholders due to reinvestment of distributions | | | 92,328 | | | 30,538 | |
Preferred Shares
Transactions in VRDP Shares were as follows:
| | | California Performance Plus (NCP) | | California Investment Quality (NQC) | |
| | | Year Ended 2/28/13 | | Year Ended 2/28/12 | | Year Ended 2/28/13 | | Year Ended 2/28/12 | |
| | | Shares | | Amount | | Shares | | Amount | | Shares | | Amount | | Shares | | Amount | |
| VRDP Shares issued: | | | | | | | | | | | | | | | | | |
| Series 1 | | 100 | | $ 10,000,000 | | — | | $ — | | — | | — | | — | | $ — | |
| Series 2 | | — | | — | | — | | — | | 100 | | $ 10,000,000 | | — | | — | |
| VRDP Shares exchanged: | | | | | | | | | | | | | | | | | |
| Series 1 | | — | | — | | — | | — | | (956) | | (95,600,000 | ) | — | | — | |
| Series 2 | | — | | — | | — | | — | | 956 | | 95,600,000 | | — | | — | |
| Total | | 100 | | $ 10,000,000 | | — | | — | | 100 | | $ 10,000,000 | | — | | — | |
5. Investment Transactions
Purchases and sales (including maturities but excluding short-term investments and derivative transactions, where applicable) during the fiscal year ended February 28, 2013, were as follows:
| | | | California Value (NCA | ) | | California Value 2 (NCB | ) | | California Performance Plus (NCP | ) | | California Opportunity (NCO | ) | | California Investment Quality (NQC | ) | | California Select Quality (NVC | ) | | California Quality Income (NUC | ) |
| Purchases | | $ | 43,117,050 | | $ | 3,762,247 | | $ | 43,037,094 | | $ | 24,490,715 | | $ | 59,716,353 | | $ | 62,701,960 | | $ | 77,446,934 | |
| Sales and maturities | | | 46,053,920 | | | 5,126,552 | | | 35,461,674 | | | 24,123,422 | | | 56,741,439 | | | 53,347,817 | | | 78,843,662 | |
| | | Notes to |
| | | Financial Statements (continued) |
6. Income Tax Information
The following information is presented on an income tax basis. Differences between amounts for financial statement and federal income tax purposes are primarily due to timing differences in recognizing taxable market discount, timing differences in recognizing certain gains and losses on investment transactions and the treatment of investments in inverse floating rate securities reflected as financing transactions, if any. To the extent that differences arise that are permanent in nature, such amounts are reclassified within the capital accounts as detailed below. Temporary differences do not require reclassification. Temporary and permanent differences do not impact the net asset values of the Funds.
As of February 28, 2013, the cost and unrealized appreciation (depreciation) of investments (excluding investments in derivatives, where applicable), as determined on a federal income tax basis, were as follows:
| | | | California Value (NCA | ) | | California Value 2 (NCB | ) | | California Performance Plus (NCP | ) | | California Opportunity (NCO | ) |
| Cost of investments | | $ | 235,398,288 | | $ | 45,705,436 | | $ | 270,941,636 | | $ | 161,725,112 | |
| Gross unrealized: | | | | | | | | | | | | | |
| Appreciation | | $ | 26,876,467 | | $ | 10,917,267 | | $ | 25,366,272 | | $ | 21,433,673 | |
| Depreciation | | | (283,406 | ) | | (12,257 | ) | | (1,187,679 | ) | | (37,339 | ) |
| Net unrealized appreciation (depreciation) of investments | | $ | 26,593,061 | | $ | 10,905,010 | | $ | 24,178,593 | | $ | 21,396,334 | |
| | | | California Investment Quality (NQC | ) | | California Select Quality (NVC | ) | | California Quality Income (NUC | ) |
| Cost of investments | | $ | 292,096,313 | | $ | 482,254,781 | | $ | 461,299,976 | |
| Gross unrealized: | | | | | | | | | | |
| Appreciation | | $ | 30,196,682 | | $ | 62,479,524 | | $ | 59,926,528 | |
| Depreciation | | | (1,475,446 | ) | | (1,042,931 | ) | | (1,541,415 | ) |
| Net unrealized appreciation (depreciation) of investments | | $ | 28,721,236 | | $ | 61,436,593 | | $ | 58,385,113 | |
Permanent differences, primarily due to federal taxes paid, taxable market discount, distribution character reclassifications and nondeductible offering costs, resulted in reclassifications among the Funds’ components of Common share net assets as of February 28, 2013, the Funds’ tax year end, as follows:
| | | | California Value (NCA | ) | | California Value 2 (NCB | ) | | California Performance Plus (NCP | ) | | California Opportunity (NCO | ) | | California Investment Quality (NQC | ) | | California Select Quality (NVC | ) | | California Quality Income (NUC | ) |
| Paid-in surplus | | $ | — | | $ | — | | $ | (18,099 | ) | $ | (26,265 | ) | $ | (565,087 | ) | $ | 9,724 | | $ | (28,906 | ) |
| Undistributed (Over-distribution of) net investment income | | | (39,173 | ) | | (2,323 | ) | | (84,310 | ) | | 21,990 | | | 437,411 | | | (57,381 | ) | | 14,975 | |
| Accumulated net realized gain (loss) | | | 39,173 | | | 2,323 | | | 102,409 | | | 4,275 | | | 127,676 | | | 47,657 | | | 13,931 | |
The tax components of undistributed net tax-exempt income, net ordinary income and net long-term capital gains as of February 28, 2013, the Funds’ tax year end, were as follows:
| | | | | | | | | | California | | | | | | California | | | California | | | California | |
| | | | California | | | California | | | Performance | | | California | | | Investment | | | Select | | | Quality | |
| | | | Value | | | Value 2 | | | Plus | | | Opportunity | | | Quality | | | Quality | | | Income | |
| | | | (NCA | ) | | (NCB | ) | | (NCP | ) | | (NCO | ) | | (NQC | ) | | (NVC | ) | | (NUC | ) |
| Undistributed net tax-exempt income * | | $ | 2,186,104 | | $ | 205,220 | | $ | 3,770,631 | | $ | 2,297,110 | | $ | 3,212,851 | | $ | 6,172,247 | | $ | 6,672,732 | |
| Undistributed net ordinary income ** | | | 1,039 | | | 4,109 | | | 1,952 | | | 6,878 | | | 17,178 | | | 24,563 | | | 6,561 | |
| Undistributed net long-term capital gains | | | — | | | — | | | — | | | — | | | — | | | — | | | — | |
| * | Undistributed net tax-exempt income (on a tax basis) has not been reduced for the dividend declared on February 1, 2013, paid on March 1, 2013. |
| ** | Net ordinary income consists of taxable market discount income and net short-term capital gains, if any. |
The tax character of distributions paid during the Funds’ tax years ended February 28, 2013 and February 29, 2012, was designated for purposes of the dividends paid deduction as follows:
| | | | | | | | | | | | | | | | | | | | | | | |
| | | | | | | | | | California | | | | | | California | | | California | | | California | |
| | | | California | | | California | | | Performance | | | California | | | Investment | | | Select | | | Quality | |
| | | | Value | | | Value 2 | | | Plus | | | Opportunity | | | Quality | | | Quality | | | Income | |
| 2013 | | | (NCA | ) | | (NCB | ) | | (NCP | ) | | (NCO | ) | | (NQC | ) | | (NVC | ) | | (NUC | ) |
| Distributions from net tax-exempt income*** | | $ | 11,824,623 | | $ | 2,613,880 | | $ | 12,843,505 | | $ | 7,970,499 | | $ | 13,656,684 | | $ | 24,242,996 | | $ | 23,480,900 | |
| Distributions from net ordinary income** | | | 50,560 | | | 16,860 | | | — | | | — | | | — | | | — | | | — | |
| Distributions from net long-term capital gains**** | | | — | | | 43,637 | | | — | | | — | | | — | | | — | | | — | |
| | | | | | | | | | California | | | | | | California | | | California | | | California | |
| | | | California | | | California | | | Performance | | | California | | | Investment | | | Select | | | Quality | |
| | | | Value | | | Value 2 | | | Plus | | | Opportunity | | | Quality | | | Quality | | | Income | |
| 2012 | | | (NCA | ) | | (NCB | ) | | (NCP | ) | | (NCO | ) | | (NQC | ) | | (NVC | ) | | (NUC | ) |
| Distributions from net tax-exempt income | | $ | 11,566,186 | | $ | 2,623,744 | | $ | 12,480,662 | | $ | 7,861,212 | | $ | 13,290,234 | | $ | 23,585,608 | | $ | 22,818,954 | |
| Distributions from net ordinary income ** | | | — | | | — | | | — | | | — | | | — | | | — | | | — | |
| Distributions from net long-term capital gains | | | — | | | 76,937 | | | — | | | — | | | — | | | — | | | — | |
| ** | Net ordinary income consists of taxable market discount income and net short-term capital gains, if any. |
| *** | The Funds hereby designate these amounts paid during the fiscal year ended February 28, 2013, as Exempt Interest Dividends. |
| **** | The Funds designated as a long-term capital gain dividend, pursuant to the Internal Revenue Code Section 852 (b)(3), the amount necessary to reduce earnings and profits of the Funds related to net capital gain to zero for the tax year ended February 28, 2013. |
As of February 28, 2013, the Funds’ tax year end, the following Funds had unused capital loss carryforwards available for federal income tax purposes to be applied against future capital gains, if any. If not applied, the carryforwards will expire as follows:
| | | | California Value (NCA | ) | | California Performance Plus (NCP | ) | | California Opportunity (NCO | ) | | California Investment Quality (NQC | ) | | California Select Quality (NVC | ) | | California Quality Income (NUC | ) |
| Expiration: | | | | | | | | | | | | | | | | | | | |
| February 28, 2017 | | $ | 1,426,925 | | $ | — | | $ | — | | $ | — | | $ | 65,078 | | $ | 790,545 | |
| February 28, 2018 | | | 251,409 | | | 516,359 | | | 664,054 | | | 1,288,738 | | | — | | | 3,225,294 | |
| Total | | $ | 1,678,334 | | $ | 516,359 | | $ | 664,054 | | $ | 1,288,738 | | $ | 65,078 | | $ | 4,015,839 | |
During the Funds’ tax year ended February 28, 2013, the following Funds utilized capital loss carryforwards as follows:
| | | | California | | | | | | California | | | California | |
| | | | Performance | | | California | | | Investment | | | Quality | |
| | | | Plus | | | Opportunity | | | Quality | | | Income | |
| | | | (NCP | ) | | (NCO | ) | | (NQC | ) | | (NUC | ) |
| Utilized capital loss carryforwards | | $ | 800,779 | | $ | 67,028 | | $ | 1,768,982 | | $ | 866,514 | |
Under the Regulated Investment Company Modernization Act of 2010 (the “Act”), capital losses incurred by the Funds after December 31, 2010, will not be subject to expiration. Capital losses incurred that will be carried forward under the provisions of the Act are as follows:
| | | | | | | | | | | | | California | |
| | | | California | | | California | | | California | | | Select | |
| | | | Value | | | Value 2 | | | Opportunity | | | Quality | |
| | | | (NCA | ) | | (NCB | ) | | (NCO | ) | | (NVC | ) |
| Post-enactment losses: | | | | | | | | | | | | | |
| Short-term | | $ | — | | $ | — | | $ | 73,472 | | $ | — | |
| Long-term | | | 263,973 | | | 99,544 | | | 1,503,310 | | | 3,591,852 | |
| | | Notes to |
| | | Financial Statements (continued) |
7. Management Fees and Other Transactions with Affiliates
Each Fund’s management fee consists of two components – a fund-level fee, based only on the amount of assets within the Fund, and a complex-level fee, based on the aggregate amount of all eligible fund assets managed by the Adviser, and for California Value (NCA) a gross interest income component. This pricing structure enables Fund shareholders to benefit from growth in the assets within their respective Fund as well as from growth in the amount of complex-wide assets managed by the Adviser.
California Value (NCA) pays an annual fund-level fee, payable monthly, of .15% of the average daily net assets* of the Fund, as well as 4.125% of the gross interest income (excluding interest on bonds underlying a “self-deposited inverse floater” trust that is attributed to the Fund over and above the net interest earned on the inverse floater itself) of the Fund.
The annual fund-level fee for each Fund (excluding California Value (NCA)), payable monthly, is calculated according to the following schedules:
| | | | California Value 2 (NCB) |
| Average Daily Managed Assets* | | | Fund-Level Fee Rate |
| For the first $125 million | | | .4000 | % |
| For the next $125 million | | | .3875 | |
| For the next $250 million | | | .3750 | |
| For the next $500 million | | | .3625 | |
| For the next $1 billion | | | .3500 | |
| For managed assets over $2 billion | | | .3375 | |
| | | | California Performance Plus (NCP) |
| | | | California Opportunity (NCO) |
| | | | California Investment Quality (NQC) |
| | | | California Select Quality (NVC) |
| | | | California Quality Income (NUC) |
| Average Daily Managed Assets* | | | Fund-Level Fee Rate |
| For the first $125 million | | | .4500 | % |
| For the next $125 million | | | .4375 | |
| For the next $250 million | | | .4250 | |
| For the next $500 million | | | .4125 | |
| For the next $1 billion | | | .4000 | |
| For the next $3 billion | | | .3875 | |
| For managed assets over $5 billion | | | .3750 | |
The annual complex-level fee for each Fund, payable monthly, is calculated according to the following schedule:
| | |
| Complex-Level Managed Asset Breakpoint Level* | Effective Rate at Breakpoint Level |
| $55 billion | .2000 | % |
| $56 billion | .1996 | |
| $57 billion | .1989 | |
| $60 billion | .1961 | |
| $63 billion | .1931 | |
| $66 billion | .1900 | |
| $71 billion | .1851 | |
| $76 billion | .1806 | |
| $80 billion | .1773 | |
| $91 billion | .1691 | |
| $125 billion | .1599 | |
| $200 billion | .1505 | |
| $250 billion | .1469 | |
| $300 billion | .1445 | |
| * | For the fund-level and complex-level fees, managed assets include closed-end fund assets managed by the Adviser that are attributable to financial leverage. For these purposes, financial leverage includes the funds’ use of preferred stock and borrowings and certain investments in the residual interest certificates (also called inverse floating rate securities) in tender option bond (TOB) trusts, including the portion of assets held by a TOB trust that has been effectively financed by the trust’s issuance of floating rate securities, subject to an agreement by the Adviser as to certain funds to limit the amount of such assets for determining managed assets in certain circumstances. The complex-level fee is calculated based upon the aggregate daily managed assets of all Nuveen Funds that constitute “eligible assets.” Eligible assets do not include assets attributable to investments in other Nuveen Funds or assets in excess of $2 billion added to the Nuveen Fund complex in connection with the Adviser’s assumption of the management of the former First American Funds effective January 1, 2011. As of February 28, 2013 , the complex-level fee rate for each of these Funds was .1668%. |
The management fee compensates the Adviser for overall investment advisory and administrative services and general office facilities. The Adviser is responsible for each Fund’s overall strategy and asset allocation decisions. The Adviser has entered into sub-advisory agreements with Nuveen Asset Management, LLC (the “Sub-Adviser”), a wholly-owned subsidiary of the Adviser, under which the Sub-Adviser manages the investment portfolios of the Funds. The Sub-Adviser is compensated for its services to the Funds from the management fees paid to the Adviser.
The Funds pay no compensation directly to those of its directors/trustees who are affiliated with the Adviser or to its officers, all of whom receive remuneration for their services to the Funds from the Adviser or its affiliates. The Board of Directors/Trustees has adopted a deferred compensation plan for independent directors/trustees that enables directors/trustees to elect to defer receipt of all or a portion of the annual compensation they are entitled to receive from certain Nuveen-advised funds. Under the plan, deferred amounts are treated as though equal dollar amounts had been invested in shares of select Nuveen-advised funds.
8. New Accounting Pronouncement
Financial Accounting Standards Board (“FASB”) Balance Sheet (Topic 210): Disclosures about Offsetting Assets and Liabilities
In January 2013, Accounting Standards Update (“ASU”) 2013-01, Clarifying the Scope of Disclosures about Offsetting Assets and Liabilities, replaced ASU 2011-11, Disclosures about Offsetting Assets and Liabilities. ASU 2013-01 is effective for fiscal years beginning on or after January 1, 2013. ASU 2011-11 was intended to enhance disclosure requirements on the offsetting of financial assets and liabilities. ASU 2013-01 limits the scope of the new balance sheet offsetting disclosures to derivatives, repurchase agreements and securities lending transactions to the extent that they are (1) offset in the financial statements or (2) subject to an enforceable master netting arrangement or similar agreement. Management is currently evaluating the application of ASU 2013-01 and its impact to the financial statements and footnote disclosures, if any.
Board Members & Officers (Unaudited)
| | | The management of the Funds, including general supervision of the duties performed for the Funds by the Adviser, is the responsibility of the board members of the Funds. The number of board members of the Funds is currently set at ten. None of the board members who are not “interested” persons of the Funds (referred to herein as “independent board members”) has ever been a director or employee of, or consultant to, Nuveen or its affiliates. The names and business addresses of the board members and officers of the Funds, their principal occupations and other affiliations during the past five years, the number of portfolios each oversees and other directorships they hold are set forth below. |
| | Name, | | Position(s) Held | | Year First | | Principal | | Number |
| | Birthdate | | with the Funds | | Elected or | | Occupation(s) | | of Portfolios |
| | & Address | | | | Appointed | | including other | | in Fund Complex |
| | | | | | and Term(1) | | Directorships | | Overseen by |
| | | | | | | During Past 5 Years | | Board Member |
| | | | | | | | | |
| Independent Board Members: | | | | | | | | |
| | | | | | | | | |
| ■ | ROBERT P. BREMNER 8/22/40 333 W. Wacker Drive Chicago, IL 60606 | | Chairman of the Board and Board Member | | 1996 Class III | | Private Investor and Management Consultant; Treasurer and Director, Humanities Council of Washington, D.C.; Board Member, Independent Directors Council affiliated with the Investment Company Institute. | | 206 |
| | | | | | | | | | |
| ■ | JACK B. EVANS 10/22/48 333 W. Wacker Drive Chicago, IL 60606 | | Board Member | | 1999 Class III | | President, The Hall-Perrine Foundation, a private philanthropic corporation (since 1996); Director and Chairman, United Fire Group, a publicly held company; member of the Board of Regents for the State of Iowa University System; Director, Source Media Group; Life Trustee of Coe College and the Iowa College Foundation; formerly, Director, Alliant Energy; formerly, Director, Federal Reserve Bank of Chicago; formerly, President and Chief Operating Officer, SCI Financial Group, Inc., a regional financial services firm. | | 206 |
| | | | | | | | | | |
| ■ | WILLIAM C. HUNTER 3/6/48 333 W. Wacker Drive Chicago, IL 60606 | | Board Member | | 2004 Class I | | Dean Emeritus (since June 30, 2012), formerly, Dean, Tippie College of Business, University of Iowa (2006-2012); Director (since 2004) of Xerox Corporation; Director (since 2005), and President (since July 2012) Beta Gamma Sigma, Inc., The International Honor Society; Director of Wellmark, Inc. (since 2009); formerly, Dean and Distinguished Professor of Finance, School of Business at the University of Connecticut (2003-2006); previously, Senior Vice President and Director of Research at the Federal Reserve Bank of Chicago (1995-2003); formerly, Director (1997-2007), Credit Research Center at Georgetown University. | | 206 |
| | | | | | | | | | |
| ■ | DAVID J. KUNDERT 10/28/42 333 W. Wacker Drive Chicago, IL 60606 | | Board Member | | 2005 Class II | | Director, Northwestern Mutual Wealth Management Company; retired (since 2004) as Chairman, JPMorgan Fleming Asset Management, President and CEO, Banc One Investment Advisors Corporation, and President, One Group Mutual Funds; prior thereto, Executive Vice President, Banc One Corporation and Chairman and CEO, Banc One Investment Management Group; Regent Emeritus, Member of Investment Committee, Luther College; member of the Wisconsin Bar Association; member of Board of Directors, Friends of Boerner Botanical Gardens; member of Board of Directors and Chair of Investment Committee, Greater Milwaukee Foundation; member of the Board of Directors (Milwaukee), College Possible. | | 206 |
| | | | | | | | | | |
| ■ | WILLIAM J. SCHNEIDER 9/24/44 333 W. Wacker Drive| Chicago, IL 60606 | | Board Member | | 1996 Class III | | Chairman of Miller-Valentine Partners Ltd., a real estate investment company; formerly, Senior Partner and Chief Operating Officer (retired 2004) of Miller-Valentine Group; Member of two Miller Valentine real estate LLC companies; member, University of Dayton Business School Advisory Council;member, Mid-America Health System Board; Board Member of Tech Town, Inc., a not-for-profit community development company; Board Member of WDPR Public Radio; formerly, member and chair, Dayton Philharmonic Orchestra Association; formerly, member, Business Advisory Council, Cleveland Federal Reserve Bank. | | 206 |
| | Name, | | Position(s) Held | | Year First | | Principal | | Number |
| | Birthdate | | with the Funds | | Elected or | | Occupation(s) | | of Portfolios |
| | & Address | | | | Appointed | | Including other | | in Fund Complex |
| | | | | | and Term(1) | | Directorships | | Overseen by |
| | | | | | | | During Past 5 Years | | Board Member |
| | | | | | | | | |
| Independent Board Members: | | | | | | | | |
| | | | | | | | | |
| ■ | JUDITH M. STOCKDALE 12/29/47 333 W. Wacker Drive Chicago, IL 60606 | | Board Member | | 1997 Class I | | Formerly, Executive Director (1994-2012), Gaylord and Dorothy Donnelley Foundation (since 1994); prior thereto, Executive Director, Great Lakes Protection Fund (1990-1994). | | 206 |
| | | | | | | | | | |
| ■ | CAROLE E. STONE 6/28/47 333 W. Wacker Drive Chicago, IL 60606 | | Board Member | | 2007 Class I | | Director, Chicago Board Options Exchange (since 2006); Director, C2 Options Exchange, Incorporated (since 2009); formerly, Commissioner, New York State Commission on Public Authority Reform (2005-2010); formerly, Chair, New York Racing Association Oversight Board (2005-2007). | | 206 |
| | | | | | | | | | |
| ■ | VIRGINIA L. STRINGER 8/16/44 333 W. Wacker Drive Chicago, IL 60606 | | Board Member | | 2011 Class I | | Board Member, Mutual Fund Directors Forum; former governance consultant and non-profit board member; former Owner and President, Strategic Management Resources, Inc. a management consulting firm; former Member, Governing Board, Investment Company Institute’s Independent Directors Council; previously, held several executive positions in general management, marketing and human resources at IBM and The Pillsbury Company; Independent Director, First American Fund Complex (1987-2010) and Chair (1997-2010). | | 206 |
| | | | | | | | | | |
| ■ | TERENCE J. TOTH 9/29/59 333 W. Wacker Drive Chicago, IL 60606 | | Board Member | | 2008 Class II | | Managing Partner, Promus Capital (since 2008); formerly, Director, Legal & General Investment Management America, Inc. (since 2008-2013); Director, Fulcrum IT Service LLC (since 2010), Quality Control Corporation (since 2012) and LogicMark LLC (since 2012); Formerly, CEO and President, Northern Trust Global Investments (2004-2007); Executive Vice President, Quantitative Management & Securities Lending (2000-2004); prior thereto, various positions with Northern Trust Company (since 1994); member: Chicago Fellowship Board (since 2005), Catalyst Schools of Chicago Board (since 2008) and Mather Foundation Board (since 2012), and a member of its investment committee; formerly, Member, Northern Trust Mutual Funds Board (2005-2007), Northern Trust Global Investments Board (2004-2007), Northern Trust Japan Board (2004-2007), Northern Trust Securities Inc. Board (2003-2007) and Northern Trust Hong Kong Board (1997-2004). | | 206 |
| Interested Board Member: | | | | | | | | |
| | | | | | | | | |
| ■ | JOHN P. AMBOIAN(2) 6/14/61 333 W. Wacker Drive Chicago, IL 60606 | | Board Member | | 2008 Class II | | Chief Executive Officer and Chairman (since 2007) and Director (since 1999) of Nuveen Investments, Inc., formerly, President (1999-2007); Chief Executive Officer (since 2007) of Nuveen Investments Advisers, Inc.; Director (since 1998) formerly, Chief Executive Officer (2007-2010) of Nuveen Fund Advisors, LLC. | | 206 |
Board Members & Officers (Unaudited) (continued)
| | Name, | | Position(s) Held | | Year First | | Principal | | Number |
| | Birthdate | | with the Funds | | Elected or | | Occupation(s) | | of Portfolios |
| | and Address | | | | Appointed(3) | | During Past 5 Years | | in Fund Complex |
| | | | | | | | | | Overseen |
| | | | | | | | | | by Officer |
| | | | | | | | | |
| Officers of the Funds: | | | | | | | | |
| | | | | | | | | | |
■ | GIFFORD R. ZIMMERMAN 9/9/56 333 W. Wacker Drive Chicago, IL 60606 | | Chief Administrative Officer | | 1988 | | Managing Director (since 2002), and Assistant Secretary of Nuveen Securities, LLC; Managing Director (since 2004) and Assistant Secretary (since 1994) of Nuveen Investments, Inc.; Managing Director (since 2002), Assistant Secretary (since 1997) and Co-General Counsel (since 2011) of Nuveen Fund Advisors, LLC; Managing Director, Assistant Secretary and Associate General Counsel of Nuveen Asset Management, LLC (since 2011); Managing Director, Associate General Counsel and Assistant Secretary, of Symphony Asset Management LLC (since 2003); Vice President and Assistant Secretary of NWQ Investment Management Company, LLC (since 2002), Nuveen Investments Advisers Inc. (since 2002), Santa Barbara Asset Management, LLC (since 2006), and of Winslow Capital Management, LLC, (since 2010); Chief Administrative Officer and Chief Compliance Officer (since 2006) of Nuveen Commodities Asset Management, LLC; Chartered Financial Analyst. | | 206 |
| | | | | | | | | | |
| ■ | WILLIAM ADAMS IV 6/9/55 333 W. Wacker Drive Chicago, IL 60606 | | Vice President | | 2007 | | Senior Executive Vice President, Global Structured Products (since 2010), formerly, Executive Vice President (1999-2010) of Nuveen Securities, LLC; Co-President of Nuveen Fund Advisors, LLC (since 2011); President (since 2011), formerly, Managing Director (2010-2011) of Nuveen Commodities Asset Management, LLC. | | 105 |
| | | | | | | | | | |
| ■ | CEDRIC H. ANTOSIEWICZ 1/11/62 333 W. Wacker Drive Chicago, IL 60606 | | Vice President | | 2007 | | Managing Director of Nuveen Securities, LLC. | | 105 |
| | | | | | | | | | |
| ■ | MARGO L. COOK 4/11/64 333 W. Wacker Drive Chicago, IL 60606 | | Vice President | | 2009 | | Executive Vice President (since 2008) of Nuveen Investments, Inc. and of Nuveen Fund Advisors, LLC (since 2011); Managing Director-Investment Services of Nuveen Commodities Asset Management, LLC (since August 2011), previously, Head of Institutional Asset Management (2007-2008) of Bear Stearns Asset Management; Head of Institutional Asset Management (1986-2007) of Bank of NY Mellon; Chartered Financial Analyst. | | 206 |
| | | | | | | | | | |
| ■ | LORNA C. FERGUSON 10/24/45 333 W. Wacker Drive Chicago, IL 60606 | | Vice President | | 1998 | | Managing Director (since 2005) of Nuveen Fund Advisors, LLC and Nuveen Securities, LLC (since 2004). | | 206 |
| | | | | | | | | | |
| ■ | STEPHEN D. FOY 5/31/54 333 W. Wacker Drive Chicago, IL 60606 | | Vice President and Controller | | 1998 | | Senior Vice President (since 2010), formerly, Vice President (2005-2010) and Funds Controller of Nuveen Securities, LLC; Vice President of Nuveen Fund Advisors, LLC; Chief Financial Officer of Nuveen Commodities Asset Management, LLC (since 2010); Certified Public Accountant. | | 206 |
| | Name, | | Position(s) Held | | Year First | | Principal | | Number |
| | Birthdate | | with the Funds | | Elected or | | Occupation(s) | | of Portfolios |
| | and Address | | | | Appointed(3) | | During Past 5 Years | | in Fund Complex |
| | | | | | | | | | Overseen |
| | | | | | | | | | by Officer |
| | | | | | | | | |
| Officers of the Funds: | | | | | | | | |
| | | | | | | | | |
| ■ | SCOTT S. GRACE 8/20/70 333 W. Wacker Drive Chicago, IL 60606s | | Vice President and Treasurer | | 2009 | | Managing Director, Corporate Finance & Development, Treasurer (since 2009) of Nuveen Securities, LLC; Managing Director and Treasurer (since 2009) of Nuveen Fund Advisors, LLC, Nuveen Investments Advisers, Inc., Nuveen Investments Holdings Inc. and (since 2011) Nuveen Asset Management, LLC; Vice President and Treasurer of NWQ Investment Management Company, LLC, Tradewinds Global Investors, LLC, Symphony Asset Management LLC and Winslow Capital Management, LLC.; Vice President of Santa Barbara Asset Management, LLC; formerly, Treasurer (2006-2009), Senior Vice President (2008-2009), previously, Vice President (2006-2008) of Janus Capital Group, Inc.; formerly, Senior Associate in Morgan Stanley’s Global Financial Services Group (2000-2003); Chartered Accountant Designation. | | 206 |
| | | | | | | | | | |
| ■ | WALTER M. KELLY 2/24/70 333 W. Wacker Drive Chicago, IL 60606 | | Chief Compliance| Officer and Vice President | | 2003 | | Senior Vice President (since 2008) and Assistant Secretary (since 2003) of Nuveen Fund Advisors, LLC; Senior Vice President (since 2008) of Nuveen Investment Holdings, Inc.; formerly, Senior Vice President (2008-2011) of Nuveen Securities, LLC. | | 206 |
| | | | | | | | | | |
| ■ | TINA M. LAZAR 8/27/61 333 W. Wacker Drive Chicago, IL 60606 | | Vice President | | 2002 | | Senior Vice President (since 2010), formerly, Vice President (2005-2010) of Nuveen Fund Advisors, LLC. | | 206 |
| | | | | | | | | | |
| ■ | KEVIN J. MCCARTHY 3/26/66 333 W. Wacker Drive Chicago, IL 60606 | | Vice President and Secretary | | 2007 | | Managing Director and Assistant Secretary (since 2008), Nuveen Securities, LLC; Managing Director (since 2008), Assistant Secretary (since 2007) and Co-General Counsel (since 2011) of Nuveen Fund Advisors, LLC; Managing Director, Assistant Secretary and Associate General Counsel (since 2011) of Nuveen Asset Management, LLC; Managing Director (since 2008), and Assistant Secretary, Nuveen Investment Holdings, Inc.; Vice President (since 2007) and Assistant Secretary of Nuveen Investments Advisers Inc., NWQ Investment Management Company, LLC, NWQ Holdings, LLC, Symphony Asset Management LLC, Santa Barbara Asset Management, LLC, and of Winslow Capital Management, LLC. (since 2010); Vice President and Secretary (since 2010) of Nuveen Commodities Asset Management, LLC; prior thereto, Partner, Bell, Boyd & Lloyd LLP (1997-2007). | | 206 |
Board Members & Officers (Unaudited) (continued)
| | Name, | | Position(s) Held | | Year First | | Principal | | Number |
| | Birthdate | | with the Funds | | Elected or | | Occupation(s) | | of Portfolios |
| | and Address | | | | Appointed(3) | | During Past 5 Years | | in Fund Complex |
| | | | | | | | | | Overseen |
| | | | | | | | | | by Officer |
| | | | | | | | | |
| Officers of the Funds: | | | | | | | | |
| | | | | | | | | |
| ■ | KATHLEEN L. PRUDHOMME 3/30/53 901 Marquette Avenue Minneapolis, MN 55402 | | Vice President and Assistant Secretary | | 2011 | | Managing Director, Assistant Secretary and Co-General Counsel (since 2011) of Nuveen Fund Advisors, LLC; Managing Director, Assistant Secretary and Associate General Counsel (since 2011) of Nuveen Asset Management, LLC; Managing Director and Assistant Secretary (since 2011) of Nuveen Securities, LLC; formerly, Deputy General Counsel, FAF Advisors, Inc. (2004-2010). | | 206 |
| (1) | For California Value (NCA) and California Value 2 (NCB) Board Members serve three year terms. The Board of Trustees for NCA and NCB are divided into three classes, Class I, Class II, and Class III, with each being elected to serve until the third succeeding annual shareholders’ meeting subsequent to its election or thereafter in each case when its respective successors are duly elected or appointed. For California Performance Plus (NCP), California Opportunity (NCO), California Investment Quality (NQC), California Select Quality (NVC) and California Quality Income (NUC), the Board Members serve a one year term to serve until the next annual meeting or until their successors shall have been duly elected and qualified. The first year elected or appointed represents the year in which the board member was first elected or appointed to any fund in the Nuveen Complex. |
| (2) | Mr. Amboian is an interested trustee because of his position with Nuveen Investments, Inc. and certain of its subsidiaries, which are affiliates of the Nuveen Funds. |
| (3) | Officers serve one year terms through August of each year. The year first elected or appointed represents the year in which the Officer was first elected or appointed to any fund in the Nuveen Complex. |
Reinvest Automatically,
Easily and Conveniently
Nuveen makes reinvesting easy. A phone call is all it takes to set up your reinvestment account.
Nuveen Closed-End Funds Automatic Reinvestment Plan
Your Nuveen Closed-End Fund allows you to conveniently reinvest distributions in additional Fund shares.
By choosing to reinvest, you’ll be able to invest money regularly and automatically, and watch your investment grow through the power of compounding. Just like distributions in cash, there may be times when income or capital gains taxes may be payable on distributions that are reinvested.
It is important to note that an automatic reinvestment plan does not ensure a profit, nor does it protect you against loss in a declining market.
Easy and convenient
To make recordkeeping easy and convenient, each month you’ll receive a statement showing your total distributions, the date of investment, the shares acquired and the price per share, and the total number of shares you own.
How shares are purchased
The shares you acquire by reinvesting will either be purchased on the open market or newly issued by the Fund. If the shares are trading at or above net asset value at the time of valuation, the Fund will issue new shares at the greater of the net asset value or 95% of the then-current market price. If the shares are trading at less than net asset value, shares for your account will be purchased on the open market. If the Plan Agent begins purchasing Fund shares on the open market while shares are trading below net asset value, but the Fund’s shares subsequently trade at or above their net asset value before the Plan Agent is able to complete its purchases, the Plan Agent may cease open-market purchases and may invest the uninvested portion of the distribution in newly-issued Fund shares at a price equal to the greater of the shares’ net asset value or 95% of the shares’ market value on the last business day immediately prior to the purchase date. Distributions received to purchase shares in the open market will normally be invested shortly after the distribution payment date. No interest will be paid on distributions awaiting reinvestment. Because the market price of the shares may increase before purchases are completed, the average purchase price per share may
Reinvest Automatically,
Easily and Conveniently (continued)
exceed the market price at the time of valuation, resulting in the acquisition of fewer shares than if the distribution had been paid in shares issued by the Fund. A pro rata portion of any applicable brokerage commissions on open market purchases will be paid by Plan participants. These commissions usually will be lower than those charged on individual transactions.
Flexible
You may change your distribution option or withdraw from the Plan at any time, should your needs or situation change.
You can reinvest whether your shares are registered in your name, or in the name of a brokerage firm, bank, or other nominee. Ask your investment advisor if his or her firm will participate on your behalf. Participants whose shares are registered in the name of one firm may not be able to transfer the shares to another firm and continue to participate in the Plan.
The Fund reserves the right to amend or terminate the Plan at any time. Although the Fund reserves the right to amend the Plan to include a service charge payable by the participants, there is no direct service charge to participants in the Plan at this time.
Call today to start reinvesting distributions
For more information on the Nuveen Automatic Reinvestment Plan or to enroll in or withdraw from the Plan, speak with your financial advisor or call us at (800) 257-8787.
Glossary of Terms
Used in this Report
| | |
| ■ | Auction Rate Bond: An auction rate bond is a security whose interest payments are adjusted periodically through an auction process, which process typically also serves as a means for buying and selling the bond. Auctions that fail to attract enough buyers for all the shares offered for sale are deemed to have “failed,” with current holders receiving a formula-based interest rate until the next scheduled auction. |
| | |
| ■ | Average Annual Total Return: This is a commonly used method to express an investment’s performance over a particular, usually multi-year time period. It expresses the return that would have been necessary each year to equal the investment’s actual cumulative performance (including change in NAV or market price and reinvested dividends and capital gains distributions, if any) over the time period being considered. |
| | |
| ■ | Duration: Duration is a measure of the expected period over which a bond’s principal and interest will be paid, and consequently is a measure of the sensitivity of a bond’s or bond Fund’s value to changes when market interest rates change. Generally, the longer a bond’s or Fund’s duration, the more the price of the bond or Fund will change as interest rates change. |
| | |
| ■ | Effective Leverage: Effective leverage is a Fund’s effective economic leverage, and includes both regulatory leverage (see Leverage) and the leverage effects of certain derivative investments in the Fund’s portfolio. Currently, the leverage effects of Tender Option Bond (TOB) inverse floater holdings are included in effective leverage values, in addition to any regulatory leverage. |
| | |
| ■ | Gross Domestic Product (GDP): The total market value of all final goods and services produced in a country/region in a given year, equal to total consumer, investment and government spending, plus the value of exports, minus the value of imports. |
| | |
| ■ | Inverse Floating Rate Securities: Inverse floating rate securities, also known as inverse floaters or tender option bonds (TOBs), are created by depositing a municipal bond, typically with a fixed interest rate, into a special purpose trust created by a broker-dealer. This trust, in turn, (a) issues floating rate certificates typically paying short-term tax-exempt interest rates to third parties in amounts equal to some fraction of the deposited bond’s par amount or market value, and (b) issues an inverse floating rate certificate (sometimes referred to as an “inverse floater”) to an investor (such as a Fund) interested in gaining investment exposure to a long-term municipal bond. The income received by the holder of the inverse floater varies inversely with the short-term rate paid to the floating rate certificates’ holders, and in most circumstances the holder of the inverse floater bears substantially all of the underlying bond’s downside investment risk. The holder of the inverse floater typically also benefits disproportionately from any potential appreciation of the underlying bond’s value. Hence, an inverse floater essentially represents an investment in the underlying bond on a leveraged basis. |
| | |
| ■ | Leverage: Using borrowed money to invest in securities or other assets, seeking to increase the return of an investment or portfolio. |
Glossary of Terms
Used in this Report (continued)
| ■ | Lipper California Municipal Debt Funds Classification Average: Calculated using the returns of all closed-end funds in this category. Lipper returns account for the effects of management fees and assume reinvestment of distributions, but do not reflect any applicable sales charges. |
| | |
| ■ | Net Asset Value (NAV): The net market value of all securities held in a portfolio. |
| | |
| ■ | Net Asset Value (NAV) Per Share: The market value of one share of a mutual fund or closed-end fund. For a Fund, the NAV is calculated daily by taking the Fund’s total assets (securities, cash, and accrued earnings), subtracting the Fund’s liabilities, and dividing by the number of shares outstanding. |
| | |
| ■ | Pre-Refunding: Pre-Refunding, also known as advanced refundings or refinancings, is a procedure used by state and local governments to refinance municipal bonds to lower interest expenses. The issuer sells new bonds with a lower yield and uses the proceeds to buy U.S. Treasury securities, the interest from which is used to make payments on the higher-yielding bonds. Because of this collateral, pre-refunding generally raises a bond’s credit rating and thus its value. |
| | |
| ■ | Regulatory Leverage: Regulatory leverage consists of preferred shares issued by or borrowings of a Fund. Both of these are part of a Fund’s capital structure. Regulatory leverage is sometimes referred to as “‘40 Act Leverage” and is subject to asset coverage limits set in the Investment Company Act of 1940. |
| | |
| ■ | S&P Municipal Bond California Index: An unleveraged, market value-weighted index designed to measure the performance of the tax-exempt, investment-grade California municipal bond market. Index returns assume reinvestment of distributions but do not reflect any applicable sales charges or management fees. |
| | |
| ■ | S&P Municipal Bond Index: An unleveraged, market value-weighted index designed to measure the performance of the tax-exempt, investment-grade U.S. municipal bond market. Index returns assume reinvestment of distributions but do not reflect any applicable sales charges or management fees. |
| | |
| ■ | Total Investment Exposure: Total investment exposure is a Fund’s assets managed by the Adviser that are attributable to financial leverage. For these purposes, financial leverage includes a Fund’s use of preferred stock and borrowings and investments in the residual interest certificates (also called inverse floating rate securities) in tender option bond (TOB) trusts, including the portion of assets held by a TOB trust that has been effectively financed by the trust’s issuance of floating rate securities. |
| | |
| ■ | Zero Coupon Bond: A zero coupon bond does not pay a regular interest coupon to its holders during the life of the bond. Tax-exempt income to the holder of the bond comes from accretion of the difference between the original purchase price of the bond at issuance and the par value of the bond at maturity and is effectively paid at maturity. The market prices of zero coupon bonds generally are more volatile than the market prices of bonds that pay interest periodically. |
| | |
Additional Fund Information
Board of
Directors/Trustees
John P. Amboian
Robert P. Bremner
Jack B. Evans
William C. Hunter
David J. Kundert
William J. Schneider
Judith M. Stockdale
Carole E. Stone
Virginia L. Stringer
Terence J. Toth
Fund Manager
Nuveen Fund Advisors, LLC
333 West Wacker Drive
Chicago, IL 60606
Custodian
State Street Bank
& Trust Company
Boston, MA
Transfer Agent and
Shareholder Services
State Street Bank &
Trust Company
Nuveen Funds
P.O. Box 43071
Providence, RI 02940-3071
(800) 257-8787
Legal Counsel
Chapman and Cutler LLP
Chicago, IL
Independent Registered
Public Accounting Firm
Ernst & Young LLP
Chicago, IL
Quarterly Portfolio of Investments and Proxy Voting Information
You may obtain (i) each Fund’s quarterly portfolio of investments, (ii) information regarding how each Fund voted proxies relating to portfolio securities held during the most recent twelve-month period ended June 30, and (iii) a description of the policies and procedures that each Fund used to determine how to vote proxies relating to portfolio securities without charge, upon request, by calling Nuveen Investments toll-free at (800) 257-8787 or on Nuveen’s website at www.nuveen.com.
You may also obtain this and other Fund information directly from the Securities and Exchange Commission (SEC). The SEC may charge a copying fee for this information. Visit the SEC on-line at http://www.sec.gov or in person at the SEC’s Public Reference Room in Washington, D.C. Call the SEC at (202) 942-8090 for room hours and operation. You may also request Fund information by sending an e-mail request to publicinfo@sec.gov or by writing to the SEC’s Public References Section at 100 F Street NE, Washington, D.C. 20549.
CEO Certification Disclosure
Each Fund’s Chief Executive Officer (CEO) has submitted to the New York Stock Exchange (NYSE) the annual CEO certification as required by Section 303A.12(a) of the NYSE Listed Company Manual.
Each Fund has filed with the SEC the certification of its Chief Executive Officer and Chief Financial Officer required by Section 302 of the Sarbanes-Oxley Act.
Common Share Information
Each Fund intends to repurchase shares of its own common stock in the future at such times and in such amounts as is deemed advisable. During the period covered by this report, the Funds repurchased shares of their common stock as shown in the accompanying table.
| | Common Shares |
| Fund | Repurchased |
| NCA | — |
| NCB | – |
| NCP | — |
| NCO | — |
| NQC | — |
| NVC | — |
| NUC | — |
Any future repurchases will be reported to shareholders in the next annual or semiannual report.
Nuveen Investments:
Serving Investors for Generations
Since 1898, financial advisors and their clients have relied on Nuveen Investments to provide dependable investment solutions through continued adherence to proven, long-term investing principles. Today, we offer a range of high quality equity and fixed-income solutions designed to be integral components of a well-diversified core portfolio.
Focused on meeting investor needs.
Nuveen Investments provides high-quality investment services designed to help secure the long-term goals of institutional and individual investors as well as the consultants and financial advisors who serve them. Nuveen Investments markets a wide range of specialized investment solutions which provide investors access to capabilities of its high-quality boutique investment affiliates—Nuveen Asset Management, Symphony Asset Management, NWQ Investment Management Company, Santa Barbara Asset Management, Tradewinds Global Investors, Winslow Capital Management and Gresham Investment Management. In total, Nuveen Investments managed $219 billion as of December 31, 2012.
Find out how we can help you.
To learn more about how the products and services of Nuveen Investments may be able to help you meet your financial goals, talk to your financial advisor, or call us at (800) 257-8787. Please read the information provided carefully before you invest. Investors should consider the investment objective and policies, risk considerations, charges and expenses of any investment carefully. Where applicable, be sure to obtain a prospectus, which contains this and other relevant information. To obtain a prospectus, please contact your securities representative or Nuveen Investments, 333 W. Wacker Dr., Chicago, IL 60606. Please read the prospectus carefully before you invest or send money.
Learn more about Nuveen Funds at: www.nuveen.com/cef
Distributed by
Nuveen Securities, LLC
333 West Wacker Drive
Chicago, IL 60606
www.nuveen.com/cef
EAN-A-0213D
ITEM 2. CODE OF ETHICS.As of the end of the period covered by this report, the registrant has adopted a code of ethics that applies to the registrant's principal executive officer, principal financial officer, principal accounting officer or controller, or persons performing similar functions. There were no amendments to or waivers from the Code during the period covered by this report. The registrant has posted the code of ethics on its website at www.nuveen.com/CEF/Shareholder/FundGovernance.aspx. (To view the code, click on Code of Conduct.)
ITEM 3. AUDIT COMMITTEE FINANCIAL EXPERT.
The registrant's Board of Directors or Trustees (“Board”) determined that the registrant has at least one “audit committee financial expert” (as defined in Item 3 of Form N-CSR) serving on its Audit Committee. The registrant's audit committee financial expert is Carole E. Stone, who is “independent” for purposes of Item 3 of Form N-CSR.
Ms. Stone served for five years as Director of the New York State Division of the Budget. As part of her role as Director, Ms. Stone was actively involved in overseeing the development of the State's operating, local assistance and capital budgets, its financial plan and related documents; overseeing the development of the State's bond-related disclosure documents and certifying that they fairly presented the State's financial position; reviewing audits of various State and local agencies and programs; and coordinating the State's system of internal audit and control. Prior to serving as Director, Ms. Stone worked as a budget analyst/examiner with increasing levels of responsibility over a 30 year period, including approximately five years as Deputy Budget Director. Ms. Stone has also served as Chair of the New York State Racing Association Oversight Board, as Chair of the Public Authorities Control Board, as a Commissioner on the New York State Commission on Public Authority Reform and as a member of the Boards of Directors of several New York State public authorities. These positions have involved overseeing operations and finances of certain entities and assessing the adequacy of project/entity financing and financial reporting. Currently, Ms. Stone is on the Board of Directors of CBOE Holdings, Inc., of the Chicago Board Options Exchange, and of C2 Options Exchange. Ms. Stone's position on the boards of these entities and as a member of both CBOE Holdings' Audit Committee and its Finance Committee has involved, among other things, the oversight of audits, audit plans and preparation of financial statements.
ITEM 4. PRINCIPAL ACCOUNTANT FEES AND SERVICES.
Nuveen California Municipal Value Fund, Inc.
The following tables show the amount of fees that Ernst & Young LLP, the Fund's auditor, billed to the Fund during the Fund's last two full fiscal years. For engagements with Ernst & Young LLP the Audit Committee approved in advance all audit services and non-audit services that Ernst & Young LLP provided to the Fund, except for those non-audit services that were subject to the pre-approval exception under Rule 2-01 of Regulation S-X (the “pre-approval exception”). The pre-approval exception for services provided directly to the Fund waives the pre-approval requirement for services other than audit, review or attest services if: (A) the aggregate amount of all such services provided constitutes no more than 5% of the total amount of revenues paid by the Fund to its accountant during the fiscal year in which the services are provided; (B) the Fund did not recognize the services as non-audit services at the time of the engagement; and (C) the services are promptly brought to the Audit Committee's attention, and the Committee (or its delegate) approves the services before the audit is completed.
The Audit Committee has delegated certain pre-approval responsibilities to its Chairman (or, in his absence, any other member of the Audit Committee).
SERVICES THAT THE FUND'S AUDITOR BILLED TO THE ADVISER AND AFFILIATED FUND SERVICE PROVIDERS
The tables also show the percentage of fees subject to the pre-approval exception. The pre-approval exception for services provided to the Adviser and any Affiliated Fund Service Provider (other than audit, review or attest services) waives the pre-approval requirement if: (A) the aggregate amount of all such services provided constitutes no more than 5% of the total amount of revenues paid to Ernst & Young LLP by the Fund, the Adviser and Affiliated Fund Service Providers during the fiscal year in which the services are provided that would have to be pre-approved by the Audit Committee; (B) the Fund did not recognize the services as non-audit services at the time of the engagement; and (C) the services are promptly brought to the Audit Committee's attention, and the Committee (or its delegate) approves the services before the Fund's audit is completed.
The following table shows the amount of fees that Ernst & Young LLP billed during the Fund's last two full fiscal years for non-audit services. The Audit Committee is required to pre-approve non-audit services that Ernst & Young LLP provides to the Adviser and any Affiliated Fund Services Provider, if the engagement related directly to the Fund's operations and financial reporting (except for those subject to the pre-approval exception described above). The Audit Committee requested and received information from Ernst & Young LLP about any non-audit services that Ernst & Young LLP rendered during the Fund's last fiscal year to the Adviser and any Affiliated Fund Service Provider. The Committee considered this information in evaluating Ernst & Young LLP's independence.
Audit Committee Pre-Approval Policies and Procedures. Generally, the Audit Committee must approve (i) all non-audit services to be performed for the Fund by the Fund's independent accountants and (ii) all audit and non-audit services to be performed by the Fund's independent accountants for the Affiliated Fund Service Providers with respect to operations and financial reporting of the Fund. Regarding tax and research projects conducted by the independent accountants for the Fund and Affiliated Fund Service Providers (with respect to operations and financial reports of the Fund) such engagements will be (i) pre-approved by the Audit Committee if they are expected to be for amounts greater than $10,000; (ii) reported to the Audit Committee chairman for his verbal approval prior to engagement if they are expected to be for amounts under $10,000 but greater than $5,000; and (iii) reported to the Audit Committee at the next Audit Committee meeting if they are expected to be for an amount under $5,000.
ITEM 5. AUDIT COMMITTEE OF LISTED REGISTRANTS.
ITEM 6. SCHEDULE OF INVESTMENTS.
a) See Portfolio of Investments in Item 1.
b) Not applicable.
ITEM 7. DISCLOSURE OF PROXY VOTING POLICIES AND PROCEDURES FOR CLOSED-END MANAGEMENT INVESTMENT COMPANIES.
ITEM 9. PURCHASES OF EQUITY SECURITIES BY CLOSED-END MANAGEMENT INVESTMENT COMPANY AND AFFILIATED PURCHASERS.
Not applicable.
ITEM 10. SUBMISSION OF MATTERS TO A VOTE OF SECURITY HOLDERS.
There have been no material changes to the procedures by which shareholders may recommend nominees to the registrant's Board implemented after the registrant last provided disclosure in response to this Item.
ITEM 11. CONTROLS AND PROCEDURES.
ITEM 12. EXHIBITS.
File the exhibits listed below as part of this Form.
Pursuant to the requirements of the Securities Exchange Act of 1934 and the Investment Company Act of 1940, the registrant has duly caused this report to be signed on its behalf by the undersigned, thereunto duly authorized.
Kevin J. McCarthy
Pursuant to the requirements of the Securities Exchange Act of 1934 and the Investment Company Act of 1940, this report has been signed below by the following persons on behalf of the registrant and in the capacities and on the dates indicated.
Gifford R. Zimmerman
Stephen D. Foy