Washington, D.C. 20549
Nuveen California Municipal Value Fund, Inc.
Kevin J. McCarthy
Form N-CSR is to be used by management investment companies to file reports with the Commission not later than 10 days after the transmission to stockholders of any report that is required to be transmitted to stockholders under Rule 30e-1 under the Investment Company Act of 1940 (17 CFR 270.30e-1). The Commission may use the information provided on Form N-CSR in its regulatory, disclosure review, inspection, and policymaking roles.
A registrant is required to disclose the information specified by Form N-CSR, and the Commission will make this information public. A registrant is not required to respond to the collection of information contained in Form N-CSR unless the Form displays a currently valid Office of Management and Budget (“OMB”) control number. Please direct comments concerning the accuracy of the information collection burden estimate and any suggestions for reducing the burden to Secretary, Securities and Exchange Commission, 450 Fifth Street, NW, Washington, DC 20549-0609. The OMB has reviewed this collection of information under the clearance requirements of 44 U.S.C. ss. 3507.
ITEM 1. REPORTS TO STOCKHOLDERS.
Life is Complex
Nuveen makes things e-simple.
It only takes a minute to sign up for e-Reports. Once enrolled, you’ll receive an e-mail as soon as your Nuveen Investments Fund information is ready—no more waiting for delivery by regular mail. Just click on the link within the e-mail to see the report and save it on your computer if you wish.
Free e-Reports right to your e-mail!
www.investordelivery.com
If you receive your Nuveen Fund dividends and statements from your financial advisor or brokerage account.
or
www.nuveen.com/accountaccess
If you receive your Nuveen Fund dividends and statements directly from Nuveen.
Table of Contents
| Chairman’s Letter to Shareholders | 4 |
| | |
| Portfolio Manager’s Comments | 5 |
| | |
| Fund Leverage | 10 |
| | |
| Common Share Information | 12 |
| | |
| Risk Considerations | 14 |
| | |
| Performance Overview and Holding Summaries | 15 |
| | |
| Report of Independent Registered Public Accounting Firm | 21 |
| | |
| Portfolios of Investments | 22 |
| | |
| Statement of Assets and Liabilities | 78 |
| | |
| Statement of Operations | 80 |
| | |
| Statement of Changes in Net Assets | 82 |
| | |
| Statement of Cash Flows | 84 |
| | |
| Financial Highlights | 86 |
| | |
| Notes to Financial Statements | 94 |
| | |
| Additional Fund Information | 111 |
| | |
| Glossary of Terms Used in this Report | 112 |
| | |
| Reinvest Automatically, Easily and Conveniently | 114 |
| | |
| Board Members & Officers | 115 |
Chairman’s Letter to Shareholders
Dear Shareholders,
A pattern of divergence has emerged in the past year. Steady and moderate growth in the U.S. economy helped sustain the stock market’s bull run another year. U.S. bonds also performed well, amid subdued inflation, interest rates that remained unexpectedly low and concerns about the economic well-being of the rest of the world. The stronger domestic economy enabled the U.S. Federal Reserve (Fed) to gradually reduce its large scale bond purchases, known as quantitative easing (QE), without disruption to the markets, as well as begin to set expectations for a transition into tightening mode.
The economic story outside the U.S. continues to improve. Despite the drama over Greece’s debt negotiations, the European economy appears to be stabilizing. Japan is on a moderate recovery path as it emerged from recession late last quarter. China’s economy decelerated and, despite running well above the rate of other major global economies, investors feared it looked slow by China’s standards. Some areas of concern were a surprisingly steep decline in oil prices, the U.S. dollar’s rally and an increase in geopolitical tensions, including the Russia-Ukraine crisis and terrorist attacks across the Middle East and Africa, as well as more recently in Europe.
While a backdrop of healthy economic growth in the U.S. and the continuation of accommodative monetary policy (with the central banks of Japan and potentially Europe stepping in where the Fed has left off) bodes well for the markets, the global outlook has become more uncertain. Indeed, volatility is likely to feature more prominently in the investment landscape going forward. Such conditions underscore the importance of professional investment management. Experienced investment teams have weathered the market’s ups and downs in the past and emerged with a better understanding of the sensitivities of their asset class and investment style, particularly in times of turbulence. We recognize the importance of maximizing gains, while striving to minimize volatility.
And, the same is true for investors like you. Maintaining an appropriate time horizon, diversification and relying on practiced investment teams are among your best strategies for achieving your long-term investment objectives. Additionally, I encourage you to communicate with your financial consultant if you have questions about your investment in a Nuveen Fund. On behalf of the other members of the Nuveen Fund Board, we look forward to continuing to earn your trust in the months and years ahead.
William J. Schneider
Chairman of the Board
April 22, 2015
Portfolio Manager’s Comments
Nuveen California Municipal Value Fund, Inc. (NCA)
Nuveen California Municipal Value Fund 2 (NCB)
Nuveen California AMT-Free Municipal Income Fund (NKX)
Nuveen California Dividend Advantage Municipal Fund (NAC)
Nuveen California Dividend Advantage Municipal Fund 2 (NVX)
Nuveen California Dividend Advantage Municipal Fund 3 (NZH)
These Funds feature portfolio management by Nuveen Asset Management, LLC, an affiliate of Nuveen Investments, Inc. Portfolio manager Scott R. Romans, PhD, reviews U.S. economic and municipal market conditions at the national and state levels, key investment strategies and the twelve-month performance of these Nuveen California Municipal Funds. Scott has managed NCA, NKX, NAC, NVX and NZH since 2003 and NCB since its inception in 2009.
FUND REORGANIZATIONS
Effective before the opening of business on June 9, 2014, certain California Funds (the Target Funds) were reorganized into larger California Funds included in this report (the Acquiring Funds) as follows:
The approved reorganizations are as follows:
| Target Funds | | Acquiring Funds |
| Nuveen California Performance Plus Municipal Fund, Inc. (NCP) | | Nuveen California Dividend Advantage Municipal Fund (NAC) |
| Nuveen California Municipal Market Opportunity Fund, Inc. (NCO) | | |
| Nuveen California Investment Quality Municipal Fund, Inc. (NQC) | | |
| Nuveen California Select Quality Municipal Fund, Inc. (NVC) | | |
| Nuveen California Quality Income Municipal Fund, Inc. (NUC) | | |
| Nuveen California Premium Income Municipal Fund (NCU) | | Nuveen California AMT-Free Municipal Income Fund (NKX) |
See Notes to Financial Statements, Note 1 – General Information and Significant Accounting Policies, Fund Reorganizations for further information.
| Certain statements in this report are forward-looking statements. Discussions of specific investments are for illustration only and are not intended as recommendations of individual investments. The forward-looking statements and other views expressed herein are those of the portfolio manager as of the date of this report. Actual future results or occurrences may differ significantly from those anticipated in any forward-looking statements, and the views expressed herein are subject to change at any time, due to numerous market and other factors. The Funds disclaim any obligation to update publicly or revise any forward-looking statements or views expressed herein. |
Ratings shown are the highest rating given by one of the following national rating agencies: Standard & Poor’s (S&P), Moody’s Investors Service, Inc. (Moody’s) or Fitch, Inc. (Fitch). Credit ratings are subject to change. AAA, AA, A and BBB are investment grade ratings; BB, B, CCC, CC, C and D are below investment grade ratings. Certain bonds backed by U.S. government or agency securities are regarded as having an implied rating equal to the rating of such securities. Holdings designated N/R are not rated by these national rating agencies.
Bond insurance guarantees only the payment of principal and interest on the bond when due, and not the value of the bonds themselves, which will fluctuate with the bond market and the financial success of the issuer and the insurer. Insurance relates specifically to the bonds in the portfolio and not to the share prices of a Fund. No representation is made as to the insurers’ ability to meet their commitments.
Refer to the Glossary of Terms Used in this Report for further definition of the terms used within this section.
Portfolio Manager’s Comments (continued)
What factors affected the U.S. economy and the national municipal bond market during the twelve-month reporting period ended February 28, 2015?
During this reporting period, the U.S. economy continued to expand at a moderate pace. The Federal Reserve (Fed) maintained efforts to bolster growth and promote progress toward its mandates of maximum employment and price stability by holding the benchmark fed funds rate at the record low level of zero to 0.25% that it established in December 2008. At its October 2014 meeting, the Fed announced that it would end its bond-buying stimulus program as of November 1, 2014, after tapering its monthly asset purchases of mortgage-backed and longer-term Treasury securities from the original $85 billion per month to $15 billion per month over the course of seven consecutive meetings (December 2013 through September 2014). In making the announcement, the Fed cited substantial improvement in the outlook for the labor market since the inception of the current asset purchase program as well as sufficient underlying strength in the broader economy to support ongoing progress toward maximum employment in a context of price stability. The Fed also reiterated that it would continue to look at a wide range of factors, including labor market conditions, indicators of inflationary pressures and readings on financial developments, in determining future actions. Additionally, the Fed stated that it would likely maintain the current target range for the fed funds rate for a considerable time after the end of the asset purchase program, especially if projected inflation continues to run below the Fed’s 2% longer run goal. However, if economic data shows faster progress, the Fed indicated it could raise the fed funds rate sooner than expected.
The Fed changed its language slightly in December, indicating it would be “patient” in normalizing monetary policy. This shift helped ease investors’ worries that the Fed might raise rates too soon. As the reporting period drew to a close, expectations were that the Fed would drop the word patient from its March post-meeting statement, in an effort to telegraph that a rate hike was likely in June. The March statement (issued after the close of this reporting period) did indeed remove the word patient but also highlighted the Fed’s less optimistic view of the economy’s overall health as well as downgraded its inflation projections.
In the fourth quarter of 2014, the U.S. economy, as measured by the U.S. gross domestic product (GDP), grew at a 2.2% annual rate, compared with 4.6% in the second quarter and 5.0% in the third quarter of 2014. The decline in real GDP growth rate from the third quarter to the fourth quarter primarily reflects an upturn in imports, a downturn in federal government spending and a decline in exports. These were partly offset by an upturn in consumer spending. The Consumer Price Index (CPI) fell 0.1% year-over-year as of January 2015 (most recent data available at the time this report was prepared), the first negative twelve-month change since October 2009. The core CPI (which excludes food and energy) increased 1.6% during the same period, below the Fed’s unofficial longer term inflation objective of 2.0%. As of February 28, 2015, the national unemployment rate was 5.5%, the lowest level since May 2008 and the level considered “full employment” by some Fed officials, down from the 6.7% reported in February 2014. The housing market continued to post gains, although price growth has shown signs of deceleration in recent months. The average home price in the S&P/Case-Shiller Index of 20 major metropolitan areas rose 4.6% for the twelve months ended January 2015 (most recent data available at the time this report was prepared).
Municipal bonds enjoyed strong performance during the twelve-month reporting period, buoyed by a backdrop of low interest rates, improving investor sentiment and favorable supply-demand dynamics. Interest rates were widely expected to rise in 2014, as the economy improved and the Fed wound down its asset purchases. However, the 10-year Treasury yield ended the year even lower than where it began. As a result, fixed income asset classes performed surprisingly well (as yields fall, prices rise and vice versa). At the same time, investors grew more confident that the Fed’s tapering would proceed at a measured pace and that the credit woes of Detroit and Puerto Rico would be contained. In addition, credit fundamentals for state and local governments were generally stabilizing, although pockets of trouble remained. California and New York showed marked improvements during 2014, whereas Illinois, New Jersey and Puerto Rico, for example, still face considerable challenges.
Investors’ declining risk aversion bolstered demand for higher yielding assets, including municipal bonds, which reversed the tide of outflows municipal bond funds suffered in 2013. While demand and inflows rose, supply continued to be subdued. More municipal bonds left the market than were added in 2014, a condition known as net negative issuance. Part of the reason for net negative issuance was that a significant portion of issuer activity focused on current refundings, in which a new bond is issued to replace the called bond (in contrast to an advanced refunding, where the called bond remains in the market as a pre-refunded bond).
These factors helped drive municipal bond yields lower and tightened yield spreads relative to Treasuries in 2014 overall. However, as the new year began, market conditions turned more volatile. A series of disappointing economic data underscored the fragility of the U.S. recovery, as well as cast further uncertainty on the timing of the Fed’s first rate hike. A change in the supply-demand balance also hampered the municipal bond sector. Issuance was unusually strong in the first two months of 2015, up 72.5% compared to the same two-month period in 2014. Over the twelve months ended February 28, 2015, municipal bond issuance nationwide totaled $358.8 billion, an increase of 13% from the issuance for the twelve-month period ended February 28, 2014. Finally, divergence in economic growth and foreign central bank policies have reinforced an interest rate differential that favors demand for U.S. Treasuries, maintaining downward pressure on yields.
How were the economic and market environments in California during the twelve-month reporting period ended February 28, 2015?
California’s economy is the largest in the United States and ranks 8th in the world according to the International Monetary Fund and continues to strengthen with employment growth driven by high technology, international trade and tourism but also supplemented by better residential construction and real estate conditions. The state’s labor force participation rate saw a large rebound reducing the risk to recovery. As of February 2015, California’s preliminary unemployment rate was 6.7%, down from 8% as of February 2014. According to the S&P/Case-Shiller Index, home prices in San Diego, Los Angeles and San Francisco rose 5.1%, 5.7% and 7.9%, respectively, over the twelve months ended January 2015 (most recent data available at the time this report was prepared) compared with an average increase of 4.6% nationally. California entered its fourth straight year of drought conditions resulting in the Governor issuing mandatory water cuts. In looking at the impact of the drought more broadly, the non-partisan Legislative Analyst Office says the drought is not likely to have a significant effect on California’s economy or state government revenues in the short term. Agriculture is exempt from the mandate though farms consume 80% of California’s water but only generate 2% of the state’s economic activity. The most significant economic risk would be a slowdown in California’s home building industry, which is a major part of the state’s economy. On the fiscal front, the Fiscal 2014 general fund budget totaled $97.1 billion and did not require major expenditure cuts and revenue raising. Fiscal Year 2015 is projected to transfer excess revenue to the rainy day fund for the first time since Fiscal Year 2008. The enacted Fiscal 2015 budget continues to pay down budgetary deferrals; implements a funding plan for California State Teachers Retirement System (teachers’ pension system); transfers funds to the rainy day fund; and provides funds for deferred maintenance and infrastructure projects. Strong revenue growth due to a recovering economy and the passage of Proposition 30 (increases state sales and personal income taxes temporarily) have aided in the State’s fiscal recovery. For Fiscal 2015-2016, the proposed General Fund Governor’s Budget totals $113.3 billion (up 1.4% over the forecast in the 2014 Budget Act). The proposed budget is expected to be again balanced, add to reserves, continue to pay down the “Wall of Debt” (education funding deferrals and budgetary obligations) and proposes to address the state’s retiree health liabilities over the next few decades. In November 2014, S&P upgraded its rating on California general obligation (GO) debt to A+ from A and revised the outlook to stable from positive. Moody’s upgraded the State GO to Aa3 with stable outlook from A1 in June 2014. During the twelve months ended February 28, 2015, municipal issuance in California totaled $48.7 billion, an increase of 6.8% for the twelve months ended February 28, 2014. For this reporting period, California was the largest state issuer in the nation, representing approximately 13.9% of total issuance nationwide.
What key strategies were used to manage these California Funds during the twelve-month reporting period ended February 28, 2015?
A backdrop of supportive technical and fundamental factors helped the municipal market rally for most of the reporting period. For the reporting period as a whole, municipal bond prices generally rose, while interest rates declined. California municipal paper as a whole outperformed the national market, due in part to increased demand triggered by recent changes in the state tax code as well as improving economic conditions in the state. During this time, we continued to take a bottom-up approach to discovering sectors that appeared undervalued as well as individual credits that we believed had the potential to perform well over the long term.
Portfolio Manager’s Comments (continued)
We continued to find opportunities to purchase bonds in both the primary and secondary markets that helped us keep the Funds fully invested. As the municipal market improved over the course of the reporting period, we increasingly positioned our portfolios more defensively by focusing on higher grade bonds that offered good liquidity and that were positioned in the longer intermediate part of the yield curve, (i.e. 18 to 22 years, rather than 25 to 30 years). At the same time, we became more selective within the lower credit quality segments of the market, as yield spreads on lower rated bonds began to tighten. One exception to our longer duration focus was our trading in tobacco bonds, which moved toward the shorter end of the yield curve during the reporting period.
Overall, our emphasis in purchase activity was on relative value and credit quality, rather than sector. That is, when considering the purchase of a lower rated bond or a slightly less liquid issue, we looked carefully at the compensation offered by the bond in question relative to its credit quality and to other opportunities available in the market. During this reporting period, our purchases of high grade, liquid bonds included California general obligation (GO) bonds as well as California State Public Works credits, which were upgraded during the reporting period. As spreads on these bonds tightened following the upgrade, we shifted our focus to other bonds in the high-grade end of the spectrum. In the second half of the reporting period, notable additions included school district GOs, community college GOs, local sales tax bonds, health care credits, and water and electric utilities credits, all of which were from the higher rated segments of the market.
In June 2014, Moody’s upgraded its credit rating on California GO debt to Aa3 from A1, the highest level since 2001, citing California’s rapidly improving financial position, high but declining debt metrics, adjusted net pension liability ratios and robust employment growth. S&P had revised its outlook for the state to positive from stable, while affirming an A rating. Fitch continued to rate the state at A with a stable outlook. Also during this reporting period, S&P upgraded its credit rating on National Public Finance Guarantee Corp. (NPFG), the insurance subsidiary of MBIA, to AA- rated from A rated, citing NPFG’s strong operating performance and competitive position in the financial guarantee market. As a result, the ratings on the Funds’ holdings of bonds backed by insurance from NPFG were similarly upgraded to AA- as of mid-March 2014. This action produced an increase in the percentage of our portfolios held in the AA- rated credit quality category (and a corresponding decrease in the A-rated category), improving the overall credit quality of the Funds. During this reporting period, S&P also upgraded its rating on Assured Guaranty Municipal (AGM) as well as AGM’s municipal-only insurer Municipal Assurance Corp. to AA from AA-.
Cash for purchases was generated primarily by proceeds from called and matured bonds, which we worked to redeploy to keep the Funds fully invested and support their income streams. The decline in municipal yields and the flattening of the municipal yield curve relative to the Treasury curve helped to make refunding deals more attractive and we saw an increase in this activity during the reporting period, as bond issuers sought to lower costs through refinancings. This provided ample cash for purchases and drove most of our trading activity for the reporting period.
As of February 28, 2015, all six of these Funds continued to use inverse floating rate securities. We employ inverse floaters for a variety of reasons, including duration management, income enhancement and total return enhancement.
How did the Funds perform during the twelve-month reporting period ended February 28, 2015?
The tables in each Fund’s Performance Overview and Holding Summaries section of this report provide the Funds’ total returns for the one-year, five-year, ten-year and/or since inception periods ended February 28, 2015. Each Fund’s returns on common share net asset value (NAV) are compared with the performance of corresponding market indexes and Lipper classification average.
For the twelve months ended February 28, 2015, the total returns at common share NAV for all six of these Funds exceeded the return for the S&P Municipal Bond California Index as well as that for the national S&P Municipal Bond Index. For this same period, NKX, NAC, NVX and NZH outperformed the average return for the Lipper California Municipal Debt Funds Classification Average, while NCA and NCB trailed this Lipper California average.
Key management factors that influenced the Funds’ returns during this reporting period included duration and yield curve positioning and credit exposure. Sector allocation had a relatively negligible impact on returns. In addition, the use of leverage was an important factor in performance. Among the primary reasons that the returns of NCA and NCB lagged those of the other Funds for this reporting period was that these two Funds do not use regulatory leverage. Leverage is discussed in more detail later in this report.
Given the combination of declining interest rates and a flattening yield curve during this reporting period, municipal bonds with longer maturities generally outperformed those with shorter maturities. Overall, credits with maturities of 15 years or more, especially those at the longest end of the municipal yield curve, outperformed the general municipal market, while bonds at the shortest end of the curve produced the weakest results. In general, the Funds’ durations and yield curve positioning were positive for their performance. Consistent with our long-term strategy, all of these Funds tended to be overweighted in the longer parts of the yield curve that performed best and underweighted in the underperforming shorter end of the curve.
During this reporting period, lower rated bonds generally outperformed higher quality bonds, as the municipal market rally continued and investors became more willing to accept risk. The B-rated category was an outlier from the overall trend, however, as the predominance of Puerto Rico bonds in this segment contributed to weaker performance. Improving credit fundamentals also supported investor demand for lower rated bonds in California. In addition to the upgrade in state GOs (described earlier in the key strategies section), evidence of a turnaround in other sectors further contributed to the stronger relative performance of the lower rated segments. For example, health care bonds benefited from an increase in health care utilization, driven by the improving jobs market. Improvements in the assessed value of California real estate along with an easing of uncertainty about the state’s tax allocation sector boosted trading volumes for real estate-related bonds, notably special tax districts, community facilities districts and incremental tax districts. In general, the Funds tended to have overweights in the lower quality categories and underweights in the AAA-rated and AA-rated categories, which helped their performance.
An Update Involving Puerto Rico
We also continue to monitor ongoing economic developments in Puerto Rico for any impact on the Funds’ holdings and performance. Shareholders should note that NCB had no exposure to Puerto Rico bonds during this reporting period. NVX had less than 2% and the other four Funds had allocations of less than 1% at the end of the reporting period. The Puerto Rico credits offered higher yields, added diversification and triple exemption (i.e., exemption from most federal, state and local taxes). However, Puerto Rico’s continued economic weakening, escalating debt service obligations, and long-standing inability to deliver a balanced budget led to multiple downgrades on its debt over the past two years. Following the latest rating reduction by Moody’s in July 2014, Puerto Rico general obligation debt was rated B2/BB+/BB (below investment grade) by Moody’s, S&P and Fitch, respectively, with negative outlooks.
On February 6, 2015, a federal court found Puerto Rico’s Recovery Act to be unconstitutional. Though the Commonwealth is pursuing an appeal of the ruling, the outcome is uncertain. Puerto Rico’s non-voting Representative in Congress recently introduced legislation that would make chapter 9 bankruptcy available to the Commonwealth’s public corporations. A congressional committee hearing was held on February 26, 2015, but the bill has not advanced out of committee.
In light of the evolving economic situation in Puerto Rico, Nuveen’s credit analysis of the Commonwealth had previously considered the possibility of a default and restructuring of public corporations and we adjusted our portfolios to prepare for such an outcome, although no such default or restructuring has occurred to date. The Nuveen complex’s entire exposure to obligations of the government of Puerto Rico and other Puerto Rico issuers totaled 0.36% of assets under management as of February 28, 2015. As of February 28, 2015, the Funds’ limited exposure to Puerto Rico generally was invested in bonds that were insured (which we believe adds value), pre-refunded (and therefore backed by securities such as U.S. Treasuries), or tobacco settlement bonds. Overall, the small size of our exposures meant that our Puerto Rico holdings had a negligible impact on performance.
Fund Leverage
IMPACT OF THE FUNDS’ LEVERAGE STRATEGY ON PERFORMANCE
One important factor impacting the returns of the Funds relative to their comparative benchmarks was the Funds’ use of leverage through their issuance of preferred shares and/or investments in inverse floating rate securities, which represent leveraged investments in underlying bonds. As mentioned previously, NCA and NCB do not use regulatory leverage. The Funds use leverage because our research has shown that, over time, leveraging provides opportunities for additional income, particularly in the recent market environment where short-term market rates are at or near historical lows, meaning that the short-term rates the Fund has been paying on its leveraging instruments have been much lower than the interest the Fund has been earning on its portfolio of long-term bonds that it has bought with the proceeds of that leverage. However, use of leverage also can expose the Fund to additional price volatility. When a Fund uses leverage, the Fund will experience a greater increase in its net asset value if the municipal bonds acquired through the use of leverage increase in value, but it will also experience a correspondingly larger decline in its net asset value if the bonds acquired through leverage decline in value, which will make the Fund’s net asset value more volatile, and its total return performance more variable over time. In addition, income in levered funds will typically decrease in comparison to unlevered funds when short-term interest rates increase and increase when short-term interest rates decrease. Leverage had a positive impact on the performance of the Funds over this reporting period. For NCA, the impact was minimal due to the low level of leverage used in the Fund.
As of February 28, 2015, the Funds’ percentages of leverage are as shown in the accompanying table.
| | | NCA | | NCB | | NKX | | NAC | | NVX | | NZH | |
| Effective Leverage* | | 1.65% | | 9.43% | | 34.43% | | 35.66% | | 31.64% | | 37.68% | |
| Regulatory Leverage* | | 0.00% | | 0.00% | | 30.10% | | 28.99% | | 29.57% | | 31.07% | |
| * | Effective leverage is a Fund’s effective economic leverage, and includes both regulatory leverage and the leverage effects of certain derivative and other investments in a Fund’s portfolio that increase the Fund’s investment exposure. Currently, the leverage effects of Tender Option Bond (TOB) inverse floater holdings are included in effective leverage values, in addition to any regulatory leverage. Regulatory leverage consists of preferred shares issued or borrowings of a Fund. Both of these are part of a Fund’s capital structure. Regulatory leverage is subject to asset coverage limits set forth in the Investment Company Act of 1940. |
THE FUNDS’ REGULATORY LEVERAGE
As of February 28, 2015, the following Funds have issued and outstanding Institutional MuniFund Term Preferred (iMTP) Shares and Variable Rate Demand Preferred (VRDP) Shares as shown in the accompanying table. As mentioned previously, NCA and NCB do not use regulatory leverage.
| | | iMTP Shares | | VRDP Shares | | | | |
| | | | | | Shares | | | | | | Shares | | | | |
| | | | | | Issued at | | | | | | Issued at | | | | |
| | | Series | | | Liquidation Value | | Series | | | | Liquidation Value | | | Total | |
| NKX | | 2018 | | $ | 36,000,000 | | 2 | | | $ | 35,500,000 | | | | |
| | | | | | | | 3 | | | $ | 42,700,000 | | | | |
| | | | | | | | 4 | | | $ | 109,000,000 | | | | |
| | | | | | | | 5 | | | $ | 104,400,000 | | | | |
| | | | | $ | 36,000,000 | | | | | $ | 291,600,000 | | $ | 327,600,000 | |
| NAC | | — | | | — | | 1 | | | $ | 136,200,000 | | | | |
| | | | | | | | 2 | * | | $ | 91,000,000 | | | | |
| | | | | | | | 3 | * | | $ | 49,800,000 | | | | |
| | | | | | | | 4 | * | | $ | 105,600,000 | | | | |
| | | | | | | | 5 | * | | $ | 158,900,000 | | | | |
| | | | | | | | 6 | * | | $ | 158,100,000 | | | | |
| | | | | | | | | | | $ | 699,600,000 | | $ | 699,600,000 | |
| NVX | | — | | | — | | 1 | | | $ | 98,000,000 | | $ | 98,000,000 | |
| NZH | | — | | | — | | 1 | | | $ | 160,000,000 | | $ | 160,000,000 | |
* VRDP Shares issued in connection with the reorganization.
During the current reporting period, NKX issued MuniFund Term Preferred (MTP) Shares in connection with its reorganization. These MTP Shares were refinanced with the issuance of iMTP Shares prior to the end of the reporting period. Refer to Notes to Financial Statements, Note 1 — General Information and Significant Accounting Policies for further details on iMTP, MTP and VRDP Shares and each Fund’s respective transactions.
Common Share Information
COMMON SHARE DISTRIBUTION INFORMATION
The following information regarding the Funds’ distributions is current as of February 28, 2015. Each Fund’s distribution levels may vary over time based on each Fund’s investment activity and portfolio investment value changes.
During the current reporting period, each Fund’s distributions to common shareholders were as shown in the accompanying table.
| | | Per Common Share Amounts | |
| Ex-Dividend Date | | | NCA | | | NCB | | | NKX | | | NAC | | | NVX | | | NZH | |
| March 2014 | | $ | 0.0390 | | $ | 0.0650 | | $ | 0.0700 | | $ | 0.0740 | | $ | 0.0750 | | $ | 0.0670 | |
| April | | | 0.0390 | | | 0.0650 | | | 0.0700 | | | 0.0740 | | | 0.0750 | | | 0.0670 | |
| May | | | 0.0390 | | | 0.0650 | | | 0.0700 | | | 0.0740 | | | 0.0750 | | | 0.0670 | |
| June* | | | 0.0390 | | | 0.0650 | | | 0.1400 | | | 0.1480 | | | 0.0700 | | | 0.0670 | |
| July | | | 0.0390 | | | 0.0650 | | | 0.0000 | | | 0.0000 | | | 0.0700 | | | 0.0670 | |
| August | | | 0.0390 | | | 0.0650 | | | 0.0700 | | | 0.0800 | | | 0.0700 | | | 0.0670 | |
| September | | | 0.0390 | | | 0.0650 | | | 0.0700 | | | 0.0800 | | | 0.0700 | | | 0.0670 | |
| October | | | 0.0390 | | | 0.0650 | | | 0.0700 | | | 0.0800 | | | 0.0700 | | | 0.0670 | |
| November | | | 0.0390 | | | 0.0650 | | | 0.0700 | | | 0.0800 | | | 0.0700 | | | 0.0670 | |
| December | | | 0.0390 | | | 0.0650 | | | 0.0720 | | | 0.0800 | | | 0.0700 | | | 0.0670 | |
| January | | | 0.0390 | | | 0.0650 | | | 0.0720 | | | 0.0800 | | | 0.0700 | | | 0.0670 | |
| February 2015 | | | 0.0390 | | | 0.0650 | | | 0.0720 | | | 0.0800 | | | 0.0700 | | | 0.0670 | |
| Long-Term Capital Gain** | | $ | — | | $ | 0.1119 | | $ | — | | $ | — | | $ | — | | $ | — | |
| Ordinary Income Distribution** | | $ | — | | $ | 0.0057 | | $ | — | | $ | — | | $ | — | | $ | — | |
| Market Yield*** | | | 4.40 | % | | 4.68 | % | | 5.89 | % | | 6.26 | % | | 5.76 | % | | 5.90 | % |
| Taxable-Equivalent Yield*** | | | 6.74 | % | | 7.17 | % | | 9.02 | % | | 9.59 | % | | 8.82 | % | | 9.04 | % |
| * | In connection with NKX’s reorganization, the Fund declared a dividend of $0.0700 per common share with an ex-dividend date of June 4, 2014, payable on July 1, 2014 and a dividend of $0.0700 per common share with an ex-dividend date of June 4, 2014, payable on August 1, 2014. In connection with NAC’s reorganization, the Fund declared a dividend of $0.0740 per common share with an ex-dividend date of June 4, 2014, payable on July 1, 2014, a dividend of $0.0686 per common share with an ex-dividend date of June 4, 2014, payable on August 1, 2014 and a dividend of $0.0054 per common share with an ex-dividend date of June 17, 2014, payable on August 1, 2014. |
| | |
| ** | Distribution paid in December 2014. |
| | |
| *** | Market Yield is based on the Fund’s current annualized monthly distribution divided by the Fund’s market price as of the end of the reporting period. Taxable-Equivalent Yield represents the yield that must be earned on a fully taxable investment in order to equal the yield of the Fund on an after-tax basis. It is based on a combined federal and state income tax rate of 34.7%. When comparing a Fund to investments that generate qualified dividend income, the Taxable-Equivalent Yield is lower. |
Each Fund in this report seeks to pay regular monthly dividends out of its net investment income at a rate that reflects its past and projected net income performance. To permit each Fund to maintain a more stable monthly dividend, the Fund may pay dividends at a rate that may be more or less than the amount of net income actually earned by the Fund during the period. If a Fund has cumulatively earned more than it has paid in dividends, it will hold the excess in reserve as undistributed net investment income (UNII) as part of the Fund’s net asset value. Conversely, if a Fund has cumulatively paid in dividends more than it has earned, the excess will constitute a negative UNII that will likewise be reflected in the Fund’s net asset value. Each Fund will, over time, pay all its net investment income as dividends to shareholders.
As of February 28, 2015, the Funds had positive UNII balances for tax purposes and positive UNII balances for financial reporting purposes.
All monthly dividends paid by each Fund during the current reporting period, were paid from net investment income. If a portion of the Fund’s monthly distributions was sourced from or comprised of elements other than net investment income, including capital
gains and/or a return of capital, shareholders would have received a notice to that effect. For financial reporting purposes, the composition and per share amounts of each Fund’s dividends for the reporting period are presented in this report’s Statement of Changes in Net Assets and Financial Highlights, respectively. For income tax purposes, distribution information for each Fund as of its most recent tax year end is presented in Note 6 – Income Tax Information within the Notes to Financial Statements of this report.
COMMON SHARE REPURCHASES
During August 2014, the Funds’ Board of Directors/Trustees reauthorized an open-market share repurchase program allowing each Fund to repurchase an aggregate of up to approximately 10% of its outstanding shares.
As of February 28, 2015, and since the inception of the Funds’ repurchase programs, the Funds have cumulatively repurchased and retired common shares as shown in the accompanying table.
| | | NCA | | NCB | | NKX | | NAC | | NVX | | NZH | |
| Common Shares Cumulatively Repurchased and Retired | | 0 | | 0 | | 0 | | 0 | | 50,700 | | 12,900 | |
| Common Shares Authorized for Repurchase | | 2,530,000 | | 330,000 | | 4,770,000 | | 10,740,000 | | 1,475,000 | | 2,415,000 | |
During the current reporting period, the Funds did not repurchase any of their outstanding common shares.
COMMON SHARE EQUITY SHELF PROGRAMS
During the reporting period, the following Funds were authorized to issue additional common shares through their ongoing equity shelf programs. Under these programs, each Fund, subject to market conditions, may raise additional capital from time to time in varying amounts and offering methods at a net price at or above the Fund’s NAV per common share. Under the equity shelf programs, the Funds are authorized to issue the following number of additional common shares.
| | | NCA | | NKX | | NAC | |
| Additional Common Shares Authorized | | 2,500,000 | | 4,100,000 | | 2,300,000 | |
During the current reporting period, NCA sold common shares through its equity shelf program at a weighted average premium to its NAV per common share as shown in the accompanying table.
| | | | NCA | |
| Common Shares Sold through Equity Shelf Program | | | 124,572 | |
| Weighted Average Premium to NAV per Common Share Sold | | | 1.22 | % |
As June 30, 2014, NCA’s, NKX’s and NAC’s shelf offering registration statements were no longer current. Therefore, each Fund may not issue additional common shares under its equity shelf programs until a post-effective amendment to the Fund’s registration statement is filed with the Securities and Exchange Commission (the “SEC”). On October 3, 2014, a post-effective amendment to NCA’s registration statement was filed with the SEC and therefore, NCA may issue additional common shares under its equity shelf program.
OTHER COMMON SHARE INFORMATION
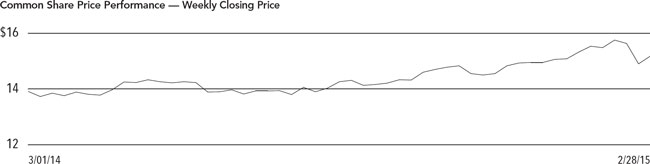
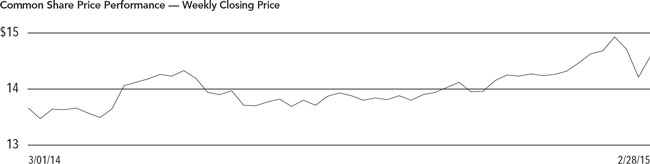
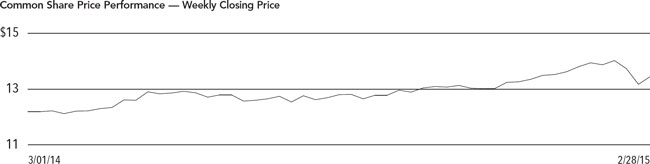
As of February 28, 2015, and during the current reporting period, the Funds’ common share prices were trading at a premium/(discount) to their common share NAVs as shown in the accompanying table.
| | | | NCA | | | NCB | | | NKX | | | NAC | | | NVX | | | NZH | |
| Common Share NAV | | $ | 10.54 | | $ | 17.50 | | $ | 15.95 | | $ | 15.96 | | $ | 15.82 | | $ | 14.70 | |
| Common Share Price | | $ | 10.64 | | $ | 16.68 | | $ | 14.67 | | $ | 15.34 | | $ | 14.59 | | $ | 13.63 | |
| Premium/(Discount) to NAV | | | 0.95 | % | | (4.69 | )% | | (8.03 | )% | | (3.88 | )% | | (7.77 | )% | | (7.28 | )% |
| 12-Month Average Premium/(Discount) to NAV | | | (1.51 | )% | | (5.89 | )% | | (9.51 | )% | | (6.95 | )% | | (9.09 | )% | | (9.33 | )% |
Risk Considerations
Fund shares are not guaranteed or endorsed by any bank or other insured depository institution, and are not federally insured by the Federal Deposit Insurance Corporation. Past performance is no guarantee of future results. Fund common shares are subject to a variety of risks, including:
Investment, Price and Market Risk. An investment in common shares is subject to investment risk, including the possible loss of the entire principal amount that you invest. Your investment in common shares represents an indirect investment in the municipal securities owned by the Fund, which generally trade in the over-the-counter markets. Shares of closed-end investment companies like these Funds frequently trade at a discount to their net asset value (NAV). Your common shares at any point in time may be worth less than your original investment, even after taking into account the reinvestment of Fund dividends and distributions.
Leverage Risk. Each Fund’s use of leverage creates the possibility of higher volatility for the Fund’s per share NAV, market price, distributions and returns. There is no assurance that a Fund’s leveraging strategy will be successful. Certain aspects of the recently adopted Volcker Rule may limit the availability of tender option bonds, which are used by the Funds for leveraging and duration management purposes. The effects of this new Rule, expected to take effect in mid-2015, may make it more difficult for a Fund to maintain current or desired levels of leverage and may cause the Fund to incur additional expenses to maintain its leverage.
Tax Risk. The tax treatment of Fund distributions may be affected by new IRS interpretations of the Internal Revenue Code and future changes in tax laws and regulations.
Issuer Credit Risk. This is the risk that a security in a Fund’s portfolio will fail to make dividend or interest payments when due.
Interest Rate Risk. Fixed-income securities such as bonds, preferred, convertible and other debt securities will decline in value if market interest rates rise.
Reinvestment Risk. If market interest rates decline, income earned from a Fund’s portfolio may be reinvested at rates below that of the original bond that generated the income.
Call Risk or Prepayment Risk. Issuers may exercise their option to prepay principal earlier than scheduled, forcing a Fund to reinvest in lower-yielding securities.
Inverse Floater Risk. The Funds invest in inverse floaters. Due to their leveraged nature, these investments can greatly increase a Fund’s exposure to interest rate risk and credit risk. In addition, investments in inverse floaters involve the risk that the Fund could lose more than its original principal investment.
| NCA | |
| | Nuveen California Municipal Value Fund, Inc. |
| | Performance Overview and Holding Summaries as of February 28, 2015 |
Refer to the Glossary of Terms Used in this Report for further definition of the terms used within this section.
Average Annual Total Returns as of February 28, 2015
| | | Average Annual | |
| | | 1-Year | | 5-Year | | 10-Year | |
| NCA at Common Share NAV | | 9.91% | | 6.91% | | 5.34% | |
| NCA at Common Share Price | | 16.36% | | 8.52% | | 6.28% | |
| S&P Municipal Bond California Index | | 7.46% | | 6.27% | | 5.11% | |
| S&P Municipal Bond Index | | 6.47% | | 5.19% | | 4.75% | |
| Lipper California Municipal Debt Funds Classification Average | | 12.44% | | 8.90% | | 5.62% | |
Past performance is not predictive of future results. Current performance may be higher or lower than the data shown. Returns do not reflect the deduction of taxes that shareholders may have to pay on Fund distributions or upon the sale of Fund shares. Returns at NAV are net of Fund expenses, and assume reinvestment of distributions. Comparative index and Lipper return information is provided for the Fund’s shares at NAV only. Indexes and Lipper averages are not available for direct investment.
This data relates to the securities held in the Fund’s portfolio of investments as of the end of the reporting period. It should not be construed as a measure of performance for the Fund itself. Holdings are subject to change.
Ratings shown are the highest rating given by one of the following national rating agencies: Standard & Poor’s Group, Moody’s Investors Service, Inc. or Fitch, Inc. Credit ratings are subject to change. AAA, AA, A and BBB are investment grade ratings; BB, B, CCC, CC, C and D are below-investment grade ratings. Certain bonds backed by U.S. Government or agency securities are regarded as having an implied rating equal to the rating of such securities. Holdings designated N/R are not rated by these national rating agencies.
| Fund Allocation | |
| (% of net assets) | |
| Long-Term Municipal Bonds | 99.8% |
| Short-Term Municipal Bonds | 0.4% |
| Other Assets Less Liabilities | 1.5% |
| Net Assets Plus Floating | |
| Rate Obligations | 101.7% |
| Floating Rate Obligations | (1.7)% |
| Net Assets | 100% |
| Portfolio Composition | |
| (% of total investments) | |
| Tax Obligation/Limited | 21.1% |
| Tax Obligation/General | 19.4% |
| U.S. Guaranteed | 17.9% |
| Health Care | 16.3% |
| Transportation | 7.0% |
| Water and Sewer | 6.8% |
| Other | 11.5% |
| Total | 100% |
| Credit Quality | |
| (% of total investment exposure) | |
| AAA/U.S. Guaranteed | 18.3% |
| AA | 38.7% |
| A | 16.8% |
| BBB | 10.2% |
| BB or Lower | 8.6% |
| N/R (not rated) | 7.4% |
| Total | 100% |
| NCB | |
| | Nuveen California Municipal Value Fund 2 |
| | Performance Overview and Holding Summaries as of February 28, 2015 |
Refer to the Glossary of Terms Used in this Report for further definition of the terms used within this section.
Average Annual Total Returns as of February 28, 2015
| | | Average Annual | |
| | | | | | | Since | |
| | | 1-Year | | 5-Year | | Inception1 | |
| NCB at Common Share NAV | | 9.68% | | 7.43% | | 8.80% | |
| NCB at Common Share Price | | 13.41% | | 8.28% | | 7.37% | |
| S&P Municipal Bond California Index | | 7.46% | | 6.27% | | 6.70% | |
| S&P Municipal Bond Index | | 6.47% | | 5.19% | | 5.92% | |
| Lipper California Municipal Debt Funds Classification Average | | 12.44% | | 8.90% | | 6.21% | |
Past performance is not predictive of future results. Current performance may be higher or lower than the data shown. Returns do not reflect the deduction of taxes that shareholders may have to pay on Fund distributions or upon the sale of Fund shares. Returns at NAV are net of Fund expenses, and assume reinvestment of distributions. Comparative index and Lipper return information is provided for the Fund’s shares at NAV only. Indexes and Lipper averages are not available for direct investment.
This data relates to the securities held in the Fund’s portfolio of investments as of the end of the reporting period. It should not be construed as a measure of performance for the Fund itself. Holdings are subject to change.
Ratings shown are the highest rating given by one of the following national rating agencies: Standard & Poor’s Group, Moody’s Investors Service, Inc. or Fitch, Inc. Credit ratings are subject to change. AAA, AA, A and BBB are investment grade ratings; BB, B, CCC, CC, C and D are below-investment grade ratings. Certain bonds backed by U.S. Government or agency securities are regarded as having an implied rating equal to the rating of such securities. Holdings designated N/R are not rated by these national rating agencies.
| Fund Allocation | |
| (% of net assets) | |
| Long-Term Municipal Bonds | 97.8% |
| Short-Term Municipal Bonds | 0.9% |
| Other Assets Less Liabilities | 1.3% |
| Net Assets | 100% |
| Portfolio Composition | |
| (% of total investments) | |
| Tax Obligation/Limited | 22.5% |
| Health Care | 19.1% |
| Tax Obligation/General | 14.9% |
| Utilities | 14.2% |
| Water and Sewer | 7.4% |
| Housing/Single Family | 5.7% |
| Consumer Staples | 5.1% |
| Other | 11.1% |
| Total | 100% |
| Credit Quality | |
| (% of total investment exposure) | |
| AAA/U.S. Guaranteed | 15.8% |
| AA | 24.7% |
| A | 38.7% |
| BBB | 11.1% |
| BB or Lower | 7.8% |
| N/R (not rated) | 1.9% |
| Total | 100% |
1 Since inception returns are from 4/28/09.
| NKX | |
| | Nuveen California AMT-Free Municipal Income Fund |
| | Performance Overview and Holding Summaries as of February 28, 2015 |
Refer to the Glossary of Terms Used in this Report for further definition of the terms used within this section.
Average Annual Total Returns as of February 28, 2015
| | | Average Annual | |
| | | 1-Year | | 5-Year | | 10-Year | |
| NKX at Common Share NAV | | 16.16% | | 8.74% | | 6.39% | |
| NKX at Common Share Price | | 17.55% | | 9.19% | | 5.97% | |
| S&P Municipal Bond California Index | | 7.46% | | 6.27% | | 5.11% | |
| S&P Municipal Bond Index | | 6.47% | | 5.19% | | 4.75% | |
| Lipper California Municipal Debt Funds Classification Average | | 12.44% | | 8.90% | | 5.62% | |
Past performance is not predictive of future results. Current performance may be higher or lower than the data shown. Returns do not reflect the deduction of taxes that shareholders may have to pay on Fund distributions or upon the sale of Fund shares. Returns at NAV are net of Fund expenses, and assume reinvestment of distributions. Comparative index and Lipper return information is provided for the Fund’s shares at NAV only. Indexes and Lipper averages are not available for direct investment.
This data relates to the securities held in the Fund’s portfolio of investments as of the end of the reporting period. It should not be construed as a measure of performance for the Fund itself. Holdings are subject to change.
Ratings shown are the highest rating given by one of the following national rating agencies: Standard & Poor’s Group, Moody’s Investors Service, Inc. or Fitch, Inc. Credit ratings are subject to change. AAA, AA, A and BBB are investment grade ratings; BB, B, CCC, CC, C and D are below-investment grade ratings. Certain bonds backed by U.S. Government or agency securities are regarded as having an implied rating equal to the rating of such securities. Holdings designated N/R are not rated by these national rating agencies.
| Fund Allocation | |
| (% of net assets) | |
| Long-Term Municipal Bonds | 140.0% |
| Short-Term Municipal Bonds | 1.2% |
| Other Assets Less Liabilities | 2.7% |
| Net Assets Plus Floating Rate Obligations, | |
| iMTP Shares, at Liquidation Value & | |
| VRDP Shares, at Liquidation Value | 143.9% |
| Floating Rate Obligations | (0.9)% |
| iMTP Shares, at Liquidation Value | (4.7)% |
| VRDP Shares, at Liquidation Value | (38.3)% |
| Net Assets | 100% |
| Portfolio Composition | |
| (% of total investments) | |
| Tax Obligation/Limited | 32.8% |
| Tax Obligation/General | 22.8% |
| Health Care | 14.7% |
| Water and Sewer | 11.2% |
| Transportation | 4.2% |
| Other | 14.3% |
| Total | 100% |
| Credit Quality | |
| (% of total investment exposure) | |
| AAA/U.S. Guaranteed | 4.6% |
| AA | 55.7% |
| A | 17.4% |
| BBB | 8.5% |
| BB or Lower | 7.3% |
| N/R (not rated) | 6.5% |
| Total | 100% |
| NAC | |
| | Nuveen California Dividend Advantage Municipal Fund |
| | Performance Overview and Holding Summaries as of February 28, 2015 |
Refer to the Glossary of Terms Used in this Report for further definition of the terms used within this section.
Average Annual Total Returns as of February 28, 2015
| | | Average Annual | |
| | | 1-Year | | 5-Year | | 10-Year | |
| NAC at Common Share NAV | | 15.39% | | 9.42% | | 6.57% | |
| NAC at Common Share Price | | 16.21% | | 10.98% | | 7.04% | |
| S&P Municipal Bond California Index | | 7.46% | | 6.27% | | 5.11% | |
| S&P Municipal Bond Index | | 6.47% | | 5.19% | | 4.75% | |
| Lipper California Municipal Debt Funds Classification Average | | 12.44% | | 8.90% | | 5.62% | |
Past performance is not predictive of future results. Current performance may be higher or lower than the data shown. Returns do not reflect the deduction of taxes that shareholders may have to pay on Fund distributions or upon the sale of Fund shares. Returns at NAV are net of Fund expenses, and assume reinvestment of distributions. Comparative index and Lipper return information is provided for the Fund’s shares at NAV only. Indexes and Lipper averages are not available for direct investment.
This data relates to the securities held in the Fund’s portfolio of investments as of the end of the reporting period. It should not be construed as a measure of performance for the Fund itself. Holdings are subject to change.
Ratings shown are the highest rating given by one of the following national rating agencies: Standard & Poor’s Group, Moody’s Investors Service, Inc. or Fitch, Inc. Credit ratings are subject to change. AAA, AA, A and BBB are investment grade ratings; BB, B, CCC, CC, C and D are below-investment grade ratings. Certain bonds backed by U.S. Government or agency securities are regarded as having an implied rating equal to the rating of such securities. Holdings designated N/R are not rated by these national rating agencies.
| Fund Allocation | |
| (% of net assets) | |
| Long-Term Municipal Bonds | 143.2% |
| Short-Term Municipal Bonds | 1.2% |
| Other Assets Less Liabilities | 1.8% |
| Net Assets Plus Floating Rate Obligations | |
| & VRDP Shares, at Liquidation Value | 146.2% |
| Floating Rate Obligations | (5.4)% |
| VRDP Shares, at Liquidation Value | (40.8)% |
| Net Assets | 100% |
| Portfolio Composition | |
| (% of total investments) | |
| Tax Obligation/Limited | 23.5% |
| Tax Obligation/General | 22.3% |
| Health Care | 21.3% |
| Water and Sewer | 8.8% |
| U.S. Guaranteed | 5.7% |
| Transportation | 5.0% |
| Other | 13.4% |
| Total | 100% |
| Credit Quality | |
| (% of total investment exposure) | |
| AAA/U.S. Guaranteed | 8.8% |
| AA | 47.6% |
| A | 19.2% |
| BBB | 11.1% |
| BB or Lower | 8.0% |
| N/R (not rated) | 5.3% |
| Total | 100% |
| NVX | |
| | Nuveen California Dividend Advantage Municipal Fund 2 |
| | Performance Overview and Holding Summaries as of February 28, 2015 |
Refer to the Glossary of Terms Used in this Report for further definition of the terms used within this section.
Average Annual Total Returns as of February 28, 2015
| | | Average Annual | |
| | | 1-Year | | 5-Year | | 10-Year | |
| NVX at Common Share NAV | | 12.57% | | 8.25% | | 6.37% | |
| NVX at Common Share Price | | 12.72% | | 8.25% | | 6.78% | |
| S&P Municipal Bond California Index | | 7.46% | | 6.27% | | 5.11% | |
| S&P Municipal Bond Index | | 6.47% | | 5.19% | | 4.75% | |
| Lipper California Municipal Debt Funds Classification Average | | 12.44% | | 8.90% | | 5.62% | |
Past performance is not predictive of future results. Current performance may be higher or lower than the data shown. Returns do not reflect the deduction of taxes that shareholders may have to pay on Fund distributions or upon the sale of Fund shares. Returns at NAV are net of Fund expenses, and assume reinvestment of distributions. Comparative index and Lipper return information is provided for the Fund’s shares at NAV only. Indexes and Lipper averages are not available for direct investment.
This data relates to the securities held in the Fund’s portfolio of investments as of the end of the reporting period. It should not be construed as a measure of performance for the Fund itself. Holdings are subject to change.
Ratings shown are the highest rating given by one of the following national rating agencies: Standard & Poor’s Group, Moody’s Investors Service, Inc. or Fitch, Inc. Credit ratings are subject to change. AAA, AA, A and BBB are investment grade ratings; BB, B, CCC, CC, C and D are below-investment grade ratings. Certain bonds backed by U.S. Government or agency securities are regarded as having an implied rating equal to the rating of such securities. Holdings designated N/R are not rated by these national rating agencies.
| Fund Allocation | |
| (% of net assets) | |
| Long-Term Municipal Bonds | 138.7% |
| Short-Term Municipal Bonds | 0.7% |
| Other Assets Less Liabilities | 3.0% |
| Net Assets Plus Floating Rate Obligations | |
| & VRDP Shares, at Liquidation Value | 142.4% |
| Floating Rate Obligations | (0.4)% |
| VRDP Shares, at Liquidation Value | (42.0)% |
| Net Assets | 100% |
| Portfolio Composition | |
| (% of total investments) | |
| Tax Obligation/General | 22.4% |
| Tax Obligation/Limited | 20.9% |
| Health Care | 15.2% |
| Water and Sewer | 8.7% |
| Utilities | 8.6% |
| Transportation | 7.4% |
| U.S. Guaranteed | 5.9% |
| Consumer Staples | 5.5% |
| Other | 5.4% |
| Total | 100% |
| Credit Quality | |
| (% of total investment exposure) | |
| AAA/U.S. Guaranteed | 10.1% |
| AA | 41.6% |
| A | 20.6% |
| BBB | 12.9% |
| BB or Lower | 9.8% |
| N/R (not rated) | 5.0% |
| Total | 100% |
| NZH | |
| | Nuveen California Dividend Advantage Municipal Fund 3 |
| | Performance Overview and Holding Summaries as of February 28, 2015 |
Refer to the Glossary of Terms Used in this Report for further definition of the terms used within this section.
Average Annual Total Returns as of February 28, 2015
| | | Average Annual | |
| | | 1-Year | | 5-Year | | 10-Year | |
| NZH at Common Share NAV | | 15.18% | | 8.82% | | 5.98% | |
| NZH at Common Share Price | | 18.47% | | 8.36% | | 6.47% | |
| S&P Municipal Bond California Index | | 7.46% | | 6.27% | | 5.11% | |
| S&P Municipal Bond Index | | 6.47% | | 5.19% | | 4.75% | |
| Lipper California Municipal Debt Funds Classification Average | | 12.44% | | 8.90% | | 5.62% | |
Past performance is not predictive of future results. Current performance may be higher or lower than the data shown. Returns do not reflect the deduction of taxes that shareholders may have to pay on Fund distributions or upon the sale of Fund shares. Returns at NAV are net of Fund expenses, and assume reinvestment of distributions. Comparative index and Lipper return information is provided for the Fund’s shares at NAV only. Indexes and Lipper averages are not available for direct investment.
This data relates to the securities held in the Fund’s portfolio of investments as of the end of the reporting period. It should not be construed as a measure of performance for the Fund itself. Holdings are subject to change.
Ratings shown are the highest rating given by one of the following national rating agencies: Standard & Poor’s Group, Moody’s Investors Service, Inc. or Fitch, Inc. Credit ratings are subject to change. AAA, AA, A and BBB are investment grade ratings; BB, B, CCC, CC, C and D are below-investment grade ratings. Certain bonds backed by U.S. Government or agency securities are regarded as having an implied rating equal to the rating of such securities. Holdings designated N/R are not rated by these national rating agencies.
| Fund Allocation | |
| (% of net assets) | |
| Long-Term Municipal Bonds | 141.3% |
| Short-Term Municipal Bonds | 1.3% |
| Other Assets Less Liabilities | 2.7% |
| Net Assets Plus Floating Rate Obligations | |
| & VRDP Shares, at Liquidation Value | 145.3% |
| Floating Rate Obligations | (0.2)% |
| VRDP Shares, at Liquidation Value | (45.1)% |
| Net Assets | 100% |
| Portfolio Composition | |
| (% of total investments) | |
| Tax Obligation/Limited | 30.4% |
| Health Care | 21.0% |
| Tax Obligation/General | 11.4% |
| Water and Sewer | 9.5% |
| Transportation | 7.5% |
| Consumer Staples | 5.5% |
| Utilities | 4.8% |
| Other | 9.9% |
| Total | 100% |
| Credit Quality | |
| (% of total investment exposure) | |
| AAA/U.S. Guaranteed | 4.3% |
| AA | 50.4% |
| A | 19.4% |
| BBB | 11.5% |
| BB or Lower | 8.6% |
| N/R (not rated) | 5.8% |
| Total | 100% |
Report of Independent Registered Public Accounting Firm
To the Board of Directors/Trustees and Shareholders of
Nuveen California Municipal Value Fund, Inc.
Nuveen California Municipal Value Fund 2
Nuveen California AMT-Free Municipal Income Fund
Nuveen California Dividend Advantage Municipal Fund
Nuveen California Dividend Advantage Municipal Fund 2
Nuveen California Dividend Advantage Municipal Fund 3:
We have audited the accompanying statement of assets and liabilities, including the portfolios of investments, of Nuveen California Municipal Value Fund, Inc., Nuveen California Municipal Value Fund 2, Nuveen California AMT-Free Municipal Income Fund, Nuveen California Dividend Advantage Municipal Fund, Nuveen California Dividend Advantage Municipal Fund 2 and Nuveen California Dividend Advantage Municipal Fund 3 (the “Funds”) as of February 28, 2015, and the related statements of operations, changes in net assets and cash flows (Nuveen California AMT-Free Municipal Income Fund, Nuveen California Dividend Advantage Municipal Fund, Nuveen California Dividend Advantage Municipal Fund 2 and Nuveen California Dividend Advantage Municipal Fund 3), and the financial highlights for the year then ended. These financial statements and financial highlights are the responsibility of the Funds’ management. Our responsibility is to express an opinion on these financial statements and financial highlights based on our audits. The statements of changes in net assets and the financial highlights for the periods presented through February 28, 2014, were audited by other auditors whose report dated April 25, 2014, expressed an unqualified opinion on those statements and those financial highlights.
We conducted our audits in accordance with the standards of the Public Company Accounting Oversight Board (United States). Those standards require that we plan and perform the audits to obtain reasonable assurance about whether the financial statements and financial highlights are free of material misstatement. An audit includes examining, on a test basis, evidence supporting the amounts and disclosures in the financial statements. Our procedures included confirmation of securities owned as of February 28, 2015, by correspondence with the custodian and brokers or other appropriate auditing procedures. An audit also includes assessing the accounting principles used and significant estimates made by management, as well as evaluating the overall financial statement presentation. We believe that our audits provide a reasonable basis for our opinion.
In our opinion, the financial statements and financial highlights referred to above present fairly, in all material respects, the financial position of the Funds as of February 28, 2015, the results of their operations, the changes in their net assets, their cash flows (Nuveen California AMT-Free Municipal Income Fund, Nuveen California Dividend Advantage Municipal Fund, Nuveen California Dividend Advantage Municipal Fund 2 and Nuveen California Dividend Advantage Municipal Fund 3) and the financial highlights for the year then ended, in conformity with U.S. generally accepted accounting principles.
/s/ KPMG LLP
Chicago, Illinois
April 28, 2015
| NCA | | |
| | Nuveen California Municipal Value Fund, Inc. | |
| | Portfolio of Investments | February 28, 2015 |
| | Principal | | | | Optional Call | | | | | |
| | Amount (000) | | Description (1) | | Provisions (2) | Ratings (3) | | | Value | |
| | | | LONG-TERM INVESTMENTS – 99.8% (99.6% of Total Investments) | | | | | | | |
| | | | MUNICIPAL BONDS – 99.8% (99.6% of Total Investments) | | | | | | | |
| | | | Consumer Staples – 4.2% (4.2% of Total Investments) | | | | | | | |
| $ | 2,000 | | California County Tobacco Securitization Agency, Tobacco Settlement Asset-Backed Bonds, Los Angeles County Securitization Corporation, Series 2006A, 5.650%, 6/01/41 | | 12/18 at 100.00 | B+ | | $ | 1,800,880 | |
| | 225 | | California County Tobacco Securitization Agency, Tobacco Settlement Asset-Backed Bonds, Sonoma County Tobacco Securitization Corporation, Series 2005, 4.250%, 6/01/21 | | 6/15 at 100.00 | BBB+ | | | 224,998 | |
| | 3,940 | | Golden State Tobacco Securitization Corporation, California, Tobacco Settlement Asset-Backed Bonds, Series 2007A-1, 5.000%, 6/01/33 | | 6/17 at 100.00 | B | | | 3,335,486 | |
| | 3,570 | | Golden State Tobacco Securitization Corporation, California, Tobacco Settlement Asset-Backed Bonds, Series 2007A-2, 5.300%, 6/01/37 | | 6/22 at 100.00 | B | | | 3,017,114 | |
| | 3,500 | | Tobacco Securitization Authority of Northern California, Tobacco Settlement Asset-Backed Bonds, Series 2005A-1, 5.500%, 6/01/45 | | 6/15 at 100.00 | B– | | | 2,853,130 | |
| | 13,235 | | Total Consumer Staples | | | | | | 11,231,608 | |
| | | | Education and Civic Organizations – 0.6% (0.6% of Total Investments) | | | | | | | |
| | 65 | | California Educational Facilities Authority, Revenue Bonds, University of Redlands, Series 2005A, 5.000%, 10/01/35 | | 10/15 at 100.00 | A3 | | | 65,658 | |
| | 95 | | California Educational Facilities Authority, Revenue Bonds, University of the Pacific, Series 2006, 5.000%, 11/01/21 | | 11/15 at 100.00 | A2 | | | 97,908 | |
| | 450 | | California Municipal Finance Authority, Charter School Revenue Bonds, Rocketship Education – Multiple Projects, Series 2014A, 7.250%, 6/01/43 | | 6/22 at 102.00 | N/R | | | 513,112 | |
| | 700 | | California Statewide Communities Development Authority, School Facility Revenue Bonds, Alliance College-Ready Public Schools, Series 2011A, 7.000%, 7/01/46 | | 7/21 at 100.00 | BBB– | | | 808,381 | |
| | 1,310 | | Total Education and Civic Organizations | | | | | | 1,485,059 | |
| | | | Health Care – 15.9% (15.9% of Total Investments) | | | | | | | |
| | 555 | | California Health Facilities Financing Authority, Revenue Bonds, Lucile Salter Packard Children’s Hospital, Series 2014A, 5.000%, 8/15/43 | | 8/24 at 100.00 | AA | | | 634,082 | |
| | 350 | | California Health Facilities Financing Authority, Revenue Bonds, Providence Health & Services, Series 2014A, 5.000%, 10/01/38 | | 10/24 at 100.00 | AA | | | 403,872 | |
| | 690 | | California Health Facilities Financing Authority, Revenue Bonds, Providence Health & Services, Series 2014B, 5.000%, 10/01/44 | | 10/24 at 100.00 | AA | | | 785,772 | |
| | | | California Health Facilities Financing Authority, Revenue Bonds, Rady Children’s Hospital – San Diego, Series 2011: | | | | | | | |
| | 560 | | 5.000%, 8/15/31 | | 8/21 at 100.00 | AA– | | | 654,399 | |
| | 670 | | 5.250%, 8/15/41 | | 8/21 at 100.00 | AA– | | | 759,056 | |
| | 1,000 | | California Health Facilities Financing Authority, Revenue Bonds, Sutter Health, Series 2011B, 6.000%, 8/15/42 | | 8/20 at 100.00 | AA– | | | 1,204,290 | |
| | 5,365 | | California Health Facilities Financing Authority, Revenue Bonds, Sutter Health, Series 2007A, 5.250%, 11/15/46 (UB) | | 11/16 at 100.00 | AA– | | | 5,786,099 | |
| | 3,870 | | California Municipal Financing Authority, Certificates of Participation, Community Hospitals of Central California, Series 2007, 5.250%, 2/01/27 | | 2/17 at 100.00 | Baa1 | | | 4,072,014 | |
| | 1,560 | | California Statewide Communities Development Authority, Revenue Bonds, Adventist Health System West, Series 2005A, 5.000%, 3/01/35 | | 3/15 at 100.00 | A | | | 1,563,058 | |
| | 2,625 | | California Statewide Communities Development Authority, Revenue Bonds, Kaiser Permanente, Series 2012A, 5.000%, 4/01/42 | | 4/22 at 100.00 | A+ | | | 2,935,931 | |
| | 1,000 | | California Statewide Communities Development Authority, Revenue Bonds, ValleyCare Health System, Series 2007A, 5.125%, 7/15/31 | | 7/17 at 100.00 | N/R | | | 1,030,110 | |
| | Principal | | | | Optional Call | | | | | |
| | Amount (000) | | Description (1) | | Provisions (2) | Ratings (3) | | | Value | |
| | | | Health Care (continued) | | | | | | | |
| $ | 3,000 | | California Statewide Community Development Authority, Health Facility Revenue Bonds, Catholic Healthcare West, Insured Series 2008K, 5.500%, 7/01/41 – AGC Insured | | 7/17 at 100.00 | AA | | $ | 3,249,300 | |
| | 1,000 | | California Statewide Community Development Authority, Health Facility Revenue Bonds, Catholic Healthcare West, Series 2008C, 5.625%, 7/01/35 | | 7/18 at 100.00 | A | | | 1,116,330 | |
| | 1,460 | | California Statewide Community Development Authority, Revenue Bonds, Kaiser Permanente System, Series 2001C, 5.250%, 8/01/31 | | 8/16 at 100.00 | A+ | | | 1,544,081 | |
| | 2,710 | | California Statewide Community Development Authority, Revenue Bonds, Sherman Oaks Health System, Series 1998A, 5.000%, 8/01/22 – AMBAC Insured | | No Opt. Call | Aa3 | | | 3,147,096 | |
| | 1,890 | | California Statewide Community Development Authority, Revenue Bonds, Sutter Health, Series 2005A, 5.000%, 11/15/43 | | 11/15 at 100.00 | AA– | | | 1,947,569 | |
| | 2,940 | | Palomar Pomerado Health Care District, California, Certificates of Participation, Series 2009, 6.750%, 11/01/39 | | 11/19 at 100.00 | Ba1 | | | 3,263,077 | |
| | 2,900 | | Palomar Pomerado Health Care District, California, Certificates of Participation, Series 2010, 6.000%, 11/01/41 | | 11/20 at 100.00 | Ba1 | | | 3,109,612 | |
| | 1,750 | | San Buenaventura, California, Revenue Bonds, Community Memorial Health System, Series 2011, 7.500%, 12/01/41 | | 12/21 at 100.00 | BB | | | 2,152,080 | |
| | 3,000 | | Santa Clara County Financing Authority, California, Insured Revenue Bonds, El Camino Hospital, Series 2007A, 5.750%, 2/01/41 – AMBAC Insured | | 8/17 at 100.00 | A+ | | | 3,256,320 | |
| | 38,895 | | Total Health Care | | | | | | 42,614,148 | |
| | | | Housing/Multifamily – 2.3% (2.2% of Total Investments) | | | | | | | |
| | 1,020 | | California Municipal Finance Authority, Mobile Home Park Revenue Bonds, Caritas Projects Series 2010A, 6.400%, 8/15/45 | | 8/20 at 100.00 | BBB | | | 1,140,187 | |
| | 1,060 | | California Municipal Finance Authority, Mobile Home Park Revenue Bonds, Caritas Projects Series 2012A, 5.500%, 8/15/47 | | 8/22 at 100.00 | BBB | | | 1,161,728 | |
| | | | California Municipal Finance Authority, Mobile Home Park Senior Revenue Bonds, Caritas Affordable Housing, Inc. Projects, Series 2014A: | | | | | | | |
| | 65 | | 5.250%, 8/15/39 | | 8/24 at 100.00 | BBB | | | 71,728 | |
| | 175 | | 5.250%, 8/15/49 | | 8/24 at 100.00 | BBB | | | 192,021 | |
| | 2,290 | | California Statewide Community Development Authority, Multifamily Housing Revenue Bonds, Harbor City Lights, Series 1999Y, 6.650%, 7/01/39 (Alternative Minimum Tax) | | 7/15 at 100.00 | N/R | | | 2,292,336 | |
| | 1,160 | | San Dimas Housing Authority, California, Mobile Home Park Revenue Bonds, Charter Oak Mobile Home Estates Acquisition Project, Series 1998A, 5.700%, 7/01/28 | | 7/15 at 100.00 | N/R | | | 1,161,311 | |
| | 5,770 | | Total Housing/Multifamily | | | | | | 6,019,311 | |
| | | | Housing/Single Family – 0.8% (0.8% of Total Investments) | | | | | | | |
| | 2,125 | | California Department of Veteran Affairs, Home Purchase Revenue Bonds, Series 2007, 5.000%, 12/01/42 (Alternative Minimum Tax) | | 12/16 at 100.00 | AA | | | 2,174,470 | |
| | 55 | | California Housing Finance Agency, Home Mortgage Revenue Bonds, Series 2006H, 5.750%, 8/01/30 – FGIC Insured (Alternative Minimum Tax) | | 2/16 at 100.00 | A– | | | 57,399 | |
| | 2,180 | | Total Housing/Single Family | | | | | | 2,231,869 | |
| | | | Long-Term Care – 1.8% (1.8% of Total Investments) | | | | | | | |
| | 4,000 | | ABAG Finance Authority for Non-Profit Corporations, California, Health Facility Revenue Bonds, The Institute on Aging, Series 2008A, 5.650%, 8/15/38 | | 8/18 at 100.00 | A+ | | | 4,512,120 | |
| | 260 | | California Statewide Community Development Authority, Certificates of Participation, Internext Group, Series 1999, 5.375%, 4/01/17 | | 4/15 at 100.00 | BBB+ | | | 261,100 | |
| | 4,260 | | Total Long-Term Care | | | | | | 4,773,220 | |
| | | | Tax Obligation/General – 19.5% (19.4% of Total Investments) | | | | | | | |
| | | | California State, General Obligation Bonds, Various Purpose Series 2009: | | | | | | | |
| | 2,500 | | 6.000%, 4/01/38 | | 4/19 at 100.00 | Aa3 | | | 3,002,450 | |
| | 1,000 | | 6.000%, 11/01/39 | | 11/19 at 100.00 | Aa3 | | | 1,228,960 | |
| | 2,000 | | California State, General Obligation Bonds, Various Purpose Series 2010, 5.500%, 3/01/40 | | 3/20 at 100.00 | Aa3 | | | 2,348,880 | |
| NCA | Nuveen California Municipal Value Fund, Inc. | |
| | Portfolio of Investments (continued) | February 28, 2015 |
| | Principal | | | | Optional Call | | | | | |
| | Amount (000) | | Description (1) | | Provisions (2) | Ratings (3) | | | Value | |
| | | | Tax Obligation/General (continued) | | | | | | | |
| | | | California State, General Obligation Bonds, Various Purpose Series 2013: | | | | | | | |
| $ | 1,000 | | 5.000%, 2/01/29 | | No Opt. Call | Aa3 | | $ | 1,162,360 | |
| | 2,500 | | 5.000%, 4/01/37 | | 4/23 at 100.00 | Aa3 | | | 2,851,125 | |
| | 2,500 | | 5.000%, 2/01/43 | | No Opt. Call | Aa3 | | | 2,839,075 | |
| | 2,240 | | 5.000%, 11/01/43 | | 11/23 at 100.00 | Aa3 | | | 2,568,899 | |
| | | | California State, General Obligation Bonds, Various Purpose Series 2014: | | | | | | | |
| | 5,000 | | 5.000%, 5/01/32 | | 5/24 at 100.00 | Aa3 | | | 5,849,350 | |
| | 1,970 | | 5.000%, 10/01/39 | | 10/24 at 100.00 | Aa3 | | | 2,283,841 | |
| | 1,000 | | 5.000%, 5/01/44 | | 5/24 at 100.00 | Aa3 | | | 1,148,130 | |
| | 6,000 | | Oceanside Unified School District, San Diego County, California, General Obligation Bonds, Election 2008 Series 2010B, 0.000%, 8/01/49 – AGM Insured | | No Opt. Call | AA | | | 674,880 | |
| | 2,000 | | Puerto Rico, General Obligation Bonds, Public Improvement Series 2002A, 5.500%, 7/01/20 – NPFG Insured | | No Opt. Call | AA– | | | 2,143,460 | |
| | 10,000 | | San Diego Unified School District, San Diego County, California, General Obligation Bonds, Series 2010C, 0.000%, 7/01/47 | | No Opt. Call | AA– | | | 2,644,400 | |
| | 11,875 | | San Mateo Union High School District, San Mateo County, California, General Obligation Bonds, Election 2010 Series 2011A, 0.000%, 9/01/41 | | 9/36 at 100.00 | AA+ | | | 7,838,212 | |
| | 1,320 | | Tahoe Forest Hospital District, Placer and Nevada Counties, California, General Obligation Bonds, Series 2010B, 5.500%, 8/01/35 | | 8/18 at 100.00 | Aa3 | | | 1,490,293 | |
| | 20,860 | | Yosemite Community College District, California, General Obligation Bonds, Capital Appreciation, Election 2004, Series 2010D, 0.000%, 8/01/42 | | No Opt. Call | Aa2 | | | 12,093,794 | |
| | 73,765 | | Total Tax Obligation/General | | | | | | 52,168,109 | |
| | | | Tax Obligation/Limited – 21.1% (21.1% of Total Investments) | | | | | | | |
| | 1,000 | | Artesia Redevelopment Agency, California, Tax Allocation Revenue Bonds, Artesia Redevelopment Project Area, Series 2007, 5.375%, 6/01/27 | | 6/15 at 100.00 | BBB+ | | | 1,003,990 | |
| | | | Bell Community Redevelopment Agency, California, Tax Allocation Bonds, Bell Project Area, Series 2003: | | | | | | | |
| | 3,000 | | 5.500%, 10/01/23 – RAAI Insured | | 5/15 at 100.00 | N/R | | | 3,002,700 | |
| | 1,000 | | 5.625%, 10/01/33 – RAAI Insured | | 5/15 at 100.00 | N/R | | | 1,000,470 | |
| | 3,500 | | California State Public Works Board, Lease Revenue Bonds, Department of Corrections & Rehabilitation, Various Correctional Facilities Series 2013F, 5.250%, 9/01/33 | | 9/23 at 100.00 | A1 | | | 4,110,610 | |
| | 2,500 | | California State Public Works Board, Lease Revenue Bonds, Department of Corrections & Rehabilitation, Various Correctional Facilities Series 2014A, 5.000%, 9/01/39 | | 9/24 at 100.00 | A1 | | | 2,870,900 | |
| | 1,000 | | California State Public Works Board, Lease Revenue Bonds, Various Capital Projects, Series 2009G-1, 5.750%, 10/01/30 | | 10/19 at 100.00 | A1 | | | 1,193,140 | |
| | 2,000 | | California State Public Works Board, Lease Revenue Bonds, Various Capital Projects, Series 2009-I, 6.375%, 11/01/34 | | 11/19 at 100.00 | A1 | | | 2,459,320 | |
| | 3,000 | | California State Public Works Board, Lease Revenue Bonds, Various Capital Projects, Series 2012G, 5.000%, 11/01/37 | | 11/22 at 100.00 | A1 | | | 3,410,820 | |
| | 340 | | Capistrano Unified School District, Orange County, California, Special Tax Bonds, Community Facilities District 98-2, Series 2005, 5.000%, 9/01/24 – FGIC Insured | | 9/15 at 100.00 | AA– | | | 347,109 | |
| | 1,005 | | Chino Redevelopment Agency, California, Merged Chino Redevelopment Project Area Tax Allocation Bonds, Series 2006, 5.000%, 9/01/38 – AMBAC Insured | | 9/16 at 101.00 | A | | | 1,032,336 | |
| | 1,000 | | Folsom Public Financing Authority, California, Special Tax Revenue Bonds, Refunding Series 2007A, 5.000%, 9/01/23 – AMBAC Insured | | 9/17 at 100.00 | N/R | | | 1,057,390 | |
| | 750 | | Fontana Redevelopment Agency, San Bernardino County, California, Tax Allocation Bonds, Jurupa Hills Redevelopment Project, Refunding Series 1997A, 5.500%, 10/01/27 | | 10/15 at 100.00 | A– | | | 752,062 | |
| | 615 | | Golden State Tobacco Securitization Corporation, California, Enhanced Tobacco Settlement Asset-Backed Revenue Bonds, Series 2005A, 5.000%, 6/01/45 – AMBAC Insured | | 6/15 at 100.00 | A1 | | | 622,109 | |
| | 675 | | Inglewood Redevelopment Agency, California, Tax Allocation Bonds, Merged Redevelopment Project, Subordinate Lien Series 2007A-1, 5.000%, 5/01/25 – AMBAC Insured | | 5/17 at 100.00 | BBB+ | | | 703,519 | |
| | Principal | | | | Optional Call | | | | | |
| | Amount (000) | | Description (1) | | Provisions (2) | Ratings (3) | | | Value | |
| | | | Tax Obligation/Limited (continued) | | | | | | | |
| | | | Irvine Unified School District, California, Special Tax Bonds, Community Facilities District Series 2006A: | | | | | | | |
| $ | 150 | | 5.000%, 9/01/26 | | 9/16 at 100.00 | N/R | | $ | 153,855 | |
| | 355 | | 5.125%, 9/01/36 | | 9/16 at 100.00 | N/R | | | 363,531 | |
| | 2,500 | | Kern County Board of Education, California, Certificates of Participation, Series 2006A, 5.000%, 6/01/31 – NPFG Insured | | 6/16 at 100.00 | AA– | | | 2,610,075 | |
| | 750 | | Lancaster Redevelopment Agency, California, Tax Allocation Bonds, Combined Redevelopment Project Areas Housing Programs, Series 2009, 6.000%, 8/01/24 | | 8/19 at 100.00 | BBB | | | 878,497 | |
| | 3,520 | | Los Angeles County Public Works Financing Authority, California, Lease Revenue Bonds, Multiple Capital Facilities Project II, Series 2012, 5.000%, 8/01/42 | | No Opt. Call | AA | | | 3,948,208 | |
| | 370 | | National City Community Development Commission, California, Tax Allocation Bonds, National City Redevelopment Project, Series 2011, 6.500%, 8/01/24 | | 8/21 at 100.00 | A– | | | 471,495 | |
| | 140 | | Novato Redevelopment Agency, California, Tax Allocation Bonds, Hamilton Field Redevelopment Project, Series 2011, 6.750%, 9/01/40 | | 9/21 at 100.00 | BBB+ | | | 171,058 | |
| | 5,910 | | Palmdale Elementary School District, Los Angeles County, California, Special Tax Bonds, Community Facilities District 90-1, Series 1999, 5.800%, 8/01/29 | | No Opt. Call | AA | | | 5,923,593 | |
| | 160 | | Patterson Public Finance Authority, California, Revenue Bonds, Community Facilities District 2001-1, Subordinate Lien Series 2013B, 5.875%, 9/01/39 | | 9/23 at 100.00 | N/R | | | 184,306 | |
| | | | Patterson Public Financing Authority, California, Revenue Bonds, Community Facilities District 2001-1, Senior Series 2013A: | | | | | | | |
| | 950 | | 5.250%, 9/01/30 | | 9/23 at 100.00 | N/R | | | 1,084,206 | |
| | 860 | | 5.750%, 9/01/39 | | 9/23 at 100.00 | N/R | | | 994,736 | |
| | 1,130 | | Pittsburg Redevelopment Agency, California, Tax Allocation Bonds, Los Medanos Community Development Project, Refunding Series 2008A, 6.500%, 9/01/28 | | 9/18 at 100.00 | BBB– | | | 1,259,667 | |
| | 440 | | Rancho Santa Fe CSD Financing Authority, California, Revenue Bonds, Superior Lien Series 2011A, 5.750%, 9/01/30 | | 9/21 at 100.00 | BBB+ | | | 505,472 | |
| | 80 | | Riverside County Redevelopment Agency, California, Tax Allocation Bonds, Jurupa Valley Project Area, Series 2011B, 6.500%, 10/01/25 | | 10/21 at 100.00 | A– | | | 100,350 | |
| | 2,000 | | Roseville, California, Special Tax Bonds, Community Facilities District 1 Fiddyment Ranch, Series 2005, 5.050%, 9/01/30 | | 9/15 at 100.00 | N/R | | | 2,015,660 | |
| | 1,000 | | San Diego County Regional Transportation Commission, California, Sales Tax Revenue Bonds, Series 2012A, 5.000%, 4/01/42 | | 4/22 at 100.00 | AAA | | | 1,135,820 | |
| | 170 | | San Francisco City and County Redevelopment Agency Successor Agency, California, Special Tax Bonds, Community Facilities District 7, Hunters Point Shipyard Phase One Improvements, Refunding Series 2014, 5.000%, 8/01/39 | | No Opt. Call | N/R | | | 187,510 | |
| | 65 | | San Francisco Redevelopment Finance Authority, California, Tax Allocation Revenue Bonds, Mission Bay North Redevelopment Project, Series 2011C, 6.750%, 8/01/41 | | 2/21 at 100.00 | A– | | | 79,705 | |
| | | | San Francisco Redevelopment Financing Authority, California, Tax Allocation Revenue Bonds, Mission Bay South Redevelopment Project, Series 2011D: | | | | | | | |
| | 65 | | 7.000%, 8/01/33 | | 2/21 at 100.00 | BBB+ | | | 79,274 | |
| | 80 | | 7.000%, 8/01/41 | | 2/21 at 100.00 | BBB+ | | | 97,568 | |
| | 2,750 | | San Jose Financing Authority, California, Lease Revenue Refunding Bonds, Convention Center Project, Series 2001F, 5.000%, 9/01/20 – NPFG Insured | | 3/15 at 100.00 | AA | | | 2,761,220 | |
| | | | San Jose Redevelopment Agency, California, Tax Allocation Bonds, Merged Area Redevelopment Project, Series 2006C: | | | | | | | |
| | 400 | | 5.000%, 8/01/24 – NPFG Insured | | 8/17 at 100.00 | AA– | | | 428,968 | |
| | 590 | | 5.000%, 8/01/25 – NPFG Insured | | 8/17 at 100.00 | AA– | | | 632,728 | |
| | 780 | | San Jose Redevelopment Agency, California, Tax Allocation Bonds, Merged Area Redevelopment Project, Series 2006D, 5.000%, 8/01/23 – AMBAC Insured | | 8/17 at 100.00 | BBB+ | | | 845,146 | |
| | 110 | | Signal Hill Redevelopment Agency, California, Project 1 Tax Allocation Bonds, Series 2011, 7.000%, 10/01/26 | | 4/21 at 100.00 | N/R | | | 126,772 | |
| | 1,360 | | Tehachapi Redevelopment Agency, California, Tax Allocation Bonds, Series 2007, 5.250%, 12/01/37 – RAAI Insured | | 12/17 at 100.00 | BB+ | | | 1,398,284 | |
| NCA | Nuveen California Municipal Value Fund, Inc. | |
| | Portfolio of Investments (continued) | February 28, 2015 |
| | Principal | | | | Optional Call | | | | | |
| | Amount (000) | | Description (1) | | Provisions (2) | Ratings (3) | | | Value | |
| | | | Tax Obligation/Limited (continued) | | | | | | | |
| $ | 1,925 | | Travis Unified School District, Solano County, California, Certificates of Participation, Series 2006, 5.000%, 9/01/26 – FGIC Insured | | 9/16 at 100.00 | A3 | | $ | 1,975,993 | |
| | 690 | | Vista Joint Powers Financing Authority, California, Special Tax Lease Revenue Refunding Bonds, Community Facilities District 90-2, Series 1997A, 5.875%, 9/01/20 | | 3/15 at 100.00 | N/R | | | 691,415 | |
| | 1,730 | | West Contra Costa Healthcare District, California, Certificates of Participation, Series 2004, 5.375%, 7/01/21 – AMBAC Insured | | 5/15 at 100.00 | A– | | | 1,736,211 | |
| | 190 | | Yorba Linda Redevelopment Agency, Orange County, California, Tax Allocation Revenue Bonds, Yorba Linda Redevelopment Project, Subordinate Lien Series 2011A, 6.500%, 9/01/32 | | 9/21 at 100.00 | A– | | | 233,523 | |
| | 52,605 | | Total Tax Obligation/Limited | | | | | | 56,641,321 | |
| | | | Transportation – 7.0% (7.0% of Total Investments) | | | | | | | |
| | 1,820 | | Foothill/Eastern Transportation Corridor Agency, California, Toll Road Revenue Bonds, Refunding Junior Lien Series 2013C, 6.500%, 1/15/43 | | 1/24 at 100.00 | BB+ | | | 2,192,026 | |
| | | | Foothill/Eastern Transportation Corridor Agency, California, Toll Road Revenue Bonds, Refunding Series 2013A: | | | | | | | |
| | 1,945 | | 5.000%, 1/15/42 – AGM Insured | | 1/24 at 100.00 | AA | | | 2,170,756 | |
| | 4,010 | | 5.750%, 1/15/46 | | 1/24 at 100.00 | BBB– | | | 4,703,650 | |
| | 4,010 | | 6.000%, 1/15/53 | | 1/24 at 100.00 | BBB– | | | 4,746,035 | |
| | 3,000 | | Los Angeles Harbors Department, California, Revenue Bonds, Series 2014C, 5.000%, 8/01/44 | | 8/24 at 100.00 | AA | | | 3,470,790 | |
| | 195 | | Palm Springs Financing Authority, California, Palm Springs International Airport Revenue Bonds, Series 2006, 5.550%, 7/01/28 (Alternative Minimum Tax) | | 7/16 at 100.00 | N/R | | | 196,170 | |
| | 1,210 | | Port of Oakland, California, Revenue Bonds, Refunding Series 2012P, 5.000%, 5/01/29 (Alternative Minimum Tax) | | No Opt. Call | A+ | | | 1,371,862 | |
| | 16,190 | | Total Transportation | | | | | | 18,851,289 | |
| | | | U.S. Guaranteed – 17.9% (17.9% of Total Investments) (4) | | | | | | | |
| | 2,500 | | Bay Area Toll Authority, California, Revenue Bonds, San Francisco Bay Area Toll Bridge, Series 2006F, 5.000%, 4/01/31 (Pre-refunded 4/01/16) (UB) | | 4/16 at 100.00 | AA (4) | | | 2,630,975 | |
| | 480 | | California Department of Water Resources, Water System Revenue Bonds, Central Valley Project, Series 2005AD, 5.000%, 12/01/22 (Pre-refunded 6/01/15) – AGM Insured | | 6/15 at 100.00 | AAA | | | 486,139 | |
| | 75 | | California Educational Facilities Authority, Revenue Bonds, University of Redlands, Series 2005A, 5.000%, 10/01/35 (Pre-refunded 10/01/15) | | 10/15 at 100.00 | N/R (4) | | | 77,160 | |
| | 2,065 | | Contra Costa County, California, GNMA Mortgage-Backed Securities Program Home Mortgage Revenue Bonds, Series 1988, 8.250%, 6/01/21 (Alternative Minimum Tax) (ETM) | | No Opt. Call | Aaa | | | 2,564,503 | |
| | 1,615 | | Loma Linda, California, Hospital Revenue Bonds, Loma Linda University Medical Center, Series 2005A, 5.000%, 12/01/22 (Pre-refunded 12/01/15) | | 12/15 at 100.00 | BBB (4) | | | 1,674,432 | |
| | 1,525 | | Loma Linda, California, Hospital Revenue Bonds, Loma Linda University Medical Center, Series 2008A, 8.250%, 12/01/38 (Pre-refunded 12/01/17) | | 12/17 at 100.00 | BBB (4) | | | 1,838,342 | |
| | 1,500 | | Los Angeles Unified School District, California, General Obligation Bonds, Series 2006F, 5.000%, 7/01/24 (Pre-refunded 7/01/16) – FGIC Insured | | 7/16 at 100.00 | Aa2 (4) | | | 1,595,880 | |
| | 21,500 | | Merced Irrigation District, California, Certificates of Participation, Water and Hydroelectric Series 2008B, 0.000%, 9/01/23 (Pre-refunded 9/01/16) | | 9/16 at 64.56 | A (4) | | | 13,786,015 | |
| | 8,565 | | Palmdale, California, GNMA Mortgage-Backed Securities Program Single Family Mortgage Revenue Bonds, Series 1988A, 0.000%, 3/01/17 (ETM) | | No Opt. Call | AA+ (4) | | | 8,464,533 | |
| | 270 | | Roseville Joint Union High School District, Placer County, California, General Obligation Bonds, Series 2006B, 5.000%, 8/01/27 (Pre-refunded 8/01/15) – FGIC Insured | | 8/15 at 100.00 | AA (4) | | | 275,659 | |
| | 18,520 | | San Bernardino County, California, GNMA Mortgage-Backed Securities Program Single Family Home Mortgage Revenue Bonds, Series 1988A, 0.000%, 9/01/21 (Alternative Minimum Tax) (ETM) | | No Opt. Call | Aaa | | | 12,946,406 | |
| | 625 | | San Mateo Union High School District, San Mateo County, California, Certificates of Participation, Phase 1, Series 2007A, 5.000%, 12/15/30 (Pre-refunded 12/15/17) – AMBAC Insured | | 12/17 at 100.00 | N/R (4) | | | 700,362 | |
| | 910 | | Santa Clara Valley Transportation Authority, California, Sales Tax Revenue Bonds, Series 2007A, 5.000%, 4/01/36 (Pre-refunded 4/01/17) – AMBAC Insured | | 4/17 at 100.00 | AA+ (4) | | | 993,511 | |
| | 60,150 | | Total U.S. Guaranteed | | | | | | 48,033,917 | |
| | Principal | | | | Optional Call | | | | | |
| | Amount (000) | | Description (1) | | Provisions (2) | Ratings (3) | | | Value | |
| | | | Utilities – 1.9% (1.9% of Total Investments) | | | | | | | |
| $ | 2,160 | | California Statewide Community Development Authority, Certificates of Participation Refunding, Rio Bravo Fresno Project, Series 1999A, 6.500%, 12/01/18 | | 6/15 at 100.00 | N/R | | $ | 2,116,865 | |
| | 1,800 | | Long Beach Bond Finance Authority, California, Natural Gas Purchase Revenue Bonds, Series 2007A, 5.500%, 11/15/37 | | No Opt. Call | A | | | 2,225,034 | |
| | 605 | | Merced Irrigation District, California, Electric System Revenue Bonds, Series 2005, 5.125%, 9/01/31 – SYNCORA GTY Insured | | 9/15 at 100.00 | N/R | | | 609,997 | |
| | 4,565 | | Total Utilities | | | | | | 4,951,896 | |
| | | | Water and Sewer – 6.8% (6.8% of Total Investments) | | | | | | | |
| | 1,000 | | Bay Area Water Supply and Conservation Agency, California, Revenue Bonds, Capital Cost Recovery Prepayment Program, Series 2013A, 5.000%, 10/01/29 | | 4/23 at 100.00 | AA– | | | 1,189,410 | |
| | | | California Pollution Control Financing Authority, Water Furnishing Revenue Bonds, Poseidon Resources Channelside LP Desalination Project, Series 2012: | | | | | | | |
| | 1,375 | | 5.000%, 7/01/37 (Alternative Minimum Tax) | | No Opt. Call | Baa3 | | | 1,503,769 | |
| | 2,675 | | 5.000%, 11/21/45 (Alternative Minimum Tax) | | No Opt. Call | Baa3 | | | 2,898,523 | |
| | 1,500 | | Castaic Lake Water Agency, California, Certificates of Participation, Series 2006C, 5.000%, 8/01/36 – NPFG Insured | | 8/16 at 100.00 | AA– | | | 1,585,095 | |
| | 410 | | Healdsburg Public Financing Authority, California, Wastewater Revenue Bonds, Series 2006, 5.000%, 4/01/36 – NPFG Insured | | 4/16 at 100.00 | AA– | | | 428,507 | |
| | 5,000 | | Los Angeles Department of Water and Power, California, Waterworks Revenue Bonds, Series 2007A-2, 5.000%, 7/01/44 – AMBAC Insured | | 7/17 at 100.00 | AA | | | 5,412,450 | |
| | | | Madera Irrigation District. California, Water Revenue Refunding Bonds, Series 2008: | | | | | | | |
| | 1,850 | | 5.500%, 1/01/33 | | 1/18 at 100.00 | A– | | | 2,043,806 | |
| | 3,000 | | 5.500%, 1/01/38 | | 1/18 at 100.00 | A– | | | 3,284,490 | |
| | 16,810 | | Total Water and Sewer | | | | | | 18,346,050 | |
| $ | 289,735 | | Total Long-Term Investments (cost $236,880,433) | | | | | | 267,347,797 | |
| NCA | Nuveen California Municipal Value Fund, Inc. | |
| | Portfolio of Investments (continued) | February 28, 2015 |
| | Principal | | | | Optional Call | | | | | |
| | Amount (000) | | Description (1) | | Provisions (2) | Ratings (3) | | | Value | |
| | | | SHORT-TERM INVESTMENTS – 0.4% (0.4% of Total Investments) | | | | | | | |
| | | | MUNICIPAL BONDS – 0.4% (0.4% of Total Investments) | | | | | | | |
| | | | Health Care – 0.4% (0.4% of Total Investments) | | | | | | | |
| $ | 880 | | California Statewide Community Development Authority, Revenue Bonds, Daughters of Charity Health System, Series 2014A, 6.000%, 7/10/15 (5) | | No Opt. Call | N/R | | $ | 887,506 | |
| | 100 | | California Statewide Community Development Authority, Revenue Bonds, Daughters of Charity Health System, Series 2014B, 6.000%, 7/10/15 (5) | | No Opt. Call | N/R | | | 100,853 | |
| | 130 | | California Statewide Community Development Authority, Revenue Bonds, Daughters of Charity Health System, Series 2014C, 6.000%, 7/10/15 (5) | | No Opt. Call | N/R | | | 131,109 | |
| $ | 1,110 | | Total Short-Term Investments (cost $1,110,000) | | | | | | 1,119,468 | |
| | | | Total Investments (cost $237,990,433) – 100.2% | | | | | | 268,467,265 | |
| | | | Floating Rate Obligations – (1.7)% | | | | | | (4,490,000 | ) |
| | | | Other Assets Less Liabilities – 1.5% | | | | | | 4,072,256 | |
| | | | Net Assets Applicable to Common Shares – 100% | | | | | $ | 268,049,521 | |
| (1) | All percentages shown in the Portfolio of Investments are based on net assets applicable to common shares unless otherwise noted. |
| (2) | Optional Call Provisions (not covered by the report of independent registered public accounting firm): Dates (month and year) and prices of the earliest optional call or redemption. There may be other call provisions at varying prices at later dates. Certain mortgage-backed securities may be subject to periodic principal paydowns. |
| (3) | Ratings (not covered by the report of independent registered public accounting firm): Using the highest of Standard & Poor’s Group (“Standard & Poor’s”), Moody’s Investors Service, Inc. (“Moody’s”) or Fitch, Inc. (“Fitch”) rating. Ratings below BBB by Standard & Poor’s, Baa by Moody’s or BBB by Fitch are considered to be below investment grade. Holdings designated N/R are not rated by any of these national rating agencies. |
| (4) | Backed by an escrow or trust containing sufficient U.S. Government or U.S. Government agency securities, which ensure the timely payment of principal and interest. Certain bonds backed by U.S. Government or agency securities are regarded as having an implied rating equal to the rating of such securities. |
| (5) | Investment valued at fair value using methods determined in good faith by, or at the discretion of, the Board. For fair value measurement disclosure purposes, investment classified as Level 3. See Notes to Financial Statements, Note 2 – Investment Valuation and Fair Value Measurements for more information. |
| (ETM) | Escrowed to maturity. |
| (UB) | Underlying bond of an inverse floating rate trust reflected as a financing transaction. See Notes to Financial Statements, Note 3 – Portfolio Securities and Investments in Derivatives, Inverse Floating Rate Securities for more information. |
See accompanying notes to financial statements.
| NCB | | |
| | Nuveen California Municipal Value Fund 2 | |
| | Portfolio of Investments | February 28, 2015 |
| | Principal | | | | Optional Call | | | | | |
| | Amount (000) | | Description (1) | | Provisions (2) | Ratings (3) | | | Value | |
| | | | LONG-TERM INVESTMENTS – 97.8% (99.0% of Total Investments) | | | | | | | |
| | | | MUNICIPAL BONDS – 97.8% (99.0% of Total Investments) | | | | | | | |
| | | | Consumer Staples – 5.1% (5.1% of Total Investments) | | | | | | | |
| $ | 2,000 | | Golden State Tobacco Securitization Corporation, California, Tobacco Settlement Asset-Backed Bonds, Series 2007A-1, 5.000%, 6/01/33 | | 6/17 at 100.00 | B | | $ | 1,693,140 | |
| | 1,500 | | Tobacco Securitization Authority of Northern California, Tobacco Settlement Asset-Backed Bonds, Series 2005A-1, 5.500%, 6/01/45 | | 6/15 at 100.00 | B– | | | 1,222,770 | |
| | 3,500 | | Total Consumer Staples | | | | | | 2,915,910 | |
| | | | Education and Civic Organizations – 2.3% (2.3% of Total Investments) | | | | | | | |
| | 865 | | California Educational Facilities Authority, Revenue Bonds, University of the Pacific, Series 2009, 5.500%, 11/01/39 | | 11/19 at 100.00 | A2 | | | 1,005,831 | |
| | 100 | | California Municipal Finance Authority, Charter School Revenue Bonds, Rocketship Education – Multiple Projects, Series 2014A, 7.250%, 6/01/43 | | 6/22 at 102.00 | N/R | | | 114,025 | |
| | 150 | | California Statewide Communities Development Authority, School Facility Revenue Bonds, Alliance College-Ready Public Schools, Series 2011A, 7.000%, 7/01/46 | | 7/21 at 100.00 | BBB– | | | 173,224 | |
| | 1,115 | | Total Education and Civic Organizations | | | | | | 1,293,080 | |
| | | | Health Care – 17.9% (18.1% of Total Investments) | | | | | | | |
| | 1,000 | | ABAG Finance Authority for Non-Profit Corporations, California, Cal-Mortgage Insured Health Facility Revenue Bonds, Saint Rose Hospital, Series 2009A, 6.000%, 5/15/29 | | 5/19 at 100.00 | A+ | | | 1,165,350 | |
| | 1,900 | | California Health Facilities Financing Authority, Revenue Bonds, Catholic Healthcare West, Series 2009A, 6.000%, 7/01/39 | | 7/19 at 100.00 | A | | | 2,212,949 | |
| | 1,000 | | California Health Facilities Financing Authority, Revenue Bonds, Childrens Hospital of Orange County, Series 2009A, 6.500%, 11/01/38 | | 11/19 at 100.00 | A | | | 1,204,930 | |
| | 70 | | California Health Facilities Financing Authority, Revenue Bonds, Lucile Salter Packard Children’s Hospital, Series 2014A, 5.000%, 8/15/43 | | 8/24 at 100.00 | AA | | | 79,974 | |
| | 75 | | California Health Facilities Financing Authority, Revenue Bonds, Providence Health & Services, Series 2014A, 5.000%, 10/01/38 | | 10/24 at 100.00 | AA | | | 86,544 | |
| | 150 | | California Health Facilities Financing Authority, Revenue Bonds, Providence Health & Services, Series 2014B, 5.000%, 10/01/44 | | 10/24 at 100.00 | AA | | | 170,820 | |
| | 850 | | California Municipal Financing Authority, Certificates of Participation, Community Hospitals of Central California, Series 2007, 5.250%, 2/01/27 | | 2/17 at 100.00 | Baa1 | | | 894,370 | |
| | 690 | | California Statewide Communities Development Authority, Revenue Bonds, Adventist Health System West, Series 2007B, 5.000%, 3/01/37 – AGC Insured | | 3/18 at 100.00 | AA | | | 742,433 | |
| | | | California Statewide Community Development Authority, Revenue Bonds, Kaiser Permanente System, Series 2006: | | | | | | | |
| | 125 | | 5.000%, 3/01/41 | | 3/16 at 100.00 | A+ | | | 129,412 | |
| | 2,000 | | 5.250%, 3/01/45 | | 3/16 at 100.00 | A+ | | | 2,076,420 | |
| | 250 | | Palomar Pomerado Health Care District, California, Certificates of Participation, Series 2009, 6.625%, 11/01/29 | | 11/19 at 100.00 | Ba1 | | | 280,672 | |
| | 725 | | Palomar Pomerado Health Care District, California, Certificates of Participation, Series 2010, 6.000%, 11/01/41 | | 11/20 at 100.00 | Ba1 | | | 777,403 | |
| | 380 | | San Buenaventura, California, Revenue Bonds, Community Memorial Health System, Series 2011, 7.500%, 12/01/41 | | 12/21 at 100.00 | BB | | | 467,309 | |
| | 9,215 | | Total Health Care | | | | | | 10,288,586 | |
| NCB | Nuveen California Municipal Value Fund 2 | |
| | Portfolio of Investments (continued) | February 28, 2015 |
| | Principal | | | | Optional Call | | | | | |
| | Amount (000) | | Description (1) | | Provisions (2) | Ratings (3) | | | Value | |
| | | | Housing/Multifamily – 1.2% (1.2% of Total Investments) | | | | | | | |
| $ | 230 | | California Municipal Finance Authority, Mobile Home Park Revenue Bonds, Caritas Projects Series 2010A, 6.400%, 8/15/45 | | 8/20 at 100.00 | BBB | | $ | 257,101 | |
| | 70 | | California Municipal Finance Authority, Mobile Home Park Revenue Bonds, Caritas Projects Series 2012A, 5.500%, 8/15/47 | | 8/22 at 100.00 | BBB | | | 76,718 | |
| | 250 | | California Municipal Finance Authority, Mobile Home Park Revenue Bonds, Caritas Projects Series 2012B, 7.250%, 8/15/47 | | 8/22 at 100.00 | A1 | | | 283,653 | |
| | | | California Municipal Finance Authority, Mobile Home Park Senior Revenue Bonds, Caritas Affordable Housing, Inc. Projects, Series 2014A: | | | | | | | |
| | 15 | | 5.250%, 8/15/39 | | 8/24 at 100.00 | BBB | | | 16,552 | |
| | 40 | | 5.250%, 8/15/49 | | 8/24 at 100.00 | BBB | | | 43,890 | |
| | 605 | | Total Housing/Multifamily | | | | | | 677,914 | |
| | | | Housing/Single Family – 5.6% (5.7% of Total Investments) | | | | | | | |
| | 690 | | California Housing Finance Agency, California, Home Mortgage Revenue Bonds, Series 2008L, 5.500%, 8/01/38 | | 2/18 at 100.00 | A– | | | 703,207 | |
| | 2,500 | | California Housing Finance Agency, Home Mortgage Revenue Bonds, Series 2006K, 4.625%, 8/01/26 (Alternative Minimum Tax) | | 2/16 at 100.00 | A– | | | 2,534,325 | |
| | 3,190 | | Total Housing/Single Family | | | | | | 3,237,532 | |
| | | | Materials – 1.0% (1.0% of Total Investments) | | | | | | | |
| | 585 | | Courtland Industrial Development Board, Alabama, Solid Waste Revenue Bonds, International Paper Company Project, Series 2005A, 5.200%, 6/01/25 (Alternative Minimum Tax) | | 6/15 at 100.00 | BBB | | | 587,849 | |
| | | | Tax Obligation/General – 14.7% (14.9% of Total Investments) | | | | | | | |
| | 2,000 | | California State, General Obligation Bonds, Various Purpose Series 2007, 5.000%, 6/01/37 – NPFG Insured | | 6/17 at 100.00 | AA– | | | 2,180,740 | |
| | 2,100 | | Carlsbad Unified School District, San Diego County, California, General Obligation Bonds, Series 2009B, 0.000%, 5/01/34 | | 5/24 at 100.00 | AA | | | 1,964,151 | |
| | 1,120 | | Oakland, California, General Obligation Bonds, Measure DD Series 2009B, 5.250%, 1/15/29 | | 1/19 at 100.00 | Aa2 | | | 1,267,706 | |
| | 4,000 | | Oceanside Unified School District, San Diego County, California, General Obligation Bonds, Election 2008 Series 2010B, 0.000%, 8/01/49 – AGM Insured | | No Opt. Call | AA | | | 449,920 | |
| | 10,000 | | San Marcos Unified School District, San Diego County, California, General Obligation Bonds, 2010 Election, Series 2012B, 0.000%, 8/01/51 | | No Opt. Call | AA– | | | 2,023,600 | |
| | 500 | | Western Riverside Water & Wastewater Financing Authority, California, Revenue Bonds, Western Municipal Water District, Series 2009, 5.625%, 9/01/39 – AGC Insured | | 8/19 at 100.00 | AA | | | 573,700 | |
| | 19,720 | | Total Tax Obligation/General | | | | | | 8,459,817 | |
| | | | Tax Obligation/Limited – 22.2% (22.5% of Total Investments) | | | | | | | |
| | 1,000 | | California Health Facilities Financing Authority, Insured Revenue Bonds, Community Program for Persons with Developmental Disabilities, Series 2011A, 6.250%, 2/01/26 | | 2/21 at 100.00 | A+ | | | 1,235,180 | |
| | 1,965 | | California State Public Works Board, Lease Revenue Bonds, Department of Education Riverside Campus Project, Series 2009B, 5.750%, 4/01/23 | | 4/19 at 100.00 | A1 | | | 2,316,008 | |
| | 500 | | California State Public Works Board, Lease Revenue Bonds, Various Capital Projects, Series 2010A-1, 6.000%, 3/01/35 | | 3/20 at 100.00 | A1 | | | 600,470 | |
| | 160 | | Fontana Redevelopment Agency, San Bernardino County, California, Tax Allocation Bonds, Jurupa Hills Redevelopment Project, Refunding Series 1997A, 5.500%, 10/01/27 | | 10/15 at 100.00 | A– | | | 160,440 | |
| | 145 | | Inglewood Redevelopment Agency, California, Tax Allocation Bonds, Merged Redevelopment Project, Subordinate Lien Series 2007A-1, 5.000%, 5/01/25 – AMBAC Insured | | 5/17 at 100.00 | BBB+ | | | 151,126 | |
| | 425 | | Lancaster Redevelopment Agency, California, Tax Allocation Bonds, Combined Redevelopment Project Areas Housing Programs, Series 2009, 6.875%, 8/01/39 | | No Opt. Call | BBB | | | 496,430 | |
| | Principal | | | | Optional Call | | | | | |
| | Amount (000) | | Description (1) | | Provisions (2) | Ratings (3) | | | Value | |
| | | | Tax Obligation/Limited (continued) | | | | | | | |
| | | | National City Community Development Commission, California, Tax Allocation Bonds, National City Redevelopment Project, Series 2011: | | | | | | | |
| $ | 1,135 | | 5.000%, 8/01/16 | | No Opt. Call | A– | | $ | 1,205,177 | |
| | 80 | | 6.500%, 8/01/24 | | 8/21 at 100.00 | A– | | | 101,945 | |
| | 30 | | Novato Redevelopment Agency, California, Tax Allocation Bonds, Hamilton Field Redevelopment Project, Series 2011, 6.750%, 9/01/40 | | 9/21 at 100.00 | BBB+ | | | 36,655 | |
| | 35 | | Patterson Public Finance Authority, California, Revenue Bonds, Community Facilities District 2001-1, Subordinate Lien Series 2013B, 5.875%, 9/01/39 | | 9/23 at 100.00 | N/R | | | 40,317 | |
| | | | Patterson Public Financing Authority, California, Revenue Bonds, Community Facilities District 2001-1, Senior Series 2013A: | | | | | | | |
| | 210 | | 5.250%, 9/01/30 | | 9/23 at 100.00 | N/R | | | 239,667 | |
| | 190 | | 5.750%, 9/01/39 | | 9/23 at 100.00 | N/R | | | 219,767 | |
| | 240 | | Pittsburg Redevelopment Agency, California, Tax Allocation Bonds, Los Medanos Community Development Project, Refunding Series 2008A, 6.500%, 9/01/28 | | 9/18 at 100.00 | BBB– | | | 267,540 | |
| | 95 | | Rancho Santa Fe CSD Financing Authority, California, Revenue Bonds, Superior Lien Series 2011A, 5.750%, 9/01/30 | | 9/21 at 100.00 | BBB+ | | | 109,136 | |
| | 15 | | Riverside County Redevelopment Agency, California, Tax Allocation Bonds, Jurupa Valley Project Area, Series 2011B, 6.500%, 10/01/25 | | 10/21 at 100.00 | A– | | | 18,816 | |
| | 1,000 | | San Francisco City and County Redevelopment Financing Authority, California, Tax Allocation Revenue Bonds, San Francisco Redevelopment Projects, Series 2009B, 6.625%, 8/01/39 | | 8/19 at 100.00 | AA– | | | 1,166,800 | |
| | 1,500 | | San Francisco City and County, California, Certificates of Participation, Multiple Capital Improvement Projects, Series 2009A, 5.250%, 4/01/31 | | 4/19 at 100.00 | AA | | | 1,713,090 | |
| | 15 | | San Francisco Redevelopment Finance Authority, California, Tax Allocation Revenue Bonds, Mission Bay North Redevelopment Project, Series 2011C, 6.750%, 8/01/41 | | 2/21 at 100.00 | A– | | | 18,393 | |
| | | | San Francisco Redevelopment Financing Authority, California, Tax Allocation Revenue Bonds, Mission Bay South Redevelopment Project, Series 2011D: | | | | | | | |
| | 15 | | 7.000%, 8/01/33 | | 2/21 at 100.00 | BBB+ | | | 18,294 | |
| | 15 | | 7.000%, 8/01/41 | | 2/21 at 100.00 | BBB+ | | | 18,294 | |
| | 125 | | San Jose Redevelopment Agency, California, Tax Allocation Bonds, Merged Area Redevelopment Project, Series 2006C, 5.000%, 8/01/25 – NPFG Insured | | 8/17 at 100.00 | AA– | | | 134,053 | |
| | 585 | | San Jose Redevelopment Agency, California, Tax Allocation Bonds, Merged Area Redevelopment Project, Series 2006D, 5.000%, 8/01/22 – AMBAC Insured | | 8/17 at 100.00 | BBB+ | | | 635,614 | |
| | 25 | | Signal Hill Redevelopment Agency, California, Project 1 Tax Allocation Bonds, Series 2011, 7.000%, 10/01/26 | | 4/21 at 100.00 | N/R | | | 28,812 | |
| | 1,750 | | Westlake Village, California, Certificates of Participation, Financing Project, Series 2009, 5.000%, 6/01/39 | | 6/16 at 100.00 | AA+ | | | 1,816,797 | |
| | 40 | | Yorba Linda Redevelopment Agency, Orange County, California, Tax Allocation Revenue Bonds, Yorba Linda Redevelopment Project, Subordinate Lien Series 2011A, 6.000%, 9/01/26 | | 9/21 at 100.00 | A– | | | 49,128 | |
| | 11,295 | | Total Tax Obligation/Limited | | | | | | 12,797,949 | |
| | | | Transportation – 5.0% (5.0% of Total Investments) | | | | | | | |
| | 395 | | Foothill/Eastern Transportation Corridor Agency, California, Toll Road Revenue Bonds, Refunding Junior Lien Series 2013C, 6.500%, 1/15/43 | | 1/24 at 100.00 | BB+ | | | 475,742 | |
| | | | Foothill/Eastern Transportation Corridor Agency, California, Toll Road Revenue Bonds, Refunding Series 2013A: | | | | | | | |
| | 865 | | 5.750%, 1/15/46 | | 1/24 at 100.00 | BBB– | | | 1,014,628 | |
| | 865 | | 6.000%, 1/15/53 | | 1/24 at 100.00 | BBB– | | | 1,023,771 | |
| | 305 | | Port of Oakland, California, Revenue Bonds, Refunding Series 2012P, 5.000%, 5/01/31 (Alternative Minimum Tax) | | No Opt. Call | A+ | | | 342,024 | |
| | 2,430 | | Total Transportation | | | | | | 2,856,165 | |
| NCB | Nuveen California Municipal Value Fund 2 | |
| | Portfolio of Investments (continued) | February 28, 2015 |
| | Principal | | | | Optional Call | | | | | |
| | Amount (000) | | Description (1) | | Provisions (2) | Ratings (3) | | | Value | |
| | | | U.S. Guaranteed – 1.5% (1.6% of Total Investments) (4) | | | | | | | |
| | | | California Educational Facilities Authority, Revenue Bonds, University of the Pacific, Series 2009: | | | | | | | |
| $ | 55 | | 5.500%, 11/01/39 (Pre-refunded 11/01/19) | | 11/19 at 100.00 | N/R (4) | | $ | 66,183 | |
| | 80 | | 5.500%, 11/01/39 (Pre-refunded 11/01/19) | | 11/19 at 100.00 | A2 (4) | | | 95,338 | |
| | 575 | | Lancaster Redevelopment Agency, California, Tax Allocation Bonds, Combined Redevelopment Project Areas Housing Programs, Series 2009, 6.875%, 8/01/39 (Pre-refunded 8/01/19) | | 8/19 at 100.00 | N/R (4) | | | 720,090 | |
| | 710 | | Total U.S. Guaranteed | | | | | | 881,611 | |
| | | | Utilities – 14.0% (14.2% of Total Investments) | | | | | | | |
| | 1,000 | | M-S-R Energy Authority, California, Gas Revenue Bonds, Citigroup Prepay Contracts, Series 2009C, 6.500%, 11/01/39 | | No Opt. Call | A | | | 1,381,910 | |
| �� | 2,495 | | Roseville Natural Gas Financing Authority, California, Gas Revenue Bonds, Series 2007, 5.000%, 2/15/17 | | No Opt. Call | A | | | 2,656,077 | |
| | 2,400 | | Southern California Public Power Authority, Natural Gas Project 1 Revenue Bonds, Series 2007A, 5.250%, 11/01/24 | | No Opt. Call | A | | | 2,850,792 | |
| | 1,000 | | Tuolumne Wind Project Authority, California, Revenue Bonds, Tuolumne Company Project, Series 2009A, 5.625%, 1/01/29 | | 1/19 at 100.00 | AA– | | | 1,160,430 | |
| | 6,895 | | Total Utilities | | | | | | 8,049,209 | |
| | | | Water and Sewer – 7.3% (7.4% of Total Investments) | | | | | | | |
| | 1,075 | | California Pollution Control Financing Authority, Water Furnishing Revenue Bonds, Poseidon Resources Channelside LP Desalination Project, Series 2012, 5.000%, 11/21/45 (Alternative Minimum Tax) | | No Opt. Call | Baa3 | | | 1,164,827 | |
| | 2,000 | | Orange County Sanitation District, California, Certificates of Participation, Tender Option Bond Trust 3020, 18.181%, 2/01/35 (IF) (5) | | 2/19 at 100.00 | AAA | | | 3,044,640 | |
| | 3,075 | | Total Water and Sewer | | | | | | 4,209,467 | |
| $ | 62,335 | | Total Long-Term Investments (cost $47,056,934) | | | | | | 56,255,089 | |
| | Principal | | | | Optional Call | | | | | |
| | Amount (000) | | Description (1) | | Provisions (2) | Ratings (3) | | | Value | |
| | | | SHORT-TERM INVESTMENTS – 0.9% (1.0% of Total Investments) | | | | | | | |
| | | | MUNICIPAL BONDS – 0.9% (1.0% of Total Investments) | | | | | | | |
| | | | Health Care – 0.9% (1.0% of Total Investments) | | | | | | | |
| $ | 340 | | California Statewide Community Development Authority, Revenue Bonds, Daughters of Charity Health System, Series 2014A, 6.000%, 7/10/15 (6) | | No Opt. Call | N/R | | $ | 342,900 | |
| | 100 | | California Statewide Community Development Authority, Revenue Bonds, Daughters of Charity Health System, Series 2014B, 6.000%, 7/10/15 (6) | | No Opt. Call | N/R | | | 100,853 | |
| | 100 | | California Statewide Community Development Authority, Revenue Bonds, Daughters of Charity Health System, Series 2014C, 6.000%, 7/10/15 (6) | | No Opt. Call | N/R | | | 100,853 | |
| $ | 540 | | Total Short-Term Investments (cost $540,000) | | | | | | 544,606 | |
| | | | Total Investments (cost $47,596,934) – 98.7% | | | | | | 56,799,695 | |
| | | | Other Assets Less Liabilities – 1.3% | | | | | | 732,756 | |
| | | | Net Assets Applicable to Common Shares – 100% | | | | | $ | 57,532,451 | |
| (1) | All percentages shown in the Portfolio of Investments are based on net assets applicable to common shares unless otherwise noted. |
| (2) | Optional Call Provisions (not covered by the report of independent registered public accounting firm): Dates (month and year) and prices of the earliest optional call or redemption. There may be other call provisions at varying prices at later dates. Certain mortgage-backed securities may be subject to periodic principal paydowns. |
| (3) | Ratings (not covered by the report of independent registered public accounting firm): Using the highest of Standard & Poor’s Group (“Standard & Poor’s”), Moody’s Investors Service, Inc. (“Moody’s”) or Fitch, Inc. (“Fitch”) rating. Ratings below BBB by Standard & Poor’s, Baa by Moody’s or BBB by Fitch are considered to be below investment grade. Holdings designated N/R are not rated by any of these national rating agencies. |
| (4) | Backed by an escrow or trust containing sufficient U.S. Government or U.S. Government agency securities, which ensure the timely payment of principal and interest. Certain bonds backed by U.S. Government or agency securities are regarded as having an implied rating equal to the rating of such securities. |
| (5) | Investment, or portion of investment, has been pledged to collateralize the net payment obligations for investments in inverse floating rate transactions. |
| (6) | Investment valued at fair value using methods determined in good faith by, or at the discretion of, the Board. For fair value measurement disclosure purposes, investment classified as Level 3. See Notes to Financial Statements, Note 2 – Investment Valuation and Fair Value Measurements for more information. |
| (IF) | Inverse floating rate investment. |
See accompanying notes to financial statements.
| NKX | | |
| | Nuveen California AMT-Free Municipal Income Fund | |
| | Portfolio of Investments | February 28, 2015 |
| | Principal | | | | Optional Call | | | | | |
| | Amount (000) | | Description (1) | | Provisions (2) | Ratings (3) | | | Value | |
| | | | LONG-TERM INVESTMENTS – 140.0% (99.2% of Total Investments) | | | | | | | |
| | | | MUNICIPAL BONDS – 140.0% (99.2% of Total Investments) | | | | | | | |
| | | | Consumer Staples – 5.4% (3.8% of Total Investments) | | | | | | | |
| $ | 1,130 | | California County Tobacco Securitization Agency, Tobacco Settlement Asset-Backed Bonds, Alameda County Tobacco Asset Securitization Corporation, Series 2002, 5.750%, 6/01/29 | | 5/15 at 100.00 | Baa1 | | $ | 1,130,181 | |
| | | | California County Tobacco Securitization Agency, Tobacco Settlement Asset-Backed Bonds, Los Angeles County Securitization Corporation, Series 2006A: | | | | | | | |
| | 1,350 | | 5.600%, 6/01/36 | | 12/18 at 100.00 | B+ | | | 1,256,391 | |
| | 325 | | 5.650%, 6/01/41 | | 12/18 at 100.00 | B+ | | | 292,643 | |
| | 7,780 | | 5.700%, 6/01/46 | | 12/18 at 100.00 | B+ | | | 6,968,313 | |
| | 110 | | California County Tobacco Securitization Agency, Tobacco Settlement Asset-Backed Bonds, Sonoma County Tobacco Securitization Corporation, Series 2005, 4.250%, 6/01/21 | | 6/15 at 100.00 | BBB+ | | | 109,999 | |
| | 2,190 | | California Statewide Financing Authority, Tobacco Settlement Asset-Backed Bonds, Pooled Tobacco Securitization Program, Series 2002A, 5.625%, 5/01/29 | | 5/15 at 100.00 | BBB | | | 2,190,219 | |
| | | | Golden State Tobacco Securitization Corporation, California, Tobacco Settlement Asset-Backed Bonds, Series 2007A-1: | | | | | | | |
| | 3,570 | | 5.000%, 6/01/33 | | 6/17 at 100.00 | B | | | 3,022,255 | |
| | 6,950 | | 5.750%, 6/01/47 | | 6/17 at 100.00 | B | | | 5,976,096 | |
| | 13,560 | | 5.125%, 6/01/47 | | 6/17 at 100.00 | B | | | 10,648,261 | |
| | 865 | | Golden State Tobacco Securitization Corporation, California, Tobacco Settlement Asset-Backed Bonds, Series 2007A-2, 5.300%, 6/01/37 | | 6/22 at 100.00 | B | | | 731,037 | |
| | | | Tobacco Securitization Authority of Northern California, Tobacco Settlement Asset-Backed Bonds, Series 2005A-1: | | | | | | | |
| | 8,450 | | 5.375%, 6/01/38 | | 6/15 at 100.00 | B– | | | 7,112,618 | |
| | 2,000 | | 5.500%, 6/01/45 | | 6/15 at 100.00 | B– | | | 1,630,360 | |
| | 48,280 | | Total Consumer Staples | | | | | | 41,068,373 | |
| | | | Education and Civic Organizations – 2.1% (1.5% of Total Investments) | | | | | | | |
| | 1,050 | | ABAG Finance Authority for Non-Profit Corporations, California, Revenue Bonds, The Jackson Laboratory, Series 2012, 5.000%, 7/01/37 | | 7/22 at 100.00 | A1 | | | 1,179,370 | |
| | 35 | | California Educational Facilities Authority, Revenue Bonds, University of Redlands, Series 2005A, 5.000%, 10/01/35 | | 10/15 at 100.00 | A3 | | | 35,355 | |
| | 45 | | California Educational Facilities Authority, Revenue Bonds, University of the Pacific, Series 2006, 5.000%, 11/01/21 | | 11/15 at 100.00 | A2 | | | 46,377 | |
| | 4,475 | | California Municipal Finance Authority Charter School Revenue Bonds, Albert Einstein Academies Project, Series 2013A, 7.125%, 8/01/43 | | 8/23 at 100.00 | BB | | | 5,180,618 | |
| | 1,780 | | California Municipal Finance Authority, Charter School Revenue Bonds, Rocketship Education – Multiple Projects, Series 2014A, 7.250%, 6/01/43 | | 6/22 at 102.00 | N/R | | | 2,029,645 | |
| | 1,600 | | California Municipal Finance Authority, Revenue Bonds, Goodwill Industries of Sacramento Valley & Northern Nevada Project, Series 2012A, 6.875%, 1/01/42 | | 1/22 at 100.00 | N/R | | | 1,762,208 | |
| | 800 | | California State University, Systemwide Revenue Bonds, Series 2005A, 5.000%, 11/01/25 – AMBAC Insured | | 5/15 at 100.00 | Aa2 | | | 806,848 | |
| | 185 | | California Statewide Communities Development Authority, Charter School Revenue Bonds, Rocketship 4 – Mosaic Elementary Charter School, Series 2011A, 8.500%, 12/01/41 | | 12/21 at 100.00 | N/R | | | 218,019 | |
| | 300 | | California Statewide Communities Development Authority, School Facility Revenue Bonds, Alliance College-Ready Public Schools, Series 2011A, 7.000%, 7/01/46 | | 7/21 at 100.00 | BBB– | | | 346,449 | |
| | 4,060 | | San Diego County, California, Certificates of Participation, Burnham Institute, Series 2006, 5.000%, 9/01/34 | | 9/15 at 102.00 | Baa1 | | | 4,168,240 | |
| | 14,330 | | Total Education and Civic Organizations | | | | | | 15,773,129 | |
| | Principal | | | | Optional Call | | | | | |
| | Amount (000) | | Description (1) | | Provisions (2) | Ratings (3) | | | Value | |
| | | | Health Care – 19.6% (13.9% of Total Investments) | | | | | | | |
| $ | 3,965 | | Antelope Valley Healthcare District, California, Revenue Bonds, Series 2011A, 6.875%, 3/01/26 | | No Opt. Call | Ba2 | | $ | 4,513,122 | |
| | 1,630 | | California Health Facilities Financing Authority, Revenue Bonds, Childrens Hospital Los Angeles, Series 2010A, 5.250%, 7/01/38 – AGC Insured | | 7/20 at 100.00 | AA | | | 1,842,438 | |
| | 1,255 | | California Health Facilities Financing Authority, Revenue Bonds, Children’s Hospital Los Angeles, Series 2012A, 5.000%, 11/15/29 | | No Opt. Call | BBB+ | | | 1,364,022 | |
| | 1,000 | | California Health Facilities Financing Authority, Revenue Bonds, City of Hope National Medical Center, Series 2012A, 5.000%, 11/15/35 | | No Opt. Call | AA– | | | 1,130,560 | |
| | 2,520 | | California Health Facilities Financing Authority, Revenue Bonds, Lucile Salter Packard Children’s Hospital, Series 2014A, 5.000%, 8/15/43 | | 8/24 at 100.00 | AA | | | 2,879,075 | |
| | 2,000 | | California Health Facilities Financing Authority, Revenue Bonds, Memorial Health Services, Series 2012A, 5.000%, 10/01/33 | | No Opt. Call | AA– | | | 2,252,440 | |
| | 1,405 | | California Health Facilities Financing Authority, Revenue Bonds, Providence Health & Services, Series 2014A, 5.000%, 10/01/38 | | 10/24 at 100.00 | AA | | | 1,621,258 | |
| | 2,800 | | California Health Facilities Financing Authority, Revenue Bonds, Providence Health & Services, Series 2014B, 5.000%, 10/01/44 | | 10/24 at 100.00 | AA | | | 3,188,640 | |
| | 335 | | California Health Facilities Financing Authority, Revenue Bonds, Rady Children’s Hospital – San Diego, Series 2011, 5.250%, 8/15/41 | | 8/21 at 100.00 | AA– | | | 379,528 | |
| | 10,265 | | California Health Facilities Financing Authority, Revenue Bonds, Sutter Health, Series 2007A, 5.250%, 11/15/46 | | 11/16 at 100.00 | AA– | | | 11,070,700 | |
| | 750 | | California Municipal Finance Authority, Revenue Bonds, Eisenhower Medical Center, Series 2010A, 5.750%, 7/01/40 | | 7/20 at 100.00 | Baa2 | | | 834,075 | |
| | 685 | | California Municipal Financing Authority, Certificates of Participation, Community Hospitals of Central California, Series 2007, 5.250%, 2/01/46 | | 2/17 at 100.00 | Baa1 | | | 710,701 | |
| | 1,000 | | California Statewide Communities Development Authority, Revenue Bonds, Adventist Health System West, Series 2005A, 5.000%, 3/01/35 | | 3/15 at 100.00 | A | | | 1,001,960 | |
| | 4,920 | | California Statewide Communities Development Authority, Revenue Bonds, Saint Joseph Health System, Trust 2554, 18.698%, 7/01/47 – AGM Insured (IF) | | 7/18 at 100.00 | AA | | | 6,659,626 | |
| | 1,815 | | California Statewide Communities Development Authority, Revenue Bonds, ValleyCare Health System, Series 2007A, 5.125%, 7/15/31 | | 7/17 at 100.00 | N/R | | | 1,869,650 | |
| | 4,000 | | California Statewide Community Development Authority, Health Facility Revenue Bonds, Catholic Healthcare West, Insured Series 2008K, 5.500%, 7/01/41 – AGC Insured | | 7/17 at 100.00 | AA | | | 4,332,400 | |
| | | | California Statewide Community Development Authority, Revenue Bonds, Childrens Hospital of Los Angeles, Series 2007: | | | | | | | |
| | 2,995 | | 5.000%, 8/15/39 – NPFG Insured | | 8/17 at 100.00 | AA– | | | 3,187,818 | |
| | 6,500 | | 5.000%, 8/15/47 | | 8/17 at 100.00 | BBB+ | | | 6,841,965 | |
| | | | California Statewide Community Development Authority, Revenue Bonds, Daughters of Charity Health System, Series 2005A: | | | | | | | |
| | 895 | | 5.250%, 7/01/24 | | 7/15 at 100.00 | CCC | | | 869,842 | |
| | 2,740 | | 5.250%, 7/01/30 | | 7/15 at 100.00 | CCC | | | 2,617,495 | |
| | 730 | | California Statewide Community Development Authority, Revenue Bonds, Kaiser Permanente System, Series 2001C, 5.250%, 8/01/31 | | 8/16 at 100.00 | A+ | | | 772,041 | |
| | 11,335 | | California Statewide Community Development Authority, Revenue Bonds, Kaiser Permanente System, Series 2006, 5.000%, 3/01/41 | | 3/16 at 100.00 | A+ | | | 11,735,125 | |
| | 5,020 | | California Statewide Community Development Authority, Revenue Bonds, Kaiser Permanente System, Series 2006, 5.000%, 3/01/41 – BHAC Insured (UB) | | 3/16 at 100.00 | AA+ | | | 5,229,485 | |
| | 2,680 | | California Statewide Community Development Authority, Revenue Bonds, Methodist Hospital Project, Series 2009, 6.750%, 2/01/38 | | 8/19 at 100.00 | Aa2 | | | 3,228,060 | |
| | 6,160 | | California Statewide Community Development Authority, Revenue Bonds, Sherman Oaks Health System, Series 1998A, 5.000%, 8/01/22 – AMBAC Insured | | No Opt. Call | Aa3 | | | 7,153,546 | |
| | 7,555 | | California Statewide Community Development Authority, Revenue Bonds, St. Joseph Health System, Series 2007A, 5.750%, 7/01/47 – FGIC Insured | | 7/18 at 100.00 | AA– | | | 8,560,117 | |
| NKX | Nuveen California AMT-Free Municipal Income Fund | |
| | Portfolio of Investments (continued) | February 28, 2015 |
| | Principal | | | | Optional Call | | | | | |
| | Amount (000) | | Description (1) | | Provisions (2) | Ratings (3) | | | Value | |
| | | | Health Care (continued) | | | | | | | |
| $ | 1,690 | | California Statewide Community Development Authority, Revenue Bonds, Sutter Health, Series 2005A, 5.000%, 11/15/43 | | 11/15 at 100.00 | AA– | | $ | 1,741,477 | |
| | 10,000 | | California Statewide Community Development Authority, Revenue Bonds, Sutter Health, Series 2007C, 5.000%, 8/15/38 – AMBAC Insured | | 8/17 at 100.00 | AA– | | | 10,651,200 | |
| | 2,600 | | Marysville, California, Revenue Bonds, The Fremont-Rideout Health Group, Series 2011, 5.250%, 1/01/42 | | 1/21 at 100.00 | A | | | 2,900,300 | |
| | | | Palomar Pomerado Health Care District, California, Certificates of Participation, Series 2009: | | | | | | | |
| | 9,250 | | 6.625%, 11/01/29 | | 11/19 at 100.00 | Ba1 | | | 10,384,882 | |
| | 7,500 | | 6.750%, 11/01/39 | | 11/19 at 100.00 | Ba1 | | | 8,324,175 | |
| | | | Palomar Pomerado Health Care District, California, Certificates of Participation, Series 2010: | | | | | | | |
| | 1,500 | | 6.000%, 11/01/30 | | 11/20 at 100.00 | Ba1 | | | 1,628,730 | |
| | 2,595 | | 6.000%, 11/01/41 | | 11/20 at 100.00 | Ba1 | | | 2,782,567 | |
| | 1,000 | | Rancho Mirage Joint Powers Financing Authority, California, Revenue Bonds, Eisenhower Medical Center, Series 2007A, 5.000%, 7/01/38 | | 7/17 at 100.00 | Baa2 | | | 1,047,110 | |
| | 850 | | San Buenaventura, California, Revenue Bonds, Community Memorial Health System, Series 2011, 7.500%, 12/01/41 | | 12/21 at 100.00 | BB | | | 1,045,296 | |
| | 9,085 | | Santa Clara County Financing Authority, California, Insured Revenue Bonds, El Camino Hospital, Series 2007A, 5.750%, 2/01/41 – AMBAC Insured | | 8/17 at 100.00 | A+ | | | 9,861,222 | |
| | 2,000 | | Sierra View Local Health Care District, California, Revenue Bonds, Series 2007, 5.250%, 7/01/37 | | 9/17 at 100.00 | A | | | 2,111,760 | |
| | 1,000 | | The Regents of the University of California, Medical Center Pooled Revenue Bonds, Series 2009E, 5.000%, 5/15/38 | | 5/17 at 101.00 | AA– | | | 1,068,170 | |
| | 136,025 | | Total Health Care | | | | | | 149,392,578 | |
| | | | Housing/Multifamily – 2.5% (1.8% of Total Investments) | | | | | | | |
| | 485 | | California Municipal Finance Authority, Mobile Home Park Revenue Bonds, Caritas Projects Series 2010A, 6.400%, 8/15/45 | | 8/20 at 100.00 | BBB | | | 542,148 | |
| | 155 | | California Municipal Finance Authority, Mobile Home Park Revenue Bonds, Caritas Projects Series 2012A, 5.500%, 8/15/47 | | 8/22 at 100.00 | BBB | | | 169,875 | |
| | 350 | | California Municipal Finance Authority, Mobile Home Park Revenue Bonds, Caritas Projects Series 2012B, 7.250%, 8/15/47 | | 8/22 at 100.00 | A1 | | | 397,114 | |
| | | | California Municipal Finance Authority, Mobile Home Park Revenue Bonds, Windsor Mobile Country Club Series 2013A: | | | | | | | |
| | 2,000 | | 5.625%, 11/15/33 | | 11/23 at 100.00 | BBB | | | 2,232,380 | |
| | 8,000 | | 6.000%, 11/15/48 | | 11/23 at 100.00 | BBB | | | 9,071,680 | |
| | | | California Municipal Finance Authority, Mobile Home Park Senior Revenue Bonds, Caritas Affordable Housing, Inc. Projects, Series 2014A: | | | | | | | |
| | 260 | | 5.250%, 8/15/39 | | 8/24 at 100.00 | BBB | | | 286,910 | |
| | 705 | | 5.250%, 8/15/49 | | 8/24 at 100.00 | BBB | | | 773,568 | |
| | 3,285 | | Independent Cities Finance Authority, California, Mobile Home Park Revenue Bonds, Rancho Vallecitos Mobile Home Park, Series 2013, 5.000%, 4/15/38 | | 4/23 at 100.00 | A– | | | 3,572,832 | |
| | | | La Verne, California, Mobile Home Park Revenue Refunding Bonds, Copacabana Mobile Home Park, Series 2014: | | | | | | | |
| | 670 | | 5.000%, 6/15/44 | | 6/24 at 100.00 | A | | | 713,001 | |
| | 185 | | 5.000%, 6/15/49 | | 6/24 at 100.00 | A | | | 196,094 | |
| | 1,165 | | Poway, California, Housing Revenue Bonds, Revenue Bonds, Poinsettia Mobile Home Park, Series 2003, 5.000%, 5/01/23 | | 5/15 at 100.00 | AA– | | | 1,170,266 | |
| | 17,260 | | Total Housing/Multifamily | | | | | | 19,125,868 | |
| | | | Housing/Single Family – 0.2% (0.1% of Total Investments) | | | | | | | |
| | 1,150 | | California Housing Finance Agency, California, Home Mortgage Revenue Bonds, Series 2008L, 5.500%, 8/01/38 | | 2/18 at 100.00 | A– | | | 1,172,011 | |
| | Principal | | | | Optional Call | | | | | |
| | Amount (000) | | Description (1) | | Provisions (2) | Ratings (3) | | | Value | |
| | | | Long-Term Care – 0.9% (0.6% of Total Investments) | | | | | | | |
| $ | 3,000 | | ABAG Finance Authority for Non-Profit Corporations, California, Cal-Mortgage Insured Revenue Bonds, Channing House, Series 2010, 6.125%, 5/15/40 | | 5/20 at 100.00 | A+ | | $ | 3,569,070 | |
| | 1,575 | | California Health Facilities Financing Authority, Insured Revenue Bonds, California-Nevada Methodist Homes, Series 2006, 5.000%, 7/01/36 | | 7/16 at 100.00 | A+ | | | 1,632,629 | |
| | 1,500 | | California Statewide Communities Development Authority, Revenue Bonds, Front Porch Communities and Services Project, Series 2007A, 5.125%, 4/01/37 | | 4/17 at 100.00 | BBB+ | | | 1,560,945 | |
| | 6,075 | | Total Long-Term Care | | | | | | 6,762,644 | |
| | | | Tax Obligation/General – 32.2% (22.8% of Total Investments) | | | | | | | |
| | 3,000 | | Alhambra Unified School District, Los Angeles County, California, General Obligation Bonds, Refunding Series 2012A, 5.000%, 8/01/29 – AGM Insured | | 8/22 at 100.00 | Aa3 | | | 3,450,630 | |
| | 1,000 | | California State, General Obligation Bonds, Refunding Series 2011, 5.250%, 9/01/25 | | 9/21 at 100.00 | Aa3 | | | 1,200,190 | |
| | 4,910 | | California State, General Obligation Bonds, Various Purpose Refunding Series 2014, 5.000%, 10/01/32 | | 10/24 at 100.00 | Aa3 | | | 5,777,057 | |
| | | | California State, General Obligation Bonds, Various Purpose Series 2009: | | | | | | | |
| | 2,350 | | 6.000%, 11/01/39 | | 11/19 at 100.00 | Aa3 | | | 2,888,056 | |
| | 1,300 | | 5.500%, 11/01/39 | | 11/19 at 100.00 | Aa3 | | | 1,534,676 | |
| | 6,000 | | California State, General Obligation Bonds, Various Purpose Series 2010, 6.000%, 3/01/33 | | 3/20 at 100.00 | Aa3 | | | 7,301,940 | |
| | | | California State, General Obligation Bonds, Various Purpose Series 2011: | | | | | | | |
| | 2,000 | | 5.000%, 9/01/31 | | No Opt. Call | Aa3 | | | 2,301,960 | |
| | 4,090 | | 5.000%, 9/01/41 | | 9/21 at 100.00 | Aa3 | | | 4,614,379 | |
| | 2,625 | | 5.000%, 10/01/41 | | 10/21 at 100.00 | Aa3 | | | 2,965,410 | |
| | | | California State, General Obligation Bonds, Various Purpose Series 2013: | | | | | | | |
| | 3,500 | | 5.000%, 4/01/37 | | 4/23 at 100.00 | Aa3 | | | 3,991,575 | |
| | 2,000 | | 5.000%, 2/01/43 | | No Opt. Call | Aa3 | | | 2,271,260 | |
| | 5,520 | | 5.000%, 11/01/43 | | 11/23 at 100.00 | Aa3 | | | 6,330,502 | |
| | | | California State, General Obligation Bonds, Various Purpose Series 2014: | | | | | | | |
| | 2,460 | | 5.000%, 10/01/39 | | 10/24 at 100.00 | Aa3 | | | 2,851,903 | |
| | 9,000 | | 5.000%, 12/01/43 | | 12/23 at 100.00 | Aa3 | | | 10,332,540 | |
| | 9,000 | | 5.000%, 10/01/44 | | 10/24 at 100.00 | Aa3 | | | 10,385,280 | |
| | 20,750 | | Coachella Valley Unified School District, Riverside County, California, General Obligation Bonds, Election 2005 Series 2010C, 0.000%, 8/01/43 – AGM Insured | | No Opt. Call | AA | | | 6,063,150 | |
| | 12,050 | | Coast Community College District, Orange County, California, General Obligation Bonds, Series 2006C, 5.000%, 8/01/31 – AGM Insured | | 8/18 at 100.00 | Aa1 | | | 13,400,082 | |
| | 2,500 | | Corona-Norco Unified School District, Riverside County, California, General Obligation Bonds, Election 2006 Series 2009B, 5.375%, 2/01/34 – AGC Insured | | 8/18 at 100.00 | AA | | | 2,837,225 | |
| | | | East Side Union High School District, Santa Clara County, California, General Obligation Bonds, 2008 Election Series 2010B: | | | | | | | |
| | 3,490 | | 5.000%, 8/01/27 – AGC Insured | | 8/19 at 100.00 | AA | | | 3,969,177 | |
| | 3,545 | | 5.000%, 8/01/28 – AGC Insured | | 8/19 at 100.00 | AA | | | 4,015,563 | |
| | 3,110 | | 5.000%, 8/01/29 – AGC Insured | | 8/19 at 100.00 | AA | | | 3,509,479 | |
| | 230 | | El Monte Union High School District, Los Angeles County, California, General Obligation Bonds, Series 2003A, 5.000%, 6/01/28 – AGM Insured | | 5/15 at 100.00 | AA | | | 230,888 | |
| | 7,100 | | Fontana Unified School District, San Bernardino County, California, General Obligation Bonds, Tender Option Bond Trust 2668, 9.888%, 2/01/16 – AGM Insured (IF) | | No Opt. Call | AA | | | 8,909,364 | |
| | 5,000 | | Grossmont Healthcare District, California, General Obligation Bonds, Series 2007A, 5.000%, 7/15/37 – AMBAC Insured | | 7/17 at 100.00 | Aa2 | | | 5,428,500 | |
| | 6,000 | | Hartnell Community College District, California, General Obligation Bonds, Series 2006B, 5.000%, 6/01/29 – AGM Insured (UB) | | 6/16 at 100.00 | AA | | | 6,347,460 | |
| | 2,000 | | Los Angeles Community College District, California, General Obligation Bonds, Series 2015A, 5.000%, 8/01/29 | | 8/24 at 100.00 | AA+ | | | 2,408,280 | |
| | 1,220 | | Los Angeles Community College District, Los Angeles County, California, General Obligation Bonds, Series 2005A, 5.000%, 8/01/24 – AGM Insured | | No Opt. Call | AA+ | | | 1,245,047 | |
| NKX | Nuveen California AMT-Free Municipal Income Fund | |
| | Portfolio of Investments (continued) | February 28, 2015 |
| | Principal | | | | Optional Call | | | | | |
| | Amount (000) | | Description (1) | | Provisions (2) | Ratings (3) | | | Value | |
| | | | Tax Obligation/General (continued) | | | | | | | |
| $ | 5,000 | | Los Angeles Unified School District, Los Angeles County, California, General Obligation Bonds, Refunding Series 2014C, 5.000%, 7/01/29 | | No Opt. Call | Aa2 | | $ | 5,980,500 | |
| | 4,500 | | Mount Diablo Unified School District, Contra Costa County, California, General Obligation Bonds, Series 2010A, 0.000%, 8/01/30 – AGM Insured | | 8/25 at 100.00 | AA | | | 3,625,830 | |
| | 3,000 | | Murrieta Valley Unified School District, Riverside County, California, General Obligation Bonds, Series 2007, 4.500%, 9/01/30 – AGM Insured | | 9/17 at 100.00 | AA | | | 3,208,680 | |
| | 10,080 | | New Haven Unified School District, Alameda County, California, General Obligation Bonds, Series 2004A, 0.000%, 8/01/26 – NPFG Insured | | No Opt. Call | AA– | | | 5,625,144 | |
| | 2,500 | | Oakland Unified School District, Alameda County, California, General Obligation Bonds, Series 2002, 5.250%, 8/01/21 – FGIC Insured | | 5/15 at 100.00 | AA– | | | 2,510,150 | |
| | 1,125 | | San Diego Unified School District, San Diego County, California, General Obligation Bonds, Election of 1998, Series 1999A, 0.000%, 7/01/21 – FGIC Insured | | No Opt. Call | AA– | | | 982,271 | |
| | 11,980 | | San Diego Unified School District, San Diego County, California, General Obligation Bonds, Refunding Series 2012R-1, 0.000%, 7/01/31 | | No Opt. Call | AA– | | | 6,532,574 | |
| | 2,000 | | San Francisco Community College District, California, General Obligation Bonds, Series 2002A, 5.000%, 6/15/26 – FGIC Insured | | 4/15 at 100.00 | A2 | | | 2,007,840 | |
| | 250 | | San Jose-Evergreen Community College District, Santa Clara County, California, General Obligation Bonds, Series 2005A, 5.000%, 9/01/25 – NPFG Insured | | No Opt. Call | Aa1 | | | 256,105 | |
| | 1,500 | | San Juan Capistano, California, General Obligation Bonds, Open Space Program, Tender Option Bond Trust 2015-XF0048, 18.017%, 8/01/17 (IF) | | No Opt. Call | AAA | | | 2,362,860 | |
| | | | San Ysidro School District, San Diego County, California, General Obligation Bonds, 1997 Election Series 2011F: | | | | | | | |
| | 7,230 | | 0.000%, 8/01/42 – AGM Insured | | 8/21 at 21.00 | AA | | | 1,128,892 | |
| | 10,450 | | 0.000%, 8/01/43 – AGM Insured | | 8/21 at 19.43 | AA | | | 1,509,189 | |
| | 21,225 | | 0.000%, 8/01/44 – AGM Insured | | 8/21 at 17.98 | AA | | | 2,834,811 | |
| | 12,550 | | 0.000%, 8/01/45 – AGM Insured | | 8/21 at 16.64 | AA | | | 1,549,799 | |
| | 23,425 | | 0.000%, 8/01/46 – AGM Insured | | 8/21 at 15.39 | AA | | | 2,665,765 | |
| | 2,870 | | Sanger Unified School District, Fresno County, California, General Obligation Bonds, Election 2012, Series 2014B, 5.000%, 8/01/39 – AGM Insured | | 8/24 at 100.00 | AA | | | 3,282,476 | |
| | 10,000 | | Southwestern Community College District, San Diego County, California, General Obligation Bonds, Election of 2008, Series 2011C, 0.000%, 8/01/41 | | No Opt. Call | Aa2 | | | 3,213,500 | |
| | | | Stockton Unified School District, San Joaquin County, California, General Obligation Bonds, Election 2008 Series 2011D: | | | | | | | |
| | 23,280 | | 0.000%, 8/01/47 – AGC Insured | | 8/37 at 100.00 | AA | | | 18,743,659 | |
| | 38,845 | | 0.000%, 8/01/50 – AGM Insured | | 8/37 at 100.00 | AA | | | 31,325,773 | |
| | 15,780 | | Sylvan Union School District, Stanislaus County, California, General Obligation Bonds, Election of 2006, Series 2010, 0.000%, 8/01/49 – AGM Insured | | No Opt. Call | AA | | | 8,841,692 | |
| | 3,905 | | West Kern Community College District, California, General Obligation Bonds, Election 2004, Series 2007C, 5.000%, 10/01/32 – SYNCORA GTY Insured | | 11/17 at 100.00 | A+ | | | 4,065,495 | |
| | 8,345 | | Yosemite Community College District, California, General Obligation Bonds, Capital Appreciation, Election 2004, Series 2010D, 0.000%, 8/01/42 | | No Opt. Call | Aa2 | | | 4,838,097 | |
| | 1,000 | | Yuba Community College District, California, General Obligation Bonds, Election 2006 Series 2011C, 5.250%, 8/01/47 | | 8/21 at 100.00 | Aa2 | | | 1,118,730 | |
| | 346,590 | | Total Tax Obligation/General | | | | | | 244,771,405 | |
| | | | Tax Obligation/Limited – 46.3% (32.8% of Total Investments) | | | | | | | |
| | 2,000 | | Baldwin Park Public Financing Authority, California, Sales Tax and Tax Allocation Bonds, Puente Merced Redevelopment Project, Series 2003, 5.250%, 8/01/21 | | 8/17 at 100.00 | A– | | | 2,037,560 | |
| | 655 | | Beaumont Financing Authority, California, Local Agency Revenue Bonds, Improvement Area 19C, Series 2013A, 5.000%, 9/01/27 | | 9/23 at 100.00 | N/R | | | 751,337 | |
| | 1,000 | | Bell Community Redevelopment Agency, California, Tax Allocation Bonds, Bell Project Area, Series 2003, 5.625%, 10/01/33 – RAAI Insured | | 5/15 at 100.00 | N/R | | | 1,000,470 | |
| | Principal | | | | Optional Call | | | | | |
| | Amount (000) | | Description (1) | | Provisions (2) | Ratings (3) | | | Value | |
| | | | Tax Obligation/Limited (continued) | | | | | | | |
| $ | 7,895 | | Brea and Olinda Unified School District, Orange County, California, Certificates of Participation Refunding, Series 2002A, 5.125%, 8/01/26 – AGM Insured | | 5/15 at 100.00 | AA | | $ | 7,926,738 | |
| | 1,165 | | Burbank Public Financing Authority, California, Revenue Refunding Bonds, Golden State Redevelopment Project, Series 2003A, 5.250%, 12/01/22 – AMBAC Insured | | 4/15 at 100.00 | A+ | | | 1,169,625 | |
| | 2,250 | | California Health Facilities Financing Authority, Insured Revenue Bonds, Community Program for Persons with Developmental Disabilities, Series 2011A, 6.250%, 2/01/26 | | 2/21 at 100.00 | A+ | | | 2,779,155 | |
| | | | California Infrastructure and Economic Development Bank, Revenue Bonds, North County Center for Self-Sufficiency Corporation, Series 2004: | | | | | | | |
| | 1,215 | | 5.000%, 12/01/19 – AMBAC Insured | | 5/15 at 100.00 | AA+ | | | 1,219,896 | |
| | 1,535 | | 5.000%, 12/01/20 – AMBAC Insured | | 5/15 at 100.00 | AA+ | | | 1,541,171 | |
| | 1,615 | | 5.000%, 12/01/21 – AMBAC Insured | | 5/15 at 100.00 | AA+ | | | 1,621,492 | |
| | 1,695 | | 5.000%, 12/01/22 – AMBAC Insured | | 5/15 at 100.00 | AA+ | | | 1,701,814 | |
| | 1,780 | | 5.000%, 12/01/23 – AMBAC Insured | | 5/15 at 100.00 | AA+ | | | 1,787,156 | |
| | 1,865 | | 5.000%, 12/01/24 – AMBAC Insured | | 5/15 at 100.00 | AA+ | | | 1,872,497 | |
| | 7,000 | | California State Public Works Board, Lease Revenue Bonds, Department of Corrections & Rehabilitation, Various Correctional Facilities Series 2013F, 5.250%, 9/01/31 | | 9/23 at 100.00 | A1 | | | 8,273,300 | |
| | | | California State Public Works Board, Lease Revenue Bonds, Department of Education, Riverside Campus Project, Series 2012H: | | | | | | | |
| | 2,790 | | 5.000%, 4/01/30 | | No Opt. Call | A1 | | | 3,211,429 | |
| | 2,065 | | 5.000%, 4/01/31 | | No Opt. Call | A1 | | | 2,369,732 | |
| | 4,000 | | California State Public Works Board, Lease Revenue Bonds, Department of General Services, Capital East End Project, Series 2002A, 5.000%, 12/01/27 – AMBAC Insured | | 5/15 at 100.00 | A1 | | | 4,025,680 | |
| | 3,100 | | California State Public Works Board, Lease Revenue Bonds, Department of Health Services, Richmond Lab, Series 2005B, 5.000%, 11/01/30 – SYNCORA GTY Insured | | 11/15 at 100.00 | A1 | | | 3,202,269 | |
| | 5,920 | | California State Public Works Board, Lease Revenue Bonds, Department of Veterans Affairs, Southern California Veterans Home – Chula Vista Facility, Series 1999A, 5.600%, 11/01/19 – AMBAC Insured | | 5/15 at 100.00 | A1 | | | 5,945,752 | |
| | 20,330 | | California State Public Works Board, Lease Revenue Bonds, Judicial Council of California, New Stockton Courthouse, Series 2014B, 5.000%, 10/01/39 | | 10/24 at 100.00 | A1 | | | 23,368,318 | |
| | 1,990 | | California State Public Works Board, Lease Revenue Bonds, Judicial Council of California, Various Projects Series 2013A, 5.000%, 3/01/33 | | No Opt. Call | A1 | | | 2,268,501 | |
| | 5,000 | | California State Public Works Board, Lease Revenue Bonds, Various Capital Projects, Series 2009G-1, 5.750%, 10/01/30 | | 10/19 at 100.00 | A1 | | | 5,965,700 | |
| | 2,000 | | California State Public Works Board, Lease Revenue Bonds, Various Capital Projects, Series 2009-I, 6.375%, 11/01/34 | | 11/19 at 100.00 | A1 | | | 2,459,320 | |
| | 165 | | Capistrano Unified School District, Orange County, California, Special Tax Bonds, Community Facilities District 98-2, Series 2005, 5.000%, 9/01/24 – FGIC Insured | | 9/15 at 100.00 | AA– | | | 168,450 | |
| | 3,020 | | Chino Redevelopment Agency, California, Merged Chino Redevelopment Project Area Tax Allocation Bonds, Series 2006, 5.000%, 9/01/38 – AMBAC Insured | | 9/16 at 101.00 | A | | | 3,102,144 | |
| | 1,100 | | Chula Vista Public Financing Authority, California, Pooled Community Facility District Assessment Revenue Bonds, Series 2005A, 4.500%, 9/01/27 – NPFG Insured | | 9/15 at 100.00 | AA– | | | 1,108,228 | |
| | 1,430 | | Cloverdale Community Development Agency, California, Tax Allocation Bonds, Cloverdale Redevelopment Project, Refunding Series 2006, 5.000%, 8/01/36 – AMBAC Insured | | 8/16 at 100.00 | N/R | | | 1,444,457 | |
| | | | Compton Community Redevelopment Agency, California, Tax Allocation Revenue Bonds, Redevelopment Projects, Second Lien Series 2010B: | | | | | | | |
| | 1,230 | | 5.000%, 8/01/25 | | 8/20 at 100.00 | N/R | | | 1,286,691 | |
| | 530 | | 5.750%, 8/01/26 | | 8/20 at 100.00 | N/R | | | 572,018 | |
| | 3,145 | | Culver City Redevelopment Agency, California, Tax Allocation Revenue Bonds, Redevelopment Project, Series 2002A, 5.125%, 11/01/25 – NPFG Insured | | 5/15 at 100.00 | AA– | | | 3,148,774 | |
| | | | El Monte, California, Senior Lien Certificates of Participation, Department of Public Services Facility Phase II, Series 2001: | | | | | | | |
| | 8,425 | | 5.000%, 1/01/21 – AMBAC Insured | | 7/15 at 100.00 | A2 | | | 8,445,051 | |
| | 5,000 | | 5.250%, 1/01/34 – AMBAC Insured | | 7/15 at 100.00 | A2 | | | 5,006,250 | |
| NKX | Nuveen California AMT-Free Municipal Income Fund | |
| | Portfolio of Investments (continued) | February 28, 2015 |
| | Principal | | | | Optional Call | | | | | |
| | Amount (000) | | Description (1) | | Provisions (2) | Ratings (3) | | | Value | |
| | | | Tax Obligation/Limited (continued) | | | | | | | |
| $ | 3,000 | | Escondido Joint Powers Financing Authority, California, Revenue Bonds, Water System Financing, Series 2012, 5.000%, 9/01/41 | | 3/22 at 100.00 | AA– | | $ | 3,334,740 | |
| | 350 | | Fontana Redevelopment Agency, San Bernardino County, California, Tax Allocation Bonds, Jurupa Hills Redevelopment Project, Refunding Series 1997A, 5.500%, 10/01/27 | | 10/15 at 100.00 | A– | | | 350,963 | |
| | 1,000 | | Fullerton Community Facilities District 1, California, Special Tax Bonds, Amerige Heights, Refunding Series 2012, 5.000%, 9/01/32 | | 9/22 at 100.00 | A– | | | 1,107,370 | |
| | 1,000 | | Golden State Tobacco Securitization Corporation, California, Enhanced Tobacco Settlement Asset-Backed Bonds, Series 2013A, 5.000%, 6/01/30 | | 6/23 at 100.00 | A1 | | | 1,139,060 | |
| | | | Golden State Tobacco Securitization Corporation, California, Enhanced Tobacco Settlement Asset-Backed Revenue Bonds, Series 2005A: | | | | | | | |
| | 7,250 | | 5.000%, 6/01/35 – FGIC Insured | | 6/15 at 100.00 | AA | | | 7,335,332 | |
| | 2,000 | | 5.000%, 6/01/45 | | 6/15 at 100.00 | A1 | | | 2,023,120 | |
| | 11,065 | | 5.000%, 6/01/45 – AMBAC Insured | | 6/15 at 100.00 | A1 | | | 11,192,911 | |
| | 7,500 | | 5.000%, 6/01/45 – AGC Insured | | 6/15 at 100.00 | AA | | | 7,586,700 | |
| | 20,000 | | Golden State Tobacco Securitization Corporation, California, Enhanced Tobacco Settlement Asset-Backed Revenue Bonds, Tender Option Bonds Trust 4686, 9.129%, 6/01/45 – AGC Insured (IF) (4) | | 6/15 at 100.00 | AA | | | 20,462,400 | |
| | 2,000 | | Golden State Tobacco Securitization Corporation, California, Enhanced Tobacco Settlement Revenue Bonds, Tender Option Bonds Trust 2040, 11.979%, 6/01/45 – FGIC Insured (IF) | | 6/15 at 100.00 | A1 | | | 2,069,360 | |
| | 425 | | Hesperia Community Redevelopment Agency, California, Tax Allocation Bonds, Series 2005A, 5.000%, 9/01/35 – SYNCORA GTY Insured | | 9/15 at 100.00 | BBB– | | | 427,006 | |
| | 3,345 | | Hesperia Public Financing Authority, California, Redevelopment and Housing Projects Tax Allocation Bonds, Series 2007A, 5.000%, 9/01/37 – SYNCORA GTY Insured | | 9/17 at 100.00 | N/R | | | 3,437,021 | |
| | 1,700 | | Hesperia Unified School District, San Bernardino County, California, Certificates of Participation, Capital Improvement, Series 2007, 5.000%, 2/01/41 – AMBAC Insured | | 2/17 at 100.00 | A– | | | 1,810,279 | |
| | 2,115 | | Inglewood Redevelopment Agency, California, Tax Allocation Bonds, Merged Redevelopment Project, Refunding Series 1998A, 5.250%, 5/01/23 – AMBAC Insured | | No Opt. Call | N/R | | | 2,351,732 | |
| | | | Inglewood Redevelopment Agency, California, Tax Allocation Bonds, Merged Redevelopment Project, Subordinate Lien Series 2007A-1: | | | | | | | |
| | 1,985 | | 5.000%, 5/01/24 – AMBAC Insured | | 5/17 at 100.00 | BBB+ | | | 2,075,139 | |
| | 710 | | 5.000%, 5/01/25 – AMBAC Insured | | 5/17 at 100.00 | BBB+ | | | 739,998 | |
| | | | Irvine Unified School District, California, Special Tax Bonds, Community Facilities District Series 2006A: | | | | | | | |
| | 75 | | 5.000%, 9/01/26 | | 9/16 at 100.00 | N/R | | | 76,928 | |
| | 175 | | 5.125%, 9/01/36 | | 9/16 at 100.00 | N/R | | | 179,205 | |
| | | | Jurupa Community Services District, California, Special Tax Bonds, Community Facilities District 39 Eastvale Area, Series 2012A: | | | | | | | |
| | 1,000 | | 5.000%, 9/01/37 | | 9/22 at 100.00 | N/R | | | 1,038,100 | |
| | 2,000 | | 5.125%, 9/01/42 | | 9/22 at 100.00 | N/R | | | 2,076,960 | |
| | | | Lake Elsinore Public Financing Authority, California, Local Agency Revenue Bonds, Canyon Hills Improvement Area D, Series 2014A: | | | | | | | |
| | 1,140 | | 5.500%, 9/01/33 | | 9/23 at 100.00 | N/R | | | 1,310,179 | |
| | 2,105 | | 5.750%, 9/01/44 | | 9/23 at 100.00 | N/R | | | 2,425,907 | |
| | 2,765 | | Lammersville Joint Unified School District, California, Community Facilities District 2007-1, Mountain House – Shea Homes, Improvement Area 1 Special Tax Bonds, Series 2013, 6.000%, 9/01/38 | | 9/23 at 100.00 | N/R | | | 2,769,341 | |
| | 2,000 | | Lammersville Joint Unified School District, California, Community Facilities District 2007-1, Mountain House – Shea Homes, Improvement Area 1 Special Tax Bonds, Series 2013, 6.000%, 9/01/38 | | 9/23 at 100.00 | N/R | | | 2,390,740 | |
| | | | Lancaster Redevelopment Agency, California, Tax Allocation Bonds, Combined Redevelopment Project Areas Housing Programs, Subordinate Refunding Series 2003: | | | | | | | |
| | 2,505 | | 4.750%, 8/01/23 – NPFG Insured | | 8/15 at 102.00 | AA– | | | 2,570,631 | |
| | 2,425 | | 4.750%, 8/01/27 – NPFG Insured | | 8/15 at 102.00 | AA– | | | 2,483,248 | |
| | 3,500 | | Livermore Redevelopment Agency, California, Tax Allocation Revenue Bonds, Livermore Redevelopment Project Area, Series 2001A, 5.000%, 8/01/26 – NPFG Insured | | 8/15 at 100.00 | AA– | | | 3,527,335 | |
| | Principal | | | | Optional Call | | | | | |
| | Amount (000) | | Description (1) | | Provisions (2) | Ratings (3) | | | Value | |
| | | | Tax Obligation/Limited (continued) | | | | | | | |
| $ | 6,190 | | Los Angeles Community Redevelopment Agency, California, Lease Revenue Bonds, Manchester Social Services Project, Series 2005, 5.000%, 9/01/37 – AMBAC Insured | | 9/15 at 100.00 | A1 | | $ | 6,257,347 | |
| | 1,500 | | Los Osos, California, Improvement Bonds, Community Services Wastewater Assessment District 1, Series 2002, 5.000%, 9/02/33 – NPFG Insured | | 9/15 at 100.00 | AA– | | | 1,507,815 | |
| | 475 | | Lynwood Redevelopment Agency, California, Project A Revenue Bonds, Subordinate Lien Series 2011A, 7.250%, 9/01/38 | | 9/21 at 100.00 | A– | | | 604,988 | |
| | 9,270 | | Moreno Valley Community Redevelopment Agency, California, Tax Allocation Bonds, Series 2007A, 5.000%, 8/01/38 – AMBAC Insured | | 8/17 at 100.00 | A– | | | 9,658,784 | |
| | 3,230 | | Murrieta Redevelopment Agency, California, Tax Allocation Bonds, Series 2005, 5.000%, 8/01/35 – NPFG Insured | | 8/15 at 100.00 | AA– | | | 3,247,087 | |
| | 1,000 | | Murrieta, California, Special Tax Bonds, Community Facilities District 2003-3, Creekside Village Improvement Area 1, Series 2005, 5.200%, 9/01/35 | | 9/15 at 100.00 | N/R | | | 1,009,870 | |
| | 170 | | National City Community Development Commission, California, Tax Allocation Bonds, National City Redevelopment Project, Series 2011, 6.500%, 8/01/24 | | 8/21 at 100.00 | A– | | | 216,633 | |
| | 65 | | Novato Redevelopment Agency, California, Tax Allocation Bonds, Hamilton Field Redevelopment Project, Series 2011, 6.750%, 9/01/40 | | 9/21 at 100.00 | BBB+ | | | 79,420 | |
| | 2,810 | | Oakland Joint Powers Financing Authority, California, Lease Revenue Bonds, Administration Building Projects, Series 2008B, 5.000%, 8/01/21 – AGC Insured | | 8/18 at 100.00 | AA | | | 3,158,103 | |
| | 3,300 | | Pacifica, California, Certificates of Participation, Series 2008, 5.375%, 1/01/37 – AMBAC Insured | | 1/16 at 102.00 | A– | | | 3,419,064 | |
| | 5,000 | | Palm Desert Financing Authority, California, Tax Allocation Revenue Bonds, Project Area 1, Refunding Series 2002, 5.000%, 4/01/25 – NPFG Insured | | 10/15 at 100.00 | AA– | | | 5,010,000 | |
| | | | Patterson Public Financing Authority, California, Revenue Bonds, Community Facilities District 2001-1, Senior Series 2013A: | | | | | | | |
| | 3,820 | | 5.250%, 9/01/30 | | 9/23 at 100.00 | N/R | | | 4,359,651 | |
| | 3,435 | | 5.750%, 9/01/39 | | 9/23 at 100.00 | N/R | | | 3,973,161 | |
| | 610 | | Patterson Public Finance Authority, California, Revenue Bonds, Community Facilities District 2001-1, Subordinate Lien Series 2013B, 5.875%, 9/01/39 | | 9/23 at 100.00 | N/R | | | 702,665 | |
| | 2,000 | | Perris Joint Powers Authority, California, Local Agency Revenue Bonds, Community Facilities District 2001-1 May Farms Improvement Area 1,2 and 3, Refunding Series 2014A, 5.375%, 9/01/33 | | 9/23 at 100.00 | N/R | | | 2,296,160 | |
| | 540 | | Pittsburg Redevelopment Agency, California, Tax Allocation Bonds, Los Medanos Community Development Project, Refunding Series 2008A, 6.500%, 9/01/28 | | 9/18 at 100.00 | BBB– | | | 601,965 | |
| | 4,140 | | Plumas County, California, Certificates of Participation, Capital Improvement Program, Series 2003A, 5.000%, 6/01/28 – AMBAC Insured | | 5/15 at 100.00 | A | | | 4,145,837 | |
| | 390 | | Poway Redevelopment Agency, California, Tax Allocation Refunding Bonds, Paguay Redevelopment Project, Series 2000, 5.750%, 6/15/33 – NPFG Insured | | 5/15 at 100.00 | AA– | | | 390,823 | |
| | | | Puerto Rico Sales Tax Financing Corporation, Sales Tax Revenue Bonds, Series 2007A: | | | | | | | |
| | 5,000 | | 0.000%, 8/01/44 – NPFG Insured | | No Opt. Call | AA– | | | 713,900 | |
| | 7,200 | | 0.000%, 8/01/45 – NPFG Insured | | No Opt. Call | AA– | | | 962,208 | |
| | 210 | | Rancho Santa Fe CSD Financing Authority, California, Revenue Bonds, Superior Lien Series 2011A, 5.750%, 9/01/30 | | 9/21 at 100.00 | BBB+ | | | 241,248 | |
| | 1,250 | | Rio Elementary School District, California, Special Tax Bonds, Community Facilities District 1, Series 2013, 5.500%, 9/01/39 | | 9/23 at 100.00 | N/R | | | 1,452,950 | |
| | 3,000 | | Riverside County Public Financing Authority, California, Tax Allocation Bonds, Multiple Projects, Series 2005A, 5.000%, 10/01/35 – SYNCORA GTY Insured | | 10/15 at 100.00 | BBB+ | | | 3,023,160 | |
| | 40 | | Riverside County Redevelopment Agency, California, Tax Allocation Bonds, Jurupa Valley Project Area, Series 2011B, 6.500%, 10/01/25 | | 10/21 at 100.00 | A– | | | 50,175 | |
| | | | Riverside County, California, Special Tax Bonds, Community Facilities District 05-8 Scott Road, Series 2013: | | | | | | | |
| | 660 | | 5.000%, 9/01/32 | | 9/22 at 100.00 | N/R | | | 737,042 | |
| | 1,775 | | 5.000%, 9/01/42 | | 9/22 at 100.00 | N/R | | | 1,958,553 | |
| NKX | Nuveen California AMT-Free Municipal Income Fund | |
| | Portfolio of Investments (continued) | February 28, 2015 |
| | Principal | | | | Optional Call | | | | | |
| | Amount (000) | | Description (1) | | Provisions (2) | Ratings (3) | | | Value | |
| | | | Tax Obligation/Limited (continued) | | | | | | | |
| $ | 1,000 | | Rocklin Unified School District, Placer County, California, Special Tax Bonds, Community Facilities District 1, Series 2004, 5.000%, 9/01/25 – NPFG Insured | | 5/15 at 100.00 | AA– | | $ | 1,003,770 | |
| | 4,475 | | Roseville Finance Authority, California, Special Tax Revenue Bonds, Series 2007A, 5.000%, 9/01/33 – AMBAC Insured | | 9/17 at 100.00 | N/R | | | 4,595,422 | |
| | 1,500 | | Roseville, California, Special Tax Bonds, Community Facilities District 1 Fiddyment Ranch, Series 2005, 5.050%, 9/01/30 | | 9/15 at 100.00 | N/R | | | 1,511,745 | |
| | 1,500 | | Sacramento City Financing Authority, California, Lease Revenue Refunding Bonds, Series 1993A, 5.400%, 11/01/20 – NPFG Insured | | No Opt. Call | AA– | | | 1,665,825 | |
| | 3,000 | | Sacramento City Financing Authority, California, Lease Revenue Refunding Bonds, Series 1993B, 5.400%, 11/01/20 | | No Opt. Call | A+ | | | 3,331,650 | |
| | 3,080 | | San Bernardino Joint Powers Financing Authority, California, Certificates of Participation Refunding, Police Station Financing Project, Series 1999, 5.500%, 9/01/20 – NPFG Insured | | 3/15 at 100.00 | AA– | | | 3,080,554 | |
| | 1,000 | | San Diego County Regional Transportation Commission, California, Sales Tax Revenue Bonds, Series 2012A, 5.000%, 4/01/42 | | 4/22 at 100.00 | AAA | | | 1,135,820 | |
| | 4,000 | | San Diego County Regional Transportation Commission, California, Sales Tax Revenue Bonds, Series 2014A, 5.000%, 4/01/36 | | 4/24 at 100.00 | AAA | | | 4,677,640 | |
| | 1,480 | | San Diego Redevelopment Agency, California, Subordinate Lien Tax Increment and Parking Revenue Bonds, Centre City Project, Series 2003B, 5.250%, 9/01/26 | | 5/15 at 100.00 | AA– | | | 1,481,894 | |
| | 690 | | San Francisco City and County Redevelopment Agency Successor Agency, California, Special Tax Bonds, Community Facilities District 7, Hunters Point Shipyard Phase One Improvements, Refunding Series 2014, 5.000%, 8/01/39 | | No Opt. Call | N/R | | | 761,070 | |
| | 2,700 | | San Francisco City and County Redevelopment Financing Authority, California, Tax Allocation Revenue Bonds, San Francisco Redevelopment Projects, Series 1998D, 0.000%, 8/01/24 – NPFG Insured | | No Opt. Call | AA– | | | 2,013,876 | |
| | 2,000 | | San Francisco City and County, California, Certificates of Participation, Multiple Capital Improvement Projects, Series 2009A, 5.200%, 4/01/26 | | 4/19 at 100.00 | AA | | | 2,281,240 | |
| | 30 | | San Francisco Redevelopment Finance Authority, California, Tax Allocation Revenue Bonds, Mission Bay North Redevelopment Project, Series 2011C, 6.750%, 8/01/41 | | 2/21 at 100.00 | A– | | | 36,787 | |
| | | | San Francisco Redevelopment Financing Authority, California, Tax Allocation Revenue Bonds, Mission Bay South Redevelopment Project, Series 2011D: | | | | | | | |
| | 30 | | 7.000%, 8/01/33 | | 2/21 at 100.00 | BBB+ | | | 36,588 | |
| | 40 | | 7.000%, 8/01/41 | | 2/21 at 100.00 | BBB+ | | | 48,784 | |
| | 380 | | San Francisco, California, Community Facilities District 6, Mission Bay South Public Improvements, Special Tax Refunding Bonds, Series 2013A, 5.000%, 8/01/33 | | 8/22 at 100.00 | N/R | | | 426,026 | |
| | 5,150 | | San Jacinto Unified School District, Riverside County, California, Certificates of Participation, Series 2010, 5.375%, 9/01/40 – AGC Insured | | 9/20 at 100.00 | AA | | | 5,903,548 | |
| | 4,000 | | San Jose Financing Authority, California, Lease Revenue Refunding Bonds, Convention Center Project, Series 2001F, 5.000%, 9/01/19 – NPFG Insured | | 5/15 at 100.00 | AA | | | 4,016,320 | |
| | | | San Jose Redevelopment Agency, California, Tax Allocation Bonds, Merged Area Redevelopment Project, Series 2005A: | | | | | | | |
| | 3,310 | | 5.000%, 8/01/20 – NPFG Insured | | 8/15 at 100.00 | AA– | | | 3,375,439 | |
| | 5,025 | | 5.000%, 8/01/28 – NPFG Insured | | 8/15 at 100.00 | AA– | | | 5,119,168 | |
| | | | San Jose Redevelopment Agency, California, Tax Allocation Bonds, Merged Area Redevelopment Project, Series 2006C: | | | | | | | |
| | 100 | | 5.000%, 8/01/24 – NPFG Insured | | 8/17 at 100.00 | AA– | | | 107,242 | |
| | 1,110 | | 5.000%, 8/01/25 – NPFG Insured | | 8/17 at 100.00 | AA– | | | 1,190,386 | |
| | 360 | | San Jose Redevelopment Agency, California, Tax Allocation Bonds, Merged Area Redevelopment Project, Series 2006D, 5.000%, 8/01/23 – AMBAC Insured | | 8/17 at 100.00 | BBB+ | | | 390,067 | |
| | 1,000 | | San Marcos Public Facilities Authority, California, Special Tax Revenue Bonds, Refunding Series 2012D, 5.000%, 9/01/36 | | 9/22 at 100.00 | N/R | | | 1,115,560 | |
| | 3,000 | | Santa Clara Redevelopment Agency, California, Tax Allocation Bonds, Bayshore North Project, Series 1999A, 5.500%, 6/01/23 – AMBAC Insured | | 6/15 at 100.00 | A– | | | 3,040,680 | |
| | Principal | | | | Optional Call | | | | | |
| | Amount (000) | | Description (1) | | Provisions (2) | Ratings (3) | | | Value | |
| | | | Tax Obligation/Limited (continued) | | | | | | | |
| $ | 50 | | Signal Hill Redevelopment Agency, California, Project 1 Tax Allocation Bonds, Series 2011, 7.000%, 10/01/26 | | 4/21 at 100.00 | N/R | | $ | 57,624 | |
| | 3,500 | | Stockton Public Financing Authority, California, Lease Revenue Bonds, Series 2004, 5.250%, 9/01/34 – FGIC Insured | | 5/15 at 100.00 | AA– | | | 3,500,175 | |
| | | | Sweetwater Union High School District Public Financing Authority, California, Special Tax Revenue Bonds, Series 2005A: | | | | | | | |
| | 3,565 | | 5.000%, 9/01/25 – AGM Insured | | 9/15 at 100.00 | AA | | | 3,647,351 | |
| | 5,510 | | 5.000%, 9/01/28 – AGM Insured | | 9/15 at 100.00 | AA | | | 5,618,988 | |
| | 2,980 | | Temecula Public Financing Authority, California, Special Tax Bonds, Community Facilities District 03-02 Roripaugh, Series 2006, 5.500%, 9/01/36 | | 9/15 at 101.00 | N/R | | | 2,985,096 | |
| | 2,160 | | Temecula Redevelopment Agency, California, Tax Allocation Revenue Bonds, Redevelopment Project 1, Series 2002, 5.125%, 8/01/27 – NPFG Insured | | 5/15 at 100.00 | AA– | | | 2,177,842 | |
| | | | Tustin Community Redevelopment Agency, California, Tax Allocation Housing Bonds Series 2010: | | | | | | | |
| | 1,205 | | 5.000%, 9/01/30 – AGM Insured | | 9/20 at 100.00 | AA | | | 1,351,998 | |
| | 3,250 | | 5.250%, 9/01/39 – AGM Insured | | 9/20 at 100.00 | AA | | | 3,707,827 | |
| | 4,500 | | Virgin Islands Public Finance Authority, Gross Receipts Taxes Loan Note, Refunding Series 2012A, 5.000%, 10/01/32 – AGM Insured | | No Opt. Call | AA | | | 5,136,570 | |
| | 1,020 | | Washington Unified School District, Yolo County, California, Certificates of Participation, Series 2007, 5.125%, 8/01/37 – AMBAC Insured | | 8/17 at 100.00 | A | | | 1,100,702 | |
| | 4,235 | | West Sacramento Financing Authority, California, Special Tax Revenue Bonds, Series 2014, 5.500%, 9/01/31 | | 9/22 at 102.00 | N/R | | | 4,731,935 | |
| | 6,000 | | Westminster Redevelopment Agency, California, Tax Allocation Bonds, Commercial Redevelopment Project 1, Police Facility Subordinate Series 2009, 6.250%, 11/01/39 | | 11/19 at 100.00 | AA | | | 7,169,160 | |
| | 95 | | Yorba Linda Redevelopment Agency, Orange County, California, Tax Allocation Revenue Bonds, Yorba Linda Redevelopment Project, Subordinate Lien Series 2011A, 6.000%, 9/01/26 | | 9/21 at 100.00 | A– | | | 116,679 | |
| | 343,155 | | Total Tax Obligation/Limited | | | | | | 352,500,337 | |
| | | | Transportation – 5.8% (4.2% of Total Investments) | | | | | | | |
| | 1,115 | | Bay Area Toll Authority, California, Revenue Bonds, San Francisco Bay Area Toll Bridge, Series 2013S-4, 5.250%, 4/01/48 | | 4/23 at 100.00 | A+ | | | 1,277,099 | |
| | 6,750 | | Foothill/Eastern Transportation Corridor Agency, California, Toll Road Revenue Bonds, Refunding Junior Lien Series 2013C, 6.500%, 1/15/43 | | 1/24 at 100.00 | BB+ | | | 8,129,767 | |
| | | | Foothill/Eastern Transportation Corridor Agency, California, Toll Road Revenue Bonds, Refunding Series 2013A: | | | | | | | |
| | 14,885 | | 5.750%, 1/15/46 | | 1/24 at 100.00 | BBB– | | | 17,459,807 | |
| | 14,885 | | 6.000%, 1/15/53 | | 1/24 at 100.00 | BBB– | | | 17,617,142 | |
| | 37,635 | | Total Transportation | | | | | | 44,483,815 | |
| | | | U.S. Guaranteed – 4.7% (3.3% of Total Investments) (5) | | | | | | | |
| | 1,425 | | Bassett Unified School District, Los Angeles County, California, General Obligation Bonds, Series 2006B, 5.250%, 8/01/30 (Pre-refunded 8/01/16) – FGIC Insured | | 8/16 at 100.00 | AA– (5) | | | 1,526,261 | |
| | 780 | | Bay Area Toll Authority, California, Revenue Bonds, San Francisco Bay Area Toll Bridge, Series 2006F, 5.000%, 4/01/31 (Pre-refunded 4/01/16) (UB) | | 4/16 at 100.00 | AA (5) | | | 820,864 | |
| | 220 | | Bay Area Toll Authority, California, Revenue Bonds, San Francisco Bay Area Toll Bridge, Tender Option Bond Trust 3211, 13.614%, 10/01/32 (Pre-refunded 4/01/18) (IF) | | 4/18 at 100.00 | AA (5) | | | 323,378 | |
| | 35 | | California Educational Facilities Authority, Revenue Bonds, University of Redlands, Series 2005A, 5.000%, 10/01/35 (Pre-refunded 10/01/15) | | 10/15 at 100.00 | N/R (5) | | | 36,008 | |
| | 3,000 | | California Infrastructure and Economic Development Bank, First Lien Revenue Bonds, San Francisco Bay Area Toll Bridge, Series 2003A, 5.000%, 7/01/22 – AGM Insured (ETM) | | No Opt. Call | Aaa | | | 3,712,350 | |
| | 2,250 | | California Infrastructure and Economic Development Bank, First Lien Revenue Bonds, San Francisco Bay Area Toll Bridge, Series 2003A, 5.000%, 7/01/36 (Pre-refunded 1/01/28) – AMBAC Insured | | 1/28 at 100.00 | Aaa | | | 2,917,845 | |
| NKX | Nuveen California AMT-Free Municipal Income Fund | |
| | Portfolio of Investments (continued) | February 28, 2015 |
| | Principal | | | | Optional Call | | | | | |
| | Amount (000) | | Description (1) | | Provisions (2) | Ratings (3) | | | Value | |
| | | | U.S. Guaranteed (5) (continued) | | | | | | | |
| $ | 1,112 | | California State Public Works Board, Lease Revenue Bonds, University of California Regents, Tender Option Bond Trust 1065, 9.446%, 3/01/33 (Pre-refunded 3/01/18) (IF) | | 3/18 at 100.00 | Aaa | | $ | 1,393,047 | |
| | 1,200 | | California State University, Systemwide Revenue Bonds, Series 2005A, 5.000%, 11/01/25 (Pre-refunded 5/01/15) – AMBAC Insured | | 5/15 at 100.00 | Aa2 (5) | | | 1,210,464 | |
| | 805 | | Central Unified School District, Fresno County, California, General Obligation Bonds, Series 1993, 5.625%, 3/01/18 – AMBAC Insured (ETM) | | 9/15 at 100.00 | N/R (5) | | | 827,669 | |
| | 6,000 | | Huntington Park Redevelopment Agency, California, Single Family Residential Mortgage Revenue Refunding Bonds, Series 1986A, 8.000%, 12/01/19 (ETM) | | No Opt. Call | Aaa | | | 7,980,840 | |
| | 760 | | Loma Linda, California, Hospital Revenue Bonds, Loma Linda University Medical Center, Series 2008A, 8.250%, 12/01/38 (Pre-refunded 12/01/17) | | 12/17 at 100.00 | BBB (5) | | | 916,157 | |
| | 35 | | Los Angeles Community College District, Los Angeles County, California, General Obligation Bonds, Series 2005A, 5.000%, 8/01/24 (Pre-refunded 8/01/15) – AGM Insured | | 8/15 at 100.00 | AA+ (5) | | | 35,734 | |
| | 1,115 | | Roseville Joint Union High School District, Placer County, California, General Obligation Bonds, Series 2006B, 5.000%, 8/01/27 (Pre-refunded 8/01/15) – FGIC Insured | | 8/15 at 100.00 | AA (5) | | | 1,138,370 | |
| | 5,500 | | Sacramento City Unified School District, Sacramento County, California, General Obligation Bonds, Series 2005, 5.000%, 7/01/27 (Pre-refunded 7/01/15) – NPFG Insured | | 7/15 at 100.00 | A1 (5) | | | 5,592,510 | |
| | 5,000 | | San Jacinto Unified School District, Riverside County, California, General Obligation Bonds, Series 2007, 5.250%, 8/01/32 (Pre-refunded 8/01/17) – AGM Insured | | 8/17 at 100.00 | AA (5) | | | 5,564,600 | |
| | 1,105 | | San Jose-Evergreen Community College District, Santa Clara County, California, General Obligation Bonds, Series 2005A, 5.000%, 9/01/25 (Pre-refunded 9/01/15) – NPFG Insured | | 9/15 at 100.00 | Aa1 (5) | | | 1,132,570 | |
| | 325 | | San Mateo Union High School District, San Mateo County, California, Certificates of Participation, Phase 1, Series 2007A, 5.000%, 12/15/30 (Pre-refunded 12/15/17) – AMBAC Insured | | 12/17 at 100.00 | N/R (5) | | | 364,189 | |
| | 30,667 | | Total U.S. Guaranteed | | | | | | 35,492,856 | |
| | | | Utilities – 4.5% (3.2% of Total Investments) | | | | | | | |
| | | | Long Beach Bond Finance Authority, California, Natural Gas Purchase Revenue Bonds, Series 2007A: | | | | | | | |
| | 2,490 | | 5.000%, 11/15/35 | | No Opt. Call | A | | | 2,907,797 | |
| | 1,835 | | 5.500%, 11/15/37 | | No Opt. Call | A | | | 2,268,299 | |
| | 10,000 | | Los Angeles Department of Water and Power, California, Power System Revenue Bonds, Series 2012B, 5.000%, 7/01/43 | | 7/22 at 100.00 | AA– | | | 11,302,100 | |
| | 4,280 | | Los Angeles Department of Water and Power, California, Power System Revenue Bonds, Series 2013B, 5.000%, 7/01/28 | | 7/23 at 100.00 | AA– | | | 5,070,644 | |
| | 3,750 | | Los Angeles Department of Water and Power, California, Power System Revenue Bonds, Tender Option Bond Trust 3345, 18.455%, 7/01/20 (IF) (4) | | No Opt. Call | AA– | | | 5,703,150 | |
| | 2,450 | | Merced Irrigation District, California, Electric System Revenue Bonds, Series 2005, 5.125%, 9/01/31 – SYNCORA GTY Insured | | 9/15 at 100.00 | N/R | | | 2,470,237 | |
| | 100 | | Sacramento City Financing Authority, California, Capital Improvement Revenue Bonds, Solid Waste and Redevelopment Projects, Series 1999, 5.800%, 12/01/19 – AMBAC Insured | | 5/15 at 100.00 | N/R | | | 100,241 | |
| | 1,000 | | Southern California Public Power Authority, California, Milford Wind Corridor Phase I Revenue Bonds, Series 2010-1, 5.000%, 7/01/28 | | 1/20 at 100.00 | AA– | | | 1,168,540 | |
| | 2,975 | | Southern California Public Power Authority, California, Revenue Bonds, Apex Power Project Series 2014A, 5.000%, 7/01/37 | | 7/24 at 100.00 | AA– | | | 3,464,536 | |
| | 28,880 | | Total Utilities | | | | | | 34,455,544 | |
| | Principal | | | | Optional Call | | | | | |
| | Amount (000) | | Description (1) | | Provisions (2) | Ratings (3) | | | Value | |
| | | | Water and Sewer – 15.8% (11.2% of Total Investments) | | | | | | | |
| $ | 13,200 | | Atwater Public Financing Authority, California, Wastewater Revenue Bonds, Series 2010, 5.125%, 5/01/40 – AGM Insured | | 5/19 at 100.00 | AA | | $ | 13,895,112 | |
| | 11,600 | | Bay Area Water Supply and Conservation Agency, California, Revenue Bonds, Capital Cost Recovery Prepayment Program, Series 2013A, 5.000%, 10/01/34 | | 4/23 at 100.00 | AA– | | | 13,454,840 | |
| | | | California Pollution Control Financing Authority, Water Furnishing Revenue Bonds, San Diego County Water Authority Desalination Project Pipeline, Series 2012: | | | | | | | |
| | 8,000 | | 5.000%, 7/01/37 | | No Opt. Call | Baa3 | | | 8,331,600 | |
| | 12,200 | | 5.000%, 11/21/45 | | No Opt. Call | Baa3 | | | 12,683,242 | |
| | 1,000 | | Castaic Lake Water Agency, California, Certificates of Participation, Series 2006C, 5.000%, 8/01/36 – NPFG Insured | | 8/16 at 100.00 | AA– | | | 1,056,730 | |
| | 2,250 | | Fortuna Public Finance Authority, California, Water Revenue Bonds, Series 2006, 5.000%, 10/01/36 – AGM Insured | | 10/16 at 100.00 | AA | | | 2,310,278 | |
| | 1,685 | | Healdsburg Public Financing Authority, California, Wastewater Revenue Bonds, Series 2006, 5.000%, 4/01/36 – NPFG Insured | | 4/16 at 100.00 | AA– | | | 1,761,061 | |
| | 5,000 | | Indio Water Authority, California, Water Revenue Bonds, Series 2006, 5.000%, 4/01/31 – AMBAC Insured | | 4/16 at 100.00 | A | | | 5,213,500 | |
| | 12,230 | | Los Angeles County Sanitation Districts Financing Authority, California, Capital Projects Revenue Bonds, District 14, Subordinate Series 2005B, 5.000%,
10/01/34 – FGIC Insured | | 10/15 at 100.00 | AA– | | | 12,525,844 | |
| | 16,000 | | Los Angeles Department of Water and Power, California, Waterworks Revenue Bonds, Series 2012A, 5.000%, 7/01/43 | | 7/22 at 100.00 | AA | | | 18,230,400 | |
| | 7,890 | | Los Angeles Department of Water and Power, California, Waterworks Revenue Bonds, Series 2014A, 5.000%, 7/01/44 | | 7/24 at 100.00 | AA | | | 9,132,438 | |
| | | | Los Angeles, California, Wastewater System Revenue Bonds, Subordinate Lien, Refunding Series 2013A: | | | | | | | |
| | 2,000 | | 5.000%, 6/01/34 | | 6/23 at 100.00 | AA | | | 2,316,040 | |
| | 3,500 | | 5.000%, 6/01/35 | | 6/23 at 100.00 | AA | | | 4,044,705 | |
| | 670 | | Metropolitan Water District of Southern California, Waterworks Revenue Bonds, Tender Option Bond Trust 09-8B, 17.896%, 7/01/35 (IF) (4) | | 7/19 at 100.00 | AAA | | | 1,057,582 | |
| | 1,500 | | Placerville Public Financing Authority, California, Wastewater System Refinancing and Improvement Project Revenue Bonds, Series 2006, 5.000%, 9/01/34 – SYNCORA GTY Insured | | 9/16 at 100.00 | N/R | | | 1,521,888 | |
| | 2,500 | | Sacramento County Sanitation Districts Financing Authority, California, Revenue Bonds, Sacramento Regional County Sanitation District, Series 2014A, 5.000%, 12/01/33 | | 6/24 at 100.00 | AA | | | 2,939,150 | |
| | 9,000 | | San Diego County Water Authority, California, Water Revenue Certificates of Participation, Series 2008A, 5.000%, 5/01/38 – AGM Insured | | 5/18 at 100.00 | AA+ | | | 9,993,690 | |
| | 110,225 | | Total Water and Sewer | | | | | | 120,468,100 | |
| $ | 1,120,272 | | Total Long-Term Investments (cost $946,834,444) | | | | | | 1,065,466,660 | |
| NKX | Nuveen California AMT-Free Municipal Income Fund | |
| | Portfolio of Investments (continued) | February 28, 2015 |
| | Principal | | | | Optional Call | | | | | |
| | Amount (000) | | Description (1) | | Provisions (2) | Ratings (3) | | | Value | |
| | | | SHORT-TERM INVESTMENTS – 1.2% (0.8% of Total Investments) | | | | | | | |
| | | | MUNICIPAL BONDS – 1.2% (0.8% of Total Investments) | | | | | | | |
| | | | Health Care – 1.2% (0.8% of Total Investments) | | | | | | | |
| $ | 6,940 | | California Statewide Community Development Authority, Revenue Bonds, Daughters of Charity Health System, Series 2014A, 6.000%, 7/10/15 (6) | | No Opt. Call | N/R | | $ | 6,999,198 | |
| | 675 | | California Statewide Community Development Authority, Revenue Bonds, Daughters of Charity Health System, Series 2014B, 6.000%, 7/10/15 (6) | | No Opt. Call | N/R | | | 680,758 | |
| | 1,030 | | California Statewide Community Development Authority, Revenue Bonds, Daughters of Charity Health System, Series 2014C, 6.000%, 7/10/15 (6) | | No Opt. Call | N/R | | | 1,038,786 | |
| $ | 8,645 | | Total Short-Term Investments (cost $8,645,000) | | | | | | 8,718,742 | |
| | | | Total Investments (cost $955,479,444) – 141.2% | | | | | | 1,074,185,402 | |
| | | | Floating Rate Obligations – (0.9)% | | | | | | (6,755,000 | ) |
| | | | Institutional MuniFund Term Preferred Shares, at Liquidation Value – (4.7)% (7) | | | | | | (36,000,000 | ) |
| | | | Variable Rate Demand Preferred Shares, at Liquidation Value – (38.3)% (8) | | | | | | (291,600,000 | ) |
| | | | Other Assets Less Liabilities – 2.7% | | | | | | 20,955,664 | |
| | | | Net Assets Applicable to Common Shares – 100% | | | | | $ | 760,786,066 | |
| (1) | All percentages shown in the Portfolio of Investments are based on net assets applicable to common shares unless otherwise noted. |
| (2) | Optional Call Provisions (not covered by the report of independent registered public accounting firm): Dates (month and year) and prices of the earliest optional call or redemption. There may be other call provisions at varying prices at later dates. Certain mortgage-backed securities may be subject to periodic principal paydowns. |
| (3) | Ratings (not covered by the report of independent registered public accounting firm): Using the highest of Standard & Poor’s Group (“Standard & Poor’s”), Moody’s Investors Service, Inc. (“Moody’s”) or Fitch, Inc. (“Fitch”) rating. Ratings below BBB by Standard & Poor’s, Baa by Moody’s or BBB by Fitch are considered to be below investment grade. Holdings designated N/R are not rated by any of these national rating agencies. |
| (4) | Investment, or portion of investment, has been pledged to collateralize the net payment obligations for investments in inverse floating rate transactions. |
| (5) | Backed by an escrow or trust containing sufficient U.S. Government or U.S. Government agency securities, which ensure the timely payment of principal and interest. Certain bonds backed by U.S. Government or agency securities are regarded as having an implied rating equal to the rating of such securities. |
| (6) | Investment valued at fair value using methods determined in good faith by, or at the discretion of, the Board. For fair value measurement disclosure purposes, investment classified as Level 3. See Notes to Financial Statements, Note 2 – Investment Valuation and Fair Value Measurements for more information. |
| (7) | Institutional MuniFund Term Preferred Shares, at Liquidation Value as a percentage of Total Investments is 3.4%. |
| (8) | Variable Rate Demand Preferred Shares, at Liquidation Value as a percentage of Total Investments is 27.1%. |
| (ETM) | Escrowed to maturity. |
| (IF) | Inverse floating rate investment. |
| (UB) | Underlying bond of an inverse floating rate trust reflected as a financing transaction. See Notes to Financial Statements, Note 3 – Portfolio Securities and Investments in Derivatives, Inverse Floating Rate Securities for more information. |
See accompanying notes to financial statements.
| NAC | | |
| | Nuveen California Dividend Advantage Municipal Fund | |
| | Portfolio of Investments | February 28, 2015 |
| | Principal | | | | Optional Call | | | | | |
| | Amount (000) | | Description (1) | | Provisions (2) | Ratings (3) | | | Value | |
| | | | LONG-TERM INVESTMENTS – 143.2% (99.2% of Total Investments) | | | | | | | |
| | | | MUNICIPAL BONDS – 143.2% (99.2% of Total Investments) | | | | | | | |
| | | | Consumer Staples – 6.5% (4.5% of Total Investments) | | | | | | | |
| $ | 3,760 | | California County Tobacco Securitization Agency, Tobacco Settlement Asset-Backed Bonds, Alameda County Tobacco Asset Securitization Corporation, Series 2002, 5.750%, 6/01/29 | | 5/15 at 100.00 | Baa1 | | $ | 3,760,602 | |
| | | | California County Tobacco Securitization Agency, Tobacco Settlement Asset-Backed Bonds, Los Angeles County Securitization Corporation, Series 2006A: | | | | | | | |
| | 11,840 | | 5.600%, 6/01/36 | | 12/18 at 100.00 | B+ | | | 11,019,014 | |
| | 13,060 | | 5.650%, 6/01/41 | | 12/18 at 100.00 | B+ | | | 11,759,746 | |
| | | | California County Tobacco Securitization Agency, Tobacco Settlement Asset-Backed Bonds, Sonoma County Tobacco Securitization Corporation, Series 2005: | | | | | | | |
| | 2,125 | | 4.250%, 6/01/21 | | 6/15 at 100.00 | BBB+ | | | 2,124,979 | |
| | 3,500 | | 5.250%, 6/01/45 | | 6/15 at 100.00 | B– | | | 2,933,350 | |
| | 4,770 | | California County Tobacco Securitization Agency, Tobacco Settlement Asset-Backed Bonds, Stanislaus County Tobacco Funding Corporation, Series 2002A, 5.500%, 6/01/33 | | 5/15 at 100.00 | Baa1 | | | 4,770,095 | |
| | 5,495 | | California Statewide Financing Authority, Tobacco Settlement Asset-Backed Bonds, Pooled Tobacco Securitization Program, Series 2002A, 5.625%, 5/01/29 | | 5/15 at 100.00 | BBB | | | 5,495,550 | |
| | | | Golden State Tobacco Securitization Corporation, California, Tobacco Settlement Asset-Backed Bonds, Series 2007A-1: | | | | | | | |
| | 27,450 | | 5.750%, 6/01/47 | | 6/17 at 100.00 | B | | | 23,603,431 | |
| | 5,075 | | 5.125%, 6/01/47 | | 6/17 at 100.00 | B | | | 3,985,245 | |
| | 39,515 | | Golden State Tobacco Securitization Corporation, California, Tobacco Settlement Asset-Backed Bonds, Series 2007A-2, 5.300%, 6/01/37 | | 6/22 at 100.00 | B | | | 33,395,311 | |
| | | | Tobacco Securitization Authority of Northern California, Tobacco Settlement Asset-Backed Bonds, Series 2005A-1: | | | | | | | |
| | 8,500 | | 5.375%, 6/01/38 | | 6/15 at 100.00 | B– | | | 7,154,705 | |
| | 1,250 | | 5.500%, 6/01/45 | | 6/15 at 100.00 | B– | | | 1,018,975 | |
| | 126,340 | | Total Consumer Staples | | | | | | 111,021,003 | |
| | | | Education and Civic Organizations – 4.4% (3.1% of Total Investments) | | | | | | | |
| | 2,225 | | ABAG Finance Authority for Non-Profit Corporations, California, Revenue Bonds, The Jackson Laboratory, Series 2012, 5.000%, 7/01/37 | | 7/22 at 100.00 | A1 | | | 2,499,142 | |
| | 3,000 | | California Educational Facilities Authority, Revenue Bonds, Dominican University, Series 2006, 5.000%, 12/01/36 | | 12/16 at 100.00 | Baa3 | | | 3,152,280 | |
| | 2,000 | | California Educational Facilities Authority, Revenue Bonds, Occidental College, Series 2005A, 5.000%, 10/01/27 – NPFG Insured | | 10/15 at 100.00 | Aa3 | | | 2,053,700 | |
| | 4,075 | | California Educational Facilities Authority, Revenue Bonds, Santa Clara University, Series 2010, 5.000%, 2/01/40 | | 2/20 at 100.00 | Aa3 | | | 4,586,576 | |
| | 605 | | California Educational Facilities Authority, Revenue Bonds, University of Redlands, Series 2005A, 5.000%, 10/01/35 | | 10/15 at 100.00 | A3 | | | 611,129 | |
| | 2,165 | | California Educational Facilities Authority, Revenue Bonds, University of San Francisco, Series 2011, 6.125%, 10/01/36 | | 10/21 at 100.00 | A2 | | | 2,633,095 | |
| | 10,000 | | California Educational Facilities Authority, Revenue Bonds, University of Southern California, Series 2007A, 4.500%, 10/01/33 (UB) | | 10/17 at 100.00 | Aa1 | | | 10,795,000 | |
| | 2,470 | | California Educational Facilities Authority, Revenue Bonds, University of Southern California, Tender Option Bond Trust 09-11B, 18.051%, 10/01/38 (IF) (4) | | 10/18 at 100.00 | Aa1 | | | 3,665,382 | |
| | | | California Educational Facilities Authority, Revenue Bonds, University of the Pacific, Series 2006: | | | | | | | |
| | 895 | | 5.000%, 11/01/21 | | 11/15 at 100.00 | A2 | | | 922,396 | |
| | 3,950 | | 5.000%, 11/01/30 | | 11/15 at 100.00 | A2 | | | 4,062,694 | |
| NAC | Nuveen California Dividend Advantage Municipal Fund | |
| | Portfolio of Investments (continued) | February 28, 2015 |
| | Principal | | | | Optional Call | | | | | |
| | Amount (000) | | Description (1) | | Provisions (2) | Ratings (3) | | | Value | |
| | | | Education and Civic Organizations (continued) | | | | | | | |
| $ | 2,740 | | California Infrastructure and Economic Development Bond Bank, Revenue Bonds, Scripps Research Institute, Series 2005A, 5.000%, 7/01/24 | | 7/15 at 100.00 | Aa3 | | $ | 2,784,881 | |
| | 3,980 | | California Municipal Finance Authority, Charter School Revenue Bonds, Rocketship Education – Multiple Projects, Series 2014A, 7.250%, 6/01/43 | | 6/22 at 102.00 | N/R | | | 4,538,195 | |
| | 1,000 | | California Municipal Finance Authority, Revenue Bonds, Biola University, Series 2013, 5.000%, 10/01/38 | | 10/23 at 100.00 | Baa1 | | | 1,088,780 | |
| | 2,500 | | California Municipal Finance Authority, Revenue Bonds, University of La Verne, Series 2010A, 6.250%, 6/01/40 | | 6/20 at 100.00 | Baa1 | | | 2,931,425 | |
| | 6,000 | | California State Public Works Board, Lease Revenue Bonds, California State University Projects, Series 1997C, 5.400%, 10/01/22 | | 4/15 at 100.00 | Aa3 | | | 6,025,500 | |
| | 4,000 | | California State Public Works Board, Lease Revenue Refunding Bonds, Community Colleges Projects, Series 1996B, 5.625%, 3/01/19 – AMBAC Insured | | 3/15 at 100.00 | A1 | | | 4,081,160 | |
| | 2,750 | | California Statewide Communities Development Authority, Revenue Bonds, Buck Institute for Research on Aging, Series 2014, 5.000%, 11/15/44 – AGM Insured | | 11/24 at 100.00 | AA | | | 3,121,113 | |
| | 4,300 | | California Statewide Communities Development Authority, School Facility Revenue Bonds, Alliance College-Ready Public Schools, Series 2011A, 7.000%, 7/01/46 | | 7/21 at 100.00 | BBB– | | | 4,965,769 | |
| | 1,815 | | California Statewide Communities Development Authority, Charter School Revenue Bonds, Rocketship 4 – Mosaic Elementary Charter School, Series 2011A, 8.500%, 12/01/41 | | 12/21 at 100.00 | N/R | | | 2,138,941 | |
| | 9,000 | | San Diego County, California, Certificates of Participation, Burnham Institute, Series 2006, 5.000%, 9/01/34 | | 9/15 at 102.00 | Baa1 | | | 9,239,940 | |
| | 69,470 | | Total Education and Civic Organizations | | | | | | 75,897,098 | |
| | | | Health Care – 29.5% (20.5% of Total Investments) | | | | | | | |
| | 3,705 | | ABAG Finance Authority for Nonprofit Corporations, California, Revenue Bonds, Sharp HealthCare, Series 2014A, 5.000%, 8/01/43 | | 8/23 at 100.00 | AA– | | | 4,182,463 | |
| | 3,000 | | Antelope Valley Healthcare District, California, Revenue Bonds, Series 2011A, 7.250%, 3/01/36 | | 3/21 at 100.00 | Ba2 | | | 3,403,260 | |
| | 1,500 | | California Health Facilities Financing Authority, Revenue Bonds, Cedars-Sinai Medical Center, Series 2009, 5.000%, 8/15/39 | | 8/19 at 100.00 | AA– | | | 1,658,205 | |
| | 16,405 | | California Health Facilities Financing Authority, Revenue Bonds, Childrens Hospital Los Angeles, Series 2010A, 5.250%, 7/01/38 – AGC Insured | | 7/20 at 100.00 | AA | | | 18,543,064 | |
| | 5,100 | | California Health Facilities Financing Authority, Revenue Bonds, Lucile Salter Packard Children’s Hospital, Series 2014A, 5.000%, 8/15/43 | | 8/24 at 100.00 | AA | | | 5,826,699 | |
| | 1,250 | | California Health Facilities Financing Authority, Revenue Bonds, Memorial Health Services, Series 2012A, 5.000%, 10/01/33 | | No Opt. Call | AA– | | | 1,407,775 | |
| | 3,135 | | California Health Facilities Financing Authority, Revenue Bonds, Providence Health & Services, Series 2014A, 5.000%, 10/01/38 | | 10/24 at 100.00 | AA | | | 3,617,539 | |
| | 6,200 | | California Health Facilities Financing Authority, Revenue Bonds, Providence Health & Services, Series 2014B, 5.000%, 10/01/44 | | 10/24 at 100.00 | AA | | | 7,060,560 | |
| | 6,420 | | California Health Facilities Financing Authority, Revenue Bonds, Rady Children’s Hospital – San Diego, Series 2011, 5.250%, 8/15/41 | | 8/21 at 100.00 | AA– | | | 7,273,346 | |
| | 3,000 | | California Health Facilities Financing Authority, Revenue Bonds, Saint Joseph Health System, Series 2009A, 5.750%, 7/01/39 | | 7/19 at 100.00 | AA– | | | 3,488,250 | |
| | 7,250 | | California Health Facilities Financing Authority, Revenue Bonds, Sutter Health, Series 2007A, 5.250%, 11/15/46 | | 11/16 at 100.00 | AA– | | | 7,819,053 | |
| | 49,980 | | California Health Facilities Financing Authority, Revenue Bonds, Sutter Health, Series 2007A, 5.250%, 11/15/46 (UB) | | 11/16 at 100.00 | AA– | | | 53,902,931 | |
| | | | California Health Facilities Financing Authority, Revenue Bonds, Sutter Health, Series 2011B: | | | | | | | |
| | 2,470 | | 6.000%, 8/15/42 | | 8/20 at 100.00 | AA– | | | 2,974,596 | |
| | 6,530 | | 6.000%, 8/15/42 (UB) | | 8/20 at 100.00 | AA– | | | 7,864,014 | |
| | 3,795 | | California Municipal Finance Authority, Revenue Bonds, Eisenhower Medical Center, Series 2010A, 5.750%, 7/01/40 | | 7/20 at 100.00 | Baa2 | | | 4,220,420 | |
| | Principal | | | | Optional Call | | | | | |
| | Amount (000) | | Description (1) | | Provisions (2) | Ratings (3) | | | Value | |
| | | | Health Care (continued) | | | | | | | |
| | | | California Municipal Financing Authority, Certificates of Participation, Community Hospitals of Central California, Series 2007: | | | | | | | |
| $ | 7,150 | | 5.250%, 2/01/27 | | 2/17 at 100.00 | Baa1 | | $ | 7,523,230 | |
| | 7,415 | | 5.250%, 2/01/46 | | 2/17 at 100.00 | Baa1 | | | 7,693,211 | |
| | 20,320 | | California Statewide Communities Development Authority, Revenue Bonds, Adventist Health System West, Series 2005A, 5.000%, 3/01/35 | | 3/15 at 100.00 | A | | | 20,359,826 | |
| | 1,335 | | California Statewide Communities Development Authority, Revenue Bonds, Huntington Memorial Hospital, Refunding Series 2014B, 5.000%, 7/01/44 | | 7/24 at 100.00 | A | | | 1,493,932 | |
| | 21,090 | | California Statewide Communities Development Authority, Revenue Bonds, Kaiser Permanente, Series 2012A, 5.000%, 4/01/42 | | 4/22 at 100.00 | A+ | | | 23,588,110 | |
| | 7,190 | | California Statewide Communities Development Authority, Revenue Bonds, Saint Joseph Health System, Trust 2554, 18.698%, 7/01/47 – AGM Insured (IF) | | 7/18 at 100.00 | AA | | | 9,732,570 | |
| | 23,125 | | California Statewide Communities Development Authority, Revenue Bonds, Sutter Health, Series 2011A, 6.000%, 8/15/42 | | 8/20 at 100.00 | AA– | | | 27,849,205 | |
| | 11,360 | | California Statewide Communities Development Authority, Revenue Bonds, ValleyCare Health System, Series 2007A, 5.125%, 7/15/31 | | 7/17 at 100.00 | N/R | | | 11,702,050 | |
| | 1,440 | | California Statewide Community Development Authority, Revenue Bonds, Childrens Hospital of Los Angeles, Series 2007, 5.000%, 8/15/47 | | 8/17 at 100.00 | BBB+ | | | 1,515,758 | |
| | | | California Statewide Community Development Authority, Revenue Bonds, Daughters of Charity Health System, Series 2005A: | | | | | | | |
| | 14,275 | | 5.250%, 7/01/24 | | 7/15 at 100.00 | CCC | | | 13,873,730 | |
| | 7,405 | | 5.250%, 7/01/30 | | 7/15 at 100.00 | CCC | | | 7,073,922 | |
| | 150 | | 5.250%, 7/01/35 | | 7/15 at 100.00 | CCC | | | 142,093 | |
| | 10,000 | | 5.000%, 7/01/39 | | 7/15 at 100.00 | CCC | | | 9,383,800 | |
| | 15,030 | | California Statewide Community Development Authority, Revenue Bonds, Kaiser Permanente System, Series 2001C, 5.250%, 8/01/31 | | 8/16 at 100.00 | A+ | | | 15,895,578 | |
| | | | California Statewide Community Development Authority, Revenue Bonds, Kaiser Permanente System, Series 2006: | | | | | | | |
| | 24,220 | | 5.000%, 3/01/41 | | 3/16 at 100.00 | A+ | | | 25,074,965 | |
| | 2,355 | | 5.250%, 3/01/45 | | 3/16 at 100.00 | A+ | | | 2,444,985 | |
| | 9,980 | | California Statewide Community Development Authority, Revenue Bonds, Kaiser Permanente System, Series 2006, 5.000%, 3/01/41 – BHAC Insured (UB) | | 3/16 at 100.00 | AA+ | | | 10,396,465 | |
| | 2,010 | | California Statewide Community Development Authority, Revenue Bonds, Methodist Hospital Project, Series 2009, 6.750%, 2/01/38 | | 8/19 at 100.00 | Aa2 | | | 2,421,045 | |
| | 3,385 | | California Statewide Community Development Authority, Revenue Bonds, Sherman Oaks Health System, Series 1998A, 5.000%, 8/01/22 – AMBAC Insured | | No Opt. Call | Aa3 | | | 3,930,967 | |
| | | | California Statewide Community Development Authority, Revenue Bonds, Sutter Health, Series 2005A: | | | | | | | |
| | 3,355 | | 5.000%, 11/15/43 | | 11/15 at 100.00 | AA– | | | 3,457,193 | |
| | 4,045 | | 5.000%, 11/15/43 (UB) (4) | | 11/15 at 100.00 | AA– | | | 4,168,211 | |
| | | | California Statewide Community Development Authority, Revenue Bonds, Sutter Health, Series 2003A: | | | | | | | |
| | 200 | | 5.000%, 8/15/38 – AMBAC Insured | | 8/17 at 100.00 | AA– | | | 213,024 | |
| | 17,470 | | 5.000%, 8/15/38 – AMBAC Insured (UB) (4) | | 8/17 at 100.00 | AA– | | | 18,607,646 | |
| | 5,000 | | California Statewide Community Development Authority, Revenue Bonds, Sutter Health, Series 2008B, 5.250%, 11/15/48 | | 5/18 at 100.00 | AA– | | | 5,462,500 | |
| | 4,565 | | California Statewide Community Development Authority, Revenue Bonds, Sutter Health, Tender Option Bond Trust 3102, 19.199%, 11/15/46 (IF) (4) | | 11/16 at 100.00 | AA– | | | 5,997,680 | |
| | | | Madera County, California, Certificates of Participation, Children s Hospital Central California, Series 2010: | | | | | | | |
| | 1,195 | | 5.500%, 3/15/36 | | 3/15 at 100.00 | A+ | | | 1,199,684 | |
| | 8,615 | | 5.375%, 3/15/36 | | 3/20 at 100.00 | A+ | | | 9,752,525 | |
| NAC | Nuveen California Dividend Advantage Municipal Fund | |
| | Portfolio of Investments (continued) | February 28, 2015 |
| | Principal | | | | Optional Call | | | | | |
| | Amount (000) | | Description (1) | | Provisions (2) | Ratings (3) | | | Value | |
| | | | Health Care (continued) | | | | | | | |
| $ | 6,200 | | Madera County, California, Certificates of Participation, Valley Children’s Hospital Project, Series 1995, 5.750%, 3/15/28 – NPFG Insured | | 3/15 at 100.00 | AA– | | $ | 6,220,150 | |
| | 11,400 | | Marysville, California, Revenue Bonds, The Fremont-Rideout Health Group, Series 2011, 5.250%, 1/01/42 | | 1/21 at 100.00 | A | | | 12,716,700 | |
| | 740 | | Oak Valley Hospital District, Stanislaus County, California, Revenue Bonds, Series 2010A, 6.500%, 11/01/29 | | 11/20 at 100.00 | BB | | | 782,979 | |
| | | | Palomar Pomerado Health Care District, California, Certificates of Participation, Series 2009: | | | | | | | |
| | 10,500 | | 6.625%, 11/01/29 | | 11/19 at 100.00 | Ba1 | | | 11,788,245 | |
| | 6,885 | | 6.750%, 11/01/39 | | 11/19 at 100.00 | Ba1 | | | 7,641,593 | |
| | 27,035 | | Palomar Pomerado Health Care District, California, Certificates of Participation, Series 2010, 6.000%, 11/01/41 | | 11/20 at 100.00 | Ba1 | | | 28,989,089 | |
| | 17,225 | | Rancho Mirage Joint Powers Financing Authority, California, Revenue Bonds, Eisenhower Medical Center, Series 2007A, 5.000%, 7/01/38 | | 7/17 at 100.00 | Baa2 | | | 18,036,470 | |
| | 11,750 | | San Buenaventura, California, Revenue Bonds, Community Memorial Health System, Series 2011, 7.500%, 12/01/41 | | 12/21 at 100.00 | BB | | | 14,449,680 | |
| | 5,500 | | Santa Clara County Financing Authority, California, Insured Revenue Bonds, El Camino Hospital, Series 2007A, 5.750%, 2/01/41 – AMBAC Insured | | 8/17 at 100.00 | A+ | | | 5,969,920 | |
| | 2,600 | | The Regents of the University of California, Medical Center Pooled Revenue Bonds, Series 2009E, 5.000%, 5/15/38 | | 5/17 at 101.00 | AA– | | | 2,777,242 | |
| | 10,700 | | Upland, California, Certificates of Participation, San Antonio Community Hospital, Series 2011, 6.500%, 1/01/41 | | 1/21 at 100.00 | A– | | | 12,633,704 | |
| | 463,955 | | Total Health Care | | | | | | 506,201,852 | |
| | | | Housing/Multifamily – 1.7% (1.1% of Total Investments) | | | | | | | |
| | 9,065 | | California Municipal Finance Authority, Mobile Home Park Revenue Bonds, Caritas Projects Series 2010A, 6.400%, 8/15/45 | | 8/20 at 100.00 | BBB | | | 10,133,129 | |
| | | | California Municipal Finance Authority, Mobile Home Park Revenue Bonds, Caritas Projects Series 2012A: | | | | | | | |
| | 6,540 | | 5.125%, 8/15/32 | | 8/22 at 100.00 | BBB | | | 7,111,923 | |
| | 3,580 | | 5.500%, 8/15/47 | | 8/22 at 100.00 | BBB | | | 3,923,573 | |
| | 2,980 | | California Municipal Finance Authority, Mobile Home Park Revenue Bonds, Caritas Projects Series 2012B, 7.250%, 8/15/47 | | 8/22 at 100.00 | A1 | | | 3,381,138 | |
| | | | California Municipal Finance Authority, Mobile Home Park Senior Revenue Bonds, Caritas Affordable Housing, Inc. Projects, Series 2014A: | | | | | | | |
| | 590 | | 5.250%, 8/15/39 | | 8/24 at 100.00 | BBB | | | 651,065 | |
| | 1,590 | | 5.250%, 8/15/49 | | 8/24 at 100.00 | BBB | | | 1,744,643 | |
| | 1,230 | | Independent Cities Finance Authority, California, Mobile Home Park Revenue Bonds, Augusta Communities Mobile Home Park, Series 2012A, 5.000%, 5/15/39 | | 5/22 at 100.00 | A– | | | 1,297,687 | |
| | 320 | | Independent Cities Lease Finance Authority, California, Mobile Home Park Revenue Bonds, San Juan Mobile Estates, Series 2006B, 5.850%, 5/15/41 | | 5/16 at 100.00 | N/R | | | 325,258 | |
| | 25,895 | | Total Housing/Multifamily | | | | | | 28,568,416 | |
| | | | Housing/Single Family – 1.5% (1.0% of Total Investments) | | | | | | | |
| | 16,790 | | California Housing Finance Agency, California, Home Mortgage Revenue Bonds, Series 2006M, 4.625%, 8/01/26 (Alternative Minimum Tax) | | 2/16 at 100.00 | A– | | | 16,887,214 | |
| | 4,870 | | California Housing Finance Agency, California, Home Mortgage Revenue Bonds, Series 2007G, 5.050%, 2/01/29 (Alternative Minimum Tax) | | 2/17 at 100.00 | A– | | | 4,995,159 | |
| | 2,395 | | California Housing Finance Agency, California, Home Mortgage Revenue Bonds, Tender Option Bond Trust 3206, 9.785%, 2/01/29 (Alternative Minimum Tax) (IF) | | 2/17 at 100.00 | A– | | | 2,442,469 | |
| | 510 | | California Housing Finance Agency, Home Mortgage Revenue Bonds, Series 2006H, 5.750%, 8/01/30 – FGIC Insured (Alternative Minimum Tax) | | 2/16 at 100.00 | A– | | | 532,241 | |
| | Principal | | | | Optional Call | | | | | |
| | Amount (000) | | Description (1) | | Provisions (2) | Ratings (3) | | | Value | |
| | | | Housing/Single Family (continued) | | | | | | | |
| $ | 220 | | California Housing Finance Agency, Home Mortgage Revenue Bonds, Series 2006K, 5.500%, 2/01/42 (Alternative Minimum Tax) | | 2/16 at 100.00 | A– | | $ | 224,547 | |
| | 24,785 | | Total Housing/Single Family | | | | | | 25,081,630 | |
| | | | Industrials – 0.2% (0.2% of Total Investments) | | | | | | | |
| | 4,055 | | California Pollution Control Financing Authority, Solid Waste Disposal Revenue Bonds, Republic Services Inc., Series 2002C, 5.250%, 6/01/23 (Mandatory put 12/01/17) (Alternative Minimum Tax) | | No Opt. Call | BBB+ | | | 4,414,030 | |
| | 5,120 | | California Statewide Communities Development Authority, Revenue Bonds, EnerTech Regional Biosolids Project, Series 2007A, 5.500%, 12/01/33 (Alternative Minimum Tax) (5) | | No Opt. Call | N/R | | | 17,664 | |
| | 9,175 | | Total Industrials | | | | | | 4,431,694 | |
| | | | Long-Term Care – 0.6% (0.4% of Total Investments) | | | | | | | |
| | 7,000 | | ABAG Finance Authority for Non-Profit Corporations, California, Cal-Mortgage Insured Revenue Bonds, Channing House, Series 2010, 6.125%, 5/15/40 | | 5/20 at 100.00 | A+ | | | 8,327,830 | |
| | 1,000 | | California Municipal Finance Authority, Revenue Bonds, Harbor Regional Center Project, Series 2009, 8.000%, 11/01/29 | | 11/19 at 100.00 | A3 | | | 1,237,590 | |
| | 250 | | California Statewide Community Development Authority, Certificates of Participation, Internext Group, Series 1999, 5.375%, 4/01/17 | | 4/15 at 100.00 | BBB+ | | | 251,057 | |
| | 8,250 | | Total Long-Term Care | | | | | | 9,816,477 | |
| | | | Tax Obligation/General – 32.3% (22.3% of Total Investments) | | | | | | | |
| | 4,125 | | Alameda Unified School District, Alameda County, California, General Obligation Bonds, Series 2004A, 0.000%, 8/01/25 – AGM Insured | | No Opt. Call | AA | | | 3,041,858 | |
| | 3,000 | | Alhambra Unified School District, Los Angeles County, California, General Obligation Bonds, Refunding Series 2012A, 5.000%, 8/01/29 – AGM Insured | | 8/22 at 100.00 | Aa3 | | | 3,450,630 | |
| | 2,325 | | Baldwin Park Unified School District, Los Angeles County, California, General Obligation Bonds, Election 2002 Series 2006, 0.000%, 8/01/30 – AMBAC Insured | | 8/16 at 50.16 | A+ | | | 1,124,068 | |
| | 5,245 | | California State, General Obligation Bonds, Various Purpose Refunding Series 2012, 5.000%, 9/01/36 | | No Opt. Call | Aa3 | | | 5,979,825 | |
| | | | California State, General Obligation Bonds, Various Purpose Refunding Series 2014: | | | | | | | |
| | 4,000 | | 5.000%, 8/01/31 | | 8/24 at 100.00 | Aa3 | | | 4,713,760 | |
| | 3,875 | | 5.000%, 8/01/33 | | 8/24 at 100.00 | Aa3 | | | 4,534,990 | |
| | 12,000 | | 5.000%, 10/01/33 | | 10/24 at 100.00 | Aa3 | | | 14,075,160 | |
| | 140 | | California State, General Obligation Bonds, Various Purpose Series 2000, 5.625%, 5/01/22 – FGIC Insured | | 5/15 at 100.00 | Aa3 | | | 140,636 | |
| | 3,200 | | California State, General Obligation Bonds, Various Purpose Series 2008, 5.125%, 4/01/33 | | 4/18 at 100.00 | Aa3 | | | 3,601,184 | |
| | | | California State, General Obligation Bonds, Various Purpose Series 2009: | | | | | | | |
| | 64,195 | | 6.000%, 11/01/39 | | 11/19 at 100.00 | Aa3 | | | 78,893,086 | |
| | 5,005 | | 5.500%, 11/01/39 | | 11/19 at 100.00 | Aa3 | | | 5,908,503 | |
| | | | California State, General Obligation Bonds, Various Purpose Series 2010: | | | | | | | |
| | 14,000 | | 6.000%, 3/01/33 | | 3/20 at 100.00 | Aa3 | | | 17,037,860 | |
| | 13,100 | | 5.500%, 3/01/40 | | 3/20 at 100.00 | Aa3 | | | 15,385,164 | |
| | 10,605 | | 5.250%, 11/01/40 | | 11/20 at 100.00 | Aa3 | | | 12,427,257 | |
| | | | California State, General Obligation Bonds, Various Purpose Series 2011: | | | | | | | |
| | 7,215 | | 5.250%, 10/01/28 | | No Opt. Call | Aa3 | | | 8,558,794 | |
| | 10,520 | | 5.000%, 9/01/31 | | No Opt. Call | Aa3 | | | 12,108,310 | |
| | 12,725 | | 5.000%, 9/01/41 | | 9/21 at 100.00 | Aa3 | | | 14,356,472 | |
| | 14,915 | | 5.000%, 10/01/41 | | 10/21 at 100.00 | Aa3 | | | 16,849,177 | |
| | | | California State, General Obligation Bonds, Various Purpose Series 2013: | | | | | | | |
| | 8,000 | | 5.000%, 2/01/29 | | No Opt. Call | Aa3 | | | 9,298,880 | |
| | 7,475 | | 5.000%, 4/01/37 | | 4/23 at 100.00 | Aa3 | | | 8,524,864 | |
| | 7,255 | | 5.000%, 2/01/43 | | No Opt. Call | Aa3 | | | 8,238,996 | |
| | 6,250 | | 5.000%, 4/01/43 | | 4/23 at 100.00 | Aa3 | | | 7,113,375 | |
| | 5,000 | | 5.000%, 11/01/43 | | 11/23 at 100.00 | Aa3 | | | 5,734,150 | |
| NAC | Nuveen California Dividend Advantage Municipal Fund | |
| | Portfolio of Investments (continued) | February 28, 2015 |
| | Principal | | | | Optional Call | | | | | |
| | Amount (000) | | Description (1) | | Provisions (2) | Ratings (3) | | | Value | |
| | | | Tax Obligation/General (continued) | | | | | | | |
| | | | California State, General Obligation Bonds, Various Purpose Series 2014: | | | | | | | |
| $ | 22,970 | | 5.000%, 5/01/32 | | 5/24 at 100.00 | Aa3 | | $ | 26,871,913 | |
| | 8,910 | | 5.000%, 10/01/39 | | 10/24 at 100.00 | Aa3 | | | 10,329,452 | |
| | 10,245 | | 5.000%, 12/01/43 | | 12/23 at 100.00 | Aa3 | | | 11,761,875 | |
| | 5,000 | | 4.000%, 11/01/44 | | 11/24 at 100.00 | Aa3 | | | 5,191,050 | |
| | 3,550 | | Centinela Valley Union High School District, Los Angeles County, California, General Obligation Bonds, Series 2002A, 5.250%, 2/01/26 – NPFG Insured | | No Opt. Call | AA– | | | 4,192,124 | |
| | 5,425 | | Coast Community College District, Orange County, California, General Obligation Bonds, Series 2006C, 5.000%, 8/01/31 – AGM Insured | | 8/18 at 100.00 | Aa1 | | | 6,032,817 | |
| | 25,000 | | Desert Community College District, Riverside County, California, General Obligation Bonds, Election 2004 Series 2007C, 0.000%, 8/01/46 – AGM Insured | | No Opt. Call | AA | | | 4,896,250 | |
| | 5,150 | | Hacienda La Puente Unified School District Facilities Financing Authority, California, General Obligation Revenue Bonds, Series 2007, 5.000%, 8/01/26 – AGM Insured | | No Opt. Call | AA | | | 6,313,179 | |
| | 3,610 | | Hartnell Community College District, California, General Obligation Bonds, Series 2006B, 5.000%, 6/01/29 – AGM Insured (UB) | | 6/16 at 100.00 | AA | | | 3,819,055 | |
| | 5,630 | | Lake Tahoe Unified School District, El Dorado County, California, General Obligation Bonds, Series 2010, 0.000%, 8/01/45 – AGM Insured | | No Opt. Call | AA | | | 2,933,230 | |
| | 6,645 | | Long Beach Community College District, California, General Obligation Bonds, Series 2005B, 5.000%, 5/01/30 – FGIC Insured | | 5/15 at 100.00 | Aa2 | | | 6,698,559 | |
| | | | Los Angeles Unified School District, Los Angeles County, California, General Obligation Bonds, Refunding Series 2014C: | | | | | | | |
| | 5,000 | | 5.000%, 7/01/29 | | No Opt. Call | Aa2 | | | 5,980,500 | |
| | 10,000 | | 5.000%, 7/01/30 | | No Opt. Call | Aa2 | | | 11,906,200 | |
| | 4,100 | | Monrovia Unified School District, Los Angeles County, California, General Obligation Bonds, Series 2001B, 0.000%, 8/01/27 – FGIC Insured | | No Opt. Call | AA– | | | 2,787,713 | |
| | 10,765 | | North Orange County Community College District, California, General Obligation Bonds, Series 2003B, 0.000%, 8/01/27 – FGIC Insured | | No Opt. Call | Aa1 | | | 7,373,379 | |
| | 2,500 | | Oakland Unified School District, Alameda County, California, General Obligation Bonds, Series 2002, 5.250%, 8/01/21 – FGIC Insured | | 5/15 at 100.00 | AA– | | | 2,510,150 | |
| | 1,815 | | Orland Joint Unified School District, Glenn and Tehama Counties, California, General Obligation Bonds, 2008 Election, Series 2012B, 0.000%, 8/01/51 (Mandatory put 8/01/42) – AGM Insured | | 8/37 at 100.00 | AA | | | 869,603 | |
| | 1,250 | | Oxnard School District, Ventura County, California, General Obligation Bonds, Election 2012 Series 2013B, 5.000%, 8/01/43 – AGM Insured | | 8/23 at 100.00 | AA | | | 1,413,063 | |
| | 2,575 | | Oxnard School District, Ventura County, California, General Obligation Refunding Bonds, Series 2001A, 5.750%, 8/01/30 – NPFG Insured | | 2/22 at 103.00 | AA– | | | 3,191,558 | |
| | 5,000 | | Pajaro Valley Unified School District, Santa Cruz County, California, General Obligation Bonds, Refunding Election 2012 Series 2013A, 5.000%, 8/01/43 | | 8/23 at 100.00 | Aa2 | | | 5,652,250 | |
| | 8,250 | | Puerto Rico, General Obligation Bonds, Public Improvement Series 2002A, 5.500%, 7/01/20 – NPFG Insured | | No Opt. Call | AA– | | | 8,841,773 | |
| | 28,000 | | San Bernardino Community College District, California, General Obligation Bonds, Election of 2008 Series 2009B, 0.000%, 8/01/44 | | No Opt. Call | Aa2 | | | 7,547,400 | |
| | 6,500 | | San Diego Community College District, California, General Obligation Bonds, Refunding Series 2011, 5.000%, 8/01/41 | | 8/21 at 100.00 | AA+ | | | 7,400,900 | |
| | 1,850 | | San Juan Capistano, California, General Obligation Bonds, Open Space Program, Tender Option Bond Trust 2015-XF0048, 18.017%, 8/01/17 (IF) | | No Opt. Call | AAA | | | 2,914,194 | |
| | 4,970 | | San Rafael City High School District, Marin County, California, General Obligation Bonds, Series 2004B, 0.000%, 8/01/27 – FGIC Insured | | No Opt. Call | AA+ | | | 3,346,351 | |
| | 2,200 | | Santa Maria Joint Union High School District, Santa Barbara and San Luis Obispo Counties, California, General Obligation Bonds, Series 2003B, 5.625%, 8/01/24 – AGM Insured | | No Opt. Call | Aa3 | | | 2,826,890 | |
| | 5,245 | | Southwestern Community College District, San Diego County, California, General Obligation Bonds, Election of 2008, Series 2011C, 5.250%, 8/01/36 | | 8/21 at 100.00 | Aa2 | | | 5,956,379 | |
| | Principal | | | | Optional Call | | | | | |
| | Amount (000) | | Description (1) | | Provisions (2) | Ratings (3) | | | Value | |
| | | | Tax Obligation/General (continued) | | | | | | | |
| $ | 4,175 | | Southwestern Community College District, San Diego County, California, General Obligation Bonds, Series 2004, 0.000%, 8/01/25 – FGIC Insured | | No Opt. Call | Aa2 | | $ | 3,104,154 | |
| | 1,440 | | Southwestern Community College District, San Diego County, California, General Obligation Bonds, Series 2005, 5.000%, 8/01/24 – NPFG Insured | | 8/15 at 102.00 | AA– | | | 1,498,349 | |
| | 26,000 | | Sylvan Union School District, Stanislaus County, California, General Obligation Bonds, Election of 2006, Series 2010, 0.000%, 8/01/49 – AGM Insured | | No Opt. Call | AA | | | 14,568,060 | |
| | | | Washington Township Health Care District, Alameda County, California, General Obligation Bonds, 2004 Election Series 2013B: | | | | | | | |
| | 4,740 | | 5.500%, 8/01/38 | | 8/24 at 100.00 | Aa3 | | | 5,737,059 | |
| | 4,830 | | 5.500%, 8/01/40 | | 8/24 at 100.00 | Aa3 | | | 5,819,474 | |
| | | | Washington Township Health Care District, Alameda County, California, General Obligation Bonds, 2012 Election Series 2013A: | | | | | | | |
| | 2,820 | | 5.500%, 8/01/38 | | 8/24 at 100.00 | Aa3 | | | 3,413,187 | |
| | 1,750 | | 5.500%, 8/01/40 | | 8/24 at 100.00 | Aa3 | | | 2,108,505 | |
| | 2,015 | | Wiseburn School District, Los Angeles County, California, General Obligation Bonds, Series 2012C, 5.000%, 8/01/26 | | 8/22 at 100.00 | Aa3 | | | 2,305,926 | |
| | 140,160 | | Yosemite Community College District, California, General Obligation Bonds, Capital Appreciation, Election 2004, Series 2010D, 0.000%, 8/01/42 | | No Opt. Call | Aa2 | | | 81,259,161 | |
| | 2,400 | | Yuba Community College District, California, General Obligation Bonds, Election 2006 Series 2011C, 5.250%, 8/01/47 | | 8/21 at 100.00 | Aa2 | | | 2,684,952 | |
| | 616,655 | | Total Tax Obligation/General | | | | | | 553,153,633 | |
| | | | Tax Obligation/Limited – 33.9% (23.5% of Total Investments) | | | | | | | |
| | | | Beaumont Financing Authority, California, Local Agency Revenue Bonds, Series 2004D: | | | | | | | |
| | 1,000 | | 5.500%, 9/01/24 | | 9/16 at 100.00 | N/R | | | 1,022,150 | |
| | 615 | | 5.800%, 9/01/35 | | 9/16 at 100.00 | N/R | | | 628,382 | |
| | 1,655 | | Bell Community Housing Authority, California, Lease Revenue Bonds, Series 2005, 5.000%, 10/01/36 – AMBAC Insured | | 10/15 at 100.00 | N/R | | | 1,563,065 | |
| | 3,370 | | Bell Community Redevelopment Agency, California, Tax Allocation Bonds, Bell Project Area, Series 2003, 5.500%, 10/01/23 – RAAI Insured | | 5/15 at 100.00 | N/R | | | 3,373,033 | |
| | 1,200 | | Burbank Public Financing Authority, California, Revenue Bonds, West Olive Redevelopment Project, Series 2002, 5.125%, 12/01/22 – AMBAC Insured | | 4/15 at 100.00 | BBB+ | | | 1,202,112 | |
| | | | California State Public Works Board, Lease Revenue Bonds, Department of Corrections & Rehabilitation, Series 2013G: | | | | | | | |
| | 5,000 | | 5.250%, 9/01/30 | | 9/23 at 100.00 | A1 | | | 5,930,300 | |
| | 11,000 | | 5.250%, 9/01/32 | | 9/23 at 100.00 | A1 | | | 12,955,360 | |
| | 7,000 | | California State Public Works Board, Lease Revenue Bonds, Department of Corrections & Rehabilitation, Various Correctional Facilities Series 2014A, 5.000%, 9/01/39 | | 9/24 at 100.00 | A1 | | | 8,038,520 | |
| | 3,070 | | California State Public Works Board, Lease Revenue Bonds, Department of General Services, Capital East End Project, Series 2002A, 5.250%, 12/01/16 – AMBAC Insured | | 5/15 at 100.00 | A1 | | | 3,082,863 | |
| | 2,030 | | California State Public Works Board, Lease Revenue Bonds, Department of General Services, Series 2002C, 5.250%, 3/01/21 – AMBAC Insured | | 5/15 at 100.00 | A1 | | | 2,038,059 | |
| | 1,575 | | California State Public Works Board, Lease Revenue Bonds, Department of General Services, Series 2003D, 5.500%, 6/01/20 | | 5/15 at 100.00 | A1 | | | 1,581,584 | |
| | 17,395 | | California State Public Works Board, Lease Revenue Bonds, Judicial Council of California, New Stockton Courthouse, Series 2014B, 5.000%, 10/01/39 | | 10/24 at 100.00 | A1 | | | 19,994,683 | |
| | 1,000 | | California State Public Works Board, Lease Revenue Bonds, Judicial Council of California, Various Projects Series 2013A, 5.000%, 3/01/30 | | No Opt. Call | A1 | | | 1,151,470 | |
| | 1,000 | | California State Public Works Board, Lease Revenue Bonds, Judicial Council of California, Yuba City Courthouse, Series 2013D, 5.000%, 6/01/32 | | 6/23 at 100.00 | A1 | | | 1,146,910 | |
| | 10,650 | | California State Public Works Board, Lease Revenue Bonds, Various Capital Projects, Series 2009G-1, 5.750%, 10/01/30 | | 10/19 at 100.00 | A1 | | | 12,706,941 | |
| | 6,860 | | California State Public Works Board, Lease Revenue Bonds, Various Capital Projects, Series 2009-I, 6.375%, 11/01/34 | | 11/19 at 100.00 | A1 | | | 8,435,468 | |
| NAC | Nuveen California Dividend Advantage Municipal Fund | |
| | Portfolio of Investments (continued) | February 28, 2015 |
| | Principal | | | | Optional Call | | | | | |
| | Amount (000) | | Description (1) | | Provisions (2) | Ratings (3) | | | Value | |
| | | | Tax Obligation/Limited (continued) | | | | | | | |
| $ | 2,650 | | California State Public Works Board, Lease Revenue Bonds, Various Capital Projects, Series 2012A, 5.000%, 4/01/33 | | No Opt. Call | A1 | | $ | 3,022,696 | |
| | 9,950 | | California State Public Works Board, Lease Revenue Bonds, Various Capital Projects, Series 2013I, 5.000%, 11/01/38 | | 11/23 at 100.00 | A1 | | | 11,329,667 | |
| | 9,000 | | California State Public Works Board, Lease Revenue Bonds, Various Capital Projects, Series 2014E, 5.000%, 9/01/39 | | 9/24 at 100.00 | A1 | | | 10,335,240 | |
| | 3,175 | | Capistrano Unified School District, Orange County, California, Special Tax Bonds, Community Facilities District 98-2, Series 2005, 5.000%, 9/01/24 – FGIC Insured | | 9/15 at 100.00 | AA– | | | 3,241,389 | |
| | 2,905 | | Carson Redevelopment Agency, California, Tax Allocation Bonds, Redevelopment Project Area 1, Series 2009A, 7.000%, 10/01/36 | | 10/19 at 100.00 | A– | | | 3,451,953 | |
| | 3,205 | | Chino Redevelopment Agency, California, Merged Chino Redevelopment Project Area Tax Allocation Bonds, Series 2006, 5.000%, 9/01/38 – AMBAC Insured | | 9/16 at 101.00 | A | | | 3,292,176 | |
| | 770 | | Chula Vista, California, Special Tax Bonds, Community Facilities District 12-1 McMillin Otay Ranch Village Seven, Series 2005, 5.250%, 9/01/30 | | 9/15 at 100.00 | N/R | | | 782,228 | |
| | | | Commerce Community Development Commission, California, Tax Allocation Refunding Bonds, Merged Area Development Projects 2 and 3, Series 1998A: | | | | | | | |
| | 615 | | 5.650%, 8/01/18 | | 8/15 at 100.00 | N/R | | | 616,470 | |
| | 2,765 | | 5.700%, 8/01/28 | | 8/15 at 100.00 | N/R | | | 2,767,903 | |
| | 4,480 | | Commerce Joint Power Financing Authority, California, Tax Allocation Bonds, Redevelopment Projects 2 and 3, Refunding Series 2003A, 5.000%, 8/01/28 – RAAI Insured | | 5/15 at 100.00 | BBB | | | 4,485,824 | |
| | 4,250 | | Coronado Community Development Agency, California, Tax Allocation Bonds, Community Development Project, Series 2005, 5.000%, 9/01/30 – AMBAC Insured | | 9/15 at 100.00 | AA– | | | 4,341,248 | |
| | 1,595 | | Fontana Public Financing Authority, California, Tax Allocation Revenue Bonds, North Fontana Redevelopment Project, Series 2003A, 5.375%, 9/01/25 – AMBAC Insured | | 5/15 at 100.00 | A+ | | | 1,598,605 | |
| | 6,655 | | Fontana Redevelopment Agency, San Bernardino County, California, Tax Allocation Bonds, Jurupa Hills Redevelopment Project, Refunding Series 1997A, 5.500%, 10/01/27 | | 10/15 at 100.00 | A– | | | 6,673,301 | |
| | 2,245 | | Fontana, California, Special Tax Bonds, Community Facilities District 2 Heritage Village, Refunding Series 1998A, 5.250%, 9/01/17 – NPFG Insured | | 3/15 at 100.00 | AA– | | | 2,293,043 | |
| | 1,000 | | Fremont, California, Special Tax Bonds, Community Facilities District 1, Pacific Commons, Series 2005, 6.300%, 9/01/31 | | 9/15 at 100.00 | N/R | | | 1,016,390 | |
| | 1,000 | | Fullerton Community Facilities District 1, California, Special Tax Bonds, Amerige Heights, Refunding Series 2012, 5.000%, 9/01/32 | | 9/22 at 100.00 | A– | | | 1,107,370 | |
| | 3,980 | | Garden Grove, California, Certificates of Participation, Financing Project, Series 2002A, 5.500%, 3/01/22 – AMBAC Insured | | 5/15 at 100.00 | A | | | 3,997,432 | |
| | 1,000 | | Golden State Tobacco Securitization Corporation, California, Enhanced Tobacco Settlement Asset-Backed Bonds, Series 2013A, 5.000%, 6/01/30 | | 6/23 at 100.00 | A1 | | | 1,139,060 | |
| | | | Golden State Tobacco Securitization Corporation, California, Enhanced Tobacco Settlement Asset-Backed Revenue Bonds, Series 2005A: | | | | | | | |
| | 39,525 | | 5.000%, 6/01/35 – FGIC Insured | | 6/15 at 100.00 | AA | | | 39,990,208 | |
| | 6,000 | | 5.000%, 6/01/45 | | 6/15 at 100.00 | A1 | | | 6,069,360 | |
| | 2,705 | | 5.000%, 6/01/45 – AGC Insured | | 6/15 at 100.00 | AA | | | 2,736,270 | |
| | | | Golden State Tobacco Securitization Corporation, California, Enhanced Tobacco Settlement Asset-Backed Revenue Bonds, Tender Option Bonds Trust 2215: | | | | | | | |
| | 5,000 | | 15.434%, 6/01/31 – FGIC Insured (IF) | | 6/15 at 100.00 | A1 | | | 5,243,000 | |
| | 3,500 | | 15.434%, 6/01/35 – FGIC Insured (IF) | | 6/15 at 100.00 | A1 | | | 3,661,840 | |
| | | | Hawthorne Community Redevelopment Agency, California, Project Area 2 Tax Allocation Bonds, Series 2006: | | | | | | | |
| | 1,770 | | 5.000%, 9/01/26 – SYNCORA GTY Insured | | 9/16 at 100.00 | N/R | | | 1,814,516 | |
| | 3,865 | | 5.250%, 9/01/36 – SYNCORA GTY Insured | | 9/16 at 100.00 | N/R | | | 3,986,748 | |
| | | | Hesperia Community Redevelopment Agency, California, Tax Allocation Bonds, Series 2005A: | | | | | | | |
| | 1,750 | | 5.000%, 9/01/25 – SYNCORA GTY Insured | | 9/15 at 100.00 | BBB– | | | 1,762,828 | |
| | 6,690 | | 5.000%, 9/01/35 – SYNCORA GTY Insured | | 9/15 at 100.00 | BBB– | | | 6,721,577 | |
| | Principal | | | | Optional Call | | | | | |
| | Amount (000) | | Description (1) | | Provisions (2) | Ratings (3) | | | Value | |
| | | | Tax Obligation/Limited (continued) | | | | | | | |
| $ | 1,500 | | Hesperia Unified School District, San Bernardino County, California, Certificates of Participation, Capital Improvement, Series 2007, 5.000%, 2/01/41 – AMBAC Insured | | 2/17 at 100.00 | A– | | $ | 1,597,305 | |
| | 2,500 | | Hesperia Unified School District, San Bernardino County, California, Certificates of Participation, Series 2013A, 5.000%, 2/01/38 – BAM Insured | | 2/23 at 100.00 | AA | | | 2,746,700 | |
| | 4,500 | | Inglewood Redevelopment Agency, California, Tax Allocation Bonds, Merged Redevelopment Project, Refunding Series 1998A, 5.250%, 5/01/23 – AMBAC Insured | | No Opt. Call | N/R | | | 5,003,685 | |
| | | | Inglewood Redevelopment Agency, California, Tax Allocation Bonds, Merged Redevelopment Project, Subordinate Lien Series 2007A-1: | | | | | | | |
| | 1,460 | | 5.000%, 5/01/23 – AMBAC Insured | | 5/17 at 100.00 | BBB+ | | | 1,531,905 | |
| | 2,435 | | 5.000%, 5/01/24 – AMBAC Insured | | 5/17 at 100.00 | BBB+ | | | 2,545,573 | |
| | 2,075 | | 5.000%, 5/01/25 – AMBAC Insured | | 5/17 at 100.00 | BBB+ | | | 2,162,669 | |
| | | | Irvine Unified School District, California, Special Tax Bonds, Community Facilities District Series 2006A: | | | | | | | |
| | 1,475 | | 5.000%, 9/01/26 | | 9/16 at 100.00 | N/R | | | 1,512,908 | |
| | 3,395 | | 5.125%, 9/01/36 | | 9/16 at 100.00 | N/R | | | 3,476,582 | |
| | | | Jurupa Public Financing Authority, California, Special Tax Revenue Bonds, Series 2014A: | | | | | | | |
| | 530 | | 5.000%, 9/01/29 | | 9/24 at 100.00 | BBB+ | | | 610,984 | |
| | 1,900 | | 5.000%, 9/01/30 | | 9/24 at 100.00 | BBB+ | | | 2,180,212 | |
| | 1,220 | | 5.000%, 9/01/31 | | 9/24 at 100.00 | BBB+ | | | 1,393,472 | |
| | 675 | | Lammersville School District, San Joaquin County, California, Special Tax Bonds, Community Facilities District 2002 Mountain House, Series 2006, 5.125%, 9/01/35 | | 9/16 at 100.00 | N/R | | | 702,851 | |
| | 1,000 | | Lindsay Redevelopment Agency, California, Project 1 Tax Allocation Bonds, Series 2007, 5.000%, 8/01/37 – RAAI Insured | | 8/17 at 100.00 | BBB+ | | | 1,059,970 | |
| | 12,820 | | Los Angeles Community Redevelopment Agency, California, Lease Revenue Bonds, Manchester Social Services Project, Series 2005, 5.000%, 9/01/37 – AMBAC Insured | | 9/15 at 100.00 | A1 | | | 12,959,482 | |
| | 5,080 | | Los Angeles County Public Works Financing Authority, California, Lease Revenue Bonds, Multiple Capital Facilities Project II, Series 2012, 5.000%, 8/01/42 | | No Opt. Call | AA | | | 5,697,982 | |
| | 1,625 | | Lynwood Redevelopment Agency, California, Project A Revenue Bonds, Subordinate Lien Series 2011A, 6.750%, 9/01/26 | | 9/21 at 100.00 | A– | | | 2,059,184 | |
| | 1,900 | | Modesto, California, Special Tax Bonds, Community Facilities District 2004-1 Village One 2, Refunding Series 2014, 5.000%, 9/01/31 | | 9/24 at 100.00 | BBB– | | | 2,104,554 | |
| | 5,720 | | Murrieta Redevelopment Agency, California, Tax Allocation Bonds, Series 2007A, 5.000%, 8/01/37 – NPFG Insured | | 8/17 at 100.00 | AA– | | | 5,882,963 | |
| | 1,850 | | Murrieta, California, Special Tax Bonds, Community Facilities District 2000-2, The Oaks Improvement Area A, Series 2004A, 5.900%, 9/01/27 | | 5/15 at 100.00 | N/R | | | 1,855,125 | |
| | | | National City Community Development Commission, California, Tax Allocation Bonds, National City Redevelopment Project, Series 2011: | | | | | | | |
| | 3,250 | | 6.500%, 8/01/24 | | 8/21 at 100.00 | A– | | | 4,141,508 | |
| | 3,000 | | 7.000%, 8/01/32 | | 8/21 at 100.00 | A– | | | 3,817,230 | |
| | 1,000 | | Norco Redevelopment Agency, California, Tax Allocation Bonds, Project Area 1, Series 2009, 7.000%, 3/01/34 | | 3/18 at 100.00 | A+ | | | 1,149,170 | |
| | | | Norco Redevelopment Agency, California, Tax Allocation Refunding Bonds, Project Area 1, Refunding Series 2010: | | | | | | | |
| | 3,775 | | 5.875%, 3/01/32 | | 3/20 at 100.00 | A+ | | | 4,469,260 | |
| | 1,500 | | 6.000%, 3/01/36 | | 3/20 at 100.00 | A+ | | | 1,787,130 | |
| | 240 | | North Natomas Community Facilities District 4, Sacramento, California, Special Tax Bonds, Series 2006D, 5.000%, 9/01/33 | | 9/15 at 101.00 | N/R | | | 245,719 | |
| | 1,210 | | Novato Redevelopment Agency, California, Tax Allocation Bonds, Hamilton Field Redevelopment Project, Series 2011, 6.750%, 9/01/40 | | 9/21 at 100.00 | BBB+ | | | 1,478,426 | |
| | 3,605 | | Oakland State Building Authority, California, Lease Revenue Bonds, Elihu M. Harris State Office Building, Series 1998A, 5.000%, 4/01/23 – AMBAC Insured | | 4/15 at 100.00 | A1 | | | 3,619,420 | |
| | 695 | | Ontario Redevelopment Financing Authority, California, Lease Revenue Bonds, Capital Projects, Series 2001, 5.250%, 8/01/18 – AMBAC Insured | | 5/15 at 100.00 | AA– | | | 697,933 | |
| NAC | Nuveen California Dividend Advantage Municipal Fund | |
| | Portfolio of Investments (continued) | February 28, 2015 |
| | Principal | | | | Optional Call | | | | | |
| | Amount (000) | | Description (1) | | Provisions (2) | Ratings (3) | | | Value | |
| | | | Tax Obligation/Limited (continued) | | | | | | | |
| $ | 29,800 | | Ontario Redevelopment Financing Authority, San Bernardino County, California, Revenue Refunding Bonds, Redevelopment Project 1, Series 1995, 7.400%, 8/01/25 – NPFG Insured | | No Opt. Call | AA– | | $ | 37,484,823 | |
| | 1,715 | | Ontario, California, Special Tax Bonds, Community Facilities District 5, Freeway Interchange Project, Series 1997, 6.375%, 9/01/17 | | 3/15 at 100.00 | N/R | | | 1,758,235 | |
| | 1,000 | | Palmdale Community Redevelopment Agency, California, Tax Allocation Bonds, Merged Redevelopment Project Areas, Series 2004, 5.000%, 12/01/24 – AMBAC Insured | | 5/15 at 100.00 | A– | | | 1,003,770 | |
| | | | Panama-Buena Vista Union School District, California, Certificates of Participation, School Construction Project, Series 2006: | | | | | | | |
| | 1,065 | | 5.000%, 9/01/22 – NPFG Insured | | 9/16 at 100.00 | AA– | | | 1,109,080 | |
| | 1,120 | | 5.000%, 9/01/23 – NPFG Insured | | 9/16 at 100.00 | AA– | | | 1,163,635 | |
| | 1,170 | | 5.000%, 9/01/24 – NPFG Insured | | 9/16 at 100.00 | AA– | | | 1,212,927 | |
| | 2,000 | | Paramount Redevelopment Agency, California, Tax Allocation Bonds, Redevelopment Project Area 1, Series 2003, 5.000%, 8/01/23 – NPFG Insured | | 5/15 at 100.00 | AA– | | | 2,007,540 | |
| | 1,385 | | Patterson Public Finance Authority, California, Revenue Bonds, Community Facilities District 2001-1, Subordinate Lien Series 2013B, 5.875%, 9/01/39 | | 9/23 at 100.00 | N/R | | | 1,595,395 | |
| | | | Patterson Public Financing Authority, California, Revenue Bonds, Community Facilities District 2001-1, Senior Series 2013A: | | | | | | | |
| | 8,535 | | 5.250%, 9/01/30 | | 9/23 at 100.00 | N/R | | | 9,740,739 | |
| | 7,665 | | 5.750%, 9/01/39 | | 9/23 at 100.00 | N/R | | | 8,865,876 | |
| | 9,435 | | Pico Rivera Water Authority, California, Revenue Bonds, Series 2001A, 6.250%, 12/01/32 | | 6/15 at 100.00 | N/R | | | 9,453,587 | |
| | 15,070 | | Pittsburg Redevelopment Agency, California, Tax Allocation Bonds, Los Medanos Community Development Project, Refunding Series 2008A, 6.500%, 9/01/28 | | 9/18 at 100.00 | BBB– | | | 16,799,283 | |
| | 8,750 | | Pittsburg Redevelopment Agency, California, Tax Allocation Bonds, Los Medanos Community Development Project, Series 1999, 0.000%, 8/01/23 – AMBAC Insured | | No Opt. Call | A | | | 6,408,325 | |
| | 1,570 | | Poway Redevelopment Agency, California, Tax Allocation Refunding Bonds, Paguay Redevelopment Project, Series 2000, 5.750%, 6/15/33 – NPFG Insured | | 5/15 at 100.00 | AA– | | | 1,573,313 | |
| | 13,655 | | Puerto Rico Sales Tax Financing Corporation, Sales Tax Revenue Bonds, Series 2007A, 0.000%, 8/01/45 – NPFG Insured | | No Opt. Call | AA– | | | 1,824,854 | |
| | 3,920 | | Rancho Santa Fe CSD Financing Authority, California, Revenue Bonds, Superior Lien Series 2011A, 5.750%, 9/01/30 | | 9/21 at 100.00 | BBB+ | | | 4,503,296 | |
| | | | Redding Redevelopment Agency, California, Tax Allocation Bonds, Canby-Hilltop-Cypress Area Project, Series 2003A: | | | | | | | |
| | 1,500 | | 5.000%, 9/01/17 – NPFG Insured | | 5/15 at 100.00 | AA– | | | 1,505,970 | |
| | 1,500 | | 5.000%, 9/01/20 – NPFG Insured | | 5/15 at 100.00 | AA– | | | 1,505,775 | |
| | 1,500 | | Riverside County Public Financing Authority, California, Tax Allocation Bonds, Multiple Projects, Series 2005A, 5.000%, 10/01/37 – SYNCORA GTY Insured | | 10/15 at 100.00 | BBB+ | | | 1,510,950 | |
| | 3,375 | | Riverside County Redevelopment Agency, California, Tax Allocation Bonds, Interstate 215 Corridor Redevelopment Project Area, Series 2010E, 6.500%, 10/01/40 | | 10/20 at 100.00 | BBB+ | | | 4,002,480 | |
| | 705 | | Riverside County Redevelopment Agency, California, Tax Allocation Bonds, Jurupa Valley Project Area, Series 2011B, 6.500%, 10/01/25 | | 10/21 at 100.00 | A– | | | 884,338 | |
| | 2,885 | | Riverside County Redevelopment Agency, California, Tax Allocation Housing Bonds, Series 2010A, 6.000%, 10/01/39 | | 10/20 at 100.00 | A– | | | 3,370,055 | |
| | | | Riverside County, California, Special Tax Bonds, Community Facilities District 05-8 Scott Road, Series 2013: | | | | | | | |
| | 555 | | 5.000%, 9/01/30 | | 9/22 at 100.00 | N/R | | | 623,987 | |
| | 710 | | 5.000%, 9/01/42 | | 9/22 at 100.00 | N/R | | | 783,421 | |
| | 35 | | Riverside Public Financing Authority, California, Revenue Bonds, Multiple Project Loans, Series 1991A, 8.000%, 2/01/18 | | 8/15 at 100.00 | N/R | | | 35,769 | |
| | 3,540 | | Rohnert Park Community Development Commission, California, Tax Allocation Bonds, Redevelopment Project Series 2007R, 5.000%, 8/01/37 – FGIC Insured | | 8/17 at 100.00 | AA– | | | 3,640,855 | |
| | 2,645 | | Roseville, California, Special Tax Bonds, Community Facilities District 1 Fiddyment Ranch, Series 2005, 5.050%, 9/01/30 | | 9/15 at 100.00 | N/R | | | 2,665,710 | |
| | Principal | | | | Optional Call | | | | | |
| | Amount (000) | | Description (1) | | Provisions (2) | Ratings (3) | | | Value | |
| | | | Tax Obligation/Limited (continued) | | | | | | | |
| $ | 8,625 | | Sacramento City Financing Authority, California, Capital Improvement Revenue Bonds, 300 Richards Boulevard Building Acquisition, Series 2006C, 5.000%, 12/01/36 – AMBAC Insured | | 12/16 at 100.00 | A+ | | $ | 9,186,143 | |
| | | | Sacramento City Financing Authority, California, Lease Revenue Refunding Bonds, Series 1993A: | | | | | | | |
| | 9,000 | | 5.400%, 11/01/20 – AMBAC Insured | | No Opt. Call | A+ | | | 9,994,950 | |
| | 1,000 | | 5.400%, 11/01/20 – NPFG Insured | | No Opt. Call | AA– | | | 1,110,550 | |
| | 4,250 | | Sacramento City Financing Authority, California, Tax Allocation Revenue Bonds, Merged Downtown Sacramento and Oak Park Projects, Series 2005A, 0.000%, 12/01/31 – FGIC Insured | | No Opt. Call | AA– | | | 2,007,573 | |
| | 2,135 | | San Diego County Regional Transportation Commission, California, Sales Tax Revenue Bonds, Series 2012A, 5.000%, 4/01/42 | | 4/22 at 100.00 | AAA | | | 2,424,976 | |
| | 10,000 | | San Diego County Regional Transportation Commission, California, Sales Tax Revenue Bonds, Series 2014A, 5.000%, 4/01/34 | | 4/24 at 100.00 | AAA | | | 11,755,300 | |
| | 1,535 | | San Francisco City and County Redevelopment Agency Successor Agency, California, Special Tax Bonds, Community Facilities District 7, Hunters Point Shipyard Phase One Improvements, Refunding Series 2014, 5.000%, 8/01/39 | | No Opt. Call | N/R | | | 1,693,105 | |
| | 2,000 | | San Francisco Redevelopment Finance Authority, California, Tax Allocation Revenue Bonds, Mission Bay North Redevelopment Project, Series 2009C, 6.500%, 8/01/39 | | 8/19 at 100.00 | A– | | | 2,336,900 | |
| | 575 | | San Francisco Redevelopment Finance Authority, California, Tax Allocation Revenue Bonds, Mission Bay North Redevelopment Project, Series 2011C, 6.750%, 8/01/41 | | 2/21 at 100.00 | A– | | | 705,082 | |
| | | | San Francisco Redevelopment Financing Authority, California, Tax Allocation Revenue Bonds, Mission Bay South Redevelopment Project, Series 2011D: | | | | | | | |
| | 575 | | 7.000%, 8/01/33 | | 2/21 at 100.00 | BBB+ | | | 701,270 | |
| | 715 | | 7.000%, 8/01/41 | | 2/21 at 100.00 | BBB+ | | | 872,014 | |
| | 255 | | San Francisco, California, Community Facilities District 6, Mission Bay South Public Improvements, Special Tax Refunding Bonds, Series 2013A, 5.000%, 8/01/33 | | 8/22 at 100.00 | N/R | | | 285,886 | |
| | 9,435 | | San Jose Financing Authority, California, Lease Revenue Refunding Bonds, Convention Center Project, Series 2001F, 5.000%, 9/01/20 – NPFG Insured | | 3/15 at 100.00 | AA | | | 9,473,495 | |
| | 2,750 | | San Jose Redevelopment Agency, California, Housing Set-Aside Tax Allocation Bonds, Merged Area Redevelopment Project, Series 2010A-1, 5.500%, 8/01/35 | | 8/20 at 100.00 | A | | | 3,061,878 | |
| | 2,765 | | San Jose Redevelopment Agency, California, Tax Allocation Bonds, Merged Area Redevelopment Project, Series 2003, 4.900%, 8/01/33 – FGIC Insured | | 5/15 at 100.00 | AA– | | | 2,812,309 | |
| | | | San Jose Redevelopment Agency, California, Tax Allocation Bonds, Merged Area Redevelopment Project, Series 2004A: | | | | | | | |
| | 370 | | 4.360%, 8/01/16 – NPFG Insured | | 5/15 at 100.00 | AA– | | | 371,225 | |
| | 700 | | 4.440%, 8/01/17 – NPFG Insured | | 5/15 at 100.00 | AA– | | | 702,373 | |
| | 1,000 | | San Jose Redevelopment Agency, California, Tax Allocation Bonds, Merged Area Redevelopment Project, Series 2005A, 5.000%, 8/01/27 – NPFG Insured | | 8/15 at 100.00 | AA– | | | 1,019,770 | |
| | | | San Jose Redevelopment Agency, California, Tax Allocation Bonds, Merged Area Redevelopment Project, Series 2006C: | | | | | | | |
| | 2,200 | | 5.000%, 8/01/24 – NPFG Insured | | 8/17 at 100.00 | AA– | | | 2,359,324 | |
| | 4,710 | | 5.000%, 8/01/25 – NPFG Insured | | 8/17 at 100.00 | AA– | | | 5,051,098 | |
| | | | San Jose Redevelopment Agency, California, Tax Allocation Bonds, Merged Area Redevelopment Project, Series 2006D: | | | | | | | |
| | 695 | | 5.000%, 8/01/19 – AMBAC Insured | | 8/17 at 100.00 | BBB+ | | | 761,963 | |
| | 910 | | 5.000%, 8/01/21 – AMBAC Insured | | 8/17 at 100.00 | BBB+ | | | 991,472 | |
| | 1,365 | | 5.000%, 8/01/23 – AMBAC Insured | | 8/17 at 100.00 | BBB+ | | | 1,479,005 | |
| | 1,825 | | San Jose Redevelopment Agency, California, Tax Allocation Bonds, Merged Area Redevelopment Project, Series 2008B, 6.250%, 8/01/20 | | 8/18 at 100.00 | BBB+ | | | 2,075,700 | |
| | 5,000 | | San Marcos Public Facilities Authority, California, Tax Allocation Bonds, Project Areas 2 and 3, Series 2005C, 5.000%, 8/01/35 – AMBAC Insured | | 8/15 at 100.00 | A– | | | 5,026,450 | |
| | 6,000 | | San Ramon Public Financing Authority, California, Tax Allocation Revenue Bonds, Series 2006A, 5.000%, 2/01/38 – AMBAC Insured | | 2/16 at 100.00 | A– | | | 6,065,940 | |
| | 7,860 | | Santa Ana Community Redevelopment Agency, California, Tax Allocation Bonds, Merged Project Area, Series 2011A, 6.750%, 9/01/28 | | 3/21 at 100.00 | A+ | | | 9,658,761 | |
| NAC | Nuveen California Dividend Advantage Municipal Fund | |
| | Portfolio of Investments (continued) | February 28, 2015 |
| | Principal | | | | Optional Call | | | | | |
| | Amount (000) | | Description (1) | | Provisions (2) | Ratings (3) | | | Value | |
| | | | Tax Obligation/Limited (continued) | | | | | | | |
| $ | 2,770 | | Santa Ana Community Redevelopment Agency, Orange County, California, Tax Allocation Refunding Bonds, South Main Street Redevelopment, Series 2003B, 5.000%, 9/01/19 – FGIC Insured | | 5/15 at 100.00 | AA– | | $ | 2,777,839 | |
| | | | Santa Clara Redevelopment Agency, California, Tax Allocation Bonds, Bayshore North Project, Series 2003: | | | | | | | |
| | 4,625 | | 5.000%, 6/01/17 – NPFG Insured | | 6/15 at 100.00 | AA– | | | 4,680,824 | |
| | 2,695 | | 5.000%, 6/01/20 – NPFG Insured | | 6/15 at 100.00 | AA– | | | 2,727,529 | |
| | 1,500 | | 5.000%, 6/01/21 – NPFG Insured | | 6/15 at 100.00 | AA– | | | 1,518,105 | |
| | 2,840 | | 5.000%, 6/01/23 – NPFG Insured | | 6/15 at 100.00 | AA– | | | 2,874,279 | |
| | 5,250 | | Santa Cruz County Redevelopment Agency, California, Tax Allocation Bonds, Live Oak-Soquel Community Improvement Projects, Subordinate Lien Series 2000, 5.250%, 9/01/25 – AMBAC Insured | | 3/15 at 100.00 | A | | | 5,377,943 | |
| | 960 | | Signal Hill Redevelopment Agency, California, Project 1 Tax Allocation Bonds, Series 2011, 7.000%, 10/01/26 | | 4/21 at 100.00 | N/R | | | 1,106,371 | |
| | | | Temecula Public Financing Authority, California, Special Tax Bonds, Community Facilities District 03-02 Roripaugh, Series 2006: | | | | | | | |
| | 4,360 | | 5.450%, 9/01/26 | | 9/15 at 101.00 | N/R | | | 4,380,012 | |
| | 2,315 | | 5.500%, 9/01/36 | | 9/15 at 101.00 | N/R | | | 2,318,959 | |
| | 1,310 | | Temecula Redevelopment Agency, California, Redevelopment Project 1 Tax Allocation Housing Bonds Series 2011A, 7.000%, 8/01/39 | | 8/21 at 100.00 | A | | | 1,645,530 | |
| | 1,350 | | Temecula Valley Unified School District, Riverside County, California, Special Tax Bonds, Community Facilities District 2002-1 Improvement Area 1, Series 2012, 5.000%, 9/01/33 | | 9/22 at 100.00 | N/R | | | 1,486,472 | |
| | 1,200 | | Turlock Public Financing Authority, California, Tax Allocation Revenue Bonds, Series 2011, 7.500%, 9/01/39 | | 3/21 at 100.00 | A– | | | 1,524,396 | |
| | 1,000 | | Union City Community Redevelopment Agency, California, Tax Allocation Revenue Bonds, Redevelopment Project, Subordinate Lien Series 2011, 6.875%, 12/01/33 | | 12/21 at 100.00 | A | | | 1,258,900 | |
| | 6,870 | | Vernon Redevelopment Agency, California, Tax Allocation Bonds, Industrial Redevelopment Project, Series 2005, 5.000%, 9/01/35 – NPFG Insured | | 9/15 at 100.00 | AA– | | | 6,899,678 | |
| | 1,620 | | Virgin Islands Public Finance Authority, Gross Receipts Taxes Loan Note, Refunding Series 2012A, 5.000%, 10/01/32 – AGM Insured | | No Opt. Call | AA | | | 1,849,165 | |
| | 6,530 | | Washington Unified School District, Yolo County, California, Certificates of Participation, Series 2007, 5.125%, 8/01/37 – AMBAC Insured | | 8/17 at 100.00 | A | | | 7,046,654 | |
| | 5,000 | | Westminster Redevelopment Agency, California, Tax Allocation Bonds, Commercial Redevelopment Project 1, Police Facility Subordinate Series 2009, 6.250%, 11/01/39 | | 11/19 at 100.00 | AA | | | 5,974,300 | |
| | 1,280 | | William S Hart School Financing Authority, California, Refunding Revenue Bonds, Series 2013, 5.000%, 9/01/34 | | 9/23 at 100.00 | A– | | | 1,420,262 | |
| | | | Yorba Linda Redevelopment Agency, Orange County, California, Tax Allocation Revenue Bonds, Yorba Linda Redevelopment Project, Subordinate Lien Series 2011A: | | | | | | | |
| | 865 | | 6.000%, 9/01/26 | | 9/21 at 100.00 | A– | | | 1,062,393 | |
| | 810 | | 6.500%, 9/01/32 | | 9/21 at 100.00 | A– | | | 995,547 | |
| | 548,605 | | Total Tax Obligation/Limited | | | | | | 580,762,802 | |
| | | | Transportation – 7.2% (5.0% of Total Investments) | | | | | | | |
| | 2,715 | | Bay Area Toll Authority, California, Revenue Bonds, San Francisco Bay Area Toll Bridge, Series 2012F-1, 5.000%, 4/01/30 | | No Opt. Call | AA | | | 3,182,767 | |
| | 15,060 | | Foothill/Eastern Transportation Corridor Agency, California, Toll Road Revenue Bonds, Refunding Junior Lien Series 2013C, 6.500%, 1/15/43 | | 1/24 at 100.00 | BB+ | | | 18,138,414 | |
| | | | Foothill/Eastern Transportation Corridor Agency, California, Toll Road Revenue Bonds, Refunding Series 2013A: | | | | | | | |
| | 33,235 | | 5.750%, 1/15/46 | | 1/24 at 100.00 | BBB– | | | 38,983,989 | |
| | 33,235 | | 6.000%, 1/15/53 | | 1/24 at 100.00 | BBB– | | | 39,335,283 | |
| | 1,250 | | Los Angeles Department of Airports, California, Revenue Bonds, Los Angeles International Airport, Senior Lien Series 2010D, 5.000%, 5/15/40 (UB) (4) | | 5/20 at 100.00 | AA | | | 1,416,350 | |
| | 1,000 | | Los Angeles Harbors Department, California, Revenue Bonds, Refunding Series 2014B, 5.000%, 8/01/44 | | 8/24 at 100.00 | AA | | | 1,156,930 | |
| | Principal | | | | Optional Call | | | | | |
| | Amount (000) | | Description (1) | | Provisions (2) | Ratings (3) | | | Value | |
| | | | Transportation (continued) | | | | | | | |
| | | | Los Angeles Harbors Department, California, Revenue Bonds, Series 2014C: | | | | | | | |
| $ | 1,575 | | 5.000%, 8/01/35 | | 8/24 at 100.00 | AA | | $ | 1,844,672 | |
| | 2,000 | | 5.000%, 8/01/44 | | 8/24 at 100.00 | AA | | | 2,313,860 | |
| | 120 | | Palm Springs Financing Authority, California, Palm Springs International Airport Revenue Bonds, Series 2006, 5.450%, 7/01/20 (Alternative Minimum Tax) | | 7/16 at 100.00 | N/R | | | 121,596 | |
| | | | Port of Oakland, California, Revenue Bonds, Refunding Series 2012P: | | | | | | | |
| | 1,000 | | 5.000%, 5/01/29 (Alternative Minimum Tax) | | No Opt. Call | A+ | | | 1,133,770 | |
| | 6,340 | | 5.000%, 5/01/31 (Alternative Minimum Tax) | | No Opt. Call | A+ | | | 7,109,613 | |
| | 1,180 | | Sacramento Regional Transit District, California, Farebox Revenue Bonds, Series 2012, 5.000%, 3/01/42 | | No Opt. Call | A | | | 1,298,425 | |
| | 4,500 | | San Francisco Airports Commission, California, Revenue Bonds, San Francisco International Airport, Second Series 2014B, 5.000%, 5/01/44 | | 5/24 at 100.00 | A+ | | | 5,178,195 | |
| | 2,465 | | San Francisco Airports Commission, California, Special Facilities Lease Revenue Bonds, San Francisco International Airport, SFO Fuel Company LLC, Series 2000A, 6.125%, 1/01/27 – AGM Insured (Alternative Minimum Tax) | | 7/15 at 100.00 | AA | | | 2,476,364 | |
| | 105,675 | | Total Transportation | | | | | | 123,690,228 | |
| | | | U.S. Guaranteed – 8.2% (5.7% of Total Investments) (6) | | | | | | | |
| | 11,100 | | Bay Area Toll Authority, California, Revenue Bonds, San Francisco Bay Area Toll Bridge, Series 2006F, 5.000%, 4/01/31 (Pre-refunded 4/01/16) (UB) | | 4/16 at 100.00 | AA (6) | | | 11,681,530 | |
| | 5,540 | | Bay Area Toll Authority, California, Revenue Bonds, San Francisco Bay Area Toll Bridge, Tender Option Bond Trust 3211, 13.614%, 10/01/32 (Pre-refunded 4/01/18) (IF) | | 4/18 at 100.00 | AA (6) | | | 8,143,247 | |
| | 10 | | California Department of Water Resources, Water System Revenue Bonds, Central Valley Project, Series 2002X, 5.500%, 12/01/17 – FGIC Insured (ETM) | | No Opt. Call | AAA | | | 11,340 | |
| | 685 | | California Educational Facilities Authority, Revenue Bonds, University of Redlands, Series 2005A, 5.000%, 10/01/35 (Pre-refunded 10/01/15) | | 10/15 at 100.00 | N/R (6) | | | 704,728 | |
| | 5,360 | | California Infrastructure and Economic Development Bank, First Lien Revenue Bonds, San Francisco Bay Area Toll Bridge, Series 2003A, 5.000%, 7/01/23 – AGM Insured (ETM) | | No Opt. Call | Aaa | | | 6,704,610 | |
| | 5,765 | | California Pollution Control Financing Authority, Solid Waste Disposal Revenue Bonds, North County Recycling Center, Series 1991A, 6.750%, 7/01/17 (ETM) | | 5/15 at 100.00 | Aaa | | | 6,072,563 | |
| | 21,235 | | California State Public Works Board, Lease Revenue Bonds, University of California Regents, Tender Option Bond Trust 1065, 9.446%, 3/01/33 (Pre-refunded 3/01/18) (IF) | | 3/18 at 100.00 | Aaa | | | 26,601,934 | |
| | 600 | | California Statewide Community Development Authority, Revenue Bonds, Thomas Jefferson School of Law, Series 2005A, 4.875%, 10/01/31 (Pre-refunded 10/01/15) | | 10/15 at 100.00 | N/R (6) | | | 614,520 | |
| | 6,000 | | Coachella Valley Unified School District, Riverside County, California, Certificates of Participation, Series 2007, 5.000%, 9/01/31 (Pre-refunded 9/01/16) – AMBAC Insured | | 9/16 at 100.00 | N/R (6) | | | 6,423,360 | |
| | 16,805 | | Contra Costa County, California, GNMA Mortgage-Backed Securities Program Home Mortgage Revenue Bonds, Series 1988, 8.250%, 6/01/21 (Alternative Minimum Tax) (ETM) | | No Opt. Call | Aaa | | | 20,869,960 | |
| | 5,000 | | El Centro Financing Authority, California, Water Revenue Bonds, Series 2006A, 4.750%, 10/01/31 (Pre-refunded 10/01/16) – AGM Insured | | 10/16 at 100.00 | AA (6) | | | 5,350,300 | |
| | 13,670 | | Loma Linda, California, Hospital Revenue Bonds, Loma Linda University Medical Center, Series 2008A, 8.250%, 12/01/38 (Pre-refunded 12/01/17) | | 12/17 at 100.00 | BBB (6) | | | 16,478,774 | |
| | 5,170 | | Newport Beach, California, Revenue Bonds, Hoag Memorial Hospital Presbyterian, Series 2011A, 6.000%, 12/01/40 (Pre-refunded 12/01/21) | | 12/21 at 100.00 | N/R (6) | | | 6,636,677 | |
| | 5,840 | | Orange County Water District, California, Revenue Certificates of Participation, Series 1999A, 5.375%, 8/15/29 (ETM) | | No Opt. Call | N/R (6) | | | 7,629,259 | |
| | 905 | | Orange County Water District, California, Revenue Certificates of Participation, Series 2003B, 5.000%, 8/15/34 – NPFG Insured (ETM) | | No Opt. Call | AAA | | | 1,198,501 | |
| | 3,025 | | Pomona, California, GNMA/FHLMC Collateralized Single Family Mortgage Revenue Refunding Bonds, Series 1990B, 7.500%, 8/01/23 (ETM) | | No Opt. Call | Aaa | | | 3,828,077 | |
| | 2,000 | | Puerto Rico Public Finance Corporation, Commonwealth Appropriation Bonds, Series 2002E, 6.000%, 8/01/26 – AGC Insured (ETM) | | No Opt. Call | AA+ (6) | | | 2,602,020 | |
| NAC | Nuveen California Dividend Advantage Municipal Fund | |
| | Portfolio of Investments (continued) | February 28, 2015 |
| | Principal | | | | Optional Call | | | | | |
| | Amount (000) | | Description (1) | | Provisions (2) | Ratings (3) | | | Value | |
| | | | U.S. Guaranteed (6) (continued) | | | | | | | |
| $ | 1,460 | | Rohnert Park Community Development Commission, California, Tax Allocation Bonds, Redevelopment Project Series 2007R, 5.000%, 8/01/37 – FGIC Insured (ETM) | | 8/17 at 100.00 | AA– (6) | | $ | 1,567,047 | |
| | 2,605 | | Roseville Joint Union High School District, Placer County, California, General Obligation Bonds, Series 2006B, 5.000%, 8/01/27 (Pre-refunded 8/01/15) – FGIC Insured | | 8/15 at 100.00 | AA (6) | | | 2,659,601 | |
| | 2,000 | | Sacramento County Sanitation Districts Financing Authority, California, Revenue Bonds, Series 2006, 5.000%, 12/01/31 (Pre-refunded 6/01/16) – FGIC Insured | | 6/16 at 100.00 | AA (6) | | | 2,120,280 | |
| | 2,600 | | San Mateo Union High School District, San Mateo County, California, Certificates of Participation, Phase 1, Series 2007A, 5.000%, 12/15/30 (Pre-refunded 12/15/17) – AMBAC Insured | | 12/17 at 100.00 | N/R (6) | | | 2,913,508 | |
| | 117,375 | | Total U.S. Guaranteed | | | | | | 140,811,836 | |
| | | | Utilities – 4.5% (3.1% of Total Investments) | | | | | | | |
| | 6,205 | | California Statewide Community Development Authority, Certificates of Participation Refunding, Rio Bravo Fresno Project, Series 1999A, 6.500%, 12/01/18 | | 6/15 at 100.00 | N/R | | | 6,081,086 | |
| | | | Long Beach Bond Finance Authority, California, Natural Gas Purchase Revenue Bonds, Series 2007A: | | | | | | | |
| | 7,470 | | 5.000%, 11/15/35 | | No Opt. Call | A | | | 8,723,391 | |
| | 7,610 | | 5.500%, 11/15/37 | | No Opt. Call | A | | | 9,406,949 | |
| | 11,500 | | Los Angeles Department of Water and Power, California, Power System Revenue Bonds, Series 2005A-1, 5.000%, 7/01/31 – AGM Insured | | 7/15 at 100.00 | AA | | | 11,701,480 | |
| | 5,230 | | Los Angeles Department of Water and Power, California, Power System Revenue Bonds, Series 2012B, 5.000%, 7/01/43 | | 7/22 at 100.00 | AA– | | | 5,910,998 | |
| | 4,865 | | Los Angeles Department of Water and Power, California, Power System Revenue Bonds, Series 2013B, 5.000%, 7/01/28 | | 7/23 at 100.00 | AA– | | | 5,763,711 | |
| | 4,000 | | Los Angeles Department of Water and Power, California, Power System Revenue Bonds, Series 2014B, 5.000%, 7/01/43 | | 1/24 at 100.00 | AA– | | | 4,583,800 | |
| | 3,000 | | Los Angeles Department of Water and Power, California, Power System Revenue Bonds, Tender Option Bond Trust 3345, 18.455%, 7/01/20 (IF) (4) | | No Opt. Call | AA– | | | 4,562,520 | |
| | | | Merced Irrigation District, California, Electric System Revenue Bonds, Series 2005: | | | | | | | |
| | 4,000 | | 5.000%, 9/01/26 – SYNCORA GTY Insured | | 9/15 at 100.00 | N/R | | | 4,038,240 | |
| | 5,675 | | 5.125%, 9/01/31 – SYNCORA GTY Insured | | 9/15 at 100.00 | N/R | | | 5,721,876 | |
| | 4,300 | | 5.250%, 9/01/36 – SYNCORA GTY Insured | | 9/15 at 100.00 | N/R | | | 4,334,486 | |
| | 2,500 | | Sacramento Municipal Utility District, California, Electric Revenue Bonds, Tender Option Bond Trust 1186, 17.287%, 8/15/41 (IF) (4) | | 8/23 at 100.00 | AA– | | | 3,953,300 | |
| | 1,565 | | Southern California Public Power Authority, California, Revenue Bonds, Apex Power Project Series 2014A, 5.000%, 7/01/35 | | 7/24 at 100.00 | AA– | | | 1,830,878 | |
| | 67,920 | | Total Utilities | | | | | | 76,612,715 | |
| | | | Water and Sewer – 12.7% (8.8% of Total Investments) | | | | | | | |
| | | | Bay Area Water Supply and Conservation Agency, California, Revenue Bonds, Capital Cost Recovery Prepayment Program, Series 2013A: | | | | | | | |
| | 7,110 | | 5.000%, 10/01/28 | | 4/23 at 100.00 | AA– | | | 8,481,235 | |
| | 3,010 | | 5.000%, 10/01/29 | | 4/23 at 100.00 | AA– | | | 3,580,124 | |
| | 4,250 | | 5.000%, 10/01/30 | | 4/23 at 100.00 | AA– | | | 5,037,823 | |
| | 4,000 | | 5.000%, 10/01/34 | | 4/23 at 100.00 | AA– | | | 4,639,600 | |
| | 1,020 | | California Department of Water Resources, Water System Revenue Bonds, Central Valley Project, Series 2002X, 5.500%, 12/01/17 – FGIC Insured | | No Opt. Call | AAA | | | 1,158,496 | |
| | | | California Pollution Control Financing Authority, Water Furnishing Revenue Bonds, Poseidon Resources Channelside LP Desalination Project, Series 2012: | | | | | | | |
| | 3,925 | | 5.000%, 7/01/37 (Alternative Minimum Tax) | | No Opt. Call | Baa3 | | | 4,292,576 | |
| | 36,420 | | 5.000%, 11/21/45 (Alternative Minimum Tax) | | No Opt. Call | Baa3 | | | 39,463,254 | |
| | 175 | | California Statewide Community Development Authority, Water and Wastewater Revenue Bonds, Pooled Financing Program, Series 2003A, 5.250%, 10/01/23 – AGM Insured | | 5/15 at 100.00 | AA | | | 175,710 | |
| | 385 | | California Statewide Community Development Authority, Water and Wastewater Revenue Bonds, Pooled Financing Program, Series 2004A, 5.250%, 10/01/24 – AGM Insured | | 5/15 at 100.00 | AA | | | 386,528 | |
| | Principal | | | | Optional Call | | | | | |
| | Amount (000) | | Description (1) | | Provisions (2) | Ratings (3) | | | Value | |
| | | | Water and Sewer (continued) | | | | | | | |
| $ | 2,500 | | Central Basin Municipal Water District, California, Certificates of Participation, Tender Option Bond Trust 3152, 18.483%, 8/01/33 – AGC Insured (IF) | | 2/20 at 100.00 | AA | | $ | 3,491,400 | |
| | 10,000 | | East Bay Municipal Utility District, Alameda and Contra Costa Counties, California, Water System Revenue Bonds, Series 2014C, 5.000%, 6/01/44 | | 6/24 at 100.00 | AAA | | | 11,615,100 | |
| | 1,950 | | East Valley Water District Financing Authority, California, Refunding Revenue Bonds, Series 2010, 5.000%, 10/01/40 | | 10/20 at 100.00 | AA– | | | 2,182,148 | |
| | 1,600 | | Eastern Municipal Water District, California, Water and Sewerage System Revenue Certificates of Participation, Tender Option Bond Trust 2015-XF0072, 14.634%, 1/01/30 (IF) | | 7/18 at 100.00 | AA+ | | | 2,496,336 | |
| | 750 | | Fortuna Public Finance Authority, California, Water Revenue Bonds, Series 2006, 5.000%, 10/01/36 – AGM Insured | | 10/16 at 100.00 | AA | | | 770,093 | |
| | 3,135 | | Healdsburg Public Financing Authority, California, Wastewater Revenue Bonds, Series 2006, 5.000%, 4/01/36 – NPFG Insured | | 4/16 at 100.00 | AA– | | | 3,276,514 | |
| | | | Los Angeles Department of Water and Power, California, Waterworks Revenue Bonds, Series 2011A: | | | | | | | |
| | 23,430 | | 5.250%, 7/01/39 (UB) | | 1/21 at 100.00 | AA | | | 26,531,195 | |
| | 2,000 | | 5.000%, 7/01/41 | | 1/21 at 100.00 | AA | | | 2,245,940 | |
| | 6,710 | | Los Angeles Department of Water and Power, California, Waterworks Revenue Bonds, Series 2014A, 5.000%, 7/01/44 | | 7/24 at 100.00 | AA | | | 7,766,624 | |
| | 1,485 | | Los Angeles, California, Wastewater System Revenue Bonds, Subordinate Lien, Refunding Series 2013A, 5.000%, 6/01/35 | | 6/23 at 100.00 | AA | | | 1,716,111 | |
| | 4,705 | | Madera Irrigation District. California, Water Revenue Refunding Bonds, Series 2008, 5.500%, 1/01/38 | | 1/18 at 100.00 | A– | | | 5,151,175 | |
| | 670 | | Metropolitan Water District of Southern California, Waterworks Revenue Bonds, Tender Option Bond Trust 09-8B, 17.896%, 7/01/35 (IF) (4) | | 7/19 at 100.00 | AAA | | | 1,057,582 | |
| | 3,380 | | Orange County Sanitation District, California, Certificates of Participation, Tender Option Bond Trust 11738, 18.337%, 8/01/29 (IF) | | 2/19 at 100.00 | AAA | | | 5,145,340 | |
| | 1,510 | | Orange County Sanitation District, California, Certificates of Participation, Tender Option Bond Trust 3020, 18.181%, 2/01/35 (IF) (4) | | 2/19 at 100.00 | AAA | | | 2,298,703 | |
| | 2,500 | | Pajaro Valley Water Management Agency, California, Revenue Certificates of Participation, Series 1999A, 5.750%, 3/01/29 – AMBAC Insured | | 3/15 at 100.00 | BBB+ | | | 2,502,625 | |
| | 3,500 | | Placerville Public Financing Authority, California, Wastewater System Refinancing and Improvement Project Revenue Bonds, Series 2006, 5.000%, 9/01/34 – SYNCORA GTY Insured | | 9/16 at 100.00 | N/R | | | 3,551,065 | |
| | 3,000 | | Sacramento County Sanitation Districts Financing Authority, California, Revenue Bonds, Sacramento Regional County Sanitation District, Series 2014A, 5.000%, 12/01/33 | | 6/24 at 100.00 | AA | | | 3,526,980 | |
| | 2,525 | | Sacramento County Sanitation Districts Financing Authority, California, Revenue Refunding Bonds, Series 2001, 5.500%, 12/01/20 – AMBAC Insured | | No Opt. Call | AA | | | 3,110,421 | |
| | | | San Diego Public Facilities Financing Authority, California, Sewerage Revenue Bonds, Refunding Series 2010A: | | | | | | | |
| | 11,320 | | 5.250%, 5/15/25 | | 5/20 at 100.00 | AA | | | 13,402,880 | |
| | 11,000 | | 5.250%, 5/15/26 | | 5/20 at 100.00 | AA | | | 13,024,000 | |
| | 12,000 | | 5.250%, 5/15/27 | | 5/20 at 100.00 | AA | | | 14,014,919 | |
| | 7,170 | | 5.250%, 5/15/28 | | 5/20 at 100.00 | AA | | | 8,358,356 | |
| | 5,580 | | San Francisco City and County Public Utilities Commission, California, Water Revenue Bonds, Series 2011A, 5.000%, 11/01/41 (UB) | | 11/21 at 100.00 | AA– | | | 6,328,222 | |
| | | | San Francisco City and County Public Utilities Commission, California, Water Revenue Bonds, Tender Option Bond Trust 2013-4A: | | | | | | | |
| | 750 | | 18.420%, 11/01/28 (IF) | | 11/21 at 100.00 | AA– | | | 1,355,910 | |
| | 750 | | 18.318%, 11/01/43 (IF) | | 5/22 at 100.00 | AA– | | | 1,147,170 | |
| | 4,000 | | West Basin Municipal Water District, California, Certificates of Participation, Refunding Series 2008B, 5.000%, 8/01/28 – AGC Insured | | 8/18 at 100.00 | AA | | | 4,486,360 | |
| | 188,215 | | Total Water and Sewer | | | | | | 217,768,515 | |
| $ | 2,372,315 | | Total Long-Term Investments (cost $2,176,186,075) | | | | | | 2,453,817,899 | |
| NAC | Nuveen California Dividend Advantage Municipal Fund | |
| | Portfolio of Investments (continued) | February 28, 2015 |
| | Principal | | | | Optional Call | | | | | |
| | Amount (000) | | Description (1) | | Provisions (2) | Ratings (3) | | | Value | |
| | | | SHORT-TERM INVESTMENTS – 1.2% (0.8% of Total Investments) | | | | | | | |
| | | | MUNICIPAL BONDS – 1.2% (0.8% of Total Investments) | | | | | | | |
| | | | Health Care – 1.2% (0.8% of Total Investments) | | | | | | | |
| $ | 16,630 | | California Statewide Community Development Authority, Revenue Bonds, Daughters of Charity Health System, Series 2014A, 6.000%, 7/10/15 (7) | | No Opt. Call | N/R | | $ | 16,771,854 | |
| | 1,620 | | California Statewide Community Development Authority, Revenue Bonds, Daughters of Charity Health System, Series 2014B, 6.000%, 7/10/15 (7) | | No Opt. Call | N/R | | | 1,633,818 | |
| | 2,460 | | California Statewide Community Development Authority, Revenue Bonds, Daughters of Charity Health System, Series 2014C, 6.000%, 7/10/15 (7) | | No Opt. Call | N/R | | | 2,480,984 | |
| $ | 20,710 | | Total Short-Term Investments (cost $20,710,000) | | | | | | 20,886,656 | |
| | | | Total Investments (cost $2,196,896,075) – 144.4% | | | | | | 2,474,704,555 | |
| | | | Floating Rate Obligations – (5.4)% | | | | | | (92,995,000 | ) |
| | | | Variable Rate Demand Preferred Shares, at Liquidation Value – (40.8)% (8) | | | | | | (699,600,000 | ) |
| | | | Other Assets Less Liabilities – 1.8% | | | | | | 31,518,711 | |
| | | | Net Assets Applicable to Common Shares – 100% | | | | | $ | 1,713,628,266 | |
| (1) | All percentages shown in the Portfolio of Investments are based on net assets applicable to common shares unless otherwise noted. |
| (2) | Optional Call Provisions (not covered by the report of independent registered public accounting firm): Dates (month and year) and prices of the earliest optional call or redemption. There may be other call provisions at varying prices at later dates. Certain mortgage-backed securities may be subject to periodic principal paydowns. |
| (3) | Ratings (not covered by the report of independent registered public accounting firm): Using the highest of Standard & Poor’s Group (“Standard & Poor’s”), Moody’s Investors Service, Inc. (“Moody’s”) or Fitch, Inc. (“Fitch”) rating. Ratings below BBB by Standard & Poor’s, Baa by Moody’s or BBB by Fitch are considered to be below investment grade. Holdings designated N/R are not rated by any of these national rating agencies. |
| (4) | Investment, or portion of investment, has been pledged to collateralize the net payment obligations for investments in inverse floating rate transactions. |
| (5) | As of, or subsequent to, the end of the reporting period this security is non-income producing. Non-income producing, in the case of a fixed-income security, generally denotes that the issuer has (1) defaulted on the payment of principal or interest, (2) is under the protection of the Federal Bankruptcy Court or (3) the Fund’s Adviser has concluded that the issue is not likely to meet its future interest payment obligations and has ceased accruing additional income on the Fund’s records. |
| (6) | Backed by an escrow or trust containing sufficient U.S. Government or U.S. Government agency securities, which ensure the timely payment of principal and interest. Certain bonds backed by U.S. Government or agency securities are regarded as having an implied rating equal to the rating of such securities. |
| (7) | Investment valued at fair value using methods determined in good faith by, or at the discretion of, the Board. For fair value measurement disclosure purposes, investment classified as Level 3. See Notes to Financial Statements, Note 2 – Investment Valuation and Fair Value Measurements for more information. |
| (8) | Variable Rate Demand Preferred Shares, at Liquidation Value as a percentage of Total Investments is 28.3%. |
| (ETM) | Escrowed to maturity. |
| (IF) | Inverse floating rate investment. |
| (UB) | Underlying bond of an inverse floating rate trust reflected as a financing transaction. See Notes to Financial Statements, Note 3 – Portfolio Securities and Investments in Derivatives, Inverse Floating Rate Securities for more information. |
See accompanying notes to financial statements.
| NVX | | |
| | Nuveen California Dividend Advantage Municipal Fund 2 | |
| | Portfolio of Investments | February 28, 2015 |
| | Principal | | | | Optional Call | | | | | |
| | Amount (000) | | Description (1) | | Provisions (2) | Ratings (3) | | | Value | |
| | | | LONG-TERM INVESTMENTS – 138.7% (99.5% of Total Investments) | | | | | | | |
| | | | MUNICIPAL BONDS – 138.7% (99.5% of Total Investments) | | | | | | | |
| | | | Consumer Staples – 7.6% (5.5% of Total Investments) | | | | | | | |
| | | | California County Tobacco Securitization Agency, Tobacco Settlement Asset-Backed Bonds, Los Angeles County Securitization Corporation, Series 2006A: | | | | | | | |
| $ | 2,000 | | 5.600%, 6/01/36 | | 12/18 at 100.00 | B+ | | $ | 1,861,320 | |
| | 2,000 | | 5.650%, 6/01/41 | | 12/18 at 100.00 | B+ | | | 1,800,880 | |
| | 290 | | California County Tobacco Securitization Agency, Tobacco Settlement Asset-Backed Bonds, Sonoma County Tobacco Securitization Corporation, Series 2005, 4.250%, 6/01/21 | | 6/15 at 100.00 | BBB+ | | | 289,997 | |
| | 2,385 | | California County Tobacco Securitization Agency, Tobacco Settlement Asset-Backed Bonds, Stanislaus County Tobacco Funding Corporation, Series 2002A, 5.500%, 6/01/33 | | 5/15 at 100.00 | Baa1 | | | 2,385,048 | |
| | | | Golden State Tobacco Securitization Corporation, California, Tobacco Settlement Asset-Backed Bonds, Series 2007A-1: | | | | | | | |
| | 3,770 | | 5.000%, 6/01/33 | | 6/17 at 100.00 | B | | | 3,191,569 | |
| | 6,040 | | 5.750%, 6/01/47 | | 6/17 at 100.00 | B | | | 5,193,615 | |
| | 3,660 | | Golden State Tobacco Securitization Corporation, California, Tobacco Settlement Asset-Backed Bonds, Series 2007A-2, 5.300%, 6/01/37 | | 6/22 at 100.00 | B | | | 3,093,176 | |
| | 20,145 | | Total Consumer Staples | | | | | | 17,815,605 | |
| | | | Education and Civic Organizations – 2.9% (2.0% of Total Investments) | | | | | | | |
| | 1,775 | | ABAG Finance Authority for Non-Profit Corporations, California, Revenue Bonds, The Jackson Laboratory, Series 2012, 5.000%, 7/01/37 | | 7/22 at 100.00 | A1 | | | 1,993,698 | |
| | 125 | | California Educational Facilities Authority, Revenue Bonds, University of the Pacific, Series 2006, 5.000%, 11/01/21 | | 11/15 at 100.00 | A2 | | | 128,826 | |
| | 555 | | California Municipal Finance Authority, Charter School Revenue Bonds, Rocketship Education – Multiple Projects, Series 2014A, 7.250%, 6/01/43 | | 6/22 at 102.00 | N/R | | | 632,839 | |
| | 2,500 | | California Municipal Finance Authority, Revenue Bonds, University of La Verne, Series 2010A, 6.250%, 6/01/40 | | 6/20 at 100.00 | Baa1 | | | 2,931,425 | |
| | 850 | | California Statewide Communities Development Authority, School Facility Revenue Bonds, Alliance College-Ready Public Schools, Series 2011A, 7.000%, 7/01/46 | | 7/21 at 100.00 | BBB– | | | 981,606 | |
| | 5,805 | | Total Education and Civic Organizations | | | | | | 6,668,394 | |
| | | | Health Care – 20.4% (14.7% of Total Investments) | | | | | | | |
| | 395 | | California Health Facilities Financing Authority, Revenue Bonds, Lucile Salter Packard Children’s Hospital, Series 2014A, 5.000%, 8/15/43 | | 8/24 at 100.00 | AA | | | 451,284 | |
| | 435 | | California Health Facilities Financing Authority, Revenue Bonds, Providence Health & Services, Series 2014A, 5.000%, 10/01/38 | | 10/24 at 100.00 | AA | | | 501,955 | |
| | 855 | | California Health Facilities Financing Authority, Revenue Bonds, Providence Health & Services, Series 2014B, 5.000%, 10/01/44 | | 10/24 at 100.00 | AA | | | 973,674 | |
| | 895 | | California Health Facilities Financing Authority, Revenue Bonds, Rady Children’s Hospital – San Diego, Series 2011, 5.250%, 8/15/41 | | 8/21 at 100.00 | AA– | | | 1,013,963 | |
| | 1,500 | | California Health Facilities Financing Authority, Revenue Bonds, Sutter Health, Series 2007A, 5.250%, 11/15/46 | | 11/16 at 100.00 | AA– | | | 1,617,735 | |
| | 4,215 | | California Municipal Financing Authority, Certificates of Participation, Community Hospitals of Central California, Series 2007, 5.250%, 2/01/27 | | 2/17 at 100.00 | Baa1 | | | 4,435,023 | |
| | 5,520 | | California Statewide Communities Development Authority, Revenue Bonds, Adventist Health System West, Series 2005A, 5.000%, 3/01/35 | | 3/15 at 100.00 | A | | | 5,530,819 | |
| | 3,200 | | California Statewide Communities Development Authority, Revenue Bonds, Kaiser Permanente, Series 2012A, 5.000%, 4/01/42 | | 4/22 at 100.00 | A+ | | | 3,579,040 | |
| | 2,225 | | California Statewide Communities Development Authority, Revenue Bonds, ValleyCare Health System, Series 2007A, 5.125%, 7/15/31 | | 7/17 at 100.00 | N/R | | | 2,291,995 | |
| NVX | Nuveen California Dividend Advantage Municipal Fund 2 | |
| | Portfolio of Investments (continued) | February 28, 2015 |
| | Principal | | | | Optional Call | | | | | |
| | Amount (000) | | Description (1) | | Provisions (2) | Ratings (3) | | | Value | |
| | | | Health Care (continued) | | | | | | | |
| $ | 5,245 | | California Statewide Community Development Authority, Revenue Bonds, Daughters of Charity Health System, Series 2005A, 5.250%, 7/01/35 | | 7/15 at 100.00 | CCC | | $ | 4,968,536 | |
| | 425 | | California Statewide Community Development Authority, Revenue Bonds, Kaiser Permanente System, Series 2001C, 5.250%, 8/01/31 | | 8/16 at 100.00 | A+ | | | 449,476 | |
| | 1,035 | | California Statewide Community Development Authority, Revenue Bonds, Sutter Health, Series 2004D, 5.050%, 8/15/38 – AGM Insured | | 8/18 at 100.00 | AA | | | 1,119,963 | |
| | 2,705 | | California Statewide Community Development Authority, Revenue Bonds, Sutter Health, Series 2005A, 5.000%, 11/15/43 | | 11/15 at 100.00 | AA– | | | 2,787,394 | |
| | 1,610 | | Madera County, California, Certificates of Participation, Children’s Hospital Central California, Series 2010, 5.375%, 3/15/36 | | 3/20 at 100.00 | A+ | | | 1,822,584 | |
| | 455 | | Oak Valley Hospital District, Stanislaus County, California, Revenue Bonds, Series 2010A, 6.500%, 11/01/29 | | 11/20 at 100.00 | BB | | | 481,426 | |
| | 1,500 | | Palomar Pomerado Health Care District, California, Certificates of Participation, Series 2009, 6.625%, 11/01/29 | | 11/19 at 100.00 | Ba1 | | | 1,684,035 | |
| | 4,800 | | Palomar Pomerado Health Care District, California, Certificates of Participation, Series 2010, 6.000%, 11/01/41 | | 11/20 at 100.00 | Ba1 | | | 5,146,944 | |
| | 5,785 | | Rancho Mirage Joint Powers Financing Authority, California, Revenue Bonds, Eisenhower Medical Center, Series 2007A, 5.000%, 7/01/38 | | 7/17 at 100.00 | Baa2 | | | 6,057,531 | |
| | 2,250 | | San Buenaventura, California, Revenue Bonds, Community Memorial Health System, Series 2011, 7.500%, 12/01/41 | | 12/21 at 100.00 | BB | | | 2,766,960 | |
| | 45,050 | | Total Health Care | | | | | | 47,680,337 | |
| | | | Housing/Multifamily – 1.5% (1.1% of Total Investments) | | | | | | | |
| | 1,295 | | California Municipal Finance Authority, Mobile Home Park Revenue Bonds, Caritas Projects Series 2010A, 6.400%, 8/15/45 | | 8/20 at 100.00 | BBB | | | 1,447,590 | |
| | 410 | | California Municipal Finance Authority, Mobile Home Park Revenue Bonds, Caritas Projects Series 2012A, 5.500%, 8/15/47 | | 8/22 at 100.00 | BBB | | | 449,348 | |
| | 940 | | California Municipal Finance Authority, Mobile Home Park Revenue Bonds, Caritas Projects Series 2012B, 7.250%, 8/15/47 | | 8/22 at 100.00 | A1 | | | 1,066,533 | |
| | | | California Municipal Finance Authority, Mobile Home Park Senior Revenue Bonds, Caritas Affordable Housing, Inc. Projects, Series 2014A: | | | | | | | |
| | 80 | | 5.250%, 8/15/39 | | 8/24 at 100.00 | BBB | | | 88,280 | |
| | 220 | | 5.250%, 8/15/49 | | 8/24 at 100.00 | BBB | | | 241,397 | |
| | 205 | | Independent Cities Lease Finance Authority, California, Mobile Home Park Revenue Bonds, San Juan Mobile Estates, Series 2006B, 5.850%, 5/15/41 | | 5/16 at 100.00 | N/R | | | 208,368 | |
| | 3,150 | | Total Housing/Multifamily | | | | | | 3,501,516 | |
| | | | Housing/Single Family – 3.2% (2.3% of Total Investments) | | | | | | | |
| | 5,775 | | California Housing Finance Agency, California, Home Mortgage Revenue Bonds, Series 2006M, 4.650%, 8/01/31 (Alternative Minimum Tax) | | 2/16 at 100.00 | A– | | | 5,787,532 | |
| | 1,490 | | California Housing Finance Agency, California, Home Mortgage Revenue Bonds, Series 2007G, 5.050%, 2/01/29 (Alternative Minimum Tax) | | 2/17 at 100.00 | A– | | | 1,528,293 | |
| | 65 | | California Housing Finance Agency, Home Mortgage Revenue Bonds, Series 2006H, 5.750%, 8/01/30 – FGIC Insured (Alternative Minimum Tax) | | 2/16 at 100.00 | A– | | | 67,835 | |
| | 7,330 | | Total Housing/Single Family | | | | | | 7,383,660 | |
| | | | Industrials – 0.0% (0.0% of Total Investments) | | | | | | | |
| | 3,175 | | California Statewide Communities Development Authority, Revenue Bonds, EnerTech Regional Biosolids Project, Series 2007A, 5.500%, 12/01/33 (Alternative Minimum Tax) (4) | | No Opt. Call | N/R | | | 10,954 | |
| | | | Tax Obligation/General – 31.3% (22.4% of Total Investments) | | | | | | | |
| | 1,300 | | Alhambra Unified School District, Los Angeles County, California, General Obligation Bonds, Refunding Series 2012A, 5.000%, 8/01/29 – AGM Insured | | 8/22 at 100.00 | Aa3 | | | 1,495,273 | |
| | Principal | | | | Optional Call | | | | | |
| | Amount (000) | | Description (1) | | Provisions (2) | Ratings (3) | | | Value | |
| | | | Tax Obligation/General (continued) | | | | | | | |
| $ | 10,000 | | California State, General Obligation Bonds, Series 2006CD, 4.600%, 12/01/32 (Alternative Minimum Tax) | | 12/15 at 100.00 | AA | | $ | 10,144,800 | |
| | 675 | | California State, General Obligation Bonds, Various Purpose Refunding Series 2014, 5.000%, 8/01/33 | | 8/24 at 100.00 | Aa3 | | | 789,966 | |
| | 13,850 | | California State, General Obligation Bonds, Various Purpose Series 2009, 6.000%, 4/01/38 | | 4/19 at 100.00 | Aa3 | | | 16,633,573 | |
| | | | California State, General Obligation Bonds, Various Purpose Series 2010: | | | | | | | |
| | 2,000 | | 6.000%, 3/01/33 | | 3/20 at 100.00 | Aa3 | | | 2,433,980 | |
| | 1,000 | | 5.250%, 11/01/40 | | 11/20 at 100.00 | Aa3 | | | 1,171,830 | |
| | | | California State, General Obligation Bonds, Various Purpose Series 2011: | | | | | | | |
| | 4,850 | | 5.250%, 10/01/28 | | No Opt. Call | Aa3 | | | 5,753,313 | |
| | 2,300 | | 5.000%, 9/01/41 | | 9/21 at 100.00 | Aa3 | | | 2,594,883 | |
| | 2,190 | | 5.000%, 10/01/41 | | 10/21 at 100.00 | Aa3 | | | 2,473,999 | |
| | | | California State, General Obligation Bonds, Various Purpose Series 2013: | | | | | | | |
| | 2,500 | | 5.000%, 2/01/43 | | No Opt. Call | Aa3 | | | 2,839,075 | |
| | 2,240 | | 5.000%, 11/01/43 | | 11/23 at 100.00 | Aa3 | | | 2,568,899 | |
| | | | California State, General Obligation Bonds, Various Purpose Series 2014: | | | | | | | |
| | 2,000 | | 5.000%, 5/01/32 | | 5/24 at 100.00 | Aa3 | | | 2,339,740 | |
| | 2,815 | | 5.000%, 10/01/44 | | 10/24 at 100.00 | Aa3 | | | 3,248,285 | |
| | 32,730 | | Desert Community College District, Riverside County, California, General Obligation Bonds, Election 2004 Series 2007C, 0.000%, 8/01/46 – AGM Insured | | No Opt. Call | AA | | | 6,410,171 | |
| | 1,285 | | Los Angeles Unified School District, Los Angeles County, California, General Obligation Bonds, Series 2009D, 5.000%, 7/01/27 | | 7/19 at 100.00 | Aa2 | | | 1,486,334 | |
| | 1,265 | | Palomar Pomerado Health, California, General Obligation Bonds, Election of 2004, Series 2007A, 5.000%, 8/01/32 – NPFG Insured | | 8/17 at 100.00 | AA– | | | 1,359,167 | |
| | 2,000 | | Puerto Rico, General Obligation Bonds, Public Improvement Series 2002A, 5.500%, 7/01/20 – NPFG Insured | | No Opt. Call | AA– | | | 2,143,460 | |
| | 21,000 | | San Marcos Unified School District, San Diego County, California, General Obligation Bonds, 2010 Election, Series 2012B, 0.000%, 8/01/51 | | No Opt. Call | AA– | | | 4,249,560 | |
| | 1,000 | | Southwestern Community College District, San Diego County, California, General Obligation Bonds, Election of 2008, Series 2011C, 5.250%, 8/01/36 | | 8/21 at 100.00 | Aa2 | | | 1,135,630 | |
| | 1,600 | | Yuba Community College District, California, General Obligation Bonds, Election 2006 Series 2011C, 5.250%, 8/01/47 | | 8/21 at 100.00 | Aa2 | | | 1,789,968 | |
| | 108,600 | | Total Tax Obligation/General | | | | | | 73,061,906 | |
| | | | Tax Obligation/Limited – 29.2% (20.9% of Total Investments) | | | | | | | |
| | | | Beaumont Financing Authority, California, Local Agency Revenue Bonds, Series 2004D: | | | | | | | |
| | 650 | | 5.500%, 9/01/24 | | 9/16 at 100.00 | N/R | | | 664,397 | |
| | 385 | | 5.800%, 9/01/35 | | 9/16 at 100.00 | N/R | | | 393,378 | |
| | 7,000 | | California State Public Works Board, Lease Revenue Bonds, Department of Corrections & Rehabilitation, Various Correctional Facilities Series 2013F, 5.250%, 9/01/31 | | 9/23 at 100.00 | A1 | | | 8,273,300 | |
| | 3,525 | | California State Public Works Board, Lease Revenue Bonds, Department of Corrections & Rehabilitation, Various Correctional Facilities Series 2014A, 5.000%, 9/01/39 | | 9/24 at 100.00 | A1 | | | 4,047,969 | |
| | 3,770 | | California State Public Works Board, Lease Revenue Bonds, Various Capital Projects, Series 2012G, 5.000%, 11/01/37 | | 11/22 at 100.00 | A1 | | | 4,286,264 | |
| | 4,520 | | California State Public Works Board, Lease Revenue Bonds, Various Capital Projects, Series 2014E, 5.000%, 9/01/39 | | 9/24 at 100.00 | A1 | | | 5,190,587 | |
| | 435 | | Capistrano Unified School District, Orange County, California, Special Tax Bonds, Community Facilities District 98-2, Series 2005, 5.000%, 9/01/24 – FGIC Insured | | 9/15 at 100.00 | AA– | | | 444,096 | |
| | 4,265 | | Escondido Joint Powers Financing Authority, California, Revenue Bonds, Water System Financing, Series 2012, 5.000%, 9/01/41 | | 3/22 at 100.00 | AA– | | | 4,740,889 | |
| | 960 | | Fontana Redevelopment Agency, San Bernardino County, California, Tax Allocation Bonds, Jurupa Hills Redevelopment Project, Refunding Series 1997A, 5.500%, 10/01/27 | | 10/15 at 100.00 | A– | | | 962,640 | |
| NVX | Nuveen California Dividend Advantage Municipal Fund 2 | |
| | Portfolio of Investments (continued) | February 28, 2015 |
| | Principal | | | | Optional Call | | | | | |
| | Amount (000) | | Description (1) | | Provisions (2) | Ratings (3) | | | Value | |
| | | | Tax Obligation/Limited (continued) | | | | | | | |
| | | | Golden State Tobacco Securitization Corporation, California, Enhanced Tobacco Settlement Asset-Backed Revenue Bonds, Series 2005A: | | | | | | | |
| $ | 2,500 | | 5.000%, 6/01/45 | | 6/15 at 100.00 | A1 | | $ | 2,528,900 | |
| | 2,995 | | 5.000%, 6/01/45 – AGM Insured | | 6/15 at 100.00 | AA | | | 3,029,622 | |
| | 1,785 | | Hawthorne Community Redevelopment Agency, California, Project Area 2 Tax Allocation Bonds, Series 2006, 5.250%, 9/01/36 – SYNCORA GTY Insured | | 9/16 at 100.00 | N/R | | | 1,841,228 | |
| | 1,800 | | Hesperia Unified School District, San Bernardino County, California, Certificates of Participation, Capital Improvement, Series 2007, 5.000%, 2/01/41 – AMBAC Insured | | 2/17 at 100.00 | A– | | | 1,916,766 | |
| | 1,500 | | Hesperia Unified School District, San Bernardino County, California, Certificates of Participation, Series 2013A, 5.000%, 2/01/38 – BAM Insured | | 2/23 at 100.00 | AA | | | 1,648,020 | |
| | 870 | | Inglewood Redevelopment Agency, California, Tax Allocation Bonds, Merged Redevelopment Project, Subordinate Lien Series 2007A-1, 5.000%, 5/01/23 – AMBAC Insured | | 5/17 at 100.00 | BBB+ | | | 912,848 | |
| | | | Irvine Unified School District, California, Special Tax Bonds, Community Facilities District Series 2006A: | | | | | | | |
| | 205 | | 5.000%, 9/01/26 | | 9/16 at 100.00 | N/R | | | 210,268 | |
| | 470 | | 5.125%, 9/01/36 | | 9/16 at 100.00 | N/R | | | 481,294 | |
| | 415 | | Lammersville School District, San Joaquin County, California, Special Tax Bonds, Community Facilities District 2002 Mountain House, Series 2006, 5.125%, 9/01/35 | | 9/16 at 100.00 | N/R | | | 432,123 | |
| | 800 | | Los Angeles Community Redevelopment Agency, California, Lease Revenue Bonds, Manchester Social Services Project, Series 2005, 5.000%, 9/01/37 – AMBAC Insured | | 9/15 at 100.00 | A1 | | | 808,704 | |
| | 1,350 | | Los Angeles County Public Works Financing Authority, California, Lease Revenue Bonds, Multiple Capital Facilities Project II, Series 2012, 5.000%, 8/01/42 | | No Opt. Call | AA | | | 1,514,228 | |
| | 750 | | Lynwood Redevelopment Agency, California, Project A Revenue Bonds, Subordinate Lien Series 2011A, 7.000%, 9/01/31 | | 9/21 at 100.00 | A– | | | 944,100 | |
| | 475 | | National City Community Development Commission, California, Tax Allocation Bonds, National City Redevelopment Project, Series 2011, 6.500%, 8/01/24 | | 8/21 at 100.00 | A– | | | 605,297 | |
| | 475 | | North Natomas Community Facilities District 4, Sacramento, California, Special Tax Bonds, Series 2006D, 5.000%, 9/01/33 | | 9/15 at 101.00 | N/R | | | 486,319 | |
| | 175 | | Novato Redevelopment Agency, California, Tax Allocation Bonds, Hamilton Field Redevelopment Project, Series 2011, 6.750%, 9/01/40 | | 9/21 at 100.00 | BBB+ | | | 213,822 | |
| | 200 | | Patterson Public Finance Authority, California, Revenue Bonds, Community Facilities District 2001-1, Subordinate Lien Series 2013B, 5.875%, 9/01/39 | | 9/23 at 100.00 | N/R | | | 230,382 | |
| | | | Patterson Public Financing Authority, California, Revenue Bonds, Community Facilities District 2001-1, Senior Series 2013A: | | | | | | | |
| | 1,200 | | 5.250%, 9/01/30 | | 9/23 at 100.00 | N/R | | | 1,369,524 | |
| | 1,080 | | 5.750%, 9/01/39 | | 9/23 at 100.00 | N/R | | | 1,249,204 | |
| | 3,085 | | Pittsburg Redevelopment Agency, California, Tax Allocation Bonds, Los Medanos Community Development Project, Refunding Series 2008A, 6.500%, 9/01/28 | | 9/18 at 100.00 | BBB– | | | 3,439,004 | |
| | 6,275 | | Puerto Rico Sales Tax Financing Corporation, Sales Tax Revenue Bonds, Series 2007A, 0.000%, 8/01/45 – NPFG Insured | | No Opt. Call | AA– | | | 838,591 | |
| | 550 | | Rancho Santa Fe CSD Financing Authority, California, Revenue Bonds, Superior Lien Series 2011A, 5.750%, 9/01/30 | | 9/21 at 100.00 | BBB+ | | | 631,840 | |
| | 100 | | Riverside County Redevelopment Agency, California, Tax Allocation Bonds, Jurupa Valley Project Area, Series 2011B, 6.500%, 10/01/25 | | 10/21 at 100.00 | A– | | | 125,438 | |
| | | | San Buenaventura Redevelopment Agency, California, Merged Project Areas Tax Allocation Bonds, Series 2008: | | | | | | | |
| | 1,000 | | 7.750%, 8/01/28 | | 8/16 at 102.00 | A | | | 1,108,690 | |
| | 1,325 | | 8.000%, 8/01/38 | | 8/16 at 102.00 | A | | | 1,473,652 | |
| | 3,000 | | San Diego County Regional Transportation Commission, California, Sales Tax Revenue Bonds, Series 2014A, 5.000%, 4/01/36 | | 4/24 at 100.00 | AAA | | | 3,508,230 | |
| | 990 | | San Diego, California, Special Tax Community Facilities District 4 Black Mountain Ranch Villages Bonds, Series 2008A, 6.000%, 9/01/37 | | 9/15 at 103.00 | N/R | | | 1,032,431 | |
| | Principal | | | | Optional Call | | | | | |
| | Amount (000) | | Description (1) | | Provisions (2) | Ratings (3) | | | Value | |
| | | | Tax Obligation/Limited (continued) | | | | | | | |
| $ | 210 | | San Francisco City and County Redevelopment Agency Successor Agency, California, Special Tax Bonds, Community Facilities District 7, Hunters Point Shipyard Phase One Improvements, Refunding Series 2014, 5.000%, 8/01/39 | | No Opt. Call | N/R | | $ | 231,630 | |
| | 80 | | San Francisco Redevelopment Finance Authority, California, Tax Allocation Revenue Bonds, Mission Bay North Redevelopment Project, Series 2011C, 6.750%, 8/01/41 | | 2/21 at 100.00 | A– | | | 98,098 | |
| | | | San Francisco Redevelopment Financing Authority, California, Tax Allocation Revenue Bonds, Mission Bay South Redevelopment Project, Series 2011D: | | | | | | | |
| | 85 | | 7.000%, 8/01/33 | | 2/21 at 100.00 | BBB+ | | | 103,666 | |
| | 105 | | 7.000%, 8/01/41 | | 2/21 at 100.00 | BBB+ | | | 128,058 | |
| | | | San Jose Redevelopment Agency, California, Tax Allocation Bonds, Merged Area Redevelopment Project, Series 2006C: | | | | | | | |
| | 1,100 | | 5.000%, 8/01/24 – NPFG Insured | | 8/17 at 100.00 | AA– | | | 1,179,662 | |
| | 765 | | 5.000%, 8/01/25 – NPFG Insured | | 8/17 at 100.00 | AA– | | | 820,401 | |
| | 995 | | San Jose Redevelopment Agency, California, Tax Allocation Bonds, Merged Area Redevelopment Project, Series 2006D, 5.000%, 8/01/23 – AMBAC Insured | | 8/17 at 100.00 | BBB+ | | | 1,078,102 | |
| | 1,530 | | San Marcos Public Facilities Authority, California, Tax Allocation Bonds, Project Areas 2 and 3, Series 2005C, 5.000%, 8/01/35 – AMBAC Insured | | 8/15 at 100.00 | A– | | | 1,538,094 | |
| | 140 | | Signal Hill Redevelopment Agency, California, Project 1 Tax Allocation Bonds, Series 2011, 7.000%, 10/01/26 | | 4/21 at 100.00 | N/R | | | 161,346 | |
| | 930 | | Temecula Public Financing Authority, California, Special Tax Bonds, Community Facilities District 03-02 Roripaugh, Series 2006, 5.500%, 9/01/36 | | 9/15 at 101.00 | N/R | | | 931,590 | |
| | 240 | | Yorba Linda Redevelopment Agency, Orange County, California, Tax Allocation Revenue Bonds, Yorba Linda Redevelopment Project, Subordinate Lien Series 2011A, 6.500%, 9/01/32 | | 9/21 at 100.00 | A– | | | 294,977 | |
| | 67,060 | | Total Tax Obligation/Limited | | | | | | 68,149,669 | |
| | | | Transportation – 10.3% (7.4% of Total Investments) | | | | | | | |
| | 2,000 | | Bay Area Toll Authority, California, Revenue Bonds, San Francisco Bay Area Toll Bridge, Series 2013S-4, 5.250%, 4/01/48 | | 4/23 at 100.00 | A+ | | | 2,290,760 | |
| | 2,240 | | Foothill/Eastern Transportation Corridor Agency, California, Toll Road Revenue Bonds, Refunding Junior Lien Series 2013C, 6.500%, 1/15/43 | | 1/24 at 100.00 | BB+ | | | 2,697,878 | |
| | | | Foothill/Eastern Transportation Corridor Agency, California, Toll Road Revenue Bonds, Refunding Series 2013A: | | | | | | | |
| | 4,940 | | 5.750%, 1/15/46 | | 1/24 at 100.00 | BBB– | | | 5,794,521 | |
| | 4,935 | | 6.000%, 1/15/53 | | 1/24 at 100.00 | BBB– | | | 5,840,819 | |
| | 4,000 | | Los Angeles Harbors Department, California, Revenue Bonds, Refunding Series 2014B, 5.000%, 8/01/44 | | 8/24 at 100.00 | AA | | | 4,627,720 | |
| | | | Port of Oakland, California, Revenue Bonds, Refunding Series 2012P: | | | | | | | |
| | 1,545 | | 5.000%, 5/01/29 (Alternative Minimum Tax) | | No Opt. Call | A+ | | | 1,751,675 | |
| | 1,000 | | 5.000%, 5/01/31 (Alternative Minimum Tax) | | No Opt. Call | A+ | | | 1,121,390 | |
| | 20,660 | | Total Transportation | | | | | | 24,124,763 | |
| | | | U.S. Guaranteed – 8.3% (5.9% of Total Investments) (5) | | | | | | | |
| | 1,930 | | Bay Area Toll Authority, California, Revenue Bonds, San Francisco Bay Area Toll Bridge, Series 2006F, 5.000%, 4/01/31 (Pre-refunded 4/01/16) (UB) | | 4/16 at 100.00 | AA (5) | | | 2,031,113 | |
| | 1,430 | | Bay Area Toll Authority, California, Revenue Bonds, San Francisco Bay Area Toll Bridge, Tender Option Bond Trust 3211, 13.614%, 10/01/32 (Pre-refunded 4/01/18) (IF) | | 4/18 at 100.00 | AA (5) | | | 2,101,957 | |
| | 2,500 | | California Health Facilities Financing Authority, Revenue Bonds, Catholic Healthcare West, Series 2008J, 5.625%, 7/01/32 (Pre-refunded 7/01/15) | | 7/15 at 100.00 | A (5) | | | 2,547,500 | |
| | 2,945 | | California State Public Works Board, Lease Revenue Bonds, University of California Regents, Tender Option Bond Trust 1065, 9.446%, 3/01/33 (Pre-refunded 3/01/18) (IF) | | 3/18 at 100.00 | Aaa | | | 3,689,319 | |
| | 385 | | California Statewide Community Development Authority, Revenue Bonds, Thomas Jefferson School of Law, Series 2005A, 4.875%, 10/01/31 (Pre-refunded 10/01/15) | | 10/15 at 100.00 | N/R (5) | | | 394,317 | |
| | 2,000 | | Loma Linda, California, Hospital Revenue Bonds, Loma Linda University Medical Center, Series 2008A, 8.250%, 12/01/38 (Pre-refunded 12/01/17) | | 12/17 at 100.00 | BBB (5) | | | 2,410,940 | |
| NVX | Nuveen California Dividend Advantage Municipal Fund 2 | |
| | Portfolio of Investments (continued) | February 28, 2015 |
| | Principal | | | | Optional Call | | | | | |
| | Amount (000) | | Description (1) | | Provisions (2) | Ratings (3) | | | Value | |
| | | | U.S. Guaranteed (5) (continued) | | | | | | | |
| $ | 2,000 | | Puerto Rico Public Finance Corporation, Commonwealth Appropriation Bonds, Series 2002E, 6.000%, 8/01/26 (ETM) | | No Opt. Call | B (5) | | $ | 2,602,020 | |
| | 355 | | Roseville Joint Union High School District, Placer County, California, General Obligation Bonds, Series 2006B, 5.000%, 8/01/27 (Pre-refunded 8/01/15) – FGIC Insured | | 8/15 at 100.00 | AA (5) | | | 362,441 | |
| | 750 | | Sacramento County Sanitation Districts Financing Authority, California, Revenue Bonds, Series 2006, 5.000%, 12/01/31 (Pre-refunded 6/01/16) – FGIC Insured | | 6/16 at 100.00 | AA (5) | | | 795,105 | |
| | 825 | | San Mateo Union High School District, San Mateo County, California, Certificates of Participation, Phase 1, Series 2007A, 5.000%, 12/15/30 (Pre-refunded 12/15/17) – AMBAC Insured | | 12/17 at 100.00 | N/R (5) | �� | | 924,478 | |
| | 1,315 | | University of California, Limited Project Revenue Bonds, Series 2007D, 5.000%, 5/15/41 (Pre-refunded 5/15/16) – FGIC Insured | | 5/16 at 101.00 | AA– (5) | | | 1,392,822 | |
| | 16,435 | | Total U.S. Guaranteed | | | | | | 19,252,012 | |
| | | | Utilities – 11.9% (8.6% of Total Investments) | | | | | | | |
| | 2,355 | | Long Beach Bond Finance Authority, California, Natural Gas Purchase Revenue Bonds, Series 2007A, 5.000%, 11/15/35 | | No Opt. Call | A | | | 2,750,145 | |
| | 500 | | Los Angeles Department of Water and Power, California, Power System Revenue Bonds, Series 2005A-1, 5.000%, 7/01/31 – AGM Insured | | 7/15 at 100.00 | AA | | | 508,760 | |
| | 14,000 | | Los Angeles Department of Water and Power, California, Power System Revenue Bonds, Series 2012B, 5.000%, 7/01/43 | | 7/22 at 100.00 | AA– | | | 15,822,940 | |
| | | | Merced Irrigation District, California, Electric System Revenue Bonds, Series 2005: | | | | | | | |
| | 790 | | 5.125%, 9/01/31 – SYNCORA GTY Insured | | 9/15 at 100.00 | N/R | | | 796,525 | |
| | 1,500 | | 5.250%, 9/01/36 – SYNCORA GTY Insured | | 9/15 at 100.00 | N/R | | | 1,512,030 | |
| | 1,500 | | Southern California Public Power Authority, California, Revenue Bonds, Apex Power Project Series 2014A, 5.000%, 7/01/38 | | 7/24 at 100.00 | AA– | | | 1,744,155 | |
| | 4,000 | | Southern California Public Power Authority, Natural Gas Project 1 Revenue Bonds, Series 2007A, 5.000%, 11/01/33 | | No Opt. Call | A | | | 4,738,440 | |
| | 24,645 | | Total Utilities | | | | | | 27,872,995 | |
| | | | Water and Sewer – 12.1% (8.7% of Total Investments) | | | | | | | |
| | 2,500 | | Bay Area Water Supply and Conservation Agency, California, Revenue Bonds, Capital Cost Recovery Prepayment Program, Series 2013A, 5.000%, 10/01/28 | | 4/23 at 100.00 | AA– | | | 2,982,150 | |
| | 5,240 | | California Pollution Control Financing Authority, Water Furnishing Revenue Bonds, Poseidon Resources Channelside LP Desalination Project, Series 2012, 5.000%, 11/21/45 (Alternative Minimum Tax) | | No Opt. Call | Baa3 | | | 5,677,854 | |
| | 1,400 | | Castaic Lake Water Agency, California, Certificates of Participation, Series 2006C, 5.000%, 8/01/36 – NPFG Insured | | 8/16 at 100.00 | AA– | | | 1,479,422 | |
| | 545 | | Healdsburg Public Financing Authority, California, Wastewater Revenue Bonds, Series 2006, 5.000%, 4/01/36 – NPFG Insured | | 4/16 at 100.00 | AA– | | | 569,601 | |
| | 7,890 | | Los Angeles Department of Water and Power, California, Waterworks Revenue Bonds, Series 2014A, 5.000%, 7/01/44 | | 7/24 at 100.00 | AA | | | 9,132,438 | |
| | 1,160 | | Metropolitan Water District of Southern California, Waterworks Revenue Bonds, Tender Option Bond Trust 09-8B, 17.896%, 7/01/35 (IF) (6) | | 7/19 at 100.00 | AAA | | | 1,831,037 | |
| | 5,825 | | Sacramento, California, Wastewater Revenue Bonds, Series 2013, 5.000%, 9/01/42 | | 9/23 at 100.00 | AA | | | 6,624,015 | |
| | 24,560 | | Total Water and Sewer | | | | | | 28,296,517 | |
| $ | 346,615 | | Total Long-Term Investments (cost $295,502,285) | | | | | | 323,818,328 | |
| | Principal | | | | Optional Call | | | | | |
| | Amount (000) | | Description (1) | | Provisions (2) | Ratings (3) | | | Value | |
| | | | SHORT-TERM INVESTMENTS – 0.7% (0.5% of Total Investments) | | | | | | | |
| | | | MUNICIPAL BONDS – 0.7% (0.5% of Total Investments) | | | | | | | |
| | | | Health Care – 0.7% (0.5% of Total Investments) | | | | | | | |
| $ | 1,320 | | California Statewide Community Development Authority, Revenue Bonds, Daughters of Charity Health System, Series 2014A, 6.000%, 7/10/15 (7) | | No Opt. Call | N/R | | $ | 1,331,260 | |
| | 125 | | California Statewide Community Development Authority, Revenue Bonds, Daughters of Charity Health System, Series 2014B, 6.000%, 7/10/15 (7) | | No Opt. Call | N/R | | | 126,066 | |
| | 200 | | California Statewide Community Development Authority, Revenue Bonds, Daughters of Charity Health System, Series 2014C, 6.000%, 7/10/15 (7) | | No Opt. Call | N/R | | | 201,706 | |
| $ | 1,645 | | Total Short-Term Investments (cost $1,645,000) | | | | | | 1,659,032 | |
| | | | Total Investments (cost $297,147,285) – 139.4% | | | | | | 325,477,360 | |
| | | | Floating Rate Obligations – (0.4)% | | | | | | (965,000 | ) |
| | | | Variable Rate Demand Preferred Shares, at Liquidation Value – (42.0)% (8) | | | | | | (98,000,000 | ) |
| | | | Other Assets Less Liabilities – 3.0% | | | | | | 6,922,970 | |
| | | | Net Assets Applicable to Common Shares – 100% | | | | | $ | 233,435,330 | |
| (1) | All percentages shown in the Portfolio of Investments are based on net assets applicable to common shares unless otherwise noted. |
| (2) | Optional Call Provisions (not covered by the report of independent registered public accounting firm): Dates (month and year) and prices of the earliest optional call or redemption. There may be other call provisions at varying prices at later dates. Certain mortgage-backed securities may be subject to periodic principal paydowns. |
| (3) | Ratings (not covered by the report of independent registered public accounting firm): Using the highest of Standard & Poor’s Group (“Standard & Poor’s”), Moody’s Investors Service, Inc. (“Moody’s”) or Fitch, Inc. (“Fitch”) rating. Ratings below BBB by Standard & Poor’s, Baa by Moody’s or BBB by Fitch are considered to be below investment grade. Holdings designated N/R are not rated by any of these national rating agencies. |
| (4) | As of, or subsequent to, the end of the reporting period this security is non-income producing. Non-income producing, in the case of a fixed-income security, generally denotes that the issuer has (1) defaulted on the payment of principal or interest, (2) is under the protection of the Federal Bankruptcy Court or (3) the Fund’s Adviser has concluded that the issue is not likely to meet its future interest payment obligations and has ceased accruing additional income on the Fund’s records. |
| (5) | Backed by an escrow or trust containing sufficient U.S. Government or U.S. Government agency securities, which ensure the timely payment of principal and interest. Certain bonds backed by U.S. Government or agency securities are regarded as having an implied rating equal to the rating of such securities. |
| (6) | Investment, or portion of investment, has been pledged to collateralize the net payment obligations for investments in inverse floating rate transactions. |
| (7) | Investment valued at fair value using methods determined in good faith by, or at the discretion of, the Board. For fair value measurement disclosure purposes, investment classified as Level 3. See Notes to Financial Statements, Note 2 – Investment Valuation and Fair Value Measurements for more information. |
| (8) | Variable Rate Demand Preferred Shares, at Liquidation Value as a percentage of Total Investments is 30.1%. |
| (ETM) | Escrowed to maturity. |
| (IF) | Inverse floating rate investment. |
| (UB) | Underlying bond of an inverse floating rate trust reflected as a financing transaction. See Notes to Financial Statements, Note 3 – Portfolio Securities and Investments in Derivatives, Inverse Floating Rate Securities for more information. |
See accompanying notes to financial statements.
| NZH | | |
| | Nuveen California Dividend Advantage Municipal Fund 3 | |
| | Portfolio of Investments | February 28, 2015 |
| | Principal | | | | Optional Call | | | | | |
| | Amount (000) | | Description (1) | | Provisions (2) | Ratings (3) | | | Value | |
| | | | LONG-TERM INVESTMENTS – 141.3% (99.1% of Total Investments) | | | | | | | |
| | | | MUNICIPAL BONDS – 141.3% (99.1% of Total Investments) | | | | | | | |
| | | | Consumer Staples – 7.9% (5.5% of Total Investments) | | | | | | | |
| $ | 2,500 | | California County Tobacco Securitization Agency, Tobacco Settlement Asset-Backed Bonds, Los Angeles County Securitization Corporation, Series 2006A, 5.650%, 6/01/41 | | 12/18 at 100.00 | B+ | | $ | 2,251,100 | |
| | 475 | | California County Tobacco Securitization Agency, Tobacco Settlement Asset-Backed Bonds, Sonoma County Tobacco Securitization Corporation, Series 2005, 4.250%, 6/01/21 | | 6/15 at 100.00 | BBB+ | | | 474,995 | |
| | | | Golden State Tobacco Securitization Corporation, California, Tobacco Settlement Asset-Backed Bonds, Series 2007A-1: | | | | | | | |
| | 16,685 | | 5.000%, 6/01/33 | | 6/17 at 100.00 | B | | | 14,125,020 | |
| | 6,625 | | 5.750%, 6/01/47 | | 6/17 at 100.00 | B | | | 5,696,639 | |
| | 6,265 | | Golden State Tobacco Securitization Corporation, California, Tobacco Settlement Asset-Backed Bonds, Series 2007A-2, 5.300%, 6/01/37 | | 6/22 at 100.00 | B | | | 5,294,739 | |
| | 32,550 | | Total Consumer Staples | | | | | | 27,842,493 | |
| | | | Education and Civic Organizations – 3.6% (2.5% of Total Investments) | | | | | | | |
| | 135 | | California Educational Facilities Authority, Revenue Bonds, University of Redlands, Series 2005A, 5.000%, 10/01/35 | | 10/15 at 100.00 | A3 | | | 136,368 | |
| | 2,160 | | California Educational Facilities Authority, Revenue Bonds, University of San Francisco, Series 2011, 6.125%, 10/01/36 | | 10/21 at 100.00 | A2 | | | 2,627,014 | |
| | | | California Educational Facilities Authority, Revenue Bonds, University of the Pacific, Series 2006: | | | | | | | |
| | 200 | | 5.000%, 11/01/21 | | 11/15 at 100.00 | A2 | | | 206,122 | |
| | 1,000 | | 5.000%, 11/01/30 | | 11/15 at 100.00 | A2 | | | 1,028,530 | |
| | 850 | | California Municipal Finance Authority, Charter School Revenue Bonds, Rocketship Education – Multiple Projects, Series 2014A, 7.250%, 6/01/43 | | 6/22 at 102.00 | N/R | | | 969,212 | |
| | 2,750 | | California Statewide Communities Development Authority, Revenue Bonds, Buck Institute for Research on Aging, Series 2014, 5.000%, 11/15/44 – AGM Insured | | 11/24 at 100.00 | AA | | | 3,121,112 | |
| | 1,300 | | California Statewide Communities Development Authority, School Facility Revenue Bonds, Alliance College-Ready Public Schools, Series 2011A, 7.000%, 7/01/46 | | 7/21 at 100.00 | BBB– | | | 1,501,279 | |
| | 3,100 | | San Diego County, California, Certificates of Participation, Burnham Institute, Series 2006, 5.000%, 9/01/34 | | 9/15 at 102.00 | Baa1 | | | 3,182,646 | |
| | 11,495 | | Total Education and Civic Organizations | | | | | | 12,772,283 | |
| | | | Health Care – 28.6% (20.1% of Total Investments) | | | | | | | |
| | 5,640 | | ABAG Finance Authority for Nonprofit Corporations, California, Revenue Bonds, Sharp HealthCare, Series 2014A, 5.000%, 8/01/43 | | 8/23 at 100.00 | AA– | | | 6,366,827 | |
| | 610 | | California Health Facilities Financing Authority, Revenue Bonds, Lucile Salter Packard Children’s Hospital, Series 2014A, 5.000%, 8/15/43 | | 8/24 at 100.00 | AA | | | 696,919 | |
| | 670 | | California Health Facilities Financing Authority, Revenue Bonds, Providence Health & Services, Series 2014A, 5.000%, 10/01/38 | | 10/24 at 100.00 | AA | | | 773,126 | |
| | 1,320 | | California Health Facilities Financing Authority, Revenue Bonds, Providence Health & Services, Series 2014B, 5.000%, 10/01/44 | | 10/24 at 100.00 | AA | | | 1,503,216 | |
| | 1,445 | | California Health Facilities Financing Authority, Revenue Bonds, Rady Children’s Hospital – San Diego, Series 2011, 5.250%, 8/15/41 | | 8/21 at 100.00 | AA– | | | 1,637,069 | |
| | 1,765 | | California Health Facilities Financing Authority, Revenue Bonds, Saint Joseph Health System, Series 2009A, 5.750%, 7/01/39 | | 7/19 at 100.00 | AA– | | | 2,052,254 | |
| | 3,530 | | California Health Facilities Financing Authority, Revenue Bonds, Sutter Health, Series 2011B, 6.000%, 8/15/42 | | 8/20 at 100.00 | AA– | | | 4,251,144 | |
| | Principal | | | | Optional Call | | | | | |
| | Amount (000) | | Description (1) | | Provisions (2) | Ratings (3) | | | Value | |
| | | | Health Care (continued) | | | | | | | |
| $ | 3,735 | | California Health Facilities Financing Authority, Revenue Bonds, Sutter Health, Tender Option Bond Trust 2015-XF0061, 19.110%, 5/15/39 (IF) | | 11/16 at 100.00 | AA– | | $ | 4,906,819 | |
| | 3,850 | | California Statewide Communities Development Authority, Revenue Bonds, Adventist Health System West, Series 2005A, 5.000%, 3/01/35 | | 3/15 at 100.00 | A | | | 3,857,546 | |
| | 1,625 | | California Statewide Communities Development Authority, Revenue Bonds, Adventist Health System West, Series 2007B, 5.000%, 3/01/37 – AGC Insured | | 3/18 at 100.00 | AA | | | 1,748,484 | |
| | 1,335 | | California Statewide Communities Development Authority, Revenue Bonds, Huntington Memorial Hospital, Refunding Series 2014B, 5.000%, 7/01/44 | | 7/24 at 100.00 | A | | | 1,493,932 | |
| | 1,000 | | California Statewide Communities Development Authority, Revenue Bonds, Kaiser Permanente, Series 2012A, 5.000%, 4/01/42 | | 4/22 at 100.00 | A+ | | | 1,118,450 | |
| | 1,594 | | California Statewide Communities Development Authority, Revenue Bonds, Saint Joseph Health System, Trust 2554, 18.698%, 7/01/47 – AGM Insured (IF) | | 7/18 at 100.00 | AA | | | 2,157,153 | |
| | 8,875 | | California Statewide Communities Development Authority, Revenue Bonds, Sutter Health, Series 2011A, 6.000%, 8/15/42 | | 8/20 at 100.00 | AA– | | | 10,688,074 | |
| | 3,435 | | California Statewide Communities Development Authority, Revenue Bonds, ValleyCare Health System, Series 2007A, 5.125%, 7/15/31 | | 7/17 at 100.00 | N/R | | | 3,538,428 | |
| | 4,500 | | California Statewide Community Development Authority, Health Facility Revenue Bonds, Catholic Healthcare West, Insured Series 2008K, 5.500%, 7/01/41 – AGC Insured | | 7/17 at 100.00 | AA | | | 4,873,950 | |
| | 2,330 | | California Statewide Community Development Authority, Revenue Bonds, Daughters of Charity Health System, Series 2005A, 5.250%, 7/01/35 | | 7/15 at 100.00 | CCC | | | 2,207,186 | |
| | 645 | | California Statewide Community Development Authority, Revenue Bonds, Kaiser Permanente System, Series 2001C, 5.250%, 8/01/31 | | 8/16 at 100.00 | A+ | | | 682,146 | |
| | 3,860 | | California Statewide Community Development Authority, Revenue Bonds, St. Joseph Health System, Series 2007A, 5.750%, 7/01/47 – FGIC Insured | | 7/18 at 100.00 | AA– | | | 4,373,534 | |
| | 5,600 | | California Statewide Community Development Authority, Revenue Bonds, Sutter Health, Tender Option Bond Trust 3102, 19.199%, 11/15/46 (IF) (4) | | 11/16 at 100.00 | AA– | | | 7,357,504 | |
| | 4,000 | | Marysville, California, Revenue Bonds, The Fremont-Rideout Health Group, Series 2011, 5.250%, 1/01/42 | | 1/21 at 100.00 | A | | | 4,462,000 | |
| | 695 | | Oak Valley Hospital District, Stanislaus County, California, Revenue Bonds, Series 2010A, 6.500%, 11/01/29 | | 11/20 at 100.00 | BB | | | 735,366 | |
| | 1,000 | | Palomar Pomerado Health Care District, California, Certificates of Participation, Series 2009, 6.750%, 11/01/39 | | 11/19 at 100.00 | Ba1 | | | 1,109,890 | |
| | 7,650 | | Palomar Pomerado Health Care District, California, Certificates of Participation, Series 2010, 6.000%, 11/01/41 | | 11/20 at 100.00 | Ba1 | | | 8,202,942 | |
| | 5,790 | | Rancho Mirage Joint Powers Financing Authority, California, Revenue Bonds, Eisenhower Medical Center, Series 2007A, 5.000%, 7/01/38 | | 7/17 at 100.00 | Baa2 | | | 6,062,767 | |
| | 3,400 | | San Buenaventura, California, Revenue Bonds, Community Memorial Health System, Series 2011, 7.500%, 12/01/41 | | 12/21 at 100.00 | BB | | | 4,181,184 | |
| | 8,760 | | The Regents of the University of California, Medical Center Pooled Revenue Bonds, Series 2013J, 5.250%, 5/15/31 | | 5/23 at 100.00 | AA– | | | 10,596,884 | |
| | 88,659 | | Total Health Care | | | | | | 101,634,794 | |
| | | | Housing/Multifamily – 1.5% (1.0% of Total Investments) | | | | | | | |
| | 1,990 | | California Municipal Finance Authority, Mobile Home Park Revenue Bonds, Caritas Projects Series 2010A, 6.400%, 8/15/45 | | 8/20 at 100.00 | BBB | | | 2,224,482 | |
| | 2,020 | | California Municipal Finance Authority, Mobile Home Park Revenue Bonds, Caritas Projects Series 2012A, 5.500%, 8/15/47 | | 8/22 at 100.00 | BBB | | | 2,213,859 | |
| | | | California Municipal Finance Authority, Mobile Home Park Senior Revenue Bonds, Caritas Affordable Housing, Inc. Projects, Series 2014A: | | | | | | | |
| | 125 | | 5.250%, 8/15/39 | | 8/24 at 100.00 | BBB | | | 137,937 | |
| | 340 | | 5.250%, 8/15/49 | | 8/24 at 100.00 | BBB | | | 373,068 | |
| NZH | Nuveen California Dividend Advantage Municipal Fund 3 | |
| | Portfolio of Investments (continued) | February 28, 2015 |
| | Principal | | | | Optional Call | | | | | |
| | Amount (000) | | Description (1) | | Provisions (2) | Ratings (3) | | | Value | |
| | | | Housing/Multifamily (continued) | | | | | | | |
| $ | 325 | | Independent Cities Lease Finance Authority, California, Mobile Home Park Revenue Bonds, San Juan Mobile Estates, Series 2006B, 5.850%, 5/15/41 | | 5/16 at 100.00 | N/R | | $ | 330,340 | |
| | 4,800 | | Total Housing/Multifamily | | | | | | 5,279,686 | |
| | | | Housing/Single Family – 4.0% (2.8% of Total Investments) | | | | | | | |
| | | | California Housing Finance Agency, California, Home Mortgage Revenue Bonds, Tender Option Bond Trust 3206: | | | | | | | |
| | 10,180 | | 9.406%, 8/01/25 (Alternative Minimum Tax) (IF) | | 2/16 at 100.00 | A– | | | 10,235,176 | |
| | 3,805 | | 9.785%, 2/01/29 (Alternative Minimum Tax) (IF) | | 2/17 at 100.00 | A– | | | 3,880,415 | |
| | 115 | | California Housing Finance Agency, Home Mortgage Revenue Bonds, Series 2006H, 5.750%, 8/01/30 – FGIC Insured (Alternative Minimum Tax) | | 2/16 at 100.00 | A– | | | 120,015 | |
| | 14,100 | | Total Housing/Single Family | | | | | | 14,235,606 | |
| | | | Industrials – 1.5% (1.0% of Total Investments) | | | | | | | |
| | 5,000 | | California Pollution Control Financing Authority, Solid Waste Disposal Revenue Bonds, Waste Management Inc., Series 2005C, 5.125%, 11/01/23 (Alternative Minimum Tax) | | 11/15 at 101.00 | A– | | | 5,173,750 | |
| | 5,205 | | California Statewide Communities Development Authority, Revenue Bonds, EnerTech Regional Biosolids Project, Series 2007A, 5.500%, 12/01/33 (Alternative Minimum Tax) (5) | | No Opt. Call | N/R | | | 17,957 | |
| | 10,205 | | Total Industrials | | | | | | 5,191,707 | |
| | | | Long-Term Care – 0.4% (0.2% of Total Investments) | | | | | | | |
| | 1,000 | | California Municipal Finance Authority, Revenue Bonds, Harbor Regional Center Project, Series 2009, 8.000%, 11/01/29 | | 11/19 at 100.00 | A3 | | | 1,237,590 | |
| | | | Tax Obligation/General – 16.2% (11.4% of Total Investments) | | | | | | | |
| | 5,450 | | California State, General Obligation Bonds, Various Purpose Refunding Series 2014, 5.000%, 8/01/33 | | 8/24 at 100.00 | Aa3 | | | 6,378,244 | |
| | | | California State, General Obligation Bonds, Various Purpose Series 2009: | | | | | | | |
| | 3,040 | | 6.000%, 11/01/39 | | 11/19 at 100.00 | Aa3 | | | 3,736,038 | |
| | 3,500 | | 5.500%, 11/01/39 | | 11/19 at 100.00 | Aa3 | | | 4,131,820 | |
| | | | California State, General Obligation Bonds, Various Purpose Series 2010: | | | | | | | |
| | 1,960 | | 5.500%, 3/01/40 | | 3/20 at 100.00 | Aa3 | | | 2,301,902 | |
| | 1,000 | | 5.250%, 11/01/40 | | 11/20 at 100.00 | Aa3 | | | 1,171,830 | |
| | | | California State, General Obligation Bonds, Various Purpose Series 2011: | | | | | | | |
| | 1,770 | | 5.250%, 10/01/28 | | No Opt. Call | Aa3 | | | 2,099,662 | |
| | 4,000 | | 5.000%, 9/01/31 | | No Opt. Call | Aa3 | | | 4,603,920 | |
| | 4,315 | | 5.000%, 10/01/41 | | 10/21 at 100.00 | Aa3 | | | 4,874,569 | |
| | 3,230 | | California State, General Obligation Bonds, Various Purpose Series 2012, 5.250%, 2/01/29 | | 2/22 at 100.00 | Aa3 | | | 3,818,797 | |
| | | | California State, General Obligation Bonds, Various Purpose Series 2013: | | | | | | | |
| | 1,260 | | 5.000%, 2/01/29 | | No Opt. Call | Aa3 | | | 1,464,574 | |
| | 1,710 | | 5.000%, 2/01/31 | | No Opt. Call | Aa3 | | | 1,971,818 | |
| | 2,465 | | 5.000%, 4/01/37 | | 4/23 at 100.00 | Aa3 | | | 2,811,209 | |
| | 1,000 | | California State, General Obligation Bonds, Various Purpose Series 2014, 5.000%, 5/01/44 | | 5/24 at 100.00 | Aa3 | | | 1,148,130 | |
| | 15 | | California, General Obligation Veterans Welfare Bonds, Series 2001BZ, 5.350%, 12/01/21 – NPFG Insured (Alternative Minimum Tax) | | 6/15 at 100.00 | AA | | | 15,044 | |
| | 1,120 | | Oxnard School District, Ventura County, California, General Obligation Bonds, Election 2012 Series 2013B, 5.000%, 8/01/43 – AGM Insured | | 8/23 at 100.00 | AA | | | 1,266,104 | |
| | 4,385 | | Pajaro Valley Unified School District, Santa Cruz County, California, General Obligation Bonds, Refunding Election 2012 Series 2013A, 5.000%, 8/01/43 | | 8/23 at 100.00 | Aa2 | | | 4,957,023 | |
| | 2,115 | | San Mateo Union High School District, San Mateo County, California, General Obligation Bonds, Election 2010 Series 2011A, 5.000%, 9/01/42 | | 9/21 at 100.00 | AA+ | | | 2,422,415 | |
| | 5,530 | | Stockton Unified School District, San Joaquin County, California, General Obligation Bonds, Election 2008 Series 2011D, 0.000%, 8/01/50 – AGM Insured | | 8/37 at 100.00 | AA | | | 4,459,558 | |
| | Principal | | | | Optional Call | | | | | |
| | Amount (000) | | Description (1) | | Provisions (2) | Ratings (3) | | | Value | |
| | | | Tax Obligation/General (continued) | | | | | | | |
| | | | Washington Township Health Care District, Alameda County, California, General Obligation Bonds, 2012 Election Series 2013A: | | | | | | | |
| $ | 1,535 | | 5.500%, 8/01/38 | | 8/24 at 100.00 | Aa3 | | $ | 1,857,887 | |
| | 1,750 | | 5.500%, 8/01/40 | | 8/24 at 100.00 | Aa3 | | | 2,108,505 | |
| | 51,150 | | Total Tax Obligation/General | | | | | | 57,599,049 | |
| | | | Tax Obligation/Limited – 43.3% (30.4% of Total Investments) | | | | | | | |
| | | | California State Public Works Board, Lease Revenue Bonds, Department of Corrections & Rehabilitation, Series 2013G: | | | | | | | |
| | 5,690 | | 5.250%, 9/01/30 | | 9/23 at 100.00 | A1 | | | 6,748,681 | |
| | 7,135 | | 5.250%, 9/01/32 | | 9/23 at 100.00 | A1 | | | 8,403,318 | |
| | �� | | California State Public Works Board, Lease Revenue Bonds, Department of Corrections & Rehabilitation, Various Correctional Facilities Series 2013F: | | | | | | | |
| | 1,685 | | 5.250%, 9/01/31 | | 9/23 at 100.00 | A1 | | | 1,991,501 | |
| | 1,450 | | 5.250%, 9/01/33 | | 9/23 at 100.00 | A1 | | | 1,702,967 | |
| | 1,000 | | California State Public Works Board, Lease Revenue Bonds, Various Capital Projects, Series 2009G-1, 5.750%, 10/01/30 | | 10/19 at 100.00 | A1 | | | 1,193,140 | |
| | 2,260 | | California State Public Works Board, Lease Revenue Bonds, Various Capital Projects, Series 2010A-1, 5.750%, 3/01/30 | | 3/20 at 100.00 | A1 | | | 2,642,211 | |
| | 715 | | Capistrano Unified School District, Orange County, California, Special Tax Bonds, Community Facilities District 98-2, Series 2005, 5.000%, 9/01/24 – FGIC Insured | | 9/15 at 100.00 | AA– | | | 729,951 | |
| | 2,160 | | Chino Redevelopment Agency, California, Merged Chino Redevelopment Project Area Tax Allocation Bonds, Series 2006, 5.000%, 9/01/38 – AMBAC Insured | | 9/16 at 101.00 | A | | | 2,218,752 | |
| | 1,445 | | Fontana Redevelopment Agency, San Bernardino County, California, Tax Allocation Bonds, Jurupa Hills Redevelopment Project, Refunding Series 1997A, 5.500%, 10/01/27 | | 10/15 at 100.00 | A– | | | 1,448,974 | |
| | 3,500 | | Fremont, California, Special Tax Bonds, Community Facilities District 1, Pacific Commons, Series 2005, 6.300%, 9/01/31 | | 9/15 at 100.00 | N/R | | | 3,557,365 | |
| | | | Golden State Tobacco Securitization Corporation, California, Enhanced Tobacco Settlement Asset-Backed Revenue Bonds, Series 2005A: | | | | | | | |
| | 3,000 | | 5.000%, 6/01/45 | | 6/15 at 100.00 | A1 | | | 3,034,680 | |
| | 5,910 | | 5.000%, 6/01/45 – AGC Insured | | 6/15 at 100.00 | AA | | | 5,978,320 | |
| | 1,310 | | Inglewood Redevelopment Agency, California, Tax Allocation Bonds, Merged Redevelopment Project, Subordinate Lien Series 2007A-1, 5.000%, 5/01/23 – AMBAC Insured | | 5/17 at 100.00 | BBB+ | | | 1,374,517 | |
| | | | Irvine Unified School District, California, Special Tax Bonds, Community Facilities District Series 2006A: | | | | | | | |
| | 330 | | 5.000%, 9/01/26 | | 9/16 at 100.00 | N/R | | | 338,481 | |
| | 760 | | 5.125%, 9/01/36 | | 9/16 at 100.00 | N/R | | | 778,263 | |
| | 680 | | Lammersville School District, San Joaquin County, California, Special Tax Bonds, Community Facilities District 2002 Mountain House, Series 2006, 5.125%, 9/01/35 | | 9/16 at 100.00 | N/R | | | 708,057 | |
| | 1,000 | | Lindsay Redevelopment Agency, California, Project 1 Tax Allocation Bonds, Series 2007, 5.000%, 8/01/37 – RAAI Insured | | 8/17 at 100.00 | BBB+ | | | 1,059,970 | |
| | 1,310 | | Los Angeles Community Redevelopment Agency, California, Lease Revenue Bonds, Manchester Social Services Project, Series 2005, 5.000%, 9/01/37 – AMBAC Insured | | 9/15 at 100.00 | A1 | | | 1,324,253 | |
| | 2,615 | | Los Angeles County Public Works Financing Authority, California, Lease Revenue Bonds, Multiple Capital Facilities Project II, Series 2012, 5.000%, 8/01/42 | | No Opt. Call | AA | | | 2,933,115 | |
| | 725 | | National City Community Development Commission, California, Tax Allocation Bonds, National City Redevelopment Project, Series 2011, 6.500%, 8/01/24 | | 8/21 at 100.00 | A– | | | 923,875 | |
| | 240 | | North Natomas Community Facilities District 4, Sacramento, California, Special Tax Bonds, Series 2006D, 5.000%, 9/01/33 | | 9/15 at 101.00 | N/R | | | 245,719 | |
| | 270 | | Novato Redevelopment Agency, California, Tax Allocation Bonds, Hamilton Field Redevelopment Project, Series 2011, 6.750%, 9/01/40 | | 9/21 at 100.00 | BBB+ | | | 329,897 | |
| | 11,165 | | Palm Desert Financing Authority, California, Tax Allocation Revenue Bonds, Project Area 1, Refunding Series 2002, 5.100%, 4/01/30 – NPFG Insured | | 10/15 at 100.00 | AA– | | | 11,182,752 | |
| NZH | Nuveen California Dividend Advantage Municipal Fund 3 | |
| | Portfolio of Investments (continued) | February 28, 2015 |
| | Principal | | | | Optional Call | | | | | |
| | Amount (000) | | Description (1) | | Provisions (2) | Ratings (3) | | | Value | |
| | | | Tax Obligation/Limited (continued) | | | | | | | |
| $ | 295 | | Patterson Public Finance Authority, California, Revenue Bonds, Community Facilities District 2001-1, Subordinate Lien Series 2013B, 5.875%, 9/01/39 | | 9/23 at 100.00 | N/R | | $ | 339,813 | |
| | | | Patterson Public Financing Authority, California, Revenue Bonds, Community Facilities District 2001-1, Senior Series 2013A: | | | | | | | |
| | 1,810 | | 5.250%, 9/01/30 | | 9/23 at 100.00 | N/R | | | 2,065,699 | |
| | 1,620 | | 5.750%, 9/01/39 | | 9/23 at 100.00 | N/R | | | 1,873,805 | |
| | 2,760 | | Pico Rivera Water Authority, California, Revenue Bonds, Series 2001A, 6.250%, 12/01/32 | | 6/15 at 100.00 | N/R | | | 2,765,437 | |
| | 2,185 | | Pittsburg Redevelopment Agency, California, Tax Allocation Bonds, Los Medanos Community Development Project, Refunding Series 2008A, 6.500%, 9/01/28 | | 9/18 at 100.00 | BBB– | | | 2,435,729 | |
| | 3,250 | | Pomona Public Financing Authority, California, Revenue Refunding Bonds, Merged Redevelopment Projects, Series 2001AD, 5.000%, 2/01/27 – NPFG Insured | | 8/15 at 100.00 | AA– | | | 3,254,973 | |
| | 995 | | Poway Unified School District, San Diego County, California, Special Tax Bonds, Community Facilities District 14 Del Sur, Series 2006, 5.125%, 9/01/26 | | 9/16 at 100.00 | N/R | | | 1,021,925 | |
| | | | Puerto Rico Sales Tax Financing Corporation, Sales Tax Revenue Bonds, Series 2007A: | | | | | | | |
| | 10,000 | | 0.000%, 8/01/44 – NPFG Insured | | No Opt. Call | AA– | | | 1,427,800 | |
| | 10,025 | | 0.000%, 8/01/45 – NPFG Insured | | No Opt. Call | AA– | | | 1,339,741 | |
| | 3,500 | | Rancho Cucamonga Redevelopment Agency Successor Agency, California, Tax Allocation Bonds, Rancho Redevelopment Project, Series 2014, 5.000%, 9/01/30 | | 9/24 at 100.00 | AA | | | 4,069,205 | |
| | 865 | | Rancho Santa Fe CSD Financing Authority, California, Revenue Bonds, Superior Lien Series 2011A, 5.750%, 9/01/30 | | 9/21 at 100.00 | BBB+ | | | 993,712 | |
| | 3,375 | | Riverside County Redevelopment Agency, California, Tax Allocation Bonds, Interstate 215 Corridor Redevelopment Project Area, Series 2010E, 6.500%, 10/01/40 | | 10/20 at 100.00 | BBB+ | | | 4,002,480 | |
| | 155 | | Riverside County Redevelopment Agency, California, Tax Allocation Bonds, Jurupa Valley Project Area, Series 2011B, 6.500%, 10/01/25 | | 10/21 at 100.00 | A– | | | 194,429 | |
| | | | Riverside County, California, Special Tax Bonds, Community Facilities District 04-2 Lake Hill Crest, Series 2012: | | | | | | | |
| | 990 | | 5.000%, 9/01/29 | | 9/22 at 100.00 | N/R | | | 1,121,789 | |
| | 2,615 | | 5.000%, 9/01/35 | | 9/22 at 100.00 | N/R | | | 2,885,417 | |
| | | | San Diego County Regional Transportation Commission, California, Sales Tax Revenue Bonds, Series 2014A: | | | | | | | |
| | 3,600 | | 5.000%, 4/01/36 | | 4/24 at 100.00 | AAA | | | 4,209,876 | |
| | 5,000 | | 5.000%, 4/01/44 | | 4/24 at 100.00 | AAA | | | 5,794,950 | |
| | 14,505 | | San Diego Redevelopment Agency, California, Subordinate Lien Tax Allocation Bonds, Centre City Project, Series 2001A, 5.000%, 9/01/26 – AGM Insured | | 5/15 at 100.00 | AA | | | 14,559,684 | |
| | 330 | | San Francisco City and County Redevelopment Agency Successor Agency, California, Special Tax Bonds, Community Facilities District 7, Hunters Point Shipyard Phase One Improvements, Refunding Series 2014, 5.000%, 8/01/39 | | No Opt. Call | N/R | | | 363,990 | |
| | 125 | | San Francisco Redevelopment Finance Authority, California, Tax Allocation Revenue Bonds, Mission Bay North Redevelopment Project, Series 2011C, 6.750%, 8/01/41 | | 2/21 at 100.00 | A– | | | 153,279 | |
| | | | San Francisco Redevelopment Financing Authority, California, Tax Allocation Revenue Bonds, Mission Bay South Redevelopment Project, Series 2011D: | | | | | | | |
| | 125 | | 7.000%, 8/01/33 | | 2/21 at 100.00 | BBB+ | | | 152,450 | |
| | 160 | | 7.000%, 8/01/41 | | 2/21 at 100.00 | BBB+ | | | 195,136 | |
| | 1,160 | | San Jose Redevelopment Agency, California, Tax Allocation Bonds, Merged Area Redevelopment Project, Series 2006C, 5.000%, 8/01/25 – NPFG Insured | | 8/17 at 100.00 | AA– | | | 1,244,007 | |
| | 1,500 | | San Jose Redevelopment Agency, California, Tax Allocation Bonds, Merged Area Redevelopment Project, Series 2006D, 5.000%, 8/01/23 – AMBAC Insured | | 8/17 at 100.00 | BBB+ | | | 1,625,280 | |
| | 6,000 | | San Marcos Public Facilities Authority, California, Tax Allocation Bonds, Project Areas 1 and 3, Series 2005A, 5.000%, 8/01/34 – AMBAC Insured | | 8/15 at 102.00 | A | | | 6,158,940 | |
| | 215 | | Signal Hill Redevelopment Agency, California, Project 1 Tax Allocation Bonds, Series 2011, 7.000%, 10/01/26 | | 4/21 at 100.00 | N/R | | | 247,781 | |
| | Principal | | | | Optional Call | | | | | |
| | Amount (000) | | Description (1) | | Provisions (2) | Ratings (3) | | | Value | |
| | | | Tax Obligation/Limited (continued) | | | | | | | |
| $ | 8,710 | | South Orange County Public Financing Authority, California, Special Tax Revenue Bonds, Ladera Ranch, Series 2005A, 5.000%, 8/15/32 – AMBAC Insured | | 8/15 at 100.00 | BBB+ | | $ | 8,787,955 | |
| | 1,500 | | Stockton Public Financing Authority, California, Lease Revenue Bonds, Series 2004, 5.250%, 9/01/34 – FGIC Insured | | 5/15 at 100.00 | AA– | | | 1,500,075 | |
| | 1,415 | | Temecula Public Financing Authority, California, Special Tax Bonds, Community Facilities District 03-02 Roripaugh, Series 2006, 5.450%, 9/01/26 | | 9/15 at 101.00 | N/R | | | 1,421,495 | |
| | 1,165 | | Temecula Redevelopment Agency, California, Redevelopment Project 1 Tax Allocation Housing Bonds Series 2011A, 7.000%, 8/01/39 | | 8/21 at 100.00 | A | | | 1,463,391 | |
| | | | Westminster Redevelopment Agency, California, Tax Allocation Bonds, Commercial Redevelopment Project 1, Police Facility Subordinate Series 2009: | | | | | | | |
| | 7,500 | | 6.250%, 11/01/39 | | 11/19 at 100.00 | AA | | | 8,961,450 | |
| | 5,000 | | 5.750%, 11/01/45 | | 11/19 at 100.00 | AA | | | 5,857,950 | |
| | 370 | | Yorba Linda Redevelopment Agency, Orange County, California, Tax Allocation Revenue Bonds, Yorba Linda Redevelopment Project, Subordinate Lien Series 2011A, 6.500%, 9/01/32 | | 9/21 at 100.00 | A– | | | 454,756 | |
| | 159,175 | | Total Tax Obligation/Limited | | | | | | 153,793,158 | |
| | | | Transportation – 10.6% (7.5% of Total Investments) | | | | | | | |
| | 3,705 | | Bay Area Toll Authority, California, Revenue Bonds, San Francisco Bay Area Toll Bridge, Series 2013S-4, 5.250%, 4/01/48 | | 4/23 at 100.00 | A+ | | | 4,243,633 | |
| | 3,425 | | Foothill/Eastern Transportation Corridor Agency, California, Toll Road Revenue Bonds, Refunding Junior Lien Series 2013C, 6.500%, 1/15/43 | | 1/24 at 100.00 | BB+ | | | 4,125,104 | |
| | | | Foothill/Eastern Transportation Corridor Agency, California, Toll Road Revenue Bonds, Refunding Series 2013A: | | | | | | | |
| | 7,560 | | 5.750%, 1/15/46 | | 1/24 at 100.00 | BBB– | | | 8,867,729 | |
| | 7,555 | | 6.000%, 1/15/53 | | 1/24 at 100.00 | BBB– | | | 8,941,720 | |
| | | | Los Angeles Harbors Department, California, Revenue Bonds, Series 2014C: | | | | | | | |
| | 1,160 | | 5.000%, 8/01/34 | | 8/24 at 100.00 | AA | | | 1,361,747 | |
| | 1,865 | | 5.000%, 8/01/36 | | 8/24 at 100.00 | AA | | | 2,180,968 | |
| | 4,610 | | 5.000%, 8/01/44 | | 8/24 at 100.00 | AA | | | 5,333,447 | |
| | 2,350 | | Port of Oakland, California, Revenue Bonds, Refunding Series 2012P, 5.000%, 5/01/29 (Alternative Minimum Tax) | | No Opt. Call | A+ | | | 2,664,360 | |
| | 32,230 | | Total Transportation | | | | | | 37,718,708 | |
| | | | U.S. Guaranteed – 3.4% (2.4% of Total Investments) (6) | | | | | | | |
| | 1,690 | | Bay Area Toll Authority, California, Revenue Bonds, San Francisco Bay Area Toll Bridge, Series 2006F, 5.000%, 4/01/31 (Pre-refunded 4/01/16) (UB) | | 4/16 at 100.00 | AA (6) | | | 1,778,539 | |
| | 155 | | California Educational Facilities Authority, Revenue Bonds, University of Redlands, Series 2005A, 5.000%, 10/01/35 (Pre-refunded 10/01/15) | | 10/15 at 100.00 | N/R (6) | | | 159,464 | |
| | 605 | | California Statewide Community Development Authority, Revenue Bonds, Thomas Jefferson School of Law, Series 2005A, 4.875%, 10/01/31 (Pre-refunded 10/01/15) | | 10/15 at 100.00 | N/R (6) | | | 619,641 | |
| | 2,950 | | Loma Linda, California, Hospital Revenue Bonds, Loma Linda University Medical Center, Series 2008A, 8.250%, 12/01/38 (Pre-refunded 12/01/17) | | 12/17 at 100.00 | BBB (6) | | | 3,556,136 | |
| | 2,330 | | Newport Beach, California, Revenue Bonds, Hoag Memorial Hospital Presbyterian, Series 2011A, 6.000%, 12/01/40 (Pre-refunded 12/01/21) | | 12/21 at 100.00 | N/R (6) | | | 2,990,998 | |
| | 1,460 | | San Jose-Evergreen Community College District, Santa Clara County, California, General Obligation Bonds, Series 2005A, 5.000%, 9/01/25 (Pre-refunded 9/01/15) – NPFG Insured | | 9/15 at 100.00 | Aa1 (6) | | | 1,496,427 | |
| | 1,345 | | San Mateo Union High School District, San Mateo County, California, Certificates of Participation, Phase 1, Series 2007A, 5.000%, 12/15/30 (Pre-refunded 12/15/17) – AMBAC Insured | | 12/17 at 100.00 | N/R (6) | | | 1,507,180 | |
| | 10,535 | | Total U.S. Guaranteed | | | | | | 12,108,385 | |
| NZH | Nuveen California Dividend Advantage Municipal Fund 3 | |
| | Portfolio of Investments (continued) | February 28, 2015 |
| | Principal | | | | Optional Call | | | | | |
| | Amount (000) | | Description (1) | | Provisions (2) | Ratings (3) | | | Value | |
| | | | Utilities – 6.8% (4.8% of Total Investments) | | | | | | | |
| $ | 3,815 | | Long Beach Bond Finance Authority, California, Natural Gas Purchase Revenue Bonds, Series 2007A, 5.000%, 11/15/35 | | No Opt. Call | A | | $ | 4,455,119 | |
| | 14,505 | | Los Angeles Department of Water and Power, California, Power System Revenue Bonds, Series 2012B, 5.000%, 7/01/43 | | 7/22 at 100.00 | AA– | | | 16,393,696 | |
| | | | Merced Irrigation District, California, Electric System Revenue Bonds, Series 2005: | | | | | | | |
| | 2,000 | | 5.000%, 9/01/26 – SYNCORA GTY Insured | | 9/15 at 100.00 | N/R | | | 2,019,120 | |
| | 1,285 | | 5.125%, 9/01/31 – SYNCORA GTY Insured | | 9/15 at 100.00 | N/R | | | 1,295,614 | |
| | 21,605 | | Total Utilities | | | | | | 24,163,549 | |
| | | | Water and Sewer – 13.5% (9.5% of Total Investments) | | | | | | | |
| | | | Bay Area Water Supply and Conservation Agency, California, Revenue Bonds, Capital Cost Recovery Prepayment Program, Series 2013A: | | | | | | | |
| | 2,000 | | 5.000%, 10/01/27 | | 4/23 at 100.00 | AA– | | | 2,404,900 | |
| | 3,000 | | 5.000%, 10/01/29 | | 4/23 at 100.00 | AA– | | | 3,568,230 | |
| | 3,000 | | 5.000%, 10/01/34 | | 4/23 at 100.00 | AA– | | | 3,479,700 | |
| | 8,840 | | California Pollution Control Financing Authority, Water Furnishing Revenue Bonds, Poseidon Resources Channelside LP Desalination Project, Series 2012, 5.000%, 11/21/45 (Alternative Minimum Tax) | | No Opt. Call | Baa3 | | | 9,578,670 | |
| | 3,000 | | East Valley Water District Financing Authority, California, Refunding Revenue Bonds, Series 2010, 5.000%, 10/01/40 | | 10/20 at 100.00 | AA– | | | 3,357,150 | |
| | 1,125 | | Fortuna Public Finance Authority, California, Water Revenue Bonds, Series 2006, 5.000%, 10/01/36 – AGM Insured | | 10/16 at 100.00 | AA | | | 1,155,139 | |
| | 890 | | Healdsburg Public Financing Authority, California, Wastewater Revenue Bonds, Series 2006, 5.000%, 4/01/36 – NPFG Insured | | 4/16 at 100.00 | AA– | | | 930,175 | |
| | 2,355 | | Los Angeles Department of Water and Power, California, Waterworks Revenue Bonds, Series 2012B, 5.000%, 7/01/37 | | No Opt. Call | AA | | | 2,698,383 | |
| | 9,470 | | Los Angeles Department of Water and Power, California, Waterworks Revenue Bonds, Series 2014A, 5.000%, 7/01/44 | | 7/24 at 100.00 | AA | | | 10,961,241 | |
| | | | Los Angeles, California, Wastewater System Revenue Bonds, Subordinate Lien, Refunding Series 2013A: | | | | | | | |
| | 1,245 | | 5.000%, 6/01/34 | | 6/23 at 100.00 | AA | | | 1,441,735 | |
| | 5,355 | | 5.000%, 6/01/35 | | 6/23 at 100.00 | AA | | | 6,188,399 | |
| | 2,000 | | Metropolitan Water District of Southern California, Water Revenue Bonds, 2006 Authorization Series 2007A, 5.000%, 7/01/37 | | 7/17 at 100.00 | AAA | | | 2,186,380 | |
| | 42,280 | | Total Water and Sewer | | | | | | 47,950,102 | |
| $ | 479,784 | | Total Long-Term Investments (cost $453,703,261) | | | | | | 501,527,110 | |
| | Principal | | | | Optional Call | | | | | |
| | Amount (000) | | Description (1) | | Provisions (2) | Ratings (3) | | | Value | |
| | | | SHORT-TERM INVESTMENTS – 1.3% (0.9% of Total Investments) | | | | | | | |
| | | | MUNICIPAL BONDS – 1.3% (0.9% of Total Investments) | | | | | | | |
| | | | Health Care – 1.3% (0.9% of Total Investments) | | | | | | | |
| $ | 3,610 | | California Statewide Community Development Authority, Revenue Bonds, Daughters of Charity Health System, Series 2014A, 6.000%, 7/10/15 (7) | | No Opt. Call | N/R | | $ | 3,640,793 | |
| | 350 | | California Statewide Community Development Authority, Revenue Bonds, Daughters of Charity Health System, Series 2014B, 6.000%, 7/10/15 (7) | | No Opt. Call | N/R | | | 352,986 | |
| | 530 | | California Statewide Community Development Authority, Revenue Bonds, Daughters of Charity Health System, Series 2014C, 6.000%, 7/10/15 (7) | | No Opt. Call | N/R | | | 534,521 | |
| $ | 4,490 | | Total Short-Term Investments (cost $4,490,000) | | | | | | 4,528,300 | |
| | | | Total Investments (cost $458,193,261) – 142.6% | | | | | | 506,055,410 | |
| | | | Floating Rate Obligations – (0.2)% | | | | | | (845,000 | ) |
| | | | Variable Rate Demand Preferred Shares, at Liquidation Value – (45.1)% (8) | | | | | | (160,000,000 | ) |
| | | | Other Assets Less Liabilities – 2.7% | | | | | | 9,751,137 | |
| | | | Net Assets Applicable to Common Shares – 100% | | | | | $ | 354,961,547 | |
| (1) | All percentages shown in the Portfolio of Investments are based on net assets applicable to common shares unless otherwise noted. |
| (2) | Optional Call Provisions (not covered by the report of independent registered public accounting firm): Dates (month and year) and prices of the earliest optional call or redemption. There may be other call provisions at varying prices at later dates. Certain mortgage-backed securities may be subject to periodic principal paydowns. |
| (3) | Ratings (not covered by the report of independent registered public accounting firm): Using the highest of Standard & Poor’s Group (“Standard & Poor’s”), Moody’s Investors Service, Inc. (“Moody’s”) or Fitch, Inc. (“Fitch”) rating. Ratings below BBB by Standard & Poor’s, Baa by Moody’s or BBB by Fitch are considered to be below investment grade. Holdings designated N/R are not rated by any of these national rating agencies. |
| (4) | Investment, or portion of investment, has been pledged to collateralize the net payment obligations for investments in inverse floating rate transactions. |
| (5) | As of, or subsequent to, the end of the reporting period this security is non-income producing. Non-income producing, in the case of a fixed-income security, generally denotes that the issuer has (1) defaulted on the payment of principal or interest, (2) is under the protection of the Federal Bankruptcy Court or (3) the Fund’s Adviser has concluded that the issue is not likely to meet its future interest payment obligations and has ceased accruing additional income on the Fund’s records. |
| (6) | Backed by an escrow or trust containing sufficient U.S. Government or U.S. Government agency securities, which ensure the timely payment of principal and interest. Certain bonds backed by U.S. Government or agency securities are regarded as having an implied rating equal to the rating of such securities. |
| (7) | Investment valued at fair value using methods determined in good faith by, or at the discretion of, the Board. For fair value measurement disclosure purposes, investment classified as Level 3. See Notes to Financial Statements, Note 2 – Investment Valuation and Fair Value Measurements for more information. |
| (8) | Variable Rate Demand Preferred Shares, at Liquidation Value as a percentage of Total Investments is 31.6%. |
| (IF) | Inverse floating rate investment. |
| (UB) | Underlying bond of an inverse floating rate trust reflected as a financing transaction. See Notes to Financial Statements, Note 3 – Portfolio Securities and Investments in Derivatives, Inverse Floating Rate Securities for more information. |
See accompanying notes to financial statements.
| Statement of | | |
| | Assets and Liabilities | February 28, 2015 |
| | | California | | California | | California AMT- | |
| | | Value | | Value 2 | | Free Income | |
| | | (NCA | ) | (NCB | ) | (NKX | ) |
| Assets | | | | | | | | | | |
| Long-term investments, at value (cost $236,880,433, $47,056,934 and $946,834,444, respectively) | | $ | 267,347,797 | | $ | 56,255,089 | | $ | 1,065,466,660 | |
| Short-term investments, at value (cost $1,110,000, $540,000 and $8,645,000, respectively) | | | 1,119,468 | | | 544,606 | | | 8,718,742 | |
| Cash | | | 1,030,428 | | | 277,572 | | | — | |
| Receivable for: | | | | | | | | | | |
| Interest | | | 2,660,903 | | | 619,355 | | | 13,577,585 | |
| Investments sold | | | 1,503,043 | | | 102,700 | | | 9,801,693 | |
| Deferred offering costs | | | — | | | — | | | 2,813,416 | |
| Other assets | | | 22,715 | | | 448 | | | 304,056 | |
| Total assets | | | 273,684,354 | | | 57,799,770 | | | 1,100,682,152 | |
| Liabilities | | | | | | | | | | |
| Cash overdraft | | | — | | | — | | | 1,327,505 | |
| Floating rate obligations | | | 4,490,000 | | | — | | | 6,755,000 | |
| Payable for: | | | | | | | | | | |
| Common share dividends | | | 924,088 | | | 202,036 | | | 3,282,958 | |
| Offering costs | | | — | | | — | | | 64,213 | |
| Institutional MuniFund Term Preferred (“iMTP”) Shares, at liquidation value | | | — | | | — | | | 36,000,000 | |
| Variable Rate Demand Preferred (“VRDP”) Shares, at liquidation value | | | — | | | — | | | 291,600,000 | |
| Accrued expenses: | | | | | | | | | | |
| Management fees | | | 109,221 | | | 27,545 | | | 516,650 | |
| Directors/Trustees fees | | | 24,446 | | | 554 | | | 20,553 | |
| Other | | | 87,078 | | | 37,184 | | | 329,207 | |
| Total liabilities | | | 5,634,833 | | | 267,319 | | | 339,896,086 | |
| Net assets applicable to common shares | | $ | 268,049,521 | | $ | 57,532,451 | | $ | 760,786,066 | |
| Common shares outstanding | | | 25,424,725 | | | 3,287,900 | | | 47,708,456 | |
| Net asset value (“NAV”) per common share outstanding | | $ | 10.54 | | $ | 17.50 | | $ | 15.95 | |
| Net assets applicable to common shares consist of: | | | | | | | | | | |
| Common shares, $.01 par value per share | | $ | 254,247 | | $ | 32,879 | | $ | 477,085 | |
| Paid-in surplus | | | 239,523,393 | | | 46,967,862 | | | 640,926,686 | |
| Undistributed (Over-distribution of) net investment income | | | 1,122,565 | | | 731,470 | | | 5,736,445 | |
| Accumulated net realized gain (loss) | | | (3,327,516 | ) | | 597,479 | | | (5,060,108 | ) |
| Net unrealized appreciation (depreciation) | | | 30,476,832 | | | 9,202,761 | | | 118,705,958 | |
| Net assets applicable to common shares | | $ | 268,049,521 | | $ | 57,532,451 | | $ | 760,786,066 | |
| Authorized shares: | | | | | | | | | | |
| Common | | | 250,000,000 | | | Unlimited | | | Unlimited | |
| Preferred | | | N/A | | | N/A | | | Unlimited | |
N/A – Fund is not authorized to issue Preferred shares.
See accompanying notes to financial statements.
| | | California Dividend | | California Dividend | | California Dividend | |
| | | Advantage | | Advantage 2 | | Advantage 3 | |
| | | (NAC | ) | (NVX | ) | (NZH | ) |
| Assets | | | | | | | | | | |
| Long-term investments, at value (cost $2,176,186,075, $295,502,285 and $453,703,261, respectively) | | $ | 2,453,817,899 | | $ | 323,818,328 | | $ | 501,527,110 | |
| Short-term investments, at value (cost $20,710,000, $1,645,000 and $4,490,000, respectively) | | | 20,886,656 | | | 1,659,032 | | | 4,528,300 | |
| Cash | | | 448,529 | | | 2,815,126 | | | 3,411,999 | |
| Receivable for: | | | | | | | | | | |
| Interest | | | 33,052,061 | | | 4,416,854 | | | 7,078,493 | |
| Investments sold | | | 3,716,200 | | | 550,750 | | | 843,550 | |
| Deferred offering costs | | | 4,051,870 | | | 335,865 | | | 285,704 | |
| Other assets | | | 752,440 | | | 114,240 | | | 182,380 | |
| Total assets | | | 2,516,725,655 | | | 333,710,195 | | | 517,857,536 | |
| Liabilities | | | | | | | | | | |
| Cash overdraft | | | — | | | — | | | — | |
| Floating rate obligations | | | 92,995,000 | | | 965,000 | | | 845,000 | |
| Payable for: | | | | | | | | | | |
| Common share dividends | | | 8,168,553 | | | 1,018,228 | | | 1,585,694 | |
| Offering costs | | | 287,852 | | | — | | | 50,405 | |
| Institutional MuniFund Term Preferred (“iMTP”) Shares, at liquidation value | | | — | | | — | | | — | |
| Variable Rate Demand Preferred (“VRDP”) Shares, at liquidation value | | | 699,600,000 | | | 98,000,000 | | | 160,000,000 | |
| Accrued expenses: | | | | | | | | | | |
| Management fees | | | 1,134,598 | | | 158,129 | | | 248,355 | |
| Directors/Trustees fees | | | 262,804 | | | 36,082 | | | 56,433 | |
| Other | | | 648,582 | | | 97,426 | | | 110,102 | |
| Total liabilities | | | 803,097,389 | | | 100,274,865 | | | 162,895,989 | |
| Net assets applicable to common shares | | $ | 1,713,628,266 | | $ | 233,435,330 | | $ | 354,961,547 | |
| Common shares outstanding | | | 107,383,777 | | | 14,759,237 | | | 24,151,884 | |
| Net asset value (“NAV”) per common share outstanding | | $ | 15.96 | | $ | 15.82 | | $ | 14.70 | |
| Net assets applicable to common shares consist of: | | | | | | | | | | |
| Common shares, $.01 par value per share | | $ | 1,073,838 | | $ | 147,592 | | $ | 241,519 | |
| Paid-in surplus | | | 1,455,223,222 | | | 207,960,328 | | | 336,981,461 | |
| Undistributed (Over-distribution of) net investment income | | | 13,917,924 | | | 1,271,425 | | | 1,496,207 | |
| Accumulated net realized gain (loss) | | | (34,395,198 | ) | | (4,274,090 | ) | | (31,619,789 | ) |
| Net unrealized appreciation (depreciation) | | | 277,808,480 | | | 28,330,075 | | | 47,862,149 | |
| Net assets applicable to common shares | | $ | 1,713,628,266 | | $ | 233,435,330 | | $ | 354,961,547 | |
| Authorized shares: | | | | | | | | | | |
| Common | | | Unlimited | | | Unlimited | | | Unlimited | |
| Preferred | | | Unlimited | | | Unlimited | | | Unlimited | |
See accompanying notes to financial statements.
| Statement of | | |
| | Operations | Year Ended February 28, 2015 |
| | | California | | California | | California AMT- | |
| | | Value | | Value 2 | | Free Income | |
| | | (NCA | ) | (NCB | ) | (NKX | ) |
| Investment Income | | $ | 13,240,389 | | $ | 3,179,437 | | $ | 50,792,129 | |
| Expenses | | | | | | | | | | |
| Management fees | | | 1,368,546 | | | 354,896 | | | 6,377,948 | |
| Interest expense and amortization of offering costs | | | 29,871 | | | — | | | 1,205,016 | |
| Liquidity fees | | | — | | | — | | | 2,550,778 | |
| Remarketing fees | | | — | | | — | | | 295,650 | |
| Custodian fees | | | 48,385 | | | 16,432 | | | 165,982 | |
| Directors/Trustees fees | | | 8,104 | | | 1,948 | | | 31,786 | |
| Professional fees | | | 33,681 | | | 24,448 | | | 71,591 | |
| Shareholder reporting expenses | | | 31,929 | | | 11,429 | | | 92,219 | |
| Shareholder servicing agent fees | | | 22,964 | | | 203 | | | 31,743 | |
| Stock exchange listing fees | | | 8,850 | | | 318 | | | 4,052 | |
| Investor relations expenses | | | 31,760 | | | 7,013 | | | 112,532 | |
| Reorganization expenses | | | — | | | — | | | 337,621 | |
| Shelf offering expenses | | | 149,228 | | | — | | | 186,263 | |
| Other | | | 18,970 | | | 9,319 | | | 130,367 | |
| Total expenses before expense reimbursement | | | 1,752,288 | | | 426,006 | | | 11,593,548 | |
| Expense reimbursement | | | (74,614 | ) | | — | | | (93,132 | ) |
| Net expenses | | | 1,677,674 | | | 426,006 | | | 11,500,416 | |
| Net investment income (loss) | | | 11,562,715 | | | 2,753,431 | | | 39,291,713 | |
| Realized and Unrealized Gain (Loss) | | | | | | | | | | |
| Net realized gain (loss) from investments | | | 196,175 | | | 1,166,712 | | | 127,614 | |
| Change in net unrealized appreciation (depreciation) of investments | | | 12,999,135 | | | 1,327,324 | | | 65,081,303 | |
| Net realized and unrealized gain (loss) | | | 13,195,310 | | | 2,494,036 | | | 65,208,917 | |
| Net increase (decrease) in net assets applicable to common shares from operations | | $ | 24,758,025 | | $ | 5,247,467 | | $ | 104,500,630 | |
See accompanying notes to financial statements.
| | | California Dividend | | California Dividend | | California Dividend | |
| | | Advantage | | Advantage 2 | | Advantage 3 | |
| | | (NAC | ) | (NVX | ) | (NZH | ) |
| Investment Income | | $ | 98,237,121 | | $ | 15,334,068 | | $ | 25,730,707 | |
| Expenses | | | | | | | | | | |
| Management fees | | | 11,530,850 | | | 2,026,731 | | | 3,174,792 | |
| Interest expense and amortization of offering costs | | | 1,479,527 | | | 152,913 | | | 221,488 | |
| Liquidity fees | | | 4,579,274 | | | 910,794 | | | 1,487,010 | |
| Remarketing fees | | | 552,815 | | | 99,360 | | | 162,221 | |
| Custodian fees | | | 292,996 | | | 58,633 | | | 84,609 | |
| Directors/Trustees fees | | | 57,241 | | | 10,140 | | | 15,542 | |
| Professional fees | | | 61,019 | | | 57,097 | | | 67,241 | |
| Shareholder reporting expenses | | | 94,200 | | | 22,621 | | | 25,162 | |
| Shareholder servicing agent fees | | | 50,851 | | | 1,271 | | | 2,122 | |
| Stock exchange listing fees | | | 6,422 | | | — | | | — | |
| Investor relations expenses | | | 201,563 | | | 35,429 | | | 53,691 | |
| Reorganization expenses | | | 267,428 | | | — | | | — | |
| Shelf offering expenses | | | 731,427 | | | — | | | — | |
| Other | | | 153,317 | | | 49,577 | | | 57,050 | |
| Total expenses before expense reimbursement | | | 20,058,930 | | | 3,424,566 | | | 5,350,928 | |
| Expense reimbursement | | | (281,043 | ) | | — | | | — | |
| Net expenses | | | 19,777,887 | | | 3,424,566 | | | 5,350,928 | |
| Net investment income (loss) | | | 78,459,234 | | | 11,909,502 | | | 20,379,779 | |
| Realized and Unrealized Gain (Loss) | | | | | | | | | | |
| Net realized gain (loss) from investments | | | 4,648,813 | | | (208,468 | ) | | 2,904,836 | |
| Change in net unrealized appreciation (depreciation) of investments | | | 82,447,263 | | | 15,230,559 | | | 25,190,058 | |
| Net realized and unrealized gain (loss) | | | 87,096,076 | | | 15,022,091 | | | 28,094,894 | |
| Net increase (decrease) in net assets applicable to common shares from operations | | $ | 165,555,310 | | $ | 26,931,593 | | $ | 48,474,673 | |
See accompanying notes to financial statements.
| Statement of | |
| | Changes in Net Assets |
| | | California Value (NCA) | | California Value 2 (NCB) | | California AMT-Free Income (NKX) | |
| | | Year | | Year | | Year | | Year | | Year | | Year | |
| | | Ended | | Ended | | Ended | | Ended | | Ended | | Ended | |
| | | 2/28/15 | | 2/28/14 | | 2/28/15 | | 2/28/14 | | 2/28/15 | | 2/28/14 | |
| Operations | | | | | | | | | | | | | | | | | | | |
| Net investment income (loss) | | $ | 11,562,715 | | $ | 11,876,534 | | $ | 2,753,431 | | $ | 2,730,748 | | $ | 39,291,713 | | $ | 35,364,037 | |
| Net realized gain (loss) from: | | | | | | | | | | | | | | | | | | | |
| Investments | | | 196,175 | | | (1,431,597 | ) | | 1,166,712 | | | (52,738 | ) | | 127,614 | | | (4,250,722 | ) |
| Swaps | | | — | | | — | | | — | | | (59,500 | ) | | — | | | — | |
| Change in net unrealized appreciation (depreciation) of: | | | | | | | | | | | | | | | | | | | |
| Investments | | | 12,999,135 | | | (9,078,446 | ) | | 1,327,324 | | | (2,615,620 | ) | | 65,081,303 | | | (39,857,654 | ) |
| Swaps | | | — | | | — | | | — | | | 32,496 | | | — | | | — | |
| Net increase (decrease) in net assets applicable to common shares from operations | | | 24,758,025 | | | 1,366,491 | | | 5,247,467 | | | 35,386 | | | 104,500,630 | | | (8,744,339 | ) |
| Distributions to Common Shareholders | | | | | | | | | | | | | | | | | | | |
| From net investment income | | | (11,841,485 | ) | | (11,863,137 | ) | | (2,583,303 | ) | | (2,568,508 | ) | | (38,337,336 | ) | | (35,265,923 | ) |
| From accumulated net realized gains | | | — | | | — | | | (367,916 | ) | | — | | | — | | | (539,785 | ) |
| Decrease in net assets applicable to common shares from distributions to common shareholders | | | (11,841,485 | ) | | (11,863,137 | ) | | (2,951,219 | ) | | (2,568,508 | ) | | (38,337,336 | ) | | (35,805,708 | ) |
| Capital Share Transactions | | | | | | | | | | | | | | | | | | | |
| Common shares: | | | | | | | | | | | | | | | | | | | |
| Issued in the Reorganizations | | | — | | | — | | | — | | | — | | | 87,770,468 | | | — | |
| Proceeds from shelf offering, net of offering costs | | | 1,321,449 | | | — | | | — | | | — | | | — | | | — | |
| Net proceeds from shares issued to shareholders due to reinvestment of distributions | | | 173,032 | | | 41,527 | | | — | | | — | | | — | | | — | |
| Net increase (decrease) in net assets applicable to common shares from capital share transactions | | | 1,494,481 | | | 41,527 | | | — | | | — | | | 87,770,468 | | | — | |
| Net increase (decrease) in net assets applicable to common shares | | | 14,411,021 | | | (10,455,119 | ) | | 2,296,248 | | | (2,533,122 | ) | | 153,933,762 | | | (44,550,047 | ) |
| Net assets applicable to common shares at the beginning of period | | | 253,638,500 | | | 264,093,619 | | | 55,236,203 | | | 57,769,325 | | | 606,852,304 | | | 651,402,351 | |
| Net assets applicable to common shares at the end of period | | $ | 268,049,521 | | $ | 253,638,500 | | $ | 57,532,451 | | $ | 55,236,203 | | $ | 760,786,066 | | $ | 606,852,304 | |
| Undistributed (Over-distribution of) net investment income at the end of period | | $ | 1,122,565 | | $ | 1,401,341 | | $ | 731,470 | | $ | 565,740 | | $ | 5,736,445 | | $ | 5,064,929 | |
See accompanying notes to financial statements.
| | | California Dividend Advantage (NAC) | | California Dividend Advantage 2 (NVX) | | California Dividend Advantage 3 (NZH) | |
| | | Year | | Year | | Year | | Year | | Year | | Year | |
| | | Ended | | Ended | | Ended | | Ended | | Ended | | Ended | |
| | | 2/28/15 | | 2/28/14 | | 2/28/15 | | 2/28/14 | | 2/28/15 | | 2/28/14 | |
| Operations | | | | | | | | | | | | | | | | | | | |
| Net investment income (loss) | | $ | 78,459,234 | | $ | 19,726,181 | | $ | 11,909,502 | | $ | 11,822,336 | | $ | 20,379,779 | | $ | 17,956,430 | |
| Net realized gain (loss) from: | | | | | | | | | | | | | | | | | | | |
| Investments | | | 4,648,813 | | | (519,724 | ) | | (208,468 | ) | | (2,252,230 | ) | | 2,904,836 | | | (8,622,695 | ) |
| Swaps | | | — | | | — | | | — | | | — | | | — | | | — | |
| Change in net unrealized appreciation (depreciation) of: | | | | | | | | | | | | | | | | | | | |
| Investments | | | 82,447,263 | | | (27,032,828 | ) | | 15,230,559 | | | (18,376,532 | ) | | 25,190,058 | | | (19,112,933 | ) |
| Swaps | | | — | | | — | | | — | | | — | | | — | | | — | |
| Net increase (decrease) in net assets applicable to common shares from operations | | | 165,555,310 | | | (7,826,371 | ) | | 26,931,593 | | | (8,806,426 | ) | | 48,474,673 | | | (9,779,198 | ) |
| Distributions to Common Shareholders | | | | | | | | | | | | | | | | | | | |
| From net investment income | | | (69,293,415 | ) | | (20,926,579 | ) | | (12,619,148 | ) | | (13,327,592 | ) | | (19,461,588 | ) | | (19,435,021 | ) |
| From accumulated net realized gains | | | — | | | — | | | — | | | — | | | — | | | — | |
| Decrease in net assets applicable to common shares from distributions to common shareholders | | | (69,293,415 | ) | | (20,926,579 | ) | | (12,619,148 | ) | | (13,327,592 | ) | | (19,461,588 | ) | | (19,435,021 | ) |
| Capital Share Transactions | | | | | | | | | | | | | | | | | | | |
| Common shares: | | | | | | | | | | | | | | | | | | | |
| Issued in the Reorganizations | | | 1,271,903,837 | | | — | | | — | | | — | | | — | | | — | |
| Proceeds from shelf offering, net of offering costs | | | — | | | — | | | — | | | — | | | — | | | — | |
| Net proceeds from shares issued to shareholders due to reinvestment of distributions | | | — | | | 119,833 | | | — | | | 20,251 | | | — | | | — | |
| Net increase (decrease) in net assets applicable to common shares from capital share transactions | | | 1,271,903,837 | | | 119,833 | | | — | | | 20,251 | | | — | | | — | |
| Net increase (decrease) in net assets applicable to common shares | | | 1,368,165,732 | | | (28,633,117 | ) | | 14,312,445 | | | (22,113,767 | ) | | 29,013,085 | | | (29,214,219 | ) |
| Net assets applicable to common shares at the beginning of period | | | 345,462,534 | | | 374,095,651 | | | 219,122,885 | | | 241,236,652 | | | 325,948,462 | | | 355,162,681 | |
| Net assets applicable to common shares at the end of period | | $ | 1,713,628,266 | | $ | 345,462,534 | | $ | 233,435,330 | | $ | 219,122,885 | | $ | 354,961,547 | | $ | 325,948,462 | |
| Undistributed (Over-distribution of) net investment income at the end of period | | $ | 13,917,924 | | $ | 4,367,852 | | $ | 1,271,425 | | $ | 1,981,689 | | $ | 1,496,207 | | $ | 580,783 | |
See accompanying notes to financial statements.
| Statement of | | |
| | Cash Flows | Year Ended February 28, 2015 |
| | | California AMT- | | California Dividend | | California Dividend | | California Dividend | |
| | | Free Income | | Advantage | | Advantage 2 | | Advantage 3 | |
| | | (NKX | ) | (NAC | ) | (NVX | ) | (NZH | ) |
| Cash Flows from Operating Activities: | | | | | | | | | | | | | |
| Net Increase (Decrease) In Net Assets Applicable to Common Shares from Operations | | $ | 104,500,630 | | $ | 165,555,310 | | $ | 26,931,593 | | $ | 48,474,673 | |
| Adjustments to reconcile the net increase (decrease) in net assets applicable to common shares from operations to net cash provided by (used in) operating activities: | | | | | | | | | | | | | |
| Purchases of investments | | | (127,607,362 | ) | | (218,318,411 | ) | | (65,095,687 | ) | | (91,137,093 | ) |
| Proceeds from sales and maturities of investments | | | 136,219,205 | | | 174,411,621 | | | 44,897,069 | | | 72,373,329 | |
| Proceeds from (Purchases of) short-term investments, net | | | (8,718,742 | ) | | (20,886,656 | ) | | 18,340,968 | | | 10,471,700 | |
| Other investment transactions, net | | | 71,057 | | | 146,282 | | | 14,034 | | | 32,334 | |
| Taxes paid on undistributed capital gains | | | (57 | ) | | — | | | — | | | (240 | ) |
| Amortization (Accretion) of premiums and discounts, net | | | (1,960,701 | ) | | (1,847,880 | ) | | (282,506 | ) | | 382,957 | |
| Amortization of deferred offering costs | | | 190,567 | | | 286,106 | | | 2,965 | | | 10,015 | |
| (Increase) Decrease in: | | | | | | | | | | | | | |
| Receivable for interest | | | (345,289 | ) | | (3,898,923 | ) | | (180,904 | ) | | 192,953 | |
| Receivable for investments sold | | | 1,115,720 | | | 21,710,535 | | | 1,159,250 | | | 1,862,004 | |
| Other assets | | | 197,346 | | | 439,379 | | | 1,164 | | | 1,666 | |
| Increase (Decrease) in: | | | | | | | | | | | | | |
| Accrued management fees | | | 88,340 | | | 879,689 | | | 7,358 | | | 13,954 | |
| Accrued Directors/Trustees fees | | | (4,543 | ) | | 197,034 | | | (3,827 | ) | | (5,996 | ) |
| Accrued reorganization expenses | | | (121,534 | ) | | (699,950 | ) | | — | | | — | |
| Accrued other expenses | | | (530,328 | ) | | (2,214,212 | ) | | 4,398 | | | 3,481 | |
| Net realized (gain) loss from investments | | | (127,614 | ) | | (4,648,813 | ) | | 208,468 | | | (2,904,836 | ) |
| Change in net unrealized (appreciation) depreciation of investments | | | (65,081,303 | ) | | (82,447,263 | ) | | (15,230,559 | ) | | (25,190,058 | ) |
| Net cash provided by (used in) operating activities | | | 37,885,392 | | | 28,663,848 | | | 10,773,784 | | | 14,580,843 | |
| Cash Flows from Financing Activities: | | | | | | | | | | | | | |
| (Payments for) deferred offering costs | | | (360,000 | ) | | — | | | — | | | — | |
| Increase (Decrease) in: | | | | | | | | | | | | | |
| Cash overdraft | | | (1,287,984 | ) | | — | | | — | | | — | |
| Floating rate obligations | | | — | | | (7,550,000 | ) | | — | | | — | |
| Payable for offering costs | | | (12,712 | ) | | 287,852 | | | — | | | (76,172 | ) |
| Accrued shelf offering costs | | | 48 | | | (46,750 | ) | | — | | | — | |
| iMTP Shares, at liquidation value | | | 36,000,000 | | | — | | | — | | | — | |
| MTP Shares, at liquidation value | | | (35,250,000 | ) | | — | | | — | | | — | |
| Cash distributions paid to common shareholders | | | (37,853,375 | ) | | (62,823,074 | ) | | (12,691,289 | ) | | (19,450,462 | ) |
| Net cash provided by (used in) financing activities | | | (38,764,023 | ) | | (70,131,972 | ) | | (12,691,289 | ) | | (19,526,634 | ) |
| Net Increase (Decrease) in Cash | | | (878,631 | ) | | (41,468,124 | ) | | (1,917,505 | ) | | (4,945,791 | ) |
| Cash at the beginning of period | | | — | | | 8,690,242 | | | 4,732,631 | | | 8,357,790 | |
| Cash acquired in connection with the Reorganizations | | | 878,631 | | | 33,226,411 | | | — | | | — | |
| Cash at the end of period | | $ | — | | $ | 448,529 | | $ | 2,815,126 | | $ | 3,411,999 | |
| | | California AMT- | | California Dividend | | California Dividend | | California Dividend | |
| | | Free Income | | Advantage | | Advantage 2 | | Advantage 3 | |
| Supplemental Disclosures of Cash Flow Information* | | (NKX | ) | (NAC | ) | (NVX | ) | (NZH | ) |
| Cash paid for interest (excluding amortization of offering costs) | | $ | 900,620 | | $ | 1,358,421 | | $ | 151,894 | | $ | 211,473 | |
| * | See Notes to Financial Statements, Note 1 – General Information and Significant Accounting Policies, Fund Reorganizations for more information of the non-cash activities related to California AMT-Free Income’s (NKX) and California Dividend Advantage’s (NAC) Reorganizations. |
See accompanying notes to financial statements.
THIS PAGE INTENTIONALLY LEFT BLANK
Selected data for a common share outstanding throughout each period:
| | | Investment Operations | | Less Distributions to Common Shareholders | | Common Share | |
| | | Beginning Common Share NAV | | Net Investment Income (Loss) | | Net Realized/ Unrealized Gain (Loss) | | Total | | From Net Investment Income | | From Accumu- lated Net Realized Gains | | Total | | Premium per Share Sold through Shelf Offering | | Ending NAV | | Ending Share Price | |
| California Value (NCA) | | | | | | | | | | | | | | | | | | | | | | | | | | | | |
| Year Ended 2/28–2/29: | | | | | | | | | | | | | | | | | | | | | | | | | | | | |
| 2015 | | $ | 10.03 | | $ | 0.46 | | $ | 0.51 | | $ | 0.97 | | $ | (0.47 | ) | $ | — | | $ | (0.47 | ) | $ | 0.01 | | $ | 10.54 | | $ | 10.64 | |
| 2014 | | | 10.45 | | | 0.47 | | | (0.42 | ) | | 0.05 | | | (0.47 | ) | | — | | | (0.47 | ) | | — | | | 10.03 | | | 9.57 | |
| 2013 | | | 10.08 | | | 0.47 | | | 0.37 | | | 0.84 | | | (0.47 | ) | | — | | | (0.47 | ) | | — | | | 10.45 | | | 10.45 | |
| 2012 | | | 9.07 | | | 0.48 | | | 0.99 | | | 1.47 | | | (0.46 | ) | | — | | | (0.46 | ) | | — | | | 10.08 | | | 10.13 | |
| 2011 | | | 9.53 | | | 0.47 | | | (0.47 | ) | | — | | | (0.46 | ) | | — | | | (0.46 | ) | | — | | | 9.07 | | | 8.36 | |
| | | | | | | | | | | | | | | | | | | | | | | | | | | | | | | | |
| California Value 2 (NCB) | | | | | | | | | | | | | | | | | | | | | | | | | | | | |
| Year Ended 2/28–2/29: | | | | | | | | | | | | | | | | | | | | | | | | | | | | |
| 2015 | | | 16.80 | | | 0.84 | | | 0.76 | | | 1.60 | | | (0.79 | ) | | (0.11 | ) | | (0.90 | ) | | — | | | 17.50 | | | 16.68 | |
| 2014 | | | 17.57 | | | 0.83 | | | (0.82 | ) | | 0.01 | | | (0.78 | ) | | — | | | (0.78 | ) | | — | | | 16.80 | | | 15.53 | |
| 2013 | | | 16.66 | | | 0.83 | | | 0.89 | | | 1.72 | | | (0.80 | ) | | (0.01 | ) | | (0.81 | ) | | — | | | 17.57 | | | 16.86 | |
| 2012 | | | 14.88 | | | 0.84 | | | 1.76 | | | 2.60 | | | (0.80 | ) | | (0.02 | ) | | (0.82 | ) | | — | | | 16.66 | | | 16.33 | |
| 2011 | | | 15.71 | | | 0.84 | | | (0.84 | ) | | — | | | (0.82 | ) | | (0.01 | ) | | (0.83 | ) | | — | | | 14.88 | | | 13.65 | |
| (a) | Total Return Based on Common Share NAV is the combination of changes in common share NAV, reinvested dividend income at NAV and reinvested capital gains distributions at NAV, if any. The last dividend declared in the period, which is typically paid on the first business day of the following month, is assumed to be reinvested at the ending NAV. The actual reinvest price for the last dividend declared in the period may often be based on the Fund’s market price (and not its NAV), and therefore may be different from the price used in the calculation. Total returns are not annualized. |
| | |
| | Total Return Based on Common Share Price is the combination of changes in the market price per share and the effect of reinvested dividend income and reinvested capital gains distributions, if any, at the average price paid per share at the time of reinvestment. The last dividend declared in the period, which is typically paid on the first business day of the following month, is assumed to be reinvested at the ending market price. The actual reinvestment for the last dividend declared in the period may take place over several days, and in some instances may not be based on the market price, so the actual reinvestment price may be different from the price used in the calculation. Total returns are not annualized. |
| | | | Common Share Supplemental Data/ Ratios Applicable to Common Shares |
| | Common Share Total Returns | | | | Ratios to Average Net Assets | | | |
| | | | | | | | | | | | | |
| | Based on NAV | (a) | Based on Share Price | (a) | Ending Net Assets (000) | | Expenses | (b) | Net Investment Income (Loss) | | Portfolio Turnover Rate | (d) |
| | | | | | | | | | | | | | | | | | | |
| | | | | | | | | | | | | | | | | | | |
| | | 9.91 | % | | 16.36 | % | $ | 268,050 | | | 0.64 | %(c) | | 4.41 | %(c) | | 13 | % |
| | | 0.62 | | | (3.80 | ) | | 253,639 | | | 0.62 | | | 4.73 | | | 20 | |
| | | 8.48 | | | 7.99 | | | 264,094 | | | 0.64 | | | 4.55 | | | 16 | |
| | | 16.58 | | | 27.44 | | | 254,563 | | | 0.65 | | | 4.98 | | | 8 | |
| | | (0.13 | ) | | (2.32 | ) | | 228,948 | | | 0.65 | | | 4.92 | | | 14 | |
| | | | | | | | | | | | | | | | | | | |
| | | | | | | | | | | | | | | | | | | |
| | | 9.68 | | | 13.41 | | | 57,532 | | | 0.75 | | | 4.84 | | | 7 | |
| | | 0.22 | | | (3.08 | ) | | 55,236 | | | 0.76 | | | 5.00 | | | 12 | |
| | | 10.54 | | | 8.39 | | | 57,769 | | | 0.74 | | | 4.81 | | | 7 | |
| | | 17.97 | | | 26.50 | | | 54,772 | | | 0.77 | | | 5.41 | | | 4 | |
| | | (0.17 | ) | | (1.25 | ) | | 48,936 | | | 0.72 | | | 5.35 | | | 5 | |
| (b) | The expense ratios reflect, among other things, the interest expense deemed to have been paid by the Fund on the floating rate certificates issued by the special purpose trusts for the self-deposited inverse floaters held by the Fund, where applicable, as described in Note 3 – Portfolio Securities and Investments in Derivatives, Inverse Floating Rate Securities, as follows: |
| California Value (NCA) | | |
| Year Ended 2/28–2/29: | | |
| 2015 | 0.01 | % |
| 2014 | 0.01 | |
| 2013 | 0.01 | |
| 2012 | 0.01 | |
| 2011 | 0.01 | |
| California Value 2 (NCB) | | |
| Year Ended 2/28–2/29: | | |
| 2015 | — | % |
| 2014 | — | |
| 2013 | — | |
| 2012 | — | |
| 2011 | — | |
| (c) | During the fiscal year ended February 28, 2015, the Adviser voluntarily reimbursed the Fund for certain expenses incurred in connection with its common shares equity shelf program. As a result the expenses and net investment income (loss) ratios to average net assets applicable to common shares reflect the voluntary expense reimbursement from Adviser as described in Note 1 – General Information and Significant Accounting Policies, Common Shares Equity Shelf Program and Offering Costs. The expenses and net investment income (loss) ratios to average net assets applicable to common shares excluding this expense reimbursement from Adviser are as follows: |
| | | | | Net Investment | |
| California Value (NCA) | | Expenses | | Income (Loss) | |
| Year Ended 2/28-2/29: | | | | | |
| 2015 | | 0.67% | | 4.38% | |
| (d) | Portfolio Turnover Rate is calculated based on the lesser of long-term purchases or sales (as disclosed in Note 5 – Investment Transactions) divided by the average long-term market value during the period. |
See accompanying notes to financial statements.
Financial Highlights (continued)
Selected data for a common share outstanding throughout each period:
| | | | | Investment Operations | | Less Distributions to Common Shareholders | | Common Share | |
| | | Beginning Common Share NAV | | Net Investment Income (Loss) | | Net Realized/ Unrealized Gain (Loss) | | Distributions from Net Investment Income to ARPS Shareholders | (a) | Distributions from Accumulated Net Realized Gains to ARPS Shareholders | (a) | Total | | From Net Investment Income | | From Accumu- lated Net Realized Gains | | Total | | Ending NAV | | Ending Share Price | |
| California AMT-Free Income (NKX) | | | | | | | | | | | | | | | | | | | | | | | | | |
| Year Ended 2/28-2/29: | | | | | | | | | | | | | | | | | | | | | | | | | | | | |
| 2015 | | $ | 14.50 | | $ | 0.85 | | $ | 1.45 | | $ | — | | $ | — | | $ | 2.30 | | $ | (0.85 | ) | $ | — | | $ | (0.85 | ) | $ | 15.95 | | $ | 14.67 | |
| 2014 | | | 15.57 | | | 0.84 | | | (1.06 | ) | | — | | | — | | | (0.22 | ) | | (0.84 | ) | | (0.01 | ) | | (0.85 | ) | | 14.50 | | | 13.25 | |
| 2013 | | | 14.73 | | | 0.77 | | | 0.97 | | | — | | | — | | | 1.74 | | | (0.88 | ) | | (0.02 | ) | | (0.90 | ) | | 15.57 | | | 15.12 | |
| 2012 | | | 12.82 | | | 0.83 | | | 1.91 | | | — | | | — | | | 2.74 | | | (0.83 | ) | | — | | | (0.83 | ) | | 14.73 | | | 15.06 | |
| 2011 | | | 14.03 | | | 0.81 | | | (1.22 | ) | | — | | | — | | | (0.41 | ) | | (0.80 | ) | | — | | | (0.80 | ) | | 12.82 | | | 11.78 | |
| | | | | | | | | | | | | | | | | | | | | | | | | | | | | | | | | | | |
| California Dividend Advantage (NAC) | | | | | | | | | | | | | | | | | | | | | | | | | |
| Year Ended 2/28-2/29: | | | | | | | | | | | | | | | | | | | | | | | | | | | | |
| 2015 | | | 14.68 | | | 0.87 | | | 1.34 | | | — | | | — | | | 2.21 | | | (0.93 | ) | | — | | | (0.93 | ) | | 15.96 | | | 15.34 | |
| 2014 | | | 15.90 | | | 0.84 | | | (1.17 | ) | | — | | | — | | | (0.33 | ) | | (0.89 | ) | | — | | | (0.89 | ) | | 14.68 | | | 14.07 | |
| 2013 | | | 14.87 | | | 0.84 | | | 1.11 | | | — | | | — | | | 1.95 | | | (0.92 | ) | | — | | | (0.92 | ) | | 15.90 | | | 15.81 | |
| 2012 | | | 12.68 | | | 0.94 | | | 2.17 | | | (0.01 | ) | | — | | | 3.10 | | | (0.91 | ) | | — | | | (0.91 | ) | | 14.87 | | | 15.14 | |
| 2011 | | | 13.88 | | | 0.98 | | | (1.27 | ) | | (0.02 | ) | | — | | | (0.31 | ) | | (0.89 | ) | | — | | | (0.89 | ) | | 12.68 | | | 12.20 | |
| (a) | The amounts shown for Auction Rate Preferred Shares (“ARPS”) are based on common share equivalents. |
| (b) | Total Return Based on Common Share NAV is the combination of changes in common share NAV, reinvested dividend income at NAV and reinvested capital gains distributions at NAV, if any. The last dividend declared in the period, which is typically paid on the first business day of the following month, is assumed to be reinvested at the ending NAV. The actual reinvest price for the last dividend declared in the period may often be based on the Fund’s market price (and not its NAV), and therefore may be different from the price used in the calculation. Total returns are not annualized. |
| | Total Return Based on Common Share Price is the combination of changes in the market price per share and the effect of reinvested dividend income and reinvested capital gains distributions, if any, at the average price paid per share at the time of reinvestment. The last dividend declared in the period, which is typically paid on the first business day of the following month, is assumed to be reinvested at the ending market price. The actual reinvestment for the last dividend declared in the period may take place over several days, and in some instances may not be based on the market price, so the actual reinvestment price may be different from the price used in the calculation. Total returns are not annualized. |
| (c) | Ratios do not reflect the effect of dividend payments to ARPS shareholders, where applicable; Net Investment Income (Loss) ratios reflect income earned and expenses incurred on assets attributable to ARPS, iMTP Shares, MTP Shares and/or VRDP Shares, where applicable. |
| (d) | After expense reimbursement from the Adviser, where applicable. As of November 30, 2010 and July 31, 2009, the Adviser is no longer reimbursing California AMT-Free Income (NKX) and California Dividend Advantage (NAC) for any fees or expenses. |
| | | | Common Share Supplemental Data/ Ratios Applicable to Common Shares |
| | Common Share Total Returns | | | | Ratios to Average Net Assets Before Reimbursement(c) | | Ratios to Average Net Assets After Reimbursement(c)(d) | | | |
| | | | | | | | | | | | | | | | | |
| | Based on NAV | (b) | Based on Share Price | (b) | Ending Net Assets (000) | | Expenses | (e) | Net Investment Income (Loss) | | Expenses | (e) | Net Investment Income (Loss) | | Portfolio Turnover Rate | (g) |
| | | | | | | | | | | | | | | | | | | | | | | | | |
| | | | | | | | | | | | | | | | | | | | | | | | | |
| | | 16.16 | % | | 17.55 | % | $ | 760,786 | | | 1.63 | % | | 5.51 | % | | 1.62 | %(f) | | 5.53 | %(f) | | 13 | % |
| | | (1.10 | ) | | (6.39 | ) | | 606,852 | | | 1.64 | | | 5.93 | | | N/A | | | N/A | | | 32 | |
| | | 12.08 | | | 6.53 | | | 651,402 | | | 1.64 | | | 5.48 | | | N/A | | | N/A | | | 20 | |
| | | 21.95 | | | 36.10 | | | 86,731 | | | 1.90 | | | 6.03 | | | N/A | | | N/A | | | 7 | |
| | | (3.18 | ) | | (2.71 | ) | | 75,493 | | | 2.06 | | | 5.74 | | | 1.97 | % | | 5.83 | % | | 8 | |
| | | | | | | | | | | | | | | | | | | | | | | | | |
| | | | | | | | | | | | | | | | | | | | | | | | | |
| | | 15.39 | | | 16.21 | | | 1,713,628 | | | 1.53 | | | 5.95 | | | 1.50 | (f) | | 5.97 | (f) | | 9 | |
| | | (1.81 | ) | | (4.95 | ) | | 345,463 | | | 1.86 | | | 5.79 | | | N/A | | | N/A | | | 25 | |
| | | 13.39 | | | 10.80 | | | 374,096 | | | 1.60 | | | 5.44 | | | N/A | | | N/A | | | 12 | |
| | | 25.30 | | | 32.82 | | | 349,203 | | | 1.50 | | | 6.84 | | | N/A | | | N/A | | | 13 | |
| | | (2.57 | ) | | 3.54 | | | 297,629 | | | 1.18 | | | 7.18 | | | N/A | | | N/A | | | 20 | |
| (e) | The expense ratios reflect, among other things, all interest expense and other costs related to iMTP Shares, MTP Shares, VRDP Shares and/or the interest expense deemed to have been paid by the Fund on the floating rate certificates issued by the special purpose trusts for the self-deposited inverse floaters held by the Fund, where applicable, each as described in Note 1 – General Information and Significant Accounting Policies, Institutional MuniFund Term Preferred Shares, MuniFund Term Preferred Shares and Variable Rate Demand Preferred Shares and Note 3 – Portfolio Securities and Investments in Derivatives, Inverse Floating Rate Securities, respectively, as follows: |
| California AMT-Free Income (NKX) | | |
| Year Ended 2/28-2/29: | | |
| 2015 | 0.57 | % |
| 2014 | 0.62 | |
| 2013 | 0.59 | |
| 2012 | 0.67 | |
| 2011 | 0.92 | |
| California Dividend Advantage (NAC) | | |
| Year Ended 2/28-2/29: | | |
| 2015 | 0.50 | % |
| 2014 | 0.61 | |
| 2013 | 0.61 | |
| 2012 | 0.46 | |
| 2011 | 0.06 | |
| (f) | During the fiscal year ended February 28, 2015, the Adviser voluntarily reimbursed the Fund for certain expenses incurred in connection with its common shares equity shelf program as described in Note 1 – General Information and Significant Accounting Policies, Common Shares Equity Shelf Program and Offering Costs. |
| (g) | Portfolio Turnover Rate is calculated based on the lesser of long-term purchases or sales (as disclosed in Note 5 – Investment Transactions) divided by the average long-term market value during the period. |
| N/A | Fund no longer has a contractual reimbursement agreement with the Adviser. |
See accompanying notes to financial statements.
Financial Highlights (continued)
Selected data for a common share outstanding throughout each period:
| | | | | Investment Operations | | Less Distributions to Common Shareholders | | Common Share | |
| | | Beginning Common Share NAV | | Net Investment Income (Loss) | | Net Realized/ Unrealized Gain (Loss) | | Distributions from Net Investment Income to ARPS Shareholders | (a) | Distributions from Accumulated Net Realized Gains to ARPS Shareholders | (a) | Total | | From Net Investment Income | | From Accumu- lated Net Realized Gains | | Total | | Ending NAV | | Ending Share Price | |
| California Dividend Advantage 2 (NVX) | | | | | | | | | | | | | | | | | | | | | | |
| Year Ended 2/28-2/29: | | | | | | | | | | | | | | | | | | | | | | | | | | | | |
| 2015 | | $ | 14.85 | | $ | 0.81 | | $ | 1.02 | | $ | — | | $ | — | | $ | 1.83 | | $ | (0.86 | ) | $ | — | | $ | (0.86 | ) | $ | 15.82 | | $ | 14.59 | |
| 2014 | | | 16.35 | | | 0.80 | | | (1.40 | ) | | — | | | — | | | (0.60 | ) | | (0.90 | ) | | — | | | (0.90 | ) | | 14.85 | | | 13.75 | |
| 2013 | | | 15.49 | | | 0.85 | | | 0.96 | | | — | | | — | | | 1.81 | | | (0.95 | ) | | — | | | (0.95 | ) | | 16.35 | | | 16.30 | |
| 2012 | | | 13.47 | | | 0.90 | | | 2.08 | | | — | * | | — | | | 2.98 | | | (0.96 | ) | | — | | | (0.96 | ) | | 15.49 | | | 15.58 | |
| 2011 | | | 14.49 | | | 1.03 | | | (1.07 | ) | | (0.02 | ) | | — | | | (0.06 | ) | | (0.96 | ) | | — | | | (0.96 | ) | | 13.47 | | | 12.83 | |
| | | | | | | | | | | | | | | | | | | | | | | | | | | | | | | | | | | |
| California Dividend Advantage 3 (NZH) | | | | | | | | | | | | | | | | | | | | | | |
| Year Ended 2/28-2/29: | | | | | | | | | | | | | | | | | | | | | | | | | | | | |
| 2015 | | | 13.50 | | | 0.84 | | | 1.17 | | | — | | | — | | | 2.01 | | | (0.81 | ) | | — | | | (0.81 | ) | | 14.70 | | | 13.63 | |
| 2014 | | | 14.71 | | | 0.74 | | | (1.15 | ) | | — | | | — | | | (0.41 | ) | | (0.80 | ) | | — | | | (0.80 | ) | | 13.50 | | | 12.24 | |
| 2013 | | | 13.91 | | | 0.75 | | | 0.90 | | | — | | | — | | | 1.65 | | | (0.85 | ) | | — | | | (0.85 | ) | | 14.71 | | | 14.25 | |
| 2012 | | | 12.13 | | | 0.82 | | | 1.86 | | | — | * | | — | | | 2.68 | | | (0.90 | ) | | — | | | (0.90 | ) | | 13.91 | | | 14.35 | |
| 2011 | | | 13.18 | | | 0.88 | | | (1.02 | ) | | (0.01 | ) | | — | | | (0.15 | ) | | (0.90 | ) | | — | | | (0.90 | ) | | 12.13 | | | 11.67 | |
| (a) | The amounts shown for ARPS are based on common share equivalents. |
| (b) | Total Return Based on Common Share NAV is the combination of changes in common share NAV, reinvested dividend income at NAV and reinvested capital gains distributions at NAV, if any. The last dividend declared in the period, which is typically paid on the first business day of the following month, is assumed to be reinvested at the ending NAV. The actual reinvest price for the last dividend declared in the period may often be based on the Fund’s market price (and not its NAV), and therefore may be different from the price used in the calculation. Total returns are not annualized. |
| | Total Return Based on Common Share Price is the combination of changes in the market price per share and the effect of reinvested dividend income and reinvested capital gains distributions, if any, at the average price paid per share at the time of reinvestment. The last dividend declared in the period, which is typically paid on the first business day of the following month, is assumed to be reinvested at the ending market price. The actual reinvestment for the last dividend declared in the period may take place over several days, and in some instances may not be based on the market price, so the actual reinvestment price may be different from the price used in the calculation. Total returns are not annualized. |
| * | Rounds to less than $.01 per share. |
| | | | Common Share Supplemental Data/ Ratios Applicable to Common Shares |
| | Common Share Total Returns | | | | Ratios to Average Net Assets Before Reimbursement(c) | | Ratios to Average Net Assets After Reimbursement(c)(d) | | | |
| | | | | | | | | | | | | | | | | |
| | Based on NAV | (b) | Based on Share Price | (b) | Ending Net Assets (000) | | Expenses | (e) | Net Investment Income (Loss) | | Expenses | (e) | Net Investment Income (Loss) | | Portfolio Turnover Rate | (f) |
| | | | | | | | | | | | | | | | | | | | | | | | | |
| | | | | | | | | | | | | | | | | | | | | | | | | |
| | | 12.57 | % | | 12.72 | % | $ | 233,435 | | | 1.50 | % | | 5.23 | % | | N/A | | | N/A | | | 14 | % |
| | | (3.42 | ) | | (9.86 | ) | | 219,123 | | | 2.24 | | | 5.43 | | | N/A | | | N/A | | | 39 | |
| | | 11.94 | | | 11.03 | | | 241,237 | | | 2.19 | | | 5.29 | | | N/A | | | N/A | | | 23 | |
| | | 22.90 | | | 30.01 | | | 228,474 | | | 2.30 | | | 6.29 | | | 2.30 | % | | 6.30 | % | | 12 | |
| | | (0.64 | ) | | 1.37 | | | 198,675 | | | 1.36 | | | 7.10 | | | 1.28 | | | 7.19 | | | 13 | |
| | | | | | | | | | | | | | | | | | | | | | | | | |
| | | | | | | | | | | | | | | | | | | | | | | | | |
| | | 15.18 | | | 18.47 | | | 354,962 | | | 1.56 | | | 5.93 | | | N/A | | | N/A | | | 15 | |
| | | (2.50 | ) | | (8.23 | ) | | 325,948 | | | 2.42 | | | 5.57 | | | N/A | | | N/A | | | 41 | |
| | | 12.15 | | | 5.41 | | | 355,163 | | | 2.53 | | | 5.22 | | | N/A | | | N/A | | | 20 | �� |
| | | 22.89 | | | 31.93 | | | 335,830 | | | 2.56 | | | 6.28 | | | 2.52 | | | 6.33 | | | 18 | |
| | | (1.40 | ) | | (1.21 | ) | | 292,563 | | | 2.07 | | | 6.61 | | | 1.94 | | | 6.74 | | | 16 | |
| (c) | Ratios do not reflect the effect of dividend payments to ARPS shareholders, where applicable; Net Investment Income (Loss) ratios reflect income earned and expenses incurred on assets attributable to ARPS, MTP Shares and/or VRDP Shares, where applicable. |
| (d) | After expense reimbursement from the Adviser, where applicable. As of March 31, 2011 and September 30, 2011, the Adviser is no longer reimbursing California Dividend Advantage 2 (NVX) and California Dividend Advantage 3 (NZH), respectively, for any fees or expenses. |
| (e) | The expense ratios reflect, among other things, all interest expense and other costs related to MTP Shares, VRDP Shares and/or the interest expense deemed to have been paid by the Fund on the floating rate certificates issued by the special purpose trusts for the self-deposited inverse floaters held by the Fund, where applicable, each as described in Note 1 – General Information and Significant Accounting Policies, MuniFund Term Preferred Shares and Variable Rate Demand Preferred Shares and Note 3 –Portfolio Securities and Investments in Derivatives, Inverse Floating Rate Securities, respectively, as follows: |
| California Dividend Advantage 2 (NVX) | | |
| Year Ended 2/28-2/29: | | |
| 2015 | 0.51 | % |
| 2014 | 1.18 | |
| 2013 | 1.15 | |
| 2012 | 1.25 | |
| 2011 | 0.26 | |
| California Dividend Advantage 3 (NZH) | | |
| Year Ended 2/28-2/29: | | |
| 2015 | 0.54 | % |
| 2014 | 1.37 | |
| 2013 | 1.47 | |
| 2012 | 1.49 | |
| 2011 | 0.94 | |
| (f) | Portfolio Turnover Rate is calculated based on the lesser of long-term purchases or sales (as disclosed in Note 5 – Investment Transactions) divided by the average long-term market value during the period. |
| N/A | Fund no longer has a contractual reimbursement agreement with the Adviser. |
See accompanying notes to financial statements.
Financial Highlights (continued)
| | | ARPS at the End of Period | | iMTP Shares at the End of Period | | VRDP Shares at the End of Period | | iMTP and VRDP Shares at the End of Period | |
| | | Aggregate | | Asset | | Aggregate | | Asset | | Aggregate | | Asset | | Asset Coverage | |
| | | Amount | | Coverage | | Amount | | Coverage | | Amount | | Coverage | | Per $1 | |
| | | Outstanding | | Per $25,000 | | Outstanding | | Per $5,000 | | Outstanding | | Per $100,000 | | Liquidation | |
| | | (000 | ) | Share | | (000 | ) | Share | | (000 | ) | Share | | Preference | |
| California AMT-Free Income (NKX) | | | | | | | | | | | | | | | | | | | |
| Year Ended 2/28-2/29: | | | | | | | | | | | | | | | | | | | | | | |
| 2015(a) | | $ | — | | $ | — | | $ | 36,000 | | $ | 16,612 | | $ | 291,600 | | $ | 332,230 | | $ | 3.32 | |
| 2014 | | | — | | | — | | | — | | | — | | | 291,600 | | | 308,111 | | | — | |
| 2013 | | | — | | | — | | | — | | | — | | | 291,600 | | | 323,389 | | | — | |
| 2012 | | | — | | | — | | | — | | | — | | | 35,500 | | | 344,312 | | | — | |
| 2011 | | | — | | | — | | | — | | | — | | | 35,500 | | | 312,655 | | | — | |
| | | | | | | | | | | | | | | | | | | | | | | |
| California Dividend Advantage (NAC) | | | | | | | | | | | | | | | | | | |
| Year Ended 2/28-2/29: | | | | | | | | | | | | | | | | | | | | | | |
| 2015 | | | — | | | — | | | — | | | — | | | 699,600 | | | 344,944 | | | — | |
| 2014 | | | — | | | — | | | — | | | — | | | 136,200 | | | 353,644 | | | — | |
| 2013 | | | — | | | — | | | — | | | — | | | 136,200 | | | 374,666 | | | — | |
| 2012 | | | — | | | — | | | — | | | — | | | 136,200 | | | 356,390 | | | — | |
| 2011 | | | 135,525 | | | 79,903 | | | — | | | — | | | — | | | — | | | — | |
| (a) | The Ending and Average Market Value Per Share for each Series of the Fund’s MTP Shares were as follows: |
| | | 2015 | |
| California AMT-Free Income (NKX) | | | |
| Series 2015 (NKX PRC) | | | |
| Ending Market Value per Share | | — | |
| Average Market Value per Share | | 10.03 | |
| For the period June 9, 2014 (effective date of the Reorganizations) through December 29, 2014. |
See accompanying notes to financial statements.
| | | ARPS at the End of Period | | VRDP Shares at the End of Period | | MTP Shares at the End of Period (a) | | ARPS and/or MTP Shares at the End of Period | |
| | | Aggregate Amount Outstanding (000 | ) | Asset Coverage Per $25,000 Share | | Aggregate Amount Outstanding (000 | ) | Asset Coverage Per $100,000 Share | | Aggregate Amount Outstanding (000 | ) | Asset Coverage Per $10 Share | | Asset Coverage Per $1 Liquidation Preference | |
| California Dividend Advantage 2 (NVX) | | | | | | | | | | | | | | | | | | | | | | |
| Year Ended 2/28-2/29: | | | | | | | | | | | | | | | | | | | | | | |
| 2015 | | $ | — | | $ | — | | $ | 98,000 | | $ | 338,199 | | $ | — | | $ | — | | $ | — | |
| 2014 | | | — | | | — | | | 98,000 | | | 323,595 | | | — | | | — | | | — | |
| 2013 | | | — | | | — | | | — | | | — | | | 97,846 | | | 34.65 | | | — | |
| 2012 | | | — | | | — | | | — | | | — | | | 97,846 | | | 33.35 | | | — | |
| 2011 | | | 39,950 | | | 77,310 | | | — | | | — | | | 55,000 | | | 30.92 | | | 3.09 | |
| | | | | | | | | | | | | | | | | | | | | | | |
| California Dividend Advantage 3 (NZH) | | | | | | | | | | | | | | | | | | | | | | |
| Year Ended 2/28-2/29: | | | | | | | | | | | | | | | | | | | | | | |
| 2015 | | | — | | | — | | | 160,000 | | | 321,851 | | | — | | | — | | | — | |
| 2014 | | | — | | | — | | | 160,000 | | | 303,718 | | | — | | | — | | | — | |
| 2013 | | | — | | | — | | | — | | | — | | | 159,545 | | | 32.26 | | | — | |
| 2012 | | | — | | | — | | | — | | | — | | | 159,545 | | | 31.05 | | | — | |
| 2011 | | | 69,500 | | | 71,960 | | | — | | | — | | | 86,250 | | | 28.78 | | | 2.88 | |
| (a) | The Ending and Average Market Value Per Share for each Series of the Fund’s MTP Shares were as follows: |
| | | | 2015 | | | 2014 | | | 2013 | | | 2012 | | | 2011 | |
| California Dividend Advantage 2 (NVX) | | | | | | | | | | | | | | | | |
| Series 2014 (NVX PRA) | | | | | | | | | | | | | | | | |
| Ending Market Value per Share | | $ | — | | $ | — | | $ | 10.05 | | $ | 10.11 | | $ | — | |
| Average Market Value per Share | | | — | | | 10.03 | △ | | 10.07 | | | 10.09 | | | — | |
| Series 2015 (NVX PRC) | | | | | | | | | | | | | | | | |
| Ending Market Value per Share | | | — | | | — | | | 10.05 | | | 10.01 | | | 9.82 | |
| Average Market Value per Share | | | — | | | 10.02 | | | 10.04 | | | 9.89 | | | 9.72 | ^ |
| | | | | | | | | | | | | | | | | |
| California Dividend Advantage 3 (NZH) | | | | | | | | | | | | | | | | |
| Series 2014 (NZH PRA) | | | | | | | | | | | | | | | | |
| Ending Market Value per Share | | | — | | | — | | | 10.05 | | | 10.17 | | | — | |
| Average Market Value per Share | | | — | | | 10.04 | | | 10.09 | | | 10.11 | | | — | |
| Series 2014-1 (NZH PRB) | | | | | | | | | | | | | | | | |
| Ending Market Value per Share | | | — | | | — | | | 10.05 | | | 10.15 | | | — | |
| Average Market Value per Share | | | — | | | 10.03 | | | 10.08 | | | 10.12 | | | — | |
| Series 2015 (NZH PRC) | | | | | | | | | | | | | | | | |
| Ending Market Value per Share | | | — | | | — | | | 10.14 | | | 10.18 | | | 10.06 | |
| Average Market Value per Share | | | — | | | 10.07 | | | 10.13 | | | 10.11 | | | 10.14 | |
| ^ | For the period October 22, 2010 (first issuance date of shares) through February 28, 2011. |
| For the period March 29, 2011 (first issuance date of shares) through February 29, 2012. |
| For the period April 11, 2011 (first issuance date of shares) through February 29, 2012. |
| For the period June 6, 2011 (first issuance date of shares) through February 29, 2012. |
| For the period March 1, 2013 through September 9, 2013. |
| For the period March 1, 2013 through October 7, 2013. |
See accompanying notes to financial statements.
Notes to Financial Statements |
1. General Information and Significant Accounting Policies
General Information
Fund Information
The funds covered in this report and their corresponding New York Stock Exchange (“NYSE”) or NYSE MKT symbols are as follows (each a “Fund” and collectively, the “Funds”):
• Nuveen California Municipal Value Fund, Inc. (NCA) (“California Value (NCA)”)
• Nuveen California Municipal Value Fund 2 (NCB) (“California Value 2 (NCB)”)
• Nuveen California AMT-Free Municipal Income Fund (NKX) (“California AMT-Free Income (NKX)”)
• Nuveen California Dividend Advantage Municipal Fund (NAC) (“California Dividend Advantage (NAC)”)
• Nuveen California Dividend Advantage Municipal Fund 2 (NVX) (“California Dividend Advantage 2 (NVX)”)
• Nuveen California Dividend Advantage Municipal Fund 3 (NZH) (“California Dividend Advantage 3 (NZH)”)
The Funds are registered under the Investment Company Act of 1940, as amended, as diversified closed-end management investment companies. Common shares of California Value (NCA), California AMT-Free Income (NKX) and California Dividend Advantage (NAC) are traded on the NYSE (Common shares of California AMT-Free Income (NKX) were formerly traded on the NYSE MKT). Common shares of California Value 2 (NCB), California Dividend Advantage 2 (NVX) and California Dividend Advantage 3 (NZH) are traded on the NYSE MKT. California Value (NCA) was incorporated under the state laws of Minnesota on July 15, 1987. California Value 2 (NCB), California AMT-Free Income (NKX), California Dividend Advantage (NAC), California Dividend Advantage 2 (NVX) and California Dividend Advantage 3 (NZH) were organized as Massachusetts business trusts on January 26, 2009, July 29, 2002, December 1, 1998, June 1, 1999 and April 6, 2001, respectively.
The end of the reporting period for the Funds is February 28, 2015, and the period covered by these Notes to Financial Statements is the fiscal year ended February 28, 2015 (“the current fiscal period”).
Investment Adviser
The Funds’ investment adviser is Nuveen Fund Advisors, LLC (the “Adviser”), a wholly-owned subsidiary of Nuveen Investments, Inc. (“Nuveen”). The Adviser is responsible for each Fund’s overall investment strategy and asset allocation decisions. The Adviser has entered into sub-advisory agreements with Nuveen Asset Management, LLC, (the “Sub-Adviser”), a subsidiary of the Adviser, under which the Sub-Adviser manages the investment portfolios of the Funds.
Investment Objectives and Principal Investment Strategies
Each Fund seeks to provide current income exempt from both regular federal and California state income taxes, and in the case of California AMT-Free Income (NKX) the alternative minimum tax applicable to individuals, by investing primarily in a portfolio of municipal obligations issued by state and local government authorities within the state of California or certain U.S. territories.
Fund Reorganizations
Effective prior to the opening of business on June 9, 2014, certain California Funds were reorganized into the two, larger-state Funds included in this report (each a “Reorganization and collectively, the “Reorganizations”) as follows:
| Target Funds | Acquiring Fund |
| Nuveen California Performance Plus Municipal Fund, Inc. (NCP) | California Dividend Advantage (NAC) |
| (“California Performance Plus (NCP)”) | |
| Nuveen California Municipal Market Opportunity Fund, Inc. (NCO) | |
| (“California Opportunity (NCO)”) | |
| Nuveen California Investment Quality Municipal Fund, Inc. (NQC) | |
| “California Investment Quality (NQC)”) | |
| Nuveen California Select Quality Municipal Fund, Inc. (NVC) | |
| (“California Select Quality (NVC)”) | |
| Nuveen California Quality Income Municipal Fund, Inc. (NUC) | |
| (“California Quality Income (NUC)”) | |
| Target Funds | Acquiring Fund |
| Nuveen California Premium Income Municipal Fund (NCU) | California AMT-Free Income (NKX) |
| (“California Premium Income (NCU)”) | |
For accounting and performance reporting purposes, the Acquiring Fund is the survivor.
Upon the closing of each Reorganization, the Target Funds transferred their assets to the Acquiring Funds in exchange for common and preferred shares of the Acquiring Funds and the assumption by the Acquiring Funds of the liabilities of the Target Funds. The Target Funds were then liquidated, dissolved and terminated in accordance with their Declaration of Trust. Shareholders of the Target Funds became shareholders of the Acquiring Funds. Holders of common shares of the Target Funds received newly issued common shares of the Acquiring Funds, the aggregate net asset value (“NAV”) of which was equal to the aggregate NAV of the common shares of the Target Funds held immediately prior to the Reorganizations (including for this purpose fractional Acquiring Funds shares to which shareholders were entitled). Holders of preferred shares of the Target Funds received on a one-for-one basis newly issued preferred shares of the Acquiring Funds, in exchange for preferred shares of the Target Funds held immediately prior to the Reorganizations. Details of the Reorganizations are further described in Note 8 – Fund Reorganizations.
Significant Accounting Policies
Each Fund is an investment company and follows accounting and reporting guidance under Financial Accounting Standards Board (FASB) Accounting Standards Codification (ASC) Topic 946 “Financial Services – Investment Companies.” The following is a summary of significant accounting policies followed by the Funds in the preparation of their financial statements in accordance with U.S. generally accepted accounting principles (“U.S. GAAP”).
Investment Transactions
Investment transactions are recorded on a trade date basis. Realized gains and losses from investment transactions are determined on the specific identification method, which is the same basis used for federal income tax purposes. Investments purchased on a when-issued/delayed delivery basis may have extended settlement periods. Any investments so purchased are subject to market fluctuation during this period. The Funds have instructed the custodian to earmark securities in the Funds’ portfolios with a current value at least equal to the amount of the when-issued/delayed delivery purchase commitments.
As of the end of the reporting period, the Funds’ outstanding when-issued/delayed delivery purchase commitments were as follows:
| | | | | | | California | | California | | California | | California | |
| | | California | | California | | AMT-Free | | Dividend | | Dividend | | Dividend | |
| | | Value | | Value 2 | | Income | | Advantage | | Advantage 2 | | Advantage 3 | |
| | | (NCA | ) | (NCB | ) | (NKX | ) | (NAC | ) | (NVX | ) | (NZH | ) |
| Outstanding when-issued/delayed delivery purchase commitments | | $ | — | | $ | — | | $ | — | | $ | — | | $ | — | | $ | — | |
Investment Income
Investment income, which reflects the amortization of premiums and accretion of discounts for financial reporting purposes, is recorded on an accrual basis. Investment income also reflects paydown gains and losses, if any.
Professional Fees
Professional fees presented on the Statement of Operations consist of legal fees incurred in the normal course of operations, audit fees, tax consulting fees and, in some cases, workout expenditures. Workout expenditures are incurred in an attempt to protect or enhance an investment or to pursue other claims or legal actions on behalf of Fund shareholders. If a refund is received for workout expenditures paid in a prior reporting period, such amounts will be recognized as “Legal fee refund” on the Statement of Operations.
Dividends and Distributions to Common Shareholders
Dividends from net investment income are declared monthly. Net realized capital gains and/or market discount from investment transactions, if any, are distributed to shareholders at least annually. Furthermore, capital gains are distributed only to the extent they exceed available capital loss carryforwards.
Distributions to common shareholders of net investment income, net realized capital gains and/or market discount, if any, are recorded on the ex-dividend date. The amount and timing of distributions are determined in accordance with federal income tax regulations, which may differ from U.S. GAAP.
Institutional MuniFund Term Preferred Shares
During the current fiscal period, California AMT-Free Income (NKX) had issued and outstanding Institutional MuniFund Term Preferred (“iMTP”) Shares, with a $5,000 liquidation value per share. iMTP Shares are issued via private placement and are not publicly available.
Notes to Financial Statements (continued)
As of the end of the reporting period, details of iMTP Shares outstanding were as follows:
| | | | | | | Shares | |
| | | | | | | Outstanding | |
| | | | | | | at $5,000 | |
| | | | | Shares | | Per Share | |
| | | Series | | Outstanding | | Liquidation Value | |
| California AMT-Free Income (NKX) | | | 2018 | | | 7,200 | | $ | 36,000,000 | |
The Fund is obligated to redeem its iMTP Shares by the date as specified in its offering document (“Term Redemption Date”), unless earlier redeemed or repurchased by the Fund. iMTP Shares are subject to optional and mandatory redemption in certain circumstances. The iMTP Shares are not subject to redemption at the option of the Fund for one year following the date of issuance (“Non-Call Expiration Date”), at which point the Fund may begin to redeem at its option (“Optional Redemption Date”). The Fund may be obligated to redeem certain of the iMTP Shares if the Fund fails to maintain certain asset coverage and leverage ratio requirements and such failures are not cured by the applicable cure date. The redemption price per share is equal to the sum of the liquidation value per share plus any accumulated but unpaid dividends. The Term Redemption Date, Optional Redemption Date and Premium Expiration Date for the Fund’s iMTP Shares are as follows:
| | | | | Term | | Optional | | Non-Call | |
| | | Series | | Redemption Date | | Redemption Date | | Expiration Date | |
| California AMT-Free Income (NKX) | | | 2018 | | | July 1, 2018 | | | January 1, 2016 | | | December 31, 2015 | |
The average liquidation value of iMTP Shares outstanding and annualized dividend rate for the Fund during the current fiscal period, were as follows:
| | | | California | |
| | | | AMT-Free | |
| | | | Income | |
| | | | (NKX | )* |
| Average liquidation value of iMTP Shares outstanding | | $ | 36,000,000 | |
| Annualized dividend rate | | | 0.49 | % |
* For the period December 19, 2014 (first issuance of shares) through February 28, 2015.
iMTP Shares generally do not trade, and market quotations are generally not available. iMTP Shares are short-term or short/intermediate-term instruments that pay a variable dividend rate tied to a short-term index, plus an additional fixed “spread” amount established at the time of issuance. The fair value of iMTP Shares is expected to be approximately their liquidation par value so long as the fixed “spread” on the iMTP Shares remains roughly in line with the “spread” rates being demanded by investors on instruments having similar terms in the current market environment. In present market conditions, the Fund’s Adviser has determined that the fair value of iMTP Shares is their liquidation value, but their fair value could vary if market conditions change materially. For financial reporting purposes, the liquidation value of iMTP Shares is recorded as a liability and recognized as “Institutional MuniFund Term Preferred (“iMTP”) Shares, at liquidation value” on the Statement of Assets and Liabilities.
Dividends on the iMTP Shares (which are treated as interest payments for financial reporting purposes) are set weekly. Unpaid dividends on iMTP Shares are recognized as a component of “Interest payable” on the Statement of Assets and Liabilities, when applicable. Dividends accrued on iMTP Shares are recognized as a component of “Interest expense and amortization of offering costs” on the Statement of Operations.
Offering costs of $360,000 were incurred in connection with the Fund’s offering of iMTP Shares, which were recorded as a deferred charge and are being amortized over the life of the shares. These offering costs are recognized as components of “Deferred offering costs” on the Statement of Assets and Liabilities and “Interest expense and amortization of offering costs” on the Statement of Operations.
MuniFund Term Preferred Shares
During the current fiscal period, California AMT-Free Income (NKX) had issued and outstanding MuniFund Term Preferred (“MTP”) Shares, with a $10 stated par value per share. The Fund’s MTP Shares were issued in one Series and traded on the NYSE.
On December 29, 2014, California AMT-Free Income (NKX) redeemed all of its outstanding Series 2015 MTP Shares.
California AMT-Free Income (NKX) MTP Shares were redeemed at their $10 liquidation value per share, plus dividend amounts owed, using proceeds from its issuance of iMTP Shares (as described above in Institutional MuniFund Term Preferred Shares).
The average liquidation value of MTP Shares outstanding for the Fund during the current fiscal period was as follows:
| | | | California | |
| | | | AMT-Free | |
| | | | Income | |
| | | | (NKX | )* |
| Average liquidation value of MTP Shares outstanding | | $ | 35,250,000 | |
| * | MTP Shares issued in connection with its Reorganization for the period June 9, 2014 through December 29, 2014. |
For financial reporting purposes only, the liquidation value of MTP Shares is recorded as a liability and recognized as “MuniFund Term Preferred (“MTP”) Shares, at liquidation value” on the Statement of Assets and Liabilities. Dividends on MTP Shares, which are recognized as interest expense for financial reporting purposes, are paid monthly at a fixed annual rate, subject to adjustments in certain circumstances. Unpaid dividends on MTP Shares are recognized as a component of “Interest payable” on the Statement of Assets and Liabilities. Dividends accrued on MTP Shares are recognized as a component of “Interest expense and amortization of offering costs” on the Statement of Operations. Costs incurred by the Funds in connection with their offerings of MTP Shares were recorded as a deferred charge, which were amortized over the life of the shares and are recognized as components of “Deferred offering costs” on the Statement of Assets and Liabilities and “Interest expense and amortization of offering costs” on the Statement of Operations.
In conjunction with California AMT-Free Income’s (NKX) redemption of MTP Shares, the remaining deferred offering costs of $113,788, were fully expensed during the current fiscal period, as the redemptions were deemed an extinguishment of debt.
Variable Rate Demand Preferred Shares
The following Funds have issued and outstanding Variable Rate Demand Preferred (“VRDP”) Shares, with a $100,000 liquidation value per share. VRDP Shares are issued via private placement and are not publicly available.
As of the end of the reporting period, details of the Funds’ VRDP Shares outstanding were as follows:
| | | | | | | Shares | | | |
| | | | | | | Outstanding | | | |
| | | | | Shares | | at $100,000 Per Share | | | |
| | | Series | | Outstanding | | Liquidation Value | | Maturity | |
| California AMT-Free Income (NKX) | | | | | | | | | | | | | |
| | | | 2 | | | 355 | | $ | 35,500,000 | | | June 1, 2040 | |
| | | | 3 | | | 427 | | | 42,700,000 | | | March 1, 2040 | |
| | | | 4 | | | 1,090 | | | 109,000,000 | | | December 1, 2040 | |
| | | | 5 | | | 1,044 | | | 104,400,000 | | | June 1, 2041 | |
| | | | | | | | | | | | | | |
| California Dividend Advantage (NAC) | | | | | | | | | | | | | |
| | | | 1 | | | 1,362 | | $ | 136,200,000 | | | June 1, 2041 | |
| | | | 2 | * | | 910 | | | 91,000,000 | | | December 1, 2040 | |
| | | | 3 | * | | 498 | | | 49,800,000 | | | March 1, 2040 | |
| | | | 4 | * | | 1,056 | | | 105,600,000 | | | December 1, 2042 | |
| | | | 5 | * | | 1,589 | | | 158,900,000 | | | August 1, 2040 | |
| | | | 6 | * | | 1,581 | | | 158,100,000 | | | August 1, 2040 | |
| | | | | | | | | | | | | | |
| California Dividend Advantage 2 (NVX) | | | | | | | | | | | | | |
| | | | 1 | | | 980 | | $ | 98,000,000 | | | August 3, 2043 | |
| | | | | | | | | | | | | | |
| California Dividend Advantage 3 (NZH) | | | | | | | | | | | | | |
| | | | 1 | | | 1,600 | | $ | 160,000,000 | | | September 1, 2043 | |
*VRDP Shares issued in connection with the Reorganization.
VRDP Shares include a liquidity feature that allows VRDP shareholders to have their shares purchased by a liquidity provider with whom each Fund has contracted in the event that purchase orders for VRDP Shares in a remarketing are not sufficient in number to be matched with the sale orders in that remarketing. Each Fund is required to redeem any VRDP Shares that are still owned by the liquidity provider after six months of continuous, unsuccessful remarketing. Each Fund pays an annual remarketing fee of 0.10% on the aggregate principal amount of all VRDP Shares outstanding. Each Fund’s VRDP Shares have successfully remarketed since issuance.
Dividends on the VRDP Shares (which are treated as interest payments for financial reporting purposes) are set weekly at a rate established by a remarketing agent; therefore, the market value of the VRDP Shares is expected to approximate its liquidation value. If remarketings for VRDP Shares are continuously unsuccessful for six months, the maximum rate is designed to escalate according to a specified schedule in order to enhance the remarketing agent’s ability to successfully remarket the VRDP Shares.
Subject to certain conditions, VRDP Shares may be redeemed, in whole or in part, at any time at the option of each Fund. Each Fund may also redeem certain of the VRDP Shares if the Fund fails to maintain certain asset coverage requirements and such failures are not cured by the applicable cure date. The redemption price per share is equal to the sum of the liquidation value per share plus any accumulated but unpaid dividends.
Notes to Financial Statements (continued)
The average liquidation value of VRDP Shares outstanding and annualized dividend rate for each Fund during the current fiscal period were as follows:
| | | California | | California | | California | | California | |
| | | AMT-Free | | Dividend | | Dividend | | Dividend | |
| | | Income | | Advantage | | Advantage 2 | | Advantage 3 | |
| | | (NKX | ) | (NAC | )* | (NVX | ) | (NZH | ) |
| Average liquidation value of VRDP Shares outstanding | | $ | 291,600,000 | | $ | 545,243,836 | | $ | 98,000,000 | | $ | 160,000,000 | |
| Annualized dividend rate | | | 0.15 | % | | 0.14 | % | | 0.15 | % | | 0.13 | % |
* Includes VRDP Shares issued in connection with its Reorganization.
For financial reporting purposes, the liquidation value of VRDP Shares is a liability and is recognized as “Variable Rate Demand Preferred (“VRDP”) Shares, at liquidation value” on the Statement of Assets and Liabilities. Unpaid dividends on VRDP Shares are recognized as a component of “Interest payable” on the Statement of Assets and Liabilities, when applicable. Dividends accrued on the VRDP Shares are recognized as a component of “Interest expense and amortization of offering costs” on the Statement of Operations. Costs incurred by the Funds in connection with their offerings of VRDP Shares were recorded as a deferred charge, which are amortized over the life of the shares and are recognized as a component of “Deferred offering costs” on the Statement of Assets and Liabilities and “Interest expense and amortization of offerings costs” on the Statement of Operations. In addition to interest expense, each Fund also pays a per annum liquidity fee to the liquidity provider, as well as a remarketing fee, which are recognized as “Liquidity fees” and “Remarketing fees,” respectively, on the Statement of Operations.
Common Shares Equity Shelf Programs and Offering Costs
The following Funds have each filed registration statements with the Securities and Exchange Commission (“SEC”) authorizing the Funds to issue additional common shares through an equity shelf program (“Shelf Offering”), which became effective with the SEC during prior fiscal periods.
Under these Shelf Offerings, the Funds, subject to market conditions, may raise additional equity capital from time to time in varying amounts and offering methods at a net price at or above each Fund’s NAV per common share.
Authorized common shares, common shares issued and offering proceeds, net of offering costs under the Funds’ Shelf Offering during the Funds’ current and prior fiscal period were as follow:
| | | California Value (NCA) | | California AMT-Free Income (NKX) | | California Dividend Advantage (NAC) | |
| | | Year | | Year | | Year | | Year | | Year | | Year | |
| | | Ended | | Ended | | Ended | | Ended | | Ended | | Ended | |
| | | 2/28/15 | | 2/28/14 | | 2/28/15 | | 2/28/14 | | 2/28/15 | | 2/28/14 | |
| Authorized common shares | | | 2,500,000 | | | 2,500,000 | | | 4,100,000 | | | 4,100,000 | | | 2,300,000 | | | 2,300,000 | |
| Common shares issued | | | 124,572 | | | — | | | — | | | — | | | — | | | — | |
| Offering proceeds, net of offering costs | | $ | 1,321,449 | | $ | — | | $ | — | | $ | — | | $ | — | | $ | — | |
As of June 30, 2014, California Value’s (NCA), California AMT-Free Income’s (NKX) and California Dividend Advantage’s (NAC) shelf offering registration statements were no longer current. Therefore, each Fund may not issue additional common shares under its equity shelf program until a post-effective amendment to the registration statement is filed with the SEC. On October 3, 2014 a post-effective amendment to the registration statement for California Value (NCA) was filed with the SEC and therefore, the Fund may issue additional common shares under its equity shelf program.
Costs incurred by the Funds in connection with their Shelf Offerings are recorded as a deferred charge and recognized as a component of “Deferred offering costs” on the Statement of Assets and Liabilities. These deferred assets are reduced during the one-year period that additional shares are sold by reducing the proceeds from such sales and recognized as a component of “Proceeds from shelf offering, net of offering costs” on the Statement of Changes in Net Assets. At the end of the one-year life of the Shelf Offering period, any remaining deferred charges will be expensed accordingly and recognized as a component of “Shelf offering expenses” on the Statement of Operations. Any additional costs the Funds may incur in connection with their Shelf Offerings are expensed as incurred and recognized as a component of “Proceeds from shelf offering, net of offering costs” on the Statement of Changes in Net Assets, when applicable.
Since the Shelf Offerings became effective, California AMT-Free Income (NKX) and California Dividend Advantage (NAC) have not issued additional common shares. As a result, during the current fiscal period, the Adviser reimbursed the Funds for half of the costs incurred in connection with the Shelf Offerings, which is recognized as “Expense reimbursement” on the Statement of Operations. California Value (NCA) was also reimbursed by the adviser for half of the costs incurred in connection with the Shelf Offering but has subsequently began issuing additional common shares.
Indemnifications
Under the Funds’ organizational documents, their officers and trustees are indemnified against certain liabilities arising out of the performance of their duties to the Funds. In addition, in the normal course of business, the Funds enter into contracts that provide general indemnifications to other parties. The Funds’ maximum exposure under these arrangements is unknown as this would involve future claims that may be made against the Funds that have not yet occurred. However, the Funds have not had prior claims or losses pursuant to these contracts and expect the risk of loss to be remote.
Netting Agreements
In the ordinary course of business, the Funds may enter into transactions subject to enforceable International Swaps and Derivative Association, Inc. (“ISDA”) master agreements or other similar arrangements (“netting agreements”). Generally, the right to offset in netting agreements allows each Fund to offset any exposure to a specific counterparty with any collateral received or delivered to that counterparty based on the terms of the agreements. Generally, a Fund manages its cash collateral and securities collateral on a counterparty basis.
The Funds’ investments subject to netting agreements as of the end of the reporting period, if any, are further described in Note 3 – Portfolio Securities and Investments in Derivatives.
Use of Estimates
The preparation of financial statements in conformity with U.S. GAAP requires management to make estimates and assumptions that affect the reported amounts of assets and liabilities at the date of the financial statements and the reported amounts of increases and decreases in net assets applicable to common shares from operations during the reporting period. Actual results may differ from those estimates.
2. Investment Valuation and Fair Value Measurements
The fair valuation input levels as described below are for fair value measurement purposes.
Fair value is defined as the price that would be received upon selling an investment or transferring a liability in an orderly transaction to an independent buyer in the principal or most advantageous market for the investment. A three-tier hierarchy is used to maximize the use of observable market data and minimize the use of unobservable inputs and to establish classification of fair value measurements for disclosure purposes. Observable inputs reflect the assumptions market participants would use in pricing the asset or liability. Observable inputs are based on market data obtained from sources independent of the reporting entity. Unobservable inputs reflect the reporting entity’s own assumptions about the assumptions market participants would use in pricing the asset or liability. Unobservable inputs are based on the best information available in the circumstances. The following is a summary of the three-tiered hierarchy of valuation input levels.
| Level 1 – | Inputs are unadjusted and prices are determined using quoted prices in active markets for identical securities. |
| | |
| Level 2 – | Prices are determined using other significant observable inputs (including quoted prices for similar securities, interest rates, prepayment speeds, credit risk, etc.). |
| | |
| Level 3 – | Prices are determined using significant unobservable inputs (including management’s assumptions in determining the fair value of investments). |
Prices of fixed income securities are provided by a pricing service approved by the Funds’ Board of Directors/Trustees (the “Board”). The pricing service establishes a security’s fair value using methods that may include consideration of the following: yields or prices of investments of comparable quality, type of issue, coupon, maturity and rating, market quotes or indications of value from security dealers, evaluations of anticipated cash flows or collateral, general market conditions and other information and analysis, including the obligor’s credit characteristics considered relevant. These securities are generally classified as Level 2. In pricing certain securities, particularly less liquid and lower quality securities, the pricing service may consider information about a security, its issuer or market activity, provided by the Adviser. These securities are generally classified as Level 2 or Level 3 depending on the priority of the significant inputs.
Certain securities may not be able to be priced by the pre-established pricing methods as described above. Such securities may be valued by the Board and/or its appointee at fair value. These securities generally include, but are not limited to, restricted securities (securities which may not be publicly sold without registration under the Securities Act of 1933, as amended) for which a pricing service is unable to provide a market price; securities whose trading has been formally suspended; debt securities that have gone into default and for which there is no current market quotation; a security whose market price is not available from a pre-established pricing source; a security with respect to which an event has occurred that is likely to materially affect the value of the security after the market has closed but before the calculation of a Fund’s NAV (as may be the case in non-U.S. markets on which the security is primarily traded) or make it difficult or impossible to obtain a reliable market quotation; and a security whose price, as provided by the pricing service, is not deemed to reflect the security’s fair value. As a general principle, the fair value of a security would appear to be the amount that the owner might reasonably expect to receive for it in a current sale. A variety of factors may be considered in determining the fair value of such securities, which may include consideration of the following: yields or prices of investments of comparable quality, type of issue, coupon,
Notes to Financial Statements (continued)
maturity and rating, market quotes or indications of value from security dealers, evaluations of anticipated cash flows or collateral, general market conditions and other information and analysis, including the obligor’s credit characteristics considered relevant. These securities are generally classified as Level 2 or Level 3 depending on the priority of the significant inputs. Regardless of the method employed to value a particular security, all valuations are subject to review by the Board and/or its appointee.
The inputs or methodologies used for valuing securities are not an indication of the risks associated with investing in those securities. The following is a summary of each Fund’s fair value measurements as of the end of the reporting period:
| California Value (NCA) | | | Level 1 | | | Level 2 | | | Level 3 | | | Total | |
| Long-Term Investments*: | | | | | | | | | | | | | |
| Municipal Bonds | | $ | — | | $ | 267,347,797 | | $ | — | | $ | 267,347,797 | |
| Short-Term Investments: | | | | | | | | | | | | | |
| Municipal Bonds | | | — | | | — | | | 1,119,468 | ** | | 1,119,468 | |
| Total | | $ | — | | $ | 267,347,797 | | $ | 1,119,468 | | $ | 268,467,265 | |
| | | | | | | | | | | | | | |
| California Value 2 (NCB) | | | | | | | | | | | | | |
| Long-Term Investments*: | | | | | | | | | | | | | |
| Municipal Bonds | | $ | — | | $ | 56,255,089 | | $ | — | | $ | 56,255,089 | |
| Short-Term Investments: | | | | | | | | | | | | | |
| Municipal Bonds | | | — | | | — | | | 544,606 | ** | | 544,606 | |
| Total | | $ | — | | $ | 56,255,089 | | $ | 544,606 | | $ | 56,799,695 | |
| | | | | | | | | | | | | | |
| California AMT-Free Income (NKX) | | | | | | | | | | | | | |
| Long-Term Investments*: | | | | | | | | | | | | | |
| Municipal Bonds | | $ | — | | $ | 1,065,466,660 | | $ | — | | $ | 1,065,466,660 | |
| Short-Term Investments: | | | | | | | | | | | | | |
| Municipal Bonds | | | — | | | — | | | 8,718,742 | ** | | 8,718,742 | |
| Total | | $ | — | | $ | 1,065,466,660 | | $ | 8,718,742 | | $ | 1,074,185,402 | |
| | | | | | | | | | | | | | |
| California Dividend Advantage (NAC) | | | | | | | | | | | | | |
| Long-Term Investments*: | | | | | | | | | | | | | |
| Municipal Bonds | | $ | — | | $ | 2,453,817,899 | | $ | — | | $ | 2,453,817,899 | |
| Short-Term Investments: | | | | | | | | | | | | | |
| Municipal Bonds | | | — | | | — | | | 20,886,656 | ** | | 20,886,656 | |
| Total | | $ | — | | $ | 2,453,817,899 | | $ | 20,886,656 | | $ | 2,474,704,555 | |
| | | | | | | | | | | | | | |
| California Dividend Advantage 2 (NVX) | | | | | | | | | | | | | |
| Long-Term Investments*: | | | | | | | | | | | | | |
| Municipal Bonds | | $ | — | | $ | 323,818,328 | | $ | — | | $ | 323,818,328 | |
| Short-Term Investments: | | | | | | | | | | | | | |
| Municipal Bonds | | | — | | | — | | | 1,659,032 | ** | | 1,659,032 | |
| Total | | $ | — | | $ | 323,818,328 | | $ | 1,659,032 | | $ | 325,477,360 | |
| | | | | | | | | | | | | | |
| California Dividend Advantage 3 (NZH) | | | | | | | | | | | | | |
| Long-Term Investments*: | | | | | | | | | | | | | |
| Municipal Bonds | | $ | — | | $ | 501,527,110 | | $ | — | | $ | 501,527,110 | |
| Short-Term Investments: | | | | | | | | | | | | | |
| Municipal Bonds | | | — | | | — | | | 4,528,300 | ** | | 4,528,300 | |
| Total | | $ | — | | $ | 501,527,110 | | $ | 4,528,300 | | $ | 506,055,410 | |
| * | Refer to the Fund’s Portfolio of Investments for industry classifications. |
| ** | Refer to the Funds’ Portfolio of Investments for breakdown of these securities classified as Level 3. |
The following is a reconciliation of the following Funds’ Level 3 investments held at the beginning and end of the measurement period:
| | | California | | California | | California | |
| | | AMT-Free | | Dividend | | Dividend | |
| | | Income | | Advantage | | Advantage 3 | |
| | | (NKX | ) | (NAC | ) | (NZH | ) |
| | | Level 3 | | Level 3 | | Level 3 | |
| | | Short-Term | | Short-Term | | Short-Term | |
| | | Municipal | | Municipal | | Municipal | |
| | | Bonds | | Bonds | | Bonds | |
| Balance at the beginning of period | | $ | — | | $ | — | | $ | — | |
| Gain (losses): | | | | | | | | | | |
| Net realized gains (losses) | | | — | | | — | | | — | |
| Change in net unrealized appreciation (depreciation) | | | 73,742 | | | 176,656 | | | 38,300 | |
| Purchases at cost | | | 8,645,000 | | | 20,710,000 | | | 4,490,000 | |
| Sales at proceeds | | | — | | | — | | | — | |
| Net discounts (premiums) | | | — | | | — | | | — | |
| Transfers in to | | | — | | | — | | | — | |
| Transfers out of | | | — | | | — | | | — | |
| Balance at the end of period | | $ | 8,718,742 | | $ | 20,886,656 | | $ | 4,528,300 | |
| Change in net unrealized appreciation (depreciation) during the period of Level 3 securities held as of the end of the reporting period | | $ | 73,742 | | $ | 176,656 | | $ | 38,300 | |
The valuation techniques and significant unobservable inputs used in recurring Level 3 fair value measurements of assets as of the end of the reporting period, were as follows:
| | | | Market Value | | Techniques | | Unobservable Inputs | | Range | |
| California AMT-Free Income (NKX) | | | | | | | | | | |
| Short-Term Municipal Bonds | | $ | 8,718,742 | | Discounted Cash Flow | | Municipal BBB Benchmark | | 1% - 4% | |
| | | | | | | | B - Rated Hospital Sector | | | |
| California Dividend Advantage (NAC) | | | | | | | | | | |
| Short-Term Municipal Bonds | | $ | 20,886,656 | | Discounted Cash Flow | | Municipal BBB Benchmark | | 1% - 4% | |
| | | | | | | | B - Rated Hospital Sector | | | |
| California Dividend Advantage 3 (NZH) | | | | | | | | | | |
| Short-Term Municipal Bonds | | $ | 4,528,300 | | Discounted Cash Flow | | Municipal BBB Benchmark | | 1% - 4% | |
| | | | | | | | B - Rated Hospital Sector | | | |
The Board is responsible for the valuation process and has appointed the oversight of the daily valuation process to the Adviser’s Valuation Committee. The Valuation Committee, pursuant to the valuation policies and procedures adopted by the Board, is responsible for making fair value determinations, evaluating the effectiveness of the Funds’ pricing policies and reporting to the Board. The Valuation Committee is aided in its efforts by the Adviser’s dedicated Securities Valuation Team, which is responsible for administering the daily valuation process and applying fair value methodologies as approved by the Valuation Committee. When determining the reliability of independent pricing services for investments owned by the Funds, the Valuation Committee, among other things, conducts due diligence reviews of the pricing services and monitors the quality of security prices received through various testing reports conducted by the Securities Valuation Team.
The Valuation Committee will consider pricing methodologies it deems relevant and appropriate when making a fair value determination, based on the facts and circumstances specific to the portfolio instrument. Fair value determinations generally will be derived as follows, using public or private market information:
| | (i) | If available, fair value determinations shall be derived by extrapolating from recent transactions or quoted prices for identical or comparable securities. |
| | | |
| | (ii) | If such information is not available, an analytical valuation methodology may be used based on other available information including, but not limited to: analyst appraisals, research reports, corporate action information, issuer financial statements and shelf registration statements. Such analytical valuation methodologies may include, but are not limited to: multiple of earnings, discount from market value of a similar freely-traded security, discounted cash flow analysis, book value or a multiple thereof, risk premium/yield analysis, yield to maturity and/or fundamental investment analysis. |
The purchase price of a portfolio instrument will be used to fair value the instrument only if no other valuation methodology is available or deemed appropriate, and it is determined that the purchase price fairly reflects the instrument’s current value.
For each portfolio security that has been fair valued pursuant to the policies adopted by the Board, the fair value price is compared against the last available and next available market quotations. The Valuation Committee reviews the results of such testing and fair valuation occurrences are reported to the Board.
Notes to Financial Statements (continued)
3. Portfolio Securities and Investments in Derivatives
Portfolio Securities
Inverse Floating Rate Securities
Each Fund is authorized to invest in inverse floating rate securities. An inverse floating rate security is created by depositing a municipal bond (referred to as an “Underlying Bond”), typically with a fixed interest rate, into a special purpose trust (referred to as the “Trust”) created by or at the direction of one or more Funds. In turn, the Trust issues (a) floating rate certificates (referred to as “Floaters”), in face amounts equal to some fraction of the Underlying Bond’s par amount or market value, and (b) an inverse floating rate certificate (referred to as an “Inverse Floater”) that represents all remaining or residual interest in the Trust. Floaters typically pay short-term tax-exempt interest rates to third parties who are also provided a right to tender their certificate and receive its par value, which may be paid from the proceeds of a remarketing of the Floaters, by a loan to the Trust from a third party liquidity provider, or by the sale of assets from the Trust. The Inverse Floater is issued to a long term investor, such as one or more of the Funds. The income received by the Inverse Floater holder varies inversely with the short-term rate paid to holders of the Floaters, and in most circumstances the Inverse Floater holder bears substantially all of the Underlying Bond’s downside investment risk and also benefits disproportionately from any potential appreciation of the Underlying Bond’s value. The value of an Inverse Floater will be more volatile than that of the Underlying Bond because the interest rate is dependent on not only the fixed coupon rate of the Underlying Bond but also on the short-term interest paid on the Floaters, and because the Inverse Floater essentially bears the risk of loss of the greater face value of the Underlying Bond.
The Inverse Floater held by a Fund gives the Fund the right to (a) cause the holders of the Floaters to tender their certificates at par, and (b) have the trustee of the Trust transfer the Underlying Bond held by the Trust to the Fund, thereby collapsing the Trust.
The Fund may acquire an Inverse Floater in a transaction where it (a) transfers an Underlying Bond that it owns to a Trust created by a third party or (b) transfers an Underlying Bond that it owns, or that it has purchased in a secondary market transaction for the purpose of creating an Inverse Floater, to a Trust created at its direction, and in return receives the Inverse Floater of the Trust (referred to as a “self-deposited Inverse Floater”). A Fund may also purchase an Inverse Floater in a secondary market transaction from a third party creator of the Trust without first owning the Underlying Bond (referred to as an “externally-deposited Inverse Floater”).
An investment in a self-deposited Inverse Floater is accounted for as a “financing” transaction (i.e., a secured borrowing). For a self-deposited Inverse Floater, the Underlying Bond deposited into the Trust is identified in the Fund’s Portfolio of Investments as “(UB) – Underlying bond of an inverse floating rate trust reflected as a financing transaction,” with the Fund recognizing the Floaters issued by the Trust as liabilities, at their liquidation value on the Statement of Assets and Liabilities as “Floating rate obligations.” In addition, the Fund recognizes in “Investment Income” the entire earnings of the Underlying Bond and recognizes the related interest paid to the holders of the Floaters as a component of “Interest expense and amortization of offering costs” on the Statement of Operations.
In contrast, an investment in an externally-deposited Inverse Floater is accounted for as a purchase of the inverse floater and is identified in the Fund’s Portfolio of Investments as “(IF) – Inverse floating rate investment.” For an externally-deposited Inverse Floater, a Fund’s Statement of Assets and Liabilities recognizes the Inverse Floater and not the Underlying Bond as an asset, and the Fund does not recognize the Floaters as a liability. Additionally, the Fund reflects in “Investment Income” only the net amount of earnings on the Inverse Floater (net of the interest paid to the holders of the Floaters and the expenses of the Trust), and does not show the amount of that interest paid as an interest expense on the Statement of Operations.
The average floating rate obligations outstanding and average annual interest rate and fees related to self-deposited Inverse Floaters during the current fiscal period were as follows:
| | | | | | | California | | California | | California | | California | |
| | | California | | California | | AMT-Free | | Dividend | | Dividend | | Dividend | |
| | | Value | | Value 2 | | Income | | Advantage | | Advantage 2 | | Advantage 3 | |
| Self-Deposited Inverse Floaters | | (NCA | ) | (NCB | ) | (NKX | ) | (NAC | ) | (NVX | ) | (NZH | ) |
| Average floating rate obligations outstanding | | $ | 4,490,000 | | $ | — | | $ | 6,755,000 | | $ | 99,303,904 | | $ | 965,000 | | $ | 845,000 | |
| Average annual interest rate and fees | | | 0.67 | % | | — | % | | 0.55 | % | | 0.62 | % | | 0.62 | % | | 0.62 | % |
As of the end of the reporting period, the total amount of floating rate obligations issued by each Fund’s self-deposited Inverse Floaters and externally-deposited Inverse Floaters was as follows:
| | | | | | | California | | California | | California | | California | |
| | | California | | California | | AMT-Free | | Dividend | | Dividend | | Dividend | |
| | | Value | | Value 2 | | Income | | Advantage | | Advantage 2 | | Advantage 3 | |
| Floating Rate Obligations Outstanding | | (NCA | ) | (NCB | ) | (NKX | ) | (NAC | ) | (NVX | ) | (NZH | ) |
| Floating rate obligations: self-deposited Inverse Floaters | | $ | 4,490,000 | | $ | — | | $ | 6,755,000 | | $ | 92,995,000 | | $ | 965,000 | | $ | 845,000 | |
| Floating rate obligations: externally-deposited Inverse Floaters | | | — | | | 5,990,000 | | | 65,148,500 | | | 157,140,500 | | | 9,075,000 | | | 53,741,500 | |
| Total | | $ | 4,490,000 | | $ | 5,990,000 | | $ | 71,903,500 | | $ | 250,135,500 | | $ | 10,040,000 | | $ | 54,586,500 | |
Each Fund may also enter into shortfall and forbearance agreements (sometimes referred to as a “recourse arrangement” or “credit recovery swap”) (Trusts involving such agreements are referred to herein as “Recourse Trusts”), under which a Fund agrees to reimburse the liquidity provider for the
Trust’s Floaters, in certain circumstances, for the amount (if any) by which the liquidation value of the Underlying Bond held by the Trust may fall short of the liquidation value of the Floaters issued by the Trust, plus any shortfalls in interest cash flows. Under these agreements, a Fund’s potential exposure to losses related to or on an Inverse Floater may increase beyond the value of the Inverse Floater as a Fund may potentially be liable to fulfill all amounts owed to holders of the Floaters. At period end, any such shortfall amount in the aggregate is recognized as “Unrealized depreciation on Recourse Trusts” on the Statement of Assets and Liabilities.
As of the end of the reporting period, each Fund’s maximum exposure to the floating rate obligations issued by externally-deposited Recourse Trusts, was as follows:
| | | | | | | California | | California | | California | | California | |
| | | California | | California | | AMT-Free | | Dividend | | Dividend | | Dividend | |
| Floating Rate Obligations – | | Value | | Value 2 | | Income | | Advantage | | Advantage 2 | | Advantage 3 | |
| Externally-Deposited Recourse Trusts | | (NCA | ) | (NCB | ) | (NKX | ) | (NAC | ) | (NVX | ) | (NZH | ) |
| Maximum exposure to Recourse Trusts | | $ | — | | $ | — | | $ | 33,260,000 | | $ | 55,200,000 | | $ | 3,480,000 | | $ | 37,765,000 | |
Zero Coupon Securities
A zero coupon security does not pay a regular interest coupon to its holders during the life of the security. Income to the holder of the security comes from accretion of the difference between the original purchase price of the security at issuance and the par value of the security at maturity and is effectively paid at maturity. The market prices of zero coupon securities generally are more volatile than the market prices of securities that pay interest periodically.
Investments in Derivatives
In addition to the inverse floating rate securities in which each Fund invests, which are considered portfolio securities for financial reporting purposes, each Fund is authorized to invest in certain other derivative instruments such as futures, options and swap contracts. Each Fund limits its investments in futures, options on futures and swap contracts to the extent necessary for the Adviser to claim the exclusion from registration by the Commodity Futures Trading Commission as a commodity pool operator with respect to the Fund. The Funds record derivative instruments at fair value, with changes in fair value recognized on the Statement of Operations, when applicable. Even though the Funds’ investments in derivatives may represent economic hedges, they are not considered to be hedge transactions for financial reporting purposes.
Although the Funds are authorized to invest in derivative instruments and may do so in future, they did not make any such investments during the current fiscal period.
Market and Counterparty Credit Risk
In the normal course of business each Fund may invest in financial instruments and enter into financial transactions where risk of potential loss exists due to changes in the market (market risk) or failure of the other party to the transaction to perform (counterparty credit risk). The potential loss could exceed the value of the financial assets recorded on the financial statements. Financial assets, which potentially expose each Fund to counterparty credit risk, consist principally of cash due from counterparties on forward, option and swap transactions, when applicable. The extent of each Fund’s exposure to counterparty credit risk in respect to these financial assets approximates their carrying value as recorded on the Statement of Assets and Liabilities.
Each Fund helps manage counterparty credit risk by entering into agreements only with counterparties the Adviser believes have the financial resources to honor their obligations and by having the Adviser monitor the financial stability of the counterparties. Additionally, counterparties may be required to pledge collateral daily (based on the daily valuation of the financial asset) on behalf of each Fund with a value approximately equal to the amount of any unrealized gain above a pre-determined threshold. Reciprocally, when each Fund has an unrealized loss, the Funds have instructed the custodian to pledge assets of the Funds as collateral with a value approximately equal to the amount of the unrealized loss above a pre-determined threshold. Collateral pledges are monitored and subsequently adjusted if and when the valuations fluctuate, either up or down, by at least the pre-determined threshold amount.
4. Fund Shares
Common Shares
Transactions in common shares during the Funds’ current and prior fiscal period were as follows:
| | | California Value (NCA) | | California Value 2 (NCB) | |
| | | Year | | Year | | Year | | Year | |
| | | Ended | | Ended | | Ended | | Ended | |
| | | 2/28/15 | | 2/28/14 | | 2/28/15 | | 2/28/14 | |
| Common shares: | | | | | | | | | | | | | |
| Sold through shelf offering* | | | 124,572 | | | — | | | — | | | — | |
| Issued to shareholders due to reinvestment of distributions | | | 16,402 | | | 3,970 | | | — | | | — | |
| | | | 140,974 | | | 3,970 | | | — | | | — | |
| Weighted average common share: | | | | | | | | | | | | | |
| Premium to NAV per shelf offering share sold* | | | 1.22 | % | | — | | | — | | | — | |
Notes to Financial Statements (continued)
| | | California AMT-Free | | California Dividend | |
| | | Income (NKX) | | Advantage (NAC) | |
| | | Year | | Year | | Year | | Year | |
| | | Ended | | Ended | | Ended | | Ended | |
| | | 2/28/15 | | 2/28/14 | | 2/28/15 | | 2/28/14 | |
| Common shares: | | | | | | | | | | | | | |
| Issued in the Reorganization** | | | 5,864,695 | | | — | | | 83,854,904 | | | — | |
| Sold through shelf offering* | | | — | | | — | | | — | | | — | |
| Issued to shareholders due to reinvestment of distributions | | | — | | | — | | | — | | | 7,517 | |
| | | | 5,864,695 | | | — | | | 83,854,904 | | | 7,517 | |
| Weighted average common share: | | | | | | | | | | | | | |
| Premium to NAV per shelf offering share sold* | | | — | | | — | | | — | | | — | |
| | | California Dividend | | California Dividend | |
| | | Advantage 2 (NVX) | | Advantage 3 (NZH) | |
| | | Year | | Year | | Year | | Year | |
| | | Ended | | Ended | | Ended | | Ended | |
| | | 2/28/15 | | 2/28/14 | | 2/28/15 | | 2/28/14 | |
| Common shares: | | | | | | | | | | | | | |
| Sold through shelf offering* | | | — | | | — | | | — | | | — | |
| Issued to shareholders due to reinvestment of distributions | | | — | | | 1,236 | | | — | | | — | |
| | | | — | | | 1,236 | | | — | | | — | |
| Weighted average common share: | | | | | | | | | | | | | |
| Premium to NAV per shelf offering share sold* | | | — | | | — | | | — | | | — | |
| * | California Value 2 (NCB), California Dividend Advantage 2 (NVX) and California Dividend Advantage 3 (NZH) are not authorized to issue additional common shares through a shelf offering as of the end of the reporting period. |
| ** | Refer to Note 8 — Fund Reorganizations for further details. |
Preferred Shares
Transactions in preferred shares for the Funds during the Funds’ current and prior fiscal period, where applicable, are noted in the following tables.
Transactions in iMTP Shares for the Funds, where applicable, were as follows:
| | | Year Ended February 28, 2015 |
| | | Series | | Shares | | Amount | |
| California AMT-Free Income (NKX) | | | | | | | | | | |
| iMTP Shares issued | | | 2018 | | | 7,200 | | $ | 36,000,000 | |
Transactions in MTP Shares for the Funds, where applicable, were as follows:
| | | Year Ended February 28, 2015 |
| | | | | NYSE | | | | | |
| | | Series | | Ticker | | Shares | | Amount | |
| California AMT-Free Income (NKX) | | | | | | | | | | | | | |
| MTP Shares issued in connection with the Reorganization | | | 2015 | | | NKX PRC | | | 3,525,000 | | $ | 35,250,000 | |
| MTP Shares redeemed | | | 2015 | | | NKX PRC | | | (3,525,000 | ) | $ | (35,250,000 | ) |
| | | Year Ended February 28, 2014 |
| | | | | NYSE/ | | | | | |
| | | | | NYSE MKT | | | | | |
| | | Series | | Ticker | | Shares | | Amount | |
| California Dividend Advantage 2 (NVX) | | | | | | | | | | | | | |
| MTP Shares redeemed: | | | 2014 | | | NVX PRA | | | (4,284,630 | ) | $ | (42,846,300 | ) |
| | | | 2015 | | | NVX PRC | | | (5,500,000 | ) | | (55,000,000 | ) |
| Total | | | | | | | | | (9,784,630 | ) | $ | (97,846,300 | ) |
| | | Year Ended February 28, 2014 |
| | | | | NYSE/ | | | | | |
| | | | | NYSEMKT | | | | | |
| | | Series | | Ticker | | Shares | | Amount | |
| California Dividend Advantage 3 (NZH) | | | | | | | | | | | | | |
| MTP Shares redeemed: | | | 2014 | | | NZH PRA | | | (2,700,000 | ) | $ | (27,000,000 | ) |
| | | | 2014-1 | | | NZH PRB | | | (8,625,000 | ) | | (86,250,000 | ) |
| | | | 2015 | | | NZH PRC | | | (4,629,450 | ) | | (46,294,500 | ) |
| Total | | | | | | | | | (15,954,450 | ) | $ | (159,544,500 | ) |
Transactions in VRDP Shares for the Funds, where applicable, were as follows:
| | | Year Ended February 28, 2015 |
| | | Series | | Shares | | Amount | |
| California Dividend Advantage (NAC) | | | | | | | | | | |
| VRDP Shares issued in connection with the Reorganizations: | | | 2 | | | 910 | | $ | 91,000,000 | |
| | | | 3 | | | 498 | | | 49,800,000 | |
| | | | 4 | | | 1,056 | | | 105,600,000 | |
| | | | 5 | | | 1,589 | | | 158,900,000 | |
| | | | 6 | | | 1,581 | | | 158,100,000 | |
| Total | | | | | | 5,634 | | $ | 563,400,000 | |
| | | Year Ended February 28, 2014 |
| | | Series | | Shares | | Amount | |
| California Dividend Advantage 2 (NVX) | | | | | | | | | | |
| VRDP Shares issued | | | 1 | | | 980 | | $ | 98,000,000 | |
| | | | | | | | | | | |
| California Dividend Advantage 3 (NZH) | | | | | | | | | | |
| VRDP Shares issued | | | 1 | | | 1,600 | | $ | 160,000,000 | |
5. Investment Transactions
Long-term purchases and sales (including maturities) during the current fiscal period were as follows:
| | | | | | | California | | California | | California | | California | |
| | | California | | California | | AMT-Free | | Dividend | | Dividend | | Dividend | |
| | | Value | | Value 2 | | Income | | Advantage | | Advantage 2 | | Advantage 3 | |
| | | (NCA | ) | (NCB | ) | (NKX | ) | (NAC | ) | (NVX | ) | (NZH | ) |
| Purchases | | $ | 34,745,528 | | $ | 4,000,068 | | $ | 127,607,362 | | $ | 218,318,411 | | $ | 65,095,687 | | $ | 91,137,093 | |
| Sales and maturities | | | 38,828,142 | | | 4,922,752 | | | 136,219,205 | | | 174,411,621 | | | 44,897,069 | | | 72,373,329 | |
6. Income Tax Information
Each Fund is a separate taxpayer for federal income tax purposes. Each Fund intends to distribute substantially all of its net investment income and net capital gains to shareholders and to otherwise comply with the requirements of Subchapter M of the Internal Revenue Code applicable to regulated investment companies. Therefore, no federal income tax provision is required. Furthermore, each Fund intends to satisfy conditions that will enable interest from municipal securities, which is exempt from regular federal and California state income taxes, and in the case of California AMT-Free Income (NKX) the alternative minimum tax applicable to individuals, to retain such tax-exempt status when distributed to shareholders of the Funds. Net realized capital gains and ordinary income distributions paid by the Funds are subject to federal taxation.
For all open tax years and all major taxing jurisdictions, management of the Funds has concluded that there are no significant uncertain tax positions that would require recognition in the financial statements. Open tax years are those that are open for examination by taxing authorities (i.e., generally the last four tax year ends and the interim tax period since then). Furthermore, management of the Funds is also not aware of any tax positions for which it is reasonably possible that the total amounts of unrecognized tax benefits will significantly change in the next twelve months.
The following information is presented on an income tax basis. Differences between amounts for financial statement and federal income tax purposes are primarily due to timing differences in recognizing taxable market discount, timing differences in recognizing certain gains and losses on investment transactions and the treatment of investments in inverse floating rate securities reflected as financing transactions, if any. To the extent that differences arise
Notes to Financial Statements (continued)
that are permanent in nature, such amounts are reclassified within the capital accounts as detailed below. Temporary differences do not require reclassification. Temporary and permanent differences do not impact the NAVs of the Funds.
As of February 28, 2015, the cost and unrealized appreciation (depreciation) of investments, as determined on a federal income tax basis, were as follows:
| | | | | | | California | | California | | California | | California | |
| | | California | | California | | AMT-Free | | Dividend | | Dividend | | Dividend | |
| | | Value | | Value 2 | | Income | | Advantage | | Advantage 2 | | Advantage 3 | |
| | | (NCA | ) | (NCB | ) | (NKX | ) | (NAC | ) | (NVX | ) | (NZH | ) |
| Cost of investments | | $ | 233,529,850 | | $ | 47,015,407 | | $ | 947,640,601 | | $ | 2,100,630,434 | | $ | 296,190,617 | | $ | 456,574,553 | |
| Gross unrealized: | | | | | | | | | | | | | | | | | | | |
| Appreciation | | $ | 31,080,252 | | $ | 9,785,948 | | $ | 120,331,950 | | $ | 292,764,225 | | $ | 32,578,393 | | $ | 54,417,314 | |
| Depreciation | | | (631,710 | ) | | (1,660 | ) | | (540,211 | ) | | (11,688,396 | ) | | (4,256,650 | ) | | (5,781,457 | ) |
| Net unrealized appreciation (depreciation) of investments | | $ | 30,448,542 | | $ | 9,784,288 | | $ | 119,791,739 | | $ | 281,075,829 | | $ | 28,321,743 | | $ | 48,635,857 | |
Permanent differences, primarily due to federal taxes paid, taxable market discount, nondeductible offering costs, nondeductible reorganization expenses and reorganization adjustments, resulted in reclassifications among the Funds’ components of common share net assets as of February 28, 2015, the Funds’ tax year end, as follows:
| | | | | | | | | California | | | California | | | California | | | California | |
| | | California | | | California | | | AMT-Free | | | Dividend | | | Dividend | | | Dividend | |
| | | Value | | | Value 2 | | | Income | | | Advantage | | | Advantage 2 | | | Advantage 3 | |
| | | (NCA) | | | (NCB) | | | (NKX) | | | (NAC) | | | (NVX) | | | (NZH) | |
| Paid-in-surplus | | $ | — | | | $ | — | | | $ | 705,807 | | | $ | 16,580,696 | | | $ | (1,019 | ) | | $ | (9,565 | ) |
| Undistributed (Over-distribution of) net investment income | | | (6 | ) | | | (4,398 | ) | | | (282,861 | ) | | | 384,253 | | | | (618 | ) | | | (2,767 | ) |
| Accumulated net realized gain (loss) | | | 6 | | | | 4,398 | | | | (422,946 | ) | | | (16,964,949 | ) | | | 1,637 | | | | 12,332 | |
The tax components of undistributed net tax-exempt income, net ordinary income and net long-term capital gains as of February 28, 2015, the Funds’ tax year end, were as follows:
| | | | | | | California | | California | | California | | California | |
| | | California | | California | | AMT-Free | | Dividend | | Dividend | | Dividend | |
| | | Value | | Value 2 | | Income | | Advantage | | Advantage 2 | | Advantage 3 | |
| | | (NCA | ) | (NCB | ) | (NKX | ) | (NAC | ) | (NVX | ) | (NZH | ) |
Undistributed net tax-exempt income1 | | $ | 1,794,956 | | $ | 303,937 | | $ | 7,958,255 | | $ | 18,977,545 | | $ | 1,493,856 | | $ | 2,338,254 | |
Undistributed net ordinary income2 | | | 28,992 | | | 59,719 | | | 21,426 | | | 144,243 | | | 13,715 | | | 18,834 | |
| Undistributed net long-term capital gains | | | — | | | 597,480 | | | — | | | — | | | — | | | — | |
| 1 | Undistributed net tax-exempt income (on a tax basis) has not been reduced for the dividend declared on February 2, 2015, paid on March 2, 2015. |
| 2 | Net ordinary income consists of taxable market discount income and net short-term capital gains, if any. |
The tax character of distributions paid during the Funds’ tax years ended February 28, 2015 and February 28, 2014, was designated for purposes of the dividends paid deduction as follows:
| | | | | | | California | | California | | California | | California | |
| | | California | | California | | AMT-Free | | Dividend | | Dividend | | Dividend | |
| | | Value | | Value 2 | | Income | | Advantage | | Advantage 2 | | Advantage 3 | |
| 2015 | | (NCA | ) | (NCB | ) | (NKX | ) | (NAC | ) | (NVX | ) | (NZH | ) |
Distributions from net tax-exempt income3 | | $ | 11,836,940 | | $ | 2,564,562 | | $ | 38,666,107 | | $ | 63,182,286 | | $ | 12,838,870 | | $ | 19,624,362 | |
Distributions from net ordinary income2 | | | — | | | 18,741 | | | 28,625 | | | — | | | — | | | 43,473 | |
Distributions from net long-term capital gains4 | | | — | | | 367,916 | | | — | | | — | | | — | | | — | |
| | | | | | | California | | California | | California | | California | |
| | | California | | California | | AMT-Free | | Dividend | | Dividend | | Dividend | |
| | | Value | | Value 2 | | Income | | Advantage | | Advantage 2 | | Advantage 3 | |
| 2014 | | (NCA | ) | (NCB | ) | (NKX | ) | (NAC | ) | (NVX | ) | (NZH | ) |
| Distributions from net tax-exempt income | | $ | 11,832,802 | | $ | 2,564,399 | | $ | 35,727,060 | | $ | 21,240,833 | | $ | 14,651,657 | | $ | 22,400,636 | |
Distributions from net ordinary income2 | | | 30,180 | | | 4,109 | | | 117,778 | | | 33,376 | | | 45,313 | | | 16,906 | |
| Distributions from net long-term capital gains | | | — | | | — | | | 539,170 | | | — | | | — | | | — | |
| 2 | Net ordinary income consists of taxable market discount income and net short-term capital gains, if any. |
| 3 | The Funds hereby designate these amounts paid during the fiscal year ended February 28, 2015, as Exempt Interest Dividends. |
| 4 | The Funds designate as long-term capital gain dividend, pursuant to the Internal Revenue Code Section 852(b)(3), the amount necessary to reduce earnings and profits of the Funds related to net capital gain to zero for the tax year ended February 28, 2015. |
As of February 28, 2015, the Funds’ tax year end, the following Funds had unused capital loss carryforwards available for federal income tax purposes to be applied against future capital gains, if any. If not applied, the carryforwards will expire as shown in the following table. The losses not subject to expiration will be utilized first by a Fund.
| | | | | California | | California | | California | | California | |
| | | California | | AMT-Free | | Dividend | | Dividend | | Dividend | |
| | | Value | | Income | | Advantage | | Advantage 2 | | Advantage 3 | |
| | | (NCA | ) | (NKX5 | ) | (NAC5 | ) | (NVX | ) | (NZH | ) |
| Expiration: | | | | | | | | | | | | | | | | |
| February 29, 2016 | | | — | | | — | | | 855,623 | | | — | | | 3,869,938 | |
| February 28, 2017 | | | 1,426,925 | | | 632,234 | | | 15,801,342 | | | — | | | 4,536,999 | |
| February 28, 2018 | | | 251,409 | | | 530,894 | | | 731,149 | | | 705,843 | | | 10,646,251 | |
| February 28, 2019 | | | — | | | — | | | — | | | — | | | 1,340,157 | |
| Not subject to expiration | | | 1,271,090 | | | 3,790,991 | | | 16,887,599 | | | 2,601,453 | | | 11,242,857 | |
| Total | | $ | 2,949,424 | | $ | 4,954,119 | | $ | 34,275,713 | | $ | 3,307,296 | | $ | 31,636,202 | |
| 5 | A portion of California AMT-Free Income’s (NKX) and California Dividend Advantage’s (NAC) capital loss carryforward is subject to limitation under the Internal Revenue Code and related regulations. |
During the Funds’ tax year ended February 28, 2015, the following Funds utilized capital loss carryforwards as follows:
| | | | | | | California | | California | |
| | | California | | California | | Dividend | | Dividend | |
| | | Value | | Value 2 | | Advantage | | Advantage 3 | |
| | | (NCA | ) | (NCB | ) | (NAC | ) | (NZH | ) |
| Utilized capital loss carryforwards | | | 135,985 | | | 205,714 | | | 4,106,809 | | | 591,751 | |
The Funds have elected to defer late-year losses in accordance with federal income tax rules. These losses are treated as having arisen on the first day of the following fiscal year. The following Funds have elected to defer losses as follows:
| | | | | California | |
| | | California | | Dividend | |
| | | Value | | Advantage 2 | |
| | | (NCA | ) | (NVX | ) |
Post-October capital losses6 | | $ | 60,575 | | $ | 161,458 | |
Late-year ordinary losses7 | | | — | | | — | |
| 6 | Capital losses incurred from November 1, 2014 through February 28, 2015, the Funds’ tax year end. |
| 7 | Ordinary losses incurred from January 1, 2015 through February 28, 2015, and specified losses incurred from November 1, 2014 through February 28, 2015. |
7. Management Fees and Other Transactions with Affiliates
Each Fund’s management fee compensates the Adviser for overall investment advisory and administrative services and general office facilities. The Sub-Adviser is compensated for its services to the Funds from the management fees paid to the Adviser.
Each Fund’s management fee consists of two components – a fund-level fee, based only on the amount of assets within the Fund, and a complex-level fee, based on the aggregate amount of all eligible fund assets managed by the Adviser, and for California Value (NCA) a gross interest income component. This pricing structure enables Fund shareholders to benefit from growth in the assets within their respective Fund as well as from growth in the amount of complex-wide assets managed by the Adviser.
California Value (NCA) pays an annual fund-level fee, payable monthly, of 0.15% of the average daily net assets* of the Fund, as well as 4.125% of the gross interest income (excluding interest on bonds underlying a “self-deposited inverse floater” trust that is attributed to the Fund over and above the net interest earned on the inverse floater itself) of the Fund.
The annual Fund-level fee, payable monthly, for each Fund (excluding California Value (NCA)) is calculated according to the following schedules:
| | California Value 2 (NCB) |
| Average Daily Managed Assets* | Fund-Level Fee |
| For the first $125 million | 0.4000 | % |
| For the next $125 million | 0.3875 | |
| For the next $250 million | 0.3750 | |
| For the next $500 million | 0.3625 | |
| For the next $1 billion | 0.3500 | |
| For managed assets over $2 billion | 0.3375 | |
Notes to Financial Statements (continued)
| | California AMT-Free Income (NKX) |
| | California Dividend Advantage (NAC) |
| | California Dividend Advantage 2 (NVX) |
| | California Dividend Advantage 3 (NZH) |
| Average Daily Managed Assets* | Fund-Level Fee |
| For the first $125 million | 0.4500 | % |
| For the next $125 million | 0.4375 | |
| For the next $250 million | 0.4250 | |
| For the next $500 million | 0.4125 | |
| For the next $1 billion | 0.4000 | |
| For managed assets over $2 billion | 0.3750 | |
The annual complex-level fee, payable monthly, for each Fund is calculated according to the following schedule:
| Complex-Level Managed Asset Breakpoint Level* | Effective Rate at Breakpoint Level |
| $55 billion | 0.2000 | % |
| $56 billion | 0.1996 | |
| $57 billion | 0.1989 | |
| $60 billion | 0.1961 | |
| $63 billion | 0.1931 | |
| $66 billion | 0.1900 | |
| $71 billion | 0.1851 | |
| $76 billion | 0.1806 | |
| $80 billion | 0.1773 | |
| $91 billion | 0.1691 | |
| $125 billion | 0.1599 | |
| $200 billion | 0.1505 | |
| $250 billion | 0.1469 | |
| $300 billion | 0.1445 | |
| * | For the fund-level and complex-level fees, managed assets include closed-end fund assets managed by the Adviser that are attributable to certain types of leverage. For these purposes, leverage includes the funds’ use of preferred stock and borrowings and certain investments in the residual interest certificates (also called inverse floating rate securities) in tender option bond (TOB) trusts, including the portion of assets held by a TOB trust that has been effectively financed by the trust’s issuance of floating rate securities, subject to an agreement by the Adviser as to certain funds to limit the amount of such assets for determining managed assets in certain circumstances. The complex-level fee is calculated based upon the aggregate daily managed assets of all Nuveen funds that constitute “eligible assets.” Eligible assets do not include assets attributable to investments in other Nuveen funds and assets in excess of $2 billion added to the Nuveen fund complex in connection with the Adviser’s assumption of the management of the former First American Funds effective January 1, 2011. As of February 28, 2015, the complex-level fee rate for each Fund was 0.1635%. |
The Funds pay no compensation directly to those of its directors/trustees who are affiliated with the Adviser or to its officers, all of whom receive remuneration for their services to the Funds from the Adviser or its affiliates. The Board has adopted a deferred compensation plan for independent directors/trustees that enables directors/trustees to elect to defer receipt of all or a portion of the annual compensation they are entitled to receive from certain Nuveen-advised funds. Under the plan, deferred amounts are treated as though equal dollar amounts had been invested in shares of select Nuveen-advised funds.
8. Fund Reorganizations
The Reorganizations were structured to qualify as tax-free reorganizations under the Internal Revenue Code for federal income tax purposes, and the Target Funds’ shareholders will recognize no gain or loss for federal income tax purposes as a result. Prior to the closing of each of the Reorganizations, the Target Funds distributed all of their net investment income and capital gains, if any. Such a distribution may be taxable to the Target Funds’ shareholders for federal income tax purposes.
Investments
The cost, fair value and net unrealized appreciation (depreciation) of the investments of the Target Funds as of the date of their respective Reorganization, were as follows:
| | | | California | |
| | | | Premium | |
| | | | Income | |
| | | | (NCU | ) |
| Cost of investments | | $ | 107,915,691 | |
| Fair value of investments | | | 119,411,307 | |
| Net unrealized appreciation (depreciation) of investments | | | 11,495,616 | |
| | | California | | | | California | | California | | California | |
| | | Performance | | California | | Investment | | Select | | Quality | |
| | | Plus | | Opportunity | | Quality | | Quality | | Income | |
| | | (NCP | ) | (NCO | ) | (NQC | ) | (NVC | ) | (NUC | ) |
| Cost of investments | | $ | 256,939,914 | | $ | 156,908,639 | | $ | 281,684,420 | | $ | 454,328,018 | | $ | 439,398,515 | |
| Fair value of investments | | | 277,147,560 | | | 175,421,545 | | | 306,932,829 | | | 503,803,106 | | | 492,770,466 | |
| Net unrealized appreciation (depreciation) of investments | | | 20,207,646 | | | 18,512,906 | | | 25,248,409 | | | 49,475,088 | | | 53,371,951 | |
For financial reporting purposes, assets received and shares issued by the Acquiring Funds were recorded at fair value; however, the cost basis of the investments received from the Target Funds were carried forward to align ongoing reporting of the Acquiring Funds’ realized and unrealized gains and losses with amounts distributable to shareholders for tax purposes.
Common Shares
The shares outstanding, net assets and NAV per common share immediately before and after the Reorganizations are as follows:
| | | | California | |
| | | | Premium | |
| | | | Income | |
| Target Fund – Prior to Reorganizations | | | (NCU | ) |
| Common shares outstanding | | | 5,732,845 | |
| Net assets applicable to common shares | | $ | 87,770,468 | |
| NAV per common share outstanding | | | 15.31 | |
| | | California | | | | California | | California | | California | |
| | | Performance | | California | | Investment | | Select | | Quality | |
| | | Plus | | Opportunity | | Quality | | Quality | | Income | |
| Target Funds – Prior to Reorganizations | | (NCP | ) | (NCO | ) | (NQC | ) | (NVC | ) | (NUC | ) |
| Common shares outstanding | | | 13,019,195 | | | 8,170,445 | | | 13,654,705 | | | 23,319,003 | | | 22,204,378 | |
| Net assets applicable to common shares | | $ | 200,670,257 | | $ | 129,835,114 | | $ | 213,670,486 | | $ | 370,311,540 | | $ | 357,416,440 | |
| NAV per common share outstanding | | | 15.41 | | | 15.89 | | | 15.65 | | | 15.88 | | | 16.10 | |
| | | | California | | | California | |
| | | | AMT-Free | | | Dividend | |
| | | | Income | | | Advantage | |
| Acquiring Funds – Prior to Reorganizations | | | (NKX | ) | | (NAC | ) |
| Common shares outstanding | | | 41,843,761 | | | 23,528,873 | |
| Net assets applicable to common shares | | $ | 626,229,196 | | $ | 356,884,296 | |
| NAV per common share outstanding | | | 14.97 | | | 15.17 | |
| | | | California | | | California | |
| | | | AMT-Free | | | Dividend | |
| | | | Income | | | Advantage | |
| Acquiring Funds – Post Reorganizations | | | (NKX | ) | | (NAC | ) |
| Common shares outstanding | | | 47,708,456 | | | 107,383,777 | |
| Net assets applicable to common shares | | $ | 713,999,664 | | $ | 1,628,788,133 | |
| NAV per common share outstanding | | | 14.97 | | | 15.17 | |
Preferred Shares
In connection with the California AMT-Free Income (NKX) and California Dividend Advantage (NAC) Reorganizations, holders of MTP and VRDP Shares of the Target Funds received on a one-for-one basis newly issued MTP and VRDP Shares of the Acquiring Funds, in exchange for MTP and VRDP Shares of the Target Funds held immediately prior to the Reorganizations.
Prior to the closing of the Reorganizations, details of the Target Fund’s outstanding MTP Shares were as follows:
| | | | | | | | | Shares Outstanding | | Annual | |
| | | | | NYSE MKT | | Shares | | at $10 Per Share | | Dividend | |
| Target Fund | | Series | | Ticker | | Outstanding | | Liquidation Value | | Rate | |
| California Premium Income (NCU) | | | 2015 | | | NCU PRC | | | 3,525,000 | | $ | 35,250,000 | | | 2.00 | % |
Notes to Financial Statements (continued)
Prior to the closing of the Reorganizations, details of each Target Fund’s outstanding VRDP Shares were as follows:
| | | | | | | Shares | | | |
| | | | | | | Outstanding | | | |
| | | | | Shares | | at $100,000 Per Share | | | |
| Target Funds | | Series | | Outstanding | | Liquidation Value | | Maturity | |
| California Performance Plus (NCP) | | | 1 | | | 910 | | $ | 91,000,000 | | | December 1, 2040 | |
| California Opportunity (NCO) | | | 1 | | | 498 | | $ | 49,800,000 | | | March 1, 2040 | |
| California Investment Quality (NQC) | | | 2 | | | 1,056 | | $ | 105,600,000 | | | December 1, 2042 | |
| California Select Quality (NVC) | | | 1 | | | 1,589 | | $ | 158,900,000 | | | August 1, 2040 | |
| California Quality Income (NUC) | | | 1 | | | 1,581 | | $ | 158,100,000 | | | August 1, 2040 | |
Details of the Fund’s MTP Shares issued in connection with the Reorganizations were as follows:
| | | | | | | | | Shares Outstanding | | Annual | |
| | | | | NYSE | | Shares | | at $10 Per Share | | Dividend | |
| Acquiring Fund | | Series | | Ticker | | Outstanding | | Liquidation Value | | Rate | |
| California AMT-Free Income (NKX) | | | 2015 | | | NKX PRC | | | 3,525,000 | | $ | 35,250,000 | | | 2.00 | % |
Details of the Fund’s VRDP Shares issued in connection with the Reorganizations were as follows:
| | | | | | | Shares | | | |
| | | | | | | Outstanding | | | |
| | | | | Shares | | at $100,000 Per Share | | | |
| Acquiring Fund | | Series | | Outstanding | | Liquidation Value | | Maturity | |
| California Dividend Advantage (NAC) | | | | | | | | | | | | | |
| | | | 2 | | | 910 | | $ | 91,000,000 | | | December 1, 2040 | |
| | | | 3 | | | 498 | | $ | 49,800,000 | | | March 1, 2040 | |
| | | | 4 | | | 1,056 | | $ | 105,600,000 | | | December 1, 2042 | |
| | | | 5 | | | 1,589 | | $ | 158,900,000 | | | August 1, 2040 | |
| | | | 6 | | | 1,581 | | $ | 158,100,000 | | | August 1, 2040 | |
Pro Forma Results of Operations
The beginning of the Target Funds’ current fiscal period was March 1, 2014. Assuming the Reorganizations had been completed on March 1, 2014, the beginning of the Acquiring Funds’ current fiscal period, the pro forma results of operations for the current fiscal period, are as follows:
| | | | California | | | California | |
| | | | AMT-Free | | | Dividend | |
| | | | Income | | | Advantage | |
| Acquiring Fund – Pro Forma Results of Operations | | | (NKX | ) | | (NAC | ) |
| Net investment income (loss) | | $ | 40,444,671 | | $ | 98,969,164 | |
| Net realized and unrealized gains (losses) | | | 68,208,604 | | | 140,373,330 | |
| Change in net assets resulting from operations | | | 108,653,275 | | | 239,342,494 | |
Because the combined investment portfolios for each Reorganization have been managed as a single integrated portfolio since each Reorganization was completed, it is not practicable to separate the amounts of revenue and earnings of the Target Funds that have been included in the Statement of Operations for the Acquiring Funds since the Reorganizations were consummated.
Cost and Expenses
In connection with the Reorganizations, the Acquiring Funds incurred certain associated costs and expenses. Such amounts were included as components of “Accrued other expenses” on the Statement of Assets and Liabilities and “Reorganization expenses” on the Statement of Operations.
Additional Fund Information (Unaudited) |
| Board of Directors/Trustees | | | | | | | | | | |
| William Adams IV* | | Robert P. Bremner | | Jack B. Evans | | William C. Hunter | | David J. Kundert | | John K. Nelson |
| William J. Schneider | | Thomas S. Schreier, Jr.* | | Judith M. Stockdale | | Carole E. Stone | | Virginia L. Stringer | | Terence J. Toth |
| * Interested Board Member. |
| Fund Manager | | Custodian | | Legal Counsel | | Independent Registered | | Transfer Agent and |
| Nuveen Fund Advisors, LLC | | State Street Bank | | Chapman and Cutler LLP | | Public Accounting Firm | | Shareholder Services |
| 333 West Wacker Drive | | & Trust Company | | Chicago, IL 60603 | | KPMG LLP | | State Street Bank |
| Chicago, IL 60606 | | Boston, MA 02111 | | | | Chicago, IL 60601 | | & Trust Company |
| | | | | | | | | Nuveen Funds |
| | | | | | | | | P.O. Box 43071 |
| | | | | | | | | Providence, RI 02940-3071 |
| | | | | | | | | (800) 257-8787 |
Quarterly Form N-Q Portfolio of Investments Information
Each Fund is required to file its complete schedule of portfolio holdings with the Securities and Exchange Commission (SEC) for the first and third quarters of each fiscal year on Form N-Q. You may obtain this information directly from the SEC. Visit the SEC on-line at http://www.sec.gov or in person at the SEC’s Public Reference Room in Washington, D.C. Call the SEC toll-free at (800) SEC-0330 for room hours and operation.
Nuveen Funds’ Proxy Voting Information
You may obtain (i) information regarding how each fund voted proxies relating to portfolio securities held during the most recent twelve-month period ended June 30, without charge, upon request, by calling Nuveen Investments toll-free at (800) 257-8787 or on Nuveen’s website at www.nuveen.com and (ii) a description of the policies and procedures that each fund used to determine how to vote proxies relating to portfolio securities without charge, upon request, by calling Nuveen Investments toll free at (800) 257-8787. You may also obtain this information directly from the SEC. Visit the SEC on-line at http://www.sec.gov.
CEO Certification Disclosure
Each Fund’s Chief Executive Officer (CEO) has submitted to the New York Stock Exchange (NYSE) the annual CEO certification as required by Section 303A.12(a) of the NYSE Listed Company Manual. Each Fund has filed with the SEC the certification of its CEO and Chief Financial Officer required by Section 302 of the Sarbanes-Oxley Act.
Common Share Repurchases
Each Fund intends to repurchase, through its open-market share repurchase program, shares of its own common stock at such times and in such amounts as is deemed advisable. During the period covered by this report, each Fund repurchased shares of its common stock as shown in the accompanying table. Any future repurchases will be reported to shareholders in the next annual or semi-annual report.
| | NCA | NCB | NKX | NAC | NVX | NZH | |
| Common shares repurchased | — | — | — | — | — | — | |
FINRA BrokerCheck
The Financial Industry Regulatory Authority (FINRA) provides information regarding the disciplinary history of FINRA member firms and associated investment professionals. This information as well as an investor brochure describing FINRA BrokerCheck is available to the public by calling the FINRA BrokerCheck Hotline number at (800) 289-9999 or by visiting www.FINRA.org.
Glossary of Terms Used in this Report (Unaudited) |
| ■ | Auction Rate Bond: An auction rate bond is a security whose interest payments are adjusted periodically through an auction process, which process typically also serves as a means for buying and selling the bond. Auctions that fail to attract enough buyers for all the shares offered for sale are deemed to have “failed,” with current holders receiving a formula-based interest rate until the next scheduled auction. |
| | |
| ■ | Average Annual Total Return: This is a commonly used method to express an investment’s performance over a particular, usually multi-year time period. It expresses the return that would have been necessary each year to equal the investment’s actual cumulative performance (including change in NAV or market price and reinvested dividends and capital gains distributions, if any) over the time period being considered. |
| | |
| ■ | Duration: Duration is a measure of the expected period over which a bond’s principal and interest will be paid, and consequently is a measure of the sensitivity of a bond’s or bond fund’s value to changes when market interest rates change. Generally, the longer a bond’s or fund’s duration, the more the price of the bond or fund will change as interest rates change. |
| | |
| ■ | Effective Leverage: Effective leverage is a fund’s effective economic leverage, and includes both regulatory leverage (see leverage) and the leverage effects of certain derivative investments in the fund’s portfolio. Currently, the leverage effects of Tender Option Bond (TOB) inverse floater holdings are included in effective leverage values, in addition to any regulatory leverage. |
| | |
| ■ | Gross Domestic Product (GDP): The total market value of all final goods and services produced in a country/region in a given year, equal to total consumer, investment and government spending, plus the value of exports, minus the value of imports. |
| | |
| ■ | Inverse Floating Rate Securities: Inverse floating rate securities, also known as inverse floaters or tender option bonds (TOBs), are created by depositing a municipal bond, typically with a fixed interest rate, into a special purpose trust. This trust, in turn, (a) issues floating rate certificates typically paying short-term tax-exempt interest rates to third parties in amounts equal to some fraction of the deposited bond’s par amount or market value, and (b) issues an inverse floating rate certificate (sometimes referred to as an “inverse floater”) to an investor (such as a fund) interested in gaining investment exposure to a long-term municipal bond. The income received by the holder of the inverse floater varies inversely with the short-term rate paid to the floating rate certificates’ holders, and in most circumstances the holder of the inverse floater bears substantially all of the underlying bond’s downside investment risk. The holder of the inverse floater typically also benefits disproportionately from any potential appreciation of the underlying bond’s value. Hence, an inverse floater essentially represents an investment in the underlying bond on a leveraged basis. |
| | |
| ■ | Leverage: Leverage is created whenever a fund has investment exposure (both reward and/or risk) equivalent to more than 100% of the investment capital. |
| | |
| ■ | Lipper California Municipal Debt Funds Classification Average: Calculated using the returns of all closed-end funds in this category. Lipper returns account for the effects of management fees and assume reinvestment of distributions, but do not reflect any applicable sales charges. |
| | |
| ■ | Net Asset Value (NAV) Per Share: A fund’s Net Assets is equal to its total assets (securities, cash, accrued earnings and receivables) less its total liabilities. NAV per share is equal to the fund’s Net Assets divided by its number of shares outstanding. |
| ■ | Pre-Refunding: Pre-Refunding, also known as advanced refundings or refinancings, is a procedure used by state and local governments to refinance municipal bonds to lower interest expenses. The issuer sells new bonds with a lower yield and uses the proceeds to buy U.S. Treasury securities, the interest from which is used to make payments on the higher-yielding bonds. Because of this collateral, pre-refunding generally raises a bond’s credit rating and thus its value. |
| | |
| ■ | Regulatory Leverage: Regulatory leverage consists of preferred shares issued by or borrowings of a fund. Both of these are part of a fund’s capital structure. Regulatory leverage is subject to asset coverage limits set in the Investment Company Act of 1940. |
| | |
| ■ | S&P Municipal Bond California Index: An unleveraged, market value-weighted index designed to measure the performance of the tax-exempt, investment-grade California municipal bond market. Index returns assume reinvestment of distributions but do not reflect any applicable sales charges or management fees. |
| | |
| ■ | S&P Municipal Bond Index: An unleveraged, market value-weighted index designed to measure the performance of the tax-exempt, investment-grade U.S. municipal bond market. Index returns assume reinvestment of distributions but do not reflect any applicable sales charges or management fees. |
| | |
| ■ | Total Investment Exposure: Total investment exposure is a fund’s assets managed by the Adviser that are attributable to financial leverage. For these purposes, financial leverage includes a fund’s use of preferred stock and borrowings and investments in the residual interest certificates (also called inverse floating rate securities) in tender option bond (TOB) trusts, including the portion of assets held by a TOB trust that has been effectively financed by the trust’s issuance of floating rate securities. |
| | |
| ■ | Zero Coupon Bond: A zero coupon bond does not pay a regular interest coupon to its holders during the life of the bond. Income to the holder of the bond comes from accretion of the difference between the original purchase price of the bond at issuance and the par value of the bond at maturity and is effectively paid at maturity. The market prices of zero coupon bonds generally are more volatile than the market prices of bonds that pay interest periodically. |
Reinvest Automatically, Easily and Conveniently |
Nuveen makes reinvesting easy. A phone call is all it takes to set up your reinvestment account.
Nuveen Closed-End Funds Automatic Reinvestment Plan
Nuveen Closed-End Fund allows you to conveniently reinvest distributions in additional Fund shares. By choosing to reinvest, you’ll be able to invest money regularly and automatically, and watch your investment grow through the power of compounding. Just like distributions in cash, there may be times when income or capital gains taxes may be payable on distributions that are reinvested. It is important to note that an automatic reinvestment plan does not ensure a profit, nor does it protect you against loss in a declining market.
Easy and convenient
To make recordkeeping easy and convenient, each month you’ll receive a statement showing your total distributions, the date of investment, the shares acquired and the price per share, and the total number of shares you own.
How shares are purchased
The shares you acquire by reinvesting will either be purchased on the open market or newly issued by the Fund. If the shares are trading at or above net asset value at the time of valuation, the Fund will issue new shares at the greater of the net asset value or 95% of the then-current market price. If the shares are trading at less than net as -set value, shares for your account will be purchased on the open market. If the Plan Agent begins purchasing Fund shares on the open market while shares are trading below net asset value, but the Fund’s shares subsequently trade at or above their net asset value before the Plan Agent is able to complete its purchases, the Plan Agent may cease open-market purchases and may invest the uninvested portion of the distribution in newly-issued Fund shares at a price equal to the greater of the shares’ net asset value or 95% of the shares’ market value on the last business day imme -diately prior to the purchase date. Distributions received to purchase shares in the open market will normally be invested shortly after the distribution payment date. No interest will be paid on distributions awaiting reinvestment. Because the market price of the shares may increase before purchases are completed, the average purchase price per share may exceed the market price at the time of valuation, resulting in the acquisition of fewer shares than if the distribution had been paid in shares issued by the Fund. A pro rata portion of any applicable brokerage commissions on open market purchases will be paid by Plan participants. These commissions usually will be lower than those charged on individual transactions.
Flexible
You may change your distribution option or withdraw from the Plan at any time, should your needs or situation change. You can reinvest whether your shares are registered in your name, or in the name of a brokerage firm, bank, or other nominee. Ask your investment advisor if his or her firm will participate on your behalf. Participants whose shares are registered in the name of one firm may not be able to transfer the shares to another firm and continue to participate in the Plan. The Fund reserves the right to amend or terminate the Plan at any time. Although the Fund reserves the right to amend the Plan to include a service charge payable by the participants, there is no direct service charge to participants in the Plan at this time.
Call today to start reinvesting distributions
For more information on the Nuveen Automatic Reinvestment Plan or to enroll in or withdraw from the Plan, speak with your financial advisor or call us at (800) 257-8787.
The management of the Funds, including general supervision of the duties performed for the Funds by the Adviser, is the responsibility of the Board of Trustees of the Funds. The number of trustees of the Funds is currently set at eleven. None of the trustees who are not “interested” persons of the Funds (referred to herein as “independent trustees”) has ever been a director or employee of, or consultant to, Nuveen or its affiliates. The names and business addresses of the trustees and officers of the Funds, their principal occupations and other affiliations during the past five years, the number of portfolios each oversees and other directorships they hold are set forth below.
| | Name, | | Position(s) Held | | Year First | | Principal | | Number |
| | Year of Birth | | with the Funds | | Elected or | | Occupation(s) | | of Portfolios |
| | & Address | | | | Appointed | | Including other | | in Fund Complex |
| | | | | | and Term(1) | | Directorships | | Overseen by |
| | | | | | | | During Past 5 Years | | Board Member |
| | | | | | | | | | |
| Independent Board Members: | | | | | | | | |
| | | | | | | | | | |
| ■ | WILLIAM J. SCHNEIDER 1944 333 W. Wacker Drive Chicago, IL 60606 | | Chairman and Board Member | | 1996 Class III | | Chairman of Miller-Valentine Partners, a real estate investment company; formerly, Senior Partner and Chief Operating Officer (retired (2004) of Miller-Valentine Group; an owner in several other Miller Valentine entities; Board Member of Med-America Health System, Board Member of WDPR Public Radio station; formerly, member, Business Advisory Council, Cleveland Federal Reserve Bank and University of Dayton Business School Advisory Council. | | 195 |
| | | | | | | | | | |
| ■ | JACK B. EVANS 1948 333 W. Wacker Drive Chicago, IL 60606 | | Board Member | | 1999 Class III | | President, The Hall-Perrine Foundation, a private philanthropic corporation (since 1996); Director and Chairman, United Fire Group, a publicly held company; formerly, President Pro-Tem of the Board of Regents for the State of Iowa University System; Director, Source Media Group; Life Trustee of Coe College; formerly, Director, Alliant Energy; formerly, Director, Federal Reserve Bank of Chicago; formerly, President and Chief Operating Officer, SCI Financial Group, Inc., a regional financial services firm. | | 195 |
| | | | | | | | | | |
| ■ | WILLIAM C. HUNTER 1948 333 W. Wacker Drive Chicago, IL 60606 | | Board Member | | 2004 Class I | | Dean Emeritus, formerly, Dean, Tippie College of Business, University of Iowa (2006-2012); Director (since 2004) of Xerox Corporation; Director (since 2005), and President (since July 2012) Beta Gamma Sigma, Inc., The International Business Honor Society; Director of Wellmark, Inc. (since 2009); formerly, Dean and Distinguished Professor of Finance, School of Business at the University of Connecticut (2003-2006); previously, Senior Vice President and Director of Research at the Federal Reserve Bank of Chicago (1995-2003); formerly, Director (1997-2007), Credit Research Center at Georgetown University. | | 195 |
| | | | | | | | | | |
| ■ | DAVID J. KUNDERT 1942 333 W. Wacker Drive Chicago, IL 60606 | | Board Member | | 2005 Class II | | Formerly, Director, Northwestern Mutual Wealth Management Company (2006-2013), retired (since 2004) as Chairman, JPMorgan Fleming Asset Management, President and CEO, Banc One Investment Advisors Corporation, and President, One Group Mutual Funds; prior thereto, Executive Vice President, Banc One Corporation and Chairman and CEO, Banc One Investment Management Group; Regent Emeritus, Member of Investment Committee, Luther College; member of the Wisconsin Bar Association; member of Board of Directors and Chair of Investment Committee, Greater Milwaukee Foundation; member of the Board of Directors (Milwaukee), College Possible. | | 195 |
Board Members & Officers (continued)
| | Name, | | Position(s) Held | | Year First | | Principal | | Number |
| | Year of Birth | | with the Funds | | Elected or | | Occupation(s) | | of Portfolios |
| | & Address | | | | Appointed(1) | | During Past 5 Years | | in Fund Complex |
| | | | | | | | | | Overseen by |
| | | | | | | | | | Board Member |
| | | | | | | | | | |
| Independent Board Members (continued): | | | | | | | | |
| | | | | | | | | | |
| ■ | JOHN K. NELSON 1962 333 W. Wacker Drive Chicago, IL 60606 | | Board Member | | 2013 Class II | | Member of Board of Directors of Core12 LLC since 2008), a private firm which develops branding, marketing and communications strategies for clients; Director of The Curran Center for Catholic American Studies (since 2009) and The President’s Council, Fordham University (since 2010); formerly, senior external advisor to the financial services practice of Deloitte Consulting LLP (2012- 2014); formerly, Chairman of the Board of Trustees of Marian University (2010 as trustee, 2011-2014 as Chairman); formerly, Chief Executive Officer of ABN AMRO N.V. North America, and Global Head of its Financial Markets Division (2007-2008); prior senior positions held at ABN AMRO include Corporate Executive Vice President and Head of Global Markets-the Americas (2006- 2007), CEO of Wholesale Banking North America and Global Head of Foreign Exchange and Futures Markets (2001-2006), and Regional Commercial Treasurer and Senior Vice President Trading- North America (1996-2001); formerly, Trustee at St. Edmund Preparatory School in New York City. | | 195 |
| | | | | | | | | | |
| ■ | JUDITH M. STOCKDALE 1947 333 W. Wacker Drive Chicago, IL 60606 | | Board Member | | 1997 Class I | | Board Member, Land Trust Alliance (since 2013) and U.S. Endowment for Forestry and Communities (since 2013); formerly, Executive Director (1994-2012), Gaylord and Dorothy Donnelley Foundation; prior thereto, Executive Director, Great Lakes Protection Fund (1990-1994). | | 195 |
| | | | | | | | | | |
| ■ | CAROLE E. STONE 1947 333 W. Wacker Drive Chicago, IL 60606 | | Board Member | | 2007 Class I | | Director, Chicago Board Options Exchange, Inc. (since 2006); Director, C2 Options Exchange, Incorporated (since 2009); Director, CBOE Holdings, Inc. (since 2010); formerly, Commissioner, New York State Commission on Public Authority Reform (2005-2010). | | 195 |
| | | | | | | | | | |
| ■ | VIRGINIA L. STRINGER 1944 333 W. Wacker Drive Chicago, IL 60606 | | Board Member | | 2011 Class I | | Board Member, Mutual Fund Directors Forum; non-profit board member and former governance consultant; former Owner , and President Strategic Management Resources, Inc., a management consulting firm; former Member, Governing Board, Investment Company Institute’s Independent Directors Council; previously, held several executive positions in general management, marketing and human resources at IBM and The Pillsbury Company; Independent Director, First American Fund Complex (1987-2010) and Chair (1997-2010). | | 195 |
| | | | | | | | | | |
| ■ | TERENCE J. TOTH 1959 333 W. Wacker Drive Chicago, IL 60606 | | Board Member | | 2008 Class II | | Managing Partner, Promus Capital (since 2008); Director, Fulcrum IT Service LLC (since 2010), Quality Control Corporation (since 2012) and LogicMark LLC (since 2012); formerly, Director, Legal & General Investment Management America, Inc. (2008-2013); formerly, CEO and President, Northern Trust Global Investments (2004-2007); Executive Vice President, Quantitative Management & Securities Lending (2000-2004); prior thereto, various positions with Northern Trust Company (since 1994); member: Chicago Fellowship Board (since 2005), Catalyst Schools of Chicago Board (since 2008) and Chairman, and Mather Foundation Board (since 2012), and a member of its investment committee; formerly, Member, Northern Trust Mutual Funds Board (2005-2007), Northern Trust Global Investments Board (2004-2007), Northern Trust Japan Board (2004-2007), Northern Trust Securities Inc. Board (2003-2007) and Northern Trust Hong Kong Board (1997-2004). | | 195 |
| | Name, | | Position(s) Held | | Year First | | Principal | | Number |
| | Year of Birth | | with the Funds | | Elected or | | Occupation(s) | | of Portfolios |
| | & Address | | | | Appointed(1) | | Including other Directorships | | in Fund Complex |
| | | | | | | | During Past 5 Years | | Overseen by |
| | | | | | | | | | Board Member |
| | | | | | | | | | |
| Interested Board Members: | | | | | | | | |
| | | | | | | | | | |
| ■ | WILLIAM ADAMS IV(2) 1955 333 W. Wacker Drive Chicago, IL 60606 | | Board Member | | 2013 Class II | | Senior Executive Vice President, Global Structured Products (since 2010); formerly, Executive Vice President, U.S. Structured Products, of Nuveen Investments, Inc. (1999-2010); Co-President of Nuveen Fund Advisors, LLC (since 2011); President (since 2011), formerly, Managing Director (2010-2011) of Nuveen Commodities Asset Management, LLC; Board Member of the Chicago Symphony Orchestra and of Gilda’s Club Chicago. | | 195 |
| | | | | | | | | | |
| ■ | THOMAS S. SCHREIER, JR.(2) 1962 333 W. Wacker Drive Chicago, IL 60606 | | Board Member | | 2013 Class III | | Vice Chairman, Wealth Management of Nuveen Investments, Inc. (since 2011); Co-President of Nuveen Fund Advisors, LLC; Chairman of Nuveen Asset Management, LLC (since 2011); Co-Chief Executive Officer of Nuveen Securities, LLC (since 2011); Member of Board of Governors and Chairman’s Council of the Investment Company Institute; Director of Allina Health and a member of its Finance, Audit and Investment Committees: formerly, Chief Executive Officer (2000-2010) and Chief Investment Officer (2007- 2010) of FAF Advisors, Inc.; formerly, President of First American Funds (2001-2010). | | 195 |
| | | | | | | | | | |
| | Name, | | Position(s) Held | | Year First | | Principal | | Number |
| | Year of Birth | | with the Funds | | Elected or | | Occupation(s) | | of Portfolios |
| | & Address | | | | Appointed(3) | | During Past 5 Years | | in Fund Complex |
| | | | | | | | | | Overseen |
| | | | | | | | | | by Officer |
| | | | | | | | | | |
| Officers of the Funds: | | | | | | | | |
| | | | | | | | | | |
| ■ | GIFFORD R. ZIMMERMAN 1956 333 W. Wacker Drive Chicago, IL 60606 | | Chief Administrative Officer | | 1988 | | Managing Director (since 2002), and Assistant Secretary of Nuveen Securities, LLC; Managing Director (since 2004) and Assistant Secretary (since 1994) of Nuveen Investments, Inc.; Managing Director (since 2002), Assistant Secretary (since 1997) and Co-General Counsel (since 2011) of Nuveen Fund Advisors, LLC; Managing Director, Assistant Secretary and Associate General Counsel of Nuveen Asset Management, LLC (since 2011); Managing Director, Associate General Counsel and Assistant Secretary, of Symphony Asset Management LLC (since 2003); Vice President and Assistant Secretary of NWQ Investment Management Company, LLC (since 2002), Nuveen Investments Advisers Inc. (since 2002), Santa Barbara Asset Management, LLC (since 2006), and of Winslow Capital Management, LLC, (since 2010); Vice President and Assistant Secretary (since 2013), formerly, Chief Administrative Officer and Chief Compliance Officer (2006-2013) of Nuveen Commodities Asset Management, LLC; Chartered Financial Analyst. | | 196 |
| | | | | | | | | | |
| ■ | CEDRIC H. ANTOSIEWICZ 1962 333 W. Wacker Drive Chicago, IL 60606 | | Vice President | | 2007 | | Managing Director of Nuveen Securities, LLC. (since 2004); Managing Director of Nuveen Fund Advisors, LLC (since 2014). | | 89 |
| | | | | | | | | | |
| ■ | MARGO L. COOK 1964 333 W. Wacker Drive Chicago, IL 60606 | | Vice President | | 2009 | | Executive Vice President (since 2008) of Nuveen Investments, Inc. and of Nuveen Fund Advisors, LLC (since 2011); Managing Director- Investment Services of Nuveen Commodities Asset Management, LLC (since August 2011), previously, Head of Institutional Asset Management (2007-2008) of Bear Stearns Asset Management; Chartered Financial Analyst. | | 196 |
Board Members & Officers (continued)
| | Name, | | Position(s) Held | | Year First | | Principal | | Number |
| | Year of Birth | | with the Funds | | Elected or | | Occupation(s) | | of Portfolios |
| | & Address | | | | Appointed(3) | | During Past 5 Years | | in Fund Complex |
| | | | | | | | | | Overseen |
| | | | | | | | | | by Officer |
| | | | | | | | | | |
| Officers of the Funds (continued): | | | | | | | | |
| | | | | | | | | | |
| ■ | LORNA C. FERGUSON 1945 333 W. Wacker Drive Chicago, IL 60606 | | Vice President | | 1998 | | Managing Director (since 2005) of Nuveen Fund Advisors, LLC and Nuveen Securities, LLC (since 2004). | | 196 |
| | | | | | | | | | |
| ■ | STEPHEN D. FOY 1954 333 W. Wacker Drive Chicago, IL 60606 | | Vice President and Controller | | 1998 | | Managing Director (since 2014), formerly, Senior Vice President (2013-2014) and Vice President (2005-2013) of Nuveen Fund Advisors, LLC; Chief Financial Officer of Nuveen Commodities Asset Management, LLC (since 2010); Certified Public Accountant. | | 196 |
| | | | | | | | | | |
| ■ | SCOTT S. GRACE 1970 333 W. Wacker Drive Chicago, IL 60606 | | Vice President and Treasurer | | 2009 | | Managing Director, Head of Business Development and Strategy, Global Structured Products Group (since November 2014); Managing Director (since 2009) and, formerly, Treasurer, of Nuveen Investments Advisers Inc., Nuveen Investments Holdings, Inc., Nuveen Fund Advisors, LLC, Nuveen Securities, LLC and (since 2011) Nuveen Asset Management LLC; Vice President and, formerly, Treasurer of NWQ Investment Management Company, LLC, Tradewinds Global Investors, LLC, Symphony Asset Management LLC and Winslow Capital Management, LLC.; Vice President of Santa Barbara Asset Management, LLC; formerly, Treasurer (2006-2009), Senior Vice President (2008-2009), previously, Vice President (2006-2008) of Janus Capital Group, Inc.; Chartered Accountant Designation. | | 196 |
| | | | | | | | | | |
| ■ | WALTER M. KELLY 1970 333 W. Wacker Drive Chicago, IL 60606 | | Chief Compliance Officer and Vice President | | 2003 | | Senior Vice President (since 2008) of Nuveen Investment Holdings, Inc. | | 196 |
| | | | | | | | | | |
| ■ | TINA M. LAZAR 1961 333 W. Wacker Drive Chicago, IL 60606 | | Vice President | | 2002 | | Senior Vice President of Nuveen Investment Holdings, Inc. and Nuveen Securities, LLC. | | 196 |
| | | | | | | | | | |
| ■ | KEVIN J. MCCARTHY 1966 333 W. Wacker Drive Chicago, IL 60606 | | Vice President and Secretary | | 2007 | | Managing Director and Assistant Secretary (since 2008), Nuveen Securities, LLC; Managing Director (since 2008), Assistant Secretary since 2007) and Co-General Counsel (since 2011) of Nuveen Fund Advisors, LLC; Managing Director, Assistant Secretary and Associate General Counsel (since 2011) of Nuveen Asset Management, LLC; Managing Director and Assistant Secretary, Nuveen Investments, Inc.; Vice President (since 2007) and Assistant Secretary of Nuveen Investments Advisers Inc., NWQ Investment Management Company, LLC, Symphony Asset Management LLC, Santa Barbara Asset Management, LLC, and of Winslow Capital Management, LLC. (since 2010); Vice President and Secretary (since 2010) of Nuveen Commodities Asset Management, LLC. | | 196 |
| | Name, | | Position(s) Held | | Year First | | Principal | | Number |
| | Year of Birth | | with the Funds | | Elected or | | Occupation(s) | | of Portfolios |
| | & Address | | | | Appointed(3) | | During Past 5 Years | | in Fund Complex |
| | | | | | | | | | Overseen |
| | | | | | | | | | by Officer |
| | | | | | | | | | |
| Officers of the Funds (continued): | | | | |
| | | | | | | | | | |
| ■ | KATHLEEN L. PRUDHOMME 1953 901 Marquette Avenue Minneapolis, MN 55402 | | Vice President and Assistant Secretary | | 2011 | | Managing Director, Assistant Secretary and Co-General Counsel (since 2011) of Nuveen Fund Advisors, LLC; Managing Director, Assistant Secretary and Associate General Counsel (since 2011) of Nuveen Asset Management, LLC; Managing Director and Assistant Secretary (since 2011) of Nuveen Securities, LLC; formerly, Deputy General Counsel, FAF Advisors, Inc. (2004-2010). | | 196 |
| | | | | | | | | | |
| ■ | JOEL T. SLAGER 1978 333 W. Wacker Drive Chicago, IL 60606 | | Vice President and Assistant Secretary | | 2013 | | Fund Tax Director for Nuveen Funds (since 2013); previously, Vice President of Morgan Stanley Investment Management, Inc., Assistant Treasurer of the Morgan Stanley Funds (from 2010 to 2013). | | 196 |
| (1) | The Board of Trustees is divided into three classes, Class I, Class II, and Class III, with each being elected to serve until the third succeeding annual shareholders’ meeting subsequent to its election or thereafter in each case when its respective successors are duly elected or appointed, except two board members are elected by the holders of Preferred Shares to serve until the next annual shareholders’ meeting subsequent to its election or thereafter in each case when its respective successors are duly elected or appointed. The year first elected or appointed represents the year in which the board member was first elected or appointed to any fund in the Nuveen Complex. |
| (2) | “Interested person” as defined in the 1940 Act, by reason of his position with Nuveen Investments, Inc. and certain of its subsidiaries, which are affiliates of the Nuveen Funds. |
| (3) | Officers serve one year terms through August of each year. The year first elected or appointed represents the year in which the Officer was first elected or appointed to any fund in the Nuveen Complex. |
| Nuveen Investments: |
| | Serving Investors for Generations |
Since 1898, financial advisors and their clients have relied on Nuveen Investments to provide dependable investment solutions through continued adherence to proven, long-term investing principles. Today, we offer a range of high quality equity and fixed-income solutions designed to be integral components of a well-diversified core portfolio.
Focused on meeting investor needs.
Nuveen Investments provides high-quality investment services designed to help secure the long-term goals of institutional and individual investors as well as the consultants and financial advisors who serve them. Nuveen Investments markets a wide range of specialized investment solutions which provide investors access to capabilities of its high-quality boutique investment affiliates—Nuveen Asset Management, Symphony Asset Management, NWQ Investment Management Company, Santa Barbara Asset Management, Tradewinds Global Investors, Winslow Capital Management and Gresham Investment Management. In total, Nuveen Investments managed $233 billion as of March 31, 2015.
Find out how we can help you.
To learn more about how the products and services of Nuveen Investments may be able to help you meet your financial goals, talk to your financial advisor, or call us at (800) 257-8787. Please read the information provided carefully before you invest. Investors should consider the investment objective and policies, risk considerations, charges and expenses of any investment carefully. Where applicable, be sure to obtain a prospectus, which contains this and other relevant information. To obtain a prospectus, please contact your securities representative or Nuveen Investments, 333 W. Wacker Dr., Chicago, IL 60606. Please read the prospectus carefully before you invest or send money.
Learn more about Nuveen Funds at: www.nuveen.com/cef
Distributed by Nuveen Investments, LLC | 333 West Wacker Drive | Chicago, IL 60606 | www.nuveen.com | |
EAN-A-0215D 7182-INV-Y-04/16
ITEM 2. CODE OF ETHICS.
As of the end of the period covered by this report, the registrant has adopted a code of ethics that applies to the registrant’s principal executive officer, principal financial officer, principal accounting officer or controller, or persons performing similar functions. There were no amendments to or waivers from the Code during the period covered by this report. The registrant has posted the code of ethics on its website at www.nuveen.com/CEF/Shareholder/FundGovernance.aspx. (To view the code, click on Code of Conduct.)
ITEM 3. AUDIT COMMITTEE FINANCIAL EXPERT.
ITEM 4. PRINCIPAL ACCOUNTANT FEES AND SERVICES.
Nuveen California Municipal Value Fund, Inc.
The Audit Committee has delegated certain pre-approval responsibilities to its Chairman (or, in his absence, any other member of the Audit Committee).
SERVICES THAT THE FUND’S AUDITOR BILLED TO THE ADVISER AND AFFILIATED FUND SERVICE PROVIDERS
The tables also show the percentage of fees subject to the pre-approval exception. The pre-approval exception for services provided to the Adviser and any Affiliated Fund Service Provider (other than audit, review or attest services) waives the pre-approval requirement if: (A) the aggregate amount of all such services provided constitutes no more than 5% of the total amount of revenues paid to KPMG LLP and Ernst & Young LLP by the Fund, the Adviser and Affiliated Fund Service Providers during the fiscal year in which the services are provided that would have to be pre-approved by the Audit Committee; (B) the Fund did not recognize the services as non-audit services at the time of the engagement; and (C) the services are promptly brought to the Audit Committee’s attention, and the Committee (or its delegate) approves the services before the Fund’s audit is completed.
The following table shows the amount of fees that KPMG LLP and Ernst & Young LLP billed during the Fund’s last two full fiscal years for non-audit services. The Audit Committee is required to pre-approve non-audit services that KPMG LLP and Ernst & Young LLP provides to the Adviser and any Affiliated Fund Services Provider, if the engagement related directly to the Fund’s operations and financial reporting (except for those subject to the pre-approval exception described above). The Audit Committee requested and received information from KPMG LLP and Ernst & Young LLP about any non-audit services that KPMG LLP and Ernst & Young LLP rendered during the Fund’s last fiscal year to the Adviser and any Affiliated Fund Service Provider. The Committee considered this information in evaluating KPMG LLP and Ernst & Young LLP’s independence.
Audit Committee Pre-Approval Policies and Procedures. Generally, the Audit Committee must approve (i) all non-audit services to be performed for the Fund by the Fund’s independent accountants and (ii) all audit and non-audit services to be performed by the Fund’s independent accountants for the Affiliated Fund Service Providers with respect to operations and financial reporting of the Fund. Regarding tax and research projects conducted by the independent accountants for the Fund and Affiliated Fund Service Providers (with respect to operations and financial reports of the Fund) such engagements will be (i) pre-approved by the Audit Committee if they are expected to be for amounts greater than $10,000; (ii) reported to the Audit Committee chairman for his verbal approval prior to engagement if they are expected to be for amounts under $10,000 but greater than $5,000; and (iii) reported to the Audit Committee at the next Audit Committee meeting if they are expected to be for an amount under $5,000.
ITEM 5. AUDIT COMMITTEE OF LISTED REGISTRANTS.
ITEM 6. SCHEDULE OF INVESTMENTS.
a) See Portfolio of Investments in Item 1.
b) Not applicable.
ITEM 7. DISCLOSURE OF PROXY VOTING POLICIES AND PROCEDURES FOR CLOSED-END MANAGEMENT INVESTMENT COMPANIES.
ITEM 9. PURCHASES OF EQUITY SECURITIES BY CLOSED-END MANAGEMENT INVESTMENT COMPANY AND AFFILIATED PURCHASERS.
Not applicable.
ITEM 10. SUBMISSION OF MATTERS TO A VOTE OF SECURITY HOLDERS.
There have been no material changes to the procedures by which shareholders may recommend nominees to the registrant’s Board implemented after the registrant last provided disclosure in response to this Item.
ITEM 11. CONTROLS AND PROCEDURES.
ITEM 12. EXHIBITS.
File the exhibits listed below as part of this Form.
Pursuant to the requirements of the Securities Exchange Act of 1934 and the Investment Company Act of 1940, the registrant has duly caused this report to be signed on its behalf by the undersigned, thereunto duly authorized.
Kevin J. McCarthy
Pursuant to the requirements of the Securities Exchange Act of 1934 and the Investment Company Act of 1940, this report has been signed below by the following persons on behalf of the registrant and in the capacities and on the dates indicated.
Gifford R. Zimmerman
Stephen D. Foy