UNITED STATES
SECURITIES AND EXCHANGE COMMISSION
Washington, D.C. 20549
FORM N-CSR
CERTIFIED SHAREHOLDER REPORT OF REGISTERED
MANAGEMENT INVESTMENT COMPANIES
Investment Company Act file number 811-5251
Fidelity Concord Street Trust
(Exact name of registrant as specified in charter)
245 Summer St., Boston, Massachusetts 02210
(Address of principal executive offices) (Zip code)
Scott C. Goebel, Secretary
245 Summer St.
Boston, Massachusetts 02210
(Name and address of agent for service)
Registrant's telephone number, including area code: 617-563-7000
Date of fiscal year end: | February 28 |
|
|
Date of reporting period: | February 28, 2014 |
Item 1. Reports to Stockholders
Spartan®
500 Index
Fund -
Institutional Class
Fidelity Advantage® Institutional Class
Annual Report
February 28, 2014
(Fidelity Cover Art)
Contents
Performance | How the fund has done over time. | |
Management's Discussion of Fund Performance | The Portfolio Manager's review of fund performance and strategy. | |
Shareholder Expense Example | An example of shareholder expenses. | |
Investment Changes | A summary of major shifts in the fund's investments over the past six months. | |
Investments | A complete list of the fund's investments with their market values. | |
Financial Statements | Statements of assets and liabilities, operations, and changes in net assets, as well as financial highlights. | |
Notes | Notes to the financial statements. | |
Report of Independent Registered Public Accounting Firm |
| |
Trustees and Officers |
| |
Distributions |
|
To view a fund's proxy voting guidelines and proxy voting record for the 12-month period ended June 30, visit http://www.fidelity.com/proxyvotingresults or visit the Securities and Exchange Commission's (SEC) web site at http://www.sec.gov. You may also call 1-800-835-5092 to request a free copy of the proxy voting guidelines.
Standard & Poor's, S&P and S&P 500 are registered service marks of The McGraw-Hill Companies, Inc. and have been licensed for use by Fidelity Distributors Corporation.
Other third-party marks appearing herein are the property of their respective owners.
All other marks appearing herein are registered or unregistered trademarks or service marks of FMR LLC or an affiliated company. © 2014 FMR LLC. All rights reserved.
This report and the financial statements contained herein are submitted for the general information of the shareholders of the fund. This report is not authorized for distribution to prospective investors in the fund unless preceded or accompanied by an effective prospectus.
A fund files its complete schedule of portfolio holdings with the SEC for the first and third quarters of each fiscal year on Form N-Q. Forms N-Q are available on the SEC's web site at http://www.sec.gov. A fund's Forms N-Q may be reviewed and copied at the SEC's Public Reference Room in Washington, DC. Information regarding the operation of the SEC's Public Reference Room may be obtained by calling 1-800-SEC-0330. For a complete list of a fund's portfolio holdings, view the most recent holdings listing, semiannual report, or annual report on Fidelity's web site at http://www.fidelity.com, http://www.advisor.fidelity.com, or http://www.401k.com, as applicable.
NOT FDIC INSURED • MAY LOSE VALUE • NO BANK GUARANTEE
Neither the fund nor Fidelity Distributors Corporation is a bank.
Annual Report
Performance: The Bottom Line
Average annual total return reflects the change in the value of an investment, assuming reinvestment of the class' distributions from dividend income and capital gains (the profits earned upon the sale of securities that have grown in value, if any) and assuming a constant rate of performance each year. The $10,000 table and the fund's returns do not reflect the deduction of taxes that a shareholder would pay on fund distributions or the redemption of fund shares. During periods of reimbursement by Fidelity, a fund's total return will be greater than it would be had the reimbursement not occurred. How a fund did yesterday is no guarantee of how it will do tomorrow.
Average Annual Total Returns
Periods ended February 28, 2014 | Past 1 | Past 5 | Past 10 |
Institutional Class A | 25.33% | 22.98% | 7.13% |
Fidelity Advantage® Institutional Class B | 25.34% | 22.99% | 7.14% |
A The initial offering of Institutional Class shares took place on May 4, 2011. Returns between October 14, 2005 and May 4, 2011 are those of Fidelity Advantage Class. Returns prior to October 14, 2005 are those of Investor Class.
B The initial offering of Fidelity Advantage® Institutional Class shares took place on May 4, 2011. Returns between October 14, 2005 and May 4, 2011 are those of Fidelity Advantage Class. Returns prior to October 14, 2005 are those of Investor Class.
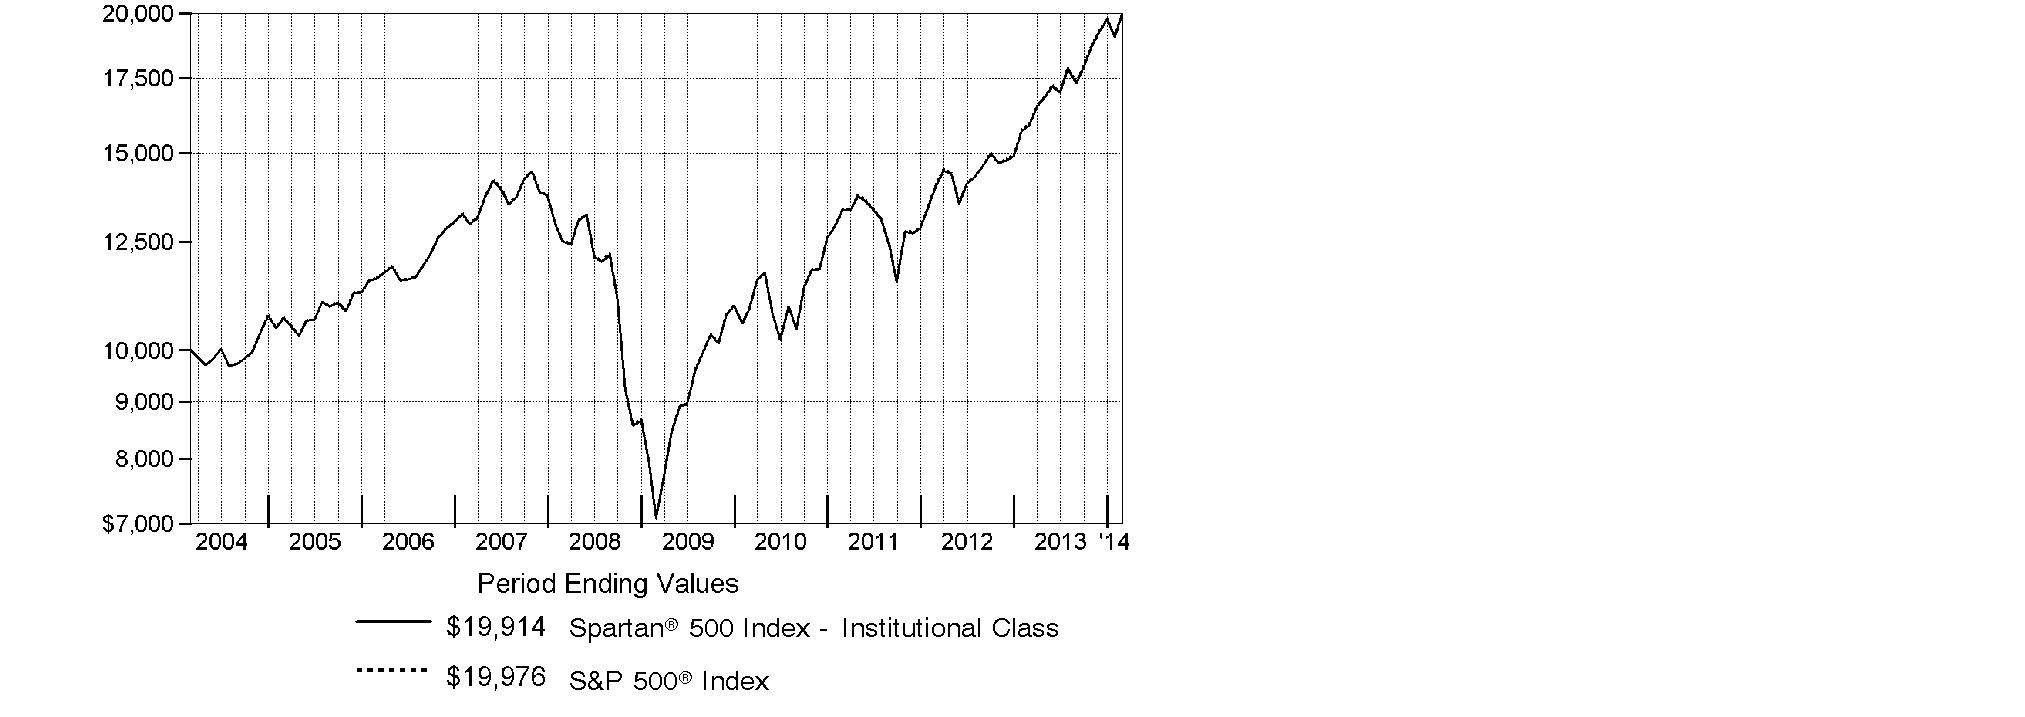
$10,000 Over 10 Years
Let's say hypothetically that $10,000 was invested in Spartan® 500 Index Fund - Institutional Class on February 29, 2004. The chart shows how the value of your investment would have changed, and also shows how the S&P 500® Index performed over the same period. The initial offering of Institutional Class took place on May 4, 2011. See above for additional information regarding the performance of Institutional Class.
Annual Report
Management's Discussion of Fund Performance
Market Recap: Stocks overcame fears of higher interest rates - not to mention their worst January in four years - to finish sharply higher for the 12 months ending February 28, 2014. The broad S&P 500® Index and the blue-chip Dow Jones Industrial AverageSM gained 25.37% and 19.01%, respectively, amid generally favorable earnings reports and accommodative monetary policies worldwide. Performance generally increased along the risk spectrum, with smaller-cap and growth strategies leading the way. An ebullient market helped the growth-oriented Nasdaq Composite Index® to a 38.10% period gain. Data still points to slow but steady improvement in the U.S., and Europe's recession may well be over. Reports from China have disappointed, but continue to suggest a relatively soft landing there. Mixed signals from the U.S. Federal Reserve as to when it might curtail its stimulative bond buying kept markets in flux during the spring and summer. Stocks regained momentum in October despite a federal budget impasse and brief government shutdown, and lower volatility prevailed through year-end. Shedding new-year concerns about China's economy, an emerging-markets sell-off and confirmation (at last) of Fed tapering - alongside confirmation of a presumably dovish Janet Yellen as new Fed chair - February saw stocks back in record territory, bearing down on the five-year anniversary of the market's bottom.
Comments from Patrick Waddell, Senior Portfolio Manager of the Geode Capital Management, LLC, investment management team for Spartan® 500 Index Fund: For the year, the fund's Institutional Class and Fidelity Advantage® Institutional Class shares gained 25.33% and 25.34%, respectively, in line with the S&P 500®. All 10 sectors in the index gained ground, and all but one - telecommunication services - was up by double digits. On an individual basis, the fund's top-three contributors were all technology stocks and household names, led by Internet search leader Google, which saw its shares rise 14% in a single day in October, thanks to better-than-expected earnings. Consumer products and computer manufacturer Apple also added value, as did software maker Microsoft, whose shares were up 42% as the company continued to generate strong financial results relative to Wall Street's expectations. Also of note, health care was the strongest-performing sector in the index, and biotechnology company Gilead Sciences, which gained 94%, contributed the most within that group. In contrast, IBM topped the list of individual detractors, as the diversified technology company lost modest ground amid declining revenues, while tobacco company Philip Morris International struggled in an environment of slowing worldwide demand for cigarettes.
The views expressed above reflect those of the portfolio manager(s) only through the end of the period as stated on the cover of this report and do not necessarily represent the views of Fidelity or any other person in the Fidelity organization. Any such views are subject to change at any time based upon market or other conditions and Fidelity disclaims any responsibility to update such views. These views may not be relied on as investment advice and, because investment decisions for a Fidelity fund are based on numerous factors, may not be relied on as an indication of trading intent on behalf of any Fidelity fund.
Annual Report
Shareholder Expense Example
As a shareholder of the Fund, you incur two types of costs: (1) transaction costs, and (2) ongoing costs, including management fees and other Fund expenses. This Example is intended to help you understand your ongoing costs (in dollars) of investing in the Fund and to compare these costs with the ongoing costs of investing in other mutual funds.
The Example is based on an investment of $1,000 invested at the beginning of the period and held for the entire period (September 1, 2013 to February 28, 2014).
Actual Expenses
The first line of the accompanying table for each class of the Fund provides information about actual account values and actual expenses. You may use the information in this line, together with the amount you invested, to estimate the expenses that you paid over the period. Simply divide your account value by $1,000.00 (for example, an $8,600 account value divided by $1,000.00 = 8.6), then multiply the result by the number in the first line for a class of the Fund under the heading entitled "Expenses Paid During Period" to estimate the expenses you paid on your account during this period. A small balance maintenance fee of $12.00 that is charged once a year may apply for certain accounts with a value of less than $2,000. This fee is not included in the table below. If it was, the estimate of expenses you paid during the period would be higher, and your ending account value lower, by this amount. In addition, the Fund, as a shareholder in the underlying Fidelity Central Funds, will indirectly bear its pro-rata share of the fees and expenses incurred by the underlying Fidelity Central Funds. These fees and expenses are not included in the Fund's annualized expense ratio used to calculate the expense estimate in the table below.
Hypothetical Example for Comparison Purposes
The second line of the accompanying table for each class of the Fund provides information about hypothetical account values and hypothetical expenses based on a Class' actual expense ratio and an assumed rate of return of 5% per year before expenses, which is not the Class' actual return. The hypothetical account values and expenses may not be used to estimate the actual ending account balance or expenses you paid for the period. You may use this information to compare the ongoing costs of investing in the Fund and other funds. To do so, compare this 5% hypothetical example with the 5% hypothetical examples that appear in the shareholder reports of the other funds. A small balance maintenance fee of $12.00 that is charged once a year may apply for certain accounts with a value of less than $2,000. This fee is not included in the table below. If it was, the estimate of expenses you paid during the period would be higher, and your ending account value lower, by this amount. In addition, the Fund, as a shareholder in the underlying Fidelity Central Funds, will indirectly bear its pro-rata share of the fees and expenses incurred by the underlying Fidelity Central Funds. These fees and expenses are not included in the Fund's annualized expense ratio used to calculate the expense estimate in the table below.
Please note that the expenses shown in the table are meant to highlight your ongoing costs only and do not reflect any transaction costs. Therefore, the second line of the table is useful in comparing ongoing costs only, and will not help you determine the relative total costs of owning different funds.
Annual Report
| Annualized | Beginning | Ending | Expenses Paid |
Investor Class | .095% |
|
|
|
Actual |
| $ 1,000.00 | $ 1,150.20 | $ .51 |
HypotheticalA |
| $ 1,000.00 | $ 1,024.35 | $ .48 |
Fidelity Advantage Class | .050% |
|
|
|
Actual |
| $ 1,000.00 | $ 1,150.40 | $ .27 |
HypotheticalA |
| $ 1,000.00 | $ 1,024.55 | $ .25 |
Institutional Class | .040% |
|
|
|
Actual |
| $ 1,000.00 | $ 1,150.50 | $ .21 |
HypotheticalA |
| $ 1,000.00 | $ 1,024.60 | $ .20 |
Fidelity Advantage Institutional Class | .020% |
|
|
|
Actual |
| $ 1,000.00 | $ 1,150.60 | $ .11 |
HypotheticalA |
| $ 1,000.00 | $ 1,024.70 | $ .10 |
A 5% return per year before expenses
B Annualized expense ratio reflects expenses net of applicable fee waivers.
* Expenses are equal to each Class' annualized expense ratio, multiplied by the average account value over the period, multiplied by 181/365 (to reflect the one-half year period).
Annual Report
Investment Changes (Unaudited)
Top Ten Stocks as of February 28, 2014 | ||
| % of fund's | % of fund's net assets |
Apple, Inc. | 2.8 | 3.1 |
Exxon Mobil Corp. | 2.5 | 2.6 |
Google, Inc. Class A | 2.0 | 1.5 |
Microsoft Corp. | 1.7 | 1.7 |
Johnson & Johnson | 1.6 | 1.6 |
General Electric Co. | 1.5 | 1.6 |
Wells Fargo & Co. | 1.3 | 1.4 |
Chevron Corp. | 1.3 | 1.6 |
Procter & Gamble Co. | 1.3 | 1.5 |
JPMorgan Chase & Co. | 1.3 | 1.3 |
| 17.3 | |
Market Sectors as of February 28, 2014 | ||
| % of fund's | % of fund's net assets |
Information Technology | 18.6 | 17.8 |
Financials | 15.7 | 16.1 |
Health Care | 13.5 | 12.7 |
Consumer Discretionary | 12.4 | 12.1 |
Industrials | 10.6 | 10.2 |
Energy | 9.9 | 10.5 |
Consumer Staples | 9.4 | 10.1 |
Materials | 3.5 | 3.4 |
Utilities | 2.9 | 3.2 |
Telecommunication Services | 2.5 | 2.5 |
Annual Report
Investments February 28, 2014
Showing Percentage of Net Assets
Common Stocks - 99.0% | |||
Shares | Value (000s) | ||
CONSUMER DISCRETIONARY - 12.4% | |||
Auto Components - 0.4% | |||
BorgWarner, Inc. (d) | 955,319 | $ 58,704 | |
Delphi Automotive PLC | 1,175,581 | 78,258 | |
Johnson Controls, Inc. | 2,875,734 | 142,061 | |
The Goodyear Tire & Rubber Co. | 1,036,511 | 27,851 | |
| 306,874 | ||
Automobiles - 0.7% | |||
Ford Motor Co. (d) | 16,559,347 | 254,848 | |
General Motors Co. | 5,470,478 | 198,031 | |
Harley-Davidson, Inc. (d) | 928,245 | 61,320 | |
| 514,199 | ||
Distributors - 0.1% | |||
Genuine Parts Co. (d) | 648,014 | 57,084 | |
Diversified Consumer Services - 0.1% | |||
Graham Holdings Co. | 18,290 | 13,145 | |
H&R Block, Inc. | 1,147,204 | 36,298 | |
| 49,443 | ||
Hotels, Restaurants & Leisure - 1.7% | |||
Carnival Corp. unit | 1,838,888 | 72,930 | |
Chipotle Mexican Grill, Inc. (a)(d) | 129,907 | 73,425 | |
Darden Restaurants, Inc. | 548,144 | 27,988 | |
International Game Technology (d) | 1,044,920 | 15,768 | |
Marriott International, Inc. Class A (d) | 943,129 | 51,146 | |
McDonald's Corp. | 4,177,287 | 397,469 | |
Starbucks Corp. | 3,163,727 | 224,498 | |
Starwood Hotels & Resorts Worldwide, Inc. | 803,996 | 66,298 | |
Wyndham Worldwide Corp. | 547,049 | 39,869 | |
Wynn Resorts Ltd. (d) | 339,100 | 82,228 | |
Yum! Brands, Inc. | 1,869,567 | 138,498 | |
| 1,190,117 | ||
Household Durables - 0.4% | |||
D.R. Horton, Inc. (d) | 1,193,072 | 29,302 | |
Garmin Ltd. (d) | 516,330 | 27,706 | |
Harman International Industries, Inc. | 283,590 | 29,700 | |
Leggett & Platt, Inc. (d) | 592,826 | 19,000 | |
Lennar Corp. Class A (d) | 738,015 | 32,384 | |
Mohawk Industries, Inc. (a) | 256,109 | 36,247 | |
Newell Rubbermaid, Inc. | 1,205,710 | 38,715 | |
Common Stocks - continued | |||
Shares | Value (000s) | ||
CONSUMER DISCRETIONARY - continued | |||
Household Durables - continued | |||
PulteGroup, Inc. | 1,447,318 | $ 30,379 | |
Whirlpool Corp. | 329,534 | 47,661 | |
| 291,094 | ||
Internet & Catalog Retail - 1.5% | |||
Amazon.com, Inc. (a) | 1,556,526 | 563,618 | |
Expedia, Inc. | 432,321 | 33,950 | |
Netflix, Inc. (a) | 248,775 | 110,862 | |
priceline.com, Inc. (a)(d) | 215,902 | 291,217 | |
TripAdvisor, Inc. (a)(d) | 465,191 | 46,631 | |
| 1,046,278 | ||
Leisure Equipment & Products - 0.1% | |||
Hasbro, Inc. | 484,811 | 26,742 | |
Mattel, Inc. | 1,420,798 | 53,010 | |
| 79,752 | ||
Media - 3.7% | |||
Cablevision Systems Corp. - NY Group Class A (d) | 898,748 | 15,818 | |
CBS Corp. Class B | 2,342,897 | 157,162 | |
Comcast Corp. Class A | 10,940,314 | 565,505 | |
DIRECTV (a) | 2,051,474 | 159,194 | |
Discovery Communications, Inc. Class A (a)(d) | 947,408 | 78,938 | |
Gannett Co., Inc. (d) | 956,734 | 28,463 | |
Interpublic Group of Companies, Inc. | 1,747,447 | 30,965 | |
News Corp. Class A (a) | 2,089,887 | 38,308 | |
Omnicom Group, Inc. | 1,080,441 | 81,768 | |
Scripps Networks Interactive, Inc. Class A | 459,930 | 37,365 | |
The Walt Disney Co. (d) | 6,860,916 | 554,431 | |
Time Warner Cable, Inc. | 1,183,417 | 166,093 | |
Time Warner, Inc. | 3,798,161 | 254,971 | |
Twenty-First Century Fox, Inc. Class A | 8,238,257 | 276,311 | |
Viacom, Inc. Class B (non-vtg.) | 1,703,789 | 149,473 | |
| 2,594,765 | ||
Multiline Retail - 0.7% | |||
Dollar General Corp. (a) | 1,236,921 | 74,092 | |
Dollar Tree, Inc. (a) | 873,611 | 47,848 | |
Family Dollar Stores, Inc. | 405,902 | 26,587 | |
Kohl's Corp. (d) | 845,053 | 47,484 | |
Macy's, Inc. | 1,546,944 | 89,506 | |
Common Stocks - continued | |||
Shares | Value (000s) | ||
CONSUMER DISCRETIONARY - continued | |||
Multiline Retail - continued | |||
Nordstrom, Inc. (d) | 600,689 | $ 36,930 | |
Target Corp. (d) | 2,653,601 | 165,956 | |
| 488,403 | ||
Specialty Retail - 2.2% | |||
AutoNation, Inc. (a) | 271,034 | 14,267 | |
AutoZone, Inc. (a)(d) | 142,871 | 76,927 | |
Bed Bath & Beyond, Inc. (a)(d) | 901,532 | 61,142 | |
Best Buy Co., Inc. (d) | 1,147,549 | 30,559 | |
CarMax, Inc. (a)(d) | 937,636 | 45,410 | |
GameStop Corp. Class A (d) | 490,751 | 18,310 | |
Gap, Inc. | 1,112,070 | 48,653 | |
Home Depot, Inc. | 5,911,951 | 484,957 | |
L Brands, Inc. | 1,023,664 | 57,663 | |
Lowe's Companies, Inc. | 4,390,550 | 219,659 | |
O'Reilly Automotive, Inc. (a)(d) | 450,563 | 67,967 | |
PetSmart, Inc. (d) | 435,474 | 29,203 | |
Ross Stores, Inc. | 909,668 | 66,224 | |
Staples, Inc. (d) | 2,772,854 | 37,683 | |
Tiffany & Co., Inc. | 462,305 | 43,110 | |
TJX Companies, Inc. | 2,985,722 | 183,502 | |
Tractor Supply Co. (d) | 586,007 | 41,349 | |
Urban Outfitters, Inc. (a) | 457,831 | 17,141 | |
| 1,543,726 | ||
Textiles, Apparel & Luxury Goods - 0.8% | |||
Coach, Inc. | 1,177,427 | 57,470 | |
Fossil Group, Inc. (a) | 206,265 | 23,702 | |
Michael Kors Holdings Ltd. (a)(d) | 753,102 | 73,827 | |
NIKE, Inc. Class B | 3,136,969 | 245,625 | |
PVH Corp. | 342,455 | 43,297 | |
Ralph Lauren Corp. | 250,312 | 40,320 | |
VF Corp. | 1,478,772 | 86,641 | |
| 570,882 | ||
TOTAL CONSUMER DISCRETIONARY | 8,732,617 | ||
CONSUMER STAPLES - 9.4% | |||
Beverages - 2.1% | |||
Beam, Inc. | 684,589 | 56,794 | |
Brown-Forman Corp. Class B (non-vtg.) | 680,229 | 57,003 | |
Coca-Cola Enterprises, Inc. | 1,013,719 | 47,726 | |
Common Stocks - continued | |||
Shares | Value (000s) | ||
CONSUMER STAPLES - continued | |||
Beverages - continued | |||
Constellation Brands, Inc. Class A (sub. vtg.) (a) | 699,478 | $ 56,679 | |
Dr. Pepper Snapple Group, Inc. | 842,330 | 43,894 | |
Molson Coors Brewing Co. Class B | 663,793 | 37,723 | |
Monster Beverage Corp. (a) | 570,173 | 42,193 | |
PepsiCo, Inc. | 6,438,286 | 515,514 | |
The Coca-Cola Co. | 15,943,297 | 609,034 | |
| 1,466,560 | ||
Food & Staples Retailing - 2.3% | |||
Costco Wholesale Corp. | 1,834,265 | 214,242 | |
CVS Caremark Corp. | 4,996,867 | 365,471 | |
Kroger Co. | 2,184,786 | 91,630 | |
Safeway, Inc. | 1,036,104 | 38,802 | |
Sysco Corp. (d) | 2,441,553 | 87,945 | |
Wal-Mart Stores, Inc. | 6,792,132 | 507,372 | |
Walgreen Co. | 3,656,038 | 248,428 | |
Whole Foods Market, Inc. (d) | 1,562,292 | 84,442 | |
| 1,638,332 | ||
Food Products - 1.5% | |||
Archer Daniels Midland Co. | 2,762,258 | 112,148 | |
Campbell Soup Co. (d) | 753,810 | 32,648 | |
ConAgra Foods, Inc. | 1,771,117 | 50,300 | |
General Mills, Inc. (d) | 2,662,732 | 133,216 | |
Hormel Foods Corp. | 565,089 | 26,813 | |
Kellogg Co. | 1,079,596 | 65,521 | |
Kraft Foods Group, Inc. | 2,501,561 | 138,261 | |
McCormick & Co., Inc. (non-vtg.) (d) | 554,371 | 36,810 | |
Mead Johnson Nutrition Co. Class A | 847,963 | 69,151 | |
Mondelez International, Inc. | 7,362,669 | 250,552 | |
The Hershey Co. | 628,922 | 66,553 | |
The J.M. Smucker Co. | 441,386 | 44,143 | |
Tyson Foods, Inc. Class A (d) | 1,140,287 | 44,984 | |
| 1,071,100 | ||
Household Products - 1.9% | |||
Clorox Co. (d) | 541,751 | 47,284 | |
Colgate-Palmolive Co. | 3,689,960 | 231,840 | |
Kimberly-Clark Corp. (d) | 1,602,179 | 176,800 | |
Procter & Gamble Co. | 11,411,548 | 897,632 | |
| 1,353,556 | ||
Common Stocks - continued | |||
Shares | Value (000s) | ||
CONSUMER STAPLES - continued | |||
Personal Products - 0.2% | |||
Avon Products, Inc. | 1,821,028 | $ 28,171 | |
Estee Lauder Companies, Inc. Class A | 1,074,933 | 73,998 | |
| 102,169 | ||
Tobacco - 1.4% | |||
Altria Group, Inc. | 8,396,367 | 304,452 | |
Lorillard, Inc. | 1,546,448 | 75,869 | |
Philip Morris International, Inc. (d) | 6,726,137 | 544,212 | |
Reynolds American, Inc. | 1,315,967 | 66,891 | |
| 991,424 | ||
TOTAL CONSUMER STAPLES | 6,623,141 | ||
ENERGY - 9.9% | |||
Energy Equipment & Services - 1.9% | |||
Baker Hughes, Inc. | 1,860,730 | 117,747 | |
Cameron International Corp. (a)(d) | 998,619 | 63,972 | |
Diamond Offshore Drilling, Inc. (d) | 291,845 | 13,804 | |
Ensco PLC Class A | 980,647 | 51,641 | |
FMC Technologies, Inc. (a)(d) | 993,236 | 49,900 | |
Halliburton Co. | 3,560,982 | 202,976 | |
Helmerich & Payne, Inc. (d) | 449,802 | 44,418 | |
Nabors Industries Ltd. | 1,090,453 | 25,102 | |
National Oilwell Varco, Inc. (d) | 1,797,228 | 138,458 | |
Noble Corp. | 1,063,841 | 33,032 | |
Rowan Companies PLC (a) | 521,561 | 17,399 | |
Schlumberger Ltd. | 5,528,778 | 514,176 | |
Transocean Ltd. (United States) (d) | 1,422,987 | 60,335 | |
| 1,332,960 | ||
Oil, Gas & Consumable Fuels - 8.0% | |||
Anadarko Petroleum Corp. | 2,112,791 | 177,812 | |
Apache Corp. (d) | 1,676,053 | 132,894 | |
Cabot Oil & Gas Corp. | 1,768,056 | 61,882 | |
Chesapeake Energy Corp. (d) | 2,122,059 | 54,983 | |
Chevron Corp. | 8,073,773 | 931,148 | |
ConocoPhillips Co. | 5,143,152 | 342,020 | |
CONSOL Energy, Inc. | 961,133 | 38,541 | |
Denbury Resources, Inc. (d) | 1,539,417 | 25,185 | |
Devon Energy Corp. | 1,602,183 | 103,213 | |
EOG Resources, Inc. | 1,145,991 | 217,074 | |
EQT Corp. | 632,728 | 64,722 | |
Common Stocks - continued | |||
Shares | Value (000s) | ||
ENERGY - continued | |||
Oil, Gas & Consumable Fuels - continued | |||
Exxon Mobil Corp. | 18,339,687 | $ 1,765,562 | |
Hess Corp. (d) | 1,194,140 | 95,567 | |
Kinder Morgan Holding Co. LLC | 2,826,626 | 90,028 | |
Marathon Oil Corp. | 2,924,575 | 97,973 | |
Marathon Petroleum Corp. | 1,263,757 | 106,156 | |
Murphy Oil Corp. (d) | 737,884 | 43,808 | |
Newfield Exploration Co. (a) | 571,465 | 16,110 | |
Noble Energy, Inc. (d) | 1,508,300 | 103,711 | |
Occidental Petroleum Corp. | 3,383,962 | 326,620 | |
ONEOK, Inc. (d) | 866,024 | 51,217 | |
Peabody Energy Corp. (d) | 1,132,792 | 19,892 | |
Phillips 66 Co. | 2,516,943 | 188,418 | |
Pioneer Natural Resources Co. | 598,736 | 120,454 | |
QEP Resources, Inc. | 752,649 | 21,774 | |
Range Resources Corp. (d) | 686,071 | 59,036 | |
Southwestern Energy Co. (a)(d) | 1,472,262 | 60,863 | |
Spectra Energy Corp. | 2,812,926 | 104,866 | |
Tesoro Corp. | 557,653 | 28,446 | |
The Williams Companies, Inc. | 2,869,134 | 118,495 | |
Valero Energy Corp. | 2,265,164 | 108,683 | |
WPX Energy, Inc. (a)(d) | 843,027 | 14,854 | |
| 5,692,007 | ||
TOTAL ENERGY | 7,024,967 | ||
FINANCIALS - 15.7% | |||
Capital Markets - 2.1% | |||
Ameriprise Financial, Inc. | 816,713 | 89,014 | |
Bank of New York Mellon Corp. | 4,821,670 | 154,293 | |
BlackRock, Inc. Class A | 533,416 | 162,607 | |
Charles Schwab Corp. (d) | 4,871,097 | 129,133 | |
E*TRADE Financial Corp. (a) | 1,205,701 | 27,092 | |
Franklin Resources, Inc. (d) | 1,694,941 | 90,256 | |
Goldman Sachs Group, Inc. | 1,769,541 | 294,540 | |
Invesco Ltd. | 1,860,957 | 63,831 | |
Legg Mason, Inc. | 445,663 | 20,483 | |
Morgan Stanley | 5,816,336 | 179,143 | |
Northern Trust Corp. | 943,094 | 58,330 | |
Common Stocks - continued | |||
Shares | Value (000s) | ||
FINANCIALS - continued | |||
Capital Markets - continued | |||
State Street Corp. | 1,842,993 | $ 121,029 | |
T. Rowe Price Group, Inc. | 1,095,332 | 88,908 | |
| 1,478,659 | ||
Commercial Banks - 2.8% | |||
BB&T Corp. | 2,959,382 | 111,865 | |
Comerica, Inc. | 767,888 | 36,997 | |
Fifth Third Bancorp | 3,706,280 | 80,408 | |
Huntington Bancshares, Inc. | 3,521,195 | 33,557 | |
KeyCorp | 3,764,366 | 49,577 | |
M&T Bank Corp. | 546,722 | 63,742 | |
PNC Financial Services Group, Inc. | 2,233,871 | 182,686 | |
Regions Financial Corp. | 5,783,177 | 61,533 | |
SunTrust Banks, Inc. | 2,247,158 | 84,673 | |
U.S. Bancorp (d) | 7,667,107 | 315,425 | |
Wells Fargo & Co. | 20,123,906 | 934,152 | |
Zions Bancorporation (d) | 775,042 | 24,181 | |
| 1,978,796 | ||
Consumer Finance - 1.0% | |||
American Express Co. (d) | 3,867,729 | 353,046 | |
Capital One Financial Corp. | 2,420,466 | 177,735 | |
Discover Financial Services | 2,010,915 | 115,386 | |
SLM Corp. | 1,831,502 | 43,846 | |
| 690,013 | ||
Diversified Financial Services - 5.0% | |||
Bank of America Corp. | 44,778,054 | 740,181 | |
Berkshire Hathaway, Inc. Class B (a) | 7,556,795 | 874,926 | |
Citigroup, Inc. | 12,733,000 | 619,206 | |
CME Group, Inc. | 1,323,403 | 97,694 | |
IntercontinentalExchange Group, Inc. | 482,938 | 100,857 | |
JPMorgan Chase & Co. | 15,781,647 | 896,713 | |
Leucadia National Corp. | 1,316,132 | 36,773 | |
McGraw Hill Financial, Inc. | 1,136,860 | 90,562 | |
Moody's Corp. (d) | 794,660 | 62,778 | |
The Nasdaq OMX Group, Inc. | 485,421 | 18,635 | |
| 3,538,325 | ||
Insurance - 2.8% | |||
ACE Ltd. | 1,427,645 | 139,724 | |
AFLAC, Inc. | 1,956,717 | 125,386 | |
Allstate Corp. | 1,909,521 | 103,611 | |
Common Stocks - continued | |||
Shares | Value (000s) | ||
FINANCIALS - continued | |||
Insurance - continued | |||
American International Group, Inc. | 6,181,132 | $ 307,635 | |
Aon PLC | 1,263,845 | 108,185 | |
Assurant, Inc. (d) | 305,277 | 20,035 | |
Cincinnati Financial Corp. (d) | 619,009 | 29,019 | |
Genworth Financial, Inc. Class A (a) | 2,074,979 | 32,245 | |
Hartford Financial Services Group, Inc. | 1,876,922 | 66,049 | |
Lincoln National Corp. (d) | 1,101,373 | 55,212 | |
Loews Corp. | 1,284,035 | 55,830 | |
Marsh & McLennan Companies, Inc. | 2,303,845 | 110,953 | |
MetLife, Inc. | 4,706,368 | 238,472 | |
Principal Financial Group, Inc. | 1,149,304 | 52,121 | |
Progressive Corp. (d) | 2,317,364 | 56,752 | |
Prudential Financial, Inc. | 1,943,745 | 164,402 | |
The Chubb Corp. | 1,056,927 | 92,460 | |
The Travelers Companies, Inc. | 1,528,412 | 128,142 | |
Torchmark Corp. (d) | 379,597 | 29,423 | |
Unum Group | 1,096,398 | 38,133 | |
XL Group PLC Class A | 1,187,284 | 36,093 | |
| 1,989,882 | ||
Real Estate Investment Trusts - 1.9% | |||
American Tower Corp. | 1,656,759 | 134,976 | |
Apartment Investment & Management Co. Class A | 612,577 | 18,310 | |
AvalonBay Communities, Inc. | 510,698 | 65,865 | |
Boston Properties, Inc. | 641,809 | 72,159 | |
Equity Residential (SBI) (d) | 1,407,146 | 82,276 | |
General Growth Properties, Inc. | 2,256,911 | 49,697 | |
HCP, Inc. (d) | 1,915,499 | 74,264 | |
Health Care REIT, Inc. (d) | 1,211,885 | 71,186 | |
Host Hotels & Resorts, Inc. | 3,174,991 | 62,452 | |
Kimco Realty Corp. (d) | 1,719,941 | 38,286 | |
Plum Creek Timber Co., Inc. (d) | 742,695 | 32,151 | |
Prologis, Inc. | 2,093,720 | 86,240 | |
Public Storage | 606,785 | 102,547 | |
Simon Property Group, Inc. | 1,302,792 | 210,127 | |
The Macerich Co. | 590,009 | 35,477 | |
Ventas, Inc. | 1,234,597 | 77,076 | |
Vornado Realty Trust (d) | 730,288 | 70,319 | |
Weyerhaeuser Co. | 2,446,498 | 72,196 | |
| 1,355,604 | ||
Common Stocks - continued | |||
Shares | Value (000s) | ||
FINANCIALS - continued | |||
Real Estate Management & Development - 0.0% | |||
CBRE Group, Inc. (a)(d) | 1,168,644 | $ 32,664 | |
Thrifts & Mortgage Finance - 0.1% | |||
Hudson City Bancorp, Inc. | 1,996,545 | 18,967 | |
People's United Financial, Inc. | 1,334,177 | 18,905 | |
| 37,872 | ||
TOTAL FINANCIALS | 11,101,815 | ||
HEALTH CARE - 13.5% | |||
Biotechnology - 2.6% | |||
Alexion Pharmaceuticals, Inc. (a) | 823,148 | 145,533 | |
Amgen, Inc. | 3,165,935 | 392,639 | |
Biogen Idec, Inc. (a) | 991,658 | 337,838 | |
Celgene Corp. (a) | 1,729,932 | 278,087 | |
Gilead Sciences, Inc. (a)(d) | 6,437,233 | 532,939 | |
Regeneron Pharmaceuticals, Inc. (a)(d) | 329,727 | 109,634 | |
Vertex Pharmaceuticals, Inc. (a)(d) | 981,348 | 79,352 | |
| 1,876,022 | ||
Health Care Equipment & Supplies - 2.1% | |||
Abbott Laboratories (d) | 6,491,125 | 258,217 | |
Baxter International, Inc. | 2,278,329 | 158,344 | |
Becton, Dickinson & Co. | 814,836 | 93,885 | |
Boston Scientific Corp. (a) | 5,605,461 | 73,432 | |
C.R. Bard, Inc. (d) | 326,995 | 47,140 | |
CareFusion Corp. (a) | 887,233 | 35,960 | |
Covidien PLC | 1,931,142 | 138,946 | |
DENTSPLY International, Inc. | 598,875 | 27,177 | |
Edwards Lifesciences Corp. (a)(d) | 459,307 | 32,041 | |
Intuitive Surgical, Inc. (a)(d) | 159,798 | 71,083 | |
Medtronic, Inc. | 4,191,225 | 248,372 | |
St. Jude Medical, Inc. (d) | 1,225,075 | 82,472 | |
Stryker Corp. (d) | 1,239,156 | 99,430 | |
Varian Medical Systems, Inc. (a)(d) | 443,824 | 37,206 | |
Zimmer Holdings, Inc. (d) | 717,804 | 67,359 | |
| 1,471,064 | ||
Health Care Providers & Services - 2.1% | |||
Aetna, Inc. | 1,542,821 | 112,179 | |
AmerisourceBergen Corp. | 965,710 | 65,523 | |
Cardinal Health, Inc. | 1,433,573 | 102,543 | |
Cigna Corp. | 1,160,420 | 92,358 | |
Common Stocks - continued | |||
Shares | Value (000s) | ||
HEALTH CARE - continued | |||
Health Care Providers & Services - continued | |||
DaVita HealthCare Partners, Inc. (a) | 741,146 | $ 50,939 | |
Express Scripts Holding Co. (a)(d) | 3,382,871 | 254,764 | |
Humana, Inc. | 654,546 | 73,610 | |
Laboratory Corp. of America Holdings (a)(d) | 366,918 | 34,322 | |
McKesson Corp. | 964,362 | 170,740 | |
Patterson Companies, Inc. (d) | 350,005 | 14,406 | |
Quest Diagnostics, Inc. (d) | 610,525 | 32,358 | |
Tenet Healthcare Corp. (a)(d) | 416,570 | 18,379 | |
UnitedHealth Group, Inc. | 4,226,523 | 326,583 | |
WellPoint, Inc. | 1,240,206 | 112,350 | |
| 1,461,054 | ||
Health Care Technology - 0.1% | |||
Cerner Corp. (a)(d) | 1,239,321 | 76,057 | |
Life Sciences Tools & Services - 0.5% | |||
Agilent Technologies, Inc. | 1,388,715 | 79,060 | |
PerkinElmer, Inc. | 471,843 | 21,384 | |
Thermo Fisher Scientific, Inc. | 1,663,590 | 207,183 | |
Waters Corp. (a)(d) | 357,389 | 39,813 | |
| 347,440 | ||
Pharmaceuticals - 6.1% | |||
AbbVie, Inc. | 6,678,680 | 340,012 | |
Actavis PLC (a)(d) | 730,680 | 161,349 | |
Allergan, Inc. | 1,247,531 | 158,436 | |
Bristol-Myers Squibb Co. | 6,912,438 | 371,682 | |
Eli Lilly & Co. (d) | 4,162,266 | 248,113 | |
Forest Laboratories, Inc. (a) | 995,294 | 97,111 | |
Hospira, Inc. (a)(d) | 696,369 | 30,139 | |
Johnson & Johnson | 11,844,826 | 1,091,145 | |
Merck & Co., Inc. | 12,266,702 | 699,079 | |
Mylan, Inc. (a)(d) | 1,607,292 | 89,317 | |
Perrigo Co. PLC | 558,573 | 91,852 | |
Pfizer, Inc. | 27,208,522 | 873,666 | |
Zoetis, Inc. Class A | 2,099,105 | 65,114 | |
| 4,317,015 | ||
TOTAL HEALTH CARE | 9,548,652 | ||
INDUSTRIALS - 10.6% | |||
Aerospace & Defense - 2.8% | |||
General Dynamics Corp. (d) | 1,404,652 | 153,866 | |
Common Stocks - continued | |||
Shares | Value (000s) | ||
INDUSTRIALS - continued | |||
Aerospace & Defense - continued | |||
Honeywell International, Inc. (d) | 3,294,177 | $ 311,102 | |
L-3 Communications Holdings, Inc. | 372,061 | 42,936 | |
Lockheed Martin Corp. | 1,129,546 | 183,325 | |
Northrop Grumman Corp. | 931,952 | 112,794 | |
Precision Castparts Corp. | 609,807 | 157,257 | |
Raytheon Co. | 1,341,192 | 131,316 | |
Rockwell Collins, Inc. (d) | 567,246 | 46,820 | |
Textron, Inc. (d) | 1,180,310 | 46,858 | |
The Boeing Co. | 2,902,337 | 374,169 | |
United Technologies Corp. | 3,543,977 | 414,716 | |
| 1,975,159 | ||
Air Freight & Logistics - 0.7% | |||
C.H. Robinson Worldwide, Inc. | 636,587 | 33,013 | |
Expeditors International of Washington, Inc. | 863,056 | 34,099 | |
FedEx Corp. | 1,249,553 | 166,603 | |
United Parcel Service, Inc. Class B (d) | 3,000,963 | 287,402 | |
| 521,117 | ||
Airlines - 0.2% | |||
Delta Air Lines, Inc. | 3,591,712 | 119,281 | |
Southwest Airlines Co. | 2,924,941 | 65,636 | |
| 184,917 | ||
Building Products - 0.1% | |||
Allegion PLC | 374,924 | 20,377 | |
Masco Corp. (d) | 1,498,686 | 34,994 | |
| 55,371 | ||
Commercial Services & Supplies - 0.5% | |||
ADT Corp. (d) | 769,567 | 23,633 | |
Cintas Corp. (d) | 422,782 | 25,646 | |
Iron Mountain, Inc. | 714,458 | 19,433 | |
Pitney Bowes, Inc. (d) | 847,998 | 21,582 | |
Republic Services, Inc. | 1,133,797 | 38,674 | |
Stericycle, Inc. (a)(d) | 359,824 | 41,020 | |
Tyco International Ltd. (d) | 1,953,413 | 82,395 | |
Waste Management, Inc. | 1,831,834 | 76,021 | |
| 328,404 | ||
Construction & Engineering - 0.2% | |||
Fluor Corp. | 685,781 | 53,278 | |
Common Stocks - continued | |||
Shares | Value (000s) | ||
INDUSTRIALS - continued | |||
Construction & Engineering - continued | |||
Jacobs Engineering Group, Inc. (a) | 552,951 | $ 33,536 | |
Quanta Services, Inc. (a) | 906,213 | 31,908 | |
| 118,722 | ||
Electrical Equipment - 0.7% | |||
AMETEK, Inc. | 1,027,514 | 54,705 | |
Eaton Corp. PLC (d) | 1,992,023 | 148,824 | |
Emerson Electric Co. | 2,955,348 | 192,866 | |
Rockwell Automation, Inc. (d) | 582,153 | 71,512 | |
Roper Industries, Inc. | 416,919 | 56,543 | |
| 524,450 | ||
Industrial Conglomerates - 2.3% | |||
3M Co. (d) | 2,685,165 | 361,772 | |
Danaher Corp. (d) | 2,517,179 | 192,539 | |
General Electric Co. | 42,474,254 | 1,081,819 | |
| 1,636,130 | ||
Machinery - 1.8% | |||
Caterpillar, Inc. (d) | 2,671,519 | 259,057 | |
Cummins, Inc. (d) | 731,522 | 106,744 | |
Deere & Co. | 1,607,246 | 138,111 | |
Dover Corp. | 715,222 | 67,445 | |
Flowserve Corp. (d) | 585,512 | 47,549 | |
Illinois Tool Works, Inc. | 1,714,236 | 141,424 | |
Ingersoll-Rand PLC | 1,124,772 | 68,769 | |
Joy Global, Inc. (d) | 446,172 | 24,539 | |
PACCAR, Inc. (d) | 1,486,532 | 97,873 | |
Pall Corp. | 465,113 | 40,000 | |
Parker Hannifin Corp. | 626,515 | 75,526 | |
Pentair Ltd. (d) | 836,835 | 67,625 | |
Snap-On, Inc. | 244,123 | 27,383 | |
Stanley Black & Decker, Inc. | 651,625 | 54,111 | |
Xylem, Inc. (d) | 774,509 | 30,477 | |
| 1,246,633 | ||
Professional Services - 0.2% | |||
Dun & Bradstreet Corp. | 160,201 | 15,894 | |
Equifax, Inc. | 510,856 | 35,791 | |
Nielsen Holdings B.V. | 1,062,335 | 50,291 | |
Robert Half International, Inc. | 581,852 | 23,821 | |
| 125,797 | ||
Common Stocks - continued | |||
Shares | Value (000s) | ||
INDUSTRIALS - continued | |||
Road & Rail - 0.9% | |||
CSX Corp. | 4,255,558 | $ 117,922 | |
Kansas City Southern | 462,674 | 43,454 | |
Norfolk Southern Corp. | 1,296,851 | 119,194 | |
Ryder System, Inc. | 220,793 | 16,630 | |
Union Pacific Corp. | 1,933,538 | 348,772 | |
| 645,972 | ||
Trading Companies & Distributors - 0.2% | |||
Fastenal Co. (d) | 1,146,107 | 54,085 | |
W.W. Grainger, Inc. (d) | 259,348 | 66,139 | |
| 120,224 | ||
TOTAL INDUSTRIALS | 7,482,896 | ||
INFORMATION TECHNOLOGY - 18.6% | |||
Communications Equipment - 1.7% | |||
Cisco Systems, Inc. | 22,445,916 | 489,321 | |
F5 Networks, Inc. (a)(d) | 325,814 | 36,602 | |
Harris Corp. | 448,674 | 33,121 | |
Juniper Networks, Inc. (a) | 2,120,084 | 56,691 | |
Motorola Solutions, Inc. | 966,643 | 63,992 | |
QUALCOMM, Inc. | 7,092,510 | 533,995 | |
| 1,213,722 | ||
Computers & Peripherals - 3.9% | |||
Apple, Inc. | 3,777,237 | 1,987,732 | |
EMC Corp. (d) | 8,639,155 | 227,815 | |
Hewlett-Packard Co. | 8,068,110 | 241,075 | |
NetApp, Inc. (d) | 1,430,806 | 57,819 | |
SanDisk Corp. (d) | 948,324 | 70,460 | |
Seagate Technology (d) | 1,369,194 | 71,458 | |
Western Digital Corp. | 883,752 | 76,878 | |
| 2,733,237 | ||
Electronic Equipment & Components - 0.5% | |||
Amphenol Corp. Class A | 664,488 | 58,488 | |
Corning, Inc. | 6,075,574 | 117,076 | |
FLIR Systems, Inc. | 594,689 | 20,303 | |
Jabil Circuit, Inc. | 776,155 | 14,367 | |
TE Connectivity Ltd. | 1,722,812 | 100,922 | |
| 311,156 | ||
Common Stocks - continued | |||
Shares | Value (000s) | ||
INFORMATION TECHNOLOGY - continued | |||
Internet Software & Services - 3.4% | |||
Akamai Technologies, Inc. (a)(d) | 751,373 | $ 45,931 | |
eBay, Inc. (a) | 4,891,428 | 287,469 | |
Facebook, Inc. Class A (a) | 6,904,847 | 472,706 | |
Google, Inc. Class A (a) | 1,178,140 | 1,432,206 | |
VeriSign, Inc. (a)(d) | 540,843 | 29,806 | |
Yahoo!, Inc. (a)(d) | 3,960,667 | 153,159 | |
| 2,421,277 | ||
IT Services - 3.6% | |||
Accenture PLC Class A (d) | 2,668,904 | 222,453 | |
Alliance Data Systems Corp. (a) | 204,505 | 58,306 | |
Automatic Data Processing, Inc. | 2,021,095 | 157,201 | |
Cognizant Technology Solutions Corp. Class A (a) | 1,269,929 | 132,149 | |
Computer Sciences Corp. | 618,014 | 39,058 | |
Fidelity National Information Services, Inc. | 1,222,221 | 67,968 | |
Fiserv, Inc. (a) | 1,082,863 | 62,860 | |
IBM Corp. (d) | 4,285,066 | 793,466 | |
MasterCard, Inc. Class A | 4,346,141 | 337,782 | |
Paychex, Inc. | 1,364,502 | 56,982 | |
Teradata Corp. (a)(d) | 685,978 | 31,500 | |
The Western Union Co. | 2,318,434 | 38,787 | |
Total System Services, Inc. | 701,122 | 21,356 | |
Visa, Inc. Class A (d) | 2,137,864 | 483,029 | |
Xerox Corp. | 4,858,300 | 53,393 | |
| 2,556,290 | ||
Semiconductors & Semiconductor Equipment - 2.0% | |||
Altera Corp. | 1,348,148 | 48,951 | |
Analog Devices, Inc. | 1,305,814 | 66,361 | |
Applied Materials, Inc. | 5,055,344 | 95,849 | |
Broadcom Corp. Class A | 2,265,323 | 67,325 | |
First Solar, Inc. (a)(d) | 296,397 | 16,915 | |
Intel Corp. | 20,869,015 | 516,717 | |
KLA-Tencor Corp. | 699,618 | 45,580 | |
Lam Research Corp. (a)(d) | 681,747 | 35,267 | |
Linear Technology Corp. (d) | 983,052 | 46,046 | |
LSI Corp. | 2,287,724 | 25,371 | |
Microchip Technology, Inc. (d) | 832,779 | 37,933 | |
Micron Technology, Inc. (a) | 4,415,848 | 106,819 | |
NVIDIA Corp. | 2,429,042 | 44,646 | |
Common Stocks - continued | |||
Shares | Value (000s) | ||
INFORMATION TECHNOLOGY - continued | |||
Semiconductors & Semiconductor Equipment - continued | |||
Texas Instruments, Inc. | 4,595,142 | $ 206,598 | |
Xilinx, Inc. (d) | 1,126,423 | 58,799 | |
| 1,419,177 | ||
Software - 3.5% | |||
Adobe Systems, Inc. (a) | 1,951,699 | 133,906 | |
Autodesk, Inc. (a) | 947,103 | 49,685 | |
CA Technologies, Inc. | 1,364,052 | 45,696 | |
Citrix Systems, Inc. (a) | 782,523 | 46,991 | |
Electronic Arts, Inc. (a)(d) | 1,297,746 | 37,103 | |
Intuit, Inc. (d) | 1,195,857 | 93,456 | |
Microsoft Corp. | 31,891,896 | 1,221,779 | |
Oracle Corp. | 14,732,338 | 576,182 | |
Red Hat, Inc. (a) | 795,546 | 46,929 | |
salesforce.com, Inc. (a)(d) | 2,328,967 | 145,258 | |
Symantec Corp. | 2,922,048 | 62,766 | |
| 2,459,751 | ||
TOTAL INFORMATION TECHNOLOGY | 13,114,610 | ||
MATERIALS - 3.5% | |||
Chemicals - 2.6% | |||
Air Products & Chemicals, Inc. | 886,969 | 107,607 | |
Airgas, Inc. | 278,641 | 30,037 | |
CF Industries Holdings, Inc. | 240,609 | 60,369 | |
E.I. du Pont de Nemours & Co. (d) | 3,887,921 | 259,013 | |
Eastman Chemical Co. | 646,179 | 56,495 | |
Ecolab, Inc. (d) | 1,138,409 | 122,664 | |
FMC Corp. (d) | 559,504 | 43,183 | |
International Flavors & Fragrances, Inc. | 342,204 | 32,095 | |
LyondellBasell Industries NV Class A | 1,833,954 | 161,535 | |
Monsanto Co. | 2,207,548 | 242,874 | |
PPG Industries, Inc. | 596,234 | 117,947 | |
Praxair, Inc. | 1,235,780 | 161,109 | |
Sherwin-Williams Co. | 361,599 | 72,493 | |
Sigma Aldrich Corp. | 502,376 | 47,429 | |
The Dow Chemical Co. | 5,091,796 | 248,021 | |
The Mosaic Co. | 1,430,666 | 69,902 | |
| 1,832,773 | ||
Construction Materials - 0.1% | |||
Vulcan Materials Co. | 545,714 | 37,070 | |
Common Stocks - continued | |||
Shares | Value (000s) | ||
MATERIALS - continued | |||
Containers & Packaging - 0.2% | |||
Avery Dennison Corp. | 405,609 | $ 20,207 | |
Ball Corp. | 607,191 | 33,736 | |
Bemis Co., Inc. (d) | 432,162 | 16,975 | |
MeadWestvaco Corp. (d) | 746,767 | 27,951 | |
Owens-Illinois, Inc. (a) | 692,669 | 23,495 | |
Sealed Air Corp. | 823,556 | 28,034 | |
| 150,398 | ||
Metals & Mining - 0.5% | |||
Alcoa, Inc. (d) | 4,490,352 | 52,717 | |
Allegheny Technologies, Inc. (d) | 453,324 | 14,407 | |
Cliffs Natural Resources, Inc. (d) | 642,838 | 12,876 | |
Freeport-McMoRan Copper & Gold, Inc. | 4,358,333 | 142,169 | |
Newmont Mining Corp. | 2,090,138 | 48,617 | |
Nucor Corp. | 1,335,898 | 67,116 | |
United States Steel Corp. (d) | 607,334 | 14,710 | |
| 352,612 | ||
Paper & Forest Products - 0.1% | |||
International Paper Co. | 1,862,397 | 91,053 | |
TOTAL MATERIALS | 2,463,906 | ||
TELECOMMUNICATION SERVICES - 2.5% | |||
Diversified Telecommunication Services - 2.3% | |||
AT&T, Inc. (d) | 22,115,865 | 706,160 | |
CenturyLink, Inc. | 2,481,406 | 77,569 | |
Frontier Communications Corp. (d) | 4,196,250 | 20,478 | |
Verizon Communications, Inc. (d) | 17,365,550 | 826,253 | |
Windstream Holdings, Inc. (d) | 2,502,405 | 20,069 | |
| 1,650,529 | ||
Wireless Telecommunication Services - 0.2% | |||
Crown Castle International Corp. | 1,402,477 | 106,448 | |
TOTAL TELECOMMUNICATION SERVICES | 1,756,977 | ||
UTILITIES - 2.9% | |||
Electric Utilities - 1.7% | |||
American Electric Power Co., Inc. | 2,045,717 | 102,695 | |
Duke Energy Corp. | 2,963,866 | 210,079 | |
Edison International | 1,367,805 | 71,632 | |
Entergy Corp. | 748,611 | 47,776 | |
Common Stocks - continued | |||
Shares | Value (000s) | ||
UTILITIES - continued | |||
Electric Utilities - continued | |||
Exelon Corp. (d) | 3,597,414 | $ 109,397 | |
FirstEnergy Corp. | 1,755,794 | 54,043 | |
NextEra Energy, Inc. | 1,808,069 | 165,239 | |
Northeast Utilities | 1,322,812 | 58,799 | |
Pepco Holdings, Inc. | 1,048,518 | 21,379 | |
Pinnacle West Capital Corp. (d) | 461,986 | 25,710 | |
PPL Corp. | 2,645,885 | 85,436 | |
Southern Co. (d) | 3,701,683 | 156,766 | |
Xcel Energy, Inc. (d) | 2,089,164 | 63,281 | |
| 1,172,232 | ||
Gas Utilities - 0.0% | |||
AGL Resources, Inc. | 498,694 | 23,459 | |
Independent Power Producers & Energy Traders - 0.1% | |||
NRG Energy, Inc. (d) | 1,357,749 | 39,470 | |
The AES Corp. | 2,756,658 | 37,628 | |
| 77,098 | ||
Multi-Utilities - 1.1% | |||
Ameren Corp. | 1,018,619 | 41,162 | |
CenterPoint Energy, Inc. | 1,799,496 | 42,558 | |
CMS Energy Corp. | 1,116,708 | 31,748 | |
Consolidated Edison, Inc. (d) | 1,229,588 | 68,918 | |
Dominion Resources, Inc. | 2,436,759 | 169,111 | |
DTE Energy Co. | 742,221 | 53,262 | |
Integrys Energy Group, Inc. | 335,042 | 19,188 | |
NiSource, Inc. | 1,315,260 | 45,797 | |
PG&E Corp. | 1,886,209 | 83,106 | |
Public Service Enterprise Group, Inc. | 2,123,682 | 77,854 | |
SCANA Corp. | 590,046 | 29,207 | |
Sempra Energy (d) | 954,207 | 90,144 | |
TECO Energy, Inc. (d) | 857,531 | 14,389 | |
Wisconsin Energy Corp. | 950,965 | 41,804 | |
| 808,248 | ||
TOTAL UTILITIES | 2,081,037 | ||
TOTAL COMMON STOCKS (Cost $40,581,185) |
| ||
U.S. Treasury Obligations - 0.1% | ||||
| Principal | Value (000s) | ||
U.S. Treasury Bills, yield at date of purchase 0.07% to 0.09% 4/3/14 to 9/18/14 (e) | $ 53,000 | $ 52,990 | ||
Money Market Funds - 7.2% | |||
Shares |
| ||
Fidelity Cash Central Fund, 0.10% (b) | 476,625,951 | 476,626 | |
Fidelity Securities Lending Cash Central Fund, 0.09% (b)(c) | 4,608,422,468 | 4,608,422 | |
TOTAL MONEY MARKET FUNDS (Cost $5,085,048) |
| ||
TOTAL INVESTMENT PORTFOLIO - 106.3% (Cost $45,719,218) | 75,068,656 | ||
NET OTHER ASSETS (LIABILITIES) - (6.3)% | (4,440,532) | ||
NET ASSETS - 100% | $ 70,628,124 | ||
Futures Contracts | |||||
Expiration | Underlying | Unrealized | |||
Purchased | |||||
Equity Index Contracts | |||||
352 CME E-mini S&P 500 Index Contracts (United States) | March 2014 | $ 32,694 | $ 1,148 | ||
1,443 CME S&P 500 Index Contracts (United States) | March 2014 | 670,129 | 7,745 | ||
TOTAL EQUITY INDEX CONTRACTS | $ 702,823 | $ 8,893 | |||
|
The face value of futures purchased as a percentage of net assets is 0.9% |
Legend |
(a) Non-income producing |
(b) Affiliated fund that is generally available only to investment companies and other accounts managed by Fidelity Investments. The rate quoted is the annualized seven-day yield of the fund at period end. A complete unaudited listing of the fund's holdings as of its most recent quarter end is available upon request. In addition, each Fidelity Central Fund's financial statements, which are not covered by the Fund's Report of Independent Registered Public Accounting Firm, are available on the SEC's website or upon request. |
(c) Investment made with cash collateral received from securities on loan. |
(d) Security or a portion of the security is on loan at period end. |
(e) Security or a portion of the security was pledged to cover margin requirements for futures contracts. At period end, the value of securities pledged amounted to $33,344,000. |
Affiliated Central Funds |
Information regarding fiscal year to date income earned by the Fund from investments in Fidelity Central Funds is as follows: |
Fund | Income earned |
Fidelity Cash Central Fund | $ 833 |
Fidelity Securities Lending Cash Central Fund | 4,627 |
Total | $ 5,460 |
Other Information |
The following is a summary of the inputs used, as of February 28, 2014, involving the Fund's assets and liabilities carried at fair value. The inputs or methodology used for valuing securities may not be an indication of the risk associated with investing in those securities. For more information on valuation inputs, and their aggregation into the levels used in the table below, please refer to the Investment Valuation section in the accompanying Notes to Financial Statements. |
Valuation Inputs at Reporting Date: | ||||
Description | Total | Level 1 | Level 2 | Level 3 |
Investments in Securities: | ||||
Equities: | ||||
Consumer Discretionary | $ 8,732,617 | $ 8,732,617 | $ - | $ - |
Consumer Staples | 6,623,141 | 6,623,141 | - | - |
Energy | 7,024,967 | 7,024,967 | - | - |
Financials | 11,101,815 | 11,101,815 | - | - |
Health Care | 9,548,652 | 9,548,652 | - | - |
Industrials | 7,482,896 | 7,482,896 | - | - |
Information Technology | 13,114,610 | 13,114,610 | - | - |
Materials | 2,463,906 | 2,463,906 | - | - |
Telecommunication Services | 1,756,977 | 1,756,977 | - | - |
Utilities | 2,081,037 | 2,081,037 | - | - |
U.S. Government and Government Agency Obligations | 52,990 | - | 52,990 | - |
Money Market Funds | 5,085,048 | 5,085,048 | - | - |
Total Investments in Securities: | $ 75,068,656 | $ 75,015,666 | $ 52,990 | $ - |
Derivative Instruments: | ||||
Assets | ||||
Futures Contracts | $ 8,893 | $ 8,893 | $ - | $ - |
Value of Derivative Instruments |
The following table is a summary of the Fund's value of derivative instruments by primary risk exposure as of February 28, 2014. For additional information on derivative instruments, please refer to the Derivative Instruments section in the accompanying Notes to Financial Statements. |
Primary Risk Exposure / | Value (000s) | |
| Asset | Liability |
Equity Risk | ||
Futures Contracts (a) | $ 8,893 | $ - |
Total Value of Derivatives | $ 8,893 | $ - |
(a) Reflects gross cumulative appreciation (depreciation) on futures contracts as presented in the Schedule of Investments. Only the period end receivable or payable for daily variation margin and net unrealized appreciation (depreciation) are presented in the Statement of Assets and Liabilities. |
See accompanying notes which are an integral part of the financial statements.
Annual Report
Financial Statements
Statement of Assets and Liabilities
Amounts in thousands (except per-share amounts) | February 28, 2014 | |
|
|
|
Assets | ||
Investment in securities, at value (including securities loaned of $4,501,014) - See accompanying schedule: Unaffiliated issuers (cost $40,634,170) | $ 69,983,608 |
|
Fidelity Central Funds (cost $5,085,048) | 5,085,048 |
|
Total Investments (cost $45,719,218) |
| $ 75,068,656 |
Receivable for fund shares sold | 72,385 | |
Dividends receivable | 153,443 | |
Distributions receivable from Fidelity Central Funds | 370 | |
Receivable for daily variation margin for derivative instruments | 1,350 | |
Receivable from investment adviser for expense reductions | 889 | |
Other receivables | 1,519 | |
Total assets | 75,298,612 | |
|
|
|
Liabilities | ||
Payable for investments purchased | $ 329 | |
Payable for fund shares redeemed | 56,579 | |
Accrued management fee | 1,431 | |
Other affiliated payables | 2,227 | |
Other payables and accrued expenses | 1,500 | |
Collateral on securities loaned, at value | 4,608,422 | |
Total liabilities | 4,670,488 | |
|
|
|
Net Assets | $ 70,628,124 | |
Net Assets consist of: |
| |
Paid in capital | $ 41,593,265 | |
Undistributed net investment income | 230,704 | |
Accumulated undistributed net realized gain (loss) on investments | (554,176) | |
Net unrealized appreciation (depreciation) on investments | 29,358,331 | |
Net Assets | $ 70,628,124 | |
See accompanying notes which are an integral part of the financial statements.
Annual Report
Financial Statements - continued
Statement of Assets and Liabilities - continued
Amounts in thousands (except per-share amounts) | February 28, 2014 | |
|
|
|
Investor Class: | $ 66.10 | |
|
|
|
Fidelity Advantage Class: | $ 66.11 | |
|
|
|
Institutional Class: | $ 66.11 | |
|
|
|
Fidelity Advantage Institutional Class: | $ 66.11 | |
See accompanying notes which are an integral part of the financial statements.
Annual Report
Statement of Operations
Amounts in thousands | Year ended February 28, 2014 | |
|
|
|
Investment Income |
|
|
Dividends |
| $ 1,286,205 |
Interest |
| 42 |
Income from Fidelity Central Funds |
| 5,460 |
Total income |
| 1,291,707 |
|
|
|
Expenses | ||
Management fee | $ 15,599 | |
Transfer agent fees | 24,348 | |
Independent trustees' compensation | 301 | |
Appreciation in deferred trustee compensation account | 1 | |
Miscellaneous | 117 | |
Total expenses before reductions | 40,366 | |
Expense reductions | (9,602) | 30,764 |
Net investment income (loss) | 1,260,943 | |
Realized and Unrealized Gain (Loss) Net realized gain (loss) on: | ||
Investment securities: |
|
|
Unaffiliated issuers | 800,214 | |
Futures contracts | 189,043 | |
Total net realized gain (loss) |
| 989,257 |
Change in net unrealized appreciation (depreciation) on: Investment securities | 11,661,786 | |
Futures contracts | (2,763) | |
Total change in net unrealized appreciation (depreciation) |
| 11,659,023 |
Net gain (loss) | 12,648,280 | |
Net increase (decrease) in net assets resulting from operations | $ 13,909,223 | |
See accompanying notes which are an integral part of the financial statements.
Annual Report
Financial Statements - continued
Statement of Changes in Net Assets
Amounts in thousands | Year ended | Year ended |
Increase (Decrease) in Net Assets |
|
|
Operations |
|
|
Net investment income (loss) | $ 1,260,943 | $ 1,076,063 |
Net realized gain (loss) | 989,257 | 816,438 |
Change in net unrealized appreciation (depreciation) | 11,659,023 | 4,290,428 |
Net increase (decrease) in net assets resulting | 13,909,223 | 6,182,929 |
Distributions to shareholders from net investment income | (1,221,746) | (1,030,033) |
Share transactions - net increase (decrease) | 4,624,796 | 3,180,920 |
Total increase (decrease) in net assets | 17,312,273 | 8,333,816 |
|
|
|
Net Assets | ||
Beginning of period | 53,315,851 | 44,982,035 |
End of period (including undistributed net investment income of $230,704 and undistributed net investment income of $191,536, respectively) | $ 70,628,124 | $ 53,315,851 |
See accompanying notes which are an integral part of the financial statements.
Annual Report
Financial Highlights - Investor Class
Years ended February 28, | 2014 | 2013 | 2012 G | 2011 | 2010 |
Selected Per-Share Data |
|
|
|
| |
Net asset value, beginning of period | $ 53.81 | $ 48.49 | $ 47.09 | $ 39.19 | $ 26.10 |
Income from Investment Operations |
|
|
|
|
|
Net investment income (loss) B | 1.19 | 1.10 | .89 | .81 | .75 |
Net realized and unrealized gain (loss) | 12.26 | 5.28 | 1.40 | 7.88 | 13.12 |
Total from investment operations | 13.45 | 6.38 | 2.29 | 8.69 | 13.87 |
Distributions from net investment income | (1.16) | (1.06) | (.89) | (.79) | (.78) |
Net asset value, end of period | $ 66.10 | $ 53.81 | $ 48.49 | $ 47.09 | $ 39.19 |
Total Return A | 25.27% | 13.36% | 5.04% | 22.47% | 53.68% |
Ratios to Average Net Assets C, E |
|
|
|
| |
Expenses before reductions | .10% | .10% | .10% | .10% | .10% |
Expenses net of fee waivers, if any | .10% H | .10% H | .10% | .10% | .10% |
Expenses net of all reductions | .10% H | .10% H | .10% | .10% | .10% |
Net investment income (loss) | 1.98% | 2.21% | 1.96% | 1.94% | 2.14% |
Supplemental Data |
|
|
|
| |
Net assets, end of period (in millions) | $ 5,751 | $ 4,705 | $ 13,407 | $ 27,881 | $ 23,666 |
Portfolio turnover rate D | 4% | 4% | 5% F | 4% | 11% F |
A Total returns would have been lower if certain expenses had not been reduced during the applicable periods shown.
B Calculated based on average shares outstanding during the period.
C Fees and expenses of any underlying Fidelity Central Funds are not included in the Fund's expense ratio. The Fund indirectly bears its proportionate share of the expenses of any underlying Fidelity Central Funds.
D Amount does not include the portfolio activity of any underlying Fidelity Central Funds.
E Expense ratios reflect operating expenses of the class. Expenses before reductions do not reflect amounts reimbursed by the investment adviser or reductions from brokerage service arrangements or reductions from other expense offset arrangements and do not represent the amount paid by the class during periods when reimbursements or reductions occur. Expenses net of fee waivers reflect expenses after reimbursement by the investment adviser but prior to reductions from brokerage service arrangements or other expense offset arrangements. Expenses net of all reductions represent the net expenses paid by the class.
F The portfolio turnover rate does not include the assets acquired in the merger.
G For the year ended February 29.
H Amount represents .095%.
See accompanying notes which are an integral part of the financial statements.
Annual Report
Financial Highlights - Fidelity Advantage Class
Years ended February 28, | 2014 | 2013 | 2012 G | 2011 | 2010 |
Selected Per-Share Data |
|
|
|
| |
Net asset value, beginning of period | $ 53.82 | $ 48.50 | $ 47.10 | $ 39.19 | $ 26.11 |
Income from Investment Operations |
|
|
|
|
|
Net investment income (loss) B | 1.22 | 1.13 | .90 | .82 | .77 |
Net realized and unrealized gain (loss) | 12.26 | 5.27 | 1.40 | 7.89 | 13.10 |
Total from investment operations | 13.48 | 6.40 | 2.30 | 8.71 | 13.87 |
Distributions from net investment income | (1.19) | (1.08) | (.90) | (.80) | (.79) |
Net asset value, end of period | $ 66.11 | $ 53.82 | $ 48.50 | $ 47.10 | $ 39.19 |
Total Return A | 25.32% | 13.39% | 5.07% | 22.53% | 53.67% |
Ratios to Average Net Assets C, E |
|
|
|
| |
Expenses before reductions | .07% | .07% | .07% | .07% | .07% |
Expenses net of fee waivers, if any | .05% | .06% | .07% | .07% | .07% |
Expenses net of all reductions | .05% | .06% | .07% | .07% | .07% |
Net investment income (loss) | 2.02% | 2.25% | 1.99% | 1.97% | 2.17% |
Supplemental Data |
|
|
|
| |
Net assets, end of period (in millions) | $ 38,736 | $ 28,996 | $ 16,230 | $ 15,595 | $ 12,455 |
Portfolio turnover rate D | 4% | 4% | 5% F | 4% | 11% F |
A Total returns would have been lower if certain expenses had not been reduced during the applicable periods shown.
B Calculated based on average shares outstanding during the period.
C Fees and expenses of any underlying Fidelity Central Funds are not included in the Fund's expense ratio. The Fund indirectly bears its proportionate share of the expenses of any underlying Fidelity Central Funds.
D Amount does not include the portfolio activity of any underlying Fidelity Central Funds.
E Expense ratios reflect operating expenses of the class. Expenses before reductions do not reflect amounts reimbursed by the investment adviser or reductions from brokerage service arrangements or reductions from other expense offset arrangements and do not represent the amount paid by the class during periods when reimbursements or reductions occur. Expenses net of fee waivers reflect expenses after reimbursement by the investment adviser but prior to reductions from brokerage service arrangements or other expense offset arrangements. Expenses net of all reductions represent the net expenses paid by the class.
F The portfolio turnover rate does not include the assets acquired in the merger.
G For the year ended February 29.
See accompanying notes which are an integral part of the financial statements.
Annual Report
Financial Highlights - Institutional Class
Years ended February 28, | 2014 | 2013 | 2012 G |
Selected Per-Share Data |
|
|
|
Net asset value, beginning of period | $ 53.82 | $ 48.50 | $ 47.74 |
Income from Investment Operations |
|
|
|
Net investment income (loss) D | 1.22 | 1.13 | .79 |
Net realized and unrealized gain (loss) | 12.26 | 5.28 | .68 |
Total from investment operations | 13.48 | 6.41 | 1.47 |
Distributions from net investment income | (1.19) | (1.09) | (.71) |
Net asset value, end of period | $ 66.11 | $ 53.82 | $ 48.50 |
Total Return B, C | 25.33% | 13.42% | 3.25% |
Ratios to Average Net Assets E, H |
|
|
|
Expenses before reductions | .05% | .05% | .05% A |
Expenses net of fee waivers, if any | .04% | .04% | .05% A |
Expenses net of all reductions | .04% | .04% | .05% A |
Net investment income (loss) | 2.03% | 2.27% | 2.19% A |
Supplemental Data |
|
|
|
Net assets, end of period (in millions) | $ 22,636 | $ 17,703 | $ 14,629 |
Portfolio turnover rate F | 4% | 4% | 5% I |
A Annualized
B Total returns for periods of less than one year are not annualized.
C Total returns would have been lower if certain expenses had not been reduced during the applicable periods shown.
D Calculated based on average shares outstanding during the period.
E Fees and expenses of any underlying Fidelity Central Funds are not included in the Fund's expense ratio. The Fund indirectly bears its proportionate share of the expenses of any underlying Fidelity Central Funds.
F Amount does not include the portfolio activity of any underlying Fidelity Central Funds.
G For the period May 4, 2011 (commencement of sale of shares) to February 29, 2012.
H Expense ratios reflect operating expenses of the class. Expenses before reductions do not reflect amounts reimbursed by the investment adviser or reductions from brokerage service arrangements or reductions from other expense offset arrangements and do not represent the amount paid by the class during periods when reimbursements or reductions occur. Expenses net of fee waivers reflect expenses after reimbursement by the investment adviser but prior to reductions from brokerage service arrangements or other expense offset arrangements. Expenses net of all reductions represent the net expenses paid by the class.
I The portfolio turnover rate does not include the assets acquired in the merger.
See accompanying notes which are an integral part of the financial statements.
Annual Report
Financial Highlights - Fidelity Advantage Institutional Class
Years ended February 28, | 2014 | 2013 | 2012 G |
Selected Per-Share Data |
|
|
|
Net asset value, beginning of period | $ 53.83 | $ 48.50 | $ 47.74 |
Income from Investment Operations |
|
|
|
Net investment income (loss) D | 1.24 | 1.14 | .81 |
Net realized and unrealized gain (loss) | 12.24 | 5.29 | .67 |
Total from investment operations | 13.48 | 6.43 | 1.48 |
Distributions from net investment income | (1.20) | (1.10) | (.72) |
Net asset value, end of period | $ 66.11 | $ 53.83 | $ 48.50 |
Total Return B, C | 25.34% | 13.46% | 3.27% |
Ratios to Average Net Assets E, H |
|
|
|
Expenses before reductions | .03% J | .03% J | .03% A, J |
Expenses net of fee waivers, if any | .02% | .02% | .03% A, J |
Expenses net of all reductions | .02% | .02% | .03% A, J |
Net investment income (loss) | 2.05% | 2.29% | 2.24% A |
Supplemental Data |
|
|
|
Net assets, end of period (in millions) | $ 3,506 | $ 1,912 | $ 716 |
Portfolio turnover rate F | 4% | 4% | 5% I |
A Annualized
B Total returns for periods of less than one year are not annualized.
C Total returns would have been lower if certain expenses had not been reduced during the applicable periods shown.
D Calculated based on average shares outstanding during the period.
E Fees and expenses of any underlying Fidelity Central Funds are not included in the Fund's expense ratio. The Fund indirectly bears its proportionate share of the expenses of any underlying Fidelity Central Funds.
F Amount does not include the portfolio activity of any underlying Fidelity Central Funds.
G For the period May 4, 2011 (commencement of sale of shares) to February 29, 2012.
H Expense ratios reflect operating expenses of the class. Expenses before reductions do not reflect amounts reimbursed by the investment adviser or reductions from brokerage service arrangements or reductions from other expense offset arrangements and do not represent the amount paid by the class during periods when reimbursements or reductions occur. Expenses net of fee waivers reflect expenses after reimbursement by the investment adviser but prior to reductions from brokerage service arrangements or other expense offset arrangements. Expenses net of all reductions represent the net expenses paid by the class.
I The portfolio turnover rate does not include the assets acquired in the merger.
J Amount represents .025%.
See accompanying notes which are an integral part of the financial statements.
Annual Report
Notes to Financial Statements
For the period ended February 28, 2014
(Amounts in thousands except percentages)
1. Organization.
Spartan 500 Index Fund (the Fund) is a fund of Fidelity Concord Street Trust (the Trust) and is authorized to issue an unlimited number of shares. The Trust is registered under the Investment Company Act of 1940, as amended (the 1940 Act), as an open-end management investment company organized as a Massachusetts business trust. The Fund offers Investor Class, Fidelity Advantage Class, Institutional Class and Fidelity Advantage Institutional Class shares, each of which has equal rights as to assets and voting privileges. Each class has exclusive voting rights with respect to matters that affect that class. The Fund offers conversion privileges between share classes to eligible shareholders.
2. Investments in Fidelity Central Funds.
The Fund invests in Fidelity Central Funds, which are open-end investment companies generally available only to other investment companies and accounts managed by the investment adviser and its affiliates. The Fund's Schedule of Investments lists each of the Fidelity Central Funds held as of period end, if any, as an investment of the Fund, but does not include the underlying holdings of each Fidelity Central Fund. As an Investing Fund, the Fund indirectly bears its proportionate share of the expenses of the underlying Fidelity Central Funds.
The Money Market Central Funds seek preservation of capital and current income and are managed by Fidelity Investments Money Management, Inc. (FIMM), an affiliate of the investment adviser. Annualized expenses of the Money Market Central Funds as of their most recent shareholder report date are less than .01%.
A complete unaudited list of holdings for each Fidelity Central Fund is available upon request or at the Securities and Exchange Commission (the SEC) website at www.sec.gov. In addition, the financial statements of the Fidelity Central Funds, which are not covered by the Fund's Report of Independent Registered Public Accounting Firm, are available on the SEC website or upon request.
3. Significant Accounting Policies.
The financial statements have been prepared in conformity with accounting principles generally accepted in the United States of America (GAAP), which require management to make certain estimates and assumptions at the date of the financial statements. Actual results could differ from those estimates. Subsequent events, if any, through the date that the financial statements were issued have been evaluated in the preparation of
Annual Report
3. Significant Accounting Policies - continued
the financial statements. The following summarizes the significant accounting policies of the Fund:
Investment Valuation. Investments are valued as of 4:00 p.m. Eastern time on the last calendar day of the period. In accordance with valuation policies and procedures approved by the Board of Trustees (the Board), the Fund attempts to obtain prices from one or more third party pricing vendors or brokers to value its investments. When current market prices, quotations or currency exchange rates are not readily available or reliable, investments will be fair valued in good faith by the Fidelity Management & Research Company (FMR) Fair Value Committee (the Committee), in accordance with procedures adopted by the Board. Factors used in determining fair value vary by investment type and may include market or investment specific events, changes in interest rates and credit quality. The frequency with which these procedures are used cannot be predicted and they may be utilized to a significant extent. The Committee oversees the Fund's valuation policies and procedures and is responsible for approving and reporting to the Board all fair value determinations.
The Fund categorizes the inputs to valuation techniques used to value its investments into a disclosure hierarchy consisting of three levels as shown below:
Level 1 - quoted prices in active markets for identical investments
Level 2 - other significant observable inputs (including quoted prices for similar investments, interest rates, prepayment speeds, etc.)
Level 3 - unobservable inputs (including the Fund's own assumptions based on the best information available)
Valuation techniques used to value the Fund's investments by major category are as follows:
Equity securities, including restricted securities, for which market quotations are readily available, are valued at the last reported sale price or official closing price as reported by a third party pricing vendor on the primary market or exchange on which they are traded and are categorized as Level 1 in the hierarchy. In the event there were no sales during the day or closing prices are not available, securities are valued at the last quoted bid price or may be valued using the last available price and are generally categorized as Level 2 in the hierarchy. For foreign equity securities, when market or security specific events arise, comparisons to the valuation of American Depositary Receipts (ADRs), futures contracts, Exchange-Traded Funds (ETFs) and certain indexes as well as quoted prices for similar securities may be used and would be categorized as Level 2 in the hierarchy. Utilizing these techniques may result in transfers between Level 1 and Level 2. For equity securities, including restricted securities, where observable inputs are
Annual Report
Notes to Financial Statements - continued
(Amounts in thousands except percentages)
3. Significant Accounting Policies - continued
Investment Valuation - continued
limited, assumptions about market activity and risk are used and these securities may be categorized as Level 3 in the hierarchy.
Debt securities, including restricted securities, are valued based on evaluated prices received from third party pricing vendors or from brokers who make markets in such securities. U.S. government and government agency obligations are valued by pricing vendors who utilize matrix pricing which considers yield or price of bonds of comparable quality, coupon, maturity and type or by broker-supplied prices. When independent prices are unavailable or unreliable, debt securities may be valued utilizing pricing methodologies which consider similar factors that would be used by third party pricing vendors. Debt securities are generally categorized as Level 2 in the hierarchy but may be Level 3 depending on the circumstances.
Futures contracts are valued at the settlement price established each day by the board of trade or exchange on which they are traded and are categorized as Level 1 in the hierarchy. Investments in open-end mutual funds, including the Fidelity Central Funds, are valued at their closing net asset value (NAV) each business day and are categorized as Level 1 in the hierarchy.
Changes in valuation techniques may result in transfers in or out of an assigned level within the disclosure hierarchy. The aggregate value of investments by input level, as of February 28, 2014, is included at the end of the Fund's Schedule of Investments.
Investment Transactions and Income. For financial reporting purposes, the Fund's investment holdings and NAV include trades executed through the end of the last business day of the period. The NAV per share for processing shareholder transactions is calculated as of the close of business of the New York Stock Exchange (NYSE), normally 4:00 p.m. Eastern time and includes trades executed through the end of the prior business day. Gains and losses on securities sold are determined on the basis of identified cost and may include proceeds received from litigation. Dividend income is recorded on the ex-dividend date, except for certain dividends from foreign securities where the ex-dividend date may have passed, which are recorded as soon as the Fund is informed of the ex-dividend date. Non-cash dividends included in dividend income, if any, are recorded at the fair market value of the securities received. Distributions received on securities that represent a return of capital or capital gain are recorded as a reduction of cost of investments and/or as a realized gain. Subsequent to ex-dividend date the Fund determines the components of these distributions, based upon receipt of tax filings or other correspondence relating to the underlying investment. Interest income and distributions from the Fidelity Central Funds are accrued as earned. Interest income includes coupon interest and amortization of premium and accretion of discount on debt securities.
Annual Report
3. Significant Accounting Policies - continued
Class Allocations and Expenses. Investment income, realized and unrealized capital gains and losses, common expenses of the Fund, and certain fund-level expense reductions, if any, are allocated daily on a pro-rata basis to each class based on the relative net assets of each class to the total net assets of the Fund. Each class differs with respect to transfer agent fees incurred. Certain expense reductions may also differ by class. For the reporting period, the allocated portion of income and expenses to each class as a percent of its average net assets may vary due to the timing of recording these transactions in relation to fluctuating net assets of the classes. Expenses directly attributable to a fund are charged to that fund. Expenses attributable to more than one fund are allocated among the respective funds on the basis of relative net assets or other appropriate methods. Expense estimates are accrued in the period to which they relate and adjustments are made when actual amounts are known.
Deferred Trustee Compensation. Under a Deferred Compensation Plan (the Plan), independent Trustees may elect to defer receipt of a portion of their annual compensation. Deferred amounts are invested in a cross-section of Fidelity funds, are marked-to-market and remain in the Fund until distributed in accordance with the Plan. The investment of deferred amounts and the offsetting payable to the Trustees are included in the accompanying Statement of Assets and Liabilities.
Income Tax Information and Distributions to Shareholders. Each year, the Fund intends to qualify as a regulated investment company under Subchapter M of the Internal Revenue Code, including distributing substantially all of its taxable income and realized gains. As a result, no provision for U.S. Federal income taxes is required. As of February 28, 2014, the Fund did not have any unrecognized tax benefits in the financial statements; nor is the Fund aware of any tax positions for which it is reasonably possible that the total amounts of unrecognized tax benefits will significantly change in the next twelve months. The Fund files a U.S. federal tax return, in addition to state and local tax returns as required. The Fund's federal income tax returns are subject to examination by the Internal Revenue Service (IRS) for a period of three fiscal years after they are filed. State and local tax returns may be subject to examination for an additional fiscal year depending on the jurisdiction.
Distributions are declared and recorded on the ex-dividend date. Income dividends and capital gain distributions are declared separately for each class. Income and capital gain distributions are determined in accordance with income tax regulations, which may differ from GAAP.
Capital accounts within the financial statements are adjusted for permanent book-tax differences. These adjustments have no impact on net assets or the results of operations. Capital accounts are not adjusted for temporary book-tax differences which will reverse in a subsequent period.
Annual Report
Notes to Financial Statements - continued
(Amounts in thousands except percentages)
3. Significant Accounting Policies - continued
Income Tax Information and Distributions to Shareholders - continued
Book-tax differences are primarily due to futures contracts, market discount, deferred trustees compensation, capital loss carryforwards and losses deferred due to wash sales.
The federal tax cost of investment securities and unrealized appreciation (depreciation) as of period end were as follows:
Gross unrealized appreciation | $ 32,001,212 |
Gross unrealized depreciation | (2,721,771) |
Net unrealized appreciation (depreciation) on securities and other investments | $ 29,279,441 |
|
|
Tax Cost | $ 45,789,215 |
The tax-based components of distributable earnings as of period end were as follows:
Undistributed ordinary income | $ 232,209 |
Capital loss carryforward | $ (475,285) |
Net unrealized appreciation (depreciation) | $ 29,279,441 |
Capital loss carryforwards are only available to offset future capital gains of the Fund to the extent provided by regulations and may be limited. Under the Regulated Investment Company Modernization Act of 2010 (the Act), the Fund is permitted to carry forward capital losses incurred in taxable years beginning after December 22, 2010 for an unlimited period and such capital losses are required to be used prior to any losses that expire. The capital loss carryforward information presented below, including any applicable limitation, is estimated as of fiscal period end and is subject to adjustment.
Fiscal year of expiration |
|
2019 | $ (475,285) |
The tax character of distributions paid was as follows:
| February 28, 2014 | February 28, 2013 |
Ordinary Income | $ 1,221,746 | $ 1,030,033 |
Annual Report
4. Derivative Instruments.
Risk Exposures and the Use of Derivative Instruments. The Fund's investment objective allows the Fund to enter into various types of derivative contracts, including futures contracts. Derivatives are investments whose value is primarily derived from underlying assets, indices or reference rates and may be transacted on an exchange or over-the-counter (OTC). Derivatives may involve a future commitment to buy or sell a specified asset based on specified terms, to exchange future cash flows at periodic intervals based on a notional principal amount, or for one party to make one or more payments upon the occurrence of specified events in exchange for periodic payments from the other party.
The Fund used derivatives to increase returns and to manage exposure to certain risks as defined below. The success of any strategy involving derivatives depends on analysis of numerous economic factors, and if the strategies for investment do not work as intended, the Fund may not achieve its objectives.
The Fund's use of derivatives increased or decreased its exposure to the following risk:
Equity Risk | Equity risk relates to the fluctuations in the value of financial instruments as a result of changes in market prices (other than those arising from interest rate risk or foreign exchange risk), whether caused by factors specific to an individual investment, its issuer, or all factors affecting all instruments traded in a market or market segment. |
The Fund is also exposed to additional risks from investing in derivatives, such as liquidity risk and counterparty credit risk. Liquidity risk is the risk that the Fund will be unable to close out the derivative in the open market in a timely manner. Counterparty credit risk is the risk that the counterparty will not be able to fulfill its obligation to the Fund. Counterparty credit risk related to exchange-traded futures contracts may be mitigated by the protection provided by the exchange on which they trade.
Investing in derivatives may involve greater risks than investing in the underlying assets directly and, to varying degrees, may involve risk of loss in excess of any initial investment and collateral received and amounts recognized in the Statement of Assets and Liabilities. In addition, there may be the risk that the change in value of the derivative contract does not correspond to the change in value of the underlying instrument.
Futures Contracts. A futures contract is an agreement between two parties to buy or sell a specified underlying instrument for a fixed price at a specified future date. The Fund used futures contracts to manage its exposure to the stock market.
Upon entering into a futures contract, a fund is required to deposit either cash or securities (initial margin) with a clearing broker in an amount equal to a certain percentage of
Annual Report
Notes to Financial Statements - continued
(Amounts in thousands except percentages)
4. Derivative Instruments - continued
Futures Contracts - continued
the face value of the contract. Futures contracts are marked-to-market daily and subsequent daily payments (variation margin) are made or received by a fund depending on the daily fluctuations in the value of the futures contracts and are recorded as unrealized appreciation or (depreciation). This receivable and/or payable, if any, is included in daily variation margin for derivative instruments in the Statement of Assets and Liabilities. Realized gain or (loss) is recorded upon the expiration or closing of a futures contract.
Any open futures contracts at period end are presented in the Schedule of Investments under the caption "Futures Contracts." The underlying face amount at value reflects each contract's exposure to the underlying instrument or index at period end and is representative of volume of activity during the period. Securities deposited to meet initial margin requirements are identified in the Schedule of Investments.
During the period the Fund recognized net realized gain (loss) of $189,043 and a change in net unrealized appreciation (depreciation) of $(2,763) related to its investment in futures contracts. These amounts are included in the Statement of Operations.
5. Purchases and Sales of Investments.
Purchases and sales of securities, other than short-term securities, aggregated $7,049,933 and $2,239,038, respectively.
Securities received in-kind through subscriptions totaled $225,644.
6. Fees and Other Transactions with Affiliates.
Management Fee and Expense Contract. Fidelity Management & Research Company (the investment adviser) and its affiliates provide the Fund with investment management related services for which the Fund pays a monthly management fee. The management fee is based on an annual rate of .025% of the Fund's average net assets. Under the management contract, the investment adviser pays all other fund-level expenses, except the compensation of the independent Trustees and certain other expenses such as interest expense, including commitment fees.
In addition, under an expense contract, the investment adviser pays class-level expenses as necessary so that the total expenses do not exceed certain amounts of each class'
Annual Report
6. Fees and Other Transactions with Affiliates - continued
Management Fee and Expense Contract - continued
average net assets on an annual basis with certain exceptions, as noted in the following table:
Investor Class | .10% |
Fidelity Advantage Class | .07% |
Institutional Class | .05% |
Fidelity Advantage Institutional Class | .025% |
Sub-Adviser. Geode Capital Management, LLC (Geode), serves as sub-adviser for the Fund. Geode provides discretionary investment advisory services to the Fund and is paid by the investment adviser for providing these services.
Transfer Agent Fees. Fidelity Investments Institutional Operations Company, Inc. (FIIOC), an affiliate of the investment adviser, is the transfer, dividend disbursing and shareholder servicing agent for each class. FIIOC receives transfer agent fees at an annual rate of .075%, .045%, .035% and ..015% of average net assets for Investor Class, Fidelity Advantage Class, Institutional Class and Fidelity Advantage Institutional Class, respectively. FIIOC pays for typesetting, printing and mailing of shareholder reports, except proxy statements. Under the expense contract, Institutional Class pays a portion of the transfer agent fees at an annual rate of .025% of average net assets and Fidelity Advantage Institutional Class does not pay transfer agent fees.
For the period, the total transfer agent fees paid by each applicable class were as follows:
| Amount |
Investor Class | $ 3,931 |
Fidelity Advantage Class | 15,327 |
Institutional Class | 5,090 |
| $ 24,348 |
7. Committed Line of Credit.
The Fund participates with other funds managed by the investment adviser or an affiliate in a $4.25 billion credit facility (the "line of credit") to be utilized for temporary or emergency purposes to fund shareholder redemptions or for other short-term liquidity purposes. The Fund has agreed to pay commitment fees on its pro-rata portion of the line of credit, which amounted to $117 and is reflected in Miscellaneous expenses on the Statement of Operations. During the period, there were no borrowings on this line of credit.
Annual Report
Notes to Financial Statements - continued
(Amounts in thousands except percentages)
8. Security Lending.
The Fund lends portfolio securities through a lending agent from time to time in order to earn additional income. On the settlement date of the loan, the Fund receives collateral (in the form of U.S. Treasury obligations, letters of credit and/or cash) against the loaned securities and maintains collateral in an amount not less than 100% of the market value of the loaned securities during the period of the loan. The market value of the loaned securities is determined at the close of business of the Fund and any additional required collateral is delivered to the Fund on the next business day. If the borrower defaults on its obligation to return the securities loaned because of insolvency or other reasons, the Fund may apply collateral received from the borrower against the obligation. The Fund may experience delays and costs in recovering the securities loaned. Any cash collateral received is invested in the Fidelity Securities Lending Cash Central Fund. The value of loaned securities and cash collateral at period end are disclosed on the Fund's Statement of Assets and Liabilities. Security lending income represents the income earned on investing cash collateral, less rebates paid to borrowers and any lending agent fees associated with the loan, plus any premium payments received for lending certain types of securities. Security lending income is presented in the Statement of Operations as a component of income from Fidelity Central Funds. Total security lending income during the period amounted to $4,627.
9. Expense Reductions.
The investment adviser contractually agreed to reimburse the Fund to the extent annual operating expenses exceeded certain levels of average net assets as noted in the table below. Some expenses, for example interest expense, including commitment fees, are excluded from this reimbursement. This reimbursement will remain in place through April 30, 2015.
| Expense | Reimbursement |
Investor Class | .095% | $ 293 |
Fidelity Advantage Class | .050% | 7,001 |
Institutional Class | .040% | 2,144 |
Fidelity Advantage Institutional Class | .020% | 151 |
In addition, through arrangements with the Fund's custodian, credits realized as a result of uninvested cash balances were used to reduce the Fund's expenses. During the period, these credits reduced the Fund's management fee by $1.
The investment adviser reimbursed a portion of the Fund's operating expenses during the period in the amount of $12.
Annual Report
10. Distributions to Shareholders.
Distributions to shareholders of each class were as follows:
Years ended February 28, | 2014 | 2013 |
From net investment income |
|
|
Investor Class | $ 100,863 | $ 226,551 |
Fidelity Advantage Class | 665,146 | 421,592 |
Institutional Class | 401,823 | 348,307 |
Fidelity Advantage Institutional Class | 53,914 | 33,583 |
Total | $ 1,221,746 | $ 1,030,033 |
11. Share Transactions.
Transactions for each class of shares were as follows:
| Shares | Dollars | ||
Years ended February 28, | 2014 | 2013 | 2014 | 2013 |
Investor Class |
|
|
|
|
Shares sold | 39,355 | 47,792 | $ 2,384,060 | $ 2,395,212 |
Reinvestment of distributions | 1,660 | 4,370 | 98,060 | 217,646 |
Shares redeemed | (41,439) | (241,211) | (2,495,889) | (12,295,797) |
Net increase (decrease) | (424) | (189,049) | $ (13,769) | $ (9,682,939) |
Fidelity Advantage Class |
|
|
|
|
Shares sold | 139,661 | 271,957 | $ 8,405,537 | $ 13,895,241 |
Reinvestment of distributions | 10,502 | 7,827 | 620,608 | 390,172 |
Shares redeemed | (102,964) | (75,714) | (6,208,026) | (3,793,810) |
Net increase (decrease) | 47,199 | 204,070 | $ 2,818,119 | $ 10,491,603 |
Institutional Class |
|
|
|
|
Shares sold | 90,088 | 92,394 | $ 5,417,050 | $ 4,615,642 |
Reinvestment of distributions | 6,803 | 6,988 | 401,823 | 348,307 |
Shares redeemed | (83,402) | (72,117) | (5,026,000) | (3,630,016) |
Net increase (decrease) | 13,489 | 27,265 | $ 792,873 | $ 1,333,933 |
Fidelity Advantage Institutional Class |
|
|
|
|
Shares sold | 24,446 | 24,302 | $ 1,448,700 | $ 1,217,091 |
Reinvestment of distributions | 908 | 673 | 53,914 | 33,583 |
Shares redeemed | (7,851) | (4,226) | (475,041) | (212,351) |
Net increase (decrease) | 17,503 | 20,749 | $ 1,027,573 | $ 1,038,323 |
Annual Report
Notes to Financial Statements - continued
(Amounts in thousands except percentages)
12. Other.
The Fund's organizational documents provide former and current trustees and officers with a limited indemnification against liabilities arising in connection with the performance of their duties to the Fund. In the normal course of business, the Fund may also enter into contracts that provide general indemnifications. The Fund's maximum exposure under these arrangements is unknown as this would be dependent on future claims that may be made against the Fund. The risk of material loss from such claims is considered remote.
Annual Report
Report of Independent Registered Public Accounting Firm
To the Trustees of Fidelity Concord Street Trust and the Shareholders of Spartan 500 Index Fund:
In our opinion, the accompanying statement of assets and liabilities, including the schedule of investments, and the related statements of operations and of changes in net assets and the financial highlights present fairly, in all material respects, the financial position of Spartan 500 Index Fund (a fund of Fidelity Concord Street Trust) at February 28, 2014, the results of its operations for the year then ended, the changes in its net assets for each of the two years in the period then ended and the financial highlights for each of the periods indicated, in conformity with accounting principles generally accepted in the United States of America. These financial statements and financial highlights (hereafter referred to as "financial statements") are the responsibility of the Spartan 500 Index Fund's management. Our responsibility is to express an opinion on these financial statements based on our audits. We conducted our audits of these financial statements in accordance with the standards of the Public Company Accounting Oversight Board (United States). Those standards require that we plan and perform the audit to obtain reasonable assurance about whether the financial statements are free of material misstatement. An audit includes examining, on a test basis, evidence supporting the amounts and disclosures in the financial statements, assessing the accounting principles used and significant estimates made by management, and evaluating the overall financial statement presentation. We believe that our audits, which included confirmation of securities at February 28, 2014 by correspondence with the custodian and brokers, provide a reasonable basis for our opinion.
PricewaterhouseCoopers LLP
Boston, Massachusetts
April 15, 2014
Annual Report
Trustees and Officers
The Trustees, Member of the Advisory Board, and officers of the trust and fund, as applicable, are listed below. The Board of Trustees governs the fund and is responsible for protecting the interests of shareholders. The Trustees are experienced executives who meet periodically throughout the year to oversee the fund's activities, review contractual arrangements with companies that provide services to the fund, oversee management of the risks associated with such activities and contractual arrangements, and review the fund's performance. Except for James C. Curvey, Ned C. Lautenbach, and William S. Stavropoulos, each of the Trustees oversees 172 funds. James C. Curvey oversees 395 funds. Ned C. Lautenbach and William S. Stavropoulos each oversees 246 funds.
The Trustees hold office without limit in time except that (a) any Trustee may resign; (b) any Trustee may be removed by written instrument, signed by at least two-thirds of the number of Trustees prior to such removal; (c) any Trustee who requests to be retired or who has become incapacitated by illness or injury may be retired by written instrument signed by a majority of the other Trustees; and (d) any Trustee may be removed at any special meeting of shareholders by a two-thirds vote of the outstanding voting securities of the trust. Each Trustee who is not an interested person (as defined in the 1940 Act) of the trust and the fund (Independent Trustee), shall retire not later than the last day of the calendar year in which his or her 75th birthday occurs. The Independent Trustees may waive this mandatory retirement age policy with respect to individual Trustees. The officers and Advisory Board Member hold office without limit in time, except that any officer and Advisory Board Member may resign or may be removed by a vote of a majority of the Trustees at any regular meeting or any special meeting of the Trustees. Except as indicated, each individual has held the office shown or other offices in the same company for the past five years.
Experience, Skills, Attributes, and Qualifications of the Fund's Trustees. The Governance and Nominating Committee has adopted a statement of policy that describes the experience, qualifications, attributes, and skills that are necessary and desirable for potential Independent Trustee candidates (Statement of Policy). The Board believes that each Trustee satisfied at the time he or she was initially elected or appointed a Trustee, and continues to satisfy, the standards contemplated by the Statement of Policy. The Governance and Nominating Committee also engages professional search firms to help identify potential Independent Trustee candidates who have the experience, qualifications, attributes, and skills consistent with the Statement of Policy. From time to time, additional criteria based on the composition and skills of the current Independent Trustees, as well as experience or skills that may be appropriate in light of future changes to board composition, business conditions, and regulatory or other developments, have also been considered by the professional search firms and the Governance and Nominating Committee. In addition, the Board takes into account the Trustees' commitment and participation in Board and committee meetings, as well as their leadership of standing and ad hoc committees throughout their tenure.
Annual Report
In determining that a particular Trustee was and continues to be qualified to serve as a Trustee, the Board has considered a variety of criteria, none of which, in isolation, was controlling. The Board believes that, collectively, the Trustees have balanced and diverse experience, qualifications, attributes, and skills, which allow the Board to operate effectively in governing the fund and protecting the interests of shareholders. Information about the specific experience, skills, attributes, and qualifications of each Trustee, which in each case led to the Board's conclusion that the Trustee should serve (or continue to serve) as a trustee of the fund, is provided below.
Board Structure and Oversight Function. James C. Curvey is an interested person (as defined in the 1940 Act) and currently serves as Chairman. The Trustees have determined that an interested Chairman is appropriate and benefits shareholders because an interested Chairman has a personal and professional stake in the quality and continuity of services provided to the fund. Independent Trustees exercise their informed business judgment to appoint an individual of their choosing to serve as Chairman, regardless of whether the Trustee happens to be independent or a member of management. The Independent Trustees have determined that they can act independently and effectively without having an Independent Trustee serve as Chairman and that a key structural component for assuring that they are in a position to do so is for the Independent Trustees to constitute a substantial majority for the Board. The Independent Trustees also regularly meet in executive session. Ned C. Lautenbach serves as Chairman of the Independent Trustees and as such (i) acts as a liaison between the Independent Trustees and management with respect to matters important to the Independent Trustees and (ii) with management prepares agendas for Board meetings.
Fidelity funds are overseen by different Boards of Trustees. The fund's Board oversees Fidelity's equity and high income funds and another Board oversees Fidelity's investment-grade bond, money market, and asset allocation funds. The asset allocation funds may invest in Fidelity funds overseen by the fund's Board. The use of separate Boards, each with its own committee structure, allows the Trustees of each group of Fidelity funds to focus on the unique issues of the funds they oversee, including common research, investment, and operational issues. On occasion, the separate Boards establish joint committees to address issues of overlapping consequences for the Fidelity funds overseen by each Board.
The Trustees operate using a system of committees to facilitate the timely and efficient consideration of all matters of importance to the Trustees, the fund, and fund shareholders and to facilitate compliance with legal and regulatory requirements and oversight of the fund's activities and associated risks. The Board, acting through its committees, has charged FMR and its affiliates with (i) identifying events or circumstances the occurrence of which could have demonstrably adverse effects on the fund's business and/or reputation; (ii) implementing processes and controls to lessen the possibility that such events or circumstances occur or to mitigate the effects of such events or circumstances if they do occur; and (iii) creating and maintaining a system designed to evaluate continuously business and market conditions in order to facilitate the identification and implementation processes described in (i) and (ii) above. Because the day-to-day operations and activities of the fund are carried out by or through FMR, its affiliates and other service providers, the fund's exposure to risks is mitigated but not eliminated by the processes overseen by the Trustees. While each of the Board's committees has responsibility for overseeing different aspects of the fund's activities, oversight is exercised primarily through the Operations, Audit, and Compliance Committees. In addition, the Independent Trustees have worked with FMR to enhance the Board's oversight of investment and financial risks, legal and regulatory risks, technology risks, and operational risks, including the development of additional risk reporting to the Board. For example, a working group comprised of Independent Trustees and FMR has worked and continues to work to review the Fidelity funds' valuation-related activities, reporting and risk management. Appropriate personnel, including but not limited to the fund's Chief Compliance Officer (CCO), FMR's internal auditor, the independent accountants, the fund's Treasurer and portfolio management personnel, make periodic reports to the Board's committees, as appropriate, including an annual review of FMR's risk management program for the Fidelity funds. The responsibilities of each standing committee, including their oversight responsibilities, are described further under "Standing Committees of the Fund's Trustees."
Annual Report
Trustees and Officers - continued
The fund's Statement of Additional Information (SAI) includes more information about the Trustees. To request a free copy, call Fidelity at 1-800-835-5092.
Interested Trustees*:
Correspondence intended for each Trustee who is an interested person may be sent to Fidelity Investments, 245 Summer Street, Boston, Massachusetts 02210.
Name, Year of Birth; Principal Occupations and Other Relevant Experience+ | |
James C. Curvey (1935) | |
Year of Election or Appointment: 2007 Trustee Chairman of the Board of Trustees | |
| Mr. Curvey also serves as Trustee of other Fidelity funds. Mr. Curvey is a Director of Fidelity Investments Money Management, Inc. (2009-present), Director of Fidelity Research & Analysis Co. (2009-present) and Director of FMR and FMR Co., Inc. (2007-present). Mr. Curvey is also Vice Chairman (2007-present) and Director of FMR LLC. In addition, Mr. Curvey serves as an Overseer for the Boston Symphony Orchestra and a member of the Trustees of Villanova University. Previously, Mr. Curvey was the Vice Chairman (2006-2007) and Director (2000-2007) of FMR Corp. |
Charles S. Morrison (1960) | |
Year of Election or Appointment: 2014 Trustee | |
| Mr. Morrison also serves as Trustee or Vice President of other funds. He serves as President, Asset Management (2014-present) and is an employee of Fidelity Investments. Previously, Mr. Morrison served as President, Fixed Income (2011-2014), Vice President of Fidelity's Money Market Funds (2005-2009), President, Money Market Group Leader of FMR (2009), and Senior Vice President, Money Market Group of FMR (2004-2009). Mr. Morrison also served as Vice President of Fidelity's Bond Funds (2002-2005), certain Balanced Funds (2002-2005), and certain Asset Allocation Funds (2002-2007), and as Senior Vice President (2002-2005) of Fidelity's Bond Division. |
* Trustees have been determined to be "Interested Trustees" by virtue of, among other things, their affiliation with the trust or various entities under common control with FMR.
+ The information above includes each Trustee's principal occupation during the last five years and other information relating to the experience, attributes, and skills relevant to each Trustee's qualifications to serve as a Trustee, which led to the conclusion that each Trustee should serve as a Trustee for the fund.
Annual Report
Trustees and Officers - continued
Independent Trustees:
Correspondence intended for each Independent Trustee (that is, the Trustees other than the Interested Trustees) may be sent to Fidelity Investments, P.O. Box 55235, Boston, Massachusetts 02205-5235.
Name, Year of Birth; Principal Occupations and Other Relevant Experience+ | |
Dennis J. Dirks (1948) | |
Year of Election or Appointment: 2005 Trustee | |
| Mr. Dirks also serves as Trustee of other Fidelity funds. Prior to his retirement in May 2003, Mr. Dirks was Chief Operating Officer and a member of the Board of The Depository Trust & Clearing Corporation (DTCC). He also served as President, Chief Operating Officer, and Board member of The Depository Trust Company (DTC) and President and Board member of the National Securities Clearing Corporation (NSCC). In addition, Mr. Dirks served as Chief Executive Officer and Board member of the Government Securities Clearing Corporation, Chief Executive Officer and Board member of the Mortgage-Backed Securities Clearing Corporation, as a Trustee and a member of the Finance Committee of Manhattan College (2005-2008), and as a Trustee and a member of the Finance Committee of AHRC of Nassau County (2006-2008). Mr. Dirks is a member of the Independent Directors Council (IDC) Governing Council (2010-present) and Board of Directors for The Brookville Center for Children's Services, Inc. (2009-present). |
Alan J. Lacy (1953) | |
Year of Election or Appointment: 2008 Trustee | |
| Mr. Lacy also serves as Trustee of other Fidelity funds. Mr. Lacy serves as Senior Adviser (2007-present) of Oak Hill Capital Partners, L.P. (private equity). Mr. Lacy also served as Chief Executive Officer (2000-2005) and Vice Chairman (2005-2006) of Sears Holdings Corporation and Sears, Roebuck and Co. (retail). In addition, Mr. Lacy serves as a member of the Board of Directors of Dave & Buster's Entertainment, Inc. (restaurant and entertainment complexes, 2010-present), Earth Fare, Inc. (retail grocery, 2012-present), The Hillman Companies, Inc. (hardware wholesalers, 2010-present), and Bristol-Myers Squibb Company (global pharmaceuticals, 2008-present). Mr. Lacy is a member of the Board of Trustees of The National Parks Conservation Association (2006-present). Previously, Mr. Lacy served as Chairman of the Board of Trustees of the National Parks Conservation Association (2008-2011) and as a member of the Board of Directors for the Western Union Company (global money transfer, 2006-2011). |
Ned C. Lautenbach (1944) | |
Year of Election or Appointment: 2000 Trustee Chairman of the Independent Trustees | |
| Mr. Lautenbach also serves as Trustee of other Fidelity funds. Mr. Lautenbach currently serves as the Lead Director of the Eaton Corporation Board of Directors (diversified industrial, 1997-present). Mr. Lautenbach is Chairman of the Board of Directors of the Philharmonic Center for the Arts in Naples, Florida (2012-present) and a member of the Council on Foreign Relations (1994-present). Previously, Mr. Lautenbach was a Partner/Advisory Partner at Clayton, Dubilier & Rice, LLC (private equity investment, 1998-2010), as well as a Director of Sony Corporation (2006-2007). |
Joseph Mauriello (1944) | |
Year of Election or Appointment: 2008 Trustee | |
| Mr. Mauriello also serves as Trustee of other Fidelity funds. Prior to his retirement in January 2006, Mr. Mauriello served in numerous senior management positions including Deputy Chairman and Chief Operating Officer (2004-2005), and Vice Chairman of Financial Services (2002-2004) of KPMG LLP US (professional services, 1965-2005). Mr. Mauriello currently serves as a member of the Board of Directors of XL Group plc. (global insurance and re-insurance, 2006-present). Previously, Mr. Mauriello served as a Director of the Hamilton Funds of the Bank of New York (2006-2007) and of Arcadia Resources Inc. (health care services and products, 2007-2012). |
Robert W. Selander (1950) | |
Year of Election or Appointment: 2011 Trustee | |
| Mr. Selander also serves as Trustee of other Fidelity funds. Previously, Mr. Selander served as a Member of the Advisory Board of other Fidelity funds (2011), and Executive Vice Chairman (2010), Chief Executive Officer (2009-2010), and President and Chief Executive Officer (1997-2009) of Mastercard, Inc. |
Cornelia M. Small (1944) | |
Year of Election or Appointment: 2005 Trustee | |
| Ms. Small also serves as Trustee of other Fidelity funds. Ms. Small is a member of the Board of Directors (2009-present) and Chair of the Investment Committee (2010-present) of the Teagle Foundation. Ms. Small also serves on the Investment Committee of the Berkshire Taconic Community Foundation (2008-present). Previously, Ms. Small served as Chairperson (2002-2008) and a member of the Investment Committee and Chairperson (2008-2012) and a member of the Board of Trustees of Smith College. In addition, Ms. Small served as Chief Investment Officer, Director of Global Equity Investments, and a member of the Board of Directors of Scudder, Stevens & Clark and Scudder Kemper Investments. |
William S. Stavropoulos (1939) | |
Year of Election or Appointment: 2001 Trustee Vice Chairman of the Independent Trustees | |
| Mr. Stavropoulos also serves as Trustee of other Fidelity funds. Mr. Stavropoulos serves as President and Founder of the Michigan Baseball Foundation, the Great Lakes Loons (2007-present). Mr. Stavropoulos is Chairman Emeritus of the Board of Directors of The Dow Chemical Company, where he previously served in numerous senior management positions, including President, CEO (1995-2000; 2002-2004), Chairman of the Executive Committee (2000-2006), and as a member of the Board of Directors (1990-2006). Currently, Mr. Stavropoulos is Chairman of the Board of Directors of Univar Inc. (global distributor of commodity and specialty chemicals), a Director of Teradata Corporation (data warehousing and technology solutions), and Maersk Inc. (industrial conglomerate), and a member of the Advisory Board for Metalmark Capital LLC (private equity investment, 2005-present). Mr. Stavropoulos is an operating advisor to Clayton, Dubilier & Rice, LLC (private equity investment). In addition, Mr. Stavropoulos is a member of the University of Notre Dame Advisory Council for the College of Science, a Trustee of the Rollin L. Gerstacker Foundation, and a Director of the Naples Philharmonic Center for the Arts. Previously, Mr. Stavropoulos served as a Director of Chemical Financial Corporation (bank holding company, 1993-2012) and Tyco International, Ltd. (multinational manufacturing and services, 2007-2012). |
David M. Thomas (1949) | |
Year of Election or Appointment: 2008 Trustee | |
| Mr. Thomas also serves as Trustee of other Fidelity funds. Mr. Thomas serves as Non-Executive Chairman of the Board of Directors of Fortune Brands Home and Security (home and security products, 2011-present), and as a member of the Board of Directors of Interpublic Group of Companies, Inc. (marketing communication, 2004-present). Previously, Mr. Thomas served as Executive Chairman (2005-2006) and Chairman and Chief Executive Officer (2000-2005) of IMS Health, Inc. (pharmaceutical and healthcare information solutions), and a Director of Fortune Brands, Inc. (consumer products, 2000-2011). |
+ The information above includes each Trustee's principal occupation during the last five years and other information relating to the experience, attributes, and skills relevant to each Trustee's qualifications to serve as a Trustee, which led to the conclusion that each Trustee should serve as a Trustee for the fund.
Advisory Board Member and Officers:
Correspondence intended for each officer and Peter S. Lynch may be sent to Fidelity Investments, 245 Summer Street, Boston, Massachusetts 02210. Officers appear below in alphabetical order.
Name, Year of Birth; Principal Occupation | |
Peter S. Lynch (1944) | |
Year of Election or Appointment: 2003 Member of the Advisory Board | |
| Mr. Lynch also serves as Member of the Advisory Board of other Fidelity funds. Mr. Lynch is Vice Chairman and a Director of FMR and FMR Co., Inc. In addition, Mr. Lynch serves as a Trustee of Boston College and as the Chairman of the Inner-City Scholarship Fund. Previously, Mr. Lynch served on the Special Olympics International Board of Directors (1997-2006). |
Elizabeth Paige Baumann (1968) | |
Year of Election or Appointment: 2012 Anti-Money Laundering (AML) Officer | |
| Ms. Baumann also serves as AML Officer of other funds. She is Chief AML Officer of FMR LLC (2012-present) and is an employee of Fidelity Investments. Previously, Ms. Baumann served as Vice President and Deputy Anti-Money Laundering Officer (2007-2012). |
William C. Coffey (1969) | |
Year of Election or Appointment: 2009 Assistant Secretary | |
| Mr. Coffey also serves as Assistant Secretary of other funds. He is Senior Vice President and Deputy General Counsel of FMR LLC (2010-present), and is an employee of Fidelity Investments. Previously, Mr. Coffey served as Vice President and Associate General Counsel of FMR LLC (2005-2009). |
Jonathan Davis (1968) | |
Year of Election or Appointment: 2010 Assistant Treasurer | |
| Mr. Davis also serves as Assistant Treasurer of other funds. Mr. Davis is an employee of Fidelity Investments. Previously, Mr. Davis served as Vice President and Associate General Counsel of FMR LLC (2003-2010). |
Adrien E. Deberghes (1967) | |
Year of Election or Appointment: 2008 Deputy Treasurer | |
| Mr. Deberghes also serves as an officer of other funds. He is an employee of Fidelity Investments (2008-present). Prior to joining Fidelity Investments, Mr. Deberghes was Senior Vice President of Mutual Fund Administration at State Street Corporation (2007-2008), Senior Director of Mutual Fund Administration at Investors Bank & Trust (2005-2007), and Director of Finance for Dunkin' Brands (2000-2005). |
Stephanie J. Dorsey (1969) | |
Year of Election or Appointment: 2010 Assistant Treasurer | |
| Ms. Dorsey also serves as an officer of other funds. She is an employee of Fidelity Investments (2008-present) and has served in other fund officer roles. Prior to joining Fidelity Investments, Ms. Dorsey served as Treasurer (2004-2008) of the JPMorgan Mutual Funds and Vice President (2004-2008) of JPMorgan Chase Bank. |
Scott C. Goebel (1968) | |
Year of Election or Appointment: 2008 Secretary and Chief Legal Officer (CLO) | |
| Mr. Goebel serves as Secretary and CLO of other funds. Mr. Goebel also serves as Secretary of Fidelity SelectCo, LLC (2013-present), Fidelity Investments Money Management, Inc. (FIMM) (2010-present) and Fidelity Research and Analysis Company (FRAC) (2010-present); General Counsel, Secretary, and Senior Vice President of FMR (2008-present) and FMR Co., Inc. (2008-present); Chief Legal Officer of Fidelity Management & Research (Hong Kong) Limited (2008-present); and Assistant Secretary of Fidelity Management & Research (Japan) Inc. (2008-present) and Fidelity Management & Research (U.K.) Inc. (2008-present). Previously, Mr. Goebel served as Secretary and CLO of other Fidelity funds (2008-2013), Assistant Secretary of FIMM (2008-2010), FRAC (2008-2010), and certain funds (2007-2008); and as Vice President and Secretary of Fidelity Distributors Corporation (FDC) (2005-2007). Mr. Goebel has been employed by FMR LLC or an affiliate since 2001. |
Joseph A. Hanlon (1968) | |
Year of Election or Appointment: 2012 Chief Compliance Officer | |
| Mr. Hanlon also serves as Chief Compliance Officer of other funds. Mr. Hanlon serves as Compliance Officer of FMR, FMR Co., Inc., Fidelity Investments Money Management, Inc. (FIMM), Fidelity Research and Analysis Company (FRAC), and Fidelity Management & Research (Hong Kong) (2009-present), as Senior Vice President of the Fidelity Asset Management Division (2009-present), and is an employee of Fidelity Investments. Previously, Mr. Hanlon served as Compliance Officer of Fidelity Management & Research (Japan) Inc. (2009-2013), Strategic Advisers, Inc. (2009-2013), and Fidelity Management & Research (U.K.) Inc. (2009-2013). |
Bruce T. Herring (1965) | |
Year of Election or Appointment: 2006 Vice President of certain Equity Funds | |
| Mr. Herring also serves as Vice President of other funds. He serves as Chief Investment Officer of Fidelity Global Asset Allocation (GAA) (2013-present), Group Chief Investment Officer of FMR, and President of Fidelity Research & Analysis Company (2010-present). Previously, Mr. Herring served as Chief Investment Officer and Director of Fidelity Management & Research (U.K.) Inc. (2010-2013), Vice President (2005-2006) and Senior Vice President (2006-2007) of Fidelity Management & Research Company, Vice President of FMR Co., Inc. (2001-2007), and as a portfolio manager for Fidelity U.S. Equity Funds. |
Brian B. Hogan (1964) | |
Year of Election or Appointment: 2009 Vice President | |
| Mr. Hogan also serves as Trustee or Vice President of other funds. Mr. Hogan serves as President of FMR's Equity Division (2009-present). Previously, Mr. Hogan served as Senior Vice President, Equity Research of FMR (2006-2009) and as a portfolio manager. |
Chris Maher (1972) | |
Year of Election or Appointment: 2013 Assistant Treasurer | |
| Mr. Maher serves as Assistant Treasurer of other funds. Mr. Maher is Vice President of Valuation Oversight and is an employee of Fidelity Investments. Previously, Mr. Maher served as Vice President of Asset Management Compliance (2013), Vice President of FMR's Program Management Group (2010-2013), and Vice President of Valuation Oversight (2008-2010). |
Christine Reynolds (1958) | |
Year of Election or Appointment: 2008 Chief Financial Officer | |
| Ms. Reynolds also serves as Chief Financial Officer of other funds. Ms. Reynolds became President of Fidelity Pricing and Cash Management Services (FPCMS) in August 2008. Ms. Reynolds served as Chief Operating Officer of FPCMS (2007-2008). Previously, Ms. Reynolds served as President, Treasurer, and Anti-Money Laundering officer of the Fidelity funds (2004-2007). |
Kenneth B. Robins (1969) | |
Year of Election or Appointment: 2008 President and Treasurer | |
| Mr. Robins also serves as an officer of other funds. Mr. Robins serves as Executive Vice President of Fidelity Investments Money Management, Inc. (FIMM) (2013-present) and is an employee of Fidelity Investments (2004-present). Previously, Mr. Robins served in other fund officer roles. |
Gary W. Ryan (1958) | |
Year of Election or Appointment: 2005 Assistant Treasurer | |
| Mr. Ryan also serves as Assistant Treasurer of other funds. Mr. Ryan is an employee of Fidelity Investments and has served in other fund officer roles. Previously, Mr. Ryan served as Vice President of Fund Reporting in Fidelity Pricing and Cash Management Services (FPCMS) (1999-2005). |
Stephen Sadoski (1971) | |
Year of Election or Appointment: 2012 Deputy Treasurer | |
| Mr. Sadoski also serves as Deputy Treasurer of other funds. He is an employee of Fidelity Investments (2012-present) and has served in another fund officer role. Prior to joining Fidelity Investments, Mr. Sadoski served as an assistant chief accountant in the Division of Investment Management of the Securities and Exchange Commission (SEC) (2009-2012) and as a senior manager at Deloitte & Touche LLP (1997-2009). |
Stacie M. Smith (1974) | |
Year of Election or Appointment: 2013 Deputy Treasurer | |
| Ms. Smith also serves as an officer of other funds. She is an employee of Fidelity Investments (2009-present) and has served in other fund officer roles. Prior to joining Fidelity Investments, Ms. Smith served as Senior Audit Manager of Ernst & Young LLP (1996-2009). |
Renee Stagnone (1975) | |
Year of Election or Appointment: 2013 Deputy Treasurer | |
| Ms. Stagnone also serves as Deputy Treasurer of other funds. Ms. Stagnone is an employee of Fidelity Investments. |
Joseph F. Zambello (1957) | |
Year of Election or Appointment: 2011 Deputy Treasurer | |
| Mr. Zambello also serves as Deputy Treasurer of other funds. Mr. Zambello is an employee of Fidelity Investments. Previously, Mr. Zambello served as Vice President of FMR's Program Management Group (2009-2011) and Vice President of the Transfer Agent Oversight Group (2005-2009). |
Annual Report
Distributions (Unaudited)
A total of 0.02% of the dividends distributed during the fiscal year was derived from interest on U.S. Government securities which is generally exempt from state income tax.
Institutional Class designates 97%, 96%, 96%, and 96%; and Fidelity Advantage Institutional Class designates 96%, 95%, 95%, and 95% of the dividends distributed in April, July, October, and December, respectively, during the fiscal year as qualifying for the dividends-received deduction for corporate shareholders.
Institutional Class designates 100%, 99%, 99%, and 99%; and Fidelity Advantage Institutional Class designates 98%, 98%, 98%, and 98% of the dividends distributed in April, July, October, and December, respectively, during the fiscal year as amounts which may be taken into account as a dividend for purposes of the maximum rate under section 1(h)(11) of the Internal Revenue Code.
The fund will notify shareholders in January 2015 of amounts for use in preparing 2014 income tax returns.
Annual Report
Investment Adviser
Fidelity Management & Research Company
Boston, MA
Investment Sub-Advisers
FMR Co., Inc.
Geode Capital Management, LLC
General Distributor
Fidelity Distributors Corporation
Smithfield, RI
Transfer and Service Agents
Fidelity Investments Institutional
Operations Company, Inc.
Boston, MA
Fidelity Service Company, Inc.
Boston, MA
Custodian
The Bank of New York Mellon
New York, NY
(Fidelity Investment logo)(registered trademark)
Corporate Headquarters
245 Summer St., Boston, MA 02210
www.fidelity.com
U5I-U5A-UANN-0414 1.925888.102
Spartan®
500 Index
Fund -
Investor Class
Fidelity Advantage® Class
Annual Report
February 28, 2014
(Fidelity Cover Art)
Contents
Performance | How the fund has done over time. | |
Management's Discussion of Fund Performance | The Portfolio Manager's review of fund performance and strategy. | |
Shareholder Expense Example | An example of shareholder expenses. | |
Investment Changes | A summary of major shifts in the fund's investments over the past six months. | |
Investments | A complete list of the fund's investments with their market values. | |
Financial Statements | Statements of assets and liabilities, operations, and changes in net assets, as well as financial highlights. | |
Notes | Notes to the financial statements. | |
Report of Independent Registered Public Accounting Firm |
| |
Trustees and Officers |
| |
Distributions |
|
To view a fund's proxy voting guidelines and proxy voting record for the 12-month period ended June 30, visit http://www.fidelity.com/proxyvotingresults or visit the Securities and Exchange Commission's (SEC) web site at http://www.sec.gov. You may also call 1-800-544-8544 to request a free copy of the proxy voting guidelines.
Standard & Poor's, S&P and S&P 500 are registered service marks of The McGraw-Hill Companies, Inc. and have been licensed for use by Fidelity Distributors Corporation.
Other third-party marks appearing herein are the property of their respective owners.
All other marks appearing herein are registered or unregistered trademarks or service marks of FMR LLC or an affiliated company. © 2014 FMR LLC. All rights reserved.
This report and the financial statements contained herein are submitted for the general information of the shareholders of the fund. This report is not authorized for distribution to prospective investors in the fund unless preceded or accompanied by an effective prospectus.
A fund files its complete schedule of portfolio holdings with the SEC for the first and third quarters of each fiscal year on Form N-Q. Forms N-Q are available on the SEC's web site at http://www.sec.gov. A fund's Forms N-Q may be reviewed and copied at the SEC's Public Reference Room in Washington, DC. Information regarding the operation of the SEC's Public Reference Room may be obtained by calling 1-800-SEC-0330. For a complete list of a fund's portfolio holdings, view the most recent holdings listing, semiannual report, or annual report on Fidelity's web site at http://www.fidelity.com, http://www.advisor.fidelity.com, or http://www.401k.com, as applicable.
NOT FDIC INSURED • MAY LOSE VALUE • NO BANK GUARANTEE
Neither the fund nor Fidelity Distributors Corporation is a bank.
Annual Report
Performance: The Bottom Line
Average annual total return reflects the change in the value of an investment, assuming reinvestment of the class' distributions from dividend income and capital gains (the profits earned upon the sale of securities that have grown in value, if any) and assuming a constant rate of performance each year. The $10,000 table and the fund's returns do not reflect the deduction of taxes that a shareholder would pay on fund distributions or the redemption of fund shares. During periods of reimbursement by Fidelity, a fund's total return will be greater than it would be had the reimbursement not occurred. How a fund did yesterday is no guarantee of how it will do tomorrow.
Average Annual Total Returns
Periods ended February 28, 2014 | Past 1 | Past 5 | Past 10 |
Investor Class | 25.27% | 22.93% | 7.10% |
Fidelity Advantage® Class A | 25.32% | 22.97% | 7.13% |
A The initial offering of Fidelity Advantage® Class took place on October 14, 2005. Returns prior to October 14, 2005, are those of Investor Class.
$10,000 Over 10 Years
Let's say hypothetically that $10,000 was invested in Spartan® 500 Index Fund - Investor Class on February 29, 2004. The chart shows how the value of your investment would have changed, and also shows how the S&P 500® Index performed over the same period.
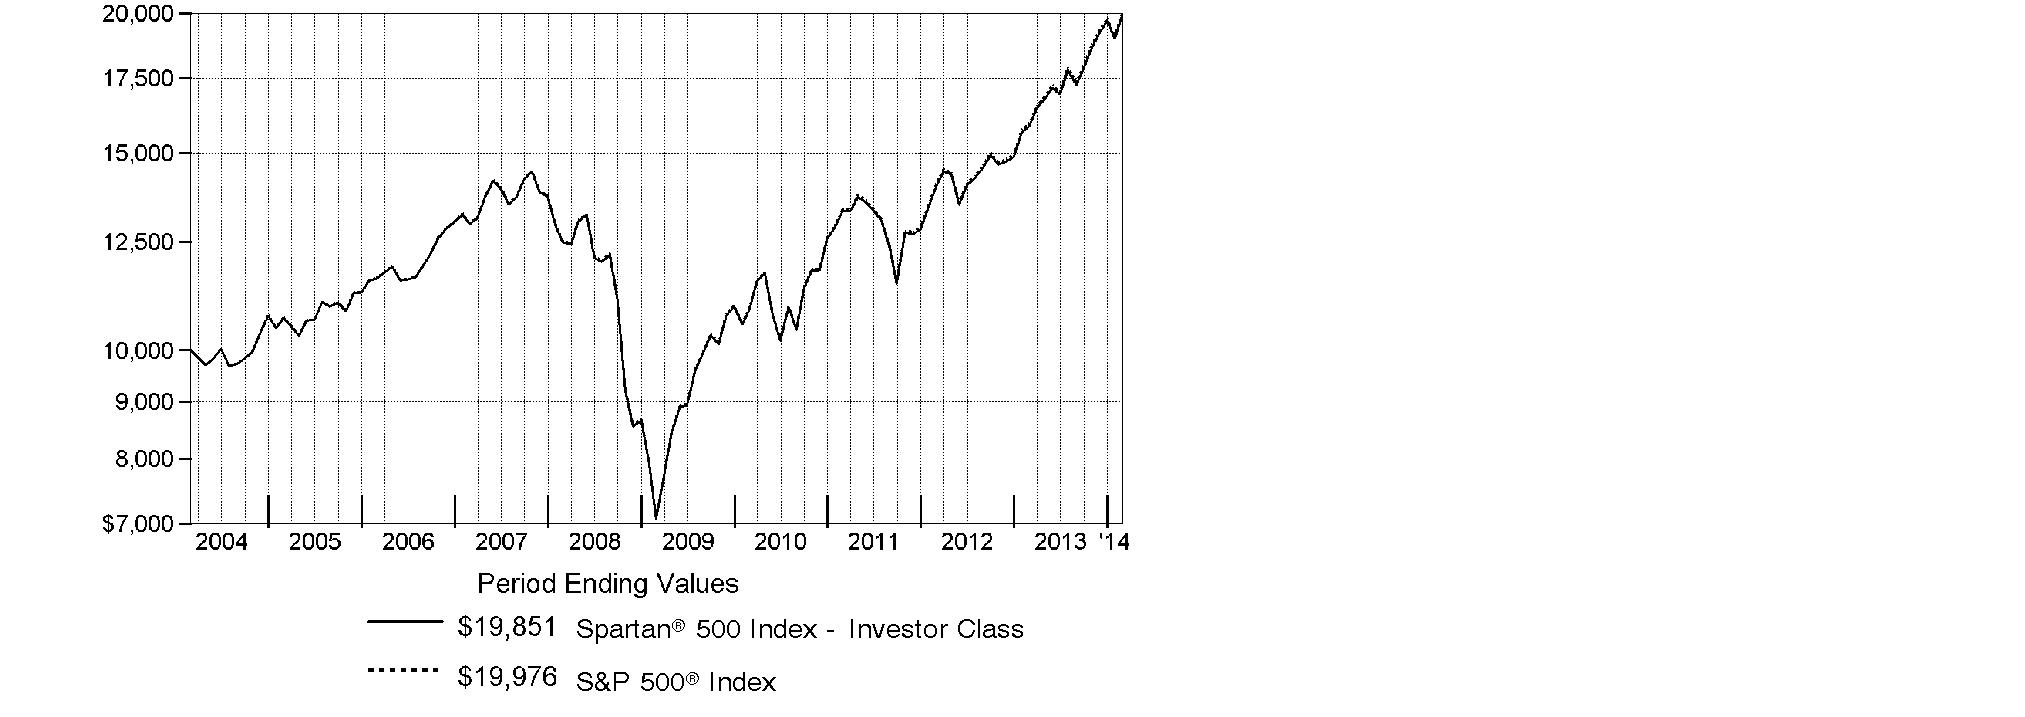
Annual Report
Management's Discussion of Fund Performance
Market Recap: Stocks overcame fears of higher interest rates - not to mention their worst January in four years - to finish sharply higher for the 12 months ending February 28, 2014. The broad S&P 500® Index and the blue-chip Dow Jones Industrial AverageSM gained 25.37% and 19.01%, respectively, amid generally favorable earnings reports and accommodative monetary policies worldwide. Performance generally increased along the risk spectrum, with smaller-cap and growth strategies leading the way. An ebullient market helped the growth-oriented Nasdaq Composite Index® to a 38.10% period gain. Data still points to slow but steady improvement in the U.S., and Europe's recession may well be over. Reports from China have disappointed, but continue to suggest a relatively soft landing there. Mixed signals from the U.S. Federal Reserve as to when it might curtail its stimulative bond buying kept markets in flux during the spring and summer. Stocks regained momentum in October despite a federal budget impasse and brief government shutdown, and lower volatility prevailed through year-end. Shedding new-year concerns about China's economy, an emerging-markets sell-off and confirmation (at last) of Fed tapering - alongside confirmation of a presumably dovish Janet Yellen as new Fed chair - February saw stocks back in record territory, bearing down on the five-year anniversary of the market's bottom.
Comments from Patrick Waddell, Senior Portfolio Manager of the Geode Capital Management, LLC, investment management team for Spartan® 500 Index Fund: For the year, the fund's Investor Class and Fidelity Advantage® Class shares gained 25.27% and 25.32%, respectively, in line with the S&P 500®. All 10 sectors in the index gained ground, and all but one - telecommunication services - was up by double digits. On an individual basis, the fund's top-three contributors were all technology stocks and household names, led by Internet search leader Google, which saw its shares rise 14% in a single day in October, thanks to better-than-expected earnings. Consumer products and computer manufacturer Apple also added value, as did software maker Microsoft, whose shares were up 42% as the company continued to generate strong financial results relative to Wall Street's expectations. Also of note, health care was the strongest-performing sector in the index, and biotechnology company Gilead Sciences, which gained 94%, contributed the most within that group. In contrast, IBM topped the list of individual detractors, as the diversified technology company lost modest ground amid declining revenues, while tobacco company Philip Morris International struggled in an environment of slowing worldwide demand for cigarettes.
The views expressed above reflect those of the portfolio manager(s) only through the end of the period as stated on the cover of this report and do not necessarily represent the views of Fidelity or any other person in the Fidelity organization. Any such views are subject to change at any time based upon market or other conditions and Fidelity disclaims any responsibility to update such views. These views may not be relied on as investment advice and, because investment decisions for a Fidelity fund are based on numerous factors, may not be relied on as an indication of trading intent on behalf of any Fidelity fund.
Annual Report
Shareholder Expense Example
As a shareholder of the Fund, you incur two types of costs: (1) transaction costs, and (2) ongoing costs, including management fees and other Fund expenses. This Example is intended to help you understand your ongoing costs (in dollars) of investing in the Fund and to compare these costs with the ongoing costs of investing in other mutual funds.
The Example is based on an investment of $1,000 invested at the beginning of the period and held for the entire period (September 1, 2013 to February 28, 2014).
Actual Expenses
The first line of the accompanying table for each class of the Fund provides information about actual account values and actual expenses. You may use the information in this line, together with the amount you invested, to estimate the expenses that you paid over the period. Simply divide your account value by $1,000.00 (for example, an $8,600 account value divided by $1,000.00 = 8.6), then multiply the result by the number in the first line for a class of the Fund under the heading entitled "Expenses Paid During Period" to estimate the expenses you paid on your account during this period. A small balance maintenance fee of $12.00 that is charged once a year may apply for certain accounts with a value of less than $2,000. This fee is not included in the table below. If it was, the estimate of expenses you paid during the period would be higher, and your ending account value lower, by this amount. In addition, the Fund, as a shareholder in the underlying Fidelity Central Funds, will indirectly bear its pro-rata share of the fees and expenses incurred by the underlying Fidelity Central Funds. These fees and expenses are not included in the Fund's annualized expense ratio used to calculate the expense estimate in the table below.
Hypothetical Example for Comparison Purposes
The second line of the accompanying table for each class of the Fund provides information about hypothetical account values and hypothetical expenses based on a Class' actual expense ratio and an assumed rate of return of 5% per year before expenses, which is not the Class' actual return. The hypothetical account values and expenses may not be used to estimate the actual ending account balance or expenses you paid for the period. You may use this information to compare the ongoing costs of investing in the Fund and other funds. To do so, compare this 5% hypothetical example with the 5% hypothetical examples that appear in the shareholder reports of the other funds. A small balance maintenance fee of $12.00 that is charged once a year may apply for certain accounts with a value of less than $2,000. This fee is not included in the table below. If it was, the estimate of expenses you paid during the period would be higher, and your ending account value lower, by this amount. In addition, the Fund, as a shareholder in the underlying Fidelity Central Funds, will indirectly bear its pro-rata share of the fees and expenses incurred by the underlying Fidelity Central Funds. These fees and expenses are not included in the Fund's annualized expense ratio used to calculate the expense estimate in the table below.
Please note that the expenses shown in the table are meant to highlight your ongoing costs only and do not reflect any transaction costs. Therefore, the second line of the table is useful in comparing ongoing costs only, and will not help you determine the relative total costs of owning different funds.
Annual Report
Shareholder Expense Example - continued
| Annualized | Beginning | Ending | Expenses Paid |
Investor Class | .095% |
|
|
|
Actual |
| $ 1,000.00 | $ 1,150.20 | $ .51 |
HypotheticalA |
| $ 1,000.00 | $ 1,024.35 | $ .48 |
Fidelity Advantage Class | .050% |
|
|
|
Actual |
| $ 1,000.00 | $ 1,150.40 | $ .27 |
HypotheticalA |
| $ 1,000.00 | $ 1,024.55 | $ .25 |
Institutional Class | .040% |
|
|
|
Actual |
| $ 1,000.00 | $ 1,150.50 | $ .21 |
HypotheticalA |
| $ 1,000.00 | $ 1,024.60 | $ .20 |
Fidelity Advantage Institutional Class | .020% |
|
|
|
Actual |
| $ 1,000.00 | $ 1,150.60 | $ .11 |
HypotheticalA |
| $ 1,000.00 | $ 1,024.70 | $ .10 |
A 5% return per year before expenses
B Annualized expense ratio reflects expenses net of applicable fee waivers.
* Expenses are equal to each Class' annualized expense ratio, multiplied by the average account value over the period, multiplied by 181/365 (to reflect the one-half year period).
Annual Report
Investment Changes (Unaudited)
Top Ten Stocks as of February 28, 2014 | ||
| % of fund's | % of fund's net assets |
Apple, Inc. | 2.8 | 3.1 |
Exxon Mobil Corp. | 2.5 | 2.6 |
Google, Inc. Class A | 2.0 | 1.5 |
Microsoft Corp. | 1.7 | 1.7 |
Johnson & Johnson | 1.6 | 1.6 |
General Electric Co. | 1.5 | 1.6 |
Wells Fargo & Co. | 1.3 | 1.4 |
Chevron Corp. | 1.3 | 1.6 |
Procter & Gamble Co. | 1.3 | 1.5 |
JPMorgan Chase & Co. | 1.3 | 1.3 |
| 17.3 | |
Market Sectors as of February 28, 2014 | ||
| % of fund's | % of fund's net assets |
Information Technology | 18.6 | 17.8 |
Financials | 15.7 | 16.1 |
Health Care | 13.5 | 12.7 |
Consumer Discretionary | 12.4 | 12.1 |
Industrials | 10.6 | 10.2 |
Energy | 9.9 | 10.5 |
Consumer Staples | 9.4 | 10.1 |
Materials | 3.5 | 3.4 |
Utilities | 2.9 | 3.2 |
Telecommunication Services | 2.5 | 2.5 |
Annual Report
Investments February 28, 2014
Showing Percentage of Net Assets
Common Stocks - 99.0% | |||
Shares | Value (000s) | ||
CONSUMER DISCRETIONARY - 12.4% | |||
Auto Components - 0.4% | |||
BorgWarner, Inc. (d) | 955,319 | $ 58,704 | |
Delphi Automotive PLC | 1,175,581 | 78,258 | |
Johnson Controls, Inc. | 2,875,734 | 142,061 | |
The Goodyear Tire & Rubber Co. | 1,036,511 | 27,851 | |
| 306,874 | ||
Automobiles - 0.7% | |||
Ford Motor Co. (d) | 16,559,347 | 254,848 | |
General Motors Co. | 5,470,478 | 198,031 | |
Harley-Davidson, Inc. (d) | 928,245 | 61,320 | |
| 514,199 | ||
Distributors - 0.1% | |||
Genuine Parts Co. (d) | 648,014 | 57,084 | |
Diversified Consumer Services - 0.1% | |||
Graham Holdings Co. | 18,290 | 13,145 | |
H&R Block, Inc. | 1,147,204 | 36,298 | |
| 49,443 | ||
Hotels, Restaurants & Leisure - 1.7% | |||
Carnival Corp. unit | 1,838,888 | 72,930 | |
Chipotle Mexican Grill, Inc. (a)(d) | 129,907 | 73,425 | |
Darden Restaurants, Inc. | 548,144 | 27,988 | |
International Game Technology (d) | 1,044,920 | 15,768 | |
Marriott International, Inc. Class A (d) | 943,129 | 51,146 | |
McDonald's Corp. | 4,177,287 | 397,469 | |
Starbucks Corp. | 3,163,727 | 224,498 | |
Starwood Hotels & Resorts Worldwide, Inc. | 803,996 | 66,298 | |
Wyndham Worldwide Corp. | 547,049 | 39,869 | |
Wynn Resorts Ltd. (d) | 339,100 | 82,228 | |
Yum! Brands, Inc. | 1,869,567 | 138,498 | |
| 1,190,117 | ||
Household Durables - 0.4% | |||
D.R. Horton, Inc. (d) | 1,193,072 | 29,302 | |
Garmin Ltd. (d) | 516,330 | 27,706 | |
Harman International Industries, Inc. | 283,590 | 29,700 | |
Leggett & Platt, Inc. (d) | 592,826 | 19,000 | |
Lennar Corp. Class A (d) | 738,015 | 32,384 | |
Mohawk Industries, Inc. (a) | 256,109 | 36,247 | |
Newell Rubbermaid, Inc. | 1,205,710 | 38,715 | |
Common Stocks - continued | |||
Shares | Value (000s) | ||
CONSUMER DISCRETIONARY - continued | |||
Household Durables - continued | |||
PulteGroup, Inc. | 1,447,318 | $ 30,379 | |
Whirlpool Corp. | 329,534 | 47,661 | |
| 291,094 | ||
Internet & Catalog Retail - 1.5% | |||
Amazon.com, Inc. (a) | 1,556,526 | 563,618 | |
Expedia, Inc. | 432,321 | 33,950 | |
Netflix, Inc. (a) | 248,775 | 110,862 | |
priceline.com, Inc. (a)(d) | 215,902 | 291,217 | |
TripAdvisor, Inc. (a)(d) | 465,191 | 46,631 | |
| 1,046,278 | ||
Leisure Equipment & Products - 0.1% | |||
Hasbro, Inc. | 484,811 | 26,742 | |
Mattel, Inc. | 1,420,798 | 53,010 | |
| 79,752 | ||
Media - 3.7% | |||
Cablevision Systems Corp. - NY Group Class A (d) | 898,748 | 15,818 | |
CBS Corp. Class B | 2,342,897 | 157,162 | |
Comcast Corp. Class A | 10,940,314 | 565,505 | |
DIRECTV (a) | 2,051,474 | 159,194 | |
Discovery Communications, Inc. Class A (a)(d) | 947,408 | 78,938 | |
Gannett Co., Inc. (d) | 956,734 | 28,463 | |
Interpublic Group of Companies, Inc. | 1,747,447 | 30,965 | |
News Corp. Class A (a) | 2,089,887 | 38,308 | |
Omnicom Group, Inc. | 1,080,441 | 81,768 | |
Scripps Networks Interactive, Inc. Class A | 459,930 | 37,365 | |
The Walt Disney Co. (d) | 6,860,916 | 554,431 | |
Time Warner Cable, Inc. | 1,183,417 | 166,093 | |
Time Warner, Inc. | 3,798,161 | 254,971 | |
Twenty-First Century Fox, Inc. Class A | 8,238,257 | 276,311 | |
Viacom, Inc. Class B (non-vtg.) | 1,703,789 | 149,473 | |
| 2,594,765 | ||
Multiline Retail - 0.7% | |||
Dollar General Corp. (a) | 1,236,921 | 74,092 | |
Dollar Tree, Inc. (a) | 873,611 | 47,848 | |
Family Dollar Stores, Inc. | 405,902 | 26,587 | |
Kohl's Corp. (d) | 845,053 | 47,484 | |
Macy's, Inc. | 1,546,944 | 89,506 | |
Common Stocks - continued | |||
Shares | Value (000s) | ||
CONSUMER DISCRETIONARY - continued | |||
Multiline Retail - continued | |||
Nordstrom, Inc. (d) | 600,689 | $ 36,930 | |
Target Corp. (d) | 2,653,601 | 165,956 | |
| 488,403 | ||
Specialty Retail - 2.2% | |||
AutoNation, Inc. (a) | 271,034 | 14,267 | |
AutoZone, Inc. (a)(d) | 142,871 | 76,927 | |
Bed Bath & Beyond, Inc. (a)(d) | 901,532 | 61,142 | |
Best Buy Co., Inc. (d) | 1,147,549 | 30,559 | |
CarMax, Inc. (a)(d) | 937,636 | 45,410 | |
GameStop Corp. Class A (d) | 490,751 | 18,310 | |
Gap, Inc. | 1,112,070 | 48,653 | |
Home Depot, Inc. | 5,911,951 | 484,957 | |
L Brands, Inc. | 1,023,664 | 57,663 | |
Lowe's Companies, Inc. | 4,390,550 | 219,659 | |
O'Reilly Automotive, Inc. (a)(d) | 450,563 | 67,967 | |
PetSmart, Inc. (d) | 435,474 | 29,203 | |
Ross Stores, Inc. | 909,668 | 66,224 | |
Staples, Inc. (d) | 2,772,854 | 37,683 | |
Tiffany & Co., Inc. | 462,305 | 43,110 | |
TJX Companies, Inc. | 2,985,722 | 183,502 | |
Tractor Supply Co. (d) | 586,007 | 41,349 | |
Urban Outfitters, Inc. (a) | 457,831 | 17,141 | |
| 1,543,726 | ||
Textiles, Apparel & Luxury Goods - 0.8% | |||
Coach, Inc. | 1,177,427 | 57,470 | |
Fossil Group, Inc. (a) | 206,265 | 23,702 | |
Michael Kors Holdings Ltd. (a)(d) | 753,102 | 73,827 | |
NIKE, Inc. Class B | 3,136,969 | 245,625 | |
PVH Corp. | 342,455 | 43,297 | |
Ralph Lauren Corp. | 250,312 | 40,320 | |
VF Corp. | 1,478,772 | 86,641 | |
| 570,882 | ||
TOTAL CONSUMER DISCRETIONARY | 8,732,617 | ||
CONSUMER STAPLES - 9.4% | |||
Beverages - 2.1% | |||
Beam, Inc. | 684,589 | 56,794 | |
Brown-Forman Corp. Class B (non-vtg.) | 680,229 | 57,003 | |
Coca-Cola Enterprises, Inc. | 1,013,719 | 47,726 | |
Common Stocks - continued | |||
Shares | Value (000s) | ||
CONSUMER STAPLES - continued | |||
Beverages - continued | |||
Constellation Brands, Inc. Class A (sub. vtg.) (a) | 699,478 | $ 56,679 | |
Dr. Pepper Snapple Group, Inc. | 842,330 | 43,894 | |
Molson Coors Brewing Co. Class B | 663,793 | 37,723 | |
Monster Beverage Corp. (a) | 570,173 | 42,193 | |
PepsiCo, Inc. | 6,438,286 | 515,514 | |
The Coca-Cola Co. | 15,943,297 | 609,034 | |
| 1,466,560 | ||
Food & Staples Retailing - 2.3% | |||
Costco Wholesale Corp. | 1,834,265 | 214,242 | |
CVS Caremark Corp. | 4,996,867 | 365,471 | |
Kroger Co. | 2,184,786 | 91,630 | |
Safeway, Inc. | 1,036,104 | 38,802 | |
Sysco Corp. (d) | 2,441,553 | 87,945 | |
Wal-Mart Stores, Inc. | 6,792,132 | 507,372 | |
Walgreen Co. | 3,656,038 | 248,428 | |
Whole Foods Market, Inc. (d) | 1,562,292 | 84,442 | |
| 1,638,332 | ||
Food Products - 1.5% | |||
Archer Daniels Midland Co. | 2,762,258 | 112,148 | |
Campbell Soup Co. (d) | 753,810 | 32,648 | |
ConAgra Foods, Inc. | 1,771,117 | 50,300 | |
General Mills, Inc. (d) | 2,662,732 | 133,216 | |
Hormel Foods Corp. | 565,089 | 26,813 | |
Kellogg Co. | 1,079,596 | 65,521 | |
Kraft Foods Group, Inc. | 2,501,561 | 138,261 | |
McCormick & Co., Inc. (non-vtg.) (d) | 554,371 | 36,810 | |
Mead Johnson Nutrition Co. Class A | 847,963 | 69,151 | |
Mondelez International, Inc. | 7,362,669 | 250,552 | |
The Hershey Co. | 628,922 | 66,553 | |
The J.M. Smucker Co. | 441,386 | 44,143 | |
Tyson Foods, Inc. Class A (d) | 1,140,287 | 44,984 | |
| 1,071,100 | ||
Household Products - 1.9% | |||
Clorox Co. (d) | 541,751 | 47,284 | |
Colgate-Palmolive Co. | 3,689,960 | 231,840 | |
Kimberly-Clark Corp. (d) | 1,602,179 | 176,800 | |
Procter & Gamble Co. | 11,411,548 | 897,632 | |
| 1,353,556 | ||
Common Stocks - continued | |||
Shares | Value (000s) | ||
CONSUMER STAPLES - continued | |||
Personal Products - 0.2% | |||
Avon Products, Inc. | 1,821,028 | $ 28,171 | |
Estee Lauder Companies, Inc. Class A | 1,074,933 | 73,998 | |
| 102,169 | ||
Tobacco - 1.4% | |||
Altria Group, Inc. | 8,396,367 | 304,452 | |
Lorillard, Inc. | 1,546,448 | 75,869 | |
Philip Morris International, Inc. (d) | 6,726,137 | 544,212 | |
Reynolds American, Inc. | 1,315,967 | 66,891 | |
| 991,424 | ||
TOTAL CONSUMER STAPLES | 6,623,141 | ||
ENERGY - 9.9% | |||
Energy Equipment & Services - 1.9% | |||
Baker Hughes, Inc. | 1,860,730 | 117,747 | |
Cameron International Corp. (a)(d) | 998,619 | 63,972 | |
Diamond Offshore Drilling, Inc. (d) | 291,845 | 13,804 | |
Ensco PLC Class A | 980,647 | 51,641 | |
FMC Technologies, Inc. (a)(d) | 993,236 | 49,900 | |
Halliburton Co. | 3,560,982 | 202,976 | |
Helmerich & Payne, Inc. (d) | 449,802 | 44,418 | |
Nabors Industries Ltd. | 1,090,453 | 25,102 | |
National Oilwell Varco, Inc. (d) | 1,797,228 | 138,458 | |
Noble Corp. | 1,063,841 | 33,032 | |
Rowan Companies PLC (a) | 521,561 | 17,399 | |
Schlumberger Ltd. | 5,528,778 | 514,176 | |
Transocean Ltd. (United States) (d) | 1,422,987 | 60,335 | |
| 1,332,960 | ||
Oil, Gas & Consumable Fuels - 8.0% | |||
Anadarko Petroleum Corp. | 2,112,791 | 177,812 | |
Apache Corp. (d) | 1,676,053 | 132,894 | |
Cabot Oil & Gas Corp. | 1,768,056 | 61,882 | |
Chesapeake Energy Corp. (d) | 2,122,059 | 54,983 | |
Chevron Corp. | 8,073,773 | 931,148 | |
ConocoPhillips Co. | 5,143,152 | 342,020 | |
CONSOL Energy, Inc. | 961,133 | 38,541 | |
Denbury Resources, Inc. (d) | 1,539,417 | 25,185 | |
Devon Energy Corp. | 1,602,183 | 103,213 | |
EOG Resources, Inc. | 1,145,991 | 217,074 | |
EQT Corp. | 632,728 | 64,722 | |
Common Stocks - continued | |||
Shares | Value (000s) | ||
ENERGY - continued | |||
Oil, Gas & Consumable Fuels - continued | |||
Exxon Mobil Corp. | 18,339,687 | $ 1,765,562 | |
Hess Corp. (d) | 1,194,140 | 95,567 | |
Kinder Morgan Holding Co. LLC | 2,826,626 | 90,028 | |
Marathon Oil Corp. | 2,924,575 | 97,973 | |
Marathon Petroleum Corp. | 1,263,757 | 106,156 | |
Murphy Oil Corp. (d) | 737,884 | 43,808 | |
Newfield Exploration Co. (a) | 571,465 | 16,110 | |
Noble Energy, Inc. (d) | 1,508,300 | 103,711 | |
Occidental Petroleum Corp. | 3,383,962 | 326,620 | |
ONEOK, Inc. (d) | 866,024 | 51,217 | |
Peabody Energy Corp. (d) | 1,132,792 | 19,892 | |
Phillips 66 Co. | 2,516,943 | 188,418 | |
Pioneer Natural Resources Co. | 598,736 | 120,454 | |
QEP Resources, Inc. | 752,649 | 21,774 | |
Range Resources Corp. (d) | 686,071 | 59,036 | |
Southwestern Energy Co. (a)(d) | 1,472,262 | 60,863 | |
Spectra Energy Corp. | 2,812,926 | 104,866 | |
Tesoro Corp. | 557,653 | 28,446 | |
The Williams Companies, Inc. | 2,869,134 | 118,495 | |
Valero Energy Corp. | 2,265,164 | 108,683 | |
WPX Energy, Inc. (a)(d) | 843,027 | 14,854 | |
| 5,692,007 | ||
TOTAL ENERGY | 7,024,967 | ||
FINANCIALS - 15.7% | |||
Capital Markets - 2.1% | |||
Ameriprise Financial, Inc. | 816,713 | 89,014 | |
Bank of New York Mellon Corp. | 4,821,670 | 154,293 | |
BlackRock, Inc. Class A | 533,416 | 162,607 | |
Charles Schwab Corp. (d) | 4,871,097 | 129,133 | |
E*TRADE Financial Corp. (a) | 1,205,701 | 27,092 | |
Franklin Resources, Inc. (d) | 1,694,941 | 90,256 | |
Goldman Sachs Group, Inc. | 1,769,541 | 294,540 | |
Invesco Ltd. | 1,860,957 | 63,831 | |
Legg Mason, Inc. | 445,663 | 20,483 | |
Morgan Stanley | 5,816,336 | 179,143 | |
Northern Trust Corp. | 943,094 | 58,330 | |
Common Stocks - continued | |||
Shares | Value (000s) | ||
FINANCIALS - continued | |||
Capital Markets - continued | |||
State Street Corp. | 1,842,993 | $ 121,029 | |
T. Rowe Price Group, Inc. | 1,095,332 | 88,908 | |
| 1,478,659 | ||
Commercial Banks - 2.8% | |||
BB&T Corp. | 2,959,382 | 111,865 | |
Comerica, Inc. | 767,888 | 36,997 | |
Fifth Third Bancorp | 3,706,280 | 80,408 | |
Huntington Bancshares, Inc. | 3,521,195 | 33,557 | |
KeyCorp | 3,764,366 | 49,577 | |
M&T Bank Corp. | 546,722 | 63,742 | |
PNC Financial Services Group, Inc. | 2,233,871 | 182,686 | |
Regions Financial Corp. | 5,783,177 | 61,533 | |
SunTrust Banks, Inc. | 2,247,158 | 84,673 | |
U.S. Bancorp (d) | 7,667,107 | 315,425 | |
Wells Fargo & Co. | 20,123,906 | 934,152 | |
Zions Bancorporation (d) | 775,042 | 24,181 | |
| 1,978,796 | ||
Consumer Finance - 1.0% | |||
American Express Co. (d) | 3,867,729 | 353,046 | |
Capital One Financial Corp. | 2,420,466 | 177,735 | |
Discover Financial Services | 2,010,915 | 115,386 | |
SLM Corp. | 1,831,502 | 43,846 | |
| 690,013 | ||
Diversified Financial Services - 5.0% | |||
Bank of America Corp. | 44,778,054 | 740,181 | |
Berkshire Hathaway, Inc. Class B (a) | 7,556,795 | 874,926 | |
Citigroup, Inc. | 12,733,000 | 619,206 | |
CME Group, Inc. | 1,323,403 | 97,694 | |
IntercontinentalExchange Group, Inc. | 482,938 | 100,857 | |
JPMorgan Chase & Co. | 15,781,647 | 896,713 | |
Leucadia National Corp. | 1,316,132 | 36,773 | |
McGraw Hill Financial, Inc. | 1,136,860 | 90,562 | |
Moody's Corp. (d) | 794,660 | 62,778 | |
The Nasdaq OMX Group, Inc. | 485,421 | 18,635 | |
| 3,538,325 | ||
Insurance - 2.8% | |||
ACE Ltd. | 1,427,645 | 139,724 | |
AFLAC, Inc. | 1,956,717 | 125,386 | |
Allstate Corp. | 1,909,521 | 103,611 | |
Common Stocks - continued | |||
Shares | Value (000s) | ||
FINANCIALS - continued | |||
Insurance - continued | |||
American International Group, Inc. | 6,181,132 | $ 307,635 | |
Aon PLC | 1,263,845 | 108,185 | |
Assurant, Inc. (d) | 305,277 | 20,035 | |
Cincinnati Financial Corp. (d) | 619,009 | 29,019 | |
Genworth Financial, Inc. Class A (a) | 2,074,979 | 32,245 | |
Hartford Financial Services Group, Inc. | 1,876,922 | 66,049 | |
Lincoln National Corp. (d) | 1,101,373 | 55,212 | |
Loews Corp. | 1,284,035 | 55,830 | |
Marsh & McLennan Companies, Inc. | 2,303,845 | 110,953 | |
MetLife, Inc. | 4,706,368 | 238,472 | |
Principal Financial Group, Inc. | 1,149,304 | 52,121 | |
Progressive Corp. (d) | 2,317,364 | 56,752 | |
Prudential Financial, Inc. | 1,943,745 | 164,402 | |
The Chubb Corp. | 1,056,927 | 92,460 | |
The Travelers Companies, Inc. | 1,528,412 | 128,142 | |
Torchmark Corp. (d) | 379,597 | 29,423 | |
Unum Group | 1,096,398 | 38,133 | |
XL Group PLC Class A | 1,187,284 | 36,093 | |
| 1,989,882 | ||
Real Estate Investment Trusts - 1.9% | |||
American Tower Corp. | 1,656,759 | 134,976 | |
Apartment Investment & Management Co. Class A | 612,577 | 18,310 | |
AvalonBay Communities, Inc. | 510,698 | 65,865 | |
Boston Properties, Inc. | 641,809 | 72,159 | |
Equity Residential (SBI) (d) | 1,407,146 | 82,276 | |
General Growth Properties, Inc. | 2,256,911 | 49,697 | |
HCP, Inc. (d) | 1,915,499 | 74,264 | |
Health Care REIT, Inc. (d) | 1,211,885 | 71,186 | |
Host Hotels & Resorts, Inc. | 3,174,991 | 62,452 | |
Kimco Realty Corp. (d) | 1,719,941 | 38,286 | |
Plum Creek Timber Co., Inc. (d) | 742,695 | 32,151 | |
Prologis, Inc. | 2,093,720 | 86,240 | |
Public Storage | 606,785 | 102,547 | |
Simon Property Group, Inc. | 1,302,792 | 210,127 | |
The Macerich Co. | 590,009 | 35,477 | |
Ventas, Inc. | 1,234,597 | 77,076 | |
Vornado Realty Trust (d) | 730,288 | 70,319 | |
Weyerhaeuser Co. | 2,446,498 | 72,196 | |
| 1,355,604 | ||
Common Stocks - continued | |||
Shares | Value (000s) | ||
FINANCIALS - continued | |||
Real Estate Management & Development - 0.0% | |||
CBRE Group, Inc. (a)(d) | 1,168,644 | $ 32,664 | |
Thrifts & Mortgage Finance - 0.1% | |||
Hudson City Bancorp, Inc. | 1,996,545 | 18,967 | |
People's United Financial, Inc. | 1,334,177 | 18,905 | |
| 37,872 | ||
TOTAL FINANCIALS | 11,101,815 | ||
HEALTH CARE - 13.5% | |||
Biotechnology - 2.6% | |||
Alexion Pharmaceuticals, Inc. (a) | 823,148 | 145,533 | |
Amgen, Inc. | 3,165,935 | 392,639 | |
Biogen Idec, Inc. (a) | 991,658 | 337,838 | |
Celgene Corp. (a) | 1,729,932 | 278,087 | |
Gilead Sciences, Inc. (a)(d) | 6,437,233 | 532,939 | |
Regeneron Pharmaceuticals, Inc. (a)(d) | 329,727 | 109,634 | |
Vertex Pharmaceuticals, Inc. (a)(d) | 981,348 | 79,352 | |
| 1,876,022 | ||
Health Care Equipment & Supplies - 2.1% | |||
Abbott Laboratories (d) | 6,491,125 | 258,217 | |
Baxter International, Inc. | 2,278,329 | 158,344 | |
Becton, Dickinson & Co. | 814,836 | 93,885 | |
Boston Scientific Corp. (a) | 5,605,461 | 73,432 | |
C.R. Bard, Inc. (d) | 326,995 | 47,140 | |
CareFusion Corp. (a) | 887,233 | 35,960 | |
Covidien PLC | 1,931,142 | 138,946 | |
DENTSPLY International, Inc. | 598,875 | 27,177 | |
Edwards Lifesciences Corp. (a)(d) | 459,307 | 32,041 | |
Intuitive Surgical, Inc. (a)(d) | 159,798 | 71,083 | |
Medtronic, Inc. | 4,191,225 | 248,372 | |
St. Jude Medical, Inc. (d) | 1,225,075 | 82,472 | |
Stryker Corp. (d) | 1,239,156 | 99,430 | |
Varian Medical Systems, Inc. (a)(d) | 443,824 | 37,206 | |
Zimmer Holdings, Inc. (d) | 717,804 | 67,359 | |
| 1,471,064 | ||
Health Care Providers & Services - 2.1% | |||
Aetna, Inc. | 1,542,821 | 112,179 | |
AmerisourceBergen Corp. | 965,710 | 65,523 | |
Cardinal Health, Inc. | 1,433,573 | 102,543 | |
Cigna Corp. | 1,160,420 | 92,358 | |
Common Stocks - continued | |||
Shares | Value (000s) | ||
HEALTH CARE - continued | |||
Health Care Providers & Services - continued | |||
DaVita HealthCare Partners, Inc. (a) | 741,146 | $ 50,939 | |
Express Scripts Holding Co. (a)(d) | 3,382,871 | 254,764 | |
Humana, Inc. | 654,546 | 73,610 | |
Laboratory Corp. of America Holdings (a)(d) | 366,918 | 34,322 | |
McKesson Corp. | 964,362 | 170,740 | |
Patterson Companies, Inc. (d) | 350,005 | 14,406 | |
Quest Diagnostics, Inc. (d) | 610,525 | 32,358 | |
Tenet Healthcare Corp. (a)(d) | 416,570 | 18,379 | |
UnitedHealth Group, Inc. | 4,226,523 | 326,583 | |
WellPoint, Inc. | 1,240,206 | 112,350 | |
| 1,461,054 | ||
Health Care Technology - 0.1% | |||
Cerner Corp. (a)(d) | 1,239,321 | 76,057 | |
Life Sciences Tools & Services - 0.5% | |||
Agilent Technologies, Inc. | 1,388,715 | 79,060 | |
PerkinElmer, Inc. | 471,843 | 21,384 | |
Thermo Fisher Scientific, Inc. | 1,663,590 | 207,183 | |
Waters Corp. (a)(d) | 357,389 | 39,813 | |
| 347,440 | ||
Pharmaceuticals - 6.1% | |||
AbbVie, Inc. | 6,678,680 | 340,012 | |
Actavis PLC (a)(d) | 730,680 | 161,349 | |
Allergan, Inc. | 1,247,531 | 158,436 | |
Bristol-Myers Squibb Co. | 6,912,438 | 371,682 | |
Eli Lilly & Co. (d) | 4,162,266 | 248,113 | |
Forest Laboratories, Inc. (a) | 995,294 | 97,111 | |
Hospira, Inc. (a)(d) | 696,369 | 30,139 | |
Johnson & Johnson | 11,844,826 | 1,091,145 | |
Merck & Co., Inc. | 12,266,702 | 699,079 | |
Mylan, Inc. (a)(d) | 1,607,292 | 89,317 | |
Perrigo Co. PLC | 558,573 | 91,852 | |
Pfizer, Inc. | 27,208,522 | 873,666 | |
Zoetis, Inc. Class A | 2,099,105 | 65,114 | |
| 4,317,015 | ||
TOTAL HEALTH CARE | 9,548,652 | ||
INDUSTRIALS - 10.6% | |||
Aerospace & Defense - 2.8% | |||
General Dynamics Corp. (d) | 1,404,652 | 153,866 | |
Common Stocks - continued | |||
Shares | Value (000s) | ||
INDUSTRIALS - continued | |||
Aerospace & Defense - continued | |||
Honeywell International, Inc. (d) | 3,294,177 | $ 311,102 | |
L-3 Communications Holdings, Inc. | 372,061 | 42,936 | |
Lockheed Martin Corp. | 1,129,546 | 183,325 | |
Northrop Grumman Corp. | 931,952 | 112,794 | |
Precision Castparts Corp. | 609,807 | 157,257 | |
Raytheon Co. | 1,341,192 | 131,316 | |
Rockwell Collins, Inc. (d) | 567,246 | 46,820 | |
Textron, Inc. (d) | 1,180,310 | 46,858 | |
The Boeing Co. | 2,902,337 | 374,169 | |
United Technologies Corp. | 3,543,977 | 414,716 | |
| 1,975,159 | ||
Air Freight & Logistics - 0.7% | |||
C.H. Robinson Worldwide, Inc. | 636,587 | 33,013 | |
Expeditors International of Washington, Inc. | 863,056 | 34,099 | |
FedEx Corp. | 1,249,553 | 166,603 | |
United Parcel Service, Inc. Class B (d) | 3,000,963 | 287,402 | |
| 521,117 | ||
Airlines - 0.2% | |||
Delta Air Lines, Inc. | 3,591,712 | 119,281 | |
Southwest Airlines Co. | 2,924,941 | 65,636 | |
| 184,917 | ||
Building Products - 0.1% | |||
Allegion PLC | 374,924 | 20,377 | |
Masco Corp. (d) | 1,498,686 | 34,994 | |
| 55,371 | ||
Commercial Services & Supplies - 0.5% | |||
ADT Corp. (d) | 769,567 | 23,633 | |
Cintas Corp. (d) | 422,782 | 25,646 | |
Iron Mountain, Inc. | 714,458 | 19,433 | |
Pitney Bowes, Inc. (d) | 847,998 | 21,582 | |
Republic Services, Inc. | 1,133,797 | 38,674 | |
Stericycle, Inc. (a)(d) | 359,824 | 41,020 | |
Tyco International Ltd. (d) | 1,953,413 | 82,395 | |
Waste Management, Inc. | 1,831,834 | 76,021 | |
| 328,404 | ||
Construction & Engineering - 0.2% | |||
Fluor Corp. | 685,781 | 53,278 | |
Common Stocks - continued | |||
Shares | Value (000s) | ||
INDUSTRIALS - continued | |||
Construction & Engineering - continued | |||
Jacobs Engineering Group, Inc. (a) | 552,951 | $ 33,536 | |
Quanta Services, Inc. (a) | 906,213 | 31,908 | |
| 118,722 | ||
Electrical Equipment - 0.7% | |||
AMETEK, Inc. | 1,027,514 | 54,705 | |
Eaton Corp. PLC (d) | 1,992,023 | 148,824 | |
Emerson Electric Co. | 2,955,348 | 192,866 | |
Rockwell Automation, Inc. (d) | 582,153 | 71,512 | |
Roper Industries, Inc. | 416,919 | 56,543 | |
| 524,450 | ||
Industrial Conglomerates - 2.3% | |||
3M Co. (d) | 2,685,165 | 361,772 | |
Danaher Corp. (d) | 2,517,179 | 192,539 | |
General Electric Co. | 42,474,254 | 1,081,819 | |
| 1,636,130 | ||
Machinery - 1.8% | |||
Caterpillar, Inc. (d) | 2,671,519 | 259,057 | |
Cummins, Inc. (d) | 731,522 | 106,744 | |
Deere & Co. | 1,607,246 | 138,111 | |
Dover Corp. | 715,222 | 67,445 | |
Flowserve Corp. (d) | 585,512 | 47,549 | |
Illinois Tool Works, Inc. | 1,714,236 | 141,424 | |
Ingersoll-Rand PLC | 1,124,772 | 68,769 | |
Joy Global, Inc. (d) | 446,172 | 24,539 | |
PACCAR, Inc. (d) | 1,486,532 | 97,873 | |
Pall Corp. | 465,113 | 40,000 | |
Parker Hannifin Corp. | 626,515 | 75,526 | |
Pentair Ltd. (d) | 836,835 | 67,625 | |
Snap-On, Inc. | 244,123 | 27,383 | |
Stanley Black & Decker, Inc. | 651,625 | 54,111 | |
Xylem, Inc. (d) | 774,509 | 30,477 | |
| 1,246,633 | ||
Professional Services - 0.2% | |||
Dun & Bradstreet Corp. | 160,201 | 15,894 | |
Equifax, Inc. | 510,856 | 35,791 | |
Nielsen Holdings B.V. | 1,062,335 | 50,291 | |
Robert Half International, Inc. | 581,852 | 23,821 | |
| 125,797 | ||
Common Stocks - continued | |||
Shares | Value (000s) | ||
INDUSTRIALS - continued | |||
Road & Rail - 0.9% | |||
CSX Corp. | 4,255,558 | $ 117,922 | |
Kansas City Southern | 462,674 | 43,454 | |
Norfolk Southern Corp. | 1,296,851 | 119,194 | |
Ryder System, Inc. | 220,793 | 16,630 | |
Union Pacific Corp. | 1,933,538 | 348,772 | |
| 645,972 | ||
Trading Companies & Distributors - 0.2% | |||
Fastenal Co. (d) | 1,146,107 | 54,085 | |
W.W. Grainger, Inc. (d) | 259,348 | 66,139 | |
| 120,224 | ||
TOTAL INDUSTRIALS | 7,482,896 | ||
INFORMATION TECHNOLOGY - 18.6% | |||
Communications Equipment - 1.7% | |||
Cisco Systems, Inc. | 22,445,916 | 489,321 | |
F5 Networks, Inc. (a)(d) | 325,814 | 36,602 | |
Harris Corp. | 448,674 | 33,121 | |
Juniper Networks, Inc. (a) | 2,120,084 | 56,691 | |
Motorola Solutions, Inc. | 966,643 | 63,992 | |
QUALCOMM, Inc. | 7,092,510 | 533,995 | |
| 1,213,722 | ||
Computers & Peripherals - 3.9% | |||
Apple, Inc. | 3,777,237 | 1,987,732 | |
EMC Corp. (d) | 8,639,155 | 227,815 | |
Hewlett-Packard Co. | 8,068,110 | 241,075 | |
NetApp, Inc. (d) | 1,430,806 | 57,819 | |
SanDisk Corp. (d) | 948,324 | 70,460 | |
Seagate Technology (d) | 1,369,194 | 71,458 | |
Western Digital Corp. | 883,752 | 76,878 | |
| 2,733,237 | ||
Electronic Equipment & Components - 0.5% | |||
Amphenol Corp. Class A | 664,488 | 58,488 | |
Corning, Inc. | 6,075,574 | 117,076 | |
FLIR Systems, Inc. | 594,689 | 20,303 | |
Jabil Circuit, Inc. | 776,155 | 14,367 | |
TE Connectivity Ltd. | 1,722,812 | 100,922 | |
| 311,156 | ||
Common Stocks - continued | |||
Shares | Value (000s) | ||
INFORMATION TECHNOLOGY - continued | |||
Internet Software & Services - 3.4% | |||
Akamai Technologies, Inc. (a)(d) | 751,373 | $ 45,931 | |
eBay, Inc. (a) | 4,891,428 | 287,469 | |
Facebook, Inc. Class A (a) | 6,904,847 | 472,706 | |
Google, Inc. Class A (a) | 1,178,140 | 1,432,206 | |
VeriSign, Inc. (a)(d) | 540,843 | 29,806 | |
Yahoo!, Inc. (a)(d) | 3,960,667 | 153,159 | |
| 2,421,277 | ||
IT Services - 3.6% | |||
Accenture PLC Class A (d) | 2,668,904 | 222,453 | |
Alliance Data Systems Corp. (a) | 204,505 | 58,306 | |
Automatic Data Processing, Inc. | 2,021,095 | 157,201 | |
Cognizant Technology Solutions Corp. Class A (a) | 1,269,929 | 132,149 | |
Computer Sciences Corp. | 618,014 | 39,058 | |
Fidelity National Information Services, Inc. | 1,222,221 | 67,968 | |
Fiserv, Inc. (a) | 1,082,863 | 62,860 | |
IBM Corp. (d) | 4,285,066 | 793,466 | |
MasterCard, Inc. Class A | 4,346,141 | 337,782 | |
Paychex, Inc. | 1,364,502 | 56,982 | |
Teradata Corp. (a)(d) | 685,978 | 31,500 | |
The Western Union Co. | 2,318,434 | 38,787 | |
Total System Services, Inc. | 701,122 | 21,356 | |
Visa, Inc. Class A (d) | 2,137,864 | 483,029 | |
Xerox Corp. | 4,858,300 | 53,393 | |
| 2,556,290 | ||
Semiconductors & Semiconductor Equipment - 2.0% | |||
Altera Corp. | 1,348,148 | 48,951 | |
Analog Devices, Inc. | 1,305,814 | 66,361 | |
Applied Materials, Inc. | 5,055,344 | 95,849 | |
Broadcom Corp. Class A | 2,265,323 | 67,325 | |
First Solar, Inc. (a)(d) | 296,397 | 16,915 | |
Intel Corp. | 20,869,015 | 516,717 | |
KLA-Tencor Corp. | 699,618 | 45,580 | |
Lam Research Corp. (a)(d) | 681,747 | 35,267 | |
Linear Technology Corp. (d) | 983,052 | 46,046 | |
LSI Corp. | 2,287,724 | 25,371 | |
Microchip Technology, Inc. (d) | 832,779 | 37,933 | |
Micron Technology, Inc. (a) | 4,415,848 | 106,819 | |
NVIDIA Corp. | 2,429,042 | 44,646 | |
Common Stocks - continued | |||
Shares | Value (000s) | ||
INFORMATION TECHNOLOGY - continued | |||
Semiconductors & Semiconductor Equipment - continued | |||
Texas Instruments, Inc. | 4,595,142 | $ 206,598 | |
Xilinx, Inc. (d) | 1,126,423 | 58,799 | |
| 1,419,177 | ||
Software - 3.5% | |||
Adobe Systems, Inc. (a) | 1,951,699 | 133,906 | |
Autodesk, Inc. (a) | 947,103 | 49,685 | |
CA Technologies, Inc. | 1,364,052 | 45,696 | |
Citrix Systems, Inc. (a) | 782,523 | 46,991 | |
Electronic Arts, Inc. (a)(d) | 1,297,746 | 37,103 | |
Intuit, Inc. (d) | 1,195,857 | 93,456 | |
Microsoft Corp. | 31,891,896 | 1,221,779 | |
Oracle Corp. | 14,732,338 | 576,182 | |
Red Hat, Inc. (a) | 795,546 | 46,929 | |
salesforce.com, Inc. (a)(d) | 2,328,967 | 145,258 | |
Symantec Corp. | 2,922,048 | 62,766 | |
| 2,459,751 | ||
TOTAL INFORMATION TECHNOLOGY | 13,114,610 | ||
MATERIALS - 3.5% | |||
Chemicals - 2.6% | |||
Air Products & Chemicals, Inc. | 886,969 | 107,607 | |
Airgas, Inc. | 278,641 | 30,037 | |
CF Industries Holdings, Inc. | 240,609 | 60,369 | |
E.I. du Pont de Nemours & Co. (d) | 3,887,921 | 259,013 | |
Eastman Chemical Co. | 646,179 | 56,495 | |
Ecolab, Inc. (d) | 1,138,409 | 122,664 | |
FMC Corp. (d) | 559,504 | 43,183 | |
International Flavors & Fragrances, Inc. | 342,204 | 32,095 | |
LyondellBasell Industries NV Class A | 1,833,954 | 161,535 | |
Monsanto Co. | 2,207,548 | 242,874 | |
PPG Industries, Inc. | 596,234 | 117,947 | |
Praxair, Inc. | 1,235,780 | 161,109 | |
Sherwin-Williams Co. | 361,599 | 72,493 | |
Sigma Aldrich Corp. | 502,376 | 47,429 | |
The Dow Chemical Co. | 5,091,796 | 248,021 | |
The Mosaic Co. | 1,430,666 | 69,902 | |
| 1,832,773 | ||
Construction Materials - 0.1% | |||
Vulcan Materials Co. | 545,714 | 37,070 | |
Common Stocks - continued | |||
Shares | Value (000s) | ||
MATERIALS - continued | |||
Containers & Packaging - 0.2% | |||
Avery Dennison Corp. | 405,609 | $ 20,207 | |
Ball Corp. | 607,191 | 33,736 | |
Bemis Co., Inc. (d) | 432,162 | 16,975 | |
MeadWestvaco Corp. (d) | 746,767 | 27,951 | |
Owens-Illinois, Inc. (a) | 692,669 | 23,495 | |
Sealed Air Corp. | 823,556 | 28,034 | |
| 150,398 | ||
Metals & Mining - 0.5% | |||
Alcoa, Inc. (d) | 4,490,352 | 52,717 | |
Allegheny Technologies, Inc. (d) | 453,324 | 14,407 | |
Cliffs Natural Resources, Inc. (d) | 642,838 | 12,876 | |
Freeport-McMoRan Copper & Gold, Inc. | 4,358,333 | 142,169 | |
Newmont Mining Corp. | 2,090,138 | 48,617 | |
Nucor Corp. | 1,335,898 | 67,116 | |
United States Steel Corp. (d) | 607,334 | 14,710 | |
| 352,612 | ||
Paper & Forest Products - 0.1% | |||
International Paper Co. | 1,862,397 | 91,053 | |
TOTAL MATERIALS | 2,463,906 | ||
TELECOMMUNICATION SERVICES - 2.5% | |||
Diversified Telecommunication Services - 2.3% | |||
AT&T, Inc. (d) | 22,115,865 | 706,160 | |
CenturyLink, Inc. | 2,481,406 | 77,569 | |
Frontier Communications Corp. (d) | 4,196,250 | 20,478 | |
Verizon Communications, Inc. (d) | 17,365,550 | 826,253 | |
Windstream Holdings, Inc. (d) | 2,502,405 | 20,069 | |
| 1,650,529 | ||
Wireless Telecommunication Services - 0.2% | |||
Crown Castle International Corp. | 1,402,477 | 106,448 | |
TOTAL TELECOMMUNICATION SERVICES | 1,756,977 | ||
UTILITIES - 2.9% | |||
Electric Utilities - 1.7% | |||
American Electric Power Co., Inc. | 2,045,717 | 102,695 | |
Duke Energy Corp. | 2,963,866 | 210,079 | |
Edison International | 1,367,805 | 71,632 | |
Entergy Corp. | 748,611 | 47,776 | |
Common Stocks - continued | |||
Shares | Value (000s) | ||
UTILITIES - continued | |||
Electric Utilities - continued | |||
Exelon Corp. (d) | 3,597,414 | $ 109,397 | |
FirstEnergy Corp. | 1,755,794 | 54,043 | |
NextEra Energy, Inc. | 1,808,069 | 165,239 | |
Northeast Utilities | 1,322,812 | 58,799 | |
Pepco Holdings, Inc. | 1,048,518 | 21,379 | |
Pinnacle West Capital Corp. (d) | 461,986 | 25,710 | |
PPL Corp. | 2,645,885 | 85,436 | |
Southern Co. (d) | 3,701,683 | 156,766 | |
Xcel Energy, Inc. (d) | 2,089,164 | 63,281 | |
| 1,172,232 | ||
Gas Utilities - 0.0% | |||
AGL Resources, Inc. | 498,694 | 23,459 | |
Independent Power Producers & Energy Traders - 0.1% | |||
NRG Energy, Inc. (d) | 1,357,749 | 39,470 | |
The AES Corp. | 2,756,658 | 37,628 | |
| 77,098 | ||
Multi-Utilities - 1.1% | |||
Ameren Corp. | 1,018,619 | 41,162 | |
CenterPoint Energy, Inc. | 1,799,496 | 42,558 | |
CMS Energy Corp. | 1,116,708 | 31,748 | |
Consolidated Edison, Inc. (d) | 1,229,588 | 68,918 | |
Dominion Resources, Inc. | 2,436,759 | 169,111 | |
DTE Energy Co. | 742,221 | 53,262 | |
Integrys Energy Group, Inc. | 335,042 | 19,188 | |
NiSource, Inc. | 1,315,260 | 45,797 | |
PG&E Corp. | 1,886,209 | 83,106 | |
Public Service Enterprise Group, Inc. | 2,123,682 | 77,854 | |
SCANA Corp. | 590,046 | 29,207 | |
Sempra Energy (d) | 954,207 | 90,144 | |
TECO Energy, Inc. (d) | 857,531 | 14,389 | |
Wisconsin Energy Corp. | 950,965 | 41,804 | |
| 808,248 | ||
TOTAL UTILITIES | 2,081,037 | ||
TOTAL COMMON STOCKS (Cost $40,581,185) |
| ||
U.S. Treasury Obligations - 0.1% | ||||
| Principal | Value (000s) | ||
U.S. Treasury Bills, yield at date of purchase 0.07% to 0.09% 4/3/14 to 9/18/14 (e) | $ 53,000 | $ 52,990 | ||
Money Market Funds - 7.2% | |||
Shares |
| ||
Fidelity Cash Central Fund, 0.10% (b) | 476,625,951 | 476,626 | |
Fidelity Securities Lending Cash Central Fund, 0.09% (b)(c) | 4,608,422,468 | 4,608,422 | |
TOTAL MONEY MARKET FUNDS (Cost $5,085,048) |
| ||
TOTAL INVESTMENT PORTFOLIO - 106.3% (Cost $45,719,218) | 75,068,656 | ||
NET OTHER ASSETS (LIABILITIES) - (6.3)% | (4,440,532) | ||
NET ASSETS - 100% | $ 70,628,124 | ||
Futures Contracts | |||||
Expiration | Underlying | Unrealized | |||
Purchased | |||||
Equity Index Contracts | |||||
352 CME E-mini S&P 500 Index Contracts (United States) | March 2014 | $ 32,694 | $ 1,148 | ||
1,443 CME S&P 500 Index Contracts (United States) | March 2014 | 670,129 | 7,745 | ||
TOTAL EQUITY INDEX CONTRACTS | $ 702,823 | $ 8,893 | |||
|
The face value of futures purchased as a percentage of net assets is 0.9% |
Legend |
(a) Non-income producing |
(b) Affiliated fund that is generally available only to investment companies and other accounts managed by Fidelity Investments. The rate quoted is the annualized seven-day yield of the fund at period end. A complete unaudited listing of the fund's holdings as of its most recent quarter end is available upon request. In addition, each Fidelity Central Fund's financial statements, which are not covered by the Fund's Report of Independent Registered Public Accounting Firm, are available on the SEC's website or upon request. |
(c) Investment made with cash collateral received from securities on loan. |
(d) Security or a portion of the security is on loan at period end. |
(e) Security or a portion of the security was pledged to cover margin requirements for futures contracts. At period end, the value of securities pledged amounted to $33,344,000. |
Affiliated Central Funds |
Information regarding fiscal year to date income earned by the Fund from investments in Fidelity Central Funds is as follows: |
Fund | Income earned |
Fidelity Cash Central Fund | $ 833 |
Fidelity Securities Lending Cash Central Fund | 4,627 |
Total | $ 5,460 |
Other Information |
The following is a summary of the inputs used, as of February 28, 2014, involving the Fund's assets and liabilities carried at fair value. The inputs or methodology used for valuing securities may not be an indication of the risk associated with investing in those securities. For more information on valuation inputs, and their aggregation into the levels used in the table below, please refer to the Investment Valuation section in the accompanying Notes to Financial Statements. |
Valuation Inputs at Reporting Date: | ||||
Description | Total | Level 1 | Level 2 | Level 3 |
Investments in Securities: | ||||
Equities: | ||||
Consumer Discretionary | $ 8,732,617 | $ 8,732,617 | $ - | $ - |
Consumer Staples | 6,623,141 | 6,623,141 | - | - |
Energy | 7,024,967 | 7,024,967 | - | - |
Financials | 11,101,815 | 11,101,815 | - | - |
Health Care | 9,548,652 | 9,548,652 | - | - |
Industrials | 7,482,896 | 7,482,896 | - | - |
Information Technology | 13,114,610 | 13,114,610 | - | - |
Materials | 2,463,906 | 2,463,906 | - | - |
Telecommunication Services | 1,756,977 | 1,756,977 | - | - |
Utilities | 2,081,037 | 2,081,037 | - | - |
U.S. Government and Government Agency Obligations | 52,990 | - | 52,990 | - |
Money Market Funds | 5,085,048 | 5,085,048 | - | - |
Total Investments in Securities: | $ 75,068,656 | $ 75,015,666 | $ 52,990 | $ - |
Derivative Instruments: | ||||
Assets | ||||
Futures Contracts | $ 8,893 | $ 8,893 | $ - | $ - |
Value of Derivative Instruments |
The following table is a summary of the Fund's value of derivative instruments by primary risk exposure as of February 28, 2014. For additional information on derivative instruments, please refer to the Derivative Instruments section in the accompanying Notes to Financial Statements. |
Primary Risk Exposure / | Value (000s) | |
| Asset | Liability |
Equity Risk | ||
Futures Contracts (a) | $ 8,893 | $ - |
Total Value of Derivatives | $ 8,893 | $ - |
(a) Reflects gross cumulative appreciation (depreciation) on futures contracts as presented in the Schedule of Investments. Only the period end receivable or payable for daily variation margin and net unrealized appreciation (depreciation) are presented in the Statement of Assets and Liabilities. |
See accompanying notes which are an integral part of the financial statements.
Annual Report
Financial Statements
Statement of Assets and Liabilities
Amounts in thousands (except per-share amounts) | February 28, 2014 | |
|
|
|
Assets | ||
Investment in securities, at value (including securities loaned of $4,501,014) - See accompanying schedule: Unaffiliated issuers (cost $40,634,170) | $ 69,983,608 |
|
Fidelity Central Funds (cost $5,085,048) | 5,085,048 |
|
Total Investments (cost $45,719,218) |
| $ 75,068,656 |
Receivable for fund shares sold | 72,385 | |
Dividends receivable | 153,443 | |
Distributions receivable from Fidelity Central Funds | 370 | |
Receivable for daily variation margin for derivative instruments | 1,350 | |
Receivable from investment adviser for expense reductions | 889 | |
Other receivables | 1,519 | |
Total assets | 75,298,612 | |
|
|
|
Liabilities | ||
Payable for investments purchased | $ 329 | |
Payable for fund shares redeemed | 56,579 | |
Accrued management fee | 1,431 | |
Other affiliated payables | 2,227 | |
Other payables and accrued expenses | 1,500 | |
Collateral on securities loaned, at value | 4,608,422 | |
Total liabilities | 4,670,488 | |
|
|
|
Net Assets | $ 70,628,124 | |
Net Assets consist of: |
| |
Paid in capital | $ 41,593,265 | |
Undistributed net investment income | 230,704 | |
Accumulated undistributed net realized gain (loss) on investments | (554,176) | |
Net unrealized appreciation (depreciation) on investments | 29,358,331 | |
Net Assets | $ 70,628,124 | |
See accompanying notes which are an integral part of the financial statements.
Annual Report
Statement of Assets and Liabilities - continued
Amounts in thousands (except per-share amounts) | February 28, 2014 | |
|
|
|
Investor Class: | $ 66.10 | |
|
|
|
Fidelity Advantage Class: | $ 66.11 | |
|
|
|
Institutional Class: | $ 66.11 | |
|
|
|
Fidelity Advantage Institutional Class: | $ 66.11 | |
See accompanying notes which are an integral part of the financial statements.
Annual Report
Financial Statements - continued
Statement of Operations
Amounts in thousands | Year ended February 28, 2014 | |
|
|
|
Investment Income |
|
|
Dividends |
| $ 1,286,205 |
Interest |
| 42 |
Income from Fidelity Central Funds |
| 5,460 |
Total income |
| 1,291,707 |
|
|
|
Expenses | ||
Management fee | $ 15,599 | |
Transfer agent fees | 24,348 | |
Independent trustees' compensation | 301 | |
Appreciation in deferred trustee compensation account | 1 | |
Miscellaneous | 117 | |
Total expenses before reductions | 40,366 | |
Expense reductions | (9,602) | 30,764 |
Net investment income (loss) | 1,260,943 | |
Realized and Unrealized Gain (Loss) Net realized gain (loss) on: | ||
Investment securities: |
|
|
Unaffiliated issuers | 800,214 | |
Futures contracts | 189,043 | |
Total net realized gain (loss) |
| 989,257 |
Change in net unrealized appreciation (depreciation) on: Investment securities | 11,661,786 | |
Futures contracts | (2,763) | |
Total change in net unrealized appreciation (depreciation) |
| 11,659,023 |
Net gain (loss) | 12,648,280 | |
Net increase (decrease) in net assets resulting from operations | $ 13,909,223 | |
See accompanying notes which are an integral part of the financial statements.
Annual Report
Statement of Changes in Net Assets
Amounts in thousands | Year ended | Year ended |
Increase (Decrease) in Net Assets |
|
|
Operations |
|
|
Net investment income (loss) | $ 1,260,943 | $ 1,076,063 |
Net realized gain (loss) | 989,257 | 816,438 |
Change in net unrealized appreciation (depreciation) | 11,659,023 | 4,290,428 |
Net increase (decrease) in net assets resulting | 13,909,223 | 6,182,929 |
Distributions to shareholders from net investment income | (1,221,746) | (1,030,033) |
Share transactions - net increase (decrease) | 4,624,796 | 3,180,920 |
Total increase (decrease) in net assets | 17,312,273 | 8,333,816 |
|
|
|
Net Assets | ||
Beginning of period | 53,315,851 | 44,982,035 |
End of period (including undistributed net investment income of $230,704 and undistributed net investment income of $191,536, respectively) | $ 70,628,124 | $ 53,315,851 |
See accompanying notes which are an integral part of the financial statements.
Annual Report
Financial Highlights - Investor Class
Years ended February 28, | 2014 | 2013 | 2012 G | 2011 | 2010 |
Selected Per-Share Data |
|
|
|
| |
Net asset value, beginning of period | $ 53.81 | $ 48.49 | $ 47.09 | $ 39.19 | $ 26.10 |
Income from Investment Operations |
|
|
|
|
|
Net investment income (loss) B | 1.19 | 1.10 | .89 | .81 | .75 |
Net realized and unrealized gain (loss) | 12.26 | 5.28 | 1.40 | 7.88 | 13.12 |
Total from investment operations | 13.45 | 6.38 | 2.29 | 8.69 | 13.87 |
Distributions from net investment income | (1.16) | (1.06) | (.89) | (.79) | (.78) |
Net asset value, end of period | $ 66.10 | $ 53.81 | $ 48.49 | $ 47.09 | $ 39.19 |
Total Return A | 25.27% | 13.36% | 5.04% | 22.47% | 53.68% |
Ratios to Average Net Assets C, E |
|
|
|
| |
Expenses before reductions | .10% | .10% | .10% | .10% | .10% |
Expenses net of fee waivers, if any | .10% H | .10% H | .10% | .10% | .10% |
Expenses net of all reductions | .10% H | .10% H | .10% | .10% | .10% |
Net investment income (loss) | 1.98% | 2.21% | 1.96% | 1.94% | 2.14% |
Supplemental Data |
|
|
|
| |
Net assets, end of period (in millions) | $ 5,751 | $ 4,705 | $ 13,407 | $ 27,881 | $ 23,666 |
Portfolio turnover rate D | 4% | 4% | 5% F | 4% | 11% F |
A Total returns would have been lower if certain expenses had not been reduced during the applicable periods shown.
B Calculated based on average shares outstanding during the period.
C Fees and expenses of any underlying Fidelity Central Funds are not included in the Fund's expense ratio. The Fund indirectly bears its proportionate share of the expenses of any underlying Fidelity Central Funds.
D Amount does not include the portfolio activity of any underlying Fidelity Central Funds.
E Expense ratios reflect operating expenses of the class. Expenses before reductions do not reflect amounts reimbursed by the investment adviser or reductions from brokerage service arrangements or reductions from other expense offset arrangements and do not represent the amount paid by the class during periods when reimbursements or reductions occur. Expenses net of fee waivers reflect expenses after reimbursement by the investment adviser but prior to reductions from brokerage service arrangements or other expense offset arrangements. Expenses net of all reductions represent the net expenses paid by the class.
F The portfolio turnover rate does not include the assets acquired in the merger.
G For the year ended February 29.
H Amount represents .095%.
See accompanying notes which are an integral part of the financial statements.
Annual Report
Financial Highlights - Fidelity Advantage Class
Years ended February 28, | 2014 | 2013 | 2012 G | 2011 | 2010 |
Selected Per-Share Data |
|
|
|
| |
Net asset value, beginning of period | $ 53.82 | $ 48.50 | $ 47.10 | $ 39.19 | $ 26.11 |
Income from Investment Operations |
|
|
|
|
|
Net investment income (loss) B | 1.22 | 1.13 | .90 | .82 | .77 |
Net realized and unrealized gain (loss) | 12.26 | 5.27 | 1.40 | 7.89 | 13.10 |
Total from investment operations | 13.48 | 6.40 | 2.30 | 8.71 | 13.87 |
Distributions from net investment income | (1.19) | (1.08) | (.90) | (.80) | (.79) |
Net asset value, end of period | $ 66.11 | $ 53.82 | $ 48.50 | $ 47.10 | $ 39.19 |
Total Return A | 25.32% | 13.39% | 5.07% | 22.53% | 53.67% |
Ratios to Average Net Assets C, E |
|
|
|
| |
Expenses before reductions | .07% | .07% | .07% | .07% | .07% |
Expenses net of fee waivers, if any | .05% | .06% | .07% | .07% | .07% |
Expenses net of all reductions | .05% | .06% | .07% | .07% | .07% |
Net investment income (loss) | 2.02% | 2.25% | 1.99% | 1.97% | 2.17% |
Supplemental Data |
|
|
|
| |
Net assets, end of period (in millions) | $ 38,736 | $ 28,996 | $ 16,230 | $ 15,595 | $ 12,455 |
Portfolio turnover rate D | 4% | 4% | 5% F | 4% | 11% F |
A Total returns would have been lower if certain expenses had not been reduced during the applicable periods shown.
B Calculated based on average shares outstanding during the period.
C Fees and expenses of any underlying Fidelity Central Funds are not included in the Fund's expense ratio. The Fund indirectly bears its proportionate share of the expenses of any underlying Fidelity Central Funds.
D Amount does not include the portfolio activity of any underlying Fidelity Central Funds.
E Expense ratios reflect operating expenses of the class. Expenses before reductions do not reflect amounts reimbursed by the investment adviser or reductions from brokerage service arrangements or reductions from other expense offset arrangements and do not represent the amount paid by the class during periods when reimbursements or reductions occur. Expenses net of fee waivers reflect expenses after reimbursement by the investment adviser but prior to reductions from brokerage service arrangements or other expense offset arrangements. Expenses net of all reductions represent the net expenses paid by the class.
F The portfolio turnover rate does not include the assets acquired in the merger.
G For the year ended February 29.
See accompanying notes which are an integral part of the financial statements.
Annual Report
Financial Highlights - Institutional Class
Years ended February 28, | 2014 | 2013 | 2012 G |
Selected Per-Share Data |
|
|
|
Net asset value, beginning of period | $ 53.82 | $ 48.50 | $ 47.74 |
Income from Investment Operations |
|
|
|
Net investment income (loss) D | 1.22 | 1.13 | .79 |
Net realized and unrealized gain (loss) | 12.26 | 5.28 | .68 |
Total from investment operations | 13.48 | 6.41 | 1.47 |
Distributions from net investment income | (1.19) | (1.09) | (.71) |
Net asset value, end of period | $ 66.11 | $ 53.82 | $ 48.50 |
Total Return B, C | 25.33% | 13.42% | 3.25% |
Ratios to Average Net Assets E, H |
|
|
|
Expenses before reductions | .05% | .05% | .05% A |
Expenses net of fee waivers, if any | .04% | .04% | .05% A |
Expenses net of all reductions | .04% | .04% | .05% A |
Net investment income (loss) | 2.03% | 2.27% | 2.19% A |
Supplemental Data |
|
|
|
Net assets, end of period (in millions) | $ 22,636 | $ 17,703 | $ 14,629 |
Portfolio turnover rate F | 4% | 4% | 5% I |
A Annualized
B Total returns for periods of less than one year are not annualized.
C Total returns would have been lower if certain expenses had not been reduced during the applicable periods shown.
D Calculated based on average shares outstanding during the period.
E Fees and expenses of any underlying Fidelity Central Funds are not included in the Fund's expense ratio. The Fund indirectly bears its proportionate share of the expenses of any underlying Fidelity Central Funds.
F Amount does not include the portfolio activity of any underlying Fidelity Central Funds.
G For the period May 4, 2011 (commencement of sale of shares) to February 29, 2012.
H Expense ratios reflect operating expenses of the class. Expenses before reductions do not reflect amounts reimbursed by the investment adviser or reductions from brokerage service arrangements or reductions from other expense offset arrangements and do not represent the amount paid by the class during periods when reimbursements or reductions occur. Expenses net of fee waivers reflect expenses after reimbursement by the investment adviser but prior to reductions from brokerage service arrangements or other expense offset arrangements. Expenses net of all reductions represent the net expenses paid by the class.
I The portfolio turnover rate does not include the assets acquired in the merger.
See accompanying notes which are an integral part of the financial statements.
Annual Report
Financial Highlights - Fidelity Advantage Institutional Class
Years ended February 28, | 2014 | 2013 | 2012 G |
Selected Per-Share Data |
|
|
|
Net asset value, beginning of period | $ 53.83 | $ 48.50 | $ 47.74 |
Income from Investment Operations |
|
|
|
Net investment income (loss) D | 1.24 | 1.14 | .81 |
Net realized and unrealized gain (loss) | 12.24 | 5.29 | .67 |
Total from investment operations | 13.48 | 6.43 | 1.48 |
Distributions from net investment income | (1.20) | (1.10) | (.72) |
Net asset value, end of period | $ 66.11 | $ 53.83 | $ 48.50 |
Total Return B, C | 25.34% | 13.46% | 3.27% |
Ratios to Average Net Assets E, H |
|
|
|
Expenses before reductions | .03% J | .03% J | .03% A, J |
Expenses net of fee waivers, if any | .02% | .02% | .03% A, J |
Expenses net of all reductions | .02% | .02% | .03% A, J |
Net investment income (loss) | 2.05% | 2.29% | 2.24% A |
Supplemental Data |
|
|
|
Net assets, end of period (in millions) | $ 3,506 | $ 1,912 | $ 716 |
Portfolio turnover rate F | 4% | 4% | 5% I |
A Annualized
B Total returns for periods of less than one year are not annualized.
C Total returns would have been lower if certain expenses had not been reduced during the applicable periods shown.
D Calculated based on average shares outstanding during the period.
E Fees and expenses of any underlying Fidelity Central Funds are not included in the Fund's expense ratio. The Fund indirectly bears its proportionate share of the expenses of any underlying Fidelity Central Funds.
F Amount does not include the portfolio activity of any underlying Fidelity Central Funds.
G For the period May 4, 2011 (commencement of sale of shares) to February 29, 2012.
H Expense ratios reflect operating expenses of the class. Expenses before reductions do not reflect amounts reimbursed by the investment adviser or reductions from brokerage service arrangements or reductions from other expense offset arrangements and do not represent the amount paid by the class during periods when reimbursements or reductions occur. Expenses net of fee waivers reflect expenses after reimbursement by the investment adviser but prior to reductions from brokerage service arrangements or other expense offset arrangements. Expenses net of all reductions represent the net expenses paid by the class.
I The portfolio turnover rate does not include the assets acquired in the merger.
J Amount represents .025%.
See accompanying notes which are an integral part of the financial statements.
Annual Report
Notes to Financial Statements
For the period ended February 28, 2014
(Amounts in thousands except percentages)
1. Organization.
Spartan 500 Index Fund (the Fund) is a fund of Fidelity Concord Street Trust (the Trust) and is authorized to issue an unlimited number of shares. The Trust is registered under the Investment Company Act of 1940, as amended (the 1940 Act), as an open-end management investment company organized as a Massachusetts business trust. The Fund offers Investor Class, Fidelity Advantage Class, Institutional Class and Fidelity Advantage Institutional Class shares, each of which has equal rights as to assets and voting privileges. Each class has exclusive voting rights with respect to matters that affect that class. The Fund offers conversion privileges between share classes to eligible shareholders.
2. Investments in Fidelity Central Funds.
The Fund invests in Fidelity Central Funds, which are open-end investment companies generally available only to other investment companies and accounts managed by the investment adviser and its affiliates. The Fund's Schedule of Investments lists each of the Fidelity Central Funds held as of period end, if any, as an investment of the Fund, but does not include the underlying holdings of each Fidelity Central Fund. As an Investing Fund, the Fund indirectly bears its proportionate share of the expenses of the underlying Fidelity Central Funds.
The Money Market Central Funds seek preservation of capital and current income and are managed by Fidelity Investments Money Management, Inc. (FIMM), an affiliate of the investment adviser. Annualized expenses of the Money Market Central Funds as of their most recent shareholder report date are less than .01%.
A complete unaudited list of holdings for each Fidelity Central Fund is available upon request or at the Securities and Exchange Commission (the SEC) website at www.sec.gov. In addition, the financial statements of the Fidelity Central Funds, which are not covered by the Fund's Report of Independent Registered Public Accounting Firm, are available on the SEC website or upon request.
3. Significant Accounting Policies.
The financial statements have been prepared in conformity with accounting principles generally accepted in the United States of America (GAAP), which require management to make certain estimates and assumptions at the date of the financial statements. Actual results could differ from those estimates. Subsequent events, if any, through the date that the financial statements were issued have been evaluated in the preparation of
Annual Report
Notes to Financial Statements - continued
(Amounts in thousands except percentages)
3. Significant Accounting Policies - continued
the financial statements. The following summarizes the significant accounting policies of the Fund:
Investment Valuation. Investments are valued as of 4:00 p.m. Eastern time on the last calendar day of the period. In accordance with valuation policies and procedures approved by the Board of Trustees (the Board), the Fund attempts to obtain prices from one or more third party pricing vendors or brokers to value its investments. When current market prices, quotations or currency exchange rates are not readily available or reliable, investments will be fair valued in good faith by the Fidelity Management & Research Company (FMR) Fair Value Committee (the Committee), in accordance with procedures adopted by the Board. Factors used in determining fair value vary by investment type and may include market or investment specific events, changes in interest rates and credit quality. The frequency with which these procedures are used cannot be predicted and they may be utilized to a significant extent. The Committee oversees the Fund's valuation policies and procedures and is responsible for approving and reporting to the Board all fair value determinations.
The Fund categorizes the inputs to valuation techniques used to value its investments into a disclosure hierarchy consisting of three levels as shown below:
Level 1 - quoted prices in active markets for identical investments
Level 2 - other significant observable inputs (including quoted prices for similar investments, interest rates, prepayment speeds, etc.)
Level 3 - unobservable inputs (including the Fund's own assumptions based on the best information available)
Valuation techniques used to value the Fund's investments by major category are as follows:
Equity securities, including restricted securities, for which market quotations are readily available, are valued at the last reported sale price or official closing price as reported by a third party pricing vendor on the primary market or exchange on which they are traded and are categorized as Level 1 in the hierarchy. In the event there were no sales during the day or closing prices are not available, securities are valued at the last quoted bid price or may be valued using the last available price and are generally categorized as Level 2 in the hierarchy. For foreign equity securities, when market or security specific events arise, comparisons to the valuation of American Depositary Receipts (ADRs), futures contracts, Exchange-Traded Funds (ETFs) and certain indexes as well as quoted prices for similar securities may be used and would be categorized as Level 2 in the hierarchy. Utilizing these techniques may result in transfers between Level 1 and Level 2. For equity securities, including restricted securities, where observable inputs are
Annual Report
3. Significant Accounting Policies - continued
Investment Valuation - continued
limited, assumptions about market activity and risk are used and these securities may be categorized as Level 3 in the hierarchy.
Debt securities, including restricted securities, are valued based on evaluated prices received from third party pricing vendors or from brokers who make markets in such securities. U.S. government and government agency obligations are valued by pricing vendors who utilize matrix pricing which considers yield or price of bonds of comparable quality, coupon, maturity and type or by broker-supplied prices. When independent prices are unavailable or unreliable, debt securities may be valued utilizing pricing methodologies which consider similar factors that would be used by third party pricing vendors. Debt securities are generally categorized as Level 2 in the hierarchy but may be Level 3 depending on the circumstances.
Futures contracts are valued at the settlement price established each day by the board of trade or exchange on which they are traded and are categorized as Level 1 in the hierarchy. Investments in open-end mutual funds, including the Fidelity Central Funds, are valued at their closing net asset value (NAV) each business day and are categorized as Level 1 in the hierarchy.
Changes in valuation techniques may result in transfers in or out of an assigned level within the disclosure hierarchy. The aggregate value of investments by input level, as of February 28, 2014, is included at the end of the Fund's Schedule of Investments.
Investment Transactions and Income. For financial reporting purposes, the Fund's investment holdings and NAV include trades executed through the end of the last business day of the period. The NAV per share for processing shareholder transactions is calculated as of the close of business of the New York Stock Exchange (NYSE), normally 4:00 p.m. Eastern time and includes trades executed through the end of the prior business day. Gains and losses on securities sold are determined on the basis of identified cost and may include proceeds received from litigation. Dividend income is recorded on the ex-dividend date, except for certain dividends from foreign securities where the ex-dividend date may have passed, which are recorded as soon as the Fund is informed of the ex-dividend date. Non-cash dividends included in dividend income, if any, are recorded at the fair market value of the securities received. Distributions received on securities that represent a return of capital or capital gain are recorded as a reduction of cost of investments and/or as a realized gain. Subsequent to ex-dividend date the Fund determines the components of these distributions, based upon receipt of tax filings or other correspondence relating to the underlying investment. Interest income and distributions from the Fidelity Central Funds are accrued as earned. Interest income includes coupon interest and amortization of premium and accretion of discount on debt securities.
Annual Report
Notes to Financial Statements - continued
(Amounts in thousands except percentages)
3. Significant Accounting Policies - continued
Class Allocations and Expenses. Investment income, realized and unrealized capital gains and losses, common expenses of the Fund, and certain fund-level expense reductions, if any, are allocated daily on a pro-rata basis to each class based on the relative net assets of each class to the total net assets of the Fund. Each class differs with respect to transfer agent fees incurred. Certain expense reductions may also differ by class. For the reporting period, the allocated portion of income and expenses to each class as a percent of its average net assets may vary due to the timing of recording these transactions in relation to fluctuating net assets of the classes. Expenses directly attributable to a fund are charged to that fund. Expenses attributable to more than one fund are allocated among the respective funds on the basis of relative net assets or other appropriate methods. Expense estimates are accrued in the period to which they relate and adjustments are made when actual amounts are known.
Deferred Trustee Compensation. Under a Deferred Compensation Plan (the Plan), independent Trustees may elect to defer receipt of a portion of their annual compensation. Deferred amounts are invested in a cross-section of Fidelity funds, are marked-to-market and remain in the Fund until distributed in accordance with the Plan. The investment of deferred amounts and the offsetting payable to the Trustees are included in the accompanying Statement of Assets and Liabilities.
Income Tax Information and Distributions to Shareholders. Each year, the Fund intends to qualify as a regulated investment company under Subchapter M of the Internal Revenue Code, including distributing substantially all of its taxable income and realized gains. As a result, no provision for U.S. Federal income taxes is required. As of February 28, 2014, the Fund did not have any unrecognized tax benefits in the financial statements; nor is the Fund aware of any tax positions for which it is reasonably possible that the total amounts of unrecognized tax benefits will significantly change in the next twelve months. The Fund files a U.S. federal tax return, in addition to state and local tax returns as required. The Fund's federal income tax returns are subject to examination by the Internal Revenue Service (IRS) for a period of three fiscal years after they are filed. State and local tax returns may be subject to examination for an additional fiscal year depending on the jurisdiction.
Distributions are declared and recorded on the ex-dividend date. Income dividends and capital gain distributions are declared separately for each class. Income and capital gain distributions are determined in accordance with income tax regulations, which may differ from GAAP.
Capital accounts within the financial statements are adjusted for permanent book-tax differences. These adjustments have no impact on net assets or the results of operations. Capital accounts are not adjusted for temporary book-tax differences which will reverse in a subsequent period.
Annual Report
3. Significant Accounting Policies - continued
Income Tax Information and Distributions to Shareholders - continued
Book-tax differences are primarily due to futures contracts, market discount, deferred trustees compensation, capital loss carryforwards and losses deferred due to wash sales.
The federal tax cost of investment securities and unrealized appreciation (depreciation) as of period end were as follows:
Gross unrealized appreciation | $ 32,001,212 |
Gross unrealized depreciation | (2,721,771) |
Net unrealized appreciation (depreciation) on securities and other investments | $ 29,279,441 |
|
|
Tax Cost | $ 45,789,215 |
The tax-based components of distributable earnings as of period end were as follows:
Undistributed ordinary income | $ 232,209 |
Capital loss carryforward | $ (475,285) |
Net unrealized appreciation (depreciation) | $ 29,279,441 |
Capital loss carryforwards are only available to offset future capital gains of the Fund to the extent provided by regulations and may be limited. Under the Regulated Investment Company Modernization Act of 2010 (the Act), the Fund is permitted to carry forward capital losses incurred in taxable years beginning after December 22, 2010 for an unlimited period and such capital losses are required to be used prior to any losses that expire. The capital loss carryforward information presented below, including any applicable limitation, is estimated as of fiscal period end and is subject to adjustment.
Fiscal year of expiration |
|
2019 | $ (475,285) |
The tax character of distributions paid was as follows:
| February 28, 2014 | February 28, 2013 |
Ordinary Income | $ 1,221,746 | $ 1,030,033 |
Annual Report
Notes to Financial Statements - continued
(Amounts in thousands except percentages)
4. Derivative Instruments.
Risk Exposures and the Use of Derivative Instruments. The Fund's investment objective allows the Fund to enter into various types of derivative contracts, including futures contracts. Derivatives are investments whose value is primarily derived from underlying assets, indices or reference rates and may be transacted on an exchange or over-the-counter (OTC). Derivatives may involve a future commitment to buy or sell a specified asset based on specified terms, to exchange future cash flows at periodic intervals based on a notional principal amount, or for one party to make one or more payments upon the occurrence of specified events in exchange for periodic payments from the other party.
The Fund used derivatives to increase returns and to manage exposure to certain risks as defined below. The success of any strategy involving derivatives depends on analysis of numerous economic factors, and if the strategies for investment do not work as intended, the Fund may not achieve its objectives.
The Fund's use of derivatives increased or decreased its exposure to the following risk:
Equity Risk | Equity risk relates to the fluctuations in the value of financial instruments as a result of changes in market prices (other than those arising from interest rate risk or foreign exchange risk), whether caused by factors specific to an individual investment, its issuer, or all factors affecting all instruments traded in a market or market segment. |
The Fund is also exposed to additional risks from investing in derivatives, such as liquidity risk and counterparty credit risk. Liquidity risk is the risk that the Fund will be unable to close out the derivative in the open market in a timely manner. Counterparty credit risk is the risk that the counterparty will not be able to fulfill its obligation to the Fund. Counterparty credit risk related to exchange-traded futures contracts may be mitigated by the protection provided by the exchange on which they trade.
Investing in derivatives may involve greater risks than investing in the underlying assets directly and, to varying degrees, may involve risk of loss in excess of any initial investment and collateral received and amounts recognized in the Statement of Assets and Liabilities. In addition, there may be the risk that the change in value of the derivative contract does not correspond to the change in value of the underlying instrument.
Futures Contracts. A futures contract is an agreement between two parties to buy or sell a specified underlying instrument for a fixed price at a specified future date. The Fund used futures contracts to manage its exposure to the stock market.
Upon entering into a futures contract, a fund is required to deposit either cash or securities (initial margin) with a clearing broker in an amount equal to a certain percentage of
Annual Report
4. Derivative Instruments - continued
Futures Contracts - continued
the face value of the contract. Futures contracts are marked-to-market daily and subsequent daily payments (variation margin) are made or received by a fund depending on the daily fluctuations in the value of the futures contracts and are recorded as unrealized appreciation or (depreciation). This receivable and/or payable, if any, is included in daily variation margin for derivative instruments in the Statement of Assets and Liabilities. Realized gain or (loss) is recorded upon the expiration or closing of a futures contract.
Any open futures contracts at period end are presented in the Schedule of Investments under the caption "Futures Contracts." The underlying face amount at value reflects each contract's exposure to the underlying instrument or index at period end and is representative of volume of activity during the period. Securities deposited to meet initial margin requirements are identified in the Schedule of Investments.
During the period the Fund recognized net realized gain (loss) of $189,043 and a change in net unrealized appreciation (depreciation) of $(2,763) related to its investment in futures contracts. These amounts are included in the Statement of Operations.
5. Purchases and Sales of Investments.
Purchases and sales of securities, other than short-term securities, aggregated $7,049,933 and $2,239,038, respectively.
Securities received in-kind through subscriptions totaled $225,644.
6. Fees and Other Transactions with Affiliates.
Management Fee and Expense Contract. Fidelity Management & Research Company (the investment adviser) and its affiliates provide the Fund with investment management related services for which the Fund pays a monthly management fee. The management fee is based on an annual rate of .025% of the Fund's average net assets. Under the management contract, the investment adviser pays all other fund-level expenses, except the compensation of the independent Trustees and certain other expenses such as interest expense, including commitment fees.
In addition, under an expense contract, the investment adviser pays class-level expenses as necessary so that the total expenses do not exceed certain amounts of each class'
Annual Report
Notes to Financial Statements - continued
(Amounts in thousands except percentages)
6. Fees and Other Transactions with Affiliates - continued
Management Fee and Expense Contract - continued
average net assets on an annual basis with certain exceptions, as noted in the following table:
Investor Class | .10% |
Fidelity Advantage Class | .07% |
Institutional Class | .05% |
Fidelity Advantage Institutional Class | .025% |
Sub-Adviser. Geode Capital Management, LLC (Geode), serves as sub-adviser for the Fund. Geode provides discretionary investment advisory services to the Fund and is paid by the investment adviser for providing these services.
Transfer Agent Fees. Fidelity Investments Institutional Operations Company, Inc. (FIIOC), an affiliate of the investment adviser, is the transfer, dividend disbursing and shareholder servicing agent for each class. FIIOC receives transfer agent fees at an annual rate of .075%, .045%, .035% and ..015% of average net assets for Investor Class, Fidelity Advantage Class, Institutional Class and Fidelity Advantage Institutional Class, respectively. FIIOC pays for typesetting, printing and mailing of shareholder reports, except proxy statements. Under the expense contract, Institutional Class pays a portion of the transfer agent fees at an annual rate of .025% of average net assets and Fidelity Advantage Institutional Class does not pay transfer agent fees.
For the period, the total transfer agent fees paid by each applicable class were as follows:
| Amount |
Investor Class | $ 3,931 |
Fidelity Advantage Class | 15,327 |
Institutional Class | 5,090 |
| $ 24,348 |
7. Committed Line of Credit.
The Fund participates with other funds managed by the investment adviser or an affiliate in a $4.25 billion credit facility (the "line of credit") to be utilized for temporary or emergency purposes to fund shareholder redemptions or for other short-term liquidity purposes. The Fund has agreed to pay commitment fees on its pro-rata portion of the line of credit, which amounted to $117 and is reflected in Miscellaneous expenses on the Statement of Operations. During the period, there were no borrowings on this line of credit.
Annual Report
8. Security Lending.
The Fund lends portfolio securities through a lending agent from time to time in order to earn additional income. On the settlement date of the loan, the Fund receives collateral (in the form of U.S. Treasury obligations, letters of credit and/or cash) against the loaned securities and maintains collateral in an amount not less than 100% of the market value of the loaned securities during the period of the loan. The market value of the loaned securities is determined at the close of business of the Fund and any additional required collateral is delivered to the Fund on the next business day. If the borrower defaults on its obligation to return the securities loaned because of insolvency or other reasons, the Fund may apply collateral received from the borrower against the obligation. The Fund may experience delays and costs in recovering the securities loaned. Any cash collateral received is invested in the Fidelity Securities Lending Cash Central Fund. The value of loaned securities and cash collateral at period end are disclosed on the Fund's Statement of Assets and Liabilities. Security lending income represents the income earned on investing cash collateral, less rebates paid to borrowers and any lending agent fees associated with the loan, plus any premium payments received for lending certain types of securities. Security lending income is presented in the Statement of Operations as a component of income from Fidelity Central Funds. Total security lending income during the period amounted to $4,627.
9. Expense Reductions.
The investment adviser contractually agreed to reimburse the Fund to the extent annual operating expenses exceeded certain levels of average net assets as noted in the table below. Some expenses, for example interest expense, including commitment fees, are excluded from this reimbursement. This reimbursement will remain in place through April 30, 2015.
| Expense | Reimbursement |
Investor Class | .095% | $ 293 |
Fidelity Advantage Class | .050% | 7,001 |
Institutional Class | .040% | 2,144 |
Fidelity Advantage Institutional Class | .020% | 151 |
In addition, through arrangements with the Fund's custodian, credits realized as a result of uninvested cash balances were used to reduce the Fund's expenses. During the period, these credits reduced the Fund's management fee by $1.
The investment adviser reimbursed a portion of the Fund's operating expenses during the period in the amount of $12.
Annual Report
Notes to Financial Statements - continued
(Amounts in thousands except percentages)
10. Distributions to Shareholders.
Distributions to shareholders of each class were as follows:
Years ended February 28, | 2014 | 2013 |
From net investment income |
|
|
Investor Class | $ 100,863 | $ 226,551 |
Fidelity Advantage Class | 665,146 | 421,592 |
Institutional Class | 401,823 | 348,307 |
Fidelity Advantage Institutional Class | 53,914 | 33,583 |
Total | $ 1,221,746 | $ 1,030,033 |
11. Share Transactions.
Transactions for each class of shares were as follows:
| Shares | Dollars | ||
Years ended February 28, | 2014 | 2013 | 2014 | 2013 |
Investor Class |
|
|
|
|
Shares sold | 39,355 | 47,792 | $ 2,384,060 | $ 2,395,212 |
Reinvestment of distributions | 1,660 | 4,370 | 98,060 | 217,646 |
Shares redeemed | (41,439) | (241,211) | (2,495,889) | (12,295,797) |
Net increase (decrease) | (424) | (189,049) | $ (13,769) | $ (9,682,939) |
Fidelity Advantage Class |
|
|
|
|
Shares sold | 139,661 | 271,957 | $ 8,405,537 | $ 13,895,241 |
Reinvestment of distributions | 10,502 | 7,827 | 620,608 | 390,172 |
Shares redeemed | (102,964) | (75,714) | (6,208,026) | (3,793,810) |
Net increase (decrease) | 47,199 | 204,070 | $ 2,818,119 | $ 10,491,603 |
Institutional Class |
|
|
|
|
Shares sold | 90,088 | 92,394 | $ 5,417,050 | $ 4,615,642 |
Reinvestment of distributions | 6,803 | 6,988 | 401,823 | 348,307 |
Shares redeemed | (83,402) | (72,117) | (5,026,000) | (3,630,016) |
Net increase (decrease) | 13,489 | 27,265 | $ 792,873 | $ 1,333,933 |
Fidelity Advantage Institutional Class |
|
|
|
|
Shares sold | 24,446 | 24,302 | $ 1,448,700 | $ 1,217,091 |
Reinvestment of distributions | 908 | 673 | 53,914 | 33,583 |
Shares redeemed | (7,851) | (4,226) | (475,041) | (212,351) |
Net increase (decrease) | 17,503 | 20,749 | $ 1,027,573 | $ 1,038,323 |
Annual Report
12. Other.
The Fund's organizational documents provide former and current trustees and officers with a limited indemnification against liabilities arising in connection with the performance of their duties to the Fund. In the normal course of business, the Fund may also enter into contracts that provide general indemnifications. The Fund's maximum exposure under these arrangements is unknown as this would be dependent on future claims that may be made against the Fund. The risk of material loss from such claims is considered remote.
Annual Report
Report of Independent Registered Public Accounting Firm
To the Trustees of Fidelity Concord Street Trust and the Shareholders of Spartan 500 Index Fund:
In our opinion, the accompanying statement of assets and liabilities, including the schedule of investments, and the related statements of operations and of changes in net assets and the financial highlights present fairly, in all material respects, the financial position of Spartan 500 Index Fund (a fund of Fidelity Concord Street Trust) at February 28, 2014, the results of its operations for the year then ended, the changes in its net assets for each of the two years in the period then ended and the financial highlights for each of the periods indicated, in conformity with accounting principles generally accepted in the United States of America. These financial statements and financial highlights (hereafter referred to as "financial statements") are the responsibility of the Spartan 500 Index Fund's management. Our responsibility is to express an opinion on these financial statements based on our audits. We conducted our audits of these financial statements in accordance with the standards of the Public Company Accounting Oversight Board (United States). Those standards require that we plan and perform the audit to obtain reasonable assurance about whether the financial statements are free of material misstatement. An audit includes examining, on a test basis, evidence supporting the amounts and disclosures in the financial statements, assessing the accounting principles used and significant estimates made by management, and evaluating the overall financial statement presentation. We believe that our audits, which included confirmation of securities at February 28, 2014 by correspondence with the custodian and brokers, provide a reasonable basis for our opinion.
PricewaterhouseCoopers LLP
Boston, Massachusetts
April 15, 2014
Annual Report
Trustees and Officers
The Trustees, Member of the Advisory Board, and officers of the trust and fund, as applicable, are listed below. The Board of Trustees governs the fund and is responsible for protecting the interests of shareholders. The Trustees are experienced executives who meet periodically throughout the year to oversee the fund's activities, review contractual arrangements with companies that provide services to the fund, oversee management of the risks associated with such activities and contractual arrangements, and review the fund's performance. Except for James C. Curvey, Ned C. Lautenbach, and William S. Stavropoulos, each of the Trustees oversees 172 funds. James C. Curvey oversees 395 funds. Ned C. Lautenbach and William S. Stavropoulos each oversees 246 funds.
The Trustees hold office without limit in time except that (a) any Trustee may resign; (b) any Trustee may be removed by written instrument, signed by at least two-thirds of the number of Trustees prior to such removal; (c) any Trustee who requests to be retired or who has become incapacitated by illness or injury may be retired by written instrument signed by a majority of the other Trustees; and (d) any Trustee may be removed at any special meeting of shareholders by a two-thirds vote of the outstanding voting securities of the trust. Each Trustee who is not an interested person (as defined in the 1940 Act) of the trust and the fund (Independent Trustee), shall retire not later than the last day of the calendar year in which his or her 75th birthday occurs. The Independent Trustees may waive this mandatory retirement age policy with respect to individual Trustees. The officers and Advisory Board Member hold office without limit in time, except that any officer and Advisory Board Member may resign or may be removed by a vote of a majority of the Trustees at any regular meeting or any special meeting of the Trustees. Except as indicated, each individual has held the office shown or other offices in the same company for the past five years.
Experience, Skills, Attributes, and Qualifications of the Fund's Trustees. The Governance and Nominating Committee has adopted a statement of policy that describes the experience, qualifications, attributes, and skills that are necessary and desirable for potential Independent Trustee candidates (Statement of Policy). The Board believes that each Trustee satisfied at the time he or she was initially elected or appointed a Trustee, and continues to satisfy, the standards contemplated by the Statement of Policy. The Governance and Nominating Committee also engages professional search firms to help identify potential Independent Trustee candidates who have the experience, qualifications, attributes, and skills consistent with the Statement of Policy. From time to time, additional criteria based on the composition and skills of the current Independent Trustees, as well as experience or skills that may be appropriate in light of future changes to board composition, business conditions, and regulatory or other developments, have also been considered by the professional search firms and the Governance and Nominating Committee. In addition, the Board takes into account the Trustees' commitment and participation in Board and committee meetings, as well as their leadership of standing and ad hoc committees throughout their tenure.
Annual Report
In determining that a particular Trustee was and continues to be qualified to serve as a Trustee, the Board has considered a variety of criteria, none of which, in isolation, was controlling. The Board believes that, collectively, the Trustees have balanced and diverse experience, qualifications, attributes, and skills, which allow the Board to operate effectively in governing the fund and protecting the interests of shareholders. Information about the specific experience, skills, attributes, and qualifications of each Trustee, which in each case led to the Board's conclusion that the Trustee should serve (or continue to serve) as a trustee of the fund, is provided below.
Board Structure and Oversight Function. James C. Curvey is an interested person (as defined in the 1940 Act) and currently serves as Chairman. The Trustees have determined that an interested Chairman is appropriate and benefits shareholders because an interested Chairman has a personal and professional stake in the quality and continuity of services provided to the fund. Independent Trustees exercise their informed business judgment to appoint an individual of their choosing to serve as Chairman, regardless of whether the Trustee happens to be independent or a member of management. The Independent Trustees have determined that they can act independently and effectively without having an Independent Trustee serve as Chairman and that a key structural component for assuring that they are in a position to do so is for the Independent Trustees to constitute a substantial majority for the Board. The Independent Trustees also regularly meet in executive session. Ned C. Lautenbach serves as Chairman of the Independent Trustees and as such (i) acts as a liaison between the Independent Trustees and management with respect to matters important to the Independent Trustees and (ii) with management prepares agendas for Board meetings.
Fidelity funds are overseen by different Boards of Trustees. The fund's Board oversees Fidelity's equity and high income funds and another Board oversees Fidelity's investment-grade bond, money market, and asset allocation funds. The asset allocation funds may invest in Fidelity funds overseen by the fund's Board. The use of separate Boards, each with its own committee structure, allows the Trustees of each group of Fidelity funds to focus on the unique issues of the funds they oversee, including common research, investment, and operational issues. On occasion, the separate Boards establish joint committees to address issues of overlapping consequences for the Fidelity funds overseen by each Board.
The Trustees operate using a system of committees to facilitate the timely and efficient consideration of all matters of importance to the Trustees, the fund, and fund shareholders and to facilitate compliance with legal and regulatory requirements and oversight of the fund's activities and associated risks. The Board, acting through its committees, has charged FMR and its affiliates with (i) identifying events or circumstances the occurrence of which could have demonstrably adverse effects on the fund's business and/or reputation; (ii) implementing processes and controls to lessen the possibility that such events or circumstances occur or to mitigate the effects of such events or circumstances if they do occur; and (iii) creating and maintaining a system designed to evaluate continuously business and market conditions in order to facilitate the identification and implementation processes described in (i) and (ii) above. Because the day-to-day operations and activities of the fund are carried out by or through FMR, its affiliates and other service providers, the fund's exposure to risks is mitigated but not eliminated by the processes overseen by the Trustees. While each of the Board's committees has responsibility for overseeing different aspects of the fund's activities, oversight is exercised primarily through the Operations, Audit, and Compliance Committees. In addition, the Independent Trustees have worked with FMR to enhance the Board's oversight of investment and financial risks, legal and regulatory risks, technology risks, and operational risks, including the development of additional risk reporting to the Board. For example, a working group comprised of Independent Trustees and FMR has worked and continues to work to review the Fidelity funds' valuation-related activities, reporting and risk management. Appropriate personnel, including but not limited to the fund's Chief Compliance Officer (CCO), FMR's internal auditor, the independent accountants, the fund's Treasurer and portfolio management personnel, make periodic reports to the Board's committees, as appropriate, including an annual review of FMR's risk management program for the Fidelity funds. The responsibilities of each standing committee, including their oversight responsibilities, are described further under "Standing Committees of the Fund's Trustees."
Annual Report
Trustees and Officers - continued
The fund's Statement of Additional Information (SAI) includes more information about the Trustees. To request a free copy, call Fidelity at 1-800-544-8544.
Interested Trustees*:
Correspondence intended for each Trustee who is an interested person may be sent to Fidelity Investments, 245 Summer Street, Boston, Massachusetts 02210.
Name, Year of Birth; Principal Occupations and Other Relevant Experience+ | |
James C. Curvey (1935) | |
Year of Election or Appointment: 2007 Trustee Chairman of the Board of Trustees | |
| Mr. Curvey also serves as Trustee of other Fidelity funds. Mr. Curvey is a Director of Fidelity Investments Money Management, Inc. (2009-present), Director of Fidelity Research & Analysis Co. (2009-present) and Director of FMR and FMR Co., Inc. (2007-present). Mr. Curvey is also Vice Chairman (2007-present) and Director of FMR LLC. In addition, Mr. Curvey serves as an Overseer for the Boston Symphony Orchestra and a member of the Trustees of Villanova University. Previously, Mr. Curvey was the Vice Chairman (2006-2007) and Director (2000-2007) of FMR Corp. |
Charles S. Morrison (1960) | |
Year of Election or Appointment: 2014 Trustee | |
| Mr. Morrison also serves as Trustee or Vice President of other funds. He serves as President, Asset Management (2014-present) and is an employee of Fidelity Investments. Previously, Mr. Morrison served as President, Fixed Income (2011-2014), Vice President of Fidelity's Money Market Funds (2005-2009), President, Money Market Group Leader of FMR (2009), and Senior Vice President, Money Market Group of FMR (2004-2009). Mr. Morrison also served as Vice President of Fidelity's Bond Funds (2002-2005), certain Balanced Funds (2002-2005), and certain Asset Allocation Funds (2002-2007), and as Senior Vice President (2002-2005) of Fidelity's Bond Division. |
* Trustees have been determined to be "Interested Trustees" by virtue of, among other things, their affiliation with the trust or various entities under common control with FMR.
+ The information above includes each Trustee's principal occupation during the last five years and other information relating to the experience, attributes, and skills relevant to each Trustee's qualifications to serve as a Trustee, which led to the conclusion that each Trustee should serve as a Trustee for the fund.
Annual Report
Trustees and Officers - continued
Independent Trustees:
Correspondence intended for each Independent Trustee (that is, the Trustees other than the Interested Trustees) may be sent to Fidelity Investments, P.O. Box 55235, Boston, Massachusetts 02205-5235.
Name, Year of Birth; Principal Occupations and Other Relevant Experience+ | |
Dennis J. Dirks (1948) | |
Year of Election or Appointment: 2005 Trustee | |
| Mr. Dirks also serves as Trustee of other Fidelity funds. Prior to his retirement in May 2003, Mr. Dirks was Chief Operating Officer and a member of the Board of The Depository Trust & Clearing Corporation (DTCC). He also served as President, Chief Operating Officer, and Board member of The Depository Trust Company (DTC) and President and Board member of the National Securities Clearing Corporation (NSCC). In addition, Mr. Dirks served as Chief Executive Officer and Board member of the Government Securities Clearing Corporation, Chief Executive Officer and Board member of the Mortgage-Backed Securities Clearing Corporation, as a Trustee and a member of the Finance Committee of Manhattan College (2005-2008), and as a Trustee and a member of the Finance Committee of AHRC of Nassau County (2006-2008). Mr. Dirks is a member of the Independent Directors Council (IDC) Governing Council (2010-present) and Board of Directors for The Brookville Center for Children's Services, Inc. (2009-present). |
Alan J. Lacy (1953) | |
Year of Election or Appointment: 2008 Trustee | |
| Mr. Lacy also serves as Trustee of other Fidelity funds. Mr. Lacy serves as Senior Adviser (2007-present) of Oak Hill Capital Partners, L.P. (private equity). Mr. Lacy also served as Chief Executive Officer (2000-2005) and Vice Chairman (2005-2006) of Sears Holdings Corporation and Sears, Roebuck and Co. (retail). In addition, Mr. Lacy serves as a member of the Board of Directors of Dave & Buster's Entertainment, Inc. (restaurant and entertainment complexes, 2010-present), Earth Fare, Inc. (retail grocery, 2012-present), The Hillman Companies, Inc. (hardware wholesalers, 2010-present), and Bristol-Myers Squibb Company (global pharmaceuticals, 2008-present). Mr. Lacy is a member of the Board of Trustees of The National Parks Conservation Association (2006-present). Previously, Mr. Lacy served as Chairman of the Board of Trustees of the National Parks Conservation Association (2008-2011) and as a member of the Board of Directors for the Western Union Company (global money transfer, 2006-2011). |
Ned C. Lautenbach (1944) | |
Year of Election or Appointment: 2000 Trustee Chairman of the Independent Trustees | |
| Mr. Lautenbach also serves as Trustee of other Fidelity funds. Mr. Lautenbach currently serves as the Lead Director of the Eaton Corporation Board of Directors (diversified industrial, 1997-present). Mr. Lautenbach is Chairman of the Board of Directors of the Philharmonic Center for the Arts in Naples, Florida (2012-present) and a member of the Council on Foreign Relations (1994-present). Previously, Mr. Lautenbach was a Partner/Advisory Partner at Clayton, Dubilier & Rice, LLC (private equity investment, 1998-2010), as well as a Director of Sony Corporation (2006-2007). |
Joseph Mauriello (1944) | |
Year of Election or Appointment: 2008 Trustee | |
| Mr. Mauriello also serves as Trustee of other Fidelity funds. Prior to his retirement in January 2006, Mr. Mauriello served in numerous senior management positions including Deputy Chairman and Chief Operating Officer (2004-2005), and Vice Chairman of Financial Services (2002-2004) of KPMG LLP US (professional services, 1965-2005). Mr. Mauriello currently serves as a member of the Board of Directors of XL Group plc. (global insurance and re-insurance, 2006-present). Previously, Mr. Mauriello served as a Director of the Hamilton Funds of the Bank of New York (2006-2007) and of Arcadia Resources Inc. (health care services and products, 2007-2012). |
Robert W. Selander (1950) | |
Year of Election or Appointment: 2011 Trustee | |
| Mr. Selander also serves as Trustee of other Fidelity funds. Previously, Mr. Selander served as a Member of the Advisory Board of other Fidelity funds (2011), and Executive Vice Chairman (2010), Chief Executive Officer (2009-2010), and President and Chief Executive Officer (1997-2009) of Mastercard, Inc. |
Cornelia M. Small (1944) | |
Year of Election or Appointment: 2005 Trustee | |
| Ms. Small also serves as Trustee of other Fidelity funds. Ms. Small is a member of the Board of Directors (2009-present) and Chair of the Investment Committee (2010-present) of the Teagle Foundation. Ms. Small also serves on the Investment Committee of the Berkshire Taconic Community Foundation (2008-present). Previously, Ms. Small served as Chairperson (2002-2008) and a member of the Investment Committee and Chairperson (2008-2012) and a member of the Board of Trustees of Smith College. In addition, Ms. Small served as Chief Investment Officer, Director of Global Equity Investments, and a member of the Board of Directors of Scudder, Stevens & Clark and Scudder Kemper Investments. |
William S. Stavropoulos (1939) | |
Year of Election or Appointment: 2001 Trustee Vice Chairman of the Independent Trustees | |
| Mr. Stavropoulos also serves as Trustee of other Fidelity funds. Mr. Stavropoulos serves as President and Founder of the Michigan Baseball Foundation, the Great Lakes Loons (2007-present). Mr. Stavropoulos is Chairman Emeritus of the Board of Directors of The Dow Chemical Company, where he previously served in numerous senior management positions, including President, CEO (1995-2000; 2002-2004), Chairman of the Executive Committee (2000-2006), and as a member of the Board of Directors (1990-2006). Currently, Mr. Stavropoulos is Chairman of the Board of Directors of Univar Inc. (global distributor of commodity and specialty chemicals), a Director of Teradata Corporation (data warehousing and technology solutions), and Maersk Inc. (industrial conglomerate), and a member of the Advisory Board for Metalmark Capital LLC (private equity investment, 2005-present). Mr. Stavropoulos is an operating advisor to Clayton, Dubilier & Rice, LLC (private equity investment). In addition, Mr. Stavropoulos is a member of the University of Notre Dame Advisory Council for the College of Science, a Trustee of the Rollin L. Gerstacker Foundation, and a Director of the Naples Philharmonic Center for the Arts. Previously, Mr. Stavropoulos served as a Director of Chemical Financial Corporation (bank holding company, 1993-2012) and Tyco International, Ltd. (multinational manufacturing and services, 2007-2012). |
David M. Thomas (1949) | |
Year of Election or Appointment: 2008 Trustee | |
| Mr. Thomas also serves as Trustee of other Fidelity funds. Mr. Thomas serves as Non-Executive Chairman of the Board of Directors of Fortune Brands Home and Security (home and security products, 2011-present), and as a member of the Board of Directors of Interpublic Group of Companies, Inc. (marketing communication, 2004-present). Previously, Mr. Thomas served as Executive Chairman (2005-2006) and Chairman and Chief Executive Officer (2000-2005) of IMS Health, Inc. (pharmaceutical and healthcare information solutions), and a Director of Fortune Brands, Inc. (consumer products, 2000-2011). |
+ The information above includes each Trustee's principal occupation during the last five years and other information relating to the experience, attributes, and skills relevant to each Trustee's qualifications to serve as a Trustee, which led to the conclusion that each Trustee should serve as a Trustee for the fund.
Advisory Board Member and Officers:
Correspondence intended for each officer and Peter S. Lynch may be sent to Fidelity Investments, 245 Summer Street, Boston, Massachusetts 02210. Officers appear below in alphabetical order.
Name, Year of Birth; Principal Occupation | |
Peter S. Lynch (1944) | |
Year of Election or Appointment: 2003 Member of the Advisory Board | |
| Mr. Lynch also serves as Member of the Advisory Board of other Fidelity funds. Mr. Lynch is Vice Chairman and a Director of FMR and FMR Co., Inc. In addition, Mr. Lynch serves as a Trustee of Boston College and as the Chairman of the Inner-City Scholarship Fund. Previously, Mr. Lynch served on the Special Olympics International Board of Directors (1997-2006). |
Elizabeth Paige Baumann (1968) | |
Year of Election or Appointment: 2012 Anti-Money Laundering (AML) Officer | |
| Ms. Baumann also serves as AML Officer of other funds. She is Chief AML Officer of FMR LLC (2012-present) and is an employee of Fidelity Investments. Previously, Ms. Baumann served as Vice President and Deputy Anti-Money Laundering Officer (2007-2012). |
William C. Coffey (1969) | |
Year of Election or Appointment: 2009 Assistant Secretary | |
| Mr. Coffey also serves as Assistant Secretary of other funds. He is Senior Vice President and Deputy General Counsel of FMR LLC (2010-present), and is an employee of Fidelity Investments. Previously, Mr. Coffey served as Vice President and Associate General Counsel of FMR LLC (2005-2009). |
Jonathan Davis (1968) | |
Year of Election or Appointment: 2010 Assistant Treasurer | |
| Mr. Davis also serves as Assistant Treasurer of other funds. Mr. Davis is an employee of Fidelity Investments. Previously, Mr. Davis served as Vice President and Associate General Counsel of FMR LLC (2003-2010). |
Adrien E. Deberghes (1967) | |
Year of Election or Appointment: 2008 Deputy Treasurer | |
| Mr. Deberghes also serves as an officer of other funds. He is an employee of Fidelity Investments (2008-present). Prior to joining Fidelity Investments, Mr. Deberghes was Senior Vice President of Mutual Fund Administration at State Street Corporation (2007-2008), Senior Director of Mutual Fund Administration at Investors Bank & Trust (2005-2007), and Director of Finance for Dunkin' Brands (2000-2005). |
Stephanie J. Dorsey (1969) | |
Year of Election or Appointment: 2010 Assistant Treasurer | |
| Ms. Dorsey also serves as an officer of other funds. She is an employee of Fidelity Investments (2008-present) and has served in other fund officer roles. Prior to joining Fidelity Investments, Ms. Dorsey served as Treasurer (2004-2008) of the JPMorgan Mutual Funds and Vice President (2004-2008) of JPMorgan Chase Bank. |
Scott C. Goebel (1968) | |
Year of Election or Appointment: 2008 Secretary and Chief Legal Officer (CLO) | |
| Mr. Goebel serves as Secretary and CLO of other funds. Mr. Goebel also serves as Secretary of Fidelity SelectCo, LLC (2013-present), Fidelity Investments Money Management, Inc. (FIMM) (2010-present) and Fidelity Research and Analysis Company (FRAC) (2010-present); General Counsel, Secretary, and Senior Vice President of FMR (2008-present) and FMR Co., Inc. (2008-present); Chief Legal Officer of Fidelity Management & Research (Hong Kong) Limited (2008-present); and Assistant Secretary of Fidelity Management & Research (Japan) Inc. (2008-present) and Fidelity Management & Research (U.K.) Inc. (2008-present). Previously, Mr. Goebel served as Secretary and CLO of other Fidelity funds (2008-2013), Assistant Secretary of FIMM (2008-2010), FRAC (2008-2010), and certain funds (2007-2008); and as Vice President and Secretary of Fidelity Distributors Corporation (FDC) (2005-2007). Mr. Goebel has been employed by FMR LLC or an affiliate since 2001. |
Joseph A. Hanlon (1968) | |
Year of Election or Appointment: 2012 Chief Compliance Officer | |
| Mr. Hanlon also serves as Chief Compliance Officer of other funds. Mr. Hanlon serves as Compliance Officer of FMR, FMR Co., Inc., Fidelity Investments Money Management, Inc. (FIMM), Fidelity Research and Analysis Company (FRAC), and Fidelity Management & Research (Hong Kong) (2009-present), as Senior Vice President of the Fidelity Asset Management Division (2009-present), and is an employee of Fidelity Investments. Previously, Mr. Hanlon served as Compliance Officer of Fidelity Management & Research (Japan) Inc. (2009-2013), Strategic Advisers, Inc. (2009-2013), and Fidelity Management & Research (U.K.) Inc. (2009-2013). |
Bruce T. Herring (1965) | |
Year of Election or Appointment: 2006 Vice President of certain Equity Funds | |
| Mr. Herring also serves as Vice President of other funds. He serves as Chief Investment Officer of Fidelity Global Asset Allocation (GAA) (2013-present), Group Chief Investment Officer of FMR, and President of Fidelity Research & Analysis Company (2010-present). Previously, Mr. Herring served as Chief Investment Officer and Director of Fidelity Management & Research (U.K.) Inc. (2010-2013), Vice President (2005-2006) and Senior Vice President (2006-2007) of Fidelity Management & Research Company, Vice President of FMR Co., Inc. (2001-2007), and as a portfolio manager for Fidelity U.S. Equity Funds. |
Brian B. Hogan (1964) | |
Year of Election or Appointment: 2009 Vice President | |
| Mr. Hogan also serves as Trustee or Vice President of other funds. Mr. Hogan serves as President of FMR's Equity Division (2009-present). Previously, Mr. Hogan served as Senior Vice President, Equity Research of FMR (2006-2009) and as a portfolio manager. |
Chris Maher (1972) | |
Year of Election or Appointment: 2013 Assistant Treasurer | |
| Mr. Maher serves as Assistant Treasurer of other funds. Mr. Maher is Vice President of Valuation Oversight and is an employee of Fidelity Investments. Previously, Mr. Maher served as Vice President of Asset Management Compliance (2013), Vice President of FMR's Program Management Group (2010-2013), and Vice President of Valuation Oversight (2008-2010). |
Christine Reynolds (1958) | |
Year of Election or Appointment: 2008 Chief Financial Officer | |
| Ms. Reynolds also serves as Chief Financial Officer of other funds. Ms. Reynolds became President of Fidelity Pricing and Cash Management Services (FPCMS) in August 2008. Ms. Reynolds served as Chief Operating Officer of FPCMS (2007-2008). Previously, Ms. Reynolds served as President, Treasurer, and Anti-Money Laundering officer of the Fidelity funds (2004-2007). |
Kenneth B. Robins (1969) | |
Year of Election or Appointment: 2008 President and Treasurer | |
| Mr. Robins also serves as an officer of other funds. Mr. Robins serves as Executive Vice President of Fidelity Investments Money Management, Inc. (FIMM) (2013-present) and is an employee of Fidelity Investments (2004-present). Previously, Mr. Robins served in other fund officer roles. |
Gary W. Ryan (1958) | |
Year of Election or Appointment: 2005 Assistant Treasurer | |
| Mr. Ryan also serves as Assistant Treasurer of other funds. Mr. Ryan is an employee of Fidelity Investments and has served in other fund officer roles. Previously, Mr. Ryan served as Vice President of Fund Reporting in Fidelity Pricing and Cash Management Services (FPCMS) (1999-2005). |
Stephen Sadoski (1971) | |
Year of Election or Appointment: 2012 Deputy Treasurer | |
| Mr. Sadoski also serves as Deputy Treasurer of other funds. He is an employee of Fidelity Investments (2012-present) and has served in another fund officer role. Prior to joining Fidelity Investments, Mr. Sadoski served as an assistant chief accountant in the Division of Investment Management of the Securities and Exchange Commission (SEC) (2009-2012) and as a senior manager at Deloitte & Touche LLP (1997-2009). |
Stacie M. Smith (1974) | |
Year of Election or Appointment: 2013 Deputy Treasurer | |
| Ms. Smith also serves as an officer of other funds. She is an employee of Fidelity Investments (2009-present) and has served in other fund officer roles. Prior to joining Fidelity Investments, Ms. Smith served as Senior Audit Manager of Ernst & Young LLP (1996-2009). |
Renee Stagnone (1975) | |
Year of Election or Appointment: 2013 Deputy Treasurer | |
| Ms. Stagnone also serves as Deputy Treasurer of other funds. Ms. Stagnone is an employee of Fidelity Investments. |
Joseph F. Zambello (1957) | |
Year of Election or Appointment: 2011 Deputy Treasurer | |
| Mr. Zambello also serves as Deputy Treasurer of other funds. Mr. Zambello is an employee of Fidelity Investments. Previously, Mr. Zambello served as Vice President of FMR's Program Management Group (2009-2011) and Vice President of the Transfer Agent Oversight Group (2005-2009). |
Annual Report
Distributions (Unaudited)
A total of 0.02% of the dividends distributed during the fiscal year was derived from interest on U.S. Government securities which is generally exempt from state income tax.
Investor Class designates 100%, 98%, 98%, and 98%; and Fidelity Advantage Class designates 97%, 96%, 96%, and 96% of the dividends distributed in April, July, October, and December, respectively during the fiscal year as qualifying for the dividends-received deduction for corporate shareholders.
Investor Class and Fidelity Advantage Class designate 100% of the dividends distributed during the fiscal year as amounts which may be taken into account as a dividend for purposes of the maximum rate under section 1(h)(11) of the Internal Revenue Code.
The fund will notify shareholders in January 2015 of amounts for use in preparing 2014 income tax returns.
Annual Report
Investment Adviser
Fidelity Management & Research Company
Boston, MA
Investment Sub-Advisers
FMR Co., Inc.
Geode Capital Management, LLC
General Distributor
Fidelity Distributors Corporation
Smithfield, RI
Transfer and Service Agents
Fidelity Investments Institutional
Operations Company, Inc.
Boston, MA
Fidelity Service Company, Inc.
Boston, MA
Custodian
The Bank of New York Mellon
New York, NY
The Fidelity Telephone
Connection
Mutual Fund 24-Hour Service
Exchanges/Redemptions
and Account Assistance 1-800-544-6666
Product Information 1-800-544-8888
Retirement Accounts 1-800-544-4774
(8 a.m. - 9 p.m.)
TDD Service 1-800-544-0118
for the deaf and hearing impaired
(9 a.m. - 9 p.m. Eastern time)
Fidelity Automated Service
Telephone (FAST®)
1-800-544-5555
Automated line for quickest service
(Fidelity Investment logo)(registered trademark)
Corporate Headquarters
245 Summer St., Boston, MA 02210
www.fidelity.com
UEI-UANN-0414 1.790915.110
Spartan® Total Market Index
Spartan Extended Market Index
Spartan International Index
Funds -
Investor Class
Fidelity Advantage® Class
Annual Report
(Fidelity Cover Art)
February 28, 2014
Contents
Spartan® Total Market Index Fund | Shareholder Expense Example | |
| Performance | |
| Management's Discussion | |
| Investment Changes | |
| Investments | |
| Financial Statements | |
| Notes to the Financial Statements | |
| ||
Shareholder Expense Example | An example of shareholder expenses | |
| ||
Spartan Extended Market Index Fund | Performance | |
| Management's Discussion | |
| Investment Changes | |
| Investments | |
| Financial Statements | |
| ||
Spartan International Index Fund | Performance | |
| Management's Discussion | |
| Investment Changes | |
| Investments | |
| Financial Statements | |
| ||
Notes | Notes to the Financial Statements | |
Report of Independent Registered Public Accounting Firm |
| |
Trustees and Officers |
| |
Distributions |
| |
To view a fund's proxy voting guidelines and proxy voting record for the 12-month period ended June 30, visit http://www.fidelity.com/proxyvotingresults or visit the Securities and Exchange Commission's (SEC) web site at http://www.sec.gov. You may also call 1-800-544-8544 to request a free copy of the proxy voting guidelines.
The funds or securities referred to herein are not sponsored, endorsed, or promoted by MSCI, and MSCI bears no liability with respect to any such funds or securities or any index on which such funds or securities are based. The prospectus contains a more detailed description of the limited relationship MSCI has with Fidelity and any related funds.
Standard & Poor's, S&P and S&P 500 are registered service marks of The McGraw-Hill Companies, Inc. and have been licensed for use by Fidelity Distributors Corporation.
Other third-party marks appearing herein are the property of their respective owners.
All other marks appearing herein are registered or unregistered trademarks or service marks of FMR LLC or an affiliated company. © 2014 FMR LLC. All rights reserved.
This report and the financial statements contained herein are submitted for the general information of the shareholders of the funds. This report is not authorized for distribution to prospective investors in the funds unless preceded or accompanied by an effective prospectus.
A fund files its complete schedule of portfolio holdings with the SEC for the first and third quarters of each fiscal year on Form N-Q. Forms N-Q are available on the SEC's web site at http://www.sec.gov. A fund's Forms N-Q may be reviewed and copied at the SEC's Public Reference Room in Washington, DC. Information regarding the operation of the SEC's Public Reference Room may be obtained by calling 1-800-SEC-0330. For a complete list of a fund's portfolio holdings, view the most recent holdings listing, semiannual report, or annual report on Fidelity's web site at http://www.fidelity.com, http://www.advisor.fidelity.com, or http://www.401k.com, as applicable.
NOT FDIC INSURED • MAY LOSE VALUE • NO BANK GUARANTEE
Neither the funds nor Fidelity Distributors Corporation is a bank.
Annual Report
Spartan Total Market Index Fund
Shareholder Expense Example
As a shareholder of the Fund, you incur two types of costs: (1) transaction costs, including redemption fees and (2) ongoing costs, including management fees and other Fund expenses. This Example is intended to help you understand your ongoing costs (in dollars) of investing in the Fund and to compare these costs with the ongoing costs of investing in other mutual funds.
The Example is based on an investment of $1,000 invested at the beginning of the period and held for the entire period (September 1, 2013 to February 28, 2014).
Actual Expenses
The first line of the accompanying table for each class of the Fund provides information about actual account values and actual expenses. You may use the information in this line, together with the amount you invested, to estimate the expenses that you paid over the period. Simply divide your account value by $1,000.00 (for example, an $8,600 account value divided by $1,000.00 = 8.6), then multiply the result by the number in the first line for a class of the Fund under the heading entitled "Expenses Paid During Period" to estimate the expenses you paid on your account during this period. A small balance maintenance fee of $12.00 that is charged once a year may apply for certain accounts with a value of less than $2,000. This fee is not included in the table below. If it was, the estimate of expenses you paid during the period would be higher, and your ending account value lower, by this amount. In addition, the Fund, as a shareholder in the underlying Fidelity Central Funds, will indirectly bear its pro-rata share of the fees and expenses incurred by the underlying Fidelity Central Funds. These fees and expenses are not included in the Fund's annualized expense ratio used to calculate the expense estimate in the table below.
Hypothetical Example for Comparison Purposes
The second line of the accompanying table for each class of the Fund provides information about hypothetical account values and hypothetical expenses based on a Class' actual expense ratio and an assumed rate of return of 5% per year before expenses, which is not the Class' actual return. The hypothetical account values and expenses may not be used to estimate the actual ending account balance or expenses you paid for the period. You may use this information to compare the ongoing costs of investing in the Fund and other funds. To do so, compare this 5% hypothetical example with the 5% hypothetical examples that appear in the shareholder reports of the other funds. A small balance maintenance fee of $12.00 that is charged once a year may apply for certain accounts with a value of less than $2,000. This fee is not included in the table below. If it was, the estimate of expenses you paid during the period would be higher, and your ending account value lower, by this amount. In addition, the Fund, as a shareholder in the underlying Fidelity Central Funds, will indirectly bear its pro-rata share of the fees and expenses incurred by the underlying Fidelity Central Funds. These fees and expenses are not included in the Fund's annualized expense ratio used to calculate the expense estimate in the table below.
Please note that the expenses shown in the table are meant to highlight your ongoing costs only and do not reflect any transaction costs. Therefore, the second line of the table is useful in comparing ongoing costs only, and will not help you determine the relative total costs of owning different funds. In addition, if these transactional costs were included, your costs would have been higher.
| Annualized | Beginning | Ending | Expenses Paid |
Investor Class | .100% |
|
|
|
Actual |
| $ 1,000.00 | $ 1,157.70 | $ .53 |
HypotheticalA |
| $ 1,000.00 | $ 1,024.30 | $ .50 |
Fidelity Advantage Class | .060% |
|
|
|
Actual |
| $ 1,000.00 | $ 1,158.00 | $ .32 |
HypotheticalA |
| $ 1,000.00 | $ 1,024.50 | $ .30 |
Institutional Class | .050% |
|
|
|
Actual |
| $ 1,000.00 | $ 1,158.10 | $ .27 |
HypotheticalA |
| $ 1,000.00 | $ 1,024.55 | $ .25 |
Fidelity Advantage Institutional Class | .045% |
|
|
|
Actual |
| $ 1,000.00 | $ 1,158.00 | $ .24 |
HypotheticalA |
| $ 1,000.00 | $ 1,024.57 | $ .23 |
Class F | .046% |
|
|
|
Actual |
| $ 1,000.00 | $ 1,158.10 | $ .25 |
HypotheticalA |
| $ 1,000.00 | $ 1,024.57 | $ .23 |
A 5% return per year before expenses
B Annualized expense ratio reflects expenses net of applicable fee waivers.
* Expenses are equal to each Class' annualized expense ratio, multiplied by the average account value over the period, multiplied by 181/365 (to reflect the one-half year period).
Annual Report
Spartan® Total Market Index Fund
Performance: The Bottom Line
Average annual total return reflects the change in the value of an investment, assuming reinvestment of the class' distributions from dividend income and capital gains (the profits earned upon the sale of securities that have grown in value, if any) and assuming a constant rate of performance each year. The $10,000 table and the fund's returns do not reflect the deduction of taxes that a shareholder would pay on fund distributions or the redemption of fund shares. During periods of reimbursement by Fidelity, a fund's total return will be greater than it would be had the reimbursement not occurred. How a fund did yesterday is no guarantee of how it will do tomorrow.
Average Annual Total Returns
Periods ended February 28, 2014 | Past 1 | Past 5 | Past 10 |
Spartan® Total Market Index Fund - Investor Class | 26.62% | 23.86% | 7.78% |
Spartan Total Market Index Fund - Fidelity Advantage® Class A | 26.65% | 23.89% | 7.81% |
A The initial offering of Fidelity Advantage® Class took place on October 14, 2005. Returns prior to October 14, 2005, are those of Investor Class.
$10,000 Over 10 Years
Let's say hypothetically that $10,000 was invested in Spartan Total Market Index Fund - Investor Class on February 29, 2004. The chart shows how the value of your investment would have changed, and also shows how the Dow Jones U.S. Total Stock Market IndexSM performed over the same period.
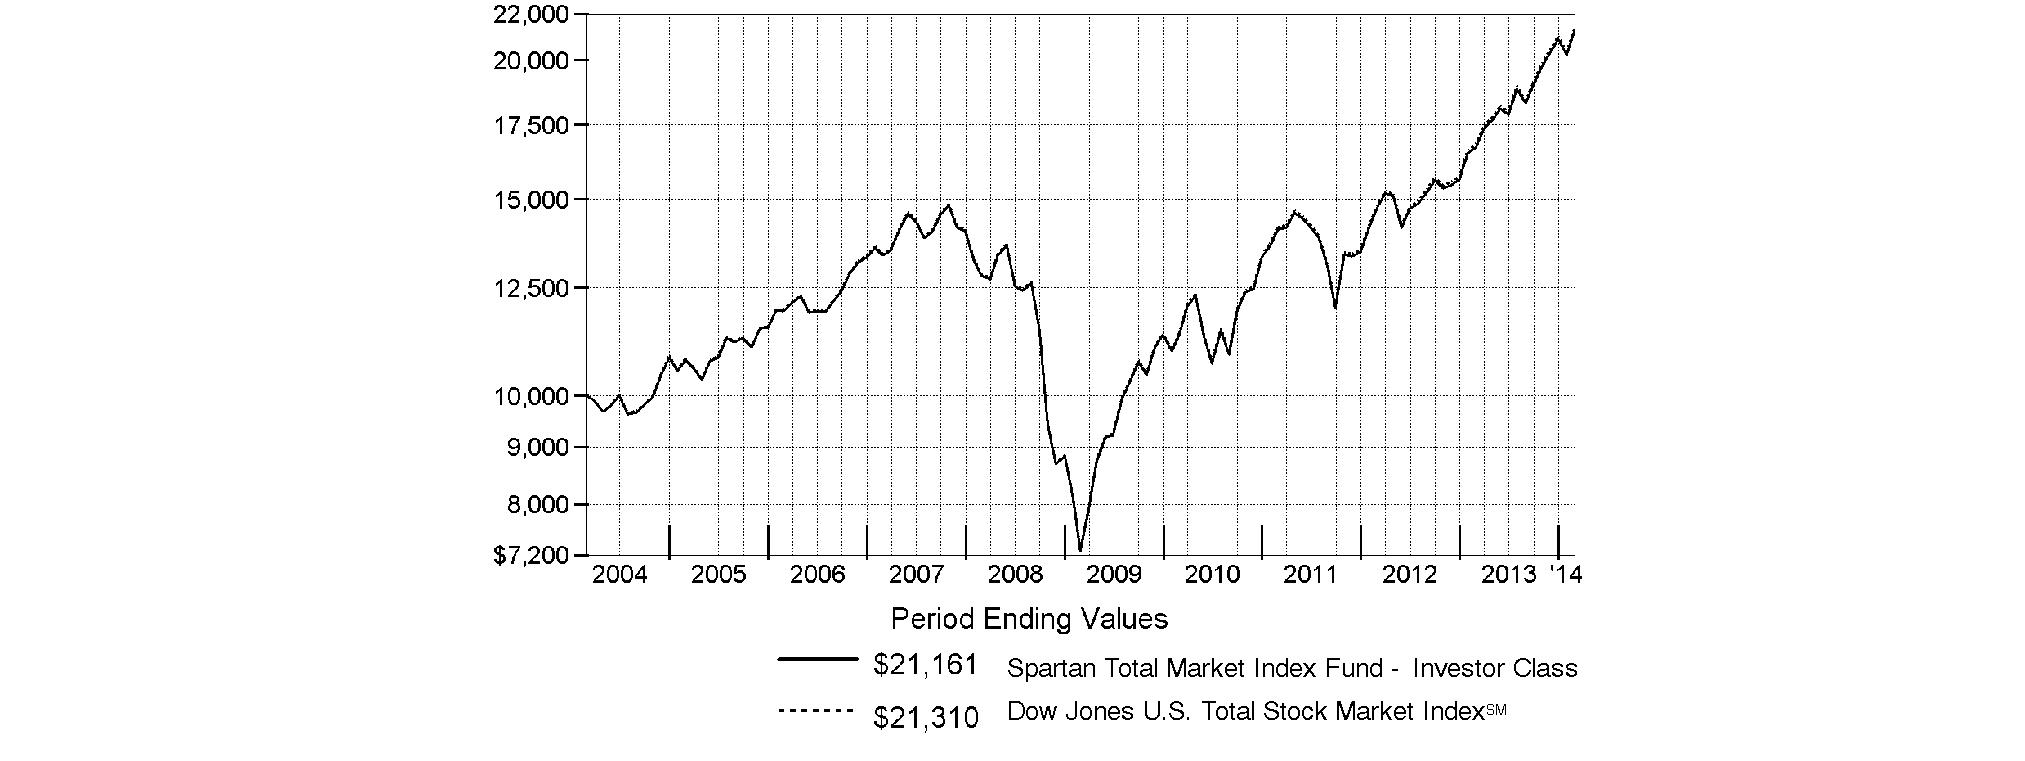
Annual Report
Spartan Total Market Index Fund
Management's Discussion of Fund Performance
Market Recap: Stocks overcame fears of higher interest rates - not to mention their worst January in four years - to finish sharply higher for the 12 months ending February 28, 2014. The broad S&P 500® Index and the blue-chip Dow Jones Industrial AverageSM gained 25.37% and 19.01%, respectively, amid generally favorable earnings reports and accommodative monetary policies worldwide. Performance generally increased along the risk spectrum, with smaller-cap and growth strategies leading the way. An ebullient market helped the growth-oriented Nasdaq Composite Index® to a 38.10% period gain, for example. On the other hand, both cyclical and defensive stocks had representation in the top-performing industry sectors: returns were highest in health care and consumer discretionary; lowest in utilities and telecommunication services. From a macroeconomic perspective, data still points to slow but steady improvement in the U.S., and Europe's recession may well be over. Reports from China have disappointed, but continue to suggest a relatively soft landing there. Mixed signals from the U.S. Federal Reserve as to when it might curtail its stimulative bond buying kept markets in flux during the spring and summer. Stocks regained momentum in October despite a federal budget impasse and brief government shutdown, and lower volatility prevailed through year-end. Shedding new-year concerns about China's economy, an emerging-markets sell-off and confirmation (at last) of Fed tapering - alongside confirmation of a presumably dovish Janet Yellen as new Fed chair - February saw stocks back in record territory, bearing down on the five-year anniversary of the market's bottom.
Comments from Patrick Waddell, Senior Portfolio Manager of the Geode Capital Management, LLC, investment management team for Spartan® Total Market Index Fund: For the year, the fund's Investor Class and Fidelity Advantage® Class shares gained 26.62% and 26.65%, respectively, in line with the 26.73% advance of the Dow Jones U.S. Total Stock Market IndexSM. In a strong market environment, all 10 sectors in the index gained ground, and all but one - telecommunication services - were up by double digits. On an individual basis, fund's top three contributors were all technology stocks and household names, as well as among the four largest stocks in the index. Internet search leader Google saw its shares rise 14% in a single day in October, thanks to better-than-expected earnings. Consumer products and computer manufacturer Apple also added value, as did software maker Microsoft, whose shares were up 42% as the company continued to generate strong financial results relative to Wall Street's expectations. Elsewhere, various health care stocks made a strong contribution, including biotechnology company Gilead Sciences, up 94%. In financials, two large banks, Wells Fargo and Bank of America, were notable contributors, gaining 36% and 48%, respectively, as the entire industry continued to bounce back from the financial crisis of 2008. On the negative side, IBM stood out, as the diversified technology company and major index component lost modest ground amid declining revenues. Tobacco company Philip Morris International struggled in an environment of slowing worldwide demand for cigarettes, while wireless communications service provider AT&T faced an increasingly competitive environment that threatened to cut into the company's revenues.
The views expressed above reflect those of the portfolio manager(s) only through the end of the period as stated on the cover of this report and do not necessarily represent the views of Fidelity or any other person in the Fidelity organization. Any such views are subject to change at any time based upon market or other conditions and Fidelity disclaims any responsibility to update such views. These views may not be relied on as investment advice and, because investment decisions for a Fidelity fund are based on numerous factors, may not be relied on as an indication of trading intent on behalf of any Fidelity fund.
Annual Report
Spartan Total Market Index Fund
Investment Changes (Unaudited)
Top Ten Stocks as of February 28, 2014 | ||
| % of fund's | % of fund's net assets |
Apple, Inc. | 2.2 | 2.5 |
Exxon Mobil Corp. | 2.0 | 2.1 |
Google, Inc. Class A | 1.6 | 1.3 |
Microsoft Corp. | 1.4 | 1.4 |
Johnson & Johnson | 1.2 | 1.3 |
General Electric Co. | 1.2 | 1.3 |
Wells Fargo & Co. | 1.1 | 1.1 |
Chevron Corp. | 1.1 | 1.3 |
Procter & Gamble Co. | 1.0 | 1.2 |
JPMorgan Chase & Co. | 1.0 | 1.0 |
| 13.8 | |
Market Sectors as of February 28, 2014 | ||
| % of fund's | % of fund's net assets |
Information Technology | 18.0 | 17.3 |
Financials | 16.9 | 17.2 |
Health Care | 13.1 | 12.4 |
Consumer Discretionary | 13.0 | 12.9 |
Industrials | 11.4 | 11.0 |
Energy | 9.1 | 9.7 |
Consumer Staples | 8.1 | 8.8 |
Materials | 3.8 | 3.7 |
Utilities | 3.0 | 3.2 |
Telecommunication Services | 2.3 | 2.2 |
Annual Report
Spartan Total Market Index Fund
Investments February 28, 2014
Showing Percentage of Net Assets
Common Stocks - 98.7% | |||
Shares | Value | ||
CONSUMER DISCRETIONARY - 13.0% | |||
Auto Components - 0.6% | |||
Allison Transmission Holdings, Inc. | 92,033 | $ 2,740,743 | |
American Axle & Manufacturing Holdings, Inc. (a)(d) | 58,540 | 1,131,578 | |
Autoliv, Inc. | 118,893 | 11,454,152 | |
BorgWarner, Inc. | 243,952 | 14,990,850 | |
Cooper Tire & Rubber Co. | 62,365 | 1,554,759 | |
Dana Holding Corp. (d) | 143,074 | 3,101,844 | |
Delphi Automotive PLC | 315,399 | 20,996,111 | |
Dorman Products, Inc. (a)(d) | 32,717 | 1,885,154 | |
Drew Industries, Inc. | 24,362 | 1,199,585 | |
Federal-Mogul Corp. Class A (a) | 65,766 | 1,239,031 | |
Fox Factory Holding Corp. | 10,471 | 174,866 | |
Fuel Systems Solutions, Inc. (a) | 20,668 | 265,584 | |
Gentex Corp. (d) | 174,142 | 5,462,835 | |
Gentherm, Inc. (a)(d) | 38,502 | 1,088,837 | |
Johnson Controls, Inc. | 761,885 | 37,637,119 | |
Lear Corp. | 91,325 | 7,415,590 | |
Modine Manufacturing Co. (a) | 42,412 | 627,273 | |
Motorcar Parts of America, Inc. (a) | 17,588 | 433,192 | |
Quantum Fuel Systems Technologies Worldwide, Inc. (a) | 11,722 | 101,161 | |
Remy International, Inc. | 14,427 | 321,578 | |
Spartan Motors, Inc. | 44,931 | 254,759 | |
Standard Motor Products, Inc. | 17,952 | 631,013 | |
Stoneridge, Inc. (a) | 33,804 | 372,182 | |
Strattec Security Corp. | 672 | 46,852 | |
Superior Industries International, Inc. | 32,436 | 592,930 | |
Tenneco, Inc. (a) | 64,500 | 3,885,480 | |
The Goodyear Tire & Rubber Co. | 279,104 | 7,499,524 | |
Tower International, Inc. (a) | 19,656 | 504,766 | |
TRW Automotive Holdings Corp. (a)(d) | 137,074 | 11,283,932 | |
UQM Technologies, Inc. (a)(d) | 38,648 | 66,861 | |
Visteon Corp. (a) | 54,951 | 4,584,562 | |
| 143,544,703 | ||
Automobiles - 0.7% | |||
Ford Motor Co. | 4,410,723 | 67,881,027 | |
General Motors Co. | 1,463,920 | 52,993,904 | |
Harley-Davidson, Inc. | 252,087 | 16,652,867 | |
Tesla Motors, Inc. (a)(d) | 92,060 | 22,537,209 | |
Thor Industries, Inc. (d) | 46,074 | 2,580,605 | |
Winnebago Industries, Inc. (a) | 39,123 | 1,043,019 | |
| 163,688,631 | ||
Distributors - 0.1% | |||
Core-Mark Holding Co., Inc. | 11,158 | 872,556 | |
Genuine Parts Co. | 171,602 | 15,116,420 | |
LKQ Corp. (a) | 344,122 | 9,597,563 | |
Pool Corp. (d) | 48,205 | 2,818,064 | |
VOXX International Corp. (a) | 18,073 | 234,949 | |
Weyco Group, Inc. | 1,992 | 52,549 | |
| 28,692,101 | ||
| |||
Shares | Value | ||
Diversified Consumer Services - 0.2% | |||
American Public Education, Inc. (a)(d) | 16,975 | $ 601,255 | |
Apollo Ed Group, Inc. Class A (non-vtg.) (a)(d) | 111,836 | 3,727,494 | |
Ascent Capital Group, Inc. (a)(d) | 16,905 | 1,241,334 | |
Bridgepoint Education, Inc. (a) | 9,049 | 174,555 | |
Bright Horizons Family Solutions, Inc. (a) | 22,321 | 881,010 | |
Capella Education Co. (d) | 13,812 | 918,222 | |
Career Education Corp. (a) | 44,821 | 331,227 | |
Carriage Services, Inc. | 15,957 | 326,002 | |
Collectors Universe, Inc. (d) | 4,772 | 85,896 | |
Corinthian Colleges, Inc. (a)(d) | 84,173 | 131,310 | |
DeVry, Inc. | 60,163 | 2,527,448 | |
Education Management Corp. (a)(d) | 26,671 | 158,426 | |
Graham Holdings Co. | 4,705 | 3,381,484 | |
Grand Canyon Education, Inc. (a)(d) | 52,030 | 2,466,222 | |
H&R Block, Inc. | 306,192 | 9,687,915 | |
Hillenbrand, Inc. | 60,464 | 1,806,664 | |
Houghton Mifflin Harcourt Co. | 90,368 | 1,836,278 | |
ITT Educational Services, Inc. (a)(d) | 22,063 | 684,615 | |
K12, Inc. (a) | 35,687 | 807,597 | |
Learning Tree International, Inc. (a) | 3,285 | 10,413 | |
LifeLock, Inc. (a)(d) | 108,404 | 2,158,324 | |
Lincoln Educational Services Corp. | 15,671 | 70,520 | |
Matthews International Corp. Class A (d) | 31,601 | 1,296,589 | |
National American University Holdings, Inc. | 5,378 | 20,221 | |
Regis Corp. (d) | 37,626 | 529,022 | |
Service Corp. International | 236,136 | 4,413,382 | |
Sotheby's Class A (Ltd. vtg.) | 74,799 | 3,516,301 | |
Steiner Leisure Ltd. (a) | 10,649 | 470,899 | |
Strayer Education, Inc. (a)(d) | 14,558 | 695,436 | |
Universal Technical Institute, Inc. | 29,419 | 398,039 | |
Weight Watchers International, Inc. (d) | 23,857 | 507,200 | |
| 45,861,300 | ||
Hotels, Restaurants & Leisure - 2.0% | |||
Ambassadors Group, Inc. | 24,177 | 95,499 | |
Bally Technologies, Inc. (a)(d) | 46,562 | 3,154,576 | |
Biglari Holdings, Inc. (d) | 1,404 | 630,382 | |
BJ's Restaurants, Inc. (a)(d) | 35,904 | 994,541 | |
Bloomin' Brands, Inc. (a) | 77,659 | 1,952,347 | |
Bob Evans Farms, Inc. | 27,901 | 1,443,598 | |
Boyd Gaming Corp. (a) | 82,652 | 960,416 | |
Bravo Brio Restaurant Group, Inc. (a) | 12,451 | 192,866 | |
Brinker International, Inc. | 84,914 | 4,670,270 | |
Buffalo Wild Wings, Inc. (a)(d) | 20,168 | 2,924,360 | |
Burger King Worldwide, Inc. | 82,686 | 2,197,794 | |
Caesars Entertainment Corp. (a) | 37,816 | 981,703 | |
Carnival Corp. unit | 487,062 | 19,316,879 | |
Carrols Restaurant Group, Inc. (a) | 6,381 | 45,305 | |
Chipotle Mexican Grill, Inc. (a)(d) | 34,438 | 19,464,702 | |
Choice Hotels International, Inc. (d) | 44,031 | 2,150,034 | |
Churchill Downs, Inc. | 15,167 | 1,410,531 | |
Common Stocks - continued | |||
Shares | Value | ||
CONSUMER DISCRETIONARY - continued | |||
Hotels, Restaurants & Leisure - continued | |||
Chuys Holdings, Inc. (a)(d) | 13,590 | $ 541,018 | |
ClubCorp Holdings, Inc. | 20,697 | 360,542 | |
Cosi, Inc. (a)(d) | 11,735 | 15,490 | |
Cracker Barrel Old Country Store, Inc. | 24,866 | 2,472,924 | |
Darden Restaurants, Inc. | 141,692 | 7,234,794 | |
Del Frisco's Restaurant Group, Inc. (a) | 28,720 | 747,869 | |
Denny's Corp. (a) | 71,197 | 484,140 | |
Diamond Resorts International, Inc. | 18,779 | 341,590 | |
DineEquity, Inc. | 19,807 | 1,658,836 | |
Domino's Pizza, Inc. | 66,862 | 5,286,110 | |
Dover Downs Gaming & Entertainment, Inc. (a) | 1,508 | 2,337 | |
Dover Motorsports, Inc. | 9,993 | 22,584 | |
Dunkin' Brands Group, Inc. | 121,165 | 6,260,596 | |
Einstein Noah Restaurant Group, Inc. | 3,797 | 56,651 | |
Empire Resorts, Inc. (a)(d) | 5,314 | 41,024 | |
Entertainment Gaming Asia, Inc. (a) | 8,246 | 9,318 | |
Extended Stay America, Inc. unit | 49,140 | 1,252,087 | |
Famous Dave's of America, Inc. (a) | 2,311 | 56,573 | |
Fiesta Restaurant Group, Inc. (a) | 33,170 | 1,666,129 | |
Frisch's Restaurants, Inc. | 500 | 11,910 | |
Hyatt Hotels Corp. Class A (a)(d) | 74,342 | 3,877,679 | |
Ignite Restaurant Group, Inc. (a)(d) | 4,841 | 59,254 | |
International Game Technology | 268,403 | 4,050,201 | |
International Speedway Corp. Class A (d) | 27,626 | 931,825 | |
Interval Leisure Group, Inc. | 46,155 | 1,254,954 | |
Isle of Capri Casinos, Inc. (a) | 20,657 | 185,913 | |
Jack in the Box, Inc. (a) | 42,139 | 2,420,886 | |
Jamba, Inc. (a)(d) | 19,136 | 241,688 | |
Kona Grill, Inc. (a) | 4,029 | 77,760 | |
Krispy Kreme Doughnuts, Inc. (a)(d) | 81,924 | 1,558,194 | |
Lakes Entertainment, Inc. (a) | 2,872 | 14,504 | |
Las Vegas Sands Corp. | 430,440 | 36,695,010 | |
Life Time Fitness, Inc. (a)(d) | 38,055 | 1,796,196 | |
Luby's, Inc. (a) | 14,614 | 92,799 | |
Marcus Corp. | 22,859 | 322,540 | |
Marriott International, Inc. Class A | 251,677 | 13,648,444 | |
Marriott Vacations Worldwide Corp. (a) | 31,069 | 1,629,258 | |
McDonald's Corp. | 1,103,535 | 105,001,355 | |
MGM Mirage, Inc. (a)(d) | 371,095 | 10,223,667 | |
Monarch Casino & Resort, Inc. (a) | 4,802 | 90,518 | |
Morgans Hotel Group Co. (a) | 27,678 | 221,424 | |
MTR Gaming Group, Inc. (a) | 11,304 | 59,798 | |
Multimedia Games Holding Co., Inc. (a) | 28,049 | 926,318 | |
Noodles & Co. (d) | 16,951 | 674,819 | |
Norwegian Cruise Line Holdings Ltd. (a) | 107,864 | 3,696,499 | |
Orient Express Hotels Ltd. Class A (a) | 110,162 | 1,696,495 | |
Panera Bread Co. Class A (a)(d) | 29,209 | 5,296,176 | |
Papa John's International, Inc. | 38,520 | 1,960,668 | |
Penn National Gaming, Inc. (a) | 66,856 | 859,100 | |
Pinnacle Entertainment, Inc. (a)(d) | 61,922 | 1,504,705 | |
| |||
Shares | Value | ||
Pizza Inn Holdings, Inc. (a) | 9,079 | $ 57,924 | |
Popeyes Louisiana Kitchen, Inc. (a) | 24,822 | 994,369 | |
Potbelly Corp. (d) | 17,598 | 376,773 | |
Premier Exhibitions, Inc. (a) | 7,733 | 6,805 | |
Red Lion Hotels Corp. (a) | 3,129 | 18,680 | |
Red Robin Gourmet Burgers, Inc. (a)(d) | 21,139 | 1,647,362 | |
Rick's Cabaret International, Inc. (a)(d) | 5,726 | 65,105 | |
Royal Caribbean Cruises Ltd. (d) | 178,138 | 9,428,844 | |
Ruby Tuesday, Inc. (a)(d) | 44,363 | 271,945 | |
Ruth's Hospitality Group, Inc. | 33,916 | 419,202 | |
Scientific Games Corp. Class A (a) | 45,645 | 611,643 | |
SeaWorld Entertainment, Inc. | 59,356 | 2,026,414 | |
Six Flags Entertainment Corp. | 100,414 | 4,096,891 | |
Sonic Corp. (a) | 98,965 | 2,016,907 | |
Speedway Motorsports, Inc. | 7,569 | 150,018 | |
Starbucks Corp. | 841,635 | 59,722,420 | |
Starwood Hotels & Resorts Worldwide, Inc. | 213,692 | 17,621,042 | |
Texas Roadhouse, Inc. Class A | 57,171 | 1,512,173 | |
The Cheesecake Factory, Inc. (d) | 58,805 | 2,794,414 | |
Town Sports International Holdings, Inc. | 13,107 | 119,012 | |
Vail Resorts, Inc. | 38,833 | 2,730,737 | |
Wendy's Co. | 318,091 | 3,047,312 | |
Wyndham Worldwide Corp. | 137,748 | 10,039,074 | |
Wynn Resorts Ltd. | 89,427 | 21,685,153 | |
Yum! Brands, Inc. | 502,140 | 37,198,531 | |
| 470,835,722 | ||
Household Durables - 0.6% | |||
Bassett Furniture Industries, Inc. | 1,947 | 29,166 | |
Beazer Homes U.S.A., Inc. (a)(d) | 23,951 | 555,424 | |
Blyth, Inc. (d) | 16,038 | 156,852 | |
Cavco Industries, Inc. (a)(d) | 9,813 | 769,830 | |
Cobra Electronics Corp. (a) | 1,032 | 3,498 | |
Comstock Holding Companies, Inc. Class A (a)(d) | 10,474 | 18,434 | |
CSS Industries, Inc. | 16,118 | 435,186 | |
D.R. Horton, Inc. (d) | 306,554 | 7,528,966 | |
Dixie Group, Inc. (a) | 6,244 | 93,660 | |
Emerson Radio Corp. (a) | 23,724 | 51,007 | |
Ethan Allen Interiors, Inc. (d) | 25,611 | 643,604 | |
Flexsteel Industries, Inc. | 2,547 | 94,621 | |
Garmin Ltd. (d) | 139,580 | 7,489,863 | |
Harman International Industries, Inc. | 77,256 | 8,091,021 | |
Helen of Troy Ltd. (a) | 38,566 | 2,518,745 | |
Hooker Furniture Corp. | 13,495 | 203,775 | |
Hovnanian Enterprises, Inc. Class A (a)(d) | 177,163 | 1,075,379 | |
iRobot Corp. (a)(d) | 34,979 | 1,466,320 | |
Jarden Corp. (a) | 133,580 | 8,211,163 | |
KB Home (d) | 76,789 | 1,566,496 | |
Kid Brands, Inc. (a) | 16,651 | 11,323 | |
Koss Corp. | 2,669 | 12,304 | |
La-Z-Boy, Inc. | 54,902 | 1,402,197 | |
Leggett & Platt, Inc. (d) | 173,875 | 5,572,694 | |
Common Stocks - continued | |||
Shares | Value | ||
CONSUMER DISCRETIONARY - continued | |||
Household Durables - continued | |||
Lennar Corp. Class A | 188,180 | $ 8,257,338 | |
Libbey, Inc. (a) | 16,641 | 387,569 | |
Lifetime Brands, Inc. | 2,385 | 39,925 | |
M.D.C. Holdings, Inc. (d) | 36,801 | 1,147,823 | |
M/I Homes, Inc. (a)(d) | 24,871 | 619,288 | |
Meritage Homes Corp. (a) | 46,552 | 2,244,272 | |
Mohawk Industries, Inc. (a) | 71,448 | 10,112,035 | |
NACCO Industries, Inc. Class A | 6,219 | 364,620 | |
Newell Rubbermaid, Inc. | 312,041 | 10,019,637 | |
NVR, Inc. (a) | 5,106 | 6,086,352 | |
Parametric Sound Corp. (a)(d) | 6,672 | 99,012 | |
PulteGroup, Inc. | 383,741 | 8,054,724 | |
Ryland Group, Inc. | 46,168 | 2,150,967 | |
Skullcandy, Inc. (a) | 12,653 | 106,412 | |
Skyline Corp. (a) | 21,741 | 125,011 | |
Standard Pacific Corp. (a)(d) | 138,811 | 1,264,568 | |
Stanley Furniture Co., Inc. (a) | 5,699 | 17,211 | |
Taylor Morrison Home Corp. | 26,856 | 674,623 | |
Tempur Sealy International, Inc. (a) | 69,336 | 3,596,458 | |
Toll Brothers, Inc. (a)(d) | 153,983 | 6,006,877 | |
TRI Pointe Homes, Inc. (d) | 13,100 | 238,682 | |
Tupperware Brands Corp. | 56,734 | 4,459,292 | |
UCP, Inc. | 9,479 | 150,716 | |
Universal Electronics, Inc. (a) | 14,332 | 598,934 | |
WCI Communities, Inc. | 8,622 | 173,992 | |
Whirlpool Corp. | 87,714 | 12,686,076 | |
William Lyon Homes, Inc. (a) | 5,678 | 175,621 | |
Zagg, Inc. (a)(d) | 21,268 | 92,090 | |
| 127,951,653 | ||
Internet & Catalog Retail - 1.3% | |||
1-800-FLOWERS.com, Inc. Class A (a) | 31,570 | 166,058 | |
Amazon.com, Inc. (a) | 416,019 | 150,640,480 | |
Blue Nile, Inc. (a)(d) | 11,337 | 398,949 | |
dELiA*s, Inc. (a)(d) | 2,977 | 3,215 | |
Expedia, Inc. | 112,037 | 8,798,266 | |
FTD Companies, Inc. (a)(d) | 14,396 | 447,140 | |
Gaiam, Inc. Class A (a) | 12,609 | 81,202 | |
Geeknet, Inc. (a) | 2,810 | 40,914 | |
Groupon, Inc. Class A (a)(d) | 426,564 | 3,544,747 | |
HomeAway, Inc. (a)(d) | 82,532 | 3,785,743 | |
HSN, Inc. | 37,772 | 2,166,224 | |
Liberty Interactive Corp.: | |||
(Venture Group) Series A (a) | 40,463 | 5,766,382 | |
Series A (a) | 531,914 | 15,531,889 | |
Netflix, Inc. (a) | 66,145 | 29,476,196 | |
NutriSystem, Inc. | 26,922 | 396,292 | |
Orbitz Worldwide, Inc. (a) | 31,286 | 302,223 | |
Overstock.com, Inc. (a)(d) | 14,467 | 284,566 | |
PetMed Express, Inc. (d) | 32,292 | 445,630 | |
priceline.com, Inc. (a) | 57,502 | 77,560,998 | |
RetailMeNot, Inc. | 11,243 | 469,620 | |
| |||
Shares | Value | ||
Shutterfly, Inc. (a)(d) | 48,378 | $ 2,639,504 | |
TripAdvisor, Inc. (a) | 123,509 | 12,380,542 | |
U.S. Auto Parts Network, Inc. (a) | 5,048 | 10,399 | |
ValueVision Media, Inc. Class A (a) | 41,726 | 233,248 | |
Vitacost.com, Inc. (a)(d) | 15,384 | 114,611 | |
zulily, Inc. (d) | 24,900 | 1,702,911 | |
| 317,387,949 | ||
Leisure Equipment & Products - 0.2% | |||
Arctic Cat, Inc. | 18,718 | 876,377 | |
Black Diamond, Inc. (a)(d) | 20,004 | 211,642 | |
Brunswick Corp. | 91,271 | 4,088,028 | |
Callaway Golf Co. | 77,147 | 649,578 | |
Hasbro, Inc. | 122,518 | 6,758,093 | |
JAKKS Pacific, Inc. (d) | 19,661 | 140,773 | |
Johnson Outdoors, Inc. Class A | 3,505 | 77,320 | |
Leapfrog Enterprises, Inc. Class A (a)(d) | 85,630 | 623,386 | |
Marine Products Corp. | 11,741 | 99,916 | |
Mattel, Inc. | 388,136 | 14,481,354 | |
Nautilus, Inc. (a) | 31,083 | 260,786 | |
Polaris Industries, Inc. | 67,562 | 9,055,335 | |
Smith & Wesson Holding Corp. (a)(d) | 80,794 | 929,131 | |
Sturm, Ruger & Co., Inc. (d) | 24,417 | 1,556,340 | |
Summer Infant, Inc. (a) | 32,605 | 60,319 | |
| 39,868,378 | ||
Media - 3.5% | |||
A.H. Belo Corp. Class A | 22,177 | 244,834 | |
AMC Networks, Inc. Class A (a)(d) | 63,313 | 4,813,054 | |
Ballantyne of Omaha, Inc. (a) | 17,964 | 83,173 | |
Cablevision Systems Corp. - NY Group Class A (d) | 252,827 | 4,449,755 | |
Carmike Cinemas, Inc. (a) | 21,753 | 647,152 | |
CBS Corp. Class B | 612,367 | 41,077,578 | |
Central European Media Enterprises Ltd. Class A (a)(d) | 56,729 | 268,895 | |
Charter Communications, Inc. Class A (a)(d) | 75,058 | 9,515,103 | |
Cinemark Holdings, Inc. | 124,821 | 3,672,234 | |
Clear Channel Outdoor Holding, Inc. Class A | 41,131 | 413,367 | |
Comcast Corp. Class A | 2,920,366 | 150,953,719 | |
Crown Media Holdings, Inc. Class A (a)(d) | 24,979 | 83,680 | |
Cumulus Media, Inc. Class A (a) | 122,704 | 804,938 | |
Digital Cinema Destinations Co. (a) | 1,935 | 10,836 | |
DIRECTV (a) | 546,908 | 42,440,061 | |
Discovery Communications, Inc. Class A (a)(d) | 266,951 | 22,242,357 | |
DISH Network Corp. Class A (a) | 230,721 | 13,575,624 | |
DreamWorks Animation SKG, Inc. Class A (a)(d) | 82,729 | 2,474,424 | |
E.W. Scripps Co. Class A (a) | 24,274 | 476,256 | |
Emmis Communications Corp. Class A (a) | 7,973 | 25,035 | |
Common Stocks - continued | |||
Shares | Value | ||
CONSUMER DISCRETIONARY - continued | |||
Media - continued | |||
Entercom Communications Corp. | 21,235 | $ 210,014 | |
Entravision Communication Corp. | 63,982 | 424,201 | |
FAB Universal Corp. (a)(d) | 3,212 | 9,861 | |
Gannett Co., Inc. | 257,425 | 7,658,394 | |
Gray Television, Inc. (a) | 54,130 | 636,028 | |
Harte-Hanks, Inc. | 45,482 | 363,401 | |
Hemisphere Media Group, Inc. (a)(d) | 2,493 | 27,772 | |
Insignia Systems, Inc. (a) | 5,038 | 15,719 | |
Interpublic Group of Companies, Inc. | 525,417 | 9,310,389 | |
John Wiley & Sons, Inc. Class A (d) | 54,942 | 3,188,284 | |
Journal Communications, Inc. Class A (a) | 23,068 | 211,534 | |
Lamar Advertising Co. Class A (a) | 69,336 | 3,717,103 | |
Liberty Global PLC Class A (a) | 419,364 | 36,295,954 | |
Liberty Media Corp. Class A (a) | 117,554 | 16,123,707 | |
Live Nation Entertainment, Inc. (a) | 175,329 | 3,978,215 | |
Loral Space & Communications Ltd. (a) | 15,593 | 1,232,159 | |
Martha Stewart Living Omnimedia, Inc. Class A (a)(d) | 39,255 | 206,481 | |
Media General, Inc. Class A (a)(d) | 21,745 | 412,503 | |
Meredith Corp. | 34,788 | 1,628,078 | |
Morningstar, Inc. | 26,885 | 2,249,199 | |
National CineMedia, Inc. | 63,847 | 980,690 | |
News Corp. Class A (a) | 570,404 | 10,455,505 | |
Nexstar Broadcasting Group, Inc. | 29,134 | 1,243,439 | |
Omnicom Group, Inc. | 286,890 | 21,711,835 | |
Radio One, Inc. Class D (non-vtg.) (a) | 32,336 | 160,710 | |
ReachLocal, Inc. (a)(d) | 5,194 | 54,953 | |
Regal Entertainment Group Class A (d) | 109,971 | 2,023,466 | |
Rentrak Corp. (a) | 11,595 | 743,355 | |
RLJ Entertainment, Inc. (a) | 17,180 | 75,592 | |
Saga Communications, Inc. Class A | 268 | 13,108 | |
Salem Communications Corp. Class A | 1,732 | 15,744 | |
Scholastic Corp. (d) | 25,364 | 894,842 | |
Scripps Networks Interactive, Inc. Class A | 122,180 | 9,925,903 | |
SFX Entertainment, Inc. (d) | 45,804 | 393,456 | |
Sinclair Broadcast Group, Inc. Class A | 75,746 | 2,243,597 | |
Sirius XM Holdings, Inc. (a)(d) | 3,471,318 | 12,531,458 | |
Sizmek, Inc. (a) | 26,444 | 327,641 | |
Spanish Broadcasting System, Inc. | 698 | 3,015 | |
Starz - Liberty Capital Series A (a) | 120,965 | 3,868,461 | |
The Madison Square Garden Co. | 76,074 | 4,336,979 | |
The McClatchy Co. Class A (a)(d) | 60,729 | 322,471 | |
The New York Times Co. Class A (d) | 162,888 | 2,674,621 | |
The Walt Disney Co. | 1,835,422 | 148,320,452 | |
Time Warner Cable, Inc. | 315,166 | 44,233,548 | |
Time Warner, Inc. | 1,015,248 | 68,153,598 | |
Twenty-First Century Fox, Inc. Class A | 2,209,366 | 74,102,136 | |
| |||
Shares | Value | ||
Viacom, Inc. Class B (non-vtg.) | 455,180 | $ 39,932,941 | |
World Wrestling Entertainment, Inc. | 44,310 | 1,015,585 | |
| 836,930,172 | ||
Multiline Retail - 0.6% | |||
Big Lots, Inc. (a)(d) | 72,215 | 2,133,953 | |
Burlington Stores, Inc. | 29,361 | 800,087 | |
Dillard's, Inc. Class A | 32,687 | 3,026,162 | |
Dollar General Corp. (a) | 325,481 | 19,496,312 | |
Dollar Tree, Inc. (a) | 232,809 | 12,750,949 | |
Family Dollar Stores, Inc. | 100,910 | 6,609,605 | |
Fred's, Inc. Class A | 41,012 | 817,369 | |
Gordmans Stores, Inc. | 10,233 | 64,980 | |
J.C. Penney Co., Inc. (a)(d) | 341,476 | 2,485,945 | |
Kohl's Corp. (d) | 228,989 | 12,866,892 | |
Macy's, Inc. | 412,775 | 23,883,162 | |
Nordstrom, Inc. (d) | 167,016 | 10,268,144 | |
Sears Holdings Corp. (a)(d) | 47,917 | 2,144,286 | |
Target Corp. | 708,070 | 44,282,698 | |
The Bon-Ton Stores, Inc. (d) | 19,775 | 214,757 | |
Tuesday Morning Corp. (a) | 41,198 | 644,337 | |
| 142,489,638 | ||
Specialty Retail - 2.3% | |||
Aarons, Inc. Class A | 97,238 | 2,988,124 | |
Abercrombie & Fitch Co. Class A | 83,791 | 3,320,637 | |
Advance Auto Parts, Inc. | 81,101 | 10,329,023 | |
Aeropostale, Inc. (a)(d) | 70,783 | 519,547 | |
America's Car Mart, Inc. (a)(d) | 10,422 | 377,693 | |
American Eagle Outfitters, Inc. | 183,756 | 2,669,975 | |
ANN, Inc. (a) | 46,918 | 1,672,627 | |
Asbury Automotive Group, Inc. (a) | 30,567 | 1,554,026 | |
Ascena Retail Group, Inc. (a) | 155,242 | 2,839,376 | |
AutoNation, Inc. (a)(d) | 67,092 | 3,531,723 | |
AutoZone, Inc. (a)(d) | 38,173 | 20,553,870 | |
Barnes & Noble, Inc. (a)(d) | 41,457 | 794,316 | |
bebe stores, Inc. | 66,951 | 406,393 | |
Bed Bath & Beyond, Inc. (a)(d) | 238,027 | 16,142,991 | |
Best Buy Co., Inc. (d) | 298,597 | 7,951,638 | |
Big 5 Sporting Goods Corp. | 16,237 | 246,478 | |
Body Central Corp. (a)(d) | 23,522 | 73,389 | |
Books-A-Million, Inc. (a) | 4,414 | 9,932 | |
Brown Shoe Co., Inc. | 39,452 | 969,730 | |
Build-A-Bear Workshop, Inc. (a) | 4,049 | 31,339 | |
Cabela's, Inc. Class A (a)(d) | 48,135 | 3,192,313 | |
Cache, Inc. (a) | 2,880 | 15,264 | |
CarMax, Inc. (a)(d) | 255,540 | 12,375,802 | |
Chico's FAS, Inc. | 157,246 | 2,599,276 | |
Christopher & Banks Corp. (a) | 22,706 | 151,222 | |
Citi Trends, Inc. (a) | 14,433 | 236,701 | |
Coldwater Creek, Inc. (a)(d) | 13,235 | 10,363 | |
Conn's, Inc. (a)(d) | 26,557 | 950,741 | |
CST Brands, Inc. (d) | 80,048 | 2,603,961 | |
Destination Maternity Corp. | 9,860 | 278,446 | |
Common Stocks - continued | |||
Shares | Value | ||
CONSUMER DISCRETIONARY - continued | |||
Specialty Retail - continued | |||
Destination XL Group, Inc. (a) | 42,389 | $ 241,617 | |
Dick's Sporting Goods, Inc. | 112,695 | 6,048,341 | |
DSW, Inc. Class A | 85,923 | 3,306,317 | |
Express, Inc. (a)(d) | 106,219 | 1,942,746 | |
Finish Line, Inc. Class A | 46,538 | 1,257,457 | |
Five Below, Inc. (a)(d) | 50,515 | 1,946,848 | |
Foot Locker, Inc. | 173,316 | 7,229,010 | |
Francesca's Holdings Corp. (a)(d) | 45,454 | 889,535 | |
GameStop Corp. Class A (d) | 126,929 | 4,735,721 | |
Gap, Inc. | 291,066 | 12,734,138 | |
Genesco, Inc. (a)(d) | 32,141 | 2,386,469 | |
GNC Holdings, Inc. | 100,621 | 4,680,889 | |
Group 1 Automotive, Inc. | 20,341 | 1,357,965 | |
Guess?, Inc. (d) | 63,670 | 1,931,748 | |
Haverty Furniture Companies, Inc. | 22,550 | 657,333 | |
hhgregg, Inc. (a)(d) | 15,184 | 160,799 | |
Hibbett Sports, Inc. (a)(d) | 34,547 | 1,980,580 | |
Home Depot, Inc. | 1,576,595 | 129,328,088 | |
Jos. A. Bank Clothiers, Inc. (a)(d) | 27,787 | 1,725,017 | |
Kirkland's, Inc. (a) | 10,699 | 189,158 | |
L Brands, Inc. | 276,125 | 15,554,121 | |
Lithia Motors, Inc. Class A (sub. vtg.) | 20,666 | 1,310,638 | |
Lowe's Companies, Inc. | 1,177,450 | 58,907,824 | |
Lumber Liquidators Holdings, Inc. (a)(d) | 28,798 | 3,089,449 | |
MarineMax, Inc. (a)(d) | 17,627 | 253,829 | |
Mattress Firm Holding Corp. (a)(d) | 21,081 | 918,921 | |
Monro Muffler Brake, Inc. | 39,787 | 2,374,090 | |
Murphy U.S.A., Inc. (d) | 44,959 | 1,823,537 | |
New York & Co., Inc. (a) | 19,427 | 86,062 | |
O'Reilly Automotive, Inc. (a) | 120,525 | 18,181,196 | |
Office Depot, Inc. (a) | 562,961 | 2,775,398 | |
Outerwall, Inc. (a)(d) | 30,388 | 2,149,343 | |
Pacific Sunwear of California, Inc. (a) | 60,120 | 171,943 | |
Penske Automotive Group, Inc. | 59,093 | 2,558,136 | |
Perfumania Holdings, Inc. (a) | 876 | 5,475 | |
PetSmart, Inc. (d) | 112,024 | 7,512,329 | |
Pier 1 Imports, Inc. | 103,847 | 1,964,785 | |
RadioShack Corp. (a)(d) | 135,907 | 364,231 | |
Rent-A-Center, Inc. (d) | 61,802 | 1,553,702 | |
Restoration Hardware Holdings, Inc. (a) | 26,612 | 1,802,165 | |
Ross Stores, Inc. | 237,822 | 17,313,442 | |
Sally Beauty Holdings, Inc. (a) | 173,033 | 4,966,047 | |
Sears Hometown & Outlet Stores, Inc. (a) | 10,000 | 231,600 | |
Select Comfort Corp. (a) | 68,724 | 1,241,155 | |
Shoe Carnival, Inc. | 12,148 | 313,904 | |
Signet Jewelers Ltd. | 91,119 | 8,706,420 | |
Sonic Automotive, Inc. Class A (sub. vtg.) | 32,657 | 775,930 | |
Stage Stores, Inc. | 33,300 | 659,340 | |
Staples, Inc. (d) | 763,388 | 10,374,443 | |
Stein Mart, Inc. | 28,029 | 380,914 | |
Systemax, Inc. (a) | 6,560 | 77,211 | |
| |||
Shares | Value | ||
The Buckle, Inc. (d) | 31,903 | $ 1,447,439 | |
The Cato Corp. Class A (sub. vtg.) | 30,985 | 869,749 | |
The Children's Place Retail Stores, Inc. | 22,249 | 1,205,228 | |
The Container Store Group, Inc. (d) | 22,029 | 788,858 | |
The Men's Wearhouse, Inc. | 53,679 | 2,887,393 | |
The Pep Boys - Manny, Moe & Jack (a) | 83,764 | 1,054,589 | |
Tiffany & Co., Inc. | 125,464 | 11,699,518 | |
Tile Shop Holdings, Inc. (a)(d) | 33,873 | 522,322 | |
Tilly's, Inc. (a) | 6,806 | 81,400 | |
TJX Companies, Inc. | 803,532 | 49,385,077 | |
Tractor Supply Co. | 152,035 | 10,727,590 | |
Trans World Entertainment Corp. | 2,977 | 12,444 | |
Ulta Salon, Cosmetics & Fragrance, Inc. (a) | 70,571 | 6,329,513 | |
Urban Outfitters, Inc. (a) | 117,805 | 4,410,619 | |
Vitamin Shoppe, Inc. (a) | 37,155 | 1,738,482 | |
West Marine, Inc. (a) | 3,285 | 40,997 | |
Wet Seal, Inc. Class A (a) | 66,930 | 127,167 | |
Williams-Sonoma, Inc. (d) | 104,808 | 6,104,018 | |
Winmark Corp. | 391 | 30,905 | |
Zale Corp. (a) | 43,224 | 939,258 | |
Zumiez, Inc. (a) | 17,893 | 425,138 | |
| 553,351,976 | ||
Textiles, Apparel & Luxury Goods - 0.9% | |||
American Apparel, Inc. (a)(d) | 42,333 | 30,484 | |
Carter's, Inc. | 59,364 | 4,471,890 | |
Cherokee, Inc. | 20,319 | 288,936 | |
Coach, Inc. | 312,163 | 15,236,676 | |
Columbia Sportswear Co. | 17,213 | 1,430,228 | |
Crocs, Inc. (a) | 99,425 | 1,514,243 | |
Culp, Inc. | 7,038 | 135,693 | |
Deckers Outdoor Corp. (a)(d) | 36,096 | 2,683,738 | |
Delta Apparel, Inc. (a) | 1,905 | 30,842 | |
Fossil Group, Inc. (a) | 55,600 | 6,388,996 | |
G-III Apparel Group Ltd. (a) | 22,660 | 1,574,643 | |
Hanesbrands, Inc. | 122,600 | 8,984,128 | |
Iconix Brand Group, Inc. (a)(d) | 61,164 | 2,461,239 | |
Joe's Jeans, Inc. (a)(d) | 32,503 | 45,829 | |
Kate Spade & Co. (a) | 135,197 | 4,626,441 | |
lululemon athletica, Inc. (a)(d) | 116,534 | 5,862,826 | |
Michael Kors Holdings Ltd. (a) | 198,823 | 19,490,619 | |
Movado Group, Inc. | 22,005 | 866,337 | |
NIKE, Inc. Class B | 832,833 | 65,210,824 | |
Oxford Industries, Inc. (d) | 16,560 | 1,295,986 | |
Perry Ellis International, Inc. (a) | 7,954 | 110,958 | |
PVH Corp. | 91,345 | 11,548,748 | |
Quiksilver, Inc. (a)(d) | 190,833 | 1,488,497 | |
R.G. Barry Corp. | 3,640 | 67,413 | |
Ralph Lauren Corp. | 67,433 | 10,862,108 | |
Skechers U.S.A., Inc. Class A (sub. vtg.) (a) | 52,325 | 1,764,922 | |
Steven Madden Ltd. (a) | 61,062 | 2,225,710 | |
Superior Uniform Group, Inc. | 859 | 14,320 | |
The Jones Group, Inc. | 74,838 | 1,118,080 | |
Common Stocks - continued | |||
Shares | Value | ||
CONSUMER DISCRETIONARY - continued | |||
Textiles, Apparel & Luxury Goods - continued | |||
Tumi Holdings, Inc. (a)(d) | 57,908 | $ 1,283,241 | |
Under Armour, Inc. Class A (sub. vtg.) (a)(d) | 88,501 | 10,013,888 | |
Unifi, Inc. (a) | 18,843 | 466,176 | |
Vera Bradley, Inc. (a)(d) | 20,509 | 543,489 | |
VF Corp. | 392,352 | 22,987,904 | |
Vince Holding Corp. | 20,302 | 548,154 | |
Wolverine World Wide, Inc. (d) | 127,356 | 3,357,104 | |
| 211,031,310 | ||
TOTAL CONSUMER DISCRETIONARY | 3,081,633,533 | ||
CONSUMER STAPLES - 8.1% | |||
Beverages - 1.7% | |||
Beam, Inc. | 184,801 | 15,331,091 | |
Boston Beer Co., Inc. Class A (a)(d) | 9,413 | 2,228,528 | |
Brown-Forman Corp. Class B (non-vtg.) | 196,483 | 16,465,275 | |
Coca-Cola Bottling Co. Consolidated | 4,325 | 327,143 | |
Coca-Cola Enterprises, Inc. | 270,815 | 12,749,970 | |
Constellation Brands, Inc. Class A (sub. vtg.) (a) | 191,384 | 15,507,846 | |
Craft Brew Alliance, Inc. (a) | 5,908 | 96,478 | |
Dr. Pepper Snapple Group, Inc. | 262,765 | 13,692,684 | |
MGP Ingredients, Inc. | 4,299 | 24,418 | |
Molson Coors Brewing Co. Class B | 177,848 | 10,107,102 | |
Monster Beverage Corp. (a) | 148,866 | 11,016,084 | |
National Beverage Corp. | 7,694 | 161,882 | |
PepsiCo, Inc. | 1,706,814 | 136,664,597 | |
Primo Water Corp. (a) | 8,907 | 28,859 | |
REED'S, Inc. (a) | 1,830 | 14,091 | |
The Coca-Cola Co. | 4,243,924 | 162,117,897 | |
| 396,533,945 | ||
Food & Staples Retailing - 1.9% | |||
Andersons, Inc. | 24,799 | 1,359,977 | |
Casey's General Stores, Inc. (d) | 41,971 | 2,874,594 | |
Chefs' Warehouse Holdings (a)(d) | 22,894 | 532,286 | |
Costco Wholesale Corp. | 492,638 | 57,540,118 | |
Crumbs Bake Shop, Inc. (a)(d) | 5,760 | 3,920 | |
CVS Caremark Corp. | 1,338,149 | 97,872,218 | |
Fairway Group Holdings Corp. (d) | 15,014 | 117,109 | |
Fresh Market, Inc. (a)(d) | 40,058 | 1,341,943 | |
Ingles Markets, Inc. Class A | 19,385 | 455,160 | |
Kroger Co. | 577,151 | 24,205,713 | |
Liberator Medical Holdings, Inc. (d) | 55,593 | 250,169 | |
Natural Grocers by Vitamin Cottage, Inc. (a)(d) | 6,984 | 284,528 | |
PriceSmart, Inc. (d) | 20,999 | 2,136,228 | |
Rite Aid Corp. (a) | 1,003,941 | 6,615,971 | |
Roundy's, Inc. | 18,846 | 115,714 | |
Safeway, Inc. | 286,105 | 10,714,632 | |
| |||
Shares | Value | ||
Spartan Stores, Inc. | 38,681 | $ 873,804 | |
Sprouts Farmers Market LLC | 59,567 | 2,324,304 | |
SUPERVALU, Inc. (a)(d) | 203,563 | 1,317,053 | |
Susser Holdings Corp. (a)(d) | 23,340 | 1,413,937 | |
Sysco Corp. | 659,822 | 23,766,788 | |
The Pantry, Inc. (a) | 24,320 | 366,746 | |
United Natural Foods, Inc. (a)(d) | 58,263 | 4,217,076 | |
Village Super Market, Inc. Class A | 3,352 | 91,878 | |
Wal-Mart Stores, Inc. | 1,819,358 | 135,906,043 | |
Walgreen Co. | 979,795 | 66,577,070 | |
Weis Markets, Inc. | 10,922 | 550,906 | |
Whole Foods Market, Inc. | 419,062 | 22,650,301 | |
| 466,476,186 | ||
Food Products - 1.6% | |||
Alico, Inc. | 172 | 6,529 | |
Annie's, Inc. (a)(d) | 13,936 | 522,321 | |
Archer Daniels Midland Co. | 727,236 | 29,525,782 | |
B&G Foods, Inc. Class A (d) | 63,705 | 1,908,602 | |
Boulder Brands, Inc. (a)(d) | 68,009 | 1,022,855 | |
Bunge Ltd. | 173,371 | 13,802,065 | |
Cal-Maine Foods, Inc. | 14,807 | 778,404 | |
Calavo Growers, Inc. | 8,788 | 273,658 | |
Campbell Soup Co. (d) | 196,834 | 8,524,881 | |
Chiquita Brands International, Inc. (a) | 44,016 | 481,535 | |
Coffee Holding Co., Inc. (a) | 3,401 | 20,848 | |
ConAgra Foods, Inc. | 467,264 | 13,270,298 | |
Darling International, Inc. (a) | 198,455 | 4,004,822 | |
Dean Foods Co. (d) | 86,659 | 1,281,687 | |
Diamond Foods, Inc. (a)(d) | 18,346 | 526,897 | |
Farmer Brothers Co. (a) | 3,100 | 65,348 | |
Flowers Foods, Inc. | 226,566 | 4,660,463 | |
Fresh Del Monte Produce, Inc. | 46,236 | 1,223,405 | |
General Mills, Inc. | 696,878 | 34,864,806 | |
Green Mountain Coffee Roasters, Inc. | 147,919 | 16,238,548 | |
Hillshire Brands Co. | 160,546 | 6,028,502 | |
Hormel Foods Corp. | 178,475 | 8,468,639 | |
Ingredion, Inc. | 84,243 | 5,546,559 | |
J&J Snack Foods Corp. | 16,924 | 1,571,901 | |
John B. Sanfilippo & Son, Inc. | 4,594 | 111,405 | |
Kellogg Co. | 293,046 | 17,784,962 | |
Kraft Foods Group, Inc. | 656,547 | 36,287,353 | |
Lancaster Colony Corp. | 21,006 | 1,894,741 | |
Lifeway Foods, Inc. (d) | 1,247 | 17,907 | |
Limoneira Co. (d) | 3,738 | 78,722 | |
McCormick & Co., Inc. (non-vtg.) (d) | 157,258 | 10,441,931 | |
Mead Johnson Nutrition Co. Class A | 221,324 | 18,048,972 | |
Mondelez International, Inc. | 1,965,952 | 66,901,347 | |
Omega Protein Corp. (a) | 32,056 | 348,449 | |
Pilgrims Pride Corp. (a) | 80,459 | 1,410,446 | |
Pinnacle Foods, Inc. | 59,152 | 1,675,185 | |
Post Holdings, Inc. (a)(d) | 36,785 | 2,101,159 | |
Sanderson Farms, Inc. (d) | 23,484 | 1,804,511 | |
Seaboard Corp. (a) | 366 | 927,821 | |
Common Stocks - continued | |||
Shares | Value | ||
CONSUMER STAPLES - continued | |||
Food Products - continued | |||
Seneca Foods Corp. Class A (a) | 7,029 | $ 212,838 | |
Snyders-Lance, Inc. | 57,191 | 1,549,304 | |
The Hain Celestial Group, Inc. (a)(d) | 54,436 | 4,861,135 | |
The Hershey Co. | 166,455 | 17,614,268 | |
The J.M. Smucker Co. | 116,444 | 11,645,564 | |
Tootsie Roll Industries, Inc. (d) | 31,326 | 911,587 | |
TreeHouse Foods, Inc. (a)(d) | 37,174 | 2,649,019 | |
Tyson Foods, Inc. Class A | 316,718 | 12,494,525 | |
WhiteWave Foods Co. (a) | 197,524 | 5,589,929 | |
| 371,982,435 | ||
Household Products - 1.6% | |||
Central Garden & Pet Co. Class A (non-vtg.) (a) | 34,714 | 255,495 | |
Church & Dwight Co., Inc. (d) | 156,776 | 10,657,632 | |
Clorox Co. (d) | 141,939 | 12,388,436 | |
Colgate-Palmolive Co. | 983,245 | 61,777,283 | |
Energizer Holdings, Inc. | 78,749 | 7,665,428 | |
Harbinger Group, Inc. (a) | 38,325 | 434,989 | |
Kimberly-Clark Corp. | 427,756 | 47,202,875 | |
Oil-Dri Corp. of America | 644 | 21,381 | |
Orchids Paper Products Co. | 2,087 | 70,269 | |
Procter & Gamble Co. | 3,041,449 | 239,240,378 | |
Spectrum Brands Holdings, Inc. | 23,337 | 1,820,519 | |
WD-40 Co. | 17,410 | 1,269,363 | |
| 382,804,048 | ||
Personal Products - 0.2% | |||
Avon Products, Inc. | 507,422 | 7,849,818 | |
Coty, Inc. Class A (d) | 75,823 | 1,125,972 | |
Cyanotech Corp. (a) | 2,300 | 13,915 | |
Elizabeth Arden, Inc. (a)(d) | 31,918 | 975,733 | |
Estee Lauder Companies, Inc. Class A | 291,289 | 20,052,335 | |
Herbalife Ltd. (d) | 102,302 | 6,813,313 | |
Inter Parfums, Inc. | 14,485 | 486,841 | |
LifeVantage Corp. (a) | 61,077 | 81,232 | |
Mannatech, Inc. (a) | 599 | 10,303 | |
MediFast, Inc. (a)(d) | 10,225 | 269,327 | |
Nature's Sunshine Products, Inc. | 2,859 | 43,199 | |
Nu Skin Enterprises, Inc. Class A (d) | 64,351 | 5,374,596 | |
Nutraceutical International Corp. (a) | 4,799 | 125,686 | |
Revlon, Inc. (a) | 13,966 | 329,737 | |
Star Scientific, Inc. (a)(d) | 176,304 | 156,893 | |
The Female Health Co. (d) | 11,731 | 81,061 | |
USANA Health Sciences, Inc. (a)(d) | 12,622 | 923,552 | |
| 44,713,513 | ||
Tobacco - 1.1% | |||
Alliance One International, Inc. (a) | 89,449 | 240,618 | |
Altria Group, Inc. | 2,227,481 | 80,768,461 | |
Lorillard, Inc. | 400,965 | 19,671,343 | |
Philip Morris International, Inc. | 1,800,078 | 145,644,311 | |
Reynolds American, Inc. | 362,408 | 18,421,199 | |
| |||
Shares | Value | ||
Universal Corp. (d) | 28,408 | $ 1,637,721 | |
Vector Group Ltd. (d) | 60,093 | 1,173,616 | |
| 267,557,269 | ||
TOTAL CONSUMER STAPLES | 1,930,067,396 | ||
ENERGY - 9.1% | |||
Energy Equipment & Services - 1.9% | |||
Atwood Oceanics, Inc. (a) | 74,378 | 3,524,773 | |
Baker Hughes, Inc. | 492,144 | 31,142,872 | |
Basic Energy Services, Inc. (a)(d) | 48,473 | 1,156,081 | |
Bolt Technology Corp. | 7,172 | 144,229 | |
Bristow Group, Inc. | 42,605 | 3,306,148 | |
C&J Energy Services, Inc. (a)(d) | 59,040 | 1,526,184 | |
Cal Dive International, Inc. (a)(d) | 171,858 | 304,189 | |
Cameron International Corp. (a) | 265,398 | 17,001,396 | |
Carbo Ceramics, Inc. (d) | 21,033 | 2,609,144 | |
Core Laboratories NV (d) | 52,255 | 9,826,553 | |
Dawson Geophysical Co. | 7,871 | 225,898 | |
Diamond Offshore Drilling, Inc. (d) | 83,655 | 3,956,882 | |
Dresser-Rand Group, Inc. (a) | 77,752 | 4,224,266 | |
Dril-Quip, Inc. (a) | 43,391 | 4,667,136 | |
ENGlobal Corp. (a) | 5,637 | 9,132 | |
Ensco PLC Class A | 255,890 | 13,475,167 | |
Era Group, Inc. (a) | 20,388 | 575,961 | |
Exterran Holdings, Inc. | 75,471 | 3,092,047 | |
FMC Technologies, Inc. (a)(d) | 260,114 | 13,068,127 | |
Forbes Energy Services Ltd. (a) | 500 | 2,035 | |
Forum Energy Technologies, Inc. (a)(d) | 70,638 | 1,829,524 | |
Frank's International NV | 47,687 | 1,127,321 | |
Geospace Technologies Corp. (a)(d) | 13,736 | 1,054,513 | |
Global Geophysical Services, Inc. (a)(d) | 29,499 | 41,299 | |
GreenHunter Energy, Inc. (a)(d) | 12,193 | 12,925 | |
Gulf Island Fabrication, Inc. | 15,288 | 320,589 | |
Gulfmark Offshore, Inc. Class A | 20,706 | 982,293 | |
Halliburton Co. | 941,615 | 53,672,055 | |
Helix Energy Solutions Group, Inc. (a) | 125,576 | 2,968,617 | |
Helmerich & Payne, Inc. | 118,617 | 11,713,429 | |
Hercules Offshore, Inc. (a)(d) | 189,533 | 902,177 | |
Hornbeck Offshore Services, Inc. (a)(d) | 29,524 | 1,262,446 | |
ION Geophysical Corp. (a)(d) | 97,381 | 396,341 | |
Key Energy Services, Inc. (a) | 163,573 | 1,478,700 | |
Matrix Service Co. (a) | 25,723 | 832,654 | |
McDermott International, Inc. (a)(d) | 280,872 | 2,339,664 | |
Mitcham Industries, Inc. (a)(d) | 23,287 | 335,100 | |
Nabors Industries Ltd. | 317,540 | 7,309,771 | |
National Oilwell Varco, Inc. | 469,940 | 36,204,178 | |
Natural Gas Services Group, Inc. (a) | 21,602 | 702,065 | |
Newpark Resources, Inc. (a)(d) | 85,435 | 950,037 | |
Noble Corp. | 280,951 | 8,723,529 | |
Nuverra Environmental Solutions, Inc. (a)(d) | 16,034 | 272,578 | |
Oceaneering International, Inc. | 112,956 | 8,085,390 | |
Common Stocks - continued | |||
Shares | Value | ||
ENERGY - continued | |||
Energy Equipment & Services - continued | |||
Oil States International, Inc. (a) | 56,000 | $ 5,315,520 | |
Parker Drilling Co. (a) | 145,338 | 1,172,878 | |
Patterson-UTI Energy, Inc. | 161,131 | 4,690,523 | |
PHI, Inc. (non-vtg.) (a) | 18,377 | 738,755 | |
Pioneer Energy Services Corp. (a) | 82,168 | 936,715 | |
RigNet, Inc. (a) | 15,376 | 735,280 | |
Rowan Companies PLC (a) | 158,021 | 5,271,581 | |
RPC, Inc. (d) | 65,463 | 1,205,174 | |
Schlumberger Ltd. | 1,469,347 | 136,649,271 | |
SEACOR Holdings, Inc. (a)(d) | 20,388 | 1,803,522 | |
Superior Energy Services, Inc. | 184,941 | 5,472,404 | |
Synthesis Energy Systems, Inc. (a) | 39,903 | 65,840 | |
Tesco Corp. (a) | 36,928 | 700,524 | |
TETRA Technologies, Inc. (a)(d) | 84,417 | 1,013,004 | |
TGC Industries, Inc. | 15,685 | 100,384 | |
Tidewater, Inc. | 61,246 | 2,983,905 | |
Transocean Ltd. (United States) (d) | 380,391 | 16,128,578 | |
Unit Corp. (a) | 53,513 | 3,285,698 | |
Vantage Drilling Co. (a)(d) | 139,486 | 244,101 | |
Weatherford International Ltd. (a) | 878,933 | 14,651,813 | |
Willbros Group, Inc. (a) | 69,552 | 687,174 | |
| 461,208,059 | ||
Oil, Gas & Consumable Fuels - 7.2% | |||
Abraxas Petroleum Corp. (a)(d) | 126,005 | 424,637 | |
Adams Resources & Energy, Inc. | 1,804 | 132,774 | |
Alon U.S.A. Energy, Inc. | 48,399 | 648,063 | |
Alpha Natural Resources, Inc. (a)(d) | 236,910 | 1,272,207 | |
Amyris, Inc. (a)(d) | 41,172 | 188,156 | |
Anadarko Petroleum Corp. | 563,338 | 47,410,526 | |
Antero Resources Corp. (d) | 39,714 | 2,396,343 | |
Apache Corp. | 447,726 | 35,500,195 | |
APCO Oil and Gas International, Inc. (a) | 12,221 | 174,638 | |
Approach Resources, Inc. (a)(d) | 29,242 | 651,219 | |
Arch Coal, Inc. (d) | 201,141 | 917,203 | |
Ardmore Shipping Corp. | 12,187 | 158,187 | |
Athlon Energy, Inc. | 38,737 | 1,439,467 | |
Barnwell Industries, Inc. (a) | 2,847 | 8,142 | |
Bill Barrett Corp. (a)(d) | 44,527 | 1,128,314 | |
BioFuel Energy Corp. (a)(d) | 979 | 2,849 | |
Bonanza Creek Energy, Inc. (a)(d) | 35,010 | 1,749,450 | |
BPZ Energy, Inc. (a)(d) | 134,116 | 276,279 | |
Cabot Oil & Gas Corp. | 466,135 | 16,314,725 | |
Callon Petroleum Co. (a) | 41,561 | 281,368 | |
Carrizo Oil & Gas, Inc. (a)(d) | 43,717 | 2,174,484 | |
Ceres, Inc. (a)(d) | 15,962 | 22,826 | |
Cheniere Energy, Inc. (a) | 242,824 | 12,002,790 | |
Chesapeake Energy Corp. | 559,542 | 14,497,733 | |
Chevron Corp. | 2,155,381 | 248,580,091 | |
Cimarex Energy Co. | 101,750 | 11,773,493 | |
Clayton Williams Energy, Inc. (a)(d) | 7,754 | 752,138 | |
Clean Energy Fuels Corp. (a)(d) | 67,120 | 561,794 | |
| |||
Shares | Value | ||
Cloud Peak Energy, Inc. (a) | 86,697 | $ 1,681,922 | |
Cobalt International Energy, Inc. (a)(d) | 333,375 | 6,427,470 | |
Comstock Resources, Inc. | 40,820 | 806,603 | |
Concho Resources, Inc. (a) | 119,921 | 14,526,031 | |
ConocoPhillips Co. | 1,373,787 | 91,356,836 | |
CONSOL Energy, Inc. | 262,364 | 10,520,796 | |
Contango Oil & Gas Co. (a) | 17,251 | 818,042 | |
Continental Resources, Inc. (a)(d) | 57,407 | 6,861,285 | |
Crosstex Energy, Inc. | 45,920 | 1,911,650 | |
CVR Energy, Inc. | 13,732 | 540,354 | |
Delek U.S. Holdings, Inc. | 36,764 | 1,020,569 | |
Denbury Resources, Inc. | 405,461 | 6,633,342 | |
Devon Energy Corp. | 424,771 | 27,363,748 | |
DHT Holdings, Inc. | 9,321 | 73,077 | |
Diamondback Energy, Inc. (a)(d) | 39,731 | 2,555,895 | |
Double Eagle Petroleum Co. (a) | 1,282 | 2,756 | |
Emerald Oil, Inc. (a) | 39,389 | 301,720 | |
Endeavour International Corp. (a)(d) | 50,764 | 246,713 | |
Energen Corp. | 88,384 | 7,109,609 | |
Energy XXI (Bermuda) Ltd. | 78,336 | 1,814,262 | |
EOG Resources, Inc. | 306,748 | 58,104,206 | |
EPL Oil & Gas, Inc. (a) | 50,327 | 1,514,843 | |
EQT Corp. | 165,052 | 16,883,169 | |
Evolution Petroleum Corp. | 6,950 | 90,350 | |
EXCO Resources, Inc. (d) | 234,793 | 1,225,619 | |
Exxon Mobil Corp. | 4,900,564 | 471,777,296 | |
Forest Oil Corp. (a) | 106,451 | 213,967 | |
FX Energy, Inc. (a)(d) | 98,760 | 370,350 | |
Gasco Energy, Inc. (a) | 44 | 1 | |
Gastar Exploration, Inc. (a) | 74,542 | 475,578 | |
Gevo, Inc. (a) | 47,917 | 65,167 | |
Goodrich Petroleum Corp. (a)(d) | 33,339 | 454,077 | |
Green Plains Renewable Energy, Inc. | 14,190 | 375,042 | |
Gulfport Energy Corp. (a) | 95,460 | 6,309,906 | |
Halcon Resources Corp. (a)(d) | 265,422 | 1,011,258 | |
Harvest Natural Resources, Inc. (a)(d) | 51,649 | 216,926 | |
Hess Corp. | 315,050 | 25,213,452 | |
HollyFrontier Corp. | 221,494 | 10,093,482 | |
Houston American Energy Corp. (a) | 36,485 | 13,514 | |
Hyperdynamics Corp. (a)(d) | 33,521 | 181,684 | |
Isramco, Inc. (a) | 123 | 17,648 | |
James River Coal Co. (a)(d) | 58,608 | 43,370 | |
Jones Energy, Inc. | 15,152 | 236,674 | |
Kinder Morgan Holding Co. LLC | 754,230 | 24,022,226 | |
KiOR, Inc. Class A (a)(d) | 22,105 | 30,947 | |
Kodiak Oil & Gas Corp. (a) | 306,801 | 3,623,320 | |
Kosmos Energy Ltd. (a) | 171,095 | 1,878,623 | |
Laredo Petroleum Holdings, Inc. (a)(d) | 61,390 | 1,601,665 | |
Lilis Energy, Inc. (a) | 8,026 | 25,683 | |
Lucas Energy, Inc. (a) | 9,400 | 8,756 | |
Magellan Petroleum Corp. (a) | 35,895 | 48,099 | |
Magnum Hunter Resources Corp. (a)(d) | 156,521 | 1,313,211 | |
Magnum Hunter Resources Corp. warrants 4/16/16 (a) | 15,652 | 6,721 | |
Common Stocks - continued | |||
Shares | Value | ||
ENERGY - continued | |||
Oil, Gas & Consumable Fuels - continued | |||
Marathon Oil Corp. | 789,876 | $ 26,460,846 | |
Marathon Petroleum Corp. | 338,483 | 28,432,572 | |
Matador Resources Co. (a)(d) | 76,387 | 1,853,149 | |
Midstates Petroleum Co., Inc. (a)(d) | 32,166 | 141,852 | |
Miller Energy Resources, Inc. (a)(d) | 32,422 | 225,009 | |
Murphy Oil Corp. | 192,672 | 11,438,937 | |
Newfield Exploration Co. (a) | 142,463 | 4,016,032 | |
Noble Energy, Inc. | 401,847 | 27,631,000 | |
Northern Oil & Gas, Inc. (a)(d) | 93,777 | 1,305,376 | |
Oasis Petroleum, Inc. (a)(d) | 118,000 | 5,141,260 | |
Occidental Petroleum Corp. | 900,060 | 86,873,791 | |
ONEOK, Inc. | 228,616 | 13,520,350 | |
Pacific Ethanol, Inc. (a) | 20,096 | 274,712 | |
Panhandle Royalty Co. Class A | 6,335 | 234,142 | |
PBF Energy, Inc. Class A | 71,419 | 1,799,759 | |
PDC Energy, Inc. (a)(d) | 36,259 | 2,252,772 | |
Peabody Energy Corp. (d) | 287,212 | 5,043,443 | |
Penn Virginia Corp. (a)(d) | 74,899 | 1,134,720 | |
Petroquest Energy, Inc. (a)(d) | 70,948 | 335,584 | |
Phillips 66 Co. | 672,891 | 50,372,620 | |
Pioneer Natural Resources Co. | 158,717 | 31,930,686 | |
QEP Resources, Inc. | 196,867 | 5,695,362 | |
Quicksilver Resources, Inc. (a)(d) | 168,400 | 550,668 | |
Range Resources Corp. | 182,957 | 15,743,450 | |
Renewable Energy Group, Inc. (a)(d) | 19,507 | 227,647 | |
Rentech, Inc. (a)(d) | 218,177 | 410,173 | |
Resolute Energy Corp. (a)(d) | 59,120 | 550,998 | |
Rex American Resources Corp. (a) | 4,837 | 230,628 | |
Rex Energy Corp. (a)(d) | 63,386 | 1,204,334 | |
Rosetta Resources, Inc. (a)(d) | 66,417 | 2,946,922 | |
Royale Energy, Inc. (a)(d) | 36,496 | 102,919 | |
Sanchez Energy Corp. (a)(d) | 43,626 | 1,299,619 | |
SandRidge Energy, Inc. (a)(d) | 475,629 | 3,067,807 | |
Saratoga Resources, Inc. (a) | 16,554 | 22,513 | |
SemGroup Corp. Class A | 56,834 | 3,826,065 | |
SM Energy Co. | 72,684 | 5,360,445 | |
Solazyme, Inc. (a)(d) | 72,848 | 893,845 | |
Southwestern Energy Co. (a) | 393,897 | 16,283,702 | |
Spectra Energy Corp. | 754,745 | 28,136,894 | |
Stone Energy Corp. (a)(d) | 67,092 | 2,411,286 | |
Swift Energy Co. (a)(d) | 41,382 | 413,820 | |
Synergy Resources Corp. (a)(d) | 85,751 | 908,103 | |
Syntroleum Corp. (a)(d) | 15,037 | 59,998 | |
Targa Resources Corp. | 33,055 | 3,198,402 | |
Teekay Corp. | 46,397 | 2,772,221 | |
Tengasco, Inc. (a) | 12,601 | 5,168 | |
Tesoro Corp. | 146,745 | 7,485,462 | |
The Williams Companies, Inc. | 760,127 | 31,393,245 | |
Triangle Petroleum Corp. (a)(d) | 83,126 | 744,809 | |
U.S. Energy Corp. (a) | 13,579 | 54,316 | |
Ultra Petroleum Corp. (a)(d) | 182,633 | 4,595,046 | |
| |||
Shares | Value | ||
Uranium Energy Corp. (a)(d) | 86,698 | $ 157,790 | |
Uranium Resources, Inc. (a)(d) | 26,282 | 84,365 | |
USEC, Inc. (a)(d) | 3,322 | 18,304 | |
VAALCO Energy, Inc. (a)(d) | 68,248 | 454,532 | |
Valero Energy Corp. | 604,594 | 29,008,420 | |
W&T Offshore, Inc. (d) | 37,319 | 562,397 | |
Warren Resources, Inc. (a) | 48,923 | 216,729 | |
Western Refining, Inc. (d) | 53,248 | 1,940,890 | |
Westmoreland Coal Co. (a) | 10,233 | 231,266 | |
Whiting Petroleum Corp. (a) | 135,243 | 9,292,547 | |
World Fuel Services Corp. (d) | 89,666 | 4,036,763 | |
WPX Energy, Inc. (a)(d) | 237,040 | 4,176,645 | |
ZaZa Energy Corp. (a)(d) | 19,430 | 17,872 | |
Zion Oil & Gas, Inc. (a)(d) | 27,782 | 46,118 | |
| 1,702,718,718 | ||
TOTAL ENERGY | 2,163,926,777 | ||
FINANCIALS - 16.9% | |||
Capital Markets - 2.0% | |||
Affiliated Managers Group, Inc. (a) | 57,328 | 10,780,530 | |
Ameriprise Financial, Inc. | 216,081 | 23,550,668 | |
Arlington Asset Investment Corp. (d) | 13,562 | 359,664 | |
Artisan Partners Asset Management, Inc. | 18,533 | 1,170,730 | |
Bank of New York Mellon Corp. | 1,292,433 | 41,357,856 | |
BGC Partners, Inc. Class A | 203,183 | 1,381,644 | |
BlackRock, Inc. Class A | 141,863 | 43,245,517 | |
Calamos Asset Management, Inc. | 22,184 | 264,655 | |
Charles Schwab Corp. | 1,285,960 | 34,090,800 | |
CIFI Corp. | 3,896 | 30,778 | |
Cohen & Steers, Inc. (d) | 17,375 | 656,949 | |
Cowen Group, Inc. Class A (a) | 80,174 | 343,145 | |
Diamond Hill Investment Group, Inc. | 1,102 | 129,320 | |
E*TRADE Financial Corp. (a) | 321,912 | 7,233,363 | |
Eaton Vance Corp. (non-vtg.) (d) | 144,041 | 5,450,511 | |
Evercore Partners, Inc. Class A | 40,806 | 2,270,446 | |
FBR & Co. (a) | 11,471 | 298,246 | |
Federated Investors, Inc. Class B (non-vtg.) (d) | 108,341 | 2,968,543 | |
Financial Engines, Inc. (d) | 56,540 | 3,195,075 | |
Franklin Resources, Inc. | 453,634 | 24,156,011 | |
FXCM, Inc. Class A (d) | 51,378 | 865,719 | |
GAMCO Investors, Inc. Class A | 6,083 | 474,839 | |
GFI Group, Inc. | 69,449 | 278,490 | |
Gleacher & Co., Inc. (a) | 1,808 | 20,051 | |
Goldman Sachs Group, Inc. | 469,978 | 78,227,838 | |
Greenhill & Co., Inc. | 23,725 | 1,263,831 | |
HFF, Inc. | 31,822 | 1,015,122 | |
ICG Group, Inc. (a) | 32,808 | 666,987 | |
Institutional Financial Markets, Inc. | 6,881 | 16,927 | |
INTL FCStone, Inc. (a)(d) | 15,053 | 273,814 | |
Common Stocks - continued | |||
Shares | Value | ||
FINANCIALS - continued | |||
Capital Markets - continued | |||
Invesco Ltd. | 497,759 | $ 17,073,134 | |
Investment Technology Group, Inc. (a) | 55,680 | 962,150 | |
Janus Capital Group, Inc. (d) | 187,399 | 2,096,995 | |
JMP Group, Inc. | 11,989 | 88,119 | |
KCG Holdings, Inc. Class A | 107,133 | 1,273,811 | |
Ladenburg Thalmann Financial Services, Inc. (a) | 42,620 | 118,910 | |
Legg Mason, Inc. | 151,820 | 6,977,647 | |
LPL Financial | 82,901 | 4,450,126 | |
Manning & Napier, Inc. Class A | 3,941 | 57,893 | |
Medallion Financial Corp. | 4,309 | 62,653 | |
Morgan Stanley | 1,549,389 | 47,721,181 | |
Northern Trust Corp. | 250,938 | 15,520,515 | |
Oppenheimer Holdings, Inc. Class A (non-vtg.) | 6,844 | 186,910 | |
Piper Jaffray Companies (a)(d) | 20,940 | 877,386 | |
Pzena Investment Management, Inc. | 4,972 | 57,476 | |
Raymond James Financial, Inc. | 163,719 | 8,641,089 | |
Safeguard Scientifics, Inc. (a)(d) | 26,745 | 524,469 | |
SEI Investments Co. | 167,937 | 5,637,645 | |
Silvercrest Asset Management Group Class A | 6,008 | 100,994 | |
State Street Corp. | 492,071 | 32,314,303 | |
Stifel Financial Corp. (a)(d) | 59,345 | 2,853,901 | |
SWS Group, Inc. (a) | 24,189 | 197,140 | |
T. Rowe Price Group, Inc. | 302,200 | 24,529,574 | |
TD Ameritrade Holding Corp. (d) | 282,750 | 9,452,333 | |
Teton Advisors, Inc. (a) | 106 | 3,445 | |
U.S. Global Investments, Inc. Class A | 7,637 | 27,340 | |
Virtus Investment Partners, Inc. (a) | 8,765 | 1,622,927 | |
Waddell & Reed Financial, Inc. Class A | 84,679 | 5,902,126 | |
Walter Investment Management Corp. (a)(d) | 38,853 | 992,694 | |
Westwood Holdings Group, Inc. | 3,640 | 207,152 | |
WisdomTree Investments, Inc. (a)(d) | 96,770 | 1,507,677 | |
| 478,077,784 | ||
Commercial Banks - 3.2% | |||
1st Source Corp. | 8,597 | 268,226 | |
1st United Bancorp, Inc. | 20,464 | 157,573 | |
Access National Corp. | 1,270 | 21,400 | |
ACNB Corp. (d) | 3,789 | 71,006 | |
American National Bankshares, Inc. | 2,748 | 61,720 | |
Ameris Bancorp (a) | 34,183 | 719,210 | |
Ames National Corp. | 1,209 | 26,937 | |
Arrow Financial Corp. | 15,818 | 413,008 | |
Associated Banc-Corp. | 184,412 | 3,077,836 | |
BancFirst Corp. | 10,611 | 583,923 | |
Bancorp, Inc., Delaware (a)(d) | 42,844 | 820,463 | |
BancorpSouth, Inc. | 84,413 | 2,020,003 | |
Bank of Hawaii Corp. | 64,151 | 3,749,626 | |
Bank of Kentucky Financial Corp. | 1,699 | 59,618 | |
| |||
Shares | Value | ||
Bank of Marin Bancorp | 2,794 | $ 123,579 | |
Bank of the Ozarks, Inc. (d) | 37,486 | 2,377,362 | |
BankUnited, Inc. | 103,014 | 3,448,909 | |
Banner Bank | 13,068 | 518,669 | |
Bar Harbor Bankshares | 2,686 | 102,068 | |
BB&T Corp. | 783,604 | 29,620,231 | |
BBCN Bancorp, Inc. | 78,753 | 1,340,376 | |
BCB Bancorp, Inc. | 2,814 | 37,370 | |
BNC Bancorp | 11,700 | 203,931 | |
BOK Financial Corp. | 42,858 | 2,774,198 | |
Boston Private Financial Holdings, Inc. | 85,484 | 1,114,711 | |
Bridge Bancorp, Inc. | 540 | 14,218 | |
Bridge Capital Holdings (a) | 1,107 | 24,598 | |
Bryn Mawr Bank Corp. | 9,420 | 268,376 | |
BSB Bancorp, Inc. (a) | 6,958 | 117,312 | |
C & F Financial Corp. | 1,992 | 72,907 | |
Camden National Corp. | 1,850 | 69,449 | |
Capital Bank Financial Corp. Series A (a) | 112,359 | 2,584,257 | |
Capital City Bank Group, Inc. (d) | 7,146 | 101,330 | |
CapitalSource, Inc. | 244,954 | 3,600,824 | |
Cardinal Financial Corp. (d) | 22,155 | 381,952 | |
Cascade Bancorp (a)(d) | 4,186 | 20,428 | |
Cathay General Bancorp | 87,127 | 2,213,897 | |
Center Bancorp, Inc. | 6,904 | 128,483 | |
Centerstate Banks of Florida, Inc. | 6,387 | 69,810 | |
Central Pacific Financial Corp. | 26,089 | 514,736 | |
Century Bancorp, Inc. Class A (non-vtg.) | 686 | 24,627 | |
Chemical Financial Corp. | 31,417 | 926,487 | |
CIT Group, Inc. | 237,879 | 11,579,950 | |
Citizens & Northern Corp. | 8,777 | 174,838 | |
City Holding Co. | 22,173 | 981,820 | |
City National Corp. | 58,166 | 4,352,562 | |
CNB Financial Corp., Pennsylvania | 7,083 | 130,398 | |
CoBiz, Inc. | 39,972 | 446,088 | |
Columbia Banking Systems, Inc. (d) | 46,707 | 1,224,658 | |
Comerica, Inc. | 197,578 | 9,519,308 | |
Commerce Bancshares, Inc. | 104,098 | 4,649,017 | |
Community Bank System, Inc. (d) | 49,202 | 1,792,429 | |
Community Trust Bancorp, Inc. | 13,652 | 540,619 | |
CommunityOne Bancorp (a) | 6,555 | 72,171 | |
CU Bancorp (a) | 6,814 | 123,061 | |
Cullen/Frost Bankers, Inc. | 71,142 | 5,310,039 | |
CVB Financial Corp. (d) | 84,778 | 1,319,993 | |
Eagle Bancorp, Inc., Maryland (d) | 22,699 | 777,668 | |
East West Bancorp, Inc. | 174,395 | 6,224,158 | |
Eastern Virginia Bankshares, Inc. (a) | 969 | 6,589 | |
Enterprise Bancorp, Inc. | 803 | 15,458 | |
Enterprise Financial Services Corp. | 12,168 | 227,785 | |
Farmers National Banc Corp. (d) | 14,652 | 109,011 | |
Fidelity Southern Corp. | 3,439 | 49,418 | |
Fifth Third Bancorp | 1,058,556 | 22,965,372 | |
Financial Institutions, Inc. | 12,700 | 279,908 | |
First Bancorp, North Carolina | 9,193 | 168,232 | |
First Bancorp, Puerto Rico (a) | 99,750 | 519,698 | |
Common Stocks - continued | |||
Shares | Value | ||
FINANCIALS - continued | |||
Commercial Banks - continued | |||
First Busey Corp. | 50,381 | $ 299,767 | |
First Citizen Bancshares, Inc. | 8,410 | 1,887,120 | |
First Commonwealth Financial Corp. (d) | 101,457 | 864,414 | |
First Community Bancshares, Inc. | 8,561 | 143,397 | |
First Connecticut Bancorp, Inc. | 11,897 | 186,545 | |
First Financial Bancorp, Ohio | 59,723 | 1,017,680 | |
First Financial Bankshares, Inc. (d) | 43,848 | 2,651,927 | |
First Financial Corp., Indiana | 8,837 | 303,904 | |
First Financial Holdings, Inc. | 28,877 | 1,768,427 | |
First Financial Service Corp. (a) | 2,521 | 10,639 | |
First Horizon National Corp. | 287,965 | 3,446,941 | |
First Interstate Bancsystem, Inc. | 19,621 | 508,184 | |
First Merchants Corp. | 33,146 | 709,987 | |
First Midwest Bancorp, Inc., Delaware | 83,782 | 1,396,646 | |
First Niagara Financial Group, Inc. | 529,611 | 4,803,572 | |
First of Long Island Corp. | 1,768 | 68,704 | |
First Republic Bank | 143,479 | 7,456,604 | |
First United Corp. (a) | 3,018 | 23,269 | |
FirstMerit Corp. | 204,257 | 4,240,375 | |
Flushing Financial Corp. | 47,044 | 974,752 | |
FNB Corp., Pennsylvania | 179,748 | 2,191,128 | |
Fulton Financial Corp. (d) | 224,854 | 2,767,953 | |
German American Bancorp, Inc. | 4,623 | 133,697 | |
Glacier Bancorp, Inc. (d) | 75,176 | 2,086,134 | |
Great Southern Bancorp, Inc. | 6,815 | 195,591 | |
Guaranty Bancorp | 16,534 | 233,460 | |
Hampton Roads Bankshares, Inc. (a) | 89,921 | 149,269 | |
Hancock Holding Co. | 109,529 | 3,774,369 | |
Hanmi Financial Corp. | 38,186 | 894,698 | |
Hawthorn Bancshares, Inc. | 1,496 | 19,463 | |
Heartland Financial U.S.A., Inc. | 8,878 | 238,818 | |
Heritage Commerce Corp. | 14,712 | 119,020 | |
Heritage Financial Corp., Washington | 12,768 | 226,377 | |
Heritage Oaks Bancorp (a) | 3,340 | 26,687 | |
Home Bancshares, Inc. (d) | 50,202 | 1,684,779 | |
Home Federal Bancorp, Inc. | 9,753 | 147,173 | |
HomeTrust Bancshares, Inc. (a)(d) | 20,129 | 315,421 | |
Horizon Bancorp Industries | 706 | 15,348 | |
Hudson Valley Holding Corp. | 14,551 | 273,413 | |
Huntington Bancshares, Inc. | 933,913 | 8,900,191 | |
IBERIABANK Corp. | 35,645 | 2,334,748 | |
Independent Bank Corp. (a) | 17,111 | 210,465 | |
Independent Bank Corp., Massachusetts (d) | 25,945 | 954,517 | |
Independent Bank Group, Inc. | 2,957 | 158,909 | |
International Bancshares Corp. | 64,813 | 1,502,365 | |
Intervest Bancshares Corp. Class A (a) | 6,160 | 45,646 | |
Investors Bancorp, Inc. | 84,986 | 2,253,829 | |
KeyCorp | 1,064,932 | 14,025,154 | |
Lakeland Bancorp, Inc. | 23,579 | 266,443 | |
Lakeland Financial Corp. | 13,545 | 514,710 | |
| |||
Shares | Value | ||
M&T Bank Corp. | 145,574 | $ 16,972,473 | |
Macatawa Bank Corp. | 22,839 | 120,590 | |
MainSource Financial Group, Inc. | 13,271 | 229,190 | |
MB Financial, Inc. | 59,673 | 1,821,817 | |
MBT Financial Corp. (a) | 1,548 | 7,461 | |
Merchants Bancshares, Inc. | 5,246 | 172,803 | |
Metro Bancorp, Inc. (a) | 11,557 | 226,748 | |
Midsouth Bancorp, Inc. | 5,240 | 91,805 | |
National Bank Holdings Corp. | 141,292 | 2,773,562 | |
National Bankshares, Inc. | 5,803 | 208,908 | |
National Penn Bancshares, Inc. | 120,787 | 1,304,500 | |
NBT Bancorp, Inc. | 54,895 | 1,288,935 | |
NewBridge Bancorp (a) | 10,719 | 77,177 | |
North Valley Bancorp (a) | 849 | 19,756 | |
Northrim Bancorp, Inc. | 2,935 | 72,113 | |
OFG Bancorp (d) | 40,168 | 642,688 | |
Old National Bancorp, Indiana | 98,018 | 1,375,193 | |
Old Second Bancorp, Inc. (a) | 18,605 | 92,281 | |
OmniAmerican Bancorp, Inc. | 6,877 | 149,712 | |
Orrstown Financial Services, Inc. (a) | 5,669 | 92,858 | |
Pacific Continental Corp. | 3,048 | 43,983 | |
Pacific Mercantile Bancorp (a) | 10,321 | 64,403 | |
Pacific Premier Bancorp, Inc. (a) | 35 | 557 | |
PacWest Bancorp (d) | 35,627 | 1,546,212 | |
Park National Corp. | 14,135 | 1,103,378 | |
Park Sterling Corp. | 28,617 | 187,728 | |
Penns Woods Bancorp, Inc. | 3,854 | 176,552 | |
Peoples Bancorp, Inc. | 3,334 | 81,583 | |
Peoples Financial Corp., Mississippi (a) | 2,667 | 36,005 | |
Pinnacle Financial Partners, Inc. | 38,294 | 1,381,648 | |
PNC Financial Services Group, Inc. | 621,024 | 50,787,343 | |
Popular, Inc. (a) | 112,654 | 3,220,778 | |
Preferred Bank, Los Angeles (a) | 1,131 | 27,178 | |
Premier Financial Bancorp, Inc. | 115 | 1,612 | |
PrivateBancorp, Inc. | 92,031 | 2,656,015 | |
Prosperity Bancshares, Inc. | 66,890 | 4,234,806 | |
Regions Financial Corp. | 1,653,454 | 17,592,751 | |
Renasant Corp. | 23,910 | 694,825 | |
Republic Bancorp, Inc., Kentucky Class A | 18,205 | 438,558 | |
Royal Bancshares of Pennsylvania, Inc. Class A (a) | 2,700 | 6,723 | |
S&T Bancorp, Inc. | 32,238 | 743,731 | |
S.Y. Bancorp, Inc. | 6,551 | 195,482 | |
Sandy Spring Bancorp, Inc. | 13,803 | 327,545 | |
Seacoast Banking Corp., Florida (a) | 23,091 | 248,921 | |
Shore Bancshares, Inc. (a) | 2,958 | 28,012 | |
Sierra Bancorp | 3,618 | 59,010 | |
Signature Bank (a)(d) | 61,743 | 8,084,011 | |
Simmons First National Corp. Class A | 10,951 | 390,184 | |
Southside Bancshares, Inc. | 13,372 | 394,875 | |
Southwest Bancorp, Inc., Oklahoma | 15,446 | 271,695 | |
State Bank Financial Corp. | 26,469 | 450,502 | |
Sterling Bancorp | 79,121 | 1,015,914 | |
Sterling Financial Corp. | 40,387 | 1,279,056 | |
Common Stocks - continued | |||
Shares | Value | ||
FINANCIALS - continued | |||
Commercial Banks - continued | |||
Suffolk Bancorp (a) | 15,697 | $ 316,608 | |
Sun Bancorp, Inc., New Jersey (a) | 48,802 | 169,831 | |
SunTrust Banks, Inc. | 625,274 | 23,560,324 | |
Susquehanna Bancshares, Inc. | 215,524 | 2,357,833 | |
SVB Financial Group (a) | 57,220 | 7,204,570 | |
Synovus Financial Corp. | 1,042,950 | 3,629,466 | |
Taylor Capital Group, Inc. (a)(d) | 9,976 | 235,434 | |
TCF Financial Corp. | 219,604 | 3,540,016 | |
Texas Capital Bancshares, Inc. (a)(d) | 44,486 | 2,800,394 | |
The First Bancorp, Inc. | 2,896 | 47,408 | |
Tompkins Financial Corp. | 8,812 | 426,589 | |
TowneBank (d) | 18,594 | 278,352 | |
Trico Bancshares | 12,062 | 301,429 | |
Trustmark Corp. | 94,171 | 2,272,346 | |
U.S. Bancorp | 2,044,982 | 84,130,559 | |
UMB Financial Corp. | 45,063 | 2,809,227 | |
Umpqua Holdings Corp. (d) | 115,463 | 2,051,778 | |
Union First Market Bankshares Corp. | 44,561 | 1,127,393 | |
United Bankshares, Inc., West Virginia | 83,407 | 2,454,668 | |
United Community Banks, Inc., Georgia (a) | 43,617 | 727,968 | |
Univest Corp. of Pennsylvania | 10,023 | 193,143 | |
Valley National Bancorp (d) | 229,522 | 2,313,582 | |
ViewPoint Financial Group (d) | 43,399 | 1,084,975 | |
Washington Banking Co., Oak Harbor | 5,615 | 103,428 | |
Washington Trust Bancorp, Inc. | 15,489 | 545,058 | |
Webster Financial Corp. | 106,126 | 3,286,722 | |
Wells Fargo & Co. | 5,376,048 | 249,556,148 | |
WesBanco, Inc. | 28,002 | 834,740 | |
West Bancorp., Inc. | 1,202 | 17,850 | |
Westamerica Bancorp. (d) | 28,148 | 1,415,281 | |
Westbury Bancorp, Inc. | 4,860 | 69,984 | |
Western Alliance Bancorp. (a) | 80,481 | 1,863,940 | |
Wilshire Bancorp, Inc. | 52,255 | 530,388 | |
Wintrust Financial Corp. | 46,573 | 2,155,398 | |
Zions Bancorporation | 204,129 | 6,368,825 | |
| 754,122,322 | ||
Consumer Finance - 0.8% | |||
American Express Co. | 1,031,844 | 94,186,720 | |
Asta Funding, Inc. (a) | 4,468 | 37,531 | |
Atlanticus Holdings Corp. (a)(d) | 35,598 | 88,995 | |
Capital One Financial Corp. | 637,759 | 46,830,643 | |
Cash America International, Inc. (d) | 29,387 | 1,176,068 | |
Consumer Portfolio Services, Inc. (a) | 11,930 | 92,935 | |
Credit Acceptance Corp. (a) | 13,731 | 1,896,800 | |
DFC Global Corp. (a)(d) | 43,285 | 356,236 | |
Discover Financial Services | 556,489 | 31,931,339 | |
Encore Capital Group, Inc. (a)(d) | 29,815 | 1,449,605 | |
EZCORP, Inc. (non-vtg.) Class A (a)(d) | 64,428 | 814,370 | |
First Cash Financial Services, Inc. (a)(d) | 35,415 | 1,870,974 | |
First Marblehead Corp. (a) | 5,188 | 36,368 | |
| |||
Shares | Value | ||
Green Dot Corp. Class A (a)(d) | 44,284 | $ 892,323 | |
Imperial Holdings, Inc. (a) | 16,708 | 91,393 | |
Nelnet, Inc. Class A | 22,213 | 891,186 | |
Portfolio Recovery Associates, Inc. (a)(d) | 50,604 | 2,744,255 | |
Regional Management Corp. (a) | 4,032 | 121,686 | |
SLM Corp. | 493,468 | 11,813,624 | |
Springleaf Holdings, Inc. | 37,440 | 1,054,685 | |
World Acceptance Corp. (a)(d) | 15,268 | 1,463,438 | |
| 199,841,174 | ||
Diversified Financial Services - 4.1% | |||
Bank of America Corp. | 11,910,171 | 196,875,127 | |
Berkshire Hathaway, Inc. Class B (a) | 2,023,147 | 234,239,960 | |
CBOE Holdings, Inc. | 109,590 | 5,921,148 | |
Citigroup, Inc. | 3,393,491 | 165,025,467 | |
CME Group, Inc. | 350,475 | 25,872,065 | |
Gain Capital Holdings, Inc. (d) | 15,735 | 162,385 | |
ING U.S., Inc. | 147,495 | 5,290,646 | |
Interactive Brokers Group, Inc. | 43,141 | 959,456 | |
IntercontinentalExchange Group, Inc. | 128,718 | 26,881,467 | |
JPMorgan Chase & Co. | 4,206,498 | 239,013,216 | |
Leucadia National Corp. | 370,953 | 10,364,427 | |
Life Partners Holdings, Inc. | 18,668 | 44,990 | |
MarketAxess Holdings, Inc. | 47,067 | 2,778,836 | |
Marlin Business Services Corp. | 13,319 | 286,359 | |
McGraw Hill Financial, Inc. | 303,994 | 24,216,162 | |
MicroFinancial, Inc. | 86 | 699 | |
Moody's Corp. | 212,214 | 16,764,906 | |
MSCI, Inc. Class A (a)(d) | 147,156 | 6,432,189 | |
NewStar Financial, Inc. (a) | 27,065 | 416,260 | |
PHH Corp. (a) | 72,291 | 1,881,735 | |
PICO Holdings, Inc. (a) | 22,896 | 574,919 | |
Resource America, Inc. Class A | 2,362 | 22,345 | |
The NASDAQ OMX Group, Inc. | 124,702 | 4,787,310 | |
Vector Capital Corp. rights (a) | 4,280 | 0 | |
| 968,812,074 | ||
Insurance - 3.1% | |||
ACE Ltd. | 376,274 | 36,825,936 | |
AFLAC, Inc. | 511,414 | 32,771,409 | |
Alleghany Corp. (a) | 18,948 | 7,304,454 | |
Allied World Assurance Co. Holdings Ltd. (d) | 33,827 | 3,373,228 | |
Allstate Corp. | 503,599 | 27,325,282 | |
AMBAC Financial Group, Inc. (a) | 43,974 | 1,519,741 | |
American Equity Investment Life Holding Co. (d) | 83,986 | 1,835,934 | |
American Financial Group, Inc. | 76,865 | 4,393,603 | |
American International Group, Inc. | 1,647,284 | 81,985,325 | |
American National Insurance Co. | 11,975 | 1,359,043 | |
Amerisafe, Inc. | 28,834 | 1,255,432 | |
Amtrust Financial Services, Inc. (d) | 37,933 | 1,433,867 | |
Aon PLC | 335,975 | 28,759,460 | |
Arch Capital Group Ltd. (a)(d) | 141,774 | 7,956,357 | |
Argo Group International Holdings, Ltd. | 32,771 | 1,446,512 | |
Common Stocks - continued | |||
Shares | Value | ||
FINANCIALS - continued | |||
Insurance - continued | |||
Arthur J. Gallagher & Co. | 138,329 | $ 6,390,800 | |
Aspen Insurance Holdings Ltd. | 68,795 | 2,583,940 | |
Assurant, Inc. | 95,115 | 6,242,397 | |
Assured Guaranty Ltd. | 183,926 | 4,515,383 | |
Axis Capital Holdings Ltd. | 130,874 | 5,754,530 | |
Baldwin & Lyons, Inc. Class B | 5,084 | 130,710 | |
Brown & Brown, Inc. | 116,705 | 3,512,821 | |
Cincinnati Financial Corp. | 161,273 | 7,560,478 | |
Citizens, Inc. Class A (a)(d) | 31,937 | 234,418 | |
CNA Financial Corp. | 65,754 | 2,728,133 | |
CNO Financial Group, Inc. | 273,436 | 4,992,941 | |
Crawford & Co. Class B | 10,464 | 88,630 | |
Donegal Group, Inc. Class A | 4,528 | 63,890 | |
eHealth, Inc. (a) | 26,343 | 1,264,464 | |
EMC Insurance Group | 5,816 | 177,388 | |
Employers Holdings, Inc. | 36,335 | 714,709 | |
Endurance Specialty Holdings Ltd. (d) | 45,122 | 2,352,661 | |
Enstar Group Ltd. (a) | 11,576 | 1,449,084 | |
Erie Indemnity Co. Class A | 26,259 | 1,905,878 | |
Everest Re Group Ltd. (d) | 51,436 | 7,676,309 | |
FBL Financial Group, Inc. Class A | 12,986 | 543,334 | |
Federated National Holding Co. | 1,278 | 20,295 | |
Fidelity National Financial, Inc. Class A | 297,669 | 9,840,937 | |
First Acceptance Corp. (a) | 4,055 | 10,543 | |
First American Financial Corp. | 131,076 | 3,531,187 | |
Fortegra Financial Corp. (a) | 10,670 | 74,583 | |
Genworth Financial, Inc. Class A (a) | 560,876 | 8,716,013 | |
Global Indemnity PLC (a) | 13,709 | 357,531 | |
Greenlight Capital Re, Ltd. (a) | 23,762 | 747,315 | |
Hallmark Financial Services, Inc. (a) | 10,337 | 87,554 | |
Hanover Insurance Group, Inc. | 48,173 | 2,834,499 | |
Hartford Financial Services Group, Inc. | 470,637 | 16,561,716 | |
HCC Insurance Holdings, Inc. | 116,739 | 5,124,842 | |
HCI Group, Inc. | 9,511 | 460,523 | |
Health Insurance Innovations (d) | 4,900 | 61,691 | |
Hilltop Holdings, Inc. (a) | 68,910 | 1,688,984 | |
Horace Mann Educators Corp. | 37,921 | 1,084,920 | |
Independence Holding Co. | 16,014 | 218,271 | |
Infinity Property & Casualty Corp. | 13,372 | 986,185 | |
Investors Title Co. | 1,086 | 83,535 | |
Kansas City Life Insurance Co. | 2,863 | 140,860 | |
Kemper Corp. | 58,114 | 2,253,661 | |
Lincoln National Corp. | 307,008 | 15,390,311 | |
Loews Corp. | 371,316 | 16,144,820 | |
Maiden Holdings Ltd. | 73,970 | 830,683 | |
Markel Corp. (a)(d) | 16,654 | 9,626,012 | |
Marsh & McLennan Companies, Inc. | 616,601 | 29,695,504 | |
MBIA, Inc. (a)(d) | 228,577 | 3,097,218 | |
Meadowbrook Insurance Group, Inc. (d) | 46,791 | 251,268 | |
Mercury General Corp. | 42,960 | 1,946,088 | |
MetLife, Inc. | 1,257,264 | 63,705,567 | |
| |||
Shares | Value | ||
Montpelier Re Holdings Ltd. (d) | 62,043 | $ 1,768,846 | |
National Interstate Corp. | 9,042 | 273,701 | |
National Western Life Insurance Co. Class A | 2,078 | 469,732 | |
Navigators Group, Inc. (a) | 15,156 | 918,757 | |
Old Republic International Corp. | 306,111 | 4,763,087 | |
OneBeacon Insurance Group Ltd. | 20,572 | 337,381 | |
PartnerRe Ltd. | 64,815 | 6,408,907 | |
Phoenix Companies, Inc. (a)(d) | 3,067 | 156,816 | |
Platinum Underwriters Holdings Ltd. | 32,909 | 1,929,126 | |
Primerica, Inc. | 51,420 | 2,304,644 | |
Principal Financial Group, Inc. | 298,650 | 13,543,778 | |
ProAssurance Corp. | 69,301 | 3,150,423 | |
Progressive Corp. | 598,738 | 14,663,094 | |
Protective Life Corp. | 78,222 | 4,078,495 | |
Prudential Financial, Inc. | 510,495 | 43,177,667 | |
Reinsurance Group of America, Inc. | 80,713 | 6,214,094 | |
RenaissanceRe Holdings Ltd. | 56,754 | 5,420,575 | |
RLI Corp. | 34,126 | 1,471,854 | |
Safety Insurance Group, Inc. | 14,899 | 831,811 | |
Selective Insurance Group, Inc. | 57,017 | 1,313,672 | |
StanCorp Financial Group, Inc. (d) | 52,960 | 3,504,893 | |
State Auto Financial Corp. | 6,222 | 124,564 | |
Stewart Information Services Corp. (d) | 21,434 | 792,629 | |
Symetra Financial Corp. | 109,204 | 2,151,319 | |
The Chubb Corp. | 278,385 | 24,353,120 | |
The Travelers Companies, Inc. | 393,876 | 33,022,564 | |
Third Point Reinsurance Ltd. (d) | 28,985 | 434,775 | |
Torchmark Corp. | 96,240 | 7,459,562 | |
Tower Group International Ltd. (d) | 63,927 | 176,439 | |
United Fire Group, Inc. | 20,054 | 581,165 | |
Universal Insurance Holdings, Inc. | 22,997 | 307,240 | |
Unum Group | 290,729 | 10,111,555 | |
Validus Holdings Ltd. | 125,147 | 4,606,661 | |
W.R. Berkley Corp. | 118,696 | 4,895,023 | |
White Mountains Insurance Group Ltd. | 7,023 | 4,070,250 | |
Willis Group Holdings PLC (d) | 207,878 | 8,556,258 | |
XL Group PLC Class A | 291,212 | 8,852,845 | |
| 723,198,919 | ||
Real Estate Investment Trusts - 3.3% | |||
Acadia Realty Trust (SBI) (d) | 57,067 | 1,509,422 | |
AG Mortgage Investment Trust, Inc. (d) | 18,957 | 347,671 | |
Agree Realty Corp. | 17,794 | 546,988 | |
Alexanders, Inc. | 2,701 | 1,012,092 | |
Alexandria Real Estate Equities, Inc. | 78,887 | 5,715,363 | |
Altisource Residential Corp. Class B | 60,332 | 1,724,289 | |
American Assets Trust, Inc. | 36,114 | 1,194,290 | |
American Campus Communities, Inc. | 134,876 | 4,982,319 | |
American Capital Agency Corp. | 420,086 | 9,363,717 | |
American Capital Mortgage Investment Corp. | 52,567 | 1,060,276 | |
American Homes 4 Rent Class A | 82,136 | 1,345,388 | |
American Realty Capital Properties, Inc. | 634,113 | 9,315,120 | |
Common Stocks - continued | |||
Shares | Value | ||
FINANCIALS - continued | |||
Real Estate Investment Trusts - continued | |||
American Residential Properties, Inc. (a)(d) | 15,232 | $ 277,222 | |
American Tower Corp. | 436,451 | 35,557,663 | |
AmREIT, Inc. Class B | 18,007 | 312,241 | |
Annaly Capital Management, Inc. (d) | 1,072,997 | 11,996,106 | |
Anworth Mortgage Asset Corp. | 251,516 | 1,302,853 | |
Apartment Investment & Management Co. Class A | 137,319 | 4,104,465 | |
Apollo Commercial Real Estate Finance, Inc. | 34,660 | 580,208 | |
Apollo Residential Mortgage, Inc. | 29,321 | 511,358 | |
Arbor Realty Trust, Inc. | 31,767 | 217,922 | |
Ares Commercial Real Estate Corp. | 39,618 | 538,409 | |
Armada Hoffler Properties, Inc. | 18,404 | 180,175 | |
Armour Residential REIT, Inc. | 489,690 | 2,100,770 | |
Ashford Hospitality Prime, Inc. | 13,979 | 234,148 | |
Ashford Hospitality Trust, Inc. | 69,895 | 781,426 | |
Associated Estates Realty Corp. (d) | 60,888 | 1,041,185 | |
AvalonBay Communities, Inc. | 132,936 | 17,144,756 | |
Aviv REIT, Inc. (d) | 12,625 | 320,170 | |
BioMed Realty Trust, Inc. | 232,867 | 4,815,690 | |
Blackstone Mortgage Trust, Inc. (d) | 31,861 | 923,013 | |
Boston Properties, Inc. | 173,248 | 19,478,273 | |
Brandywine Realty Trust (SBI) (d) | 189,114 | 2,770,520 | |
BRE Properties, Inc. | 90,165 | 5,569,492 | |
Brixmor Property Group, Inc. (d) | 46,627 | 1,029,524 | |
BRT Realty Trust (a) | 5,568 | 39,700 | |
Camden Property Trust (SBI) | 107,447 | 7,166,715 | |
Campus Crest Communities, Inc. (d) | 55,980 | 463,514 | |
Capstead Mortgage Corp. (d) | 97,016 | 1,250,536 | |
CBL & Associates Properties, Inc. | 198,768 | 3,536,083 | |
Cedar Shopping Centers, Inc. | 59,877 | 368,244 | |
Chambers Street Properties (d) | 312,279 | 2,470,127 | |
Chatham Lodging Trust | 26,521 | 553,493 | |
Chesapeake Lodging Trust | 44,367 | 1,155,760 | |
Chimera Investment Corp. | 1,225,514 | 3,909,390 | |
Colony Financial, Inc. | 80,404 | 1,815,522 | |
Columbia Property Trust, Inc. (d) | 148,227 | 3,933,945 | |
CommonWealth REIT | 127,873 | 3,471,752 | |
Coresite Realty Corp. | 24,333 | 757,730 | |
Corporate Office Properties Trust (SBI) | 106,736 | 2,846,649 | |
Corrections Corp. of America (d) | 120,697 | 4,025,245 | |
Cousins Properties, Inc. | 234,370 | 2,706,974 | |
CubeSmart (d) | 141,018 | 2,469,225 | |
CyrusOne, Inc. | 16,200 | 359,964 | |
CYS Investments, Inc. (d) | 197,203 | 1,735,386 | |
DCT Industrial Trust, Inc. | 349,621 | 2,768,998 | |
DDR Corp. | 308,138 | 5,121,254 | |
DiamondRock Hospitality Co. | 202,906 | 2,560,674 | |
Digital Realty Trust, Inc. (d) | 143,555 | 7,774,939 | |
Douglas Emmett, Inc. | 131,928 | 3,552,821 | |
| |||
Shares | Value | ||
Duke Realty LP | 350,539 | $ 5,889,055 | |
DuPont Fabros Technology, Inc. (d) | 100,616 | 2,672,361 | |
EastGroup Properties, Inc. (d) | 28,464 | 1,765,907 | |
Education Realty Trust, Inc. | 122,580 | 1,155,929 | |
Ellington Residential Mortgage REIT | 7,146 | 120,982 | |
Empire State Realty Trust, Inc. | 146,821 | 2,249,298 | |
EPR Properties | 65,817 | 3,505,413 | |
Equity Lifestyle Properties, Inc. | 92,610 | 3,727,553 | |
Equity One, Inc. (d) | 85,144 | 1,975,341 | |
Equity Residential (SBI) | 375,538 | 21,957,707 | |
Essex Property Trust, Inc. | 38,906 | 6,507,029 | |
Excel Trust, Inc. | 44,534 | 558,011 | |
Extra Space Storage, Inc. | 137,773 | 6,764,654 | |
Federal Realty Investment Trust (SBI) (d) | 65,716 | 7,314,848 | |
FelCor Lodging Trust, Inc. | 200,216 | 1,743,881 | |
First Industrial Realty Trust, Inc. (d) | 100,981 | 1,942,874 | |
First Potomac Realty Trust | 64,690 | 820,269 | |
Five Oaks Investment Corp. | 4,880 | 55,144 | |
Franklin Street Properties Corp. | 99,285 | 1,243,048 | |
Gaming & Leisure Properties | 93,984 | 3,578,911 | |
General Growth Properties, Inc. | 597,700 | 13,161,354 | |
Getty Realty Corp. | 23,628 | 454,603 | |
Gladstone Commercial Corp. | 10,709 | 186,337 | |
Glimcher Realty Trust | 157,267 | 1,530,208 | |
Government Properties Income Trust | 51,672 | 1,287,150 | |
Gramercy Property Trust, Inc. (a) | 85,386 | 495,239 | |
Hannon Armstrong Sustainable Infrastructure Capital, Inc. | 14,671 | 210,235 | |
Hatteras Financial Corp. | 121,103 | 2,388,151 | |
HCP, Inc. | 513,882 | 19,923,205 | |
Health Care REIT, Inc. | 319,414 | 18,762,378 | |
Healthcare Realty Trust, Inc. | 119,232 | 2,857,991 | |
Healthcare Trust of America, Inc. (d) | 307,681 | 3,455,258 | |
Hersha Hospitality Trust | 166,640 | 936,517 | |
Highwoods Properties, Inc. (SBI) (d) | 89,662 | 3,381,154 | |
Home Properties, Inc. (d) | 74,137 | 4,369,635 | |
Hospitality Properties Trust (SBI) | 164,136 | 4,349,604 | |
Host Hotels & Resorts, Inc. | 818,486 | 16,099,620 | |
Hudson Pacific Properties, Inc. | 49,472 | 1,128,456 | |
Inland Real Estate Corp. | 85,277 | 913,317 | |
Invesco Mortgage Capital, Inc. | 135,801 | 2,285,531 | |
Investors Real Estate Trust | 102,538 | 900,284 | |
iStar Financial, Inc. (a)(d) | 71,516 | 1,108,498 | |
JAVELIN Mortgage Investment Corp. (d) | 12,977 | 188,167 | |
Kilroy Realty Corp. (d) | 91,661 | 5,272,341 | |
Kimco Realty Corp. | 418,673 | 9,319,661 | |
Kite Realty Group Trust | 133,192 | 823,127 | |
LaSalle Hotel Properties (SBI) (d) | 107,841 | 3,379,737 | |
Lexington Corporate Properties Trust (d) | 259,496 | 2,960,849 | |
Liberty Property Trust (SBI) (d) | 176,490 | 6,752,507 | |
LTC Properties, Inc. | 32,625 | 1,229,310 | |
Mack-Cali Realty Corp. | 122,465 | 2,724,846 | |
Medical Properties Trust, Inc. | 160,702 | 2,119,659 | |
MFA Financial, Inc. | 486,658 | 3,825,132 | |
Common Stocks - continued | |||
Shares | Value | ||
FINANCIALS - continued | |||
Real Estate Investment Trusts - continued | |||
Mid-America Apartment Communities, Inc. (d) | 78,844 | $ 5,333,008 | |
Monmouth Real Estate Investment Corp. Class A | 35,864 | 347,164 | |
National Health Investors, Inc. | 34,486 | 2,127,786 | |
National Retail Properties, Inc. (d) | 132,178 | 4,743,868 | |
New York Mortgage Trust, Inc. (d) | 61,040 | 471,839 | |
NorthStar Realty Finance Corp. | 317,869 | 4,930,148 | |
Omega Healthcare Investors, Inc. (d) | 127,635 | 4,079,215 | |
One Liberty Properties, Inc. | 11,261 | 246,841 | |
Parkway Properties, Inc. | 64,262 | 1,184,349 | |
Pebblebrook Hotel Trust | 72,830 | 2,420,869 | |
Pennsylvania Real Estate Investment Trust (SBI) | 59,632 | 1,118,696 | |
PennyMac Mortgage Investment Trust | 70,569 | 1,716,238 | |
Physicians Realty Trust | 13,134 | 175,864 | |
Piedmont Office Realty Trust, Inc. Class A | 174,747 | 3,019,628 | |
Plum Creek Timber Co., Inc. | 200,436 | 8,676,874 | |
PMC Commercial Trust | 8,500 | 81,430 | |
Post Properties, Inc. | 73,877 | 3,585,251 | |
Potlatch Corp. | 43,845 | 1,738,016 | |
Power (REIT) (a) | 718 | 6,642 | |
Prologis, Inc. | 574,154 | 23,649,403 | |
PS Business Parks, Inc. | 26,075 | 2,190,822 | |
Public Storage | 159,990 | 27,038,310 | |
QTS Realty Trust, Inc. Class A | 15,035 | 384,295 | |
RAIT Financial Trust (d) | 83,839 | 696,702 | |
Ramco-Gershenson Properties Trust (SBI) (d) | 70,480 | 1,177,016 | |
Rayonier, Inc. | 140,834 | 6,631,873 | |
Realty Income Corp. | 238,560 | 10,596,835 | |
Redwood Trust, Inc. | 89,769 | 1,804,357 | |
Regency Centers Corp. | 116,777 | 5,928,768 | |
Resource Capital Corp. | 118,128 | 688,686 | |
Retail Opportunity Investments Corp. | 70,350 | 1,043,291 | |
Retail Properties America, Inc. | 250,044 | 3,485,613 | |
Rexford Industrial Realty, Inc. | 19,146 | 271,682 | |
RLJ Lodging Trust | 133,852 | 3,478,813 | |
Rouse Properties, Inc. (d) | 34,930 | 653,890 | |
Ryman Hospitality Properties, Inc. (d) | 49,860 | 2,103,593 | |
Sabra Health Care REIT, Inc. (d) | 44,632 | 1,270,673 | |
Saul Centers, Inc. | 14,444 | 671,213 | |
Select Income (REIT) | 38,717 | 1,128,601 | |
Senior Housing Properties Trust (SBI) | 240,030 | 5,352,669 | |
Silver Bay Realty Trust Corp. | 47,769 | 748,540 | |
Simon Property Group, Inc. | 342,693 | 55,272,954 | |
SL Green Realty Corp. (d) | 129,295 | 12,842,872 | |
SoTHERLY Hotels, Inc. | 2,721 | 16,789 | |
Sovran Self Storage, Inc. | 33,865 | 2,505,671 | |
Spirit Realty Capital, Inc. | 431,927 | 4,716,643 | |
Stag Industrial, Inc. | 38,576 | 899,207 | |
Starwood Property Trust, Inc. (d) | 220,370 | 5,293,287 | |
| |||
Shares | Value | ||
Starwood Waypoint Residential (a) | 44,074 | $ 1,194,846 | |
Strategic Hotel & Resorts, Inc. (a)(d) | 334,781 | 3,344,462 | |
Summit Hotel Properties, Inc. | 86,907 | 803,021 | |
Sun Communities, Inc. (d) | 36,167 | 1,665,852 | |
Sunstone Hotel Investors, Inc. | 192,214 | 2,598,733 | |
Supertel Hospitality, Inc., Maryland (a) | 703 | 1,758 | |
Tanger Factory Outlet Centers, Inc. (d) | 110,651 | 3,796,436 | |
Taubman Centers, Inc. (d) | 65,656 | 4,625,465 | |
Terreno Realty Corp. | 21,026 | 392,766 | |
The Geo Group, Inc. | 86,331 | 2,782,448 | |
The Macerich Co. | 163,662 | 9,840,996 | |
Two Harbors Investment Corp. | 449,289 | 4,663,620 | |
UDR, Inc. | 279,578 | 7,215,908 | |
UMH Properties, Inc. | 10,346 | 95,907 | |
Universal Health Realty Income Trust (SBI) | 13,491 | 574,447 | |
Urstadt Biddle Properties, Inc. Class A | 26,585 | 521,332 | |
Ventas, Inc. | 330,294 | 20,620,254 | |
Vornado Realty Trust | 190,771 | 18,369,340 | |
Washington REIT (SBI) | 61,934 | 1,557,640 | |
Weingarten Realty Investors (SBI) | 108,015 | 3,294,458 | |
Western Asset Mortgage Capital Corp. (d) | 19,742 | 325,151 | |
Weyerhaeuser Co. | 648,424 | 19,134,992 | |
Whitestone REIT Class B | 2,558 | 36,784 | |
Winthrop Realty Trust | 32,907 | 383,037 | |
WP Carey, Inc. | 66,643 | 4,233,163 | |
ZAIS Financial Corp. (d) | 6,000 | 104,460 | |
| 771,771,510 | ||
Real Estate Management & Development - 0.2% | |||
Alexander & Baldwin, Inc. | 43,253 | 1,800,190 | |
Altisource Portfolio Solutions SA | 18,423 | 1,812,455 | |
American Spectrum Realty, Inc. (a) | 1,984 | 2,778 | |
AV Homes, Inc. (a)(d) | 12,051 | 238,007 | |
CBRE Group, Inc. (a) | 310,765 | 8,685,882 | |
Consolidated-Tomoka Land Co. | 2,432 | 86,482 | |
Forest City Enterprises, Inc. Class A (a)(d) | 164,146 | 3,197,564 | |
Forestar Group, Inc. (a)(d) | 38,487 | 725,865 | |
Gladstone Land Corp. | 8,000 | 102,400 | |
Howard Hughes Corp. (a) | 34,443 | 4,754,167 | |
Jones Lang LaSalle, Inc. | 53,062 | 6,537,238 | |
Kennedy-Wilson Holdings, Inc. | 81,481 | 2,061,469 | |
Maui Land & Pineapple, Inc. (a)(d) | 31,310 | 194,435 | |
RE/MAX Holdings, Inc. | 10,289 | 315,049 | |
Realogy Holdings Corp. (a)(d) | 174,285 | 8,271,566 | |
Tejon Ranch Co. (a) | 11,342 | 402,074 | |
The St. Joe Co. (a)(d) | 111,664 | 2,158,465 | |
Transcontinental Realty Investors, Inc. (a) | 20,697 | 327,013 | |
ZipRealty, Inc. (a) | 19,987 | 94,738 | |
| 41,767,837 | ||
Thrifts & Mortgage Finance - 0.2% | |||
Astoria Financial Corp. | 69,632 | 953,958 | |
Banc of California, Inc. | 4,303 | 55,035 | |
Bank Mutual Corp. | 56,001 | 370,727 | |
Common Stocks - continued | |||
Shares | Value | ||
FINANCIALS - continued | |||
Thrifts & Mortgage Finance - continued | |||
BankFinancial Corp. | 19,300 | $ 192,614 | |
BBX Capital Corp. (a) | 18,261 | 353,168 | |
Beneficial Mutual Bancorp, Inc. (a) | 37,525 | 451,801 | |
Berkshire Hills Bancorp, Inc. | 20,197 | 507,551 | |
BofI Holding, Inc. (a)(d) | 11,427 | 1,063,854 | |
Brookline Bancorp, Inc., Delaware | 86,924 | 793,616 | |
Camco Financial Corp. (a)(d) | 10,386 | 62,835 | |
Cape Bancorp, Inc. | 2,611 | 27,755 | |
Capitol Federal Financial, Inc. | 194,739 | 2,366,079 | |
Charter Financial Corp. | 1,496 | 15,753 | |
Chicopee Bancorp, Inc. | 1,816 | 32,470 | |
Clifton Savings Bancorp, Inc. | 15,589 | 205,307 | |
Dime Community Bancshares, Inc. | 51,879 | 871,567 | |
Doral Financial Corp. (a) | 7,972 | 91,678 | |
ESB Financial Corp. | 9,498 | 124,519 | |
ESSA Bancorp, Inc. | 4,298 | 48,267 | |
Essent Group Ltd. | 38,008 | 881,786 | |
EverBank Financial Corp. | 121,901 | 2,184,466 | |
Farmer Mac Class C (non-vtg.) | 8,894 | 279,805 | |
First Defiance Financial Corp. | 6,145 | 170,032 | |
First Financial Northwest, Inc. | 2,197 | 22,717 | |
Flagstar Bancorp, Inc. (a) | 37,206 | 823,741 | |
Fox Chase Bancorp, Inc. | 14,307 | 245,222 | |
Franklin Financial Corp./VA (a) | 16,347 | 323,671 | |
HF Financial Corp. | 2,735 | 36,321 | |
Hingham Institution for Savings | 1,505 | 117,842 | |
Home Loan Servicing Solutions Ltd. (d) | 65,442 | 1,342,870 | |
HomeStreet, Inc. | 7,892 | 148,685 | |
Hudson City Bancorp, Inc. | 532,335 | 5,057,183 | |
IF Bancorp, Inc. | 3,112 | 51,192 | |
Impac Mortgage Holdings, Inc. (a)(d) | 5,393 | 37,751 | |
Kearny Financial Corp. (a) | 2,196 | 27,626 | |
Madison County Financial, Inc. | 4,682 | 80,530 | |
Meridian Interstate Bancorp, Inc. (a) | 750 | 18,150 | |
MGIC Investment Corp. (a)(d) | 403,619 | 3,616,426 | |
NASB Financial, Inc. | 1,203 | 30,484 | |
Nationstar Mortgage Holdings, Inc. (a)(d) | 18,397 | 530,386 | |
New York Community Bancorp, Inc. (d) | 541,088 | 8,646,586 | |
Northfield Bancorp, Inc. | 23,534 | 297,940 | |
Northwest Bancshares, Inc. | 92,094 | 1,321,549 | |
OceanFirst Financial Corp. | 5,851 | 110,467 | |
Ocwen Financial Corp. (a) | 133,402 | 4,994,571 | |
Oritani Financial Corp. | 41,599 | 651,440 | |
PennyMac Financial Services, Inc. | 12,245 | 211,716 | |
People's United Financial, Inc. | 329,770 | 4,672,841 | |
Peoples Federal Bancshares, Inc. | 1,156 | 20,739 | |
Poage Bankshares, Inc. | 2,365 | 32,661 | |
Provident Financial Holdings, Inc. | 3,066 | 47,124 | |
Provident Financial Services, Inc. | 56,391 | 1,046,617 | |
Radian Group, Inc. | 200,792 | 3,122,316 | |
Riverview Bancorp, Inc. (a) | 6,875 | 23,238 | |
| |||
Shares | Value | ||
Rockville Financial, Inc. | 26,525 | $ 349,334 | |
Security National Financial Corp. | 10,153 | 39,495 | |
Simplicity Bancorp, Inc. | 10,338 | 182,362 | |
Territorial Bancorp, Inc. | 13,244 | 294,017 | |
TFS Financial Corp. (a) | 149,374 | 1,765,601 | |
Timberland Bancorp, Inc. | 5,034 | 53,813 | |
Tree.com, Inc. (a) | 3,275 | 110,728 | |
Trustco Bank Corp., New York | 86,500 | 584,740 | |
United Community Financial Corp. (a) | 29,429 | 109,182 | |
United Financial Bancorp, Inc. | 9,158 | 161,272 | |
Walker & Dunlop, Inc. (a) | 10,954 | 184,356 | |
Washington Federal, Inc. | 113,789 | 2,551,149 | |
Westfield Financial, Inc. | 28,907 | 219,404 | |
WSFS Financial Corp. | 10,396 | 741,131 | |
| 57,161,829 | ||
TOTAL FINANCIALS | 3,994,753,449 | ||
HEALTH CARE - 13.1% | |||
Biotechnology - 2.9% | |||
Aastrom Biosciences, Inc. (a) | 3,923 | 13,221 | |
ACADIA Pharmaceuticals, Inc. (a)(d) | 82,586 | 2,337,184 | |
Acceleron Pharma, Inc. (d) | 12,418 | 582,777 | |
Achillion Pharmaceuticals, Inc. (a)(d) | 72,544 | 253,904 | |
Acorda Therapeutics, Inc. (a) | 40,293 | 1,476,336 | |
Aegerion Pharmaceuticals, Inc. (a)(d) | 28,027 | 1,534,759 | |
Agenus, Inc. (a)(d) | 22,142 | 108,274 | |
Agios Pharmaceuticals, Inc. (d) | 7,262 | 227,010 | |
Alexion Pharmaceuticals, Inc. (a) | 219,098 | 38,736,526 | |
Alkermes PLC (a)(d) | 151,179 | 7,357,882 | |
Alnylam Pharmaceuticals, Inc. (a)(d) | 62,752 | 5,097,972 | |
AMAG Pharmaceuticals, Inc. (a)(d) | 31,420 | 651,337 | |
Amgen, Inc. | 847,536 | 105,111,415 | |
Amicus Therapeutics, Inc. (a)(d) | 25,384 | 63,968 | |
Anacor Pharmaceuticals, Inc. (a)(d) | 28,185 | 535,515 | |
Anthera Pharmaceuticals, Inc. (a) | 5,648 | 16,718 | |
Arena Pharmaceuticals, Inc. (a)(d) | 260,488 | 1,695,777 | |
ARIAD Pharmaceuticals, Inc. (a)(d) | 193,266 | 1,679,482 | |
ArQule, Inc. (a) | 65,290 | 146,903 | |
Array BioPharma, Inc. (a)(d) | 101,050 | 487,061 | |
Arrowhead Research Corp. (a) | 20,335 | 395,312 | |
Athersys, Inc. (a)(d) | 49,216 | 186,036 | |
AVEO Pharmaceuticals, Inc. (a) | 43,200 | 80,784 | |
BioCryst Pharmaceuticals, Inc. (a)(d) | 79,931 | 934,393 | |
Biogen Idec, Inc. (a) | 265,622 | 90,492,103 | |
BioMarin Pharmaceutical, Inc. (a) | 169,338 | 13,716,378 | |
Biospecifics Technologies Corp. (a) | 1,441 | 34,195 | |
Biota Pharmaceuticals, Inc. (a) | 5,848 | 38,714 | |
BioTime, Inc. (a)(d) | 32,076 | 115,153 | |
Bluebird Bio, Inc. (d) | 7,366 | 187,833 | |
Catalyst Pharmaceutical Partners, Inc. (a)(d) | 25,961 | 58,153 | |
Common Stocks - continued | |||
Shares | Value | ||
HEALTH CARE - continued | |||
Biotechnology - continued | |||
Cel-Sci Corp. (a)(d) | 28,340 | $ 31,457 | |
Celgene Corp. (a) | 463,123 | 74,447,022 | |
Cell Therapeutics, Inc. (a)(d) | 129,276 | 497,713 | |
Celldex Therapeutics, Inc. (a)(d) | 107,399 | 3,138,199 | |
Cellular Dynamics International, Inc. (d) | 4,597 | 68,449 | |
Celsion Corp. (a) | 10,682 | 39,844 | |
Cepheid, Inc. (a)(d) | 80,169 | 4,301,869 | |
Chelsea Therapeutics International Ltd. (a)(d) | 75,408 | 430,580 | |
ChemoCentryx, Inc. (a)(d) | 15,137 | 115,041 | |
Chimerix, Inc. | 17,212 | 344,240 | |
Cleveland Biolabs, Inc. (a) | 35,489 | 24,945 | |
Clovis Oncology, Inc. (a) | 39,949 | 3,180,739 | |
Codexis, Inc. (a) | 21,294 | 39,607 | |
Conatus Pharmaceuticals, Inc. (d) | 7,362 | 82,602 | |
Coronado Biosciences, Inc. (a)(d) | 18,457 | 52,418 | |
Cubist Pharmaceuticals, Inc. (a)(d) | 78,426 | 6,236,436 | |
Cubist Pharmaceuticals, Inc. rights (a) | 32,062 | 0 | |
Curis, Inc. (a)(d) | 69,058 | 210,627 | |
Cyclacel Pharmaceuticals, Inc. (a)(d) | 11,529 | 44,733 | |
Cytokinetics, Inc. (a) | 26,522 | 261,242 | |
Cytori Therapeutics, Inc. (a)(d) | 69,588 | 219,202 | |
CytRx Corp. (a) | 25,756 | 152,476 | |
DARA BioSciences, Inc. (a) | 1,702 | 4,970 | |
Dendreon Corp. (a)(d) | 131,169 | 377,767 | |
Discovery Laboratories, Inc. (a) | 38,893 | 102,678 | |
Durata Therapeutics, Inc. (a)(d) | 10,654 | 146,066 | |
Dyax Corp. (a)(d) | 146,558 | 1,417,216 | |
Dynavax Technologies Corp. (a)(d) | 275,972 | 513,308 | |
Emergent BioSolutions, Inc. (a) | 25,651 | 634,606 | |
Enanta Pharmaceuticals, Inc. (d) | 3,858 | 142,129 | |
EntreMed, Inc. (a) | 289 | 555 | |
Enzon Pharmaceuticals, Inc. | 43,430 | 41,693 | |
Epizyme, Inc. | 4,503 | 134,640 | |
Esperion Therapeutics, Inc. (d) | 6,156 | 95,726 | |
Exact Sciences Corp. (a)(d) | 79,977 | 1,075,691 | |
Exelixis, Inc. (a)(d) | 160,939 | 1,136,229 | |
Foundation Medicine, Inc. (d) | 12,644 | 450,506 | |
Galectin Therapeutics, Inc. (a)(d) | 13,518 | 227,913 | |
Galena Biopharma, Inc. (a)(d) | 133,911 | 528,948 | |
Genomic Health, Inc. (a)(d) | 18,393 | 485,759 | |
GenVec, Inc. (a) | 8,140 | 29,223 | |
Geron Corp. (a)(d) | 128,101 | 609,120 | |
Gilead Sciences, Inc. (a)(d) | 1,722,310 | 142,590,045 | |
GTx, Inc. (a)(d) | 19,627 | 33,366 | |
Halozyme Therapeutics, Inc. (a)(d) | 112,522 | 1,585,435 | |
Harvard Apparatus (a) | 3,080 | 15,585 | |
Heat Biologics, Inc. (d) | 3,136 | 23,144 | |
Hemispherx Biopharma, Inc. (a) | 130,774 | 51,133 | |
Hyperion Therapeutics, Inc. (a)(d) | 5,781 | 179,211 | |
iBio, Inc. (a) | 40,361 | 21,783 | |
| |||
Shares | Value | ||
Idenix Pharmaceuticals, Inc. (a)(d) | 141,515 | $ 965,132 | |
Idera Pharmaceuticals, Inc. (a) | 80,821 | 467,954 | |
ImmunoCellular Therapeutics Ltd. (a)(d) | 41,923 | 57,015 | |
ImmunoGen, Inc. (a)(d) | 90,051 | 1,476,836 | |
Immunomedics, Inc. (a)(d) | 54,782 | 259,667 | |
Incyte Corp. (a)(d) | 167,261 | 10,748,192 | |
Infinity Pharmaceuticals, Inc. (a)(d) | 41,127 | 644,871 | |
Inovio Pharmaceuticals, Inc. (a)(d) | 175,405 | 577,082 | |
Insmed, Inc. (a)(d) | 32,411 | 648,544 | |
Insys Therapeutics, Inc. (a)(d) | 4,354 | 292,937 | |
Intercept Pharmaceuticals, Inc. (a) | 12,590 | 5,168,195 | |
InterMune, Inc. (a) | 93,683 | 2,814,237 | |
Intrexon Corp. (d) | 13,260 | 344,495 | |
Ironwood Pharmaceuticals, Inc. | 150,069 | 2,177,501 | |
Isis Pharmaceuticals, Inc. (a)(d) | 138,050 | 7,040,550 | |
IsoRay, Inc. (a)(d) | 31,040 | 24,366 | |
Karyopharm Therapeutics, Inc. | 6,103 | 244,974 | |
Keryx Biopharmaceuticals, Inc. (a)(d) | 105,438 | 1,692,280 | |
KYTHERA Biopharmaceuticals, Inc. (a)(d) | 13,619 | 680,541 | |
Lexicon Pharmaceuticals, Inc. (a)(d) | 482,347 | 863,401 | |
Ligand Pharmaceuticals, Inc. | 23,017 | 1,605,436 | |
Lpath, Inc. (a) | 7,871 | 36,521 | |
Macrogenics, Inc. | 4,799 | 167,965 | |
MannKind Corp. (a)(d) | 286,250 | 1,771,888 | |
Mast Therapeutics, Inc. (a) | 29,390 | 24,394 | |
Medgenics, Inc. (a)(d) | 4,479 | 38,654 | |
Medivation, Inc. (a)(d) | 85,572 | 6,153,483 | |
Merrimack Pharmaceuticals, Inc. (a)(d) | 95,963 | 477,896 | |
Metabolix, Inc. (a)(d) | 41,636 | 53,294 | |
MiMedx Group, Inc. (a) | 79,098 | 565,551 | |
Momenta Pharmaceuticals, Inc. (a) | 43,036 | 636,933 | |
Myriad Genetics, Inc. (a)(d) | 87,108 | 3,154,181 | |
Nanosphere, Inc. (a)(d) | 36,229 | 86,950 | |
NanoViricides, Inc. (a)(d) | 32,620 | 129,828 | |
Navidea Biopharmaceuticals, Inc. (a)(d) | 114,446 | 211,725 | |
Neuralstem, Inc. (a) | 54,208 | 193,523 | |
Neurocrine Biosciences, Inc. (a) | 83,489 | 1,471,911 | |
NewLink Genetics Corp. (a)(d) | 12,482 | 551,704 | |
Northwest Biotherapeutics, Inc. (a)(d) | 40,748 | 288,903 | |
Novavax, Inc. (a)(d) | 198,633 | 1,271,251 | |
NPS Pharmaceuticals, Inc. (a)(d) | 102,906 | 3,599,652 | |
OncoGenex Pharmaceuticals, Inc. (a)(d) | 10,565 | 116,426 | |
OncoMed Pharmaceuticals, Inc. (d) | 5,827 | 201,148 | |
Onconova Therapeutics, Inc. (d) | 6,241 | 53,049 | |
Oncothyreon, Inc. (a) | 43,661 | 134,912 | |
Opexa Therapeutics, Inc. (a)(d) | 5,726 | 10,421 | |
Ophthotech Corp. (d) | 12,066 | 406,262 | |
Opko Health, Inc. (a)(d) | 254,677 | 2,424,525 | |
Oragenics, Inc. (a) | 9,973 | 37,299 | |
Orexigen Therapeutics, Inc. (a)(d) | 77,934 | 540,862 | |
Organovo Holdings, Inc. (a)(d) | 69,396 | 713,391 | |
Osiris Therapeutics, Inc. (a)(d) | 18,170 | 277,456 | |
Common Stocks - continued | |||
Shares | Value | ||
HEALTH CARE - continued | |||
Biotechnology - continued | |||
OvaScience, Inc. (a) | 10,225 | $ 110,328 | |
OXiGENE, Inc. (a) | 561 | 1,195 | |
Oxygen Biotherapeutics, Inc. (a)(d) | 1,373 | 8,883 | |
Palatin Technologies, Inc. (a)(d) | 9,275 | 9,739 | |
PDL BioPharma, Inc. (d) | 181,078 | 1,551,838 | |
Peregrine Pharmaceuticals, Inc. (a)(d) | 84,902 | 153,673 | |
Pharmacyclics, Inc. (a) | 74,587 | 10,342,233 | |
PharmAthene, Inc. (a)(d) | 51,372 | 96,579 | |
Portola Pharmaceuticals, Inc. (d) | 6,348 | 154,828 | |
Progenics Pharmaceuticals, Inc. (a)(d) | 45,935 | 214,516 | |
Prothena Corp. PLC (a) | 18,701 | 673,423 | |
PTC Therapeutics, Inc. (a) | 10,292 | 322,757 | |
Puma Biotechnology, Inc. (a)(d) | 28,653 | 3,331,198 | |
Raptor Pharmaceutical Corp. (a)(d) | 62,748 | 993,301 | |
Receptos, Inc. | 18,327 | 850,098 | |
Regeneron Pharmaceuticals, Inc. (a) | 88,505 | 29,427,913 | |
Regulus Therapeutics, Inc. (a)(d) | 11,075 | 124,372 | |
Repligen Corp. (a)(d) | 22,058 | 330,208 | |
Rexahn Pharmaceuticals, Inc. (a)(d) | 45,000 | 60,750 | |
Rigel Pharmaceuticals, Inc. (a) | 75,480 | 259,651 | |
Sangamo Biosciences, Inc. (a)(d) | 84,275 | 1,533,805 | |
Sarepta Therapeutics, Inc. (a)(d) | 40,979 | 1,189,620 | |
Seattle Genetics, Inc. (a)(d) | 128,581 | 6,762,075 | |
SIGA Technologies, Inc. (a)(d) | 72,968 | 234,227 | |
Spectrum Pharmaceuticals, Inc. (a)(d) | 41,659 | 347,853 | |
StemCells, Inc. (a)(d) | 41,468 | 60,958 | |
Stemline Therapeutics, Inc. (d) | 10,674 | 276,030 | |
Sunesis Pharmaceuticals, Inc. (a)(d) | 32,643 | 213,812 | |
Synageva BioPharma Corp. (a)(d) | 21,459 | 2,460,704 | |
Synergy Pharmaceuticals, Inc. (a)(d) | 111,018 | 673,879 | |
Synta Pharmaceuticals Corp. (a)(d) | 94,692 | 585,197 | |
Synthetic Biologics, Inc. (a) | 46,314 | 125,048 | |
Targacept, Inc. (a)(d) | 18,977 | 93,557 | |
Telik, Inc. (a) | 380 | 528 | |
TESARO, Inc. (a)(d) | 12,275 | 405,198 | |
Tetraphase Pharmaceuticals, Inc. | 10,243 | 139,305 | |
TG Therapeutics, Inc. (a)(d) | 7,226 | 47,692 | |
Theravance, Inc. (a)(d) | 88,275 | 3,266,175 | |
Threshold Pharmaceuticals, Inc. (a) | 37,822 | 189,110 | |
Trovagene, Inc. (a)(d) | 4,592 | 28,746 | |
United Therapeutics Corp. (a)(d) | 53,357 | 5,411,467 | |
Vanda Pharmaceuticals, Inc. (a)(d) | 44,094 | 667,142 | |
Verastem, Inc. (a)(d) | 13,711 | 183,316 | |
Vertex Pharmaceuticals, Inc. (a) | 268,044 | 21,674,038 | |
Vical, Inc. (a)(d) | 65,666 | 99,812 | |
XOMA Corp. (a) | 72,501 | 606,108 | |
Zalicus, Inc. (a)(d) | 17,476 | 26,389 | |
ZIOPHARM Oncology, Inc. (a)(d) | 79,220 | 337,477 | |
| 682,179,876 | ||
Health Care Equipment & Supplies - 2.1% | |||
Abaxis, Inc. (a)(d) | 23,291 | 883,893 | |
| |||
Shares | Value | ||
Abbott Laboratories | 1,738,741 | $ 69,167,117 | |
Abiomed, Inc. (a)(d) | 36,354 | 1,024,819 | |
Accuray, Inc. (a)(d) | 58,561 | 549,302 | |
Alere, Inc. (a) | 93,479 | 3,434,418 | |
Align Technology, Inc. (a)(d) | 76,057 | 3,980,063 | |
Alphatec Holdings, Inc. (a) | 36,801 | 51,889 | |
Analogic Corp. | 12,756 | 1,202,381 | |
Angiodynamics, Inc. (a) | 26,377 | 406,206 | |
Anika Therapeutics, Inc. (a) | 9,287 | 365,629 | |
Antares Pharma, Inc. (a)(d) | 97,369 | 433,292 | |
ArthroCare Corp. (a) | 39,236 | 1,893,137 | |
Atossa Genetics, Inc. (a)(d) | 789 | 1,736 | |
Atricure, Inc. (a) | 12,717 | 264,386 | |
Atrion Corp. | 1,172 | 339,212 | |
Bacterin International Holdings, Inc. (a)(d) | 9,747 | 6,492 | |
Baxano Surgical, Inc. (a)(d) | 18,036 | 27,415 | |
Baxter International, Inc. | 605,834 | 42,105,463 | |
Becton, Dickinson & Co. | 213,454 | 24,594,170 | |
BioLase Technology, Inc. (d) | 31,016 | 95,839 | |
Boston Scientific Corp. (a) | 1,493,547 | 19,565,466 | |
BSD Medical Corp. (a)(d) | 46,363 | 53,317 | |
C.R. Bard, Inc. | 84,581 | 12,193,197 | |
Cantel Medical Corp. | 48,934 | 1,583,015 | |
Cardica, Inc. (a) | 23,778 | 27,107 | |
Cardiovascular Systems, Inc. (a)(d) | 37,106 | 1,298,710 | |
CareFusion Corp. (a) | 231,213 | 9,371,063 | |
Cerus Corp. (a)(d) | 66,771 | 431,341 | |
Cesca Therapeutics, Inc. (a)(d) | 15,844 | 35,174 | |
CONMED Corp. | 26,543 | 1,237,435 | |
Covidien PLC | 520,911 | 37,479,546 | |
Cryolife, Inc. | 20,961 | 208,772 | |
Cutera, Inc. (a) | 15,449 | 165,304 | |
Cyberonics, Inc. (a)(d) | 26,017 | 1,781,384 | |
Cynosure, Inc. Class A (a) | 17,160 | 528,185 | |
Delcath Systems, Inc. (a)(d) | 119,898 | 37,516 | |
DENTSPLY International, Inc. | 165,101 | 7,492,283 | |
Derma Sciences, Inc. (a) | 7,901 | 116,066 | |
DexCom, Inc. (a) | 82,473 | 3,719,532 | |
Echo Therapeutics, Inc. (a)(d) | 2,009 | 6,288 | |
Edwards Lifesciences Corp. (a)(d) | 125,427 | 8,749,788 | |
Endologix, Inc. (a)(d) | 68,176 | 920,376 | |
EnteroMedics, Inc. (a)(d) | 53,456 | 129,898 | |
ERBA Diagnostics, Inc. (a)(d) | 3,094 | 7,890 | |
Exactech, Inc. (a) | 3,102 | 72,277 | |
Fonar Corp. (a) | 719 | 16,293 | |
Genmark Diagnostics, Inc. (a)(d) | 33,235 | 414,108 | |
Globus Medical, Inc. (a) | 81,315 | 1,923,913 | |
Greatbatch, Inc. (a) | 22,320 | 967,126 | |
Haemonetics Corp. (a)(d) | 65,465 | 2,388,163 | |
Hansen Medical, Inc. (a)(d) | 48,696 | 113,949 | |
HeartWare International, Inc. (a)(d) | 17,704 | 1,700,115 | |
Hill-Rom Holdings, Inc. | 58,209 | 2,202,046 | |
Hologic, Inc. (a)(d) | 312,892 | 6,814,788 | |
Common Stocks - continued | |||
Shares | Value | ||
HEALTH CARE - continued | |||
Health Care Equipment & Supplies - continued | |||
ICU Medical, Inc. (a)(d) | 17,344 | $ 1,003,524 | |
IDEXX Laboratories, Inc. (a)(d) | 62,216 | 7,832,994 | |
Insulet Corp. (a)(d) | 65,054 | 3,084,210 | |
Integra LifeSciences Holdings Corp. (a)(d) | 24,422 | 1,148,811 | |
Intuitive Surgical, Inc. (a) | 43,523 | 19,360,336 | |
Invacare Corp. | 28,414 | 563,165 | |
Kewaunee Scientific Corp. | 1,376 | 22,374 | |
LeMaitre Vascular, Inc. | 3,845 | 31,491 | |
Masimo Corp. (a)(d) | 62,689 | 1,601,704 | |
Medical Action Industries, Inc. (a) | 18,788 | 137,528 | |
Medtronic, Inc. | 1,114,252 | 66,030,574 | |
MELA Sciences, Inc. (a)(d) | 40,114 | 28,280 | |
Meridian Bioscience, Inc. (d) | 44,602 | 930,398 | |
Merit Medical Systems, Inc. (a) | 38,544 | 581,629 | |
Misonix, Inc. (a) | 2,579 | 17,279 | |
Natus Medical, Inc. (a) | 24,629 | 618,188 | |
Neogen Corp. (a) | 37,855 | 1,639,879 | |
NuVasive, Inc. (a)(d) | 44,714 | 1,643,240 | |
NxStage Medical, Inc. (a) | 54,843 | 760,672 | |
OraSure Technologies, Inc. (a) | 46,551 | 323,064 | |
Orthofix International NV (a) | 16,427 | 365,008 | |
PhotoMedex, Inc. (a)(d) | 6,551 | 95,907 | |
Quidel Corp. (a)(d) | 35,813 | 1,003,480 | |
ResMed, Inc. (d) | 155,104 | 6,827,678 | |
Retractable Technologies, Inc. (a) | 5,248 | 18,893 | |
Rockwell Medical Technologies, Inc. (a)(d) | 40,985 | 520,100 | |
RTI Biologics, Inc. (a) | 29,474 | 110,822 | |
Sirona Dental Systems, Inc. (a)(d) | 67,791 | 4,776,554 | |
St. Jude Medical, Inc. | 324,571 | 21,850,120 | |
Staar Surgical Co. (a) | 22,695 | 321,361 | |
Stereotaxis, Inc. (a) | 3,270 | 16,219 | |
Steris Corp. | 82,536 | 3,809,036 | |
Stryker Corp. | 333,990 | 26,799,358 | |
SurModics, Inc. (a) | 19,525 | 486,173 | |
Symmetry Medical, Inc. (a) | 29,367 | 310,703 | |
Synergetics U.S.A., Inc. (a) | 3,622 | 12,532 | |
Tandem Diabetes Care, Inc. | 11,476 | 295,507 | |
TearLab Corp. (a)(d) | 17,390 | 139,990 | |
Teleflex, Inc. | 53,220 | 5,427,908 | |
The Cooper Companies, Inc. (d) | 58,635 | 7,517,593 | |
The Spectranetics Corp. (a) | 40,582 | 1,215,837 | |
Thoratec Corp. (a) | 57,172 | 2,123,368 | |
Tornier NV (a) | 21,770 | 417,984 | |
Unilife Corp. (a)(d) | 142,037 | 657,631 | |
Uroplasty, Inc. (a) | 1,597 | 6,580 | |
Varian Medical Systems, Inc. (a)(d) | 116,002 | 9,724,448 | |
Vascular Solutions, Inc. (a) | 2,125 | 55,293 | |
Vermillion, Inc. (a)(d) | 5,249 | 17,847 | |
Volcano Corp. (a)(d) | 51,974 | 1,115,362 | |
West Pharmaceutical Services, Inc. | 83,154 | 3,790,159 | |
Wright Medical Group, Inc. (a)(d) | 47,593 | 1,514,409 | |
| |||
Shares | Value | ||
Zeltiq Aesthetics, Inc. (a)(d) | 23,737 | $ 450,766 | |
Zimmer Holdings, Inc. | 197,443 | 18,528,051 | |
| 502,260,307 | ||
Health Care Providers & Services - 2.2% | |||
Acadia Healthcare Co., Inc. (a)(d) | 44,959 | 2,222,773 | |
Accretive Health, Inc. (a)(d) | 67,415 | 558,196 | |
Aetna, Inc. | 410,919 | 29,877,920 | |
Air Methods Corp. (a)(d) | 37,158 | 2,007,275 | |
Alliance Healthcare Services, Inc. (a) | 17,141 | 516,630 | |
Almost Family, Inc. (a) | 9,932 | 272,335 | |
Amedisys, Inc. (a)(d) | 30,453 | 516,483 | |
AmerisourceBergen Corp. | 242,456 | 16,450,640 | |
AMN Healthcare Services, Inc. (a) | 76,320 | 1,063,138 | |
AmSurg Corp. (a) | 32,040 | 1,405,274 | |
Bio-Reference Laboratories, Inc. (a)(d) | 31,917 | 806,223 | |
BioScrip, Inc. (a)(d) | 61,696 | 439,892 | |
BioTelemetry, Inc. (a) | 34,161 | 383,970 | |
Brookdale Senior Living, Inc. (a) | 136,171 | 4,567,175 | |
Capital Senior Living Corp. (a) | 26,619 | 676,655 | |
Cardinal Health, Inc. | 378,369 | 27,064,735 | |
Centene Corp. (a)(d) | 59,283 | 3,775,141 | |
Chemed Corp. (d) | 19,372 | 1,638,871 | |
Chindex International, Inc. (a) | 9,187 | 176,850 | |
Cigna Corp. | 313,010 | 24,912,466 | |
Community Health Systems, Inc. (a) | 133,147 | 5,526,932 | |
Corvel Corp. (a) | 17,696 | 814,193 | |
Cross Country Healthcare, Inc. (a) | 40,427 | 420,441 | |
DaVita HealthCare Partners, Inc. (a) | 194,861 | 13,392,797 | |
Emeritus Corp. (a) | 47,874 | 1,509,467 | |
Envision Healthcare Holdings, Inc. | 72,467 | 2,439,239 | |
ExamWorks Group, Inc. (a)(d) | 29,906 | 1,087,980 | |
Express Scripts Holding Co. (a) | 897,442 | 67,586,357 | |
Five Star Quality Care, Inc. (a) | 32,241 | 186,675 | |
Gentiva Health Services, Inc. (a) | 24,132 | 258,454 | |
Hanger, Inc. (a) | 33,622 | 1,191,900 | |
HCA Holdings, Inc. (a) | 345,647 | 17,697,126 | |
Health Net, Inc. (a) | 90,547 | 3,083,125 | |
HealthSouth Corp. (d) | 110,704 | 3,617,807 | |
Healthways, Inc. (a)(d) | 33,821 | 505,962 | |
Henry Schein, Inc. (a)(d) | 98,971 | 11,781,508 | |
Hooper Holmes, Inc. (a) | 6,267 | 3,510 | |
Humana, Inc. | 170,662 | 19,192,649 | |
IPC The Hospitalist Co., Inc. (a)(d) | 20,567 | 1,055,704 | |
Kindred Healthcare, Inc. | 69,839 | 1,512,713 | |
Laboratory Corp. of America Holdings (a)(d) | 96,901 | 9,064,120 | |
Landauer, Inc. | 14,935 | 723,750 | |
LCA-Vision, Inc. (a) | 27,238 | 148,175 | |
LHC Group, Inc. (a) | 12,810 | 301,804 | |
LifePoint Hospitals, Inc. (a)(d) | 49,772 | 2,700,131 | |
Magellan Health Services, Inc. (a) | 33,160 | 2,027,402 | |
McKesson Corp. | 255,109 | 45,167,048 | |
MEDNAX, Inc. (a)(d) | 110,274 | 6,706,865 | |
Common Stocks - continued | |||
Shares | Value | ||
HEALTH CARE - continued | |||
Health Care Providers & Services - continued | |||
Molina Healthcare, Inc. (a)(d) | 24,412 | $ 919,844 | |
MWI Veterinary Supply, Inc. (a)(d) | 16,104 | 2,623,664 | |
National Healthcare Corp. | 6,159 | 317,189 | |
National Research Corp.: | |||
Class A (a) | 960 | 16,800 | |
Class B (d) | 3,356 | 134,408 | |
NeoStem, Inc. (a)(d) | 15,337 | 107,359 | |
Omnicare, Inc. | 126,227 | 7,434,770 | |
Owens & Minor, Inc. | 59,970 | 2,082,158 | |
Patterson Companies, Inc. (d) | 106,597 | 4,387,533 | |
PDI, Inc. (a) | 1,365 | 6,484 | |
PharMerica Corp. (a) | 29,176 | 703,142 | |
Premier, Inc. (d) | 38,595 | 1,291,003 | |
Providence Service Corp. (a) | 13,245 | 352,185 | |
Quest Diagnostics, Inc. (d) | 161,387 | 8,553,511 | |
RadNet, Inc. (a) | 27,076 | 52,527 | |
Select Medical Holdings Corp. | 68,408 | 766,854 | |
Sharps Compliance Corp. (a) | 5,184 | 24,883 | |
Skilled Healthcare Group, Inc. (a)(d) | 27,157 | 130,625 | |
Surgical Care Affiliates, Inc. | 14,337 | 436,132 | |
Team Health Holdings, Inc. (a)(d) | 79,380 | 3,573,688 | |
Tenet Healthcare Corp. (a) | 109,083 | 4,812,742 | |
The Ensign Group, Inc. | 18,939 | 749,984 | |
Triple-S Management Corp. (a) | 20,220 | 338,685 | |
U.S. Physical Therapy, Inc. | 11,240 | 372,943 | |
UnitedHealth Group, Inc. | 1,126,842 | 87,071,081 | |
Universal American Spin Corp. | 33,569 | 251,432 | |
Universal Health Services, Inc. Class B | 113,232 | 9,090,265 | |
VCA Antech, Inc. (a) | 87,077 | 2,696,775 | |
Wellcare Health Plans, Inc. (a) | 52,863 | 3,267,991 | |
WellPoint, Inc. | 330,284 | 29,920,428 | |
| 511,523,561 | ||
Health Care Technology - 0.2% | |||
Allscripts Healthcare Solutions, Inc. (a) | 176,070 | 3,269,620 | |
athenahealth, Inc. (a)(d) | 41,563 | 8,057,819 | |
Authentidate Holding Corp. (a) | 816 | 857 | |
Cerner Corp. (a)(d) | 329,819 | 20,240,992 | |
CollabRx, Inc. (a) | 87 | 279 | |
Computer Programs & Systems, Inc. | 21,937 | 1,501,149 | |
HealthStream, Inc. (a)(d) | 34,016 | 980,341 | |
HMS Holdings Corp. (a)(d) | 102,544 | 2,098,050 | |
MedAssets, Inc. (a) | 61,276 | 1,488,394 | |
Medidata Solutions, Inc. (a)(d) | 52,930 | 3,392,813 | |
Merge Healthcare, Inc. (a)(d) | 37,852 | 95,009 | |
Omnicell, Inc. (a) | 38,848 | 1,118,045 | |
Quality Systems, Inc. | 52,869 | 923,093 | |
Veeva Systems, Inc. Class A (d) | 21,176 | 747,513 | |
Vocera Communications, Inc. (a)(d) | 14,570 | 247,981 | |
| 44,161,955 | ||
| |||
Shares | Value | ||
Life Sciences Tools & Services - 0.6% | |||
Accelerate Diagnostics, Inc. (a)(d) | 24,477 | $ 361,770 | |
Affymetrix, Inc. (a)(d) | 55,779 | 430,614 | |
Agilent Technologies, Inc. | 366,572 | 20,868,944 | |
Albany Molecular Research, Inc. (a)(d) | 23,897 | 372,793 | |
Apricus Biosciences, Inc. (a)(d) | 18,211 | 42,523 | |
BG Medicine, Inc. (a)(d) | 3,134 | 4,074 | |
Bio-Rad Laboratories, Inc. Class A (a) | 24,617 | 3,193,317 | |
Bruker BioSciences Corp. (a) | 117,243 | 2,666,106 | |
Cambrex Corp. (a) | 26,613 | 534,123 | |
Charles River Laboratories International, Inc. (a) | 45,219 | 2,686,461 | |
Covance, Inc. (a)(d) | 69,154 | 7,161,588 | |
Enzo Biochem, Inc. (a) | 14,697 | 54,526 | |
Fluidigm Corp. (a) | 33,180 | 1,554,483 | |
Furiex Pharmaceuticals, Inc. (a)(d) | 9,211 | 852,294 | |
Harvard Bioscience, Inc. (a) | 12,320 | 60,122 | |
Illumina, Inc. (a)(d) | 140,797 | 24,145,278 | |
Luminex Corp. (a) | 39,871 | 736,816 | |
Mettler-Toledo International, Inc. (a)(d) | 36,042 | 8,857,682 | |
Nanostring Technologies, Inc. | 6,707 | 126,762 | |
NeoGenomics, Inc. (a)(d) | 21,535 | 77,095 | |
Pacific Biosciences of California, Inc. (a) | 41,271 | 274,865 | |
PAREXEL International Corp. (a) | 64,767 | 3,469,568 | |
PerkinElmer, Inc. | 134,059 | 6,075,554 | |
pSivida Corp. (a)(d) | 25,265 | 110,661 | |
Quintiles Transnational Holdings, Inc. | 25,574 | 1,384,832 | |
Sequenom, Inc. (a)(d) | 91,772 | 217,500 | |
Techne Corp. | 39,549 | 3,513,533 | |
Thermo Fisher Scientific, Inc. | 445,114 | 55,434,498 | |
Waters Corp. (a) | 93,206 | 10,383,148 | |
| 155,651,530 | ||
Pharmaceuticals - 5.1% | |||
AbbVie, Inc. | 1,788,172 | 91,035,837 | |
AcelRx Pharmaceuticals, Inc. (a)(d) | 17,182 | 196,390 | |
Actavis PLC (a) | 193,171 | 42,656,020 | |
Acura Pharmaceuticals, Inc. (a) | 2,885 | 5,712 | |
Akorn, Inc. (a)(d) | 79,308 | 2,047,733 | |
Alexza Pharmaceuticals, Inc. (a) | 13,886 | 76,095 | |
Alimera Sciences, Inc. (a)(d) | 3,741 | 25,102 | |
Allergan, Inc. | 335,503 | 42,608,881 | |
Ampio Pharmaceuticals, Inc. (a)(d) | 26,020 | 185,262 | |
ANI Pharmaceuticals, Inc. (a) | 3,574 | 108,221 | |
Aratana Therapeutics, Inc. (d) | 7,153 | 167,166 | |
AstraZeneca PLC rights (a) | 7,692 | 0 | |
Auxilium Pharmaceuticals, Inc. (a)(d) | 49,047 | 1,508,195 | |
AVANIR Pharmaceuticals Class A (a) | 141,865 | 590,158 | |
Biodel, Inc. (a)(d) | 8,109 | 25,543 | |
Biodelivery Sciences International, Inc. (a)(d) | 15,298 | 143,342 | |
Bristol-Myers Squibb Co. | 1,848,869 | 99,413,686 | |
Cadence Pharmaceuticals, Inc. (a) | 96,716 | 1,353,057 | |
Cempra, Inc. (a) | 20,803 | 236,946 | |
Common Stocks - continued | |||
Shares | Value | ||
HEALTH CARE - continued | |||
Pharmaceuticals - continued | |||
Columbia Laboratories, Inc. (a) | 5,322 | $ 36,349 | |
Corcept Therapeutics, Inc. (a)(d) | 36,105 | 118,424 | |
Cumberland Pharmaceuticals, Inc. (a) | 7,158 | 33,142 | |
DepoMed, Inc. (a)(d) | 51,564 | 621,346 | |
Durect Corp. (a) | 121,504 | 168,891 | |
Eli Lilly & Co. | 1,106,346 | 65,949,285 | |
Endo Health Solutions, Inc. (a)(d) | 153,698 | 12,268,174 | |
Endocyte, Inc. (a)(d) | 47,373 | 623,902 | |
Forest Laboratories, Inc. (a) | 269,775 | 26,321,947 | |
Hi-Tech Pharmacal Co., Inc. (a) | 12,868 | 557,956 | |
Horizon Pharma, Inc. (a)(d) | 61,460 | 751,041 | |
Hospira, Inc. (a) | 214,554 | 9,285,897 | |
Impax Laboratories, Inc. (a) | 76,645 | 1,975,142 | |
Jazz Pharmaceuticals PLC (a) | 64,644 | 9,822,333 | |
Johnson & Johnson | 3,156,660 | 290,791,519 | |
Lannett Co., Inc. (a)(d) | 27,670 | 1,186,766 | |
Mallinckrodt PLC (a)(d) | 76,544 | 5,181,263 | |
Merck & Co., Inc. | 3,275,273 | 186,657,808 | |
Mylan, Inc. (a) | 432,560 | 24,037,359 | |
Nektar Therapeutics (a)(d) | 149,616 | 1,919,573 | |
Ocera Therapeutics, Inc. (a)(d) | 890 | 13,768 | |
Omeros Corp. (a)(d) | 38,961 | 520,519 | |
Pacira Pharmaceuticals, Inc. (a)(d) | 42,514 | 3,326,295 | |
Pain Therapeutics, Inc. (a) | 34,536 | 195,128 | |
Pernix Therapeutics Holdings, Inc. (a)(d) | 8,953 | 32,858 | |
Perrigo Co. PLC | 148,774 | 24,464,397 | |
Pfizer, Inc. | 7,258,348 | 233,065,554 | |
Pozen, Inc. (d) | 23,223 | 184,855 | |
Prestige Brands Holdings, Inc. (a) | 52,110 | 1,484,614 | |
Questcor Pharmaceuticals, Inc. (d) | 62,679 | 3,807,749 | |
Relypsa, Inc. | 13,726 | 541,628 | |
Repros Therapeutics, Inc. (a)(d) | 21,711 | 424,450 | |
Sagent Pharmaceuticals, Inc. (a) | 25,120 | 531,539 | |
Salix Pharmaceuticals Ltd. (a)(d) | 73,563 | 7,938,919 | |
SciClone Pharmaceuticals, Inc. (a)(d) | 46,113 | 214,425 | |
Sucampo Pharmaceuticals, Inc. | 39,776 | 357,984 | |
Supernus Pharmaceuticals, Inc. (a) | 9,151 | 91,876 | |
The Medicines Company (a)(d) | 85,688 | 2,617,768 | |
TherapeuticsMD, Inc. (a) | 93,850 | 644,750 | |
Transcept Pharmaceuticals, Inc. (a) | 2,494 | 8,305 | |
Ventrus Biosciences, Inc. (a) | 6,995 | 9,513 | |
VIVUS, Inc. (a)(d) | 111,051 | 669,638 | |
XenoPort, Inc. (a)(d) | 57,569 | 359,806 | |
Zoetis, Inc. Class A | 573,163 | 17,779,516 | |
Zogenix, Inc. (a) | 115,304 | 501,572 | |
| 1,220,478,889 | ||
TOTAL HEALTH CARE | 3,116,256,118 | ||
| |||
Shares | Value | ||
INDUSTRIALS - 11.4% | |||
Aerospace & Defense - 2.6% | |||
AAR Corp. | 45,448 | $ 1,313,447 | |
AeroVironment, Inc. (a)(d) | 21,575 | 674,003 | |
Alliant Techsystems, Inc. | 36,077 | 4,862,819 | |
American Science & Engineering, Inc. | 13,204 | 868,163 | |
API Technologies Corp. (a) | 22,349 | 62,130 | |
Ascent Solar Technologies, Inc. (a)(d) | 33,082 | 24,113 | |
Astronics Corp. (a) | 14,668 | 981,289 | |
Astrotech Corp. (a)(d) | 8,707 | 23,335 | |
BE Aerospace, Inc. (a) | 108,614 | 9,150,730 | |
Breeze Industrial Products Corp. (a) | 1,281 | 12,298 | |
CPI Aerostructures, Inc. (a)(d) | 3,805 | 54,678 | |
Cubic Corp. | 23,380 | 1,215,760 | |
Curtiss-Wright Corp. | 58,485 | 3,986,338 | |
DigitalGlobe, Inc. (a) | 87,334 | 2,714,341 | |
Ducommun, Inc. (a) | 15,643 | 434,875 | |
Engility Holdings, Inc. (a)(d) | 14,341 | 598,450 | |
Erickson Air-Crane, Inc. (a)(d) | 6,239 | 134,326 | |
Esterline Technologies Corp. (a) | 36,596 | 3,941,389 | |
Exelis, Inc. | 193,690 | 3,957,087 | |
GenCorp, Inc. (non-vtg.) (a)(d) | 89,447 | 1,666,398 | |
General Dynamics Corp. (d) | 385,838 | 42,264,695 | |
HEICO Corp. (d) | 25,580 | 1,590,820 | |
HEICO Corp. Class A | 45,413 | 2,086,273 | |
Hexcel Corp. (a) | 105,445 | 4,745,025 | |
Honeywell International, Inc. | 879,783 | 83,086,707 | |
Huntington Ingalls Industries, Inc. | 51,071 | 5,175,024 | |
Innovative Solutions & Support, Inc. (a)(d) | 21,878 | 172,617 | |
KEYW Holding Corp. (a)(d) | 30,869 | 564,903 | |
Kratos Defense & Security Solutions, Inc. (a)(d) | 44,930 | 350,454 | |
L-3 Communications Holdings, Inc. | 103,771 | 11,975,173 | |
LMI Aerospace, Inc. (a)(d) | 6,877 | 102,536 | |
Lockheed Martin Corp. | 301,222 | 48,888,331 | |
Micronet Enertec Technologies, Inc. (a) | 3,018 | 16,207 | |
Moog, Inc. Class A (a) | 52,323 | 3,240,363 | |
National Presto Industries, Inc. | 4,216 | 324,801 | |
Northrop Grumman Corp. | 254,273 | 30,774,661 | |
Orbital Sciences Corp. (a) | 63,924 | 1,816,720 | |
Precision Castparts Corp. | 163,555 | 42,177,563 | |
Raytheon Co. | 362,581 | 35,500,306 | |
Rockwell Collins, Inc. (d) | 149,774 | 12,362,346 | |
SIFCO Industries, Inc. | 891 | 23,612 | |
Sparton Corp. (a) | 3,920 | 127,008 | |
Spirit AeroSystems Holdings, Inc. | 123,657 | 3,565,031 | |
Sypris Solutions, Inc. | 16,848 | 47,343 | |
Taser International, Inc. (a)(d) | 58,908 | 1,132,801 | |
Teledyne Technologies, Inc. (a) | 43,609 | 4,272,810 | |
Textron, Inc. | 315,614 | 12,529,876 | |
The Boeing Co. | 774,186 | 99,808,059 | |
TransDigm Group, Inc. | 58,956 | 10,502,422 | |
Common Stocks - continued | |||
Shares | Value | ||
INDUSTRIALS - continued | |||
Aerospace & Defense - continued | |||
Triumph Group, Inc. | 65,091 | $ 4,243,933 | |
United Technologies Corp. | 942,267 | 110,264,084 | |
| 610,408,473 | ||
Air Freight & Logistics - 0.6% | |||
Air Transport Services Group, Inc. (a) | 108,399 | 692,670 | |
Atlas Air Worldwide Holdings, Inc. (a)(d) | 36,312 | 1,094,081 | |
C.H. Robinson Worldwide, Inc. | 169,940 | 8,813,088 | |
Echo Global Logistics, Inc. (a) | 11,731 | 186,758 | |
Expeditors International of Washington, Inc. | 229,912 | 9,083,823 | |
FedEx Corp. | 337,318 | 44,974,609 | |
Forward Air Corp. | 38,499 | 1,665,467 | |
Hub Group, Inc. Class A (a)(d) | 45,548 | 1,779,560 | |
Pacer International, Inc. (a) | 35,751 | 320,686 | |
Park-Ohio Holdings Corp. (a) | 6,346 | 334,053 | |
Radiant Logistics, Inc. (a) | 14,104 | 38,786 | |
United Parcel Service, Inc. Class B | 794,382 | 76,077,964 | |
UTi Worldwide, Inc. (d) | 106,552 | 1,048,472 | |
XPO Logistics, Inc. (a) | 37,140 | 1,167,682 | |
| 147,277,699 | ||
Airlines - 0.4% | |||
Alaska Air Group, Inc. | 74,312 | 6,438,392 | |
Allegiant Travel Co. | 24,598 | 2,441,597 | |
American Airlines Group, Inc. (a)(d) | 209,909 | 7,751,939 | |
Delta Air Lines, Inc. | 944,561 | 31,368,871 | |
Hawaiian Holdings, Inc. (a)(d) | 71,807 | 864,556 | |
JetBlue Airways Corp. (a)(d) | 285,846 | 2,524,020 | |
Republic Airways Holdings, Inc. (a) | 81,894 | 784,545 | |
SkyWest, Inc. | 63,299 | 803,897 | |
Southwest Airlines Co. | 753,609 | 16,910,986 | |
Spirit Airlines, Inc. (a) | 81,901 | 4,625,768 | |
United Continental Holdings, Inc. (a)(d) | 402,944 | 18,116,362 | |
| 92,630,933 | ||
Building Products - 0.3% | |||
A.O. Smith Corp. | 98,582 | 4,899,525 | |
AAON, Inc. (d) | 50,511 | 1,509,269 | |
Allegion Plc | 94,511 | 5,136,673 | |
American Woodmark Corp. (a) | 9,343 | 300,004 | |
Apogee Enterprises, Inc. | 33,247 | 1,138,045 | |
Armstrong World Industries, Inc. (a) | 49,085 | 2,694,276 | |
Builders FirstSource, Inc. (a) | 87,836 | 756,268 | |
Fortune Brands Home & Security, Inc. | 177,871 | 8,313,691 | |
Gibraltar Industries, Inc. (a) | 56,316 | 1,037,904 | |
Griffon Corp. | 38,833 | 481,529 | |
Insteel Industries, Inc. | 19,643 | 390,896 | |
Lennox International, Inc. | 51,841 | 4,763,151 | |
Masco Corp. | 405,986 | 9,479,773 | |
Masonite International Corp. (a) | 19,654 | 1,134,036 | |
NCI Building Systems, Inc. (a) | 22,930 | 391,186 | |
Nortek, Inc. (a) | 14,350 | 1,038,797 | |
| |||
Shares | Value | ||
Owens Corning | 130,235 | $ 5,959,554 | |
Patrick Industries, Inc. (a) | 10,446 | 440,717 | |
PGT, Inc. (a) | 39,227 | 454,641 | |
Ply Gem Holdings, Inc. (d) | 16,220 | 207,778 | |
Quanex Building Products Corp. (d) | 44,676 | 868,501 | |
Simpson Manufacturing Co. Ltd. (d) | 50,637 | 1,790,018 | |
Trex Co., Inc. (a)(d) | 23,416 | 1,831,600 | |
Universal Forest Products, Inc. (d) | 26,737 | 1,490,053 | |
USG Corp. (a)(d) | 96,486 | 3,408,850 | |
| 59,916,735 | ||
Commercial Services & Supplies - 0.6% | |||
ABM Industries, Inc. | 53,056 | 1,497,771 | |
ACCO Brands Corp. (a)(d) | 120,265 | 711,969 | |
Acorn Energy, Inc. (d) | 16,876 | 57,378 | |
ADT Corp. (d) | 218,622 | 6,713,882 | |
ARC Document Solutions, Inc. (a) | 46,203 | 364,542 | |
Casella Waste Systems, Inc. Class A (a) | 64,851 | 347,601 | |
CECO Environmental Corp. (d) | 21,126 | 341,185 | |
Cenveo, Inc. (a)(d) | 104,135 | 353,018 | |
Cintas Corp. | 112,418 | 6,819,276 | |
Clean Harbors, Inc. (a)(d) | 65,972 | 3,117,837 | |
Copart, Inc. (a) | 124,595 | 4,538,996 | |
Courier Corp. | 17,378 | 286,216 | |
Covanta Holding Corp. | 154,806 | 2,786,508 | |
Deluxe Corp. (d) | 54,408 | 2,746,516 | |
EnerNOC, Inc. (a) | 25,460 | 552,227 | |
Ennis, Inc. | 21,290 | 336,382 | |
Fuel Tech, Inc. (a) | 51,934 | 331,858 | |
G&K Services, Inc. Class A | 20,257 | 1,268,696 | |
Healthcare Services Group, Inc. (d) | 92,468 | 2,490,163 | |
Heritage-Crystal Clean, Inc. (a)(d) | 7,679 | 138,990 | |
Herman Miller, Inc. | 61,359 | 1,729,097 | |
HNI Corp. | 49,416 | 1,756,739 | |
Hudson Technologies, Inc. (a)(d) | 5,394 | 16,883 | |
Industrial Services of America, Inc. (a)(d) | 1,620 | 5,881 | |
InnerWorkings, Inc. (a)(d) | 28,532 | 224,832 | |
Interface, Inc. | 56,426 | 1,086,765 | |
Intersections, Inc. | 12,865 | 78,862 | |
Iron Mountain, Inc. | 183,385 | 4,988,072 | |
KAR Auction Services, Inc. | 146,171 | 4,554,688 | |
Kimball International, Inc. Class B | 27,103 | 508,723 | |
Knoll, Inc. | 38,287 | 596,129 | |
McGrath RentCorp. | 21,172 | 685,338 | |
Metalico, Inc. (a) | 55,605 | 108,430 | |
Mine Safety Appliances Co. | 37,550 | 1,931,948 | |
Mobile Mini, Inc. | 51,612 | 2,323,056 | |
Multi-Color Corp. | 7,946 | 269,131 | |
NL Industries, Inc. | 6,707 | 75,320 | |
Performant Financial Corp. (a) | 31,038 | 245,511 | |
Perma-Fix Environmental Services, Inc. (a) | 6,937 | 24,141 | |
Pitney Bowes, Inc. | 221,034 | 5,625,315 | |
Quad/Graphics, Inc. | 28,077 | 628,082 | |
Common Stocks - continued | |||
Shares | Value | ||
INDUSTRIALS - continued | |||
Commercial Services & Supplies - continued | |||
R.R. Donnelley & Sons Co. | 225,027 | $ 4,304,767 | |
Republic Services, Inc. | 307,369 | 10,484,357 | |
Rollins, Inc. | 104,837 | 3,130,433 | |
Schawk, Inc. Class A | 4,209 | 58,842 | |
SP Plus Corp. (a)(d) | 13,389 | 351,461 | |
Standard Register Co. (a) | 3,970 | 43,511 | |
Steelcase, Inc. Class A | 74,937 | 1,114,313 | |
Stericycle, Inc. (a) | 95,694 | 10,909,116 | |
Swisher Hygiene, Inc. (Canada) (a) | 177,418 | 86,935 | |
Team, Inc. (a)(d) | 18,138 | 784,287 | |
Tetra Tech, Inc. (a) | 66,137 | 1,910,037 | |
The Brink's Co. | 51,214 | 1,557,418 | |
TRC Companies, Inc. (a) | 13,255 | 91,460 | |
Tyco International Ltd. | 530,926 | 22,394,459 | |
U.S. Ecology, Inc. | 25,366 | 911,400 | |
UniFirst Corp. | 16,509 | 1,810,872 | |
United Stationers, Inc. | 42,632 | 1,817,402 | |
Viad Corp. | 19,833 | 476,984 | |
Virco Manufacturing Co. (a) | 2,682 | 7,027 | |
Waste Connections, Inc. | 164,872 | 7,134,011 | |
Waste Management, Inc. | 506,566 | 21,022,489 | |
West Corp. (d) | 20,707 | 520,160 | |
| 154,185,695 | ||
Construction & Engineering - 0.3% | |||
AECOM Technology Corp. (a) | 100,199 | 3,200,356 | |
Aegion Corp. (a)(d) | 40,317 | 933,339 | |
Ameresco, Inc. Class A (a) | 38,199 | 391,922 | |
Argan, Inc. | 7,465 | 213,424 | |
Chicago Bridge & Iron Co. NV (d) | 123,066 | 10,360,927 | |
Comfort Systems U.S.A., Inc. | 43,738 | 718,615 | |
Dycom Industries, Inc. (a) | 36,171 | 1,044,980 | |
EMCOR Group, Inc. | 78,469 | 3,670,780 | |
Fluor Corp. | 170,796 | 13,269,141 | |
Foster Wheeler AG (d) | 112,721 | 3,620,599 | |
Furmanite Corp. (a) | 40,654 | 481,343 | |
Goldfield Corp. | 41,171 | 95,928 | |
Granite Construction, Inc. (d) | 41,521 | 1,526,312 | |
Great Lakes Dredge & Dock Corp. (a)(d) | 55,973 | 462,337 | |
Integrated Electrical Services, Inc. (a) | 13,442 | 73,528 | |
Jacobs Engineering Group, Inc. (a) | 160,940 | 9,761,011 | |
KBR, Inc. | 162,921 | 4,499,878 | |
Layne Christensen Co. (a)(d) | 24,456 | 434,339 | |
MasTec, Inc. (a)(d) | 84,984 | 3,479,245 | |
MYR Group, Inc. (a) | 25,270 | 588,033 | |
Northwest Pipe Co. (a) | 12,188 | 432,065 | |
Orion Marine Group, Inc. (a) | 21,656 | 244,496 | |
Pike Corp. (a) | 29,417 | 305,348 | |
Primoris Services Corp. | 35,637 | 1,114,369 | |
Quanta Services, Inc. (a) | 244,181 | 8,597,613 | |
Sterling Construction Co., Inc. (a) | 31,847 | 301,591 | |
| |||
Shares | Value | ||
Tutor Perini Corp. (a) | 46,969 | $ 1,157,786 | |
UniTek Global Services, Inc. (a) | 18,062 | 28,899 | |
URS Corp. | 82,388 | 3,831,042 | |
| 74,839,246 | ||
Electrical Equipment - 0.8% | |||
Active Power, Inc. (a) | 10,523 | 35,673 | |
Acuity Brands, Inc. | 52,894 | 7,460,699 | |
Allied Motion Technologies, Inc. | 4,209 | 48,319 | |
Altair Nanotechnologies, Inc. (a)(d) | 10,605 | 57,373 | |
American Superconductor Corp. (a)(d) | 126,771 | 234,526 | |
AMETEK, Inc. | 270,508 | 14,401,846 | |
AZZ, Inc. (d) | 24,628 | 1,092,744 | |
Babcock & Wilcox Co. (d) | 118,199 | 3,895,839 | |
Brady Corp. Class A | 52,937 | 1,416,065 | |
Broadwind Energy, Inc. (a) | 15,938 | 153,802 | |
Capstone Turbine Corp. (a)(d) | 814,128 | 1,457,289 | |
Eaton Corp. PLC | 526,249 | 39,316,063 | |
Emerson Electric Co. | 776,096 | 50,648,025 | |
Encore Wire Corp. | 23,059 | 1,205,755 | |
EnerSys | 48,550 | 3,448,992 | |
Enphase Energy, Inc. (a)(d) | 22,269 | 179,711 | |
Espey Manufacturing & Electronics Corp. | 2,015 | 58,052 | |
Franklin Electric Co., Inc. | 44,071 | 1,921,055 | |
FuelCell Energy, Inc. (a)(d) | 246,058 | 479,813 | |
Generac Holdings, Inc. (d) | 81,773 | 4,658,608 | |
General Cable Corp. (d) | 55,434 | 1,706,259 | |
Global Power Equipment Group, Inc. | 10,454 | 191,517 | |
GrafTech International Ltd. (a)(d) | 132,891 | 1,289,043 | |
Hubbell, Inc. Class B | 60,658 | 7,251,057 | |
II-VI, Inc. (a) | 56,117 | 919,758 | |
LSI Industries, Inc. | 24,011 | 199,051 | |
MagneTek, Inc. (a) | 2,664 | 64,362 | |
Ocean Power Technologies, Inc. (a)(d) | 11,040 | 44,822 | |
Plug Power, Inc. (a)(d) | 108,624 | 507,274 | |
Polypore International, Inc. (a)(d) | 50,063 | 1,732,680 | |
Powell Industries, Inc. | 7,721 | 526,032 | |
Power Solutions International, Inc. (a)(d) | 3,494 | 258,905 | |
PowerSecure International, Inc. (a)(d) | 20,869 | 474,352 | |
Preformed Line Products Co. | 1,961 | 121,778 | |
Real Goods Solar, Inc. Class A (a)(d) | 22,046 | 83,995 | |
Regal-Beloit Corp. | 57,797 | 4,259,061 | |
Revolution Lighting Technologies, Inc. (a)(d) | 38,693 | 122,270 | |
Rockwell Automation, Inc. | 151,793 | 18,646,252 | |
Roper Industries, Inc. | 118,631 | 16,088,736 | |
Sensata Technologies Holding BV (a) | 179,473 | 7,293,783 | |
SL Industries, Inc. (a) | 3,648 | 96,672 | |
SolarCity Corp. (a)(d) | 54,174 | 4,602,623 | |
Thermon Group Holdings, Inc. (a)(d) | 33,050 | 802,785 | |
Ultralife Corp. (a) | 13,410 | 50,690 | |
Vicor Corp. (a) | 10,982 | 118,276 | |
| 199,622,282 | ||
Common Stocks - continued | |||
Shares | Value | ||
INDUSTRIALS - continued | |||
Industrial Conglomerates - 1.9% | |||
3M Co. | 714,842 | $ 96,310,663 | |
Carlisle Companies, Inc. | 71,430 | 5,665,828 | |
Danaher Corp. | 685,221 | 52,412,554 | |
General Electric Co. | 11,343,330 | 288,914,615 | |
Raven Industries, Inc. | 39,990 | 1,462,434 | |
| 444,766,094 | ||
Machinery - 2.2% | |||
Accuride Corp. (a)(d) | 79,004 | 348,408 | |
Actuant Corp. Class A | 71,032 | 2,490,382 | |
Adept Technology, Inc. (a) | 17,085 | 287,711 | |
AGCO Corp. | 95,174 | 4,994,732 | |
Alamo Group, Inc. | 17,898 | 941,077 | |
Albany International Corp. Class A | 47,080 | 1,698,646 | |
Altra Industrial Motion Corp. | 25,498 | 902,629 | |
American Railcar Industries, Inc. | 11,797 | 816,942 | |
Ampco-Pittsburgh Corp. | 10,414 | 212,966 | |
Astec Industries, Inc. (d) | 19,808 | 796,678 | |
Barnes Group, Inc. | 47,337 | 1,820,108 | |
Blount International, Inc. (a) | 50,491 | 618,515 | |
Briggs & Stratton Corp. | 42,488 | 967,877 | |
Caterpillar, Inc. (d) | 709,570 | 68,807,003 | |
Chart Industries, Inc. (a)(d) | 32,250 | 2,694,810 | |
CIRCOR International, Inc. | 19,714 | 1,410,734 | |
CLARCOR, Inc. | 59,963 | 3,473,657 | |
Colfax Corp. (a) | 110,540 | 7,862,710 | |
Columbus McKinnon Corp. (NY Shares) (a) | 26,972 | 686,707 | |
Commercial Vehicle Group, Inc. (a) | 77,079 | 687,545 | |
Crane Co. | 52,315 | 3,736,337 | |
Cummins, Inc. | 194,981 | 28,451,628 | |
Deere & Co. | 423,519 | 36,392,988 | |
Donaldson Co., Inc. | 164,610 | 7,051,892 | |
Douglas Dynamics, Inc. (d) | 29,195 | 472,375 | |
Dover Corp. | 187,794 | 17,708,974 | |
Dynamic Materials Corp. | 17,783 | 369,175 | |
Eastern Co. | 2,354 | 37,452 | |
Energy Recovery, Inc. (a)(d) | 81,715 | 366,083 | |
EnPro Industries, Inc. (a)(d) | 22,235 | 1,592,693 | |
ESCO Technologies, Inc. | 28,907 | 1,036,027 | |
ExOne Co. (d) | 13,829 | 640,283 | |
Federal Signal Corp. (a) | 80,990 | 1,040,722 | |
Flowserve Corp. | 155,118 | 12,597,133 | |
FreightCar America, Inc. | 19,411 | 496,145 | |
Gencor Industries, Inc. (a) | 1,849 | 19,895 | |
Global Brass & Copper Holdings, Inc. | 9,550 | 161,682 | |
Gorman-Rupp Co. | 17,750 | 559,125 | |
Graco, Inc. | 71,760 | 5,599,433 | |
Graham Corp. | 12,124 | 421,551 | |
Greenbrier Companies, Inc. (a)(d) | 21,771 | 915,906 | |
Hardinge, Inc. | 14,874 | 219,392 | |
| |||
Shares | Value | ||
Harsco Corp. | 94,707 | $ 2,379,040 | |
Hurco Companies, Inc. | 3,319 | 83,008 | |
Hyster-Yale Materials Handling Class A | 12,438 | 1,255,492 | |
IDEX Corp. | 88,258 | 6,625,528 | |
Illinois Tool Works, Inc. | 441,791 | 36,447,758 | |
Ingersoll-Rand PLC | 297,503 | 18,189,333 | |
ITT Corp. | 114,023 | 5,005,610 | |
John Bean Technologies Corp. | 23,559 | 710,539 | |
Joy Global, Inc. (d) | 114,975 | 6,323,625 | |
Kadant, Inc. | 18,429 | 739,924 | |
Kennametal, Inc. | 99,076 | 4,333,584 | |
L.B. Foster Co. Class A | 10,636 | 494,468 | |
Lincoln Electric Holdings, Inc. | 88,988 | 6,671,430 | |
Lindsay Corp. (d) | 16,477 | 1,398,238 | |
Lydall, Inc. (a) | 11,611 | 235,239 | |
Manitex International, Inc. (a)(d) | 11,053 | 165,684 | |
Manitowoc Co., Inc. (d) | 166,345 | 5,146,714 | |
Meritor, Inc. (a) | 118,384 | 1,469,145 | |
Middleby Corp. (a)(d) | 20,717 | 6,143,834 | |
Miller Industries, Inc. | 16,197 | 292,356 | |
Mueller Industries, Inc. | 29,480 | 1,841,910 | |
Mueller Water Products, Inc. Class A | 162,577 | 1,568,868 | |
Navistar International Corp. (a)(d) | 79,012 | 2,962,950 | |
NN, Inc. | 12,121 | 233,814 | |
Nordson Corp. | 68,102 | 4,982,342 | |
Omega Flex, Inc. | 258 | 5,766 | |
Oshkosh Truck Corp. | 95,506 | 5,523,112 | |
PACCAR, Inc. | 408,900 | 26,921,976 | |
Pall Corp. | 118,435 | 10,185,410 | |
Parker Hannifin Corp. | 164,290 | 19,805,160 | |
Pentair Ltd. | 221,668 | 17,912,991 | |
PMFG, Inc. (a)(d) | 15,367 | 100,500 | |
Proto Labs, Inc. (a)(d) | 23,655 | 1,842,725 | |
RBC Bearings, Inc. (a) | 25,318 | 1,626,682 | |
Rexnord Corp. (a) | 39,840 | 1,194,802 | |
Snap-On, Inc. | 66,115 | 7,416,120 | |
SPX Corp. | 46,613 | 5,019,288 | |
Standex International Corp. | 10,804 | 597,569 | |
Stanley Black & Decker, Inc. | 173,666 | 14,421,225 | |
Sun Hydraulics Corp. (d) | 22,598 | 955,895 | |
Tecumseh Products Co. Class A (non-vtg.) (a) | 29,489 | 232,963 | |
Tennant Co. | 17,192 | 1,053,182 | |
Terex Corp. | 120,683 | 5,374,014 | |
Timken Co. | 84,686 | 5,111,647 | |
Titan International, Inc. (d) | 48,022 | 910,497 | |
Toro Co. | 67,215 | 4,451,649 | |
TriMas Corp. (a) | 46,817 | 1,573,519 | |
Trinity Industries, Inc. | 83,300 | 5,981,773 | |
Twin Disc, Inc. | 8,286 | 205,244 | |
Valmont Industries, Inc. (d) | 30,830 | 4,489,773 | |
Wabash National Corp. (a)(d) | 74,589 | 1,007,697 | |
WABCO Holdings, Inc. (a) | 75,595 | 7,744,708 | |
Wabtec Corp. | 121,942 | 9,678,537 | |
Common Stocks - continued | |||
Shares | Value | ||
INDUSTRIALS - continued | |||
Machinery - continued | |||
Watts Water Technologies, Inc. Class A | 38,674 | $ 2,383,092 | |
Woodward, Inc. | 78,842 | 3,436,723 | |
Xerium Technologies, Inc. (a) | 6,895 | 108,596 | |
Xylem, Inc. | 206,552 | 8,127,821 | |
| 513,507,817 | ||
Marine - 0.0% | |||
Baltic Trading Ltd. | 21,117 | 144,651 | |
Eagle Bulk Shipping, Inc. (a)(d) | 34,302 | 162,591 | |
Genco Shipping & Trading Ltd. (a)(d) | 76,288 | 125,112 | |
International Shipholding Corp. | 10,420 | 317,393 | |
Kirby Corp. (a) | 63,347 | 6,626,730 | |
Matson, Inc. | 37,893 | 913,979 | |
| 8,290,456 | ||
Professional Services - 0.4% | |||
Acacia Research Corp. (d) | 48,838 | 748,687 | |
Advisory Board Co. (a)(d) | 38,842 | 2,488,995 | |
Barrett Business Services, Inc. | 6,681 | 467,670 | |
CBIZ, Inc. (a)(d) | 37,390 | 341,371 | |
CDI Corp. | 9,649 | 176,287 | |
Corporate Executive Board Co. | 37,937 | 2,836,929 | |
CRA International, Inc. (a) | 15,589 | 364,315 | |
CTPartners Executive Search, Inc. (a) | 859 | 6,013 | |
Dun & Bradstreet Corp. | 40,399 | 4,007,985 | |
Equifax, Inc. | 155,277 | 10,878,707 | |
Exponent, Inc. | 15,525 | 1,106,001 | |
Franklin Covey Co. (a) | 5,338 | 111,831 | |
FTI Consulting, Inc. (a)(d) | 68,234 | 1,991,750 | |
GP Strategies Corp. (a) | 13,487 | 392,741 | |
Heidrick & Struggles International, Inc. | 22,259 | 409,343 | |
Hill International, Inc. (a) | 13,945 | 62,753 | |
Hudson Global, Inc. (a) | 13,947 | 49,930 | |
Huron Consulting Group, Inc. (a) | 28,844 | 1,908,607 | |
ICF International, Inc. (a) | 17,107 | 691,465 | |
IHS, Inc. Class A (a) | 75,073 | 8,999,751 | |
Insperity, Inc. | 20,805 | 607,298 | |
Kelly Services, Inc. Class A (non-vtg.) | 19,294 | 485,437 | |
Kforce, Inc. | 25,995 | 569,550 | |
Korn/Ferry International (a) | 56,905 | 1,444,818 | |
Manpower, Inc. | 81,876 | 6,399,428 | |
Mastech Holdings, Inc. | 373 | 5,091 | |
MISTRAS Group, Inc. (a) | 12,788 | 281,848 | |
Navigant Consulting, Inc. (a) | 41,733 | 727,406 | |
Nielsen Holdings B.V. | 285,021 | 13,492,894 | |
Odyssey Marine Exploration, Inc. (a)(d) | 46,227 | 101,237 | |
On Assignment, Inc. (a) | 52,146 | 1,793,822 | |
Pendrell Corp. (a) | 150,288 | 228,438 | |
RCM Technologies, Inc. (a) | 9,908 | 68,464 | |
Resources Connection, Inc. | 43,312 | 593,374 | |
Robert Half International, Inc. | 170,458 | 6,978,551 | |
RPX Corp. (a) | 42,529 | 681,315 | |
| |||
Shares | Value | ||
Spherix, Inc. (a) | 11 | $ 51 | |
Towers Watson & Co. | 75,492 | 8,236,177 | |
TrueBlue, Inc. (a) | 38,883 | 1,107,388 | |
Verisk Analytics, Inc. (a) | 175,777 | 11,199,632 | |
VSE Corp. | 1,834 | 88,582 | |
WageWorks, Inc. (a) | 36,355 | 2,150,398 | |
| 95,282,330 | ||
Road & Rail - 1.0% | |||
AMERCO | 7,919 | 1,844,652 | |
Arkansas Best Corp. | 25,682 | 854,183 | |
Avis Budget Group, Inc. (a)(d) | 135,454 | 6,364,983 | |
Celadon Group, Inc. | 62,978 | 1,429,601 | |
Con-way, Inc. (d) | 72,845 | 2,778,308 | |
Covenant Transport Group, Inc. Class A (a) | 9,633 | 95,945 | |
CSX Corp. | 1,133,651 | 31,413,469 | |
Genesee & Wyoming, Inc. Class A (a) | 61,185 | 6,052,420 | |
Heartland Express, Inc. (d) | 52,772 | 1,075,493 | |
Hertz Global Holdings, Inc. (a) | 494,988 | 13,864,614 | |
J.B. Hunt Transport Services, Inc. | 118,822 | 8,539,737 | |
Kansas City Southern | 125,208 | 11,759,535 | |
Knight Transportation, Inc. (d) | 54,848 | 1,178,135 | |
Landstar System, Inc. (d) | 49,655 | 2,865,590 | |
Marten Transport Ltd. | 31,198 | 608,049 | |
Norfolk Southern Corp. | 346,466 | 31,843,690 | |
Old Dominion Freight Lines, Inc. (a) | 69,360 | 3,692,726 | |
Patriot Transportation Holding, Inc. (a) | 1,312 | 46,773 | |
Providence & Worcester Railroad Co. | 4,631 | 82,432 | |
Quality Distribution, Inc. (a) | 25,189 | 322,923 | |
Roadrunner Transportation Systems, Inc. (a) | 23,847 | 560,643 | |
Ryder System, Inc. | 50,983 | 3,840,040 | |
Saia, Inc. (a) | 26,740 | 923,600 | |
Swift Transporation Co. (a)(d) | 119,320 | 2,906,635 | |
U.S.A. Truck, Inc. (a) | 1,841 | 28,296 | |
Union Pacific Corp. | 514,413 | 92,789,817 | |
Universal Truckload Services, Inc. | 6,117 | 159,042 | |
Werner Enterprises, Inc. (d) | 41,229 | 1,065,770 | |
YRC Worldwide, Inc. (a)(d) | 9,461 | 247,878 | |
| 229,234,979 | ||
Trading Companies & Distributors - 0.3% | |||
Aceto Corp. | 32,506 | 594,535 | |
AeroCentury Corp. (a)(d) | 688 | 11,703 | |
Air Lease Corp. Class A | 121,471 | 4,488,353 | |
Aircastle Ltd. | 65,692 | 1,294,132 | |
Applied Industrial Technologies, Inc. | 52,950 | 2,702,039 | |
Beacon Roofing Supply, Inc. (a)(d) | 65,628 | 2,480,082 | |
BlueLinx Corp. (a)(d) | 23,385 | 34,142 | |
CAI International, Inc. (a)(d) | 15,310 | 372,645 | |
DXP Enterprises, Inc. (a) | 10,800 | 1,099,008 | |
Essex Rental Corp. (a) | 16,688 | 52,567 | |
Fastenal Co. (d) | 297,869 | 14,056,438 | |
GATX Corp. | 53,842 | 3,493,807 | |
Common Stocks - continued | |||
Shares | Value | ||
INDUSTRIALS - continued | |||
Trading Companies & Distributors - continued | |||
H&E Equipment Services, Inc. (a) | 32,737 | $ 1,071,155 | |
HD Supply Holdings, Inc. (a)(d) | 66,187 | 1,540,171 | |
Houston Wire & Cable Co. | 15,647 | 217,650 | |
Kaman Corp. | 26,535 | 1,053,970 | |
Lawson Products, Inc. (a) | 4,764 | 70,174 | |
MRC Global, Inc. (a) | 114,871 | 2,954,482 | |
MSC Industrial Direct Co., Inc. | 57,280 | 4,944,982 | |
Rush Enterprises, Inc. Class A (a)(d) | 31,753 | 908,136 | |
TAL International Group, Inc. | 30,588 | 1,355,048 | |
Textainer Group Holdings Ltd. (d) | 14,461 | 527,393 | |
Titan Machinery, Inc. (a)(d) | 17,235 | 272,658 | |
United Rentals, Inc. (a)(d) | 99,613 | 8,799,812 | |
W.W. Grainger, Inc. | 68,361 | 17,433,422 | |
Watsco, Inc. | 30,156 | 2,966,747 | |
WESCO International, Inc. (a)(d) | 60,754 | 5,237,602 | |
Willis Lease Finance Corp. (a) | 2,006 | 35,907 | |
| 80,068,760 | ||
Transportation Infrastructure - 0.0% | |||
Wesco Aircraft Holdings, Inc. (a) | 39,594 | 858,794 | |
TOTAL INDUSTRIALS | 2,710,890,293 | ||
INFORMATION TECHNOLOGY - 18.0% | |||
Communications Equipment - 1.6% | |||
ADTRAN, Inc. (d) | 58,980 | 1,545,276 | |
Alliance Fiber Optic Products, Inc. (d) | 19,146 | 230,518 | |
Ambient Corp. (a) | 1,932 | 3,651 | |
Arris Group, Inc. (a)(d) | 139,734 | 4,010,366 | |
Aruba Networks, Inc. (a)(d) | 133,375 | 2,735,521 | |
Aviat Networks, Inc. (a) | 66,605 | 129,880 | |
Bel Fuse, Inc. Class B (non-vtg.) | 7,032 | 133,608 | |
Black Box Corp. | 16,753 | 445,630 | |
Blonder Tongue Laboratories, Inc. (a) | 3,352 | 3,386 | |
Brocade Communications Systems, Inc. (a) | 517,605 | 4,953,480 | |
CalAmp Corp. (a)(d) | 30,277 | 970,075 | |
Calix Networks, Inc. (a) | 25,252 | 200,753 | |
Ciena Corp. (a)(d) | 106,654 | 2,620,489 | |
Cisco Systems, Inc. | 6,002,230 | 130,848,614 | |
Clearfield, Inc. (a) | 10,596 | 247,946 | |
CommScope Holding Co., Inc. (d) | 65,332 | 1,580,381 | |
Communications Systems, Inc. | 4,311 | 58,069 | |
Comtech Telecommunications Corp. | 22,438 | 718,240 | |
Digi International, Inc. (a) | 21,456 | 204,905 | |
EchoStar Holding Corp. Class A (a) | 42,704 | 2,127,513 | |
EMCORE Corp. (a)(d) | 29,659 | 144,736 | |
Emulex Corp. (a) | 91,750 | 667,940 | |
Entrada Networks, Inc. (a) | 150 | 0 | |
Extreme Networks, Inc. (a) | 100,558 | 576,197 | |
| |||
Shares | Value | ||
F5 Networks, Inc. (a) | 85,953 | $ 9,655,960 | |
Finisar Corp. (a)(d) | 110,449 | 2,617,641 | |
Harmonic, Inc. (a) | 107,478 | 697,532 | |
Harris Corp. | 115,971 | 8,560,979 | |
Infinera Corp. (a)(d) | 140,398 | 1,168,111 | |
InterDigital, Inc. | 54,293 | 1,655,937 | |
Interphase Corp. (a) | 10,718 | 51,339 | |
Ixia (a) | 83,745 | 1,035,088 | |
JDS Uniphase Corp. (a) | 268,467 | 3,699,475 | |
Juniper Networks, Inc. (a) | 570,419 | 15,253,004 | |
KVH Industries, Inc. (a) | 23,641 | 305,678 | |
Lantronix, Inc. (a) | 71 | 181 | |
Meru Networks, Inc. (a)(d) | 20,865 | 88,050 | |
Motorola Solutions, Inc. | 252,045 | 16,685,379 | |
NETGEAR, Inc. (a)(d) | 37,791 | 1,291,696 | |
Novatel Wireless, Inc. (a) | 27,517 | 66,316 | |
NumereX Corp. Class A (a) | 2,670 | 39,623 | |
Oclaro, Inc. (a) | 126,427 | 356,524 | |
Oplink Communications, Inc. (a) | 15,273 | 267,583 | |
Optical Cable Corp. | 564 | 2,194 | |
Palo Alto Networks, Inc. (a) | 52,358 | 3,725,272 | |
Parkervision, Inc. (a)(d) | 100,275 | 501,375 | |
PC-Tel, Inc. | 2,259 | 19,653 | |
Plantronics, Inc. | 53,885 | 2,391,416 | |
Polycom, Inc. (a)(d) | 189,613 | 2,533,230 | |
Procera Networks, Inc. (a)(d) | 21,122 | 232,976 | |
QUALCOMM, Inc. | 1,892,307 | 142,471,794 | |
Relm Wireless Corp. (a) | 9,436 | 29,723 | |
Riverbed Technology, Inc. (a)(d) | 188,588 | 4,201,741 | |
Ruckus Wireless, Inc. (a) | 70,783 | 990,962 | |
ShoreTel, Inc. (a) | 56,073 | 492,882 | |
Sonus Networks, Inc. (a) | 287,303 | 1,071,640 | |
Tessco Technologies, Inc. | 4,838 | 184,231 | |
Ubiquiti Networks, Inc. (a)(d) | 20,342 | 1,005,098 | |
ViaSat, Inc. (a)(d) | 47,347 | 3,158,518 | |
Westell Technologies, Inc. Class A (a) | 20,974 | 86,623 | |
Zhone Technologies, Inc. (a)(d) | 5,862 | 22,803 | |
Zoom Technologies, Inc. (a) | 3,134 | 14,385 | |
| 381,789,786 | ||
Computers & Peripherals - 3.2% | |||
3D Systems Corp. (a)(d) | 106,440 | 8,085,182 | |
Apple, Inc. | 1,010,277 | 531,648,119 | |
Astro-Med, Inc. | 4,606 | 63,655 | |
Concurrent Computer Corp. | 6,675 | 55,136 | |
Cray, Inc. (a)(d) | 45,237 | 1,569,272 | |
Crossroads Systems, Inc. (a)(d) | 9,071 | 20,591 | |
Dataram Corp. (a) | 556 | 1,518 | |
Diebold, Inc. | 89,599 | 3,350,107 | |
Dot Hill Systems Corp. (a) | 109,713 | 584,770 | |
Electronics for Imaging, Inc. (a) | 55,580 | 2,478,868 | |
EMC Corp. (d) | 2,290,422 | 60,398,428 | |
Fusion-io, Inc. (a)(d) | 99,991 | 1,096,901 | |
Hewlett-Packard Co. | 2,158,308 | 64,490,243 | |
Common Stocks - continued | |||
Shares | Value | ||
INFORMATION TECHNOLOGY - continued | |||
Computers & Peripherals - continued | |||
Hutchinson Technology, Inc. (a) | 41,790 | $ 152,116 | |
Imation Corp. (a) | 19,750 | 126,400 | |
Immersion Corp. (a) | 59,681 | 713,188 | |
Intevac, Inc. (a) | 17,689 | 133,198 | |
Lexmark International, Inc. Class A | 71,862 | 3,028,265 | |
NCR Corp. (a) | 203,607 | 6,932,818 | |
NetApp, Inc. | 387,745 | 15,668,775 | |
Overland Storage, Inc. (a) | 5,087 | 5,290 | |
QLogic Corp. (a) | 107,276 | 1,225,092 | |
Quantum Corp. (a)(d) | 267,446 | 312,912 | |
Qumu Corp. (a) | 6,017 | 95,069 | |
SanDisk Corp. | 251,675 | 18,699,453 | |
Scan-Optics, Inc. (a) | 300 | 0 | |
Seagate Technology | 368,699 | 19,242,401 | |
Silicon Graphics International Corp. (a)(d) | 32,579 | 401,047 | |
Super Micro Computer, Inc. (a) | 48,860 | 986,483 | |
Transact Technologies, Inc. | 3,411 | 39,568 | |
U.S.A. Technologies, Inc. (a)(d) | 38,549 | 80,953 | |
Video Display Corp. (a) | 2,957 | 11,296 | |
Western Digital Corp. | 235,126 | 20,453,611 | |
Xplore Technologies Corp. (a) | 2,067 | 12,381 | |
| 762,163,106 | ||
Electronic Equipment & Components - 0.8% | |||
Advanced Photonix, Inc. Class A (a) | 4,544 | 2,990 | |
Aeroflex Holding Corp. (a) | 11,165 | 89,208 | |
Agilysys, Inc. (a) | 38,149 | 553,923 | |
Amphenol Corp. Class A | 175,748 | 15,469,339 | |
Anixter International, Inc. | 27,054 | 2,893,425 | |
Arrow Electronics, Inc. (a) | 128,186 | 7,259,173 | |
Audience, Inc. (a) | 9,607 | 112,594 | |
Avnet, Inc. | 154,170 | 6,711,020 | |
AVX Corp. | 71,883 | 922,259 | |
Badger Meter, Inc. | 35,716 | 1,961,523 | |
Belden, Inc. | 50,406 | 3,635,785 | |
Benchmark Electronics, Inc. (a) | 50,023 | 1,192,548 | |
CDW Corp. | 67,267 | 1,760,377 | |
Checkpoint Systems, Inc. (a) | 41,082 | 601,851 | |
ClearSign Combustion Corp. (a)(d) | 7,019 | 65,628 | |
Cognex Corp. (a) | 109,040 | 4,106,446 | |
Coherent, Inc. (a) | 23,544 | 1,604,524 | |
Control4 Corp. (d) | 4,856 | 101,539 | |
Corning, Inc. | 1,625,355 | 31,320,591 | |
CTS Corp. | 23,806 | 486,119 | |
Daktronics, Inc. | 32,196 | 456,217 | |
Dolby Laboratories, Inc. Class A (a)(d) | 54,035 | 2,227,863 | |
DTS, Inc. (a)(d) | 19,732 | 400,757 | |
Echelon Corp. (a) | 32,190 | 96,570 | |
Electro Rent Corp. | 12,184 | 221,383 | |
Electro Scientific Industries, Inc. | 21,640 | 204,065 | |
eMagin Corp. (a) | 5,084 | 13,523 | |
| |||
Shares | Value | ||
Fabrinet (a) | 24,522 | $ 476,217 | |
FARO Technologies, Inc. (a) | 18,648 | 1,073,006 | |
FEI Co. | 46,062 | 4,728,264 | |
FLIR Systems, Inc. | 171,079 | 5,840,637 | |
Frequency Electronics, Inc. (a) | 430 | 4,945 | |
Giga-Tronics, Inc. (a) | 2,579 | 3,585 | |
GSI Group, Inc. (a) | 5,175 | 64,946 | |
I. D. Systems Inc. (a) | 6,071 | 36,365 | |
Identive Group, Inc. (a) | 106,182 | 92,378 | |
IEC Electronics Corp. (a) | 86 | 372 | |
Ingram Micro, Inc. Class A (a) | 191,225 | 5,631,576 | |
Insight Enterprises, Inc. (a) | 39,665 | 911,502 | |
Intelli-Check, Inc. (a) | 4,366 | 3,308 | |
InvenSense, Inc. (a)(d) | 57,254 | 1,153,668 | |
IPG Photonics Corp. (a)(d) | 46,113 | 3,309,530 | |
Iteris, Inc. (a) | 1,032 | 2,291 | |
Itron, Inc. (a)(d) | 38,500 | 1,347,500 | |
Jabil Circuit, Inc. | 217,842 | 4,032,255 | |
KEMET Corp. (a) | 34,374 | 195,244 | |
KEY Tronic Corp. (a) | 6,483 | 67,099 | |
LightPath Technologies, Inc. Class A (a) | 376 | 617 | |
Littelfuse, Inc. | 24,950 | 2,354,532 | |
LoJack Corp. (a) | 24,621 | 149,696 | |
LRAD Corp. (a) | 56,581 | 123,912 | |
Maxwell Technologies, Inc. (a)(d) | 38,769 | 396,219 | |
Measurement Specialties, Inc. (a) | 15,282 | 932,202 | |
Mercury Systems, Inc. (a)(d) | 23,393 | 259,662 | |
Mesa Laboratories, Inc. | 2,184 | 190,882 | |
Methode Electronics, Inc. Class A | 42,247 | 1,432,173 | |
MicroVision, Inc. (a) | 33,140 | 67,274 | |
MOCON, Inc. | 2,209 | 37,089 | |
MTS Systems Corp. | 16,730 | 1,187,161 | |
Multi-Fineline Electronix, Inc. (a) | 10,240 | 149,197 | |
National Instruments Corp. | 115,875 | 3,356,899 | |
Neonode, Inc. (a)(d) | 33,197 | 239,682 | |
NetList, Inc. (a)(d) | 104,599 | 200,307 | |
Newport Corp. (a) | 41,609 | 861,306 | |
OSI Systems, Inc. (a) | 22,707 | 1,395,799 | |
Park Electrochemical Corp. | 16,314 | 464,786 | |
PC Connection, Inc. | 12,636 | 255,879 | |
PC Mall, Inc. (a) | 4,077 | 39,588 | |
Planar Systems, Inc. (a) | 2,277 | 5,283 | |
Plexus Corp. (a) | 33,577 | 1,381,694 | |
Pulse Electronics Corp. (a) | 5,013 | 20,052 | |
RadiSys Corp. (a) | 9,220 | 38,263 | |
RealD, Inc. (a)(d) | 37,860 | 418,353 | |
Research Frontiers, Inc. (a)(d) | 16,855 | 101,299 | |
RF Industries Ltd. | 5,778 | 38,366 | |
Richardson Electronics Ltd. | 23,707 | 260,540 | |
Rofin-Sinar Technologies, Inc. (a) | 22,270 | 522,677 | |
Rogers Corp. (a) | 16,870 | 1,091,489 | |
Sanmina Corp. (a) | 78,959 | 1,339,145 | |
ScanSource, Inc. (a) | 24,927 | 978,634 | |
Speed Commerce, Inc. (a)(d) | 43,920 | 172,166 | |
Common Stocks - continued | |||
Shares | Value | ||
INFORMATION TECHNOLOGY - continued | |||
Electronic Equipment & Components - continued | |||
SYNNEX Corp. (a) | 30,841 | $ 1,834,423 | |
TE Connectivity Ltd. | 462,365 | 27,085,342 | |
Tech Data Corp. (a) | 39,838 | 2,294,669 | |
Trimble Navigation Ltd. (a)(d) | 301,758 | 11,512,068 | |
TTM Technologies, Inc. (a) | 53,211 | 446,972 | |
Uni-Pixel, Inc. (a)(d) | 12,876 | 126,957 | |
Universal Display Corp. (a)(d) | 48,773 | 1,684,619 | |
Viasystems Group, Inc. (a) | 4,710 | 61,042 | |
Vishay Intertechnology, Inc. | 163,262 | 2,308,525 | |
Vishay Precision Group, Inc. (a) | 9,596 | 164,379 | |
Wayside Technology Group, Inc. | 1,232 | 17,420 | |
Wireless Telecom Group, Inc. (a) | 11,200 | 40,320 | |
Zebra Technologies Corp. Class A (a) | 57,315 | 3,954,162 | |
Zygo Corp. (a) | 11,158 | 168,597 | |
| 185,608,246 | ||
Internet Software & Services - 3.2% | |||
Akamai Technologies, Inc. (a) | 208,821 | 12,765,228 | |
Angie's List, Inc. (a)(d) | 39,732 | 552,672 | |
AOL, Inc. (a)(d) | 89,529 | 3,919,580 | |
Autobytel, Inc. (a) | 1,148 | 18,092 | |
Bankrate, Inc. (a)(d) | 42,017 | 845,802 | |
Bazaarvoice, Inc. (a)(d) | 31,078 | 210,087 | |
Benefitfocus, Inc. | 9,816 | 635,880 | |
Blucora, Inc. (a)(d) | 40,993 | 788,705 | |
Brightcove, Inc. (a) | 25,472 | 247,078 | |
BroadVision, Inc. (a) | 490 | 6,326 | |
Carbonite, Inc. (a) | 9,443 | 95,941 | |
ChannelAdvisor Corp. (a) | 9,463 | 429,431 | |
comScore, Inc. (a) | 35,536 | 1,123,648 | |
Constant Contact, Inc. (a) | 30,835 | 850,121 | |
Conversant, Inc. (a)(d) | 68,992 | 1,715,141 | |
Cornerstone OnDemand, Inc. (a)(d) | 56,736 | 3,312,248 | |
CoStar Group, Inc. (a) | 32,267 | 6,486,958 | |
Crexendo, Inc. (a) | 6,585 | 20,677 | |
Cvent, Inc. | 5,589 | 219,536 | |
Daegis, Inc. (a) | 3,645 | 4,301 | |
Dealertrack Technologies (a)(d) | 45,834 | 2,478,244 | |
Demand Media, Inc. (a)(d) | 42,676 | 206,979 | |
Demandware, Inc. (a) | 37,767 | 2,836,679 | |
Dice Holdings, Inc. (a)(d) | 50,678 | 372,990 | |
Digital River, Inc. (a) | 35,934 | 638,547 | |
E2open, Inc. (a)(d) | 9,328 | 259,225 | |
Earthlink Holdings Corp. | 136,356 | 534,516 | |
eBay, Inc. (a) | 1,308,058 | 76,874,569 | |
eGain Communications Corp. (a)(d) | 8,558 | 71,716 | |
Endurance International Group Holdings, Inc. | 22,941 | 346,180 | |
Envestnet, Inc. (a) | 31,274 | 1,308,504 | |
Equinix, Inc. (a)(d) | 57,542 | 10,930,678 | |
Facebook, Inc. Class A (a) | 1,846,553 | 126,415,018 | |
Global Eagle Entertainment, Inc. (a)(d) | 63,441 | 1,115,293 | |
| |||
Shares | Value | ||
GlowPoint, Inc. (a) | 18,770 | $ 24,776 | |
Gogo, Inc. (d) | 13,710 | 285,854 | |
Google, Inc. Class A (a) | 314,888 | 382,793,597 | |
IAC/InterActiveCorp | 87,877 | 6,813,104 | |
Internap Network Services Corp. (a) | 49,823 | 379,651 | |
IntraLinks Holdings, Inc. (a) | 36,458 | 423,277 | |
Inuvo, Inc. (a) | 9,640 | 11,954 | |
iPass, Inc. (a) | 33,662 | 52,176 | |
j2 Global, Inc. | 55,909 | 2,873,723 | |
Limelight Networks, Inc. (a) | 33,081 | 71,455 | |
LinkedIn Corp. (a)(d) | 109,767 | 22,396,859 | |
Liquidity Services, Inc. (a)(d) | 37,923 | 971,587 | |
LivePerson, Inc. (a)(d) | 55,381 | 724,383 | |
Local Corp. (a) | 28,399 | 45,154 | |
LogMeIn, Inc. (a) | 22,955 | 960,667 | |
Marchex, Inc. Class B | 28,685 | 339,630 | |
Marin Software, Inc. (d) | 7,083 | 81,100 | |
Marketo, Inc. | 21,521 | 882,361 | |
Mediabistro, Inc. (a) | 147 | 340 | |
MeetMe, Inc. (a)(d) | 18,724 | 49,806 | |
Millennial Media, Inc. (a)(d) | 34,415 | 207,867 | |
Monster Worldwide, Inc. (a) | 97,552 | 777,489 | |
Move, Inc. (a) | 35,516 | 458,512 | |
NIC, Inc. | 78,994 | 1,535,643 | |
OpenTable, Inc. (a)(d) | 23,366 | 1,862,037 | |
Pandora Media, Inc. (a) | 184,344 | 6,898,152 | |
Perficient, Inc. (a) | 34,438 | 702,880 | |
QuinStreet, Inc. (a) | 17,620 | 116,116 | |
Rackspace Hosting, Inc. (a)(d) | 132,627 | 4,876,695 | |
RealNetworks, Inc. (a) | 28,670 | 215,312 | |
Rocket Fuel, Inc. | 8,626 | 483,574 | |
SciQuest, Inc. (a)(d) | 19,825 | 585,234 | |
Selectica, Inc. (a) | 552 | 3,853 | |
Shutterstock, Inc. (a)(d) | 10,696 | 1,062,968 | |
Spark Networks, Inc. (a)(d) | 16,620 | 100,052 | |
SPS Commerce, Inc. (a) | 19,140 | 1,297,692 | |
Stamps.com, Inc. (a) | 12,471 | 438,730 | |
Support.com, Inc. (a) | 117,655 | 295,314 | |
Synacor, Inc. (a) | 20,037 | 52,697 | |
TechTarget, Inc. (a) | 1,217 | 8,434 | |
Textura Corp. (d) | 17,853 | 480,424 | |
TheStreet.com, Inc. | 3,696 | 10,792 | |
Travelzoo, Inc. (a) | 5,383 | 127,146 | |
Tremor Video, Inc. (d) | 9,207 | 39,958 | |
Trulia, Inc. (a)(d) | 42,135 | 1,262,365 | |
Twitter, Inc. (d) | 80,705 | 4,431,512 | |
United Online, Inc. | 10,283 | 115,272 | |
Unwired Planet, Inc. | 100,320 | 148,474 | |
VeriSign, Inc. (a)(d) | 144,977 | 7,989,682 | |
Vocus, Inc. (a)(d) | 23,379 | 312,110 | |
Web.com Group, Inc. (a)(d) | 64,573 | 2,353,686 | |
WebMD Health Corp. (a)(d) | 44,803 | 1,989,701 | |
XO Group, Inc. (a) | 29,832 | 356,194 | |
Xoom Corp. | 19,461 | 545,492 | |
Common Stocks - continued | |||
Shares | Value | ||
INFORMATION TECHNOLOGY - continued | |||
Internet Software & Services - continued | |||
Yahoo!, Inc. (a) | 1,058,836 | $ 40,945,188 | |
Yelp, Inc. (a)(d) | 60,050 | 5,669,921 | |
YuMe, Inc. (d) | 6,211 | 39,688 | |
Zillow, Inc. (a)(d) | 23,405 | 1,956,658 | |
Zix Corp. (a) | 43,773 | 197,854 | |
| 769,769,412 | ||
IT Services - 3.4% | |||
Accenture PLC Class A | 713,976 | 59,509,900 | |
Acxiom Corp. (a) | 91,117 | 3,392,286 | |
Alliance Data Systems Corp. (a)(d) | 50,917 | 14,516,946 | |
Amdocs Ltd. | 195,710 | 8,705,181 | |
Automatic Data Processing, Inc. | 560,035 | 43,559,522 | |
Blackhawk Network Holdings, Inc. (d) | 10,875 | 269,483 | |
Booz Allen Hamilton Holding Corp. | 80,553 | 1,694,030 | |
Broadridge Financial Solutions, Inc. | 126,853 | 4,789,969 | |
CACI International, Inc. Class A (a)(d) | 20,462 | 1,613,019 | |
Cardtronics, Inc. (a) | 44,777 | 1,814,364 | |
Cass Information Systems, Inc. | 3,955 | 205,660 | |
Ciber, Inc. (a) | 53,912 | 257,699 | |
Cognizant Technology Solutions Corp. Class A (a) | 339,084 | 35,285,081 | |
Computer Sciences Corp. | 174,620 | 11,035,984 | |
Computer Task Group, Inc. | 11,646 | 189,248 | |
Convergys Corp. (d) | 123,097 | 2,519,796 | |
CoreLogic, Inc. (a) | 113,020 | 3,684,452 | |
CSG Systems International, Inc. | 47,456 | 1,328,768 | |
CSP, Inc. | 3,696 | 30,677 | |
Datalink Corp. (a) | 21,583 | 315,328 | |
DST Systems, Inc. | 31,684 | 2,977,662 | |
Edgewater Technology, Inc. (a) | 2,875 | 19,665 | |
EPAM Systems, Inc. (a) | 32,476 | 1,361,719 | |
Euronet Worldwide, Inc. (a) | 64,215 | 2,456,866 | |
EVERTEC, Inc. | 73,649 | 1,786,725 | |
ExlService Holdings, Inc. (a) | 29,161 | 816,216 | |
Fidelity National Information Services, Inc. | 329,470 | 18,321,827 | |
Fiserv, Inc. (a) | 303,216 | 17,601,689 | |
FleetCor Technologies, Inc. (a) | 84,060 | 10,921,916 | |
Forrester Research, Inc. | 14,844 | 537,650 | |
Gartner, Inc. Class A (a)(d) | 108,666 | 7,558,807 | |
Genpact Ltd. (a) | 139,916 | 2,333,799 | |
Global Cash Access Holdings, Inc. (a) | 58,402 | 490,577 | |
Global Payments, Inc. (d) | 86,730 | 6,099,721 | |
Hackett Group, Inc. | 12,619 | 74,326 | |
Heartland Payment Systems, Inc. | 51,995 | 2,102,678 | |
Higher One Holdings, Inc. (a) | 26,817 | 214,536 | |
IBM Corp. | 1,144,549 | 211,936,138 | |
iGATE Corp. (a) | 38,740 | 1,311,349 | |
Information Services Group, Inc. (a) | 18,000 | 94,140 | |
Innodata, Inc. (a) | 14,010 | 45,953 | |
| |||
Shares | Value | ||
Jack Henry & Associates, Inc. | 97,558 | $ 5,671,047 | |
Leidos Holdings, Inc. (d) | 88,093 | 3,934,233 | |
Lionbridge Technologies, Inc. (a) | 34,685 | 248,345 | |
ManTech International Corp. Class A | 23,021 | 673,825 | |
MasterCard, Inc. Class A | 1,154,284 | 89,710,952 | |
Mattersight Corp. (a) | 4,307 | 24,291 | |
Maximus, Inc. | 80,539 | 3,848,959 | |
ModusLink Global Solutions, Inc. (a) | 31,030 | 141,807 | |
MoneyGram International, Inc. (a) | 66,937 | 1,273,811 | |
NCI, Inc. Class A (a) | 12,261 | 147,132 | |
Neustar, Inc. Class A (a)(d) | 66,766 | 2,391,558 | |
Paychex, Inc. | 360,083 | 15,037,066 | |
PFSweb, Inc. (a) | 1,815 | 15,881 | |
Planet Payment, Inc. (a) | 40,113 | 136,785 | |
PRG-Schultz International, Inc. (a) | 5,640 | 34,066 | |
Sapient Corp. (a) | 136,229 | 2,371,747 | |
Science Applications International Corp. | 56,960 | 2,124,608 | |
ServiceSource International, Inc. (a)(d) | 52,332 | 477,268 | |
StarTek, Inc. (a) | 2,150 | 14,943 | |
Sykes Enterprises, Inc. (a) | 37,324 | 734,536 | |
Syntel, Inc. (a) | 20,991 | 1,980,711 | |
Teletech Holdings, Inc. (a) | 19,293 | 464,575 | |
Teradata Corp. (a)(d) | 183,403 | 8,421,866 | |
The Management Network Group, Inc. (a) | 206 | 700 | |
The Western Union Co. | 621,408 | 10,396,156 | |
Total System Services, Inc. | 171,609 | 5,227,210 | |
Unisys Corp. (a)(d) | 40,780 | 1,395,492 | |
Vantiv, Inc. (a)(d) | 129,522 | 4,122,685 | |
VeriFone Systems, Inc. (a) | 114,397 | 3,311,793 | |
Virtusa Corp. (a) | 35,863 | 1,304,337 | |
Visa, Inc. Class A | 570,296 | 128,852,678 | |
WEX, Inc. (a) | 45,780 | 4,432,420 | |
Xerox Corp. | 1,318,733 | 14,492,876 | |
| 797,197,711 | ||
Semiconductors & Semiconductor Equipment - 2.2% | |||
Advanced Energy Industries, Inc. (a) | 37,951 | 1,041,375 | |
Advanced Micro Devices, Inc. (a)(d) | 718,505 | 2,665,654 | |
AEHR Test Systems (a) | 3,126 | 7,346 | |
Aetrium, Inc. (a) | 206 | 1,226 | |
Altera Corp. | 377,370 | 13,702,305 | |
Amkor Technology, Inc. (a)(d) | 161,169 | 954,120 | |
Amtech Systems, Inc. (a) | 12,381 | 138,172 | |
ANADIGICS, Inc. (a)(d) | 109,969 | 200,144 | |
Analog Devices, Inc. | 340,001 | 17,278,851 | |
Applied Materials, Inc. | 1,333,558 | 25,284,260 | |
Applied Micro Circuits Corp. (a)(d) | 98,689 | 1,130,976 | |
Atmel Corp. (a)(d) | 480,018 | 3,868,945 | |
ATMI, Inc. (a) | 28,610 | 973,026 | |
Avago Technologies Ltd. | 276,576 | 17,064,739 | |
Axcelis Technologies, Inc. (a) | 123,333 | 275,033 | |
AXT, Inc. (a) | 31,515 | 72,169 | |
Broadcom Corp. Class A | 594,914 | 17,680,844 | |
Common Stocks - continued | |||
Shares | Value | ||
INFORMATION TECHNOLOGY - continued | |||
Semiconductors & Semiconductor Equipment - continued | |||
Brooks Automation, Inc. | 71,516 | $ 741,621 | |
BTU International, Inc. (a) | 4,067 | 12,323 | |
Cabot Microelectronics Corp. (a)(d) | 30,653 | 1,353,943 | |
Cavium, Inc. (a)(d) | 71,032 | 2,992,578 | |
Ceva, Inc. (a)(d) | 20,686 | 374,003 | |
Cirrus Logic, Inc. (a)(d) | 62,020 | 1,193,885 | |
Cohu, Inc. | 20,738 | 209,246 | |
Cree, Inc. (a)(d) | 134,448 | 8,259,141 | |
CVD Equipment Corp. (a)(d) | 24,298 | 359,610 | |
Cypress Semiconductor Corp. (d) | 200,786 | 1,965,695 | |
Diodes, Inc. (a) | 35,635 | 848,469 | |
DSP Group, Inc. (a) | 34,788 | 294,306 | |
Entegris, Inc. (a) | 143,226 | 1,725,873 | |
Entropic Communications, Inc. (a) | 130,146 | 570,039 | |
Exar Corp. (a) | 56,777 | 650,097 | |
Fairchild Semiconductor International, Inc. (a)(d) | 143,511 | 2,020,635 | |
First Solar, Inc. (a)(d) | 80,138 | 4,573,476 | |
FormFactor, Inc. (a) | 44,109 | 314,497 | |
Freescale Semiconductor, Inc. (a) | 51,501 | 1,171,648 | |
GigOptix, Inc. (a) | 17,428 | 28,408 | |
GSI Technology, Inc. (a) | 7,703 | 52,457 | |
GT Advanced Technologies, Inc. (a)(d) | 153,295 | 2,196,717 | |
Hittite Microwave Corp. | 37,699 | 2,223,487 | |
Ikanos Communications, Inc. (a) | 35,040 | 32,237 | |
Inphi Corp. (a) | 23,714 | 311,839 | |
Integrated Device Technology, Inc. (a) | 149,111 | 1,758,019 | |
Integrated Silicon Solution, Inc. (a) | 27,085 | 329,895 | |
Intel Corp. | 5,568,938 | 137,886,905 | |
Intermolecular, Inc. (a)(d) | 6,975 | 18,484 | |
International Rectifier Corp. (a)(d) | 83,741 | 2,256,820 | |
Intersil Corp. Class A | 155,240 | 1,974,653 | |
Intest Corp. (a) | 2,175 | 8,657 | |
IXYS Corp. | 38,644 | 425,857 | |
KLA-Tencor Corp. | 196,151 | 12,779,238 | |
Kopin Corp. (a) | 49,853 | 198,913 | |
Kulicke & Soffa Industries, Inc. (a) | 82,587 | 953,054 | |
Lam Research Corp. (a) | 188,211 | 9,736,155 | |
Lattice Semiconductor Corp. (a) | 136,230 | 1,031,261 | |
Linear Technology Corp. | 269,546 | 12,625,535 | |
LSI Corp. | 591,975 | 6,565,003 | |
LTX-Credence Corp. (a) | 48,731 | 493,158 | |
M/A-COM Technology Solutions, Inc. (a) | 10,000 | 169,600 | |
Marvell Technology Group Ltd. | 465,712 | 7,120,736 | |
Mattson Technology, Inc. (a) | 72,551 | 185,005 | |
Maxim Integrated Products, Inc. | 303,732 | 9,935,074 | |
MaxLinear, Inc. Class A (a) | 15,441 | 144,373 | |
Micrel, Inc. | 33,398 | 348,675 | |
Microchip Technology, Inc. (d) | 217,370 | 9,901,204 | |
Micron Technology, Inc. (a) | 1,180,658 | 28,560,117 | |
Microsemi Corp. (a) | 100,802 | 2,324,494 | |
| |||
Shares | Value | ||
MKS Instruments, Inc. | 59,577 | $ 1,790,885 | |
Monolithic Power Systems, Inc. (a)(d) | 35,284 | 1,264,579 | |
MoSys, Inc. (a)(d) | 19,247 | 85,072 | |
Nanometrics, Inc. (a) | 28,664 | 526,271 | |
NeoPhotonics Corp. (a) | 16,785 | 138,476 | |
NVE Corp. (a) | 6,043 | 341,006 | |
NVIDIA Corp. | 631,690 | 11,610,462 | |
Omnivision Technologies, Inc. (a)(d) | 50,229 | 867,455 | |
ON Semiconductor Corp. (a) | 539,501 | 5,038,939 | |
PDF Solutions, Inc. (a) | 22,154 | 451,720 | |
Peregrine Semiconductor Corp. (a)(d) | 21,553 | 143,974 | |
Pericom Semiconductor Corp. (a) | 17,514 | 141,688 | |
Photronics, Inc. (a)(d) | 74,723 | 650,090 | |
Pixelworks, Inc. (a) | 22,798 | 113,534 | |
PLX Technology, Inc. (a) | 44,805 | 267,038 | |
PMC-Sierra, Inc. (a) | 199,312 | 1,462,950 | |
Power Integrations, Inc. | 37,256 | 2,202,947 | |
QuickLogic Corp. (a)(d) | 38,003 | 193,435 | |
Rambus, Inc. (a)(d) | 118,235 | 1,090,127 | |
RF Micro Devices, Inc. (a) | 315,164 | 2,231,361 | |
Rubicon Technology, Inc. (a)(d) | 25,049 | 323,383 | |
Rudolph Technologies, Inc. (a)(d) | 29,614 | 339,673 | |
Semtech Corp. (a) | 76,311 | 1,903,959 | |
Sigma Designs, Inc. (a) | 22,818 | 111,808 | |
Silicon Image, Inc. (a) | 84,424 | 510,765 | |
Silicon Laboratories, Inc. (a)(d) | 47,316 | 2,459,013 | |
Skyworks Solutions, Inc. (a)(d) | 219,186 | 7,772,336 | |
Spansion, Inc. Class A (a) | 45,268 | 738,321 | |
STR Holdings, Inc. (a) | 37,233 | 55,105 | |
SunEdison, Inc. (a)(d) | 278,643 | 5,115,885 | |
SunPower Corp. (a)(d) | 42,366 | 1,403,586 | |
Supertex, Inc. (a) | 19,548 | 643,716 | |
Synaptics, Inc. (a)(d) | 36,621 | 2,381,830 | |
Teradyne, Inc. (a)(d) | 265,875 | 5,391,945 | |
Tessera Technologies, Inc. | 44,982 | 977,009 | |
Texas Instruments, Inc. | 1,203,895 | 54,127,119 | |
TriQuint Semiconductor, Inc. (a)(d) | 199,172 | 2,437,865 | |
Ultra Clean Holdings, Inc. (a) | 18,783 | 247,184 | |
Ultratech, Inc. (a)(d) | 31,408 | 823,518 | |
Veeco Instruments, Inc. (a)(d) | 53,983 | 2,135,028 | |
Vitesse Semiconductor Corp. (a) | 9,484 | 34,522 | |
Xilinx, Inc. | 308,585 | 16,108,137 | |
| 521,200,016 | ||
Software - 3.6% | |||
Accelrys, Inc. (a) | 51,411 | 641,609 | |
ACI Worldwide, Inc. (a)(d) | 49,960 | 2,999,099 | |
Activision Blizzard, Inc. | 489,202 | 9,466,059 | |
Actuate Corp. (a) | 42,170 | 239,526 | |
Adobe Systems, Inc. (a) | 523,566 | 35,921,863 | |
Advent Software, Inc. | 46,269 | 1,420,458 | |
American Software, Inc. Class A | 10,878 | 113,784 | |
ANSYS, Inc. (a) | 112,596 | 9,404,018 | |
Aspen Technology, Inc. (a) | 119,658 | 5,617,943 | |
Common Stocks - continued | |||
Shares | Value | ||
INFORMATION TECHNOLOGY - continued | |||
Software - continued | |||
Autodesk, Inc. (a) | 253,631 | $ 13,305,482 | |
Barracuda Networks, Inc. (d) | 9,965 | 358,242 | |
Blackbaud, Inc. | 47,578 | 1,490,143 | |
Bottomline Technologies, Inc. (a)(d) | 44,605 | 1,591,952 | |
BroadSoft, Inc. (a)(d) | 26,590 | 797,966 | |
BSQUARE Corp. (a) | 11,182 | 39,696 | |
CA Technologies, Inc. | 349,083 | 11,694,281 | |
Cadence Design Systems, Inc. (a)(d) | 338,143 | 5,183,732 | |
Callidus Software, Inc. (a)(d) | 32,625 | 402,266 | |
Citrix Systems, Inc. (a) | 209,768 | 12,596,568 | |
CommVault Systems, Inc. (a)(d) | 50,590 | 3,484,639 | |
Compuware Corp. | 202,971 | 2,222,532 | |
Comverse, Inc. (a) | 23,221 | 803,679 | |
Concur Technologies, Inc. (a)(d) | 54,717 | 6,754,814 | |
Cyan, Inc. (d) | 8,834 | 29,682 | |
Datawatch Corp. (a) | 1,950 | 65,540 | |
Digimarc Corp. | 6,216 | 182,626 | |
Document Security Systems, Inc. (a)(d) | 19,824 | 32,511 | |
Ebix, Inc. (d) | 31,393 | 510,136 | |
Electronic Arts, Inc. (a)(d) | 359,966 | 10,291,428 | |
Ellie Mae, Inc. (a)(d) | 31,804 | 985,924 | |
Envivio, Inc. (a) | 6,801 | 24,552 | |
EPIQ Systems, Inc. | 38,746 | 549,418 | |
ePlus, Inc. (a) | 2,450 | 139,332 | |
Evolving Systems, Inc. | 4,973 | 42,121 | |
FactSet Research Systems, Inc. | 53,360 | 5,618,274 | |
Fair Isaac Corp. | 37,437 | 2,011,490 | |
FalconStor Software, Inc. (a) | 37,427 | 64,749 | |
FireEye, Inc. (d) | 17,216 | 1,474,378 | |
Fonix Corp. (a) | 1 | 0 | |
Fortinet, Inc. (a) | 146,518 | 3,391,892 | |
Gigamon, Inc. (a)(d) | 13,202 | 416,655 | |
Glu Mobile, Inc. (a) | 98,358 | 494,741 | |
GSE Systems, Inc. (a) | 388 | 698 | |
Guidance Software, Inc. (a) | 13,894 | 151,584 | |
Guidewire Software, Inc. (a)(d) | 70,818 | 3,796,553 | |
Imperva, Inc. (a) | 22,847 | 1,431,821 | |
Infoblox, Inc. (a)(d) | 50,781 | 1,172,025 | |
Informatica Corp. (a) | 135,700 | 5,639,692 | |
Interactive Intelligence Group, Inc. (a) | 16,038 | 1,277,106 | |
Intuit, Inc. | 316,972 | 24,771,362 | |
Jive Software, Inc. (a)(d) | 30,754 | 250,338 | |
Liquid Holdings Group, Inc. (d) | 3,912 | 18,778 | |
Majesco Entertainment Co. (a) | 19,952 | 10,595 | |
Manhattan Associates, Inc. (a) | 82,280 | 3,117,589 | |
Mentor Graphics Corp. | 118,491 | 2,564,145 | |
MICROS Systems, Inc. (a)(d) | 83,538 | 4,637,194 | |
Microsoft Corp. | 8,530,245 | 326,793,686 | |
MicroStrategy, Inc. Class A (a) | 12,438 | 1,606,119 | |
Mitek Systems, Inc. (a)(d) | 15,896 | 84,408 | |
| |||
Shares | Value | ||
Model N, Inc. | 6,345 | $ 69,732 | |
Monotype Imaging Holdings, Inc. | 41,411 | 1,177,729 | |
NetScout Systems, Inc. (a) | 39,020 | 1,481,980 | |
NetSol Technologies, Inc. (a)(d) | 10,165 | 47,166 | |
NetSuite, Inc. (a)(d) | 37,824 | 4,353,164 | |
Nuance Communications, Inc. (a)(d) | 295,143 | 4,512,736 | |
Oracle Corp. | 3,941,524 | 154,153,004 | |
Parametric Technology Corp. (a) | 128,240 | 5,041,114 | |
Peerless Systems Corp. (a) | 172 | 635 | |
Pegasystems, Inc. | 22,064 | 918,524 | |
Progress Software Corp. (a) | 56,172 | 1,400,930 | |
Proofpoint, Inc. (a)(d) | 24,372 | 1,010,219 | |
PROS Holdings, Inc. (a) | 23,721 | 817,188 | |
QAD, Inc. Class B | 4,298 | 71,433 | |
Qlik Technologies, Inc. (a) | 106,112 | 3,236,416 | |
Qualys, Inc. (a) | 15,390 | 417,223 | |
Rally Software Development Corp. | 9,834 | 195,598 | |
RealPage, Inc. (a)(d) | 66,111 | 1,170,165 | |
Red Hat, Inc. (a) | 210,389 | 12,410,847 | |
Rosetta Stone, Inc. (a) | 8,315 | 96,038 | |
Rovi Corp. (a) | 119,303 | 2,963,487 | |
salesforce.com, Inc. (a)(d) | 619,024 | 38,608,527 | |
SeaChange International, Inc. (a) | 17,668 | 186,397 | |
ServiceNow, Inc. (a)(d) | 114,859 | 7,817,304 | |
Silver Spring Networks, Inc. (d) | 4,334 | 76,278 | |
Smith Micro Software, Inc. (a) | 41,455 | 72,546 | |
SolarWinds, Inc. (a) | 71,945 | 3,322,420 | |
Solera Holdings, Inc. | 82,773 | 5,663,329 | |
Sonic Foundry, Inc. (a) | 155 | 1,544 | |
Splunk, Inc. (a) | 92,581 | 8,586,888 | |
SS&C Technologies Holdings, Inc. (a) | 79,064 | 3,058,196 | |
Symantec Corp. | 783,009 | 16,819,033 | |
Synchronoss Technologies, Inc. (a)(d) | 29,419 | 1,011,425 | |
Synopsys, Inc. (a) | 184,472 | 7,452,669 | |
Tableau Software, Inc. | 16,291 | 1,536,893 | |
Take-Two Interactive Software, Inc. (a)(d) | 106,405 | 2,103,627 | |
Tangoe, Inc. (a)(d) | 45,871 | 872,466 | |
TeleCommunication Systems, Inc. | 49,377 | 107,148 | |
TeleNav, Inc. (a) | 12,035 | 72,330 | |
TIBCO Software, Inc. (a) | 175,849 | 3,831,750 | |
TiVo, Inc. (a) | 121,206 | 1,636,281 | |
Tyler Technologies, Inc. (a) | 30,080 | 2,820,902 | |
Ultimate Software Group, Inc. (a)(d) | 32,943 | 5,468,538 | |
Vasco Data Security International, Inc. (a) | 30,246 | 241,363 | |
Verint Systems, Inc. (a) | 68,085 | 3,187,059 | |
VirnetX Holding Corp. (a)(d) | 42,196 | 822,822 | |
VMware, Inc. Class A (a)(d) | 93,456 | 8,976,449 | |
Voltari Corp. (a)(d) | 4,240 | 15,985 | |
Vringo, Inc. (a)(d) | 39,609 | 160,416 | |
Wave Systems Corp. Class A (a)(d) | 27,069 | 28,422 | |
Common Stocks - continued | |||
Shares | Value | ||
INFORMATION TECHNOLOGY - continued | |||
Software - continued | |||
Workday, Inc. Class A (a)(d) | 33,866 | $ 3,722,551 | |
Zynga, Inc. (a) | 705,556 | 3,570,113 | |
| 857,596,492 | ||
TOTAL INFORMATION TECHNOLOGY | 4,275,324,769 | ||
MATERIALS - 3.8% | |||
Chemicals - 2.6% | |||
A. Schulman, Inc. | 30,292 | 1,052,647 | |
Advanced Emissions Solutions, Inc. (a) | 14,209 | 765,865 | |
Air Products & Chemicals, Inc. | 232,770 | 28,239,656 | |
Airgas, Inc. | 78,679 | 8,481,596 | |
Albemarle Corp. | 94,402 | 6,229,588 | |
American Vanguard Corp. (d) | 23,997 | 533,933 | |
Arabian American Development Co. (a) | 28,770 | 352,145 | |
Ashland, Inc. | 82,040 | 7,742,115 | |
Axiall Corp. | 81,160 | 3,284,545 | |
Balchem Corp. | 30,888 | 1,560,153 | |
Cabot Corp. | 67,007 | 3,627,759 | |
Calgon Carbon Corp. (a) | 83,129 | 1,673,387 | |
Celanese Corp. Class A | 183,332 | 9,788,095 | |
CF Industries Holdings, Inc. | 64,252 | 16,120,827 | |
Chase Corp. | 3,188 | 96,118 | |
Chemtura Corp. (a) | 94,872 | 2,348,082 | |
Clean Diesel Technologies, Inc. (a)(d) | 42,378 | 114,421 | |
Core Molding Technologies, Inc. (a) | 5,919 | 87,897 | |
Cytec Industries, Inc. | 39,374 | 3,727,537 | |
E.I. du Pont de Nemours & Co. | 1,030,606 | 68,658,972 | |
Eastman Chemical Co. | 168,147 | 14,701,092 | |
Ecolab, Inc. | 304,750 | 32,836,813 | |
Ferro Corp. (a) | 111,135 | 1,458,091 | |
Flotek Industries, Inc. (a)(d) | 68,404 | 1,740,882 | |
FMC Corp. | 146,802 | 11,330,178 | |
FutureFuel Corp. | 18,211 | 315,961 | |
GSE Holding, Inc. (a) | 3,278 | 2,000 | |
H.B. Fuller Co. | 56,146 | 2,721,958 | |
Hawkins, Inc. | 5,329 | 189,872 | |
Huntsman Corp. | 203,808 | 4,964,763 | |
Innophos Holdings, Inc. | 26,761 | 1,469,714 | |
Innospec, Inc. | 50,796 | 2,210,134 | |
International Flavors & Fragrances, Inc. | 91,400 | 8,572,406 | |
Intrepid Potash, Inc. (a)(d) | 76,176 | 1,128,167 | |
KMG Chemicals, Inc. | 10,303 | 152,897 | |
Koppers Holdings, Inc. | 22,254 | 879,923 | |
Kraton Performance Polymers, Inc. (a) | 33,124 | 918,860 | |
Kronos Worldwide, Inc. | 25,586 | 390,954 | |
Landec Corp. (a) | 25,874 | 263,656 | |
LSB Industries, Inc. (a) | 18,952 | 619,541 | |
LyondellBasell Industries NV Class A | 485,892 | 42,797,367 | |
Marrone Bio Innovations, Inc. (d) | 5,712 | 82,995 | |
| |||
Shares | Value | ||
Material Sciences Corp. (a) | 4,565 | $ 58,021 | |
Minerals Technologies, Inc. | 52,154 | 2,790,239 | |
Monsanto Co. | 586,694 | 64,548,074 | |
NewMarket Corp. (d) | 12,456 | 4,604,610 | |
Olin Corp. (d) | 81,888 | 2,144,647 | |
OM Group, Inc. | 32,193 | 1,017,299 | |
OMNOVA Solutions, Inc. (a) | 35,057 | 334,093 | |
Penford Corp. (a) | 6,469 | 86,361 | |
PolyOne Corp. | 103,882 | 3,895,575 | |
PPG Industries, Inc. | 155,823 | 30,824,906 | |
Praxair, Inc. | 323,450 | 42,168,177 | |
Quaker Chemical Corp. | 14,473 | 1,118,473 | |
Rockwood Holdings, Inc. | 88,136 | 6,952,168 | |
RPM International, Inc. | 164,614 | 6,890,742 | |
Senomyx, Inc. (a) | 31,786 | 316,589 | |
Sensient Technologies Corp. | 58,886 | 3,087,393 | |
Sherwin-Williams Co. | 94,962 | 19,037,982 | |
Sigma Aldrich Corp. | 130,116 | 12,284,252 | |
Stepan Co. | 25,296 | 1,537,997 | |
Taminco Corp. | 29,142 | 662,106 | |
The Dow Chemical Co. | 1,354,312 | 65,968,538 | |
The Mosaic Co. | 379,794 | 18,556,735 | |
The Scotts Miracle-Gro Co. Class A (d) | 51,798 | 2,958,184 | |
Tredegar Corp. | 24,439 | 608,775 | |
Tronox Ltd. Class A | 73,931 | 1,751,425 | |
Valhi, Inc. | 16,022 | 176,082 | |
Valspar Corp. | 85,270 | 6,373,933 | |
W.R. Grace & Co. (a) | 88,375 | 8,955,923 | |
Westlake Chemical Corp. (d) | 20,522 | 2,736,198 | |
Zep, Inc. | 16,526 | 290,858 | |
Zoltek Companies, Inc. (a) | 40,249 | 674,171 | |
| 607,644,088 | ||
Construction Materials - 0.1% | |||
Eagle Materials, Inc. | 69,831 | 6,173,060 | |
Headwaters, Inc. (a) | 105,333 | 1,404,089 | |
Martin Marietta Materials, Inc. | 56,358 | 6,874,549 | |
Texas Industries, Inc. (a)(d) | 20,369 | 1,729,328 | |
U.S. Concrete, Inc. (a) | 16,515 | 449,538 | |
Vulcan Materials Co. | 135,141 | 9,180,128 | |
| 25,810,692 | ||
Containers & Packaging - 0.3% | |||
AEP Industries, Inc. (a) | 6,511 | 277,499 | |
Aptargroup, Inc. (d) | 80,686 | 5,338,993 | |
Avery Dennison Corp. | 106,008 | 5,281,319 | |
Ball Corp. | 162,242 | 9,014,166 | |
Bemis Co., Inc. | 120,781 | 4,744,278 | |
Berry Plastics Group, Inc. (a) | 94,779 | 2,305,973 | |
Crown Holdings, Inc. (a) | 150,108 | 6,757,862 | |
Graphic Packaging Holding Co. (a) | 324,660 | 3,324,518 | |
Greif, Inc. Class A | 37,275 | 1,865,987 | |
MeadWestvaco Corp. (d) | 211,721 | 7,924,717 | |
Myers Industries, Inc. | 25,717 | 552,916 | |
Owens-Illinois, Inc. (a) | 185,599 | 6,295,518 | |
Common Stocks - continued | |||
Shares | Value | ||
MATERIALS - continued | |||
Containers & Packaging - continued | |||
Packaging Corp. of America | 102,376 | $ 7,462,187 | |
Rock-Tenn Co. Class A | 80,530 | 8,988,759 | |
Sealed Air Corp. | 219,080 | 7,457,483 | |
Silgan Holdings, Inc. | 46,246 | 2,229,520 | |
Sonoco Products Co. | 108,130 | 4,539,297 | |
UFP Technologies, Inc. (a) | 2,454 | 62,798 | |
| 84,423,790 | ||
Metals & Mining - 0.6% | |||
A.M. Castle & Co. (a)(d) | 36,860 | 538,893 | |
AK Steel Holding Corp. (a)(d) | 121,218 | 752,764 | |
Alcoa, Inc. (d) | 1,189,039 | 13,959,318 | |
Allegheny Technologies, Inc. (d) | 125,307 | 3,982,256 | |
Allied Nevada Gold Corp. (a)(d) | 93,899 | 491,092 | |
Amcol International Corp. | 23,278 | 1,033,078 | |
Carpenter Technology Corp. | 60,383 | 3,571,654 | |
Century Aluminum Co. (a) | 60,542 | 716,817 | |
Cliffs Natural Resources, Inc. (d) | 159,769 | 3,200,173 | |
Coeur d'Alene Mines Corp. (a)(d) | 146,764 | 1,614,404 | |
Commercial Metals Co. | 130,792 | 2,530,825 | |
Compass Minerals International, Inc. | 33,319 | 2,843,777 | |
Comstock Mining, Inc. (a)(d) | 56,723 | 113,446 | |
Freeport-McMoRan Copper & Gold, Inc. | 1,143,264 | 37,293,272 | |
Friedman Industries | 2,001 | 16,908 | |
General Moly, Inc. (a)(d) | 60,513 | 72,010 | |
Globe Specialty Metals, Inc. | 70,310 | 1,397,060 | |
Gold Resource Corp. | 44,371 | 228,511 | |
Golden Minerals Co. (a)(d) | 71,014 | 75,275 | |
Handy & Harman Ltd. (a) | 5,646 | 103,209 | |
Haynes International, Inc. | 12,361 | 612,240 | |
Hecla Mining Co. | 336,707 | 1,138,070 | |
Horsehead Holding Corp. (a)(d) | 61,719 | 1,096,747 | |
Kaiser Aluminum Corp. (d) | 16,273 | 1,148,711 | |
Materion Corp. | 22,336 | 660,922 | |
McEwen Mining, Inc. (a)(d) | 267,762 | 779,187 | |
Mines Management, Inc. (a)(d) | 24,109 | 32,788 | |
Molycorp, Inc. (a)(d) | 202,465 | 1,056,867 | |
Newmont Mining Corp. | 560,419 | 13,035,346 | |
Noranda Aluminium Holding Corp. | 73,305 | 315,945 | |
Nucor Corp. | 393,954 | 19,792,249 | |
Olympic Steel, Inc. | 12,703 | 349,460 | |
Paramount Gold & Silver Corp. (a)(d) | 34,874 | 47,080 | |
Reliance Steel & Aluminum Co. | 95,402 | 6,609,451 | |
Royal Gold, Inc. (d) | 79,101 | 5,435,030 | |
RTI International Metals, Inc. (a)(d) | 27,976 | 760,108 | |
Schnitzer Steel Industries, Inc. Class A (d) | 20,284 | 514,605 | |
Silver Bull Resources, Inc. (a)(d) | 60,971 | 23,169 | |
Solitario Exploration & Royalty Corp. (a) | 18,115 | 28,259 | |
Steel Dynamics, Inc. | 277,791 | 4,844,675 | |
Stillwater Mining Co. (a)(d) | 124,032 | 1,679,393 | |
SunCoke Energy, Inc. (a) | 69,275 | 1,543,447 | |
| |||
Shares | Value | ||
Synalloy Corp. | 8,615 | $ 117,422 | |
Timberline Resources Corp. (a) | 18,994 | 2,792 | |
U.S. Antimony Corp. (a)(d) | 24,962 | 46,180 | |
U.S. Silica Holdings, Inc. (d) | 63,033 | 2,067,482 | |
United States Steel Corp. (d) | 162,680 | 3,940,110 | |
Universal Stainless & Alloy Products, Inc. (a)(d) | 6,659 | 219,947 | |
Walter Energy, Inc. (d) | 65,194 | 703,443 | |
Worthington Industries, Inc. | 60,686 | 2,418,944 | |
| 145,554,811 | ||
Paper & Forest Products - 0.2% | |||
Boise Cascade Co. | 37,823 | 1,119,183 | |
Clearwater Paper Corp. (a) | 22,216 | 1,418,492 | |
Deltic Timber Corp. | 13,533 | 851,767 | |
Domtar Corp. | 36,405 | 4,032,946 | |
International Paper Co. | 492,581 | 24,082,285 | |
Kapstone Paper & Packaging Corp. (a) | 106,018 | 3,370,312 | |
Louisiana-Pacific Corp. (a)(d) | 160,954 | 3,024,326 | |
Neenah Paper, Inc. | 13,754 | 690,588 | |
P.H. Glatfelter Co. | 45,036 | 1,366,843 | |
Resolute Forest Products (a)(d) | 103,317 | 2,116,965 | |
Schweitzer-Mauduit International, Inc. | 39,736 | 1,912,494 | |
Verso Paper Corp. (a)(d) | 23,529 | 57,646 | |
Wausau-Mosinee Paper Corp. | 43,988 | 582,841 | |
| 44,626,688 | ||
TOTAL MATERIALS | 908,060,069 | ||
TELECOMMUNICATION SERVICES - 2.3% | |||
Diversified Telecommunication Services - 2.0% | |||
8x8, Inc. (a) | 89,195 | 943,683 | |
Alaska Communication Systems Group, Inc. (a) | 135,810 | 297,424 | |
AT&T, Inc. | 5,886,551 | 187,957,573 | |
Atlantic Tele-Network, Inc. | 16,949 | 1,110,837 | |
Cbeyond, Inc. (a) | 59,758 | 409,342 | |
CenturyLink, Inc. | 676,308 | 21,141,388 | |
Cincinnati Bell, Inc. (a)(d) | 198,209 | 664,000 | |
Cogent Communications Group, Inc. | 64,769 | 2,483,243 | |
Consolidated Communications Holdings, Inc. | 59,983 | 1,143,276 | |
Elephant Talk Communication, Inc. (a)(d) | 63,184 | 80,244 | |
FairPoint Communications, Inc. (a)(d) | 43,838 | 582,169 | |
Frontier Communications Corp. (d) | 1,084,701 | 5,293,341 | |
General Communications, Inc. | 33,964 | 353,565 | |
Hawaiian Telcom Holdco, Inc. (a)(d) | 11,736 | 337,997 | |
HickoryTech Corp. | 2,523 | 34,388 | |
IDT Corp. Class B | 44,765 | 803,532 | |
inContact, Inc. (a) | 42,838 | 386,399 | |
Inteliquent, Inc. | 28,172 | 393,281 | |
Intelsat SA | 20,815 | 412,970 | |
Iridium Communications, Inc. (a)(d) | 61,404 | 400,354 | |
Level 3 Communications, Inc. (a) | 186,783 | 6,877,350 | |
Common Stocks - continued | |||
Shares | Value | ||
TELECOMMUNICATION SERVICES - continued | |||
Diversified Telecommunication Services - continued | |||
Lumos Networks Corp. | 15,837 | $ 229,953 | |
ORBCOMM, Inc. (a)(d) | 36,232 | 282,972 | |
Premiere Global Services, Inc. (a) | 64,433 | 728,737 | |
Straight Path Communications, Inc. | 22,382 | 182,637 | |
Towerstream Corp. (a)(d) | 39,383 | 103,971 | |
TW Telecom, Inc. (a) | 182,316 | 5,580,693 | |
Verizon Communications, Inc. | 4,656,446 | 221,553,701 | |
Vonage Holdings Corp. (a) | 198,077 | 913,135 | |
Windstream Holdings, Inc. (d) | 719,900 | 5,773,598 | |
xG Technology, Inc. (a) | 1,492 | 1,925 | |
| 467,457,678 | ||
Wireless Telecommunication Services - 0.3% | |||
Boingo Wireless, Inc. (a)(d) | 15,589 | 90,572 | |
Crown Castle International Corp. | 367,969 | 27,928,847 | |
Leap Wireless International, Inc. (a) | 51,525 | 902,718 | |
NII Holdings, Inc. (a)(d) | 160,624 | 184,718 | |
NTELOS Holdings Corp. (d) | 10,948 | 153,053 | |
SBA Communications Corp. | 144,863 | 13,786,612 | |
Shenandoah Telecommunications Co. (d) | 22,919 | 605,749 | |
Sprint Corp. (a)(d) | 965,514 | 8,438,592 | |
T-Mobile U.S., Inc. (a) | 283,965 | 8,660,933 | |
Telephone & Data Systems, Inc. | 127,836 | 2,913,382 | |
U.S. Cellular Corp. (d) | 27,310 | 985,618 | |
U.S.A. Mobility, Inc. | 43,148 | 623,489 | |
| 65,274,283 | ||
TOTAL TELECOMMUNICATION SERVICES | 532,731,961 | ||
UTILITIES - 3.0% | |||
Electric Utilities - 1.6% | |||
Allete, Inc. | 47,344 | 2,391,345 | |
American Electric Power Co., Inc. | 543,716 | 27,294,543 | |
Cleco Corp. | 77,341 | 3,822,966 | |
Duke Energy Corp. | 793,610 | 56,251,077 | |
Edison International | 374,884 | 19,632,675 | |
El Paso Electric Co. | 44,691 | 1,575,358 | |
Empire District Electric Co. | 52,048 | 1,235,620 | |
Entergy Corp. | 192,366 | 12,276,798 | |
Exelon Corp. | 959,959 | 29,192,353 | |
FirstEnergy Corp. | 464,435 | 14,295,309 | |
Genie Energy Ltd. Class B (a) | 11,430 | 130,988 | |
Great Plains Energy, Inc. | 172,510 | 4,531,838 | |
Hawaiian Electric Industries, Inc. (d) | 141,071 | 3,584,614 | |
IDACORP, Inc. | 64,805 | 3,641,393 | |
ITC Holdings Corp. (d) | 64,744 | 6,642,734 | |
MGE Energy, Inc. | 45,573 | 1,758,206 | |
NextEra Energy, Inc. | 475,747 | 43,478,518 | |
Northeast Utilities | 345,580 | 15,361,031 | |
NRG Yield, Inc. Class A | 38,525 | 1,470,885 | |
| |||
Shares | Value | ||
OGE Energy Corp. | 236,316 | $ 8,507,376 | |
Otter Tail Corp. | 43,707 | 1,320,826 | |
Pepco Holdings, Inc. | 313,266 | 6,387,494 | |
Pinnacle West Capital Corp. | 111,381 | 6,198,353 | |
PNM Resources, Inc. | 88,029 | 2,301,958 | |
Portland General Electric Co. (d) | 105,772 | 3,363,550 | |
PPL Corp. | 688,750 | 22,239,738 | |
Southern Co. | 966,778 | 40,943,048 | |
UIL Holdings Corp. | 67,226 | 2,602,991 | |
Unitil Corp. | 19,695 | 619,999 | |
UNS Energy Corp. | 49,000 | 2,964,990 | |
Westar Energy, Inc. (d) | 158,635 | 5,428,490 | |
Xcel Energy, Inc. | 551,741 | 16,712,235 | |
| 368,159,299 | ||
Gas Utilities - 0.2% | |||
AGL Resources, Inc. | 144,950 | 6,818,448 | |
Atmos Energy Corp. | 111,091 | 5,121,295 | |
Chesapeake Utilities Corp. | 10,363 | 613,904 | |
Delta Natural Gas Co., Inc. | 3,078 | 63,284 | |
Gas Natural, Inc. | 8,386 | 78,493 | |
Laclede Group, Inc. | 39,614 | 1,816,302 | |
National Fuel Gas Co. (d) | 95,902 | 7,204,158 | |
New Jersey Resources Corp. | 42,760 | 1,924,628 | |
Northwest Natural Gas Co. (d) | 34,699 | 1,487,546 | |
ONE Gas, Inc. (a) | 57,154 | 1,942,093 | |
Piedmont Natural Gas Co., Inc. (d) | 100,435 | 3,396,712 | |
Questar Corp. | 223,693 | 5,312,709 | |
South Jersey Industries, Inc. | 34,725 | 1,985,576 | |
Southwest Gas Corp. | 59,138 | 3,194,635 | |
UGI Corp. | 117,609 | 5,255,946 | |
WGL Holdings, Inc. | 56,924 | 2,287,776 | |
| 48,503,505 | ||
Independent Power Producers & Energy Traders - 0.1% | |||
American DG Energy, Inc. (a) | 24,722 | 49,691 | |
Black Hills Corp. | 46,600 | 2,642,686 | |
Calpine Corp. (a) | 397,038 | 7,563,574 | |
Dynegy, Inc. (a)(d) | 119,122 | 2,786,264 | |
NRG Energy, Inc. | 349,560 | 10,161,709 | |
Ormat Technologies, Inc. | 29,840 | 828,060 | |
Pattern Energy Group, Inc. | 12,537 | 343,514 | |
The AES Corp. | 753,024 | 10,278,778 | |
| 34,654,276 | ||
Multi-Utilities - 1.0% | |||
Alliant Energy Corp. | 146,690 | 7,956,466 | |
Ameren Corp. | 265,803 | 10,741,099 | |
Avista Corp. | 75,556 | 2,236,458 | |
CenterPoint Energy, Inc. | 475,745 | 11,251,369 | |
CMS Energy Corp. | 256,908 | 7,303,894 | |
Consolidated Edison, Inc. | 319,943 | 17,932,805 | |
Dominion Resources, Inc. | 648,847 | 45,029,982 | |
DTE Energy Co. | 188,435 | 13,522,096 | |
Integrys Energy Group, Inc. | 96,715 | 5,538,868 | |
Common Stocks - continued | |||
Shares | Value | ||
UTILITIES - continued | |||
Multi-Utilities - continued | |||
MDU Resources Group, Inc. | 236,188 | $ 8,020,944 | |
NiSource, Inc. | 341,808 | 11,901,755 | |
NorthWestern Energy Corp. | 42,329 | 1,944,594 | |
PG&E Corp. | 504,980 | 22,249,419 | |
Public Service Enterprise Group, Inc. | 546,907 | 20,049,611 | |
SCANA Corp. | 162,365 | 8,037,068 | |
Sempra Energy | 251,902 | 23,797,182 | |
TECO Energy, Inc. (d) | 187,457 | 3,145,528 | |
Vectren Corp. | 101,909 | 3,920,439 | |
Wisconsin Energy Corp. | 230,273 | 10,122,801 | |
| 234,702,378 | ||
Water Utilities - 0.1% | |||
American States Water Co. | 52,884 | 1,588,107 | |
American Water Works Co., Inc. | 210,972 | 9,459,984 | |
Aqua America, Inc. | 225,525 | 5,680,975 | |
Artesian Resources Corp. Class A | 8,755 | 190,509 | |
Cadiz, Inc. (a)(d) | 5,759 | 42,962 | |
California Water Service Group | 51,749 | 1,216,619 | |
Connecticut Water Service, Inc. | 5,010 | 164,528 | |
Middlesex Water Co. | 7,054 | 142,561 | |
Pure Cycle Corp. (a) | 17,116 | 107,146 | |
SJW Corp. | 12,324 | 364,667 | |
York Water Co. | 5,248 | 105,852 | |
| 19,063,910 | ||
TOTAL UTILITIES | 705,083,368 | ||
TOTAL COMMON STOCKS (Cost $16,250,440,878) |
| ||
U.S. Treasury Obligations - 0.1% | ||||
| Principal Amount |
| ||
U.S. Treasury Bills, yield at date of purchase 0.07% to 0.09% 4/3/14 to 6/26/14 (e) | $ 15,000,000 |
| ||
Money Market Funds - 9.3% | |||
Shares | Value | ||
Fidelity Cash Central Fund, 0.10% (b) | 281,284,910 | $ 281,284,910 | |
Fidelity Securities Lending Cash Central Fund, 0.09% (b)(c) | 1,931,617,603 | 1,931,617,603 | |
TOTAL MONEY MARKET FUNDS (Cost $2,212,902,513) |
| ||
TOTAL INVESTMENT (Cost $18,478,340,064) | 25,646,628,240 |
NET OTHER ASSETS (LIABILITIES) - (8.1)% | (1,925,167,819) | ||
NET ASSETS - 100% | $ 23,721,460,421 | ||
Futures Contracts | |||||
| Expiration | Underlying | Unrealized Appreciation/ | ||
Purchased | |||||
Equity Index Contracts | |||||
946 CME E-mini S&P 500 Index Contracts (United States) | March 2014 | $ 87,864,480 | $ 3,274,319 | ||
124 CME E-mini S&P MidCap 400 Index Contracts (United States) | March 2014 | 17,040,080 | 1,121,729 | ||
314 CME S&P 500 Index Contracts (United States) | March 2014 | 145,821,600 | 7,197,628 | ||
289 ICE Russell 2000 Index Contracts (United States) | March 2014 | 34,156,910 | 2,331,815 | ||
TOTAL EQUITY INDEX CONTRACTS | $ 284,883,070 | $ 13,925,491 | |||
The face value of futures purchased as a percentage of net assets is 1.2% |
Legend |
(a) Non-income producing |
(b) Affiliated fund that is generally available only to investment companies and other accounts managed by Fidelity Investments. The rate quoted is the annualized seven-day yield of the fund at period end. A complete unaudited listing of the fund's holdings as of its most recent quarter end is available upon request. In addition, each Fidelity Central Fund's financial statements, which are not covered by the Fund's Report of Independent Registered Public Accounting Firm, are available on the SEC's website or upon request. |
(c) Investment made with cash collateral received from securities on loan. |
(d) Security or a portion of the security is on loan at period end. |
(e) Security or a portion of the security was pledged to cover margin requirements for futures contracts. At period end, the value of securities pledged amounted to $14,997,994. |
Affiliated Central Funds |
Information regarding fiscal year to date income earned by the Fund from investments in Fidelity Central Funds is as follows: |
Fund | Income earned |
Fidelity Cash Central Fund | $ 320,160 |
Fidelity Securities Lending Cash Central Fund | 6,971,619 |
Total | $ 7,291,779 |
Other Information |
The following is a summary of the inputs used, as of February 28, 2014, involving the Fund's assets and liabilities carried at fair value. The inputs or methodology used for valuing securities may not be an indication of the risk associated with investing in those securities. For more information on valuation inputs, and their aggregation into the levels used in the table below, please refer to the Investment Valuation section in the accompanying Notes to Financial Statements. |
Valuation Inputs at Reporting Date: | ||||
Description | Total | Level 1 | Level 2 | Level 3 |
Investments in Securities: | ||||
Equities: | ||||
Consumer Discretionary | $ 3,081,633,533 | $ 3,081,623,672 | $ - | $ 9,861 |
Consumer Staples | 1,930,067,396 | 1,930,067,396 | - | - |
Energy | 2,163,926,777 | 2,163,920,056 | - | 6,721 |
Financials | 3,994,753,449 | 3,994,750,004 | - | 3,445 |
Health Care | 3,116,256,118 | 3,116,256,118 | - | - |
Industrials | 2,710,890,293 | 2,710,890,293 | - | - |
Information Technology | 4,275,324,769 | 4,275,324,769 | - | - |
Materials | 908,060,069 | 908,060,069 | - | - |
Telecommunication Services | 532,731,961 | 532,731,961 | - | - |
Utilities | 705,083,368 | 705,083,368 | - | - |
U.S. Government and Government Agency Obligations | 14,997,994 | - | 14,997,994 | - |
Money Market Funds | 2,212,902,513 | 2,212,902,513 | - | - |
Total Investments in Securities: | $ 25,646,628,240 | $ 25,631,610,219 | $ 14,997,994 | $ 20,027 |
Derivative Instruments: | ||||
Assets | ||||
Futures Contracts | $ 13,925,491 | $ 13,925,491 | $ - | $ - |
Value of Derivative Instruments |
The following table is a summary of the Fund's value of derivative instruments by primary risk exposure as of February 28, 2014. For additional information on derivative instruments, please refer to the Derivative Instruments section in the accompanying Notes to Financial Statements. |
Primary Risk Exposure / | Value | |
| Asset | Liability |
Equity Risk | ||
Futures Contracts (a) | $ 13,925,491 | $ - |
Total Value of Derivatives | $ 13,925,491 | $ - |
(a) Reflects gross cumulative appreciation (depreciation) on futures contracts as presented in the Schedule of Investments. Only the period end receivable or payable for daily variation margin and net unrealized appreciation (depreciation) are presented in the Statement of Assets and Liabilities. |
See accompanying notes which are an integral part of the financial statements.
Annual Report
Spartan Total Market Index Fund
Financial Statements
Statement of Assets and Liabilities
| February 28, 2014 | |
|
|
|
Assets | ||
Investment in securities, at value (including securities loaned of $1,873,697,915) - See accompanying schedule: Unaffiliated issuers (cost $16,265,437,551) | $ 23,433,725,727 |
|
Fidelity Central Funds (cost $2,212,902,513) | 2,212,902,513 |
|
Total Investments (cost $18,478,340,064) |
| $ 25,646,628,240 |
Segregated cash with brokers for derivative instruments | 1,466,500 | |
Cash |
| 43,426 |
Receivable for investments sold | 1,586,542 | |
Receivable for fund shares sold | 20,376,252 | |
Dividends receivable | 44,826,154 | |
Distributions receivable from Fidelity Central Funds | 606,198 | |
Receivable for daily variation margin for derivative instruments | 416,694 | |
Receivable from investment adviser for expense reductions | 165,649 | |
Other receivables | 269,138 | |
Total assets | 25,716,384,793 | |
|
|
|
Liabilities | ||
Payable for investments purchased | $ 2,075,242 | |
Payable for fund shares redeemed | 59,692,620 | |
Accrued management fee | 863,747 | |
Other affiliated payables | 411,813 | |
Other payables and accrued expenses | 263,347 | |
Collateral on securities loaned, at value | 1,931,617,603 | |
Total liabilities | 1,994,924,372 | |
|
|
|
Net Assets | $ 23,721,460,421 | |
Net Assets consist of: |
| |
Paid in capital | $ 16,762,706,991 | |
Undistributed net investment income | 64,203,855 | |
Accumulated undistributed net realized gain (loss) on investments | (287,664,092) | |
Net unrealized appreciation (depreciation) on investments | 7,182,213,667 | |
Net Assets | $ 23,721,460,421 | |
Statement of Assets and Liabilities - continued
| February 28, 2014 | |
|
|
|
Investor Class: | $ 54.91 | |
|
|
|
Fidelity Advantage Class: | $ 54.91 | |
|
|
|
Institutional Class: | $ 54.91 | |
|
|
|
Fidelity Advantage Institutional Class: | $ 54.90 | |
|
|
|
Class F: | $ 54.92 | |
See accompanying notes which are an integral part of the financial statements.
Annual Report
Spartan Total Market Index Fund
Financial Statements - continued
Statement of Operations
| Year ended February 28, 2014 | |
|
|
|
Investment Income |
|
|
Dividends |
| $ 371,829,732 |
Interest |
| 13,401 |
Income from Fidelity Central Funds |
| 7,291,779 |
Total income |
| 379,134,912 |
|
|
|
Expenses | ||
Management fee | $ 8,782,815 | |
Transfer agent fees | 4,332,747 | |
Independent trustees' compensation | 91,991 | |
Miscellaneous | 35,669 | |
Total expenses before reductions | 13,243,222 | |
Expense reductions | (1,661,728) | 11,581,494 |
Net investment income (loss) | 367,553,418 | |
Realized and Unrealized Gain (Loss) Net realized gain (loss) on: | ||
Investment securities: |
|
|
Unaffiliated issuers | 32,936,630 | |
Futures contracts | 61,726,820 | |
Total net realized gain (loss) |
| 94,663,450 |
Change in net unrealized appreciation (depreciation) on: Investment securities | 4,092,286,619 | |
Futures contracts | 1,481,401 | |
Total change in net unrealized appreciation (depreciation) |
| 4,093,768,020 |
Net gain (loss) | 4,188,431,470 | |
Net increase (decrease) in net assets resulting from operations | $ 4,555,984,888 | |
Statement of Changes in Net Assets
| Year ended | Year ended |
Increase (Decrease) in Net Assets |
|
|
Operations |
|
|
Net investment income (loss) | $ 367,553,418 | $ 296,694,580 |
Net realized gain (loss) | 94,663,450 | 79,867,728 |
Change in net unrealized appreciation (depreciation) | 4,093,768,020 | 1,452,200,750 |
Net increase (decrease) in net assets resulting from operations | 4,555,984,888 | 1,828,763,058 |
Distributions to shareholders from net investment income | (333,228,634) | (264,325,861) |
Share transactions - net increase (decrease) | 3,674,586,365 | 1,964,414,886 |
Redemption fees | 409,245 | 275,392 |
Total increase (decrease) in net assets | 7,897,751,864 | 3,529,127,475 |
|
|
|
Net Assets | ||
Beginning of period | 15,823,708,557 | 12,294,581,082 |
End of period (including undistributed net investment income of $64,203,855 and undistributed net investment income of $46,240,356, respectively) | $ 23,721,460,421 | $ 15,823,708,557 |
See accompanying notes which are an integral part of the financial statements.
Annual Report
Financial Highlights - Investor Class
Years ended February 28, | 2014 | 2013 | 2012 F | 2011 | 2010 |
Selected Per-Share Data |
|
|
|
|
|
Net asset value, beginning of period | $ 44.05 | $ 39.55 | $ 38.56 | $ 31.54 | $ 20.60 |
Income from Investment Operations |
|
|
|
|
|
Net investment income (loss) B | .92 | .87 | .68 | .61 | .56 |
Net realized and unrealized gain (loss) | 10.74 | 4.40 | .96 | 7.03 | 10.96 |
Total from investment operations | 11.66 | 5.27 | 1.64 | 7.64 | 11.52 |
Distributions from net investment income | (.80) | (.77) | (.65) | (.60) | (.57) |
Distributions from net realized gain | - | - | - | (.02 | (.02) |
Total distributions | (.80) | (.77) | (.65) | (.62) | (.58) H |
Redemption fees added to paid in capital B, G | - | - | - | - | - |
Net asset value, end of period | $ 54.91 | $ 44.05 | $ 39.55 | $ 38.56 | $ 31.54 |
Total Return A | 26.62% | 13.50% | 4.46% | 24.39% | 56.10% |
Ratios to Average Net Assets C, E |
|
|
|
|
|
Expenses before reductions | .10% | .10% | .10% | .10% | .10% |
Expenses net of fee waivers, if any | .10% | .10% | .10% | .10% | .10% |
Expenses net of all reductions | .10% | .10% | .10% | .10% | .10% |
Net investment income (loss) | 1.85% | 2.15% | 1.84% | 1.80% | 2.00% |
Supplemental Data |
|
|
|
|
|
Net assets, end of period (000 omitted) | $ 1,694,212 | $ 1,305,435 | $ 3,379,770 | $ 6,289,666 | $ 5,357,908 |
Portfolio turnover rate D | 2% | 3% | 17% | 4% | 7% |
ATotal returns would have been lower if certain expenses had not been reduced during the applicable periods shown. BCalculated based on average shares outstanding during the period. CFees and expenses of any underlying Fidelity Central Funds are not included in the Fund's expense ratio. The Fund indirectly bears its proportionate share of the expenses of any underlying Fidelity Central Funds. DAmount does not include the portfolio activity of any underlying Fidelity Central Funds. EExpense ratios reflect operating expenses of the class. Expenses before reductions do not reflect amounts reimbursed by the investment adviser or reductions from expense offset arrangements and do not represent the amount paid by the class during periods when reimbursements or reductions occur. Expenses net of fee waivers reflect expenses after reimbursement by the investment adviser but prior to reductions from expense offset arrangements. Expenses net of all reductions represent the net expenses paid by the class. FFor the year ended February 29. GAmount represents less than $.01 per share. HTotal distributions of $.58 per share is comprised of distributions from net investment income of $.565 and distributions from net realized gain of $.015 per share. |
Financial Highlights - Fidelity Advantage Class
Years ended February 28, | 2014 | 2013 | 2012 F | 2011 | 2010 |
Selected Per-Share Data |
|
|
|
|
|
Net asset value, beginning of period | $ 44.06 | $ 39.56 | $ 38.56 | $ 31.54 | $ 20.61 |
Income from Investment Operations |
|
|
|
|
|
Net investment income (loss) B | .94 | .89 | .69 | .62 | .57 |
Net realized and unrealized gain (loss) | 10.73 | 4.39 | .97 | 7.03 | 10.95 |
Total from investment operations | 11.67 | 5.28 | 1.66 | 7.65 | 11.52 |
Distributions from net investment income | (.82) | (.78) | (.66) | (.61) | (.57) |
Distributions from net realized gain | - | - | - | (.02) | (.02) |
Total distributions | (.82) | (.78) | (.66) | (.63) | (.59) H |
Redemption fees added to paid in capital B, G | - | - | - | - | - |
Net asset value, end of period | $ 54.91 | $ 44.06 | $ 39.56 | $ 38.56 | $ 31.54 |
Total Return A | 26.65% | 13.53% | 4.51% | 24.43% | 56.07% |
Ratios to Average Net Assets C, E |
|
|
|
|
|
Expenses before reductions | .07% | .07% | .07% | .07% | .07% |
Expenses net of fee waivers, if any | .06% | .07% | .07% | .07% | .07% |
Expenses net of all reductions | .06% | .07% | .07% | .07% | .07% |
Net investment income (loss) | 1.89% | 2.18% | 1.87% | 1.83% | 2.03% |
Supplemental Data |
|
|
|
|
|
Net assets, end of period (000 omitted) | $ 14,943,835 | $ 10,262,592 | $ 6,536,903 | $ 5,078,759 | $ 3,752,204 |
Portfolio turnover rate D | 2% | 3% | 17% | 4% | 7% |
ATotal returns would have been lower if certain expenses had not been reduced during the applicable periods shown. BCalculated based on average shares outstanding during the period. CFees and expenses of any underlying Fidelity Central Funds are not included in the Fund's expense ratio. The Fund indirectly bears its proportionate share of the expenses of any underlying Fidelity Central Funds. DAmount does not include the portfolio activity of any underlying Fidelity Central Funds. EExpense ratios reflect operating expenses of the class. Expenses before reductions do not reflect amounts reimbursed by the investment adviser or reductions from expense offset arrangements and do not represent the amount paid by the class during periods when reimbursements or reductions occur. Expenses net of fee waivers reflect expenses after reimbursement by the investment adviser but prior to reductions from expense offset arrangements. Expenses net of all reductions represent the net expenses paid by the class. FFor the year ended February 29. GAmount represents less than $.01 per share. HTotal distributions of $.59 per share is comprised of distributions from net investment income of $.574 and distributions from net realized gain of $.015 per share. |
See accompanying notes which are an integral part of the financial statements.
Annual Report
Financial Highlights - Institutional Class
Years ended February 28, | 2014 | 2013 | 2012 G, I |
Selected Per-Share Data |
|
|
|
Net asset value, beginning of period | $ 44.05 | $ 39.55 | $ 34.49 |
Income from Investment Operations |
|
|
|
Net investment income (loss) D | .94 | .89 | .36 |
Net realized and unrealized gain (loss) | 10.75 | 4.40 | 5.26 |
Total from investment operations | 11.69 | 5.29 | 5.62 |
Distributions from net investment income | (.83) | (.79) | (.56) |
Redemption fees added to paid in capital D, J | - | - | - |
Net asset value, end of period | $ 54.91 | $ 44.05 | $ 39.55 |
Total Return B, C | 26.69% | 13.55% | 16.49% |
Ratios to Average Net Assets E, H |
|
|
|
Expenses before reductions | .07% | .07% | .07% A |
Expenses net of fee waivers, if any | .05% | .06% | .06% A |
Expenses net of all reductions | .05% | .06% | .06% A |
Net investment income (loss) | 1.90% | 2.19% | 2.03% A |
Supplemental Data |
|
|
|
Net assets, end of period (000 omitted) | $ 1,254,047 | $ 876,155 | $ 693,534 |
Portfolio turnover rate F | 2% | 3% | 17% K |
AAnnualized BTotal returns for periods of less than one year are not annualized. CTotal returns would have been lower if certain expenses had not been reduced during the applicable periods shown. DCalculated based on average shares outstanding during the period. EFees and expenses of any underlying Fidelity Central Funds are not included in the Fund's expense ratio. The Fund indirectly bears its proportionate share of the expenses of any underlying Fidelity Central Funds. FAmount does not include the portfolio activity of any underlying Fidelity Central Funds. GFor the period September 8, 2011 (commencement of sale of shares) to February 29, 2012. HExpense ratios reflect operating expenses of the class. Expenses before reductions do not reflect amounts reimbursed by the investment adviser or reductions from expense offset arrangements and do not represent the amount paid by the class during periods when reimbursements or reductions occur. Expense ratios before reductions for start-up periods may not be representative of longer-term operating periods. Expenses net of fee waivers reflect expenses after reimbursement by the investment adviser but prior to reductions from expense offset arrangements. Expenses net of all reductions represent the net expenses paid by the class. IFor the year ended February 29. JAmount represents less than $.01 per share. KAmount not annualized. |
Financial Highlights - Fidelity Advantage Institutional Class
Years ended February 28, | 2014 | 2013 | 2012 G, I |
Selected Per-Share Data |
|
|
|
Net asset value, beginning of period | $ 44.05 | $ 39.55 | $ 34.49 |
Income from Investment Operations |
|
|
|
Net investment income (loss) D | .95 | .90 | .36 |
Net realized and unrealized gain (loss) | 10.73 | 4.39 | 5.26 |
Total from investment operations | 11.68 | 5.29 | 5.62 |
Distributions from net investment income | (.83) | (.79) | (.56) |
Redemption fees added to paid in capital D, J | - | - | - |
Net asset value, end of period | $ 54.90 | $ 44.05 | $ 39.55 |
Total Return B, C | 26.67% | 13.57% | 16.50% |
Ratios to Average Net Assets E, H |
|
|
|
Expenses before reductions | .06% | .06% | .06% A |
Expenses net of fee waivers, if any | .05% L | .05% L | .05% A, L |
Expenses net of all reductions | .05% L | .05% L | .05% A, L |
Net investment income (loss) | 1.90% | 2.20% | 2.02% A |
Supplemental Data |
|
|
|
Net assets, end of period (000 omitted) | $ 740,877 | $ 546,329 | $ 189,758 |
Portfolio turnover rate F | 2% | 3% | 17% K |
AAnnualized BTotal returns for periods of less than one year are not annualized. CTotal returns would have been lower if certain expenses had not been reduced during the applicable periods shown. DCalculated based on average shares outstanding during the period. EFees and expenses of any underlying Fidelity Central Funds are not included in the Fund's expense ratio. The Fund indirectly bears its proportionate share of the expenses of any underlying Fidelity Central Funds. FAmount does not include the portfolio activity of any underlying Fidelity Central Funds. GFor the period September 8, 2011 (commencement of sale of shares) to February 29, 2012. HExpense ratios reflect operating expenses of the class. Expenses before reductions do not reflect amounts reimbursed by the investment adviser or reductions from expense offset arrangements and do not represent the amount paid by the class during periods when reimbursements or reductions occur. Expense ratios before reductions for start-up periods may not be representative of longer-term operating periods. Expenses net of fee waivers reflect expenses after reimbursement by the investment adviser but prior to reductions from expense offset arrangements. Expenses net of all reductions represent the net expenses paid by the class. IFor the year ended February 29. JAmount represents less than $.01 per share. KAmount not annualized. LAmount represents .045%. |
See accompanying notes which are an integral part of the financial statements.
Annual Report
Financial Highlights - Class F
Years ended February 28, | 2014 | 2013 | 2012 I | 2011 | 2010 G |
Selected Per-Share Data |
|
|
|
|
|
Net asset value, beginning of period | $ 44.06 | $ 39.56 | $ 38.56 | $ 31.54 | $ 30.10 |
Income from Investment Operations |
|
|
|
|
|
Net investment income (loss) D | .95 | .90 | .69 | .63 | .26 |
Net realized and unrealized gain (loss) | 10.74 | 4.39 | .97 | 7.02 | 1.67 |
Total from investment operations | 11.69 | 5.29 | 1.66 | 7.65 | 1.93 |
Distributions from net investment income | (.83) | (.79) | (.66) | (.61) | (.47) |
Distributions from net realized gain | - | - | - | (.02) | (.02) |
Total distributions | (.83) | (.79) | (.66) | (.63) | (.49) K |
Redemption fees added to paid in capital D, J | - | - | - | - | - |
Net asset value, end of period | $ 54.92 | $ 44.06 | $ 39.56 | $ 38.56 | $ 31.54 |
Total Return B, C | 26.69% | 13.55% | 4.51% | 24.43% | 6.42% |
Ratios to Average Net Assets E, H |
|
|
|
|
|
Expenses before reductions | .05% L | .05% L | .06% | .07% | .07% A |
Expenses net of fee waivers, if any | .05% L | .05% L | .06% | .07% | .07% A |
Expenses net of all reductions | .05% L | .05% L | .06% | .07% | .07% A |
Net investment income (loss) | 1.90% | 2.20% | 1.89% | 1.83% | 1.98% |
Supplemental Data |
|
|
|
|
|
Net assets, end of period (000 omitted) | $ 5,088,489 | $ 2,833,198 | $ 1,494,616 | $ 745,283 | $ 70,077 |
Portfolio turnover rate F | 2% | 3% | 17% | 4% | 7% |
AAnnualized BTotal returns for periods of less than one year are not annualized. CTotal returns would have been lower if certain expenses had not been reduced during the applicable periods shown. DCalculated based on average shares outstanding during the period. EFees and expenses of any underlying Fidelity Central Funds are not included in the Fund's expense ratio. The Fund indirectly bears its proportionate share of the expenses of any underlying Fidelity Central Funds. FAmount does not include the portfolio activity of any underlying Fidelity Central Funds. GFor the period September 24, 2009 (commencement of sale of shares) to February 28, 2010. HExpense ratios reflect operating expenses of the class. Expenses before reductions do not reflect amounts reimbursed by the investment adviser or reductions from expense offset arrangements and do not represent the amount paid by the class during periods when reimbursements or reductions occur. Expense ratios before reductions for start-up periods may not be representative of longer-term operating periods. Expenses net of fee waivers reflect expenses after reimbursement by the investment adviser but prior to reductions from expense offset arrangements. Expenses net of all reductions represent the net expenses paid by the class. IFor the year ended February 29. JAmount represents less than $.01 per share. KTotal distributions of $.49 per share is comprised of distributions from net investment income of $.472 and distributions from net realized gain of $.015 per share. LAmount represents .046%. |
See accompanying notes which are an integral part of the financial statements.
Annual Report
Notes to Financial Statements
For the period ended February 28, 2014
1. Organization.
Spartan Total Market Index Fund (the Fund) is a fund of Fidelity Concord Street Trust (the Trust) and is authorized to issue an unlimited number of shares. The Trust is registered under the Investment Company Act of 1940, as amended (the 1940 Act), as an open-end management investment company organized as a Massachusetts business trust. The Fund offers Investor Class, Fidelity Advantage Class, Institutional Class, Fidelity Advantage Institutional Class and Class F shares, each of which has equal rights as to assets and voting privileges. Each class has exclusive voting rights with respect to matters that affect that class. The Fund offers conversion privileges between share classes to eligible shareholders. Class F shares of the Fund are only available for purchase by mutual funds for which Fidelity Management & Research Company (FMR) or an affiliate serves as investment manager.
2. Investments in Fidelity Central Funds.
The Fund invests in Fidelity Central Funds, which are open-end investment companies generally available only to other investment companies and accounts managed by the investment adviser and its affiliates. The Fund's Schedule of Investments lists each of the Fidelity Central Funds held as of period end, if any, as an investment of the Fund, but does not include the underlying holdings of each Fidelity Central Fund. As an Investing Fund, the Fund indirectly bears its proportionate share of the expenses of the underlying Fidelity Central Funds.
The Money Market Central Funds seek preservation of capital and current income and are managed by Fidelity Investments Money Management, Inc. (FIMM), an affiliate of the investment adviser. Annualized expenses of the Money Market Central Funds as of their most recent shareholder report date are less than .01%.
A complete unaudited list of holdings for each Fidelity Central Fund is available upon request or at the Securities and Exchange Commission (the SEC) website at www.sec.gov. In addition, the financial statements of the Fidelity Central Funds, which are not covered by the Fund's Report of Independent Registered Public Accounting Firm, are available on the SEC website or upon request.
3. Significant Accounting Policies.
The financial statements have been prepared in conformity with accounting principles generally accepted in the United States of America (GAAP), which require management to make certain estimates and assumptions at the date of the financial statements. Actual results could differ from those estimates. Subsequent events, if any, through the date that the financial statements were issued have been evaluated in the preparation of the financial statements. The following summarizes the significant accounting policies of the Fund:
Investment Valuation. Investments are valued as of 4:00 p.m. Eastern time on the last calendar day of the period. In accordance with valuation policies and procedures approved by the Board of Trustees (the Board), the Fund attempts to obtain prices from one or more third party pricing vendors or brokers to value its investments. When current market prices, quotations or currency exchange rates are not readily available or reliable, investments will be fair valued in good faith by the FMR Fair Value Committee (the Committee), in accordance with procedures adopted by the Board. Factors used in determining fair value vary by investment type and may include market or investment specific events, changes in interest rates and credit quality. The frequency with which these procedures are used cannot be predicted and they may be utilized to a significant extent. The Committee oversees the Fund's valuation policies and procedures and is responsible for approving and reporting to the Board all fair value determinations.
The Fund categorizes the inputs to valuation techniques used to value its investments into a disclosure hierarchy consisting of three levels as shown below:
Level 1 - quoted prices in active markets for identical investments
Level 2 - other significant observable inputs (including quoted prices for similar investments, interest rates, prepayment speeds, etc.)
Level 3 - unobservable inputs (including the Fund's own assumptions based on the best information available)
Valuation techniques used to value the Fund's investments by major category are as follows:
Equity securities, including restricted securities, for which market quotations are readily available, are valued at the last reported sale price or official closing price as reported by a third party pricing vendor on the primary market or exchange on which they are traded and are categorized as Level 1 in the hierarchy. In the event there were no sales during the day or closing prices are not available, securities are valued at the last quoted bid price or may be valued using the last available price and are generally categorized as Level 2 in the hierarchy. For foreign equity securities, when market or security specific events arise, comparisons to the valuation of American Depositary Receipts (ADRs), futures contracts, Exchange-Traded Funds (ETFs) and certain indexes as well as quoted prices for similar securities may be used and would be categorized as Level 2 in the hierarchy. Utilizing these techniques may result in transfers between Level 1 and Level 2. For equity securities, including restricted securities, where observable inputs are limited, assumptions about market activity and risk are used and these securities may be categorized as Level 3 in the hierarchy.
Annual Report
3. Significant Accounting Policies - continued
Investment Valuation - continued
Debt securities, including restricted securities, are valued based on evaluated prices received from third party pricing vendors or from brokers who make markets in such securities. U.S. government and government agency obligations are valued by pricing vendors who utilize matrix pricing which considers yield or price of bonds of comparable quality, coupon, maturity and type or by broker-supplied prices. When independent prices are unavailable or unreliable, debt securities may be valued utilizing pricing methodologies which consider similar factors that would be used by third party pricing vendors. Debt securities are generally categorized as Level 2 in the hierarchy but may be Level 3 depending on the circumstances.
Futures contracts are valued at the settlement price established each day by the board of trade or exchange on which they are traded and are categorized as Level 1 in the hierarchy. Investments in open-end mutual funds, including the Fidelity Central Funds, are valued at their closing net asset value (NAV) each business day and are categorized as Level 1 in the hierarchy.
Changes in valuation techniques may result in transfers in or out of an assigned level within the disclosure hierarchy. The aggregate value of investments by input level, as of February 28, 2014, is included at the end of the Fund's Schedule of Investments.
Investment Transactions and Income. For financial reporting purposes, the Fund's investment holdings and NAV include trades executed through the end of the last business day of the period. The NAV per share for processing shareholder transactions is calculated as of the close of business of the New York Stock Exchange (NYSE), normally 4:00 p.m. Eastern time and includes trades executed through the end of the prior business day. Gains and losses on securities sold are determined on the basis of identified cost and may include proceeds received from litigation. Dividend income is recorded on the ex-dividend date, except for certain dividends from foreign securities where the ex-dividend date may have passed, which are recorded as soon as the Fund is informed of the ex-dividend date. Non-cash dividends included in dividend income, if any, are recorded at the fair market value of the securities received. Distributions received on securities that represent a return of capital or capital gain are recorded as a reduction of cost of investments and/or as a realized gain. Subsequent to ex-dividend date the Fund determines the components of these distributions, based upon receipt of tax filings or other correspondence relating to the underlying investment. Interest income and distributions from the Fidelity Central Funds are accrued as earned. Interest income includes coupon interest and amortization of premium and accretion of discount on debt securities.
Class Allocations and Expenses. Investment income, realized and unrealized capital gains and losses, common expenses of the Fund, and certain fund-level expense reductions, if any, are allocated daily on a pro-rata basis to each class based on the relative net assets of each class to the total net assets of the Fund. Each class differs with respect to transfer agent fees incurred. Certain expense reductions may also differ by class. For the reporting period, the allocated portion of income and expenses to each class as a percent of its average net assets may vary due to the timing of recording these transactions in relation to fluctuating net assets of the classes. Expenses directly attributable to a fund are charged to that fund. Expenses attributable to more than one fund are allocated among the respective funds on the basis of relative net assets or other appropriate methods. Expense estimates are accrued in the period to which they relate and adjustments are made when actual amounts are known.
Deferred Trustee Compensation. Under a Deferred Compensation Plan (the Plan), independent Trustees may elect to defer receipt of a portion of their annual compensation. Deferred amounts are invested in a cross-section of Fidelity funds, are marked-to-market and remain in the Fund until distributed in accordance with the Plan. The investment of deferred amounts and the offsetting payable to the Trustees are included in the accompanying Statement of Assets and Liabilities.
Income Tax Information and Distributions to Shareholders. Each year, the Fund intends to qualify as a regulated investment company under Subchapter M of the Internal Revenue Code, including distributing substantially all of its taxable income and realized gains. As a result, no provision for U.S. Federal income taxes is required. As of February 28, 2014, the Fund did not have any unrecognized tax benefits in the financial statements; nor is the Fund aware of any tax positions for which it is reasonably possible that the total amounts of unrecognized tax benefits will significantly change in the next twelve months. The Fund files a U.S. federal tax return, in addition to state and local tax returns as required. The Fund's federal income tax returns are subject to examination by the Internal Revenue Service (IRS) for a period of three fiscal years after they are filed. State and local tax returns may be subject to examination for an additional fiscal year depending on the jurisdiction.
Distributions are declared and recorded on the ex-dividend date. Income dividends and capital gain distributions are declared separately for each class. Income and capital gain distributions are determined in accordance with income tax regulations, which may differ from GAAP. In addition, the Fund claimed a portion of the payment made to redeeming shareholders as a distribution for income tax purposes.
Capital accounts within the financial statements are adjusted for permanent book-tax differences. These adjustments have no impact on net assets or the results of operations. Capital accounts are not adjusted for temporary book-tax differences which will reverse in a subsequent period.
Book-tax differences are primarily due to futures contracts, passive foreign investment companies (PFIC), market discount, partnerships, deferred trustees compensation, capital loss carryforwards and losses deferred due to wash sales.
Annual Report
Notes to Financial Statements - continued
3. Significant Accounting Policies - continued
Income Tax Information and Distributions to Shareholders - continued
The federal tax cost of investment securities and unrealized appreciation (depreciation) as of period end were as follows:
Gross unrealized appreciation | $ 8,072,503,089 |
Gross unrealized depreciation | (970,747,070) |
Net unrealized appreciation (depreciation) on securities and other investments | $ 7,101,756,019 |
|
|
Tax Cost | $ 18,544,872,221 |
The tax-based components of distributable earnings as of period end were as follows:
Undistributed ordinary income | $ 64,467,196 |
Capital loss carryforward | $ (207,206,435) |
Net unrealized appreciation (depreciation) | $ 7,101,756,019 |
Capital loss carryforwards are only available to offset future capital gains of the Fund to the extent provided by regulations and may be limited. Under the Regulated Investment Company Modernization Act of 2010 (the Act), the Fund is permitted to carry forward capital losses incurred in taxable years beginning after December 22, 2010 for an unlimited period and such capital losses are required to be used prior to any losses that expire. The capital loss carryforward information presented below, including any applicable limitation, is estimated as of fiscal period end and is subject to adjustment.
Fiscal year of expiration |
|
2018 | $ (6,920,192) |
2019 | (200,286,243) |
Total with expiration | $ (207,206,435) |
The tax character of distributions paid was as follows:
| February 28, 2014 | February 28, 2013 |
Ordinary Income | $ 333,228,634 | $ 264,325,861 |
Short-Term Trading (Redemption) Fees. Shares held by investors in the Fund less than 90 days may have been subject to a redemption fee equal to .50% of the NAV of shares redeemed. All redemption fees, which reduce the proceeds of the shareholder redemption, are retained by the Fund and accounted for as an addition to paid in capital.
4. Derivative Instruments.
Risk Exposures and the Use of Derivative Instruments. The Fund's investment objective allows the Fund to enter into various types of derivative contracts, including futures contracts. Derivatives are investments whose value is primarily derived from underlying assets, indices or reference rates and may be transacted on an exchange or over-the-counter (OTC). Derivatives may involve a future commitment to buy or sell a specified asset based on specified terms, to exchange future cash flows at periodic intervals based on a notional principal amount, or for one party to make one or more payments upon the occurrence of specified events in exchange for periodic payments from the other party.
The Fund used derivatives to increase returns and to manage exposure to certain risks as defined below. The success of any strategy involving derivatives depends on analysis of numerous economic factors, and if the strategies for investment do not work as intended, the Fund may not achieve its objectives.
The Fund's use of derivatives increased or decreased its exposure to the following risk:
Equity Risk | Equity risk relates to the fluctuations in the value of financial instruments as a result of changes in market prices (other than those arising from interest rate risk or foreign exchange risk), whether caused by factors specific to an individual investment, its issuer, or all factors affecting all instruments traded in a market or market segment.
|
Annual Report
4. Derivative Instruments - continued
Risk Exposures and the Use of Derivative Instruments - continued
The Fund is also exposed to additional risks from investing in derivatives, such as liquidity risk and counterparty credit risk. Liquidity risk is the risk that the Fund will be unable to close out the derivative in the open market in a timely manner. Counterparty credit risk is the risk that the counterparty will not be able to fulfill its obligation to the Fund. Counterparty credit risk related to exchange-traded futures contracts may be mitigated by the protection provided by the exchange on which they trade.
Investing in derivatives may involve greater risks than investing in the underlying assets directly and, to varying degrees, may involve risk of loss in excess of any initial investment and collateral received and amounts recognized in the Statement of Assets and Liabilities. In addition, there may be the risk that the change in value of the derivative contract does not correspond to the change in value of the underlying instrument.
Futures Contracts. A futures contract is an agreement between two parties to buy or sell a specified underlying instrument for a fixed price at a specified future date. The Fund used futures contracts to manage its exposure to the stock market.
Upon entering into a futures contract, a fund is required to deposit either cash or securities (initial margin) with a clearing broker in an amount equal to a certain percentage of the face value of the contract. Futures contracts are marked-to-market daily and subsequent daily payments (variation margin) are made or received by a fund depending on the daily fluctuations in the value of the futures contracts and are recorded as unrealized appreciation or (depreciation). This receivable and/or payable, if any, is included in daily variation margin for derivative instruments in the Statement of Assets and Liabilities. Realized gain or (loss) is recorded upon the expiration or closing of a futures contract.
Any open futures contracts at period end are presented in the Schedule of Investments under the caption "Futures Contracts." The underlying face amount at value reflects each contract's exposure to the underlying instrument or index at period end and is representative of volume of activity during the period. Securities deposited to meet initial margin requirements are identified in the Schedule of Investments. Cash deposited to meet initial margin requirements is presented as segregated cash with brokers for derivative instruments in the Statement of Assets and Liabilities.
During the period the Fund recognized net realized gain (loss) of $61,726,820 and a change in net unrealized appreciation (depreciation) of $1,481,401 related to its investment in futures contracts. These amounts are included in the Statement of Operations.
5. Purchases and Sales of Investments.
Purchases and sales of securities, other than short-term securities, aggregated $4,118,323,342 and $426,916,601, respectively.
6. Fees and Other Transactions with Affiliates.
Management Fee and Expense Contract. Fidelity Management & Research Company (FMR) (the investment adviser) and its affiliates provide the Fund with investment management related services for which the Fund pays a monthly management fee. The management fee is based on an annual rate of .045% of the Fund's average net assets. Under the management contract, the investment adviser pays all other fund-level expenses, except the compensation of the independent Trustees and certain other expenses such as interest expense, including commitment fees.
In addition, under an expense contract, the investment adviser pays class-level expenses as necessary so that the total expenses do not exceed certain amounts of each class' average net assets on an annual basis with certain exceptions, as noted in the following table:
Investor Class | .10% |
Fidelity Advantage Class | .07% |
Institutional Class | .07% |
Fidelity Advantage Institutional Class | .06% |
Sub-Adviser. Geode Capital Management, LLC (Geode), serves as sub-adviser for the Funds. Geode provides discretionary investment advisory services to the Funds and is paid by the investment adviser for providing these services.
Transfer Agent Fees. Fidelity Investments Institutional Operations Company, Inc. (FIIOC), an affiliate of the investment adviser, is the transfer, dividend disbursing and shareholder servicing agent for each class. FIIOC receives transfer agent fees at an annual rate of .075%, .045%, .035% and ..015% of average net assets for Investor Class, Fidelity Advantage Class, Institutional Class and Fidelity Advantage Institutional Class, respectively. FIIOC receives no fees for providing transfer agency services to Class F. FIIOC pays for typesetting, printing and mailing of shareholder reports, except proxy statements.
Annual Report
Notes to Financial Statements - continued
6. Fees and Other Transactions with Affiliates - continued
Transfer Agent Fees - continued
Under the expense contract, Investor Class, Fidelity Advantage Class, Institutional Class and Fidelity Advantage Institutional Class pay all or a portion of the transfer agent fees at an annual rate of .055%, .025%, .025% and .015% of average net assets, respectively.
For the period, the total transfer agent fees paid by each applicable class were as follows:
| Amount |
Investor Class | $ 825,264 |
Fidelity Advantage Class | 3,145,998 |
Institutional Class | 258,718 |
Fidelity Advantage Institutional Class | 102,767 |
| $ 4,332,747 |
7. Committed Line of Credit.
The Fund participates with other funds managed by the investment adviser or an affiliate in a $4.25 billion credit facility (the "line of credit") to be utilized for temporary or emergency purposes to fund shareholder redemptions or for other short-term liquidity purposes. The Fund has agreed to pay commitment fees on its pro-rata portion of the line of credit, which amounted to $35,669 and is reflected in Miscellaneous expenses on the Statement of Operations. During the period, there were no borrowings on this line of credit.
8. Security Lending.
The Fund lends portfolio securities through a lending agent from time to time in order to earn additional income. On the settlement date of the loan, the Fund receives collateral (in the form of U.S. Treasury obligations, letters of credit and/or cash) against the loaned securities and maintains collateral in an amount not less than 100% of the market value of the loaned securities during the period of the loan. The market value of the loaned securities is determined at the close of business of the Fund and any additional required collateral is delivered to the Fund on the next business day. If the borrower defaults on its obligation to return the securities loaned because of insolvency or other reasons, the Fund may apply collateral received from the borrower against the obligation. The Fund may experience delays and costs in recovering the securities loaned. Any cash collateral received is invested in the Fidelity Securities Lending Cash Central Fund. The value of loaned securities and cash collateral at period end are disclosed on the Fund's Statement of Assets and Liabilities. Security lending income represents the income earned on investing cash collateral, less rebates paid to borrowers and any lending agent fees associated with the loan, plus any premium payments received for lending certain types of securities. Security lending income is presented in the Statement of Operations as a component of income from Fidelity Central Funds. Total security lending income during the period amounted to $6,971,619.
9. Expense Reductions.
The investment adviser contractually agreed to reimburse certain classes of the Fund to the extent annual operating expenses exceeded certain levels of average net assets as noted in the table below. This reimbursement will remain in place through April 30, 2015. Some expenses, for example interest expense, including commitment fees, are excluded from this reimbursement.
| Expense | Reimbursement |
Fidelity Advantage Class | .06% | $ 1,333,201 |
Institutional Class | .05% | 213,091 |
Fidelity Advantage Institutional Class | .045% | 106,042 |
In addition, the investment adviser reimbursed a portion of the Fund's operating expenses during the period in the amount of $8,773.
Through arrangements with the Fund's custodian, credits realized as a result of uninvested cash balances were used to reduce the Fund's expenses. During the period, these credits reduced the Fund's management fee by $621.
Annual Report
10. Distributions to Shareholders.
Distributions to shareholders of each class were as follows:
Years ended February 28, | 2014 | 2013 |
From net investment income |
|
|
Investor Class | $ 24,178,210 | $ 58,496,193 |
Fidelity Advantage Class | 212,433,599 | 134,301,377 |
Institutional Class | 16,995,240 | 15,312,994 |
Fidelity Advantage Institutional Class | 11,661,673 | 9,729,037 |
Class F | 67,959,912 | 46,486,260 |
Total | $ 333,228,634 | $ 264,325,861 |
11. Share Transactions.
Transactions for each class of shares were as follows:
| Shares | Dollars | ||
Years ended February 28, | 2014 | 2013 | 2014 | 2013 |
Investor Class |
|
|
|
|
Shares sold | 13,726,971 | 18,000,373 | $ 685,400,376 | $ 734,600,452 |
Reinvestment of distributions | 466,133 | 1,376,779 | 23,728,673 | 55,808,530 |
Shares redeemed | (12,971,415) | (75,188,401) | (649,468,987) | (3,168,012,059) |
Net increase (decrease) | 1,221,689 | (55,811,249) | $ 59,660,062 | $ (2,377,603,077) |
Fidelity Advantage Class |
|
|
|
|
Shares sold | 72,166,611 | 97,957,582 | $ 3,601,364,439 | $ 4,121,057,430 |
Reinvestment of distributions | 3,745,162 | 2,934,640 | 190,913,094 | 119,002,705 |
Shares redeemed | (36,714,608) | (33,199,050) | (1,840,823,512) | (1,350,946,307) |
Net increase (decrease) | 39,197,165 | 67,693,172 | $ 1,951,454,021 | $ 2,889,113,828 |
Institutional Class |
|
|
|
|
Shares sold | 7,454,458 | 8,433,106 | $ 381,027,979 | $ 338,510,978 |
Reinvestment of distributions | 333,909 | 377,853 | 16,995,240 | 15,312,994 |
Shares redeemed | (4,837,839) | (6,455,224) | (242,799,293) | (253,857,664) |
Net increase (decrease) | 2,950,528 | 2,355,735 | $ 155,223,926 | $ 99,966,308 |
Fidelity Advantage Institutional Class |
|
|
|
|
Shares sold | 4,684,496 | 10,372,973 | $ 230,291,144 | $ 406,066,075 |
Reinvestment of distributions | 228,738 | 239,832 | 11,661,673 | 9,729,037 |
Shares redeemed | (3,821,617) | (3,007,383) | (196,468,546) | (124,740,192) |
Net increase (decrease) | 1,091,617 | 7,605,422 | $ 45,484,271 | $ 291,054,920 |
Class F |
|
|
|
|
Shares sold | 37,948,097 | 31,085,123 | $ 1,934,234,147 | $ 1,254,633,446 |
Reinvestment of distributions | 1,330,096 | 1,145,187 | 67,959,912 | 46,486,260 |
Shares redeemed | (10,922,888) | (5,709,687) | (539,429,974) | (239,236,799) |
Net increase (decrease) | 28,355,305 | 26,520,623 | $ 1,462,764,085 | $ 1,061,882,907 |
12. Other.
The Fund's organizational documents provide former and current trustees and officers with a limited indemnification against liabilities arising in connection with the performance of their duties to the Fund. In the normal course of business, the Fund may also enter into contracts that provide general indemnifications. The Fund's maximum exposure under these arrangements is unknown as this would be dependent on future claims that may be made against the Fund. The risk of material loss from such claims is considered remote.
Mutual funds managed by the investment adviser or its affiliates were the owners of record, in the aggregate, of approximately 21% of the total outstanding shares of the Fund.
Annual Report
Shareholder Expense Example
As a shareholder of a Fund, you incur two types of costs: (1) transaction costs, including redemption fees and (2) ongoing costs, including management fees and other Fund expenses. This Example is intended to help you understand your ongoing costs (in dollars) of investing in the Funds and to compare these costs with the ongoing costs of investing in other mutual funds.
The Example is based on an investment of $1,000 invested at the beginning of the period and held for the entire period (September 1, 2013 to February 28, 2014).
Actual Expenses
The first line of the accompanying table for each class of each fund provides information about actual account values and actual expenses. You may use the information in this line, together with the amount you invested, to estimate the expenses that you paid over the period. Simply divide your account value by $1,000.00 (for example, an $8,600 account value divided by $1,000.00 = 8.6), then multiply the result by the number in the first line for a class of the fund under the heading entitled "Expenses Paid During Period" to estimate the expenses you paid on your account during this period. A small balance maintenance fee of $12.00 that is charged once a year may apply for certain accounts with a value of less than $2,000. This fee is not included in the table below. If it was, the estimate of expenses you paid during the period would be higher, and your ending account value lower, by this amount. In addition, each Fund, as a shareholder in the underlying Fidelity Central Funds, will indirectly bear its pro-rata share of the fees and expenses incurred by the underlying Fidelity Central Funds. These fees and expenses are not included in the Fund's annualized expense ratio used to calculate the expense estimate in the table below.
Hypothetical Example for Comparison Purposes
The second line of the accompanying table for each class of each fund provides information about hypothetical account values and hypothetical expenses based on a Class' actual expense ratio and an assumed rate of return of 5% per year before expenses, which is not the Class' actual return. The hypothetical account values and expenses may not be used to estimate the actual ending account balance or expenses you paid for the period. You may use this information to compare the ongoing costs of investing in the Fund and other funds. To do so, compare this 5% hypothetical example with the 5% hypothetical examples that appear in the shareholder reports of the other funds. A small balance maintenance fee of $12.00 that is charged once a year may apply for certain accounts with a value of less than $2,000. This fee is not included in the table below. If it was, the estimate of expenses you paid during the period would be higher, and your ending account value lower, by this amount. In addition, each Fund, as a shareholder in the underlying Fidelity Central Funds, will indirectly bear its pro-rata share of the fees and expenses incurred by the underlying Fidelity Central Funds. These fees and expenses are not included in the Fund's annualized expense ratio used to calculate the expense estimate in the table below.
Please note that the expenses shown in the table are meant to highlight your ongoing costs only and do not reflect any transaction costs. Therefore, the second line of the table is useful in comparing ongoing costs only, and will not help you determine the relative total costs of owning different funds. In addition, if these transactional costs were included, your costs would have been higher.
| Annualized | Beginning | Ending | Expenses Paid |
Spartan Extended Market Index |
|
|
|
|
Investor Class | .10% |
|
|
|
Actual |
| $ 1,000.00 | $ 1,189.60 | $ .54 |
HypotheticalA |
| $ 1,000.00 | $ 1,024.30 | $ .50 |
Fidelity Advantage Class | .07% |
|
|
|
Actual |
| $ 1,000.00 | $ 1,189.80 | $ .38 |
HypotheticalA |
| $ 1,000.00 | $ 1,024.45 | $ .35 |
Fidelity Advantage Institutional Class | .06% |
|
|
|
Actual |
| $ 1,000.00 | $ 1,189.70 | $ .33 |
HypotheticalA |
| $ 1,000.00 | $ 1,024.50 | $ .30 |
Spartan International Index |
|
|
|
|
Investor Class | .20% |
|
|
|
Actual |
| $ 1,000.00 | $ 1,150.00 | $ 1.07 |
HypotheticalA |
| $ 1,000.00 | $ 1,023.80 | $ 1.00 |
Fidelity Advantage Class | .12% |
|
|
|
Actual |
| $ 1,000.00 | $ 1,150.60 | $ .64 |
HypotheticalA |
| $ 1,000.00 | $ 1,024.20 | $ .60 |
Institutional Class | .07% |
|
|
|
Actual |
| $ 1,000.00 | $ 1,150.60 | $ .37 |
HypotheticalA |
| $ 1,000.00 | $ 1,024.45 | $ .35 |
| Annualized | Beginning | Ending | Expenses Paid |
Spartan International Index - continued |
|
|
|
|
Fidelity Advantage Institutional Class | .06% |
|
|
|
Actual |
| $ 1,000.00 | $ 1,150.70 | $ .32 |
HypotheticalA |
| $ 1,000.00 | $ 1,024.50 | $ .30 |
A 5% return per year before expenses
B Annualized expense ratio reflects expenses net of applicable fee waivers.
* Expenses are equal to each Class' annualized expense ratio, multiplied by the average account value over the period, multiplied by 181/365 (to reflect the one-half year period).
Annual Report
Spartan Extended Market Index Fund
Performance: The Bottom Line
Average annual total return reflects the change in the value of an investment, assuming reinvestment of the class' distributions from dividend income and capital gains (the profits earned upon the sale of securities that have grown in value, if any) and assuming a constant rate of performance each year. The $10,000 table and the fund's returns do not reflect the deduction of taxes that a shareholder would pay on fund distributions or the redemption of fund shares. During periods of reimbursement by Fidelity, a fund's total return will be greater than it would be had the reimbursement not occurred. How a fund did yesterday is no guarantee of how it will do tomorrow.
Average Annual Total Returns
Periods ended February 28, 2014 | Past 1 | Past 5 | Past 10 |
Spartan Extended Market Index Fund - Investor Class | 32.38% | 27.99% | 10.15% |
Spartan Extended Market Index Fund - Fidelity Advantage® Class A | 32.44% | 28.03% | 10.18% |
A The initial offering of Fidelity Advantage Class took place on October 14, 2005. Returns prior to October 14, 2005 are those of Investor Class.
$10,000 Over 10 Years
Let's say hypothetically that $10,000 was invested in Spartan Extended Market Index Fund - Investor Class on February 29, 2004. The chart shows how the value of your investment would have changed, and also shows how the Dow Jones U.S. Completion Total Stock Market Index performed over the same period.
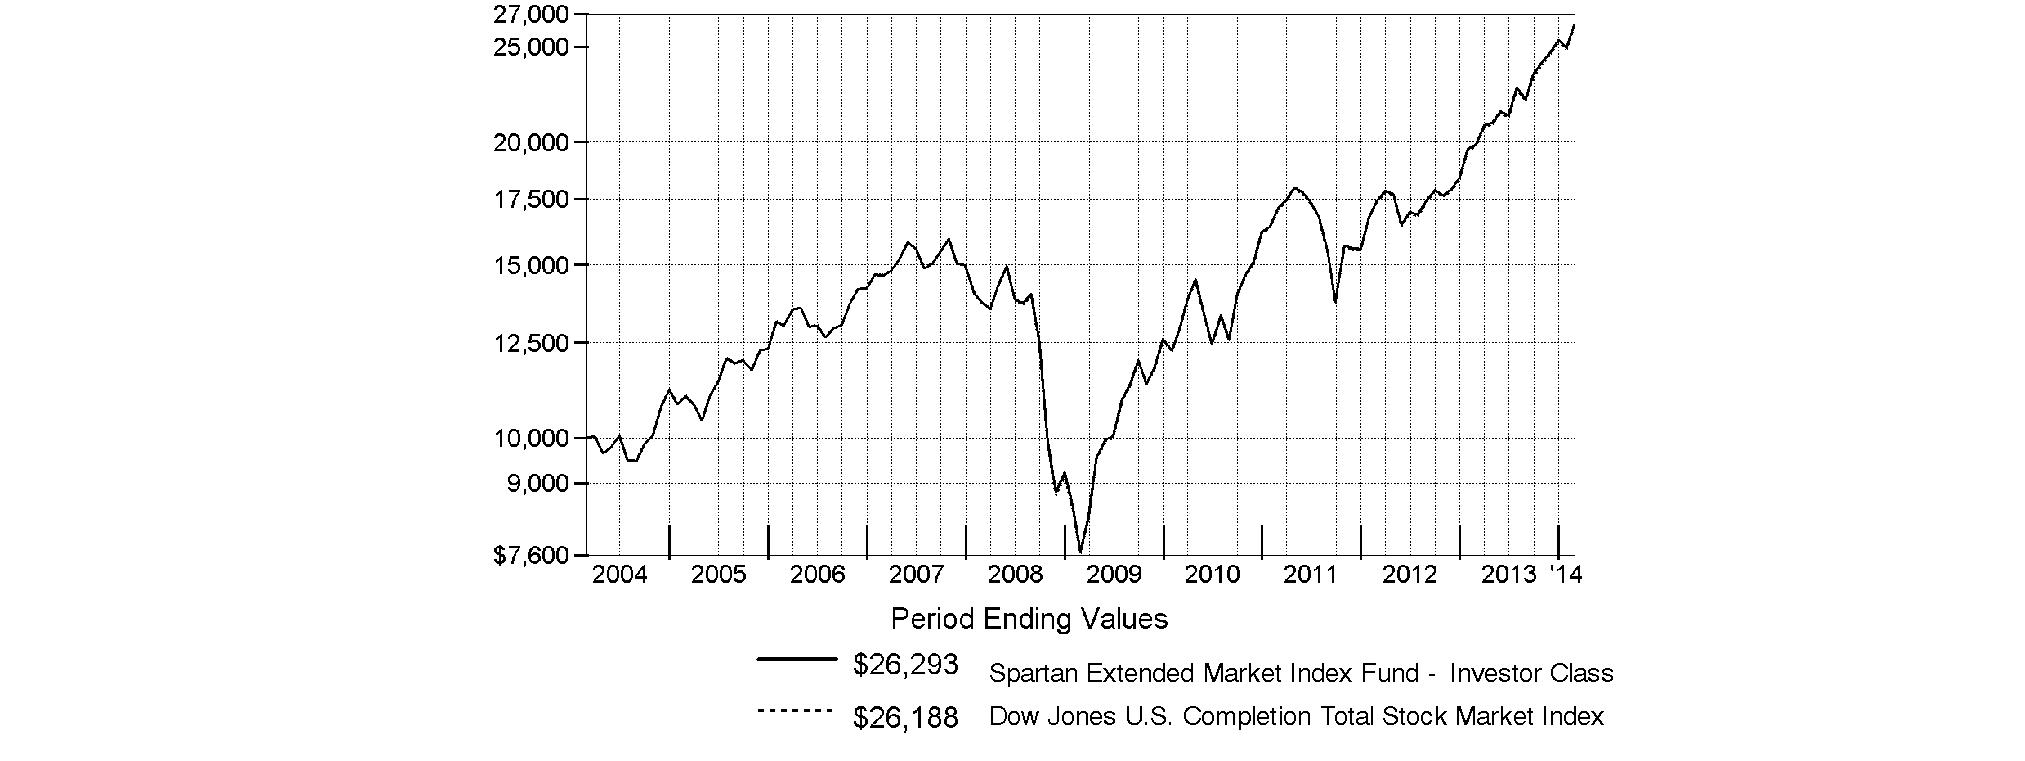
Annual Report
Spartan Extended Market Index Fund
Management's Discussion of Fund Performance
Market Recap: Stocks overcame fears of higher interest rates - not to mention their worst January in four years - to finish sharply higher for the 12 months ending February 28, 2014. The broad S&P 500® Index and the blue-chip Dow Jones Industrial AverageSM gained 25.37% and 19.01%, respectively, amid generally favorable earnings reports and accommodative monetary policies worldwide. Performance generally increased along the risk spectrum, with smaller-cap and growth strategies leading the way. An ebullient market helped the growth-oriented Nasdaq Composite Index® to a 38.10% period gain, for example. On the other hand, both cyclical and defensive stocks had representation in the top-performing industry sectors: returns were highest in health care and consumer discretionary; lowest in utilities and telecommunication services. From a macroeconomic perspective, data still points to slow but steady improvement in the U.S., and Europe's recession may well be over. Reports from China have disappointed, but continue to suggest a relatively soft landing there. Mixed signals from the U.S. Federal Reserve as to when it might curtail its stimulative bond buying kept markets in flux during the spring and summer. Stocks regained momentum in October despite a federal budget impasse and brief government shutdown, and lower volatility prevailed through year-end. Shedding new-year concerns about China's economy, an emerging-markets sell-off and confirmation (at last) of Fed tapering - alongside confirmation of a presumably dovish Janet Yellen as new Fed chair - February saw stocks back in record territory, bearing down on the five-year anniversary of the market's bottom.
Comments from Patrick Waddell, Senior Portfolio Manager of the Geode Capital Management, LLC, investment management team for Spartan® Extended Market Index Fund: For the year, the fund's Investor Class and Fidelity Advantage® Class shares gained 32.38% and 32.44%, respectively, in line with the 32.38% advance of the Dow Jones U.S. Completion Total Stock Market IndexSM. In a strong market environment, all 10 sectors in the Dow Jones Completion index were up by double digits, and even the worst-faring category - financials - rose about 17%. Not surprisingly in such a strong market environment, many more stocks contributed to performance than detracted from it. The biggest individual contributor was social networking company Facebook, whose shares more than doubled during the period, thanks in part to better-than-expected earnings. Another stock to add significant value was Tesla Motors, a maker of electric vehicles. Tesla's shares were up about sevenfold, thanks to healthy growth in revenue and mounting optimism on the part of investors about demand for the company's cars. Elsewhere, Illumina, a maker of genetic-analysis tools, did very well, as did many of its counterparts in the pharmaceutical, biotechnology & life sciences industry - the second-best performing group in the index. Also contributing was casino gaming operator Las Vegas Sands, whose strong financial results were lifted by good performance from its Asian properties. In contrast, two notable individual detractors were Annaly Capital Management and American Capital Agency. As the market rose, these and other mortgage real estate investment trusts (REITs) tended to be left behind, as investors worried about the potential impact of higher interest rates. Also detracting was lululemon athletica, a retailer of yogawear whose shares were hit in January after the company reported weaker-than-expected earnings.
The views expressed above reflect those of the portfolio manager(s) only through the end of the period as stated on the cover of this report and do not necessarily represent the views of Fidelity or any other person in the Fidelity organization. Any such views are subject to change at any time based upon market or other conditions and Fidelity disclaims any responsibility to update such views. These views may not be relied on as investment advice and, because investment decisions for a Fidelity fund are based on numerous factors, may not be relied on as an indication of trading intent on behalf of any Fidelity fund.
Annual Report
Spartan Extended Market Index Fund
Investment Changes (Unaudited)
Top Ten Stocks as of February 28, 2014 | ||
| % of fund's | % of fund's net assets |
Las Vegas Sands Corp. | 0.8 | 0.6 |
Liberty Global PLC Class A | 0.8 | 0.8 |
Illumina, Inc. | 0.5 | 0.3 |
Tesla Motors, Inc. | 0.5 | 0.3 |
LinkedIn Corp. | 0.5 | 0.5 |
United Continental Holdings, Inc. | 0.4 | 0.3 |
HCA Holdings, Inc. | 0.4 | 0.3 |
Avago Technologies Ltd. | 0.4 | 0.2 |
Green Mountain Coffee Roasters, Inc. | 0.4 | 0.3 |
Liberty Interactive Corp. Series A | 0.3 | 0.3 |
| 5.0 | |
Market Sectors as of February 28, 2014 | ||
| % of fund's | % of fund's net assets |
Financials | 21.5 | 21.6 |
Information Technology | 16.1 | 15.3 |
Consumer Discretionary | 15.7 | 16.1 |
Industrials | 14.7 | 14.7 |
Health Care | 11.9 | 11.1 |
Energy | 6.0 | 6.4 |
Materials | 5.2 | 5.1 |
Consumer Staples | 3.3 | 3.7 |
Utilities | 3.1 | 3.3 |
Telecommunication Services | 1.2 | 1.2 |
Annual Report
Spartan Extended Market Index Fund
Investments February 28, 2014
Showing Percentage of Net Assets
Common Stocks - 98.7% | |||
Shares | Value | ||
CONSUMER DISCRETIONARY - 15.7% | |||
Auto Components - 1.3% | |||
Allison Transmission Holdings, Inc. | 286,508 | $ 8,532,208 | |
American Axle & Manufacturing Holdings, Inc. (a) | 235,674 | 4,555,578 | |
Autoliv, Inc. (d) | 316,575 | 30,498,836 | |
Cooper Tire & Rubber Co. | 205,507 | 5,123,290 | |
Dana Holding Corp. | 487,155 | 10,561,520 | |
Dorman Products, Inc. (a)(d) | 103,132 | 5,942,466 | |
Drew Industries, Inc. | 78,727 | 3,876,517 | |
Federal-Mogul Corp. Class A (a) | 112,607 | 2,121,516 | |
Fox Factory Holding Corp. | 39,294 | 656,210 | |
Fuel Systems Solutions, Inc. (a) | 54,919 | 705,709 | |
Gentex Corp. | 480,934 | 15,086,900 | |
Gentherm, Inc. (a) | 117,071 | 3,310,768 | |
Lear Corp. | 260,626 | 21,162,831 | |
Modine Manufacturing Co. (a) | 171,375 | 2,534,636 | |
Motorcar Parts of America, Inc. (a) | 46,991 | 1,157,388 | |
Quantum Fuel Systems Technologies Worldwide, Inc. (a) | 70,417 | 607,699 | |
Remy International, Inc. | 47,195 | 1,051,977 | |
Shiloh Industries, Inc. (a) | 22,518 | 439,101 | |
Spartan Motors, Inc. | 75,935 | 430,551 | |
Standard Motor Products, Inc. | 71,623 | 2,517,548 | |
Stoneridge, Inc. (a) | 89,076 | 980,727 | |
Strattec Security Corp. | 10,303 | 718,325 | |
Superior Industries International, Inc. | 84,602 | 1,546,525 | |
Tenneco, Inc. (a) | 198,342 | 11,948,122 | |
Tower International, Inc. (a) | 57,875 | 1,486,230 | |
TRW Automotive Holdings Corp. (a) | 381,676 | 31,419,568 | |
UQM Technologies, Inc. (a)(d) | 78,497 | 135,800 | |
Visteon Corp. (a) | 163,505 | 13,641,222 | |
| 182,749,768 | ||
Automobiles - 0.5% | |||
Tesla Motors, Inc. (a)(d) | 273,734 | 67,012,821 | |
Thor Industries, Inc. | 150,431 | 8,425,640 | |
Winnebago Industries, Inc. (a) | 100,663 | 2,683,676 | |
| 78,122,137 | ||
Distributors - 0.3% | |||
Core-Mark Holding Co., Inc. | 41,529 | 3,247,568 | |
LKQ Corp. (a) | 1,000,300 | 27,898,367 | |
Pool Corp. | 154,363 | 9,024,061 | |
VOXX International Corp. (a) | 62,477 | 812,201 | |
Weyco Group, Inc. | 16,952 | 447,194 | |
| 41,429,391 | ||
Diversified Consumer Services - 0.7% | |||
American Public Education, Inc. (a)(d) | 58,621 | 2,076,356 | |
Apollo Ed Group, Inc. Class A (non-vtg.) (a) | 328,402 | 10,945,639 | |
Ascent Capital Group, Inc. (a)(d) | 43,140 | 3,167,770 | |
Bridgepoint Education, Inc. (a) | 37,103 | 715,717 | |
Bright Horizons Family Solutions, Inc. (a) | 73,892 | 2,916,517 | |
| |||
Shares | Value | ||
Cambium Learning Group, Inc. (a) | 16,192 | $ 33,194 | |
Capella Education Co. | 34,672 | 2,304,995 | |
Career Education Corp. (a) | 187,149 | 1,383,031 | |
Carriage Services, Inc. | 49,366 | 1,008,547 | |
Collectors Universe, Inc. (d) | 17,833 | 320,994 | |
Corinthian Colleges, Inc. (a)(d) | 321,385 | 501,361 | |
DeVry, Inc. | 188,899 | 7,935,647 | |
Education Management Corp. (a)(d) | 71,409 | 424,169 | |
Grand Canyon Education, Inc. (a)(d) | 150,716 | 7,143,938 | |
Hillenbrand, Inc. | 215,614 | 6,442,546 | |
Houghton Mifflin Harcourt Co. | 84,821 | 1,723,563 | |
ITT Educational Services, Inc. (a)(d) | 61,723 | 1,915,265 | |
JTH Holding, Inc. Class A (a)(d) | 11,299 | 285,865 | |
K12, Inc. (a)(d) | 105,616 | 2,390,090 | |
Learning Tree International, Inc. (a) | 12,160 | 38,547 | |
LifeLock, Inc. (a)(d) | 225,007 | 4,479,889 | |
Lincoln Educational Services Corp. | 64,172 | 288,774 | |
Matthews International Corp. Class A | 93,477 | 3,835,361 | |
National American University Holdings, Inc. | 23,237 | 87,371 | |
Regis Corp. | 155,503 | 2,186,372 | |
Service Corp. International | 703,436 | 13,147,219 | |
Sotheby's Class A (Ltd. vtg.) | 223,768 | 10,519,334 | |
Steiner Leisure Ltd. (a) | 44,479 | 1,966,861 | |
Strayer Education, Inc. (a)(d) | 37,506 | 1,791,662 | |
Universal Technical Institute, Inc. | 65,787 | 890,098 | |
Weight Watchers International, Inc. (d) | 88,957 | 1,891,226 | |
| 94,757,918 | ||
Hotels, Restaurants & Leisure - 3.2% | |||
Ambassadors Group, Inc. | 48,627 | 192,077 | |
Ark Restaurants Corp. | 8,457 | 186,054 | |
Bally Technologies, Inc. (a) | 124,956 | 8,465,769 | |
Biglari Holdings, Inc. (d) | 5,497 | 2,468,098 | |
BJ's Restaurants, Inc. (a)(d) | 87,061 | 2,411,590 | |
Bloomin' Brands, Inc. (a) | 147,792 | 3,715,491 | |
Bob Evans Farms, Inc. | 93,507 | 4,838,052 | |
Boyd Gaming Corp. (a) | 254,155 | 2,953,281 | |
Bravo Brio Restaurant Group, Inc. (a) | 63,389 | 981,896 | |
Brinker International, Inc. | 221,072 | 12,158,960 | |
Buffalo Wild Wings, Inc. (a)(d) | 60,734 | 8,806,430 | |
Burger King Worldwide, Inc. (d) | 215,326 | 5,723,365 | |
Caesars Entertainment Corp. (a)(d) | 126,132 | 3,274,387 | |
Carrols Restaurant Group, Inc. (a) | 55,247 | 392,254 | |
Century Casinos, Inc. (a) | 65,094 | 441,988 | |
Choice Hotels International, Inc. | 116,208 | 5,674,437 | |
Churchill Downs, Inc. | 48,125 | 4,475,625 | |
Chuys Holdings, Inc. (a)(d) | 60,855 | 2,422,638 | |
ClubCorp Holdings, Inc. | 71,917 | 1,252,794 | |
Cosi, Inc. (a)(d) | 22,932 | 30,270 | |
Cracker Barrel Old Country Store, Inc. | 81,287 | 8,083,992 | |
Del Frisco's Restaurant Group, Inc. (a) | 86,188 | 2,244,336 | |
Denny's Corp. (a)(d) | 303,172 | 2,061,570 | |
Diamond Resorts International, Inc. | 63,881 | 1,161,995 | |
Common Stocks - continued | |||
Shares | Value | ||
CONSUMER DISCRETIONARY - continued | |||
Hotels, Restaurants & Leisure - continued | |||
DineEquity, Inc. | 55,945 | $ 4,685,394 | |
Diversified Restaurant Holdings, Inc. (a) | 9,282 | 44,368 | |
Domino's Pizza, Inc. | 179,478 | 14,189,531 | |
Dover Downs Gaming & Entertainment, Inc. (a) | 28,631 | 44,378 | |
Dover Motorsports, Inc. | 22,686 | 51,270 | |
Dunkin' Brands Group, Inc. | 350,404 | 18,105,375 | |
Einstein Noah Restaurant Group, Inc. | 32,777 | 489,033 | |
Empire Resorts, Inc. (a)(d) | 31,800 | 245,496 | |
Entertainment Gaming Asia, Inc. (a) | 41,906 | 47,354 | |
Extended Stay America, Inc. unit | 110,822 | 2,823,745 | |
Famous Dave's of America, Inc. (a) | 17,917 | 438,608 | |
Fiesta Restaurant Group, Inc. (a) | 77,817 | 3,908,748 | |
Frisch's Restaurants, Inc. | 8,068 | 192,180 | |
Full House Resorts, Inc. (a) | 24,413 | 58,347 | |
Gaming Partners International Corp. (a) | 1,584 | 15,143 | |
Hyatt Hotels Corp. Class A (a)(d) | 197,385 | 10,295,602 | |
Ignite Restaurant Group, Inc. (a)(d) | 17,224 | 210,822 | |
International Speedway Corp. Class A | 94,111 | 3,174,364 | |
Interval Leisure Group, Inc. | 143,029 | 3,888,959 | |
Isle of Capri Casinos, Inc. (a) | 74,961 | 674,649 | |
Jack in the Box, Inc. (a) | 141,594 | 8,134,575 | |
Jamba, Inc. (a)(d) | 49,896 | 630,186 | |
Kona Grill, Inc. (a) | 11,867 | 229,033 | |
Krispy Kreme Doughnuts, Inc. (a)(d) | 219,940 | 4,183,259 | |
Lakes Entertainment, Inc. (a) | 51,180 | 258,459 | |
Las Vegas Sands Corp. | 1,287,138 | 109,728,491 | |
Life Time Fitness, Inc. (a)(d) | 132,536 | 6,255,699 | |
Luby's, Inc. (a) | 44,166 | 280,454 | |
Marcus Corp. | 53,086 | 749,043 | |
Marriott Vacations Worldwide Corp. (a) | 107,619 | 5,643,540 | |
MGM Mirage, Inc. (a) | 1,096,796 | 30,216,730 | |
Monarch Casino & Resort, Inc. (a) | 28,201 | 531,589 | |
Morgans Hotel Group Co. (a) | 89,969 | 719,752 | |
MTR Gaming Group, Inc. (a) | 52,052 | 275,355 | |
Multimedia Games Holding Co., Inc. (a) | 98,765 | 3,261,714 | |
Nathan's Famous, Inc. (a) | 8,467 | 423,181 | |
Noodles & Co. (d) | 37,994 | 1,512,541 | |
Norwegian Cruise Line Holdings Ltd. (a) | 241,987 | 8,292,894 | |
Orient Express Hotels Ltd. Class A (a) | 299,489 | 4,612,131 | |
Panera Bread Co. Class A (a) | 87,353 | 15,838,846 | |
Papa John's International, Inc. | 110,932 | 5,646,439 | |
Penn National Gaming, Inc. (a) | 234,807 | 3,017,270 | |
Pinnacle Entertainment, Inc. (a) | 191,005 | 4,641,422 | |
Pizza Inn Holdings, Inc. (a)(d) | 13,090 | 83,514 | |
Popeyes Louisiana Kitchen, Inc. (a) | 85,411 | 3,421,565 | |
Potbelly Corp. (d) | 31,455 | 673,452 | |
Premier Exhibitions, Inc. (a) | 89,421 | 78,690 | |
Red Lion Hotels Corp. (a) | 45,825 | 273,575 | |
Red Robin Gourmet Burgers, Inc. (a)(d) | 45,201 | 3,522,514 | |
Rick's Cabaret International, Inc. (a) | 17,933 | 203,898 | |
| |||
Shares | Value | ||
Royal Caribbean Cruises Ltd. | 537,982 | $ 28,475,387 | |
Ruby Tuesday, Inc. (a) | 207,290 | 1,270,688 | |
Ruth's Hospitality Group, Inc. | 111,579 | 1,379,116 | |
Scientific Games Corp. Class A (a) | 172,823 | 2,315,828 | |
SeaWorld Entertainment, Inc. | 184,302 | 6,292,070 | |
Six Flags Entertainment Corp. | 318,122 | 12,979,378 | |
Sonic Corp. (a) | 187,706 | 3,825,448 | |
Speedway Motorsports, Inc. | 37,455 | 742,358 | |
Texas Roadhouse, Inc. Class A | 206,875 | 5,471,844 | |
The Cheesecake Factory, Inc. | 153,024 | 7,271,700 | |
Town Sports International Holdings, Inc. | 64,415 | 584,888 | |
Vail Resorts, Inc. | 122,937 | 8,644,930 | |
Wendy's Co. | 918,539 | 8,799,604 | |
| 459,393,765 | ||
Household Durables - 1.1% | |||
Bassett Furniture Industries, Inc. | 27,362 | 409,883 | |
Beazer Homes U.S.A., Inc. (a)(d) | 89,545 | 2,076,549 | |
Blyth, Inc. (d) | 30,867 | 301,879 | |
Cavco Industries, Inc. (a)(d) | 22,709 | 1,781,521 | |
Cobra Electronics Corp. (a) | 2,458 | 8,333 | |
Comstock Holding Companies, Inc. Class A (a)(d) | 37,485 | 65,974 | |
CSS Industries, Inc. | 27,206 | 734,562 | |
Dixie Group, Inc. (a) | 27,024 | 405,360 | |
Emerson Radio Corp. (a) | 24,397 | 52,454 | |
Ethan Allen Interiors, Inc. (d) | 88,458 | 2,222,950 | |
Flexsteel Industries, Inc. | 18,647 | 692,736 | |
Helen of Troy Ltd. (a) | 104,425 | 6,819,997 | |
Hooker Furniture Corp. | 30,101 | 454,525 | |
Hovnanian Enterprises, Inc. Class A (a)(d) | 440,144 | 2,671,674 | |
iRobot Corp. (a)(d) | 93,339 | 3,912,771 | |
Jarden Corp. (a) | 398,136 | 24,473,420 | |
KB Home (d) | 272,393 | 5,556,817 | |
Kid Brands, Inc. (a) | 42,456 | 28,870 | |
Koss Corp. | 1,389 | 6,403 | |
La-Z-Boy, Inc. | 172,544 | 4,406,774 | |
LGI Homes, Inc. | 38,417 | 653,089 | |
Libbey, Inc. (a) | 74,313 | 1,730,750 | |
Lifetime Brands, Inc. | 19,423 | 325,141 | |
M.D.C. Holdings, Inc. | 131,539 | 4,102,701 | |
M/I Homes, Inc. (a)(d) | 86,608 | 2,156,539 | |
Meritage Homes Corp. (a) | 116,169 | 5,600,507 | |
NACCO Industries, Inc. Class A | 18,522 | 1,085,945 | |
NVR, Inc. (a) | 13,899 | 16,567,608 | |
Parametric Sound Corp. (a)(d) | 17,421 | 258,528 | |
Ryland Group, Inc. | 153,341 | 7,144,157 | |
Skullcandy, Inc. (a) | 64,637 | 543,597 | |
Skyline Corp. (a) | 14,802 | 85,112 | |
Standard Pacific Corp. (a) | 475,584 | 4,332,570 | |
Stanley Furniture Co., Inc. (a) | 37,789 | 114,123 | |
Taylor Morrison Home Corp. | 101,009 | 2,537,346 | |
Tempur Sealy International, Inc. (a) | 200,471 | 10,398,431 | |
Toll Brothers, Inc. (a) | 510,195 | 19,902,707 | |
Common Stocks - continued | |||
Shares | Value | ||
CONSUMER DISCRETIONARY - continued | |||
Household Durables - continued | |||
TRI Pointe Homes, Inc. (d) | 50,626 | $ 922,406 | |
Tupperware Brands Corp. | 165,897 | 13,039,504 | |
UCP, Inc. | 26,900 | 427,710 | |
Universal Electronics, Inc. (a) | 54,073 | 2,259,711 | |
WCI Communities, Inc. | 24,468 | 493,764 | |
Wells-Gardner Electronics Corp. (a) | 4,238 | 8,264 | |
William Lyon Homes, Inc. (a) | 37,718 | 1,166,618 | |
Zagg, Inc. (a)(d) | 72,915 | 315,722 | |
| 153,256,002 | ||
Internet & Catalog Retail - 0.8% | |||
1-800-FLOWERS.com, Inc. Class A (a) | 119,868 | 630,506 | |
Blue Nile, Inc. (a)(d) | 48,330 | 1,700,733 | |
CafePress, Inc. (a) | 18,875 | 107,021 | |
dELiA*s, Inc. (a)(d) | 110,057 | 118,862 | |
FTD Companies, Inc. (a)(d) | 66,872 | 2,077,044 | |
Gaiam, Inc. Class A (a) | 35,599 | 229,258 | |
Geeknet, Inc. (a) | 16,239 | 236,440 | |
Groupon, Inc. Class A (a)(d) | 1,235,521 | 10,267,180 | |
HomeAway, Inc. (a)(d) | 209,635 | 9,615,957 | |
HSN, Inc. | 114,107 | 6,544,036 | |
Liberty Interactive Corp.: | |||
(Venture Group) Series A (a) | 117,978 | 16,813,045 | |
Series A (a) | 1,569,149 | 45,819,151 | |
NutriSystem, Inc. | 94,402 | 1,389,597 | |
Orbitz Worldwide, Inc. (a) | 100,772 | 973,458 | |
Overstock.com, Inc. (a)(d) | 48,655 | 957,044 | |
PetMed Express, Inc. (d) | 64,034 | 883,669 | |
RetailMeNot, Inc. | 31,905 | 1,332,672 | |
Shutterfly, Inc. (a)(d) | 125,827 | 6,865,121 | |
U.S. Auto Parts Network, Inc. (a) | 28,450 | 58,607 | |
ValueVision Media, Inc. Class A (a) | 136,770 | 764,544 | |
Vitacost.com, Inc. (a)(d) | 57,854 | 431,012 | |
zulily, Inc. (d) | 39,463 | 2,698,875 | |
| 110,513,832 | ||
Leisure Equipment & Products - 0.4% | |||
Arctic Cat, Inc. | 47,692 | 2,232,939 | |
Black Diamond, Inc. (a)(d) | 70,114 | 741,806 | |
Brunswick Corp. | 299,098 | 13,396,599 | |
Callaway Golf Co. | 252,931 | 2,129,679 | |
Escalade, Inc. | 11,862 | 139,141 | |
JAKKS Pacific, Inc. (d) | 56,230 | 402,607 | |
Johnson Outdoors, Inc. Class A | 15,962 | 352,122 | |
Leapfrog Enterprises, Inc. Class A (a)(d) | 208,450 | 1,517,516 | |
Marine Products Corp. | 22,297 | 189,747 | |
Nautilus, Inc. (a) | 95,784 | 803,628 | |
Polaris Industries, Inc. | 208,717 | 27,974,340 | |
Smith & Wesson Holding Corp. (a)(d) | 225,106 | 2,588,719 | |
Sturm, Ruger & Co., Inc. (d) | 64,180 | 4,090,833 | |
Summer Infant, Inc. (a) | 37,416 | 69,220 | |
| 56,628,896 | ||
| |||
Shares | Value | ||
Media - 3.0% | |||
A.H. Belo Corp. Class A | 47,589 | $ 525,383 | |
AMC Networks, Inc. Class A (a) | 197,619 | 15,022,996 | |
Ballantyne of Omaha, Inc. (a) | 47,765 | 221,152 | |
Beasley Broadcast Group, Inc. Class A | 5,286 | 47,468 | |
Carmike Cinemas, Inc. (a) | 81,336 | 2,419,746 | |
Central European Media Enterprises Ltd. Class A (a)(d) | 252,596 | 1,197,305 | |
Charter Communications, Inc. Class A (a) | 222,361 | 28,188,704 | |
Cinemark Holdings, Inc. | 345,085 | 10,152,401 | |
Clear Channel Outdoor Holding, Inc. Class A | 134,797 | 1,354,710 | |
Crown Media Holdings, Inc. Class A (a)(d) | 89,832 | 300,937 | |
Cumulus Media, Inc. Class A (a) | 339,494 | 2,227,081 | |
Digital Cinema Destinations Co. (a) | 8,182 | 45,819 | |
DISH Network Corp. Class A (a) | 697,096 | 41,017,129 | |
DreamWorks Animation SKG, Inc. Class A (a) | 236,110 | 7,062,050 | |
E.W. Scripps Co. Class A (a) | 110,895 | 2,175,760 | |
Emmis Communications Corp. Class A (a) | 80,456 | 252,632 | |
Entercom Communications Corp. Class A (a)(d) | 55,913 | 552,980 | |
Entravision Communication Corp. Class A | 226,807 | 1,503,730 | |
FAB Universal Corp. (a)(d) | 52,613 | 161,522 | |
Gray Television, Inc. (a) | 162,058 | 1,904,182 | |
Harte-Hanks, Inc. | 168,026 | 1,342,528 | |
Hemisphere Media Group, Inc. (a)(d) | 13,887 | 154,701 | |
Insignia Systems, Inc. (a) | 22,896 | 71,436 | |
John Wiley & Sons, Inc. Class A | 163,947 | 9,513,844 | |
Journal Communications, Inc. Class A (a) | 139,138 | 1,275,895 | |
Lamar Advertising Co. Class A (a) | 211,052 | 11,314,498 | |
Lee Enterprises, Inc. (a)(d) | 166,014 | 853,312 | |
Liberty Global PLC Class A (a)(d) | 1,233,594 | 106,767,561 | |
Liberty Media Corp. Class A (a) | 331,692 | 45,494,875 | |
Live Nation Entertainment, Inc. (a) | 474,363 | 10,763,296 | |
Loral Space & Communications Ltd. (a) | 49,449 | 3,907,460 | |
Martha Stewart Living Omnimedia, Inc. Class A (a)(d) | 86,467 | 454,816 | |
Media General, Inc. Class A (a)(d) | 69,425 | 1,316,992 | |
Meredith Corp. | 122,000 | 5,709,600 | |
Morningstar, Inc. | 76,494 | 6,399,488 | |
National CineMedia, Inc. | 209,473 | 3,217,505 | |
Nexstar Broadcasting Group, Inc. Class A (d) | 95,400 | 4,071,672 | |
NTN Communications, Inc. (a) | 49,847 | 28,493 | |
Radio One, Inc. Class D (non-vtg.) (a) | 89,989 | 447,245 | |
ReachLocal, Inc. (a)(d) | 35,865 | 379,452 | |
Reading International, Inc. Class A (a) | 33,132 | 245,839 | |
Regal Entertainment Group Class A (d) | 267,938 | 4,930,059 | |
Rentrak Corp. (a) | 36,764 | 2,356,940 | |
RLJ Entertainment, Inc. (a) | 42,349 | 186,336 | |
Saga Communications, Inc. Class A | 11,404 | 557,770 | |
Common Stocks - continued | |||
Shares | Value | ||
CONSUMER DISCRETIONARY - continued | |||
Media - continued | |||
Salem Communications Corp. Class A | 20,080 | $ 182,527 | |
Scholastic Corp. | 93,383 | 3,294,552 | |
SFX Entertainment, Inc. (d) | 74,713 | 641,785 | |
Sinclair Broadcast Group, Inc. Class A | 243,124 | 7,201,333 | |
Sirius XM Holdings, Inc. (a)(d) | 9,987,802 | 36,055,965 | |
Sizmek, Inc. (a)(d) | 83,242 | 1,031,368 | |
Spanish Broadcasting System, Inc. Class A (a) | 17,489 | 75,552 | |
SPAR Group, Inc. (a) | 4,346 | 8,562 | |
Starz - Liberty Capital Series A (a) | 312,351 | 9,988,985 | |
The Madison Square Garden Co. Class A (a) | 206,437 | 11,768,973 | |
The McClatchy Co. Class A (a)(d) | 208,390 | 1,106,551 | |
The New York Times Co. Class A (d) | 434,888 | 7,140,861 | |
Value Line, Inc. | 1,396 | 20,912 | |
World Wrestling Entertainment, Inc. Class A | 105,315 | 2,413,820 | |
| 419,027,046 | ||
Multiline Retail - 0.2% | |||
Big Lots, Inc. (a)(d) | 195,109 | 5,765,471 | |
Burlington Stores, Inc. | 49,352 | 1,344,842 | |
Dillard's, Inc. Class A | 79,764 | 7,384,551 | |
Fred's, Inc. Class A | 123,849 | 2,468,311 | |
Gordmans Stores, Inc. | 23,635 | 150,082 | |
J.C. Penney Co., Inc. (a)(d) | 1,002,259 | 7,296,446 | |
Sears Holdings Corp. (a)(d) | 145,081 | 6,492,375 | |
The Bon-Ton Stores, Inc. (d) | 31,972 | 347,216 | |
Tuesday Morning Corp. (a) | 123,106 | 1,925,378 | |
| 33,174,672 | ||
Specialty Retail - 3.0% | |||
Aarons, Inc. Class A | 249,123 | 7,655,550 | |
Abercrombie & Fitch Co. Class A | 250,585 | 9,930,684 | |
Advance Auto Parts, Inc. | 242,026 | 30,824,431 | |
Aeropostale, Inc. (a)(d) | 259,054 | 1,901,456 | |
America's Car Mart, Inc. (a)(d) | 28,636 | 1,037,769 | |
American Eagle Outfitters, Inc. | 563,431 | 8,186,652 | |
ANN, Inc. (a) | 150,919 | 5,380,262 | |
Appliance Recycling Centers of America, Inc. (a) | 2,967 | 8,753 | |
Asbury Automotive Group, Inc. (a) | 103,543 | 5,264,126 | |
Ascena Retail Group, Inc. (a) | 427,994 | 7,828,010 | |
Barnes & Noble, Inc. (a)(d) | 129,563 | 2,482,427 | |
bebe stores, Inc. | 123,042 | 746,865 | |
Big 5 Sporting Goods Corp. | 67,233 | 1,020,597 | |
Body Central Corp. (a)(d) | 37,768 | 117,836 | |
Books-A-Million, Inc. (a)(d) | 28,953 | 65,144 | |
Brown Shoe Co., Inc. | 144,261 | 3,545,935 | |
Build-A-Bear Workshop, Inc. (a) | 42,241 | 326,945 | |
Cabela's, Inc. Class A (a)(d) | 152,592 | 10,119,901 | |
Cache, Inc. (a) | 37,741 | 200,027 | |
Chico's FAS, Inc. | 523,459 | 8,652,777 | |
| |||
Shares | Value | ||
Christopher & Banks Corp. (a) | 115,035 | $ 766,133 | |
Citi Trends, Inc. (a) | 51,244 | 840,402 | |
Coldwater Creek, Inc. (a)(d) | 41,025 | 32,123 | |
Conn's, Inc. (a)(d) | 81,268 | 2,909,394 | |
CST Brands, Inc. | 250,104 | 8,135,883 | |
Destination Maternity Corp. | 38,764 | 1,094,695 | |
Destination XL Group, Inc. (a) | 127,750 | 728,175 | |
Dick's Sporting Goods, Inc. | 330,841 | 17,756,236 | |
Dover Saddlery, Inc. (a) | 1,537 | 8,292 | |
DSW, Inc. Class A | 241,797 | 9,304,349 | |
Express, Inc. (a) | 281,732 | 5,152,878 | |
Finish Line, Inc. Class A | 158,333 | 4,278,158 | |
Five Below, Inc. (a)(d) | 153,992 | 5,934,852 | |
Foot Locker, Inc. | 489,694 | 20,425,137 | |
Francesca's Holdings Corp. (a)(d) | 141,202 | 2,763,323 | |
Genesco, Inc. (a)(d) | 79,494 | 5,902,430 | |
GNC Holdings, Inc. | 311,521 | 14,491,957 | |
Group 1 Automotive, Inc. | 69,849 | 4,663,119 | |
Guess?, Inc. | 204,424 | 6,202,224 | |
Hastings Entertainment, Inc. (a) | 13,630 | 27,124 | |
Haverty Furniture Companies, Inc. | 67,771 | 1,975,525 | |
hhgregg, Inc. (a)(d) | 51,212 | 542,335 | |
Hibbett Sports, Inc. (a)(d) | 89,175 | 5,112,403 | |
Jos. A. Bank Clothiers, Inc. (a)(d) | 90,911 | 5,643,755 | |
Kirkland's, Inc. (a) | 53,316 | 942,627 | |
Lithia Motors, Inc. Class A (sub. vtg.) | 75,277 | 4,774,067 | |
Lumber Liquidators Holdings, Inc. (a)(d) | 91,038 | 9,766,557 | |
MarineMax, Inc. (a)(d) | 78,241 | 1,126,670 | |
Mattress Firm Holding Corp. (a)(d) | 54,318 | 2,367,722 | |
Monro Muffler Brake, Inc. (d) | 102,892 | 6,139,566 | |
Murphy U.S.A., Inc. | 146,243 | 5,931,616 | |
New York & Co., Inc. (a) | 101,159 | 448,134 | |
Office Depot, Inc. (a)(d) | 1,580,700 | 7,792,851 | |
Outerwall, Inc. (a)(d) | 91,690 | 6,485,234 | |
Pacific Sunwear of California, Inc. (a) | 152,515 | 436,193 | |
Penske Automotive Group, Inc. | 149,572 | 6,474,972 | |
Perfumania Holdings, Inc. (a) | 10,679 | 66,744 | |
Pier 1 Imports, Inc. | 346,476 | 6,555,326 | |
RadioShack Corp. (a)(d) | 360,003 | 964,808 | |
Rent-A-Center, Inc. | 179,370 | 4,509,362 | |
Restoration Hardware Holdings, Inc. (a) | 89,564 | 6,065,274 | |
Sally Beauty Holdings, Inc. (a) | 461,023 | 13,231,360 | |
Sears Hometown & Outlet Stores, Inc. (a)(d) | 48,309 | 1,118,836 | |
Select Comfort Corp. (a)(d) | 182,933 | 3,303,770 | |
Shoe Carnival, Inc. | 52,398 | 1,353,964 | |
Signet Jewelers Ltd. | 265,981 | 25,414,485 | |
Sonic Automotive, Inc. Class A (sub. vtg.) | 113,026 | 2,685,498 | |
Stage Stores, Inc. | 107,717 | 2,132,797 | |
Stein Mart, Inc. | 98,915 | 1,344,255 | |
Systemax, Inc. (a) | 25,296 | 297,734 | |
Tandy Leather Factory, Inc. (a) | 3,074 | 29,695 | |
The Buckle, Inc. (d) | 98,501 | 4,468,990 | |
The Cato Corp. Class A (sub. vtg.) | 93,688 | 2,629,822 | |
Common Stocks - continued | |||
Shares | Value | ||
CONSUMER DISCRETIONARY - continued | |||
Specialty Retail - continued | |||
The Children's Place Retail Stores, Inc. | 76,274 | $ 4,131,763 | |
The Container Store Group, Inc. (d) | 41,471 | 1,485,077 | |
The Men's Wearhouse, Inc. | 150,199 | 8,079,204 | |
The Pep Boys - Manny, Moe & Jack (a) | 186,870 | 2,352,693 | |
Tile Shop Holdings, Inc. (a)(d) | 81,131 | 1,251,040 | |
Tilly's, Inc. (a) | 34,668 | 414,629 | |
Trans World Entertainment Corp. | 29,120 | 121,722 | |
Ulta Salon, Cosmetics & Fragrance, Inc. (a) | 213,106 | 19,113,477 | |
Vitamin Shoppe, Inc. (a) | 100,996 | 4,725,603 | |
West Marine, Inc. (a) | 34,107 | 425,655 | |
Wet Seal, Inc. Class A (a) | 314,133 | 596,853 | |
Williams-Sonoma, Inc. | 291,357 | 16,968,632 | |
Winmark Corp. | 7,287 | 575,964 | |
Zale Corp. (a) | 107,361 | 2,332,955 | |
Zumiez, Inc. (a) | 76,306 | 1,813,031 | |
| 423,234,276 | ||
Textiles, Apparel & Luxury Goods - 1.2% | |||
American Apparel, Inc. (a)(d) | 196,695 | 141,640 | |
Carter's, Inc. | 178,025 | 13,410,623 | |
Charles & Colvard Ltd. (a) | 45,090 | 184,418 | |
Cherokee, Inc. | 28,809 | 409,664 | |
Columbia Sportswear Co. (d) | 45,436 | 3,775,277 | |
Crocs, Inc. (a) | 290,134 | 4,418,741 | |
Crown Crafts, Inc. | 2,227 | 20,488 | |
Culp, Inc. | 19,568 | 377,271 | |
Deckers Outdoor Corp. (a)(d) | 113,251 | 8,420,212 | |
Delta Apparel, Inc. (a) | 17,128 | 277,302 | |
DGSE Companies, Inc. (a)(d) | 6,929 | 16,907 | |
Forward Industries, Inc. (NY Shares) (a)(d) | 18,823 | 31,623 | |
G-III Apparel Group Ltd. (a) | 54,426 | 3,782,063 | |
Hanesbrands, Inc. | 328,386 | 24,064,126 | |
Iconix Brand Group, Inc. (a)(d) | 168,100 | 6,764,344 | |
Joe's Jeans, Inc. (a)(d) | 173,010 | 243,944 | |
Kate Spade & Co. (a) | 405,968 | 13,892,225 | |
Lakeland Industries, Inc. (a) | 25,549 | 166,579 | |
lululemon athletica, Inc. (a)(d) | 354,843 | 17,852,151 | |
Movado Group, Inc. | 64,810 | 2,551,570 | |
Oxford Industries, Inc. | 49,939 | 3,908,226 | |
Perry Ellis International, Inc. (a) | 47,883 | 667,968 | |
Quiksilver, Inc. (a)(d) | 451,488 | 3,521,606 | |
R.G. Barry Corp. | 22,932 | 424,701 | |
Rocky Brands, Inc. | 16,536 | 227,535 | |
Skechers U.S.A., Inc. Class A (sub. vtg.) (a) | 137,965 | 4,653,559 | |
Steven Madden Ltd. (a) | 194,277 | 7,081,397 | |
Superior Uniform Group, Inc. | 5,649 | 94,169 | |
The Jones Group, Inc. | 247,683 | 3,700,384 | |
Tumi Holdings, Inc. (a) | 172,727 | 3,827,630 | |
| |||
Shares | Value | ||
Under Armour, Inc. Class A (sub. vtg.) (a)(d) | 266,466 | $ 30,150,628 | |
Unifi, Inc. (a) | 51,404 | 1,271,735 | |
Vera Bradley, Inc. (a)(d) | 83,488 | 2,212,432 | |
Vince Holding Corp. | 36,383 | 982,341 | |
Wolverine World Wide, Inc. (d) | 336,421 | 8,868,058 | |
| 172,393,537 | ||
TOTAL CONSUMER DISCRETIONARY | 2,224,681,240 | ||
CONSUMER STAPLES - 3.3% | |||
Beverages - 0.1% | |||
Boston Beer Co., Inc. Class A (a)(d) | 29,160 | 6,903,630 | |
Coca-Cola Bottling Co. Consolidated | 16,170 | 1,223,099 | |
Craft Brew Alliance, Inc. (a) | 22,005 | 359,342 | |
Crystal Rock Holdings, Inc. (a) | 4,384 | 5,480 | |
MGP Ingredients, Inc. | 21,690 | 123,199 | |
National Beverage Corp. | 48,005 | 1,010,025 | |
Primo Water Corp. (a) | 56,566 | 183,274 | |
REED'S, Inc. (a) | 9,804 | 75,491 | |
| 9,883,540 | ||
Food & Staples Retailing - 0.6% | |||
Andersons, Inc. | 90,564 | 4,966,530 | |
Casey's General Stores, Inc. | 128,096 | 8,773,295 | |
Chefs' Warehouse Holdings (a)(d) | 70,559 | 1,640,497 | |
Crumbs Bake Shop, Inc. (a)(d) | 21,400 | 14,563 | |
Fairway Group Holdings Corp. (d) | 42,643 | 332,615 | |
Fresh Market, Inc. (a)(d) | 133,802 | 4,482,367 | |
Ingles Markets, Inc. Class A | 40,864 | 959,487 | |
Liberator Medical Holdings, Inc. (d) | 136,818 | 615,681 | |
Natural Grocers by Vitamin Cottage, Inc. (a)(d) | 29,349 | 1,195,678 | |
PriceSmart, Inc. | 58,985 | 6,000,544 | |
Rite Aid Corp. (a) | 2,963,139 | 19,527,086 | |
Roundy's, Inc. | 107,362 | 659,203 | |
Spartan Stores, Inc. | 132,984 | 3,004,109 | |
Sprouts Farmers Market LLC | 132,201 | 5,158,483 | |
SUPERVALU, Inc. (a)(d) | 672,397 | 4,350,409 | |
Susser Holdings Corp. (a)(d) | 60,865 | 3,687,202 | |
The Pantry, Inc. (a) | 91,715 | 1,383,062 | |
United Natural Foods, Inc. (a) | 165,813 | 12,001,545 | |
Village Super Market, Inc. Class A | 15,258 | 418,222 | |
Weis Markets, Inc. | 41,677 | 2,102,188 | |
| 81,272,766 | ||
Food Products - 1.8% | |||
Alico, Inc. | 8,218 | 311,955 | |
Annie's, Inc. (a)(d) | 60,400 | 2,263,792 | |
B&G Foods, Inc. Class A | 180,727 | 5,414,581 | |
Boulder Brands, Inc. (a)(d) | 196,281 | 2,952,066 | |
Bunge Ltd. | 478,113 | 38,062,576 | |
Cal-Maine Foods, Inc. | 55,257 | 2,904,860 | |
Calavo Growers, Inc. | 43,985 | 1,369,693 | |
Common Stocks - continued | |||
Shares | Value | ||
CONSUMER STAPLES - continued | |||
Food Products - continued | |||
Chiquita Brands International, Inc. (a) | 152,765 | $ 1,671,249 | |
Coffee Holding Co., Inc. (a) | 4,500 | 27,585 | |
Darling International, Inc. (a) | 533,810 | 10,772,286 | |
Dean Foods Co. (d) | 301,086 | 4,453,062 | |
Diamond Foods, Inc. (a)(d) | 73,051 | 2,098,025 | |
Farmer Brothers Co. (a) | 17,793 | 375,076 | |
Flowers Foods, Inc. | 587,606 | 12,087,055 | |
Fresh Del Monte Produce, Inc. | 130,882 | 3,463,138 | |
Golden Enterprises Ltd. | 2,595 | 11,159 | |
Green Mountain Coffee Roasters, Inc. (d) | 436,821 | 47,954,209 | |
Griffin Land & Nurseries, Inc. | 6,082 | 186,292 | |
Hillshire Brands Co. | 403,740 | 15,160,437 | |
Ingredion, Inc. | 250,264 | 16,477,382 | |
Inventure Foods, Inc. (a) | 25,815 | 358,570 | |
J&J Snack Foods Corp. | 52,992 | 4,921,897 | |
John B. Sanfilippo & Son, Inc. | 24,690 | 598,733 | |
Lancaster Colony Corp. | 70,760 | 6,382,552 | |
Lifeway Foods, Inc. (d) | 17,769 | 255,163 | |
Limoneira Co. (d) | 31,411 | 661,516 | |
Omega Protein Corp. (a) | 65,292 | 709,724 | |
Pilgrims Pride Corp. (a)(d) | 197,595 | 3,463,840 | |
Pinnacle Foods, Inc. | 187,064 | 5,297,652 | |
Post Holdings, Inc. (a)(d) | 109,272 | 6,241,617 | |
Rocky Mountain Chocolate Factory, Inc. | 795 | 9,437 | |
S&W Seed Co. (a)(d) | 19,822 | 125,473 | |
Sanderson Farms, Inc. | 68,298 | 5,248,018 | |
Seaboard Corp. (a) | 1,177 | 2,983,730 | |
Seneca Foods Corp. Class A (a) | 22,104 | 669,309 | |
Snyders-Lance, Inc. | 171,540 | 4,647,019 | |
The Hain Celestial Group, Inc. (a)(d) | 156,487 | 13,974,289 | |
Tootsie Roll Industries, Inc. (d) | 80,752 | 2,349,883 | |
TreeHouse Foods, Inc. (a)(d) | 120,634 | 8,596,379 | |
WhiteWave Foods Co. (a) | 573,744 | 16,236,955 | |
| 251,748,234 | ||
Household Products - 0.4% | |||
Central Garden & Pet Co. Class A (non-vtg.) (a) | 136,630 | 1,005,597 | |
Church & Dwight Co., Inc. | 453,005 | 30,795,280 | |
Energizer Holdings, Inc. | 203,901 | 19,847,723 | |
Harbinger Group, Inc. (a) | 120,650 | 1,369,378 | |
Ocean Bio-Chem, Inc. (a) | 20,307 | 58,890 | |
Oil-Dri Corp. of America | 15,023 | 498,764 | |
Orchids Paper Products Co. | 28,220 | 950,167 | |
Spectrum Brands Holdings, Inc. | 71,652 | 5,589,573 | |
WD-40 Co. | 50,695 | 3,696,172 | |
| 63,811,544 | ||
Personal Products - 0.3% | |||
CCA Industries, Inc. | 3,083 | 9,804 | |
Coty, Inc. Class A (d) | 202,981 | 3,014,268 | |
Cyanotech Corp. (a) | 3,808 | 23,038 | |
| |||
Shares | Value | ||
Elizabeth Arden, Inc. (a)(d) | 90,496 | $ 2,766,463 | |
Herbalife Ltd. (d) | 275,038 | 18,317,531 | |
IGI Laboratories, Inc. (a) | 30,015 | 124,562 | |
Inter Parfums, Inc. | 62,362 | 2,095,987 | |
LifeVantage Corp. (a)(d) | 379,647 | 504,931 | |
Mannatech, Inc. (a) | 3,529 | 60,699 | |
MediFast, Inc. (a)(d) | 48,925 | 1,288,685 | |
Natural Alternatives International, Inc. (a) | 20,104 | 106,953 | |
Nature's Sunshine Products, Inc. | 25,452 | 384,580 | |
Nu Skin Enterprises, Inc. Class A | 196,647 | 16,423,957 | |
Nutraceutical International Corp. (a) | 24,021 | 629,110 | |
Reliv International, Inc. | 10,690 | 23,090 | |
Revlon, Inc. (a) | 42,260 | 997,759 | |
Star Scientific, Inc. (a)(d) | 503,999 | 448,509 | |
Synutra International, Inc. (a)(d) | 18,499 | 135,413 | |
The Female Health Co. (d) | 57,839 | 399,667 | |
United-Guardian, Inc. | 5,269 | 146,794 | |
USANA Health Sciences, Inc. (a)(d) | 23,842 | 1,744,519 | |
| 49,646,319 | ||
Tobacco - 0.1% | |||
Alliance One International, Inc. (a) | 300,348 | 807,936 | |
Universal Corp. (d) | 77,461 | 4,465,627 | |
Vector Group Ltd. (d) | 215,169 | 4,202,251 | |
| 9,475,814 | ||
TOTAL CONSUMER STAPLES | 465,838,217 | ||
ENERGY - 6.0% | |||
Energy Equipment & Services - 2.2% | |||
Atwood Oceanics, Inc. (a) | 189,231 | 8,967,657 | |
Basic Energy Services, Inc. (a)(d) | 97,645 | 2,328,833 | |
Bolt Technology Corp. | 27,943 | 561,934 | |
Bristow Group, Inc. | 119,830 | 9,298,808 | |
C&J Energy Services, Inc. (a)(d) | 156,985 | 4,058,062 | |
Cal Dive International, Inc. (a)(d) | 284,336 | 503,275 | |
Carbo Ceramics, Inc. (d) | 65,328 | 8,103,938 | |
Core Laboratories NV | 149,801 | 28,170,078 | |
Dawson Geophysical Co. | 24,309 | 697,668 | |
Dresser-Rand Group, Inc. (a) | 248,572 | 13,504,917 | |
Dril-Quip, Inc. (a) | 134,770 | 14,495,861 | |
ENGlobal Corp. (a) | 44,577 | 72,215 | |
Era Group, Inc. (a) | 62,838 | 1,775,174 | |
Exterran Holdings, Inc. | 192,871 | 7,901,925 | |
Forbes Energy Services Ltd. (a) | 24,064 | 97,940 | |
Forum Energy Technologies, Inc. (a) | 189,033 | 4,895,955 | |
Frank's International NV | 110,623 | 2,615,128 | |
Geospace Technologies Corp. (a)(d) | 42,504 | 3,263,032 | |
Global Geophysical Services, Inc. (a)(d) | 67,238 | 94,133 | |
GreenHunter Energy, Inc. (a)(d) | 33,031 | 35,013 | |
Gulf Island Fabrication, Inc. | 43,462 | 911,398 | |
Gulfmark Offshore, Inc. Class A | 86,906 | 4,122,821 | |
Helix Energy Solutions Group, Inc. (a) | 334,224 | 7,901,055 | |
Hercules Offshore, Inc. (a) | 544,655 | 2,592,558 | |
Common Stocks - continued | |||
Shares | Value | ||
ENERGY - continued | |||
Energy Equipment & Services - continued | |||
Hornbeck Offshore Services, Inc. (a) | 106,861 | $ 4,569,376 | |
ION Geophysical Corp. (a)(d) | 451,417 | 1,837,267 | |
Key Energy Services, Inc. (a) | 445,865 | 4,030,620 | |
Matrix Service Co. (a) | 89,548 | 2,898,669 | |
McDermott International, Inc. (a)(d) | 775,119 | 6,456,741 | |
Mitcham Industries, Inc. (a) | 33,864 | 487,303 | |
Natural Gas Services Group, Inc. (a) | 42,549 | 1,382,843 | |
Newpark Resources, Inc. (a)(d) | 285,013 | 3,169,345 | |
Nuverra Environmental Solutions, Inc. (a)(d) | 49,849 | 847,433 | |
Oceaneering International, Inc. | 353,224 | 25,283,774 | |
Oil States International, Inc. (a) | 179,226 | 17,012,132 | |
Parker Drilling Co. (a) | 401,755 | 3,242,163 | |
Patterson-UTI Energy, Inc. | 476,596 | 13,873,710 | |
PHI, Inc. (non-vtg.) (a) | 37,596 | 1,511,359 | |
Pioneer Energy Services Corp. (a) | 219,417 | 2,501,354 | |
RigNet, Inc. (a) | 35,362 | 1,691,011 | |
RPC, Inc. (d) | 207,837 | 3,826,279 | |
SEACOR Holdings, Inc. (a)(d) | 65,838 | 5,824,029 | |
Superior Energy Services, Inc. | 528,300 | 15,632,397 | |
Synthesis Energy Systems, Inc. (a) | 189,821 | 313,205 | |
Tesco Corp. (a) | 108,916 | 2,066,137 | |
TETRA Technologies, Inc. (a) | 259,787 | 3,117,444 | |
TGC Industries, Inc. | 38,640 | 247,296 | |
Tidewater, Inc. | 163,672 | 7,974,100 | |
Unit Corp. (a) | 157,348 | 9,661,167 | |
Vantage Drilling Co. (a)(d) | 693,926 | 1,214,371 | |
Weatherford International Ltd. (a) | 2,543,594 | 42,401,712 | |
Willbros Group, Inc. (a) | 147,556 | 1,457,853 | |
| 311,500,468 | ||
Oil, Gas & Consumable Fuels - 3.8% | |||
Abraxas Petroleum Corp. (a)(d) | 313,135 | 1,055,265 | |
Adams Resources & Energy, Inc. | 9,909 | 729,302 | |
Alon U.S.A. Energy, Inc. | 82,812 | 1,108,853 | |
Alpha Natural Resources, Inc. (a)(d) | 720,455 | 3,868,843 | |
American Eagle Energy Corp. (a) | 29,846 | 57,901 | |
Amyris, Inc. (a)(d) | 109,799 | 501,781 | |
Antero Resources Corp. | 122,422 | 7,386,943 | |
APCO Oil and Gas International, Inc. (a) | 49,691 | 710,084 | |
Approach Resources, Inc. (a)(d) | 124,387 | 2,770,098 | |
Arch Coal, Inc. (d) | 713,323 | 3,252,753 | |
Ardmore Shipping Corp. (d) | 39,534 | 513,151 | |
Athlon Energy, Inc. | 114,586 | 4,258,016 | |
Barnwell Industries, Inc. (a) | 11,298 | 32,312 | |
Bill Barrett Corp. (a)(d) | 163,644 | 4,146,739 | |
BioFuel Energy Corp. (a)(d) | 12,280 | 35,735 | |
Bonanza Creek Energy, Inc. (a)(d) | 97,380 | 4,866,079 | |
BPZ Energy, Inc. (a)(d) | 372,244 | 766,823 | |
Callon Petroleum Co. (a) | 147,830 | 1,000,809 | |
Carrizo Oil & Gas, Inc. (a)(d) | 135,804 | 6,754,891 | |
Ceres, Inc. (a)(d) | 30,062 | 42,989 | |
| |||
Shares | Value | ||
Cheniere Energy, Inc. (a) | 728,638 | $ 36,016,576 | |
Cimarex Energy Co. | 287,770 | 33,297,867 | |
Clayton Williams Energy, Inc. (a) | 21,381 | 2,073,957 | |
Clean Energy Fuels Corp. (a)(d) | 236,563 | 1,980,032 | |
Cloud Peak Energy, Inc. (a) | 205,532 | 3,987,321 | |
Cobalt International Energy, Inc. (a) | 987,614 | 19,041,198 | |
Comstock Resources, Inc. | 152,811 | 3,019,545 | |
Concho Resources, Inc. (a) | 348,976 | 42,271,463 | |
Contango Oil & Gas Co. (a) | 54,222 | 2,571,207 | |
Continental Resources, Inc. (a)(d) | 142,154 | 16,990,246 | |
Crosstex Energy, Inc. | 149,064 | 6,205,534 | |
CVR Energy, Inc. (d) | 52,267 | 2,056,706 | |
Delek U.S. Holdings, Inc. | 124,667 | 3,460,756 | |
DHT Holdings, Inc. | 179,426 | 1,406,700 | |
Diamondback Energy, Inc. (a)(d) | 133,637 | 8,596,868 | |
Double Eagle Petroleum Co. (a) | 27,291 | 58,676 | |
Earthstone Energy, Inc. (a) | 4,213 | 92,812 | |
Emerald Oil, Inc. (a) | 203,832 | 1,561,353 | |
Endeavour International Corp. (a)(d) | 148,049 | 719,518 | |
Energen Corp. | 239,351 | 19,253,394 | |
Energy XXI (Bermuda) Ltd. | 249,028 | 5,767,488 | |
EPL Oil & Gas, Inc. (a) | 120,207 | 3,618,231 | |
Evolution Petroleum Corp. | 68,734 | 893,542 | |
EXCO Resources, Inc. (d) | 572,041 | 2,986,054 | |
FieldPoint Petroleum Corp. (a) | 9,981 | 45,713 | |
FieldPoint Petroleum Corp. warrants 3/23/18 (a) | 9,981 | 7,785 | |
Forest Oil Corp. (a) | 391,009 | 785,928 | |
FX Energy, Inc. (a)(d) | 156,740 | 587,775 | |
Gasco Energy, Inc. (a) | 14 | 0 | |
Gastar Exploration, Inc. (a) | 187,114 | 1,193,787 | |
Gevo, Inc. (a) | 159,386 | 216,765 | |
GMX Resources, Inc. (a) | 1 | 0 | |
Goodrich Petroleum Corp. (a)(d) | 118,604 | 1,615,386 | |
Green Plains Renewable Energy, Inc. | 76,943 | 2,033,603 | |
Gulfport Energy Corp. (a) | 279,422 | 18,469,794 | |
Halcon Resources Corp. (a)(d) | 875,442 | 3,335,434 | |
Hallador Energy Co. | 22,224 | 181,126 | |
Harvest Natural Resources, Inc. (a)(d) | 143,319 | 601,940 | |
HollyFrontier Corp. | 660,507 | 30,099,304 | |
Houston American Energy Corp. (a) | 98,796 | 36,594 | |
Hyperdynamics Corp. (a)(d) | 66,951 | 362,874 | |
Isramco, Inc. (a)(d) | 2,413 | 346,217 | |
James River Coal Co. (a)(d) | 122,505 | 90,654 | |
Jones Energy, Inc. | 42,997 | 671,613 | |
KiOR, Inc. Class A (a)(d) | 74,649 | 104,509 | |
Kodiak Oil & Gas Corp. (a) | 879,259 | 10,384,049 | |
Kosmos Energy Ltd. (a) | 384,441 | 4,221,162 | |
Laredo Petroleum Holdings, Inc. (a)(d) | 196,262 | 5,120,476 | |
Lilis Energy, Inc. (a) | 5,111 | 16,355 | |
Lucas Energy, Inc. (a) | 25,312 | 23,578 | |
Magellan Petroleum Corp. (a) | 109,622 | 146,893 | |
Magnum Hunter Resources Corp. (a)(d) | 548,526 | 4,602,133 | |
Common Stocks - continued | |||
Shares | Value | ||
ENERGY - continued | |||
Oil, Gas & Consumable Fuels - continued | |||
Magnum Hunter Resources Corp. warrants 4/16/16 (a) | 45,510 | $ 19,543 | |
Matador Resources Co. (a)(d) | 184,920 | 4,486,159 | |
Mexco Energy Corp. (a) | 2,175 | 19,140 | |
Midstates Petroleum Co., Inc. (a)(d) | 114,326 | 504,178 | |
Miller Energy Resources, Inc. (a)(d) | 137,671 | 955,437 | |
Northern Oil & Gas, Inc. (a)(d) | 212,435 | 2,957,095 | |
Oasis Petroleum, Inc. (a) | 315,514 | 13,746,945 | |
Pacific Ethanol, Inc. (a) | 59,602 | 814,759 | |
Panhandle Royalty Co. Class A | 15,804 | 584,116 | |
PBF Energy, Inc. Class A | 185,646 | 4,678,279 | |
PDC Energy, Inc. (a)(d) | 117,112 | 7,276,169 | |
Penn Virginia Corp. (a)(d) | 180,541 | 2,735,196 | |
Petroquest Energy, Inc. (a) | 184,191 | 871,223 | |
PostRock Energy Corp. (a) | 17,510 | 22,763 | |
PrimeEnergy Corp. (a) | 1,965 | 97,661 | |
Pyramid Oil Co. (a) | 7,060 | 48,643 | |
Quicksilver Resources, Inc. (a)(d) | 441,131 | 1,442,498 | |
Renewable Energy Group, Inc. (a)(d) | 75,100 | 876,417 | |
Rentech, Inc. (a) | 810,143 | 1,523,069 | |
Resolute Energy Corp. (a)(d) | 207,547 | 1,934,338 | |
Rex American Resources Corp. (a) | 20,943 | 998,562 | |
Rex Energy Corp. (a)(d) | 150,832 | 2,865,808 | |
Ring Energy, Inc. (a) | 12,462 | 171,851 | |
Rosetta Resources, Inc. (a)(d) | 199,831 | 8,866,501 | |
Royale Energy, Inc. (a)(d) | 17,323 | 48,851 | |
Sanchez Energy Corp. (a)(d) | 145,553 | 4,336,024 | |
SandRidge Energy, Inc. (a)(d) | 1,201,026 | 7,746,618 | |
Saratoga Resources, Inc. (a) | 38,209 | 51,964 | |
SemGroup Corp. Class A | 137,901 | 9,283,495 | |
SM Energy Co. | 221,938 | 16,367,928 | |
Solazyme, Inc. (a)(d) | 161,875 | 1,986,206 | |
Stone Energy Corp. (a)(d) | 168,818 | 6,067,319 | |
Swift Energy Co. (a)(d) | 152,498 | 1,524,980 | |
Synergy Resources Corp. (a) | 233,774 | 2,475,667 | |
Syntroleum Corp. (a)(d) | 21,880 | 87,301 | |
Targa Resources Corp. | 94,329 | 9,127,274 | |
Teekay Corp. | 129,554 | 7,740,852 | |
Tengasco, Inc. (a) | 63,216 | 25,925 | |
TransAtlantic Petroleum Ltd. (a) | 111,284 | 89,027 | |
Triangle Petroleum Corp. (a)(d) | 200,315 | 1,794,822 | |
U.S. Energy Corp. (a) | 91,127 | 364,508 | |
Ultra Petroleum Corp. (a)(d) | 504,286 | 12,687,836 | |
Uranium Energy Corp. (a)(d) | 267,406 | 486,679 | |
Uranium Resources, Inc. (a)(d) | 43,869 | 140,819 | |
USEC, Inc. (a)(d) | 15,552 | 85,692 | |
VAALCO Energy, Inc. (a)(d) | 208,727 | 1,390,122 | |
W&T Offshore, Inc. | 130,520 | 1,966,936 | |
Warren Resources, Inc. (a) | 249,928 | 1,107,181 | |
Western Refining, Inc. (d) | 177,022 | 6,452,452 | |
Westmoreland Coal Co. (a) | 46,315 | 1,046,719 | |
| |||
Shares | Value | ||
Whiting Petroleum Corp. (a) | 393,733 | $ 27,053,394 | |
World Fuel Services Corp. | 248,189 | 11,173,469 | |
ZaZa Energy Corp. (a)(d) | 90,988 | 83,691 | |
Zion Oil & Gas, Inc. (a)(d) | 112,487 | 186,728 | |
| 538,564,687 | ||
TOTAL ENERGY | 850,065,155 | ||
FINANCIALS - 21.5% | |||
Capital Markets - 1.7% | |||
Affiliated Managers Group, Inc. (a) | 171,184 | 32,191,151 | |
Arlington Asset Investment Corp. (d) | 49,499 | 1,312,713 | |
Artisan Partners Asset Management, Inc. | 61,338 | 3,874,721 | |
BGC Partners, Inc. Class A | 572,665 | 3,894,122 | |
Calamos Asset Management, Inc. Class A | 63,145 | 753,320 | |
CIFI Corp. | 13,714 | 108,341 | |
Cohen & Steers, Inc. (d) | 64,487 | 2,438,253 | |
Cowen Group, Inc. Class A (a) | 378,186 | 1,618,636 | |
Diamond Hill Investment Group, Inc. | 7,229 | 848,323 | |
Eaton Vance Corp. (non-vtg.) | 387,046 | 14,645,821 | |
Evercore Partners, Inc. Class A | 106,659 | 5,934,507 | |
FBR & Co. (a) | 35,461 | 921,986 | |
Federated Investors, Inc. Class B (non-vtg.) (d) | 315,876 | 8,655,002 | |
Financial Engines, Inc. | 169,748 | 9,592,459 | |
FXCM, Inc. Class A (d) | 131,893 | 2,222,397 | |
GAMCO Investors, Inc. Class A | 14,987 | 1,169,885 | |
GFI Group, Inc. | 209,271 | 839,177 | |
Gleacher & Co., Inc. (a) | 9,266 | 102,760 | |
Greenhill & Co., Inc. | 87,741 | 4,673,963 | |
HFF, Inc. | 120,005 | 3,828,160 | |
ICG Group, Inc. (a) | 122,256 | 2,485,464 | |
Institutional Financial Markets, Inc. | 16,813 | 41,360 | |
INTL FCStone, Inc. (a)(d) | 50,495 | 918,504 | |
Investment Technology Group, Inc. (a) | 123,406 | 2,132,456 | |
Janus Capital Group, Inc. (d) | 495,666 | 5,546,503 | |
JMP Group, Inc. | 44,707 | 328,596 | |
KCG Holdings, Inc. Class A | 337,844 | 4,016,965 | |
Ladenburg Thalmann Financial Services, Inc. (a) | 294,559 | 821,820 | |
LPL Financial | 261,852 | 14,056,215 | |
Manning & Napier, Inc. Class A | 42,186 | 619,712 | |
Marcus & Millichap, Inc. | 40,476 | 678,783 | |
Medallion Financial Corp. | 68,389 | 994,376 | |
Oppenheimer Holdings, Inc. Class A (non-vtg.) | 32,675 | 892,354 | |
Piper Jaffray Companies (a)(d) | 58,981 | 2,471,304 | |
Pzena Investment Management, Inc. | 50,731 | 586,450 | |
Raymond James Financial, Inc. | 402,242 | 21,230,333 | |
RCS Capital Corp. Class A | 5,235 | 119,149 | |
Safeguard Scientifics, Inc. (a)(d) | 76,767 | 1,505,401 | |
SEI Investments Co. | 476,702 | 16,002,886 | |
Common Stocks - continued | |||
Shares | Value | ||
FINANCIALS - continued | |||
Capital Markets - continued | |||
Silvercrest Asset Management Group Class A | 16,670 | $ 280,223 | |
Stifel Financial Corp. (a)(d) | 203,928 | 9,806,898 | |
SWS Group, Inc. (a) | 96,417 | 785,799 | |
TD Ameritrade Holding Corp. | 778,984 | 26,041,435 | |
Teton Advisors, Inc. (a) | 145 | 4,713 | |
U.S. Global Investments, Inc. Class A | 36,632 | 131,143 | |
Virtus Investment Partners, Inc. (a) | 23,713 | 4,390,699 | |
Waddell & Reed Financial, Inc. Class A | 279,988 | 19,515,164 | |
Walter Investment Management Corp. (a)(d) | 123,473 | 3,154,735 | |
Westwood Holdings Group, Inc. | 21,548 | 1,226,297 | |
WisdomTree Investments, Inc. (a)(d) | 328,844 | 5,123,390 | |
| 245,534,824 | ||
Commercial Banks - 4.7% | |||
1st Source Corp. | 47,766 | 1,490,299 | |
1st United Bancorp, Inc. | 71,684 | 551,967 | |
Access National Corp. | 15,817 | 266,516 | |
ACNB Corp. (d) | 11,654 | 218,396 | |
Ameriana Bancorp | 2,223 | 30,900 | |
American National Bankshares, Inc. | 18,331 | 411,714 | |
American River Bankshares (a) | 3,552 | 35,129 | |
Ameris Bancorp (a) | 82,350 | 1,732,644 | |
AmeriServ Financial, Inc. | 14,728 | 46,982 | |
Ames National Corp. | 16,110 | 358,931 | |
Arrow Financial Corp. | 40,467 | 1,056,593 | |
Associated Banc-Corp. | 583,660 | 9,741,285 | |
Auburn National Bancorp., Inc. | 2,289 | 55,623 | |
BancFirst Corp. | 24,757 | 1,362,378 | |
Bancorp, Inc., Delaware (a) | 129,188 | 2,473,950 | |
BancorpSouth, Inc. | 276,510 | 6,616,884 | |
Bank of Hawaii Corp. | 151,832 | 8,874,580 | |
Bank of Kentucky Financial Corp. | 10,625 | 372,831 | |
Bank of Marin Bancorp | 15,657 | 692,509 | |
Bank of the Ozarks, Inc. | 112,081 | 7,108,177 | |
BankUnited, Inc. | 283,087 | 9,477,753 | |
Banner Bank | 75,557 | 2,998,857 | |
Bar Harbor Bankshares | 9,461 | 359,518 | |
Baylake Corp. | 5,875 | 73,438 | |
BBCN Bancorp, Inc. | 287,266 | 4,889,267 | |
BCB Bancorp, Inc. | 9,297 | 123,464 | |
BNC Bancorp (d) | 76,230 | 1,328,689 | |
BOK Financial Corp. | 92,125 | 5,963,251 | |
Boston Private Financial Holdings, Inc. | 288,220 | 3,758,389 | |
Bridge Bancorp, Inc. | 30,474 | 802,380 | |
Bridge Capital Holdings (a) | 23,080 | 512,838 | |
Bryn Mawr Bank Corp. | 25,285 | 720,370 | |
BSB Bancorp, Inc. (a) | 19,579 | 330,102 | |
C & F Financial Corp. | 6,736 | 246,538 | |
Camden National Corp. | 17,382 | 652,520 | |
| |||
Shares | Value | ||
Capital Bank Financial Corp.: | |||
rights (a) | 10,774 | $ 0 | |
Series A (a) | 170,724 | 3,926,652 | |
Capital City Bank Group, Inc. (d) | 33,531 | 475,470 | |
CapitalSource, Inc. | 661,961 | 9,730,827 | |
Cardinal Financial Corp. | 103,936 | 1,791,857 | |
Cascade Bancorp (a)(d) | 30,976 | 151,163 | |
Cathay General Bancorp | 256,474 | 6,517,004 | |
Center Bancorp, Inc. | 41,583 | 773,860 | |
Centerstate Banks of Florida, Inc. | 94,937 | 1,037,661 | |
Central Pacific Financial Corp. | 124,369 | 2,453,800 | |
Central Valley Community Bancorp | 8,755 | 101,208 | |
Century Bancorp, Inc. Class A (non-vtg.) | 7,814 | 280,523 | |
Chemical Financial Corp. | 110,706 | 3,264,720 | |
Chemung Financial Corp. | 11,097 | 324,809 | |
CIT Group, Inc. | 659,699 | 32,114,147 | |
Citizens & Northern Corp. | 30,086 | 599,313 | |
Citizens Holding Co. | 2,280 | 41,906 | |
City Holding Co. (d) | 58,474 | 2,589,229 | |
City National Corp. | 156,768 | 11,730,949 | |
CNB Financial Corp., Pennsylvania | 24,450 | 450,125 | |
CoBiz, Inc. | 133,405 | 1,488,800 | |
Colony Bankcorp, Inc. (a) | 4,518 | 27,786 | |
Columbia Banking Systems, Inc. | 193,061 | 5,062,059 | |
Commerce Bancshares, Inc. | 284,515 | 12,706,440 | |
Community Bank System, Inc. | 176,437 | 6,427,600 | |
Community Trust Bancorp, Inc. | 52,840 | 2,092,464 | |
CommunityOne Bancorp (a)(d) | 21,639 | 238,245 | |
CU Bancorp (a) | 16,798 | 303,372 | |
Cullen/Frost Bankers, Inc. | 175,898 | 13,129,027 | |
CVB Financial Corp. | 323,112 | 5,030,854 | |
Eagle Bancorp, Inc., Maryland | 81,397 | 2,788,661 | |
East West Bancorp, Inc. | 486,885 | 17,376,926 | |
Eastern Virginia Bankshares, Inc. (a) | 3,557 | 24,188 | |
Enterprise Bancorp, Inc. | 14,913 | 287,075 | |
Enterprise Financial Services Corp. | 58,302 | 1,091,413 | |
Farmers Capital Bank Corp. (a) | 21,180 | 414,916 | |
Farmers National Banc Corp. | 41,229 | 306,744 | |
Fidelity Southern Corp. | 42,096 | 604,920 | |
Financial Institutions, Inc. | 32,310 | 712,112 | |
First Bancorp, North Carolina | 41,814 | 765,196 | |
First Bancorp, Puerto Rico (a) | 367,628 | 1,915,342 | |
First Busey Corp. | 193,866 | 1,153,503 | |
First Citizen Bancshares, Inc. | 29,067 | 6,522,344 | |
First Commonwealth Financial Corp. | 341,940 | 2,913,329 | |
First Community Bancshares, Inc. | 40,060 | 671,005 | |
First Connecticut Bancorp, Inc. | 47,822 | 749,849 | |
First Financial Bancorp, Ohio | 253,298 | 4,316,198 | |
First Financial Bankshares, Inc. (d) | 109,188 | 6,603,690 | |
First Financial Corp., Indiana | 30,489 | 1,048,517 | |
First Financial Holdings, Inc. | 86,329 | 5,286,788 | |
First Financial Service Corp. (a) | 745 | 3,144 | |
First Horizon National Corp. | 761,724 | 9,117,836 | |
First Internet Bancorp | 1,845 | 42,417 | |
Common Stocks - continued | |||
Shares | Value | ||
FINANCIALS - continued | |||
Commercial Banks - continued | |||
First Interstate Bancsystem, Inc. | 80,392 | $ 2,082,153 | |
First Merchants Corp. | 134,492 | 2,880,819 | |
First Midwest Bancorp, Inc., Delaware | 296,196 | 4,937,587 | |
First Niagara Financial Group, Inc. | 1,150,441 | 10,434,500 | |
First of Long Island Corp. | 17,771 | 690,581 | |
First Republic Bank | 411,169 | 21,368,453 | |
First Security Group, Inc. | 32,694 | 70,292 | |
First South Bancorp, Inc., Virginia | 39,689 | 346,088 | |
First United Corp. (a) | 14,602 | 112,581 | |
Firstbank Corp., Michigan | 12,755 | 234,054 | |
FirstMerit Corp. | 542,865 | 11,269,877 | |
Flushing Financial Corp. | 104,087 | 2,156,683 | |
FNB Corp., Pennsylvania | 551,647 | 6,724,577 | |
Fulton Financial Corp. | 674,238 | 8,299,870 | |
German American Bancorp, Inc. | 31,949 | 923,965 | |
Glacier Bancorp, Inc. | 243,311 | 6,751,880 | |
Great Southern Bancorp, Inc. | 22,484 | 645,291 | |
Guaranty Bancorp | 48,684 | 687,418 | |
Hampton Roads Bankshares, Inc. (a) | 275,254 | 456,922 | |
Hancock Holding Co. | 295,673 | 10,188,892 | |
Hanmi Financial Corp. | 118,757 | 2,782,477 | |
Hawthorn Bancshares, Inc. | 6,989 | 90,927 | |
Heartland Financial U.S.A., Inc. | 44,583 | 1,199,283 | |
Heritage Commerce Corp. | 57,846 | 467,974 | |
Heritage Financial Corp., Washington | 35,332 | 626,436 | |
Heritage Oaks Bancorp (a) | 59,207 | 473,064 | |
Home Bancshares, Inc. | 164,845 | 5,532,198 | |
Home Federal Bancorp, Inc. | 41,355 | 624,047 | |
HomeTrust Bancshares, Inc. (a) | 58,805 | 921,474 | |
Horizon Bancorp Industries | 16,035 | 348,601 | |
Hudson Valley Holding Corp. | 43,646 | 820,108 | |
IBERIABANK Corp. | 107,973 | 7,072,232 | |
Independent Bank Corp. (a) | 78,883 | 970,261 | |
Independent Bank Corp., Massachusetts | 94,643 | 3,481,916 | |
Independent Bank Group, Inc. | 12,518 | 672,717 | |
International Bancshares Corp. | 210,616 | 4,882,079 | |
Intervest Bancshares Corp. Class A (a)(d) | 47,999 | 355,673 | |
Investors Bancorp, Inc. | 220,213 | 5,840,049 | |
Lakeland Bancorp, Inc. | 90,484 | 1,022,469 | |
Lakeland Financial Corp. | 58,722 | 2,231,436 | |
LCNB Corp. (d) | 22,903 | 400,803 | |
Macatawa Bank Corp. (d) | 64,065 | 338,263 | |
MainSource Financial Group, Inc. | 47,324 | 817,285 | |
MB Financial, Inc. | 196,866 | 6,010,319 | |
MBT Financial Corp. (a) | 11,242 | 54,186 | |
Mercantile Bank Corp. | 19,339 | 392,582 | |
Merchants Bancshares, Inc. | 14,012 | 461,555 | |
Metro Bancorp, Inc. (a) | 42,825 | 840,227 | |
Middleburg Financial Corp. | 14,592 | 268,201 | |
Midsouth Bancorp, Inc. | 24,320 | 426,086 | |
MidWestOne Financial Group, Inc. | 16,620 | 433,450 | |
| |||
Shares | Value | ||
Monarch Financial Holdings, Inc. | 10,098 | $ 118,954 | |
MutualFirst Financial, Inc. | 7,773 | 147,842 | |
National Bank Holdings Corp. | 165,480 | 3,248,372 | |
National Bankshares, Inc. (d) | 16,169 | 582,084 | |
National Penn Bancshares, Inc. | 448,215 | 4,840,722 | |
NBT Bancorp, Inc. | 184,680 | 4,336,286 | |
NewBridge Bancorp (a)(d) | 47,976 | 345,427 | |
North Valley Bancorp (a) | 24,641 | 573,396 | |
Northeast Bancorp | 15,002 | 139,519 | |
Northrim Bancorp, Inc. | 12,118 | 297,739 | |
Norwood Financial Corp. | 3,054 | 88,688 | |
OBA Financial Services, Inc. (a) | 5,103 | 94,303 | |
OFG Bancorp (d) | 149,770 | 2,396,320 | |
Ohio Valley Banc Corp. | 7,485 | 167,215 | |
Old National Bancorp, Indiana | 383,224 | 5,376,633 | |
Old Second Bancorp, Inc. (a)(d) | 34,774 | 172,479 | |
OmniAmerican Bancorp, Inc. | 32,753 | 713,033 | |
Orrstown Financial Services, Inc. (a) | 18,291 | 299,607 | |
Pacific Continental Corp. | 43,214 | 623,578 | |
Pacific Mercantile Bancorp (a) | 29,298 | 182,820 | |
Pacific Premier Bancorp, Inc. (a) | 35,923 | 571,176 | |
PacWest Bancorp (d) | 133,344 | 5,787,130 | |
Park National Corp. (d) | 52,197 | 4,074,498 | |
Park Sterling Corp. | 124,780 | 818,557 | |
Patriot National Bancorp, Inc. (a) | 14,022 | 17,528 | |
Peapack-Gladstone Financial Corp. | 21,894 | 407,228 | |
Penns Woods Bancorp, Inc. | 11,224 | 514,171 | |
Peoples Bancorp of North Carolina | 1,842 | 28,367 | |
Peoples Bancorp, Inc. | 20,954 | 512,744 | |
Peoples Financial Corp., Mississippi (a) | 7,232 | 97,632 | |
Pinnacle Financial Partners, Inc. | 116,895 | 4,217,572 | |
Popular, Inc. (a) | 344,493 | 9,849,055 | |
Porter Bancorp, Inc. (a) | 3,733 | 3,696 | |
Preferred Bank, Los Angeles (a) | 27,407 | 658,590 | |
Premier Financial Bancorp, Inc. | 6,092 | 85,410 | |
PrivateBancorp, Inc. | 217,626 | 6,280,686 | |
Prosperity Bancshares, Inc. | 186,499 | 11,807,252 | |
QCR Holdings, Inc. | 6,005 | 103,887 | |
Renasant Corp. | 112,407 | 3,266,547 | |
Republic Bancorp, Inc., Kentucky Class A | 30,943 | 745,417 | |
Republic First Bancorp, Inc. (a) | 44,636 | 164,260 | |
Royal Bancshares of Pennsylvania, Inc. Class A (a) | 6,704 | 16,693 | |
S&T Bancorp, Inc. | 97,041 | 2,238,736 | |
S.Y. Bancorp, Inc. | 39,985 | 1,193,152 | |
Sandy Spring Bancorp, Inc. | 80,527 | 1,910,906 | |
SB Financial Group, Inc. | 532 | 4,575 | |
Seacoast Banking Corp., Florida (a) | 75,186 | 810,505 | |
Shore Bancshares, Inc. (a) | 20,686 | 195,896 | |
Sierra Bancorp | 31,765 | 518,087 | |
Signature Bank (a)(d) | 157,568 | 20,630,378 | |
Simmons First National Corp. Class A | 52,680 | 1,876,988 | |
Southern National Bancorp of Virginia, Inc. | 12,282 | 122,820 | |
Common Stocks - continued | |||
Shares | Value | ||
FINANCIALS - continued | |||
Commercial Banks - continued | |||
Southside Bancshares, Inc. | 54,624 | $ 1,613,047 | |
Southwest Bancorp, Inc., Oklahoma | 58,607 | 1,030,897 | |
State Bank Financial Corp. | 129,459 | 2,203,392 | |
Sterling Bancorp | 304,891 | 3,914,800 | |
Sterling Financial Corp. | 78,788 | 2,495,216 | |
Suffolk Bancorp (a) | 26,410 | 532,690 | |
Summit Financial Group, Inc. (a) | 1,800 | 18,846 | |
Sun Bancorp, Inc., New Jersey (a) | 136,043 | 473,430 | |
Susquehanna Bancshares, Inc. | 634,995 | 6,946,845 | |
SVB Financial Group (a) | 153,018 | 19,266,496 | |
Synovus Financial Corp. | 3,203,582 | 11,148,465 | |
Taylor Capital Group, Inc. (a) | 53,053 | 1,252,051 | |
TCF Financial Corp. | 553,071 | 8,915,505 | |
Texas Capital Bancshares, Inc. (a)(d) | 134,877 | 8,490,507 | |
The First Bancorp, Inc. | 21,478 | 351,595 | |
Tompkins Financial Corp. | 41,723 | 2,019,810 | |
Tower Financial Corp. | 3,165 | 73,934 | |
TowneBank (d) | 72,900 | 1,091,313 | |
Trico Bancshares | 46,177 | 1,153,963 | |
Trustmark Corp. | 245,441 | 5,922,491 | |
Two River Bancorp | 1,393 | 11,297 | |
UMB Financial Corp. | 129,352 | 8,063,804 | |
Umpqua Holdings Corp. (d) | 370,508 | 6,583,927 | |
Union Bankshares, Inc. | 388 | 8,858 | |
Union First Market Bankshares Corp. | 169,630 | 4,291,639 | |
United Bancorp, Inc. | 370 | 3,078 | |
United Bankshares, Inc., West Virginia (d) | 216,395 | 6,368,505 | |
United Community Banks, Inc., Georgia (a) | 141,348 | 2,359,098 | |
United Security Bancshares, Inc. (a) | 8,545 | 65,113 | |
United Security Bancshares, California | 7,792 | 40,986 | |
Univest Corp. of Pennsylvania | 47,341 | 912,261 | |
Valley National Bancorp (d) | 708,708 | 7,143,777 | |
VantageSouth Bancshares, Inc. (a) | 11,111 | 67,110 | |
ViewPoint Financial Group | 138,306 | 3,457,650 | |
Washington Banking Co., Oak Harbor | 48,330 | 890,239 | |
Washington Trust Bancorp, Inc. | 39,990 | 1,407,248 | |
Webster Financial Corp. | 301,055 | 9,323,673 | |
WesBanco, Inc. | 97,343 | 2,901,795 | |
West Bancorp., Inc. | 33,706 | 500,534 | |
Westamerica Bancorp. (d) | 98,932 | 4,974,301 | |
Westbury Bancorp, Inc. | 13,612 | 196,013 | |
Western Alliance Bancorp. (a) | 263,514 | 6,102,984 | |
Wilshire Bancorp, Inc. | 227,726 | 2,311,419 | |
Wintrust Financial Corp. | 167,102 | 7,733,481 | |
Xenith Bankshares, Inc. (a) | 17,541 | 105,597 | |
Yadkin Financial Corp. (a) | 44,751 | 859,219 | |
| 667,308,561 | ||
Consumer Finance - 0.3% | |||
Asta Funding, Inc. (a) | 25,295 | 212,478 | |
| |||
Shares | Value | ||
Atlanticus Holdings Corp. (a)(d) | 33,601 | $ 84,003 | |
Cash America International, Inc. (d) | 101,875 | 4,077,038 | |
Consumer Portfolio Services, Inc. (a) | 34,741 | 270,632 | |
Credit Acceptance Corp. (a) | 36,903 | 5,097,780 | |
DFC Global Corp. (a) | 126,272 | 1,039,219 | |
Encore Capital Group, Inc. (a)(d) | 79,228 | 3,852,065 | |
EZCORP, Inc. (non-vtg.) Class A (a) | 197,585 | 2,497,474 | |
First Cash Financial Services, Inc. (a)(d) | 101,068 | 5,339,422 | |
First Marblehead Corp. (a) | 22,462 | 157,459 | |
Green Dot Corp. Class A (a) | 72,624 | 1,463,374 | |
Imperial Holdings, Inc. (a)(d) | 53,799 | 294,281 | |
JGWPT Holdings, Inc. | 37,576 | 718,453 | |
Nelnet, Inc. Class A | 61,950 | 2,485,434 | |
Nicholas Financial, Inc. | 73,640 | 1,162,039 | |
Portfolio Recovery Associates, Inc. (a)(d) | 166,653 | 9,037,592 | |
QC Holdings, Inc. | 15,915 | 38,673 | |
Regional Management Corp. (a) | 35,651 | 1,075,947 | |
Springleaf Holdings, Inc. (d) | 77,086 | 2,171,513 | |
World Acceptance Corp. (a)(d) | 35,872 | 3,438,331 | |
| 44,513,207 | ||
Diversified Financial Services - 0.5% | |||
California First National Bancorp | 1,545 | 23,144 | |
Catskill Litigation Trust (a) | 1,036 | 0 | |
CBOE Holdings, Inc. | 289,485 | 15,640,875 | |
Gain Capital Holdings, Inc. (d) | 46,117 | 475,927 | |
ING U.S., Inc. | 366,313 | 13,139,647 | |
Interactive Brokers Group, Inc. | 167,002 | 3,714,124 | |
Life Partners Holdings, Inc. (d) | 51,198 | 123,387 | |
MarketAxess Holdings, Inc. | 130,538 | 7,706,964 | |
Marlin Business Services Corp. | 28,530 | 613,395 | |
MicroFinancial, Inc. | 17,898 | 145,511 | |
MSCI, Inc. Class A (a) | 398,294 | 17,409,431 | |
NCP Litigation Trust (a) | 200 | 0 | |
NewStar Financial, Inc. (a) | 69,745 | 1,072,678 | |
PHH Corp. (a) | 177,919 | 4,631,232 | |
PICO Holdings, Inc. (a) | 85,950 | 2,158,205 | |
Resource America, Inc. Class A | 25,148 | 237,900 | |
Vector Capital Corp. rights (a) | 49,572 | 1 | |
| 67,092,421 | ||
Insurance - 4.0% | |||
Alleghany Corp. (a) | 54,712 | 21,091,476 | |
Allied World Assurance Co. Holdings Ltd. | 108,644 | 10,833,980 | |
AMBAC Financial Group, Inc. (a) | 152,251 | 5,261,795 | |
American Equity Investment Life Holding Co. | 229,949 | 5,026,685 | |
American Financial Group, Inc. | 226,460 | 12,944,454 | |
American National Insurance Co. | 20,273 | 2,300,783 | |
Amerisafe, Inc. | 62,486 | 2,720,640 | |
Amtrust Financial Services, Inc. (d) | 103,569 | 3,914,908 | |
Arch Capital Group Ltd. (a)(d) | 397,262 | 22,294,343 | |
Argo Group International Holdings, Ltd. | 89,165 | 3,935,743 | |
Arthur J. Gallagher & Co. | 424,118 | 19,594,252 | |
Common Stocks - continued | |||
Shares | Value | ||
FINANCIALS - continued | |||
Insurance - continued | |||
Aspen Insurance Holdings Ltd. | 210,817 | $ 7,918,287 | |
Assured Guaranty Ltd. | 531,990 | 13,060,355 | |
Axis Capital Holdings Ltd. | 350,058 | 15,392,050 | |
Baldwin & Lyons, Inc. Class B | 20,123 | 517,362 | |
Brown & Brown, Inc. | 383,128 | 11,532,153 | |
Citizens, Inc. Class A (a)(d) | 105,942 | 777,614 | |
CNA Financial Corp. | 130,900 | 5,431,041 | |
CNO Financial Group, Inc. | 731,060 | 13,349,156 | |
Crawford & Co. Class B | 71,993 | 609,781 | |
Donegal Group, Inc. Class A | 26,385 | 372,292 | |
eHealth, Inc. (a)(d) | 61,993 | 2,975,664 | |
EMC Insurance Group | 12,011 | 366,336 | |
Employers Holdings, Inc. | 101,985 | 2,006,045 | |
Endurance Specialty Holdings Ltd. | 150,695 | 7,857,237 | |
Enstar Group Ltd. (a) | 32,640 | 4,085,875 | |
Erie Indemnity Co. Class A | 88,774 | 6,443,217 | |
Everest Re Group Ltd. | 156,575 | 23,367,253 | |
FBL Financial Group, Inc. Class A | 37,269 | 1,559,335 | |
Federated National Holding Co. | 17,351 | 275,534 | |
Fidelity National Financial, Inc. Class A | 907,507 | 30,002,181 | |
First Acceptance Corp. (a) | 24,679 | 64,165 | |
First American Financial Corp. | 349,879 | 9,425,740 | |
Fortegra Financial Corp. (a) | 15,197 | 106,227 | |
Global Indemnity PLC (a)(d) | 37,631 | 981,416 | |
Greenlight Capital Re, Ltd. (a)(d) | 101,968 | 3,206,894 | |
Hallmark Financial Services, Inc. (a) | 27,548 | 233,332 | |
Hanover Insurance Group, Inc. | 149,874 | 8,818,586 | |
HCC Insurance Holdings, Inc. | 326,998 | 14,355,212 | |
HCI Group, Inc. (d) | 31,967 | 1,547,842 | |
Health Insurance Innovations (d) | 12,600 | 158,634 | |
Hilltop Holdings, Inc. (a) | 229,448 | 5,623,770 | |
Horace Mann Educators Corp. | 137,825 | 3,943,173 | |
Independence Holding Co. | 12,745 | 173,714 | |
Infinity Property & Casualty Corp. | 40,020 | 2,951,475 | |
Investors Title Co. | 2,693 | 207,146 | |
Kansas City Life Insurance Co. | 10,866 | 534,607 | |
Kemper Corp. | 177,471 | 6,882,325 | |
Maiden Holdings Ltd. | 199,442 | 2,239,734 | |
Markel Corp. (a) | 46,363 | 26,797,814 | |
MBIA, Inc. (a)(d) | 476,702 | 6,459,312 | |
Meadowbrook Insurance Group, Inc. | 152,822 | 820,654 | |
Mercury General Corp. | 128,965 | 5,842,115 | |
Montpelier Re Holdings Ltd. | 152,603 | 4,350,712 | |
National Interstate Corp. (d) | 62,455 | 1,890,513 | |
National Western Life Insurance Co. Class A | 7,764 | 1,755,052 | |
Navigators Group, Inc. (a) | 38,081 | 2,308,470 | |
Old Republic International Corp. | 782,580 | 12,176,945 | |
OneBeacon Insurance Group Ltd. | 65,270 | 1,070,428 | |
PartnerRe Ltd. | 154,297 | 15,256,887 | |
Phoenix Companies, Inc. (a) | 17,250 | 881,993 | |
| |||
Shares | Value | ||
Platinum Underwriters Holdings Ltd. | 97,663 | $ 5,725,005 | |
Primerica, Inc. | 182,311 | 8,171,179 | |
ProAssurance Corp. | 211,456 | 9,612,790 | |
Protective Life Corp. | 259,672 | 13,539,298 | |
Reinsurance Group of America, Inc. | 231,645 | 17,834,349 | |
RenaissanceRe Holdings Ltd. | 142,151 | 13,576,842 | |
RLI Corp. | 114,998 | 4,959,864 | |
Safety Insurance Group, Inc. | 44,258 | 2,470,924 | |
Selective Insurance Group, Inc. | 195,872 | 4,512,891 | |
StanCorp Financial Group, Inc. | 147,970 | 9,792,655 | |
State Auto Financial Corp. | 38,206 | 764,884 | |
Stewart Information Services Corp. | 72,916 | 2,696,434 | |
Symetra Financial Corp. | 339,358 | 6,685,353 | |
Third Point Reinsurance Ltd. | 89,837 | 1,347,555 | |
Tower Group International Ltd. (d) | 117,565 | 324,479 | |
United Fire Group, Inc. | 77,762 | 2,253,543 | |
United Insurance Holdings Corp. | 59,225 | 773,479 | |
Universal Insurance Holdings, Inc. | 99,404 | 1,328,037 | |
Validus Holdings Ltd. | 323,014 | 11,890,145 | |
W.R. Berkley Corp. | 350,264 | 14,444,887 | |
White Mountains Insurance Group Ltd. | 19,596 | 11,357,058 | |
Willis Group Holdings PLC | 595,283 | 24,501,848 | |
| 567,446,213 | ||
Real Estate Investment Trusts - 8.6% | |||
Acadia Realty Trust (SBI) | 200,571 | 5,305,103 | |
AG Mortgage Investment Trust, Inc. | 104,641 | 1,919,116 | |
Agree Realty Corp. | 53,329 | 1,639,333 | |
Alexanders, Inc. | 8,052 | 3,017,165 | |
Alexandria Real Estate Equities, Inc. | 234,944 | 17,021,693 | |
Altisource Residential Corp. Class B | 180,731 | 5,165,292 | |
American Assets Trust, Inc. | 122,663 | 4,056,465 | |
American Campus Communities, Inc. | 345,329 | 12,756,453 | |
American Capital Agency Corp. | 1,269,000 | 28,286,010 | |
American Capital Mortgage Investment Corp. | 184,016 | 3,711,603 | |
American Homes 4 Rent Class A | 176,591 | 2,892,561 | |
American Realty Capital Properties, Inc. | 1,890,749 | 27,775,103 | |
American Residential Properties, Inc. (a)(d) | 57,037 | 1,038,073 | |
AmREIT, Inc. Class B | 50,317 | 872,497 | |
Annaly Capital Management, Inc. | 3,147,349 | 35,187,362 | |
Anworth Mortgage Asset Corp. | 536,989 | 2,781,603 | |
Apollo Commercial Real Estate Finance, Inc. | 139,860 | 2,341,256 | |
Apollo Residential Mortgage, Inc. | 117,920 | 2,056,525 | |
Arbor Realty Trust, Inc. | 114,120 | 782,863 | |
Ares Commercial Real Estate Corp. | 140,190 | 1,905,182 | |
Armada Hoffler Properties, Inc. | 52,271 | 511,733 | |
Armour Residential REIT, Inc. | 1,242,005 | 5,328,201 | |
Ashford Hospitality Prime, Inc. | 67,990 | 1,138,833 | |
Ashford Hospitality Trust, Inc. | 258,873 | 2,894,200 | |
Associated Estates Realty Corp. | 198,620 | 3,396,402 | |
Aviv REIT, Inc. | 63,187 | 1,602,422 | |
BioMed Realty Trust, Inc. | 624,919 | 12,923,325 | |
Common Stocks - continued | |||
Shares | Value | ||
FINANCIALS - continued | |||
Real Estate Investment Trusts - continued | |||
Blackstone Mortgage Trust, Inc. (d) | 115,336 | $ 3,341,284 | |
Brandywine Realty Trust (SBI) | 520,180 | 7,620,637 | |
BRE Properties, Inc. | 257,061 | 15,878,658 | |
Brixmor Property Group, Inc. (d) | 161,900 | 3,574,752 | |
BRT Realty Trust (a) | 8,802 | 62,758 | |
Camden Property Trust (SBI) | 281,434 | 18,771,648 | |
Campus Crest Communities, Inc. | 230,994 | 1,912,630 | |
Capstead Mortgage Corp. (d) | 334,305 | 4,309,191 | |
CBL & Associates Properties, Inc. | 557,567 | 9,919,117 | |
Cedar Shopping Centers, Inc. | 243,292 | 1,496,246 | |
Chambers Street Properties (d) | 831,672 | 6,578,526 | |
Chatham Lodging Trust | 91,880 | 1,917,536 | |
Cherry Hill Mortgage Investment Corp. | 38,323 | 696,712 | |
Chesapeake Lodging Trust | 171,097 | 4,457,077 | |
Chimera Investment Corp. | 3,420,897 | 10,912,661 | |
Colony Financial, Inc. | 268,339 | 6,059,095 | |
Columbia Property Trust, Inc. | 425,860 | 11,302,324 | |
CommonWealth REIT (d) | 369,850 | 10,041,428 | |
Coresite Realty Corp. | 71,084 | 2,213,556 | |
Corporate Office Properties Trust (SBI) | 291,288 | 7,768,651 | |
Corrections Corp. of America (d) | 383,671 | 12,795,428 | |
Cousins Properties, Inc. | 616,364 | 7,119,004 | |
CubeSmart | 427,083 | 7,478,223 | |
CyrusOne, Inc. | 66,522 | 1,478,119 | |
CYS Investments, Inc. | 568,403 | 5,001,946 | |
DCT Industrial Trust, Inc. | 1,016,781 | 8,052,906 | |
DDR Corp. | 908,582 | 15,100,633 | |
DiamondRock Hospitality Co. | 624,027 | 7,875,221 | |
Digital Realty Trust, Inc. (d) | 424,875 | 23,011,230 | |
Douglas Emmett, Inc. | 426,031 | 11,473,015 | |
Duke Realty LP | 1,072,656 | 18,020,621 | |
DuPont Fabros Technology, Inc. (d) | 210,268 | 5,584,718 | |
EastGroup Properties, Inc. | 104,946 | 6,510,850 | |
Education Realty Trust, Inc. | 391,132 | 3,688,375 | |
Ellington Residential Mortgage REIT | 20,297 | 343,628 | |
Empire State Realty Trust, Inc. | 283,009 | 4,335,698 | |
EPR Properties | 174,225 | 9,279,224 | |
Equity Lifestyle Properties, Inc. | 273,332 | 11,001,613 | |
Equity One, Inc. | 224,592 | 5,210,534 | |
Essex Property Trust, Inc. | 122,740 | 20,528,265 | |
Excel Trust, Inc. | 176,835 | 2,215,743 | |
Extra Space Storage, Inc. | 360,984 | 17,724,314 | |
Federal Realty Investment Trust (SBI) | 209,479 | 23,317,107 | |
FelCor Lodging Trust, Inc. | 371,704 | 3,237,542 | |
First Industrial Realty Trust, Inc. | 329,206 | 6,333,923 | |
First Potomac Realty Trust | 225,311 | 2,856,943 | |
Five Oaks Investment Corp. | 46,855 | 529,462 | |
Franklin Street Properties Corp. | 330,769 | 4,141,228 | |
Gaming & Leisure Properties | 291,614 | 11,104,661 | |
Getty Realty Corp. | 107,657 | 2,071,321 | |
Gladstone Commercial Corp. | 42,375 | 737,325 | |
| |||
Shares | Value | ||
Glimcher Realty Trust | 521,855 | $ 5,077,649 | |
Government Properties Income Trust (d) | 187,222 | 4,663,700 | |
Gramercy Property Trust, Inc. (a) | 181,520 | 1,052,816 | |
Hannon Armstrong Sustainable Infrastructure Capital, Inc. | 41,668 | 597,102 | |
Hatteras Financial Corp. | 327,863 | 6,465,458 | |
Healthcare Realty Trust, Inc. | 332,649 | 7,973,597 | |
Healthcare Trust of America, Inc. | 608,455 | 6,832,950 | |
Hersha Hospitality Trust | 621,806 | 3,494,550 | |
Highwoods Properties, Inc. (SBI) | 283,235 | 10,680,792 | |
Home Properties, Inc. | 193,491 | 11,404,360 | |
Hospitality Properties Trust (SBI) | 486,101 | 12,881,677 | |
Hudson Pacific Properties, Inc. | 158,929 | 3,625,170 | |
Independence Realty Trust, Inc. | 26,999 | 232,191 | |
Inland Real Estate Corp. | 300,656 | 3,220,026 | |
Invesco Mortgage Capital, Inc. | 454,438 | 7,648,192 | |
Investors Real Estate Trust | 391,462 | 3,437,036 | |
iStar Financial, Inc. (a)(d) | 266,363 | 4,128,627 | |
JAVELIN Mortgage Investment Corp. (d) | 46,815 | 678,818 | |
Kilroy Realty Corp. | 266,153 | 15,309,121 | |
Kite Realty Group Trust | 475,019 | 2,935,617 | |
LaSalle Hotel Properties (SBI) | 334,090 | 10,470,381 | |
Lexington Corporate Properties Trust | 663,426 | 7,569,691 | |
Liberty Property Trust (SBI) | 475,596 | 18,196,303 | |
LTC Properties, Inc. | 115,693 | 4,359,312 | |
Mack-Cali Realty Corp. | 293,454 | 6,529,352 | |
Medical Properties Trust, Inc. | 537,748 | 7,092,896 | |
MFA Financial, Inc. | 1,217,966 | 9,573,213 | |
Mid-America Apartment Communities, Inc. (d) | 242,922 | 16,431,244 | |
Monmouth Real Estate Investment Corp. Class A | 157,116 | 1,520,883 | |
National Health Investors, Inc. | 101,862 | 6,284,885 | |
National Retail Properties, Inc. (d) | 396,763 | 14,239,824 | |
New York Mortgage Trust, Inc. (d) | 247,724 | 1,914,907 | |
NorthStar Realty Finance Corp. | 1,040,313 | 16,135,255 | |
Omega Healthcare Investors, Inc. (d) | 398,237 | 12,727,655 | |
One Liberty Properties, Inc. | 35,770 | 784,078 | |
Orchid Island Capital, Inc. (d) | 903 | 11,441 | |
Parkway Properties, Inc. | 268,779 | 4,953,597 | |
Pebblebrook Hotel Trust | 207,254 | 6,889,123 | |
Pennsylvania Real Estate Investment Trust (SBI) | 231,409 | 4,341,233 | |
PennyMac Mortgage Investment Trust | 233,473 | 5,678,063 | |
Physicians Realty Trust | 99,817 | 1,336,550 | |
Piedmont Office Realty Trust, Inc. Class A | 550,830 | 9,518,342 | |
PMC Commercial Trust | 15,439 | 147,906 | |
Post Properties, Inc. | 176,369 | 8,559,188 | |
Potlatch Corp. | 133,057 | 5,274,379 | |
Power (REIT) (a) | 1,227 | 11,350 | |
Preferred Apartment Communities, Inc. Class A | 22,297 | 183,058 | |
PS Business Parks, Inc. | 73,314 | 6,159,842 | |
QTS Realty Trust, Inc. Class A | 55,322 | 1,414,030 | |
Common Stocks - continued | |||
Shares | Value | ||
FINANCIALS - continued | |||
Real Estate Investment Trusts - continued | |||
RAIT Financial Trust (d) | 248,382 | $ 2,064,054 | |
Ramco-Gershenson Properties Trust (SBI) | 248,170 | 4,144,439 | |
Rayonier, Inc. | 419,443 | 19,751,571 | |
Realty Income Corp. (d) | 679,850 | 30,198,937 | |
Redwood Trust, Inc. (d) | 288,721 | 5,803,292 | |
Regency Centers Corp. | 304,312 | 15,449,920 | |
Resource Capital Corp. | 434,839 | 2,535,111 | |
Retail Opportunity Investments Corp. | 217,500 | 3,225,525 | |
Retail Properties America, Inc. | 632,021 | 8,810,373 | |
Rexford Industrial Realty, Inc. | 54,330 | 770,943 | |
RLJ Lodging Trust | 409,110 | 10,632,769 | |
Rouse Properties, Inc. (d) | 115,811 | 2,167,982 | |
Ryman Hospitality Properties, Inc. (d) | 163,023 | 6,877,940 | |
Sabra Health Care REIT, Inc. | 131,566 | 3,745,684 | |
Saul Centers, Inc. | 44,429 | 2,064,616 | |
Select Income (REIT) | 107,558 | 3,135,316 | |
Senior Housing Properties Trust (SBI) | 613,743 | 13,686,469 | |
Silver Bay Realty Trust Corp. | 142,660 | 2,235,482 | |
SL Green Realty Corp. | 307,276 | 30,521,725 | |
SoTHERLY Hotels, Inc. | 27,804 | 171,551 | |
Sovran Self Storage, Inc. | 105,708 | 7,821,335 | |
Spirit Realty Capital, Inc. | 1,134,045 | 12,383,771 | |
Stag Industrial, Inc. | 159,251 | 3,712,141 | |
Starwood Property Trust, Inc. | 637,854 | 15,321,253 | |
Starwood Waypoint Residential (a) | 127,570 | 3,458,423 | |
Strategic Hotel & Resorts, Inc. (a)(d) | 594,160 | 5,935,658 | |
Summit Hotel Properties, Inc. | 290,927 | 2,688,165 | |
Sun Communities, Inc. | 121,106 | 5,578,142 | |
Sunstone Hotel Investors, Inc. | 595,200 | 8,047,104 | |
Supertel Hospitality, Inc., Maryland (a) | 1,649 | 4,123 | |
Tanger Factory Outlet Centers, Inc. | 306,072 | 10,501,330 | |
Taubman Centers, Inc. | 207,363 | 14,608,723 | |
Terreno Realty Corp. | 69,706 | 1,302,108 | |
The Geo Group, Inc. | 237,822 | 7,665,003 | |
Trade Street Residential, Inc. | 3,743 | 27,286 | |
Two Harbors Investment Corp. | 1,198,997 | 12,445,589 | |
UDR, Inc. | 817,768 | 21,106,592 | |
UMH Properties, Inc. | 45,741 | 424,019 | |
Universal Health Realty Income Trust (SBI) | 45,124 | 1,921,380 | |
Urstadt Biddle Properties, Inc. Class A | 86,921 | 1,704,521 | |
Washington REIT (SBI) | 225,206 | 5,663,931 | |
Weingarten Realty Investors (SBI) | 374,033 | 11,408,007 | |
Western Asset Mortgage Capital Corp. (d) | 79,800 | 1,314,306 | |
Whitestone REIT Class B | 74,608 | 1,072,863 | |
Winthrop Realty Trust | 108,839 | 1,266,886 | |
WP Carey, Inc. | 185,918 | 11,809,511 | |
ZAIS Financial Corp. | 15,500 | 269,855 | |
| 1,213,402,835 | ||
| |||
Shares | Value | ||
Real Estate Management & Development - 0.7% | |||
Alexander & Baldwin, Inc. | 145,924 | $ 6,073,357 | |
Altisource Portfolio Solutions SA | 55,909 | 5,500,327 | |
American Realty Investments, Inc. (a) | 1,965 | 19,257 | |
AV Homes, Inc. (a) | 31,513 | 622,382 | |
Consolidated-Tomoka Land Co. | 12,368 | 439,806 | |
Forest City Enterprises, Inc. Class A (a)(d) | 524,820 | 10,223,494 | |
Forestar Group, Inc. (a)(d) | 117,514 | 2,216,314 | |
Gladstone Land Corp. | 66,704 | 853,811 | |
Howard Hughes Corp. (a) | 104,438 | 14,415,577 | |
InterGroup Corp. (a) | 336 | 6,152 | |
Jones Lang LaSalle, Inc. | 147,378 | 18,156,970 | |
Kennedy-Wilson Holdings, Inc. | 235,554 | 5,959,516 | |
Maui Land & Pineapple, Inc. (a) | 17,943 | 111,426 | |
RE/MAX Holdings, Inc. (d) | 43,468 | 1,330,990 | |
Realogy Holdings Corp. (a) | 484,103 | 22,975,528 | |
Tejon Ranch Co. (a) | 43,935 | 1,557,496 | |
The St. Joe Co. (a)(d) | 317,132 | 6,130,162 | |
Transcontinental Realty Investors, Inc. (a) | 1,497 | 23,653 | |
ZipRealty, Inc. (a) | 28,991 | 137,417 | |
| 96,753,635 | ||
Thrifts & Mortgage Finance - 1.0% | |||
Astoria Financial Corp. | 297,236 | 4,072,133 | |
Banc of California, Inc. | 43,498 | 556,339 | |
Bank Mutual Corp. | 123,703 | 818,914 | |
BankFinancial Corp. | 56,765 | 566,515 | |
BBX Capital Corp. (a) | 42,087 | 813,963 | |
Beneficial Mutual Bancorp, Inc. (a) | 112,435 | 1,353,717 | |
Berkshire Hills Bancorp, Inc. | 88,805 | 2,231,670 | |
BofI Holding, Inc. (a)(d) | 39,084 | 3,638,720 | |
Brookline Bancorp, Inc., Delaware | 228,749 | 2,088,478 | |
Camco Financial Corp. (a)(d) | 28,595 | 173,000 | |
Cape Bancorp, Inc. | 25,193 | 267,802 | |
Capitol Federal Financial, Inc. | 470,721 | 5,719,260 | |
Charter Financial Corp. | 19,819 | 208,694 | |
Cheviot Financial Corp. | 44 | 452 | |
Chicopee Bancorp, Inc. | 13,096 | 234,156 | |
Clifton Savings Bancorp, Inc. | 25,210 | 332,016 | |
Dime Community Bancshares, Inc. | 105,672 | 1,775,290 | |
Doral Financial Corp. (a)(d) | 18,344 | 210,956 | |
Elmira Savings Bank | 185 | 4,192 | |
ESB Financial Corp. | 37,377 | 490,012 | |
ESSA Bancorp, Inc. | 32,482 | 364,773 | |
Essent Group Ltd. (d) | 69,085 | 1,602,772 | |
EverBank Financial Corp. (d) | 292,629 | 5,243,912 | |
Farmer Mac Class C (non-vtg.) | 28,644 | 901,140 | |
First Clover Leaf Financial Corp. | 10,566 | 96,785 | |
First Defiance Financial Corp. | 23,633 | 653,925 | |
First Federal Bancshares of Arkansas, Inc. (a) | 4,711 | 40,891 | |
First Financial Northwest, Inc. | 34,706 | 358,860 | |
Flagstar Bancorp, Inc. (a) | 65,811 | 1,457,056 | |
Fox Chase Bancorp, Inc. | 32,985 | 565,363 | |
Common Stocks - continued | |||
Shares | Value | ||
FINANCIALS - continued | |||
Thrifts & Mortgage Finance - continued | |||
Franklin Financial Corp./VA (a) | 27,950 | $ 553,410 | |
Hampden Bancorp, Inc. | 5,136 | 81,919 | |
Heritage Financial Group, Inc. | 17,720 | 330,832 | |
HF Financial Corp. | 632 | 8,393 | |
Hingham Institution for Savings | 1,083 | 84,799 | |
HMN Financial, Inc. (a) | 2,852 | 36,392 | |
Home Bancorp, Inc. (a) | 15,826 | 329,023 | |
Home Loan Servicing Solutions Ltd. (d) | 220,032 | 4,515,057 | |
HomeStreet, Inc. | 35,323 | 665,485 | |
HopFed Bancorp, Inc. | 11,426 | 131,856 | |
IF Bancorp, Inc. | 11,597 | 190,771 | |
Impac Mortgage Holdings, Inc. (a)(d) | 20,302 | 142,114 | |
Kearny Financial Corp. (a)(d) | 52,612 | 661,859 | |
Madison County Financial, Inc. | 11,541 | 198,505 | |
Meridian Interstate Bancorp, Inc. (a) | 27,315 | 661,023 | |
Meta Financial Group, Inc. | 11,444 | 488,773 | |
MGIC Investment Corp. (a) | 1,083,448 | 9,707,694 | |
NASB Financial, Inc. (d) | 3,724 | 94,366 | |
Nationstar Mortgage Holdings, Inc. (a)(d) | 67,203 | 1,937,462 | |
New Hampshire Thrift Bancshare | 20,505 | 305,525 | |
New York Community Bancorp, Inc. (d) | 1,441,888 | 23,041,370 | |
NMI Holdings, Inc. (a) | 20,200 | 220,988 | |
Northfield Bancorp, Inc. | 217,420 | 2,752,537 | |
Northwest Bancshares, Inc. | 341,018 | 4,893,608 | |
Ocean Shore Holding Co. | 5,120 | 71,219 | |
OceanFirst Financial Corp. | 36,227 | 683,966 | |
Ocwen Financial Corp. (a) | 384,211 | 14,384,860 | |
Oneida Financial Corp. | 2,810 | 35,490 | |
Oritani Financial Corp. | 151,918 | 2,379,036 | |
PennyMac Financial Services, Inc. | 41,987 | 725,955 | |
Peoples Federal Bancshares, Inc. (d) | 9,219 | 165,389 | |
Poage Bankshares, Inc. | 6,654 | 91,892 | |
Provident Financial Holdings, Inc. | 21,034 | 323,293 | |
Provident Financial Services, Inc. | 185,760 | 3,447,706 | |
Pulaski Financial Corp. | 11,679 | 117,257 | |
Radian Group, Inc. (d) | 563,566 | 8,763,451 | |
Riverview Bancorp, Inc. (a) | 20,156 | 68,127 | |
Rockville Financial, Inc. (d) | 88,020 | 1,159,223 | |
Security National Financial Corp. Class A | 22,623 | 88,003 | |
SI Financial Group, Inc. | 15,322 | 180,646 | |
Simplicity Bancorp, Inc. | 22,747 | 401,257 | |
Southern Missouri Bancorp, Inc. | 3,317 | 114,337 | |
Stonegate Mortgage Corp. (a)(d) | 38,473 | 559,013 | |
Territorial Bancorp, Inc. | 28,348 | 629,326 | |
TFS Financial Corp. (a) | 321,262 | 3,797,317 | |
Timberland Bancorp, Inc. | 12,774 | 136,554 | |
Tree.com, Inc. (a) | 19,805 | 669,607 | |
Trustco Bank Corp., New York | 304,547 | 2,058,738 | |
United Community Financial Corp. (a) | 251,020 | 931,284 | |
United Financial Bancorp, Inc. | 56,278 | 991,056 | |
| |||
Shares | Value | ||
Walker & Dunlop, Inc. (a)(d) | 71,009 | $ 1,195,081 | |
Washington Federal, Inc. | 344,651 | 7,727,075 | |
Waterstone Financial, Inc. Maryland (a) | 32,153 | 339,536 | |
Westfield Financial, Inc. | 94,628 | 718,227 | |
WSFS Financial Corp. | 26,632 | 1,898,595 | |
| 143,728,033 | ||
TOTAL FINANCIALS | 3,045,779,729 | ||
HEALTH CARE - 11.9% | |||
Biotechnology - 3.8% | |||
Aastrom Biosciences, Inc. (a) | 10,915 | 36,784 | |
ACADIA Pharmaceuticals, Inc. (a)(d) | 260,192 | 7,363,434 | |
Acceleron Pharma, Inc. (d) | 24,726 | 1,160,391 | |
Achillion Pharmaceuticals, Inc. (a)(d) | 269,162 | 942,067 | |
Acorda Therapeutics, Inc. (a) | 137,733 | 5,046,537 | |
Advaxis, Inc. (a)(d) | 24,640 | 120,736 | |
Aegerion Pharmaceuticals, Inc. (a)(d) | 80,924 | 4,431,398 | |
Agenus, Inc. (a)(d) | 142,693 | 697,769 | |
Agios Pharmaceuticals, Inc. (d) | 20,886 | 652,896 | |
Alkermes PLC (a) | 480,357 | 23,378,975 | |
Alnylam Pharmaceuticals, Inc. (a)(d) | 176,628 | 14,349,259 | |
AMAG Pharmaceuticals, Inc. (a)(d) | 69,941 | 1,449,877 | |
Ambit Biosciences Corp. | 22,527 | 245,770 | |
Amicus Therapeutics, Inc. (a)(d) | 103,509 | 260,843 | |
Anacor Pharmaceuticals, Inc. (a)(d) | 103,358 | 1,963,802 | |
Anthera Pharmaceuticals, Inc. (a)(d) | 86,499 | 256,037 | |
ARCA biopharma, Inc. (a) | 3,372 | 6,339 | |
Arena Pharmaceuticals, Inc. (a)(d) | 734,863 | 4,783,958 | |
ARIAD Pharmaceuticals, Inc. (a)(d) | 611,762 | 5,316,212 | |
ArQule, Inc. (a) | 171,131 | 385,045 | |
Array BioPharma, Inc. (a) | 344,560 | 1,660,779 | |
Arrowhead Research Corp. (a) | 102,724 | 1,996,955 | |
Athersys, Inc. (a)(d) | 250,029 | 945,110 | |
AVEO Pharmaceuticals, Inc. (a)(d) | 115,401 | 215,800 | |
BIND Therapeutics, Inc. (d) | 24,951 | 340,831 | |
BioCryst Pharmaceuticals, Inc. (a)(d) | 188,333 | 2,201,613 | |
BioMarin Pharmaceutical, Inc. (a)(d) | 471,303 | 38,175,543 | |
Biospecifics Technologies Corp. (a) | 11,833 | 280,797 | |
Biota Pharmaceuticals, Inc. (a) | 30,922 | 204,704 | |
BioTime, Inc. (a)(d) | 88,187 | 316,591 | |
Bluebird Bio, Inc. (d) | 28,596 | 729,198 | |
Cancer Genetics, Inc. | 27,876 | 525,741 | |
Catalyst Pharmaceutical Partners, Inc. (a)(d) | 139,457 | 312,384 | |
Cel-Sci Corp. (a)(d) | 195,290 | 216,772 | |
Cell Therapeutics, Inc. (a)(d) | 498,131 | 1,917,804 | |
Celldex Therapeutics, Inc. (a)(d) | 292,289 | 8,540,685 | |
Cellular Dynamics International, Inc. (d) | 13,046 | 194,255 | |
Celsion Corp. (a) | 37,190 | 138,719 | |
Cepheid, Inc. (a)(d) | 226,032 | 12,128,877 | |
Chelsea Therapeutics International Ltd. (a)(d) | 213,607 | 1,219,696 | |
Common Stocks - continued | |||
Shares | Value | ||
HEALTH CARE - continued | |||
Biotechnology - continued | |||
ChemoCentryx, Inc. (a)(d) | 80,697 | $ 613,297 | |
Chimerix, Inc. | 53,588 | 1,071,760 | |
Cleveland Biolabs, Inc. (a)(d) | 93,847 | 65,965 | |
Clovis Oncology, Inc. (a) | 95,040 | 7,567,085 | |
Codexis, Inc. (a)(d) | 66,590 | 123,857 | |
Conatus Pharmaceuticals, Inc. (d) | 20,891 | 234,397 | |
CorMedix, Inc. (a)(d) | 49,454 | 137,977 | |
Coronado Biosciences, Inc. (a)(d) | 64,425 | 182,967 | |
Cubist Pharmaceuticals, Inc. (a) | 244,905 | 19,474,846 | |
Cubist Pharmaceuticals, Inc. rights (a) | 105,448 | 1 | |
Curis, Inc. (a)(d) | 272,013 | 829,640 | |
Cyclacel Pharmaceuticals, Inc. (a)(d) | 58,323 | 226,293 | |
Cytokinetics, Inc. (a)(d) | 77,233 | 760,745 | |
Cytori Therapeutics, Inc. (a)(d) | 195,899 | 617,082 | |
CytRx Corp. (a)(d) | 159,962 | 946,975 | |
DARA BioSciences, Inc. (a)(d) | 4,466 | 13,041 | |
Dendreon Corp. (a)(d) | 576,266 | 1,659,646 | |
Discovery Laboratories, Inc. (a)(d) | 244,661 | 645,905 | |
Durata Therapeutics, Inc. (a)(d) | 32,482 | 445,328 | |
Dyax Corp. (a) | 403,876 | 3,905,481 | |
Dynavax Technologies Corp. (a)(d) | 919,827 | 1,710,878 | |
Emergent BioSolutions, Inc. (a) | 97,373 | 2,409,008 | |
Enanta Pharmaceuticals, Inc. (d) | 16,537 | 609,223 | |
EntreMed, Inc. (a) | 37,512 | 72,023 | |
Enzon Pharmaceuticals, Inc. | 134,828 | 129,435 | |
Epizyme, Inc. | 38,847 | 1,161,525 | |
Esperion Therapeutics, Inc. (d) | 17,081 | 265,610 | |
Exact Sciences Corp. (a)(d) | 244,783 | 3,292,331 | |
Exelixis, Inc. (a)(d) | 599,718 | 4,234,009 | |
Fibrocell Science, Inc. (a)(d) | 81,352 | 462,893 | |
Five Prime Therapeutics, Inc. | 23,768 | 331,801 | |
Forticell Bioscience, Inc. (a) | 2 | 0 | |
Foundation Medicine, Inc. (d) | 25,039 | 892,140 | |
Galectin Therapeutics, Inc. (a)(d) | 56,964 | 960,413 | |
Galena Biopharma, Inc. (a)(d) | 335,154 | 1,323,858 | |
Genomic Health, Inc. (a)(d) | 59,800 | 1,579,318 | |
GenVec, Inc. (a)(d) | 39,959 | 143,453 | |
Geron Corp. (a)(d) | 495,598 | 2,356,569 | |
GTx, Inc. (a)(d) | 79,767 | 135,604 | |
Halozyme Therapeutics, Inc. (a)(d) | 334,834 | 4,717,811 | |
Harvard Apparatus (a) | 15,331 | 77,575 | |
Heat Biologics, Inc. (d) | 8,898 | 65,667 | |
Hemispherx Biopharma, Inc. (a) | 433,733 | 169,590 | |
Hyperion Therapeutics, Inc. (a)(d) | 18,970 | 588,070 | |
iBio, Inc. (a) | 102,306 | 55,215 | |
Idenix Pharmaceuticals, Inc. (a)(d) | 372,755 | 2,542,189 | |
Idera Pharmaceuticals, Inc. (a)(d) | 239,487 | 1,386,630 | |
ImmunoCellular Therapeutics Ltd. (a)(d) | 177,102 | 240,859 | |
ImmunoGen, Inc. (a)(d) | 301,232 | 4,940,205 | |
Immunomedics, Inc. (a)(d) | 254,275 | 1,205,264 | |
Incyte Corp. (a) | 480,449 | 30,873,653 | |
| |||
Shares | Value | ||
Infinity Pharmaceuticals, Inc. (a)(d) | 143,814 | $ 2,255,004 | |
Inovio Pharmaceuticals, Inc. (a)(d) | 651,417 | 2,143,162 | |
Insmed, Inc. (a) | 107,814 | 2,157,358 | |
Insys Therapeutics, Inc. (a)(d) | 14,182 | 954,165 | |
Intercept Pharmaceuticals, Inc. (a) | 33,307 | 13,672,524 | |
InterMune, Inc. (a)(d) | 306,558 | 9,209,002 | |
Intrexon Corp. (d) | 37,626 | 977,523 | |
Ironwood Pharmaceuticals, Inc. Class A (a)(d) | 401,292 | 5,822,747 | |
Isis Pharmaceuticals, Inc. (a)(d) | 387,534 | 19,764,234 | |
IsoRay, Inc. (a)(d) | 76,668 | 60,184 | |
KaloBios Pharmaceuticals, Inc. | 71,639 | 232,827 | |
Karyopharm Therapeutics, Inc. | 27,979 | 1,123,077 | |
Keryx Biopharmaceuticals, Inc. (a)(d) | 294,874 | 4,732,728 | |
KYTHERA Biopharmaceuticals, Inc. (a)(d) | 42,822 | 2,139,815 | |
Lexicon Pharmaceuticals, Inc. (a)(d) | 983,912 | 1,761,202 | |
Ligand Pharmaceuticals, Inc.: | |||
Class B (a)(d) | 69,939 | 4,878,245 | |
General CVR (a) | 26,087 | 1,591 | |
Glucagon CVR (a) | 26,087 | 4,435 | |
rights (a) | 26,087 | 170 | |
TR Beta CVR (a) | 26,087 | 136 | |
LipoScience, Inc. (a) | 15,054 | 62,625 | |
Lpath, Inc. (a) | 19,435 | 90,178 | |
Macrogenics, Inc. | 30,033 | 1,051,155 | |
MannKind Corp. (a)(d) | 685,467 | 4,243,041 | |
Mast Therapeutics, Inc. (a)(d) | 531,478 | 441,127 | |
Medgenics, Inc. (a)(d) | 34,205 | 295,189 | |
MediciNova, Inc. (a)(d) | 47,646 | 108,156 | |
Medivation, Inc. (a) | 250,204 | 17,992,170 | |
MEI Pharma, Inc. (a) | 32,936 | 284,238 | |
Merrimack Pharmaceuticals, Inc. (a)(d) | 311,736 | 1,552,445 | |
Metabolix, Inc. (a)(d) | 85,270 | 109,146 | |
MiMedx Group, Inc. (a) | 267,984 | 1,916,086 | |
Momenta Pharmaceuticals, Inc. (a) | 146,858 | 2,173,498 | |
Myriad Genetics, Inc. (a)(d) | 249,963 | 9,051,160 | |
Nanosphere, Inc. (a) | 173,475 | 416,340 | |
NanoViricides, Inc. (a)(d) | 143,363 | 570,585 | |
Navidea Biopharmaceuticals, Inc. (a)(d) | 444,645 | 822,593 | |
Neuralstem, Inc. (a)(d) | 278,617 | 994,663 | |
Neurocrine Biosciences, Inc. (a) | 213,411 | 3,762,436 | |
NewLink Genetics Corp. (a)(d) | 50,794 | 2,245,095 | |
Northwest Biotherapeutics, Inc. (a)(d) | 109,855 | 778,872 | |
Novavax, Inc. (a)(d) | 635,933 | 4,069,971 | |
NPS Pharmaceuticals, Inc. (a)(d) | 312,837 | 10,943,038 | |
Ohr Pharmaceutical, Inc. (a) | 55,086 | 779,467 | |
OncoGenex Pharmaceuticals, Inc. (a)(d) | 52,280 | 576,126 | |
OncoMed Pharmaceuticals, Inc. (d) | 16,535 | 570,788 | |
Onconova Therapeutics, Inc. (d) | 17,664 | 150,144 | |
Oncothyreon, Inc. (a)(d) | 199,043 | 615,043 | |
Opexa Therapeutics, Inc. (a)(d) | 68,287 | 124,282 | |
Ophthotech Corp. (d) | 37,946 | 1,277,642 | |
Opko Health, Inc. (a)(d) | 728,512 | 6,935,434 | |
Oragenics, Inc. (a) | 27,929 | 104,454 | |
Common Stocks - continued | |||
Shares | Value | ||
HEALTH CARE - continued | |||
Biotechnology - continued | |||
Orexigen Therapeutics, Inc. (a)(d) | 365,940 | $ 2,539,624 | |
Organovo Holdings, Inc. (a)(d) | 196,595 | 2,020,997 | |
Osiris Therapeutics, Inc. (a)(d) | 56,117 | 856,907 | |
OvaScience, Inc. (a)(d) | 30,226 | 326,139 | |
OXiGENE, Inc. (a) | 3,950 | 8,414 | |
Oxygen Biotherapeutics, Inc. (a)(d) | 22,365 | 144,702 | |
PDL BioPharma, Inc. (d) | 475,632 | 4,076,166 | |
Peregrine Pharmaceuticals, Inc. (a)(d) | 579,602 | 1,049,080 | |
Pharmacyclics, Inc. (a) | 223,164 | 30,943,920 | |
PharmAthene, Inc. (a)(d) | 123,056 | 231,345 | |
Portola Pharmaceuticals, Inc. (d) | 39,606 | 965,990 | |
Progenics Pharmaceuticals, Inc. (a)(d) | 203,243 | 949,145 | |
Prothena Corp. PLC (a)(d) | 73,496 | 2,646,591 | |
PTC Therapeutics, Inc. (a) | 45,263 | 1,419,448 | |
Puma Biotechnology, Inc. (a) | 63,396 | 7,370,419 | |
Raptor Pharmaceutical Corp. (a)(d) | 210,398 | 3,330,600 | |
Receptos, Inc. | 41,822 | 1,939,913 | |
Regado Biosciences, Inc. | 15,222 | 109,142 | |
Regulus Therapeutics, Inc. (a)(d) | 53,984 | 606,240 | |
Repligen Corp. (a)(d) | 104,226 | 1,560,263 | |
Rexahn Pharmaceuticals, Inc. (a)(d) | 422,481 | 570,349 | |
Rigel Pharmaceuticals, Inc. (a) | 289,108 | 994,532 | |
Sangamo Biosciences, Inc. (a)(d) | 216,693 | 3,943,813 | |
Sarepta Therapeutics, Inc. (a)(d) | 114,397 | 3,320,945 | |
Seattle Genetics, Inc. (a)(d) | 372,346 | 19,581,676 | |
SIGA Technologies, Inc. (a)(d) | 109,876 | 352,702 | |
Sorrento Therapeutics, Inc. (a) | 29,155 | 335,866 | |
Spectrum Pharmaceuticals, Inc. (a)(d) | 191,900 | 1,602,365 | |
StemCells, Inc. (a)(d) | 120,758 | 177,514 | |
Stemline Therapeutics, Inc. (d) | 33,876 | 876,033 | |
Sunesis Pharmaceuticals, Inc. (a)(d) | 112,982 | 740,032 | |
Synageva BioPharma Corp. (a)(d) | 64,476 | 7,393,463 | |
Synergy Pharmaceuticals, Inc. (a)(d) | 261,133 | 1,585,077 | |
Synta Pharmaceuticals Corp. (a)(d) | 218,784 | 1,352,085 | |
Synthetic Biologics, Inc. (a)(d) | 102,779 | 277,503 | |
Targacept, Inc. (a) | 150,431 | 741,625 | |
Telik, Inc. (a) | 3,787 | 5,264 | |
TESARO, Inc. (a)(d) | 63,757 | 2,104,619 | |
Tetraphase Pharmaceuticals, Inc. | 48,666 | 661,858 | |
TG Therapeutics, Inc. (a)(d) | 94,974 | 626,828 | |
Theravance, Inc. (a)(d) | 259,909 | 9,616,633 | |
Threshold Pharmaceuticals, Inc. (a)(d) | 165,509 | 827,545 | |
Trovagene, Inc. (a)(d) | 57,904 | 362,479 | |
United Therapeutics Corp. (a)(d) | 152,435 | 15,459,958 | |
Vanda Pharmaceuticals, Inc. (a)(d) | 115,941 | 1,754,187 | |
Venaxis, Inc. (a)(d) | 80,385 | 208,197 | |
Verastem, Inc. (a)(d) | 49,464 | 661,334 | |
Vical, Inc. (a)(d) | 181,350 | 275,652 | |
XOMA Corp. (a) | 238,944 | 1,997,572 | |
| |||
Shares | Value | ||
Zalicus, Inc. (a)(d) | 60,609 | $ 91,520 | |
ZIOPHARM Oncology, Inc. (a)(d) | 319,265 | 1,360,069 | |
| 543,517,746 | ||
Health Care Equipment & Supplies - 2.3% | |||
Abaxis, Inc. (a)(d) | 70,562 | 2,677,828 | |
Abiomed, Inc. (a)(d) | 115,137 | 3,245,712 | |
Accuray, Inc. (a)(d) | 224,824 | 2,108,849 | |
Alere, Inc. (a) | 253,720 | 9,321,673 | |
Align Technology, Inc. (a)(d) | 232,898 | 12,187,552 | |
Allied Healthcare Products, Inc. (a) | 4,954 | 10,651 | |
Alphatec Holdings, Inc. (a) | 230,873 | 325,531 | |
Analogic Corp. | 42,044 | 3,963,067 | |
Angiodynamics, Inc. (a) | 99,901 | 1,538,475 | |
Anika Therapeutics, Inc. (a) | 35,451 | 1,395,706 | |
Antares Pharma, Inc. (a)(d) | 441,109 | 1,962,935 | |
ArthroCare Corp. (a) | 95,471 | 4,606,476 | |
Atossa Genetics, Inc. (a)(d) | 64,731 | 142,408 | |
Atricure, Inc. (a) | 74,631 | 1,551,578 | |
Atrion Corp. | 4,266 | 1,234,708 | |
Bacterin International Holdings, Inc. (a)(d) | 73,764 | 49,127 | |
Baxano Surgical, Inc. (a)(d) | 51,338 | 78,034 | |
BioLase Technology, Inc. (d) | 116,573 | 360,211 | |
Bovie Medical Corp. (a) | 27,980 | 89,256 | |
BSD Medical Corp. (a)(d) | 95,648 | 109,995 | |
Cantel Medical Corp. | 116,324 | 3,763,081 | |
Cardica, Inc. (a) | 84,418 | 96,237 | |
Cardiovascular Systems, Inc. (a) | 93,931 | 3,287,585 | |
Cerus Corp. (a)(d) | 226,749 | 1,464,799 | |
Cesca Therapeutics, Inc. (a)(d) | 36,219 | 80,406 | |
Chembio Diagnostics, Inc. (a) | 4,082 | 15,512 | |
CONMED Corp. | 92,250 | 4,300,695 | |
Cryolife, Inc. | 80,349 | 800,276 | |
Cutera, Inc. (a) | 39,466 | 422,286 | |
Cyberonics, Inc. (a)(d) | 83,817 | 5,738,950 | |
Cynosure, Inc. Class A (a) | 68,678 | 2,113,909 | |
Delcath Systems, Inc. (a)(d) | 289,673 | 90,639 | |
Derma Sciences, Inc. (a)(d) | 77,138 | 1,133,157 | |
DexCom, Inc. (a) | 220,569 | 9,947,662 | |
Digirad Corp. | 45,825 | 160,388 | |
Dynatronics Corp. (a) | 3,425 | 12,364 | |
Echo Therapeutics, Inc. (a)(d) | 18,765 | 58,734 | |
Endologix, Inc. (a)(d) | 216,309 | 2,920,172 | |
EnteroMedics, Inc. (a)(d) | 152,453 | 370,461 | |
ERBA Diagnostics, Inc. (a)(d) | 26,639 | 67,929 | |
Escalon Medical Corp. (a) | 3,512 | 5,338 | |
Exactech, Inc. (a) | 24,904 | 580,263 | |
Fonar Corp. (a)(d) | 24,768 | 561,243 | |
Genmark Diagnostics, Inc. (a) | 132,359 | 1,649,193 | |
Globus Medical, Inc. (a) | 188,317 | 4,455,580 | |
Greatbatch, Inc. (a) | 81,776 | 3,543,354 | |
Haemonetics Corp. (a)(d) | 170,591 | 6,223,160 | |
Hansen Medical, Inc. (a)(d) | 236,840 | 554,206 | |
Common Stocks - continued | |||
Shares | Value | ||
HEALTH CARE - continued | |||
Health Care Equipment & Supplies - continued | |||
HeartWare International, Inc. (a) | 49,830 | $ 4,785,175 | |
Hill-Rom Holdings, Inc. | 199,491 | 7,546,745 | |
Hologic, Inc. (a)(d) | 904,880 | 19,708,286 | |
ICU Medical, Inc. (a)(d) | 44,824 | 2,593,517 | |
IDEXX Laboratories, Inc. (a)(d) | 171,398 | 21,579,008 | |
Insulet Corp. (a)(d) | 180,801 | 8,571,775 | |
Integra LifeSciences Holdings Corp. (a)(d) | 79,170 | 3,724,157 | |
Invacare Corp. | 97,998 | 1,942,320 | |
Iridex Corp. (a) | 9,439 | 88,727 | |
Kewaunee Scientific Corp. | 5,250 | 85,365 | |
Kips Bay Medical, Inc. (a) | 9,803 | 7,058 | |
Ldr Holding Corp. (d) | 26,225 | 819,531 | |
LeMaitre Vascular, Inc. | 17,157 | 140,516 | |
Masimo Corp. (a) | 180,137 | 4,602,500 | |
Medical Action Industries, Inc. (a) | 37,965 | 277,904 | |
MELA Sciences, Inc. (a)(d) | 117,358 | 82,737 | |
Meridian Bioscience, Inc. (d) | 134,771 | 2,811,323 | |
Merit Medical Systems, Inc. (a) | 136,240 | 2,055,862 | |
Misonix, Inc. (a) | 11,163 | 74,792 | |
Natus Medical, Inc. (a) | 90,072 | 2,260,807 | |
Neogen Corp. (a) | 124,941 | 5,412,444 | |
NeuroMetrix, Inc. (a)(d) | 685 | 1,589 | |
NuVasive, Inc. (a)(d) | 149,477 | 5,493,280 | |
NxStage Medical, Inc. (a) | 197,959 | 2,745,691 | |
OraSure Technologies, Inc. (a) | 177,113 | 1,229,164 | |
Orthofix International NV (a) | 73,558 | 1,634,459 | |
PhotoMedex, Inc. (a)(d) | 47,544 | 696,044 | |
Quidel Corp. (a)(d) | 101,129 | 2,833,635 | |
ResMed, Inc. (d) | 471,002 | 20,733,508 | |
Retractable Technologies, Inc. (a) | 5,601 | 20,164 | |
Rockwell Medical Technologies, Inc. (a)(d) | 112,115 | 1,422,739 | |
RTI Biologics, Inc. (a) | 147,974 | 556,382 | |
Sirona Dental Systems, Inc. (a)(d) | 182,312 | 12,845,704 | |
Staar Surgical Co. (a) | 83,499 | 1,182,346 | |
Stereotaxis, Inc. (a) | 64,951 | 322,157 | |
Steris Corp. | 202,247 | 9,333,699 | |
SurModics, Inc. (a) | 43,320 | 1,078,668 | |
Symmetry Medical, Inc. (a) | 136,148 | 1,440,446 | |
Synergetics U.S.A., Inc. (a) | 71,442 | 247,189 | |
Tandem Diabetes Care, Inc. | 31,616 | 814,112 | |
TearLab Corp. (a)(d) | 100,207 | 806,666 | |
Teleflex, Inc. | 136,290 | 13,900,217 | |
The Cooper Companies, Inc. | 161,997 | 20,769,635 | |
The Spectranetics Corp. (a) | 135,737 | 4,066,681 | |
Thoratec Corp. (a) | 190,369 | 7,070,305 | |
Tornier NV (a) | 93,726 | 1,799,539 | |
Unilife Corp. (a)(d) | 338,238 | 1,566,042 | |
Uroplasty, Inc. (a) | 64,999 | 267,796 | |
Utah Medical Products, Inc. | 6,852 | 376,791 | |
Vascular Solutions, Inc. (a)(d) | 53,247 | 1,385,487 | |
Veracyte, Inc. | 12,799 | 204,912 | |
| |||
Shares | Value | ||
Vermillion, Inc. (a)(d) | 42,513 | $ 144,544 | |
Vision Sciences, Inc. (a) | 22,011 | 31,916 | |
Volcano Corp. (a)(d) | 185,809 | 3,987,461 | |
West Pharmaceutical Services, Inc. | 239,769 | 10,928,671 | |
Wright Medical Group, Inc. (a) | 165,918 | 5,279,511 | |
Zeltiq Aesthetics, Inc. (a)(d) | 77,310 | 1,468,117 | |
| 329,233,167 | ||
Health Care Providers & Services - 2.6% | |||
Acadia Healthcare Co., Inc. (a)(d) | 117,379 | 5,803,218 | |
Accretive Health, Inc. (a)(d) | 197,962 | 1,639,125 | |
Adcare Health Systems, Inc. (a) | 10,908 | 47,341 | |
Addus HomeCare Corp. (a) | 22,321 | 641,952 | |
Air Methods Corp. (a)(d) | 116,433 | 6,289,711 | |
Alliance Healthcare Services, Inc. (a) | 33,193 | 1,000,437 | |
Almost Family, Inc. (a) | 28,394 | 778,563 | |
Amedisys, Inc. (a)(d) | 117,539 | 1,993,461 | |
American CareSource Holdings, Inc. (a) | 2,053 | 4,024 | |
American Shared Hospital Services (a) | 115 | 351 | |
AMN Healthcare Services, Inc. (a) | 168,489 | 2,347,052 | |
AmSurg Corp. (a) | 111,041 | 4,870,258 | |
Bio-Reference Laboratories, Inc. (a)(d) | 87,412 | 2,208,027 | |
BioScrip, Inc. (a) | 205,484 | 1,465,101 | |
BioTelemetry, Inc. (a) | 83,325 | 936,573 | |
Brookdale Senior Living, Inc. (a)(d) | 330,979 | 11,101,036 | |
Capital Senior Living Corp. (a) | 91,513 | 2,326,260 | |
Centene Corp. (a)(d) | 182,255 | 11,605,998 | |
Chemed Corp. (d) | 61,290 | 5,185,134 | |
Chindex International, Inc. (a) | 41,105 | 791,271 | |
Community Health Systems, Inc. (a) | 378,360 | 15,705,724 | |
Corvel Corp. (a) | 38,096 | 1,752,797 | |
Cross Country Healthcare, Inc. (a) | 94,255 | 980,252 | |
Diversicare Healthcare Services, Inc. | 12,213 | 67,172 | |
Emeritus Corp. (a) | 135,332 | 4,267,018 | |
Envision Healthcare Holdings, Inc. | 227,756 | 7,666,267 | |
ExamWorks Group, Inc. (a) | 87,727 | 3,191,508 | |
Five Star Quality Care, Inc. (a) | 149,941 | 868,158 | |
Gentiva Health Services, Inc. (a)(d) | 96,791 | 1,036,632 | |
Hanger, Inc. (a) | 115,793 | 4,104,862 | |
HCA Holdings, Inc. (a) | 1,014,934 | 51,964,621 | |
Health Net, Inc. (a) | 261,005 | 8,887,220 | |
HealthSouth Corp. | 287,800 | 9,405,304 | |
Healthways, Inc. (a)(d) | 117,627 | 1,759,700 | |
Henry Schein, Inc. (a)(d) | 277,554 | 33,040,028 | |
Hooper Holmes, Inc. (a) | 128,551 | 71,989 | |
InfuSystems Holdings, Inc. (a) | 5,400 | 14,256 | |
IPC The Hospitalist Co., Inc. (a)(d) | 55,906 | 2,869,655 | |
Kindred Healthcare, Inc. | 192,213 | 4,163,334 | |
Landauer, Inc. | 33,237 | 1,610,665 | |
LCA-Vision, Inc. (a) | 71,178 | 387,208 | |
LHC Group, Inc. (a) | 42,300 | 996,588 | |
LifePoint Hospitals, Inc. (a) | 156,942 | 8,514,104 | |
Magellan Health Services, Inc. (a) | 92,138 | 5,633,317 | |
MEDNAX, Inc. (a)(d) | 335,141 | 20,383,276 | |
Common Stocks - continued | |||
Shares | Value | ||
HEALTH CARE - continued | |||
Health Care Providers & Services - continued | |||
Molina Healthcare, Inc. (a)(d) | 97,946 | $ 3,690,605 | |
MWI Veterinary Supply, Inc. (a) | 43,441 | 7,077,408 | |
National Healthcare Corp. | 34,496 | 1,776,544 | |
National Research Corp.: | |||
Class A (a) | 27,189 | 475,808 | |
Class B (d) | 8,693 | 348,155 | |
NeoStem, Inc. (a)(d) | 70,595 | 494,165 | |
Omnicare, Inc. | 333,010 | 19,614,289 | |
Owens & Minor, Inc. (d) | 203,979 | 7,082,151 | |
PDI, Inc. (a) | 19,284 | 91,599 | |
PharMerica Corp. (a) | 102,387 | 2,467,527 | |
Premier, Inc. | 96,494 | 3,227,724 | |
Providence Service Corp. (a) | 40,157 | 1,067,775 | |
Psychemedics Corp. | 15,744 | 280,401 | |
RadNet, Inc. (a) | 74,982 | 145,465 | |
Select Medical Holdings Corp. | 206,647 | 2,316,513 | |
Sharps Compliance Corp. (a) | 29,684 | 142,483 | |
Skilled Healthcare Group, Inc. (a)(d) | 74,963 | 360,572 | |
SunLink Health Systems, Inc. (a) | 19,190 | 23,988 | |
Surgical Care Affiliates, Inc. | 36,872 | 1,121,646 | |
Team Health Holdings, Inc. (a) | 230,667 | 10,384,628 | |
The Ensign Group, Inc. | 73,014 | 2,891,354 | |
Triple-S Management Corp. (a) | 81,088 | 1,358,224 | |
U.S. Physical Therapy, Inc. | 38,321 | 1,271,491 | |
Universal American Spin Corp. (d) | 125,867 | 942,744 | |
Universal Health Services, Inc. Class B | 293,335 | 23,548,934 | |
VCA Antech, Inc. (a) | 291,115 | 9,015,832 | |
Wellcare Health Plans, Inc. (a) | 145,091 | 8,969,526 | |
| 360,564,099 | ||
Health Care Technology - 0.5% | |||
Allscripts Healthcare Solutions, Inc. (a) | 519,124 | 9,640,133 | |
Arrhythmia Research Technology, Inc. (a) | 9,913 | 46,095 | |
athenahealth, Inc. (a)(d) | 123,498 | 23,942,557 | |
Authentidate Holding Corp. (a)(d) | 33,216 | 34,877 | |
CollabRx, Inc. (a) | 177 | 568 | |
Computer Programs & Systems, Inc. | 35,893 | 2,456,158 | |
HealthStream, Inc. (a)(d) | 67,498 | 1,945,292 | |
HMS Holdings Corp. (a)(d) | 294,558 | 6,026,657 | |
iCAD, Inc. (a) | 30,867 | 359,601 | |
MedAssets, Inc. (a) | 208,027 | 5,052,976 | |
Medidata Solutions, Inc. (a)(d) | 166,837 | 10,694,252 | |
Merge Healthcare, Inc. (a)(d) | 198,185 | 497,444 | |
Omnicell, Inc. (a)(d) | 122,796 | 3,534,069 | |
Quality Systems, Inc. | 152,647 | 2,665,217 | |
Simulations Plus, Inc. | 26,420 | 150,594 | |
Streamline Health Solutions, Inc. (a) | 32,477 | 203,631 | |
Veeva Systems, Inc. Class A (d) | 45,341 | 1,600,537 | |
Vocera Communications, Inc. (a)(d) | 68,642 | 1,168,287 | |
| 70,018,945 | ||
| |||
Shares | Value | ||
Life Sciences Tools & Services - 1.3% | |||
Accelerate Diagnostics, Inc. (a)(d) | 79,168 | $ 1,170,103 | |
Affymetrix, Inc. (a)(d) | 232,638 | 1,795,965 | |
Albany Molecular Research, Inc. (a)(d) | 66,949 | 1,044,404 | |
Apricus Biosciences, Inc. (a)(d) | 103,681 | 242,095 | |
BG Medicine, Inc. (a)(d) | 33,527 | 43,585 | |
Bio-Rad Laboratories, Inc. Class A (a) | 70,269 | 9,115,295 | |
Bioanalytical Systems, Inc. (a)(d) | 4,772 | 12,884 | |
Bruker BioSciences Corp. (a) | 369,173 | 8,394,994 | |
Cambrex Corp. (a) | 99,659 | 2,000,156 | |
Charles River Laboratories International, Inc. (a) | 152,413 | 9,054,856 | |
CombiMatrix Corp. (a)(d) | 13,852 | 39,478 | |
Covance, Inc. (a)(d) | 182,057 | 18,853,823 | |
Enzo Biochem, Inc. (a) | 134,553 | 499,192 | |
Fluidigm Corp. (a) | 84,882 | 3,976,722 | |
Furiex Pharmaceuticals, Inc. (a) | 30,575 | 2,829,105 | |
Harvard Bioscience, Inc. (a) | 61,324 | 299,261 | |
Illumina, Inc. (a)(d) | 420,643 | 72,136,068 | |
Luminex Corp. (a)(d) | 123,438 | 2,281,134 | |
Mettler-Toledo International, Inc. (a) | 97,486 | 23,958,159 | |
Nanostring Technologies, Inc. | 36,430 | 688,527 | |
NeoGenomics, Inc. (a)(d) | 129,047 | 461,988 | |
Pacific Biosciences of California, Inc. (a) | 178,598 | 1,189,463 | |
PAREXEL International Corp. (a) | 186,275 | 9,978,752 | |
pSivida Corp. (a)(d) | 82,313 | 360,531 | |
Quintiles Transnational Holdings, Inc. | 80,908 | 4,381,168 | |
Response Genetics, Inc. (a) | 8,201 | 11,727 | |
Sequenom, Inc. (a)(d) | 403,889 | 957,217 | |
Techne Corp. | 109,192 | 9,700,617 | |
VirtualScopics, Inc. (a) | 2,167 | 7,324 | |
| 185,484,593 | ||
Pharmaceuticals - 1.4% | |||
AcelRx Pharmaceuticals, Inc. (a)(d) | 81,141 | 927,442 | |
Acura Pharmaceuticals, Inc. (a) | 93,798 | 185,720 | |
Aerie Pharmaceuticals, Inc. | 30,148 | 692,500 | |
Akorn, Inc. (a)(d) | 243,141 | 6,277,901 | |
Alexza Pharmaceuticals, Inc. (a) | 37,601 | 206,053 | |
Alimera Sciences, Inc. (a)(d) | 47,590 | 319,329 | |
Ampio Pharmaceuticals, Inc. (a)(d) | 110,055 | 783,592 | |
ANI Pharmaceuticals, Inc. (a)(d) | 24,842 | 752,216 | |
Aratana Therapeutics, Inc. (d) | 67,352 | 1,574,016 | |
AstraZeneca PLC rights (a) | 21,542 | 0 | |
Auxilium Pharmaceuticals, Inc. (a)(d) | 159,396 | 4,901,427 | |
AVANIR Pharmaceuticals Class A (a) | 506,360 | 2,106,458 | |
Biodel, Inc. (a)(d) | 35,927 | 113,170 | |
Biodelivery Sciences International, Inc. (a)(d) | 132,799 | 1,244,327 | |
Cadence Pharmaceuticals, Inc. (a) | 223,033 | 3,120,232 | |
Cempra, Inc. (a) | 75,436 | 859,216 | |
Columbia Laboratories, Inc. (a)(d) | 40,260 | 274,976 | |
Corcept Therapeutics, Inc. (a)(d) | 220,514 | 723,286 | |
Cumberland Pharmaceuticals, Inc. (a) | 32,551 | 150,711 | |
Common Stocks - continued | |||
Shares | Value | ||
HEALTH CARE - continued | |||
Pharmaceuticals - continued | |||
DepoMed, Inc. (a) | 202,001 | $ 2,434,112 | |
Durect Corp. (a) | 379,275 | 527,192 | |
Endo Health Solutions, Inc. (a)(d) | 456,243 | 36,417,316 | |
Endocyte, Inc. (a)(d) | 101,288 | 1,333,963 | |
Evoke Pharma, Inc. | 10,276 | 106,459 | |
Heska Corp. (a) | 15,048 | 146,116 | |
Hi-Tech Pharmacal Co., Inc. (a) | 35,059 | 1,520,158 | |
Horizon Pharma, Inc. (a)(d) | 169,961 | 2,076,923 | |
Impax Laboratories, Inc. (a) | 232,534 | 5,992,401 | |
Jazz Pharmaceuticals PLC (a) | 174,160 | 26,462,741 | |
Lannett Co., Inc. (a)(d) | 91,970 | 3,944,593 | |
Mallinckrodt PLC (a) | 191,626 | 12,971,164 | |
Nektar Therapeutics (a) | 416,539 | 5,344,195 | |
NovaBay Pharmaceuticals, Inc. (a)(d) | 72,124 | 90,876 | |
Ocera Therapeutics, Inc. (a)(d) | 3,249 | 50,262 | |
Omeros Corp. (a)(d) | 89,410 | 1,194,518 | |
Pacira Pharmaceuticals, Inc. (a)(d) | 112,002 | 8,763,036 | |
Pain Therapeutics, Inc. (a) | 127,482 | 720,273 | |
Pernix Therapeutics Holdings, Inc. (a)(d) | 25,474 | 93,490 | |
Pozen, Inc. | 81,989 | 652,632 | |
Prestige Brands Holdings, Inc. (a) | 172,300 | 4,908,827 | |
Questcor Pharmaceuticals, Inc. (d) | 185,588 | 11,274,471 | |
Relypsa, Inc. | 25,364 | 1,000,863 | |
Repros Therapeutics, Inc. (a)(d) | 72,970 | 1,426,564 | |
Sagent Pharmaceuticals, Inc. (a) | 73,832 | 1,562,285 | |
Salix Pharmaceuticals Ltd. (a) | 208,275 | 22,477,038 | |
SciClone Pharmaceuticals, Inc. (a)(d) | 165,132 | 767,864 | |
Sucampo Pharmaceuticals, Inc. Class A (a) | 85,589 | 770,301 | |
Supernus Pharmaceuticals, Inc. (a)(d) | 58,414 | 586,477 | |
The Medicines Company (a)(d) | 210,985 | 6,445,592 | |
TherapeuticsMD, Inc. (a)(d) | 329,975 | 2,266,928 | |
Transcept Pharmaceuticals, Inc. (a) | 34,975 | 116,467 | |
Ventrus Biosciences, Inc. (a) | 67,306 | 91,536 | |
VIVUS, Inc. (a)(d) | 332,213 | 2,003,244 | |
XenoPort, Inc. (a)(d) | 188,526 | 1,178,288 | |
Zogenix, Inc. (a)(d) | 375,255 | 1,632,359 | |
| 194,564,096 | ||
TOTAL HEALTH CARE | 1,683,382,646 | ||
INDUSTRIALS - 14.7% | |||
Aerospace & Defense - 1.7% | |||
AAR Corp. | 128,048 | 3,700,587 | |
AeroVironment, Inc. (a) | 65,978 | 2,061,153 | |
Alliant Techsystems, Inc. | 105,362 | 14,201,744 | |
American Science & Engineering, Inc. | 30,419 | 2,000,049 | |
API Technologies Corp. (a) | 67,799 | 188,481 | |
Arotech Corp. (a) | 51,558 | 175,813 | |
Ascent Solar Technologies, Inc. (a)(d) | 112,670 | 82,125 | |
| |||
Shares | Value | ||
Astronics Corp. (a) | 51,486 | $ 3,444,413 | |
Astrotech Corp. (a)(d) | 39,511 | 105,889 | |
BE Aerospace, Inc. (a) | 322,786 | 27,194,721 | |
Breeze Industrial Products Corp. (a) | 10,964 | 105,254 | |
CPI Aerostructures, Inc. (a)(d) | 13,911 | 199,901 | |
Cubic Corp. | 77,870 | 4,049,240 | |
Curtiss-Wright Corp. | 159,374 | 10,862,932 | |
DigitalGlobe, Inc. (a) | 230,125 | 7,152,285 | |
Ducommun, Inc. (a) | 32,079 | 891,796 | |
Engility Holdings, Inc. (a)(d) | 61,914 | 2,583,671 | |
Erickson Air-Crane, Inc. (a)(d) | 16,337 | 351,736 | |
Esterline Technologies Corp. (a) | 106,718 | 11,493,529 | |
Exelis, Inc. | 634,969 | 12,972,417 | |
GenCorp, Inc. (non-vtg.) (a)(d) | 209,446 | 3,901,979 | |
HEICO Corp. | 99,781 | 6,205,380 | |
HEICO Corp. Class A | 120,967 | 5,557,224 | |
Hexcel Corp. (a) | 328,659 | 14,789,655 | |
Huntington Ingalls Industries, Inc. | 158,950 | 16,106,404 | |
Innovative Solutions & Support, Inc. (a) | 34,266 | 270,359 | |
KEYW Holding Corp. (a)(d) | 90,660 | 1,659,078 | |
Kratos Defense & Security Solutions, Inc. (a) | 148,815 | 1,160,757 | |
LMI Aerospace, Inc. (a)(d) | 40,944 | 610,475 | |
Micronet Enertec Technologies, Inc. (a) | 8,571 | 46,026 | |
Moog, Inc. Class A (a) | 157,374 | 9,746,172 | |
National Presto Industries, Inc. (d) | 16,984 | 1,308,447 | |
Orbital Sciences Corp. (a) | 211,700 | 6,016,514 | |
SIFCO Industries, Inc. | 1,004 | 26,606 | |
Sparton Corp. (a) | 27,651 | 895,892 | |
Spirit AeroSystems Holdings, Inc. Class A (a) | 332,245 | 9,578,623 | |
Sypris Solutions, Inc. | 19,374 | 54,441 | |
Taser International, Inc. (a)(d) | 173,546 | 3,337,290 | |
Teledyne Technologies, Inc. (a) | 132,210 | 12,953,936 | |
TransDigm Group, Inc. | 163,452 | 29,117,339 | |
Triumph Group, Inc. | 172,726 | 11,261,735 | |
| 238,422,068 | ||
Air Freight & Logistics - 0.2% | |||
Air Transport Services Group, Inc. (a) | 167,461 | 1,070,076 | |
Atlas Air Worldwide Holdings, Inc. (a) | 85,402 | 2,573,162 | |
Echo Global Logistics, Inc. (a) | 53,905 | 858,168 | |
Forward Air Corp. | 118,062 | 5,107,362 | |
Hub Group, Inc. Class A (a)(d) | 118,664 | 4,636,202 | |
Pacer International, Inc. (a) | 128,388 | 1,151,640 | |
Park-Ohio Holdings Corp. (a) | 29,198 | 1,536,983 | |
Radiant Logistics, Inc. (a) | 37,185 | 102,259 | |
UTi Worldwide, Inc. | 311,951 | 3,069,598 | |
XPO Logistics, Inc. (a)(d) | 149,548 | 4,701,789 | |
| 24,807,239 | ||
Airlines - 0.9% | |||
Alaska Air Group, Inc. | 226,441 | 19,618,848 | |
Allegiant Travel Co. | 49,305 | 4,894,014 | |
American Airlines Group, Inc. (a)(d) | 635,985 | 23,486,926 | |
Common Stocks - continued | |||
Shares | Value | ||
INDUSTRIALS - continued | |||
Airlines - continued | |||
Hawaiian Holdings, Inc. (a)(d) | 198,497 | $ 2,389,904 | |
JetBlue Airways Corp. (a)(d) | 733,599 | 6,477,679 | |
Republic Airways Holdings, Inc. (a) | 176,772 | 1,693,476 | |
SkyWest, Inc. | 180,939 | 2,297,925 | |
Spirit Airlines, Inc. (a) | 241,407 | 13,634,667 | |
United Continental Holdings, Inc. (a) | 1,200,940 | 53,994,262 | |
| 128,487,701 | ||
Building Products - 0.9% | |||
A.O. Smith Corp. | 252,068 | 12,527,780 | |
AAON, Inc. | 93,160 | 2,783,621 | |
American Woodmark Corp. (a) | 43,110 | 1,384,262 | |
Apogee Enterprises, Inc. | 103,282 | 3,535,343 | |
Armstrong World Industries, Inc. (a) | 126,358 | 6,935,791 | |
Builders FirstSource, Inc. (a) | 172,637 | 1,486,405 | |
Fortune Brands Home & Security, Inc. | 544,162 | 25,434,132 | |
Gibraltar Industries, Inc. (a) | 106,106 | 1,955,534 | |
Griffon Corp. | 169,928 | 2,107,107 | |
Insteel Industries, Inc. | 51,506 | 1,024,969 | |
Lennox International, Inc. | 149,634 | 13,748,372 | |
Masonite International Corp. (a) | 55,755 | 3,217,064 | |
NCI Building Systems, Inc. (a) | 106,899 | 1,823,697 | |
Norcraft Companies, Inc. | 31,325 | 544,115 | |
Nortek, Inc. (a) | 55,700 | 4,032,123 | |
Owens Corning | 361,504 | 16,542,423 | |
Patrick Industries, Inc. (a) | 36,314 | 1,532,088 | |
PGT, Inc. (a)(d) | 118,950 | 1,378,631 | |
Ply Gem Holdings, Inc. | 61,929 | 793,310 | |
Quanex Building Products Corp. | 127,404 | 2,476,734 | |
Simpson Manufacturing Co. Ltd. | 142,646 | 5,042,536 | |
Trex Co., Inc. (a)(d) | 50,709 | 3,966,458 | |
Universal Forest Products, Inc. | 66,762 | 3,720,646 | |
USG Corp. (a)(d) | 307,217 | 10,853,977 | |
| 128,847,118 | ||
Commercial Services & Supplies - 1.4% | |||
ABM Industries, Inc. | 181,384 | 5,120,470 | |
ACCO Brands Corp. (a)(d) | 398,384 | 2,358,433 | |
Acme United Corp. | 1,357 | 21,508 | |
Acorn Energy, Inc. (d) | 65,930 | 224,162 | |
Amrep Corp. (a) | 2,745 | 20,203 | |
ARC Document Solutions, Inc. (a) | 122,333 | 965,207 | |
Avalon Holdings Corp. Class A (a) | 128 | 692 | |
Casella Waste Systems, Inc. Class A (a) | 94,671 | 507,437 | |
CECO Environmental Corp. (d) | 73,503 | 1,187,073 | |
Cenveo, Inc. (a)(d) | 175,472 | 594,850 | |
Clean Harbors, Inc. (a)(d) | 181,523 | 8,578,777 | |
Command Security Corp. (a) | 4,127 | 8,460 | |
CompX International, Inc. Class A | 729 | 8,311 | |
Copart, Inc. (a) | 373,565 | 13,608,973 | |
Courier Corp. | 28,388 | 467,550 | |
Covanta Holding Corp. | 436,144 | 7,850,592 | |
| |||
Shares | Value | ||
Deluxe Corp. | 167,617 | $ 8,461,306 | |
Ecology & Environment, Inc. Class A | 5,634 | 67,495 | |
EnerNOC, Inc. (a) | 96,330 | 2,089,398 | |
Ennis, Inc. | 84,717 | 1,338,529 | |
Food Technology Service, Inc. (a) | 11,431 | 82,075 | |
Fuel Tech, Inc. (a) | 72,552 | 463,607 | |
G&K Services, Inc. Class A | 68,430 | 4,285,771 | |
Healthcare Services Group, Inc. | 246,803 | 6,646,405 | |
Heritage-Crystal Clean, Inc. (a) | 21,398 | 387,304 | |
Herman Miller, Inc. | 199,407 | 5,619,289 | |
HNI Corp. | 150,326 | 5,344,089 | |
Hudson Technologies, Inc. (a)(d) | 33,341 | 104,357 | |
Humitech International Group, Inc. (a) | 75 | 0 | |
Industrial Services of America, Inc. (a)(d) | 12,843 | 46,620 | |
InnerWorkings, Inc. (a)(d) | 130,564 | 1,028,844 | |
Interface, Inc. | 206,587 | 3,978,866 | |
Intersections, Inc. | 42,827 | 262,530 | |
KAR Auction Services, Inc. | 458,159 | 14,276,234 | |
Kimball International, Inc. Class B | 106,993 | 2,008,259 | |
Knoll, Inc. | 168,647 | 2,625,834 | |
McGrath RentCorp. | 87,775 | 2,841,277 | |
Metalico, Inc. (a) | 92,179 | 179,749 | |
Mine Safety Appliances Co. | 109,856 | 5,652,091 | |
Mobile Mini, Inc. | 138,265 | 6,223,308 | |
Multi-Color Corp. | 45,195 | 1,530,755 | |
NL Industries, Inc. | 19,361 | 217,424 | |
Performant Financial Corp. (a) | 101,625 | 803,854 | |
Perma-Fix Environmental Services, Inc. (a) | 24,334 | 84,682 | |
Quad/Graphics, Inc. (d) | 87,062 | 1,947,577 | |
R.R. Donnelley & Sons Co. | 648,066 | 12,397,503 | |
Rollins, Inc. | 255,303 | 7,623,348 | |
Schawk, Inc. Class A | 27,510 | 384,590 | |
SP Plus Corp. (a) | 59,437 | 1,560,221 | |
Standard Register Co. (a) | 7,636 | 83,691 | |
Steelcase, Inc. Class A | 204,828 | 3,045,792 | |
Swisher Hygiene, Inc. (Canada) (a)(d) | 364,761 | 178,734 | |
Team, Inc. (a) | 67,994 | 2,940,061 | |
Tetra Tech, Inc. (a) | 220,994 | 6,382,307 | |
The Brink's Co. | 170,136 | 5,173,836 | |
TRC Companies, Inc. (a) | 46,338 | 319,732 | |
U.S. Ecology, Inc. | 72,607 | 2,608,770 | |
UniFirst Corp. | 51,036 | 5,598,139 | |
United Stationers, Inc. | 140,267 | 5,979,582 | |
Versar, Inc. (a) | 11,390 | 43,168 | |
Viad Corp. | 69,798 | 1,678,642 | |
Virco Manufacturing Co. (a) | 4,818 | 12,623 | |
Waste Connections, Inc. | 405,562 | 17,548,668 | |
West Corp. | 82,531 | 2,073,179 | |
| 195,752,813 | ||
Construction & Engineering - 0.9% | |||
AECOM Technology Corp. (a) | 334,577 | 10,686,389 | |
Aegion Corp. (a)(d) | 132,798 | 3,074,274 | |
Common Stocks - continued | |||
Shares | Value | ||
INDUSTRIALS - continued | |||
Construction & Engineering - continued | |||
Ameresco, Inc. Class A (a)(d) | 58,398 | $ 599,163 | |
Argan, Inc. | 32,135 | 918,740 | |
Chicago Bridge & Iron Co. NV | 353,500 | 29,761,165 | |
Comfort Systems U.S.A., Inc. | 125,897 | 2,068,488 | |
Dycom Industries, Inc. (a) | 117,169 | 3,385,012 | |
EMCOR Group, Inc. | 228,213 | 10,675,804 | |
Foster Wheeler AG | 323,497 | 10,390,724 | |
Furmanite Corp. (a) | 125,414 | 1,484,902 | |
Goldfield Corp. | 60,575 | 141,140 | |
Granite Construction, Inc. | 124,703 | 4,584,082 | |
Great Lakes Dredge & Dock Corp. (a)(d) | 189,686 | 1,566,806 | |
Integrated Electrical Services, Inc. (a) | 32,747 | 179,126 | |
KBR, Inc. | 486,926 | 13,448,896 | |
Layne Christensen Co. (a)(d) | 69,984 | 1,242,916 | |
MasTec, Inc. (a)(d) | 204,727 | 8,381,523 | |
MYR Group, Inc. (a) | 70,284 | 1,635,509 | |
Northwest Pipe Co. (a) | 30,517 | 1,081,828 | |
Orion Marine Group, Inc. (a) | 86,249 | 973,751 | |
Pike Corp. (a) | 85,970 | 892,369 | |
Primoris Services Corp. | 118,109 | 3,693,268 | |
Sterling Construction Co., Inc. (a) | 38,185 | 361,612 | |
Tutor Perini Corp. (a) | 129,585 | 3,194,270 | |
UniTek Global Services, Inc. (a) | 33,766 | 54,026 | |
URS Corp. | 248,137 | 11,538,371 | |
Willdan Group, Inc. (a) | 13,349 | 61,539 | |
| 126,075,693 | ||
Electrical Equipment - 1.2% | |||
Active Power, Inc. (a) | 47,662 | 161,574 | |
Acuity Brands, Inc. | 141,914 | 20,016,970 | |
Allied Motion Technologies, Inc. | 14,531 | 166,816 | |
Altair Nanotechnologies, Inc. (a)(d) | 24,072 | 130,230 | |
American Superconductor Corp. (a)(d) | 173,059 | 320,159 | |
AZZ, Inc. | 86,866 | 3,854,244 | |
Babcock & Wilcox Co. | 376,282 | 12,402,255 | |
Brady Corp. Class A | 171,982 | 4,600,519 | |
Broadwind Energy, Inc. (a) | 50,197 | 484,401 | |
Capstone Turbine Corp. (a)(d) | 1,142,904 | 2,045,798 | |
Digital Power Corp. (a) | 4,959 | 3,075 | |
Encore Wire Corp. | 61,999 | 3,241,928 | |
EnerSys | 153,666 | 10,916,433 | |
Enphase Energy, Inc. (a)(d) | 40,205 | 324,454 | |
Espey Manufacturing & Electronics Corp. | 2,487 | 71,650 | |
Franklin Electric Co., Inc. | 135,690 | 5,914,727 | |
FuelCell Energy, Inc. (a)(d) | 636,902 | 1,241,959 | |
Generac Holdings, Inc. | 227,790 | 12,977,196 | |
General Cable Corp. | 173,857 | 5,351,318 | |
Global Power Equipment Group, Inc. | 46,800 | 857,376 | |
GrafTech International Ltd. (a)(d) | 386,768 | 3,751,650 | |
Hubbell, Inc. Class B | 177,553 | 21,224,686 | |
II-VI, Inc. (a) | 188,032 | 3,081,844 | |
Lime Energy Co. (a)(d) | 4,467 | 13,490 | |
| |||
Shares | Value | ||
LSI Industries, Inc. | 51,035 | $ 423,080 | |
MagneTek, Inc. (a) | 6,645 | 160,543 | |
Ocean Power Technologies, Inc. (a)(d) | 24,836 | 100,834 | |
Orion Energy Systems, Inc. (a) | 65,072 | 359,848 | |
Plug Power, Inc. (a)(d) | 334,144 | 1,560,452 | |
Polypore International, Inc. (a)(d) | 153,378 | 5,308,413 | |
Powell Industries, Inc. | 33,460 | 2,279,630 | |
Power Solutions International, Inc. (a)(d) | 16,088 | 1,192,121 | |
PowerSecure International, Inc. (a)(d) | 63,459 | 1,442,423 | |
Preformed Line Products Co. | 8,094 | 502,637 | |
Real Goods Solar, Inc. Class A (a)(d) | 83,434 | 317,884 | |
Regal-Beloit Corp. | 153,599 | 11,318,710 | |
Revolution Lighting Technologies, Inc. (a)(d) | 124,109 | 392,184 | |
Sensata Technologies Holding BV (a) | 487,402 | 19,808,017 | |
SL Industries, Inc. (a) | 10,551 | 279,602 | |
SolarCity Corp. (a)(d) | 160,513 | 13,637,184 | |
Thermon Group Holdings, Inc. (a)(d) | 109,926 | 2,670,103 | |
Ultralife Corp. (a) | 43,594 | 164,785 | |
Vicor Corp. (a)(d) | 52,357 | 563,885 | |
ZBB Energy Corp. (a)(d) | 34,839 | 32,052 | |
| 175,669,139 | ||
Industrial Conglomerates - 0.1% | |||
Carlisle Companies, Inc. | 213,316 | 16,920,225 | |
Raven Industries, Inc. | 124,554 | 4,554,940 | |
| 21,475,165 | ||
Machinery - 3.8% | |||
Accuride Corp. (a)(d) | 132,658 | 585,022 | |
Actuant Corp. Class A | 241,358 | 8,462,011 | |
Adept Technology, Inc. (a) | 40,541 | 682,710 | |
AGCO Corp. | 296,134 | 15,541,112 | |
Alamo Group, Inc. | 26,680 | 1,402,834 | |
Albany International Corp. Class A | 100,741 | 3,634,735 | |
Altra Industrial Motion Corp. | 94,746 | 3,354,008 | |
American Railcar Industries, Inc. | 32,423 | 2,245,293 | |
Ampco-Pittsburgh Corp. | 25,813 | 527,876 | |
Art's-Way Manufacturing Co., Inc. | 9,831 | 58,494 | |
Astec Industries, Inc. | 69,250 | 2,785,235 | |
Barnes Group, Inc. | 158,563 | 6,096,747 | |
Blount International, Inc. (a)(d) | 172,961 | 2,118,772 | |
Briggs & Stratton Corp. | 162,631 | 3,704,734 | |
Chart Industries, Inc. (a) | 100,740 | 8,417,834 | |
Chicago Rivet & Machine Co. | 772 | 30,772 | |
CIRCOR International, Inc. | 60,186 | 4,306,910 | |
CLARCOR, Inc. | 168,156 | 9,741,277 | |
Colfax Corp. (a) | 304,642 | 21,669,185 | |
Columbus McKinnon Corp. (NY Shares) (a) | 62,931 | 1,602,223 | |
Commercial Vehicle Group, Inc. (a) | 75,400 | 672,568 | |
Crane Co. | 163,017 | 11,642,674 | |
Donaldson Co., Inc. | 452,816 | 19,398,637 | |
Douglas Dynamics, Inc. | 74,542 | 1,206,090 | |
Dynamic Materials Corp. | 39,486 | 819,729 | |
Common Stocks - continued | |||
Shares | Value | ||
INDUSTRIALS - continued | |||
Machinery - continued | |||
Eastern Co. | 11,293 | $ 179,672 | |
Energy Recovery, Inc. (a)(d) | 141,452 | 633,705 | |
EnPro Industries, Inc. (a)(d) | 68,032 | 4,873,132 | |
ESCO Technologies, Inc. | 95,557 | 3,424,763 | |
ExOne Co. (d) | 33,912 | 1,570,126 | |
Federal Signal Corp. (a) | 206,448 | 2,652,857 | |
FreightCar America, Inc. | 47,091 | 1,203,646 | |
Global Brass & Copper Holdings, Inc. | 80,528 | 1,363,339 | |
Gorman-Rupp Co. | 63,289 | 1,993,604 | |
Graco, Inc. | 204,383 | 15,948,005 | |
Graham Corp. | 31,448 | 1,093,447 | |
Greenbrier Companies, Inc. (a)(d) | 83,214 | 3,500,813 | |
Hardinge, Inc. | 28,207 | 416,053 | |
Harsco Corp. | 267,202 | 6,712,114 | |
Hurco Companies, Inc. | 14,365 | 359,269 | |
Hyster-Yale Materials Handling Class A | 38,190 | 3,854,899 | |
IDEX Corp. | 266,127 | 19,978,154 | |
Internet Media Services, Inc. (a) | 7,375 | 5 | |
ITT Corp. | 295,751 | 12,983,469 | |
John Bean Technologies Corp. | 85,902 | 2,590,804 | |
Kadant, Inc. | 36,513 | 1,465,997 | |
Kennametal, Inc. | 255,674 | 11,183,181 | |
Key Technology, Inc. (a) | 12,346 | 156,794 | |
L.B. Foster Co. Class A | 30,153 | 1,401,813 | |
Lincoln Electric Holdings, Inc. | 273,476 | 20,502,496 | |
Lindsay Corp. (d) | 43,068 | 3,654,750 | |
Lydall, Inc. (a) | 39,995 | 810,299 | |
Manitex International, Inc. (a)(d) | 34,692 | 520,033 | |
Manitowoc Co., Inc. (d) | 441,343 | 13,655,152 | |
Meritor, Inc. (a) | 317,981 | 3,946,144 | |
MFRI, Inc. (a) | 13,428 | 208,134 | |
Middleby Corp. (a)(d) | 63,969 | 18,970,647 | |
Miller Industries, Inc. | 29,446 | 531,500 | |
Mueller Industries, Inc. | 100,310 | 6,267,369 | |
Mueller Water Products, Inc. Class A | 534,113 | 5,154,190 | |
Navistar International Corp. (a)(d) | 224,675 | 8,425,313 | |
NN, Inc. | 55,838 | 1,077,115 | |
Nordson Corp. | 200,809 | 14,691,186 | |
Omega Flex, Inc. | 5,411 | 120,936 | |
Oshkosh Truck Corp. | 284,653 | 16,461,483 | |
PMFG, Inc. (a) | 42,899 | 280,559 | |
Proto Labs, Inc. (a)(d) | 68,148 | 5,308,729 | |
RBC Bearings, Inc. (a) | 81,190 | 5,216,458 | |
Rexnord Corp. (a) | 175,648 | 5,267,684 | |
SPX Corp. | 151,748 | 16,340,225 | |
Standex International Corp. | 44,238 | 2,446,804 | |
Sun Hydraulics Corp. | 84,826 | 3,588,140 | |
Taylor Devices, Inc. (a) | 3,820 | 32,088 | |
Tecumseh Products Co. Class A (non-vtg.) (a) | 49,815 | 393,539 | |
Tennant Co. | 63,191 | 3,871,081 | |
| |||
Shares | Value | ||
Terex Corp. | 370,340 | $ 16,491,240 | |
The L.S. Starrett Co. Class A | 14,574 | 273,117 | |
Timken Co. | 262,687 | 15,855,787 | |
Titan International, Inc. (d) | 188,051 | 3,565,447 | |
Toro Co. | 195,916 | 12,975,517 | |
TriMas Corp. (a) | 147,403 | 4,954,215 | |
Trinity Industries, Inc. | 259,296 | 18,620,046 | |
Twin Disc, Inc. | 22,386 | 554,501 | |
Valmont Industries, Inc. (d) | 87,256 | 12,707,091 | |
Wabash National Corp. (a)(d) | 244,547 | 3,303,830 | |
WABCO Holdings, Inc. (a) | 204,823 | 20,984,116 | |
Wabtec Corp. | 315,454 | 25,037,584 | |
Watts Water Technologies, Inc. Class A | 99,738 | 6,145,856 | |
Woodward, Inc. | 201,903 | 8,800,952 | |
WSI Industries, Inc. | 5,668 | 36,502 | |
Xerium Technologies, Inc. (a) | 41,758 | 657,689 | |
| 538,952,687 | ||
Marine - 0.2% | |||
Baltic Trading Ltd. (d) | 148,093 | 1,014,437 | |
Eagle Bulk Shipping, Inc. (a)(d) | 42,249 | 200,260 | |
Genco Shipping & Trading Ltd. (a)(d) | 119,131 | 195,375 | |
International Shipholding Corp. | 22,466 | 684,314 | |
Kirby Corp. (a) | 183,646 | 19,211,208 | |
Matson, Inc. | 138,917 | 3,350,678 | |
Rand Logistics, Inc. (a)(d) | 30,737 | 208,089 | |
| 24,864,361 | ||
Professional Services - 1.3% | |||
Acacia Research Corp. (d) | 177,375 | 2,719,159 | |
Advisory Board Co. (a)(d) | 120,223 | 7,703,890 | |
Barrett Business Services, Inc. | 22,755 | 1,592,850 | |
CBIZ, Inc. (a)(d) | 163,829 | 1,495,759 | |
CDI Corp. | 40,979 | 748,686 | |
Corp. Resources Services, Inc. (a)(d) | 34,388 | 89,753 | |
Corporate Executive Board Co. | 113,872 | 8,515,348 | |
CRA International, Inc. (a) | 27,449 | 641,483 | |
CTPartners Executive Search, Inc. (a) | 10,063 | 70,441 | |
DLH Holdings Corp. (a) | 2,300 | 5,658 | |
Exponent, Inc. | 45,555 | 3,245,338 | |
Franklin Covey Co. (a) | 43,285 | 906,821 | |
FTI Consulting, Inc. (a) | 136,944 | 3,997,395 | |
GP Strategies Corp. (a) | 66,351 | 1,932,141 | |
Heidrick & Struggles International, Inc. | 47,268 | 869,259 | |
Hill International, Inc. (a) | 70,728 | 318,276 | |
Hudson Global, Inc. (a)(d) | 73,448 | 262,944 | |
Huron Consulting Group, Inc. (a) | 79,894 | 5,286,586 | |
ICF International, Inc. (a)(d) | 69,969 | 2,828,147 | |
IHS, Inc. Class A (a) | 205,698 | 24,659,076 | |
Insperity, Inc. | 79,669 | 2,325,538 | |
Kelly Services, Inc. Class A (non-vtg.) | 92,870 | 2,336,609 | |
Kforce, Inc. | 104,013 | 2,278,925 | |
Korn/Ferry International (a) | 172,794 | 4,387,240 | |
Lightbridge Corp. (a)(d) | 43,052 | 133,461 | |
Luna Innovations, Inc. (a) | 26,569 | 39,588 | |
Common Stocks - continued | |||
Shares | Value | ||
INDUSTRIALS - continued | |||
Professional Services - continued | |||
Manpower, Inc. | 255,928 | $ 20,003,332 | |
Mastech Holdings, Inc. | 3,140 | 42,861 | |
MISTRAS Group, Inc. (a) | 57,199 | 1,260,666 | |
Navigant Consulting, Inc. (a) | 172,532 | 3,007,233 | |
Odyssey Marine Exploration, Inc. (a)(d) | 239,959 | 525,510 | |
On Assignment, Inc. (a) | 156,999 | 5,400,766 | |
Pendrell Corp. (a) | 486,872 | 740,045 | |
RCM Technologies, Inc. (a) | 26,829 | 185,388 | |
Resources Connection, Inc. | 137,971 | 1,890,203 | |
RPX Corp. (a) | 126,709 | 2,029,878 | |
Spherix, Inc. (a) | 11,044 | 51,575 | |
Towers Watson & Co. | 212,666 | 23,201,861 | |
TrueBlue, Inc. (a) | 140,541 | 4,002,608 | |
Verisk Analytics, Inc. (a) | 497,227 | 31,680,818 | |
VSE Corp. | 11,665 | 563,420 | |
WageWorks, Inc. (a) | 97,655 | 5,776,293 | |
| 179,752,828 | ||
Road & Rail - 1.1% | |||
AMERCO | 19,924 | 4,641,097 | |
Arkansas Best Corp. | 77,866 | 2,589,823 | |
Avis Budget Group, Inc. (a)(d) | 356,954 | 16,773,268 | |
Celadon Group, Inc. | 79,105 | 1,795,684 | |
Con-way, Inc. | 185,796 | 7,086,259 | |
Covenant Transport Group, Inc. Class A (a) | 20,231 | 201,501 | |
Genesee & Wyoming, Inc. Class A (a) | 163,916 | 16,214,571 | |
Heartland Express, Inc. | 164,198 | 3,346,355 | |
Hertz Global Holdings, Inc. (a) | 1,487,435 | 41,663,054 | |
J.B. Hunt Transport Services, Inc. | 298,562 | 21,457,651 | |
Knight Transportation, Inc. | 212,636 | 4,567,421 | |
Landstar System, Inc. | 154,958 | 8,942,626 | |
Marten Transport Ltd. | 92,034 | 1,793,743 | |
Old Dominion Freight Lines, Inc. (a) | 233,075 | 12,408,913 | |
P.A.M. Transportation Services, Inc. (a) | 12,026 | 218,633 | |
Patriot Transportation Holding, Inc. (a) | 15,144 | 539,884 | |
Quality Distribution, Inc. (a) | 101,880 | 1,306,102 | |
Roadrunner Transportation Systems, Inc. (a) | 88,451 | 2,079,483 | |
Saia, Inc. (a) | 87,509 | 3,022,561 | |
Swift Transporation Co. (a)(d) | 357,132 | 8,699,736 | |
U.S.A. Truck, Inc. (a) | 28,518 | 438,322 | |
Universal Truckload Services, Inc. | 18,107 | 470,782 | |
Werner Enterprises, Inc. | 156,098 | 4,035,133 | |
YRC Worldwide, Inc. (a)(d) | 32,458 | 850,400 | |
| 165,143,002 | ||
Trading Companies & Distributors - 1.0% | |||
Aceto Corp. | 86,257 | 1,577,641 | |
AeroCentury Corp. (a)(d) | 740 | 12,587 | |
Air Lease Corp. Class A | 302,013 | 11,159,380 | |
Aircastle Ltd. | 214,971 | 4,234,929 | |
Applied Industrial Technologies, Inc. | 144,113 | 7,354,086 | |
| |||
Shares | Value | ||
Beacon Roofing Supply, Inc. (a)(d) | 160,838 | $ 6,078,068 | |
BlueLinx Corp. (a)(d) | 73,361 | 107,107 | |
CAI International, Inc. (a)(d) | 57,232 | 1,393,027 | |
DXP Enterprises, Inc. (a) | 33,811 | 3,440,607 | |
Essex Rental Corp. (a) | 27,827 | 87,655 | |
GATX Corp. | 159,648 | 10,359,559 | |
H&E Equipment Services, Inc. (a) | 99,601 | 3,258,945 | |
HD Supply Holdings, Inc. (a)(d) | 192,007 | 4,468,003 | |
Houston Wire & Cable Co. | 39,527 | 549,821 | |
Kaman Corp. | 99,263 | 3,942,726 | |
Lawson Products, Inc. (a) | 23,255 | 342,546 | |
MRC Global, Inc. (a) | 336,811 | 8,662,779 | |
MSC Industrial Direct Co., Inc. Class A | 154,283 | 13,319,251 | |
Rush Enterprises, Inc. Class A (a)(d) | 119,446 | 3,416,156 | |
Stock Building Supply Holdings, Inc. | 34,275 | 762,962 | |
TAL International Group, Inc. | 111,519 | 4,940,292 | |
Textainer Group Holdings Ltd. (d) | 68,600 | 2,501,842 | |
Titan Machinery, Inc. (a)(d) | 64,538 | 1,020,991 | |
Transcat, Inc. (a) | 4,695 | 43,429 | |
United Rentals, Inc. (a)(d) | 306,291 | 27,057,747 | |
Watsco, Inc. | 85,928 | 8,453,597 | |
WESCO International, Inc. (a)(d) | 140,830 | 12,140,954 | |
Willis Lease Finance Corp. (a) | 19,324 | 345,900 | |
| 141,032,587 | ||
Transportation Infrastructure - 0.0% | |||
Wesco Aircraft Holdings, Inc. (a) | 147,953 | 3,209,101 | |
TOTAL INDUSTRIALS | 2,092,491,502 | ||
INFORMATION TECHNOLOGY - 16.1% | |||
Communications Equipment - 1.2% | |||
ADTRAN, Inc. | 197,013 | 5,161,741 | |
Alliance Fiber Optic Products, Inc. (d) | 38,110 | 458,844 | |
Ambient Corp. (a) | 4,086 | 7,723 | |
American Electric Technologies, Inc. (a) | 1,200 | 11,328 | |
Applied Optoelectronics, Inc. | 13,050 | 308,763 | |
Arris Group, Inc. (a) | 381,476 | 10,948,361 | |
Aruba Networks, Inc. (a)(d) | 360,797 | 7,399,946 | |
Aviat Networks, Inc. (a) | 167,167 | 325,976 | |
Aware, Inc. (a) | 13,571 | 76,812 | |
Bel Fuse, Inc. Class B (non-vtg.) | 23,302 | 442,738 | |
Black Box Corp. | 57,867 | 1,539,262 | |
Brocade Communications Systems, Inc. (a) | 1,480,625 | 14,169,581 | |
CalAmp Corp. (a) | 110,023 | 3,525,137 | |
Calix Networks, Inc. (a) | 117,823 | 936,693 | |
Ciena Corp. (a)(d) | 340,243 | 8,359,771 | |
Clearfield, Inc. (a) | 36,827 | 861,752 | |
ClearOne, Inc. (a) | 5,738 | 62,143 | |
CommScope Holding Co., Inc. | 150,608 | 3,643,208 | |
Communications Systems, Inc. | 7,926 | 106,763 | |
Comtech Telecommunications Corp. | 62,000 | 1,984,620 | |
Digi International, Inc. (a) | 68,270 | 651,979 | |
Common Stocks - continued | |||
Shares | Value | ||
INFORMATION TECHNOLOGY - continued | |||
Communications Equipment - continued | |||
EchoStar Holding Corp. Class A (a) | 139,551 | $ 6,952,431 | |
EMCORE Corp. (a)(d) | 83,286 | 406,436 | |
Emulex Corp. (a) | 343,768 | 2,502,631 | |
Entrada Networks, Inc. (a) | 292 | 0 | |
Extreme Networks, Inc. (a) | 334,521 | 1,916,805 | |
Finisar Corp. (a) | 317,054 | 7,514,180 | |
Harmonic, Inc. (a) | 331,637 | 2,152,324 | |
Infinera Corp. (a)(d) | 415,664 | 3,458,324 | |
InfoSonics Corp. (a)(d) | 41,938 | 127,911 | |
InterDigital, Inc. (d) | 140,409 | 4,282,475 | |
Interphase Corp. (a) | 11,825 | 56,642 | |
Ixia (a) | 193,434 | 2,390,844 | |
JDS Uniphase Corp. (a) | 764,116 | 10,529,518 | |
KVH Industries, Inc. (a)(d) | 40,349 | 521,713 | |
Lantronix, Inc. (a) | 2,994 | 7,635 | |
Meru Networks, Inc. (a)(d) | 44,480 | 187,706 | |
NETGEAR, Inc. (a)(d) | 134,826 | 4,608,353 | |
Novatel Wireless, Inc. (a) | 94,259 | 227,164 | |
NumereX Corp. Class A (a) | 29,504 | 437,839 | |
Oclaro, Inc. (a) | 344,328 | 971,005 | |
Oplink Communications, Inc. (a) | 58,370 | 1,022,642 | |
Optical Cable Corp. | 11,466 | 44,603 | |
Palo Alto Networks, Inc. (a) | 150,940 | 10,739,381 | |
Parkervision, Inc. (a)(d) | 304,980 | 1,524,900 | |
PC-Tel, Inc. | 44,393 | 386,219 | |
Plantronics, Inc. | 151,062 | 6,704,132 | |
Polycom, Inc. (a)(d) | 484,718 | 6,475,832 | |
Procera Networks, Inc. (a)(d) | 67,503 | 744,558 | |
Relm Wireless Corp. (a) | 22,872 | 72,047 | |
Riverbed Technology, Inc. (a) | 540,599 | 12,044,546 | |
Ruckus Wireless, Inc. (a) | 183,342 | 2,566,788 | |
ShoreTel, Inc. (a) | 188,141 | 1,653,759 | |
Sonus Networks, Inc. (a)(d) | 960,885 | 3,584,101 | |
Technical Communications Corp. (a) | 2,835 | 19,845 | |
Tessco Technologies, Inc. | 20,333 | 774,281 | |
Ubiquiti Networks, Inc. (a)(d) | 53,471 | 2,642,002 | |
ViaSat, Inc. (a)(d) | 144,625 | 9,647,934 | |
Westell Technologies, Inc. Class A (a) | 150,024 | 619,599 | |
Zhone Technologies, Inc. (a)(d) | 84,494 | 328,682 | |
Zoom Technologies, Inc. (a)(d) | 4,729 | 21,706 | |
| 171,852,634 | ||
Computers & Peripherals - 0.6% | |||
3D Systems Corp. (a)(d) | 316,500 | 24,041,340 | |
Concurrent Computer Corp. | 24,916 | 205,806 | |
Cray, Inc. (a)(d) | 134,778 | 4,675,449 | |
Crossroads Systems, Inc. (a)(d) | 24,612 | 55,869 | |
Dataram Corp. (a) | 3,942 | 10,762 | |
Diebold, Inc. | 221,486 | 8,281,362 | |
Dot Hill Systems Corp. (a) | 189,368 | 1,009,331 | |
Electronics for Imaging, Inc. (a) | 158,522 | 7,070,081 | |
Fusion-io, Inc. (a)(d) | 320,315 | 3,513,856 | |
| |||
Shares | Value | ||
Hutchinson Technology, Inc. (a) | 81,684 | $ 297,330 | |
Imation Corp. (a) | 104,323 | 667,667 | |
Immersion Corp. (a) | 100,218 | 1,197,605 | |
Intevac, Inc. (a) | 59,350 | 446,906 | |
Lexmark International, Inc. Class A | 204,090 | 8,600,353 | |
NCR Corp. (a) | 551,457 | 18,777,111 | |
Overland Storage, Inc. (a) | 57,061 | 59,343 | |
QLogic Corp. (a) | 297,783 | 3,400,682 | |
Quantum Corp. (a)(d) | 964,773 | 1,128,784 | |
Qumu Corp. (a) | 32,359 | 511,272 | |
Silicon Graphics International Corp. (a)(d) | 125,239 | 1,541,692 | |
Super Micro Computer, Inc. (a) | 132,262 | 2,670,370 | |
Transact Technologies, Inc. | 18,832 | 218,451 | |
U.S.A. Technologies, Inc. (a)(d) | 79,221 | 166,364 | |
Violin Memory, Inc. (d) | 53,384 | 232,220 | |
Xplore Technologies Corp. (a) | 5,105 | 30,579 | |
| 88,810,585 | ||
Electronic Equipment & Components - 2.2% | |||
ADDvantage Technologies Group, Inc. (a) | 11,928 | 33,756 | |
Advanced Photonix, Inc. Class A (a) | 41,087 | 27,035 | |
Aeroflex Holding Corp. (a) | 62,535 | 499,655 | |
Agilysys, Inc. (a) | 46,798 | 679,507 | |
Anixter International, Inc. | 92,980 | 9,944,211 | |
Arrow Electronics, Inc. (a) | 330,435 | 18,712,534 | |
Audience, Inc. (a) | 28,401 | 332,860 | |
Avnet, Inc. | 456,204 | 19,858,560 | |
AVX Corp. | 194,808 | 2,499,387 | |
Badger Meter, Inc. | 48,888 | 2,684,929 | |
Belden, Inc. | 142,773 | 10,298,216 | |
Benchmark Electronics, Inc. (a) | 187,285 | 4,464,874 | |
CDW Corp. | 141,832 | 3,711,743 | |
Checkpoint Systems, Inc. (a) | 133,119 | 1,950,193 | |
ClearSign Combustion Corp. (a)(d) | 26,018 | 243,268 | |
Cognex Corp. (a) | 278,233 | 10,478,255 | |
Coherent, Inc. (a) | 85,373 | 5,818,170 | |
Control4 Corp. (d) | 13,781 | 288,161 | |
CTS Corp. | 113,780 | 2,323,388 | |
CUI Global, Inc. (a) | 68,064 | 594,199 | |
Daktronics, Inc. | 130,632 | 1,851,055 | |
Digital Ally, Inc. (a)(d) | 4,790 | 39,134 | |
Dolby Laboratories, Inc. Class A (a)(d) | 165,187 | 6,810,660 | |
DTS, Inc. (a)(d) | 52,729 | 1,070,926 | |
Dynasil Corp. of America (a) | 9,408 | 14,018 | |
Echelon Corp. (a) | 108,441 | 325,323 | |
Electro Rent Corp. | 50,058 | 909,554 | |
Electro Scientific Industries, Inc. | 80,453 | 758,672 | |
eMagin Corp. (a) | 60,537 | 161,028 | |
Fabrinet (a) | 89,055 | 1,729,448 | |
FARO Technologies, Inc. (a) | 58,086 | 3,342,268 | |
FEI Co. | 135,291 | 13,887,621 | |
Frequency Electronics, Inc. (a) | 13,041 | 149,972 | |
Giga-Tronics, Inc. (a) | 4,585 | 6,373 | |
Common Stocks - continued | |||
Shares | Value | ||
INFORMATION TECHNOLOGY - continued | |||
Electronic Equipment & Components - continued | |||
GSI Group, Inc. (a) | 43,195 | $ 542,097 | |
I. D. Systems Inc. (a) | 33,896 | 203,037 | |
Identive Group, Inc. (a) | 118,347 | 102,962 | |
IEC Electronics Corp. (a) | 18,101 | 78,377 | |
Image Sensing Systems, Inc. (a) | 2,863 | 14,458 | |
Ingram Micro, Inc. Class A (a) | 517,433 | 15,238,402 | |
Insight Enterprises, Inc. (a) | 143,877 | 3,306,293 | |
Intelli-Check, Inc. (a) | 25,728 | 19,492 | |
IntriCon Corp. (a) | 1,667 | 7,918 | |
InvenSense, Inc. (a)(d) | 179,424 | 3,615,394 | |
IPG Photonics Corp. (a)(d) | 115,394 | 8,281,827 | |
Iteris, Inc. (a) | 52,448 | 116,435 | |
Itron, Inc. (a)(d) | 128,382 | 4,493,370 | |
KEMET Corp. (a) | 140,529 | 798,205 | |
KEY Tronic Corp. (a) | 23,864 | 246,992 | |
Knowles Corp. (a)(e) | 275,000 | 8,841,250 | |
LGL Group, Inc. (a) | 3,009 | 16,550 | |
LGL Group, Inc. warrants 8/6/18 (a) | 15,045 | 903 | |
LightPath Technologies, Inc. Class A (a)(d) | 13,246 | 21,723 | |
Littelfuse, Inc. | 75,391 | 7,114,649 | |
LoJack Corp. (a) | 47,516 | 288,897 | |
LRAD Corp. (a)(d) | 62,271 | 136,373 | |
Maxwell Technologies, Inc. (a) | 96,283 | 984,012 | |
Measurement Specialties, Inc. (a) | 48,916 | 2,983,876 | |
Mercury Systems, Inc. (a)(d) | 104,306 | 1,157,797 | |
Mesa Laboratories, Inc. | 9,752 | 852,325 | |
Methode Electronics, Inc. Class A | 115,949 | 3,930,671 | |
MicroVision, Inc. (a)(d) | 62,948 | 127,784 | |
MOCON, Inc. | 7,499 | 125,908 | |
MTS Systems Corp. | 51,551 | 3,658,059 | |
Multi-Fineline Electronix, Inc. (a) | 21,997 | 320,496 | |
Napco Security Technolgies, Inc. (a) | 24,581 | 171,084 | |
National Instruments Corp. | 333,517 | 9,661,987 | |
Neonode, Inc. (a)(d) | 105,122 | 758,981 | |
NetList, Inc. (a)(d) | 111,854 | 214,200 | |
Newport Corp. (a) | 137,508 | 2,846,416 | |
OSI Systems, Inc. (a) | 63,679 | 3,914,348 | |
Par Technology Corp. (a) | 27,309 | 135,999 | |
Park Electrochemical Corp. | 73,421 | 2,091,764 | |
PC Connection, Inc. | 55,090 | 1,115,573 | |
PC Mall, Inc. (a) | 21,739 | 211,086 | |
Perceptron, Inc. | 25,360 | 360,366 | |
Planar Systems, Inc. (a) | 44,256 | 102,674 | |
Plexus Corp. (a) | 110,531 | 4,548,351 | |
Pulse Electronics Corp. (a) | 9,108 | 36,432 | |
RadiSys Corp. (a) | 67,810 | 281,412 | |
RealD, Inc. (a)(d) | 152,655 | 1,686,838 | |
Research Frontiers, Inc. (a)(d) | 60,513 | 363,683 | |
RF Industries Ltd. | 13,982 | 92,840 | |
Richardson Electronics Ltd. | 36,856 | 405,047 | |
Rofin-Sinar Technologies, Inc. (a) | 95,815 | 2,248,778 | |
| |||
Shares | Value | ||
Rogers Corp. (a) | 60,069 | $ 3,886,464 | |
Sanmina Corp. (a) | 283,697 | 4,811,501 | |
ScanSource, Inc. (a) | 97,450 | 3,825,887 | |
Sigmatron International, Inc. (a) | 762 | 8,123 | |
Speed Commerce, Inc. (a)(d) | 125,360 | 491,411 | |
Superconductor Technologies, Inc. (a)(d) | 11,800 | 32,922 | |
SYNNEX Corp. (a) | 87,558 | 5,207,950 | |
Tech Data Corp. (a) | 131,415 | 7,569,504 | |
Trimble Navigation Ltd. (a)(d) | 857,708 | 32,721,560 | |
TTM Technologies, Inc. (a) | 184,245 | 1,547,658 | |
Uni-Pixel, Inc. (a)(d) | 29,629 | 292,142 | |
Universal Display Corp. (a)(d) | 136,998 | 4,731,911 | |
Viasystems Group, Inc. (a) | 12,420 | 160,963 | |
Vishay Intertechnology, Inc. | 447,015 | 6,320,792 | |
Vishay Precision Group, Inc. (a) | 39,013 | 668,293 | |
Wayside Technology Group, Inc. | 460 | 6,504 | |
Wireless Telecom Group, Inc. (a) | 11,376 | 40,954 | |
Zebra Technologies Corp. Class A (a) | 171,724 | 11,847,239 | |
Zygo Corp. (a) | 52,026 | 786,113 | |
| 310,331,235 | ||
Internet Software & Services - 2.6% | |||
Angie's List, Inc. (a)(d) | 136,078 | 1,892,845 | |
AOL, Inc. (a) | 260,406 | 11,400,575 | |
Autobytel, Inc. (a) | 31,669 | 499,103 | |
Bankrate, Inc. (a)(d) | 141,571 | 2,849,824 | |
Bazaarvoice, Inc. (a)(d) | 165,633 | 1,119,679 | |
Benefitfocus, Inc. (d) | 17,943 | 1,162,348 | |
Blucora, Inc. (a)(d) | 133,872 | 2,575,697 | |
Bridgeline Digital, Inc. (a) | 24,241 | 27,392 | |
Brightcove, Inc. (a) | 86,582 | 839,845 | |
BroadVision, Inc. (a) | 7,417 | 95,753 | |
Carbonite, Inc. (a) | 42,143 | 428,173 | |
ChannelAdvisor Corp. (a) | 38,133 | 1,730,476 | |
Chegg, Inc. (d) | 66,239 | 417,306 | |
comScore, Inc. (a) | 120,662 | 3,815,332 | |
Constant Contact, Inc. (a) | 108,170 | 2,982,247 | |
Conversant, Inc. (a)(d) | 216,825 | 5,390,270 | |
Cornerstone OnDemand, Inc. (a)(d) | 148,697 | 8,680,931 | |
CoStar Group, Inc. (a) | 96,353 | 19,370,807 | |
Crexendo, Inc. (a) | 12,555 | 39,423 | |
Cvent, Inc. (d) | 35,347 | 1,388,430 | |
Dealertrack Technologies, Inc. (a)(d) | 150,316 | 8,127,586 | |
Demand Media, Inc. (a)(d) | 172,444 | 836,353 | |
Demandware, Inc. (a) | 90,442 | 6,793,099 | |
Dice Holdings, Inc. (a)(d) | 145,947 | 1,074,170 | |
Digital River, Inc. (a) | 103,713 | 1,842,980 | |
E2open, Inc. (a)(d) | 49,259 | 1,368,908 | |
Earthlink Holdings Corp. | 353,573 | 1,386,006 | |
eGain Communications Corp. (a)(d) | 32,997 | 276,515 | |
Endurance International Group Holdings, Inc. (d) | 80,391 | 1,213,100 | |
Envestnet, Inc. (a) | 96,140 | 4,022,498 | |
Equinix, Inc. (a) | 164,896 | 31,323,644 | |
Common Stocks - continued | |||
Shares | Value | ||
INFORMATION TECHNOLOGY - continued | |||
Internet Software & Services - continued | |||
Global Eagle Entertainment, Inc. (a) | 183,765 | $ 3,230,589 | |
GlowPoint, Inc. (a) | 51,449 | 67,913 | |
Gogo, Inc. (d) | 38,042 | 793,176 | |
IAC/InterActiveCorp | 254,393 | 19,723,089 | |
Internap Network Services Corp. (a) | 187,544 | 1,429,085 | |
Internet Patents Corp. (a) | 283 | 911 | |
IntraLinks Holdings, Inc. (a) | 131,309 | 1,524,497 | |
Inuvo, Inc. (a) | 37,507 | 46,509 | |
iPass, Inc. (a) | 125,462 | 194,466 | |
j2 Global, Inc. (d) | 144,163 | 7,409,978 | |
Limelight Networks, Inc. (a) | 156,398 | 337,820 | |
LinkedIn Corp. (a) | 321,929 | 65,686,393 | |
Liquidity Services, Inc. (a)(d) | 90,620 | 2,321,684 | |
LiveDeal, Inc. (a)(d) | 32,301 | 251,302 | |
LivePerson, Inc. (a) | 177,068 | 2,316,049 | |
Local Corp. (a)(d) | 49,826 | 79,223 | |
LogMeIn, Inc. (a) | 79,339 | 3,320,337 | |
LookSmart Ltd. (a) | 14,768 | 32,490 | |
Marchex, Inc. Class B | 75,653 | 895,732 | |
Marin Software, Inc. (d) | 33,252 | 380,735 | |
Marketo, Inc. | 61,264 | 2,511,824 | |
Mediabistro, Inc. (a) | 5,114 | 11,813 | |
MeetMe, Inc. (a)(d) | 65,453 | 174,105 | |
Millennial Media, Inc. (a)(d) | 114,638 | 692,414 | |
Monster Worldwide, Inc. (a) | 344,947 | 2,749,228 | |
Move, Inc. (a) | 134,032 | 1,730,353 | |
NIC, Inc. | 203,445 | 3,954,971 | |
Onvia.com, Inc. (a)(d) | 2,326 | 11,909 | |
OpenTable, Inc. (a)(d) | 78,033 | 6,218,450 | |
Pandora Media, Inc. (a) | 541,724 | 20,271,312 | |
Perficient, Inc. (a) | 107,714 | 2,198,443 | |
QuinStreet, Inc. (a) | 78,393 | 516,610 | |
Rackspace Hosting, Inc. (a)(d) | 382,021 | 14,046,912 | |
RealNetworks, Inc. (a) | 72,712 | 546,067 | |
Reis, Inc. (a)(d) | 22,987 | 405,491 | |
Rocket Fuel, Inc. (d) | 29,420 | 1,649,285 | |
SciQuest, Inc. (a)(d) | 81,678 | 2,411,135 | |
Selectica, Inc. (a) | 2,268 | 15,831 | |
Shutterstock, Inc. (a)(d) | 35,142 | 3,492,412 | |
Spark Networks, Inc. (a)(d) | 65,828 | 396,285 | |
SPS Commerce, Inc. (a) | 53,558 | 3,631,232 | |
Stamps.com, Inc. (a)(d) | 52,541 | 1,848,392 | |
Support.com, Inc. (a) | 167,715 | 420,965 | |
Synacor, Inc. (a) | 40,770 | 107,225 | |
TechTarget, Inc. (a) | 30,780 | 213,305 | |
Textura Corp. (d) | 60,822 | 1,636,720 | |
TheStreet.com, Inc. | 80,374 | 234,692 | |
Travelzoo, Inc. (a) | 32,602 | 770,059 | |
Tremor Video, Inc. (d) | 25,546 | 110,870 | |
Trulia, Inc. (a)(d) | 112,796 | 3,379,368 | |
Twitter, Inc. (d) | 234,137 | 12,856,463 | |
| |||
Shares | Value | ||
United Online, Inc. (d) | 42,358 | $ 474,833 | |
Unwired Planet, Inc. (d) | 271,737 | 402,171 | |
Vocus, Inc. (a) | 57,794 | 771,550 | |
Web.com Group, Inc. (a)(d) | 147,983 | 5,393,980 | |
WebMD Health Corp. (a)(d) | 127,188 | 5,648,419 | |
World Energy Solutions, Inc. (a) | 2,295 | 10,373 | |
XO Group, Inc. (a) | 69,721 | 832,469 | |
Xoom Corp. | 47,742 | 1,338,208 | |
Yelp, Inc. (a)(d) | 188,449 | 17,793,355 | |
YuMe, Inc. (d) | 17,622 | 112,605 | |
Zillow, Inc. (a)(d) | 78,002 | 6,520,967 | |
Zix Corp. (a)(d) | 180,557 | 816,118 | |
| 364,342,482 | ||
IT Services - 2.3% | |||
Acxiom Corp. (a) | 251,988 | 9,381,513 | |
Amdocs Ltd. | 531,891 | 23,658,512 | |
Blackhawk Network Holdings, Inc. (d) | 44,597 | 1,105,114 | |
Booz Allen Hamilton Holding Corp. Class A | 238,671 | 5,019,251 | |
Broadridge Financial Solutions, Inc. | 389,371 | 14,702,649 | |
CACI International, Inc. Class A (a) | 78,671 | 6,201,635 | |
Cardtronics, Inc. (a) | 151,336 | 6,132,135 | |
Cass Information Systems, Inc. | 27,691 | 1,439,932 | |
Ciber, Inc. (a) | 226,365 | 1,082,025 | |
Computer Task Group, Inc. | 39,786 | 646,523 | |
Convergys Corp. | 345,643 | 7,075,312 | |
CoreLogic, Inc. (a) | 310,531 | 10,123,311 | |
CSG Systems International, Inc. | 111,587 | 3,124,436 | |
CSP, Inc. | 3,555 | 29,507 | |
Datalink Corp. (a) | 72,718 | 1,062,410 | |
DST Systems, Inc. | 97,486 | 9,161,734 | |
Edgewater Technology, Inc. (a) | 11,761 | 80,445 | |
EPAM Systems, Inc. (a) | 84,110 | 3,526,732 | |
Euronet Worldwide, Inc. (a)(d) | 159,345 | 6,096,540 | |
EVERTEC, Inc. | 239,314 | 5,805,758 | |
ExlService Holdings, Inc. (a) | 105,564 | 2,954,736 | |
FleetCor Technologies, Inc. (a) | 242,841 | 31,552,331 | |
Forrester Research, Inc. | 46,079 | 1,668,981 | |
Gartner, Inc. Class A (a)(d) | 305,943 | 21,281,395 | |
Genpact Ltd. (a) | 379,737 | 6,334,013 | |
Global Cash Access Holdings, Inc. (a) | 213,120 | 1,790,208 | |
Global Payments, Inc. | 241,213 | 16,964,510 | |
Hackett Group, Inc. | 102,623 | 604,449 | |
Heartland Payment Systems, Inc. | 125,346 | 5,068,992 | |
Higher One Holdings, Inc. (a)(d) | 107,033 | 856,264 | |
iGATE Corp. (a) | 97,307 | 3,293,842 | |
Information Services Group, Inc. (a) | 84,828 | 443,650 | |
Innodata, Inc. (a) | 58,124 | 190,647 | |
InterCloud Systems, Inc. (a)(d) | 11,195 | 150,461 | |
Jack Henry & Associates, Inc. | 290,389 | 16,880,313 | |
Leidos Holdings, Inc. (d) | 241,990 | 10,807,273 | |
Lionbridge Technologies, Inc. (a) | 195,313 | 1,398,441 | |
ManTech International Corp. Class A | 86,321 | 2,526,616 | |
Common Stocks - continued | |||
Shares | Value | ||
INFORMATION TECHNOLOGY - continued | |||
IT Services - continued | |||
Mattersight Corp. (a) | 15,883 | $ 89,580 | |
Maximus, Inc. | 228,641 | 10,926,753 | |
ModusLink Global Solutions, Inc. (a) | 116,317 | 531,569 | |
MoneyGram International, Inc. (a) | 76,773 | 1,460,990 | |
NCI, Inc. Class A (a) | 29,120 | 349,440 | |
Neustar, Inc. Class A (a)(d) | 205,265 | 7,352,592 | |
Newtek Business Services, Inc. (a) | 5,503 | 16,619 | |
PFSweb, Inc. (a) | 60,946 | 533,278 | |
Planet Payment, Inc. (a) | 147,113 | 501,655 | |
PRG-Schultz International, Inc. (a) | 96,195 | 581,018 | |
Sapient Corp. (a) | 373,262 | 6,498,491 | |
Science Applications International Corp. | 142,727 | 5,323,717 | |
ServiceSource International, Inc. (a)(d) | 189,283 | 1,726,261 | |
StarTek, Inc. (a) | 22,269 | 154,770 | |
Sykes Enterprises, Inc. (a) | 130,390 | 2,566,075 | |
Syntel, Inc. (a) | 56,918 | 5,370,782 | |
Teletech Holdings, Inc. (a) | 76,566 | 1,843,709 | |
The Management Network Group, Inc. (a) | 2,929 | 9,959 | |
Unisys Corp. (a)(d) | 147,904 | 5,061,275 | |
Vantiv, Inc. (a)(d) | 401,928 | 12,793,368 | |
VeriFone Systems, Inc. (a) | 357,769 | 10,357,413 | |
Virtusa Corp. (a) | 90,504 | 3,291,630 | |
WEX, Inc. (a)(d) | 128,374 | 12,429,171 | |
WidePoint Corp. (a)(d) | 172,571 | 257,131 | |
WPCS International, Inc. (a)(d) | 5,571 | 8,635 | |
| 330,258,477 | ||
Semiconductors & Semiconductor Equipment - 3.0% | |||
Advanced Energy Industries, Inc. (a) | 130,785 | 3,588,740 | |
Advanced Micro Devices, Inc. (a)(d) | 2,016,925 | 7,482,792 | |
AEHR Test Systems (a) | 9,000 | 21,150 | |
Aetrium, Inc. (a)(d) | 674 | 4,010 | |
Alpha & Omega Semiconductor Ltd. (a) | 18,317 | 133,531 | |
Amkor Technology, Inc. (a)(d) | 453,070 | 2,682,174 | |
Amtech Systems, Inc. (a) | 19,914 | 222,240 | |
ANADIGICS, Inc. (a) | 271,811 | 494,696 | |
Applied Micro Circuits Corp. (a) | 253,177 | 2,901,408 | |
Atmel Corp. (a) | 1,411,126 | 11,373,676 | |
ATMI, Inc. (a) | 108,511 | 3,690,459 | |
Avago Technologies Ltd. | 822,677 | 50,759,171 | |
Axcelis Technologies, Inc. (a) | 355,900 | 793,657 | |
AXT, Inc. (a) | 91,754 | 210,117 | |
Brooks Automation, Inc. | 221,731 | 2,299,350 | |
BTU International, Inc. (a) | 13,926 | 42,196 | |
Cabot Microelectronics Corp. (a) | 79,227 | 3,499,457 | |
Cascade Microtech, Inc. (a) | 31,120 | 276,968 | |
Cavium, Inc. (a)(d) | 178,619 | 7,525,218 | |
Ceva, Inc. (a)(d) | 72,624 | 1,313,042 | |
Cirrus Logic, Inc. (a)(d) | 206,805 | 3,980,996 | |
Cohu, Inc. | 56,455 | 569,631 | |
Cree, Inc. (a)(d) | 400,253 | 24,587,542 | |
| |||
Shares | Value | ||
CVD Equipment Corp. (a)(d) | 12,898 | $ 190,890 | |
CyberOptics Corp. (a) | 9,297 | 78,095 | |
Cypress Semiconductor Corp. (d) | 460,703 | 4,510,282 | |
Diodes, Inc. (a) | 122,440 | 2,915,296 | |
DSP Group, Inc. (a) | 67,110 | 567,751 | |
Entegris, Inc. (a) | 491,313 | 5,920,322 | |
Entropic Communications, Inc. (a)(d) | 344,149 | 1,507,373 | |
Exar Corp. (a) | 162,732 | 1,863,281 | |
Fairchild Semiconductor International, Inc. (a) | 438,835 | 6,178,797 | |
FormFactor, Inc. (a) | 187,509 | 1,336,939 | |
Freescale Semiconductor, Inc. (a)(d) | 321,017 | 7,303,137 | |
GigOptix, Inc. (a) | 52,290 | 85,233 | |
GSI Technology, Inc. (a) | 45,956 | 312,960 | |
GT Advanced Technologies, Inc. (a)(d) | 435,587 | 6,241,962 | |
Hittite Microwave Corp. | 105,948 | 6,248,813 | |
Ikanos Communications, Inc. (a) | 301,764 | 277,623 | |
Inphi Corp. (a) | 80,086 | 1,053,131 | |
Integrated Device Technology, Inc. (a) | 452,674 | 5,337,026 | |
Integrated Silicon Solution, Inc. (a) | 93,866 | 1,143,288 | |
Intermolecular, Inc. (a) | 45,789 | 121,341 | |
International Rectifier Corp. (a)(d) | 245,261 | 6,609,784 | |
Intersil Corp. Class A | 414,470 | 5,272,058 | |
Intest Corp. (a) | 34,005 | 135,340 | |
IXYS Corp. | 82,833 | 912,820 | |
Kopin Corp. (a)(d) | 161,243 | 643,360 | |
Kulicke & Soffa Industries, Inc. (a) | 256,842 | 2,963,957 | |
Lattice Semiconductor Corp. (a) | 418,047 | 3,164,616 | |
LTX-Credence Corp. (a) | 178,150 | 1,802,878 | |
M/A-COM Technology Solutions, Inc. (a) | 40,640 | 689,254 | |
Marvell Technology Group Ltd. | 1,355,027 | 20,718,363 | |
Mattson Technology, Inc. (a) | 251,767 | 642,006 | |
Maxim Integrated Products, Inc. | 933,448 | 30,533,084 | |
MaxLinear, Inc. Class A (a) | 93,581 | 874,982 | |
Micrel, Inc. | 158,460 | 1,654,322 | |
Microsemi Corp. (a) | 319,052 | 7,357,339 | |
MKS Instruments, Inc. | 182,366 | 5,481,922 | |
Monolithic Power Systems, Inc. (a) | 122,120 | 4,376,781 | |
MoSys, Inc. (a)(d) | 140,688 | 621,841 | |
Nanometrics, Inc. (a) | 71,378 | 1,310,500 | |
NeoPhotonics Corp. (a) | 56,859 | 469,087 | |
NVE Corp. (a) | 12,321 | 695,274 | |
Omnivision Technologies, Inc. (a)(d) | 183,726 | 3,172,948 | |
ON Semiconductor Corp. (a) | 1,476,038 | 13,786,195 | |
PDF Solutions, Inc. (a) | 78,702 | 1,604,734 | |
Peregrine Semiconductor Corp. (a)(d) | 97,452 | 650,979 | |
Pericom Semiconductor Corp. (a) | 65,839 | 532,638 | |
Photronics, Inc. (a)(d) | 218,612 | 1,901,924 | |
Pixelworks, Inc. (a) | 60,695 | 302,261 | |
PLX Technology, Inc. (a) | 108,735 | 648,061 | |
PMC-Sierra, Inc. (a) | 712,587 | 5,230,389 | |
Power Integrations, Inc. | 104,568 | 6,183,106 | |
QuickLogic Corp. (a)(d) | 185,965 | 946,562 | |
Rambus, Inc. (a)(d) | 389,646 | 3,592,536 | |
Common Stocks - continued | |||
Shares | Value | ||
INFORMATION TECHNOLOGY - continued | |||
Semiconductors & Semiconductor Equipment - continued | |||
RF Micro Devices, Inc. (a) | 937,422 | $ 6,636,948 | |
Rubicon Technology, Inc. (a)(d) | 73,071 | 943,347 | |
Rudolph Technologies, Inc. (a)(d) | 108,233 | 1,241,433 | |
Semtech Corp. (a) | 224,858 | 5,610,207 | |
Sigma Designs, Inc. (a) | 104,992 | 514,461 | |
Silicon Image, Inc. (a) | 253,525 | 1,533,826 | |
Silicon Laboratories, Inc. (a)(d) | 129,940 | 6,752,982 | |
Skyworks Solutions, Inc. (a) | 620,533 | 22,004,100 | |
Spansion, Inc. Class A (a) | 179,228 | 2,923,209 | |
STR Holdings, Inc. (a) | 118,407 | 175,242 | |
SunEdison, Inc. (a) | 813,615 | 14,937,971 | |
SunPower Corp. (a)(d) | 131,739 | 4,364,513 | |
Supertex, Inc. (a) | 30,678 | 1,010,227 | |
Synaptics, Inc. (a)(d) | 116,634 | 7,585,875 | |
Teradyne, Inc. (a)(d) | 636,208 | 12,902,298 | |
Tessera Technologies, Inc. | 173,295 | 3,763,967 | |
TriQuint Semiconductor, Inc. (a) | 534,464 | 6,541,839 | |
Ultra Clean Holdings, Inc. (a) | 95,950 | 1,262,702 | |
Ultratech, Inc. (a)(d) | 92,383 | 2,422,282 | |
Veeco Instruments, Inc. (a)(d) | 133,922 | 5,296,615 | |
Vitesse Semiconductor Corp. (a)(d) | 196,561 | 715,482 | |
| 426,267,188 | ||
Software - 4.2% | |||
Accelrys, Inc. (a) | 202,545 | 2,527,762 | |
ACI Worldwide, Inc. (a)(d) | 126,659 | 7,603,340 | |
Activision Blizzard, Inc. | 1,430,848 | 27,686,909 | |
Actuate Corp. (a) | 156,442 | 888,591 | |
Advent Software, Inc. | 133,647 | 4,102,963 | |
American Software, Inc. Class A | 75,568 | 790,441 | |
ANSYS, Inc. (a) | 308,722 | 25,784,461 | |
Aspen Technology, Inc. (a) | 314,767 | 14,778,311 | |
Astea International, Inc. (a) | 13,242 | 41,845 | |
Asure Software, Inc. (a) | 1,517 | 10,300 | |
Barracuda Networks, Inc. (d) | 19,714 | 708,718 | |
Blackbaud, Inc. | 151,007 | 4,729,539 | |
Bottomline Technologies, Inc. (a)(d) | 125,050 | 4,463,035 | |
BroadSoft, Inc. (a) | 92,739 | 2,783,097 | |
BSQUARE Corp. (a) | 30,361 | 107,782 | |
Cadence Design Systems, Inc. (a)(d) | 950,944 | 14,577,972 | |
Callidus Software, Inc. (a) | 133,285 | 1,643,404 | |
Cinedigm Corp. (a) | 93,487 | 274,852 | |
CommVault Systems, Inc. (a) | 145,179 | 9,999,930 | |
Compuware Corp. | 734,208 | 8,039,578 | |
Comverse, Inc. (a) | 80,352 | 2,780,983 | |
Concur Technologies, Inc. (a)(d) | 154,897 | 19,122,035 | |
Cover-All Technologies, Inc. (a) | 2,815 | 4,223 | |
Covisint Corp. (d) | 45,291 | 486,878 | |
Cyan, Inc. (d) | 28,568 | 95,988 | |
Datawatch Corp. (a) | 22,345 | 751,015 | |
Digimarc Corp. | 26,174 | 768,992 | |
Document Security Systems, Inc. (a)(d) | 51,596 | 84,617 | |
| |||
Shares | Value | ||
Ebix, Inc. (d) | 116,379 | $ 1,891,159 | |
Ellie Mae, Inc. (a)(d) | 85,614 | 2,654,034 | |
Envivio, Inc. (a) | 37,039 | 133,711 | |
EPIQ Systems, Inc. | 109,472 | 1,552,313 | |
ePlus, Inc. (a) | 12,135 | 690,117 | |
Evolving Systems, Inc. | 19,877 | 168,358 | |
FactSet Research Systems, Inc. (d) | 132,341 | 13,934,184 | |
Fair Isaac Corp. | 120,516 | 6,475,325 | |
FalconStor Software, Inc. (a) | 102,011 | 176,479 | |
FireEye, Inc. (d) | 54,961 | 4,706,860 | |
Fonix Corp. (a) | 1 | 0 | |
Fortinet, Inc. (a) | 451,507 | 10,452,387 | |
Gigamon, Inc. (a) | 46,149 | 1,456,462 | |
Globalscape, Inc. | 29,423 | 66,496 | |
Glu Mobile, Inc. (a)(d) | 197,835 | 995,110 | |
GSE Systems, Inc. (a) | 33,148 | 59,666 | |
Guidance Software, Inc. (a)(d) | 41,724 | 455,209 | |
Guidewire Software, Inc. (a)(d) | 224,302 | 12,024,830 | |
Imperva, Inc. (a) | 69,546 | 4,358,448 | |
Infoblox, Inc. (a) | 155,992 | 3,600,295 | |
Informatica Corp. (a) | 360,693 | 14,990,401 | |
Interactive Intelligence Group, Inc. (a) | 53,898 | 4,291,898 | |
Jive Software, Inc. (a)(d) | 129,531 | 1,054,382 | |
Liquid Holdings Group, Inc. (d) | 11,100 | 53,280 | |
Majesco Entertainment Co. (a)(d) | 169,132 | 89,809 | |
Mandalay Digital Group, Inc. (a)(d) | 73,394 | 356,695 | |
Manhattan Associates, Inc. (a) | 258,002 | 9,775,696 | |
Mavenir Systems, Inc. | 4,167 | 64,380 | |
Mentor Graphics Corp. | 325,605 | 7,046,092 | |
MICROS Systems, Inc. (a)(d) | 243,392 | 13,510,690 | |
MicroStrategy, Inc. Class A (a) | 30,627 | 3,954,865 | |
Mitek Systems, Inc. (a)(d) | 72,082 | 382,755 | |
Model N, Inc. | 21,246 | 233,494 | |
Monotype Imaging Holdings, Inc. | 133,751 | 3,803,878 | |
NetScout Systems, Inc. (a)(d) | 124,546 | 4,730,257 | |
NetSol Technologies, Inc. (a)(d) | 25,363 | 117,684 | |
NetSuite, Inc. (a)(d) | 102,494 | 11,796,034 | |
Nuance Communications, Inc. (a)(d) | 857,305 | 13,108,193 | |
Parametric Technology Corp. (a) | 400,151 | 15,729,936 | |
Park City Group, Inc. (a)(d) | 29,640 | 280,098 | |
Peerless Systems Corp. (a) | 15,698 | 57,926 | |
Pegasystems, Inc. | 60,905 | 2,535,475 | |
Progress Software Corp. (a) | 184,237 | 4,594,871 | |
Proofpoint, Inc. (a) | 78,982 | 3,273,804 | |
PROS Holdings, Inc. (a) | 84,746 | 2,919,500 | |
QAD, Inc. Class B | 24,367 | 404,980 | |
Qlik Technologies, Inc. (a) | 291,552 | 8,892,336 | |
Qualys, Inc. (a) | 57,711 | 1,564,545 | |
Rally Software Development Corp. | 42,605 | 847,413 | |
RealPage, Inc. (a)(d) | 178,593 | 3,161,096 | |
Rosetta Stone, Inc. (a) | 51,040 | 589,512 | |
Rovi Corp. (a) | 338,708 | 8,413,507 | |
SeaChange International, Inc. (a) | 85,138 | 898,206 | |
ServiceNow, Inc. (a) | 336,852 | 22,926,147 | |
Common Stocks - continued | |||
Shares | Value | ||
INFORMATION TECHNOLOGY - continued | |||
Software - continued | |||
Silver Spring Networks, Inc. (d) | 15,724 | $ 276,742 | |
Smith Micro Software, Inc. (a)(d) | 72,854 | 127,495 | |
SolarWinds, Inc. (a) | 219,380 | 10,130,968 | |
Solera Holdings, Inc. (d) | 229,281 | 15,687,406 | |
Sonic Foundry, Inc. (a) | 2,194 | 21,852 | |
Splunk, Inc. (a) | 288,274 | 26,737,414 | |
SS&C Technologies Holdings, Inc. (a) | 207,654 | 8,032,057 | |
Synchronoss Technologies, Inc. (a)(d) | 109,873 | 3,777,434 | |
Synopsys, Inc. (a) | 512,747 | 20,714,979 | |
Tableau Software, Inc. | 51,463 | 4,855,019 | |
Take-Two Interactive Software, Inc. (a) | 310,072 | 6,130,123 | |
Tangoe, Inc. (a)(d) | 124,007 | 2,358,613 | |
TeleCommunication Systems, Inc. Class A (a) | 140,898 | 305,749 | |
TeleNav, Inc. (a) | 41,916 | 251,915 | |
TIBCO Software, Inc. (a) | 511,834 | 11,152,863 | |
TiVo, Inc. (a) | 405,366 | 5,472,441 | |
Tyler Technologies, Inc. (a) | 93,495 | 8,767,961 | |
Ultimate Software Group, Inc. (a)(d) | 92,392 | 15,337,072 | |
Vasco Data Security International, Inc. (a) | 82,596 | 659,116 | |
Verint Systems, Inc. (a) | 178,748 | 8,367,194 | |
VirnetX Holding Corp. (a)(d) | 146,692 | 2,860,494 | |
VMware, Inc. Class A (a)(d) | 282,104 | 27,096,089 | |
Voltari Corp. (a)(d) | 11,296 | 42,586 | |
Vringo, Inc. (a)(d) | 250,377 | 1,014,027 | |
Wave Systems Corp. Class A (a)(d) | 76,840 | 80,682 | |
Workday, Inc. Class A (a)(d) | 102,359 | 11,251,301 | |
Zynga, Inc. (a) | 2,082,457 | 10,537,232 | |
| 589,985,663 | ||
TOTAL INFORMATION TECHNOLOGY | 2,281,848,264 | ||
MATERIALS - 5.2% | |||
Chemicals - 2.5% | |||
A. Schulman, Inc. | 101,315 | 3,520,696 | |
Advanced Emissions Solutions, Inc. (a) | 36,134 | 1,947,623 | |
Albemarle Corp. | 268,050 | 17,688,620 | |
American Vanguard Corp. | 87,623 | 1,949,612 | |
Arabian American Development Co. (a) | 47,222 | 577,997 | |
Ashland, Inc. | 233,762 | 22,060,120 | |
Axiall Corp. | 230,635 | 9,333,798 | |
Balchem Corp. | 101,519 | 5,127,725 | |
BioAmber, Inc. (a) | 1,374 | 20,019 | |
Cabot Corp. | 204,657 | 11,080,130 | |
Calgon Carbon Corp. (a) | 186,696 | 3,758,190 | |
Celanese Corp. Class A | 516,465 | 27,574,066 | |
Chase Corp. | 14,663 | 442,089 | |
Chemtura Corp. (a) | 321,400 | 7,954,650 | |
Clean Diesel Technologies, Inc. (a)(d) | 33,479 | 90,393 | |
Core Molding Technologies, Inc. (a) | 11,521 | 171,087 | |
| |||
Shares | Value | ||
Cytec Industries, Inc. | 115,084 | $ 10,895,002 | |
Ferro Corp. (a) | 290,187 | 3,807,253 | |
Flotek Industries, Inc. (a)(d) | 160,657 | 4,088,721 | |
FutureFuel Corp. | 76,784 | 1,332,202 | |
GSE Holding, Inc. (a) | 16,500 | 10,065 | |
H.B. Fuller Co. | 167,929 | 8,141,198 | |
Hawkins, Inc. | 23,388 | 833,314 | |
Huntsman Corp. | 637,556 | 15,530,864 | |
Innophos Holdings, Inc. | 76,666 | 4,210,497 | |
Innospec, Inc. | 83,762 | 3,644,485 | |
Intrepid Potash, Inc. (a)(d) | 188,036 | 2,784,813 | |
KMG Chemicals, Inc. | 19,780 | 293,535 | |
Koppers Holdings, Inc. | 69,481 | 2,747,279 | |
Kraton Performance Polymers, Inc. (a) | 113,645 | 3,152,512 | |
Kronos Worldwide, Inc. (d) | 80,119 | 1,224,218 | |
Landec Corp. (a) | 84,086 | 856,836 | |
LSB Industries, Inc. (a) | 68,793 | 2,248,843 | |
Marrone Bio Innovations, Inc. (d) | 16,210 | 235,531 | |
Material Sciences Corp. (a) | 23,734 | 301,659 | |
Minerals Technologies, Inc. | 115,626 | 6,185,991 | |
NewMarket Corp. | 38,320 | 14,165,754 | |
Northern Technologies International Corp. (a) | 1,103 | 24,773 | |
Olin Corp. (d) | 258,726 | 6,776,034 | |
OM Group, Inc. | 107,994 | 3,412,610 | |
OMNOVA Solutions, Inc. (a) | 142,209 | 1,355,252 | |
Penford Corp. (a) | 33,122 | 442,179 | |
PolyOne Corp. | 312,837 | 11,731,388 | |
Prospect Global Resources, Inc. (a)(d) | 7,186 | 11,354 | |
Quaker Chemical Corp. | 44,800 | 3,462,144 | |
Rockwood Holdings, Inc. | 247,601 | 19,530,767 | |
RPM International, Inc. | 433,899 | 18,163,012 | |
Senomyx, Inc. (a) | 137,685 | 1,371,343 | |
Sensient Technologies Corp. | 170,930 | 8,961,860 | |
Stepan Co. | 69,028 | 4,196,902 | |
Taminco Corp. | 96,977 | 2,203,317 | |
The Scotts Miracle-Gro Co. Class A | 139,505 | 7,967,131 | |
TOR Minerals International, Inc. (a) | 3,831 | 39,038 | |
Tredegar Corp. | 82,660 | 2,059,061 | |
Tronox Ltd. Class A (d) | 212,649 | 5,037,655 | |
Valhi, Inc. | 64,947 | 713,768 | |
Valspar Corp. | 261,741 | 19,565,140 | |
W.R. Grace & Co. (a) | 250,853 | 25,421,443 | |
Westlake Chemical Corp. | 66,362 | 8,848,045 | |
Zep, Inc. | 66,805 | 1,175,768 | |
Zoltek Companies, Inc. (a)(d) | 83,484 | 1,398,357 | |
| 353,855,728 | ||
Construction Materials - 0.3% | |||
Eagle Materials, Inc. | 161,457 | 14,272,799 | |
Headwaters, Inc. (a) | 262,531 | 3,499,538 | |
Martin Marietta Materials, Inc. | 148,186 | 18,075,728 | |
Texas Industries, Inc. (a)(d) | 73,139 | 6,209,501 | |
Common Stocks - continued | |||
Shares | Value | ||
MATERIALS - continued | |||
Construction Materials - continued | |||
U.S. Concrete, Inc. (a) | 41,450 | $ 1,128,269 | |
United States Lime & Minerals, Inc. | 7,538 | 426,651 | |
| 43,612,486 | ||
Containers & Packaging - 0.9% | |||
AEP Industries, Inc. (a) | 13,400 | 571,108 | |
Aptargroup, Inc. | 216,708 | 14,339,568 | |
Berry Plastics Group, Inc. (a) | 260,893 | 6,347,527 | |
Crown Holdings, Inc. (a) | 447,499 | 20,146,405 | |
Graphic Packaging Holding Co. (a) | 749,526 | 7,675,146 | |
Greif, Inc. Class A | 102,600 | 5,136,156 | |
Myers Industries, Inc. | 100,702 | 2,165,093 | |
Packaging Corp. of America | 323,206 | 23,558,485 | |
Rock-Tenn Co. Class A | 237,672 | 26,528,949 | |
Silgan Holdings, Inc. | 149,251 | 7,195,391 | |
Sonoco Products Co. | 338,423 | 14,206,998 | |
UFP Technologies, Inc. (a) | 15,846 | 405,499 | |
| 128,276,325 | ||
Metals & Mining - 1.1% | |||
A.M. Castle & Co. (a)(d) | 55,605 | 812,945 | |
AK Steel Holding Corp. (a)(d) | 444,492 | 2,760,295 | |
Allied Nevada Gold Corp. (a)(d) | 330,091 | 1,726,376 | |
Amcol International Corp. | 88,795 | 3,940,722 | |
Carpenter Technology Corp. | 174,898 | 10,345,217 | |
Century Aluminum Co. (a) | 185,637 | 2,197,942 | |
Coeur d'Alene Mines Corp. (a) | 347,159 | 3,818,749 | |
Commercial Metals Co. | 401,716 | 7,773,205 | |
Compass Minerals International, Inc. | 110,113 | 9,398,145 | |
Comstock Mining, Inc. (a)(d) | 165,183 | 330,366 | |
Friedman Industries | 15,788 | 133,409 | |
General Moly, Inc. (a)(d) | 202,841 | 241,381 | |
Globe Specialty Metals, Inc. | 217,947 | 4,330,607 | |
Gold Resource Corp. | 132,594 | 682,859 | |
Golden Minerals Co. (a)(d) | 115,781 | 122,728 | |
Handy & Harman Ltd. (a) | 37,596 | 687,255 | |
Haynes International, Inc. | 42,986 | 2,129,097 | |
Hecla Mining Co. (d) | 1,188,592 | 4,017,441 | |
Horsehead Holding Corp. (a)(d) | 166,082 | 2,951,277 | |
Kaiser Aluminum Corp. | 61,713 | 4,356,321 | |
Materion Corp. | 70,361 | 2,081,982 | |
McEwen Mining, Inc. (a)(d) | 803,888 | 2,339,314 | |
Mines Management, Inc. (a)(d) | 69,165 | 94,064 | |
Molycorp, Inc. (a)(d) | 623,108 | 3,252,624 | |
Noranda Aluminium Holding Corp. | 229,718 | 990,085 | |
Olympic Steel, Inc. | 27,830 | 765,603 | |
Paramount Gold & Silver Corp. (a)(d) | 435,955 | 588,539 | |
Reliance Steel & Aluminum Co. | 254,081 | 17,602,732 | |
Royal Gold, Inc. (d) | 217,631 | 14,953,426 | |
RTI International Metals, Inc. (a)(d) | 102,679 | 2,789,788 | |
Schnitzer Steel Industries, Inc. Class A | 90,821 | 2,304,129 | |
Silver Bull Resources, Inc. (a)(d) | 148,902 | 56,583 | |
| |||
Shares | Value | ||
Solitario Exploration & Royalty Corp. (a) | 57,827 | $ 90,210 | |
Steel Dynamics, Inc. | 729,711 | 12,726,160 | |
Stillwater Mining Co. (a)(d) | 414,791 | 5,616,270 | |
SunCoke Energy, Inc. (a) | 247,253 | 5,508,797 | |
Synalloy Corp. | 24,589 | 335,148 | |
Timberline Resources Corp. (a)(d) | 213,150 | 31,333 | |
U.S. Antimony Corp. (a)(d) | 84,807 | 156,893 | |
U.S. Silica Holdings, Inc. (d) | 175,640 | 5,760,992 | |
Universal Stainless & Alloy Products, Inc. (a) | 20,455 | 675,629 | |
Walter Energy, Inc. (d) | 205,462 | 2,216,935 | |
Worthington Industries, Inc. | 180,460 | 7,193,136 | |
| 150,886,709 | ||
Paper & Forest Products - 0.4% | |||
Boise Cascade Co. | 107,309 | 3,175,273 | |
Clearwater Paper Corp. (a) | 77,454 | 4,945,438 | |
Deltic Timber Corp. | 40,804 | 2,568,204 | |
Domtar Corp. | 109,125 | 12,088,868 | |
Kapstone Paper & Packaging Corp. (a) | 270,598 | 8,602,310 | |
Louisiana-Pacific Corp. (a) | 461,795 | 8,677,128 | |
Mercer International, Inc. (SBI) (a) | 33,044 | 288,474 | |
Neenah Paper, Inc. | 54,327 | 2,727,759 | |
P.H. Glatfelter Co. | 158,468 | 4,809,504 | |
Resolute Forest Products (a)(d) | 321,268 | 6,582,781 | |
Schweitzer-Mauduit International, Inc. | 104,283 | 5,019,141 | |
Verso Paper Corp. (a)(d) | 62,871 | 154,034 | |
Wausau-Mosinee Paper Corp. | 177,425 | 2,350,881 | |
| 61,989,795 | ||
TOTAL MATERIALS | 738,621,043 | ||
TELECOMMUNICATION SERVICES - 1.2% | |||
Diversified Telecommunication Services - 0.5% | |||
8x8, Inc. (a) | 295,012 | 3,121,227 | |
Alaska Communication Systems Group, Inc. (a) | 128,803 | 282,079 | |
Alteva | 16,362 | 141,531 | |
Atlantic Tele-Network, Inc. | 43,046 | 2,821,235 | |
Cbeyond, Inc. (a) | 109,968 | 753,281 | |
Cincinnati Bell, Inc. (a) | 727,137 | 2,435,909 | |
Cogent Communications Group, Inc. | 147,097 | 5,639,699 | |
Consolidated Communications Holdings, Inc. (d) | 137,165 | 2,614,365 | |
Elephant Talk Communication, Inc. (a)(d) | 237,541 | 301,677 | |
FairPoint Communications, Inc. (a)(d) | 71,797 | 953,464 | |
General Communications, Inc. Class A (a) | 105,141 | 1,094,518 | |
Hawaiian Telcom Holdco, Inc. (a)(d) | 21,226 | 611,309 | |
HickoryTech Corp. | 38,075 | 518,962 | |
IDT Corp. Class B | 56,794 | 1,019,452 | |
inContact, Inc. (a) | 182,175 | 1,643,219 | |
Inteliquent, Inc. | 104,102 | 1,453,264 | |
Intelsat SA (d) | 65,669 | 1,302,873 | |
Iridium Communications, Inc. (a)(d) | 219,539 | 1,431,394 | |
Common Stocks - continued | |||
Shares | Value | ||
TELECOMMUNICATION SERVICES - continued | |||
Diversified Telecommunication Services - continued | |||
Level 3 Communications, Inc. (a) | 535,608 | $ 19,721,087 | |
Lumos Networks Corp. | 56,988 | 827,466 | |
ORBCOMM, Inc. (a) | 132,401 | 1,034,052 | |
Premiere Global Services, Inc. (a) | 161,424 | 1,825,705 | |
Straight Path Communications, Inc. Class B (a) | 22,231 | 181,405 | |
Towerstream Corp. (a)(d) | 186,972 | 493,606 | |
TW Telecom, Inc. (a) | 474,044 | 14,510,487 | |
Vonage Holdings Corp. (a) | 585,092 | 2,697,274 | |
xG Technology, Inc. (a) | 9,209 | 11,880 | |
| 69,442,420 | ||
Wireless Telecommunication Services - 0.7% | |||
Boingo Wireless, Inc. (a)(d) | 67,800 | 393,918 | |
Leap Wireless International, Inc. (a) | 194,908 | 3,414,788 | |
NII Holdings, Inc. (a)(d) | 572,344 | 658,196 | |
NTELOS Holdings Corp. (d) | 51,213 | 715,958 | |
RingCentral, Inc. (d) | 39,424 | 853,530 | |
SBA Communications Corp. Class A (a)(d) | 420,876 | 40,054,769 | |
Shenandoah Telecommunications Co. | 72,976 | 1,928,756 | |
Sprint Corp. (a) | 2,884,105 | 25,207,078 | |
T-Mobile U.S., Inc. (a) | 849,915 | 25,922,408 | |
Telephone & Data Systems, Inc. | 337,314 | 7,687,386 | |
U.S. Cellular Corp. (d) | 57,098 | 2,060,667 | |
U.S.A. Mobility, Inc. | 66,494 | 960,838 | |
| 109,858,292 | ||
TOTAL TELECOMMUNICATION SERVICES | 179,300,712 | ||
UTILITIES - 3.1% | |||
Electric Utilities - 1.1% | |||
Allete, Inc. | 131,977 | 6,666,158 | |
Cleco Corp. | 207,557 | 10,259,543 | |
El Paso Electric Co. | 144,539 | 5,095,000 | |
Empire District Electric Co. | 165,090 | 3,919,237 | |
Genie Energy Ltd. Class B (a) | 48,524 | 556,085 | |
Great Plains Energy, Inc. | 496,305 | 13,037,932 | |
Hawaiian Electric Industries, Inc. (d) | 366,432 | 9,311,037 | |
IDACORP, Inc. | 168,641 | 9,475,938 | |
ITC Holdings Corp. | 173,616 | 17,813,002 | |
MGE Energy, Inc. | 131,008 | 5,054,289 | |
NRG Yield, Inc. Class A | 67,077 | 2,561,000 | |
OGE Energy Corp. | 658,646 | 23,711,256 | |
Otter Tail Corp. | 123,988 | 3,746,917 | |
PNM Resources, Inc. | 274,636 | 7,181,731 | |
Portland General Electric Co. | 260,349 | 8,279,098 | |
UIL Holdings Corp. | 195,360 | 7,564,339 | |
Unitil Corp. | 41,223 | 1,297,700 | |
| |||
Shares | Value | ||
UNS Energy Corp. | 140,349 | $ 8,492,518 | |
Westar Energy, Inc. (d) | 409,301 | 14,006,280 | |
| 158,029,060 | ||
Gas Utilities - 0.9% | |||
Atmos Energy Corp. | 329,153 | 15,173,953 | |
Chesapeake Utilities Corp. | 31,396 | 1,859,899 | |
Delta Natural Gas Co., Inc. | 13,699 | 281,651 | |
Gas Natural, Inc. | 31,805 | 297,695 | |
Laclede Group, Inc. | 114,681 | 5,258,124 | |
National Fuel Gas Co. | 273,569 | 20,550,503 | |
New Jersey Resources Corp. | 153,835 | 6,924,113 | |
Northwest Natural Gas Co. | 94,806 | 4,064,333 | |
ONE Gas, Inc. (a) | 165,679 | 5,629,772 | |
Piedmont Natural Gas Co., Inc. (d) | 253,429 | 8,570,969 | |
Questar Corp. | 576,190 | 13,684,513 | |
RGC Resources, Inc. | 2,242 | 42,934 | |
South Jersey Industries, Inc. | 108,730 | 6,217,181 | |
Southwest Gas Corp. | 165,026 | 8,914,705 | |
UGI Corp. | 370,129 | 16,541,065 | |
WGL Holdings, Inc. | 174,837 | 7,026,699 | |
| 121,038,109 | ||
Independent Power Producers & Energy Traders - 0.3% | |||
American DG Energy, Inc. (a)(d) | 66,943 | 134,555 | |
Black Hills Corp. | 138,974 | 7,881,216 | |
Calpine Corp. (a) | 1,112,085 | 21,185,219 | |
Dynegy, Inc. (a)(d) | 332,223 | 7,770,696 | |
Ormat Technologies, Inc. (d) | 66,515 | 1,845,791 | |
Pattern Energy Group, Inc. | 58,378 | 1,599,557 | |
U.S. Geothermal, Inc. (a)(d) | 223,992 | 111,996 | |
| 40,529,030 | ||
Multi-Utilities - 0.4% | |||
Alliant Energy Corp. | 346,914 | 18,816,615 | |
Avista Corp. | 203,057 | 6,010,487 | |
MDU Resources Group, Inc. | 627,883 | 21,322,907 | |
NorthWestern Energy Corp. | 130,322 | 5,986,993 | |
Vectren Corp. | 277,101 | 10,660,075 | |
| 62,797,077 | ||
Water Utilities - 0.4% | |||
American States Water Co. | 135,315 | 4,063,509 | |
American Water Works Co., Inc. | 585,460 | 26,252,026 | |
Aqua America, Inc. | 609,206 | 15,345,899 | |
Artesian Resources Corp. Class A | 17,456 | 379,843 | |
Cadiz, Inc. (a)(d) | 34,362 | 256,341 | |
California Water Service Group | 194,287 | 4,567,687 | |
Connecticut Water Service, Inc. | 31,001 | 1,018,073 | |
Middlesex Water Co. | 55,095 | 1,113,470 | |
Pure Cycle Corp. (a)(d) | 69,664 | 436,097 | |
Common Stocks - continued | |||
Shares | Value | ||
UTILITIES - continued | |||
Water Utilities - continued | |||
SJW Corp. | 41,452 | $ 1,226,565 | |
York Water Co. | 39,414 | 794,980 | |
| 55,454,490 | ||
TOTAL UTILITIES | 437,847,766 | ||
TOTAL COMMON STOCKS (Cost $9,928,007,212) |
| ||
U.S. Treasury Obligations - 0.1% | ||||
| Principal Amount |
| ||
U.S. Treasury Bills, yield at date of purchase 0.07% to 0.08% 5/29/14 to 9/18/14 (f) | $ 8,000,000 |
| ||
Money Market Funds - 16.9% | |||
Shares |
| ||
Fidelity Cash Central Fund, 0.10% (b) | 197,332,090 | 197,332,090 | |
Fidelity Securities Lending Cash Central Fund, 0.09% (b)(c) | 2,204,715,174 | 2,204,715,174 | |
TOTAL MONEY MARKET FUNDS (Cost $2,402,047,264) |
| ||
TOTAL INVESTMENT PORTFOLIO - 115.7% (Cost $12,338,052,445) | 16,409,901,872 | |
NET OTHER ASSETS (LIABILITIES) - (15.7)% | (2,230,249,707) | |
NET ASSETS - 100% | $ 14,179,652,165 | |
Futures Contracts | |||||
Expiration Date | Underlying Face Amount at Value | Unrealized Appreciation/ | |||
Purchased | |||||
Equity Index Contracts | |||||
527 CME E-mini S&P MidCap 400 Index Contracts (United States) | March 2014 | $ 72,420,340 | $ 4,393,505 | ||
915 ICE Russell 2000 Index Contracts (United States) | March 2014 | 108,143,850 | 6,907,271 | ||
TOTAL EQUITY INDEX CONTRACTS | $ 180,564,190 | $ 11,300,776 | |||
|
The face value of futures purchased as a percentage of net assets is 1.3% |
Legend |
(a) Non-income producing |
(b) Affiliated fund that is generally available only to investment companies and other accounts managed by Fidelity Investments. The rate quoted is the annualized seven-day yield of the fund at period end. A complete unaudited listing of the fund's holdings as of its most recent quarter end is available upon request. In addition, each Fidelity Central Fund's financial statements, which are not covered by the Fund's Report of Independent Registered Public Accounting Firm, are available on the SEC's website or upon request. |
(c) Investment made with cash collateral received from securities on loan. |
(d) Security or a portion of the security is on loan at period end. |
(e) Security or a portion of the security purchased on a delayed delivery or when-issued basis. |
(f) Security or a portion of the security was pledged to cover margin requirements for futures contracts. At period end, the value of securities pledged amounted to $7,858,351. |
|
Affiliated Central Funds |
Information regarding fiscal year to date income earned by the Fund from investments in Fidelity Central Funds is as follows: |
Fund | Income earned |
Fidelity Cash Central Fund | $ 173,150 |
Fidelity Securities Lending Cash Central Fund | 17,867,424 |
Total | $ 18,040,574 |
Other Information |
The following is a summary of the inputs used, as of February 28, 2014, involving the Fund's assets and liabilities carried at fair value. The inputs or methodology used for valuing securities may not be an indication of the risk associated with investing in those securities. For more information on valuation inputs, and their aggregation into the levels used in the table below, please refer to the Investment Valuation section in the accompanying Notes to Financial Statements. |
Valuation Inputs at Reporting Date: | ||||
Description | Total | Level 1 | Level 2 | Level 3 |
Investments in Securities: | ||||
Equities: | ||||
Consumer Discretionary | $ 2,224,681,240 | $ 2,224,519,718 | $ - | $ 161,522 |
Consumer Staples | 465,838,217 | 465,838,217 | - | - |
Energy | 850,065,155 | 850,045,612 | - | 19,543 |
Financials | 3,045,779,729 | 3,045,775,015 | - | 4,714 |
Health Care | 1,683,382,646 | 1,683,382,645 | - | 1 |
Industrials | 2,092,491,502 | 2,092,491,502 | - | - |
Information Technology | 2,281,848,264 | 2,281,848,264 | - | - |
Materials | 738,621,043 | 738,621,043 | - | - |
Telecommunication Services | 179,300,712 | 179,300,712 | - | - |
Utilities | 437,847,766 | 437,847,766 | - | - |
U.S. Government and Government Agency Obligations | 7,998,334 | - | 7,998,334 | - |
Money Market Funds | 2,402,047,264 | 2,402,047,264 | - | - |
Total Investments in Securities: | $ 16,409,901,872 | $ 16,401,717,758 | $ 7,998,334 | $ 185,780 |
Derivative Instruments: | ||||
Assets | ||||
Futures Contracts | $ 11,300,776 | $ 11,300,776 | $ - | $ - |
Value of Derivative Instruments |
The following table is a summary of the Fund's value of derivative instruments by primary risk exposure as of February 28, 2014. For additional information on derivative instruments, please refer to the Derivative Instruments section in the accompanying Notes to Financial Statements. |
Primary Risk Exposure / | Value | |
| Asset | Liability |
Equity Risk | ||
Futures Contracts (a) | $ 11,300,776 | $ - |
Total Value of Derivatives | $ 11,300,776 | $ - |
(a) Reflects gross cumulative appreciation (depreciation) on futures contracts as presented in the Schedule of Investments. Only the period end receivable or payable for daily variation margin and net unrealized appreciation (depreciation) are presented in the Statement of Assets and Liabilities. |
See accompanying notes which are an integral part of the financial statements.
Annual Report
Spartan Extended Market Index Fund
Financial Statements
Statement of Assets and Liabilities
| February 28, 2014 | |
|
|
|
Assets | ||
Investment in securities, at value (including securities loaned of $2,118,946,977) - See accompanying schedule: Unaffiliated issuers (cost $9,936,005,181) | $ 14,007,854,608 |
|
Fidelity Central Funds (cost $2,402,047,264) | 2,402,047,264 |
|
Total Investments (cost $12,338,052,445) |
| $ 16,409,901,872 |
Cash |
| 103,379 |
Receivable for investments sold | 4,243,238 | |
Receivable for fund shares sold | 27,479,897 | |
Dividends receivable | 11,101,867 | |
Distributions receivable from Fidelity Central Funds | 1,673,120 | |
Receivable from investment adviser for expense reductions | 1,489 | |
Other receivables | 13,813 | |
Total assets | 16,454,518,675 | |
|
|
|
Liabilities | ||
Payable for investments purchased | $ 45,799,551 | |
Delayed delivery | 8,841,938 | |
Payable for fund shares redeemed | 14,292,387 | |
Accrued management fee | 679,361 | |
Payable for daily variation margin for derivative instruments | 381,394 | |
Other affiliated payables | 156,705 | |
Collateral on securities loaned, at value | 2,204,715,174 | |
Total liabilities | 2,274,866,510 | |
|
|
|
Net Assets | $ 14,179,652,165 | |
Net Assets consist of: |
| |
Paid in capital | $ 9,911,453,410 | |
Undistributed net investment income | 30,389,384 | |
Accumulated undistributed net realized gain (loss) on investments | 154,659,168 | |
Net unrealized appreciation (depreciation) on investments | 4,083,150,203 | |
Net Assets | $ 14,179,652,165 | |
Statement of Assets and Liabilities - continued
| February 28, 2014 | |
|
|
|
Investor Class: | $ 55.29 | |
|
|
|
Fidelity Advantage Class: | $ 55.30 | |
|
|
|
Fidelity Advantage Institutional Class: | $ 55.28 | |
See accompanying notes which are an integral part of the financial statements.
Annual Report
Spartan Extended Market Index Fund
Financial Statements - continued
Statement of Operations
| Year ended February 28, 2014 | |
|
|
|
Investment Income |
|
|
Dividends |
| $ 141,393,037 |
Interest |
| 6,600 |
Income from Fidelity Central Funds (including $17,867,424 from security lending) |
| 18,040,574 |
Total income |
| 159,440,211 |
|
|
|
Expenses | ||
Management fee | $ 6,621,238 | |
Transfer agent fees | 1,518,898 | |
Independent trustees' compensation | 50,973 | |
Miscellaneous | 19,487 | |
Total expenses before reductions | 8,210,596 | |
Expense reductions | (10,995) | 8,199,601 |
Net investment income (loss) | 151,240,610 | |
Realized and Unrealized Gain (Loss) Net realized gain (loss) on: | ||
Investment securities: |
|
|
Unaffiliated issuers | 370,098,640 | |
Futures contracts | 29,980,279 | |
Total net realized gain (loss) |
| 400,078,919 |
Change in net unrealized appreciation (depreciation) on: Investment securities | 2,532,453,660 | |
Futures contracts | 3,578,730 | |
Total change in net unrealized appreciation (depreciation) |
| 2,536,032,390 |
Net gain (loss) | 2,936,111,309 | |
Net increase (decrease) in net assets resulting from operations | $ 3,087,351,919 | |
Statement of Changes in Net Assets
| Year ended | Year ended |
Increase (Decrease) in Net Assets |
|
|
Operations |
|
|
Net investment income (loss) | $ 151,240,610 | $ 128,474,031 |
Net realized gain (loss) | 400,078,919 | 189,721,174 |
Change in net unrealized appreciation (depreciation) | 2,536,032,390 | 639,557,587 |
Net increase (decrease) in net assets resulting from operations | 3,087,351,919 | 957,752,792 |
Distributions to shareholders from net investment income | (130,454,906) | (123,000,708) |
Distributions to shareholders from net realized gain | (244,937,001) | (200,713,554) |
Total distributions | (375,391,907) | (323,714,262) |
Share transactions - net increase (decrease) | 3,320,572,816 | 994,205,584 |
Redemption fees | 1,184,464 | 653,587 |
Total increase (decrease) in net assets | 6,033,717,292 | 1,628,897,701 |
|
|
|
Net Assets | ||
Beginning of period | 8,145,934,873 | 6,517,037,172 |
End of period (including undistributed net investment income of $30,389,384 and undistributed net investment income of $12,923,003, respectively) | $ 14,179,652,165 | $ 8,145,934,873 |
See accompanying notes which are an integral part of the financial statements.
Annual Report
Financial Highlights - Investor Class
Years ended February 28, | 2014 | 2013 | 2012 F | 2011 | 2010 |
Selected Per-Share Data |
|
|
|
|
|
Net asset value, beginning of period | $ 43.12 | $ 39.66 | $ 40.35 | $ 31.08 | $ 18.73 |
Income from Investment Operations |
|
|
|
|
|
Net investment income (loss) B | .67 | .73 | .48 | .43 | .36 |
Net realized and unrealized gain (loss) | 13.09 | 4.61 | .10 | 9.71 | 12.40 |
Total from investment operations | 13.76 | 5.34 | .58 | 10.14 | 12.76 |
Distributions from net investment income | (.54) | (.70) | (.45) | (.36) | (.35) |
Distributions from net realized gain | (1.06) | (1.17) | (.84) | (.51) | (.06) |
Total distributions | (1.60) | (1.88) J | (1.28) I | (.87) | (.41) H |
Redemption fees added to paid in capital B | .01 | - G | .01 | - G | - G |
Net asset value, end of period | $ 55.29 | $ 43.12 | $ 39.66 | $ 40.35 | $ 31.08 |
Total Return A | 32.38% | 14.00% | 1.76% | 32.95% | 68.20% |
Ratios to Average Net Assets C, E |
|
|
|
|
|
Expenses before reductions | .10% | .10% | .10% | .10% | .10% |
Expenses net of fee waivers, if any | .10% | .10% | .10% | .10% | .10% |
Expenses net of all reductions | .10% | .10% | .10% | .10% | .10% |
Net investment income (loss) | 1.35% | 1.85% | 1.26% | 1.24% | 1.35% |
Supplemental Data |
|
|
|
|
|
Net assets, end of period (000 omitted) | $ 1,803,152 | $ 971,857 | $ 2,606,631 | $ 4,440,988 | $ 2,692,346 |
Portfolio turnover rate D | 14% | 10% | 11% | 8% | 26% |
ATotal returns would have been lower if certain expenses had not been reduced during the applicable periods shown. BCalculated based on average shares outstanding during the period. CFees and expenses of any underlying Fidelity Central Funds are not included in the Fund's expense ratio. The Fund indirectly bears its proportionate share of the expenses of any underlying Fidelity Central Funds. DAmount does not include the portfolio activity of any underlying Fidelity Central Funds. EExpense ratios reflect operating expenses of the class. Expenses before reductions do not reflect amounts reimbursed by the investment adviser or reductions from expense offset arrangements and do not represent the amount paid by the class during periods when reimbursements or reductions occur. Expenses net of fee waivers reflect expenses after reimbursement by the investment adviser but prior to reductions from expense offset arrangements. Expenses net of all reductions represent the net expenses paid by the class. FFor the year ended February 29. GAmount represents less than $.01 per share. HTotal distributions of $.41 per share is comprised of distributions from net investment income of $.350 and distributions from net realized gain of $.055 per share. ITotal distributions of $1.28 per share is comprised of distributions from net investment income of $.446 and distributions from net realized gain of $.837 per share. JTotal distributions of $1.88 per share is comprised of distributions from net investment income of $.703 and distributions from net realized gain of $1.172 per share. |
Financial Highlights - Fidelity Advantage Class
Years ended February 28, | 2014 | 2013 | 2012 F | 2011 | 2010 |
Selected Per-Share Data |
|
|
|
|
|
Net asset value, beginning of period | $ 43.12 | $ 39.66 | $ 40.36 | $ 31.08 | $ 18.73 |
Income from Investment Operations |
|
|
|
|
|
Net investment income (loss) B | .68 | .75 | .48 | .44 | .37 |
Net realized and unrealized gain (loss) | 13.11 | 4.60 | .10 | 9.72 | 12.39 |
Total from investment operations | 13.79 | 5.35 | .58 | 10.16 | 12.76 |
Distributions from net investment income | (.56) | (.72) | (.46) | (.37) | (.36) |
Distributions from net realized gain | (1.06) | (1.17) | (.84) | (.51) | (.06) |
Total distributions | (1.62) | (1.89) | (1.29) I | (.88) | (.41) H |
Redemption fees added to paid in capital B | .01 | - G | .01 | - G | - G |
Net asset value, end of period | $ 55.30 | $ 43.12 | $ 39.66 | $ 40.36 | $ 31.08 |
Total Return A | 32.44% | 14.04% | 1.76% | 33.02% | 68.25% |
Ratios to Average Net Assets C, E |
|
|
|
|
|
Expenses before reductions | .07% | .07% | .07% | .07% | .07% |
Expenses net of fee waivers, if any | .07% | .07% | .07% | .07% | .07% |
Expenses net of all reductions | .07% | .07% | .07% | .07% | .07% |
Net investment income (loss) | 1.38% | 1.88% | 1.29% | 1.27% | 1.38% |
Supplemental Data |
|
|
|
|
|
Net assets, end of period (000 omitted) | $ 12,280,754 | $ 7,173,852 | $ 3,910,289 | $ 1,525,199 | $ 900,218 |
Portfolio turnover rate D | 14% | 10% | 11% | 8% | 26% |
ATotal returns would have been lower if certain expenses had not been reduced during the applicable periods shown. BCalculated based on average shares outstanding during the period. CFees and expenses of any underlying Fidelity Central Funds are not included in the Fund's expense ratio. The Fund indirectly bears its proportionate share of the expenses of any underlying Fidelity Central Funds. DAmount does not include the portfolio activity of any underlying Fidelity Central Funds. EExpense ratios reflect operating expenses of the class. Expenses before reductions do not reflect amounts reimbursed by the investment adviser or reductions from expense offset arrangements and do not represent the amount paid by the class during periods when reimbursements or reductions occur. Expenses net of fee waivers reflect expenses after reimbursement by the investment adviser but prior to reductions from expense offset arrangements. Expenses net of all reductions represent the net expenses paid by the class. FFor the year ended February 29. GAmount represents less than $.01 per share. HTotal distributions of $.41 per share is comprised of distributions from net investment income of $.358 and distributions from net realized gain of $.055 per share. ITotal distributions of $1.29 per share is comprised of distributions from net investment income of $.457 and distributions from net realized gain of $.837 per share. |
See accompanying notes which are an integral part of the financial statements.
Annual Report
Financial Highlights - Fidelity Advantage Institutional Class
Years ended February 28, | 2014 | 2013 | 2012 G, I |
Selected Per-Share Data |
|
|
|
Net asset value, beginning of period | $ 43.11 | $ 39.66 | $ 34.67 |
Income from Investment Operations |
|
|
|
Net investment income (loss) D | .72 | .75 | .25 |
Net realized and unrealized gain (loss) | 13.06 | 4.60 | 5.52 |
Total from investment operations | 13.78 | 5.35 | 5.77 |
Distributions from net investment income | (.56) | (.72) | (.40) |
Distributions from net realized gain | (1.06) | (1.17) | (.38) |
Total distributions | (1.62) | (1.90) K | (.78) |
Redemption fees added to paid in capital D | .01 | - J | - J |
Net asset value, end of period | $ 55.28 | $ 43.11 | $ 39.66 |
Total Return B, C | 32.44% | 14.04% | 16.99% |
Ratios to Average Net Assets E, H |
|
|
|
Expenses before reductions | .07% | .07% | .07% A |
Expenses net of fee waivers, if any | .06% | .06% | .06% A |
Expenses net of all reductions | .06% | .06% | .06% A |
Net investment income (loss) | 1.39% | 1.89% | 1.44% A |
Supplemental Data |
|
|
|
Net assets, end of period (000 omitted) | $ 95,747 | $ 226 | $ 117 |
Portfolio turnover rate F | 14% | 10% | 11% L |
AAnnualized BTotal returns for periods of less than one year are not annualized. CTotal returns would have been lower if certain expenses had not been reduced during the applicable periods shown. DCalculated based on average shares outstanding during the period. EFees and expenses of any underlying Fidelity Central Funds are not included in the Fund's expense ratio. The Fund indirectly bears its proportionate share of the expenses of any underlying Fidelity Central Funds. FAmount does not include the portfolio activity of any underlying Fidelity Central Funds. GFor the period September 8, 2011 (commencement of sale of shares) to February 29, 2012. HExpense ratios reflect operating expenses of the class. Expenses before reductions do not reflect amounts reimbursed by the investment adviser or reductions from expense offset arrangements and do not represent the amount paid by the class during periods when reimbursements or reductions occur. Expense ratios before reductions for start-up periods may not be representative of longer-term operating periods. Expenses net of fee waivers reflect expenses after reimbursement by the investment adviser but prior to reductions from expense offset arrangements. Expenses net of all reductions represent the net expenses paid by the class. IFor the year ended February 29. JAmount represents less than $.01 per share. KTotal distributions of $1.90 per share is comprised of distributions from net investment income of $.723 and distributions from net realized gain of $1.172 per share. LAmount not annualized. |
See accompanying notes which are an integral part of the financial statements.
Annual Report
Spartan International Index Fund
Performance: The Bottom Line
Average annual total return reflects the change in the value of an investment, assuming reinvestment of the class' distributions from dividend income and capital gains (the profits earned upon the sale of securities that have grown in value, if any) and assuming a constant rate of performance each year. The $10,000 table and the fund's returns do not reflect the deduction of taxes that a shareholder would pay on fund distributions or the redemption of fund shares. During periods of reimbursement by Fidelity, a fund's total return will be greater than it would be had the reimbursement not occurred. How a fund did yesterday is no guarantee of how it will do tomorrow.
Average Annual Total Returns
Periods ended February 28, 2014 | Past 1 | Past 5 | Past 10 |
Spartan International Index Fund - Investor Class | 19.66% | 17.93% | 6.64% |
Spartan International Index Fund - Fidelity Advantage Class A | 19.79% | 17.99% | 6.68% |
A The initial offering of Fidelity Advantage Class took place on October 14, 2005. Returns prior to October 14, 2005, are those of Investor Class.
$10,000 Over 10 Years
Let's say hypothetically that $10,000 was invested in Spartan International Index Fund - Investor Class on February 29, 2004. The chart shows how the value of your investment would have changed, and also shows how the MSCI EAFE Index performed over the same period.
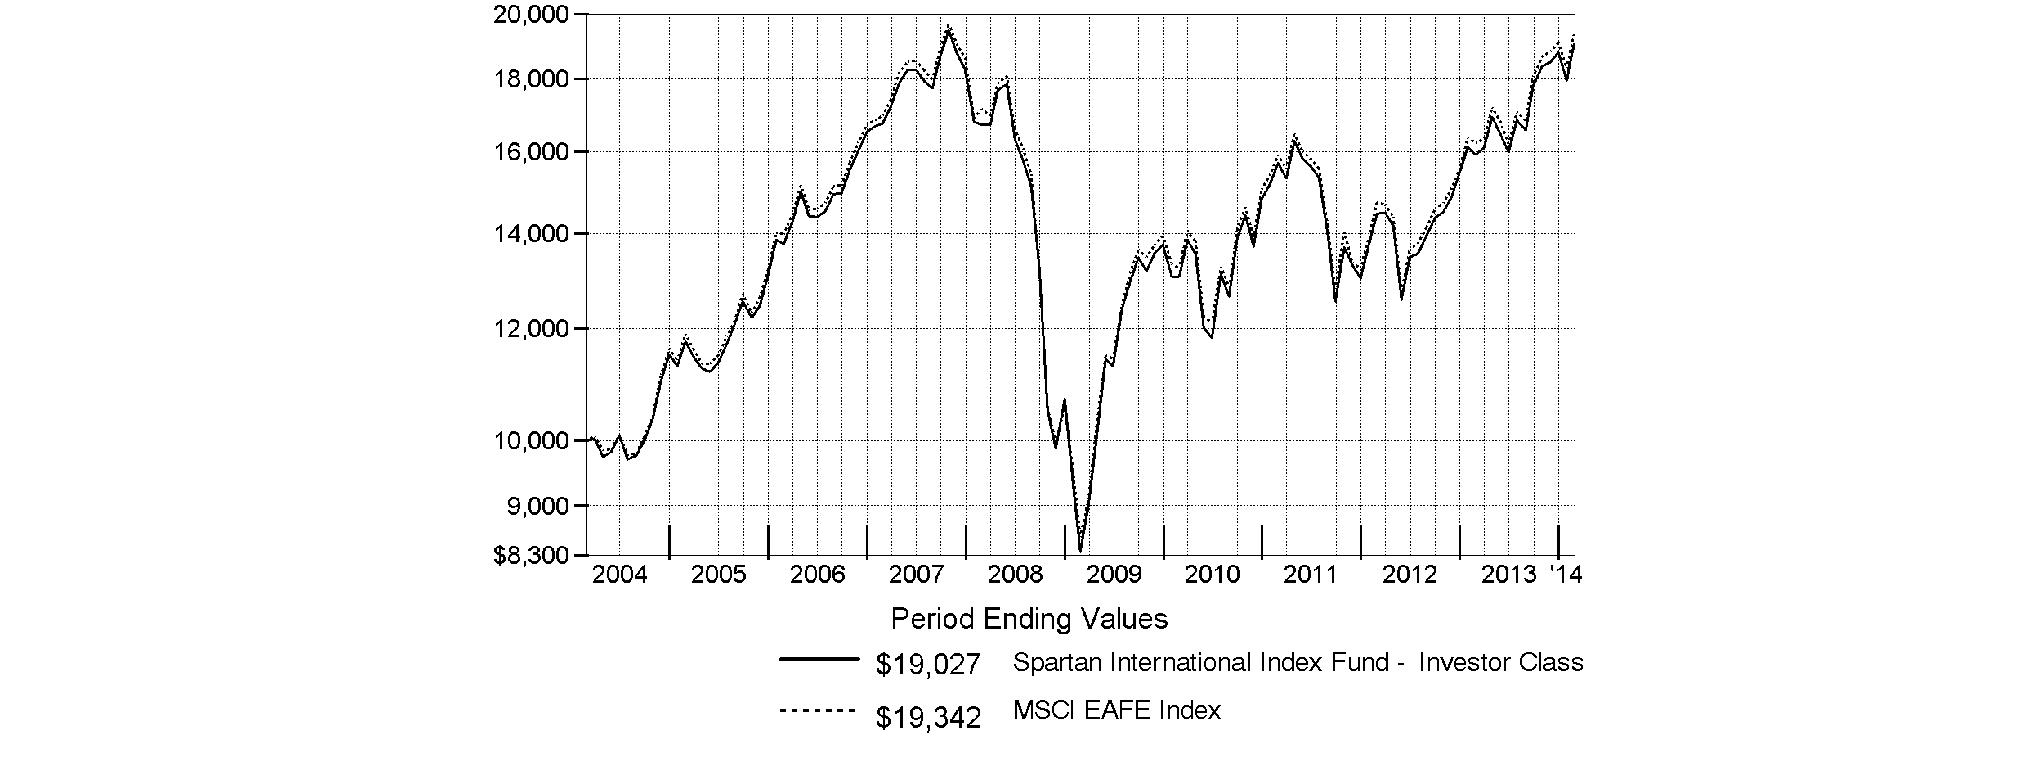
Annual Report
Spartan International Index Fund
Management's Discussion of Fund Performance
Market Recap: Overall, international equity markets remained upbeat for the 12 months ending February 28, 2014: the MSCI® ACWI® (All Country World Index) ex USA Index posted a 12.38% gain in U.S.-dollar terms. During the period, investors wrestled with fears of a U.S. debt default, a eurozone breakup, Middle East tensions, China's economic slowdown and a sell-off in emerging markets, plus off-again/on-again signals that the U.S. Federal Reserve would taper its massive stimulus program. But central banks worldwide maintained accommodative monetary policies, which, combined with modest cyclical improvements around the globe and generally low valuations, underpinned the broad equity rally. Economic stabilization helped bolster the U.K. (+22%) and the rest of Europe (+28%), with Italy (+39%) and Spain (+35%) in particular responding to rising sentiment and ultra-low interest rates. Japan's remarkable rebound (+14%) moderated later in the period but continued to benefit from expansionary policies, positive export trade and healthy consumer spending there, despite yen weakness. Asia-Pacific ex Japan fell flat, impeded by mining-industry malaise in Australia (-3%) and currency headwinds generally. Emerging-markets stocks (-7%) suffered from weakness in global commodities, U.S. dollar strength and major investor outflows driven by declining regional trade and Fed taper-talk.
Comments from Patrick Waddell, Senior Portfolio Manager of the Geode Capital Management, LLC, investment management team for Spartan® International Index Fund: For the year, the fund's Investor Class and Fidelity Advantage® Class shares gained 19.66% and 19.79%, respectively, in line with the 19.42% advance of the benchmark MSCI® EAFE® Index. (The fund's performance relative to the index can be affected by Fidelity's methodologies for valuing certain foreign stocks and for incorporating foreign exchange rates, which differ from those used by the index.) Of the 10 market sectors in the index, health care was the top-performing group, and, accordingly, many large pharmaceutical companies enjoyed a very good result. Switzerland's Roche Holding and Novartis, Germany's Bayer, and U.K.-based GlaxoSmithKline and AstraZeneca stood out as notable contributors. Topping the list, however, was U.K.-based mobile communications provider Vodafone. The company saw its shares rise sharply in August, after news broke of plans to sell its 45% stake in U.S. mobile operator Verizon Wireless. The deal was finalized late in the period. Another telecom stock to do very well was SoftBank, a Japanese company that in July completed its acquisition of U.S. wireless service provider Sprint. In energy, diversified energy producers BP and Total, based in the U.K. and France, respectively, added value. Of final note, the fund received a modest boost from favorable currency fluctuations. In a strong market environment, there were many more contributors than detractors. Amid generally lower commodity prices, various mining companies hampered the fund's result, including Australia's Newcrest Mining and BHP Billiton. Also in the materials sector, Switzerland's Syngenta, a maker of farm chemicals, declined in part on weaker-than-expected earnings announced in February 2014. Meanwhile, the biggest individual detractor was U.K. bank Standard Chartered, whose shares fell sharply in December after the company forecast a lower-than-expected profit.
The views expressed above reflect those of the portfolio manager(s) only through the end of the period as stated on the cover of this report and do not necessarily represent the views of Fidelity or any other person in the Fidelity organization. Any such views are subject to change at any time based upon market or other conditions and Fidelity disclaims any responsibility to update such views. These views may not be relied on as investment advice and, because investment decisions for a Fidelity fund are based on numerous factors, may not be relied on as an indication of trading intent on behalf of any Fidelity fund.
Annual Report
Spartan International Index Fund
Investment Changes (Unaudited)
Top Ten Stocks as of February 28, 2014 | ||
| % of fund's | % of fund's net assets |
Nestle SA (Switzerland, Food Products) | 1.8 | 1.8 |
Roche Holding AG (participation certificate) (Switzerland, Pharmaceuticals) | 1.6 | 1.5 |
HSBC Holdings PLC (United Kingdom) (United Kingdom, Commercial Banks) | 1.5 | 1.6 |
Novartis AG (Switzerland, Pharmaceuticals) | 1.4 | 1.4 |
Toyota Motor Corp. (Japan, Automobiles) | 1.2 | 1.4 |
BP PLC (United Kingdom, Oil, Gas & Consumable Fuels) | 1.2 | 1.1 |
Royal Dutch Shell PLC Class A (United Kingdom) (United Kingdom, Oil, Gas & Consumable Fuels) | 1.0 | 1.0 |
Total SA (France, Oil, Gas & Consumable Fuels) | 1.0 | 1.0 |
GlaxoSmithKline PLC (United Kingdom, Pharmaceuticals) | 1.0 | 1.1 |
Sanofi SA (France, Pharmaceuticals) | 0.9 | 1.0 |
| 12.6 | |
Market Sectors as of February 28, 2014 | ||
| % of fund's | % of fund's net assets |
Financials | 24.7 | 24.0 |
Industrials | 12.2 | 12.8 |
Consumer Discretionary | 11.2 | 11.7 |
Consumer Staples | 10.8 | 11.3 |
Health Care | 10.6 | 10.5 |
Materials | 8.2 | 7.9 |
Energy | 6.7 | 6.7 |
Telecommunication Services | 5.0 | 5.0 |
Information Technology | 4.5 | 4.3 |
Utilities | 4.1 | 3.9 |
Geographic Diversification (% of fund's net assets) | |||
As of February 28, 2014 | |||
 | United Kingdom | 20.0% |
|
 | Japan | 19.8% |
|
 | France | 9.5% |
|
 | Germany | 9.5% |
|
 | Switzerland | 9.1% |
|
 | Australia | 7.4% |
|
 | Spain | 3.4% |
|
 | Sweden | 3.2% |
|
 | Netherlands | 3.1% |
|
 | Other* | 15.0% |
|

Percentages are based on country or territory of incorporation and are adjusted for the effect of futures contracts, if applicable. |
* Includes Short-Term Investments and Net Other Assets (Liabilities)
As of August 31, 2013 | |||
| Japan | 21.1% |
|
| United Kingdom | 20.6% |
|
| France | 9.1% |
|
| Switzerland | 9.0% |
|
| Germany | 8.7% |
|
| Australia | 7.9% |
|
| Sweden | 3.1% |
|
| Netherlands | 3.1% |
|
| Spain | 2.9% |
|
| Other* | 14.5% |
|

Percentages are based on country or territory of incorporation and are adjusted for the effect of futures contracts, if applicable. |
* Includes Short-Term Investments and Net Other Assets (Liabilities)
Annual Report
Spartan International Index Fund
Investments February 28, 2014
Showing Percentage of Net Assets
Common Stocks - 97.1% | |||
Shares | Value | ||
Australia - 7.3% | |||
AGL Energy Ltd. | 537,236 | $ 7,502,650 | |
ALS Ltd. (d) | 367,433 | 2,488,600 | |
Alumina Ltd. (a) | 2,423,075 | 2,781,319 | |
Amcor Ltd. | 1,158,570 | 10,452,223 | |
AMP Ltd. | 2,837,716 | 12,230,699 | |
APA Group unit | 800,137 | 4,769,535 | |
Asciano Ltd. | 927,003 | 4,458,668 | |
ASX Ltd. | 184,945 | 6,198,740 | |
Australia & New Zealand Banking Group Ltd. | 2,635,368 | 75,582,694 | |
Bank Queensland Ltd. | 308,512 | 3,300,855 | |
Bendigo & Adelaide Bank Ltd. | 401,429 | 3,986,935 | |
BHP Billiton Ltd. | 3,084,992 | 105,810,963 | |
Boral Ltd. | 741,819 | 3,687,129 | |
Brambles Ltd. | 1,498,885 | 12,532,656 | |
Caltex Australia Ltd. | 127,020 | 2,378,005 | |
CFS Retail Property Trust unit | 2,025,982 | 3,561,534 | |
Coca-Cola Amatil Ltd. | 554,753 | 5,593,882 | |
Cochlear Ltd. | 54,793 | 2,801,657 | |
Commonwealth Bank of Australia | 1,548,229 | 103,147,430 | |
Computershare Ltd. | 452,046 | 4,788,159 | |
Crown Ltd. | 384,676 | 5,931,630 | |
CSL Ltd. | 467,654 | 30,129,858 | |
DEXUS Property Group unit | 4,443,826 | 4,243,030 | |
Echo Entertainment Group Ltd. | 739,039 | 1,754,221 | |
Federation Centres unit | 1,373,987 | 2,930,325 | |
Flight Centre Travel Group Ltd. | 53,588 | 2,479,428 | |
Fortescue Metals Group Ltd. | 1,487,290 | 7,219,877 | |
Goodman Group unit | 1,660,880 | 7,114,014 | |
Harvey Norman Holdings Ltd. (d) | 494,029 | 1,415,118 | |
Iluka Resources Ltd. | 400,569 | 3,356,434 | |
Incitec Pivot Ltd. | 1,552,664 | 4,350,532 | |
Insurance Australia Group Ltd. | 2,210,351 | 10,710,168 | |
Leighton Holdings Ltd. (d) | 163,907 | 2,642,962 | |
Lend Lease Group unit | 523,376 | 5,268,150 | |
Macquarie Group Ltd. | 277,152 | 13,916,504 | |
Metcash Ltd. | 865,946 | 2,395,453 | |
Mirvac Group unit | 3,606,917 | 5,680,886 | |
National Australia Bank Ltd. | 2,256,457 | 69,950,706 | |
Newcrest Mining Ltd. | 736,178 | 7,449,569 | |
Orica Ltd. | 355,179 | 7,651,028 | |
Origin Energy Ltd. | 1,056,037 | 13,607,601 | |
Qantas Airways Ltd. (a) | 1,067,591 | 1,109,855 | |
QBE Insurance Group Ltd. | 1,177,774 | 13,473,649 | |
QR National Ltd. | 1,950,285 | 8,858,314 | |
Ramsay Health Care Ltd. | 125,876 | 5,419,703 | |
realestate.com.au Ltd. | 50,162 | 2,219,751 | |
Rio Tinto Ltd. | 418,625 | 24,968,752 | |
Santos Ltd. | 932,371 | 11,348,497 | |
SEEK Ltd. | 311,397 | 4,754,443 | |
Sonic Healthcare Ltd. | 364,241 | 5,645,779 | |
SP AusNet unit | 1,659,769 | 1,962,451 | |
| |||
Shares | Value | ||
Stockland Corp. Ltd. unit | 2,295,296 | $ 7,906,081 | |
Suncorp-Metway Ltd. | 1,236,138 | 13,391,242 | |
Sydney Airport unit | 1,029,009 | 3,728,039 | |
Tabcorp Holdings Ltd. | 750,504 | 2,377,478 | |
Tatts Group Ltd. | 1,345,468 | 3,505,835 | |
Telstra Corp. Ltd. | 4,185,857 | 18,863,010 | |
The GPT Group unit | 1,625,620 | 5,396,314 | |
Toll Holdings Ltd. | 646,452 | 3,068,903 | |
Transurban Group unit | 1,349,498 | 8,513,868 | |
Treasury Wine Estates Ltd. | 631,072 | 2,179,341 | |
Wesfarmers Ltd. | 1,097,532 | 42,064,486 | |
Westfield Group unit | 1,954,556 | 17,912,400 | |
Westfield Retail Trust unit | 2,853,062 | 7,917,842 | |
Westpac Banking Corp. | 2,986,196 | 89,621,707 | |
Woodside Petroleum Ltd. | 632,404 | 21,416,161 | |
Woolworths Ltd. | 1,204,215 | 38,760,146 | |
WorleyParsons Ltd. | 196,323 | 2,944,924 | |
TOTAL AUSTRALIA | 957,580,798 | ||
Austria - 0.3% | |||
Andritz AG | 69,305 | 4,355,955 | |
Erste Group Bank AG | 247,642 | 8,788,199 | |
IMMOEAST AG (a)(d) | 321,410 | 4 | |
IMMOFINANZ Immobilien Anlagen AG | 922,347 | 4,672,334 | |
OMV AG | 141,761 | 6,451,329 | |
Raiffeisen International Bank-Holding AG | 112,697 | 3,927,781 | |
Telekom Austria AG | 265,155 | 2,582,084 | |
Vienna Insurance Group AG | 35,723 | 1,829,344 | |
Voestalpine AG | 106,564 | 4,803,233 | |
TOTAL AUSTRIA | 37,410,263 | ||
Bailiwick of Guernsey - 0.1% | |||
Resolution Ltd. | 1,362,887 | 8,622,236 | |
Bailiwick of Jersey - 1.2% | |||
Experian PLC | 960,010 | 17,377,991 | |
Glencore Xstrata PLC | 10,189,830 | 56,172,646 | |
Petrofac Ltd. | 250,035 | 5,727,763 | |
Randgold Resources Ltd. | 84,695 | 6,707,921 | |
Shire PLC | 564,242 | 31,211,131 | |
Wolseley PLC | 254,639 | 14,821,863 | |
WPP PLC | 1,290,510 | 28,266,188 | |
TOTAL BAILIWICK OF JERSEY | 160,285,503 | ||
Belgium - 1.2% | |||
Ageas | 215,167 | 9,873,599 | |
Anheuser-Busch InBev SA NV | 771,755 | 80,720,989 | |
Belgacom SA | 146,572 | 4,421,558 | |
Colruyt NV | 71,973 | 3,996,126 | |
Delhaize Group SA | 98,671 | 7,097,152 | |
Groupe Bruxelles Lambert SA | 77,392 | 7,613,359 | |
Groupe Bruxelles Lambert SA (strip VVPR) (a) | 2,466 | 3 | |
KBC Groupe SA | 240,125 | 15,239,820 | |
Common Stocks - continued | |||
Shares | Value | ||
Belgium - continued | |||
Solvay SA Class A | 56,853 | $ 8,820,500 | |
Telenet Group Holding NV | 49,411 | 3,153,661 | |
UCB SA | 105,629 | 8,478,253 | |
Umicore SA | 109,120 | 5,365,025 | |
TOTAL BELGIUM | 154,780,045 | ||
Bermuda - 0.3% | |||
Cheung Kong Infrastructure Holdings Ltd. | 606,450 | 3,954,149 | |
First Pacific Co. Ltd. | 2,298,665 | 2,277,768 | |
Kerry Properties Ltd. | 613,181 | 2,022,722 | |
Li & Fung Ltd. | 5,655,246 | 7,403,766 | |
Noble Group Ltd. | 4,118,890 | 3,346,710 | |
NWS Holdings Ltd. | 1,384,695 | 2,173,246 | |
Seadrill Ltd. | 360,452 | 13,296,247 | |
Shangri-La Asia Ltd. | 1,487,380 | 2,483,902 | |
Yue Yuen Industrial (Holdings) Ltd. | 726,500 | 2,223,344 | |
TOTAL BERMUDA | 39,181,854 | ||
Cayman Islands - 0.2% | |||
ASM Pacific Technology Ltd. | 226,729 | 2,053,856 | |
MGM China Holdings Ltd. | 914,800 | 3,901,770 | |
Sands China Ltd. | 2,321,600 | 19,415,098 | |
Wynn Macau Ltd. | 1,488,800 | 7,174,894 | |
TOTAL CAYMAN ISLANDS | 32,545,618 | ||
Denmark - 1.4% | |||
A.P. Moller - Maersk A/S: | |||
Series A | 527 | 6,175,058 | |
Series B | 1,268 | 15,502,599 | |
Carlsberg A/S Series B | 102,262 | 10,790,802 | |
Coloplast A/S Series B | 106,675 | 8,985,443 | |
Danske Bank A/S | 629,838 | 16,682,290 | |
DSV de Sammensluttede Vognmaend A/S | 173,362 | 5,553,741 | |
Novo Nordisk A/S Series B | 1,912,279 | 91,003,479 | |
Novozymes A/S Series B | 217,190 | 10,103,262 | |
TDC A/S | 779,981 | 7,747,152 | |
Tryg A/S | 23,440 | 2,263,143 | |
William Demant Holding A/S (a) | 24,010 | 2,161,411 | |
TOTAL DENMARK | 176,968,380 | ||
Finland - 0.9% | |||
Elisa Corp. (A Shares) | 133,588 | 3,739,460 | |
Fortum Corp. | 427,055 | 10,115,202 | |
Kone Oyj (B Shares) (d) | 300,205 | 12,228,146 | |
Metso Corp. | 123,139 | 3,987,467 | |
Neste Oil Oyj (d) | 121,203 | 2,594,769 | |
Nokia Corp. (a) | 3,596,161 | 27,372,862 | |
Nokian Tyres PLC | 108,615 | 4,872,442 | |
Orion Oyj (B Shares) | 94,037 | 3,097,011 | |
Pohjola Bank PLC (A Shares) | 132,861 | 3,080,919 | |
Sampo Oyj (A Shares) | 419,797 | 21,271,455 | |
| |||
Shares | Value | ||
Stora Enso Oyj (R Shares) | 525,122 | $ 5,983,438 | |
UPM-Kymmene Corp. | 508,742 | 9,241,170 | |
Wartsila Corp. | 170,530 | 10,081,435 | |
TOTAL FINLAND | 117,665,776 | ||
France - 9.2% | |||
Accor SA | 153,311 | 7,835,052 | |
Aeroports de Paris | 28,759 | 3,490,870 | |
Air Liquide SA | 39,251 | 5,404,813 | |
Air Liquide SA | 10,300 | 1,418,297 | |
Alcatel-Lucent SA (a) | 2,678,648 | 11,591,237 | |
Alstom SA | 206,009 | 5,543,305 | |
Arkema SA | 59,938 | 6,519,315 | |
Atos Origin SA | 66,678 | 6,483,911 | |
AXA SA | 1,723,487 | 45,056,917 | |
BIC SA | 27,874 | 3,573,510 | |
BNP Paribas SA | 956,114 | 78,470,798 | |
Bouygues SA | 184,612 | 7,443,291 | |
Bureau Veritas SA | 212,256 | 5,856,609 | |
Cap Gemini SA | 136,902 | 10,720,032 | |
Carrefour SA | 590,666 | 21,784,716 | |
Casino Guichard Perrachon SA | 54,125 | 6,151,517 | |
Christian Dior SA | 52,347 | 10,354,079 | |
CNP Assurances | 165,454 | 3,567,236 | |
Compagnie de St. Gobain | 399,163 | 23,966,964 | |
Compagnie Generale de Geophysique SA (a) | 153,454 | 2,351,119 | |
Credit Agricole SA (a) | 960,523 | 15,273,330 | |
Danone SA | 545,454 | 38,463,073 | |
Dassault Systemes SA | 60,904 | 7,000,999 | |
Edenred SA | 194,739 | 6,262,999 | |
EDF SA | 31,735 | 1,262,207 | |
EDF SA | 14,600 | 580,691 | |
EDF SA | 186,140 | 7,403,410 | |
Essilor International SA | 196,652 | 20,537,056 | |
Eurazeo SA | 29,645 | 2,324,608 | |
Eutelsat Communications | 136,702 | 4,459,683 | |
Fonciere des Regions | 27,340 | 2,562,370 | |
France Telecom SA | 1,780,553 | 22,207,143 | |
GDF Suez | 1,274,961 | 32,715,215 | |
Gecina SA | 21,049 | 2,895,515 | |
Groupe Eurotunnel SA | 527,755 | 6,341,975 | |
ICADE | 34,488 | 3,399,862 | |
Iliad SA | 25,011 | 6,100,158 | |
Imerys SA | 32,771 | 3,053,282 | |
JCDecaux SA | 64,286 | 2,838,600 | |
Kering SA | 72,675 | 14,906,557 | |
Klepierre SA | 94,994 | 4,332,212 | |
L'Oreal SA | 30,358 | 5,143,611 | |
L'Oreal SA | 196,844 | 33,351,638 | |
L'Oreal SA | 5,100 | 864,102 | |
Lafarge SA (a) | 159,515 | 11,993,126 | |
Lafarge SA (Bearer) | 19,833 | 1,491,143 | |
Lagardere S.C.A. (Reg.) | 106,464 | 4,275,576 | |
Common Stocks - continued | |||
Shares | Value | ||
France - continued | |||
Legrand SA | 254,234 | $ 15,766,799 | |
LVMH Moet Hennessy - Louis Vuitton SA | 243,783 | 45,376,172 | |
Michelin CGDE Series B | 179,766 | 21,976,963 | |
Natixis SA | 883,389 | 6,373,500 | |
Pernod Ricard SA | 203,970 | 24,012,529 | |
Publicis Groupe SA (d) | 173,898 | 16,514,161 | |
Remy Cointreau SA (d) | 23,781 | 2,018,732 | |
Renault SA | 184,550 | 18,394,368 | |
Rexel SA | 231,243 | 5,839,484 | |
Safran SA | 260,261 | 18,324,743 | |
Sanofi SA | 1,147,528 | 119,354,283 | |
Schneider Electric SA | 509,601 | 45,545,296 | |
Schneider Electric SA CDI | 17,736 | 1,576,576 | |
SCOR SE | 148,044 | 5,186,279 | |
Societe Generale Series A | 690,151 | 46,082,771 | |
Sodexo SA | 5,930 | 632,714 | |
Sodexo SA | 77,845 | 8,305,843 | |
Sodexo SA | 6,851 | 730,982 | |
Suez Environnement SA | 268,088 | 5,358,206 | |
Technip SA | 97,834 | 9,613,517 | |
Thales SA | 87,793 | 5,828,791 | |
Total SA | 2,053,955 | 133,258,760 | |
Unibail-Rodamco | 93,448 | 24,623,480 | |
Valeo SA | 72,781 | 10,191,628 | |
Vallourec SA | 102,437 | 5,505,874 | |
Veolia Environnement SA | 340,619 | 6,435,032 | |
VINCI SA | 461,767 | 34,501,216 | |
Vivendi SA | 1,157,099 | 33,084,833 | |
Wendel SA | 30,904 | 4,645,325 | |
Zodiac Aerospace | 165,757 | 5,853,704 | |
TOTAL FRANCE | 1,210,536,290 | ||
Germany - 8.7% | |||
adidas AG | 200,806 | 23,393,361 | |
Allianz SE | 438,189 | 78,144,663 | |
Axel Springer Verlag AG | 40,408 | 2,856,246 | |
BASF AG | 881,865 | 101,542,015 | |
Bayer AG | 794,053 | 112,781,626 | |
Bayerische Motoren Werke AG (BMW) | 317,531 | 36,903,853 | |
Beiersdorf AG | 96,396 | 9,850,091 | |
Brenntag AG | 49,338 | 9,176,642 | |
Celesio AG | 44,454 | 1,569,585 | |
Commerzbank AG (a) | 929,055 | 16,850,402 | |
Continental AG | 105,589 | 25,702,042 | |
Daimler AG (Germany) | 924,299 | 86,142,685 | |
Deutsche Bank AG | 978,704 | 47,334,486 | |
Deutsche Boerse AG | 185,041 | 15,181,695 | |
Deutsche Lufthansa AG (a) | 220,953 | 5,730,601 | |
Deutsche Post AG | 870,122 | 32,680,010 | |
Deutsche Telekom AG | 2,777,768 | 46,992,311 | |
Deutsche Wohnen AG (Bearer) | 280,410 | 5,941,216 | |
E.ON AG | 1,729,308 | 32,987,840 | |
| |||
Shares | Value | ||
Fraport AG Frankfurt Airport Services Worldwide | 35,098 | $ 2,798,712 | |
Fresenius Medical Care AG & Co. KGaA | 207,188 | 14,215,028 | |
Fresenius SE & Co. KGaA | 120,554 | 18,736,717 | |
GEA Group AG | 176,205 | 8,546,602 | |
Hannover Reuck SE | 57,938 | 4,934,261 | |
HeidelbergCement Finance AG | 134,947 | 11,123,886 | |
Henkel AG & Co. KGaA | 124,066 | 12,550,788 | |
Hochtief AG | 33,236 | 3,089,725 | |
Hugo Boss AG | 30,381 | 4,046,298 | |
Infineon Technologies AG | 1,036,824 | 11,763,873 | |
K&S AG | 165,217 | 5,586,061 | |
Kabel Deutschland Holding AG | 20,897 | 2,969,503 | |
Lanxess AG | 80,202 | 5,953,598 | |
Linde AG | 178,205 | 36,933,350 | |
MAN SE | 37,855 | 4,885,492 | |
Merck KGaA | 62,300 | 10,921,072 | |
Metro AG | 124,765 | 5,174,143 | |
Muenchener Rueckversicherungs AG | 172,114 | 37,690,314 | |
OSRAM Licht AG (a) | 81,433 | 5,536,359 | |
ProSiebenSat.1 Media AG | 209,806 | 10,005,515 | |
RWE AG | 469,897 | 18,819,095 | |
SAP AG | 884,662 | 71,155,240 | |
Siemens AG | 761,308 | 101,503,257 | |
Sky Deutschland AG (a) | 419,566 | 4,395,574 | |
Suedzucker AG (Bearer) | 76,616 | 2,130,924 | |
Telefonica Deutschland Holding AG | 262,375 | 2,100,506 | |
Thyssenkrupp AG (a) | 434,559 | 11,852,478 | |
United Internet AG | 102,295 | 4,760,483 | |
Volkswagen AG | 28,241 | 7,215,393 | |
TOTAL GERMANY | 1,133,155,617 | ||
Hong Kong - 2.3% | |||
AIA Group Ltd. | 11,562,000 | 56,539,536 | |
Bank of East Asia Ltd. | 1,290,874 | 5,347,765 | |
BOC Hong Kong (Holdings) Ltd. | 3,552,066 | 10,779,024 | |
Cathay Pacific Airways Ltd. | 1,111,327 | 2,262,593 | |
Cheung Kong Holdings Ltd. | 1,334,449 | 20,909,471 | |
CLP Holdings Ltd. | 1,698,157 | 13,249,500 | |
Galaxy Entertainment Group Ltd. (a) | 2,024,000 | 20,303,767 | |
Hang Lung Properties Ltd. | 2,135,423 | 5,929,781 | |
Hang Seng Bank Ltd. | 735,301 | 11,919,370 | |
Henderson Land Development Co. Ltd. | 1,035,605 | 5,804,849 | |
HKT Trust/HKT Ltd. unit | 2,134,000 | 2,265,839 | |
Hong Kong & China Gas Co. Ltd. | 5,519,112 | 11,890,852 | |
Hong Kong Exchanges and Clearing Ltd. | 1,058,371 | 16,419,953 | |
Hopewell Holdings Ltd. | 533,500 | 1,804,560 | |
Hutchison Whampoa Ltd. | 2,046,158 | 27,578,989 | |
Hysan Development Co. Ltd. | 616,677 | 2,574,603 | |
Link (REIT) | 2,219,308 | 10,309,328 | |
MTR Corp. Ltd. | 1,384,951 | 5,023,661 | |
New World Development Co. Ltd. | 3,672,491 | 4,751,185 | |
PCCW Ltd. | 3,904,000 | 1,856,281 | |
Common Stocks - continued | |||
Shares | Value | ||
Hong Kong - continued | |||
Power Assets Holdings Ltd. | 1,330,676 | $ 11,119,616 | |
Sino Land Ltd. | 2,844,689 | 4,032,134 | |
SJM Holdings Ltd. | 1,869,000 | 5,996,753 | |
Sun Hung Kai Properties Ltd. | 1,538,611 | 19,687,274 | |
Swire Pacific Ltd. (A Shares) | 655,884 | 7,365,495 | |
Swire Properties Ltd. | 1,114,200 | 2,964,768 | |
Wharf Holdings Ltd. | 1,454,585 | 10,149,510 | |
Wheelock and Co. Ltd. | 879,000 | 3,584,843 | |
TOTAL HONG KONG | 302,421,300 | ||
Ireland - 0.4% | |||
Bank of Ireland (a) | 21,742,483 | 11,561,849 | |
CRH PLC | 701,582 | 20,691,523 | |
CRH PLC sponsored ADR | 2,500 | 73,650 | |
James Hardie Industries PLC CDI | 423,805 | 5,483,645 | |
Kerry Group PLC Class A | 142,482 | 10,763,634 | |
Ryanair Holdings PLC (a) | 261,736 | 2,670,506 | |
TOTAL IRELAND | 51,244,807 | ||
Isle of Man - 0.0% | |||
Genting Singapore PLC | 5,908,859 | 6,269,408 | |
Israel - 0.5% | |||
Bank Hapoalim BM (Reg.) | 1,001,382 | 5,439,719 | |
Bank Leumi le-Israel BM (a) | 1,193,420 | 4,553,432 | |
Bezeq The Israeli Telecommunication Corp. Ltd. | 1,793,377 | 2,908,207 | |
Delek Group Ltd. | 4,023 | 1,507,277 | |
Israel Chemicals Ltd. | 415,506 | 3,513,717 | |
Israel Corp. Ltd. (Class A) (a) | 2,466 | 1,308,480 | |
Mizrahi Tefahot Bank Ltd. | 116,998 | 1,442,163 | |
NICE Systems Ltd. | 53,809 | 2,219,143 | |
NICE Systems Ltd. sponsored ADR | 1,000 | 41,080 | |
Teva Pharmaceutical Industries Ltd. | 787,445 | 39,330,180 | |
Teva Pharmaceutical Industries Ltd. sponsored ADR | 30,300 | 1,511,667 | |
TOTAL ISRAEL | 63,775,065 | ||
Italy - 2.2% | |||
Assicurazioni Generali SpA | 1,121,804 | 25,223,860 | |
Atlantia SpA | 355,961 | 9,020,873 | |
Banca Monte dei Paschi di Siena SpA (a)(d) | 5,995,872 | 1,521,975 | |
Enel Green Power SpA | 1,673,518 | 4,698,452 | |
Enel SpA | 6,321,714 | 32,460,206 | |
Eni SpA | 2,443,584 | 58,662,150 | |
EXOR SpA | 95,750 | 3,894,865 | |
Fiat SpA (a)(d) | 841,475 | 8,809,886 | |
Finmeccanica SpA (a)(d) | 389,128 | 3,826,933 | |
Intesa Sanpaolo SpA | 11,164,188 | 34,610,700 | |
Luxottica Group SpA | 159,604 | 8,861,452 | |
Mediobanca SpA (a) | 494,219 | 4,928,682 | |
Pirelli & C. S.p.A. | 229,935 | 3,998,979 | |
Prysmian SpA | 194,228 | 5,024,061 | |
| |||
Shares | Value | ||
Saipem SpA | 255,231 | $ 6,003,113 | |
Snam Rete Gas SpA | 1,950,605 | 11,103,540 | |
Telecom Italia SpA (d) | 9,694,476 | 11,011,643 | |
Terna SpA | 1,438,462 | 7,346,384 | |
UniCredit SpA | 4,170,111 | 33,183,364 | |
Unione di Banche Italiane ScpA | 819,324 | 7,113,442 | |
Unipolsai SpA (a) | 873,745 | 2,988,543 | |
TOTAL ITALY | 284,293,103 | ||
Japan - 19.6% | |||
ABC-MART, Inc. | 24,500 | 970,178 | |
ACOM Co. Ltd. (a)(d) | 395,300 | 1,134,201 | |
Advantest Corp. (d) | 140,790 | 1,533,910 | |
AEON Co. Ltd. | 600,700 | 7,361,003 | |
AEON Financial Service Co. Ltd. | 107,400 | 2,629,859 | |
AEON Mall Co. Ltd. | 108,440 | 2,999,495 | |
Air Water, Inc. | 143,000 | 2,117,530 | |
Aisin Seiki Co. Ltd. | 185,300 | 6,427,326 | |
Ajinomoto Co., Inc. | 569,866 | 8,847,101 | |
Alfresa Holdings Corp. | 40,100 | 2,352,334 | |
All Nippon Airways Ltd. | 1,126,000 | 2,514,610 | |
Amada Co. Ltd. | 340,000 | 2,842,265 | |
Aozora Bank Ltd. | 1,023,000 | 2,980,986 | |
Asahi Glass Co. Ltd. | 968,677 | 5,334,048 | |
Asahi Group Holdings | 371,003 | 10,431,329 | |
Asahi Kasei Corp. | 1,211,727 | 8,635,523 | |
Asics Corp. | 154,500 | 3,015,004 | |
Astellas Pharma, Inc. | 416,600 | 27,079,328 | |
Bank of Kyoto Ltd. | 309,000 | 2,383,463 | |
Bank of Yokohama Ltd. | 1,125,084 | 5,690,443 | |
Benesse Holdings, Inc. | 69,700 | 2,619,657 | |
Bridgestone Corp. | 624,479 | 22,585,489 | |
Brother Industries Ltd. | 227,700 | 3,248,702 | |
Calbee, Inc. | 68,500 | 1,663,196 | |
Canon, Inc. | 1,087,844 | 33,941,537 | |
Casio Computer Co. Ltd. | 214,700 | 2,433,493 | |
Central Japan Railway Co. | 138,200 | 16,129,617 | |
Chiba Bank Ltd. | 712,674 | 4,327,359 | |
Chiyoda Corp. | 150,000 | 2,283,190 | |
Chubu Electric Power Co., Inc. | 621,564 | 7,689,600 | |
Chugai Pharmaceutical Co. Ltd. | 215,825 | 5,530,953 | |
Chugoku Electric Power Co., Inc. | 286,100 | 4,056,621 | |
Citizen Holdings Co. Ltd. | 251,666 | 2,070,006 | |
Coca-Cola West Co. Ltd. | 56,800 | 1,052,059 | |
Credit Saison Co. Ltd. | 152,752 | 3,363,034 | |
Dai Nippon Printing Co. Ltd. | 536,242 | 5,402,359 | |
Dai-ichi Mutual Life Insurance Co. | 817,300 | 11,971,789 | |
Daicel Chemical Industries Ltd. | 281,000 | 2,424,270 | |
Daido Steel Co. Ltd. | 274,000 | 1,257,325 | |
Daihatsu Motor Co. Ltd. | 186,300 | 2,993,028 | |
Daiichi Sankyo Kabushiki Kaisha | 644,070 | 11,130,985 | |
Daikin Industries Ltd. | 225,294 | 12,980,739 | |
Dainippon Sumitomo Pharma Co. Ltd. | 154,100 | 2,860,699 | |
Daito Trust Construction Co. Ltd. | 69,663 | 6,478,926 | |
Common Stocks - continued | |||
Shares | Value | ||
Japan - continued | |||
Daiwa House Industry Co. Ltd. | 568,184 | $ 10,341,385 | |
Daiwa Securities Group, Inc. | 1,592,985 | 14,416,010 | |
DeNA Co. Ltd. (d) | 99,900 | 2,159,575 | |
DENSO Corp. | 466,738 | 25,041,086 | |
Dentsu, Inc. | 208,200 | 7,851,587 | |
Don Quijote Holdings Co. Ltd. | 53,100 | 2,880,141 | |
East Japan Railway Co. | 322,100 | 25,188,824 | |
Eisai Co. Ltd. | 241,678 | 9,456,571 | |
Electric Power Development Co. Ltd. | 111,180 | 3,452,184 | |
FamilyMart Co. Ltd. | 55,900 | 2,488,228 | |
Fanuc Corp. | 183,972 | 32,026,550 | |
Fast Retailing Co. Ltd. | 50,900 | 17,621,114 | |
Fuji Electric Co. Ltd. | 532,153 | 2,446,342 | |
Fuji Heavy Industries Ltd. | 563,100 | 15,285,114 | |
Fujifilm Holdings Corp. | 444,905 | 12,830,839 | |
Fujitsu Ltd. (a) | 1,796,075 | 11,230,548 | |
Fukuoka Financial Group, Inc. | 732,300 | 2,960,260 | |
GREE, Inc. (a)(d) | 103,500 | 1,145,141 | |
GungHo Online Entertainment, Inc. (d) | 328,700 | 2,025,105 | |
Gunma Bank Ltd. | 362,663 | 1,906,502 | |
Hakuhodo DY Holdings, Inc. | 223,600 | 1,669,804 | |
Hamamatsu Photonics K.K. | 67,900 | 2,755,498 | |
Hankyu Hanshin Holdings, Inc. | 1,096,000 | 6,009,315 | |
Hino Motors Ltd. | 248,600 | 3,689,324 | |
Hirose Electric Co. Ltd. | 28,498 | 4,060,342 | |
Hiroshima Bank Ltd. | 473,000 | 1,798,673 | |
Hisamitsu Pharmaceutical Co., Inc. | 59,800 | 2,796,973 | |
Hitachi Chemical Co. Ltd. | 97,900 | 1,366,002 | |
Hitachi Construction Machinery Co. Ltd. | 105,200 | 2,050,239 | |
Hitachi High-Technologies Corp. | 61,500 | 1,484,170 | |
Hitachi Ltd. | 4,639,271 | 36,738,383 | |
Hitachi Metals Ltd. | 184,000 | 2,746,349 | |
Hokkaido Electric Power Co., Inc. (a) | 178,300 | 1,816,813 | |
Hokuhoku Financial Group, Inc. | 1,113,000 | 2,088,857 | |
Hokuriku Electric Power Co., Inc. | 160,800 | 2,065,104 | |
Honda Motor Co. Ltd. | 1,562,860 | 56,252,121 | |
Honda Motor Co. Ltd. sponsored ADR (d) | 2,457 | 88,575 | |
Hoya Corp. | 418,716 | 12,408,838 | |
Hulic Co. Ltd. | 257,800 | 2,966,334 | |
Ibiden Co. Ltd. | 118,400 | 2,315,181 | |
Idemitsu Kosan Co. Ltd. | 82,800 | 1,689,846 | |
Iida Group Holdings Co. Ltd. (a) | 128,000 | 1,934,401 | |
INPEX Corp. | 838,700 | 10,657,102 | |
Isetan Mitsukoshi Holdings Ltd. | 343,387 | 3,889,183 | |
Ishikawajima-Harima Heavy Industries Co. Ltd. | 1,258,185 | 5,777,052 | |
Isuzu Motors Ltd. | 1,147,000 | 7,013,019 | |
Itochu Corp. | 1,444,486 | 18,001,053 | |
ITOCHU Techno-Solutions Corp. | 23,500 | 1,088,754 | |
Iyo Bank Ltd. | 246,000 | 2,226,255 | |
J. Front Retailing Co. Ltd. | 464,800 | 2,954,211 | |
Japan Airlines Co. Ltd. | 57,700 | 2,868,841 | |
| |||
Shares | Value | ||
Japan Exchange Group, Inc. | 238,000 | $ 5,645,396 | |
Japan Petroleum Exploration Co. Ltd. | 28,200 | 1,030,795 | |
Japan Prime Realty Investment Corp. | 740 | 2,563,132 | |
Japan Real Estate Investment Corp. | 1,140 | 6,172,153 | |
Japan Retail Fund Investment Corp. | 2,215 | 4,370,364 | |
Japan Steel Works Ltd. | 308,000 | 1,511,440 | |
Japan Tobacco, Inc. | 1,056,100 | 33,636,508 | |
JFE Holdings, Inc. | 471,675 | 9,627,208 | |
JGC Corp. | 199,117 | 7,385,267 | |
Joyo Bank Ltd. | 646,941 | 3,083,093 | |
JSR Corp. | 169,616 | 2,904,988 | |
JTEKT Corp. | 195,600 | 3,273,867 | |
JX Holdings, Inc. | 2,165,768 | 11,247,916 | |
Kajima Corp. | 810,317 | 2,862,383 | |
Kakaku.com, Inc. | 141,700 | 2,357,257 | |
Kamigumi Co. Ltd. | 219,663 | 2,035,396 | |
Kaneka Corp. | 273,559 | 1,784,840 | |
Kansai Electric Power Co., Inc. (a) | 673,936 | 7,533,583 | |
Kansai Paint Co. Ltd. | 221,000 | 2,866,463 | |
Kao Corp. | 495,050 | 17,046,625 | |
Kawasaki Heavy Industries Ltd. | 1,361,945 | 5,589,856 | |
KDDI Corp. | 516,700 | 31,599,122 | |
Keihin Electric Express Railway Co. Ltd. | 456,061 | 3,822,541 | |
Keio Corp. | 554,410 | 3,929,603 | |
Keisei Electric Railway Co. | 266,000 | 2,339,284 | |
Keyence Corp. | 43,762 | 18,778,485 | |
Kikkoman Corp. | 150,849 | 2,941,084 | |
Kinden Corp. | 122,000 | 1,267,112 | |
Kintetsu Corp. | 1,732,100 | 6,280,288 | |
Kirin Holdings Co. Ltd. | 833,256 | 11,374,083 | |
Kobe Steel Ltd. (a) | 2,923,000 | 4,004,265 | |
Koito Manufacturing Co. Ltd. | 90,000 | 1,698,831 | |
Komatsu Ltd. | 896,445 | 18,955,047 | |
Konami Corp. | 97,100 | 2,445,418 | |
Konica Minolta, Inc. | 463,000 | 4,723,726 | |
Kubota Corp. | 1,024,864 | 14,402,274 | |
Kuraray Co. Ltd. | 327,486 | 3,676,597 | |
Kurita Water Industries Ltd. (d) | 102,400 | 2,161,297 | |
Kyocera Corp. | 311,904 | 14,128,901 | |
Kyowa Hakko Kirin Co., Ltd. | 229,689 | 2,469,424 | |
Kyushu Electric Power Co., Inc. (a) | 410,570 | 5,268,786 | |
Lawson, Inc. | 62,416 | 4,329,930 | |
LIXIL Group Corp. | 256,659 | 7,492,717 | |
M3, Inc. | 679 | 2,258,441 | |
Mabuchi Motor Co. Ltd. | 23,721 | 1,582,643 | |
Makita Corp. | 107,400 | 5,973,116 | |
Marubeni Corp. | 1,583,244 | 11,130,529 | |
Marui Group Co. Ltd. | 209,949 | 1,734,212 | |
Maruichi Steel Tube Ltd. | 45,500 | 1,271,067 | |
Mazda Motor Corp. (a) | 2,593,000 | 12,524,227 | |
McDonald's Holdings Co. (Japan) Ltd. (d) | 64,000 | 1,710,524 | |
Medipal Holdings Corp. | 132,200 | 2,039,442 | |
Meiji Holdings Co. Ltd. | 59,129 | 3,902,774 | |
Miraca Holdings, Inc. | 53,500 | 2,439,226 | |
Common Stocks - continued | |||
Shares | Value | ||
Japan - continued | |||
Mitsubishi Chemical Holdings Corp. | 1,308,875 | $ 5,922,933 | |
Mitsubishi Corp. | 1,348,502 | 25,882,384 | |
Mitsubishi Electric Corp. | 1,854,106 | 22,066,163 | |
Mitsubishi Estate Co. Ltd. | 1,201,723 | 28,502,527 | |
Mitsubishi Gas Chemical Co., Inc. | 373,867 | 2,384,196 | |
Mitsubishi Heavy Industries Ltd. | 2,914,256 | 17,953,668 | |
Mitsubishi Logistics Corp. | 118,000 | 1,642,948 | |
Mitsubishi Materials Corp. | 1,058,937 | 3,330,317 | |
Mitsubishi Motors Corp. of Japan (a) | 608,300 | 6,751,692 | |
Mitsubishi Tanabe Pharma Corp. | 214,900 | 3,163,213 | |
Mitsubishi UFJ Financial Group, Inc. | 12,239,330 | 70,922,692 | |
Mitsubishi UFJ Lease & Finance Co. Ltd. | 557,300 | 2,842,082 | |
Mitsui & Co. Ltd. | 1,667,523 | 25,706,168 | |
Mitsui Chemicals, Inc. | 801,683 | 2,078,456 | |
Mitsui Fudosan Co. Ltd. | 803,677 | 24,024,170 | |
Mitsui OSK Lines Ltd. | 1,041,285 | 4,335,160 | |
Mizuho Financial Group, Inc. | 22,073,600 | 45,400,985 | |
MS&AD Insurance Group Holdings, Inc. | 485,584 | 11,538,096 | |
Murata Manufacturing Co. Ltd. | 194,454 | 18,516,789 | |
Nabtesco Corp. | 106,000 | 2,654,947 | |
Namco Bandai Holdings, Inc. | 168,850 | 3,777,846 | |
NEC Corp. | 2,377,951 | 8,040,734 | |
Nexon Co. Ltd. | 106,600 | 905,005 | |
NGK Insulators Ltd. | 253,309 | 5,499,258 | |
NGK Spark Plug Co. Ltd. | 172,000 | 3,870,296 | |
NHK Spring Co. Ltd. | 150,800 | 1,567,715 | |
Nidec Corp. | 97,142 | 11,945,371 | |
Nikon Corp. | 327,038 | 6,003,604 | |
Nintendo Co. Ltd. | 102,096 | 12,618,983 | |
Nippon Building Fund, Inc. | 1,333 | 7,623,130 | |
Nippon Electric Glass Co. Ltd. | 368,000 | 1,670,606 | |
Nippon Express Co. Ltd. | 786,546 | 3,674,341 | |
Nippon Meat Packers, Inc. | 166,740 | 2,682,013 | |
Nippon Paint Co. Ltd. | 166,000 | 2,541,299 | |
Nippon Prologis REIT, Inc. | 1,270 | 2,720,448 | |
Nippon Steel & Sumitomo Metal Corp. | 7,298,636 | 21,384,459 | |
Nippon Telegraph & Telephone Corp. | 360,000 | 20,267,668 | |
Nippon Yusen KK | 1,556,578 | 4,986,293 | |
Nishi-Nippon City Bank Ltd. | 639,000 | 1,513,206 | |
Nissan Motor Co. Ltd. | 2,386,848 | 21,304,137 | |
Nisshin Seifun Group, Inc. | 201,949 | 2,180,236 | |
Nissin Food Holdings Co. Ltd. | 56,323 | 2,518,126 | |
Nitori Holdings Co. Ltd. | 65,800 | 2,974,157 | |
Nitto Denko Corp. | 157,594 | 7,395,477 | |
NKSJ Holdings, Inc. | 319,603 | 8,097,592 | |
NOK Corp. | 90,300 | 1,478,233 | |
Nomura Holdings, Inc. | 3,482,047 | 23,620,414 | |
Nomura Real Estate Holdings, Inc. | 118,300 | 2,422,494 | |
Nomura Research Institute Ltd. | 97,100 | 3,177,194 | |
NSK Ltd. | 447,576 | 4,923,133 | |
NTT Data Corp. | 120,800 | 5,015,350 | |
NTT DoCoMo, Inc. | 1,466,300 | 24,439,628 | |
| |||
Shares | Value | ||
NTT Urban Development Co. | 111,200 | $ 958,263 | |
Obayashi Corp. | 618,704 | 3,801,212 | |
Odakyu Electric Railway Co. Ltd. | 597,000 | 5,350,435 | |
Oji Holdings Corp. | 762,352 | 3,661,655 | |
Olympus Corp. (a) | 231,329 | 8,037,497 | |
Omron Corp. | 196,460 | 8,252,594 | |
Ono Pharmaceutical Co. Ltd. | 79,400 | 7,856,519 | |
Oracle Corp. Japan | 36,000 | 1,498,084 | |
Oriental Land Co. Ltd. | 48,356 | 7,255,538 | |
ORIX Corp. | 1,244,680 | 18,345,484 | |
Osaka Gas Co. Ltd. | 1,794,525 | 7,475,363 | |
Otsuka Corp. | 15,000 | 1,926,403 | |
Otsuka Holdings Co. Ltd. | 347,700 | 10,669,815 | |
Panasonic Corp. | 2,119,573 | 26,548,430 | |
Park24 Co. Ltd. | 92,800 | 1,872,049 | |
Rakuten, Inc. | 701,400 | 10,055,444 | |
Resona Holdings, Inc. | 2,117,400 | 11,062,696 | |
Ricoh Co. Ltd. | 645,770 | 8,134,384 | |
Rinnai Corp. | 32,800 | 2,752,402 | |
ROHM Co. Ltd. | 92,644 | 4,788,321 | |
Sankyo Co. Ltd. (Gunma) | 52,700 | 2,185,261 | |
Sanrio Co. Ltd. (d) | 47,900 | 1,828,550 | |
Santen Pharmaceutical Co. Ltd. | 71,100 | 3,322,005 | |
SBI Holdings, Inc. Japan | 200,460 | 2,383,380 | |
Secom Co. Ltd. | 200,767 | 11,366,075 | |
Sega Sammy Holdings, Inc. | 179,900 | 4,203,618 | |
Seiko Epson Corp. | 124,400 | 3,740,434 | |
Sekisui Chemical Co. Ltd. | 406,293 | 4,627,037 | |
Sekisui House Ltd. | 518,967 | 6,521,199 | |
Seven & i Holdings Co., Ltd. | 723,000 | 27,185,591 | |
Seven Bank Ltd. | 560,900 | 2,050,258 | |
Sharp Corp. (a)(d) | 1,468,675 | 4,773,217 | |
Shikoku Electric Power Co., Inc. (a) | 172,600 | 2,672,866 | |
Shimadzu Corp. | 231,000 | 1,913,462 | |
Shimamura Co. Ltd. | 21,300 | 1,923,425 | |
SHIMANO, Inc. | 75,200 | 6,805,463 | |
SHIMIZU Corp. | 571,416 | 3,093,654 | |
Shin-Etsu Chemical Co., Ltd. | 393,962 | 22,375,802 | |
Shinsei Bank Ltd. | 1,610,000 | 3,356,611 | |
Shionogi & Co. Ltd. | 285,491 | 6,202,959 | |
Shiseido Co. Ltd. | 344,650 | 6,116,357 | |
Shizuoka Bank Ltd. | 542,274 | 5,248,749 | |
Showa Denko K.K. | 1,405,336 | 2,036,292 | |
Showa Shell Sekiyu K.K. | 180,300 | 1,775,353 | |
SMC Corp. | 49,571 | 12,574,190 | |
SoftBank Corp. | 922,230 | 69,889,653 | |
Sojitz Corp. | 1,187,100 | 2,107,518 | |
Sony Corp. | 996,685 | 17,429,197 | |
Sony Financial Holdings, Inc. | 167,300 | 2,706,690 | |
Stanley Electric Co. Ltd. | 137,525 | 3,152,656 | |
Sumco Corp. | 111,800 | 860,884 | |
Sumitomo Chemical Co. Ltd. | 1,440,334 | 5,914,772 | |
Sumitomo Corp. | 1,078,942 | 14,273,083 | |
Sumitomo Electric Industries Ltd. | 723,006 | 11,098,114 | |
Common Stocks - continued | |||
Shares | Value | ||
Japan - continued | |||
Sumitomo Heavy Industries Ltd. | 526,822 | $ 2,436,663 | |
Sumitomo Metal Mining Co. Ltd. | 499,065 | 6,532,956 | |
Sumitomo Mitsui Financial Group, Inc. | 1,221,800 | 54,856,433 | |
Sumitomo Mitsui Trust Holdings, Inc. | 3,183,722 | 14,935,403 | |
Sumitomo Realty & Development Co. Ltd. | 343,000 | 13,858,766 | |
Sumitomo Rubber Industries Ltd. | 162,300 | 2,183,243 | |
Suntory Beverage & Food Ltd. | 133,100 | 4,688,646 | |
Suzuken Co. Ltd. | 68,160 | 2,585,218 | |
Suzuki Motor Corp. | 349,800 | 9,411,323 | |
Sysmex Corp. | 69,700 | 4,157,207 | |
T&D Holdings, Inc. | 554,200 | 6,814,874 | |
Taiheiyo Cement Corp. | 1,134,000 | 4,004,896 | |
Taisei Corp. | 938,594 | 4,193,255 | |
Taisho Pharmaceutical Holdings Co. Ltd. | 31,457 | 2,392,426 | |
Taiyo Nippon Sanso Corp. | 235,000 | 1,759,556 | |
Takashimaya Co. Ltd. | 259,000 | 2,255,426 | |
Takeda Pharmaceutical Co. Ltd. | 758,142 | 36,433,932 | |
TDK Corp. | 119,025 | 5,156,464 | |
Teijin Ltd. | 916,341 | 2,204,187 | |
Terumo Corp. | 144,812 | 6,199,512 | |
The Chugoku Bank Ltd. | 154,500 | 1,914,361 | |
The Hachijuni Bank Ltd. | 399,000 | 2,140,650 | |
The Suruga Bank Ltd. | 175,000 | 3,079,738 | |
THK Co. Ltd. | 110,000 | 2,519,505 | |
Tobu Railway Co. Ltd. | 988,297 | 4,810,637 | |
Toho Co. Ltd. | 107,254 | 2,080,506 | |
Toho Gas Co. Ltd. | 394,000 | 1,997,681 | |
Tohoku Electric Power Co., Inc. (a) | 430,490 | 5,050,654 | |
Tokio Marine Holdings, Inc. | 664,400 | 19,738,327 | |
Tokyo Electric Power Co., Inc. (a) | 1,384,318 | 6,474,533 | |
Tokyo Electron Ltd. | 164,118 | 9,405,927 | |
Tokyo Gas Co. Ltd. | 2,304,395 | 11,576,206 | |
Tokyo Tatemono Co. Ltd. | 400,000 | 3,267,114 | |
Tokyu Corp. | 1,090,954 | 6,666,770 | |
Tokyu Fudosan Holdings Corp. | 498,200 | 3,935,443 | |
TonenGeneral Sekiyu K.K. | 275,856 | 2,434,103 | |
Toppan Printing Co. Ltd. | 539,013 | 4,014,764 | |
Toray Industries, Inc. | 1,407,883 | 9,727,372 | |
Toshiba Corp. | 3,862,880 | 16,765,669 | |
Toto Ltd. | 271,185 | 3,848,254 | |
Toyo Seikan Group Holdings Ltd. | 156,100 | 2,740,435 | |
Toyo Suisan Kaisha Ltd. | 86,000 | 2,890,046 | |
Toyoda Gosei Co. Ltd. | 60,300 | 1,272,717 | |
Toyota Boshoku Corp. | 63,000 | 668,566 | |
Toyota Industries Corp. | 156,086 | 7,208,452 | |
Toyota Motor Corp. | 2,647,151 | 152,351,789 | |
Toyota Motor Corp. sponsored ADR | 830 | 95,699 | |
Toyota Tsusho Corp. | 204,400 | 5,052,660 | |
Trend Micro, Inc. | 101,200 | 3,404,712 | |
Tsumura & Co. | 56,200 | 1,494,875 | |
Ube Industries Ltd. | 1,009,605 | 1,931,582 | |
Unicharm Corp. | 109,780 | 6,224,138 | |
| |||
Shares | Value | ||
United Urban Investment Corp. | 2,266 | $ 3,462,346 | |
USS Co. Ltd. | 211,500 | 2,849,233 | |
West Japan Railway Co. | 160,500 | 6,597,792 | |
Yahoo! Japan Corp. | 1,381,700 | 8,760,579 | |
Yakult Honsha Co. Ltd. | 86,366 | 4,141,359 | |
Yamada Denki Co. Ltd. | 875,050 | 2,897,630 | |
Yamaguchi Financial Group, Inc. | 200,000 | 1,743,146 | |
Yamaha Corp. | 150,843 | 2,071,155 | |
Yamaha Motor Co. Ltd. | 270,700 | 3,915,401 | |
Yamato Holdings Co. Ltd. | 356,832 | 7,408,196 | |
Yamato Kogyo Co. Ltd. | 39,600 | 1,194,576 | |
Yamazaki Baking Co. Ltd. | 103,000 | 1,193,249 | |
Yaskawa Electric Corp. | 207,000 | 3,091,281 | |
Yokogawa Electric Corp. | 203,900 | 3,189,745 | |
Yokohama Rubber Co. Ltd. | 193,000 | 1,886,264 | |
TOTAL JAPAN | 2,569,699,051 | ||
Luxembourg - 0.4% | |||
ArcelorMittal SA (Netherlands) | 959,910 | 15,074,157 | |
Millicom International Cellular SA (depository receipt) | 63,496 | 6,620,305 | |
RTL Group SA | 37,496 | 4,836,055 | |
SES SA (France) (depositary receipt) | 291,739 | 10,167,855 | |
Subsea 7 SA | 252,656 | 4,819,912 | |
Tenaris SA | 453,491 | 9,470,042 | |
TOTAL LUXEMBOURG | 50,988,326 | ||
Malta - 0.0% | |||
BGP Holdings PLC (a) | 5,796,476 | 80 | |
Mauritius - 0.0% | |||
Golden Agri-Resources Ltd. | 6,889,680 | 3,016,426 | |
Netherlands - 3.1% | |||
AEGON NV | 1,738,295 | 15,669,980 | |
Airbus Group NV | 563,569 | 41,531,776 | |
Akzo Nobel NV | 230,172 | 19,065,562 | |
ASML Holding NV (Netherlands) | 343,304 | 29,629,007 | |
CNH Industrial NV | 907,172 | 9,979,791 | |
Corio NV | 65,493 | 3,074,504 | |
Delta Lloyd NV | 183,623 | 5,242,713 | |
Fugro NV (Certificaten Van Aandelen) (d) | 68,227 | 3,965,656 | |
Gemalto NV (d) | 76,005 | 8,550,141 | |
Heineken Holding NV | 96,771 | 6,259,899 | |
Heineken NV (Bearer) | 221,334 | 14,966,804 | |
ING Groep NV (Certificaten Van Aandelen) (a) | 3,686,149 | 53,530,482 | |
Koninklijke Ahold NV | 966,942 | 18,038,065 | |
Koninklijke Boskalis Westminster NV | 75,276 | 3,768,059 | |
Koninklijke KPN NV (a) | 3,074,381 | 10,957,212 | |
Koninklijke Philips Electronics NV | 903,351 | 31,548,718 | |
OCI NV (a) | 90,280 | 4,416,302 | |
QIAGEN NV (a) | 223,864 | 5,047,506 | |
Randstad Holding NV | 119,343 | 7,519,062 | |
Reed Elsevier NV | 666,117 | 14,577,873 | |
Common Stocks - continued | |||
Shares | Value | ||
Netherlands - continued | |||
Royal DSM NV | 148,337 | $ 9,478,881 | |
STMicroelectronics NV | 606,744 | 5,503,144 | |
TNT Express NV | 416,865 | 4,059,438 | |
Unilever NV (Certificaten Van Aandelen) (Bearer) | 1,564,575 | 61,870,836 | |
Vopak NV | 67,101 | 3,930,772 | |
Wolters Kluwer NV | 289,647 | 8,367,809 | |
Ziggo NV | 152,097 | 6,959,494 | |
TOTAL NETHERLANDS | 407,509,486 | ||
New Zealand - 0.1% | |||
Auckland International Airport Ltd. | 1,020,686 | 3,200,479 | |
Contact Energy Ltd. | 341,126 | 1,530,100 | |
Fletcher Building Ltd. | 663,071 | 5,236,754 | |
Ryman Healthcare Group Ltd. | 353,248 | 2,339,689 | |
Telecom Corp. of New Zealand Ltd. | 1,768,426 | 3,706,621 | |
TOTAL NEW ZEALAND | 16,013,643 | ||
Norway - 0.7% | |||
Aker Solutions ASA | 159,173 | 2,675,867 | |
DNB ASA | 938,514 | 17,028,353 | |
Gjensidige Forsikring ASA | 190,814 | 4,002,580 | |
Norsk Hydro ASA | 1,300,099 | 6,433,346 | |
Orkla ASA | 737,089 | 5,821,063 | |
Statoil ASA | 1,071,066 | 28,250,470 | |
Telenor ASA | 655,245 | 14,476,089 | |
Yara International ASA | 173,590 | 7,039,621 | |
TOTAL NORWAY | 85,727,389 | ||
Portugal - 0.2% | |||
Banco Espirito Santo SA (Reg.) (a)(d) | 1,736,612 | 3,394,216 | |
Energias de Portugal SA | 1,933,509 | 8,380,102 | |
Galp Energia SGPS SA Class B | 334,747 | 5,627,785 | |
Jeronimo Martins SGPS SA | 242,680 | 4,125,170 | |
Portugal Telecom SGPS SA (Reg.) (d) | 609,258 | 2,728,019 | |
TOTAL PORTUGAL | 24,255,292 | ||
Singapore - 1.3% | |||
Ascendas Real Estate Investment Trust | 1,980,183 | 3,374,114 | |
CapitaCommercial Trust (REIT) | 1,952,000 | 2,255,891 | |
CapitaLand Ltd. | 2,441,437 | 5,488,972 | |
CapitaMall Trust | 2,298,200 | 3,444,626 | |
CapitaMalls Asia Ltd. | 1,284,000 | 1,813,087 | |
City Developments Ltd. | 439,000 | 3,251,852 | |
ComfortDelgro Corp. Ltd. | 1,934,784 | 2,945,713 | |
DBS Group Holdings Ltd. | 1,644,020 | 21,424,849 | |
Global Logistic Properties Ltd. | 2,990,000 | 6,675,107 | |
Hutchison Port Holdings Trust | 5,045,000 | 3,153,125 | |
Jardine Cycle & Carriage Ltd. | 101,267 | 3,134,712 | |
Keppel Corp. Ltd. | 1,392,400 | 11,500,357 | |
Keppel Land Ltd. | 670,000 | 1,696,604 | |
Olam International Ltd. | 1,448,700 | 2,028,511 | |
Oversea-Chinese Banking Corp. Ltd. | 2,472,793 | 18,648,603 | |
| |||
Shares | Value | ||
SembCorp Industries Ltd. | 955,130 | $ 4,076,246 | |
SembCorp Marine Ltd. | 806,800 | 2,615,823 | |
Singapore Airlines Ltd. | 510,425 | 4,115,129 | |
Singapore Exchange Ltd. | 826,000 | 4,483,004 | |
Singapore Press Holdings Ltd. | 1,554,021 | 5,087,514 | |
Singapore Technologies Engineering Ltd. | 1,481,161 | 4,440,036 | |
Singapore Telecommunications Ltd. | 7,645,827 | 21,713,389 | |
StarHub Ltd. | 572,000 | 1,886,136 | |
United Overseas Bank Ltd. | 1,218,829 | 19,835,477 | |
UOL Group Ltd. | 446,984 | 2,157,963 | |
Wilmar International Ltd. | 1,844,000 | 5,018,578 | |
Yangzijiang Shipbuilding Holdings Ltd. | 1,893,000 | 1,694,912 | |
TOTAL SINGAPORE | 167,960,330 | ||
Spain - 3.4% | |||
Abertis Infraestructuras SA (d) | 370,338 | 8,700,242 | |
ACS Actividades de Construccion y Servicios SA | 167,623 | 6,026,032 | |
Amadeus IT Holding SA Class A | 365,177 | 16,061,675 | |
Banco Bilbao Vizcaya Argentaria SA | 5,554,638 | 68,624,833 | |
Banco de Sabadell SA | 3,260,877 | 10,775,366 | |
Banco Popular Espanol SA | 1,581,158 | 11,401,236 | |
Banco Santander SA (Spain) | 11,134,211 | 100,504,543 | |
Bankia SA (a) | 3,883,906 | 8,154,013 | |
Cintra Concesiones de Infrastructuras de Transporte SA | 388,043 | 8,194,921 | |
Criteria CaixaCorp SA | 1,666,343 | 10,511,243 | |
Distribuidora Internacional de Alimentacion SA | 579,124 | 4,972,049 | |
Enagas SA | 182,598 | 5,314,264 | |
Gas Natural SDG SA | 337,533 | 8,663,351 | |
Grifols SA | 143,160 | 8,161,035 | |
Iberdrola SA (d) | 4,615,717 | 30,689,464 | |
Inditex SA | 209,520 | 30,163,607 | |
International Consolidated Airlines Group SA (a) | 199,436 | 1,456,790 | |
International Consolidated Airlines Group SA CDI (a) | 777,807 | 5,691,823 | |
MAPFRE SA (Reg.) | 1,035,357 | 4,287,310 | |
Red Electrica Corporacion SA | 104,226 | 8,113,882 | |
Repsol YPF SA | 833,894 | 20,954,390 | |
Telefonica SA | 3,933,022 | 60,137,161 | |
Zardoya Otis SA | 161,792 | 2,800,452 | |
TOTAL SPAIN | 440,359,682 | ||
Sweden - 3.2% | |||
Alfa Laval AB | 300,248 | 8,148,160 | |
ASSA ABLOY AB (B Shares) | 320,782 | 16,335,159 | |
Atlas Copco AB: | |||
(A Shares) | 646,526 | 18,160,588 | |
(B Shares) | 373,529 | 9,921,313 | |
Boliden AB | 259,977 | 4,123,691 | |
Electrolux AB (B Shares) | 231,340 | 5,480,734 | |
Elekta AB (B Shares) (d) | 355,696 | 4,729,373 | |
Getinge AB (B Shares) | 192,280 | 6,921,498 | |
Common Stocks - continued | |||
Shares | Value | ||
Sweden - continued | |||
H&M Hennes & Mauritz AB (B Shares) | 911,913 | $ 41,132,195 | |
Hexagon AB (B Shares) | 228,801 | 8,118,383 | |
Husqvarna AB (B Shares) | 386,452 | 2,612,852 | |
Industrivarden AB (C Shares) | 118,190 | 2,285,770 | |
Investment AB Kinnevik (B Shares) | 214,890 | 8,342,021 | |
Investor AB (B Shares) | 437,893 | 15,605,741 | |
Lundin Petroleum AB (a) | 211,841 | 4,252,250 | |
Nordea Bank AB | 2,918,031 | 41,802,211 | |
Sandvik AB | 1,024,473 | 14,292,594 | |
Scania AB (B Shares) | 307,134 | 9,436,791 | |
Securitas AB (B Shares) | 297,951 | 3,283,123 | |
Skandinaviska Enskilda Banken AB (A Shares) | 1,458,904 | 20,512,691 | |
Skanska AB (B Shares) | 363,217 | 7,885,616 | |
SKF AB (B Shares) | 380,129 | 10,179,618 | |
Svenska Cellulosa AB (SCA) (B Shares) | 563,495 | 17,111,426 | |
Svenska Handelsbanken AB (A Shares) | 479,591 | 25,057,978 | |
Swedbank AB (A Shares) | 869,955 | 24,558,710 | |
Swedish Match Co. AB | 193,342 | 6,121,424 | |
Tele2 AB (B Shares) | 310,048 | 3,846,797 | |
Telefonaktiebolaget LM Ericsson (B Shares) | 2,922,685 | 37,781,053 | |
TeliaSonera AB | 2,288,773 | 17,637,936 | |
Volvo AB (B Shares) | 1,465,625 | 22,058,723 | |
TOTAL SWEDEN | 417,736,419 | ||
Switzerland - 9.1% | |||
ABB Ltd. (Reg.) | 2,111,735 | 53,895,970 | |
Actelion Ltd. | 98,131 | 10,404,452 | |
Adecco SA (Reg.) | 127,055 | 10,971,947 | |
Aryzta AG | 83,347 | 6,955,850 | |
Baloise Holdings AG | 45,696 | 5,891,900 | |
Barry Callebaut AG | 2,069 | 2,580,663 | |
Coca-Cola HBC AG | 12,175 | 302,757 | |
Coca-Cola HBC AG sponsored ADR | 179,380 | 4,457,593 | |
Compagnie Financiere Richemont SA Series A | 501,188 | 49,919,351 | |
Credit Suisse Group AG | 1,455,115 | 45,688,327 | |
Ems-Chemie Holding AG | 7,964 | 3,069,694 | |
Geberit AG (Reg.) | 36,450 | 11,463,411 | |
Givaudan SA | 8,855 | 13,894,144 | |
Holcim Ltd. (Reg.) | 219,846 | 17,847,646 | |
Julius Baer Group Ltd. | 215,781 | 10,113,124 | |
Kuehne & Nagel International AG | 51,547 | 7,361,345 | |
Lindt & Spruengli AG | 99 | 5,748,078 | |
Lindt & Spruengli AG (participation certificate) | 810 | 3,991,518 | |
Lonza Group AG | 50,769 | 5,368,410 | |
Nestle SA | 3,096,959 | 233,960,327 | |
Novartis AG | 2,209,069 | 183,861,069 | |
Pargesa Holding SA | 25,750 | 2,213,417 | |
Partners Group Holding AG | 16,784 | 4,372,046 | |
| |||
Shares | Value | ||
Roche Holding AG (participation certificate) | 674,660 | $ 207,727,906 | |
Schindler Holding AG: | |||
(participation certificate) | 44,322 | 6,647,040 | |
(Reg.) | 20,187 | 3,066,496 | |
SGS SA (Reg.) | 5,256 | 13,021,972 | |
Sika AG (Bearer) | 2,074 | 7,649,865 | |
Sonova Holding AG Class B | 48,253 | 6,825,097 | |
Sulzer AG (Reg.) | 23,371 | 3,308,345 | |
Swatch Group AG (Bearer) | 29,586 | 19,746,426 | |
Swatch Group AG (Bearer) (Reg.) | 41,750 | 4,908,414 | |
Swiss Life Holding AG | 31,004 | 7,716,629 | |
Swiss Prime Site AG | 52,517 | 4,412,742 | |
Swiss Re Ltd. | 338,021 | 31,592,184 | |
Swisscom AG | 22,369 | 13,250,994 | |
Syngenta AG (Switzerland) | 89,428 | 32,555,438 | |
Transocean Ltd. (Switzerland) | 346,068 | 14,625,750 | |
UBS AG | 3,504,282 | 74,967,028 | |
Zurich Insurance Group AG | 142,941 | 43,800,568 | |
TOTAL SWITZERLAND | 1,190,155,933 | ||
United Kingdom - 19.8% | |||
3i Group PLC | 937,548 | 6,609,578 | |
Aberdeen Asset Management PLC | 915,046 | 5,985,126 | |
Admiral Group PLC | 187,620 | 4,508,470 | |
Aggreko PLC | 256,558 | 6,702,060 | |
AMEC PLC | 284,941 | 5,358,372 | |
Anglo American PLC (United Kingdom) | 1,338,655 | 34,188,803 | |
Antofagasta PLC | 379,564 | 5,723,568 | |
ARM Holdings PLC | 1,344,317 | 22,534,761 | |
ASOS PLC (a) | 51,985 | 6,058,783 | |
Associated British Foods PLC | 342,216 | 17,180,273 | |
AstraZeneca PLC (United Kingdom) | 1,205,310 | 81,933,611 | |
Aviva PLC | 2,825,469 | 22,464,009 | |
Babcock International Group PLC | 349,082 | 8,598,808 | |
BAE Systems PLC | 3,088,229 | 21,249,257 | |
Barclays PLC | 14,690,230 | 61,883,558 | |
BG Group PLC | 3,273,290 | 59,663,817 | |
BHP Billiton PLC | 2,028,169 | 65,361,450 | |
BP PLC | 17,935,868 | 151,576,986 | |
British American Tobacco PLC (United Kingdom) | 1,814,001 | 98,883,743 | |
British Land Co. PLC | 913,992 | 10,667,761 | |
British Sky Broadcasting Group PLC | 991,297 | 15,603,778 | |
BT Group PLC | 7,589,803 | 52,201,379 | |
Bunzl PLC | 321,908 | 8,479,273 | |
Burberry Group PLC | 427,065 | 11,020,334 | |
Capita Group PLC | 633,981 | 12,102,615 | |
Capital Shopping Centres Group PLC | 648,438 | 3,525,728 | |
Carnival PLC (d) | 176,102 | 7,241,955 | |
Centrica PLC | 4,895,528 | 26,151,003 | |
Cobham PLC | 1,026,256 | 5,126,336 | |
Compass Group PLC | 1,724,287 | 27,271,538 | |
Common Stocks - continued | |||
Shares | Value | ||
United Kingdom - continued | |||
Croda International PLC | 130,554 | $ 5,555,114 | |
Diageo PLC | 2,410,175 | 75,684,336 | |
Direct Line Insurance Group PLC | 1,084,718 | 4,804,416 | |
easyJet PLC | 150,756 | 4,344,638 | |
Fresnillo PLC | 176,789 | 2,816,840 | |
G4S PLC (United Kingdom) | 1,487,522 | 5,913,468 | |
GKN PLC | 1,568,073 | 10,652,938 | |
GlaxoSmithKline PLC | 4,663,885 | 130,633,624 | |
GlaxoSmithKline PLC sponsored ADR (d) | 2,239 | 125,250 | |
Hammerson PLC | 682,101 | 6,562,009 | |
Hargreaves Lansdown PLC | 213,062 | 4,984,258 | |
HSBC Holdings PLC (United Kingdom) | 18,004,391 | 190,018,564 | |
ICAP PLC | 527,787 | 3,875,488 | |
IMI PLC | 262,132 | 6,694,035 | |
Imperial Tobacco Group PLC | 927,936 | 37,867,939 | |
Inmarsat PLC | 427,002 | 4,965,926 | |
InterContinental Hotel Group PLC | 249,423 | 8,112,215 | |
Intertek Group PLC | 155,419 | 7,654,155 | |
Investec PLC | 553,520 | 4,121,911 | |
ITV PLC | 3,665,186 | 12,391,688 | |
J Sainsbury PLC | 1,194,534 | 6,853,051 | |
Johnson Matthey PLC | 196,485 | 10,732,761 | |
Kingfisher PLC | 2,275,747 | 15,014,757 | |
Land Securities Group PLC | 754,810 | 13,726,683 | |
Legal & General Group PLC | 5,672,102 | 22,833,717 | |
Lloyds Banking Group PLC (a) | 47,967,081 | 66,242,670 | |
London Stock Exchange Group PLC | 169,163 | 5,741,921 | |
Marks & Spencer Group PLC | 1,554,419 | 13,105,865 | |
Meggitt PLC | 768,989 | 6,490,061 | |
Melrose PLC | 1,029,575 | 5,658,414 | |
National Grid PLC | 3,582,272 | 50,127,584 | |
Next PLC | 149,182 | 16,824,887 | |
Old Mutual PLC | 4,696,180 | 15,499,921 | |
Pearson PLC | 785,530 | 13,302,871 | |
Persimmon PLC | 294,154 | 7,122,643 | |
Prudential PLC | 2,451,672 | 55,512,559 | |
Prudential PLC ADR (d) | 2,253 | 102,286 | |
Reckitt Benckiser Group PLC | 621,813 | 51,167,367 | |
Reed Elsevier PLC | 1,119,556 | 17,163,359 | |
Rexam PLC | 761,138 | 6,292,521 | |
Rio Tinto PLC | 1,220,888 | 70,006,535 | |
Rolls-Royce Group PLC | 1,805,448 | 30,202,896 | |
Royal & Sun Alliance Insurance Group PLC | 3,549,455 | 5,780,287 | |
Royal Bank of Scotland Group PLC (a) | 2,078,652 | 11,382,655 | |
Royal Dutch Shell PLC: | |||
Class A (Netherlands) | 33,000 | 1,204,283 | |
Class A (United Kingdom) | 3,677,753 | 133,888,905 | |
Class B (United Kingdom) | 2,377,337 | 92,484,350 | |
Royal Mail PLC | 623,014 | 6,259,609 | |
SABMiller PLC | 924,256 | 45,301,556 | |
| |||
Shares | Value | ||
Sage Group PLC | 1,063,186 | $ 7,685,806 | |
Schroders PLC | 100,110 | 4,548,052 | |
Scottish & Southern Energy PLC | 926,962 | 21,777,986 | |
Segro PLC | 710,091 | 4,243,837 | |
Serco Group PLC | 474,968 | 3,662,622 | |
Severn Trent PLC | 229,983 | 7,124,684 | |
Smith & Nephew PLC | 856,445 | 13,631,421 | |
Smiths Group PLC | 378,519 | 8,671,054 | |
Standard Chartered PLC (United Kingdom) | 2,330,084 | 49,358,303 | |
Standard Life PLC | 2,278,250 | 14,878,670 | |
Tate & Lyle PLC | 444,619 | 4,779,926 | |
Tesco PLC | 7,759,511 | 42,728,741 | |
The Weir Group PLC | 204,223 | 8,778,668 | |
Travis Perkins PLC | 236,177 | 7,731,833 | |
TUI Travel PLC | 429,106 | 3,214,116 | |
Tullow Oil PLC | 875,477 | 11,713,580 | |
Unilever PLC | 1,232,075 | 50,391,909 | |
United Utilities Group PLC | 654,174 | 8,539,010 | |
Vodafone Group PLC | 25,235,621 | 105,155,919 | |
Vodafone Group PLC sponsored ADR | 14,727 | 612,201 | |
Whitbread PLC | 173,134 | 13,008,779 | |
William Hill PLC | 831,946 | 5,539,105 | |
WM Morrison Supermarkets PLC | 2,129,402 | 8,390,304 | |
TOTAL UNITED KINGDOM | 2,595,829,045 | ||
TOTAL COMMON STOCKS (Cost $11,109,858,367) |
| ||
Nonconvertible Preferred Stocks - 0.9% | |||
|
|
|
|
France - 0.3% | |||
Air Liquide SA | 250,075 | 34,435,009 | |
Germany - 0.6% | |||
Bayerische Motoren Werke AG (BMW) (non-vtg.) | 51,952 | 4,561,431 | |
FUCHS PETROLUB AG | 34,589 | 3,451,833 | |
Henkel AG & Co. KGaA | 171,569 | 19,146,629 | |
Porsche Automobil Holding SE (Germany) | 146,925 | 15,451,376 | |
Volkswagen AG | 138,963 | 36,252,209 | |
TOTAL GERMANY | 78,863,478 | ||
Italy - 0.0% | |||
Telecom Italia SpA (Risparmio Shares) | 5,744,968 | 5,029,885 | |
TOTAL NONCONVERTIBLE PREFERRED STOCKS (Cost $72,910,407) |
| ||
Government Obligations - 0.1% | ||||
| Principal Amount | Value | ||
United States of America - 0.1% | ||||
U.S. Treasury Bills, yield at date of purchase 0.08% to 0.09% 4/3/14 to 7/24/14 (e) | $ 17,000,000 | $ 16,997,994 | ||
Money Market Funds - 3.5% | |||
Shares |
| ||
Fidelity Cash Central Fund, 0.10% (b) | 332,513,105 | 332,513,105 | |
Fidelity Securities Lending Cash Central Fund, 0.09% (b)(c) | 122,985,480 | 122,985,480 | |
TOTAL MONEY MARKET FUNDS (Cost $455,498,585) |
| ||
TOTAL INVESTMENT PORTFOLIO - 101.6% (Cost $11,655,263,764) | 13,296,812,116 | |
NET OTHER ASSETS (LIABILITIES) - (1.6)% | (207,437,165) | |
NET ASSETS - 100% | $ 13,089,374,951 | |
Futures Contracts | |||||
Expiration Date | Underlying Face Amount at Value | Unrealized Appreciation/ | |||
Purchased | |||||
Equity Index Contracts | |||||
78 CAC 40 Index Contracts (France) | March 2014 | $ 4,701,516 | $ 85,456 | ||
56 CME Nikkei 225 Index Contracts (Japan) | March 2014 | 4,035,707 | (222,289) | ||
11 DAX 100 Index Contracts (Germany) | March 2014 | 3,650,580 | 152,549 | ||
673 Euro Stoxx 50 Index Contracts (Germany) | March 2014 | 28,997,467 | 1,558,547 | ||
29 Hang Seng Index Contracts (Hong Kong) | March 2014 | 4,264,087 | 55,569 | ||
289 LIFFE FTSE 100 Index Contracts (United Kingdom) | March 2014 | 32,083,772 | 1,455,707 | ||
1,464 NYSE E-mini MSCI EAFE Index Contracts (United States) | March 2014 | 141,224,760 | 138,430 | ||
240 OMX Stockholm 30 Index Contracts (Sweden) | March 2014 | 5,021,883 | 138,151 | ||
95 SFE SPI 200 Index Contracts (Australia) | March 2014 | 11,440,969 | 624,439 | ||
47 Singapore Exch Derivatives Ltd. | March 2014 | 2,613,669 | (6,594) | ||
201 TSE TOPIX Index Contracts (Japan) | March 2014 | 23,702,044 | (770,358) | ||
TOTAL EQUITY INDEX CONTRACTS | $ 261,736,454 | $ 3,209,607 | |||
|
The face value of futures purchased as a percentage of net assets is 1.8% |
Forward Foreign Currency Contracts | ||||||
Settlement Date | Currency | Counterparty | Type | Quantity | Contract Amount* | Unrealized |
3/14/14 | JPY | Goldman Sachs Bank USA | Buy | 60,000,000 | $ 574,614 | $ 14,993 |
3/14/14 | JPY | Goldman Sachs Bank USA | Buy | 100,000,000 | 953,353 | 29,325 |
3/14/14 | JPY | Goldman Sachs Bank USA | Buy | 100,000,000 | 958,954 | 23,723 |
3/14/14 | JPY | Goldman Sachs Bank USA | Buy | 130,000,000 | 1,268,107 | 9,373 |
3/14/14 | JPY | Goldman Sachs Bank USA | Buy | 180,000,000 | 1,751,961 | 16,857 |
3/14/14 | JPY | Goldman Sachs Bank USA | Buy | 200,000,000 | 1,918,423 | 46,931 |
3/14/14 | JPY | Goldman Sachs Bank USA | Buy | 1,000,000,000 | 9,737,004 | 89,766 |
3/14/14 | JPY | Goldman Sachs Bank USA | Buy | 1,090,000,000 | 10,574,311 | 136,868 |
3/21/14 | AUD | Goldman Sachs Bank USA | Buy | 400,000 | 354,924 | 1,498 |
3/21/14 | AUD | Goldman Sachs Bank USA | Buy | 400,000 | 363,696 | (7,274) |
3/21/14 | AUD | Goldman Sachs Bank USA | Buy | 500,000 | 437,143 | 8,385 |
3/21/14 | AUD | Goldman Sachs Bank USA | Buy | 700,000 | 622,013 | 1,725 |
3/21/14 | AUD | Goldman Sachs Bank USA | Buy | 1,100,000 | 990,770 | (10,610) |
3/21/14 | AUD | Goldman Sachs Bank USA | Buy | 4,400,000 | 3,911,468 | 9,172 |
3/21/14 | AUD | Goldman Sachs Bank USA | Buy | 5,000,000 | 4,442,000 | 13,273 |
3/21/14 | EUR | Goldman Sachs Bank USA | Buy | 300,000 | 413,223 | 861 |
3/21/14 | EUR | Goldman Sachs Bank USA | Buy | 600,000 | 825,636 | 2,533 |
3/21/14 | EUR | Goldman Sachs Bank USA | Buy | 800,000 | 1,093,050 | 11,174 |
3/21/14 | EUR | Goldman Sachs Bank USA | Buy | 900,000 | 1,230,656 | 11,597 |
3/21/14 | EUR | Goldman Sachs Bank USA | Buy | 1,000,000 | 1,365,290 | 14,991 |
3/21/14 | EUR | Goldman Sachs Bank USA | Buy | 1,100,000 | 1,488,380 | 29,929 |
3/21/14 | EUR | Goldman Sachs Bank USA | Buy | 1,300,000 | 1,772,488 | 21,878 |
3/21/14 | EUR | Goldman Sachs Bank USA | Buy | 5,000,000 | 6,784,100 | 117,304 |
3/21/14 | EUR | Goldman Sachs Bank USA | Buy | 9,600,000 | 13,219,008 | 31,688 |
3/21/14 | EUR | Goldman Sachs Bank USA | Buy | 10,000,000 | 13,735,500 | 67,309 |
3/21/14 | EUR | Goldman Sachs Bank USA | Sell | 4,000,000 | 5,461,400 | (59,724) |
3/21/14 | GBP | Goldman Sachs Bank USA | Buy | 400,000 | 665,490 | 4,222 |
3/21/14 | GBP | Goldman Sachs Bank USA | Buy | 600,000 | 981,405 | 23,163 |
3/21/14 | GBP | Goldman Sachs Bank USA | Buy | 600,000 | 983,964 | 20,604 |
3/21/14 | GBP | Goldman Sachs Bank USA | Buy | 600,000 | 993,588 | 10,980 |
3/21/14 | GBP | Goldman Sachs Bank USA | Buy | 800,000 | 1,322,008 | 17,416 |
3/21/14 | GBP | Goldman Sachs Bank USA | Buy | 1,000,000 | 1,640,950 | 33,330 |
3/21/14 | GBP | Goldman Sachs Bank USA | Buy | 1,000,000 | 1,643,600 | 30,680 |
3/21/14 | GBP | Goldman Sachs Bank USA | Buy | 7,000,000 | 11,389,490 | 330,473 |
3/21/14 | GBP | Goldman Sachs Bank USA | Buy | 7,000,000 | 11,416,020 | 303,943 |
3/21/14 | SEK | Goldman Sachs Bank USA | Buy | 1,000,000 | 151,680 | 4,230 |
3/21/14 | SEK | Goldman Sachs Bank USA | Buy | 1,400,000 | 215,158 | 3,116 |
3/21/14 | SEK | Goldman Sachs Bank USA | Buy | 1,800,000 | 274,849 | 5,789 |
3/21/14 | SEK | Goldman Sachs Bank USA | Buy | 3,200,000 | 493,829 | 5,082 |
3/21/14 | SEK | Goldman Sachs Bank USA | Buy | 11,000,000 | 1,673,681 | 41,324 |
3/21/14 | SEK | Goldman Sachs Bank USA | Buy | 12,000,000 | 1,821,256 | 49,659 |
$ 1,517,556 | ||||||
|
* Amount in U.S. Dollars unless otherwise noted |
Currency Abbreviations | ||
AUD | - | Australian dollar |
EUR | - | European Monetary Unit |
GBP | - | British pound |
JPY | - | Japanese yen |
SEK | - | Swedish krona |
Legend |
(a) Non-income producing |
(b) Affiliated fund that is generally available only to investment companies and other accounts managed by Fidelity Investments. The rate quoted is the annualized seven-day yield of the fund at period end. A complete unaudited listing of the fund's holdings as of its most recent quarter end is available upon request. In addition, each Fidelity Central Fund's financial statements, which are not covered by the Fund's Report of Independent Registered Public Accounting Firm, are available on the SEC's website or upon request. |
(c) Investment made with cash collateral received from securities on loan. |
(d) Security or a portion of the security is on loan at period end. |
(e) Security or a portion of the security was pledged to cover margin requirements for futures contracts. At period end, the value of securities pledged amounted to $16,997,994. |
Affiliated Central Funds |
Information regarding fiscal year to date income earned by the Fund from investments in Fidelity Central Funds is as follows: |
Fund | Income earned |
Fidelity Cash Central Fund | $ 183,498 |
Fidelity Securities Lending Cash Central Fund | 2,827,474 |
Total | $ 3,010,972 |
Other Information |
Categorizations in the Schedule of Investments are based on country or territory of incorporation. |
The following is a summary of the inputs used, as of February 28, 2014, involving the Fund's assets and liabilities carried at fair value. The inputs or methodology used for valuing securities may not be an indication of the risk associated with investing in those securities. For more information on valuation inputs, and their aggregation into the levels used in the tables below, please refer to the Investment Valuation section in the accompanying Notes to Financial Statements. |
Valuation Inputs at Reporting Date: | ||||
Description | Total | Level 1 | Level 2 | Level 3 |
Investments in Securities: | ||||
Equities: | ||||
Consumer Discretionary | $ 1,522,420,489 | $ 1,035,751,328 | $ 486,669,161 | $ - |
Consumer Staples | 1,396,474,367 | 580,065,709 | 816,408,658 | - |
Energy | 874,459,534 | 241,983,217 | 632,476,317 | - |
Financials | 3,267,141,266 | 1,866,050,418 | 1,401,090,761 | 87 |
Health Care | 1,368,633,696 | 340,330,104 | 1,028,303,592 | - |
Industrials | 1,655,994,697 | 1,011,287,541 | 644,707,156 | - |
Information Technology | 583,353,096 | 186,573,732 | 396,779,364 | - |
Materials | 1,042,601,016 | 562,237,723 | 480,363,293 | - |
Telecommunication Services | 643,961,719 | 181,344,976 | 462,616,743 | - |
Utilities | 469,275,657 | 371,963,756 | 97,311,901 | - |
Government Obligations | 16,997,994 | - | 16,997,994 | - |
Money Market Funds | 455,498,585 | 455,498,585 | - | - |
Total Investments in Securities: | $ 13,296,812,116 | $ 6,833,087,089 | $ 6,463,724,940 | $ 87 |
Derivative Instruments: | ||||
Assets | ||||
Forward Foreign Currency Contracts | $ 1,595,164 | $ - | $ 1,595,164 | $ - |
Futures Contracts | 4,208,848 | 4,208,848 | - | - |
Total Assets | $ 5,804,012 | $ 4,208,848 | $ 1,595,164 | $ - |
Liabilities | ||||
Forward Foreign Currency Contracts | $ (77,608) | $ - | $ (77,608) | $ - |
Futures Contracts | (999,241) | (999,241) | - | - |
Total Liabilities | $ (1,076,849) | $ (999,241) | $ (77,608) | $ - |
Total Derivative Instruments: | $ 4,727,163 | $ 3,209,607 | $ 1,517,556 | $ - |
The following is a summary of transfers between Level 1 and Level 2 for the period ended February 28, 2014. Transfers are assumed to have occurred at the beginning of the period, and are primarily attributable to the valuation techniques used for foreign equity securities, as discussed in the accompanying Notes to Financial Statements: |
Transfers | Total |
Level 1 to Level 2 | $ 1,598,250,916 |
Level 2 to Level 1 | $ 20,748,375 |
Value of Derivative Instruments |
The following table is a summary of the Fund's value of derivative instruments by primary risk exposure as of February 28, 2014. For additional information on derivative instruments, please refer to the Derivative Instruments section in the accompanying Notes to Financial Statements. |
Primary Risk Exposure / | Value | |
| Asset | Liability |
Equity Risk | ||
Futures Contracts (b) | $ 4,208,848 | $ (999,241) |
Foreign Exchange Risk | ||
Forward Foreign Currency Contracts (a) | 1,595,164 | (77,608) |
Total Value of Derivatives | $ 5,804,012 | $ (1,076,849) |
(a) Gross value is presented in the Statement of Assets and Liabilities in the unrealized appreciation/depreciation on forward foreign currency contracts line-items. |
(b) Reflects gross cumulative appreciation (depreciation) on futures contracts as presented in the Schedule of Investments. Only the period end receivable or payable for daily variation margin and net unrealized appreciation (depreciation) are presented in the Statement of Assets and Liabilities. |
See accompanying notes which are an integral part of the financial statements.
Annual Report
Spartan International Index Fund
Financial Statements
Statement of Assets and Liabilities
| February 28, 2014 | |
|
|
|
Assets | ||
Investment in securities, at value (including securities loaned of $117,095,876) - See accompanying schedule: Unaffiliated issuers (cost $11,199,765,179) | $ 12,841,313,531 |
|
Fidelity Central Funds (cost $455,498,585) | 455,498,585 |
|
Total Investments (cost $11,655,263,764) |
| $ 13,296,812,116 |
Segregated cash with brokers for derivative instruments | 8,011,056 | |
Foreign currency held at value (cost $3,282,396) | 3,286,212 | |
Receivable for investments sold | 3,359,631 | |
Unrealized appreciation on foreign currency contracts | 1,595,164 | |
Receivable for fund shares sold | 15,479,819 | |
Dividends receivable | 61,148,588 | |
Interest receivable | 11,154 | |
Distributions receivable from Fidelity Central Funds | 137,776 | |
Receivable for daily variation margin for derivative instruments | 536,746 | |
Receivable from investment adviser for expense reductions | 351,306 | |
Other receivables | 12,019 | |
Total assets | 13,390,741,587 | |
|
|
|
Liabilities | ||
Payable for investments purchased | $ 150,552,330 | |
Unrealized depreciation on foreign currency contracts | 77,608 | |
Payable for fund shares redeemed | 26,120,008 | |
Accrued management fee | 631,941 | |
Other affiliated payables | 999,269 | |
Collateral on securities loaned, at value | 122,985,480 | |
Total liabilities | 301,366,636 | |
|
|
|
Net Assets | $ 13,089,374,951 | |
Net Assets consist of: |
| |
Paid in capital | $ 12,031,720,199 | |
Undistributed net investment income | 87,257,584 | |
Accumulated undistributed net realized gain (loss) on investments and foreign currency transactions | (677,044,919) | |
Net unrealized appreciation (depreciation) on investments and assets and liabilities in foreign currencies | 1,647,442,087 | |
Net Assets | $ 13,089,374,951 | |
Statement of Assets and Liabilities - continued
| February 28, 2014 | |
|
|
|
Investor Class: | $ 41.19 | |
|
|
|
Fidelity Advantage Class: | $ 41.20 | |
|
|
|
Institutional Class: | $ 41.20 | |
|
|
|
Fidelity Advantage Institutional Class: | $ 41.20 | |
See accompanying notes which are an integral part of the financial statements.
Annual Report
Spartan International Index Fund
Financial Statements - continued
Statement of Operations
| Year ended February 28, 2014 | |
|
|
|
Investment Income |
|
|
Dividends |
| $ 364,989,949 |
Special dividends |
| 80,204,752 |
Interest |
| 28,840 |
Income from Fidelity Central Funds (including $2,827,474 from security lending) |
| 3,010,972 |
Income before foreign taxes withheld |
| 448,234,513 |
Less foreign taxes withheld |
| (23,361,082) |
Total income |
| 424,873,431 |
|
|
|
Expenses | ||
Management fee | $ 6,848,368 | |
Transfer agent fees | 10,860,499 | |
Independent trustees' compensation | 54,915 | |
Interest | 1,184 | |
Miscellaneous | 21,554 | |
Total expenses before reductions | 17,786,520 | |
Expense reductions | (3,698,864) | 14,087,656 |
Net investment income (loss) | 410,785,775 | |
Realized and Unrealized Gain (Loss) Net realized gain (loss) on: | ||
Investment securities: |
|
|
Unaffiliated issuers | (32,829,350) | |
Foreign currency transactions | (13,161,732) | |
Futures contracts | 31,776,987 | |
Total net realized gain (loss) |
| (14,214,095) |
Change in net unrealized appreciation (depreciation) on: Investment securities | 1,660,685,904 | |
Assets and liabilities in foreign currencies | 12,944,663 | |
Futures contracts | 1,009,614 | |
Total change in net unrealized appreciation (depreciation) |
| 1,674,640,181 |
Net gain (loss) | 1,660,426,086 | |
Net increase (decrease) in net assets resulting from operations | $ 2,071,211,861 | |
Statement of Changes in Net Assets
| Year ended | Year ended |
Increase (Decrease) in Net Assets |
|
|
Operations |
|
|
Net investment income (loss) | $ 410,785,775 | $ 283,086,353 |
Net realized gain (loss) | (14,214,095) | (79,042,694) |
Change in net unrealized appreciation (depreciation) | 1,674,640,181 | 690,009,936 |
Net increase (decrease) in net assets resulting from operations | 2,071,211,861 | 894,053,595 |
Distributions to shareholders from net investment income | (295,551,780) | (263,200,177) |
Distributions to shareholders from net realized gain | (11,664,541) | (10,605,696) |
Total distributions | (307,216,321) | (273,805,873) |
Share transactions - net increase (decrease) | 1,293,577,160 | 690,478,893 |
Redemption fees | 896,226 | 579,443 |
Total increase (decrease) in net assets | 3,058,468,926 | 1,311,306,058 |
|
|
|
Net Assets | ||
Beginning of period | 10,030,906,025 | 8,719,599,967 |
End of period (including undistributed net investment income of $87,257,584 and undistributed net investment income of $9,035,338, respectively) | $ 13,089,374,951 | $ 10,030,906,025 |
See accompanying notes which are an integral part of the financial statements.
Annual Report
Financial Highlights - Investor Class
Years ended February 28, | 2014 | 2013 | 2012 G | 2011 | 2010 |
Selected Per-Share Data |
|
|
|
|
|
Net asset value, beginning of period | $ 35.31 | $ 33.06 | $ 37.29 | $ 31.74 | $ 20.85 |
Income from Investment Operations |
|
|
|
|
|
Net investment income (loss) B | 1.35 E | 1.03 | 1.19 | .94 | .82 |
Net realized and unrealized gain (loss) | 5.53 | 2.23 | (4.28) | 5.45 | 10.93 |
Total from investment operations | 6.88 | 3.26 | (3.09) | 6.39 | 11.75 |
Distributions from net investment income | (.96) | (.97) | (1.12) | (.81) | (.74) |
Distributions from net realized gain | (.04) | (.04) | (.02) | (.03) | (.12) |
Total distributions | (1.00) | (1.01) | (1.14) | (.84) | (.86) |
Redemption fees added to paid in capital B, H | - | - | - | - | - |
Net asset value, end of period | $ 41.19 | $ 35.31 | $ 33.06 | $ 37.29 | $ 31.74 |
Total Return A | 19.66% | 10.01% | (7.92)% | 20.34% | 56.36% |
Ratios to Average Net Assets C, F |
|
|
|
|
|
Expenses before reductions | .20% | .20% | .20% | .20% | .20% |
Expenses net of fee waivers, if any | .20% | .20% | .11% | .10% | .10% |
Expenses net of all reductions | .20% | .20% | .11% | .10% | .10% |
Net investment income (loss) | 3.52% E | 3.16% | 3.54% | 2.84% | 2.72% |
Supplemental Data |
|
|
|
|
|
Net assets, end of period (000 omitted) | $ 2,640,165 | $ 2,282,743 | $ 3,424,239 | $ 6,932,647 | $ 5,488,131 |
Portfolio turnover rate D | 2% | 1% | 9% | 1% | 2% |
ATotal returns would have been lower if certain expenses had not been reduced during the applicable periods shown. BCalculated based on average shares outstanding during the period. CFees and expenses of any underlying Fidelity Central Funds are not included in the Fund's expense ratio. The Fund indirectly bears its proportionate share of the expenses of any underlying Fidelity Central Funds. DAmount does not include the portfolio activity of any underlying Fidelity Central Funds. EInvestment income per share reflects a large, non-recurring dividend which amounted to $.27 per share. Excluding this non-recurring dividend, the ratio of net investment income (loss) to average net assets would have been 2.82%. FExpense ratios reflect operating expenses of the class. Expenses before reductions do not reflect amounts reimbursed by the investment adviser or reductions from expense offset arrangements and do not represent the amount paid by the class during periods when reimbursements or reductions occur. Expenses net of fee waivers reflect expenses after reimbursement by the investment adviser but prior to reductions from expense offset arrangements. Expenses net of all reductions represent the net expenses paid by the class. GFor the year ended February 29. HAmount represents less than $.01 per share. |
Financial Highlights - Fidelity Advantage Class
Years ended February 28, | 2014 | 2013 | 2012 G | 2011 | 2010 |
Selected Per-Share Data |
|
|
|
|
|
Net asset value, beginning of period | $ 35.31 | $ 33.07 | $ 37.29 | $ 31.74 | $ 20.85 |
Income from Investment Operations |
|
|
|
|
|
Net investment income (loss) B | 1.38 E | 1.06 | 1.20 | .96 | .83 |
Net realized and unrealized gain (loss) | 5.54 | 2.22 | (4.28) | 5.44 | 10.93 |
Total from investment operations | 6.92 | 3.28 | (3.08) | 6.40 | 11.76 |
Distributions from net investment income | (.99) | (1.00) | (1.12) | (.82) | (.75) |
Distributions from net realized gain | (.04) | (.04) | (.02) | (.03) | (.12) |
Total distributions | (1.03) | (1.04) | (1.14) | (.85) | (.87) |
Redemption fees added to paid in capital B, H | - | - | - | - | - |
Net asset value, end of period | $ 41.20 | $ 35.31 | $ 33.07 | $ 37.29 | $ 31.74 |
Total Return A | 19.79% | 10.07% | (7.87)% | 20.38% | 56.40% |
Ratios to Average Net Assets C, F |
|
|
|
|
|
Expenses before reductions | .17% | .17% | .17% | .17% | .17% |
Expenses net of fee waivers, if any | .12% | .12% | .07% | .07% | .07% |
Expenses net of all reductions | .12% | .12% | .07% | .07% | .07% |
Net investment income (loss) | 3.60% E | 3.24% | 3.57% | 2.87% | 2.75% |
Supplemental Data |
|
|
|
|
|
Net assets, end of period (000 omitted) | $ 7,201,814 | $ 5,322,884 | $ 3,476,600 | $ 3,062,970 | $ 2,178,395 |
Portfolio turnover rate D | 2% | 1% | 9% | 1% | 2% |
ATotal returns would have been lower if certain expenses had not been reduced during the applicable periods shown. BCalculated based on average shares outstanding during the period. CFees and expenses of any underlying Fidelity Central Funds are not included in the Fund's expense ratio. The Fund indirectly bears its proportionate share of the expenses of any underlying Fidelity Central Funds. DAmount does not include the portfolio activity of any underlying Fidelity Central Funds. EInvestment income per share reflects a large, non-recurring dividend which amounted to $.27 per share. Excluding this non-recurring dividend, the ratio of net investment income (loss) to average net assets would have been 2.90%. FExpense ratios reflect operating expenses of the class. Expenses before reductions do not reflect amounts reimbursed by the investment adviser or reductions from expense offset arrangements and do not represent the amount paid by the class during periods when reimbursements or reductions occur. Expenses net of fee waivers reflect expenses after reimbursement by the investment adviser but prior to reductions from expense offset arrangements. Expenses net of all reductions represent the net expenses paid by the class. GFor the year ended February 29. HAmount represents less than $.01 per share. |
See accompanying notes which are an integral part of the financial statements.
Annual Report
Financial Highlights - Institutional Class
Years ended February 28, | 2014 | 2013 | 2012 H,J |
Selected Per-Share Data |
|
|
|
Net asset value, beginning of period | $ 35.31 | $ 33.07 | $ 31.29 |
Income from Investment Operations |
|
|
|
Net investment income (loss) D | 1.40 G | 1.07 | .32 |
Net realized and unrealized gain (loss) | 5.54 | 2.22 | 2.48 |
Total from investment operations | 6.94 | 3.29 | 2.80 |
Distributions from net investment income | (1.01) | (1.01) | (1.02) |
Distributions from net realized gain | (.04) | (.04) | - |
Total distributions | (1.05) | (1.05) | (1.02) |
Redemption fees added to paid in capital D, K | - | - | - |
Net asset value, end of period | $ 41.20 | $ 35.31 | $ 33.07 |
Total Return B, C | 19.85% | 10.12% | 9.44% |
Ratios to Average Net Assets E, I |
|
|
|
Expenses before reductions | .10% M | .10% M | .10% A, M |
Expenses net of fee waivers, if any | .07% | .07% | .07% A |
Expenses net of all reductions | .07% | .07% | .07% A |
Net investment income (loss) | 3.65% G | 3.29% | 2.19% A |
Supplemental Data |
|
|
|
Net assets, end of period (000 omitted) | $ 1,595,562 | $ 1,269,545 | $ 860,659 |
Portfolio turnover rate F | 2% | 1% | 9% L |
AAnnualized BTotal returns for periods of less than one year are not annualized. CTotal returns would have been lower if certain expenses had not been reduced during the applicable periods shown. DCalculated based on average shares outstanding during the period. EFees and expenses of any underlying Fidelity Central Funds are not included in the Fund's expense ratio. The Fund indirectly bears its proportionate share of the expenses of any underlying Fidelity Central Funds. FAmount does not include the portfolio activity of any underlying Fidelity Central Funds. GInvestment income per share reflects a large, non-recurring dividend which amounted to $.27 per share. Excluding this non-recurring dividend, the ratio of net investment income (loss) to average net assets would have been 2.95%. HFor the period September 8, 2011 (commencement of sale of shares) to February 29, 2012. IExpense ratios reflect operating expenses of the class. Expenses before reductions do not reflect amounts reimbursed by the investment adviser or reductions from expense offset arrangements and do not represent the amount paid by the class during periods when reimbursements or reductions occur. Expenses net of fee waivers reflect expenses after reimbursement by the investment adviser but prior to reductions from expense offset arrangements. Expenses net of all reductions represent the net expenses paid by the class. JFor the year ended February 29. KAmount represents less than $.01 per share. LAmount not annualized. MAmount represents .095%. |
Financial Highlights - Fidelity Advantage Institutional Class
Years ended February 28, | 2014 | 2013 | 2012 H,J |
Selected Per-Share Data |
|
|
|
Net asset value, beginning of period | $ 35.31 | $ 33.07 | $ 31.29 |
Income from Investment Operations |
|
|
|
Net investment income (loss) D | 1.41 G | 1.08 | .32 |
Net realized and unrealized gain (loss) | 5.53 | 2.22 | 2.48 |
Total from investment operations | 6.94 | 3.30 | 2.80 |
Distributions from net investment income | (1.01) | (1.02) | (1.02) |
Distributions from net realized gain | (.04) | (.04) | - |
Total distributions | (1.05) | (1.06) | (1.02) |
Redemption fees added to paid in capital D, K | - | - | - |
Net asset value, end of period | $ 41.20 | $ 35.31 | $ 33.07 |
Total Return B, C | 19.86% | 10.13% | 9.45% |
Ratios to Average Net Assets E, I |
|
|
|
Expenses before reductions | .08% M | .08% M | .08% A, M |
Expenses net of fee waivers, if any | .06% | .06% | .06% A |
Expenses net of all reductions | .06% | .06% | .06% A |
Net investment income (loss) | 3.66% G | 3.30% | 2.17% A |
Supplemental Data |
|
|
|
Net assets, end of period (000 omitted) | $ 1,651,834 | $ 1,155,733 | $ 958,101 |
Portfolio turnover rate F | 2% | 1% | 9% L |
AAnnualized BTotal returns for periods of less than one year are not annualized. CTotal returns would have been lower if certain expenses had not been reduced during the applicable periods shown. DCalculated based on average shares outstanding during the period. EFees and expenses of any underlying Fidelity Central Funds are not included in the Fund's expense ratio. The Fund indirectly bears its proportionate share of the expenses of any underlying Fidelity Central Funds. FAmount does not include the portfolio activity of any underlying Fidelity Central Funds. GInvestment income per share reflects a large, non-recurring dividend which amounted to $.27 per share. Excluding this non-recurring dividend, the ratio of net investment income (loss) to average net assets would have been 2.96%. HFor the period September 8, 2011 (commencement of sale of shares) to February 29, 2012. IExpense ratios reflect operating expenses of the class. Expenses before reductions do not reflect amounts reimbursed by the investment adviser or reductions from expense offset arrangements and do not represent the amount paid by the class during periods when reimbursements or reductions occur. Expenses net of fee waivers reflect expenses after reimbursement by the investment adviser but prior to reductions from expense offset arrangements. Expenses net of all reductions represent the net expenses paid by the class. JFor the year ended February 29. KAmount represents less than $.01 per share. LAmount not annualized. MAmount represents .075%. |
See accompanying notes which are an integral part of the financial statements.
Annual Report
Notes to Financial Statements
For the period ended February 28, 2014
1. Organization.
Spartan Extended Market Index Fund and Spartan International Index Fund (the Funds) are funds of Fidelity Concord Street Trust (the Trust). The Trust is registered under the Investment Company Act of 1940, as amended (the 1940 Act), as an open-end management investment company organized as a Massachusetts business trust. Each Fund is authorized to issue an unlimited number of shares. Spartan Extended Market Index Fund offers Investor Class, Fidelity Advantage Class and Fidelity Advantage Institutional Class shares. Spartan International Index Fund offers Investor Class, Fidelity Advantage Class, Institutional Class and Fidelity Advantage Institutional Class shares. Each class has exclusive voting rights with respect to matters that affect that class. Each Fund offers conversion privileges between share classes within each Fund to eligible shareholders.
2. Investments in Fidelity Central Funds.
The Funds invests in Fidelity Central Funds, which are open-end investment companies generally available only to other investment companies and accounts managed by the investment adviser and its affiliates. The Funds' Schedules of Investments list each of the Fidelity Central Funds held as of period end, if any, as an investment of each Fund, but do not include the underlying holdings of each Fidelity Central Fund. As an Investing Fund, each Fund indirectly bears its proportionate share of the expenses of the underlying Fidelity Central Funds.
The Money Market Central Funds seek preservation of capital and current income and are managed by Fidelity Investments Money Management, Inc. (FIMM), an affiliate of the investment adviser. Annualized expenses of the Money Market Central Funds as of their most recent shareholder report date are less than .01%.
A complete unaudited list of holdings for each Fidelity Central Fund is available upon request or at the Securities and Exchange Commission (the SEC) website at www.sec.gov. In addition, the financial statements of the Fidelity Central Funds, which are not covered by the Funds' Report of Independent Registered Public Accounting Firm, are available on the SEC website or upon request.
3. Significant Accounting Policies.
The financial statements have been prepared in conformity with accounting principles generally accepted in the United States of America (GAAP), which require management to make certain estimates and assumptions at the date of the financial statements. Actual results could differ from those estimates. Subsequent events, if any, through the date that the financial statements were issued have been evaluated in the preparation of the financial statements. The following summarizes the significant accounting policies of the Funds:
Investment Valuation. Investments are valued as of 4:00 p.m. Eastern time on the last calendar day of the period. In accordance with valuation policies and procedures approved by the Board of Trustees (the Board), each Fund attempts to obtain prices from one or more third party pricing vendors or brokers to value its investments. When current market prices, quotations or currency exchange rates are not readily available or reliable, investments will be fair valued in good faith by the Fidelity Management & Research Company (FMR) Fair Value Committee (the Committee), in accordance with procedures adopted by the Board. Factors used in determining fair value vary by investment type and may include market or investment specific events, changes in interest rates and credit quality. The frequency with which these procedures are used cannot be predicted and they may be utilized to a significant extent. The Committee oversees each Fund's valuation policies and procedures and is responsible for approving and reporting to the Board all fair value determinations.
Each Fund categorizes the inputs to valuation techniques used to value their investments into a disclosure hierarchy consisting of three levels as shown below:
Level 1 - quoted prices in active markets for identical investments
Level 2 - other significant observable inputs (including quoted prices for similar investments, interest rates, prepayment speeds, etc.)
Level 3 - unobservable inputs (including the Fund's own assumptions based on the best information available)
Valuation techniques used to value each Fund's investments by major category are as follows:
Equity securities, including restricted securities, for which market quotations are readily available, are valued at the last reported sale price or official closing price as reported by a third party pricing vendor on the primary market or exchange on which they are traded and are categorized as Level 1 in the hierarchy. In the event there were no sales during the day or closing prices are not available, securities are valued at the last quoted bid price or may be valued using the last available price and are generally categorized as Level 2 in the hierarchy. For foreign equity securities, when market or security specific events arise, comparisons to the valuation of American Depositary Receipts (ADRs), futures contracts, Exchange-Traded Funds (ETFs) and certain indexes as well as quoted prices for similar securities may be used and would be categorized as Level 2 in the hierarchy. Utilizing these techniques may result in transfers between Level 1 and Level 2. For equity securities, including restricted securities, where observable inputs are limited, assumptions about market activity and risk are used and these securities may be categorized as Level 3 in the hierarchy.
Annual Report
Notes to Financial Statements - continued
3. Significant Accounting Policies - continued
Investment Valuation - continued
Debt securities, including restricted securities, are valued based on evaluated prices received from third party pricing vendors or from brokers who make markets in such securities. U.S. government and government agency obligations are valued by pricing vendors who utilize matrix pricing which considers yield or price of bonds of comparable quality, coupon, maturity and type or by broker-supplied prices. When independent prices are unavailable or unreliable, debt securities may be valued utilizing pricing methodologies which consider similar factors that would be used by third party pricing vendors. Debt securities are generally categorized as Level 2 in the hierarchy but may be Level 3 depending on the circumstances.
The U.S. dollar value of foreign currency contracts is determined using currency exchange rates supplied by a pricing service and are categorized as Level 2 in the hierarchy. Futures contracts are valued at the settlement price established each day by the board of trade or exchange on which they are traded and are categorized as Level 1 in the hierarchy. Investments in open-end mutual funds, including the Fidelity Central Funds, are valued at their closing net asset value (NAV) each business day and are categorized as Level 1 in the hierarchy.
Changes in valuation techniques may result in transfers in or out of an assigned level within the disclosure hierarchy. The aggregate value of investments by input level, as of February 28, 2014, including information on transfers between Levels 1 and 2, is included at the end of each applicable Fund's Schedule of Investments.
Foreign Currency. Foreign-denominated assets, including investment securities, and liabilities are translated into U.S. dollars at the exchange rates at period end. Purchases and sales of investment securities, income and dividends received and expenses denominated in foreign currencies are translated into U.S. dollars at the exchange rate in effect on the transaction date.
The effects of exchange rate fluctuations on investments are included with the net realized and unrealized gain (loss) on investment securities. Other foreign currency transactions resulting in realized and unrealized gain (loss) are disclosed separately.
Realized gains and losses on foreign currency transactions arise from the disposition of foreign currency, closed foreign currency contracts, realized changes in the value of foreign currency between the trade and settlement dates on security transactions, and the difference between the amounts of dividends, interest and foreign withholding taxes recorded on transaction date and the U.S. dollar equivalent of the amounts actually received or paid. Unrealized gains and losses on assets and liabilities in foreign currencies arise from changes in the value of foreign currency including foreign currency contracts, and from assets and liabilities denominated in foreign currencies, other than investments, which are held at period end.
Investment Transactions and Income. For financial reporting purposes, the Funds' investment holdings and NAV include trades executed through the end of the last business day of the period. The NAV per share for processing shareholder transactions is calculated as of the close of business of the New York Stock Exchange (NYSE), normally 4:00 p.m. Eastern time and includes trades executed through the end of the prior business day. Gains and losses on securities sold are determined on the basis of identified cost and may include proceeds received from litigation. Dividend income is recorded on the ex-dividend date, except for certain dividends from foreign securities where the ex-dividend date may have passed, which are recorded as soon as the Funds are informed of the ex-dividend date. Non-cash dividends included in dividend income, if any, are recorded at the fair market value of the securities received. Distributions received on securities that represent a return of capital or capital gain are recorded as a reduction of cost of investments and/or as a realized gain. Subsequent to ex-dividend date the Funds determine the components of these distributions, based upon receipt of tax filings or other correspondence relating to the underlying investment. Interest income and distributions from the Fidelity Central Funds are accrued as earned. Interest income includes coupon interest and amortization of premium and accretion of discount on debt securities. Investment income is recorded net of foreign taxes withheld where recovery of such taxes is uncertain. Large, non-recurring dividends recognized by the Funds are presented separately on the Statement of Operations as "Special Dividends" and the impact of these dividends is presented in the Financial Highlights. Interest income and distributions from the Fidelity Central Funds are accrued as earned. Interest income includes coupon interest and amortization of premium and accretion of discount on debt securities. Investment income is recorded net of foreign taxes withheld where recovery of such taxes is uncertain.
Class Allocations and Expenses. Investment income, realized and unrealized capital gains and losses, common expenses of each Fund, and certain fund-level expense reductions, if any, are allocated daily on a pro-rata basis to each class based on the relative net assets of each class to the total net assets of each Fund. Each class differs with respect to transfer agent fees incurred. Certain expense reductions may also differ by class. For the reporting period, the allocated portion of income and expenses to each class as a percent of its average net assets may vary due to the timing of recording these transactions in relation to fluctuating net assets of the classes. Expenses directly attributable to a fund are charged to that fund. Expenses attributable to more than one fund are allocated among the respective funds on the basis of relative net assets or other appropriate methods. Expense estimates are accrued in the period to which they relate and adjustments are made when actual amounts are known.
Annual Report
3. Significant Accounting Policies - continued
Income Tax Information and Distributions to Shareholders. Each year, each Fund intends to qualify as a regulated investment company under Subchapter M of the Internal Revenue Code, including distributing substantially all of its taxable income and realized gains. As a result, no provision for U.S. Federal income taxes is required. As of February 28, 2014, each Fund did not have any unrecognized tax benefits in the financial statements; nor is each Fund aware of any tax positions for which it is reasonably possible that the total amounts of unrecognized tax benefits will significantly change in the next twelve months. Each Fund files a U.S. federal tax return, in addition to state and local tax returns as required. The Fund's federal income tax returns are subject to examination by the Internal Revenue Service (IRS) for a period of three fiscal years after they are filed. State and local tax returns may be subject to examination for an additional fiscal year depending on the jurisdiction. Foreign taxes are provided for based on each Fund's understanding of the tax rules and rates that exist in the foreign markets in which it invests.
Distributions are declared and recorded on the ex-dividend date. Income dividends and capital gain distributions are declared separately for each class. Income and capital gain distributions are determined in accordance with income tax regulations, which may differ from GAAP. In addition, the Funds claimed a portion of the payment made to redeeming shareholders as a distribution for income tax purposes.
Capital accounts within the financial statements are adjusted for permanent book-tax differences. These adjustments have no impact on net assets or the results of operations. Capital accounts are not adjusted for temporary book-tax differences which will reverse in a subsequent period.
Book-tax differences are primarily due to futures contracts, foreign currency transactions, passive foreign investment companies (PFIC), market discount, redemptions in kind, capital loss carryforwards and losses deferred due to wash sales and excise tax regulations.
The federal tax cost of investment securities and unrealized appreciation (depreciation) as of period end were as follows for each Fund:
| Tax cost | Gross unrealized | Gross unrealized | Net unrealized |
Spartan Extended Market Index | $ 12,362,212,608 | $ 4,811,646,787 | $ (763,957,523) | $ 4,047,689,264 |
Spartan International Index | 11,728,086,520 | 3,118,649,486 | (1,549,923,890) | 1,568,725,596 |
The tax-based components of distributable earnings as of period end were as follows for each Fund:
| Undistributed | Undistributed | Capital loss | Net unrealized |
Spartan Extended Market Index | $ 79,696,068 | $ 140,813,422 | $ - | $ 4,047,689,264 |
Spartan International Index | 88,793,896 | - | (591,421,265) | 1,572,472,329 |
Capital loss carryforwards are only available to offset future capital gains of the Funds to the extent provided by regulations and may be limited. Under the Regulated Investment Company Modernization Act of 2010 (the Act), the Funds are permitted to carry forward capital losses incurred in taxable years beginning after December 22, 2010 for an unlimited period and such capital losses are required to be used prior to any losses that expire. The capital loss carryforward information presented below, including any applicable limitation, is estimated as of fiscal period end and is subject to adjustment.
| Fiscal year of |
| ||
| 2017 | 2018 | 2019 | Total with |
Spartan International Index | $ (119,933,607) | $ (148,608,684) | $ (49,793,394) | $ (318,335,685) |
| No expiration |
|
| |
| Short-term | Long-term | Total no | Total capital loss |
Spartan International Index | $ - | $ (273,085,580) | $ (273,085,580) | $ (591,421,265) |
Certain of the Funds intends to elect to defer to the next fiscal year capital losses recognized during the period November 1, 2013 to February 28, 2014. Loss deferrals were as follows:
| Capital losses |
Spartan International Index | $ (10,653,905) |
Annual Report
Notes to Financial Statements - continued
3. Significant Accounting Policies - continued
Income Tax Information and Distributions to Shareholders - continued
The tax character of distributions paid was as follows:
February 28, 2014 |
|
|
|
| Ordinary Income | Long-term | Total |
Spartan Extended Market Index | $ 164,440,567 | $ 210,951,340 | $ 375,391,907 |
Spartan International Index | 307,216,321 | - | 307,216,321 |
February 28, 2013 |
|
|
|
| Ordinary Income | Long-term | Total |
Spartan Extended Market Index | $ 123,000,708 | $ 200,713,554 | $ 323,714,262 |
Spartan International Index | 273,805,873 | - | 273,805,873 |
Short-Term Trading (Redemption) Fees. Shares held by investors in the Funds less than 90 days may be subject to a redemption fee equal to ..75% and 1.00% of the net asset value of shares redeemed from Spartan Extended Market Index and Spartan International Index, respectively. All redemption fees, which reduce the proceeds of the shareholder redemption, are retained by the Funds and accounted for as an addition to paid in capital.
Delayed Delivery Transactions and When-Issued Securities. During the period, the Funds transacted in securities on a delayed delivery or when-issued basis. Payment and delivery may take place after the customary settlement period for that security. The price of the underlying securities and the date when the securities will be delivered and paid for are fixed at the time the transaction is negotiated. The securities purchased on a delayed delivery or when-issued basis are identified as such in each applicable Fund's Schedule of Investments. With respect to purchase commitments, each applicable Fund identifies securities as segregated in its records with a value at least equal to the amount of the commitment. Losses may arise due to changes in the value of the underlying securities or if the counterparty does not perform under the contract's terms, or if the issuer does not issue the securities due to political, economic, or other factors.
4. Derivative Instruments.
Risk Exposures and the Use of Derivative Instruments. The Funds' investment objective allows the Funds to enter into various types of derivative contracts, including futures contracts and forward foreign currency contracts. Derivatives are investments whose value is primarily derived from underlying assets, indices or reference rates and may be transacted on an exchange or over-the-counter (OTC). Derivatives may involve a future commitment to buy or sell a specified asset based on specified terms, to exchange future cash flows at periodic intervals based on a notional principal amount, or for one party to make one or more payments upon the occurrence of specified events in exchange for periodic payments from the other party.
The Funds used derivatives to increase returns and to manage exposure to certain risks as defined below. The success of any strategy involving derivatives depends on analysis of numerous economic factors, and if the strategies for investment do not work as intended, the Funds may not achieve their objectives.
The Funds' use of derivatives increased or decreased their exposure to the following risks:
Equity Risk | Equity risk relates to the fluctuations in the value of financial instruments as a result of changes in market prices (other than those arising from interest rate risk or foreign exchange risk), whether caused by factors specific to an individual investment, its issuer, or all factors affecting all instruments traded in a market or market segment. |
Foreign Exchange Risk | Foreign exchange rate risk relates to fluctuations in the value of an asset or liability due to changes in currency exchange rates. |
The Funds are also exposed to additional risks from investing in derivatives, such as liquidity risk and counterparty credit risk. Liquidity risk is the risk that the Funds will be unable to close out the derivative in the open market in a timely manner. Counterparty credit risk is the risk that the counterparty will not be able to fulfill its obligation to the Funds. Derivative counterparty credit risk is managed through formal evaluation of the creditworthiness of all potential counterparties. On certain OTC derivatives such as forward foreign currency contracts, the Funds attempt to reduce their exposure to counterparty credit risk by entering into an International Swaps and Derivatives Association, Inc. (ISDA) Master Agreement with each of its counterparties. The ISDA Master Agreement gives the Funds the right to terminate all transactions traded under such agreement upon the deterioration in the credit quality of the counterparty beyond specified levels. The ISDA Master Agreement gives each party the right, upon an event of default by the other party or a termination of the agreement, to close out all transactions traded under such agreement and to net amounts owed under each transaction to one net payable by one party to the other. To mitigate counterparty credit risk on bi-lateral OTC derivatives, the Funds receive collateral in the form of cash or securities once the Fund's net unrealized appreciation on outstanding derivative contracts under an ISDA Master Agreement exceeds
Annual Report
4. Derivative Instruments - continued
Risk Exposures and the Use of Derivative Instruments - continued
certain applicable thresholds, subject to certain minimum transfer provisions. The collateral received is held in segregated accounts with the Funds' custodian bank in accordance with the collateral agreements entered into between the Funds, the counterparty and the Funds' custodian bank. The Funds could experience delays and costs in gaining access to the collateral even though it is held by the Funds' custodian bank. The Funds' maximum risk of loss from counterparty credit risk related to bi-lateral OTC derivatives is generally the aggregate unrealized appreciation and unpaid counterparty payments in excess of any collateral pledged by the counterparty to the Funds. The Fund may be required to pledge collateral for the benefit of the counterparties on bi-lateral OTC derivatives in an amount not less than each counterparty's unrealized appreciation on outstanding derivative contracts, subject to certain minimum transfer provisions, and any such pledged collateral is identified in the Schedule of Investments. Exchange-traded futures contracts are not covered by the ISDA Master Agreement; however counterparty credit risk related to exchange-traded futures contracts may be mitigated by the protection provided by the exchange on which they trade.
Investing in derivatives may involve greater risks than investing in the underlying assets directly and, to varying degrees, may involve risk of loss in excess of any initial investment and collateral received and amounts recognized in the Statement of Assets and Liabilities. In addition, there may be the risk that the change in value of the derivative contract does not correspond to the change in value of the underlying instrument.
Net Realized Gain (Loss) and Change in Net Unrealized Appreciation (Depreciation) on Derivatives. The table below, which reflects the impacts of derivatives on the financial performance of the Funds, summarizes the net realized gain (loss) and change in net unrealized appreciation (depreciation) for derivatives during the period as presented in the Statement of Operations.
Primary Risk Exposure / Derivative Type | Net Realized Gain (Loss) | Change in Net Unrealized Appreciation (Depreciation) |
Spartan Extended Market Index |
|
|
Equity Risk |
|
|
Futures Contracts | $ 29,980,279 | $ 3,578,730 |
Totals (a) | $ 29,980,279 | $ 3,578,730 |
Spartan International Index |
|
|
Equity Risk |
|
|
Futures Contracts | $ 31,776,987 | $ 1,009,614 |
Foreign Exchange Risk |
|
|
Forward Foreign Currency Contracts | (11,555,091) | 10,552,889 |
Totals (a) | $ 20,221,896 | $ 11,562,503 |
(a) A summary of the value of derivatives by primary risk exposure as of period end is included at the end of the Schedule of Investments.
Forward Foreign Currency Contracts. Forward foreign currency contracts represent obligations to purchase or sell foreign currency on a specified future date at a price fixed at the time the contracts are entered into. Spartan International Index Fund used forward foreign currency contracts to facilitate transactions in foreign-denominated securities and to manage exposure to certain foreign currencies.
Forward foreign currency contracts are valued daily and fluctuations in exchange rates on open contracts are recorded as unrealized appreciation or (depreciation) and reflected in the Statement of Assets and Liabilities. When the contract is closed, the Fund realizes a gain or loss equal to the difference between the closing value and the value at the time it was opened. The net realized gain (loss) and change in net unrealized appreciation (depreciation) on forward foreign currency contracts during the period is included in the Statement of Operations as part of net realized gain (loss) on foreign currency transactions and change in unrealized gain (loss) on assets and liabilities in foreign currencies, respectively.
Any open forward foreign currency contracts at period end are presented in the Schedule of Investments under the caption "Forward foreign Currency Contracts." The contract amount and unrealized appreciation (depreciation) reflects each contract's exposure to the underlying currency at period end and is representative of volume of activity during the period.
Futures Contracts. A futures contract is an agreement between two parties to buy or sell a specified underlying instrument for a fixed price at a specified future date. The Funds used futures contracts to manage their exposure to the stock market and to fluctuations in currency values.
Upon entering into a futures contract, a fund is required to deposit either cash or securities (initial margin) with a clearing broker in an amount equal to a certain percentage of the face value of the contract. Futures contracts are marked-to-market daily and subsequent daily payments are made or received by a fund depending on the daily fluctuations in the value of the futures contracts and are recorded as unrealized appreciation or (depreciation). This receivable and/or payable, if any, is included in daily variation margin for derivative instruments in the Statement of Assets and Liabilities. Realized gain or (loss) is recorded upon the expiration or closing of a futures contract.
Any open futures contracts at period end are presented in the Schedule of Investments under the caption "Futures Contracts." The underlying face amount at value reflects each contract's exposure to the underlying instrument or index at period end and is representative of volume of activity during
Annual Report
Notes to Financial Statements - continued
4. Derivative Instruments - continued
Futures Contracts - continued
the period. Securities deposited to meet initial margin requirements are identified in the Schedule of Investments. Cash deposited to meet initial margin requirements is presented as segregated cash with brokers for derivative instruments in the Statement of Assets and Liabilities.
5. Purchases and Sales of Investments.
Purchases and sales of securities, other than short-term securities, are noted in the table below.
| Purchases ($) | Sales ($) |
Spartan Extended Market Index | 4,550,928,346 | 1,472,651,780 |
Spartan International Index | 1,561,385,444 | 201,077,200 |
Spartan International Index delivered securities in-kind through redemptions totaling $36,573,220. Realized gain (loss) of $18,270,945 on securities delivered in-kind through redemptions is included in the accompanying Statement of Operations as realized gain or loss on investment securities and is not taxable to the Fund.
6. Fees and Other Transactions with Affiliates.
Management Fee and Expense Contract. Fidelity Management & Research Company (the investment adviser) and its affiliates provide the Funds with investment management related services for which the Funds pay a monthly management fee. The management fee is based on an annual rate of .06% for each Fund's average net assets. Under the management contract, the investment adviser pays all other fund-level expenses, except the compensation of the independent Trustees and certain other expenses such as interest expense, including commitment fees.
In addition, under an expense contract, the investment adviser pays class-level expenses as necessary so that the total expenses do not exceed certain amounts of each class' average net assets on an annual basis with certain exceptions, as noted in the following table:
| Investor Class | Advantage Class | Institutional Class | Fidelity Advantage Institutional Class |
Spartan Extended Market Index Fund | .10% | .07% | n/a | .07% |
Spartan International Index Fund | .20% | .17% | .095% | .075% |
Sub-Adviser. Geode Capital Management, LLC (Geode), serves as sub-adviser for the Funds. Geode provides discretionary investment advisory services to the Funds and is paid by the investment adviser for providing these services.
Transfer Agent Fees. Fidelity Investments Institutional Operations Company, Inc. (FIIOC), an affiliate of the investment adviser, is the transfer, dividend disbursing and shareholder servicing agent for each class of the Funds. FIIOC receives transfer agent fees at annual rates based on average net assets noted in the table below. FIIOC pays for typesetting, printing and mailing of shareholder reports, except proxy statements. Under the expense contract, each class pays all or a portion of the transfer agent fees at an annual rate based on average net assets as noted in the following table:
| Received by FIIOC | Paid by Class |
Spartan Extended Market Index |
|
|
Investor Class | .075% | .04% |
Fidelity Advantage Class | .045% | .01% |
Fidelity Advantage Institutional Class | .015% | .01% |
Spartan International Index |
|
|
Investor Class | .21% | .14% |
Fidelity Advantage Class | .11% | .11% |
Institutional Class | .035% | .035% |
Fidelity Advantage Institutional Class | .015% | .015% |
Annual Report
6. Fees and Other Transactions with Affiliates - continued
Transfer Agent Fees - continued
For the period, the total transfer agent fees paid by each applicable class were as follows:
| Amount |
Spartan Extended Market Index |
|
Investor Class | $ 553,811 |
Fidelity Advantage Class | 961,911 |
Fidelity Advantage Institutional Class | 3,176 |
| $ 1,518,898 |
Spartan International Index |
|
Investor Class | $ 3,402,037 |
Fidelity Advantage Class | 6,743,178 |
Institutional Class | 502,635 |
Fidelity Advantage Institutional Class | 212,649 |
| $ 10,860,499 |
Interfund Lending Program. Pursuant to an Exemptive Order issued by the SEC, the Funds, along with other registered investment companies having management contracts with FMR or other affiliated entities of FMR, may participate in an interfund lending program. This program provides an alternative credit facility allowing the funds to borrow from, or lend money to, other participating affiliated funds. At period end, there were no interfund loans outstanding. Each applicable fund's activity in this program during the period for which loans were outstanding was as follows:
| Borrower or | Average Loan | Weighted Average Interest Rate | Interest Expense |
Spartan International Index | Borrower | $ 19,347,857 | .31% | $ 1,184 |
7. Committed Line of Credit.
Certain Funds participate with other funds managed by the investment adviser or an affiliate in a $4.25 billion credit facility (the "line of credit") to be utilized for temporary or emergency purposes to fund shareholder redemptions or for other short-term liquidity purposes. The participating funds have agreed to pay commitment fees on their pro-rata portion of the line of credit, which are reflected in Miscellaneous expenses on the Statement of Operations, and are as follows:
Spartan Extended Market Index | $ 19,487 |
Spartan International Index | 21,554 |
During the period, there were no borrowings on this line of credit.
8. Security Lending.
Certain Funds lend portfolio securities through a lending agent from time to time in order to earn additional income. On the settlement date of the loan, each applicable Fund receives collateral (in the form of U.S. Treasury obligations, letters of credit and/or cash) against the loaned securities and maintains collateral in an amount not less than 100% of the market value of the loaned securities during the period of the loan. The market value of the loaned securities is determined at the close of business of the Funds and any additional required collateral is delivered to the Funds on the next business day. If the borrower defaults on its obligation to return the securities loaned because of insolvency or other reasons, the Funds may apply collateral received from the borrower against the obligation. The Funds may experience delays and costs in recovering the securities loaned. Any cash collateral received is invested in the Fidelity Securities Lending Cash Central Fund. The value of loaned securities and cash collateral at period end are disclosed on each applicable Fund's Statement of Assets and Liabilities. Security lending income represents the income earned on investing cash collateral, less rebates paid to borrowers and any lending agent fees associated with the loan, plus any premium payments received for lending certain types of securities. Security lending income is presented on each applicable Fund's Statement of Operations as a component of income from Fidelity Central Funds.
Annual Report
Notes to Financial Statements - continued
9. Expense Reductions.
The investment adviser contractually agreed to reimburse certain classes to the extent annual operating expenses exceeded certain levels of average net assets as noted in the table below. This reimbursement will remain in place through April 30, 2015. Some expenses, for example interest expense, including commitment fees, are excluded from these reimbursements. Total reimbursements are included in the following table:
| Expense | Reimbursement |
Spartan Extended Market Index |
|
|
Fidelity Advantage Institutional Class | .06% | $ 4,062 |
Spartan International Index |
|
|
Fidelity Advantage Class | .12% | 3,106,055 |
Institutional Class | .07% | 366,676 |
Fidelity Advantage Institutional Class | .06% | 220,515 |
In addition, the investment adviser reimbursed a portion of each Fund's operating expenses during the period as follows:
| Reimbursement |
Spartan Extended Market Index | $ 5,701 |
Spartan International Index | 5,544 |
Through arrangements with each applicable Fund's custodian, credits realized as a result of uninvested cash balances were used to reduce each applicable Fund's expenses as noted in the table below.
| Management fee |
Spartan Extended Market Index | $ 1,232 |
Spartan International Index | 74 |
10. Distributions to Shareholders.
Distributions to shareholders of each class were as follows:
Years ended February 28, | 2014 | 2013 |
Spartan Extended Market Index |
|
|
From net investment income |
|
|
Investor Class | $ 16,621,797 | $ 34,726,754 |
Fidelity Advantage Class | 112,997,472 | 88,271,798 |
Fidelity Advantage Institutional Class | 835,637 | 2,156 |
Total | $ 130,454,906 | $ 123,000,708 |
From net realized gain |
|
|
Investor Class | $ 31,841,694 | $ 59,938,933 |
Fidelity Advantage Class | 211,703,785 | 140,771,137 |
Fidelity Advantage Institutional Class | 1,391,522 | 3,484 |
Total | $ 244,937,001 | $ 200,713,554 |
Spartan International Index |
|
|
From net investment income |
|
|
Investor Class | $ 58,011,983 | $ 87,597,672 |
Fidelity Advantage Class | 160,441,037 | 109,365,106 |
Institutional Class | 37,902,014 | 34,315,538 |
Fidelity Advantage Institutional Class | 39,196,746 | 31,921,861 |
Total | $ 295,551,780 | $ 263,200,177 |
From net realized gain |
|
|
Investor Class | $ 2,366,597 | $ 3,612,275 |
Fidelity Advantage Class | 6,326,343 | 4,386,091 |
Institutional Class | 1,463,888 | 1,352,974 |
Fidelity Advantage Institutional Class | 1,507,713 | 1,254,356 |
Total | $ 11,664,541 | $ 10,605,696 |
Annual Report
11. Share Transactions.
Transactions for each class of shares were as follows:
| Shares | Dollars | ||
Years ended February 28, | 2014 | 2013 | 2014 | 2013 |
Spartan Extended Market Index |
|
|
|
|
Investor Class |
|
|
|
|
Shares sold | 19,932,366 | 13,321,094 | $ 967,050,540 | $ 530,659,536 |
Reinvestment of distributions | 950,199 | 2,332,565 | 47,450,450 | 90,866,565 |
Shares redeemed | (10,812,918) | (58,837,328) | (534,857,352) | (2,389,706,038) |
Net increase (decrease) | 10,069,647 | (43,183,669) | $ 479,643,638 | $ (1,768,179,937) |
Fidelity Advantage Class |
|
|
|
|
Shares sold | 84,733,601 | 89,341,752 | $ 4,185,536,521 | $ 3,625,244,734 |
Reinvestment of distributions | 6,264,021 | 5,670,305 | 312,421,897 | 220,926,287 |
Shares redeemed | (35,284,757) | (27,226,963) | (1,747,457,820) | (1,083,879,441) |
Net increase (decrease) | 55,712,865 | 67,785,094 | $ 2,750,500,598 | $ 2,762,291,580 |
Fidelity Advantage Institutional Class |
|
|
|
|
Shares sold | 1,794,400 | 2,138 | $ 94,062,308 | $ 88,301 |
Reinvestment of distributions | 43,657 | 145 | 2,227,159 | 5,640 |
Shares redeemed | (111,385) | - | (5,860,887) | - |
Net increase (decrease) | 1,726,672 | 2,283 | $ 90,428,580 | $ 93,941 |
Spartan International Index |
|
|
|
|
Investor Class |
|
|
|
|
Shares sold | 20,112,329 | 22,480,598 | $ 772,478,855 | $ 738,516,301 |
Reinvestment of distributions | 1,523,594 | 2,603,169 | 58,871,715 | 87,570,598 |
Shares redeemed | (22,200,847) | (63,993,981) | (857,809,530) | (2,162,502,955) |
Net increase (decrease) | (564,924) | (38,910,214) | $ (26,458,960) | $ (1,336,416,056) |
Fidelity Advantage Class |
|
|
|
|
Shares sold | 53,596,060 | 75,323,150 | $ 2,066,510,885 | $ 2,547,792,654 |
Reinvestment of distributions | 3,892,047 | 3,011,886 | 150,388,696 | 101,319,852 |
Shares redeemed | (33,423,301) | (32,726,415) | (1,274,395,424) | (1,057,404,449) |
Net increase (decrease) | 24,064,806 | 45,608,621 | $ 942,504,157 | $ 1,591,708,057 |
Institutional Class |
|
|
|
|
Shares sold | 12,102,316 | 16,830,227 | $ 463,354,188 | $ 541,022,171 |
Reinvestment of distributions | 1,018,728 | 1,060,233 | 39,363,642 | 35,666,241 |
Shares redeemed | (10,345,415) | (7,965,479)A | (398,770,131) | (261,596,672)A |
Net increase (decrease) | 2,775,629 | 9,924,981 | $ 103,947,699 | $ 315,091,740 |
Fidelity Advantage Institutional Class |
|
|
|
|
Shares sold | 14,681,068 | 8,644,925 | $ 551,158,148 | $ 280,664,871 |
Reinvestment of distributions | 1,053,409 | 986,213 | 40,703,723 | 33,176,217 |
Shares redeemed | (8,369,672) | (5,875,458) | (318,277,607) | (193,745,936) |
Net increase (decrease) | 7,364,805 | 3,755,680 | $ 273,584,264 | $ 120,095,152 |
A Amount includes in-kind redemptions.
12. Other.
The Funds' organizational documents provide former and current trustees and officers with a limited indemnification against liabilities arising in connection with the performance of their duties to the Funds. In the normal course of business, the Funds may also enter into contracts that provide general indemnifications. The Funds' maximum exposure under these arrangements is unknown as this would be dependent on future claims that may be made against the Funds. The risk of material loss from such claims is considered remote.
Annual Report
Report of Independent Registered Public Accounting Firm
To the Trustees of Fidelity Concord Street Trust and the Shareholders of Spartan Total Market Index Fund, Spartan Extended Market Index Fund and Spartan International Index Fund:
In our opinion, the accompanying statements of assets and liabilities, including the schedules of investments, and the related statements of operations and of changes in net assets and the financial highlights present fairly, in all material respects, the financial positions of Spartan Total Market Index Fund, Spartan Extended Market Index Fund and Spartan International Index Fund (funds of Fidelity Concord Street Trust) at February 28, 2014, the results of each of their operations for the periods indicated, the changes in each of their net assets for each of the periods indicated and the financial highlights for each of the periods indicated, in conformity with accounting principles generally accepted in the United States of America. These financial statements and financial highlights (hereafter referred to as "financial statements") are the responsibility of the Fidelity Concord Street Trust's management Our responsibility is to express an opinion on these financial statements based on our audits. We conducted our audits of these financial statements in accordance with the standards of the Public Company Accounting Oversight Board (United States). Those standards require that we plan and perform the audit to obtain reasonable assurance about whether the financial statements are free of material misstatement. An audit includes examining, on a test basis, evidence supporting the amounts and disclosures in the financial statements, assessing the accounting principles used and significant estimates made by management, and evaluating the overall financial statement presentation. We believe that our audits, which included confirmation of securities at February 28, 2014 by correspondence with the custodian and brokers, provide a reasonable basis for our opinion.
PricewaterhouseCoopers LLP
Boston, Massachusetts
April 21, 2014
Annual Report
Trustees and Officers
The Trustees, Member of the Advisory Board, and officers of the trust and funds, as applicable, are listed below. The Board of Trustees governs each fund and is responsible for protecting the interests of shareholders. The Trustees are experienced executives who meet periodically throughout the year to oversee each fund's activities, review contractual arrangements with companies that provide services to each fund, oversee management of the risks associated with such activities and contractual arrangements, and review each fund's performance. Except for James C. Curvey, Ned C. Lautenbach, and William S. Stavropoulos, each of the Trustees oversees 172 funds. Mr. Curvey oversees 395 funds. Mr. Lautenbach and Mr. Stavropoulos each oversees 246 funds.
The Trustees hold office without limit in time except that (a) any Trustee may resign; (b) any Trustee may be removed by written instrument, signed by at least two-thirds of the number of Trustees prior to such removal; (c) any Trustee who requests to be retired or who has become incapacitated by illness or injury may be retired by written instrument signed by a majority of the other Trustees; and (d) any Trustee may be removed at any special meeting of shareholders by a two-thirds vote of the outstanding voting securities of the trust. Each Trustee who is not an interested person (as defined in the 1940 Act) of the trust and the fund (Independent Trustee), shall retire not later than the last day of the calendar year in which his or her 75th birthday occurs. The Independent Trustees may waive this mandatory retirement age policy with respect to individual Trustees. The officers and Advisory Board Member hold office without limit in time, except that any officer and Advisory Board Member may resign or may be removed by a vote of a majority of the Trustees at any regular meeting or any special meeting of the Trustees. Except as indicated, each individual has held the office shown or other offices in the same company for the past five years.
Experience, Skills, Attributes, and Qualifications of the Funds' Trustees. The Governance and Nominating Committee has adopted a statement of policy that describes the experience, qualifications, attributes, and skills that are necessary and desirable for potential Independent Trustee candidates (Statement of Policy). The Board believes that each Trustee satisfied at the time he or she was initially elected or appointed a Trustee, and continues to satisfy, the standards contemplated by the Statement of Policy. The Governance and Nominating Committee also engages professional search firms to help identify potential Independent Trustee candidates who have the experience, qualifications, attributes, and skills consistent with the Statement of Policy. From time to time, additional criteria based on the composition and skills of the current Independent Trustees, as well as experience or skills that may be appropriate in light of future changes to board composition, business conditions, and regulatory or other developments, have also been considered by the professional search firms and the Governance and Nominating Committee. In addition, the Board takes into account the Trustees' commitment and participation in Board and committee meetings, as well as their leadership of standing and ad hoc committees throughout their tenure.
In determining that a particular Trustee was and continues to be qualified to serve as a Trustee, the Board has considered a variety of criteria, none of which, in isolation, was controlling. The Board believes that, collectively, the Trustees have balanced and diverse experience, qualifications, attributes, and skills, which allow the Board to operate effectively in governing each fund and protecting the interests of shareholders. Information about the specific experience, skills, attributes, and qualifications of each Trustee, which in each case led to the Board's conclusion that the Trustee should serve (or continue to serve) as a trustee of the funds, is provided below.
Board Structure and Oversight Function. James C. Curvey is an interested person (as defined in the 1940 Act) and currently serves as Chairman. The Trustees have determined that an interested Chairman is appropriate and benefits shareholders because an interested Chairman has a personal and professional stake in the quality and continuity of services provided to the funds. Independent Trustees exercise their informed business judgment to appoint an individual of their choosing to serve as Chairman, regardless of whether the Trustee happens to be independent or a member of management. The Independent Trustees have determined that they can act independently and effectively without having an Independent Trustee serve as Chairman and that a key structural component for assuring that they are in a position to do so is for the Independent Trustees to constitute a substantial majority for the Board. The Independent Trustees also regularly meet in executive session. Ned C. Lautenbach serves as Chairman of the Independent Trustees and as such (i) acts as a liaison between the Independent Trustees and management with respect to matters important to the Independent Trustees and (ii) with management prepares agendas for Board meetings.
Fidelity funds are overseen by different Boards of Trustees. The funds' Board oversees Fidelity's equity and high income funds and another Board oversees Fidelity's investment-grade bond, money market, and asset allocation funds. The asset allocation funds may invest in Fidelity funds overseen by the funds' Board. The use of separate Boards, each with its own committee structure, allows the Trustees of each group of Fidelity funds to focus on the unique issues of the funds they oversee, including common research, investment, and operational issues. On occasion, the separate Boards establish joint committees to address issues of overlapping consequences for the Fidelity funds overseen by each Board.
The Trustees operate using a system of committees to facilitate the timely and efficient consideration of all matters of importance to the Trustees, each fund, and fund shareholders and to facilitate compliance with legal and regulatory requirements and oversight of the funds' activities and associated risks. The Board, acting through its committees, has charged FMR and its affiliates with (i) identifying events or circumstances the occurrence of which could have demonstrably adverse effects on the funds' business and/or reputation; (ii) implementing processes and controls to lessen the possibility that such events or circumstances occur or to mitigate the effects of such events or circumstances if they do occur; and (iii) creating and maintaining a system designed to evaluate continuously business and market conditions in order to facilitate the identification and implementation processes described in (i) and (ii) above. Because the day-to-day operations and activities of the funds are carried out by or through FMR, its affiliates and other service providers, the funds' exposure to risks is mitigated but not eliminated by the processes overseen by the Trustees. While each of the Board's committees has responsibility for overseeing different aspects of the funds' activities, oversight is exercised primarily through the Operations, Audit, and Compliance Committees. In addition, the Independent Trustees have worked with FMR to enhance the Board's oversight of investment and financial risks, legal and regulatory risks, technology risks, and operational risks, including the development of additional risk reporting to the Board. For example, a working group comprised of Independent Trustees and FMR has worked and continues to work to review the Fidelity funds' valuation-related activities, reporting and risk management. Appropriate personnel, including but not limited to the funds' Chief Compliance Officer (CCO), FMR's internal auditor, the independent accountants, the funds' Treasurer and portfolio management personnel, make periodic reports to the Board's committees, as appropriate, including an annual review of FMR's risk management program for the Fidelity funds. The responsibilities of each standing committee, including their oversight responsibilities, are described further under "Standing Committees of the Funds' Trustees."
Annual Report
Trustees and Officers - continued
The funds' Statement of Additional Information (SAI) includes more information about the Trustees. To Request a free copy, call Fidelity at 1-800-544-8544.
Interested Trustees*:
Correspondence intended for each Trustee who is an interested person may be sent to Fidelity Investments, 245 Summer Street, Boston, Massachusetts 02210.
Name, Year of Birth; Principal Occupations and Other Relevant Experience+ | |
James C. Curvey (1935) | |
Year of Election or Appointment: 2007 Trustee Chairman of the Board of Trustees | |
| Mr. Curvey also serves as Trustee of other Fidelity funds. Mr. Curvey is a Director of Fidelity Investments Money Management, Inc. (2009-present), Director of Fidelity Research & Analysis Co. (2009-present) and Director of FMR and FMR Co., Inc. (2007-present). Mr. Curvey is also Vice Chairman (2007-present) and Director of FMR LLC. In addition, Mr. Curvey serves as an Overseer for the Boston Symphony Orchestra and a member of the Trustees of Villanova University. Previously, Mr. Curvey was the Vice Chairman (2006-2007) and Director (2000-2007) of FMR Corp. |
Charles S. Morrison (1960) | |
Year of Election or Appointment: 2014 Trustee | |
| Mr. Morrison also serves as Trustee or Vice President of other funds. He serves as President, Asset Management (2014-present) and is an employee of Fidelity Investments. Previously, Mr. Morrison served as President, Fixed Income (2011-2014), Vice President of Fidelity's Money Market Funds (2005-2009), President, Money Market Group Leader of FMR (2009), and Senior Vice President, Money Market Group of FMR (2004-2009). Mr. Morrison also served as Vice President of Fidelity's Bond Funds (2002-2005), certain Balanced Funds (2002-2005), and certain Asset Allocation Funds (2002-2007), and as Senior Vice President (2002-2005) of Fidelity's Bond Division. |
* Trustees have been determined to be "Interested Trustees" by virtue of, among other things, their affiliation with the trust or various entities under common control with FMR.
+ The information above includes each Trustee's principal occupation during the last five years and other information relating to the experience, attributes, and skills relevant to each Trustee's qualifications to serve as a Trustee, which led to the conclusion that each Trustee should serve as a Trustee for each fund.
Independent Trustees:
Correspondence intended for each Independent Trustee (that is, the Trustees other than the Interested Trustees) may be sent to Fidelity Investments, P.O. Box 55235, Boston, Massachusetts 02205-5235.
Name, Year of Birth; Principal Occupations and Other Relevant Experience+ | |
Dennis J. Dirks (1948) | |
Year of Election or Appointment: 2005 Trustee | |
| Mr. Dirks also serves as Trustee of other Fidelity funds. Prior to his retirement in May 2003, Mr. Dirks was Chief Operating Officer and a member of the Board of The Depository Trust & Clearing Corporation (DTCC). He also served as President, Chief Operating Officer, and Board member of The Depository Trust Company (DTC) and President and Board member of the National Securities Clearing Corporation (NSCC). In addition, Mr. Dirks served as Chief Executive Officer and Board member of the Government Securities Clearing Corporation, Chief Executive Officer and Board member of the Mortgage-Backed Securities Clearing Corporation, as a Trustee and a member of the Finance Committee of Manhattan College (2005-2008), and as a Trustee and a member of the Finance Committee of AHRC of Nassau County (2006-2008). Mr. Dirks is a member of the Independent Directors Council (IDC) Governing Council (2010-present) and Board of Directors for The Brookville Center for Children's Services, Inc. (2009-present). |
Alan J. Lacy (1953) | |
Year of Election or Appointment: 2008 Trustee | |
| Mr. Lacy also serves as Trustee of other Fidelity funds. Mr. Lacy serves as Senior Adviser (2007-present) of Oak Hill Capital Partners, L.P. (private equity). Mr. Lacy also served as Chief Executive Officer (2000-2005) and Vice Chairman (2005-2006) of Sears Holdings Corporation and Sears, Roebuck and Co. (retail). In addition, Mr. Lacy serves as a member of the Board of Directors of Dave & Buster's Entertainment, Inc. (restaurant and entertainment complexes, 2010-present), Earth Fare, Inc. (retail grocery, 2012-present), The Hillman Companies, Inc. (hardware wholesalers, 2010-present), and Bristol-Myers Squibb Company (global pharmaceuticals, 2008-present). Mr. Lacy is a member of the Board of Trustees of The National Parks Conservation Association (2006-present). Previously, Mr. Lacy served as Chairman of the Board of Trustees of the National Parks Conservation Association (2008-2011) and as a member of the Board of Directors for the Western Union Company (global money transfer, 2006-2011). |
Ned C. Lautenbach (1944) | |
Year of Election or Appointment: 2000 Trustee Chairman of the Independent Trustees | |
| Mr. Lautenbach also serves as Trustee of other Fidelity funds. Mr. Lautenbach currently serves as the Lead Director of the Eaton Corporation Board of Directors (diversified industrial, 1997-present). Mr. Lautenbach is Chairman of the Board of Directors of the Philharmonic Center for the Arts in Naples, Florida (2012-present) and a member of the Council on Foreign Relations (1994-present). Previously, Mr. Lautenbach was a Partner/Advisory Partner at Clayton, Dubilier & Rice, LLC (private equity investment, 1998-2010), as well as a Director of Sony Corporation (2006-2007). |
Joseph Mauriello (1944) | |
Year of Election or Appointment: 2008 Trustee | |
| Mr. Mauriello also serves as Trustee of other Fidelity funds. Prior to his retirement in January 2006, Mr. Mauriello served in numerous senior management positions including Deputy Chairman and Chief Operating Officer (2004-2005), and Vice Chairman of Financial Services (2002-2004) of KPMG LLP US (professional services, 1965-2005). Mr. Mauriello currently serves as a member of the Board of Directors of XL Group plc. (global insurance and re-insurance, 2006-present). Previously, Mr. Mauriello served as a Director of the Hamilton Funds of the Bank of New York (2006-2007) and of Arcadia Resources Inc. (health care services and products, 2007-2012). |
Robert W. Selander (1950) | |
Year of Election or Appointment: 2011 Trustee | |
| Mr. Selander also serves as Trustee of other Fidelity funds. Previously, Mr. Selander served as a Member of the Advisory Board of other Fidelity funds (2011), and Executive Vice Chairman (2010), Chief Executive Officer (2009-2010), and President and Chief Executive Officer (1997-2009) of Mastercard, Inc. |
Cornelia M. Small (1944) | |
Year of Election or Appointment: 2005 Trustee | |
| Ms. Small also serves as Trustee of other Fidelity funds. Ms. Small is a member of the Board of Directors (2009-present) and Chair of the Investment Committee (2010-present) of the Teagle Foundation. Ms. Small also serves on the Investment Committee of the Berkshire Taconic Community Foundation (2008-present). Previously, Ms. Small served as Chairperson (2002-2008) and a member of the Investment Committee and Chairperson (2008-2012) and a member of the Board of Trustees of Smith College. In addition, Ms. Small served as Chief Investment Officer, Director of Global Equity Investments, and a member of the Board of Directors of Scudder, Stevens & Clark and Scudder Kemper Investments. |
William S. Stavropoulos (1939) | |
Year of Election or Appointment: 2001 Trustee Vice Chairman of the Independent Trustees | |
| Mr. Stavropoulos also serves as Trustee of other Fidelity funds. Mr. Stavropoulos serves as President and Founder of the Michigan Baseball Foundation, the Great Lakes Loons (2007-present). Mr. Stavropoulos is Chairman Emeritus of the Board of Directors of The Dow Chemical Company, where he previously served in numerous senior management positions, including President, CEO (1995-2000; 2002-2004), Chairman of the Executive Committee (2000-2006), and as a member of the Board of Directors (1990-2006). Currently, Mr. Stavropoulos is Chairman of the Board of Directors of Univar Inc. (global distributor of commodity and specialty chemicals), a Director of Teradata Corporation (data warehousing and technology solutions), and Maersk Inc. (industrial conglomerate), and a member of the Advisory Board for Metalmark Capital LLC (private equity investment, 2005-present). Mr. Stavropoulos is an operating advisor to Clayton, Dubilier & Rice, LLC (private equity investment). In addition, Mr. Stavropoulos is a member of the University of Notre Dame Advisory Council for the College of Science, a Trustee of the Rollin L. Gerstacker Foundation, and a Director of the Naples Philharmonic Center for the Arts. Previously, Mr. Stavropoulos served as a Director of Chemical Financial Corporation (bank holding company, 1993-2012) and Tyco International, Ltd. (multinational manufacturing and services, 2007-2012). |
David M. Thomas (1949) | |
Year of Election or Appointment: 2008 Trustee | |
| Mr. Thomas also serves as Trustee of other Fidelity funds. Mr. Thomas serves as Non-Executive Chairman of the Board of Directors of Fortune Brands Home and Security (home and security products, 2011-present), and as a member of the Board of Directors of Interpublic Group of Companies, Inc. (marketing communication, 2004-present). Previously, Mr. Thomas served as Executive Chairman (2005-2006) and Chairman and Chief Executive Officer (2000-2005) of IMS Health, Inc. (pharmaceutical and healthcare information solutions), and a Director of Fortune Brands, Inc. (consumer products, 2000-2011). |
+ The information above includes each Trustee's principal occupation during the last five years and other information relating to the experience, attributes, and skills relevant to each Trustee's qualifications to serve as a Trustee, which led to the conclusion that each Trustee should serve as a Trustee for each fund.
Advisory Board Member and Officers:
Correspondence intended for each officer and Peter S. Lynch may be sent to Fidelity Investments, 245 Summer Street, Boston, Massachusetts 02210. Officers appear below in alphabetical order.
Name, Year of Birth; Principal Occupation | |
Peter S. Lynch (1944) | |
Year of Election or Appointment: 2003 Member of the Advisory Board | |
| Mr. Lynch also serves as Member of the Advisory Board of other Fidelity funds. Mr. Lynch is Vice Chairman and a Director of FMR and FMR Co., Inc. In addition, Mr. Lynch serves as a Trustee of Boston College and as the Chairman of the Inner-City Scholarship Fund. Previously, Mr. Lynch served on the Special Olympics International Board of Directors (1997-2006). |
Elizabeth Paige Baumann (1968) | |
Year of Election or Appointment: 2012 Anti-Money Laundering (AML) Officer | |
| Ms. Baumann also serves as AML Officer of other funds. She is Chief AML Officer of FMR LLC (2012-present) and is an employee of Fidelity Investments. Previously, Ms. Baumann served as Vice President and Deputy Anti-Money Laundering Officer (2007-2012). |
William C. Coffey (1969) | |
Year of Election or Appointment: 2009 Assistant Secretary | |
| Mr. Coffey also serves as Assistant Secretary of other funds. He is Senior Vice President and Deputy General Counsel of FMR LLC (2010-present), and is an employee of Fidelity Investments. Previously, Mr. Coffey served as Vice President and Associate General Counsel of FMR LLC (2005-2009). |
Jonathan Davis (1968) | |
Year of Election or Appointment: 2010 Assistant Treasurer | |
| Mr. Davis also serves as Assistant Treasurer of other funds. Mr. Davis is an employee of Fidelity Investments. Previously, Mr. Davis served as Vice President and Associate General Counsel of FMR LLC (2003-2010). |
Adrien E. Deberghes (1967) | |
Year of Election or Appointment: 2008 Deputy Treasurer | |
| Mr. Deberghes also serves as an officer of other funds. He is an employee of Fidelity Investments (2008-present). Prior to joining Fidelity Investments, Mr. Deberghes was Senior Vice President of Mutual Fund Administration at State Street Corporation (2007-2008), Senior Director of Mutual Fund Administration at Investors Bank & Trust (2005-2007), and Director of Finance for Dunkin' Brands (2000-2005). |
Stephanie J. Dorsey (1969) | |
Year of Election or Appointment: 2010 Assistant Treasurer | |
| Ms. Dorsey also serves as an officer of other funds. She is an employee of Fidelity Investments (2008-present) and has served in other fund officer roles. Prior to joining Fidelity Investments, Ms. Dorsey served as Treasurer (2004-2008) of the JPMorgan Mutual Funds and Vice President (2004-2008) of JPMorgan Chase Bank. |
Scott C. Goebel (1968) | |
Year of Election or Appointment: 2008 Secretary and Chief Legal Officer (CLO) | |
| Mr. Goebel serves as Secretary and CLO of other funds. Mr. Goebel also serves as Secretary of Fidelity SelectCo, LLC (2013-present), Fidelity Investments Money Management, Inc. (FIMM) (2010-present) and Fidelity Research and Analysis Company (FRAC) (2010-present); General Counsel, Secretary, and Senior Vice President of FMR (2008-present) and FMR Co., Inc. (2008-present); Chief Legal Officer of Fidelity Management & Research (Hong Kong) Limited (2008-present); and Assistant Secretary of Fidelity Management & Research (Japan) Inc. (2008-present) and Fidelity Management & Research (U.K.) Inc. (2008-present). Previously, Mr. Goebel served as Secretary and CLO of other Fidelity funds (2008-2013), Assistant Secretary of FIMM (2008-2010), FRAC (2008-2010), and certain funds (2007-2008); and as Vice President and Secretary of Fidelity Distributors Corporation (FDC) (2005-2007). Mr. Goebel has been employed by FMR LLC or an affiliate since 2001. |
Joseph A. Hanlon (1968) | |
Year of Election or Appointment: 2012 Chief Compliance Officer | |
| Mr. Hanlon also serves as Chief Compliance Officer of other funds. Mr. Hanlon serves as Compliance Officer of FMR, FMR Co., Inc., Fidelity Investments Money Management, Inc. (FIMM), Fidelity Research and Analysis Company (FRAC), and Fidelity Management & Research (Hong Kong) (2009-present), as Senior Vice President of the Fidelity Asset Management Division (2009-present), and is an employee of Fidelity Investments. Previously, Mr. Hanlon served as Compliance Officer of Fidelity Management & Research (Japan) Inc. (2009-2013), Strategic Advisers, Inc. (2009-2013), and Fidelity Management & Research (U.K.) Inc. (2009-2013). |
Bruce T. Herring (1965) | |
Year of Election or Appointment: 2006 Vice President of certain Equity Funds | |
| Mr. Herring also serves as Vice President of other funds. He serves as Chief Investment Officer of Fidelity Global Asset Allocation (GAA) (2013-present), Group Chief Investment Officer of FMR, and President of Fidelity Research & Analysis Company (2010-present). Previously, Mr. Herring served as Chief Investment Officer and Director of Fidelity Management & Research (U.K.) Inc. (2010-2013), Vice President (2005-2006) and Senior Vice President (2006-2007) of Fidelity Management & Research Company, Vice President of FMR Co., Inc. (2001-2007), and as a portfolio manager for Fidelity U.S. Equity Funds. |
Brian B. Hogan (1964) | |
Year of Election or Appointment: 2009 Vice President | |
| Mr. Hogan also serves as Trustee or Vice President of other funds. Mr. Hogan serves as President of FMR's Equity Division (2009-present). Previously, Mr. Hogan served as Senior Vice President, Equity Research of FMR (2006-2009) and as a portfolio manager. |
Chris Maher (1972) | |
Year of Election or Appointment: 2013 Assistant Treasurer | |
| Mr. Maher serves as Assistant Treasurer of other funds. Mr. Maher is Vice President of Valuation Oversight and is an employee of Fidelity Investments. Previously, Mr. Maher served as Vice President of Asset Management Compliance (2013), Vice President of FMR's Program Management Group (2010-2013), and Vice President of Valuation Oversight (2008-2010). |
Christine Reynolds (1958) | |
Year of Election or Appointment: 2008 Chief Financial Officer | |
| Ms. Reynolds also serves as Chief Financial Officer of other funds. Ms. Reynolds became President of Fidelity Pricing and Cash Management Services (FPCMS) in August 2008. Ms. Reynolds served as Chief Operating Officer of FPCMS (2007-2008). Previously, Ms. Reynolds served as President, Treasurer, and Anti-Money Laundering officer of the Fidelity funds (2004-2007). |
Kenneth B. Robins (1969) | |
Year of Election or Appointment: 2008 President and Treasurer | |
| Mr. Robins also serves as an officer of other funds. Mr. Robins serves as Executive Vice President of Fidelity Investments Money Management, Inc. (FIMM) (2013-present) and is an employee of Fidelity Investments (2004-present). Previously, Mr. Robins served in other fund officer roles. |
Gary W. Ryan (1958) | |
Year of Election or Appointment: 2005 Assistant Treasurer | |
| Mr. Ryan also serves as Assistant Treasurer of other funds. Mr. Ryan is an employee of Fidelity Investments and has served in other fund officer roles. Previously, Mr. Ryan served as Vice President of Fund Reporting in Fidelity Pricing and Cash Management Services (FPCMS) (1999-2005). |
Stephen Sadoski (1971) | |
Year of Election or Appointment: 2012 Deputy Treasurer | |
| Mr. Sadoski also serves as Deputy Treasurer of other funds. He is an employee of Fidelity Investments (2012-present) and has served in another fund officer role. Prior to joining Fidelity Investments, Mr. Sadoski served as an assistant chief accountant in the Division of Investment Management of the Securities and Exchange Commission (SEC) (2009-2012) and as a senior manager at Deloitte & Touche LLP (1997-2009). |
Stacie M. Smith (1974) | |
Year of Election or Appointment: 2013 Deputy Treasurer | |
| Ms. Smith also serves as an officer of other funds. She is an employee of Fidelity Investments (2009-present) and has served in other fund officer roles. Prior to joining Fidelity Investments, Ms. Smith served as Senior Audit Manager of Ernst & Young LLP (1996-2009). |
Renee Stagnone (1975) | |
Year of Election or Appointment: 2013 Deputy Treasurer | |
| Ms. Stagnone also serves as Deputy Treasurer of other funds. Ms. Stagnone is an employee of Fidelity Investments. |
Joseph F. Zambello (1957) | |
Year of Election or Appointment: 2011 Deputy Treasurer | |
| Mr. Zambello also serves as Deputy Treasurer of other funds. Mr. Zambello is an employee of Fidelity Investments. Previously, Mr. Zambello served as Vice President of FMR's Program Management Group (2009-2011) and Vice President of the Transfer Agent Oversight Group (2005-2009). |
Annual Report
Distributions (Unaudited)
The Board of Trustees of each fund voted to pay to shareholders of record at the opening of business on record date, the following distributions per share derived from capital gains realized from sales of portfolio securities and dividends derived from net investment income:
| Pay Date | Record Date | Dividends | Capital Gains |
Spartan Total Market Index Fund |
|
|
|
|
Investor Class | 4/14/14 | 4/11/14 | $0.14300 | - |
Fidelity Advantage Class | 4/14/14 | 4/11/14 | $0.14899 | - |
Spartan Extended Market Index Fund |
|
|
|
|
Investor Class | 4/14/14 | 4/11/14 | $0.11100 | $0.725 |
Fidelity Advantage Class | 4/14/14 | 4/11/14 | $0.11542 | $0.725 |
Spartan International Index Fund |
|
|
|
|
Investor Class | 4/14/14 | 4/11/14 | $0.26700 | - |
Fidelity Advantage Class | 4/14/14 | 4/11/14 | $0.27604 | - |
The funds hereby designate as capital gain dividend the amounts noted below for the taxable year ended February 28, 2014, or, if subsequently determined to be different, the net capital gain of such year.
Spartan Extended Market Index Fund | $309,303,411 |
A percentage of the dividends distributed during the fiscal year for the following funds qualify for the dividends-received deduction for corporate shareholders:
| April 2013 | December 2013 | |
Spartan Total Market Index Fund |
|
| |
Investor Class | 100% | 97% | |
Fidelity Advantage Class | 97% | 94% | |
Spartan Extended Market Index Fund |
|
| |
Investor Class | 22% | 48% | |
Fidelity Advantage Class | 21% | 47% | |
A percentage of the dividends distributed during the fiscal year for the following funds may be taken into account as a dividend for purposes of the maximum rate under section 1(h)(11) of the Internal Revenue Code.
| April 2013 | December 2013 | |
Spartan Total Market Index Fund |
|
| |
Investor Class | 100% | 100% | |
Fidelity Advantage Class | 100% | 98% | |
Spartan Extended Market Index Fund |
|
| |
Investor Class | 23% | 53% | |
Fidelity Advantage Class | 22% | 52% | |
Spartan International Index Fund |
|
| |
Investor Class | - | 90% | |
Fidelity Advantage Class | - | 88% | |
The amounts per share which represent income derived from sources within, and taxes paid to, foreign countries or possessions of the United States are as follows:
| Pay Date | Income | Taxes |
Spartan International Index Fund |
|
|
|
Investor Class | 12/16/13 | $0.4720 | $0.0612 |
Fidelity Advantage Class | 12/16/13 | $0.4867 | $0.0612 |
The funds will notify shareholders in January 2015 of amounts for use in preparing 2014 income tax returns.
Annual Report
Fidelity Management & Research Company
Boston, MA
Investment Sub-Advisers
FMR Co., Inc.
Geode Capital Management, LLC
General Distributor
Fidelity Distributors Corporation
Smithfield, RI
Transfer and Service Agents
Fidelity Investments Institutional Operations Company, Inc.
Boston, MA
Fidelity Service Company, Inc.
Boston, MA
Custodian
The Bank of New York Mellon
New York, NY
The Fidelity Telephone Connection
Mutual Fund 24-Hour Service
Exchanges/Redemptions
and Account Assistance 1-800-544-6666
Product Information 1-800-544-6666
Retirement Accounts 1-800-544-4774
(8 a.m. - 9 p.m.)
TDD Service 1-800-544-0118
for the deaf and hearing impaired
(9 a.m. - 9 p.m. Eastern time)
Fidelity Automated Service
Telephone (FAST®) (automated graphic) 1-800-544-5555
(automated graphic) Automated line for quickest service
(Mail Graphic)
(FidelityLogo)
P.O. Box 673023
Dallas, TX 75267-3023
SIF-UANNPRO-0414
1.790918.110
Spartan® Total Market Index
Spartan Extended Market Index
Spartan International Index
Funds -
Institutional Class
Fidelity Advantage® Institutional Class
Annual Report
(Fidelity Cover Art)
February 28, 2014
Contents
Spartan® Total Market Index Fund | Shareholder Expense Example | |
| Performance | |
| Management's Discussion | |
| Investment Changes | |
| Investments | |
| Financial Statements | |
| Notes to the Financial Statements | |
| ||
Shareholder Expense Example | An example of shareholder expenses | |
| ||
Spartan Extended Market Index Fund | Performance | |
| Management's Discussion | |
| Investment Changes | |
| Investments | |
| Financial Statements | |
| ||
Spartan International Index Fund | Performance | |
| Management's Discussion | |
| Investment Changes | |
| Investments | |
| Financial Statements | |
| ||
Notes | Notes to the Financial Statements | |
Report of Independent Registered Public Accounting Firm |
| |
Trustees and Officers |
| |
Distributions |
| |
To view a fund's proxy voting guidelines and proxy voting record for the 12-month period ended June 30, visit http://www.fidelity.com/proxyvotingresults or visit the Securities and Exchange Commission's (SEC) web site at http://www.sec.gov. You may also call 1-800-835-5092 to request a free copy of the proxy voting guidelines.
The funds or securities referred to herein are not sponsored, endorsed, or promoted by MSCI, and MSCI bears no liability with respect to any such funds or securities or any index on which such funds or securities are based. The prospectus contains a more detailed description of the limited relationship MSCI has with Fidelity and any related funds.
Standard & Poor's, S&P and S&P 500 are registered service marks of The McGraw-Hill Companies, Inc. and have been licensed for use by Fidelity Distributors Corporation.
Other third-party marks appearing herein are the property of their respective owners.
All other marks appearing herein are registered or unregistered trademarks or service marks of FMR LLC or an affiliated company. © 2014 FMR LLC. All rights reserved.
This report and the financial statements contained herein are submitted for the general information of the shareholders of the funds. This report is not authorized for distribution to prospective investors in the funds unless preceded or accompanied by an effective prospectus.
A fund files its complete schedule of portfolio holdings with the SEC for the first and third quarters of each fiscal year on Form N-Q. Forms N-Q are available on the SEC's web site at http://www.sec.gov. A fund's Forms N-Q may be reviewed and copied at the SEC's Public Reference Room in Washington, DC. Information regarding the operation of the SEC's Public Reference Room may be obtained by calling 1-800-SEC-0330. For a complete list of a fund's portfolio holdings, view the most recent holdings listing, semiannual report, or annual report on Fidelity's web site at http://www.fidelity.com, http://www.advisor.fidelity.com, or http://www.401k.com, as applicable.
NOT FDIC INSURED • MAY LOSE VALUE • NO BANK GUARANTEE
Neither the funds nor Fidelity Distributors Corporation is a bank.
Annual Report
Spartan Total Market Index Fund
Shareholder Expense Example
As a shareholder of the Fund, you incur two types of costs: (1) transaction costs, including redemption fees and (2) ongoing costs, including management fees and other Fund expenses. This Example is intended to help you understand your ongoing costs (in dollars) of investing in the Fund and to compare these costs with the ongoing costs of investing in other mutual funds.
The Example is based on an investment of $1,000 invested at the beginning of the period and held for the entire period (September 1, 2013 to February 28, 2014).
Actual Expenses
The first line of the accompanying table for each class of the Fund provides information about actual account values and actual expenses. You may use the information in this line, together with the amount you invested, to estimate the expenses that you paid over the period. Simply divide your account value by $1,000.00 (for example, an $8,600 account value divided by $1,000.00 = 8.6), then multiply the result by the number in the first line for a class of the Fund under the heading entitled "Expenses Paid During Period" to estimate the expenses you paid on your account during this period. A small balance maintenance fee of $12.00 that is charged once a year may apply for certain accounts with a value of less than $2,000. This fee is not included in the table below. If it was, the estimate of expenses you paid during the period would be higher, and your ending account value lower, by this amount. In addition, the Fund, as a shareholder in the underlying Fidelity Central Funds, will indirectly bear its pro-rata share of the fees and expenses incurred by the underlying Fidelity Central Funds. These fees and expenses are not included in the Fund's annualized expense ratio used to calculate the expense estimate in the table below.
Hypothetical Example for Comparison Purposes
The second line of the accompanying table for each class of the Fund provides information about hypothetical account values and hypothetical expenses based on a Class' actual expense ratio and an assumed rate of return of 5% per year before expenses, which is not the Class' actual return. The hypothetical account values and expenses may not be used to estimate the actual ending account balance or expenses you paid for the period. You may use this information to compare the ongoing costs of investing in the Fund and other funds. To do so, compare this 5% hypothetical example with the 5% hypothetical examples that appear in the shareholder reports of the other funds. A small balance maintenance fee of $12.00 that is charged once a year may apply for certain accounts with a value of less than $2,000. This fee is not included in the table below. If it was, the estimate of expenses you paid during the period would be higher, and your ending account value lower, by this amount. In addition, the Fund, as a shareholder in the underlying Fidelity Central Funds, will indirectly bear its pro-rata share of the fees and expenses incurred by the underlying Fidelity Central Funds. These fees and expenses are not included in the Fund's annualized expense ratio used to calculate the expense estimate in the table below.
Please note that the expenses shown in the table are meant to highlight your ongoing costs only and do not reflect any transaction costs. Therefore, the second line of the table is useful in comparing ongoing costs only, and will not help you determine the relative total costs of owning different funds. In addition, if these transactional costs were included, your costs would have been higher.
| Annualized | Beginning | Ending | Expenses Paid |
Investor Class | .100% |
|
|
|
Actual |
| $ 1,000.00 | $ 1,157.70 | $ .53 |
HypotheticalA |
| $ 1,000.00 | $ 1,024.30 | $ .50 |
Fidelity Advantage Class | .060% |
|
|
|
Actual |
| $ 1,000.00 | $ 1,158.00 | $ .32 |
HypotheticalA |
| $ 1,000.00 | $ 1,024.50 | $ .30 |
Institutional Class | .050% |
|
|
|
Actual |
| $ 1,000.00 | $ 1,158.10 | $ .27 |
HypotheticalA |
| $ 1,000.00 | $ 1,024.55 | $ .25 |
Fidelity Advantage Institutional Class | .045% |
|
|
|
Actual |
| $ 1,000.00 | $ 1,158.00 | $ .24 |
HypotheticalA |
| $ 1,000.00 | $ 1,024.57 | $ .23 |
Class F | .046% |
|
|
|
Actual |
| $ 1,000.00 | $ 1,158.10 | $ .25 |
HypotheticalA |
| $ 1,000.00 | $ 1,024.57 | $ .23 |
A 5% return per year before expenses
B Annualized expense ratio reflects expenses net of applicable fee waivers.
* Expenses are equal to each Class' annualized expense ratio, multiplied by the average account value over the period, multiplied by 181/365 (to reflect the one-half year period).
Annual Report
Spartan® Total Market Index Fund
Performance: The Bottom Line
Average annual total return reflects the change in the value of an investment, assuming reinvestment of the class' distributions from dividend income and capital gains (the profits earned upon the sale of securities that have grown in value, if any) and assuming a constant rate of performance each year. The $10,000 table and the fund's returns does not reflect the deduction of taxes that a shareholder would pay on fund distributions or the redemption of fund shares. During periods of reimbursement by Fidelity, a fund's total return will be greater than it would be had the reimbursement not occurred. How a fund did yesterday is no guarantee of how it will do tomorrow.
Average Annual Total Returns
Periods ended February 28, 2014 | Past 1 | Past 5 | Past 10 |
Spartan® Total Market Index Fund - Institutional ClassA | 26.69% | 23.89% | 7.81% |
Spartan Total Market Index Fund - Fidelity Advantage® Institutional ClassB | 26.67% | 23.90% | 7.82% |
A The initial offering of Institutional Class shares took place September 8, 2011. Returns between October 14, 2005 and September 8, 2011 are those of Fidelity Advantage Class. Returns prior to October 14, 2005 are those of Investor Class.
B The initial offering of Fidelity Advantage® Institutional Class shares took place September 8, 2011. Returns between October 14, 2005 and September 8, 2011 are those of Fidelity Advantage Class. Returns prior to October 14, 2005 are those of Investor Class.
$10,000 Over 10 Years
Let's say hypothetically that $10,000 was invested in Spartan Total Market Index Fund - Institutional Class on February 29, 2004. The chart shows how the value of your investment would have changed, and also shows how the Dow Jones U.S. Total Stock Market IndexSM performed over the same period. The initial offering of Institutional Class took place on September 8, 2011. See above for additional information regarding the performance of Institutional Class.
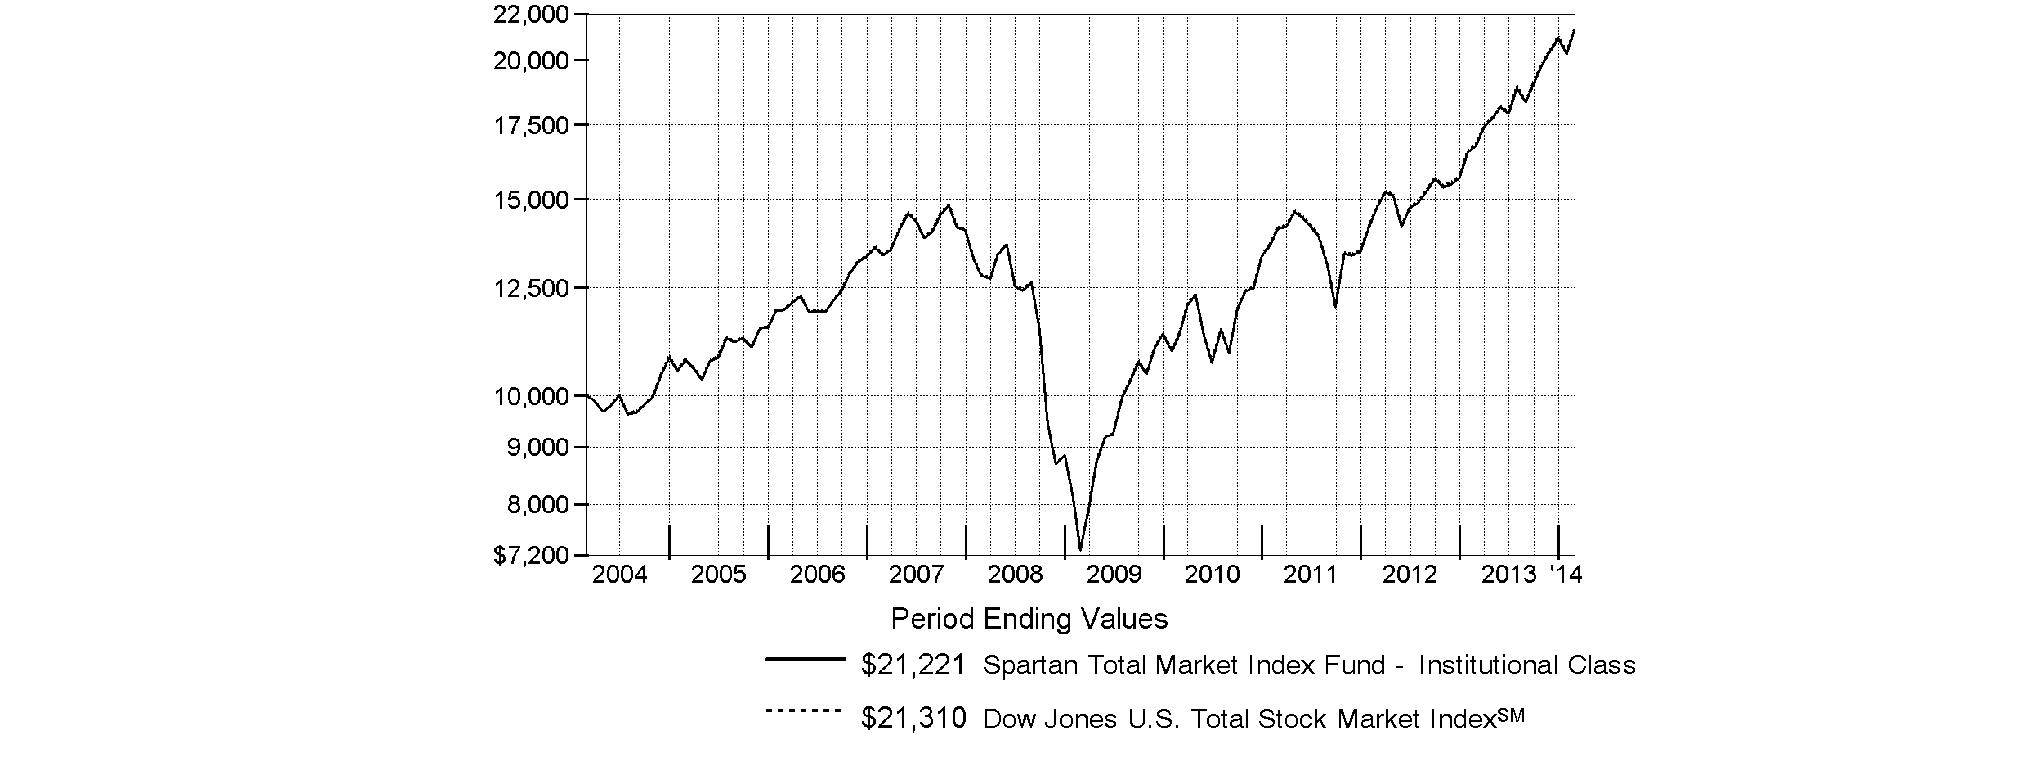
Annual Report
Spartan Total Market Index Fund
Management's Discussion of Fund Performance
Market Recap: Stocks overcame fears of higher interest rates - not to mention their worst January in four years - to finish sharply higher for the 12 months ending February 28, 2014. The broad S&P 500® Index and the blue-chip Dow Jones Industrial AverageSM gained 25.37% and 19.01%, respectively, amid generally favorable earnings reports and accommodative monetary policies worldwide. Performance generally increased along the risk spectrum, with smaller-cap and growth strategies leading the way. An ebullient market helped the growth-oriented Nasdaq Composite Index® to a 38.10% period gain, for example. On the other hand, both cyclical and defensive stocks had representation in the top-performing industry sectors: returns were highest in health care and consumer discretionary; lowest in utilities and telecommunication services. From a macroeconomic perspective, data still points to slow but steady improvement in the U.S., and Europe's recession may well be over. Reports from China have disappointed, but continue to suggest a relatively soft landing there. Mixed signals from the U.S. Federal Reserve as to when it might curtail its stimulative bond buying kept markets in flux during the spring and summer. Stocks regained momentum in October despite a federal budget impasse and brief government shutdown, and lower volatility prevailed through year-end. Shedding new-year concerns about China's economy, an emerging-markets sell-off and confirmation (at last) of Fed tapering - alongside confirmation of a presumably dovish Janet Yellen as new Fed chair - February saw stocks back in record territory, bearing down on the five-year anniversary of the market's bottom.
Comments from Patrick Waddell, Senior Portfolio Manager of the Geode Capital Management, LLC, investment management team for Spartan® Total Market Index Fund: For the year, the fund's Institutional Class and Fidelity Advantage® Institutional Class shares gained 26.69% and 26.67%, respectively, in line with the 26.73% advance of the Dow Jones U.S. Total Stock Market IndexSM. In a strong market environment, all 10 sectors in the index gained ground, and all but one - telecommunication services - were up by double digits. On an individual basis, fund's top three contributors were all technology stocks and household names, as well as among the four largest stocks in the index. Internet search leader Google saw its shares rise 14% in a single day in October, thanks to better-than-expected earnings. Consumer products and computer manufacturer Apple also added value, as did software maker Microsoft, whose shares were up 42% as the company continued to generate strong financial results relative to Wall Street's expectations. Elsewhere, various health care stocks made a strong contribution, including biotechnology company Gilead Sciences, up 94%. In financials, two large banks, Wells Fargo and Bank of America, were notable contributors, gaining 36% and 48%, respectively, as the entire industry continued to bounce back from the financial crisis of 2008. On the negative side, IBM stood out, as the diversified technology company and major index component lost modest ground amid declining revenues. Tobacco company Philip Morris International struggled in an environment of slowing worldwide demand for cigarettes, while wireless communications service provider AT&T faced an increasingly competitive environment that threatened to cut into the company's revenues.
The views expressed above reflect those of the portfolio manager(s) only through the end of the period as stated on the cover of this report and do not necessarily represent the views of Fidelity or any other person in the Fidelity organization. Any such views are subject to change at any time based upon market or other conditions and Fidelity disclaims any responsibility to update such views. These views may not be relied on as investment advice and, because investment decisions for a Fidelity fund are based on numerous factors, may not be relied on as an indication of trading intent on behalf of any Fidelity fund.
Annual Report
Spartan Total Market Index Fund
Investment Changes (Unaudited)
Top Ten Stocks as of February 28, 2014 | ||
| % of fund's | % of fund's net assets |
Apple, Inc. | 2.2 | 2.5 |
Exxon Mobil Corp. | 2.0 | 2.1 |
Google, Inc. Class A | 1.6 | 1.3 |
Microsoft Corp. | 1.4 | 1.4 |
Johnson & Johnson | 1.2 | 1.3 |
General Electric Co. | 1.2 | 1.3 |
Wells Fargo & Co. | 1.1 | 1.1 |
Chevron Corp. | 1.1 | 1.3 |
Procter & Gamble Co. | 1.0 | 1.2 |
JPMorgan Chase & Co. | 1.0 | 1.0 |
| 13.8 | |
Market Sectors as of February 28, 2014 | ||
| % of fund's | % of fund's net assets |
Information Technology | 18.0 | 17.3 |
Financials | 16.9 | 17.2 |
Health Care | 13.1 | 12.4 |
Consumer Discretionary | 13.0 | 12.9 |
Industrials | 11.4 | 11.0 |
Energy | 9.1 | 9.7 |
Consumer Staples | 8.1 | 8.8 |
Materials | 3.8 | 3.7 |
Utilities | 3.0 | 3.2 |
Telecommunication Services | 2.3 | 2.2 |
Annual Report
Spartan Total Market Index Fund
Investments February 28, 2014
Showing Percentage of Net Assets
Common Stocks - 98.7% | |||
Shares | Value | ||
CONSUMER DISCRETIONARY - 13.0% | |||
Auto Components - 0.6% | |||
Allison Transmission Holdings, Inc. | 92,033 | $ 2,740,743 | |
American Axle & Manufacturing Holdings, Inc. (a)(d) | 58,540 | 1,131,578 | |
Autoliv, Inc. | 118,893 | 11,454,152 | |
BorgWarner, Inc. | 243,952 | 14,990,850 | |
Cooper Tire & Rubber Co. | 62,365 | 1,554,759 | |
Dana Holding Corp. (d) | 143,074 | 3,101,844 | |
Delphi Automotive PLC | 315,399 | 20,996,111 | |
Dorman Products, Inc. (a)(d) | 32,717 | 1,885,154 | |
Drew Industries, Inc. | 24,362 | 1,199,585 | |
Federal-Mogul Corp. Class A (a) | 65,766 | 1,239,031 | |
Fox Factory Holding Corp. | 10,471 | 174,866 | |
Fuel Systems Solutions, Inc. (a) | 20,668 | 265,584 | |
Gentex Corp. (d) | 174,142 | 5,462,835 | |
Gentherm, Inc. (a)(d) | 38,502 | 1,088,837 | |
Johnson Controls, Inc. | 761,885 | 37,637,119 | |
Lear Corp. | 91,325 | 7,415,590 | |
Modine Manufacturing Co. (a) | 42,412 | 627,273 | |
Motorcar Parts of America, Inc. (a) | 17,588 | 433,192 | |
Quantum Fuel Systems Technologies Worldwide, Inc. (a) | 11,722 | 101,161 | |
Remy International, Inc. | 14,427 | 321,578 | |
Spartan Motors, Inc. | 44,931 | 254,759 | |
Standard Motor Products, Inc. | 17,952 | 631,013 | |
Stoneridge, Inc. (a) | 33,804 | 372,182 | |
Strattec Security Corp. | 672 | 46,852 | |
Superior Industries International, Inc. | 32,436 | 592,930 | |
Tenneco, Inc. (a) | 64,500 | 3,885,480 | |
The Goodyear Tire & Rubber Co. | 279,104 | 7,499,524 | |
Tower International, Inc. (a) | 19,656 | 504,766 | |
TRW Automotive Holdings Corp. (a)(d) | 137,074 | 11,283,932 | |
UQM Technologies, Inc. (a)(d) | 38,648 | 66,861 | |
Visteon Corp. (a) | 54,951 | 4,584,562 | |
| 143,544,703 | ||
Automobiles - 0.7% | |||
Ford Motor Co. | 4,410,723 | 67,881,027 | |
General Motors Co. | 1,463,920 | 52,993,904 | |
Harley-Davidson, Inc. | 252,087 | 16,652,867 | |
Tesla Motors, Inc. (a)(d) | 92,060 | 22,537,209 | |
Thor Industries, Inc. (d) | 46,074 | 2,580,605 | |
Winnebago Industries, Inc. (a) | 39,123 | 1,043,019 | |
| 163,688,631 | ||
Distributors - 0.1% | |||
Core-Mark Holding Co., Inc. | 11,158 | 872,556 | |
Genuine Parts Co. | 171,602 | 15,116,420 | |
LKQ Corp. (a) | 344,122 | 9,597,563 | |
Pool Corp. (d) | 48,205 | 2,818,064 | |
VOXX International Corp. (a) | 18,073 | 234,949 | |
Weyco Group, Inc. | 1,992 | 52,549 | |
| 28,692,101 | ||
| |||
Shares | Value | ||
Diversified Consumer Services - 0.2% | |||
American Public Education, Inc. (a)(d) | 16,975 | $ 601,255 | |
Apollo Ed Group, Inc. Class A (non-vtg.) (a)(d) | 111,836 | 3,727,494 | |
Ascent Capital Group, Inc. (a)(d) | 16,905 | 1,241,334 | |
Bridgepoint Education, Inc. (a) | 9,049 | 174,555 | |
Bright Horizons Family Solutions, Inc. (a) | 22,321 | 881,010 | |
Capella Education Co. (d) | 13,812 | 918,222 | |
Career Education Corp. (a) | 44,821 | 331,227 | |
Carriage Services, Inc. | 15,957 | 326,002 | |
Collectors Universe, Inc. (d) | 4,772 | 85,896 | |
Corinthian Colleges, Inc. (a)(d) | 84,173 | 131,310 | |
DeVry, Inc. | 60,163 | 2,527,448 | |
Education Management Corp. (a)(d) | 26,671 | 158,426 | |
Graham Holdings Co. | 4,705 | 3,381,484 | |
Grand Canyon Education, Inc. (a)(d) | 52,030 | 2,466,222 | |
H&R Block, Inc. | 306,192 | 9,687,915 | |
Hillenbrand, Inc. | 60,464 | 1,806,664 | |
Houghton Mifflin Harcourt Co. | 90,368 | 1,836,278 | |
ITT Educational Services, Inc. (a)(d) | 22,063 | 684,615 | |
K12, Inc. (a) | 35,687 | 807,597 | |
Learning Tree International, Inc. (a) | 3,285 | 10,413 | |
LifeLock, Inc. (a)(d) | 108,404 | 2,158,324 | |
Lincoln Educational Services Corp. | 15,671 | 70,520 | |
Matthews International Corp. Class A (d) | 31,601 | 1,296,589 | |
National American University Holdings, Inc. | 5,378 | 20,221 | |
Regis Corp. (d) | 37,626 | 529,022 | |
Service Corp. International | 236,136 | 4,413,382 | |
Sotheby's Class A (Ltd. vtg.) | 74,799 | 3,516,301 | |
Steiner Leisure Ltd. (a) | 10,649 | 470,899 | |
Strayer Education, Inc. (a)(d) | 14,558 | 695,436 | |
Universal Technical Institute, Inc. | 29,419 | 398,039 | |
Weight Watchers International, Inc. (d) | 23,857 | 507,200 | |
| 45,861,300 | ||
Hotels, Restaurants & Leisure - 2.0% | |||
Ambassadors Group, Inc. | 24,177 | 95,499 | |
Bally Technologies, Inc. (a)(d) | 46,562 | 3,154,576 | |
Biglari Holdings, Inc. (d) | 1,404 | 630,382 | |
BJ's Restaurants, Inc. (a)(d) | 35,904 | 994,541 | |
Bloomin' Brands, Inc. (a) | 77,659 | 1,952,347 | |
Bob Evans Farms, Inc. | 27,901 | 1,443,598 | |
Boyd Gaming Corp. (a) | 82,652 | 960,416 | |
Bravo Brio Restaurant Group, Inc. (a) | 12,451 | 192,866 | |
Brinker International, Inc. | 84,914 | 4,670,270 | |
Buffalo Wild Wings, Inc. (a)(d) | 20,168 | 2,924,360 | |
Burger King Worldwide, Inc. | 82,686 | 2,197,794 | |
Caesars Entertainment Corp. (a) | 37,816 | 981,703 | |
Carnival Corp. unit | 487,062 | 19,316,879 | |
Carrols Restaurant Group, Inc. (a) | 6,381 | 45,305 | |
Chipotle Mexican Grill, Inc. (a)(d) | 34,438 | 19,464,702 | |
Choice Hotels International, Inc. (d) | 44,031 | 2,150,034 | |
Churchill Downs, Inc. | 15,167 | 1,410,531 | |
Common Stocks - continued | |||
Shares | Value | ||
CONSUMER DISCRETIONARY - continued | |||
Hotels, Restaurants & Leisure - continued | |||
Chuys Holdings, Inc. (a)(d) | 13,590 | $ 541,018 | |
ClubCorp Holdings, Inc. | 20,697 | 360,542 | |
Cosi, Inc. (a)(d) | 11,735 | 15,490 | |
Cracker Barrel Old Country Store, Inc. | 24,866 | 2,472,924 | |
Darden Restaurants, Inc. | 141,692 | 7,234,794 | |
Del Frisco's Restaurant Group, Inc. (a) | 28,720 | 747,869 | |
Denny's Corp. (a) | 71,197 | 484,140 | |
Diamond Resorts International, Inc. | 18,779 | 341,590 | |
DineEquity, Inc. | 19,807 | 1,658,836 | |
Domino's Pizza, Inc. | 66,862 | 5,286,110 | |
Dover Downs Gaming & Entertainment, Inc. (a) | 1,508 | 2,337 | |
Dover Motorsports, Inc. | 9,993 | 22,584 | |
Dunkin' Brands Group, Inc. | 121,165 | 6,260,596 | |
Einstein Noah Restaurant Group, Inc. | 3,797 | 56,651 | |
Empire Resorts, Inc. (a)(d) | 5,314 | 41,024 | |
Entertainment Gaming Asia, Inc. (a) | 8,246 | 9,318 | |
Extended Stay America, Inc. unit | 49,140 | 1,252,087 | |
Famous Dave's of America, Inc. (a) | 2,311 | 56,573 | |
Fiesta Restaurant Group, Inc. (a) | 33,170 | 1,666,129 | |
Frisch's Restaurants, Inc. | 500 | 11,910 | |
Hyatt Hotels Corp. Class A (a)(d) | 74,342 | 3,877,679 | |
Ignite Restaurant Group, Inc. (a)(d) | 4,841 | 59,254 | |
International Game Technology | 268,403 | 4,050,201 | |
International Speedway Corp. Class A (d) | 27,626 | 931,825 | |
Interval Leisure Group, Inc. | 46,155 | 1,254,954 | |
Isle of Capri Casinos, Inc. (a) | 20,657 | 185,913 | |
Jack in the Box, Inc. (a) | 42,139 | 2,420,886 | |
Jamba, Inc. (a)(d) | 19,136 | 241,688 | |
Kona Grill, Inc. (a) | 4,029 | 77,760 | |
Krispy Kreme Doughnuts, Inc. (a)(d) | 81,924 | 1,558,194 | |
Lakes Entertainment, Inc. (a) | 2,872 | 14,504 | |
Las Vegas Sands Corp. | 430,440 | 36,695,010 | |
Life Time Fitness, Inc. (a)(d) | 38,055 | 1,796,196 | |
Luby's, Inc. (a) | 14,614 | 92,799 | |
Marcus Corp. | 22,859 | 322,540 | |
Marriott International, Inc. Class A | 251,677 | 13,648,444 | |
Marriott Vacations Worldwide Corp. (a) | 31,069 | 1,629,258 | |
McDonald's Corp. | 1,103,535 | 105,001,355 | |
MGM Mirage, Inc. (a)(d) | 371,095 | 10,223,667 | |
Monarch Casino & Resort, Inc. (a) | 4,802 | 90,518 | |
Morgans Hotel Group Co. (a) | 27,678 | 221,424 | |
MTR Gaming Group, Inc. (a) | 11,304 | 59,798 | |
Multimedia Games Holding Co., Inc. (a) | 28,049 | 926,318 | |
Noodles & Co. (d) | 16,951 | 674,819 | |
Norwegian Cruise Line Holdings Ltd. (a) | 107,864 | 3,696,499 | |
Orient Express Hotels Ltd. Class A (a) | 110,162 | 1,696,495 | |
Panera Bread Co. Class A (a)(d) | 29,209 | 5,296,176 | |
Papa John's International, Inc. | 38,520 | 1,960,668 | |
Penn National Gaming, Inc. (a) | 66,856 | 859,100 | |
Pinnacle Entertainment, Inc. (a)(d) | 61,922 | 1,504,705 | |
| |||
Shares | Value | ||
Pizza Inn Holdings, Inc. (a) | 9,079 | $ 57,924 | |
Popeyes Louisiana Kitchen, Inc. (a) | 24,822 | 994,369 | |
Potbelly Corp. (d) | 17,598 | 376,773 | |
Premier Exhibitions, Inc. (a) | 7,733 | 6,805 | |
Red Lion Hotels Corp. (a) | 3,129 | 18,680 | |
Red Robin Gourmet Burgers, Inc. (a)(d) | 21,139 | 1,647,362 | |
Rick's Cabaret International, Inc. (a)(d) | 5,726 | 65,105 | |
Royal Caribbean Cruises Ltd. (d) | 178,138 | 9,428,844 | |
Ruby Tuesday, Inc. (a)(d) | 44,363 | 271,945 | |
Ruth's Hospitality Group, Inc. | 33,916 | 419,202 | |
Scientific Games Corp. Class A (a) | 45,645 | 611,643 | |
SeaWorld Entertainment, Inc. | 59,356 | 2,026,414 | |
Six Flags Entertainment Corp. | 100,414 | 4,096,891 | |
Sonic Corp. (a) | 98,965 | 2,016,907 | |
Speedway Motorsports, Inc. | 7,569 | 150,018 | |
Starbucks Corp. | 841,635 | 59,722,420 | |
Starwood Hotels & Resorts Worldwide, Inc. | 213,692 | 17,621,042 | |
Texas Roadhouse, Inc. Class A | 57,171 | 1,512,173 | |
The Cheesecake Factory, Inc. (d) | 58,805 | 2,794,414 | |
Town Sports International Holdings, Inc. | 13,107 | 119,012 | |
Vail Resorts, Inc. | 38,833 | 2,730,737 | |
Wendy's Co. | 318,091 | 3,047,312 | |
Wyndham Worldwide Corp. | 137,748 | 10,039,074 | |
Wynn Resorts Ltd. | 89,427 | 21,685,153 | |
Yum! Brands, Inc. | 502,140 | 37,198,531 | |
| 470,835,722 | ||
Household Durables - 0.6% | |||
Bassett Furniture Industries, Inc. | 1,947 | 29,166 | |
Beazer Homes U.S.A., Inc. (a)(d) | 23,951 | 555,424 | |
Blyth, Inc. (d) | 16,038 | 156,852 | |
Cavco Industries, Inc. (a)(d) | 9,813 | 769,830 | |
Cobra Electronics Corp. (a) | 1,032 | 3,498 | |
Comstock Holding Companies, Inc. Class A (a)(d) | 10,474 | 18,434 | |
CSS Industries, Inc. | 16,118 | 435,186 | |
D.R. Horton, Inc. (d) | 306,554 | 7,528,966 | |
Dixie Group, Inc. (a) | 6,244 | 93,660 | |
Emerson Radio Corp. (a) | 23,724 | 51,007 | |
Ethan Allen Interiors, Inc. (d) | 25,611 | 643,604 | |
Flexsteel Industries, Inc. | 2,547 | 94,621 | |
Garmin Ltd. (d) | 139,580 | 7,489,863 | |
Harman International Industries, Inc. | 77,256 | 8,091,021 | |
Helen of Troy Ltd. (a) | 38,566 | 2,518,745 | |
Hooker Furniture Corp. | 13,495 | 203,775 | |
Hovnanian Enterprises, Inc. Class A (a)(d) | 177,163 | 1,075,379 | |
iRobot Corp. (a)(d) | 34,979 | 1,466,320 | |
Jarden Corp. (a) | 133,580 | 8,211,163 | |
KB Home (d) | 76,789 | 1,566,496 | |
Kid Brands, Inc. (a) | 16,651 | 11,323 | |
Koss Corp. | 2,669 | 12,304 | |
La-Z-Boy, Inc. | 54,902 | 1,402,197 | |
Leggett & Platt, Inc. (d) | 173,875 | 5,572,694 | |
Common Stocks - continued | |||
Shares | Value | ||
CONSUMER DISCRETIONARY - continued | |||
Household Durables - continued | |||
Lennar Corp. Class A | 188,180 | $ 8,257,338 | |
Libbey, Inc. (a) | 16,641 | 387,569 | |
Lifetime Brands, Inc. | 2,385 | 39,925 | |
M.D.C. Holdings, Inc. (d) | 36,801 | 1,147,823 | |
M/I Homes, Inc. (a)(d) | 24,871 | 619,288 | |
Meritage Homes Corp. (a) | 46,552 | 2,244,272 | |
Mohawk Industries, Inc. (a) | 71,448 | 10,112,035 | |
NACCO Industries, Inc. Class A | 6,219 | 364,620 | |
Newell Rubbermaid, Inc. | 312,041 | 10,019,637 | |
NVR, Inc. (a) | 5,106 | 6,086,352 | |
Parametric Sound Corp. (a)(d) | 6,672 | 99,012 | |
PulteGroup, Inc. | 383,741 | 8,054,724 | |
Ryland Group, Inc. | 46,168 | 2,150,967 | |
Skullcandy, Inc. (a) | 12,653 | 106,412 | |
Skyline Corp. (a) | 21,741 | 125,011 | |
Standard Pacific Corp. (a)(d) | 138,811 | 1,264,568 | |
Stanley Furniture Co., Inc. (a) | 5,699 | 17,211 | |
Taylor Morrison Home Corp. | 26,856 | 674,623 | |
Tempur Sealy International, Inc. (a) | 69,336 | 3,596,458 | |
Toll Brothers, Inc. (a)(d) | 153,983 | 6,006,877 | |
TRI Pointe Homes, Inc. (d) | 13,100 | 238,682 | |
Tupperware Brands Corp. | 56,734 | 4,459,292 | |
UCP, Inc. | 9,479 | 150,716 | |
Universal Electronics, Inc. (a) | 14,332 | 598,934 | |
WCI Communities, Inc. | 8,622 | 173,992 | |
Whirlpool Corp. | 87,714 | 12,686,076 | |
William Lyon Homes, Inc. (a) | 5,678 | 175,621 | |
Zagg, Inc. (a)(d) | 21,268 | 92,090 | |
| 127,951,653 | ||
Internet & Catalog Retail - 1.3% | |||
1-800-FLOWERS.com, Inc. Class A (a) | 31,570 | 166,058 | |
Amazon.com, Inc. (a) | 416,019 | 150,640,480 | |
Blue Nile, Inc. (a)(d) | 11,337 | 398,949 | |
dELiA*s, Inc. (a)(d) | 2,977 | 3,215 | |
Expedia, Inc. | 112,037 | 8,798,266 | |
FTD Companies, Inc. (a)(d) | 14,396 | 447,140 | |
Gaiam, Inc. Class A (a) | 12,609 | 81,202 | |
Geeknet, Inc. (a) | 2,810 | 40,914 | |
Groupon, Inc. Class A (a)(d) | 426,564 | 3,544,747 | |
HomeAway, Inc. (a)(d) | 82,532 | 3,785,743 | |
HSN, Inc. | 37,772 | 2,166,224 | |
Liberty Interactive Corp.: | |||
(Venture Group) Series A (a) | 40,463 | 5,766,382 | |
Series A (a) | 531,914 | 15,531,889 | |
Netflix, Inc. (a) | 66,145 | 29,476,196 | |
NutriSystem, Inc. | 26,922 | 396,292 | |
Orbitz Worldwide, Inc. (a) | 31,286 | 302,223 | |
Overstock.com, Inc. (a)(d) | 14,467 | 284,566 | |
PetMed Express, Inc. (d) | 32,292 | 445,630 | |
priceline.com, Inc. (a) | 57,502 | 77,560,998 | |
RetailMeNot, Inc. | 11,243 | 469,620 | |
| |||
Shares | Value | ||
Shutterfly, Inc. (a)(d) | 48,378 | $ 2,639,504 | |
TripAdvisor, Inc. (a) | 123,509 | 12,380,542 | |
U.S. Auto Parts Network, Inc. (a) | 5,048 | 10,399 | |
ValueVision Media, Inc. Class A (a) | 41,726 | 233,248 | |
Vitacost.com, Inc. (a)(d) | 15,384 | 114,611 | |
zulily, Inc. (d) | 24,900 | 1,702,911 | |
| 317,387,949 | ||
Leisure Equipment & Products - 0.2% | |||
Arctic Cat, Inc. | 18,718 | 876,377 | |
Black Diamond, Inc. (a)(d) | 20,004 | 211,642 | |
Brunswick Corp. | 91,271 | 4,088,028 | |
Callaway Golf Co. | 77,147 | 649,578 | |
Hasbro, Inc. | 122,518 | 6,758,093 | |
JAKKS Pacific, Inc. (d) | 19,661 | 140,773 | |
Johnson Outdoors, Inc. Class A | 3,505 | 77,320 | |
Leapfrog Enterprises, Inc. Class A (a)(d) | 85,630 | 623,386 | |
Marine Products Corp. | 11,741 | 99,916 | |
Mattel, Inc. | 388,136 | 14,481,354 | |
Nautilus, Inc. (a) | 31,083 | 260,786 | |
Polaris Industries, Inc. | 67,562 | 9,055,335 | |
Smith & Wesson Holding Corp. (a)(d) | 80,794 | 929,131 | |
Sturm, Ruger & Co., Inc. (d) | 24,417 | 1,556,340 | |
Summer Infant, Inc. (a) | 32,605 | 60,319 | |
| 39,868,378 | ||
Media - 3.5% | |||
A.H. Belo Corp. Class A | 22,177 | 244,834 | |
AMC Networks, Inc. Class A (a)(d) | 63,313 | 4,813,054 | |
Ballantyne of Omaha, Inc. (a) | 17,964 | 83,173 | |
Cablevision Systems Corp. - NY Group Class A (d) | 252,827 | 4,449,755 | |
Carmike Cinemas, Inc. (a) | 21,753 | 647,152 | |
CBS Corp. Class B | 612,367 | 41,077,578 | |
Central European Media Enterprises Ltd. Class A (a)(d) | 56,729 | 268,895 | |
Charter Communications, Inc. Class A (a)(d) | 75,058 | 9,515,103 | |
Cinemark Holdings, Inc. | 124,821 | 3,672,234 | |
Clear Channel Outdoor Holding, Inc. Class A | 41,131 | 413,367 | |
Comcast Corp. Class A | 2,920,366 | 150,953,719 | |
Crown Media Holdings, Inc. Class A (a)(d) | 24,979 | 83,680 | |
Cumulus Media, Inc. Class A (a) | 122,704 | 804,938 | |
Digital Cinema Destinations Co. (a) | 1,935 | 10,836 | |
DIRECTV (a) | 546,908 | 42,440,061 | |
Discovery Communications, Inc. Class A (a)(d) | 266,951 | 22,242,357 | |
DISH Network Corp. Class A (a) | 230,721 | 13,575,624 | |
DreamWorks Animation SKG, Inc. Class A (a)(d) | 82,729 | 2,474,424 | |
E.W. Scripps Co. Class A (a) | 24,274 | 476,256 | |
Emmis Communications Corp. Class A (a) | 7,973 | 25,035 | |
Common Stocks - continued | |||
Shares | Value | ||
CONSUMER DISCRETIONARY - continued | |||
Media - continued | |||
Entercom Communications Corp. | 21,235 | $ 210,014 | |
Entravision Communication Corp. | 63,982 | 424,201 | |
FAB Universal Corp. (a)(d) | 3,212 | 9,861 | |
Gannett Co., Inc. | 257,425 | 7,658,394 | |
Gray Television, Inc. (a) | 54,130 | 636,028 | |
Harte-Hanks, Inc. | 45,482 | 363,401 | |
Hemisphere Media Group, Inc. (a)(d) | 2,493 | 27,772 | |
Insignia Systems, Inc. (a) | 5,038 | 15,719 | |
Interpublic Group of Companies, Inc. | 525,417 | 9,310,389 | |
John Wiley & Sons, Inc. Class A (d) | 54,942 | 3,188,284 | |
Journal Communications, Inc. Class A (a) | 23,068 | 211,534 | |
Lamar Advertising Co. Class A (a) | 69,336 | 3,717,103 | |
Liberty Global PLC Class A (a) | 419,364 | 36,295,954 | |
Liberty Media Corp. Class A (a) | 117,554 | 16,123,707 | |
Live Nation Entertainment, Inc. (a) | 175,329 | 3,978,215 | |
Loral Space & Communications Ltd. (a) | 15,593 | 1,232,159 | |
Martha Stewart Living Omnimedia, Inc. Class A (a)(d) | 39,255 | 206,481 | |
Media General, Inc. Class A (a)(d) | 21,745 | 412,503 | |
Meredith Corp. | 34,788 | 1,628,078 | |
Morningstar, Inc. | 26,885 | 2,249,199 | |
National CineMedia, Inc. | 63,847 | 980,690 | |
News Corp. Class A (a) | 570,404 | 10,455,505 | |
Nexstar Broadcasting Group, Inc. | 29,134 | 1,243,439 | |
Omnicom Group, Inc. | 286,890 | 21,711,835 | |
Radio One, Inc. Class D (non-vtg.) (a) | 32,336 | 160,710 | |
ReachLocal, Inc. (a)(d) | 5,194 | 54,953 | |
Regal Entertainment Group Class A (d) | 109,971 | 2,023,466 | |
Rentrak Corp. (a) | 11,595 | 743,355 | |
RLJ Entertainment, Inc. (a) | 17,180 | 75,592 | |
Saga Communications, Inc. Class A | 268 | 13,108 | |
Salem Communications Corp. Class A | 1,732 | 15,744 | |
Scholastic Corp. (d) | 25,364 | 894,842 | |
Scripps Networks Interactive, Inc. Class A | 122,180 | 9,925,903 | |
SFX Entertainment, Inc. (d) | 45,804 | 393,456 | |
Sinclair Broadcast Group, Inc. Class A | 75,746 | 2,243,597 | |
Sirius XM Holdings, Inc. (a)(d) | 3,471,318 | 12,531,458 | |
Sizmek, Inc. (a) | 26,444 | 327,641 | |
Spanish Broadcasting System, Inc. | 698 | 3,015 | |
Starz - Liberty Capital Series A (a) | 120,965 | 3,868,461 | |
The Madison Square Garden Co. | 76,074 | 4,336,979 | |
The McClatchy Co. Class A (a)(d) | 60,729 | 322,471 | |
The New York Times Co. Class A (d) | 162,888 | 2,674,621 | |
The Walt Disney Co. | 1,835,422 | 148,320,452 | |
Time Warner Cable, Inc. | 315,166 | 44,233,548 | |
Time Warner, Inc. | 1,015,248 | 68,153,598 | |
Twenty-First Century Fox, Inc. Class A | 2,209,366 | 74,102,136 | |
| |||
Shares | Value | ||
Viacom, Inc. Class B (non-vtg.) | 455,180 | $ 39,932,941 | |
World Wrestling Entertainment, Inc. | 44,310 | 1,015,585 | |
| 836,930,172 | ||
Multiline Retail - 0.6% | |||
Big Lots, Inc. (a)(d) | 72,215 | 2,133,953 | |
Burlington Stores, Inc. | 29,361 | 800,087 | |
Dillard's, Inc. Class A | 32,687 | 3,026,162 | |
Dollar General Corp. (a) | 325,481 | 19,496,312 | |
Dollar Tree, Inc. (a) | 232,809 | 12,750,949 | |
Family Dollar Stores, Inc. | 100,910 | 6,609,605 | |
Fred's, Inc. Class A | 41,012 | 817,369 | |
Gordmans Stores, Inc. | 10,233 | 64,980 | |
J.C. Penney Co., Inc. (a)(d) | 341,476 | 2,485,945 | |
Kohl's Corp. (d) | 228,989 | 12,866,892 | |
Macy's, Inc. | 412,775 | 23,883,162 | |
Nordstrom, Inc. (d) | 167,016 | 10,268,144 | |
Sears Holdings Corp. (a)(d) | 47,917 | 2,144,286 | |
Target Corp. | 708,070 | 44,282,698 | |
The Bon-Ton Stores, Inc. (d) | 19,775 | 214,757 | |
Tuesday Morning Corp. (a) | 41,198 | 644,337 | |
| 142,489,638 | ||
Specialty Retail - 2.3% | |||
Aarons, Inc. Class A | 97,238 | 2,988,124 | |
Abercrombie & Fitch Co. Class A | 83,791 | 3,320,637 | |
Advance Auto Parts, Inc. | 81,101 | 10,329,023 | |
Aeropostale, Inc. (a)(d) | 70,783 | 519,547 | |
America's Car Mart, Inc. (a)(d) | 10,422 | 377,693 | |
American Eagle Outfitters, Inc. | 183,756 | 2,669,975 | |
ANN, Inc. (a) | 46,918 | 1,672,627 | |
Asbury Automotive Group, Inc. (a) | 30,567 | 1,554,026 | |
Ascena Retail Group, Inc. (a) | 155,242 | 2,839,376 | |
AutoNation, Inc. (a)(d) | 67,092 | 3,531,723 | |
AutoZone, Inc. (a)(d) | 38,173 | 20,553,870 | |
Barnes & Noble, Inc. (a)(d) | 41,457 | 794,316 | |
bebe stores, Inc. | 66,951 | 406,393 | |
Bed Bath & Beyond, Inc. (a)(d) | 238,027 | 16,142,991 | |
Best Buy Co., Inc. (d) | 298,597 | 7,951,638 | |
Big 5 Sporting Goods Corp. | 16,237 | 246,478 | |
Body Central Corp. (a)(d) | 23,522 | 73,389 | |
Books-A-Million, Inc. (a) | 4,414 | 9,932 | |
Brown Shoe Co., Inc. | 39,452 | 969,730 | |
Build-A-Bear Workshop, Inc. (a) | 4,049 | 31,339 | |
Cabela's, Inc. Class A (a)(d) | 48,135 | 3,192,313 | |
Cache, Inc. (a) | 2,880 | 15,264 | |
CarMax, Inc. (a)(d) | 255,540 | 12,375,802 | |
Chico's FAS, Inc. | 157,246 | 2,599,276 | |
Christopher & Banks Corp. (a) | 22,706 | 151,222 | |
Citi Trends, Inc. (a) | 14,433 | 236,701 | |
Coldwater Creek, Inc. (a)(d) | 13,235 | 10,363 | |
Conn's, Inc. (a)(d) | 26,557 | 950,741 | |
CST Brands, Inc. (d) | 80,048 | 2,603,961 | |
Destination Maternity Corp. | 9,860 | 278,446 | |
Common Stocks - continued | |||
Shares | Value | ||
CONSUMER DISCRETIONARY - continued | |||
Specialty Retail - continued | |||
Destination XL Group, Inc. (a) | 42,389 | $ 241,617 | |
Dick's Sporting Goods, Inc. | 112,695 | 6,048,341 | |
DSW, Inc. Class A | 85,923 | 3,306,317 | |
Express, Inc. (a)(d) | 106,219 | 1,942,746 | |
Finish Line, Inc. Class A | 46,538 | 1,257,457 | |
Five Below, Inc. (a)(d) | 50,515 | 1,946,848 | |
Foot Locker, Inc. | 173,316 | 7,229,010 | |
Francesca's Holdings Corp. (a)(d) | 45,454 | 889,535 | |
GameStop Corp. Class A (d) | 126,929 | 4,735,721 | |
Gap, Inc. | 291,066 | 12,734,138 | |
Genesco, Inc. (a)(d) | 32,141 | 2,386,469 | |
GNC Holdings, Inc. | 100,621 | 4,680,889 | |
Group 1 Automotive, Inc. | 20,341 | 1,357,965 | |
Guess?, Inc. (d) | 63,670 | 1,931,748 | |
Haverty Furniture Companies, Inc. | 22,550 | 657,333 | |
hhgregg, Inc. (a)(d) | 15,184 | 160,799 | |
Hibbett Sports, Inc. (a)(d) | 34,547 | 1,980,580 | |
Home Depot, Inc. | 1,576,595 | 129,328,088 | |
Jos. A. Bank Clothiers, Inc. (a)(d) | 27,787 | 1,725,017 | |
Kirkland's, Inc. (a) | 10,699 | 189,158 | |
L Brands, Inc. | 276,125 | 15,554,121 | |
Lithia Motors, Inc. Class A (sub. vtg.) | 20,666 | 1,310,638 | |
Lowe's Companies, Inc. | 1,177,450 | 58,907,824 | |
Lumber Liquidators Holdings, Inc. (a)(d) | 28,798 | 3,089,449 | |
MarineMax, Inc. (a)(d) | 17,627 | 253,829 | |
Mattress Firm Holding Corp. (a)(d) | 21,081 | 918,921 | |
Monro Muffler Brake, Inc. | 39,787 | 2,374,090 | |
Murphy U.S.A., Inc. (d) | 44,959 | 1,823,537 | |
New York & Co., Inc. (a) | 19,427 | 86,062 | |
O'Reilly Automotive, Inc. (a) | 120,525 | 18,181,196 | |
Office Depot, Inc. (a) | 562,961 | 2,775,398 | |
Outerwall, Inc. (a)(d) | 30,388 | 2,149,343 | |
Pacific Sunwear of California, Inc. (a) | 60,120 | 171,943 | |
Penske Automotive Group, Inc. | 59,093 | 2,558,136 | |
Perfumania Holdings, Inc. (a) | 876 | 5,475 | |
PetSmart, Inc. (d) | 112,024 | 7,512,329 | |
Pier 1 Imports, Inc. | 103,847 | 1,964,785 | |
RadioShack Corp. (a)(d) | 135,907 | 364,231 | |
Rent-A-Center, Inc. (d) | 61,802 | 1,553,702 | |
Restoration Hardware Holdings, Inc. (a) | 26,612 | 1,802,165 | |
Ross Stores, Inc. | 237,822 | 17,313,442 | |
Sally Beauty Holdings, Inc. (a) | 173,033 | 4,966,047 | |
Sears Hometown & Outlet Stores, Inc. (a) | 10,000 | 231,600 | |
Select Comfort Corp. (a) | 68,724 | 1,241,155 | |
Shoe Carnival, Inc. | 12,148 | 313,904 | |
Signet Jewelers Ltd. | 91,119 | 8,706,420 | |
Sonic Automotive, Inc. Class A (sub. vtg.) | 32,657 | 775,930 | |
Stage Stores, Inc. | 33,300 | 659,340 | |
Staples, Inc. (d) | 763,388 | 10,374,443 | |
Stein Mart, Inc. | 28,029 | 380,914 | |
Systemax, Inc. (a) | 6,560 | 77,211 | |
| |||
Shares | Value | ||
The Buckle, Inc. (d) | 31,903 | $ 1,447,439 | |
The Cato Corp. Class A (sub. vtg.) | 30,985 | 869,749 | |
The Children's Place Retail Stores, Inc. | 22,249 | 1,205,228 | |
The Container Store Group, Inc. (d) | 22,029 | 788,858 | |
The Men's Wearhouse, Inc. | 53,679 | 2,887,393 | |
The Pep Boys - Manny, Moe & Jack (a) | 83,764 | 1,054,589 | |
Tiffany & Co., Inc. | 125,464 | 11,699,518 | |
Tile Shop Holdings, Inc. (a)(d) | 33,873 | 522,322 | |
Tilly's, Inc. (a) | 6,806 | 81,400 | |
TJX Companies, Inc. | 803,532 | 49,385,077 | |
Tractor Supply Co. | 152,035 | 10,727,590 | |
Trans World Entertainment Corp. | 2,977 | 12,444 | |
Ulta Salon, Cosmetics & Fragrance, Inc. (a) | 70,571 | 6,329,513 | |
Urban Outfitters, Inc. (a) | 117,805 | 4,410,619 | |
Vitamin Shoppe, Inc. (a) | 37,155 | 1,738,482 | |
West Marine, Inc. (a) | 3,285 | 40,997 | |
Wet Seal, Inc. Class A (a) | 66,930 | 127,167 | |
Williams-Sonoma, Inc. (d) | 104,808 | 6,104,018 | |
Winmark Corp. | 391 | 30,905 | |
Zale Corp. (a) | 43,224 | 939,258 | |
Zumiez, Inc. (a) | 17,893 | 425,138 | |
| 553,351,976 | ||
Textiles, Apparel & Luxury Goods - 0.9% | |||
American Apparel, Inc. (a)(d) | 42,333 | 30,484 | |
Carter's, Inc. | 59,364 | 4,471,890 | |
Cherokee, Inc. | 20,319 | 288,936 | |
Coach, Inc. | 312,163 | 15,236,676 | |
Columbia Sportswear Co. | 17,213 | 1,430,228 | |
Crocs, Inc. (a) | 99,425 | 1,514,243 | |
Culp, Inc. | 7,038 | 135,693 | |
Deckers Outdoor Corp. (a)(d) | 36,096 | 2,683,738 | |
Delta Apparel, Inc. (a) | 1,905 | 30,842 | |
Fossil Group, Inc. (a) | 55,600 | 6,388,996 | |
G-III Apparel Group Ltd. (a) | 22,660 | 1,574,643 | |
Hanesbrands, Inc. | 122,600 | 8,984,128 | |
Iconix Brand Group, Inc. (a)(d) | 61,164 | 2,461,239 | |
Joe's Jeans, Inc. (a)(d) | 32,503 | 45,829 | |
Kate Spade & Co. (a) | 135,197 | 4,626,441 | |
lululemon athletica, Inc. (a)(d) | 116,534 | 5,862,826 | |
Michael Kors Holdings Ltd. (a) | 198,823 | 19,490,619 | |
Movado Group, Inc. | 22,005 | 866,337 | |
NIKE, Inc. Class B | 832,833 | 65,210,824 | |
Oxford Industries, Inc. (d) | 16,560 | 1,295,986 | |
Perry Ellis International, Inc. (a) | 7,954 | 110,958 | |
PVH Corp. | 91,345 | 11,548,748 | |
Quiksilver, Inc. (a)(d) | 190,833 | 1,488,497 | |
R.G. Barry Corp. | 3,640 | 67,413 | |
Ralph Lauren Corp. | 67,433 | 10,862,108 | |
Skechers U.S.A., Inc. Class A (sub. vtg.) (a) | 52,325 | 1,764,922 | |
Steven Madden Ltd. (a) | 61,062 | 2,225,710 | |
Superior Uniform Group, Inc. | 859 | 14,320 | |
The Jones Group, Inc. | 74,838 | 1,118,080 | |
Common Stocks - continued | |||
Shares | Value | ||
CONSUMER DISCRETIONARY - continued | |||
Textiles, Apparel & Luxury Goods - continued | |||
Tumi Holdings, Inc. (a)(d) | 57,908 | $ 1,283,241 | |
Under Armour, Inc. Class A (sub. vtg.) (a)(d) | 88,501 | 10,013,888 | |
Unifi, Inc. (a) | 18,843 | 466,176 | |
Vera Bradley, Inc. (a)(d) | 20,509 | 543,489 | |
VF Corp. | 392,352 | 22,987,904 | |
Vince Holding Corp. | 20,302 | 548,154 | |
Wolverine World Wide, Inc. (d) | 127,356 | 3,357,104 | |
| 211,031,310 | ||
TOTAL CONSUMER DISCRETIONARY | 3,081,633,533 | ||
CONSUMER STAPLES - 8.1% | |||
Beverages - 1.7% | |||
Beam, Inc. | 184,801 | 15,331,091 | |
Boston Beer Co., Inc. Class A (a)(d) | 9,413 | 2,228,528 | |
Brown-Forman Corp. Class B (non-vtg.) | 196,483 | 16,465,275 | |
Coca-Cola Bottling Co. Consolidated | 4,325 | 327,143 | |
Coca-Cola Enterprises, Inc. | 270,815 | 12,749,970 | |
Constellation Brands, Inc. Class A (sub. vtg.) (a) | 191,384 | 15,507,846 | |
Craft Brew Alliance, Inc. (a) | 5,908 | 96,478 | |
Dr. Pepper Snapple Group, Inc. | 262,765 | 13,692,684 | |
MGP Ingredients, Inc. | 4,299 | 24,418 | |
Molson Coors Brewing Co. Class B | 177,848 | 10,107,102 | |
Monster Beverage Corp. (a) | 148,866 | 11,016,084 | |
National Beverage Corp. | 7,694 | 161,882 | |
PepsiCo, Inc. | 1,706,814 | 136,664,597 | |
Primo Water Corp. (a) | 8,907 | 28,859 | |
REED'S, Inc. (a) | 1,830 | 14,091 | |
The Coca-Cola Co. | 4,243,924 | 162,117,897 | |
| 396,533,945 | ||
Food & Staples Retailing - 1.9% | |||
Andersons, Inc. | 24,799 | 1,359,977 | |
Casey's General Stores, Inc. (d) | 41,971 | 2,874,594 | |
Chefs' Warehouse Holdings (a)(d) | 22,894 | 532,286 | |
Costco Wholesale Corp. | 492,638 | 57,540,118 | |
Crumbs Bake Shop, Inc. (a)(d) | 5,760 | 3,920 | |
CVS Caremark Corp. | 1,338,149 | 97,872,218 | |
Fairway Group Holdings Corp. (d) | 15,014 | 117,109 | |
Fresh Market, Inc. (a)(d) | 40,058 | 1,341,943 | |
Ingles Markets, Inc. Class A | 19,385 | 455,160 | |
Kroger Co. | 577,151 | 24,205,713 | |
Liberator Medical Holdings, Inc. (d) | 55,593 | 250,169 | |
Natural Grocers by Vitamin Cottage, Inc. (a)(d) | 6,984 | 284,528 | |
PriceSmart, Inc. (d) | 20,999 | 2,136,228 | |
Rite Aid Corp. (a) | 1,003,941 | 6,615,971 | |
Roundy's, Inc. | 18,846 | 115,714 | |
Safeway, Inc. | 286,105 | 10,714,632 | |
| |||
Shares | Value | ||
Spartan Stores, Inc. | 38,681 | $ 873,804 | |
Sprouts Farmers Market LLC | 59,567 | 2,324,304 | |
SUPERVALU, Inc. (a)(d) | 203,563 | 1,317,053 | |
Susser Holdings Corp. (a)(d) | 23,340 | 1,413,937 | |
Sysco Corp. | 659,822 | 23,766,788 | |
The Pantry, Inc. (a) | 24,320 | 366,746 | |
United Natural Foods, Inc. (a)(d) | 58,263 | 4,217,076 | |
Village Super Market, Inc. Class A | 3,352 | 91,878 | |
Wal-Mart Stores, Inc. | 1,819,358 | 135,906,043 | |
Walgreen Co. | 979,795 | 66,577,070 | |
Weis Markets, Inc. | 10,922 | 550,906 | |
Whole Foods Market, Inc. | 419,062 | 22,650,301 | |
| 466,476,186 | ||
Food Products - 1.6% | |||
Alico, Inc. | 172 | 6,529 | |
Annie's, Inc. (a)(d) | 13,936 | 522,321 | |
Archer Daniels Midland Co. | 727,236 | 29,525,782 | |
B&G Foods, Inc. Class A (d) | 63,705 | 1,908,602 | |
Boulder Brands, Inc. (a)(d) | 68,009 | 1,022,855 | |
Bunge Ltd. | 173,371 | 13,802,065 | |
Cal-Maine Foods, Inc. | 14,807 | 778,404 | |
Calavo Growers, Inc. | 8,788 | 273,658 | |
Campbell Soup Co. (d) | 196,834 | 8,524,881 | |
Chiquita Brands International, Inc. (a) | 44,016 | 481,535 | |
Coffee Holding Co., Inc. (a) | 3,401 | 20,848 | |
ConAgra Foods, Inc. | 467,264 | 13,270,298 | |
Darling International, Inc. (a) | 198,455 | 4,004,822 | |
Dean Foods Co. (d) | 86,659 | 1,281,687 | |
Diamond Foods, Inc. (a)(d) | 18,346 | 526,897 | |
Farmer Brothers Co. (a) | 3,100 | 65,348 | |
Flowers Foods, Inc. | 226,566 | 4,660,463 | |
Fresh Del Monte Produce, Inc. | 46,236 | 1,223,405 | |
General Mills, Inc. | 696,878 | 34,864,806 | |
Green Mountain Coffee Roasters, Inc. | 147,919 | 16,238,548 | |
Hillshire Brands Co. | 160,546 | 6,028,502 | |
Hormel Foods Corp. | 178,475 | 8,468,639 | |
Ingredion, Inc. | 84,243 | 5,546,559 | |
J&J Snack Foods Corp. | 16,924 | 1,571,901 | |
John B. Sanfilippo & Son, Inc. | 4,594 | 111,405 | |
Kellogg Co. | 293,046 | 17,784,962 | |
Kraft Foods Group, Inc. | 656,547 | 36,287,353 | |
Lancaster Colony Corp. | 21,006 | 1,894,741 | |
Lifeway Foods, Inc. (d) | 1,247 | 17,907 | |
Limoneira Co. (d) | 3,738 | 78,722 | |
McCormick & Co., Inc. (non-vtg.) (d) | 157,258 | 10,441,931 | |
Mead Johnson Nutrition Co. Class A | 221,324 | 18,048,972 | |
Mondelez International, Inc. | 1,965,952 | 66,901,347 | |
Omega Protein Corp. (a) | 32,056 | 348,449 | |
Pilgrims Pride Corp. (a) | 80,459 | 1,410,446 | |
Pinnacle Foods, Inc. | 59,152 | 1,675,185 | |
Post Holdings, Inc. (a)(d) | 36,785 | 2,101,159 | |
Sanderson Farms, Inc. (d) | 23,484 | 1,804,511 | |
Seaboard Corp. (a) | 366 | 927,821 | |
Common Stocks - continued | |||
Shares | Value | ||
CONSUMER STAPLES - continued | |||
Food Products - continued | |||
Seneca Foods Corp. Class A (a) | 7,029 | $ 212,838 | |
Snyders-Lance, Inc. | 57,191 | 1,549,304 | |
The Hain Celestial Group, Inc. (a)(d) | 54,436 | 4,861,135 | |
The Hershey Co. | 166,455 | 17,614,268 | |
The J.M. Smucker Co. | 116,444 | 11,645,564 | |
Tootsie Roll Industries, Inc. (d) | 31,326 | 911,587 | |
TreeHouse Foods, Inc. (a)(d) | 37,174 | 2,649,019 | |
Tyson Foods, Inc. Class A | 316,718 | 12,494,525 | |
WhiteWave Foods Co. (a) | 197,524 | 5,589,929 | |
| 371,982,435 | ||
Household Products - 1.6% | |||
Central Garden & Pet Co. Class A (non-vtg.) (a) | 34,714 | 255,495 | |
Church & Dwight Co., Inc. (d) | 156,776 | 10,657,632 | |
Clorox Co. (d) | 141,939 | 12,388,436 | |
Colgate-Palmolive Co. | 983,245 | 61,777,283 | |
Energizer Holdings, Inc. | 78,749 | 7,665,428 | |
Harbinger Group, Inc. (a) | 38,325 | 434,989 | |
Kimberly-Clark Corp. | 427,756 | 47,202,875 | |
Oil-Dri Corp. of America | 644 | 21,381 | |
Orchids Paper Products Co. | 2,087 | 70,269 | |
Procter & Gamble Co. | 3,041,449 | 239,240,378 | |
Spectrum Brands Holdings, Inc. | 23,337 | 1,820,519 | |
WD-40 Co. | 17,410 | 1,269,363 | |
| 382,804,048 | ||
Personal Products - 0.2% | |||
Avon Products, Inc. | 507,422 | 7,849,818 | |
Coty, Inc. Class A (d) | 75,823 | 1,125,972 | |
Cyanotech Corp. (a) | 2,300 | 13,915 | |
Elizabeth Arden, Inc. (a)(d) | 31,918 | 975,733 | |
Estee Lauder Companies, Inc. Class A | 291,289 | 20,052,335 | |
Herbalife Ltd. (d) | 102,302 | 6,813,313 | |
Inter Parfums, Inc. | 14,485 | 486,841 | |
LifeVantage Corp. (a) | 61,077 | 81,232 | |
Mannatech, Inc. (a) | 599 | 10,303 | |
MediFast, Inc. (a)(d) | 10,225 | 269,327 | |
Nature's Sunshine Products, Inc. | 2,859 | 43,199 | |
Nu Skin Enterprises, Inc. Class A (d) | 64,351 | 5,374,596 | |
Nutraceutical International Corp. (a) | 4,799 | 125,686 | |
Revlon, Inc. (a) | 13,966 | 329,737 | |
Star Scientific, Inc. (a)(d) | 176,304 | 156,893 | |
The Female Health Co. (d) | 11,731 | 81,061 | |
USANA Health Sciences, Inc. (a)(d) | 12,622 | 923,552 | |
| 44,713,513 | ||
Tobacco - 1.1% | |||
Alliance One International, Inc. (a) | 89,449 | 240,618 | |
Altria Group, Inc. | 2,227,481 | 80,768,461 | |
Lorillard, Inc. | 400,965 | 19,671,343 | |
Philip Morris International, Inc. | 1,800,078 | 145,644,311 | |
Reynolds American, Inc. | 362,408 | 18,421,199 | |
| |||
Shares | Value | ||
Universal Corp. (d) | 28,408 | $ 1,637,721 | |
Vector Group Ltd. (d) | 60,093 | 1,173,616 | |
| 267,557,269 | ||
TOTAL CONSUMER STAPLES | 1,930,067,396 | ||
ENERGY - 9.1% | |||
Energy Equipment & Services - 1.9% | |||
Atwood Oceanics, Inc. (a) | 74,378 | 3,524,773 | |
Baker Hughes, Inc. | 492,144 | 31,142,872 | |
Basic Energy Services, Inc. (a)(d) | 48,473 | 1,156,081 | |
Bolt Technology Corp. | 7,172 | 144,229 | |
Bristow Group, Inc. | 42,605 | 3,306,148 | |
C&J Energy Services, Inc. (a)(d) | 59,040 | 1,526,184 | |
Cal Dive International, Inc. (a)(d) | 171,858 | 304,189 | |
Cameron International Corp. (a) | 265,398 | 17,001,396 | |
Carbo Ceramics, Inc. (d) | 21,033 | 2,609,144 | |
Core Laboratories NV (d) | 52,255 | 9,826,553 | |
Dawson Geophysical Co. | 7,871 | 225,898 | |
Diamond Offshore Drilling, Inc. (d) | 83,655 | 3,956,882 | |
Dresser-Rand Group, Inc. (a) | 77,752 | 4,224,266 | |
Dril-Quip, Inc. (a) | 43,391 | 4,667,136 | |
ENGlobal Corp. (a) | 5,637 | 9,132 | |
Ensco PLC Class A | 255,890 | 13,475,167 | |
Era Group, Inc. (a) | 20,388 | 575,961 | |
Exterran Holdings, Inc. | 75,471 | 3,092,047 | |
FMC Technologies, Inc. (a)(d) | 260,114 | 13,068,127 | |
Forbes Energy Services Ltd. (a) | 500 | 2,035 | |
Forum Energy Technologies, Inc. (a)(d) | 70,638 | 1,829,524 | |
Frank's International NV | 47,687 | 1,127,321 | |
Geospace Technologies Corp. (a)(d) | 13,736 | 1,054,513 | |
Global Geophysical Services, Inc. (a)(d) | 29,499 | 41,299 | |
GreenHunter Energy, Inc. (a)(d) | 12,193 | 12,925 | |
Gulf Island Fabrication, Inc. | 15,288 | 320,589 | |
Gulfmark Offshore, Inc. Class A | 20,706 | 982,293 | |
Halliburton Co. | 941,615 | 53,672,055 | |
Helix Energy Solutions Group, Inc. (a) | 125,576 | 2,968,617 | |
Helmerich & Payne, Inc. | 118,617 | 11,713,429 | |
Hercules Offshore, Inc. (a)(d) | 189,533 | 902,177 | |
Hornbeck Offshore Services, Inc. (a)(d) | 29,524 | 1,262,446 | |
ION Geophysical Corp. (a)(d) | 97,381 | 396,341 | |
Key Energy Services, Inc. (a) | 163,573 | 1,478,700 | |
Matrix Service Co. (a) | 25,723 | 832,654 | |
McDermott International, Inc. (a)(d) | 280,872 | 2,339,664 | |
Mitcham Industries, Inc. (a)(d) | 23,287 | 335,100 | |
Nabors Industries Ltd. | 317,540 | 7,309,771 | |
National Oilwell Varco, Inc. | 469,940 | 36,204,178 | |
Natural Gas Services Group, Inc. (a) | 21,602 | 702,065 | |
Newpark Resources, Inc. (a)(d) | 85,435 | 950,037 | |
Noble Corp. | 280,951 | 8,723,529 | |
Nuverra Environmental Solutions, Inc. (a)(d) | 16,034 | 272,578 | |
Oceaneering International, Inc. | 112,956 | 8,085,390 | |
Common Stocks - continued | |||
Shares | Value | ||
ENERGY - continued | |||
Energy Equipment & Services - continued | |||
Oil States International, Inc. (a) | 56,000 | $ 5,315,520 | |
Parker Drilling Co. (a) | 145,338 | 1,172,878 | |
Patterson-UTI Energy, Inc. | 161,131 | 4,690,523 | |
PHI, Inc. (non-vtg.) (a) | 18,377 | 738,755 | |
Pioneer Energy Services Corp. (a) | 82,168 | 936,715 | |
RigNet, Inc. (a) | 15,376 | 735,280 | |
Rowan Companies PLC (a) | 158,021 | 5,271,581 | |
RPC, Inc. (d) | 65,463 | 1,205,174 | |
Schlumberger Ltd. | 1,469,347 | 136,649,271 | |
SEACOR Holdings, Inc. (a)(d) | 20,388 | 1,803,522 | |
Superior Energy Services, Inc. | 184,941 | 5,472,404 | |
Synthesis Energy Systems, Inc. (a) | 39,903 | 65,840 | |
Tesco Corp. (a) | 36,928 | 700,524 | |
TETRA Technologies, Inc. (a)(d) | 84,417 | 1,013,004 | |
TGC Industries, Inc. | 15,685 | 100,384 | |
Tidewater, Inc. | 61,246 | 2,983,905 | |
Transocean Ltd. (United States) (d) | 380,391 | 16,128,578 | |
Unit Corp. (a) | 53,513 | 3,285,698 | |
Vantage Drilling Co. (a)(d) | 139,486 | 244,101 | |
Weatherford International Ltd. (a) | 878,933 | 14,651,813 | |
Willbros Group, Inc. (a) | 69,552 | 687,174 | |
| 461,208,059 | ||
Oil, Gas & Consumable Fuels - 7.2% | |||
Abraxas Petroleum Corp. (a)(d) | 126,005 | 424,637 | |
Adams Resources & Energy, Inc. | 1,804 | 132,774 | |
Alon U.S.A. Energy, Inc. | 48,399 | 648,063 | |
Alpha Natural Resources, Inc. (a)(d) | 236,910 | 1,272,207 | |
Amyris, Inc. (a)(d) | 41,172 | 188,156 | |
Anadarko Petroleum Corp. | 563,338 | 47,410,526 | |
Antero Resources Corp. (d) | 39,714 | 2,396,343 | |
Apache Corp. | 447,726 | 35,500,195 | |
APCO Oil and Gas International, Inc. (a) | 12,221 | 174,638 | |
Approach Resources, Inc. (a)(d) | 29,242 | 651,219 | |
Arch Coal, Inc. (d) | 201,141 | 917,203 | |
Ardmore Shipping Corp. | 12,187 | 158,187 | |
Athlon Energy, Inc. | 38,737 | 1,439,467 | |
Barnwell Industries, Inc. (a) | 2,847 | 8,142 | |
Bill Barrett Corp. (a)(d) | 44,527 | 1,128,314 | |
BioFuel Energy Corp. (a)(d) | 979 | 2,849 | |
Bonanza Creek Energy, Inc. (a)(d) | 35,010 | 1,749,450 | |
BPZ Energy, Inc. (a)(d) | 134,116 | 276,279 | |
Cabot Oil & Gas Corp. | 466,135 | 16,314,725 | |
Callon Petroleum Co. (a) | 41,561 | 281,368 | |
Carrizo Oil & Gas, Inc. (a)(d) | 43,717 | 2,174,484 | |
Ceres, Inc. (a)(d) | 15,962 | 22,826 | |
Cheniere Energy, Inc. (a) | 242,824 | 12,002,790 | |
Chesapeake Energy Corp. | 559,542 | 14,497,733 | |
Chevron Corp. | 2,155,381 | 248,580,091 | |
Cimarex Energy Co. | 101,750 | 11,773,493 | |
Clayton Williams Energy, Inc. (a)(d) | 7,754 | 752,138 | |
Clean Energy Fuels Corp. (a)(d) | 67,120 | 561,794 | |
| |||
Shares | Value | ||
Cloud Peak Energy, Inc. (a) | 86,697 | $ 1,681,922 | |
Cobalt International Energy, Inc. (a)(d) | 333,375 | 6,427,470 | |
Comstock Resources, Inc. | 40,820 | 806,603 | |
Concho Resources, Inc. (a) | 119,921 | 14,526,031 | |
ConocoPhillips Co. | 1,373,787 | 91,356,836 | |
CONSOL Energy, Inc. | 262,364 | 10,520,796 | |
Contango Oil & Gas Co. (a) | 17,251 | 818,042 | |
Continental Resources, Inc. (a)(d) | 57,407 | 6,861,285 | |
Crosstex Energy, Inc. | 45,920 | 1,911,650 | |
CVR Energy, Inc. | 13,732 | 540,354 | |
Delek U.S. Holdings, Inc. | 36,764 | 1,020,569 | |
Denbury Resources, Inc. | 405,461 | 6,633,342 | |
Devon Energy Corp. | 424,771 | 27,363,748 | |
DHT Holdings, Inc. | 9,321 | 73,077 | |
Diamondback Energy, Inc. (a)(d) | 39,731 | 2,555,895 | |
Double Eagle Petroleum Co. (a) | 1,282 | 2,756 | |
Emerald Oil, Inc. (a) | 39,389 | 301,720 | |
Endeavour International Corp. (a)(d) | 50,764 | 246,713 | |
Energen Corp. | 88,384 | 7,109,609 | |
Energy XXI (Bermuda) Ltd. | 78,336 | 1,814,262 | |
EOG Resources, Inc. | 306,748 | 58,104,206 | |
EPL Oil & Gas, Inc. (a) | 50,327 | 1,514,843 | |
EQT Corp. | 165,052 | 16,883,169 | |
Evolution Petroleum Corp. | 6,950 | 90,350 | |
EXCO Resources, Inc. (d) | 234,793 | 1,225,619 | |
Exxon Mobil Corp. | 4,900,564 | 471,777,296 | |
Forest Oil Corp. (a) | 106,451 | 213,967 | |
FX Energy, Inc. (a)(d) | 98,760 | 370,350 | |
Gasco Energy, Inc. (a) | 44 | 1 | |
Gastar Exploration, Inc. (a) | 74,542 | 475,578 | |
Gevo, Inc. (a) | 47,917 | 65,167 | |
Goodrich Petroleum Corp. (a)(d) | 33,339 | 454,077 | |
Green Plains Renewable Energy, Inc. | 14,190 | 375,042 | |
Gulfport Energy Corp. (a) | 95,460 | 6,309,906 | |
Halcon Resources Corp. (a)(d) | 265,422 | 1,011,258 | |
Harvest Natural Resources, Inc. (a)(d) | 51,649 | 216,926 | |
Hess Corp. | 315,050 | 25,213,452 | |
HollyFrontier Corp. | 221,494 | 10,093,482 | |
Houston American Energy Corp. (a) | 36,485 | 13,514 | |
Hyperdynamics Corp. (a)(d) | 33,521 | 181,684 | |
Isramco, Inc. (a) | 123 | 17,648 | |
James River Coal Co. (a)(d) | 58,608 | 43,370 | |
Jones Energy, Inc. | 15,152 | 236,674 | |
Kinder Morgan Holding Co. LLC | 754,230 | 24,022,226 | |
KiOR, Inc. Class A (a)(d) | 22,105 | 30,947 | |
Kodiak Oil & Gas Corp. (a) | 306,801 | 3,623,320 | |
Kosmos Energy Ltd. (a) | 171,095 | 1,878,623 | |
Laredo Petroleum Holdings, Inc. (a)(d) | 61,390 | 1,601,665 | |
Lilis Energy, Inc. (a) | 8,026 | 25,683 | |
Lucas Energy, Inc. (a) | 9,400 | 8,756 | |
Magellan Petroleum Corp. (a) | 35,895 | 48,099 | |
Magnum Hunter Resources Corp. (a)(d) | 156,521 | 1,313,211 | |
Magnum Hunter Resources Corp. warrants 4/16/16 (a) | 15,652 | 6,721 | |
Common Stocks - continued | |||
Shares | Value | ||
ENERGY - continued | |||
Oil, Gas & Consumable Fuels - continued | |||
Marathon Oil Corp. | 789,876 | $ 26,460,846 | |
Marathon Petroleum Corp. | 338,483 | 28,432,572 | |
Matador Resources Co. (a)(d) | 76,387 | 1,853,149 | |
Midstates Petroleum Co., Inc. (a)(d) | 32,166 | 141,852 | |
Miller Energy Resources, Inc. (a)(d) | 32,422 | 225,009 | |
Murphy Oil Corp. | 192,672 | 11,438,937 | |
Newfield Exploration Co. (a) | 142,463 | 4,016,032 | |
Noble Energy, Inc. | 401,847 | 27,631,000 | |
Northern Oil & Gas, Inc. (a)(d) | 93,777 | 1,305,376 | |
Oasis Petroleum, Inc. (a)(d) | 118,000 | 5,141,260 | |
Occidental Petroleum Corp. | 900,060 | 86,873,791 | |
ONEOK, Inc. | 228,616 | 13,520,350 | |
Pacific Ethanol, Inc. (a) | 20,096 | 274,712 | |
Panhandle Royalty Co. Class A | 6,335 | 234,142 | |
PBF Energy, Inc. Class A | 71,419 | 1,799,759 | |
PDC Energy, Inc. (a)(d) | 36,259 | 2,252,772 | |
Peabody Energy Corp. (d) | 287,212 | 5,043,443 | |
Penn Virginia Corp. (a)(d) | 74,899 | 1,134,720 | |
Petroquest Energy, Inc. (a)(d) | 70,948 | 335,584 | |
Phillips 66 Co. | 672,891 | 50,372,620 | |
Pioneer Natural Resources Co. | 158,717 | 31,930,686 | |
QEP Resources, Inc. | 196,867 | 5,695,362 | |
Quicksilver Resources, Inc. (a)(d) | 168,400 | 550,668 | |
Range Resources Corp. | 182,957 | 15,743,450 | |
Renewable Energy Group, Inc. (a)(d) | 19,507 | 227,647 | |
Rentech, Inc. (a)(d) | 218,177 | 410,173 | |
Resolute Energy Corp. (a)(d) | 59,120 | 550,998 | |
Rex American Resources Corp. (a) | 4,837 | 230,628 | |
Rex Energy Corp. (a)(d) | 63,386 | 1,204,334 | |
Rosetta Resources, Inc. (a)(d) | 66,417 | 2,946,922 | |
Royale Energy, Inc. (a)(d) | 36,496 | 102,919 | |
Sanchez Energy Corp. (a)(d) | 43,626 | 1,299,619 | |
SandRidge Energy, Inc. (a)(d) | 475,629 | 3,067,807 | |
Saratoga Resources, Inc. (a) | 16,554 | 22,513 | |
SemGroup Corp. Class A | 56,834 | 3,826,065 | |
SM Energy Co. | 72,684 | 5,360,445 | |
Solazyme, Inc. (a)(d) | 72,848 | 893,845 | |
Southwestern Energy Co. (a) | 393,897 | 16,283,702 | |
Spectra Energy Corp. | 754,745 | 28,136,894 | |
Stone Energy Corp. (a)(d) | 67,092 | 2,411,286 | |
Swift Energy Co. (a)(d) | 41,382 | 413,820 | |
Synergy Resources Corp. (a)(d) | 85,751 | 908,103 | |
Syntroleum Corp. (a)(d) | 15,037 | 59,998 | |
Targa Resources Corp. | 33,055 | 3,198,402 | |
Teekay Corp. | 46,397 | 2,772,221 | |
Tengasco, Inc. (a) | 12,601 | 5,168 | |
Tesoro Corp. | 146,745 | 7,485,462 | |
The Williams Companies, Inc. | 760,127 | 31,393,245 | |
Triangle Petroleum Corp. (a)(d) | 83,126 | 744,809 | |
U.S. Energy Corp. (a) | 13,579 | 54,316 | |
Ultra Petroleum Corp. (a)(d) | 182,633 | 4,595,046 | |
| |||
Shares | Value | ||
Uranium Energy Corp. (a)(d) | 86,698 | $ 157,790 | |
Uranium Resources, Inc. (a)(d) | 26,282 | 84,365 | |
USEC, Inc. (a)(d) | 3,322 | 18,304 | |
VAALCO Energy, Inc. (a)(d) | 68,248 | 454,532 | |
Valero Energy Corp. | 604,594 | 29,008,420 | |
W&T Offshore, Inc. (d) | 37,319 | 562,397 | |
Warren Resources, Inc. (a) | 48,923 | 216,729 | |
Western Refining, Inc. (d) | 53,248 | 1,940,890 | |
Westmoreland Coal Co. (a) | 10,233 | 231,266 | |
Whiting Petroleum Corp. (a) | 135,243 | 9,292,547 | |
World Fuel Services Corp. (d) | 89,666 | 4,036,763 | |
WPX Energy, Inc. (a)(d) | 237,040 | 4,176,645 | |
ZaZa Energy Corp. (a)(d) | 19,430 | 17,872 | |
Zion Oil & Gas, Inc. (a)(d) | 27,782 | 46,118 | |
| 1,702,718,718 | ||
TOTAL ENERGY | 2,163,926,777 | ||
FINANCIALS - 16.9% | |||
Capital Markets - 2.0% | |||
Affiliated Managers Group, Inc. (a) | 57,328 | 10,780,530 | |
Ameriprise Financial, Inc. | 216,081 | 23,550,668 | |
Arlington Asset Investment Corp. (d) | 13,562 | 359,664 | |
Artisan Partners Asset Management, Inc. | 18,533 | 1,170,730 | |
Bank of New York Mellon Corp. | 1,292,433 | 41,357,856 | |
BGC Partners, Inc. Class A | 203,183 | 1,381,644 | |
BlackRock, Inc. Class A | 141,863 | 43,245,517 | |
Calamos Asset Management, Inc. | 22,184 | 264,655 | |
Charles Schwab Corp. | 1,285,960 | 34,090,800 | |
CIFI Corp. | 3,896 | 30,778 | |
Cohen & Steers, Inc. (d) | 17,375 | 656,949 | |
Cowen Group, Inc. Class A (a) | 80,174 | 343,145 | |
Diamond Hill Investment Group, Inc. | 1,102 | 129,320 | |
E*TRADE Financial Corp. (a) | 321,912 | 7,233,363 | |
Eaton Vance Corp. (non-vtg.) (d) | 144,041 | 5,450,511 | |
Evercore Partners, Inc. Class A | 40,806 | 2,270,446 | |
FBR & Co. (a) | 11,471 | 298,246 | |
Federated Investors, Inc. Class B (non-vtg.) (d) | 108,341 | 2,968,543 | |
Financial Engines, Inc. (d) | 56,540 | 3,195,075 | |
Franklin Resources, Inc. | 453,634 | 24,156,011 | |
FXCM, Inc. Class A (d) | 51,378 | 865,719 | |
GAMCO Investors, Inc. Class A | 6,083 | 474,839 | |
GFI Group, Inc. | 69,449 | 278,490 | |
Gleacher & Co., Inc. (a) | 1,808 | 20,051 | |
Goldman Sachs Group, Inc. | 469,978 | 78,227,838 | |
Greenhill & Co., Inc. | 23,725 | 1,263,831 | |
HFF, Inc. | 31,822 | 1,015,122 | |
ICG Group, Inc. (a) | 32,808 | 666,987 | |
Institutional Financial Markets, Inc. | 6,881 | 16,927 | |
INTL FCStone, Inc. (a)(d) | 15,053 | 273,814 | |
Common Stocks - continued | |||
Shares | Value | ||
FINANCIALS - continued | |||
Capital Markets - continued | |||
Invesco Ltd. | 497,759 | $ 17,073,134 | |
Investment Technology Group, Inc. (a) | 55,680 | 962,150 | |
Janus Capital Group, Inc. (d) | 187,399 | 2,096,995 | |
JMP Group, Inc. | 11,989 | 88,119 | |
KCG Holdings, Inc. Class A | 107,133 | 1,273,811 | |
Ladenburg Thalmann Financial Services, Inc. (a) | 42,620 | 118,910 | |
Legg Mason, Inc. | 151,820 | 6,977,647 | |
LPL Financial | 82,901 | 4,450,126 | |
Manning & Napier, Inc. Class A | 3,941 | 57,893 | |
Medallion Financial Corp. | 4,309 | 62,653 | |
Morgan Stanley | 1,549,389 | 47,721,181 | |
Northern Trust Corp. | 250,938 | 15,520,515 | |
Oppenheimer Holdings, Inc. Class A (non-vtg.) | 6,844 | 186,910 | |
Piper Jaffray Companies (a)(d) | 20,940 | 877,386 | |
Pzena Investment Management, Inc. | 4,972 | 57,476 | |
Raymond James Financial, Inc. | 163,719 | 8,641,089 | |
Safeguard Scientifics, Inc. (a)(d) | 26,745 | 524,469 | |
SEI Investments Co. | 167,937 | 5,637,645 | |
Silvercrest Asset Management Group Class A | 6,008 | 100,994 | |
State Street Corp. | 492,071 | 32,314,303 | |
Stifel Financial Corp. (a)(d) | 59,345 | 2,853,901 | |
SWS Group, Inc. (a) | 24,189 | 197,140 | |
T. Rowe Price Group, Inc. | 302,200 | 24,529,574 | |
TD Ameritrade Holding Corp. (d) | 282,750 | 9,452,333 | |
Teton Advisors, Inc. (a) | 106 | 3,445 | |
U.S. Global Investments, Inc. Class A | 7,637 | 27,340 | |
Virtus Investment Partners, Inc. (a) | 8,765 | 1,622,927 | |
Waddell & Reed Financial, Inc. Class A | 84,679 | 5,902,126 | |
Walter Investment Management Corp. (a)(d) | 38,853 | 992,694 | |
Westwood Holdings Group, Inc. | 3,640 | 207,152 | |
WisdomTree Investments, Inc. (a)(d) | 96,770 | 1,507,677 | |
| 478,077,784 | ||
Commercial Banks - 3.2% | |||
1st Source Corp. | 8,597 | 268,226 | |
1st United Bancorp, Inc. | 20,464 | 157,573 | |
Access National Corp. | 1,270 | 21,400 | |
ACNB Corp. (d) | 3,789 | 71,006 | |
American National Bankshares, Inc. | 2,748 | 61,720 | |
Ameris Bancorp (a) | 34,183 | 719,210 | |
Ames National Corp. | 1,209 | 26,937 | |
Arrow Financial Corp. | 15,818 | 413,008 | |
Associated Banc-Corp. | 184,412 | 3,077,836 | |
BancFirst Corp. | 10,611 | 583,923 | |
Bancorp, Inc., Delaware (a)(d) | 42,844 | 820,463 | |
BancorpSouth, Inc. | 84,413 | 2,020,003 | |
Bank of Hawaii Corp. | 64,151 | 3,749,626 | |
Bank of Kentucky Financial Corp. | 1,699 | 59,618 | |
| |||
Shares | Value | ||
Bank of Marin Bancorp | 2,794 | $ 123,579 | |
Bank of the Ozarks, Inc. (d) | 37,486 | 2,377,362 | |
BankUnited, Inc. | 103,014 | 3,448,909 | |
Banner Bank | 13,068 | 518,669 | |
Bar Harbor Bankshares | 2,686 | 102,068 | |
BB&T Corp. | 783,604 | 29,620,231 | |
BBCN Bancorp, Inc. | 78,753 | 1,340,376 | |
BCB Bancorp, Inc. | 2,814 | 37,370 | |
BNC Bancorp | 11,700 | 203,931 | |
BOK Financial Corp. | 42,858 | 2,774,198 | |
Boston Private Financial Holdings, Inc. | 85,484 | 1,114,711 | |
Bridge Bancorp, Inc. | 540 | 14,218 | |
Bridge Capital Holdings (a) | 1,107 | 24,598 | |
Bryn Mawr Bank Corp. | 9,420 | 268,376 | |
BSB Bancorp, Inc. (a) | 6,958 | 117,312 | |
C & F Financial Corp. | 1,992 | 72,907 | |
Camden National Corp. | 1,850 | 69,449 | |
Capital Bank Financial Corp. Series A (a) | 112,359 | 2,584,257 | |
Capital City Bank Group, Inc. (d) | 7,146 | 101,330 | |
CapitalSource, Inc. | 244,954 | 3,600,824 | |
Cardinal Financial Corp. (d) | 22,155 | 381,952 | |
Cascade Bancorp (a)(d) | 4,186 | 20,428 | |
Cathay General Bancorp | 87,127 | 2,213,897 | |
Center Bancorp, Inc. | 6,904 | 128,483 | |
Centerstate Banks of Florida, Inc. | 6,387 | 69,810 | |
Central Pacific Financial Corp. | 26,089 | 514,736 | |
Century Bancorp, Inc. Class A (non-vtg.) | 686 | 24,627 | |
Chemical Financial Corp. | 31,417 | 926,487 | |
CIT Group, Inc. | 237,879 | 11,579,950 | |
Citizens & Northern Corp. | 8,777 | 174,838 | |
City Holding Co. | 22,173 | 981,820 | |
City National Corp. | 58,166 | 4,352,562 | |
CNB Financial Corp., Pennsylvania | 7,083 | 130,398 | |
CoBiz, Inc. | 39,972 | 446,088 | |
Columbia Banking Systems, Inc. (d) | 46,707 | 1,224,658 | |
Comerica, Inc. | 197,578 | 9,519,308 | |
Commerce Bancshares, Inc. | 104,098 | 4,649,017 | |
Community Bank System, Inc. (d) | 49,202 | 1,792,429 | |
Community Trust Bancorp, Inc. | 13,652 | 540,619 | |
CommunityOne Bancorp (a) | 6,555 | 72,171 | |
CU Bancorp (a) | 6,814 | 123,061 | |
Cullen/Frost Bankers, Inc. | 71,142 | 5,310,039 | |
CVB Financial Corp. (d) | 84,778 | 1,319,993 | |
Eagle Bancorp, Inc., Maryland (d) | 22,699 | 777,668 | |
East West Bancorp, Inc. | 174,395 | 6,224,158 | |
Eastern Virginia Bankshares, Inc. (a) | 969 | 6,589 | |
Enterprise Bancorp, Inc. | 803 | 15,458 | |
Enterprise Financial Services Corp. | 12,168 | 227,785 | |
Farmers National Banc Corp. (d) | 14,652 | 109,011 | |
Fidelity Southern Corp. | 3,439 | 49,418 | |
Fifth Third Bancorp | 1,058,556 | 22,965,372 | |
Financial Institutions, Inc. | 12,700 | 279,908 | |
First Bancorp, North Carolina | 9,193 | 168,232 | |
First Bancorp, Puerto Rico (a) | 99,750 | 519,698 | |
Common Stocks - continued | |||
Shares | Value | ||
FINANCIALS - continued | |||
Commercial Banks - continued | |||
First Busey Corp. | 50,381 | $ 299,767 | |
First Citizen Bancshares, Inc. | 8,410 | 1,887,120 | |
First Commonwealth Financial Corp. (d) | 101,457 | 864,414 | |
First Community Bancshares, Inc. | 8,561 | 143,397 | |
First Connecticut Bancorp, Inc. | 11,897 | 186,545 | |
First Financial Bancorp, Ohio | 59,723 | 1,017,680 | |
First Financial Bankshares, Inc. (d) | 43,848 | 2,651,927 | |
First Financial Corp., Indiana | 8,837 | 303,904 | |
First Financial Holdings, Inc. | 28,877 | 1,768,427 | |
First Financial Service Corp. (a) | 2,521 | 10,639 | |
First Horizon National Corp. | 287,965 | 3,446,941 | |
First Interstate Bancsystem, Inc. | 19,621 | 508,184 | |
First Merchants Corp. | 33,146 | 709,987 | |
First Midwest Bancorp, Inc., Delaware | 83,782 | 1,396,646 | |
First Niagara Financial Group, Inc. | 529,611 | 4,803,572 | |
First of Long Island Corp. | 1,768 | 68,704 | |
First Republic Bank | 143,479 | 7,456,604 | |
First United Corp. (a) | 3,018 | 23,269 | |
FirstMerit Corp. | 204,257 | 4,240,375 | |
Flushing Financial Corp. | 47,044 | 974,752 | |
FNB Corp., Pennsylvania | 179,748 | 2,191,128 | |
Fulton Financial Corp. (d) | 224,854 | 2,767,953 | |
German American Bancorp, Inc. | 4,623 | 133,697 | |
Glacier Bancorp, Inc. (d) | 75,176 | 2,086,134 | |
Great Southern Bancorp, Inc. | 6,815 | 195,591 | |
Guaranty Bancorp | 16,534 | 233,460 | |
Hampton Roads Bankshares, Inc. (a) | 89,921 | 149,269 | |
Hancock Holding Co. | 109,529 | 3,774,369 | |
Hanmi Financial Corp. | 38,186 | 894,698 | |
Hawthorn Bancshares, Inc. | 1,496 | 19,463 | |
Heartland Financial U.S.A., Inc. | 8,878 | 238,818 | |
Heritage Commerce Corp. | 14,712 | 119,020 | |
Heritage Financial Corp., Washington | 12,768 | 226,377 | |
Heritage Oaks Bancorp (a) | 3,340 | 26,687 | |
Home Bancshares, Inc. (d) | 50,202 | 1,684,779 | |
Home Federal Bancorp, Inc. | 9,753 | 147,173 | |
HomeTrust Bancshares, Inc. (a)(d) | 20,129 | 315,421 | |
Horizon Bancorp Industries | 706 | 15,348 | |
Hudson Valley Holding Corp. | 14,551 | 273,413 | |
Huntington Bancshares, Inc. | 933,913 | 8,900,191 | |
IBERIABANK Corp. | 35,645 | 2,334,748 | |
Independent Bank Corp. (a) | 17,111 | 210,465 | |
Independent Bank Corp., Massachusetts (d) | 25,945 | 954,517 | |
Independent Bank Group, Inc. | 2,957 | 158,909 | |
International Bancshares Corp. | 64,813 | 1,502,365 | |
Intervest Bancshares Corp. Class A (a) | 6,160 | 45,646 | |
Investors Bancorp, Inc. | 84,986 | 2,253,829 | |
KeyCorp | 1,064,932 | 14,025,154 | |
Lakeland Bancorp, Inc. | 23,579 | 266,443 | |
Lakeland Financial Corp. | 13,545 | 514,710 | |
| |||
Shares | Value | ||
M&T Bank Corp. | 145,574 | $ 16,972,473 | |
Macatawa Bank Corp. | 22,839 | 120,590 | |
MainSource Financial Group, Inc. | 13,271 | 229,190 | |
MB Financial, Inc. | 59,673 | 1,821,817 | |
MBT Financial Corp. (a) | 1,548 | 7,461 | |
Merchants Bancshares, Inc. | 5,246 | 172,803 | |
Metro Bancorp, Inc. (a) | 11,557 | 226,748 | |
Midsouth Bancorp, Inc. | 5,240 | 91,805 | |
National Bank Holdings Corp. | 141,292 | 2,773,562 | |
National Bankshares, Inc. | 5,803 | 208,908 | |
National Penn Bancshares, Inc. | 120,787 | 1,304,500 | |
NBT Bancorp, Inc. | 54,895 | 1,288,935 | |
NewBridge Bancorp (a) | 10,719 | 77,177 | |
North Valley Bancorp (a) | 849 | 19,756 | |
Northrim Bancorp, Inc. | 2,935 | 72,113 | |
OFG Bancorp (d) | 40,168 | 642,688 | |
Old National Bancorp, Indiana | 98,018 | 1,375,193 | |
Old Second Bancorp, Inc. (a) | 18,605 | 92,281 | |
OmniAmerican Bancorp, Inc. | 6,877 | 149,712 | |
Orrstown Financial Services, Inc. (a) | 5,669 | 92,858 | |
Pacific Continental Corp. | 3,048 | 43,983 | |
Pacific Mercantile Bancorp (a) | 10,321 | 64,403 | |
Pacific Premier Bancorp, Inc. (a) | 35 | 557 | |
PacWest Bancorp (d) | 35,627 | 1,546,212 | |
Park National Corp. | 14,135 | 1,103,378 | |
Park Sterling Corp. | 28,617 | 187,728 | |
Penns Woods Bancorp, Inc. | 3,854 | 176,552 | |
Peoples Bancorp, Inc. | 3,334 | 81,583 | |
Peoples Financial Corp., Mississippi (a) | 2,667 | 36,005 | |
Pinnacle Financial Partners, Inc. | 38,294 | 1,381,648 | |
PNC Financial Services Group, Inc. | 621,024 | 50,787,343 | |
Popular, Inc. (a) | 112,654 | 3,220,778 | |
Preferred Bank, Los Angeles (a) | 1,131 | 27,178 | |
Premier Financial Bancorp, Inc. | 115 | 1,612 | |
PrivateBancorp, Inc. | 92,031 | 2,656,015 | |
Prosperity Bancshares, Inc. | 66,890 | 4,234,806 | |
Regions Financial Corp. | 1,653,454 | 17,592,751 | |
Renasant Corp. | 23,910 | 694,825 | |
Republic Bancorp, Inc., Kentucky Class A | 18,205 | 438,558 | |
Royal Bancshares of Pennsylvania, Inc. Class A (a) | 2,700 | 6,723 | |
S&T Bancorp, Inc. | 32,238 | 743,731 | |
S.Y. Bancorp, Inc. | 6,551 | 195,482 | |
Sandy Spring Bancorp, Inc. | 13,803 | 327,545 | |
Seacoast Banking Corp., Florida (a) | 23,091 | 248,921 | |
Shore Bancshares, Inc. (a) | 2,958 | 28,012 | |
Sierra Bancorp | 3,618 | 59,010 | |
Signature Bank (a)(d) | 61,743 | 8,084,011 | |
Simmons First National Corp. Class A | 10,951 | 390,184 | |
Southside Bancshares, Inc. | 13,372 | 394,875 | |
Southwest Bancorp, Inc., Oklahoma | 15,446 | 271,695 | |
State Bank Financial Corp. | 26,469 | 450,502 | |
Sterling Bancorp | 79,121 | 1,015,914 | |
Sterling Financial Corp. | 40,387 | 1,279,056 | |
Common Stocks - continued | |||
Shares | Value | ||
FINANCIALS - continued | |||
Commercial Banks - continued | |||
Suffolk Bancorp (a) | 15,697 | $ 316,608 | |
Sun Bancorp, Inc., New Jersey (a) | 48,802 | 169,831 | |
SunTrust Banks, Inc. | 625,274 | 23,560,324 | |
Susquehanna Bancshares, Inc. | 215,524 | 2,357,833 | |
SVB Financial Group (a) | 57,220 | 7,204,570 | |
Synovus Financial Corp. | 1,042,950 | 3,629,466 | |
Taylor Capital Group, Inc. (a)(d) | 9,976 | 235,434 | |
TCF Financial Corp. | 219,604 | 3,540,016 | |
Texas Capital Bancshares, Inc. (a)(d) | 44,486 | 2,800,394 | |
The First Bancorp, Inc. | 2,896 | 47,408 | |
Tompkins Financial Corp. | 8,812 | 426,589 | |
TowneBank (d) | 18,594 | 278,352 | |
Trico Bancshares | 12,062 | 301,429 | |
Trustmark Corp. | 94,171 | 2,272,346 | |
U.S. Bancorp | 2,044,982 | 84,130,559 | |
UMB Financial Corp. | 45,063 | 2,809,227 | |
Umpqua Holdings Corp. (d) | 115,463 | 2,051,778 | |
Union First Market Bankshares Corp. | 44,561 | 1,127,393 | |
United Bankshares, Inc., West Virginia | 83,407 | 2,454,668 | |
United Community Banks, Inc., Georgia (a) | 43,617 | 727,968 | |
Univest Corp. of Pennsylvania | 10,023 | 193,143 | |
Valley National Bancorp (d) | 229,522 | 2,313,582 | |
ViewPoint Financial Group (d) | 43,399 | 1,084,975 | |
Washington Banking Co., Oak Harbor | 5,615 | 103,428 | |
Washington Trust Bancorp, Inc. | 15,489 | 545,058 | |
Webster Financial Corp. | 106,126 | 3,286,722 | |
Wells Fargo & Co. | 5,376,048 | 249,556,148 | |
WesBanco, Inc. | 28,002 | 834,740 | |
West Bancorp., Inc. | 1,202 | 17,850 | |
Westamerica Bancorp. (d) | 28,148 | 1,415,281 | |
Westbury Bancorp, Inc. | 4,860 | 69,984 | |
Western Alliance Bancorp. (a) | 80,481 | 1,863,940 | |
Wilshire Bancorp, Inc. | 52,255 | 530,388 | |
Wintrust Financial Corp. | 46,573 | 2,155,398 | |
Zions Bancorporation | 204,129 | 6,368,825 | |
| 754,122,322 | ||
Consumer Finance - 0.8% | |||
American Express Co. | 1,031,844 | 94,186,720 | |
Asta Funding, Inc. (a) | 4,468 | 37,531 | |
Atlanticus Holdings Corp. (a)(d) | 35,598 | 88,995 | |
Capital One Financial Corp. | 637,759 | 46,830,643 | |
Cash America International, Inc. (d) | 29,387 | 1,176,068 | |
Consumer Portfolio Services, Inc. (a) | 11,930 | 92,935 | |
Credit Acceptance Corp. (a) | 13,731 | 1,896,800 | |
DFC Global Corp. (a)(d) | 43,285 | 356,236 | |
Discover Financial Services | 556,489 | 31,931,339 | |
Encore Capital Group, Inc. (a)(d) | 29,815 | 1,449,605 | |
EZCORP, Inc. (non-vtg.) Class A (a)(d) | 64,428 | 814,370 | |
First Cash Financial Services, Inc. (a)(d) | 35,415 | 1,870,974 | |
First Marblehead Corp. (a) | 5,188 | 36,368 | |
| |||
Shares | Value | ||
Green Dot Corp. Class A (a)(d) | 44,284 | $ 892,323 | |
Imperial Holdings, Inc. (a) | 16,708 | 91,393 | |
Nelnet, Inc. Class A | 22,213 | 891,186 | |
Portfolio Recovery Associates, Inc. (a)(d) | 50,604 | 2,744,255 | |
Regional Management Corp. (a) | 4,032 | 121,686 | |
SLM Corp. | 493,468 | 11,813,624 | |
Springleaf Holdings, Inc. | 37,440 | 1,054,685 | |
World Acceptance Corp. (a)(d) | 15,268 | 1,463,438 | |
| 199,841,174 | ||
Diversified Financial Services - 4.1% | |||
Bank of America Corp. | 11,910,171 | 196,875,127 | |
Berkshire Hathaway, Inc. Class B (a) | 2,023,147 | 234,239,960 | |
CBOE Holdings, Inc. | 109,590 | 5,921,148 | |
Citigroup, Inc. | 3,393,491 | 165,025,467 | |
CME Group, Inc. | 350,475 | 25,872,065 | |
Gain Capital Holdings, Inc. (d) | 15,735 | 162,385 | |
ING U.S., Inc. | 147,495 | 5,290,646 | |
Interactive Brokers Group, Inc. | 43,141 | 959,456 | |
IntercontinentalExchange Group, Inc. | 128,718 | 26,881,467 | |
JPMorgan Chase & Co. | 4,206,498 | 239,013,216 | |
Leucadia National Corp. | 370,953 | 10,364,427 | |
Life Partners Holdings, Inc. | 18,668 | 44,990 | |
MarketAxess Holdings, Inc. | 47,067 | 2,778,836 | |
Marlin Business Services Corp. | 13,319 | 286,359 | |
McGraw Hill Financial, Inc. | 303,994 | 24,216,162 | |
MicroFinancial, Inc. | 86 | 699 | |
Moody's Corp. | 212,214 | 16,764,906 | |
MSCI, Inc. Class A (a)(d) | 147,156 | 6,432,189 | |
NewStar Financial, Inc. (a) | 27,065 | 416,260 | |
PHH Corp. (a) | 72,291 | 1,881,735 | |
PICO Holdings, Inc. (a) | 22,896 | 574,919 | |
Resource America, Inc. Class A | 2,362 | 22,345 | |
The NASDAQ OMX Group, Inc. | 124,702 | 4,787,310 | |
Vector Capital Corp. rights (a) | 4,280 | 0 | |
| 968,812,074 | ||
Insurance - 3.1% | |||
ACE Ltd. | 376,274 | 36,825,936 | |
AFLAC, Inc. | 511,414 | 32,771,409 | |
Alleghany Corp. (a) | 18,948 | 7,304,454 | |
Allied World Assurance Co. Holdings Ltd. (d) | 33,827 | 3,373,228 | |
Allstate Corp. | 503,599 | 27,325,282 | |
AMBAC Financial Group, Inc. (a) | 43,974 | 1,519,741 | |
American Equity Investment Life Holding Co. (d) | 83,986 | 1,835,934 | |
American Financial Group, Inc. | 76,865 | 4,393,603 | |
American International Group, Inc. | 1,647,284 | 81,985,325 | |
American National Insurance Co. | 11,975 | 1,359,043 | |
Amerisafe, Inc. | 28,834 | 1,255,432 | |
Amtrust Financial Services, Inc. (d) | 37,933 | 1,433,867 | |
Aon PLC | 335,975 | 28,759,460 | |
Arch Capital Group Ltd. (a)(d) | 141,774 | 7,956,357 | |
Argo Group International Holdings, Ltd. | 32,771 | 1,446,512 | |
Common Stocks - continued | |||
Shares | Value | ||
FINANCIALS - continued | |||
Insurance - continued | |||
Arthur J. Gallagher & Co. | 138,329 | $ 6,390,800 | |
Aspen Insurance Holdings Ltd. | 68,795 | 2,583,940 | |
Assurant, Inc. | 95,115 | 6,242,397 | |
Assured Guaranty Ltd. | 183,926 | 4,515,383 | |
Axis Capital Holdings Ltd. | 130,874 | 5,754,530 | |
Baldwin & Lyons, Inc. Class B | 5,084 | 130,710 | |
Brown & Brown, Inc. | 116,705 | 3,512,821 | |
Cincinnati Financial Corp. | 161,273 | 7,560,478 | |
Citizens, Inc. Class A (a)(d) | 31,937 | 234,418 | |
CNA Financial Corp. | 65,754 | 2,728,133 | |
CNO Financial Group, Inc. | 273,436 | 4,992,941 | |
Crawford & Co. Class B | 10,464 | 88,630 | |
Donegal Group, Inc. Class A | 4,528 | 63,890 | |
eHealth, Inc. (a) | 26,343 | 1,264,464 | |
EMC Insurance Group | 5,816 | 177,388 | |
Employers Holdings, Inc. | 36,335 | 714,709 | |
Endurance Specialty Holdings Ltd. (d) | 45,122 | 2,352,661 | |
Enstar Group Ltd. (a) | 11,576 | 1,449,084 | |
Erie Indemnity Co. Class A | 26,259 | 1,905,878 | |
Everest Re Group Ltd. (d) | 51,436 | 7,676,309 | |
FBL Financial Group, Inc. Class A | 12,986 | 543,334 | |
Federated National Holding Co. | 1,278 | 20,295 | |
Fidelity National Financial, Inc. Class A | 297,669 | 9,840,937 | |
First Acceptance Corp. (a) | 4,055 | 10,543 | |
First American Financial Corp. | 131,076 | 3,531,187 | |
Fortegra Financial Corp. (a) | 10,670 | 74,583 | |
Genworth Financial, Inc. Class A (a) | 560,876 | 8,716,013 | |
Global Indemnity PLC (a) | 13,709 | 357,531 | |
Greenlight Capital Re, Ltd. (a) | 23,762 | 747,315 | |
Hallmark Financial Services, Inc. (a) | 10,337 | 87,554 | |
Hanover Insurance Group, Inc. | 48,173 | 2,834,499 | |
Hartford Financial Services Group, Inc. | 470,637 | 16,561,716 | |
HCC Insurance Holdings, Inc. | 116,739 | 5,124,842 | |
HCI Group, Inc. | 9,511 | 460,523 | |
Health Insurance Innovations (d) | 4,900 | 61,691 | |
Hilltop Holdings, Inc. (a) | 68,910 | 1,688,984 | |
Horace Mann Educators Corp. | 37,921 | 1,084,920 | |
Independence Holding Co. | 16,014 | 218,271 | |
Infinity Property & Casualty Corp. | 13,372 | 986,185 | |
Investors Title Co. | 1,086 | 83,535 | |
Kansas City Life Insurance Co. | 2,863 | 140,860 | |
Kemper Corp. | 58,114 | 2,253,661 | |
Lincoln National Corp. | 307,008 | 15,390,311 | |
Loews Corp. | 371,316 | 16,144,820 | |
Maiden Holdings Ltd. | 73,970 | 830,683 | |
Markel Corp. (a)(d) | 16,654 | 9,626,012 | |
Marsh & McLennan Companies, Inc. | 616,601 | 29,695,504 | |
MBIA, Inc. (a)(d) | 228,577 | 3,097,218 | |
Meadowbrook Insurance Group, Inc. (d) | 46,791 | 251,268 | |
Mercury General Corp. | 42,960 | 1,946,088 | |
MetLife, Inc. | 1,257,264 | 63,705,567 | |
| |||
Shares | Value | ||
Montpelier Re Holdings Ltd. (d) | 62,043 | $ 1,768,846 | |
National Interstate Corp. | 9,042 | 273,701 | |
National Western Life Insurance Co. Class A | 2,078 | 469,732 | |
Navigators Group, Inc. (a) | 15,156 | 918,757 | |
Old Republic International Corp. | 306,111 | 4,763,087 | |
OneBeacon Insurance Group Ltd. | 20,572 | 337,381 | |
PartnerRe Ltd. | 64,815 | 6,408,907 | |
Phoenix Companies, Inc. (a)(d) | 3,067 | 156,816 | |
Platinum Underwriters Holdings Ltd. | 32,909 | 1,929,126 | |
Primerica, Inc. | 51,420 | 2,304,644 | |
Principal Financial Group, Inc. | 298,650 | 13,543,778 | |
ProAssurance Corp. | 69,301 | 3,150,423 | |
Progressive Corp. | 598,738 | 14,663,094 | |
Protective Life Corp. | 78,222 | 4,078,495 | |
Prudential Financial, Inc. | 510,495 | 43,177,667 | |
Reinsurance Group of America, Inc. | 80,713 | 6,214,094 | |
RenaissanceRe Holdings Ltd. | 56,754 | 5,420,575 | |
RLI Corp. | 34,126 | 1,471,854 | |
Safety Insurance Group, Inc. | 14,899 | 831,811 | |
Selective Insurance Group, Inc. | 57,017 | 1,313,672 | |
StanCorp Financial Group, Inc. (d) | 52,960 | 3,504,893 | |
State Auto Financial Corp. | 6,222 | 124,564 | |
Stewart Information Services Corp. (d) | 21,434 | 792,629 | |
Symetra Financial Corp. | 109,204 | 2,151,319 | |
The Chubb Corp. | 278,385 | 24,353,120 | |
The Travelers Companies, Inc. | 393,876 | 33,022,564 | |
Third Point Reinsurance Ltd. (d) | 28,985 | 434,775 | |
Torchmark Corp. | 96,240 | 7,459,562 | |
Tower Group International Ltd. (d) | 63,927 | 176,439 | |
United Fire Group, Inc. | 20,054 | 581,165 | |
Universal Insurance Holdings, Inc. | 22,997 | 307,240 | |
Unum Group | 290,729 | 10,111,555 | |
Validus Holdings Ltd. | 125,147 | 4,606,661 | |
W.R. Berkley Corp. | 118,696 | 4,895,023 | |
White Mountains Insurance Group Ltd. | 7,023 | 4,070,250 | |
Willis Group Holdings PLC (d) | 207,878 | 8,556,258 | |
XL Group PLC Class A | 291,212 | 8,852,845 | |
| 723,198,919 | ||
Real Estate Investment Trusts - 3.3% | |||
Acadia Realty Trust (SBI) (d) | 57,067 | 1,509,422 | |
AG Mortgage Investment Trust, Inc. (d) | 18,957 | 347,671 | |
Agree Realty Corp. | 17,794 | 546,988 | |
Alexanders, Inc. | 2,701 | 1,012,092 | |
Alexandria Real Estate Equities, Inc. | 78,887 | 5,715,363 | |
Altisource Residential Corp. Class B | 60,332 | 1,724,289 | |
American Assets Trust, Inc. | 36,114 | 1,194,290 | |
American Campus Communities, Inc. | 134,876 | 4,982,319 | |
American Capital Agency Corp. | 420,086 | 9,363,717 | |
American Capital Mortgage Investment Corp. | 52,567 | 1,060,276 | |
American Homes 4 Rent Class A | 82,136 | 1,345,388 | |
American Realty Capital Properties, Inc. | 634,113 | 9,315,120 | |
Common Stocks - continued | |||
Shares | Value | ||
FINANCIALS - continued | |||
Real Estate Investment Trusts - continued | |||
American Residential Properties, Inc. (a)(d) | 15,232 | $ 277,222 | |
American Tower Corp. | 436,451 | 35,557,663 | |
AmREIT, Inc. Class B | 18,007 | 312,241 | |
Annaly Capital Management, Inc. (d) | 1,072,997 | 11,996,106 | |
Anworth Mortgage Asset Corp. | 251,516 | 1,302,853 | |
Apartment Investment & Management Co. Class A | 137,319 | 4,104,465 | |
Apollo Commercial Real Estate Finance, Inc. | 34,660 | 580,208 | |
Apollo Residential Mortgage, Inc. | 29,321 | 511,358 | |
Arbor Realty Trust, Inc. | 31,767 | 217,922 | |
Ares Commercial Real Estate Corp. | 39,618 | 538,409 | |
Armada Hoffler Properties, Inc. | 18,404 | 180,175 | |
Armour Residential REIT, Inc. | 489,690 | 2,100,770 | |
Ashford Hospitality Prime, Inc. | 13,979 | 234,148 | |
Ashford Hospitality Trust, Inc. | 69,895 | 781,426 | |
Associated Estates Realty Corp. (d) | 60,888 | 1,041,185 | |
AvalonBay Communities, Inc. | 132,936 | 17,144,756 | |
Aviv REIT, Inc. (d) | 12,625 | 320,170 | |
BioMed Realty Trust, Inc. | 232,867 | 4,815,690 | |
Blackstone Mortgage Trust, Inc. (d) | 31,861 | 923,013 | |
Boston Properties, Inc. | 173,248 | 19,478,273 | |
Brandywine Realty Trust (SBI) (d) | 189,114 | 2,770,520 | |
BRE Properties, Inc. | 90,165 | 5,569,492 | |
Brixmor Property Group, Inc. (d) | 46,627 | 1,029,524 | |
BRT Realty Trust (a) | 5,568 | 39,700 | |
Camden Property Trust (SBI) | 107,447 | 7,166,715 | |
Campus Crest Communities, Inc. (d) | 55,980 | 463,514 | |
Capstead Mortgage Corp. (d) | 97,016 | 1,250,536 | |
CBL & Associates Properties, Inc. | 198,768 | 3,536,083 | |
Cedar Shopping Centers, Inc. | 59,877 | 368,244 | |
Chambers Street Properties (d) | 312,279 | 2,470,127 | |
Chatham Lodging Trust | 26,521 | 553,493 | |
Chesapeake Lodging Trust | 44,367 | 1,155,760 | |
Chimera Investment Corp. | 1,225,514 | 3,909,390 | |
Colony Financial, Inc. | 80,404 | 1,815,522 | |
Columbia Property Trust, Inc. (d) | 148,227 | 3,933,945 | |
CommonWealth REIT | 127,873 | 3,471,752 | |
Coresite Realty Corp. | 24,333 | 757,730 | |
Corporate Office Properties Trust (SBI) | 106,736 | 2,846,649 | |
Corrections Corp. of America (d) | 120,697 | 4,025,245 | |
Cousins Properties, Inc. | 234,370 | 2,706,974 | |
CubeSmart (d) | 141,018 | 2,469,225 | |
CyrusOne, Inc. | 16,200 | 359,964 | |
CYS Investments, Inc. (d) | 197,203 | 1,735,386 | |
DCT Industrial Trust, Inc. | 349,621 | 2,768,998 | |
DDR Corp. | 308,138 | 5,121,254 | |
DiamondRock Hospitality Co. | 202,906 | 2,560,674 | |
Digital Realty Trust, Inc. (d) | 143,555 | 7,774,939 | |
Douglas Emmett, Inc. | 131,928 | 3,552,821 | |
| |||
Shares | Value | ||
Duke Realty LP | 350,539 | $ 5,889,055 | |
DuPont Fabros Technology, Inc. (d) | 100,616 | 2,672,361 | |
EastGroup Properties, Inc. (d) | 28,464 | 1,765,907 | |
Education Realty Trust, Inc. | 122,580 | 1,155,929 | |
Ellington Residential Mortgage REIT | 7,146 | 120,982 | |
Empire State Realty Trust, Inc. | 146,821 | 2,249,298 | |
EPR Properties | 65,817 | 3,505,413 | |
Equity Lifestyle Properties, Inc. | 92,610 | 3,727,553 | |
Equity One, Inc. (d) | 85,144 | 1,975,341 | |
Equity Residential (SBI) | 375,538 | 21,957,707 | |
Essex Property Trust, Inc. | 38,906 | 6,507,029 | |
Excel Trust, Inc. | 44,534 | 558,011 | |
Extra Space Storage, Inc. | 137,773 | 6,764,654 | |
Federal Realty Investment Trust (SBI) (d) | 65,716 | 7,314,848 | |
FelCor Lodging Trust, Inc. | 200,216 | 1,743,881 | |
First Industrial Realty Trust, Inc. (d) | 100,981 | 1,942,874 | |
First Potomac Realty Trust | 64,690 | 820,269 | |
Five Oaks Investment Corp. | 4,880 | 55,144 | |
Franklin Street Properties Corp. | 99,285 | 1,243,048 | |
Gaming & Leisure Properties | 93,984 | 3,578,911 | |
General Growth Properties, Inc. | 597,700 | 13,161,354 | |
Getty Realty Corp. | 23,628 | 454,603 | |
Gladstone Commercial Corp. | 10,709 | 186,337 | |
Glimcher Realty Trust | 157,267 | 1,530,208 | |
Government Properties Income Trust | 51,672 | 1,287,150 | |
Gramercy Property Trust, Inc. (a) | 85,386 | 495,239 | |
Hannon Armstrong Sustainable Infrastructure Capital, Inc. | 14,671 | 210,235 | |
Hatteras Financial Corp. | 121,103 | 2,388,151 | |
HCP, Inc. | 513,882 | 19,923,205 | |
Health Care REIT, Inc. | 319,414 | 18,762,378 | |
Healthcare Realty Trust, Inc. | 119,232 | 2,857,991 | |
Healthcare Trust of America, Inc. (d) | 307,681 | 3,455,258 | |
Hersha Hospitality Trust | 166,640 | 936,517 | |
Highwoods Properties, Inc. (SBI) (d) | 89,662 | 3,381,154 | |
Home Properties, Inc. (d) | 74,137 | 4,369,635 | |
Hospitality Properties Trust (SBI) | 164,136 | 4,349,604 | |
Host Hotels & Resorts, Inc. | 818,486 | 16,099,620 | |
Hudson Pacific Properties, Inc. | 49,472 | 1,128,456 | |
Inland Real Estate Corp. | 85,277 | 913,317 | |
Invesco Mortgage Capital, Inc. | 135,801 | 2,285,531 | |
Investors Real Estate Trust | 102,538 | 900,284 | |
iStar Financial, Inc. (a)(d) | 71,516 | 1,108,498 | |
JAVELIN Mortgage Investment Corp. (d) | 12,977 | 188,167 | |
Kilroy Realty Corp. (d) | 91,661 | 5,272,341 | |
Kimco Realty Corp. | 418,673 | 9,319,661 | |
Kite Realty Group Trust | 133,192 | 823,127 | |
LaSalle Hotel Properties (SBI) (d) | 107,841 | 3,379,737 | |
Lexington Corporate Properties Trust (d) | 259,496 | 2,960,849 | |
Liberty Property Trust (SBI) (d) | 176,490 | 6,752,507 | |
LTC Properties, Inc. | 32,625 | 1,229,310 | |
Mack-Cali Realty Corp. | 122,465 | 2,724,846 | |
Medical Properties Trust, Inc. | 160,702 | 2,119,659 | |
MFA Financial, Inc. | 486,658 | 3,825,132 | |
Common Stocks - continued | |||
Shares | Value | ||
FINANCIALS - continued | |||
Real Estate Investment Trusts - continued | |||
Mid-America Apartment Communities, Inc. (d) | 78,844 | $ 5,333,008 | |
Monmouth Real Estate Investment Corp. Class A | 35,864 | 347,164 | |
National Health Investors, Inc. | 34,486 | 2,127,786 | |
National Retail Properties, Inc. (d) | 132,178 | 4,743,868 | |
New York Mortgage Trust, Inc. (d) | 61,040 | 471,839 | |
NorthStar Realty Finance Corp. | 317,869 | 4,930,148 | |
Omega Healthcare Investors, Inc. (d) | 127,635 | 4,079,215 | |
One Liberty Properties, Inc. | 11,261 | 246,841 | |
Parkway Properties, Inc. | 64,262 | 1,184,349 | |
Pebblebrook Hotel Trust | 72,830 | 2,420,869 | |
Pennsylvania Real Estate Investment Trust (SBI) | 59,632 | 1,118,696 | |
PennyMac Mortgage Investment Trust | 70,569 | 1,716,238 | |
Physicians Realty Trust | 13,134 | 175,864 | |
Piedmont Office Realty Trust, Inc. Class A | 174,747 | 3,019,628 | |
Plum Creek Timber Co., Inc. | 200,436 | 8,676,874 | |
PMC Commercial Trust | 8,500 | 81,430 | |
Post Properties, Inc. | 73,877 | 3,585,251 | |
Potlatch Corp. | 43,845 | 1,738,016 | |
Power (REIT) (a) | 718 | 6,642 | |
Prologis, Inc. | 574,154 | 23,649,403 | |
PS Business Parks, Inc. | 26,075 | 2,190,822 | |
Public Storage | 159,990 | 27,038,310 | |
QTS Realty Trust, Inc. Class A | 15,035 | 384,295 | |
RAIT Financial Trust (d) | 83,839 | 696,702 | |
Ramco-Gershenson Properties Trust (SBI) (d) | 70,480 | 1,177,016 | |
Rayonier, Inc. | 140,834 | 6,631,873 | |
Realty Income Corp. | 238,560 | 10,596,835 | |
Redwood Trust, Inc. | 89,769 | 1,804,357 | |
Regency Centers Corp. | 116,777 | 5,928,768 | |
Resource Capital Corp. | 118,128 | 688,686 | |
Retail Opportunity Investments Corp. | 70,350 | 1,043,291 | |
Retail Properties America, Inc. | 250,044 | 3,485,613 | |
Rexford Industrial Realty, Inc. | 19,146 | 271,682 | |
RLJ Lodging Trust | 133,852 | 3,478,813 | |
Rouse Properties, Inc. (d) | 34,930 | 653,890 | |
Ryman Hospitality Properties, Inc. (d) | 49,860 | 2,103,593 | |
Sabra Health Care REIT, Inc. (d) | 44,632 | 1,270,673 | |
Saul Centers, Inc. | 14,444 | 671,213 | |
Select Income (REIT) | 38,717 | 1,128,601 | |
Senior Housing Properties Trust (SBI) | 240,030 | 5,352,669 | |
Silver Bay Realty Trust Corp. | 47,769 | 748,540 | |
Simon Property Group, Inc. | 342,693 | 55,272,954 | |
SL Green Realty Corp. (d) | 129,295 | 12,842,872 | |
SoTHERLY Hotels, Inc. | 2,721 | 16,789 | |
Sovran Self Storage, Inc. | 33,865 | 2,505,671 | |
Spirit Realty Capital, Inc. | 431,927 | 4,716,643 | |
Stag Industrial, Inc. | 38,576 | 899,207 | |
Starwood Property Trust, Inc. (d) | 220,370 | 5,293,287 | |
| |||
Shares | Value | ||
Starwood Waypoint Residential (a) | 44,074 | $ 1,194,846 | |
Strategic Hotel & Resorts, Inc. (a)(d) | 334,781 | 3,344,462 | |
Summit Hotel Properties, Inc. | 86,907 | 803,021 | |
Sun Communities, Inc. (d) | 36,167 | 1,665,852 | |
Sunstone Hotel Investors, Inc. | 192,214 | 2,598,733 | |
Supertel Hospitality, Inc., Maryland (a) | 703 | 1,758 | |
Tanger Factory Outlet Centers, Inc. (d) | 110,651 | 3,796,436 | |
Taubman Centers, Inc. (d) | 65,656 | 4,625,465 | |
Terreno Realty Corp. | 21,026 | 392,766 | |
The Geo Group, Inc. | 86,331 | 2,782,448 | |
The Macerich Co. | 163,662 | 9,840,996 | |
Two Harbors Investment Corp. | 449,289 | 4,663,620 | |
UDR, Inc. | 279,578 | 7,215,908 | |
UMH Properties, Inc. | 10,346 | 95,907 | |
Universal Health Realty Income Trust (SBI) | 13,491 | 574,447 | |
Urstadt Biddle Properties, Inc. Class A | 26,585 | 521,332 | |
Ventas, Inc. | 330,294 | 20,620,254 | |
Vornado Realty Trust | 190,771 | 18,369,340 | |
Washington REIT (SBI) | 61,934 | 1,557,640 | |
Weingarten Realty Investors (SBI) | 108,015 | 3,294,458 | |
Western Asset Mortgage Capital Corp. (d) | 19,742 | 325,151 | |
Weyerhaeuser Co. | 648,424 | 19,134,992 | |
Whitestone REIT Class B | 2,558 | 36,784 | |
Winthrop Realty Trust | 32,907 | 383,037 | |
WP Carey, Inc. | 66,643 | 4,233,163 | |
ZAIS Financial Corp. (d) | 6,000 | 104,460 | |
| 771,771,510 | ||
Real Estate Management & Development - 0.2% | |||
Alexander & Baldwin, Inc. | 43,253 | 1,800,190 | |
Altisource Portfolio Solutions SA | 18,423 | 1,812,455 | |
American Spectrum Realty, Inc. (a) | 1,984 | 2,778 | |
AV Homes, Inc. (a)(d) | 12,051 | 238,007 | |
CBRE Group, Inc. (a) | 310,765 | 8,685,882 | |
Consolidated-Tomoka Land Co. | 2,432 | 86,482 | |
Forest City Enterprises, Inc. Class A (a)(d) | 164,146 | 3,197,564 | |
Forestar Group, Inc. (a)(d) | 38,487 | 725,865 | |
Gladstone Land Corp. | 8,000 | 102,400 | |
Howard Hughes Corp. (a) | 34,443 | 4,754,167 | |
Jones Lang LaSalle, Inc. | 53,062 | 6,537,238 | |
Kennedy-Wilson Holdings, Inc. | 81,481 | 2,061,469 | |
Maui Land & Pineapple, Inc. (a)(d) | 31,310 | 194,435 | |
RE/MAX Holdings, Inc. | 10,289 | 315,049 | |
Realogy Holdings Corp. (a)(d) | 174,285 | 8,271,566 | |
Tejon Ranch Co. (a) | 11,342 | 402,074 | |
The St. Joe Co. (a)(d) | 111,664 | 2,158,465 | |
Transcontinental Realty Investors, Inc. (a) | 20,697 | 327,013 | |
ZipRealty, Inc. (a) | 19,987 | 94,738 | |
| 41,767,837 | ||
Thrifts & Mortgage Finance - 0.2% | |||
Astoria Financial Corp. | 69,632 | 953,958 | |
Banc of California, Inc. | 4,303 | 55,035 | |
Bank Mutual Corp. | 56,001 | 370,727 | |
Common Stocks - continued | |||
Shares | Value | ||
FINANCIALS - continued | |||
Thrifts & Mortgage Finance - continued | |||
BankFinancial Corp. | 19,300 | $ 192,614 | |
BBX Capital Corp. (a) | 18,261 | 353,168 | |
Beneficial Mutual Bancorp, Inc. (a) | 37,525 | 451,801 | |
Berkshire Hills Bancorp, Inc. | 20,197 | 507,551 | |
BofI Holding, Inc. (a)(d) | 11,427 | 1,063,854 | |
Brookline Bancorp, Inc., Delaware | 86,924 | 793,616 | |
Camco Financial Corp. (a)(d) | 10,386 | 62,835 | |
Cape Bancorp, Inc. | 2,611 | 27,755 | |
Capitol Federal Financial, Inc. | 194,739 | 2,366,079 | |
Charter Financial Corp. | 1,496 | 15,753 | |
Chicopee Bancorp, Inc. | 1,816 | 32,470 | |
Clifton Savings Bancorp, Inc. | 15,589 | 205,307 | |
Dime Community Bancshares, Inc. | 51,879 | 871,567 | |
Doral Financial Corp. (a) | 7,972 | 91,678 | |
ESB Financial Corp. | 9,498 | 124,519 | |
ESSA Bancorp, Inc. | 4,298 | 48,267 | |
Essent Group Ltd. | 38,008 | 881,786 | |
EverBank Financial Corp. | 121,901 | 2,184,466 | |
Farmer Mac Class C (non-vtg.) | 8,894 | 279,805 | |
First Defiance Financial Corp. | 6,145 | 170,032 | |
First Financial Northwest, Inc. | 2,197 | 22,717 | |
Flagstar Bancorp, Inc. (a) | 37,206 | 823,741 | |
Fox Chase Bancorp, Inc. | 14,307 | 245,222 | |
Franklin Financial Corp./VA (a) | 16,347 | 323,671 | |
HF Financial Corp. | 2,735 | 36,321 | |
Hingham Institution for Savings | 1,505 | 117,842 | |
Home Loan Servicing Solutions Ltd. (d) | 65,442 | 1,342,870 | |
HomeStreet, Inc. | 7,892 | 148,685 | |
Hudson City Bancorp, Inc. | 532,335 | 5,057,183 | |
IF Bancorp, Inc. | 3,112 | 51,192 | |
Impac Mortgage Holdings, Inc. (a)(d) | 5,393 | 37,751 | |
Kearny Financial Corp. (a) | 2,196 | 27,626 | |
Madison County Financial, Inc. | 4,682 | 80,530 | |
Meridian Interstate Bancorp, Inc. (a) | 750 | 18,150 | |
MGIC Investment Corp. (a)(d) | 403,619 | 3,616,426 | |
NASB Financial, Inc. | 1,203 | 30,484 | |
Nationstar Mortgage Holdings, Inc. (a)(d) | 18,397 | 530,386 | |
New York Community Bancorp, Inc. (d) | 541,088 | 8,646,586 | |
Northfield Bancorp, Inc. | 23,534 | 297,940 | |
Northwest Bancshares, Inc. | 92,094 | 1,321,549 | |
OceanFirst Financial Corp. | 5,851 | 110,467 | |
Ocwen Financial Corp. (a) | 133,402 | 4,994,571 | |
Oritani Financial Corp. | 41,599 | 651,440 | |
PennyMac Financial Services, Inc. | 12,245 | 211,716 | |
People's United Financial, Inc. | 329,770 | 4,672,841 | |
Peoples Federal Bancshares, Inc. | 1,156 | 20,739 | |
Poage Bankshares, Inc. | 2,365 | 32,661 | |
Provident Financial Holdings, Inc. | 3,066 | 47,124 | |
Provident Financial Services, Inc. | 56,391 | 1,046,617 | |
Radian Group, Inc. | 200,792 | 3,122,316 | |
Riverview Bancorp, Inc. (a) | 6,875 | 23,238 | |
| |||
Shares | Value | ||
Rockville Financial, Inc. | 26,525 | $ 349,334 | |
Security National Financial Corp. | 10,153 | 39,495 | |
Simplicity Bancorp, Inc. | 10,338 | 182,362 | |
Territorial Bancorp, Inc. | 13,244 | 294,017 | |
TFS Financial Corp. (a) | 149,374 | 1,765,601 | |
Timberland Bancorp, Inc. | 5,034 | 53,813 | |
Tree.com, Inc. (a) | 3,275 | 110,728 | |
Trustco Bank Corp., New York | 86,500 | 584,740 | |
United Community Financial Corp. (a) | 29,429 | 109,182 | |
United Financial Bancorp, Inc. | 9,158 | 161,272 | |
Walker & Dunlop, Inc. (a) | 10,954 | 184,356 | |
Washington Federal, Inc. | 113,789 | 2,551,149 | |
Westfield Financial, Inc. | 28,907 | 219,404 | |
WSFS Financial Corp. | 10,396 | 741,131 | |
| 57,161,829 | ||
TOTAL FINANCIALS | 3,994,753,449 | ||
HEALTH CARE - 13.1% | |||
Biotechnology - 2.9% | |||
Aastrom Biosciences, Inc. (a) | 3,923 | 13,221 | |
ACADIA Pharmaceuticals, Inc. (a)(d) | 82,586 | 2,337,184 | |
Acceleron Pharma, Inc. (d) | 12,418 | 582,777 | |
Achillion Pharmaceuticals, Inc. (a)(d) | 72,544 | 253,904 | |
Acorda Therapeutics, Inc. (a) | 40,293 | 1,476,336 | |
Aegerion Pharmaceuticals, Inc. (a)(d) | 28,027 | 1,534,759 | |
Agenus, Inc. (a)(d) | 22,142 | 108,274 | |
Agios Pharmaceuticals, Inc. (d) | 7,262 | 227,010 | |
Alexion Pharmaceuticals, Inc. (a) | 219,098 | 38,736,526 | |
Alkermes PLC (a)(d) | 151,179 | 7,357,882 | |
Alnylam Pharmaceuticals, Inc. (a)(d) | 62,752 | 5,097,972 | |
AMAG Pharmaceuticals, Inc. (a)(d) | 31,420 | 651,337 | |
Amgen, Inc. | 847,536 | 105,111,415 | |
Amicus Therapeutics, Inc. (a)(d) | 25,384 | 63,968 | |
Anacor Pharmaceuticals, Inc. (a)(d) | 28,185 | 535,515 | |
Anthera Pharmaceuticals, Inc. (a) | 5,648 | 16,718 | |
Arena Pharmaceuticals, Inc. (a)(d) | 260,488 | 1,695,777 | |
ARIAD Pharmaceuticals, Inc. (a)(d) | 193,266 | 1,679,482 | |
ArQule, Inc. (a) | 65,290 | 146,903 | |
Array BioPharma, Inc. (a)(d) | 101,050 | 487,061 | |
Arrowhead Research Corp. (a) | 20,335 | 395,312 | |
Athersys, Inc. (a)(d) | 49,216 | 186,036 | |
AVEO Pharmaceuticals, Inc. (a) | 43,200 | 80,784 | |
BioCryst Pharmaceuticals, Inc. (a)(d) | 79,931 | 934,393 | |
Biogen Idec, Inc. (a) | 265,622 | 90,492,103 | |
BioMarin Pharmaceutical, Inc. (a) | 169,338 | 13,716,378 | |
Biospecifics Technologies Corp. (a) | 1,441 | 34,195 | |
Biota Pharmaceuticals, Inc. (a) | 5,848 | 38,714 | |
BioTime, Inc. (a)(d) | 32,076 | 115,153 | |
Bluebird Bio, Inc. (d) | 7,366 | 187,833 | |
Catalyst Pharmaceutical Partners, Inc. (a)(d) | 25,961 | 58,153 | |
Common Stocks - continued | |||
Shares | Value | ||
HEALTH CARE - continued | |||
Biotechnology - continued | |||
Cel-Sci Corp. (a)(d) | 28,340 | $ 31,457 | |
Celgene Corp. (a) | 463,123 | 74,447,022 | |
Cell Therapeutics, Inc. (a)(d) | 129,276 | 497,713 | |
Celldex Therapeutics, Inc. (a)(d) | 107,399 | 3,138,199 | |
Cellular Dynamics International, Inc. (d) | 4,597 | 68,449 | |
Celsion Corp. (a) | 10,682 | 39,844 | |
Cepheid, Inc. (a)(d) | 80,169 | 4,301,869 | |
Chelsea Therapeutics International Ltd. (a)(d) | 75,408 | 430,580 | |
ChemoCentryx, Inc. (a)(d) | 15,137 | 115,041 | |
Chimerix, Inc. | 17,212 | 344,240 | |
Cleveland Biolabs, Inc. (a) | 35,489 | 24,945 | |
Clovis Oncology, Inc. (a) | 39,949 | 3,180,739 | |
Codexis, Inc. (a) | 21,294 | 39,607 | |
Conatus Pharmaceuticals, Inc. (d) | 7,362 | 82,602 | |
Coronado Biosciences, Inc. (a)(d) | 18,457 | 52,418 | |
Cubist Pharmaceuticals, Inc. (a)(d) | 78,426 | 6,236,436 | |
Cubist Pharmaceuticals, Inc. rights (a) | 32,062 | 0 | |
Curis, Inc. (a)(d) | 69,058 | 210,627 | |
Cyclacel Pharmaceuticals, Inc. (a)(d) | 11,529 | 44,733 | |
Cytokinetics, Inc. (a) | 26,522 | 261,242 | |
Cytori Therapeutics, Inc. (a)(d) | 69,588 | 219,202 | |
CytRx Corp. (a) | 25,756 | 152,476 | |
DARA BioSciences, Inc. (a) | 1,702 | 4,970 | |
Dendreon Corp. (a)(d) | 131,169 | 377,767 | |
Discovery Laboratories, Inc. (a) | 38,893 | 102,678 | |
Durata Therapeutics, Inc. (a)(d) | 10,654 | 146,066 | |
Dyax Corp. (a)(d) | 146,558 | 1,417,216 | |
Dynavax Technologies Corp. (a)(d) | 275,972 | 513,308 | |
Emergent BioSolutions, Inc. (a) | 25,651 | 634,606 | |
Enanta Pharmaceuticals, Inc. (d) | 3,858 | 142,129 | |
EntreMed, Inc. (a) | 289 | 555 | |
Enzon Pharmaceuticals, Inc. | 43,430 | 41,693 | |
Epizyme, Inc. | 4,503 | 134,640 | |
Esperion Therapeutics, Inc. (d) | 6,156 | 95,726 | |
Exact Sciences Corp. (a)(d) | 79,977 | 1,075,691 | |
Exelixis, Inc. (a)(d) | 160,939 | 1,136,229 | |
Foundation Medicine, Inc. (d) | 12,644 | 450,506 | |
Galectin Therapeutics, Inc. (a)(d) | 13,518 | 227,913 | |
Galena Biopharma, Inc. (a)(d) | 133,911 | 528,948 | |
Genomic Health, Inc. (a)(d) | 18,393 | 485,759 | |
GenVec, Inc. (a) | 8,140 | 29,223 | |
Geron Corp. (a)(d) | 128,101 | 609,120 | |
Gilead Sciences, Inc. (a)(d) | 1,722,310 | 142,590,045 | |
GTx, Inc. (a)(d) | 19,627 | 33,366 | |
Halozyme Therapeutics, Inc. (a)(d) | 112,522 | 1,585,435 | |
Harvard Apparatus (a) | 3,080 | 15,585 | |
Heat Biologics, Inc. (d) | 3,136 | 23,144 | |
Hemispherx Biopharma, Inc. (a) | 130,774 | 51,133 | |
Hyperion Therapeutics, Inc. (a)(d) | 5,781 | 179,211 | |
iBio, Inc. (a) | 40,361 | 21,783 | |
| |||
Shares | Value | ||
Idenix Pharmaceuticals, Inc. (a)(d) | 141,515 | $ 965,132 | |
Idera Pharmaceuticals, Inc. (a) | 80,821 | 467,954 | |
ImmunoCellular Therapeutics Ltd. (a)(d) | 41,923 | 57,015 | |
ImmunoGen, Inc. (a)(d) | 90,051 | 1,476,836 | |
Immunomedics, Inc. (a)(d) | 54,782 | 259,667 | |
Incyte Corp. (a)(d) | 167,261 | 10,748,192 | |
Infinity Pharmaceuticals, Inc. (a)(d) | 41,127 | 644,871 | |
Inovio Pharmaceuticals, Inc. (a)(d) | 175,405 | 577,082 | |
Insmed, Inc. (a)(d) | 32,411 | 648,544 | |
Insys Therapeutics, Inc. (a)(d) | 4,354 | 292,937 | |
Intercept Pharmaceuticals, Inc. (a) | 12,590 | 5,168,195 | |
InterMune, Inc. (a) | 93,683 | 2,814,237 | |
Intrexon Corp. (d) | 13,260 | 344,495 | |
Ironwood Pharmaceuticals, Inc. | 150,069 | 2,177,501 | |
Isis Pharmaceuticals, Inc. (a)(d) | 138,050 | 7,040,550 | |
IsoRay, Inc. (a)(d) | 31,040 | 24,366 | |
Karyopharm Therapeutics, Inc. | 6,103 | 244,974 | |
Keryx Biopharmaceuticals, Inc. (a)(d) | 105,438 | 1,692,280 | |
KYTHERA Biopharmaceuticals, Inc. (a)(d) | 13,619 | 680,541 | |
Lexicon Pharmaceuticals, Inc. (a)(d) | 482,347 | 863,401 | |
Ligand Pharmaceuticals, Inc. | 23,017 | 1,605,436 | |
Lpath, Inc. (a) | 7,871 | 36,521 | |
Macrogenics, Inc. | 4,799 | 167,965 | |
MannKind Corp. (a)(d) | 286,250 | 1,771,888 | |
Mast Therapeutics, Inc. (a) | 29,390 | 24,394 | |
Medgenics, Inc. (a)(d) | 4,479 | 38,654 | |
Medivation, Inc. (a)(d) | 85,572 | 6,153,483 | |
Merrimack Pharmaceuticals, Inc. (a)(d) | 95,963 | 477,896 | |
Metabolix, Inc. (a)(d) | 41,636 | 53,294 | |
MiMedx Group, Inc. (a) | 79,098 | 565,551 | |
Momenta Pharmaceuticals, Inc. (a) | 43,036 | 636,933 | |
Myriad Genetics, Inc. (a)(d) | 87,108 | 3,154,181 | |
Nanosphere, Inc. (a)(d) | 36,229 | 86,950 | |
NanoViricides, Inc. (a)(d) | 32,620 | 129,828 | |
Navidea Biopharmaceuticals, Inc. (a)(d) | 114,446 | 211,725 | |
Neuralstem, Inc. (a) | 54,208 | 193,523 | |
Neurocrine Biosciences, Inc. (a) | 83,489 | 1,471,911 | |
NewLink Genetics Corp. (a)(d) | 12,482 | 551,704 | |
Northwest Biotherapeutics, Inc. (a)(d) | 40,748 | 288,903 | |
Novavax, Inc. (a)(d) | 198,633 | 1,271,251 | |
NPS Pharmaceuticals, Inc. (a)(d) | 102,906 | 3,599,652 | |
OncoGenex Pharmaceuticals, Inc. (a)(d) | 10,565 | 116,426 | |
OncoMed Pharmaceuticals, Inc. (d) | 5,827 | 201,148 | |
Onconova Therapeutics, Inc. (d) | 6,241 | 53,049 | |
Oncothyreon, Inc. (a) | 43,661 | 134,912 | |
Opexa Therapeutics, Inc. (a)(d) | 5,726 | 10,421 | |
Ophthotech Corp. (d) | 12,066 | 406,262 | |
Opko Health, Inc. (a)(d) | 254,677 | 2,424,525 | |
Oragenics, Inc. (a) | 9,973 | 37,299 | |
Orexigen Therapeutics, Inc. (a)(d) | 77,934 | 540,862 | |
Organovo Holdings, Inc. (a)(d) | 69,396 | 713,391 | |
Osiris Therapeutics, Inc. (a)(d) | 18,170 | 277,456 | |
Common Stocks - continued | |||
Shares | Value | ||
HEALTH CARE - continued | |||
Biotechnology - continued | |||
OvaScience, Inc. (a) | 10,225 | $ 110,328 | |
OXiGENE, Inc. (a) | 561 | 1,195 | |
Oxygen Biotherapeutics, Inc. (a)(d) | 1,373 | 8,883 | |
Palatin Technologies, Inc. (a)(d) | 9,275 | 9,739 | |
PDL BioPharma, Inc. (d) | 181,078 | 1,551,838 | |
Peregrine Pharmaceuticals, Inc. (a)(d) | 84,902 | 153,673 | |
Pharmacyclics, Inc. (a) | 74,587 | 10,342,233 | |
PharmAthene, Inc. (a)(d) | 51,372 | 96,579 | |
Portola Pharmaceuticals, Inc. (d) | 6,348 | 154,828 | |
Progenics Pharmaceuticals, Inc. (a)(d) | 45,935 | 214,516 | |
Prothena Corp. PLC (a) | 18,701 | 673,423 | |
PTC Therapeutics, Inc. (a) | 10,292 | 322,757 | |
Puma Biotechnology, Inc. (a)(d) | 28,653 | 3,331,198 | |
Raptor Pharmaceutical Corp. (a)(d) | 62,748 | 993,301 | |
Receptos, Inc. | 18,327 | 850,098 | |
Regeneron Pharmaceuticals, Inc. (a) | 88,505 | 29,427,913 | |
Regulus Therapeutics, Inc. (a)(d) | 11,075 | 124,372 | |
Repligen Corp. (a)(d) | 22,058 | 330,208 | |
Rexahn Pharmaceuticals, Inc. (a)(d) | 45,000 | 60,750 | |
Rigel Pharmaceuticals, Inc. (a) | 75,480 | 259,651 | |
Sangamo Biosciences, Inc. (a)(d) | 84,275 | 1,533,805 | |
Sarepta Therapeutics, Inc. (a)(d) | 40,979 | 1,189,620 | |
Seattle Genetics, Inc. (a)(d) | 128,581 | 6,762,075 | |
SIGA Technologies, Inc. (a)(d) | 72,968 | 234,227 | |
Spectrum Pharmaceuticals, Inc. (a)(d) | 41,659 | 347,853 | |
StemCells, Inc. (a)(d) | 41,468 | 60,958 | |
Stemline Therapeutics, Inc. (d) | 10,674 | 276,030 | |
Sunesis Pharmaceuticals, Inc. (a)(d) | 32,643 | 213,812 | |
Synageva BioPharma Corp. (a)(d) | 21,459 | 2,460,704 | |
Synergy Pharmaceuticals, Inc. (a)(d) | 111,018 | 673,879 | |
Synta Pharmaceuticals Corp. (a)(d) | 94,692 | 585,197 | |
Synthetic Biologics, Inc. (a) | 46,314 | 125,048 | |
Targacept, Inc. (a)(d) | 18,977 | 93,557 | |
Telik, Inc. (a) | 380 | 528 | |
TESARO, Inc. (a)(d) | 12,275 | 405,198 | |
Tetraphase Pharmaceuticals, Inc. | 10,243 | 139,305 | |
TG Therapeutics, Inc. (a)(d) | 7,226 | 47,692 | |
Theravance, Inc. (a)(d) | 88,275 | 3,266,175 | |
Threshold Pharmaceuticals, Inc. (a) | 37,822 | 189,110 | |
Trovagene, Inc. (a)(d) | 4,592 | 28,746 | |
United Therapeutics Corp. (a)(d) | 53,357 | 5,411,467 | |
Vanda Pharmaceuticals, Inc. (a)(d) | 44,094 | 667,142 | |
Verastem, Inc. (a)(d) | 13,711 | 183,316 | |
Vertex Pharmaceuticals, Inc. (a) | 268,044 | 21,674,038 | |
Vical, Inc. (a)(d) | 65,666 | 99,812 | |
XOMA Corp. (a) | 72,501 | 606,108 | |
Zalicus, Inc. (a)(d) | 17,476 | 26,389 | |
ZIOPHARM Oncology, Inc. (a)(d) | 79,220 | 337,477 | |
| 682,179,876 | ||
Health Care Equipment & Supplies - 2.1% | |||
Abaxis, Inc. (a)(d) | 23,291 | 883,893 | |
| |||
Shares | Value | ||
Abbott Laboratories | 1,738,741 | $ 69,167,117 | |
Abiomed, Inc. (a)(d) | 36,354 | 1,024,819 | |
Accuray, Inc. (a)(d) | 58,561 | 549,302 | |
Alere, Inc. (a) | 93,479 | 3,434,418 | |
Align Technology, Inc. (a)(d) | 76,057 | 3,980,063 | |
Alphatec Holdings, Inc. (a) | 36,801 | 51,889 | |
Analogic Corp. | 12,756 | 1,202,381 | |
Angiodynamics, Inc. (a) | 26,377 | 406,206 | |
Anika Therapeutics, Inc. (a) | 9,287 | 365,629 | |
Antares Pharma, Inc. (a)(d) | 97,369 | 433,292 | |
ArthroCare Corp. (a) | 39,236 | 1,893,137 | |
Atossa Genetics, Inc. (a)(d) | 789 | 1,736 | |
Atricure, Inc. (a) | 12,717 | 264,386 | |
Atrion Corp. | 1,172 | 339,212 | |
Bacterin International Holdings, Inc. (a)(d) | 9,747 | 6,492 | |
Baxano Surgical, Inc. (a)(d) | 18,036 | 27,415 | |
Baxter International, Inc. | 605,834 | 42,105,463 | |
Becton, Dickinson & Co. | 213,454 | 24,594,170 | |
BioLase Technology, Inc. (d) | 31,016 | 95,839 | |
Boston Scientific Corp. (a) | 1,493,547 | 19,565,466 | |
BSD Medical Corp. (a)(d) | 46,363 | 53,317 | |
C.R. Bard, Inc. | 84,581 | 12,193,197 | |
Cantel Medical Corp. | 48,934 | 1,583,015 | |
Cardica, Inc. (a) | 23,778 | 27,107 | |
Cardiovascular Systems, Inc. (a)(d) | 37,106 | 1,298,710 | |
CareFusion Corp. (a) | 231,213 | 9,371,063 | |
Cerus Corp. (a)(d) | 66,771 | 431,341 | |
Cesca Therapeutics, Inc. (a)(d) | 15,844 | 35,174 | |
CONMED Corp. | 26,543 | 1,237,435 | |
Covidien PLC | 520,911 | 37,479,546 | |
Cryolife, Inc. | 20,961 | 208,772 | |
Cutera, Inc. (a) | 15,449 | 165,304 | |
Cyberonics, Inc. (a)(d) | 26,017 | 1,781,384 | |
Cynosure, Inc. Class A (a) | 17,160 | 528,185 | |
Delcath Systems, Inc. (a)(d) | 119,898 | 37,516 | |
DENTSPLY International, Inc. | 165,101 | 7,492,283 | |
Derma Sciences, Inc. (a) | 7,901 | 116,066 | |
DexCom, Inc. (a) | 82,473 | 3,719,532 | |
Echo Therapeutics, Inc. (a)(d) | 2,009 | 6,288 | |
Edwards Lifesciences Corp. (a)(d) | 125,427 | 8,749,788 | |
Endologix, Inc. (a)(d) | 68,176 | 920,376 | |
EnteroMedics, Inc. (a)(d) | 53,456 | 129,898 | |
ERBA Diagnostics, Inc. (a)(d) | 3,094 | 7,890 | |
Exactech, Inc. (a) | 3,102 | 72,277 | |
Fonar Corp. (a) | 719 | 16,293 | |
Genmark Diagnostics, Inc. (a)(d) | 33,235 | 414,108 | |
Globus Medical, Inc. (a) | 81,315 | 1,923,913 | |
Greatbatch, Inc. (a) | 22,320 | 967,126 | |
Haemonetics Corp. (a)(d) | 65,465 | 2,388,163 | |
Hansen Medical, Inc. (a)(d) | 48,696 | 113,949 | |
HeartWare International, Inc. (a)(d) | 17,704 | 1,700,115 | |
Hill-Rom Holdings, Inc. | 58,209 | 2,202,046 | |
Hologic, Inc. (a)(d) | 312,892 | 6,814,788 | |
Common Stocks - continued | |||
Shares | Value | ||
HEALTH CARE - continued | |||
Health Care Equipment & Supplies - continued | |||
ICU Medical, Inc. (a)(d) | 17,344 | $ 1,003,524 | |
IDEXX Laboratories, Inc. (a)(d) | 62,216 | 7,832,994 | |
Insulet Corp. (a)(d) | 65,054 | 3,084,210 | |
Integra LifeSciences Holdings Corp. (a)(d) | 24,422 | 1,148,811 | |
Intuitive Surgical, Inc. (a) | 43,523 | 19,360,336 | |
Invacare Corp. | 28,414 | 563,165 | |
Kewaunee Scientific Corp. | 1,376 | 22,374 | |
LeMaitre Vascular, Inc. | 3,845 | 31,491 | |
Masimo Corp. (a)(d) | 62,689 | 1,601,704 | |
Medical Action Industries, Inc. (a) | 18,788 | 137,528 | |
Medtronic, Inc. | 1,114,252 | 66,030,574 | |
MELA Sciences, Inc. (a)(d) | 40,114 | 28,280 | |
Meridian Bioscience, Inc. (d) | 44,602 | 930,398 | |
Merit Medical Systems, Inc. (a) | 38,544 | 581,629 | |
Misonix, Inc. (a) | 2,579 | 17,279 | |
Natus Medical, Inc. (a) | 24,629 | 618,188 | |
Neogen Corp. (a) | 37,855 | 1,639,879 | |
NuVasive, Inc. (a)(d) | 44,714 | 1,643,240 | |
NxStage Medical, Inc. (a) | 54,843 | 760,672 | |
OraSure Technologies, Inc. (a) | 46,551 | 323,064 | |
Orthofix International NV (a) | 16,427 | 365,008 | |
PhotoMedex, Inc. (a)(d) | 6,551 | 95,907 | |
Quidel Corp. (a)(d) | 35,813 | 1,003,480 | |
ResMed, Inc. (d) | 155,104 | 6,827,678 | |
Retractable Technologies, Inc. (a) | 5,248 | 18,893 | |
Rockwell Medical Technologies, Inc. (a)(d) | 40,985 | 520,100 | |
RTI Biologics, Inc. (a) | 29,474 | 110,822 | |
Sirona Dental Systems, Inc. (a)(d) | 67,791 | 4,776,554 | |
St. Jude Medical, Inc. | 324,571 | 21,850,120 | |
Staar Surgical Co. (a) | 22,695 | 321,361 | |
Stereotaxis, Inc. (a) | 3,270 | 16,219 | |
Steris Corp. | 82,536 | 3,809,036 | |
Stryker Corp. | 333,990 | 26,799,358 | |
SurModics, Inc. (a) | 19,525 | 486,173 | |
Symmetry Medical, Inc. (a) | 29,367 | 310,703 | |
Synergetics U.S.A., Inc. (a) | 3,622 | 12,532 | |
Tandem Diabetes Care, Inc. | 11,476 | 295,507 | |
TearLab Corp. (a)(d) | 17,390 | 139,990 | |
Teleflex, Inc. | 53,220 | 5,427,908 | |
The Cooper Companies, Inc. (d) | 58,635 | 7,517,593 | |
The Spectranetics Corp. (a) | 40,582 | 1,215,837 | |
Thoratec Corp. (a) | 57,172 | 2,123,368 | |
Tornier NV (a) | 21,770 | 417,984 | |
Unilife Corp. (a)(d) | 142,037 | 657,631 | |
Uroplasty, Inc. (a) | 1,597 | 6,580 | |
Varian Medical Systems, Inc. (a)(d) | 116,002 | 9,724,448 | |
Vascular Solutions, Inc. (a) | 2,125 | 55,293 | |
Vermillion, Inc. (a)(d) | 5,249 | 17,847 | |
Volcano Corp. (a)(d) | 51,974 | 1,115,362 | |
West Pharmaceutical Services, Inc. | 83,154 | 3,790,159 | |
Wright Medical Group, Inc. (a)(d) | 47,593 | 1,514,409 | |
| |||
Shares | Value | ||
Zeltiq Aesthetics, Inc. (a)(d) | 23,737 | $ 450,766 | |
Zimmer Holdings, Inc. | 197,443 | 18,528,051 | |
| 502,260,307 | ||
Health Care Providers & Services - 2.2% | |||
Acadia Healthcare Co., Inc. (a)(d) | 44,959 | 2,222,773 | |
Accretive Health, Inc. (a)(d) | 67,415 | 558,196 | |
Aetna, Inc. | 410,919 | 29,877,920 | |
Air Methods Corp. (a)(d) | 37,158 | 2,007,275 | |
Alliance Healthcare Services, Inc. (a) | 17,141 | 516,630 | |
Almost Family, Inc. (a) | 9,932 | 272,335 | |
Amedisys, Inc. (a)(d) | 30,453 | 516,483 | |
AmerisourceBergen Corp. | 242,456 | 16,450,640 | |
AMN Healthcare Services, Inc. (a) | 76,320 | 1,063,138 | |
AmSurg Corp. (a) | 32,040 | 1,405,274 | |
Bio-Reference Laboratories, Inc. (a)(d) | 31,917 | 806,223 | |
BioScrip, Inc. (a)(d) | 61,696 | 439,892 | |
BioTelemetry, Inc. (a) | 34,161 | 383,970 | |
Brookdale Senior Living, Inc. (a) | 136,171 | 4,567,175 | |
Capital Senior Living Corp. (a) | 26,619 | 676,655 | |
Cardinal Health, Inc. | 378,369 | 27,064,735 | |
Centene Corp. (a)(d) | 59,283 | 3,775,141 | |
Chemed Corp. (d) | 19,372 | 1,638,871 | |
Chindex International, Inc. (a) | 9,187 | 176,850 | |
Cigna Corp. | 313,010 | 24,912,466 | |
Community Health Systems, Inc. (a) | 133,147 | 5,526,932 | |
Corvel Corp. (a) | 17,696 | 814,193 | |
Cross Country Healthcare, Inc. (a) | 40,427 | 420,441 | |
DaVita HealthCare Partners, Inc. (a) | 194,861 | 13,392,797 | |
Emeritus Corp. (a) | 47,874 | 1,509,467 | |
Envision Healthcare Holdings, Inc. | 72,467 | 2,439,239 | |
ExamWorks Group, Inc. (a)(d) | 29,906 | 1,087,980 | |
Express Scripts Holding Co. (a) | 897,442 | 67,586,357 | |
Five Star Quality Care, Inc. (a) | 32,241 | 186,675 | |
Gentiva Health Services, Inc. (a) | 24,132 | 258,454 | |
Hanger, Inc. (a) | 33,622 | 1,191,900 | |
HCA Holdings, Inc. (a) | 345,647 | 17,697,126 | |
Health Net, Inc. (a) | 90,547 | 3,083,125 | |
HealthSouth Corp. (d) | 110,704 | 3,617,807 | |
Healthways, Inc. (a)(d) | 33,821 | 505,962 | |
Henry Schein, Inc. (a)(d) | 98,971 | 11,781,508 | |
Hooper Holmes, Inc. (a) | 6,267 | 3,510 | |
Humana, Inc. | 170,662 | 19,192,649 | |
IPC The Hospitalist Co., Inc. (a)(d) | 20,567 | 1,055,704 | |
Kindred Healthcare, Inc. | 69,839 | 1,512,713 | |
Laboratory Corp. of America Holdings (a)(d) | 96,901 | 9,064,120 | |
Landauer, Inc. | 14,935 | 723,750 | |
LCA-Vision, Inc. (a) | 27,238 | 148,175 | |
LHC Group, Inc. (a) | 12,810 | 301,804 | |
LifePoint Hospitals, Inc. (a)(d) | 49,772 | 2,700,131 | |
Magellan Health Services, Inc. (a) | 33,160 | 2,027,402 | |
McKesson Corp. | 255,109 | 45,167,048 | |
MEDNAX, Inc. (a)(d) | 110,274 | 6,706,865 | |
Common Stocks - continued | |||
Shares | Value | ||
HEALTH CARE - continued | |||
Health Care Providers & Services - continued | |||
Molina Healthcare, Inc. (a)(d) | 24,412 | $ 919,844 | |
MWI Veterinary Supply, Inc. (a)(d) | 16,104 | 2,623,664 | |
National Healthcare Corp. | 6,159 | 317,189 | |
National Research Corp.: | |||
Class A (a) | 960 | 16,800 | |
Class B (d) | 3,356 | 134,408 | |
NeoStem, Inc. (a)(d) | 15,337 | 107,359 | |
Omnicare, Inc. | 126,227 | 7,434,770 | |
Owens & Minor, Inc. | 59,970 | 2,082,158 | |
Patterson Companies, Inc. (d) | 106,597 | 4,387,533 | |
PDI, Inc. (a) | 1,365 | 6,484 | |
PharMerica Corp. (a) | 29,176 | 703,142 | |
Premier, Inc. (d) | 38,595 | 1,291,003 | |
Providence Service Corp. (a) | 13,245 | 352,185 | |
Quest Diagnostics, Inc. (d) | 161,387 | 8,553,511 | |
RadNet, Inc. (a) | 27,076 | 52,527 | |
Select Medical Holdings Corp. | 68,408 | 766,854 | |
Sharps Compliance Corp. (a) | 5,184 | 24,883 | |
Skilled Healthcare Group, Inc. (a)(d) | 27,157 | 130,625 | |
Surgical Care Affiliates, Inc. | 14,337 | 436,132 | |
Team Health Holdings, Inc. (a)(d) | 79,380 | 3,573,688 | |
Tenet Healthcare Corp. (a) | 109,083 | 4,812,742 | |
The Ensign Group, Inc. | 18,939 | 749,984 | |
Triple-S Management Corp. (a) | 20,220 | 338,685 | |
U.S. Physical Therapy, Inc. | 11,240 | 372,943 | |
UnitedHealth Group, Inc. | 1,126,842 | 87,071,081 | |
Universal American Spin Corp. | 33,569 | 251,432 | |
Universal Health Services, Inc. Class B | 113,232 | 9,090,265 | |
VCA Antech, Inc. (a) | 87,077 | 2,696,775 | |
Wellcare Health Plans, Inc. (a) | 52,863 | 3,267,991 | |
WellPoint, Inc. | 330,284 | 29,920,428 | |
| 511,523,561 | ||
Health Care Technology - 0.2% | |||
Allscripts Healthcare Solutions, Inc. (a) | 176,070 | 3,269,620 | |
athenahealth, Inc. (a)(d) | 41,563 | 8,057,819 | |
Authentidate Holding Corp. (a) | 816 | 857 | |
Cerner Corp. (a)(d) | 329,819 | 20,240,992 | |
CollabRx, Inc. (a) | 87 | 279 | |
Computer Programs & Systems, Inc. | 21,937 | 1,501,149 | |
HealthStream, Inc. (a)(d) | 34,016 | 980,341 | |
HMS Holdings Corp. (a)(d) | 102,544 | 2,098,050 | |
MedAssets, Inc. (a) | 61,276 | 1,488,394 | |
Medidata Solutions, Inc. (a)(d) | 52,930 | 3,392,813 | |
Merge Healthcare, Inc. (a)(d) | 37,852 | 95,009 | |
Omnicell, Inc. (a) | 38,848 | 1,118,045 | |
Quality Systems, Inc. | 52,869 | 923,093 | |
Veeva Systems, Inc. Class A (d) | 21,176 | 747,513 | |
Vocera Communications, Inc. (a)(d) | 14,570 | 247,981 | |
| 44,161,955 | ||
| |||
Shares | Value | ||
Life Sciences Tools & Services - 0.6% | |||
Accelerate Diagnostics, Inc. (a)(d) | 24,477 | $ 361,770 | |
Affymetrix, Inc. (a)(d) | 55,779 | 430,614 | |
Agilent Technologies, Inc. | 366,572 | 20,868,944 | |
Albany Molecular Research, Inc. (a)(d) | 23,897 | 372,793 | |
Apricus Biosciences, Inc. (a)(d) | 18,211 | 42,523 | |
BG Medicine, Inc. (a)(d) | 3,134 | 4,074 | |
Bio-Rad Laboratories, Inc. Class A (a) | 24,617 | 3,193,317 | |
Bruker BioSciences Corp. (a) | 117,243 | 2,666,106 | |
Cambrex Corp. (a) | 26,613 | 534,123 | |
Charles River Laboratories International, Inc. (a) | 45,219 | 2,686,461 | |
Covance, Inc. (a)(d) | 69,154 | 7,161,588 | |
Enzo Biochem, Inc. (a) | 14,697 | 54,526 | |
Fluidigm Corp. (a) | 33,180 | 1,554,483 | |
Furiex Pharmaceuticals, Inc. (a)(d) | 9,211 | 852,294 | |
Harvard Bioscience, Inc. (a) | 12,320 | 60,122 | |
Illumina, Inc. (a)(d) | 140,797 | 24,145,278 | |
Luminex Corp. (a) | 39,871 | 736,816 | |
Mettler-Toledo International, Inc. (a)(d) | 36,042 | 8,857,682 | |
Nanostring Technologies, Inc. | 6,707 | 126,762 | |
NeoGenomics, Inc. (a)(d) | 21,535 | 77,095 | |
Pacific Biosciences of California, Inc. (a) | 41,271 | 274,865 | |
PAREXEL International Corp. (a) | 64,767 | 3,469,568 | |
PerkinElmer, Inc. | 134,059 | 6,075,554 | |
pSivida Corp. (a)(d) | 25,265 | 110,661 | |
Quintiles Transnational Holdings, Inc. | 25,574 | 1,384,832 | |
Sequenom, Inc. (a)(d) | 91,772 | 217,500 | |
Techne Corp. | 39,549 | 3,513,533 | |
Thermo Fisher Scientific, Inc. | 445,114 | 55,434,498 | |
Waters Corp. (a) | 93,206 | 10,383,148 | |
| 155,651,530 | ||
Pharmaceuticals - 5.1% | |||
AbbVie, Inc. | 1,788,172 | 91,035,837 | |
AcelRx Pharmaceuticals, Inc. (a)(d) | 17,182 | 196,390 | |
Actavis PLC (a) | 193,171 | 42,656,020 | |
Acura Pharmaceuticals, Inc. (a) | 2,885 | 5,712 | |
Akorn, Inc. (a)(d) | 79,308 | 2,047,733 | |
Alexza Pharmaceuticals, Inc. (a) | 13,886 | 76,095 | |
Alimera Sciences, Inc. (a)(d) | 3,741 | 25,102 | |
Allergan, Inc. | 335,503 | 42,608,881 | |
Ampio Pharmaceuticals, Inc. (a)(d) | 26,020 | 185,262 | |
ANI Pharmaceuticals, Inc. (a) | 3,574 | 108,221 | |
Aratana Therapeutics, Inc. (d) | 7,153 | 167,166 | |
AstraZeneca PLC rights (a) | 7,692 | 0 | |
Auxilium Pharmaceuticals, Inc. (a)(d) | 49,047 | 1,508,195 | |
AVANIR Pharmaceuticals Class A (a) | 141,865 | 590,158 | |
Biodel, Inc. (a)(d) | 8,109 | 25,543 | |
Biodelivery Sciences International, Inc. (a)(d) | 15,298 | 143,342 | |
Bristol-Myers Squibb Co. | 1,848,869 | 99,413,686 | |
Cadence Pharmaceuticals, Inc. (a) | 96,716 | 1,353,057 | |
Cempra, Inc. (a) | 20,803 | 236,946 | |
Common Stocks - continued | |||
Shares | Value | ||
HEALTH CARE - continued | |||
Pharmaceuticals - continued | |||
Columbia Laboratories, Inc. (a) | 5,322 | $ 36,349 | |
Corcept Therapeutics, Inc. (a)(d) | 36,105 | 118,424 | |
Cumberland Pharmaceuticals, Inc. (a) | 7,158 | 33,142 | |
DepoMed, Inc. (a)(d) | 51,564 | 621,346 | |
Durect Corp. (a) | 121,504 | 168,891 | |
Eli Lilly & Co. | 1,106,346 | 65,949,285 | |
Endo Health Solutions, Inc. (a)(d) | 153,698 | 12,268,174 | |
Endocyte, Inc. (a)(d) | 47,373 | 623,902 | |
Forest Laboratories, Inc. (a) | 269,775 | 26,321,947 | |
Hi-Tech Pharmacal Co., Inc. (a) | 12,868 | 557,956 | |
Horizon Pharma, Inc. (a)(d) | 61,460 | 751,041 | |
Hospira, Inc. (a) | 214,554 | 9,285,897 | |
Impax Laboratories, Inc. (a) | 76,645 | 1,975,142 | |
Jazz Pharmaceuticals PLC (a) | 64,644 | 9,822,333 | |
Johnson & Johnson | 3,156,660 | 290,791,519 | |
Lannett Co., Inc. (a)(d) | 27,670 | 1,186,766 | |
Mallinckrodt PLC (a)(d) | 76,544 | 5,181,263 | |
Merck & Co., Inc. | 3,275,273 | 186,657,808 | |
Mylan, Inc. (a) | 432,560 | 24,037,359 | |
Nektar Therapeutics (a)(d) | 149,616 | 1,919,573 | |
Ocera Therapeutics, Inc. (a)(d) | 890 | 13,768 | |
Omeros Corp. (a)(d) | 38,961 | 520,519 | |
Pacira Pharmaceuticals, Inc. (a)(d) | 42,514 | 3,326,295 | |
Pain Therapeutics, Inc. (a) | 34,536 | 195,128 | |
Pernix Therapeutics Holdings, Inc. (a)(d) | 8,953 | 32,858 | |
Perrigo Co. PLC | 148,774 | 24,464,397 | |
Pfizer, Inc. | 7,258,348 | 233,065,554 | |
Pozen, Inc. (d) | 23,223 | 184,855 | |
Prestige Brands Holdings, Inc. (a) | 52,110 | 1,484,614 | |
Questcor Pharmaceuticals, Inc. (d) | 62,679 | 3,807,749 | |
Relypsa, Inc. | 13,726 | 541,628 | |
Repros Therapeutics, Inc. (a)(d) | 21,711 | 424,450 | |
Sagent Pharmaceuticals, Inc. (a) | 25,120 | 531,539 | |
Salix Pharmaceuticals Ltd. (a)(d) | 73,563 | 7,938,919 | |
SciClone Pharmaceuticals, Inc. (a)(d) | 46,113 | 214,425 | |
Sucampo Pharmaceuticals, Inc. | 39,776 | 357,984 | |
Supernus Pharmaceuticals, Inc. (a) | 9,151 | 91,876 | |
The Medicines Company (a)(d) | 85,688 | 2,617,768 | |
TherapeuticsMD, Inc. (a) | 93,850 | 644,750 | |
Transcept Pharmaceuticals, Inc. (a) | 2,494 | 8,305 | |
Ventrus Biosciences, Inc. (a) | 6,995 | 9,513 | |
VIVUS, Inc. (a)(d) | 111,051 | 669,638 | |
XenoPort, Inc. (a)(d) | 57,569 | 359,806 | |
Zoetis, Inc. Class A | 573,163 | 17,779,516 | |
Zogenix, Inc. (a) | 115,304 | 501,572 | |
| 1,220,478,889 | ||
TOTAL HEALTH CARE | 3,116,256,118 | ||
| |||
Shares | Value | ||
INDUSTRIALS - 11.4% | |||
Aerospace & Defense - 2.6% | |||
AAR Corp. | 45,448 | $ 1,313,447 | |
AeroVironment, Inc. (a)(d) | 21,575 | 674,003 | |
Alliant Techsystems, Inc. | 36,077 | 4,862,819 | |
American Science & Engineering, Inc. | 13,204 | 868,163 | |
API Technologies Corp. (a) | 22,349 | 62,130 | |
Ascent Solar Technologies, Inc. (a)(d) | 33,082 | 24,113 | |
Astronics Corp. (a) | 14,668 | 981,289 | |
Astrotech Corp. (a)(d) | 8,707 | 23,335 | |
BE Aerospace, Inc. (a) | 108,614 | 9,150,730 | |
Breeze Industrial Products Corp. (a) | 1,281 | 12,298 | |
CPI Aerostructures, Inc. (a)(d) | 3,805 | 54,678 | |
Cubic Corp. | 23,380 | 1,215,760 | |
Curtiss-Wright Corp. | 58,485 | 3,986,338 | |
DigitalGlobe, Inc. (a) | 87,334 | 2,714,341 | |
Ducommun, Inc. (a) | 15,643 | 434,875 | |
Engility Holdings, Inc. (a)(d) | 14,341 | 598,450 | |
Erickson Air-Crane, Inc. (a)(d) | 6,239 | 134,326 | |
Esterline Technologies Corp. (a) | 36,596 | 3,941,389 | |
Exelis, Inc. | 193,690 | 3,957,087 | |
GenCorp, Inc. (non-vtg.) (a)(d) | 89,447 | 1,666,398 | |
General Dynamics Corp. (d) | 385,838 | 42,264,695 | |
HEICO Corp. (d) | 25,580 | 1,590,820 | |
HEICO Corp. Class A | 45,413 | 2,086,273 | |
Hexcel Corp. (a) | 105,445 | 4,745,025 | |
Honeywell International, Inc. | 879,783 | 83,086,707 | |
Huntington Ingalls Industries, Inc. | 51,071 | 5,175,024 | |
Innovative Solutions & Support, Inc. (a)(d) | 21,878 | 172,617 | |
KEYW Holding Corp. (a)(d) | 30,869 | 564,903 | |
Kratos Defense & Security Solutions, Inc. (a)(d) | 44,930 | 350,454 | |
L-3 Communications Holdings, Inc. | 103,771 | 11,975,173 | |
LMI Aerospace, Inc. (a)(d) | 6,877 | 102,536 | |
Lockheed Martin Corp. | 301,222 | 48,888,331 | |
Micronet Enertec Technologies, Inc. (a) | 3,018 | 16,207 | |
Moog, Inc. Class A (a) | 52,323 | 3,240,363 | |
National Presto Industries, Inc. | 4,216 | 324,801 | |
Northrop Grumman Corp. | 254,273 | 30,774,661 | |
Orbital Sciences Corp. (a) | 63,924 | 1,816,720 | |
Precision Castparts Corp. | 163,555 | 42,177,563 | |
Raytheon Co. | 362,581 | 35,500,306 | |
Rockwell Collins, Inc. (d) | 149,774 | 12,362,346 | |
SIFCO Industries, Inc. | 891 | 23,612 | |
Sparton Corp. (a) | 3,920 | 127,008 | |
Spirit AeroSystems Holdings, Inc. | 123,657 | 3,565,031 | |
Sypris Solutions, Inc. | 16,848 | 47,343 | |
Taser International, Inc. (a)(d) | 58,908 | 1,132,801 | |
Teledyne Technologies, Inc. (a) | 43,609 | 4,272,810 | |
Textron, Inc. | 315,614 | 12,529,876 | |
The Boeing Co. | 774,186 | 99,808,059 | |
TransDigm Group, Inc. | 58,956 | 10,502,422 | |
Common Stocks - continued | |||
Shares | Value | ||
INDUSTRIALS - continued | |||
Aerospace & Defense - continued | |||
Triumph Group, Inc. | 65,091 | $ 4,243,933 | |
United Technologies Corp. | 942,267 | 110,264,084 | |
| 610,408,473 | ||
Air Freight & Logistics - 0.6% | |||
Air Transport Services Group, Inc. (a) | 108,399 | 692,670 | |
Atlas Air Worldwide Holdings, Inc. (a)(d) | 36,312 | 1,094,081 | |
C.H. Robinson Worldwide, Inc. | 169,940 | 8,813,088 | |
Echo Global Logistics, Inc. (a) | 11,731 | 186,758 | |
Expeditors International of Washington, Inc. | 229,912 | 9,083,823 | |
FedEx Corp. | 337,318 | 44,974,609 | |
Forward Air Corp. | 38,499 | 1,665,467 | |
Hub Group, Inc. Class A (a)(d) | 45,548 | 1,779,560 | |
Pacer International, Inc. (a) | 35,751 | 320,686 | |
Park-Ohio Holdings Corp. (a) | 6,346 | 334,053 | |
Radiant Logistics, Inc. (a) | 14,104 | 38,786 | |
United Parcel Service, Inc. Class B | 794,382 | 76,077,964 | |
UTi Worldwide, Inc. (d) | 106,552 | 1,048,472 | |
XPO Logistics, Inc. (a) | 37,140 | 1,167,682 | |
| 147,277,699 | ||
Airlines - 0.4% | |||
Alaska Air Group, Inc. | 74,312 | 6,438,392 | |
Allegiant Travel Co. | 24,598 | 2,441,597 | |
American Airlines Group, Inc. (a)(d) | 209,909 | 7,751,939 | |
Delta Air Lines, Inc. | 944,561 | 31,368,871 | |
Hawaiian Holdings, Inc. (a)(d) | 71,807 | 864,556 | |
JetBlue Airways Corp. (a)(d) | 285,846 | 2,524,020 | |
Republic Airways Holdings, Inc. (a) | 81,894 | 784,545 | |
SkyWest, Inc. | 63,299 | 803,897 | |
Southwest Airlines Co. | 753,609 | 16,910,986 | |
Spirit Airlines, Inc. (a) | 81,901 | 4,625,768 | |
United Continental Holdings, Inc. (a)(d) | 402,944 | 18,116,362 | |
| 92,630,933 | ||
Building Products - 0.3% | |||
A.O. Smith Corp. | 98,582 | 4,899,525 | |
AAON, Inc. (d) | 50,511 | 1,509,269 | |
Allegion Plc | 94,511 | 5,136,673 | |
American Woodmark Corp. (a) | 9,343 | 300,004 | |
Apogee Enterprises, Inc. | 33,247 | 1,138,045 | |
Armstrong World Industries, Inc. (a) | 49,085 | 2,694,276 | |
Builders FirstSource, Inc. (a) | 87,836 | 756,268 | |
Fortune Brands Home & Security, Inc. | 177,871 | 8,313,691 | |
Gibraltar Industries, Inc. (a) | 56,316 | 1,037,904 | |
Griffon Corp. | 38,833 | 481,529 | |
Insteel Industries, Inc. | 19,643 | 390,896 | |
Lennox International, Inc. | 51,841 | 4,763,151 | |
Masco Corp. | 405,986 | 9,479,773 | |
Masonite International Corp. (a) | 19,654 | 1,134,036 | |
NCI Building Systems, Inc. (a) | 22,930 | 391,186 | |
Nortek, Inc. (a) | 14,350 | 1,038,797 | |
| |||
Shares | Value | ||
Owens Corning | 130,235 | $ 5,959,554 | |
Patrick Industries, Inc. (a) | 10,446 | 440,717 | |
PGT, Inc. (a) | 39,227 | 454,641 | |
Ply Gem Holdings, Inc. (d) | 16,220 | 207,778 | |
Quanex Building Products Corp. (d) | 44,676 | 868,501 | |
Simpson Manufacturing Co. Ltd. (d) | 50,637 | 1,790,018 | |
Trex Co., Inc. (a)(d) | 23,416 | 1,831,600 | |
Universal Forest Products, Inc. (d) | 26,737 | 1,490,053 | |
USG Corp. (a)(d) | 96,486 | 3,408,850 | |
| 59,916,735 | ||
Commercial Services & Supplies - 0.6% | |||
ABM Industries, Inc. | 53,056 | 1,497,771 | |
ACCO Brands Corp. (a)(d) | 120,265 | 711,969 | |
Acorn Energy, Inc. (d) | 16,876 | 57,378 | |
ADT Corp. (d) | 218,622 | 6,713,882 | |
ARC Document Solutions, Inc. (a) | 46,203 | 364,542 | |
Casella Waste Systems, Inc. Class A (a) | 64,851 | 347,601 | |
CECO Environmental Corp. (d) | 21,126 | 341,185 | |
Cenveo, Inc. (a)(d) | 104,135 | 353,018 | |
Cintas Corp. | 112,418 | 6,819,276 | |
Clean Harbors, Inc. (a)(d) | 65,972 | 3,117,837 | |
Copart, Inc. (a) | 124,595 | 4,538,996 | |
Courier Corp. | 17,378 | 286,216 | |
Covanta Holding Corp. | 154,806 | 2,786,508 | |
Deluxe Corp. (d) | 54,408 | 2,746,516 | |
EnerNOC, Inc. (a) | 25,460 | 552,227 | |
Ennis, Inc. | 21,290 | 336,382 | |
Fuel Tech, Inc. (a) | 51,934 | 331,858 | |
G&K Services, Inc. Class A | 20,257 | 1,268,696 | |
Healthcare Services Group, Inc. (d) | 92,468 | 2,490,163 | |
Heritage-Crystal Clean, Inc. (a)(d) | 7,679 | 138,990 | |
Herman Miller, Inc. | 61,359 | 1,729,097 | |
HNI Corp. | 49,416 | 1,756,739 | |
Hudson Technologies, Inc. (a)(d) | 5,394 | 16,883 | |
Industrial Services of America, Inc. (a)(d) | 1,620 | 5,881 | |
InnerWorkings, Inc. (a)(d) | 28,532 | 224,832 | |
Interface, Inc. | 56,426 | 1,086,765 | |
Intersections, Inc. | 12,865 | 78,862 | |
Iron Mountain, Inc. | 183,385 | 4,988,072 | |
KAR Auction Services, Inc. | 146,171 | 4,554,688 | |
Kimball International, Inc. Class B | 27,103 | 508,723 | |
Knoll, Inc. | 38,287 | 596,129 | |
McGrath RentCorp. | 21,172 | 685,338 | |
Metalico, Inc. (a) | 55,605 | 108,430 | |
Mine Safety Appliances Co. | 37,550 | 1,931,948 | |
Mobile Mini, Inc. | 51,612 | 2,323,056 | |
Multi-Color Corp. | 7,946 | 269,131 | |
NL Industries, Inc. | 6,707 | 75,320 | |
Performant Financial Corp. (a) | 31,038 | 245,511 | |
Perma-Fix Environmental Services, Inc. (a) | 6,937 | 24,141 | |
Pitney Bowes, Inc. | 221,034 | 5,625,315 | |
Quad/Graphics, Inc. | 28,077 | 628,082 | |
Common Stocks - continued | |||
Shares | Value | ||
INDUSTRIALS - continued | |||
Commercial Services & Supplies - continued | |||
R.R. Donnelley & Sons Co. | 225,027 | $ 4,304,767 | |
Republic Services, Inc. | 307,369 | 10,484,357 | |
Rollins, Inc. | 104,837 | 3,130,433 | |
Schawk, Inc. Class A | 4,209 | 58,842 | |
SP Plus Corp. (a)(d) | 13,389 | 351,461 | |
Standard Register Co. (a) | 3,970 | 43,511 | |
Steelcase, Inc. Class A | 74,937 | 1,114,313 | |
Stericycle, Inc. (a) | 95,694 | 10,909,116 | |
Swisher Hygiene, Inc. (Canada) (a) | 177,418 | 86,935 | |
Team, Inc. (a)(d) | 18,138 | 784,287 | |
Tetra Tech, Inc. (a) | 66,137 | 1,910,037 | |
The Brink's Co. | 51,214 | 1,557,418 | |
TRC Companies, Inc. (a) | 13,255 | 91,460 | |
Tyco International Ltd. | 530,926 | 22,394,459 | |
U.S. Ecology, Inc. | 25,366 | 911,400 | |
UniFirst Corp. | 16,509 | 1,810,872 | |
United Stationers, Inc. | 42,632 | 1,817,402 | |
Viad Corp. | 19,833 | 476,984 | |
Virco Manufacturing Co. (a) | 2,682 | 7,027 | |
Waste Connections, Inc. | 164,872 | 7,134,011 | |
Waste Management, Inc. | 506,566 | 21,022,489 | |
West Corp. (d) | 20,707 | 520,160 | |
| 154,185,695 | ||
Construction & Engineering - 0.3% | |||
AECOM Technology Corp. (a) | 100,199 | 3,200,356 | |
Aegion Corp. (a)(d) | 40,317 | 933,339 | |
Ameresco, Inc. Class A (a) | 38,199 | 391,922 | |
Argan, Inc. | 7,465 | 213,424 | |
Chicago Bridge & Iron Co. NV (d) | 123,066 | 10,360,927 | |
Comfort Systems U.S.A., Inc. | 43,738 | 718,615 | |
Dycom Industries, Inc. (a) | 36,171 | 1,044,980 | |
EMCOR Group, Inc. | 78,469 | 3,670,780 | |
Fluor Corp. | 170,796 | 13,269,141 | |
Foster Wheeler AG (d) | 112,721 | 3,620,599 | |
Furmanite Corp. (a) | 40,654 | 481,343 | |
Goldfield Corp. | 41,171 | 95,928 | |
Granite Construction, Inc. (d) | 41,521 | 1,526,312 | |
Great Lakes Dredge & Dock Corp. (a)(d) | 55,973 | 462,337 | |
Integrated Electrical Services, Inc. (a) | 13,442 | 73,528 | |
Jacobs Engineering Group, Inc. (a) | 160,940 | 9,761,011 | |
KBR, Inc. | 162,921 | 4,499,878 | |
Layne Christensen Co. (a)(d) | 24,456 | 434,339 | |
MasTec, Inc. (a)(d) | 84,984 | 3,479,245 | |
MYR Group, Inc. (a) | 25,270 | 588,033 | |
Northwest Pipe Co. (a) | 12,188 | 432,065 | |
Orion Marine Group, Inc. (a) | 21,656 | 244,496 | |
Pike Corp. (a) | 29,417 | 305,348 | |
Primoris Services Corp. | 35,637 | 1,114,369 | |
Quanta Services, Inc. (a) | 244,181 | 8,597,613 | |
Sterling Construction Co., Inc. (a) | 31,847 | 301,591 | |
| |||
Shares | Value | ||
Tutor Perini Corp. (a) | 46,969 | $ 1,157,786 | |
UniTek Global Services, Inc. (a) | 18,062 | 28,899 | |
URS Corp. | 82,388 | 3,831,042 | |
| 74,839,246 | ||
Electrical Equipment - 0.8% | |||
Active Power, Inc. (a) | 10,523 | 35,673 | |
Acuity Brands, Inc. | 52,894 | 7,460,699 | |
Allied Motion Technologies, Inc. | 4,209 | 48,319 | |
Altair Nanotechnologies, Inc. (a)(d) | 10,605 | 57,373 | |
American Superconductor Corp. (a)(d) | 126,771 | 234,526 | |
AMETEK, Inc. | 270,508 | 14,401,846 | |
AZZ, Inc. (d) | 24,628 | 1,092,744 | |
Babcock & Wilcox Co. (d) | 118,199 | 3,895,839 | |
Brady Corp. Class A | 52,937 | 1,416,065 | |
Broadwind Energy, Inc. (a) | 15,938 | 153,802 | |
Capstone Turbine Corp. (a)(d) | 814,128 | 1,457,289 | |
Eaton Corp. PLC | 526,249 | 39,316,063 | |
Emerson Electric Co. | 776,096 | 50,648,025 | |
Encore Wire Corp. | 23,059 | 1,205,755 | |
EnerSys | 48,550 | 3,448,992 | |
Enphase Energy, Inc. (a)(d) | 22,269 | 179,711 | |
Espey Manufacturing & Electronics Corp. | 2,015 | 58,052 | |
Franklin Electric Co., Inc. | 44,071 | 1,921,055 | |
FuelCell Energy, Inc. (a)(d) | 246,058 | 479,813 | |
Generac Holdings, Inc. (d) | 81,773 | 4,658,608 | |
General Cable Corp. (d) | 55,434 | 1,706,259 | |
Global Power Equipment Group, Inc. | 10,454 | 191,517 | |
GrafTech International Ltd. (a)(d) | 132,891 | 1,289,043 | |
Hubbell, Inc. Class B | 60,658 | 7,251,057 | |
II-VI, Inc. (a) | 56,117 | 919,758 | |
LSI Industries, Inc. | 24,011 | 199,051 | |
MagneTek, Inc. (a) | 2,664 | 64,362 | |
Ocean Power Technologies, Inc. (a)(d) | 11,040 | 44,822 | |
Plug Power, Inc. (a)(d) | 108,624 | 507,274 | |
Polypore International, Inc. (a)(d) | 50,063 | 1,732,680 | |
Powell Industries, Inc. | 7,721 | 526,032 | |
Power Solutions International, Inc. (a)(d) | 3,494 | 258,905 | |
PowerSecure International, Inc. (a)(d) | 20,869 | 474,352 | |
Preformed Line Products Co. | 1,961 | 121,778 | |
Real Goods Solar, Inc. Class A (a)(d) | 22,046 | 83,995 | |
Regal-Beloit Corp. | 57,797 | 4,259,061 | |
Revolution Lighting Technologies, Inc. (a)(d) | 38,693 | 122,270 | |
Rockwell Automation, Inc. | 151,793 | 18,646,252 | |
Roper Industries, Inc. | 118,631 | 16,088,736 | |
Sensata Technologies Holding BV (a) | 179,473 | 7,293,783 | |
SL Industries, Inc. (a) | 3,648 | 96,672 | |
SolarCity Corp. (a)(d) | 54,174 | 4,602,623 | |
Thermon Group Holdings, Inc. (a)(d) | 33,050 | 802,785 | |
Ultralife Corp. (a) | 13,410 | 50,690 | |
Vicor Corp. (a) | 10,982 | 118,276 | |
| 199,622,282 | ||
Common Stocks - continued | |||
Shares | Value | ||
INDUSTRIALS - continued | |||
Industrial Conglomerates - 1.9% | |||
3M Co. | 714,842 | $ 96,310,663 | |
Carlisle Companies, Inc. | 71,430 | 5,665,828 | |
Danaher Corp. | 685,221 | 52,412,554 | |
General Electric Co. | 11,343,330 | 288,914,615 | |
Raven Industries, Inc. | 39,990 | 1,462,434 | |
| 444,766,094 | ||
Machinery - 2.2% | |||
Accuride Corp. (a)(d) | 79,004 | 348,408 | |
Actuant Corp. Class A | 71,032 | 2,490,382 | |
Adept Technology, Inc. (a) | 17,085 | 287,711 | |
AGCO Corp. | 95,174 | 4,994,732 | |
Alamo Group, Inc. | 17,898 | 941,077 | |
Albany International Corp. Class A | 47,080 | 1,698,646 | |
Altra Industrial Motion Corp. | 25,498 | 902,629 | |
American Railcar Industries, Inc. | 11,797 | 816,942 | |
Ampco-Pittsburgh Corp. | 10,414 | 212,966 | |
Astec Industries, Inc. (d) | 19,808 | 796,678 | |
Barnes Group, Inc. | 47,337 | 1,820,108 | |
Blount International, Inc. (a) | 50,491 | 618,515 | |
Briggs & Stratton Corp. | 42,488 | 967,877 | |
Caterpillar, Inc. (d) | 709,570 | 68,807,003 | |
Chart Industries, Inc. (a)(d) | 32,250 | 2,694,810 | |
CIRCOR International, Inc. | 19,714 | 1,410,734 | |
CLARCOR, Inc. | 59,963 | 3,473,657 | |
Colfax Corp. (a) | 110,540 | 7,862,710 | |
Columbus McKinnon Corp. (NY Shares) (a) | 26,972 | 686,707 | |
Commercial Vehicle Group, Inc. (a) | 77,079 | 687,545 | |
Crane Co. | 52,315 | 3,736,337 | |
Cummins, Inc. | 194,981 | 28,451,628 | |
Deere & Co. | 423,519 | 36,392,988 | |
Donaldson Co., Inc. | 164,610 | 7,051,892 | |
Douglas Dynamics, Inc. (d) | 29,195 | 472,375 | |
Dover Corp. | 187,794 | 17,708,974 | |
Dynamic Materials Corp. | 17,783 | 369,175 | |
Eastern Co. | 2,354 | 37,452 | |
Energy Recovery, Inc. (a)(d) | 81,715 | 366,083 | |
EnPro Industries, Inc. (a)(d) | 22,235 | 1,592,693 | |
ESCO Technologies, Inc. | 28,907 | 1,036,027 | |
ExOne Co. (d) | 13,829 | 640,283 | |
Federal Signal Corp. (a) | 80,990 | 1,040,722 | |
Flowserve Corp. | 155,118 | 12,597,133 | |
FreightCar America, Inc. | 19,411 | 496,145 | |
Gencor Industries, Inc. (a) | 1,849 | 19,895 | |
Global Brass & Copper Holdings, Inc. | 9,550 | 161,682 | |
Gorman-Rupp Co. | 17,750 | 559,125 | |
Graco, Inc. | 71,760 | 5,599,433 | |
Graham Corp. | 12,124 | 421,551 | |
Greenbrier Companies, Inc. (a)(d) | 21,771 | 915,906 | |
Hardinge, Inc. | 14,874 | 219,392 | |
| |||
Shares | Value | ||
Harsco Corp. | 94,707 | $ 2,379,040 | |
Hurco Companies, Inc. | 3,319 | 83,008 | |
Hyster-Yale Materials Handling Class A | 12,438 | 1,255,492 | |
IDEX Corp. | 88,258 | 6,625,528 | |
Illinois Tool Works, Inc. | 441,791 | 36,447,758 | |
Ingersoll-Rand PLC | 297,503 | 18,189,333 | |
ITT Corp. | 114,023 | 5,005,610 | |
John Bean Technologies Corp. | 23,559 | 710,539 | |
Joy Global, Inc. (d) | 114,975 | 6,323,625 | |
Kadant, Inc. | 18,429 | 739,924 | |
Kennametal, Inc. | 99,076 | 4,333,584 | |
L.B. Foster Co. Class A | 10,636 | 494,468 | |
Lincoln Electric Holdings, Inc. | 88,988 | 6,671,430 | |
Lindsay Corp. (d) | 16,477 | 1,398,238 | |
Lydall, Inc. (a) | 11,611 | 235,239 | |
Manitex International, Inc. (a)(d) | 11,053 | 165,684 | |
Manitowoc Co., Inc. (d) | 166,345 | 5,146,714 | |
Meritor, Inc. (a) | 118,384 | 1,469,145 | |
Middleby Corp. (a)(d) | 20,717 | 6,143,834 | |
Miller Industries, Inc. | 16,197 | 292,356 | |
Mueller Industries, Inc. | 29,480 | 1,841,910 | |
Mueller Water Products, Inc. Class A | 162,577 | 1,568,868 | |
Navistar International Corp. (a)(d) | 79,012 | 2,962,950 | |
NN, Inc. | 12,121 | 233,814 | |
Nordson Corp. | 68,102 | 4,982,342 | |
Omega Flex, Inc. | 258 | 5,766 | |
Oshkosh Truck Corp. | 95,506 | 5,523,112 | |
PACCAR, Inc. | 408,900 | 26,921,976 | |
Pall Corp. | 118,435 | 10,185,410 | |
Parker Hannifin Corp. | 164,290 | 19,805,160 | |
Pentair Ltd. | 221,668 | 17,912,991 | |
PMFG, Inc. (a)(d) | 15,367 | 100,500 | |
Proto Labs, Inc. (a)(d) | 23,655 | 1,842,725 | |
RBC Bearings, Inc. (a) | 25,318 | 1,626,682 | |
Rexnord Corp. (a) | 39,840 | 1,194,802 | |
Snap-On, Inc. | 66,115 | 7,416,120 | |
SPX Corp. | 46,613 | 5,019,288 | |
Standex International Corp. | 10,804 | 597,569 | |
Stanley Black & Decker, Inc. | 173,666 | 14,421,225 | |
Sun Hydraulics Corp. (d) | 22,598 | 955,895 | |
Tecumseh Products Co. Class A (non-vtg.) (a) | 29,489 | 232,963 | |
Tennant Co. | 17,192 | 1,053,182 | |
Terex Corp. | 120,683 | 5,374,014 | |
Timken Co. | 84,686 | 5,111,647 | |
Titan International, Inc. (d) | 48,022 | 910,497 | |
Toro Co. | 67,215 | 4,451,649 | |
TriMas Corp. (a) | 46,817 | 1,573,519 | |
Trinity Industries, Inc. | 83,300 | 5,981,773 | |
Twin Disc, Inc. | 8,286 | 205,244 | |
Valmont Industries, Inc. (d) | 30,830 | 4,489,773 | |
Wabash National Corp. (a)(d) | 74,589 | 1,007,697 | |
WABCO Holdings, Inc. (a) | 75,595 | 7,744,708 | |
Wabtec Corp. | 121,942 | 9,678,537 | |
Common Stocks - continued | |||
Shares | Value | ||
INDUSTRIALS - continued | |||
Machinery - continued | |||
Watts Water Technologies, Inc. Class A | 38,674 | $ 2,383,092 | |
Woodward, Inc. | 78,842 | 3,436,723 | |
Xerium Technologies, Inc. (a) | 6,895 | 108,596 | |
Xylem, Inc. | 206,552 | 8,127,821 | |
| 513,507,817 | ||
Marine - 0.0% | |||
Baltic Trading Ltd. | 21,117 | 144,651 | |
Eagle Bulk Shipping, Inc. (a)(d) | 34,302 | 162,591 | |
Genco Shipping & Trading Ltd. (a)(d) | 76,288 | 125,112 | |
International Shipholding Corp. | 10,420 | 317,393 | |
Kirby Corp. (a) | 63,347 | 6,626,730 | |
Matson, Inc. | 37,893 | 913,979 | |
| 8,290,456 | ||
Professional Services - 0.4% | |||
Acacia Research Corp. (d) | 48,838 | 748,687 | |
Advisory Board Co. (a)(d) | 38,842 | 2,488,995 | |
Barrett Business Services, Inc. | 6,681 | 467,670 | |
CBIZ, Inc. (a)(d) | 37,390 | 341,371 | |
CDI Corp. | 9,649 | 176,287 | |
Corporate Executive Board Co. | 37,937 | 2,836,929 | |
CRA International, Inc. (a) | 15,589 | 364,315 | |
CTPartners Executive Search, Inc. (a) | 859 | 6,013 | |
Dun & Bradstreet Corp. | 40,399 | 4,007,985 | |
Equifax, Inc. | 155,277 | 10,878,707 | |
Exponent, Inc. | 15,525 | 1,106,001 | |
Franklin Covey Co. (a) | 5,338 | 111,831 | |
FTI Consulting, Inc. (a)(d) | 68,234 | 1,991,750 | |
GP Strategies Corp. (a) | 13,487 | 392,741 | |
Heidrick & Struggles International, Inc. | 22,259 | 409,343 | |
Hill International, Inc. (a) | 13,945 | 62,753 | |
Hudson Global, Inc. (a) | 13,947 | 49,930 | |
Huron Consulting Group, Inc. (a) | 28,844 | 1,908,607 | |
ICF International, Inc. (a) | 17,107 | 691,465 | |
IHS, Inc. Class A (a) | 75,073 | 8,999,751 | |
Insperity, Inc. | 20,805 | 607,298 | |
Kelly Services, Inc. Class A (non-vtg.) | 19,294 | 485,437 | |
Kforce, Inc. | 25,995 | 569,550 | |
Korn/Ferry International (a) | 56,905 | 1,444,818 | |
Manpower, Inc. | 81,876 | 6,399,428 | |
Mastech Holdings, Inc. | 373 | 5,091 | |
MISTRAS Group, Inc. (a) | 12,788 | 281,848 | |
Navigant Consulting, Inc. (a) | 41,733 | 727,406 | |
Nielsen Holdings B.V. | 285,021 | 13,492,894 | |
Odyssey Marine Exploration, Inc. (a)(d) | 46,227 | 101,237 | |
On Assignment, Inc. (a) | 52,146 | 1,793,822 | |
Pendrell Corp. (a) | 150,288 | 228,438 | |
RCM Technologies, Inc. (a) | 9,908 | 68,464 | |
Resources Connection, Inc. | 43,312 | 593,374 | |
Robert Half International, Inc. | 170,458 | 6,978,551 | |
RPX Corp. (a) | 42,529 | 681,315 | |
| |||
Shares | Value | ||
Spherix, Inc. (a) | 11 | $ 51 | |
Towers Watson & Co. | 75,492 | 8,236,177 | |
TrueBlue, Inc. (a) | 38,883 | 1,107,388 | |
Verisk Analytics, Inc. (a) | 175,777 | 11,199,632 | |
VSE Corp. | 1,834 | 88,582 | |
WageWorks, Inc. (a) | 36,355 | 2,150,398 | |
| 95,282,330 | ||
Road & Rail - 1.0% | |||
AMERCO | 7,919 | 1,844,652 | |
Arkansas Best Corp. | 25,682 | 854,183 | |
Avis Budget Group, Inc. (a)(d) | 135,454 | 6,364,983 | |
Celadon Group, Inc. | 62,978 | 1,429,601 | |
Con-way, Inc. (d) | 72,845 | 2,778,308 | |
Covenant Transport Group, Inc. Class A (a) | 9,633 | 95,945 | |
CSX Corp. | 1,133,651 | 31,413,469 | |
Genesee & Wyoming, Inc. Class A (a) | 61,185 | 6,052,420 | |
Heartland Express, Inc. (d) | 52,772 | 1,075,493 | |
Hertz Global Holdings, Inc. (a) | 494,988 | 13,864,614 | |
J.B. Hunt Transport Services, Inc. | 118,822 | 8,539,737 | |
Kansas City Southern | 125,208 | 11,759,535 | |
Knight Transportation, Inc. (d) | 54,848 | 1,178,135 | |
Landstar System, Inc. (d) | 49,655 | 2,865,590 | |
Marten Transport Ltd. | 31,198 | 608,049 | |
Norfolk Southern Corp. | 346,466 | 31,843,690 | |
Old Dominion Freight Lines, Inc. (a) | 69,360 | 3,692,726 | |
Patriot Transportation Holding, Inc. (a) | 1,312 | 46,773 | |
Providence & Worcester Railroad Co. | 4,631 | 82,432 | |
Quality Distribution, Inc. (a) | 25,189 | 322,923 | |
Roadrunner Transportation Systems, Inc. (a) | 23,847 | 560,643 | |
Ryder System, Inc. | 50,983 | 3,840,040 | |
Saia, Inc. (a) | 26,740 | 923,600 | |
Swift Transporation Co. (a)(d) | 119,320 | 2,906,635 | |
U.S.A. Truck, Inc. (a) | 1,841 | 28,296 | |
Union Pacific Corp. | 514,413 | 92,789,817 | |
Universal Truckload Services, Inc. | 6,117 | 159,042 | |
Werner Enterprises, Inc. (d) | 41,229 | 1,065,770 | |
YRC Worldwide, Inc. (a)(d) | 9,461 | 247,878 | |
| 229,234,979 | ||
Trading Companies & Distributors - 0.3% | |||
Aceto Corp. | 32,506 | 594,535 | |
AeroCentury Corp. (a)(d) | 688 | 11,703 | |
Air Lease Corp. Class A | 121,471 | 4,488,353 | |
Aircastle Ltd. | 65,692 | 1,294,132 | |
Applied Industrial Technologies, Inc. | 52,950 | 2,702,039 | |
Beacon Roofing Supply, Inc. (a)(d) | 65,628 | 2,480,082 | |
BlueLinx Corp. (a)(d) | 23,385 | 34,142 | |
CAI International, Inc. (a)(d) | 15,310 | 372,645 | |
DXP Enterprises, Inc. (a) | 10,800 | 1,099,008 | |
Essex Rental Corp. (a) | 16,688 | 52,567 | |
Fastenal Co. (d) | 297,869 | 14,056,438 | |
GATX Corp. | 53,842 | 3,493,807 | |
Common Stocks - continued | |||
Shares | Value | ||
INDUSTRIALS - continued | |||
Trading Companies & Distributors - continued | |||
H&E Equipment Services, Inc. (a) | 32,737 | $ 1,071,155 | |
HD Supply Holdings, Inc. (a)(d) | 66,187 | 1,540,171 | |
Houston Wire & Cable Co. | 15,647 | 217,650 | |
Kaman Corp. | 26,535 | 1,053,970 | |
Lawson Products, Inc. (a) | 4,764 | 70,174 | |
MRC Global, Inc. (a) | 114,871 | 2,954,482 | |
MSC Industrial Direct Co., Inc. | 57,280 | 4,944,982 | |
Rush Enterprises, Inc. Class A (a)(d) | 31,753 | 908,136 | |
TAL International Group, Inc. | 30,588 | 1,355,048 | |
Textainer Group Holdings Ltd. (d) | 14,461 | 527,393 | |
Titan Machinery, Inc. (a)(d) | 17,235 | 272,658 | |
United Rentals, Inc. (a)(d) | 99,613 | 8,799,812 | |
W.W. Grainger, Inc. | 68,361 | 17,433,422 | |
Watsco, Inc. | 30,156 | 2,966,747 | |
WESCO International, Inc. (a)(d) | 60,754 | 5,237,602 | |
Willis Lease Finance Corp. (a) | 2,006 | 35,907 | |
| 80,068,760 | ||
Transportation Infrastructure - 0.0% | |||
Wesco Aircraft Holdings, Inc. (a) | 39,594 | 858,794 | |
TOTAL INDUSTRIALS | 2,710,890,293 | ||
INFORMATION TECHNOLOGY - 18.0% | |||
Communications Equipment - 1.6% | |||
ADTRAN, Inc. (d) | 58,980 | 1,545,276 | |
Alliance Fiber Optic Products, Inc. (d) | 19,146 | 230,518 | |
Ambient Corp. (a) | 1,932 | 3,651 | |
Arris Group, Inc. (a)(d) | 139,734 | 4,010,366 | |
Aruba Networks, Inc. (a)(d) | 133,375 | 2,735,521 | |
Aviat Networks, Inc. (a) | 66,605 | 129,880 | |
Bel Fuse, Inc. Class B (non-vtg.) | 7,032 | 133,608 | |
Black Box Corp. | 16,753 | 445,630 | |
Blonder Tongue Laboratories, Inc. (a) | 3,352 | 3,386 | |
Brocade Communications Systems, Inc. (a) | 517,605 | 4,953,480 | |
CalAmp Corp. (a)(d) | 30,277 | 970,075 | |
Calix Networks, Inc. (a) | 25,252 | 200,753 | |
Ciena Corp. (a)(d) | 106,654 | 2,620,489 | |
Cisco Systems, Inc. | 6,002,230 | 130,848,614 | |
Clearfield, Inc. (a) | 10,596 | 247,946 | |
CommScope Holding Co., Inc. (d) | 65,332 | 1,580,381 | |
Communications Systems, Inc. | 4,311 | 58,069 | |
Comtech Telecommunications Corp. | 22,438 | 718,240 | |
Digi International, Inc. (a) | 21,456 | 204,905 | |
EchoStar Holding Corp. Class A (a) | 42,704 | 2,127,513 | |
EMCORE Corp. (a)(d) | 29,659 | 144,736 | |
Emulex Corp. (a) | 91,750 | 667,940 | |
Entrada Networks, Inc. (a) | 150 | 0 | |
Extreme Networks, Inc. (a) | 100,558 | 576,197 | |
| |||
Shares | Value | ||
F5 Networks, Inc. (a) | 85,953 | $ 9,655,960 | |
Finisar Corp. (a)(d) | 110,449 | 2,617,641 | |
Harmonic, Inc. (a) | 107,478 | 697,532 | |
Harris Corp. | 115,971 | 8,560,979 | |
Infinera Corp. (a)(d) | 140,398 | 1,168,111 | |
InterDigital, Inc. | 54,293 | 1,655,937 | |
Interphase Corp. (a) | 10,718 | 51,339 | |
Ixia (a) | 83,745 | 1,035,088 | |
JDS Uniphase Corp. (a) | 268,467 | 3,699,475 | |
Juniper Networks, Inc. (a) | 570,419 | 15,253,004 | |
KVH Industries, Inc. (a) | 23,641 | 305,678 | |
Lantronix, Inc. (a) | 71 | 181 | |
Meru Networks, Inc. (a)(d) | 20,865 | 88,050 | |
Motorola Solutions, Inc. | 252,045 | 16,685,379 | |
NETGEAR, Inc. (a)(d) | 37,791 | 1,291,696 | |
Novatel Wireless, Inc. (a) | 27,517 | 66,316 | |
NumereX Corp. Class A (a) | 2,670 | 39,623 | |
Oclaro, Inc. (a) | 126,427 | 356,524 | |
Oplink Communications, Inc. (a) | 15,273 | 267,583 | |
Optical Cable Corp. | 564 | 2,194 | |
Palo Alto Networks, Inc. (a) | 52,358 | 3,725,272 | |
Parkervision, Inc. (a)(d) | 100,275 | 501,375 | |
PC-Tel, Inc. | 2,259 | 19,653 | |
Plantronics, Inc. | 53,885 | 2,391,416 | |
Polycom, Inc. (a)(d) | 189,613 | 2,533,230 | |
Procera Networks, Inc. (a)(d) | 21,122 | 232,976 | |
QUALCOMM, Inc. | 1,892,307 | 142,471,794 | |
Relm Wireless Corp. (a) | 9,436 | 29,723 | |
Riverbed Technology, Inc. (a)(d) | 188,588 | 4,201,741 | |
Ruckus Wireless, Inc. (a) | 70,783 | 990,962 | |
ShoreTel, Inc. (a) | 56,073 | 492,882 | |
Sonus Networks, Inc. (a) | 287,303 | 1,071,640 | |
Tessco Technologies, Inc. | 4,838 | 184,231 | |
Ubiquiti Networks, Inc. (a)(d) | 20,342 | 1,005,098 | |
ViaSat, Inc. (a)(d) | 47,347 | 3,158,518 | |
Westell Technologies, Inc. Class A (a) | 20,974 | 86,623 | |
Zhone Technologies, Inc. (a)(d) | 5,862 | 22,803 | |
Zoom Technologies, Inc. (a) | 3,134 | 14,385 | |
| 381,789,786 | ||
Computers & Peripherals - 3.2% | |||
3D Systems Corp. (a)(d) | 106,440 | 8,085,182 | |
Apple, Inc. | 1,010,277 | 531,648,119 | |
Astro-Med, Inc. | 4,606 | 63,655 | |
Concurrent Computer Corp. | 6,675 | 55,136 | |
Cray, Inc. (a)(d) | 45,237 | 1,569,272 | |
Crossroads Systems, Inc. (a)(d) | 9,071 | 20,591 | |
Dataram Corp. (a) | 556 | 1,518 | |
Diebold, Inc. | 89,599 | 3,350,107 | |
Dot Hill Systems Corp. (a) | 109,713 | 584,770 | |
Electronics for Imaging, Inc. (a) | 55,580 | 2,478,868 | |
EMC Corp. (d) | 2,290,422 | 60,398,428 | |
Fusion-io, Inc. (a)(d) | 99,991 | 1,096,901 | |
Hewlett-Packard Co. | 2,158,308 | 64,490,243 | |
Common Stocks - continued | |||
Shares | Value | ||
INFORMATION TECHNOLOGY - continued | |||
Computers & Peripherals - continued | |||
Hutchinson Technology, Inc. (a) | 41,790 | $ 152,116 | |
Imation Corp. (a) | 19,750 | 126,400 | |
Immersion Corp. (a) | 59,681 | 713,188 | |
Intevac, Inc. (a) | 17,689 | 133,198 | |
Lexmark International, Inc. Class A | 71,862 | 3,028,265 | |
NCR Corp. (a) | 203,607 | 6,932,818 | |
NetApp, Inc. | 387,745 | 15,668,775 | |
Overland Storage, Inc. (a) | 5,087 | 5,290 | |
QLogic Corp. (a) | 107,276 | 1,225,092 | |
Quantum Corp. (a)(d) | 267,446 | 312,912 | |
Qumu Corp. (a) | 6,017 | 95,069 | |
SanDisk Corp. | 251,675 | 18,699,453 | |
Scan-Optics, Inc. (a) | 300 | 0 | |
Seagate Technology | 368,699 | 19,242,401 | |
Silicon Graphics International Corp. (a)(d) | 32,579 | 401,047 | |
Super Micro Computer, Inc. (a) | 48,860 | 986,483 | |
Transact Technologies, Inc. | 3,411 | 39,568 | |
U.S.A. Technologies, Inc. (a)(d) | 38,549 | 80,953 | |
Video Display Corp. (a) | 2,957 | 11,296 | |
Western Digital Corp. | 235,126 | 20,453,611 | |
Xplore Technologies Corp. (a) | 2,067 | 12,381 | |
| 762,163,106 | ||
Electronic Equipment & Components - 0.8% | |||
Advanced Photonix, Inc. Class A (a) | 4,544 | 2,990 | |
Aeroflex Holding Corp. (a) | 11,165 | 89,208 | |
Agilysys, Inc. (a) | 38,149 | 553,923 | |
Amphenol Corp. Class A | 175,748 | 15,469,339 | |
Anixter International, Inc. | 27,054 | 2,893,425 | |
Arrow Electronics, Inc. (a) | 128,186 | 7,259,173 | |
Audience, Inc. (a) | 9,607 | 112,594 | |
Avnet, Inc. | 154,170 | 6,711,020 | |
AVX Corp. | 71,883 | 922,259 | |
Badger Meter, Inc. | 35,716 | 1,961,523 | |
Belden, Inc. | 50,406 | 3,635,785 | |
Benchmark Electronics, Inc. (a) | 50,023 | 1,192,548 | |
CDW Corp. | 67,267 | 1,760,377 | |
Checkpoint Systems, Inc. (a) | 41,082 | 601,851 | |
ClearSign Combustion Corp. (a)(d) | 7,019 | 65,628 | |
Cognex Corp. (a) | 109,040 | 4,106,446 | |
Coherent, Inc. (a) | 23,544 | 1,604,524 | |
Control4 Corp. (d) | 4,856 | 101,539 | |
Corning, Inc. | 1,625,355 | 31,320,591 | |
CTS Corp. | 23,806 | 486,119 | |
Daktronics, Inc. | 32,196 | 456,217 | |
Dolby Laboratories, Inc. Class A (a)(d) | 54,035 | 2,227,863 | |
DTS, Inc. (a)(d) | 19,732 | 400,757 | |
Echelon Corp. (a) | 32,190 | 96,570 | |
Electro Rent Corp. | 12,184 | 221,383 | |
Electro Scientific Industries, Inc. | 21,640 | 204,065 | |
eMagin Corp. (a) | 5,084 | 13,523 | |
| |||
Shares | Value | ||
Fabrinet (a) | 24,522 | $ 476,217 | |
FARO Technologies, Inc. (a) | 18,648 | 1,073,006 | |
FEI Co. | 46,062 | 4,728,264 | |
FLIR Systems, Inc. | 171,079 | 5,840,637 | |
Frequency Electronics, Inc. (a) | 430 | 4,945 | |
Giga-Tronics, Inc. (a) | 2,579 | 3,585 | |
GSI Group, Inc. (a) | 5,175 | 64,946 | |
I. D. Systems Inc. (a) | 6,071 | 36,365 | |
Identive Group, Inc. (a) | 106,182 | 92,378 | |
IEC Electronics Corp. (a) | 86 | 372 | |
Ingram Micro, Inc. Class A (a) | 191,225 | 5,631,576 | |
Insight Enterprises, Inc. (a) | 39,665 | 911,502 | |
Intelli-Check, Inc. (a) | 4,366 | 3,308 | |
InvenSense, Inc. (a)(d) | 57,254 | 1,153,668 | |
IPG Photonics Corp. (a)(d) | 46,113 | 3,309,530 | |
Iteris, Inc. (a) | 1,032 | 2,291 | |
Itron, Inc. (a)(d) | 38,500 | 1,347,500 | |
Jabil Circuit, Inc. | 217,842 | 4,032,255 | |
KEMET Corp. (a) | 34,374 | 195,244 | |
KEY Tronic Corp. (a) | 6,483 | 67,099 | |
LightPath Technologies, Inc. Class A (a) | 376 | 617 | |
Littelfuse, Inc. | 24,950 | 2,354,532 | |
LoJack Corp. (a) | 24,621 | 149,696 | |
LRAD Corp. (a) | 56,581 | 123,912 | |
Maxwell Technologies, Inc. (a)(d) | 38,769 | 396,219 | |
Measurement Specialties, Inc. (a) | 15,282 | 932,202 | |
Mercury Systems, Inc. (a)(d) | 23,393 | 259,662 | |
Mesa Laboratories, Inc. | 2,184 | 190,882 | |
Methode Electronics, Inc. Class A | 42,247 | 1,432,173 | |
MicroVision, Inc. (a) | 33,140 | 67,274 | |
MOCON, Inc. | 2,209 | 37,089 | |
MTS Systems Corp. | 16,730 | 1,187,161 | |
Multi-Fineline Electronix, Inc. (a) | 10,240 | 149,197 | |
National Instruments Corp. | 115,875 | 3,356,899 | |
Neonode, Inc. (a)(d) | 33,197 | 239,682 | |
NetList, Inc. (a)(d) | 104,599 | 200,307 | |
Newport Corp. (a) | 41,609 | 861,306 | |
OSI Systems, Inc. (a) | 22,707 | 1,395,799 | |
Park Electrochemical Corp. | 16,314 | 464,786 | |
PC Connection, Inc. | 12,636 | 255,879 | |
PC Mall, Inc. (a) | 4,077 | 39,588 | |
Planar Systems, Inc. (a) | 2,277 | 5,283 | |
Plexus Corp. (a) | 33,577 | 1,381,694 | |
Pulse Electronics Corp. (a) | 5,013 | 20,052 | |
RadiSys Corp. (a) | 9,220 | 38,263 | |
RealD, Inc. (a)(d) | 37,860 | 418,353 | |
Research Frontiers, Inc. (a)(d) | 16,855 | 101,299 | |
RF Industries Ltd. | 5,778 | 38,366 | |
Richardson Electronics Ltd. | 23,707 | 260,540 | |
Rofin-Sinar Technologies, Inc. (a) | 22,270 | 522,677 | |
Rogers Corp. (a) | 16,870 | 1,091,489 | |
Sanmina Corp. (a) | 78,959 | 1,339,145 | |
ScanSource, Inc. (a) | 24,927 | 978,634 | |
Speed Commerce, Inc. (a)(d) | 43,920 | 172,166 | |
Common Stocks - continued | |||
Shares | Value | ||
INFORMATION TECHNOLOGY - continued | |||
Electronic Equipment & Components - continued | |||
SYNNEX Corp. (a) | 30,841 | $ 1,834,423 | |
TE Connectivity Ltd. | 462,365 | 27,085,342 | |
Tech Data Corp. (a) | 39,838 | 2,294,669 | |
Trimble Navigation Ltd. (a)(d) | 301,758 | 11,512,068 | |
TTM Technologies, Inc. (a) | 53,211 | 446,972 | |
Uni-Pixel, Inc. (a)(d) | 12,876 | 126,957 | |
Universal Display Corp. (a)(d) | 48,773 | 1,684,619 | |
Viasystems Group, Inc. (a) | 4,710 | 61,042 | |
Vishay Intertechnology, Inc. | 163,262 | 2,308,525 | |
Vishay Precision Group, Inc. (a) | 9,596 | 164,379 | |
Wayside Technology Group, Inc. | 1,232 | 17,420 | |
Wireless Telecom Group, Inc. (a) | 11,200 | 40,320 | |
Zebra Technologies Corp. Class A (a) | 57,315 | 3,954,162 | |
Zygo Corp. (a) | 11,158 | 168,597 | |
| 185,608,246 | ||
Internet Software & Services - 3.2% | |||
Akamai Technologies, Inc. (a) | 208,821 | 12,765,228 | |
Angie's List, Inc. (a)(d) | 39,732 | 552,672 | |
AOL, Inc. (a)(d) | 89,529 | 3,919,580 | |
Autobytel, Inc. (a) | 1,148 | 18,092 | |
Bankrate, Inc. (a)(d) | 42,017 | 845,802 | |
Bazaarvoice, Inc. (a)(d) | 31,078 | 210,087 | |
Benefitfocus, Inc. | 9,816 | 635,880 | |
Blucora, Inc. (a)(d) | 40,993 | 788,705 | |
Brightcove, Inc. (a) | 25,472 | 247,078 | |
BroadVision, Inc. (a) | 490 | 6,326 | |
Carbonite, Inc. (a) | 9,443 | 95,941 | |
ChannelAdvisor Corp. (a) | 9,463 | 429,431 | |
comScore, Inc. (a) | 35,536 | 1,123,648 | |
Constant Contact, Inc. (a) | 30,835 | 850,121 | |
Conversant, Inc. (a)(d) | 68,992 | 1,715,141 | |
Cornerstone OnDemand, Inc. (a)(d) | 56,736 | 3,312,248 | |
CoStar Group, Inc. (a) | 32,267 | 6,486,958 | |
Crexendo, Inc. (a) | 6,585 | 20,677 | |
Cvent, Inc. | 5,589 | 219,536 | |
Daegis, Inc. (a) | 3,645 | 4,301 | |
Dealertrack Technologies (a)(d) | 45,834 | 2,478,244 | |
Demand Media, Inc. (a)(d) | 42,676 | 206,979 | |
Demandware, Inc. (a) | 37,767 | 2,836,679 | |
Dice Holdings, Inc. (a)(d) | 50,678 | 372,990 | |
Digital River, Inc. (a) | 35,934 | 638,547 | |
E2open, Inc. (a)(d) | 9,328 | 259,225 | |
Earthlink Holdings Corp. | 136,356 | 534,516 | |
eBay, Inc. (a) | 1,308,058 | 76,874,569 | |
eGain Communications Corp. (a)(d) | 8,558 | 71,716 | |
Endurance International Group Holdings, Inc. | 22,941 | 346,180 | |
Envestnet, Inc. (a) | 31,274 | 1,308,504 | |
Equinix, Inc. (a)(d) | 57,542 | 10,930,678 | |
Facebook, Inc. Class A (a) | 1,846,553 | 126,415,018 | |
Global Eagle Entertainment, Inc. (a)(d) | 63,441 | 1,115,293 | |
| |||
Shares | Value | ||
GlowPoint, Inc. (a) | 18,770 | $ 24,776 | |
Gogo, Inc. (d) | 13,710 | 285,854 | |
Google, Inc. Class A (a) | 314,888 | 382,793,597 | |
IAC/InterActiveCorp | 87,877 | 6,813,104 | |
Internap Network Services Corp. (a) | 49,823 | 379,651 | |
IntraLinks Holdings, Inc. (a) | 36,458 | 423,277 | |
Inuvo, Inc. (a) | 9,640 | 11,954 | |
iPass, Inc. (a) | 33,662 | 52,176 | |
j2 Global, Inc. | 55,909 | 2,873,723 | |
Limelight Networks, Inc. (a) | 33,081 | 71,455 | |
LinkedIn Corp. (a)(d) | 109,767 | 22,396,859 | |
Liquidity Services, Inc. (a)(d) | 37,923 | 971,587 | |
LivePerson, Inc. (a)(d) | 55,381 | 724,383 | |
Local Corp. (a) | 28,399 | 45,154 | |
LogMeIn, Inc. (a) | 22,955 | 960,667 | |
Marchex, Inc. Class B | 28,685 | 339,630 | |
Marin Software, Inc. (d) | 7,083 | 81,100 | |
Marketo, Inc. | 21,521 | 882,361 | |
Mediabistro, Inc. (a) | 147 | 340 | |
MeetMe, Inc. (a)(d) | 18,724 | 49,806 | |
Millennial Media, Inc. (a)(d) | 34,415 | 207,867 | |
Monster Worldwide, Inc. (a) | 97,552 | 777,489 | |
Move, Inc. (a) | 35,516 | 458,512 | |
NIC, Inc. | 78,994 | 1,535,643 | |
OpenTable, Inc. (a)(d) | 23,366 | 1,862,037 | |
Pandora Media, Inc. (a) | 184,344 | 6,898,152 | |
Perficient, Inc. (a) | 34,438 | 702,880 | |
QuinStreet, Inc. (a) | 17,620 | 116,116 | |
Rackspace Hosting, Inc. (a)(d) | 132,627 | 4,876,695 | |
RealNetworks, Inc. (a) | 28,670 | 215,312 | |
Rocket Fuel, Inc. | 8,626 | 483,574 | |
SciQuest, Inc. (a)(d) | 19,825 | 585,234 | |
Selectica, Inc. (a) | 552 | 3,853 | |
Shutterstock, Inc. (a)(d) | 10,696 | 1,062,968 | |
Spark Networks, Inc. (a)(d) | 16,620 | 100,052 | |
SPS Commerce, Inc. (a) | 19,140 | 1,297,692 | |
Stamps.com, Inc. (a) | 12,471 | 438,730 | |
Support.com, Inc. (a) | 117,655 | 295,314 | |
Synacor, Inc. (a) | 20,037 | 52,697 | |
TechTarget, Inc. (a) | 1,217 | 8,434 | |
Textura Corp. (d) | 17,853 | 480,424 | |
TheStreet.com, Inc. | 3,696 | 10,792 | |
Travelzoo, Inc. (a) | 5,383 | 127,146 | |
Tremor Video, Inc. (d) | 9,207 | 39,958 | |
Trulia, Inc. (a)(d) | 42,135 | 1,262,365 | |
Twitter, Inc. (d) | 80,705 | 4,431,512 | |
United Online, Inc. | 10,283 | 115,272 | |
Unwired Planet, Inc. | 100,320 | 148,474 | |
VeriSign, Inc. (a)(d) | 144,977 | 7,989,682 | |
Vocus, Inc. (a)(d) | 23,379 | 312,110 | |
Web.com Group, Inc. (a)(d) | 64,573 | 2,353,686 | |
WebMD Health Corp. (a)(d) | 44,803 | 1,989,701 | |
XO Group, Inc. (a) | 29,832 | 356,194 | |
Xoom Corp. | 19,461 | 545,492 | |
Common Stocks - continued | |||
Shares | Value | ||
INFORMATION TECHNOLOGY - continued | |||
Internet Software & Services - continued | |||
Yahoo!, Inc. (a) | 1,058,836 | $ 40,945,188 | |
Yelp, Inc. (a)(d) | 60,050 | 5,669,921 | |
YuMe, Inc. (d) | 6,211 | 39,688 | |
Zillow, Inc. (a)(d) | 23,405 | 1,956,658 | |
Zix Corp. (a) | 43,773 | 197,854 | |
| 769,769,412 | ||
IT Services - 3.4% | |||
Accenture PLC Class A | 713,976 | 59,509,900 | |
Acxiom Corp. (a) | 91,117 | 3,392,286 | |
Alliance Data Systems Corp. (a)(d) | 50,917 | 14,516,946 | |
Amdocs Ltd. | 195,710 | 8,705,181 | |
Automatic Data Processing, Inc. | 560,035 | 43,559,522 | |
Blackhawk Network Holdings, Inc. (d) | 10,875 | 269,483 | |
Booz Allen Hamilton Holding Corp. | 80,553 | 1,694,030 | |
Broadridge Financial Solutions, Inc. | 126,853 | 4,789,969 | |
CACI International, Inc. Class A (a)(d) | 20,462 | 1,613,019 | |
Cardtronics, Inc. (a) | 44,777 | 1,814,364 | |
Cass Information Systems, Inc. | 3,955 | 205,660 | |
Ciber, Inc. (a) | 53,912 | 257,699 | |
Cognizant Technology Solutions Corp. Class A (a) | 339,084 | 35,285,081 | |
Computer Sciences Corp. | 174,620 | 11,035,984 | |
Computer Task Group, Inc. | 11,646 | 189,248 | |
Convergys Corp. (d) | 123,097 | 2,519,796 | |
CoreLogic, Inc. (a) | 113,020 | 3,684,452 | |
CSG Systems International, Inc. | 47,456 | 1,328,768 | |
CSP, Inc. | 3,696 | 30,677 | |
Datalink Corp. (a) | 21,583 | 315,328 | |
DST Systems, Inc. | 31,684 | 2,977,662 | |
Edgewater Technology, Inc. (a) | 2,875 | 19,665 | |
EPAM Systems, Inc. (a) | 32,476 | 1,361,719 | |
Euronet Worldwide, Inc. (a) | 64,215 | 2,456,866 | |
EVERTEC, Inc. | 73,649 | 1,786,725 | |
ExlService Holdings, Inc. (a) | 29,161 | 816,216 | |
Fidelity National Information Services, Inc. | 329,470 | 18,321,827 | |
Fiserv, Inc. (a) | 303,216 | 17,601,689 | |
FleetCor Technologies, Inc. (a) | 84,060 | 10,921,916 | |
Forrester Research, Inc. | 14,844 | 537,650 | |
Gartner, Inc. Class A (a)(d) | 108,666 | 7,558,807 | |
Genpact Ltd. (a) | 139,916 | 2,333,799 | |
Global Cash Access Holdings, Inc. (a) | 58,402 | 490,577 | |
Global Payments, Inc. (d) | 86,730 | 6,099,721 | |
Hackett Group, Inc. | 12,619 | 74,326 | |
Heartland Payment Systems, Inc. | 51,995 | 2,102,678 | |
Higher One Holdings, Inc. (a) | 26,817 | 214,536 | |
IBM Corp. | 1,144,549 | 211,936,138 | |
iGATE Corp. (a) | 38,740 | 1,311,349 | |
Information Services Group, Inc. (a) | 18,000 | 94,140 | |
Innodata, Inc. (a) | 14,010 | 45,953 | |
| |||
Shares | Value | ||
Jack Henry & Associates, Inc. | 97,558 | $ 5,671,047 | |
Leidos Holdings, Inc. (d) | 88,093 | 3,934,233 | |
Lionbridge Technologies, Inc. (a) | 34,685 | 248,345 | |
ManTech International Corp. Class A | 23,021 | 673,825 | |
MasterCard, Inc. Class A | 1,154,284 | 89,710,952 | |
Mattersight Corp. (a) | 4,307 | 24,291 | |
Maximus, Inc. | 80,539 | 3,848,959 | |
ModusLink Global Solutions, Inc. (a) | 31,030 | 141,807 | |
MoneyGram International, Inc. (a) | 66,937 | 1,273,811 | |
NCI, Inc. Class A (a) | 12,261 | 147,132 | |
Neustar, Inc. Class A (a)(d) | 66,766 | 2,391,558 | |
Paychex, Inc. | 360,083 | 15,037,066 | |
PFSweb, Inc. (a) | 1,815 | 15,881 | |
Planet Payment, Inc. (a) | 40,113 | 136,785 | |
PRG-Schultz International, Inc. (a) | 5,640 | 34,066 | |
Sapient Corp. (a) | 136,229 | 2,371,747 | |
Science Applications International Corp. | 56,960 | 2,124,608 | |
ServiceSource International, Inc. (a)(d) | 52,332 | 477,268 | |
StarTek, Inc. (a) | 2,150 | 14,943 | |
Sykes Enterprises, Inc. (a) | 37,324 | 734,536 | |
Syntel, Inc. (a) | 20,991 | 1,980,711 | |
Teletech Holdings, Inc. (a) | 19,293 | 464,575 | |
Teradata Corp. (a)(d) | 183,403 | 8,421,866 | |
The Management Network Group, Inc. (a) | 206 | 700 | |
The Western Union Co. | 621,408 | 10,396,156 | |
Total System Services, Inc. | 171,609 | 5,227,210 | |
Unisys Corp. (a)(d) | 40,780 | 1,395,492 | |
Vantiv, Inc. (a)(d) | 129,522 | 4,122,685 | |
VeriFone Systems, Inc. (a) | 114,397 | 3,311,793 | |
Virtusa Corp. (a) | 35,863 | 1,304,337 | |
Visa, Inc. Class A | 570,296 | 128,852,678 | |
WEX, Inc. (a) | 45,780 | 4,432,420 | |
Xerox Corp. | 1,318,733 | 14,492,876 | |
| 797,197,711 | ||
Semiconductors & Semiconductor Equipment - 2.2% | |||
Advanced Energy Industries, Inc. (a) | 37,951 | 1,041,375 | |
Advanced Micro Devices, Inc. (a)(d) | 718,505 | 2,665,654 | |
AEHR Test Systems (a) | 3,126 | 7,346 | |
Aetrium, Inc. (a) | 206 | 1,226 | |
Altera Corp. | 377,370 | 13,702,305 | |
Amkor Technology, Inc. (a)(d) | 161,169 | 954,120 | |
Amtech Systems, Inc. (a) | 12,381 | 138,172 | |
ANADIGICS, Inc. (a)(d) | 109,969 | 200,144 | |
Analog Devices, Inc. | 340,001 | 17,278,851 | |
Applied Materials, Inc. | 1,333,558 | 25,284,260 | |
Applied Micro Circuits Corp. (a)(d) | 98,689 | 1,130,976 | |
Atmel Corp. (a)(d) | 480,018 | 3,868,945 | |
ATMI, Inc. (a) | 28,610 | 973,026 | |
Avago Technologies Ltd. | 276,576 | 17,064,739 | |
Axcelis Technologies, Inc. (a) | 123,333 | 275,033 | |
AXT, Inc. (a) | 31,515 | 72,169 | |
Broadcom Corp. Class A | 594,914 | 17,680,844 | |
Common Stocks - continued | |||
Shares | Value | ||
INFORMATION TECHNOLOGY - continued | |||
Semiconductors & Semiconductor Equipment - continued | |||
Brooks Automation, Inc. | 71,516 | $ 741,621 | |
BTU International, Inc. (a) | 4,067 | 12,323 | |
Cabot Microelectronics Corp. (a)(d) | 30,653 | 1,353,943 | |
Cavium, Inc. (a)(d) | 71,032 | 2,992,578 | |
Ceva, Inc. (a)(d) | 20,686 | 374,003 | |
Cirrus Logic, Inc. (a)(d) | 62,020 | 1,193,885 | |
Cohu, Inc. | 20,738 | 209,246 | |
Cree, Inc. (a)(d) | 134,448 | 8,259,141 | |
CVD Equipment Corp. (a)(d) | 24,298 | 359,610 | |
Cypress Semiconductor Corp. (d) | 200,786 | 1,965,695 | |
Diodes, Inc. (a) | 35,635 | 848,469 | |
DSP Group, Inc. (a) | 34,788 | 294,306 | |
Entegris, Inc. (a) | 143,226 | 1,725,873 | |
Entropic Communications, Inc. (a) | 130,146 | 570,039 | |
Exar Corp. (a) | 56,777 | 650,097 | |
Fairchild Semiconductor International, Inc. (a)(d) | 143,511 | 2,020,635 | |
First Solar, Inc. (a)(d) | 80,138 | 4,573,476 | |
FormFactor, Inc. (a) | 44,109 | 314,497 | |
Freescale Semiconductor, Inc. (a) | 51,501 | 1,171,648 | |
GigOptix, Inc. (a) | 17,428 | 28,408 | |
GSI Technology, Inc. (a) | 7,703 | 52,457 | |
GT Advanced Technologies, Inc. (a)(d) | 153,295 | 2,196,717 | |
Hittite Microwave Corp. | 37,699 | 2,223,487 | |
Ikanos Communications, Inc. (a) | 35,040 | 32,237 | |
Inphi Corp. (a) | 23,714 | 311,839 | |
Integrated Device Technology, Inc. (a) | 149,111 | 1,758,019 | |
Integrated Silicon Solution, Inc. (a) | 27,085 | 329,895 | |
Intel Corp. | 5,568,938 | 137,886,905 | |
Intermolecular, Inc. (a)(d) | 6,975 | 18,484 | |
International Rectifier Corp. (a)(d) | 83,741 | 2,256,820 | |
Intersil Corp. Class A | 155,240 | 1,974,653 | |
Intest Corp. (a) | 2,175 | 8,657 | |
IXYS Corp. | 38,644 | 425,857 | |
KLA-Tencor Corp. | 196,151 | 12,779,238 | |
Kopin Corp. (a) | 49,853 | 198,913 | |
Kulicke & Soffa Industries, Inc. (a) | 82,587 | 953,054 | |
Lam Research Corp. (a) | 188,211 | 9,736,155 | |
Lattice Semiconductor Corp. (a) | 136,230 | 1,031,261 | |
Linear Technology Corp. | 269,546 | 12,625,535 | |
LSI Corp. | 591,975 | 6,565,003 | |
LTX-Credence Corp. (a) | 48,731 | 493,158 | |
M/A-COM Technology Solutions, Inc. (a) | 10,000 | 169,600 | |
Marvell Technology Group Ltd. | 465,712 | 7,120,736 | |
Mattson Technology, Inc. (a) | 72,551 | 185,005 | |
Maxim Integrated Products, Inc. | 303,732 | 9,935,074 | |
MaxLinear, Inc. Class A (a) | 15,441 | 144,373 | |
Micrel, Inc. | 33,398 | 348,675 | |
Microchip Technology, Inc. (d) | 217,370 | 9,901,204 | |
Micron Technology, Inc. (a) | 1,180,658 | 28,560,117 | |
Microsemi Corp. (a) | 100,802 | 2,324,494 | |
| |||
Shares | Value | ||
MKS Instruments, Inc. | 59,577 | $ 1,790,885 | |
Monolithic Power Systems, Inc. (a)(d) | 35,284 | 1,264,579 | |
MoSys, Inc. (a)(d) | 19,247 | 85,072 | |
Nanometrics, Inc. (a) | 28,664 | 526,271 | |
NeoPhotonics Corp. (a) | 16,785 | 138,476 | |
NVE Corp. (a) | 6,043 | 341,006 | |
NVIDIA Corp. | 631,690 | 11,610,462 | |
Omnivision Technologies, Inc. (a)(d) | 50,229 | 867,455 | |
ON Semiconductor Corp. (a) | 539,501 | 5,038,939 | |
PDF Solutions, Inc. (a) | 22,154 | 451,720 | |
Peregrine Semiconductor Corp. (a)(d) | 21,553 | 143,974 | |
Pericom Semiconductor Corp. (a) | 17,514 | 141,688 | |
Photronics, Inc. (a)(d) | 74,723 | 650,090 | |
Pixelworks, Inc. (a) | 22,798 | 113,534 | |
PLX Technology, Inc. (a) | 44,805 | 267,038 | |
PMC-Sierra, Inc. (a) | 199,312 | 1,462,950 | |
Power Integrations, Inc. | 37,256 | 2,202,947 | |
QuickLogic Corp. (a)(d) | 38,003 | 193,435 | |
Rambus, Inc. (a)(d) | 118,235 | 1,090,127 | |
RF Micro Devices, Inc. (a) | 315,164 | 2,231,361 | |
Rubicon Technology, Inc. (a)(d) | 25,049 | 323,383 | |
Rudolph Technologies, Inc. (a)(d) | 29,614 | 339,673 | |
Semtech Corp. (a) | 76,311 | 1,903,959 | |
Sigma Designs, Inc. (a) | 22,818 | 111,808 | |
Silicon Image, Inc. (a) | 84,424 | 510,765 | |
Silicon Laboratories, Inc. (a)(d) | 47,316 | 2,459,013 | |
Skyworks Solutions, Inc. (a)(d) | 219,186 | 7,772,336 | |
Spansion, Inc. Class A (a) | 45,268 | 738,321 | |
STR Holdings, Inc. (a) | 37,233 | 55,105 | |
SunEdison, Inc. (a)(d) | 278,643 | 5,115,885 | |
SunPower Corp. (a)(d) | 42,366 | 1,403,586 | |
Supertex, Inc. (a) | 19,548 | 643,716 | |
Synaptics, Inc. (a)(d) | 36,621 | 2,381,830 | |
Teradyne, Inc. (a)(d) | 265,875 | 5,391,945 | |
Tessera Technologies, Inc. | 44,982 | 977,009 | |
Texas Instruments, Inc. | 1,203,895 | 54,127,119 | |
TriQuint Semiconductor, Inc. (a)(d) | 199,172 | 2,437,865 | |
Ultra Clean Holdings, Inc. (a) | 18,783 | 247,184 | |
Ultratech, Inc. (a)(d) | 31,408 | 823,518 | |
Veeco Instruments, Inc. (a)(d) | 53,983 | 2,135,028 | |
Vitesse Semiconductor Corp. (a) | 9,484 | 34,522 | |
Xilinx, Inc. | 308,585 | 16,108,137 | |
| 521,200,016 | ||
Software - 3.6% | |||
Accelrys, Inc. (a) | 51,411 | 641,609 | |
ACI Worldwide, Inc. (a)(d) | 49,960 | 2,999,099 | |
Activision Blizzard, Inc. | 489,202 | 9,466,059 | |
Actuate Corp. (a) | 42,170 | 239,526 | |
Adobe Systems, Inc. (a) | 523,566 | 35,921,863 | |
Advent Software, Inc. | 46,269 | 1,420,458 | |
American Software, Inc. Class A | 10,878 | 113,784 | |
ANSYS, Inc. (a) | 112,596 | 9,404,018 | |
Aspen Technology, Inc. (a) | 119,658 | 5,617,943 | |
Common Stocks - continued | |||
Shares | Value | ||
INFORMATION TECHNOLOGY - continued | |||
Software - continued | |||
Autodesk, Inc. (a) | 253,631 | $ 13,305,482 | |
Barracuda Networks, Inc. (d) | 9,965 | 358,242 | |
Blackbaud, Inc. | 47,578 | 1,490,143 | |
Bottomline Technologies, Inc. (a)(d) | 44,605 | 1,591,952 | |
BroadSoft, Inc. (a)(d) | 26,590 | 797,966 | |
BSQUARE Corp. (a) | 11,182 | 39,696 | |
CA Technologies, Inc. | 349,083 | 11,694,281 | |
Cadence Design Systems, Inc. (a)(d) | 338,143 | 5,183,732 | |
Callidus Software, Inc. (a)(d) | 32,625 | 402,266 | |
Citrix Systems, Inc. (a) | 209,768 | 12,596,568 | |
CommVault Systems, Inc. (a)(d) | 50,590 | 3,484,639 | |
Compuware Corp. | 202,971 | 2,222,532 | |
Comverse, Inc. (a) | 23,221 | 803,679 | |
Concur Technologies, Inc. (a)(d) | 54,717 | 6,754,814 | |
Cyan, Inc. (d) | 8,834 | 29,682 | |
Datawatch Corp. (a) | 1,950 | 65,540 | |
Digimarc Corp. | 6,216 | 182,626 | |
Document Security Systems, Inc. (a)(d) | 19,824 | 32,511 | |
Ebix, Inc. (d) | 31,393 | 510,136 | |
Electronic Arts, Inc. (a)(d) | 359,966 | 10,291,428 | |
Ellie Mae, Inc. (a)(d) | 31,804 | 985,924 | |
Envivio, Inc. (a) | 6,801 | 24,552 | |
EPIQ Systems, Inc. | 38,746 | 549,418 | |
ePlus, Inc. (a) | 2,450 | 139,332 | |
Evolving Systems, Inc. | 4,973 | 42,121 | |
FactSet Research Systems, Inc. | 53,360 | 5,618,274 | |
Fair Isaac Corp. | 37,437 | 2,011,490 | |
FalconStor Software, Inc. (a) | 37,427 | 64,749 | |
FireEye, Inc. (d) | 17,216 | 1,474,378 | |
Fonix Corp. (a) | 1 | 0 | |
Fortinet, Inc. (a) | 146,518 | 3,391,892 | |
Gigamon, Inc. (a)(d) | 13,202 | 416,655 | |
Glu Mobile, Inc. (a) | 98,358 | 494,741 | |
GSE Systems, Inc. (a) | 388 | 698 | |
Guidance Software, Inc. (a) | 13,894 | 151,584 | |
Guidewire Software, Inc. (a)(d) | 70,818 | 3,796,553 | |
Imperva, Inc. (a) | 22,847 | 1,431,821 | |
Infoblox, Inc. (a)(d) | 50,781 | 1,172,025 | |
Informatica Corp. (a) | 135,700 | 5,639,692 | |
Interactive Intelligence Group, Inc. (a) | 16,038 | 1,277,106 | |
Intuit, Inc. | 316,972 | 24,771,362 | |
Jive Software, Inc. (a)(d) | 30,754 | 250,338 | |
Liquid Holdings Group, Inc. (d) | 3,912 | 18,778 | |
Majesco Entertainment Co. (a) | 19,952 | 10,595 | |
Manhattan Associates, Inc. (a) | 82,280 | 3,117,589 | |
Mentor Graphics Corp. | 118,491 | 2,564,145 | |
MICROS Systems, Inc. (a)(d) | 83,538 | 4,637,194 | |
Microsoft Corp. | 8,530,245 | 326,793,686 | |
MicroStrategy, Inc. Class A (a) | 12,438 | 1,606,119 | |
Mitek Systems, Inc. (a)(d) | 15,896 | 84,408 | |
| |||
Shares | Value | ||
Model N, Inc. | 6,345 | $ 69,732 | |
Monotype Imaging Holdings, Inc. | 41,411 | 1,177,729 | |
NetScout Systems, Inc. (a) | 39,020 | 1,481,980 | |
NetSol Technologies, Inc. (a)(d) | 10,165 | 47,166 | |
NetSuite, Inc. (a)(d) | 37,824 | 4,353,164 | |
Nuance Communications, Inc. (a)(d) | 295,143 | 4,512,736 | |
Oracle Corp. | 3,941,524 | 154,153,004 | |
Parametric Technology Corp. (a) | 128,240 | 5,041,114 | |
Peerless Systems Corp. (a) | 172 | 635 | |
Pegasystems, Inc. | 22,064 | 918,524 | |
Progress Software Corp. (a) | 56,172 | 1,400,930 | |
Proofpoint, Inc. (a)(d) | 24,372 | 1,010,219 | |
PROS Holdings, Inc. (a) | 23,721 | 817,188 | |
QAD, Inc. Class B | 4,298 | 71,433 | |
Qlik Technologies, Inc. (a) | 106,112 | 3,236,416 | |
Qualys, Inc. (a) | 15,390 | 417,223 | |
Rally Software Development Corp. | 9,834 | 195,598 | |
RealPage, Inc. (a)(d) | 66,111 | 1,170,165 | |
Red Hat, Inc. (a) | 210,389 | 12,410,847 | |
Rosetta Stone, Inc. (a) | 8,315 | 96,038 | |
Rovi Corp. (a) | 119,303 | 2,963,487 | |
salesforce.com, Inc. (a)(d) | 619,024 | 38,608,527 | |
SeaChange International, Inc. (a) | 17,668 | 186,397 | |
ServiceNow, Inc. (a)(d) | 114,859 | 7,817,304 | |
Silver Spring Networks, Inc. (d) | 4,334 | 76,278 | |
Smith Micro Software, Inc. (a) | 41,455 | 72,546 | |
SolarWinds, Inc. (a) | 71,945 | 3,322,420 | |
Solera Holdings, Inc. | 82,773 | 5,663,329 | |
Sonic Foundry, Inc. (a) | 155 | 1,544 | |
Splunk, Inc. (a) | 92,581 | 8,586,888 | |
SS&C Technologies Holdings, Inc. (a) | 79,064 | 3,058,196 | |
Symantec Corp. | 783,009 | 16,819,033 | |
Synchronoss Technologies, Inc. (a)(d) | 29,419 | 1,011,425 | |
Synopsys, Inc. (a) | 184,472 | 7,452,669 | |
Tableau Software, Inc. | 16,291 | 1,536,893 | |
Take-Two Interactive Software, Inc. (a)(d) | 106,405 | 2,103,627 | |
Tangoe, Inc. (a)(d) | 45,871 | 872,466 | |
TeleCommunication Systems, Inc. | 49,377 | 107,148 | |
TeleNav, Inc. (a) | 12,035 | 72,330 | |
TIBCO Software, Inc. (a) | 175,849 | 3,831,750 | |
TiVo, Inc. (a) | 121,206 | 1,636,281 | |
Tyler Technologies, Inc. (a) | 30,080 | 2,820,902 | |
Ultimate Software Group, Inc. (a)(d) | 32,943 | 5,468,538 | |
Vasco Data Security International, Inc. (a) | 30,246 | 241,363 | |
Verint Systems, Inc. (a) | 68,085 | 3,187,059 | |
VirnetX Holding Corp. (a)(d) | 42,196 | 822,822 | |
VMware, Inc. Class A (a)(d) | 93,456 | 8,976,449 | |
Voltari Corp. (a)(d) | 4,240 | 15,985 | |
Vringo, Inc. (a)(d) | 39,609 | 160,416 | |
Wave Systems Corp. Class A (a)(d) | 27,069 | 28,422 | |
Common Stocks - continued | |||
Shares | Value | ||
INFORMATION TECHNOLOGY - continued | |||
Software - continued | |||
Workday, Inc. Class A (a)(d) | 33,866 | $ 3,722,551 | |
Zynga, Inc. (a) | 705,556 | 3,570,113 | |
| 857,596,492 | ||
TOTAL INFORMATION TECHNOLOGY | 4,275,324,769 | ||
MATERIALS - 3.8% | |||
Chemicals - 2.6% | |||
A. Schulman, Inc. | 30,292 | 1,052,647 | |
Advanced Emissions Solutions, Inc. (a) | 14,209 | 765,865 | |
Air Products & Chemicals, Inc. | 232,770 | 28,239,656 | |
Airgas, Inc. | 78,679 | 8,481,596 | |
Albemarle Corp. | 94,402 | 6,229,588 | |
American Vanguard Corp. (d) | 23,997 | 533,933 | |
Arabian American Development Co. (a) | 28,770 | 352,145 | |
Ashland, Inc. | 82,040 | 7,742,115 | |
Axiall Corp. | 81,160 | 3,284,545 | |
Balchem Corp. | 30,888 | 1,560,153 | |
Cabot Corp. | 67,007 | 3,627,759 | |
Calgon Carbon Corp. (a) | 83,129 | 1,673,387 | |
Celanese Corp. Class A | 183,332 | 9,788,095 | |
CF Industries Holdings, Inc. | 64,252 | 16,120,827 | |
Chase Corp. | 3,188 | 96,118 | |
Chemtura Corp. (a) | 94,872 | 2,348,082 | |
Clean Diesel Technologies, Inc. (a)(d) | 42,378 | 114,421 | |
Core Molding Technologies, Inc. (a) | 5,919 | 87,897 | |
Cytec Industries, Inc. | 39,374 | 3,727,537 | |
E.I. du Pont de Nemours & Co. | 1,030,606 | 68,658,972 | |
Eastman Chemical Co. | 168,147 | 14,701,092 | |
Ecolab, Inc. | 304,750 | 32,836,813 | |
Ferro Corp. (a) | 111,135 | 1,458,091 | |
Flotek Industries, Inc. (a)(d) | 68,404 | 1,740,882 | |
FMC Corp. | 146,802 | 11,330,178 | |
FutureFuel Corp. | 18,211 | 315,961 | |
GSE Holding, Inc. (a) | 3,278 | 2,000 | |
H.B. Fuller Co. | 56,146 | 2,721,958 | |
Hawkins, Inc. | 5,329 | 189,872 | |
Huntsman Corp. | 203,808 | 4,964,763 | |
Innophos Holdings, Inc. | 26,761 | 1,469,714 | |
Innospec, Inc. | 50,796 | 2,210,134 | |
International Flavors & Fragrances, Inc. | 91,400 | 8,572,406 | |
Intrepid Potash, Inc. (a)(d) | 76,176 | 1,128,167 | |
KMG Chemicals, Inc. | 10,303 | 152,897 | |
Koppers Holdings, Inc. | 22,254 | 879,923 | |
Kraton Performance Polymers, Inc. (a) | 33,124 | 918,860 | |
Kronos Worldwide, Inc. | 25,586 | 390,954 | |
Landec Corp. (a) | 25,874 | 263,656 | |
LSB Industries, Inc. (a) | 18,952 | 619,541 | |
LyondellBasell Industries NV Class A | 485,892 | 42,797,367 | |
Marrone Bio Innovations, Inc. (d) | 5,712 | 82,995 | |
| |||
Shares | Value | ||
Material Sciences Corp. (a) | 4,565 | $ 58,021 | |
Minerals Technologies, Inc. | 52,154 | 2,790,239 | |
Monsanto Co. | 586,694 | 64,548,074 | |
NewMarket Corp. (d) | 12,456 | 4,604,610 | |
Olin Corp. (d) | 81,888 | 2,144,647 | |
OM Group, Inc. | 32,193 | 1,017,299 | |
OMNOVA Solutions, Inc. (a) | 35,057 | 334,093 | |
Penford Corp. (a) | 6,469 | 86,361 | |
PolyOne Corp. | 103,882 | 3,895,575 | |
PPG Industries, Inc. | 155,823 | 30,824,906 | |
Praxair, Inc. | 323,450 | 42,168,177 | |
Quaker Chemical Corp. | 14,473 | 1,118,473 | |
Rockwood Holdings, Inc. | 88,136 | 6,952,168 | |
RPM International, Inc. | 164,614 | 6,890,742 | |
Senomyx, Inc. (a) | 31,786 | 316,589 | |
Sensient Technologies Corp. | 58,886 | 3,087,393 | |
Sherwin-Williams Co. | 94,962 | 19,037,982 | |
Sigma Aldrich Corp. | 130,116 | 12,284,252 | |
Stepan Co. | 25,296 | 1,537,997 | |
Taminco Corp. | 29,142 | 662,106 | |
The Dow Chemical Co. | 1,354,312 | 65,968,538 | |
The Mosaic Co. | 379,794 | 18,556,735 | |
The Scotts Miracle-Gro Co. Class A (d) | 51,798 | 2,958,184 | |
Tredegar Corp. | 24,439 | 608,775 | |
Tronox Ltd. Class A | 73,931 | 1,751,425 | |
Valhi, Inc. | 16,022 | 176,082 | |
Valspar Corp. | 85,270 | 6,373,933 | |
W.R. Grace & Co. (a) | 88,375 | 8,955,923 | |
Westlake Chemical Corp. (d) | 20,522 | 2,736,198 | |
Zep, Inc. | 16,526 | 290,858 | |
Zoltek Companies, Inc. (a) | 40,249 | 674,171 | |
| 607,644,088 | ||
Construction Materials - 0.1% | |||
Eagle Materials, Inc. | 69,831 | 6,173,060 | |
Headwaters, Inc. (a) | 105,333 | 1,404,089 | |
Martin Marietta Materials, Inc. | 56,358 | 6,874,549 | |
Texas Industries, Inc. (a)(d) | 20,369 | 1,729,328 | |
U.S. Concrete, Inc. (a) | 16,515 | 449,538 | |
Vulcan Materials Co. | 135,141 | 9,180,128 | |
| 25,810,692 | ||
Containers & Packaging - 0.3% | |||
AEP Industries, Inc. (a) | 6,511 | 277,499 | |
Aptargroup, Inc. (d) | 80,686 | 5,338,993 | |
Avery Dennison Corp. | 106,008 | 5,281,319 | |
Ball Corp. | 162,242 | 9,014,166 | |
Bemis Co., Inc. | 120,781 | 4,744,278 | |
Berry Plastics Group, Inc. (a) | 94,779 | 2,305,973 | |
Crown Holdings, Inc. (a) | 150,108 | 6,757,862 | |
Graphic Packaging Holding Co. (a) | 324,660 | 3,324,518 | |
Greif, Inc. Class A | 37,275 | 1,865,987 | |
MeadWestvaco Corp. (d) | 211,721 | 7,924,717 | |
Myers Industries, Inc. | 25,717 | 552,916 | |
Owens-Illinois, Inc. (a) | 185,599 | 6,295,518 | |
Common Stocks - continued | |||
Shares | Value | ||
MATERIALS - continued | |||
Containers & Packaging - continued | |||
Packaging Corp. of America | 102,376 | $ 7,462,187 | |
Rock-Tenn Co. Class A | 80,530 | 8,988,759 | |
Sealed Air Corp. | 219,080 | 7,457,483 | |
Silgan Holdings, Inc. | 46,246 | 2,229,520 | |
Sonoco Products Co. | 108,130 | 4,539,297 | |
UFP Technologies, Inc. (a) | 2,454 | 62,798 | |
| 84,423,790 | ||
Metals & Mining - 0.6% | |||
A.M. Castle & Co. (a)(d) | 36,860 | 538,893 | |
AK Steel Holding Corp. (a)(d) | 121,218 | 752,764 | |
Alcoa, Inc. (d) | 1,189,039 | 13,959,318 | |
Allegheny Technologies, Inc. (d) | 125,307 | 3,982,256 | |
Allied Nevada Gold Corp. (a)(d) | 93,899 | 491,092 | |
Amcol International Corp. | 23,278 | 1,033,078 | |
Carpenter Technology Corp. | 60,383 | 3,571,654 | |
Century Aluminum Co. (a) | 60,542 | 716,817 | |
Cliffs Natural Resources, Inc. (d) | 159,769 | 3,200,173 | |
Coeur d'Alene Mines Corp. (a)(d) | 146,764 | 1,614,404 | |
Commercial Metals Co. | 130,792 | 2,530,825 | |
Compass Minerals International, Inc. | 33,319 | 2,843,777 | |
Comstock Mining, Inc. (a)(d) | 56,723 | 113,446 | |
Freeport-McMoRan Copper & Gold, Inc. | 1,143,264 | 37,293,272 | |
Friedman Industries | 2,001 | 16,908 | |
General Moly, Inc. (a)(d) | 60,513 | 72,010 | |
Globe Specialty Metals, Inc. | 70,310 | 1,397,060 | |
Gold Resource Corp. | 44,371 | 228,511 | |
Golden Minerals Co. (a)(d) | 71,014 | 75,275 | |
Handy & Harman Ltd. (a) | 5,646 | 103,209 | |
Haynes International, Inc. | 12,361 | 612,240 | |
Hecla Mining Co. | 336,707 | 1,138,070 | |
Horsehead Holding Corp. (a)(d) | 61,719 | 1,096,747 | |
Kaiser Aluminum Corp. (d) | 16,273 | 1,148,711 | |
Materion Corp. | 22,336 | 660,922 | |
McEwen Mining, Inc. (a)(d) | 267,762 | 779,187 | |
Mines Management, Inc. (a)(d) | 24,109 | 32,788 | |
Molycorp, Inc. (a)(d) | 202,465 | 1,056,867 | |
Newmont Mining Corp. | 560,419 | 13,035,346 | |
Noranda Aluminium Holding Corp. | 73,305 | 315,945 | |
Nucor Corp. | 393,954 | 19,792,249 | |
Olympic Steel, Inc. | 12,703 | 349,460 | |
Paramount Gold & Silver Corp. (a)(d) | 34,874 | 47,080 | |
Reliance Steel & Aluminum Co. | 95,402 | 6,609,451 | |
Royal Gold, Inc. (d) | 79,101 | 5,435,030 | |
RTI International Metals, Inc. (a)(d) | 27,976 | 760,108 | |
Schnitzer Steel Industries, Inc. Class A (d) | 20,284 | 514,605 | |
Silver Bull Resources, Inc. (a)(d) | 60,971 | 23,169 | |
Solitario Exploration & Royalty Corp. (a) | 18,115 | 28,259 | |
Steel Dynamics, Inc. | 277,791 | 4,844,675 | |
Stillwater Mining Co. (a)(d) | 124,032 | 1,679,393 | |
SunCoke Energy, Inc. (a) | 69,275 | 1,543,447 | |
| |||
Shares | Value | ||
Synalloy Corp. | 8,615 | $ 117,422 | |
Timberline Resources Corp. (a) | 18,994 | 2,792 | |
U.S. Antimony Corp. (a)(d) | 24,962 | 46,180 | |
U.S. Silica Holdings, Inc. (d) | 63,033 | 2,067,482 | |
United States Steel Corp. (d) | 162,680 | 3,940,110 | |
Universal Stainless & Alloy Products, Inc. (a)(d) | 6,659 | 219,947 | |
Walter Energy, Inc. (d) | 65,194 | 703,443 | |
Worthington Industries, Inc. | 60,686 | 2,418,944 | |
| 145,554,811 | ||
Paper & Forest Products - 0.2% | |||
Boise Cascade Co. | 37,823 | 1,119,183 | |
Clearwater Paper Corp. (a) | 22,216 | 1,418,492 | |
Deltic Timber Corp. | 13,533 | 851,767 | |
Domtar Corp. | 36,405 | 4,032,946 | |
International Paper Co. | 492,581 | 24,082,285 | |
Kapstone Paper & Packaging Corp. (a) | 106,018 | 3,370,312 | |
Louisiana-Pacific Corp. (a)(d) | 160,954 | 3,024,326 | |
Neenah Paper, Inc. | 13,754 | 690,588 | |
P.H. Glatfelter Co. | 45,036 | 1,366,843 | |
Resolute Forest Products (a)(d) | 103,317 | 2,116,965 | |
Schweitzer-Mauduit International, Inc. | 39,736 | 1,912,494 | |
Verso Paper Corp. (a)(d) | 23,529 | 57,646 | |
Wausau-Mosinee Paper Corp. | 43,988 | 582,841 | |
| 44,626,688 | ||
TOTAL MATERIALS | 908,060,069 | ||
TELECOMMUNICATION SERVICES - 2.3% | |||
Diversified Telecommunication Services - 2.0% | |||
8x8, Inc. (a) | 89,195 | 943,683 | |
Alaska Communication Systems Group, Inc. (a) | 135,810 | 297,424 | |
AT&T, Inc. | 5,886,551 | 187,957,573 | |
Atlantic Tele-Network, Inc. | 16,949 | 1,110,837 | |
Cbeyond, Inc. (a) | 59,758 | 409,342 | |
CenturyLink, Inc. | 676,308 | 21,141,388 | |
Cincinnati Bell, Inc. (a)(d) | 198,209 | 664,000 | |
Cogent Communications Group, Inc. | 64,769 | 2,483,243 | |
Consolidated Communications Holdings, Inc. | 59,983 | 1,143,276 | |
Elephant Talk Communication, Inc. (a)(d) | 63,184 | 80,244 | |
FairPoint Communications, Inc. (a)(d) | 43,838 | 582,169 | |
Frontier Communications Corp. (d) | 1,084,701 | 5,293,341 | |
General Communications, Inc. | 33,964 | 353,565 | |
Hawaiian Telcom Holdco, Inc. (a)(d) | 11,736 | 337,997 | |
HickoryTech Corp. | 2,523 | 34,388 | |
IDT Corp. Class B | 44,765 | 803,532 | |
inContact, Inc. (a) | 42,838 | 386,399 | |
Inteliquent, Inc. | 28,172 | 393,281 | |
Intelsat SA | 20,815 | 412,970 | |
Iridium Communications, Inc. (a)(d) | 61,404 | 400,354 | |
Level 3 Communications, Inc. (a) | 186,783 | 6,877,350 | |
Common Stocks - continued | |||
Shares | Value | ||
TELECOMMUNICATION SERVICES - continued | |||
Diversified Telecommunication Services - continued | |||
Lumos Networks Corp. | 15,837 | $ 229,953 | |
ORBCOMM, Inc. (a)(d) | 36,232 | 282,972 | |
Premiere Global Services, Inc. (a) | 64,433 | 728,737 | |
Straight Path Communications, Inc. | 22,382 | 182,637 | |
Towerstream Corp. (a)(d) | 39,383 | 103,971 | |
TW Telecom, Inc. (a) | 182,316 | 5,580,693 | |
Verizon Communications, Inc. | 4,656,446 | 221,553,701 | |
Vonage Holdings Corp. (a) | 198,077 | 913,135 | |
Windstream Holdings, Inc. (d) | 719,900 | 5,773,598 | |
xG Technology, Inc. (a) | 1,492 | 1,925 | |
| 467,457,678 | ||
Wireless Telecommunication Services - 0.3% | |||
Boingo Wireless, Inc. (a)(d) | 15,589 | 90,572 | |
Crown Castle International Corp. | 367,969 | 27,928,847 | |
Leap Wireless International, Inc. (a) | 51,525 | 902,718 | |
NII Holdings, Inc. (a)(d) | 160,624 | 184,718 | |
NTELOS Holdings Corp. (d) | 10,948 | 153,053 | |
SBA Communications Corp. | 144,863 | 13,786,612 | |
Shenandoah Telecommunications Co. (d) | 22,919 | 605,749 | |
Sprint Corp. (a)(d) | 965,514 | 8,438,592 | |
T-Mobile U.S., Inc. (a) | 283,965 | 8,660,933 | |
Telephone & Data Systems, Inc. | 127,836 | 2,913,382 | |
U.S. Cellular Corp. (d) | 27,310 | 985,618 | |
U.S.A. Mobility, Inc. | 43,148 | 623,489 | |
| 65,274,283 | ||
TOTAL TELECOMMUNICATION SERVICES | 532,731,961 | ||
UTILITIES - 3.0% | |||
Electric Utilities - 1.6% | |||
Allete, Inc. | 47,344 | 2,391,345 | |
American Electric Power Co., Inc. | 543,716 | 27,294,543 | |
Cleco Corp. | 77,341 | 3,822,966 | |
Duke Energy Corp. | 793,610 | 56,251,077 | |
Edison International | 374,884 | 19,632,675 | |
El Paso Electric Co. | 44,691 | 1,575,358 | |
Empire District Electric Co. | 52,048 | 1,235,620 | |
Entergy Corp. | 192,366 | 12,276,798 | |
Exelon Corp. | 959,959 | 29,192,353 | |
FirstEnergy Corp. | 464,435 | 14,295,309 | |
Genie Energy Ltd. Class B (a) | 11,430 | 130,988 | |
Great Plains Energy, Inc. | 172,510 | 4,531,838 | |
Hawaiian Electric Industries, Inc. (d) | 141,071 | 3,584,614 | |
IDACORP, Inc. | 64,805 | 3,641,393 | |
ITC Holdings Corp. (d) | 64,744 | 6,642,734 | |
MGE Energy, Inc. | 45,573 | 1,758,206 | |
NextEra Energy, Inc. | 475,747 | 43,478,518 | |
Northeast Utilities | 345,580 | 15,361,031 | |
NRG Yield, Inc. Class A | 38,525 | 1,470,885 | |
| |||
Shares | Value | ||
OGE Energy Corp. | 236,316 | $ 8,507,376 | |
Otter Tail Corp. | 43,707 | 1,320,826 | |
Pepco Holdings, Inc. | 313,266 | 6,387,494 | |
Pinnacle West Capital Corp. | 111,381 | 6,198,353 | |
PNM Resources, Inc. | 88,029 | 2,301,958 | |
Portland General Electric Co. (d) | 105,772 | 3,363,550 | |
PPL Corp. | 688,750 | 22,239,738 | |
Southern Co. | 966,778 | 40,943,048 | |
UIL Holdings Corp. | 67,226 | 2,602,991 | |
Unitil Corp. | 19,695 | 619,999 | |
UNS Energy Corp. | 49,000 | 2,964,990 | |
Westar Energy, Inc. (d) | 158,635 | 5,428,490 | |
Xcel Energy, Inc. | 551,741 | 16,712,235 | |
| 368,159,299 | ||
Gas Utilities - 0.2% | |||
AGL Resources, Inc. | 144,950 | 6,818,448 | |
Atmos Energy Corp. | 111,091 | 5,121,295 | |
Chesapeake Utilities Corp. | 10,363 | 613,904 | |
Delta Natural Gas Co., Inc. | 3,078 | 63,284 | |
Gas Natural, Inc. | 8,386 | 78,493 | |
Laclede Group, Inc. | 39,614 | 1,816,302 | |
National Fuel Gas Co. (d) | 95,902 | 7,204,158 | |
New Jersey Resources Corp. | 42,760 | 1,924,628 | |
Northwest Natural Gas Co. (d) | 34,699 | 1,487,546 | |
ONE Gas, Inc. (a) | 57,154 | 1,942,093 | |
Piedmont Natural Gas Co., Inc. (d) | 100,435 | 3,396,712 | |
Questar Corp. | 223,693 | 5,312,709 | |
South Jersey Industries, Inc. | 34,725 | 1,985,576 | |
Southwest Gas Corp. | 59,138 | 3,194,635 | |
UGI Corp. | 117,609 | 5,255,946 | |
WGL Holdings, Inc. | 56,924 | 2,287,776 | |
| 48,503,505 | ||
Independent Power Producers & Energy Traders - 0.1% | |||
American DG Energy, Inc. (a) | 24,722 | 49,691 | |
Black Hills Corp. | 46,600 | 2,642,686 | |
Calpine Corp. (a) | 397,038 | 7,563,574 | |
Dynegy, Inc. (a)(d) | 119,122 | 2,786,264 | |
NRG Energy, Inc. | 349,560 | 10,161,709 | |
Ormat Technologies, Inc. | 29,840 | 828,060 | |
Pattern Energy Group, Inc. | 12,537 | 343,514 | |
The AES Corp. | 753,024 | 10,278,778 | |
| 34,654,276 | ||
Multi-Utilities - 1.0% | |||
Alliant Energy Corp. | 146,690 | 7,956,466 | |
Ameren Corp. | 265,803 | 10,741,099 | |
Avista Corp. | 75,556 | 2,236,458 | |
CenterPoint Energy, Inc. | 475,745 | 11,251,369 | |
CMS Energy Corp. | 256,908 | 7,303,894 | |
Consolidated Edison, Inc. | 319,943 | 17,932,805 | |
Dominion Resources, Inc. | 648,847 | 45,029,982 | |
DTE Energy Co. | 188,435 | 13,522,096 | |
Integrys Energy Group, Inc. | 96,715 | 5,538,868 | |
Common Stocks - continued | |||
Shares | Value | ||
UTILITIES - continued | |||
Multi-Utilities - continued | |||
MDU Resources Group, Inc. | 236,188 | $ 8,020,944 | |
NiSource, Inc. | 341,808 | 11,901,755 | |
NorthWestern Energy Corp. | 42,329 | 1,944,594 | |
PG&E Corp. | 504,980 | 22,249,419 | |
Public Service Enterprise Group, Inc. | 546,907 | 20,049,611 | |
SCANA Corp. | 162,365 | 8,037,068 | |
Sempra Energy | 251,902 | 23,797,182 | |
TECO Energy, Inc. (d) | 187,457 | 3,145,528 | |
Vectren Corp. | 101,909 | 3,920,439 | |
Wisconsin Energy Corp. | 230,273 | 10,122,801 | |
| 234,702,378 | ||
Water Utilities - 0.1% | |||
American States Water Co. | 52,884 | 1,588,107 | |
American Water Works Co., Inc. | 210,972 | 9,459,984 | |
Aqua America, Inc. | 225,525 | 5,680,975 | |
Artesian Resources Corp. Class A | 8,755 | 190,509 | |
Cadiz, Inc. (a)(d) | 5,759 | 42,962 | |
California Water Service Group | 51,749 | 1,216,619 | |
Connecticut Water Service, Inc. | 5,010 | 164,528 | |
Middlesex Water Co. | 7,054 | 142,561 | |
Pure Cycle Corp. (a) | 17,116 | 107,146 | |
SJW Corp. | 12,324 | 364,667 | |
York Water Co. | 5,248 | 105,852 | |
| 19,063,910 | ||
TOTAL UTILITIES | 705,083,368 | ||
TOTAL COMMON STOCKS (Cost $16,250,440,878) |
| ||
U.S. Treasury Obligations - 0.1% | ||||
| Principal Amount |
| ||
U.S. Treasury Bills, yield at date of purchase 0.07% to 0.09% 4/3/14 to 6/26/14 (e) | $ 15,000,000 |
| ||
Money Market Funds - 9.3% | |||
Shares | Value | ||
Fidelity Cash Central Fund, 0.10% (b) | 281,284,910 | $ 281,284,910 | |
Fidelity Securities Lending Cash Central Fund, 0.09% (b)(c) | 1,931,617,603 | 1,931,617,603 | |
TOTAL MONEY MARKET FUNDS (Cost $2,212,902,513) |
| ||
TOTAL INVESTMENT (Cost $18,478,340,064) | 25,646,628,240 |
NET OTHER ASSETS (LIABILITIES) - (8.1)% | (1,925,167,819) | ||
NET ASSETS - 100% | $ 23,721,460,421 | ||
Futures Contracts | |||||
| Expiration | Underlying | Unrealized Appreciation/ | ||
Purchased | |||||
Equity Index Contracts | |||||
946 CME E-mini S&P 500 Index Contracts (United States) | March 2014 | $ 87,864,480 | $ 3,274,319 | ||
124 CME E-mini S&P MidCap 400 Index Contracts (United States) | March 2014 | 17,040,080 | 1,121,729 | ||
314 CME S&P 500 Index Contracts (United States) | March 2014 | 145,821,600 | 7,197,628 | ||
289 ICE Russell 2000 Index Contracts (United States) | March 2014 | 34,156,910 | 2,331,815 | ||
TOTAL EQUITY INDEX CONTRACTS | $ 284,883,070 | $ 13,925,491 | |||
The face value of futures purchased as a percentage of net assets is 1.2% |
Legend |
(a) Non-income producing |
(b) Affiliated fund that is generally available only to investment companies and other accounts managed by Fidelity Investments. The rate quoted is the annualized seven-day yield of the fund at period end. A complete unaudited listing of the fund's holdings as of its most recent quarter end is available upon request. In addition, each Fidelity Central Fund's financial statements, which are not covered by the Fund's Report of Independent Registered Public Accounting Firm, are available on the SEC's website or upon request. |
(c) Investment made with cash collateral received from securities on loan. |
(d) Security or a portion of the security is on loan at period end. |
(e) Security or a portion of the security was pledged to cover margin requirements for futures contracts. At period end, the value of securities pledged amounted to $14,997,994. |
Affiliated Central Funds |
Information regarding fiscal year to date income earned by the Fund from investments in Fidelity Central Funds is as follows: |
Fund | Income earned |
Fidelity Cash Central Fund | $ 320,160 |
Fidelity Securities Lending Cash Central Fund | 6,971,619 |
Total | $ 7,291,779 |
Other Information |
The following is a summary of the inputs used, as of February 28, 2014, involving the Fund's assets and liabilities carried at fair value. The inputs or methodology used for valuing securities may not be an indication of the risk associated with investing in those securities. For more information on valuation inputs, and their aggregation into the levels used in the table below, please refer to the Investment Valuation section in the accompanying Notes to Financial Statements. |
Valuation Inputs at Reporting Date: | ||||
Description | Total | Level 1 | Level 2 | Level 3 |
Investments in Securities: | ||||
Equities: | ||||
Consumer Discretionary | $ 3,081,633,533 | $ 3,081,623,672 | $ - | $ 9,861 |
Consumer Staples | 1,930,067,396 | 1,930,067,396 | - | - |
Energy | 2,163,926,777 | 2,163,920,056 | - | 6,721 |
Financials | 3,994,753,449 | 3,994,750,004 | - | 3,445 |
Health Care | 3,116,256,118 | 3,116,256,118 | - | - |
Industrials | 2,710,890,293 | 2,710,890,293 | - | - |
Information Technology | 4,275,324,769 | 4,275,324,769 | - | - |
Materials | 908,060,069 | 908,060,069 | - | - |
Telecommunication Services | 532,731,961 | 532,731,961 | - | - |
Utilities | 705,083,368 | 705,083,368 | - | - |
U.S. Government and Government Agency Obligations | 14,997,994 | - | 14,997,994 | - |
Money Market Funds | 2,212,902,513 | 2,212,902,513 | - | - |
Total Investments in Securities: | $ 25,646,628,240 | $ 25,631,610,219 | $ 14,997,994 | $ 20,027 |
Derivative Instruments: | ||||
Assets | ||||
Futures Contracts | $ 13,925,491 | $ 13,925,491 | $ - | $ - |
Value of Derivative Instruments |
The following table is a summary of the Fund's value of derivative instruments by primary risk exposure as of February 28, 2014. For additional information on derivative instruments, please refer to the Derivative Instruments section in the accompanying Notes to Financial Statements. |
Primary Risk Exposure / | Value | |
| Asset | Liability |
Equity Risk | ||
Futures Contracts (a) | $ 13,925,491 | $ - |
Total Value of Derivatives | $ 13,925,491 | $ - |
(a) Reflects gross cumulative appreciation (depreciation) on futures contracts as presented in the Schedule of Investments. Only the period end receivable or payable for daily variation margin and net unrealized appreciation (depreciation) are presented in the Statement of Assets and Liabilities. |
See accompanying notes which are an integral part of the financial statements.
Annual Report
Spartan Total Market Index Fund
Financial Statements
Statement of Assets and Liabilities
| February 28, 2014 | |
|
|
|
Assets | ||
Investment in securities, at value (including securities loaned of $1,873,697,915) - See accompanying schedule: Unaffiliated issuers (cost $16,265,437,551) | $ 23,433,725,727 |
|
Fidelity Central Funds (cost $2,212,902,513) | 2,212,902,513 |
|
Total Investments (cost $18,478,340,064) |
| $ 25,646,628,240 |
Segregated cash with brokers for derivative instruments | 1,466,500 | |
Cash |
| 43,426 |
Receivable for investments sold | 1,586,542 | |
Receivable for fund shares sold | 20,376,252 | |
Dividends receivable | 44,826,154 | |
Distributions receivable from Fidelity Central Funds | 606,198 | |
Receivable for daily variation margin for derivative instruments | 416,694 | |
Receivable from investment adviser for expense reductions | 165,649 | |
Other receivables | 269,138 | |
Total assets | 25,716,384,793 | |
|
|
|
Liabilities | ||
Payable for investments purchased | $ 2,075,242 | |
Payable for fund shares redeemed | 59,692,620 | |
Accrued management fee | 863,747 | |
Other affiliated payables | 411,813 | |
Other payables and accrued expenses | 263,347 | |
Collateral on securities loaned, at value | 1,931,617,603 | |
Total liabilities | 1,994,924,372 | |
|
|
|
Net Assets | $ 23,721,460,421 | |
Net Assets consist of: |
| |
Paid in capital | $ 16,762,706,991 | |
Undistributed net investment income | 64,203,855 | |
Accumulated undistributed net realized gain (loss) on investments | (287,664,092) | |
Net unrealized appreciation (depreciation) on investments | 7,182,213,667 | |
Net Assets | $ 23,721,460,421 | |
Statement of Assets and Liabilities - continued
| February 28, 2014 | |
|
|
|
Investor Class: | $ 54.91 | |
|
|
|
Fidelity Advantage Class: | $ 54.91 | |
|
|
|
Institutional Class: | $ 54.91 | |
|
|
|
Fidelity Advantage Institutional Class: | $ 54.90 | |
|
|
|
Class F: | $ 54.92 | |
See accompanying notes which are an integral part of the financial statements.
Annual Report
Spartan Total Market Index Fund
Financial Statements - continued
Statement of Operations
| Year ended February 28, 2014 | |
|
|
|
Investment Income |
|
|
Dividends |
| $ 371,829,732 |
Interest |
| 13,401 |
Income from Fidelity Central Funds |
| 7,291,779 |
Total income |
| 379,134,912 |
|
|
|
Expenses | ||
Management fee | $ 8,782,815 | |
Transfer agent fees | 4,332,747 | |
Independent trustees' compensation | 91,991 | |
Miscellaneous | 35,669 | |
Total expenses before reductions | 13,243,222 | |
Expense reductions | (1,661,728) | 11,581,494 |
Net investment income (loss) | 367,553,418 | |
Realized and Unrealized Gain (Loss) Net realized gain (loss) on: | ||
Investment securities: |
|
|
Unaffiliated issuers | 32,936,630 | |
Futures contracts | 61,726,820 | |
Total net realized gain (loss) |
| 94,663,450 |
Change in net unrealized appreciation (depreciation) on: Investment securities | 4,092,286,619 | |
Futures contracts | 1,481,401 | |
Total change in net unrealized appreciation (depreciation) |
| 4,093,768,020 |
Net gain (loss) | 4,188,431,470 | |
Net increase (decrease) in net assets resulting from operations | $ 4,555,984,888 | |
Statement of Changes in Net Assets
| Year ended | Year ended |
Increase (Decrease) in Net Assets |
|
|
Operations |
|
|
Net investment income (loss) | $ 367,553,418 | $ 296,694,580 |
Net realized gain (loss) | 94,663,450 | 79,867,728 |
Change in net unrealized appreciation (depreciation) | 4,093,768,020 | 1,452,200,750 |
Net increase (decrease) in net assets resulting from operations | 4,555,984,888 | 1,828,763,058 |
Distributions to shareholders from net investment income | (333,228,634) | (264,325,861) |
Share transactions - net increase (decrease) | 3,674,586,365 | 1,964,414,886 |
Redemption fees | 409,245 | 275,392 |
Total increase (decrease) in net assets | 7,897,751,864 | 3,529,127,475 |
|
|
|
Net Assets | ||
Beginning of period | 15,823,708,557 | 12,294,581,082 |
End of period (including undistributed net investment income of $64,203,855 and undistributed net investment income of $46,240,356, respectively) | $ 23,721,460,421 | $ 15,823,708,557 |
See accompanying notes which are an integral part of the financial statements.
Annual Report
Financial Highlights - Investor Class
Years ended February 28, | 2014 | 2013 | 2012 F | 2011 | 2010 |
Selected Per-Share Data |
|
|
|
|
|
Net asset value, beginning of period | $ 44.05 | $ 39.55 | $ 38.56 | $ 31.54 | $ 20.60 |
Income from Investment Operations |
|
|
|
|
|
Net investment income (loss) B | .92 | .87 | .68 | .61 | .56 |
Net realized and unrealized gain (loss) | 10.74 | 4.40 | .96 | 7.03 | 10.96 |
Total from investment operations | 11.66 | 5.27 | 1.64 | 7.64 | 11.52 |
Distributions from net investment income | (.80) | (.77) | (.65) | (.60) | (.57) |
Distributions from net realized gain | - | - | - | (.02 | (.02) |
Total distributions | (.80) | (.77) | (.65) | (.62) | (.58) H |
Redemption fees added to paid in capital B, G | - | - | - | - | - |
Net asset value, end of period | $ 54.91 | $ 44.05 | $ 39.55 | $ 38.56 | $ 31.54 |
Total Return A | 26.62% | 13.50% | 4.46% | 24.39% | 56.10% |
Ratios to Average Net Assets C, E |
|
|
|
|
|
Expenses before reductions | .10% | .10% | .10% | .10% | .10% |
Expenses net of fee waivers, if any | .10% | .10% | .10% | .10% | .10% |
Expenses net of all reductions | .10% | .10% | .10% | .10% | .10% |
Net investment income (loss) | 1.85% | 2.15% | 1.84% | 1.80% | 2.00% |
Supplemental Data |
|
|
|
|
|
Net assets, end of period (000 omitted) | $ 1,694,212 | $ 1,305,435 | $ 3,379,770 | $ 6,289,666 | $ 5,357,908 |
Portfolio turnover rate D | 2% | 3% | 17% | 4% | 7% |
ATotal returns would have been lower if certain expenses had not been reduced during the applicable periods shown. BCalculated based on average shares outstanding during the period. CFees and expenses of any underlying Fidelity Central Funds are not included in the Fund's expense ratio. The Fund indirectly bears its proportionate share of the expenses of any underlying Fidelity Central Funds. DAmount does not include the portfolio activity of any underlying Fidelity Central Funds. EExpense ratios reflect operating expenses of the class. Expenses before reductions do not reflect amounts reimbursed by the investment adviser or reductions from expense offset arrangements and do not represent the amount paid by the class during periods when reimbursements or reductions occur. Expenses net of fee waivers reflect expenses after reimbursement by the investment adviser but prior to reductions from expense offset arrangements. Expenses net of all reductions represent the net expenses paid by the class. FFor the year ended February 29. GAmount represents less than $.01 per share. HTotal distributions of $.58 per share is comprised of distributions from net investment income of $.565 and distributions from net realized gain of $.015 per share. |
Financial Highlights - Fidelity Advantage Class
Years ended February 28, | 2014 | 2013 | 2012 F | 2011 | 2010 |
Selected Per-Share Data |
|
|
|
|
|
Net asset value, beginning of period | $ 44.06 | $ 39.56 | $ 38.56 | $ 31.54 | $ 20.61 |
Income from Investment Operations |
|
|
|
|
|
Net investment income (loss) B | .94 | .89 | .69 | .62 | .57 |
Net realized and unrealized gain (loss) | 10.73 | 4.39 | .97 | 7.03 | 10.95 |
Total from investment operations | 11.67 | 5.28 | 1.66 | 7.65 | 11.52 |
Distributions from net investment income | (.82) | (.78) | (.66) | (.61) | (.57) |
Distributions from net realized gain | - | - | - | (.02) | (.02) |
Total distributions | (.82) | (.78) | (.66) | (.63) | (.59) H |
Redemption fees added to paid in capital B, G | - | - | - | - | - |
Net asset value, end of period | $ 54.91 | $ 44.06 | $ 39.56 | $ 38.56 | $ 31.54 |
Total Return A | 26.65% | 13.53% | 4.51% | 24.43% | 56.07% |
Ratios to Average Net Assets C, E |
|
|
|
|
|
Expenses before reductions | .07% | .07% | .07% | .07% | .07% |
Expenses net of fee waivers, if any | .06% | .07% | .07% | .07% | .07% |
Expenses net of all reductions | .06% | .07% | .07% | .07% | .07% |
Net investment income (loss) | 1.89% | 2.18% | 1.87% | 1.83% | 2.03% |
Supplemental Data |
|
|
|
|
|
Net assets, end of period (000 omitted) | $ 14,943,835 | $ 10,262,592 | $ 6,536,903 | $ 5,078,759 | $ 3,752,204 |
Portfolio turnover rate D | 2% | 3% | 17% | 4% | 7% |
ATotal returns would have been lower if certain expenses had not been reduced during the applicable periods shown. BCalculated based on average shares outstanding during the period. CFees and expenses of any underlying Fidelity Central Funds are not included in the Fund's expense ratio. The Fund indirectly bears its proportionate share of the expenses of any underlying Fidelity Central Funds. DAmount does not include the portfolio activity of any underlying Fidelity Central Funds. EExpense ratios reflect operating expenses of the class. Expenses before reductions do not reflect amounts reimbursed by the investment adviser or reductions from expense offset arrangements and do not represent the amount paid by the class during periods when reimbursements or reductions occur. Expenses net of fee waivers reflect expenses after reimbursement by the investment adviser but prior to reductions from expense offset arrangements. Expenses net of all reductions represent the net expenses paid by the class. FFor the year ended February 29. GAmount represents less than $.01 per share. HTotal distributions of $.59 per share is comprised of distributions from net investment income of $.574 and distributions from net realized gain of $.015 per share. |
See accompanying notes which are an integral part of the financial statements.
Annual Report
Financial Highlights - Institutional Class
Years ended February 28, | 2014 | 2013 | 2012 G, I |
Selected Per-Share Data |
|
|
|
Net asset value, beginning of period | $ 44.05 | $ 39.55 | $ 34.49 |
Income from Investment Operations |
|
|
|
Net investment income (loss) D | .94 | .89 | .36 |
Net realized and unrealized gain (loss) | 10.75 | 4.40 | 5.26 |
Total from investment operations | 11.69 | 5.29 | 5.62 |
Distributions from net investment income | (.83) | (.79) | (.56) |
Redemption fees added to paid in capital D, J | - | - | - |
Net asset value, end of period | $ 54.91 | $ 44.05 | $ 39.55 |
Total Return B, C | 26.69% | 13.55% | 16.49% |
Ratios to Average Net Assets E, H |
|
|
|
Expenses before reductions | .07% | .07% | .07% A |
Expenses net of fee waivers, if any | .05% | .06% | .06% A |
Expenses net of all reductions | .05% | .06% | .06% A |
Net investment income (loss) | 1.90% | 2.19% | 2.03% A |
Supplemental Data |
|
|
|
Net assets, end of period (000 omitted) | $ 1,254,047 | $ 876,155 | $ 693,534 |
Portfolio turnover rate F | 2% | 3% | 17% K |
AAnnualized BTotal returns for periods of less than one year are not annualized. CTotal returns would have been lower if certain expenses had not been reduced during the applicable periods shown. DCalculated based on average shares outstanding during the period. EFees and expenses of any underlying Fidelity Central Funds are not included in the Fund's expense ratio. The Fund indirectly bears its proportionate share of the expenses of any underlying Fidelity Central Funds. FAmount does not include the portfolio activity of any underlying Fidelity Central Funds. GFor the period September 8, 2011 (commencement of sale of shares) to February 29, 2012. HExpense ratios reflect operating expenses of the class. Expenses before reductions do not reflect amounts reimbursed by the investment adviser or reductions from expense offset arrangements and do not represent the amount paid by the class during periods when reimbursements or reductions occur. Expense ratios before reductions for start-up periods may not be representative of longer-term operating periods. Expenses net of fee waivers reflect expenses after reimbursement by the investment adviser but prior to reductions from expense offset arrangements. Expenses net of all reductions represent the net expenses paid by the class. IFor the year ended February 29. JAmount represents less than $.01 per share. KAmount not annualized. |
Financial Highlights - Fidelity Advantage Institutional Class
Years ended February 28, | 2014 | 2013 | 2012 G, I |
Selected Per-Share Data |
|
|
|
Net asset value, beginning of period | $ 44.05 | $ 39.55 | $ 34.49 |
Income from Investment Operations |
|
|
|
Net investment income (loss) D | .95 | .90 | .36 |
Net realized and unrealized gain (loss) | 10.73 | 4.39 | 5.26 |
Total from investment operations | 11.68 | 5.29 | 5.62 |
Distributions from net investment income | (.83) | (.79) | (.56) |
Redemption fees added to paid in capital D, J | - | - | - |
Net asset value, end of period | $ 54.90 | $ 44.05 | $ 39.55 |
Total Return B, C | 26.67% | 13.57% | 16.50% |
Ratios to Average Net Assets E, H |
|
|
|
Expenses before reductions | .06% | .06% | .06% A |
Expenses net of fee waivers, if any | .05% L | .05% L | .05% A, L |
Expenses net of all reductions | .05% L | .05% L | .05% A, L |
Net investment income (loss) | 1.90% | 2.20% | 2.02% A |
Supplemental Data |
|
|
|
Net assets, end of period (000 omitted) | $ 740,877 | $ 546,329 | $ 189,758 |
Portfolio turnover rate F | 2% | 3% | 17% K |
AAnnualized BTotal returns for periods of less than one year are not annualized. CTotal returns would have been lower if certain expenses had not been reduced during the applicable periods shown. DCalculated based on average shares outstanding during the period. EFees and expenses of any underlying Fidelity Central Funds are not included in the Fund's expense ratio. The Fund indirectly bears its proportionate share of the expenses of any underlying Fidelity Central Funds. FAmount does not include the portfolio activity of any underlying Fidelity Central Funds. GFor the period September 8, 2011 (commencement of sale of shares) to February 29, 2012. HExpense ratios reflect operating expenses of the class. Expenses before reductions do not reflect amounts reimbursed by the investment adviser or reductions from expense offset arrangements and do not represent the amount paid by the class during periods when reimbursements or reductions occur. Expense ratios before reductions for start-up periods may not be representative of longer-term operating periods. Expenses net of fee waivers reflect expenses after reimbursement by the investment adviser but prior to reductions from expense offset arrangements. Expenses net of all reductions represent the net expenses paid by the class. IFor the year ended February 29. JAmount represents less than $.01 per share. KAmount not annualized. LAmount represents .045%. |
See accompanying notes which are an integral part of the financial statements.
Annual Report
Financial Highlights - Class F
Years ended February 28, | 2014 | 2013 | 2012 I | 2011 | 2010 G |
Selected Per-Share Data |
|
|
|
|
|
Net asset value, beginning of period | $ 44.06 | $ 39.56 | $ 38.56 | $ 31.54 | $ 30.10 |
Income from Investment Operations |
|
|
|
|
|
Net investment income (loss) D | .95 | .90 | .69 | .63 | .26 |
Net realized and unrealized gain (loss) | 10.74 | 4.39 | .97 | 7.02 | 1.67 |
Total from investment operations | 11.69 | 5.29 | 1.66 | 7.65 | 1.93 |
Distributions from net investment income | (.83) | (.79) | (.66) | (.61) | (.47) |
Distributions from net realized gain | - | - | - | (.02) | (.02) |
Total distributions | (.83) | (.79) | (.66) | (.63) | (.49) K |
Redemption fees added to paid in capital D, J | - | - | - | - | - |
Net asset value, end of period | $ 54.92 | $ 44.06 | $ 39.56 | $ 38.56 | $ 31.54 |
Total Return B, C | 26.69% | 13.55% | 4.51% | 24.43% | 6.42% |
Ratios to Average Net Assets E, H |
|
|
|
|
|
Expenses before reductions | .05% L | .05% L | .06% | .07% | .07% A |
Expenses net of fee waivers, if any | .05% L | .05% L | .06% | .07% | .07% A |
Expenses net of all reductions | .05% L | .05% L | .06% | .07% | .07% A |
Net investment income (loss) | 1.90% | 2.20% | 1.89% | 1.83% | 1.98% |
Supplemental Data |
|
|
|
|
|
Net assets, end of period (000 omitted) | $ 5,088,489 | $ 2,833,198 | $ 1,494,616 | $ 745,283 | $ 70,077 |
Portfolio turnover rate F | 2% | 3% | 17% | 4% | 7% |
AAnnualized BTotal returns for periods of less than one year are not annualized. CTotal returns would have been lower if certain expenses had not been reduced during the applicable periods shown. DCalculated based on average shares outstanding during the period. EFees and expenses of any underlying Fidelity Central Funds are not included in the Fund's expense ratio. The Fund indirectly bears its proportionate share of the expenses of any underlying Fidelity Central Funds. FAmount does not include the portfolio activity of any underlying Fidelity Central Funds. GFor the period September 24, 2009 (commencement of sale of shares) to February 28, 2010. HExpense ratios reflect operating expenses of the class. Expenses before reductions do not reflect amounts reimbursed by the investment adviser or reductions from expense offset arrangements and do not represent the amount paid by the class during periods when reimbursements or reductions occur. Expense ratios before reductions for start-up periods may not be representative of longer-term operating periods. Expenses net of fee waivers reflect expenses after reimbursement by the investment adviser but prior to reductions from expense offset arrangements. Expenses net of all reductions represent the net expenses paid by the class. IFor the year ended February 29. JAmount represents less than $.01 per share. KTotal distributions of $.49 per share is comprised of distributions from net investment income of $.472 and distributions from net realized gain of $.015 per share. LAmount represents .046%. |
See accompanying notes which are an integral part of the financial statements.
Annual Report
Notes to Financial Statements
For the period ended February 28, 2014
1. Organization.
Spartan Total Market Index Fund (the Fund) is a fund of Fidelity Concord Street Trust (the Trust) and is authorized to issue an unlimited number of shares. The Trust is registered under the Investment Company Act of 1940, as amended (the 1940 Act), as an open-end management investment company organized as a Massachusetts business trust. The Fund offers Investor Class, Fidelity Advantage Class, Institutional Class, Fidelity Advantage Institutional Class and Class F shares, each of which has equal rights as to assets and voting privileges. Each class has exclusive voting rights with respect to matters that affect that class. The Fund offers conversion privileges between share classes to eligible shareholders. Class F shares of the Fund are only available for purchase by mutual funds for which Fidelity Management & Research Company (FMR) or an affiliate serves as investment manager.
2. Investments in Fidelity Central Funds.
The Fund invests in Fidelity Central Funds, which are open-end investment companies generally available only to other investment companies and accounts managed by the investment adviser and its affiliates. The Fund's Schedule of Investments lists each of the Fidelity Central Funds held as of period end, if any, as an investment of the Fund, but does not include the underlying holdings of each Fidelity Central Fund. As an Investing Fund, the Fund indirectly bears its proportionate share of the expenses of the underlying Fidelity Central Funds.
The Money Market Central Funds seek preservation of capital and current income and are managed by Fidelity Investments Money Management, Inc. (FIMM), an affiliate of the investment adviser. Annualized expenses of the Money Market Central Funds as of their most recent shareholder report date are less than .01%.
A complete unaudited list of holdings for each Fidelity Central Fund is available upon request or at the Securities and Exchange Commission (the SEC) website at www.sec.gov. In addition, the financial statements of the Fidelity Central Funds, which are not covered by the Fund's Report of Independent Registered Public Accounting Firm, are available on the SEC website or upon request.
3. Significant Accounting Policies.
The financial statements have been prepared in conformity with accounting principles generally accepted in the United States of America (GAAP), which require management to make certain estimates and assumptions at the date of the financial statements. Actual results could differ from those estimates. Subsequent events, if any, through the date that the financial statements were issued have been evaluated in the preparation of the financial statements. The following summarizes the significant accounting policies of the Fund:
Investment Valuation. Investments are valued as of 4:00 p.m. Eastern time on the last calendar day of the period. In accordance with valuation policies and procedures approved by the Board of Trustees (the Board), the Fund attempts to obtain prices from one or more third party pricing vendors or brokers to value its investments. When current market prices, quotations or currency exchange rates are not readily available or reliable, investments will be fair valued in good faith by the FMR Fair Value Committee (the Committee), in accordance with procedures adopted by the Board. Factors used in determining fair value vary by investment type and may include market or investment specific events, changes in interest rates and credit quality. The frequency with which these procedures are used cannot be predicted and they may be utilized to a significant extent. The Committee oversees the Fund's valuation policies and procedures and is responsible for approving and reporting to the Board all fair value determinations.
The Fund categorizes the inputs to valuation techniques used to value its investments into a disclosure hierarchy consisting of three levels as shown below:
Level 1 - quoted prices in active markets for identical investments
Level 2 - other significant observable inputs (including quoted prices for similar investments, interest rates, prepayment speeds, etc.)
Level 3 - unobservable inputs (including the Fund's own assumptions based on the best information available)
Valuation techniques used to value the Fund's investments by major category are as follows:
Equity securities, including restricted securities, for which market quotations are readily available, are valued at the last reported sale price or official closing price as reported by a third party pricing vendor on the primary market or exchange on which they are traded and are categorized as Level 1 in the hierarchy. In the event there were no sales during the day or closing prices are not available, securities are valued at the last quoted bid price or may be valued using the last available price and are generally categorized as Level 2 in the hierarchy. For foreign equity securities, when market or security specific events arise, comparisons to the valuation of American Depositary Receipts (ADRs), futures contracts, Exchange-Traded Funds (ETFs) and certain indexes as well as quoted prices for similar securities may be used and would be categorized as Level 2 in the hierarchy. Utilizing these techniques may result in transfers between Level 1 and Level 2. For equity securities, including restricted securities, where observable inputs are limited, assumptions about market activity and risk are used and these securities may be categorized as Level 3 in the hierarchy.
Annual Report
3. Significant Accounting Policies - continued
Investment Valuation - continued
Debt securities, including restricted securities, are valued based on evaluated prices received from third party pricing vendors or from brokers who make markets in such securities. U.S. government and government agency obligations are valued by pricing vendors who utilize matrix pricing which considers yield or price of bonds of comparable quality, coupon, maturity and type or by broker-supplied prices. When independent prices are unavailable or unreliable, debt securities may be valued utilizing pricing methodologies which consider similar factors that would be used by third party pricing vendors. Debt securities are generally categorized as Level 2 in the hierarchy but may be Level 3 depending on the circumstances.
Futures contracts are valued at the settlement price established each day by the board of trade or exchange on which they are traded and are categorized as Level 1 in the hierarchy. Investments in open-end mutual funds, including the Fidelity Central Funds, are valued at their closing net asset value (NAV) each business day and are categorized as Level 1 in the hierarchy.
Changes in valuation techniques may result in transfers in or out of an assigned level within the disclosure hierarchy. The aggregate value of investments by input level, as of February 28, 2014, is included at the end of the Fund's Schedule of Investments.
Investment Transactions and Income. For financial reporting purposes, the Fund's investment holdings and NAV include trades executed through the end of the last business day of the period. The NAV per share for processing shareholder transactions is calculated as of the close of business of the New York Stock Exchange (NYSE), normally 4:00 p.m. Eastern time and includes trades executed through the end of the prior business day. Gains and losses on securities sold are determined on the basis of identified cost and may include proceeds received from litigation. Dividend income is recorded on the ex-dividend date, except for certain dividends from foreign securities where the ex-dividend date may have passed, which are recorded as soon as the Fund is informed of the ex-dividend date. Non-cash dividends included in dividend income, if any, are recorded at the fair market value of the securities received. Distributions received on securities that represent a return of capital or capital gain are recorded as a reduction of cost of investments and/or as a realized gain. Subsequent to ex-dividend date the Fund determines the components of these distributions, based upon receipt of tax filings or other correspondence relating to the underlying investment. Interest income and distributions from the Fidelity Central Funds are accrued as earned. Interest income includes coupon interest and amortization of premium and accretion of discount on debt securities.
Class Allocations and Expenses. Investment income, realized and unrealized capital gains and losses, common expenses of the Fund, and certain fund-level expense reductions, if any, are allocated daily on a pro-rata basis to each class based on the relative net assets of each class to the total net assets of the Fund. Each class differs with respect to transfer agent fees incurred. Certain expense reductions may also differ by class. For the reporting period, the allocated portion of income and expenses to each class as a percent of its average net assets may vary due to the timing of recording these transactions in relation to fluctuating net assets of the classes. Expenses directly attributable to a fund are charged to that fund. Expenses attributable to more than one fund are allocated among the respective funds on the basis of relative net assets or other appropriate methods. Expense estimates are accrued in the period to which they relate and adjustments are made when actual amounts are known.
Deferred Trustee Compensation. Under a Deferred Compensation Plan (the Plan), independent Trustees may elect to defer receipt of a portion of their annual compensation. Deferred amounts are invested in a cross-section of Fidelity funds, are marked-to-market and remain in the Fund until distributed in accordance with the Plan. The investment of deferred amounts and the offsetting payable to the Trustees are included in the accompanying Statement of Assets and Liabilities.
Income Tax Information and Distributions to Shareholders. Each year, the Fund intends to qualify as a regulated investment company under Subchapter M of the Internal Revenue Code, including distributing substantially all of its taxable income and realized gains. As a result, no provision for U.S. Federal income taxes is required. As of February 28, 2014, the Fund did not have any unrecognized tax benefits in the financial statements; nor is the Fund aware of any tax positions for which it is reasonably possible that the total amounts of unrecognized tax benefits will significantly change in the next twelve months. The Fund files a U.S. federal tax return, in addition to state and local tax returns as required. The Fund's federal income tax returns are subject to examination by the Internal Revenue Service (IRS) for a period of three fiscal years after they are filed. State and local tax returns may be subject to examination for an additional fiscal year depending on the jurisdiction.
Distributions are declared and recorded on the ex-dividend date. Income dividends and capital gain distributions are declared separately for each class. Income and capital gain distributions are determined in accordance with income tax regulations, which may differ from GAAP. In addition, the Fund claimed a portion of the payment made to redeeming shareholders as a distribution for income tax purposes.
Capital accounts within the financial statements are adjusted for permanent book-tax differences. These adjustments have no impact on net assets or the results of operations. Capital accounts are not adjusted for temporary book-tax differences which will reverse in a subsequent period.
Book-tax differences are primarily due to futures contracts, passive foreign investment companies (PFIC), market discount, partnerships, deferred trustees compensation, capital loss carryforwards and losses deferred due to wash sales.
Annual Report
Notes to Financial Statements - continued
3. Significant Accounting Policies - continued
Income Tax Information and Distributions to Shareholders - continued
The federal tax cost of investment securities and unrealized appreciation (depreciation) as of period end were as follows:
Gross unrealized appreciation | $ 8,072,503,089 |
Gross unrealized depreciation | (970,747,070) |
Net unrealized appreciation (depreciation) on securities and other investments | $ 7,101,756,019 |
|
|
Tax Cost | $ 18,544,872,221 |
The tax-based components of distributable earnings as of period end were as follows:
Undistributed ordinary income | $ 64,467,196 |
Capital loss carryforward | $ (207,206,435) |
Net unrealized appreciation (depreciation) | $ 7,101,756,019 |
Capital loss carryforwards are only available to offset future capital gains of the Fund to the extent provided by regulations and may be limited. Under the Regulated Investment Company Modernization Act of 2010 (the Act), the Fund is permitted to carry forward capital losses incurred in taxable years beginning after December 22, 2010 for an unlimited period and such capital losses are required to be used prior to any losses that expire. The capital loss carryforward information presented below, including any applicable limitation, is estimated as of fiscal period end and is subject to adjustment.
Fiscal year of expiration |
|
2018 | $ (6,920,192) |
2019 | (200,286,243) |
Total with expiration | $ (207,206,435) |
The tax character of distributions paid was as follows:
| February 28, 2014 | February 28, 2013 |
Ordinary Income | $ 333,228,634 | $ 264,325,861 |
Short-Term Trading (Redemption) Fees. Shares held by investors in the Fund less than 90 days may have been subject to a redemption fee equal to .50% of the NAV of shares redeemed. All redemption fees, which reduce the proceeds of the shareholder redemption, are retained by the Fund and accounted for as an addition to paid in capital.
4. Derivative Instruments.
Risk Exposures and the Use of Derivative Instruments. The Fund's investment objective allows the Fund to enter into various types of derivative contracts, including futures contracts. Derivatives are investments whose value is primarily derived from underlying assets, indices or reference rates and may be transacted on an exchange or over-the-counter (OTC). Derivatives may involve a future commitment to buy or sell a specified asset based on specified terms, to exchange future cash flows at periodic intervals based on a notional principal amount, or for one party to make one or more payments upon the occurrence of specified events in exchange for periodic payments from the other party.
The Fund used derivatives to increase returns and to manage exposure to certain risks as defined below. The success of any strategy involving derivatives depends on analysis of numerous economic factors, and if the strategies for investment do not work as intended, the Fund may not achieve its objectives.
The Fund's use of derivatives increased or decreased its exposure to the following risk:
Equity Risk | Equity risk relates to the fluctuations in the value of financial instruments as a result of changes in market prices (other than those arising from interest rate risk or foreign exchange risk), whether caused by factors specific to an individual investment, its issuer, or all factors affecting all instruments traded in a market or market segment.
|
Annual Report
4. Derivative Instruments - continued
Risk Exposures and the Use of Derivative Instruments - continued
The Fund is also exposed to additional risks from investing in derivatives, such as liquidity risk and counterparty credit risk. Liquidity risk is the risk that the Fund will be unable to close out the derivative in the open market in a timely manner. Counterparty credit risk is the risk that the counterparty will not be able to fulfill its obligation to the Fund. Counterparty credit risk related to exchange-traded futures contracts may be mitigated by the protection provided by the exchange on which they trade.
Investing in derivatives may involve greater risks than investing in the underlying assets directly and, to varying degrees, may involve risk of loss in excess of any initial investment and collateral received and amounts recognized in the Statement of Assets and Liabilities. In addition, there may be the risk that the change in value of the derivative contract does not correspond to the change in value of the underlying instrument.
Futures Contracts. A futures contract is an agreement between two parties to buy or sell a specified underlying instrument for a fixed price at a specified future date. The Fund used futures contracts to manage its exposure to the stock market.
Upon entering into a futures contract, a fund is required to deposit either cash or securities (initial margin) with a clearing broker in an amount equal to a certain percentage of the face value of the contract. Futures contracts are marked-to-market daily and subsequent daily payments (variation margin) are made or received by a fund depending on the daily fluctuations in the value of the futures contracts and are recorded as unrealized appreciation or (depreciation). This receivable and/or payable, if any, is included in daily variation margin for derivative instruments in the Statement of Assets and Liabilities. Realized gain or (loss) is recorded upon the expiration or closing of a futures contract.
Any open futures contracts at period end are presented in the Schedule of Investments under the caption "Futures Contracts." The underlying face amount at value reflects each contract's exposure to the underlying instrument or index at period end and is representative of volume of activity during the period. Securities deposited to meet initial margin requirements are identified in the Schedule of Investments. Cash deposited to meet initial margin requirements is presented as segregated cash with brokers for derivative instruments in the Statement of Assets and Liabilities.
During the period the Fund recognized net realized gain (loss) of $61,726,820 and a change in net unrealized appreciation (depreciation) of $1,481,401 related to its investment in futures contracts. These amounts are included in the Statement of Operations.
5. Purchases and Sales of Investments.
Purchases and sales of securities, other than short-term securities, aggregated $4,118,323,342 and $426,916,601, respectively.
6. Fees and Other Transactions with Affiliates.
Management Fee and Expense Contract. Fidelity Management & Research Company (FMR) (the investment adviser) and its affiliates provide the Fund with investment management related services for which the Fund pays a monthly management fee. The management fee is based on an annual rate of .045% of the Fund's average net assets. Under the management contract, the investment adviser pays all other fund-level expenses, except the compensation of the independent Trustees and certain other expenses such as interest expense, including commitment fees.
In addition, under an expense contract, the investment adviser pays class-level expenses as necessary so that the total expenses do not exceed certain amounts of each class' average net assets on an annual basis with certain exceptions, as noted in the following table:
Investor Class | .10% |
Fidelity Advantage Class | .07% |
Institutional Class | .07% |
Fidelity Advantage Institutional Class | .06% |
Sub-Adviser. Geode Capital Management, LLC (Geode), serves as sub-adviser for the Funds. Geode provides discretionary investment advisory services to the Funds and is paid by the investment adviser for providing these services.
Transfer Agent Fees. Fidelity Investments Institutional Operations Company, Inc. (FIIOC), an affiliate of the investment adviser, is the transfer, dividend disbursing and shareholder servicing agent for each class. FIIOC receives transfer agent fees at an annual rate of .075%, .045%, .035% and ..015% of average net assets for Investor Class, Fidelity Advantage Class, Institutional Class and Fidelity Advantage Institutional Class, respectively. FIIOC receives no fees for providing transfer agency services to Class F. FIIOC pays for typesetting, printing and mailing of shareholder reports, except proxy statements.
Annual Report
Notes to Financial Statements - continued
6. Fees and Other Transactions with Affiliates - continued
Transfer Agent Fees - continued
Under the expense contract, Investor Class, Fidelity Advantage Class, Institutional Class and Fidelity Advantage Institutional Class pay all or a portion of the transfer agent fees at an annual rate of .055%, .025%, .025% and .015% of average net assets, respectively.
For the period, the total transfer agent fees paid by each applicable class were as follows:
| Amount |
Investor Class | $ 825,264 |
Fidelity Advantage Class | 3,145,998 |
Institutional Class | 258,718 |
Fidelity Advantage Institutional Class | 102,767 |
| $ 4,332,747 |
7. Committed Line of Credit.
The Fund participates with other funds managed by the investment adviser or an affiliate in a $4.25 billion credit facility (the "line of credit") to be utilized for temporary or emergency purposes to fund shareholder redemptions or for other short-term liquidity purposes. The Fund has agreed to pay commitment fees on its pro-rata portion of the line of credit, which amounted to $35,669 and is reflected in Miscellaneous expenses on the Statement of Operations. During the period, there were no borrowings on this line of credit.
8. Security Lending.
The Fund lends portfolio securities through a lending agent from time to time in order to earn additional income. On the settlement date of the loan, the Fund receives collateral (in the form of U.S. Treasury obligations, letters of credit and/or cash) against the loaned securities and maintains collateral in an amount not less than 100% of the market value of the loaned securities during the period of the loan. The market value of the loaned securities is determined at the close of business of the Fund and any additional required collateral is delivered to the Fund on the next business day. If the borrower defaults on its obligation to return the securities loaned because of insolvency or other reasons, the Fund may apply collateral received from the borrower against the obligation. The Fund may experience delays and costs in recovering the securities loaned. Any cash collateral received is invested in the Fidelity Securities Lending Cash Central Fund. The value of loaned securities and cash collateral at period end are disclosed on the Fund's Statement of Assets and Liabilities. Security lending income represents the income earned on investing cash collateral, less rebates paid to borrowers and any lending agent fees associated with the loan, plus any premium payments received for lending certain types of securities. Security lending income is presented in the Statement of Operations as a component of income from Fidelity Central Funds. Total security lending income during the period amounted to $6,971,619.
9. Expense Reductions.
The investment adviser contractually agreed to reimburse certain classes of the Fund to the extent annual operating expenses exceeded certain levels of average net assets as noted in the table below. This reimbursement will remain in place through April 30, 2015. Some expenses, for example interest expense, including commitment fees, are excluded from this reimbursement.
| Expense | Reimbursement |
Fidelity Advantage Class | .06% | $ 1,333,201 |
Institutional Class | .05% | 213,091 |
Fidelity Advantage Institutional Class | .045% | 106,042 |
In addition, the investment adviser reimbursed a portion of the Fund's operating expenses during the period in the amount of $8,773.
Through arrangements with the Fund's custodian, credits realized as a result of uninvested cash balances were used to reduce the Fund's expenses. During the period, these credits reduced the Fund's management fee by $621.
Annual Report
10. Distributions to Shareholders.
Distributions to shareholders of each class were as follows:
Years ended February 28, | 2014 | 2013 |
From net investment income |
|
|
Investor Class | $ 24,178,210 | $ 58,496,193 |
Fidelity Advantage Class | 212,433,599 | 134,301,377 |
Institutional Class | 16,995,240 | 15,312,994 |
Fidelity Advantage Institutional Class | 11,661,673 | 9,729,037 |
Class F | 67,959,912 | 46,486,260 |
Total | $ 333,228,634 | $ 264,325,861 |
11. Share Transactions.
Transactions for each class of shares were as follows:
| Shares | Dollars | ||
Years ended February 28, | 2014 | 2013 | 2014 | 2013 |
Investor Class |
|
|
|
|
Shares sold | 13,726,971 | 18,000,373 | $ 685,400,376 | $ 734,600,452 |
Reinvestment of distributions | 466,133 | 1,376,779 | 23,728,673 | 55,808,530 |
Shares redeemed | (12,971,415) | (75,188,401) | (649,468,987) | (3,168,012,059) |
Net increase (decrease) | 1,221,689 | (55,811,249) | $ 59,660,062 | $ (2,377,603,077) |
Fidelity Advantage Class |
|
|
|
|
Shares sold | 72,166,611 | 97,957,582 | $ 3,601,364,439 | $ 4,121,057,430 |
Reinvestment of distributions | 3,745,162 | 2,934,640 | 190,913,094 | 119,002,705 |
Shares redeemed | (36,714,608) | (33,199,050) | (1,840,823,512) | (1,350,946,307) |
Net increase (decrease) | 39,197,165 | 67,693,172 | $ 1,951,454,021 | $ 2,889,113,828 |
Institutional Class |
|
|
|
|
Shares sold | 7,454,458 | 8,433,106 | $ 381,027,979 | $ 338,510,978 |
Reinvestment of distributions | 333,909 | 377,853 | 16,995,240 | 15,312,994 |
Shares redeemed | (4,837,839) | (6,455,224) | (242,799,293) | (253,857,664) |
Net increase (decrease) | 2,950,528 | 2,355,735 | $ 155,223,926 | $ 99,966,308 |
Fidelity Advantage Institutional Class |
|
|
|
|
Shares sold | 4,684,496 | 10,372,973 | $ 230,291,144 | $ 406,066,075 |
Reinvestment of distributions | 228,738 | 239,832 | 11,661,673 | 9,729,037 |
Shares redeemed | (3,821,617) | (3,007,383) | (196,468,546) | (124,740,192) |
Net increase (decrease) | 1,091,617 | 7,605,422 | $ 45,484,271 | $ 291,054,920 |
Class F |
|
|
|
|
Shares sold | 37,948,097 | 31,085,123 | $ 1,934,234,147 | $ 1,254,633,446 |
Reinvestment of distributions | 1,330,096 | 1,145,187 | 67,959,912 | 46,486,260 |
Shares redeemed | (10,922,888) | (5,709,687) | (539,429,974) | (239,236,799) |
Net increase (decrease) | 28,355,305 | 26,520,623 | $ 1,462,764,085 | $ 1,061,882,907 |
12. Other.
The Fund's organizational documents provide former and current trustees and officers with a limited indemnification against liabilities arising in connection with the performance of their duties to the Fund. In the normal course of business, the Fund may also enter into contracts that provide general indemnifications. The Fund's maximum exposure under these arrangements is unknown as this would be dependent on future claims that may be made against the Fund. The risk of material loss from such claims is considered remote.
Mutual funds managed by the investment adviser or its affiliates were the owners of record, in the aggregate, of approximately 21% of the total outstanding shares of the Fund.
Annual Report
Shareholder Expense Example
As a shareholder of a Fund, you incur two types of costs: (1) transaction costs, including redemption fees and (2) ongoing costs, including management fees and other Fund expenses. This Example is intended to help you understand your ongoing costs (in dollars) of investing in the Funds and to compare these costs with the ongoing costs of investing in other mutual funds.
The Example is based on an investment of $1,000 invested at the beginning of the period and held for the entire period (September 1, 2013 to February 28, 2014).
Actual Expenses
The first line of the accompanying table for each class of each fund provides information about actual account values and actual expenses. You may use the information in this line, together with the amount you invested, to estimate the expenses that you paid over the period. Simply divide your account value by $1,000.00 (for example, an $8,600 account value divided by $1,000.00 = 8.6), then multiply the result by the number in the first line for a class of the fund under the heading entitled "Expenses Paid During Period" to estimate the expenses you paid on your account during this period. A small balance maintenance fee of $12.00 that is charged once a year may apply for certain accounts with a value of less than $2,000. This fee is not included in the table below. If it was, the estimate of expenses you paid during the period would be higher, and your ending account value lower, by this amount. In addition, each Fund, as a shareholder in the underlying Fidelity Central Funds, will indirectly bear its pro-rata share of the fees and expenses incurred by the underlying Fidelity Central Funds. These fees and expenses are not included in the Fund's annualized expense ratio used to calculate the expense estimate in the table below.
Hypothetical Example for Comparison Purposes
The second line of the accompanying table for each class of each fund provides information about hypothetical account values and hypothetical expenses based on a Class' actual expense ratio and an assumed rate of return of 5% per year before expenses, which is not the Class' actual return. The hypothetical account values and expenses may not be used to estimate the actual ending account balance or expenses you paid for the period. You may use this information to compare the ongoing costs of investing in the Fund and other funds. To do so, compare this 5% hypothetical example with the 5% hypothetical examples that appear in the shareholder reports of the other funds. A small balance maintenance fee of $12.00 that is charged once a year may apply for certain accounts with a value of less than $2,000. This fee is not included in the table below. If it was, the estimate of expenses you paid during the period would be higher, and your ending account value lower, by this amount. In addition, each Fund, as a shareholder in the underlying Fidelity Central Funds, will indirectly bear its pro-rata share of the fees and expenses incurred by the underlying Fidelity Central Funds. These fees and expenses are not included in the Fund's annualized expense ratio used to calculate the expense estimate in the table below.
Please note that the expenses shown in the table are meant to highlight your ongoing costs only and do not reflect any transaction costs. Therefore, the second line of the table is useful in comparing ongoing costs only, and will not help you determine the relative total costs of owning different funds. In addition, if these transactional costs were included, your costs would have been higher.
| Annualized | Beginning | Ending | Expenses Paid |
Spartan Extended Market Index |
|
|
|
|
Investor Class | .10% |
|
|
|
Actual |
| $ 1,000.00 | $ 1,189.60 | $ .54 |
HypotheticalA |
| $ 1,000.00 | $ 1,024.30 | $ .50 |
Fidelity Advantage Class | .07% |
|
|
|
Actual |
| $ 1,000.00 | $ 1,189.80 | $ .38 |
HypotheticalA |
| $ 1,000.00 | $ 1,024.45 | $ .35 |
Fidelity Advantage Institutional Class | .06% |
|
|
|
Actual |
| $ 1,000.00 | $ 1,189.70 | $ .33 |
HypotheticalA |
| $ 1,000.00 | $ 1,024.50 | $ .30 |
Spartan International Index |
|
|
|
|
Investor Class | .20% |
|
|
|
Actual |
| $ 1,000.00 | $ 1,150.00 | $ 1.07 |
HypotheticalA |
| $ 1,000.00 | $ 1,023.80 | $ 1.00 |
Fidelity Advantage Class | .12% |
|
|
|
Actual |
| $ 1,000.00 | $ 1,150.60 | $ .64 |
HypotheticalA |
| $ 1,000.00 | $ 1,024.20 | $ .60 |
Institutional Class | .07% |
|
|
|
Actual |
| $ 1,000.00 | $ 1,150.60 | $ .37 |
HypotheticalA |
| $ 1,000.00 | $ 1,024.45 | $ .35 |
| Annualized | Beginning | Ending | Expenses Paid |
Spartan International Index - continued |
|
|
|
|
Fidelity Advantage Institutional Class | .06% |
|
|
|
Actual |
| $ 1,000.00 | $ 1,150.70 | $ .32 |
HypotheticalA |
| $ 1,000.00 | $ 1,024.50 | $ .30 |
A 5% return per year before expenses
B Annualized expense ratio reflects expenses net of applicable fee waivers.
* Expenses are equal to each Class' annualized expense ratio, multiplied by the average account value over the period, multiplied by 181/365 (to reflect the one-half year period).
Annual Report
Spartan Extended Market Index Fund
Performance: The Bottom Line
Average annual total return reflects the change in the value of an investment, assuming reinvestment of the class' distributions from dividend income and capital gains (the profits earned upon the sale of securities that have grown in value, if any) and assuming a constant rate of performance each year. The $10,000 table and the fund's returns does not reflect the deduction of taxes that a shareholder would pay on fund distributions or the redemption of fund shares. During periods of reimbursement by Fidelity, a fund's total return will be greater than it would be had the reimbursement not occurred. How a fund did yesterday is no guarantee of how it will do tomorrow.
Average Annual Total Returns
Periods ended February 28, 2014 | Past 1 | Past 5 | Past 10 |
Spartan Extended Market Index Fund - Fidelity Advantage Institutional ClassA | 32.44% | 28.03% | 10.18% |
A The initial offering of Fidelity Advantage Institutional Class shares took place September 8, 2011. Returns between October 14, 2005 and September 8, 2011 are those of Fidelity Advantage Class. Returns prior to October 14, 2005 are those of Investor Class.
$10,000 Over 10 Years
Let's say hypothetically that $10,000 was invested in Spartan® Extended Market Index Fund - Fidelity Advantage Institutional Class on February 29, 2004. The chart shows how the value of your investment would have changed, and also shows how the Dow Jones U.S. Completion Total Stock Market Index performed over the same period. The initial offering of Fidelity Advantage Institutional Class took place on September 8, 2011. See above for additional information regarding the performance of Fidelity Advantage Institutional Class.
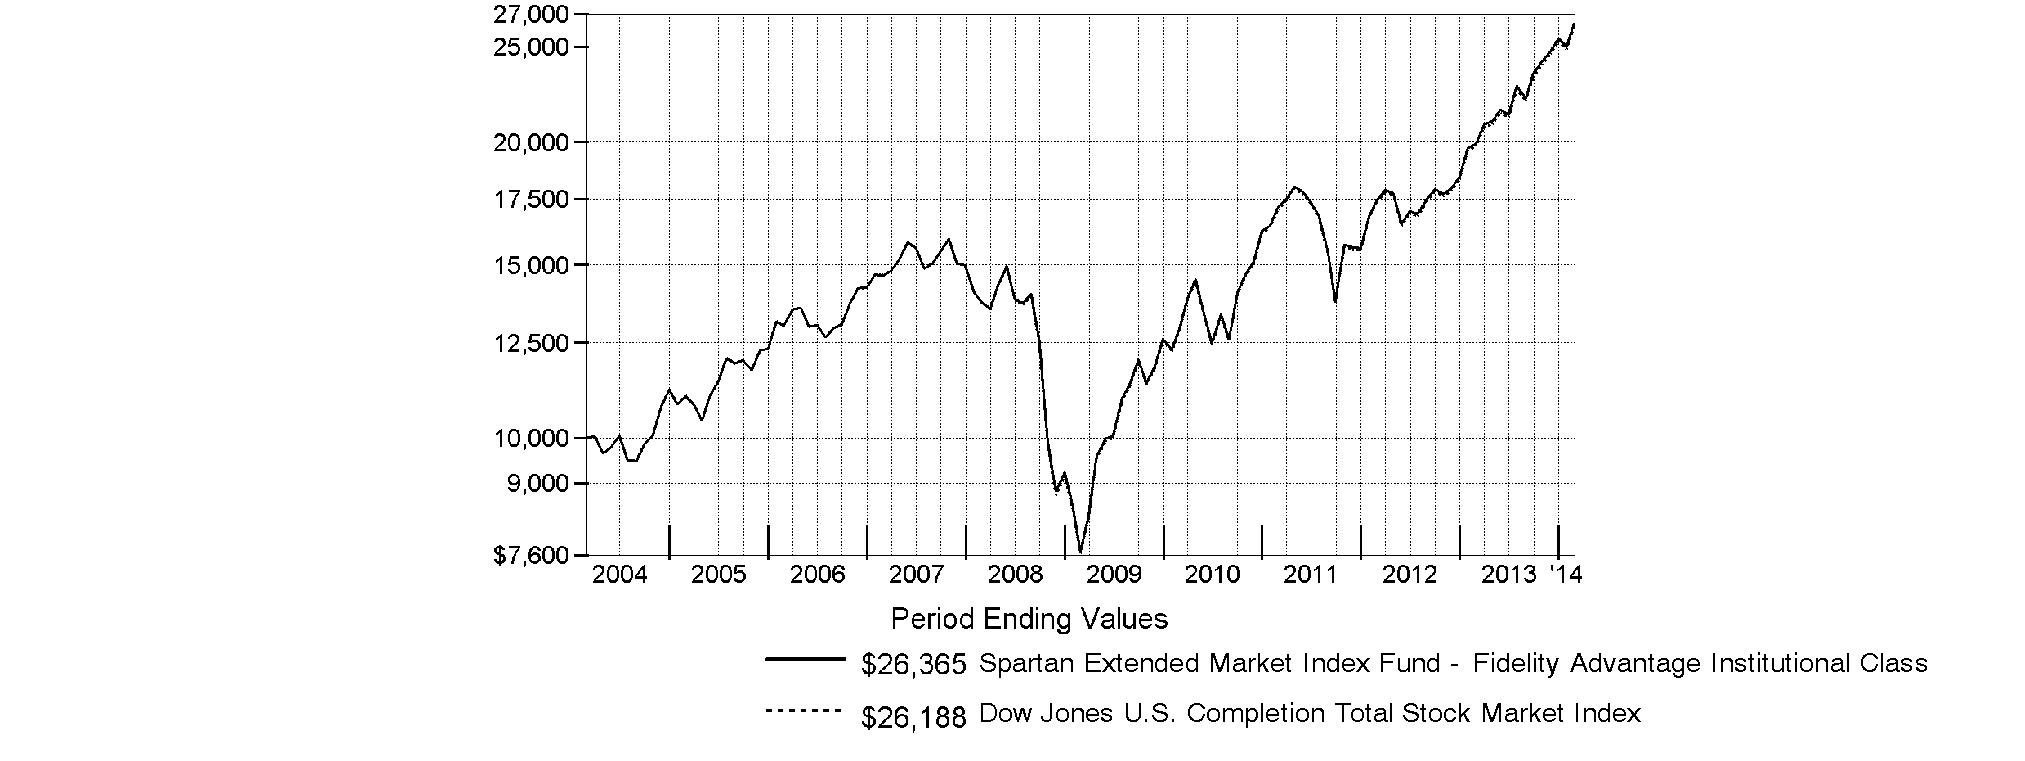
Annual Report
Spartan Extended Market Index Fund
Management's Discussion of Fund Performance
Market Recap: Stocks overcame fears of higher interest rates - not to mention their worst January in four years - to finish sharply higher for the 12 months ending February 28, 2014. The broad S&P 500® Index and the blue-chip Dow Jones Industrial AverageSM gained 25.37% and 19.01%, respectively, amid generally favorable earnings reports and accommodative monetary policies worldwide. Performance generally increased along the risk spectrum, with smaller-cap and growth strategies leading the way. An ebullient market helped the growth-oriented Nasdaq Composite Index® to a 38.10% period gain, for example. On the other hand, both cyclical and defensive stocks had representation in the top-performing industry sectors: returns were highest in health care and consumer discretionary; lowest in utilities and telecommunication services. From a macroeconomic perspective, data still points to slow but steady improvement in the U.S., and Europe's recession may well be over. Reports from China have disappointed, but continue to suggest a relatively soft landing there. Mixed signals from the U.S. Federal Reserve as to when it might curtail its stimulative bond buying kept markets in flux during the spring and summer. Stocks regained momentum in October despite a federal budget impasse and brief government shutdown, and lower volatility prevailed through year-end. Shedding new-year concerns about China's economy, an emerging-markets sell-off and confirmation (at last) of Fed tapering - alongside confirmation of a presumably dovish Janet Yellen as new Fed chair - February saw stocks back in record territory, bearing down on the five-year anniversary of the market's bottom.
Comments from Patrick Waddell, Senior Portfolio Manager of the Geode Capital Management, LLC, investment management team for Spartan® Extended Market Index Fund: For the year, the fund's Fidelity Advantage® Institutional Class shares gained 32.44%, in line with the 32.38% advance of the Dow Jones U.S. Completion Total Stock Market IndexSM. In a strong market environment, all 10 sectors in the Dow Jones Completion index were up by double digits, and even the worst-faring category - financials - rose about 17%. Not surprisingly in such a strong market environment, many more stocks contributed to performance than detracted from it. The biggest individual contributor was social networking company Facebook, whose shares more than doubled during the period, thanks in part to better-than-expected earnings. Another stock to add significant value was Tesla Motors, a maker of electric vehicles. Tesla's shares were up about sevenfold, thanks to healthy growth in revenue and mounting optimism on the part of investors about demand for the company's cars. Elsewhere, Illumina, a maker of genetic-analysis tools, did very well, as did many of its counterparts in the pharmaceutical, biotechnology & life sciences industry - the second-best performing group in the index. Also contributing was casino gaming operator Las Vegas Sands, whose strong financial results were lifted by good performance from its Asian properties. In contrast, two notable individual detractors were Annaly Capital Management and American Capital Agency. As the market rose, these and other mortgage real estate investment trusts (REITs) tended to be left behind, as investors worried about the potential impact of higher interest rates. Also detracting was lululemon athletica, a retailer of yogawear whose shares were hit in January after the company reported weaker-than-expected earnings.
The views expressed above reflect those of the portfolio manager(s) only through the end of the period as stated on the cover of this report and do not necessarily represent the views of Fidelity or any other person in the Fidelity organization. Any such views are subject to change at any time based upon market or other conditions and Fidelity disclaims any responsibility to update such views. These views may not be relied on as investment advice and, because investment decisions for a Fidelity fund are based on numerous factors, may not be relied on as an indication of trading intent on behalf of any Fidelity fund.
Annual Report
Spartan Extended Market Index Fund
Investment Changes (Unaudited)
Top Ten Stocks as of February 28, 2014 | ||
| % of fund's | % of fund's net assets |
Las Vegas Sands Corp. | 0.8 | 0.6 |
Liberty Global PLC Class A | 0.8 | 0.8 |
Illumina, Inc. | 0.5 | 0.3 |
Tesla Motors, Inc. | 0.5 | 0.3 |
LinkedIn Corp. | 0.5 | 0.5 |
United Continental Holdings, Inc. | 0.4 | 0.3 |
HCA Holdings, Inc. | 0.4 | 0.3 |
Avago Technologies Ltd. | 0.4 | 0.2 |
Green Mountain Coffee Roasters, Inc. | 0.4 | 0.3 |
Liberty Interactive Corp. Series A | 0.3 | 0.3 |
| 5.0 | |
Market Sectors as of February 28, 2014 | ||
| % of fund's | % of fund's net assets |
Financials | 21.5 | 21.6 |
Information Technology | 16.1 | 15.3 |
Consumer Discretionary | 15.7 | 16.1 |
Industrials | 14.7 | 14.7 |
Health Care | 11.9 | 11.1 |
Energy | 6.0 | 6.4 |
Materials | 5.2 | 5.1 |
Consumer Staples | 3.3 | 3.7 |
Utilities | 3.1 | 3.3 |
Telecommunication Services | 1.2 | 1.2 |
Annual Report
Spartan Extended Market Index Fund
Investments February 28, 2014
Showing Percentage of Net Assets
Common Stocks - 98.7% | |||
Shares | Value | ||
CONSUMER DISCRETIONARY - 15.7% | |||
Auto Components - 1.3% | |||
Allison Transmission Holdings, Inc. | 286,508 | $ 8,532,208 | |
American Axle & Manufacturing Holdings, Inc. (a) | 235,674 | 4,555,578 | |
Autoliv, Inc. (d) | 316,575 | 30,498,836 | |
Cooper Tire & Rubber Co. | 205,507 | 5,123,290 | |
Dana Holding Corp. | 487,155 | 10,561,520 | |
Dorman Products, Inc. (a)(d) | 103,132 | 5,942,466 | |
Drew Industries, Inc. | 78,727 | 3,876,517 | |
Federal-Mogul Corp. Class A (a) | 112,607 | 2,121,516 | |
Fox Factory Holding Corp. | 39,294 | 656,210 | |
Fuel Systems Solutions, Inc. (a) | 54,919 | 705,709 | |
Gentex Corp. | 480,934 | 15,086,900 | |
Gentherm, Inc. (a) | 117,071 | 3,310,768 | |
Lear Corp. | 260,626 | 21,162,831 | |
Modine Manufacturing Co. (a) | 171,375 | 2,534,636 | |
Motorcar Parts of America, Inc. (a) | 46,991 | 1,157,388 | |
Quantum Fuel Systems Technologies Worldwide, Inc. (a) | 70,417 | 607,699 | |
Remy International, Inc. | 47,195 | 1,051,977 | |
Shiloh Industries, Inc. (a) | 22,518 | 439,101 | |
Spartan Motors, Inc. | 75,935 | 430,551 | |
Standard Motor Products, Inc. | 71,623 | 2,517,548 | |
Stoneridge, Inc. (a) | 89,076 | 980,727 | |
Strattec Security Corp. | 10,303 | 718,325 | |
Superior Industries International, Inc. | 84,602 | 1,546,525 | |
Tenneco, Inc. (a) | 198,342 | 11,948,122 | |
Tower International, Inc. (a) | 57,875 | 1,486,230 | |
TRW Automotive Holdings Corp. (a) | 381,676 | 31,419,568 | |
UQM Technologies, Inc. (a)(d) | 78,497 | 135,800 | |
Visteon Corp. (a) | 163,505 | 13,641,222 | |
| 182,749,768 | ||
Automobiles - 0.5% | |||
Tesla Motors, Inc. (a)(d) | 273,734 | 67,012,821 | |
Thor Industries, Inc. | 150,431 | 8,425,640 | |
Winnebago Industries, Inc. (a) | 100,663 | 2,683,676 | |
| 78,122,137 | ||
Distributors - 0.3% | |||
Core-Mark Holding Co., Inc. | 41,529 | 3,247,568 | |
LKQ Corp. (a) | 1,000,300 | 27,898,367 | |
Pool Corp. | 154,363 | 9,024,061 | |
VOXX International Corp. (a) | 62,477 | 812,201 | |
Weyco Group, Inc. | 16,952 | 447,194 | |
| 41,429,391 | ||
Diversified Consumer Services - 0.7% | |||
American Public Education, Inc. (a)(d) | 58,621 | 2,076,356 | |
Apollo Ed Group, Inc. Class A (non-vtg.) (a) | 328,402 | 10,945,639 | |
Ascent Capital Group, Inc. (a)(d) | 43,140 | 3,167,770 | |
Bridgepoint Education, Inc. (a) | 37,103 | 715,717 | |
Bright Horizons Family Solutions, Inc. (a) | 73,892 | 2,916,517 | |
| |||
Shares | Value | ||
Cambium Learning Group, Inc. (a) | 16,192 | $ 33,194 | |
Capella Education Co. | 34,672 | 2,304,995 | |
Career Education Corp. (a) | 187,149 | 1,383,031 | |
Carriage Services, Inc. | 49,366 | 1,008,547 | |
Collectors Universe, Inc. (d) | 17,833 | 320,994 | |
Corinthian Colleges, Inc. (a)(d) | 321,385 | 501,361 | |
DeVry, Inc. | 188,899 | 7,935,647 | |
Education Management Corp. (a)(d) | 71,409 | 424,169 | |
Grand Canyon Education, Inc. (a)(d) | 150,716 | 7,143,938 | |
Hillenbrand, Inc. | 215,614 | 6,442,546 | |
Houghton Mifflin Harcourt Co. | 84,821 | 1,723,563 | |
ITT Educational Services, Inc. (a)(d) | 61,723 | 1,915,265 | |
JTH Holding, Inc. Class A (a)(d) | 11,299 | 285,865 | |
K12, Inc. (a)(d) | 105,616 | 2,390,090 | |
Learning Tree International, Inc. (a) | 12,160 | 38,547 | |
LifeLock, Inc. (a)(d) | 225,007 | 4,479,889 | |
Lincoln Educational Services Corp. | 64,172 | 288,774 | |
Matthews International Corp. Class A | 93,477 | 3,835,361 | |
National American University Holdings, Inc. | 23,237 | 87,371 | |
Regis Corp. | 155,503 | 2,186,372 | |
Service Corp. International | 703,436 | 13,147,219 | |
Sotheby's Class A (Ltd. vtg.) | 223,768 | 10,519,334 | |
Steiner Leisure Ltd. (a) | 44,479 | 1,966,861 | |
Strayer Education, Inc. (a)(d) | 37,506 | 1,791,662 | |
Universal Technical Institute, Inc. | 65,787 | 890,098 | |
Weight Watchers International, Inc. (d) | 88,957 | 1,891,226 | |
| 94,757,918 | ||
Hotels, Restaurants & Leisure - 3.2% | |||
Ambassadors Group, Inc. | 48,627 | 192,077 | |
Ark Restaurants Corp. | 8,457 | 186,054 | |
Bally Technologies, Inc. (a) | 124,956 | 8,465,769 | |
Biglari Holdings, Inc. (d) | 5,497 | 2,468,098 | |
BJ's Restaurants, Inc. (a)(d) | 87,061 | 2,411,590 | |
Bloomin' Brands, Inc. (a) | 147,792 | 3,715,491 | |
Bob Evans Farms, Inc. | 93,507 | 4,838,052 | |
Boyd Gaming Corp. (a) | 254,155 | 2,953,281 | |
Bravo Brio Restaurant Group, Inc. (a) | 63,389 | 981,896 | |
Brinker International, Inc. | 221,072 | 12,158,960 | |
Buffalo Wild Wings, Inc. (a)(d) | 60,734 | 8,806,430 | |
Burger King Worldwide, Inc. (d) | 215,326 | 5,723,365 | |
Caesars Entertainment Corp. (a)(d) | 126,132 | 3,274,387 | |
Carrols Restaurant Group, Inc. (a) | 55,247 | 392,254 | |
Century Casinos, Inc. (a) | 65,094 | 441,988 | |
Choice Hotels International, Inc. | 116,208 | 5,674,437 | |
Churchill Downs, Inc. | 48,125 | 4,475,625 | |
Chuys Holdings, Inc. (a)(d) | 60,855 | 2,422,638 | |
ClubCorp Holdings, Inc. | 71,917 | 1,252,794 | |
Cosi, Inc. (a)(d) | 22,932 | 30,270 | |
Cracker Barrel Old Country Store, Inc. | 81,287 | 8,083,992 | |
Del Frisco's Restaurant Group, Inc. (a) | 86,188 | 2,244,336 | |
Denny's Corp. (a)(d) | 303,172 | 2,061,570 | |
Diamond Resorts International, Inc. | 63,881 | 1,161,995 | |
Common Stocks - continued | |||
Shares | Value | ||
CONSUMER DISCRETIONARY - continued | |||
Hotels, Restaurants & Leisure - continued | |||
DineEquity, Inc. | 55,945 | $ 4,685,394 | |
Diversified Restaurant Holdings, Inc. (a) | 9,282 | 44,368 | |
Domino's Pizza, Inc. | 179,478 | 14,189,531 | |
Dover Downs Gaming & Entertainment, Inc. (a) | 28,631 | 44,378 | |
Dover Motorsports, Inc. | 22,686 | 51,270 | |
Dunkin' Brands Group, Inc. | 350,404 | 18,105,375 | |
Einstein Noah Restaurant Group, Inc. | 32,777 | 489,033 | |
Empire Resorts, Inc. (a)(d) | 31,800 | 245,496 | |
Entertainment Gaming Asia, Inc. (a) | 41,906 | 47,354 | |
Extended Stay America, Inc. unit | 110,822 | 2,823,745 | |
Famous Dave's of America, Inc. (a) | 17,917 | 438,608 | |
Fiesta Restaurant Group, Inc. (a) | 77,817 | 3,908,748 | |
Frisch's Restaurants, Inc. | 8,068 | 192,180 | |
Full House Resorts, Inc. (a) | 24,413 | 58,347 | |
Gaming Partners International Corp. (a) | 1,584 | 15,143 | |
Hyatt Hotels Corp. Class A (a)(d) | 197,385 | 10,295,602 | |
Ignite Restaurant Group, Inc. (a)(d) | 17,224 | 210,822 | |
International Speedway Corp. Class A | 94,111 | 3,174,364 | |
Interval Leisure Group, Inc. | 143,029 | 3,888,959 | |
Isle of Capri Casinos, Inc. (a) | 74,961 | 674,649 | |
Jack in the Box, Inc. (a) | 141,594 | 8,134,575 | |
Jamba, Inc. (a)(d) | 49,896 | 630,186 | |
Kona Grill, Inc. (a) | 11,867 | 229,033 | |
Krispy Kreme Doughnuts, Inc. (a)(d) | 219,940 | 4,183,259 | |
Lakes Entertainment, Inc. (a) | 51,180 | 258,459 | |
Las Vegas Sands Corp. | 1,287,138 | 109,728,491 | |
Life Time Fitness, Inc. (a)(d) | 132,536 | 6,255,699 | |
Luby's, Inc. (a) | 44,166 | 280,454 | |
Marcus Corp. | 53,086 | 749,043 | |
Marriott Vacations Worldwide Corp. (a) | 107,619 | 5,643,540 | |
MGM Mirage, Inc. (a) | 1,096,796 | 30,216,730 | |
Monarch Casino & Resort, Inc. (a) | 28,201 | 531,589 | |
Morgans Hotel Group Co. (a) | 89,969 | 719,752 | |
MTR Gaming Group, Inc. (a) | 52,052 | 275,355 | |
Multimedia Games Holding Co., Inc. (a) | 98,765 | 3,261,714 | |
Nathan's Famous, Inc. (a) | 8,467 | 423,181 | |
Noodles & Co. (d) | 37,994 | 1,512,541 | |
Norwegian Cruise Line Holdings Ltd. (a) | 241,987 | 8,292,894 | |
Orient Express Hotels Ltd. Class A (a) | 299,489 | 4,612,131 | |
Panera Bread Co. Class A (a) | 87,353 | 15,838,846 | |
Papa John's International, Inc. | 110,932 | 5,646,439 | |
Penn National Gaming, Inc. (a) | 234,807 | 3,017,270 | |
Pinnacle Entertainment, Inc. (a) | 191,005 | 4,641,422 | |
Pizza Inn Holdings, Inc. (a)(d) | 13,090 | 83,514 | |
Popeyes Louisiana Kitchen, Inc. (a) | 85,411 | 3,421,565 | |
Potbelly Corp. (d) | 31,455 | 673,452 | |
Premier Exhibitions, Inc. (a) | 89,421 | 78,690 | |
Red Lion Hotels Corp. (a) | 45,825 | 273,575 | |
Red Robin Gourmet Burgers, Inc. (a)(d) | 45,201 | 3,522,514 | |
Rick's Cabaret International, Inc. (a) | 17,933 | 203,898 | |
| |||
Shares | Value | ||
Royal Caribbean Cruises Ltd. | 537,982 | $ 28,475,387 | |
Ruby Tuesday, Inc. (a) | 207,290 | 1,270,688 | |
Ruth's Hospitality Group, Inc. | 111,579 | 1,379,116 | |
Scientific Games Corp. Class A (a) | 172,823 | 2,315,828 | |
SeaWorld Entertainment, Inc. | 184,302 | 6,292,070 | |
Six Flags Entertainment Corp. | 318,122 | 12,979,378 | |
Sonic Corp. (a) | 187,706 | 3,825,448 | |
Speedway Motorsports, Inc. | 37,455 | 742,358 | |
Texas Roadhouse, Inc. Class A | 206,875 | 5,471,844 | |
The Cheesecake Factory, Inc. | 153,024 | 7,271,700 | |
Town Sports International Holdings, Inc. | 64,415 | 584,888 | |
Vail Resorts, Inc. | 122,937 | 8,644,930 | |
Wendy's Co. | 918,539 | 8,799,604 | |
| 459,393,765 | ||
Household Durables - 1.1% | |||
Bassett Furniture Industries, Inc. | 27,362 | 409,883 | |
Beazer Homes U.S.A., Inc. (a)(d) | 89,545 | 2,076,549 | |
Blyth, Inc. (d) | 30,867 | 301,879 | |
Cavco Industries, Inc. (a)(d) | 22,709 | 1,781,521 | |
Cobra Electronics Corp. (a) | 2,458 | 8,333 | |
Comstock Holding Companies, Inc. Class A (a)(d) | 37,485 | 65,974 | |
CSS Industries, Inc. | 27,206 | 734,562 | |
Dixie Group, Inc. (a) | 27,024 | 405,360 | |
Emerson Radio Corp. (a) | 24,397 | 52,454 | |
Ethan Allen Interiors, Inc. (d) | 88,458 | 2,222,950 | |
Flexsteel Industries, Inc. | 18,647 | 692,736 | |
Helen of Troy Ltd. (a) | 104,425 | 6,819,997 | |
Hooker Furniture Corp. | 30,101 | 454,525 | |
Hovnanian Enterprises, Inc. Class A (a)(d) | 440,144 | 2,671,674 | |
iRobot Corp. (a)(d) | 93,339 | 3,912,771 | |
Jarden Corp. (a) | 398,136 | 24,473,420 | |
KB Home (d) | 272,393 | 5,556,817 | |
Kid Brands, Inc. (a) | 42,456 | 28,870 | |
Koss Corp. | 1,389 | 6,403 | |
La-Z-Boy, Inc. | 172,544 | 4,406,774 | |
LGI Homes, Inc. | 38,417 | 653,089 | |
Libbey, Inc. (a) | 74,313 | 1,730,750 | |
Lifetime Brands, Inc. | 19,423 | 325,141 | |
M.D.C. Holdings, Inc. | 131,539 | 4,102,701 | |
M/I Homes, Inc. (a)(d) | 86,608 | 2,156,539 | |
Meritage Homes Corp. (a) | 116,169 | 5,600,507 | |
NACCO Industries, Inc. Class A | 18,522 | 1,085,945 | |
NVR, Inc. (a) | 13,899 | 16,567,608 | |
Parametric Sound Corp. (a)(d) | 17,421 | 258,528 | |
Ryland Group, Inc. | 153,341 | 7,144,157 | |
Skullcandy, Inc. (a) | 64,637 | 543,597 | |
Skyline Corp. (a) | 14,802 | 85,112 | |
Standard Pacific Corp. (a) | 475,584 | 4,332,570 | |
Stanley Furniture Co., Inc. (a) | 37,789 | 114,123 | |
Taylor Morrison Home Corp. | 101,009 | 2,537,346 | |
Tempur Sealy International, Inc. (a) | 200,471 | 10,398,431 | |
Toll Brothers, Inc. (a) | 510,195 | 19,902,707 | |
Common Stocks - continued | |||
Shares | Value | ||
CONSUMER DISCRETIONARY - continued | |||
Household Durables - continued | |||
TRI Pointe Homes, Inc. (d) | 50,626 | $ 922,406 | |
Tupperware Brands Corp. | 165,897 | 13,039,504 | |
UCP, Inc. | 26,900 | 427,710 | |
Universal Electronics, Inc. (a) | 54,073 | 2,259,711 | |
WCI Communities, Inc. | 24,468 | 493,764 | |
Wells-Gardner Electronics Corp. (a) | 4,238 | 8,264 | |
William Lyon Homes, Inc. (a) | 37,718 | 1,166,618 | |
Zagg, Inc. (a)(d) | 72,915 | 315,722 | |
| 153,256,002 | ||
Internet & Catalog Retail - 0.8% | |||
1-800-FLOWERS.com, Inc. Class A (a) | 119,868 | 630,506 | |
Blue Nile, Inc. (a)(d) | 48,330 | 1,700,733 | |
CafePress, Inc. (a) | 18,875 | 107,021 | |
dELiA*s, Inc. (a)(d) | 110,057 | 118,862 | |
FTD Companies, Inc. (a)(d) | 66,872 | 2,077,044 | |
Gaiam, Inc. Class A (a) | 35,599 | 229,258 | |
Geeknet, Inc. (a) | 16,239 | 236,440 | |
Groupon, Inc. Class A (a)(d) | 1,235,521 | 10,267,180 | |
HomeAway, Inc. (a)(d) | 209,635 | 9,615,957 | |
HSN, Inc. | 114,107 | 6,544,036 | |
Liberty Interactive Corp.: | |||
(Venture Group) Series A (a) | 117,978 | 16,813,045 | |
Series A (a) | 1,569,149 | 45,819,151 | |
NutriSystem, Inc. | 94,402 | 1,389,597 | |
Orbitz Worldwide, Inc. (a) | 100,772 | 973,458 | |
Overstock.com, Inc. (a)(d) | 48,655 | 957,044 | |
PetMed Express, Inc. (d) | 64,034 | 883,669 | |
RetailMeNot, Inc. | 31,905 | 1,332,672 | |
Shutterfly, Inc. (a)(d) | 125,827 | 6,865,121 | |
U.S. Auto Parts Network, Inc. (a) | 28,450 | 58,607 | |
ValueVision Media, Inc. Class A (a) | 136,770 | 764,544 | |
Vitacost.com, Inc. (a)(d) | 57,854 | 431,012 | |
zulily, Inc. (d) | 39,463 | 2,698,875 | |
| 110,513,832 | ||
Leisure Equipment & Products - 0.4% | |||
Arctic Cat, Inc. | 47,692 | 2,232,939 | |
Black Diamond, Inc. (a)(d) | 70,114 | 741,806 | |
Brunswick Corp. | 299,098 | 13,396,599 | |
Callaway Golf Co. | 252,931 | 2,129,679 | |
Escalade, Inc. | 11,862 | 139,141 | |
JAKKS Pacific, Inc. (d) | 56,230 | 402,607 | |
Johnson Outdoors, Inc. Class A | 15,962 | 352,122 | |
Leapfrog Enterprises, Inc. Class A (a)(d) | 208,450 | 1,517,516 | |
Marine Products Corp. | 22,297 | 189,747 | |
Nautilus, Inc. (a) | 95,784 | 803,628 | |
Polaris Industries, Inc. | 208,717 | 27,974,340 | |
Smith & Wesson Holding Corp. (a)(d) | 225,106 | 2,588,719 | |
Sturm, Ruger & Co., Inc. (d) | 64,180 | 4,090,833 | |
Summer Infant, Inc. (a) | 37,416 | 69,220 | |
| 56,628,896 | ||
| |||
Shares | Value | ||
Media - 3.0% | |||
A.H. Belo Corp. Class A | 47,589 | $ 525,383 | |
AMC Networks, Inc. Class A (a) | 197,619 | 15,022,996 | |
Ballantyne of Omaha, Inc. (a) | 47,765 | 221,152 | |
Beasley Broadcast Group, Inc. Class A | 5,286 | 47,468 | |
Carmike Cinemas, Inc. (a) | 81,336 | 2,419,746 | |
Central European Media Enterprises Ltd. Class A (a)(d) | 252,596 | 1,197,305 | |
Charter Communications, Inc. Class A (a) | 222,361 | 28,188,704 | |
Cinemark Holdings, Inc. | 345,085 | 10,152,401 | |
Clear Channel Outdoor Holding, Inc. Class A | 134,797 | 1,354,710 | |
Crown Media Holdings, Inc. Class A (a)(d) | 89,832 | 300,937 | |
Cumulus Media, Inc. Class A (a) | 339,494 | 2,227,081 | |
Digital Cinema Destinations Co. (a) | 8,182 | 45,819 | |
DISH Network Corp. Class A (a) | 697,096 | 41,017,129 | |
DreamWorks Animation SKG, Inc. Class A (a) | 236,110 | 7,062,050 | |
E.W. Scripps Co. Class A (a) | 110,895 | 2,175,760 | |
Emmis Communications Corp. Class A (a) | 80,456 | 252,632 | |
Entercom Communications Corp. Class A (a)(d) | 55,913 | 552,980 | |
Entravision Communication Corp. Class A | 226,807 | 1,503,730 | |
FAB Universal Corp. (a)(d) | 52,613 | 161,522 | |
Gray Television, Inc. (a) | 162,058 | 1,904,182 | |
Harte-Hanks, Inc. | 168,026 | 1,342,528 | |
Hemisphere Media Group, Inc. (a)(d) | 13,887 | 154,701 | |
Insignia Systems, Inc. (a) | 22,896 | 71,436 | |
John Wiley & Sons, Inc. Class A | 163,947 | 9,513,844 | |
Journal Communications, Inc. Class A (a) | 139,138 | 1,275,895 | |
Lamar Advertising Co. Class A (a) | 211,052 | 11,314,498 | |
Lee Enterprises, Inc. (a)(d) | 166,014 | 853,312 | |
Liberty Global PLC Class A (a)(d) | 1,233,594 | 106,767,561 | |
Liberty Media Corp. Class A (a) | 331,692 | 45,494,875 | |
Live Nation Entertainment, Inc. (a) | 474,363 | 10,763,296 | |
Loral Space & Communications Ltd. (a) | 49,449 | 3,907,460 | |
Martha Stewart Living Omnimedia, Inc. Class A (a)(d) | 86,467 | 454,816 | |
Media General, Inc. Class A (a)(d) | 69,425 | 1,316,992 | |
Meredith Corp. | 122,000 | 5,709,600 | |
Morningstar, Inc. | 76,494 | 6,399,488 | |
National CineMedia, Inc. | 209,473 | 3,217,505 | |
Nexstar Broadcasting Group, Inc. Class A (d) | 95,400 | 4,071,672 | |
NTN Communications, Inc. (a) | 49,847 | 28,493 | |
Radio One, Inc. Class D (non-vtg.) (a) | 89,989 | 447,245 | |
ReachLocal, Inc. (a)(d) | 35,865 | 379,452 | |
Reading International, Inc. Class A (a) | 33,132 | 245,839 | |
Regal Entertainment Group Class A (d) | 267,938 | 4,930,059 | |
Rentrak Corp. (a) | 36,764 | 2,356,940 | |
RLJ Entertainment, Inc. (a) | 42,349 | 186,336 | |
Saga Communications, Inc. Class A | 11,404 | 557,770 | |
Common Stocks - continued | |||
Shares | Value | ||
CONSUMER DISCRETIONARY - continued | |||
Media - continued | |||
Salem Communications Corp. Class A | 20,080 | $ 182,527 | |
Scholastic Corp. | 93,383 | 3,294,552 | |
SFX Entertainment, Inc. (d) | 74,713 | 641,785 | |
Sinclair Broadcast Group, Inc. Class A | 243,124 | 7,201,333 | |
Sirius XM Holdings, Inc. (a)(d) | 9,987,802 | 36,055,965 | |
Sizmek, Inc. (a)(d) | 83,242 | 1,031,368 | |
Spanish Broadcasting System, Inc. Class A (a) | 17,489 | 75,552 | |
SPAR Group, Inc. (a) | 4,346 | 8,562 | |
Starz - Liberty Capital Series A (a) | 312,351 | 9,988,985 | |
The Madison Square Garden Co. Class A (a) | 206,437 | 11,768,973 | |
The McClatchy Co. Class A (a)(d) | 208,390 | 1,106,551 | |
The New York Times Co. Class A (d) | 434,888 | 7,140,861 | |
Value Line, Inc. | 1,396 | 20,912 | |
World Wrestling Entertainment, Inc. Class A | 105,315 | 2,413,820 | |
| 419,027,046 | ||
Multiline Retail - 0.2% | |||
Big Lots, Inc. (a)(d) | 195,109 | 5,765,471 | |
Burlington Stores, Inc. | 49,352 | 1,344,842 | |
Dillard's, Inc. Class A | 79,764 | 7,384,551 | |
Fred's, Inc. Class A | 123,849 | 2,468,311 | |
Gordmans Stores, Inc. | 23,635 | 150,082 | |
J.C. Penney Co., Inc. (a)(d) | 1,002,259 | 7,296,446 | |
Sears Holdings Corp. (a)(d) | 145,081 | 6,492,375 | |
The Bon-Ton Stores, Inc. (d) | 31,972 | 347,216 | |
Tuesday Morning Corp. (a) | 123,106 | 1,925,378 | |
| 33,174,672 | ||
Specialty Retail - 3.0% | |||
Aarons, Inc. Class A | 249,123 | 7,655,550 | |
Abercrombie & Fitch Co. Class A | 250,585 | 9,930,684 | |
Advance Auto Parts, Inc. | 242,026 | 30,824,431 | |
Aeropostale, Inc. (a)(d) | 259,054 | 1,901,456 | |
America's Car Mart, Inc. (a)(d) | 28,636 | 1,037,769 | |
American Eagle Outfitters, Inc. | 563,431 | 8,186,652 | |
ANN, Inc. (a) | 150,919 | 5,380,262 | |
Appliance Recycling Centers of America, Inc. (a) | 2,967 | 8,753 | |
Asbury Automotive Group, Inc. (a) | 103,543 | 5,264,126 | |
Ascena Retail Group, Inc. (a) | 427,994 | 7,828,010 | |
Barnes & Noble, Inc. (a)(d) | 129,563 | 2,482,427 | |
bebe stores, Inc. | 123,042 | 746,865 | |
Big 5 Sporting Goods Corp. | 67,233 | 1,020,597 | |
Body Central Corp. (a)(d) | 37,768 | 117,836 | |
Books-A-Million, Inc. (a)(d) | 28,953 | 65,144 | |
Brown Shoe Co., Inc. | 144,261 | 3,545,935 | |
Build-A-Bear Workshop, Inc. (a) | 42,241 | 326,945 | |
Cabela's, Inc. Class A (a)(d) | 152,592 | 10,119,901 | |
Cache, Inc. (a) | 37,741 | 200,027 | |
Chico's FAS, Inc. | 523,459 | 8,652,777 | |
| |||
Shares | Value | ||
Christopher & Banks Corp. (a) | 115,035 | $ 766,133 | |
Citi Trends, Inc. (a) | 51,244 | 840,402 | |
Coldwater Creek, Inc. (a)(d) | 41,025 | 32,123 | |
Conn's, Inc. (a)(d) | 81,268 | 2,909,394 | |
CST Brands, Inc. | 250,104 | 8,135,883 | |
Destination Maternity Corp. | 38,764 | 1,094,695 | |
Destination XL Group, Inc. (a) | 127,750 | 728,175 | |
Dick's Sporting Goods, Inc. | 330,841 | 17,756,236 | |
Dover Saddlery, Inc. (a) | 1,537 | 8,292 | |
DSW, Inc. Class A | 241,797 | 9,304,349 | |
Express, Inc. (a) | 281,732 | 5,152,878 | |
Finish Line, Inc. Class A | 158,333 | 4,278,158 | |
Five Below, Inc. (a)(d) | 153,992 | 5,934,852 | |
Foot Locker, Inc. | 489,694 | 20,425,137 | |
Francesca's Holdings Corp. (a)(d) | 141,202 | 2,763,323 | |
Genesco, Inc. (a)(d) | 79,494 | 5,902,430 | |
GNC Holdings, Inc. | 311,521 | 14,491,957 | |
Group 1 Automotive, Inc. | 69,849 | 4,663,119 | |
Guess?, Inc. | 204,424 | 6,202,224 | |
Hastings Entertainment, Inc. (a) | 13,630 | 27,124 | |
Haverty Furniture Companies, Inc. | 67,771 | 1,975,525 | |
hhgregg, Inc. (a)(d) | 51,212 | 542,335 | |
Hibbett Sports, Inc. (a)(d) | 89,175 | 5,112,403 | |
Jos. A. Bank Clothiers, Inc. (a)(d) | 90,911 | 5,643,755 | |
Kirkland's, Inc. (a) | 53,316 | 942,627 | |
Lithia Motors, Inc. Class A (sub. vtg.) | 75,277 | 4,774,067 | |
Lumber Liquidators Holdings, Inc. (a)(d) | 91,038 | 9,766,557 | |
MarineMax, Inc. (a)(d) | 78,241 | 1,126,670 | |
Mattress Firm Holding Corp. (a)(d) | 54,318 | 2,367,722 | |
Monro Muffler Brake, Inc. (d) | 102,892 | 6,139,566 | |
Murphy U.S.A., Inc. | 146,243 | 5,931,616 | |
New York & Co., Inc. (a) | 101,159 | 448,134 | |
Office Depot, Inc. (a)(d) | 1,580,700 | 7,792,851 | |
Outerwall, Inc. (a)(d) | 91,690 | 6,485,234 | |
Pacific Sunwear of California, Inc. (a) | 152,515 | 436,193 | |
Penske Automotive Group, Inc. | 149,572 | 6,474,972 | |
Perfumania Holdings, Inc. (a) | 10,679 | 66,744 | |
Pier 1 Imports, Inc. | 346,476 | 6,555,326 | |
RadioShack Corp. (a)(d) | 360,003 | 964,808 | |
Rent-A-Center, Inc. | 179,370 | 4,509,362 | |
Restoration Hardware Holdings, Inc. (a) | 89,564 | 6,065,274 | |
Sally Beauty Holdings, Inc. (a) | 461,023 | 13,231,360 | |
Sears Hometown & Outlet Stores, Inc. (a)(d) | 48,309 | 1,118,836 | |
Select Comfort Corp. (a)(d) | 182,933 | 3,303,770 | |
Shoe Carnival, Inc. | 52,398 | 1,353,964 | |
Signet Jewelers Ltd. | 265,981 | 25,414,485 | |
Sonic Automotive, Inc. Class A (sub. vtg.) | 113,026 | 2,685,498 | |
Stage Stores, Inc. | 107,717 | 2,132,797 | |
Stein Mart, Inc. | 98,915 | 1,344,255 | |
Systemax, Inc. (a) | 25,296 | 297,734 | |
Tandy Leather Factory, Inc. (a) | 3,074 | 29,695 | |
The Buckle, Inc. (d) | 98,501 | 4,468,990 | |
The Cato Corp. Class A (sub. vtg.) | 93,688 | 2,629,822 | |
Common Stocks - continued | |||
Shares | Value | ||
CONSUMER DISCRETIONARY - continued | |||
Specialty Retail - continued | |||
The Children's Place Retail Stores, Inc. | 76,274 | $ 4,131,763 | |
The Container Store Group, Inc. (d) | 41,471 | 1,485,077 | |
The Men's Wearhouse, Inc. | 150,199 | 8,079,204 | |
The Pep Boys - Manny, Moe & Jack (a) | 186,870 | 2,352,693 | |
Tile Shop Holdings, Inc. (a)(d) | 81,131 | 1,251,040 | |
Tilly's, Inc. (a) | 34,668 | 414,629 | |
Trans World Entertainment Corp. | 29,120 | 121,722 | |
Ulta Salon, Cosmetics & Fragrance, Inc. (a) | 213,106 | 19,113,477 | |
Vitamin Shoppe, Inc. (a) | 100,996 | 4,725,603 | |
West Marine, Inc. (a) | 34,107 | 425,655 | |
Wet Seal, Inc. Class A (a) | 314,133 | 596,853 | |
Williams-Sonoma, Inc. | 291,357 | 16,968,632 | |
Winmark Corp. | 7,287 | 575,964 | |
Zale Corp. (a) | 107,361 | 2,332,955 | |
Zumiez, Inc. (a) | 76,306 | 1,813,031 | |
| 423,234,276 | ||
Textiles, Apparel & Luxury Goods - 1.2% | |||
American Apparel, Inc. (a)(d) | 196,695 | 141,640 | |
Carter's, Inc. | 178,025 | 13,410,623 | |
Charles & Colvard Ltd. (a) | 45,090 | 184,418 | |
Cherokee, Inc. | 28,809 | 409,664 | |
Columbia Sportswear Co. (d) | 45,436 | 3,775,277 | |
Crocs, Inc. (a) | 290,134 | 4,418,741 | |
Crown Crafts, Inc. | 2,227 | 20,488 | |
Culp, Inc. | 19,568 | 377,271 | |
Deckers Outdoor Corp. (a)(d) | 113,251 | 8,420,212 | |
Delta Apparel, Inc. (a) | 17,128 | 277,302 | |
DGSE Companies, Inc. (a)(d) | 6,929 | 16,907 | |
Forward Industries, Inc. (NY Shares) (a)(d) | 18,823 | 31,623 | |
G-III Apparel Group Ltd. (a) | 54,426 | 3,782,063 | |
Hanesbrands, Inc. | 328,386 | 24,064,126 | |
Iconix Brand Group, Inc. (a)(d) | 168,100 | 6,764,344 | |
Joe's Jeans, Inc. (a)(d) | 173,010 | 243,944 | |
Kate Spade & Co. (a) | 405,968 | 13,892,225 | |
Lakeland Industries, Inc. (a) | 25,549 | 166,579 | |
lululemon athletica, Inc. (a)(d) | 354,843 | 17,852,151 | |
Movado Group, Inc. | 64,810 | 2,551,570 | |
Oxford Industries, Inc. | 49,939 | 3,908,226 | |
Perry Ellis International, Inc. (a) | 47,883 | 667,968 | |
Quiksilver, Inc. (a)(d) | 451,488 | 3,521,606 | |
R.G. Barry Corp. | 22,932 | 424,701 | |
Rocky Brands, Inc. | 16,536 | 227,535 | |
Skechers U.S.A., Inc. Class A (sub. vtg.) (a) | 137,965 | 4,653,559 | |
Steven Madden Ltd. (a) | 194,277 | 7,081,397 | |
Superior Uniform Group, Inc. | 5,649 | 94,169 | |
The Jones Group, Inc. | 247,683 | 3,700,384 | |
Tumi Holdings, Inc. (a) | 172,727 | 3,827,630 | |
| |||
Shares | Value | ||
Under Armour, Inc. Class A (sub. vtg.) (a)(d) | 266,466 | $ 30,150,628 | |
Unifi, Inc. (a) | 51,404 | 1,271,735 | |
Vera Bradley, Inc. (a)(d) | 83,488 | 2,212,432 | |
Vince Holding Corp. | 36,383 | 982,341 | |
Wolverine World Wide, Inc. (d) | 336,421 | 8,868,058 | |
| 172,393,537 | ||
TOTAL CONSUMER DISCRETIONARY | 2,224,681,240 | ||
CONSUMER STAPLES - 3.3% | |||
Beverages - 0.1% | |||
Boston Beer Co., Inc. Class A (a)(d) | 29,160 | 6,903,630 | |
Coca-Cola Bottling Co. Consolidated | 16,170 | 1,223,099 | |
Craft Brew Alliance, Inc. (a) | 22,005 | 359,342 | |
Crystal Rock Holdings, Inc. (a) | 4,384 | 5,480 | |
MGP Ingredients, Inc. | 21,690 | 123,199 | |
National Beverage Corp. | 48,005 | 1,010,025 | |
Primo Water Corp. (a) | 56,566 | 183,274 | |
REED'S, Inc. (a) | 9,804 | 75,491 | |
| 9,883,540 | ||
Food & Staples Retailing - 0.6% | |||
Andersons, Inc. | 90,564 | 4,966,530 | |
Casey's General Stores, Inc. | 128,096 | 8,773,295 | |
Chefs' Warehouse Holdings (a)(d) | 70,559 | 1,640,497 | |
Crumbs Bake Shop, Inc. (a)(d) | 21,400 | 14,563 | |
Fairway Group Holdings Corp. (d) | 42,643 | 332,615 | |
Fresh Market, Inc. (a)(d) | 133,802 | 4,482,367 | |
Ingles Markets, Inc. Class A | 40,864 | 959,487 | |
Liberator Medical Holdings, Inc. (d) | 136,818 | 615,681 | |
Natural Grocers by Vitamin Cottage, Inc. (a)(d) | 29,349 | 1,195,678 | |
PriceSmart, Inc. | 58,985 | 6,000,544 | |
Rite Aid Corp. (a) | 2,963,139 | 19,527,086 | |
Roundy's, Inc. | 107,362 | 659,203 | |
Spartan Stores, Inc. | 132,984 | 3,004,109 | |
Sprouts Farmers Market LLC | 132,201 | 5,158,483 | |
SUPERVALU, Inc. (a)(d) | 672,397 | 4,350,409 | |
Susser Holdings Corp. (a)(d) | 60,865 | 3,687,202 | |
The Pantry, Inc. (a) | 91,715 | 1,383,062 | |
United Natural Foods, Inc. (a) | 165,813 | 12,001,545 | |
Village Super Market, Inc. Class A | 15,258 | 418,222 | |
Weis Markets, Inc. | 41,677 | 2,102,188 | |
| 81,272,766 | ||
Food Products - 1.8% | |||
Alico, Inc. | 8,218 | 311,955 | |
Annie's, Inc. (a)(d) | 60,400 | 2,263,792 | |
B&G Foods, Inc. Class A | 180,727 | 5,414,581 | |
Boulder Brands, Inc. (a)(d) | 196,281 | 2,952,066 | |
Bunge Ltd. | 478,113 | 38,062,576 | |
Cal-Maine Foods, Inc. | 55,257 | 2,904,860 | |
Calavo Growers, Inc. | 43,985 | 1,369,693 | |
Common Stocks - continued | |||
Shares | Value | ||
CONSUMER STAPLES - continued | |||
Food Products - continued | |||
Chiquita Brands International, Inc. (a) | 152,765 | $ 1,671,249 | |
Coffee Holding Co., Inc. (a) | 4,500 | 27,585 | |
Darling International, Inc. (a) | 533,810 | 10,772,286 | |
Dean Foods Co. (d) | 301,086 | 4,453,062 | |
Diamond Foods, Inc. (a)(d) | 73,051 | 2,098,025 | |
Farmer Brothers Co. (a) | 17,793 | 375,076 | |
Flowers Foods, Inc. | 587,606 | 12,087,055 | |
Fresh Del Monte Produce, Inc. | 130,882 | 3,463,138 | |
Golden Enterprises Ltd. | 2,595 | 11,159 | |
Green Mountain Coffee Roasters, Inc. (d) | 436,821 | 47,954,209 | |
Griffin Land & Nurseries, Inc. | 6,082 | 186,292 | |
Hillshire Brands Co. | 403,740 | 15,160,437 | |
Ingredion, Inc. | 250,264 | 16,477,382 | |
Inventure Foods, Inc. (a) | 25,815 | 358,570 | |
J&J Snack Foods Corp. | 52,992 | 4,921,897 | |
John B. Sanfilippo & Son, Inc. | 24,690 | 598,733 | |
Lancaster Colony Corp. | 70,760 | 6,382,552 | |
Lifeway Foods, Inc. (d) | 17,769 | 255,163 | |
Limoneira Co. (d) | 31,411 | 661,516 | |
Omega Protein Corp. (a) | 65,292 | 709,724 | |
Pilgrims Pride Corp. (a)(d) | 197,595 | 3,463,840 | |
Pinnacle Foods, Inc. | 187,064 | 5,297,652 | |
Post Holdings, Inc. (a)(d) | 109,272 | 6,241,617 | |
Rocky Mountain Chocolate Factory, Inc. | 795 | 9,437 | |
S&W Seed Co. (a)(d) | 19,822 | 125,473 | |
Sanderson Farms, Inc. | 68,298 | 5,248,018 | |
Seaboard Corp. (a) | 1,177 | 2,983,730 | |
Seneca Foods Corp. Class A (a) | 22,104 | 669,309 | |
Snyders-Lance, Inc. | 171,540 | 4,647,019 | |
The Hain Celestial Group, Inc. (a)(d) | 156,487 | 13,974,289 | |
Tootsie Roll Industries, Inc. (d) | 80,752 | 2,349,883 | |
TreeHouse Foods, Inc. (a)(d) | 120,634 | 8,596,379 | |
WhiteWave Foods Co. (a) | 573,744 | 16,236,955 | |
| 251,748,234 | ||
Household Products - 0.4% | |||
Central Garden & Pet Co. Class A (non-vtg.) (a) | 136,630 | 1,005,597 | |
Church & Dwight Co., Inc. | 453,005 | 30,795,280 | |
Energizer Holdings, Inc. | 203,901 | 19,847,723 | |
Harbinger Group, Inc. (a) | 120,650 | 1,369,378 | |
Ocean Bio-Chem, Inc. (a) | 20,307 | 58,890 | |
Oil-Dri Corp. of America | 15,023 | 498,764 | |
Orchids Paper Products Co. | 28,220 | 950,167 | |
Spectrum Brands Holdings, Inc. | 71,652 | 5,589,573 | |
WD-40 Co. | 50,695 | 3,696,172 | |
| 63,811,544 | ||
Personal Products - 0.3% | |||
CCA Industries, Inc. | 3,083 | 9,804 | |
Coty, Inc. Class A (d) | 202,981 | 3,014,268 | |
Cyanotech Corp. (a) | 3,808 | 23,038 | |
| |||
Shares | Value | ||
Elizabeth Arden, Inc. (a)(d) | 90,496 | $ 2,766,463 | |
Herbalife Ltd. (d) | 275,038 | 18,317,531 | |
IGI Laboratories, Inc. (a) | 30,015 | 124,562 | |
Inter Parfums, Inc. | 62,362 | 2,095,987 | |
LifeVantage Corp. (a)(d) | 379,647 | 504,931 | |
Mannatech, Inc. (a) | 3,529 | 60,699 | |
MediFast, Inc. (a)(d) | 48,925 | 1,288,685 | |
Natural Alternatives International, Inc. (a) | 20,104 | 106,953 | |
Nature's Sunshine Products, Inc. | 25,452 | 384,580 | |
Nu Skin Enterprises, Inc. Class A | 196,647 | 16,423,957 | |
Nutraceutical International Corp. (a) | 24,021 | 629,110 | |
Reliv International, Inc. | 10,690 | 23,090 | |
Revlon, Inc. (a) | 42,260 | 997,759 | |
Star Scientific, Inc. (a)(d) | 503,999 | 448,509 | |
Synutra International, Inc. (a)(d) | 18,499 | 135,413 | |
The Female Health Co. (d) | 57,839 | 399,667 | |
United-Guardian, Inc. | 5,269 | 146,794 | |
USANA Health Sciences, Inc. (a)(d) | 23,842 | 1,744,519 | |
| 49,646,319 | ||
Tobacco - 0.1% | |||
Alliance One International, Inc. (a) | 300,348 | 807,936 | |
Universal Corp. (d) | 77,461 | 4,465,627 | |
Vector Group Ltd. (d) | 215,169 | 4,202,251 | |
| 9,475,814 | ||
TOTAL CONSUMER STAPLES | 465,838,217 | ||
ENERGY - 6.0% | |||
Energy Equipment & Services - 2.2% | |||
Atwood Oceanics, Inc. (a) | 189,231 | 8,967,657 | |
Basic Energy Services, Inc. (a)(d) | 97,645 | 2,328,833 | |
Bolt Technology Corp. | 27,943 | 561,934 | |
Bristow Group, Inc. | 119,830 | 9,298,808 | |
C&J Energy Services, Inc. (a)(d) | 156,985 | 4,058,062 | |
Cal Dive International, Inc. (a)(d) | 284,336 | 503,275 | |
Carbo Ceramics, Inc. (d) | 65,328 | 8,103,938 | |
Core Laboratories NV | 149,801 | 28,170,078 | |
Dawson Geophysical Co. | 24,309 | 697,668 | |
Dresser-Rand Group, Inc. (a) | 248,572 | 13,504,917 | |
Dril-Quip, Inc. (a) | 134,770 | 14,495,861 | |
ENGlobal Corp. (a) | 44,577 | 72,215 | |
Era Group, Inc. (a) | 62,838 | 1,775,174 | |
Exterran Holdings, Inc. | 192,871 | 7,901,925 | |
Forbes Energy Services Ltd. (a) | 24,064 | 97,940 | |
Forum Energy Technologies, Inc. (a) | 189,033 | 4,895,955 | |
Frank's International NV | 110,623 | 2,615,128 | |
Geospace Technologies Corp. (a)(d) | 42,504 | 3,263,032 | |
Global Geophysical Services, Inc. (a)(d) | 67,238 | 94,133 | |
GreenHunter Energy, Inc. (a)(d) | 33,031 | 35,013 | |
Gulf Island Fabrication, Inc. | 43,462 | 911,398 | |
Gulfmark Offshore, Inc. Class A | 86,906 | 4,122,821 | |
Helix Energy Solutions Group, Inc. (a) | 334,224 | 7,901,055 | |
Hercules Offshore, Inc. (a) | 544,655 | 2,592,558 | |
Common Stocks - continued | |||
Shares | Value | ||
ENERGY - continued | |||
Energy Equipment & Services - continued | |||
Hornbeck Offshore Services, Inc. (a) | 106,861 | $ 4,569,376 | |
ION Geophysical Corp. (a)(d) | 451,417 | 1,837,267 | |
Key Energy Services, Inc. (a) | 445,865 | 4,030,620 | |
Matrix Service Co. (a) | 89,548 | 2,898,669 | |
McDermott International, Inc. (a)(d) | 775,119 | 6,456,741 | |
Mitcham Industries, Inc. (a) | 33,864 | 487,303 | |
Natural Gas Services Group, Inc. (a) | 42,549 | 1,382,843 | |
Newpark Resources, Inc. (a)(d) | 285,013 | 3,169,345 | |
Nuverra Environmental Solutions, Inc. (a)(d) | 49,849 | 847,433 | |
Oceaneering International, Inc. | 353,224 | 25,283,774 | |
Oil States International, Inc. (a) | 179,226 | 17,012,132 | |
Parker Drilling Co. (a) | 401,755 | 3,242,163 | |
Patterson-UTI Energy, Inc. | 476,596 | 13,873,710 | |
PHI, Inc. (non-vtg.) (a) | 37,596 | 1,511,359 | |
Pioneer Energy Services Corp. (a) | 219,417 | 2,501,354 | |
RigNet, Inc. (a) | 35,362 | 1,691,011 | |
RPC, Inc. (d) | 207,837 | 3,826,279 | |
SEACOR Holdings, Inc. (a)(d) | 65,838 | 5,824,029 | |
Superior Energy Services, Inc. | 528,300 | 15,632,397 | |
Synthesis Energy Systems, Inc. (a) | 189,821 | 313,205 | |
Tesco Corp. (a) | 108,916 | 2,066,137 | |
TETRA Technologies, Inc. (a) | 259,787 | 3,117,444 | |
TGC Industries, Inc. | 38,640 | 247,296 | |
Tidewater, Inc. | 163,672 | 7,974,100 | |
Unit Corp. (a) | 157,348 | 9,661,167 | |
Vantage Drilling Co. (a)(d) | 693,926 | 1,214,371 | |
Weatherford International Ltd. (a) | 2,543,594 | 42,401,712 | |
Willbros Group, Inc. (a) | 147,556 | 1,457,853 | |
| 311,500,468 | ||
Oil, Gas & Consumable Fuels - 3.8% | |||
Abraxas Petroleum Corp. (a)(d) | 313,135 | 1,055,265 | |
Adams Resources & Energy, Inc. | 9,909 | 729,302 | |
Alon U.S.A. Energy, Inc. | 82,812 | 1,108,853 | |
Alpha Natural Resources, Inc. (a)(d) | 720,455 | 3,868,843 | |
American Eagle Energy Corp. (a) | 29,846 | 57,901 | |
Amyris, Inc. (a)(d) | 109,799 | 501,781 | |
Antero Resources Corp. | 122,422 | 7,386,943 | |
APCO Oil and Gas International, Inc. (a) | 49,691 | 710,084 | |
Approach Resources, Inc. (a)(d) | 124,387 | 2,770,098 | |
Arch Coal, Inc. (d) | 713,323 | 3,252,753 | |
Ardmore Shipping Corp. (d) | 39,534 | 513,151 | |
Athlon Energy, Inc. | 114,586 | 4,258,016 | |
Barnwell Industries, Inc. (a) | 11,298 | 32,312 | |
Bill Barrett Corp. (a)(d) | 163,644 | 4,146,739 | |
BioFuel Energy Corp. (a)(d) | 12,280 | 35,735 | |
Bonanza Creek Energy, Inc. (a)(d) | 97,380 | 4,866,079 | |
BPZ Energy, Inc. (a)(d) | 372,244 | 766,823 | |
Callon Petroleum Co. (a) | 147,830 | 1,000,809 | |
Carrizo Oil & Gas, Inc. (a)(d) | 135,804 | 6,754,891 | |
Ceres, Inc. (a)(d) | 30,062 | 42,989 | |
| |||
Shares | Value | ||
Cheniere Energy, Inc. (a) | 728,638 | $ 36,016,576 | |
Cimarex Energy Co. | 287,770 | 33,297,867 | |
Clayton Williams Energy, Inc. (a) | 21,381 | 2,073,957 | |
Clean Energy Fuels Corp. (a)(d) | 236,563 | 1,980,032 | |
Cloud Peak Energy, Inc. (a) | 205,532 | 3,987,321 | |
Cobalt International Energy, Inc. (a) | 987,614 | 19,041,198 | |
Comstock Resources, Inc. | 152,811 | 3,019,545 | |
Concho Resources, Inc. (a) | 348,976 | 42,271,463 | |
Contango Oil & Gas Co. (a) | 54,222 | 2,571,207 | |
Continental Resources, Inc. (a)(d) | 142,154 | 16,990,246 | |
Crosstex Energy, Inc. | 149,064 | 6,205,534 | |
CVR Energy, Inc. (d) | 52,267 | 2,056,706 | |
Delek U.S. Holdings, Inc. | 124,667 | 3,460,756 | |
DHT Holdings, Inc. | 179,426 | 1,406,700 | |
Diamondback Energy, Inc. (a)(d) | 133,637 | 8,596,868 | |
Double Eagle Petroleum Co. (a) | 27,291 | 58,676 | |
Earthstone Energy, Inc. (a) | 4,213 | 92,812 | |
Emerald Oil, Inc. (a) | 203,832 | 1,561,353 | |
Endeavour International Corp. (a)(d) | 148,049 | 719,518 | |
Energen Corp. | 239,351 | 19,253,394 | |
Energy XXI (Bermuda) Ltd. | 249,028 | 5,767,488 | |
EPL Oil & Gas, Inc. (a) | 120,207 | 3,618,231 | |
Evolution Petroleum Corp. | 68,734 | 893,542 | |
EXCO Resources, Inc. (d) | 572,041 | 2,986,054 | |
FieldPoint Petroleum Corp. (a) | 9,981 | 45,713 | |
FieldPoint Petroleum Corp. warrants 3/23/18 (a) | 9,981 | 7,785 | |
Forest Oil Corp. (a) | 391,009 | 785,928 | |
FX Energy, Inc. (a)(d) | 156,740 | 587,775 | |
Gasco Energy, Inc. (a) | 14 | 0 | |
Gastar Exploration, Inc. (a) | 187,114 | 1,193,787 | |
Gevo, Inc. (a) | 159,386 | 216,765 | |
GMX Resources, Inc. (a) | 1 | 0 | |
Goodrich Petroleum Corp. (a)(d) | 118,604 | 1,615,386 | |
Green Plains Renewable Energy, Inc. | 76,943 | 2,033,603 | |
Gulfport Energy Corp. (a) | 279,422 | 18,469,794 | |
Halcon Resources Corp. (a)(d) | 875,442 | 3,335,434 | |
Hallador Energy Co. | 22,224 | 181,126 | |
Harvest Natural Resources, Inc. (a)(d) | 143,319 | 601,940 | |
HollyFrontier Corp. | 660,507 | 30,099,304 | |
Houston American Energy Corp. (a) | 98,796 | 36,594 | |
Hyperdynamics Corp. (a)(d) | 66,951 | 362,874 | |
Isramco, Inc. (a)(d) | 2,413 | 346,217 | |
James River Coal Co. (a)(d) | 122,505 | 90,654 | |
Jones Energy, Inc. | 42,997 | 671,613 | |
KiOR, Inc. Class A (a)(d) | 74,649 | 104,509 | |
Kodiak Oil & Gas Corp. (a) | 879,259 | 10,384,049 | |
Kosmos Energy Ltd. (a) | 384,441 | 4,221,162 | |
Laredo Petroleum Holdings, Inc. (a)(d) | 196,262 | 5,120,476 | |
Lilis Energy, Inc. (a) | 5,111 | 16,355 | |
Lucas Energy, Inc. (a) | 25,312 | 23,578 | |
Magellan Petroleum Corp. (a) | 109,622 | 146,893 | |
Magnum Hunter Resources Corp. (a)(d) | 548,526 | 4,602,133 | |
Common Stocks - continued | |||
Shares | Value | ||
ENERGY - continued | |||
Oil, Gas & Consumable Fuels - continued | |||
Magnum Hunter Resources Corp. warrants 4/16/16 (a) | 45,510 | $ 19,543 | |
Matador Resources Co. (a)(d) | 184,920 | 4,486,159 | |
Mexco Energy Corp. (a) | 2,175 | 19,140 | |
Midstates Petroleum Co., Inc. (a)(d) | 114,326 | 504,178 | |
Miller Energy Resources, Inc. (a)(d) | 137,671 | 955,437 | |
Northern Oil & Gas, Inc. (a)(d) | 212,435 | 2,957,095 | |
Oasis Petroleum, Inc. (a) | 315,514 | 13,746,945 | |
Pacific Ethanol, Inc. (a) | 59,602 | 814,759 | |
Panhandle Royalty Co. Class A | 15,804 | 584,116 | |
PBF Energy, Inc. Class A | 185,646 | 4,678,279 | |
PDC Energy, Inc. (a)(d) | 117,112 | 7,276,169 | |
Penn Virginia Corp. (a)(d) | 180,541 | 2,735,196 | |
Petroquest Energy, Inc. (a) | 184,191 | 871,223 | |
PostRock Energy Corp. (a) | 17,510 | 22,763 | |
PrimeEnergy Corp. (a) | 1,965 | 97,661 | |
Pyramid Oil Co. (a) | 7,060 | 48,643 | |
Quicksilver Resources, Inc. (a)(d) | 441,131 | 1,442,498 | |
Renewable Energy Group, Inc. (a)(d) | 75,100 | 876,417 | |
Rentech, Inc. (a) | 810,143 | 1,523,069 | |
Resolute Energy Corp. (a)(d) | 207,547 | 1,934,338 | |
Rex American Resources Corp. (a) | 20,943 | 998,562 | |
Rex Energy Corp. (a)(d) | 150,832 | 2,865,808 | |
Ring Energy, Inc. (a) | 12,462 | 171,851 | |
Rosetta Resources, Inc. (a)(d) | 199,831 | 8,866,501 | |
Royale Energy, Inc. (a)(d) | 17,323 | 48,851 | |
Sanchez Energy Corp. (a)(d) | 145,553 | 4,336,024 | |
SandRidge Energy, Inc. (a)(d) | 1,201,026 | 7,746,618 | |
Saratoga Resources, Inc. (a) | 38,209 | 51,964 | |
SemGroup Corp. Class A | 137,901 | 9,283,495 | |
SM Energy Co. | 221,938 | 16,367,928 | |
Solazyme, Inc. (a)(d) | 161,875 | 1,986,206 | |
Stone Energy Corp. (a)(d) | 168,818 | 6,067,319 | |
Swift Energy Co. (a)(d) | 152,498 | 1,524,980 | |
Synergy Resources Corp. (a) | 233,774 | 2,475,667 | |
Syntroleum Corp. (a)(d) | 21,880 | 87,301 | |
Targa Resources Corp. | 94,329 | 9,127,274 | |
Teekay Corp. | 129,554 | 7,740,852 | |
Tengasco, Inc. (a) | 63,216 | 25,925 | |
TransAtlantic Petroleum Ltd. (a) | 111,284 | 89,027 | |
Triangle Petroleum Corp. (a)(d) | 200,315 | 1,794,822 | |
U.S. Energy Corp. (a) | 91,127 | 364,508 | |
Ultra Petroleum Corp. (a)(d) | 504,286 | 12,687,836 | |
Uranium Energy Corp. (a)(d) | 267,406 | 486,679 | |
Uranium Resources, Inc. (a)(d) | 43,869 | 140,819 | |
USEC, Inc. (a)(d) | 15,552 | 85,692 | |
VAALCO Energy, Inc. (a)(d) | 208,727 | 1,390,122 | |
W&T Offshore, Inc. | 130,520 | 1,966,936 | |
Warren Resources, Inc. (a) | 249,928 | 1,107,181 | |
Western Refining, Inc. (d) | 177,022 | 6,452,452 | |
Westmoreland Coal Co. (a) | 46,315 | 1,046,719 | |
| |||
Shares | Value | ||
Whiting Petroleum Corp. (a) | 393,733 | $ 27,053,394 | |
World Fuel Services Corp. | 248,189 | 11,173,469 | |
ZaZa Energy Corp. (a)(d) | 90,988 | 83,691 | |
Zion Oil & Gas, Inc. (a)(d) | 112,487 | 186,728 | |
| 538,564,687 | ||
TOTAL ENERGY | 850,065,155 | ||
FINANCIALS - 21.5% | |||
Capital Markets - 1.7% | |||
Affiliated Managers Group, Inc. (a) | 171,184 | 32,191,151 | |
Arlington Asset Investment Corp. (d) | 49,499 | 1,312,713 | |
Artisan Partners Asset Management, Inc. | 61,338 | 3,874,721 | |
BGC Partners, Inc. Class A | 572,665 | 3,894,122 | |
Calamos Asset Management, Inc. Class A | 63,145 | 753,320 | |
CIFI Corp. | 13,714 | 108,341 | |
Cohen & Steers, Inc. (d) | 64,487 | 2,438,253 | |
Cowen Group, Inc. Class A��(a) | 378,186 | 1,618,636 | |
Diamond Hill Investment Group, Inc. | 7,229 | 848,323 | |
Eaton Vance Corp. (non-vtg.) | 387,046 | 14,645,821 | |
Evercore Partners, Inc. Class A | 106,659 | 5,934,507 | |
FBR & Co. (a) | 35,461 | 921,986 | |
Federated Investors, Inc. Class B (non-vtg.) (d) | 315,876 | 8,655,002 | |
Financial Engines, Inc. | 169,748 | 9,592,459 | |
FXCM, Inc. Class A (d) | 131,893 | 2,222,397 | |
GAMCO Investors, Inc. Class A | 14,987 | 1,169,885 | |
GFI Group, Inc. | 209,271 | 839,177 | |
Gleacher & Co., Inc. (a) | 9,266 | 102,760 | |
Greenhill & Co., Inc. | 87,741 | 4,673,963 | |
HFF, Inc. | 120,005 | 3,828,160 | |
ICG Group, Inc. (a) | 122,256 | 2,485,464 | |
Institutional Financial Markets, Inc. | 16,813 | 41,360 | |
INTL FCStone, Inc. (a)(d) | 50,495 | 918,504 | |
Investment Technology Group, Inc. (a) | 123,406 | 2,132,456 | |
Janus Capital Group, Inc. (d) | 495,666 | 5,546,503 | |
JMP Group, Inc. | 44,707 | 328,596 | |
KCG Holdings, Inc. Class A | 337,844 | 4,016,965 | |
Ladenburg Thalmann Financial Services, Inc. (a) | 294,559 | 821,820 | |
LPL Financial | 261,852 | 14,056,215 | |
Manning & Napier, Inc. Class A | 42,186 | 619,712 | |
Marcus & Millichap, Inc. | 40,476 | 678,783 | |
Medallion Financial Corp. | 68,389 | 994,376 | |
Oppenheimer Holdings, Inc. Class A (non-vtg.) | 32,675 | 892,354 | |
Piper Jaffray Companies (a)(d) | 58,981 | 2,471,304 | |
Pzena Investment Management, Inc. | 50,731 | 586,450 | |
Raymond James Financial, Inc. | 402,242 | 21,230,333 | |
RCS Capital Corp. Class A | 5,235 | 119,149 | |
Safeguard Scientifics, Inc. (a)(d) | 76,767 | 1,505,401 | |
SEI Investments Co. | 476,702 | 16,002,886 | |
Common Stocks - continued | |||
Shares | Value | ||
FINANCIALS - continued | |||
Capital Markets - continued | |||
Silvercrest Asset Management Group Class A | 16,670 | $ 280,223 | |
Stifel Financial Corp. (a)(d) | 203,928 | 9,806,898 | |
SWS Group, Inc. (a) | 96,417 | 785,799 | |
TD Ameritrade Holding Corp. | 778,984 | 26,041,435 | |
Teton Advisors, Inc. (a) | 145 | 4,713 | |
U.S. Global Investments, Inc. Class A | 36,632 | 131,143 | |
Virtus Investment Partners, Inc. (a) | 23,713 | 4,390,699 | |
Waddell & Reed Financial, Inc. Class A | 279,988 | 19,515,164 | |
Walter Investment Management Corp. (a)(d) | 123,473 | 3,154,735 | |
Westwood Holdings Group, Inc. | 21,548 | 1,226,297 | |
WisdomTree Investments, Inc. (a)(d) | 328,844 | 5,123,390 | |
| 245,534,824 | ||
Commercial Banks - 4.7% | |||
1st Source Corp. | 47,766 | 1,490,299 | |
1st United Bancorp, Inc. | 71,684 | 551,967 | |
Access National Corp. | 15,817 | 266,516 | |
ACNB Corp. (d) | 11,654 | 218,396 | |
Ameriana Bancorp | 2,223 | 30,900 | |
American National Bankshares, Inc. | 18,331 | 411,714 | |
American River Bankshares (a) | 3,552 | 35,129 | |
Ameris Bancorp (a) | 82,350 | 1,732,644 | |
AmeriServ Financial, Inc. | 14,728 | 46,982 | |
Ames National Corp. | 16,110 | 358,931 | |
Arrow Financial Corp. | 40,467 | 1,056,593 | |
Associated Banc-Corp. | 583,660 | 9,741,285 | |
Auburn National Bancorp., Inc. | 2,289 | 55,623 | |
BancFirst Corp. | 24,757 | 1,362,378 | |
Bancorp, Inc., Delaware (a) | 129,188 | 2,473,950 | |
BancorpSouth, Inc. | 276,510 | 6,616,884 | |
Bank of Hawaii Corp. | 151,832 | 8,874,580 | |
Bank of Kentucky Financial Corp. | 10,625 | 372,831 | |
Bank of Marin Bancorp | 15,657 | 692,509 | |
Bank of the Ozarks, Inc. | 112,081 | 7,108,177 | |
BankUnited, Inc. | 283,087 | 9,477,753 | |
Banner Bank | 75,557 | 2,998,857 | |
Bar Harbor Bankshares | 9,461 | 359,518 | |
Baylake Corp. | 5,875 | 73,438 | |
BBCN Bancorp, Inc. | 287,266 | 4,889,267 | |
BCB Bancorp, Inc. | 9,297 | 123,464 | |
BNC Bancorp (d) | 76,230 | 1,328,689 | |
BOK Financial Corp. | 92,125 | 5,963,251 | |
Boston Private Financial Holdings, Inc. | 288,220 | 3,758,389 | |
Bridge Bancorp, Inc. | 30,474 | 802,380 | |
Bridge Capital Holdings (a) | 23,080 | 512,838 | |
Bryn Mawr Bank Corp. | 25,285 | 720,370 | |
BSB Bancorp, Inc. (a) | 19,579 | 330,102 | |
C & F Financial Corp. | 6,736 | 246,538 | |
Camden National Corp. | 17,382 | 652,520 | |
| |||
Shares | Value | ||
Capital Bank Financial Corp.: | |||
rights (a) | 10,774 | $ 0 | |
Series A (a) | 170,724 | 3,926,652 | |
Capital City Bank Group, Inc. (d) | 33,531 | 475,470 | |
CapitalSource, Inc. | 661,961 | 9,730,827 | |
Cardinal Financial Corp. | 103,936 | 1,791,857 | |
Cascade Bancorp (a)(d) | 30,976 | 151,163 | |
Cathay General Bancorp | 256,474 | 6,517,004 | |
Center Bancorp, Inc. | 41,583 | 773,860 | |
Centerstate Banks of Florida, Inc. | 94,937 | 1,037,661 | |
Central Pacific Financial Corp. | 124,369 | 2,453,800 | |
Central Valley Community Bancorp | 8,755 | 101,208 | |
Century Bancorp, Inc. Class A (non-vtg.) | 7,814 | 280,523 | |
Chemical Financial Corp. | 110,706 | 3,264,720 | |
Chemung Financial Corp. | 11,097 | 324,809 | |
CIT Group, Inc. | 659,699 | 32,114,147 | |
Citizens & Northern Corp. | 30,086 | 599,313 | |
Citizens Holding Co. | 2,280 | 41,906 | |
City Holding Co. (d) | 58,474 | 2,589,229 | |
City National Corp. | 156,768 | 11,730,949 | |
CNB Financial Corp., Pennsylvania | 24,450 | 450,125 | |
CoBiz, Inc. | 133,405 | 1,488,800 | |
Colony Bankcorp, Inc. (a) | 4,518 | 27,786 | |
Columbia Banking Systems, Inc. | 193,061 | 5,062,059 | |
Commerce Bancshares, Inc. | 284,515 | 12,706,440 | |
Community Bank System, Inc. | 176,437 | 6,427,600 | |
Community Trust Bancorp, Inc. | 52,840 | 2,092,464 | |
CommunityOne Bancorp (a)(d) | 21,639 | 238,245 | |
CU Bancorp (a) | 16,798 | 303,372 | |
Cullen/Frost Bankers, Inc. | 175,898 | 13,129,027 | |
CVB Financial Corp. | 323,112 | 5,030,854 | |
Eagle Bancorp, Inc., Maryland | 81,397 | 2,788,661 | |
East West Bancorp, Inc. | 486,885 | 17,376,926 | |
Eastern Virginia Bankshares, Inc. (a) | 3,557 | 24,188 | |
Enterprise Bancorp, Inc. | 14,913 | 287,075 | |
Enterprise Financial Services Corp. | 58,302 | 1,091,413 | |
Farmers Capital Bank Corp. (a) | 21,180 | 414,916 | |
Farmers National Banc Corp. | 41,229 | 306,744 | |
Fidelity Southern Corp. | 42,096 | 604,920 | |
Financial Institutions, Inc. | 32,310 | 712,112 | |
First Bancorp, North Carolina | 41,814 | 765,196 | |
First Bancorp, Puerto Rico (a) | 367,628 | 1,915,342 | |
First Busey Corp. | 193,866 | 1,153,503 | |
First Citizen Bancshares, Inc. | 29,067 | 6,522,344 | |
First Commonwealth Financial Corp. | 341,940 | 2,913,329 | |
First Community Bancshares, Inc. | 40,060 | 671,005 | |
First Connecticut Bancorp, Inc. | 47,822 | 749,849 | |
First Financial Bancorp, Ohio | 253,298 | 4,316,198 | |
First Financial Bankshares, Inc. (d) | 109,188 | 6,603,690 | |
First Financial Corp., Indiana | 30,489 | 1,048,517 | |
First Financial Holdings, Inc. | 86,329 | 5,286,788 | |
First Financial Service Corp. (a) | 745 | 3,144 | |
First Horizon National Corp. | 761,724 | 9,117,836 | |
First Internet Bancorp | 1,845 | 42,417 | |
Common Stocks - continued | |||
Shares | Value | ||
FINANCIALS - continued | |||
Commercial Banks - continued | |||
First Interstate Bancsystem, Inc. | 80,392 | $ 2,082,153 | |
First Merchants Corp. | 134,492 | 2,880,819 | |
First Midwest Bancorp, Inc., Delaware | 296,196 | 4,937,587 | |
First Niagara Financial Group, Inc. | 1,150,441 | 10,434,500 | |
First of Long Island Corp. | 17,771 | 690,581 | |
First Republic Bank | 411,169 | 21,368,453 | |
First Security Group, Inc. | 32,694 | 70,292 | |
First South Bancorp, Inc., Virginia | 39,689 | 346,088 | |
First United Corp. (a) | 14,602 | 112,581 | |
Firstbank Corp., Michigan | 12,755 | 234,054 | |
FirstMerit Corp. | 542,865 | 11,269,877 | |
Flushing Financial Corp. | 104,087 | 2,156,683 | |
FNB Corp., Pennsylvania | 551,647 | 6,724,577 | |
Fulton Financial Corp. | 674,238 | 8,299,870 | |
German American Bancorp, Inc. | 31,949 | 923,965 | |
Glacier Bancorp, Inc. | 243,311 | 6,751,880 | |
Great Southern Bancorp, Inc. | 22,484 | 645,291 | |
Guaranty Bancorp | 48,684 | 687,418 | |
Hampton Roads Bankshares, Inc. (a) | 275,254 | 456,922 | |
Hancock Holding Co. | 295,673 | 10,188,892 | |
Hanmi Financial Corp. | 118,757 | 2,782,477 | |
Hawthorn Bancshares, Inc. | 6,989 | 90,927 | |
Heartland Financial U.S.A., Inc. | 44,583 | 1,199,283 | |
Heritage Commerce Corp. | 57,846 | 467,974 | |
Heritage Financial Corp., Washington | 35,332 | 626,436 | |
Heritage Oaks Bancorp (a) | 59,207 | 473,064 | |
Home Bancshares, Inc. | 164,845 | 5,532,198 | |
Home Federal Bancorp, Inc. | 41,355 | 624,047 | |
HomeTrust Bancshares, Inc. (a) | 58,805 | 921,474 | |
Horizon Bancorp Industries | 16,035 | 348,601 | |
Hudson Valley Holding Corp. | 43,646 | 820,108 | |
IBERIABANK Corp. | 107,973 | 7,072,232 | |
Independent Bank Corp. (a) | 78,883 | 970,261 | |
Independent Bank Corp., Massachusetts | 94,643 | 3,481,916 | |
Independent Bank Group, Inc. | 12,518 | 672,717 | |
International Bancshares Corp. | 210,616 | 4,882,079 | |
Intervest Bancshares Corp. Class A (a)(d) | 47,999 | 355,673 | |
Investors Bancorp, Inc. | 220,213 | 5,840,049 | |
Lakeland Bancorp, Inc. | 90,484 | 1,022,469 | |
Lakeland Financial Corp. | 58,722 | 2,231,436 | |
LCNB Corp. (d) | 22,903 | 400,803 | |
Macatawa Bank Corp. (d) | 64,065 | 338,263 | |
MainSource Financial Group, Inc. | 47,324 | 817,285 | |
MB Financial, Inc. | 196,866 | 6,010,319 | |
MBT Financial Corp. (a) | 11,242 | 54,186 | |
Mercantile Bank Corp. | 19,339 | 392,582 | |
Merchants Bancshares, Inc. | 14,012 | 461,555 | |
Metro Bancorp, Inc. (a) | 42,825 | 840,227 | |
Middleburg Financial Corp. | 14,592 | 268,201 | |
Midsouth Bancorp, Inc. | 24,320 | 426,086 | |
MidWestOne Financial Group, Inc. | 16,620 | 433,450 | |
| |||
Shares | Value | ||
Monarch Financial Holdings, Inc. | 10,098 | $ 118,954 | |
MutualFirst Financial, Inc. | 7,773 | 147,842 | |
National Bank Holdings Corp. | 165,480 | 3,248,372 | |
National Bankshares, Inc. (d) | 16,169 | 582,084 | |
National Penn Bancshares, Inc. | 448,215 | 4,840,722 | |
NBT Bancorp, Inc. | 184,680 | 4,336,286 | |
NewBridge Bancorp (a)(d) | 47,976 | 345,427 | |
North Valley Bancorp (a) | 24,641 | 573,396 | |
Northeast Bancorp | 15,002 | 139,519 | |
Northrim Bancorp, Inc. | 12,118 | 297,739 | |
Norwood Financial Corp. | 3,054 | 88,688 | |
OBA Financial Services, Inc. (a) | 5,103 | 94,303 | |
OFG Bancorp (d) | 149,770 | 2,396,320 | |
Ohio Valley Banc Corp. | 7,485 | 167,215 | |
Old National Bancorp, Indiana | 383,224 | 5,376,633 | |
Old Second Bancorp, Inc. (a)(d) | 34,774 | 172,479 | |
OmniAmerican Bancorp, Inc. | 32,753 | 713,033 | |
Orrstown Financial Services, Inc. (a) | 18,291 | 299,607 | |
Pacific Continental Corp. | 43,214 | 623,578 | |
Pacific Mercantile Bancorp (a) | 29,298 | 182,820 | |
Pacific Premier Bancorp, Inc. (a) | 35,923 | 571,176 | |
PacWest Bancorp (d) | 133,344 | 5,787,130 | |
Park National Corp. (d) | 52,197 | 4,074,498 | |
Park Sterling Corp. | 124,780 | 818,557 | |
Patriot National Bancorp, Inc. (a) | 14,022 | 17,528 | |
Peapack-Gladstone Financial Corp. | 21,894 | 407,228 | |
Penns Woods Bancorp, Inc. | 11,224 | 514,171 | |
Peoples Bancorp of North Carolina | 1,842 | 28,367 | |
Peoples Bancorp, Inc. | 20,954 | 512,744 | |
Peoples Financial Corp., Mississippi (a) | 7,232 | 97,632 | |
Pinnacle Financial Partners, Inc. | 116,895 | 4,217,572 | |
Popular, Inc. (a) | 344,493 | 9,849,055 | |
Porter Bancorp, Inc. (a) | 3,733 | 3,696 | |
Preferred Bank, Los Angeles (a) | 27,407 | 658,590 | |
Premier Financial Bancorp, Inc. | 6,092 | 85,410 | |
PrivateBancorp, Inc. | 217,626 | 6,280,686 | |
Prosperity Bancshares, Inc. | 186,499 | 11,807,252 | |
QCR Holdings, Inc. | 6,005 | 103,887 | |
Renasant Corp. | 112,407 | 3,266,547 | |
Republic Bancorp, Inc., Kentucky Class A | 30,943 | 745,417 | |
Republic First Bancorp, Inc. (a) | 44,636 | 164,260 | |
Royal Bancshares of Pennsylvania, Inc. Class A (a) | 6,704 | 16,693 | |
S&T Bancorp, Inc. | 97,041 | 2,238,736 | |
S.Y. Bancorp, Inc. | 39,985 | 1,193,152 | |
Sandy Spring Bancorp, Inc. | 80,527 | 1,910,906 | |
SB Financial Group, Inc. | 532 | 4,575 | |
Seacoast Banking Corp., Florida (a) | 75,186 | 810,505 | |
Shore Bancshares, Inc. (a) | 20,686 | 195,896 | |
Sierra Bancorp | 31,765 | 518,087 | |
Signature Bank (a)(d) | 157,568 | 20,630,378 | |
Simmons First National Corp. Class A | 52,680 | 1,876,988 | |
Southern National Bancorp of Virginia, Inc. | 12,282 | 122,820 | |
Common Stocks - continued | |||
Shares | Value | ||
FINANCIALS - continued | |||
Commercial Banks - continued | |||
Southside Bancshares, Inc. | 54,624 | $ 1,613,047 | |
Southwest Bancorp, Inc., Oklahoma | 58,607 | 1,030,897 | |
State Bank Financial Corp. | 129,459 | 2,203,392 | |
Sterling Bancorp | 304,891 | 3,914,800 | |
Sterling Financial Corp. | 78,788 | 2,495,216 | |
Suffolk Bancorp (a) | 26,410 | 532,690 | |
Summit Financial Group, Inc. (a) | 1,800 | 18,846 | |
Sun Bancorp, Inc., New Jersey (a) | 136,043 | 473,430 | |
Susquehanna Bancshares, Inc. | 634,995 | 6,946,845 | |
SVB Financial Group (a) | 153,018 | 19,266,496 | |
Synovus Financial Corp. | 3,203,582 | 11,148,465 | |
Taylor Capital Group, Inc. (a) | 53,053 | 1,252,051 | |
TCF Financial Corp. | 553,071 | 8,915,505 | |
Texas Capital Bancshares, Inc. (a)(d) | 134,877 | 8,490,507 | |
The First Bancorp, Inc. | 21,478 | 351,595 | |
Tompkins Financial Corp. | 41,723 | 2,019,810 | |
Tower Financial Corp. | 3,165 | 73,934 | |
TowneBank (d) | 72,900 | 1,091,313 | |
Trico Bancshares | 46,177 | 1,153,963 | |
Trustmark Corp. | 245,441 | 5,922,491 | |
Two River Bancorp | 1,393 | 11,297 | |
UMB Financial Corp. | 129,352 | 8,063,804 | |
Umpqua Holdings Corp. (d) | 370,508 | 6,583,927 | |
Union Bankshares, Inc. | 388 | 8,858 | |
Union First Market Bankshares Corp. | 169,630 | 4,291,639 | |
United Bancorp, Inc. | 370 | 3,078 | |
United Bankshares, Inc., West Virginia (d) | 216,395 | 6,368,505 | |
United Community Banks, Inc., Georgia (a) | 141,348 | 2,359,098 | |
United Security Bancshares, Inc. (a) | 8,545 | 65,113 | |
United Security Bancshares, California | 7,792 | 40,986 | |
Univest Corp. of Pennsylvania | 47,341 | 912,261 | |
Valley National Bancorp (d) | 708,708 | 7,143,777 | |
VantageSouth Bancshares, Inc. (a) | 11,111 | 67,110 | |
ViewPoint Financial Group | 138,306 | 3,457,650 | |
Washington Banking Co., Oak Harbor | 48,330 | 890,239 | |
Washington Trust Bancorp, Inc. | 39,990 | 1,407,248 | |
Webster Financial Corp. | 301,055 | 9,323,673 | |
WesBanco, Inc. | 97,343 | 2,901,795 | |
West Bancorp., Inc. | 33,706 | 500,534 | |
Westamerica Bancorp. (d) | 98,932 | 4,974,301 | |
Westbury Bancorp, Inc. | 13,612 | 196,013 | |
Western Alliance Bancorp. (a) | 263,514 | 6,102,984 | |
Wilshire Bancorp, Inc. | 227,726 | 2,311,419 | |
Wintrust Financial Corp. | 167,102 | 7,733,481 | |
Xenith Bankshares, Inc. (a) | 17,541 | 105,597 | |
Yadkin Financial Corp. (a) | 44,751 | 859,219 | |
| 667,308,561 | ||
Consumer Finance - 0.3% | |||
Asta Funding, Inc. (a) | 25,295 | 212,478 | |
| |||
Shares | Value | ||
Atlanticus Holdings Corp. (a)(d) | 33,601 | $ 84,003 | |
Cash America International, Inc. (d) | 101,875 | 4,077,038 | |
Consumer Portfolio Services, Inc. (a) | 34,741 | 270,632 | |
Credit Acceptance Corp. (a) | 36,903 | 5,097,780 | |
DFC Global Corp. (a) | 126,272 | 1,039,219 | |
Encore Capital Group, Inc. (a)(d) | 79,228 | 3,852,065 | |
EZCORP, Inc. (non-vtg.) Class A (a) | 197,585 | 2,497,474 | |
First Cash Financial Services, Inc. (a)(d) | 101,068 | 5,339,422 | |
First Marblehead Corp. (a) | 22,462 | 157,459 | |
Green Dot Corp. Class A (a) | 72,624 | 1,463,374 | |
Imperial Holdings, Inc. (a)(d) | 53,799 | 294,281 | |
JGWPT Holdings, Inc. | 37,576 | 718,453 | |
Nelnet, Inc. Class A | 61,950 | 2,485,434 | |
Nicholas Financial, Inc. | 73,640 | 1,162,039 | |
Portfolio Recovery Associates, Inc. (a)(d) | 166,653 | 9,037,592 | |
QC Holdings, Inc. | 15,915 | 38,673 | |
Regional Management Corp. (a) | 35,651 | 1,075,947 | |
Springleaf Holdings, Inc. (d) | 77,086 | 2,171,513 | |
World Acceptance Corp. (a)(d) | 35,872 | 3,438,331 | |
| 44,513,207 | ||
Diversified Financial Services - 0.5% | |||
California First National Bancorp | 1,545 | 23,144 | |
Catskill Litigation Trust (a) | 1,036 | 0 | |
CBOE Holdings, Inc. | 289,485 | 15,640,875 | |
Gain Capital Holdings, Inc. (d) | 46,117 | 475,927 | |
ING U.S., Inc. | 366,313 | 13,139,647 | |
Interactive Brokers Group, Inc. | 167,002 | 3,714,124 | |
Life Partners Holdings, Inc. (d) | 51,198 | 123,387 | |
MarketAxess Holdings, Inc. | 130,538 | 7,706,964 | |
Marlin Business Services Corp. | 28,530 | 613,395 | |
MicroFinancial, Inc. | 17,898 | 145,511 | |
MSCI, Inc. Class A (a) | 398,294 | 17,409,431 | |
NCP Litigation Trust (a) | 200 | 0 | |
NewStar Financial, Inc. (a) | 69,745 | 1,072,678 | |
PHH Corp. (a) | 177,919 | 4,631,232 | |
PICO Holdings, Inc. (a) | 85,950 | 2,158,205 | |
Resource America, Inc. Class A | 25,148 | 237,900 | |
Vector Capital Corp. rights (a) | 49,572 | 1 | |
| 67,092,421 | ||
Insurance - 4.0% | |||
Alleghany Corp. (a) | 54,712 | 21,091,476 | |
Allied World Assurance Co. Holdings Ltd. | 108,644 | 10,833,980 | |
AMBAC Financial Group, Inc. (a) | 152,251 | 5,261,795 | |
American Equity Investment Life Holding Co. | 229,949 | 5,026,685 | |
American Financial Group, Inc. | 226,460 | 12,944,454 | |
American National Insurance Co. | 20,273 | 2,300,783 | |
Amerisafe, Inc. | 62,486 | 2,720,640 | |
Amtrust Financial Services, Inc. (d) | 103,569 | 3,914,908 | |
Arch Capital Group Ltd. (a)(d) | 397,262 | 22,294,343 | |
Argo Group International Holdings, Ltd. | 89,165 | 3,935,743 | |
Arthur J. Gallagher & Co. | 424,118 | 19,594,252 | |
Common Stocks - continued | |||
Shares | Value | ||
FINANCIALS - continued | |||
Insurance - continued | |||
Aspen Insurance Holdings Ltd. | 210,817 | $ 7,918,287 | |
Assured Guaranty Ltd. | 531,990 | 13,060,355 | |
Axis Capital Holdings Ltd. | 350,058 | 15,392,050 | |
Baldwin & Lyons, Inc. Class B | 20,123 | 517,362 | |
Brown & Brown, Inc. | 383,128 | 11,532,153 | |
Citizens, Inc. Class A (a)(d) | 105,942 | 777,614 | |
CNA Financial Corp. | 130,900 | 5,431,041 | |
CNO Financial Group, Inc. | 731,060 | 13,349,156 | |
Crawford & Co. Class B | 71,993 | 609,781 | |
Donegal Group, Inc. Class A | 26,385 | 372,292 | |
eHealth, Inc. (a)(d) | 61,993 | 2,975,664 | |
EMC Insurance Group | 12,011 | 366,336 | |
Employers Holdings, Inc. | 101,985 | 2,006,045 | |
Endurance Specialty Holdings Ltd. | 150,695 | 7,857,237 | |
Enstar Group Ltd. (a) | 32,640 | 4,085,875 | |
Erie Indemnity Co. Class A | 88,774 | 6,443,217 | |
Everest Re Group Ltd. | 156,575 | 23,367,253 | |
FBL Financial Group, Inc. Class A | 37,269 | 1,559,335 | |
Federated National Holding Co. | 17,351 | 275,534 | |
Fidelity National Financial, Inc. Class A | 907,507 | 30,002,181 | |
First Acceptance Corp. (a) | 24,679 | 64,165 | |
First American Financial Corp. | 349,879 | 9,425,740 | |
Fortegra Financial Corp. (a) | 15,197 | 106,227 | |
Global Indemnity PLC (a)(d) | 37,631 | 981,416 | |
Greenlight Capital Re, Ltd. (a)(d) | 101,968 | 3,206,894 | |
Hallmark Financial Services, Inc. (a) | 27,548 | 233,332 | |
Hanover Insurance Group, Inc. | 149,874 | 8,818,586 | |
HCC Insurance Holdings, Inc. | 326,998 | 14,355,212 | |
HCI Group, Inc. (d) | 31,967 | 1,547,842 | |
Health Insurance Innovations (d) | 12,600 | 158,634 | |
Hilltop Holdings, Inc. (a) | 229,448 | 5,623,770 | |
Horace Mann Educators Corp. | 137,825 | 3,943,173 | |
Independence Holding Co. | 12,745 | 173,714 | |
Infinity Property & Casualty Corp. | 40,020 | 2,951,475 | |
Investors Title Co. | 2,693 | 207,146 | |
Kansas City Life Insurance Co. | 10,866 | 534,607 | |
Kemper Corp. | 177,471 | 6,882,325 | |
Maiden Holdings Ltd. | 199,442 | 2,239,734 | |
Markel Corp. (a) | 46,363 | 26,797,814 | |
MBIA, Inc. (a)(d) | 476,702 | 6,459,312 | |
Meadowbrook Insurance Group, Inc. | 152,822 | 820,654 | |
Mercury General Corp. | 128,965 | 5,842,115 | |
Montpelier Re Holdings Ltd. | 152,603 | 4,350,712 | |
National Interstate Corp. (d) | 62,455 | 1,890,513 | |
National Western Life Insurance Co. Class A | 7,764 | 1,755,052 | |
Navigators Group, Inc. (a) | 38,081 | 2,308,470 | |
Old Republic International Corp. | 782,580 | 12,176,945 | |
OneBeacon Insurance Group Ltd. | 65,270 | 1,070,428 | |
PartnerRe Ltd. | 154,297 | 15,256,887 | |
Phoenix Companies, Inc. (a) | 17,250 | 881,993 | |
| |||
Shares | Value | ||
Platinum Underwriters Holdings Ltd. | 97,663 | $ 5,725,005 | |
Primerica, Inc. | 182,311 | 8,171,179 | |
ProAssurance Corp. | 211,456 | 9,612,790 | |
Protective Life Corp. | 259,672 | 13,539,298 | |
Reinsurance Group of America, Inc. | 231,645 | 17,834,349 | |
RenaissanceRe Holdings Ltd. | 142,151 | 13,576,842 | |
RLI Corp. | 114,998 | 4,959,864 | |
Safety Insurance Group, Inc. | 44,258 | 2,470,924 | |
Selective Insurance Group, Inc. | 195,872 | 4,512,891 | |
StanCorp Financial Group, Inc. | 147,970 | 9,792,655 | |
State Auto Financial Corp. | 38,206 | 764,884 | |
Stewart Information Services Corp. | 72,916 | 2,696,434 | |
Symetra Financial Corp. | 339,358 | 6,685,353 | |
Third Point Reinsurance Ltd. | 89,837 | 1,347,555 | |
Tower Group International Ltd. (d) | 117,565 | 324,479 | |
United Fire Group, Inc. | 77,762 | 2,253,543 | |
United Insurance Holdings Corp. | 59,225 | 773,479 | |
Universal Insurance Holdings, Inc. | 99,404 | 1,328,037 | |
Validus Holdings Ltd. | 323,014 | 11,890,145 | |
W.R. Berkley Corp. | 350,264 | 14,444,887 | |
White Mountains Insurance Group Ltd. | 19,596 | 11,357,058 | |
Willis Group Holdings PLC | 595,283 | 24,501,848 | |
| 567,446,213 | ||
Real Estate Investment Trusts - 8.6% | |||
Acadia Realty Trust (SBI) | 200,571 | 5,305,103 | |
AG Mortgage Investment Trust, Inc. | 104,641 | 1,919,116 | |
Agree Realty Corp. | 53,329 | 1,639,333 | |
Alexanders, Inc. | 8,052 | 3,017,165 | |
Alexandria Real Estate Equities, Inc. | 234,944 | 17,021,693 | |
Altisource Residential Corp. Class B | 180,731 | 5,165,292 | |
American Assets Trust, Inc. | 122,663 | 4,056,465 | |
American Campus Communities, Inc. | 345,329 | 12,756,453 | |
American Capital Agency Corp. | 1,269,000 | 28,286,010 | |
American Capital Mortgage Investment Corp. | 184,016 | 3,711,603 | |
American Homes 4 Rent Class A | 176,591 | 2,892,561 | |
American Realty Capital Properties, Inc. | 1,890,749 | 27,775,103 | |
American Residential Properties, Inc. (a)(d) | 57,037 | 1,038,073 | |
AmREIT, Inc. Class B | 50,317 | 872,497 | |
Annaly Capital Management, Inc. | 3,147,349 | 35,187,362 | |
Anworth Mortgage Asset Corp. | 536,989 | 2,781,603 | |
Apollo Commercial Real Estate Finance, Inc. | 139,860 | 2,341,256 | |
Apollo Residential Mortgage, Inc. | 117,920 | 2,056,525 | |
Arbor Realty Trust, Inc. | 114,120 | 782,863 | |
Ares Commercial Real Estate Corp. | 140,190 | 1,905,182 | |
Armada Hoffler Properties, Inc. | 52,271 | 511,733 | |
Armour Residential REIT, Inc. | 1,242,005 | 5,328,201 | |
Ashford Hospitality Prime, Inc. | 67,990 | 1,138,833 | |
Ashford Hospitality Trust, Inc. | 258,873 | 2,894,200 | |
Associated Estates Realty Corp. | 198,620 | 3,396,402 | |
Aviv REIT, Inc. | 63,187 | 1,602,422 | |
BioMed Realty Trust, Inc. | 624,919 | 12,923,325 | |
Common Stocks - continued | |||
Shares | Value | ||
FINANCIALS - continued | |||
Real Estate Investment Trusts - continued | |||
Blackstone Mortgage Trust, Inc. (d) | 115,336 | $ 3,341,284 | |
Brandywine Realty Trust (SBI) | 520,180 | 7,620,637 | |
BRE Properties, Inc. | 257,061 | 15,878,658 | |
Brixmor Property Group, Inc. (d) | 161,900 | 3,574,752 | |
BRT Realty Trust (a) | 8,802 | 62,758 | |
Camden Property Trust (SBI) | 281,434 | 18,771,648 | |
Campus Crest Communities, Inc. | 230,994 | 1,912,630 | |
Capstead Mortgage Corp. (d) | 334,305 | 4,309,191 | |
CBL & Associates Properties, Inc. | 557,567 | 9,919,117 | |
Cedar Shopping Centers, Inc. | 243,292 | 1,496,246 | |
Chambers Street Properties (d) | 831,672 | 6,578,526 | |
Chatham Lodging Trust | 91,880 | 1,917,536 | |
Cherry Hill Mortgage Investment Corp. | 38,323 | 696,712 | |
Chesapeake Lodging Trust | 171,097 | 4,457,077 | |
Chimera Investment Corp. | 3,420,897 | 10,912,661 | |
Colony Financial, Inc. | 268,339 | 6,059,095 | |
Columbia Property Trust, Inc. | 425,860 | 11,302,324 | |
CommonWealth REIT (d) | 369,850 | 10,041,428 | |
Coresite Realty Corp. | 71,084 | 2,213,556 | |
Corporate Office Properties Trust (SBI) | 291,288 | 7,768,651 | |
Corrections Corp. of America (d) | 383,671 | 12,795,428 | |
Cousins Properties, Inc. | 616,364 | 7,119,004 | |
CubeSmart | 427,083 | 7,478,223 | |
CyrusOne, Inc. | 66,522 | 1,478,119 | |
CYS Investments, Inc. | 568,403 | 5,001,946 | |
DCT Industrial Trust, Inc. | 1,016,781 | 8,052,906 | |
DDR Corp. | 908,582 | 15,100,633 | |
DiamondRock Hospitality Co. | 624,027 | 7,875,221 | |
Digital Realty Trust, Inc. (d) | 424,875 | 23,011,230 | |
Douglas Emmett, Inc. | 426,031 | 11,473,015 | |
Duke Realty LP | 1,072,656 | 18,020,621 | |
DuPont Fabros Technology, Inc. (d) | 210,268 | 5,584,718 | |
EastGroup Properties, Inc. | 104,946 | 6,510,850 | |
Education Realty Trust, Inc. | 391,132 | 3,688,375 | |
Ellington Residential Mortgage REIT | 20,297 | 343,628 | |
Empire State Realty Trust, Inc. | 283,009 | 4,335,698 | |
EPR Properties | 174,225 | 9,279,224 | |
Equity Lifestyle Properties, Inc. | 273,332 | 11,001,613 | |
Equity One, Inc. | 224,592 | 5,210,534 | |
Essex Property Trust, Inc. | 122,740 | 20,528,265 | |
Excel Trust, Inc. | 176,835 | 2,215,743 | |
Extra Space Storage, Inc. | 360,984 | 17,724,314 | |
Federal Realty Investment Trust (SBI) | 209,479 | 23,317,107 | |
FelCor Lodging Trust, Inc. | 371,704 | 3,237,542 | |
First Industrial Realty Trust, Inc. | 329,206 | 6,333,923 | |
First Potomac Realty Trust | 225,311 | 2,856,943 | |
Five Oaks Investment Corp. | 46,855 | 529,462 | |
Franklin Street Properties Corp. | 330,769 | 4,141,228 | |
Gaming & Leisure Properties | 291,614 | 11,104,661 | |
Getty Realty Corp. | 107,657 | 2,071,321 | |
Gladstone Commercial Corp. | 42,375 | 737,325 | |
| |||
Shares | Value | ||
Glimcher Realty Trust | 521,855 | $ 5,077,649 | |
Government Properties Income Trust (d) | 187,222 | 4,663,700 | |
Gramercy Property Trust, Inc. (a) | 181,520 | 1,052,816 | |
Hannon Armstrong Sustainable Infrastructure Capital, Inc. | 41,668 | 597,102 | |
Hatteras Financial Corp. | 327,863 | 6,465,458 | |
Healthcare Realty Trust, Inc. | 332,649 | 7,973,597 | |
Healthcare Trust of America, Inc. | 608,455 | 6,832,950 | |
Hersha Hospitality Trust | 621,806 | 3,494,550 | |
Highwoods Properties, Inc. (SBI) | 283,235 | 10,680,792 | |
Home Properties, Inc. | 193,491 | 11,404,360 | |
Hospitality Properties Trust (SBI) | 486,101 | 12,881,677 | |
Hudson Pacific Properties, Inc. | 158,929 | 3,625,170 | |
Independence Realty Trust, Inc. | 26,999 | 232,191 | |
Inland Real Estate Corp. | 300,656 | 3,220,026 | |
Invesco Mortgage Capital, Inc. | 454,438 | 7,648,192 | |
Investors Real Estate Trust | 391,462 | 3,437,036 | |
iStar Financial, Inc. (a)(d) | 266,363 | 4,128,627 | |
JAVELIN Mortgage Investment Corp. (d) | 46,815 | 678,818 | |
Kilroy Realty Corp. | 266,153 | 15,309,121 | |
Kite Realty Group Trust | 475,019 | 2,935,617 | |
LaSalle Hotel Properties (SBI) | 334,090 | 10,470,381 | |
Lexington Corporate Properties Trust | 663,426 | 7,569,691 | |
Liberty Property Trust (SBI) | 475,596 | 18,196,303 | |
LTC Properties, Inc. | 115,693 | 4,359,312 | |
Mack-Cali Realty Corp. | 293,454 | 6,529,352 | |
Medical Properties Trust, Inc. | 537,748 | 7,092,896 | |
MFA Financial, Inc. | 1,217,966 | 9,573,213 | |
Mid-America Apartment Communities, Inc. (d) | 242,922 | 16,431,244 | |
Monmouth Real Estate Investment Corp. Class A | 157,116 | 1,520,883 | |
National Health Investors, Inc. | 101,862 | 6,284,885 | |
National Retail Properties, Inc. (d) | 396,763 | 14,239,824 | |
New York Mortgage Trust, Inc. (d) | 247,724 | 1,914,907 | |
NorthStar Realty Finance Corp. | 1,040,313 | 16,135,255 | |
Omega Healthcare Investors, Inc. (d) | 398,237 | 12,727,655 | |
One Liberty Properties, Inc. | 35,770 | 784,078 | |
Orchid Island Capital, Inc. (d) | 903 | 11,441 | |
Parkway Properties, Inc. | 268,779 | 4,953,597 | |
Pebblebrook Hotel Trust | 207,254 | 6,889,123 | |
Pennsylvania Real Estate Investment Trust (SBI) | 231,409 | 4,341,233 | |
PennyMac Mortgage Investment Trust | 233,473 | 5,678,063 | |
Physicians Realty Trust | 99,817 | 1,336,550 | |
Piedmont Office Realty Trust, Inc. Class A | 550,830 | 9,518,342 | |
PMC Commercial Trust | 15,439 | 147,906 | |
Post Properties, Inc. | 176,369 | 8,559,188 | |
Potlatch Corp. | 133,057 | 5,274,379 | |
Power (REIT) (a) | 1,227 | 11,350 | |
Preferred Apartment Communities, Inc. Class A | 22,297 | 183,058 | |
PS Business Parks, Inc. | 73,314 | 6,159,842 | |
QTS Realty Trust, Inc. Class A | 55,322 | 1,414,030 | |
Common Stocks - continued | |||
Shares | Value | ||
FINANCIALS - continued | |||
Real Estate Investment Trusts - continued | |||
RAIT Financial Trust (d) | 248,382 | $ 2,064,054 | |
Ramco-Gershenson Properties Trust (SBI) | 248,170 | 4,144,439 | |
Rayonier, Inc. | 419,443 | 19,751,571 | |
Realty Income Corp. (d) | 679,850 | 30,198,937 | |
Redwood Trust, Inc. (d) | 288,721 | 5,803,292 | |
Regency Centers Corp. | 304,312 | 15,449,920 | |
Resource Capital Corp. | 434,839 | 2,535,111 | |
Retail Opportunity Investments Corp. | 217,500 | 3,225,525 | |
Retail Properties America, Inc. | 632,021 | 8,810,373 | |
Rexford Industrial Realty, Inc. | 54,330 | 770,943 | |
RLJ Lodging Trust | 409,110 | 10,632,769 | |
Rouse Properties, Inc. (d) | 115,811 | 2,167,982 | |
Ryman Hospitality Properties, Inc. (d) | 163,023 | 6,877,940 | |
Sabra Health Care REIT, Inc. | 131,566 | 3,745,684 | |
Saul Centers, Inc. | 44,429 | 2,064,616 | |
Select Income (REIT) | 107,558 | 3,135,316 | |
Senior Housing Properties Trust (SBI) | 613,743 | 13,686,469 | |
Silver Bay Realty Trust Corp. | 142,660 | 2,235,482 | |
SL Green Realty Corp. | 307,276 | 30,521,725 | |
SoTHERLY Hotels, Inc. | 27,804 | 171,551 | |
Sovran Self Storage, Inc. | 105,708 | 7,821,335 | |
Spirit Realty Capital, Inc. | 1,134,045 | 12,383,771 | |
Stag Industrial, Inc. | 159,251 | 3,712,141 | |
Starwood Property Trust, Inc. | 637,854 | 15,321,253 | |
Starwood Waypoint Residential (a) | 127,570 | 3,458,423 | |
Strategic Hotel & Resorts, Inc. (a)(d) | 594,160 | 5,935,658 | |
Summit Hotel Properties, Inc. | 290,927 | 2,688,165 | |
Sun Communities, Inc. | 121,106 | 5,578,142 | |
Sunstone Hotel Investors, Inc. | 595,200 | 8,047,104 | |
Supertel Hospitality, Inc., Maryland (a) | 1,649 | 4,123 | |
Tanger Factory Outlet Centers, Inc. | 306,072 | 10,501,330 | |
Taubman Centers, Inc. | 207,363 | 14,608,723 | |
Terreno Realty Corp. | 69,706 | 1,302,108 | |
The Geo Group, Inc. | 237,822 | 7,665,003 | |
Trade Street Residential, Inc. | 3,743 | 27,286 | |
Two Harbors Investment Corp. | 1,198,997 | 12,445,589 | |
UDR, Inc. | 817,768 | 21,106,592 | |
UMH Properties, Inc. | 45,741 | 424,019 | |
Universal Health Realty Income Trust (SBI) | 45,124 | 1,921,380 | |
Urstadt Biddle Properties, Inc. Class A | 86,921 | 1,704,521 | |
Washington REIT (SBI) | 225,206 | 5,663,931 | |
Weingarten Realty Investors (SBI) | 374,033 | 11,408,007 | |
Western Asset Mortgage Capital Corp. (d) | 79,800 | 1,314,306 | |
Whitestone REIT Class B | 74,608 | 1,072,863 | |
Winthrop Realty Trust | 108,839 | 1,266,886 | |
WP Carey, Inc. | 185,918 | 11,809,511 | |
ZAIS Financial Corp. | 15,500 | 269,855 | |
| 1,213,402,835 | ||
| |||
Shares | Value | ||
Real Estate Management & Development - 0.7% | |||
Alexander & Baldwin, Inc. | 145,924 | $ 6,073,357 | |
Altisource Portfolio Solutions SA | 55,909 | 5,500,327 | |
American Realty Investments, Inc. (a) | 1,965 | 19,257 | |
AV Homes, Inc. (a) | 31,513 | 622,382 | |
Consolidated-Tomoka Land Co. | 12,368 | 439,806 | |
Forest City Enterprises, Inc. Class A (a)(d) | 524,820 | 10,223,494 | |
Forestar Group, Inc. (a)(d) | 117,514 | 2,216,314 | |
Gladstone Land Corp. | 66,704 | 853,811 | |
Howard Hughes Corp. (a) | 104,438 | 14,415,577 | |
InterGroup Corp. (a) | 336 | 6,152 | |
Jones Lang LaSalle, Inc. | 147,378 | 18,156,970 | |
Kennedy-Wilson Holdings, Inc. | 235,554 | 5,959,516 | |
Maui Land & Pineapple, Inc. (a) | 17,943 | 111,426 | |
RE/MAX Holdings, Inc. (d) | 43,468 | 1,330,990 | |
Realogy Holdings Corp. (a) | 484,103 | 22,975,528 | |
Tejon Ranch Co. (a) | 43,935 | 1,557,496 | |
The St. Joe Co. (a)(d) | 317,132 | 6,130,162 | |
Transcontinental Realty Investors, Inc. (a) | 1,497 | 23,653 | |
ZipRealty, Inc. (a) | 28,991 | 137,417 | |
| 96,753,635 | ||
Thrifts & Mortgage Finance - 1.0% | |||
Astoria Financial Corp. | 297,236 | 4,072,133 | |
Banc of California, Inc. | 43,498 | 556,339 | |
Bank Mutual Corp. | 123,703 | 818,914 | |
BankFinancial Corp. | 56,765 | 566,515 | |
BBX Capital Corp. (a) | 42,087 | 813,963 | |
Beneficial Mutual Bancorp, Inc. (a) | 112,435 | 1,353,717 | |
Berkshire Hills Bancorp, Inc. | 88,805 | 2,231,670 | |
BofI Holding, Inc. (a)(d) | 39,084 | 3,638,720 | |
Brookline Bancorp, Inc., Delaware | 228,749 | 2,088,478 | |
Camco Financial Corp. (a)(d) | 28,595 | 173,000 | |
Cape Bancorp, Inc. | 25,193 | 267,802 | |
Capitol Federal Financial, Inc. | 470,721 | 5,719,260 | |
Charter Financial Corp. | 19,819 | 208,694 | |
Cheviot Financial Corp. | 44 | 452 | |
Chicopee Bancorp, Inc. | 13,096 | 234,156 | |
Clifton Savings Bancorp, Inc. | 25,210 | 332,016 | |
Dime Community Bancshares, Inc. | 105,672 | 1,775,290 | |
Doral Financial Corp. (a)(d) | 18,344 | 210,956 | |
Elmira Savings Bank | 185 | 4,192 | |
ESB Financial Corp. | 37,377 | 490,012 | |
ESSA Bancorp, Inc. | 32,482 | 364,773 | |
Essent Group Ltd. (d) | 69,085 | 1,602,772 | |
EverBank Financial Corp. (d) | 292,629 | 5,243,912 | |
Farmer Mac Class C (non-vtg.) | 28,644 | 901,140 | |
First Clover Leaf Financial Corp. | 10,566 | 96,785 | |
First Defiance Financial Corp. | 23,633 | 653,925 | |
First Federal Bancshares of Arkansas, Inc. (a) | 4,711 | 40,891 | |
First Financial Northwest, Inc. | 34,706 | 358,860 | |
Flagstar Bancorp, Inc. (a) | 65,811 | 1,457,056 | |
Fox Chase Bancorp, Inc. | 32,985 | 565,363 | |
Common Stocks - continued | |||
Shares | Value | ||
FINANCIALS - continued | |||
Thrifts & Mortgage Finance - continued | |||
Franklin Financial Corp./VA (a) | 27,950 | $ 553,410 | |
Hampden Bancorp, Inc. | 5,136 | 81,919 | |
Heritage Financial Group, Inc. | 17,720 | 330,832 | |
HF Financial Corp. | 632 | 8,393 | |
Hingham Institution for Savings | 1,083 | 84,799 | |
HMN Financial, Inc. (a) | 2,852 | 36,392 | |
Home Bancorp, Inc. (a) | 15,826 | 329,023 | |
Home Loan Servicing Solutions Ltd. (d) | 220,032 | 4,515,057 | |
HomeStreet, Inc. | 35,323 | 665,485 | |
HopFed Bancorp, Inc. | 11,426 | 131,856 | |
IF Bancorp, Inc. | 11,597 | 190,771 | |
Impac Mortgage Holdings, Inc. (a)(d) | 20,302 | 142,114 | |
Kearny Financial Corp. (a)(d) | 52,612 | 661,859 | |
Madison County Financial, Inc. | 11,541 | 198,505 | |
Meridian Interstate Bancorp, Inc. (a) | 27,315 | 661,023 | |
Meta Financial Group, Inc. | 11,444 | 488,773 | |
MGIC Investment Corp. (a) | 1,083,448 | 9,707,694 | |
NASB Financial, Inc. (d) | 3,724 | 94,366 | |
Nationstar Mortgage Holdings, Inc. (a)(d) | 67,203 | 1,937,462 | |
New Hampshire Thrift Bancshare | 20,505 | 305,525 | |
New York Community Bancorp, Inc. (d) | 1,441,888 | 23,041,370 | |
NMI Holdings, Inc. (a) | 20,200 | 220,988 | |
Northfield Bancorp, Inc. | 217,420 | 2,752,537 | |
Northwest Bancshares, Inc. | 341,018 | 4,893,608 | |
Ocean Shore Holding Co. | 5,120 | 71,219 | |
OceanFirst Financial Corp. | 36,227 | 683,966 | |
Ocwen Financial Corp. (a) | 384,211 | 14,384,860 | |
Oneida Financial Corp. | 2,810 | 35,490 | |
Oritani Financial Corp. | 151,918 | 2,379,036 | |
PennyMac Financial Services, Inc. | 41,987 | 725,955 | |
Peoples Federal Bancshares, Inc. (d) | 9,219 | 165,389 | |
Poage Bankshares, Inc. | 6,654 | 91,892 | |
Provident Financial Holdings, Inc. | 21,034 | 323,293 | |
Provident Financial Services, Inc. | 185,760 | 3,447,706 | |
Pulaski Financial Corp. | 11,679 | 117,257 | |
Radian Group, Inc. (d) | 563,566 | 8,763,451 | |
Riverview Bancorp, Inc. (a) | 20,156 | 68,127 | |
Rockville Financial, Inc. (d) | 88,020 | 1,159,223 | |
Security National Financial Corp. Class A | 22,623 | 88,003 | |
SI Financial Group, Inc. | 15,322 | 180,646 | |
Simplicity Bancorp, Inc. | 22,747 | 401,257 | |
Southern Missouri Bancorp, Inc. | 3,317 | 114,337 | |
Stonegate Mortgage Corp. (a)(d) | 38,473 | 559,013 | |
Territorial Bancorp, Inc. | 28,348 | 629,326 | |
TFS Financial Corp. (a) | 321,262 | 3,797,317 | |
Timberland Bancorp, Inc. | 12,774 | 136,554 | |
Tree.com, Inc. (a) | 19,805 | 669,607 | |
Trustco Bank Corp., New York | 304,547 | 2,058,738 | |
United Community Financial Corp. (a) | 251,020 | 931,284 | |
United Financial Bancorp, Inc. | 56,278 | 991,056 | |
| |||
Shares | Value | ||
Walker & Dunlop, Inc. (a)(d) | 71,009 | $ 1,195,081 | |
Washington Federal, Inc. | 344,651 | 7,727,075 | |
Waterstone Financial, Inc. Maryland (a) | 32,153 | 339,536 | |
Westfield Financial, Inc. | 94,628 | 718,227 | |
WSFS Financial Corp. | 26,632 | 1,898,595 | |
| 143,728,033 | ||
TOTAL FINANCIALS | 3,045,779,729 | ||
HEALTH CARE - 11.9% | |||
Biotechnology - 3.8% | |||
Aastrom Biosciences, Inc. (a) | 10,915 | 36,784 | |
ACADIA Pharmaceuticals, Inc. (a)(d) | 260,192 | 7,363,434 | |
Acceleron Pharma, Inc. (d) | 24,726 | 1,160,391 | |
Achillion Pharmaceuticals, Inc. (a)(d) | 269,162 | 942,067 | |
Acorda Therapeutics, Inc. (a) | 137,733 | 5,046,537 | |
Advaxis, Inc. (a)(d) | 24,640 | 120,736 | |
Aegerion Pharmaceuticals, Inc. (a)(d) | 80,924 | 4,431,398 | |
Agenus, Inc. (a)(d) | 142,693 | 697,769 | |
Agios Pharmaceuticals, Inc. (d) | 20,886 | 652,896 | |
Alkermes PLC (a) | 480,357 | 23,378,975 | |
Alnylam Pharmaceuticals, Inc. (a)(d) | 176,628 | 14,349,259 | |
AMAG Pharmaceuticals, Inc. (a)(d) | 69,941 | 1,449,877 | |
Ambit Biosciences Corp. | 22,527 | 245,770 | |
Amicus Therapeutics, Inc. (a)(d) | 103,509 | 260,843 | |
Anacor Pharmaceuticals, Inc. (a)(d) | 103,358 | 1,963,802 | |
Anthera Pharmaceuticals, Inc. (a)(d) | 86,499 | 256,037 | |
ARCA biopharma, Inc. (a) | 3,372 | 6,339 | |
Arena Pharmaceuticals, Inc. (a)(d) | 734,863 | 4,783,958 | |
ARIAD Pharmaceuticals, Inc. (a)(d) | 611,762 | 5,316,212 | |
ArQule, Inc. (a) | 171,131 | 385,045 | |
Array BioPharma, Inc. (a) | 344,560 | 1,660,779 | |
Arrowhead Research Corp. (a) | 102,724 | 1,996,955 | |
Athersys, Inc. (a)(d) | 250,029 | 945,110 | |
AVEO Pharmaceuticals, Inc. (a)(d) | 115,401 | 215,800 | |
BIND Therapeutics, Inc. (d) | 24,951 | 340,831 | |
BioCryst Pharmaceuticals, Inc. (a)(d) | 188,333 | 2,201,613 | |
BioMarin Pharmaceutical, Inc. (a)(d) | 471,303 | 38,175,543 | |
Biospecifics Technologies Corp. (a) | 11,833 | 280,797 | |
Biota Pharmaceuticals, Inc. (a) | 30,922 | 204,704 | |
BioTime, Inc. (a)(d) | 88,187 | 316,591 | |
Bluebird Bio, Inc. (d) | 28,596 | 729,198 | |
Cancer Genetics, Inc. | 27,876 | 525,741 | |
Catalyst Pharmaceutical Partners, Inc. (a)(d) | 139,457 | 312,384 | |
Cel-Sci Corp. (a)(d) | 195,290 | 216,772 | |
Cell Therapeutics, Inc. (a)(d) | 498,131 | 1,917,804 | |
Celldex Therapeutics, Inc. (a)(d) | 292,289 | 8,540,685 | |
Cellular Dynamics International, Inc. (d) | 13,046 | 194,255 | |
Celsion Corp. (a) | 37,190 | 138,719 | |
Cepheid, Inc. (a)(d) | 226,032 | 12,128,877 | |
Chelsea Therapeutics International Ltd. (a)(d) | 213,607 | 1,219,696 | |
Common Stocks - continued | |||
Shares | Value | ||
HEALTH CARE - continued | |||
Biotechnology - continued | |||
ChemoCentryx, Inc. (a)(d) | 80,697 | $ 613,297 | |
Chimerix, Inc. | 53,588 | 1,071,760 | |
Cleveland Biolabs, Inc. (a)(d) | 93,847 | 65,965 | |
Clovis Oncology, Inc. (a) | 95,040 | 7,567,085 | |
Codexis, Inc. (a)(d) | 66,590 | 123,857 | |
Conatus Pharmaceuticals, Inc. (d) | 20,891 | 234,397 | |
CorMedix, Inc. (a)(d) | 49,454 | 137,977 | |
Coronado Biosciences, Inc. (a)(d) | 64,425 | 182,967 | |
Cubist Pharmaceuticals, Inc. (a) | 244,905 | 19,474,846 | |
Cubist Pharmaceuticals, Inc. rights (a) | 105,448 | 1 | |
Curis, Inc. (a)(d) | 272,013 | 829,640 | |
Cyclacel Pharmaceuticals, Inc. (a)(d) | 58,323 | 226,293 | |
Cytokinetics, Inc. (a)(d) | 77,233 | 760,745 | |
Cytori Therapeutics, Inc. (a)(d) | 195,899 | 617,082 | |
CytRx Corp. (a)(d) | 159,962 | 946,975 | |
DARA BioSciences, Inc. (a)(d) | 4,466 | 13,041 | |
Dendreon Corp. (a)(d) | 576,266 | 1,659,646 | |
Discovery Laboratories, Inc. (a)(d) | 244,661 | 645,905 | |
Durata Therapeutics, Inc. (a)(d) | 32,482 | 445,328 | |
Dyax Corp. (a) | 403,876 | 3,905,481 | |
Dynavax Technologies Corp. (a)(d) | 919,827 | 1,710,878 | |
Emergent BioSolutions, Inc. (a) | 97,373 | 2,409,008 | |
Enanta Pharmaceuticals, Inc. (d) | 16,537 | 609,223 | |
EntreMed, Inc. (a) | 37,512 | 72,023 | |
Enzon Pharmaceuticals, Inc. | 134,828 | 129,435 | |
Epizyme, Inc. | 38,847 | 1,161,525 | |
Esperion Therapeutics, Inc. (d) | 17,081 | 265,610 | |
Exact Sciences Corp. (a)(d) | 244,783 | 3,292,331 | |
Exelixis, Inc. (a)(d) | 599,718 | 4,234,009 | |
Fibrocell Science, Inc. (a)(d) | 81,352 | 462,893 | |
Five Prime Therapeutics, Inc. | 23,768 | 331,801 | |
Forticell Bioscience, Inc. (a) | 2 | 0 | |
Foundation Medicine, Inc. (d) | 25,039 | 892,140 | |
Galectin Therapeutics, Inc. (a)(d) | 56,964 | 960,413 | |
Galena Biopharma, Inc. (a)(d) | 335,154 | 1,323,858 | |
Genomic Health, Inc. (a)(d) | 59,800 | 1,579,318 | |
GenVec, Inc. (a)(d) | 39,959 | 143,453 | |
Geron Corp. (a)(d) | 495,598 | 2,356,569 | |
GTx, Inc. (a)(d) | 79,767 | 135,604 | |
Halozyme Therapeutics, Inc. (a)(d) | 334,834 | 4,717,811 | |
Harvard Apparatus (a) | 15,331 | 77,575 | |
Heat Biologics, Inc. (d) | 8,898 | 65,667 | |
Hemispherx Biopharma, Inc. (a) | 433,733 | 169,590 | |
Hyperion Therapeutics, Inc. (a)(d) | 18,970 | 588,070 | |
iBio, Inc. (a) | 102,306 | 55,215 | |
Idenix Pharmaceuticals, Inc. (a)(d) | 372,755 | 2,542,189 | |
Idera Pharmaceuticals, Inc. (a)(d) | 239,487 | 1,386,630 | |
ImmunoCellular Therapeutics Ltd. (a)(d) | 177,102 | 240,859 | |
ImmunoGen, Inc. (a)(d) | 301,232 | 4,940,205 | |
Immunomedics, Inc. (a)(d) | 254,275 | 1,205,264 | |
Incyte Corp. (a) | 480,449 | 30,873,653 | |
| |||
Shares | Value | ||
Infinity Pharmaceuticals, Inc. (a)(d) | 143,814 | $ 2,255,004 | |
Inovio Pharmaceuticals, Inc. (a)(d) | 651,417 | 2,143,162 | |
Insmed, Inc. (a) | 107,814 | 2,157,358 | |
Insys Therapeutics, Inc. (a)(d) | 14,182 | 954,165 | |
Intercept Pharmaceuticals, Inc. (a) | 33,307 | 13,672,524 | |
InterMune, Inc. (a)(d) | 306,558 | 9,209,002 | |
Intrexon Corp. (d) | 37,626 | 977,523 | |
Ironwood Pharmaceuticals, Inc. Class A (a)(d) | 401,292 | 5,822,747 | |
Isis Pharmaceuticals, Inc. (a)(d) | 387,534 | 19,764,234 | |
IsoRay, Inc. (a)(d) | 76,668 | 60,184 | |
KaloBios Pharmaceuticals, Inc. | 71,639 | 232,827 | |
Karyopharm Therapeutics, Inc. | 27,979 | 1,123,077 | |
Keryx Biopharmaceuticals, Inc. (a)(d) | 294,874 | 4,732,728 | |
KYTHERA Biopharmaceuticals, Inc. (a)(d) | 42,822 | 2,139,815 | |
Lexicon Pharmaceuticals, Inc. (a)(d) | 983,912 | 1,761,202 | |
Ligand Pharmaceuticals, Inc.: | |||
Class B (a)(d) | 69,939 | 4,878,245 | |
General CVR (a) | 26,087 | 1,591 | |
Glucagon CVR (a) | 26,087 | 4,435 | |
rights (a) | 26,087 | 170 | |
TR Beta CVR (a) | 26,087 | 136 | |
LipoScience, Inc. (a) | 15,054 | 62,625 | |
Lpath, Inc. (a) | 19,435 | 90,178 | |
Macrogenics, Inc. | 30,033 | 1,051,155 | |
MannKind Corp. (a)(d) | 685,467 | 4,243,041 | |
Mast Therapeutics, Inc. (a)(d) | 531,478 | 441,127 | |
Medgenics, Inc. (a)(d) | 34,205 | 295,189 | |
MediciNova, Inc. (a)(d) | 47,646 | 108,156 | |
Medivation, Inc. (a) | 250,204 | 17,992,170 | |
MEI Pharma, Inc. (a) | 32,936 | 284,238 | |
Merrimack Pharmaceuticals, Inc. (a)(d) | 311,736 | 1,552,445 | |
Metabolix, Inc. (a)(d) | 85,270 | 109,146 | |
MiMedx Group, Inc. (a) | 267,984 | 1,916,086 | |
Momenta Pharmaceuticals, Inc. (a) | 146,858 | 2,173,498 | |
Myriad Genetics, Inc. (a)(d) | 249,963 | 9,051,160 | |
Nanosphere, Inc. (a) | 173,475 | 416,340 | |
NanoViricides, Inc. (a)(d) | 143,363 | 570,585 | |
Navidea Biopharmaceuticals, Inc. (a)(d) | 444,645 | 822,593 | |
Neuralstem, Inc. (a)(d) | 278,617 | 994,663 | |
Neurocrine Biosciences, Inc. (a) | 213,411 | 3,762,436 | |
NewLink Genetics Corp. (a)(d) | 50,794 | 2,245,095 | |
Northwest Biotherapeutics, Inc. (a)(d) | 109,855 | 778,872 | |
Novavax, Inc. (a)(d) | 635,933 | 4,069,971 | |
NPS Pharmaceuticals, Inc. (a)(d) | 312,837 | 10,943,038 | |
Ohr Pharmaceutical, Inc. (a) | 55,086 | 779,467 | |
OncoGenex Pharmaceuticals, Inc. (a)(d) | 52,280 | 576,126 | |
OncoMed Pharmaceuticals, Inc. (d) | 16,535 | 570,788 | |
Onconova Therapeutics, Inc. (d) | 17,664 | 150,144 | |
Oncothyreon, Inc. (a)(d) | 199,043 | 615,043 | |
Opexa Therapeutics, Inc. (a)(d) | 68,287 | 124,282 | |
Ophthotech Corp. (d) | 37,946 | 1,277,642 | |
Opko Health, Inc. (a)(d) | 728,512 | 6,935,434 | |
Oragenics, Inc. (a) | 27,929 | 104,454 | |
Common Stocks - continued | |||
Shares | Value | ||
HEALTH CARE - continued | |||
Biotechnology - continued | |||
Orexigen Therapeutics, Inc. (a)(d) | 365,940 | $ 2,539,624 | |
Organovo Holdings, Inc. (a)(d) | 196,595 | 2,020,997 | |
Osiris Therapeutics, Inc. (a)(d) | 56,117 | 856,907 | |
OvaScience, Inc. (a)(d) | 30,226 | 326,139 | |
OXiGENE, Inc. (a) | 3,950 | 8,414 | |
Oxygen Biotherapeutics, Inc. (a)(d) | 22,365 | 144,702 | |
PDL BioPharma, Inc. (d) | 475,632 | 4,076,166 | |
Peregrine Pharmaceuticals, Inc. (a)(d) | 579,602 | 1,049,080 | |
Pharmacyclics, Inc. (a) | 223,164 | 30,943,920 | |
PharmAthene, Inc. (a)(d) | 123,056 | 231,345 | |
Portola Pharmaceuticals, Inc. (d) | 39,606 | 965,990 | |
Progenics Pharmaceuticals, Inc. (a)(d) | 203,243 | 949,145 | |
Prothena Corp. PLC (a)(d) | 73,496 | 2,646,591 | |
PTC Therapeutics, Inc. (a) | 45,263 | 1,419,448 | |
Puma Biotechnology, Inc. (a) | 63,396 | 7,370,419 | |
Raptor Pharmaceutical Corp. (a)(d) | 210,398 | 3,330,600 | |
Receptos, Inc. | 41,822 | 1,939,913 | |
Regado Biosciences, Inc. | 15,222 | 109,142 | |
Regulus Therapeutics, Inc. (a)(d) | 53,984 | 606,240 | |
Repligen Corp. (a)(d) | 104,226 | 1,560,263 | |
Rexahn Pharmaceuticals, Inc. (a)(d) | 422,481 | 570,349 | |
Rigel Pharmaceuticals, Inc. (a) | 289,108 | 994,532 | |
Sangamo Biosciences, Inc. (a)(d) | 216,693 | 3,943,813 | |
Sarepta Therapeutics, Inc. (a)(d) | 114,397 | 3,320,945 | |
Seattle Genetics, Inc. (a)(d) | 372,346 | 19,581,676 | |
SIGA Technologies, Inc. (a)(d) | 109,876 | 352,702 | |
Sorrento Therapeutics, Inc. (a) | 29,155 | 335,866 | |
Spectrum Pharmaceuticals, Inc. (a)(d) | 191,900 | 1,602,365 | |
StemCells, Inc. (a)(d) | 120,758 | 177,514 | |
Stemline Therapeutics, Inc. (d) | 33,876 | 876,033 | |
Sunesis Pharmaceuticals, Inc. (a)(d) | 112,982 | 740,032 | |
Synageva BioPharma Corp. (a)(d) | 64,476 | 7,393,463 | |
Synergy Pharmaceuticals, Inc. (a)(d) | 261,133 | 1,585,077 | |
Synta Pharmaceuticals Corp. (a)(d) | 218,784 | 1,352,085 | |
Synthetic Biologics, Inc. (a)(d) | 102,779 | 277,503 | |
Targacept, Inc. (a) | 150,431 | 741,625 | |
Telik, Inc. (a) | 3,787 | 5,264 | |
TESARO, Inc. (a)(d) | 63,757 | 2,104,619 | |
Tetraphase Pharmaceuticals, Inc. | 48,666 | 661,858 | |
TG Therapeutics, Inc. (a)(d) | 94,974 | 626,828 | |
Theravance, Inc. (a)(d) | 259,909 | 9,616,633 | |
Threshold Pharmaceuticals, Inc. (a)(d) | 165,509 | 827,545 | |
Trovagene, Inc. (a)(d) | 57,904 | 362,479 | |
United Therapeutics Corp. (a)(d) | 152,435 | 15,459,958 | |
Vanda Pharmaceuticals, Inc. (a)(d) | 115,941 | 1,754,187 | |
Venaxis, Inc. (a)(d) | 80,385 | 208,197 | |
Verastem, Inc. (a)(d) | 49,464 | 661,334 | |
Vical, Inc. (a)(d) | 181,350 | 275,652 | |
XOMA Corp. (a) | 238,944 | 1,997,572 | |
| |||
Shares | Value | ||
Zalicus, Inc. (a)(d) | 60,609 | $ 91,520 | |
ZIOPHARM Oncology, Inc. (a)(d) | 319,265 | 1,360,069 | |
| 543,517,746 | ||
Health Care Equipment & Supplies - 2.3% | |||
Abaxis, Inc. (a)(d) | 70,562 | 2,677,828 | |
Abiomed, Inc. (a)(d) | 115,137 | 3,245,712 | |
Accuray, Inc. (a)(d) | 224,824 | 2,108,849 | |
Alere, Inc. (a) | 253,720 | 9,321,673 | |
Align Technology, Inc. (a)(d) | 232,898 | 12,187,552 | |
Allied Healthcare Products, Inc. (a) | 4,954 | 10,651 | |
Alphatec Holdings, Inc. (a) | 230,873 | 325,531 | |
Analogic Corp. | 42,044 | 3,963,067 | |
Angiodynamics, Inc. (a) | 99,901 | 1,538,475 | |
Anika Therapeutics, Inc. (a) | 35,451 | 1,395,706 | |
Antares Pharma, Inc. (a)(d) | 441,109 | 1,962,935 | |
ArthroCare Corp. (a) | 95,471 | 4,606,476 | |
Atossa Genetics, Inc. (a)(d) | 64,731 | 142,408 | |
Atricure, Inc. (a) | 74,631 | 1,551,578 | |
Atrion Corp. | 4,266 | 1,234,708 | |
Bacterin International Holdings, Inc. (a)(d) | 73,764 | 49,127 | |
Baxano Surgical, Inc. (a)(d) | 51,338 | 78,034 | |
BioLase Technology, Inc. (d) | 116,573 | 360,211 | |
Bovie Medical Corp. (a) | 27,980 | 89,256 | |
BSD Medical Corp. (a)(d) | 95,648 | 109,995 | |
Cantel Medical Corp. | 116,324 | 3,763,081 | |
Cardica, Inc. (a) | 84,418 | 96,237 | |
Cardiovascular Systems, Inc. (a) | 93,931 | 3,287,585 | |
Cerus Corp. (a)(d) | 226,749 | 1,464,799 | |
Cesca Therapeutics, Inc. (a)(d) | 36,219 | 80,406 | |
Chembio Diagnostics, Inc. (a) | 4,082 | 15,512 | |
CONMED Corp. | 92,250 | 4,300,695 | |
Cryolife, Inc. | 80,349 | 800,276 | |
Cutera, Inc. (a) | 39,466 | 422,286 | |
Cyberonics, Inc. (a)(d) | 83,817 | 5,738,950 | |
Cynosure, Inc. Class A (a) | 68,678 | 2,113,909 | |
Delcath Systems, Inc. (a)(d) | 289,673 | 90,639 | |
Derma Sciences, Inc. (a)(d) | 77,138 | 1,133,157 | |
DexCom, Inc. (a) | 220,569 | 9,947,662 | |
Digirad Corp. | 45,825 | 160,388 | |
Dynatronics Corp. (a) | 3,425 | 12,364 | |
Echo Therapeutics, Inc. (a)(d) | 18,765 | 58,734 | |
Endologix, Inc. (a)(d) | 216,309 | 2,920,172 | |
EnteroMedics, Inc. (a)(d) | 152,453 | 370,461 | |
ERBA Diagnostics, Inc. (a)(d) | 26,639 | 67,929 | |
Escalon Medical Corp. (a) | 3,512 | 5,338 | |
Exactech, Inc. (a) | 24,904 | 580,263 | |
Fonar Corp. (a)(d) | 24,768 | 561,243 | |
Genmark Diagnostics, Inc. (a) | 132,359 | 1,649,193 | |
Globus Medical, Inc. (a) | 188,317 | 4,455,580 | |
Greatbatch, Inc. (a) | 81,776 | 3,543,354 | |
Haemonetics Corp. (a)(d) | 170,591 | 6,223,160 | |
Hansen Medical, Inc. (a)(d) | 236,840 | 554,206 | |
Common Stocks - continued | |||
Shares | Value | ||
HEALTH CARE - continued | |||
Health Care Equipment & Supplies - continued | |||
HeartWare International, Inc. (a) | 49,830 | $ 4,785,175 | |
Hill-Rom Holdings, Inc. | 199,491 | 7,546,745 | |
Hologic, Inc. (a)(d) | 904,880 | 19,708,286 | |
ICU Medical, Inc. (a)(d) | 44,824 | 2,593,517 | |
IDEXX Laboratories, Inc. (a)(d) | 171,398 | 21,579,008 | |
Insulet Corp. (a)(d) | 180,801 | 8,571,775 | |
Integra LifeSciences Holdings Corp. (a)(d) | 79,170 | 3,724,157 | |
Invacare Corp. | 97,998 | 1,942,320 | |
Iridex Corp. (a) | 9,439 | 88,727 | |
Kewaunee Scientific Corp. | 5,250 | 85,365 | |
Kips Bay Medical, Inc. (a) | 9,803 | 7,058 | |
Ldr Holding Corp. (d) | 26,225 | 819,531 | |
LeMaitre Vascular, Inc. | 17,157 | 140,516 | |
Masimo Corp. (a) | 180,137 | 4,602,500 | |
Medical Action Industries, Inc. (a) | 37,965 | 277,904 | |
MELA Sciences, Inc. (a)(d) | 117,358 | 82,737 | |
Meridian Bioscience, Inc. (d) | 134,771 | 2,811,323 | |
Merit Medical Systems, Inc. (a) | 136,240 | 2,055,862 | |
Misonix, Inc. (a) | 11,163 | 74,792 | |
Natus Medical, Inc. (a) | 90,072 | 2,260,807 | |
Neogen Corp. (a) | 124,941 | 5,412,444 | |
NeuroMetrix, Inc. (a)(d) | 685 | 1,589 | |
NuVasive, Inc. (a)(d) | 149,477 | 5,493,280 | |
NxStage Medical, Inc. (a) | 197,959 | 2,745,691 | |
OraSure Technologies, Inc. (a) | 177,113 | 1,229,164 | |
Orthofix International NV (a) | 73,558 | 1,634,459 | |
PhotoMedex, Inc. (a)(d) | 47,544 | 696,044 | |
Quidel Corp. (a)(d) | 101,129 | 2,833,635 | |
ResMed, Inc. (d) | 471,002 | 20,733,508 | |
Retractable Technologies, Inc. (a) | 5,601 | 20,164 | |
Rockwell Medical Technologies, Inc. (a)(d) | 112,115 | 1,422,739 | |
RTI Biologics, Inc. (a) | 147,974 | 556,382 | |
Sirona Dental Systems, Inc. (a)(d) | 182,312 | 12,845,704 | |
Staar Surgical Co. (a) | 83,499 | 1,182,346 | |
Stereotaxis, Inc. (a) | 64,951 | 322,157 | |
Steris Corp. | 202,247 | 9,333,699 | |
SurModics, Inc. (a) | 43,320 | 1,078,668 | |
Symmetry Medical, Inc. (a) | 136,148 | 1,440,446 | |
Synergetics U.S.A., Inc. (a) | 71,442 | 247,189 | |
Tandem Diabetes Care, Inc. | 31,616 | 814,112 | |
TearLab Corp. (a)(d) | 100,207 | 806,666 | |
Teleflex, Inc. | 136,290 | 13,900,217 | |
The Cooper Companies, Inc. | 161,997 | 20,769,635 | |
The Spectranetics Corp. (a) | 135,737 | 4,066,681 | |
Thoratec Corp. (a) | 190,369 | 7,070,305 | |
Tornier NV (a) | 93,726 | 1,799,539 | |
Unilife Corp. (a)(d) | 338,238 | 1,566,042 | |
Uroplasty, Inc. (a) | 64,999 | 267,796 | |
Utah Medical Products, Inc. | 6,852 | 376,791 | |
Vascular Solutions, Inc. (a)(d) | 53,247 | 1,385,487 | |
Veracyte, Inc. | 12,799 | 204,912 | |
| |||
Shares | Value | ||
Vermillion, Inc. (a)(d) | 42,513 | $ 144,544 | |
Vision Sciences, Inc. (a) | 22,011 | 31,916 | |
Volcano Corp. (a)(d) | 185,809 | 3,987,461 | |
West Pharmaceutical Services, Inc. | 239,769 | 10,928,671 | |
Wright Medical Group, Inc. (a) | 165,918 | 5,279,511 | |
Zeltiq Aesthetics, Inc. (a)(d) | 77,310 | 1,468,117 | |
| 329,233,167 | ||
Health Care Providers & Services - 2.6% | |||
Acadia Healthcare Co., Inc. (a)(d) | 117,379 | 5,803,218 | |
Accretive Health, Inc. (a)(d) | 197,962 | 1,639,125 | |
Adcare Health Systems, Inc. (a) | 10,908 | 47,341 | |
Addus HomeCare Corp. (a) | 22,321 | 641,952 | |
Air Methods Corp. (a)(d) | 116,433 | 6,289,711 | |
Alliance Healthcare Services, Inc. (a) | 33,193 | 1,000,437 | |
Almost Family, Inc. (a) | 28,394 | 778,563 | |
Amedisys, Inc. (a)(d) | 117,539 | 1,993,461 | |
American CareSource Holdings, Inc. (a) | 2,053 | 4,024 | |
American Shared Hospital Services (a) | 115 | 351 | |
AMN Healthcare Services, Inc. (a) | 168,489 | 2,347,052 | |
AmSurg Corp. (a) | 111,041 | 4,870,258 | |
Bio-Reference Laboratories, Inc. (a)(d) | 87,412 | 2,208,027 | |
BioScrip, Inc. (a) | 205,484 | 1,465,101 | |
BioTelemetry, Inc. (a) | 83,325 | 936,573 | |
Brookdale Senior Living, Inc. (a)(d) | 330,979 | 11,101,036 | |
Capital Senior Living Corp. (a) | 91,513 | 2,326,260 | |
Centene Corp. (a)(d) | 182,255 | 11,605,998 | |
Chemed Corp. (d) | 61,290 | 5,185,134 | |
Chindex International, Inc. (a) | 41,105 | 791,271 | |
Community Health Systems, Inc. (a) | 378,360 | 15,705,724 | |
Corvel Corp. (a) | 38,096 | 1,752,797 | |
Cross Country Healthcare, Inc. (a) | 94,255 | 980,252 | |
Diversicare Healthcare Services, Inc. | 12,213 | 67,172 | |
Emeritus Corp. (a) | 135,332 | 4,267,018 | |
Envision Healthcare Holdings, Inc. | 227,756 | 7,666,267 | |
ExamWorks Group, Inc. (a) | 87,727 | 3,191,508 | |
Five Star Quality Care, Inc. (a) | 149,941 | 868,158 | |
Gentiva Health Services, Inc. (a)(d) | 96,791 | 1,036,632 | |
Hanger, Inc. (a) | 115,793 | 4,104,862 | |
HCA Holdings, Inc. (a) | 1,014,934 | 51,964,621 | |
Health Net, Inc. (a) | 261,005 | 8,887,220 | |
HealthSouth Corp. | 287,800 | 9,405,304 | |
Healthways, Inc. (a)(d) | 117,627 | 1,759,700 | |
Henry Schein, Inc. (a)(d) | 277,554 | 33,040,028 | |
Hooper Holmes, Inc. (a) | 128,551 | 71,989 | |
InfuSystems Holdings, Inc. (a) | 5,400 | 14,256 | |
IPC The Hospitalist Co., Inc. (a)(d) | 55,906 | 2,869,655 | |
Kindred Healthcare, Inc. | 192,213 | 4,163,334 | |
Landauer, Inc. | 33,237 | 1,610,665 | |
LCA-Vision, Inc. (a) | 71,178 | 387,208 | |
LHC Group, Inc. (a) | 42,300 | 996,588 | |
LifePoint Hospitals, Inc. (a) | 156,942 | 8,514,104 | |
Magellan Health Services, Inc. (a) | 92,138 | 5,633,317 | |
MEDNAX, Inc. (a)(d) | 335,141 | 20,383,276 | |
Common Stocks - continued | |||
Shares | Value | ||
HEALTH CARE - continued | |||
Health Care Providers & Services - continued | |||
Molina Healthcare, Inc. (a)(d) | 97,946 | $ 3,690,605 | |
MWI Veterinary Supply, Inc. (a) | 43,441 | 7,077,408 | |
National Healthcare Corp. | 34,496 | 1,776,544 | |
National Research Corp.: | |||
Class A (a) | 27,189 | 475,808 | |
Class B (d) | 8,693 | 348,155 | |
NeoStem, Inc. (a)(d) | 70,595 | 494,165 | |
Omnicare, Inc. | 333,010 | 19,614,289 | |
Owens & Minor, Inc. (d) | 203,979 | 7,082,151 | |
PDI, Inc. (a) | 19,284 | 91,599 | |
PharMerica Corp. (a) | 102,387 | 2,467,527 | |
Premier, Inc. | 96,494 | 3,227,724 | |
Providence Service Corp. (a) | 40,157 | 1,067,775 | |
Psychemedics Corp. | 15,744 | 280,401 | |
RadNet, Inc. (a) | 74,982 | 145,465 | |
Select Medical Holdings Corp. | 206,647 | 2,316,513 | |
Sharps Compliance Corp. (a) | 29,684 | 142,483 | |
Skilled Healthcare Group, Inc. (a)(d) | 74,963 | 360,572 | |
SunLink Health Systems, Inc. (a) | 19,190 | 23,988 | |
Surgical Care Affiliates, Inc. | 36,872 | 1,121,646 | |
Team Health Holdings, Inc. (a) | 230,667 | 10,384,628 | |
The Ensign Group, Inc. | 73,014 | 2,891,354 | |
Triple-S Management Corp. (a) | 81,088 | 1,358,224 | |
U.S. Physical Therapy, Inc. | 38,321 | 1,271,491 | |
Universal American Spin Corp. (d) | 125,867 | 942,744 | |
Universal Health Services, Inc. Class B | 293,335 | 23,548,934 | |
VCA Antech, Inc. (a) | 291,115 | 9,015,832 | |
Wellcare Health Plans, Inc. (a) | 145,091 | 8,969,526 | |
| 360,564,099 | ||
Health Care Technology - 0.5% | |||
Allscripts Healthcare Solutions, Inc. (a) | 519,124 | 9,640,133 | |
Arrhythmia Research Technology, Inc. (a) | 9,913 | 46,095 | |
athenahealth, Inc. (a)(d) | 123,498 | 23,942,557 | |
Authentidate Holding Corp. (a)(d) | 33,216 | 34,877 | |
CollabRx, Inc. (a) | 177 | 568 | |
Computer Programs & Systems, Inc. | 35,893 | 2,456,158 | |
HealthStream, Inc. (a)(d) | 67,498 | 1,945,292 | |
HMS Holdings Corp. (a)(d) | 294,558 | 6,026,657 | |
iCAD, Inc. (a) | 30,867 | 359,601 | |
MedAssets, Inc. (a) | 208,027 | 5,052,976 | |
Medidata Solutions, Inc. (a)(d) | 166,837 | 10,694,252 | |
Merge Healthcare, Inc. (a)(d) | 198,185 | 497,444 | |
Omnicell, Inc. (a)(d) | 122,796 | 3,534,069 | |
Quality Systems, Inc. | 152,647 | 2,665,217 | |
Simulations Plus, Inc. | 26,420 | 150,594 | |
Streamline Health Solutions, Inc. (a) | 32,477 | 203,631 | |
Veeva Systems, Inc. Class A (d) | 45,341 | 1,600,537 | |
Vocera Communications, Inc. (a)(d) | 68,642 | 1,168,287 | |
| 70,018,945 | ||
| |||
Shares | Value | ||
Life Sciences Tools & Services - 1.3% | |||
Accelerate Diagnostics, Inc. (a)(d) | 79,168 | $ 1,170,103 | |
Affymetrix, Inc. (a)(d) | 232,638 | 1,795,965 | |
Albany Molecular Research, Inc. (a)(d) | 66,949 | 1,044,404 | |
Apricus Biosciences, Inc. (a)(d) | 103,681 | 242,095 | |
BG Medicine, Inc. (a)(d) | 33,527 | 43,585 | |
Bio-Rad Laboratories, Inc. Class A (a) | 70,269 | 9,115,295 | |
Bioanalytical Systems, Inc. (a)(d) | 4,772 | 12,884 | |
Bruker BioSciences Corp. (a) | 369,173 | 8,394,994 | |
Cambrex Corp. (a) | 99,659 | 2,000,156 | |
Charles River Laboratories International, Inc. (a) | 152,413 | 9,054,856 | |
CombiMatrix Corp. (a)(d) | 13,852 | 39,478 | |
Covance, Inc. (a)(d) | 182,057 | 18,853,823 | |
Enzo Biochem, Inc. (a) | 134,553 | 499,192 | |
Fluidigm Corp. (a) | 84,882 | 3,976,722 | |
Furiex Pharmaceuticals, Inc. (a) | 30,575 | 2,829,105 | |
Harvard Bioscience, Inc. (a) | 61,324 | 299,261 | |
Illumina, Inc. (a)(d) | 420,643 | 72,136,068 | |
Luminex Corp. (a)(d) | 123,438 | 2,281,134 | |
Mettler-Toledo International, Inc. (a) | 97,486 | 23,958,159 | |
Nanostring Technologies, Inc. | 36,430 | 688,527 | |
NeoGenomics, Inc. (a)(d) | 129,047 | 461,988 | |
Pacific Biosciences of California, Inc. (a) | 178,598 | 1,189,463 | |
PAREXEL International Corp. (a) | 186,275 | 9,978,752 | |
pSivida Corp. (a)(d) | 82,313 | 360,531 | |
Quintiles Transnational Holdings, Inc. | 80,908 | 4,381,168 | |
Response Genetics, Inc. (a) | 8,201 | 11,727 | |
Sequenom, Inc. (a)(d) | 403,889 | 957,217 | |
Techne Corp. | 109,192 | 9,700,617 | |
VirtualScopics, Inc. (a) | 2,167 | 7,324 | |
| 185,484,593 | ||
Pharmaceuticals - 1.4% | |||
AcelRx Pharmaceuticals, Inc. (a)(d) | 81,141 | 927,442 | |
Acura Pharmaceuticals, Inc. (a) | 93,798 | 185,720 | |
Aerie Pharmaceuticals, Inc. | 30,148 | 692,500 | |
Akorn, Inc. (a)(d) | 243,141 | 6,277,901 | |
Alexza Pharmaceuticals, Inc. (a) | 37,601 | 206,053 | |
Alimera Sciences, Inc. (a)(d) | 47,590 | 319,329 | |
Ampio Pharmaceuticals, Inc. (a)(d) | 110,055 | 783,592 | |
ANI Pharmaceuticals, Inc. (a)(d) | 24,842 | 752,216 | |
Aratana Therapeutics, Inc. (d) | 67,352 | 1,574,016 | |
AstraZeneca PLC rights (a) | 21,542 | 0 | |
Auxilium Pharmaceuticals, Inc. (a)(d) | 159,396 | 4,901,427 | |
AVANIR Pharmaceuticals Class A (a) | 506,360 | 2,106,458 | |
Biodel, Inc. (a)(d) | 35,927 | 113,170 | |
Biodelivery Sciences International, Inc. (a)(d) | 132,799 | 1,244,327 | |
Cadence Pharmaceuticals, Inc. (a) | 223,033 | 3,120,232 | |
Cempra, Inc. (a) | 75,436 | 859,216 | |
Columbia Laboratories, Inc. (a)(d) | 40,260 | 274,976 | |
Corcept Therapeutics, Inc. (a)(d) | 220,514 | 723,286 | |
Cumberland Pharmaceuticals, Inc. (a) | 32,551 | 150,711 | |
Common Stocks - continued | |||
Shares | Value | ||
HEALTH CARE - continued | |||
Pharmaceuticals - continued | |||
DepoMed, Inc. (a) | 202,001 | $ 2,434,112 | |
Durect Corp. (a) | 379,275 | 527,192 | |
Endo Health Solutions, Inc. (a)(d) | 456,243 | 36,417,316 | |
Endocyte, Inc. (a)(d) | 101,288 | 1,333,963 | |
Evoke Pharma, Inc. | 10,276 | 106,459 | |
Heska Corp. (a) | 15,048 | 146,116 | |
Hi-Tech Pharmacal Co., Inc. (a) | 35,059 | 1,520,158 | |
Horizon Pharma, Inc. (a)(d) | 169,961 | 2,076,923 | |
Impax Laboratories, Inc. (a) | 232,534 | 5,992,401 | |
Jazz Pharmaceuticals PLC (a) | 174,160 | 26,462,741 | |
Lannett Co., Inc. (a)(d) | 91,970 | 3,944,593 | |
Mallinckrodt PLC (a) | 191,626 | 12,971,164 | |
Nektar Therapeutics (a) | 416,539 | 5,344,195 | |
NovaBay Pharmaceuticals, Inc. (a)(d) | 72,124 | 90,876 | |
Ocera Therapeutics, Inc. (a)(d) | 3,249 | 50,262 | |
Omeros Corp. (a)(d) | 89,410 | 1,194,518 | |
Pacira Pharmaceuticals, Inc. (a)(d) | 112,002 | 8,763,036 | |
Pain Therapeutics, Inc. (a) | 127,482 | 720,273 | |
Pernix Therapeutics Holdings, Inc. (a)(d) | 25,474 | 93,490 | |
Pozen, Inc. | 81,989 | 652,632 | |
Prestige Brands Holdings, Inc. (a) | 172,300 | 4,908,827 | |
Questcor Pharmaceuticals, Inc. (d) | 185,588 | 11,274,471 | |
Relypsa, Inc. | 25,364 | 1,000,863 | |
Repros Therapeutics, Inc. (a)(d) | 72,970 | 1,426,564 | |
Sagent Pharmaceuticals, Inc. (a) | 73,832 | 1,562,285 | |
Salix Pharmaceuticals Ltd. (a) | 208,275 | 22,477,038 | |
SciClone Pharmaceuticals, Inc. (a)(d) | 165,132 | 767,864 | |
Sucampo Pharmaceuticals, Inc. Class A (a) | 85,589 | 770,301 | |
Supernus Pharmaceuticals, Inc. (a)(d) | 58,414 | 586,477 | |
The Medicines Company (a)(d) | 210,985 | 6,445,592 | |
TherapeuticsMD, Inc. (a)(d) | 329,975 | 2,266,928 | |
Transcept Pharmaceuticals, Inc. (a) | 34,975 | 116,467 | |
Ventrus Biosciences, Inc. (a) | 67,306 | 91,536 | |
VIVUS, Inc. (a)(d) | 332,213 | 2,003,244 | |
XenoPort, Inc. (a)(d) | 188,526 | 1,178,288 | |
Zogenix, Inc. (a)(d) | 375,255 | 1,632,359 | |
| 194,564,096 | ||
TOTAL HEALTH CARE | 1,683,382,646 | ||
INDUSTRIALS - 14.7% | |||
Aerospace & Defense - 1.7% | |||
AAR Corp. | 128,048 | 3,700,587 | |
AeroVironment, Inc. (a) | 65,978 | 2,061,153 | |
Alliant Techsystems, Inc. | 105,362 | 14,201,744 | |
American Science & Engineering, Inc. | 30,419 | 2,000,049 | |
API Technologies Corp. (a) | 67,799 | 188,481 | |
Arotech Corp. (a) | 51,558 | 175,813 | |
Ascent Solar Technologies, Inc. (a)(d) | 112,670 | 82,125 | |
| |||
Shares | Value | ||
Astronics Corp. (a) | 51,486 | $ 3,444,413 | |
Astrotech Corp. (a)(d) | 39,511 | 105,889 | |
BE Aerospace, Inc. (a) | 322,786 | 27,194,721 | |
Breeze Industrial Products Corp. (a) | 10,964 | 105,254 | |
CPI Aerostructures, Inc. (a)(d) | 13,911 | 199,901 | |
Cubic Corp. | 77,870 | 4,049,240 | |
Curtiss-Wright Corp. | 159,374 | 10,862,932 | |
DigitalGlobe, Inc. (a) | 230,125 | 7,152,285 | |
Ducommun, Inc. (a) | 32,079 | 891,796 | |
Engility Holdings, Inc. (a)(d) | 61,914 | 2,583,671 | |
Erickson Air-Crane, Inc. (a)(d) | 16,337 | 351,736 | |
Esterline Technologies Corp. (a) | 106,718 | 11,493,529 | |
Exelis, Inc. | 634,969 | 12,972,417 | |
GenCorp, Inc. (non-vtg.) (a)(d) | 209,446 | 3,901,979 | |
HEICO Corp. | 99,781 | 6,205,380 | |
HEICO Corp. Class A | 120,967 | 5,557,224 | |
Hexcel Corp. (a) | 328,659 | 14,789,655 | |
Huntington Ingalls Industries, Inc. | 158,950 | 16,106,404 | |
Innovative Solutions & Support, Inc. (a) | 34,266 | 270,359 | |
KEYW Holding Corp. (a)(d) | 90,660 | 1,659,078 | |
Kratos Defense & Security Solutions, Inc. (a) | 148,815 | 1,160,757 | |
LMI Aerospace, Inc. (a)(d) | 40,944 | 610,475 | |
Micronet Enertec Technologies, Inc. (a) | 8,571 | 46,026 | |
Moog, Inc. Class A (a) | 157,374 | 9,746,172 | |
National Presto Industries, Inc. (d) | 16,984 | 1,308,447 | |
Orbital Sciences Corp. (a) | 211,700 | 6,016,514 | |
SIFCO Industries, Inc. | 1,004 | 26,606 | |
Sparton Corp. (a) | 27,651 | 895,892 | |
Spirit AeroSystems Holdings, Inc. Class A (a) | 332,245 | 9,578,623 | |
Sypris Solutions, Inc. | 19,374 | 54,441 | |
Taser International, Inc. (a)(d) | 173,546 | 3,337,290 | |
Teledyne Technologies, Inc. (a) | 132,210 | 12,953,936 | |
TransDigm Group, Inc. | 163,452 | 29,117,339 | |
Triumph Group, Inc. | 172,726 | 11,261,735 | |
| 238,422,068 | ||
Air Freight & Logistics - 0.2% | |||
Air Transport Services Group, Inc. (a) | 167,461 | 1,070,076 | |
Atlas Air Worldwide Holdings, Inc. (a) | 85,402 | 2,573,162 | |
Echo Global Logistics, Inc. (a) | 53,905 | 858,168 | |
Forward Air Corp. | 118,062 | 5,107,362 | |
Hub Group, Inc. Class A (a)(d) | 118,664 | 4,636,202 | |
Pacer International, Inc. (a) | 128,388 | 1,151,640 | |
Park-Ohio Holdings Corp. (a) | 29,198 | 1,536,983 | |
Radiant Logistics, Inc. (a) | 37,185 | 102,259 | |
UTi Worldwide, Inc. | 311,951 | 3,069,598 | |
XPO Logistics, Inc. (a)(d) | 149,548 | 4,701,789 | |
| 24,807,239 | ||
Airlines - 0.9% | |||
Alaska Air Group, Inc. | 226,441 | 19,618,848 | |
Allegiant Travel Co. | 49,305 | 4,894,014 | |
American Airlines Group, Inc. (a)(d) | 635,985 | 23,486,926 | |
Common Stocks - continued | |||
Shares | Value | ||
INDUSTRIALS - continued | |||
Airlines - continued | |||
Hawaiian Holdings, Inc. (a)(d) | 198,497 | $ 2,389,904 | |
JetBlue Airways Corp. (a)(d) | 733,599 | 6,477,679 | |
Republic Airways Holdings, Inc. (a) | 176,772 | 1,693,476 | |
SkyWest, Inc. | 180,939 | 2,297,925 | |
Spirit Airlines, Inc. (a) | 241,407 | 13,634,667 | |
United Continental Holdings, Inc. (a) | 1,200,940 | 53,994,262 | |
| 128,487,701 | ||
Building Products - 0.9% | |||
A.O. Smith Corp. | 252,068 | 12,527,780 | |
AAON, Inc. | 93,160 | 2,783,621 | |
American Woodmark Corp. (a) | 43,110 | 1,384,262 | |
Apogee Enterprises, Inc. | 103,282 | 3,535,343 | |
Armstrong World Industries, Inc. (a) | 126,358 | 6,935,791 | |
Builders FirstSource, Inc. (a) | 172,637 | 1,486,405 | |
Fortune Brands Home & Security, Inc. | 544,162 | 25,434,132 | |
Gibraltar Industries, Inc. (a) | 106,106 | 1,955,534 | |
Griffon Corp. | 169,928 | 2,107,107 | |
Insteel Industries, Inc. | 51,506 | 1,024,969 | |
Lennox International, Inc. | 149,634 | 13,748,372 | |
Masonite International Corp. (a) | 55,755 | 3,217,064 | |
NCI Building Systems, Inc. (a) | 106,899 | 1,823,697 | |
Norcraft Companies, Inc. | 31,325 | 544,115 | |
Nortek, Inc. (a) | 55,700 | 4,032,123 | |
Owens Corning | 361,504 | 16,542,423 | |
Patrick Industries, Inc. (a) | 36,314 | 1,532,088 | |
PGT, Inc. (a)(d) | 118,950 | 1,378,631 | |
Ply Gem Holdings, Inc. | 61,929 | 793,310 | |
Quanex Building Products Corp. | 127,404 | 2,476,734 | |
Simpson Manufacturing Co. Ltd. | 142,646 | 5,042,536 | |
Trex Co., Inc. (a)(d) | 50,709 | 3,966,458 | |
Universal Forest Products, Inc. | 66,762 | 3,720,646 | |
USG Corp. (a)(d) | 307,217 | 10,853,977 | |
| 128,847,118 | ||
Commercial Services & Supplies - 1.4% | |||
ABM Industries, Inc. | 181,384 | 5,120,470 | |
ACCO Brands Corp. (a)(d) | 398,384 | 2,358,433 | |
Acme United Corp. | 1,357 | 21,508 | |
Acorn Energy, Inc. (d) | 65,930 | 224,162 | |
Amrep Corp. (a) | 2,745 | 20,203 | |
ARC Document Solutions, Inc. (a) | 122,333 | 965,207 | |
Avalon Holdings Corp. Class A (a) | 128 | 692 | |
Casella Waste Systems, Inc. Class A (a) | 94,671 | 507,437 | |
CECO Environmental Corp. (d) | 73,503 | 1,187,073 | |
Cenveo, Inc. (a)(d) | 175,472 | 594,850 | |
Clean Harbors, Inc. (a)(d) | 181,523 | 8,578,777 | |
Command Security Corp. (a) | 4,127 | 8,460 | |
CompX International, Inc. Class A | 729 | 8,311 | |
Copart, Inc. (a) | 373,565 | 13,608,973 | |
Courier Corp. | 28,388 | 467,550 | |
Covanta Holding Corp. | 436,144 | 7,850,592 | |
| |||
Shares | Value | ||
Deluxe Corp. | 167,617 | $ 8,461,306 | |
Ecology & Environment, Inc. Class A | 5,634 | 67,495 | |
EnerNOC, Inc. (a) | 96,330 | 2,089,398 | |
Ennis, Inc. | 84,717 | 1,338,529 | |
Food Technology Service, Inc. (a) | 11,431 | 82,075 | |
Fuel Tech, Inc. (a) | 72,552 | 463,607 | |
G&K Services, Inc. Class A | 68,430 | 4,285,771 | |
Healthcare Services Group, Inc. | 246,803 | 6,646,405 | |
Heritage-Crystal Clean, Inc. (a) | 21,398 | 387,304 | |
Herman Miller, Inc. | 199,407 | 5,619,289 | |
HNI Corp. | 150,326 | 5,344,089 | |
Hudson Technologies, Inc. (a)(d) | 33,341 | 104,357 | |
Humitech International Group, Inc. (a) | 75 | 0 | |
Industrial Services of America, Inc. (a)(d) | 12,843 | 46,620 | |
InnerWorkings, Inc. (a)(d) | 130,564 | 1,028,844 | |
Interface, Inc. | 206,587 | 3,978,866 | |
Intersections, Inc. | 42,827 | 262,530 | |
KAR Auction Services, Inc. | 458,159 | 14,276,234 | |
Kimball International, Inc. Class B | 106,993 | 2,008,259 | |
Knoll, Inc. | 168,647 | 2,625,834 | |
McGrath RentCorp. | 87,775 | 2,841,277 | |
Metalico, Inc. (a) | 92,179 | 179,749 | |
Mine Safety Appliances Co. | 109,856 | 5,652,091 | |
Mobile Mini, Inc. | 138,265 | 6,223,308 | |
Multi-Color Corp. | 45,195 | 1,530,755 | |
NL Industries, Inc. | 19,361 | 217,424 | |
Performant Financial Corp. (a) | 101,625 | 803,854 | |
Perma-Fix Environmental Services, Inc. (a) | 24,334 | 84,682 | |
Quad/Graphics, Inc. (d) | 87,062 | 1,947,577 | |
R.R. Donnelley & Sons Co. | 648,066 | 12,397,503 | |
Rollins, Inc. | 255,303 | 7,623,348 | |
Schawk, Inc. Class A | 27,510 | 384,590 | |
SP Plus Corp. (a) | 59,437 | 1,560,221 | |
Standard Register Co. (a) | 7,636 | 83,691 | |
Steelcase, Inc. Class A | 204,828 | 3,045,792 | |
Swisher Hygiene, Inc. (Canada) (a)(d) | 364,761 | 178,734 | |
Team, Inc. (a) | 67,994 | 2,940,061 | |
Tetra Tech, Inc. (a) | 220,994 | 6,382,307 | |
The Brink's Co. | 170,136 | 5,173,836 | |
TRC Companies, Inc. (a) | 46,338 | 319,732 | |
U.S. Ecology, Inc. | 72,607 | 2,608,770 | |
UniFirst Corp. | 51,036 | 5,598,139 | |
United Stationers, Inc. | 140,267 | 5,979,582 | |
Versar, Inc. (a) | 11,390 | 43,168 | |
Viad Corp. | 69,798 | 1,678,642 | |
Virco Manufacturing Co. (a) | 4,818 | 12,623 | |
Waste Connections, Inc. | 405,562 | 17,548,668 | |
West Corp. | 82,531 | 2,073,179 | |
| 195,752,813 | ||
Construction & Engineering - 0.9% | |||
AECOM Technology Corp. (a) | 334,577 | 10,686,389 | |
Aegion Corp. (a)(d) | 132,798 | 3,074,274 | |
Common Stocks - continued | |||
Shares | Value | ||
INDUSTRIALS - continued | |||
Construction & Engineering - continued | |||
Ameresco, Inc. Class A (a)(d) | 58,398 | $ 599,163 | |
Argan, Inc. | 32,135 | 918,740 | |
Chicago Bridge & Iron Co. NV | 353,500 | 29,761,165 | |
Comfort Systems U.S.A., Inc. | 125,897 | 2,068,488 | |
Dycom Industries, Inc. (a) | 117,169 | 3,385,012 | |
EMCOR Group, Inc. | 228,213 | 10,675,804 | |
Foster Wheeler AG | 323,497 | 10,390,724 | |
Furmanite Corp. (a) | 125,414 | 1,484,902 | |
Goldfield Corp. | 60,575 | 141,140 | |
Granite Construction, Inc. | 124,703 | 4,584,082 | |
Great Lakes Dredge & Dock Corp. (a)(d) | 189,686 | 1,566,806 | |
Integrated Electrical Services, Inc. (a) | 32,747 | 179,126 | |
KBR, Inc. | 486,926 | 13,448,896 | |
Layne Christensen Co. (a)(d) | 69,984 | 1,242,916 | |
MasTec, Inc. (a)(d) | 204,727 | 8,381,523 | |
MYR Group, Inc. (a) | 70,284 | 1,635,509 | |
Northwest Pipe Co. (a) | 30,517 | 1,081,828 | |
Orion Marine Group, Inc. (a) | 86,249 | 973,751 | |
Pike Corp. (a) | 85,970 | 892,369 | |
Primoris Services Corp. | 118,109 | 3,693,268 | |
Sterling Construction Co., Inc. (a) | 38,185 | 361,612 | |
Tutor Perini Corp. (a) | 129,585 | 3,194,270 | |
UniTek Global Services, Inc. (a) | 33,766 | 54,026 | |
URS Corp. | 248,137 | 11,538,371 | |
Willdan Group, Inc. (a) | 13,349 | 61,539 | |
| 126,075,693 | ||
Electrical Equipment - 1.2% | |||
Active Power, Inc. (a) | 47,662 | 161,574 | |
Acuity Brands, Inc. | 141,914 | 20,016,970 | |
Allied Motion Technologies, Inc. | 14,531 | 166,816 | |
Altair Nanotechnologies, Inc. (a)(d) | 24,072 | 130,230 | |
American Superconductor Corp. (a)(d) | 173,059 | 320,159 | |
AZZ, Inc. | 86,866 | 3,854,244 | |
Babcock & Wilcox Co. | 376,282 | 12,402,255 | |
Brady Corp. Class A | 171,982 | 4,600,519 | |
Broadwind Energy, Inc. (a) | 50,197 | 484,401 | |
Capstone Turbine Corp. (a)(d) | 1,142,904 | 2,045,798 | |
Digital Power Corp. (a) | 4,959 | 3,075 | |
Encore Wire Corp. | 61,999 | 3,241,928 | |
EnerSys | 153,666 | 10,916,433 | |
Enphase Energy, Inc. (a)(d) | 40,205 | 324,454 | |
Espey Manufacturing & Electronics Corp. | 2,487 | 71,650 | |
Franklin Electric Co., Inc. | 135,690 | 5,914,727 | |
FuelCell Energy, Inc. (a)(d) | 636,902 | 1,241,959 | |
Generac Holdings, Inc. | 227,790 | 12,977,196 | |
General Cable Corp. | 173,857 | 5,351,318 | |
Global Power Equipment Group, Inc. | 46,800 | 857,376 | |
GrafTech International Ltd. (a)(d) | 386,768 | 3,751,650 | |
Hubbell, Inc. Class B | 177,553 | 21,224,686 | |
II-VI, Inc. (a) | 188,032 | 3,081,844 | |
Lime Energy Co. (a)(d) | 4,467 | 13,490 | |
| |||
Shares | Value | ||
LSI Industries, Inc. | 51,035 | $ 423,080 | |
MagneTek, Inc. (a) | 6,645 | 160,543 | |
Ocean Power Technologies, Inc. (a)(d) | 24,836 | 100,834 | |
Orion Energy Systems, Inc. (a) | 65,072 | 359,848 | |
Plug Power, Inc. (a)(d) | 334,144 | 1,560,452 | |
Polypore International, Inc. (a)(d) | 153,378 | 5,308,413 | |
Powell Industries, Inc. | 33,460 | 2,279,630 | |
Power Solutions International, Inc. (a)(d) | 16,088 | 1,192,121 | |
PowerSecure International, Inc. (a)(d) | 63,459 | 1,442,423 | |
Preformed Line Products Co. | 8,094 | 502,637 | |
Real Goods Solar, Inc. Class A (a)(d) | 83,434 | 317,884 | |
Regal-Beloit Corp. | 153,599 | 11,318,710 | |
Revolution Lighting Technologies, Inc. (a)(d) | 124,109 | 392,184 | |
Sensata Technologies Holding BV (a) | 487,402 | 19,808,017 | |
SL Industries, Inc. (a) | 10,551 | 279,602 | |
SolarCity Corp. (a)(d) | 160,513 | 13,637,184 | |
Thermon Group Holdings, Inc. (a)(d) | 109,926 | 2,670,103 | |
Ultralife Corp. (a) | 43,594 | 164,785 | |
Vicor Corp. (a)(d) | 52,357 | 563,885 | |
ZBB Energy Corp. (a)(d) | 34,839 | 32,052 | |
| 175,669,139 | ||
Industrial Conglomerates - 0.1% | |||
Carlisle Companies, Inc. | 213,316 | 16,920,225 | |
Raven Industries, Inc. | 124,554 | 4,554,940 | |
| 21,475,165 | ||
Machinery - 3.8% | |||
Accuride Corp. (a)(d) | 132,658 | 585,022 | |
Actuant Corp. Class A | 241,358 | 8,462,011 | |
Adept Technology, Inc. (a) | 40,541 | 682,710 | |
AGCO Corp. | 296,134 | 15,541,112 | |
Alamo Group, Inc. | 26,680 | 1,402,834 | |
Albany International Corp. Class A | 100,741 | 3,634,735 | |
Altra Industrial Motion Corp. | 94,746 | 3,354,008 | |
American Railcar Industries, Inc. | 32,423 | 2,245,293 | |
Ampco-Pittsburgh Corp. | 25,813 | 527,876 | |
Art's-Way Manufacturing Co., Inc. | 9,831 | 58,494 | |
Astec Industries, Inc. | 69,250 | 2,785,235 | |
Barnes Group, Inc. | 158,563 | 6,096,747 | |
Blount International, Inc. (a)(d) | 172,961 | 2,118,772 | |
Briggs & Stratton Corp. | 162,631 | 3,704,734 | |
Chart Industries, Inc. (a) | 100,740 | 8,417,834 | |
Chicago Rivet & Machine Co. | 772 | 30,772 | |
CIRCOR International, Inc. | 60,186 | 4,306,910 | |
CLARCOR, Inc. | 168,156 | 9,741,277 | |
Colfax Corp. (a) | 304,642 | 21,669,185 | |
Columbus McKinnon Corp. (NY Shares) (a) | 62,931 | 1,602,223 | |
Commercial Vehicle Group, Inc. (a) | 75,400 | 672,568 | |
Crane Co. | 163,017 | 11,642,674 | |
Donaldson Co., Inc. | 452,816 | 19,398,637 | |
Douglas Dynamics, Inc. | 74,542 | 1,206,090 | |
Dynamic Materials Corp. | 39,486 | 819,729 | |
Common Stocks - continued | |||
Shares | Value | ||
INDUSTRIALS - continued | |||
Machinery - continued | |||
Eastern Co. | 11,293 | $ 179,672 | |
Energy Recovery, Inc. (a)(d) | 141,452 | 633,705 | |
EnPro Industries, Inc. (a)(d) | 68,032 | 4,873,132 | |
ESCO Technologies, Inc. | 95,557 | 3,424,763 | |
ExOne Co. (d) | 33,912 | 1,570,126 | |
Federal Signal Corp. (a) | 206,448 | 2,652,857 | |
FreightCar America, Inc. | 47,091 | 1,203,646 | |
Global Brass & Copper Holdings, Inc. | 80,528 | 1,363,339 | |
Gorman-Rupp Co. | 63,289 | 1,993,604 | |
Graco, Inc. | 204,383 | 15,948,005 | |
Graham Corp. | 31,448 | 1,093,447 | |
Greenbrier Companies, Inc. (a)(d) | 83,214 | 3,500,813 | |
Hardinge, Inc. | 28,207 | 416,053 | |
Harsco Corp. | 267,202 | 6,712,114 | |
Hurco Companies, Inc. | 14,365 | 359,269 | |
Hyster-Yale Materials Handling Class A | 38,190 | 3,854,899 | |
IDEX Corp. | 266,127 | 19,978,154 | |
Internet Media Services, Inc. (a) | 7,375 | 5 | |
ITT Corp. | 295,751 | 12,983,469 | |
John Bean Technologies Corp. | 85,902 | 2,590,804 | |
Kadant, Inc. | 36,513 | 1,465,997 | |
Kennametal, Inc. | 255,674 | 11,183,181 | |
Key Technology, Inc. (a) | 12,346 | 156,794 | |
L.B. Foster Co. Class A | 30,153 | 1,401,813 | |
Lincoln Electric Holdings, Inc. | 273,476 | 20,502,496 | |
Lindsay Corp. (d) | 43,068 | 3,654,750 | |
Lydall, Inc. (a) | 39,995 | 810,299 | |
Manitex International, Inc. (a)(d) | 34,692 | 520,033 | |
Manitowoc Co., Inc. (d) | 441,343 | 13,655,152 | |
Meritor, Inc. (a) | 317,981 | 3,946,144 | |
MFRI, Inc. (a) | 13,428 | 208,134 | |
Middleby Corp. (a)(d) | 63,969 | 18,970,647 | |
Miller Industries, Inc. | 29,446 | 531,500 | |
Mueller Industries, Inc. | 100,310 | 6,267,369 | |
Mueller Water Products, Inc. Class A | 534,113 | 5,154,190 | |
Navistar International Corp. (a)(d) | 224,675 | 8,425,313 | |
NN, Inc. | 55,838 | 1,077,115 | |
Nordson Corp. | 200,809 | 14,691,186 | |
Omega Flex, Inc. | 5,411 | 120,936 | |
Oshkosh Truck Corp. | 284,653 | 16,461,483 | |
PMFG, Inc. (a) | 42,899 | 280,559 | |
Proto Labs, Inc. (a)(d) | 68,148 | 5,308,729 | |
RBC Bearings, Inc. (a) | 81,190 | 5,216,458 | |
Rexnord Corp. (a) | 175,648 | 5,267,684 | |
SPX Corp. | 151,748 | 16,340,225 | |
Standex International Corp. | 44,238 | 2,446,804 | |
Sun Hydraulics Corp. | 84,826 | 3,588,140 | |
Taylor Devices, Inc. (a) | 3,820 | 32,088 | |
Tecumseh Products Co. Class A (non-vtg.) (a) | 49,815 | 393,539 | |
Tennant Co. | 63,191 | 3,871,081 | |
| |||
Shares | Value | ||
Terex Corp. | 370,340 | $ 16,491,240 | |
The L.S. Starrett Co. Class A | 14,574 | 273,117 | |
Timken Co. | 262,687 | 15,855,787 | |
Titan International, Inc. (d) | 188,051 | 3,565,447 | |
Toro Co. | 195,916 | 12,975,517 | |
TriMas Corp. (a) | 147,403 | 4,954,215 | |
Trinity Industries, Inc. | 259,296 | 18,620,046 | |
Twin Disc, Inc. | 22,386 | 554,501 | |
Valmont Industries, Inc. (d) | 87,256 | 12,707,091 | |
Wabash National Corp. (a)(d) | 244,547 | 3,303,830 | |
WABCO Holdings, Inc. (a) | 204,823 | 20,984,116 | |
Wabtec Corp. | 315,454 | 25,037,584 | |
Watts Water Technologies, Inc. Class A | 99,738 | 6,145,856 | |
Woodward, Inc. | 201,903 | 8,800,952 | |
WSI Industries, Inc. | 5,668 | 36,502 | |
Xerium Technologies, Inc. (a) | 41,758 | 657,689 | |
| 538,952,687 | ||
Marine - 0.2% | |||
Baltic Trading Ltd. (d) | 148,093 | 1,014,437 | |
Eagle Bulk Shipping, Inc. (a)(d) | 42,249 | 200,260 | |
Genco Shipping & Trading Ltd. (a)(d) | 119,131 | 195,375 | |
International Shipholding Corp. | 22,466 | 684,314 | |
Kirby Corp. (a) | 183,646 | 19,211,208 | |
Matson, Inc. | 138,917 | 3,350,678 | |
Rand Logistics, Inc. (a)(d) | 30,737 | 208,089 | |
| 24,864,361 | ||
Professional Services - 1.3% | |||
Acacia Research Corp. (d) | 177,375 | 2,719,159 | |
Advisory Board Co. (a)(d) | 120,223 | 7,703,890 | |
Barrett Business Services, Inc. | 22,755 | 1,592,850 | |
CBIZ, Inc. (a)(d) | 163,829 | 1,495,759 | |
CDI Corp. | 40,979 | 748,686 | |
Corp. Resources Services, Inc. (a)(d) | 34,388 | 89,753 | |
Corporate Executive Board Co. | 113,872 | 8,515,348 | |
CRA International, Inc. (a) | 27,449 | 641,483 | |
CTPartners Executive Search, Inc. (a) | 10,063 | 70,441 | |
DLH Holdings Corp. (a) | 2,300 | 5,658 | |
Exponent, Inc. | 45,555 | 3,245,338 | |
Franklin Covey Co. (a) | 43,285 | 906,821 | |
FTI Consulting, Inc. (a) | 136,944 | 3,997,395 | |
GP Strategies Corp. (a) | 66,351 | 1,932,141 | |
Heidrick & Struggles International, Inc. | 47,268 | 869,259 | |
Hill International, Inc. (a) | 70,728 | 318,276 | |
Hudson Global, Inc. (a)(d) | 73,448 | 262,944 | |
Huron Consulting Group, Inc. (a) | 79,894 | 5,286,586 | |
ICF International, Inc. (a)(d) | 69,969 | 2,828,147 | |
IHS, Inc. Class A (a) | 205,698 | 24,659,076 | |
Insperity, Inc. | 79,669 | 2,325,538 | |
Kelly Services, Inc. Class A (non-vtg.) | 92,870 | 2,336,609 | |
Kforce, Inc. | 104,013 | 2,278,925 | |
Korn/Ferry International (a) | 172,794 | 4,387,240 | |
Lightbridge Corp. (a)(d) | 43,052 | 133,461 | |
Luna Innovations, Inc. (a) | 26,569 | 39,588 | |
Common Stocks - continued | |||
Shares | Value | ||
INDUSTRIALS - continued | |||
Professional Services - continued | |||
Manpower, Inc. | 255,928 | $ 20,003,332 | |
Mastech Holdings, Inc. | 3,140 | 42,861 | |
MISTRAS Group, Inc. (a) | 57,199 | 1,260,666 | |
Navigant Consulting, Inc. (a) | 172,532 | 3,007,233 | |
Odyssey Marine Exploration, Inc. (a)(d) | 239,959 | 525,510 | |
On Assignment, Inc. (a) | 156,999 | 5,400,766 | |
Pendrell Corp. (a) | 486,872 | 740,045 | |
RCM Technologies, Inc. (a) | 26,829 | 185,388 | |
Resources Connection, Inc. | 137,971 | 1,890,203 | |
RPX Corp. (a) | 126,709 | 2,029,878 | |
Spherix, Inc. (a) | 11,044 | 51,575 | |
Towers Watson & Co. | 212,666 | 23,201,861 | |
TrueBlue, Inc. (a) | 140,541 | 4,002,608 | |
Verisk Analytics, Inc. (a) | 497,227 | 31,680,818 | |
VSE Corp. | 11,665 | 563,420 | |
WageWorks, Inc. (a) | 97,655 | 5,776,293 | |
| 179,752,828 | ||
Road & Rail - 1.1% | |||
AMERCO | 19,924 | 4,641,097 | |
Arkansas Best Corp. | 77,866 | 2,589,823 | |
Avis Budget Group, Inc. (a)(d) | 356,954 | 16,773,268 | |
Celadon Group, Inc. | 79,105 | 1,795,684 | |
Con-way, Inc. | 185,796 | 7,086,259 | |
Covenant Transport Group, Inc. Class A (a) | 20,231 | 201,501 | |
Genesee & Wyoming, Inc. Class A (a) | 163,916 | 16,214,571 | |
Heartland Express, Inc. | 164,198 | 3,346,355 | |
Hertz Global Holdings, Inc. (a) | 1,487,435 | 41,663,054 | |
J.B. Hunt Transport Services, Inc. | 298,562 | 21,457,651 | |
Knight Transportation, Inc. | 212,636 | 4,567,421 | |
Landstar System, Inc. | 154,958 | 8,942,626 | |
Marten Transport Ltd. | 92,034 | 1,793,743 | |
Old Dominion Freight Lines, Inc. (a) | 233,075 | 12,408,913 | |
P.A.M. Transportation Services, Inc. (a) | 12,026 | 218,633 | |
Patriot Transportation Holding, Inc. (a) | 15,144 | 539,884 | |
Quality Distribution, Inc. (a) | 101,880 | 1,306,102 | |
Roadrunner Transportation Systems, Inc. (a) | 88,451 | 2,079,483 | |
Saia, Inc. (a) | 87,509 | 3,022,561 | |
Swift Transporation Co. (a)(d) | 357,132 | 8,699,736 | |
U.S.A. Truck, Inc. (a) | 28,518 | 438,322 | |
Universal Truckload Services, Inc. | 18,107 | 470,782 | |
Werner Enterprises, Inc. | 156,098 | 4,035,133 | |
YRC Worldwide, Inc. (a)(d) | 32,458 | 850,400 | |
| 165,143,002 | ||
Trading Companies & Distributors - 1.0% | |||
Aceto Corp. | 86,257 | 1,577,641 | |
AeroCentury Corp. (a)(d) | 740 | 12,587 | |
Air Lease Corp. Class A | 302,013 | 11,159,380 | |
Aircastle Ltd. | 214,971 | 4,234,929 | |
Applied Industrial Technologies, Inc. | 144,113 | 7,354,086 | |
| |||
Shares | Value | ||
Beacon Roofing Supply, Inc. (a)(d) | 160,838 | $ 6,078,068 | |
BlueLinx Corp. (a)(d) | 73,361 | 107,107 | |
CAI International, Inc. (a)(d) | 57,232 | 1,393,027 | |
DXP Enterprises, Inc. (a) | 33,811 | 3,440,607 | |
Essex Rental Corp. (a) | 27,827 | 87,655 | |
GATX Corp. | 159,648 | 10,359,559 | |
H&E Equipment Services, Inc. (a) | 99,601 | 3,258,945 | |
HD Supply Holdings, Inc. (a)(d) | 192,007 | 4,468,003 | |
Houston Wire & Cable Co. | 39,527 | 549,821 | |
Kaman Corp. | 99,263 | 3,942,726 | |
Lawson Products, Inc. (a) | 23,255 | 342,546 | |
MRC Global, Inc. (a) | 336,811 | 8,662,779 | |
MSC Industrial Direct Co., Inc. Class A | 154,283 | 13,319,251 | |
Rush Enterprises, Inc. Class A (a)(d) | 119,446 | 3,416,156 | |
Stock Building Supply Holdings, Inc. | 34,275 | 762,962 | |
TAL International Group, Inc. | 111,519 | 4,940,292 | |
Textainer Group Holdings Ltd. (d) | 68,600 | 2,501,842 | |
Titan Machinery, Inc. (a)(d) | 64,538 | 1,020,991 | |
Transcat, Inc. (a) | 4,695 | 43,429 | |
United Rentals, Inc. (a)(d) | 306,291 | 27,057,747 | |
Watsco, Inc. | 85,928 | 8,453,597 | |
WESCO International, Inc. (a)(d) | 140,830 | 12,140,954 | |
Willis Lease Finance Corp. (a) | 19,324 | 345,900 | |
| 141,032,587 | ||
Transportation Infrastructure - 0.0% | |||
Wesco Aircraft Holdings, Inc. (a) | 147,953 | 3,209,101 | |
TOTAL INDUSTRIALS | 2,092,491,502 | ||
INFORMATION TECHNOLOGY - 16.1% | |||
Communications Equipment - 1.2% | |||
ADTRAN, Inc. | 197,013 | 5,161,741 | |
Alliance Fiber Optic Products, Inc. (d) | 38,110 | 458,844 | |
Ambient Corp. (a) | 4,086 | 7,723 | |
American Electric Technologies, Inc. (a) | 1,200 | 11,328 | |
Applied Optoelectronics, Inc. | 13,050 | 308,763 | |
Arris Group, Inc. (a) | 381,476 | 10,948,361 | |
Aruba Networks, Inc. (a)(d) | 360,797 | 7,399,946 | |
Aviat Networks, Inc. (a) | 167,167 | 325,976 | |
Aware, Inc. (a) | 13,571 | 76,812 | |
Bel Fuse, Inc. Class B (non-vtg.) | 23,302 | 442,738 | |
Black Box Corp. | 57,867 | 1,539,262 | |
Brocade Communications Systems, Inc. (a) | 1,480,625 | 14,169,581 | |
CalAmp Corp. (a) | 110,023 | 3,525,137 | |
Calix Networks, Inc. (a) | 117,823 | 936,693 | |
Ciena Corp. (a)(d) | 340,243 | 8,359,771 | |
Clearfield, Inc. (a) | 36,827 | 861,752 | |
ClearOne, Inc. (a) | 5,738 | 62,143 | |
CommScope Holding Co., Inc. | 150,608 | 3,643,208 | |
Communications Systems, Inc. | 7,926 | 106,763 | |
Comtech Telecommunications Corp. | 62,000 | 1,984,620 | |
Digi International, Inc. (a) | 68,270 | 651,979 | |
Common Stocks - continued | |||
Shares | Value | ||
INFORMATION TECHNOLOGY - continued | |||
Communications Equipment - continued | |||
EchoStar Holding Corp. Class A (a) | 139,551 | $ 6,952,431 | |
EMCORE Corp. (a)(d) | 83,286 | 406,436 | |
Emulex Corp. (a) | 343,768 | 2,502,631 | |
Entrada Networks, Inc. (a) | 292 | 0 | |
Extreme Networks, Inc. (a) | 334,521 | 1,916,805 | |
Finisar Corp. (a) | 317,054 | 7,514,180 | |
Harmonic, Inc. (a) | 331,637 | 2,152,324 | |
Infinera Corp. (a)(d) | 415,664 | 3,458,324 | |
InfoSonics Corp. (a)(d) | 41,938 | 127,911 | |
InterDigital, Inc. (d) | 140,409 | 4,282,475 | |
Interphase Corp. (a) | 11,825 | 56,642 | |
Ixia (a) | 193,434 | 2,390,844 | |
JDS Uniphase Corp. (a) | 764,116 | 10,529,518 | |
KVH Industries, Inc. (a)(d) | 40,349 | 521,713 | |
Lantronix, Inc. (a) | 2,994 | 7,635 | |
Meru Networks, Inc. (a)(d) | 44,480 | 187,706 | |
NETGEAR, Inc. (a)(d) | 134,826 | 4,608,353 | |
Novatel Wireless, Inc. (a) | 94,259 | 227,164 | |
NumereX Corp. Class A (a) | 29,504 | 437,839 | |
Oclaro, Inc. (a) | 344,328 | 971,005 | |
Oplink Communications, Inc. (a) | 58,370 | 1,022,642 | |
Optical Cable Corp. | 11,466 | 44,603 | |
Palo Alto Networks, Inc. (a) | 150,940 | 10,739,381 | |
Parkervision, Inc. (a)(d) | 304,980 | 1,524,900 | |
PC-Tel, Inc. | 44,393 | 386,219 | |
Plantronics, Inc. | 151,062 | 6,704,132 | |
Polycom, Inc. (a)(d) | 484,718 | 6,475,832 | |
Procera Networks, Inc. (a)(d) | 67,503 | 744,558 | |
Relm Wireless Corp. (a) | 22,872 | 72,047 | |
Riverbed Technology, Inc. (a) | 540,599 | 12,044,546 | |
Ruckus Wireless, Inc. (a) | 183,342 | 2,566,788 | |
ShoreTel, Inc. (a) | 188,141 | 1,653,759 | |
Sonus Networks, Inc. (a)(d) | 960,885 | 3,584,101 | |
Technical Communications Corp. (a) | 2,835 | 19,845 | |
Tessco Technologies, Inc. | 20,333 | 774,281 | |
Ubiquiti Networks, Inc. (a)(d) | 53,471 | 2,642,002 | |
ViaSat, Inc. (a)(d) | 144,625 | 9,647,934 | |
Westell Technologies, Inc. Class A (a) | 150,024 | 619,599 | |
Zhone Technologies, Inc. (a)(d) | 84,494 | 328,682 | |
Zoom Technologies, Inc. (a)(d) | 4,729 | 21,706 | |
| 171,852,634 | ||
Computers & Peripherals - 0.6% | |||
3D Systems Corp. (a)(d) | 316,500 | 24,041,340 | |
Concurrent Computer Corp. | 24,916 | 205,806 | |
Cray, Inc. (a)(d) | 134,778 | 4,675,449 | |
Crossroads Systems, Inc. (a)(d) | 24,612 | 55,869 | |
Dataram Corp. (a) | 3,942 | 10,762 | |
Diebold, Inc. | 221,486 | 8,281,362 | |
Dot Hill Systems Corp. (a) | 189,368 | 1,009,331 | |
Electronics for Imaging, Inc. (a) | 158,522 | 7,070,081 | |
Fusion-io, Inc. (a)(d) | 320,315 | 3,513,856 | |
| |||
Shares | Value | ||
Hutchinson Technology, Inc. (a) | 81,684 | $ 297,330 | |
Imation Corp. (a) | 104,323 | 667,667 | |
Immersion Corp. (a) | 100,218 | 1,197,605 | |
Intevac, Inc. (a) | 59,350 | 446,906 | |
Lexmark International, Inc. Class A | 204,090 | 8,600,353 | |
NCR Corp. (a) | 551,457 | 18,777,111 | |
Overland Storage, Inc. (a) | 57,061 | 59,343 | |
QLogic Corp. (a) | 297,783 | 3,400,682 | |
Quantum Corp. (a)(d) | 964,773 | 1,128,784 | |
Qumu Corp. (a) | 32,359 | 511,272 | |
Silicon Graphics International Corp. (a)(d) | 125,239 | 1,541,692 | |
Super Micro Computer, Inc. (a) | 132,262 | 2,670,370 | |
Transact Technologies, Inc. | 18,832 | 218,451 | |
U.S.A. Technologies, Inc. (a)(d) | 79,221 | 166,364 | |
Violin Memory, Inc. (d) | 53,384 | 232,220 | |
Xplore Technologies Corp. (a) | 5,105 | 30,579 | |
| 88,810,585 | ||
Electronic Equipment & Components - 2.2% | |||
ADDvantage Technologies Group, Inc. (a) | 11,928 | 33,756 | |
Advanced Photonix, Inc. Class A (a) | 41,087 | 27,035 | |
Aeroflex Holding Corp. (a) | 62,535 | 499,655 | |
Agilysys, Inc. (a) | 46,798 | 679,507 | |
Anixter International, Inc. | 92,980 | 9,944,211 | |
Arrow Electronics, Inc. (a) | 330,435 | 18,712,534 | |
Audience, Inc. (a) | 28,401 | 332,860 | |
Avnet, Inc. | 456,204 | 19,858,560 | |
AVX Corp. | 194,808 | 2,499,387 | |
Badger Meter, Inc. | 48,888 | 2,684,929 | |
Belden, Inc. | 142,773 | 10,298,216 | |
Benchmark Electronics, Inc. (a) | 187,285 | 4,464,874 | |
CDW Corp. | 141,832 | 3,711,743 | |
Checkpoint Systems, Inc. (a) | 133,119 | 1,950,193 | |
ClearSign Combustion Corp. (a)(d) | 26,018 | 243,268 | |
Cognex Corp. (a) | 278,233 | 10,478,255 | |
Coherent, Inc. (a) | 85,373 | 5,818,170 | |
Control4 Corp. (d) | 13,781 | 288,161 | |
CTS Corp. | 113,780 | 2,323,388 | |
CUI Global, Inc. (a) | 68,064 | 594,199 | |
Daktronics, Inc. | 130,632 | 1,851,055 | |
Digital Ally, Inc. (a)(d) | 4,790 | 39,134 | |
Dolby Laboratories, Inc. Class A (a)(d) | 165,187 | 6,810,660 | |
DTS, Inc. (a)(d) | 52,729 | 1,070,926 | |
Dynasil Corp. of America (a) | 9,408 | 14,018 | |
Echelon Corp. (a) | 108,441 | 325,323 | |
Electro Rent Corp. | 50,058 | 909,554 | |
Electro Scientific Industries, Inc. | 80,453 | 758,672 | |
eMagin Corp. (a) | 60,537 | 161,028 | |
Fabrinet (a) | 89,055 | 1,729,448 | |
FARO Technologies, Inc. (a) | 58,086 | 3,342,268 | |
FEI Co. | 135,291 | 13,887,621 | |
Frequency Electronics, Inc. (a) | 13,041 | 149,972 | |
Giga-Tronics, Inc. (a) | 4,585 | 6,373 | |
Common Stocks - continued | |||
Shares | Value | ||
INFORMATION TECHNOLOGY - continued | |||
Electronic Equipment & Components - continued | |||
GSI Group, Inc. (a) | 43,195 | $ 542,097 | |
I. D. Systems Inc. (a) | 33,896 | 203,037 | |
Identive Group, Inc. (a) | 118,347 | 102,962 | |
IEC Electronics Corp. (a) | 18,101 | 78,377 | |
Image Sensing Systems, Inc. (a) | 2,863 | 14,458 | |
Ingram Micro, Inc. Class A (a) | 517,433 | 15,238,402 | |
Insight Enterprises, Inc. (a) | 143,877 | 3,306,293 | |
Intelli-Check, Inc. (a) | 25,728 | 19,492 | |
IntriCon Corp. (a) | 1,667 | 7,918 | |
InvenSense, Inc. (a)(d) | 179,424 | 3,615,394 | |
IPG Photonics Corp. (a)(d) | 115,394 | 8,281,827 | |
Iteris, Inc. (a) | 52,448 | 116,435 | |
Itron, Inc. (a)(d) | 128,382 | 4,493,370 | |
KEMET Corp. (a) | 140,529 | 798,205 | |
KEY Tronic Corp. (a) | 23,864 | 246,992 | |
Knowles Corp. (a)(e) | 275,000 | 8,841,250 | |
LGL Group, Inc. (a) | 3,009 | 16,550 | |
LGL Group, Inc. warrants 8/6/18 (a) | 15,045 | 903 | |
LightPath Technologies, Inc. Class A (a)(d) | 13,246 | 21,723 | |
Littelfuse, Inc. | 75,391 | 7,114,649 | |
LoJack Corp. (a) | 47,516 | 288,897 | |
LRAD Corp. (a)(d) | 62,271 | 136,373 | |
Maxwell Technologies, Inc. (a) | 96,283 | 984,012 | |
Measurement Specialties, Inc. (a) | 48,916 | 2,983,876 | |
Mercury Systems, Inc. (a)(d) | 104,306 | 1,157,797 | |
Mesa Laboratories, Inc. | 9,752 | 852,325 | |
Methode Electronics, Inc. Class A | 115,949 | 3,930,671 | |
MicroVision, Inc. (a)(d) | 62,948 | 127,784 | |
MOCON, Inc. | 7,499 | 125,908 | |
MTS Systems Corp. | 51,551 | 3,658,059 | |
Multi-Fineline Electronix, Inc. (a) | 21,997 | 320,496 | |
Napco Security Technolgies, Inc. (a) | 24,581 | 171,084 | |
National Instruments Corp. | 333,517 | 9,661,987 | |
Neonode, Inc. (a)(d) | 105,122 | 758,981 | |
NetList, Inc. (a)(d) | 111,854 | 214,200 | |
Newport Corp. (a) | 137,508 | 2,846,416 | |
OSI Systems, Inc. (a) | 63,679 | 3,914,348 | |
Par Technology Corp. (a) | 27,309 | 135,999 | |
Park Electrochemical Corp. | 73,421 | 2,091,764 | |
PC Connection, Inc. | 55,090 | 1,115,573 | |
PC Mall, Inc. (a) | 21,739 | 211,086 | |
Perceptron, Inc. | 25,360 | 360,366 | |
Planar Systems, Inc. (a) | 44,256 | 102,674 | |
Plexus Corp. (a) | 110,531 | 4,548,351 | |
Pulse Electronics Corp. (a) | 9,108 | 36,432 | |
RadiSys Corp. (a) | 67,810 | 281,412 | |
RealD, Inc. (a)(d) | 152,655 | 1,686,838 | |
Research Frontiers, Inc. (a)(d) | 60,513 | 363,683 | |
RF Industries Ltd. | 13,982 | 92,840 | |
Richardson Electronics Ltd. | 36,856 | 405,047 | |
Rofin-Sinar Technologies, Inc. (a) | 95,815 | 2,248,778 | |
| |||
Shares | Value | ||
Rogers Corp. (a) | 60,069 | $ 3,886,464 | |
Sanmina Corp. (a) | 283,697 | 4,811,501 | |
ScanSource, Inc. (a) | 97,450 | 3,825,887 | |
Sigmatron International, Inc. (a) | 762 | 8,123 | |
Speed Commerce, Inc. (a)(d) | 125,360 | 491,411 | |
Superconductor Technologies, Inc. (a)(d) | 11,800 | 32,922 | |
SYNNEX Corp. (a) | 87,558 | 5,207,950 | |
Tech Data Corp. (a) | 131,415 | 7,569,504 | |
Trimble Navigation Ltd. (a)(d) | 857,708 | 32,721,560 | |
TTM Technologies, Inc. (a) | 184,245 | 1,547,658 | |
Uni-Pixel, Inc. (a)(d) | 29,629 | 292,142 | |
Universal Display Corp. (a)(d) | 136,998 | 4,731,911 | |
Viasystems Group, Inc. (a) | 12,420 | 160,963 | |
Vishay Intertechnology, Inc. | 447,015 | 6,320,792 | |
Vishay Precision Group, Inc. (a) | 39,013 | 668,293 | |
Wayside Technology Group, Inc. | 460 | 6,504 | |
Wireless Telecom Group, Inc. (a) | 11,376 | 40,954 | |
Zebra Technologies Corp. Class A (a) | 171,724 | 11,847,239 | |
Zygo Corp. (a) | 52,026 | 786,113 | |
| 310,331,235 | ||
Internet Software & Services - 2.6% | |||
Angie's List, Inc. (a)(d) | 136,078 | 1,892,845 | |
AOL, Inc. (a) | 260,406 | 11,400,575 | |
Autobytel, Inc. (a) | 31,669 | 499,103 | |
Bankrate, Inc. (a)(d) | 141,571 | 2,849,824 | |
Bazaarvoice, Inc. (a)(d) | 165,633 | 1,119,679 | |
Benefitfocus, Inc. (d) | 17,943 | 1,162,348 | |
Blucora, Inc. (a)(d) | 133,872 | 2,575,697 | |
Bridgeline Digital, Inc. (a) | 24,241 | 27,392 | |
Brightcove, Inc. (a) | 86,582 | 839,845 | |
BroadVision, Inc. (a) | 7,417 | 95,753 | |
Carbonite, Inc. (a) | 42,143 | 428,173 | |
ChannelAdvisor Corp. (a) | 38,133 | 1,730,476 | |
Chegg, Inc. (d) | 66,239 | 417,306 | |
comScore, Inc. (a) | 120,662 | 3,815,332 | |
Constant Contact, Inc. (a) | 108,170 | 2,982,247 | |
Conversant, Inc. (a)(d) | 216,825 | 5,390,270 | |
Cornerstone OnDemand, Inc. (a)(d) | 148,697 | 8,680,931 | |
CoStar Group, Inc. (a) | 96,353 | 19,370,807 | |
Crexendo, Inc. (a) | 12,555 | 39,423 | |
Cvent, Inc. (d) | 35,347 | 1,388,430 | |
Dealertrack Technologies, Inc. (a)(d) | 150,316 | 8,127,586 | |
Demand Media, Inc. (a)(d) | 172,444 | 836,353 | |
Demandware, Inc. (a) | 90,442 | 6,793,099 | |
Dice Holdings, Inc. (a)(d) | 145,947 | 1,074,170 | |
Digital River, Inc. (a) | 103,713 | 1,842,980 | |
E2open, Inc. (a)(d) | 49,259 | 1,368,908 | |
Earthlink Holdings Corp. | 353,573 | 1,386,006 | |
eGain Communications Corp. (a)(d) | 32,997 | 276,515 | |
Endurance International Group Holdings, Inc. (d) | 80,391 | 1,213,100 | |
Envestnet, Inc. (a) | 96,140 | 4,022,498 | |
Equinix, Inc. (a) | 164,896 | 31,323,644 | |
Common Stocks - continued | |||
Shares | Value | ||
INFORMATION TECHNOLOGY - continued | |||
Internet Software & Services - continued | |||
Global Eagle Entertainment, Inc. (a) | 183,765 | $ 3,230,589 | |
GlowPoint, Inc. (a) | 51,449 | 67,913 | |
Gogo, Inc. (d) | 38,042 | 793,176 | |
IAC/InterActiveCorp | 254,393 | 19,723,089 | |
Internap Network Services Corp. (a) | 187,544 | 1,429,085 | |
Internet Patents Corp. (a) | 283 | 911 | |
IntraLinks Holdings, Inc. (a) | 131,309 | 1,524,497 | |
Inuvo, Inc. (a) | 37,507 | 46,509 | |
iPass, Inc. (a) | 125,462 | 194,466 | |
j2 Global, Inc. (d) | 144,163 | 7,409,978 | |
Limelight Networks, Inc. (a) | 156,398 | 337,820 | |
LinkedIn Corp. (a) | 321,929 | 65,686,393 | |
Liquidity Services, Inc. (a)(d) | 90,620 | 2,321,684 | |
LiveDeal, Inc. (a)(d) | 32,301 | 251,302 | |
LivePerson, Inc. (a) | 177,068 | 2,316,049 | |
Local Corp. (a)(d) | 49,826 | 79,223 | |
LogMeIn, Inc. (a) | 79,339 | 3,320,337 | |
LookSmart Ltd. (a) | 14,768 | 32,490 | |
Marchex, Inc. Class B | 75,653 | 895,732 | |
Marin Software, Inc. (d) | 33,252 | 380,735 | |
Marketo, Inc. | 61,264 | 2,511,824 | |
Mediabistro, Inc. (a) | 5,114 | 11,813 | |
MeetMe, Inc. (a)(d) | 65,453 | 174,105 | |
Millennial Media, Inc. (a)(d) | 114,638 | 692,414 | |
Monster Worldwide, Inc. (a) | 344,947 | 2,749,228 | |
Move, Inc. (a) | 134,032 | 1,730,353 | |
NIC, Inc. | 203,445 | 3,954,971 | |
Onvia.com, Inc. (a)(d) | 2,326 | 11,909 | |
OpenTable, Inc. (a)(d) | 78,033 | 6,218,450 | |
Pandora Media, Inc. (a) | 541,724 | 20,271,312 | |
Perficient, Inc. (a) | 107,714 | 2,198,443 | |
QuinStreet, Inc. (a) | 78,393 | 516,610 | |
Rackspace Hosting, Inc. (a)(d) | 382,021 | 14,046,912 | |
RealNetworks, Inc. (a) | 72,712 | 546,067 | |
Reis, Inc. (a)(d) | 22,987 | 405,491 | |
Rocket Fuel, Inc. (d) | 29,420 | 1,649,285 | |
SciQuest, Inc. (a)(d) | 81,678 | 2,411,135 | |
Selectica, Inc. (a) | 2,268 | 15,831 | |
Shutterstock, Inc. (a)(d) | 35,142 | 3,492,412 | |
Spark Networks, Inc. (a)(d) | 65,828 | 396,285 | |
SPS Commerce, Inc. (a) | 53,558 | 3,631,232 | |
Stamps.com, Inc. (a)(d) | 52,541 | 1,848,392 | |
Support.com, Inc. (a) | 167,715 | 420,965 | |
Synacor, Inc. (a) | 40,770 | 107,225 | |
TechTarget, Inc. (a) | 30,780 | 213,305 | |
Textura Corp. (d) | 60,822 | 1,636,720 | |
TheStreet.com, Inc. | 80,374 | 234,692 | |
Travelzoo, Inc. (a) | 32,602 | 770,059 | |
Tremor Video, Inc. (d) | 25,546 | 110,870 | |
Trulia, Inc. (a)(d) | 112,796 | 3,379,368 | |
Twitter, Inc. (d) | 234,137 | 12,856,463 | |
| |||
Shares | Value | ||
United Online, Inc. (d) | 42,358 | $ 474,833 | |
Unwired Planet, Inc. (d) | 271,737 | 402,171 | |
Vocus, Inc. (a) | 57,794 | 771,550 | |
Web.com Group, Inc. (a)(d) | 147,983 | 5,393,980 | |
WebMD Health Corp. (a)(d) | 127,188 | 5,648,419 | |
World Energy Solutions, Inc. (a) | 2,295 | 10,373 | |
XO Group, Inc. (a) | 69,721 | 832,469 | |
Xoom Corp. | 47,742 | 1,338,208 | |
Yelp, Inc. (a)(d) | 188,449 | 17,793,355 | |
YuMe, Inc. (d) | 17,622 | 112,605 | |
Zillow, Inc. (a)(d) | 78,002 | 6,520,967 | |
Zix Corp. (a)(d) | 180,557 | 816,118 | |
| 364,342,482 | ||
IT Services - 2.3% | |||
Acxiom Corp. (a) | 251,988 | 9,381,513 | |
Amdocs Ltd. | 531,891 | 23,658,512 | |
Blackhawk Network Holdings, Inc. (d) | 44,597 | 1,105,114 | |
Booz Allen Hamilton Holding Corp. Class A | 238,671 | 5,019,251 | |
Broadridge Financial Solutions, Inc. | 389,371 | 14,702,649 | |
CACI International, Inc. Class A (a) | 78,671 | 6,201,635 | |
Cardtronics, Inc. (a) | 151,336 | 6,132,135 | |
Cass Information Systems, Inc. | 27,691 | 1,439,932 | |
Ciber, Inc. (a) | 226,365 | 1,082,025 | |
Computer Task Group, Inc. | 39,786 | 646,523 | |
Convergys Corp. | 345,643 | 7,075,312 | |
CoreLogic, Inc. (a) | 310,531 | 10,123,311 | |
CSG Systems International, Inc. | 111,587 | 3,124,436 | |
CSP, Inc. | 3,555 | 29,507 | |
Datalink Corp. (a) | 72,718 | 1,062,410 | |
DST Systems, Inc. | 97,486 | 9,161,734 | |
Edgewater Technology, Inc. (a) | 11,761 | 80,445 | |
EPAM Systems, Inc. (a) | 84,110 | 3,526,732 | |
Euronet Worldwide, Inc. (a)(d) | 159,345 | 6,096,540 | |
EVERTEC, Inc. | 239,314 | 5,805,758 | |
ExlService Holdings, Inc. (a) | 105,564 | 2,954,736 | |
FleetCor Technologies, Inc. (a) | 242,841 | 31,552,331 | |
Forrester Research, Inc. | 46,079 | 1,668,981 | |
Gartner, Inc. Class A (a)(d) | 305,943 | 21,281,395 | |
Genpact Ltd. (a) | 379,737 | 6,334,013 | |
Global Cash Access Holdings, Inc. (a) | 213,120 | 1,790,208 | |
Global Payments, Inc. | 241,213 | 16,964,510 | |
Hackett Group, Inc. | 102,623 | 604,449 | |
Heartland Payment Systems, Inc. | 125,346 | 5,068,992 | |
Higher One Holdings, Inc. (a)(d) | 107,033 | 856,264 | |
iGATE Corp. (a) | 97,307 | 3,293,842 | |
Information Services Group, Inc. (a) | 84,828 | 443,650 | |
Innodata, Inc. (a) | 58,124 | 190,647 | |
InterCloud Systems, Inc. (a)(d) | 11,195 | 150,461 | |
Jack Henry & Associates, Inc. | 290,389 | 16,880,313 | |
Leidos Holdings, Inc. (d) | 241,990 | 10,807,273 | |
Lionbridge Technologies, Inc. (a) | 195,313 | 1,398,441 | |
ManTech International Corp. Class A | 86,321 | 2,526,616 | |
Common Stocks - continued | |||
Shares | Value | ||
INFORMATION TECHNOLOGY - continued | |||
IT Services - continued | |||
Mattersight Corp. (a) | 15,883 | $ 89,580 | |
Maximus, Inc. | 228,641 | 10,926,753 | |
ModusLink Global Solutions, Inc. (a) | 116,317 | 531,569 | |
MoneyGram International, Inc. (a) | 76,773 | 1,460,990 | |
NCI, Inc. Class A (a) | 29,120 | 349,440 | |
Neustar, Inc. Class A (a)(d) | 205,265 | 7,352,592 | |
Newtek Business Services, Inc. (a) | 5,503 | 16,619 | |
PFSweb, Inc. (a) | 60,946 | 533,278 | |
Planet Payment, Inc. (a) | 147,113 | 501,655 | |
PRG-Schultz International, Inc. (a) | 96,195 | 581,018 | |
Sapient Corp. (a) | 373,262 | 6,498,491 | |
Science Applications International Corp. | 142,727 | 5,323,717 | |
ServiceSource International, Inc. (a)(d) | 189,283 | 1,726,261 | |
StarTek, Inc. (a) | 22,269 | 154,770 | |
Sykes Enterprises, Inc. (a) | 130,390 | 2,566,075 | |
Syntel, Inc. (a) | 56,918 | 5,370,782 | |
Teletech Holdings, Inc. (a) | 76,566 | 1,843,709 | |
The Management Network Group, Inc. (a) | 2,929 | 9,959 | |
Unisys Corp. (a)(d) | 147,904 | 5,061,275 | |
Vantiv, Inc. (a)(d) | 401,928 | 12,793,368 | |
VeriFone Systems, Inc. (a) | 357,769 | 10,357,413 | |
Virtusa Corp. (a) | 90,504 | 3,291,630 | |
WEX, Inc. (a)(d) | 128,374 | 12,429,171 | |
WidePoint Corp. (a)(d) | 172,571 | 257,131 | |
WPCS International, Inc. (a)(d) | 5,571 | 8,635 | |
| 330,258,477 | ||
Semiconductors & Semiconductor Equipment - 3.0% | |||
Advanced Energy Industries, Inc. (a) | 130,785 | 3,588,740 | |
Advanced Micro Devices, Inc. (a)(d) | 2,016,925 | 7,482,792 | |
AEHR Test Systems (a) | 9,000 | 21,150 | |
Aetrium, Inc. (a)(d) | 674 | 4,010 | |
Alpha & Omega Semiconductor Ltd. (a) | 18,317 | 133,531 | |
Amkor Technology, Inc. (a)(d) | 453,070 | 2,682,174 | |
Amtech Systems, Inc. (a) | 19,914 | 222,240 | |
ANADIGICS, Inc. (a) | 271,811 | 494,696 | |
Applied Micro Circuits Corp. (a) | 253,177 | 2,901,408 | |
Atmel Corp. (a) | 1,411,126 | 11,373,676 | |
ATMI, Inc. (a) | 108,511 | 3,690,459 | |
Avago Technologies Ltd. | 822,677 | 50,759,171 | |
Axcelis Technologies, Inc. (a) | 355,900 | 793,657 | |
AXT, Inc. (a) | 91,754 | 210,117 | |
Brooks Automation, Inc. | 221,731 | 2,299,350 | |
BTU International, Inc. (a) | 13,926 | 42,196 | |
Cabot Microelectronics Corp. (a) | 79,227 | 3,499,457 | |
Cascade Microtech, Inc. (a) | 31,120 | 276,968 | |
Cavium, Inc. (a)(d) | 178,619 | 7,525,218 | |
Ceva, Inc. (a)(d) | 72,624 | 1,313,042 | |
Cirrus Logic, Inc. (a)(d) | 206,805 | 3,980,996 | |
Cohu, Inc. | 56,455 | 569,631 | |
Cree, Inc. (a)(d) | 400,253 | 24,587,542 | |
| |||
Shares | Value | ||
CVD Equipment Corp. (a)(d) | 12,898 | $ 190,890 | |
CyberOptics Corp. (a) | 9,297 | 78,095 | |
Cypress Semiconductor Corp. (d) | 460,703 | 4,510,282 | |
Diodes, Inc. (a) | 122,440 | 2,915,296 | |
DSP Group, Inc. (a) | 67,110 | 567,751 | |
Entegris, Inc. (a) | 491,313 | 5,920,322 | |
Entropic Communications, Inc. (a)(d) | 344,149 | 1,507,373 | |
Exar Corp. (a) | 162,732 | 1,863,281 | |
Fairchild Semiconductor International, Inc. (a) | 438,835 | 6,178,797 | |
FormFactor, Inc. (a) | 187,509 | 1,336,939 | |
Freescale Semiconductor, Inc. (a)(d) | 321,017 | 7,303,137 | |
GigOptix, Inc. (a) | 52,290 | 85,233 | |
GSI Technology, Inc. (a) | 45,956 | 312,960 | |
GT Advanced Technologies, Inc. (a)(d) | 435,587 | 6,241,962 | |
Hittite Microwave Corp. | 105,948 | 6,248,813 | |
Ikanos Communications, Inc. (a) | 301,764 | 277,623 | |
Inphi Corp. (a) | 80,086 | 1,053,131 | |
Integrated Device Technology, Inc. (a) | 452,674 | 5,337,026 | |
Integrated Silicon Solution, Inc. (a) | 93,866 | 1,143,288 | |
Intermolecular, Inc. (a) | 45,789 | 121,341 | |
International Rectifier Corp. (a)(d) | 245,261 | 6,609,784 | |
Intersil Corp. Class A | 414,470 | 5,272,058 | |
Intest Corp. (a) | 34,005 | 135,340 | |
IXYS Corp. | 82,833 | 912,820 | |
Kopin Corp. (a)(d) | 161,243 | 643,360 | |
Kulicke & Soffa Industries, Inc. (a) | 256,842 | 2,963,957 | |
Lattice Semiconductor Corp. (a) | 418,047 | 3,164,616 | |
LTX-Credence Corp. (a) | 178,150 | 1,802,878 | |
M/A-COM Technology Solutions, Inc. (a) | 40,640 | 689,254 | |
Marvell Technology Group Ltd. | 1,355,027 | 20,718,363 | |
Mattson Technology, Inc. (a) | 251,767 | 642,006 | |
Maxim Integrated Products, Inc. | 933,448 | 30,533,084 | |
MaxLinear, Inc. Class A (a) | 93,581 | 874,982 | |
Micrel, Inc. | 158,460 | 1,654,322 | |
Microsemi Corp. (a) | 319,052 | 7,357,339 | |
MKS Instruments, Inc. | 182,366 | 5,481,922 | |
Monolithic Power Systems, Inc. (a) | 122,120 | 4,376,781 | |
MoSys, Inc. (a)(d) | 140,688 | 621,841 | |
Nanometrics, Inc. (a) | 71,378 | 1,310,500 | |
NeoPhotonics Corp. (a) | 56,859 | 469,087 | |
NVE Corp. (a) | 12,321 | 695,274 | |
Omnivision Technologies, Inc. (a)(d) | 183,726 | 3,172,948 | |
ON Semiconductor Corp. (a) | 1,476,038 | 13,786,195 | |
PDF Solutions, Inc. (a) | 78,702 | 1,604,734 | |
Peregrine Semiconductor Corp. (a)(d) | 97,452 | 650,979 | |
Pericom Semiconductor Corp. (a) | 65,839 | 532,638 | |
Photronics, Inc. (a)(d) | 218,612 | 1,901,924 | |
Pixelworks, Inc. (a) | 60,695 | 302,261 | |
PLX Technology, Inc. (a) | 108,735 | 648,061 | |
PMC-Sierra, Inc. (a) | 712,587 | 5,230,389 | |
Power Integrations, Inc. | 104,568 | 6,183,106 | |
QuickLogic Corp. (a)(d) | 185,965 | 946,562 | |
Rambus, Inc. (a)(d) | 389,646 | 3,592,536 | |
Common Stocks - continued | |||
Shares | Value | ||
INFORMATION TECHNOLOGY - continued | |||
Semiconductors & Semiconductor Equipment - continued | |||
RF Micro Devices, Inc. (a) | 937,422 | $ 6,636,948 | |
Rubicon Technology, Inc. (a)(d) | 73,071 | 943,347 | |
Rudolph Technologies, Inc. (a)(d) | 108,233 | 1,241,433 | |
Semtech Corp. (a) | 224,858 | 5,610,207 | |
Sigma Designs, Inc. (a) | 104,992 | 514,461 | |
Silicon Image, Inc. (a) | 253,525 | 1,533,826 | |
Silicon Laboratories, Inc. (a)(d) | 129,940 | 6,752,982 | |
Skyworks Solutions, Inc. (a) | 620,533 | 22,004,100 | |
Spansion, Inc. Class A (a) | 179,228 | 2,923,209 | |
STR Holdings, Inc. (a) | 118,407 | 175,242 | |
SunEdison, Inc. (a) | 813,615 | 14,937,971 | |
SunPower Corp. (a)(d) | 131,739 | 4,364,513 | |
Supertex, Inc. (a) | 30,678 | 1,010,227 | |
Synaptics, Inc. (a)(d) | 116,634 | 7,585,875 | |
Teradyne, Inc. (a)(d) | 636,208 | 12,902,298 | |
Tessera Technologies, Inc. | 173,295 | 3,763,967 | |
TriQuint Semiconductor, Inc. (a) | 534,464 | 6,541,839 | |
Ultra Clean Holdings, Inc. (a) | 95,950 | 1,262,702 | |
Ultratech, Inc. (a)(d) | 92,383 | 2,422,282 | |
Veeco Instruments, Inc. (a)(d) | 133,922 | 5,296,615 | |
Vitesse Semiconductor Corp. (a)(d) | 196,561 | 715,482 | |
| 426,267,188 | ||
Software - 4.2% | |||
Accelrys, Inc. (a) | 202,545 | 2,527,762 | |
ACI Worldwide, Inc. (a)(d) | 126,659 | 7,603,340 | |
Activision Blizzard, Inc. | 1,430,848 | 27,686,909 | |
Actuate Corp. (a) | 156,442 | 888,591 | |
Advent Software, Inc. | 133,647 | 4,102,963 | |
American Software, Inc. Class A | 75,568 | 790,441 | |
ANSYS, Inc. (a) | 308,722 | 25,784,461 | |
Aspen Technology, Inc. (a) | 314,767 | 14,778,311 | |
Astea International, Inc. (a) | 13,242 | 41,845 | |
Asure Software, Inc. (a) | 1,517 | 10,300 | |
Barracuda Networks, Inc. (d) | 19,714 | 708,718 | |
Blackbaud, Inc. | 151,007 | 4,729,539 | |
Bottomline Technologies, Inc. (a)(d) | 125,050 | 4,463,035 | |
BroadSoft, Inc. (a) | 92,739 | 2,783,097 | |
BSQUARE Corp. (a) | 30,361 | 107,782 | |
Cadence Design Systems, Inc. (a)(d) | 950,944 | 14,577,972 | |
Callidus Software, Inc. (a) | 133,285 | 1,643,404 | |
Cinedigm Corp. (a) | 93,487 | 274,852 | |
CommVault Systems, Inc. (a) | 145,179 | 9,999,930 | |
Compuware Corp. | 734,208 | 8,039,578 | |
Comverse, Inc. (a) | 80,352 | 2,780,983 | |
Concur Technologies, Inc. (a)(d) | 154,897 | 19,122,035 | |
Cover-All Technologies, Inc. (a) | 2,815 | 4,223 | |
Covisint Corp. (d) | 45,291 | 486,878 | |
Cyan, Inc. (d) | 28,568 | 95,988 | |
Datawatch Corp. (a) | 22,345 | 751,015 | |
Digimarc Corp. | 26,174 | 768,992 | |
Document Security Systems, Inc. (a)(d) | 51,596 | 84,617 | |
| |||
Shares | Value | ||
Ebix, Inc. (d) | 116,379 | $ 1,891,159 | |
Ellie Mae, Inc. (a)(d) | 85,614 | 2,654,034 | |
Envivio, Inc. (a) | 37,039 | 133,711 | |
EPIQ Systems, Inc. | 109,472 | 1,552,313 | |
ePlus, Inc. (a) | 12,135 | 690,117 | |
Evolving Systems, Inc. | 19,877 | 168,358 | |
FactSet Research Systems, Inc. (d) | 132,341 | 13,934,184 | |
Fair Isaac Corp. | 120,516 | 6,475,325 | |
FalconStor Software, Inc. (a) | 102,011 | 176,479 | |
FireEye, Inc. (d) | 54,961 | 4,706,860 | |
Fonix Corp. (a) | 1 | 0 | |
Fortinet, Inc. (a) | 451,507 | 10,452,387 | |
Gigamon, Inc. (a) | 46,149 | 1,456,462 | |
Globalscape, Inc. | 29,423 | 66,496 | |
Glu Mobile, Inc. (a)(d) | 197,835 | 995,110 | |
GSE Systems, Inc. (a) | 33,148 | 59,666 | |
Guidance Software, Inc. (a)(d) | 41,724 | 455,209 | |
Guidewire Software, Inc. (a)(d) | 224,302 | 12,024,830 | |
Imperva, Inc. (a) | 69,546 | 4,358,448 | |
Infoblox, Inc. (a) | 155,992 | 3,600,295 | |
Informatica Corp. (a) | 360,693 | 14,990,401 | |
Interactive Intelligence Group, Inc. (a) | 53,898 | 4,291,898 | |
Jive Software, Inc. (a)(d) | 129,531 | 1,054,382 | |
Liquid Holdings Group, Inc. (d) | 11,100 | 53,280 | |
Majesco Entertainment Co. (a)(d) | 169,132 | 89,809 | |
Mandalay Digital Group, Inc. (a)(d) | 73,394 | 356,695 | |
Manhattan Associates, Inc. (a) | 258,002 | 9,775,696 | |
Mavenir Systems, Inc. | 4,167 | 64,380 | |
Mentor Graphics Corp. | 325,605 | 7,046,092 | |
MICROS Systems, Inc. (a)(d) | 243,392 | 13,510,690 | |
MicroStrategy, Inc. Class A (a) | 30,627 | 3,954,865 | |
Mitek Systems, Inc. (a)(d) | 72,082 | 382,755 | |
Model N, Inc. | 21,246 | 233,494 | |
Monotype Imaging Holdings, Inc. | 133,751 | 3,803,878 | |
NetScout Systems, Inc. (a)(d) | 124,546 | 4,730,257 | |
NetSol Technologies, Inc. (a)(d) | 25,363 | 117,684 | |
NetSuite, Inc. (a)(d) | 102,494 | 11,796,034 | |
Nuance Communications, Inc. (a)(d) | 857,305 | 13,108,193 | |
Parametric Technology Corp. (a) | 400,151 | 15,729,936 | |
Park City Group, Inc. (a)(d) | 29,640 | 280,098 | |
Peerless Systems Corp. (a) | 15,698 | 57,926 | |
Pegasystems, Inc. | 60,905 | 2,535,475 | |
Progress Software Corp. (a) | 184,237 | 4,594,871 | |
Proofpoint, Inc. (a) | 78,982 | 3,273,804 | |
PROS Holdings, Inc. (a) | 84,746 | 2,919,500 | |
QAD, Inc. Class B | 24,367 | 404,980 | |
Qlik Technologies, Inc. (a) | 291,552 | 8,892,336 | |
Qualys, Inc. (a) | 57,711 | 1,564,545 | |
Rally Software Development Corp. | 42,605 | 847,413 | |
RealPage, Inc. (a)(d) | 178,593 | 3,161,096 | |
Rosetta Stone, Inc. (a) | 51,040 | 589,512 | |
Rovi Corp. (a) | 338,708 | 8,413,507 | |
SeaChange International, Inc. (a) | 85,138 | 898,206 | |
ServiceNow, Inc. (a) | 336,852 | 22,926,147 | |
Common Stocks - continued | |||
Shares | Value | ||
INFORMATION TECHNOLOGY - continued | |||
Software - continued | |||
Silver Spring Networks, Inc. (d) | 15,724 | $ 276,742 | |
Smith Micro Software, Inc. (a)(d) | 72,854 | 127,495 | |
SolarWinds, Inc. (a) | 219,380 | 10,130,968 | |
Solera Holdings, Inc. (d) | 229,281 | 15,687,406 | |
Sonic Foundry, Inc. (a) | 2,194 | 21,852 | |
Splunk, Inc. (a) | 288,274 | 26,737,414 | |
SS&C Technologies Holdings, Inc. (a) | 207,654 | 8,032,057 | |
Synchronoss Technologies, Inc. (a)(d) | 109,873 | 3,777,434 | |
Synopsys, Inc. (a) | 512,747 | 20,714,979 | |
Tableau Software, Inc. | 51,463 | 4,855,019 | |
Take-Two Interactive Software, Inc. (a) | 310,072 | 6,130,123 | |
Tangoe, Inc. (a)(d) | 124,007 | 2,358,613 | |
TeleCommunication Systems, Inc. Class A (a) | 140,898 | 305,749 | |
TeleNav, Inc. (a) | 41,916 | 251,915 | |
TIBCO Software, Inc. (a) | 511,834 | 11,152,863 | |
TiVo, Inc. (a) | 405,366 | 5,472,441 | |
Tyler Technologies, Inc. (a) | 93,495 | 8,767,961 | |
Ultimate Software Group, Inc. (a)(d) | 92,392 | 15,337,072 | |
Vasco Data Security International, Inc. (a) | 82,596 | 659,116 | |
Verint Systems, Inc. (a) | 178,748 | 8,367,194 | |
VirnetX Holding Corp. (a)(d) | 146,692 | 2,860,494 | |
VMware, Inc. Class A (a)(d) | 282,104 | 27,096,089 | |
Voltari Corp. (a)(d) | 11,296 | 42,586 | |
Vringo, Inc. (a)(d) | 250,377 | 1,014,027 | |
Wave Systems Corp. Class A (a)(d) | 76,840 | 80,682 | |
Workday, Inc. Class A (a)(d) | 102,359 | 11,251,301 | |
Zynga, Inc. (a) | 2,082,457 | 10,537,232 | |
| 589,985,663 | ||
TOTAL INFORMATION TECHNOLOGY | 2,281,848,264 | ||
MATERIALS - 5.2% | |||
Chemicals - 2.5% | |||
A. Schulman, Inc. | 101,315 | 3,520,696 | |
Advanced Emissions Solutions, Inc. (a) | 36,134 | 1,947,623 | |
Albemarle Corp. | 268,050 | 17,688,620 | |
American Vanguard Corp. | 87,623 | 1,949,612 | |
Arabian American Development Co. (a) | 47,222 | 577,997 | |
Ashland, Inc. | 233,762 | 22,060,120 | |
Axiall Corp. | 230,635 | 9,333,798 | |
Balchem Corp. | 101,519 | 5,127,725 | |
BioAmber, Inc. (a) | 1,374 | 20,019 | |
Cabot Corp. | 204,657 | 11,080,130 | |
Calgon Carbon Corp. (a) | 186,696 | 3,758,190 | |
Celanese Corp. Class A | 516,465 | 27,574,066 | |
Chase Corp. | 14,663 | 442,089 | |
Chemtura Corp. (a) | 321,400 | 7,954,650 | |
Clean Diesel Technologies, Inc. (a)(d) | 33,479 | 90,393 | |
Core Molding Technologies, Inc. (a) | 11,521 | 171,087 | |
| |||
Shares | Value | ||
Cytec Industries, Inc. | 115,084 | $ 10,895,002 | |
Ferro Corp. (a) | 290,187 | 3,807,253 | |
Flotek Industries, Inc. (a)(d) | 160,657 | 4,088,721 | |
FutureFuel Corp. | 76,784 | 1,332,202 | |
GSE Holding, Inc. (a) | 16,500 | 10,065 | |
H.B. Fuller Co. | 167,929 | 8,141,198 | |
Hawkins, Inc. | 23,388 | 833,314 | |
Huntsman Corp. | 637,556 | 15,530,864 | |
Innophos Holdings, Inc. | 76,666 | 4,210,497 | |
Innospec, Inc. | 83,762 | 3,644,485 | |
Intrepid Potash, Inc. (a)(d) | 188,036 | 2,784,813 | |
KMG Chemicals, Inc. | 19,780 | 293,535 | |
Koppers Holdings, Inc. | 69,481 | 2,747,279 | |
Kraton Performance Polymers, Inc. (a) | 113,645 | 3,152,512 | |
Kronos Worldwide, Inc. (d) | 80,119 | 1,224,218 | |
Landec Corp. (a) | 84,086 | 856,836 | |
LSB Industries, Inc. (a) | 68,793 | 2,248,843 | |
Marrone Bio Innovations, Inc. (d) | 16,210 | 235,531 | |
Material Sciences Corp. (a) | 23,734 | 301,659 | |
Minerals Technologies, Inc. | 115,626 | 6,185,991 | |
NewMarket Corp. | 38,320 | 14,165,754 | |
Northern Technologies International Corp. (a) | 1,103 | 24,773 | |
Olin Corp. (d) | 258,726 | 6,776,034 | |
OM Group, Inc. | 107,994 | 3,412,610 | |
OMNOVA Solutions, Inc. (a) | 142,209 | 1,355,252 | |
Penford Corp. (a) | 33,122 | 442,179 | |
PolyOne Corp. | 312,837 | 11,731,388 | |
Prospect Global Resources, Inc. (a)(d) | 7,186 | 11,354 | |
Quaker Chemical Corp. | 44,800 | 3,462,144 | |
Rockwood Holdings, Inc. | 247,601 | 19,530,767 | |
RPM International, Inc. | 433,899 | 18,163,012 | |
Senomyx, Inc. (a) | 137,685 | 1,371,343 | |
Sensient Technologies Corp. | 170,930 | 8,961,860 | |
Stepan Co. | 69,028 | 4,196,902 | |
Taminco Corp. | 96,977 | 2,203,317 | |
The Scotts Miracle-Gro Co. Class A | 139,505 | 7,967,131 | |
TOR Minerals International, Inc. (a) | 3,831 | 39,038 | |
Tredegar Corp. | 82,660 | 2,059,061 | |
Tronox Ltd. Class A (d) | 212,649 | 5,037,655 | |
Valhi, Inc. | 64,947 | 713,768 | |
Valspar Corp. | 261,741 | 19,565,140 | |
W.R. Grace & Co. (a) | 250,853 | 25,421,443 | |
Westlake Chemical Corp. | 66,362 | 8,848,045 | |
Zep, Inc. | 66,805 | 1,175,768 | |
Zoltek Companies, Inc. (a)(d) | 83,484 | 1,398,357 | |
| 353,855,728 | ||
Construction Materials - 0.3% | |||
Eagle Materials, Inc. | 161,457 | 14,272,799 | |
Headwaters, Inc. (a) | 262,531 | 3,499,538 | |
Martin Marietta Materials, Inc. | 148,186 | 18,075,728 | |
Texas Industries, Inc. (a)(d) | 73,139 | 6,209,501 | |
Common Stocks - continued | |||
Shares | Value | ||
MATERIALS - continued | |||
Construction Materials - continued | |||
U.S. Concrete, Inc. (a) | 41,450 | $ 1,128,269 | |
United States Lime & Minerals, Inc. | 7,538 | 426,651 | |
| 43,612,486 | ||
Containers & Packaging - 0.9% | |||
AEP Industries, Inc. (a) | 13,400 | 571,108 | |
Aptargroup, Inc. | 216,708 | 14,339,568 | |
Berry Plastics Group, Inc. (a) | 260,893 | 6,347,527 | |
Crown Holdings, Inc. (a) | 447,499 | 20,146,405 | |
Graphic Packaging Holding Co. (a) | 749,526 | 7,675,146 | |
Greif, Inc. Class A | 102,600 | 5,136,156 | |
Myers Industries, Inc. | 100,702 | 2,165,093 | |
Packaging Corp. of America | 323,206 | 23,558,485 | |
Rock-Tenn Co. Class A | 237,672 | 26,528,949 | |
Silgan Holdings, Inc. | 149,251 | 7,195,391 | |
Sonoco Products Co. | 338,423 | 14,206,998 | |
UFP Technologies, Inc. (a) | 15,846 | 405,499 | |
| 128,276,325 | ||
Metals & Mining - 1.1% | |||
A.M. Castle & Co. (a)(d) | 55,605 | 812,945 | |
AK Steel Holding Corp. (a)(d) | 444,492 | 2,760,295 | |
Allied Nevada Gold Corp. (a)(d) | 330,091 | 1,726,376 | |
Amcol International Corp. | 88,795 | 3,940,722 | |
Carpenter Technology Corp. | 174,898 | 10,345,217 | |
Century Aluminum Co. (a) | 185,637 | 2,197,942 | |
Coeur d'Alene Mines Corp. (a) | 347,159 | 3,818,749 | |
Commercial Metals Co. | 401,716 | 7,773,205 | |
Compass Minerals International, Inc. | 110,113 | 9,398,145 | |
Comstock Mining, Inc. (a)(d) | 165,183 | 330,366 | |
Friedman Industries | 15,788 | 133,409 | |
General Moly, Inc. (a)(d) | 202,841 | 241,381 | |
Globe Specialty Metals, Inc. | 217,947 | 4,330,607 | |
Gold Resource Corp. | 132,594 | 682,859 | |
Golden Minerals Co. (a)(d) | 115,781 | 122,728 | |
Handy & Harman Ltd. (a) | 37,596 | 687,255 | |
Haynes International, Inc. | 42,986 | 2,129,097 | |
Hecla Mining Co. (d) | 1,188,592 | 4,017,441 | |
Horsehead Holding Corp. (a)(d) | 166,082 | 2,951,277 | |
Kaiser Aluminum Corp. | 61,713 | 4,356,321 | |
Materion Corp. | 70,361 | 2,081,982 | |
McEwen Mining, Inc. (a)(d) | 803,888 | 2,339,314 | |
Mines Management, Inc. (a)(d) | 69,165 | 94,064 | |
Molycorp, Inc. (a)(d) | 623,108 | 3,252,624 | |
Noranda Aluminium Holding Corp. | 229,718 | 990,085 | |
Olympic Steel, Inc. | 27,830 | 765,603 | |
Paramount Gold & Silver Corp. (a)(d) | 435,955 | 588,539 | |
Reliance Steel & Aluminum Co. | 254,081 | 17,602,732 | |
Royal Gold, Inc. (d) | 217,631 | 14,953,426 | |
RTI International Metals, Inc. (a)(d) | 102,679 | 2,789,788 | |
Schnitzer Steel Industries, Inc. Class A | 90,821 | 2,304,129 | |
Silver Bull Resources, Inc. (a)(d) | 148,902 | 56,583 | |
| |||
Shares | Value | ||
Solitario Exploration & Royalty Corp. (a) | 57,827 | $ 90,210 | |
Steel Dynamics, Inc. | 729,711 | 12,726,160 | |
Stillwater Mining Co. (a)(d) | 414,791 | 5,616,270 | |
SunCoke Energy, Inc. (a) | 247,253 | 5,508,797 | |
Synalloy Corp. | 24,589 | 335,148 | |
Timberline Resources Corp. (a)(d) | 213,150 | 31,333 | |
U.S. Antimony Corp. (a)(d) | 84,807 | 156,893 | |
U.S. Silica Holdings, Inc. (d) | 175,640 | 5,760,992 | |
Universal Stainless & Alloy Products, Inc. (a) | 20,455 | 675,629 | |
Walter Energy, Inc. (d) | 205,462 | 2,216,935 | |
Worthington Industries, Inc. | 180,460 | 7,193,136 | |
| 150,886,709 | ||
Paper & Forest Products - 0.4% | |||
Boise Cascade Co. | 107,309 | 3,175,273 | |
Clearwater Paper Corp. (a) | 77,454 | 4,945,438 | |
Deltic Timber Corp. | 40,804 | 2,568,204 | |
Domtar Corp. | 109,125 | 12,088,868 | |
Kapstone Paper & Packaging Corp. (a) | 270,598 | 8,602,310 | |
Louisiana-Pacific Corp. (a) | 461,795 | 8,677,128 | |
Mercer International, Inc. (SBI) (a) | 33,044 | 288,474 | |
Neenah Paper, Inc. | 54,327 | 2,727,759 | |
P.H. Glatfelter Co. | 158,468 | 4,809,504 | |
Resolute Forest Products (a)(d) | 321,268 | 6,582,781 | |
Schweitzer-Mauduit International, Inc. | 104,283 | 5,019,141 | |
Verso Paper Corp. (a)(d) | 62,871 | 154,034 | |
Wausau-Mosinee Paper Corp. | 177,425 | 2,350,881 | |
| 61,989,795 | ||
TOTAL MATERIALS | 738,621,043 | ||
TELECOMMUNICATION SERVICES - 1.2% | |||
Diversified Telecommunication Services - 0.5% | |||
8x8, Inc. (a) | 295,012 | 3,121,227 | |
Alaska Communication Systems Group, Inc. (a) | 128,803 | 282,079 | |
Alteva | 16,362 | 141,531 | |
Atlantic Tele-Network, Inc. | 43,046 | 2,821,235 | |
Cbeyond, Inc. (a) | 109,968 | 753,281 | |
Cincinnati Bell, Inc. (a) | 727,137 | 2,435,909 | |
Cogent Communications Group, Inc. | 147,097 | 5,639,699 | |
Consolidated Communications Holdings, Inc. (d) | 137,165 | 2,614,365 | |
Elephant Talk Communication, Inc. (a)(d) | 237,541 | 301,677 | |
FairPoint Communications, Inc. (a)(d) | 71,797 | 953,464 | |
General Communications, Inc. Class A (a) | 105,141 | 1,094,518 | |
Hawaiian Telcom Holdco, Inc. (a)(d) | 21,226 | 611,309 | |
HickoryTech Corp. | 38,075 | 518,962 | |
IDT Corp. Class B | 56,794 | 1,019,452 | |
inContact, Inc. (a) | 182,175 | 1,643,219 | |
Inteliquent, Inc. | 104,102 | 1,453,264 | |
Intelsat SA (d) | 65,669 | 1,302,873 | |
Iridium Communications, Inc. (a)(d) | 219,539 | 1,431,394 | |
Common Stocks - continued | |||
Shares | Value | ||
TELECOMMUNICATION SERVICES - continued | |||
Diversified Telecommunication Services - continued | |||
Level 3 Communications, Inc. (a) | 535,608 | $ 19,721,087 | |
Lumos Networks Corp. | 56,988 | 827,466 | |
ORBCOMM, Inc. (a) | 132,401 | 1,034,052 | |
Premiere Global Services, Inc. (a) | 161,424 | 1,825,705 | |
Straight Path Communications, Inc. Class B (a) | 22,231 | 181,405 | |
Towerstream Corp. (a)(d) | 186,972 | 493,606 | |
TW Telecom, Inc. (a) | 474,044 | 14,510,487 | |
Vonage Holdings Corp. (a) | 585,092 | 2,697,274 | |
xG Technology, Inc. (a) | 9,209 | 11,880 | |
| 69,442,420 | ||
Wireless Telecommunication Services - 0.7% | |||
Boingo Wireless, Inc. (a)(d) | 67,800 | 393,918 | |
Leap Wireless International, Inc. (a) | 194,908 | 3,414,788 | |
NII Holdings, Inc. (a)(d) | 572,344 | 658,196 | |
NTELOS Holdings Corp. (d) | 51,213 | 715,958 | |
RingCentral, Inc. (d) | 39,424 | 853,530 | |
SBA Communications Corp. Class A (a)(d) | 420,876 | 40,054,769 | |
Shenandoah Telecommunications Co. | 72,976 | 1,928,756 | |
Sprint Corp. (a) | 2,884,105 | 25,207,078 | |
T-Mobile U.S., Inc. (a) | 849,915 | 25,922,408 | |
Telephone & Data Systems, Inc. | 337,314 | 7,687,386 | |
U.S. Cellular Corp. (d) | 57,098 | 2,060,667 | |
U.S.A. Mobility, Inc. | 66,494 | 960,838 | |
| 109,858,292 | ||
TOTAL TELECOMMUNICATION SERVICES | 179,300,712 | ||
UTILITIES - 3.1% | |||
Electric Utilities - 1.1% | |||
Allete, Inc. | 131,977 | 6,666,158 | |
Cleco Corp. | 207,557 | 10,259,543 | |
El Paso Electric Co. | 144,539 | 5,095,000 | |
Empire District Electric Co. | 165,090 | 3,919,237 | |
Genie Energy Ltd. Class B (a) | 48,524 | 556,085 | |
Great Plains Energy, Inc. | 496,305 | 13,037,932 | |
Hawaiian Electric Industries, Inc. (d) | 366,432 | 9,311,037 | |
IDACORP, Inc. | 168,641 | 9,475,938 | |
ITC Holdings Corp. | 173,616 | 17,813,002 | |
MGE Energy, Inc. | 131,008 | 5,054,289 | |
NRG Yield, Inc. Class A | 67,077 | 2,561,000 | |
OGE Energy Corp. | 658,646 | 23,711,256 | |
Otter Tail Corp. | 123,988 | 3,746,917 | |
PNM Resources, Inc. | 274,636 | 7,181,731 | |
Portland General Electric Co. | 260,349 | 8,279,098 | |
UIL Holdings Corp. | 195,360 | 7,564,339 | |
Unitil Corp. | 41,223 | 1,297,700 | |
| |||
Shares | Value | ||
UNS Energy Corp. | 140,349 | $ 8,492,518 | |
Westar Energy, Inc. (d) | 409,301 | 14,006,280 | |
| 158,029,060 | ||
Gas Utilities - 0.9% | |||
Atmos Energy Corp. | 329,153 | 15,173,953 | |
Chesapeake Utilities Corp. | 31,396 | 1,859,899 | |
Delta Natural Gas Co., Inc. | 13,699 | 281,651 | |
Gas Natural, Inc. | 31,805 | 297,695 | |
Laclede Group, Inc. | 114,681 | 5,258,124 | |
National Fuel Gas Co. | 273,569 | 20,550,503 | |
New Jersey Resources Corp. | 153,835 | 6,924,113 | |
Northwest Natural Gas Co. | 94,806 | 4,064,333 | |
ONE Gas, Inc. (a) | 165,679 | 5,629,772 | |
Piedmont Natural Gas Co., Inc. (d) | 253,429 | 8,570,969 | |
Questar Corp. | 576,190 | 13,684,513 | |
RGC Resources, Inc. | 2,242 | 42,934 | |
South Jersey Industries, Inc. | 108,730 | 6,217,181 | |
Southwest Gas Corp. | 165,026 | 8,914,705 | |
UGI Corp. | 370,129 | 16,541,065 | |
WGL Holdings, Inc. | 174,837 | 7,026,699 | |
| 121,038,109 | ||
Independent Power Producers & Energy Traders - 0.3% | |||
American DG Energy, Inc. (a)(d) | 66,943 | 134,555 | |
Black Hills Corp. | 138,974 | 7,881,216 | |
Calpine Corp. (a) | 1,112,085 | 21,185,219 | |
Dynegy, Inc. (a)(d) | 332,223 | 7,770,696 | |
Ormat Technologies, Inc. (d) | 66,515 | 1,845,791 | |
Pattern Energy Group, Inc. | 58,378 | 1,599,557 | |
U.S. Geothermal, Inc. (a)(d) | 223,992 | 111,996 | |
| 40,529,030 | ||
Multi-Utilities - 0.4% | |||
Alliant Energy Corp. | 346,914 | 18,816,615 | |
Avista Corp. | 203,057 | 6,010,487 | |
MDU Resources Group, Inc. | 627,883 | 21,322,907 | |
NorthWestern Energy Corp. | 130,322 | 5,986,993 | |
Vectren Corp. | 277,101 | 10,660,075 | |
| 62,797,077 | ||
Water Utilities - 0.4% | |||
American States Water Co. | 135,315 | 4,063,509 | |
American Water Works Co., Inc. | 585,460 | 26,252,026 | |
Aqua America, Inc. | 609,206 | 15,345,899 | |
Artesian Resources Corp. Class A | 17,456 | 379,843 | |
Cadiz, Inc. (a)(d) | 34,362 | 256,341 | |
California Water Service Group | 194,287 | 4,567,687 | |
Connecticut Water Service, Inc. | 31,001 | 1,018,073 | |
Middlesex Water Co. | 55,095 | 1,113,470 | |
Pure Cycle Corp. (a)(d) | 69,664 | 436,097 | |
Common Stocks - continued | |||
Shares | Value | ||
UTILITIES - continued | |||
Water Utilities - continued | |||
SJW Corp. | 41,452 | $ 1,226,565 | |
York Water Co. | 39,414 | 794,980 | |
| 55,454,490 | ||
TOTAL UTILITIES | 437,847,766 | ||
TOTAL COMMON STOCKS (Cost $9,928,007,212) |
| ||
U.S. Treasury Obligations - 0.1% | ||||
| Principal Amount |
| ||
U.S. Treasury Bills, yield at date of purchase 0.07% to 0.08% 5/29/14 to 9/18/14 (f) | $ 8,000,000 |
| ||
Money Market Funds - 16.9% | |||
Shares |
| ||
Fidelity Cash Central Fund, 0.10% (b) | 197,332,090 | 197,332,090 | |
Fidelity Securities Lending Cash Central Fund, 0.09% (b)(c) | 2,204,715,174 | 2,204,715,174 | |
TOTAL MONEY MARKET FUNDS (Cost $2,402,047,264) |
| ||
TOTAL INVESTMENT PORTFOLIO - 115.7% (Cost $12,338,052,445) | 16,409,901,872 | |
NET OTHER ASSETS (LIABILITIES) - (15.7)% | (2,230,249,707) | |
NET ASSETS - 100% | $ 14,179,652,165 | |
Futures Contracts | |||||
Expiration Date | Underlying Face Amount at Value | Unrealized Appreciation/ | |||
Purchased | |||||
Equity Index Contracts | |||||
527 CME E-mini S&P MidCap 400 Index Contracts (United States) | March 2014 | $ 72,420,340 | $ 4,393,505 | ||
915 ICE Russell 2000 Index Contracts (United States) | March 2014 | 108,143,850 | 6,907,271 | ||
TOTAL EQUITY INDEX CONTRACTS | $ 180,564,190 | $ 11,300,776 | |||
|
The face value of futures purchased as a percentage of net assets is 1.3% |
Legend |
(a) Non-income producing |
(b) Affiliated fund that is generally available only to investment companies and other accounts managed by Fidelity Investments. The rate quoted is the annualized seven-day yield of the fund at period end. A complete unaudited listing of the fund's holdings as of its most recent quarter end is available upon request. In addition, each Fidelity Central Fund's financial statements, which are not covered by the Fund's Report of Independent Registered Public Accounting Firm, are available on the SEC's website or upon request. |
(c) Investment made with cash collateral received from securities on loan. |
(d) Security or a portion of the security is on loan at period end. |
(e) Security or a portion of the security purchased on a delayed delivery or when-issued basis. |
(f) Security or a portion of the security was pledged to cover margin requirements for futures contracts. At period end, the value of securities pledged amounted to $7,858,351. |
|
Affiliated Central Funds |
Information regarding fiscal year to date income earned by the Fund from investments in Fidelity Central Funds is as follows: |
Fund | Income earned |
Fidelity Cash Central Fund | $ 173,150 |
Fidelity Securities Lending Cash Central Fund | 17,867,424 |
Total | $ 18,040,574 |
Other Information |
The following is a summary of the inputs used, as of February 28, 2014, involving the Fund's assets and liabilities carried at fair value. The inputs or methodology used for valuing securities may not be an indication of the risk associated with investing in those securities. For more information on valuation inputs, and their aggregation into the levels used in the table below, please refer to the Investment Valuation section in the accompanying Notes to Financial Statements. |
Valuation Inputs at Reporting Date: | ||||
Description | Total | Level 1 | Level 2 | Level 3 |
Investments in Securities: | ||||
Equities: | ||||
Consumer Discretionary | $ 2,224,681,240 | $ 2,224,519,718 | $ - | $ 161,522 |
Consumer Staples | 465,838,217 | 465,838,217 | - | - |
Energy | 850,065,155 | 850,045,612 | - | 19,543 |
Financials | 3,045,779,729 | 3,045,775,015 | - | 4,714 |
Health Care | 1,683,382,646 | 1,683,382,645 | - | 1 |
Industrials | 2,092,491,502 | 2,092,491,502 | - | - |
Information Technology | 2,281,848,264 | 2,281,848,264 | - | - |
Materials | 738,621,043 | 738,621,043 | - | - |
Telecommunication Services | 179,300,712 | 179,300,712 | - | - |
Utilities | 437,847,766 | 437,847,766 | - | - |
U.S. Government and Government Agency Obligations | 7,998,334 | - | 7,998,334 | - |
Money Market Funds | 2,402,047,264 | 2,402,047,264 | - | - |
Total Investments in Securities: | $ 16,409,901,872 | $ 16,401,717,758 | $ 7,998,334 | $ 185,780 |
Derivative Instruments: | ||||
Assets | ||||
Futures Contracts | $ 11,300,776 | $ 11,300,776 | $ - | $ - |
Value of Derivative Instruments |
The following table is a summary of the Fund's value of derivative instruments by primary risk exposure as of February 28, 2014. For additional information on derivative instruments, please refer to the Derivative Instruments section in the accompanying Notes to Financial Statements. |
Primary Risk Exposure / | Value | |
| Asset | Liability |
Equity Risk | ||
Futures Contracts (a) | $ 11,300,776 | $ - |
Total Value of Derivatives | $ 11,300,776 | $ - |
(a) Reflects gross cumulative appreciation (depreciation) on futures contracts as presented in the Schedule of Investments. Only the period end receivable or payable for daily variation margin and net unrealized appreciation (depreciation) are presented in the Statement of Assets and Liabilities. |
See accompanying notes which are an integral part of the financial statements.
Annual Report
Spartan Extended Market Index Fund
Financial Statements
Statement of Assets and Liabilities
| February 28, 2014 | |
|
|
|
Assets | ||
Investment in securities, at value (including securities loaned of $2,118,946,977) - See accompanying schedule: Unaffiliated issuers (cost $9,936,005,181) | $ 14,007,854,608 |
|
Fidelity Central Funds (cost $2,402,047,264) | 2,402,047,264 |
|
Total Investments (cost $12,338,052,445) |
| $ 16,409,901,872 |
Cash |
| 103,379 |
Receivable for investments sold | 4,243,238 | |
Receivable for fund shares sold | 27,479,897 | |
Dividends receivable | 11,101,867 | |
Distributions receivable from Fidelity Central Funds | 1,673,120 | |
Receivable from investment adviser for expense reductions | 1,489 | |
Other receivables | 13,813 | |
Total assets | 16,454,518,675 | |
|
|
|
Liabilities | ||
Payable for investments purchased | $ 45,799,551 | |
Delayed delivery | 8,841,938 | |
Payable for fund shares redeemed | 14,292,387 | |
Accrued management fee | 679,361 | |
Payable for daily variation margin for derivative instruments | 381,394 | |
Other affiliated payables | 156,705 | |
Collateral on securities loaned, at value | 2,204,715,174 | |
Total liabilities | 2,274,866,510 | |
|
|
|
Net Assets | $ 14,179,652,165 | |
Net Assets consist of: |
| |
Paid in capital | $ 9,911,453,410 | |
Undistributed net investment income | 30,389,384 | |
Accumulated undistributed net realized gain (loss) on investments | 154,659,168 | |
Net unrealized appreciation (depreciation) on investments | 4,083,150,203 | |
Net Assets | $ 14,179,652,165 | |
Statement of Assets and Liabilities - continued
| February 28, 2014 | |
|
|
|
Investor Class: | $ 55.29 | |
|
|
|
Fidelity Advantage Class: | $ 55.30 | |
|
|
|
Fidelity Advantage Institutional Class: | $ 55.28 | |
See accompanying notes which are an integral part of the financial statements.
Annual Report
Spartan Extended Market Index Fund
Financial Statements - continued
Statement of Operations
| Year ended February 28, 2014 | |
|
|
|
Investment Income |
|
|
Dividends |
| $ 141,393,037 |
Interest |
| 6,600 |
Income from Fidelity Central Funds (including $17,867,424 from security lending) |
| 18,040,574 |
Total income |
| 159,440,211 |
|
|
|
Expenses | ||
Management fee | $ 6,621,238 | |
Transfer agent fees | 1,518,898 | |
Independent trustees' compensation | 50,973 | |
Miscellaneous | 19,487 | |
Total expenses before reductions | 8,210,596 | |
Expense reductions | (10,995) | 8,199,601 |
Net investment income (loss) | 151,240,610 | |
Realized and Unrealized Gain (Loss) Net realized gain (loss) on: | ||
Investment securities: |
|
|
Unaffiliated issuers | 370,098,640 | |
Futures contracts | 29,980,279 | |
Total net realized gain (loss) |
| 400,078,919 |
Change in net unrealized appreciation (depreciation) on: Investment securities | 2,532,453,660 | |
Futures contracts | 3,578,730 | |
Total change in net unrealized appreciation (depreciation) |
| 2,536,032,390 |
Net gain (loss) | 2,936,111,309 | |
Net increase (decrease) in net assets resulting from operations | $ 3,087,351,919 | |
Statement of Changes in Net Assets
| Year ended | Year ended |
Increase (Decrease) in Net Assets |
|
|
Operations |
|
|
Net investment income (loss) | $ 151,240,610 | $ 128,474,031 |
Net realized gain (loss) | 400,078,919 | 189,721,174 |
Change in net unrealized appreciation (depreciation) | 2,536,032,390 | 639,557,587 |
Net increase (decrease) in net assets resulting from operations | 3,087,351,919 | 957,752,792 |
Distributions to shareholders from net investment income | (130,454,906) | (123,000,708) |
Distributions to shareholders from net realized gain | (244,937,001) | (200,713,554) |
Total distributions | (375,391,907) | (323,714,262) |
Share transactions - net increase (decrease) | 3,320,572,816 | 994,205,584 |
Redemption fees | 1,184,464 | 653,587 |
Total increase (decrease) in net assets | 6,033,717,292 | 1,628,897,701 |
|
|
|
Net Assets | ||
Beginning of period | 8,145,934,873 | 6,517,037,172 |
End of period (including undistributed net investment income of $30,389,384 and undistributed net investment income of $12,923,003, respectively) | $ 14,179,652,165 | $ 8,145,934,873 |
See accompanying notes which are an integral part of the financial statements.
Annual Report
Financial Highlights - Investor Class
Years ended February 28, | 2014 | 2013 | 2012 F | 2011 | 2010 |
Selected Per-Share Data |
|
|
|
|
|
Net asset value, beginning of period | $ 43.12 | $ 39.66 | $ 40.35 | $ 31.08 | $ 18.73 |
Income from Investment Operations |
|
|
|
|
|
Net investment income (loss) B | .67 | .73 | .48 | .43 | .36 |
Net realized and unrealized gain (loss) | 13.09 | 4.61 | .10 | 9.71 | 12.40 |
Total from investment operations | 13.76 | 5.34 | .58 | 10.14 | 12.76 |
Distributions from net investment income | (.54) | (.70) | (.45) | (.36) | (.35) |
Distributions from net realized gain | (1.06) | (1.17) | (.84) | (.51) | (.06) |
Total distributions | (1.60) | (1.88) J | (1.28) I | (.87) | (.41) H |
Redemption fees added to paid in capital B | .01 | - G | .01 | - G | - G |
Net asset value, end of period | $ 55.29 | $ 43.12 | $ 39.66 | $ 40.35 | $ 31.08 |
Total Return A | 32.38% | 14.00% | 1.76% | 32.95% | 68.20% |
Ratios to Average Net Assets C, E |
|
|
|
|
|
Expenses before reductions | .10% | .10% | .10% | .10% | .10% |
Expenses net of fee waivers, if any | .10% | .10% | .10% | .10% | .10% |
Expenses net of all reductions | .10% | .10% | .10% | .10% | .10% |
Net investment income (loss) | 1.35% | 1.85% | 1.26% | 1.24% | 1.35% |
Supplemental Data |
|
|
|
|
|
Net assets, end of period (000 omitted) | $ 1,803,152 | $ 971,857 | $ 2,606,631 | $ 4,440,988 | $ 2,692,346 |
Portfolio turnover rate D | 14% | 10% | 11% | 8% | 26% |
ATotal returns would have been lower if certain expenses had not been reduced during the applicable periods shown. BCalculated based on average shares outstanding during the period. CFees and expenses of any underlying Fidelity Central Funds are not included in the Fund's expense ratio. The Fund indirectly bears its proportionate share of the expenses of any underlying Fidelity Central Funds. DAmount does not include the portfolio activity of any underlying Fidelity Central Funds. EExpense ratios reflect operating expenses of the class. Expenses before reductions do not reflect amounts reimbursed by the investment adviser or reductions from expense offset arrangements and do not represent the amount paid by the class during periods when reimbursements or reductions occur. Expenses net of fee waivers reflect expenses after reimbursement by the investment adviser but prior to reductions from expense offset arrangements. Expenses net of all reductions represent the net expenses paid by the class. FFor the year ended February 29. GAmount represents less than $.01 per share. HTotal distributions of $.41 per share is comprised of distributions from net investment income of $.350 and distributions from net realized gain of $.055 per share. ITotal distributions of $1.28 per share is comprised of distributions from net investment income of $.446 and distributions from net realized gain of $.837 per share. JTotal distributions of $1.88 per share is comprised of distributions from net investment income of $.703 and distributions from net realized gain of $1.172 per share. |
Financial Highlights - Fidelity Advantage Class
Years ended February 28, | 2014 | 2013 | 2012 F | 2011 | 2010 |
Selected Per-Share Data |
|
|
|
|
|
Net asset value, beginning of period | $ 43.12 | $ 39.66 | $ 40.36 | $ 31.08 | $ 18.73 |
Income from Investment Operations |
|
|
|
|
|
Net investment income (loss) B | .68 | .75 | .48 | .44 | .37 |
Net realized and unrealized gain (loss) | 13.11 | 4.60 | .10 | 9.72 | 12.39 |
Total from investment operations | 13.79 | 5.35 | .58 | 10.16 | 12.76 |
Distributions from net investment income | (.56) | (.72) | (.46) | (.37) | (.36) |
Distributions from net realized gain | (1.06) | (1.17) | (.84) | (.51) | (.06) |
Total distributions | (1.62) | (1.89) | (1.29) I | (.88) | (.41) H |
Redemption fees added to paid in capital B | .01 | - G | .01 | - G | - G |
Net asset value, end of period | $ 55.30 | $ 43.12 | $ 39.66 | $ 40.36 | $ 31.08 |
Total Return A | 32.44% | 14.04% | 1.76% | 33.02% | 68.25% |
Ratios to Average Net Assets C, E |
|
|
|
|
|
Expenses before reductions | .07% | .07% | .07% | .07% | .07% |
Expenses net of fee waivers, if any | .07% | .07% | .07% | .07% | .07% |
Expenses net of all reductions | .07% | .07% | .07% | .07% | .07% |
Net investment income (loss) | 1.38% | 1.88% | 1.29% | 1.27% | 1.38% |
Supplemental Data |
|
|
|
|
|
Net assets, end of period (000 omitted) | $ 12,280,754 | $ 7,173,852 | $ 3,910,289 | $ 1,525,199 | $ 900,218 |
Portfolio turnover rate D | 14% | 10% | 11% | 8% | 26% |
ATotal returns would have been lower if certain expenses had not been reduced during the applicable periods shown. BCalculated based on average shares outstanding during the period. CFees and expenses of any underlying Fidelity Central Funds are not included in the Fund's expense ratio. The Fund indirectly bears its proportionate share of the expenses of any underlying Fidelity Central Funds. DAmount does not include the portfolio activity of any underlying Fidelity Central Funds. EExpense ratios reflect operating expenses of the class. Expenses before reductions do not reflect amounts reimbursed by the investment adviser or reductions from expense offset arrangements and do not represent the amount paid by the class during periods when reimbursements or reductions occur. Expenses net of fee waivers reflect expenses after reimbursement by the investment adviser but prior to reductions from expense offset arrangements. Expenses net of all reductions represent the net expenses paid by the class. FFor the year ended February 29. GAmount represents less than $.01 per share. HTotal distributions of $.41 per share is comprised of distributions from net investment income of $.358 and distributions from net realized gain of $.055 per share. ITotal distributions of $1.29 per share is comprised of distributions from net investment income of $.457 and distributions from net realized gain of $.837 per share. |
See accompanying notes which are an integral part of the financial statements.
Annual Report
Financial Highlights - Fidelity Advantage Institutional Class
Years ended February 28, | 2014 | 2013 | 2012 G, I |
Selected Per-Share Data |
|
|
|
Net asset value, beginning of period | $ 43.11 | $ 39.66 | $ 34.67 |
Income from Investment Operations |
|
|
|
Net investment income (loss) D | .72 | .75 | .25 |
Net realized and unrealized gain (loss) | 13.06 | 4.60 | 5.52 |
Total from investment operations | 13.78 | 5.35 | 5.77 |
Distributions from net investment income | (.56) | (.72) | (.40) |
Distributions from net realized gain | (1.06) | (1.17) | (.38) |
Total distributions | (1.62) | (1.90) K | (.78) |
Redemption fees added to paid in capital D | .01 | - J | - J |
Net asset value, end of period | $ 55.28 | $ 43.11 | $ 39.66 |
Total Return B, C | 32.44% | 14.04% | 16.99% |
Ratios to Average Net Assets E, H |
|
|
|
Expenses before reductions | .07% | .07% | .07% A |
Expenses net of fee waivers, if any | .06% | .06% | .06% A |
Expenses net of all reductions | .06% | .06% | .06% A |
Net investment income (loss) | 1.39% | 1.89% | 1.44% A |
Supplemental Data |
|
|
|
Net assets, end of period (000 omitted) | $ 95,747 | $ 226 | $ 117 |
Portfolio turnover rate F | 14% | 10% | 11% L |
AAnnualized BTotal returns for periods of less than one year are not annualized. CTotal returns would have been lower if certain expenses had not been reduced during the applicable periods shown. DCalculated based on average shares outstanding during the period. EFees and expenses of any underlying Fidelity Central Funds are not included in the Fund's expense ratio. The Fund indirectly bears its proportionate share of the expenses of any underlying Fidelity Central Funds. FAmount does not include the portfolio activity of any underlying Fidelity Central Funds. GFor the period September 8, 2011 (commencement of sale of shares) to February 29, 2012. HExpense ratios reflect operating expenses of the class. Expenses before reductions do not reflect amounts reimbursed by the investment adviser or reductions from expense offset arrangements and do not represent the amount paid by the class during periods when reimbursements or reductions occur. Expense ratios before reductions for start-up periods may not be representative of longer-term operating periods. Expenses net of fee waivers reflect expenses after reimbursement by the investment adviser but prior to reductions from expense offset arrangements. Expenses net of all reductions represent the net expenses paid by the class. IFor the year ended February 29. JAmount represents less than $.01 per share. KTotal distributions of $1.90 per share is comprised of distributions from net investment income of $.723 and distributions from net realized gain of $1.172 per share. LAmount not annualized. |
See accompanying notes which are an integral part of the financial statements.
Annual Report
Spartan International Index Fund
Performance: The Bottom Line
Average annual total return reflects the change in the value of an investment, assuming reinvestment of the class' distributions from dividend income and capital gains (the profits earned upon the sale of securities that have grown in value, if any) and assuming a constant rate of performance each year. The $10,000 table and the fund's returns does not reflect the deduction of taxes that a shareholder would pay on fund distributions or the redemption of fund shares. During periods of reimbursement by Fidelity, a fund's total return will be greater than it would be had the reimbursement not occurred. How a fund did yesterday is no guarantee of how it will do tomorrow.
Average Annual Total Returns
Periods ended February 28, 2014 | Past 1 | Past 5 | Past 10 |
Spartan International Index Fund - Institutional ClassA | 19.85% | 18.02% | 6.70% |
Spartan International Index Fund - Fidelity Advantage Institutional ClassB | 19.86% | 18.02% | 6.70% |
A The initial offering of Institutional Class shares took place September 8, 2011. Returns between October 14, 2005 and September 8, 2011 are those of Fidelity Advantage Class. Returns prior to October 14, 2005 are those of Investor Class.
B The initial offering of Fidelity Advantage Institutional Class shares took place September 8, 2011. Returns between October 14, 2005 and September 8, 2011 are those of Fidelity Advantage Class. Returns prior to October 14, 2005 are those of Investor Class.
$10,000 Over 10 Years
Let's say hypothetically that $10,000 was invested in Spartan International Index Fund - Institutional Class on February 29, 2004. The chart shows how the value of your investment would have changed, and also shows how the MSCI EAFE Index performed over the same period. The initial offering of Institutional Class took place on September 8, 2011. See above for additional information regarding the performance of Institutional Class.
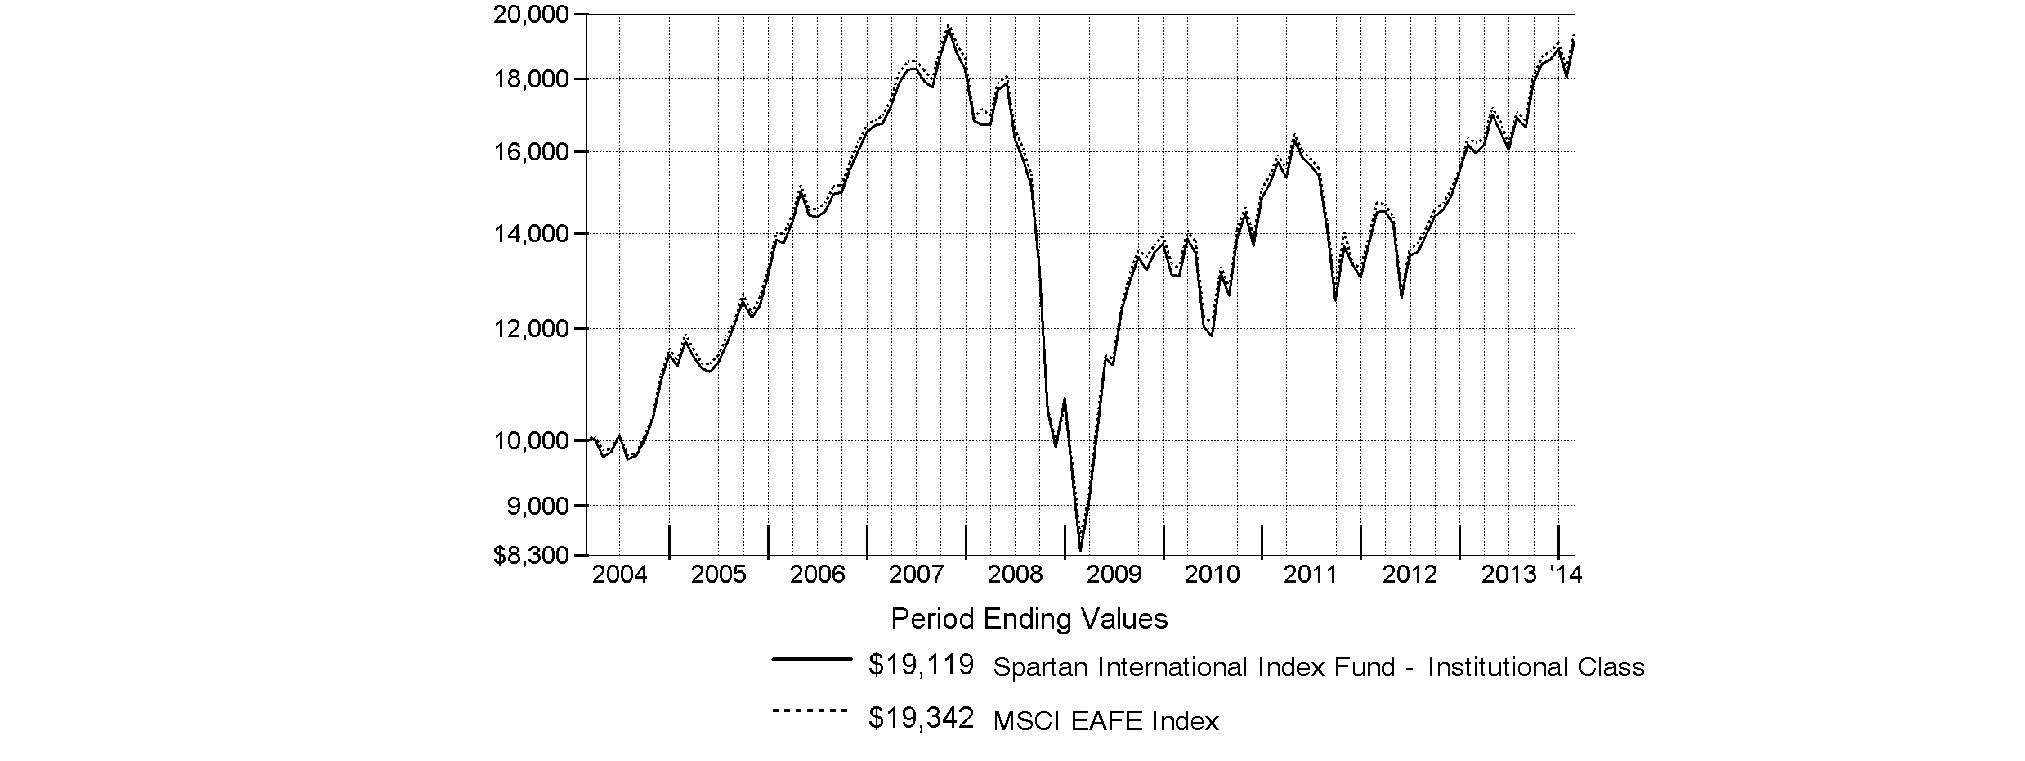
Annual Report
Spartan International Index Fund
Management's Discussion of Fund Performance
Market Recap: Overall, international equity markets remained upbeat for the 12 months ending February 28, 2014: the MSCI® ACWI® (All Country World Index) ex USA Index posted a 12.38% gain in U.S.-dollar terms. During the period, investors wrestled with fears of a U.S. debt default, a eurozone breakup, Middle East tensions, China's economic slowdown and a sell-off in emerging markets, plus off-again/on-again signals that the U.S. Federal Reserve would taper its massive stimulus program. But central banks worldwide maintained accommodative monetary policies, which, combined with modest cyclical improvements around the globe and generally low valuations, underpinned the broad equity rally. Economic stabilization helped bolster the U.K. (+22%) and the rest of Europe (+28%), with Italy (+39%) and Spain (+35%) in particular responding to rising sentiment and ultra-low interest rates. Japan's remarkable rebound (+14%) moderated later in the period but continued to benefit from expansionary policies, positive export trade and healthy consumer spending there, despite yen weakness. Asia-Pacific ex Japan fell flat, impeded by mining-industry malaise in Australia (-3%) and currency headwinds generally. Emerging-markets stocks (-7%) suffered from weakness in global commodities, U.S. dollar strength and major investor outflows driven by declining regional trade and Fed taper-talk.
Comments from Patrick Waddell, Senior Portfolio Manager of the Geode Capital Management, LLC, investment management team for Spartan® International Index Fund: For the year, the fund's Institutional Class and Fidelity Advantage® Institutional Class shares gained 19.85% and 19.86%, respectively, in line with the 19.42% advance of the benchmark MSCI® EAFE® Index. (The fund's performance relative to the index can be affected by Fidelity's methodologies for valuing certain foreign stocks and for incorporating foreign exchange rates, which differ from those used by the index.) Of the 10 market sectors in the index, health care was the top-performing group, and, accordingly, many large pharmaceutical companies enjoyed a very good result. Switzerland's Roche Holding and Novartis, Germany's Bayer, and U.K.-based GlaxoSmithKline and AstraZeneca stood out as notable contributors. Topping the list, however, was U.K.-based mobile communications provider Vodafone. The company saw its shares rise sharply in August, after news broke of plans to sell its 45% stake in U.S. mobile operator Verizon Wireless. The deal was finalized late in the period. Another telecom stock to do very well was SoftBank, a Japanese company that in July completed its acquisition of U.S. wireless service provider Sprint. In energy, diversified energy producers BP and Total, based in the U.K. and France, respectively, added value. Of final note, the fund received a modest boost from favorable currency fluctuations. In a strong market environment, there were many more contributors than detractors. Amid generally lower commodity prices, various mining companies hampered the fund's result, including Australia's Newcrest Mining and BHP Billiton. Also in the materials sector, Switzerland's Syngenta, a maker of farm chemicals, declined in part on weaker-than-expected earnings announced in February 2014. Meanwhile, the biggest individual detractor was U.K. bank Standard Chartered, whose shares fell sharply in December after the company forecast a lower-than-expected profit.
The views expressed above reflect those of the portfolio manager(s) only through the end of the period as stated on the cover of this report and do not necessarily represent the views of Fidelity or any other person in the Fidelity organization. Any such views are subject to change at any time based upon market or other conditions and Fidelity disclaims any responsibility to update such views. These views may not be relied on as investment advice and, because investment decisions for a Fidelity fund are based on numerous factors, may not be relied on as an indication of trading intent on behalf of any Fidelity fund.
Annual Report
Spartan International Index Fund
Investment Changes (Unaudited)
Top Ten Stocks as of February 28, 2014 | ||
| % of fund's | % of fund's net assets |
Nestle SA (Switzerland, Food Products) | 1.8 | 1.8 |
Roche Holding AG (participation certificate) (Switzerland, Pharmaceuticals) | 1.6 | 1.5 |
HSBC Holdings PLC (United Kingdom) (United Kingdom, Commercial Banks) | 1.5 | 1.6 |
Novartis AG (Switzerland, Pharmaceuticals) | 1.4 | 1.4 |
Toyota Motor Corp. (Japan, Automobiles) | 1.2 | 1.4 |
BP PLC (United Kingdom, Oil, Gas & Consumable Fuels) | 1.2 | 1.1 |
Royal Dutch Shell PLC Class A (United Kingdom) (United Kingdom, Oil, Gas & Consumable Fuels) | 1.0 | 1.0 |
Total SA (France, Oil, Gas & Consumable Fuels) | 1.0 | 1.0 |
GlaxoSmithKline PLC (United Kingdom, Pharmaceuticals) | 1.0 | 1.1 |
Sanofi SA (France, Pharmaceuticals) | 0.9 | 1.0 |
| 12.6 | |
Market Sectors as of February 28, 2014 | ||
| % of fund's | % of fund's net assets |
Financials | 24.7 | 24.0 |
Industrials | 12.2 | 12.8 |
Consumer Discretionary | 11.2 | 11.7 |
Consumer Staples | 10.8 | 11.3 |
Health Care | 10.6 | 10.5 |
Materials | 8.2 | 7.9 |
Energy | 6.7 | 6.7 |
Telecommunication Services | 5.0 | 5.0 |
Information Technology | 4.5 | 4.3 |
Utilities | 4.1 | 3.9 |
Geographic Diversification (% of fund's net assets) | |||
As of February 28, 2014 | |||
 | United Kingdom | 20.0% |
|
 | Japan | 19.8% |
|
 | France | 9.5% |
|
 | Germany | 9.5% |
|
 | Switzerland | 9.1% |
|
 | Australia | 7.4% |
|
 | Spain | 3.4% |
|
 | Sweden | 3.2% |
|
 | Netherlands | 3.1% |
|
 | Other* | 15.0% |
|

Percentages are based on country or territory of incorporation and are adjusted for the effect of futures contracts, if applicable. |
* Includes Short-Term Investments and Net Other Assets (Liabilities)
As of August 31, 2013 | |||
| Japan | 21.1% |
|
| United Kingdom | 20.6% |
|
| France | 9.1% |
|
| Switzerland | 9.0% |
|
| Germany | 8.7% |
|
| Australia | 7.9% |
|
| Sweden | 3.1% |
|
| Netherlands | 3.1% |
|
| Spain | 2.9% |
|
| Other* | 14.5% |
|

Percentages are based on country or territory of incorporation and are adjusted for the effect of futures contracts, if applicable. |
* Includes Short-Term Investments and Net Other Assets (Liabilities)
Annual Report
Spartan International Index Fund
Investments February 28, 2014
Showing Percentage of Net Assets
Common Stocks - 97.1% | |||
Shares | Value | ||
Australia - 7.3% | |||
AGL Energy Ltd. | 537,236 | $ 7,502,650 | |
ALS Ltd. (d) | 367,433 | 2,488,600 | |
Alumina Ltd. (a) | 2,423,075 | 2,781,319 | |
Amcor Ltd. | 1,158,570 | 10,452,223 | |
AMP Ltd. | 2,837,716 | 12,230,699 | |
APA Group unit | 800,137 | 4,769,535 | |
Asciano Ltd. | 927,003 | 4,458,668 | |
ASX Ltd. | 184,945 | 6,198,740 | |
Australia & New Zealand Banking Group Ltd. | 2,635,368 | 75,582,694 | |
Bank Queensland Ltd. | 308,512 | 3,300,855 | |
Bendigo & Adelaide Bank Ltd. | 401,429 | 3,986,935 | |
BHP Billiton Ltd. | 3,084,992 | 105,810,963 | |
Boral Ltd. | 741,819 | 3,687,129 | |
Brambles Ltd. | 1,498,885 | 12,532,656 | |
Caltex Australia Ltd. | 127,020 | 2,378,005 | |
CFS Retail Property Trust unit | 2,025,982 | 3,561,534 | |
Coca-Cola Amatil Ltd. | 554,753 | 5,593,882 | |
Cochlear Ltd. | 54,793 | 2,801,657 | |
Commonwealth Bank of Australia | 1,548,229 | 103,147,430 | |
Computershare Ltd. | 452,046 | 4,788,159 | |
Crown Ltd. | 384,676 | 5,931,630 | |
CSL Ltd. | 467,654 | 30,129,858 | |
DEXUS Property Group unit | 4,443,826 | 4,243,030 | |
Echo Entertainment Group Ltd. | 739,039 | 1,754,221 | |
Federation Centres unit | 1,373,987 | 2,930,325 | |
Flight Centre Travel Group Ltd. | 53,588 | 2,479,428 | |
Fortescue Metals Group Ltd. | 1,487,290 | 7,219,877 | |
Goodman Group unit | 1,660,880 | 7,114,014 | |
Harvey Norman Holdings Ltd. (d) | 494,029 | 1,415,118 | |
Iluka Resources Ltd. | 400,569 | 3,356,434 | |
Incitec Pivot Ltd. | 1,552,664 | 4,350,532 | |
Insurance Australia Group Ltd. | 2,210,351 | 10,710,168 | |
Leighton Holdings Ltd. (d) | 163,907 | 2,642,962 | |
Lend Lease Group unit | 523,376 | 5,268,150 | |
Macquarie Group Ltd. | 277,152 | 13,916,504 | |
Metcash Ltd. | 865,946 | 2,395,453 | |
Mirvac Group unit | 3,606,917 | 5,680,886 | |
National Australia Bank Ltd. | 2,256,457 | 69,950,706 | |
Newcrest Mining Ltd. | 736,178 | 7,449,569 | |
Orica Ltd. | 355,179 | 7,651,028 | |
Origin Energy Ltd. | 1,056,037 | 13,607,601 | |
Qantas Airways Ltd. (a) | 1,067,591 | 1,109,855 | |
QBE Insurance Group Ltd. | 1,177,774 | 13,473,649 | |
QR National Ltd. | 1,950,285 | 8,858,314 | |
Ramsay Health Care Ltd. | 125,876 | 5,419,703 | |
realestate.com.au Ltd. | 50,162 | 2,219,751 | |
Rio Tinto Ltd. | 418,625 | 24,968,752 | |
Santos Ltd. | 932,371 | 11,348,497 | |
SEEK Ltd. | 311,397 | 4,754,443 | |
Sonic Healthcare Ltd. | 364,241 | 5,645,779 | |
SP AusNet unit | 1,659,769 | 1,962,451 | |
| |||
Shares | Value | ||
Stockland Corp. Ltd. unit | 2,295,296 | $ 7,906,081 | |
Suncorp-Metway Ltd. | 1,236,138 | 13,391,242 | |
Sydney Airport unit | 1,029,009 | 3,728,039 | |
Tabcorp Holdings Ltd. | 750,504 | 2,377,478 | |
Tatts Group Ltd. | 1,345,468 | 3,505,835 | |
Telstra Corp. Ltd. | 4,185,857 | 18,863,010 | |
The GPT Group unit | 1,625,620 | 5,396,314 | |
Toll Holdings Ltd. | 646,452 | 3,068,903 | |
Transurban Group unit | 1,349,498 | 8,513,868 | |
Treasury Wine Estates Ltd. | 631,072 | 2,179,341 | |
Wesfarmers Ltd. | 1,097,532 | 42,064,486 | |
Westfield Group unit | 1,954,556 | 17,912,400 | |
Westfield Retail Trust unit | 2,853,062 | 7,917,842 | |
Westpac Banking Corp. | 2,986,196 | 89,621,707 | |
Woodside Petroleum Ltd. | 632,404 | 21,416,161 | |
Woolworths Ltd. | 1,204,215 | 38,760,146 | |
WorleyParsons Ltd. | 196,323 | 2,944,924 | |
TOTAL AUSTRALIA | 957,580,798 | ||
Austria - 0.3% | |||
Andritz AG | 69,305 | 4,355,955 | |
Erste Group Bank AG | 247,642 | 8,788,199 | |
IMMOEAST AG (a)(d) | 321,410 | 4 | |
IMMOFINANZ Immobilien Anlagen AG | 922,347 | 4,672,334 | |
OMV AG | 141,761 | 6,451,329 | |
Raiffeisen International Bank-Holding AG | 112,697 | 3,927,781 | |
Telekom Austria AG | 265,155 | 2,582,084 | |
Vienna Insurance Group AG | 35,723 | 1,829,344 | |
Voestalpine AG | 106,564 | 4,803,233 | |
TOTAL AUSTRIA | 37,410,263 | ||
Bailiwick of Guernsey - 0.1% | |||
Resolution Ltd. | 1,362,887 | 8,622,236 | |
Bailiwick of Jersey - 1.2% | |||
Experian PLC | 960,010 | 17,377,991 | |
Glencore Xstrata PLC | 10,189,830 | 56,172,646 | |
Petrofac Ltd. | 250,035 | 5,727,763 | |
Randgold Resources Ltd. | 84,695 | 6,707,921 | |
Shire PLC | 564,242 | 31,211,131 | |
Wolseley PLC | 254,639 | 14,821,863 | |
WPP PLC | 1,290,510 | 28,266,188 | |
TOTAL BAILIWICK OF JERSEY | 160,285,503 | ||
Belgium - 1.2% | |||
Ageas | 215,167 | 9,873,599 | |
Anheuser-Busch InBev SA NV | 771,755 | 80,720,989 | |
Belgacom SA | 146,572 | 4,421,558 | |
Colruyt NV | 71,973 | 3,996,126 | |
Delhaize Group SA | 98,671 | 7,097,152 | |
Groupe Bruxelles Lambert SA | 77,392 | 7,613,359 | |
Groupe Bruxelles Lambert SA (strip VVPR) (a) | 2,466 | 3 | |
KBC Groupe SA | 240,125 | 15,239,820 | |
Common Stocks - continued | |||
Shares | Value | ||
Belgium - continued | |||
Solvay SA Class A | 56,853 | $ 8,820,500 | |
Telenet Group Holding NV | 49,411 | 3,153,661 | |
UCB SA | 105,629 | 8,478,253 | |
Umicore SA | 109,120 | 5,365,025 | |
TOTAL BELGIUM | 154,780,045 | ||
Bermuda - 0.3% | |||
Cheung Kong Infrastructure Holdings Ltd. | 606,450 | 3,954,149 | |
First Pacific Co. Ltd. | 2,298,665 | 2,277,768 | |
Kerry Properties Ltd. | 613,181 | 2,022,722 | |
Li & Fung Ltd. | 5,655,246 | 7,403,766 | |
Noble Group Ltd. | 4,118,890 | 3,346,710 | |
NWS Holdings Ltd. | 1,384,695 | 2,173,246 | |
Seadrill Ltd. | 360,452 | 13,296,247 | |
Shangri-La Asia Ltd. | 1,487,380 | 2,483,902 | |
Yue Yuen Industrial (Holdings) Ltd. | 726,500 | 2,223,344 | |
TOTAL BERMUDA | 39,181,854 | ||
Cayman Islands - 0.2% | |||
ASM Pacific Technology Ltd. | 226,729 | 2,053,856 | |
MGM China Holdings Ltd. | 914,800 | 3,901,770 | |
Sands China Ltd. | 2,321,600 | 19,415,098 | |
Wynn Macau Ltd. | 1,488,800 | 7,174,894 | |
TOTAL CAYMAN ISLANDS | 32,545,618 | ||
Denmark - 1.4% | |||
A.P. Moller - Maersk A/S: | |||
Series A | 527 | 6,175,058 | |
Series B | 1,268 | 15,502,599 | |
Carlsberg A/S Series B | 102,262 | 10,790,802 | |
Coloplast A/S Series B | 106,675 | 8,985,443 | |
Danske Bank A/S | 629,838 | 16,682,290 | |
DSV de Sammensluttede Vognmaend A/S | 173,362 | 5,553,741 | |
Novo Nordisk A/S Series B | 1,912,279 | 91,003,479 | |
Novozymes A/S Series B | 217,190 | 10,103,262 | |
TDC A/S | 779,981 | 7,747,152 | |
Tryg A/S | 23,440 | 2,263,143 | |
William Demant Holding A/S (a) | 24,010 | 2,161,411 | |
TOTAL DENMARK | 176,968,380 | ||
Finland - 0.9% | |||
Elisa Corp. (A Shares) | 133,588 | 3,739,460 | |
Fortum Corp. | 427,055 | 10,115,202 | |
Kone Oyj (B Shares) (d) | 300,205 | 12,228,146 | |
Metso Corp. | 123,139 | 3,987,467 | |
Neste Oil Oyj (d) | 121,203 | 2,594,769 | |
Nokia Corp. (a) | 3,596,161 | 27,372,862 | |
Nokian Tyres PLC | 108,615 | 4,872,442 | |
Orion Oyj (B Shares) | 94,037 | 3,097,011 | |
Pohjola Bank PLC (A Shares) | 132,861 | 3,080,919 | |
Sampo Oyj (A Shares) | 419,797 | 21,271,455 | |
| |||
Shares | Value | ||
Stora Enso Oyj (R Shares) | 525,122 | $ 5,983,438 | |
UPM-Kymmene Corp. | 508,742 | 9,241,170 | |
Wartsila Corp. | 170,530 | 10,081,435 | |
TOTAL FINLAND | 117,665,776 | ||
France - 9.2% | |||
Accor SA | 153,311 | 7,835,052 | |
Aeroports de Paris | 28,759 | 3,490,870 | |
Air Liquide SA | 39,251 | 5,404,813 | |
Air Liquide SA | 10,300 | 1,418,297 | |
Alcatel-Lucent SA (a) | 2,678,648 | 11,591,237 | |
Alstom SA | 206,009 | 5,543,305 | |
Arkema SA | 59,938 | 6,519,315 | |
Atos Origin SA | 66,678 | 6,483,911 | |
AXA SA | 1,723,487 | 45,056,917 | |
BIC SA | 27,874 | 3,573,510 | |
BNP Paribas SA | 956,114 | 78,470,798 | |
Bouygues SA | 184,612 | 7,443,291 | |
Bureau Veritas SA | 212,256 | 5,856,609 | |
Cap Gemini SA | 136,902 | 10,720,032 | |
Carrefour SA | 590,666 | 21,784,716 | |
Casino Guichard Perrachon SA | 54,125 | 6,151,517 | |
Christian Dior SA | 52,347 | 10,354,079 | |
CNP Assurances | 165,454 | 3,567,236 | |
Compagnie de St. Gobain | 399,163 | 23,966,964 | |
Compagnie Generale de Geophysique SA (a) | 153,454 | 2,351,119 | |
Credit Agricole SA (a) | 960,523 | 15,273,330 | |
Danone SA | 545,454 | 38,463,073 | |
Dassault Systemes SA | 60,904 | 7,000,999 | |
Edenred SA | 194,739 | 6,262,999 | |
EDF SA | 31,735 | 1,262,207 | |
EDF SA | 14,600 | 580,691 | |
EDF SA | 186,140 | 7,403,410 | |
Essilor International SA | 196,652 | 20,537,056 | |
Eurazeo SA | 29,645 | 2,324,608 | |
Eutelsat Communications | 136,702 | 4,459,683 | |
Fonciere des Regions | 27,340 | 2,562,370 | |
France Telecom SA | 1,780,553 | 22,207,143 | |
GDF Suez | 1,274,961 | 32,715,215 | |
Gecina SA | 21,049 | 2,895,515 | |
Groupe Eurotunnel SA | 527,755 | 6,341,975 | |
ICADE | 34,488 | 3,399,862 | |
Iliad SA | 25,011 | 6,100,158 | |
Imerys SA | 32,771 | 3,053,282 | |
JCDecaux SA | 64,286 | 2,838,600 | |
Kering SA | 72,675 | 14,906,557 | |
Klepierre SA | 94,994 | 4,332,212 | |
L'Oreal SA | 30,358 | 5,143,611 | |
L'Oreal SA | 196,844 | 33,351,638 | |
L'Oreal SA | 5,100 | 864,102 | |
Lafarge SA (a) | 159,515 | 11,993,126 | |
Lafarge SA (Bearer) | 19,833 | 1,491,143 | |
Lagardere S.C.A. (Reg.) | 106,464 | 4,275,576 | |
Common Stocks - continued | |||
Shares | Value | ||
France - continued | |||
Legrand SA | 254,234 | $ 15,766,799 | |
LVMH Moet Hennessy - Louis Vuitton SA | 243,783 | 45,376,172 | |
Michelin CGDE Series B | 179,766 | 21,976,963 | |
Natixis SA | 883,389 | 6,373,500 | |
Pernod Ricard SA | 203,970 | 24,012,529 | |
Publicis Groupe SA (d) | 173,898 | 16,514,161 | |
Remy Cointreau SA (d) | 23,781 | 2,018,732 | |
Renault SA | 184,550 | 18,394,368 | |
Rexel SA | 231,243 | 5,839,484 | |
Safran SA | 260,261 | 18,324,743 | |
Sanofi SA | 1,147,528 | 119,354,283 | |
Schneider Electric SA | 509,601 | 45,545,296 | |
Schneider Electric SA CDI | 17,736 | 1,576,576 | |
SCOR SE | 148,044 | 5,186,279 | |
Societe Generale Series A | 690,151 | 46,082,771 | |
Sodexo SA | 5,930 | 632,714 | |
Sodexo SA | 77,845 | 8,305,843 | |
Sodexo SA | 6,851 | 730,982 | |
Suez Environnement SA | 268,088 | 5,358,206 | |
Technip SA | 97,834 | 9,613,517 | |
Thales SA | 87,793 | 5,828,791 | |
Total SA | 2,053,955 | 133,258,760 | |
Unibail-Rodamco | 93,448 | 24,623,480 | |
Valeo SA | 72,781 | 10,191,628 | |
Vallourec SA | 102,437 | 5,505,874 | |
Veolia Environnement SA | 340,619 | 6,435,032 | |
VINCI SA | 461,767 | 34,501,216 | |
Vivendi SA | 1,157,099 | 33,084,833 | |
Wendel SA | 30,904 | 4,645,325 | |
Zodiac Aerospace | 165,757 | 5,853,704 | |
TOTAL FRANCE | 1,210,536,290 | ||
Germany - 8.7% | |||
adidas AG | 200,806 | 23,393,361 | |
Allianz SE | 438,189 | 78,144,663 | |
Axel Springer Verlag AG | 40,408 | 2,856,246 | |
BASF AG | 881,865 | 101,542,015 | |
Bayer AG | 794,053 | 112,781,626 | |
Bayerische Motoren Werke AG (BMW) | 317,531 | 36,903,853 | |
Beiersdorf AG | 96,396 | 9,850,091 | |
Brenntag AG | 49,338 | 9,176,642 | |
Celesio AG | 44,454 | 1,569,585 | |
Commerzbank AG (a) | 929,055 | 16,850,402 | |
Continental AG | 105,589 | 25,702,042 | |
Daimler AG (Germany) | 924,299 | 86,142,685 | |
Deutsche Bank AG | 978,704 | 47,334,486 | |
Deutsche Boerse AG | 185,041 | 15,181,695 | |
Deutsche Lufthansa AG (a) | 220,953 | 5,730,601 | |
Deutsche Post AG | 870,122 | 32,680,010 | |
Deutsche Telekom AG | 2,777,768 | 46,992,311 | |
Deutsche Wohnen AG (Bearer) | 280,410 | 5,941,216 | |
E.ON AG | 1,729,308 | 32,987,840 | |
| |||
Shares | Value | ||
Fraport AG Frankfurt Airport Services Worldwide | 35,098 | $ 2,798,712 | |
Fresenius Medical Care AG & Co. KGaA | 207,188 | 14,215,028 | |
Fresenius SE & Co. KGaA | 120,554 | 18,736,717 | |
GEA Group AG | 176,205 | 8,546,602 | |
Hannover Reuck SE | 57,938 | 4,934,261 | |
HeidelbergCement Finance AG | 134,947 | 11,123,886 | |
Henkel AG & Co. KGaA | 124,066 | 12,550,788 | |
Hochtief AG | 33,236 | 3,089,725 | |
Hugo Boss AG | 30,381 | 4,046,298 | |
Infineon Technologies AG | 1,036,824 | 11,763,873 | |
K&S AG | 165,217 | 5,586,061 | |
Kabel Deutschland Holding AG | 20,897 | 2,969,503 | |
Lanxess AG | 80,202 | 5,953,598 | |
Linde AG | 178,205 | 36,933,350 | |
MAN SE | 37,855 | 4,885,492 | |
Merck KGaA | 62,300 | 10,921,072 | |
Metro AG | 124,765 | 5,174,143 | |
Muenchener Rueckversicherungs AG | 172,114 | 37,690,314 | |
OSRAM Licht AG (a) | 81,433 | 5,536,359 | |
ProSiebenSat.1 Media AG | 209,806 | 10,005,515 | |
RWE AG | 469,897 | 18,819,095 | |
SAP AG | 884,662 | 71,155,240 | |
Siemens AG | 761,308 | 101,503,257 | |
Sky Deutschland AG (a) | 419,566 | 4,395,574 | |
Suedzucker AG (Bearer) | 76,616 | 2,130,924 | |
Telefonica Deutschland Holding AG | 262,375 | 2,100,506 | |
Thyssenkrupp AG (a) | 434,559 | 11,852,478 | |
United Internet AG | 102,295 | 4,760,483 | |
Volkswagen AG | 28,241 | 7,215,393 | |
TOTAL GERMANY | 1,133,155,617 | ||
Hong Kong - 2.3% | |||
AIA Group Ltd. | 11,562,000 | 56,539,536 | |
Bank of East Asia Ltd. | 1,290,874 | 5,347,765 | |
BOC Hong Kong (Holdings) Ltd. | 3,552,066 | 10,779,024 | |
Cathay Pacific Airways Ltd. | 1,111,327 | 2,262,593 | |
Cheung Kong Holdings Ltd. | 1,334,449 | 20,909,471 | |
CLP Holdings Ltd. | 1,698,157 | 13,249,500 | |
Galaxy Entertainment Group Ltd. (a) | 2,024,000 | 20,303,767 | |
Hang Lung Properties Ltd. | 2,135,423 | 5,929,781 | |
Hang Seng Bank Ltd. | 735,301 | 11,919,370 | |
Henderson Land Development Co. Ltd. | 1,035,605 | 5,804,849 | |
HKT Trust/HKT Ltd. unit | 2,134,000 | 2,265,839 | |
Hong Kong & China Gas Co. Ltd. | 5,519,112 | 11,890,852 | |
Hong Kong Exchanges and Clearing Ltd. | 1,058,371 | 16,419,953 | |
Hopewell Holdings Ltd. | 533,500 | 1,804,560 | |
Hutchison Whampoa Ltd. | 2,046,158 | 27,578,989 | |
Hysan Development Co. Ltd. | 616,677 | 2,574,603 | |
Link (REIT) | 2,219,308 | 10,309,328 | |
MTR Corp. Ltd. | 1,384,951 | 5,023,661 | |
New World Development Co. Ltd. | 3,672,491 | 4,751,185 | |
PCCW Ltd. | 3,904,000 | 1,856,281 | |
Common Stocks - continued | |||
Shares | Value | ||
Hong Kong - continued | |||
Power Assets Holdings Ltd. | 1,330,676 | $ 11,119,616 | |
Sino Land Ltd. | 2,844,689 | 4,032,134 | |
SJM Holdings Ltd. | 1,869,000 | 5,996,753 | |
Sun Hung Kai Properties Ltd. | 1,538,611 | 19,687,274 | |
Swire Pacific Ltd. (A Shares) | 655,884 | 7,365,495 | |
Swire Properties Ltd. | 1,114,200 | 2,964,768 | |
Wharf Holdings Ltd. | 1,454,585 | 10,149,510 | |
Wheelock and Co. Ltd. | 879,000 | 3,584,843 | |
TOTAL HONG KONG | 302,421,300 | ||
Ireland - 0.4% | |||
Bank of Ireland (a) | 21,742,483 | 11,561,849 | |
CRH PLC | 701,582 | 20,691,523 | |
CRH PLC sponsored ADR | 2,500 | 73,650 | |
James Hardie Industries PLC CDI | 423,805 | 5,483,645 | |
Kerry Group PLC Class A | 142,482 | 10,763,634 | |
Ryanair Holdings PLC (a) | 261,736 | 2,670,506 | |
TOTAL IRELAND | 51,244,807 | ||
Isle of Man - 0.0% | |||
Genting Singapore PLC | 5,908,859 | 6,269,408 | |
Israel - 0.5% | |||
Bank Hapoalim BM (Reg.) | 1,001,382 | 5,439,719 | |
Bank Leumi le-Israel BM (a) | 1,193,420 | 4,553,432 | |
Bezeq The Israeli Telecommunication Corp. Ltd. | 1,793,377 | 2,908,207 | |
Delek Group Ltd. | 4,023 | 1,507,277 | |
Israel Chemicals Ltd. | 415,506 | 3,513,717 | |
Israel Corp. Ltd. (Class A) (a) | 2,466 | 1,308,480 | |
Mizrahi Tefahot Bank Ltd. | 116,998 | 1,442,163 | |
NICE Systems Ltd. | 53,809 | 2,219,143 | |
NICE Systems Ltd. sponsored ADR | 1,000 | 41,080 | |
Teva Pharmaceutical Industries Ltd. | 787,445 | 39,330,180 | |
Teva Pharmaceutical Industries Ltd. sponsored ADR | 30,300 | 1,511,667 | |
TOTAL ISRAEL | 63,775,065 | ||
Italy - 2.2% | |||
Assicurazioni Generali SpA | 1,121,804 | 25,223,860 | |
Atlantia SpA | 355,961 | 9,020,873 | |
Banca Monte dei Paschi di Siena SpA (a)(d) | 5,995,872 | 1,521,975 | |
Enel Green Power SpA | 1,673,518 | 4,698,452 | |
Enel SpA | 6,321,714 | 32,460,206 | |
Eni SpA | 2,443,584 | 58,662,150 | |
EXOR SpA | 95,750 | 3,894,865 | |
Fiat SpA (a)(d) | 841,475 | 8,809,886 | |
Finmeccanica SpA (a)(d) | 389,128 | 3,826,933 | |
Intesa Sanpaolo SpA | 11,164,188 | 34,610,700 | |
Luxottica Group SpA | 159,604 | 8,861,452 | |
Mediobanca SpA (a) | 494,219 | 4,928,682 | |
Pirelli & C. S.p.A. | 229,935 | 3,998,979 | |
Prysmian SpA | 194,228 | 5,024,061 | |
| |||
Shares | Value | ||
Saipem SpA | 255,231 | $ 6,003,113 | |
Snam Rete Gas SpA | 1,950,605 | 11,103,540 | |
Telecom Italia SpA (d) | 9,694,476 | 11,011,643 | |
Terna SpA | 1,438,462 | 7,346,384 | |
UniCredit SpA | 4,170,111 | 33,183,364 | |
Unione di Banche Italiane ScpA | 819,324 | 7,113,442 | |
Unipolsai SpA (a) | 873,745 | 2,988,543 | |
TOTAL ITALY | 284,293,103 | ||
Japan - 19.6% | |||
ABC-MART, Inc. | 24,500 | 970,178 | |
ACOM Co. Ltd. (a)(d) | 395,300 | 1,134,201 | |
Advantest Corp. (d) | 140,790 | 1,533,910 | |
AEON Co. Ltd. | 600,700 | 7,361,003 | |
AEON Financial Service Co. Ltd. | 107,400 | 2,629,859 | |
AEON Mall Co. Ltd. | 108,440 | 2,999,495 | |
Air Water, Inc. | 143,000 | 2,117,530 | |
Aisin Seiki Co. Ltd. | 185,300 | 6,427,326 | |
Ajinomoto Co., Inc. | 569,866 | 8,847,101 | |
Alfresa Holdings Corp. | 40,100 | 2,352,334 | |
All Nippon Airways Ltd. | 1,126,000 | 2,514,610 | |
Amada Co. Ltd. | 340,000 | 2,842,265 | |
Aozora Bank Ltd. | 1,023,000 | 2,980,986 | |
Asahi Glass Co. Ltd. | 968,677 | 5,334,048 | |
Asahi Group Holdings | 371,003 | 10,431,329 | |
Asahi Kasei Corp. | 1,211,727 | 8,635,523 | |
Asics Corp. | 154,500 | 3,015,004 | |
Astellas Pharma, Inc. | 416,600 | 27,079,328 | |
Bank of Kyoto Ltd. | 309,000 | 2,383,463 | |
Bank of Yokohama Ltd. | 1,125,084 | 5,690,443 | |
Benesse Holdings, Inc. | 69,700 | 2,619,657 | |
Bridgestone Corp. | 624,479 | 22,585,489 | |
Brother Industries Ltd. | 227,700 | 3,248,702 | |
Calbee, Inc. | 68,500 | 1,663,196 | |
Canon, Inc. | 1,087,844 | 33,941,537 | |
Casio Computer Co. Ltd. | 214,700 | 2,433,493 | |
Central Japan Railway Co. | 138,200 | 16,129,617 | |
Chiba Bank Ltd. | 712,674 | 4,327,359 | |
Chiyoda Corp. | 150,000 | 2,283,190 | |
Chubu Electric Power Co., Inc. | 621,564 | 7,689,600 | |
Chugai Pharmaceutical Co. Ltd. | 215,825 | 5,530,953 | |
Chugoku Electric Power Co., Inc. | 286,100 | 4,056,621 | |
Citizen Holdings Co. Ltd. | 251,666 | 2,070,006 | |
Coca-Cola West Co. Ltd. | 56,800 | 1,052,059 | |
Credit Saison Co. Ltd. | 152,752 | 3,363,034 | |
Dai Nippon Printing Co. Ltd. | 536,242 | 5,402,359 | |
Dai-ichi Mutual Life Insurance Co. | 817,300 | 11,971,789 | |
Daicel Chemical Industries Ltd. | 281,000 | 2,424,270 | |
Daido Steel Co. Ltd. | 274,000 | 1,257,325 | |
Daihatsu Motor Co. Ltd. | 186,300 | 2,993,028 | |
Daiichi Sankyo Kabushiki Kaisha | 644,070 | 11,130,985 | |
Daikin Industries Ltd. | 225,294 | 12,980,739 | |
Dainippon Sumitomo Pharma Co. Ltd. | 154,100 | 2,860,699 | |
Daito Trust Construction Co. Ltd. | 69,663 | 6,478,926 | |
Common Stocks - continued | |||
Shares | Value | ||
Japan - continued | |||
Daiwa House Industry Co. Ltd. | 568,184 | $ 10,341,385 | |
Daiwa Securities Group, Inc. | 1,592,985 | 14,416,010 | |
DeNA Co. Ltd. (d) | 99,900 | 2,159,575 | |
DENSO Corp. | 466,738 | 25,041,086 | |
Dentsu, Inc. | 208,200 | 7,851,587 | |
Don Quijote Holdings Co. Ltd. | 53,100 | 2,880,141 | |
East Japan Railway Co. | 322,100 | 25,188,824 | |
Eisai Co. Ltd. | 241,678 | 9,456,571 | |
Electric Power Development Co. Ltd. | 111,180 | 3,452,184 | |
FamilyMart Co. Ltd. | 55,900 | 2,488,228 | |
Fanuc Corp. | 183,972 | 32,026,550 | |
Fast Retailing Co. Ltd. | 50,900 | 17,621,114 | |
Fuji Electric Co. Ltd. | 532,153 | 2,446,342 | |
Fuji Heavy Industries Ltd. | 563,100 | 15,285,114 | |
Fujifilm Holdings Corp. | 444,905 | 12,830,839 | |
Fujitsu Ltd. (a) | 1,796,075 | 11,230,548 | |
Fukuoka Financial Group, Inc. | 732,300 | 2,960,260 | |
GREE, Inc. (a)(d) | 103,500 | 1,145,141 | |
GungHo Online Entertainment, Inc. (d) | 328,700 | 2,025,105 | |
Gunma Bank Ltd. | 362,663 | 1,906,502 | |
Hakuhodo DY Holdings, Inc. | 223,600 | 1,669,804 | |
Hamamatsu Photonics K.K. | 67,900 | 2,755,498 | |
Hankyu Hanshin Holdings, Inc. | 1,096,000 | 6,009,315 | |
Hino Motors Ltd. | 248,600 | 3,689,324 | |
Hirose Electric Co. Ltd. | 28,498 | 4,060,342 | |
Hiroshima Bank Ltd. | 473,000 | 1,798,673 | |
Hisamitsu Pharmaceutical Co., Inc. | 59,800 | 2,796,973 | |
Hitachi Chemical Co. Ltd. | 97,900 | 1,366,002 | |
Hitachi Construction Machinery Co. Ltd. | 105,200 | 2,050,239 | |
Hitachi High-Technologies Corp. | 61,500 | 1,484,170 | |
Hitachi Ltd. | 4,639,271 | 36,738,383 | |
Hitachi Metals Ltd. | 184,000 | 2,746,349 | |
Hokkaido Electric Power Co., Inc. (a) | 178,300 | 1,816,813 | |
Hokuhoku Financial Group, Inc. | 1,113,000 | 2,088,857 | |
Hokuriku Electric Power Co., Inc. | 160,800 | 2,065,104 | |
Honda Motor Co. Ltd. | 1,562,860 | 56,252,121 | |
Honda Motor Co. Ltd. sponsored ADR (d) | 2,457 | 88,575 | |
Hoya Corp. | 418,716 | 12,408,838 | |
Hulic Co. Ltd. | 257,800 | 2,966,334 | |
Ibiden Co. Ltd. | 118,400 | 2,315,181 | |
Idemitsu Kosan Co. Ltd. | 82,800 | 1,689,846 | |
Iida Group Holdings Co. Ltd. (a) | 128,000 | 1,934,401 | |
INPEX Corp. | 838,700 | 10,657,102 | |
Isetan Mitsukoshi Holdings Ltd. | 343,387 | 3,889,183 | |
Ishikawajima-Harima Heavy Industries Co. Ltd. | 1,258,185 | 5,777,052 | |
Isuzu Motors Ltd. | 1,147,000 | 7,013,019 | |
Itochu Corp. | 1,444,486 | 18,001,053 | |
ITOCHU Techno-Solutions Corp. | 23,500 | 1,088,754 | |
Iyo Bank Ltd. | 246,000 | 2,226,255 | |
J. Front Retailing Co. Ltd. | 464,800 | 2,954,211 | |
Japan Airlines Co. Ltd. | 57,700 | 2,868,841 | |
| |||
Shares | Value | ||
Japan Exchange Group, Inc. | 238,000 | $ 5,645,396 | |
Japan Petroleum Exploration Co. Ltd. | 28,200 | 1,030,795 | |
Japan Prime Realty Investment Corp. | 740 | 2,563,132 | |
Japan Real Estate Investment Corp. | 1,140 | 6,172,153 | |
Japan Retail Fund Investment Corp. | 2,215 | 4,370,364 | |
Japan Steel Works Ltd. | 308,000 | 1,511,440 | |
Japan Tobacco, Inc. | 1,056,100 | 33,636,508 | |
JFE Holdings, Inc. | 471,675 | 9,627,208 | |
JGC Corp. | 199,117 | 7,385,267 | |
Joyo Bank Ltd. | 646,941 | 3,083,093 | |
JSR Corp. | 169,616 | 2,904,988 | |
JTEKT Corp. | 195,600 | 3,273,867 | |
JX Holdings, Inc. | 2,165,768 | 11,247,916 | |
Kajima Corp. | 810,317 | 2,862,383 | |
Kakaku.com, Inc. | 141,700 | 2,357,257 | |
Kamigumi Co. Ltd. | 219,663 | 2,035,396 | |
Kaneka Corp. | 273,559 | 1,784,840 | |
Kansai Electric Power Co., Inc. (a) | 673,936 | 7,533,583 | |
Kansai Paint Co. Ltd. | 221,000 | 2,866,463 | |
Kao Corp. | 495,050 | 17,046,625 | |
Kawasaki Heavy Industries Ltd. | 1,361,945 | 5,589,856 | |
KDDI Corp. | 516,700 | 31,599,122 | |
Keihin Electric Express Railway Co. Ltd. | 456,061 | 3,822,541 | |
Keio Corp. | 554,410 | 3,929,603 | |
Keisei Electric Railway Co. | 266,000 | 2,339,284 | |
Keyence Corp. | 43,762 | 18,778,485 | |
Kikkoman Corp. | 150,849 | 2,941,084 | |
Kinden Corp. | 122,000 | 1,267,112 | |
Kintetsu Corp. | 1,732,100 | 6,280,288 | |
Kirin Holdings Co. Ltd. | 833,256 | 11,374,083 | |
Kobe Steel Ltd. (a) | 2,923,000 | 4,004,265 | |
Koito Manufacturing Co. Ltd. | 90,000 | 1,698,831 | |
Komatsu Ltd. | 896,445 | 18,955,047 | |
Konami Corp. | 97,100 | 2,445,418 | |
Konica Minolta, Inc. | 463,000 | 4,723,726 | |
Kubota Corp. | 1,024,864 | 14,402,274 | |
Kuraray Co. Ltd. | 327,486 | 3,676,597 | |
Kurita Water Industries Ltd. (d) | 102,400 | 2,161,297 | |
Kyocera Corp. | 311,904 | 14,128,901 | |
Kyowa Hakko Kirin Co., Ltd. | 229,689 | 2,469,424 | |
Kyushu Electric Power Co., Inc. (a) | 410,570 | 5,268,786 | |
Lawson, Inc. | 62,416 | 4,329,930 | |
LIXIL Group Corp. | 256,659 | 7,492,717 | |
M3, Inc. | 679 | 2,258,441 | |
Mabuchi Motor Co. Ltd. | 23,721 | 1,582,643 | |
Makita Corp. | 107,400 | 5,973,116 | |
Marubeni Corp. | 1,583,244 | 11,130,529 | |
Marui Group Co. Ltd. | 209,949 | 1,734,212 | |
Maruichi Steel Tube Ltd. | 45,500 | 1,271,067 | |
Mazda Motor Corp. (a) | 2,593,000 | 12,524,227 | |
McDonald's Holdings Co. (Japan) Ltd. (d) | 64,000 | 1,710,524 | |
Medipal Holdings Corp. | 132,200 | 2,039,442 | |
Meiji Holdings Co. Ltd. | 59,129 | 3,902,774 | |
Miraca Holdings, Inc. | 53,500 | 2,439,226 | |
Common Stocks - continued | |||
Shares | Value | ||
Japan - continued | |||
Mitsubishi Chemical Holdings Corp. | 1,308,875 | $ 5,922,933 | |
Mitsubishi Corp. | 1,348,502 | 25,882,384 | |
Mitsubishi Electric Corp. | 1,854,106 | 22,066,163 | |
Mitsubishi Estate Co. Ltd. | 1,201,723 | 28,502,527 | |
Mitsubishi Gas Chemical Co., Inc. | 373,867 | 2,384,196 | |
Mitsubishi Heavy Industries Ltd. | 2,914,256 | 17,953,668 | |
Mitsubishi Logistics Corp. | 118,000 | 1,642,948 | |
Mitsubishi Materials Corp. | 1,058,937 | 3,330,317 | |
Mitsubishi Motors Corp. of Japan (a) | 608,300 | 6,751,692 | |
Mitsubishi Tanabe Pharma Corp. | 214,900 | 3,163,213 | |
Mitsubishi UFJ Financial Group, Inc. | 12,239,330 | 70,922,692 | |
Mitsubishi UFJ Lease & Finance Co. Ltd. | 557,300 | 2,842,082 | |
Mitsui & Co. Ltd. | 1,667,523 | 25,706,168 | |
Mitsui Chemicals, Inc. | 801,683 | 2,078,456 | |
Mitsui Fudosan Co. Ltd. | 803,677 | 24,024,170 | |
Mitsui OSK Lines Ltd. | 1,041,285 | 4,335,160 | |
Mizuho Financial Group, Inc. | 22,073,600 | 45,400,985 | |
MS&AD Insurance Group Holdings, Inc. | 485,584 | 11,538,096 | |
Murata Manufacturing Co. Ltd. | 194,454 | 18,516,789 | |
Nabtesco Corp. | 106,000 | 2,654,947 | |
Namco Bandai Holdings, Inc. | 168,850 | 3,777,846 | |
NEC Corp. | 2,377,951 | 8,040,734 | |
Nexon Co. Ltd. | 106,600 | 905,005 | |
NGK Insulators Ltd. | 253,309 | 5,499,258 | |
NGK Spark Plug Co. Ltd. | 172,000 | 3,870,296 | |
NHK Spring Co. Ltd. | 150,800 | 1,567,715 | |
Nidec Corp. | 97,142 | 11,945,371 | |
Nikon Corp. | 327,038 | 6,003,604 | |
Nintendo Co. Ltd. | 102,096 | 12,618,983 | |
Nippon Building Fund, Inc. | 1,333 | 7,623,130 | |
Nippon Electric Glass Co. Ltd. | 368,000 | 1,670,606 | |
Nippon Express Co. Ltd. | 786,546 | 3,674,341 | |
Nippon Meat Packers, Inc. | 166,740 | 2,682,013 | |
Nippon Paint Co. Ltd. | 166,000 | 2,541,299 | |
Nippon Prologis REIT, Inc. | 1,270 | 2,720,448 | |
Nippon Steel & Sumitomo Metal Corp. | 7,298,636 | 21,384,459 | |
Nippon Telegraph & Telephone Corp. | 360,000 | 20,267,668 | |
Nippon Yusen KK | 1,556,578 | 4,986,293 | |
Nishi-Nippon City Bank Ltd. | 639,000 | 1,513,206 | |
Nissan Motor Co. Ltd. | 2,386,848 | 21,304,137 | |
Nisshin Seifun Group, Inc. | 201,949 | 2,180,236 | |
Nissin Food Holdings Co. Ltd. | 56,323 | 2,518,126 | |
Nitori Holdings Co. Ltd. | 65,800 | 2,974,157 | |
Nitto Denko Corp. | 157,594 | 7,395,477 | |
NKSJ Holdings, Inc. | 319,603 | 8,097,592 | |
NOK Corp. | 90,300 | 1,478,233 | |
Nomura Holdings, Inc. | 3,482,047 | 23,620,414 | |
Nomura Real Estate Holdings, Inc. | 118,300 | 2,422,494 | |
Nomura Research Institute Ltd. | 97,100 | 3,177,194 | |
NSK Ltd. | 447,576 | 4,923,133 | |
NTT Data Corp. | 120,800 | 5,015,350 | |
NTT DoCoMo, Inc. | 1,466,300 | 24,439,628 | |
| |||
Shares | Value | ||
NTT Urban Development Co. | 111,200 | $ 958,263 | |
Obayashi Corp. | 618,704 | 3,801,212 | |
Odakyu Electric Railway Co. Ltd. | 597,000 | 5,350,435 | |
Oji Holdings Corp. | 762,352 | 3,661,655 | |
Olympus Corp. (a) | 231,329 | 8,037,497 | |
Omron Corp. | 196,460 | 8,252,594 | |
Ono Pharmaceutical Co. Ltd. | 79,400 | 7,856,519 | |
Oracle Corp. Japan | 36,000 | 1,498,084 | |
Oriental Land Co. Ltd. | 48,356 | 7,255,538 | |
ORIX Corp. | 1,244,680 | 18,345,484 | |
Osaka Gas Co. Ltd. | 1,794,525 | 7,475,363 | |
Otsuka Corp. | 15,000 | 1,926,403 | |
Otsuka Holdings Co. Ltd. | 347,700 | 10,669,815 | |
Panasonic Corp. | 2,119,573 | 26,548,430 | |
Park24 Co. Ltd. | 92,800 | 1,872,049 | |
Rakuten, Inc. | 701,400 | 10,055,444 | |
Resona Holdings, Inc. | 2,117,400 | 11,062,696 | |
Ricoh Co. Ltd. | 645,770 | 8,134,384 | |
Rinnai Corp. | 32,800 | 2,752,402 | |
ROHM Co. Ltd. | 92,644 | 4,788,321 | |
Sankyo Co. Ltd. (Gunma) | 52,700 | 2,185,261 | |
Sanrio Co. Ltd. (d) | 47,900 | 1,828,550 | |
Santen Pharmaceutical Co. Ltd. | 71,100 | 3,322,005 | |
SBI Holdings, Inc. Japan | 200,460 | 2,383,380 | |
Secom Co. Ltd. | 200,767 | 11,366,075 | |
Sega Sammy Holdings, Inc. | 179,900 | 4,203,618 | |
Seiko Epson Corp. | 124,400 | 3,740,434 | |
Sekisui Chemical Co. Ltd. | 406,293 | 4,627,037 | |
Sekisui House Ltd. | 518,967 | 6,521,199 | |
Seven & i Holdings Co., Ltd. | 723,000 | 27,185,591 | |
Seven Bank Ltd. | 560,900 | 2,050,258 | |
Sharp Corp. (a)(d) | 1,468,675 | 4,773,217 | |
Shikoku Electric Power Co., Inc. (a) | 172,600 | 2,672,866 | |
Shimadzu Corp. | 231,000 | 1,913,462 | |
Shimamura Co. Ltd. | 21,300 | 1,923,425 | |
SHIMANO, Inc. | 75,200 | 6,805,463 | |
SHIMIZU Corp. | 571,416 | 3,093,654 | |
Shin-Etsu Chemical Co., Ltd. | 393,962 | 22,375,802 | |
Shinsei Bank Ltd. | 1,610,000 | 3,356,611 | |
Shionogi & Co. Ltd. | 285,491 | 6,202,959 | |
Shiseido Co. Ltd. | 344,650 | 6,116,357 | |
Shizuoka Bank Ltd. | 542,274 | 5,248,749 | |
Showa Denko K.K. | 1,405,336 | 2,036,292 | |
Showa Shell Sekiyu K.K. | 180,300 | 1,775,353 | |
SMC Corp. | 49,571 | 12,574,190 | |
SoftBank Corp. | 922,230 | 69,889,653 | |
Sojitz Corp. | 1,187,100 | 2,107,518 | |
Sony Corp. | 996,685 | 17,429,197 | |
Sony Financial Holdings, Inc. | 167,300 | 2,706,690 | |
Stanley Electric Co. Ltd. | 137,525 | 3,152,656 | |
Sumco Corp. | 111,800 | 860,884 | |
Sumitomo Chemical Co. Ltd. | 1,440,334 | 5,914,772 | |
Sumitomo Corp. | 1,078,942 | 14,273,083 | |
Sumitomo Electric Industries Ltd. | 723,006 | 11,098,114 | |
Common Stocks - continued | |||
Shares | Value | ||
Japan - continued | |||
Sumitomo Heavy Industries Ltd. | 526,822 | $ 2,436,663 | |
Sumitomo Metal Mining Co. Ltd. | 499,065 | 6,532,956 | |
Sumitomo Mitsui Financial Group, Inc. | 1,221,800 | 54,856,433 | |
Sumitomo Mitsui Trust Holdings, Inc. | 3,183,722 | 14,935,403 | |
Sumitomo Realty & Development Co. Ltd. | 343,000 | 13,858,766 | |
Sumitomo Rubber Industries Ltd. | 162,300 | 2,183,243 | |
Suntory Beverage & Food Ltd. | 133,100 | 4,688,646 | |
Suzuken Co. Ltd. | 68,160 | 2,585,218 | |
Suzuki Motor Corp. | 349,800 | 9,411,323 | |
Sysmex Corp. | 69,700 | 4,157,207 | |
T&D Holdings, Inc. | 554,200 | 6,814,874 | |
Taiheiyo Cement Corp. | 1,134,000 | 4,004,896 | |
Taisei Corp. | 938,594 | 4,193,255 | |
Taisho Pharmaceutical Holdings Co. Ltd. | 31,457 | 2,392,426 | |
Taiyo Nippon Sanso Corp. | 235,000 | 1,759,556 | |
Takashimaya Co. Ltd. | 259,000 | 2,255,426 | |
Takeda Pharmaceutical Co. Ltd. | 758,142 | 36,433,932 | |
TDK Corp. | 119,025 | 5,156,464 | |
Teijin Ltd. | 916,341 | 2,204,187 | |
Terumo Corp. | 144,812 | 6,199,512 | |
The Chugoku Bank Ltd. | 154,500 | 1,914,361 | |
The Hachijuni Bank Ltd. | 399,000 | 2,140,650 | |
The Suruga Bank Ltd. | 175,000 | 3,079,738 | |
THK Co. Ltd. | 110,000 | 2,519,505 | |
Tobu Railway Co. Ltd. | 988,297 | 4,810,637 | |
Toho Co. Ltd. | 107,254 | 2,080,506 | |
Toho Gas Co. Ltd. | 394,000 | 1,997,681 | |
Tohoku Electric Power Co., Inc. (a) | 430,490 | 5,050,654 | |
Tokio Marine Holdings, Inc. | 664,400 | 19,738,327 | |
Tokyo Electric Power Co., Inc. (a) | 1,384,318 | 6,474,533 | |
Tokyo Electron Ltd. | 164,118 | 9,405,927 | |
Tokyo Gas Co. Ltd. | 2,304,395 | 11,576,206 | |
Tokyo Tatemono Co. Ltd. | 400,000 | 3,267,114 | |
Tokyu Corp. | 1,090,954 | 6,666,770 | |
Tokyu Fudosan Holdings Corp. | 498,200 | 3,935,443 | |
TonenGeneral Sekiyu K.K. | 275,856 | 2,434,103 | |
Toppan Printing Co. Ltd. | 539,013 | 4,014,764 | |
Toray Industries, Inc. | 1,407,883 | 9,727,372 | |
Toshiba Corp. | 3,862,880 | 16,765,669 | |
Toto Ltd. | 271,185 | 3,848,254 | |
Toyo Seikan Group Holdings Ltd. | 156,100 | 2,740,435 | |
Toyo Suisan Kaisha Ltd. | 86,000 | 2,890,046 | |
Toyoda Gosei Co. Ltd. | 60,300 | 1,272,717 | |
Toyota Boshoku Corp. | 63,000 | 668,566 | |
Toyota Industries Corp. | 156,086 | 7,208,452 | |
Toyota Motor Corp. | 2,647,151 | 152,351,789 | |
Toyota Motor Corp. sponsored ADR | 830 | 95,699 | |
Toyota Tsusho Corp. | 204,400 | 5,052,660 | |
Trend Micro, Inc. | 101,200 | 3,404,712 | |
Tsumura & Co. | 56,200 | 1,494,875 | |
Ube Industries Ltd. | 1,009,605 | 1,931,582 | |
Unicharm Corp. | 109,780 | 6,224,138 | |
| |||
Shares | Value | ||
United Urban Investment Corp. | 2,266 | $ 3,462,346 | |
USS Co. Ltd. | 211,500 | 2,849,233 | |
West Japan Railway Co. | 160,500 | 6,597,792 | |
Yahoo! Japan Corp. | 1,381,700 | 8,760,579 | |
Yakult Honsha Co. Ltd. | 86,366 | 4,141,359 | |
Yamada Denki Co. Ltd. | 875,050 | 2,897,630 | |
Yamaguchi Financial Group, Inc. | 200,000 | 1,743,146 | |
Yamaha Corp. | 150,843 | 2,071,155 | |
Yamaha Motor Co. Ltd. | 270,700 | 3,915,401 | |
Yamato Holdings Co. Ltd. | 356,832 | 7,408,196 | |
Yamato Kogyo Co. Ltd. | 39,600 | 1,194,576 | |
Yamazaki Baking Co. Ltd. | 103,000 | 1,193,249 | |
Yaskawa Electric Corp. | 207,000 | 3,091,281 | |
Yokogawa Electric Corp. | 203,900 | 3,189,745 | |
Yokohama Rubber Co. Ltd. | 193,000 | 1,886,264 | |
TOTAL JAPAN | 2,569,699,051 | ||
Luxembourg - 0.4% | |||
ArcelorMittal SA (Netherlands) | 959,910 | 15,074,157 | |
Millicom International Cellular SA (depository receipt) | 63,496 | 6,620,305 | |
RTL Group SA | 37,496 | 4,836,055 | |
SES SA (France) (depositary receipt) | 291,739 | 10,167,855 | |
Subsea 7 SA | 252,656 | 4,819,912 | |
Tenaris SA | 453,491 | 9,470,042 | |
TOTAL LUXEMBOURG | 50,988,326 | ||
Malta - 0.0% | |||
BGP Holdings PLC (a) | 5,796,476 | 80 | |
Mauritius - 0.0% | |||
Golden Agri-Resources Ltd. | 6,889,680 | 3,016,426 | |
Netherlands - 3.1% | |||
AEGON NV | 1,738,295 | 15,669,980 | |
Airbus Group NV | 563,569 | 41,531,776 | |
Akzo Nobel NV | 230,172 | 19,065,562 | |
ASML Holding NV (Netherlands) | 343,304 | 29,629,007 | |
CNH Industrial NV | 907,172 | 9,979,791 | |
Corio NV | 65,493 | 3,074,504 | |
Delta Lloyd NV | 183,623 | 5,242,713 | |
Fugro NV (Certificaten Van Aandelen) (d) | 68,227 | 3,965,656 | |
Gemalto NV (d) | 76,005 | 8,550,141 | |
Heineken Holding NV | 96,771 | 6,259,899 | |
Heineken NV (Bearer) | 221,334 | 14,966,804 | |
ING Groep NV (Certificaten Van Aandelen) (a) | 3,686,149 | 53,530,482 | |
Koninklijke Ahold NV | 966,942 | 18,038,065 | |
Koninklijke Boskalis Westminster NV | 75,276 | 3,768,059 | |
Koninklijke KPN NV (a) | 3,074,381 | 10,957,212 | |
Koninklijke Philips Electronics NV | 903,351 | 31,548,718 | |
OCI NV (a) | 90,280 | 4,416,302 | |
QIAGEN NV (a) | 223,864 | 5,047,506 | |
Randstad Holding NV | 119,343 | 7,519,062 | |
Reed Elsevier NV | 666,117 | 14,577,873 | |
Common Stocks - continued | |||
Shares | Value | ||
Netherlands - continued | |||
Royal DSM NV | 148,337 | $ 9,478,881 | |
STMicroelectronics NV | 606,744 | 5,503,144 | |
TNT Express NV | 416,865 | 4,059,438 | |
Unilever NV (Certificaten Van Aandelen) (Bearer) | 1,564,575 | 61,870,836 | |
Vopak NV | 67,101 | 3,930,772 | |
Wolters Kluwer NV | 289,647 | 8,367,809 | |
Ziggo NV | 152,097 | 6,959,494 | |
TOTAL NETHERLANDS | 407,509,486 | ||
New Zealand - 0.1% | |||
Auckland International Airport Ltd. | 1,020,686 | 3,200,479 | |
Contact Energy Ltd. | 341,126 | 1,530,100 | |
Fletcher Building Ltd. | 663,071 | 5,236,754 | |
Ryman Healthcare Group Ltd. | 353,248 | 2,339,689 | |
Telecom Corp. of New Zealand Ltd. | 1,768,426 | 3,706,621 | |
TOTAL NEW ZEALAND | 16,013,643 | ||
Norway - 0.7% | |||
Aker Solutions ASA | 159,173 | 2,675,867 | |
DNB ASA | 938,514 | 17,028,353 | |
Gjensidige Forsikring ASA | 190,814 | 4,002,580 | |
Norsk Hydro ASA | 1,300,099 | 6,433,346 | |
Orkla ASA | 737,089 | 5,821,063 | |
Statoil ASA | 1,071,066 | 28,250,470 | |
Telenor ASA | 655,245 | 14,476,089 | |
Yara International ASA | 173,590 | 7,039,621 | |
TOTAL NORWAY | 85,727,389 | ||
Portugal - 0.2% | |||
Banco Espirito Santo SA (Reg.) (a)(d) | 1,736,612 | 3,394,216 | |
Energias de Portugal SA | 1,933,509 | 8,380,102 | |
Galp Energia SGPS SA Class B | 334,747 | 5,627,785 | |
Jeronimo Martins SGPS SA | 242,680 | 4,125,170 | |
Portugal Telecom SGPS SA (Reg.) (d) | 609,258 | 2,728,019 | |
TOTAL PORTUGAL | 24,255,292 | ||
Singapore - 1.3% | |||
Ascendas Real Estate Investment Trust | 1,980,183 | 3,374,114 | |
CapitaCommercial Trust (REIT) | 1,952,000 | 2,255,891 | |
CapitaLand Ltd. | 2,441,437 | 5,488,972 | |
CapitaMall Trust | 2,298,200 | 3,444,626 | |
CapitaMalls Asia Ltd. | 1,284,000 | 1,813,087 | |
City Developments Ltd. | 439,000 | 3,251,852 | |
ComfortDelgro Corp. Ltd. | 1,934,784 | 2,945,713 | |
DBS Group Holdings Ltd. | 1,644,020 | 21,424,849 | |
Global Logistic Properties Ltd. | 2,990,000 | 6,675,107 | |
Hutchison Port Holdings Trust | 5,045,000 | 3,153,125 | |
Jardine Cycle & Carriage Ltd. | 101,267 | 3,134,712 | |
Keppel Corp. Ltd. | 1,392,400 | 11,500,357 | |
Keppel Land Ltd. | 670,000 | 1,696,604 | |
Olam International Ltd. | 1,448,700 | 2,028,511 | |
Oversea-Chinese Banking Corp. Ltd. | 2,472,793 | 18,648,603 | |
| |||
Shares | Value | ||
SembCorp Industries Ltd. | 955,130 | $ 4,076,246 | |
SembCorp Marine Ltd. | 806,800 | 2,615,823 | |
Singapore Airlines Ltd. | 510,425 | 4,115,129 | |
Singapore Exchange Ltd. | 826,000 | 4,483,004 | |
Singapore Press Holdings Ltd. | 1,554,021 | 5,087,514 | |
Singapore Technologies Engineering Ltd. | 1,481,161 | 4,440,036 | |
Singapore Telecommunications Ltd. | 7,645,827 | 21,713,389 | |
StarHub Ltd. | 572,000 | 1,886,136 | |
United Overseas Bank Ltd. | 1,218,829 | 19,835,477 | |
UOL Group Ltd. | 446,984 | 2,157,963 | |
Wilmar International Ltd. | 1,844,000 | 5,018,578 | |
Yangzijiang Shipbuilding Holdings Ltd. | 1,893,000 | 1,694,912 | |
TOTAL SINGAPORE | 167,960,330 | ||
Spain - 3.4% | |||
Abertis Infraestructuras SA (d) | 370,338 | 8,700,242 | |
ACS Actividades de Construccion y Servicios SA | 167,623 | 6,026,032 | |
Amadeus IT Holding SA Class A | 365,177 | 16,061,675 | |
Banco Bilbao Vizcaya Argentaria SA | 5,554,638 | 68,624,833 | |
Banco de Sabadell SA | 3,260,877 | 10,775,366 | |
Banco Popular Espanol SA | 1,581,158 | 11,401,236 | |
Banco Santander SA (Spain) | 11,134,211 | 100,504,543 | |
Bankia SA (a) | 3,883,906 | 8,154,013 | |
Cintra Concesiones de Infrastructuras de Transporte SA | 388,043 | 8,194,921 | |
Criteria CaixaCorp SA | 1,666,343 | 10,511,243 | |
Distribuidora Internacional de Alimentacion SA | 579,124 | 4,972,049 | |
Enagas SA | 182,598 | 5,314,264 | |
Gas Natural SDG SA | 337,533 | 8,663,351 | |
Grifols SA | 143,160 | 8,161,035 | |
Iberdrola SA (d) | 4,615,717 | 30,689,464 | |
Inditex SA | 209,520 | 30,163,607 | |
International Consolidated Airlines Group SA (a) | 199,436 | 1,456,790 | |
International Consolidated Airlines Group SA CDI (a) | 777,807 | 5,691,823 | |
MAPFRE SA (Reg.) | 1,035,357 | 4,287,310 | |
Red Electrica Corporacion SA | 104,226 | 8,113,882 | |
Repsol YPF SA | 833,894 | 20,954,390 | |
Telefonica SA | 3,933,022 | 60,137,161 | |
Zardoya Otis SA | 161,792 | 2,800,452 | |
TOTAL SPAIN | 440,359,682 | ||
Sweden - 3.2% | |||
Alfa Laval AB | 300,248 | 8,148,160 | |
ASSA ABLOY AB (B Shares) | 320,782 | 16,335,159 | |
Atlas Copco AB: | |||
(A Shares) | 646,526 | 18,160,588 | |
(B Shares) | 373,529 | 9,921,313 | |
Boliden AB | 259,977 | 4,123,691 | |
Electrolux AB (B Shares) | 231,340 | 5,480,734 | |
Elekta AB (B Shares) (d) | 355,696 | 4,729,373 | |
Getinge AB (B Shares) | 192,280 | 6,921,498 | |
Common Stocks - continued | |||
Shares | Value | ||
Sweden - continued | |||
H&M Hennes & Mauritz AB (B Shares) | 911,913 | $ 41,132,195 | |
Hexagon AB (B Shares) | 228,801 | 8,118,383 | |
Husqvarna AB (B Shares) | 386,452 | 2,612,852 | |
Industrivarden AB (C Shares) | 118,190 | 2,285,770 | |
Investment AB Kinnevik (B Shares) | 214,890 | 8,342,021 | |
Investor AB (B Shares) | 437,893 | 15,605,741 | |
Lundin Petroleum AB (a) | 211,841 | 4,252,250 | |
Nordea Bank AB | 2,918,031 | 41,802,211 | |
Sandvik AB | 1,024,473 | 14,292,594 | |
Scania AB (B Shares) | 307,134 | 9,436,791 | |
Securitas AB (B Shares) | 297,951 | 3,283,123 | |
Skandinaviska Enskilda Banken AB (A Shares) | 1,458,904 | 20,512,691 | |
Skanska AB (B Shares) | 363,217 | 7,885,616 | |
SKF AB (B Shares) | 380,129 | 10,179,618 | |
Svenska Cellulosa AB (SCA) (B Shares) | 563,495 | 17,111,426 | |
Svenska Handelsbanken AB (A Shares) | 479,591 | 25,057,978 | |
Swedbank AB (A Shares) | 869,955 | 24,558,710 | |
Swedish Match Co. AB | 193,342 | 6,121,424 | |
Tele2 AB (B Shares) | 310,048 | 3,846,797 | |
Telefonaktiebolaget LM Ericsson (B Shares) | 2,922,685 | 37,781,053 | |
TeliaSonera AB | 2,288,773 | 17,637,936 | |
Volvo AB (B Shares) | 1,465,625 | 22,058,723 | |
TOTAL SWEDEN | 417,736,419 | ||
Switzerland - 9.1% | |||
ABB Ltd. (Reg.) | 2,111,735 | 53,895,970 | |
Actelion Ltd. | 98,131 | 10,404,452 | |
Adecco SA (Reg.) | 127,055 | 10,971,947 | |
Aryzta AG | 83,347 | 6,955,850 | |
Baloise Holdings AG | 45,696 | 5,891,900 | |
Barry Callebaut AG | 2,069 | 2,580,663 | |
Coca-Cola HBC AG | 12,175 | 302,757 | |
Coca-Cola HBC AG sponsored ADR | 179,380 | 4,457,593 | |
Compagnie Financiere Richemont SA Series A | 501,188 | 49,919,351 | |
Credit Suisse Group AG | 1,455,115 | 45,688,327 | |
Ems-Chemie Holding AG | 7,964 | 3,069,694 | |
Geberit AG (Reg.) | 36,450 | 11,463,411 | |
Givaudan SA | 8,855 | 13,894,144 | |
Holcim Ltd. (Reg.) | 219,846 | 17,847,646 | |
Julius Baer Group Ltd. | 215,781 | 10,113,124 | |
Kuehne & Nagel International AG | 51,547 | 7,361,345 | |
Lindt & Spruengli AG | 99 | 5,748,078 | |
Lindt & Spruengli AG (participation certificate) | 810 | 3,991,518 | |
Lonza Group AG | 50,769 | 5,368,410 | |
Nestle SA | 3,096,959 | 233,960,327 | |
Novartis AG | 2,209,069 | 183,861,069 | |
Pargesa Holding SA | 25,750 | 2,213,417 | |
Partners Group Holding AG | 16,784 | 4,372,046 | |
| |||
Shares | Value | ||
Roche Holding AG (participation certificate) | 674,660 | $ 207,727,906 | |
Schindler Holding AG: | |||
(participation certificate) | 44,322 | 6,647,040 | |
(Reg.) | 20,187 | 3,066,496 | |
SGS SA (Reg.) | 5,256 | 13,021,972 | |
Sika AG (Bearer) | 2,074 | 7,649,865 | |
Sonova Holding AG Class B | 48,253 | 6,825,097 | |
Sulzer AG (Reg.) | 23,371 | 3,308,345 | |
Swatch Group AG (Bearer) | 29,586 | 19,746,426 | |
Swatch Group AG (Bearer) (Reg.) | 41,750 | 4,908,414 | |
Swiss Life Holding AG | 31,004 | 7,716,629 | |
Swiss Prime Site AG | 52,517 | 4,412,742 | |
Swiss Re Ltd. | 338,021 | 31,592,184 | |
Swisscom AG | 22,369 | 13,250,994 | |
Syngenta AG (Switzerland) | 89,428 | 32,555,438 | |
Transocean Ltd. (Switzerland) | 346,068 | 14,625,750 | |
UBS AG | 3,504,282 | 74,967,028 | |
Zurich Insurance Group AG | 142,941 | 43,800,568 | |
TOTAL SWITZERLAND | 1,190,155,933 | ||
United Kingdom - 19.8% | |||
3i Group PLC | 937,548 | 6,609,578 | |
Aberdeen Asset Management PLC | 915,046 | 5,985,126 | |
Admiral Group PLC | 187,620 | 4,508,470 | |
Aggreko PLC | 256,558 | 6,702,060 | |
AMEC PLC | 284,941 | 5,358,372 | |
Anglo American PLC (United Kingdom) | 1,338,655 | 34,188,803 | |
Antofagasta PLC | 379,564 | 5,723,568 | |
ARM Holdings PLC | 1,344,317 | 22,534,761 | |
ASOS PLC (a) | 51,985 | 6,058,783 | |
Associated British Foods PLC | 342,216 | 17,180,273 | |
AstraZeneca PLC (United Kingdom) | 1,205,310 | 81,933,611 | |
Aviva PLC | 2,825,469 | 22,464,009 | |
Babcock International Group PLC | 349,082 | 8,598,808 | |
BAE Systems PLC | 3,088,229 | 21,249,257 | |
Barclays PLC | 14,690,230 | 61,883,558 | |
BG Group PLC | 3,273,290 | 59,663,817 | |
BHP Billiton PLC | 2,028,169 | 65,361,450 | |
BP PLC | 17,935,868 | 151,576,986 | |
British American Tobacco PLC (United Kingdom) | 1,814,001 | 98,883,743 | |
British Land Co. PLC | 913,992 | 10,667,761 | |
British Sky Broadcasting Group PLC | 991,297 | 15,603,778 | |
BT Group PLC | 7,589,803 | 52,201,379 | |
Bunzl PLC | 321,908 | 8,479,273 | |
Burberry Group PLC | 427,065 | 11,020,334 | |
Capita Group PLC | 633,981 | 12,102,615 | |
Capital Shopping Centres Group PLC | 648,438 | 3,525,728 | |
Carnival PLC (d) | 176,102 | 7,241,955 | |
Centrica PLC | 4,895,528 | 26,151,003 | |
Cobham PLC | 1,026,256 | 5,126,336 | |
Compass Group PLC | 1,724,287 | 27,271,538 | |
Common Stocks - continued | |||
Shares | Value | ||
United Kingdom - continued | |||
Croda International PLC | 130,554 | $ 5,555,114 | |
Diageo PLC | 2,410,175 | 75,684,336 | |
Direct Line Insurance Group PLC | 1,084,718 | 4,804,416 | |
easyJet PLC | 150,756 | 4,344,638 | |
Fresnillo PLC | 176,789 | 2,816,840 | |
G4S PLC (United Kingdom) | 1,487,522 | 5,913,468 | |
GKN PLC | 1,568,073 | 10,652,938 | |
GlaxoSmithKline PLC | 4,663,885 | 130,633,624 | |
GlaxoSmithKline PLC sponsored ADR (d) | 2,239 | 125,250 | |
Hammerson PLC | 682,101 | 6,562,009 | |
Hargreaves Lansdown PLC | 213,062 | 4,984,258 | |
HSBC Holdings PLC (United Kingdom) | 18,004,391 | 190,018,564 | |
ICAP PLC | 527,787 | 3,875,488 | |
IMI PLC | 262,132 | 6,694,035 | |
Imperial Tobacco Group PLC | 927,936 | 37,867,939 | |
Inmarsat PLC | 427,002 | 4,965,926 | |
InterContinental Hotel Group PLC | 249,423 | 8,112,215 | |
Intertek Group PLC | 155,419 | 7,654,155 | |
Investec PLC | 553,520 | 4,121,911 | |
ITV PLC | 3,665,186 | 12,391,688 | |
J Sainsbury PLC | 1,194,534 | 6,853,051 | |
Johnson Matthey PLC | 196,485 | 10,732,761 | |
Kingfisher PLC | 2,275,747 | 15,014,757 | |
Land Securities Group PLC | 754,810 | 13,726,683 | |
Legal & General Group PLC | 5,672,102 | 22,833,717 | |
Lloyds Banking Group PLC (a) | 47,967,081 | 66,242,670 | |
London Stock Exchange Group PLC | 169,163 | 5,741,921 | |
Marks & Spencer Group PLC | 1,554,419 | 13,105,865 | |
Meggitt PLC | 768,989 | 6,490,061 | |
Melrose PLC | 1,029,575 | 5,658,414 | |
National Grid PLC | 3,582,272 | 50,127,584 | |
Next PLC | 149,182 | 16,824,887 | |
Old Mutual PLC | 4,696,180 | 15,499,921 | |
Pearson PLC | 785,530 | 13,302,871 | |
Persimmon PLC | 294,154 | 7,122,643 | |
Prudential PLC | 2,451,672 | 55,512,559 | |
Prudential PLC ADR (d) | 2,253 | 102,286 | |
Reckitt Benckiser Group PLC | 621,813 | 51,167,367 | |
Reed Elsevier PLC | 1,119,556 | 17,163,359 | |
Rexam PLC | 761,138 | 6,292,521 | |
Rio Tinto PLC | 1,220,888 | 70,006,535 | |
Rolls-Royce Group PLC | 1,805,448 | 30,202,896 | |
Royal & Sun Alliance Insurance Group PLC | 3,549,455 | 5,780,287 | |
Royal Bank of Scotland Group PLC (a) | 2,078,652 | 11,382,655 | |
Royal Dutch Shell PLC: | |||
Class A (Netherlands) | 33,000 | 1,204,283 | |
Class A (United Kingdom) | 3,677,753 | 133,888,905 | |
Class B (United Kingdom) | 2,377,337 | 92,484,350 | |
Royal Mail PLC | 623,014 | 6,259,609 | |
SABMiller PLC | 924,256 | 45,301,556 | |
| |||
Shares | Value | ||
Sage Group PLC | 1,063,186 | $ 7,685,806 | |
Schroders PLC | 100,110 | 4,548,052 | |
Scottish & Southern Energy PLC | 926,962 | 21,777,986 | |
Segro PLC | 710,091 | 4,243,837 | |
Serco Group PLC | 474,968 | 3,662,622 | |
Severn Trent PLC | 229,983 | 7,124,684 | |
Smith & Nephew PLC | 856,445 | 13,631,421 | |
Smiths Group PLC | 378,519 | 8,671,054 | |
Standard Chartered PLC (United Kingdom) | 2,330,084 | 49,358,303 | |
Standard Life PLC | 2,278,250 | 14,878,670 | |
Tate & Lyle PLC | 444,619 | 4,779,926 | |
Tesco PLC | 7,759,511 | 42,728,741 | |
The Weir Group PLC | 204,223 | 8,778,668 | |
Travis Perkins PLC | 236,177 | 7,731,833 | |
TUI Travel PLC | 429,106 | 3,214,116 | |
Tullow Oil PLC | 875,477 | 11,713,580 | |
Unilever PLC | 1,232,075 | 50,391,909 | |
United Utilities Group PLC | 654,174 | 8,539,010 | |
Vodafone Group PLC | 25,235,621 | 105,155,919 | |
Vodafone Group PLC sponsored ADR | 14,727 | 612,201 | |
Whitbread PLC | 173,134 | 13,008,779 | |
William Hill PLC | 831,946 | 5,539,105 | |
WM Morrison Supermarkets PLC | 2,129,402 | 8,390,304 | |
TOTAL UNITED KINGDOM | 2,595,829,045 | ||
TOTAL COMMON STOCKS (Cost $11,109,858,367) |
| ||
Nonconvertible Preferred Stocks - 0.9% | |||
|
|
|
|
France - 0.3% | |||
Air Liquide SA | 250,075 | 34,435,009 | |
Germany - 0.6% | |||
Bayerische Motoren Werke AG (BMW) (non-vtg.) | 51,952 | 4,561,431 | |
FUCHS PETROLUB AG | 34,589 | 3,451,833 | |
Henkel AG & Co. KGaA | 171,569 | 19,146,629 | |
Porsche Automobil Holding SE (Germany) | 146,925 | 15,451,376 | |
Volkswagen AG | 138,963 | 36,252,209 | |
TOTAL GERMANY | 78,863,478 | ||
Italy - 0.0% | |||
Telecom Italia SpA (Risparmio Shares) | 5,744,968 | 5,029,885 | |
TOTAL NONCONVERTIBLE PREFERRED STOCKS (Cost $72,910,407) |
| ||
Government Obligations - 0.1% | ||||
| Principal Amount | Value | ||
United States of America - 0.1% | ||||
U.S. Treasury Bills, yield at date of purchase 0.08% to 0.09% 4/3/14 to 7/24/14 (e) | $ 17,000,000 | $ 16,997,994 | ||
Money Market Funds - 3.5% | |||
Shares |
| ||
Fidelity Cash Central Fund, 0.10% (b) | 332,513,105 | 332,513,105 | |
Fidelity Securities Lending Cash Central Fund, 0.09% (b)(c) | 122,985,480 | 122,985,480 | |
TOTAL MONEY MARKET FUNDS (Cost $455,498,585) |
| ||
TOTAL INVESTMENT PORTFOLIO - 101.6% (Cost $11,655,263,764) | 13,296,812,116 | |
NET OTHER ASSETS (LIABILITIES) - (1.6)% | (207,437,165) | |
NET ASSETS - 100% | $ 13,089,374,951 | |
Futures Contracts | |||||
Expiration Date | Underlying Face Amount at Value | Unrealized Appreciation/ | |||
Purchased | |||||
Equity Index Contracts | |||||
78 CAC 40 Index Contracts (France) | March 2014 | $ 4,701,516 | $ 85,456 | ||
56 CME Nikkei 225 Index Contracts (Japan) | March 2014 | 4,035,707 | (222,289) | ||
11 DAX 100 Index Contracts (Germany) | March 2014 | 3,650,580 | 152,549 | ||
673 Euro Stoxx 50 Index Contracts (Germany) | March 2014 | 28,997,467 | 1,558,547 | ||
29 Hang Seng Index Contracts (Hong Kong) | March 2014 | 4,264,087 | 55,569 | ||
289 LIFFE FTSE 100 Index Contracts (United Kingdom) | March 2014 | 32,083,772 | 1,455,707 | ||
1,464 NYSE E-mini MSCI EAFE Index Contracts (United States) | March 2014 | 141,224,760 | 138,430 | ||
240 OMX Stockholm 30 Index Contracts (Sweden) | March 2014 | 5,021,883 | 138,151 | ||
95 SFE SPI 200 Index Contracts (Australia) | March 2014 | 11,440,969 | 624,439 | ||
47 Singapore Exch Derivatives Ltd. | March 2014 | 2,613,669 | (6,594) | ||
201 TSE TOPIX Index Contracts (Japan) | March 2014 | 23,702,044 | (770,358) | ||
TOTAL EQUITY INDEX CONTRACTS | $ 261,736,454 | $ 3,209,607 | |||
|
The face value of futures purchased as a percentage of net assets is 1.8% |
Forward Foreign Currency Contracts | ||||||
Settlement Date | Currency | Counterparty | Type | Quantity | Contract Amount* | Unrealized |
3/14/14 | JPY | Goldman Sachs Bank USA | Buy | 60,000,000 | $ 574,614 | $ 14,993 |
3/14/14 | JPY | Goldman Sachs Bank USA | Buy | 100,000,000 | 953,353 | 29,325 |
3/14/14 | JPY | Goldman Sachs Bank USA | Buy | 100,000,000 | 958,954 | 23,723 |
3/14/14 | JPY | Goldman Sachs Bank USA | Buy | 130,000,000 | 1,268,107 | 9,373 |
3/14/14 | JPY | Goldman Sachs Bank USA | Buy | 180,000,000 | 1,751,961 | 16,857 |
3/14/14 | JPY | Goldman Sachs Bank USA | Buy | 200,000,000 | 1,918,423 | 46,931 |
3/14/14 | JPY | Goldman Sachs Bank USA | Buy | 1,000,000,000 | 9,737,004 | 89,766 |
3/14/14 | JPY | Goldman Sachs Bank USA | Buy | 1,090,000,000 | 10,574,311 | 136,868 |
3/21/14 | AUD | Goldman Sachs Bank USA | Buy | 400,000 | 354,924 | 1,498 |
3/21/14 | AUD | Goldman Sachs Bank USA | Buy | 400,000 | 363,696 | (7,274) |
3/21/14 | AUD | Goldman Sachs Bank USA | Buy | 500,000 | 437,143 | 8,385 |
3/21/14 | AUD | Goldman Sachs Bank USA | Buy | 700,000 | 622,013 | 1,725 |
3/21/14 | AUD | Goldman Sachs Bank USA | Buy | 1,100,000 | 990,770 | (10,610) |
3/21/14 | AUD | Goldman Sachs Bank USA | Buy | 4,400,000 | 3,911,468 | 9,172 |
3/21/14 | AUD | Goldman Sachs Bank USA | Buy | 5,000,000 | 4,442,000 | 13,273 |
3/21/14 | EUR | Goldman Sachs Bank USA | Buy | 300,000 | 413,223 | 861 |
3/21/14 | EUR | Goldman Sachs Bank USA | Buy | 600,000 | 825,636 | 2,533 |
3/21/14 | EUR | Goldman Sachs Bank USA | Buy | 800,000 | 1,093,050 | 11,174 |
3/21/14 | EUR | Goldman Sachs Bank USA | Buy | 900,000 | 1,230,656 | 11,597 |
3/21/14 | EUR | Goldman Sachs Bank USA | Buy | 1,000,000 | 1,365,290 | 14,991 |
3/21/14 | EUR | Goldman Sachs Bank USA | Buy | 1,100,000 | 1,488,380 | 29,929 |
3/21/14 | EUR | Goldman Sachs Bank USA | Buy | 1,300,000 | 1,772,488 | 21,878 |
3/21/14 | EUR | Goldman Sachs Bank USA | Buy | 5,000,000 | 6,784,100 | 117,304 |
3/21/14 | EUR | Goldman Sachs Bank USA | Buy | 9,600,000 | 13,219,008 | 31,688 |
3/21/14 | EUR | Goldman Sachs Bank USA | Buy | 10,000,000 | 13,735,500 | 67,309 |
3/21/14 | EUR | Goldman Sachs Bank USA | Sell | 4,000,000 | 5,461,400 | (59,724) |
3/21/14 | GBP | Goldman Sachs Bank USA | Buy | 400,000 | 665,490 | 4,222 |
3/21/14 | GBP | Goldman Sachs Bank USA | Buy | 600,000 | 981,405 | 23,163 |
3/21/14 | GBP | Goldman Sachs Bank USA | Buy | 600,000 | 983,964 | 20,604 |
3/21/14 | GBP | Goldman Sachs Bank USA | Buy | 600,000 | 993,588 | 10,980 |
3/21/14 | GBP | Goldman Sachs Bank USA | Buy | 800,000 | 1,322,008 | 17,416 |
3/21/14 | GBP | Goldman Sachs Bank USA | Buy | 1,000,000 | 1,640,950 | 33,330 |
3/21/14 | GBP | Goldman Sachs Bank USA | Buy | 1,000,000 | 1,643,600 | 30,680 |
3/21/14 | GBP | Goldman Sachs Bank USA | Buy | 7,000,000 | 11,389,490 | 330,473 |
3/21/14 | GBP | Goldman Sachs Bank USA | Buy | 7,000,000 | 11,416,020 | 303,943 |
3/21/14 | SEK | Goldman Sachs Bank USA | Buy | 1,000,000 | 151,680 | 4,230 |
3/21/14 | SEK | Goldman Sachs Bank USA | Buy | 1,400,000 | 215,158 | 3,116 |
3/21/14 | SEK | Goldman Sachs Bank USA | Buy | 1,800,000 | 274,849 | 5,789 |
3/21/14 | SEK | Goldman Sachs Bank USA | Buy | 3,200,000 | 493,829 | 5,082 |
3/21/14 | SEK | Goldman Sachs Bank USA | Buy | 11,000,000 | 1,673,681 | 41,324 |
3/21/14 | SEK | Goldman Sachs Bank USA | Buy | 12,000,000 | 1,821,256 | 49,659 |
$ 1,517,556 | ||||||
|
* Amount in U.S. Dollars unless otherwise noted |
Currency Abbreviations | ||
AUD | - | Australian dollar |
EUR | - | European Monetary Unit |
GBP | - | British pound |
JPY | - | Japanese yen |
SEK | - | Swedish krona |
Legend |
(a) Non-income producing |
(b) Affiliated fund that is generally available only to investment companies and other accounts managed by Fidelity Investments. The rate quoted is the annualized seven-day yield of the fund at period end. A complete unaudited listing of the fund's holdings as of its most recent quarter end is available upon request. In addition, each Fidelity Central Fund's financial statements, which are not covered by the Fund's Report of Independent Registered Public Accounting Firm, are available on the SEC's website or upon request. |
(c) Investment made with cash collateral received from securities on loan. |
(d) Security or a portion of the security is on loan at period end. |
(e) Security or a portion of the security was pledged to cover margin requirements for futures contracts. At period end, the value of securities pledged amounted to $16,997,994. |
Affiliated Central Funds |
Information regarding fiscal year to date income earned by the Fund from investments in Fidelity Central Funds is as follows: |
Fund | Income earned |
Fidelity Cash Central Fund | $ 183,498 |
Fidelity Securities Lending Cash Central Fund | 2,827,474 |
Total | $ 3,010,972 |
Other Information |
Categorizations in the Schedule of Investments are based on country or territory of incorporation. |
The following is a summary of the inputs used, as of February 28, 2014, involving the Fund's assets and liabilities carried at fair value. The inputs or methodology used for valuing securities may not be an indication of the risk associated with investing in those securities. For more information on valuation inputs, and their aggregation into the levels used in the tables below, please refer to the Investment Valuation section in the accompanying Notes to Financial Statements. |
Valuation Inputs at Reporting Date: | ||||
Description | Total | Level 1 | Level 2 | Level 3 |
Investments in Securities: | ||||
Equities: | ||||
Consumer Discretionary | $ 1,522,420,489 | $ 1,035,751,328 | $ 486,669,161 | $ - |
Consumer Staples | 1,396,474,367 | 580,065,709 | 816,408,658 | - |
Energy | 874,459,534 | 241,983,217 | 632,476,317 | - |
Financials | 3,267,141,266 | 1,866,050,418 | 1,401,090,761 | 87 |
Health Care | 1,368,633,696 | 340,330,104 | 1,028,303,592 | - |
Industrials | 1,655,994,697 | 1,011,287,541 | 644,707,156 | - |
Information Technology | 583,353,096 | 186,573,732 | 396,779,364 | - |
Materials | 1,042,601,016 | 562,237,723 | 480,363,293 | - |
Telecommunication Services | 643,961,719 | 181,344,976 | 462,616,743 | - |
Utilities | 469,275,657 | 371,963,756 | 97,311,901 | - |
Government Obligations | 16,997,994 | - | 16,997,994 | - |
Money Market Funds | 455,498,585 | 455,498,585 | - | - |
Total Investments in Securities: | $ 13,296,812,116 | $ 6,833,087,089 | $ 6,463,724,940 | $ 87 |
Derivative Instruments: | ||||
Assets | ||||
Forward Foreign Currency Contracts | $ 1,595,164 | $ - | $ 1,595,164 | $ - |
Futures Contracts | 4,208,848 | 4,208,848 | - | - |
Total Assets | $ 5,804,012 | $ 4,208,848 | $ 1,595,164 | $ - |
Liabilities | ||||
Forward Foreign Currency Contracts | $ (77,608) | $ - | $ (77,608) | $ - |
Futures Contracts | (999,241) | (999,241) | - | - |
Total Liabilities | $ (1,076,849) | $ (999,241) | $ (77,608) | $ - |
Total Derivative Instruments: | $ 4,727,163 | $ 3,209,607 | $ 1,517,556 | $ - |
The following is a summary of transfers between Level 1 and Level 2 for the period ended February 28, 2014. Transfers are assumed to have occurred at the beginning of the period, and are primarily attributable to the valuation techniques used for foreign equity securities, as discussed in the accompanying Notes to Financial Statements: |
Transfers | Total |
Level 1 to Level 2 | $ 1,598,250,916 |
Level 2 to Level 1 | $ 20,748,375 |
Value of Derivative Instruments |
The following table is a summary of the Fund's value of derivative instruments by primary risk exposure as of February 28, 2014. For additional information on derivative instruments, please refer to the Derivative Instruments section in the accompanying Notes to Financial Statements. |
Primary Risk Exposure / | Value | |
| Asset | Liability |
Equity Risk | ||
Futures Contracts (b) | $ 4,208,848 | $ (999,241) |
Foreign Exchange Risk | ||
Forward Foreign Currency Contracts (a) | 1,595,164 | (77,608) |
Total Value of Derivatives | $ 5,804,012 | $ (1,076,849) |
(a) Gross value is presented in the Statement of Assets and Liabilities in the unrealized appreciation/depreciation on forward foreign currency contracts line-items. |
(b) Reflects gross cumulative appreciation (depreciation) on futures contracts as presented in the Schedule of Investments. Only the period end receivable or payable for daily variation margin and net unrealized appreciation (depreciation) are presented in the Statement of Assets and Liabilities. |
See accompanying notes which are an integral part of the financial statements.
Annual Report
Spartan International Index Fund
Financial Statements
Statement of Assets and Liabilities
| February 28, 2014 | |
|
|
|
Assets | ||
Investment in securities, at value (including securities loaned of $117,095,876) - See accompanying schedule: Unaffiliated issuers (cost $11,199,765,179) | $ 12,841,313,531 |
|
Fidelity Central Funds (cost $455,498,585) | 455,498,585 |
|
Total Investments (cost $11,655,263,764) |
| $ 13,296,812,116 |
Segregated cash with brokers for derivative instruments | 8,011,056 | |
Foreign currency held at value (cost $3,282,396) | 3,286,212 | |
Receivable for investments sold | 3,359,631 | |
Unrealized appreciation on foreign currency contracts | 1,595,164 | |
Receivable for fund shares sold | 15,479,819 | |
Dividends receivable | 61,148,588 | |
Interest receivable | 11,154 | |
Distributions receivable from Fidelity Central Funds | 137,776 | |
Receivable for daily variation margin for derivative instruments | 536,746 | |
Receivable from investment adviser for expense reductions | 351,306 | |
Other receivables | 12,019 | |
Total assets | 13,390,741,587 | |
|
|
|
Liabilities | ||
Payable for investments purchased | $ 150,552,330 | |
Unrealized depreciation on foreign currency contracts | 77,608 | |
Payable for fund shares redeemed | 26,120,008 | |
Accrued management fee | 631,941 | |
Other affiliated payables | 999,269 | |
Collateral on securities loaned, at value | 122,985,480 | |
Total liabilities | 301,366,636 | |
|
|
|
Net Assets | $ 13,089,374,951 | |
Net Assets consist of: |
| |
Paid in capital | $ 12,031,720,199 | |
Undistributed net investment income | 87,257,584 | |
Accumulated undistributed net realized gain (loss) on investments and foreign currency transactions | (677,044,919) | |
Net unrealized appreciation (depreciation) on investments and assets and liabilities in foreign currencies | 1,647,442,087 | |
Net Assets | $ 13,089,374,951 | |
Statement of Assets and Liabilities - continued
| February 28, 2014 | |
|
|
|
Investor Class: | $ 41.19 | |
|
|
|
Fidelity Advantage Class: | $ 41.20 | |
|
|
|
Institutional Class: | $ 41.20 | |
|
|
|
Fidelity Advantage Institutional Class: | $ 41.20 | |
See accompanying notes which are an integral part of the financial statements.
Annual Report
Spartan International Index Fund
Financial Statements - continued
Statement of Operations
| Year ended February 28, 2014 | |
|
|
|
Investment Income |
|
|
Dividends |
| $ 364,989,949 |
Special dividends |
| 80,204,752 |
Interest |
| 28,840 |
Income from Fidelity Central Funds (including $2,827,474 from security lending) |
| 3,010,972 |
Income before foreign taxes withheld |
| 448,234,513 |
Less foreign taxes withheld |
| (23,361,082) |
Total income |
| 424,873,431 |
|
|
|
Expenses | ||
Management fee | $ 6,848,368 | |
Transfer agent fees | 10,860,499 | |
Independent trustees' compensation | 54,915 | |
Interest | 1,184 | |
Miscellaneous | 21,554 | |
Total expenses before reductions | 17,786,520 | |
Expense reductions | (3,698,864) | 14,087,656 |
Net investment income (loss) | 410,785,775 | |
Realized and Unrealized Gain (Loss) Net realized gain (loss) on: | ||
Investment securities: |
|
|
Unaffiliated issuers | (32,829,350) | |
Foreign currency transactions | (13,161,732) | |
Futures contracts | 31,776,987 | |
Total net realized gain (loss) |
| (14,214,095) |
Change in net unrealized appreciation (depreciation) on: Investment securities | 1,660,685,904 | |
Assets and liabilities in foreign currencies | 12,944,663 | |
Futures contracts | 1,009,614 | |
Total change in net unrealized appreciation (depreciation) |
| 1,674,640,181 |
Net gain (loss) | 1,660,426,086 | |
Net increase (decrease) in net assets resulting from operations | $ 2,071,211,861 | |
Statement of Changes in Net Assets
| Year ended | Year ended |
Increase (Decrease) in Net Assets |
|
|
Operations |
|
|
Net investment income (loss) | $ 410,785,775 | $ 283,086,353 |
Net realized gain (loss) | (14,214,095) | (79,042,694) |
Change in net unrealized appreciation (depreciation) | 1,674,640,181 | 690,009,936 |
Net increase (decrease) in net assets resulting from operations | 2,071,211,861 | 894,053,595 |
Distributions to shareholders from net investment income | (295,551,780) | (263,200,177) |
Distributions to shareholders from net realized gain | (11,664,541) | (10,605,696) |
Total distributions | (307,216,321) | (273,805,873) |
Share transactions - net increase (decrease) | 1,293,577,160 | 690,478,893 |
Redemption fees | 896,226 | 579,443 |
Total increase (decrease) in net assets | 3,058,468,926 | 1,311,306,058 |
|
|
|
Net Assets | ||
Beginning of period | 10,030,906,025 | 8,719,599,967 |
End of period (including undistributed net investment income of $87,257,584 and undistributed net investment income of $9,035,338, respectively) | $ 13,089,374,951 | $ 10,030,906,025 |
See accompanying notes which are an integral part of the financial statements.
Annual Report
Financial Highlights - Investor Class
Years ended February 28, | 2014 | 2013 | 2012 G | 2011 | 2010 |
Selected Per-Share Data |
|
|
|
|
|
Net asset value, beginning of period | $ 35.31 | $ 33.06 | $ 37.29 | $ 31.74 | $ 20.85 |
Income from Investment Operations |
|
|
|
|
|
Net investment income (loss) B | 1.35 E | 1.03 | 1.19 | .94 | .82 |
Net realized and unrealized gain (loss) | 5.53 | 2.23 | (4.28) | 5.45 | 10.93 |
Total from investment operations | 6.88 | 3.26 | (3.09) | 6.39 | 11.75 |
Distributions from net investment income | (.96) | (.97) | (1.12) | (.81) | (.74) |
Distributions from net realized gain | (.04) | (.04) | (.02) | (.03) | (.12) |
Total distributions | (1.00) | (1.01) | (1.14) | (.84) | (.86) |
Redemption fees added to paid in capital B, H | - | - | - | - | - |
Net asset value, end of period | $ 41.19 | $ 35.31 | $ 33.06 | $ 37.29 | $ 31.74 |
Total Return A | 19.66% | 10.01% | (7.92)% | 20.34% | 56.36% |
Ratios to Average Net Assets C, F |
|
|
|
|
|
Expenses before reductions | .20% | .20% | .20% | .20% | .20% |
Expenses net of fee waivers, if any | .20% | .20% | .11% | .10% | .10% |
Expenses net of all reductions | .20% | .20% | .11% | .10% | .10% |
Net investment income (loss) | 3.52% E | 3.16% | 3.54% | 2.84% | 2.72% |
Supplemental Data |
|
|
|
|
|
Net assets, end of period (000 omitted) | $ 2,640,165 | $ 2,282,743 | $ 3,424,239 | $ 6,932,647 | $ 5,488,131 |
Portfolio turnover rate D | 2% | 1% | 9% | 1% | 2% |
ATotal returns would have been lower if certain expenses had not been reduced during the applicable periods shown. BCalculated based on average shares outstanding during the period. CFees and expenses of any underlying Fidelity Central Funds are not included in the Fund's expense ratio. The Fund indirectly bears its proportionate share of the expenses of any underlying Fidelity Central Funds. DAmount does not include the portfolio activity of any underlying Fidelity Central Funds. EInvestment income per share reflects a large, non-recurring dividend which amounted to $.27 per share. Excluding this non-recurring dividend, the ratio of net investment income (loss) to average net assets would have been 2.82%. FExpense ratios reflect operating expenses of the class. Expenses before reductions do not reflect amounts reimbursed by the investment adviser or reductions from expense offset arrangements and do not represent the amount paid by the class during periods when reimbursements or reductions occur. Expenses net of fee waivers reflect expenses after reimbursement by the investment adviser but prior to reductions from expense offset arrangements. Expenses net of all reductions represent the net expenses paid by the class. GFor the year ended February 29. HAmount represents less than $.01 per share. |
Financial Highlights - Fidelity Advantage Class
Years ended February 28, | 2014 | 2013 | 2012 G | 2011 | 2010 |
Selected Per-Share Data |
|
|
|
|
|
Net asset value, beginning of period | $ 35.31 | $ 33.07 | $ 37.29 | $ 31.74 | $ 20.85 |
Income from Investment Operations |
|
|
|
|
|
Net investment income (loss) B | 1.38 E | 1.06 | 1.20 | .96 | .83 |
Net realized and unrealized gain (loss) | 5.54 | 2.22 | (4.28) | 5.44 | 10.93 |
Total from investment operations | 6.92 | 3.28 | (3.08) | 6.40 | 11.76 |
Distributions from net investment income | (.99) | (1.00) | (1.12) | (.82) | (.75) |
Distributions from net realized gain | (.04) | (.04) | (.02) | (.03) | (.12) |
Total distributions | (1.03) | (1.04) | (1.14) | (.85) | (.87) |
Redemption fees added to paid in capital B, H | - | - | - | - | - |
Net asset value, end of period | $ 41.20 | $ 35.31 | $ 33.07 | $ 37.29 | $ 31.74 |
Total Return A | 19.79% | 10.07% | (7.87)% | 20.38% | 56.40% |
Ratios to Average Net Assets C, F |
|
|
|
|
|
Expenses before reductions | .17% | .17% | .17% | .17% | .17% |
Expenses net of fee waivers, if any | .12% | .12% | .07% | .07% | .07% |
Expenses net of all reductions | .12% | .12% | .07% | .07% | .07% |
Net investment income (loss) | 3.60% E | 3.24% | 3.57% | 2.87% | 2.75% |
Supplemental Data |
|
|
|
|
|
Net assets, end of period (000 omitted) | $ 7,201,814 | $ 5,322,884 | $ 3,476,600 | $ 3,062,970 | $ 2,178,395 |
Portfolio turnover rate D | 2% | 1% | 9% | 1% | 2% |
ATotal returns would have been lower if certain expenses had not been reduced during the applicable periods shown. BCalculated based on average shares outstanding during the period. CFees and expenses of any underlying Fidelity Central Funds are not included in the Fund's expense ratio. The Fund indirectly bears its proportionate share of the expenses of any underlying Fidelity Central Funds. DAmount does not include the portfolio activity of any underlying Fidelity Central Funds. EInvestment income per share reflects a large, non-recurring dividend which amounted to $.27 per share. Excluding this non-recurring dividend, the ratio of net investment income (loss) to average net assets would have been 2.90%. FExpense ratios reflect operating expenses of the class. Expenses before reductions do not reflect amounts reimbursed by the investment adviser or reductions from expense offset arrangements and do not represent the amount paid by the class during periods when reimbursements or reductions occur. Expenses net of fee waivers reflect expenses after reimbursement by the investment adviser but prior to reductions from expense offset arrangements. Expenses net of all reductions represent the net expenses paid by the class. GFor the year ended February 29. HAmount represents less than $.01 per share. |
See accompanying notes which are an integral part of the financial statements.
Annual Report
Financial Highlights - Institutional Class
Years ended February 28, | 2014 | 2013 | 2012 H,J |
Selected Per-Share Data |
|
|
|
Net asset value, beginning of period | $ 35.31 | $ 33.07 | $ 31.29 |
Income from Investment Operations |
|
|
|
Net investment income (loss) D | 1.40 G | 1.07 | .32 |
Net realized and unrealized gain (loss) | 5.54 | 2.22 | 2.48 |
Total from investment operations | 6.94 | 3.29 | 2.80 |
Distributions from net investment income | (1.01) | (1.01) | (1.02) |
Distributions from net realized gain | (.04) | (.04) | - |
Total distributions | (1.05) | (1.05) | (1.02) |
Redemption fees added to paid in capital D, K | - | - | - |
Net asset value, end of period | $ 41.20 | $ 35.31 | $ 33.07 |
Total Return B, C | 19.85% | 10.12% | 9.44% |
Ratios to Average Net Assets E, I |
|
|
|
Expenses before reductions | .10% M | .10% M | .10% A, M |
Expenses net of fee waivers, if any | .07% | .07% | .07% A |
Expenses net of all reductions | .07% | .07% | .07% A |
Net investment income (loss) | 3.65% G | 3.29% | 2.19% A |
Supplemental Data |
|
|
|
Net assets, end of period (000 omitted) | $ 1,595,562 | $ 1,269,545 | $ 860,659 |
Portfolio turnover rate F | 2% | 1% | 9% L |
AAnnualized BTotal returns for periods of less than one year are not annualized. CTotal returns would have been lower if certain expenses had not been reduced during the applicable periods shown. DCalculated based on average shares outstanding during the period. EFees and expenses of any underlying Fidelity Central Funds are not included in the Fund's expense ratio. The Fund indirectly bears its proportionate share of the expenses of any underlying Fidelity Central Funds. FAmount does not include the portfolio activity of any underlying Fidelity Central Funds. GInvestment income per share reflects a large, non-recurring dividend which amounted to $.27 per share. Excluding this non-recurring dividend, the ratio of net investment income (loss) to average net assets would have been 2.95%. HFor the period September 8, 2011 (commencement of sale of shares) to February 29, 2012. IExpense ratios reflect operating expenses of the class. Expenses before reductions do not reflect amounts reimbursed by the investment adviser or reductions from expense offset arrangements and do not represent the amount paid by the class during periods when reimbursements or reductions occur. Expenses net of fee waivers reflect expenses after reimbursement by the investment adviser but prior to reductions from expense offset arrangements. Expenses net of all reductions represent the net expenses paid by the class. JFor the year ended February 29. KAmount represents less than $.01 per share. LAmount not annualized. MAmount represents .095%. |
Financial Highlights - Fidelity Advantage Institutional Class
Years ended February 28, | 2014 | 2013 | 2012 H,J |
Selected Per-Share Data |
|
|
|
Net asset value, beginning of period | $ 35.31 | $ 33.07 | $ 31.29 |
Income from Investment Operations |
|
|
|
Net investment income (loss) D | 1.41 G | 1.08 | .32 |
Net realized and unrealized gain (loss) | 5.53 | 2.22 | 2.48 |
Total from investment operations | 6.94 | 3.30 | 2.80 |
Distributions from net investment income | (1.01) | (1.02) | (1.02) |
Distributions from net realized gain | (.04) | (.04) | - |
Total distributions | (1.05) | (1.06) | (1.02) |
Redemption fees added to paid in capital D, K | - | - | - |
Net asset value, end of period | $ 41.20 | $ 35.31 | $ 33.07 |
Total Return B, C | 19.86% | 10.13% | 9.45% |
Ratios to Average Net Assets E, I |
|
|
|
Expenses before reductions | .08% M | .08% M | .08% A, M |
Expenses net of fee waivers, if any | .06% | .06% | .06% A |
Expenses net of all reductions | .06% | .06% | .06% A |
Net investment income (loss) | 3.66% G | 3.30% | 2.17% A |
Supplemental Data |
|
|
|
Net assets, end of period (000 omitted) | $ 1,651,834 | $ 1,155,733 | $ 958,101 |
Portfolio turnover rate F | 2% | 1% | 9% L |
AAnnualized BTotal returns for periods of less than one year are not annualized. CTotal returns would have been lower if certain expenses had not been reduced during the applicable periods shown. DCalculated based on average shares outstanding during the period. EFees and expenses of any underlying Fidelity Central Funds are not included in the Fund's expense ratio. The Fund indirectly bears its proportionate share of the expenses of any underlying Fidelity Central Funds. FAmount does not include the portfolio activity of any underlying Fidelity Central Funds. GInvestment income per share reflects a large, non-recurring dividend which amounted to $.27 per share. Excluding this non-recurring dividend, the ratio of net investment income (loss) to average net assets would have been 2.96%. HFor the period September 8, 2011 (commencement of sale of shares) to February 29, 2012. IExpense ratios reflect operating expenses of the class. Expenses before reductions do not reflect amounts reimbursed by the investment adviser or reductions from expense offset arrangements and do not represent the amount paid by the class during periods when reimbursements or reductions occur. Expenses net of fee waivers reflect expenses after reimbursement by the investment adviser but prior to reductions from expense offset arrangements. Expenses net of all reductions represent the net expenses paid by the class. JFor the year ended February 29. KAmount represents less than $.01 per share. LAmount not annualized. MAmount represents .075%. |
See accompanying notes which are an integral part of the financial statements.
Annual Report
Notes to Financial Statements
For the period ended February 28, 2014
1. Organization.
Spartan Extended Market Index Fund and Spartan International Index Fund (the Funds) are funds of Fidelity Concord Street Trust (the Trust). The Trust is registered under the Investment Company Act of 1940, as amended (the 1940 Act), as an open-end management investment company organized as a Massachusetts business trust. Each Fund is authorized to issue an unlimited number of shares. Spartan Extended Market Index Fund offers Investor Class, Fidelity Advantage Class and Fidelity Advantage Institutional Class shares. Spartan International Index Fund offers Investor Class, Fidelity Advantage Class, Institutional Class and Fidelity Advantage Institutional Class shares. Each class has exclusive voting rights with respect to matters that affect that class. Each Fund offers conversion privileges between share classes within each Fund to eligible shareholders.
2. Investments in Fidelity Central Funds.
The Funds invests in Fidelity Central Funds, which are open-end investment companies generally available only to other investment companies and accounts managed by the investment adviser and its affiliates. The Funds' Schedules of Investments list each of the Fidelity Central Funds held as of period end, if any, as an investment of each Fund, but do not include the underlying holdings of each Fidelity Central Fund. As an Investing Fund, each Fund indirectly bears its proportionate share of the expenses of the underlying Fidelity Central Funds.
The Money Market Central Funds seek preservation of capital and current income and are managed by Fidelity Investments Money Management, Inc. (FIMM), an affiliate of the investment adviser. Annualized expenses of the Money Market Central Funds as of their most recent shareholder report date are less than .01%.
A complete unaudited list of holdings for each Fidelity Central Fund is available upon request or at the Securities and Exchange Commission (the SEC) website at www.sec.gov. In addition, the financial statements of the Fidelity Central Funds, which are not covered by the Funds' Report of Independent Registered Public Accounting Firm, are available on the SEC website or upon request.
3. Significant Accounting Policies.
The financial statements have been prepared in conformity with accounting principles generally accepted in the United States of America (GAAP), which require management to make certain estimates and assumptions at the date of the financial statements. Actual results could differ from those estimates. Subsequent events, if any, through the date that the financial statements were issued have been evaluated in the preparation of the financial statements. The following summarizes the significant accounting policies of the Funds:
Investment Valuation. Investments are valued as of 4:00 p.m. Eastern time on the last calendar day of the period. In accordance with valuation policies and procedures approved by the Board of Trustees (the Board), each Fund attempts to obtain prices from one or more third party pricing vendors or brokers to value its investments. When current market prices, quotations or currency exchange rates are not readily available or reliable, investments will be fair valued in good faith by the Fidelity Management & Research Company (FMR) Fair Value Committee (the Committee), in accordance with procedures adopted by the Board. Factors used in determining fair value vary by investment type and may include market or investment specific events, changes in interest rates and credit quality. The frequency with which these procedures are used cannot be predicted and they may be utilized to a significant extent. The Committee oversees each Fund's valuation policies and procedures and is responsible for approving and reporting to the Board all fair value determinations.
Each Fund categorizes the inputs to valuation techniques used to value their investments into a disclosure hierarchy consisting of three levels as shown below:
Level 1 - quoted prices in active markets for identical investments
Level 2 - other significant observable inputs (including quoted prices for similar investments, interest rates, prepayment speeds, etc.)
Level 3 - unobservable inputs (including the Fund's own assumptions based on the best information available)
Valuation techniques used to value each Fund's investments by major category are as follows:
Equity securities, including restricted securities, for which market quotations are readily available, are valued at the last reported sale price or official closing price as reported by a third party pricing vendor on the primary market or exchange on which they are traded and are categorized as Level 1 in the hierarchy. In the event there were no sales during the day or closing prices are not available, securities are valued at the last quoted bid price or may be valued using the last available price and are generally categorized as Level 2 in the hierarchy. For foreign equity securities, when market or security specific events arise, comparisons to the valuation of American Depositary Receipts (ADRs), futures contracts, Exchange-Traded Funds (ETFs) and certain indexes as well as quoted prices for similar securities may be used and would be categorized as Level 2 in the hierarchy. Utilizing these techniques may result in transfers between Level 1 and Level 2. For equity securities, including restricted securities, where observable inputs are limited, assumptions about market activity and risk are used and these securities may be categorized as Level 3 in the hierarchy.
Annual Report
Notes to Financial Statements - continued
3. Significant Accounting Policies - continued
Investment Valuation - continued
Debt securities, including restricted securities, are valued based on evaluated prices received from third party pricing vendors or from brokers who make markets in such securities. U.S. government and government agency obligations are valued by pricing vendors who utilize matrix pricing which considers yield or price of bonds of comparable quality, coupon, maturity and type or by broker-supplied prices. When independent prices are unavailable or unreliable, debt securities may be valued utilizing pricing methodologies which consider similar factors that would be used by third party pricing vendors. Debt securities are generally categorized as Level 2 in the hierarchy but may be Level 3 depending on the circumstances.
The U.S. dollar value of foreign currency contracts is determined using currency exchange rates supplied by a pricing service and are categorized as Level 2 in the hierarchy. Futures contracts are valued at the settlement price established each day by the board of trade or exchange on which they are traded and are categorized as Level 1 in the hierarchy. Investments in open-end mutual funds, including the Fidelity Central Funds, are valued at their closing net asset value (NAV) each business day and are categorized as Level 1 in the hierarchy.
Changes in valuation techniques may result in transfers in or out of an assigned level within the disclosure hierarchy. The aggregate value of investments by input level, as of February 28, 2014, including information on transfers between Levels 1 and 2, is included at the end of each applicable Fund's Schedule of Investments.
Foreign Currency. Foreign-denominated assets, including investment securities, and liabilities are translated into U.S. dollars at the exchange rates at period end. Purchases and sales of investment securities, income and dividends received and expenses denominated in foreign currencies are translated into U.S. dollars at the exchange rate in effect on the transaction date.
The effects of exchange rate fluctuations on investments are included with the net realized and unrealized gain (loss) on investment securities. Other foreign currency transactions resulting in realized and unrealized gain (loss) are disclosed separately.
Realized gains and losses on foreign currency transactions arise from the disposition of foreign currency, closed foreign currency contracts, realized changes in the value of foreign currency between the trade and settlement dates on security transactions, and the difference between the amounts of dividends, interest and foreign withholding taxes recorded on transaction date and the U.S. dollar equivalent of the amounts actually received or paid. Unrealized gains and losses on assets and liabilities in foreign currencies arise from changes in the value of foreign currency including foreign currency contracts, and from assets and liabilities denominated in foreign currencies, other than investments, which are held at period end.
Investment Transactions and Income. For financial reporting purposes, the Funds' investment holdings and NAV include trades executed through the end of the last business day of the period. The NAV per share for processing shareholder transactions is calculated as of the close of business of the New York Stock Exchange (NYSE), normally 4:00 p.m. Eastern time and includes trades executed through the end of the prior business day. Gains and losses on securities sold are determined on the basis of identified cost and may include proceeds received from litigation. Dividend income is recorded on the ex-dividend date, except for certain dividends from foreign securities where the ex-dividend date may have passed, which are recorded as soon as the Funds are informed of the ex-dividend date. Non-cash dividends included in dividend income, if any, are recorded at the fair market value of the securities received. Distributions received on securities that represent a return of capital or capital gain are recorded as a reduction of cost of investments and/or as a realized gain. Subsequent to ex-dividend date the Funds determine the components of these distributions, based upon receipt of tax filings or other correspondence relating to the underlying investment. Interest income and distributions from the Fidelity Central Funds are accrued as earned. Interest income includes coupon interest and amortization of premium and accretion of discount on debt securities. Investment income is recorded net of foreign taxes withheld where recovery of such taxes is uncertain. Large, non-recurring dividends recognized by the Funds are presented separately on the Statement of Operations as "Special Dividends" and the impact of these dividends is presented in the Financial Highlights. Interest income and distributions from the Fidelity Central Funds are accrued as earned. Interest income includes coupon interest and amortization of premium and accretion of discount on debt securities. Investment income is recorded net of foreign taxes withheld where recovery of such taxes is uncertain.
Class Allocations and Expenses. Investment income, realized and unrealized capital gains and losses, common expenses of each Fund, and certain fund-level expense reductions, if any, are allocated daily on a pro-rata basis to each class based on the relative net assets of each class to the total net assets of each Fund. Each class differs with respect to transfer agent fees incurred. Certain expense reductions may also differ by class. For the reporting period, the allocated portion of income and expenses to each class as a percent of its average net assets may vary due to the timing of recording these transactions in relation to fluctuating net assets of the classes. Expenses directly attributable to a fund are charged to that fund. Expenses attributable to more than one fund are allocated among the respective funds on the basis of relative net assets or other appropriate methods. Expense estimates are accrued in the period to which they relate and adjustments are made when actual amounts are known.
Annual Report
3. Significant Accounting Policies - continued
Income Tax Information and Distributions to Shareholders. Each year, each Fund intends to qualify as a regulated investment company under Subchapter M of the Internal Revenue Code, including distributing substantially all of its taxable income and realized gains. As a result, no provision for U.S. Federal income taxes is required. As of February 28, 2014, each Fund did not have any unrecognized tax benefits in the financial statements; nor is each Fund aware of any tax positions for which it is reasonably possible that the total amounts of unrecognized tax benefits will significantly change in the next twelve months. Each Fund files a U.S. federal tax return, in addition to state and local tax returns as required. The Fund's federal income tax returns are subject to examination by the Internal Revenue Service (IRS) for a period of three fiscal years after they are filed. State and local tax returns may be subject to examination for an additional fiscal year depending on the jurisdiction. Foreign taxes are provided for based on each Fund's understanding of the tax rules and rates that exist in the foreign markets in which it invests.
Distributions are declared and recorded on the ex-dividend date. Income dividends and capital gain distributions are declared separately for each class. Income and capital gain distributions are determined in accordance with income tax regulations, which may differ from GAAP. In addition, the Funds claimed a portion of the payment made to redeeming shareholders as a distribution for income tax purposes.
Capital accounts within the financial statements are adjusted for permanent book-tax differences. These adjustments have no impact on net assets or the results of operations. Capital accounts are not adjusted for temporary book-tax differences which will reverse in a subsequent period.
Book-tax differences are primarily due to futures contracts, foreign currency transactions, passive foreign investment companies (PFIC), market discount, redemptions in kind, capital loss carryforwards and losses deferred due to wash sales and excise tax regulations.
The federal tax cost of investment securities and unrealized appreciation (depreciation) as of period end were as follows for each Fund:
| Tax cost | Gross unrealized | Gross unrealized | Net unrealized |
Spartan Extended Market Index | $ 12,362,212,608 | $ 4,811,646,787 | $ (763,957,523) | $ 4,047,689,264 |
Spartan International Index | 11,728,086,520 | 3,118,649,486 | (1,549,923,890) | 1,568,725,596 |
The tax-based components of distributable earnings as of period end were as follows for each Fund:
| Undistributed | Undistributed | Capital loss | Net unrealized |
Spartan Extended Market Index | $ 79,696,068 | $ 140,813,422 | $ - | $ 4,047,689,264 |
Spartan International Index | 88,793,896 | - | (591,421,265) | 1,572,472,329 |
Capital loss carryforwards are only available to offset future capital gains of the Funds to the extent provided by regulations and may be limited. Under the Regulated Investment Company Modernization Act of 2010 (the Act), the Funds are permitted to carry forward capital losses incurred in taxable years beginning after December 22, 2010 for an unlimited period and such capital losses are required to be used prior to any losses that expire. The capital loss carryforward information presented below, including any applicable limitation, is estimated as of fiscal period end and is subject to adjustment.
| Fiscal year of |
| ||
| 2017 | 2018 | 2019 | Total with |
Spartan International Index | $ (119,933,607) | $ (148,608,684) | $ (49,793,394) | $ (318,335,685) |
| No expiration |
|
| |
| Short-term | Long-term | Total no | Total capital loss |
Spartan International Index | $ - | $ (273,085,580) | $ (273,085,580) | $ (591,421,265) |
Certain of the Funds intends to elect to defer to the next fiscal year capital losses recognized during the period November 1, 2013 to February 28, 2014. Loss deferrals were as follows:
| Capital losses |
Spartan International Index | $ (10,653,905) |
Annual Report
Notes to Financial Statements - continued
3. Significant Accounting Policies - continued
Income Tax Information and Distributions to Shareholders - continued
The tax character of distributions paid was as follows:
February 28, 2014 |
|
|
|
| Ordinary Income | Long-term | Total |
Spartan Extended Market Index | $ 164,440,567 | $ 210,951,340 | $ 375,391,907 |
Spartan International Index | 307,216,321 | - | 307,216,321 |
February 28, 2013 |
|
|
|
| Ordinary Income | Long-term | Total |
Spartan Extended Market Index | $ 123,000,708 | $ 200,713,554 | $ 323,714,262 |
Spartan International Index | 273,805,873 | - | 273,805,873 |
Short-Term Trading (Redemption) Fees. Shares held by investors in the Funds less than 90 days may be subject to a redemption fee equal to ..75% and 1.00% of the net asset value of shares redeemed from Spartan Extended Market Index and Spartan International Index, respectively. All redemption fees, which reduce the proceeds of the shareholder redemption, are retained by the Funds and accounted for as an addition to paid in capital.
Delayed Delivery Transactions and When-Issued Securities. During the period, the Funds transacted in securities on a delayed delivery or when-issued basis. Payment and delivery may take place after the customary settlement period for that security. The price of the underlying securities and the date when the securities will be delivered and paid for are fixed at the time the transaction is negotiated. The securities purchased on a delayed delivery or when-issued basis are identified as such in each applicable Fund's Schedule of Investments. With respect to purchase commitments, each applicable Fund identifies securities as segregated in its records with a value at least equal to the amount of the commitment. Losses may arise due to changes in the value of the underlying securities or if the counterparty does not perform under the contract's terms, or if the issuer does not issue the securities due to political, economic, or other factors.
4. Derivative Instruments.
Risk Exposures and the Use of Derivative Instruments. The Funds' investment objective allows the Funds to enter into various types of derivative contracts, including futures contracts and forward foreign currency contracts. Derivatives are investments whose value is primarily derived from underlying assets, indices or reference rates and may be transacted on an exchange or over-the-counter (OTC). Derivatives may involve a future commitment to buy or sell a specified asset based on specified terms, to exchange future cash flows at periodic intervals based on a notional principal amount, or for one party to make one or more payments upon the occurrence of specified events in exchange for periodic payments from the other party.
The Funds used derivatives to increase returns and to manage exposure to certain risks as defined below. The success of any strategy involving derivatives depends on analysis of numerous economic factors, and if the strategies for investment do not work as intended, the Funds may not achieve their objectives.
The Funds' use of derivatives increased or decreased their exposure to the following risks:
Equity Risk | Equity risk relates to the fluctuations in the value of financial instruments as a result of changes in market prices (other than those arising from interest rate risk or foreign exchange risk), whether caused by factors specific to an individual investment, its issuer, or all factors affecting all instruments traded in a market or market segment. |
Foreign Exchange Risk | Foreign exchange rate risk relates to fluctuations in the value of an asset or liability due to changes in currency exchange rates. |
The Funds are also exposed to additional risks from investing in derivatives, such as liquidity risk and counterparty credit risk. Liquidity risk is the risk that the Funds will be unable to close out the derivative in the open market in a timely manner. Counterparty credit risk is the risk that the counterparty will not be able to fulfill its obligation to the Funds. Derivative counterparty credit risk is managed through formal evaluation of the creditworthiness of all potential counterparties. On certain OTC derivatives such as forward foreign currency contracts, the Funds attempt to reduce their exposure to counterparty credit risk by entering into an International Swaps and Derivatives Association, Inc. (ISDA) Master Agreement with each of its counterparties. The ISDA Master Agreement gives the Funds the right to terminate all transactions traded under such agreement upon the deterioration in the credit quality of the counterparty beyond specified levels. The ISDA Master Agreement gives each party the right, upon an event of default by the other party or a termination of the agreement, to close out all transactions traded under such agreement and to net amounts owed under each transaction to one net payable by one party to the other. To mitigate counterparty credit risk on bi-lateral OTC derivatives, the Funds receive collateral in the form of cash or securities once the Fund's net unrealized appreciation on outstanding derivative contracts under an ISDA Master Agreement exceeds
Annual Report
4. Derivative Instruments - continued
Risk Exposures and the Use of Derivative Instruments - continued
certain applicable thresholds, subject to certain minimum transfer provisions. The collateral received is held in segregated accounts with the Funds' custodian bank in accordance with the collateral agreements entered into between the Funds, the counterparty and the Funds' custodian bank. The Funds could experience delays and costs in gaining access to the collateral even though it is held by the Funds' custodian bank. The Funds' maximum risk of loss from counterparty credit risk related to bi-lateral OTC derivatives is generally the aggregate unrealized appreciation and unpaid counterparty payments in excess of any collateral pledged by the counterparty to the Funds. The Fund may be required to pledge collateral for the benefit of the counterparties on bi-lateral OTC derivatives in an amount not less than each counterparty's unrealized appreciation on outstanding derivative contracts, subject to certain minimum transfer provisions, and any such pledged collateral is identified in the Schedule of Investments. Exchange-traded futures contracts are not covered by the ISDA Master Agreement; however counterparty credit risk related to exchange-traded futures contracts may be mitigated by the protection provided by the exchange on which they trade.
Investing in derivatives may involve greater risks than investing in the underlying assets directly and, to varying degrees, may involve risk of loss in excess of any initial investment and collateral received and amounts recognized in the Statement of Assets and Liabilities. In addition, there may be the risk that the change in value of the derivative contract does not correspond to the change in value of the underlying instrument.
Net Realized Gain (Loss) and Change in Net Unrealized Appreciation (Depreciation) on Derivatives. The table below, which reflects the impacts of derivatives on the financial performance of the Funds, summarizes the net realized gain (loss) and change in net unrealized appreciation (depreciation) for derivatives during the period as presented in the Statement of Operations.
Primary Risk Exposure / Derivative Type | Net Realized Gain (Loss) | Change in Net Unrealized Appreciation (Depreciation) |
Spartan Extended Market Index |
|
|
Equity Risk |
|
|
Futures Contracts | $ 29,980,279 | $ 3,578,730 |
Totals (a) | $ 29,980,279 | $ 3,578,730 |
Spartan International Index |
|
|
Equity Risk |
|
|
Futures Contracts | $ 31,776,987 | $ 1,009,614 |
Foreign Exchange Risk |
|
|
Forward Foreign Currency Contracts | (11,555,091) | 10,552,889 |
Totals (a) | $ 20,221,896 | $ 11,562,503 |
(a) A summary of the value of derivatives by primary risk exposure as of period end is included at the end of the Schedule of Investments.
Forward Foreign Currency Contracts. Forward foreign currency contracts represent obligations to purchase or sell foreign currency on a specified future date at a price fixed at the time the contracts are entered into. Spartan International Index Fund used forward foreign currency contracts to facilitate transactions in foreign-denominated securities and to manage exposure to certain foreign currencies.
Forward foreign currency contracts are valued daily and fluctuations in exchange rates on open contracts are recorded as unrealized appreciation or (depreciation) and reflected in the Statement of Assets and Liabilities. When the contract is closed, the Fund realizes a gain or loss equal to the difference between the closing value and the value at the time it was opened. The net realized gain (loss) and change in net unrealized appreciation (depreciation) on forward foreign currency contracts during the period is included in the Statement of Operations as part of net realized gain (loss) on foreign currency transactions and change in unrealized gain (loss) on assets and liabilities in foreign currencies, respectively.
Any open forward foreign currency contracts at period end are presented in the Schedule of Investments under the caption "Forward foreign Currency Contracts." The contract amount and unrealized appreciation (depreciation) reflects each contract's exposure to the underlying currency at period end and is representative of volume of activity during the period.
Futures Contracts. A futures contract is an agreement between two parties to buy or sell a specified underlying instrument for a fixed price at a specified future date. The Funds used futures contracts to manage their exposure to the stock market and to fluctuations in currency values.
Upon entering into a futures contract, a fund is required to deposit either cash or securities (initial margin) with a clearing broker in an amount equal to a certain percentage of the face value of the contract. Futures contracts are marked-to-market daily and subsequent daily payments are made or received by a fund depending on the daily fluctuations in the value of the futures contracts and are recorded as unrealized appreciation or (depreciation). This receivable and/or payable, if any, is included in daily variation margin for derivative instruments in the Statement of Assets and Liabilities. Realized gain or (loss) is recorded upon the expiration or closing of a futures contract.
Any open futures contracts at period end are presented in the Schedule of Investments under the caption "Futures Contracts." The underlying face amount at value reflects each contract's exposure to the underlying instrument or index at period end and is representative of volume of activity during
Annual Report
Notes to Financial Statements - continued
4. Derivative Instruments - continued
Futures Contracts - continued
the period. Securities deposited to meet initial margin requirements are identified in the Schedule of Investments. Cash deposited to meet initial margin requirements is presented as segregated cash with brokers for derivative instruments in the Statement of Assets and Liabilities.
5. Purchases and Sales of Investments.
Purchases and sales of securities, other than short-term securities, are noted in the table below.
| Purchases ($) | Sales ($) |
Spartan Extended Market Index | 4,550,928,346 | 1,472,651,780 |
Spartan International Index | 1,561,385,444 | 201,077,200 |
Spartan International Index delivered securities in-kind through redemptions totaling $36,573,220. Realized gain (loss) of $18,270,945 on securities delivered in-kind through redemptions is included in the accompanying Statement of Operations as realized gain or loss on investment securities and is not taxable to the Fund.
6. Fees and Other Transactions with Affiliates.
Management Fee and Expense Contract. Fidelity Management & Research Company (the investment adviser) and its affiliates provide the Funds with investment management related services for which the Funds pay a monthly management fee. The management fee is based on an annual rate of .06% for each Fund's average net assets. Under the management contract, the investment adviser pays all other fund-level expenses, except the compensation of the independent Trustees and certain other expenses such as interest expense, including commitment fees.
In addition, under an expense contract, the investment adviser pays class-level expenses as necessary so that the total expenses do not exceed certain amounts of each class' average net assets on an annual basis with certain exceptions, as noted in the following table:
| Investor Class | Advantage Class | Institutional Class | Fidelity Advantage Institutional Class |
Spartan Extended Market Index Fund | .10% | .07% | n/a | .07% |
Spartan International Index Fund | .20% | .17% | .095% | .075% |
Sub-Adviser. Geode Capital Management, LLC (Geode), serves as sub-adviser for the Funds. Geode provides discretionary investment advisory services to the Funds and is paid by the investment adviser for providing these services.
Transfer Agent Fees. Fidelity Investments Institutional Operations Company, Inc. (FIIOC), an affiliate of the investment adviser, is the transfer, dividend disbursing and shareholder servicing agent for each class of the Funds. FIIOC receives transfer agent fees at annual rates based on average net assets noted in the table below. FIIOC pays for typesetting, printing and mailing of shareholder reports, except proxy statements. Under the expense contract, each class pays all or a portion of the transfer agent fees at an annual rate based on average net assets as noted in the following table:
| Received by FIIOC | Paid by Class |
Spartan Extended Market Index |
|
|
Investor Class | .075% | .04% |
Fidelity Advantage Class | .045% | .01% |
Fidelity Advantage Institutional Class | .015% | .01% |
Spartan International Index |
|
|
Investor Class | .21% | .14% |
Fidelity Advantage Class | .11% | .11% |
Institutional Class | .035% | .035% |
Fidelity Advantage Institutional Class | .015% | .015% |
Annual Report
6. Fees and Other Transactions with Affiliates - continued
Transfer Agent Fees - continued
For the period, the total transfer agent fees paid by each applicable class were as follows:
| Amount |
Spartan Extended Market Index |
|
Investor Class | $ 553,811 |
Fidelity Advantage Class | 961,911 |
Fidelity Advantage Institutional Class | 3,176 |
| $ 1,518,898 |
Spartan International Index |
|
Investor Class | $ 3,402,037 |
Fidelity Advantage Class | 6,743,178 |
Institutional Class | 502,635 |
Fidelity Advantage Institutional Class | 212,649 |
| $ 10,860,499 |
Interfund Lending Program. Pursuant to an Exemptive Order issued by the SEC, the Funds, along with other registered investment companies having management contracts with FMR or other affiliated entities of FMR, may participate in an interfund lending program. This program provides an alternative credit facility allowing the funds to borrow from, or lend money to, other participating affiliated funds. At period end, there were no interfund loans outstanding. Each applicable fund's activity in this program during the period for which loans were outstanding was as follows:
| Borrower or | Average Loan | Weighted Average Interest Rate | Interest Expense |
Spartan International Index | Borrower | $ 19,347,857 | .31% | $ 1,184 |
7. Committed Line of Credit.
Certain Funds participate with other funds managed by the investment adviser or an affiliate in a $4.25 billion credit facility (the "line of credit") to be utilized for temporary or emergency purposes to fund shareholder redemptions or for other short-term liquidity purposes. The participating funds have agreed to pay commitment fees on their pro-rata portion of the line of credit, which are reflected in Miscellaneous expenses on the Statement of Operations, and are as follows:
Spartan Extended Market Index | $ 19,487 |
Spartan International Index | 21,554 |
During the period, there were no borrowings on this line of credit.
8. Security Lending.
Certain Funds lend portfolio securities through a lending agent from time to time in order to earn additional income. On the settlement date of the loan, each applicable Fund receives collateral (in the form of U.S. Treasury obligations, letters of credit and/or cash) against the loaned securities and maintains collateral in an amount not less than 100% of the market value of the loaned securities during the period of the loan. The market value of the loaned securities is determined at the close of business of the Funds and any additional required collateral is delivered to the Funds on the next business day. If the borrower defaults on its obligation to return the securities loaned because of insolvency or other reasons, the Funds may apply collateral received from the borrower against the obligation. The Funds may experience delays and costs in recovering the securities loaned. Any cash collateral received is invested in the Fidelity Securities Lending Cash Central Fund. The value of loaned securities and cash collateral at period end are disclosed on each applicable Fund's Statement of Assets and Liabilities. Security lending income represents the income earned on investing cash collateral, less rebates paid to borrowers and any lending agent fees associated with the loan, plus any premium payments received for lending certain types of securities. Security lending income is presented on each applicable Fund's Statement of Operations as a component of income from Fidelity Central Funds.
Annual Report
Notes to Financial Statements - continued
9. Expense Reductions.
The investment adviser contractually agreed to reimburse certain classes to the extent annual operating expenses exceeded certain levels of average net assets as noted in the table below. This reimbursement will remain in place through April 30, 2015. Some expenses, for example interest expense, including commitment fees, are excluded from these reimbursements. Total reimbursements are included in the following table:
| Expense | Reimbursement |
Spartan Extended Market Index |
|
|
Fidelity Advantage Institutional Class | .06% | $ 4,062 |
Spartan International Index |
|
|
Fidelity Advantage Class | .12% | 3,106,055 |
Institutional Class | .07% | 366,676 |
Fidelity Advantage Institutional Class | .06% | 220,515 |
In addition, the investment adviser reimbursed a portion of each Fund's operating expenses during the period as follows:
| Reimbursement |
Spartan Extended Market Index | $ 5,701 |
Spartan International Index | 5,544 |
Through arrangements with each applicable Fund's custodian, credits realized as a result of uninvested cash balances were used to reduce each applicable Fund's expenses as noted in the table below.
| Management fee |
Spartan Extended Market Index | $ 1,232 |
Spartan International Index | 74 |
10. Distributions to Shareholders.
Distributions to shareholders of each class were as follows:
Years ended February 28, | 2014 | 2013 |
Spartan Extended Market Index |
|
|
From net investment income |
|
|
Investor Class | $ 16,621,797 | $ 34,726,754 |
Fidelity Advantage Class | 112,997,472 | 88,271,798 |
Fidelity Advantage Institutional Class | 835,637 | 2,156 |
Total | $ 130,454,906 | $ 123,000,708 |
From net realized gain |
|
|
Investor Class | $ 31,841,694 | $ 59,938,933 |
Fidelity Advantage Class | 211,703,785 | 140,771,137 |
Fidelity Advantage Institutional Class | 1,391,522 | 3,484 |
Total | $ 244,937,001 | $ 200,713,554 |
Spartan International Index |
|
|
From net investment income |
|
|
Investor Class | $ 58,011,983 | $ 87,597,672 |
Fidelity Advantage Class | 160,441,037 | 109,365,106 |
Institutional Class | 37,902,014 | 34,315,538 |
Fidelity Advantage Institutional Class | 39,196,746 | 31,921,861 |
Total | $ 295,551,780 | $ 263,200,177 |
From net realized gain |
|
|
Investor Class | $ 2,366,597 | $ 3,612,275 |
Fidelity Advantage Class | 6,326,343 | 4,386,091 |
Institutional Class | 1,463,888 | 1,352,974 |
Fidelity Advantage Institutional Class | 1,507,713 | 1,254,356 |
Total | $ 11,664,541 | $ 10,605,696 |
Annual Report
11. Share Transactions.
Transactions for each class of shares were as follows:
| Shares | Dollars | ||
Years ended February 28, | 2014 | 2013 | 2014 | 2013 |
Spartan Extended Market Index |
|
|
|
|
Investor Class |
|
|
|
|
Shares sold | 19,932,366 | 13,321,094 | $ 967,050,540 | $ 530,659,536 |
Reinvestment of distributions | 950,199 | 2,332,565 | 47,450,450 | 90,866,565 |
Shares redeemed | (10,812,918) | (58,837,328) | (534,857,352) | (2,389,706,038) |
Net increase (decrease) | 10,069,647 | (43,183,669) | $ 479,643,638 | $ (1,768,179,937) |
Fidelity Advantage Class |
|
|
|
|
Shares sold | 84,733,601 | 89,341,752 | $ 4,185,536,521 | $ 3,625,244,734 |
Reinvestment of distributions | 6,264,021 | 5,670,305 | 312,421,897 | 220,926,287 |
Shares redeemed | (35,284,757) | (27,226,963) | (1,747,457,820) | (1,083,879,441) |
Net increase (decrease) | 55,712,865 | 67,785,094 | $ 2,750,500,598 | $ 2,762,291,580 |
Fidelity Advantage Institutional Class |
|
|
|
|
Shares sold | 1,794,400 | 2,138 | $ 94,062,308 | $ 88,301 |
Reinvestment of distributions | 43,657 | 145 | 2,227,159 | 5,640 |
Shares redeemed | (111,385) | - | (5,860,887) | - |
Net increase (decrease) | 1,726,672 | 2,283 | $ 90,428,580 | $ 93,941 |
Spartan International Index |
|
|
|
|
Investor Class |
|
|
|
|
Shares sold | 20,112,329 | 22,480,598 | $ 772,478,855 | $ 738,516,301 |
Reinvestment of distributions | 1,523,594 | 2,603,169 | 58,871,715 | 87,570,598 |
Shares redeemed | (22,200,847) | (63,993,981) | (857,809,530) | (2,162,502,955) |
Net increase (decrease) | (564,924) | (38,910,214) | $ (26,458,960) | $ (1,336,416,056) |
Fidelity Advantage Class |
|
|
|
|
Shares sold | 53,596,060 | 75,323,150 | $ 2,066,510,885 | $ 2,547,792,654 |
Reinvestment of distributions | 3,892,047 | 3,011,886 | 150,388,696 | 101,319,852 |
Shares redeemed | (33,423,301) | (32,726,415) | (1,274,395,424) | (1,057,404,449) |
Net increase (decrease) | 24,064,806 | 45,608,621 | $ 942,504,157 | $ 1,591,708,057 |
Institutional Class |
|
|
|
|
Shares sold | 12,102,316 | 16,830,227 | $ 463,354,188 | $ 541,022,171 |
Reinvestment of distributions | 1,018,728 | 1,060,233 | 39,363,642 | 35,666,241 |
Shares redeemed | (10,345,415) | (7,965,479)A | (398,770,131) | (261,596,672)A |
Net increase (decrease) | 2,775,629 | 9,924,981 | $ 103,947,699 | $ 315,091,740 |
Fidelity Advantage Institutional Class |
|
|
|
|
Shares sold | 14,681,068 | 8,644,925 | $ 551,158,148 | $ 280,664,871 |
Reinvestment of distributions | 1,053,409 | 986,213 | 40,703,723 | 33,176,217 |
Shares redeemed | (8,369,672) | (5,875,458) | (318,277,607) | (193,745,936) |
Net increase (decrease) | 7,364,805 | 3,755,680 | $ 273,584,264 | $ 120,095,152 |
A Amount includes in-kind redemptions.
12. Other.
The Funds' organizational documents provide former and current trustees and officers with a limited indemnification against liabilities arising in connection with the performance of their duties to the Funds. In the normal course of business, the Funds may also enter into contracts that provide general indemnifications. The Funds' maximum exposure under these arrangements is unknown as this would be dependent on future claims that may be made against the Funds. The risk of material loss from such claims is considered remote.
Annual Report
Report of Independent Registered Public Accounting Firm
To the Trustees of Fidelity Concord Street Trust and the Shareholders of Spartan Total Market Index Fund, Spartan Extended Market Index Fund and Spartan International Index Fund:
In our opinion, the accompanying statements of assets and liabilities, including the schedules of investments, and the related statements of operations and of changes in net assets and the financial highlights present fairly, in all material respects, the financial positions of Spartan Total Market Index Fund, Spartan Extended Market Index Fund and Spartan International Index Fund (funds of Fidelity Concord Street Trust) at February 28, 2014, the results of each of their operations for the periods indicated, the changes in each of their net assets for each of the periods indicated and the financial highlights for each of the periods indicated, in conformity with accounting principles generally accepted in the United States of America. These financial statements and financial highlights (hereafter referred to as "financial statements") are the responsibility of the Fidelity Concord Street Trust's management Our responsibility is to express an opinion on these financial statements based on our audits. We conducted our audits of these financial statements in accordance with the standards of the Public Company Accounting Oversight Board (United States). Those standards require that we plan and perform the audit to obtain reasonable assurance about whether the financial statements are free of material misstatement. An audit includes examining, on a test basis, evidence supporting the amounts and disclosures in the financial statements, assessing the accounting principles used and significant estimates made by management, and evaluating the overall financial statement presentation. We believe that our audits, which included confirmation of securities at February 28, 2014 by correspondence with the custodian and brokers, provide a reasonable basis for our opinion.
PricewaterhouseCoopers LLP
Boston, Massachusetts
April 21, 2014
Annual Report
Trustees and Officers
The Trustees, Member of the Advisory Board, and officers of the trust and funds, as applicable, are listed below. The Board of Trustees governs each fund and is responsible for protecting the interests of shareholders. The Trustees are experienced executives who meet periodically throughout the year to oversee each fund's activities, review contractual arrangements with companies that provide services to each fund, oversee management of the risks associated with such activities and contractual arrangements, and review each fund's performance. Except for James C. Curvey, Ned C. Lautenbach, and William S. Stavropoulos, each of the Trustees oversees 172 funds. Mr. Curvey oversees 395 funds. Mr. Lautenbach and Mr. Stavropoulos each oversees 246 funds.
The Trustees hold office without limit in time except that (a) any Trustee may resign; (b) any Trustee may be removed by written instrument, signed by at least two-thirds of the number of Trustees prior to such removal; (c) any Trustee who requests to be retired or who has become incapacitated by illness or injury may be retired by written instrument signed by a majority of the other Trustees; and (d) any Trustee may be removed at any special meeting of shareholders by a two-thirds vote of the outstanding voting securities of the trust. Each Trustee who is not an interested person (as defined in the 1940 Act) of the trust and the fund (Independent Trustee), shall retire not later than the last day of the calendar year in which his or her 75th birthday occurs. The Independent Trustees may waive this mandatory retirement age policy with respect to individual Trustees. The officers and Advisory Board Member hold office without limit in time, except that any officer and Advisory Board Member may resign or may be removed by a vote of a majority of the Trustees at any regular meeting or any special meeting of the Trustees. Except as indicated, each individual has held the office shown or other offices in the same company for the past five years.
Experience, Skills, Attributes, and Qualifications of the Funds' Trustees. The Governance and Nominating Committee has adopted a statement of policy that describes the experience, qualifications, attributes, and skills that are necessary and desirable for potential Independent Trustee candidates (Statement of Policy). The Board believes that each Trustee satisfied at the time he or she was initially elected or appointed a Trustee, and continues to satisfy, the standards contemplated by the Statement of Policy. The Governance and Nominating Committee also engages professional search firms to help identify potential Independent Trustee candidates who have the experience, qualifications, attributes, and skills consistent with the Statement of Policy. From time to time, additional criteria based on the composition and skills of the current Independent Trustees, as well as experience or skills that may be appropriate in light of future changes to board composition, business conditions, and regulatory or other developments, have also been considered by the professional search firms and the Governance and Nominating Committee. In addition, the Board takes into account the Trustees' commitment and participation in Board and committee meetings, as well as their leadership of standing and ad hoc committees throughout their tenure.
In determining that a particular Trustee was and continues to be qualified to serve as a Trustee, the Board has considered a variety of criteria, none of which, in isolation, was controlling. The Board believes that, collectively, the Trustees have balanced and diverse experience, qualifications, attributes, and skills, which allow the Board to operate effectively in governing each fund and protecting the interests of shareholders. Information about the specific experience, skills, attributes, and qualifications of each Trustee, which in each case led to the Board's conclusion that the Trustee should serve (or continue to serve) as a trustee of the funds, is provided below.
Board Structure and Oversight Function. James C. Curvey is an interested person (as defined in the 1940 Act) and currently serves as Chairman. The Trustees have determined that an interested Chairman is appropriate and benefits shareholders because an interested Chairman has a personal and professional stake in the quality and continuity of services provided to the funds. Independent Trustees exercise their informed business judgment to appoint an individual of their choosing to serve as Chairman, regardless of whether the Trustee happens to be independent or a member of management. The Independent Trustees have determined that they can act independently and effectively without having an Independent Trustee serve as Chairman and that a key structural component for assuring that they are in a position to do so is for the Independent Trustees to constitute a substantial majority for the Board. The Independent Trustees also regularly meet in executive session. Ned C. Lautenbach serves as Chairman of the Independent Trustees and as such (i) acts as a liaison between the Independent Trustees and management with respect to matters important to the Independent Trustees and (ii) with management prepares agendas for Board meetings.
Fidelity funds are overseen by different Boards of Trustees. The funds' Board oversees Fidelity's equity and high income funds and another Board oversees Fidelity's investment-grade bond, money market, and asset allocation funds. The asset allocation funds may invest in Fidelity funds overseen by the funds' Board. The use of separate Boards, each with its own committee structure, allows the Trustees of each group of Fidelity funds to focus on the unique issues of the funds they oversee, including common research, investment, and operational issues. On occasion, the separate Boards establish joint committees to address issues of overlapping consequences for the Fidelity funds overseen by each Board.
The Trustees operate using a system of committees to facilitate the timely and efficient consideration of all matters of importance to the Trustees, each fund, and fund shareholders and to facilitate compliance with legal and regulatory requirements and oversight of the funds' activities and associated risks. The Board, acting through its committees, has charged FMR and its affiliates with (i) identifying events or circumstances the occurrence of which could have demonstrably adverse effects on the funds' business and/or reputation; (ii) implementing processes and controls to lessen the possibility that such events or circumstances occur or to mitigate the effects of such events or circumstances if they do occur; and (iii) creating and maintaining a system designed to evaluate continuously business and market conditions in order to facilitate the identification and implementation processes described in (i) and (ii) above. Because the day-to-day operations and activities of the funds are carried out by or through FMR, its affiliates and other service providers, the funds' exposure to risks is mitigated but not eliminated by the processes overseen by the Trustees. While each of the Board's committees has responsibility for overseeing different aspects of the funds' activities, oversight is exercised primarily through the Operations, Audit, and Compliance Committees. In addition, the Independent Trustees have worked with FMR to enhance the Board's oversight of investment and financial risks, legal and regulatory risks, technology risks, and operational risks, including the development of additional risk reporting to the Board. For example, a working group comprised of Independent Trustees and FMR has worked and continues to work to review the Fidelity funds' valuation-related activities, reporting and risk management. Appropriate personnel, including but not limited to the funds' Chief Compliance Officer (CCO), FMR's internal auditor, the independent accountants, the funds' Treasurer and portfolio management personnel, make periodic reports to the Board's committees, as appropriate, including an annual review of FMR's risk management program for the Fidelity funds. The responsibilities of each standing committee, including their oversight responsibilities, are described further under "Standing Committees of the Funds' Trustees."
Annual Report
Trustees and Officers - continued
The funds' Statement of Additional Information (SAI) includes more information about the Trustees. To Request a free copy, call Fidelity at 1-800-835-5092.
Interested Trustees*:
Correspondence intended for each Trustee who is an interested person may be sent to Fidelity Investments, 245 Summer Street, Boston, Massachusetts 02210.
Name, Year of Birth; Principal Occupations and Other Relevant Experience+ | |
James C. Curvey (1935) | |
Year of Election or Appointment: 2007 Trustee Chairman of the Board of Trustees | |
| Mr. Curvey also serves as Trustee of other Fidelity funds. Mr. Curvey is a Director of Fidelity Investments Money Management, Inc. (2009-present), Director of Fidelity Research & Analysis Co. (2009-present) and Director of FMR and FMR Co., Inc. (2007-present). Mr. Curvey is also Vice Chairman (2007-present) and Director of FMR LLC. In addition, Mr. Curvey serves as an Overseer for the Boston Symphony Orchestra and a member of the Trustees of Villanova University. Previously, Mr. Curvey was the Vice Chairman (2006-2007) and Director (2000-2007) of FMR Corp. |
Charles S. Morrison (1960) | |
Year of Election or Appointment: 2014 Trustee | |
| Mr. Morrison also serves as Trustee or Vice President of other funds. He serves as President, Asset Management (2014-present) and is an employee of Fidelity Investments. Previously, Mr. Morrison served as President, Fixed Income (2011-2014), Vice President of Fidelity's Money Market Funds (2005-2009), President, Money Market Group Leader of FMR (2009), and Senior Vice President, Money Market Group of FMR (2004-2009). Mr. Morrison also served as Vice President of Fidelity's Bond Funds (2002-2005), certain Balanced Funds (2002-2005), and certain Asset Allocation Funds (2002-2007), and as Senior Vice President (2002-2005) of Fidelity's Bond Division. |
* Trustees have been determined to be "Interested Trustees" by virtue of, among other things, their affiliation with the trust or various entities under common control with FMR.
+ The information above includes each Trustee's principal occupation during the last five years and other information relating to the experience, attributes, and skills relevant to each Trustee's qualifications to serve as a Trustee, which led to the conclusion that each Trustee should serve as a Trustee for each fund.
Independent Trustees:
Correspondence intended for each Independent Trustee (that is, the Trustees other than the Interested Trustees) may be sent to Fidelity Investments, P.O. Box 55235, Boston, Massachusetts 02205-5235.
Name, Year of Birth; Principal Occupations and Other Relevant Experience+ | |
Dennis J. Dirks (1948) | |
Year of Election or Appointment: 2005 Trustee | |
| Mr. Dirks also serves as Trustee of other Fidelity funds. Prior to his retirement in May 2003, Mr. Dirks was Chief Operating Officer and a member of the Board of The Depository Trust & Clearing Corporation (DTCC). He also served as President, Chief Operating Officer, and Board member of The Depository Trust Company (DTC) and President and Board member of the National Securities Clearing Corporation (NSCC). In addition, Mr. Dirks served as Chief Executive Officer and Board member of the Government Securities Clearing Corporation, Chief Executive Officer and Board member of the Mortgage-Backed Securities Clearing Corporation, as a Trustee and a member of the Finance Committee of Manhattan College (2005-2008), and as a Trustee and a member of the Finance Committee of AHRC of Nassau County (2006-2008). Mr. Dirks is a member of the Independent Directors Council (IDC) Governing Council (2010-present) and Board of Directors for The Brookville Center for Children's Services, Inc. (2009-present). |
Alan J. Lacy (1953) | |
Year of Election or Appointment: 2008 Trustee | |
| Mr. Lacy also serves as Trustee of other Fidelity funds. Mr. Lacy serves as Senior Adviser (2007-present) of Oak Hill Capital Partners, L.P. (private equity). Mr. Lacy also served as Chief Executive Officer (2000-2005) and Vice Chairman (2005-2006) of Sears Holdings Corporation and Sears, Roebuck and Co. (retail). In addition, Mr. Lacy serves as a member of the Board of Directors of Dave & Buster's Entertainment, Inc. (restaurant and entertainment complexes, 2010-present), Earth Fare, Inc. (retail grocery, 2012-present), The Hillman Companies, Inc. (hardware wholesalers, 2010-present), and Bristol-Myers Squibb Company (global pharmaceuticals, 2008-present). Mr. Lacy is a member of the Board of Trustees of The National Parks Conservation Association (2006-present). Previously, Mr. Lacy served as Chairman of the Board of Trustees of the National Parks Conservation Association (2008-2011) and as a member of the Board of Directors for the Western Union Company (global money transfer, 2006-2011). |
Ned C. Lautenbach (1944) | |
Year of Election or Appointment: 2000 Trustee Chairman of the Independent Trustees | |
| Mr. Lautenbach also serves as Trustee of other Fidelity funds. Mr. Lautenbach currently serves as the Lead Director of the Eaton Corporation Board of Directors (diversified industrial, 1997-present). Mr. Lautenbach is Chairman of the Board of Directors of the Philharmonic Center for the Arts in Naples, Florida (2012-present) and a member of the Council on Foreign Relations (1994-present). Previously, Mr. Lautenbach was a Partner/Advisory Partner at Clayton, Dubilier & Rice, LLC (private equity investment, 1998-2010), as well as a Director of Sony Corporation (2006-2007). |
Joseph Mauriello (1944) | |
Year of Election or Appointment: 2008 Trustee | |
| Mr. Mauriello also serves as Trustee of other Fidelity funds. Prior to his retirement in January 2006, Mr. Mauriello served in numerous senior management positions including Deputy Chairman and Chief Operating Officer (2004-2005), and Vice Chairman of Financial Services (2002-2004) of KPMG LLP US (professional services, 1965-2005). Mr. Mauriello currently serves as a member of the Board of Directors of XL Group plc. (global insurance and re-insurance, 2006-present). Previously, Mr. Mauriello served as a Director of the Hamilton Funds of the Bank of New York (2006-2007) and of Arcadia Resources Inc. (health care services and products, 2007-2012). |
Robert W. Selander (1950) | |
Year of Election or Appointment: 2011 Trustee | |
| Mr. Selander also serves as Trustee of other Fidelity funds. Previously, Mr. Selander served as a Member of the Advisory Board of other Fidelity funds (2011), and Executive Vice Chairman (2010), Chief Executive Officer (2009-2010), and President and Chief Executive Officer (1997-2009) of Mastercard, Inc. |
Cornelia M. Small (1944) | |
Year of Election or Appointment: 2005 Trustee | |
| Ms. Small also serves as Trustee of other Fidelity funds. Ms. Small is a member of the Board of Directors (2009-present) and Chair of the Investment Committee (2010-present) of the Teagle Foundation. Ms. Small also serves on the Investment Committee of the Berkshire Taconic Community Foundation (2008-present). Previously, Ms. Small served as Chairperson (2002-2008) and a member of the Investment Committee and Chairperson (2008-2012) and a member of the Board of Trustees of Smith College. In addition, Ms. Small served as Chief Investment Officer, Director of Global Equity Investments, and a member of the Board of Directors of Scudder, Stevens & Clark and Scudder Kemper Investments. |
William S. Stavropoulos (1939) | |
Year of Election or Appointment: 2001 Trustee Vice Chairman of the Independent Trustees | |
| Mr. Stavropoulos also serves as Trustee of other Fidelity funds. Mr. Stavropoulos serves as President and Founder of the Michigan Baseball Foundation, the Great Lakes Loons (2007-present). Mr. Stavropoulos is Chairman Emeritus of the Board of Directors of The Dow Chemical Company, where he previously served in numerous senior management positions, including President, CEO (1995-2000; 2002-2004), Chairman of the Executive Committee (2000-2006), and as a member of the Board of Directors (1990-2006). Currently, Mr. Stavropoulos is Chairman of the Board of Directors of Univar Inc. (global distributor of commodity and specialty chemicals), a Director of Teradata Corporation (data warehousing and technology solutions), and Maersk Inc. (industrial conglomerate), and a member of the Advisory Board for Metalmark Capital LLC (private equity investment, 2005-present). Mr. Stavropoulos is an operating advisor to Clayton, Dubilier & Rice, LLC (private equity investment). In addition, Mr. Stavropoulos is a member of the University of Notre Dame Advisory Council for the College of Science, a Trustee of the Rollin L. Gerstacker Foundation, and a Director of the Naples Philharmonic Center for the Arts. Previously, Mr. Stavropoulos served as a Director of Chemical Financial Corporation (bank holding company, 1993-2012) and Tyco International, Ltd. (multinational manufacturing and services, 2007-2012). |
David M. Thomas (1949) | |
Year of Election or Appointment: 2008 Trustee | |
| Mr. Thomas also serves as Trustee of other Fidelity funds. Mr. Thomas serves as Non-Executive Chairman of the Board of Directors of Fortune Brands Home and Security (home and security products, 2011-present), and as a member of the Board of Directors of Interpublic Group of Companies, Inc. (marketing communication, 2004-present). Previously, Mr. Thomas served as Executive Chairman (2005-2006) and Chairman and Chief Executive Officer (2000-2005) of IMS Health, Inc. (pharmaceutical and healthcare information solutions), and a Director of Fortune Brands, Inc. (consumer products, 2000-2011). |
+ The information above includes each Trustee's principal occupation during the last five years and other information relating to the experience, attributes, and skills relevant to each Trustee's qualifications to serve as a Trustee, which led to the conclusion that each Trustee should serve as a Trustee for each fund.
Advisory Board Member and Officers:
Correspondence intended for each officer and Peter S. Lynch may be sent to Fidelity Investments, 245 Summer Street, Boston, Massachusetts 02210. Officers appear below in alphabetical order.
Name, Year of Birth; Principal Occupation | |
Peter S. Lynch (1944) | |
Year of Election or Appointment: 2003 Member of the Advisory Board | |
| Mr. Lynch also serves as Member of the Advisory Board of other Fidelity funds. Mr. Lynch is Vice Chairman and a Director of FMR and FMR Co., Inc. In addition, Mr. Lynch serves as a Trustee of Boston College and as the Chairman of the Inner-City Scholarship Fund. Previously, Mr. Lynch served on the Special Olympics International Board of Directors (1997-2006). |
Elizabeth Paige Baumann (1968) | |
Year of Election or Appointment: 2012 Anti-Money Laundering (AML) Officer | |
| Ms. Baumann also serves as AML Officer of other funds. She is Chief AML Officer of FMR LLC (2012-present) and is an employee of Fidelity Investments. Previously, Ms. Baumann served as Vice President and Deputy Anti-Money Laundering Officer (2007-2012). |
William C. Coffey (1969) | |
Year of Election or Appointment: 2009 Assistant Secretary | |
| Mr. Coffey also serves as Assistant Secretary of other funds. He is Senior Vice President and Deputy General Counsel of FMR LLC (2010-present), and is an employee of Fidelity Investments. Previously, Mr. Coffey served as Vice President and Associate General Counsel of FMR LLC (2005-2009). |
Jonathan Davis (1968) | |
Year of Election or Appointment: 2010 Assistant Treasurer | |
| Mr. Davis also serves as Assistant Treasurer of other funds. Mr. Davis is an employee of Fidelity Investments. Previously, Mr. Davis served as Vice President and Associate General Counsel of FMR LLC (2003-2010). |
Adrien E. Deberghes (1967) | |
Year of Election or Appointment: 2008 Deputy Treasurer | |
| Mr. Deberghes also serves as an officer of other funds. He is an employee of Fidelity Investments (2008-present). Prior to joining Fidelity Investments, Mr. Deberghes was Senior Vice President of Mutual Fund Administration at State Street Corporation (2007-2008), Senior Director of Mutual Fund Administration at Investors Bank & Trust (2005-2007), and Director of Finance for Dunkin' Brands (2000-2005). |
Stephanie J. Dorsey (1969) | |
Year of Election or Appointment: 2010 Assistant Treasurer | |
| Ms. Dorsey also serves as an officer of other funds. She is an employee of Fidelity Investments (2008-present) and has served in other fund officer roles. Prior to joining Fidelity Investments, Ms. Dorsey served as Treasurer (2004-2008) of the JPMorgan Mutual Funds and Vice President (2004-2008) of JPMorgan Chase Bank. |
Scott C. Goebel (1968) | |
Year of Election or Appointment: 2008 Secretary and Chief Legal Officer (CLO) | |
| Mr. Goebel serves as Secretary and CLO of other funds. Mr. Goebel also serves as Secretary of Fidelity SelectCo, LLC (2013-present), Fidelity Investments Money Management, Inc. (FIMM) (2010-present) and Fidelity Research and Analysis Company (FRAC) (2010-present); General Counsel, Secretary, and Senior Vice President of FMR (2008-present) and FMR Co., Inc. (2008-present); Chief Legal Officer of Fidelity Management & Research (Hong Kong) Limited (2008-present); and Assistant Secretary of Fidelity Management & Research (Japan) Inc. (2008-present) and Fidelity Management & Research (U.K.) Inc. (2008-present). Previously, Mr. Goebel served as Secretary and CLO of other Fidelity funds (2008-2013), Assistant Secretary of FIMM (2008-2010), FRAC (2008-2010), and certain funds (2007-2008); and as Vice President and Secretary of Fidelity Distributors Corporation (FDC) (2005-2007). Mr. Goebel has been employed by FMR LLC or an affiliate since 2001. |
Joseph A. Hanlon (1968) | |
Year of Election or Appointment: 2012 Chief Compliance Officer | |
| Mr. Hanlon also serves as Chief Compliance Officer of other funds. Mr. Hanlon serves as Compliance Officer of FMR, FMR Co., Inc., Fidelity Investments Money Management, Inc. (FIMM), Fidelity Research and Analysis Company (FRAC), and Fidelity Management & Research (Hong Kong) (2009-present), as Senior Vice President of the Fidelity Asset Management Division (2009-present), and is an employee of Fidelity Investments. Previously, Mr. Hanlon served as Compliance Officer of Fidelity Management & Research (Japan) Inc. (2009-2013), Strategic Advisers, Inc. (2009-2013), and Fidelity Management & Research (U.K.) Inc. (2009-2013). |
Bruce T. Herring (1965) | |
Year of Election or Appointment: 2006 Vice President of certain Equity Funds | |
| Mr. Herring also serves as Vice President of other funds. He serves as Chief Investment Officer of Fidelity Global Asset Allocation (GAA) (2013-present), Group Chief Investment Officer of FMR, and President of Fidelity Research & Analysis Company (2010-present). Previously, Mr. Herring served as Chief Investment Officer and Director of Fidelity Management & Research (U.K.) Inc. (2010-2013), Vice President (2005-2006) and Senior Vice President (2006-2007) of Fidelity Management & Research Company, Vice President of FMR Co., Inc. (2001-2007), and as a portfolio manager for Fidelity U.S. Equity Funds. |
Brian B. Hogan (1964) | |
Year of Election or Appointment: 2009 Vice President | |
| Mr. Hogan also serves as Trustee or Vice President of other funds. Mr. Hogan serves as President of FMR's Equity Division (2009-present). Previously, Mr. Hogan served as Senior Vice President, Equity Research of FMR (2006-2009) and as a portfolio manager. |
Chris Maher (1972) | |
Year of Election or Appointment: 2013 Assistant Treasurer | |
| Mr. Maher serves as Assistant Treasurer of other funds. Mr. Maher is Vice President of Valuation Oversight and is an employee of Fidelity Investments. Previously, Mr. Maher served as Vice President of Asset Management Compliance (2013), Vice President of FMR's Program Management Group (2010-2013), and Vice President of Valuation Oversight (2008-2010). |
Christine Reynolds (1958) | |
Year of Election or Appointment: 2008 Chief Financial Officer | |
| Ms. Reynolds also serves as Chief Financial Officer of other funds. Ms. Reynolds became President of Fidelity Pricing and Cash Management Services (FPCMS) in August 2008. Ms. Reynolds served as Chief Operating Officer of FPCMS (2007-2008). Previously, Ms. Reynolds served as President, Treasurer, and Anti-Money Laundering officer of the Fidelity funds (2004-2007). |
Kenneth B. Robins (1969) | |
Year of Election or Appointment: 2008 President and Treasurer | |
| Mr. Robins also serves as an officer of other funds. Mr. Robins serves as Executive Vice President of Fidelity Investments Money Management, Inc. (FIMM) (2013-present) and is an employee of Fidelity Investments (2004-present). Previously, Mr. Robins served in other fund officer roles. |
Gary W. Ryan (1958) | |
Year of Election or Appointment: 2005 Assistant Treasurer | |
| Mr. Ryan also serves as Assistant Treasurer of other funds. Mr. Ryan is an employee of Fidelity Investments and has served in other fund officer roles. Previously, Mr. Ryan served as Vice President of Fund Reporting in Fidelity Pricing and Cash Management Services (FPCMS) (1999-2005). |
Stephen Sadoski (1971) | |
Year of Election or Appointment: 2012 Deputy Treasurer | |
| Mr. Sadoski also serves as Deputy Treasurer of other funds. He is an employee of Fidelity Investments (2012-present) and has served in another fund officer role. Prior to joining Fidelity Investments, Mr. Sadoski served as an assistant chief accountant in the Division of Investment Management of the Securities and Exchange Commission (SEC) (2009-2012) and as a senior manager at Deloitte & Touche LLP (1997-2009). |
Stacie M. Smith (1974) | |
Year of Election or Appointment: 2013 Deputy Treasurer | |
| Ms. Smith also serves as an officer of other funds. She is an employee of Fidelity Investments (2009-present) and has served in other fund officer roles. Prior to joining Fidelity Investments, Ms. Smith served as Senior Audit Manager of Ernst & Young LLP (1996-2009). |
Renee Stagnone (1975) | |
Year of Election or Appointment: 2013 Deputy Treasurer | |
| Ms. Stagnone also serves as Deputy Treasurer of other funds. Ms. Stagnone is an employee of Fidelity Investments. |
Joseph F. Zambello (1957) | |
Year of Election or Appointment: 2011 Deputy Treasurer | |
| Mr. Zambello also serves as Deputy Treasurer of other funds. Mr. Zambello is an employee of Fidelity Investments. Previously, Mr. Zambello served as Vice President of FMR's Program Management Group (2009-2011) and Vice President of the Transfer Agent Oversight Group (2005-2009). |
Annual Report
Distributions (Unaudited)
The Board of Trustees of each fund voted to pay to shareholders of record at the opening of business on record date, the following distributions per share derived from capital gains realized from sales of portfolio securities and dividends derived from net investment income:
| Pay Date | Record Date | Dividends | Capital Gains |
Spartan Total Market Index Fund |
|
|
|
|
Institutional Class | 4/14/14 | 4/11/14 | $0.15049 | - |
Fidelity Advantage Institutional Class | 4/14/14 | 4/11/14 | $0.15124 | - |
Spartan Extended Market Index Fund |
|
|
|
|
Fidelity Advantage Institutional Class | 4/14/14 | 4/11/14 | $0.11689 | $0.725 |
Spartan International Index Fund |
|
|
|
|
Institutional Class | 4/14/14 | 4/11/14 | $0.28169 | - |
Fidelity Advantage Institutional Class | 4/14/14 | 4/11/14 | $0.28282 | - |
The funds hereby designate as capital gain dividend the amounts noted below for the taxable year ended February 28, 2014, or, if subsequently determined to be different, the net capital gain of such year.
Spartan Extended Market Index Fund | $309,303,411 |
A percentage of the dividends distributed during the fiscal year for the following funds qualify for the dividends-received deduction for corporate shareholders:
| April 2013 | December 2013 |
Spartan Total Market Index Fund |
|
|
Institutional Class | 96% | 94% |
Fidelity Advantage Institutional Class | 95% | 94% |
Spartan Extended Market Index Fund |
|
|
Fidelity Advantage Institutional Class | 21% | 47% |
A percentage of the dividends distributed during the fiscal year for the following funds may be taken into account as a dividend for purposes of the maximum rate under section 1(h)(11) of the Internal Revenue Code.
| April 2013 | December 2013 |
Spartan Total Market Index Fund |
|
|
Institutional Class | 98% | 98% |
Fidelity Advantage Institutional Class | 98% | 98% |
Spartan Extended Market Index Fund |
|
|
Fidelity Advantage Institutional Class | 22% | 51% |
Spartan International Index Fund |
|
|
Institutional Class | - | 86% |
Fidelity Advantage Institutional Class | - | 86% |
The amounts per share which represent income derived from sources within, and taxes paid to, foreign countries or possessions of the United States are as follows:
| Pay Date | Income | Taxes |
Spartan International Index Fund |
|
|
|
Institutional Class | 12/16/13 | $0.4960 | $0.0612 |
Fidelity Advantage Institutional Class | 12/16/13 | $0.4978 | $0.0612 |
The funds will notify shareholders in January 2015 of amounts for use in preparing 2014 income tax returns.
Annual Report
Fidelity Management & Research Company
Boston, MA
Investment Sub-Advisers
FMR Co., Inc.
Geode Capital Management, LLC
General Distributor
Fidelity Distributors Corporation
Smithfield, RI
Transfer and Service Agents
Fidelity Investments Institutional Operations Company, Inc.
Boston, MA
Fidelity Service Company, Inc.
Boston, MA
Custodian
The Bank of New York Mellon
New York, NY
(Mail Graphic)
(FidelityLogo)
P.O. Box 673023
Dallas, TX 75267-3023
SIF-I-UANNPRO-0414
1.938970.102
Spartan® Total Market Index
Fund
Class F
Annual Report
February 28, 2014
(Fidelity Cover Art)
Contents
Performance | How the fund has done over time. | |
Management's Discussion of Fund Performance | The Portfolio Manager's review of fund performance and strategy. | |
Shareholder Expense Example | An example of shareholder expenses. | |
Investment Changes | A summary of major shifts in the fund's investments over the past six months. | |
Investments | A complete list of the fund's investments with their market values. | |
Financial Statements | Statements of assets and liabilities, operations, and changes in net assets, as well as financial highlights. | |
Notes | Notes to the financial statements. | |
Report of Independent Registered Public Accounting Firm |
| |
Trustees and Officers |
| |
Distributions |
|
To view a fund's proxy voting guidelines and proxy voting record for the 12-month period ended June 30, visit http://www.fidelity.com/proxyvotingresults or visit the Securities and Exchange Commission's (SEC) web site at http://www.sec.gov. You may also call 1-800-835-5092 to request a free copy of the proxy voting guidelines.
Standard & Poor's, S&P and S&P 500 are registered service marks of The McGraw-Hill Companies, Inc. and have been licensed for use by Fidelity Distributors Corporation.
Other third-party marks appearing herein are the property of their respective owners.
All other marks appearing herein are registered or unregistered trademarks or service marks of FMR LLC or an affiliated company. © 2014 FMR LLC. All rights reserved.
This report and the financial statements contained herein are submitted for the general information of the shareholders of the fund. This report is not authorized for distribution to prospective investors in the fund unless preceded or accompanied by an effective prospectus.
A fund files its complete schedule of portfolio holdings with the SEC for the first and third quarters of each fiscal year on Form N-Q. Forms N-Q are available on the SEC's web site at http://www.sec.gov. A fund's Forms N-Q may be reviewed and copied at the SEC's Public Reference Room in Washington, DC. Information regarding the operation of the SEC's Public Reference Room may be obtained by calling 1-800-SEC-0330. For a complete list of a fund's portfolio holdings, view the most recent holdings listing, semiannual report, or annual report on Fidelity's web site at http://www.fidelity.com, http://www.advisor.fidelity.com, or http://www.401k.com, as applicable.
NOT FDIC INSURED • MAY LOSE VALUE • NO BANK GUARANTEE
Neither the fund nor Fidelity Distributors Corporation is a bank.
Annual Report
Performance: The Bottom Line
Average annual total return reflects the change in the value of an investment, assuming reinvestment of the class' distributions from dividend income and capital gains (the profits earned upon the sale of securities that have grown in value, if any) and assuming a constant rate of performance each year. The $10,000 table and the fund's returns do not reflect the deduction of taxes that a shareholder would pay on fund distributions or the redemption of fund shares. During periods of reimbursement by Fidelity, a fund's total return will be greater than it would be had the reimbursement not occurred. How a fund did yesterday is no guarantee of how it will do tomorrow.
Average Annual Total Returns
Periods ended February 28, 2014 | Past 1 | Past 5 | Past 10 |
Class F A | 26.69% | 23.91% | 7.81% |
A The initial offering of Class F took place on September 24, 2009. Returns prior to September 24, 2009, are those of Investor Class, the original class of the fund.
$10,000 Over 10 Years
Let's say hypothetically that $10,000 was invested in Spartan® Total Market Index Fund - Class F on February 29, 2004. The chart shows how the value of your investment would have changed, and also shows how the Dow Jones U.S. Total Stock Market IndexSM performed over the same period. The initial offering of Class F took place on September 24, 2009. See above for additional information regarding the performance of Class F.
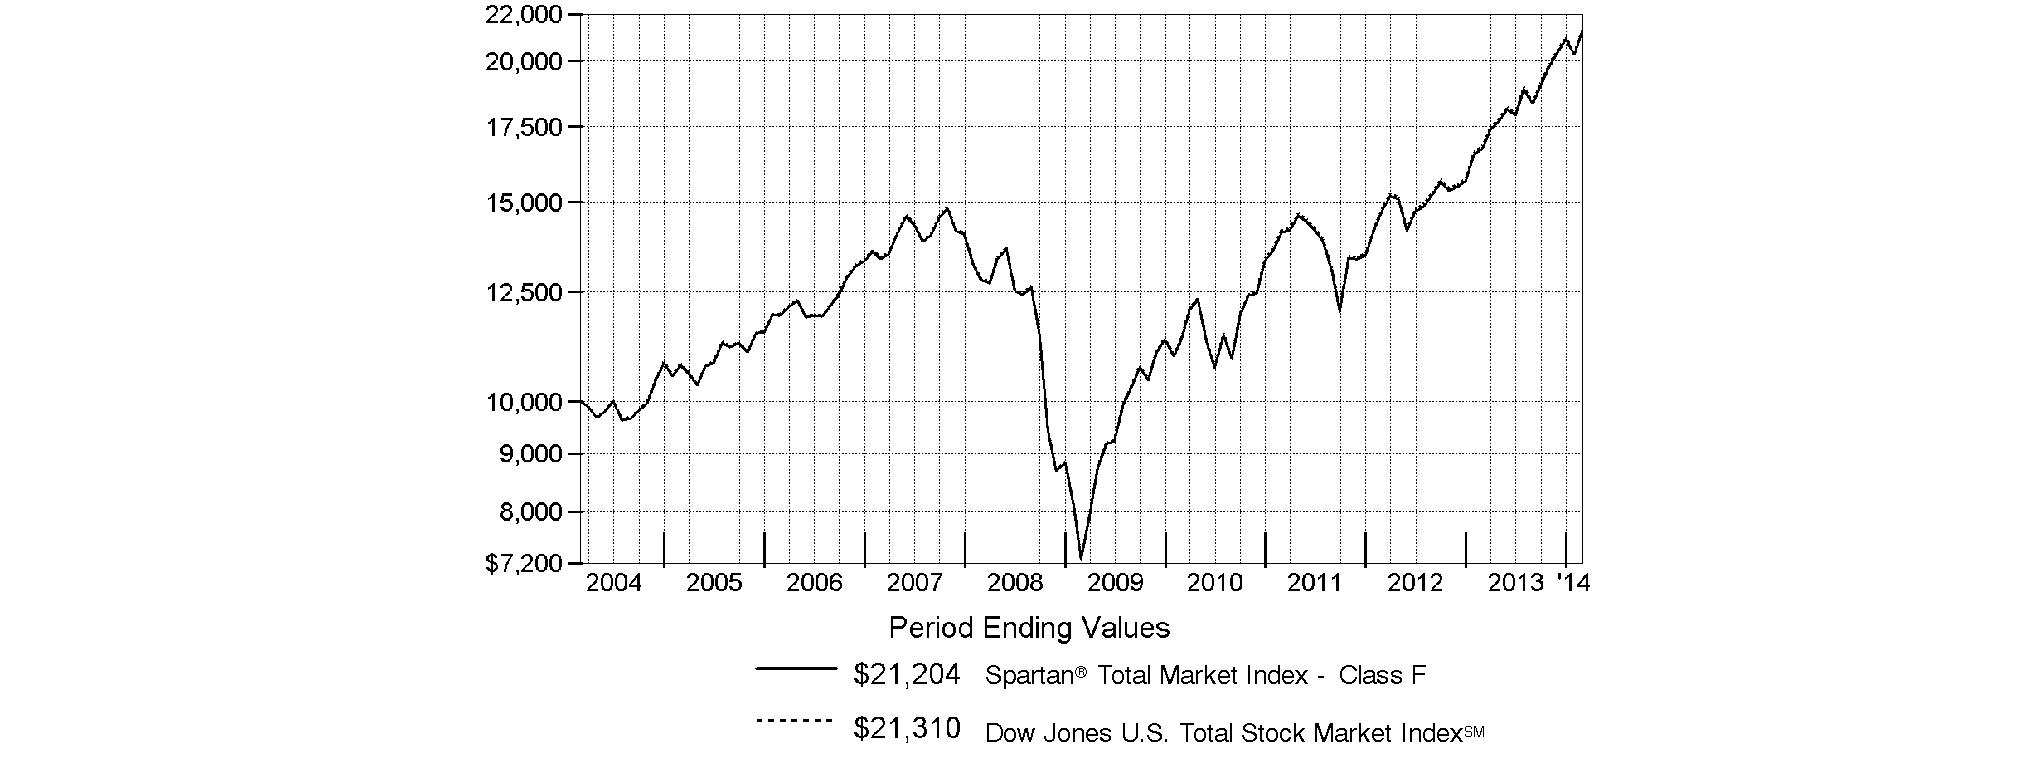
Annual Report
Management's Discussion of Fund Performance
Market Recap: Stocks overcame fears of higher interest rates - not to mention their worst January in four years - to finish sharply higher for the 12 months ending February 28, 2014. The broad S&P 500® Index and the blue-chip Dow Jones Industrial AverageSM gained 25.37% and 19.01%, respectively, amid generally favorable earnings reports and accommodative monetary policies worldwide. Performance generally increased along the risk spectrum, with smaller-cap and growth strategies leading the way. An ebullient market helped the growth-oriented Nasdaq Composite Index® to a 38.10% period gain, for example. On the other hand, both cyclical and defensive stocks had representation in the top-performing industry sectors: returns were highest in health care and consumer discretionary; lowest in utilities and telecommunication services. From a macroeconomic perspective, data still points to slow but steady improvement in the U.S., and Europe's recession may well be over. Reports from China have disappointed, but continue to suggest a relatively soft landing there. Mixed signals from the U.S. Federal Reserve as to when it might curtail its stimulative bond buying kept markets in flux during the spring and summer. Stocks regained momentum in October despite a federal budget impasse and brief government shutdown, and lower volatility prevailed through year-end. Shedding new-year concerns about China's economy, an emerging-markets sell-off and confirmation (at last) of Fed tapering - alongside confirmation of a presumably dovish Janet Yellen as new Fed chair - February saw stocks back in record territory, bearing down on the five-year anniversary of the market's bottom.
Comments from Patrick Waddell, Senior Portfolio Manager of the Geode Capital Management, LLC, investment management team for Spartan® Total Market Index Fund: For the year, the fund's Class F shares gained 26.69%, in line with the 26.73% advance of the Dow Jones U.S. Total Stock Market IndexSM. In a strong market environment, all 10 sectors in the index gained ground, and all but one - telecommunication services - were up by double digits. On an individual basis, fund's top three contributors were all technology stocks and household names, as well as among the four largest stocks in the index. Internet search leader Google saw its shares rise 14% in a single day in October, thanks to better-than-expected earnings. Consumer products and computer manufacturer Apple also added value, as did software maker Microsoft, whose shares were up 42% as the company continued to generate strong financial results relative to Wall Street's expectations. Elsewhere, various health care stocks made a strong contribution, including biotechnology company Gilead Sciences, up 94%. In financials, two large banks, Wells Fargo and Bank of America, were notable contributors, gaining 36% and 48%, respectively, as the entire industry continued to bounce back from the financial crisis of 2008. On the negative side, IBM stood out, as the diversified technology company and major index component lost modest ground amid declining revenues. Tobacco company Philip Morris International struggled in an environment of slowing worldwide demand for cigarettes, while wireless communications service provider AT&T faced an increasingly competitive environment that threatened to cut into the company's revenues.
The views expressed above reflect those of the portfolio manager(s) only through the end of the period as stated on the cover of this report and do not necessarily represent the views of Fidelity or any other person in the Fidelity organization. Any such views are subject to change at any time based upon market or other conditions and Fidelity disclaims any responsibility to update such views. These views may not be relied on as investment advice and, because investment decisions for a Fidelity fund are based on numerous factors, may not be relied on as an indication of trading intent on behalf of any Fidelity fund.
Annual Report
Spartan Total Market Index Fund
Shareholder Expense Example
As a shareholder of the Fund, you incur two types of costs: (1) transaction costs, including redemption fees and (2) ongoing costs, including management fees and other Fund expenses. This Example is intended to help you understand your ongoing costs (in dollars) of investing in the Fund and to compare these costs with the ongoing costs of investing in other mutual funds.
The Example is based on an investment of $1,000 invested at the beginning of the period and held for the entire period (September 1, 2013 to February 28, 2014).
Actual Expenses
The first line of the accompanying table for each class of the Fund provides information about actual account values and actual expenses. You may use the information in this line, together with the amount you invested, to estimate the expenses that you paid over the period. Simply divide your account value by $1,000.00 (for example, an $8,600 account value divided by $1,000.00 = 8.6), then multiply the result by the number in the first line for a class of the Fund under the heading entitled "Expenses Paid During Period" to estimate the expenses you paid on your account during this period. A small balance maintenance fee of $12.00 that is charged once a year may apply for certain accounts with a value of less than $2,000. This fee is not included in the table below. If it was, the estimate of expenses you paid during the period would be higher, and your ending account value lower, by this amount. In addition, the Fund, as a shareholder in the underlying Fidelity Central Funds, will indirectly bear its pro-rata share of the fees and expenses incurred by the underlying Fidelity Central Funds. These fees and expenses are not included in the Fund's annualized expense ratio used to calculate the expense estimate in the table below.
Hypothetical Example for Comparison Purposes
The second line of the accompanying table for each class of the Fund provides information about hypothetical account values and hypothetical expenses based on a Class' actual expense ratio and an assumed rate of return of 5% per year before expenses, which is not the Class' actual return. The hypothetical account values and expenses may not be used to estimate the actual ending account balance or expenses you paid for the period. You may use this information to compare the ongoing costs of investing in the Fund and other funds. To do so, compare this 5% hypothetical example with the 5% hypothetical examples that appear in the shareholder reports of the other funds. A small balance maintenance fee of $12.00 that is charged once a year may apply for certain accounts with a value of less than $2,000. This fee is not included in the table below. If it was, the estimate of expenses you paid during the period would be higher, and your ending account value lower, by this amount. In addition, the Fund, as a shareholder in the underlying Fidelity Central Funds, will indirectly bear its pro-rata share of the fees and expenses incurred by the underlying Fidelity Central Funds. These fees and expenses are not included in the Fund's annualized expense ratio used to calculate the expense estimate in the table below.
Please note that the expenses shown in the table are meant to highlight your ongoing costs only and do not reflect any transaction costs. Therefore, the second line of the table is useful in comparing ongoing costs only, and will not help you determine the relative total costs of owning different funds. In addition, if these transactional costs were included, your costs would have been higher.
| Annualized | Beginning | Ending | Expenses Paid |
Investor Class | .100% |
|
|
|
Actual |
| $ 1,000.00 | $ 1,157.70 | $ .53 |
HypotheticalA |
| $ 1,000.00 | $ 1,024.30 | $ .50 |
Fidelity Advantage Class | .060% |
|
|
|
Actual |
| $ 1,000.00 | $ 1,158.00 | $ .32 |
HypotheticalA |
| $ 1,000.00 | $ 1,024.50 | $ .30 |
Institutional Class | .050% |
|
|
|
Actual |
| $ 1,000.00 | $ 1,158.10 | $ .27 |
HypotheticalA |
| $ 1,000.00 | $ 1,024.55 | $ .25 |
Fidelity Advantage Institutional Class | .045% |
|
|
|
Actual |
| $ 1,000.00 | $ 1,158.00 | $ .24 |
HypotheticalA |
| $ 1,000.00 | $ 1,024.57 | $ .23 |
Class F | .046% |
|
|
|
Actual |
| $ 1,000.00 | $ 1,158.10 | $ .25 |
HypotheticalA |
| $ 1,000.00 | $ 1,024.57 | $ .23 |
A 5% return per year before expenses
B Annualized expense ratio reflects expenses net of applicable fee waivers.
* Expenses are equal to each Class' annualized expense ratio, multiplied by the average account value over the period, multiplied by 181/365 (to reflect the one-half year period).
Annual Report
Spartan Total Market Index Fund
Investment Changes (Unaudited)
Top Ten Stocks as of February 28, 2014 | ||
| % of fund's | % of fund's net assets |
Apple, Inc. | 2.2 | 2.5 |
Exxon Mobil Corp. | 2.0 | 2.1 |
Google, Inc. Class A | 1.6 | 1.3 |
Microsoft Corp. | 1.4 | 1.4 |
Johnson & Johnson | 1.2 | 1.3 |
General Electric Co. | 1.2 | 1.3 |
Wells Fargo & Co. | 1.1 | 1.1 |
Chevron Corp. | 1.1 | 1.3 |
Procter & Gamble Co. | 1.0 | 1.2 |
JPMorgan Chase & Co. | 1.0 | 1.0 |
| 13.8 | |
Market Sectors as of February 28, 2014 | ||
| % of fund's | % of fund's net assets |
Information Technology | 18.0 | 17.3 |
Financials | 16.9 | 17.2 |
Health Care | 13.1 | 12.4 |
Consumer Discretionary | 13.0 | 12.9 |
Industrials | 11.4 | 11.0 |
Energy | 9.1 | 9.7 |
Consumer Staples | 8.1 | 8.8 |
Materials | 3.8 | 3.7 |
Utilities | 3.0 | 3.2 |
Telecommunication Services | 2.3 | 2.2 |
Annual Report
Spartan Total Market Index Fund
Investments February 28, 2014
Showing Percentage of Net Assets
Common Stocks - 98.7% | |||
Shares | Value | ||
CONSUMER DISCRETIONARY - 13.0% | |||
Auto Components - 0.6% | |||
Allison Transmission Holdings, Inc. | 92,033 | $ 2,740,743 | |
American Axle & Manufacturing Holdings, Inc. (a)(d) | 58,540 | 1,131,578 | |
Autoliv, Inc. | 118,893 | 11,454,152 | |
BorgWarner, Inc. | 243,952 | 14,990,850 | |
Cooper Tire & Rubber Co. | 62,365 | 1,554,759 | |
Dana Holding Corp. (d) | 143,074 | 3,101,844 | |
Delphi Automotive PLC | 315,399 | 20,996,111 | |
Dorman Products, Inc. (a)(d) | 32,717 | 1,885,154 | |
Drew Industries, Inc. | 24,362 | 1,199,585 | |
Federal-Mogul Corp. Class A (a) | 65,766 | 1,239,031 | |
Fox Factory Holding Corp. | 10,471 | 174,866 | |
Fuel Systems Solutions, Inc. (a) | 20,668 | 265,584 | |
Gentex Corp. (d) | 174,142 | 5,462,835 | |
Gentherm, Inc. (a)(d) | 38,502 | 1,088,837 | |
Johnson Controls, Inc. | 761,885 | 37,637,119 | |
Lear Corp. | 91,325 | 7,415,590 | |
Modine Manufacturing Co. (a) | 42,412 | 627,273 | |
Motorcar Parts of America, Inc. (a) | 17,588 | 433,192 | |
Quantum Fuel Systems Technologies Worldwide, Inc. (a) | 11,722 | 101,161 | |
Remy International, Inc. | 14,427 | 321,578 | |
Spartan Motors, Inc. | 44,931 | 254,759 | |
Standard Motor Products, Inc. | 17,952 | 631,013 | |
Stoneridge, Inc. (a) | 33,804 | 372,182 | |
Strattec Security Corp. | 672 | 46,852 | |
Superior Industries International, Inc. | 32,436 | 592,930 | |
Tenneco, Inc. (a) | 64,500 | 3,885,480 | |
The Goodyear Tire & Rubber Co. | 279,104 | 7,499,524 | |
Tower International, Inc. (a) | 19,656 | 504,766 | |
TRW Automotive Holdings Corp. (a)(d) | 137,074 | 11,283,932 | |
UQM Technologies, Inc. (a)(d) | 38,648 | 66,861 | |
Visteon Corp. (a) | 54,951 | 4,584,562 | |
| 143,544,703 | ||
Automobiles - 0.7% | |||
Ford Motor Co. | 4,410,723 | 67,881,027 | |
General Motors Co. | 1,463,920 | 52,993,904 | |
Harley-Davidson, Inc. | 252,087 | 16,652,867 | |
Tesla Motors, Inc. (a)(d) | 92,060 | 22,537,209 | |
Thor Industries, Inc. (d) | 46,074 | 2,580,605 | |
Winnebago Industries, Inc. (a) | 39,123 | 1,043,019 | |
| 163,688,631 | ||
Distributors - 0.1% | |||
Core-Mark Holding Co., Inc. | 11,158 | 872,556 | |
Genuine Parts Co. | 171,602 | 15,116,420 | |
LKQ Corp. (a) | 344,122 | 9,597,563 | |
Pool Corp. (d) | 48,205 | 2,818,064 | |
VOXX International Corp. (a) | 18,073 | 234,949 | |
Weyco Group, Inc. | 1,992 | 52,549 | |
| 28,692,101 | ||
| |||
Shares | Value | ||
Diversified Consumer Services - 0.2% | |||
American Public Education, Inc. (a)(d) | 16,975 | $ 601,255 | |
Apollo Ed Group, Inc. Class A (non-vtg.) (a)(d) | 111,836 | 3,727,494 | |
Ascent Capital Group, Inc. (a)(d) | 16,905 | 1,241,334 | |
Bridgepoint Education, Inc. (a) | 9,049 | 174,555 | |
Bright Horizons Family Solutions, Inc. (a) | 22,321 | 881,010 | |
Capella Education Co. (d) | 13,812 | 918,222 | |
Career Education Corp. (a) | 44,821 | 331,227 | |
Carriage Services, Inc. | 15,957 | 326,002 | |
Collectors Universe, Inc. (d) | 4,772 | 85,896 | |
Corinthian Colleges, Inc. (a)(d) | 84,173 | 131,310 | |
DeVry, Inc. | 60,163 | 2,527,448 | |
Education Management Corp. (a)(d) | 26,671 | 158,426 | |
Graham Holdings Co. | 4,705 | 3,381,484 | |
Grand Canyon Education, Inc. (a)(d) | 52,030 | 2,466,222 | |
H&R Block, Inc. | 306,192 | 9,687,915 | |
Hillenbrand, Inc. | 60,464 | 1,806,664 | |
Houghton Mifflin Harcourt Co. | 90,368 | 1,836,278 | |
ITT Educational Services, Inc. (a)(d) | 22,063 | 684,615 | |
K12, Inc. (a) | 35,687 | 807,597 | |
Learning Tree International, Inc. (a) | 3,285 | 10,413 | |
LifeLock, Inc. (a)(d) | 108,404 | 2,158,324 | |
Lincoln Educational Services Corp. | 15,671 | 70,520 | |
Matthews International Corp. Class A (d) | 31,601 | 1,296,589 | |
National American University Holdings, Inc. | 5,378 | 20,221 | |
Regis Corp. (d) | 37,626 | 529,022 | |
Service Corp. International | 236,136 | 4,413,382 | |
Sotheby's Class A (Ltd. vtg.) | 74,799 | 3,516,301 | |
Steiner Leisure Ltd. (a) | 10,649 | 470,899 | |
Strayer Education, Inc. (a)(d) | 14,558 | 695,436 | |
Universal Technical Institute, Inc. | 29,419 | 398,039 | |
Weight Watchers International, Inc. (d) | 23,857 | 507,200 | |
| 45,861,300 | ||
Hotels, Restaurants & Leisure - 2.0% | |||
Ambassadors Group, Inc. | 24,177 | 95,499 | |
Bally Technologies, Inc. (a)(d) | 46,562 | 3,154,576 | |
Biglari Holdings, Inc. (d) | 1,404 | 630,382 | |
BJ's Restaurants, Inc. (a)(d) | 35,904 | 994,541 | |
Bloomin' Brands, Inc. (a) | 77,659 | 1,952,347 | |
Bob Evans Farms, Inc. | 27,901 | 1,443,598 | |
Boyd Gaming Corp. (a) | 82,652 | 960,416 | |
Bravo Brio Restaurant Group, Inc. (a) | 12,451 | 192,866 | |
Brinker International, Inc. | 84,914 | 4,670,270 | |
Buffalo Wild Wings, Inc. (a)(d) | 20,168 | 2,924,360 | |
Burger King Worldwide, Inc. | 82,686 | 2,197,794 | |
Caesars Entertainment Corp. (a) | 37,816 | 981,703 | |
Carnival Corp. unit | 487,062 | 19,316,879 | |
Carrols Restaurant Group, Inc. (a) | 6,381 | 45,305 | |
Chipotle Mexican Grill, Inc. (a)(d) | 34,438 | 19,464,702 | |
Choice Hotels International, Inc. (d) | 44,031 | 2,150,034 | |
Churchill Downs, Inc. | 15,167 | 1,410,531 | |
Common Stocks - continued | |||
Shares | Value | ||
CONSUMER DISCRETIONARY - continued | |||
Hotels, Restaurants & Leisure - continued | |||
Chuys Holdings, Inc. (a)(d) | 13,590 | $ 541,018 | |
ClubCorp Holdings, Inc. | 20,697 | 360,542 | |
Cosi, Inc. (a)(d) | 11,735 | 15,490 | |
Cracker Barrel Old Country Store, Inc. | 24,866 | 2,472,924 | |
Darden Restaurants, Inc. | 141,692 | 7,234,794 | |
Del Frisco's Restaurant Group, Inc. (a) | 28,720 | 747,869 | |
Denny's Corp. (a) | 71,197 | 484,140 | |
Diamond Resorts International, Inc. | 18,779 | 341,590 | |
DineEquity, Inc. | 19,807 | 1,658,836 | |
Domino's Pizza, Inc. | 66,862 | 5,286,110 | |
Dover Downs Gaming & Entertainment, Inc. (a) | 1,508 | 2,337 | |
Dover Motorsports, Inc. | 9,993 | 22,584 | |
Dunkin' Brands Group, Inc. | 121,165 | 6,260,596 | |
Einstein Noah Restaurant Group, Inc. | 3,797 | 56,651 | |
Empire Resorts, Inc. (a)(d) | 5,314 | 41,024 | |
Entertainment Gaming Asia, Inc. (a) | 8,246 | 9,318 | |
Extended Stay America, Inc. unit | 49,140 | 1,252,087 | |
Famous Dave's of America, Inc. (a) | 2,311 | 56,573 | |
Fiesta Restaurant Group, Inc. (a) | 33,170 | 1,666,129 | |
Frisch's Restaurants, Inc. | 500 | 11,910 | |
Hyatt Hotels Corp. Class A (a)(d) | 74,342 | 3,877,679 | |
Ignite Restaurant Group, Inc. (a)(d) | 4,841 | 59,254 | |
International Game Technology | 268,403 | 4,050,201 | |
International Speedway Corp. Class A (d) | 27,626 | 931,825 | |
Interval Leisure Group, Inc. | 46,155 | 1,254,954 | |
Isle of Capri Casinos, Inc. (a) | 20,657 | 185,913 | |
Jack in the Box, Inc. (a) | 42,139 | 2,420,886 | |
Jamba, Inc. (a)(d) | 19,136 | 241,688 | |
Kona Grill, Inc. (a) | 4,029 | 77,760 | |
Krispy Kreme Doughnuts, Inc. (a)(d) | 81,924 | 1,558,194 | |
Lakes Entertainment, Inc. (a) | 2,872 | 14,504 | |
Las Vegas Sands Corp. | 430,440 | 36,695,010 | |
Life Time Fitness, Inc. (a)(d) | 38,055 | 1,796,196 | |
Luby's, Inc. (a) | 14,614 | 92,799 | |
Marcus Corp. | 22,859 | 322,540 | |
Marriott International, Inc. Class A | 251,677 | 13,648,444 | |
Marriott Vacations Worldwide Corp. (a) | 31,069 | 1,629,258 | |
McDonald's Corp. | 1,103,535 | 105,001,355 | |
MGM Mirage, Inc. (a)(d) | 371,095 | 10,223,667 | |
Monarch Casino & Resort, Inc. (a) | 4,802 | 90,518 | |
Morgans Hotel Group Co. (a) | 27,678 | 221,424 | |
MTR Gaming Group, Inc. (a) | 11,304 | 59,798 | |
Multimedia Games Holding Co., Inc. (a) | 28,049 | 926,318 | |
Noodles & Co. (d) | 16,951 | 674,819 | |
Norwegian Cruise Line Holdings Ltd. (a) | 107,864 | 3,696,499 | |
Orient Express Hotels Ltd. Class A (a) | 110,162 | 1,696,495 | |
Panera Bread Co. Class A (a)(d) | 29,209 | 5,296,176 | |
Papa John's International, Inc. | 38,520 | 1,960,668 | |
Penn National Gaming, Inc. (a) | 66,856 | 859,100 | |
Pinnacle Entertainment, Inc. (a)(d) | 61,922 | 1,504,705 | |
| |||
Shares | Value | ||
Pizza Inn Holdings, Inc. (a) | 9,079 | $ 57,924 | |
Popeyes Louisiana Kitchen, Inc. (a) | 24,822 | 994,369 | |
Potbelly Corp. (d) | 17,598 | 376,773 | |
Premier Exhibitions, Inc. (a) | 7,733 | 6,805 | |
Red Lion Hotels Corp. (a) | 3,129 | 18,680 | |
Red Robin Gourmet Burgers, Inc. (a)(d) | 21,139 | 1,647,362 | |
Rick's Cabaret International, Inc. (a)(d) | 5,726 | 65,105 | |
Royal Caribbean Cruises Ltd. (d) | 178,138 | 9,428,844 | |
Ruby Tuesday, Inc. (a)(d) | 44,363 | 271,945 | |
Ruth's Hospitality Group, Inc. | 33,916 | 419,202 | |
Scientific Games Corp. Class A (a) | 45,645 | 611,643 | |
SeaWorld Entertainment, Inc. | 59,356 | 2,026,414 | |
Six Flags Entertainment Corp. | 100,414 | 4,096,891 | |
Sonic Corp. (a) | 98,965 | 2,016,907 | |
Speedway Motorsports, Inc. | 7,569 | 150,018 | |
Starbucks Corp. | 841,635 | 59,722,420 | |
Starwood Hotels & Resorts Worldwide, Inc. | 213,692 | 17,621,042 | |
Texas Roadhouse, Inc. Class A | 57,171 | 1,512,173 | |
The Cheesecake Factory, Inc. (d) | 58,805 | 2,794,414 | |
Town Sports International Holdings, Inc. | 13,107 | 119,012 | |
Vail Resorts, Inc. | 38,833 | 2,730,737 | |
Wendy's Co. | 318,091 | 3,047,312 | |
Wyndham Worldwide Corp. | 137,748 | 10,039,074 | |
Wynn Resorts Ltd. | 89,427 | 21,685,153 | |
Yum! Brands, Inc. | 502,140 | 37,198,531 | |
| 470,835,722 | ||
Household Durables - 0.6% | |||
Bassett Furniture Industries, Inc. | 1,947 | 29,166 | |
Beazer Homes U.S.A., Inc. (a)(d) | 23,951 | 555,424 | |
Blyth, Inc. (d) | 16,038 | 156,852 | |
Cavco Industries, Inc. (a)(d) | 9,813 | 769,830 | |
Cobra Electronics Corp. (a) | 1,032 | 3,498 | |
Comstock Holding Companies, Inc. Class A (a)(d) | 10,474 | 18,434 | |
CSS Industries, Inc. | 16,118 | 435,186 | |
D.R. Horton, Inc. (d) | 306,554 | 7,528,966 | |
Dixie Group, Inc. (a) | 6,244 | 93,660 | |
Emerson Radio Corp. (a) | 23,724 | 51,007 | |
Ethan Allen Interiors, Inc. (d) | 25,611 | 643,604 | |
Flexsteel Industries, Inc. | 2,547 | 94,621 | |
Garmin Ltd. (d) | 139,580 | 7,489,863 | |
Harman International Industries, Inc. | 77,256 | 8,091,021 | |
Helen of Troy Ltd. (a) | 38,566 | 2,518,745 | |
Hooker Furniture Corp. | 13,495 | 203,775 | |
Hovnanian Enterprises, Inc. Class A (a)(d) | 177,163 | 1,075,379 | |
iRobot Corp. (a)(d) | 34,979 | 1,466,320 | |
Jarden Corp. (a) | 133,580 | 8,211,163 | |
KB Home (d) | 76,789 | 1,566,496 | |
Kid Brands, Inc. (a) | 16,651 | 11,323 | |
Koss Corp. | 2,669 | 12,304 | |
La-Z-Boy, Inc. | 54,902 | 1,402,197 | |
Leggett & Platt, Inc. (d) | 173,875 | 5,572,694 | |
Common Stocks - continued | |||
Shares | Value | ||
CONSUMER DISCRETIONARY - continued | |||
Household Durables - continued | |||
Lennar Corp. Class A | 188,180 | $ 8,257,338 | |
Libbey, Inc. (a) | 16,641 | 387,569 | |
Lifetime Brands, Inc. | 2,385 | 39,925 | |
M.D.C. Holdings, Inc. (d) | 36,801 | 1,147,823 | |
M/I Homes, Inc. (a)(d) | 24,871 | 619,288 | |
Meritage Homes Corp. (a) | 46,552 | 2,244,272 | |
Mohawk Industries, Inc. (a) | 71,448 | 10,112,035 | |
NACCO Industries, Inc. Class A | 6,219 | 364,620 | |
Newell Rubbermaid, Inc. | 312,041 | 10,019,637 | |
NVR, Inc. (a) | 5,106 | 6,086,352 | |
Parametric Sound Corp. (a)(d) | 6,672 | 99,012 | |
PulteGroup, Inc. | 383,741 | 8,054,724 | |
Ryland Group, Inc. | 46,168 | 2,150,967 | |
Skullcandy, Inc. (a) | 12,653 | 106,412 | |
Skyline Corp. (a) | 21,741 | 125,011 | |
Standard Pacific Corp. (a)(d) | 138,811 | 1,264,568 | |
Stanley Furniture Co., Inc. (a) | 5,699 | 17,211 | |
Taylor Morrison Home Corp. | 26,856 | 674,623 | |
Tempur Sealy International, Inc. (a) | 69,336 | 3,596,458 | |
Toll Brothers, Inc. (a)(d) | 153,983 | 6,006,877 | |
TRI Pointe Homes, Inc. (d) | 13,100 | 238,682 | |
Tupperware Brands Corp. | 56,734 | 4,459,292 | |
UCP, Inc. | 9,479 | 150,716 | |
Universal Electronics, Inc. (a) | 14,332 | 598,934 | |
WCI Communities, Inc. | 8,622 | 173,992 | |
Whirlpool Corp. | 87,714 | 12,686,076 | |
William Lyon Homes, Inc. (a) | 5,678 | 175,621 | |
Zagg, Inc. (a)(d) | 21,268 | 92,090 | |
| 127,951,653 | ||
Internet & Catalog Retail - 1.3% | |||
1-800-FLOWERS.com, Inc. Class A (a) | 31,570 | 166,058 | |
Amazon.com, Inc. (a) | 416,019 | 150,640,480 | |
Blue Nile, Inc. (a)(d) | 11,337 | 398,949 | |
dELiA*s, Inc. (a)(d) | 2,977 | 3,215 | |
Expedia, Inc. | 112,037 | 8,798,266 | |
FTD Companies, Inc. (a)(d) | 14,396 | 447,140 | |
Gaiam, Inc. Class A (a) | 12,609 | 81,202 | |
Geeknet, Inc. (a) | 2,810 | 40,914 | |
Groupon, Inc. Class A (a)(d) | 426,564 | 3,544,747 | |
HomeAway, Inc. (a)(d) | 82,532 | 3,785,743 | |
HSN, Inc. | 37,772 | 2,166,224 | |
Liberty Interactive Corp.: | |||
(Venture Group) Series A (a) | 40,463 | 5,766,382 | |
Series A (a) | 531,914 | 15,531,889 | |
Netflix, Inc. (a) | 66,145 | 29,476,196 | |
NutriSystem, Inc. | 26,922 | 396,292 | |
Orbitz Worldwide, Inc. (a) | 31,286 | 302,223 | |
Overstock.com, Inc. (a)(d) | 14,467 | 284,566 | |
PetMed Express, Inc. (d) | 32,292 | 445,630 | |
priceline.com, Inc. (a) | 57,502 | 77,560,998 | |
RetailMeNot, Inc. | 11,243 | 469,620 | |
| |||
Shares | Value | ||
Shutterfly, Inc. (a)(d) | 48,378 | $ 2,639,504 | |
TripAdvisor, Inc. (a) | 123,509 | 12,380,542 | |
U.S. Auto Parts Network, Inc. (a) | 5,048 | 10,399 | |
ValueVision Media, Inc. Class A (a) | 41,726 | 233,248 | |
Vitacost.com, Inc. (a)(d) | 15,384 | 114,611 | |
zulily, Inc. (d) | 24,900 | 1,702,911 | |
| 317,387,949 | ||
Leisure Equipment & Products - 0.2% | |||
Arctic Cat, Inc. | 18,718 | 876,377 | |
Black Diamond, Inc. (a)(d) | 20,004 | 211,642 | |
Brunswick Corp. | 91,271 | 4,088,028 | |
Callaway Golf Co. | 77,147 | 649,578 | |
Hasbro, Inc. | 122,518 | 6,758,093 | |
JAKKS Pacific, Inc. (d) | 19,661 | 140,773 | |
Johnson Outdoors, Inc. Class A | 3,505 | 77,320 | |
Leapfrog Enterprises, Inc. Class A (a)(d) | 85,630 | 623,386 | |
Marine Products Corp. | 11,741 | 99,916 | |
Mattel, Inc. | 388,136 | 14,481,354 | |
Nautilus, Inc. (a) | 31,083 | 260,786 | |
Polaris Industries, Inc. | 67,562 | 9,055,335 | |
Smith & Wesson Holding Corp. (a)(d) | 80,794 | 929,131 | |
Sturm, Ruger & Co., Inc. (d) | 24,417 | 1,556,340 | |
Summer Infant, Inc. (a) | 32,605 | 60,319 | |
| 39,868,378 | ||
Media - 3.5% | |||
A.H. Belo Corp. Class A | 22,177 | 244,834 | |
AMC Networks, Inc. Class A (a)(d) | 63,313 | 4,813,054 | |
Ballantyne of Omaha, Inc. (a) | 17,964 | 83,173 | |
Cablevision Systems Corp. - NY Group Class A (d) | 252,827 | 4,449,755 | |
Carmike Cinemas, Inc. (a) | 21,753 | 647,152 | |
CBS Corp. Class B | 612,367 | 41,077,578 | |
Central European Media Enterprises Ltd. Class A (a)(d) | 56,729 | 268,895 | |
Charter Communications, Inc. Class A (a)(d) | 75,058 | 9,515,103 | |
Cinemark Holdings, Inc. | 124,821 | 3,672,234 | |
Clear Channel Outdoor Holding, Inc. Class A | 41,131 | 413,367 | |
Comcast Corp. Class A | 2,920,366 | 150,953,719 | |
Crown Media Holdings, Inc. Class A (a)(d) | 24,979 | 83,680 | |
Cumulus Media, Inc. Class A (a) | 122,704 | 804,938 | |
Digital Cinema Destinations Co. (a) | 1,935 | 10,836 | |
DIRECTV (a) | 546,908 | 42,440,061 | |
Discovery Communications, Inc. Class A (a)(d) | 266,951 | 22,242,357 | |
DISH Network Corp. Class A (a) | 230,721 | 13,575,624 | |
DreamWorks Animation SKG, Inc. Class A (a)(d) | 82,729 | 2,474,424 | |
E.W. Scripps Co. Class A (a) | 24,274 | 476,256 | |
Emmis Communications Corp. Class A (a) | 7,973 | 25,035 | |
Common Stocks - continued | |||
Shares | Value | ||
CONSUMER DISCRETIONARY - continued | |||
Media - continued | |||
Entercom Communications Corp. | 21,235 | $ 210,014 | |
Entravision Communication Corp. | 63,982 | 424,201 | |
FAB Universal Corp. (a)(d) | 3,212 | 9,861 | |
Gannett Co., Inc. | 257,425 | 7,658,394 | |
Gray Television, Inc. (a) | 54,130 | 636,028 | |
Harte-Hanks, Inc. | 45,482 | 363,401 | |
Hemisphere Media Group, Inc. (a)(d) | 2,493 | 27,772 | |
Insignia Systems, Inc. (a) | 5,038 | 15,719 | |
Interpublic Group of Companies, Inc. | 525,417 | 9,310,389 | |
John Wiley & Sons, Inc. Class A (d) | 54,942 | 3,188,284 | |
Journal Communications, Inc. Class A (a) | 23,068 | 211,534 | |
Lamar Advertising Co. Class A (a) | 69,336 | 3,717,103 | |
Liberty Global PLC Class A (a) | 419,364 | 36,295,954 | |
Liberty Media Corp. Class A (a) | 117,554 | 16,123,707 | |
Live Nation Entertainment, Inc. (a) | 175,329 | 3,978,215 | |
Loral Space & Communications Ltd. (a) | 15,593 | 1,232,159 | |
Martha Stewart Living Omnimedia, Inc. Class A (a)(d) | 39,255 | 206,481 | |
Media General, Inc. Class A (a)(d) | 21,745 | 412,503 | |
Meredith Corp. | 34,788 | 1,628,078 | |
Morningstar, Inc. | 26,885 | 2,249,199 | |
National CineMedia, Inc. | 63,847 | 980,690 | |
News Corp. Class A (a) | 570,404 | 10,455,505 | |
Nexstar Broadcasting Group, Inc. | 29,134 | 1,243,439 | |
Omnicom Group, Inc. | 286,890 | 21,711,835 | |
Radio One, Inc. Class D (non-vtg.) (a) | 32,336 | 160,710 | |
ReachLocal, Inc. (a)(d) | 5,194 | 54,953 | |
Regal Entertainment Group Class A (d) | 109,971 | 2,023,466 | |
Rentrak Corp. (a) | 11,595 | 743,355 | |
RLJ Entertainment, Inc. (a) | 17,180 | 75,592 | |
Saga Communications, Inc. Class A | 268 | 13,108 | |
Salem Communications Corp. Class A | 1,732 | 15,744 | |
Scholastic Corp. (d) | 25,364 | 894,842 | |
Scripps Networks Interactive, Inc. Class A | 122,180 | 9,925,903 | |
SFX Entertainment, Inc. (d) | 45,804 | 393,456 | |
Sinclair Broadcast Group, Inc. Class A | 75,746 | 2,243,597 | |
Sirius XM Holdings, Inc. (a)(d) | 3,471,318 | 12,531,458 | |
Sizmek, Inc. (a) | 26,444 | 327,641 | |
Spanish Broadcasting System, Inc. | 698 | 3,015 | |
Starz - Liberty Capital Series A (a) | 120,965 | 3,868,461 | |
The Madison Square Garden Co. | 76,074 | 4,336,979 | |
The McClatchy Co. Class A (a)(d) | 60,729 | 322,471 | |
The New York Times Co. Class A (d) | 162,888 | 2,674,621 | |
The Walt Disney Co. | 1,835,422 | 148,320,452 | |
Time Warner Cable, Inc. | 315,166 | 44,233,548 | |
Time Warner, Inc. | 1,015,248 | 68,153,598 | |
Twenty-First Century Fox, Inc. Class A | 2,209,366 | 74,102,136 | |
| |||
Shares | Value | ||
Viacom, Inc. Class B (non-vtg.) | 455,180 | $ 39,932,941 | |
World Wrestling Entertainment, Inc. | 44,310 | 1,015,585 | |
| 836,930,172 | ||
Multiline Retail - 0.6% | |||
Big Lots, Inc. (a)(d) | 72,215 | 2,133,953 | |
Burlington Stores, Inc. | 29,361 | 800,087 | |
Dillard's, Inc. Class A | 32,687 | 3,026,162 | |
Dollar General Corp. (a) | 325,481 | 19,496,312 | |
Dollar Tree, Inc. (a) | 232,809 | 12,750,949 | |
Family Dollar Stores, Inc. | 100,910 | 6,609,605 | |
Fred's, Inc. Class A | 41,012 | 817,369 | |
Gordmans Stores, Inc. | 10,233 | 64,980 | |
J.C. Penney Co., Inc. (a)(d) | 341,476 | 2,485,945 | |
Kohl's Corp. (d) | 228,989 | 12,866,892 | |
Macy's, Inc. | 412,775 | 23,883,162 | |
Nordstrom, Inc. (d) | 167,016 | 10,268,144 | |
Sears Holdings Corp. (a)(d) | 47,917 | 2,144,286 | |
Target Corp. | 708,070 | 44,282,698 | |
The Bon-Ton Stores, Inc. (d) | 19,775 | 214,757 | |
Tuesday Morning Corp. (a) | 41,198 | 644,337 | |
| 142,489,638 | ||
Specialty Retail - 2.3% | |||
Aarons, Inc. Class A | 97,238 | 2,988,124 | |
Abercrombie & Fitch Co. Class A | 83,791 | 3,320,637 | |
Advance Auto Parts, Inc. | 81,101 | 10,329,023 | |
Aeropostale, Inc. (a)(d) | 70,783 | 519,547 | |
America's Car Mart, Inc. (a)(d) | 10,422 | 377,693 | |
American Eagle Outfitters, Inc. | 183,756 | 2,669,975 | |
ANN, Inc. (a) | 46,918 | 1,672,627 | |
Asbury Automotive Group, Inc. (a) | 30,567 | 1,554,026 | |
Ascena Retail Group, Inc. (a) | 155,242 | 2,839,376 | |
AutoNation, Inc. (a)(d) | 67,092 | 3,531,723 | |
AutoZone, Inc. (a)(d) | 38,173 | 20,553,870 | |
Barnes & Noble, Inc. (a)(d) | 41,457 | 794,316 | |
bebe stores, Inc. | 66,951 | 406,393 | |
Bed Bath & Beyond, Inc. (a)(d) | 238,027 | 16,142,991 | |
Best Buy Co., Inc. (d) | 298,597 | 7,951,638 | |
Big 5 Sporting Goods Corp. | 16,237 | 246,478 | |
Body Central Corp. (a)(d) | 23,522 | 73,389 | |
Books-A-Million, Inc. (a) | 4,414 | 9,932 | |
Brown Shoe Co., Inc. | 39,452 | 969,730 | |
Build-A-Bear Workshop, Inc. (a) | 4,049 | 31,339 | |
Cabela's, Inc. Class A (a)(d) | 48,135 | 3,192,313 | |
Cache, Inc. (a) | 2,880 | 15,264 | |
CarMax, Inc. (a)(d) | 255,540 | 12,375,802 | |
Chico's FAS, Inc. | 157,246 | 2,599,276 | |
Christopher & Banks Corp. (a) | 22,706 | 151,222 | |
Citi Trends, Inc. (a) | 14,433 | 236,701 | |
Coldwater Creek, Inc. (a)(d) | 13,235 | 10,363 | |
Conn's, Inc. (a)(d) | 26,557 | 950,741 | |
CST Brands, Inc. (d) | 80,048 | 2,603,961 | |
Destination Maternity Corp. | 9,860 | 278,446 | |
Common Stocks - continued | |||
Shares | Value | ||
CONSUMER DISCRETIONARY - continued | |||
Specialty Retail - continued | |||
Destination XL Group, Inc. (a) | 42,389 | $ 241,617 | |
Dick's Sporting Goods, Inc. | 112,695 | 6,048,341 | |
DSW, Inc. Class A | 85,923 | 3,306,317 | |
Express, Inc. (a)(d) | 106,219 | 1,942,746 | |
Finish Line, Inc. Class A | 46,538 | 1,257,457 | |
Five Below, Inc. (a)(d) | 50,515 | 1,946,848 | |
Foot Locker, Inc. | 173,316 | 7,229,010 | |
Francesca's Holdings Corp. (a)(d) | 45,454 | 889,535 | |
GameStop Corp. Class A (d) | 126,929 | 4,735,721 | |
Gap, Inc. | 291,066 | 12,734,138 | |
Genesco, Inc. (a)(d) | 32,141 | 2,386,469 | |
GNC Holdings, Inc. | 100,621 | 4,680,889 | |
Group 1 Automotive, Inc. | 20,341 | 1,357,965 | |
Guess?, Inc. (d) | 63,670 | 1,931,748 | |
Haverty Furniture Companies, Inc. | 22,550 | 657,333 | |
hhgregg, Inc. (a)(d) | 15,184 | 160,799 | |
Hibbett Sports, Inc. (a)(d) | 34,547 | 1,980,580 | |
Home Depot, Inc. | 1,576,595 | 129,328,088 | |
Jos. A. Bank Clothiers, Inc. (a)(d) | 27,787 | 1,725,017 | |
Kirkland's, Inc. (a) | 10,699 | 189,158 | |
L Brands, Inc. | 276,125 | 15,554,121 | |
Lithia Motors, Inc. Class A (sub. vtg.) | 20,666 | 1,310,638 | |
Lowe's Companies, Inc. | 1,177,450 | 58,907,824 | |
Lumber Liquidators Holdings, Inc. (a)(d) | 28,798 | 3,089,449 | |
MarineMax, Inc. (a)(d) | 17,627 | 253,829 | |
Mattress Firm Holding Corp. (a)(d) | 21,081 | 918,921 | |
Monro Muffler Brake, Inc. | 39,787 | 2,374,090 | |
Murphy U.S.A., Inc. (d) | 44,959 | 1,823,537 | |
New York & Co., Inc. (a) | 19,427 | 86,062 | |
O'Reilly Automotive, Inc. (a) | 120,525 | 18,181,196 | |
Office Depot, Inc. (a) | 562,961 | 2,775,398 | |
Outerwall, Inc. (a)(d) | 30,388 | 2,149,343 | |
Pacific Sunwear of California, Inc. (a) | 60,120 | 171,943 | |
Penske Automotive Group, Inc. | 59,093 | 2,558,136 | |
Perfumania Holdings, Inc. (a) | 876 | 5,475 | |
PetSmart, Inc. (d) | 112,024 | 7,512,329 | |
Pier 1 Imports, Inc. | 103,847 | 1,964,785 | |
RadioShack Corp. (a)(d) | 135,907 | 364,231 | |
Rent-A-Center, Inc. (d) | 61,802 | 1,553,702 | |
Restoration Hardware Holdings, Inc. (a) | 26,612 | 1,802,165 | |
Ross Stores, Inc. | 237,822 | 17,313,442 | |
Sally Beauty Holdings, Inc. (a) | 173,033 | 4,966,047 | |
Sears Hometown & Outlet Stores, Inc. (a) | 10,000 | 231,600 | |
Select Comfort Corp. (a) | 68,724 | 1,241,155 | |
Shoe Carnival, Inc. | 12,148 | 313,904 | |
Signet Jewelers Ltd. | 91,119 | 8,706,420 | |
Sonic Automotive, Inc. Class A (sub. vtg.) | 32,657 | 775,930 | |
Stage Stores, Inc. | 33,300 | 659,340 | |
Staples, Inc. (d) | 763,388 | 10,374,443 | |
Stein Mart, Inc. | 28,029 | 380,914 | |
Systemax, Inc. (a) | 6,560 | 77,211 | |
| |||
Shares | Value | ||
The Buckle, Inc. (d) | 31,903 | $ 1,447,439 | |
The Cato Corp. Class A (sub. vtg.) | 30,985 | 869,749 | |
The Children's Place Retail Stores, Inc. | 22,249 | 1,205,228 | |
The Container Store Group, Inc. (d) | 22,029 | 788,858 | |
The Men's Wearhouse, Inc. | 53,679 | 2,887,393 | |
The Pep Boys - Manny, Moe & Jack (a) | 83,764 | 1,054,589 | |
Tiffany & Co., Inc. | 125,464 | 11,699,518 | |
Tile Shop Holdings, Inc. (a)(d) | 33,873 | 522,322 | |
Tilly's, Inc. (a) | 6,806 | 81,400 | |
TJX Companies, Inc. | 803,532 | 49,385,077 | |
Tractor Supply Co. | 152,035 | 10,727,590 | |
Trans World Entertainment Corp. | 2,977 | 12,444 | |
Ulta Salon, Cosmetics & Fragrance, Inc. (a) | 70,571 | 6,329,513 | |
Urban Outfitters, Inc. (a) | 117,805 | 4,410,619 | |
Vitamin Shoppe, Inc. (a) | 37,155 | 1,738,482 | |
West Marine, Inc. (a) | 3,285 | 40,997 | |
Wet Seal, Inc. Class A (a) | 66,930 | 127,167 | |
Williams-Sonoma, Inc. (d) | 104,808 | 6,104,018 | |
Winmark Corp. | 391 | 30,905 | |
Zale Corp. (a) | 43,224 | 939,258 | |
Zumiez, Inc. (a) | 17,893 | 425,138 | |
| 553,351,976 | ||
Textiles, Apparel & Luxury Goods - 0.9% | |||
American Apparel, Inc. (a)(d) | 42,333 | 30,484 | |
Carter's, Inc. | 59,364 | 4,471,890 | |
Cherokee, Inc. | 20,319 | 288,936 | |
Coach, Inc. | 312,163 | 15,236,676 | |
Columbia Sportswear Co. | 17,213 | 1,430,228 | |
Crocs, Inc. (a) | 99,425 | 1,514,243 | |
Culp, Inc. | 7,038 | 135,693 | |
Deckers Outdoor Corp. (a)(d) | 36,096 | 2,683,738 | |
Delta Apparel, Inc. (a) | 1,905 | 30,842 | |
Fossil Group, Inc. (a) | 55,600 | 6,388,996 | |
G-III Apparel Group Ltd. (a) | 22,660 | 1,574,643 | |
Hanesbrands, Inc. | 122,600 | 8,984,128 | |
Iconix Brand Group, Inc. (a)(d) | 61,164 | 2,461,239 | |
Joe's Jeans, Inc. (a)(d) | 32,503 | 45,829 | |
Kate Spade & Co. (a) | 135,197 | 4,626,441 | |
lululemon athletica, Inc. (a)(d) | 116,534 | 5,862,826 | |
Michael Kors Holdings Ltd. (a) | 198,823 | 19,490,619 | |
Movado Group, Inc. | 22,005 | 866,337 | |
NIKE, Inc. Class B | 832,833 | 65,210,824 | |
Oxford Industries, Inc. (d) | 16,560 | 1,295,986 | |
Perry Ellis International, Inc. (a) | 7,954 | 110,958 | |
PVH Corp. | 91,345 | 11,548,748 | |
Quiksilver, Inc. (a)(d) | 190,833 | 1,488,497 | |
R.G. Barry Corp. | 3,640 | 67,413 | |
Ralph Lauren Corp. | 67,433 | 10,862,108 | |
Skechers U.S.A., Inc. Class A (sub. vtg.) (a) | 52,325 | 1,764,922 | |
Steven Madden Ltd. (a) | 61,062 | 2,225,710 | |
Superior Uniform Group, Inc. | 859 | 14,320 | |
The Jones Group, Inc. | 74,838 | 1,118,080 | |
Common Stocks - continued | |||
Shares | Value | ||
CONSUMER DISCRETIONARY - continued | |||
Textiles, Apparel & Luxury Goods - continued | |||
Tumi Holdings, Inc. (a)(d) | 57,908 | $ 1,283,241 | |
Under Armour, Inc. Class A (sub. vtg.) (a)(d) | 88,501 | 10,013,888 | |
Unifi, Inc. (a) | 18,843 | 466,176 | |
Vera Bradley, Inc. (a)(d) | 20,509 | 543,489 | |
VF Corp. | 392,352 | 22,987,904 | |
Vince Holding Corp. | 20,302 | 548,154 | |
Wolverine World Wide, Inc. (d) | 127,356 | 3,357,104 | |
| 211,031,310 | ||
TOTAL CONSUMER DISCRETIONARY | 3,081,633,533 | ||
CONSUMER STAPLES - 8.1% | |||
Beverages - 1.7% | |||
Beam, Inc. | 184,801 | 15,331,091 | |
Boston Beer Co., Inc. Class A (a)(d) | 9,413 | 2,228,528 | |
Brown-Forman Corp. Class B (non-vtg.) | 196,483 | 16,465,275 | |
Coca-Cola Bottling Co. Consolidated | 4,325 | 327,143 | |
Coca-Cola Enterprises, Inc. | 270,815 | 12,749,970 | |
Constellation Brands, Inc. Class A (sub. vtg.) (a) | 191,384 | 15,507,846 | |
Craft Brew Alliance, Inc. (a) | 5,908 | 96,478 | |
Dr. Pepper Snapple Group, Inc. | 262,765 | 13,692,684 | |
MGP Ingredients, Inc. | 4,299 | 24,418 | |
Molson Coors Brewing Co. Class B | 177,848 | 10,107,102 | |
Monster Beverage Corp. (a) | 148,866 | 11,016,084 | |
National Beverage Corp. | 7,694 | 161,882 | |
PepsiCo, Inc. | 1,706,814 | 136,664,597 | |
Primo Water Corp. (a) | 8,907 | 28,859 | |
REED'S, Inc. (a) | 1,830 | 14,091 | |
The Coca-Cola Co. | 4,243,924 | 162,117,897 | |
| 396,533,945 | ||
Food & Staples Retailing - 1.9% | |||
Andersons, Inc. | 24,799 | 1,359,977 | |
Casey's General Stores, Inc. (d) | 41,971 | 2,874,594 | |
Chefs' Warehouse Holdings (a)(d) | 22,894 | 532,286 | |
Costco Wholesale Corp. | 492,638 | 57,540,118 | |
Crumbs Bake Shop, Inc. (a)(d) | 5,760 | 3,920 | |
CVS Caremark Corp. | 1,338,149 | 97,872,218 | |
Fairway Group Holdings Corp. (d) | 15,014 | 117,109 | |
Fresh Market, Inc. (a)(d) | 40,058 | 1,341,943 | |
Ingles Markets, Inc. Class A | 19,385 | 455,160 | |
Kroger Co. | 577,151 | 24,205,713 | |
Liberator Medical Holdings, Inc. (d) | 55,593 | 250,169 | |
Natural Grocers by Vitamin Cottage, Inc. (a)(d) | 6,984 | 284,528 | |
PriceSmart, Inc. (d) | 20,999 | 2,136,228 | |
Rite Aid Corp. (a) | 1,003,941 | 6,615,971 | |
Roundy's, Inc. | 18,846 | 115,714 | |
Safeway, Inc. | 286,105 | 10,714,632 | |
| |||
Shares | Value | ||
Spartan Stores, Inc. | 38,681 | $ 873,804 | |
Sprouts Farmers Market LLC | 59,567 | 2,324,304 | |
SUPERVALU, Inc. (a)(d) | 203,563 | 1,317,053 | |
Susser Holdings Corp. (a)(d) | 23,340 | 1,413,937 | |
Sysco Corp. | 659,822 | 23,766,788 | |
The Pantry, Inc. (a) | 24,320 | 366,746 | |
United Natural Foods, Inc. (a)(d) | 58,263 | 4,217,076 | |
Village Super Market, Inc. Class A | 3,352 | 91,878 | |
Wal-Mart Stores, Inc. | 1,819,358 | 135,906,043 | |
Walgreen Co. | 979,795 | 66,577,070 | |
Weis Markets, Inc. | 10,922 | 550,906 | |
Whole Foods Market, Inc. | 419,062 | 22,650,301 | |
| 466,476,186 | ||
Food Products - 1.6% | |||
Alico, Inc. | 172 | 6,529 | |
Annie's, Inc. (a)(d) | 13,936 | 522,321 | |
Archer Daniels Midland Co. | 727,236 | 29,525,782 | |
B&G Foods, Inc. Class A (d) | 63,705 | 1,908,602 | |
Boulder Brands, Inc. (a)(d) | 68,009 | 1,022,855 | |
Bunge Ltd. | 173,371 | 13,802,065 | |
Cal-Maine Foods, Inc. | 14,807 | 778,404 | |
Calavo Growers, Inc. | 8,788 | 273,658 | |
Campbell Soup Co. (d) | 196,834 | 8,524,881 | |
Chiquita Brands International, Inc. (a) | 44,016 | 481,535 | |
Coffee Holding Co., Inc. (a) | 3,401 | 20,848 | |
ConAgra Foods, Inc. | 467,264 | 13,270,298 | |
Darling International, Inc. (a) | 198,455 | 4,004,822 | |
Dean Foods Co. (d) | 86,659 | 1,281,687 | |
Diamond Foods, Inc. (a)(d) | 18,346 | 526,897 | |
Farmer Brothers Co. (a) | 3,100 | 65,348 | |
Flowers Foods, Inc. | 226,566 | 4,660,463 | |
Fresh Del Monte Produce, Inc. | 46,236 | 1,223,405 | |
General Mills, Inc. | 696,878 | 34,864,806 | |
Green Mountain Coffee Roasters, Inc. | 147,919 | 16,238,548 | |
Hillshire Brands Co. | 160,546 | 6,028,502 | |
Hormel Foods Corp. | 178,475 | 8,468,639 | |
Ingredion, Inc. | 84,243 | 5,546,559 | |
J&J Snack Foods Corp. | 16,924 | 1,571,901 | |
John B. Sanfilippo & Son, Inc. | 4,594 | 111,405 | |
Kellogg Co. | 293,046 | 17,784,962 | |
Kraft Foods Group, Inc. | 656,547 | 36,287,353 | |
Lancaster Colony Corp. | 21,006 | 1,894,741 | |
Lifeway Foods, Inc. (d) | 1,247 | 17,907 | |
Limoneira Co. (d) | 3,738 | 78,722 | |
McCormick & Co., Inc. (non-vtg.) (d) | 157,258 | 10,441,931 | |
Mead Johnson Nutrition Co. Class A | 221,324 | 18,048,972 | |
Mondelez International, Inc. | 1,965,952 | 66,901,347 | |
Omega Protein Corp. (a) | 32,056 | 348,449 | |
Pilgrims Pride Corp. (a) | 80,459 | 1,410,446 | |
Pinnacle Foods, Inc. | 59,152 | 1,675,185 | |
Post Holdings, Inc. (a)(d) | 36,785 | 2,101,159 | |
Sanderson Farms, Inc. (d) | 23,484 | 1,804,511 | |
Seaboard Corp. (a) | 366 | 927,821 | |
Common Stocks - continued | |||
Shares | Value | ||
CONSUMER STAPLES - continued | |||
Food Products - continued | |||
Seneca Foods Corp. Class A (a) | 7,029 | $ 212,838 | |
Snyders-Lance, Inc. | 57,191 | 1,549,304 | |
The Hain Celestial Group, Inc. (a)(d) | 54,436 | 4,861,135 | |
The Hershey Co. | 166,455 | 17,614,268 | |
The J.M. Smucker Co. | 116,444 | 11,645,564 | |
Tootsie Roll Industries, Inc. (d) | 31,326 | 911,587 | |
TreeHouse Foods, Inc. (a)(d) | 37,174 | 2,649,019 | |
Tyson Foods, Inc. Class A | 316,718 | 12,494,525 | |
WhiteWave Foods Co. (a) | 197,524 | 5,589,929 | |
| 371,982,435 | ||
Household Products - 1.6% | |||
Central Garden & Pet Co. Class A (non-vtg.) (a) | 34,714 | 255,495 | |
Church & Dwight Co., Inc. (d) | 156,776 | 10,657,632 | |
Clorox Co. (d) | 141,939 | 12,388,436 | |
Colgate-Palmolive Co. | 983,245 | 61,777,283 | |
Energizer Holdings, Inc. | 78,749 | 7,665,428 | |
Harbinger Group, Inc. (a) | 38,325 | 434,989 | |
Kimberly-Clark Corp. | 427,756 | 47,202,875 | |
Oil-Dri Corp. of America | 644 | 21,381 | |
Orchids Paper Products Co. | 2,087 | 70,269 | |
Procter & Gamble Co. | 3,041,449 | 239,240,378 | |
Spectrum Brands Holdings, Inc. | 23,337 | 1,820,519 | |
WD-40 Co. | 17,410 | 1,269,363 | |
| 382,804,048 | ||
Personal Products - 0.2% | |||
Avon Products, Inc. | 507,422 | 7,849,818 | |
Coty, Inc. Class A (d) | 75,823 | 1,125,972 | |
Cyanotech Corp. (a) | 2,300 | 13,915 | |
Elizabeth Arden, Inc. (a)(d) | 31,918 | 975,733 | |
Estee Lauder Companies, Inc. Class A | 291,289 | 20,052,335 | |
Herbalife Ltd. (d) | 102,302 | 6,813,313 | |
Inter Parfums, Inc. | 14,485 | 486,841 | |
LifeVantage Corp. (a) | 61,077 | 81,232 | |
Mannatech, Inc. (a) | 599 | 10,303 | |
MediFast, Inc. (a)(d) | 10,225 | 269,327 | |
Nature's Sunshine Products, Inc. | 2,859 | 43,199 | |
Nu Skin Enterprises, Inc. Class A (d) | 64,351 | 5,374,596 | |
Nutraceutical International Corp. (a) | 4,799 | 125,686 | |
Revlon, Inc. (a) | 13,966 | 329,737 | |
Star Scientific, Inc. (a)(d) | 176,304 | 156,893 | |
The Female Health Co. (d) | 11,731 | 81,061 | |
USANA Health Sciences, Inc. (a)(d) | 12,622 | 923,552 | |
| 44,713,513 | ||
Tobacco - 1.1% | |||
Alliance One International, Inc. (a) | 89,449 | 240,618 | |
Altria Group, Inc. | 2,227,481 | 80,768,461 | |
Lorillard, Inc. | 400,965 | 19,671,343 | |
Philip Morris International, Inc. | 1,800,078 | 145,644,311 | |
Reynolds American, Inc. | 362,408 | 18,421,199 | |
| |||
Shares | Value | ||
Universal Corp. (d) | 28,408 | $ 1,637,721 | |
Vector Group Ltd. (d) | 60,093 | 1,173,616 | |
| 267,557,269 | ||
TOTAL CONSUMER STAPLES | 1,930,067,396 | ||
ENERGY - 9.1% | |||
Energy Equipment & Services - 1.9% | |||
Atwood Oceanics, Inc. (a) | 74,378 | 3,524,773 | |
Baker Hughes, Inc. | 492,144 | 31,142,872 | |
Basic Energy Services, Inc. (a)(d) | 48,473 | 1,156,081 | |
Bolt Technology Corp. | 7,172 | 144,229 | |
Bristow Group, Inc. | 42,605 | 3,306,148 | |
C&J Energy Services, Inc. (a)(d) | 59,040 | 1,526,184 | |
Cal Dive International, Inc. (a)(d) | 171,858 | 304,189 | |
Cameron International Corp. (a) | 265,398 | 17,001,396 | |
Carbo Ceramics, Inc. (d) | 21,033 | 2,609,144 | |
Core Laboratories NV (d) | 52,255 | 9,826,553 | |
Dawson Geophysical Co. | 7,871 | 225,898 | |
Diamond Offshore Drilling, Inc. (d) | 83,655 | 3,956,882 | |
Dresser-Rand Group, Inc. (a) | 77,752 | 4,224,266 | |
Dril-Quip, Inc. (a) | 43,391 | 4,667,136 | |
ENGlobal Corp. (a) | 5,637 | 9,132 | |
Ensco PLC Class A | 255,890 | 13,475,167 | |
Era Group, Inc. (a) | 20,388 | 575,961 | |
Exterran Holdings, Inc. | 75,471 | 3,092,047 | |
FMC Technologies, Inc. (a)(d) | 260,114 | 13,068,127 | |
Forbes Energy Services Ltd. (a) | 500 | 2,035 | |
Forum Energy Technologies, Inc. (a)(d) | 70,638 | 1,829,524 | |
Frank's International NV | 47,687 | 1,127,321 | |
Geospace Technologies Corp. (a)(d) | 13,736 | 1,054,513 | |
Global Geophysical Services, Inc. (a)(d) | 29,499 | 41,299 | |
GreenHunter Energy, Inc. (a)(d) | 12,193 | 12,925 | |
Gulf Island Fabrication, Inc. | 15,288 | 320,589 | |
Gulfmark Offshore, Inc. Class A | 20,706 | 982,293 | |
Halliburton Co. | 941,615 | 53,672,055 | |
Helix Energy Solutions Group, Inc. (a) | 125,576 | 2,968,617 | |
Helmerich & Payne, Inc. | 118,617 | 11,713,429 | |
Hercules Offshore, Inc. (a)(d) | 189,533 | 902,177 | |
Hornbeck Offshore Services, Inc. (a)(d) | 29,524 | 1,262,446 | |
ION Geophysical Corp. (a)(d) | 97,381 | 396,341 | |
Key Energy Services, Inc. (a) | 163,573 | 1,478,700 | |
Matrix Service Co. (a) | 25,723 | 832,654 | |
McDermott International, Inc. (a)(d) | 280,872 | 2,339,664 | |
Mitcham Industries, Inc. (a)(d) | 23,287 | 335,100 | |
Nabors Industries Ltd. | 317,540 | 7,309,771 | |
National Oilwell Varco, Inc. | 469,940 | 36,204,178 | |
Natural Gas Services Group, Inc. (a) | 21,602 | 702,065 | |
Newpark Resources, Inc. (a)(d) | 85,435 | 950,037 | |
Noble Corp. | 280,951 | 8,723,529 | |
Nuverra Environmental Solutions, Inc. (a)(d) | 16,034 | 272,578 | |
Oceaneering International, Inc. | 112,956 | 8,085,390 | |
Common Stocks - continued | |||
Shares | Value | ||
ENERGY - continued | |||
Energy Equipment & Services - continued | |||
Oil States International, Inc. (a) | 56,000 | $ 5,315,520 | |
Parker Drilling Co. (a) | 145,338 | 1,172,878 | |
Patterson-UTI Energy, Inc. | 161,131 | 4,690,523 | |
PHI, Inc. (non-vtg.) (a) | 18,377 | 738,755 | |
Pioneer Energy Services Corp. (a) | 82,168 | 936,715 | |
RigNet, Inc. (a) | 15,376 | 735,280 | |
Rowan Companies PLC (a) | 158,021 | 5,271,581 | |
RPC, Inc. (d) | 65,463 | 1,205,174 | |
Schlumberger Ltd. | 1,469,347 | 136,649,271 | |
SEACOR Holdings, Inc. (a)(d) | 20,388 | 1,803,522 | |
Superior Energy Services, Inc. | 184,941 | 5,472,404 | |
Synthesis Energy Systems, Inc. (a) | 39,903 | 65,840 | |
Tesco Corp. (a) | 36,928 | 700,524 | |
TETRA Technologies, Inc. (a)(d) | 84,417 | 1,013,004 | |
TGC Industries, Inc. | 15,685 | 100,384 | |
Tidewater, Inc. | 61,246 | 2,983,905 | |
Transocean Ltd. (United States) (d) | 380,391 | 16,128,578 | |
Unit Corp. (a) | 53,513 | 3,285,698 | |
Vantage Drilling Co. (a)(d) | 139,486 | 244,101 | |
Weatherford International Ltd. (a) | 878,933 | 14,651,813 | |
Willbros Group, Inc. (a) | 69,552 | 687,174 | |
| 461,208,059 | ||
Oil, Gas & Consumable Fuels - 7.2% | |||
Abraxas Petroleum Corp. (a)(d) | 126,005 | 424,637 | |
Adams Resources & Energy, Inc. | 1,804 | 132,774 | |
Alon U.S.A. Energy, Inc. | 48,399 | 648,063 | |
Alpha Natural Resources, Inc. (a)(d) | 236,910 | 1,272,207 | |
Amyris, Inc. (a)(d) | 41,172 | 188,156 | |
Anadarko Petroleum Corp. | 563,338 | 47,410,526 | |
Antero Resources Corp. (d) | 39,714 | 2,396,343 | |
Apache Corp. | 447,726 | 35,500,195 | |
APCO Oil and Gas International, Inc. (a) | 12,221 | 174,638 | |
Approach Resources, Inc. (a)(d) | 29,242 | 651,219 | |
Arch Coal, Inc. (d) | 201,141 | 917,203 | |
Ardmore Shipping Corp. | 12,187 | 158,187 | |
Athlon Energy, Inc. | 38,737 | 1,439,467 | |
Barnwell Industries, Inc. (a) | 2,847 | 8,142 | |
Bill Barrett Corp. (a)(d) | 44,527 | 1,128,314 | |
BioFuel Energy Corp. (a)(d) | 979 | 2,849 | |
Bonanza Creek Energy, Inc. (a)(d) | 35,010 | 1,749,450 | |
BPZ Energy, Inc. (a)(d) | 134,116 | 276,279 | |
Cabot Oil & Gas Corp. | 466,135 | 16,314,725 | |
Callon Petroleum Co. (a) | 41,561 | 281,368 | |
Carrizo Oil & Gas, Inc. (a)(d) | 43,717 | 2,174,484 | |
Ceres, Inc. (a)(d) | 15,962 | 22,826 | |
Cheniere Energy, Inc. (a) | 242,824 | 12,002,790 | |
Chesapeake Energy Corp. | 559,542 | 14,497,733 | |
Chevron Corp. | 2,155,381 | 248,580,091 | |
Cimarex Energy Co. | 101,750 | 11,773,493 | |
Clayton Williams Energy, Inc. (a)(d) | 7,754 | 752,138 | |
Clean Energy Fuels Corp. (a)(d) | 67,120 | 561,794 | |
| |||
Shares | Value | ||
Cloud Peak Energy, Inc. (a) | 86,697 | $ 1,681,922 | |
Cobalt International Energy, Inc. (a)(d) | 333,375 | 6,427,470 | |
Comstock Resources, Inc. | 40,820 | 806,603 | |
Concho Resources, Inc. (a) | 119,921 | 14,526,031 | |
ConocoPhillips Co. | 1,373,787 | 91,356,836 | |
CONSOL Energy, Inc. | 262,364 | 10,520,796 | |
Contango Oil & Gas Co. (a) | 17,251 | 818,042 | |
Continental Resources, Inc. (a)(d) | 57,407 | 6,861,285 | |
Crosstex Energy, Inc. | 45,920 | 1,911,650 | |
CVR Energy, Inc. | 13,732 | 540,354 | |
Delek U.S. Holdings, Inc. | 36,764 | 1,020,569 | |
Denbury Resources, Inc. | 405,461 | 6,633,342 | |
Devon Energy Corp. | 424,771 | 27,363,748 | |
DHT Holdings, Inc. | 9,321 | 73,077 | |
Diamondback Energy, Inc. (a)(d) | 39,731 | 2,555,895 | |
Double Eagle Petroleum Co. (a) | 1,282 | 2,756 | |
Emerald Oil, Inc. (a) | 39,389 | 301,720 | |
Endeavour International Corp. (a)(d) | 50,764 | 246,713 | |
Energen Corp. | 88,384 | 7,109,609 | |
Energy XXI (Bermuda) Ltd. | 78,336 | 1,814,262 | |
EOG Resources, Inc. | 306,748 | 58,104,206 | |
EPL Oil & Gas, Inc. (a) | 50,327 | 1,514,843 | |
EQT Corp. | 165,052 | 16,883,169 | |
Evolution Petroleum Corp. | 6,950 | 90,350 | |
EXCO Resources, Inc. (d) | 234,793 | 1,225,619 | |
Exxon Mobil Corp. | 4,900,564 | 471,777,296 | |
Forest Oil Corp. (a) | 106,451 | 213,967 | |
FX Energy, Inc. (a)(d) | 98,760 | 370,350 | |
Gasco Energy, Inc. (a) | 44 | 1 | |
Gastar Exploration, Inc. (a) | 74,542 | 475,578 | |
Gevo, Inc. (a) | 47,917 | 65,167 | |
Goodrich Petroleum Corp. (a)(d) | 33,339 | 454,077 | |
Green Plains Renewable Energy, Inc. | 14,190 | 375,042 | |
Gulfport Energy Corp. (a) | 95,460 | 6,309,906 | |
Halcon Resources Corp. (a)(d) | 265,422 | 1,011,258 | |
Harvest Natural Resources, Inc. (a)(d) | 51,649 | 216,926 | |
Hess Corp. | 315,050 | 25,213,452 | |
HollyFrontier Corp. | 221,494 | 10,093,482 | |
Houston American Energy Corp. (a) | 36,485 | 13,514 | |
Hyperdynamics Corp. (a)(d) | 33,521 | 181,684 | |
Isramco, Inc. (a) | 123 | 17,648 | |
James River Coal Co. (a)(d) | 58,608 | 43,370 | |
Jones Energy, Inc. | 15,152 | 236,674 | |
Kinder Morgan Holding Co. LLC | 754,230 | 24,022,226 | |
KiOR, Inc. Class A (a)(d) | 22,105 | 30,947 | |
Kodiak Oil & Gas Corp. (a) | 306,801 | 3,623,320 | |
Kosmos Energy Ltd. (a) | 171,095 | 1,878,623 | |
Laredo Petroleum Holdings, Inc. (a)(d) | 61,390 | 1,601,665 | |
Lilis Energy, Inc. (a) | 8,026 | 25,683 | |
Lucas Energy, Inc. (a) | 9,400 | 8,756 | |
Magellan Petroleum Corp. (a) | 35,895 | 48,099 | |
Magnum Hunter Resources Corp. (a)(d) | 156,521 | 1,313,211 | |
Magnum Hunter Resources Corp. warrants 4/16/16 (a) | 15,652 | 6,721 | |
Common Stocks - continued | |||
Shares | Value | ||
ENERGY - continued | |||
Oil, Gas & Consumable Fuels - continued | |||
Marathon Oil Corp. | 789,876 | $ 26,460,846 | |
Marathon Petroleum Corp. | 338,483 | 28,432,572 | |
Matador Resources Co. (a)(d) | 76,387 | 1,853,149 | |
Midstates Petroleum Co., Inc. (a)(d) | 32,166 | 141,852 | |
Miller Energy Resources, Inc. (a)(d) | 32,422 | 225,009 | |
Murphy Oil Corp. | 192,672 | 11,438,937 | |
Newfield Exploration Co. (a) | 142,463 | 4,016,032 | |
Noble Energy, Inc. | 401,847 | 27,631,000 | |
Northern Oil & Gas, Inc. (a)(d) | 93,777 | 1,305,376 | |
Oasis Petroleum, Inc. (a)(d) | 118,000 | 5,141,260 | |
Occidental Petroleum Corp. | 900,060 | 86,873,791 | |
ONEOK, Inc. | 228,616 | 13,520,350 | |
Pacific Ethanol, Inc. (a) | 20,096 | 274,712 | |
Panhandle Royalty Co. Class A | 6,335 | 234,142 | |
PBF Energy, Inc. Class A | 71,419 | 1,799,759 | |
PDC Energy, Inc. (a)(d) | 36,259 | 2,252,772 | |
Peabody Energy Corp. (d) | 287,212 | 5,043,443 | |
Penn Virginia Corp. (a)(d) | 74,899 | 1,134,720 | |
Petroquest Energy, Inc. (a)(d) | 70,948 | 335,584 | |
Phillips 66 Co. | 672,891 | 50,372,620 | |
Pioneer Natural Resources Co. | 158,717 | 31,930,686 | |
QEP Resources, Inc. | 196,867 | 5,695,362 | |
Quicksilver Resources, Inc. (a)(d) | 168,400 | 550,668 | |
Range Resources Corp. | 182,957 | 15,743,450 | |
Renewable Energy Group, Inc. (a)(d) | 19,507 | 227,647 | |
Rentech, Inc. (a)(d) | 218,177 | 410,173 | |
Resolute Energy Corp. (a)(d) | 59,120 | 550,998 | |
Rex American Resources Corp. (a) | 4,837 | 230,628 | |
Rex Energy Corp. (a)(d) | 63,386 | 1,204,334 | |
Rosetta Resources, Inc. (a)(d) | 66,417 | 2,946,922 | |
Royale Energy, Inc. (a)(d) | 36,496 | 102,919 | |
Sanchez Energy Corp. (a)(d) | 43,626 | 1,299,619 | |
SandRidge Energy, Inc. (a)(d) | 475,629 | 3,067,807 | |
Saratoga Resources, Inc. (a) | 16,554 | 22,513 | |
SemGroup Corp. Class A | 56,834 | 3,826,065 | |
SM Energy Co. | 72,684 | 5,360,445 | |
Solazyme, Inc. (a)(d) | 72,848 | 893,845 | |
Southwestern Energy Co. (a) | 393,897 | 16,283,702 | |
Spectra Energy Corp. | 754,745 | 28,136,894 | |
Stone Energy Corp. (a)(d) | 67,092 | 2,411,286 | |
Swift Energy Co. (a)(d) | 41,382 | 413,820 | |
Synergy Resources Corp. (a)(d) | 85,751 | 908,103 | |
Syntroleum Corp. (a)(d) | 15,037 | 59,998 | |
Targa Resources Corp. | 33,055 | 3,198,402 | |
Teekay Corp. | 46,397 | 2,772,221 | |
Tengasco, Inc. (a) | 12,601 | 5,168 | |
Tesoro Corp. | 146,745 | 7,485,462 | |
The Williams Companies, Inc. | 760,127 | 31,393,245 | |
Triangle Petroleum Corp. (a)(d) | 83,126 | 744,809 | |
U.S. Energy Corp. (a) | 13,579 | 54,316 | |
Ultra Petroleum Corp. (a)(d) | 182,633 | 4,595,046 | |
| |||
Shares | Value | ||
Uranium Energy Corp. (a)(d) | 86,698 | $ 157,790 | |
Uranium Resources, Inc. (a)(d) | 26,282 | 84,365 | |
USEC, Inc. (a)(d) | 3,322 | 18,304 | |
VAALCO Energy, Inc. (a)(d) | 68,248 | 454,532 | |
Valero Energy Corp. | 604,594 | 29,008,420 | |
W&T Offshore, Inc. (d) | 37,319 | 562,397 | |
Warren Resources, Inc. (a) | 48,923 | 216,729 | |
Western Refining, Inc. (d) | 53,248 | 1,940,890 | |
Westmoreland Coal Co. (a) | 10,233 | 231,266 | |
Whiting Petroleum Corp. (a) | 135,243 | 9,292,547 | |
World Fuel Services Corp. (d) | 89,666 | 4,036,763 | |
WPX Energy, Inc. (a)(d) | 237,040 | 4,176,645 | |
ZaZa Energy Corp. (a)(d) | 19,430 | 17,872 | |
Zion Oil & Gas, Inc. (a)(d) | 27,782 | 46,118 | |
| 1,702,718,718 | ||
TOTAL ENERGY | 2,163,926,777 | ||
FINANCIALS - 16.9% | |||
Capital Markets - 2.0% | |||
Affiliated Managers Group, Inc. (a) | 57,328 | 10,780,530 | |
Ameriprise Financial, Inc. | 216,081 | 23,550,668 | |
Arlington Asset Investment Corp. (d) | 13,562 | 359,664 | |
Artisan Partners Asset Management, Inc. | 18,533 | 1,170,730 | |
Bank of New York Mellon Corp. | 1,292,433 | 41,357,856 | |
BGC Partners, Inc. Class A | 203,183 | 1,381,644 | |
BlackRock, Inc. Class A | 141,863 | 43,245,517 | |
Calamos Asset Management, Inc. | 22,184 | 264,655 | |
Charles Schwab Corp. | 1,285,960 | 34,090,800 | |
CIFI Corp. | 3,896 | 30,778 | |
Cohen & Steers, Inc. (d) | 17,375 | 656,949 | |
Cowen Group, Inc. Class A (a) | 80,174 | 343,145 | |
Diamond Hill Investment Group, Inc. | 1,102 | 129,320 | |
E*TRADE Financial Corp. (a) | 321,912 | 7,233,363 | |
Eaton Vance Corp. (non-vtg.) (d) | 144,041 | 5,450,511 | |
Evercore Partners, Inc. Class A | 40,806 | 2,270,446 | |
FBR & Co. (a) | 11,471 | 298,246 | |
Federated Investors, Inc. Class B (non-vtg.) (d) | 108,341 | 2,968,543 | |
Financial Engines, Inc. (d) | 56,540 | 3,195,075 | |
Franklin Resources, Inc. | 453,634 | 24,156,011 | |
FXCM, Inc. Class A (d) | 51,378 | 865,719 | |
GAMCO Investors, Inc. Class A | 6,083 | 474,839 | |
GFI Group, Inc. | 69,449 | 278,490 | |
Gleacher & Co., Inc. (a) | 1,808 | 20,051 | |
Goldman Sachs Group, Inc. | 469,978 | 78,227,838 | |
Greenhill & Co., Inc. | 23,725 | 1,263,831 | |
HFF, Inc. | 31,822 | 1,015,122 | |
ICG Group, Inc. (a) | 32,808 | 666,987 | |
Institutional Financial Markets, Inc. | 6,881 | 16,927 | |
INTL FCStone, Inc. (a)(d) | 15,053 | 273,814 | |
Common Stocks - continued | |||
Shares | Value | ||
FINANCIALS - continued | |||
Capital Markets - continued | |||
Invesco Ltd. | 497,759 | $ 17,073,134 | |
Investment Technology Group, Inc. (a) | 55,680 | 962,150 | |
Janus Capital Group, Inc. (d) | 187,399 | 2,096,995 | |
JMP Group, Inc. | 11,989 | 88,119 | |
KCG Holdings, Inc. Class A | 107,133 | 1,273,811 | |
Ladenburg Thalmann Financial Services, Inc. (a) | 42,620 | 118,910 | |
Legg Mason, Inc. | 151,820 | 6,977,647 | |
LPL Financial | 82,901 | 4,450,126 | |
Manning & Napier, Inc. Class A | 3,941 | 57,893 | |
Medallion Financial Corp. | 4,309 | 62,653 | |
Morgan Stanley | 1,549,389 | 47,721,181 | |
Northern Trust Corp. | 250,938 | 15,520,515 | |
Oppenheimer Holdings, Inc. Class A (non-vtg.) | 6,844 | 186,910 | |
Piper Jaffray Companies (a)(d) | 20,940 | 877,386 | |
Pzena Investment Management, Inc. | 4,972 | 57,476 | |
Raymond James Financial, Inc. | 163,719 | 8,641,089 | |
Safeguard Scientifics, Inc. (a)(d) | 26,745 | 524,469 | |
SEI Investments Co. | 167,937 | 5,637,645 | |
Silvercrest Asset Management Group Class A | 6,008 | 100,994 | |
State Street Corp. | 492,071 | 32,314,303 | |
Stifel Financial Corp. (a)(d) | 59,345 | 2,853,901 | |
SWS Group, Inc. (a) | 24,189 | 197,140 | |
T. Rowe Price Group, Inc. | 302,200 | 24,529,574 | |
TD Ameritrade Holding Corp. (d) | 282,750 | 9,452,333 | |
Teton Advisors, Inc. (a) | 106 | 3,445 | |
U.S. Global Investments, Inc. Class A | 7,637 | 27,340 | |
Virtus Investment Partners, Inc. (a) | 8,765 | 1,622,927 | |
Waddell & Reed Financial, Inc. Class A | 84,679 | 5,902,126 | |
Walter Investment Management Corp. (a)(d) | 38,853 | 992,694 | |
Westwood Holdings Group, Inc. | 3,640 | 207,152 | |
WisdomTree Investments, Inc. (a)(d) | 96,770 | 1,507,677 | |
| 478,077,784 | ||
Commercial Banks - 3.2% | |||
1st Source Corp. | 8,597 | 268,226 | |
1st United Bancorp, Inc. | 20,464 | 157,573 | |
Access National Corp. | 1,270 | 21,400 | |
ACNB Corp. (d) | 3,789 | 71,006 | |
American National Bankshares, Inc. | 2,748 | 61,720 | |
Ameris Bancorp (a) | 34,183 | 719,210 | |
Ames National Corp. | 1,209 | 26,937 | |
Arrow Financial Corp. | 15,818 | 413,008 | |
Associated Banc-Corp. | 184,412 | 3,077,836 | |
BancFirst Corp. | 10,611 | 583,923 | |
Bancorp, Inc., Delaware (a)(d) | 42,844 | 820,463 | |
BancorpSouth, Inc. | 84,413 | 2,020,003 | |
Bank of Hawaii Corp. | 64,151 | 3,749,626 | |
Bank of Kentucky Financial Corp. | 1,699 | 59,618 | |
| |||
Shares | Value | ||
Bank of Marin Bancorp | 2,794 | $ 123,579 | |
Bank of the Ozarks, Inc. (d) | 37,486 | 2,377,362 | |
BankUnited, Inc. | 103,014 | 3,448,909 | |
Banner Bank | 13,068 | 518,669 | |
Bar Harbor Bankshares | 2,686 | 102,068 | |
BB&T Corp. | 783,604 | 29,620,231 | |
BBCN Bancorp, Inc. | 78,753 | 1,340,376 | |
BCB Bancorp, Inc. | 2,814 | 37,370 | |
BNC Bancorp | 11,700 | 203,931 | |
BOK Financial Corp. | 42,858 | 2,774,198 | |
Boston Private Financial Holdings, Inc. | 85,484 | 1,114,711 | |
Bridge Bancorp, Inc. | 540 | 14,218 | |
Bridge Capital Holdings (a) | 1,107 | 24,598 | |
Bryn Mawr Bank Corp. | 9,420 | 268,376 | |
BSB Bancorp, Inc. (a) | 6,958 | 117,312 | |
C & F Financial Corp. | 1,992 | 72,907 | |
Camden National Corp. | 1,850 | 69,449 | |
Capital Bank Financial Corp. Series A (a) | 112,359 | 2,584,257 | |
Capital City Bank Group, Inc. (d) | 7,146 | 101,330 | |
CapitalSource, Inc. | 244,954 | 3,600,824 | |
Cardinal Financial Corp. (d) | 22,155 | 381,952 | |
Cascade Bancorp (a)(d) | 4,186 | 20,428 | |
Cathay General Bancorp | 87,127 | 2,213,897 | |
Center Bancorp, Inc. | 6,904 | 128,483 | |
Centerstate Banks of Florida, Inc. | 6,387 | 69,810 | |
Central Pacific Financial Corp. | 26,089 | 514,736 | |
Century Bancorp, Inc. Class A (non-vtg.) | 686 | 24,627 | |
Chemical Financial Corp. | 31,417 | 926,487 | |
CIT Group, Inc. | 237,879 | 11,579,950 | |
Citizens & Northern Corp. | 8,777 | 174,838 | |
City Holding Co. | 22,173 | 981,820 | |
City National Corp. | 58,166 | 4,352,562 | |
CNB Financial Corp., Pennsylvania | 7,083 | 130,398 | |
CoBiz, Inc. | 39,972 | 446,088 | |
Columbia Banking Systems, Inc. (d) | 46,707 | 1,224,658 | |
Comerica, Inc. | 197,578 | 9,519,308 | |
Commerce Bancshares, Inc. | 104,098 | 4,649,017 | |
Community Bank System, Inc. (d) | 49,202 | 1,792,429 | |
Community Trust Bancorp, Inc. | 13,652 | 540,619 | |
CommunityOne Bancorp (a) | 6,555 | 72,171 | |
CU Bancorp (a) | 6,814 | 123,061 | |
Cullen/Frost Bankers, Inc. | 71,142 | 5,310,039 | |
CVB Financial Corp. (d) | 84,778 | 1,319,993 | |
Eagle Bancorp, Inc., Maryland (d) | 22,699 | 777,668 | |
East West Bancorp, Inc. | 174,395 | 6,224,158 | |
Eastern Virginia Bankshares, Inc. (a) | 969 | 6,589 | |
Enterprise Bancorp, Inc. | 803 | 15,458 | |
Enterprise Financial Services Corp. | 12,168 | 227,785 | |
Farmers National Banc Corp. (d) | 14,652 | 109,011 | |
Fidelity Southern Corp. | 3,439 | 49,418 | |
Fifth Third Bancorp | 1,058,556 | 22,965,372 | |
Financial Institutions, Inc. | 12,700 | 279,908 | |
First Bancorp, North Carolina | 9,193 | 168,232 | |
First Bancorp, Puerto Rico (a) | 99,750 | 519,698 | |
Common Stocks - continued | |||
Shares | Value | ||
FINANCIALS - continued | |||
Commercial Banks - continued | |||
First Busey Corp. | 50,381 | $ 299,767 | |
First Citizen Bancshares, Inc. | 8,410 | 1,887,120 | |
First Commonwealth Financial Corp. (d) | 101,457 | 864,414 | |
First Community Bancshares, Inc. | 8,561 | 143,397 | |
First Connecticut Bancorp, Inc. | 11,897 | 186,545 | |
First Financial Bancorp, Ohio | 59,723 | 1,017,680 | |
First Financial Bankshares, Inc. (d) | 43,848 | 2,651,927 | |
First Financial Corp., Indiana | 8,837 | 303,904 | |
First Financial Holdings, Inc. | 28,877 | 1,768,427 | |
First Financial Service Corp. (a) | 2,521 | 10,639 | |
First Horizon National Corp. | 287,965 | 3,446,941 | |
First Interstate Bancsystem, Inc. | 19,621 | 508,184 | |
First Merchants Corp. | 33,146 | 709,987 | |
First Midwest Bancorp, Inc., Delaware | 83,782 | 1,396,646 | |
First Niagara Financial Group, Inc. | 529,611 | 4,803,572 | |
First of Long Island Corp. | 1,768 | 68,704 | |
First Republic Bank | 143,479 | 7,456,604 | |
First United Corp. (a) | 3,018 | 23,269 | |
FirstMerit Corp. | 204,257 | 4,240,375 | |
Flushing Financial Corp. | 47,044 | 974,752 | |
FNB Corp., Pennsylvania | 179,748 | 2,191,128 | |
Fulton Financial Corp. (d) | 224,854 | 2,767,953 | |
German American Bancorp, Inc. | 4,623 | 133,697 | |
Glacier Bancorp, Inc. (d) | 75,176 | 2,086,134 | |
Great Southern Bancorp, Inc. | 6,815 | 195,591 | |
Guaranty Bancorp | 16,534 | 233,460 | |
Hampton Roads Bankshares, Inc. (a) | 89,921 | 149,269 | |
Hancock Holding Co. | 109,529 | 3,774,369 | |
Hanmi Financial Corp. | 38,186 | 894,698 | |
Hawthorn Bancshares, Inc. | 1,496 | 19,463 | |
Heartland Financial U.S.A., Inc. | 8,878 | 238,818 | |
Heritage Commerce Corp. | 14,712 | 119,020 | |
Heritage Financial Corp., Washington | 12,768 | 226,377 | |
Heritage Oaks Bancorp (a) | 3,340 | 26,687 | |
Home Bancshares, Inc. (d) | 50,202 | 1,684,779 | |
Home Federal Bancorp, Inc. | 9,753 | 147,173 | |
HomeTrust Bancshares, Inc. (a)(d) | 20,129 | 315,421 | |
Horizon Bancorp Industries | 706 | 15,348 | |
Hudson Valley Holding Corp. | 14,551 | 273,413 | |
Huntington Bancshares, Inc. | 933,913 | 8,900,191 | |
IBERIABANK Corp. | 35,645 | 2,334,748 | |
Independent Bank Corp. (a) | 17,111 | 210,465 | |
Independent Bank Corp., Massachusetts (d) | 25,945 | 954,517 | |
Independent Bank Group, Inc. | 2,957 | 158,909 | |
International Bancshares Corp. | 64,813 | 1,502,365 | |
Intervest Bancshares Corp. Class A (a) | 6,160 | 45,646 | |
Investors Bancorp, Inc. | 84,986 | 2,253,829 | |
KeyCorp | 1,064,932 | 14,025,154 | |
Lakeland Bancorp, Inc. | 23,579 | 266,443 | |
Lakeland Financial Corp. | 13,545 | 514,710 | |
| |||
Shares | Value | ||
M&T Bank Corp. | 145,574 | $ 16,972,473 | |
Macatawa Bank Corp. | 22,839 | 120,590 | |
MainSource Financial Group, Inc. | 13,271 | 229,190 | |
MB Financial, Inc. | 59,673 | 1,821,817 | |
MBT Financial Corp. (a) | 1,548 | 7,461 | |
Merchants Bancshares, Inc. | 5,246 | 172,803 | |
Metro Bancorp, Inc. (a) | 11,557 | 226,748 | |
Midsouth Bancorp, Inc. | 5,240 | 91,805 | |
National Bank Holdings Corp. | 141,292 | 2,773,562 | |
National Bankshares, Inc. | 5,803 | 208,908 | |
National Penn Bancshares, Inc. | 120,787 | 1,304,500 | |
NBT Bancorp, Inc. | 54,895 | 1,288,935 | |
NewBridge Bancorp (a) | 10,719 | 77,177 | |
North Valley Bancorp (a) | 849 | 19,756 | |
Northrim Bancorp, Inc. | 2,935 | 72,113 | |
OFG Bancorp (d) | 40,168 | 642,688 | |
Old National Bancorp, Indiana | 98,018 | 1,375,193 | |
Old Second Bancorp, Inc. (a) | 18,605 | 92,281 | |
OmniAmerican Bancorp, Inc. | 6,877 | 149,712 | |
Orrstown Financial Services, Inc. (a) | 5,669 | 92,858 | |
Pacific Continental Corp. | 3,048 | 43,983 | |
Pacific Mercantile Bancorp (a) | 10,321 | 64,403 | |
Pacific Premier Bancorp, Inc. (a) | 35 | 557 | |
PacWest Bancorp (d) | 35,627 | 1,546,212 | |
Park National Corp. | 14,135 | 1,103,378 | |
Park Sterling Corp. | 28,617 | 187,728 | |
Penns Woods Bancorp, Inc. | 3,854 | 176,552 | |
Peoples Bancorp, Inc. | 3,334 | 81,583 | |
Peoples Financial Corp., Mississippi (a) | 2,667 | 36,005 | |
Pinnacle Financial Partners, Inc. | 38,294 | 1,381,648 | |
PNC Financial Services Group, Inc. | 621,024 | 50,787,343 | |
Popular, Inc. (a) | 112,654 | 3,220,778 | |
Preferred Bank, Los Angeles (a) | 1,131 | 27,178 | |
Premier Financial Bancorp, Inc. | 115 | 1,612 | |
PrivateBancorp, Inc. | 92,031 | 2,656,015 | |
Prosperity Bancshares, Inc. | 66,890 | 4,234,806 | |
Regions Financial Corp. | 1,653,454 | 17,592,751 | |
Renasant Corp. | 23,910 | 694,825 | |
Republic Bancorp, Inc., Kentucky Class A | 18,205 | 438,558 | |
Royal Bancshares of Pennsylvania, Inc. Class A (a) | 2,700 | 6,723 | |
S&T Bancorp, Inc. | 32,238 | 743,731 | |
S.Y. Bancorp, Inc. | 6,551 | 195,482 | |
Sandy Spring Bancorp, Inc. | 13,803 | 327,545 | |
Seacoast Banking Corp., Florida (a) | 23,091 | 248,921 | |
Shore Bancshares, Inc. (a) | 2,958 | 28,012 | |
Sierra Bancorp | 3,618 | 59,010 | |
Signature Bank (a)(d) | 61,743 | 8,084,011 | |
Simmons First National Corp. Class A | 10,951 | 390,184 | |
Southside Bancshares, Inc. | 13,372 | 394,875 | |
Southwest Bancorp, Inc., Oklahoma | 15,446 | 271,695 | |
State Bank Financial Corp. | 26,469 | 450,502 | |
Sterling Bancorp | 79,121 | 1,015,914 | |
Sterling Financial Corp. | 40,387 | 1,279,056 | |
Common Stocks - continued | |||
Shares | Value | ||
FINANCIALS - continued | |||
Commercial Banks - continued | |||
Suffolk Bancorp (a) | 15,697 | $ 316,608 | |
Sun Bancorp, Inc., New Jersey (a) | 48,802 | 169,831 | |
SunTrust Banks, Inc. | 625,274 | 23,560,324 | |
Susquehanna Bancshares, Inc. | 215,524 | 2,357,833 | |
SVB Financial Group (a) | 57,220 | 7,204,570 | |
Synovus Financial Corp. | 1,042,950 | 3,629,466 | |
Taylor Capital Group, Inc. (a)(d) | 9,976 | 235,434 | |
TCF Financial Corp. | 219,604 | 3,540,016 | |
Texas Capital Bancshares, Inc. (a)(d) | 44,486 | 2,800,394 | |
The First Bancorp, Inc. | 2,896 | 47,408 | |
Tompkins Financial Corp. | 8,812 | 426,589 | |
TowneBank (d) | 18,594 | 278,352 | |
Trico Bancshares | 12,062 | 301,429 | |
Trustmark Corp. | 94,171 | 2,272,346 | |
U.S. Bancorp | 2,044,982 | 84,130,559 | |
UMB Financial Corp. | 45,063 | 2,809,227 | |
Umpqua Holdings Corp. (d) | 115,463 | 2,051,778 | |
Union First Market Bankshares Corp. | 44,561 | 1,127,393 | |
United Bankshares, Inc., West Virginia | 83,407 | 2,454,668 | |
United Community Banks, Inc., Georgia (a) | 43,617 | 727,968 | |
Univest Corp. of Pennsylvania | 10,023 | 193,143 | |
Valley National Bancorp (d) | 229,522 | 2,313,582 | |
ViewPoint Financial Group (d) | 43,399 | 1,084,975 | |
Washington Banking Co., Oak Harbor | 5,615 | 103,428 | |
Washington Trust Bancorp, Inc. | 15,489 | 545,058 | |
Webster Financial Corp. | 106,126 | 3,286,722 | |
Wells Fargo & Co. | 5,376,048 | 249,556,148 | |
WesBanco, Inc. | 28,002 | 834,740 | |
West Bancorp., Inc. | 1,202 | 17,850 | |
Westamerica Bancorp. (d) | 28,148 | 1,415,281 | |
Westbury Bancorp, Inc. | 4,860 | 69,984 | |
Western Alliance Bancorp. (a) | 80,481 | 1,863,940 | |
Wilshire Bancorp, Inc. | 52,255 | 530,388 | |
Wintrust Financial Corp. | 46,573 | 2,155,398 | |
Zions Bancorporation | 204,129 | 6,368,825 | |
| 754,122,322 | ||
Consumer Finance - 0.8% | |||
American Express Co. | 1,031,844 | 94,186,720 | |
Asta Funding, Inc. (a) | 4,468 | 37,531 | |
Atlanticus Holdings Corp. (a)(d) | 35,598 | 88,995 | |
Capital One Financial Corp. | 637,759 | 46,830,643 | |
Cash America International, Inc. (d) | 29,387 | 1,176,068 | |
Consumer Portfolio Services, Inc. (a) | 11,930 | 92,935 | |
Credit Acceptance Corp. (a) | 13,731 | 1,896,800 | |
DFC Global Corp. (a)(d) | 43,285 | 356,236 | |
Discover Financial Services | 556,489 | 31,931,339 | |
Encore Capital Group, Inc. (a)(d) | 29,815 | 1,449,605 | |
EZCORP, Inc. (non-vtg.) Class A (a)(d) | 64,428 | 814,370 | |
First Cash Financial Services, Inc. (a)(d) | 35,415 | 1,870,974 | |
First Marblehead Corp. (a) | 5,188 | 36,368 | |
| |||
Shares | Value | ||
Green Dot Corp. Class A (a)(d) | 44,284 | $ 892,323 | |
Imperial Holdings, Inc. (a) | 16,708 | 91,393 | |
Nelnet, Inc. Class A | 22,213 | 891,186 | |
Portfolio Recovery Associates, Inc. (a)(d) | 50,604 | 2,744,255 | |
Regional Management Corp. (a) | 4,032 | 121,686 | |
SLM Corp. | 493,468 | 11,813,624 | |
Springleaf Holdings, Inc. | 37,440 | 1,054,685 | |
World Acceptance Corp. (a)(d) | 15,268 | 1,463,438 | |
| 199,841,174 | ||
Diversified Financial Services - 4.1% | |||
Bank of America Corp. | 11,910,171 | 196,875,127 | |
Berkshire Hathaway, Inc. Class B (a) | 2,023,147 | 234,239,960 | |
CBOE Holdings, Inc. | 109,590 | 5,921,148 | |
Citigroup, Inc. | 3,393,491 | 165,025,467 | |
CME Group, Inc. | 350,475 | 25,872,065 | |
Gain Capital Holdings, Inc. (d) | 15,735 | 162,385 | |
ING U.S., Inc. | 147,495 | 5,290,646 | |
Interactive Brokers Group, Inc. | 43,141 | 959,456 | |
IntercontinentalExchange Group, Inc. | 128,718 | 26,881,467 | |
JPMorgan Chase & Co. | 4,206,498 | 239,013,216 | |
Leucadia National Corp. | 370,953 | 10,364,427 | |
Life Partners Holdings, Inc. | 18,668 | 44,990 | |
MarketAxess Holdings, Inc. | 47,067 | 2,778,836 | |
Marlin Business Services Corp. | 13,319 | 286,359 | |
McGraw Hill Financial, Inc. | 303,994 | 24,216,162 | |
MicroFinancial, Inc. | 86 | 699 | |
Moody's Corp. | 212,214 | 16,764,906 | |
MSCI, Inc. Class A (a)(d) | 147,156 | 6,432,189 | |
NewStar Financial, Inc. (a) | 27,065 | 416,260 | |
PHH Corp. (a) | 72,291 | 1,881,735 | |
PICO Holdings, Inc. (a) | 22,896 | 574,919 | |
Resource America, Inc. Class A | 2,362 | 22,345 | |
The NASDAQ OMX Group, Inc. | 124,702 | 4,787,310 | |
Vector Capital Corp. rights (a) | 4,280 | 0 | |
| 968,812,074 | ||
Insurance - 3.1% | |||
ACE Ltd. | 376,274 | 36,825,936 | |
AFLAC, Inc. | 511,414 | 32,771,409 | |
Alleghany Corp. (a) | 18,948 | 7,304,454 | |
Allied World Assurance Co. Holdings Ltd. (d) | 33,827 | 3,373,228 | |
Allstate Corp. | 503,599 | 27,325,282 | |
AMBAC Financial Group, Inc. (a) | 43,974 | 1,519,741 | |
American Equity Investment Life Holding Co. (d) | 83,986 | 1,835,934 | |
American Financial Group, Inc. | 76,865 | 4,393,603 | |
American International Group, Inc. | 1,647,284 | 81,985,325 | |
American National Insurance Co. | 11,975 | 1,359,043 | |
Amerisafe, Inc. | 28,834 | 1,255,432 | |
Amtrust Financial Services, Inc. (d) | 37,933 | 1,433,867 | |
Aon PLC | 335,975 | 28,759,460 | |
Arch Capital Group Ltd. (a)(d) | 141,774 | 7,956,357 | |
Argo Group International Holdings, Ltd. | 32,771 | 1,446,512 | |
Common Stocks - continued | |||
Shares | Value | ||
FINANCIALS - continued | |||
Insurance - continued | |||
Arthur J. Gallagher & Co. | 138,329 | $ 6,390,800 | |
Aspen Insurance Holdings Ltd. | 68,795 | 2,583,940 | |
Assurant, Inc. | 95,115 | 6,242,397 | |
Assured Guaranty Ltd. | 183,926 | 4,515,383 | |
Axis Capital Holdings Ltd. | 130,874 | 5,754,530 | |
Baldwin & Lyons, Inc. Class B | 5,084 | 130,710 | |
Brown & Brown, Inc. | 116,705 | 3,512,821 | |
Cincinnati Financial Corp. | 161,273 | 7,560,478 | |
Citizens, Inc. Class A (a)(d) | 31,937 | 234,418 | |
CNA Financial Corp. | 65,754 | 2,728,133 | |
CNO Financial Group, Inc. | 273,436 | 4,992,941 | |
Crawford & Co. Class B | 10,464 | 88,630 | |
Donegal Group, Inc. Class A | 4,528 | 63,890 | |
eHealth, Inc. (a) | 26,343 | 1,264,464 | |
EMC Insurance Group | 5,816 | 177,388 | |
Employers Holdings, Inc. | 36,335 | 714,709 | |
Endurance Specialty Holdings Ltd. (d) | 45,122 | 2,352,661 | |
Enstar Group Ltd. (a) | 11,576 | 1,449,084 | |
Erie Indemnity Co. Class A | 26,259 | 1,905,878 | |
Everest Re Group Ltd. (d) | 51,436 | 7,676,309 | |
FBL Financial Group, Inc. Class A | 12,986 | 543,334 | |
Federated National Holding Co. | 1,278 | 20,295 | |
Fidelity National Financial, Inc. Class A | 297,669 | 9,840,937 | |
First Acceptance Corp. (a) | 4,055 | 10,543 | |
First American Financial Corp. | 131,076 | 3,531,187 | |
Fortegra Financial Corp. (a) | 10,670 | 74,583 | |
Genworth Financial, Inc. Class A (a) | 560,876 | 8,716,013 | |
Global Indemnity PLC (a) | 13,709 | 357,531 | |
Greenlight Capital Re, Ltd. (a) | 23,762 | 747,315 | |
Hallmark Financial Services, Inc. (a) | 10,337 | 87,554 | |
Hanover Insurance Group, Inc. | 48,173 | 2,834,499 | |
Hartford Financial Services Group, Inc. | 470,637 | 16,561,716 | |
HCC Insurance Holdings, Inc. | 116,739 | 5,124,842 | |
HCI Group, Inc. | 9,511 | 460,523 | |
Health Insurance Innovations (d) | 4,900 | 61,691 | |
Hilltop Holdings, Inc. (a) | 68,910 | 1,688,984 | |
Horace Mann Educators Corp. | 37,921 | 1,084,920 | |
Independence Holding Co. | 16,014 | 218,271 | |
Infinity Property & Casualty Corp. | 13,372 | 986,185 | |
Investors Title Co. | 1,086 | 83,535 | |
Kansas City Life Insurance Co. | 2,863 | 140,860 | |
Kemper Corp. | 58,114 | 2,253,661 | |
Lincoln National Corp. | 307,008 | 15,390,311 | |
Loews Corp. | 371,316 | 16,144,820 | |
Maiden Holdings Ltd. | 73,970 | 830,683 | |
Markel Corp. (a)(d) | 16,654 | 9,626,012 | |
Marsh & McLennan Companies, Inc. | 616,601 | 29,695,504 | |
MBIA, Inc. (a)(d) | 228,577 | 3,097,218 | |
Meadowbrook Insurance Group, Inc. (d) | 46,791 | 251,268 | |
Mercury General Corp. | 42,960 | 1,946,088 | |
MetLife, Inc. | 1,257,264 | 63,705,567 | |
| |||
Shares | Value | ||
Montpelier Re Holdings Ltd. (d) | 62,043 | $ 1,768,846 | |
National Interstate Corp. | 9,042 | 273,701 | |
National Western Life Insurance Co. Class A | 2,078 | 469,732 | |
Navigators Group, Inc. (a) | 15,156 | 918,757 | |
Old Republic International Corp. | 306,111 | 4,763,087 | |
OneBeacon Insurance Group Ltd. | 20,572 | 337,381 | |
PartnerRe Ltd. | 64,815 | 6,408,907 | |
Phoenix Companies, Inc. (a)(d) | 3,067 | 156,816 | |
Platinum Underwriters Holdings Ltd. | 32,909 | 1,929,126 | |
Primerica, Inc. | 51,420 | 2,304,644 | |
Principal Financial Group, Inc. | 298,650 | 13,543,778 | |
ProAssurance Corp. | 69,301 | 3,150,423 | |
Progressive Corp. | 598,738 | 14,663,094 | |
Protective Life Corp. | 78,222 | 4,078,495 | |
Prudential Financial, Inc. | 510,495 | 43,177,667 | |
Reinsurance Group of America, Inc. | 80,713 | 6,214,094 | |
RenaissanceRe Holdings Ltd. | 56,754 | 5,420,575 | |
RLI Corp. | 34,126 | 1,471,854 | |
Safety Insurance Group, Inc. | 14,899 | 831,811 | |
Selective Insurance Group, Inc. | 57,017 | 1,313,672 | |
StanCorp Financial Group, Inc. (d) | 52,960 | 3,504,893 | |
State Auto Financial Corp. | 6,222 | 124,564 | |
Stewart Information Services Corp. (d) | 21,434 | 792,629 | |
Symetra Financial Corp. | 109,204 | 2,151,319 | |
The Chubb Corp. | 278,385 | 24,353,120 | |
The Travelers Companies, Inc. | 393,876 | 33,022,564 | |
Third Point Reinsurance Ltd. (d) | 28,985 | 434,775 | |
Torchmark Corp. | 96,240 | 7,459,562 | |
Tower Group International Ltd. (d) | 63,927 | 176,439 | |
United Fire Group, Inc. | 20,054 | 581,165 | |
Universal Insurance Holdings, Inc. | 22,997 | 307,240 | |
Unum Group | 290,729 | 10,111,555 | |
Validus Holdings Ltd. | 125,147 | 4,606,661 | |
W.R. Berkley Corp. | 118,696 | 4,895,023 | |
White Mountains Insurance Group Ltd. | 7,023 | 4,070,250 | |
Willis Group Holdings PLC (d) | 207,878 | 8,556,258 | |
XL Group PLC Class A | 291,212 | 8,852,845 | |
| 723,198,919 | ||
Real Estate Investment Trusts - 3.3% | |||
Acadia Realty Trust (SBI) (d) | 57,067 | 1,509,422 | |
AG Mortgage Investment Trust, Inc. (d) | 18,957 | 347,671 | |
Agree Realty Corp. | 17,794 | 546,988 | |
Alexanders, Inc. | 2,701 | 1,012,092 | |
Alexandria Real Estate Equities, Inc. | 78,887 | 5,715,363 | |
Altisource Residential Corp. Class B | 60,332 | 1,724,289 | |
American Assets Trust, Inc. | 36,114 | 1,194,290 | |
American Campus Communities, Inc. | 134,876 | 4,982,319 | |
American Capital Agency Corp. | 420,086 | 9,363,717 | |
American Capital Mortgage Investment Corp. | 52,567 | 1,060,276 | |
American Homes 4 Rent Class A | 82,136 | 1,345,388 | |
American Realty Capital Properties, Inc. | 634,113 | 9,315,120 | |
Common Stocks - continued | |||
Shares | Value | ||
FINANCIALS - continued | |||
Real Estate Investment Trusts - continued | |||
American Residential Properties, Inc. (a)(d) | 15,232 | $ 277,222 | |
American Tower Corp. | 436,451 | 35,557,663 | |
AmREIT, Inc. Class B | 18,007 | 312,241 | |
Annaly Capital Management, Inc. (d) | 1,072,997 | 11,996,106 | |
Anworth Mortgage Asset Corp. | 251,516 | 1,302,853 | |
Apartment Investment & Management Co. Class A | 137,319 | 4,104,465 | |
Apollo Commercial Real Estate Finance, Inc. | 34,660 | 580,208 | |
Apollo Residential Mortgage, Inc. | 29,321 | 511,358 | |
Arbor Realty Trust, Inc. | 31,767 | 217,922 | |
Ares Commercial Real Estate Corp. | 39,618 | 538,409 | |
Armada Hoffler Properties, Inc. | 18,404 | 180,175 | |
Armour Residential REIT, Inc. | 489,690 | 2,100,770 | |
Ashford Hospitality Prime, Inc. | 13,979 | 234,148 | |
Ashford Hospitality Trust, Inc. | 69,895 | 781,426 | |
Associated Estates Realty Corp. (d) | 60,888 | 1,041,185 | |
AvalonBay Communities, Inc. | 132,936 | 17,144,756 | |
Aviv REIT, Inc. (d) | 12,625 | 320,170 | |
BioMed Realty Trust, Inc. | 232,867 | 4,815,690 | |
Blackstone Mortgage Trust, Inc. (d) | 31,861 | 923,013 | |
Boston Properties, Inc. | 173,248 | 19,478,273 | |
Brandywine Realty Trust (SBI) (d) | 189,114 | 2,770,520 | |
BRE Properties, Inc. | 90,165 | 5,569,492 | |
Brixmor Property Group, Inc. (d) | 46,627 | 1,029,524 | |
BRT Realty Trust (a) | 5,568 | 39,700 | |
Camden Property Trust (SBI) | 107,447 | 7,166,715 | |
Campus Crest Communities, Inc. (d) | 55,980 | 463,514 | |
Capstead Mortgage Corp. (d) | 97,016 | 1,250,536 | |
CBL & Associates Properties, Inc. | 198,768 | 3,536,083 | |
Cedar Shopping Centers, Inc. | 59,877 | 368,244 | |
Chambers Street Properties (d) | 312,279 | 2,470,127 | |
Chatham Lodging Trust | 26,521 | 553,493 | |
Chesapeake Lodging Trust | 44,367 | 1,155,760 | |
Chimera Investment Corp. | 1,225,514 | 3,909,390 | |
Colony Financial, Inc. | 80,404 | 1,815,522 | |
Columbia Property Trust, Inc. (d) | 148,227 | 3,933,945 | |
CommonWealth REIT | 127,873 | 3,471,752 | |
Coresite Realty Corp. | 24,333 | 757,730 | |
Corporate Office Properties Trust (SBI) | 106,736 | 2,846,649 | |
Corrections Corp. of America (d) | 120,697 | 4,025,245 | |
Cousins Properties, Inc. | 234,370 | 2,706,974 | |
CubeSmart (d) | 141,018 | 2,469,225 | |
CyrusOne, Inc. | 16,200 | 359,964 | |
CYS Investments, Inc. (d) | 197,203 | 1,735,386 | |
DCT Industrial Trust, Inc. | 349,621 | 2,768,998 | |
DDR Corp. | 308,138 | 5,121,254 | |
DiamondRock Hospitality Co. | 202,906 | 2,560,674 | |
Digital Realty Trust, Inc. (d) | 143,555 | 7,774,939 | |
Douglas Emmett, Inc. | 131,928 | 3,552,821 | |
| |||
Shares | Value | ||
Duke Realty LP | 350,539 | $ 5,889,055 | |
DuPont Fabros Technology, Inc. (d) | 100,616 | 2,672,361 | |
EastGroup Properties, Inc. (d) | 28,464 | 1,765,907 | |
Education Realty Trust, Inc. | 122,580 | 1,155,929 | |
Ellington Residential Mortgage REIT | 7,146 | 120,982 | |
Empire State Realty Trust, Inc. | 146,821 | 2,249,298 | |
EPR Properties | 65,817 | 3,505,413 | |
Equity Lifestyle Properties, Inc. | 92,610 | 3,727,553 | |
Equity One, Inc. (d) | 85,144 | 1,975,341 | |
Equity Residential (SBI) | 375,538 | 21,957,707 | |
Essex Property Trust, Inc. | 38,906 | 6,507,029 | |
Excel Trust, Inc. | 44,534 | 558,011 | |
Extra Space Storage, Inc. | 137,773 | 6,764,654 | |
Federal Realty Investment Trust (SBI) (d) | 65,716 | 7,314,848 | |
FelCor Lodging Trust, Inc. | 200,216 | 1,743,881 | |
First Industrial Realty Trust, Inc. (d) | 100,981 | 1,942,874 | |
First Potomac Realty Trust | 64,690 | 820,269 | |
Five Oaks Investment Corp. | 4,880 | 55,144 | |
Franklin Street Properties Corp. | 99,285 | 1,243,048 | |
Gaming & Leisure Properties | 93,984 | 3,578,911 | |
General Growth Properties, Inc. | 597,700 | 13,161,354 | |
Getty Realty Corp. | 23,628 | 454,603 | |
Gladstone Commercial Corp. | 10,709 | 186,337 | |
Glimcher Realty Trust | 157,267 | 1,530,208 | |
Government Properties Income Trust | 51,672 | 1,287,150 | |
Gramercy Property Trust, Inc. (a) | 85,386 | 495,239 | |
Hannon Armstrong Sustainable Infrastructure Capital, Inc. | 14,671 | 210,235 | |
Hatteras Financial Corp. | 121,103 | 2,388,151 | |
HCP, Inc. | 513,882 | 19,923,205 | |
Health Care REIT, Inc. | 319,414 | 18,762,378 | |
Healthcare Realty Trust, Inc. | 119,232 | 2,857,991 | |
Healthcare Trust of America, Inc. (d) | 307,681 | 3,455,258 | |
Hersha Hospitality Trust | 166,640 | 936,517 | |
Highwoods Properties, Inc. (SBI) (d) | 89,662 | 3,381,154 | |
Home Properties, Inc. (d) | 74,137 | 4,369,635 | |
Hospitality Properties Trust (SBI) | 164,136 | 4,349,604 | |
Host Hotels & Resorts, Inc. | 818,486 | 16,099,620 | |
Hudson Pacific Properties, Inc. | 49,472 | 1,128,456 | |
Inland Real Estate Corp. | 85,277 | 913,317 | |
Invesco Mortgage Capital, Inc. | 135,801 | 2,285,531 | |
Investors Real Estate Trust | 102,538 | 900,284 | |
iStar Financial, Inc. (a)(d) | 71,516 | 1,108,498 | |
JAVELIN Mortgage Investment Corp. (d) | 12,977 | 188,167 | |
Kilroy Realty Corp. (d) | 91,661 | 5,272,341 | |
Kimco Realty Corp. | 418,673 | 9,319,661 | |
Kite Realty Group Trust | 133,192 | 823,127 | |
LaSalle Hotel Properties (SBI) (d) | 107,841 | 3,379,737 | |
Lexington Corporate Properties Trust (d) | 259,496 | 2,960,849 | |
Liberty Property Trust (SBI) (d) | 176,490 | 6,752,507 | |
LTC Properties, Inc. | 32,625 | 1,229,310 | |
Mack-Cali Realty Corp. | 122,465 | 2,724,846 | |
Medical Properties Trust, Inc. | 160,702 | 2,119,659 | |
MFA Financial, Inc. | 486,658 | 3,825,132 | |
Common Stocks - continued | |||
Shares | Value | ||
FINANCIALS - continued | |||
Real Estate Investment Trusts - continued | |||
Mid-America Apartment Communities, Inc. (d) | 78,844 | $ 5,333,008 | |
Monmouth Real Estate Investment Corp. Class A | 35,864 | 347,164 | |
National Health Investors, Inc. | 34,486 | 2,127,786 | |
National Retail Properties, Inc. (d) | 132,178 | 4,743,868 | |
New York Mortgage Trust, Inc. (d) | 61,040 | 471,839 | |
NorthStar Realty Finance Corp. | 317,869 | 4,930,148 | |
Omega Healthcare Investors, Inc. (d) | 127,635 | 4,079,215 | |
One Liberty Properties, Inc. | 11,261 | 246,841 | |
Parkway Properties, Inc. | 64,262 | 1,184,349 | |
Pebblebrook Hotel Trust | 72,830 | 2,420,869 | |
Pennsylvania Real Estate Investment Trust (SBI) | 59,632 | 1,118,696 | |
PennyMac Mortgage Investment Trust | 70,569 | 1,716,238 | |
Physicians Realty Trust | 13,134 | 175,864 | |
Piedmont Office Realty Trust, Inc. Class A | 174,747 | 3,019,628 | |
Plum Creek Timber Co., Inc. | 200,436 | 8,676,874 | |
PMC Commercial Trust | 8,500 | 81,430 | |
Post Properties, Inc. | 73,877 | 3,585,251 | |
Potlatch Corp. | 43,845 | 1,738,016 | |
Power (REIT) (a) | 718 | 6,642 | |
Prologis, Inc. | 574,154 | 23,649,403 | |
PS Business Parks, Inc. | 26,075 | 2,190,822 | |
Public Storage | 159,990 | 27,038,310 | |
QTS Realty Trust, Inc. Class A | 15,035 | 384,295 | |
RAIT Financial Trust (d) | 83,839 | 696,702 | |
Ramco-Gershenson Properties Trust (SBI) (d) | 70,480 | 1,177,016 | |
Rayonier, Inc. | 140,834 | 6,631,873 | |
Realty Income Corp. | 238,560 | 10,596,835 | |
Redwood Trust, Inc. | 89,769 | 1,804,357 | |
Regency Centers Corp. | 116,777 | 5,928,768 | |
Resource Capital Corp. | 118,128 | 688,686 | |
Retail Opportunity Investments Corp. | 70,350 | 1,043,291 | |
Retail Properties America, Inc. | 250,044 | 3,485,613 | |
Rexford Industrial Realty, Inc. | 19,146 | 271,682 | |
RLJ Lodging Trust | 133,852 | 3,478,813 | |
Rouse Properties, Inc. (d) | 34,930 | 653,890 | |
Ryman Hospitality Properties, Inc. (d) | 49,860 | 2,103,593 | |
Sabra Health Care REIT, Inc. (d) | 44,632 | 1,270,673 | |
Saul Centers, Inc. | 14,444 | 671,213 | |
Select Income (REIT) | 38,717 | 1,128,601 | |
Senior Housing Properties Trust (SBI) | 240,030 | 5,352,669 | |
Silver Bay Realty Trust Corp. | 47,769 | 748,540 | |
Simon Property Group, Inc. | 342,693 | 55,272,954 | |
SL Green Realty Corp. (d) | 129,295 | 12,842,872 | |
SoTHERLY Hotels, Inc. | 2,721 | 16,789 | |
Sovran Self Storage, Inc. | 33,865 | 2,505,671 | |
Spirit Realty Capital, Inc. | 431,927 | 4,716,643 | |
Stag Industrial, Inc. | 38,576 | 899,207 | |
Starwood Property Trust, Inc. (d) | 220,370 | 5,293,287 | |
| |||
Shares | Value | ||
Starwood Waypoint Residential (a) | 44,074 | $ 1,194,846 | |
Strategic Hotel & Resorts, Inc. (a)(d) | 334,781 | 3,344,462 | |
Summit Hotel Properties, Inc. | 86,907 | 803,021 | |
Sun Communities, Inc. (d) | 36,167 | 1,665,852 | |
Sunstone Hotel Investors, Inc. | 192,214 | 2,598,733 | |
Supertel Hospitality, Inc., Maryland (a) | 703 | 1,758 | |
Tanger Factory Outlet Centers, Inc. (d) | 110,651 | 3,796,436 | |
Taubman Centers, Inc. (d) | 65,656 | 4,625,465 | |
Terreno Realty Corp. | 21,026 | 392,766 | |
The Geo Group, Inc. | 86,331 | 2,782,448 | |
The Macerich Co. | 163,662 | 9,840,996 | |
Two Harbors Investment Corp. | 449,289 | 4,663,620 | |
UDR, Inc. | 279,578 | 7,215,908 | |
UMH Properties, Inc. | 10,346 | 95,907 | |
Universal Health Realty Income Trust (SBI) | 13,491 | 574,447 | |
Urstadt Biddle Properties, Inc. Class A | 26,585 | 521,332 | |
Ventas, Inc. | 330,294 | 20,620,254 | |
Vornado Realty Trust | 190,771 | 18,369,340 | |
Washington REIT (SBI) | 61,934 | 1,557,640 | |
Weingarten Realty Investors (SBI) | 108,015 | 3,294,458 | |
Western Asset Mortgage Capital Corp. (d) | 19,742 | 325,151 | |
Weyerhaeuser Co. | 648,424 | 19,134,992 | |
Whitestone REIT Class B | 2,558 | 36,784 | |
Winthrop Realty Trust | 32,907 | 383,037 | |
WP Carey, Inc. | 66,643 | 4,233,163 | |
ZAIS Financial Corp. (d) | 6,000 | 104,460 | |
| 771,771,510 | ||
Real Estate Management & Development - 0.2% | |||
Alexander & Baldwin, Inc. | 43,253 | 1,800,190 | |
Altisource Portfolio Solutions SA | 18,423 | 1,812,455 | |
American Spectrum Realty, Inc. (a) | 1,984 | 2,778 | |
AV Homes, Inc. (a)(d) | 12,051 | 238,007 | |
CBRE Group, Inc. (a) | 310,765 | 8,685,882 | |
Consolidated-Tomoka Land Co. | 2,432 | 86,482 | |
Forest City Enterprises, Inc. Class A (a)(d) | 164,146 | 3,197,564 | |
Forestar Group, Inc. (a)(d) | 38,487 | 725,865 | |
Gladstone Land Corp. | 8,000 | 102,400 | |
Howard Hughes Corp. (a) | 34,443 | 4,754,167 | |
Jones Lang LaSalle, Inc. | 53,062 | 6,537,238 | |
Kennedy-Wilson Holdings, Inc. | 81,481 | 2,061,469 | |
Maui Land & Pineapple, Inc. (a)(d) | 31,310 | 194,435 | |
RE/MAX Holdings, Inc. | 10,289 | 315,049 | |
Realogy Holdings Corp. (a)(d) | 174,285 | 8,271,566 | |
Tejon Ranch Co. (a) | 11,342 | 402,074 | |
The St. Joe Co. (a)(d) | 111,664 | 2,158,465 | |
Transcontinental Realty Investors, Inc. (a) | 20,697 | 327,013 | |
ZipRealty, Inc. (a) | 19,987 | 94,738 | |
| 41,767,837 | ||
Thrifts & Mortgage Finance - 0.2% | |||
Astoria Financial Corp. | 69,632 | 953,958 | |
Banc of California, Inc. | 4,303 | 55,035 | |
Bank Mutual Corp. | 56,001 | 370,727 | |
Common Stocks - continued | |||
Shares | Value | ||
FINANCIALS - continued | |||
Thrifts & Mortgage Finance - continued | |||
BankFinancial Corp. | 19,300 | $ 192,614 | |
BBX Capital Corp. (a) | 18,261 | 353,168 | |
Beneficial Mutual Bancorp, Inc. (a) | 37,525 | 451,801 | |
Berkshire Hills Bancorp, Inc. | 20,197 | 507,551 | |
BofI Holding, Inc. (a)(d) | 11,427 | 1,063,854 | |
Brookline Bancorp, Inc., Delaware | 86,924 | 793,616 | |
Camco Financial Corp. (a)(d) | 10,386 | 62,835 | |
Cape Bancorp, Inc. | 2,611 | 27,755 | |
Capitol Federal Financial, Inc. | 194,739 | 2,366,079 | |
Charter Financial Corp. | 1,496 | 15,753 | |
Chicopee Bancorp, Inc. | 1,816 | 32,470 | |
Clifton Savings Bancorp, Inc. | 15,589 | 205,307 | |
Dime Community Bancshares, Inc. | 51,879 | 871,567 | |
Doral Financial Corp. (a) | 7,972 | 91,678 | |
ESB Financial Corp. | 9,498 | 124,519 | |
ESSA Bancorp, Inc. | 4,298 | 48,267 | |
Essent Group Ltd. | 38,008 | 881,786 | |
EverBank Financial Corp. | 121,901 | 2,184,466 | |
Farmer Mac Class C (non-vtg.) | 8,894 | 279,805 | |
First Defiance Financial Corp. | 6,145 | 170,032 | |
First Financial Northwest, Inc. | 2,197 | 22,717 | |
Flagstar Bancorp, Inc. (a) | 37,206 | 823,741 | |
Fox Chase Bancorp, Inc. | 14,307 | 245,222 | |
Franklin Financial Corp./VA (a) | 16,347 | 323,671 | |
HF Financial Corp. | 2,735 | 36,321 | |
Hingham Institution for Savings | 1,505 | 117,842 | |
Home Loan Servicing Solutions Ltd. (d) | 65,442 | 1,342,870 | |
HomeStreet, Inc. | 7,892 | 148,685 | |
Hudson City Bancorp, Inc. | 532,335 | 5,057,183 | |
IF Bancorp, Inc. | 3,112 | 51,192 | |
Impac Mortgage Holdings, Inc. (a)(d) | 5,393 | 37,751 | |
Kearny Financial Corp. (a) | 2,196 | 27,626 | |
Madison County Financial, Inc. | 4,682 | 80,530 | |
Meridian Interstate Bancorp, Inc. (a) | 750 | 18,150 | |
MGIC Investment Corp. (a)(d) | 403,619 | 3,616,426 | |
NASB Financial, Inc. | 1,203 | 30,484 | |
Nationstar Mortgage Holdings, Inc. (a)(d) | 18,397 | 530,386 | |
New York Community Bancorp, Inc. (d) | 541,088 | 8,646,586 | |
Northfield Bancorp, Inc. | 23,534 | 297,940 | |
Northwest Bancshares, Inc. | 92,094 | 1,321,549 | |
OceanFirst Financial Corp. | 5,851 | 110,467 | |
Ocwen Financial Corp. (a) | 133,402 | 4,994,571 | |
Oritani Financial Corp. | 41,599 | 651,440 | |
PennyMac Financial Services, Inc. | 12,245 | 211,716 | |
People's United Financial, Inc. | 329,770 | 4,672,841 | |
Peoples Federal Bancshares, Inc. | 1,156 | 20,739 | |
Poage Bankshares, Inc. | 2,365 | 32,661 | |
Provident Financial Holdings, Inc. | 3,066 | 47,124 | |
Provident Financial Services, Inc. | 56,391 | 1,046,617 | |
Radian Group, Inc. | 200,792 | 3,122,316 | |
Riverview Bancorp, Inc. (a) | 6,875 | 23,238 | |
| |||
Shares | Value | ||
Rockville Financial, Inc. | 26,525 | $ 349,334 | |
Security National Financial Corp. | 10,153 | 39,495 | |
Simplicity Bancorp, Inc. | 10,338 | 182,362 | |
Territorial Bancorp, Inc. | 13,244 | 294,017 | |
TFS Financial Corp. (a) | 149,374 | 1,765,601 | |
Timberland Bancorp, Inc. | 5,034 | 53,813 | |
Tree.com, Inc. (a) | 3,275 | 110,728 | |
Trustco Bank Corp., New York | 86,500 | 584,740 | |
United Community Financial Corp. (a) | 29,429 | 109,182 | |
United Financial Bancorp, Inc. | 9,158 | 161,272 | |
Walker & Dunlop, Inc. (a) | 10,954 | 184,356 | |
Washington Federal, Inc. | 113,789 | 2,551,149 | |
Westfield Financial, Inc. | 28,907 | 219,404 | |
WSFS Financial Corp. | 10,396 | 741,131 | |
| 57,161,829 | ||
TOTAL FINANCIALS | 3,994,753,449 | ||
HEALTH CARE - 13.1% | |||
Biotechnology - 2.9% | |||
Aastrom Biosciences, Inc. (a) | 3,923 | 13,221 | |
ACADIA Pharmaceuticals, Inc. (a)(d) | 82,586 | 2,337,184 | |
Acceleron Pharma, Inc. (d) | 12,418 | 582,777 | |
Achillion Pharmaceuticals, Inc. (a)(d) | 72,544 | 253,904 | |
Acorda Therapeutics, Inc. (a) | 40,293 | 1,476,336 | |
Aegerion Pharmaceuticals, Inc. (a)(d) | 28,027 | 1,534,759 | |
Agenus, Inc. (a)(d) | 22,142 | 108,274 | |
Agios Pharmaceuticals, Inc. (d) | 7,262 | 227,010 | |
Alexion Pharmaceuticals, Inc. (a) | 219,098 | 38,736,526 | |
Alkermes PLC (a)(d) | 151,179 | 7,357,882 | |
Alnylam Pharmaceuticals, Inc. (a)(d) | 62,752 | 5,097,972 | |
AMAG Pharmaceuticals, Inc. (a)(d) | 31,420 | 651,337 | |
Amgen, Inc. | 847,536 | 105,111,415 | |
Amicus Therapeutics, Inc. (a)(d) | 25,384 | 63,968 | |
Anacor Pharmaceuticals, Inc. (a)(d) | 28,185 | 535,515 | |
Anthera Pharmaceuticals, Inc. (a) | 5,648 | 16,718 | |
Arena Pharmaceuticals, Inc. (a)(d) | 260,488 | 1,695,777 | |
ARIAD Pharmaceuticals, Inc. (a)(d) | 193,266 | 1,679,482 | |
ArQule, Inc. (a) | 65,290 | 146,903 | |
Array BioPharma, Inc. (a)(d) | 101,050 | 487,061 | |
Arrowhead Research Corp. (a) | 20,335 | 395,312 | |
Athersys, Inc. (a)(d) | 49,216 | 186,036 | |
AVEO Pharmaceuticals, Inc. (a) | 43,200 | 80,784 | |
BioCryst Pharmaceuticals, Inc. (a)(d) | 79,931 | 934,393 | |
Biogen Idec, Inc. (a) | 265,622 | 90,492,103 | |
BioMarin Pharmaceutical, Inc. (a) | 169,338 | 13,716,378 | |
Biospecifics Technologies Corp. (a) | 1,441 | 34,195 | |
Biota Pharmaceuticals, Inc. (a) | 5,848 | 38,714 | |
BioTime, Inc. (a)(d) | 32,076 | 115,153 | |
Bluebird Bio, Inc. (d) | 7,366 | 187,833 | |
Catalyst Pharmaceutical Partners, Inc. (a)(d) | 25,961 | 58,153 | |
Common Stocks - continued | |||
Shares | Value | ||
HEALTH CARE - continued | |||
Biotechnology - continued | |||
Cel-Sci Corp. (a)(d) | 28,340 | $ 31,457 | |
Celgene Corp. (a) | 463,123 | 74,447,022 | |
Cell Therapeutics, Inc. (a)(d) | 129,276 | 497,713 | |
Celldex Therapeutics, Inc. (a)(d) | 107,399 | 3,138,199 | |
Cellular Dynamics International, Inc. (d) | 4,597 | 68,449 | |
Celsion Corp. (a) | 10,682 | 39,844 | |
Cepheid, Inc. (a)(d) | 80,169 | 4,301,869 | |
Chelsea Therapeutics International Ltd. (a)(d) | 75,408 | 430,580 | |
ChemoCentryx, Inc. (a)(d) | 15,137 | 115,041 | |
Chimerix, Inc. | 17,212 | 344,240 | |
Cleveland Biolabs, Inc. (a) | 35,489 | 24,945 | |
Clovis Oncology, Inc. (a) | 39,949 | 3,180,739 | |
Codexis, Inc. (a) | 21,294 | 39,607 | |
Conatus Pharmaceuticals, Inc. (d) | 7,362 | 82,602 | |
Coronado Biosciences, Inc. (a)(d) | 18,457 | 52,418 | |
Cubist Pharmaceuticals, Inc. (a)(d) | 78,426 | 6,236,436 | |
Cubist Pharmaceuticals, Inc. rights (a) | 32,062 | 0 | |
Curis, Inc. (a)(d) | 69,058 | 210,627 | |
Cyclacel Pharmaceuticals, Inc. (a)(d) | 11,529 | 44,733 | |
Cytokinetics, Inc. (a) | 26,522 | 261,242 | |
Cytori Therapeutics, Inc. (a)(d) | 69,588 | 219,202 | |
CytRx Corp. (a) | 25,756 | 152,476 | |
DARA BioSciences, Inc. (a) | 1,702 | 4,970 | |
Dendreon Corp. (a)(d) | 131,169 | 377,767 | |
Discovery Laboratories, Inc. (a) | 38,893 | 102,678 | |
Durata Therapeutics, Inc. (a)(d) | 10,654 | 146,066 | |
Dyax Corp. (a)(d) | 146,558 | 1,417,216 | |
Dynavax Technologies Corp. (a)(d) | 275,972 | 513,308 | |
Emergent BioSolutions, Inc. (a) | 25,651 | 634,606 | |
Enanta Pharmaceuticals, Inc. (d) | 3,858 | 142,129 | |
EntreMed, Inc. (a) | 289 | 555 | |
Enzon Pharmaceuticals, Inc. | 43,430 | 41,693 | |
Epizyme, Inc. | 4,503 | 134,640 | |
Esperion Therapeutics, Inc. (d) | 6,156 | 95,726 | |
Exact Sciences Corp. (a)(d) | 79,977 | 1,075,691 | |
Exelixis, Inc. (a)(d) | 160,939 | 1,136,229 | |
Foundation Medicine, Inc. (d) | 12,644 | 450,506 | |
Galectin Therapeutics, Inc. (a)(d) | 13,518 | 227,913 | |
Galena Biopharma, Inc. (a)(d) | 133,911 | 528,948 | |
Genomic Health, Inc. (a)(d) | 18,393 | 485,759 | |
GenVec, Inc. (a) | 8,140 | 29,223 | |
Geron Corp. (a)(d) | 128,101 | 609,120 | |
Gilead Sciences, Inc. (a)(d) | 1,722,310 | 142,590,045 | |
GTx, Inc. (a)(d) | 19,627 | 33,366 | |
Halozyme Therapeutics, Inc. (a)(d) | 112,522 | 1,585,435 | |
Harvard Apparatus (a) | 3,080 | 15,585 | |
Heat Biologics, Inc. (d) | 3,136 | 23,144 | |
Hemispherx Biopharma, Inc. (a) | 130,774 | 51,133 | |
Hyperion Therapeutics, Inc. (a)(d) | 5,781 | 179,211 | |
iBio, Inc. (a) | 40,361 | 21,783 | |
| |||
Shares | Value | ||
Idenix Pharmaceuticals, Inc. (a)(d) | 141,515 | $ 965,132 | |
Idera Pharmaceuticals, Inc. (a) | 80,821 | 467,954 | |
ImmunoCellular Therapeutics Ltd. (a)(d) | 41,923 | 57,015 | |
ImmunoGen, Inc. (a)(d) | 90,051 | 1,476,836 | |
Immunomedics, Inc. (a)(d) | 54,782 | 259,667 | |
Incyte Corp. (a)(d) | 167,261 | 10,748,192 | |
Infinity Pharmaceuticals, Inc. (a)(d) | 41,127 | 644,871 | |
Inovio Pharmaceuticals, Inc. (a)(d) | 175,405 | 577,082 | |
Insmed, Inc. (a)(d) | 32,411 | 648,544 | |
Insys Therapeutics, Inc. (a)(d) | 4,354 | 292,937 | |
Intercept Pharmaceuticals, Inc. (a) | 12,590 | 5,168,195 | |
InterMune, Inc. (a) | 93,683 | 2,814,237 | |
Intrexon Corp. (d) | 13,260 | 344,495 | |
Ironwood Pharmaceuticals, Inc. | 150,069 | 2,177,501 | |
Isis Pharmaceuticals, Inc. (a)(d) | 138,050 | 7,040,550 | |
IsoRay, Inc. (a)(d) | 31,040 | 24,366 | |
Karyopharm Therapeutics, Inc. | 6,103 | 244,974 | |
Keryx Biopharmaceuticals, Inc. (a)(d) | 105,438 | 1,692,280 | |
KYTHERA Biopharmaceuticals, Inc. (a)(d) | 13,619 | 680,541 | |
Lexicon Pharmaceuticals, Inc. (a)(d) | 482,347 | 863,401 | |
Ligand Pharmaceuticals, Inc. | 23,017 | 1,605,436 | |
Lpath, Inc. (a) | 7,871 | 36,521 | |
Macrogenics, Inc. | 4,799 | 167,965 | |
MannKind Corp. (a)(d) | 286,250 | 1,771,888 | |
Mast Therapeutics, Inc. (a) | 29,390 | 24,394 | |
Medgenics, Inc. (a)(d) | 4,479 | 38,654 | |
Medivation, Inc. (a)(d) | 85,572 | 6,153,483 | |
Merrimack Pharmaceuticals, Inc. (a)(d) | 95,963 | 477,896 | |
Metabolix, Inc. (a)(d) | 41,636 | 53,294 | |
MiMedx Group, Inc. (a) | 79,098 | 565,551 | |
Momenta Pharmaceuticals, Inc. (a) | 43,036 | 636,933 | |
Myriad Genetics, Inc. (a)(d) | 87,108 | 3,154,181 | |
Nanosphere, Inc. (a)(d) | 36,229 | 86,950 | |
NanoViricides, Inc. (a)(d) | 32,620 | 129,828 | |
Navidea Biopharmaceuticals, Inc. (a)(d) | 114,446 | 211,725 | |
Neuralstem, Inc. (a) | 54,208 | 193,523 | |
Neurocrine Biosciences, Inc. (a) | 83,489 | 1,471,911 | |
NewLink Genetics Corp. (a)(d) | 12,482 | 551,704 | |
Northwest Biotherapeutics, Inc. (a)(d) | 40,748 | 288,903 | |
Novavax, Inc. (a)(d) | 198,633 | 1,271,251 | |
NPS Pharmaceuticals, Inc. (a)(d) | 102,906 | 3,599,652 | |
OncoGenex Pharmaceuticals, Inc. (a)(d) | 10,565 | 116,426 | |
OncoMed Pharmaceuticals, Inc. (d) | 5,827 | 201,148 | |
Onconova Therapeutics, Inc. (d) | 6,241 | 53,049 | |
Oncothyreon, Inc. (a) | 43,661 | 134,912 | |
Opexa Therapeutics, Inc. (a)(d) | 5,726 | 10,421 | |
Ophthotech Corp. (d) | 12,066 | 406,262 | |
Opko Health, Inc. (a)(d) | 254,677 | 2,424,525 | |
Oragenics, Inc. (a) | 9,973 | 37,299 | |
Orexigen Therapeutics, Inc. (a)(d) | 77,934 | 540,862 | |
Organovo Holdings, Inc. (a)(d) | 69,396 | 713,391 | |
Osiris Therapeutics, Inc. (a)(d) | 18,170 | 277,456 | |
Common Stocks - continued | |||
Shares | Value | ||
HEALTH CARE - continued | |||
Biotechnology - continued | |||
OvaScience, Inc. (a) | 10,225 | $ 110,328 | |
OXiGENE, Inc. (a) | 561 | 1,195 | |
Oxygen Biotherapeutics, Inc. (a)(d) | 1,373 | 8,883 | |
Palatin Technologies, Inc. (a)(d) | 9,275 | 9,739 | |
PDL BioPharma, Inc. (d) | 181,078 | 1,551,838 | |
Peregrine Pharmaceuticals, Inc. (a)(d) | 84,902 | 153,673 | |
Pharmacyclics, Inc. (a) | 74,587 | 10,342,233 | |
PharmAthene, Inc. (a)(d) | 51,372 | 96,579 | |
Portola Pharmaceuticals, Inc. (d) | 6,348 | 154,828 | |
Progenics Pharmaceuticals, Inc. (a)(d) | 45,935 | 214,516 | |
Prothena Corp. PLC (a) | 18,701 | 673,423 | |
PTC Therapeutics, Inc. (a) | 10,292 | 322,757 | |
Puma Biotechnology, Inc. (a)(d) | 28,653 | 3,331,198 | |
Raptor Pharmaceutical Corp. (a)(d) | 62,748 | 993,301 | |
Receptos, Inc. | 18,327 | 850,098 | |
Regeneron Pharmaceuticals, Inc. (a) | 88,505 | 29,427,913 | |
Regulus Therapeutics, Inc. (a)(d) | 11,075 | 124,372 | |
Repligen Corp. (a)(d) | 22,058 | 330,208 | |
Rexahn Pharmaceuticals, Inc. (a)(d) | 45,000 | 60,750 | |
Rigel Pharmaceuticals, Inc. (a) | 75,480 | 259,651 | |
Sangamo Biosciences, Inc. (a)(d) | 84,275 | 1,533,805 | |
Sarepta Therapeutics, Inc. (a)(d) | 40,979 | 1,189,620 | |
Seattle Genetics, Inc. (a)(d) | 128,581 | 6,762,075 | |
SIGA Technologies, Inc. (a)(d) | 72,968 | 234,227 | |
Spectrum Pharmaceuticals, Inc. (a)(d) | 41,659 | 347,853 | |
StemCells, Inc. (a)(d) | 41,468 | 60,958 | |
Stemline Therapeutics, Inc. (d) | 10,674 | 276,030 | |
Sunesis Pharmaceuticals, Inc. (a)(d) | 32,643 | 213,812 | |
Synageva BioPharma Corp. (a)(d) | 21,459 | 2,460,704 | |
Synergy Pharmaceuticals, Inc. (a)(d) | 111,018 | 673,879 | |
Synta Pharmaceuticals Corp. (a)(d) | 94,692 | 585,197 | |
Synthetic Biologics, Inc. (a) | 46,314 | 125,048 | |
Targacept, Inc. (a)(d) | 18,977 | 93,557 | |
Telik, Inc. (a) | 380 | 528 | |
TESARO, Inc. (a)(d) | 12,275 | 405,198 | |
Tetraphase Pharmaceuticals, Inc. | 10,243 | 139,305 | |
TG Therapeutics, Inc. (a)(d) | 7,226 | 47,692 | |
Theravance, Inc. (a)(d) | 88,275 | 3,266,175 | |
Threshold Pharmaceuticals, Inc. (a) | 37,822 | 189,110 | |
Trovagene, Inc. (a)(d) | 4,592 | 28,746 | |
United Therapeutics Corp. (a)(d) | 53,357 | 5,411,467 | |
Vanda Pharmaceuticals, Inc. (a)(d) | 44,094 | 667,142 | |
Verastem, Inc. (a)(d) | 13,711 | 183,316 | |
Vertex Pharmaceuticals, Inc. (a) | 268,044 | 21,674,038 | |
Vical, Inc. (a)(d) | 65,666 | 99,812 | |
XOMA Corp. (a) | 72,501 | 606,108 | |
Zalicus, Inc. (a)(d) | 17,476 | 26,389 | |
ZIOPHARM Oncology, Inc. (a)(d) | 79,220 | 337,477 | |
| 682,179,876 | ||
Health Care Equipment & Supplies - 2.1% | |||
Abaxis, Inc. (a)(d) | 23,291 | 883,893 | |
| |||
Shares | Value | ||
Abbott Laboratories | 1,738,741 | $ 69,167,117 | |
Abiomed, Inc. (a)(d) | 36,354 | 1,024,819 | |
Accuray, Inc. (a)(d) | 58,561 | 549,302 | |
Alere, Inc. (a) | 93,479 | 3,434,418 | |
Align Technology, Inc. (a)(d) | 76,057 | 3,980,063 | |
Alphatec Holdings, Inc. (a) | 36,801 | 51,889 | |
Analogic Corp. | 12,756 | 1,202,381 | |
Angiodynamics, Inc. (a) | 26,377 | 406,206 | |
Anika Therapeutics, Inc. (a) | 9,287 | 365,629 | |
Antares Pharma, Inc. (a)(d) | 97,369 | 433,292 | |
ArthroCare Corp. (a) | 39,236 | 1,893,137 | |
Atossa Genetics, Inc. (a)(d) | 789 | 1,736 | |
Atricure, Inc. (a) | 12,717 | 264,386 | |
Atrion Corp. | 1,172 | 339,212 | |
Bacterin International Holdings, Inc. (a)(d) | 9,747 | 6,492 | |
Baxano Surgical, Inc. (a)(d) | 18,036 | 27,415 | |
Baxter International, Inc. | 605,834 | 42,105,463 | |
Becton, Dickinson & Co. | 213,454 | 24,594,170 | |
BioLase Technology, Inc. (d) | 31,016 | 95,839 | |
Boston Scientific Corp. (a) | 1,493,547 | 19,565,466 | |
BSD Medical Corp. (a)(d) | 46,363 | 53,317 | |
C.R. Bard, Inc. | 84,581 | 12,193,197 | |
Cantel Medical Corp. | 48,934 | 1,583,015 | |
Cardica, Inc. (a) | 23,778 | 27,107 | |
Cardiovascular Systems, Inc. (a)(d) | 37,106 | 1,298,710 | |
CareFusion Corp. (a) | 231,213 | 9,371,063 | |
Cerus Corp. (a)(d) | 66,771 | 431,341 | |
Cesca Therapeutics, Inc. (a)(d) | 15,844 | 35,174 | |
CONMED Corp. | 26,543 | 1,237,435 | |
Covidien PLC | 520,911 | 37,479,546 | |
Cryolife, Inc. | 20,961 | 208,772 | |
Cutera, Inc. (a) | 15,449 | 165,304 | |
Cyberonics, Inc. (a)(d) | 26,017 | 1,781,384 | |
Cynosure, Inc. Class A (a) | 17,160 | 528,185 | |
Delcath Systems, Inc. (a)(d) | 119,898 | 37,516 | |
DENTSPLY International, Inc. | 165,101 | 7,492,283 | |
Derma Sciences, Inc. (a) | 7,901 | 116,066 | |
DexCom, Inc. (a) | 82,473 | 3,719,532 | |
Echo Therapeutics, Inc. (a)(d) | 2,009 | 6,288 | |
Edwards Lifesciences Corp. (a)(d) | 125,427 | 8,749,788 | |
Endologix, Inc. (a)(d) | 68,176 | 920,376 | |
EnteroMedics, Inc. (a)(d) | 53,456 | 129,898 | |
ERBA Diagnostics, Inc. (a)(d) | 3,094 | 7,890 | |
Exactech, Inc. (a) | 3,102 | 72,277 | |
Fonar Corp. (a) | 719 | 16,293 | |
Genmark Diagnostics, Inc. (a)(d) | 33,235 | 414,108 | |
Globus Medical, Inc. (a) | 81,315 | 1,923,913 | |
Greatbatch, Inc. (a) | 22,320 | 967,126 | |
Haemonetics Corp. (a)(d) | 65,465 | 2,388,163 | |
Hansen Medical, Inc. (a)(d) | 48,696 | 113,949 | |
HeartWare International, Inc. (a)(d) | 17,704 | 1,700,115 | |
Hill-Rom Holdings, Inc. | 58,209 | 2,202,046 | |
Hologic, Inc. (a)(d) | 312,892 | 6,814,788 | |
Common Stocks - continued | |||
Shares | Value | ||
HEALTH CARE - continued | |||
Health Care Equipment & Supplies - continued | |||
ICU Medical, Inc. (a)(d) | 17,344 | $ 1,003,524 | |
IDEXX Laboratories, Inc. (a)(d) | 62,216 | 7,832,994 | |
Insulet Corp. (a)(d) | 65,054 | 3,084,210 | |
Integra LifeSciences Holdings Corp. (a)(d) | 24,422 | 1,148,811 | |
Intuitive Surgical, Inc. (a) | 43,523 | 19,360,336 | |
Invacare Corp. | 28,414 | 563,165 | |
Kewaunee Scientific Corp. | 1,376 | 22,374 | |
LeMaitre Vascular, Inc. | 3,845 | 31,491 | |
Masimo Corp. (a)(d) | 62,689 | 1,601,704 | |
Medical Action Industries, Inc. (a) | 18,788 | 137,528 | |
Medtronic, Inc. | 1,114,252 | 66,030,574 | |
MELA Sciences, Inc. (a)(d) | 40,114 | 28,280 | |
Meridian Bioscience, Inc. (d) | 44,602 | 930,398 | |
Merit Medical Systems, Inc. (a) | 38,544 | 581,629 | |
Misonix, Inc. (a) | 2,579 | 17,279 | |
Natus Medical, Inc. (a) | 24,629 | 618,188 | |
Neogen Corp. (a) | 37,855 | 1,639,879 | |
NuVasive, Inc. (a)(d) | 44,714 | 1,643,240 | |
NxStage Medical, Inc. (a) | 54,843 | 760,672 | |
OraSure Technologies, Inc. (a) | 46,551 | 323,064 | |
Orthofix International NV (a) | 16,427 | 365,008 | |
PhotoMedex, Inc. (a)(d) | 6,551 | 95,907 | |
Quidel Corp. (a)(d) | 35,813 | 1,003,480 | |
ResMed, Inc. (d) | 155,104 | 6,827,678 | |
Retractable Technologies, Inc. (a) | 5,248 | 18,893 | |
Rockwell Medical Technologies, Inc. (a)(d) | 40,985 | 520,100 | |
RTI Biologics, Inc. (a) | 29,474 | 110,822 | |
Sirona Dental Systems, Inc. (a)(d) | 67,791 | 4,776,554 | |
St. Jude Medical, Inc. | 324,571 | 21,850,120 | |
Staar Surgical Co. (a) | 22,695 | 321,361 | |
Stereotaxis, Inc. (a) | 3,270 | 16,219 | |
Steris Corp. | 82,536 | 3,809,036 | |
Stryker Corp. | 333,990 | 26,799,358 | |
SurModics, Inc. (a) | 19,525 | 486,173 | |
Symmetry Medical, Inc. (a) | 29,367 | 310,703 | |
Synergetics U.S.A., Inc. (a) | 3,622 | 12,532 | |
Tandem Diabetes Care, Inc. | 11,476 | 295,507 | |
TearLab Corp. (a)(d) | 17,390 | 139,990 | |
Teleflex, Inc. | 53,220 | 5,427,908 | |
The Cooper Companies, Inc. (d) | 58,635 | 7,517,593 | |
The Spectranetics Corp. (a) | 40,582 | 1,215,837 | |
Thoratec Corp. (a) | 57,172 | 2,123,368 | |
Tornier NV (a) | 21,770 | 417,984 | |
Unilife Corp. (a)(d) | 142,037 | 657,631 | |
Uroplasty, Inc. (a) | 1,597 | 6,580 | |
Varian Medical Systems, Inc. (a)(d) | 116,002 | 9,724,448 | |
Vascular Solutions, Inc. (a) | 2,125 | 55,293 | |
Vermillion, Inc. (a)(d) | 5,249 | 17,847 | |
Volcano Corp. (a)(d) | 51,974 | 1,115,362 | |
West Pharmaceutical Services, Inc. | 83,154 | 3,790,159 | |
Wright Medical Group, Inc. (a)(d) | 47,593 | 1,514,409 | |
| |||
Shares | Value | ||
Zeltiq Aesthetics, Inc. (a)(d) | 23,737 | $ 450,766 | |
Zimmer Holdings, Inc. | 197,443 | 18,528,051 | |
| 502,260,307 | ||
Health Care Providers & Services - 2.2% | |||
Acadia Healthcare Co., Inc. (a)(d) | 44,959 | 2,222,773 | |
Accretive Health, Inc. (a)(d) | 67,415 | 558,196 | |
Aetna, Inc. | 410,919 | 29,877,920 | |
Air Methods Corp. (a)(d) | 37,158 | 2,007,275 | |
Alliance Healthcare Services, Inc. (a) | 17,141 | 516,630 | |
Almost Family, Inc. (a) | 9,932 | 272,335 | |
Amedisys, Inc. (a)(d) | 30,453 | 516,483 | |
AmerisourceBergen Corp. | 242,456 | 16,450,640 | |
AMN Healthcare Services, Inc. (a) | 76,320 | 1,063,138 | |
AmSurg Corp. (a) | 32,040 | 1,405,274 | |
Bio-Reference Laboratories, Inc. (a)(d) | 31,917 | 806,223 | |
BioScrip, Inc. (a)(d) | 61,696 | 439,892 | |
BioTelemetry, Inc. (a) | 34,161 | 383,970 | |
Brookdale Senior Living, Inc. (a) | 136,171 | 4,567,175 | |
Capital Senior Living Corp. (a) | 26,619 | 676,655 | |
Cardinal Health, Inc. | 378,369 | 27,064,735 | |
Centene Corp. (a)(d) | 59,283 | 3,775,141 | |
Chemed Corp. (d) | 19,372 | 1,638,871 | |
Chindex International, Inc. (a) | 9,187 | 176,850 | |
Cigna Corp. | 313,010 | 24,912,466 | |
Community Health Systems, Inc. (a) | 133,147 | 5,526,932 | |
Corvel Corp. (a) | 17,696 | 814,193 | |
Cross Country Healthcare, Inc. (a) | 40,427 | 420,441 | |
DaVita HealthCare Partners, Inc. (a) | 194,861 | 13,392,797 | |
Emeritus Corp. (a) | 47,874 | 1,509,467 | |
Envision Healthcare Holdings, Inc. | 72,467 | 2,439,239 | |
ExamWorks Group, Inc. (a)(d) | 29,906 | 1,087,980 | |
Express Scripts Holding Co. (a) | 897,442 | 67,586,357 | |
Five Star Quality Care, Inc. (a) | 32,241 | 186,675 | |
Gentiva Health Services, Inc. (a) | 24,132 | 258,454 | |
Hanger, Inc. (a) | 33,622 | 1,191,900 | |
HCA Holdings, Inc. (a) | 345,647 | 17,697,126 | |
Health Net, Inc. (a) | 90,547 | 3,083,125 | |
HealthSouth Corp. (d) | 110,704 | 3,617,807 | |
Healthways, Inc. (a)(d) | 33,821 | 505,962 | |
Henry Schein, Inc. (a)(d) | 98,971 | 11,781,508 | |
Hooper Holmes, Inc. (a) | 6,267 | 3,510 | |
Humana, Inc. | 170,662 | 19,192,649 | |
IPC The Hospitalist Co., Inc. (a)(d) | 20,567 | 1,055,704 | |
Kindred Healthcare, Inc. | 69,839 | 1,512,713 | |
Laboratory Corp. of America Holdings (a)(d) | 96,901 | 9,064,120 | |
Landauer, Inc. | 14,935 | 723,750 | |
LCA-Vision, Inc. (a) | 27,238 | 148,175 | |
LHC Group, Inc. (a) | 12,810 | 301,804 | |
LifePoint Hospitals, Inc. (a)(d) | 49,772 | 2,700,131 | |
Magellan Health Services, Inc. (a) | 33,160 | 2,027,402 | |
McKesson Corp. | 255,109 | 45,167,048 | |
MEDNAX, Inc. (a)(d) | 110,274 | 6,706,865 | |
Common Stocks - continued | |||
Shares | Value | ||
HEALTH CARE - continued | |||
Health Care Providers & Services - continued | |||
Molina Healthcare, Inc. (a)(d) | 24,412 | $ 919,844 | |
MWI Veterinary Supply, Inc. (a)(d) | 16,104 | 2,623,664 | |
National Healthcare Corp. | 6,159 | 317,189 | |
National Research Corp.: | |||
Class A (a) | 960 | 16,800 | |
Class B (d) | 3,356 | 134,408 | |
NeoStem, Inc. (a)(d) | 15,337 | 107,359 | |
Omnicare, Inc. | 126,227 | 7,434,770 | |
Owens & Minor, Inc. | 59,970 | 2,082,158 | |
Patterson Companies, Inc. (d) | 106,597 | 4,387,533 | |
PDI, Inc. (a) | 1,365 | 6,484 | |
PharMerica Corp. (a) | 29,176 | 703,142 | |
Premier, Inc. (d) | 38,595 | 1,291,003 | |
Providence Service Corp. (a) | 13,245 | 352,185 | |
Quest Diagnostics, Inc. (d) | 161,387 | 8,553,511 | |
RadNet, Inc. (a) | 27,076 | 52,527 | |
Select Medical Holdings Corp. | 68,408 | 766,854 | |
Sharps Compliance Corp. (a) | 5,184 | 24,883 | |
Skilled Healthcare Group, Inc. (a)(d) | 27,157 | 130,625 | |
Surgical Care Affiliates, Inc. | 14,337 | 436,132 | |
Team Health Holdings, Inc. (a)(d) | 79,380 | 3,573,688 | |
Tenet Healthcare Corp. (a) | 109,083 | 4,812,742 | |
The Ensign Group, Inc. | 18,939 | 749,984 | |
Triple-S Management Corp. (a) | 20,220 | 338,685 | |
U.S. Physical Therapy, Inc. | 11,240 | 372,943 | |
UnitedHealth Group, Inc. | 1,126,842 | 87,071,081 | |
Universal American Spin Corp. | 33,569 | 251,432 | |
Universal Health Services, Inc. Class B | 113,232 | 9,090,265 | |
VCA Antech, Inc. (a) | 87,077 | 2,696,775 | |
Wellcare Health Plans, Inc. (a) | 52,863 | 3,267,991 | |
WellPoint, Inc. | 330,284 | 29,920,428 | |
| 511,523,561 | ||
Health Care Technology - 0.2% | |||
Allscripts Healthcare Solutions, Inc. (a) | 176,070 | 3,269,620 | |
athenahealth, Inc. (a)(d) | 41,563 | 8,057,819 | |
Authentidate Holding Corp. (a) | 816 | 857 | |
Cerner Corp. (a)(d) | 329,819 | 20,240,992 | |
CollabRx, Inc. (a) | 87 | 279 | |
Computer Programs & Systems, Inc. | 21,937 | 1,501,149 | |
HealthStream, Inc. (a)(d) | 34,016 | 980,341 | |
HMS Holdings Corp. (a)(d) | 102,544 | 2,098,050 | |
MedAssets, Inc. (a) | 61,276 | 1,488,394 | |
Medidata Solutions, Inc. (a)(d) | 52,930 | 3,392,813 | |
Merge Healthcare, Inc. (a)(d) | 37,852 | 95,009 | |
Omnicell, Inc. (a) | 38,848 | 1,118,045 | |
Quality Systems, Inc. | 52,869 | 923,093 | |
Veeva Systems, Inc. Class A (d) | 21,176 | 747,513 | |
Vocera Communications, Inc. (a)(d) | 14,570 | 247,981 | |
| 44,161,955 | ||
| |||
Shares | Value | ||
Life Sciences Tools & Services - 0.6% | |||
Accelerate Diagnostics, Inc. (a)(d) | 24,477 | $ 361,770 | |
Affymetrix, Inc. (a)(d) | 55,779 | 430,614 | |
Agilent Technologies, Inc. | 366,572 | 20,868,944 | |
Albany Molecular Research, Inc. (a)(d) | 23,897 | 372,793 | |
Apricus Biosciences, Inc. (a)(d) | 18,211 | 42,523 | |
BG Medicine, Inc. (a)(d) | 3,134 | 4,074 | |
Bio-Rad Laboratories, Inc. Class A (a) | 24,617 | 3,193,317 | |
Bruker BioSciences Corp. (a) | 117,243 | 2,666,106 | |
Cambrex Corp. (a) | 26,613 | 534,123 | |
Charles River Laboratories International, Inc. (a) | 45,219 | 2,686,461 | |
Covance, Inc. (a)(d) | 69,154 | 7,161,588 | |
Enzo Biochem, Inc. (a) | 14,697 | 54,526 | |
Fluidigm Corp. (a) | 33,180 | 1,554,483 | |
Furiex Pharmaceuticals, Inc. (a)(d) | 9,211 | 852,294 | |
Harvard Bioscience, Inc. (a) | 12,320 | 60,122 | |
Illumina, Inc. (a)(d) | 140,797 | 24,145,278 | |
Luminex Corp. (a) | 39,871 | 736,816 | |
Mettler-Toledo International, Inc. (a)(d) | 36,042 | 8,857,682 | |
Nanostring Technologies, Inc. | 6,707 | 126,762 | |
NeoGenomics, Inc. (a)(d) | 21,535 | 77,095 | |
Pacific Biosciences of California, Inc. (a) | 41,271 | 274,865 | |
PAREXEL International Corp. (a) | 64,767 | 3,469,568 | |
PerkinElmer, Inc. | 134,059 | 6,075,554 | |
pSivida Corp. (a)(d) | 25,265 | 110,661 | |
Quintiles Transnational Holdings, Inc. | 25,574 | 1,384,832 | |
Sequenom, Inc. (a)(d) | 91,772 | 217,500 | |
Techne Corp. | 39,549 | 3,513,533 | |
Thermo Fisher Scientific, Inc. | 445,114 | 55,434,498 | |
Waters Corp. (a) | 93,206 | 10,383,148 | |
| 155,651,530 | ||
Pharmaceuticals - 5.1% | |||
AbbVie, Inc. | 1,788,172 | 91,035,837 | |
AcelRx Pharmaceuticals, Inc. (a)(d) | 17,182 | 196,390 | |
Actavis PLC (a) | 193,171 | 42,656,020 | |
Acura Pharmaceuticals, Inc. (a) | 2,885 | 5,712 | |
Akorn, Inc. (a)(d) | 79,308 | 2,047,733 | |
Alexza Pharmaceuticals, Inc. (a) | 13,886 | 76,095 | |
Alimera Sciences, Inc. (a)(d) | 3,741 | 25,102 | |
Allergan, Inc. | 335,503 | 42,608,881 | |
Ampio Pharmaceuticals, Inc. (a)(d) | 26,020 | 185,262 | |
ANI Pharmaceuticals, Inc. (a) | 3,574 | 108,221 | |
Aratana Therapeutics, Inc. (d) | 7,153 | 167,166 | |
AstraZeneca PLC rights (a) | 7,692 | 0 | |
Auxilium Pharmaceuticals, Inc. (a)(d) | 49,047 | 1,508,195 | |
AVANIR Pharmaceuticals Class A (a) | 141,865 | 590,158 | |
Biodel, Inc. (a)(d) | 8,109 | 25,543 | |
Biodelivery Sciences International, Inc. (a)(d) | 15,298 | 143,342 | |
Bristol-Myers Squibb Co. | 1,848,869 | 99,413,686 | |
Cadence Pharmaceuticals, Inc. (a) | 96,716 | 1,353,057 | |
Cempra, Inc. (a) | 20,803 | 236,946 | |
Common Stocks - continued | |||
Shares | Value | ||
HEALTH CARE - continued | |||
Pharmaceuticals - continued | |||
Columbia Laboratories, Inc. (a) | 5,322 | $ 36,349 | |
Corcept Therapeutics, Inc. (a)(d) | 36,105 | 118,424 | |
Cumberland Pharmaceuticals, Inc. (a) | 7,158 | 33,142 | |
DepoMed, Inc. (a)(d) | 51,564 | 621,346 | |
Durect Corp. (a) | 121,504 | 168,891 | |
Eli Lilly & Co. | 1,106,346 | 65,949,285 | |
Endo Health Solutions, Inc. (a)(d) | 153,698 | 12,268,174 | |
Endocyte, Inc. (a)(d) | 47,373 | 623,902 | |
Forest Laboratories, Inc. (a) | 269,775 | 26,321,947 | |
Hi-Tech Pharmacal Co., Inc. (a) | 12,868 | 557,956 | |
Horizon Pharma, Inc. (a)(d) | 61,460 | 751,041 | |
Hospira, Inc. (a) | 214,554 | 9,285,897 | |
Impax Laboratories, Inc. (a) | 76,645 | 1,975,142 | |
Jazz Pharmaceuticals PLC (a) | 64,644 | 9,822,333 | |
Johnson & Johnson | 3,156,660 | 290,791,519 | |
Lannett Co., Inc. (a)(d) | 27,670 | 1,186,766 | |
Mallinckrodt PLC (a)(d) | 76,544 | 5,181,263 | |
Merck & Co., Inc. | 3,275,273 | 186,657,808 | |
Mylan, Inc. (a) | 432,560 | 24,037,359 | |
Nektar Therapeutics (a)(d) | 149,616 | 1,919,573 | |
Ocera Therapeutics, Inc. (a)(d) | 890 | 13,768 | |
Omeros Corp. (a)(d) | 38,961 | 520,519 | |
Pacira Pharmaceuticals, Inc. (a)(d) | 42,514 | 3,326,295 | |
Pain Therapeutics, Inc. (a) | 34,536 | 195,128 | |
Pernix Therapeutics Holdings, Inc. (a)(d) | 8,953 | 32,858 | |
Perrigo Co. PLC | 148,774 | 24,464,397 | |
Pfizer, Inc. | 7,258,348 | 233,065,554 | |
Pozen, Inc. (d) | 23,223 | 184,855 | |
Prestige Brands Holdings, Inc. (a) | 52,110 | 1,484,614 | |
Questcor Pharmaceuticals, Inc. (d) | 62,679 | 3,807,749 | |
Relypsa, Inc. | 13,726 | 541,628 | |
Repros Therapeutics, Inc. (a)(d) | 21,711 | 424,450 | |
Sagent Pharmaceuticals, Inc. (a) | 25,120 | 531,539 | |
Salix Pharmaceuticals Ltd. (a)(d) | 73,563 | 7,938,919 | |
SciClone Pharmaceuticals, Inc. (a)(d) | 46,113 | 214,425 | |
Sucampo Pharmaceuticals, Inc. | 39,776 | 357,984 | |
Supernus Pharmaceuticals, Inc. (a) | 9,151 | 91,876 | |
The Medicines Company (a)(d) | 85,688 | 2,617,768 | |
TherapeuticsMD, Inc. (a) | 93,850 | 644,750 | |
Transcept Pharmaceuticals, Inc. (a) | 2,494 | 8,305 | |
Ventrus Biosciences, Inc. (a) | 6,995 | 9,513 | |
VIVUS, Inc. (a)(d) | 111,051 | 669,638 | |
XenoPort, Inc. (a)(d) | 57,569 | 359,806 | |
Zoetis, Inc. Class A | 573,163 | 17,779,516 | |
Zogenix, Inc. (a) | 115,304 | 501,572 | |
| 1,220,478,889 | ||
TOTAL HEALTH CARE | 3,116,256,118 | ||
| |||
Shares | Value | ||
INDUSTRIALS - 11.4% | |||
Aerospace & Defense - 2.6% | |||
AAR Corp. | 45,448 | $ 1,313,447 | |
AeroVironment, Inc. (a)(d) | 21,575 | 674,003 | |
Alliant Techsystems, Inc. | 36,077 | 4,862,819 | |
American Science & Engineering, Inc. | 13,204 | 868,163 | |
API Technologies Corp. (a) | 22,349 | 62,130 | |
Ascent Solar Technologies, Inc. (a)(d) | 33,082 | 24,113 | |
Astronics Corp. (a) | 14,668 | 981,289 | |
Astrotech Corp. (a)(d) | 8,707 | 23,335 | |
BE Aerospace, Inc. (a) | 108,614 | 9,150,730 | |
Breeze Industrial Products Corp. (a) | 1,281 | 12,298 | |
CPI Aerostructures, Inc. (a)(d) | 3,805 | 54,678 | |
Cubic Corp. | 23,380 | 1,215,760 | |
Curtiss-Wright Corp. | 58,485 | 3,986,338 | |
DigitalGlobe, Inc. (a) | 87,334 | 2,714,341 | |
Ducommun, Inc. (a) | 15,643 | 434,875 | |
Engility Holdings, Inc. (a)(d) | 14,341 | 598,450 | |
Erickson Air-Crane, Inc. (a)(d) | 6,239 | 134,326 | |
Esterline Technologies Corp. (a) | 36,596 | 3,941,389 | |
Exelis, Inc. | 193,690 | 3,957,087 | |
GenCorp, Inc. (non-vtg.) (a)(d) | 89,447 | 1,666,398 | |
General Dynamics Corp. (d) | 385,838 | 42,264,695 | |
HEICO Corp. (d) | 25,580 | 1,590,820 | |
HEICO Corp. Class A | 45,413 | 2,086,273 | |
Hexcel Corp. (a) | 105,445 | 4,745,025 | |
Honeywell International, Inc. | 879,783 | 83,086,707 | |
Huntington Ingalls Industries, Inc. | 51,071 | 5,175,024 | |
Innovative Solutions & Support, Inc. (a)(d) | 21,878 | 172,617 | |
KEYW Holding Corp. (a)(d) | 30,869 | 564,903 | |
Kratos Defense & Security Solutions, Inc. (a)(d) | 44,930 | 350,454 | |
L-3 Communications Holdings, Inc. | 103,771 | 11,975,173 | |
LMI Aerospace, Inc. (a)(d) | 6,877 | 102,536 | |
Lockheed Martin Corp. | 301,222 | 48,888,331 | |
Micronet Enertec Technologies, Inc. (a) | 3,018 | 16,207 | |
Moog, Inc. Class A (a) | 52,323 | 3,240,363 | |
National Presto Industries, Inc. | 4,216 | 324,801 | |
Northrop Grumman Corp. | 254,273 | 30,774,661 | |
Orbital Sciences Corp. (a) | 63,924 | 1,816,720 | |
Precision Castparts Corp. | 163,555 | 42,177,563 | |
Raytheon Co. | 362,581 | 35,500,306 | |
Rockwell Collins, Inc. (d) | 149,774 | 12,362,346 | |
SIFCO Industries, Inc. | 891 | 23,612 | |
Sparton Corp. (a) | 3,920 | 127,008 | |
Spirit AeroSystems Holdings, Inc. | 123,657 | 3,565,031 | |
Sypris Solutions, Inc. | 16,848 | 47,343 | |
Taser International, Inc. (a)(d) | 58,908 | 1,132,801 | |
Teledyne Technologies, Inc. (a) | 43,609 | 4,272,810 | |
Textron, Inc. | 315,614 | 12,529,876 | |
The Boeing Co. | 774,186 | 99,808,059 | |
TransDigm Group, Inc. | 58,956 | 10,502,422 | |
Common Stocks - continued | |||
Shares | Value | ||
INDUSTRIALS - continued | |||
Aerospace & Defense - continued | |||
Triumph Group, Inc. | 65,091 | $ 4,243,933 | |
United Technologies Corp. | 942,267 | 110,264,084 | |
| 610,408,473 | ||
Air Freight & Logistics - 0.6% | |||
Air Transport Services Group, Inc. (a) | 108,399 | 692,670 | |
Atlas Air Worldwide Holdings, Inc. (a)(d) | 36,312 | 1,094,081 | |
C.H. Robinson Worldwide, Inc. | 169,940 | 8,813,088 | |
Echo Global Logistics, Inc. (a) | 11,731 | 186,758 | |
Expeditors International of Washington, Inc. | 229,912 | 9,083,823 | |
FedEx Corp. | 337,318 | 44,974,609 | |
Forward Air Corp. | 38,499 | 1,665,467 | |
Hub Group, Inc. Class A (a)(d) | 45,548 | 1,779,560 | |
Pacer International, Inc. (a) | 35,751 | 320,686 | |
Park-Ohio Holdings Corp. (a) | 6,346 | 334,053 | |
Radiant Logistics, Inc. (a) | 14,104 | 38,786 | |
United Parcel Service, Inc. Class B | 794,382 | 76,077,964 | |
UTi Worldwide, Inc. (d) | 106,552 | 1,048,472 | |
XPO Logistics, Inc. (a) | 37,140 | 1,167,682 | |
| 147,277,699 | ||
Airlines - 0.4% | |||
Alaska Air Group, Inc. | 74,312 | 6,438,392 | |
Allegiant Travel Co. | 24,598 | 2,441,597 | |
American Airlines Group, Inc. (a)(d) | 209,909 | 7,751,939 | |
Delta Air Lines, Inc. | 944,561 | 31,368,871 | |
Hawaiian Holdings, Inc. (a)(d) | 71,807 | 864,556 | |
JetBlue Airways Corp. (a)(d) | 285,846 | 2,524,020 | |
Republic Airways Holdings, Inc. (a) | 81,894 | 784,545 | |
SkyWest, Inc. | 63,299 | 803,897 | |
Southwest Airlines Co. | 753,609 | 16,910,986 | |
Spirit Airlines, Inc. (a) | 81,901 | 4,625,768 | |
United Continental Holdings, Inc. (a)(d) | 402,944 | 18,116,362 | |
| 92,630,933 | ||
Building Products - 0.3% | |||
A.O. Smith Corp. | 98,582 | 4,899,525 | |
AAON, Inc. (d) | 50,511 | 1,509,269 | |
Allegion Plc | 94,511 | 5,136,673 | |
American Woodmark Corp. (a) | 9,343 | 300,004 | |
Apogee Enterprises, Inc. | 33,247 | 1,138,045 | |
Armstrong World Industries, Inc. (a) | 49,085 | 2,694,276 | |
Builders FirstSource, Inc. (a) | 87,836 | 756,268 | |
Fortune Brands Home & Security, Inc. | 177,871 | 8,313,691 | |
Gibraltar Industries, Inc. (a) | 56,316 | 1,037,904 | |
Griffon Corp. | 38,833 | 481,529 | |
Insteel Industries, Inc. | 19,643 | 390,896 | |
Lennox International, Inc. | 51,841 | 4,763,151 | |
Masco Corp. | 405,986 | 9,479,773 | |
Masonite International Corp. (a) | 19,654 | 1,134,036 | |
NCI Building Systems, Inc. (a) | 22,930 | 391,186 | |
Nortek, Inc. (a) | 14,350 | 1,038,797 | |
| |||
Shares | Value | ||
Owens Corning | 130,235 | $ 5,959,554 | |
Patrick Industries, Inc. (a) | 10,446 | 440,717 | |
PGT, Inc. (a) | 39,227 | 454,641 | |
Ply Gem Holdings, Inc. (d) | 16,220 | 207,778 | |
Quanex Building Products Corp. (d) | 44,676 | 868,501 | |
Simpson Manufacturing Co. Ltd. (d) | 50,637 | 1,790,018 | |
Trex Co., Inc. (a)(d) | 23,416 | 1,831,600 | |
Universal Forest Products, Inc. (d) | 26,737 | 1,490,053 | |
USG Corp. (a)(d) | 96,486 | 3,408,850 | |
| 59,916,735 | ||
Commercial Services & Supplies - 0.6% | |||
ABM Industries, Inc. | 53,056 | 1,497,771 | |
ACCO Brands Corp. (a)(d) | 120,265 | 711,969 | |
Acorn Energy, Inc. (d) | 16,876 | 57,378 | |
ADT Corp. (d) | 218,622 | 6,713,882 | |
ARC Document Solutions, Inc. (a) | 46,203 | 364,542 | |
Casella Waste Systems, Inc. Class A (a) | 64,851 | 347,601 | |
CECO Environmental Corp. (d) | 21,126 | 341,185 | |
Cenveo, Inc. (a)(d) | 104,135 | 353,018 | |
Cintas Corp. | 112,418 | 6,819,276 | |
Clean Harbors, Inc. (a)(d) | 65,972 | 3,117,837 | |
Copart, Inc. (a) | 124,595 | 4,538,996 | |
Courier Corp. | 17,378 | 286,216 | |
Covanta Holding Corp. | 154,806 | 2,786,508 | |
Deluxe Corp. (d) | 54,408 | 2,746,516 | |
EnerNOC, Inc. (a) | 25,460 | 552,227 | |
Ennis, Inc. | 21,290 | 336,382 | |
Fuel Tech, Inc. (a) | 51,934 | 331,858 | |
G&K Services, Inc. Class A | 20,257 | 1,268,696 | |
Healthcare Services Group, Inc. (d) | 92,468 | 2,490,163 | |
Heritage-Crystal Clean, Inc. (a)(d) | 7,679 | 138,990 | |
Herman Miller, Inc. | 61,359 | 1,729,097 | |
HNI Corp. | 49,416 | 1,756,739 | |
Hudson Technologies, Inc. (a)(d) | 5,394 | 16,883 | |
Industrial Services of America, Inc. (a)(d) | 1,620 | 5,881 | |
InnerWorkings, Inc. (a)(d) | 28,532 | 224,832 | |
Interface, Inc. | 56,426 | 1,086,765 | |
Intersections, Inc. | 12,865 | 78,862 | |
Iron Mountain, Inc. | 183,385 | 4,988,072 | |
KAR Auction Services, Inc. | 146,171 | 4,554,688 | |
Kimball International, Inc. Class B | 27,103 | 508,723 | |
Knoll, Inc. | 38,287 | 596,129 | |
McGrath RentCorp. | 21,172 | 685,338 | |
Metalico, Inc. (a) | 55,605 | 108,430 | |
Mine Safety Appliances Co. | 37,550 | 1,931,948 | |
Mobile Mini, Inc. | 51,612 | 2,323,056 | |
Multi-Color Corp. | 7,946 | 269,131 | |
NL Industries, Inc. | 6,707 | 75,320 | |
Performant Financial Corp. (a) | 31,038 | 245,511 | |
Perma-Fix Environmental Services, Inc. (a) | 6,937 | 24,141 | |
Pitney Bowes, Inc. | 221,034 | 5,625,315 | |
Quad/Graphics, Inc. | 28,077 | 628,082 | |
Common Stocks - continued | |||
Shares | Value | ||
INDUSTRIALS - continued | |||
Commercial Services & Supplies - continued | |||
R.R. Donnelley & Sons Co. | 225,027 | $ 4,304,767 | |
Republic Services, Inc. | 307,369 | 10,484,357 | |
Rollins, Inc. | 104,837 | 3,130,433 | |
Schawk, Inc. Class A | 4,209 | 58,842 | |
SP Plus Corp. (a)(d) | 13,389 | 351,461 | |
Standard Register Co. (a) | 3,970 | 43,511 | |
Steelcase, Inc. Class A | 74,937 | 1,114,313 | |
Stericycle, Inc. (a) | 95,694 | 10,909,116 | |
Swisher Hygiene, Inc. (Canada) (a) | 177,418 | 86,935 | |
Team, Inc. (a)(d) | 18,138 | 784,287 | |
Tetra Tech, Inc. (a) | 66,137 | 1,910,037 | |
The Brink's Co. | 51,214 | 1,557,418 | |
TRC Companies, Inc. (a) | 13,255 | 91,460 | |
Tyco International Ltd. | 530,926 | 22,394,459 | |
U.S. Ecology, Inc. | 25,366 | 911,400 | |
UniFirst Corp. | 16,509 | 1,810,872 | |
United Stationers, Inc. | 42,632 | 1,817,402 | |
Viad Corp. | 19,833 | 476,984 | |
Virco Manufacturing Co. (a) | 2,682 | 7,027 | |
Waste Connections, Inc. | 164,872 | 7,134,011 | |
Waste Management, Inc. | 506,566 | 21,022,489 | |
West Corp. (d) | 20,707 | 520,160 | |
| 154,185,695 | ||
Construction & Engineering - 0.3% | |||
AECOM Technology Corp. (a) | 100,199 | 3,200,356 | |
Aegion Corp. (a)(d) | 40,317 | 933,339 | |
Ameresco, Inc. Class A (a) | 38,199 | 391,922 | |
Argan, Inc. | 7,465 | 213,424 | |
Chicago Bridge & Iron Co. NV (d) | 123,066 | 10,360,927 | |
Comfort Systems U.S.A., Inc. | 43,738 | 718,615 | |
Dycom Industries, Inc. (a) | 36,171 | 1,044,980 | |
EMCOR Group, Inc. | 78,469 | 3,670,780 | |
Fluor Corp. | 170,796 | 13,269,141 | |
Foster Wheeler AG (d) | 112,721 | 3,620,599 | |
Furmanite Corp. (a) | 40,654 | 481,343 | |
Goldfield Corp. | 41,171 | 95,928 | |
Granite Construction, Inc. (d) | 41,521 | 1,526,312 | |
Great Lakes Dredge & Dock Corp. (a)(d) | 55,973 | 462,337 | |
Integrated Electrical Services, Inc. (a) | 13,442 | 73,528 | |
Jacobs Engineering Group, Inc. (a) | 160,940 | 9,761,011 | |
KBR, Inc. | 162,921 | 4,499,878 | |
Layne Christensen Co. (a)(d) | 24,456 | 434,339 | |
MasTec, Inc. (a)(d) | 84,984 | 3,479,245 | |
MYR Group, Inc. (a) | 25,270 | 588,033 | |
Northwest Pipe Co. (a) | 12,188 | 432,065 | |
Orion Marine Group, Inc. (a) | 21,656 | 244,496 | |
Pike Corp. (a) | 29,417 | 305,348 | |
Primoris Services Corp. | 35,637 | 1,114,369 | |
Quanta Services, Inc. (a) | 244,181 | 8,597,613 | |
Sterling Construction Co., Inc. (a) | 31,847 | 301,591 | |
| |||
Shares | Value | ||
Tutor Perini Corp. (a) | 46,969 | $ 1,157,786 | |
UniTek Global Services, Inc. (a) | 18,062 | 28,899 | |
URS Corp. | 82,388 | 3,831,042 | |
| 74,839,246 | ||
Electrical Equipment - 0.8% | |||
Active Power, Inc. (a) | 10,523 | 35,673 | |
Acuity Brands, Inc. | 52,894 | 7,460,699 | |
Allied Motion Technologies, Inc. | 4,209 | 48,319 | |
Altair Nanotechnologies, Inc. (a)(d) | 10,605 | 57,373 | |
American Superconductor Corp. (a)(d) | 126,771 | 234,526 | |
AMETEK, Inc. | 270,508 | 14,401,846 | |
AZZ, Inc. (d) | 24,628 | 1,092,744 | |
Babcock & Wilcox Co. (d) | 118,199 | 3,895,839 | |
Brady Corp. Class A | 52,937 | 1,416,065 | |
Broadwind Energy, Inc. (a) | 15,938 | 153,802 | |
Capstone Turbine Corp. (a)(d) | 814,128 | 1,457,289 | |
Eaton Corp. PLC | 526,249 | 39,316,063 | |
Emerson Electric Co. | 776,096 | 50,648,025 | |
Encore Wire Corp. | 23,059 | 1,205,755 | |
EnerSys | 48,550 | 3,448,992 | |
Enphase Energy, Inc. (a)(d) | 22,269 | 179,711 | |
Espey Manufacturing & Electronics Corp. | 2,015 | 58,052 | |
Franklin Electric Co., Inc. | 44,071 | 1,921,055 | |
FuelCell Energy, Inc. (a)(d) | 246,058 | 479,813 | |
Generac Holdings, Inc. (d) | 81,773 | 4,658,608 | |
General Cable Corp. (d) | 55,434 | 1,706,259 | |
Global Power Equipment Group, Inc. | 10,454 | 191,517 | |
GrafTech International Ltd. (a)(d) | 132,891 | 1,289,043 | |
Hubbell, Inc. Class B | 60,658 | 7,251,057 | |
II-VI, Inc. (a) | 56,117 | 919,758 | |
LSI Industries, Inc. | 24,011 | 199,051 | |
MagneTek, Inc. (a) | 2,664 | 64,362 | |
Ocean Power Technologies, Inc. (a)(d) | 11,040 | 44,822 | |
Plug Power, Inc. (a)(d) | 108,624 | 507,274 | |
Polypore International, Inc. (a)(d) | 50,063 | 1,732,680 | |
Powell Industries, Inc. | 7,721 | 526,032 | |
Power Solutions International, Inc. (a)(d) | 3,494 | 258,905 | |
PowerSecure International, Inc. (a)(d) | 20,869 | 474,352 | |
Preformed Line Products Co. | 1,961 | 121,778 | |
Real Goods Solar, Inc. Class A (a)(d) | 22,046 | 83,995 | |
Regal-Beloit Corp. | 57,797 | 4,259,061 | |
Revolution Lighting Technologies, Inc. (a)(d) | 38,693 | 122,270 | |
Rockwell Automation, Inc. | 151,793 | 18,646,252 | |
Roper Industries, Inc. | 118,631 | 16,088,736 | |
Sensata Technologies Holding BV (a) | 179,473 | 7,293,783 | |
SL Industries, Inc. (a) | 3,648 | 96,672 | |
SolarCity Corp. (a)(d) | 54,174 | 4,602,623 | |
Thermon Group Holdings, Inc. (a)(d) | 33,050 | 802,785 | |
Ultralife Corp. (a) | 13,410 | 50,690 | |
Vicor Corp. (a) | 10,982 | 118,276 | |
| 199,622,282 | ||
Common Stocks - continued | |||
Shares | Value | ||
INDUSTRIALS - continued | |||
Industrial Conglomerates - 1.9% | |||
3M Co. | 714,842 | $ 96,310,663 | |
Carlisle Companies, Inc. | 71,430 | 5,665,828 | |
Danaher Corp. | 685,221 | 52,412,554 | |
General Electric Co. | 11,343,330 | 288,914,615 | |
Raven Industries, Inc. | 39,990 | 1,462,434 | |
| 444,766,094 | ||
Machinery - 2.2% | |||
Accuride Corp. (a)(d) | 79,004 | 348,408 | |
Actuant Corp. Class A | 71,032 | 2,490,382 | |
Adept Technology, Inc. (a) | 17,085 | 287,711 | |
AGCO Corp. | 95,174 | 4,994,732 | |
Alamo Group, Inc. | 17,898 | 941,077 | |
Albany International Corp. Class A | 47,080 | 1,698,646 | |
Altra Industrial Motion Corp. | 25,498 | 902,629 | |
American Railcar Industries, Inc. | 11,797 | 816,942 | |
Ampco-Pittsburgh Corp. | 10,414 | 212,966 | |
Astec Industries, Inc. (d) | 19,808 | 796,678 | |
Barnes Group, Inc. | 47,337 | 1,820,108 | |
Blount International, Inc. (a) | 50,491 | 618,515 | |
Briggs & Stratton Corp. | 42,488 | 967,877 | |
Caterpillar, Inc. (d) | 709,570 | 68,807,003 | |
Chart Industries, Inc. (a)(d) | 32,250 | 2,694,810 | |
CIRCOR International, Inc. | 19,714 | 1,410,734 | |
CLARCOR, Inc. | 59,963 | 3,473,657 | |
Colfax Corp. (a) | 110,540 | 7,862,710 | |
Columbus McKinnon Corp. (NY Shares) (a) | 26,972 | 686,707 | |
Commercial Vehicle Group, Inc. (a) | 77,079 | 687,545 | |
Crane Co. | 52,315 | 3,736,337 | |
Cummins, Inc. | 194,981 | 28,451,628 | |
Deere & Co. | 423,519 | 36,392,988 | |
Donaldson Co., Inc. | 164,610 | 7,051,892 | |
Douglas Dynamics, Inc. (d) | 29,195 | 472,375 | |
Dover Corp. | 187,794 | 17,708,974 | |
Dynamic Materials Corp. | 17,783 | 369,175 | |
Eastern Co. | 2,354 | 37,452 | |
Energy Recovery, Inc. (a)(d) | 81,715 | 366,083 | |
EnPro Industries, Inc. (a)(d) | 22,235 | 1,592,693 | |
ESCO Technologies, Inc. | 28,907 | 1,036,027 | |
ExOne Co. (d) | 13,829 | 640,283 | |
Federal Signal Corp. (a) | 80,990 | 1,040,722 | |
Flowserve Corp. | 155,118 | 12,597,133 | |
FreightCar America, Inc. | 19,411 | 496,145 | |
Gencor Industries, Inc. (a) | 1,849 | 19,895 | |
Global Brass & Copper Holdings, Inc. | 9,550 | 161,682 | |
Gorman-Rupp Co. | 17,750 | 559,125 | |
Graco, Inc. | 71,760 | 5,599,433 | |
Graham Corp. | 12,124 | 421,551 | |
Greenbrier Companies, Inc. (a)(d) | 21,771 | 915,906 | |
Hardinge, Inc. | 14,874 | 219,392 | |
| |||
Shares | Value | ||
Harsco Corp. | 94,707 | $ 2,379,040 | |
Hurco Companies, Inc. | 3,319 | 83,008 | |
Hyster-Yale Materials Handling Class A | 12,438 | 1,255,492 | |
IDEX Corp. | 88,258 | 6,625,528 | |
Illinois Tool Works, Inc. | 441,791 | 36,447,758 | |
Ingersoll-Rand PLC | 297,503 | 18,189,333 | |
ITT Corp. | 114,023 | 5,005,610 | |
John Bean Technologies Corp. | 23,559 | 710,539 | |
Joy Global, Inc. (d) | 114,975 | 6,323,625 | |
Kadant, Inc. | 18,429 | 739,924 | |
Kennametal, Inc. | 99,076 | 4,333,584 | |
L.B. Foster Co. Class A | 10,636 | 494,468 | |
Lincoln Electric Holdings, Inc. | 88,988 | 6,671,430 | |
Lindsay Corp. (d) | 16,477 | 1,398,238 | |
Lydall, Inc. (a) | 11,611 | 235,239 | |
Manitex International, Inc. (a)(d) | 11,053 | 165,684 | |
Manitowoc Co., Inc. (d) | 166,345 | 5,146,714 | |
Meritor, Inc. (a) | 118,384 | 1,469,145 | |
Middleby Corp. (a)(d) | 20,717 | 6,143,834 | |
Miller Industries, Inc. | 16,197 | 292,356 | |
Mueller Industries, Inc. | 29,480 | 1,841,910 | |
Mueller Water Products, Inc. Class A | 162,577 | 1,568,868 | |
Navistar International Corp. (a)(d) | 79,012 | 2,962,950 | |
NN, Inc. | 12,121 | 233,814 | |
Nordson Corp. | 68,102 | 4,982,342 | |
Omega Flex, Inc. | 258 | 5,766 | |
Oshkosh Truck Corp. | 95,506 | 5,523,112 | |
PACCAR, Inc. | 408,900 | 26,921,976 | |
Pall Corp. | 118,435 | 10,185,410 | |
Parker Hannifin Corp. | 164,290 | 19,805,160 | |
Pentair Ltd. | 221,668 | 17,912,991 | |
PMFG, Inc. (a)(d) | 15,367 | 100,500 | |
Proto Labs, Inc. (a)(d) | 23,655 | 1,842,725 | |
RBC Bearings, Inc. (a) | 25,318 | 1,626,682 | |
Rexnord Corp. (a) | 39,840 | 1,194,802 | |
Snap-On, Inc. | 66,115 | 7,416,120 | |
SPX Corp. | 46,613 | 5,019,288 | |
Standex International Corp. | 10,804 | 597,569 | |
Stanley Black & Decker, Inc. | 173,666 | 14,421,225 | |
Sun Hydraulics Corp. (d) | 22,598 | 955,895 | |
Tecumseh Products Co. Class A (non-vtg.) (a) | 29,489 | 232,963 | |
Tennant Co. | 17,192 | 1,053,182 | |
Terex Corp. | 120,683 | 5,374,014 | |
Timken Co. | 84,686 | 5,111,647 | |
Titan International, Inc. (d) | 48,022 | 910,497 | |
Toro Co. | 67,215 | 4,451,649 | |
TriMas Corp. (a) | 46,817 | 1,573,519 | |
Trinity Industries, Inc. | 83,300 | 5,981,773 | |
Twin Disc, Inc. | 8,286 | 205,244 | |
Valmont Industries, Inc. (d) | 30,830 | 4,489,773 | |
Wabash National Corp. (a)(d) | 74,589 | 1,007,697 | |
WABCO Holdings, Inc. (a) | 75,595 | 7,744,708 | |
Wabtec Corp. | 121,942 | 9,678,537 | |
Common Stocks - continued | |||
Shares | Value | ||
INDUSTRIALS - continued | |||
Machinery - continued | |||
Watts Water Technologies, Inc. Class A | 38,674 | $ 2,383,092 | |
Woodward, Inc. | 78,842 | 3,436,723 | |
Xerium Technologies, Inc. (a) | 6,895 | 108,596 | |
Xylem, Inc. | 206,552 | 8,127,821 | |
| 513,507,817 | ||
Marine - 0.0% | |||
Baltic Trading Ltd. | 21,117 | 144,651 | |
Eagle Bulk Shipping, Inc. (a)(d) | 34,302 | 162,591 | |
Genco Shipping & Trading Ltd. (a)(d) | 76,288 | 125,112 | |
International Shipholding Corp. | 10,420 | 317,393 | |
Kirby Corp. (a) | 63,347 | 6,626,730 | |
Matson, Inc. | 37,893 | 913,979 | |
| 8,290,456 | ||
Professional Services - 0.4% | |||
Acacia Research Corp. (d) | 48,838 | 748,687 | |
Advisory Board Co. (a)(d) | 38,842 | 2,488,995 | |
Barrett Business Services, Inc. | 6,681 | 467,670 | |
CBIZ, Inc. (a)(d) | 37,390 | 341,371 | |
CDI Corp. | 9,649 | 176,287 | |
Corporate Executive Board Co. | 37,937 | 2,836,929 | |
CRA International, Inc. (a) | 15,589 | 364,315 | |
CTPartners Executive Search, Inc. (a) | 859 | 6,013 | |
Dun & Bradstreet Corp. | 40,399 | 4,007,985 | |
Equifax, Inc. | 155,277 | 10,878,707 | |
Exponent, Inc. | 15,525 | 1,106,001 | |
Franklin Covey Co. (a) | 5,338 | 111,831 | |
FTI Consulting, Inc. (a)(d) | 68,234 | 1,991,750 | |
GP Strategies Corp. (a) | 13,487 | 392,741 | |
Heidrick & Struggles International, Inc. | 22,259 | 409,343 | |
Hill International, Inc. (a) | 13,945 | 62,753 | |
Hudson Global, Inc. (a) | 13,947 | 49,930 | |
Huron Consulting Group, Inc. (a) | 28,844 | 1,908,607 | |
ICF International, Inc. (a) | 17,107 | 691,465 | |
IHS, Inc. Class A (a) | 75,073 | 8,999,751 | |
Insperity, Inc. | 20,805 | 607,298 | |
Kelly Services, Inc. Class A (non-vtg.) | 19,294 | 485,437 | |
Kforce, Inc. | 25,995 | 569,550 | |
Korn/Ferry International (a) | 56,905 | 1,444,818 | |
Manpower, Inc. | 81,876 | 6,399,428 | |
Mastech Holdings, Inc. | 373 | 5,091 | |
MISTRAS Group, Inc. (a) | 12,788 | 281,848 | |
Navigant Consulting, Inc. (a) | 41,733 | 727,406 | |
Nielsen Holdings B.V. | 285,021 | 13,492,894 | |
Odyssey Marine Exploration, Inc. (a)(d) | 46,227 | 101,237 | |
On Assignment, Inc. (a) | 52,146 | 1,793,822 | |
Pendrell Corp. (a) | 150,288 | 228,438 | |
RCM Technologies, Inc. (a) | 9,908 | 68,464 | |
Resources Connection, Inc. | 43,312 | 593,374 | |
Robert Half International, Inc. | 170,458 | 6,978,551 | |
RPX Corp. (a) | 42,529 | 681,315 | |
| |||
Shares | Value | ||
Spherix, Inc. (a) | 11 | $ 51 | |
Towers Watson & Co. | 75,492 | 8,236,177 | |
TrueBlue, Inc. (a) | 38,883 | 1,107,388 | |
Verisk Analytics, Inc. (a) | 175,777 | 11,199,632 | |
VSE Corp. | 1,834 | 88,582 | |
WageWorks, Inc. (a) | 36,355 | 2,150,398 | |
| 95,282,330 | ||
Road & Rail - 1.0% | |||
AMERCO | 7,919 | 1,844,652 | |
Arkansas Best Corp. | 25,682 | 854,183 | |
Avis Budget Group, Inc. (a)(d) | 135,454 | 6,364,983 | |
Celadon Group, Inc. | 62,978 | 1,429,601 | |
Con-way, Inc. (d) | 72,845 | 2,778,308 | |
Covenant Transport Group, Inc. Class A (a) | 9,633 | 95,945 | |
CSX Corp. | 1,133,651 | 31,413,469 | |
Genesee & Wyoming, Inc. Class A (a) | 61,185 | 6,052,420 | |
Heartland Express, Inc. (d) | 52,772 | 1,075,493 | |
Hertz Global Holdings, Inc. (a) | 494,988 | 13,864,614 | |
J.B. Hunt Transport Services, Inc. | 118,822 | 8,539,737 | |
Kansas City Southern | 125,208 | 11,759,535 | |
Knight Transportation, Inc. (d) | 54,848 | 1,178,135 | |
Landstar System, Inc. (d) | 49,655 | 2,865,590 | |
Marten Transport Ltd. | 31,198 | 608,049 | |
Norfolk Southern Corp. | 346,466 | 31,843,690 | |
Old Dominion Freight Lines, Inc. (a) | 69,360 | 3,692,726 | |
Patriot Transportation Holding, Inc. (a) | 1,312 | 46,773 | |
Providence & Worcester Railroad Co. | 4,631 | 82,432 | |
Quality Distribution, Inc. (a) | 25,189 | 322,923 | |
Roadrunner Transportation Systems, Inc. (a) | 23,847 | 560,643 | |
Ryder System, Inc. | 50,983 | 3,840,040 | |
Saia, Inc. (a) | 26,740 | 923,600 | |
Swift Transporation Co. (a)(d) | 119,320 | 2,906,635 | |
U.S.A. Truck, Inc. (a) | 1,841 | 28,296 | |
Union Pacific Corp. | 514,413 | 92,789,817 | |
Universal Truckload Services, Inc. | 6,117 | 159,042 | |
Werner Enterprises, Inc. (d) | 41,229 | 1,065,770 | |
YRC Worldwide, Inc. (a)(d) | 9,461 | 247,878 | |
| 229,234,979 | ||
Trading Companies & Distributors - 0.3% | |||
Aceto Corp. | 32,506 | 594,535 | |
AeroCentury Corp. (a)(d) | 688 | 11,703 | |
Air Lease Corp. Class A | 121,471 | 4,488,353 | |
Aircastle Ltd. | 65,692 | 1,294,132 | |
Applied Industrial Technologies, Inc. | 52,950 | 2,702,039 | |
Beacon Roofing Supply, Inc. (a)(d) | 65,628 | 2,480,082 | |
BlueLinx Corp. (a)(d) | 23,385 | 34,142 | |
CAI International, Inc. (a)(d) | 15,310 | 372,645 | |
DXP Enterprises, Inc. (a) | 10,800 | 1,099,008 | |
Essex Rental Corp. (a) | 16,688 | 52,567 | |
Fastenal Co. (d) | 297,869 | 14,056,438 | |
GATX Corp. | 53,842 | 3,493,807 | |
Common Stocks - continued | |||
Shares | Value | ||
INDUSTRIALS - continued | |||
Trading Companies & Distributors - continued | |||
H&E Equipment Services, Inc. (a) | 32,737 | $ 1,071,155 | |
HD Supply Holdings, Inc. (a)(d) | 66,187 | 1,540,171 | |
Houston Wire & Cable Co. | 15,647 | 217,650 | |
Kaman Corp. | 26,535 | 1,053,970 | |
Lawson Products, Inc. (a) | 4,764 | 70,174 | |
MRC Global, Inc. (a) | 114,871 | 2,954,482 | |
MSC Industrial Direct Co., Inc. | 57,280 | 4,944,982 | |
Rush Enterprises, Inc. Class A (a)(d) | 31,753 | 908,136 | |
TAL International Group, Inc. | 30,588 | 1,355,048 | |
Textainer Group Holdings Ltd. (d) | 14,461 | 527,393 | |
Titan Machinery, Inc. (a)(d) | 17,235 | 272,658 | |
United Rentals, Inc. (a)(d) | 99,613 | 8,799,812 | |
W.W. Grainger, Inc. | 68,361 | 17,433,422 | |
Watsco, Inc. | 30,156 | 2,966,747 | |
WESCO International, Inc. (a)(d) | 60,754 | 5,237,602 | |
Willis Lease Finance Corp. (a) | 2,006 | 35,907 | |
| 80,068,760 | ||
Transportation Infrastructure - 0.0% | |||
Wesco Aircraft Holdings, Inc. (a) | 39,594 | 858,794 | |
TOTAL INDUSTRIALS | 2,710,890,293 | ||
INFORMATION TECHNOLOGY - 18.0% | |||
Communications Equipment - 1.6% | |||
ADTRAN, Inc. (d) | 58,980 | 1,545,276 | |
Alliance Fiber Optic Products, Inc. (d) | 19,146 | 230,518 | |
Ambient Corp. (a) | 1,932 | 3,651 | |
Arris Group, Inc. (a)(d) | 139,734 | 4,010,366 | |
Aruba Networks, Inc. (a)(d) | 133,375 | 2,735,521 | |
Aviat Networks, Inc. (a) | 66,605 | 129,880 | |
Bel Fuse, Inc. Class B (non-vtg.) | 7,032 | 133,608 | |
Black Box Corp. | 16,753 | 445,630 | |
Blonder Tongue Laboratories, Inc. (a) | 3,352 | 3,386 | |
Brocade Communications Systems, Inc. (a) | 517,605 | 4,953,480 | |
CalAmp Corp. (a)(d) | 30,277 | 970,075 | |
Calix Networks, Inc. (a) | 25,252 | 200,753 | |
Ciena Corp. (a)(d) | 106,654 | 2,620,489 | |
Cisco Systems, Inc. | 6,002,230 | 130,848,614 | |
Clearfield, Inc. (a) | 10,596 | 247,946 | |
CommScope Holding Co., Inc. (d) | 65,332 | 1,580,381 | |
Communications Systems, Inc. | 4,311 | 58,069 | |
Comtech Telecommunications Corp. | 22,438 | 718,240 | |
Digi International, Inc. (a) | 21,456 | 204,905 | |
EchoStar Holding Corp. Class A (a) | 42,704 | 2,127,513 | |
EMCORE Corp. (a)(d) | 29,659 | 144,736 | |
Emulex Corp. (a) | 91,750 | 667,940 | |
Entrada Networks, Inc. (a) | 150 | 0 | |
Extreme Networks, Inc. (a) | 100,558 | 576,197 | |
| |||
Shares | Value | ||
F5 Networks, Inc. (a) | 85,953 | $ 9,655,960 | |
Finisar Corp. (a)(d) | 110,449 | 2,617,641 | |
Harmonic, Inc. (a) | 107,478 | 697,532 | |
Harris Corp. | 115,971 | 8,560,979 | |
Infinera Corp. (a)(d) | 140,398 | 1,168,111 | |
InterDigital, Inc. | 54,293 | 1,655,937 | |
Interphase Corp. (a) | 10,718 | 51,339 | |
Ixia (a) | 83,745 | 1,035,088 | |
JDS Uniphase Corp. (a) | 268,467 | 3,699,475 | |
Juniper Networks, Inc. (a) | 570,419 | 15,253,004 | |
KVH Industries, Inc. (a) | 23,641 | 305,678 | |
Lantronix, Inc. (a) | 71 | 181 | |
Meru Networks, Inc. (a)(d) | 20,865 | 88,050 | |
Motorola Solutions, Inc. | 252,045 | 16,685,379 | |
NETGEAR, Inc. (a)(d) | 37,791 | 1,291,696 | |
Novatel Wireless, Inc. (a) | 27,517 | 66,316 | |
NumereX Corp. Class A (a) | 2,670 | 39,623 | |
Oclaro, Inc. (a) | 126,427 | 356,524 | |
Oplink Communications, Inc. (a) | 15,273 | 267,583 | |
Optical Cable Corp. | 564 | 2,194 | |
Palo Alto Networks, Inc. (a) | 52,358 | 3,725,272 | |
Parkervision, Inc. (a)(d) | 100,275 | 501,375 | |
PC-Tel, Inc. | 2,259 | 19,653 | |
Plantronics, Inc. | 53,885 | 2,391,416 | |
Polycom, Inc. (a)(d) | 189,613 | 2,533,230 | |
Procera Networks, Inc. (a)(d) | 21,122 | 232,976 | |
QUALCOMM, Inc. | 1,892,307 | 142,471,794 | |
Relm Wireless Corp. (a) | 9,436 | 29,723 | |
Riverbed Technology, Inc. (a)(d) | 188,588 | 4,201,741 | |
Ruckus Wireless, Inc. (a) | 70,783 | 990,962 | |
ShoreTel, Inc. (a) | 56,073 | 492,882 | |
Sonus Networks, Inc. (a) | 287,303 | 1,071,640 | |
Tessco Technologies, Inc. | 4,838 | 184,231 | |
Ubiquiti Networks, Inc. (a)(d) | 20,342 | 1,005,098 | |
ViaSat, Inc. (a)(d) | 47,347 | 3,158,518 | |
Westell Technologies, Inc. Class A (a) | 20,974 | 86,623 | |
Zhone Technologies, Inc. (a)(d) | 5,862 | 22,803 | |
Zoom Technologies, Inc. (a) | 3,134 | 14,385 | |
| 381,789,786 | ||
Computers & Peripherals - 3.2% | |||
3D Systems Corp. (a)(d) | 106,440 | 8,085,182 | |
Apple, Inc. | 1,010,277 | 531,648,119 | |
Astro-Med, Inc. | 4,606 | 63,655 | |
Concurrent Computer Corp. | 6,675 | 55,136 | |
Cray, Inc. (a)(d) | 45,237 | 1,569,272 | |
Crossroads Systems, Inc. (a)(d) | 9,071 | 20,591 | |
Dataram Corp. (a) | 556 | 1,518 | |
Diebold, Inc. | 89,599 | 3,350,107 | |
Dot Hill Systems Corp. (a) | 109,713 | 584,770 | |
Electronics for Imaging, Inc. (a) | 55,580 | 2,478,868 | |
EMC Corp. (d) | 2,290,422 | 60,398,428 | |
Fusion-io, Inc. (a)(d) | 99,991 | 1,096,901 | |
Hewlett-Packard Co. | 2,158,308 | 64,490,243 | |
Common Stocks - continued | |||
Shares | Value | ||
INFORMATION TECHNOLOGY - continued | |||
Computers & Peripherals - continued | |||
Hutchinson Technology, Inc. (a) | 41,790 | $ 152,116 | |
Imation Corp. (a) | 19,750 | 126,400 | |
Immersion Corp. (a) | 59,681 | 713,188 | |
Intevac, Inc. (a) | 17,689 | 133,198 | |
Lexmark International, Inc. Class A | 71,862 | 3,028,265 | |
NCR Corp. (a) | 203,607 | 6,932,818 | |
NetApp, Inc. | 387,745 | 15,668,775 | |
Overland Storage, Inc. (a) | 5,087 | 5,290 | |
QLogic Corp. (a) | 107,276 | 1,225,092 | |
Quantum Corp. (a)(d) | 267,446 | 312,912 | |
Qumu Corp. (a) | 6,017 | 95,069 | |
SanDisk Corp. | 251,675 | 18,699,453 | |
Scan-Optics, Inc. (a) | 300 | 0 | |
Seagate Technology | 368,699 | 19,242,401 | |
Silicon Graphics International Corp. (a)(d) | 32,579 | 401,047 | |
Super Micro Computer, Inc. (a) | 48,860 | 986,483 | |
Transact Technologies, Inc. | 3,411 | 39,568 | |
U.S.A. Technologies, Inc. (a)(d) | 38,549 | 80,953 | |
Video Display Corp. (a) | 2,957 | 11,296 | |
Western Digital Corp. | 235,126 | 20,453,611 | |
Xplore Technologies Corp. (a) | 2,067 | 12,381 | |
| 762,163,106 | ||
Electronic Equipment & Components - 0.8% | |||
Advanced Photonix, Inc. Class A (a) | 4,544 | 2,990 | |
Aeroflex Holding Corp. (a) | 11,165 | 89,208 | |
Agilysys, Inc. (a) | 38,149 | 553,923 | |
Amphenol Corp. Class A | 175,748 | 15,469,339 | |
Anixter International, Inc. | 27,054 | 2,893,425 | |
Arrow Electronics, Inc. (a) | 128,186 | 7,259,173 | |
Audience, Inc. (a) | 9,607 | 112,594 | |
Avnet, Inc. | 154,170 | 6,711,020 | |
AVX Corp. | 71,883 | 922,259 | |
Badger Meter, Inc. | 35,716 | 1,961,523 | |
Belden, Inc. | 50,406 | 3,635,785 | |
Benchmark Electronics, Inc. (a) | 50,023 | 1,192,548 | |
CDW Corp. | 67,267 | 1,760,377 | |
Checkpoint Systems, Inc. (a) | 41,082 | 601,851 | |
ClearSign Combustion Corp. (a)(d) | 7,019 | 65,628 | |
Cognex Corp. (a) | 109,040 | 4,106,446 | |
Coherent, Inc. (a) | 23,544 | 1,604,524 | |
Control4 Corp. (d) | 4,856 | 101,539 | |
Corning, Inc. | 1,625,355 | 31,320,591 | |
CTS Corp. | 23,806 | 486,119 | |
Daktronics, Inc. | 32,196 | 456,217 | |
Dolby Laboratories, Inc. Class A (a)(d) | 54,035 | 2,227,863 | |
DTS, Inc. (a)(d) | 19,732 | 400,757 | |
Echelon Corp. (a) | 32,190 | 96,570 | |
Electro Rent Corp. | 12,184 | 221,383 | |
Electro Scientific Industries, Inc. | 21,640 | 204,065 | |
eMagin Corp. (a) | 5,084 | 13,523 | |
| |||
Shares | Value | ||
Fabrinet (a) | 24,522 | $ 476,217 | |
FARO Technologies, Inc. (a) | 18,648 | 1,073,006 | |
FEI Co. | 46,062 | 4,728,264 | |
FLIR Systems, Inc. | 171,079 | 5,840,637 | |
Frequency Electronics, Inc. (a) | 430 | 4,945 | |
Giga-Tronics, Inc. (a) | 2,579 | 3,585 | |
GSI Group, Inc. (a) | 5,175 | 64,946 | |
I. D. Systems Inc. (a) | 6,071 | 36,365 | |
Identive Group, Inc. (a) | 106,182 | 92,378 | |
IEC Electronics Corp. (a) | 86 | 372 | |
Ingram Micro, Inc. Class A (a) | 191,225 | 5,631,576 | |
Insight Enterprises, Inc. (a) | 39,665 | 911,502 | |
Intelli-Check, Inc. (a) | 4,366 | 3,308 | |
InvenSense, Inc. (a)(d) | 57,254 | 1,153,668 | |
IPG Photonics Corp. (a)(d) | 46,113 | 3,309,530 | |
Iteris, Inc. (a) | 1,032 | 2,291 | |
Itron, Inc. (a)(d) | 38,500 | 1,347,500 | |
Jabil Circuit, Inc. | 217,842 | 4,032,255 | |
KEMET Corp. (a) | 34,374 | 195,244 | |
KEY Tronic Corp. (a) | 6,483 | 67,099 | |
LightPath Technologies, Inc. Class A (a) | 376 | 617 | |
Littelfuse, Inc. | 24,950 | 2,354,532 | |
LoJack Corp. (a) | 24,621 | 149,696 | |
LRAD Corp. (a) | 56,581 | 123,912 | |
Maxwell Technologies, Inc. (a)(d) | 38,769 | 396,219 | |
Measurement Specialties, Inc. (a) | 15,282 | 932,202 | |
Mercury Systems, Inc. (a)(d) | 23,393 | 259,662 | |
Mesa Laboratories, Inc. | 2,184 | 190,882 | |
Methode Electronics, Inc. Class A | 42,247 | 1,432,173 | |
MicroVision, Inc. (a) | 33,140 | 67,274 | |
MOCON, Inc. | 2,209 | 37,089 | |
MTS Systems Corp. | 16,730 | 1,187,161 | |
Multi-Fineline Electronix, Inc. (a) | 10,240 | 149,197 | |
National Instruments Corp. | 115,875 | 3,356,899 | |
Neonode, Inc. (a)(d) | 33,197 | 239,682 | |
NetList, Inc. (a)(d) | 104,599 | 200,307 | |
Newport Corp. (a) | 41,609 | 861,306 | |
OSI Systems, Inc. (a) | 22,707 | 1,395,799 | |
Park Electrochemical Corp. | 16,314 | 464,786 | |
PC Connection, Inc. | 12,636 | 255,879 | |
PC Mall, Inc. (a) | 4,077 | 39,588 | |
Planar Systems, Inc. (a) | 2,277 | 5,283 | |
Plexus Corp. (a) | 33,577 | 1,381,694 | |
Pulse Electronics Corp. (a) | 5,013 | 20,052 | |
RadiSys Corp. (a) | 9,220 | 38,263 | |
RealD, Inc. (a)(d) | 37,860 | 418,353 | |
Research Frontiers, Inc. (a)(d) | 16,855 | 101,299 | |
RF Industries Ltd. | 5,778 | 38,366 | |
Richardson Electronics Ltd. | 23,707 | 260,540 | |
Rofin-Sinar Technologies, Inc. (a) | 22,270 | 522,677 | |
Rogers Corp. (a) | 16,870 | 1,091,489 | |
Sanmina Corp. (a) | 78,959 | 1,339,145 | |
ScanSource, Inc. (a) | 24,927 | 978,634 | |
Speed Commerce, Inc. (a)(d) | 43,920 | 172,166 | |
Common Stocks - continued | |||
Shares | Value | ||
INFORMATION TECHNOLOGY - continued | |||
Electronic Equipment & Components - continued | |||
SYNNEX Corp. (a) | 30,841 | $ 1,834,423 | |
TE Connectivity Ltd. | 462,365 | 27,085,342 | |
Tech Data Corp. (a) | 39,838 | 2,294,669 | |
Trimble Navigation Ltd. (a)(d) | 301,758 | 11,512,068 | |
TTM Technologies, Inc. (a) | 53,211 | 446,972 | |
Uni-Pixel, Inc. (a)(d) | 12,876 | 126,957 | |
Universal Display Corp. (a)(d) | 48,773 | 1,684,619 | |
Viasystems Group, Inc. (a) | 4,710 | 61,042 | |
Vishay Intertechnology, Inc. | 163,262 | 2,308,525 | |
Vishay Precision Group, Inc. (a) | 9,596 | 164,379 | |
Wayside Technology Group, Inc. | 1,232 | 17,420 | |
Wireless Telecom Group, Inc. (a) | 11,200 | 40,320 | |
Zebra Technologies Corp. Class A (a) | 57,315 | 3,954,162 | |
Zygo Corp. (a) | 11,158 | 168,597 | |
| 185,608,246 | ||
Internet Software & Services - 3.2% | |||
Akamai Technologies, Inc. (a) | 208,821 | 12,765,228 | |
Angie's List, Inc. (a)(d) | 39,732 | 552,672 | |
AOL, Inc. (a)(d) | 89,529 | 3,919,580 | |
Autobytel, Inc. (a) | 1,148 | 18,092 | |
Bankrate, Inc. (a)(d) | 42,017 | 845,802 | |
Bazaarvoice, Inc. (a)(d) | 31,078 | 210,087 | |
Benefitfocus, Inc. | 9,816 | 635,880 | |
Blucora, Inc. (a)(d) | 40,993 | 788,705 | |
Brightcove, Inc. (a) | 25,472 | 247,078 | |
BroadVision, Inc. (a) | 490 | 6,326 | |
Carbonite, Inc. (a) | 9,443 | 95,941 | |
ChannelAdvisor Corp. (a) | 9,463 | 429,431 | |
comScore, Inc. (a) | 35,536 | 1,123,648 | |
Constant Contact, Inc. (a) | 30,835 | 850,121 | |
Conversant, Inc. (a)(d) | 68,992 | 1,715,141 | |
Cornerstone OnDemand, Inc. (a)(d) | 56,736 | 3,312,248 | |
CoStar Group, Inc. (a) | 32,267 | 6,486,958 | |
Crexendo, Inc. (a) | 6,585 | 20,677 | |
Cvent, Inc. | 5,589 | 219,536 | |
Daegis, Inc. (a) | 3,645 | 4,301 | |
Dealertrack Technologies (a)(d) | 45,834 | 2,478,244 | |
Demand Media, Inc. (a)(d) | 42,676 | 206,979 | |
Demandware, Inc. (a) | 37,767 | 2,836,679 | |
Dice Holdings, Inc. (a)(d) | 50,678 | 372,990 | |
Digital River, Inc. (a) | 35,934 | 638,547 | |
E2open, Inc. (a)(d) | 9,328 | 259,225 | |
Earthlink Holdings Corp. | 136,356 | 534,516 | |
eBay, Inc. (a) | 1,308,058 | 76,874,569 | |
eGain Communications Corp. (a)(d) | 8,558 | 71,716 | |
Endurance International Group Holdings, Inc. | 22,941 | 346,180 | |
Envestnet, Inc. (a) | 31,274 | 1,308,504 | |
Equinix, Inc. (a)(d) | 57,542 | 10,930,678 | |
Facebook, Inc. Class A (a) | 1,846,553 | 126,415,018 | |
Global Eagle Entertainment, Inc. (a)(d) | 63,441 | 1,115,293 | |
| |||
Shares | Value | ||
GlowPoint, Inc. (a) | 18,770 | $ 24,776 | |
Gogo, Inc. (d) | 13,710 | 285,854 | |
Google, Inc. Class A (a) | 314,888 | 382,793,597 | |
IAC/InterActiveCorp | 87,877 | 6,813,104 | |
Internap Network Services Corp. (a) | 49,823 | 379,651 | |
IntraLinks Holdings, Inc. (a) | 36,458 | 423,277 | |
Inuvo, Inc. (a) | 9,640 | 11,954 | |
iPass, Inc. (a) | 33,662 | 52,176 | |
j2 Global, Inc. | 55,909 | 2,873,723 | |
Limelight Networks, Inc. (a) | 33,081 | 71,455 | |
LinkedIn Corp. (a)(d) | 109,767 | 22,396,859 | |
Liquidity Services, Inc. (a)(d) | 37,923 | 971,587 | |
LivePerson, Inc. (a)(d) | 55,381 | 724,383 | |
Local Corp. (a) | 28,399 | 45,154 | |
LogMeIn, Inc. (a) | 22,955 | 960,667 | |
Marchex, Inc. Class B | 28,685 | 339,630 | |
Marin Software, Inc. (d) | 7,083 | 81,100 | |
Marketo, Inc. | 21,521 | 882,361 | |
Mediabistro, Inc. (a) | 147 | 340 | |
MeetMe, Inc. (a)(d) | 18,724 | 49,806 | |
Millennial Media, Inc. (a)(d) | 34,415 | 207,867 | |
Monster Worldwide, Inc. (a) | 97,552 | 777,489 | |
Move, Inc. (a) | 35,516 | 458,512 | |
NIC, Inc. | 78,994 | 1,535,643 | |
OpenTable, Inc. (a)(d) | 23,366 | 1,862,037 | |
Pandora Media, Inc. (a) | 184,344 | 6,898,152 | |
Perficient, Inc. (a) | 34,438 | 702,880 | |
QuinStreet, Inc. (a) | 17,620 | 116,116 | |
Rackspace Hosting, Inc. (a)(d) | 132,627 | 4,876,695 | |
RealNetworks, Inc. (a) | 28,670 | 215,312 | |
Rocket Fuel, Inc. | 8,626 | 483,574 | |
SciQuest, Inc. (a)(d) | 19,825 | 585,234 | |
Selectica, Inc. (a) | 552 | 3,853 | |
Shutterstock, Inc. (a)(d) | 10,696 | 1,062,968 | |
Spark Networks, Inc. (a)(d) | 16,620 | 100,052 | |
SPS Commerce, Inc. (a) | 19,140 | 1,297,692 | |
Stamps.com, Inc. (a) | 12,471 | 438,730 | |
Support.com, Inc. (a) | 117,655 | 295,314 | |
Synacor, Inc. (a) | 20,037 | 52,697 | |
TechTarget, Inc. (a) | 1,217 | 8,434 | |
Textura Corp. (d) | 17,853 | 480,424 | |
TheStreet.com, Inc. | 3,696 | 10,792 | |
Travelzoo, Inc. (a) | 5,383 | 127,146 | |
Tremor Video, Inc. (d) | 9,207 | 39,958 | |
Trulia, Inc. (a)(d) | 42,135 | 1,262,365 | |
Twitter, Inc. (d) | 80,705 | 4,431,512 | |
United Online, Inc. | 10,283 | 115,272 | |
Unwired Planet, Inc. | 100,320 | 148,474 | |
VeriSign, Inc. (a)(d) | 144,977 | 7,989,682 | |
Vocus, Inc. (a)(d) | 23,379 | 312,110 | |
Web.com Group, Inc. (a)(d) | 64,573 | 2,353,686 | |
WebMD Health Corp. (a)(d) | 44,803 | 1,989,701 | |
XO Group, Inc. (a) | 29,832 | 356,194 | |
Xoom Corp. | 19,461 | 545,492 | |
Common Stocks - continued | |||
Shares | Value | ||
INFORMATION TECHNOLOGY - continued | |||
Internet Software & Services - continued | |||
Yahoo!, Inc. (a) | 1,058,836 | $ 40,945,188 | |
Yelp, Inc. (a)(d) | 60,050 | 5,669,921 | |
YuMe, Inc. (d) | 6,211 | 39,688 | |
Zillow, Inc. (a)(d) | 23,405 | 1,956,658 | |
Zix Corp. (a) | 43,773 | 197,854 | |
| 769,769,412 | ||
IT Services - 3.4% | |||
Accenture PLC Class A | 713,976 | 59,509,900 | |
Acxiom Corp. (a) | 91,117 | 3,392,286 | |
Alliance Data Systems Corp. (a)(d) | 50,917 | 14,516,946 | |
Amdocs Ltd. | 195,710 | 8,705,181 | |
Automatic Data Processing, Inc. | 560,035 | 43,559,522 | |
Blackhawk Network Holdings, Inc. (d) | 10,875 | 269,483 | |
Booz Allen Hamilton Holding Corp. | 80,553 | 1,694,030 | |
Broadridge Financial Solutions, Inc. | 126,853 | 4,789,969 | |
CACI International, Inc. Class A (a)(d) | 20,462 | 1,613,019 | |
Cardtronics, Inc. (a) | 44,777 | 1,814,364 | |
Cass Information Systems, Inc. | 3,955 | 205,660 | |
Ciber, Inc. (a) | 53,912 | 257,699 | |
Cognizant Technology Solutions Corp. Class A (a) | 339,084 | 35,285,081 | |
Computer Sciences Corp. | 174,620 | 11,035,984 | |
Computer Task Group, Inc. | 11,646 | 189,248 | |
Convergys Corp. (d) | 123,097 | 2,519,796 | |
CoreLogic, Inc. (a) | 113,020 | 3,684,452 | |
CSG Systems International, Inc. | 47,456 | 1,328,768 | |
CSP, Inc. | 3,696 | 30,677 | |
Datalink Corp. (a) | 21,583 | 315,328 | |
DST Systems, Inc. | 31,684 | 2,977,662 | |
Edgewater Technology, Inc. (a) | 2,875 | 19,665 | |
EPAM Systems, Inc. (a) | 32,476 | 1,361,719 | |
Euronet Worldwide, Inc. (a) | 64,215 | 2,456,866 | |
EVERTEC, Inc. | 73,649 | 1,786,725 | |
ExlService Holdings, Inc. (a) | 29,161 | 816,216 | |
Fidelity National Information Services, Inc. | 329,470 | 18,321,827 | |
Fiserv, Inc. (a) | 303,216 | 17,601,689 | |
FleetCor Technologies, Inc. (a) | 84,060 | 10,921,916 | |
Forrester Research, Inc. | 14,844 | 537,650 | |
Gartner, Inc. Class A (a)(d) | 108,666 | 7,558,807 | |
Genpact Ltd. (a) | 139,916 | 2,333,799 | |
Global Cash Access Holdings, Inc. (a) | 58,402 | 490,577 | |
Global Payments, Inc. (d) | 86,730 | 6,099,721 | |
Hackett Group, Inc. | 12,619 | 74,326 | |
Heartland Payment Systems, Inc. | 51,995 | 2,102,678 | |
Higher One Holdings, Inc. (a) | 26,817 | 214,536 | |
IBM Corp. | 1,144,549 | 211,936,138 | |
iGATE Corp. (a) | 38,740 | 1,311,349 | |
Information Services Group, Inc. (a) | 18,000 | 94,140 | |
Innodata, Inc. (a) | 14,010 | 45,953 | |
| |||
Shares | Value | ||
Jack Henry & Associates, Inc. | 97,558 | $ 5,671,047 | |
Leidos Holdings, Inc. (d) | 88,093 | 3,934,233 | |
Lionbridge Technologies, Inc. (a) | 34,685 | 248,345 | |
ManTech International Corp. Class A | 23,021 | 673,825 | |
MasterCard, Inc. Class A | 1,154,284 | 89,710,952 | |
Mattersight Corp. (a) | 4,307 | 24,291 | |
Maximus, Inc. | 80,539 | 3,848,959 | |
ModusLink Global Solutions, Inc. (a) | 31,030 | 141,807 | |
MoneyGram International, Inc. (a) | 66,937 | 1,273,811 | |
NCI, Inc. Class A (a) | 12,261 | 147,132 | |
Neustar, Inc. Class A (a)(d) | 66,766 | 2,391,558 | |
Paychex, Inc. | 360,083 | 15,037,066 | |
PFSweb, Inc. (a) | 1,815 | 15,881 | |
Planet Payment, Inc. (a) | 40,113 | 136,785 | |
PRG-Schultz International, Inc. (a) | 5,640 | 34,066 | |
Sapient Corp. (a) | 136,229 | 2,371,747 | |
Science Applications International Corp. | 56,960 | 2,124,608 | |
ServiceSource International, Inc. (a)(d) | 52,332 | 477,268 | |
StarTek, Inc. (a) | 2,150 | 14,943 | |
Sykes Enterprises, Inc. (a) | 37,324 | 734,536 | |
Syntel, Inc. (a) | 20,991 | 1,980,711 | |
Teletech Holdings, Inc. (a) | 19,293 | 464,575 | |
Teradata Corp. (a)(d) | 183,403 | 8,421,866 | |
The Management Network Group, Inc. (a) | 206 | 700 | |
The Western Union Co. | 621,408 | 10,396,156 | |
Total System Services, Inc. | 171,609 | 5,227,210 | |
Unisys Corp. (a)(d) | 40,780 | 1,395,492 | |
Vantiv, Inc. (a)(d) | 129,522 | 4,122,685 | |
VeriFone Systems, Inc. (a) | 114,397 | 3,311,793 | |
Virtusa Corp. (a) | 35,863 | 1,304,337 | |
Visa, Inc. Class A | 570,296 | 128,852,678 | |
WEX, Inc. (a) | 45,780 | 4,432,420 | |
Xerox Corp. | 1,318,733 | 14,492,876 | |
| 797,197,711 | ||
Semiconductors & Semiconductor Equipment - 2.2% | |||
Advanced Energy Industries, Inc. (a) | 37,951 | 1,041,375 | |
Advanced Micro Devices, Inc. (a)(d) | 718,505 | 2,665,654 | |
AEHR Test Systems (a) | 3,126 | 7,346 | |
Aetrium, Inc. (a) | 206 | 1,226 | |
Altera Corp. | 377,370 | 13,702,305 | |
Amkor Technology, Inc. (a)(d) | 161,169 | 954,120 | |
Amtech Systems, Inc. (a) | 12,381 | 138,172 | |
ANADIGICS, Inc. (a)(d) | 109,969 | 200,144 | |
Analog Devices, Inc. | 340,001 | 17,278,851 | |
Applied Materials, Inc. | 1,333,558 | 25,284,260 | |
Applied Micro Circuits Corp. (a)(d) | 98,689 | 1,130,976 | |
Atmel Corp. (a)(d) | 480,018 | 3,868,945 | |
ATMI, Inc. (a) | 28,610 | 973,026 | |
Avago Technologies Ltd. | 276,576 | 17,064,739 | |
Axcelis Technologies, Inc. (a) | 123,333 | 275,033 | |
AXT, Inc. (a) | 31,515 | 72,169 | |
Broadcom Corp. Class A | 594,914 | 17,680,844 | |
Common Stocks - continued | |||
Shares | Value | ||
INFORMATION TECHNOLOGY - continued | |||
Semiconductors & Semiconductor Equipment - continued | |||
Brooks Automation, Inc. | 71,516 | $ 741,621 | |
BTU International, Inc. (a) | 4,067 | 12,323 | |
Cabot Microelectronics Corp. (a)(d) | 30,653 | 1,353,943 | |
Cavium, Inc. (a)(d) | 71,032 | 2,992,578 | |
Ceva, Inc. (a)(d) | 20,686 | 374,003 | |
Cirrus Logic, Inc. (a)(d) | 62,020 | 1,193,885 | |
Cohu, Inc. | 20,738 | 209,246 | |
Cree, Inc. (a)(d) | 134,448 | 8,259,141 | |
CVD Equipment Corp. (a)(d) | 24,298 | 359,610 | |
Cypress Semiconductor Corp. (d) | 200,786 | 1,965,695 | |
Diodes, Inc. (a) | 35,635 | 848,469 | |
DSP Group, Inc. (a) | 34,788 | 294,306 | |
Entegris, Inc. (a) | 143,226 | 1,725,873 | |
Entropic Communications, Inc. (a) | 130,146 | 570,039 | |
Exar Corp. (a) | 56,777 | 650,097 | |
Fairchild Semiconductor International, Inc. (a)(d) | 143,511 | 2,020,635 | |
First Solar, Inc. (a)(d) | 80,138 | 4,573,476 | |
FormFactor, Inc. (a) | 44,109 | 314,497 | |
Freescale Semiconductor, Inc. (a) | 51,501 | 1,171,648 | |
GigOptix, Inc. (a) | 17,428 | 28,408 | |
GSI Technology, Inc. (a) | 7,703 | 52,457 | |
GT Advanced Technologies, Inc. (a)(d) | 153,295 | 2,196,717 | |
Hittite Microwave Corp. | 37,699 | 2,223,487 | |
Ikanos Communications, Inc. (a) | 35,040 | 32,237 | |
Inphi Corp. (a) | 23,714 | 311,839 | |
Integrated Device Technology, Inc. (a) | 149,111 | 1,758,019 | |
Integrated Silicon Solution, Inc. (a) | 27,085 | 329,895 | |
Intel Corp. | 5,568,938 | 137,886,905 | |
Intermolecular, Inc. (a)(d) | 6,975 | 18,484 | |
International Rectifier Corp. (a)(d) | 83,741 | 2,256,820 | |
Intersil Corp. Class A | 155,240 | 1,974,653 | |
Intest Corp. (a) | 2,175 | 8,657 | |
IXYS Corp. | 38,644 | 425,857 | |
KLA-Tencor Corp. | 196,151 | 12,779,238 | |
Kopin Corp. (a) | 49,853 | 198,913 | |
Kulicke & Soffa Industries, Inc. (a) | 82,587 | 953,054 | |
Lam Research Corp. (a) | 188,211 | 9,736,155 | |
Lattice Semiconductor Corp. (a) | 136,230 | 1,031,261 | |
Linear Technology Corp. | 269,546 | 12,625,535 | |
LSI Corp. | 591,975 | 6,565,003 | |
LTX-Credence Corp. (a) | 48,731 | 493,158 | |
M/A-COM Technology Solutions, Inc. (a) | 10,000 | 169,600 | |
Marvell Technology Group Ltd. | 465,712 | 7,120,736 | |
Mattson Technology, Inc. (a) | 72,551 | 185,005 | |
Maxim Integrated Products, Inc. | 303,732 | 9,935,074 | |
MaxLinear, Inc. Class A (a) | 15,441 | 144,373 | |
Micrel, Inc. | 33,398 | 348,675 | |
Microchip Technology, Inc. (d) | 217,370 | 9,901,204 | |
Micron Technology, Inc. (a) | 1,180,658 | 28,560,117 | |
Microsemi Corp. (a) | 100,802 | 2,324,494 | |
| |||
Shares | Value | ||
MKS Instruments, Inc. | 59,577 | $ 1,790,885 | |
Monolithic Power Systems, Inc. (a)(d) | 35,284 | 1,264,579 | |
MoSys, Inc. (a)(d) | 19,247 | 85,072 | |
Nanometrics, Inc. (a) | 28,664 | 526,271 | |
NeoPhotonics Corp. (a) | 16,785 | 138,476 | |
NVE Corp. (a) | 6,043 | 341,006 | |
NVIDIA Corp. | 631,690 | 11,610,462 | |
Omnivision Technologies, Inc. (a)(d) | 50,229 | 867,455 | |
ON Semiconductor Corp. (a) | 539,501 | 5,038,939 | |
PDF Solutions, Inc. (a) | 22,154 | 451,720 | |
Peregrine Semiconductor Corp. (a)(d) | 21,553 | 143,974 | |
Pericom Semiconductor Corp. (a) | 17,514 | 141,688 | |
Photronics, Inc. (a)(d) | 74,723 | 650,090 | |
Pixelworks, Inc. (a) | 22,798 | 113,534 | |
PLX Technology, Inc. (a) | 44,805 | 267,038 | |
PMC-Sierra, Inc. (a) | 199,312 | 1,462,950 | |
Power Integrations, Inc. | 37,256 | 2,202,947 | |
QuickLogic Corp. (a)(d) | 38,003 | 193,435 | |
Rambus, Inc. (a)(d) | 118,235 | 1,090,127 | |
RF Micro Devices, Inc. (a) | 315,164 | 2,231,361 | |
Rubicon Technology, Inc. (a)(d) | 25,049 | 323,383 | |
Rudolph Technologies, Inc. (a)(d) | 29,614 | 339,673 | |
Semtech Corp. (a) | 76,311 | 1,903,959 | |
Sigma Designs, Inc. (a) | 22,818 | 111,808 | |
Silicon Image, Inc. (a) | 84,424 | 510,765 | |
Silicon Laboratories, Inc. (a)(d) | 47,316 | 2,459,013 | |
Skyworks Solutions, Inc. (a)(d) | 219,186 | 7,772,336 | |
Spansion, Inc. Class A (a) | 45,268 | 738,321 | |
STR Holdings, Inc. (a) | 37,233 | 55,105 | |
SunEdison, Inc. (a)(d) | 278,643 | 5,115,885 | |
SunPower Corp. (a)(d) | 42,366 | 1,403,586 | |
Supertex, Inc. (a) | 19,548 | 643,716 | |
Synaptics, Inc. (a)(d) | 36,621 | 2,381,830 | |
Teradyne, Inc. (a)(d) | 265,875 | 5,391,945 | |
Tessera Technologies, Inc. | 44,982 | 977,009 | |
Texas Instruments, Inc. | 1,203,895 | 54,127,119 | |
TriQuint Semiconductor, Inc. (a)(d) | 199,172 | 2,437,865 | |
Ultra Clean Holdings, Inc. (a) | 18,783 | 247,184 | |
Ultratech, Inc. (a)(d) | 31,408 | 823,518 | |
Veeco Instruments, Inc. (a)(d) | 53,983 | 2,135,028 | |
Vitesse Semiconductor Corp. (a) | 9,484 | 34,522 | |
Xilinx, Inc. | 308,585 | 16,108,137 | |
| 521,200,016 | ||
Software - 3.6% | |||
Accelrys, Inc. (a) | 51,411 | 641,609 | |
ACI Worldwide, Inc. (a)(d) | 49,960 | 2,999,099 | |
Activision Blizzard, Inc. | 489,202 | 9,466,059 | |
Actuate Corp. (a) | 42,170 | 239,526 | |
Adobe Systems, Inc. (a) | 523,566 | 35,921,863 | |
Advent Software, Inc. | 46,269 | 1,420,458 | |
American Software, Inc. Class A | 10,878 | 113,784 | |
ANSYS, Inc. (a) | 112,596 | 9,404,018 | |
Aspen Technology, Inc. (a) | 119,658 | 5,617,943 | |
Common Stocks - continued | |||
Shares | Value | ||
INFORMATION TECHNOLOGY - continued | |||
Software - continued | |||
Autodesk, Inc. (a) | 253,631 | $ 13,305,482 | |
Barracuda Networks, Inc. (d) | 9,965 | 358,242 | |
Blackbaud, Inc. | 47,578 | 1,490,143 | |
Bottomline Technologies, Inc. (a)(d) | 44,605 | 1,591,952 | |
BroadSoft, Inc. (a)(d) | 26,590 | 797,966 | |
BSQUARE Corp. (a) | 11,182 | 39,696 | |
CA Technologies, Inc. | 349,083 | 11,694,281 | |
Cadence Design Systems, Inc. (a)(d) | 338,143 | 5,183,732 | |
Callidus Software, Inc. (a)(d) | 32,625 | 402,266 | |
Citrix Systems, Inc. (a) | 209,768 | 12,596,568 | |
CommVault Systems, Inc. (a)(d) | 50,590 | 3,484,639 | |
Compuware Corp. | 202,971 | 2,222,532 | |
Comverse, Inc. (a) | 23,221 | 803,679 | |
Concur Technologies, Inc. (a)(d) | 54,717 | 6,754,814 | |
Cyan, Inc. (d) | 8,834 | 29,682 | |
Datawatch Corp. (a) | 1,950 | 65,540 | |
Digimarc Corp. | 6,216 | 182,626 | |
Document Security Systems, Inc. (a)(d) | 19,824 | 32,511 | |
Ebix, Inc. (d) | 31,393 | 510,136 | |
Electronic Arts, Inc. (a)(d) | 359,966 | 10,291,428 | |
Ellie Mae, Inc. (a)(d) | 31,804 | 985,924 | |
Envivio, Inc. (a) | 6,801 | 24,552 | |
EPIQ Systems, Inc. | 38,746 | 549,418 | |
ePlus, Inc. (a) | 2,450 | 139,332 | |
Evolving Systems, Inc. | 4,973 | 42,121 | |
FactSet Research Systems, Inc. | 53,360 | 5,618,274 | |
Fair Isaac Corp. | 37,437 | 2,011,490 | |
FalconStor Software, Inc. (a) | 37,427 | 64,749 | |
FireEye, Inc. (d) | 17,216 | 1,474,378 | |
Fonix Corp. (a) | 1 | 0 | |
Fortinet, Inc. (a) | 146,518 | 3,391,892 | |
Gigamon, Inc. (a)(d) | 13,202 | 416,655 | |
Glu Mobile, Inc. (a) | 98,358 | 494,741 | |
GSE Systems, Inc. (a) | 388 | 698 | |
Guidance Software, Inc. (a) | 13,894 | 151,584 | |
Guidewire Software, Inc. (a)(d) | 70,818 | 3,796,553 | |
Imperva, Inc. (a) | 22,847 | 1,431,821 | |
Infoblox, Inc. (a)(d) | 50,781 | 1,172,025 | |
Informatica Corp. (a) | 135,700 | 5,639,692 | |
Interactive Intelligence Group, Inc. (a) | 16,038 | 1,277,106 | |
Intuit, Inc. | 316,972 | 24,771,362 | |
Jive Software, Inc. (a)(d) | 30,754 | 250,338 | |
Liquid Holdings Group, Inc. (d) | 3,912 | 18,778 | |
Majesco Entertainment Co. (a) | 19,952 | 10,595 | |
Manhattan Associates, Inc. (a) | 82,280 | 3,117,589 | |
Mentor Graphics Corp. | 118,491 | 2,564,145 | |
MICROS Systems, Inc. (a)(d) | 83,538 | 4,637,194 | |
Microsoft Corp. | 8,530,245 | 326,793,686 | |
MicroStrategy, Inc. Class A (a) | 12,438 | 1,606,119 | |
Mitek Systems, Inc. (a)(d) | 15,896 | 84,408 | |
| |||
Shares | Value | ||
Model N, Inc. | 6,345 | $ 69,732 | |
Monotype Imaging Holdings, Inc. | 41,411 | 1,177,729 | |
NetScout Systems, Inc. (a) | 39,020 | 1,481,980 | |
NetSol Technologies, Inc. (a)(d) | 10,165 | 47,166 | |
NetSuite, Inc. (a)(d) | 37,824 | 4,353,164 | |
Nuance Communications, Inc. (a)(d) | 295,143 | 4,512,736 | |
Oracle Corp. | 3,941,524 | 154,153,004 | |
Parametric Technology Corp. (a) | 128,240 | 5,041,114 | |
Peerless Systems Corp. (a) | 172 | 635 | |
Pegasystems, Inc. | 22,064 | 918,524 | |
Progress Software Corp. (a) | 56,172 | 1,400,930 | |
Proofpoint, Inc. (a)(d) | 24,372 | 1,010,219 | |
PROS Holdings, Inc. (a) | 23,721 | 817,188 | |
QAD, Inc. Class B | 4,298 | 71,433 | |
Qlik Technologies, Inc. (a) | 106,112 | 3,236,416 | |
Qualys, Inc. (a) | 15,390 | 417,223 | |
Rally Software Development Corp. | 9,834 | 195,598 | |
RealPage, Inc. (a)(d) | 66,111 | 1,170,165 | |
Red Hat, Inc. (a) | 210,389 | 12,410,847 | |
Rosetta Stone, Inc. (a) | 8,315 | 96,038 | |
Rovi Corp. (a) | 119,303 | 2,963,487 | |
salesforce.com, Inc. (a)(d) | 619,024 | 38,608,527 | |
SeaChange International, Inc. (a) | 17,668 | 186,397 | |
ServiceNow, Inc. (a)(d) | 114,859 | 7,817,304 | |
Silver Spring Networks, Inc. (d) | 4,334 | 76,278 | |
Smith Micro Software, Inc. (a) | 41,455 | 72,546 | |
SolarWinds, Inc. (a) | 71,945 | 3,322,420 | |
Solera Holdings, Inc. | 82,773 | 5,663,329 | |
Sonic Foundry, Inc. (a) | 155 | 1,544 | |
Splunk, Inc. (a) | 92,581 | 8,586,888 | |
SS&C Technologies Holdings, Inc. (a) | 79,064 | 3,058,196 | |
Symantec Corp. | 783,009 | 16,819,033 | |
Synchronoss Technologies, Inc. (a)(d) | 29,419 | 1,011,425 | |
Synopsys, Inc. (a) | 184,472 | 7,452,669 | |
Tableau Software, Inc. | 16,291 | 1,536,893 | |
Take-Two Interactive Software, Inc. (a)(d) | 106,405 | 2,103,627 | |
Tangoe, Inc. (a)(d) | 45,871 | 872,466 | |
TeleCommunication Systems, Inc. | 49,377 | 107,148 | |
TeleNav, Inc. (a) | 12,035 | 72,330 | |
TIBCO Software, Inc. (a) | 175,849 | 3,831,750 | |
TiVo, Inc. (a) | 121,206 | 1,636,281 | |
Tyler Technologies, Inc. (a) | 30,080 | 2,820,902 | |
Ultimate Software Group, Inc. (a)(d) | 32,943 | 5,468,538 | |
Vasco Data Security International, Inc. (a) | 30,246 | 241,363 | |
Verint Systems, Inc. (a) | 68,085 | 3,187,059 | |
VirnetX Holding Corp. (a)(d) | 42,196 | 822,822 | |
VMware, Inc. Class A (a)(d) | 93,456 | 8,976,449 | |
Voltari Corp. (a)(d) | 4,240 | 15,985 | |
Vringo, Inc. (a)(d) | 39,609 | 160,416 | |
Wave Systems Corp. Class A (a)(d) | 27,069 | 28,422 | |
Common Stocks - continued | |||
Shares | Value | ||
INFORMATION TECHNOLOGY - continued | |||
Software - continued | |||
Workday, Inc. Class A (a)(d) | 33,866 | $ 3,722,551 | |
Zynga, Inc. (a) | 705,556 | 3,570,113 | |
| 857,596,492 | ||
TOTAL INFORMATION TECHNOLOGY | 4,275,324,769 | ||
MATERIALS - 3.8% | |||
Chemicals - 2.6% | |||
A. Schulman, Inc. | 30,292 | 1,052,647 | |
Advanced Emissions Solutions, Inc. (a) | 14,209 | 765,865 | |
Air Products & Chemicals, Inc. | 232,770 | 28,239,656 | |
Airgas, Inc. | 78,679 | 8,481,596 | |
Albemarle Corp. | 94,402 | 6,229,588 | |
American Vanguard Corp. (d) | 23,997 | 533,933 | |
Arabian American Development Co. (a) | 28,770 | 352,145 | |
Ashland, Inc. | 82,040 | 7,742,115 | |
Axiall Corp. | 81,160 | 3,284,545 | |
Balchem Corp. | 30,888 | 1,560,153 | |
Cabot Corp. | 67,007 | 3,627,759 | |
Calgon Carbon Corp. (a) | 83,129 | 1,673,387 | |
Celanese Corp. Class A | 183,332 | 9,788,095 | |
CF Industries Holdings, Inc. | 64,252 | 16,120,827 | |
Chase Corp. | 3,188 | 96,118 | |
Chemtura Corp. (a) | 94,872 | 2,348,082 | |
Clean Diesel Technologies, Inc. (a)(d) | 42,378 | 114,421 | |
Core Molding Technologies, Inc. (a) | 5,919 | 87,897 | |
Cytec Industries, Inc. | 39,374 | 3,727,537 | |
E.I. du Pont de Nemours & Co. | 1,030,606 | 68,658,972 | |
Eastman Chemical Co. | 168,147 | 14,701,092 | |
Ecolab, Inc. | 304,750 | 32,836,813 | |
Ferro Corp. (a) | 111,135 | 1,458,091 | |
Flotek Industries, Inc. (a)(d) | 68,404 | 1,740,882 | |
FMC Corp. | 146,802 | 11,330,178 | |
FutureFuel Corp. | 18,211 | 315,961 | |
GSE Holding, Inc. (a) | 3,278 | 2,000 | |
H.B. Fuller Co. | 56,146 | 2,721,958 | |
Hawkins, Inc. | 5,329 | 189,872 | |
Huntsman Corp. | 203,808 | 4,964,763 | |
Innophos Holdings, Inc. | 26,761 | 1,469,714 | |
Innospec, Inc. | 50,796 | 2,210,134 | |
International Flavors & Fragrances, Inc. | 91,400 | 8,572,406 | |
Intrepid Potash, Inc. (a)(d) | 76,176 | 1,128,167 | |
KMG Chemicals, Inc. | 10,303 | 152,897 | |
Koppers Holdings, Inc. | 22,254 | 879,923 | |
Kraton Performance Polymers, Inc. (a) | 33,124 | 918,860 | |
Kronos Worldwide, Inc. | 25,586 | 390,954 | |
Landec Corp. (a) | 25,874 | 263,656 | |
LSB Industries, Inc. (a) | 18,952 | 619,541 | |
LyondellBasell Industries NV Class A | 485,892 | 42,797,367 | |
Marrone Bio Innovations, Inc. (d) | 5,712 | 82,995 | |
| |||
Shares | Value | ||
Material Sciences Corp. (a) | 4,565 | $ 58,021 | |
Minerals Technologies, Inc. | 52,154 | 2,790,239 | |
Monsanto Co. | 586,694 | 64,548,074 | |
NewMarket Corp. (d) | 12,456 | 4,604,610 | |
Olin Corp. (d) | 81,888 | 2,144,647 | |
OM Group, Inc. | 32,193 | 1,017,299 | |
OMNOVA Solutions, Inc. (a) | 35,057 | 334,093 | |
Penford Corp. (a) | 6,469 | 86,361 | |
PolyOne Corp. | 103,882 | 3,895,575 | |
PPG Industries, Inc. | 155,823 | 30,824,906 | |
Praxair, Inc. | 323,450 | 42,168,177 | |
Quaker Chemical Corp. | 14,473 | 1,118,473 | |
Rockwood Holdings, Inc. | 88,136 | 6,952,168 | |
RPM International, Inc. | 164,614 | 6,890,742 | |
Senomyx, Inc. (a) | 31,786 | 316,589 | |
Sensient Technologies Corp. | 58,886 | 3,087,393 | |
Sherwin-Williams Co. | 94,962 | 19,037,982 | |
Sigma Aldrich Corp. | 130,116 | 12,284,252 | |
Stepan Co. | 25,296 | 1,537,997 | |
Taminco Corp. | 29,142 | 662,106 | |
The Dow Chemical Co. | 1,354,312 | 65,968,538 | |
The Mosaic Co. | 379,794 | 18,556,735 | |
The Scotts Miracle-Gro Co. Class A (d) | 51,798 | 2,958,184 | |
Tredegar Corp. | 24,439 | 608,775 | |
Tronox Ltd. Class A | 73,931 | 1,751,425 | |
Valhi, Inc. | 16,022 | 176,082 | |
Valspar Corp. | 85,270 | 6,373,933 | |
W.R. Grace & Co. (a) | 88,375 | 8,955,923 | |
Westlake Chemical Corp. (d) | 20,522 | 2,736,198 | |
Zep, Inc. | 16,526 | 290,858 | |
Zoltek Companies, Inc. (a) | 40,249 | 674,171 | |
| 607,644,088 | ||
Construction Materials - 0.1% | |||
Eagle Materials, Inc. | 69,831 | 6,173,060 | |
Headwaters, Inc. (a) | 105,333 | 1,404,089 | |
Martin Marietta Materials, Inc. | 56,358 | 6,874,549 | |
Texas Industries, Inc. (a)(d) | 20,369 | 1,729,328 | |
U.S. Concrete, Inc. (a) | 16,515 | 449,538 | |
Vulcan Materials Co. | 135,141 | 9,180,128 | |
| 25,810,692 | ||
Containers & Packaging - 0.3% | |||
AEP Industries, Inc. (a) | 6,511 | 277,499 | |
Aptargroup, Inc. (d) | 80,686 | 5,338,993 | |
Avery Dennison Corp. | 106,008 | 5,281,319 | |
Ball Corp. | 162,242 | 9,014,166 | |
Bemis Co., Inc. | 120,781 | 4,744,278 | |
Berry Plastics Group, Inc. (a) | 94,779 | 2,305,973 | |
Crown Holdings, Inc. (a) | 150,108 | 6,757,862 | |
Graphic Packaging Holding Co. (a) | 324,660 | 3,324,518 | |
Greif, Inc. Class A | 37,275 | 1,865,987 | |
MeadWestvaco Corp. (d) | 211,721 | 7,924,717 | |
Myers Industries, Inc. | 25,717 | 552,916 | |
Owens-Illinois, Inc. (a) | 185,599 | 6,295,518 | |
Common Stocks - continued | |||
Shares | Value | ||
MATERIALS - continued | |||
Containers & Packaging - continued | |||
Packaging Corp. of America | 102,376 | $ 7,462,187 | |
Rock-Tenn Co. Class A | 80,530 | 8,988,759 | |
Sealed Air Corp. | 219,080 | 7,457,483 | |
Silgan Holdings, Inc. | 46,246 | 2,229,520 | |
Sonoco Products Co. | 108,130 | 4,539,297 | |
UFP Technologies, Inc. (a) | 2,454 | 62,798 | |
| 84,423,790 | ||
Metals & Mining - 0.6% | |||
A.M. Castle & Co. (a)(d) | 36,860 | 538,893 | |
AK Steel Holding Corp. (a)(d) | 121,218 | 752,764 | |
Alcoa, Inc. (d) | 1,189,039 | 13,959,318 | |
Allegheny Technologies, Inc. (d) | 125,307 | 3,982,256 | |
Allied Nevada Gold Corp. (a)(d) | 93,899 | 491,092 | |
Amcol International Corp. | 23,278 | 1,033,078 | |
Carpenter Technology Corp. | 60,383 | 3,571,654 | |
Century Aluminum Co. (a) | 60,542 | 716,817 | |
Cliffs Natural Resources, Inc. (d) | 159,769 | 3,200,173 | |
Coeur d'Alene Mines Corp. (a)(d) | 146,764 | 1,614,404 | |
Commercial Metals Co. | 130,792 | 2,530,825 | |
Compass Minerals International, Inc. | 33,319 | 2,843,777 | |
Comstock Mining, Inc. (a)(d) | 56,723 | 113,446 | |
Freeport-McMoRan Copper & Gold, Inc. | 1,143,264 | 37,293,272 | |
Friedman Industries | 2,001 | 16,908 | |
General Moly, Inc. (a)(d) | 60,513 | 72,010 | |
Globe Specialty Metals, Inc. | 70,310 | 1,397,060 | |
Gold Resource Corp. | 44,371 | 228,511 | |
Golden Minerals Co. (a)(d) | 71,014 | 75,275 | |
Handy & Harman Ltd. (a) | 5,646 | 103,209 | |
Haynes International, Inc. | 12,361 | 612,240 | |
Hecla Mining Co. | 336,707 | 1,138,070 | |
Horsehead Holding Corp. (a)(d) | 61,719 | 1,096,747 | |
Kaiser Aluminum Corp. (d) | 16,273 | 1,148,711 | |
Materion Corp. | 22,336 | 660,922 | |
McEwen Mining, Inc. (a)(d) | 267,762 | 779,187 | |
Mines Management, Inc. (a)(d) | 24,109 | 32,788 | |
Molycorp, Inc. (a)(d) | 202,465 | 1,056,867 | |
Newmont Mining Corp. | 560,419 | 13,035,346 | |
Noranda Aluminium Holding Corp. | 73,305 | 315,945 | |
Nucor Corp. | 393,954 | 19,792,249 | |
Olympic Steel, Inc. | 12,703 | 349,460 | |
Paramount Gold & Silver Corp. (a)(d) | 34,874 | 47,080 | |
Reliance Steel & Aluminum Co. | 95,402 | 6,609,451 | |
Royal Gold, Inc. (d) | 79,101 | 5,435,030 | |
RTI International Metals, Inc. (a)(d) | 27,976 | 760,108 | |
Schnitzer Steel Industries, Inc. Class A (d) | 20,284 | 514,605 | |
Silver Bull Resources, Inc. (a)(d) | 60,971 | 23,169 | |
Solitario Exploration & Royalty Corp. (a) | 18,115 | 28,259 | |
Steel Dynamics, Inc. | 277,791 | 4,844,675 | |
Stillwater Mining Co. (a)(d) | 124,032 | 1,679,393 | |
SunCoke Energy, Inc. (a) | 69,275 | 1,543,447 | |
| |||
Shares | Value | ||
Synalloy Corp. | 8,615 | $ 117,422 | |
Timberline Resources Corp. (a) | 18,994 | 2,792 | |
U.S. Antimony Corp. (a)(d) | 24,962 | 46,180 | |
U.S. Silica Holdings, Inc. (d) | 63,033 | 2,067,482 | |
United States Steel Corp. (d) | 162,680 | 3,940,110 | |
Universal Stainless & Alloy Products, Inc. (a)(d) | 6,659 | 219,947 | |
Walter Energy, Inc. (d) | 65,194 | 703,443 | |
Worthington Industries, Inc. | 60,686 | 2,418,944 | |
| 145,554,811 | ||
Paper & Forest Products - 0.2% | |||
Boise Cascade Co. | 37,823 | 1,119,183 | |
Clearwater Paper Corp. (a) | 22,216 | 1,418,492 | |
Deltic Timber Corp. | 13,533 | 851,767 | |
Domtar Corp. | 36,405 | 4,032,946 | |
International Paper Co. | 492,581 | 24,082,285 | |
Kapstone Paper & Packaging Corp. (a) | 106,018 | 3,370,312 | |
Louisiana-Pacific Corp. (a)(d) | 160,954 | 3,024,326 | |
Neenah Paper, Inc. | 13,754 | 690,588 | |
P.H. Glatfelter Co. | 45,036 | 1,366,843 | |
Resolute Forest Products (a)(d) | 103,317 | 2,116,965 | |
Schweitzer-Mauduit International, Inc. | 39,736 | 1,912,494 | |
Verso Paper Corp. (a)(d) | 23,529 | 57,646 | |
Wausau-Mosinee Paper Corp. | 43,988 | 582,841 | |
| 44,626,688 | ||
TOTAL MATERIALS | 908,060,069 | ||
TELECOMMUNICATION SERVICES - 2.3% | |||
Diversified Telecommunication Services - 2.0% | |||
8x8, Inc. (a) | 89,195 | 943,683 | |
Alaska Communication Systems Group, Inc. (a) | 135,810 | 297,424 | |
AT&T, Inc. | 5,886,551 | 187,957,573 | |
Atlantic Tele-Network, Inc. | 16,949 | 1,110,837 | |
Cbeyond, Inc. (a) | 59,758 | 409,342 | |
CenturyLink, Inc. | 676,308 | 21,141,388 | |
Cincinnati Bell, Inc. (a)(d) | 198,209 | 664,000 | |
Cogent Communications Group, Inc. | 64,769 | 2,483,243 | |
Consolidated Communications Holdings, Inc. | 59,983 | 1,143,276 | |
Elephant Talk Communication, Inc. (a)(d) | 63,184 | 80,244 | |
FairPoint Communications, Inc. (a)(d) | 43,838 | 582,169 | |
Frontier Communications Corp. (d) | 1,084,701 | 5,293,341 | |
General Communications, Inc. | 33,964 | 353,565 | |
Hawaiian Telcom Holdco, Inc. (a)(d) | 11,736 | 337,997 | |
HickoryTech Corp. | 2,523 | 34,388 | |
IDT Corp. Class B | 44,765 | 803,532 | |
inContact, Inc. (a) | 42,838 | 386,399 | |
Inteliquent, Inc. | 28,172 | 393,281 | |
Intelsat SA | 20,815 | 412,970 | |
Iridium Communications, Inc. (a)(d) | 61,404 | 400,354 | |
Level 3 Communications, Inc. (a) | 186,783 | 6,877,350 | |
Common Stocks - continued | |||
Shares | Value | ||
TELECOMMUNICATION SERVICES - continued | |||
Diversified Telecommunication Services - continued | |||
Lumos Networks Corp. | 15,837 | $ 229,953 | |
ORBCOMM, Inc. (a)(d) | 36,232 | 282,972 | |
Premiere Global Services, Inc. (a) | 64,433 | 728,737 | |
Straight Path Communications, Inc. | 22,382 | 182,637 | |
Towerstream Corp. (a)(d) | 39,383 | 103,971 | |
TW Telecom, Inc. (a) | 182,316 | 5,580,693 | |
Verizon Communications, Inc. | 4,656,446 | 221,553,701 | |
Vonage Holdings Corp. (a) | 198,077 | 913,135 | |
Windstream Holdings, Inc. (d) | 719,900 | 5,773,598 | |
xG Technology, Inc. (a) | 1,492 | 1,925 | |
| 467,457,678 | ||
Wireless Telecommunication Services - 0.3% | |||
Boingo Wireless, Inc. (a)(d) | 15,589 | 90,572 | |
Crown Castle International Corp. | 367,969 | 27,928,847 | |
Leap Wireless International, Inc. (a) | 51,525 | 902,718 | |
NII Holdings, Inc. (a)(d) | 160,624 | 184,718 | |
NTELOS Holdings Corp. (d) | 10,948 | 153,053 | |
SBA Communications Corp. | 144,863 | 13,786,612 | |
Shenandoah Telecommunications Co. (d) | 22,919 | 605,749 | |
Sprint Corp. (a)(d) | 965,514 | 8,438,592 | |
T-Mobile U.S., Inc. (a) | 283,965 | 8,660,933 | |
Telephone & Data Systems, Inc. | 127,836 | 2,913,382 | |
U.S. Cellular Corp. (d) | 27,310 | 985,618 | |
U.S.A. Mobility, Inc. | 43,148 | 623,489 | |
| 65,274,283 | ||
TOTAL TELECOMMUNICATION SERVICES | 532,731,961 | ||
UTILITIES - 3.0% | |||
Electric Utilities - 1.6% | |||
Allete, Inc. | 47,344 | 2,391,345 | |
American Electric Power Co., Inc. | 543,716 | 27,294,543 | |
Cleco Corp. | 77,341 | 3,822,966 | |
Duke Energy Corp. | 793,610 | 56,251,077 | |
Edison International | 374,884 | 19,632,675 | |
El Paso Electric Co. | 44,691 | 1,575,358 | |
Empire District Electric Co. | 52,048 | 1,235,620 | |
Entergy Corp. | 192,366 | 12,276,798 | |
Exelon Corp. | 959,959 | 29,192,353 | |
FirstEnergy Corp. | 464,435 | 14,295,309 | |
Genie Energy Ltd. Class B (a) | 11,430 | 130,988 | |
Great Plains Energy, Inc. | 172,510 | 4,531,838 | |
Hawaiian Electric Industries, Inc. (d) | 141,071 | 3,584,614 | |
IDACORP, Inc. | 64,805 | 3,641,393 | |
ITC Holdings Corp. (d) | 64,744 | 6,642,734 | |
MGE Energy, Inc. | 45,573 | 1,758,206 | |
NextEra Energy, Inc. | 475,747 | 43,478,518 | |
Northeast Utilities | 345,580 | 15,361,031 | |
NRG Yield, Inc. Class A | 38,525 | 1,470,885 | |
| |||
Shares | Value | ||
OGE Energy Corp. | 236,316 | $ 8,507,376 | |
Otter Tail Corp. | 43,707 | 1,320,826 | |
Pepco Holdings, Inc. | 313,266 | 6,387,494 | |
Pinnacle West Capital Corp. | 111,381 | 6,198,353 | |
PNM Resources, Inc. | 88,029 | 2,301,958 | |
Portland General Electric Co. (d) | 105,772 | 3,363,550 | |
PPL Corp. | 688,750 | 22,239,738 | |
Southern Co. | 966,778 | 40,943,048 | |
UIL Holdings Corp. | 67,226 | 2,602,991 | |
Unitil Corp. | 19,695 | 619,999 | |
UNS Energy Corp. | 49,000 | 2,964,990 | |
Westar Energy, Inc. (d) | 158,635 | 5,428,490 | |
Xcel Energy, Inc. | 551,741 | 16,712,235 | |
| 368,159,299 | ||
Gas Utilities - 0.2% | |||
AGL Resources, Inc. | 144,950 | 6,818,448 | |
Atmos Energy Corp. | 111,091 | 5,121,295 | |
Chesapeake Utilities Corp. | 10,363 | 613,904 | |
Delta Natural Gas Co., Inc. | 3,078 | 63,284 | |
Gas Natural, Inc. | 8,386 | 78,493 | |
Laclede Group, Inc. | 39,614 | 1,816,302 | |
National Fuel Gas Co. (d) | 95,902 | 7,204,158 | |
New Jersey Resources Corp. | 42,760 | 1,924,628 | |
Northwest Natural Gas Co. (d) | 34,699 | 1,487,546 | |
ONE Gas, Inc. (a) | 57,154 | 1,942,093 | |
Piedmont Natural Gas Co., Inc. (d) | 100,435 | 3,396,712 | |
Questar Corp. | 223,693 | 5,312,709 | |
South Jersey Industries, Inc. | 34,725 | 1,985,576 | |
Southwest Gas Corp. | 59,138 | 3,194,635 | |
UGI Corp. | 117,609 | 5,255,946 | |
WGL Holdings, Inc. | 56,924 | 2,287,776 | |
| 48,503,505 | ||
Independent Power Producers & Energy Traders - 0.1% | |||
American DG Energy, Inc. (a) | 24,722 | 49,691 | |
Black Hills Corp. | 46,600 | 2,642,686 | |
Calpine Corp. (a) | 397,038 | 7,563,574 | |
Dynegy, Inc. (a)(d) | 119,122 | 2,786,264 | |
NRG Energy, Inc. | 349,560 | 10,161,709 | |
Ormat Technologies, Inc. | 29,840 | 828,060 | |
Pattern Energy Group, Inc. | 12,537 | 343,514 | |
The AES Corp. | 753,024 | 10,278,778 | |
| 34,654,276 | ||
Multi-Utilities - 1.0% | |||
Alliant Energy Corp. | 146,690 | 7,956,466 | |
Ameren Corp. | 265,803 | 10,741,099 | |
Avista Corp. | 75,556 | 2,236,458 | |
CenterPoint Energy, Inc. | 475,745 | 11,251,369 | |
CMS Energy Corp. | 256,908 | 7,303,894 | |
Consolidated Edison, Inc. | 319,943 | 17,932,805 | |
Dominion Resources, Inc. | 648,847 | 45,029,982 | |
DTE Energy Co. | 188,435 | 13,522,096 | |
Integrys Energy Group, Inc. | 96,715 | 5,538,868 | |
Common Stocks - continued | |||
Shares | Value | ||
UTILITIES - continued | |||
Multi-Utilities - continued | |||
MDU Resources Group, Inc. | 236,188 | $ 8,020,944 | |
NiSource, Inc. | 341,808 | 11,901,755 | |
NorthWestern Energy Corp. | 42,329 | 1,944,594 | |
PG&E Corp. | 504,980 | 22,249,419 | |
Public Service Enterprise Group, Inc. | 546,907 | 20,049,611 | |
SCANA Corp. | 162,365 | 8,037,068 | |
Sempra Energy | 251,902 | 23,797,182 | |
TECO Energy, Inc. (d) | 187,457 | 3,145,528 | |
Vectren Corp. | 101,909 | 3,920,439 | |
Wisconsin Energy Corp. | 230,273 | 10,122,801 | |
| 234,702,378 | ||
Water Utilities - 0.1% | |||
American States Water Co. | 52,884 | 1,588,107 | |
American Water Works Co., Inc. | 210,972 | 9,459,984 | |
Aqua America, Inc. | 225,525 | 5,680,975 | |
Artesian Resources Corp. Class A | 8,755 | 190,509 | |
Cadiz, Inc. (a)(d) | 5,759 | 42,962 | |
California Water Service Group | 51,749 | 1,216,619 | |
Connecticut Water Service, Inc. | 5,010 | 164,528 | |
Middlesex Water Co. | 7,054 | 142,561 | |
Pure Cycle Corp. (a) | 17,116 | 107,146 | |
SJW Corp. | 12,324 | 364,667 | |
York Water Co. | 5,248 | 105,852 | |
| 19,063,910 | ||
TOTAL UTILITIES | 705,083,368 | ||
TOTAL COMMON STOCKS (Cost $16,250,440,878) |
| ||
U.S. Treasury Obligations - 0.1% | ||||
| Principal Amount |
| ||
U.S. Treasury Bills, yield at date of purchase 0.07% to 0.09% 4/3/14 to 6/26/14 (e) | $ 15,000,000 |
| ||
Money Market Funds - 9.3% | |||
Shares | Value | ||
Fidelity Cash Central Fund, 0.10% (b) | 281,284,910 | $ 281,284,910 | |
Fidelity Securities Lending Cash Central Fund, 0.09% (b)(c) | 1,931,617,603 | 1,931,617,603 | |
TOTAL MONEY MARKET FUNDS (Cost $2,212,902,513) |
| ||
TOTAL INVESTMENT (Cost $18,478,340,064) | 25,646,628,240 |
NET OTHER ASSETS (LIABILITIES) - (8.1)% | (1,925,167,819) | ||
NET ASSETS - 100% | $ 23,721,460,421 | ||
Futures Contracts | |||||
| Expiration | Underlying | Unrealized Appreciation/ | ||
Purchased | |||||
Equity Index Contracts | |||||
946 CME E-mini S&P 500 Index Contracts (United States) | March 2014 | $ 87,864,480 | $ 3,274,319 | ||
124 CME E-mini S&P MidCap 400 Index Contracts (United States) | March 2014 | 17,040,080 | 1,121,729 | ||
314 CME S&P 500 Index Contracts (United States) | March 2014 | 145,821,600 | 7,197,628 | ||
289 ICE Russell 2000 Index Contracts (United States) | March 2014 | 34,156,910 | 2,331,815 | ||
TOTAL EQUITY INDEX CONTRACTS | $ 284,883,070 | $ 13,925,491 | |||
The face value of futures purchased as a percentage of net assets is 1.2% |
Legend |
(a) Non-income producing |
(b) Affiliated fund that is generally available only to investment companies and other accounts managed by Fidelity Investments. The rate quoted is the annualized seven-day yield of the fund at period end. A complete unaudited listing of the fund's holdings as of its most recent quarter end is available upon request. In addition, each Fidelity Central Fund's financial statements, which are not covered by the Fund's Report of Independent Registered Public Accounting Firm, are available on the SEC's website or upon request. |
(c) Investment made with cash collateral received from securities on loan. |
(d) Security or a portion of the security is on loan at period end. |
(e) Security or a portion of the security was pledged to cover margin requirements for futures contracts. At period end, the value of securities pledged amounted to $14,997,994. |
Affiliated Central Funds |
Information regarding fiscal year to date income earned by the Fund from investments in Fidelity Central Funds is as follows: |
Fund | Income earned |
Fidelity Cash Central Fund | $ 320,160 |
Fidelity Securities Lending Cash Central Fund | 6,971,619 |
Total | $ 7,291,779 |
Other Information |
The following is a summary of the inputs used, as of February 28, 2014, involving the Fund's assets and liabilities carried at fair value. The inputs or methodology used for valuing securities may not be an indication of the risk associated with investing in those securities. For more information on valuation inputs, and their aggregation into the levels used in the table below, please refer to the Investment Valuation section in the accompanying Notes to Financial Statements. |
Valuation Inputs at Reporting Date: | ||||
Description | Total | Level 1 | Level 2 | Level 3 |
Investments in Securities: | ||||
Equities: | ||||
Consumer Discretionary | $ 3,081,633,533 | $ 3,081,623,672 | $ - | $ 9,861 |
Consumer Staples | 1,930,067,396 | 1,930,067,396 | - | - |
Energy | 2,163,926,777 | 2,163,920,056 | - | 6,721 |
Financials | 3,994,753,449 | 3,994,750,004 | - | 3,445 |
Health Care | 3,116,256,118 | 3,116,256,118 | - | - |
Industrials | 2,710,890,293 | 2,710,890,293 | - | - |
Information Technology | 4,275,324,769 | 4,275,324,769 | - | - |
Materials | 908,060,069 | 908,060,069 | - | - |
Telecommunication Services | 532,731,961 | 532,731,961 | - | - |
Utilities | 705,083,368 | 705,083,368 | - | - |
U.S. Government and Government Agency Obligations | 14,997,994 | - | 14,997,994 | - |
Money Market Funds | 2,212,902,513 | 2,212,902,513 | - | - |
Total Investments in Securities: | $ 25,646,628,240 | $ 25,631,610,219 | $ 14,997,994 | $ 20,027 |
Derivative Instruments: | ||||
Assets | ||||
Futures Contracts | $ 13,925,491 | $ 13,925,491 | $ - | $ - |
Value of Derivative Instruments |
The following table is a summary of the Fund's value of derivative instruments by primary risk exposure as of February 28, 2014. For additional information on derivative instruments, please refer to the Derivative Instruments section in the accompanying Notes to Financial Statements. |
Primary Risk Exposure / | Value | |
| Asset | Liability |
Equity Risk | ||
Futures Contracts (a) | $ 13,925,491 | $ - |
Total Value of Derivatives | $ 13,925,491 | $ - |
(a) Reflects gross cumulative appreciation (depreciation) on futures contracts as presented in the Schedule of Investments. Only the period end receivable or payable for daily variation margin and net unrealized appreciation (depreciation) are presented in the Statement of Assets and Liabilities. |
See accompanying notes which are an integral part of the financial statements.
Annual Report
Spartan Total Market Index Fund
Financial Statements
Statement of Assets and Liabilities
| February 28, 2014 | |
|
|
|
Assets | ||
Investment in securities, at value (including securities loaned of $1,873,697,915) - See accompanying schedule: Unaffiliated issuers (cost $16,265,437,551) | $ 23,433,725,727 |
|
Fidelity Central Funds (cost $2,212,902,513) | 2,212,902,513 |
|
Total Investments (cost $18,478,340,064) |
| $ 25,646,628,240 |
Segregated cash with brokers for derivative instruments | 1,466,500 | |
Cash |
| 43,426 |
Receivable for investments sold | 1,586,542 | |
Receivable for fund shares sold | 20,376,252 | |
Dividends receivable | 44,826,154 | |
Distributions receivable from Fidelity Central Funds | 606,198 | |
Receivable for daily variation margin for derivative instruments | 416,694 | |
Receivable from investment adviser for expense reductions | 165,649 | |
Other receivables | 269,138 | |
Total assets | 25,716,384,793 | |
|
|
|
Liabilities | ||
Payable for investments purchased | $ 2,075,242 | |
Payable for fund shares redeemed | 59,692,620 | |
Accrued management fee | 863,747 | |
Other affiliated payables | 411,813 | |
Other payables and accrued expenses | 263,347 | |
Collateral on securities loaned, at value | 1,931,617,603 | |
Total liabilities | 1,994,924,372 | |
|
|
|
Net Assets | $ 23,721,460,421 | |
Net Assets consist of: |
| |
Paid in capital | $ 16,762,706,991 | |
Undistributed net investment income | 64,203,855 | |
Accumulated undistributed net realized gain (loss) on investments | (287,664,092) | |
Net unrealized appreciation (depreciation) on investments | 7,182,213,667 | |
Net Assets | $ 23,721,460,421 | |
Statement of Assets and Liabilities - continued
| February 28, 2014 | |
|
|
|
Investor Class: | $ 54.91 | |
|
|
|
Fidelity Advantage Class: | $ 54.91 | |
|
|
|
Institutional Class: | $ 54.91 | |
|
|
|
Fidelity Advantage Institutional Class: | $ 54.90 | |
|
|
|
Class F: | $ 54.92 | |
See accompanying notes which are an integral part of the financial statements.
Annual Report
Spartan Total Market Index Fund
Financial Statements - continued
Statement of Operations
| Year ended February 28, 2014 | |
|
|
|
Investment Income |
|
|
Dividends |
| $ 371,829,732 |
Interest |
| 13,401 |
Income from Fidelity Central Funds |
| 7,291,779 |
Total income |
| 379,134,912 |
|
|
|
Expenses | ||
Management fee | $ 8,782,815 | |
Transfer agent fees | 4,332,747 | |
Independent trustees' compensation | 91,991 | |
Miscellaneous | 35,669 | |
Total expenses before reductions | 13,243,222 | |
Expense reductions | (1,661,728) | 11,581,494 |
Net investment income (loss) | 367,553,418 | |
Realized and Unrealized Gain (Loss) Net realized gain (loss) on: | ||
Investment securities: |
|
|
Unaffiliated issuers | 32,936,630 | |
Futures contracts | 61,726,820 | |
Total net realized gain (loss) |
| 94,663,450 |
Change in net unrealized appreciation (depreciation) on: Investment securities | 4,092,286,619 | |
Futures contracts | 1,481,401 | |
Total change in net unrealized appreciation (depreciation) |
| 4,093,768,020 |
Net gain (loss) | 4,188,431,470 | |
Net increase (decrease) in net assets resulting from operations | $ 4,555,984,888 | |
Statement of Changes in Net Assets
| Year ended | Year ended |
Increase (Decrease) in Net Assets |
|
|
Operations |
|
|
Net investment income (loss) | $ 367,553,418 | $ 296,694,580 |
Net realized gain (loss) | 94,663,450 | 79,867,728 |
Change in net unrealized appreciation (depreciation) | 4,093,768,020 | 1,452,200,750 |
Net increase (decrease) in net assets resulting from operations | 4,555,984,888 | 1,828,763,058 |
Distributions to shareholders from net investment income | (333,228,634) | (264,325,861) |
Share transactions - net increase (decrease) | 3,674,586,365 | 1,964,414,886 |
Redemption fees | 409,245 | 275,392 |
Total increase (decrease) in net assets | 7,897,751,864 | 3,529,127,475 |
|
|
|
Net Assets | ||
Beginning of period | 15,823,708,557 | 12,294,581,082 |
End of period (including undistributed net investment income of $64,203,855 and undistributed net investment income of $46,240,356, respectively) | $ 23,721,460,421 | $ 15,823,708,557 |
See accompanying notes which are an integral part of the financial statements.
Annual Report
Financial Highlights - Investor Class
Years ended February 28, | 2014 | 2013 | 2012 F | 2011 | 2010 |
Selected Per-Share Data |
|
|
|
|
|
Net asset value, beginning of period | $ 44.05 | $ 39.55 | $ 38.56 | $ 31.54 | $ 20.60 |
Income from Investment Operations |
|
|
|
|
|
Net investment income (loss) B | .92 | .87 | .68 | .61 | .56 |
Net realized and unrealized gain (loss) | 10.74 | 4.40 | .96 | 7.03 | 10.96 |
Total from investment operations | 11.66 | 5.27 | 1.64 | 7.64 | 11.52 |
Distributions from net investment income | (.80) | (.77) | (.65) | (.60) | (.57) |
Distributions from net realized gain | - | - | - | (.02 | (.02) |
Total distributions | (.80) | (.77) | (.65) | (.62) | (.58) H |
Redemption fees added to paid in capital B, G | - | - | - | - | - |
Net asset value, end of period | $ 54.91 | $ 44.05 | $ 39.55 | $ 38.56 | $ 31.54 |
Total Return A | 26.62% | 13.50% | 4.46% | 24.39% | 56.10% |
Ratios to Average Net Assets C, E |
|
|
|
|
|
Expenses before reductions | .10% | .10% | .10% | .10% | .10% |
Expenses net of fee waivers, if any | .10% | .10% | .10% | .10% | .10% |
Expenses net of all reductions | .10% | .10% | .10% | .10% | .10% |
Net investment income (loss) | 1.85% | 2.15% | 1.84% | 1.80% | 2.00% |
Supplemental Data |
|
|
|
|
|
Net assets, end of period (000 omitted) | $ 1,694,212 | $ 1,305,435 | $ 3,379,770 | $ 6,289,666 | $ 5,357,908 |
Portfolio turnover rate D | 2% | 3% | 17% | 4% | 7% |
ATotal returns would have been lower if certain expenses had not been reduced during the applicable periods shown. BCalculated based on average shares outstanding during the period. CFees and expenses of any underlying Fidelity Central Funds are not included in the Fund's expense ratio. The Fund indirectly bears its proportionate share of the expenses of any underlying Fidelity Central Funds. DAmount does not include the portfolio activity of any underlying Fidelity Central Funds. EExpense ratios reflect operating expenses of the class. Expenses before reductions do not reflect amounts reimbursed by the investment adviser or reductions from expense offset arrangements and do not represent the amount paid by the class during periods when reimbursements or reductions occur. Expenses net of fee waivers reflect expenses after reimbursement by the investment adviser but prior to reductions from expense offset arrangements. Expenses net of all reductions represent the net expenses paid by the class. FFor the year ended February 29. GAmount represents less than $.01 per share. HTotal distributions of $.58 per share is comprised of distributions from net investment income of $.565 and distributions from net realized gain of $.015 per share. |
Financial Highlights - Fidelity Advantage Class
Years ended February 28, | 2014 | 2013 | 2012 F | 2011 | 2010 |
Selected Per-Share Data |
|
|
|
|
|
Net asset value, beginning of period | $ 44.06 | $ 39.56 | $ 38.56 | $ 31.54 | $ 20.61 |
Income from Investment Operations |
|
|
|
|
|
Net investment income (loss) B | .94 | .89 | .69 | .62 | .57 |
Net realized and unrealized gain (loss) | 10.73 | 4.39 | .97 | 7.03 | 10.95 |
Total from investment operations | 11.67 | 5.28 | 1.66 | 7.65 | 11.52 |
Distributions from net investment income | (.82) | (.78) | (.66) | (.61) | (.57) |
Distributions from net realized gain | - | - | - | (.02) | (.02) |
Total distributions | (.82) | (.78) | (.66) | (.63) | (.59) H |
Redemption fees added to paid in capital B, G | - | - | - | - | - |
Net asset value, end of period | $ 54.91 | $ 44.06 | $ 39.56 | $ 38.56 | $ 31.54 |
Total Return A | 26.65% | 13.53% | 4.51% | 24.43% | 56.07% |
Ratios to Average Net Assets C, E |
|
|
|
|
|
Expenses before reductions | .07% | .07% | .07% | .07% | .07% |
Expenses net of fee waivers, if any | .06% | .07% | .07% | .07% | .07% |
Expenses net of all reductions | .06% | .07% | .07% | .07% | .07% |
Net investment income (loss) | 1.89% | 2.18% | 1.87% | 1.83% | 2.03% |
Supplemental Data |
|
|
|
|
|
Net assets, end of period (000 omitted) | $ 14,943,835 | $ 10,262,592 | $ 6,536,903 | $ 5,078,759 | $ 3,752,204 |
Portfolio turnover rate D | 2% | 3% | 17% | 4% | 7% |
ATotal returns would have been lower if certain expenses had not been reduced during the applicable periods shown. BCalculated based on average shares outstanding during the period. CFees and expenses of any underlying Fidelity Central Funds are not included in the Fund's expense ratio. The Fund indirectly bears its proportionate share of the expenses of any underlying Fidelity Central Funds. DAmount does not include the portfolio activity of any underlying Fidelity Central Funds. EExpense ratios reflect operating expenses of the class. Expenses before reductions do not reflect amounts reimbursed by the investment adviser or reductions from expense offset arrangements and do not represent the amount paid by the class during periods when reimbursements or reductions occur. Expenses net of fee waivers reflect expenses after reimbursement by the investment adviser but prior to reductions from expense offset arrangements. Expenses net of all reductions represent the net expenses paid by the class. FFor the year ended February 29. GAmount represents less than $.01 per share. HTotal distributions of $.59 per share is comprised of distributions from net investment income of $.574 and distributions from net realized gain of $.015 per share. |
See accompanying notes which are an integral part of the financial statements.
Annual Report
Financial Highlights - Institutional Class
Years ended February 28, | 2014 | 2013 | 2012 G, I |
Selected Per-Share Data |
|
|
|
Net asset value, beginning of period | $ 44.05 | $ 39.55 | $ 34.49 |
Income from Investment Operations |
|
|
|
Net investment income (loss) D | .94 | .89 | .36 |
Net realized and unrealized gain (loss) | 10.75 | 4.40 | 5.26 |
Total from investment operations | 11.69 | 5.29 | 5.62 |
Distributions from net investment income | (.83) | (.79) | (.56) |
Redemption fees added to paid in capital D, J | - | - | - |
Net asset value, end of period | $ 54.91 | $ 44.05 | $ 39.55 |
Total Return B, C | 26.69% | 13.55% | 16.49% |
Ratios to Average Net Assets E, H |
|
|
|
Expenses before reductions | .07% | .07% | .07% A |
Expenses net of fee waivers, if any | .05% | .06% | .06% A |
Expenses net of all reductions | .05% | .06% | .06% A |
Net investment income (loss) | 1.90% | 2.19% | 2.03% A |
Supplemental Data |
|
|
|
Net assets, end of period (000 omitted) | $ 1,254,047 | $ 876,155 | $ 693,534 |
Portfolio turnover rate F | 2% | 3% | 17% K |
AAnnualized BTotal returns for periods of less than one year are not annualized. CTotal returns would have been lower if certain expenses had not been reduced during the applicable periods shown. DCalculated based on average shares outstanding during the period. EFees and expenses of any underlying Fidelity Central Funds are not included in the Fund's expense ratio. The Fund indirectly bears its proportionate share of the expenses of any underlying Fidelity Central Funds. FAmount does not include the portfolio activity of any underlying Fidelity Central Funds. GFor the period September 8, 2011 (commencement of sale of shares) to February 29, 2012. HExpense ratios reflect operating expenses of the class. Expenses before reductions do not reflect amounts reimbursed by the investment adviser or reductions from expense offset arrangements and do not represent the amount paid by the class during periods when reimbursements or reductions occur. Expense ratios before reductions for start-up periods may not be representative of longer-term operating periods. Expenses net of fee waivers reflect expenses after reimbursement by the investment adviser but prior to reductions from expense offset arrangements. Expenses net of all reductions represent the net expenses paid by the class. IFor the year ended February 29. JAmount represents less than $.01 per share. KAmount not annualized. |
Financial Highlights - Fidelity Advantage Institutional Class
Years ended February 28, | 2014 | 2013 | 2012 G, I |
Selected Per-Share Data |
|
|
|
Net asset value, beginning of period | $ 44.05 | $ 39.55 | $ 34.49 |
Income from Investment Operations |
|
|
|
Net investment income (loss) D | .95 | .90 | .36 |
Net realized and unrealized gain (loss) | 10.73 | 4.39 | 5.26 |
Total from investment operations | 11.68 | 5.29 | 5.62 |
Distributions from net investment income | (.83) | (.79) | (.56) |
Redemption fees added to paid in capital D, J | - | - | - |
Net asset value, end of period | $ 54.90 | $ 44.05 | $ 39.55 |
Total Return B, C | 26.67% | 13.57% | 16.50% |
Ratios to Average Net Assets E, H |
|
|
|
Expenses before reductions | .06% | .06% | .06% A |
Expenses net of fee waivers, if any | .05% L | .05% L | .05% A, L |
Expenses net of all reductions | .05% L | .05% L | .05% A, L |
Net investment income (loss) | 1.90% | 2.20% | 2.02% A |
Supplemental Data |
|
|
|
Net assets, end of period (000 omitted) | $ 740,877 | $ 546,329 | $ 189,758 |
Portfolio turnover rate F | 2% | 3% | 17% K |
AAnnualized BTotal returns for periods of less than one year are not annualized. CTotal returns would have been lower if certain expenses had not been reduced during the applicable periods shown. DCalculated based on average shares outstanding during the period. EFees and expenses of any underlying Fidelity Central Funds are not included in the Fund's expense ratio. The Fund indirectly bears its proportionate share of the expenses of any underlying Fidelity Central Funds. FAmount does not include the portfolio activity of any underlying Fidelity Central Funds. GFor the period September 8, 2011 (commencement of sale of shares) to February 29, 2012. HExpense ratios reflect operating expenses of the class. Expenses before reductions do not reflect amounts reimbursed by the investment adviser or reductions from expense offset arrangements and do not represent the amount paid by the class during periods when reimbursements or reductions occur. Expense ratios before reductions for start-up periods may not be representative of longer-term operating periods. Expenses net of fee waivers reflect expenses after reimbursement by the investment adviser but prior to reductions from expense offset arrangements. Expenses net of all reductions represent the net expenses paid by the class. IFor the year ended February 29. JAmount represents less than $.01 per share. KAmount not annualized. LAmount represents .045%. |
See accompanying notes which are an integral part of the financial statements.
Annual Report
Financial Highlights - Class F
Years ended February 28, | 2014 | 2013 | 2012 I | 2011 | 2010 G |
Selected Per-Share Data |
|
|
|
|
|
Net asset value, beginning of period | $ 44.06 | $ 39.56 | $ 38.56 | $ 31.54 | $ 30.10 |
Income from Investment Operations |
|
|
|
|
|
Net investment income (loss) D | .95 | .90 | .69 | .63 | .26 |
Net realized and unrealized gain (loss) | 10.74 | 4.39 | .97 | 7.02 | 1.67 |
Total from investment operations | 11.69 | 5.29 | 1.66 | 7.65 | 1.93 |
Distributions from net investment income | (.83) | (.79) | (.66) | (.61) | (.47) |
Distributions from net realized gain | - | - | - | (.02) | (.02) |
Total distributions | (.83) | (.79) | (.66) | (.63) | (.49) K |
Redemption fees added to paid in capital D, J | - | - | - | - | - |
Net asset value, end of period | $ 54.92 | $ 44.06 | $ 39.56 | $ 38.56 | $ 31.54 |
Total Return B, C | 26.69% | 13.55% | 4.51% | 24.43% | 6.42% |
Ratios to Average Net Assets E, H |
|
|
|
|
|
Expenses before reductions | .05% L | .05% L | .06% | .07% | .07% A |
Expenses net of fee waivers, if any | .05% L | .05% L | .06% | .07% | .07% A |
Expenses net of all reductions | .05% L | .05% L | .06% | .07% | .07% A |
Net investment income (loss) | 1.90% | 2.20% | 1.89% | 1.83% | 1.98% |
Supplemental Data |
|
|
|
|
|
Net assets, end of period (000 omitted) | $ 5,088,489 | $ 2,833,198 | $ 1,494,616 | $ 745,283 | $ 70,077 |
Portfolio turnover rate F | 2% | 3% | 17% | 4% | 7% |
AAnnualized BTotal returns for periods of less than one year are not annualized. CTotal returns would have been lower if certain expenses had not been reduced during the applicable periods shown. DCalculated based on average shares outstanding during the period. EFees and expenses of any underlying Fidelity Central Funds are not included in the Fund's expense ratio. The Fund indirectly bears its proportionate share of the expenses of any underlying Fidelity Central Funds. FAmount does not include the portfolio activity of any underlying Fidelity Central Funds. GFor the period September 24, 2009 (commencement of sale of shares) to February 28, 2010. HExpense ratios reflect operating expenses of the class. Expenses before reductions do not reflect amounts reimbursed by the investment adviser or reductions from expense offset arrangements and do not represent the amount paid by the class during periods when reimbursements or reductions occur. Expense ratios before reductions for start-up periods may not be representative of longer-term operating periods. Expenses net of fee waivers reflect expenses after reimbursement by the investment adviser but prior to reductions from expense offset arrangements. Expenses net of all reductions represent the net expenses paid by the class. IFor the year ended February 29. JAmount represents less than $.01 per share. KTotal distributions of $.49 per share is comprised of distributions from net investment income of $.472 and distributions from net realized gain of $.015 per share. LAmount represents .046%. |
See accompanying notes which are an integral part of the financial statements.
Annual Report
Notes to Financial Statements
For the period ended February 28, 2014
1. Organization.
Spartan Total Market Index Fund (the Fund) is a fund of Fidelity Concord Street Trust (the Trust) and is authorized to issue an unlimited number of shares. The Trust is registered under the Investment Company Act of 1940, as amended (the 1940 Act), as an open-end management investment company organized as a Massachusetts business trust. The Fund offers Investor Class, Fidelity Advantage Class, Institutional Class, Fidelity Advantage Institutional Class and Class F shares, each of which has equal rights as to assets and voting privileges. Each class has exclusive voting rights with respect to matters that affect that class. The Fund offers conversion privileges between share classes to eligible shareholders. Class F shares of the Fund are only available for purchase by mutual funds for which Fidelity Management & Research Company (FMR) or an affiliate serves as investment manager.
2. Investments in Fidelity Central Funds.
The Fund invests in Fidelity Central Funds, which are open-end investment companies generally available only to other investment companies and accounts managed by the investment adviser and its affiliates. The Fund's Schedule of Investments lists each of the Fidelity Central Funds held as of period end, if any, as an investment of the Fund, but does not include the underlying holdings of each Fidelity Central Fund. As an Investing Fund, the Fund indirectly bears its proportionate share of the expenses of the underlying Fidelity Central Funds.
The Money Market Central Funds seek preservation of capital and current income and are managed by Fidelity Investments Money Management, Inc. (FIMM), an affiliate of the investment adviser. Annualized expenses of the Money Market Central Funds as of their most recent shareholder report date are less than .01%.
A complete unaudited list of holdings for each Fidelity Central Fund is available upon request or at the Securities and Exchange Commission (the SEC) website at www.sec.gov. In addition, the financial statements of the Fidelity Central Funds, which are not covered by the Fund's Report of Independent Registered Public Accounting Firm, are available on the SEC website or upon request.
3. Significant Accounting Policies.
The financial statements have been prepared in conformity with accounting principles generally accepted in the United States of America (GAAP), which require management to make certain estimates and assumptions at the date of the financial statements. Actual results could differ from those estimates. Subsequent events, if any, through the date that the financial statements were issued have been evaluated in the preparation of the financial statements. The following summarizes the significant accounting policies of the Fund:
Investment Valuation. Investments are valued as of 4:00 p.m. Eastern time on the last calendar day of the period. In accordance with valuation policies and procedures approved by the Board of Trustees (the Board), the Fund attempts to obtain prices from one or more third party pricing vendors or brokers to value its investments. When current market prices, quotations or currency exchange rates are not readily available or reliable, investments will be fair valued in good faith by the FMR Fair Value Committee (the Committee), in accordance with procedures adopted by the Board. Factors used in determining fair value vary by investment type and may include market or investment specific events, changes in interest rates and credit quality. The frequency with which these procedures are used cannot be predicted and they may be utilized to a significant extent. The Committee oversees the Fund's valuation policies and procedures and is responsible for approving and reporting to the Board all fair value determinations.
The Fund categorizes the inputs to valuation techniques used to value its investments into a disclosure hierarchy consisting of three levels as shown below:
Level 1 - quoted prices in active markets for identical investments
Level 2 - other significant observable inputs (including quoted prices for similar investments, interest rates, prepayment speeds, etc.)
Level 3 - unobservable inputs (including the Fund's own assumptions based on the best information available)
Valuation techniques used to value the Fund's investments by major category are as follows:
Equity securities, including restricted securities, for which market quotations are readily available, are valued at the last reported sale price or official closing price as reported by a third party pricing vendor on the primary market or exchange on which they are traded and are categorized as Level 1 in the hierarchy. In the event there were no sales during the day or closing prices are not available, securities are valued at the last quoted bid price or may be valued using the last available price and are generally categorized as Level 2 in the hierarchy. For foreign equity securities, when market or security specific events arise, comparisons to the valuation of American Depositary Receipts (ADRs), futures contracts, Exchange-Traded Funds (ETFs) and certain indexes as well as quoted prices for similar securities may be used and would be categorized as Level 2 in the hierarchy. Utilizing these techniques may result in transfers between Level 1 and Level 2. For equity securities, including restricted securities, where observable inputs are limited, assumptions about market activity and risk are used and these securities may be categorized as Level 3 in the hierarchy.
Annual Report
3. Significant Accounting Policies - continued
Investment Valuation - continued
Debt securities, including restricted securities, are valued based on evaluated prices received from third party pricing vendors or from brokers who make markets in such securities. U.S. government and government agency obligations are valued by pricing vendors who utilize matrix pricing which considers yield or price of bonds of comparable quality, coupon, maturity and type or by broker-supplied prices. When independent prices are unavailable or unreliable, debt securities may be valued utilizing pricing methodologies which consider similar factors that would be used by third party pricing vendors. Debt securities are generally categorized as Level 2 in the hierarchy but may be Level 3 depending on the circumstances.
Futures contracts are valued at the settlement price established each day by the board of trade or exchange on which they are traded and are categorized as Level 1 in the hierarchy. Investments in open-end mutual funds, including the Fidelity Central Funds, are valued at their closing net asset value (NAV) each business day and are categorized as Level 1 in the hierarchy.
Changes in valuation techniques may result in transfers in or out of an assigned level within the disclosure hierarchy. The aggregate value of investments by input level, as of February 28, 2014, is included at the end of the Fund's Schedule of Investments.
Investment Transactions and Income. For financial reporting purposes, the Fund's investment holdings and NAV include trades executed through the end of the last business day of the period. The NAV per share for processing shareholder transactions is calculated as of the close of business of the New York Stock Exchange (NYSE), normally 4:00 p.m. Eastern time and includes trades executed through the end of the prior business day. Gains and losses on securities sold are determined on the basis of identified cost and may include proceeds received from litigation. Dividend income is recorded on the ex-dividend date, except for certain dividends from foreign securities where the ex-dividend date may have passed, which are recorded as soon as the Fund is informed of the ex-dividend date. Non-cash dividends included in dividend income, if any, are recorded at the fair market value of the securities received. Distributions received on securities that represent a return of capital or capital gain are recorded as a reduction of cost of investments and/or as a realized gain. Subsequent to ex-dividend date the Fund determines the components of these distributions, based upon receipt of tax filings or other correspondence relating to the underlying investment. Interest income and distributions from the Fidelity Central Funds are accrued as earned. Interest income includes coupon interest and amortization of premium and accretion of discount on debt securities.
Class Allocations and Expenses. Investment income, realized and unrealized capital gains and losses, common expenses of the Fund, and certain fund-level expense reductions, if any, are allocated daily on a pro-rata basis to each class based on the relative net assets of each class to the total net assets of the Fund. Each class differs with respect to transfer agent fees incurred. Certain expense reductions may also differ by class. For the reporting period, the allocated portion of income and expenses to each class as a percent of its average net assets may vary due to the timing of recording these transactions in relation to fluctuating net assets of the classes. Expenses directly attributable to a fund are charged to that fund. Expenses attributable to more than one fund are allocated among the respective funds on the basis of relative net assets or other appropriate methods. Expense estimates are accrued in the period to which they relate and adjustments are made when actual amounts are known.
Deferred Trustee Compensation. Under a Deferred Compensation Plan (the Plan), independent Trustees may elect to defer receipt of a portion of their annual compensation. Deferred amounts are invested in a cross-section of Fidelity funds, are marked-to-market and remain in the Fund until distributed in accordance with the Plan. The investment of deferred amounts and the offsetting payable to the Trustees are included in the accompanying Statement of Assets and Liabilities.
Income Tax Information and Distributions to Shareholders. Each year, the Fund intends to qualify as a regulated investment company under Subchapter M of the Internal Revenue Code, including distributing substantially all of its taxable income and realized gains. As a result, no provision for U.S. Federal income taxes is required. As of February 28, 2014, the Fund did not have any unrecognized tax benefits in the financial statements; nor is the Fund aware of any tax positions for which it is reasonably possible that the total amounts of unrecognized tax benefits will significantly change in the next twelve months. The Fund files a U.S. federal tax return, in addition to state and local tax returns as required. The Fund's federal income tax returns are subject to examination by the Internal Revenue Service (IRS) for a period of three fiscal years after they are filed. State and local tax returns may be subject to examination for an additional fiscal year depending on the jurisdiction.
Distributions are declared and recorded on the ex-dividend date. Income dividends and capital gain distributions are declared separately for each class. Income and capital gain distributions are determined in accordance with income tax regulations, which may differ from GAAP. In addition, the Fund claimed a portion of the payment made to redeeming shareholders as a distribution for income tax purposes.
Capital accounts within the financial statements are adjusted for permanent book-tax differences. These adjustments have no impact on net assets or the results of operations. Capital accounts are not adjusted for temporary book-tax differences which will reverse in a subsequent period.
Book-tax differences are primarily due to futures contracts, passive foreign investment companies (PFIC), market discount, partnerships, deferred trustees compensation, capital loss carryforwards and losses deferred due to wash sales.
Annual Report
Notes to Financial Statements - continued
3. Significant Accounting Policies - continued
Income Tax Information and Distributions to Shareholders - continued
The federal tax cost of investment securities and unrealized appreciation (depreciation) as of period end were as follows:
Gross unrealized appreciation | $ 8,072,503,089 |
Gross unrealized depreciation | (970,747,070) |
Net unrealized appreciation (depreciation) on securities and other investments | $ 7,101,756,019 |
|
|
Tax Cost | $ 18,544,872,221 |
The tax-based components of distributable earnings as of period end were as follows:
Undistributed ordinary income | $ 64,467,196 |
Capital loss carryforward | $ (207,206,435) |
Net unrealized appreciation (depreciation) | $ 7,101,756,019 |
Capital loss carryforwards are only available to offset future capital gains of the Fund to the extent provided by regulations and may be limited. Under the Regulated Investment Company Modernization Act of 2010 (the Act), the Fund is permitted to carry forward capital losses incurred in taxable years beginning after December 22, 2010 for an unlimited period and such capital losses are required to be used prior to any losses that expire. The capital loss carryforward information presented below, including any applicable limitation, is estimated as of fiscal period end and is subject to adjustment.
Fiscal year of expiration |
|
2018 | $ (6,920,192) |
2019 | (200,286,243) |
Total with expiration | $ (207,206,435) |
The tax character of distributions paid was as follows:
| February 28, 2014 | February 28, 2013 |
Ordinary Income | $ 333,228,634 | $ 264,325,861 |
Short-Term Trading (Redemption) Fees. Shares held by investors in the Fund less than 90 days may have been subject to a redemption fee equal to .50% of the NAV of shares redeemed. All redemption fees, which reduce the proceeds of the shareholder redemption, are retained by the Fund and accounted for as an addition to paid in capital.
4. Derivative Instruments.
Risk Exposures and the Use of Derivative Instruments. The Fund's investment objective allows the Fund to enter into various types of derivative contracts, including futures contracts. Derivatives are investments whose value is primarily derived from underlying assets, indices or reference rates and may be transacted on an exchange or over-the-counter (OTC). Derivatives may involve a future commitment to buy or sell a specified asset based on specified terms, to exchange future cash flows at periodic intervals based on a notional principal amount, or for one party to make one or more payments upon the occurrence of specified events in exchange for periodic payments from the other party.
The Fund used derivatives to increase returns and to manage exposure to certain risks as defined below. The success of any strategy involving derivatives depends on analysis of numerous economic factors, and if the strategies for investment do not work as intended, the Fund may not achieve its objectives.
The Fund's use of derivatives increased or decreased its exposure to the following risk:
Equity Risk | Equity risk relates to the fluctuations in the value of financial instruments as a result of changes in market prices (other than those arising from interest rate risk or foreign exchange risk), whether caused by factors specific to an individual investment, its issuer, or all factors affecting all instruments traded in a market or market segment.
|
Annual Report
4. Derivative Instruments - continued
Risk Exposures and the Use of Derivative Instruments - continued
The Fund is also exposed to additional risks from investing in derivatives, such as liquidity risk and counterparty credit risk. Liquidity risk is the risk that the Fund will be unable to close out the derivative in the open market in a timely manner. Counterparty credit risk is the risk that the counterparty will not be able to fulfill its obligation to the Fund. Counterparty credit risk related to exchange-traded futures contracts may be mitigated by the protection provided by the exchange on which they trade.
Investing in derivatives may involve greater risks than investing in the underlying assets directly and, to varying degrees, may involve risk of loss in excess of any initial investment and collateral received and amounts recognized in the Statement of Assets and Liabilities. In addition, there may be the risk that the change in value of the derivative contract does not correspond to the change in value of the underlying instrument.
Futures Contracts. A futures contract is an agreement between two parties to buy or sell a specified underlying instrument for a fixed price at a specified future date. The Fund used futures contracts to manage its exposure to the stock market.
Upon entering into a futures contract, a fund is required to deposit either cash or securities (initial margin) with a clearing broker in an amount equal to a certain percentage of the face value of the contract. Futures contracts are marked-to-market daily and subsequent daily payments (variation margin) are made or received by a fund depending on the daily fluctuations in the value of the futures contracts and are recorded as unrealized appreciation or (depreciation). This receivable and/or payable, if any, is included in daily variation margin for derivative instruments in the Statement of Assets and Liabilities. Realized gain or (loss) is recorded upon the expiration or closing of a futures contract.
Any open futures contracts at period end are presented in the Schedule of Investments under the caption "Futures Contracts." The underlying face amount at value reflects each contract's exposure to the underlying instrument or index at period end and is representative of volume of activity during the period. Securities deposited to meet initial margin requirements are identified in the Schedule of Investments. Cash deposited to meet initial margin requirements is presented as segregated cash with brokers for derivative instruments in the Statement of Assets and Liabilities.
During the period the Fund recognized net realized gain (loss) of $61,726,820 and a change in net unrealized appreciation (depreciation) of $1,481,401 related to its investment in futures contracts. These amounts are included in the Statement of Operations.
5. Purchases and Sales of Investments.
Purchases and sales of securities, other than short-term securities, aggregated $4,118,323,342 and $426,916,601, respectively.
6. Fees and Other Transactions with Affiliates.
Management Fee and Expense Contract. Fidelity Management & Research Company (FMR) (the investment adviser) and its affiliates provide the Fund with investment management related services for which the Fund pays a monthly management fee. The management fee is based on an annual rate of .045% of the Fund's average net assets. Under the management contract, the investment adviser pays all other fund-level expenses, except the compensation of the independent Trustees and certain other expenses such as interest expense, including commitment fees.
In addition, under an expense contract, the investment adviser pays class-level expenses as necessary so that the total expenses do not exceed certain amounts of each class' average net assets on an annual basis with certain exceptions, as noted in the following table:
Investor Class | .10% |
Fidelity Advantage Class | .07% |
Institutional Class | .07% |
Fidelity Advantage Institutional Class | .06% |
Sub-Adviser. Geode Capital Management, LLC (Geode), serves as sub-adviser for the Funds. Geode provides discretionary investment advisory services to the Funds and is paid by the investment adviser for providing these services.
Transfer Agent Fees. Fidelity Investments Institutional Operations Company, Inc. (FIIOC), an affiliate of the investment adviser, is the transfer, dividend disbursing and shareholder servicing agent for each class. FIIOC receives transfer agent fees at an annual rate of .075%, .045%, .035% and ..015% of average net assets for Investor Class, Fidelity Advantage Class, Institutional Class and Fidelity Advantage Institutional Class, respectively. FIIOC receives no fees for providing transfer agency services to Class F. FIIOC pays for typesetting, printing and mailing of shareholder reports, except proxy statements.
Annual Report
Notes to Financial Statements - continued
6. Fees and Other Transactions with Affiliates - continued
Transfer Agent Fees - continued
Under the expense contract, Investor Class, Fidelity Advantage Class, Institutional Class and Fidelity Advantage Institutional Class pay all or a portion of the transfer agent fees at an annual rate of .055%, .025%, .025% and .015% of average net assets, respectively.
For the period, the total transfer agent fees paid by each applicable class were as follows:
| Amount |
Investor Class | $ 825,264 |
Fidelity Advantage Class | 3,145,998 |
Institutional Class | 258,718 |
Fidelity Advantage Institutional Class | 102,767 |
| $ 4,332,747 |
7. Committed Line of Credit.
The Fund participates with other funds managed by the investment adviser or an affiliate in a $4.25 billion credit facility (the "line of credit") to be utilized for temporary or emergency purposes to fund shareholder redemptions or for other short-term liquidity purposes. The Fund has agreed to pay commitment fees on its pro-rata portion of the line of credit, which amounted to $35,669 and is reflected in Miscellaneous expenses on the Statement of Operations. During the period, there were no borrowings on this line of credit.
8. Security Lending.
The Fund lends portfolio securities through a lending agent from time to time in order to earn additional income. On the settlement date of the loan, the Fund receives collateral (in the form of U.S. Treasury obligations, letters of credit and/or cash) against the loaned securities and maintains collateral in an amount not less than 100% of the market value of the loaned securities during the period of the loan. The market value of the loaned securities is determined at the close of business of the Fund and any additional required collateral is delivered to the Fund on the next business day. If the borrower defaults on its obligation to return the securities loaned because of insolvency or other reasons, the Fund may apply collateral received from the borrower against the obligation. The Fund may experience delays and costs in recovering the securities loaned. Any cash collateral received is invested in the Fidelity Securities Lending Cash Central Fund. The value of loaned securities and cash collateral at period end are disclosed on the Fund's Statement of Assets and Liabilities. Security lending income represents the income earned on investing cash collateral, less rebates paid to borrowers and any lending agent fees associated with the loan, plus any premium payments received for lending certain types of securities. Security lending income is presented in the Statement of Operations as a component of income from Fidelity Central Funds. Total security lending income during the period amounted to $6,971,619.
9. Expense Reductions.
The investment adviser contractually agreed to reimburse certain classes of the Fund to the extent annual operating expenses exceeded certain levels of average net assets as noted in the table below. This reimbursement will remain in place through April 30, 2015. Some expenses, for example interest expense, including commitment fees, are excluded from this reimbursement.
| Expense | Reimbursement |
Fidelity Advantage Class | .06% | $ 1,333,201 |
Institutional Class | .05% | 213,091 |
Fidelity Advantage Institutional Class | .045% | 106,042 |
In addition, the investment adviser reimbursed a portion of the Fund's operating expenses during the period in the amount of $8,773.
Through arrangements with the Fund's custodian, credits realized as a result of uninvested cash balances were used to reduce the Fund's expenses. During the period, these credits reduced the Fund's management fee by $621.
Annual Report
10. Distributions to Shareholders.
Distributions to shareholders of each class were as follows:
Years ended February 28, | 2014 | 2013 |
From net investment income |
|
|
Investor Class | $ 24,178,210 | $ 58,496,193 |
Fidelity Advantage Class | 212,433,599 | 134,301,377 |
Institutional Class | 16,995,240 | 15,312,994 |
Fidelity Advantage Institutional Class | 11,661,673 | 9,729,037 |
Class F | 67,959,912 | 46,486,260 |
Total | $ 333,228,634 | $ 264,325,861 |
11. Share Transactions.
Transactions for each class of shares were as follows:
| Shares | Dollars | ||
Years ended February 28, | 2014 | 2013 | 2014 | 2013 |
Investor Class |
|
|
|
|
Shares sold | 13,726,971 | 18,000,373 | $ 685,400,376 | $ 734,600,452 |
Reinvestment of distributions | 466,133 | 1,376,779 | 23,728,673 | 55,808,530 |
Shares redeemed | (12,971,415) | (75,188,401) | (649,468,987) | (3,168,012,059) |
Net increase (decrease) | 1,221,689 | (55,811,249) | $ 59,660,062 | $ (2,377,603,077) |
Fidelity Advantage Class |
|
|
|
|
Shares sold | 72,166,611 | 97,957,582 | $ 3,601,364,439 | $ 4,121,057,430 |
Reinvestment of distributions | 3,745,162 | 2,934,640 | 190,913,094 | 119,002,705 |
Shares redeemed | (36,714,608) | (33,199,050) | (1,840,823,512) | (1,350,946,307) |
Net increase (decrease) | 39,197,165 | 67,693,172 | $ 1,951,454,021 | $ 2,889,113,828 |
Institutional Class |
|
|
|
|
Shares sold | 7,454,458 | 8,433,106 | $ 381,027,979 | $ 338,510,978 |
Reinvestment of distributions | 333,909 | 377,853 | 16,995,240 | 15,312,994 |
Shares redeemed | (4,837,839) | (6,455,224) | (242,799,293) | (253,857,664) |
Net increase (decrease) | 2,950,528 | 2,355,735 | $ 155,223,926 | $ 99,966,308 |
Fidelity Advantage Institutional Class |
|
|
|
|
Shares sold | 4,684,496 | 10,372,973 | $ 230,291,144 | $ 406,066,075 |
Reinvestment of distributions | 228,738 | 239,832 | 11,661,673 | 9,729,037 |
Shares redeemed | (3,821,617) | (3,007,383) | (196,468,546) | (124,740,192) |
Net increase (decrease) | 1,091,617 | 7,605,422 | $ 45,484,271 | $ 291,054,920 |
Class F |
|
|
|
|
Shares sold | 37,948,097 | 31,085,123 | $ 1,934,234,147 | $ 1,254,633,446 |
Reinvestment of distributions | 1,330,096 | 1,145,187 | 67,959,912 | 46,486,260 |
Shares redeemed | (10,922,888) | (5,709,687) | (539,429,974) | (239,236,799) |
Net increase (decrease) | 28,355,305 | 26,520,623 | $ 1,462,764,085 | $ 1,061,882,907 |
12. Other.
The Fund's organizational documents provide former and current trustees and officers with a limited indemnification against liabilities arising in connection with the performance of their duties to the Fund. In the normal course of business, the Fund may also enter into contracts that provide general indemnifications. The Fund's maximum exposure under these arrangements is unknown as this would be dependent on future claims that may be made against the Fund. The risk of material loss from such claims is considered remote.
Mutual funds managed by the investment adviser or its affiliates were the owners of record, in the aggregate, of approximately 21% of the total outstanding shares of the Fund.
Annual Report
Report of Independent Registered Public Accounting Firm
To the Trustees of Fidelity Concord Street Trust and the Shareholders of Spartan Total Market Index Fund:
In our opinion, the accompanying statement of assets and liabilities, including the schedule of investments, and the related statements of operations and of changes in net assets and the financial highlights present fairly, in all material respects, the financial position of Spartan Total Market Index Fund (a fund of Fidelity Concord Street Trust) at February 28, 2014, the results of its operations for the year then ended, the changes in its net assets for each of the two years in the period then ended and the financial highlights for each of the five years in the period then ended, in conformity with accounting principles generally accepted in the United States of America. These financial statements and financial highlights (hereafter referred to as "financial statements") are the responsibility of the Spartan Total Market Index Fund's management. Our responsibility is to express an opinion on these financial statements based on our audits. We conducted our audits of these financial statements in accordance with the standards of the Public Company Accounting Oversight Board (United States). Those standards require that we plan and perform the audit to obtain reasonable assurance about whether the financial statements are free of material misstatement. An audit includes examining, on a test basis, evidence supporting the amounts and disclosures in the financial statements, assessing the accounting principles used and significant estimates made by management, and evaluating the overall financial statement presentation. We believe that our audits, which included confirmation of securities at February 28, 2014 by correspondence with the custodian and brokers, provide a reasonable basis for our opinion.
PricewaterhouseCoopers LLP
Boston, Massachusetts
April 21, 2014
Annual Report
Trustees and Officers
The Trustees, Member of the Advisory Board, and officers of the trust and fund, as applicable, are listed below. The Board of Trustees governs the fund and is responsible for protecting the interests of shareholders. The Trustees are experienced executives who meet periodically throughout the year to oversee the fund's activities, review contractual arrangements with companies that provide services to the fund, oversee management of the risks associated with such activities and contractual arrangements, and review the fund's performance. Except for James C. Curvey, Ned C. Lautenbach, and William S. Stavropoulos, each of the Trustees oversees 172 funds. Mr. Curvey oversees 395 funds. Mr. Lautenbach and Mr. Stavropoulos each oversees 246 funds.
The Trustees hold office without limit in time except that (a) any Trustee may resign; (b) any Trustee may be removed by written instrument, signed by at least two-thirds of the number of Trustees prior to such removal; (c) any Trustee who requests to be retired or who has become incapacitated by illness or injury may be retired by written instrument signed by a majority of the other Trustees; and (d) any Trustee may be removed at any special meeting of shareholders by a two-thirds vote of the outstanding voting securities of the trust. Each Trustee who is not an interested person (as defined in the 1940 Act) of the trust and the fund (Independent Trustee), shall retire not later than the last day of the calendar year in which his or her 75th birthday occurs. The Independent Trustees may waive this mandatory retirement age policy with respect to individual Trustees. The officers and Advisory Board Member hold office without limit in time, except that any officer and Advisory Board Member may resign or may be removed by a vote of a majority of the Trustees at any regular meeting or any special meeting of the Trustees. Except as indicated, each individual has held the office shown or other offices in the same company for the past five years.
Experience, Skills, Attributes, and Qualifications of the Fund's Trustees. The Governance and Nominating Committee has adopted a statement of policy that describes the experience, qualifications, attributes, and skills that are necessary and desirable for potential Independent Trustee candidates (Statement of Policy). The Board believes that each Trustee satisfied at the time he or she was initially elected or appointed a Trustee, and continues to satisfy, the standards contemplated by the Statement of Policy. The Governance and Nominating Committee also engages professional search firms to help identify potential Independent Trustee candidates who have the experience, qualifications, attributes, and skills consistent with the Statement of Policy. From time to time, additional criteria based on the composition and skills of the current Independent Trustees, as well as experience or skills that may be appropriate in light of future changes to board composition, business conditions, and regulatory or other developments, have also been considered by the professional search firms and the Governance and Nominating Committee. In addition, the Board takes into account the Trustees' commitment and participation in Board and committee meetings, as well as their leadership of standing and ad hoc committees throughout their tenure.
In determining that a particular Trustee was and continues to be qualified to serve as a Trustee, the Board has considered a variety of criteria, none of which, in isolation, was controlling. The Board believes that, collectively, the Trustees have balanced and diverse experience, qualifications, attributes, and skills, which allow the Board to operate effectively in governing the fund and protecting the interests of shareholders. Information about the specific experience, skills, attributes, and qualifications of each Trustee, which in each case led to the Board's conclusion that the Trustee should serve (or continue to serve) as a trustee of the fund, is provided below.
Board Structure and Oversight Function. James C. Curvey is an interested person (as defined in the 1940 Act) and currently serves as Chairman. The Trustees have determined that an interested Chairman is appropriate and benefits shareholders because an interested Chairman has a personal and professional stake in the quality and continuity of services provided to the fund. Independent Trustees exercise their informed business judgment to appoint an individual of their choosing to serve as Chairman, regardless of whether the Trustee happens to be independent or a member of management. The Independent Trustees have determined that they can act independently and effectively without having an Independent Trustee serve as Chairman and that a key structural component for assuring that they are in a position to do so is for the Independent Trustees to constitute a substantial majority for the Board. The Independent Trustees also regularly meet in executive session. Ned C. Lautenbach serves as Chairman of the Independent Trustees and as such (i) acts as a liaison between the Independent Trustees and management with respect to matters important to the Independent Trustees and (ii) with management prepares agendas for Board meetings.
Fidelity funds are overseen by different Boards of Trustees. The fund's Board oversees Fidelity's equity and high income funds and another Board oversees Fidelity's investment-grade bond, money market, and asset allocation funds. The asset allocation funds may invest in Fidelity funds overseen by the fund's Board. The use of separate Boards, each with its own committee structure, allows the Trustees of each group of Fidelity funds to focus on the unique issues of the funds they oversee, including common research, investment, and operational issues. On occasion, the separate Boards establish joint committees to address issues of overlapping consequences for the Fidelity funds overseen by each Board.
The Trustees operate using a system of committees to facilitate the timely and efficient consideration of all matters of importance to the Trustees, the fund, and fund shareholders and to facilitate compliance with legal and regulatory requirements and oversight of the fund's activities and associated risks. The Board, acting through its committees, has charged FMR and its affiliates with (i) identifying events or circumstances the occurrence of which could have demonstrably adverse effects on the fund's business and/or reputation; (ii) implementing processes and controls to lessen the possibility that such events or circumstances occur or to mitigate the effects of such events or circumstances if they do occur; and (iii) creating and maintaining a system designed to evaluate continuously business and market conditions in order to facilitate the identification and implementation processes described in (i) and (ii) above. Because the day-to-day operations and activities of the fund are carried out by or through FMR, its affiliates and other service providers, the fund's exposure to risks is mitigated but not eliminated by the processes overseen by the Trustees. While each of the Board's committees has responsibility for overseeing different aspects of the fund's activities, oversight is exercised primarily through the Operations, Audit, and Compliance Committees. In addition, the Independent Trustees have worked with FMR to enhance the Board's oversight of investment and financial risks, legal and regulatory risks, technology risks, and operational risks, including the development of additional risk reporting to the Board. For example, a working group comprised of Independent Trustees and FMR has worked and continues to work to review the Fidelity funds' valuation-related activities, reporting and risk management. Appropriate personnel, including but not limited to the fund's Chief Compliance Officer (CCO), FMR's internal auditor, the independent accountants, the fund's Treasurer and portfolio management personnel, make periodic reports to the Board's committees, as appropriate, including an annual review of FMR's risk management program for the Fidelity funds. The responsibilities of each standing committee, including their oversight responsibilities, are described further under "Standing Committees of the Fund's Trustees."
Annual Report
The fund's Statement of Additional Information (SAI) includes more information about the Trustees. To request a free copy, call Fidelity at 1-800-835-5092.
Interested Trustees*:
Correspondence intended for each Trustee who is an interested person may be sent to Fidelity Investments, 245 Summer Street, Boston, Massachusetts 02210.
Name, Year of Birth; Principal Occupations and Other Relevant Experience+ | |
James C. Curvey (1935) | |
Year of Election or Appointment: 2007 Trustee Chairman of the Board of Trustees | |
| Mr. Curvey also serves as Trustee of other Fidelity funds. Mr. Curvey is a Director of Fidelity Investments Money Management, Inc. (2009-present), Director of Fidelity Research & Analysis Co. (2009-present) and Director of FMR and FMR Co., Inc. (2007-present). Mr. Curvey is also Vice Chairman (2007-present) and Director of FMR LLC. In addition, Mr. Curvey serves as an Overseer for the Boston Symphony Orchestra and a member of the Trustees of Villanova University. Previously, Mr. Curvey was the Vice Chairman (2006-2007) and Director (2000-2007) of FMR Corp. |
Charles S. Morrison (1960) | |
Year of Election or Appointment: 2014 Trustee | |
| Mr. Morrison also serves as Trustee or Vice President of other funds. He serves as President, Asset Management (2014-present) and is an employee of Fidelity Investments. Previously, Mr. Morrison served as President, Fixed Income (2011-2014), Vice President of Fidelity's Money Market Funds (2005-2009), President, Money Market Group Leader of FMR (2009), and Senior Vice President, Money Market Group of FMR (2004-2009). Mr. Morrison also served as Vice President of Fidelity's Bond Funds (2002-2005), certain Balanced Funds (2002-2005), and certain Asset Allocation Funds (2002-2007), and as Senior Vice President (2002-2005) of Fidelity's Bond Division. |
* Trustees have been determined to be "Interested Trustees" by virtue of, among other things, their affiliation with the trust or various entities under common control with FMR.
+ The information above includes each Trustee's principal occupation during the last five years and other information relating to the experience, attributes, and skills relevant to each Trustee's qualifications to serve as a Trustee, which led to the conclusion that each Trustee should serve as a Trustee for the fund.
Independent Trustees:
Correspondence intended for each Independent Trustee (that is, the Trustees other than the Interested Trustees) may be sent to Fidelity Investments, P.O. Box 55235, Boston, Massachusetts 02205-5235.
Name, Year of Birth; Principal Occupations and Other Relevant Experience+ | |
Dennis J. Dirks (1948) | |
Year of Election or Appointment: 2005 Trustee | |
| Mr. Dirks also serves as Trustee of other Fidelity funds. Prior to his retirement in May 2003, Mr. Dirks was Chief Operating Officer and a member of the Board of The Depository Trust & Clearing Corporation (DTCC). He also served as President, Chief Operating Officer, and Board member of The Depository Trust Company (DTC) and President and Board member of the National Securities Clearing Corporation (NSCC). In addition, Mr. Dirks served as Chief Executive Officer and Board member of the Government Securities Clearing Corporation, Chief Executive Officer and Board member of the Mortgage-Backed Securities Clearing Corporation, as a Trustee and a member of the Finance Committee of Manhattan College (2005-2008), and as a Trustee and a member of the Finance Committee of AHRC of Nassau County (2006-2008). Mr. Dirks is a member of the Independent Directors Council (IDC) Governing Council (2010-present) and Board of Directors for The Brookville Center for Children's Services, Inc. (2009-present). |
Alan J. Lacy (1953) | |
Year of Election or Appointment: 2008 Trustee | |
| Mr. Lacy also serves as Trustee of other Fidelity funds. Mr. Lacy serves as Senior Adviser (2007-present) of Oak Hill Capital Partners, L.P. (private equity). Mr. Lacy also served as Chief Executive Officer (2000-2005) and Vice Chairman (2005-2006) of Sears Holdings Corporation and Sears, Roebuck and Co. (retail). In addition, Mr. Lacy serves as a member of the Board of Directors of Dave & Buster's Entertainment, Inc. (restaurant and entertainment complexes, 2010-present), Earth Fare, Inc. (retail grocery, 2012-present), The Hillman Companies, Inc. (hardware wholesalers, 2010-present), and Bristol-Myers Squibb Company (global pharmaceuticals, 2008-present). Mr. Lacy is a member of the Board of Trustees of The National Parks Conservation Association (2006-present). Previously, Mr. Lacy served as Chairman of the Board of Trustees of the National Parks Conservation Association (2008-2011) and as a member of the Board of Directors for the Western Union Company (global money transfer, 2006-2011). |
Ned C. Lautenbach (1944) | |
Year of Election or Appointment: 2000 Trustee Chairman of the Independent Trustees | |
| Mr. Lautenbach also serves as Trustee of other Fidelity funds. Mr. Lautenbach currently serves as the Lead Director of the Eaton Corporation Board of Directors (diversified industrial, 1997-present). Mr. Lautenbach is Chairman of the Board of Directors of the Philharmonic Center for the Arts in Naples, Florida (2012-present) and a member of the Council on Foreign Relations (1994-present). Previously, Mr. Lautenbach was a Partner/Advisory Partner at Clayton, Dubilier & Rice, LLC (private equity investment, 1998-2010), as well as a Director of Sony Corporation (2006-2007). |
Joseph Mauriello (1944) | |
Year of Election or Appointment: 2008 Trustee | |
| Mr. Mauriello also serves as Trustee of other Fidelity funds. Prior to his retirement in January 2006, Mr. Mauriello served in numerous senior management positions including Deputy Chairman and Chief Operating Officer (2004-2005), and Vice Chairman of Financial Services (2002-2004) of KPMG LLP US (professional services, 1965-2005). Mr. Mauriello currently serves as a member of the Board of Directors of XL Group plc. (global insurance and re-insurance, 2006-present). Previously, Mr. Mauriello served as a Director of the Hamilton Funds of the Bank of New York (2006-2007) and of Arcadia Resources Inc. (health care services and products, 2007-2012). |
Robert W. Selander (1950) | |
Year of Election or Appointment: 2011 Trustee | |
| Mr. Selander also serves as Trustee of other Fidelity funds. Previously, Mr. Selander served as a Member of the Advisory Board of other Fidelity funds (2011), and Executive Vice Chairman (2010), Chief Executive Officer (2009-2010), and President and Chief Executive Officer (1997-2009) of Mastercard, Inc. |
Cornelia M. Small (1944) | |
Year of Election or Appointment: 2005 Trustee | |
| Ms. Small also serves as Trustee of other Fidelity funds. Ms. Small is a member of the Board of Directors (2009-present) and Chair of the Investment Committee (2010-present) of the Teagle Foundation. Ms. Small also serves on the Investment Committee of the Berkshire Taconic Community Foundation (2008-present). Previously, Ms. Small served as Chairperson (2002-2008) and a member of the Investment Committee and Chairperson (2008-2012) and a member of the Board of Trustees of Smith College. In addition, Ms. Small served as Chief Investment Officer, Director of Global Equity Investments, and a member of the Board of Directors of Scudder, Stevens & Clark and Scudder Kemper Investments. |
William S. Stavropoulos (1939) | |
Year of Election or Appointment: 2001 Trustee Vice Chairman of the Independent Trustees | |
| Mr. Stavropoulos also serves as Trustee of other Fidelity funds. Mr. Stavropoulos serves as President and Founder of the Michigan Baseball Foundation, the Great Lakes Loons (2007-present). Mr. Stavropoulos is Chairman Emeritus of the Board of Directors of The Dow Chemical Company, where he previously served in numerous senior management positions, including President, CEO (1995-2000; 2002-2004), Chairman of the Executive Committee (2000-2006), and as a member of the Board of Directors (1990-2006). Currently, Mr. Stavropoulos is Chairman of the Board of Directors of Univar Inc. (global distributor of commodity and specialty chemicals), a Director of Teradata Corporation (data warehousing and technology solutions), and Maersk Inc. (industrial conglomerate), and a member of the Advisory Board for Metalmark Capital LLC (private equity investment, 2005-present). Mr. Stavropoulos is an operating advisor to Clayton, Dubilier & Rice, LLC (private equity investment). In addition, Mr. Stavropoulos is a member of the University of Notre Dame Advisory Council for the College of Science, a Trustee of the Rollin L. Gerstacker Foundation, and a Director of the Naples Philharmonic Center for the Arts. Previously, Mr. Stavropoulos served as a Director of Chemical Financial Corporation (bank holding company, 1993-2012) and Tyco International, Ltd. (multinational manufacturing and services, 2007-2012). |
David M. Thomas (1949) | |
Year of Election or Appointment: 2008 Trustee | |
| Mr. Thomas also serves as Trustee of other Fidelity funds. Mr. Thomas serves as Non-Executive Chairman of the Board of Directors of Fortune Brands Home and Security (home and security products, 2011-present), and as a member of the Board of Directors of Interpublic Group of Companies, Inc. (marketing communication, 2004-present). Previously, Mr. Thomas served as Executive Chairman (2005-2006) and Chairman and Chief Executive Officer (2000-2005) of IMS Health, Inc. (pharmaceutical and healthcare information solutions), and a Director of Fortune Brands, Inc. (consumer products, 2000-2011). |
+ The information above includes each Trustee's principal occupation during the last five years and other information relating to the experience, attributes, and skills relevant to each Trustee's qualifications to serve as a Trustee, which led to the conclusion that each Trustee should serve as a Trustee for the fund.
Advisory Board Member and Officers:
Correspondence intended for each officer and Peter S. Lynch may be sent to Fidelity Investments, 245 Summer Street, Boston, Massachusetts 02210. Officers appear below in alphabetical order.
Name, Year of Birth; Principal Occupation | |
Peter S. Lynch (1944) | |
Year of Election or Appointment: 2003 Member of the Advisory Board | |
| Mr. Lynch also serves as Member of the Advisory Board of other Fidelity funds. Mr. Lynch is Vice Chairman and a Director of FMR and FMR Co., Inc. In addition, Mr. Lynch serves as a Trustee of Boston College and as the Chairman of the Inner-City Scholarship Fund. Previously, Mr. Lynch served on the Special Olympics International Board of Directors (1997-2006). |
Elizabeth Paige Baumann (1968) | |
Year of Election or Appointment: 2012 Anti-Money Laundering (AML) Officer | |
| Ms. Baumann also serves as AML Officer of other funds. She is Chief AML Officer of FMR LLC (2012-present) and is an employee of Fidelity Investments. Previously, Ms. Baumann served as Vice President and Deputy Anti-Money Laundering Officer (2007-2012). |
William C. Coffey (1969) | |
Year of Election or Appointment: 2009 Assistant Secretary | |
| Mr. Coffey also serves as Assistant Secretary of other funds. He is Senior Vice President and Deputy General Counsel of FMR LLC (2010-present), and is an employee of Fidelity Investments. Previously, Mr. Coffey served as Vice President and Associate General Counsel of FMR LLC (2005-2009). |
Jonathan Davis (1968) | |
Year of Election or Appointment: 2010 Assistant Treasurer | |
| Mr. Davis also serves as Assistant Treasurer of other funds. Mr. Davis is an employee of Fidelity Investments. Previously, Mr. Davis served as Vice President and Associate General Counsel of FMR LLC (2003-2010). |
Adrien E. Deberghes (1967) | |
Year of Election or Appointment: 2008 Deputy Treasurer | |
| Mr. Deberghes also serves as an officer of other funds. He is an employee of Fidelity Investments (2008-present). Prior to joining Fidelity Investments, Mr. Deberghes was Senior Vice President of Mutual Fund Administration at State Street Corporation (2007-2008), Senior Director of Mutual Fund Administration at Investors Bank & Trust (2005-2007), and Director of Finance for Dunkin' Brands (2000-2005). |
Stephanie J. Dorsey (1969) | |
Year of Election or Appointment: 2010 Assistant Treasurer | |
| Ms. Dorsey also serves as an officer of other funds. She is an employee of Fidelity Investments (2008-present) and has served in other fund officer roles. Prior to joining Fidelity Investments, Ms. Dorsey served as Treasurer (2004-2008) of the JPMorgan Mutual Funds and Vice President (2004-2008) of JPMorgan Chase Bank. |
Scott C. Goebel (1968) | |
Year of Election or Appointment: 2008 Secretary and Chief Legal Officer (CLO) | |
| Mr. Goebel serves as Secretary and CLO of other funds. Mr. Goebel also serves as Secretary of Fidelity SelectCo, LLC (2013-present), Fidelity Investments Money Management, Inc. (FIMM) (2010-present) and Fidelity Research and Analysis Company (FRAC) (2010-present); General Counsel, Secretary, and Senior Vice President of FMR (2008-present) and FMR Co., Inc. (2008-present); Chief Legal Officer of Fidelity Management & Research (Hong Kong) Limited (2008-present); and Assistant Secretary of Fidelity Management & Research (Japan) Inc. (2008-present) and Fidelity Management & Research (U.K.) Inc. (2008-present). Previously, Mr. Goebel served as Secretary and CLO of other Fidelity funds (2008-2013), Assistant Secretary of FIMM (2008-2010), FRAC (2008-2010), and certain funds (2007-2008); and as Vice President and Secretary of Fidelity Distributors Corporation (FDC) (2005-2007). Mr. Goebel has been employed by FMR LLC or an affiliate since 2001. |
Joseph A. Hanlon (1968) | |
Year of Election or Appointment: 2012 Chief Compliance Officer | |
| Mr. Hanlon also serves as Chief Compliance Officer of other funds. Mr. Hanlon serves as Compliance Officer of FMR, FMR Co., Inc., Fidelity Investments Money Management, Inc. (FIMM), Fidelity Research and Analysis Company (FRAC), and Fidelity Management & Research (Hong Kong) (2009-present), as Senior Vice President of the Fidelity Asset Management Division (2009-present), and is an employee of Fidelity Investments. Previously, Mr. Hanlon served as Compliance Officer of Fidelity Management & Research (Japan) Inc. (2009-2013), Strategic Advisers, Inc. (2009-2013), and Fidelity Management & Research (U.K.) Inc. (2009-2013). |
Bruce T. Herring (1965) | |
Year of Election or Appointment: 2006 Vice President of certain Equity Funds | |
| Mr. Herring also serves as Vice President of other funds. He serves as Chief Investment Officer of Fidelity Global Asset Allocation (GAA) (2013-present), Group Chief Investment Officer of FMR, and President of Fidelity Research & Analysis Company (2010-present). Previously, Mr. Herring served as Chief Investment Officer and Director of Fidelity Management & Research (U.K.) Inc. (2010-2013), Vice President (2005-2006) and Senior Vice President (2006-2007) of Fidelity Management & Research Company, Vice President of FMR Co., Inc. (2001-2007), and as a portfolio manager for Fidelity U.S. Equity Funds. |
Brian B. Hogan (1964) | |
Year of Election or Appointment: 2009 Vice President | |
| Mr. Hogan also serves as Trustee or Vice President of other funds. Mr. Hogan serves as President of FMR's Equity Division (2009-present). Previously, Mr. Hogan served as Senior Vice President, Equity Research of FMR (2006-2009) and as a portfolio manager. |
Chris Maher (1972) | |
Year of Election or Appointment: 2013 Assistant Treasurer | |
| Mr. Maher serves as Assistant Treasurer of other funds. Mr. Maher is Vice President of Valuation Oversight and is an employee of Fidelity Investments. Previously, Mr. Maher served as Vice President of Asset Management Compliance (2013), Vice President of FMR's Program Management Group (2010-2013), and Vice President of Valuation Oversight (2008-2010). |
Christine Reynolds (1958) | |
Year of Election or Appointment: 2008 Chief Financial Officer | |
| Ms. Reynolds also serves as Chief Financial Officer of other funds. Ms. Reynolds became President of Fidelity Pricing and Cash Management Services (FPCMS) in August 2008. Ms. Reynolds served as Chief Operating Officer of FPCMS (2007-2008). Previously, Ms. Reynolds served as President, Treasurer, and Anti-Money Laundering officer of the Fidelity funds (2004-2007). |
Kenneth B. Robins (1969) | |
Year of Election or Appointment: 2008 President and Treasurer | |
| Mr. Robins also serves as an officer of other funds. Mr. Robins serves as Executive Vice President of Fidelity Investments Money Management, Inc. (FIMM) (2013-present) and is an employee of Fidelity Investments (2004-present). Previously, Mr. Robins served in other fund officer roles. |
Gary W. Ryan (1958) | |
Year of Election or Appointment: 2005 Assistant Treasurer | |
| Mr. Ryan also serves as Assistant Treasurer of other funds. Mr. Ryan is an employee of Fidelity Investments and has served in other fund officer roles. Previously, Mr. Ryan served as Vice President of Fund Reporting in Fidelity Pricing and Cash Management Services (FPCMS) (1999-2005). |
Stephen Sadoski (1971) | |
Year of Election or Appointment: 2012 Deputy Treasurer | |
| Mr. Sadoski also serves as Deputy Treasurer of other funds. He is an employee of Fidelity Investments (2012-present) and has served in another fund officer role. Prior to joining Fidelity Investments, Mr. Sadoski served as an assistant chief accountant in the Division of Investment Management of the Securities and Exchange Commission (SEC) (2009-2012) and as a senior manager at Deloitte & Touche LLP (1997-2009). |
Stacie M. Smith (1974) | |
Year of Election or Appointment: 2013 Deputy Treasurer | |
| Ms. Smith also serves as an officer of other funds. She is an employee of Fidelity Investments (2009-present) and has served in other fund officer roles. Prior to joining Fidelity Investments, Ms. Smith served as Senior Audit Manager of Ernst & Young LLP (1996-2009). |
Renee Stagnone (1975) | |
Year of Election or Appointment: 2013 Deputy Treasurer | |
| Ms. Stagnone also serves as Deputy Treasurer of other funds. Ms. Stagnone is an employee of Fidelity Investments. |
Joseph F. Zambello (1957) | |
Year of Election or Appointment: 2011 Deputy Treasurer | |
| Mr. Zambello also serves as Deputy Treasurer of other funds. Mr. Zambello is an employee of Fidelity Investments. Previously, Mr. Zambello served as Vice President of FMR's Program Management Group (2009-2011) and Vice President of the Transfer Agent Oversight Group (2005-2009). |
Annual Report
Distributions (Unaudited)
Class F designates 95% and 94%, of the dividends distributed in April and December, respectively, during the fiscal year as qualifying for the dividends-received deduction for corporate shareholders.
Class F designates 98% of the dividends distributed during the fiscal year as amounts which may be taken into account as a dividend for the purposes of the maximum rate under section 1(h)(11) of the Internal Revenue Code.
The fund will notify shareholders in January 2015 of amounts for use in preparing 2014 income tax returns.
Annual Report
Investment Adviser
Fidelity Management & Research Company
Boston, MA
Investment Sub-Advisers
FMR Co., Inc.
Geode Capital Management, LLC
General Distributor
Fidelity Distributors Corporation
Smithfield, RI
Transfer and Service Agents
Fidelity Investments Institutional
Operations Company, Inc.
Boston, MA
Fidelity Service Company, Inc.
Boston, MA
Custodian
The Bank of New York Mellon
New York, NY
(Fidelity Investment logo)(registered trademark)
Corporate Headquarters
245 Summer St., Boston, MA 02210
www.fidelity.com
STI-F-ANN-0414 1.899048.104
Item 2. Code of Ethics
As of the end of the period, February 28, 2014, Fidelity Concord Street Trust (the trust) has adopted a code of ethics, as defined in Item 2 of Form N-CSR, that applies to its President and Treasurer and its Chief Financial Officer. A copy of the code of ethics is filed as an exhibit to this Form N-CSR.
Item 3. Audit Committee Financial Expert
The Board of Trustees of the trust has determined that Joseph Mauriello is an audit committee financial expert, as defined in Item 3 of Form N-CSR. Mr. Mauriello is independent for purposes of Item 3 of Form N-CSR.
Item 4. Principal Accountant Fees and Services
Fees and Services
The following table presents fees billed by PricewaterhouseCoopers LLP ("PwC") in each of the last two fiscal years for services rendered to Spartan Extended Market Index Fund, Spartan International Index Fund, Spartan Total Market Index Fund and Spartan 500 Index Fund (the "Funds"):
Services Billed by PwC
February 28, 2014 FeesA
| Audit Fees | Audit-Related Fees | Tax Fees | All Other Fees |
Spartan Extended Market Index Fund | $83,000 | $- | $4,400 | $5,300 |
Spartan International Index Fund | $85,000 | $- | $28,900 | $5,500 |
Spartan Total Market Index Fund | $96,000 | $- | $6,400 | $8,300 |
Spartan 500 Index Fund | $116,000 | $- | $4,400 | $16,300 |
February 28, 2013 FeesA
| Audit Fees | Audit-Related Fees | Tax Fees | All Other Fees |
Spartan Extended Market Index Fund | $78,000 | $- | $4,400 | $4,200 |
Spartan International Index Fund | $89,000 | $- | $51,400 | $5,000 |
Spartan Total Market Index Fund | $96,000 | $- | $6,400 | $6,900 |
Spartan 500 Index Fund | $130,000 | $- | $4,400 | $18,300 |
A Amounts may reflect rounding.
The following table presents fees billed by PwC that were required to be approved by the Audit Committee for services that relate directly to the operations and financial reporting of the Funds and that are rendered on behalf of Fidelity Management & Research Company ("FMR") and entities controlling, controlled by, or under common control with FMR (not including any sub-adviser whose role is primarily portfolio management and is subcontracted with or overseen by another investment adviser) that provide ongoing services to the Funds ("Fund Service Providers"):
Services Billed by PwC
| February 28, 2014A | February 28, 2013A |
Audit-Related Fees | $4,970,000 | $4,755,000 |
Tax Fees | $- | $- |
All Other Fees | $50,000 | $- |
A Amounts may reflect rounding.
"Audit-Related Fees" represent fees billed for assurance and related services that are reasonably related to the performance of the fund audit or the review of the fund's financial statements and that are not reported under Audit Fees.
"Tax Fees" represent fees billed for tax compliance, tax advice or tax planning that relate directly to the operations and financial reporting of the fund.
"All Other Fees" represent fees billed for services provided to the fund or Fund Service Provider, a significant portion of which are assurance related, that relate directly to the operations and financial reporting of the fund, excluding those services that are reported under Audit Fees, Audit-Related Fees or Tax Fees.
Assurance services must be performed by an independent public accountant.
* * *
The aggregate non-audit fees billed by PwC for services rendered to the Funds, FMR (not including any sub-adviser whose role is primarily portfolio management and is subcontracted with or overseen by another investment adviser), and any Fund Service Provider for each of the last two fiscal years of the Funds are as follows:
Billed By | February 28, 2014 A | February 28, 2013 A |
PwC | $5,565,000 | $5,505,000 |
A Amounts may reflect rounding.
The trust's Audit Committee has considered non-audit services that were not pre-approved that were provided by PwC to Fund Service Providers to be compatible with maintaining the independence of PwC in its audit of the Funds, taking into account representations from PwC, in accordance with Public Company Accounting Oversight Board rules, regarding its independence from the Funds and their related entities and FMR's review of the appropriateness and permissibility under applicable law of such non-audit services prior to their provision to the Fund Service Providers.
Audit Committee Pre-Approval Policies and Procedures
The trust's Audit Committee must pre-approve all audit and non-audit services provided by a fund's independent registered public accounting firm relating to the operations or financial reporting of the fund. Prior to the commencement of any audit or non-audit services to a fund, the Audit Committee reviews the services to determine whether they are appropriate and permissible under applicable law.
The Audit Committee has adopted policies and procedures to, among other purposes, provide a framework for the Committee's consideration of non-audit services by the audit firms that audit the Fidelity funds. The policies and procedures require that any non-audit service provided by a fund audit firm to a Fidelity fund and any non-audit service provided by a fund auditor to a Fund Service Provider that relates directly to the operations and financial reporting of a Fidelity fund ("Covered Service") are subject to approval by the Audit Committee before such service is provided.
All Covered Services must be approved in advance of provision of the service either: (i) by formal resolution of the Audit Committee, or (ii) by oral or written approval of the service by the Chair of the Audit Committee (or if the Chair is unavailable, such other member of the Audit Committee as may be designated by the Chair to act in the Chair's absence). The approval contemplated by (ii) above is permitted where the Treasurer determines that action on such an engagement is necessary before the next meeting of the Audit Committee.
Non-audit services provided by a fund audit firm to a Fund Service Provider that do not relate directly to the operations and financial reporting of a Fidelity fund are reported to the Audit Committee on a periodic basis.
Non-Audit Services Approved Pursuant to Rule 2-01(c)(7)(i)(C) and (ii) of Regulation S-X ("De Minimis Exception")
There were no non-audit services approved or required to be approved by the Audit Committee pursuant to the De Minimis Exception during the Funds' last two fiscal years relating to services provided to (i) the Funds or (ii) any Fund Service Provider that relate directly to the operations and financial reporting of the Funds.
Item 5. Audit Committee of Listed Registrants
Not applicable.
Item 6. Investments
(a) Not applicable.
(b) Not applicable
Item 7. Disclosure of Proxy Voting Policies and Procedures for Closed-End Management Investment Companies
Not applicable.
Item 8. Portfolio Managers of Closed-End Management Investment Companies
Not applicable.
Item 9. Purchase of Equity Securities by Closed-End Management Investment Company and Affiliated Purchasers
Not applicable.
Item 10. Submission of Matters to a Vote of Security Holders
There were no material changes to the procedures by which shareholders may recommend nominees to the trust's Board of Trustees.
Item 11. Controls and Procedures
(a)(i) The President and Treasurer and the Chief Financial Officer have concluded that the trust's disclosure controls and procedures (as defined in Rule 30a-3(c) under the Investment Company Act) provide reasonable assurances that material information relating to the trust is made known to them by the appropriate persons, based on their evaluation of these controls and procedures as of a date within 90 days of the filing date of this report.
(a)(ii) There was no change in the trust's internal control over financial reporting (as defined in Rule 30a-3(d) under the Investment Company Act) that occurred during the second fiscal quarter of the period covered by this report that has materially affected, or is reasonably likely to materially affect, the trust's internal control over financial reporting.
Item 12. Exhibits
(a) | (1) | Code of Ethics pursuant to Item 2 of Form N-CSR is filed and attached hereto as EX-99.CODE ETH. |
(a) | (2) | Certification pursuant to Rule 30a-2(a) under the Investment Company Act of 1940 (17 CFR 270.30a-2(a)) is filed and attached hereto as Exhibit 99.CERT. |
(a) | (3) | Not applicable. |
(b) |
| Certification pursuant to Rule 30a-2(b) under the Investment Company Act of 1940 (17 CFR 270.30a-2(b)) is furnished and attached hereto as Exhibit 99.906CERT. |
SIGNATURES
Pursuant to the requirements of the Securities Exchange Act of 1934 and the Investment Company Act of 1940, the registrant has duly caused this report to be signed on its behalf by the undersigned, thereunto duly authorized.
Fidelity Concord Street Trust
By: | /s/Kenneth B. Robins |
| Kenneth B. Robins |
| President and Treasurer |
|
|
Date: | April 25, 2014 |
Pursuant to the requirements of the Securities Exchange Act of 1934 and the Investment Company Act of 1940, this report has been signed below by the following persons on behalf of the registrant and in the capacities and on the dates indicated.
By: | /s/Kenneth B. Robins |
| Kenneth B. Robins |
| President and Treasurer |
|
|
Date: | April 25, 2014 |
By: | /s/Christine Reynolds |
| Christine Reynolds |
| Chief Financial Officer |
|
|
Date: | April 25, 2014 |