UNITED STATES
SECURITIES AND EXCHANGE COMMISSION
Washington, D.C. 20549
FORM N-CSR
CERTIFIED SHAREHOLDER REPORT OF REGISTERED
MANAGEMENT INVESTMENT COMPANIES
Investment Company Act file number 811-5251
Fidelity Concord Street Trust
(Exact name of registrant as specified in charter)
245 Summer St., Boston, Massachusetts 02210
(Address of principal executive offices) (Zip code)
Marc Bryant, Secretary
245 Summer St.
Boston, Massachusetts 02210
(Name and address of agent for service)
Registrant's telephone number, including area code:
617-563-7000
Date of fiscal year end: | November 30 |
|
|
Date of reporting period: | November 30, 2016 |
Item 1.
Reports to Stockholders
Fidelity® Nasdaq Composite Index® Fund Annual Report November 30, 2016 |
 |
Contents
Board Approval of Investment Advisory Contracts and Management Fees |
To view a fund's proxy voting guidelines and proxy voting record for the 12-month period ended June 30, visit http://www.fidelity.com/proxyvotingresults or visit the Securities and Exchange Commission's (SEC) web site at http://www.sec.gov.
You may also call 1-800-544-8544 to request a free copy of the proxy voting guidelines.
Nasdaq®, OMX®, NASDAQ OMX®, Nasdaq Composite®, and The Nasdaq Stock Market®, Inc. are registered trademarks of The NASDAQ OMXGroup, Inc. (which with its Affiliates are the Corporations) and are licensed for use by Fidelity. The product has not been passed on by the Corporations as to its legality or suitability. The product is not issued, endorsed or sold by the Corporations. The Corporations make no warranties and bear no liability with respect to shares of the product.
Standard & Poor's, S&P and S&P 500 are registered service marks of The McGraw-Hill Companies, Inc. and have been licensed for use by Fidelity Distributors Corporation.
Other third-party marks appearing herein are the property of their respective owners.
All other marks appearing herein are registered or unregistered trademarks or service marks of FMR LLC or an affiliated company. © 2017 FMR LLC. All rights reserved.
This report and the financial statements contained herein are submitted for the general information of the shareholders of the Fund. This report is not authorized for distribution to prospective investors in the Fund unless preceded or accompanied by an effective prospectus.
A fund files its complete schedule of portfolio holdings with the SEC for the first and third quarters of each fiscal year on Form N-Q. Forms N-Q are available on the SEC’s web site at http://www.sec.gov. A fund's Forms N-Q may be reviewed and copied at the SEC’s Public Reference Room in Washington, DC. Information regarding the operation of the SEC's Public Reference Room may be obtained by calling 1-800-SEC-0330.
For a complete list of a fund's portfolio holdings, view the most recent holdings listing, semiannual report, or annual report on Fidelity's web site at http://www.fidelity.com, http://www.institutional.fidelity.com, or http://www.401k.com, as applicable.
NOT FDIC INSURED •MAY LOSE VALUE •NO BANK GUARANTEE
Neither the Fund nor Fidelity Distributors Corporation is a bank.
Performance: The Bottom Line
Average annual total return reflects the change in the value of an investment, assuming reinvestment of distributions from dividend income and capital gains (the profits earned upon the sale of securities that have grown in value, if any) and assuming a constant rate of performance each year. The hypothetical investment and the average annual total returns do not reflect the deduction of taxes that a shareholder would pay on fund distributions or the redemption of fund shares. During periods of reimbursement by Fidelity, a fund’s total return will be greater than it would be had the reimbursement not occurred. How a fund did yesterday is no guarantee of how it will do tomorrow.
Average Annual Total Returns
| For the periods ended November 30, 2016 | Past 1 year | Past 5 years | Past 10 years |
| Fidelity® Nasdaq Composite Index�� Fund | 5.43% | 16.51% | 9.16% |
$10,000 Over 10 Years
Let's say hypothetically that $10,000 was invested in Fidelity® Nasdaq Composite Index® Fund on November 30, 2006.
The chart shows how the value of your investment would have changed, and also shows how the Nasdaq Composite Index® performed over the same period.
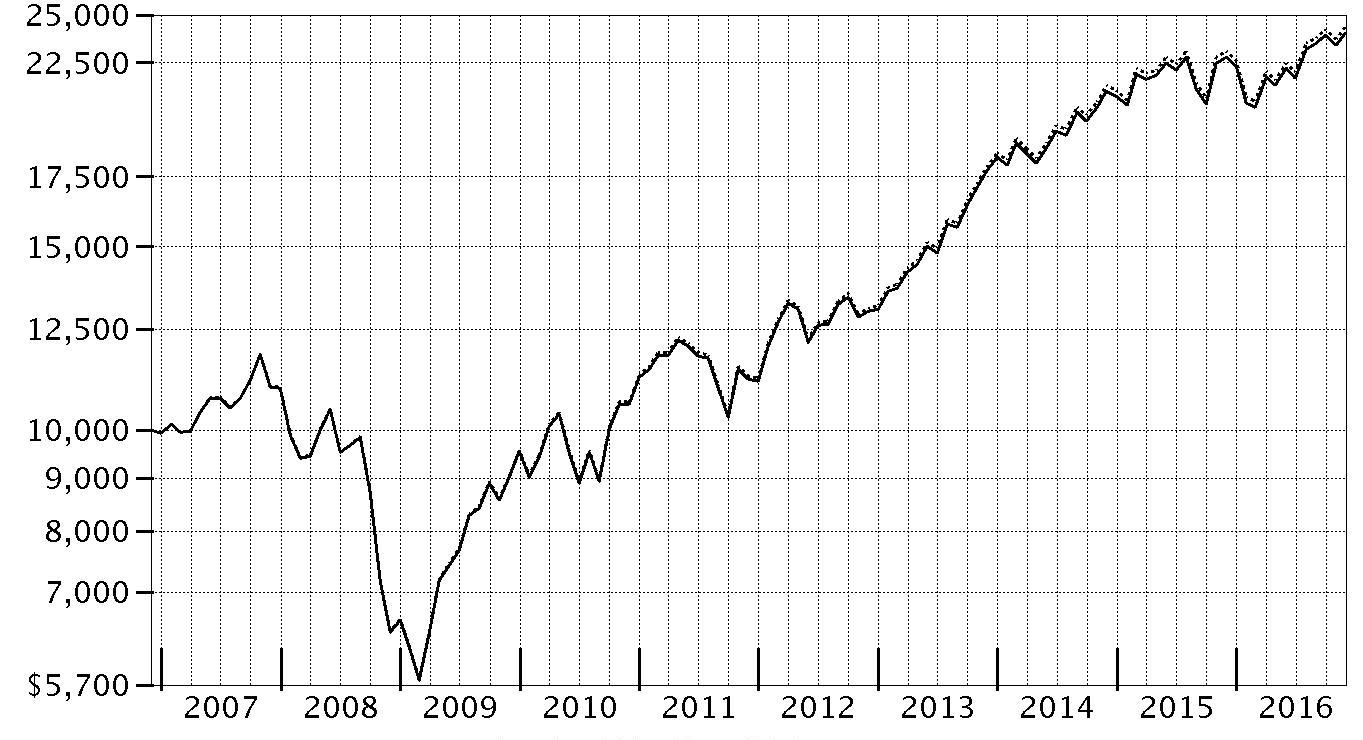
| Period Ending Values | ||
| $24,016 | Fidelity® Nasdaq Composite Index® Fund | |
| $24,354 | Nasdaq Composite Index® | |
Management's Discussion of Fund Performance
Market Recap: The S&P 500 index returned 8.06% for the 12 months ending November 30, 2016, rising sharply in the final month on post-election optimism for economic growth. The period began during a fairly volatile stretch, with stocks hampered by persistent oil-price weakness and U.S.-dollar strength. Markets regained positive momentum in February amid U.S. job gains, a rally in energy and other stimuli that helped keep the roughly seven-year uptrend intact. Markets tumbled briefly following the U.K.'s June 23 vote to exit the European Union – dubbed "Brexit" – then recovered quickly and settled into a flattish stretch until the November 8 U.S. presidential election. For the year, 10 of the 11 sectors in the S&P 500 advanced, with six posting double-digit gains. Telecommunication services (+16%) led the way, its strength attributable to demand for dividend-paying equities early in the period, as well as to company-specific news. Cyclical sectors including industrials (+15%), financials (+14%), energy (+13%) and materials (+12%) posted strong gains, the latter two driven by a rebound in commodity prices. Conversely, real estate (+1%) lagged the index due to a late-period slump related to expectations for rising interest rates. Consumer discretionary (+3%) also underperformed, as competitive pressure continued to weigh on brick-and-mortar retailers.Comments from Patrick Waddell, Senior Portfolio Manager of the Geode Capital Management, LLC, investment management team: For the year, the fund gained 5.43%, roughly in line with the 5.53% increase in the NASDAQ Composite Index. Technology stocks, a group that made up nearly half of the index weighting, contributed strongly in absolute terms for the period. In this category, the largest individual contributor was software manufacturer Microsoft (+14%). Other technology-sector contributors this period included social media giant Facebook (+13%), communications equipment manufacturer Qualcomm (+44%), networking equipment company Cisco Systems (+13%), chip maker Texas Instruments (+ 31%) and semiconductor equipment company Applied Materials (+74%). Other contributors included online retailer Amazon.com (+13%) and cable and media company Comcast (+16%). In contrast, many of the fund’s biggest detractors were health care companies caught up in a wave of concern about drug pricing in the U.S., led by Gilead Sciences (-29%), Regeneron Pharmaceuticals (-30%), Alexion Pharmaceuticals (-31%) and Vertex Pharmaceuticals (-37%). Also weighing on results was consumer electronics company Apple (-5%) – the largest average position in the index throughout the 12 months – and China-based online search company Baidu (-23%).The views expressed above reflect those of the portfolio manager(s) only through the end of the period as stated on the cover of this report and do not necessarily represent the views of Fidelity or any other person in the Fidelity organization. Any such views are subject to change at any time based upon market or other conditions and Fidelity disclaims any responsibility to update such views. These views may not be relied on as investment advice and, because investment decisions for a Fidelity fund are based on numerous factors, may not be relied on as an indication of trading intent on behalf of any Fidelity fund.
Investment Summary (Unaudited)
Top Ten Stocks as of November 30, 2016
| % of fund's net assets | % of fund's net assets 6 months ago | |
| Apple, Inc. | 7.3 | 7.4 |
| Microsoft Corp. | 5.8 | 5.6 |
| Amazon.com, Inc. | 4.4 | 4.6 |
| Facebook, Inc. Class A | 3.4 | 3.7 |
| Alphabet, Inc. Class C | 3.2 | 3.4 |
| Alphabet, Inc. Class A | 2.8 | 2.9 |
| Comcast Corp. Class A | 2.1 | 2.1 |
| Intel Corp. | 2.0 | 2.0 |
| Cisco Systems, Inc. | 1.9 | 2.0 |
| Amgen, Inc. | 1.3 | 1.6 |
| 34.2 |
Top Market Sectors as of November 30, 2016
| % of fund's net assets | % of fund's net assets 6 months ago | |
| Information Technology | 46.7 | 45.7 |
| Consumer Discretionary | 18.9 | 18.7 |
| Health Care | 13.1 | 14.5 |
| Financials | 7.4 | 8.5 |
| Consumer Staples | 5.1 | 5.6 |
| Industrials | 4.6 | 4.3 |
| Telecommunication Services | 1.1 | 1.2 |
| Real Estate | 0.8 | 0.0 |
| Energy | 0.6 | 0.5 |
| Materials | 0.6 | 0.5 |
Prior period industry classifications reflect the categories in place as of the date indicated and have not been adjusted to reflect current industry classifications.
Asset Allocation (% of fund's net assets)
| As of November 30, 2016 * | ||
| Stocks and Equity Futures | 99.9% | |
| Short-Term Investments and Net Other Assets (Liabilities) | 0.1% | |

* Foreign investments - 7.6%
| As of May 31, 2016 * | ||
| Stocks and Equity Futures | 99.7% | |
| Short-Term Investments and Net Other Assets (Liabilities) | 0.3% | |

* Foreign investments - 7.7%
Percentages shown as 0.0% may reflect amounts less than 0.05%.
Investments November 30, 2016
Showing Percentage of Net Assets
| Common Stocks - 99.0% | |||
| Shares | Value | ||
| CONSUMER DISCRETIONARY - 18.9% | |||
| Auto Components - 0.3% | |||
| China Automotive Systems, Inc. (a) | 9,677 | $66,578 | |
| China XD Plastics Co. Ltd. (a) | 13,378 | 61,539 | |
| Dorman Products, Inc. (a)(b) | 11,478 | 829,171 | |
| Federal-Mogul Corp. Class A (a)(b) | 54,919 | 525,575 | |
| Fox Factory Holding Corp. (a) | 11,959 | 300,171 | |
| Gentex Corp. (b) | 93,617 | 1,730,978 | |
| Gentherm, Inc. (a) | 11,810 | 376,149 | |
| Kandi Technolgies, Inc. (a)(b) | 19,321 | 100,469 | |
| Motorcar Parts of America, Inc. (a) | 6,419 | 157,009 | |
| Shiloh Industries, Inc. (a) | 6,437 | 45,381 | |
| SORL Auto Parts, Inc. (a) | 7,832 | 30,075 | |
| Spartan Motors, Inc. | 12,316 | 110,228 | |
| Strattec Security Corp. | 1,501 | 58,389 | |
| Sypris Solutions, Inc. (a) | 1,434 | 1,405 | |
| The Goodyear Tire & Rubber Co. | 86,992 | 2,669,784 | |
| VOXX International Corp. (a) | 10,039 | 48,689 | |
| Workhorse Group, Inc. (a)(b) | 8,768 | 64,971 | |
| 7,176,561 | |||
| Automobiles - 0.4% | |||
| Tesla Motors, Inc. (a)(b) | 53,053 | 10,048,238 | |
| Distributors - 0.2% | |||
| Core-Mark Holding Co., Inc. | 15,346 | 560,282 | |
| Educational Development Corp. | 1,826 | 16,525 | |
| Fenix Parts, Inc. (a) | 9,442 | 32,386 | |
| LKQ Corp. (a) | 101,017 | 3,316,388 | |
| Pool Corp. | 13,456 | 1,353,808 | |
| Weyco Group, Inc. | 4,744 | 136,485 | |
| 5,415,874 | |||
| Diversified Consumer Services - 0.1% | |||
| American Public Education, Inc. (a) | 5,267 | 121,668 | |
| Apollo Education Group, Inc. Class A (non-vtg.) (a) | 35,941 | 338,924 | |
| Ascent Capital Group, Inc. (a) | 3,915 | 70,744 | |
| ATA, Inc. ADR (a)(b) | 2,232 | 8,593 | |
| Cambium Learning Group, Inc. (a) | 16,088 | 80,118 | |
| Capella Education Co. | 3,864 | 337,134 | |
| Career Education Corp. (a) | 23,870 | 238,461 | |
| Collectors Universe, Inc. | 3,024 | 60,359 | |
| Grand Canyon Education, Inc. (a) | 15,441 | 881,681 | |
| Houghton Mifflin Harcourt Co. (a) | 40,741 | 450,188 | |
| Liberty Tax, Inc. | 4,498 | 55,325 | |
| Lincoln Educational Services Corp. (a)(b) | 11,240 | 22,255 | |
| National American University Holdings, Inc. | 1,829 | 3,640 | |
| Strayer Education, Inc. (a) | 3,733 | 273,368 | |
| Tarena International, Inc. ADR | 10,560 | 177,302 | |
| 3,119,760 | |||
| Hotels, Restaurants & Leisure - 2.7% | |||
| Amaya, Inc. (a)(b) | 47,924 | 699,256 | |
| BJ's Restaurants, Inc. (a) | 8,401 | 311,677 | |
| Bloomin' Brands, Inc. | 36,662 | 681,913 | |
| Bob Evans Farms, Inc. (b) | 6,331 | 282,679 | |
| Bojangles', Inc. (a)(b) | 11,915 | 213,279 | |
| Bravo Brio Restaurant Group, Inc. (a) | 8,076 | 33,515 | |
| Buffalo Wild Wings, Inc. (a) | 5,986 | 1,009,240 | |
| Caesars Acquisition Co. (a)(b) | 51,977 | 623,724 | |
| Caesars Entertainment Corp. (a)(b) | 49,728 | 372,960 | |
| Carrols Restaurant Group, Inc. (a) | 12,895 | 175,372 | |
| Century Casinos, Inc. (a) | 11,415 | 78,764 | |
| China Lodging Group Ltd. ADR | 10,436 | 546,638 | |
| Churchill Downs, Inc. | 5,427 | 830,874 | |
| Chuy's Holdings, Inc. (a)(b) | 5,362 | 168,099 | |
| Cracker Barrel Old Country Store, Inc. (b) | 7,910 | 1,287,273 | |
| Dave & Buster's Entertainment, Inc. (a) | 13,754 | 644,375 | |
| Del Frisco's Restaurant Group, Inc. (a) | 7,307 | 125,680 | |
| Del Taco Restaurants, Inc. (a)(b) | 11,946 | 173,456 | |
| Denny's Corp. (a) | 25,042 | 302,758 | |
| Diversified Restaurant Holdings, Inc. (a) | 7,360 | 10,304 | |
| Dunkin' Brands Group, Inc. | 29,993 | 1,628,320 | |
| El Pollo Loco Holdings, Inc. (a)(b) | 12,071 | 152,095 | |
| Eldorado Resorts, Inc. (a)(b) | 15,001 | 206,264 | |
| Empire Resorts, Inc. (a)(b) | 10,744 | 234,219 | |
| Famous Dave's of America, Inc. (a) | 1,737 | 8,077 | |
| Fiesta Restaurant Group, Inc. (a) | 8,876 | 254,297 | |
| Fogo de Chao, Inc. (a)(b) | 9,961 | 137,960 | |
| Gaming Partners International Corp. | 2,789 | 32,408 | |
| GigaMedia Ltd. (a) | 1,007 | 2,578 | |
| Golden Entertainment, Inc. | 8,990 | 111,656 | |
| Good Times Restaurants, Inc. (a)(b) | 8,038 | 25,722 | |
| Habit Restaurants, Inc. Class A (a)(b) | 6,360 | 106,848 | |
| Iao Kun Group Holding Co. Ltd. | 14,955 | 3,141 | |
| Icahn Enterprises LP | 48,247 | 2,789,159 | |
| Ignite Restaurant Group, Inc. (a)(b) | 10,009 | 2,723 | |
| Ilg, Inc. | 48,118 | 869,492 | |
| International Speedway Corp. Class A | 8,895 | 327,336 | |
| Isle of Capri Casinos, Inc. (a) | 13,455 | 301,661 | |
| Jack in the Box, Inc. | 10,657 | 1,108,541 | |
| Jamba, Inc. (a)(b) | 6,501 | 64,490 | |
| Kona Grill, Inc. (a) | 3,779 | 46,482 | |
| Lindblad Expeditions Holdings (a)(b) | 18,088 | 172,921 | |
| Marriott International, Inc. Class A | 130,222 | 10,258,889 | |
| Melco Crown Entertainment Ltd. sponsored ADR (b) | 56,985 | 1,120,325 | |
| Monarch Casino & Resort, Inc. (a) | 6,333 | 157,565 | |
| Morgans Hotel Group Co. (a) | 9,232 | 19,849 | |
| Nathan's Famous, Inc. (a)(b) | 1,506 | 93,146 | |
| Noodles & Co. (a)(b) | 9,877 | 41,483 | |
| Norwegian Cruise Line Holdings Ltd. (a) | 76,818 | 3,058,125 | |
| Panera Bread Co. Class A (a)(b) | 7,324 | 1,553,494 | |
| Papa John's International, Inc. | 12,264 | 1,083,647 | |
| Papa Murphy's Holdings, Inc. (a)(b) | 5,342 | 25,321 | |
| Peak Resorts, Inc. | 8,205 | 39,384 | |
| Penn National Gaming, Inc. (a) | 27,445 | 364,470 | |
| Pinnacle Entertainment, Inc. | 19,263 | 262,555 | |
| Popeyes Louisiana Kitchen, Inc. (a) | 7,112 | 425,867 | |
| Potbelly Corp. (a) | 9,518 | 129,921 | |
| Rave Restaurant Group, Inc. (a) | 4,931 | 10,651 | |
| RCI Hospitality Holdings, Inc. | 4,425 | 53,897 | |
| Red Robin Gourmet Burgers, Inc. (a) | 4,333 | 222,933 | |
| Red Rock Resorts, Inc. | 14,330 | 328,444 | |
| Ruth's Hospitality Group, Inc. | 10,732 | 182,444 | |
| Scientific Games Corp. Class A (a)(b) | 28,879 | 425,965 | |
| Sonic Corp. | 15,238 | 397,712 | |
| Starbucks Corp. | 488,086 | 28,294,345 | |
| Texas Roadhouse, Inc. Class A (b) | 22,945 | 1,075,891 | |
| The Cheesecake Factory, Inc. | 15,511 | 917,786 | |
| Town Sports International Holdings, Inc. (a) | 11,510 | 25,898 | |
| Tuniu Corp. Class A sponsored ADR (a)(b) | 12,168 | 110,485 | |
| Wendy's Co. (b) | 84,601 | 1,063,435 | |
| Wingstop, Inc. | 9,900 | 303,831 | |
| Wynn Resorts Ltd. (b) | 34,210 | 3,489,078 | |
| 72,695,062 | |||
| Household Durables - 0.2% | |||
| Bassett Furniture Industries, Inc. | 3,729 | 108,327 | |
| Cavco Industries, Inc. (a) | 2,956 | 279,490 | |
| Dixie Group, Inc. (a) | 3,770 | 12,818 | |
| Flexsteel Industries, Inc. | 2,745 | 150,646 | |
| Garmin Ltd. (b) | 62,407 | 3,255,149 | |
| GoPro, Inc. Class A (a)(b) | 33,592 | 335,248 | |
| Green Brick Partners, Inc. (a)(b) | 16,112 | 147,425 | |
| Helen of Troy Ltd. (a) | 9,366 | 797,047 | |
| Hooker Furniture Corp. | 4,235 | 115,616 | |
| iRobot Corp. (a)(b) | 8,564 | 488,148 | |
| LGI Homes, Inc. (a)(b) | 6,945 | 226,754 | |
| Lifetime Brands, Inc. | 5,439 | 90,831 | |
| Live Ventures, Inc. (a)(b) | 1,819 | 4,566 | |
| Nova LifeStyle, Inc. (a)(b) | 8,342 | 21,272 | |
| SGOCO Technology Ltd. (a) | 250 | 938 | |
| SodaStream International Ltd. (a)(b) | 7,370 | 268,415 | |
| Stanley Furniture Co., Inc. | 825 | 759 | |
| Turtle Beach Corp. (a)(b) | 21,513 | 30,764 | |
| Universal Electronics, Inc. (a) | 4,724 | 318,161 | |
| Vuzix Corp. (a)(b) | 6,024 | 48,192 | |
| Zagg, Inc. (a) | 10,728 | 70,805 | |
| 6,771,371 | |||
| Internet & Direct Marketing Retail - 7.2% | |||
| 1-800-FLOWERS.com, Inc. Class A (a) | 12,682 | 133,795 | |
| Amazon.com, Inc. (a)(b) | 158,235 | 118,766,444 | |
| Blue Nile, Inc. | 3,584 | 144,507 | |
| CafePress, Inc. (a) | 1,330 | 4,057 | |
| Cnova NV (a)(b) | 148,172 | 810,501 | |
| Ctrip.com International Ltd. ADR (a)(b) | 141,107 | 6,382,270 | |
| Duluth Holdings, Inc. (b) | 9,739 | 326,354 | |
| Etsy, Inc. (a) | 37,304 | 462,570 | |
| EVINE Live, Inc. (a) | 25,338 | 42,314 | |
| Expedia, Inc. | 46,031 | 5,710,146 | |
| FTD Companies, Inc. (a) | 9,560 | 218,542 | |
| Gaia, Inc. Class A (a) | 4,419 | 37,562 | |
| Groupon, Inc. Class A (a)(b) | 187,789 | 745,522 | |
| HSN, Inc. | 17,285 | 658,559 | |
| JD.com, Inc. sponsored ADR (a)(b) | 306,716 | 8,241,459 | |
| Lands' End, Inc. (a)(b) | 10,395 | 184,511 | |
| Liberty Expedia Holdings, Inc. (a) | 18,825 | 827,547 | |
| Liberty Interactive Corp.: | |||
| (Venture Group) Series A (a) | 28,237 | 1,101,808 | |
| QVC Group Series A (a) | 151,248 | 3,132,346 | |
| Liberty TripAdvisor Holdings, Inc. (a) | 25,793 | 413,978 | |
| MakeMyTrip Ltd. (a) | 14,272 | 344,669 | |
| Netflix, Inc. (a) | 143,245 | 16,759,665 | |
| NutriSystem, Inc. | 9,742 | 358,019 | |
| Overstock.com, Inc. (a) | 8,867 | 150,296 | |
| Overstock.com, Inc. rights 12/6/16 (a)(b) | 887 | 0 | |
| PetMed Express, Inc. (b) | 7,027 | 153,399 | |
| Priceline Group, Inc. (a) | 16,445 | 24,728,018 | |
| Qunar Cayman Islands Ltd. sponsored ADR (a)(b) | 23,534 | 706,726 | |
| Shutterfly, Inc. (a) | 11,027 | 558,738 | |
| TripAdvisor, Inc. (a)(b) | 44,159 | 2,131,997 | |
| U.S. Auto Parts Network, Inc. (a) | 15,907 | 45,335 | |
| 194,281,654 | |||
| Leisure Products - 0.3% | |||
| Arctic Cat, Inc. (b) | 4,512 | 68,763 | |
| Black Diamond, Inc. (a)(b) | 14,880 | 91,512 | |
| Escalade, Inc. | 5,185 | 71,294 | |
| Hasbro, Inc. | 41,897 | 3,577,585 | |
| JAKKS Pacific, Inc. (a)(b) | 11,010 | 77,621 | |
| Johnson Outdoors, Inc. Class A | 3,138 | 131,168 | |
| Malibu Boats, Inc. Class A (a) | 5,676 | 103,303 | |
| Mattel, Inc. (b) | 112,194 | 3,541,965 | |
| MCBC Holdings, Inc. | 6,935 | 93,206 | |
| Smith & Wesson Holding Corp. (a)(b) | 18,622 | 434,451 | |
| Summer Infant, Inc. (a) | 1,750 | 3,973 | |
| 8,194,841 | |||
| Media - 5.5% | |||
| AirMedia Group, Inc. ADR (a) | 20,876 | 58,453 | |
| AMC Networks, Inc. Class A (a) | 19,731 | 1,090,138 | |
| Beasley Broadcast Group, Inc. Class A | 689 | 4,375 | |
| Carmike Cinemas, Inc. (a)(b) | 7,720 | 260,936 | |
| Central European Media Enterprises Ltd. Class A (a)(b) | 48,238 | 127,831 | |
| Charter Communications, Inc. Class A (a) | 90,519 | 24,920,786 | |
| Cinedigm Corp. (a) | 1,960 | 2,920 | |
| Comcast Corp. Class A (b) | 800,907 | 55,671,046 | |
| Cumulus Media, Inc. Class A (a) | 7,572 | 9,162 | |
| Daily Journal Corp. (a)(b) | 588 | 142,137 | |
| Discovery Communications, Inc.: | |||
| Class A (a)(b) | 50,631 | 1,371,594 | |
| Class B (a) | 715 | 19,269 | |
| Class C (non-vtg.) (a)(b) | 79,621 | 2,105,179 | |
| DISH Network Corp. Class A (a) | 76,566 | 4,398,717 | |
| Emmis Communications Corp. Class A (a) | 621 | 2,037 | |
| Global Eagle Entertainment, Inc. (a) | 27,882 | 179,002 | |
| Hemisphere Media Group, Inc. (a) | 7,054 | 83,590 | |
| Insignia Systems, Inc. | 738 | 1,668 | |
| Liberty Broadband Corp.: | |||
| Class A (a) | 8,148 | 566,530 | |
| Class C (a)(b) | 51,496 | 3,672,180 | |
| Liberty Global PLC: | |||
| Class A (a) | 89,358 | 2,798,693 | |
| Class B (a) | 247 | 7,781 | |
| Class C (a) | 216,241 | 6,584,538 | |
| LiLAC Class A (a)(b) | 16,663 | 359,588 | |
| LiLAC Class C (a)(b) | 40,736 | 862,381 | |
| Liberty Media Corp.: | |||
| Liberty Braves Class A (a) | 4,387 | 88,398 | |
| Liberty Braves Class C (a) | 11,827 | 235,002 | |
| Liberty Media Class A (a) | 12,564 | 393,128 | |
| Liberty Media Class C (a) | 15,938 | 496,469 | |
| Liberty SiriusXM Class A (a) | 35,365 | 1,283,750 | |
| Liberty SiriusXM Class C (a) | 75,501 | 2,699,916 | |
| Loral Space & Communications Ltd. (a)(b) | 7,294 | 287,384 | |
| MDC Partners, Inc. Class A | 17,539 | 108,742 | |
| National CineMedia, Inc. | 21,120 | 323,981 | |
| News Corp.: | |||
| Class A | 127,018 | 1,468,328 | |
| Class B | 66,226 | 791,401 | |
| Nexstar Broadcasting Group, Inc. Class A (b) | 10,084 | 601,511 | |
| Radio One, Inc. Class D (non-vtg.) (a)(b) | 18,618 | 53,992 | |
| Reading International, Inc. Class A (a) | 8,651 | 135,907 | |
| Salem Communications Corp. Class A | 6,056 | 34,519 | |
| Scholastic Corp. (b) | 12,337 | 543,938 | |
| Scripps Networks Interactive, Inc. Class A (b) | 31,315 | 2,168,877 | |
| Sinclair Broadcast Group, Inc. Class A | 22,352 | 727,558 | |
| Sirius XM Holdings, Inc. (b) | 1,610,248 | 7,358,833 | |
| Spanish Broadcasting System, Inc. Class A (a) | 311 | 1,260 | |
| Starz Series A (a)(b) | 32,373 | 1,096,150 | |
| Tribune Publishing Co. | 12,223 | 159,143 | |
| Twenty-First Century Fox, Inc.: | |||
| Class A | 354,940 | 9,977,363 | |
| Class B | 267,724 | 7,512,335 | |
| Viacom, Inc.: | |||
| Class A (b) | 17,167 | 713,718 | |
| Class B (non-vtg.) | 114,558 | 4,293,634 | |
| Videocon d2h Ltd. sponsored ADR (a) | 13,671 | 127,687 | |
| VisionChina Media, Inc. ADR (a) | 1,079 | 5,719 | |
| Wecast Network, Inc. (a) | 15,827 | 18,992 | |
| WPP PLC ADR (b) | 5,697 | 605,249 | |
| 149,613,415 | |||
| Multiline Retail - 0.3% | |||
| Dollar Tree, Inc. (a)(b) | 79,327 | 6,993,468 | |
| Fred's, Inc. Class A | 14,161 | 141,468 | |
| Gordmans Stores, Inc. (a)(b) | 3,931 | 2,830 | |
| Ollie's Bargain Outlet Holdings, Inc. (a)(b) | 19,832 | 595,952 | |
| Sears Canada, Inc. (a)(b) | 29,750 | 50,052 | |
| Sears Holdings Corp. (a)(b) | 36,159 | 465,728 | |
| The Bon-Ton Stores, Inc. (b) | 5,468 | 8,639 | |
| Tuesday Morning Corp. (a) | 14,954 | 69,536 | |
| 8,327,673 | |||
| Specialty Retail - 1.5% | |||
| America's Car Mart, Inc. (a)(b) | 2,497 | 113,738 | |
| Ascena Retail Group, Inc. (a)(b) | 65,137 | 393,427 | |
| bebe stores, Inc. (a)(b) | 19,126 | 10,519 | |
| Bed Bath & Beyond, Inc. (b) | 50,633 | 2,268,865 | |
| Big 5 Sporting Goods Corp. | 7,420 | 143,577 | |
| Citi Trends, Inc. | 4,611 | 80,047 | |
| Conn's, Inc. (a)(b) | 9,568 | 107,640 | |
| DavidsTea, Inc. (a) | 9,202 | 87,879 | |
| Destination Maternity Corp. (b) | 6,011 | 40,274 | |
| Destination XL Group, Inc. (a)(b) | 19,982 | 81,926 | |
| Finish Line, Inc. Class A (b) | 13,458 | 301,998 | |
| Five Below, Inc. (a)(b) | 17,855 | 702,773 | |
| Francesca's Holdings Corp. (a)(b) | 12,836 | 205,119 | |
| Hibbett Sports, Inc. (a)(b) | 7,488 | 301,392 | |
| Kirkland's, Inc. (a) | 4,778 | 70,189 | |
| Michaels Companies, Inc. (a) | 69,125 | 1,685,268 | |
| Monro Muffler Brake, Inc. (b) | 10,670 | 638,066 | |
| O'Reilly Automotive, Inc. (a)(b) | 31,795 | 8,727,728 | |
| Office Depot, Inc. | 180,972 | 881,334 | |
| Perfumania Holdings, Inc. (a) | 1,858 | 3,159 | |
| Rent-A-Center, Inc. (b) | 16,571 | 191,395 | |
| Ross Stores, Inc. | 133,148 | 8,999,473 | |
| Sears Hometown & Outlet Stores, Inc. (a)(b) | 7,167 | 43,002 | |
| Select Comfort Corp. (a) | 15,318 | 346,493 | |
| Shagrir Group Vehicle Services Ltd. (a) | 902 | 1,883 | |
| Shoe Carnival, Inc. | 6,746 | 176,138 | |
| Sportsman's Warehouse Holdings, Inc. (a)(b) | 13,189 | 118,701 | |
| Staples, Inc. | 214,144 | 2,070,772 | |
| Stein Mart, Inc. | 15,416 | 76,772 | |
| Tandy Leather Factory, Inc. (a) | 1,041 | 7,860 | |
| The Children's Place Retail Stores, Inc. (b) | 6,134 | 637,016 | |
| Tile Shop Holdings, Inc. (a)(b) | 16,986 | 340,569 | |
| Tractor Supply Co. | 45,002 | 3,378,300 | |
| Trans World Entertainment Corp. (a) | 6,821 | 24,897 | |
| TravelCenters of America LLC (a) | 16,708 | 110,273 | |
| Ulta Salon, Cosmetics & Fragrance, Inc. (a) | 21,004 | 5,450,538 | |
| Urban Outfitters, Inc. (a)(b) | 38,804 | 1,226,206 | |
| West Marine, Inc. (a) | 10,472 | 100,741 | |
| Winmark Corp. | 1,713 | 196,567 | |
| Zumiez, Inc. (a)(b) | 8,312 | 206,138 | |
| 40,548,652 | |||
| Textiles, Apparel & Luxury Goods - 0.2% | |||
| Charles & Colvard Ltd. (a) | 4,097 | 3,564 | |
| Cherokee, Inc. (a) | 3,256 | 34,025 | |
| Columbia Sportswear Co. | 23,643 | 1,344,577 | |
| Crocs, Inc. (a) | 23,643 | 165,501 | |
| Crown Crafts, Inc. | 4,553 | 35,969 | |
| Differential Brands Group, Inc.(a) | 3,423 | 10,269 | |
| Fossil Group, Inc. (a)(b) | 15,384 | 514,133 | |
| G-III Apparel Group Ltd. (a) | 15,016 | 407,835 | |
| Iconix Brand Group, Inc. (a) | 18,589 | 166,743 | |
| Kingold Jewelry, Inc. (a)(b) | 26,949 | 38,537 | |
| Lakeland Industries, Inc. (a) | 2,257 | 25,617 | |
| lululemon athletica, Inc. (a)(b) | 42,061 | 2,397,056 | |
| Perry Ellis International, Inc. (a) | 4,580 | 116,882 | |
| Rocky Brands, Inc. | 3,378 | 35,976 | |
| Sequential Brands Group, Inc. (a)(b) | 19,492 | 99,799 | |
| Steven Madden Ltd. (a)(b) | 20,608 | 763,526 | |
| Superior Uniform Group, Inc. | 5,441 | 104,413 | |
| Vera Bradley, Inc. (a) | 12,194 | 175,837 | |
| 6,440,259 | |||
| TOTAL CONSUMER DISCRETIONARY | 512,633,360 | ||
| CONSUMER STAPLES - 5.1% | |||
| Beverages - 0.4% | |||
| Coca-Cola Bottling Co. Consolidated | 2,396 | 387,625 | |
| Craft Brew Alliance, Inc. (a)(b) | 6,958 | 105,762 | |
| MGP Ingredients, Inc. | 5,345 | 252,819 | |
| Monster Beverage Corp. (a)(b) | 191,553 | 8,571,997 | |
| National Beverage Corp. (b) | 15,377 | 776,385 | |
| Primo Water Corp. (a) | 8,555 | 110,017 | |
| 10,204,605 | |||
| Food & Staples Retailing - 2.3% | |||
| Andersons, Inc. | 9,610 | 378,154 | |
| Casey's General Stores, Inc. (b) | 12,906 | 1,554,528 | |
| Chefs' Warehouse Holdings (a)(b) | 8,602 | 111,396 | |
| China Jo-Jo Drugstores, Inc. (a) | 1,100 | 1,826 | |
| Costco Wholesale Corp. | 146,327 | 21,965,146 | |
| G Willi-Food International Ltd. | 4,242 | 25,452 | |
| Ingles Markets, Inc. Class A | 4,841 | 222,202 | |
| PriceSmart, Inc. | 10,228 | 933,816 | |
| SpartanNash Co. | 12,585 | 455,703 | |
| Sprouts Farmers Market LLC (a)(b) | 49,157 | 983,632 | |
| United Natural Foods, Inc. (a) | 16,630 | 780,779 | |
| Village Super Market, Inc. Class A | 4,168 | 143,921 | |
| Walgreens Boots Alliance, Inc. | 361,777 | 30,653,365 | |
| Whole Foods Market, Inc. (b) | 107,587 | 3,269,569 | |
| 61,479,489 | |||
| Food Products - 2.4% | |||
| Alico, Inc. | 3,689 | 100,710 | |
| Blue Buffalo Pet Products, Inc. (a)(b) | 65,251 | 1,528,831 | |
| Bridgford Foods Corp. (a) | 433 | 5,309 | |
| Cal-Maine Foods, Inc. (b) | 14,499 | 590,109 | |
| Calavo Growers, Inc. | 5,889 | 317,712 | |
| Farmer Brothers Co. (a)(b) | 6,095 | 212,411 | |
| Freshpet, Inc. (a)(b) | 11,791 | 109,067 | |
| Gores Holdings, Inc. (a) | 12,031 | 155,801 | |
| Inventure Foods, Inc. (a)(b) | 6,705 | 60,613 | |
| J&J Snack Foods Corp. | 6,624 | 804,352 | |
| John B. Sanfilippo & Son, Inc. | 2,814 | 179,252 | |
| Lancaster Colony Corp. | 9,054 | 1,226,908 | |
| Landec Corp. (a) | 8,847 | 126,512 | |
| Lifeway Foods, Inc. (a) | 5,561 | 64,674 | |
| Limoneira Co. (b) | 5,024 | 90,131 | |
| Mondelez International, Inc. | 519,504 | 21,424,345 | |
| Origin Agritech Ltd. (a)(b) | 10,619 | 28,247 | |
| Pilgrim's Pride Corp. (b) | 88,685 | 1,561,743 | |
| S&W Seed Co. (a)(b) | 8,090 | 38,832 | |
| Sanderson Farms, Inc. (b) | 7,538 | 607,940 | |
| Seneca Foods Corp. Class A (a) | 3,635 | 136,676 | |
| SkyPeople Fruit Juice, Inc. (a)(b) | 213 | 1,740 | |
| Snyders-Lance, Inc. (b) | 31,399 | 1,169,927 | |
| SunOpta, Inc. (a) | 28,883 | 210,846 | |
| The Hain Celestial Group, Inc. (a) | 33,832 | 1,325,876 | |
| The Kraft Heinz Co. | 405,907 | 33,142,307 | |
| 65,220,871 | |||
| Household Products - 0.0% | |||
| Central Garden & Pet Co. (a) | 6,313 | 182,319 | |
| Central Garden & Pet Co. Class A (non-vtg.) (a) | 9,545 | 261,247 | |
| WD-40 Co. (b) | 4,761 | 513,712 | |
| 957,278 | |||
| Personal Products - 0.0% | |||
| Inter Parfums, Inc. | 10,400 | 358,280 | |
| LifeVantage Corp. (a)(b) | 4,117 | 33,307 | |
| Mannatech, Inc. | 1,439 | 23,528 | |
| Natural Alternatives International, Inc. (a) | 2,371 | 29,045 | |
| Natural Health Trends Corp. (b) | 4,009 | 101,388 | |
| Nature's Sunshine Products, Inc. | 7,919 | 119,577 | |
| Neptune Technologies & Bioressources, Inc. (a)(b) | 17,693 | 18,176 | |
| Nutraceutical International Corp. | 3,678 | 118,616 | |
| Reliv International, Inc. (a) | 131 | 552 | |
| Synutra International, Inc. (a)(b) | 19,248 | 99,127 | |
| The Female Health Co. (a)(b) | 6,933 | 7,765 | |
| United-Guardian, Inc. | 2,237 | 36,239 | |
| 945,600 | |||
| TOTAL CONSUMER STAPLES | 138,807,843 | ||
| ENERGY - 0.6% | |||
| Energy Equipment & Services - 0.1% | |||
| Archrock Partners LP | 19,891 | 317,063 | |
| CSI Compressco LP | 12,448 | 124,480 | |
| Dawson Geophysical Co. (a)(b) | 7,613 | 59,762 | |
| ENGlobal Corp. (a) | 5,041 | 6,755 | |
| Geospace Technologies Corp. (a) | 4,623 | 97,869 | |
| Gulf Island Fabrication, Inc. | 5,322 | 63,066 | |
| Mammoth Energy Services, Inc. (b) | 11,890 | 190,597 | |
| Matrix Service Co. (a) | 9,776 | 203,830 | |
| Mitcham Industries, Inc. (a) | 2,123 | 8,110 | |
| Ocean Rig UDW, Inc. (United States) (a)(b) | 54,499 | 92,103 | |
| Patterson-UTI Energy, Inc. (b) | 48,981 | 1,306,323 | |
| PHI, Inc. (non-vtg.) (a) | 5,206 | 78,715 | |
| Profire Energy, Inc. (a)(b) | 7,873 | 10,471 | |
| RigNet, Inc. (a) | 7,072 | 121,992 | |
| SAExploration Holdings, Inc. | 3,303 | 28,175 | |
| SAExploration Holdings, Inc.: | |||
| warrants 7/27/21 (c) | 30 | 81 | |
| warrants 7/27/21 (c) | 30 | 97 | |
| Synthesis Energy Systems, Inc. (a)(b) | 23,079 | 21,925 | |
| Tesco Corp. | 19,394 | 150,304 | |
| 2,881,718 | |||
| Oil, Gas & Consumable Fuels - 0.5% | |||
| Abraxas Petroleum Corp. (a) | 51,492 | 108,133 | |
| Aemetis, Inc. (a)(b) | 5,390 | 9,217 | |
| Alliance Holdings GP, LP | 20,040 | 580,358 | |
| Alliance Resource Partners LP | 24,777 | 587,215 | |
| Amyris, Inc. (a)(b) | 82,041 | 72,393 | |
| Approach Resources, Inc. (a)(b) | 15,911 | 55,848 | |
| Blueknight Energy Partners LP | 13,867 | 91,522 | |
| Calumet Specialty Products Partners LP | 26,709 | 106,836 | |
| Capital Product Partners LP | 36,962 | 107,190 | |
| Carrizo Oil & Gas, Inc. (a) | 22,078 | 934,783 | |
| Centennial Resource Development, Inc. (a)(b) | 56,469 | 1,027,736 | |
| Clean Energy Fuels Corp. (a)(b) | 43,974 | 160,065 | |
| Diamondback Energy, Inc. (a) | 25,725 | 2,774,441 | |
| Dorchester Minerals LP | 11,954 | 199,034 | |
| EV Energy Partners LP | 19,111 | 35,738 | |
| Extraction Oil & Gas, Inc. (b) | 51,579 | 1,213,654 | |
| Gevo, Inc. (a)(b) | 46,115 | 14,987 | |
| Golar LNG Ltd. (b) | 30,818 | 751,959 | |
| Golar LNG Partners LP | 15,174 | 338,077 | |
| Green Plains Partners LP | 6,490 | 118,443 | |
| Green Plains, Inc. | 12,800 | 346,880 | |
| Gulfport Energy Corp. (a) | 41,246 | 1,059,610 | |
| Hallador Energy Co. | 13,014 | 119,599 | |
| Hongli Clean Energy Technologies Corp. (a) | 448 | 1,711 | |
| Isramco, Inc. (a)(b) | 884 | 104,091 | |
| Legacy Reserves LP | 24,413 | 46,995 | |
| Lonestar Resources U.S., Inc. (a)(b) | 3,155 | 28,300 | |
| Magellan Petroleum Corp. (a)(b) | 569 | 3,357 | |
| Marine Petroleum Trust | 339 | 1,183 | |
| Martin Midstream Partners LP | 11,473 | 195,041 | |
| Memorial Production Partners LP | 27,639 | 14,367 | |
| Mid-Con Energy Partners LP (a) | 7,322 | 18,232 | |
| Pacific Ethanol, Inc. (a) | 12,497 | 107,474 | |
| PDC Energy, Inc. (a)(b) | 18,585 | 1,383,653 | |
| PennTex Midstream Partners LP | 7,073 | 111,329 | |
| PrimeEnergy Corp. (a) | 333 | 17,150 | |
| Renewable Energy Group, Inc. (a) | 13,388 | 130,533 | |
| Rex Energy Corp. (a)(b) | 49,595 | 22,476 | |
| StealthGas, Inc. (a) | 12,561 | 44,717 | |
| Torchlight Energy Resources, Inc. (a)(b) | 26,806 | 34,312 | |
| TransGlobe Energy Corp. (a) | 19,974 | 35,240 | |
| U.S. Energy Corp. (a) | 529 | 809 | |
| Uranium Resources, Inc. (a) | 473 | 747 | |
| Vanguard Natural Resources LLC | 42,060 | 24,437 | |
| Vertex Energy, Inc. (a)(b) | 4,311 | 4,570 | |
| Viper Energy Partners LP | 29,730 | 466,761 | |
| Westmoreland Coal Co. (a) | 6,789 | 117,585 | |
| Zion Oil & Gas, Inc. (a) | 3,214 | 4,307 | |
| 13,733,095 | |||
| TOTAL ENERGY | 16,614,813 | ||
| FINANCIALS - 7.4% | |||
| Banks - 3.5% | |||
| 1st Source Corp. | 11,305 | 444,965 | |
| Access National Corp. (b) | 4,256 | 116,487 | |
| ACNB Corp. | 2,601 | 80,891 | |
| Allegiance Bancshares, Inc. (a) | 4,276 | 130,846 | |
| American National Bankshares, Inc. | 4,129 | 128,618 | |
| American River Bankshares (a) | 684 | 9,296 | |
| Ameris Bancorp | 11,054 | 495,772 | |
| Ames National Corp. (b) | 4,791 | 143,970 | |
| Anchor Bancorp (a) | 1,168 | 29,901 | |
| Arrow Financial Corp. | 6,539 | 247,501 | |
| Atlantic Capital Bancshares, Inc. (a) | 11,079 | 178,372 | |
| BancFirst Corp. | 5,454 | 446,955 | |
| Bancorp, Inc., Delaware (a) | 18,533 | 128,248 | |
| Bank of Commerce Holdings | 7,378 | 61,975 | |
| Bank of Marin Bancorp | 2,839 | 180,135 | |
| Bank of the Ozarks, Inc. (b) | 39,799 | 1,931,047 | |
| Bankwell Financial Group, Inc. | 3,662 | 106,747 | |
| Banner Corp. (b) | 11,493 | 599,130 | |
| BCB Bancorp, Inc. | 4,294 | 51,957 | |
| Blue Hills Bancorp, Inc. | 10,150 | 176,610 | |
| BNC Bancorp | 16,090 | 485,918 | |
| BOK Financial Corp. (b) | 22,316 | 1,792,421 | |
| Boston Private Financial Holdings, Inc. | 24,048 | 360,720 | |
| Bridge Bancorp, Inc. | 5,725 | 192,646 | |
| Brookline Bancorp, Inc., Delaware | 24,941 | 371,621 | |
| Bryn Mawr Bank Corp. | 7,262 | 267,242 | |
| C & F Financial Corp. | 1,712 | 77,211 | |
| California First National Bancorp | 3,963 | 61,030 | |
| Camden National Corp. | 5,031 | 195,957 | |
| Capital Bank Financial Corp. Series A | 12,322 | 441,128 | |
| Capital City Bank Group, Inc. | 7,950 | 149,858 | |
| Cardinal Financial Corp. | 10,114 | 323,547 | |
| Carolina Financial Corp. | 4,948 | 131,270 | |
| Cascade Bancorp (a) | 29,989 | 218,320 | |
| Cathay General Bancorp | 24,735 | 868,199 | |
| Centerstate Banks of Florida, Inc. | 14,725 | 330,135 | |
| Central Valley Community Bancorp | 4,976 | 82,204 | |
| Century Bancorp, Inc. Class A (non-vtg.) | 1,598 | 86,851 | |
| Chemical Financial Corp. | 23,359 | 1,211,865 | |
| Chemung Financial Corp. (b) | 2,085 | 65,552 | |
| Citizens & Northern Corp. | 5,396 | 128,695 | |
| Citizens Holding Co. | 1,328 | 32,138 | |
| City Holding Co. | 4,893 | 300,822 | |
| Civista Bancshares, Inc. (b) | 2,823 | 53,637 | |
| CNB Financial Corp., Pennsylvania | 7,829 | 182,103 | |
| CoBiz, Inc. | 14,313 | 216,556 | |
| Codorus Valley Bancorp, Inc. | 3,966 | 95,184 | |
| Colony Bankcorp, Inc. (a) | 217 | 2,441 | |
| Columbia Banking Systems, Inc. | 18,260 | 727,113 | |
| Commerce Bancshares, Inc. | 32,627 | 1,788,286 | |
| Commerce Union Bancshares, Inc. (b) | 2,659 | 55,174 | |
| Community Trust Bancorp, Inc. | 8,447 | 356,886 | |
| ConnectOne Bancorp, Inc. | 12,161 | 285,784 | |
| County Bancorp, Inc. | 2,691 | 60,763 | |
| CU Bancorp (a) | 6,745 | 188,186 | |
| CVB Financial Corp. | 33,762 | 701,237 | |
| DNB Financial Corp. | 927 | 25,493 | |
| Eagle Bancorp, Inc. (a)(b) | 11,065 | 650,069 | |
| East West Bancorp, Inc. | 47,393 | 2,269,177 | |
| Eastern Virginia Bankshares, Inc. | 5,032 | 46,093 | |
| Enterprise Bancorp, Inc. | 3,918 | 123,613 | |
| Enterprise Financial Services Corp. | 7,240 | 278,016 | |
| Equity Bancshares, Inc. | 2,827 | 88,542 | |
| Farmers Capital Bank Corp. | 4,701 | 168,766 | |
| Farmers National Banc Corp. | 10,314 | 122,221 | |
| Fidelity Southern Corp. | 8,808 | 196,418 | |
| Fifth Third Bancorp (b) | 253,276 | 6,590,242 | |
| Financial Institutions, Inc. | 6,422 | 196,834 | |
| First Bancorp, North Carolina | 7,553 | 188,825 | |
| First Busey Corp. | 12,667 | 347,202 | |
| First Business Finance Services, Inc. | 3,986 | 87,493 | |
| First Citizen Bancshares, Inc. | 3,575 | 1,274,023 | |
| First Community Bancshares, Inc. | 6,673 | 188,179 | |
| First Community Financial Partners, Inc. (a)(b) | 7,744 | 84,410 | |
| First Connecticut Bancorp, Inc. | 8,186 | 177,227 | |
| First Financial Bancorp, Ohio | 21,788 | 583,918 | |
| First Financial Bankshares, Inc. (b) | 21,661 | 932,506 | |
| First Financial Corp., Indiana | 4,769 | 218,420 | |
| First Financial Northwest, Inc. | 6,788 | 115,124 | |
| First Foundation, Inc. (a) | 5,772 | 161,731 | |
| First Hawaiian, Inc. (b) | 47,689 | 1,430,193 | |
| First Internet Bancorp (b) | 1,663 | 48,310 | |
| First Interstate Bancsystem, Inc. | 8,036 | 303,359 | |
| First Merchants Corp. | 13,461 | 462,116 | |
| First Mid-Illinois Bancshares, Inc. | 4,179 | 127,251 | |
| First Midwest Bancorp, Inc., Delaware | 23,888 | 580,001 | |
| First NBC Bank Holding Co. (a)(b) | 5,831 | 41,109 | |
| First Northwest Bancorp (a)(b) | 4,336 | 63,913 | |
| First of Long Island Corp. | 8,065 | 206,464 | |
| First South Bancorp, Inc., Virginia | 619 | 6,877 | |
| First United Corp. (a) | 493 | 6,384 | |
| Flushing Financial Corp. | 9,880 | 258,658 | |
| Fulton Financial Corp. (b) | 52,368 | 929,532 | |
| German American Bancorp, Inc. | 6,184 | 293,369 | |
| Glacier Bancorp, Inc. | 23,700 | 812,910 | |
| Great Southern Bancorp, Inc. | 5,315 | 263,890 | |
| Green Bancorp, Inc. (a) | 12,894 | 161,175 | |
| Grupo Financiero Galicia SA sponsored ADR (b) | 15,917 | 432,783 | |
| Guaranty Bancorp | 9,082 | 193,447 | |
| Hancock Holding Co. | 24,596 | 1,021,964 | |
| Hanmi Financial Corp. | 11,040 | 338,928 | |
| HarborOne Bancorp, Inc. | 10,357 | 194,712 | |
| Hawthorn Bancshares, Inc. | 705 | 11,562 | |
| Heartland Financial U.S.A., Inc. | 8,263 | 354,070 | |
| Heritage Commerce Corp. | 14,464 | 179,209 | |
| Heritage Financial Corp., Washington | 12,452 | 282,038 | |
| Heritage Oaks Bancorp | 14,879 | 148,046 | |
| Home Bancshares, Inc. | 47,374 | 1,225,565 | |
| HomeTrust Bancshares, Inc. (a) | 7,652 | 181,352 | |
| Hope Bancorp, Inc. (b) | 44,726 | 890,047 | |
| Horizon Bancorp Industries | 9,334 | 212,629 | |
| Huntington Bancshares, Inc. | 359,061 | 4,473,900 | |
| IBERIABANK Corp. (b) | 13,262 | 1,098,757 | |
| Independent Bank Corp. | 7,711 | 145,738 | |
| Independent Bank Corp., Massachusetts | 9,921 | 645,857 | |
| Independent Bank Group, Inc. | 5,870 | 352,787 | |
| International Bancshares Corp. | 25,171 | 979,781 | |
| Investar Holding Corp. | 1,376 | 24,699 | |
| Investors Bancorp, Inc. | 97,952 | 1,326,270 | |
| Lakeland Bancorp, Inc. | 17,459 | 306,405 | |
| Lakeland Financial Corp. | 8,143 | 343,635 | |
| Landmark Bancorp, Inc. | 543 | 14,677 | |
| LCNB Corp. (b) | 4,073 | 84,311 | |
| LegacyTexas Financial Group, Inc. | 15,448 | 606,488 | |
| Live Oak Bancshares, Inc. (b) | 10,398 | 180,405 | |
| Macatawa Bank Corp. (b) | 15,222 | 143,543 | |
| MainSource Financial Group, Inc. | 9,195 | 281,091 | |
| MB Financial, Inc. | 27,683 | 1,197,843 | |
| MBT Financial Corp. | 9,373 | 89,512 | |
| Mercantile Bank Corp. | 6,559 | 215,201 | |
| Merchants Bancshares, Inc. | 2,816 | 139,110 | |
| Middleburg Financial Corp. | 2,232 | 77,540 | |
| Midland States Bancorp, Inc. | 6,137 | 199,821 | |
| MidWestOne Financial Group, Inc. | 4,560 | 152,714 | |
| MutualFirst Financial, Inc. | 3,641 | 108,320 | |
| National Bankshares, Inc. (b) | 2,969 | 107,181 | |
| National Commerce Corp. (a)(b) | 4,298 | 140,545 | |
| NBT Bancorp, Inc. | 18,118 | 700,080 | |
| Nicolet Bankshares, Inc. (a)(b) | 3,118 | 137,722 | |
| Northeast Bancorp | 3,226 | 37,906 | |
| Northrim Bancorp, Inc. | 2,711 | 76,179 | |
| Norwood Financial Corp. | 895 | 29,759 | |
| Oak Valley Bancorp Oakdale California | 1,916 | 22,187 | |
| Ohio Valley Banc Corp. | 1,615 | 39,164 | |
| Old Line Bancshares, Inc. | 4,801 | 105,094 | |
| Old National Bancorp, Indiana | 39,741 | 677,584 | |
| Old Point Financial Corp. | 453 | 9,740 | |
| Old Second Bancorp, Inc. | 12,946 | 119,103 | |
| Opus Bank | 11,059 | 279,793 | |
| Orrstown Financial Services, Inc. | 3,193 | 71,044 | |
| Pacific Continental Corp. | 7,115 | 141,233 | |
| Pacific Mercantile Bancorp (a) | 11,962 | 72,370 | |
| Pacific Premier Bancorp, Inc. (a) | 9,384 | 300,757 | |
| PacWest Bancorp (b) | 38,718 | 1,984,298 | |
| Park Sterling Corp. | 17,930 | 174,459 | |
| Patriot National Bancorp, Inc. (a) | 1,723 | 24,036 | |
| Peapack-Gladstone Financial Corp. | 5,501 | 147,262 | |
| Penns Woods Bancorp, Inc. | 2,428 | 114,893 | |
| People's Utah Bancorp | 6,673 | 154,146 | |
| Peoples Bancorp of North Carolina | 1,863 | 41,284 | |
| Peoples Bancorp, Inc. | 6,192 | 180,868 | |
| Peoples Financial Services Corp. | 3,284 | 144,890 | |
| Peoples United Financial, Inc. (b) | 96,750 | 1,811,160 | |
| Pinnacle Financial Partners, Inc. (b) | 15,007 | 967,952 | |
| Popular, Inc. | 33,685 | 1,369,295 | |
| Preferred Bank, Los Angeles | 4,831 | 217,830 | |
| Premier Financial Bancorp, Inc. | 5,570 | 102,432 | |
| PrivateBancorp, Inc. | 26,178 | 1,224,607 | |
| QCR Holdings, Inc. | 4,346 | 165,800 | |
| Randolph Bancorp, Inc. | 2,023 | 30,042 | |
| Renasant Corp. | 13,219 | 548,060 | |
| Republic Bancorp, Inc., Kentucky Class A | 7,206 | 266,838 | |
| Republic First Bancorp, Inc. (a) | 15,141 | 81,004 | |
| S&T Bancorp, Inc. | 12,564 | 444,640 | |
| Sandy Spring Bancorp, Inc. | 12,284 | 447,138 | |
| SB Financial Group, Inc. | 723 | 10,230 | |
| Seacoast Banking Corp., Florida (a) | 12,593 | 258,912 | |
| ServisFirst Bancshares, Inc. (b) | 8,559 | 630,114 | |
| Shore Bancshares, Inc. | 6,024 | 84,035 | |
| Sierra Bancorp | 5,359 | 122,453 | |
| Signature Bank (a) | 18,027 | 2,702,428 | |
| Simmons First National Corp. Class A | 9,854 | 595,674 | |
| SmartFinancial, Inc. (a)(b) | 1,062 | 20,157 | |
| South State Corp. | 8,095 | 687,670 | |
| Southern First Bancshares, Inc. (a) | 2,719 | 83,473 | |
| Southern National Bancorp of Virginia, Inc. | 5,523 | 82,072 | |
| Southside Bancshares, Inc. | 8,738 | 336,151 | |
| Southwest Bancorp, Inc., Oklahoma | 6,487 | 141,741 | |
| State Bank Financial Corp. | 14,199 | 350,573 | |
| Stock Yards Bancorp, Inc. | 7,992 | 329,270 | |
| Stonegate Bank | 4,587 | 178,847 | |
| Summit Financial Group, Inc. (b) | 4,582 | 112,167 | |
| Sun Bancorp, Inc. | 8,794 | 201,822 | |
| SVB Financial Group (a)(b) | 17,467 | 2,760,310 | |
| Texas Capital Bancshares, Inc. (a) | 14,697 | 1,069,207 | |
| The First Bancorp, Inc. | 4,381 | 127,137 | |
| TowneBank | 21,672 | 698,922 | |
| Trico Bancshares | 8,202 | 256,395 | |
| TriState Capital Holdings, Inc. (a) | 11,591 | 236,456 | |
| Triumph Bancorp, Inc. (a) | 6,458 | 138,524 | |
| Trustmark Corp. | 19,965 | 673,020 | |
| UMB Financial Corp. | 16,111 | 1,224,758 | |
| Umpqua Holdings Corp. | 69,246 | 1,230,501 | |
| Union Bankshares Corp. | 14,349 | 484,996 | |
| Union Bankshares, Inc. (b) | 1,395 | 61,241 | |
| United Bankshares, Inc., West Virginia (b) | 23,559 | 1,087,248 | |
| United Community Bank, Inc. | 21,586 | 586,707 | |
| United Security Bancshares, Inc. | 450 | 4,878 | |
| United Security Bancshares, California | 1,214 | 8,012 | |
| Unity Bancorp, Inc. | 858 | 11,669 | |
| Univest Corp. of Pennsylvania | 9,555 | 272,795 | |
| Veritex Holdings, Inc. (a) | 5,040 | 100,044 | |
| Washington Trust Bancorp, Inc. | 5,751 | 293,013 | |
| WashingtonFirst Bankshares, Inc. | 3,807 | 104,160 | |
| Wellesley Bancorp, Inc. | 1,635 | 40,058 | |
| WesBanco, Inc. | 17,163 | 684,289 | |
| West Bancorp., Inc. | 7,617 | 169,478 | |
| Westamerica Bancorp. (b) | 8,501 | 527,317 | |
| Wintrust Financial Corp. | 16,144 | 1,062,921 | |
| Xenith Bankshares, Inc. (a) | 89,325 | 223,313 | |
| Zions Bancorporation | 66,609 | 2,650,372 | |
| 95,968,838 | |||
| Capital Markets - 2.1% | |||
| American Capital Ltd. (a) | 104,256 | 1,806,756 | |
| American Capital Senior Floating Ltd. | 6,994 | 81,830 | |
| B. Riley Financial, Inc. | 6,963 | 116,282 | |
| BGC Partners, Inc. Class A | 82,250 | 803,583 | |
| Calamos Asset Management, Inc. Class A | 10,100 | 69,084 | |
| Capital Southwest Corp. | 8,313 | 123,864 | |
| Capitala Finance Corp. | 7,384 | 91,931 | |
| Carlyle Group LP | 28,190 | 438,355 | |
| CBOE Holdings, Inc. | 27,330 | 1,883,037 | |
| CM Finance, Inc. | 5,770 | 56,546 | |
| CME Group, Inc. (b) | 112,952 | 12,753,410 | |
| Cowen Group, Inc. Class A (a)(b) | 35,439 | 129,352 | |
| Diamond Hill Investment Group, Inc. | 1,589 | 332,260 | |
| E*TRADE Financial Corp. (a) | 91,520 | 3,158,355 | |
| FBR & Co. | 4,327 | 49,977 | |
| Fifth Street Asset Management, Inc. Class A | 4,060 | 25,172 | |
| Financial Engines, Inc. (b) | 20,585 | 717,387 | |
| Harris & Harris Group, Inc. (a)(b) | 12,222 | 15,278 | |
| Harvest Capital Credit Corp. | 5,062 | 64,996 | |
| Hennessy Advisors, Inc. | 2,494 | 84,771 | |
| Horizon Technology Finance Corp. (b) | 4,364 | 47,524 | |
| Interactive Brokers Group, Inc. | 23,171 | 850,839 | |
| INTL FCStone, Inc. (a) | 6,458 | 265,488 | |
| LPL Financial | 29,402 | 1,211,068 | |
| MarketAxess Holdings, Inc. | 12,577 | 2,084,889 | |
| Morningstar, Inc. | 15,406 | 1,123,251 | |
| Newtek Business Services Corp. (b) | 6,404 | 98,109 | |
| Northern Trust Corp. | 75,252 | 6,181,952 | |
| Paragon Commercial Corp. | 1,899 | 77,137 | |
| Quinpario Acquistion Corp. 2 (a) | 14,089 | 139,904 | |
| SEI Investments Co. | 53,939 | 2,544,842 | |
| Siebert Financial Corp. | 2,067 | 3,038 | |
| Silvercrest Asset Management Group Class A | 4,684 | 62,766 | |
| T. Rowe Price Group, Inc. (b) | 82,511 | 6,110,765 | |
| TD Ameritrade Holding Corp. | 175,904 | 7,213,823 | |
| The NASDAQ OMX Group, Inc. | 55,380 | 3,549,304 | |
| TheStreet.com, Inc. | 8,907 | 7,927 | |
| U.S. Global Investments, Inc. Class A | 870 | 1,253 | |
| Value Line, Inc. (b) | 1,458 | 32,222 | |
| Virtu Financial, Inc. Class A | 13,610 | 188,499 | |
| Virtus Investment Partners, Inc. (b) | 2,673 | 309,533 | |
| Wins Finance Holdings, Inc. (a)(b) | 1,214 | 185,208 | |
| WisdomTree Investments, Inc. (b) | 45,691 | 505,342 | |
| Yintech Investment Holdings Ltd. sponsored ADR | 3,598 | 62,965 | |
| 55,659,874 | |||
| Consumer Finance - 0.2% | |||
| Asta Funding, Inc. (a) | 7,175 | 63,858 | |
| Atlanticus Holdings Corp. (a) | 2,291 | 7,033 | |
| Consumer Portfolio Services, Inc. (a) | 11,810 | 59,641 | |
| Credit Acceptance Corp. (a)(b) | 6,708 | 1,286,863 | |
| Encore Capital Group, Inc. (a)(b) | 8,260 | 226,737 | |
| EZCORP, Inc. (non-vtg.) Class A (a) | 17,248 | 200,939 | |
| Navient Corp. | 105,078 | 1,810,494 | |
| Nicholas Financial, Inc. (a) | 4,973 | 49,133 | |
| PRA Group, Inc. (a)(b) | 15,506 | 557,441 | |
| SLM Corp. (a) | 142,686 | 1,436,848 | |
| World Acceptance Corp. (a)(b) | 3,024 | 170,160 | |
| 5,869,147 | |||
| Diversified Financial Services - 0.0% | |||
| A-Mark Precious Metals, Inc. | 3,619 | 59,243 | |
| Ability, Inc. (a) | 4,624 | 16,461 | |
| Boulevard Acquisition Corp. II (a) | 4,613 | 45,623 | |
| China Commercial Credit, Inc. (a) | 1,526 | 2,213 | |
| Double Eagle Acquisition Corp. (a) | 1,100 | 10,835 | |
| Marlin Business Services Corp. | 6,662 | 135,572 | |
| NewStar Financial, Inc. (a) | 16,205 | 137,580 | |
| Pace Holdings Corp. (a) | 9,866 | 97,575 | |
| PICO Holdings, Inc. (a) | 9,027 | 129,086 | |
| Smart Sand, Inc. | 9,764 | 133,474 | |
| Tiptree Financial, Inc. | 13,335 | 86,011 | |
| 853,673 | |||
| Insurance - 1.0% | |||
| AMBAC Financial Group, Inc. (a) | 14,678 | 359,611 | |
| American National Insurance Co. | 9,117 | 1,098,599 | |
| Amerisafe, Inc. | 6,213 | 394,836 | |
| AmTrust Financial Services, Inc. (b) | 56,187 | 1,430,521 | |
| Arch Capital Group Ltd. (a) | 40,758 | 3,371,502 | |
| Argo Group International Holdings, Ltd. | 9,726 | 617,115 | |
| Atlas Financial Holdings, Inc. (a) | 5,400 | 91,260 | |
| Baldwin & Lyons, Inc. Class B | 5,653 | 149,805 | |
| Cincinnati Financial Corp. (b) | 54,920 | 4,214,561 | |
| CNinsure, Inc. ADR (a) | 13,271 | 126,075 | |
| Conifer Holdings, Inc. (a) | 3,170 | 22,666 | |
| Donegal Group, Inc. Class A | 9,906 | 158,991 | |
| eHealth, Inc. (a) | 6,376 | 64,780 | |
| EMC Insurance Group | 9,137 | 252,273 | |
| Enstar Group Ltd. (a) | 5,667 | 1,114,416 | |
| Erie Indemnity Co. Class A | 16,691 | 1,788,774 | |
| Federated National Holding Co. | 4,343 | 75,525 | |
| Global Indemnity Ltd. (a) | 5,659 | 211,420 | |
| Greenlight Capital Re, Ltd. (a) | 10,496 | 238,784 | |
| Hallmark Financial Services, Inc. (a) | 8,020 | 85,573 | |
| Health Insurance Innovations, Inc. (a) | 2,090 | 28,215 | |
| Infinity Property & Casualty Corp. | 3,697 | 318,866 | |
| Investors Title Co. | 621 | 76,650 | |
| James River Group Holdings Ltd. | 9,997 | 389,683 | |
| Kingstone Companies, Inc. | 3,333 | 42,162 | |
| Kinsale Capital Group, Inc. | 6,913 | 197,090 | |
| Maiden Holdings Ltd. (b) | 30,429 | 468,607 | |
| National General Holdings Corp. | 34,791 | 785,929 | |
| National Western Life Group, Inc. | 1,104 | 288,630 | |
| Navigators Group, Inc. (b) | 4,746 | 500,228 | |
| Oxbridge Re Holdings Ltd. | 1,344 | 7,325 | |
| Safety Insurance Group, Inc. | 4,986 | 350,765 | |
| Selective Insurance Group, Inc. | 18,586 | 763,885 | |
| State Auto Financial Corp. | 14,792 | 381,486 | |
| State National Companies, Inc. | 15,066 | 202,336 | |
| Trupanion, Inc. (a)(b) | 9,397 | 156,460 | |
| Unico American Corp. (a) | 912 | 9,257 | |
| United Fire Group, Inc. | 8,472 | 384,629 | |
| United Insurance Holdings Corp. | 7,853 | 106,644 | |
| Willis Group Holdings PLC | 45,573 | 5,667,914 | |
| WMI Holdings Corp. (a) | 78,943 | 134,203 | |
| 27,128,051 | |||
| Mortgage Real Estate Investment Trusts - 0.1% | |||
| Agnc Investment Corp. | 107,836 | 2,012,220 | |
| American Capital Mortgage Investment Corp. | 14,816 | 247,427 | |
| CIM Commercial Trust Corp. | 29,458 | 449,235 | |
| New York Mortgage Trust, Inc. (b) | 32,846 | 219,411 | |
| 2,928,293 | |||
| Thrifts & Mortgage Finance - 0.5% | |||
| America First Tax Exempt Investors LP | 22,769 | 129,783 | |
| ASB Bancorp, Inc. (a) | 1,233 | 34,154 | |
| Bank Mutual Corp. (b) | 21,336 | 190,957 | |
| BankFinancial Corp. | 9,953 | 140,337 | |
| Bear State Financial, Inc. (b) | 15,359 | 152,054 | |
| Beneficial Bancorp, Inc. | 25,418 | 442,273 | |
| BofI Holding, Inc. (a)(b) | 20,747 | 490,252 | |
| BSB Bancorp, Inc. (a) | 5,184 | 138,154 | |
| Capitol Federal Financial, Inc. | 45,002 | 715,982 | |
| Carver Bancorp, Inc. (a) | 695 | 3,253 | |
| Charter Financial Corp. | 6,783 | 97,065 | |
| Citizens Community Bancorp, Inc. | 2,795 | 31,863 | |
| Clifton Bancorp, Inc. | 9,922 | 162,026 | |
| Dime Community Bancshares, Inc. | 16,798 | 314,123 | |
| ESSA Bancorp, Inc. (b) | 5,151 | 76,286 | |
| First Capital, Inc. | 744 | 24,403 | |
| First Defiance Financial Corp. | 3,399 | 157,340 | |
| Hingham Institution for Savings | 854 | 143,062 | |
| HMN Financial, Inc. (a) | 448 | 7,190 | |
| Home Bancorp, Inc. | 2,884 | 97,191 | |
| HomeStreet, Inc. (a) | 7,795 | 226,445 | |
| HopFed Bancorp, Inc. | 2,721 | 35,074 | |
| Kearny Financial Corp. | 27,149 | 411,307 | |
| Lake Shore Bancorp, Inc. | 812 | 11,514 | |
| Lake Sunapee Bank Group (b) | 3,331 | 72,616 | |
| Lendingtree, Inc. (a)(b) | 3,867 | 405,262 | |
| Malvern Bancorp, Inc. (a) | 3,267 | 65,340 | |
| Meridian Bancorp, Inc. | 18,347 | 325,659 | |
| Meta Financial Group, Inc. | 2,741 | 249,294 | |
| NMI Holdings, Inc. (a) | 20,555 | 176,773 | |
| Northfield Bancorp, Inc. (b) | 18,421 | 341,341 | |
| Northwest Bancshares, Inc. (b) | 31,175 | 566,450 | |
| Ocean Shore Holding Co. | 2,171 | 59,268 | |
| OceanFirst Financial Corp. (d) | 10,909 | 258,761 | |
| Oritani Financial Corp. | 17,470 | 308,346 | |
| Provident Financial Holdings, Inc. | 4,259 | 83,945 | |
| Prudential Bancorp, Inc. | 3,638 | 58,135 | |
| Riverview Bancorp, Inc. | 11,994 | 72,804 | |
| Severn Bancorp, Inc. (a) | 677 | 4,468 | |
| SI Financial Group, Inc. | 7,040 | 98,560 | |
| Southern Missouri Bancorp, Inc. | 3,040 | 87,856 | |
| Territorial Bancorp, Inc. | 5,176 | 162,889 | |
| TFS Financial Corp. | 98,375 | 1,832,726 | |
| Trustco Bank Corp., New York | 36,411 | 296,750 | |
| United Community Financial Corp. | 21,064 | 172,304 | |
| United Financial Bancorp, Inc. New | 25,398 | 428,718 | |
| Washington Federal, Inc. (b) | 28,547 | 926,350 | |
| Waterstone Financial, Inc. | 10,847 | 194,161 | |
| Westfield Financial, Inc. | 14,410 | 121,044 | |
| WSFS Financial Corp. | 9,722 | 414,643 | |
| 12,016,551 | |||
| TOTAL FINANCIALS | 200,424,427 | ||
| HEALTH CARE - 13.1% | |||
| Biotechnology - 8.3% | |||
| Abeona Therapeutics, Inc. (a)(b) | 13,245 | 82,781 | |
| AC Immune SA (b) | 17,649 | 204,552 | |
| ACADIA Pharmaceuticals, Inc. (a)(b) | 39,937 | 1,077,900 | |
| Acceleron Pharma, Inc. (a) | 13,050 | 439,655 | |
| Achillion Pharmaceuticals, Inc. (a) | 43,363 | 179,523 | |
| Acorda Therapeutics, Inc. (a) | 15,466 | 321,693 | |
| Adamas Pharmaceuticals, Inc. (a)(b) | 7,682 | 115,230 | |
| Adaptimmune Therapeutics PLC sponsored ADR (a)(b) | 13,732 | 57,262 | |
| ADMA Biologics, Inc. (a)(b) | 4,173 | 23,118 | |
| Aduro Biotech, Inc. (a)(b) | 22,256 | 253,718 | |
| Advanced Accelerator Applications SA sponsored ADR (b) | 11,727 | 343,015 | |
| Advaxis, Inc. (a)(b) | 11,351 | 94,327 | |
| Adverum Biotechnologies, Inc. (a) | 17,955 | 51,172 | |
| Aeglea BioTherapeutics, Inc. (b) | 3,074 | 15,893 | |
| Affimed NV (a)(b) | 18,764 | 37,528 | |
| Agenus, Inc. (a)(b) | 29,549 | 121,742 | |
| Agios Pharmaceuticals, Inc. (a)(b) | 13,704 | 797,710 | |
| Aimmune Therapeutics, Inc. (a) | 13,570 | 308,039 | |
| Akebia Therapeutics, Inc. (a) | 12,072 | 103,940 | |
| Alder Biopharmaceuticals, Inc. (a)(b) | 16,720 | 393,756 | |
| Aldeyra Therapeutics, Inc. (a)(b) | 4,419 | 22,758 | |
| Alexion Pharmaceuticals, Inc. (a) | 75,207 | 9,219,626 | |
| Alkermes PLC (a)(b) | 51,658 | 2,935,724 | |
| Alnylam Pharmaceuticals, Inc. (a)(b) | 28,332 | 1,242,925 | |
| AMAG Pharmaceuticals, Inc. (a)(b) | 11,418 | 379,078 | |
| Amarin Corp. PLC ADR (a)(b) | 91,565 | 296,671 | |
| Amgen, Inc. | 249,932 | 36,007,703 | |
| Amicus Therapeutics, Inc. (a)(b) | 48,846 | 292,099 | |
| Anavex Life Sciences Corp. (a)(b) | 12,694 | 50,395 | |
| Anthera Pharmaceuticals, Inc. (a)(b) | 16,116 | 24,174 | |
| Applied Genetic Technologies Corp. (a) | 5,947 | 54,712 | |
| Aquinox Pharmaceuticals, Inc. (a)(b) | 7,745 | 107,888 | |
| Arbutus Biopharma Corp. (a)(b) | 21,181 | 56,130 | |
| Ardelyx, Inc. (a)(b) | 18,297 | 270,796 | |
| Arena Pharmaceuticals, Inc. (a)(b) | 79,017 | 114,575 | |
| Argos Therapeutics, Inc. (a)(b) | 14,047 | 65,319 | |
| ARIAD Pharmaceuticals, Inc. (a)(b) | 63,867 | 860,927 | |
| ArQule, Inc. (a) | 26,211 | 35,909 | |
| Array BioPharma, Inc. (a) | 61,061 | 494,289 | |
| Arrowhead Pharmaceuticals, Inc. (a)(b) | 25,907 | 37,306 | |
| Ascendis Pharma A/S sponsored ADR (a)(b) | 6,221 | 127,717 | |
| Atara Biotherapeutics, Inc. (a)(b) | 9,928 | 197,071 | |
| Athersys, Inc. (a)(b) | 32,263 | 53,234 | |
| aTyr Pharma, Inc. (a)(b) | 8,217 | 25,473 | |
| Audentes Therapeutics, Inc. (b) | 7,261 | 119,298 | |
| Aurinia Pharmaceuticals, Inc. (a)(b) | 9,563 | 29,072 | |
| AVEO Pharmaceuticals, Inc. (a)(b) | 33,803 | 21,019 | |
| Aviragen Therapeutics, Inc. (a)(b) | 7,051 | 9,942 | |
| BeiGene Ltd. ADR | 3,313 | 105,022 | |
| Bellicum Pharmaceuticals, Inc. (a)(b) | 9,264 | 166,104 | |
| BioCryst Pharmaceuticals, Inc. (a) | 26,209 | 146,508 | |
| Biogen, Inc. (a) | 73,208 | 21,528,277 | |
| BioMarin Pharmaceutical, Inc. (a) | 57,721 | 4,942,649 | |
| Biospecifics Technologies Corp. (a) | 2,378 | 117,378 | |
| bluebird bio, Inc. (a)(b) | 12,122 | 731,563 | |
| Blueprint Medicines Corp. (a)(b) | 9,158 | 268,970 | |
| Calithera Biosciences, Inc. (a) | 7,315 | 25,603 | |
| Cancer Genetics, Inc. (a)(b) | 3,642 | 5,463 | |
| Capricor Therapeutics, Inc. (a)(b) | 3,109 | 9,793 | |
| Cara Therapeutics, Inc. (a)(b) | 8,007 | 72,063 | |
| CareDx, Inc. (a)(b) | 5,786 | 20,540 | |
| Cascadian Therapeutics, Inc. (a)(b) | 7,578 | 42,513 | |
| CASI Pharmaceuticals, Inc. (a) | 899 | 1,223 | |
| Catabasis Pharmaceuticals, Inc. (a)(b) | 5,874 | 20,970 | |
| Catalyst Biosciences, Inc. (a) | 1,132 | 804 | |
| Catalyst Pharmaceutical Partners, Inc. (a)(b) | 24,398 | 26,594 | |
| Celgene Corp. (a) | 258,913 | 30,683,780 | |
| Celldex Therapeutics, Inc. (a)(b) | 35,972 | 137,053 | |
| Cellectis SA sponsored ADR (a) | 2,735 | 46,112 | |
| Cellular Biomedicine Group, Inc. (a) | 5,056 | 67,750 | |
| Celsion Corp. (a) | 10,874 | 7,090 | |
| Cerulean Pharma, Inc. (a) | 8,259 | 5,611 | |
| ChemoCentryx, Inc. (a)(b) | 16,612 | 130,238 | |
| Chiasma, Inc. (a)(b) | 6,835 | 13,328 | |
| Chimerix, Inc. (a) | 15,639 | 76,475 | |
| China Biologic Products, Inc. (a) | 8,961 | 1,072,811 | |
| Cidara Therapeutics, Inc. (a)(b) | 6,456 | 67,142 | |
| Cleveland Biolabs, Inc. (a)(b) | 4,912 | 7,859 | |
| Clovis Oncology, Inc. (a)(b) | 12,687 | 434,783 | |
| Coherus BioSciences, Inc. (a)(b) | 14,375 | 386,688 | |
| Colucid Pharmaceuticals, Inc. (a) | 6,213 | 219,630 | |
| Conatus Pharmaceuticals, Inc. (a)(b) | 13,278 | 24,033 | |
| Concert Pharmaceuticals, Inc. (a) | 6,666 | 60,261 | |
| ContraFect Corp. (a)(b) | 12,357 | 29,039 | |
| Corbus Pharmaceuticals Holdings, Inc. (a)(b) | 14,493 | 110,147 | |
| Corvus Pharmaceuticals, Inc. | 7,500 | 115,725 | |
| CRISPR Therapeutics AG (b) | 14,903 | 325,183 | |
| CTI BioPharma Corp. (a) | 78,057 | 32,745 | |
| Cubist Pharmaceuticals, Inc. rights (a) | 5,544 | 0 | |
| Curis, Inc. (a) | 46,136 | 133,333 | |
| Cyclacel Pharmaceuticals, Inc. (b) | 2,985 | 11,821 | |
| Cytokinetics, Inc. (a)(b) | 13,407 | 160,884 | |
| CytomX Therapeutics, Inc. (a) | 12,732 | 141,834 | |
| Cytori Therapeutics, Inc. (a)(b) | 4,734 | 7,290 | |
| CytRx Corp. (a)(b) | 18,151 | 9,092 | |
| DBV Technologies SA sponsored ADR (a) | 7,882 | 287,851 | |
| DelMar Pharmaceuticals, Inc. (a) | 4,500 | 18,180 | |
| Dicerna Pharmaceuticals, Inc. (a) | 5,947 | 17,722 | |
| Dimension Therapeutics, Inc. (a) | 8,907 | 39,191 | |
| Dyax Corp. rights 12/31/19 (a) | 43,075 | 106,395 | |
| Dynavax Technologies Corp. (a)(b) | 13,400 | 57,620 | |
| Eagle Pharmaceuticals, Inc. (a)(b) | 5,119 | 404,196 | |
| Edge Therapeutics, Inc. (a)(b) | 10,663 | 129,129 | |
| Editas Medicine, Inc. | 11,522 | 164,419 | |
| Eiger Biopharmaceuticals, Inc. (a) | 2,548 | 31,340 | |
| Eleven Biotherapeutics, Inc. (a)(b) | 5,420 | 12,141 | |
| Enanta Pharmaceuticals, Inc. (a) | 5,883 | 184,962 | |
| Enzymotec Ltd. (a) | 8,720 | 55,372 | |
| Epizyme, Inc. (a)(b) | 20,018 | 222,200 | |
| Esperion Therapeutics, Inc. (a)(b) | 7,431 | 78,471 | |
| Exact Sciences Corp. (a)(b) | 31,830 | 470,129 | |
| Exelixis, Inc. (a) | 94,817 | 1,604,304 | |
| Fate Therapeutics, Inc. (a)(b) | 9,778 | 28,747 | |
| Fibrocell Science, Inc. (a)(b) | 11,742 | 9,392 | |
| FibroGen, Inc. (a) | 20,092 | 445,038 | |
| Five Prime Therapeutics, Inc. (a) | 9,477 | 545,117 | |
| Flexion Therapeutics, Inc. (a) | 10,269 | 169,439 | |
| Fortress Biotech, Inc. (a)(b) | 18,811 | 44,958 | |
| Forward Pharma A/S sponsored ADR (a)(b) | 4,401 | 91,761 | |
| Foundation Medicine, Inc. (a)(b) | 11,677 | 239,962 | |
| Galapagos Genomics NV sponsored ADR (a)(b) | 3,059 | 180,848 | |
| Galectin Therapeutics, Inc. (a)(b) | 9,741 | 7,988 | |
| Galena Biopharma, Inc. (a)(b) | 2,534 | 7,729 | |
| Galmed Pharmaceuticals Ltd. (a)(b) | 4,237 | 15,041 | |
| Genocea Biosciences, Inc. (a)(b) | 9,398 | 37,780 | |
| Genomic Health, Inc. (a) | 10,671 | 324,719 | |
| GenVec, Inc. (a)(b) | 3,850 | 1,328 | |
| Geron Corp. (a)(b) | 52,259 | 106,608 | |
| Gilead Sciences, Inc. | 440,424 | 32,459,249 | |
| Global Blood Therapeutics, Inc. (a)(b) | 10,573 | 202,473 | |
| GlycoMimetics, Inc. (a)(b) | 9,309 | 59,112 | |
| Grifols SA ADR (b) | 48,102 | 751,834 | |
| GTx, Inc. (a) | 45,909 | 36,544 | |
| Halozyme Therapeutics, Inc. (a)(b) | 43,276 | 511,090 | |
| Harvard Apparatus (a) | 528 | 422 | |
| Heron Therapeutics, Inc. (a)(b) | 11,769 | 180,654 | |
| Histogenics Corp. (a)(b) | 3,605 | 6,958 | |
| Idera Pharmaceuticals, Inc. (a)(b) | 51,849 | 87,625 | |
| Ignyta, Inc. (a) | 17,939 | 112,119 | |
| Immune Design Corp. (a)(b) | 8,906 | 65,459 | |
| ImmunoGen, Inc. (a)(b) | 26,823 | 47,745 | |
| Immunomedics, Inc. (a)(b) | 37,850 | 121,877 | |
| Incyte Corp. (a) | 63,259 | 6,470,763 | |
| Infinity Pharmaceuticals, Inc. (a)(b) | 15,673 | 18,181 | |
| Inotek Pharmaceuticals Corp. (a)(b) | 10,414 | 66,650 | |
| Inovio Pharmaceuticals, Inc. (a)(b) | 24,252 | 171,704 | |
| Insmed, Inc. (a) | 20,823 | 284,234 | |
| Insys Therapeutics, Inc. (a)(b) | 22,974 | 270,863 | |
| Intellia Therapeutics, Inc. (a)(b) | 11,913 | 187,630 | |
| Intercept Pharmaceuticals, Inc. (a)(b) | 8,284 | 837,678 | |
| Ionis Pharmaceuticals, Inc. (a)(b) | 40,058 | 1,752,938 | |
| Ironwood Pharmaceuticals, Inc. Class A (a)(b) | 42,752 | 667,145 | |
| Juno Therapeutics, Inc. (a)(b) | 35,242 | 706,602 | |
| Kamada (a) | 11,602 | 64,391 | |
| Karyopharm Therapeutics, Inc. (a) | 13,904 | 128,334 | |
| Keryx Biopharmaceuticals, Inc. (a)(b) | 35,650 | 206,770 | |
| Kindred Biosciences, Inc. (a) | 6,727 | 28,590 | |
| Kite Pharma, Inc. (a)(b) | 16,483 | 839,479 | |
| Kura Oncology, Inc. (a)(b) | 8,648 | 41,943 | |
| La Jolla Pharmaceutical Co. (a)(b) | 6,107 | 110,537 | |
| Lexicon Pharmaceuticals, Inc. (a)(b) | 33,990 | 517,668 | |
| Ligand Pharmaceuticals, Inc.: | |||
| Class B (a)(b) | 6,899 | 720,256 | |
| General CVR | 1,518 | 30 | |
| Glucagon CVR (a) | 1,518 | 46 | |
| MRK CVR rights (a) | 1,639 | 0 | |
| rights (a) | 1,518 | 8 | |
| TR Beta CVR | 1,518 | 31 | |
| Lion Biotechnologies, Inc. (a)(b) | 24,634 | 163,816 | |
| Loxo Oncology, Inc. (a)(b) | 7,662 | 211,165 | |
| Macrocure Ltd. (a)(b) | 5,698 | 8,889 | |
| Macrogenics, Inc. (a) | 11,499 | 298,169 | |
| Madrigal Pharmaceuticals, Inc. (a) | 1,121 | 17,947 | |
| MannKind Corp. (a)(b) | 166,570 | 78,371 | |
| Mateon Therapeutics, Inc. (a)(b) | 4,000 | 1,679 | |
| MediciNova, Inc. (a)(b) | 13,076 | 92,447 | |
| MEI Pharma, Inc. (a)(b) | 6,684 | 10,360 | |
| Merrimack Pharmaceuticals, Inc. (a)(b) | 42,620 | 234,836 | |
| Mesoblast Ltd. sponsored ADR (a)(b) | 2,255 | 10,193 | |
| Microbot Medical, Inc. (a)(b) | 561 | 4,583 | |
| MiMedx Group, Inc. (a)(b) | 35,879 | 340,133 | |
| Minerva Neurosciences, Inc. (a)(b) | 11,885 | 153,317 | |
| Mirati Therapeutics, Inc. (a) | 7,619 | 40,762 | |
| Momenta Pharmaceuticals, Inc. (a) | 23,588 | 333,770 | |
| Myriad Genetics, Inc. (a)(b) | 22,220 | 370,852 | |
| NantKwest, Inc. (a)(b) | 27,775 | 181,649 | |
| Natera, Inc. (a) | 16,743 | 200,916 | |
| Neothetics, Inc. (a)(b) | 4,838 | 5,757 | |
| Neuralstem, Inc. (a)(b) | 28,402 | 7,970 | |
| Neurocrine Biosciences, Inc. (a) | 31,307 | 1,454,210 | |
| NewLink Genetics Corp. (a) | 8,904 | 98,656 | |
| Nexvet Biopharma PLC (a)(b) | 5,964 | 28,150 | |
| Nivalis Therapeutics, Inc. (a) | 5,852 | 12,699 | |
| Northwest Biotherapeutics, Inc. (a)(b) | 27,004 | 13,637 | |
| Novavax, Inc. (a)(b) | 88,451 | 107,026 | |
| Novelion Therapeutics, Inc. (a) | 35,660 | 53,624 | |
| Novelion Therapeutics, Inc.: | |||
| warrants | 35,660 | 0 | |
| warrants | 35,660 | 0 | |
| Nymox Pharmaceutical Corp. (a)(b) | 17,849 | 55,867 | |
| Ohr Pharmaceutical, Inc.(a)(b) | 12,628 | 34,096 | |
| OncoGenex Pharmaceuticals, Inc. (a)(b) | 48,200 | 22,172 | |
| Oncolytics Biotech, Inc. (a) | 17,521 | 2,739 | |
| OncoMed Pharmaceuticals, Inc. (a)(b) | 12,446 | 105,667 | |
| Onconova Therapeutics, Inc. (a) | 282 | 821 | |
| OncoSec Medical, Inc. (a)(b) | 4,800 | 6,576 | |
| Ophthotech Corp. (a) | 11,659 | 357,348 | |
| Opko Health, Inc. (a)(b) | 182,353 | 1,894,648 | |
| Organovo Holdings, Inc. (a)(b) | 35,389 | 106,875 | |
| Osiris Therapeutics, Inc. (b) | 12,134 | 72,197 | |
| Otonomy, Inc. (a) | 10,298 | 175,066 | |
| OvaScience, Inc. (a)(b) | 12,030 | 40,301 | |
| PDL BioPharma, Inc. (b) | 54,324 | 118,970 | |
| Peregrine Pharmaceuticals, Inc. (a) | 84,708 | 25,539 | |
| Pieris Pharmaceuticals, Inc. (a) | 12,868 | 19,817 | |
| Pluristem Therapeutics, Inc. (a)(b) | 26,881 | 39,784 | |
| Portola Pharmaceuticals, Inc. (a) | 18,220 | 327,778 | |
| Prana Biotechnology Ltd. ADR (a) | 548 | 1,354 | |
| Progenics Pharmaceuticals, Inc. (a) | 23,306 | 208,589 | |
| ProNai Therapeutics, Inc. (a)(b) | 10,497 | 13,961 | |
| ProQR Therapeutics BV (a)(b) | 8,978 | 38,157 | |
| Protagonist Therapeutics, Inc. | 6,546 | 163,323 | |
| Proteon Therapeutics, Inc. (a)(b) | 4,823 | 49,195 | |
| Proteostasis Therapeutics, Inc. | 7,956 | 83,777 | |
| Prothena Corp. PLC (a)(b) | 11,424 | 674,244 | |
| PTC Therapeutics, Inc. (a) | 12,131 | 135,139 | |
| Radius Health, Inc. (a)(b) | 14,154 | 753,276 | |
| Recro Pharma, Inc. (a)(b) | 4,763 | 38,104 | |
| Regeneron Pharmaceuticals, Inc. (a)(b) | 34,724 | 13,168,730 | |
| REGENXBIO, Inc. (a)(b) | 9,313 | 207,214 | |
| Regulus Therapeutics, Inc. (a) | 17,161 | 42,044 | |
| Repligen Corp. (a)(b) | 11,153 | 359,127 | |
| Retrophin, Inc. (a) | 12,022 | 246,090 | |
| Rigel Pharmaceuticals, Inc. (a) | 30,988 | 80,569 | |
| Sage Therapeutics, Inc. (a) | 12,141 | 608,386 | |
| Sangamo Biosciences, Inc. (a)(b) | 23,422 | 74,950 | |
| Sarepta Therapeutics, Inc. (a)(b) | 18,161 | 622,196 | |
| Seattle Genetics, Inc. (a)(b) | 47,485 | 3,077,503 | |
| Selecta Biosciences, Inc. (b) | 6,298 | 129,109 | |
| Seres Therapeutics, Inc. (a)(b) | 12,580 | 125,674 | |
| Shire PLC sponsored ADR | 29,823 | 5,207,096 | |
| Sinovac Biotech Ltd. (a) | 21,163 | 129,306 | |
| Sophiris Bio, Inc. (a) | 11,199 | 30,909 | |
| Sorrento Therapeutics, Inc. (a)(b) | 20,174 | 105,914 | |
| Spark Therapeutics, Inc. (a) | 10,027 | 551,585 | |
| Spectrum Pharmaceuticals, Inc. (a)(b) | 30,874 | 120,717 | |
| Stemline Therapeutics, Inc. (a) | 6,809 | 89,879 | |
| Strongbridge Biopharma PLC (a) | 4,354 | 16,545 | |
| Sunesis Pharmaceuticals, Inc. (a) | 3,658 | 14,742 | |
| Syndax Pharmaceuticals, Inc. (b) | 6,433 | 62,271 | |
| Synergy Pharmaceuticals, Inc. (a)(b) | 58,630 | 308,394 | |
| Syros Pharmaceuticals, Inc. (b) | 8,662 | 117,630 | |
| T2 Biosystems, Inc. (a)(b) | 11,585 | 67,541 | |
| Tenax Therapeutics, Inc. (a)(b) | 12,195 | 23,536 | |
| TESARO, Inc. (a)(b) | 17,020 | 2,309,444 | |
| TG Therapeutics, Inc. (a)(b) | 20,375 | 117,156 | |
| Threshold Pharmaceuticals, Inc. (a)(b) | 20,539 | 9,910 | |
| Tobira Therapeutics, Inc. rights (a)(b) | 6,103 | 111,136 | |
| Tokai Pharmaceuticals, Inc. (a)(b) | 10,069 | 10,371 | |
| TONIX Pharmaceuticals Holding (a)(b) | 12,583 | 4,794 | |
| TRACON Pharmaceuticals, Inc. (a) | 3,559 | 20,464 | |
| Trevena, Inc. (a) | 19,772 | 108,351 | |
| Trillium Therapeutics, Inc. (a)(b) | 4,186 | 31,604 | |
| Trovagene, Inc. (a)(b) | 10,513 | 30,488 | |
| Ultragenyx Pharmaceutical, Inc. (a)(b) | 13,007 | 1,018,318 | |
| uniQure B.V. (a)(b) | 9,527 | 59,830 | |
| United Therapeutics Corp. (a)(b) | 14,400 | 1,808,784 | |
| Vanda Pharmaceuticals, Inc. (a) | 14,302 | 235,268 | |
| VBI Vaccines, Inc. (a) | 11,281 | 32,602 | |
| VBL Therapeutics (a)(b) | 11,422 | 61,108 | |
| Verastem, Inc. (a) | 8,737 | 9,960 | |
| Vericel Corp. (a)(b) | 7,531 | 18,074 | |
| Versartis, Inc. (a) | 11,317 | 140,897 | |
| Vertex Pharmaceuticals, Inc. (a) | 84,106 | 6,863,891 | |
| Vical, Inc. (a)(b) | 1,345 | 3,107 | |
| Vital Therapies, Inc. (a)(b) | 10,589 | 54,004 | |
| Voyager Therapeutics, Inc. (a)(b) | 8,943 | 111,430 | |
| vTv Therapeutics, Inc. Class A (a) | 3,233 | 16,876 | |
| Windtree Therapeutics, Inc. (a) | 1,658 | 2,404 | |
| Xbiotech, Inc. (a)(b) | 11,130 | 155,709 | |
| Xencor, Inc. (a) | 13,246 | 338,568 | |
| Xenon Pharmaceuticals, Inc. (a) | 5,274 | 41,137 | |
| XOMA Corp. (a)(b) | 1,441 | 8,041 | |
| Zafgen, Inc. (a) | 8,564 | 28,946 | |
| ZIOPHARM Oncology, Inc. (a)(b) | 42,695 | 276,664 | |
| 225,527,823 | |||
| Health Care Equipment & Supplies - 1.6% | |||
| Abaxis, Inc. | 7,363 | 379,857 | |
| Abiomed, Inc. (a) | 14,245 | 1,598,859 | |
| Accuray, Inc. (a)(b) | 27,145 | 137,082 | |
| Aethlon Medical, Inc. (a)(b) | 3,425 | 15,824 | |
| Align Technology, Inc. (a)(b) | 27,483 | 2,557,293 | |
| Alliqua Biomedical, Inc. (a)(b) | 8,560 | 5,564 | |
| Alphatec Holdings, Inc. (a) | 2,443 | 12,777 | |
| Analogic Corp. | 4,220 | 388,873 | |
| Angiodynamics, Inc. (a) | 12,361 | 201,484 | |
| Anika Therapeutics, Inc. (a)(b) | 5,266 | 245,712 | |
| Antares Pharma, Inc. (a)(b) | 55,668 | 112,449 | |
| Atossa Genetics, Inc. (a) | 289 | 590 | |
| Atricure, Inc. (a)(b) | 11,412 | 205,302 | |
| Atrion Corp. | 641 | 314,475 | |
| Avinger, Inc. (a)(b) | 8,085 | 31,532 | |
| AxoGen, Inc. (a)(b) | 9,371 | 78,248 | |
| Bellerophon Therapeutics, Inc. (a)(b) | 4,624 | 2,173 | |
| BioLase Technology, Inc. (a)(b) | 19,079 | 33,388 | |
| Cardiovascular Systems, Inc. (a) | 10,562 | 255,495 | |
| Cerus Corp. (a)(b) | 34,203 | 178,540 | |
| Cesca Therapeutics, Inc. (a)(b) | 5,298 | 16,583 | |
| Chembio Diagnostics, Inc. (a)(b) | 4,651 | 32,790 | |
| Cogentix Medical, Inc. (a) | 12,430 | 32,318 | |
| ConforMis, Inc. (a)(b) | 14,908 | 133,874 | |
| CONMED Corp. | 9,003 | 392,351 | |
| Cutera, Inc. (a) | 6,383 | 104,362 | |
| Cynosure, Inc. Class A (a)(b) | 7,750 | 351,463 | |
| CytoSorbents Corp. (a)(b) | 8,905 | 45,861 | |
| Delcath Systems, Inc. (a) | 22 | 46 | |
| Dentsply Sirona, Inc. (b) | 78,218 | 4,550,723 | |
| Derma Sciences, Inc. (a) | 13,335 | 64,008 | |
| DexCom, Inc. (a)(b) | 28,350 | 1,850,972 | |
| Dextera Surgical, Inc. (a)(b) | 2,691 | 3,821 | |
| EDAP TMS SA sponsored ADR (a)(b) | 10,586 | 32,076 | |
| Ekso Bionics Holdings, Inc. (a)(b) | 9,233 | 40,348 | |
| Endologix, Inc. (a)(b) | 26,304 | 193,334 | |
| Entellus Medical, Inc. (a)(b) | 7,435 | 137,027 | |
| EnteroMedics, Inc. (a) | 762 | 41 | |
| Exactech, Inc. (a) | 5,512 | 138,351 | |
| Fonar Corp. (a) | 2,012 | 40,240 | |
| Genmark Diagnostics, Inc. (a)(b) | 15,914 | 184,921 | |
| Hologic, Inc. (a) | 91,954 | 3,519,999 | |
| ICU Medical, Inc. (a) | 5,283 | 793,771 | |
| IDEXX Laboratories, Inc. (a) | 30,248 | 3,558,677 | |
| Inogen, Inc. (a)(b) | 6,955 | 448,111 | |
| Insulet Corp. (a) | 18,657 | 627,808 | |
| Integra LifeSciences Holdings Corp. (a)(b) | 12,078 | 975,902 | |
| Intuitive Surgical, Inc. (a) | 12,846 | 8,269,484 | |
| InVivo Therapeutics Holdings Corp. (a)(b) | 11,305 | 55,960 | |
| Invuity, Inc. (a)(b) | 6,138 | 41,738 | |
| IRadimed Corp. (a) | 4,579 | 50,598 | |
| iRhythm Technologies, Inc. | 6,845 | 208,773 | |
| Iridex Corp. (a)(b) | 3,543 | 55,944 | |
| K2M Group Holdings, Inc. (a)(b) | 13,461 | 253,067 | |
| Kewaunee Scientific Corp. | 1,882 | 46,109 | |
| Lantheus Holdings, Inc. (a) | 11,820 | 107,562 | |
| LeMaitre Vascular, Inc. | 5,777 | 130,965 | |
| Lianluo Smart Ltd. (a) | 837 | 1,356 | |
| LivaNova PLC (a) | 16,082 | 711,950 | |
| Lombard Medical, Inc. (a) | 1,819 | 1,419 | |
| Masimo Corp. (a) | 16,137 | 998,396 | |
| Mazor Robotics Ltd. sponsored ADR (a)(b) | 4,710 | 110,402 | |
| MELA Sciences, Inc. (a) | 309 | 188 | |
| Meridian Bioscience, Inc. (b) | 13,844 | 239,501 | |
| Merit Medical Systems, Inc. (a) | 14,515 | 341,828 | |
| Misonix, Inc. (a)(b) | 2,036 | 18,731 | |
| Natus Medical, Inc. (a) | 11,088 | 441,857 | |
| Neogen Corp. (a) | 12,591 | 796,758 | |
| Neovasc, Inc. (a)(b) | 20,561 | 10,714 | |
| Novadaq Technologies, Inc. (a)(b) | 19,177 | 152,457 | |
| Novocure Ltd. (a)(b) | 28,962 | 224,456 | |
| NuVasive, Inc. (a)(b) | 16,669 | 1,081,818 | |
| Nuvectra Corp. (a) | 5,013 | 28,775 | |
| NxStage Medical, Inc. (a) | 21,230 | 524,806 | |
| OraSure Technologies, Inc. (a)(b) | 18,584 | 156,663 | |
| Orthofix International NV (a) | 6,032 | 227,225 | |
| Oxford Immunotec Global PLC (a)(b) | 9,580 | 141,497 | |
| PhotoMedex, Inc. (a) | 379 | 966 | |
| Pulse Biosciences, Inc. | 4,825 | 29,867 | |
| Quidel Corp. (a)(b) | 10,740 | 246,268 | |
| Quotient Ltd. (a)(b) | 9,433 | 40,656 | |
| ReWalk Robotics Ltd. (a)(b) | 5,150 | 14,163 | |
| Rockwell Medical Technologies, Inc. (a)(b) | 16,859 | 109,584 | |
| Roka Bioscience, Inc. (a)(b) | 282 | 1,348 | |
| RTI Biologics, Inc. (a) | 23,895 | 69,296 | |
| Seaspine Holdings Corp. (a) | 4,796 | 33,572 | |
| Second Sight Medical Products, Inc. (a)(b) | 17,650 | 35,830 | |
| Sientra, Inc. (a)(b) | 6,064 | 49,907 | |
| Span-America Medical System, Inc. | 503 | 9,949 | |
| Staar Surgical Co. (a)(b) | 15,043 | 163,217 | |
| Sunshine Heart, Inc. (a)(b) | 14,640 | 3,030 | |
| SurModics, Inc. (a) | 4,719 | 113,020 | |
| Synergetics U.S.A., Inc. (a)(b) | 7,788 | 1,480 | |
| Syneron Medical Ltd. (a) | 14,426 | 118,293 | |
| Tactile Systems Technology, Inc. (b) | 6,138 | 100,234 | |
| Tandem Diabetes Care, Inc. (a)(b) | 10,614 | 26,004 | |
| TearLab Corp. (a)(b) | 8,271 | 4,466 | |
| The Spectranetics Corp. (a) | 14,144 | 309,046 | |
| Trinity Biotech PLC sponsored ADR (a)(b) | 8,762 | 58,618 | |
| Unilife Corp. (a)(b) | 4,382 | 10,955 | |
| Utah Medical Products, Inc. | 1,583 | 107,961 | |
| Vascular Solutions, Inc. (a) | 5,732 | 315,833 | |
| Veracyte, Inc. (a)(b) | 11,785 | 89,920 | |
| Vermillion, Inc. (a)(b) | 8,983 | 10,780 | |
| ViewRay, Inc. (a)(b) | 13,854 | 45,580 | |
| Viveve Medical, Inc. (b) | 5,086 | 32,703 | |
| Wright Medical Group NV (a)(b) | 33,521 | 772,324 | |
| Zeltiq Aesthetics, Inc. (a)(b) | 13,116 | 577,235 | |
| Zosano Pharma Corp. (a) | 3,225 | 2,580 | |
| 43,960,977 | |||
| Health Care Providers & Services - 1.2% | |||
| Acadia Healthcare Co., Inc. (a)(b) | 29,135 | 1,107,421 | |
| Aceto Corp. | 10,010 | 204,504 | |
| Addus HomeCare Corp. (a) | 3,760 | 130,472 | |
| Air Methods Corp. (a)(b) | 12,281 | 401,589 | |
| Alliance Healthcare Services, Inc. (a) | 3,497 | 26,577 | |
| Almost Family, Inc. (a) | 3,287 | 132,137 | |
| Amedisys, Inc. (a) | 11,048 | 436,286 | |
| AmSurg Corp. (a)(b) | 18,296 | 1,246,324 | |
| BioScrip, Inc. (a)(b) | 41,164 | 46,927 | |
| BioTelemetry, Inc. (a) | 9,533 | 185,417 | |
| Caladrius Biosciences, Inc. (a) | 2,086 | 7,802 | |
| Corvel Corp. (a) | 6,621 | 213,196 | |
| Cross Country Healthcare, Inc. (a) | 11,481 | 164,638 | |
| Digirad Corp. | 7,344 | 34,150 | |
| Express Scripts Holding Co. (a)(b) | 210,700 | 15,987,916 | |
| Five Star Quality Care, Inc. (a) | 17,859 | 41,076 | |
| HealthEquity, Inc. (a)(b) | 19,105 | 850,746 | |
| Healthways, Inc. (a) | 11,894 | 275,941 | |
| Henry Schein, Inc. (a)(b) | 27,486 | 4,094,315 | |
| iKang Healthcare Group, Inc. sponsored ADR (a)(b) | 16,091 | 246,836 | |
| Interpace Diagnostics Group, Inc. (a) | 1,717 | 266 | |
| LHC Group, Inc. (a) | 6,129 | 257,786 | |
| LifePoint Hospitals, Inc. (a)(b) | 13,699 | 752,760 | |
| Magellan Health Services, Inc. (a) | 8,033 | 584,802 | |
| National Research Corp.: | |||
| Class A | 11,131 | 178,096 | |
| Class B | 369 | 14,306 | |
| Patterson Companies, Inc. (b) | 32,624 | 1,263,854 | |
| Premier, Inc. (a) | 15,612 | 470,546 | |
| Providence Service Corp. (a) | 4,859 | 178,374 | |
| Psychemedics Corp. | 2,537 | 63,400 | |
| RadNet, Inc. (a) | 18,526 | 114,861 | |
| Sharps Compliance Corp. (a)(b) | 5,820 | 25,084 | |
| Surgery Partners, Inc. (a) | 16,450 | 242,638 | |
| Surgical Care Affiliates, Inc. (a) | 13,061 | 549,215 | |
| The Ensign Group, Inc. | 16,127 | 348,666 | |
| VCA, Inc. (a) | 26,462 | 1,656,521 | |
| 32,535,445 | |||
| Health Care Technology - 0.4% | |||
| Allscripts Healthcare Solutions, Inc. (a)(b) | 63,217 | 694,123 | |
| athenahealth, Inc. (a)(b) | 13,197 | 1,248,436 | |
| Cerner Corp. (a)(b) | 112,943 | 5,622,303 | |
| Computer Programs & Systems, Inc. (b) | 4,316 | 103,800 | |
| Connecture, Inc. (a) | 5,953 | 10,894 | |
| HealthStream, Inc. (a) | 10,902 | 273,204 | |
| HMS Holdings Corp. (a) | 28,661 | 525,070 | |
| iCAD, Inc. (a) | 7,155 | 26,259 | |
| Inovalon Holdings, Inc. Class A (a)(b) | 22,074 | 338,836 | |
| Medidata Solutions, Inc. (a)(b) | 20,339 | 1,123,323 | |
| NantHealth, Inc. (b) | 40,128 | 462,676 | |
| Omnicell, Inc. (a)(b) | 12,391 | 444,217 | |
| Quality Systems, Inc. | 20,944 | 274,785 | |
| Simulations Plus, Inc. | 6,174 | 58,344 | |
| Streamline Health Solutions, Inc. (a) | 5,177 | 8,542 | |
| 11,214,812 | |||
| Life Sciences Tools & Services - 0.7% | |||
| Accelerate Diagnostics, Inc. (a)(b) | 17,213 | 429,464 | |
| Albany Molecular Research, Inc. (a)(b) | 15,641 | 263,551 | |
| Bio-Techne Corp. | 12,373 | 1,303,619 | |
| Bruker Corp. | 53,703 | 1,217,984 | |
| ChromaDex, Inc. (a)(b) | 14,893 | 36,190 | |
| Compugen Ltd. (a)(b) | 17,966 | 108,694 | |
| Fluidigm Corp. (a)(b) | 9,903 | 63,676 | |
| Harvard Bioscience, Inc. (a) | 10,582 | 25,926 | |
| ICON PLC (a) | 18,270 | 1,381,943 | |
| Illumina, Inc. (a) | 48,988 | 6,522,262 | |
| INC Research Holdings, Inc. Class A (a) | 17,667 | 874,517 | |
| Luminex Corp. (a)(b) | 14,213 | 288,950 | |
| Medpace Holdings, Inc. | 13,395 | 477,934 | |
| Nanostring Technologies, Inc. (a) | 6,880 | 151,360 | |
| NeoGenomics, Inc. (a) | 26,005 | 232,485 | |
| Pacific Biosciences of California, Inc. (a)(b) | 31,025 | 236,100 | |
| PAREXEL International Corp. (a)(b) | 17,500 | 1,032,500 | |
| PRA Health Sciences, Inc. (a) | 20,109 | 1,080,255 | |
| pSivida Corp. (a)(b) | 15,200 | 28,272 | |
| QIAGEN NV (a) | 77,430 | 2,115,388 | |
| VWR Corp. (a) | 43,480 | 1,182,656 | |
| 19,053,726 | |||
| Pharmaceuticals - 0.9% | |||
| Acasti Pharma, Inc. (a) | 1,813 | 2,538 | |
| AcelRx Pharmaceuticals, Inc. (a)(b) | 16,081 | 49,851 | |
| Achaogen, Inc. (a)(b) | 7,852 | 44,835 | |
| Aclaris Therapeutics, Inc. (a)(b) | 7,286 | 218,216 | |
| Acura Pharmaceuticals, Inc. (a) | 981 | 898 | |
| Adamis Pharmaceuticals Corp. (a)(b) | 6,035 | 17,200 | |
| Aerie Pharmaceuticals, Inc. (a) | 12,028 | 446,840 | |
| Agile Therapeutics, Inc. (a) | 10,487 | 72,046 | |
| Akorn, Inc. (a)(b) | 41,820 | 887,420 | |
| Alcobra Pharma Ltd. (a)(b) | 11,033 | 21,073 | |
| Alimera Sciences, Inc. (a)(b) | 32,140 | 35,354 | |
| Amphastar Pharmaceuticals, Inc. (a)(b) | 15,612 | 316,455 | |
| ANI Pharmaceuticals, Inc. (a)(b) | 3,828 | 225,584 | |
| ANI Pharmaceuticals, Inc. rights (a) | 1,389 | 0 | |
| Apricus Biosciences, Inc. (a)(b) | 929 | 1,319 | |
| Aralez Pharmaceuticals, Inc. (a)(b) | 23,321 | 118,471 | |
| Aratana Therapeutics, Inc. (a)(b) | 11,760 | 83,849 | |
| Assembly Biosciences, Inc. (a)(b) | 6,069 | 77,987 | |
| AstraZeneca PLC rights (a) | 3,011 | 0 | |
| Auris Medical Holding AG (a)(b) | 12,197 | 14,636 | |
| Avexis, Inc. (b) | 7,786 | 460,308 | |
| Axsome Therapeutics, Inc. (a) | 6,818 | 44,658 | |
| Bio Path Holdings, Inc. (a)(b) | 31,477 | 38,717 | |
| Biodelivery Sciences International, Inc. (a)(b) | 15,383 | 26,151 | |
| Cardiome Pharma Corp. (a)(b) | 9,692 | 26,653 | |
| Cempra, Inc. (a)(b) | 17,299 | 112,444 | |
| Clearside Biomedical, Inc. (b) | 6,860 | 100,430 | |
| Collegium Pharmaceutical, Inc. (a)(b) | 11,399 | 188,767 | |
| Concordia International Corp. (a)(b) | 15,887 | 40,830 | |
| Corcept Therapeutics, Inc. (a)(b) | 35,547 | 298,239 | |
| Corium International, Inc. (a)(b) | 9,743 | 49,300 | |
| Cumberland Pharmaceuticals, Inc. (a) | 4,718 | 26,138 | |
| CymaBay Therapeutics, Inc. (a)(b) | 15,586 | 31,016 | |
| DepoMed, Inc. (a)(b) | 20,251 | 386,794 | |
| Dermira, Inc. (a) | 12,127 | 387,821 | |
| Dipexium Pharmaceuticals, Inc. (a) | 4,009 | 5,613 | |
| Durect Corp. (a)(b) | 51,370 | 67,295 | |
| Egalet Corp. (a)(b) | 9,167 | 61,694 | |
| Endo International PLC (a)(b) | 73,644 | 1,179,040 | |
| Endocyte, Inc. (a)(b) | 14,909 | 39,658 | |
| Flamel Technologies SA sponsored ADR (a) | 13,217 | 140,365 | |
| Flex Pharma, Inc. (a)(b) | 6,410 | 39,422 | |
| Foamix Pharmaceuticals Ltd. (a)(b) | 13,156 | 120,904 | |
| Gemphire Therapeutics, Inc. | 2,800 | 26,684 | |
| GW Pharmaceuticals PLC ADR (a)(b) | 6,238 | 696,473 | |
| Heska Corp. (a) | 2,644 | 174,795 | |
| Horizon Pharma PLC (a)(b) | 53,476 | 1,058,825 | |
| Hutchison China Meditech Ltd. sponsored ADR (a)(b) | 4,466 | 61,809 | |
| Impax Laboratories, Inc. (a)(b) | 24,576 | 355,123 | |
| Imprimis Pharmaceuticals, Inc. (a)(b) | 5,164 | 14,046 | |
| Innocoll Holdings PLC (a)(b) | 9,257 | 26,382 | |
| Innoviva, Inc. (a)(b) | 36,657 | 379,033 | |
| IntelliPharmaCeutics International Corp. (a)(b) | 13,756 | 38,379 | |
| Intersect ENT, Inc. (a) | 9,120 | 94,848 | |
| Intra-Cellular Therapies, Inc. (a) | 13,486 | 187,995 | |
| Jazz Pharmaceuticals PLC (a) | 20,868 | 2,162,551 | |
| Juniper Pharmaceuticals, Inc. (a) | 2,768 | 15,362 | |
| Kalvista Pharmaceuticals, Inc. (a)(b) | 722 | 5,913 | |
| KemPharm, Inc. (a)(b) | 8,237 | 29,653 | |
| Lipocine, Inc. (a)(b) | 5,021 | 17,172 | |
| Marinus Pharmaceuticals, Inc. (a)(b) | 8,484 | 8,908 | |
| MediWound Ltd. (a) | 7,454 | 39,879 | |
| Merus B.V. (b) | 4,878 | 75,121 | |
| Mylan N.V. (a) | 180,319 | 6,601,479 | |
| MyoKardia, Inc. (a)(b) | 10,582 | 166,667 | |
| Nabriva Therapeutics AG: | |||
| rights (a) | 1,746 | 0 | |
| sponsored ADR (a)(b) | 6,327 | 25,688 | |
| Nektar Therapeutics (a) | 50,644 | 622,162 | |
| Neos Therapeutics, Inc. (a)(b) | 6,228 | 44,219 | |
| NeuroDerm Ltd. (a)(b) | 7,471 | 121,777 | |
| Ocera Therapeutics, Inc. (a) | 5,923 | 12,734 | |
| Ocular Therapeutix, Inc. (a)(b) | 8,480 | 78,779 | |
| Omeros Corp. (a)(b) | 15,406 | 189,340 | |
| Oncobiologics, Inc. (a) | 3,600 | 13,104 | |
| Oramed Pharmaceuticals, Inc. (a)(b) | 5,254 | 32,260 | |
| Orexigen Therapeutics, Inc. (a)(b) | 4,379 | 8,583 | |
| Pacira Pharmaceuticals, Inc. (a)(b) | 12,365 | 393,825 | |
| Pain Therapeutics, Inc. (a)(b) | 17,995 | 11,511 | |
| Paratek Pharmaceuticals, Inc. (a) | 7,964 | 107,116 | |
| Parnell Pharmaceuticals Holdings Ltd. (a) | 1,667 | 2,234 | |
| Pernix Therapeutics Holdings, Inc. (a)(b) | 1,633 | 4,932 | |
| Phibro Animal Health Corp. Class A | 6,459 | 177,300 | |
| ProPhase Labs, Inc. (a) | 1,566 | 3,163 | |
| Reata Pharmaceuticals, Inc. (b) | 2,652 | 68,925 | |
| RedHill Biopharma Ltd. sponsored ADR (a)(b) | 3,164 | 34,519 | |
| Repros Therapeutics, Inc. (a)(b) | 10,497 | 18,790 | |
| Revance Therapeutics, Inc. (a)(b) | 10,150 | 170,013 | |
| SciClone Pharmaceuticals, Inc. (a) | 17,860 | 177,707 | |
| SCYNEXIS, Inc. (a) | 9,903 | 38,127 | |
| Sucampo Pharmaceuticals, Inc. Class A (a) | 15,774 | 256,328 | |
| Supernus Pharmaceuticals, Inc. (a) | 16,031 | 345,468 | |
| Teligent, Inc. (a)(b) | 18,936 | 136,150 | |
| Tetraphase Pharmaceuticals, Inc. (a)(b) | 10,751 | 45,047 | |
| The Medicines Company (a)(b) | 23,540 | 826,254 | |
| Theravance Biopharma, Inc. (a)(b) | 15,758 | 438,703 | |
| Titan Pharmaceuticals, Inc. (a)(b) | 7,882 | 34,681 | |
| VIVUS, Inc. (a)(b) | 35,567 | 47,660 | |
| WAVE Life Sciences (a)(b) | 8,146 | 289,998 | |
| Zogenix, Inc. (a)(b) | 8,409 | 105,953 | |
| Zynerba Pharmaceuticals, Inc. (a)(b) | 4,037 | 50,785 | |
| 23,677,761 | |||
| TOTAL HEALTH CARE | 355,970,544 | ||
| INDUSTRIALS - 4.6% | |||
| Aerospace & Defense - 0.2% | |||
| AeroVironment, Inc. (a)(b) | 7,477 | 211,599 | |
| Arotech Corp. (a)(b) | 12,878 | 50,224 | |
| Astronics Corp. (a) | 6,529 | 241,051 | |
| Astronics Corp. Class B | 607 | 22,574 | |
| Astrotech Corp. (a) | 3,584 | 5,878 | |
| BE Aerospace, Inc. | 33,528 | 2,013,021 | |
| Elbit Systems Ltd. (b) | 14,450 | 1,459,450 | |
| Innovative Solutions & Support, Inc. (a)(b) | 1,668 | 5,921 | |
| KEYW Holding Corp. (a) | 13,776 | 172,613 | |
| KLX, Inc. (a) | 17,258 | 672,889 | |
| Kratos Defense & Security Solutions, Inc. (a)(b) | 20,475 | 149,877 | |
| LMI Aerospace, Inc. (a)(b) | 5,819 | 52,720 | |
| Mercury Systems, Inc. (a) | 13,600 | 404,056 | |
| Taser International, Inc. (a)(b) | 17,158 | 467,212 | |
| TAT Technologies Ltd. | 863 | 6,516 | |
| 5,935,601 | |||
| Air Freight & Logistics - 0.3% | |||
| Air Transport Services Group, Inc. (a) | 20,894 | 338,483 | |
| Atlas Air Worldwide Holdings, Inc. (a) | 8,221 | 406,117 | |
| C.H. Robinson Worldwide, Inc. (b) | 46,776 | 3,501,184 | |
| Echo Global Logistics, Inc. (a) | 9,606 | 241,111 | |
| Expeditors International of Washington, Inc. (b) | 59,660 | 3,146,468 | |
| Forward Air Corp. | 9,898 | 478,865 | |
| Hub Group, Inc. Class A (a) | 10,966 | 469,893 | |
| Park-Ohio Holdings Corp. | 4,231 | 178,337 | |
| 8,760,458 | |||
| Airlines - 0.7% | |||
| Allegiant Travel Co. | 5,447 | 890,040 | |
| American Airlines Group, Inc. (b) | 176,711 | 8,206,459 | |
| Hawaiian Holdings, Inc. (a) | 17,807 | 914,389 | |
| JetBlue Airways Corp. (a) | 106,758 | 2,144,768 | |
| Ryanair Holdings PLC sponsored ADR | 35,278 | 2,816,596 | |
| SkyWest, Inc. | 19,655 | 724,287 | |
| Spirit Airlines, Inc. (a)(b) | 22,878 | 1,272,017 | |
| Virgin America, Inc. (a)(b) | 14,884 | 840,946 | |
| 17,809,502 | |||
| Building Products - 0.2% | |||
| AAON, Inc. (b) | 17,624 | 579,830 | |
| American Woodmark Corp. (a) | 5,416 | 415,136 | |
| Apogee Enterprises, Inc. | 9,587 | 457,300 | |
| Builders FirstSource, Inc. (a) | 37,931 | 419,517 | |
| Caesarstone Sdot-Yam Ltd. (a)(b) | 11,618 | 316,010 | |
| China Ceramics Co. Ltd. (a) | 187 | 441 | |
| CSW Industrials, Inc. (a) | 5,469 | 199,619 | |
| Gibraltar Industries, Inc. (a) | 10,146 | 456,570 | |
| Insteel Industries, Inc. | 6,078 | 240,506 | |
| Patrick Industries, Inc. (a) | 5,029 | 358,819 | |
| PGT, Inc. (a)(b) | 16,273 | 180,630 | |
| Tecogen, Inc. New (a)(b) | 3,759 | 15,750 | |
| Universal Forest Products, Inc. | 6,860 | 681,472 | |
| 4,321,600 | |||
| Commercial Services & Supplies - 0.6% | |||
| Aqua Metals, Inc. (a)(b) | 5,152 | 63,370 | |
| Casella Waste Systems, Inc. Class A (a) | 15,918 | 201,522 | |
| CECO Environmental Corp. | 10,990 | 155,948 | |
| China Recycling Energy Corp. (a) | 1,607 | 2,812 | |
| Cintas Corp. | 34,886 | 3,997,936 | |
| Copart, Inc. (a) | 37,672 | 2,061,412 | |
| Essendant, Inc. | 11,803 | 228,624�� | |
| Fuel Tech, Inc. (a) | 2,055 | 2,466 | |
| G&K Services, Inc. Class A | 6,344 | 608,516 | |
| Healthcare Services Group, Inc. | 24,381 | 949,640 | |
| Heritage-Crystal Clean, Inc. (a) | 8,319 | 135,600 | |
| Herman Miller, Inc. | 19,676 | 639,470 | |
| Hudson Technologies, Inc. (a) | 9,731 | 74,053 | |
| Industrial Services of America, Inc. (a) | 694 | 1,742 | |
| InnerWorkings, Inc. (a)(b) | 17,882 | 165,409 | |
| Interface, Inc. | 21,115 | 367,401 | |
| Intersections, Inc. (a)(b) | 8,109 | 18,245 | |
| Kimball International, Inc. Class B | 12,619 | 189,285 | |
| MagneGas Corp. (a)(b) | 23,634 | 11,226 | |
| Matthews International Corp. Class A | 10,583 | 769,913 | |
| McGrath RentCorp. | 9,031 | 333,425 | |
| Mobile Mini, Inc. | 14,714 | 451,720 | |
| Multi-Color Corp. | 5,675 | 408,033 | |
| Odyssey Marine Exploration, Inc. (a)(b) | 4,993 | 19,573 | |
| Performant Financial Corp. (a)(b) | 14,422 | 51,631 | |
| Perma-Fix Environmental Services, Inc. (a) | 973 | 3,892 | |
| Pointer Telocation Ltd. (a) | 2,302 | 17,725 | |
| Quest Resource Holding Corp. (a)(b) | 3,836 | 7,595 | |
| SP Plus Corp. (a)(b) | 8,253 | 229,021 | |
| Stericycle, Inc. (a)(b) | 28,810 | 2,102,266 | |
| Tetra Tech, Inc. | 21,314 | 913,305 | |
| U.S. Ecology, Inc. | 6,966 | 323,571 | |
| Virco Manufacturing Co. (a) | 1,086 | 4,453 | |
| VSE Corp. | 3,728 | 144,311 | |
| West Corp. | 27,270 | 650,662 | |
| 16,305,773 | |||
| Construction & Engineering - 0.0% | |||
| Aegion Corp. (a) | 11,978 | 289,748 | |
| Great Lakes Dredge & Dock Corp. (a)(b) | 23,277 | 98,927 | |
| Ies Holdings, Inc. (a) | 7,097 | 139,456 | |
| Layne Christensen Co. (a)(b) | 7,238 | 77,012 | |
| MYR Group, Inc. (a) | 5,705 | 213,709 | |
| Northwest Pipe Co. (a) | 2,404 | 42,118 | |
| NV5 Holdings, Inc. (a) | 3,624 | 132,457 | |
| Primoris Services Corp. | 16,597 | 380,569 | |
| Sterling Construction Co., Inc. (a) | 9,228 | 76,500 | |
| 1,450,496 | |||
| Electrical Equipment - 0.1% | |||
| Allied Motion Technologies, Inc. | 2,975 | 63,606 | |
| American Superconductor Corp. (a)(b) | 6,555 | 50,736 | |
| Ballard Power Systems, Inc. (a)(b) | 58,349 | 110,765 | |
| Broadwind Energy, Inc. (a) | 6,588 | 26,945 | |
| Capstone Turbine Corp. (a) | 4,970 | 4,423 | |
| Encore Wire Corp. | 7,114 | 302,345 | |
| Energous Corp. (a)(b) | 5,693 | 90,234 | |
| Energy Focus, Inc. (a)(b) | 4,044 | 19,613 | |
| Enphase Energy, Inc. (a)(b) | 16,647 | 18,645 | |
| FuelCell Energy, Inc. (a)(b) | 10,205 | 22,961 | |
| Highpower International, Inc. (a)(b) | 2,296 | 6,314 | |
| Hydrogenics Corp. (a)(b) | 5,242 | 25,424 | |
| Ideal Power, Inc. (a)(b) | 3,212 | 14,936 | |
| LSI Industries, Inc. | 9,643 | 94,694 | |
| Pioneer Power Solutions, Inc. (a) | 1,000 | 5,550 | |
| Plug Power, Inc. (a)(b) | 58,332 | 79,623 | |
| Powell Industries, Inc. | 4,063 | 174,872 | |
| Power Solutions International, Inc. (a)(b) | 4,273 | 55,164 | |
| Preformed Line Products Co. | 1,863 | 104,216 | |
| Real Goods Solar, Inc. (a) | 15 | 7 | |
| Revolution Lighting Technologies, Inc. (a)(b) | 5,784 | 31,291 | |
| Sunrun, Inc. (a)(b) | 32,709 | 166,816 | |
| TPI Composites, Inc. (b) | 11,576 | 175,608 | |
| Ultralife Corp. (a) | 6,195 | 31,285 | |
| Vicor Corp. (a) | 10,110 | 147,606 | |
| 1,823,679 | |||
| Industrial Conglomerates - 0.0% | |||
| Raven Industries, Inc. | 12,486 | 312,774 | |
| Machinery - 0.7% | |||
| Altra Industrial Motion Corp. | 8,355 | 292,425 | |
| American Railcar Industries, Inc. | 6,038 | 271,046 | |
| ARC Group Worldwide, Inc. (a) | 3,852 | 20,993 | |
| Astec Industries, Inc. | 7,646 | 506,930 | |
| Blue Bird Corp. (a) | 7,955 | 129,667 | |
| Chart Industries, Inc. (a) | 10,150 | 360,833 | |
| Cleantech Solutions International, Inc. (a) | 197 | 140 | |
| Columbus McKinnon Corp. (NY Shares) | 7,165 | 188,583 | |
| Commercial Vehicle Group, Inc. (a) | 10,545 | 54,096 | |
| Dmc Global, Inc. | 4,562 | 74,589 | |
| Eastern Co. | 3,496 | 74,640 | |
| Energy Recovery, Inc. (a) | 16,254 | 177,006 | |
| ExOne Co. (a)(b) | 5,769 | 56,940 | |
| Franklin Electric Co., Inc. | 15,275 | 596,489 | |
| FreightCar America, Inc. | 3,936 | 57,780 | |
| Gencor Industries, Inc. (a) | 5,290 | 74,325 | |
| Hardinge, Inc. | 3,857 | 42,543 | |
| Hurco Companies, Inc. | 2,512 | 81,891 | |
| Jason Industries, Inc. (a) | 6,627 | 11,597 | |
| Key Technology, Inc. (a) | 1,513 | 18,504 | |
| Kornit Digital Ltd. (a)(b) | 10,723 | 122,242 | |
| L.B. Foster Co. Class A | 2,834 | 34,717 | |
| Lincoln Electric Holdings, Inc. | 21,801 | 1,711,597 | |
| Manitex International, Inc. (a)(b) | 6,059 | 32,719 | |
| MFRI, Inc. (a) | 997 | 8,225 | |
| Middleby Corp. (a)(b) | 19,132 | 2,620,701 | |
| NN, Inc. | 8,983 | 152,262 | |
| Nordson Corp. (b) | 19,444 | 2,075,258 | |
| Omega Flex, Inc. | 4,007 | 179,233 | |
| PACCAR, Inc. | 115,960 | 7,206,914 | |
| RBC Bearings, Inc. (a)(b) | 9,860 | 835,734 | |
| Sun Hydraulics Corp. | 8,943 | 355,395 | |
| Taylor Devices, Inc. (a) | 1,597 | 23,684 | |
| TriMas Corp. (a) | 15,221 | 326,490 | |
| Twin Disc, Inc. | 3,944 | 57,227 | |
| Westport Fuel Systems, Inc. (a)(b) | 26,542 | 33,708 | |
| Woodward, Inc. | 21,250 | 1,439,263 | |
| 20,306,386 | |||
| Marine - 0.0% | |||
| Diana Containerships, Inc. (b) | 2,026 | 7,253 | |
| DryShips, Inc. (a)(b) | 902 | 4,736 | |
| Eagle Bulk Shipping, Inc. (a)(b) | 16,353 | 103,351 | |
| Euroseas Ltd. (a) | 273 | 655 | |
| Golden Ocean Group Ltd. (a)(b) | 38,482 | 161,624 | |
| Rand Logistics, Inc. (a) | 1,744 | 1,604 | |
| Seanergy Martime Holdings Corp. (a)(b) | 5,859 | 14,062 | |
| Star Bulk Carriers Corp. (a)(b) | 17,502 | 90,485 | |
| 383,770 | |||
| Professional Services - 0.5% | |||
| 51job, Inc. sponsored ADR (a)(b) | 8,985 | 317,799 | |
| Acacia Research Corp. | 15,251 | 105,232 | |
| Advisory Board Co. (a) | 13,510 | 478,254 | |
| Barrett Business Services, Inc. | 2,472 | 144,093 | |
| CRA International, Inc. | 2,842 | 93,388 | |
| Exponent, Inc. | 8,455 | 512,796 | |
| Heidrick & Struggles International, Inc. | 6,697 | 141,976 | |
| Hudson Global, Inc. | 2,817 | 4,113 | |
| Huron Consulting Group, Inc. (a) | 7,136 | 376,424 | |
| ICF International, Inc. (a) | 6,544 | 362,210 | |
| IHS Markit Ltd. (a)(b) | 146,341 | 5,259,496 | |
| Kelly Services, Inc. Class A (non-vtg.) | 12,990 | 261,619 | |
| Kforce, Inc. | 9,285 | 205,199 | |
| Lightbridge Corp. (a)(b) | 441 | 578 | |
| Marathon Patent Group, Inc. (a)(b) | 6,000 | 10,860 | |
| Pendrell Corp. (a) | 9,270 | 57,103 | |
| RCM Technologies, Inc. | 3,957 | 25,562 | |
| Resources Connection, Inc. | 12,622 | 203,214 | |
| RPX Corp. (a) | 16,247 | 169,781 | |
| Spherix, Inc. (a)(b) | 18,182 | 20,546 | |
| Verisk Analytics, Inc. (a)(b) | 55,412 | 4,603,629 | |
| Willdan Group, Inc. (a) | 2,439 | 59,951 | |
| 13,413,823 | |||
| Road & Rail - 0.9% | |||
| AMERCO (b) | 6,534 | 2,231,100 | |
| ArcBest Corp. | 11,086 | 337,569 | |
| Avis Budget Group, Inc. (a) | 29,715 | 1,137,787 | |
| Covenant Transport Group, Inc. Class A (a) | 5,080 | 105,308 | |
| CSX Corp. | 312,885 | 11,204,412 | |
| Heartland Express, Inc. (b) | 27,211 | 585,309 | |
| J.B. Hunt Transport Services, Inc. | 37,251 | 3,552,628 | |
| Landstar System, Inc. (b) | 13,852 | 1,128,245 | |
| Marten Transport Ltd. | 11,052 | 269,116 | |
| Old Dominion Freight Lines, Inc. (a)(b) | 27,205 | 2,374,997 | |
| P.A.M. Transportation Services, Inc. (a) | 4,508 | 111,753 | |
| Patriot Transportation Holding, Inc. (a) | 659 | 15,388 | |
| Saia, Inc. (a) | 8,108 | 338,509 | |
| Student Transportation, Inc. (a)(b) | 35,842 | 204,918 | |
| U.S.A. Truck, Inc. (a) | 3,742 | 33,715 | |
| Universal Logistics Holdings I | 10,735 | 152,437 | |
| Werner Enterprises, Inc. (b) | 23,501 | 635,702 | |
| YRC Worldwide, Inc. (a) | 11,291 | 143,170 | |
| 24,562,063 | |||
| Trading Companies & Distributors - 0.4% | |||
| Beacon Roofing Supply, Inc. (a) | 19,746 | 916,017 | |
| BMC Stock Holdings, Inc. (a) | 21,907 | 412,947 | |
| DXP Enterprises, Inc. (a) | 5,313 | 178,995 | |
| Fastenal Co. (b) | 97,458 | 4,619,509 | |
| General Finance Corp. (a) | 6,826 | 27,645 | |
| H&E Equipment Services, Inc. | 11,078 | 203,946 | |
| HD Supply Holdings, Inc. (a) | 67,510 | 2,649,092 | |
| Houston Wire & Cable Co. | 7,080 | 43,188 | |
| Huttig Building Products, Inc. (a) | 9,520 | 58,262 | |
| Lawson Products, Inc. (a) | 3,661 | 86,766 | |
| Nexeo Solutions, Inc. (a)(b) | 33,437 | 250,778 | |
| Rush Enterprises, Inc.: | |||
| Class A (a)(b) | 9,998 | 302,440 | |
| Class B (a)(b) | 3,179 | 87,836 | |
| Titan Machinery, Inc. (a)(b) | 8,041 | 112,494 | |
| Willis Lease Finance Corp. (a) | 2,622 | 70,243 | |
| 10,020,158 | |||
| Transportation Infrastructure - 0.0% | |||
| Grupo Aeroportuario Norte S.A.B. de CV ADR (b) | 2,270 | 85,534 | |
| TOTAL INDUSTRIALS | 125,491,617 | ||
| INFORMATION TECHNOLOGY - 46.7% | |||
| Communications Equipment - 2.7% | |||
| ADTRAN, Inc. | 15,699 | 319,475 | |
| Applied Optoelectronics, Inc. (a)(b) | 5,283 | 130,860 | |
| Arris International PLC (a) | 62,767 | 1,800,785 | |
| AudioCodes Ltd. (a) | 14,232 | 89,092 | |
| Aviat Networks, Inc. (a) | 1,379 | 17,417 | |
| Bel Fuse, Inc.: | |||
| Class A | 300 | 7,134 | |
| Class B (non-vtg.) | 3,204 | 93,877 | |
| Black Box Corp. | 5,455 | 83,734 | |
| Brocade Communications Systems, Inc. | 132,217 | 1,631,558 | |
| CalAmp Corp. (a) | 12,476 | 181,401 | |
| Ceragon Networks Ltd. (a) | 28,260 | 64,998 | |
| Cisco Systems, Inc. | 1,677,036 | 50,009,214 | |
| Clearfield, Inc. (a)(b) | 4,785 | 91,872 | |
| ClearOne, Inc. | 2,453 | 26,860 | |
| CommScope Holding Co., Inc. (a) | 63,329 | 2,278,577 | |
| Communications Systems, Inc. | 2,071 | 10,355 | |
| Comtech Telecommunications Corp. | 8,843 | 101,695 | |
| Dasan Zhone Solutions, Inc. (a)(b) | 17,554 | 19,309 | |
| Digi International, Inc. (a) | 8,481 | 113,645 | |
| DragonWave, Inc. (a) | 609 | 1,768 | |
| EchoStar Holding Corp. Class A (a) | 14,961 | 763,011 | |
| EMCORE Corp. | 8,637 | 55,277 | |
| EXFO, Inc. (sub. vtg.) (a) | 8,342 | 35,832 | |
| Extreme Networks, Inc. (a) | 34,471 | 145,812 | |
| F5 Networks, Inc. (a) | 22,251 | 3,131,828 | |
| Finisar Corp. (a) | 36,364 | 1,208,376 | |
| Gilat Satellite Networks Ltd. (a) | 13,064 | 62,054 | |
| Harmonic, Inc. (a)(b) | 28,525 | 132,641 | |
| Infinera Corp. (a)(b) | 46,485 | 395,123 | |
| InterDigital, Inc. | 11,326 | 897,019 | |
| Ituran Location & Control Ltd. (b) | 8,718 | 217,514 | |
| Ixia (a) | 26,918 | 370,123 | |
| KVH Industries, Inc. (a) | 5,647 | 61,552 | |
| Lumentum Holdings, Inc. (a) | 20,014 | 802,561 | |
| Mitel Networks Corp. (a) | 42,788 | 308,501 | |
| MRV Communications, Inc. (a) | 3,804 | 30,052 | |
| NETGEAR, Inc. (a) | 10,715 | 575,396 | |
| NetScout Systems, Inc. (a) | 29,993 | 935,782 | |
| Oclaro, Inc. (a) | 53,600 | 479,184 | |
| Parkervision, Inc. (a)(b) | 1,087 | 2,913 | |
| PC-Tel, Inc. | 8,979 | 44,356 | |
| Radcom Ltd. (a) | 3,990 | 75,212 | |
| Radware Ltd. (a)(b) | 19,063 | 255,635 | |
| Resonant, Inc. (a) | 5,889 | 27,619 | |
| ShoreTel, Inc. (a) | 23,379 | 163,653 | |
| Sierra Wireless, Inc. (a)(b) | 11,364 | 174,437 | |
| Silicom Ltd. | 2,758 | 108,472 | |
| Sonus Networks, Inc. (a) | 15,739 | 94,906 | |
| Telefonaktiebolaget LM Ericsson (B Shares) sponsored ADR (b) | 113,622 | 581,745 | |
| Tessco Technologies, Inc. | 3,589 | 43,965 | |
| Ubiquiti Networks, Inc. (a)(b) | 27,206 | 1,522,448 | |
| UTStarcom Holdings Corp. (a) | 21,290 | 42,154 | |
| ViaSat, Inc. (a)(b) | 19,148 | 1,364,869 | |
| Viavi Solutions, Inc. (a) | 76,273 | 598,743 | |
| Westell Technologies, Inc. Class A (a) | 16,462 | 8,888 | |
| Wi-Lan, Inc. | 44,084 | 59,072 | |
| xG Technology, Inc. (a) | 40 | 14 | |
| 72,850,365 | |||
| Electronic Equipment & Components - 1.0% | |||
| Agilysys, Inc. (a) | 9,207 | 94,003 | |
| Applied DNA Sciences, Inc. (a)(b) | 6,250 | 13,750 | |
| Cardtronics PLC | 16,249 | 803,838 | |
| CDW Corp. | 54,251 | 2,779,821 | |
| China BAK Battery, Inc. (a) | 782 | 1,251 | |
| ClearSign Combustion Corp. (a)(b) | 5,845 | 23,380 | |
| Cognex Corp. (b) | 28,074 | 1,676,299 | |
| Coherent, Inc. (a) | 8,036 | 1,048,698 | |
| Control4 Corp. (a) | 8,561 | 97,938 | |
| CUI Global, Inc. (a)(b) | 7,874 | 48,031 | |
| Daktronics, Inc. | 15,315 | 157,591 | |
| Deswell Industries, Inc. | 1,530 | 2,754 | |
| Digital Ally, Inc. (a)(b) | 3,324 | 16,620 | |
| DTS, Inc. | 6,391 | 271,362 | |
| Echelon Corp. (a) | 339 | 1,749 | |
| Electro Scientific Industries, Inc. (a) | 10,892 | 56,638 | |
| ePlus, Inc. (a) | 2,395 | 266,324 | |
| FARO Technologies, Inc. (a) | 5,684 | 206,898 | |
| Flextronics International Ltd. (a) | 180,401 | 2,568,910 | |
| FLIR Systems, Inc. | 45,351 | 1,628,554 | |
| Frequency Electronics, Inc. (a) | 801 | 8,394 | |
| Hollysys Automation Technologies Ltd. | 19,614 | 369,920 | |
| I. D. Systems Inc. (a) | 5,073 | 24,655 | |
| Identiv, Inc. (a)(b) | 2,829 | 7,469 | |
| II-VI, Inc. (a) | 21,860 | 660,172 | |
| Insight Enterprises, Inc. (a) | 12,125 | 424,618 | |
| IPG Photonics Corp. (a) | 17,589 | 1,687,137 | |
| Iteris, Inc. (a) | 7,581 | 24,411 | |
| Itron, Inc. (a) | 12,689 | 814,634 | |
| KEY Tronic Corp. (a) | 4,924 | 38,013 | |
| Kimball Electronics, Inc. (a) | 9,891 | 172,598 | |
| Littelfuse, Inc. | 7,443 | 1,085,115 | |
| LRAD Corp. | 9,621 | 17,125 | |
| Magal Security Systems Ltd. (a) | 7,555 | 45,406 | |
| Maxwell Technologies, Inc. (a)(b) | 9,752 | 48,760 | |
| Mesa Laboratories, Inc. | 1,263 | 156,688 | |
| MicroVision, Inc. (a)(b) | 15,058 | 24,846 | |
| MOCON, Inc. | 2,300 | 40,250 | |
| MTS Systems Corp. | 5,465 | 294,290 | |
| Napco Security Technolgies, Inc. (a) | 6,882 | 58,841 | |
| National Instruments Corp. (b) | 42,288 | 1,246,227 | |
| Neonode, Inc. (a)(b) | 20,179 | 33,295 | |
| NetList, Inc. (a) | 25,631 | 27,938 | |
| Novanta, Inc. (a) | 15,417 | 312,194 | |
| Orbotech Ltd. (a) | 15,320 | 485,184 | |
| OSI Systems, Inc. (a) | 6,112 | 462,678 | |
| PC Connection, Inc. | 9,206 | 247,089 | |
| PC Mall, Inc. (a) | 4,541 | 91,501 | |
| Perceptron, Inc. (a) | 4,209 | 28,116 | |
| Plexus Corp. (a) | 11,172 | 570,889 | |
| RadiSys Corp. (a) | 14,163 | 59,201 | |
| Research Frontiers, Inc. (a)(b) | 7,119 | 12,601 | |
| Richardson Electronics Ltd. | 6,648 | 40,154 | |
| RMG Networks Holding Corp. (a) | 2,029 | 1,560 | |
| RMG Networks Holding Corp. rights 12/22/16 (a) | 425 | 0 | |
| Sanmina Corp. (a) | 23,756 | 780,385 | |
| ScanSource, Inc. (a) | 8,166 | 309,083 | |
| Supercom Ltd. (a)(b) | 7,335 | 23,472 | |
| Tech Data Corp. (a) | 11,698 | 992,809 | |
| Trimble, Inc. (a) | 82,489 | 2,325,365 | |
| TTM Technologies, Inc. (a) | 33,462 | 454,079 | |
| Uni-Pixel, Inc. (a)(b) | 10,946 | 12,916 | |
| Universal Display Corp. (a)(b) | 15,603 | 852,704 | |
| Wayside Technology Group, Inc. | 1,282 | 22,435 | |
| Zebra Technologies Corp. Class A (a) | 17,524 | 1,385,272 | |
| 28,544,898 | |||
| Internet Software & Services - 12.4% | |||
| 21Vianet Group, Inc. ADR (a)(b) | 19,017 | 149,283 | |
| 2U, Inc. (a)(b) | 18,173 | 600,799 | |
| Actua Corp. (a)(b) | 14,632 | 198,264 | |
| Akamai Technologies, Inc. (a) | 58,416 | 3,896,347 | |
| Alarm.com Holdings, Inc. (a) | 15,031 | 445,218 | |
| Alphabet, Inc.: | |||
| Class A (a) | 98,532 | 76,449,008 | |
| Class C (a) | 114,502 | 86,797,096 | |
| Angie's List, Inc. (a)(b) | 18,948 | 162,763 | |
| AppFolio, Inc. (a) | 4,692 | 102,755 | |
| Autobytel, Inc. (a) | 3,383 | 46,855 | |
| Baidu.com, Inc. sponsored ADR (a)(b) | 91,820 | 15,329,349 | |
| Baozun, Inc. sponsored ADR (a)(b) | 7,587 | 114,488 | |
| Bazaarvoice, Inc. (a) | 28,290 | 149,937 | |
| Benefitfocus, Inc. (a)(b) | 9,994 | 272,836 | |
| BlackLine, Inc. | 16,292 | 438,906 | |
| Blucora, Inc. (a) | 13,543 | 191,633 | |
| Brightcove, Inc. (a) | 11,340 | 94,122 | |
| BroadVision, Inc. (a) | 599 | 2,935 | |
| Carbonite, Inc. (a) | 9,007 | 166,630 | |
| China Finance Online Co. Ltd. ADR (a) | 8,455 | 35,257 | |
| ChinaCache International Holdings Ltd. sponsored ADR (a)(b) | 7,308 | 24,189 | |
| Cimpress NV (a)(b) | 10,512 | 914,018 | |
| CommerceHub, Inc.: | |||
| Series A, (a) | 5,943 | 89,858 | |
| Series C, (a) | 8,941 | 131,880 | |
| comScore, Inc. (a)(b) | 18,871 | 548,014 | |
| Cornerstone OnDemand, Inc. (a) | 18,816 | 675,683 | |
| CoStar Group, Inc. (a)(b) | 11,285 | 2,156,676 | |
| Coupa Software, Inc. | 15,652 | 496,794 | |
| Criteo SA sponsored ADR (a)(b) | 19,904 | 821,438 | |
| Cyren Ltd. (a) | 7,440 | 16,368 | |
| Determine, Inc. (a) | 245 | 446 | |
| EarthLink Holdings Corp. | 36,204 | 191,157 | |
| eBay, Inc. (a) | 377,798 | 10,506,562 | |
| eGain Communications Corp. (a)(b) | 3,510 | 8,249 | |
| Endurance International Group Holdings, Inc. (a)(b) | 46,733 | 371,527 | |
| Facebook, Inc. Class A (a) | 775,067 | 91,783,434 | |
| Five9, Inc. (a) | 17,078 | 270,345 | |
| Functionx, Inc. (a)(b) | 123 | 381 | |
| Global Sources Ltd. (a) | 10,027 | 90,243 | |
| Gogo, Inc. (a)(b) | 28,432 | 266,976 | |
| Hortonworks, Inc. (a)(b) | 20,744 | 188,563 | |
| IAC/InterActiveCorp | 24,311 | 1,637,589 | |
| Internap Network Services Corp. (a) | 15,802 | 17,066 | |
| iPass, Inc. (a) | 17,897 | 28,814 | |
| j2 Global, Inc. | 15,897 | 1,168,588 | |
| Limelight Networks, Inc. (a) | 37,824 | 80,187 | |
| Liquidity Services, Inc. (a) | 10,641 | 97,897 | |
| LivePerson, Inc. (a) | 20,172 | 161,376 | |
| LogMeIn, Inc. | 8,414 | 848,552 | |
| Marchex, Inc. Class B (a) | 14,684 | 38,472 | |
| Match Group, Inc. (a)(b) | 14,363 | 258,247 | |
| MeetMe, Inc. (a)(b) | 15,935 | 76,807 | |
| MercadoLibre, Inc. | 14,931 | 2,356,410 | |
| Mimecast Ltd. (a) | 18,668 | 381,947 | |
| MINDBODY, Inc. (a)(b) | 11,185 | 241,596 | |
| Momo, Inc. ADR (a)(b) | 21,802 | 469,288 | |
| Net Element International, Inc. (a)(b) | 909 | 836 | |
| NetEase, Inc. ADR | 25,684 | 5,755,784 | |
| NIC, Inc. | 23,226 | 582,973 | |
| NumereX Corp. Class A (a) | 9,528 | 76,319 | |
| Nutanix, Inc. Class A (a)(b) | 5,042 | 161,344 | |
| Perion Network Ltd. (a)(b) | 21,960 | 25,254 | |
| Points International Ltd. (a) | 4,960 | 33,926 | |
| QuinStreet, Inc. (a) | 15,140 | 48,297 | |
| Qumu Corp. (a) | 2,780 | 7,673 | |
| RealNetworks, Inc. (a) | 17,726 | 82,958 | |
| Reis, Inc. | 4,351 | 95,069 | |
| Remark Media, Inc. (a)(b) | 6,690 | 27,095 | |
| RetailMeNot, Inc. (a) | 15,100 | 138,920 | |
| Rightside Group Ltd. (a) | 6,964 | 54,667 | |
| Rocket Fuel, Inc. (a)(b) | 12,998 | 23,656 | |
| SecureWorks Corp. | 2,841 | 35,086 | |
| SINA Corp. (a) | 23,885 | 1,840,578 | |
| Sohu.com, Inc. (a)(b) | 13,030 | 451,229 | |
| SPS Commerce, Inc. (a) | 6,210 | 430,167 | |
| Stamps.com, Inc. (a)(b) | 5,660 | 601,092 | |
| Support.com, Inc. (a) | 26,933 | 19,271 | |
| Synacor, Inc. (a)(b) | 12,178 | 37,143 | |
| TechTarget, Inc. (a) | 10,468 | 88,036 | |
| Travelzoo, Inc. (a)(b) | 5,478 | 61,628 | |
| TrueCar, Inc. (a)(b) | 27,950 | 346,021 | |
| Tucows, Inc. (a)(b) | 3,552 | 123,077 | |
| Unwired Planet, Inc. unit (a) | 3,433 | 13,560 | |
| VeriSign, Inc. (a)(b) | 36,754 | 2,898,053 | |
| Web.com Group, Inc. (a) | 17,061 | 272,123 | |
| WebMD Health Corp. (a) | 12,819 | 683,765 | |
| Weibo Corp. sponsored ADR (a)(b) | 15,734 | 807,312 | |
| Wix.com Ltd. (a) | 14,801 | 732,650 | |
| Wowo Ltd. sponsored ADR (a)(b) | 6,361 | 21,691 | |
| Xunlei Ltd. sponsored ADR (a) | 10,609 | 47,741 | |
| Yahoo!, Inc. (a) | 318,610 | 13,069,382 | |
| Yandex NV Series A (a) | 94,740 | 1,801,007 | |
| YY, Inc. ADR (a)(b) | 12,381 | 535,726 | |
| Zillow Group, Inc.: | |||
| Class A (a)(b) | 19,143 | 672,876 | |
| Class C (a)(b) | 38,132 | 1,369,701 | |
| 337,133,804 | |||
| IT Services - 2.7% | |||
| Acxiom Corp. (a) | 25,163 | 667,574 | |
| ALJ Regional Holdings, Inc. (a)(b) | 10,154 | 44,373 | |
| Amdocs Ltd. | 49,582 | 2,923,851 | |
| Automatic Data Processing, Inc. | 151,579 | 14,554,616 | |
| Blackhawk Network Holdings, Inc. (a) | 19,554 | 703,944 | |
| BluePhoenix Solutions Ltd. (a) | 284 | 352 | |
| CardConnect Corp. (a) | 9,839 | 96,914 | |
| Cass Information Systems, Inc. | 4,336 | 303,520 | |
| China Customer Relations Centers, Inc. (b) | 6,463 | 88,737 | |
| China Information Technology, Inc. (a)(b) | 20,266 | 16,213 | |
| Cognizant Technology Solutions Corp. Class A (a) | 202,845 | 11,172,703 | |
| Computer Task Group, Inc. | 7,107 | 29,565 | |
| CSG Systems International, Inc. | 10,905 | 485,273 | |
| Datalink Corp. (a) | 8,904 | 99,725 | |
| Edgewater Technology, Inc. (a) | 6,041 | 41,683 | |
| Euronet Worldwide, Inc. (a) | 17,333 | 1,243,123 | |
| ExlService Holdings, Inc. (a) | 11,412 | 542,755 | |
| Fiserv, Inc. (a)(b) | 72,748 | 7,610,896 | |
| Forrester Research, Inc. | 6,239 | 255,175 | |
| Hackett Group, Inc. | 9,871 | 175,309 | |
| Information Services Group, Inc. (a) | 14,505 | 50,913 | |
| Innodata, Inc. (a) | 1,720 | 4,128 | |
| Jack Henry & Associates, Inc. | 27,621 | 2,387,559 | |
| JetPay Corp. (a)(b) | 3,116 | 8,569 | |
| Lionbridge Technologies, Inc. (a) | 23,241 | 116,670 | |
| ManTech International Corp. Class A | 7,917 | 340,510 | |
| Mattersight Corp. (a)(b) | 9,378 | 35,636 | |
| ModusLink Global Solutions, Inc. (a)(b) | 36,789 | 51,137 | |
| MoneyGram International, Inc. (a) | 19,181 | 209,457 | |
| NCI, Inc. Class A | 3,649 | 47,802 | |
| Net 1 UEPS Technologies, Inc. (a) | 19,657 | 224,286 | |
| Paychex, Inc. (b) | 119,787 | 7,061,444 | |
| PayPal Holdings, Inc. (a)(b) | 403,303 | 15,841,742 | |
| Perficient, Inc. (a) | 12,377 | 222,786 | |
| PFSweb, Inc. (a) | 5,819 | 46,261 | |
| Planet Payment, Inc. (a)(b) | 19,100 | 76,782 | |
| PRG-Schultz International, Inc. (a) | 9,669 | 52,696 | |
| QIWI PLC Class B sponsored ADR (b) | 15,087 | 200,657 | |
| Sabre Corp. (b) | 94,420 | 2,440,757 | |
| ServiceSource International, Inc. (a) | 29,508 | 174,982 | |
| Sykes Enterprises, Inc. (a) | 13,777 | 388,236 | |
| Syntel, Inc. (b) | 28,476 | 552,434 | |
| Sysorex Global (a) | 2,625 | 656 | |
| Teletech Holdings, Inc. | 16,076 | 462,185 | |
| Virtusa Corp. (a) | 9,711 | 215,778 | |
| 72,270,364 | |||
| Semiconductors & Semiconductor Equipment - 9.7% | |||
| Acacia Communications, Inc. (b) | 12,770 | 884,450 | |
| Actions Semiconductor Co. Ltd. ADR (a) | 203 | 432 | |
| Adesto Technologies Corp. (a)(b) | 6,015 | 10,827 | |
| Advanced Energy Industries, Inc. (a) | 12,752 | 704,038 | |
| Advanced Micro Devices, Inc. (a)(b) | 311,458 | 2,775,091 | |
| Aixtron AG sponsored ADR (a) | 4,986 | 19,794 | |
| Alpha & Omega Semiconductor Ltd. (a) | 8,033 | 174,718 | |
| Ambarella, Inc. (a)(b) | 10,738 | 660,602 | |
| Amkor Technology, Inc. (a) | 78,216 | 924,513 | |
| Amtech Systems, Inc. (a)(b) | 3,169 | 13,753 | |
| Analog Devices, Inc. (b) | 103,682 | 7,697,352 | |
| Applied Materials, Inc. | 361,060 | 11,626,132 | |
| Applied Micro Circuits Corp. (a) | 29,384 | 257,110 | |
| ASML Holding NV (b) | 21,735 | 2,241,531 | |
| Atomera, Inc. | 6,089 | 41,101 | |
| Axcelis Technologies, Inc. (a) | 9,097 | 124,174 | |
| AXT, Inc. (a) | 11,530 | 55,344 | |
| Broadcom Ltd. | 132,358 | 22,565,715 | |
| Brooks Automation, Inc. | 25,957 | 423,099 | |
| Cabot Microelectronics Corp. | 7,962 | 474,376 | |
| Camtek Ltd. (a) | 16,454 | 49,033 | |
| Canadian Solar, Inc. (a)(b) | 18,996 | 219,024 | |
| Cavium, Inc. (a) | 22,178 | 1,264,811 | |
| Ceva, Inc. (a) | 7,519 | 239,104 | |
| ChipMOS TECHNOLOGIES, Inc. sponsored ADR (a)(b) | 8,545 | 135,096 | |
| Cirrus Logic, Inc. (a) | 20,725 | 1,139,875 | |
| Cohu, Inc. | 10,522 | 130,999 | |
| Cree, Inc. (a)(b) | 32,833 | 831,332 | |
| CVD Equipment Corp. (a) | 3,218 | 24,940 | |
| CyberOptics Corp. (a) | 2,498 | 72,192 | |
| Cypress Semiconductor Corp. (b) | 105,856 | 1,190,880 | |
| Diodes, Inc. (a) | 16,502 | 401,824 | |
| DSP Group, Inc. (a) | 7,996 | 93,553 | |
| Entegris, Inc. (a) | 46,524 | 835,106 | |
| First Solar, Inc. (a)(b) | 33,705 | 1,021,936 | |
| FormFactor, Inc. (a) | 23,284 | 260,781 | |
| GSI Technology, Inc. (a) | 9,353 | 50,974 | |
| Hanwha Solarone Co. Ltd. sponsored ADR (a) | 2,413 | 19,618 | |
| Himax Technologies, Inc. sponsored ADR (b) | 37,121 | 273,582 | |
| Impinj, Inc. (b) | 6,200 | 169,322 | |
| Integrated Device Technology, Inc. (a)(b) | 44,602 | 1,043,687 | |
| Intel Corp. (b) | 1,580,159 | 54,831,517 | |
| Intermolecular, Inc. (a) | 16,622 | 16,954 | |
| Intersil Corp. Class A | 45,110 | 999,187 | |
| IXYS Corp. | 13,453 | 157,400 | |
| JA Solar Holdings Co. Ltd. ADR (a)(b) | 12,054 | 65,574 | |
| KLA-Tencor Corp. | 52,385 | 4,182,418 | |
| Kopin Corp. (a)(b) | 29,573 | 75,707 | |
| Kulicke & Soffa Industries, Inc. (a) | 22,965 | 354,350 | |
| Lam Research Corp. (b) | 54,049 | 5,730,275 | |
| Lattice Semiconductor Corp. (a) | 39,888 | 279,615 | |
| Linear Technology Corp. | 79,342 | 4,961,255 | |
| M/A-COM Technology Solutions Holdings, Inc. (a)(b) | 17,572 | 875,437 | |
| Marvell Technology Group Ltd. | 169,907 | 2,436,466 | |
| Maxim Integrated Products, Inc. | 94,217 | 3,699,902 | |
| Mellanox Technologies Ltd. (a)(b) | 15,696 | 650,599 | |
| Microchip Technology, Inc. (b) | 72,667 | 4,809,102 | |
| Micron Technology, Inc. (a) | 348,033 | 6,797,084 | |
| Microsemi Corp. (a)(b) | 37,529 | 2,054,713 | |
| MKS Instruments, Inc. | 17,378 | 1,000,104 | |
| Monolithic Power Systems, Inc. | 13,111 | 1,075,626 | |
| MoSys, Inc. (a)(b) | 17,551 | 5,697 | |
| Nanometrics, Inc. (a) | 8,366 | 200,031 | |
| Nova Measuring Instruments Ltd. (a) | 12,404 | 155,918 | |
| NVE Corp. | 2,064 | 137,813 | |
| NVIDIA Corp. (b) | 178,726 | 16,478,537 | |
| NXP Semiconductors NV (a) | 113,293 | 11,233,001 | |
| O2Micro International Ltd. sponsored ADR (a) | 3,450 | 6,383 | |
| ON Semiconductor Corp. (a)(b) | 138,773 | 1,634,746 | |
| PDF Solutions, Inc. (a)(b) | 9,836 | 231,638 | |
| Photronics, Inc. (a) | 22,233 | 222,330 | |
| Pixelworks, Inc. (a)(b) | 14,146 | 43,570 | |
| Power Integrations, Inc. | 9,544 | 642,311 | |
| Qorvo, Inc. (a)(b) | 42,531 | 2,271,581 | |
| Qualcomm, Inc. | 492,273 | 33,538,559 | |
| QuickLogic Corp. (a)(b) | 20,189 | 17,766 | |
| Rambus, Inc. (a) | 35,854 | 471,480 | |
| Rubicon Technology, Inc. (a) | 5,346 | 2,649 | |
| SemiLEDs Corp. (a) | 200 | 848 | |
| Semtech Corp. (a) | 21,022 | 590,718 | |
| Sigma Designs, Inc. (a) | 12,546 | 94,095 | |
| Silicon Laboratories, Inc. (a) | 13,568 | 900,237 | |
| Silicon Motion Technology Corp. sponsored ADR | 11,436 | 525,942 | |
| Siliconware Precision Industries Co. Ltd. sponsored ADR (b) | 19,012 | 142,590 | |
| Skyworks Solutions, Inc. (b) | 63,423 | 4,874,058 | |
| SolarEdge Technologies, Inc. (a)(b) | 13,776 | 181,843 | |
| SPI Energy Co. Ltd. sponsored ADR (a)(b) | 21,564 | 45,716 | |
| SunEdison Semiconductor Ltd. (a) | 13,231 | 158,243 | |
| SunPower Corp. (a)(b) | 45,911 | 310,358 | |
| Sunworks, Inc. (a)(b) | 9,585 | 21,470 | |
| Synaptics, Inc. (a)(b) | 11,487 | 626,960 | |
| Tessera Technologies, Inc. | 15,798 | 625,601 | |
| Texas Instruments, Inc. (b) | 334,464 | 24,726,924 | |
| Tower Semiconductor Ltd. (a)(b) | 29,132 | 523,211 | |
| Ultra Clean Holdings, Inc. (a) | 10,799 | 108,422 | |
| Ultratech, Inc.(a) | 8,120 | 186,110 | |
| Veeco Instruments, Inc. (a) | 13,514 | 360,148 | |
| Xcerra Corp. (a) | 18,282 | 115,908 | |
| Xilinx, Inc. | 83,715 | 4,518,936 | |
| 263,127,454 | |||
| Software - 10.2% | |||
| 8x8, Inc. (a) | 30,258 | 413,022 | |
| ACI Worldwide, Inc. (a)(b) | 40,141 | 747,024 | |
| Activision Blizzard, Inc. | 247,959 | 9,077,779 | |
| Adobe Systems, Inc. (a) | 166,054 | 17,072,012 | |
| Allot Communications Ltd. (a) | 12,391 | 57,618 | |
| American Software, Inc. Class A | 11,793 | 129,959 | |
| ANSYS, Inc. (a)(b) | 28,885 | 2,716,057 | |
| Aspen Technology, Inc. (a) | 25,774 | 1,361,640 | |
| Atlassian Corp. PLC (b) | 24,801 | 673,099 | |
| Attunity Ltd. (a)(b) | 7,466 | 42,482 | |
| Autodesk, Inc. (a) | 74,667 | 5,421,571 | |
| Aware, Inc. (a) | 11,224 | 65,099 | |
| Blackbaud, Inc. (b) | 15,504 | 973,341 | |
| Bottomline Technologies, Inc. (a)(b) | 13,774 | 345,176 | |
| BroadSoft, Inc. (a) | 9,693 | 402,260 | |
| BSQUARE Corp. (a) | 4,329 | 25,108 | |
| CA Technologies, Inc. | 139,460 | 4,457,142 | |
| Cadence Design Systems, Inc. (a) | 96,863 | 2,545,560 | |
| Callidus Software, Inc. (a)(b) | 25,625 | 402,313 | |
| CDK Global, Inc. | 51,503 | 2,971,723 | |
| Changyou.com Ltd. (A Shares) ADR (a) | 6,081 | 146,735 | |
| Check Point Software Technologies Ltd. (a)(b) | 57,100 | 4,701,043 | |
| Citrix Systems, Inc. (a)(b) | 52,089 | 4,517,679 | |
| CommVault Systems, Inc. (a) | 14,972 | 808,488 | |
| CounterPath Corp. (a) | 952 | 1,875 | |
| Covisint Corp. (a) | 20,413 | 45,929 | |
| CyberArk Software Ltd. (a) | 11,014 | 561,824 | |
| Datawatch Corp. (a)(b) | 4,467 | 26,802 | |
| Descartes Systems Group, Inc. (a) | 27,519 | 611,101 | |
| Digimarc Corp. (a)(b) | 3,176 | 98,615 | |
| Digital Turbine, Inc. (a)(b) | 32,983 | 25,727 | |
| Ebix, Inc. (b) | 10,538 | 628,065 | |
| Electronic Arts, Inc. (a) | 100,486 | 7,962,511 | |
| EnerNOC, Inc. (a)(b) | 9,543 | 56,304 | |
| Everbridge, Inc. (b) | 8,822 | 140,358 | |
| Evolving Systems, Inc. | 7,319 | 28,910 | |
| Exa Corp. (a) | 5,387 | 79,889 | |
| FalconStor Software, Inc. (a)(b) | 4,107 | 2,259 | |
| FireEye, Inc. (a)(b) | 59,425 | 763,017 | |
| Form Holdings Corp. (a)(b) | 8,159 | 19,010 | |
| Fortinet, Inc. (a) | 59,069 | 1,777,977 | |
| Glu Mobile, Inc. (a)(b) | 49,755 | 111,949 | |
| Guidance Software, Inc. (a)(b) | 12,274 | 86,532 | |
| Inseego Corp. (a)(b) | 19,413 | 44,650 | |
| Interactive Intelligence Group, Inc. (a)(b) | 7,254 | 438,504 | |
| Intuit, Inc. | 84,639 | 9,621,762 | |
| Jive Software, Inc. (a)(b) | 32,701 | 124,264 | |
| KongZhong Corp. sponsored ADR (a) | 14,582 | 97,116 | |
| Magic Software Enterprises Ltd. (b) | 19,010 | 137,823 | |
| Majesco Entertainment Co. (b) | 2,379 | 7,684 | |
| Manhattan Associates, Inc. (a) | 23,799 | 1,247,068 | |
| Materialise NV ADR (a)(b) | 6,225 | 50,547 | |
| Mentor Graphics Corp. | 35,417 | 1,294,491 | |
| Microsoft Corp. | 2,600,180 | 156,686,847 | |
| MicroStrategy, Inc. Class A (a) | 3,065 | 594,702 | |
| Mitek Systems, Inc. (a)(b) | 10,386 | 58,162 | |
| MobileIron, Inc. (a)(b) | 27,822 | 115,461 | |
| Monotype Imaging Holdings, Inc. | 13,423 | 263,091 | |
| NetSol Technologies, Inc. (a) | 5,108 | 29,116 | |
| NICE Systems Ltd. sponsored ADR | 13,046 | 858,296 | |
| Nuance Communications, Inc. (a) | 95,808 | 1,553,048 | |
| NXT-ID, Inc. (a)(b) | 787 | 2,534 | |
| Open Text Corp. | 41,649 | 2,653,717 | |
| Parametric Technology Corp. (a) | 37,715 | 1,837,098 | |
| Park City Group, Inc. (a) | 7,999 | 116,785 | |
| Paylocity Holding Corp. (a)(b) | 16,978 | 562,142 | |
| Pegasystems, Inc. | 25,383 | 916,326 | |
| Progress Software Corp. | 15,684 | 463,776 | |
| Proofpoint, Inc. (a)(b) | 14,708 | 1,132,663 | |
| QAD, Inc. Class A | 7,546 | 218,834 | |
| Qualys, Inc. (a) | 11,665 | 387,278 | |
| Rapid7, Inc. (a)(b) | 14,292 | 165,787 | |
| RealPage, Inc. (a) | 29,903 | 855,226 | |
| Sapiens International Corp. NV | 17,677 | 261,796 | |
| SeaChange International, Inc. (a)(b) | 14,266 | 37,234 | |
| SITO Mobile Ltd. (a) | 6,884 | 24,438 | |
| Smith Micro Software, Inc. (a) | 735 | 1,036 | |
| Sonic Foundry, Inc. (a) | 478 | 2,433 | |
| Sphere 3D Corp. (a)(b) | 24,109 | 19,287 | |
| Splunk, Inc. (a)(b) | 44,152 | 2,544,038 | |
| SS&C Technologies Holdings, Inc. | 67,177 | 2,015,982 | |
| Symantec Corp. | 204,914 | 4,997,852 | |
| Synchronoss Technologies, Inc. (a)(b) | 14,793 | 717,165 | |
| Synopsys, Inc. (a) | 50,084 | 3,029,080 | |
| Take-Two Interactive Software, Inc. (a)(b) | 29,615 | 1,457,946 | |
| Talend SA ADR (b) | 3,035 | 70,078 | |
| Tangoe, Inc. (a)(b) | 12,630 | 100,030 | |
| TeleNav, Inc. (a) | 16,786 | 100,716 | |
| The9 Ltd. sponsored ADR (a) | 6,231 | 9,035 | |
| TiVo Corp. (a) | 40,629 | 822,737 | |
| Top Image Systems Ltd. (a) | 2,532 | 3,798 | |
| Tubemogul, Inc. (a)(b) | 11,667 | 163,338 | |
| Ultimate Software Group, Inc. (a) | 9,888 | 2,026,348 | |
| Upland Software, Inc. (a) | 6,211 | 58,508 | |
| Varonis Systems, Inc. (a) | 8,496 | 248,083 | |
| Vasco Data Security International, Inc. (a) | 13,699 | 198,636 | |
| Verint Systems, Inc. (a) | 21,206 | 796,285 | |
| Voltari Corp. (a)(b) | 3,627 | 10,337 | |
| Zix Corp. (a) | 18,885 | 84,038 | |
| Zynga, Inc. (a) | 282,819 | 808,862 | |
| 276,246,498 | |||
| Technology Hardware, Storage & Peripherals - 8.0% | |||
| Apple, Inc. | 1,799,716 | 198,904,559 | |
| Astro-Med, Inc. | 3,663 | 48,535 | |
| Avid Technology, Inc. (a) | 12,939 | 54,473 | |
| BlackBerry Ltd. (a)(b) | 174,831 | 1,345,755 | |
| China TechFaith Wireless Communication Technology Ltd. sponsored ADR (a) | 356 | 812 | |
| Concurrent Computer Corp. | 5,268 | 29,553 | |
| CPI Card Group | 20,070 | 75,263 | |
| Cray, Inc. (a) | 13,526 | 261,052 | |
| Electronics for Imaging, Inc. (a)(b) | 15,224 | 662,548 | |
| Immersion Corp. (a)(b) | 10,589 | 109,067 | |
| Intevac, Inc. (a) | 8,266 | 52,489 | |
| Logitech International SA (b) | 53,425 | 1,307,844 | |
| NetApp, Inc. | 92,101 | 3,367,213 | |
| On Track Innovations Ltd. (a)(b) | 5,512 | 6,614 | |
| Seagate Technology LLC (b) | 100,556 | 4,032,296 | |
| Stratasys Ltd. (a)(b) | 17,735 | 320,117 | |
| Super Micro Computer, Inc. (a) | 15,909 | 435,111 | |
| Transact Technologies, Inc. | 1,837 | 11,665 | |
| U.S.A. Technologies, Inc. (a)(b) | 13,783 | 58,578 | |
| Western Digital Corp. | 95,302 | 6,066,925 | |
| 217,150,469 | |||
| TOTAL INFORMATION TECHNOLOGY | 1,267,323,852 | ||
| MATERIALS - 0.6% | |||
| Chemicals - 0.2% | |||
| A. Schulman, Inc. | 9,620 | 320,346 | |
| Advanced Emissions Solutions, Inc. (a)(b) | 9,725 | 87,720 | |
| AgroFresh Solutions, Inc. (a)(b) | 17,874 | 50,047 | |
| Balchem Corp. (b) | 10,586 | 845,398 | |
| Burcon NutraScience Corp. (a) | 2,165 | 4,400 | |
| Burcon NutraScience Corp. rights 11/30/16 (a) | 2,165 | 8 | |
| Codexis, Inc. (a) | 16,144 | 76,684 | |
| Fuwei Films Holdings Co. Ltd. (a) | 926 | 556 | |
| Gulf Resources, Inc. (a) | 18,051 | 42,420 | |
| Hawkins, Inc. | 3,857 | 187,257 | |
| Innophos Holdings, Inc. | 6,606 | 360,159 | |
| Innospec, Inc. | 7,775 | 510,818 | |
| Marrone Bio Innovations, Inc. (a)(b) | 5,015 | 11,685 | |
| Metabolix, Inc. (a) | 4,567 | 1,302 | |
| Methanex Corp. (b) | 29,941 | 1,317,957 | |
| Northern Technologies International Corp. (a) | 492 | 6,839 | |
| Senomyx, Inc. (a)(b) | 14,455 | 15,611 | |
| Tantech Holdings Ltd. (a)(b) | 5,755 | 12,719 | |
| Terravia Holdings, Inc. (a)(b) | 29,761 | 40,177 | |
| 3,892,103 | |||
| Construction Materials - 0.0% | |||
| China Advanced Construction Materials Group, Inc. (a) | 135 | 317 | |
| Forterra, Inc. (b) | 20,582 | 407,729 | |
| Tecnoglass, Inc. (b) | 9,962 | 121,835 | |
| U.S. Concrete, Inc. (a)(b) | 5,032 | 286,069 | |
| United States Lime & Minerals, Inc. | 1,849 | 134,145 | |
| 950,095 | |||
| Containers & Packaging - 0.1% | |||
| AEP Industries, Inc. | 1,718 | 202,466 | |
| Silgan Holdings, Inc. (b) | 19,798 | 980,199 | |
| UFP Technologies, Inc. (a) | 3,182 | 79,868 | |
| 1,262,533 | |||
| Metals & Mining - 0.3% | |||
| Century Aluminum Co. (a)(b) | 27,987 | 258,040 | |
| China Natural Resources, Inc. (a) | 3,570 | 9,318 | |
| Ferroglobe PLC | 23,476 | 267,861 | |
| Ferroglobe Representation & Warranty Insurance | 23,476 | 0 | |
| Handy & Harman Ltd. (a) | 4,841 | 111,827 | |
| Haynes International, Inc. | 3,976 | 173,234 | |
| Kaiser Aluminum Corp. | 5,973 | 492,115 | |
| Mountain Province Diamonds, Inc. (a) | 57,110 | 283,573 | |
| Olympic Steel, Inc. | 4,194 | 102,543 | |
| Pan American Silver Corp. (b) | 51,028 | 859,822 | |
| Pershing Gold Corp. (a)(b) | 11,050 | 41,327 | |
| Randgold Resources Ltd. sponsored ADR (b) | 13,669 | 982,528 | |
| Real Industries, Inc. (a) | 11,150 | 65,228 | |
| Royal Gold, Inc. | 21,708 | 1,511,745 | |
| Schnitzer Steel Industries, Inc. Class A | 8,459 | 236,006 | |
| Silver Standard Resources, Inc. (a)(b) | 39,281 | 388,628 | |
| Steel Dynamics, Inc. | 81,829 | 2,903,293 | |
| Synalloy Corp. | 3,081 | 31,272 | |
| Universal Stainless & Alloy Products, Inc. (a) | 2,467 | 30,344 | |
| 8,748,704 | |||
| Paper & Forest Products - 0.0% | |||
| Mercer International, Inc. (SBI) | 20,514 | 194,883 | |
| Pope Resources, Inc. LP | 1,780 | 119,260 | |
| Rentech, Inc. (a) | 5,467 | 8,911 | |
| 323,054 | |||
| TOTAL MATERIALS | 15,176,489 | ||
| REAL ESTATE - 0.8% | |||
| Equity Real Estate Investment Trusts (REITs) - 0.8% | |||
| CareTrust (REIT), Inc. | 23,113 | 327,049 | |
| Communications Sales & Leasing, Inc. | 53,856 | 1,342,630 | |
| CyrusOne, Inc. | 27,714 | 1,182,834 | |
| Equinix, Inc. (b) | 23,734 | 8,040,130 | |
| Gaming & Leisure Properties | 68,674 | 2,095,244 | |
| Gladstone Commercial Corp. | 7,404 | 136,160 | |
| Gladstone Land Corp. (b) | 5,578 | 60,856 | |
| Global Self Storage, Inc. | 4,374 | 21,826 | |
| Government Properties Income Trust (b) | 23,516 | 441,866 | |
| Gyrodyne LLC | 1,037 | 19,444 | |
| Hospitality Properties Trust (SBI) | 57,844 | 1,677,187 | |
| Lamar Advertising Co. Class A (b) | 27,282 | 1,808,524 | |
| Potlatch Corp. | 13,406 | 550,651 | |
| Retail Opportunity Investments Corp. | 36,725 | 758,004 | |
| Sabra Health Care REIT, Inc. | 21,657 | 479,269 | |
| Select Income REIT | 30,885 | 754,829 | |
| Senior Housing Properties Trust (SBI) | 79,520 | 1,436,131 | |
| Sotherly Hotels, Inc. | 7,917 | 43,464 | |
| Wheeler REIT, Inc. | 28,143 | 45,873 | |
| 21,221,971 | |||
| Real Estate Management & Development - 0.0% | |||
| Altisource Portfolio Solutions SA (a)(b) | 5,841 | 157,357 | |
| AV Homes, Inc. (a)(b) | 7,112 | 112,725 | |
| China HGS Real Estate, Inc. (a)(b) | 10,514 | 22,290 | |
| Colliers International Group, Inc. | 12,492 | 442,005 | |
| Cresud S.A.C.I.F. y A. sponsored ADR | 14,542 | 237,180 | |
| Elbit Imaging Ltd. (a) | 37 | 127 | |
| FirstService Corp. | 11,854 | 514,735 | |
| FRP Holdings, Inc. (a) | 3,769 | 143,034 | |
| Griffin Industrial Realty, Inc. | 1,996 | 62,774 | |
| Landmark Infrastructure Partners LP | 5,278 | 77,323 | |
| Stratus Properties, Inc. (a)(b) | 2,797 | 83,211 | |
| The RMR Group, Inc. | 5,203 | 215,925 | |
| 2,068,686 | |||
| TOTAL REAL ESTATE | 23,290,657 | ||
| TELECOMMUNICATION SERVICES - 1.1% | |||
| Diversified Telecommunication Services - 0.3% | |||
| Alaska Communication Systems Group, Inc. (a) | 28,590 | 43,457 | |
| Atlantic Tele-Network, Inc. | 7,583 | 548,327 | |
| B Communications Ltd. | 6,305 | 140,412 | |
| Cogent Communications Group, Inc. | 15,092 | 565,195 | |
| Consolidated Communications Holdings, Inc. | 17,582 | 502,494 | |
| FairPoint Communications, Inc. (a) | 9,909 | 164,985 | |
| Frontier Communications Corp. (b) | 390,393 | 1,424,934 | |
| General Communications, Inc. Class A (a) | 12,200 | 205,692 | |
| Hawaiian Telcom Holdco, Inc. (a) | 4,893 | 111,756 | |
| Inteliquent, Inc. | 11,373 | 257,485 | |
| Internet Gold Golden Lines Ltd. (a) | 2,697 | 31,690 | |
| Iridium Communications, Inc. (a)(b) | 30,514 | 268,523 | |
| Lumos Networks Corp. (a) | 7,652 | 111,260 | |
| magicJack VocalTec Ltd. (a)(b) | 6,098 | 43,296 | |
| ORBCOMM, Inc. (a)(b) | 23,845 | 200,536 | |
| PDVWireless, Inc. (a)(b) | 4,448 | 104,973 | |
| SBA Communications Corp. Class A (a) | 41,483 | 4,105,158 | |
| Sify Technologies Ltd. sponsored ADR | 1,965 | 1,788 | |
| Windstream Holdings, Inc. (b) | 31,478 | 233,252 | |
| 9,065,213 | |||
| Wireless Telecommunication Services - 0.8% | |||
| Airgain, Inc. (b) | 2,589 | 50,770 | |
| America Movil S.A.B. de CV Series A sponsored ADR (b) | 3,795 | 45,920 | |
| Boingo Wireless, Inc. (a) | 12,453 | 151,927 | |
| Leap Wireless International, Inc. rights (a) | 9,737 | 31,937 | |
| NII Holdings, Inc. (a)(b) | 32,877 | 55,891 | |
| Partner Communications Co. Ltd. ADR (a) | 1,446 | 7,056 | |
| Shenandoah Telecommunications Co. (b) | 16,340 | 458,337 | |
| Spok Holdings, Inc. | 6,714 | 122,195 | |
| T-Mobile U.S., Inc. (a) | 274,676 | 14,890,186 | |
| VimpelCom Ltd. sponsored ADR (b) | 443,566 | 1,490,382 | |
| Vodafone Group PLC sponsored ADR | 132,709 | 3,243,408 | |
| 20,548,009 | |||
| TOTAL TELECOMMUNICATION SERVICES | 29,613,222 | ||
| UTILITIES - 0.1% | |||
| Electric Utilities - 0.0% | |||
| MGE Energy, Inc. | 12,266 | 726,147 | |
| Otter Tail Corp. | 13,247 | 508,022 | |
| Spark Energy, Inc. Class A, (b) | 1,866 | 47,583 | |
| 1,281,752 | |||
| Gas Utilities - 0.0% | |||
| Delta Natural Gas Co., Inc. (b) | 3,357 | 85,637 | |
| RGC Resources, Inc. | 598 | 14,777 | |
| 100,414 | |||
| Independent Power and Renewable Electricity Producers - 0.1% | |||
| 8Point3 Energy Partners LP | 8,945 | 114,317 | |
| Atlantica Yield PLC | 32,708 | 592,669 | |
| Pattern Energy Group, Inc. (b) | 27,887 | 547,422 | |
| TerraForm Global, Inc. | 39,101 | 148,584 | |
| Terraform Power, Inc. (b) | 29,948 | 378,243 | |
| 1,781,235 | |||
| Water Utilities - 0.0% | |||
| Artesian Resources Corp. Class A | 3,139 | 98,941 | |
| Cadiz, Inc. (a)(b) | 5,673 | 58,999 | |
| Connecticut Water Service, Inc. | 4,354 | 237,380 | |
| Consolidated Water Co., Inc. (b) | 4,308 | 47,173 | |
| Middlesex Water Co. | 5,668 | 230,914 | |
| Pure Cycle Corp. (a) | 9,138 | 45,233 | |
| York Water Co. | 7,311 | 266,120 | |
| 984,760 | |||
| TOTAL UTILITIES | 4,148,161 | ||
| TOTAL COMMON STOCKS | |||
| (Cost $2,035,695,144) | 2,689,494,985 | ||
| Principal Amount | Value | ||
| U.S. Treasury Obligations - 0.1% | |||
| U.S. Treasury Bills, yield at date of purchase 0.55% 8/17/17 (e) | |||
| (Cost $1,992,144) | 2,000,000 | 1,990,716 | |
| Shares | Value | ||
| Money Market Funds - 16.1% | |||
| Fidelity Cash Central Fund, 0.39% (f) | 13,280,127 | $13,282,783 | |
| Fidelity Securities Lending Cash Central Fund 0.48% (f)(g) | 423,553,538 | 423,638,249 | |
| TOTAL MONEY MARKET FUNDS | |||
| (Cost $436,849,205) | 436,921,032 | ||
| TOTAL INVESTMENT PORTFOLIO - 115.2% | |||
| (Cost $2,474,536,493) | 3,128,406,733 | ||
| NET OTHER ASSETS (LIABILITIES) - (15.2)% | (413,269,767) | ||
| NET ASSETS - 100% | $2,715,136,966 |
| Futures Contracts | |||
| Expiration Date | Underlying Face Amount at Value | Unrealized Appreciation/(Depreciation) | |
| Purchased | |||
| Equity Index Contracts | |||
| 258 CME E-mini NASDAQ 100 Index Contracts (United States) | Dec. 2016 | 24,850,560 | $109,220 |
The face value of futures purchased as a percentage of Net Assets is 0.9%
Legend
(a) Non-income producing
(b) Security or a portion of the security is on loan at period end.
(c) Security exempt from registration under Rule 144A of the Securities Act of 1933. These securities may be resold in transactions exempt from registration, normally to qualified institutional buyers. At the end of the period, the value of these securities amounted to $178 or 0.0% of net assets.
(d) Security or a portion of the security purchased on a delayed delivery or when-issued basis.
(e) Security or a portion of the security was pledged to cover margin requirements for futures contracts. At period end, the value of securities pledged amounted to $773,393.
(f) Affiliated fund that is generally available only to investment companies and other accounts managed by Fidelity Investments. The rate quoted is the annualized seven-day yield of the fund at period end. A complete unaudited listing of the fund's holdings as of its most recent quarter end is available upon request. In addition, each Fidelity Central Fund's financial statements, which are not covered by the Fund's Report of Independent Registered Public Accounting Firm, are available on the SEC's website or upon request.
(g) Investment made with cash collateral received from securities on loan.
Affiliated Central Funds
Information regarding fiscal year to date income earned by the Fund from investments in Fidelity Central Funds is as follows:
| Fund | Income earned |
| Fidelity Cash Central Fund | $63,437 |
| Fidelity Securities Lending Cash Central Fund | 3,519,078 |
| Total | $3,582,515 |
Investment Valuation
The following is a summary of the inputs used, as of November 30, 2016, involving the Fund's assets and liabilities carried at fair value. The inputs or methodology used for valuing securities may not be an indication of the risk associated with investing in those securities. For more information on valuation inputs, and their aggregation into the levels used below, please refer to the Investment Valuation section in the accompanying Notes to Financial Statements.
| Valuation Inputs at Reporting Date: | ||||
| Description | Total | Level 1 | Level 2 | Level 3 |
| Investments in Securities: | ||||
| Equities: | ||||
| Consumer Discretionary | $512,633,360 | $512,633,360 | $-- | $-- |
| Consumer Staples | 138,807,843 | 138,807,843 | -- | -- |
| Energy | 16,614,813 | 16,614,635 | 178 | -- |
| Financials | 200,424,427 | 200,424,427 | -- | -- |
| Health Care | 355,970,544 | 355,751,456 | 77 | 219,011 |
| Industrials | 125,491,617 | 125,491,617 | -- | -- |
| Information Technology | 1,267,323,852 | 1,267,323,852 | -- | -- |
| Materials | 15,176,489 | 15,176,481 | 8 | -- |
| Real Estate | 23,290,657 | 23,290,657 | -- | -- |
| Telecommunication Services | 29,613,222 | 29,581,285 | -- | 31,937 |
| Utilities | 4,148,161 | 4,148,161 | -- | -- |
| U.S. Government and Government Agency Obligations | 1,990,716 | -- | 1,990,716 | -- |
| Money Market Funds | 436,921,032 | 436,921,032 | -- | -- |
| Total Investments in Securities: | $3,128,406,733 | $3,126,164,806 | $1,990,979 | $250,948 |
| Derivative Instruments: | ||||
| Assets | ||||
| Futures Contracts | $109,220 | $109,220 | $-- | $-- |
| Total Assets | $109,220 | $109,220 | $-- | $-- |
| Total Derivative Instruments: | $109,220 | $109,220 | $-- | $-- |
Value of Derivative Instruments
The following table is a summary of the Fund's value of derivative instruments by primary risk exposure as of November 30, 2016. For additional information on derivative instruments, please refer to the Derivative Instruments section in the accompanying Notes to Financial Statements.
| Primary Risk Exposure / Derivative Type | Value | |
| Asset | Liability | |
| Equity Risk | ||
| Futures Contracts(a) | $109,220 | $0 |
| Total Equity Risk | 109,220 | 0 |
| Total Value of Derivatives | $109,220 | $0 |
(a) Reflects gross cumulative appreciation (depreciation) on futures contracts as presented in the Schedule of Investments. In the Statement of Assets and Liabilities, the period end daily variation margin is included in receivable or payable for daily variation margin for derivative instruments, and the net cumulative appreciation (depreciation) is included in net unrealized appreciation (depreciation).
See accompanying notes which are an integral part of the financial statements.
Financial Statements
Statement of Assets and Liabilities
| November 30, 2016 | ||
| Assets | ||
| Investment in securities, at value (including securities loaned of $410,374,031) — See accompanying schedule: Unaffiliated issuers (cost $2,037,687,288) | $2,691,485,701 | |
| Fidelity Central Funds (cost $436,849,205) | 436,921,032 | |
| Total Investments (cost $2,474,536,493) | $3,128,406,733 | |
| Cash | 41,765 | |
| Foreign currency held at value (cost $6,267) | 6,264 | |
| Receivable for investments sold | 63,471 | |
| Receivable for fund shares sold | 8,903,920 | |
| Dividends receivable | 3,648,579 | |
| Distributions receivable from Fidelity Central Funds | 251,391 | |
| Prepaid expenses | 5,543 | |
| Receivable from investment adviser for expense reductions | 304,632 | |
| Other receivables | 1,068 | |
| Total assets | 3,141,633,366 | |
| Liabilities | ||
| Payable for investments purchased | ||
| Regular delivery | $283,754 | |
| Delayed delivery | 29,379 | |
| Payable for fund shares redeemed | 1,418,160 | |
| Accrued management fee | 528,858 | |
| Payable for daily variation margin for derivative instruments | 225,894 | |
| Other affiliated payables | 357,869 | |
| Other payables and accrued expenses | 97,544 | |
| Collateral on securities loaned, at value | 423,554,942 | |
| Total liabilities | 426,496,400 | |
| Net Assets | $2,715,136,966 | |
| Net Assets consist of: | ||
| Paid in capital | $2,050,439,769 | |
| Undistributed net investment income | 23,981,498 | |
| Accumulated undistributed net realized gain (loss) on investments and foreign currency transactions | (13,263,270) | |
| Net unrealized appreciation (depreciation) on investments and assets and liabilities in foreign currencies | 653,978,969 | |
| Net Assets, for 38,538,387 shares outstanding | $2,715,136,966 | |
| Net Asset Value, offering price and redemption price per share ($2,715,136,966 ÷ 38,538,387 shares) | $70.45 |
See accompanying notes which are an integral part of the financial statements.
Statement of Operations
| Year ended November 30, 2016 | ||
| Investment Income | ||
| Dividends | $31,143,449 | |
| Interest | 11,742 | |
| Income from Fidelity Central Funds (including $3,519,078 from security lending) | 3,582,515 | |
| Total income | 34,737,706 | |
| Expenses | ||
| Management fee | $5,592,774 | |
| Transfer agent fees | 3,273,942 | |
| Licensing fees | 103,914 | |
| Accounting and security lending fees | 606,471 | |
| Custodian fees and expenses | 36,271 | |
| Independent trustees' fees and expenses | 9,832 | |
| Registration fees | 151,446 | |
| Audit | 86,087 | |
| Legal | 18,948 | |
| Miscellaneous | 16,935 | |
| Total expenses before reductions | 9,896,620 | |
| Expense reductions | (3,126,308) | 6,770,312 |
| Net investment income (loss) | 27,967,394 | |
| Realized and Unrealized Gain (Loss) | ||
| Net realized gain (loss) on: | ||
| Investment securities: | ||
| Unaffiliated issuers | 900,991 | |
| Fidelity Central Funds | 18,353 | |
| Foreign currency transactions | (357) | |
| Futures contracts | 683,471 | |
| Total net realized gain (loss) | 1,602,458 | |
| Change in net unrealized appreciation (depreciation) on: Investment securities | 131,180,187 | |
| Assets and liabilities in foreign currencies | (99) | |
| Futures contracts | (520,976) | |
| Total change in net unrealized appreciation (depreciation) | 130,659,112 | |
| Net gain (loss) | 132,261,570 | |
| Net increase (decrease) in net assets resulting from operations | $160,228,964 |
See accompanying notes which are an integral part of the financial statements.
Statement of Changes in Net Assets
| Year ended November 30, 2016 | Year ended November 30, 2015 | |
| Increase (Decrease) in Net Assets | ||
| Operations | ||
| Net investment income (loss) | $27,967,394 | $18,666,406 |
| Net realized gain (loss) | 1,602,458 | 3,328,550 |
| Change in net unrealized appreciation (depreciation) | 130,659,112 | 104,270,168 |
| Net increase (decrease) in net assets resulting from operations | 160,228,964 | 126,265,124 |
| Distributions to shareholders from net investment income | (17,116,229) | (10,755,970) |
| Distributions to shareholders from net realized gain | (14,738,930) | (5,388,196) |
| Total distributions | (31,855,159) | (16,144,166) |
| Share transactions | ||
| Proceeds from sales of shares | 1,051,858,524 | 1,178,089,711 |
| Reinvestment of distributions | 30,550,054 | 15,574,587 |
| Cost of shares redeemed | (572,369,348) | (485,576,890) |
| Net increase (decrease) in net assets resulting from share transactions | 510,039,230 | 708,087,408 |
| Redemption fees | 347,337 | 465,280 |
| Total increase (decrease) in net assets | 638,760,372 | 818,673,646 |
| Net Assets | ||
| Beginning of period | 2,076,376,594 | 1,257,702,948 |
| End of period | $2,715,136,966 | $2,076,376,594 |
| Other Information | ||
| Undistributed net investment income end of period | $23,981,498 | $15,462,730 |
| Shares | ||
| Sold | 16,331,216 | 18,263,948 |
| Issued in reinvestment of distributions | 474,816 | 254,019 |
| Redeemed | (8,850,966) | (7,636,754) |
| Net increase (decrease) | 7,955,066 | 10,881,213 |
See accompanying notes which are an integral part of the financial statements.
Financial Highlights — Fidelity Nasdaq Composite Index Fund
| Years ended November 30, | 2016 | 2015 | 2014 | 2013 | 2012 |
| Selected Per–Share Data | |||||
| Net asset value, beginning of period | $67.89 | $63.84 | $54.46 | $40.41 | $35.04 |
| Income from Investment Operations | |||||
| Net investment income (loss)A | .78 | .68 | .75B | .57 | .44 |
| Net realized and unrealized gain (loss) | 2.80 | 4.13 | 9.54 | 13.95 | 5.19 |
| Total from investment operations | 3.58 | 4.81 | 10.29 | 14.52 | 5.63 |
| Distributions from net investment income | (.55) | (.52) | (.40) | (.48) | (.27) |
| Distributions from net realized gain | (.48) | (.26) | (.52) | – | – |
| Total distributions | (1.03) | (.78) | (.92) | (.48) | (.27) |
| Redemption fees added to paid in capitalA | .01 | .02 | .01 | .01 | .01 |
| Net asset value, end of period | $70.45 | $67.89 | $63.84 | $54.46 | $40.41 |
| Total ReturnC | 5.43% | 7.70% | 19.25% | 36.39% | 16.24% |
| Ratios to Average Net AssetsD,E | |||||
| Expenses before reductions | .42% | .52% | .55% | .56% | .58% |
| Expenses net of fee waivers, if any | .29% | .29% | .29% | .33% | .35% |
| Expenses net of all reductions | .29% | .29% | .29% | .33% | .35% |
| Net investment income (loss) | 1.20% | 1.05% | 1.31%B | 1.23% | 1.13% |
| Supplemental Data | |||||
| Net assets, end of period (000 omitted) | $2,715,137 | $2,076,377 | $1,257,703 | $688,916 | $481,320 |
| Portfolio turnover rateF | 4% | 9% | 5% | 14% | 10% |
A Calculated based on average shares outstanding during the period.
B Net Investment income per share reflects a large, non-recurring dividend which amounted to $.14 per share. Excluding this non-recurring dividend, the ratio of net investment income (loss) to average net assets would have been 1.07%.
C Total returns would have been lower if certain expenses had not been reduced during the applicable periods shown.
D Fees and expenses of any underlying Fidelity Central Funds are not included in the Fund's expense ratio. The Fund indirectly bears its proportionate share of the expenses of any underlying Fidelity Central Funds.
E Expense ratios reflect operating expenses of the Fund. Expenses before reductions do not reflect amounts reimbursed by the investment adviser or reductions from expense offset arrangements and do not represent the amount paid by the Fund during periods when reimbursements or reductions occur. Expenses net of fee waivers reflect expenses after reimbursement by the investment adviser but prior to reductions from expense offset arrangements. Expenses net of all reductions represent the net expenses paid by the Fund.
F Amount does not include the portfolio activity of any underlying Fidelity Central Funds.
See accompanying notes which are an integral part of the financial statements.
Notes to Financial Statements
For the period ended November 30, 2016
1. Organization.
Fidelity Nasdaq Composite Index Fund (the Fund) is a fund of Fidelity Concord Street Trust (the Trust) (formerly a fund of Fidelity Commonwealth Trust) and is authorized to issue an unlimited number of shares. Share transactions on the Statement of Changes in Net Assets may contain exchanges between affiliated funds. The Trust is registered under the Investment Company Act of 1940, as amended (the 1940 Act), as an open-end management investment company organized as a Massachusetts business trust.
2. Investments in Fidelity Central Funds.
The Fund invests in Fidelity Central Funds, which are open-end investment companies generally available only to other investment companies and accounts managed by the investment adviser and its affiliates. The Fund's Schedule of Investments lists each of the Fidelity Central Funds held as of period end, if any, as an investment of the Fund, but does not include the underlying holdings of each Fidelity Central Fund. As an Investing Fund, the Fund indirectly bears its proportionate share of the expenses of the underlying Fidelity Central Funds.
The Money Market Central Funds seek preservation of capital and current income and are managed by Fidelity Investments Money Management, Inc. (FIMM), an affiliate of the investment adviser. Annualized expenses of the Money Market Central Funds as of their most recent shareholder report date are less than .005%.
A complete unaudited list of holdings for each Fidelity Central Fund is available upon request or at the Securities and Exchange Commission (the SEC) website at www.sec.gov. In addition, the financial statements of the Fidelity Central Funds, which are not covered by the Fund's Report of Independent Registered Public Accounting Firm, are available on the SEC website or upon request.
3. Significant Accounting Policies.
The financial statements have been prepared in conformity with accounting principles generally accepted in the United States of America (GAAP), which require management to make certain estimates and assumptions at the date of the financial statements. Actual results could differ from those estimates. Subsequent events, if any, through the date that the financial statements were issued have been evaluated in the preparation of the financial statements. The following summarizes the significant accounting policies of the Fund:
Investment Valuation. Investments are valued as of 4:00 p.m. Eastern time on the last calendar day of the period. The Board of Trustees (the Board) has delegated the day to day responsibility for the valuation of the Fund's investments to the Fair Value Committee (the Committee) established by the Fund's investment adviser. In accordance with valuation policies and procedures approved by the Board, the Fund attempts to obtain prices from one or more third party pricing vendors or brokers to value its investments. When current market prices, quotations or currency exchange rates are not readily available or reliable, investments will be fair valued in good faith by the Committee, in accordance with procedures adopted by the Board. Factors used in determining fair value vary by investment type and may include market or investment specific events, changes in interest rates and credit quality. The frequency with which these procedures are used cannot be predicted and they may be utilized to a significant extent. The Committee oversees the Fund's valuation policies and procedures and reports to the Board on the Committee's activities and fair value determinations. The Board monitors the appropriateness of the procedures used in valuing the Fund's investments and ratifies the fair value determinations of the Committee.
The Fund categorizes the inputs to valuation techniques used to value its investments into a disclosure hierarchy consisting of three levels as shown below:
- Level 1 – quoted prices in active markets for identical investments
- Level 2 – other significant observable inputs (including quoted prices for similar investments, interest rates, prepayment speeds, etc.)
- Level 3 – unobservable inputs (including the Fund's own assumptions based on the best information available)
Valuation techniques used to value the Fund's investments by major category are as follows:
Equity securities, including restricted securities, for which market quotations are readily available, are valued at the last reported sale price or official closing price as reported by a third party pricing vendor on the primary market or exchange on which they are traded and are categorized as Level 1 in the hierarchy. In the event there were no sales during the day or closing prices are not available, securities are valued at the last quoted bid price or may be valued using the last available price and are generally categorized as Level 2 in the hierarchy. For foreign equity securities, when market or security specific events arise, comparisons to the valuation of American Depositary Receipts (ADRs), futures contracts, Exchange-Traded Funds (ETFs) and certain indexes as well as quoted prices for similar securities may be used and would be categorized as Level 2 in the hierarchy. Utilizing these techniques may result in transfers between Level 1 and Level 2. For equity securities, including restricted securities, where observable inputs are limited, assumptions about market activity and risk are used and these securities may be categorized as Level 3 in the hierarchy.
Debt securities, including restricted securities, are valued based on evaluated prices received from third party pricing vendors or from brokers who make markets in such securities. U.S. government and government agency obligations are valued by pricing vendors who utilize matrix pricing which considers yield or price of bonds of comparable quality, coupon, maturity and type or by broker-supplied prices. When independent prices are unavailable or unreliable, debt securities may be valued utilizing pricing methodologies which consider similar factors that would be used by third party pricing vendors. Debt securities are generally categorized as Level 2 in the hierarchy but may be Level 3 depending on the circumstances.
Futures contracts are valued at the settlement price established each day by the board of trade or exchange on which they are traded and are categorized as Level 1 in the hierarchy. Investments in open-end mutual funds, including the Fidelity Central Funds, are valued at their closing net asset value (NAV) each business day and are categorized as Level 1 in the hierarchy.
Changes in valuation techniques may result in transfers in or out of an assigned level within the disclosure hierarchy. The aggregate value of investments by input level as of November 30, 2016 is included at the end of the Fund's Schedule of Investments.
Foreign Currency. The Fund may use foreign currency contracts to facilitate transactions in foreign-denominated securities. Gains and losses from these transactions may arise from changes in the value of the foreign currency or if the counterparties do not perform under the contracts' terms.
Foreign-denominated assets, including investment securities, and liabilities are translated into U.S. dollars at the exchange rates at period end. Purchases and sales of investment securities, income and dividends received and expenses denominated in foreign currencies are translated into U.S. dollars at the exchange rate in effect on the transaction date.
The effects of exchange rate fluctuations on investments are included with the net realized and unrealized gain (loss) on investment securities. Other foreign currency transactions resulting in realized and unrealized gain (loss) are disclosed separately.
Investment Transactions and Income. For financial reporting purposes, the Fund's investment holdings and NAV include trades executed through the end of the last business day of the period. The NAV per share for processing shareholder transactions is calculated as of the close of business of the New York Stock Exchange (NYSE), normally 4:00 p.m. Eastern time and includes trades executed through the end of the prior business day. Gains and losses on securities sold are determined on the basis of identified cost and may include proceeds received from litigation. Dividend income is recorded on the ex-dividend date, except for certain dividends from foreign securities where the ex-dividend date may have passed, which are recorded as soon as the Fund is informed of the ex-dividend date. Non-cash dividends included in dividend income, if any, are recorded at the fair market value of the securities received. Income and capital gain distributions from Fidelity Central Funds, if any, are recorded on the ex-dividend date. Certain distributions received by the Fund represent a return of capital or capital gain. The Fund determines the components of these distributions subsequent to the ex-dividend date, based upon receipt of tax filings or other correspondence relating to the underlying investment. These distributions are recorded as a reduction of cost of investments and/or as a realized gain. Interest income is accrued as earned and includes coupon interest and amortization of premium and accretion of discount on debt securities as applicable. Investment income is recorded net of foreign taxes withheld where recovery of such taxes is uncertain.
Expenses. Expenses directly attributable to a fund are charged to that fund. Expenses attributable to more than one fund are allocated among the respective funds on the basis of relative net assets or other appropriate methods. Expense estimates are accrued in the period to which they relate and adjustments are made when actual amounts are known.
Income Tax Information and Distributions to Shareholders. Each year, the Fund intends to qualify as a regulated investment company under Subchapter M of the Internal Revenue Code, including distributing substantially all of its taxable income and realized gains. As a result, no provision for U.S. Federal income taxes is required. As of November 30, 2016, the Fund did not have any unrecognized tax benefits in the financial statements; nor is the Fund aware of any tax positions for which it is reasonably possible that the total amounts of unrecognized tax benefits will significantly change in the next twelve months. The Fund files a U.S. federal tax return, in addition to state and local tax returns as required. The Fund's federal income tax returns are subject to examination by the Internal Revenue Service (IRS) for a period of three fiscal years after they are filed. State and local tax returns may be subject to examination for an additional fiscal year depending on the jurisdiction. Foreign taxes are provided for based on the Fund's understanding of the tax rules and rates that exist in the foreign markets in which it invests.
Distributions are declared and recorded on the ex-dividend date. Income and capital gain distributions are determined in accordance with income tax regulations, which may differ from GAAP. In addition, the fund claimed a portion of the payments made to redeeming shareholders as a distribution for income tax purposes
Capital accounts within the financial statements are adjusted for permanent book-tax differences. These adjustments have no impact on net assets or the results of operations. Capital accounts are not adjusted for temporary book-tax differences which will reverse in a subsequent period.
Book-tax differences are primarily due to futures contracts, foreign currency transactions, passive foreign investment companies (PFIC), capital loss carryforwards, market discount, partnerships and losses deferred due to wash sales.
The federal tax cost of investment securities and unrealized appreciation (depreciation) as of period end were as follows:
| Gross unrealized appreciation | $794,252,293 |
| Gross unrealized depreciation | (154,343,776) |
| Net unrealized appreciation (depreciation) on securities | $639,908,517 |
| Tax Cost | $2,488,498,216 |
The tax-based components of distributable earnings as of period end were as follows:
| Undistributed ordinary income | $25,166,276 |
| Capital loss carryforward | $(46,930) |
| Net unrealized appreciation (depreciation) on securities and other investments | $639,908,026 |
Capital loss carryforwards are only available to offset future capital gains of the Fund to the extent provided by regulations and may be limited. Under the Regulated Investment Company Modernization Act of 2010 (the Act), the Fund is permitted to carry forward capital losses incurred in taxable years beginning after December 22, 2010 for an unlimited period and such capital losses are required to be used prior to any losses that expire. The capital loss carryforward information presented below, including any applicable limitation, is estimated as of fiscal period end and is subject to adjustment.
| No expiration | |
| Short-term | $(46,930) |
The tax character of distributions paid was as follows:
| November 30, 2016 | November 30, 2015 | |
| Ordinary Income | $17,116,229 | $ 12,314,917 |
| Long-term Capital Gains | 14,738,930 | 3,829,249 |
| Total | $31,855,159 | $ 16,144,166 |
Short-Term Trading (Redemption) Fees. Shares held by investors in the Fund less than 90 days may have been subject to a redemption fee equal to .75% of the NAV of shares redeemed. All redemption fees, which reduce the proceeds of the shareholder redemption, are retained by the Fund and accounted for as an addition to paid in capital. In November 2016, the Board of Trustees approved the elimination of these redemption fees effective December 12, 2016.
Delayed Delivery Transactions and When-Issued Securities. During the period, the Fund transacted in securities on a delayed delivery or when-issued basis. Payment and delivery may take place after the customary settlement period for that security. The price of the underlying securities and the date when the securities will be delivered and paid for are fixed at the time the transaction is negotiated. The securities purchased on a delayed delivery or when-issued basis are identified as such in the Fund's Schedule of Investments. The Fund may receive compensation for interest forgone in the purchase of a delayed delivery or when-issued security. With respect to purchase commitments, the Fund identifies securities as segregated in its records with a value at least equal to the amount of the commitment. Losses may arise due to changes in the value of the underlying securities or if the counterparty does not perform under the contract's terms, or if the issuer does not issue the securities due to political, economic, or other factors.
Restricted Securities. The Fund may invest in securities that are subject to legal or contractual restrictions on resale. These securities generally may be resold in transactions exempt from registration or to the public if the securities are registered. Disposal of these securities may involve time-consuming negotiations and expense, and prompt sale at an acceptable price may be difficult. Information regarding restricted securities is included at the end of the Fund's Schedule of Investments.
4. Derivative Instruments.
Risk Exposures and the Use of Derivative Instruments. The Fund's investment objective allows the Fund to enter into various types of derivative contracts, including futures contracts. Derivatives are investments whose value is primarily derived from underlying assets, indices or reference rates and may be transacted on an exchange or over-the-counter (OTC). Derivatives may involve a future commitment to buy or sell a specified asset based on specified terms, to exchange future cash flows at periodic intervals based on a notional principal amount, or for one party to make one or more payments upon the occurrence of specified events in exchange for periodic payments from the other party.
The Fund used derivatives to increase returns and to manage exposure to certain risks as defined below. The success of any strategy involving derivatives depends on analysis of numerous economic factors, and if the strategies for investment do not work as intended, the Fund may not achieve its objectives.
The Fund's use of derivatives increased or decreased its exposure to the following risk:
| Equity Risk | Equity risk relates to the fluctuations in the value of financial instruments as a result of changes in market prices (other than those arising from interest rate risk or foreign exchange risk), whether caused by factors specific to an individual investment, its issuer, or all factors affecting all instruments traded in a market or market segment. |
The Fund is also exposed to additional risks from investing in derivatives, such as liquidity risk and counterparty credit risk. Liquidity risk is the risk that the Fund will be unable to close out the derivative in the open market in a timely manner. Counterparty credit risk is the risk that the counterparty will not be able to fulfill its obligation to the Fund. Counterparty credit risk related to exchange-traded futures contracts may be mitigated by the protection provided by the exchange on which they trade.
Investing in derivatives may involve greater risks than investing in the underlying assets directly and, to varying degrees, may involve risk of loss in excess of any initial investment and collateral received and amounts recognized in the Statement of Assets and Liabilities. In addition, there may be the risk that the change in value of the derivative contract does not correspond to the change in value of the underlying instrument.
Futures Contracts. A futures contract is an agreement between two parties to buy or sell a specified underlying instrument for a fixed price at a specified future date. The Fund used futures contracts to manage its exposure to the stock market.
Upon entering into a futures contract, a fund is required to deposit either cash or securities (initial margin) with a clearing broker in an amount equal to a certain percentage of the face value of the contract. Futures contracts are marked-to-market daily and subsequent daily payments (variation margin) are made or received by a fund depending on the daily fluctuations in the value of the futures contracts and are recorded as unrealized appreciation or (depreciation). This receivable and/or payable, if any, is included in daily variation margin for derivative instruments in the Statement of Assets and Liabilities. Realized gain or (loss) is recorded upon the expiration or closing of a futures contract.
Any open futures contracts at period end are presented in the Schedule of Investments under the caption "Futures Contracts". The underlying face amount at value reflects each contract's exposure to the underlying instrument or index at period end and is representative of volume of activity during the period. Securities deposited to meet initial margin requirements are identified in the Schedule of Investments.
During the period the Fund recognized net realized gain (loss) of $683,471 and a change in net unrealized appreciation (depreciation) of $(520,976) related to its investment in futures contracts. These amounts are included in the Statement of Operations.
5. Purchases and Sales of Investments.
Purchases and sales of securities, other than short-term securities, aggregated $622,599,504 and $85,458,586, respectively.
6. Fees and Other Transactions with Affiliates.
Management Fee. Fidelity Management & Research Company (the investment adviser) and its affiliates provide the Fund with investment management related services for which the Fund pays a monthly management fee that is based on an annual rate of .24% of the Fund's average net assets.
Sub-Adviser. Geode Capital Management, LLC (Geode), serves as sub-adviser for the Fund. Geode provides discretionary investment advisory services to the Fund and is paid by the investment adviser for providing these services.
Transfer Agent Fees. Fidelity Investments Institutional Operations Company, Inc. (FIIOC), an affiliate of the investment adviser, is the Fund's transfer, dividend disbursing and shareholder servicing agent. FIIOC receives an asset-based fee of .14% of the Fund's average net assets. FIIOC pays for typesetting, printing and mailing of shareholder reports, except proxy statements.
Accounting and Security Lending Fees. Fidelity Service Company, Inc. (FSC), an affiliate of the investment adviser, maintains the Fund's accounting records. The accounting fee is based on the level of average net assets for each month. Under a separate contract, FSC administers the security lending program. The security lending fee is based on the number and duration of lending transactions.
Licensing Fees. Under the terms of a license agreement, the investment adviser pays NASDAQ OMX Group an annual licensing fee for the use of the NASDAQ Composite Index. The investment adviser has entered into a sub-license agreement with the Fund whereby the Fund pays the investment adviser the amount of the license fee at the rate of up to .06% of the Fund's average net assets.
Effective January 1, 2016, the licensing fee is paid by the investment adviser, not by the Fund.
Interfund Trades. The Fund may purchase from or sell securities to other Fidelity Funds under procedures adopted by the Board. The procedures have been designed to ensure these interfund trades are executed in accordance with Rule 17a-7 of the 1940 Act. Interfund trades are included within the respective purchases and sales amounts shown in the Purchases and Sales of Investments note.
7. Committed Line of Credit.
The Fund participates with other funds managed by the investment adviser or an affiliate in a $4.25 billion credit facility (the "line of credit") to be utilized for temporary or emergency purposes to fund shareholder redemptions or for other short-term liquidity purposes. The Fund has agreed to pay commitment fees on its pro-rata portion of the line of credit, which amounted to $5,791 and is reflected in Miscellaneous expenses on the Statement of Operations. During the period, the Fund did not borrow on this line of credit.
8. Security Lending.
The Fund lends portfolio securities through a lending agent from time to time in order to earn additional income. On the settlement date of the loan, the Fund receives collateral (in the form of U.S. Treasury obligations, letters of credit and/or cash) against the loaned securities and maintains collateral in an amount not less than 100% of the market value of the loaned securities during the period of the loan. The market value of the loaned securities is determined at the close of business of the Fund and any additional required collateral is delivered to the Fund on the next business day. The Fund or borrower may terminate the loan at any time, and if the borrower defaults on its obligation to return the securities loaned because of insolvency or other reasons, the Fund may apply collateral received from the borrower against the obligation. The Fund may experience delays and costs in recovering the securities loaned. Any cash collateral received is invested in the Fidelity Securities Lending Cash Central Fund. The value of loaned securities and cash collateral at period end are disclosed on the Fund's Statement of Assets and Liabilities. Security lending income represents the income earned on investing cash collateral, less rebates paid to borrowers and any lending agent fees associated with the loan, plus any premium payments received for lending certain types of securities. Security lending income is presented in the Statement of Operations as a component of income from Fidelity Central Funds.
9. Expense Reductions.
The investment adviser contractually agreed to waive expenses of the Fund to the extent annual operating expenses exceeded .29% of average net assets. This waiver will remain in place through January 31, 2017. Some expenses, for example interest expense, including commitment fees, are excluded from this waiver. During the period this waiver reduced the Fund's expenses by $3,125,684.
In addition, through arrangements with the Fund's custodian, credits realized as a result of certain uninvested cash balances were used to reduce the Fund's expenses. During the period, these credits reduced the Fund's custody expenses by $624.
10. Other.
The Fund's organizational documents provide former and current trustees and officers with a limited indemnification against liabilities arising in connection with the performance of their duties to the Fund. In the normal course of business, the Fund may also enter into contracts that provide general indemnifications. The Fund's maximum exposure under these arrangements is unknown as this would be dependent on future claims that may be made against the Fund. The risk of material loss from such claims is considered remote.
Report of Independent Registered Public Accounting Firm
To the Trustees of Fidelity Concord Street Trust and Shareholders of Fidelity Nasdaq Composite Index Fund:
We have audited the accompanying statement of assets and liabilities of Fidelity Nasdaq Composite Index Fund (the Fund), a fund of Fidelity Concord Street Trust, including the schedule of investments, as of November 30, 2016, and the related statement of operations for the year then ended, the statement of changes in net assets for each of the two years in the period then ended, and the financial highlights for each of the five years in the period then ended. These financial statements and financial highlights are the responsibility of the Fund's management. Our responsibility is to express an opinion on these financial statements and financial highlights based on our audits.
We conducted our audits in accordance with the standards of the Public Company Accounting Oversight Board (United States). Those standards require that we plan and perform the audit to obtain reasonable assurance about whether the financial statements and financial highlights are free of material misstatement. The Fund is not required to have, nor were we engaged to perform, an audit of its internal control over financial reporting. Our audits included consideration of internal control over financial reporting as a basis for designing audit procedures that are appropriate in the circumstances, but not for the purpose of expressing an opinion on the effectiveness of the Fund's internal control over financial reporting. Accordingly, we express no such opinion. An audit also includes examining, on a test basis, evidence supporting the amounts and disclosures in the financial statements, assessing the accounting principles used and significant estimates made by management, as well as evaluating the overall financial statement presentation. Our procedures included confirmation of securities owned as of November 30, 2016, by correspondence with the custodians and brokers; when replies were not received from brokers, we performed other auditing procedures. We believe that our audits provide a reasonable basis for our opinion.
In our opinion, such financial statements and financial highlights referred to above present fairly, in all material respects, the financial position of Fidelity Nasdaq Composite Index Fund as of November 30, 2016, the results of its operations for the year then ended, the changes in its net assets for each of the two years in the period then ended, and the financial highlights for each of the five years in the period then ended in conformity with accounting principles generally accepted in the United States of America.
DELOITTE & TOUCHE LLP
Boston, Massachusetts
January 19, 2017
Trustees and Officers
The Trustees, Members of the Advisory Board (if any), and officers of the trust and fund, as applicable, are listed below. The Board of Trustees governs the fund and is responsible for protecting the interests of shareholders. The Trustees are experienced executives who meet periodically throughout the year to oversee the fund's activities, review contractual arrangements with companies that provide services to the fund, oversee management of the risks associated with such activities and contractual arrangements, and review the fund's performance. Except for Jonathan Chiel, each of the Trustees oversees 170 funds. Mr. Chiel oversees 120 funds.
The Trustees hold office without limit in time except that (a) any Trustee may resign; (b) any Trustee may be removed by written instrument, signed by at least two-thirds of the number of Trustees prior to such removal; (c) any Trustee who requests to be retired or who has become incapacitated by illness or injury may be retired by written instrument signed by a majority of the other Trustees; and (d) any Trustee may be removed at any special meeting of shareholders by a two-thirds vote of the outstanding voting securities of the trust. Each Trustee who is not an interested person (as defined in the 1940 Act) of the trust and the fund is referred to herein as an Independent Trustee. Each Independent Trustee shall retire not later than the last day of the calendar year in which his or her 75th birthday occurs. The Independent Trustees may waive this mandatory retirement age policy with respect to individual Trustees. Officers and Advisory Board Members hold office without limit in time, except that any officer or Advisory Board Member may resign or may be removed by a vote of a majority of the Trustees at any regular meeting or any special meeting of the Trustees. Except as indicated, each individual has held the office shown or other offices in the same company for the past five years.
The fund’s Statement of Additional Information (SAI) includes more information about the Trustees. To request a free copy, call Fidelity at 1-800-544-8544.
Experience, Skills, Attributes, and Qualifications of the Trustees. The Governance and Nominating Committee has adopted a statement of policy that describes the experience, qualifications, attributes, and skills that are necessary and desirable for potential Independent Trustee candidates (Statement of Policy). The Board believes that each Trustee satisfied at the time he or she was initially elected or appointed a Trustee, and continues to satisfy, the standards contemplated by the Statement of Policy. The Governance and Nominating Committee also engages professional search firms to help identify potential Independent Trustee candidates who have the experience, qualifications, attributes, and skills consistent with the Statement of Policy. From time to time, additional criteria based on the composition and skills of the current Independent Trustees, as well as experience or skills that may be appropriate in light of future changes to board composition, business conditions, and regulatory or other developments, have also been considered by the professional search firms and the Governance and Nominating Committee. In addition, the Board takes into account the Trustees' commitment and participation in Board and committee meetings, as well as their leadership of standing and ad hoc committees throughout their tenure.
In determining that a particular Trustee was and continues to be qualified to serve as a Trustee, the Board has considered a variety of criteria, none of which, in isolation, was controlling. The Board believes that, collectively, the Trustees have balanced and diverse experience, qualifications, attributes, and skills, which allow the Board to operate effectively in governing the fund and protecting the interests of shareholders. Information about the specific experience, skills, attributes, and qualifications of each Trustee, which in each case led to the Board's conclusion that the Trustee should serve (or continue to serve) as a trustee of the fund, is provided below.
Board Structure and Oversight Function. James C. Curvey is an interested person and currently serves as Chairman. The Trustees have determined that an interested Chairman is appropriate and benefits shareholders because an interested Chairman has a personal and professional stake in the quality and continuity of services provided to the fund. Independent Trustees exercise their informed business judgment to appoint an individual of their choosing to serve as Chairman, regardless of whether the Trustee happens to be independent or a member of management. The Independent Trustees have determined that they can act independently and effectively without having an Independent Trustee serve as Chairman and that a key structural component for assuring that they are in a position to do so is for the Independent Trustees to constitute a substantial majority for the Board. The Independent Trustees also regularly meet in executive session. Ned C. Lautenbach serves as Chairman of the Independent Trustees and as such (i) acts as a liaison between the Independent Trustees and management with respect to matters important to the Independent Trustees and (ii) with management prepares agendas for Board meetings.
Fidelity® funds are overseen by different Boards of Trustees. The fund's Board oversees Fidelity's high income and certain equity funds, and other Boards oversee Fidelity's investment-grade bond, money market, asset allocation, and sector funds. The asset allocation funds may invest in Fidelity® funds overseen by the fund's Board. The use of separate Boards, each with its own committee structure, allows the Trustees of each group of Fidelity® funds to focus on the unique issues of the funds they oversee, including common research, investment, and operational issues. On occasion, the separate Boards establish joint committees to address issues of overlapping consequences for the Fidelity® funds overseen by each Board.
The Trustees operate using a system of committees to facilitate the timely and efficient consideration of all matters of importance to the Trustees, the fund, and fund shareholders and to facilitate compliance with legal and regulatory requirements and oversight of the fund's activities and associated risks. The Board, acting through its committees, has charged FMR and its affiliates with (i) identifying events or circumstances the occurrence of which could have demonstrably adverse effects on the fund's business and/or reputation; (ii) implementing processes and controls to lessen the possibility that such events or circumstances occur or to mitigate the effects of such events or circumstances if they do occur; and (iii) creating and maintaining a system designed to evaluate continuously business and market conditions in order to facilitate the identification and implementation processes described in (i) and (ii) above. Because the day-to-day operations and activities of the fund are carried out by or through FMR, its affiliates, and other service providers, the fund's exposure to risks is mitigated but not eliminated by the processes overseen by the Trustees. While each of the Board's committees has responsibility for overseeing different aspects of the fund's activities, oversight is exercised primarily through the Operations, Audit, and Compliance Committees. In addition, the Independent Trustees have worked with FMR to enhance the Board's oversight of investment and financial risks, legal and regulatory risks, technology risks, and operational risks, including the development of additional risk reporting to the Board. For example, a working group comprised of Independent Trustees and FMR has worked and continues to work to review the Fidelity® funds' valuation-related activities, reporting and risk management. Appropriate personnel, including but not limited to the fund's Chief Compliance Officer (CCO), FMR's internal auditor, the independent accountants, the fund's Treasurer and portfolio management personnel, make periodic reports to the Board's committees, as appropriate, including an annual review of Fidelity's risk management program for the Fidelity® funds. The responsibilities of each standing committee, including their oversight responsibilities, are described further under "Standing Committees of the Trustees."
Interested Trustees*:
Correspondence intended for a Trustee who is an interested person may be sent to Fidelity Investments, 245 Summer Street, Boston, Massachusetts 02210.
Name, Year of Birth; Principal Occupations and Other Relevant Experience+
Jonathan Chiel (1957)
Year of Election or Appointment: 2016
Trustee
Mr. Chiel also serves as Trustee of other Fidelity funds. Mr. Chiel is Executive Vice President and General Counsel for FMR LLC (diversified financial services company, 2012-present). Previously, Mr. Chiel served as general counsel (2004-2012) and senior vice president and deputy general counsel (2000-2004) for John Hancock Financial Services; a partner with Choate, Hall & Stewart (1996-2000) (law firm); and an Assistant United States Attorney for the United States Attorney’s Office of the District of Massachusetts (1986-95), including Chief of the Criminal Division (1993-1995). Mr. Chiel is a director on the boards of the Boston Bar Foundation and the Maimonides School.
James C. Curvey (1935)
Year of Election or Appointment: 2007
Trustee
Chairman of the Board of Trustees
Mr. Curvey also serves as Trustee of other Fidelity® funds. Mr. Curvey is a Director of Fidelity Research & Analysis Co. (investment adviser firm, 2009-present), and Vice Chairman (2007-present) and Director of FMR LLC (diversified financial services company). In addition, Mr. Curvey serves as an Overseer for the Boston Symphony Orchestra and a member of the board of Artis-Naples, Naples, Florida, and as a Trustee for Brewster Academy, Wolfeboro, New Hampshire. Previously, Mr. Curvey served as a Director of Fidelity Investments Money Management, Inc. (investment adviser firm, 2009-2014) and a Director of FMR and FMR Co., Inc. (investment adviser firms, 2007-2014).
Charles S. Morrison (1960)
Year of Election or Appointment: 2014
Trustee
Mr. Morrison also serves as Trustee of other funds. He serves as President of Fidelity Management & Research Company (FMR) (investment adviser firm, 2016-present), a Director of Fidelity Investments Money Management, Inc. (FIMM) (investment adviser firm, 2014-present), Director of Fidelity SelectCo, LLC (investment adviser firm, 2014-present), President, Asset Management (2014-present), and is an employee of Fidelity Investments. Previously, Mr. Morrison served as Vice President of Fidelity's Fixed Income and Asset Allocation Funds (2012-2014), President, Fixed Income (2011-2014), Vice President of Fidelity's Money Market Funds (2005-2009), President, Money Market Group Leader of FMR (investment adviser firm, 2009), and Senior Vice President, Money Market Group of FMR (2004-2009). Mr. Morrison also served as Vice President of Fidelity's Bond Funds (2002-2005), certain Balanced Funds (2002-2005), and certain Asset Allocation Funds (2002-2007), and as Senior Vice President (2002-2005) of Fidelity's Bond Division.
* Determined to be an “Interested Trustee” by virtue of, among other things, his or her affiliation with the trust or various entities under common control with FMR.
+ The information includes the Trustee's principal occupation during the last five years and other information relating to the experience, attributes, and skills relevant to the Trustee's qualifications to serve as a Trustee, which led to the conclusion that the Trustee should serve as a Trustee for the fund.
Independent Trustees:
Correspondence intended for an Independent Trustee may be sent to Fidelity Investments, P.O. Box 55235, Boston, Massachusetts 02205-5235.
Name, Year of Birth; Principal Occupations and Other Relevant Experience+
Dennis J. Dirks (1948)
Year of Election or Appointment: 2005
Trustee
Mr. Dirks also serves as Trustee of other Fidelity® funds. Prior to his retirement in May 2003, Mr. Dirks was Chief Operating Officer and a member of the Board of The Depository Trust & Clearing Corporation (DTCC). He also served as President, Chief Operating Officer, and Board member of The Depository Trust Company (DTC) and President and Board member of the National Securities Clearing Corporation (NSCC). In addition, Mr. Dirks served as Chief Executive Officer and Board member of the Government Securities Clearing Corporation, Chief Executive Officer and Board member of the Mortgage-Backed Securities Clearing Corporation, as a Trustee and a member of the Finance Committee of Manhattan College (2005-2008), as a Trustee and a member of the Finance Committee of AHRC of Nassau County (2006-2008), and as a member of the Independent Directors Council (IDC) Governing Council (2010-2015). Mr. Dirks is a member of the Board of Directors for The Brookville Center for Children's Services, Inc. (2009-present) and the Finance Committee of the Asolo Repertory Theatre (2016-present).
Alan J. Lacy (1953)
Year of Election or Appointment: 2008
Trustee
Mr. Lacy also serves as Trustee of other Fidelity® funds. Mr. Lacy serves as Chairman (2014-present) and a member (2010-present) of the Board of Directors of Dave & Buster's Entertainment, Inc. (restaurant and entertainment complexes) and a Director of Bristol-Myers Squibb Company (global pharmaceuticals, 2008-present). He is a Trustee of the California Chapter of The Nature Conservancy (2015-present) and a Director of the Center for Advanced Study in the Behavioral Sciences at Stanford University (2015-present). In addition, Mr. Lacy served as Senior Adviser (2007-2014) of Oak Hill Capital Partners, L.P. (private equity) and also served as Chief Executive Officer (2005) and Vice Chairman (2005-2006) of Sears Holdings Corporation (retail) and Chief Executive Officer and Chairman of the Board of Sears, Roebuck and Co. (retail, 2000-2005). Previously, Mr. Lacy served as Chairman (2008-2011) and a member (2006-2015) of the Board of Trustees of the National Parks Conservation Association and as a member of the Board of Directors for The Western Union Company (global money transfer, 2006-2011), The Hillman Companies, Inc. (hardware wholesalers, 2010-2014), and Earth Fare, Inc. (retail grocery, 2010-2014).
Ned C. Lautenbach (1944)
Year of Election or Appointment: 2000
Trustee
Chairman of the Independent Trustees
Mr. Lautenbach also serves as Trustee of other Fidelity® funds. Mr. Lautenbach currently serves as the Lead Director of the Eaton Corporation Board of Directors (diversified industrial, 1997-present). Mr. Lautenbach is Chairman of the Board of Directors of Artis-Naples in Naples, Florida (2012-present), a member of the Council on Foreign Relations (1994-present), and currently Vice Chair of the Board of Governors, State University System of Florida (2013-present). Previously, Mr. Lautenbach was a Partner and Advisory Partner at Clayton, Dubilier & Rice, LLC (private equity investment, 1998-2010), as well as a Director of Sony Corporation (2006-2007). Mr. Lautenbach also had a 30-year career with IBM (technology company) during which time he served as Senior Vice President and a member of the Corporate Executive Committee (1968-1998).
Joseph Mauriello (1944)
Year of Election or Appointment: 2008
Trustee
Mr. Mauriello also serves as Trustee of other Fidelity® funds. Prior to his retirement in January 2006, Mr. Mauriello served in numerous senior management positions including Deputy Chairman and Chief Operating Officer (2004-2005), and Vice Chairman of Financial Services (2002-2004) of KPMG LLP US (professional services, 1965-2005). Mr. Mauriello currently serves as a member of the Board of Directors of XL Group plc. (global insurance and re-insurance, 2006-present) and the Independent Directors Council (IDC) Governing Council (2015-present). Previously, Mr. Mauriello served as a Director of the Hamilton Funds of the Bank of New York (2006-2007) and of Arcadia Resources Inc. (health care services and products, 2007-2012).
Robert W. Selander (1950)
Year of Election or Appointment: 2011
Trustee
Mr. Selander also serves as Trustee of other Fidelity® funds. Mr. Selander serves as a Director of The Western Union Company (global money transfer, 2014-present) and a non-executive Chairman of Health Equity, Inc. (health savings custodian, 2015-present). Previously, Mr. Selander served as a Member of the Advisory Board of certain Fidelity® funds (2011), and Executive Vice Chairman (2010), Chief Executive Officer (2009-2010), and President and Chief Executive Officer (1997-2009) of Mastercard, Inc.
Cornelia M. Small (1944)
Year of Election or Appointment: 2005
Trustee
Ms. Small also serves as Trustee of other Fidelity® funds. Ms. Small is a member of the Board of Directors (2009-present) and Chair of the Investment Committee (2010-present) of the Teagle Foundation. Ms. Small also serves on the Investment Committee of the Berkshire Taconic Community Foundation (2008-present). Previously, Ms. Small served as Chairperson (2002-2008) and a member of the Investment Committee and Chairperson (2008-2012) and a member of the Board of Trustees of Smith College. In addition, Ms. Small served as Chief Investment Officer, Director of Global Equity Investments, and a member of the Board of Directors of Scudder, Stevens & Clark and Scudder Kemper Investments.
William S. Stavropoulos (1939)
Year of Election or Appointment: 2001
Trustee
Vice Chairman of the Independent Trustees
Mr. Stavropoulos also serves as Trustee of other Fidelity® funds. Mr. Stavropoulos serves as President and Founder of the Michigan Baseball Foundation, the Great Lakes Loons (2007-present). Mr. Stavropoulos is Chairman Emeritus of the Board of Directors of The Dow Chemical Company, where he previously served in numerous senior management positions, including President, CEO (1995-2000; 2002-2004), Chairman of the Executive Committee (2000-2006), and as a member of the Board of Directors (1990-2006). Currently, Mr. Stavropoulos is Chairman of the Board of Directors of Univar Inc. (global distributor of commodity and specialty chemicals), a Director of Teradata Corporation (data warehousing and technology solutions), and a member of the Advisory Board for Metalmark Capital LLC (private equity investment, 2005-present). Mr. Stavropoulos is an operating advisor to Clayton, Dubilier & Rice, LLC (private equity investment). In addition, Mr. Stavropoulos is a member of the University of Notre Dame Advisory Council for the College of Science, a Trustee of the Rollin L. Gerstacker Foundation, and a Director of Artis-Naples in Naples, Florida. Previously, Mr. Stavropoulos served as a Director of Chemical Financial Corporation (bank holding company, 1993-2012) and Tyco International, Ltd. (multinational manufacturing and services, 2007-2012).
David M. Thomas (1949)
Year of Election or Appointment: 2008
Trustee
Mr. Thomas also serves as Trustee of other Fidelity® funds. Mr. Thomas serves as Non-Executive Chairman of the Board of Directors of Fortune Brands Home and Security (home and security products, 2011-present), as a member of the Board of Directors (2004-present) and Presiding Director (2013-present) of Interpublic Group of Companies, Inc. (marketing communication), and as a member of the Board of Trustees of the University of Florida (2013-present). Previously, Mr. Thomas served as Executive Chairman (2005-2006) and Chairman and Chief Executive Officer (2000-2005) of IMS Health, Inc. (pharmaceutical and healthcare information solutions), and a Director of Fortune Brands, Inc. (consumer products, 2000-2011).
+ The information includes the Trustee's principal occupation during the last five years and other information relating to the experience, attributes, and skills relevant to the Trustee's qualifications to serve as a Trustee, which led to the conclusion that the Trustee should serve as a Trustee for the fund.
Advisory Board Members and Officers:
Correspondence intended for an officer or Peter S. Lynch may be sent to Fidelity Investments, 245 Summer Street, Boston, Massachusetts 02210. Officers appear below in alphabetical order.
Name, Year of Birth; Principal Occupation
Peter S. Lynch (1944)
Year of Election or Appointment: 2003
Member of the Advisory Board
Mr. Lynch also serves as Member of the Advisory Board of other Fidelity® funds. Mr. Lynch is Vice Chairman and a Director of FMR (investment adviser firm) and FMR Co., Inc. (investment adviser firm). In addition, Mr. Lynch serves as a Trustee of Boston College and as the Chairman of the Inner-City Scholarship Fund. Previously, Mr. Lynch served on the Special Olympics International Board of Directors (1997-2006).
Marc R. Bryant (1966)
Year of Election or Appointment: 2015
Secretary and Chief Legal Officer (CLO)
Mr. Bryant also serves as Secretary and CLO of other funds. Mr. Bryant serves as CLO, Secretary, and Senior Vice President of Fidelity Management & Research Company (investment adviser firm, 2015-present) and FMR Co., Inc. (investment adviser firm, 2015-present); Secretary of Fidelity SelectCo, LLC (investment adviser firm, 2015-present) and Fidelity Investments Money Management, Inc. (investment adviser firm, 2015-present); and CLO of Fidelity Management & Research (Hong Kong) Limited and FMR Investment Management (UK) Limited (investment adviser firms, 2015-present) and Fidelity Management & Research (Japan) Limited (investment adviser firm, 2016-present). He is Senior Vice President and Deputy General Counsel of FMR LLC (diversified financial services company). Previously, Mr. Bryant served as Secretary and CLO of Fidelity Rutland Square Trust II (2010-2014) and Assistant Secretary of Fidelity's Fixed Income and Asset Allocation Funds (2013-2015). Prior to joining Fidelity Investments, Mr. Bryant served as a Senior Vice President and the Head of Global Retail Legal for AllianceBernstein L.P. (2006-2010), and as the General Counsel for ProFund Advisors LLC (2001-2006).
Jeffrey S. Christian (1961)
Year of Election or Appointment: 2016
Assistant Treasurer
Mr. Christian also serves as Assistant Treasurer of other funds. Mr. Christian is an employee of Fidelity Investments (2003-present).
William C. Coffey (1969)
Year of Election or Appointment: 2009
Assistant Secretary
Mr. Coffey also serves as Assistant Secretary of other funds. He is Senior Vice President and Deputy General Counsel of FMR LLC (diversified financial services company, 2010-present), and is an employee of Fidelity Investments. Previously, Mr. Coffey served as Vice President and Associate General Counsel of FMR LLC (2005-2009).
Jonathan Davis (1968)
Year of Election or Appointment: 2010
Assistant Treasurer
Mr. Davis also serves as Assistant Treasurer of other funds, and is an employee of Fidelity Investments. Previously, Mr. Davis served as Vice President and Associate General Counsel of FMR LLC (diversified financial services company, 2003-2010).
Adrien E. Deberghes (1967)
Year of Election or Appointment: 2016
Assistant Treasurer
Mr. Deberghes also serves as an officer of other funds. He serves as Executive Vice President of Fidelity Investments Money Management, Inc. (FIMM) (investment adviser firm, 2016-present) and is an employee of Fidelity Investments (2008-present). Prior to joining Fidelity Investments, Mr. Deberghes was Senior Vice President of Mutual Fund Administration at State Street Corporation (2007-2008), Senior Director of Mutual Fund Administration at Investors Bank & Trust (2005-2007), and Director of Finance for Dunkin' Brands (2000-2005). Previously, Mr. Deberghes served in other fund officer roles.
Stephanie J. Dorsey (1969)
Year of Election or Appointment: 2010
Assistant Treasurer
Ms. Dorsey also serves as an officer of other funds. She is an employee of Fidelity Investments (2008-present) and has served in other fund officer roles. Prior to joining Fidelity Investments, Ms. Dorsey served as Treasurer (2004-2008) of the JPMorgan Mutual Funds and Vice President (2004-2008) of JPMorgan Chase Bank.
Howard J. Galligan III (1966)
Year of Election or Appointment: 2014
Chief Financial Officer
Mr. Galligan also serves as Chief Financial Officer of other funds. Mr. Galligan serves as President of Fidelity Pricing and Cash Management Services (FPCMS) (2014-present) and as a Director of Strategic Advisers, Inc. (investment adviser firm, 2008-present). Previously, Mr. Galligan served as Chief Administrative Officer of Asset Management (2011-2014) and Chief Operating Officer and Senior Vice President of Investment Support for Strategic Advisers, Inc. (2003-2011).
Scott C. Goebel (1968)
Year of Election or Appointment: 2015
Vice President
Mr. Goebel serves as Vice President of other funds and is an employee of Fidelity Investments (2001-present). Previously, Mr. Goebel served as Senior Vice President of Fidelity Management & Research Company (FMR) (investment adviser firm, 2016), Secretary of Fidelity SelectCo, LLC (investment adviser firm, 2013-2015), Fidelity Investments Money Management, Inc. (FIMM) (investment adviser firm, 2010-2015), and Fidelity Research and Analysis Company (FRAC) (investment adviser firm, 2010-2015); General Counsel, Secretary, and Senior Vice President of FMR (investment adviser firm, 2008-2015) and FMR Co., Inc. (investment adviser firm, 2008-2015); Assistant Secretary of Fidelity Management & Research (Japan) Limited (investment adviser firm, 2008-2015) and Fidelity Management & Research (U.K.) Inc. (investment adviser firm, 2008-2015); Chief Legal Officer (CLO) of Fidelity Management & Research (Hong Kong) Limited (investment adviser firm, 2008-2015); Secretary and CLO of certain Fidelity® funds (2008-2015); Assistant Secretary of FIMM (2008-2010), FRAC (2008-2010), and certain funds (2007-2008); and as Vice President and Secretary of Fidelity Distributors Corporation (FDC) (2005-2007).
Brian B. Hogan (1964)
Year of Election or Appointment: 2009
Vice President
Mr. Hogan also serves as Trustee or Vice President of other funds. Mr. Hogan serves as a Director of FMR Investment Management (UK) Limited (investment adviser firm, 2015-present) and Fidelity SelectCo, LLC (investment adviser firm, 2014-present) and President of the Equity Division of FMR (investment adviser firm, 2009-present). Previously, Mr. Hogan served as Senior Vice President, Equity Research of FMR (2006-2009) and as a portfolio manager. Mr. Brian B. Hogan is not related to Mr. Colm A. Hogan.
Colm A. Hogan (1973)
Year of Election or Appointment: 2016
Deputy Treasurer
Mr. Hogan also serves as an officer of other funds. Mr. Hogan is an employee of Fidelity Investments (2005-present). Mr. Colm A. Hogan is not related to Mr. Brian B. Hogan.
Chris Maher (1972)
Year of Election or Appointment: 2013
Assistant Treasurer
Mr. Maher serves as Assistant Treasurer of other funds. Mr. Maher is Vice President of Valuation Oversight and is an employee of Fidelity Investments. Previously, Mr. Maher served as Vice President of Asset Management Compliance (2013), Vice President of the Program Management Group of FMR (investment adviser firm, 2010-2013), and Vice President of Valuation Oversight (2008-2010).
John F. Papandrea (1972)
Year of Election or Appointment: 2016
Anti-Money Laundering (AML) Officer
Mr. Papandrea also serves as AML Officer of other funds. Mr. Papandrea is Vice President of FMR LLC (diversified financial services company, 2008-present) and is an employee of Fidelity Investments (2005-present).
Kenneth B. Robins (1969)
Year of Election or Appointment: 2016
Chief Compliance Officer
Mr. Robins also serves as an officer of other funds. Mr. Robins serves as Compliance Officer of Fidelity Management & Research Company and FMR Co., Inc. (investment adviser firms, 2016-present) and is an employee of Fidelity Investments (2004-present). Previously, Mr. Robins served as Executive Vice President of Fidelity Investments Money Management, Inc. (investment adviser firm, 2013-2016) and served in other fund officer roles.
Stacie M. Smith (1974)
Year of Election or Appointment: 2016
President and Treasurer
Ms. Smith also serves as an officer of other funds. She is an employee of Fidelity Investments (2009-present) and has served in other fund officer roles. Prior to joining Fidelity Investments, Ms. Smith served as Senior Audit Manager of Ernst & Young LLP (accounting firm, 1996-2009). Previously, Ms. Smith served as Deputy Treasurer of certain Fidelity® funds (2013-2016).
Marc L. Spector (1972)
Year of Election or Appointment: 2016
Assistant Treasurer
Mr. Spector also serves as an officer of other funds. Mr. Spector is an employee of Fidelity Investments (2016-present). Prior to joining Fidelity Investments, Mr. Spector served as Director at the Siegfried Group (accounting firm, 2013-2016), and prior to Siegfried Group as audit senior manager at Deloitte & Touche (accounting firm, 2005-2013).
Renee Stagnone (1975)
Year of Election or Appointment: 2016
Assistant Treasurer
Ms. Stagnone also serves as an officer of other funds. Ms. Stagnone is an employee of Fidelity Investments (1997-present). Previously, Ms. Stagnone served as Deputy Treasurer of certain Fidelity® funds (2013-2016).
Shareholder Expense Example
As a shareholder of the Fund, you incur two types of costs: (1) transaction costs, including redemption fees and (2) ongoing costs, including management fees and other Fund expenses. This Example is intended to help you understand your ongoing costs (in dollars) of investing in the Fund and to compare these costs with the ongoing costs of investing in other mutual funds.
The Example is based on an investment of $1,000 invested at the beginning of the period and held for the entire period (June 1, 2016 to November 30, 2016).
Actual Expenses
The first line of the accompanying table provides information about actual account values and actual expenses. You may use the information in this line, together with the amount you invested, to estimate the expenses that you paid over the period. Simply divide your account value by $1,000.00 (for example, an $8,600 account value divided by $1,000.00 = 8.6), then multiply the result by the number in the first line under the heading entitled "Expenses Paid During Period" to estimate the expenses you paid on your account during this period. A small balance maintenance fee of $12.00 that is charged once a year may apply for certain accounts with a value of less than $2,000. This fee is not included in the table below. If it was, the estimate of expenses you paid during the period would be higher, and your ending account value lower, by this amount. In addition, the Fund, as a shareholder in the underlying Fidelity Central Funds, will indirectly bear its pro-rata share of the fees and expenses incurred by the underlying Fidelity Central Funds. These fees and expenses are not included in the Fund's annualized expense ratio used to calculate the expense estimate in the table below.
Hypothetical Example for Comparison Purposes
The second line of the accompanying table provides information about hypothetical account values and hypothetical expenses based on the Fund's actual expense ratio and an assumed rate of return of 5% per year before expenses, which is not the Fund's actual return. The hypothetical account values and expenses may not be used to estimate the actual ending account balance or expenses you paid for the period. You may use this information to compare the ongoing costs of investing in the Fund and other funds. To do so, compare this 5% hypothetical example with the 5% hypothetical examples that appear in the shareholder reports of the other funds. A small balance maintenance fee of $12.00 that is charged once a year may apply for certain accounts with a value of less than $2,000. This fee is not included in the table below. If it was, the estimate of expenses you paid during the period would be higher, and your ending account value lower, by this amount. In addition, the Fund, as a shareholder in the underlying Fidelity Central Funds, will indirectly bear its pro-rata share of the fees and expenses incurred by the underlying Fidelity Central Funds. These fees and expenses are not included in the Fund's annualized expense ratio used to calculate the expense estimate in the table below.
Please note that the expenses shown in the table are meant to highlight your ongoing costs only and do not reflect any transaction costs. Therefore, the second line of the table is useful in comparing ongoing costs only, and will not help you determine the relative total costs of owning different funds. In addition, if these transactional costs were included, your costs would have been higher.
| Annualized Expense Ratio-A | Beginning Account Value June 1, 2016 | Ending Account Value November 30, 2016 | Expenses Paid During Period-B June 1, 2016 to November 30, 2016 | |
| Actual | .29% | $1,000.00 | $1,081.00 | $1.51 |
| Hypothetical-C | $1,000.00 | $1,023.55 | $1.47 |
A Annualized expense ratio reflects expenses net of applicable fee waivers.
B Expenses are equal to the Fund's annualized expense ratio, multiplied by the average account value over the period, multiplied by 183/366 (to reflect the one-half year period).
C 5% return per year before expenses
Distributions (Unaudited)
The Board of Trustees of Fidelity NASDAQ Composite Index Fund voted to pay on December 28th 2016, to shareholders of record at the opening of business on December 27th 2016 a distribution of $ 0.027 per share derived from capital gains realized from sales of portfolio securities and a dividend of $ 0.645 per share from net investment income.
The fund designates 100% of the dividends distributed during the fiscal year as qualifying for the dividends–received deduction for corporate shareholders.
The fund designates 100%, and 86% of the dividends distributed on December 11, 2015 and December 28, 2015, respectively, during the fiscal year as amounts which may be taken into account as a dividend for purposes of the maximum rate under section 1(h)(11) of the Internal Revenue Code
The fund will notify shareholders in January 2017 of amounts for use in preparing 2016 income tax returns.
Board Approval of Investment Advisory Contracts and Management Fees
Fidelity Nasdaq Composite Index Fund
Each year, the Board of Trustees, including the Independent Trustees (together, the Board), votes on the renewal of the management contract with Fidelity Management & Research Company (FMR) and the sub-advisory agreements (together, the Advisory Contracts) for the fund, including the fund's sub-advisory agreement with Geode Capital Management, LLC (Geode). The Board, assisted by the advice of fund counsel and Independent Trustees' counsel, requests and considers a broad range of information relevant to the renewal of the Advisory Contracts throughout the year.
The Board meets regularly and, at each of its meetings, covers an extensive agenda of topics and materials and considers factors that are relevant to its annual consideration of the renewal of the fund's Advisory Contracts, including the services and support provided to the fund and its shareholders. The Board has established various standing committees (Committees), each composed of and chaired by Independent Trustees with varying backgrounds, to which the Board has assigned specific subject matter responsibilities in order to enhance effective decision-making by the Board. The Board, acting directly and through its Committees, requests and receives information concerning the annual consideration of the renewal of the fund's Advisory Contracts. The Board also meets as needed to consider matters specifically related to the Board's annual consideration of the renewal of the Advisory Contracts. Members of the Board may also meet with trustees of other Fidelity funds through ad hoc joint committees to discuss certain matters relevant to all of the Fidelity funds.
At its July 2016 meeting, the Board unanimously determined to renew the fund's Advisory Contracts. In reaching its determination, the Board considered all factors it believed relevant, including (i) the nature, extent, and quality of the services to be provided to the fund and its shareholders (including the investment performance of the fund); (ii) the competitiveness of the fund's management fee and total expense ratio relative to peer funds; (iii) the total costs of the services to be provided by and the profits to be realized by Fidelity from its relationships with the fund; and (iv) the extent to which, if any, economies of scale exist and would be realized as the fund grows, and whether any economies of scale are appropriately shared with fund shareholders.
In considering whether to renew the Advisory Contracts for the fund, the Board reached a determination, with the assistance of fund counsel and Independent Trustees' counsel and through the exercise of its business judgment, that the renewal of the Advisory Contracts was in the best interests of the fund and its shareholders and that the compensation payable under the Advisory Contracts was fair and reasonable. The Board's decision to renew the Advisory Contracts was not based on any single factor, but rather was based on a comprehensive consideration of all the information provided to the Board at its meetings throughout the year. The Board, in reaching its determination to renew the Advisory Contracts, was aware that shareholders of the fund have a broad range of investment choices available to them, including a wide choice among funds offered by Fidelity's competitors, and that the fund's shareholders, who have the opportunity to review and weigh the disclosure provided by the fund in its prospectus and other public disclosures, have chosen to invest in this fund, which is part of the Fidelity family of funds.
Nature, Extent, and Quality of Services Provided. The Board considered staffing as it relates to the fund, including the backgrounds of investment personnel of Fidelity and Geode, and also considered the fund's investment objective, strategies, and related investment philosophy. The Independent Trustees also had discussions with senior management of Fidelity's investment operations and investment groups and with representatives of Geode. The Board considered the structure of the investment personnel compensation programs and whether the structures provide appropriate incentives to act in the best interests of the fund. Additionally, the Board considered the portfolio managers' investments, if any, in the funds that they manage.Resources Dedicated to Investment Management and Support Services. The Board and the Fund Oversight and Research Committees reviewed the general qualifications and capabilities of Fidelity's and Geode's investment staffs, including their size, education, experience, and resources, as well as Fidelity's approach to recruiting, training, managing, and compensating investment personnel. The Board noted that Fidelity has continued to increase the resources devoted to non-U.S. offices, including expansion of Fidelity's global investment organization. Additionally, in its deliberations, the Board considered Fidelity's and Geode's trading, risk management, compliance, and technology and operations capabilities and resources, which are integral parts of the investment management process.Shareholder and Administrative Services. The Board considered (i) the nature, extent, quality, and cost of advisory, administrative, and shareholder services performed by FMR, the sub-advisers (together with FMR, the Investment Advisers), and their affiliates under the Advisory Contracts and under separate agreements covering transfer agency, pricing and bookkeeping, and securities lending services for the fund; (ii) the nature and extent of the supervision of third party service providers, principally custodians, subcustodians, and pricing vendors; and (iii) the resources devoted to, and the record of compliance with, the fund's compliance policies and procedures. The Board also reviewed the allocation of fund brokerage, including allocations to brokers affiliated with the Investment Advisers.The Board noted that the growth of fund assets over time across the complex allows Fidelity to reinvest in the development of services designed to enhance the value or convenience of the Fidelity funds as investment vehicles. These services include 24-hour access to account information and market information through telephone representatives and over the Internet, investor education materials and asset allocation tools, and the expanded availability of Fidelity Investor Centers.In 2014, the Board formed an ad hoc Committee on Transfer Agency Fees to review the variety of transfer agency fee structures throughout the industry and Fidelity's competitive positioning with respect to industry participants.Investment in a Large Fund Family. The Board considered the benefits to shareholders of investing in a Fidelity fund, including the benefits of investing in a fund that is part of a large family of funds offering a variety of investment disciplines and providing a large variety of mutual fund investor services. The Board noted that Fidelity had taken, or had made recommendations that resulted in the Fidelity funds taking, a number of actions over the previous year that benefited particular funds, including: (i) continuing to dedicate additional resources to investment research and to the support of the senior management team that oversees asset management; (ii) continuing efforts to enhance Fidelity's global research capabilities; (iii) launching new funds and making other enhancements to meet client needs; (iv) broadening eligibility requirements for certain lower-priced share classes of, and streamlining the fee structure for, certain existing equity index funds; (v) lowering expense caps for certain existing funds and classes to reduce expenses paid by shareholders; (vi) eliminating redemption fees for certain variable insurance product funds and classes; (vii) continuing to launch dedicated lower cost underlying funds to meet portfolio construction needs related to expanding underlying fund options for Fidelity funds of funds, specifically for the Freedom Fund product lines; (viii) launching a lower cost share class for use by the Freedom Index Fund product line; (ix) rationalizing product lines and gaining increased efficiencies through fund mergers and share class consolidations; (x) continuing to develop, acquire and implement systems and technology to improve services to the funds and shareholders, strengthen information security, and increase efficiency; (xi) implementing investment enhancements to further strengthen Fidelity's target date product line to increase investors' probability of success in achieving their goals; (xii) accelerating the conversion of all remaining Class B shares to Class A shares, which have a lower expense structure; and (xiii) implementing changes to Fidelity's money market fund product line in response to recent regulatory reforms.Investment Performance. The Board considered whether the fund has operated in accordance with its investment objective, as well as its record of compliance with its investment restrictions and its performance history.The Board took into account discussions with representatives of the Investment Advisers about fund investment performance that occur at Board meetings throughout the year. In this regard the Board noted that as part of regularly scheduled fund reviews and other reports to the Board on fund performance, the Board considers annualized return information for the fund, for different time periods, measured against the securities market index the fund seeks to track. The Board also periodically considers the fund's tracking error versus its benchmark index. In its evaluation of fund investment performance, the Board gave particular attention to information indicating changes in performance of certain Fidelity funds for specific time periods and discussed with the Investment Advisers the reasons for any overperformance or underperformance.In addition to reviewing absolute and relative fund performance, the Independent Trustees periodically consider the appropriateness of fund performance metrics in evaluating the results achieved. In general, the Independent Trustees believe that an index fund's performance should be evaluated based on net performance (after fees and expenses) of both the highest performing and lowest performing fund share classes, where applicable, compared to a fund's benchmark index, over appropriate time periods taking into account relevant factors including the following: general market conditions; the characteristics of the fund's benchmark index; the extent to which statistical sampling is employed; any securities lending revenues; and fund cash flows and other factors.The Independent Trustees recognize that shareholders evaluate performance on a net basis over their own holding periods, for which one-, three-, and five-year periods are often used as a proxy. For this reason, the performance information reviewed by the Board also included net cumulative calendar year total return information for the fund and its benchmark index for the most recent one-, three-, and five-year periods, as shown below. A peer group is not shown below because the fund does not generally utilize a peer group for performance comparison purposes.Fidelity Nasdaq Composite Index Fund
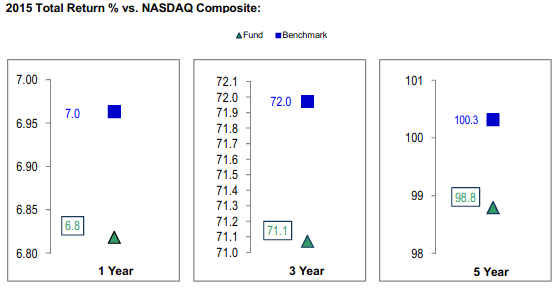
Fidelity Nasdaq Composite Index Fund

![]()
Corporate Headquarters
245 Summer St.
Boston, MA 02210
www.fidelity.com
EIF-ANN-0117
1.795539.113
Fidelity® Series 100 Index Fund Fidelity® Series 100 Index Fund Annual Report November 30, 2016 |
|
Contents
Board Approval of Investment Advisory Contracts and Management Fees |
To view a fund's proxy voting guidelines and proxy voting record for the 12-month period ended June 30, visit http://www.fidelity.com/proxyvotingresults or visit the Securities and Exchange Commission's (SEC) web site at http://www.sec.gov.
You may also call 1-800-544-8544, or for Class F, call 1-800-835-5092, to request a free copy of the proxy voting guidelines.
Standard & Poor's, S&P and S&P 500 are registered service marks of The McGraw-Hill Companies, Inc. and have been licensed for use by Fidelity Distributors Corporation.
Other third-party marks appearing herein are the property of their respective owners.
All other marks appearing herein are registered or unregistered trademarks or service marks of FMR LLC or an affiliated company. © 2017 FMR LLC. All rights reserved.
This report and the financial statements contained herein are submitted for the general information of the shareholders of the Fund. This report is not authorized for distribution to prospective investors in the Fund unless preceded or accompanied by an effective prospectus.
A fund files its complete schedule of portfolio holdings with the SEC for the first and third quarters of each fiscal year on Form N-Q. Forms N-Q are available on the SEC’s web site at http://www.sec.gov. A fund's Forms N-Q may be reviewed and copied at the SEC’s Public Reference Room in Washington, DC. Information regarding the operation of the SEC's Public Reference Room may be obtained by calling 1-800-SEC-0330.
For a complete list of a fund's portfolio holdings, view the most recent holdings listing, semiannual report, or annual report on Fidelity's web site at http://www.fidelity.com, http://www.institutional.fidelity.com, or http://www.401k.com, as applicable.
NOT FDIC INSURED •MAY LOSE VALUE •NO BANK GUARANTEE
Neither the Fund nor Fidelity Distributors Corporation is a bank.
Performance: The Bottom Line
Average annual total return reflects the change in the value of an investment, assuming reinvestment of distributions from dividend income and capital gains (the profits earned upon the sale of securities that have grown in value, if any) and assuming a constant rate of performance each year. The hypothetical investment and the average annual total returns do not reflect the deduction of taxes that a shareholder would pay on fund distributions or the redemption of fund shares. During periods of reimbursement by Fidelity, a fund’s total return will be greater than it would be had the reimbursement not occurred. How a fund did yesterday is no guarantee of how it will do tomorrow.
Average Annual Total Returns
| For the periods ended November 30, 2016 | Past 1 year | Past 5 years | Life of fundA |
| Fidelity® Series 100 Index Fund | 7.00% | 14.02% | 6.58% |
| Class F | 7.06% | 14.05% | 6.59% |
A From March 29, 2007
The initial offering of Class F shares took place on December 4, 2013. Returns prior to December 4, 2013 are those of Fidelity® Series 100 Index Fund, the original class of the fund.
$10,000 Over Life of Fund
Let's say hypothetically that $10,000 was invested in Fidelity® Series 100 Index Fund, a class of the fund, on March 29, 2007, when the fund started.
The chart shows how the value of your investment would have changed, and also shows how the S&P 100® Index performed over the same period.
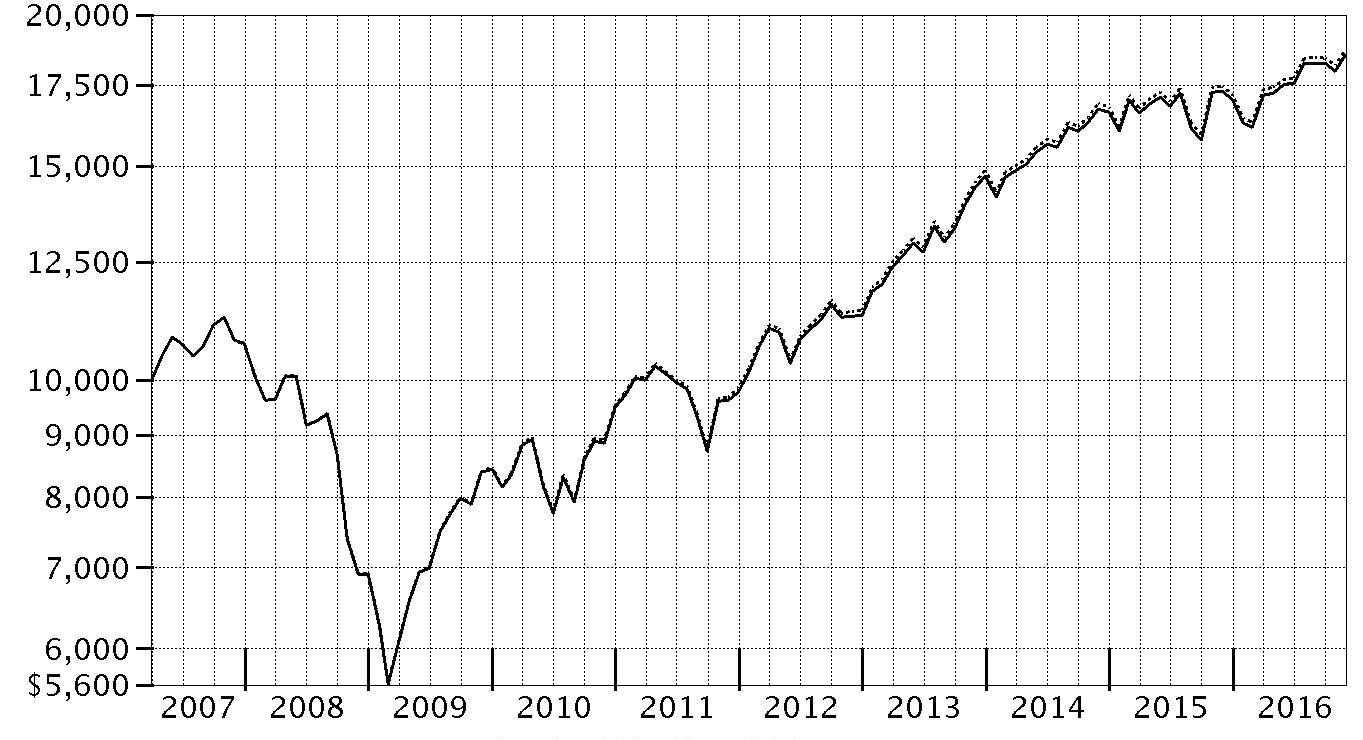
| Period Ending Values | ||
| $18,526 | Fidelity® Series 100 Index Fund | |
| $18,719 | S&P 100® Index | |
Management's Discussion of Fund Performance
Market Recap: The S&P 500 index returned 8.06% for the 12 months ending November 30, 2016, rising sharply in the final month on post-election optimism for economic growth. The period began during a fairly volatile stretch, with stocks hampered by persistent oil-price weakness and U.S.-dollar strength. Markets regained positive momentum in February amid U.S. job gains, a rally in energy and other stimuli that helped keep the roughly seven-year uptrend intact. Markets tumbled briefly following the U.K.’s June 23 vote to exit the European Union – dubbed “Brexit” – then recovered quickly and settled into a flattish stretch until the November 8 U.S. presidential election. For the year, 10 of the 11 sectors in the S&P 500 advanced, with six posting double-digit gains. Telecommunication services (+16%) led the way, its strength attributable to demand for dividend-paying equities early in the period, as well as to company-specific news. Cyclical sectors including industrials (+15%), financials (+14%), energy (+13%) and materials (+12%) posted strong gains, the latter two driven by a rebound in commodity prices. Conversely, real estate (+1%) lagged the index due to a late-period slump related to expectations for rising interest rates. Consumer discretionary (+3%) also underperformed, as competitive pressure continued to weigh on brick-and-mortar retailers.Comments from Patrick Waddell, Senior Portfolio Manager of the Geode Capital Management, LLC, investment management team: For the year, the fund’s share classes gained about 7%, roughly in line with the 7.10% increase in the S&P 100 index. Stocks struggled amid early-period volatility, but rallied between February and August 2016, and then again after the November U.S. elections, benefiting from mounting optimism about the economy’s growth prospects. Each sector gained ground with the exception of health care and real estate, the latter of which was added to the benchmark mid-year. The largest individual contributor was software company Microsoft (+14%). Various financial stocks also added value, especially banks JPMorgan Chase (+24%) and Bank of America (+23%), as well as insurance-focused conglomerate Berkshire Hathaway (+17%). Elsewhere, oil and gas producers Chevron and Exxon Mobil benefited from higher energy prices. In contrast, many of the fund’s biggest detractors were health care companies caught up in a wave of concern about drug pricing in the U.S. From this group, the biggest laggards were Allergan (-38%), Gilead Sciences (-29%), Bristol-Myers Squibb (-14%) and Eli Lilly (-16%). Also weighing on results was consumer electronics company Apple (-5%) – the largest position in the index the past 12 months – and athletic-wear manufacturer Nike (-23%).The views expressed above reflect those of the portfolio manager(s) only through the end of the period as stated on the cover of this report and do not necessarily represent the views of Fidelity or any other person in the Fidelity organization. Any such views are subject to change at any time based upon market or other conditions and Fidelity disclaims any responsibility to update such views. These views may not be relied on as investment advice and, because investment decisions for a Fidelity fund are based on numerous factors, may not be relied on as an indication of trading intent on behalf of any Fidelity fund.
Investment Summary (Unaudited)
Top Ten Stocks as of November 30, 2016
| % of fund's net assets | % of fund's net assets 6 months ago | |
| Apple, Inc. | 5.0 | 4.8 |
| Microsoft Corp. | 3.9 | 3.6 |
| Exxon Mobil Corp. | 3.0 | 3.2 |
| Johnson & Johnson | 2.5 | 2.7 |
| Berkshire Hathaway, Inc. Class B | 2.5 | 2.3 |
| Amazon.com, Inc. | 2.5 | 2.4 |
| JPMorgan Chase & Co. | 2.4 | 2.1 |
| General Electric Co. | 2.3 | 2.4 |
| Facebook, Inc. Class A | 2.3 | 2.3 |
| Wells Fargo & Co. | 2.0 | 2.0 |
| 28.4 |
Top Market Sectors as of November 30, 2016
| % of fund's net assets | % of fund's net assets 6 months ago | |
| Information Technology | 24.1 | 24.1 |
| Financials | 14.8 | 13.7 |
| Health Care | 14.3 | 15.0 |
| Consumer Discretionary | 11.7 | 12.0 |
| Consumer Staples | 10.6 | 11.2 |
| Industrials | 9.2 | 9.4 |
| Energy | 7.4 | 7.3 |
| Telecommunication Services | 3.7 | 3.9 |
| Utilities | 1.5 | 1.6 |
| Materials | 1.4 | 1.4 |
Prior period industry classifications reflect the categories in place as of the date indicated and have not been adjusted to reflect current industry classifications.
Asset Allocation (% of fund's net assets)
| As of November 30, 2016* | ||
| Stocks and Equity Futures | 100.0% | |

* Foreign investments - 2.9%
| As of May 31, 2016* | ||
| Stocks and Equity Futures | 100.0% | |

* Foreign investments - 3.2%
Investments November 30, 2016
Showing Percentage of Net Assets
| Common Stocks - 99.2% | |||
| Shares | Value | ||
| CONSUMER DISCRETIONARY - 11.7% | |||
| Automobiles - 0.8% | |||
| Ford Motor Co. | 1,048,094 | $12,535,204 | |
| General Motors Co. | 381,742 | 13,181,551 | |
| 25,716,755 | |||
| Hotels, Restaurants & Leisure - 1.5% | |||
| McDonald's Corp. | 229,194 | 27,335,968 | |
| Starbucks Corp. | 393,896 | 22,834,151 | |
| 50,170,119 | |||
| Internet & Direct Marketing Retail - 3.1% | |||
| Amazon.com, Inc. (a) | 105,680 | 79,320,238 | |
| Priceline Group, Inc. (a) | 13,332 | 20,047,062 | |
| 99,367,300 | |||
| Media - 3.5% | |||
| Comcast Corp. Class A | 645,226 | 44,849,659 | |
| The Walt Disney Co. | 397,101 | 39,360,651 | |
| Time Warner, Inc. | 208,911 | 19,182,208 | |
| Twenty-First Century Fox, Inc.: | |||
| Class A | 285,768 | 8,032,938 | |
| Class B | 130,824 | 3,670,921 | |
| 115,096,377 | |||
| Multiline Retail - 0.4% | |||
| Target Corp. | 154,396 | 11,925,547 | |
| Specialty Retail - 1.8% | |||
| Home Depot, Inc. | 331,847 | 42,941,002 | |
| Lowe's Companies, Inc. | 234,914 | 16,573,183 | |
| 59,514,185 | |||
| Textiles, Apparel & Luxury Goods - 0.6% | |||
| NIKE, Inc. Class B | 362,141 | 18,132,400 | |
| TOTAL CONSUMER DISCRETIONARY | 379,922,683 | ||
| CONSUMER STAPLES - 10.6% | |||
| Beverages - 2.5% | |||
| PepsiCo, Inc. | 386,526 | 38,691,253 | |
| The Coca-Cola Co. | 1,043,270 | 42,095,945 | |
| 80,787,198 | |||
| Food & Staples Retailing - 2.7% | |||
| Costco Wholesale Corp. | 117,655 | 17,661,192 | |
| CVS Health Corp. | 286,361 | 22,018,297 | |
| Wal-Mart Stores, Inc. | 407,082 | 28,670,785 | |
| Walgreens Boots Alliance, Inc. | 229,642 | 19,457,567 | |
| 87,807,841 | |||
| Food Products - 0.9% | |||
| Mondelez International, Inc. | 417,782 | 17,229,330 | |
| The Kraft Heinz Co. | 160,023 | 13,065,878 | |
| 30,295,208 | |||
| Household Products - 2.3% | |||
| Colgate-Palmolive Co. | 239,435 | 15,618,345 | |
| Procter & Gamble Co. | 716,767 | 59,104,607 | |
| 74,722,952 | |||
| Tobacco - 2.2% | |||
| Altria Group, Inc. | 524,762 | 33,548,035 | |
| Philip Morris International, Inc. | 416,652 | 36,782,039 | |
| 70,330,074 | |||
| TOTAL CONSUMER STAPLES | 343,943,273 | ||
| ENERGY - 7.4% | |||
| Energy Equipment & Services - 1.3% | |||
| Halliburton Co. | 231,273 | 12,278,284 | |
| Schlumberger Ltd. | 373,509 | 31,393,431 | |
| 43,671,715 | |||
| Oil, Gas & Consumable Fuels - 6.1% | |||
| Chevron Corp. | 506,677 | 56,524,886 | |
| ConocoPhillips Co. | 332,635 | 16,139,450 | |
| Exxon Mobil Corp. | 1,113,697 | 97,225,748 | |
| Kinder Morgan, Inc. | 515,615 | 11,446,653 | |
| Occidental Petroleum Corp. | 205,173 | 14,641,145 | |
| 195,977,882 | |||
| TOTAL ENERGY | 239,649,597 | ||
| FINANCIALS - 14.8% | |||
| Banks - 8.2% | |||
| Bank of America Corp. | 2,740,780 | 57,885,274 | |
| Citigroup, Inc. | 780,318 | 44,002,132 | |
| JPMorgan Chase & Co. | 970,097 | 77,772,676 | |
| U.S. Bancorp | 432,099 | 21,440,752 | |
| Wells Fargo & Co. | 1,219,609 | 64,541,708 | |
| 265,642,542 | |||
| Capital Markets - 2.0% | |||
| Bank of New York Mellon Corp. | 286,753 | 13,597,827 | |
| BlackRock, Inc. Class A | 32,769 | 12,150,418 | |
| Goldman Sachs Group, Inc. | 101,275 | 22,208,595 | |
| Morgan Stanley | 395,371 | 16,352,545 | |
| 64,309,385 | |||
| Consumer Finance - 0.8% | |||
| American Express Co. | 208,410 | 15,013,856 | |
| Capital One Financial Corp. | 135,921 | 11,422,801 | |
| 26,436,657 | |||
| Diversified Financial Services - 2.5% | |||
| Berkshire Hathaway, Inc. Class B (a) | 509,936 | 80,284,324 | |
| Insurance - 1.3% | |||
| Allstate Corp. | 99,766 | 6,975,639 | |
| American International Group, Inc. | 273,177 | 17,300,299 | |
| MetLife, Inc. | 295,132 | 16,235,211 | |
| 40,511,149 | |||
| TOTAL FINANCIALS | 477,184,057 | ||
| HEALTH CARE - 14.3% | |||
| Biotechnology - 3.8% | |||
| AbbVie, Inc. | 437,390 | 26,593,312 | |
| Amgen, Inc. | 200,993 | 28,957,062 | |
| Biogen, Inc. (a) | 58,851 | 17,306,314 | |
| Celgene Corp. (a) | 208,178 | 24,671,175 | |
| Gilead Sciences, Inc. | 354,430 | 26,121,491 | |
| 123,649,354 | |||
| Health Care Equipment & Supplies - 1.7% | |||
| Abbott Laboratories | 394,808 | 15,030,341 | |
| Danaher Corp. | 163,207 | 12,757,891 | |
| Medtronic PLC | 371,157 | 27,098,173 | |
| 54,886,405 | |||
| Health Care Providers & Services - 1.3% | |||
| UnitedHealth Group, Inc. | 255,791 | 40,496,831 | |
| Pharmaceuticals - 7.5% | |||
| Allergan PLC | 100,738 | 19,573,393 | |
| Bristol-Myers Squibb Co. | 448,755 | 25,327,732 | |
| Eli Lilly & Co. | 260,891 | 17,511,004 | |
| Johnson & Johnson | 734,795 | 81,782,684 | |
| Merck & Co., Inc. | 742,673 | 45,444,161 | |
| Pfizer, Inc. | 1,629,098 | 52,359,210 | |
| 241,998,184 | |||
| TOTAL HEALTH CARE | 461,030,774 | ||
| INDUSTRIALS - 9.2% | |||
| Aerospace & Defense - 2.8% | |||
| General Dynamics Corp. | 77,072 | 13,514,575 | |
| Lockheed Martin Corp. | 67,800 | 17,983,950 | |
| Raytheon Co. | 79,256 | 11,851,942 | |
| The Boeing Co. | 155,817 | 23,459,808 | |
| United Technologies Corp. | 209,045 | 22,518,327 | |
| 89,328,602 | |||
| Air Freight & Logistics - 1.0% | |||
| FedEx Corp. | 65,609 | 12,575,277 | |
| United Parcel Service, Inc. Class B | 185,660 | 21,521,707 | |
| 34,096,984 | |||
| Electrical Equipment - 0.3% | |||
| Emerson Electric Co. | 172,840 | 9,755,090 | |
| Industrial Conglomerates - 3.9% | |||
| 3M Co. | 162,328 | 27,878,211 | |
| General Electric Co. | 2,406,786 | 74,032,737 | |
| Honeywell International, Inc. | 204,354 | 23,284,095 | |
| 125,195,043 | |||
| Machinery - 0.5% | |||
| Caterpillar, Inc. | 156,911 | 14,994,415 | |
| Road & Rail - 0.7% | |||
| Union Pacific Corp. | 223,702 | 22,667,724 | |
| TOTAL INDUSTRIALS | 296,037,858 | ||
| INFORMATION TECHNOLOGY - 24.1% | |||
| Communications Equipment - 1.2% | |||
| Cisco Systems, Inc. | 1,350,868 | 40,282,884 | |
| Internet Software & Services - 6.0% | |||
| Alphabet, Inc.: | |||
| Class A (a) | 79,188 | 61,440,385 | |
| Class C (a) | 79,365 | 60,161,845 | |
| Facebook, Inc. Class A (a) | 623,895 | 73,881,646 | |
| 195,483,876 | |||
| IT Services - 4.2% | |||
| Accenture PLC Class A | 167,201 | 19,968,815 | |
| IBM Corp. | 233,614 | 37,896,863 | |
| MasterCard, Inc. Class A | 257,547 | 26,321,303 | |
| PayPal Holdings, Inc. (a) | 301,460 | 11,841,349 | |
| Visa, Inc. Class A | 506,654 | 39,174,487 | |
| 135,202,817 | |||
| Semiconductors & Semiconductor Equipment - 2.8% | |||
| Intel Corp. | 1,270,640 | 44,091,208 | |
| Qualcomm, Inc. | 395,789 | 26,965,105 | |
| Texas Instruments, Inc. | 269,440 | 19,919,699 | |
| 90,976,012 | |||
| Software - 4.9% | |||
| Microsoft Corp. | 2,092,895 | 126,117,853 | |
| Oracle Corp. | 808,309 | 32,485,939 | |
| 158,603,792 | |||
| Technology Hardware, Storage & Peripherals - 5.0% | |||
| Apple, Inc. | 1,447,215 | 159,946,199 | |
| TOTAL INFORMATION TECHNOLOGY | 780,495,580 | ||
| MATERIALS - 1.4% | |||
| Chemicals - 1.4% | |||
| E.I. du Pont de Nemours & Co. | 234,824 | 17,285,395 | |
| Monsanto Co. | 117,523 | 12,070,787 | |
| The Dow Chemical Co. | 302,641 | 16,863,157 | |
| 46,219,339 | |||
| REAL ESTATE - 0.5% | |||
| Equity Real Estate Investment Trusts (REITs) - 0.5% | |||
| Simon Property Group, Inc. | 84,394 | 15,161,382 | |
| TELECOMMUNICATION SERVICES - 3.7% | |||
| Diversified Telecommunication Services - 3.7% | |||
| AT&T, Inc. | 1,652,289 | 63,827,924 | |
| Verizon Communications, Inc. | 1,094,803 | 54,630,670 | |
| 118,458,594 | |||
| UTILITIES - 1.5% | |||
| Electric Utilities - 1.5% | |||
| Duke Energy Corp. | 185,032 | 13,649,811 | |
| Exelon Corp. | 247,863 | 8,058,026 | |
| NextEra Energy, Inc. | 125,445 | 14,329,582 | |
| Southern Co. | 262,858 | 12,307,012 | |
| 48,344,431 | |||
| TOTAL COMMON STOCKS | |||
| (Cost $2,842,909,783) | 3,206,447,568 | ||
| Principal Amount | Value | ||
| U.S. Treasury Obligations - 0.0% | |||
| U.S. Treasury Bills, yield at date of purchase 0.55% 8/17/17 (b) | |||
| (Cost $498,036) | 500,000 | 497,679 | |
| Shares | Value | ||
| Money Market Funds - 0.6% | |||
| Fidelity Cash Central Fund, 0.39% (c) | 20,558,169 | $20,562,281 | |
| Fidelity Securities Lending Cash Central Fund 0.48% (c)(d) | 63 | 63 | |
| TOTAL MONEY MARKET FUNDS | |||
| (Cost $20,563,183) | 20,562,344 | ||
| TOTAL INVESTMENT PORTFOLIO - 99.8% | |||
| (Cost $2,863,971,002) | 3,227,507,591 | ||
| NET OTHER ASSETS (LIABILITIES) - 0.2% | 6,086,090 | ||
| NET ASSETS - 100% | $3,233,593,681 |
| Futures Contracts | |||
| Expiration Date | Underlying Face Amount at Value | Unrealized Appreciation/(Depreciation) | |
| Purchased | |||
| Equity Index Contracts | |||
| 249 CME E-mini S&P 500 Index Contracts (United States) | Dec. 2016 | 27,375,060 | $249,567 |
The face value of futures purchased as a percentage of Net Assets is 0.8%
Legend
(a) Non-income producing
(b) Security or a portion of the security was pledged to cover margin requirements for futures contracts. At period end, the value of securities pledged amounted to $497,679.
(c) Affiliated fund that is generally available only to investment companies and other accounts managed by Fidelity Investments. The rate quoted is the annualized seven-day yield of the fund at period end. A complete unaudited listing of the fund's holdings as of its most recent quarter end is available upon request. In addition, each Fidelity Central Fund's financial statements, which are not covered by the Fund's Report of Independent Registered Public Accounting Firm, are available on the SEC's website or upon request.
(d) Investment made with cash collateral received from securities on loan.
Affiliated Central Funds
Information regarding fiscal year to date income earned by the Fund from investments in Fidelity Central Funds is as follows:
| Fund | Income earned |
| Fidelity Cash Central Fund | $51,689 |
| Fidelity Securities Lending Cash Central Fund | 130,827 |
| Total | $182,516 |
Investment Valuation
The following is a summary of the inputs used, as of November 30, 2016, involving the Fund's assets and liabilities carried at fair value. The inputs or methodology used for valuing securities may not be an indication of the risk associated with investing in those securities. For more information on valuation inputs, and their aggregation into the levels used below, please refer to the Investment Valuation section in the accompanying Notes to Financial Statements.
| Valuation Inputs at Reporting Date: | ||||
| Description | Total | Level 1 | Level 2 | Level 3 |
| Investments in Securities: | ||||
| Equities: | ||||
| Consumer Discretionary | $379,922,683 | $379,922,683 | $-- | $-- |
| Consumer Staples | 343,943,273 | 343,943,273 | -- | -- |
| Energy | 239,649,597 | 239,649,597 | -- | -- |
| Financials | 477,184,057 | 477,184,057 | -- | -- |
| Health Care | 461,030,774 | 461,030,774 | -- | -- |
| Industrials | 296,037,858 | 296,037,858 | -- | -- |
| Information Technology | 780,495,580 | 780,495,580 | -- | -- |
| Materials | 46,219,339 | 46,219,339 | -- | -- |
| Real Estate | 15,161,382 | 15,161,382 | -- | -- |
| Telecommunication Services | 118,458,594 | 118,458,594 | -- | -- |
| Utilities | 48,344,431 | 48,344,431 | -- | -- |
| U.S. Government and Government Agency Obligations | 497,679 | -- | 497,679 | -- |
| Money Market Funds | 20,562,344 | 20,562,344 | -- | -- |
| Total Investments in Securities: | $3,227,507,591 | $3,227,009,912 | $497,679 | $-- |
| Derivative Instruments: | ||||
| Assets | ||||
| Futures Contracts | $249,567 | $249,567 | $-- | $-- |
| Total Assets | $249,567 | $249,567 | $-- | $-- |
| Total Derivative Instruments: | $249,567 | $249,567 | $-- | $-- |
Value of Derivative Instruments
The following table is a summary of the Fund's value of derivative instruments by primary risk exposure as of November 30, 2016. For additional information on derivative instruments, please refer to the Derivative Instruments section in the accompanying Notes to Financial Statements.
| Primary Risk Exposure / Derivative Type | Value | |
| Asset | Liability | |
| Equity Risk | ||
| Futures Contracts(a) | $249,567 | $0 |
| Total Equity Risk | 249,567 | 0 |
| Total Value of Derivatives | $249,567 | $0 |
(a) Reflects gross cumulative appreciation (depreciation) on futures contracts as presented in the Schedule of Investments. In the Statement of Assets and Liabilities, the period end daily variation margin is included in receivable or payable for daily variation margin for derivative instruments, and the net cumulative appreciation (depreciation) is included in net unrealized appreciation (depreciation).
See accompanying notes which are an integral part of the financial statements.
Financial Statements
Statement of Assets and Liabilities
| November 30, 2016 | ||
| Assets | ||
| Investment in securities, at value — See accompanying schedule: Unaffiliated issuers (cost $2,843,407,819) | $3,206,945,247 | |
| Fidelity Central Funds (cost $20,563,183) | 20,562,344 | |
| Total Investments (cost $2,863,971,002) | $3,227,507,591 | |
| Segregated cash with brokers for derivative instruments | 813,577 | |
| Receivable for investments sold | 64,785,154 | |
| Receivable for fund shares sold | 2,832 | |
| Dividends receivable | 9,133,881 | |
| Distributions receivable from Fidelity Central Funds | 4,080 | |
| Total assets | 3,302,247,115 | |
| Liabilities | ||
| Payable for fund shares redeemed | 68,386,939 | |
| Accrued management fee | 135,417 | |
| Payable for daily variation margin for derivative instruments | 66,221 | |
| Other affiliated payables | 64,857 | |
| Total liabilities | 68,653,434 | |
| Net Assets | $3,233,593,681 | |
| Net Assets consist of: | ||
| Paid in capital | $3,155,565,222 | |
| Undistributed net investment income | 68,942,562 | |
| Accumulated undistributed net realized gain (loss) on investments | (354,700,259) | |
| Net unrealized appreciation (depreciation) on investments | 363,786,156 | |
| Net Assets | $3,233,593,681 | |
| Series 100 Index: | ||
| Net Asset Value, offering price and redemption price per share ($1,544,113,067 ÷ 106,489,786 shares) | $14.50 | |
| Class F: | ||
| Net Asset Value, offering price and redemption price per share ($1,689,480,614 ÷ 116,477,448 shares) | $14.50 |
See accompanying notes which are an integral part of the financial statements.
Statement of Operations
| Year ended November 30, 2016 | ||
| Investment Income | ||
| Dividends | $76,344,824 | |
| Interest | 6,786 | |
| Income from Fidelity Central Funds | 182,516 | |
| Total income | 76,534,126 | |
| Expenses | ||
| Management fee | $1,599,087 | |
| Transfer agent fees | 785,160 | |
| Independent trustees' fees and expenses | 14,011 | |
| Interest | 1,041 | |
| Miscellaneous | 8,280 | |
| Total expenses before reductions | 2,407,579 | |
| Expense reductions | (71) | 2,407,508 |
| Net investment income (loss) | 74,126,618 | |
| Realized and Unrealized Gain (Loss) | ||
| Net realized gain (loss) on: | ||
| Investment securities: | ||
| Unaffiliated issuers | 109,029,160 | |
| Fidelity Central Funds | 1,982 | |
| Futures contracts | 1,636,827 | |
| Total net realized gain (loss) | 110,667,969 | |
| Change in net unrealized appreciation (depreciation) on: Investment securities | 31,877,729 | |
| Futures contracts | 311,165 | |
| Total change in net unrealized appreciation (depreciation) | 32,188,894 | |
| Net gain (loss) | 142,856,863 | |
| Net increase (decrease) in net assets resulting from operations | $216,983,481 |
See accompanying notes which are an integral part of the financial statements.
Statement of Changes in Net Assets
| Year ended November 30, 2016 | Year ended November 30, 2015 | |
| Increase (Decrease) in Net Assets | ||
| Operations | ||
| Net investment income (loss) | $74,126,618 | $76,195,556 |
| Net realized gain (loss) | 110,667,969 | 135,052,301 |
| Change in net unrealized appreciation (depreciation) | 32,188,894 | (89,819,666) |
| Net increase (decrease) in net assets resulting from operations | 216,983,481 | 121,428,191 |
| Distributions to shareholders from net investment income | (75,790,365) | (70,740,615) |
| Share transactions - net increase (decrease) | (288,847,188) | (254,445,510) |
| Total increase (decrease) in net assets | (147,654,072) | (203,757,934) |
| Net Assets | ||
| Beginning of period | 3,381,247,753 | 3,585,005,687 |
| End of period | $3,233,593,681 | $3,381,247,753 |
| Other Information | ||
| Undistributed net investment income end of period | $68,942,562 | $70,638,423 |
See accompanying notes which are an integral part of the financial statements.
Financial Highlights — Fidelity Series 100 Index Fund
| Years ended November 30, | 2016 | 2015 | 2014 | 2013 | 2012 |
| Selected Per–Share Data | |||||
| Net asset value, beginning of period | $13.87 | $13.67 | $11.77 | $10.19 | $8.85 |
| Income from Investment Operations | |||||
| Net investment income (loss)A | .31 | .29 | .27 | .25 | .21 |
| Net realized and unrealized gain (loss) | .63 | .18 | 1.63 | 2.35 | 1.31 |
| Total from investment operations | .94 | .47 | 1.90 | 2.60 | 1.52 |
| Distributions from net investment income | (.31) | (.27) | – | (1.02) | (.18) |
| Total distributions | (.31) | (.27) | – | (1.02) | (.18) |
| Net asset value, end of period | $14.50 | $13.87 | $13.67 | $11.77 | $10.19 |
| Total ReturnB | 7.00% | 3.48% | 16.14% | 27.56% | 17.49% |
| Ratios to Average Net AssetsC,D | |||||
| Expenses before reductions | .10% | .10% | .10% | .18% | .20% |
| Expenses net of fee waivers, if any | .10% | .10% | .10% | .17% | .20% |
| Expenses net of all reductions | .10% | .10% | .10% | .17% | .20% |
| Net investment income (loss) | 2.27% | 2.17% | 2.11% | 2.34% | 2.17% |
| Supplemental Data | |||||
| Net assets, end of period (000 omitted) | $1,544,113 | $1,670,998 | $1,814,733 | $2,710,285 | $8,019,529 |
| Portfolio turnover rateE | 4% | 10% | 8% | 19% | 10% |
A Calculated based on average shares outstanding during the period.
B Total returns would have been lower if certain expenses had not been reduced during the applicable periods shown.
C Fees and expenses of any underlying Fidelity Central Funds are not included in the Fund's expense ratio. The Fund indirectly bears its proportionate share of the expenses of any underlying Fidelity Central Funds.
D Expense ratios reflect operating expenses of the class. Expenses before reductions do not reflect amounts reimbursed by the investment adviser or reductions from expense offset arrangements and do not represent the amount paid by the class during periods when reimbursements or reductions occur. Expenses net of fee waivers reflect expenses after reimbursement by the investment adviser but prior to reductions from expense offset arrangements. Expenses net of all reductions represent the net expenses paid by the class.
E Amount does not include the portfolio activity of any underlying Fidelity Central Funds.
See accompanying notes which are an integral part of the financial statements.
Financial Highlights — Fidelity Series 100 Index Fund Class F
| Years ended November 30, | 2016 | 2015 | 2014 A |
| Selected Per–Share Data | |||
| Net asset value, beginning of period | $13.87 | $13.68 | $11.69 |
| Income from Investment Operations | |||
| Net investment income (loss)B | .32 | .30 | .27 |
| Net realized and unrealized gain (loss) | .63 | .16 | 1.72 |
| Total from investment operations | .95 | .46 | 1.99 |
| Distributions from net investment income | (.32) | (.27) | – |
| Total distributions | (.32) | (.27) | – |
| Net asset value, end of period | $14.50 | $13.87 | $13.68 |
| Total ReturnC,D | 7.06% | 3.45% | 17.02% |
| Ratios to Average Net AssetsE,F | |||
| Expenses before reductions | .05% | .05% | .05%G |
| Expenses net of fee waivers, if any | .05% | .05% | .05%G |
| Expenses net of all reductions | .05% | .05% | .05%G |
| Net investment income (loss) | 2.32% | 2.22% | 2.16%G |
| Supplemental Data | |||
| Net assets, end of period (000 omitted) | $1,689,481 | $1,710,250 | $1,770,273 |
| Portfolio turnover rateH | 4% | 10% | 8% |
A For the period December 4, 2013 (commencement of sale of shares) to November 30, 2014.
B Calculated based on average shares outstanding during the period.
C Total returns for periods of less than one year are not annualized.
D Total returns would have been lower if certain expenses had not been reduced during the applicable periods shown.
E Fees and expenses of any underlying Fidelity Central Funds are not included in the Fund's expense ratio. The Fund indirectly bears its proportionate share of the expenses of any underlying Fidelity Central Funds.
F Expense ratios reflect operating expenses of the class. Expenses before reductions do not reflect amounts reimbursed by the investment adviser or reductions from expense offset arrangements and do not represent the amount paid by the class during periods when reimbursements or reductions occur. Expenses net of fee waivers reflect expenses after reimbursement by the investment adviser but prior to reductions from expense offset arrangements. Expenses net of all reductions represent the net expenses paid by the class.
G Annualized
H Amount does not include the portfolio activity of any underlying Fidelity Central Funds.
See accompanying notes which are an integral part of the financial statements.
Notes to Financial Statements
For the period ended November 30, 2016
1. Organization.
Fidelity Series 100 Index Fund (the Fund) is a fund of Fidelity Concord Street Trust (the Trust) (formerly a fund of Fidelity Commonwealth Trust) and is authorized to issue an unlimited number of shares. Shares of the Fund are only available for purchase by mutual funds for which Fidelity Management & Research Company (FMR) or an affiliate serves as an investment manager. The Trust is registered under the Investment Company Act of 1940, as amended (the 1940 Act), as an open-end management investment company organized as a Massachusetts business trust. The Fund offers Series 100 Index and Class F shares, each of which has equal rights as to assets and voting privileges. Each class has exclusive voting rights with respect to matters that affect that class.
2. Investments in Fidelity Central Funds.
The Fund invests in Fidelity Central Funds, which are open-end investment companies generally available only to other investment companies and accounts managed by the investment adviser and its affiliates. The Fund's Schedule of Investments lists each of the Fidelity Central Funds held as of period end, if any, as an investment of the Fund, but does not include the underlying holdings of each Fidelity Central Fund. As an Investing Fund, the Fund indirectly bears its proportionate share of the expenses of the underlying Fidelity Central Funds.
The Money Market Central Funds seek preservation of capital and current income and are managed by Fidelity Investments Money Management, Inc. (FIMM), an affiliate of the investment adviser. Annualized expenses of the Money Market Central Funds as of their most recent shareholder report date are less than .005%.
A complete unaudited list of holdings for each Fidelity Central Fund is available upon request or at the Securities and Exchange Commission (the SEC) website at www.sec.gov. In addition, the financial statements of the Fidelity Central Funds, which are not covered by the Fund's Report of Independent Registered Public Accounting Firm, are available on the SEC website or upon request.
3. Significant Accounting Policies.
The financial statements have been prepared in conformity with accounting principles generally accepted in the United States of America (GAAP), which require management to make certain estimates and assumptions at the date of the financial statements. Actual results could differ from those estimates. Subsequent events, if any, through the date that the financial statements were issued have been evaluated in the preparation of the financial statements. The following summarizes the significant accounting policies of the Fund:
Investment Valuation. Investments are valued as of 4:00 p.m. Eastern time on the last calendar day of the period. The Board of Trustees (the Board) has delegated the day to day responsibility for the valuation of the Fund's investments to the Fair Value Committee (the Committee) established by the Fund's investment adviser. In accordance with valuation policies and procedures approved by the Board, the Fund attempts to obtain prices from one or more third party pricing vendors or brokers to value its investments. When current market prices, quotations or currency exchange rates are not readily available or reliable, investments will be fair valued in good faith by the Committee, in accordance with procedures adopted by the Board. Factors used in determining fair value vary by investment type and may include market or investment specific events, changes in interest rates and credit quality. The frequency with which these procedures are used cannot be predicted and they may be utilized to a significant extent. The Committee oversees the Fund's valuation policies and procedures and reports to the Board on the Committee's activities and fair value determinations. The Board monitors the appropriateness of the procedures used in valuing the Fund's investments and ratifies the fair value determinations of the Committee.
The Fund categorizes the inputs to valuation techniques used to value its investments into a disclosure hierarchy consisting of three levels as shown below:
- Level 1 – quoted prices in active markets for identical investments
- Level 2 – other significant observable inputs (including quoted prices for similar investments, interest rates, prepayment speeds, etc.)
- Level 3 – unobservable inputs (including the Fund's own assumptions based on the best information available)
Valuation techniques used to value the Fund's investments by major category are as follows:
Equity securities, including restricted securities, for which market quotations are readily available, are valued at the last reported sale price or official closing price as reported by a third party pricing vendor on the primary market or exchange on which they are traded and are categorized as Level 1 in the hierarchy. In the event there were no sales during the day or closing prices are not available, securities are valued at the last quoted bid price or may be valued using the last available price and are generally categorized as Level 2 in the hierarchy. For foreign equity securities, when market or security specific events arise, comparisons to the valuation of American Depositary Receipts (ADRs), futures contracts, Exchange-Traded Funds (ETFs) and certain indexes as well as quoted prices for similar securities may be used and would be categorized as Level 2 in the hierarchy. Utilizing these techniques may result in transfers between Level 1 and Level 2. For equity securities, including restricted securities, where observable inputs are limited, assumptions about market activity and risk are used and these securities may be categorized as Level 3 in the hierarchy.
Debt securities, including restricted securities, are valued based on evaluated prices received from third party pricing vendors or from brokers who make markets in such securities. U.S. government and government agency obligations are valued by pricing vendors who utilize matrix pricing which considers yield or price of bonds of comparable quality, coupon, maturity and type or by broker-supplied prices. When independent prices are unavailable or unreliable, debt securities may be valued utilizing pricing methodologies which consider similar factors that would be used by third party pricing vendors. Debt securities are generally categorized as Level 2 in the hierarchy but may be Level 3 depending on the circumstances.
Futures contracts are valued at the settlement price established each day by the board of trade or exchange on which they are traded and are categorized as Level 1 in the hierarchy. Investments in open-end mutual funds, including the Fidelity Central Funds, are valued at their closing net asset value (NAV) each business day and are categorized as Level 1 in the hierarchy.
Changes in valuation techniques may result in transfers in or out of an assigned level within the disclosure hierarchy. The aggregate value of investments by input level as of November 30, 2016, is included at the end of the Fund's Schedule of Investments.
Investment Transactions and Income. For financial reporting purposes, the Fund's investment holdings and NAV include trades executed through the end of the last business day of the period. The NAV per share for processing shareholder transactions is calculated as of the close of business of the New York Stock Exchange (NYSE), normally 4:00 p.m. Eastern time and includes trades executed through the end of the prior business day. Gains and losses on securities sold are determined on the basis of identified cost and may include proceeds received from litigation. Dividend income is recorded on the ex-dividend date, except for certain dividends from foreign securities where the ex-dividend date may have passed, which are recorded as soon as the Fund is informed of the ex-dividend date. Non-cash dividends included in dividend income, if any, are recorded at the fair market value of the securities received. Income and capital gain distributions from Fidelity Central Funds, if any, are recorded on the ex-dividend date. Certain distributions received by the Fund represent a return of capital or capital gain. The Fund determines the components of these distributions subsequent to the ex-dividend date, based upon receipt of tax filings or other correspondence relating to the underlying investment. These distributions are recorded as a reduction of cost of investments and/or as a realized gain. Interest income is accrued as earned and includes coupon interest and amortization of premium and accretion of discount on debt securities as applicable.
Class Allocations and Expenses. Investment income, realized and unrealized capital gains and losses, common expenses of the Fund, and certain fund-level expense reductions, if any, are allocated daily on a pro-rata basis to each class based on the relative net assets of each class to the total net assets of the Fund. Each class differs with respect to transfer agent fees incurred. Certain expense reductions may also differ by class. For the reporting period, the allocated portion of income and expenses to each class as a percent of its average net assets may vary due to the timing of recording these transactions in relation to fluctuating net assets of the classes. Expenses directly attributable to a fund are charged to that fund. Expenses attributable to more than one fund are allocated among the respective funds on the basis of relative net assets or other appropriate methods. Expense estimates are accrued in the period to which they relate and adjustments are made when actual amounts are known.
Income Tax Information and Distributions to Shareholders. Each year, the Fund intends to qualify as a regulated investment company under Subchapter M of the Internal Revenue Code, including distributing substantially all of its taxable income and realized gains. As a result, no provision for U.S. Federal income taxes is required. As of November 30, 2016, the Fund did not have any unrecognized tax benefits in the financial statements; nor is the Fund aware of any tax positions for which it is reasonably possible that the total amounts of unrecognized tax benefits will significantly change in the next twelve months. The Fund files a U.S. federal tax return, in addition to state and local tax returns as required. The Fund's federal income tax returns are subject to examination by the Internal Revenue Service (IRS) for a period of three fiscal years after they are filed. State and local tax returns may be subject to examination for an additional fiscal year depending on the jurisdiction.
Distributions are declared and recorded on the ex-dividend date. Income dividends and capital gain distributions are declared separately for each class. Income and capital gain distributions are determined in accordance with income tax regulations, which may differ from GAAP.
Capital accounts within the financial statements are adjusted for permanent book-tax differences. These adjustments have no impact on net assets or the results of operations. Capital accounts are not adjusted for temporary book-tax differences which will reverse in a subsequent period.
Book-tax differences are primarily due to in-kind transactions, futures contracts, market discount, capital loss carryforwards and losses deferred due to wash sales.
The federal tax cost of investment securities and unrealized appreciation (depreciation) as of period end were as follows:
| Gross unrealized appreciation | $696,892,236 |
| Gross unrealized depreciation | (351,768,517) |
| Net unrealized appreciation (depreciation) on securities | $345,123,719 |
| Tax Cost | $2,882,383,872 |
The tax-based components of distributable earnings as of period end were as follows:
| Undistributed ordinary income | $68,941,978 |
| Capital loss carryforward | $(336,037,239) |
| Net unrealized appreciation (depreciation) on securities and other investments | $345,123,719 |
Capital loss carryforwards are only available to offset future capital gains of the Fund to the extent provided by regulations and may be limited. Under the Regulated Investment Company Modernization Act of 2010 (the Act), the Fund is permitted to carry forward capital losses incurred in taxable years beginning after December 22, 2010 for an unlimited period and such capital losses are required to be used prior to any losses that expire. The capital loss carryforward information presented below, including any applicable limitation, is estimated as of fiscal period end and is subject to adjustment.
| Fiscal year of expiration | |
| 2017 | $(38,718,659) |
| 2018 | (297,318,580) |
| Total capital loss carryforward | $(336,037,239) |
The tax character of distributions paid was as follows:
| November 30, 2016 | November 30, 2015 | |
| Ordinary Income | $75,790,365 | $ 70,740,615 |
4. Derivative Instruments.
Risk Exposures and the Use of Derivative Instruments. The Fund's investment objective allows the Fund to enter into various types of derivative contracts, including futures contracts. Derivatives are investments whose value is primarily derived from underlying assets, indices or reference rates and may be transacted on an exchange or over-the-counter (OTC). Derivatives may involve a future commitment to buy or sell a specified asset based on specified terms, to exchange future cash flows at periodic intervals based on a notional principal amount, or for one party to make one or more payments upon the occurrence of specified events in exchange for periodic payments from the other party.
The Fund used derivatives to increase returns and to manage exposure to certain risks as defined below. The success of any strategy involving derivatives depends on analysis of numerous economic factors, and if the strategies for investment do not work as intended, the Fund may not achieve its objectives.
The Fund's use of derivatives increased or decreased its exposure to the following risk:
| Equity Risk | Equity risk relates to the fluctuations in the value of financial instruments as a result of changes in market prices (other than those arising from interest rate risk or foreign exchange risk), whether caused by factors specific to an individual investment, its issuer, or all factors affecting all instruments traded in a market or market segment. |
The Fund is also exposed to additional risks from investing in derivatives, such as liquidity risk and counterparty credit risk. Liquidity risk is the risk that the Fund will be unable to close out the derivative in the open market in a timely manner. Counterparty credit risk is the risk that the counterparty will not be able to fulfill its obligation to the Fund. Counterparty credit risk related to exchange-traded futures contracts may be mitigated by the protection provided by the exchange on which they trade.
Investing in derivatives may involve greater risks than investing in the underlying assets directly and, to varying degrees, may involve risk of loss in excess of any initial investment and collateral received and amounts recognized in the Statement of Assets and Liabilities. In addition, there may be the risk that the change in value of the derivative contract does not correspond to the change in value of the underlying instrument.
Futures Contracts. A futures contract is an agreement between two parties to buy or sell a specified underlying instrument for a fixed price at a specified future date. The Fund used futures contracts to manage its exposure to the stock market.
Upon entering into a futures contract, a fund is required to deposit either cash or securities (initial margin) with a clearing broker in an amount equal to a certain percentage of the face value of the contract. Futures contracts are marked-to-market daily and subsequent daily payments (variation margin) are made or received by a fund depending on the daily fluctuations in the value of the futures contracts and are recorded as unrealized appreciation or (depreciation). This receivable and/or payable, if any, is included in daily variation margin for derivative instruments in the Statement of Assets and Liabilities. Realized gain or (loss) is recorded upon the expiration or closing of a futures contract.
Any open futures contracts at period end are presented in the Schedule of Investments under the caption "Futures Contracts". The underlying face amount at value reflects each contract's exposure to the underlying instrument or index at period end and is representative of volume of activity during the period. Securities deposited to meet initial margin requirements are identified in the Schedule of Investments. Cash deposited to meet initial margin requirements is presented as segregated cash with brokers for derivative instruments in the Statement of Assets and Liabilities.
During the period the Fund recognized net realized gain (loss) of $1,636,827 and a change in net unrealized appreciation (depreciation) of $311,165 related to its investment in futures contracts. These amounts are included in the Statement of Operations.
5. Purchases and Sales of Investments.
Purchases and sales of securities, other than short-term securities, aggregated $135,005,108 and $440,704,273, respectively.
6. Fees and Other Transactions with Affiliates.
Management Fee and Expense Contract. Fidelity Management & Research Company (the investment adviser) and its affiliates provide the Fund with investment management related services for which the Fund pays a monthly management fee that is based on an annual rate of .05% of the Fund's average net assets. Under the management contract, the investment adviser pays all other fund-level expenses, except the compensation of the independent Trustees and certain other expenses such as transfer agent and interest expense, including commitment fees. The management fee is reduced by an amount equal to the fees and expenses paid by the Fund to the independent Trustees.
In addition, under the expense contract, the investment adviser pays class-level expenses for Series 100 Index so that the total expenses do not exceed .10%, expressed as a percentage of class average net assets, with certain exceptions such as interest expense, including commitment fees.
Sub-Adviser. Geode Capital Management, LLC (Geode), serves as sub-adviser for the Fund. Geode provides discretionary investment advisory services to the Fund and is paid by the investment adviser for providing these services.
Transfer Agent Fees. Fidelity Investments Institutional Operations Company, Inc., (FIIOC), an affiliate of the investment adviser, is the transfer, dividend disbursing and shareholder servicing agent for each class of the Fund. FIIOC receives transfer agent fees at an annual rate of .075% of average net assets for Series 100 Index. FIIOC receives no fees for providing transfer agency services to Class F. FIIOC pays for typesetting, printing and mailing of shareholder reports, except proxy statements.
Under the expense contract, Series 100 Index pays a portion of the transfer agent fees at an annual rate of .05% of average net assets.
For the period, transfer agent fees for each applicable class were as follows:
| Amount | |
| Series 100 Index | $785,160 |
Interfund Lending Program. Pursuant to an Exemptive Order issued by the SEC, the Fund, along with other registered investment companies having management contracts with FMR or other affiliated entities of FMR, may participate in an interfund lending program. This program provides an alternative credit facility allowing the funds to borrow from, or lend money to, other participating affiliated funds. At period end, there were no interfund loans outstanding. The Fund's activity in this program during the period for which loans were outstanding was as follows:
| Borrower or Lender | Average Loan Balance | Weighted Average Interest Rate | Interest Expense |
| Borrower | $30,292,000 | .62% | $1,041 |
Interfund Trades. The Fund may purchase from or sell securities to other Fidelity Funds under procedures adopted by the Board. The procedures have been designed to ensure these interfund trades are executed in accordance with Rule 17a-7 of the 1940 Act. Interfund trades are included within the respective purchases and sales amounts shown in the Purchases and Sales of Investments note.
7. Committed Line of Credit.
The Fund participates with other funds managed by the investment adviser or an affiliate in a $4.25 billion credit facility (the "line of credit") to be utilized for temporary or emergency purposes to fund shareholder redemptions or for other short-term liquidity purposes. The Fund has agreed to pay commitment fees on its pro-rata portion of the line of credit, which amounted to $8,280 and is reflected in Miscellaneous expenses on the Statement of Operations. During the period, the Fund did not borrow on this line of credit.
8. Security Lending.
The Fund lends portfolio securities through a lending agent from time to time in order to earn additional income. On the settlement date of the loan, the Fund receives collateral (in the form of U.S. Treasury obligations, letters of credit and/or cash) against the loaned securities and maintains collateral in an amount not less than 100% of the market value of the loaned securities during the period of the loan. The market value of the loaned securities is determined at the close of business of the Fund and any additional required collateral is delivered to the Fund on the next business day. The Fund or borrower may terminate the loan at any time, and if the borrower defaults on its obligation to return the securities loaned because of insolvency or other reasons, the Fund may apply collateral received from the borrower against the obligation. The Fund may experience delays and costs in recovering the securities loaned. Any cash collateral received is invested in the Fidelity Securities Lending Cash Central Fund. At period end, there were no security loans outstanding. Security lending income represents the income earned on investing cash collateral, less rebates paid to borrowers and any lending agent fees associated with the loan, plus any premium payments received for lending certain types of securities. Security lending income is presented in the Statement of Operations as a component of income from Fidelity Central Funds. Total security lending income during the period amounted to $130,827.
9. Expense Reductions.
Through arrangements with the Fund's custodian, credits realized as a result of certain uninvested cash balances were used to reduce the Fund's expenses. During the period, these credits reduced the Fund's custody expenses by $71.
10. Distributions to Shareholders.
Distributions to shareholders of each class were as follows:
| Year ended November 30, 2016 | Year ended November 30, 2015 | |
| From net investment income | ||
| Series 100 Index | $37,042,690 | $35,250,235 |
| Class F | 38,747,675 | 35,490,380 |
| Total | $75,790,365 | $70,740,615 |
11. Share Transactions.
Transactions for each class of shares were as follows:
| Shares | Shares | Dollars | Dollars | |
| Year ended November 30, 2016 | Year ended November 30, 2015 | Year ended November 30, 2016 | Year ended November 30, 2015 | |
| Series 100 Index | ||||
| Shares sold | 7,974,111 | 11,702,848 | $107,582,811 | $156,655,563 |
| Reinvestment of distributions | 2,823,376 | 2,630,615 | 37,042,690 | 35,250,235 |
| Shares redeemed | (24,807,548) | (26,569,388) | (338,780,299) | (359,046,239) |
| Net increase (decrease) | (14,010,061) | (12,235,925) | $(194,154,798) | $(167,140,441) |
| Class F | ||||
| Shares sold | 15,865,327 | 16,342,253 | $214,624,314 | $218,162,260 |
| Reinvestment of distributions | 2,955,582 | 2,648,536 | 38,747,675 | 35,490,380 |
| Shares redeemed | (25,631,264) | (25,150,141) | (348,064,379) | (340,957,709) |
| Net increase (decrease) | (6,810,355) | (6,159,352) | $(94,692,390) | $(87,305,069) |
12. Other.
The Fund's organizational documents provide former and current trustees and officers with a limited indemnification against liabilities arising in connection with the performance of their duties to the Fund. In the normal course of business, the Fund may also enter into contracts that provide general indemnifications. The Fund's maximum exposure under these arrangements is unknown as this would be dependent on future claims that may be made against the Fund. The risk of material loss from such claims is considered remote.
At the end of the period, mutual funds managed by the investment adviser or its affiliates were the owners of record of all of the outstanding shares of the Fund.
Report of Independent Registered Public Accounting Firm
To the Trustees of Fidelity Concord Street Trust and Shareholders of Fidelity Series 100 Index Fund:
We have audited the accompanying statement of assets and liabilities of Series 100 Index Fund (the Fund), a fund of Fidelity Concord Trust, including the schedule of investments, as of November 30, 2016, and the related statement of operations for the year then ended, the statement of changes in net assets for each of the two years in the period then ended, and the financial highlights for each of the five years in the period then ended. These financial statements and financial highlights are the responsibility of the Fund's management. Our responsibility is to express an opinion on these financial statements and financial highlights based on our audits.
We conducted our audits in accordance with the standards of the Public Company Accounting Oversight Board (United States). Those standards require that we plan and perform the audit to obtain reasonable assurance about whether the financial statements and financial highlights are free of material misstatement. The Fund is not required to have, nor were we engaged to perform, an audit of its internal control over financial reporting. Our audits included consideration of internal control over financial reporting as a basis for designing audit procedures that are appropriate in the circumstances, but not for the purpose of expressing an opinion on the effectiveness of the Fund's internal control over financial reporting. Accordingly, we express no such opinion. An audit also includes examining, on a test basis, evidence supporting the amounts and disclosures in the financial statements, assessing the accounting principles used and significant estimates made by management, as well as evaluating the overall financial statement presentation. Our procedures included confirmation of securities owned as of November 30, 2016, by correspondence with the custodians and brokers; when replies were not received from brokers, we performed other auditing procedures. We believe that our audits provide a reasonable basis for our opinion.
In our opinion, such financial statements and financial highlights referred to above present fairly, in all material respects, the financial position of Fidelity Series 100 Index Fund as of November 30, 2016, the results of its operations for the year then ended, the changes in its net assets for each of the two years in the period then ended, and the financial highlights for the each of the five years in the period then ended, in conformity with accounting principles generally accepted in the United States of America.
DELOITTE & TOUCHE LLP
Boston, Massachusetts
January 13, 2017
Trustees and Officers
The Trustees, Members of the Advisory Board (if any), and officers of the trust and fund, as applicable, are listed below. The Board of Trustees governs the fund and is responsible for protecting the interests of shareholders. The Trustees are experienced executives who meet periodically throughout the year to oversee the fund's activities, review contractual arrangements with companies that provide services to the fund, oversee management of the risks associated with such activities and contractual arrangements, and review the fund's performance. Except for Jonathan Chiel, each of the Trustees oversees 170 funds. Mr. Chiel oversees 120 funds.
The Trustees hold office without limit in time except that (a) any Trustee may resign; (b) any Trustee may be removed by written instrument, signed by at least two-thirds of the number of Trustees prior to such removal; (c) any Trustee who requests to be retired or who has become incapacitated by illness or injury may be retired by written instrument signed by a majority of the other Trustees; and (d) any Trustee may be removed at any special meeting of shareholders by a two-thirds vote of the outstanding voting securities of the trust. Each Trustee who is not an interested person (as defined in the 1940 Act) of the trust and the fund is referred to herein as an Independent Trustee. Each Independent Trustee shall retire not later than the last day of the calendar year in which his or her 75th birthday occurs. The Independent Trustees may waive this mandatory retirement age policy with respect to individual Trustees. Officers and Advisory Board Members hold office without limit in time, except that any officer or Advisory Board Member may resign or may be removed by a vote of a majority of the Trustees at any regular meeting or any special meeting of the Trustees. Except as indicated, each individual has held the office shown or other offices in the same company for the past five years.
The fund’s Statement of Additional Information (SAI) includes more information about the Trustees. To request a free copy, call Fidelity 1-800-544-8544, or for Class F, call 1-800-835-5092.
Experience, Skills, Attributes, and Qualifications of the Trustees. The Governance and Nominating Committee has adopted a statement of policy that describes the experience, qualifications, attributes, and skills that are necessary and desirable for potential Independent Trustee candidates (Statement of Policy). The Board believes that each Trustee satisfied at the time he or she was initially elected or appointed a Trustee, and continues to satisfy, the standards contemplated by the Statement of Policy. The Governance and Nominating Committee also engages professional search firms to help identify potential Independent Trustee candidates who have the experience, qualifications, attributes, and skills consistent with the Statement of Policy. From time to time, additional criteria based on the composition and skills of the current Independent Trustees, as well as experience or skills that may be appropriate in light of future changes to board composition, business conditions, and regulatory or other developments, have also been considered by the professional search firms and the Governance and Nominating Committee. In addition, the Board takes into account the Trustees' commitment and participation in Board and committee meetings, as well as their leadership of standing and ad hoc committees throughout their tenure.
In determining that a particular Trustee was and continues to be qualified to serve as a Trustee, the Board has considered a variety of criteria, none of which, in isolation, was controlling. The Board believes that, collectively, the Trustees have balanced and diverse experience, qualifications, attributes, and skills, which allow the Board to operate effectively in governing the fund and protecting the interests of shareholders. Information about the specific experience, skills, attributes, and qualifications of each Trustee, which in each case led to the Board's conclusion that the Trustee should serve (or continue to serve) as a trustee of the fund, is provided below.
Board Structure and Oversight Function. James C. Curvey is an interested person and currently serves as Chairman. The Trustees have determined that an interested Chairman is appropriate and benefits shareholders because an interested Chairman has a personal and professional stake in the quality and continuity of services provided to the fund. Independent Trustees exercise their informed business judgment to appoint an individual of their choosing to serve as Chairman, regardless of whether the Trustee happens to be independent or a member of management. The Independent Trustees have determined that they can act independently and effectively without having an Independent Trustee serve as Chairman and that a key structural component for assuring that they are in a position to do so is for the Independent Trustees to constitute a substantial majority for the Board. The Independent Trustees also regularly meet in executive session. Ned C. Lautenbach serves as Chairman of the Independent Trustees and as such (i) acts as a liaison between the Independent Trustees and management with respect to matters important to the Independent Trustees and (ii) with management prepares agendas for Board meetings.
Fidelity® funds are overseen by different Boards of Trustees. The fund's Board oversees Fidelity's high income and certain equity funds, and other Boards oversee Fidelity's investment-grade bond, money market, asset allocation, and sector funds. The asset allocation funds may invest in Fidelity® funds overseen by the fund's Board. The use of separate Boards, each with its own committee structure, allows the Trustees of each group of Fidelity® funds to focus on the unique issues of the funds they oversee, including common research, investment, and operational issues. On occasion, the separate Boards establish joint committees to address issues of overlapping consequences for the Fidelity® funds overseen by each Board.
The Trustees operate using a system of committees to facilitate the timely and efficient consideration of all matters of importance to the Trustees, the fund, and fund shareholders and to facilitate compliance with legal and regulatory requirements and oversight of the fund's activities and associated risks. The Board, acting through its committees, has charged FMR and its affiliates with (i) identifying events or circumstances the occurrence of which could have demonstrably adverse effects on the fund's business and/or reputation; (ii) implementing processes and controls to lessen the possibility that such events or circumstances occur or to mitigate the effects of such events or circumstances if they do occur; and (iii) creating and maintaining a system designed to evaluate continuously business and market conditions in order to facilitate the identification and implementation processes described in (i) and (ii) above. Because the day-to-day operations and activities of the fund are carried out by or through FMR, its affiliates, and other service providers, the fund's exposure to risks is mitigated but not eliminated by the processes overseen by the Trustees. While each of the Board's committees has responsibility for overseeing different aspects of the fund's activities, oversight is exercised primarily through the Operations, Audit, and Compliance Committees. In addition, the Independent Trustees have worked with FMR to enhance the Board's oversight of investment and financial risks, legal and regulatory risks, technology risks, and operational risks, including the development of additional risk reporting to the Board. For example, a working group comprised of Independent Trustees and FMR has worked and continues to work to review the Fidelity® funds' valuation-related activities, reporting and risk management. Appropriate personnel, including but not limited to the fund's Chief Compliance Officer (CCO), FMR's internal auditor, the independent accountants, the fund's Treasurer and portfolio management personnel, make periodic reports to the Board's committees, as appropriate, including an annual review of Fidelity's risk management program for the Fidelity® funds. The responsibilities of each standing committee, including their oversight responsibilities, are described further under "Standing Committees of the Trustees."
Interested Trustees*:
Correspondence intended for a Trustee who is an interested person may be sent to Fidelity Investments, 245 Summer Street, Boston, Massachusetts 02210.
Name, Year of Birth; Principal Occupations and Other Relevant Experience+
Jonathan Chiel (1957)
Year of Election or Appointment: 2016
Trustee
Mr. Chiel also serves as Trustee of other Fidelity funds. Mr. Chiel is Executive Vice President and General Counsel for FMR LLC (diversified financial services company, 2012-present). Previously, Mr. Chiel served as general counsel (2004-2012) and senior vice president and deputy general counsel (2000-2004) for John Hancock Financial Services; a partner with Choate, Hall & Stewart (1996-2000) (law firm); and an Assistant United States Attorney for the United States Attorney’s Office of the District of Massachusetts (1986-95), including Chief of the Criminal Division (1993-1995). Mr. Chiel is a director on the boards of the Boston Bar Foundation and the Maimonides School.
James C. Curvey (1935)
Year of Election or Appointment: 2007
Trustee
Chairman of the Board of Trustees
Mr. Curvey also serves as Trustee of other Fidelity® funds. Mr. Curvey is a Director of Fidelity Research & Analysis Co. (investment adviser firm, 2009-present), and Vice Chairman (2007-present) and Director of FMR LLC (diversified financial services company). In addition, Mr. Curvey serves as an Overseer for the Boston Symphony Orchestra and a member of the board of Artis-Naples, Naples, Florida, and as a Trustee for Brewster Academy, Wolfeboro, New Hampshire. Previously, Mr. Curvey served as a Director of Fidelity Investments Money Management, Inc. (investment adviser firm, 2009-2014) and a Director of FMR and FMR Co., Inc. (investment adviser firms, 2007-2014).
Charles S. Morrison (1960)
Year of Election or Appointment: 2014
Trustee
Mr. Morrison also serves as Trustee of other funds. He serves as President of Fidelity Management & Research Company (FMR) (investment adviser firm, 2016-present), a Director of Fidelity Investments Money Management, Inc. (FIMM) (investment adviser firm, 2014-present), Director of Fidelity SelectCo, LLC (investment adviser firm, 2014-present), President, Asset Management (2014-present), and is an employee of Fidelity Investments. Previously, Mr. Morrison served as Vice President of Fidelity's Fixed Income and Asset Allocation Funds (2012-2014), President, Fixed Income (2011-2014), Vice President of Fidelity's Money Market Funds (2005-2009), President, Money Market Group Leader of FMR (investment adviser firm, 2009), and Senior Vice President, Money Market Group of FMR (2004-2009). Mr. Morrison also served as Vice President of Fidelity's Bond Funds (2002-2005), certain Balanced Funds (2002-2005), and certain Asset Allocation Funds (2002-2007), and as Senior Vice President (2002-2005) of Fidelity's Bond Division.
* Determined to be an “Interested Trustee” by virtue of, among other things, his or her affiliation with the trust or various entities under common control with FMR.
+ The information includes the Trustee's principal occupation during the last five years and other information relating to the experience, attributes, and skills relevant to the Trustee's qualifications to serve as a Trustee, which led to the conclusion that the Trustee should serve as a Trustee for the fund.
Independent Trustees:
Correspondence intended for an Independent Trustee may be sent to Fidelity Investments, P.O. Box 55235, Boston, Massachusetts 02205-5235.
Name, Year of Birth; Principal Occupations and Other Relevant Experience+
Dennis J. Dirks (1948)
Year of Election or Appointment: 2005
Trustee
Mr. Dirks also serves as Trustee of other Fidelity® funds. Prior to his retirement in May 2003, Mr. Dirks was Chief Operating Officer and a member of the Board of The Depository Trust & Clearing Corporation (DTCC). He also served as President, Chief Operating Officer, and Board member of The Depository Trust Company (DTC) and President and Board member of the National Securities Clearing Corporation (NSCC). In addition, Mr. Dirks served as Chief Executive Officer and Board member of the Government Securities Clearing Corporation, Chief Executive Officer and Board member of the Mortgage-Backed Securities Clearing Corporation, as a Trustee and a member of the Finance Committee of Manhattan College (2005-2008), as a Trustee and a member of the Finance Committee of AHRC of Nassau County (2006-2008), and as a member of the Independent Directors Council (IDC) Governing Council (2010-2015). Mr. Dirks is a member of the Board of Directors for The Brookville Center for Children's Services, Inc. (2009-present) and the Finance Committee of the Asolo Repertory Theatre (2016-present).
Alan J. Lacy (1953)
Year of Election or Appointment: 2008
Trustee
Mr. Lacy also serves as Trustee of other Fidelity® funds. Mr. Lacy serves as Chairman (2014-present) and a member (2010-present) of the Board of Directors of Dave & Buster's Entertainment, Inc. (restaurant and entertainment complexes) and a Director of Bristol-Myers Squibb Company (global pharmaceuticals, 2008-present). He is a Trustee of the California Chapter of The Nature Conservancy (2015-present) and a Director of the Center for Advanced Study in the Behavioral Sciences at Stanford University (2015-present). In addition, Mr. Lacy served as Senior Adviser (2007-2014) of Oak Hill Capital Partners, L.P. (private equity) and also served as Chief Executive Officer (2005) and Vice Chairman (2005-2006) of Sears Holdings Corporation (retail) and Chief Executive Officer and Chairman of the Board of Sears, Roebuck and Co. (retail, 2000-2005). Previously, Mr. Lacy served as Chairman (2008-2011) and a member (2006-2015) of the Board of Trustees of the National Parks Conservation Association and as a member of the Board of Directors for The Western Union Company (global money transfer, 2006-2011), The Hillman Companies, Inc. (hardware wholesalers, 2010-2014), and Earth Fare, Inc. (retail grocery, 2010-2014).
Ned C. Lautenbach (1944)
Year of Election or Appointment: 2000
Trustee
Chairman of the Independent Trustees
Mr. Lautenbach also serves as Trustee of other Fidelity® funds. Mr. Lautenbach currently serves as the Lead Director of the Eaton Corporation Board of Directors (diversified industrial, 1997-present). Mr. Lautenbach is Chairman of the Board of Directors of Artis-Naples in Naples, Florida (2012-present), a member of the Council on Foreign Relations (1994-present), and currently Vice Chair of the Board of Governors, State University System of Florida (2013-present). Previously, Mr. Lautenbach was a Partner and Advisory Partner at Clayton, Dubilier & Rice, LLC (private equity investment, 1998-2010), as well as a Director of Sony Corporation (2006-2007). Mr. Lautenbach also had a 30-year career with IBM (technology company) during which time he served as Senior Vice President and a member of the Corporate Executive Committee (1968-1998).
Joseph Mauriello (1944)
Year of Election or Appointment: 2008
Trustee
Mr. Mauriello also serves as Trustee of other Fidelity® funds. Prior to his retirement in January 2006, Mr. Mauriello served in numerous senior management positions including Deputy Chairman and Chief Operating Officer (2004-2005), and Vice Chairman of Financial Services (2002-2004) of KPMG LLP US (professional services, 1965-2005). Mr. Mauriello currently serves as a member of the Board of Directors of XL Group plc. (global insurance and re-insurance, 2006-present) and the Independent Directors Council (IDC) Governing Council (2015-present). Previously, Mr. Mauriello served as a Director of the Hamilton Funds of the Bank of New York (2006-2007) and of Arcadia Resources Inc. (health care services and products, 2007-2012).
Robert W. Selander (1950)
Year of Election or Appointment: 2011
Trustee
Mr. Selander also serves as Trustee of other Fidelity® funds. Mr. Selander serves as a Director of The Western Union Company (global money transfer, 2014-present) and a non-executive Chairman of Health Equity, Inc. (health savings custodian, 2015-present). Previously, Mr. Selander served as a Member of the Advisory Board of certain Fidelity® funds (2011), and Executive Vice Chairman (2010), Chief Executive Officer (2009-2010), and President and Chief Executive Officer (1997-2009) of Mastercard, Inc.
Cornelia M. Small (1944)
Year of Election or Appointment: 2005
Trustee
Ms. Small also serves as Trustee of other Fidelity® funds. Ms. Small is a member of the Board of Directors (2009-present) and Chair of the Investment Committee (2010-present) of the Teagle Foundation. Ms. Small also serves on the Investment Committee of the Berkshire Taconic Community Foundation (2008-present). Previously, Ms. Small served as Chairperson (2002-2008) and a member of the Investment Committee and Chairperson (2008-2012) and a member of the Board of Trustees of Smith College. In addition, Ms. Small served as Chief Investment Officer, Director of Global Equity Investments, and a member of the Board of Directors of Scudder, Stevens & Clark and Scudder Kemper Investments.
William S. Stavropoulos (1939)
Year of Election or Appointment: 2001
Trustee
Vice Chairman of the Independent Trustees
Mr. Stavropoulos also serves as Trustee of other Fidelity® funds. Mr. Stavropoulos serves as President and Founder of the Michigan Baseball Foundation, the Great Lakes Loons (2007-present). Mr. Stavropoulos is Chairman Emeritus of the Board of Directors of The Dow Chemical Company, where he previously served in numerous senior management positions, including President, CEO (1995-2000; 2002-2004), Chairman of the Executive Committee (2000-2006), and as a member of the Board of Directors (1990-2006). Currently, Mr. Stavropoulos is Chairman of the Board of Directors of Univar Inc. (global distributor of commodity and specialty chemicals), a Director of Teradata Corporation (data warehousing and technology solutions), and a member of the Advisory Board for Metalmark Capital LLC (private equity investment, 2005-present). Mr. Stavropoulos is an operating advisor to Clayton, Dubilier & Rice, LLC (private equity investment). In addition, Mr. Stavropoulos is a member of the University of Notre Dame Advisory Council for the College of Science, a Trustee of the Rollin L. Gerstacker Foundation, and a Director of Artis-Naples in Naples, Florida. Previously, Mr. Stavropoulos served as a Director of Chemical Financial Corporation (bank holding company, 1993-2012) and Tyco International, Ltd. (multinational manufacturing and services, 2007-2012).
David M. Thomas (1949)
Year of Election or Appointment: 2008
Trustee
Mr. Thomas also serves as Trustee of other Fidelity® funds. Mr. Thomas serves as Non-Executive Chairman of the Board of Directors of Fortune Brands Home and Security (home and security products, 2011-present), as a member of the Board of Directors (2004-present) and Presiding Director (2013-present) of Interpublic Group of Companies, Inc. (marketing communication), and as a member of the Board of Trustees of the University of Florida (2013-present). Previously, Mr. Thomas served as Executive Chairman (2005-2006) and Chairman and Chief Executive Officer (2000-2005) of IMS Health, Inc. (pharmaceutical and healthcare information solutions), and a Director of Fortune Brands, Inc. (consumer products, 2000-2011).
+ The information includes the Trustee's principal occupation during the last five years and other information relating to the experience, attributes, and skills relevant to the Trustee's qualifications to serve as a Trustee, which led to the conclusion that the Trustee should serve as a Trustee for the fund.
Advisory Board Members and Officers:
Correspondence intended for an officer or Peter S. Lynch may be sent to Fidelity Investments, 245 Summer Street, Boston, Massachusetts 02210. Officers appear below in alphabetical order.
Name, Year of Birth; Principal Occupation
Peter S. Lynch (1944)
Year of Election or Appointment: 2003
Member of the Advisory Board
Mr. Lynch also serves as Member of the Advisory Board of other Fidelity® funds. Mr. Lynch is Vice Chairman and a Director of FMR (investment adviser firm) and FMR Co., Inc. (investment adviser firm). In addition, Mr. Lynch serves as a Trustee of Boston College and as the Chairman of the Inner-City Scholarship Fund. Previously, Mr. Lynch served on the Special Olympics International Board of Directors (1997-2006).
Marc R. Bryant (1966)
Year of Election or Appointment: 2015
Secretary and Chief Legal Officer (CLO)
Mr. Bryant also serves as Secretary and CLO of other funds. Mr. Bryant serves as CLO, Secretary, and Senior Vice President of Fidelity Management & Research Company (investment adviser firm, 2015-present) and FMR Co., Inc. (investment adviser firm, 2015-present); Secretary of Fidelity SelectCo, LLC (investment adviser firm, 2015-present) and Fidelity Investments Money Management, Inc. (investment adviser firm, 2015-present); and CLO of Fidelity Management & Research (Hong Kong) Limited and FMR Investment Management (UK) Limited (investment adviser firms, 2015-present) and Fidelity Management & Research (Japan) Limited (investment adviser firm, 2016-present). He is Senior Vice President and Deputy General Counsel of FMR LLC (diversified financial services company). Previously, Mr. Bryant served as Secretary and CLO of Fidelity Rutland Square Trust II (2010-2014) and Assistant Secretary of Fidelity's Fixed Income and Asset Allocation Funds (2013-2015). Prior to joining Fidelity Investments, Mr. Bryant served as a Senior Vice President and the Head of Global Retail Legal for AllianceBernstein L.P. (2006-2010), and as the General Counsel for ProFund Advisors LLC (2001-2006).
Jeffrey S. Christian (1961)
Year of Election or Appointment: 2016
Assistant Treasurer
Mr. Christian also serves as Assistant Treasurer of other funds. Mr. Christian is an employee of Fidelity Investments (2003-present).
William C. Coffey (1969)
Year of Election or Appointment: 2009
Assistant Secretary
Mr. Coffey also serves as Assistant Secretary of other funds. He is Senior Vice President and Deputy General Counsel of FMR LLC (diversified financial services company, 2010-present), and is an employee of Fidelity Investments. Previously, Mr. Coffey served as Vice President and Associate General Counsel of FMR LLC (2005-2009).
Jonathan Davis (1968)
Year of Election or Appointment: 2010
Assistant Treasurer
Mr. Davis also serves as Assistant Treasurer of other funds, and is an employee of Fidelity Investments. Previously, Mr. Davis served as Vice President and Associate General Counsel of FMR LLC (diversified financial services company, 2003-2010).
Adrien E. Deberghes (1967)
Year of Election or Appointment: 2016
Assistant Treasurer
Mr. Deberghes also serves as an officer of other funds. He serves as Executive Vice President of Fidelity Investments Money Management, Inc. (FIMM) (investment adviser firm, 2016-present) and is an employee of Fidelity Investments (2008-present). Prior to joining Fidelity Investments, Mr. Deberghes was Senior Vice President of Mutual Fund Administration at State Street Corporation (2007-2008), Senior Director of Mutual Fund Administration at Investors Bank & Trust (2005-2007), and Director of Finance for Dunkin' Brands (2000-2005). Previously, Mr. Deberghes served in other fund officer roles.
Stephanie J. Dorsey (1969)
Year of Election or Appointment: 2010
Assistant Treasurer
Ms. Dorsey also serves as an officer of other funds. She is an employee of Fidelity Investments (2008-present) and has served in other fund officer roles. Prior to joining Fidelity Investments, Ms. Dorsey served as Treasurer (2004-2008) of the JPMorgan Mutual Funds and Vice President (2004-2008) of JPMorgan Chase Bank.
Howard J. Galligan III (1966)
Year of Election or Appointment: 2014
Chief Financial Officer
Mr. Galligan also serves as Chief Financial Officer of other funds. Mr. Galligan serves as President of Fidelity Pricing and Cash Management Services (FPCMS) (2014-present) and as a Director of Strategic Advisers, Inc. (investment adviser firm, 2008-present). Previously, Mr. Galligan served as Chief Administrative Officer of Asset Management (2011-2014) and Chief Operating Officer and Senior Vice President of Investment Support for Strategic Advisers, Inc. (2003-2011).
Scott C. Goebel (1968)
Year of Election or Appointment: 2015
Vice President
Mr. Goebel serves as Vice President of other funds and is an employee of Fidelity Investments (2001-present). Previously, Mr. Goebel served as Senior Vice President of Fidelity Management & Research Company (FMR) (investment adviser firm, 2016), Secretary of Fidelity SelectCo, LLC (investment adviser firm, 2013-2015), Fidelity Investments Money Management, Inc. (FIMM) (investment adviser firm, 2010-2015), and Fidelity Research and Analysis Company (FRAC) (investment adviser firm, 2010-2015); General Counsel, Secretary, and Senior Vice President of FMR (investment adviser firm, 2008-2015) and FMR Co., Inc. (investment adviser firm, 2008-2015); Assistant Secretary of Fidelity Management & Research (Japan) Limited (investment adviser firm, 2008-2015) and Fidelity Management & Research (U.K.) Inc. (investment adviser firm, 2008-2015); Chief Legal Officer (CLO) of Fidelity Management & Research (Hong Kong) Limited (investment adviser firm, 2008-2015); Secretary and CLO of certain Fidelity® funds (2008-2015); Assistant Secretary of FIMM (2008-2010), FRAC (2008-2010), and certain funds (2007-2008); and as Vice President and Secretary of Fidelity Distributors Corporation (FDC) (2005-2007).
Brian B. Hogan (1964)
Year of Election or Appointment: 2009
Vice President
Mr. Hogan also serves as Trustee or Vice President of other funds. Mr. Hogan serves as a Director of FMR Investment Management (UK) Limited (investment adviser firm, 2015-present) and Fidelity SelectCo, LLC (investment adviser firm, 2014-present) and President of the Equity Division of FMR (investment adviser firm, 2009-present). Previously, Mr. Hogan served as Senior Vice President, Equity Research of FMR (2006-2009) and as a portfolio manager. Mr. Brian B. Hogan is not related to Mr. Colm A. Hogan.
Colm A. Hogan (1973)
Year of Election or Appointment: 2016
Deputy Treasurer
Mr. Hogan also serves as an officer of other funds. Mr. Hogan is an employee of Fidelity Investments (2005-present). Mr. Colm A. Hogan is not related to Mr. Brian B. Hogan.
Chris Maher (1972)
Year of Election or Appointment: 2013
Assistant Treasurer
Mr. Maher serves as Assistant Treasurer of other funds. Mr. Maher is Vice President of Valuation Oversight and is an employee of Fidelity Investments. Previously, Mr. Maher served as Vice President of Asset Management Compliance (2013), Vice President of the Program Management Group of FMR (investment adviser firm, 2010-2013), and Vice President of Valuation Oversight (2008-2010).
John F. Papandrea (1972)
Year of Election or Appointment: 2016
Anti-Money Laundering (AML) Officer
Mr. Papandrea also serves as AML Officer of other funds. Mr. Papandrea is Vice President of FMR LLC (diversified financial services company, 2008-present) and is an employee of Fidelity Investments (2005-present).
Kenneth B. Robins (1969)
Year of Election or Appointment: 2016
Chief Compliance Officer
Mr. Robins also serves as an officer of other funds. Mr. Robins serves as Compliance Officer of Fidelity Management & Research Company and FMR Co., Inc. (investment adviser firms, 2016-present) and is an employee of Fidelity Investments (2004-present). Previously, Mr. Robins served as Executive Vice President of Fidelity Investments Money Management, Inc. (investment adviser firm, 2013-2016) and served in other fund officer roles.
Stacie M. Smith (1974)
Year of Election or Appointment: 2016
President and Treasurer
Ms. Smith also serves as an officer of other funds. She is an employee of Fidelity Investments (2009-present) and has served in other fund officer roles. Prior to joining Fidelity Investments, Ms. Smith served as Senior Audit Manager of Ernst & Young LLP (accounting firm, 1996-2009). Previously, Ms. Smith served as Deputy Treasurer of certain Fidelity® funds (2013-2016).
Marc L. Spector (1972)
Year of Election or Appointment: 2016
Assistant Treasurer
Mr. Spector also serves as an officer of other funds. Mr. Spector is an employee of Fidelity Investments (2016-present). Prior to joining Fidelity Investments, Mr. Spector served as Director at the Siegfried Group (accounting firm, 2013-2016), and prior to Siegfried Group as audit senior manager at Deloitte & Touche (accounting firm, 2005-2013).
Renee Stagnone (1975)
Year of Election or Appointment: 2016
Assistant Treasurer
Ms. Stagnone also serves as an officer of other funds. Ms. Stagnone is an employee of Fidelity Investments (1997-present). Previously, Ms. Stagnone served as Deputy Treasurer of certain Fidelity® funds (2013-2016).
Shareholder Expense Example
As a shareholder of the Fund, you incur two types of costs: (1) transaction costs, and (2) ongoing costs, including management fees and other Fund expenses. This Example is intended to help you understand your ongoing costs (in dollars) of investing in the Fund and to compare these costs with the ongoing costs of investing in other mutual funds.
The Example is based on an investment of $1,000 invested at the beginning of the period and held for the entire period (June 1, 2016 to November 30, 2016).
Actual Expenses
The first line of the accompanying table for each class of the Fund provides information about actual account values and actual expenses. You may use the information in this line, together with the amount you invested, to estimate the expenses that you paid over the period. Simply divide your account value by $1,000.00 (for example, an $8,600 account value divided by $1,000.00 = 8.6), then multiply the result by the number in the first line for a class of the Fund under the heading entitled "Expenses Paid During Period" to estimate the expenses you paid on your account during this period. In addition, the Fund, as a shareholder in the underlying Fidelity Central Funds, will indirectly bear its pro-rata share of the fees and expenses incurred by the underlying Fidelity Central Funds. These fees and expenses are not included in the Fund's annualized expense ratio used to calculate the expense estimate in the table below.
Hypothetical Example for Comparison Purposes
The second line of the accompanying table for each class of the Fund provides information about hypothetical account values and hypothetical expenses based on a Class' actual expense ratio and an assumed rate of return of 5% per year before expenses, which is not the Class' actual return. The hypothetical account values and expenses may not be used to estimate the actual ending account balance or expenses you paid for the period. You may use this information to compare the ongoing costs of investing in the Fund and other funds. To do so, compare this 5% hypothetical example with the 5% hypothetical examples that appear in the shareholder reports of the other funds. In addition, the Fund, as a shareholder in the underlying Fidelity Central Funds, will indirectly bear its pro-rata share of the fees and expenses incurred by the underlying Fidelity Central Funds. These fees and expenses are not included in the Fund's annualized expense ratio used to calculate the expense estimate in the table below.
Please note that the expenses shown in the table are meant to highlight your ongoing costs only and do not reflect any transaction costs. Therefore, the second line of the table is useful in comparing ongoing costs only, and will not help you determine the relative total costs of owning different funds.
| Annualized Expense Ratio-A | Beginning Account Value June 1, 2016 | Ending Account Value November 30, 2016 | Expenses Paid During Period-B June 1, 2016 to November 30, 2016 | |
| Series 100 Index | .10% | |||
| Actual | $1,000.00 | $1,056.90 | $.51 | |
| Hypothetical-C | $1,000.00 | $1,024.50 | $.51 | |
| Class F | .05% | |||
| Actual | $1,000.00 | $1,056.90 | $.26 | |
| Hypothetical-C | $1,000.00 | $1,024.75 | $.25 |
A Annualized expense ratio reflects expenses net of applicable fee waivers.
B Expenses are equal to each Class' annualized expense ratio, multiplied by the average account value over the period, multiplied by 183/366 (to reflect the one-half year period).
C 5% return per year before expenses
Distributions (Unaudited)
Fidelity Series 100 Index Fund designates 100% and Class F designates 99% of the dividend distributed during the fiscal year as qualifying for the dividends–received deduction for corporate shareholders.
Fidelity Series 100 Index Fund designates 100% and Class F designates 99% of the dividend distributed during the fiscal year as amounts which may be taken into account as a dividend for purposes of the maximum rate under section 1(h)(11) of the Internal Revenue Code.
The fund will notify shareholders in January 2017 of amounts for use in preparing 2016 income tax returns.
Board Approval of Investment Advisory Contracts and Management Fees
Fidelity Series 100 Index Fund
Each year, the Board of Trustees, including the Independent Trustees (together, the Board), votes on the renewal of the management contract with Fidelity Management & Research Company (FMR) and the sub-advisory agreements (together, the Advisory Contracts) for the fund, including the fund's sub-advisory agreement with Geode Capital Management, LLC (Geode). The Board, assisted by the advice of fund counsel and Independent Trustees' counsel, requests and considers a broad range of information relevant to the renewal of the Advisory Contracts throughout the year.
The Board meets regularly and, at each of its meetings, covers an extensive agenda of topics and materials and considers factors that are relevant to its annual consideration of the renewal of the fund's Advisory Contracts, including the services and support provided to the fund and its shareholders. The Board has established various standing committees (Committees), each composed of and chaired by Independent Trustees with varying backgrounds, to which the Board has assigned specific subject matter responsibilities in order to enhance effective decision-making by the Board. The Board, acting directly and through its Committees, requests and receives information concerning the annual consideration of the renewal of the fund's Advisory Contracts. The Board also meets as needed to consider matters specifically related to the Board's annual consideration of the renewal of the Advisory Contracts. Members of the Board may also meet with trustees of other Fidelity funds through ad hoc joint committees to discuss certain matters relevant to all of the Fidelity funds.
At its July 2016 meeting, the Board unanimously determined to renew the fund's Advisory Contracts. In reaching its determination, the Board considered all factors it believed relevant, including (i) the nature, extent, and quality of the services to be provided to the fund and its shareholders (including the investment performance of the fund); (ii) the competitiveness of the fund's management fee and total expense ratio relative to peer funds; (iii) the total costs of the services to be provided by and the profits to be realized by Fidelity from its relationships with the fund; and (iv) the extent to which, if any, economies of scale exist and would be realized as the fund grows, and whether any economies of scale are appropriately shared with fund shareholders.
In considering whether to renew the Advisory Contracts for the fund, the Board reached a determination, with the assistance of fund counsel and Independent Trustees' counsel and through the exercise of its business judgment, that the renewal of the Advisory Contracts was in the best interests of the fund and its shareholders and that the compensation payable under the Advisory Contracts was fair and reasonable. The Board's decision to renew the Advisory Contracts was not based on any single factor, but rather was based on a comprehensive consideration of all the information provided to the Board at its meetings throughout the year. The Board, in reaching its determination to renew the Advisory Contracts, was aware that shareholders of the fund have a broad range of investment choices available to them, including a wide choice among funds offered by Fidelity's competitors, and that the fund's shareholders, who have the opportunity to review and weigh the disclosure provided by the fund in its prospectus and other public disclosures, have chosen to invest in this fund, which is part of the Fidelity family of funds.
Nature, Extent, and Quality of Services Provided. The Board considered staffing as it relates to the fund, including the backgrounds of investment personnel of Fidelity and Geode, and also considered the fund's investment objective, strategies, and related investment philosophy. The Independent Trustees also had discussions with senior management of Fidelity's investment operations and investment groups and with representatives of Geode. The Board considered the structure of the investment personnel compensation programs and whether the structures provide appropriate incentives to act in the best interests of the fund. Additionally, the Board considered the portfolio managers' investments, if any, in the funds that they manage.Resources Dedicated to Investment Management and Support Services. The Board and the Fund Oversight and Research Committees reviewed the general qualifications and capabilities of Fidelity's and Geode's investment staffs, including their size, education, experience, and resources, as well as Fidelity's approach to recruiting, training, managing, and compensating investment personnel. The Board noted that Fidelity has continued to increase the resources devoted to non-U.S. offices, including expansion of Fidelity's global investment organization. Additionally, in its deliberations, the Board considered Fidelity's and Geode's trading, risk management, compliance, and technology and operations capabilities and resources, which are integral parts of the investment management process.Shareholder and Administrative Services. The Board considered (i) the nature, extent, quality, and cost of advisory, administrative, and shareholder services performed by FMR, the sub-advisers (together with FMR, the Investment Advisers), and their affiliates under the Advisory Contracts and under separate agreements covering transfer agency, pricing and bookkeeping, and securities lending services for the fund; (ii) the nature and extent of the supervision of third party service providers, principally custodians, subcustodians, and pricing vendors; and (iii) the resources devoted to, and the record of compliance with, the fund's compliance policies and procedures. The Board also reviewed the allocation of fund brokerage, including allocations to brokers affiliated with the Investment Advisers.The Board noted that the growth of fund assets over time across the complex allows Fidelity to reinvest in the development of services designed to enhance the value or convenience of the Fidelity funds as investment vehicles. These services include 24-hour access to account information and market information through telephone representatives and over the Internet, investor education materials and asset allocation tools, and the expanded availability of Fidelity Investor Centers.In 2014, the Board formed an ad hoc Committee on Transfer Agency Fees to review the variety of transfer agency fee structures throughout the industry and Fidelity's competitive positioning with respect to industry participants.Investment in a Large Fund Family. The Board considered the benefits to shareholders of investing in a Fidelity fund, including the benefits of investing in a fund that is part of a large family of funds offering a variety of investment disciplines and providing a large variety of mutual fund investor services. The Board noted that Fidelity had taken, or had made recommendations that resulted in the Fidelity funds taking, a number of actions over the previous year that benefited particular funds, including: (i) continuing to dedicate additional resources to investment research and to the support of the senior management team that oversees asset management; (ii) continuing efforts to enhance Fidelity's global research capabilities; (iii) launching new funds and making other enhancements to meet client needs; (iv) broadening eligibility requirements for certain lower-priced share classes of, and streamlining the fee structure for, certain existing equity index funds; (v) lowering expense caps for certain existing funds and classes to reduce expenses paid by shareholders; (vi) eliminating redemption fees for certain variable insurance product funds and classes; (vii) continuing to launch dedicated lower cost underlying funds to meet portfolio construction needs related to expanding underlying fund options for Fidelity funds of funds, specifically for the Freedom Fund product lines; (viii) launching a lower cost share class for use by the Freedom Index Fund product line; (ix) rationalizing product lines and gaining increased efficiencies through fund mergers and share class consolidations; (x) continuing to develop, acquire and implement systems and technology to improve services to the funds and shareholders, strengthen information security, and increase efficiency; (xi) implementing investment enhancements to further strengthen Fidelity's target date product line to increase investors' probability of success in achieving their goals; (xii) accelerating the conversion of all remaining Class B shares to Class A shares, which have a lower expense structure; and (xiii) implementing changes to Fidelity's money market fund product line in response to recent regulatory reforms.Investment Performance. The Board considered whether the fund has operated in accordance with its investment objective, as well as its record of compliance with its investment restrictions and its performance history.The Board took into account discussions with representatives of the Investment Advisers about fund investment performance that occur at Board meetings throughout the year. In this regard the Board noted that as part of regularly scheduled fund reviews and other reports to the Board on fund performance, the Board considers annualized return information for the fund, for different time periods, measured against the securities market index the fund seeks to track. The Board also periodically considers the fund's tracking error versus its benchmark index. In its evaluation of fund investment performance, the Board gave particular attention to information indicating changes in performance of certain Fidelity funds for specific time periods and discussed with the Investment Advisers the reasons for any overperformance or underperformance.In addition to reviewing absolute and relative fund performance, the Independent Trustees periodically consider the appropriateness of fund performance metrics in evaluating the results achieved. In general, the Independent Trustees believe that an index fund's performance should be evaluated based on net performance (after fees and expenses) of both the highest performing and lowest performing fund share classes, where applicable, compared to a fund's benchmark index, over appropriate time periods taking into account relevant factors including the following: general market conditions; the characteristics of the fund's benchmark index; the extent to which statistical sampling is employed; any securities lending revenues; and fund cash flows and other factors.The Independent Trustees recognize that shareholders evaluate performance on a net basis over their own holding periods, for which one-, three-, and five-year periods are often used as a proxy. For this reason, the performance information reviewed by the Board also included net cumulative calendar year total return information for the fund and its benchmark index for the most recent one-, three-, and five-year periods, as shown below. A peer group is not shown below because the fund does not generally utilize a peer group for performance comparison purposes.Fidelity Series 100 Index Fund
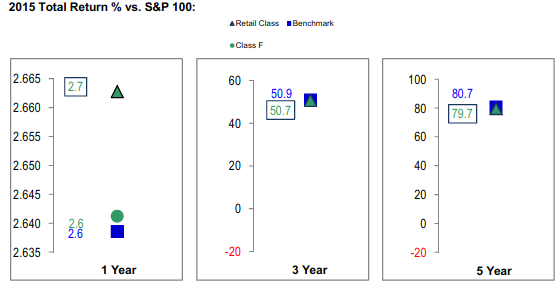
Fidelity Series 100 Index Fund
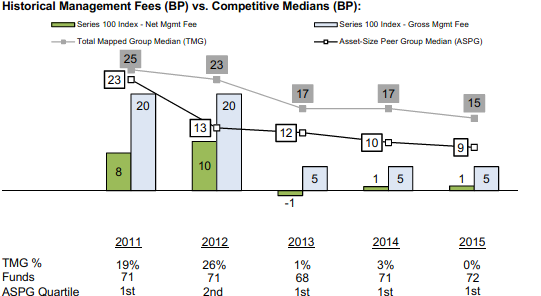
![]()
Corporate Headquarters
245 Summer St.
Boston, MA 02210
www.fidelity.com
HUN-ANN-0117
1.842443.109
Item 2.
Code of Ethics
As of the end of the period, November 30, 2016, Fidelity Concord Street Trust (the trust) has adopted a code of ethics, as defined in Item 2 of Form N-CSR, that applies to its President and Treasurer and its Chief Financial Officer. A copy of the code of ethics is filed as an exhibit to this Form N-CSR.
Item 3.
Audit Committee Financial Expert
The Board of Trustees of the trust has determined that Joseph Mauriello is an audit committee financial expert, as defined in Item 3 of Form N-CSR. Mr. Mauriello is independent for purposes of Item 3 of Form N-CSR.
Item 4.
Principal Accountant Fees and Services
Fees and Services
The following table presents fees billed by Deloitte & Touche LLP, the member firms of Deloitte Touche Tohmatsu, and their respective affiliates (collectively, “Deloitte Entities”) in each of the last two fiscal years for services rendered to Fidelity Nasdaq Composite Index Fund and Fidelity Series 100 Index Fund (the “Funds”):
Services Billed by Deloitte Entities
November 30, 2016 FeesA
| Audit Fees | Audit-Related Fees | Tax Fees | All Other Fees |
Fidelity Nasdaq Composite Index Fund | $70,000 | $- | $6,500 | $1,900 |
Fidelity Series 100 Index Fund | $56,000 | $- | $6,100 | $1,600 |
November 30, 2015 FeesA
| Audit Fees | Audit-Related Fees | Tax Fees | All Other Fees |
Fidelity Nasdaq Composite Index Fund | $53,000 | $- | $6,200 | $1,000 |
Fidelity Series 100 Index Fund | $53,000 | $- | $5,800 | $1,400 |
A Amounts may reflect rounding.
The following table presents fees billed by Deloitte Entities that were required to be approved by the Audit Committee for services that relate directly to the operations and financial reporting of the Funds and that are rendered on behalf of Fidelity Management & Research Company (“FMR”) and entities controlling, controlled by, or under common control with FMR (not including any sub-adviser whose role is primarily portfolio management and is subcontracted with or overseen by another investment adviser) that provide ongoing services to the Funds (“Fund Service Providers”):
Services Billed by Deloitte Entities
| November 30, 2016A | November 30, 2015A |
Audit-Related Fees | $35,000 | $- |
Tax Fees | $- | $10,000 |
All Other Fees | $- | $10,000 |
A Amounts may reflect rounding.
“Audit-Related Fees” represent fees billed for assurance and related services that are reasonably related to the performance of the fund audit or the review of the fund's financial statements and that are not reported under Audit Fees.
“Tax Fees” represent fees billed for tax compliance, tax advice or tax planning that relate directly to the operations and financial reporting of the fund.
“All Other Fees” represent fees billed for services provided to the fund or Fund Service Provider, a significant portion of which are assurance related, that relate directly to the operations and financial reporting of the fund, excluding those services that are reported under Audit Fees, Audit-Related Fees or Tax Fees.
Assurance services must be performed by an independent public accountant.
* * *
The aggregate non-audit fees billed by Deloitte Entities for services rendered to the Funds, FMR (not including any sub-adviser whose role is primarily portfolio management and is subcontracted with or overseen by another investment adviser), and any Fund Service Provider for each of the last two fiscal years of the Funds are as follows:
Billed By | November 30, 2016 A | November 30, 2015 A |
Deloitte Entities | $280,000 | $145,000 |
A Amounts may reflect rounding.
The trust's Audit Committee has considered non-audit services that were not pre-approved that were provided by Deloitte Entities to Fund Service Providers to be compatible with maintaining the independence of Deloitte Entities in its audit of the Funds, taking into account representations from Deloitte Entities, in accordance with Public Company Accounting Oversight Board rules, regarding its independence from the Funds and their related entities and FMR’s review of the appropriateness and permissibility under applicable law of such non-audit services prior to their provision to the Fund Service Providers.
Audit Committee Pre-Approval Policies and Procedures
The trust’s Audit Committee must pre-approve all audit and non-audit services provided by a fund’s independent registered public accounting firm relating to the operations or financial reporting of the fund. Prior to the commencement of any audit or non-audit services to a fund, the Audit Committee reviews the services to determine whether they are appropriate and permissible under applicable law.
The Audit Committee has adopted policies and procedures to, among other purposes, provide a framework for the Committee’s consideration of non-audit services by the audit firms that audit the Fidelity funds. The policies and procedures require that any non-audit service provided by a fund audit firm to a Fidelity fund and any non-audit service provided by a fund auditor to a Fund Service Provider that relates directly to the operations and financial reporting of a Fidelity fund (“Covered Service”) are subject to approval by the Audit Committee before such service is provided.
All Covered Services must be approved in advance of provision of the service either: (i) by formal resolution of the Audit Committee, or (ii) by oral or written approval of the service by the Chair of the Audit Committee (or if the Chair is unavailable, such other member of the Audit Committee as may be designated by the Chair to act in the Chair’s absence). The approval contemplated by (ii) above is permitted where the Treasurer determines that action on such an engagement is necessary before the next meeting of the Audit Committee.
Non-audit services provided by a fund audit firm to a Fund Service Provider that do not relate directly to the operations and financial reporting of a Fidelity fund are reported to the Audit Committee on a periodic basis.
Non-Audit Services Approved Pursuant to Rule 2-01(c)(7)(i)(C) and (ii) of Regulation S-X (“De Minimis Exception”)
There were no non-audit services approved or required to be approved by the Audit Committee pursuant to the De Minimis Exception during the Funds’ last two fiscal years relating to services provided to (i) the Funds or (ii) any Fund Service Provider that relate directly to the operations and financial reporting of the Funds.
Item 5.
Audit Committee of Listed Registrants
Not applicable.
Item 6.
Investments
(a)
Not applicable.
(b)
Not applicable
Item 7.
Disclosure of Proxy Voting Policies and Procedures for Closed-End Management Investment Companies
Not applicable.
Item 8.
Portfolio Managers of Closed-End Management Investment Companies
Not applicable.
Item 9.
Purchase of Equity Securities by Closed-End Management Investment Company and Affiliated Purchasers
Not applicable.
Item 10.
Submission of Matters to a Vote of Security Holders
There were no material changes to the procedures by which shareholders may recommend nominees to the trust’s Board of Trustees.
Item 11.
Controls and Procedures
(a)(i) The President and Treasurer and the Chief Financial Officer have concluded that the trust’s disclosure controls and procedures (as defined in Rule 30a-3(c) under the Investment Company Act) provide reasonable assurances that material information relating to the trust is made known to them by the appropriate persons, based on their evaluation of these controls and procedures as of a date within 90 days of the filing date of this report.
(a)(ii) There was no change in the trust’s internal control over financial reporting (as defined in Rule 30a-3(d) under the Investment Company Act) that occurred during the second fiscal quarter of the period covered by this report that has materially affected, or is reasonably likely to materially affect, the trust’s internal control over financial reporting.
Item 12.
Exhibits
(a) | (1) | Code of Ethics pursuant to Item 2 of Form N-CSR is filed and attached hereto as EX-99.CODE ETH. |
(a) | (2) | Certification pursuant to Rule 30a-2(a) under the Investment Company Act of 1940 (17 CFR 270.30a-2(a)) is filed and attached hereto as Exhibit 99.CERT. |
(a) | (3) | Not applicable. |
(b) |
| Certification pursuant to Rule 30a-2(b) under the Investment Company Act of 1940 (17 CFR 270.30a-2(b)) is furnished and attached hereto as Exhibit 99.906CERT. |
SIGNATURES
Pursuant to the requirements of the Securities Exchange Act of 1934 and the Investment Company Act of 1940, the registrant has duly caused this report to be signed on its behalf by the undersigned, thereunto duly authorized.
Fidelity Concord Street Trust
By: | /s/ Stacie M. Smith |
| Stacie M. Smith |
| President and Treasurer |
|
|
Date: | January 25, 2017 |
Pursuant to the requirements of the Securities Exchange Act of 1934 and the Investment Company Act of 1940, this report has been signed below by the following persons on behalf of the registrant and in the capacities and on the dates indicated.
By: | /s/Stacie M. Smith |
| Stacie M. Smith |
| President and Treasurer |
|
|
Date: | January 25, 2017 |
By: | /s/Howard J. Galligan III |
| Howard J. Galligan III |
| Chief Financial Officer |
|
|
Date: | January 25, 2017 |