UNITED STATES
SECURITIES AND EXCHANGE COMMISSION
Washington, D.C. 20549
FORM N-CSR
CERTIFIED SHAREHOLDER REPORT OF REGISTERED
MANAGEMENT INVESTMENT COMPANIES
Investment Company Act file number 811-5251
Fidelity Concord Street Trust
(Exact name of registrant as specified in charter)
245 Summer St., Boston, Massachusetts 02210
(Address of principal executive offices) (Zip code)
Marc Bryant, Secretary
245 Summer St.
Boston, Massachusetts 02210
(Name and address of agent for service)
Registrant's telephone number, including area code:
617-563-7000
Date of fiscal year end: | April 30 |
|
|
Date of reporting period: | April 30, 2017 |
Item 1.
Reports to Stockholders
Fidelity® Small Cap Stock Fund Annual Report April 30, 2017 |
 |
Contents
Board Approval of Investment Advisory Contracts and Management Fees |
To view a fund's proxy voting guidelines and proxy voting record for the 12-month period ended June 30, visit http://www.fidelity.com/proxyvotingresults or visit the Securities and Exchange Commission's (SEC) web site at http://www.sec.gov.
You may also call 1-800-544-8544 to request a free copy of the proxy voting guidelines.
Standard & Poor's, S&P and S&P 500 are registered service marks of The McGraw-Hill Companies, Inc. and have been licensed for use by Fidelity Distributors Corporation.
Other third-party marks appearing herein are the property of their respective owners.
All other marks appearing herein are registered or unregistered trademarks or service marks of FMR LLC or an affiliated company. © 2017 FMR LLC. All rights reserved.
This report and the financial statements contained herein are submitted for the general information of the shareholders of the Fund. This report is not authorized for distribution to prospective investors in the Fund unless preceded or accompanied by an effective prospectus.
A fund files its complete schedule of portfolio holdings with the SEC for the first and third quarters of each fiscal year on Form N-Q. Forms N-Q are available on the SEC’s web site at http://www.sec.gov. A fund's Forms N-Q may be reviewed and copied at the SEC’s Public Reference Room in Washington, DC. Information regarding the operation of the SEC's Public Reference Room may be obtained by calling 1-800-SEC-0330.
For a complete list of a fund's portfolio holdings, view the most recent holdings listing, semiannual report, or annual report on Fidelity's web site at http://www.fidelity.com, http://www.institutional.fidelity.com, or http://www.401k.com, as applicable.
NOT FDIC INSURED •MAY LOSE VALUE •NO BANK GUARANTEE
Neither the Fund nor Fidelity Distributors Corporation is a bank.
Performance: The Bottom Line
Average annual total return reflects the change in the value of an investment, assuming reinvestment of distributions from dividend income and capital gains (the profits earned upon the sale of securities that have grown in value, if any) and assuming a constant rate of performance each year. The hypothetical investment and the average annual total returns do not reflect the deduction of taxes that a shareholder would pay on fund distributions or the redemption of fund shares. During periods of reimbursement by Fidelity, a fund’s total return will be greater than it would be had the reimbursement not occurred. How a fund did yesterday is no guarantee of how it will do tomorrow.
Average Annual Total Returns
| For the periods ended April 30, 2017 | Past 1 year | Past 5 years | Past 10 years |
| Fidelity® Small Cap Stock Fund | 15.44% | 10.84% | 6.10% |
$10,000 Over 10 Years
Let's say hypothetically that $10,000 was invested in Fidelity® Small Cap Stock Fund on April 30, 2007.
The chart shows how the value of your investment would have changed, and also shows how the Russell 2000® Index performed over the same period.
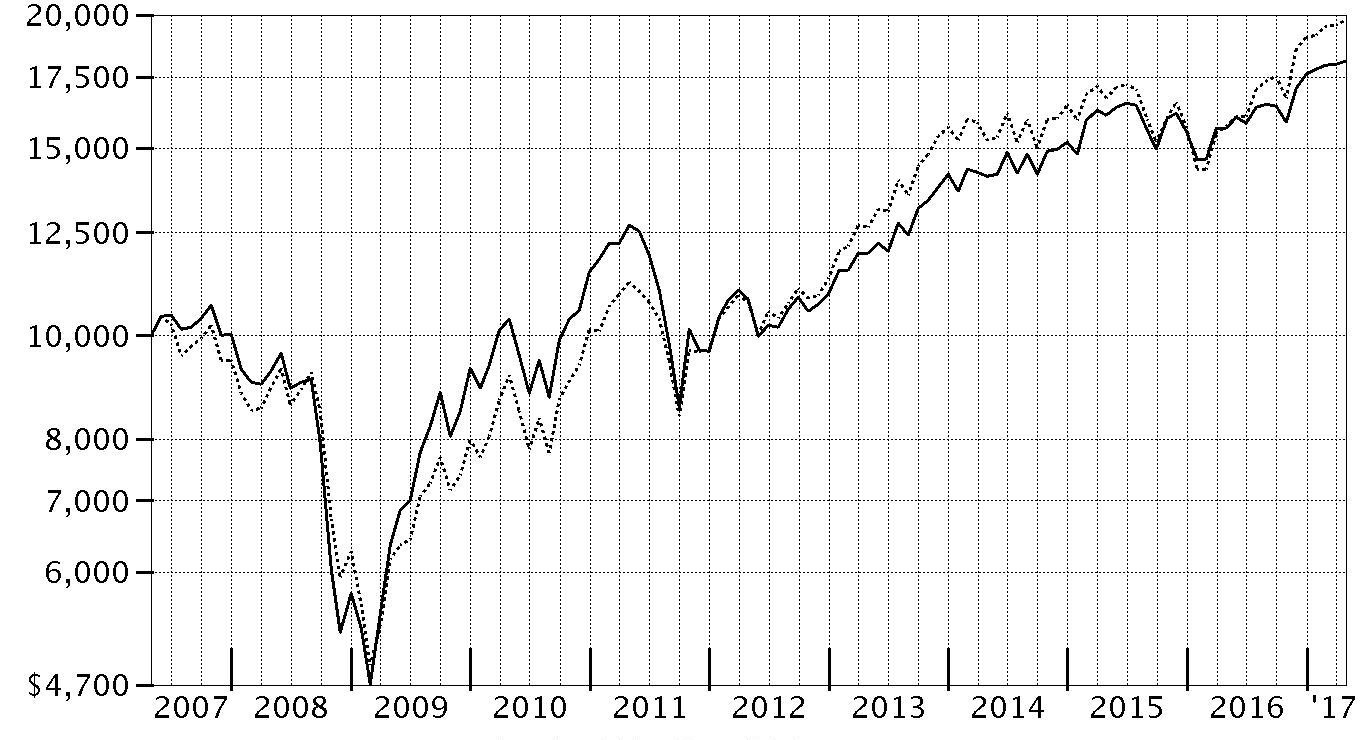
| Period Ending Values | ||
| $18,087 | Fidelity® Small Cap Stock Fund | |
| $19,758 | Russell 2000® Index | |
Management's Discussion of Fund Performance
Market Recap: The U.S. equity bellwether S&P 500® index gained 17.92% for the year ending April 30, 2017, rising sharply following the November election and continuing to gain ground through the end of February on optimism for President Trump’s pro-business agenda. Equity markets leveled off, however, as the fledgling administration faced the first test of its domestic agenda. Stocks reacted with uncertainty to efforts by Congress in March to repeal and replace the Affordable Care Act (ACA), and were relatively flat through April 30. In a stark reversal from 2016, growth-oriented stocks topped their value counterparts through the first third of 2017. Sector-wise, information technology (+35%) fared best, anchored by twin rallies in the June 2016 and March 2017 quarters as growth regained favor. Financials (+27%) also handily outperformed, riding an uptick in bond yields and a surge in banks, particularly post-election. Industrials (+19%) and materials (+16%) did well amid a call for increased infrastructure spending and a rise in commodity prices, respectively. Conversely, consumer staples (+9%), real estate (+5%) and telecommunication services (0%) were held back amid an improved backdrop for riskier assets that curbed demand for dividend-rich sectors, as well as the likelihood of one or two additional interest rate hikes later in 2017. Energy (+2%) also struggled this period.Comments from Lead Portfolio Manager Lionel Harris: For the year, the fund returned 15.44%, significantly trailing the 25.63% gain in the benchmark Russell 2000® index. Market conditions tended to favor more-speculative, weaker-quality companies, making the fund’s emphasis on higher-quality, more attractively priced stocks a poor fit for recent conditions. Stock selection in the consumer discretionary, information technology, health care and energy sectors detracted most from the fund’s relative performance. On an individual basis, the fund’s biggest detractor was hunting products and outdoor accessories maker Vista Outdoor. Weakness in Vista’s hunting and shooting accessories business weighed on results. I sold the fund’s stake in April 2017, as I thought it could be some time before this business bounces back. Other detractors were World Fuel Services, which specializes in global fuel logistics, and Genpact, one of the fund’s largest holdings at period end and an example of how some relatively stable companies were left behind in a market environment favoring lower-quality businesses. On the positive side, the fund benefited from a position in U.S. homebuilder KB Home, which I saw as well-positioned to capitalize on continuing demand for new homes. Another contributor was TriNet Group, a professional employer organization firm with a track record of generating very good free cash flow.The views expressed above reflect those of the portfolio manager(s) only through the end of the period as stated on the cover of this report and do not necessarily represent the views of Fidelity or any other person in the Fidelity organization. Any such views are subject to change at any time based upon market or other conditions and Fidelity disclaims any responsibility to update such views. These views may not be relied on as investment advice and, because investment decisions for a Fidelity fund are based on numerous factors, may not be relied on as an indication of trading intent on behalf of any Fidelity fund.
Investment Summary (Unaudited)
Top Ten Stocks as of April 30, 2017
| % of fund's net assets | % of fund's net assets 6 months ago | |
| CoreSite Realty Corp. | 2.2 | 1.9 |
| Investors Bancorp, Inc. | 2.2 | 2.2 |
| Allison Transmission Holdings, Inc. | 2.1 | 1.6 |
| Coca-Cola Bottling Co. Consolidated | 2.1 | 1.4 |
| j2 Global, Inc. | 2.1 | 1.7 |
| Genpact Ltd. | 2.0 | 2.0 |
| Community Bank System, Inc. | 1.9 | 1.9 |
| Dechra Pharmaceuticals PLC | 1.9 | 1.4 |
| LivaNova PLC | 1.9 | 1.7 |
| HD Supply Holdings, Inc. | 1.8 | 2.1 |
| 20.2 |
Top Five Market Sectors as of April 30, 2017
| % of fund's net assets | % of fund's net assets 6 months ago | |
| Financials | 21.3 | 18.8 |
| Industrials | 17.7 | 17.3 |
| Information Technology | 16.3 | 18.2 |
| Health Care | 14.3 | 14.7 |
| Consumer Discretionary | 9.1 | 11.7 |
Asset Allocation (% of fund's net assets)
| As of April 30, 2017 * | ||
| Stocks | 99.0% | |
| Short-Term Investments and Net Other Assets (Liabilities) | 1.0% | |

* Foreign investments - 21.6%
| As of October 31, 2016 * | ||
| Stocks | 98.7% | |
| Short-Term Investments and Net Other Assets (Liabilities) | 1.3% | |

* Foreign investments - 17.2%
Investments April 30, 2017
Showing Percentage of Net Assets
| Common Stocks - 99.0% | |||
| Shares | Value (000s) | ||
| CONSUMER DISCRETIONARY - 9.1% | |||
| Hotels, Restaurants & Leisure - 1.5% | |||
| Buffalo Wild Wings, Inc. (a) | 48,800 | $7,688 | |
| Cedar Fair LP (depositary unit) | 116,804 | 8,371 | |
| Del Frisco's Restaurant Group, Inc. (a) | 685,814 | 11,796 | |
| 27,855 | |||
| Household Durables - 2.1% | |||
| KB Home | 1,258,000 | 25,915 | |
| New Home Co. LLC (a) | 1,034,354 | 12,061 | |
| 37,976 | |||
| Internet & Direct Marketing Retail - 0.2% | |||
| HSN, Inc. | 90,002 | 3,321 | |
| Media - 3.2% | |||
| AMC Networks, Inc. Class A (a) | 206,491 | 12,323 | |
| Cinemark Holdings, Inc. | 445,620 | 19,251 | |
| Emerald Expositions Events, Inc. | 449,324 | 8,762 | |
| Lions Gate Entertainment Corp. Class B (a) | 685,580 | 16,351 | |
| 56,687 | |||
| Multiline Retail - 0.3% | |||
| Ollie's Bargain Outlet Holdings, Inc. (a) | 150,000 | 5,745 | |
| Specialty Retail - 1.3% | |||
| Murphy U.S.A., Inc. (a) | 270,810 | 18,840 | |
| Select Comfort Corp. (a) | 123,000 | 3,801 | |
| 22,641 | |||
| Textiles, Apparel & Luxury Goods - 0.5% | |||
| Steven Madden Ltd. (a) | 222,132 | 8,452 | |
| TOTAL CONSUMER DISCRETIONARY | 162,677 | ||
| CONSUMER STAPLES - 5.2% | |||
| Beverages - 2.1% | |||
| Coca-Cola Bottling Co. Consolidated | 176,542 | 37,402 | |
| Food & Staples Retailing - 1.9% | |||
| Performance Food Group Co. (a) | 809,556 | 20,158 | |
| United Natural Foods, Inc. (a) | 322,000 | 13,373 | |
| 33,531 | |||
| Food Products - 1.2% | |||
| TreeHouse Foods, Inc. (a) | 242,400 | 21,234 | |
| TOTAL CONSUMER STAPLES | 92,167 | ||
| ENERGY - 4.4% | |||
| Energy Equipment & Services - 0.7% | |||
| Dril-Quip, Inc. (a) | 247,964 | 12,783 | |
| Oil, Gas & Consumable Fuels - 3.7% | |||
| ARC Resources Ltd. | 605,000 | 7,942 | |
| Ardmore Shipping Corp. | 1,056,435 | 8,187 | |
| Extraction Oil & Gas, Inc. | 368,000 | 5,759 | |
| Parsley Energy, Inc. Class A (a) | 346,500 | 10,322 | |
| PDC Energy, Inc. (a) | 164,000 | 9,058 | |
| World Fuel Services Corp. | 633,900 | 23,347 | |
| 64,615 | |||
| TOTAL ENERGY | 77,398 | ||
| FINANCIALS - 21.3% | |||
| Banks - 12.2% | |||
| Camden National Corp. | 300,325 | 12,839 | |
| Community Bank System, Inc. (b) | 619,010 | 34,634 | |
| East West Bancorp, Inc. | 179,803 | 9,758 | |
| Hilltop Holdings, Inc. | 1,075,000 | 29,896 | |
| Investors Bancorp, Inc. | 2,818,000 | 39,029 | |
| Popular, Inc. | 346,555 | 14,524 | |
| Prosperity Bancshares, Inc. | 443,878 | 29,829 | |
| UMB Financial Corp. | 444,409 | 32,215 | |
| United Community Bank, Inc. | 523,200 | 14,310 | |
| 217,034 | |||
| Capital Markets - 4.8% | |||
| Greenhill & Co., Inc. | 610,000 | 15,433 | |
| Monex Group, Inc. | 4,113,100 | 10,294 | |
| MSCI, Inc. | 98,000 | 9,831 | |
| OM Asset Management Ltd. | 1,575,305 | 24,512 | |
| Vontobel Holdings AG | 433,530 | 25,533 | |
| 85,603 | |||
| Insurance - 4.3% | |||
| Allied World Assurance Co. Holdings AG | 595,000 | 31,589 | |
| Employers Holdings, Inc. | 816,600 | 32,664 | |
| Primerica, Inc. | 129,408 | 10,844 | |
| 75,097 | |||
| TOTAL FINANCIALS | 377,734 | ||
| HEALTH CARE - 14.3% | |||
| Biotechnology - 3.0% | |||
| Achillion Pharmaceuticals, Inc. (a) | 309,882 | 1,057 | |
| Adverum Biotechnologies, Inc. (a)(b) | 305,723 | 871 | |
| Applied Genetic Technologies Corp. (a) | 223,792 | 1,253 | |
| Aptevo Therapeutics, Inc. (a) | 600,000 | 1,200 | |
| Arena Pharmaceuticals, Inc. (a) | 1,200,000 | 1,608 | |
| ArQule, Inc. (a) | 500,000 | 495 | |
| Aviragen Therapeutics, Inc. (a) | 1,000,000 | 600 | |
| Dyax Corp. rights 12/31/19 (a) | 632,800 | 1,614 | |
| Emergent BioSolutions, Inc. (a) | 52,100 | 1,558 | |
| Enanta Pharmaceuticals, Inc. (a) | 10,000 | 318 | |
| Five Prime Therapeutics, Inc. (a) | 75,700 | 2,639 | |
| Immune Design Corp. (a) | 33,811 | 221 | |
| MEI Pharma, Inc. (a) | 379,349 | 603 | |
| Osiris Therapeutics, Inc. (a)(b) | 200,000 | 948 | |
| Otonomy, Inc. (a) | 392,000 | 5,233 | |
| OvaScience, Inc. (a)(b) | 431,200 | 651 | |
| PDL BioPharma, Inc. | 500,000 | 1,125 | |
| Pfenex, Inc. (a) | 254,087 | 1,222 | |
| Progenics Pharmaceuticals, Inc. (a) | 20,460 | 162 | |
| Sorrento Therapeutics, Inc. (a)(b) | 250,000 | 488 | |
| Spark Therapeutics, Inc. (a) | 87,017 | 5,044 | |
| United Therapeutics Corp. (a) | 184,930 | 23,246 | |
| Verastem, Inc. (a) | 661,288 | 1,283 | |
| Vical, Inc. (a) | 350,000 | 833 | |
| 54,272 | |||
| Health Care Equipment & Supplies - 3.1% | |||
| Hill-Rom Holdings, Inc. | 185,592 | 14,038 | |
| LivaNova PLC (a) | 641,900 | 33,828 | |
| NxStage Medical, Inc. (a) | 227,950 | 6,813 | |
| 54,679 | |||
| Health Care Providers & Services - 2.8% | |||
| Envision Healthcare Corp. (a) | 194,000 | 10,870 | |
| HealthSouth Corp. | 434,092 | 20,359 | |
| Ship Healthcare Holdings, Inc. | 712,000 | 19,142 | |
| 50,371 | |||
| Life Sciences Tools & Services - 1.5% | |||
| ICON PLC (a) | 211,401 | 17,861 | |
| PAREXEL International Corp. (a) | 140,488 | 8,967 | |
| 26,828 | |||
| Pharmaceuticals - 3.9% | |||
| Alliance Pharma PLC (b) | 16,907,226 | 10,402 | |
| Amphastar Pharmaceuticals, Inc. (a) | 299,171 | 4,517 | |
| Dechra Pharmaceuticals PLC | 1,555,902 | 34,057 | |
| Endocyte, Inc. (a)(b) | 545,020 | 1,254 | |
| Innoviva, Inc. (a) | 412,057 | 4,856 | |
| The Medicines Company (a) | 141,100 | 6,959 | |
| Theravance Biopharma, Inc. (a) | 165,000 | 6,654 | |
| 68,699 | |||
| TOTAL HEALTH CARE | 254,849 | ||
| INDUSTRIALS - 17.7% | |||
| Aerospace & Defense - 1.7% | |||
| Astronics Corp. (a) | 443,008 | 14,402 | |
| Astronics Corp. Class B | 6,263 | 203 | |
| Moog, Inc. Class A (a) | 230,610 | 15,831 | |
| 30,436 | |||
| Air Freight & Logistics - 0.7% | |||
| Hub Group, Inc. Class A (a) | 302,618 | 11,847 | |
| Building Products - 0.7% | |||
| Gibraltar Industries, Inc. (a) | 340,111 | 13,349 | |
| Construction & Engineering - 2.4% | |||
| AECOM (a) | 496,063 | 16,970 | |
| Dycom Industries, Inc. (a)(b) | 239,000 | 25,253 | |
| 42,223 | |||
| Machinery - 4.7% | |||
| Allison Transmission Holdings, Inc. | 980,000 | 37,906 | |
| Colfax Corp. (a) | 351,400 | 14,221 | |
| Douglas Dynamics, Inc. | 99,119 | 3,162 | |
| Luxfer Holdings PLC sponsored ADR | 558,726 | 6,532 | |
| Rexnord Corp. (a) | 900,734 | 21,978 | |
| 83,799 | |||
| Professional Services - 2.7% | |||
| Resources Connection, Inc. | 1,057,831 | 14,704 | |
| TriNet Group, Inc. (a) | 621,601 | 18,275 | |
| WageWorks, Inc. (a) | 199,535 | 14,726 | |
| 47,705 | |||
| Road & Rail - 1.6% | |||
| Landstar System, Inc. | 342,200 | 29,241 | |
| Trading Companies & Distributors - 3.2% | |||
| HD Supply Holdings, Inc. (a) | 810,581 | 32,666 | |
| MSC Industrial Direct Co., Inc. Class A | 138,000 | 12,355 | |
| Watsco, Inc. | 82,800 | 11,493 | |
| 56,514 | |||
| TOTAL INDUSTRIALS | 315,114 | ||
| INFORMATION TECHNOLOGY - 16.3% | |||
| Communications Equipment - 1.9% | |||
| CommScope Holding Co., Inc. (a) | 613,000 | 25,771 | |
| NETGEAR, Inc. (a) | 171,112 | 8,068 | |
| 33,839 | |||
| Electronic Equipment & Components - 0.6% | |||
| Cardtronics PLC | 257,574 | 10,710 | |
| Internet Software & Services - 4.2% | |||
| Bankrate, Inc. (a) | 2,200,674 | 23,327 | |
| j2 Global, Inc. | 406,000 | 36,637 | |
| Stamps.com, Inc. (a) | 135,400 | 14,373 | |
| 74,337 | |||
| IT Services - 6.8% | |||
| Genpact Ltd. | 1,445,850 | 35,308 | |
| Maximus, Inc. | 430,000 | 26,226 | |
| Paysafe Group PLC (a) | 4,693,513 | 27,593 | |
| Perficient, Inc. (a) | 860,615 | 14,992 | |
| Virtusa Corp. (a) | 536,100 | 16,608 | |
| 120,727 | |||
| Semiconductors & Semiconductor Equipment - 1.9% | |||
| Cree, Inc. (a) | 452,000 | 9,890 | |
| ON Semiconductor Corp. (a) | 1,747,800 | 24,784 | |
| 34,674 | |||
| Software - 0.9% | |||
| Micro Focus International PLC | 468,000 | 15,687 | |
| TOTAL INFORMATION TECHNOLOGY | 289,974 | ||
| MATERIALS - 3.2% | |||
| Construction Materials - 0.3% | |||
| Eagle Materials, Inc. | 61,000 | 5,854 | |
| Containers & Packaging - 1.5% | |||
| Silgan Holdings, Inc. | 449,980 | 27,278 | |
| Paper & Forest Products - 1.4% | |||
| Schweitzer-Mauduit International, Inc. | 570,686 | 24,568 | |
| TOTAL MATERIALS | 57,700 | ||
| REAL ESTATE - 6.1% | |||
| Equity Real Estate Investment Trusts (REITs) - 4.8% | |||
| CoreSite Realty Corp. | 403,037 | 39,437 | |
| Corrections Corp. of America | 367,130 | 12,648 | |
| CubeSmart | 881,900 | 22,347 | |
| WP Carey, Inc. | 184,513 | 11,551 | |
| 85,983 | |||
| Real Estate Management & Development - 1.3% | |||
| Leopalace21 Corp. | 4,169,900 | 22,145 | |
| TOTAL REAL ESTATE | 108,128 | ||
| UTILITIES - 1.4% | |||
| Electric Utilities - 0.6% | |||
| IDACORP, Inc. | 129,648 | 10,958 | |
| Independent Power and Renewable Electricity Producers - 0.8% | |||
| Pattern Energy Group, Inc. | 620,800 | 13,670 | |
| TOTAL UTILITIES | 24,628 | ||
| TOTAL COMMON STOCKS | |||
| (Cost $1,415,990) | 1,760,369 | ||
| Money Market Funds - 2.8% | |||
| Fidelity Cash Central Fund, 0.85% (c) | 18,582,094 | 18,586 | |
| Fidelity Securities Lending Cash Central Fund 0.86% (c)(d) | 30,717,131 | 30,720 | |
| TOTAL MONEY MARKET FUNDS | |||
| (Cost $49,305) | 49,306 | ||
| TOTAL INVESTMENT PORTFOLIO - 101.8% | |||
| (Cost $1,465,295) | 1,809,675 | ||
| NET OTHER ASSETS (LIABILITIES) - (1.8)% | (32,492) | ||
| NET ASSETS - 100% | $1,777,183 |
Legend
(a) Non-income producing
(b) Security or a portion of the security is on loan at period end.
(c) Affiliated fund that is generally available only to investment companies and other accounts managed by Fidelity Investments. The rate quoted is the annualized seven-day yield of the fund at period end. A complete unaudited listing of the fund's holdings as of its most recent quarter end is available upon request. In addition, each Fidelity Central Fund's financial statements, which are not covered by the Fund's Report of Independent Registered Public Accounting Firm, are available on the SEC's website or upon request.
(d) Investment made with cash collateral received from securities on loan.
Affiliated Central Funds
Information regarding fiscal year to date income earned by the Fund from investments in Fidelity Central Funds is as follows:
| Fund | Income earned |
| (Amounts in thousands) | |
| Fidelity Cash Central Fund | $145 |
| Fidelity Securities Lending Cash Central Fund | 232 |
| Total | $377 |
Other Affiliated Issuers
An affiliated company is a company in which the Fund has ownership of at least 5% of the voting securities. Fiscal year to date transactions with companies which are or were affiliates are as follows:
| Affiliate (Amounts in thousands) | Value, beginning of period | Purchases | Sales Proceeds | Dividend Income | Value, end of period |
| Ardmore Shipping Corp. | $14,788 | $4,433 | $7,217 | $466 | $-- |
| Total | $14,788 | $4,433 | $7,217 | $466 | $-- |
Investment Valuation
The following is a summary of the inputs used, as of April 30, 2017, involving the Fund's assets and liabilities carried at fair value. The inputs or methodology used for valuing securities may not be an indication of the risk associated with investing in those securities. For more information on valuation inputs, and their aggregation into the levels used below, please refer to the Investment Valuation section in the accompanying Notes to Financial Statements.
| Valuation Inputs at Reporting Date: | ||||
| Description | Total | Level 1 | Level 2 | Level 3 |
| (Amounts in thousands) | ||||
| Investments in Securities: | ||||
| Equities: | ||||
| Consumer Discretionary | $162,677 | $162,677 | $-- | $-- |
| Consumer Staples | 92,167 | 92,167 | -- | -- |
| Energy | 77,398 | 77,398 | -- | -- |
| Financials | 377,734 | 377,734 | -- | -- |
| Health Care | 254,849 | 253,235 | -- | 1,614 |
| Industrials | 315,114 | 315,114 | -- | -- |
| Information Technology | 289,974 | 289,974 | -- | -- |
| Materials | 57,700 | 57,700 | -- | -- |
| Real Estate | 108,128 | 108,128 | -- | -- |
| Utilities | 24,628 | 24,628 | -- | -- |
| Money Market Funds | 49,306 | 49,306 | -- | -- |
| Total Investments in Securities: | $1,809,675 | $1,808,061 | $-- | $1,614 |
The following is a summary of transfers between Level 1 and Level 2 for the period ended April 30, 2017. Transfers are assumed to have occurred at the beginning of the period, and are primarily attributable to the valuation techniques used for foreign equity securities, as discussed in the accompanying Notes to Financial Statements:
| Transfers | Total (000s) |
| (Amounts in thousands) | |
| Level 1 to Level 2 | $0 |
| Level 2 to Level 1 | $49,680 |
Other Information
Distribution of investments by country or territory of incorporation, as a percentage of Total Net Assets, is as follows (Unaudited):
| United States of America | 78.4% |
| United Kingdom | 7.7% |
| Switzerland | 3.2% |
| Japan | 3.0% |
| Bermuda | 2.0% |
| Isle of Man | 1.6% |
| Canada | 1.4% |
| Ireland | 1.0% |
| Others (Individually Less Than 1%) | 1.7% |
| 100.0% |
See accompanying notes which are an integral part of the financial statements.
Financial Statements
Statement of Assets and Liabilities
| Amounts in thousands (except per-share amount) | April 30, 2017 | |
| Assets | ||
| Investment in securities, at value (including securities loaned of $29,589) — See accompanying schedule: Unaffiliated issuers (cost $1,415,990) | $1,760,369 | |
| Fidelity Central Funds (cost $49,305) | 49,306 | |
| Total Investments (cost $1,465,295) | $1,809,675 | |
| Receivable for investments sold | 18,653 | |
| Receivable for fund shares sold | 551 | |
| Dividends receivable | 1,763 | |
| Distributions receivable from Fidelity Central Funds | 29 | |
| Prepaid expenses | 1 | |
| Other receivables | 40 | |
| Total assets | 1,830,712 | |
| Liabilities | ||
| Payable for investments purchased | $19,872 | |
| Payable for fund shares redeemed | 1,616 | |
| Accrued management fee | 960 | |
| Other affiliated payables | 311 | |
| Other payables and accrued expenses | 50 | |
| Collateral on securities loaned | 30,720 | |
| Total liabilities | 53,529 | |
| Net Assets | $1,777,183 | |
| Net Assets consist of: | ||
| Paid in capital | $1,381,915 | |
| Undistributed net investment income | 817 | |
| Accumulated undistributed net realized gain (loss) on investments and foreign currency transactions | 50,110 | |
| Net unrealized appreciation (depreciation) on investments and assets and liabilities in foreign currencies | 344,341 | |
| Net Assets, for 91,716 shares outstanding | $1,777,183 | |
| Net Asset Value, offering price and redemption price per share ($1,777,183 ÷ 91,716 shares) | $19.38 |
See accompanying notes which are an integral part of the financial statements.
Statement of Operations
| Amounts in thousands | Year ended April 30, 2017 | |
| Investment Income | ||
| Dividends (including $466 earned from other affiliated issuers) | $21,356 | |
| Income from Fidelity Central Funds | 377 | |
| Total income | 21,733 | |
| Expenses | ||
| Management fee | ||
| Basic fee | $13,074 | |
| Performance adjustment | 1,762 | |
| Transfer agent fees | 3,623 | |
| Accounting and security lending fees | 581 | |
| Custodian fees and expenses | 57 | |
| Independent trustees' fees and expenses | 8 | |
| Registration fees | 34 | |
| Audit | 61 | |
| Legal | 10 | |
| Interest | 1 | |
| Miscellaneous | 15 | |
| Total expenses before reductions | 19,226 | |
| Expense reductions | (148) | 19,078 |
| Net investment income (loss) | 2,655 | |
| Realized and Unrealized Gain (Loss) | ||
| Net realized gain (loss) on: | ||
| Investment securities: | ||
| Unaffiliated issuers | 109,514 | |
| Fidelity Central Funds | 5 | |
| Other affiliated issuers | (4,769) | |
| Foreign currency transactions | (6) | |
| Total net realized gain (loss) | 104,744 | |
| Change in net unrealized appreciation (depreciation) on: Investment securities | 158,126 | |
| Assets and liabilities in foreign currencies | (60) | |
| Total change in net unrealized appreciation (depreciation) | 158,066 | |
| Net gain (loss) | 262,810 | |
| Net increase (decrease) in net assets resulting from operations | $265,465 |
See accompanying notes which are an integral part of the financial statements.
Statement of Changes in Net Assets
| Amounts in thousands | Year ended April 30, 2017 | Year ended April 30, 2016 |
| Increase (Decrease) in Net Assets | ||
| Operations | ||
| Net investment income (loss) | $2,655 | $3,301 |
| Net realized gain (loss) | 104,744 | 117,811 |
| Change in net unrealized appreciation (depreciation) | 158,066 | (188,989) |
| Net increase (decrease) in net assets resulting from operations | 265,465 | (67,877) |
| Distributions to shareholders from net investment income | (295) | (11,174) |
| Distributions to shareholders from net realized gain | (76,245) | (189,953) |
| Total distributions | (76,540) | (201,127) |
| Share transactions | ||
| Proceeds from sales of shares | 152,963 | 511,008 |
| Reinvestment of distributions | 74,170 | 195,114 |
| Cost of shares redeemed | (594,783) | (394,729) |
| Net increase (decrease) in net assets resulting from share transactions | (367,650) | 311,393 |
| Redemption fees | 179 | 320 |
| Total increase (decrease) in net assets | (178,546) | 42,709 |
| Net Assets | ||
| Beginning of period | 1,955,729 | 1,913,020 |
| End of period | $1,777,183 | $1,955,729 |
| Other Information | ||
| Undistributed net investment income end of period | $817 | $– |
| Distributions in excess of net investment income end of period | $– | $(1,529) |
| Shares | ||
| Sold | 8,392 | 27,869 |
| Issued in reinvestment of distributions | 4,179 | 10,433 |
| Redeemed | (32,761) | (22,415) |
| Net increase (decrease) | (20,190) | 15,887 |
See accompanying notes which are an integral part of the financial statements.
Financial Highlights — Fidelity Small Cap Stock Fund
| Years ended April 30, | 2017 | 2016 | 2015 | 2014 | 2013 |
| Selected Per–Share Data | |||||
| Net asset value, beginning of period | $17.48 | $19.92 | $20.83 | $19.78 | $18.49 |
| Income from Investment Operations | |||||
| Net investment income (loss)A | .03 | .03 | .14 | .12B | .09 |
| Net realized and unrealized gain (loss) | 2.60 | (.50)C | 2.50 | 3.24 | 1.76 |
| Total from investment operations | 2.63 | (.47) | 2.64 | 3.36 | 1.85 |
| Distributions from net investment income | –D | (.11) | (.12) | (.06) | (.08) |
| Distributions from net realized gain | (.72) | (1.86) | (3.43) | (2.25) | (.48) |
| Total distributions | (.73)E | (1.97) | (3.55) | (2.31) | (.56) |
| Redemption fees added to paid in capitalA,D | – | – | – | – | – |
| Net asset value, end of period | $19.38 | $17.48 | $19.92 | $20.83 | $19.78 |
| Total ReturnF | 15.44% | (2.79)%C | 14.23% | 18.08% | 10.52% |
| Ratios to Average Net AssetsG,H | |||||
| Expenses before reductions | 1.02% | 1.00% | .66% | .68% | .72% |
| Expenses net of fee waivers, if any | 1.02% | .99% | .66% | .67% | .72% |
| Expenses net of all reductions | 1.02% | .99% | .66% | .67% | .69% |
| Net investment income (loss) | .14% | .17% | .71% | .57%B | .51% |
| Supplemental Data | |||||
| Net assets, end of period (in millions) | $1,777 | $1,956 | $1,913 | $2,050 | $2,500 |
| Portfolio turnover rateI | 48% | 59% | 64% | 50% | 75% |
A Calculated based on average shares outstanding during the period.
B Net Investment income per share reflects a large, non-recurring dividend which amounted to $.03 per share. Excluding this non-recurring dividend, the ratio of net investment income (loss) to average net assets would have been .43%.
C Net realized and unrealized gain (loss) per share reflects proceeds received from litigation which amounted to $.03 per share. Excluding these litigation proceeds, the total return would have been (2.96)%.
D Amount represents less than $.005 per share.
E Total distributions of $.73 per share is comprised of distributions from net investment income of $.003 and distributions from net realized gain of $.723 per share.
F Total returns would have been lower if certain expenses had not been reduced during the applicable periods shown.
G Fees and expenses of any underlying Fidelity Central Funds are not included in the Fund's expense ratio. The Fund indirectly bears its proportionate share of the expenses of any underlying Fidelity Central Funds.
H Expense ratios reflect operating expenses of the Fund. Expenses before reductions do not reflect amounts reimbursed by the investment adviser or reductions from brokerage service arrangements or reductions from other expense offset arrangements and do not represent the amount paid by the Fund during periods when reimbursements or reductions occur. Expenses net of fee waivers reflect expenses after reimbursement by the investment adviser but prior to reductions from brokerage service arrangements or other expense offset arrangements. Expenses net of all reductions represent the net expenses paid by the Fund.
I Amount does not include the portfolio activity of any underlying Fidelity Central Funds.
See accompanying notes which are an integral part of the financial statements.
Notes to Financial Statements
For the period ended April 30, 2017
(Amounts in thousands except percentages)
1. Organization.
Fidelity Small Cap Stock Fund (the Fund) is a fund of Fidelity Concord Street Trust (the Trust) (formerly a fund of Fidelity Commonwealth Trust) and is authorized to issue an unlimited number of shares. Share transactions on the Statement of Changes in Net Assets may contain exchanges between affiliated funds. The Trust is registered under the Investment Company Act of 1940, as amended (the 1940 Act), as an open-end management investment company organized as a Massachusetts business trust.
2. Investments in Fidelity Central Funds.
The Fund invests in Fidelity Central Funds, which are open-end investment companies generally available only to other investment companies and accounts managed by the investment adviser and its affiliates. The Fund's Schedule of Investments lists each of the Fidelity Central Funds held as of period end, if any, as an investment of the Fund, but does not include the underlying holdings of each Fidelity Central Fund. As an Investing Fund, the Fund indirectly bears its proportionate share of the expenses of the underlying Fidelity Central Funds.
The Money Market Central Funds seek preservation of capital and current income and are managed by Fidelity Investments Money Management, Inc. (FIMM), an affiliate of the investment adviser. Annualized expenses of the Money Market Central Funds as of their most recent shareholder report date are less than .005%.
A complete unaudited list of holdings for each Fidelity Central Fund is available upon request or at the Securities and Exchange Commission (the SEC) website at www.sec.gov. In addition, the financial statements of the Fidelity Central Funds, which are not covered by the Fund's Report of Independent Registered Public Accounting Firm, are available on the SEC website or upon request.
3. Significant Accounting Policies.
The Fund is an investment company and applies the accounting and reporting guidance of the Financial Accounting Standards Board (FASB) Accounting Standards Codification Topic 946 Financial Services – Investments Companies. The financial statements have been prepared in conformity with accounting principles generally accepted in the United States of America (GAAP), which require management to make certain estimates and assumptions at the date of the financial statements. Actual results could differ from those estimates. Subsequent events, if any, through the date that the financial statements were issued have been evaluated in the preparation of the financial statements. The following summarizes the significant accounting policies of the Fund:
Investment Valuation. Investments are valued as of 4:00 p.m. Eastern time on the last calendar day of the period. The Board of Trustees (the Board) has delegated the day to day responsibility for the valuation of the Fund's investments to the Fair Value Committee (the Committee) established by the Fund's investment adviser. In accordance with valuation policies and procedures approved by the Board, the Fund attempts to obtain prices from one or more third party pricing vendors or brokers to value its investments. When current market prices, quotations or currency exchange rates are not readily available or reliable, investments will be fair valued in good faith by the Committee, in accordance with procedures adopted by the Board. Factors used in determining fair value vary by investment type and may include market or investment specific events. The frequency with which these procedures are used cannot be predicted and they may be utilized to a significant extent. The Committee oversees the Fund's valuation policies and procedures and reports to the Board on the Committee's activities and fair value determinations. The Board monitors the appropriateness of the procedures used in valuing the Fund's investments and ratifies the fair value determinations of the Committee.
The Fund categorizes the inputs to valuation techniques used to value its investments into a disclosure hierarchy consisting of three levels as shown below:
- Level 1 – quoted prices in active markets for identical investments
- Level 2 – other significant observable inputs (including quoted prices for similar investments, interest rates, prepayment speeds, etc.)
- Level 3 – unobservable inputs (including the Fund's own assumptions based on the best information available)
Valuation techniques used to value the Fund's investments by major category are as follows:
Equity securities, including restricted securities, for which market quotations are readily available, are valued at the last reported sale price or official closing price as reported by a third party pricing vendor on the primary market or exchange on which they are traded and are categorized as Level 1 in the hierarchy. In the event there were no sales during the day or closing prices are not available, securities are valued at the last quoted bid price or may be valued using the last available price and are generally categorized as Level 2 in the hierarchy. For foreign equity securities, when market or security specific events arise, comparisons to the valuation of American Depositary Receipts (ADRs), futures contracts, Exchange-Traded Funds (ETFs) and certain indexes as well as quoted prices for similar securities may be used and would be categorized as Level 2 in the hierarchy. Utilizing these techniques may result in transfers between Level 1 and Level 2. For equity securities, including restricted securities, where observable inputs are limited, assumptions about market activity and risk are used and these securities may be categorized as Level 3 in the hierarchy.
Investments in open-end mutual funds, including the Fidelity Central Funds, are valued at their closing net asset value (NAV) each business day and are categorized as Level 1 in the hierarchy.
Changes in valuation techniques may result in transfers in or out of an assigned level within the disclosure hierarchy. The aggregate value of investments by input level as of April 30, 2017, including information on transfers between Levels 1 and 2, is included at the end of the Fund's Schedule of Investments.
Foreign Currency. The Fund may use foreign currency contracts to facilitate transactions in foreign-denominated securities. Gains and losses from these transactions may arise from changes in the value of the foreign currency or if the counterparties do not perform under the contracts' terms.
Foreign-denominated assets, including investment securities, and liabilities are translated into U.S. dollars at the exchange rates at period end. Purchases and sales of investment securities, income and dividends received and expenses denominated in foreign currencies are translated into U.S. dollars at the exchange rate in effect on the transaction date.
The effects of exchange rate fluctuations on investments are included with the net realized and unrealized gain (loss) on investment securities. Other foreign currency transactions resulting in realized and unrealized gain (loss) are disclosed separately.
Investment Transactions and Income. For financial reporting purposes, the Fund's investment holdings and NAV include trades executed through the end of the last business day of the period. The NAV per share for processing shareholder transactions is calculated as of the close of business of the New York Stock Exchange (NYSE), normally 4:00 p.m. Eastern time and includes trades executed through the end of the prior business day. Gains and losses on securities sold are determined on the basis of identified cost and may include proceeds received from litigation. Dividend income is recorded on the ex-dividend date, except for certain dividends from foreign securities where the ex-dividend date may have passed, which are recorded as soon as the Fund is informed of the ex-dividend date. Non-cash dividends included in dividend income, if any, are recorded at the fair market value of the securities received. Income and capital gain distributions from Fidelity Central Funds, if any, are recorded on the ex-dividend date. Certain distributions received by the Fund represent a return of capital or capital gain. The Fund determines the components of these distributions subsequent to the ex-dividend date, based upon receipt of tax filings or other correspondence relating to the underlying investment. These distributions are recorded as a reduction of cost of investments and/or as a realized gain. Investment income is recorded net of foreign taxes withheld where recovery of such taxes is uncertain.
Expenses. Expenses directly attributable to a fund are charged to that fund. Expenses attributable to more than one fund are allocated among the respective funds on the basis of relative net assets or other appropriate methods. Expense estimates are accrued in the period to which they relate and adjustments are made when actual amounts are known.
Income Tax Information and Distributions to Shareholders. Each year, the Fund intends to qualify as a regulated investment company under Subchapter M of the Internal Revenue Code, including distributing substantially all of its taxable income and realized gains. As a result, no provision for U.S. Federal income taxes is required. As of April 30, 2017, the Fund did not have any unrecognized tax benefits in the financial statements; nor is the Fund aware of any tax positions for which it is reasonably possible that the total amounts of unrecognized tax benefits will significantly change in the next twelve months. The Fund files a U.S. federal tax return, in addition to state and local tax returns as required. The Fund's federal income tax returns are subject to examination by the Internal Revenue Service (IRS) for a period of three fiscal years after they are filed. State and local tax returns may be subject to examination for an additional fiscal year depending on the jurisdiction. Foreign taxes are provided for based on the Fund's understanding of the tax rules and rates that exist in the foreign markets in which it invests.
Distributions are declared and recorded on the ex-dividend date. Income and capital gain distributions are determined in accordance with income tax regulations, which may differ from GAAP. In addition, the Fund claimed a portion of the payment made to redeeming shareholders as a distribution for income tax purposes.
Capital accounts within the financial statements are adjusted for permanent book-tax differences. These adjustments have no impact on net assets or the results of operations. Capital accounts are not adjusted for temporary book-tax differences which will reverse in a subsequent period.
Book-tax differences are primarily due to foreign currency transactions and losses deferred due to wash sales and excise tax regulations.
The federal tax cost of investment securities and unrealized appreciation (depreciation) as of period end were as follows:
| Gross unrealized appreciation | $407,782 |
| Gross unrealized depreciation | (66,345) |
| Net unrealized appreciation (depreciation) on securities | $341,437 |
| Tax Cost | $1,468,238 |
The tax-based components of distributable earnings as of period end were as follows:
| Undistributed ordinary income | $818 |
| Undistributed long-term capital gain | $53,053 |
| Net unrealized appreciation (depreciation) on securities and other investments | $341,397 |
The tax character of distributions paid was as follows:
| April 30, 2017 | April 30, 2016 | |
| Ordinary Income | $295 | $ 17,512 |
| Long-term Capital Gains | 76,245 | 183,615 |
| Total | $76,540 | $ 201,127 |
Short-Term Trading (Redemption) Fees. Shares held by investors in the Fund less than 90 days may have been subject to a redemption fee equal to 2.00% of the NAV of shares redeemed. All redemption fees, which reduce the proceeds of the shareholder redemption, are retained by the Fund and accounted for as an addition to paid in capital.
4. Purchases and Sales of Investments.
Purchases and sales of securities, other than short-term securities, aggregated $890,052 and $1,293,209, respectively.
5. Fees and Other Transactions with Affiliates.
Management Fee. Fidelity Management & Research Company (the investment adviser) and its affiliates provide the Fund with investment management related services for which the Fund pays a monthly management fee. The management fee is the sum of an individual fund fee rate that is based on an annual rate of .45% of the Fund's average net assets and an annualized group fee rate that averaged .25% during the period. The group fee rate is based upon the average net assets of all the mutual funds advised by the investment adviser, including any mutual funds previously advised by the investment adviser that are currently advised by Fidelity SelectCo, LLC, an affiliate of the investment adviser. The group fee rate decreases as assets under management increase and increases as assets under management decrease. In addition, the management fee is subject to a performance adjustment (up to a maximum of +/- .20% of the Fund's average net assets over a 36 month performance period). The upward or downward adjustment to the management fee is based on the Fund's relative investment performance as compared to its benchmark index, the Russell 2000 Index, over the same 36 month performance period. For the reporting period, the total annual management fee rate, including the performance adjustment, was .79% of the Fund's average net assets. The performance adjustment included in the management fee rate may be higher or lower than the maximum performance adjustment rate due to the difference between the average net assets for the reporting and performance periods.
Transfer Agent Fees. Fidelity Investments Institutional Operations Company, Inc. (FIIOC), an affiliate of the investment adviser, is the Fund's transfer, dividend disbursing and shareholder servicing agent. FIIOC receives account fees and asset-based fees that vary according to account size and type of account. FIIOC pays for typesetting, printing and mailing of shareholder reports, except proxy statements. For the period, the transfer agent fees were equivalent to an annual rate of .19% of average net assets.
Accounting and Security Lending Fees. Fidelity Service Company, Inc. (FSC), an affiliate of the investment adviser, maintains the Fund's accounting records. The accounting fee is based on the level of average net assets for each month. Under a separate contract, FSC administers the security lending program. The security lending fee is based on the number and duration of lending transactions.
Brokerage Commissions. The Fund placed a portion of its portfolio transactions with brokerage firms which are affiliates of the investment adviser. Brokerage commissions are included in net realized gain (loss) and change in net unrealized appreciation (depreciation) in the Statement of Operations. The commissions paid to these affiliated firms were $66 for the period.
Interfund Lending Program. Pursuant to an Exemptive Order issued by the SEC, the Fund, along with other registered investment companies having management contracts with Fidelity Management & Research Company (FMR) or other affiliated entities of FMR, may participate in an interfund lending program. This program provides an alternative credit facility allowing the funds to borrow from, or lend money to, other participating affiliated funds. At period end, there were no interfund loans outstanding. The Fund's activity in this program during the period for which loans were outstanding was as follows:
| Borrower or Lender | Average Loan Balance | Weighted Average Interest Rate | Interest Expense |
| Borrower | $8,241 | .60% | $1 |
Interfund Trades. The Fund may purchase from or sell securities to other Fidelity Funds under procedures adopted by the Board. The procedures have been designed to ensure these interfund trades are executed in accordance with Rule 17a-7 of the 1940 Act. Interfund trades are included within the respective purchases and sales amounts shown in the Purchases and Sales of Investments note.
6. Committed Line of Credit.
The Fund participates with other funds managed by the investment adviser or an affiliate in a $4.25 billion credit facility (the "line of credit") to be utilized for temporary or emergency purposes to fund shareholder redemptions or for other short-term liquidity purposes. The Fund has agreed to pay commitment fees on its pro-rata portion of the line of credit, which amounted to $6 and is reflected in Miscellaneous expenses on the Statement of Operations. During the period, the Fund did not borrow on this line of credit.
7. Security Lending.
The Fund lends portfolio securities through a lending agent from time to time in order to earn additional income. For equity securities, a lending agent is used and may loan securities to certain qualified borrowers, including Fidelity Capital Markets (FCM), a broker-dealer affiliated with the Fund. On the settlement date of the loan, the Fund receives collateral (in the form of U.S. Treasury obligations, letters of credit and/or cash) against the loaned securities and maintains collateral in an amount not less than 100% of the market value of the loaned securities during the period of the loan. The market value of the loaned securities is determined at the close of business of the Fund and any additional required collateral is delivered to the Fund on the next business day. The Fund or borrower may terminate the loan at any time, and if the borrower defaults on its obligation to return the securities loaned because of insolvency or other reasons, the Fund may apply collateral received from the borrower against the obligation. The Fund may experience delays and costs in recovering the securities loaned. Any cash collateral received is invested in the Fidelity Securities Lending Cash Central Fund. The value of loaned securities and cash collateral at period end are disclosed on the Fund's Statement of Assets and Liabilities. The value of securities loaned to FCM at period end was $409. Security lending income represents the income earned on investing cash collateral, less rebates paid to borrowers and any lending agent fees associated with the loan, plus any premium payments received for lending certain types of securities. Security lending income is presented in the Statement of Operations as a component of income from Fidelity Central Funds. Total security lending income during the period amounted to $232, including $10 from securities loaned to FCM.
8. Expense Reductions.
Commissions paid to certain brokers with whom the investment adviser, or its affiliates, places trades on behalf of the Fund include an amount in addition to trade execution, which may be rebated back to the Fund to offset certain expenses. This amount totaled $132 for the period. In addition, through arrangements with the Fund's custodian, credits realized as a result of certain uninvested cash balances were used to reduce the Fund's expenses. During the period, these credits reduced the Fund's custody expenses by $1.
In addition, during the period the investment adviser reimbursed and/or waived a portion of operating expenses in the amount of $15.
9. Other.
The Fund's organizational documents provide former and current trustees and officers with a limited indemnification against liabilities arising in connection with the performance of their duties to the Fund. In the normal course of business, the Fund may also enter into contracts that provide general indemnifications. The Fund's maximum exposure under these arrangements is unknown as this would be dependent on future claims that may be made against the Fund. The risk of material loss from such claims is considered remote.
Report of Independent Registered Public Accounting Firm
To the Trustees of Fidelity Concord Street Trust and Shareholders of Fidelity Small Cap Stock Fund:
We have audited the accompanying statement of assets and liabilities of Fidelity Small Cap Stock Fund (the Fund), a fund of Fidelity Concord Street Trust, including the schedule of investments, as of April 30, 2017, and the related statement of operations for the year then ended, the statement of changes in net assets for each of the two years in the period then ended, and the financial highlights for each of the five years in the period then ended. These financial statements and financial highlights are the responsibility of the Fund's management. Our responsibility is to express an opinion on these financial statements and financial highlights based on our audits.
We conducted our audits in accordance with the standards of the Public Company Accounting Oversight Board (United States). Those standards require that we plan and perform the audit to obtain reasonable assurance about whether the financial statements and financial highlights are free of material misstatement. The Fund is not required to have, nor were we engaged to perform, an audit of its internal control over financial reporting. Our audits included consideration of internal control over financial reporting as a basis for designing audit procedures that are appropriate in the circumstances, but not for the purpose of expressing an opinion on the effectiveness of the Fund's internal control over financial reporting. Accordingly, we express no such opinion. An audit also includes examining, on a test basis, evidence supporting the amounts and disclosures in the financial statements, assessing the accounting principles used and significant estimates made by management, as well as evaluating the overall financial statement presentation. Our procedures included confirmation of securities owned as of April 30, 2017, by correspondence with the custodians and brokers; when replies were not received from brokers, we performed other auditing procedures. We believe that our audits provide a reasonable basis for our opinion.
In our opinion, such financial statements and financial highlights referred to above present fairly, in all material respects, the financial position of Fidelity Small Cap Stock Fund as of April 30, 2017, the results of its operations for the year then ended, the changes in its net assets for each of the two years in the period then ended, and the financial highlights for each of the five years in the period then ended in conformity with accounting principles generally accepted in the United States of America.
DELOITTE & TOUCHE LLP
Boston, Massachusetts
June 14, 2017
Trustees and Officers
The Trustees, Members of the Advisory Board (if any), and officers of the trust and fund, as applicable, are listed below. The Board of Trustees governs the fund and is responsible for protecting the interests of shareholders. The Trustees are experienced executives who meet periodically throughout the year to oversee the fund's activities, review contractual arrangements with companies that provide services to the fund, oversee management of the risks associated with such activities and contractual arrangements, and review the fund's performance. Except for Jonathan Chiel, each of the Trustees oversees 189 funds. Mr. Chiel oversees 142 funds.
The Trustees hold office without limit in time except that (a) any Trustee may resign; (b) any Trustee may be removed by written instrument, signed by at least two-thirds of the number of Trustees prior to such removal; (c) any Trustee who requests to be retired or who has become incapacitated by illness or injury may be retired by written instrument signed by a majority of the other Trustees; and (d) any Trustee may be removed at any special meeting of shareholders by a two-thirds vote of the outstanding voting securities of the trust. Each Trustee who is not an interested person (as defined in the 1940 Act) of the trust and the fund is referred to herein as an Independent Trustee. Each Independent Trustee shall retire not later than the last day of the calendar year in which his or her 75th birthday occurs. The Independent Trustees may waive this mandatory retirement age policy with respect to individual Trustees. Officers and Advisory Board Members hold office without limit in time, except that any officer or Advisory Board Member may resign or may be removed by a vote of a majority of the Trustees at any regular meeting or any special meeting of the Trustees. Except as indicated, each individual has held the office shown or other offices in the same company for the past five years.
The fund’s Statement of Additional Information (SAI) includes more information about the Trustees. To request a free copy, call Fidelity at 1-800-544-8544.
Experience, Skills, Attributes, and Qualifications of the Trustees. The Governance and Nominating Committee has adopted a statement of policy that describes the experience, qualifications, attributes, and skills that are necessary and desirable for potential Independent Trustee candidates (Statement of Policy). The Board believes that each Trustee satisfied at the time he or she was initially elected or appointed a Trustee, and continues to satisfy, the standards contemplated by the Statement of Policy. The Governance and Nominating Committee also engages professional search firms to help identify potential Independent Trustee candidates who have the experience, qualifications, attributes, and skills consistent with the Statement of Policy. From time to time, additional criteria based on the composition and skills of the current Independent Trustees, as well as experience or skills that may be appropriate in light of future changes to board composition, business conditions, and regulatory or other developments, have also been considered by the professional search firms and the Governance and Nominating Committee. In addition, the Board takes into account the Trustees' commitment and participation in Board and committee meetings, as well as their leadership of standing and ad hoc committees throughout their tenure.
In determining that a particular Trustee was and continues to be qualified to serve as a Trustee, the Board has considered a variety of criteria, none of which, in isolation, was controlling. The Board believes that, collectively, the Trustees have balanced and diverse experience, qualifications, attributes, and skills, which allow the Board to operate effectively in governing the fund and protecting the interests of shareholders. Information about the specific experience, skills, attributes, and qualifications of each Trustee, which in each case led to the Board's conclusion that the Trustee should serve (or continue to serve) as a trustee of the fund, is provided below.
Board Structure and Oversight Function. James C. Curvey is an interested person and currently serves as Chairman. The Trustees have determined that an interested Chairman is appropriate and benefits shareholders because an interested Chairman has a personal and professional stake in the quality and continuity of services provided to the fund. Independent Trustees exercise their informed business judgment to appoint an individual of their choosing to serve as Chairman, regardless of whether the Trustee happens to be independent or a member of management. The Independent Trustees have determined that they can act independently and effectively without having an Independent Trustee serve as Chairman and that a key structural component for assuring that they are in a position to do so is for the Independent Trustees to constitute a substantial majority for the Board. The Independent Trustees also regularly meet in executive session. Ned C. Lautenbach serves as Chairman of the Independent Trustees and as such (i) acts as a liaison between the Independent Trustees and management with respect to matters important to the Independent Trustees and (ii) with management prepares agendas for Board meetings.
Fidelity® funds are overseen by different Boards of Trustees. The fund's Board oversees Fidelity's high income and certain equity funds, and other Boards oversee Fidelity's investment-grade bond, money market, asset allocation, and sector funds. The asset allocation funds may invest in Fidelity® funds overseen by the fund's Board. The use of separate Boards, each with its own committee structure, allows the Trustees of each group of Fidelity® funds to focus on the unique issues of the funds they oversee, including common research, investment, and operational issues. On occasion, the separate Boards establish joint committees to address issues of overlapping consequences for the Fidelity® funds overseen by each Board.
The Trustees operate using a system of committees to facilitate the timely and efficient consideration of all matters of importance to the Trustees, the fund, and fund shareholders and to facilitate compliance with legal and regulatory requirements and oversight of the fund's activities and associated risks. The Board, acting through its committees, has charged FMR and its affiliates with (i) identifying events or circumstances the occurrence of which could have demonstrably adverse effects on the fund's business and/or reputation; (ii) implementing processes and controls to lessen the possibility that such events or circumstances occur or to mitigate the effects of such events or circumstances if they do occur; and (iii) creating and maintaining a system designed to evaluate continuously business and market conditions in order to facilitate the identification and implementation processes described in (i) and (ii) above. Because the day-to-day operations and activities of the fund are carried out by or through FMR, its affiliates, and other service providers, the fund's exposure to risks is mitigated but not eliminated by the processes overseen by the Trustees. While each of the Board's committees has responsibility for overseeing different aspects of the fund's activities, oversight is exercised primarily through the Operations, Audit, and Compliance Committees. In addition, the Independent Trustees have worked with FMR to enhance the Board's oversight of investment and financial risks, legal and regulatory risks, technology risks, and operational risks, including the development of additional risk reporting to the Board. For example, a working group comprised of Independent Trustees and FMR has worked and continues to work to review the Fidelity® funds' valuation-related activities, reporting and risk management. Appropriate personnel, including but not limited to the fund's Chief Compliance Officer (CCO), FMR's internal auditor, the independent accountants, the fund's Treasurer and portfolio management personnel, make periodic reports to the Board's committees, as appropriate, including an annual review of Fidelity's risk management program for the Fidelity® funds. The responsibilities of each standing committee, including their oversight responsibilities, are described further under "Standing Committees of the Trustees."
Interested Trustees*:
Correspondence intended for a Trustee who is an interested person may be sent to Fidelity Investments, 245 Summer Street, Boston, Massachusetts 02210.
Name, Year of Birth; Principal Occupations and Other Relevant Experience+
Jonathan Chiel (1957)
Year of Election or Appointment: 2016
Trustee
Mr. Chiel also serves as Trustee of other Fidelity funds. Mr. Chiel is Executive Vice President and General Counsel for FMR LLC (diversified financial services company, 2012-present). Previously, Mr. Chiel served as general counsel (2004-2012) and senior vice president and deputy general counsel (2000-2004) for John Hancock Financial Services; a partner with Choate, Hall & Stewart (1996-2000) (law firm); and an Assistant United States Attorney for the United States Attorney’s Office of the District of Massachusetts (1986-95), including Chief of the Criminal Division (1993-1995). Mr. Chiel is a director on the boards of the Boston Bar Foundation and the Maimonides School.
James C. Curvey (1935)
Year of Election or Appointment: 2007
Trustee
Chairman of the Board of Trustees
Mr. Curvey also serves as Trustee of other Fidelity® funds. Mr. Curvey is a Director of Fidelity Research & Analysis Co. (investment adviser firm, 2009-present), and Vice Chairman (2007-present) and Director of FMR LLC (diversified financial services company). In addition, Mr. Curvey serves as an Overseer for the Boston Symphony Orchestra and a member of the board of Artis-Naples, Naples, Florida, and as a Trustee for Brewster Academy, Wolfeboro, New Hampshire. Previously, Mr. Curvey served as a Director of Fidelity Investments Money Management, Inc. (investment adviser firm, 2009-2014) and a Director of FMR and FMR Co., Inc. (investment adviser firms, 2007-2014).
Charles S. Morrison (1960)
Year of Election or Appointment: 2014
Trustee
Mr. Morrison also serves as Trustee of other funds. He serves as President of Fidelity Management & Research Company (FMR) (investment adviser firm, 2016-present), a Director of Fidelity Investments Money Management, Inc. (FIMM) (investment adviser firm, 2014-present), Director of Fidelity SelectCo, LLC (investment adviser firm, 2014-present), President, Asset Management (2014-present), and is an employee of Fidelity Investments. Previously, Mr. Morrison served as Vice President of Fidelity's Fixed Income and Asset Allocation Funds (2012-2014), President, Fixed Income (2011-2014), Vice President of Fidelity's Money Market Funds (2005-2009), President, Money Market Group Leader of FMR (investment adviser firm, 2009), and Senior Vice President, Money Market Group of FMR (2004-2009). Mr. Morrison also served as Vice President of Fidelity's Bond Funds (2002-2005), certain Balanced Funds (2002-2005), and certain Asset Allocation Funds (2002-2007), and as Senior Vice President (2002-2005) of Fidelity's Bond Division.
* Determined to be an “Interested Trustee” by virtue of, among other things, his or her affiliation with the trust or various entities under common control with FMR.
+ The information includes the Trustee's principal occupation during the last five years and other information relating to the experience, attributes, and skills relevant to the Trustee's qualifications to serve as a Trustee, which led to the conclusion that the Trustee should serve as a Trustee for the fund.
Independent Trustees:
Correspondence intended for an Independent Trustee may be sent to Fidelity Investments, P.O. Box 55235, Boston, Massachusetts 02205-5235.
Name, Year of Birth; Principal Occupations and Other Relevant Experience+
Dennis J. Dirks (1948)
Year of Election or Appointment: 2005
Trustee
Mr. Dirks also serves as Trustee of other Fidelity® funds. Prior to his retirement in May 2003, Mr. Dirks was Chief Operating Officer and a member of the Board of The Depository Trust & Clearing Corporation (DTCC). He also served as President, Chief Operating Officer, and Board member of The Depository Trust Company (DTC) and President and Board member of the National Securities Clearing Corporation (NSCC). In addition, Mr. Dirks served as Chief Executive Officer and Board member of the Government Securities Clearing Corporation, Chief Executive Officer and Board member of the Mortgage-Backed Securities Clearing Corporation, as a Trustee and a member of the Finance Committee of Manhattan College (2005-2008), as a Trustee and a member of the Finance Committee of AHRC of Nassau County (2006-2008), as a member of the Independent Directors Council (IDC) Governing Council (2010-2015), and as a member of the Board of Directors for The Brookville Center for Children’s Services, Inc. (2009-2017). Mr. Dirks is a member of the Finance Committee (2016-present) and Board of Directors (2017-present) of the Asolo Repertory Theatre.
Alan J. Lacy (1953)
Year of Election or Appointment: 2008
Trustee
Mr. Lacy also serves as Trustee of other Fidelity® funds. Mr. Lacy serves as a Director of Bristol-Myers Squibb Company (global pharmaceuticals, 2008-present). He is a Trustee of the California Chapter of The Nature Conservancy (2015-present) and a Director of the Center for Advanced Study in the Behavioral Sciences at Stanford University (2015-present). In addition, Mr. Lacy served as Senior Adviser (2007-2014) of Oak Hill Capital Partners, L.P. (private equity) and also served as Chief Executive Officer (2005) and Vice Chairman (2005-2006) of Sears Holdings Corporation (retail) and Chief Executive Officer and Chairman of the Board of Sears, Roebuck and Co. (retail, 2000-2005). Previously, Mr. Lacy served as Chairman (2014-2017) and a member (2010-2017) of the Board of Directors of Dave & Buster’s Entertainment, Inc. (restaurant and entertainment complexes), as Chairman (2008-2011) and a member (2006-2015) of the Board of Trustees of the National Parks Conservation Association, and as a member of the Board of Directors for The Hillman Companies, Inc. (hardware wholesalers, 2010-2014), Earth Fare, Inc. (retail grocery, 2010-2014), and The Western Union Company (global money transfer, 2006-2011).
Ned C. Lautenbach (1944)
Year of Election or Appointment: 2000
Trustee
Chairman of the Independent Trustees
Mr. Lautenbach also serves as Trustee of other Fidelity® funds. Mr. Lautenbach currently serves as the Lead Director of the Eaton Corporation Board of Directors (diversified industrial, 1997-present). Mr. Lautenbach is Chairman of the Board of Directors of Artis-Naples in Naples, Florida (2012-present), a member of the Council on Foreign Relations (1994-present), and currently Vice Chair of the Board of Governors, State University System of Florida (2013-present). Previously, Mr. Lautenbach was a Partner and Advisory Partner at Clayton, Dubilier & Rice, LLC (private equity investment, 1998-2010), as well as a Director of Sony Corporation (2006-2007). Mr. Lautenbach also had a 30-year career with IBM (technology company) during which time he served as Senior Vice President and a member of the Corporate Executive Committee (1968-1998).
Joseph Mauriello (1944)
Year of Election or Appointment: 2008
Trustee
Mr. Mauriello also serves as Trustee of other Fidelity® funds. Prior to his retirement in January 2006, Mr. Mauriello served in numerous senior management positions including Deputy Chairman and Chief Operating Officer (2004-2005), and Vice Chairman of Financial Services (2002-2004) of KPMG LLP US (professional services, 1965-2005). Mr. Mauriello currently serves as a member of the Board of Directors of XL Group plc. (global insurance and re-insurance, 2006-present) and the Independent Directors Council (IDC) Governing Council (2015-present). Previously, Mr. Mauriello served as a Director of the Hamilton Funds of the Bank of New York (2006-2007) and of Arcadia Resources Inc. (health care services and products, 2007-2012).
Robert W. Selander (1950)
Year of Election or Appointment: 2011
Trustee
Mr. Selander also serves as Trustee of other Fidelity® funds. Mr. Selander serves as a Director of The Western Union Company (global money transfer, 2014-present) and a non-executive Chairman of Health Equity, Inc. (health savings custodian, 2015-present). Previously, Mr. Selander served as a Member of the Advisory Board of certain Fidelity® funds (2011), and Executive Vice Chairman (2010), Chief Executive Officer (2009-2010), and President and Chief Executive Officer (1997-2009) of Mastercard, Inc.
Cornelia M. Small (1944)
Year of Election or Appointment: 2005
Trustee
Ms. Small also serves as Trustee of other Fidelity® funds. Ms. Small is a member of the Board of Directors (2009-present) and Chair of the Investment Committee (2010-present) of the Teagle Foundation. Ms. Small also serves on the Investment Committee of the Berkshire Taconic Community Foundation (2008-present). Previously, Ms. Small served as Chairperson (2002-2008) and a member of the Investment Committee and Chairperson (2008-2012) and a member of the Board of Trustees of Smith College. In addition, Ms. Small served as Chief Investment Officer, Director of Global Equity Investments, and a member of the Board of Directors of Scudder, Stevens & Clark and Scudder Kemper Investments.
William S. Stavropoulos (1939)
Year of Election or Appointment: 2001
Trustee
Vice Chairman of the Independent Trustees
Mr. Stavropoulos also serves as Trustee of other Fidelity® funds. Mr. Stavropoulos serves as President and Founder of the Michigan Baseball Foundation, the Great Lakes Loons (2007-present). Mr. Stavropoulos is Chairman Emeritus of the Board of Directors of The Dow Chemical Company, where he previously served in numerous senior management positions, including President, CEO (1995-2000; 2002-2004), Chairman of the Executive Committee (2000-2006), and as a member of the Board of Directors (1990-2006). Currently, Mr. Stavropoulos is Chairman of the Board of Directors of Univar Inc. (global distributor of commodity and specialty chemicals), a Director of Teradata Corporation (data warehousing and technology solutions), and a member of the Advisory Board for Metalmark Capital LLC (private equity investment, 2005-present). Mr. Stavropoulos is an operating advisor to Clayton, Dubilier & Rice, LLC (private equity investment). In addition, Mr. Stavropoulos is a member of the University of Notre Dame Advisory Council for the College of Science, a Trustee of the Rollin L. Gerstacker Foundation, and a Director of Artis-Naples in Naples, Florida. Previously, Mr. Stavropoulos served as a Director of Chemical Financial Corporation (bank holding company, 1993-2012) and Tyco International, Ltd. (multinational manufacturing and services, 2007-2012).
David M. Thomas (1949)
Year of Election or Appointment: 2008
Trustee
Mr. Thomas also serves as Trustee of other Fidelity® funds. Mr. Thomas serves as Non-Executive Chairman of the Board of Directors of Fortune Brands Home and Security (home and security products, 2011-present), as a member of the Board of Directors (2004-present) and Presiding Director (2013-present) of Interpublic Group of Companies, Inc. (marketing communication), and as a member of the Board of Trustees of the University of Florida (2013-present). Previously, Mr. Thomas served as Executive Chairman (2005-2006) and Chairman and Chief Executive Officer (2000-2005) of IMS Health, Inc. (pharmaceutical and healthcare information solutions), and a Director of Fortune Brands, Inc. (consumer products, 2000-2011).
+ The information includes the Trustee's principal occupation during the last five years and other information relating to the experience, attributes, and skills relevant to the Trustee's qualifications to serve as a Trustee, which led to the conclusion that the Trustee should serve as a Trustee for the fund.
Advisory Board Members and Officers:
Correspondence intended for an officer or Peter S. Lynch may be sent to Fidelity Investments, 245 Summer Street, Boston, Massachusetts 02210. Officers appear below in alphabetical order.
Name, Year of Birth; Principal Occupation
Peter S. Lynch (1944)
Year of Election or Appointment: 2003
Member of the Advisory Board
Mr. Lynch also serves as Member of the Advisory Board of other Fidelity® funds. Mr. Lynch is Vice Chairman and a Director of FMR (investment adviser firm) and FMR Co., Inc. (investment adviser firm). In addition, Mr. Lynch serves as a Trustee of Boston College and as the Chairman of the Inner-City Scholarship Fund. Previously, Mr. Lynch served on the Special Olympics International Board of Directors (1997-2006).
Elizabeth Paige Baumann (1968)
Year of Election or Appointment: 2017
Anti-Money Laundering (AML) Officer
Ms. Baumann also serves as AML Officer of other funds. She is Chief AML Officer (2012-present) and Senior Vice President (2014-present) of FMR LLC (diversified financial services company) and is an employee of Fidelity Investments. Previously, Ms. Baumann served as AML Officer of the funds (2012-2016), and Vice President (2007-2014) and Deputy Anti-Money Laundering Officer (2007-2012) of FMR LLC.
Marc R. Bryant (1966)
Year of Election or Appointment: 2015
Secretary and Chief Legal Officer (CLO)
Mr. Bryant also serves as Secretary and CLO of other funds. Mr. Bryant serves as CLO, Secretary, and Senior Vice President of Fidelity Management & Research Company (investment adviser firm, 2015-present) and FMR Co., Inc. (investment adviser firm, 2015-present); Secretary of Fidelity SelectCo, LLC (investment adviser firm, 2015-present) and Fidelity Investments Money Management, Inc. (investment adviser firm, 2015-present); and CLO of Fidelity Management & Research (Hong Kong) Limited and FMR Investment Management (UK) Limited (investment adviser firms, 2015-present) and Fidelity Management & Research (Japan) Limited (investment adviser firm, 2016-present). He is Senior Vice President and Deputy General Counsel of FMR LLC (diversified financial services company). Previously, Mr. Bryant served as Secretary and CLO of Fidelity Rutland Square Trust II (2010-2014) and Assistant Secretary of Fidelity's Fixed Income and Asset Allocation Funds (2013-2015). Prior to joining Fidelity Investments, Mr. Bryant served as a Senior Vice President and the Head of Global Retail Legal for AllianceBernstein L.P. (2006-2010), and as the General Counsel for ProFund Advisors LLC (2001-2006).
Jeffrey S. Christian (1961)
Year of Election or Appointment: 2016
Assistant Treasurer
Mr. Christian also serves as Assistant Treasurer of other funds. Mr. Christian is an employee of Fidelity Investments (2003-present).
William C. Coffey (1969)
Year of Election or Appointment: 2009
Assistant Secretary
Mr. Coffey also serves as Assistant Secretary of other funds. He is Senior Vice President and Deputy General Counsel of FMR LLC (diversified financial services company, 2010-present), and is an employee of Fidelity Investments. Previously, Mr. Coffey served as Vice President and Associate General Counsel of FMR LLC (2005-2009).
Jonathan Davis (1968)
Year of Election or Appointment: 2010
Assistant Treasurer
Mr. Davis also serves as Assistant Treasurer of other funds, and is an employee of Fidelity Investments. Previously, Mr. Davis served as Vice President and Associate General Counsel of FMR LLC (diversified financial services company, 2003-2010).
Adrien E. Deberghes (1967)
Year of Election or Appointment: 2016
Assistant Treasurer
Mr. Deberghes also serves as an officer of other funds. He serves as Executive Vice President of Fidelity Investments Money Management, Inc. (FIMM) (investment adviser firm, 2016-present) and is an employee of Fidelity Investments (2008-present). Prior to joining Fidelity Investments, Mr. Deberghes was Senior Vice President of Mutual Fund Administration at State Street Corporation (2007-2008), Senior Director of Mutual Fund Administration at Investors Bank & Trust (2005-2007), and Director of Finance for Dunkin' Brands (2000-2005). Previously, Mr. Deberghes served in other fund officer roles.
Stephanie J. Dorsey (1969)
Year of Election or Appointment: 2010
Assistant Treasurer
Ms. Dorsey also serves as an officer of other funds. She is an employee of Fidelity Investments (2008-present) and has served in other fund officer roles. Prior to joining Fidelity Investments, Ms. Dorsey served as Treasurer (2004-2008) of the JPMorgan Mutual Funds and Vice President (2004-2008) of JPMorgan Chase Bank.
Howard J. Galligan III (1966)
Year of Election or Appointment: 2014
Chief Financial Officer
Mr. Galligan also serves as Chief Financial Officer of other funds. Mr. Galligan serves as President of Fidelity Pricing and Cash Management Services (FPCMS) (2014-present) and as a Director of Strategic Advisers, Inc. (investment adviser firm, 2008-present). Previously, Mr. Galligan served as Chief Administrative Officer of Asset Management (2011-2014) and Chief Operating Officer and Senior Vice President of Investment Support for Strategic Advisers, Inc. (2003-2011).
Scott C. Goebel (1968)
Year of Election or Appointment: 2015
Vice President
Mr. Goebel serves as Vice President of other funds and is an employee of Fidelity Investments (2001-present). Previously, Mr. Goebel served as Senior Vice President of Fidelity Management & Research Company (FMR) (investment adviser firm, 2016), Secretary of Fidelity SelectCo, LLC (investment adviser firm, 2013-2015), Fidelity Investments Money Management, Inc. (FIMM) (investment adviser firm, 2010-2015), and Fidelity Research and Analysis Company (FRAC) (investment adviser firm, 2010-2015); General Counsel, Secretary, and Senior Vice President of FMR (investment adviser firm, 2008-2015) and FMR Co., Inc. (investment adviser firm, 2008-2015); Assistant Secretary of Fidelity Management & Research (Japan) Limited (investment adviser firm, 2008-2015) and Fidelity Management & Research (U.K.) Inc. (investment adviser firm, 2008-2015); Chief Legal Officer (CLO) of Fidelity Management & Research (Hong Kong) Limited (investment adviser firm, 2008-2015); Secretary and CLO of certain Fidelity® funds (2008-2015); Assistant Secretary of FIMM (2008-2010), FRAC (2008-2010), and certain funds (2007-2008); and as Vice President and Secretary of Fidelity Distributors Corporation (FDC) (2005-2007).
Thomas C. Hense (1964)
Year of Election or Appointment: 2008, 2010, or 2015
Vice President
Mr. Hense serves as Vice President of Fidelity Advisor® Multi-Asset Income Fund (2015) and other funds (High Income (2008), Small Cap (2008), and Value (2010) funds), and is an employee of Fidelity Investments (1993-present). Previously, Mr. Hense served as a portfolio manager for Fidelity's Institutional Money Management Group (Pyramis) (2003-2008).
Brian B. Hogan (1964)
Year of Election or Appointment: 2009
Vice President
Mr. Hogan also serves as Trustee or Vice President of other funds. Mr. Hogan serves as a Director of FMR Investment Management (UK) Limited (investment adviser firm, 2015-present) and Fidelity SelectCo, LLC (investment adviser firm, 2014-present) and President of the Equity Division of FMR (investment adviser firm, 2009-present). Previously, Mr. Hogan served as Senior Vice President, Equity Research of FMR (2006-2009) and as a portfolio manager. Mr. Brian B. Hogan is not related to Mr. Colm A. Hogan.
Colm A. Hogan (1973)
Year of Election or Appointment: 2016
Deputy Treasurer
Mr. Hogan also serves as an officer of other funds. Mr. Hogan is an employee of Fidelity Investments (2005-present). Mr. Colm A. Hogan is not related to Mr. Brian B. Hogan.
Chris Maher (1972)
Year of Election or Appointment: 2013
Assistant Treasurer
Mr. Maher serves as Assistant Treasurer of other funds. Mr. Maher is Vice President of Valuation Oversight and is an employee of Fidelity Investments. Previously, Mr. Maher served as Vice President of Asset Management Compliance (2013), Vice President of the Program Management Group of FMR (investment adviser firm, 2010-2013), and Vice President of Valuation Oversight (2008-2010).
Kenneth B. Robins (1969)
Year of Election or Appointment: 2016
Chief Compliance Officer
Mr. Robins also serves as an officer of other funds. Mr. Robins serves as Compliance Officer of Fidelity Management & Research Company and FMR Co., Inc. (investment adviser firms, 2016-present) and is an employee of Fidelity Investments (2004-present). Previously, Mr. Robins served as Executive Vice President of Fidelity Investments Money Management, Inc. (investment adviser firm, 2013-2016) and served in other fund officer roles.
Stacie M. Smith (1974)
Year of Election or Appointment: 2016
President and Treasurer
Ms. Smith also serves as an officer of other funds. She is an employee of Fidelity Investments (2009-present) and has served in other fund officer roles. Prior to joining Fidelity Investments, Ms. Smith served as Senior Audit Manager of Ernst & Young LLP (accounting firm, 1996-2009). Previously, Ms. Smith served as Deputy Treasurer of certain Fidelity® funds (2013-2016).
Marc L. Spector (1972)
Year of Election or Appointment: 2016
Assistant Treasurer
Mr. Spector also serves as an officer of other funds. Mr. Spector is an employee of Fidelity Investments (2016-present). Prior to joining Fidelity Investments, Mr. Spector served as Director at the Siegfried Group (accounting firm, 2013-2016), and prior to Siegfried Group as audit senior manager at Deloitte & Touche (accounting firm, 2005-2013).
Renee Stagnone (1975)
Year of Election or Appointment: 2016
Assistant Treasurer
Ms. Stagnone also serves as an officer of other funds. Ms. Stagnone is an employee of Fidelity Investments (1997-present). Previously, Ms. Stagnone served as Deputy Treasurer of certain Fidelity® funds (2013-2016).
Shareholder Expense Example
As a shareholder of the Fund, you incur two types of costs: (1) transaction costs, including redemption fees and (2) ongoing costs, including management fees and other Fund expenses. This Example is intended to help you understand your ongoing costs (in dollars) of investing in the Fund and to compare these costs with the ongoing costs of investing in other mutual funds.
The Example is based on an investment of $1,000 invested at the beginning of the period and held for the entire period (November 1, 2016 to April 30, 2017).
Actual Expenses
The first line of the accompanying table provides information about actual account values and actual expenses. You may use the information in this line, together with the amount you invested, to estimate the expenses that you paid over the period. Simply divide your account value by $1,000.00 (for example, an $8,600 account value divided by $1,000.00 = 8.6), then multiply the result by the number in the first line under the heading entitled "Expenses Paid During Period" to estimate the expenses you paid on your account during this period. A small balance maintenance fee of $12.00 that is charged once a year may apply for certain accounts with a value of less than $2,000. This fee is not included in the table below. If it was, the estimate of expenses you paid during the period would be higher, and your ending account value lower, by this amount. In addition, the Fund, as a shareholder in the underlying Fidelity Central Funds, will indirectly bear its pro-rata share of the fees and expenses incurred by the underlying Fidelity Central Funds. These fees and expenses are not included in the Fund's annualized expense ratio used to calculate the expense estimate in the table below.
Hypothetical Example for Comparison Purposes
The second line of the accompanying table provides information about hypothetical account values and hypothetical expenses based on the Fund's actual expense ratio and an assumed rate of return of 5% per year before expenses, which is not the Fund's actual return. The hypothetical account values and expenses may not be used to estimate the actual ending account balance or expenses you paid for the period. You may use this information to compare the ongoing costs of investing in the Fund and other funds. To do so, compare this 5% hypothetical example with the 5% hypothetical examples that appear in the shareholder reports of the other funds. A small balance maintenance fee of $12.00 that is charged once a year may apply for certain accounts with a value of less than $2,000. This fee is not included in the table below. If it was, the estimate of expenses you paid during the period would be higher, and your ending account value lower, by this amount. In addition, the Fund, as a shareholder in the underlying Fidelity Central Funds, will indirectly bear its pro-rata share of the fees and expenses incurred by the underlying Fidelity Central Funds. These fees and expenses are not included in the Fund's annualized expense ratio used to calculate the expense estimate in the table below.
Please note that the expenses shown in the table are meant to highlight your ongoing costs only and do not reflect any transaction costs. Therefore, the second line of the table is useful in comparing ongoing costs only, and will not help you determine the relative total costs of owning different funds. In addition, if these transactional costs were included, your costs would have been higher.
| Annualized Expense Ratio-A | Beginning Account Value November 1, 2016 | Ending Account Value April 30, 2017 | Expenses Paid During Period-B November 1, 2016 to April 30, 2017 | |
| Actual | .97% | $1,000.00 | $1,139.10 | $5.14 |
| Hypothetical-C | $1,000.00 | $1,019.98 | $4.86 |
A Annualized expense ratio reflects expenses net of applicable fee waivers.
B Expenses are equal to the Fund's annualized expense ratio, multiplied by the average account value over the period, multiplied by 181/365 (to reflect the one-half year period).
C 5% return per year before expenses
Distributions (Unaudited)
The Board of Trustees of Fidelity Small Cap Stock Fund voted to pay on June 12, 2017, to shareholders of record at the opening of business on June 9, 2017, a distribution of $0.591 per share derived from capital gains realized from sales of portfolio securities and a dividend of $0.010 per share from net investment income.
The fund hereby designates as a capital gain dividend with respect to the taxable year ended April 30, 2017, $87,723,307, or, if subsequently determined to be different, the net capital gain of such year.
The fund designates 100% of the dividends distributed during the fiscal year as qualifying for the dividends–received deduction for corporate shareholders.
The fund designates 100% of the dividends distributed during the fiscal year as amounts which may be taken into account as a dividend for the purposes of the maximum rate under section 1(h)(11) of the Internal Revenue Code.
The fund will notify shareholders in January 2018 of amounts for use in preparing 2017 income tax returns.
Board Approval of Investment Advisory Contracts and Management Fees
Fidelity Small Cap Stock Fund
On September 14, 2016, the Board of Trustees, including the Independent Trustees (together, the Board) voted to approve the management contract and sub-advisory agreements (collectively, the Advisory Contracts) for the fund in connection with reorganizing the fund from one Trust to another. In reaching this determination, the Board considered that the contractual terms of and the fees payable under the fund's Advisory Contracts are identical to those in the fund's current Advisory Contracts. The Board considered that the approval of the Advisory Contracts will not result in any changes to (i) the investment process or strategies employed in the management of the fund's assets; (ii) the nature, extent and quality of services provided under the fund's Advisory Contracts; or (iii) the day-to-day management of the fund or the persons primarily responsible for such management. The Board considered that it approved the Advisory Contracts for the fund at its July 2016 meeting and that it will again consider the renewal of the Advisory Contracts in July 2017.
Because the Board was approving Advisory Contracts with terms identical to the current Advisory Contracts, it did not consider the fund's investment performance, competitiveness of management fees and total expenses, costs of services and profitability, or economies of scale to be significant factors in its decision.
In connection with its consideration of future renewal of the fund's Advisory Contracts, the Board will consider: (i) the nature, extent and quality of services provided to the fund, including shareholder and administrative services and investment performance; (ii) the competitiveness of the fund's management fee and total expenses; (iii) the costs of the services and profitability, including the revenues earned and the expenses incurred by Fidelity conducting the business of developing, marketing, distributing, managing, administering, and servicing the fund and its shareholders, to the extent applicable; and (iv) whether there have been economies of scale in respect of the management of the Fidelity funds, whether the Fidelity funds (including the fund) have appropriately benefited from any such economies of scale, and whether there is potential for realization of any further economies.
Based on its evaluation of all of the conclusions noted above, and after considering all factors it believed relevant, the Board ultimately concluded that the advisory fee structures are fair and reasonable, and that the fund's Advisory Contracts should be approved, without modification, as part of the process of reorganizing the fund from one Trust to another.
![]()
Corporate Headquarters
245 Summer St.
Boston, MA 02210
www.fidelity.com
SLCX-ANN-0617
1.703590.119
Fidelity® Mid-Cap Stock Fund Class K Annual Report April 30, 2017 |
|
Contents
Board Approval of Investment Advisory Contracts and Management Fees |
To view a fund's proxy voting guidelines and proxy voting record for the 12-month period ended June 30, visit http://www.fidelity.com/proxyvotingresults or visit the Securities and Exchange Commission's (SEC) web site at http://www.sec.gov.
You may also call 1-800-835-5092 to request a free copy of the proxy voting guidelines.
Standard & Poor's, S&P and S&P 500 are registered service marks of The McGraw-Hill Companies, Inc. and have been licensed for use by Fidelity Distributors Corporation.
Other third-party marks appearing herein are the property of their respective owners.
All other marks appearing herein are registered or unregistered trademarks or service marks of FMR LLC or an affiliated company. © 2017 FMR LLC. All rights reserved.
This report and the financial statements contained herein are submitted for the general information of the shareholders of the Fund. This report is not authorized for distribution to prospective investors in the Fund unless preceded or accompanied by an effective prospectus.
A fund files its complete schedule of portfolio holdings with the SEC for the first and third quarters of each fiscal year on Form N-Q. Forms N-Q are available on the SEC’s web site at http://www.sec.gov. A fund's Forms N-Q may be reviewed and copied at the SEC’s Public Reference Room in Washington, DC. Information regarding the operation of the SEC's Public Reference Room may be obtained by calling 1-800-SEC-0330.
For a complete list of a fund's portfolio holdings, view the most recent holdings listing, semiannual report, or annual report on Fidelity's web site at http://www.fidelity.com, http://www.institutional.fidelity.com, or http://www.401k.com, as applicable.
NOT FDIC INSURED •MAY LOSE VALUE •NO BANK GUARANTEE
Neither the Fund nor Fidelity Distributors Corporation is a bank.
Performance: The Bottom Line
Average annual total return reflects the change in the value of an investment, assuming reinvestment of distributions from dividend income and capital gains (the profits earned upon the sale of securities that have grown in value, if any) and assuming a constant rate of performance each year. The hypothetical investment and the average annual total returns do not reflect the deduction of taxes that a shareholder would pay on fund distributions or the redemption of fund shares. During periods of reimbursement by Fidelity, a fund’s total return will be greater than it would be had the reimbursement not occurred. How a fund did yesterday is no guarantee of how it will do tomorrow.
Average Annual Total Returns
| For the periods ended April 30, 2017 | Past 1 year | Past 5 years | Past 10 years |
| Class K | 16.96% | 12.40% | 6.90% |
The initial offering of Class K shares took place on May 9, 2008. Returns prior to May 9, 2008 are those of Fidelity® Mid-Cap Stock Fund, the original class of the fund.
$10,000 Over 10 Years
Let's say hypothetically that $10,000 was invested in Fidelity® Mid-Cap Stock Fund - Class K on April 30, 2007. The chart shows how the value of your investment would have changed, and also shows how the S&P MidCap 400® Index performed over the same period. See above for additional information regarding the performance of Class K.
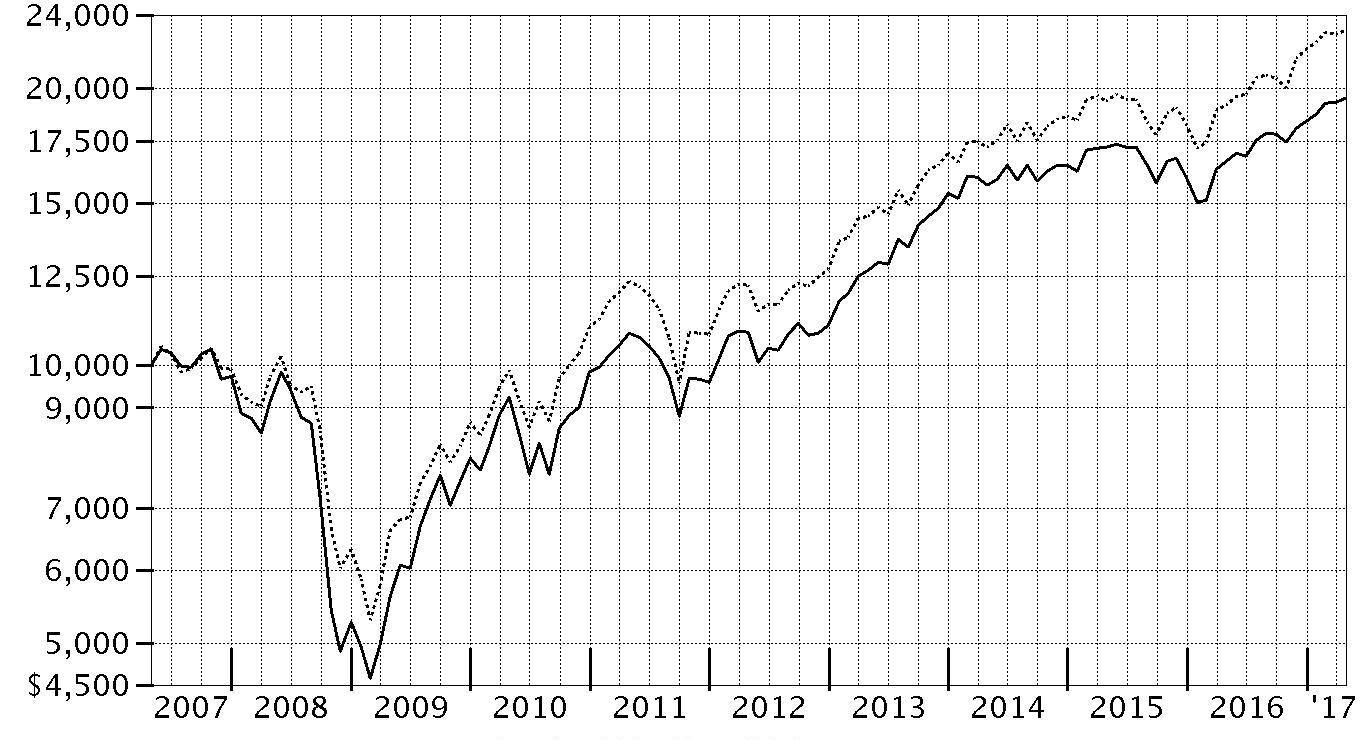
| Period Ending Values | ||
| $19,487 | Fidelity® Mid-Cap Stock Fund - Class K | |
| $23,091 | S&P MidCap 400® Index | |
Management's Discussion of Fund Performance
Market Recap: The U.S. equity bellwether S&P 500® index gained 17.92% for the year ending April 30, 2017, rising sharply following the November election and continuing to gain ground through the end of February on optimism for President Trump’s pro-business agenda. Equity markets leveled off, however, as the fledgling administration faced the first test of its domestic agenda. Stocks reacted with uncertainty to efforts by Congress in March to repeal and replace the Affordable Care Act (ACA), and were relatively flat through April 30. In a stark reversal from 2016, growth-oriented stocks topped their value counterparts through the first third of 2017. Sector-wise, information technology (+35%) fared best, anchored by twin rallies in the June 2016 and March 2017 quarters as growth regained favor. Financials (+27%) also handily outperformed, riding an uptick in bond yields and a surge in banks, particularly post-election. Industrials (+19%) and materials (+16%) did well amid a call for increased infrastructure spending and a rise in commodity prices, respectively. Conversely, consumer staples (+9%), real estate (+5%) and telecommunication services (0%) were held back amid an improved backdrop for riskier assets that curbed demand for dividend-rich sectors, as well as the likelihood of one or two additional interest rate hikes later in 2017. Energy (+2%) also struggled this period.Comments from Portfolio Manager John Roth: For the year, the fund's share classes gained about 17%, underperforming the 20.46% return of the benchmark S&P MidCap 400® Index. Versus the benchmark, the fund was poorly positioned amid a rally among more-cyclical stocks following the November U.S. presidential election. In particular, positioning in financials and picks in information technology weighed on the fund's results. Notably, the fund’s cash position of about 7%, on average, was a significant detractor amid a strong market. The fund’s largest individual detractor was an non-index stake in Allstar Co-Invest. Allstar represents a private investment in sporting-goods retailer Academy Sports + Outdoors. Our stake returned -61% the past year, as Academy struggled amid weak conditions for the sporting-goods industry. Elsewhere, we did not own chipmaker Advanced Micro Devices (AMD), which outperformed as investors grew excited about burgeoning opportunities in tech. Stock picking in energy helped, including a sizable out-of-benchmark stake in Williams Companies, the fund’s largest individual contributor and its biggest holding. Williams owns a majority stake in Williams Partners, a master limited partnership (MLP) and North American pipeline owner – and another big non-index fund position and contributor this period.The views expressed above reflect those of the portfolio manager(s) only through the end of the period as stated on the cover of this report and do not necessarily represent the views of Fidelity or any other person in the Fidelity organization. Any such views are subject to change at any time based upon market or other conditions and Fidelity disclaims any responsibility to update such views. These views may not be relied on as investment advice and, because investment decisions for a Fidelity fund are based on numerous factors, may not be relied on as an indication of trading intent on behalf of any Fidelity fund.
Investment Summary (Unaudited)
Top Ten Stocks as of April 30, 2017
| % of fund's net assets | % of fund's net assets 6 months ago | |
| The Williams Companies, Inc. | 2.1 | 2.2 |
| Eurofins Scientific SA | 2.1 | 2.0 |
| Boston Scientific Corp. | 1.6 | 1.4 |
| Williams Partners LP | 1.5 | 1.5 |
| ARAMARK Holdings Corp. | 1.5 | 1.3 |
| NVR, Inc. | 1.4 | 1.2 |
| First Data Corp. Class A | 1.4 | 1.3 |
| Aspen Technology, Inc. | 1.4 | 1.2 |
| Arch Capital Group Ltd. | 1.3 | 1.2 |
| First American Financial Corp. | 1.3 | 1.3 |
| 15.6 |
Top Five Market Sectors as of April 30, 2017
| % of fund's net assets | % of fund's net assets 6 months ago | |
| Information Technology | 18.2 | 18.0 |
| Financials | 15.5 | 13.1 |
| Industrials | 12.8 | 10.8 |
| Health Care | 11.5 | 9.9 |
| Consumer Discretionary | 11.0 | 11.6 |
Asset Allocation (% of fund's net assets)
| As of April 30, 2017 * | ||
| Stocks | 92.8% | |
| Bonds | 0.1% | |
| Convertible Securities | 0.1% | |
| Other Investments | 0.2% | |
| Short-Term Investments and Net Other Assets (Liabilities) | 6.8% | |

* Foreign investments - 13.0%
| As of October 31, 2016* | ||
| Stocks | 90.2% | |
| Bonds | 0.1% | |
| Short-Term Investments and Net Other Assets (Liabilities) | 9.7% | |

* Foreign investments - 11.3%
Investments April 30, 2017
Showing Percentage of Net Assets
| Common Stocks - 92.7% | |||
| Shares | Value (000s) | ||
| CONSUMER DISCRETIONARY - 10.9% | |||
| Auto Components - 0.3% | |||
| Magna International, Inc. Class A (sub. vtg.) | 574,500 | $23,998 | |
| Automobiles - 0.5% | |||
| Fiat Chrysler Automobiles NV (a) | 3,522,500 | 40,051 | |
| Distributors - 0.9% | |||
| Pool Corp. | 592,501 | 70,875 | |
| Hotels, Restaurants & Leisure - 2.0% | |||
| ARAMARK Holdings Corp. | 3,206,840 | 117,114 | |
| Noodles & Co. (a)(b)(c) | 2,354,500 | 13,774 | |
| Whitbread PLC | 406,510 | 21,245 | |
| 152,133 | |||
| Household Durables - 3.3% | |||
| D.R. Horton, Inc. | 1,206,433 | 39,680 | |
| Lennar Corp. Class A | 583,900 | 29,487 | |
| NVR, Inc. (a) | 54,400 | 114,852 | |
| Toll Brothers, Inc. | 2,111,287 | 75,985 | |
| 260,004 | |||
| Leisure Products - 0.2% | |||
| New Academy Holding Co. LLC unit (a)(d)(e) | 294,000 | 17,675 | |
| Media - 0.3% | |||
| WME Entertainment Parent, LLC Class A (e)(f) | 8,324,258 | 18,813 | |
| Multiline Retail - 0.3% | |||
| Dollar General Corp. | 308,100 | 22,402 | |
| Specialty Retail - 2.4% | |||
| AutoZone, Inc. (a) | 47,100 | 32,602 | |
| Citi Trends, Inc. (c) | 887,653 | 16,679 | |
| Ross Stores, Inc. | 478,500 | 31,103 | |
| Sally Beauty Holdings, Inc. (a) | 889,900 | 16,926 | |
| Tiffany & Co., Inc. | 755,300 | 69,223 | |
| Ulta Beauty, Inc. (a) | 84,600 | 23,810 | |
| 190,343 | |||
| Textiles, Apparel & Luxury Goods - 0.7% | |||
| Brunello Cucinelli SpA (b) | 2,067,300 | 54,136 | |
| TOTAL CONSUMER DISCRETIONARY | 850,430 | ||
| CONSUMER STAPLES - 2.6% | |||
| Beverages - 0.8% | |||
| Molson Coors Brewing Co. Class B | 606,100 | 58,119 | |
| Food Products - 1.1% | |||
| Amira Nature Foods Ltd. (a)(b) | 1,783,275 | 9,255 | |
| Amplify Snack Brands, Inc. (a)(b) | 3,540,897 | 31,868 | |
| Greencore Group PLC | 3,913,584 | 11,557 | |
| The Hershey Co. | 301,400 | 32,611 | |
| 85,291 | |||
| Household Products - 0.4% | |||
| Church & Dwight Co., Inc. | 616,646 | 30,542 | |
| Personal Products - 0.3% | |||
| Coty, Inc. Class A | 1,454,800 | 25,968 | |
| TOTAL CONSUMER STAPLES | 199,920 | ||
| ENERGY - 9.0% | |||
| Energy Equipment & Services - 1.4% | |||
| Borr Drilling Ltd. (a) | 7,496,000 | 29,684 | |
| Helmerich & Payne, Inc. (b) | 220,000 | 13,341 | |
| Oceaneering International, Inc. | 1,734,900 | 45,784 | |
| TechnipFMC PLC (a) | 674,200 | 20,314 | |
| 109,123 | |||
| Oil, Gas & Consumable Fuels - 7.6% | |||
| Cabot Oil & Gas Corp. | 2,062,800 | 47,939 | |
| Cimarex Energy Co. | 414,500 | 48,364 | |
| Cobalt International Energy, Inc. (a)(b) | 3,085,300 | 1,207 | |
| Denbury Resources, Inc. (a)(b) | 4,034,200 | 8,956 | |
| Diamondback Energy, Inc. (a) | 522,000 | 52,116 | |
| Energy Transfer Equity LP | 1,017,000 | 18,977 | |
| GasLog Ltd. (b) | 1,850,477 | 25,907 | |
| Golar LNG Ltd. (b) | 1,428,800 | 36,449 | |
| Range Resources Corp. | 662,600 | 17,552 | |
| SM Energy Co. | 1,451,300 | 32,785 | |
| Southwestern Energy Co. (a) | 1,239,400 | 9,308 | |
| The Williams Companies, Inc. | 5,378,000 | 164,725 | |
| Whiting Petroleum Corp. (a) | 1,751,200 | 14,535 | |
| Williams Partners LP | 2,944,100 | 120,502 | |
| 599,322 | |||
| TOTAL ENERGY | 708,445 | ||
| FINANCIALS - 15.5% | |||
| Banks - 6.7% | |||
| First Republic Bank | 1,000,300 | 92,488 | |
| FNB Corp., Pennsylvania | 3,698,600 | 52,668 | |
| Huntington Bancshares, Inc. | 5,169,700 | 66,482 | |
| M&T Bank Corp. | 454,400 | 70,618 | |
| Prosperity Bancshares, Inc. | 592,900 | 39,843 | |
| Regions Financial Corp. | 5,797,524 | 79,716 | |
| SunTrust Banks, Inc. | 1,070,300 | 60,804 | |
| Texas Capital Bancshares, Inc. (a) | 245,400 | 18,675 | |
| UMB Financial Corp. | 631,300 | 45,763 | |
| 527,057 | |||
| Capital Markets - 1.0% | |||
| KKR & Co. LP | 4,039,184 | 76,664 | |
| Insurance - 6.0% | |||
| Arch Capital Group Ltd. (a) | 1,080,700 | 104,795 | |
| Brown & Brown, Inc. | 1,181,800 | 50,699 | |
| First American Financial Corp. | 2,404,000 | 104,358 | |
| FNF Group | 2,009,400 | 82,285 | |
| Progressive Corp. | 1,774,700 | 70,491 | |
| Willis Group Holdings PLC | 407,100 | 53,990 | |
| 466,618 | |||
| Thrifts & Mortgage Finance - 1.8% | |||
| MGIC Investment Corp. (a) | 5,946,709 | 62,678 | |
| Radian Group, Inc. | 4,783,944 | 80,753 | |
| 143,431 | |||
| TOTAL FINANCIALS | 1,213,770 | ||
| HEALTH CARE - 11.4% | |||
| Health Care Equipment & Supplies - 3.7% | |||
| Boston Scientific Corp. (a) | 4,733,400 | 124,867 | |
| DexCom, Inc. (a) | 292,900 | 22,834 | |
| Sartorius Stedim Biotech | 222,388 | 14,915 | |
| Teleflex, Inc. | 315,200 | 65,212 | |
| The Cooper Companies, Inc. | 307,165 | 61,534 | |
| 289,362 | |||
| Health Care Providers & Services - 3.1% | |||
| Acadia Healthcare Co., Inc. (a)(b) | 562,100 | 24,496 | |
| Amplifon SpA | 2,524,582 | 32,203 | |
| Henry Schein, Inc. (a) | 227,700 | 39,574 | |
| MEDNAX, Inc. (a) | 936,600 | 56,533 | |
| Premier, Inc. (a) | 580,400 | 19,618 | |
| Teladoc, Inc. (a)(b) | 465,100 | 11,534 | |
| Universal Health Services, Inc. Class B | 498,900 | 60,247 | |
| 244,205 | |||
| Health Care Technology - 1.0% | |||
| Cerner Corp. (a) | 446,400 | 28,904 | |
| HealthStream, Inc. (a) | 854,400 | 23,744 | |
| Medidata Solutions, Inc. (a) | 396,300 | 25,930 | |
| 78,578 | |||
| Life Sciences Tools & Services - 2.9% | |||
| Agilent Technologies, Inc. | 1,178,100 | 64,854 | |
| Eurofins Scientific SA | 332,300 | 163,649 | |
| 228,503 | |||
| Pharmaceuticals - 0.7% | |||
| Catalent, Inc. (a) | 1,770,050 | 51,827 | |
| TOTAL HEALTH CARE | 892,475 | ||
| INDUSTRIALS - 12.8% | |||
| Aerospace & Defense - 3.3% | |||
| Elbit Systems Ltd. (b) | 192,200 | 22,831 | |
| HEICO Corp. | 41,892 | 2,977 | |
| HEICO Corp. Class A | 299,500 | 18,359 | |
| KEYW Holding Corp. (a)(b)(c) | 4,531,636 | 43,005 | |
| Rockwell Collins, Inc. | 443,200 | 46,133 | |
| Space Exploration Technologies Corp. Class A (a)(e) | 124,710 | 13,095 | |
| Teledyne Technologies, Inc. (a) | 476,400 | 64,233 | |
| Textron, Inc. | 553,600 | 25,831 | |
| TransDigm Group, Inc. | 79,500 | 19,615 | |
| 256,079 | |||
| Air Freight & Logistics - 0.9% | |||
| C.H. Robinson Worldwide, Inc. | 495,600 | 36,030 | |
| Expeditors International of Washington, Inc. | 567,657 | 31,840 | |
| PostNL NV (b) | 1,093,527 | 5,416 | |
| 73,286 | |||
| Commercial Services & Supplies - 1.0% | |||
| KAR Auction Services, Inc. | 714,700 | 31,175 | |
| Stericycle, Inc. (a) | 324,600 | 27,701 | |
| U.S. Ecology, Inc. | 457,981 | 21,594 | |
| 80,470 | |||
| Construction & Engineering - 0.5% | |||
| Jacobs Engineering Group, Inc. | 638,800 | 35,083 | |
| Electrical Equipment - 2.1% | |||
| AMETEK, Inc. | 1,189,992 | 68,068 | |
| Generac Holdings, Inc. (a) | 817,700 | 28,759 | |
| Melrose Industries PLC | 11,264,617 | 34,505 | |
| Regal Beloit Corp. | 381,100 | 30,050 | |
| 161,382 | |||
| Machinery - 3.2% | |||
| Donaldson Co., Inc. | 1,200,800 | 55,573 | |
| Flowserve Corp. | 1,153,400 | 58,673 | |
| Kennametal, Inc. | 903,800 | 37,580 | |
| Pentair PLC | 910,800 | 58,756 | |
| Rational AG | 76,000 | 38,190 | |
| 248,772 | |||
| Marine - 0.1% | |||
| Goodbulk Ltd. (a)(c) | 906,187 | 9,884 | |
| Road & Rail - 0.7% | |||
| Genesee & Wyoming, Inc. Class A (a) | 806,600 | 54,655 | |
| Trading Companies & Distributors - 1.0% | |||
| Rush Enterprises, Inc. Class A (a) | 738,700 | 27,886 | |
| United Rentals, Inc. (a) | 490,173 | 53,752 | |
| 81,638 | |||
| TOTAL INDUSTRIALS | 1,001,249 | ||
| INFORMATION TECHNOLOGY - 18.2% | |||
| Communications Equipment - 0.3% | |||
| Juniper Networks, Inc. | 817,800 | 24,591 | |
| Electronic Equipment & Components - 4.4% | |||
| Amphenol Corp. Class A | 1,122,200 | 81,146 | |
| Arrow Electronics, Inc. (a) | 1,329,000 | 93,695 | |
| CDW Corp. | 550,700 | 32,541 | |
| Fabrinet (a) | 1,117,231 | 38,734 | |
| IPG Photonics Corp. (a) | 336,500 | 42,507 | |
| Keysight Technologies, Inc. (a) | 1,528,900 | 57,227 | |
| 345,850 | |||
| Internet Software & Services - 1.4% | |||
| Akamai Technologies, Inc. (a) | 566,200 | 34,504 | |
| Endurance International Group Holdings, Inc. (a) | 2,344,600 | 17,819 | |
| GoDaddy, Inc. (a) | 1,128,000 | 43,902 | |
| LogMeIn, Inc. | 128,281 | 14,496 | |
| 110,721 | |||
| IT Services - 5.8% | |||
| Fidelity National Information Services, Inc. | 663,186 | 55,834 | |
| First Data Corp. Class A (a) | 6,852,773 | 107,040 | |
| Fiserv, Inc. (a) | 534,800 | 63,716 | |
| FleetCor Technologies, Inc. (a) | 338,100 | 47,719 | |
| Leidos Holdings, Inc. | 1,423,200 | 74,946 | |
| Total System Services, Inc. | 624,100 | 35,767 | |
| WNS Holdings Ltd. sponsored ADR (a) | 2,005,300 | 64,210 | |
| 449,232 | |||
| Semiconductors & Semiconductor Equipment - 1.9% | |||
| Analog Devices, Inc. | 122,989 | 9,372 | |
| KLA-Tencor Corp. | 477,700 | 46,920 | |
| Maxim Integrated Products, Inc. | 756,400 | 33,395 | |
| Silicon Laboratories, Inc. (a) | 526,494 | 37,460 | |
| Xilinx, Inc. | 378,900 | 23,912 | |
| 151,059 | |||
| Software - 4.4% | |||
| ANSYS, Inc. (a) | 887,000 | 97,712 | |
| Aspen Technology, Inc. (a) | 1,716,800 | 105,566 | |
| Citrix Systems, Inc. (a) | 746,500 | 60,422 | |
| Mobileye NV (a) | 801,200 | 49,610 | |
| Red Hat, Inc. (a) | 371,300 | 32,704 | |
| 346,014 | |||
| TOTAL INFORMATION TECHNOLOGY | 1,427,467 | ||
| MATERIALS - 2.7% | |||
| Chemicals - 0.6% | |||
| Albemarle Corp. U.S. | 215,000 | 23,416 | |
| Potash Corp. of Saskatchewan, Inc. | 1,233,500 | 20,802 | |
| 44,218 | |||
| Construction Materials - 0.2% | |||
| Forterra, Inc. | 994,600 | 19,136 | |
| Containers & Packaging - 0.8% | |||
| WestRock Co. | 1,156,900 | 61,964 | |
| Metals & Mining - 1.1% | |||
| Franco-Nevada Corp. | 342,600 | 23,301 | |
| Freeport-McMoRan, Inc. (a) | 1,595,900 | 20,348 | |
| Newcrest Mining Ltd. | 1,286,984 | 20,392 | |
| Novagold Resources, Inc. (a)(b) | 5,118,176 | 21,222 | |
| 85,263 | |||
| TOTAL MATERIALS | 210,581 | ||
| REAL ESTATE - 4.1% | |||
| Equity Real Estate Investment Trusts (REITs) - 3.6% | |||
| Apartment Investment & Management Co. Class A | 912,500 | 39,913 | |
| Cousins Properties, Inc. | 5,242,791 | 44,511 | |
| Essex Property Trust, Inc. | 262,600 | 64,198 | |
| Healthcare Realty Trust, Inc. | 1,239,500 | 40,656 | |
| Healthcare Trust of America, Inc. | 1,110,600 | 35,417 | |
| National Retail Properties, Inc. | 357,700 | 15,102 | |
| Parkway, Inc. | 655,373 | 13,206 | |
| VEREIT, Inc. | 3,822,100 | 31,991 | |
| 284,994 | |||
| Real Estate Management & Development - 0.5% | |||
| Realogy Holdings Corp. | 1,136,000 | 34,705 | |
| TOTAL REAL ESTATE | 319,699 | ||
| TELECOMMUNICATION SERVICES - 0.2% | |||
| Diversified Telecommunication Services - 0.2% | |||
| Iridium Communications, Inc. (a)(b) | 1,809,500 | 19,181 | |
| UTILITIES - 5.3% | |||
| Electric Utilities - 3.8% | |||
| Alliant Energy Corp. | 2,027,400 | 79,717 | |
| IDACORP, Inc. | 948,433 | 80,162 | |
| OGE Energy Corp. | 2,171,600 | 75,528 | |
| Xcel Energy, Inc. | 1,346,882 | 60,677 | |
| 296,084 | |||
| Gas Utilities - 1.5% | |||
| Atmos Energy Corp. | 1,214,597 | 98,407 | |
| Spire, Inc. | 333,000 | 22,827 | |
| 121,234 | |||
| TOTAL UTILITIES | 417,318 | ||
| TOTAL COMMON STOCKS | |||
| (Cost $5,368,172) | 7,260,535 | ||
| Preferred Stocks - 0.2% | |||
| Convertible Preferred Stocks - 0.1% | |||
| CONSUMER DISCRETIONARY - 0.1% | |||
| Leisure Products - 0.1% | |||
| Peloton Interactive, Inc. Series E (e) | 439,714 | 9,525 | |
| Nonconvertible Preferred Stocks - 0.1% | |||
| HEALTH CARE - 0.1% | |||
| Health Care Equipment & Supplies - 0.1% | |||
| Sartorius AG (non-vtg.) | 95,836 | 8,775 | |
| TOTAL PREFERRED STOCKS | |||
| (Cost $16,979) | 18,300 | ||
| Principal Amount (000s) | Value (000s) | ||
| Nonconvertible Bonds - 0.1% | |||
| ENERGY - 0.1% | |||
| Energy Equipment & Services - 0.1% | |||
| Pacific Drilling SA 5.375% 6/1/20(g) | 26,110 | 12,533 | |
| (Cost $16,873) | |||
| Shares | Value (000s) | ||
| Other - 0.2% | |||
| ENERGY - 0.2% | |||
| Oil, Gas & Consumable Fuels - 0.2% | |||
| Utica Shale Drilling Program (non-operating revenue interest) (e)(f) | |||
| (Cost $13,599) | 13,598,556 | 13,599 | |
| Money Market Funds - 7.8% | |||
| Fidelity Cash Central Fund, 0.85% (h) | 488,294,972 | 488,393 | |
| Fidelity Securities Lending Cash Central Fund 0.86% (h)(i) | 122,879,828 | 122,892 | |
| TOTAL MONEY MARKET FUNDS | |||
| (Cost $611,198) | 611,285 | ||
| TOTAL INVESTMENT PORTFOLIO - 101.0% | |||
| (Cost $6,026,821) | 7,916,252 | ||
| NET OTHER ASSETS (LIABILITIES) - (1.0)% | (81,426) | ||
| NET ASSETS - 100% | $7,834,826 |
Legend
(a) Non-income producing
(b) Security or a portion of the security is on loan at period end.
(c) Affiliated company
(d) Investment is owned by an entity that is treated as a U.S. Corporation for tax purposes in which the Fund holds a percentage ownership.
(e) Restricted securities - Investment in securities not registered under the Securities Act of 1933 (excluding 144A issues). At the end of the period, the value of restricted securities (excluding 144A issues) amounted to $72,707,000 or 0.9% of net assets.
(f) Investment is owned by a wholly-owned subsidiary (Subsidiary) that is treated as a corporation for U.S. tax purposes.
(g) Security exempt from registration under Rule 144A of the Securities Act of 1933. These securities may be resold in transactions exempt from registration, normally to qualified institutional buyers. At the end of the period, the value of these securities amounted to $12,533,000 or 0.2% of net assets.
(h) Affiliated fund that is generally available only to investment companies and other accounts managed by Fidelity Investments. The rate quoted is the annualized seven-day yield of the fund at period end. A complete unaudited listing of the fund's holdings as of its most recent quarter end is available upon request. In addition, each Fidelity Central Fund's financial statements, which are not covered by the Fund's Report of Independent Registered Public Accounting Firm, are available on the SEC's website or upon request.
(i) Investment made with cash collateral received from securities on loan.
Additional information on each restricted holding is as follows:
| Security | Acquisition Date | Acquisition Cost (000s) |
| New Academy Holding Co. LLC unit | 8/1/11 | $30,988 |
| Peloton Interactive, Inc. Series E | 3/31/17 | $9,525 |
| Space Exploration Technologies Corp. Class A | 4/8/16 - 4/6/17 | $12,269 |
| Utica Shale Drilling Program (non-operating revenue interest) | 10/5/16 - 11/4/16 | $13,599 |
| WME Entertainment Parent, LLC Class A | 8/16/16 | $16,835 |
Affiliated Central Funds
Information regarding fiscal year to date income earned by the Fund from investments in Fidelity Central Funds is as follows:
| Fund | Income earned |
| (Amounts in thousands) | |
| Fidelity Cash Central Fund | $2,690 |
| Fidelity Securities Lending Cash Central Fund | 2,399 |
| Total | $5,089 |
Other Affiliated Issuers
An affiliated company is a company in which the Fund has ownership of at least 5% of the voting securities. Fiscal year to date transactions with companies which are or were affiliates are as follows:
| Affiliate (Amounts in thousands) | Value, beginning of period | Purchases | Sales Proceeds* | Dividend Income | Value, end of period |
| Citi Trends, Inc. | $16,152 | $-- | $197 | $214 | $16,679 |
| Goodbulk Ltd. | -- | 9,968 | -- | -- | 9,884 |
| KEYW Holding Corp. | 24,249 | 11,293 | 467 | -- | 43,005 |
| Noodles & Co. | 26,599 | -- | 233 | -- | 13,774 |
| Total | $67,000 | $21,261 | $897 | $214 | $83,342 |
* Includes the value of securities delivered through in-kind transactions, if applicable.
Investment Valuation
The following is a summary of the inputs used, as of April 30, 2017, involving the Fund's assets and liabilities carried at fair value. The inputs or methodology used for valuing securities may not be an indication of the risk associated with investing in those securities. For more information on valuation inputs, and their aggregation into the levels used below, please refer to the Investment Valuation section in the accompanying Notes to Financial Statements.
| Valuation Inputs at Reporting Date: | ||||
| Description | Total | Level 1 | Level 2 | Level 3 |
| (Amounts in thousands) | ||||
| Investments in Securities: | ||||
| Equities: | ||||
| Consumer Discretionary | $859,955 | $813,942 | $-- | $46,013 |
| Consumer Staples | 199,920 | 199,920 | -- | -- |
| Energy | 708,445 | 708,445 | -- | -- |
| Financials | 1,213,770 | 1,213,770 | -- | -- |
| Health Care | 901,250 | 901,250 | -- | -- |
| Industrials | 1,001,249 | 988,154 | -- | 13,095 |
| Information Technology | 1,427,467 | 1,427,467 | -- | -- |
| Materials | 210,581 | 210,581 | -- | -- |
| Real Estate | 319,699 | 319,699 | -- | -- |
| Telecommunication Services | 19,181 | 19,181 | -- | -- |
| Utilities | 417,318 | 417,318 | -- | -- |
| Corporate Bonds | 12,533 | -- | 12,533 | -- |
| Other | 13,599 | -- | -- | 13,599 |
| Money Market Funds | 611,285 | 611,285 | -- | -- |
| Total Investments in Securities: | $7,916,252 | $7,831,012 | $12,533 | $72,707 |
Other Information
Distribution of investments by country or territory of incorporation, as a percentage of Total Net Assets, is as follows (Unaudited):
| United States of America | 87.0% |
| Bermuda | 2.6% |
| Luxembourg | 2.2% |
| Netherlands | 1.2% |
| Canada | 1.2% |
| Italy | 1.1% |
| Ireland | 1.0% |
| Others (Individually Less Than 1%) | 3.7% |
| 100.0% |
See accompanying notes which are an integral part of the financial statements.
Financial Statements
Statement of Assets and Liabilities
| Amounts in thousands (except per-share amounts) | April 30, 2017 | |
| Assets | ||
| Investment in securities, at value (including securities loaned of $117,597) — See accompanying schedule: Unaffiliated issuers (cost $5,286,567) | $7,221,625 | |
| Fidelity Central Funds (cost $611,198) | 611,285 | |
| Other affiliated issuers (cost $129,056) | 83,342 | |
| Total Investments (cost $6,026,821) | $7,916,252 | |
| Restricted cash | 337 | |
| Foreign currency held at value (cost $406) | 406 | |
| Receivable for investments sold | 43,800 | |
| Receivable for fund shares sold | 3,343 | |
| Dividends receivable | 2,358 | |
| Interest receivable | 585 | |
| Distributions receivable from Fidelity Central Funds | 482 | |
| Prepaid expenses | 5 | |
| Other receivables | 489 | |
| Total assets | 7,968,057 | |
| Liabilities | ||
| Payable for investments purchased | $745 | |
| Payable for fund shares redeemed | 5,989 | |
| Accrued management fee | 2,196 | |
| Other affiliated payables | 934 | |
| Other payables and accrued expenses | 498 | |
| Collateral on securities loaned | 122,869 | |
| Total liabilities | 133,231 | |
| Net Assets | $7,834,826 | |
| Net Assets consist of: | ||
| Paid in capital | $5,771,596 | |
| Distributions in excess of net investment income | (9,883) | |
| Accumulated undistributed net realized gain (loss) on investments and foreign currency transactions | 183,667 | |
| Net unrealized appreciation (depreciation) on investments and assets and liabilities in foreign currencies | 1,889,446 | |
| Net Assets | $7,834,826 | |
| Mid-Cap Stock: | ||
| Net Asset Value, offering price and redemption price per share ($5,621,573 ÷ 153,515 shares) | $36.62 | |
| Class K: | ||
| Net Asset Value, offering price and redemption price per share ($2,213,253 ÷ 60,410 shares) | $36.64 |
See accompanying notes which are an integral part of the financial statements.
Statement of Operations
| Amounts in thousands | Year ended April 30, 2017 | |
| Investment Income | ||
| Dividends (including $214 earned from other affiliated issuers) | $82,318 | |
| Interest | 3,353 | |
| Income from Fidelity Central Funds | 5,089 | |
| Total income | 90,760 | |
| Expenses | ||
| Management fee | ||
| Basic fee | $40,733 | |
| Performance adjustment | (11,370) | |
| Transfer agent fees | 9,752 | |
| Accounting and security lending fees | 1,225 | |
| Custodian fees and expenses | 132 | |
| Independent trustees' fees and expenses | 31 | |
| Registration fees | 114 | |
| Audit | 79 | |
| Legal | 26 | |
| Miscellaneous | 67 | |
| Total expenses before reductions | 40,789 | |
| Expense reductions | (336) | 40,453 |
| Net investment income (loss) | 50,307 | |
| Realized and Unrealized Gain (Loss) | ||
| Net realized gain (loss) on: | ||
| Investment securities: | ||
| Unaffiliated issuers | 386,861 | |
| Fidelity Central Funds | (18) | |
| Other affiliated issuers | (209) | |
| Foreign currency transactions | 1 | |
| Total net realized gain (loss) | 386,635 | |
| Change in net unrealized appreciation (depreciation) on: Investment securities | 721,303 | |
| Assets and liabilities in foreign currencies | 6 | |
| Total change in net unrealized appreciation (depreciation) | 721,309 | |
| Net gain (loss) | 1,107,944 | |
| Net increase (decrease) in net assets resulting from operations | $1,158,251 |
See accompanying notes which are an integral part of the financial statements.
Statement of Changes in Net Assets
| Amounts in thousands | Year ended April 30, 2017 | Year ended April 30, 2016 |
| Increase (Decrease) in Net Assets | ||
| Operations | ||
| Net investment income (loss) | $50,307 | $46,833 |
| Net realized gain (loss) | 386,635 | 857,446 |
| Change in net unrealized appreciation (depreciation) | 721,309 | (1,201,757) |
| Net increase (decrease) in net assets resulting from operations | 1,158,251 | (297,478) |
| Distributions to shareholders from net investment income | (58,332) | (48,569) |
| Distributions to shareholders from net realized gain | (541,715) | (930,371) |
| Total distributions | (600,047) | (978,940) |
| Share transactions - net increase (decrease) | 152,647 | (61,224) |
| Redemption fees | 28 | 35 |
| Total increase (decrease) in net assets | 710,879 | (1,337,607) |
| Net Assets | ||
| Beginning of period | 7,123,947 | 8,461,554 |
| End of period | $7,834,826 | $7,123,947 |
| Other Information | ||
| Undistributed net investment income end of period | $– | $17,650 |
| Distributions in excess of net investment income end of period | $(9,883) | $– |
See accompanying notes which are an integral part of the financial statements.
Financial Highlights — Fidelity Mid-Cap Stock Fund
| Years ended April 30, | 2017 | 2016 | 2015 | 2014 | 2013 |
| Selected Per–Share Data | |||||
| Net asset value, beginning of period | $34.07 | $40.11 | $40.26 | $33.69 | $30.15 |
| Income from Investment Operations | |||||
| Net investment income (loss)A | .22 | .21 | .18 | .10 | .29 |
| Net realized and unrealized gain (loss) | 5.19 | (1.54) | 3.52 | 7.69 | 4.45 |
| Total from investment operations | 5.41 | (1.33) | 3.70 | 7.79 | 4.74 |
| Distributions from net investment income | (.27) | (.22) | (.09) | (.08) | (.33) |
| Distributions from net realized gain | (2.59) | (4.49) | (3.76) | (1.14) | (.87) |
| Total distributions | (2.86) | (4.71) | (3.85) | (1.22) | (1.20) |
| Redemption fees added to paid in capitalA,B | – | – | – | – | – |
| Net asset value, end of period | $36.62 | $34.07 | $40.11 | $40.26 | $33.69 |
| Total ReturnC | 16.80% | (3.44)% | 9.83% | 23.50% | 16.54% |
| Ratios to Average Net AssetsD,E | |||||
| Expenses before reductions | .58% | .72% | .73% | .78% | .65% |
| Expenses net of fee waivers, if any | .58% | .72% | .72% | .78% | .65% |
| Expenses net of all reductions | .58% | .72% | .72% | .78% | .63% |
| Net investment income (loss) | .64% | .59% | .46% | .25% | .95% |
| Supplemental Data | |||||
| Net assets, end of period (in millions) | $5,622 | $5,136 | $5,874 | $5,966 | $4,750 |
| Portfolio turnover rateF | 27%G | 23%G | 29% | 27% | 46% |
A Calculated based on average shares outstanding during the period.
B Amount represents less than $.005 per share.
C Total returns would have been lower if certain expenses had not been reduced during the applicable periods shown.
D Fees and expenses of any underlying Fidelity Central Funds are not included in the Fund's expense ratio. The Fund indirectly bears its proportionate share of the expenses of any underlying Fidelity Central Funds.
E Expense ratios reflect operating expenses of the class. Expenses before reductions do not reflect amounts reimbursed by the investment adviser or reductions from brokerage service arrangements or reductions from other expense offset arrangements and do not represent the amount paid by the class during periods when reimbursements or reductions occur. Expenses net of fee waivers reflect expenses after reimbursement by the investment adviser but prior to reductions from brokerage service arrangements or other expense offset arrangements. Expenses net of all reductions represent the net expenses paid by the class.
F Amount does not include the portfolio activity of any underlying Fidelity Central Funds.
G Portfolio turnover rate excludes securities received or delivered in-kind.
See accompanying notes which are an integral part of the financial statements.
Financial Highlights — Fidelity Mid-Cap Stock Fund Class K
| Years ended April 30, | 2017 | 2016 | 2015 | 2014 | 2013 |
| Selected Per–Share Data | |||||
| Net asset value, beginning of period | $34.08 | $40.12 | $40.27 | $33.68 | $30.15 |
| Income from Investment Operations | |||||
| Net investment income (loss)A | .26 | .25 | .22 | .15 | .33 |
| Net realized and unrealized gain (loss) | 5.20 | (1.54) | 3.51 | 7.69 | 4.45 |
| Total from investment operations | 5.46 | (1.29) | 3.73 | 7.84 | 4.78 |
| Distributions from net investment income | (.31) | (.26) | (.13) | (.12) | (.38) |
| Distributions from net realized gain | (2.59) | (4.49) | (3.76) | (1.14) | (.87) |
| Total distributions | (2.90) | (4.75) | (3.88)B | (1.25)C | (1.25) |
| Redemption fees added to paid in capitalA,D | – | – | – | – | – |
| Net asset value, end of period | $36.64 | $34.08 | $40.12 | $40.27 | $33.68 |
| Total ReturnE | 16.96% | (3.33)% | 9.92% | 23.67% | 16.72% |
| Ratios to Average Net AssetsF,G | |||||
| Expenses before reductions | .46% | .60% | .61% | .65% | .50% |
| Expenses net of fee waivers, if any | .46% | .60% | .61% | .65% | .50% |
| Expenses net of all reductions | .46% | .60% | .61% | .65% | .48% |
| Net investment income (loss) | .76% | .71% | .57% | .39% | 1.11% |
| Supplemental Data | |||||
| Net assets, end of period (in millions) | $2,213 | $1,988 | $2,588 | $2,927 | $2,447 |
| Portfolio turnover rateH | 27%I | 23%I | 29% | 27% | 46% |
A Calculated based on average shares outstanding during the period.
B Total distributions of $3.88 per share is comprised of distributions from net investment income of $.127 and distributions from net realized gain of $3.757 per share.
C Total distributions of $1.25 per share is comprised of distributions from net investment income of $.116 and distributions from net realized gain of $1.136 per share.
D Amount represents less than $.005 per share.
E Total returns would have been lower if certain expenses had not been reduced during the applicable periods shown.
F Fees and expenses of any underlying Fidelity Central Funds are not included in the Fund's expense ratio. The Fund indirectly bears its proportionate share of the expenses of any underlying Fidelity Central Funds.
G Expense ratios reflect operating expenses of the class. Expenses before reductions do not reflect amounts reimbursed by the investment adviser or reductions from brokerage service arrangements or reductions from other expense offset arrangements and do not represent the amount paid by the class during periods when reimbursements or reductions occur. Expenses net of fee waivers reflect expenses after reimbursement by the investment adviser but prior to reductions from brokerage service arrangements or other expense offset arrangements. Expenses net of all reductions represent the net expenses paid by the class.
H Amount does not include the portfolio activity of any underlying Fidelity Central Funds.
I Portfolio turnover rate excludes securities received or delivered in-kind.
See accompanying notes which are an integral part of the financial statements.
Notes to Financial Statements
For the period ended April 30, 2017
(Amounts in thousands except percentages)
1. Organization.
Fidelity Mid-Cap Stock Fund (the Fund) is a fund of Fidelity Concord Street Trust (the Trust) (formerly a fund of Fidelity Commonwealth Trust) and is authorized to issue an unlimited number of shares. The Trust is registered under the Investment Company Act of 1940, as amended (the 1940 Act), as an open-end management investment company organized as a Massachusetts business trust. The Fund offers Mid-Cap Stock and Class K shares, each of which has equal rights as to assets and voting privileges. Each class has exclusive voting rights with respect to matters that affect that class.
2. Investments in Fidelity Central Funds.
The Fund invests in Fidelity Central Funds, which are open-end investment companies generally available only to other investment companies and accounts managed by the investment adviser and its affiliates. The Fund's Schedule of Investments lists each of the Fidelity Central Funds held as of period end, if any, as an investment of the Fund, but does not include the underlying holdings of each Fidelity Central Fund. As an Investing Fund, the Fund indirectly bears its proportionate share of the expenses of the underlying Fidelity Central Funds.
The Money Market Central Funds seek preservation of capital and current income and are managed by Fidelity Investments Money Management, Inc. (FIMM), an affiliate of the investment adviser. Annualized expenses of the Money Market Central Funds as of their most recent shareholder report date are less than .005%.
A complete unaudited list of holdings for each Fidelity Central Fund is available upon request or at the Securities and Exchange Commission (the SEC) website at www.sec.gov. In addition, the financial statements of the Fidelity Central Funds, which are not covered by the Fund's Report of Independent Registered Public Accounting Firm, are available on the SEC website or upon request.
3. Significant Accounting Policies.
The Fund is an investment company and applies the accounting and reporting guidance of the Financial Accounting Standards Board (FASB) Accounting Standards Codification Topic 946 Financial Services – Investments Companies. The financial statements have been prepared in conformity with accounting principles generally accepted in the United States of America (GAAP), which require management to make certain estimates and assumptions at the date of the financial statements. Actual results could differ from those estimates. Subsequent events, if any, through the date that the financial statements were issued have been evaluated in the preparation of the financial statements. The following summarizes the significant accounting policies of the Fund:
Investment Valuation. Investments are valued as of 4:00 p.m. Eastern time on the last calendar day of the period. The Board of Trustees (the Board) has delegated the day to day responsibility for the valuation of the Fund's investments to the Fair Value Committee (the Committee) established by the Fund's investment adviser. In accordance with valuation policies and procedures approved by the Board, the Fund attempts to obtain prices from one or more third party pricing vendors or brokers to value its investments. When current market prices, quotations or currency exchange rates are not readily available or reliable, investments will be fair valued in good faith by the Committee, in accordance with procedures adopted by the Board. Factors used in determining fair value vary by investment type and may include market or investment specific events, changes in interest rates and credit quality. The frequency with which these procedures are used cannot be predicted and they may be utilized to a significant extent. The Committee oversees the Fund's valuation policies and procedures and reports to the Board on the Committee's activities and fair value determinations. The Board monitors the appropriateness of the procedures used in valuing the Fund's investments and ratifies the fair value determinations of the Committee.
The Fund categorizes the inputs to valuation techniques used to value its investments into a disclosure hierarchy consisting of three levels as shown below:
- Level 1 – quoted prices in active markets for identical investments
- Level 2 – other significant observable inputs (including quoted prices for similar investments, interest rates, prepayment speeds, etc.)
- Level 3 – unobservable inputs (including the Fund's own assumptions based on the best information available)
Valuation techniques used to value the Fund's investments by major category are as follows:
Equity securities, including restricted securities, for which market quotations are readily available, are valued at the last reported sale price or official closing price as reported by a third party pricing vendor on the primary market or exchange on which they are traded and are categorized as Level 1 in the hierarchy. In the event there were no sales during the day or closing prices are not available, securities are valued at the last quoted bid price or may be valued using the last available price and are generally categorized as Level 2 in the hierarchy. For foreign equity securities, when market or security specific events arise, comparisons to the valuation of American Depositary Receipts (ADRs), futures contracts, Exchange-Traded Funds (ETFs) and certain indexes as well as quoted prices for similar securities may be used and would be categorized as Level 2 in the hierarchy. Utilizing these techniques may result in transfers between Level 1 and Level 2. For equity securities, including restricted securities, where observable inputs are limited, assumptions about market activity and risk are used and these securities may be categorized as Level 3 in the hierarchy.
Debt securities, including restricted securities, are valued based on evaluated prices received from third party pricing vendors or from brokers who make markets in such securities. Corporate bonds are valued by pricing vendors who utilize matrix pricing which considers yield or price of bonds of comparable quality, coupon, maturity and type or by broker-supplied prices. When independent prices are unavailable or unreliable, debt securities may be valued utilizing pricing methodologies which consider similar factors that would be used by third party pricing vendors. Debt securities are generally categorized as Level 2 in the hierarchy but may be Level 3 depending on the circumstances.
Investments in open-end mutual funds, including the Fidelity Central Funds, are valued at their closing net asset value (NAV) each business day and are categorized as Level 1 in the hierarchy.
Changes in valuation techniques may result in transfers in or out of an assigned level within the disclosure hierarchy. The aggregate value of investments by input level as of April 30, 2017 is included at the end of the Fund's Schedule of Investments.
Foreign Currency. The Fund may use foreign currency contracts to facilitate transactions in foreign-denominated securities. Gains and losses from these transactions may arise from changes in the value of the foreign currency or if the counterparties do not perform under the contracts' terms.
Foreign-denominated assets, including investment securities, and liabilities are translated into U.S. dollars at the exchange rates at period end. Purchases and sales of investment securities, income and dividends received and expenses denominated in foreign currencies are translated into U.S. dollars at the exchange rate in effect on the transaction date.
The effects of exchange rate fluctuations on investments are included with the net realized and unrealized gain (loss) on investment securities. Other foreign currency transactions resulting in realized and unrealized gain (loss) are disclosed separately.
Investment Transactions and Income. For financial reporting purposes, the Fund's investment holdings and NAV include trades executed through the end of the last business day of the period. The NAV per share for processing shareholder transactions is calculated as of the close of business of the New York Stock Exchange (NYSE), normally 4:00 p.m. Eastern time and includes trades executed through the end of the prior business day. Gains and losses on securities sold are determined on the basis of identified cost and may include proceeds received from litigation. Dividend income is recorded on the ex-dividend date, except for certain dividends from foreign securities where the ex-dividend date may have passed, which are recorded as soon as the Fund is informed of the ex-dividend date. Non-cash dividends included in dividend income, if any, are recorded at the fair market value of the securities received. Income and capital gain distributions from Fidelity Central Funds, if any, are recorded on the ex-dividend date. Certain distributions received by the Fund represent a return of capital or capital gain. The Fund determines the components of these distributions subsequent to the ex-dividend date, based upon receipt of tax filings or other correspondence relating to the underlying investment. These distributions are recorded as a reduction of cost of investments and/or as a realized gain. Interest income is accrued as earned and includes coupon interest and amortization of premium and accretion of discount on debt securities as applicable. Investment income is recorded net of foreign taxes withheld where recovery of such taxes is uncertain.
Class Allocations and Expenses. Investment income, realized and unrealized capital gains and losses, common expenses of the Fund, and certain fund-level expense reductions, if any, are allocated daily on a pro-rata basis to each class based on the relative net assets of each class to the total net assets of the Fund. Each class differs with respect to transfer agent fees incurred. Certain expense reductions may also differ by class. For the reporting period, the allocated portion of income and expenses to each class as a percent of its average net assets may vary due to the timing of recording these transactions in relation to fluctuating net assets of the classes. Expenses directly attributable to a fund are charged to that fund. Expenses attributable to more than one fund are allocated among the respective funds on the basis of relative net assets or other appropriate methods. Expense estimates are accrued in the period to which they relate and adjustments are made when actual amounts are known.
Deferred Trustee Compensation. Under a Deferred Compensation Plan (the Plan), independent Trustees may elect to defer receipt of a portion of their annual compensation. Deferred amounts are invested in a cross-section of Fidelity funds, are marked-to-market and remain in the Fund until distributed in accordance with the Plan. The investment of deferred amounts and the offsetting payable to the Trustees are included in the accompanying Statement of Assets and Liabilities.
Income Tax Information and Distributions to Shareholders. Each year, the Fund intends to qualify as a regulated investment company under Subchapter M of the Internal Revenue Code, including distributing substantially all of its taxable income and realized gains. As a result, no provision for U.S. Federal income taxes is required. As of April 30, 2017, the Fund did not have any unrecognized tax benefits in the financial statements; nor is the Fund aware of any tax positions for which it is reasonably possible that the total amounts of unrecognized tax benefits will significantly change in the next twelve months. The Fund files a U.S. federal tax return, in addition to state and local tax returns as required. The Fund's federal income tax returns are subject to examination by the Internal Revenue Service (IRS) for a period of three fiscal years after they are filed. State and local tax returns may be subject to examination for an additional fiscal year depending on the jurisdiction. Foreign taxes are provided for based on the Fund's understanding of the tax rules and rates that exist in the foreign markets in which it invests.
Distributions are declared and recorded on the ex-dividend date. Income dividends and capital gain distributions are declared separately for each class. Income and capital gain distributions are determined in accordance with income tax regulations, which may differ from GAAP. In addition, the Fund claimed a portion of the payment made to redeeming shareholders as a distribution for income tax purposes.
Capital accounts within the financial statements are adjusted for permanent book-tax differences. These adjustments have no impact on net assets or the results of operations. Capital accounts are not adjusted for temporary book-tax differences which will reverse in a subsequent period.
Book-tax differences are primarily due to foreign currency transactions, partnerships, passive foreign investment companies (PFIC), market discount, redemptions in kind, deferred trustees compensation and losses deferred due to wash sales.
The federal tax cost of investment securities and unrealized appreciation (depreciation) as of period end were as follows:
| Gross unrealized appreciation | $2,275,881 |
| Gross unrealized depreciation | (381,970) |
| Net unrealized appreciation (depreciation) on securities | $1,893,911 |
| Tax Cost | $6,022,341 |
The tax-based components of distributable earnings as of period end were as follows:
| Undistributed ordinary income | $39,753 |
| Undistributed long-term capital gain | $148,858 |
| Net unrealized appreciation (depreciation) on securities and other investments | $1,875,049 |
The tax character of distributions paid was as follows:
| April 30, 2017 | April 30, 2016 | |
| Ordinary Income | $75,159 | $ 48,569 |
| Long-term Capital Gains | 524,888 | 930,371 |
| Total | $600,047 | $ 978,940 |
Short-Term Trading (Redemption) Fees. Shares held by investors in the Fund less than 30 days may have been subject to a redemption fee equal to .75% of the NAV of shares redeemed. All redemption fees, which reduce the proceeds of the shareholder redemption, are retained by the Fund and accounted for as an addition to paid in capital. In November 2016, the Board of Trustees approved the elimination of these redemption fees effective December 12, 2016.
Restricted Securities. The Fund may invest in securities that are subject to legal or contractual restrictions on resale. These securities generally may be resold in transactions exempt from registration or to the public if the securities are registered. Disposal of these securities may involve time-consuming negotiations and expense, and prompt sale at an acceptable price may be difficult. Information regarding restricted securities is included at the end of the Fund's Schedule of Investments.
Consolidated Subsidiary. The Fund invests in certain investments through a wholly-owned subsidiary ("Subsidiary"), which may be subject to federal and state taxes upon disposition.
As of period end, the Fund held an investment of $32,749 in these Subsidiaries, representing .42% of the Fund's net assets. The financial statements have been consolidated and include accounts of the Fund and each Subsidiary. Accordingly, all inter-company transactions and balances have been eliminated.
Any cash held by the Subsidiaries is restricted as to its use and is presented as Restricted cash in the Statement of Assets and Liabilities.
4. Purchases and Sales of Investments.
Purchases and sales of securities, other than short-term securities and in-kind transactions, aggregated $1,875,147 and $2,243,645, respectively.
Redemptions In-Kind. During the period, 2,668 shares of the Fund held by an unaffiliated entity were redeemed in-kind for investments and cash, including accrued interest, with a value of $91,425. The net realized gain of $26,420 on investments delivered through the in-kind redemptions is included in the accompanying Statement of Operations. The amount of the redemptions is included in share transactions activity shown in the accompanying Statement of Changes in Net Assets as well as the Notes to Financial Statements. The Fund recognized no gain or loss for federal income tax purposes.
Prior Fiscal Year Redemptions In-Kind. During the prior period, 7,169 shares of the Fund held by unaffiliated entities were redeemed in-kind for investments and cash, including accrued interest, with a value of $265,315. The Fund had a net realized gain of $85,469 on investments delivered through the in-kind redemptions. The amount the redemptions is included in share transactions activity shown in the accompanying Statement of Changes in Net Assets as well as the Notes to Financial Statements. The Fund recognized no gain or loss for federal income tax purposes.
5. Fees and Other Transactions with Affiliates.
Management Fee. Fidelity Management & Research Company (the investment adviser) and its affiliates provide the Fund with investment management related services for which the Fund pays a monthly management fee. The management fee is the sum of an individual fund fee rate that is based on an annual rate of .30% of the Fund's average net assets and an annualized group fee rate that averaged .25% during the period. The group fee rate is based upon the average net assets of all the mutual funds advised by the investment adviser, including any mutual funds previously advised by the investment adviser that are currently advised by Fidelity SelectCo, LLC, an affiliate of the investment adviser. The group fee rate decreases as assets under management increase and increases as assets under management decrease. In addition, the management fee is subject to a performance adjustment (up to a maximum of +/- .20% of the Fund's average net assets over a 36 month performance period). The upward or downward adjustment to the management fee is based on the relative investment performance of Mid-Cap Stock as compared to its benchmark index, the S&P MidCap 400 Index, over the same 36 month performance period. For the reporting period, the total annual management fee rate, including the performance adjustment, was .39% of the Fund's average net assets. The performance adjustment included in the management fee rate may be higher or lower than the maximum performance adjustment rate due to the difference between the average net assets for the reporting and performance periods.
Transfer Agent Fees. Fidelity Investments Institutional Operations Company, Inc., (FIIOC), an affiliate of the investment adviser, is the transfer, dividend disbursing and shareholder servicing agent for each class of the Fund. FIIOC receives account fees and asset-based fees that vary according to the account size and type of account of the shareholders of Mid-Cap Stock. FIIOC receives an asset-based fee of Class K's average net assets. FIIOC pays for typesetting, printing and mailing of shareholder reports, except proxy statements.
For the period, transfer agent fees for each class were as follows:
| Amount | % of Class-Level Average Net Assets | |
| Mid-Cap Stock | $8,778 | .16 |
| Class K | 974 | .05 |
| $9,752 |
Accounting and Security Lending Fees. Fidelity Service Company, Inc. (FSC), an affiliate of the investment adviser, maintains the Fund's accounting records. The accounting fee is based on the level of average net assets for each month. Under a separate contract, FSC administers the security lending program. The security lending fee is based on the number and duration of lending transactions.
Brokerage Commissions. The Fund placed a portion of its portfolio transactions with brokerage firms which are affiliates of the investment adviser. Brokerage commissions are included in net realized gain (loss) and change in net unrealized appreciation (depreciation) in the Statement of Operations. The commissions paid to these affiliated firms were $77 for the period.
Interfund Trades. The Fund may purchase from or sell securities to other Fidelity Funds under procedures adopted by the Board. The procedures have been designed to ensure these interfund trades are executed in accordance with Rule 17a-7 of the 1940 Act. Interfund trades are included within the respective purchases and sales amounts shown in the Purchases and Sales of Investments note.
6. Committed Line of Credit.
The Fund participates with other funds managed by the investment adviser or an affiliate in a $4.25 billion credit facility (the "line of credit") to be utilized for temporary or emergency purposes to fund shareholder redemptions or for other short-term liquidity purposes. The Fund has agreed to pay commitment fees on its pro-rata portion of the line of credit, which amounted to $25 and is reflected in Miscellaneous expenses on the Statement of Operations. During the period, the Fund did not borrow on this line of credit.
7. Security Lending.
The Fund lends portfolio securities through a lending agent from time to time in order to earn additional income. For equity securities, a lending agent is used and may loan securities to certain qualified borrowers, including Fidelity Capital Markets (FCM), a broker-dealer affiliated with the Fund. On the settlement date of the loan, the Fund receives collateral (in the form of U.S. Treasury obligations, letters of credit and/or cash) against the loaned securities and maintains collateral in an amount not less than 100% of the market value of the loaned securities during the period of the loan. The market value of the loaned securities is determined at the close of business of the Fund and any additional required collateral is delivered to the Fund on the next business day. The Fund or borrower may terminate the loan at any time, and if the borrower defaults on its obligation to return the securities loaned because of insolvency or other reasons, the Fund may apply collateral received from the borrower against the obligation. The Fund may experience delays and costs in recovering the securities loaned. Any cash collateral received is invested in the Fidelity Securities Lending Cash Central Fund. The value of loaned securities and cash collateral at period end are disclosed on the Fund's Statement of Assets and Liabilities. The value of securities loaned to FCM at period end was $7,550. Security lending income represents the income earned on investing cash collateral, less rebates paid to borrowers and any lending agent fees associated with the loan, plus any premium payments received for lending certain types of securities. Security lending income is presented in the Statement of Operations as a component of income from Fidelity Central Funds. Total security lending income during the period amounted to $2,399, including $142 from securities loaned to FCM.
8. Expense Reductions.
Commissions paid to certain brokers with whom the investment adviser, or its affiliates, places trades on behalf of the Fund include an amount in addition to trade execution, which may be rebated back to the Fund to offset certain expenses. This amount totaled $274 for the period.
In addition, through arrangements with the Fund's custodian, credits realized as a result of certain uninvested cash balances were used to reduce the Fund's expenses. During the period, these credits reduced the Fund's custody expenses by $1.
In addition, during the period the investment adviser reimbursed and/or waived a portion of fund-level operating expenses in the amount of $61.
9. Distributions to Shareholders.
Distributions to shareholders of each class were as follows:
| Year ended April 30, 2017 | Year ended April 30, 2016 | |
| From net investment income | ||
| Mid-Cap Stock | $40,418 | $32,540 |
| Class K | 17,914 | 16,029 |
| Total | $58,332 | $48,569 |
| From net realized gain | ||
| Mid-Cap Stock | $391,773 | $657,512 |
| Class K | 149,942 | 272,859 |
| Total | $541,715 | $930,371 |
10. Share Transactions.
Share transactions for each class were as follows and may contain automatic conversions between classes or exchanges between affiliated funds:
| Shares | Shares | Dollars | Dollars | |
| Year ended April 30, 2017 | Year ended April 30, 2016 | Year ended April 30, 2017 | Year ended April 30, 2016 | |
| Mid-Cap Stock | ||||
| Shares sold | 16,037 | 11,317 | $556,563 | $392,342 |
| Reinvestment of distributions | 12,275 | 18,581 | 412,221 | 658,782 |
| Shares redeemed | (25,541) | (25,606) | (885,025) | (889,201) |
| Net increase (decrease) | 2,771 | 4,292 | $83,759 | $161,923 |
| Class K | ||||
| Shares sold | 13,774 | 10,618 | $477,891 | $370,206 |
| Reinvestment of distributions | 4,995 | 8,154 | 167,856 | 288,888 |
| Shares redeemed | (16,690)(a) | (24,946)(b) | (576,859)(a) | (882,241)(b) |
| Net increase (decrease) | 2,079 | (6,174) | $68,888 | $(223,147) |
(a) Amount includes in-kind redemptions (see Note 4: Redemptions In-Kind).
(b) Amount includes in-kind redemptions (see Note 4: Prior Fiscal Year Redemptions In-Kind).
11. Other.
The Fund's organizational documents provide former and current trustees and officers with a limited indemnification against liabilities arising in connection with the performance of their duties to the Fund. In the normal course of business, the Fund may also enter into contracts that provide general indemnifications. The Fund's maximum exposure under these arrangements is unknown as this would be dependent on future claims that may be made against the Fund. The risk of material loss from such claims is considered remote.
Report of Independent Registered Public Accounting Firm
To the Trustees of Fidelity Concord Street Trust and Shareholders of Fidelity Mid-Cap Stock Fund:
We have audited the accompanying statement of assets and liabilities of Fidelity Mid-Cap Stock Fund (the Fund), a fund of Fidelity Concord Street Trust, including the schedule of investments, as of April 30, 2017, and the related statement of operations for the year then ended, the statement of changes in net assets for each of the two years in the period then ended, and the financial highlights for each of the five years in the period then ended. These financial statements and financial highlights are the responsibility of the Fund's management. Our responsibility is to express an opinion on these financial statements and financial highlights based on our audits.
We conducted our audits in accordance with the standards of the Public Company Accounting Oversight Board (United States). Those standards require that we plan and perform the audit to obtain reasonable assurance about whether the financial statements and financial highlights are free of material misstatement. The Fund is not required to have, nor were we engaged to perform, an audit of its internal control over financial reporting. Our audits included consideration of internal control over financial reporting as a basis for designing audit procedures that are appropriate in the circumstances, but not for the purpose of expressing an opinion on the effectiveness of the Fund's internal control over financial reporting. Accordingly, we express no such opinion. An audit also includes examining, on a test basis, evidence supporting the amounts and disclosures in the financial statements, assessing the accounting principles used and significant estimates made by management, as well as evaluating the overall financial statement presentation. Our procedures included confirmation of securities owned as of April 30, 2017, by correspondence with the custodians and brokers; when replies were not received from brokers, we performed other auditing procedures. We believe that our audits provide a reasonable basis for our opinion.
In our opinion, such financial statements and financial highlights referred to above present fairly, in all material respects, the financial position of Fidelity Mid-Cap Stock Fund as of April 30, 2017, the results of its operations for the year then ended, the changes in its net assets for each of the two years in the period then ended, and the financial highlights for each of the five years in the period then ended in conformity with accounting principles generally accepted in the United States of America.
DELOITTE & TOUCHE LLP
Boston, Massachusetts
June 14, 2017
Trustees and Officers
The Trustees, Members of the Advisory Board (if any), and officers of the trust and fund, as applicable, are listed below. The Board of Trustees governs the fund and is responsible for protecting the interests of shareholders. The Trustees are experienced executives who meet periodically throughout the year to oversee the fund's activities, review contractual arrangements with companies that provide services to the fund, oversee management of the risks associated with such activities and contractual arrangements, and review the fund's performance. Except for Jonathan Chiel, each of the Trustees oversees 189 funds. Mr. Chiel oversees 142 funds.
The Trustees hold office without limit in time except that (a) any Trustee may resign; (b) any Trustee may be removed by written instrument, signed by at least two-thirds of the number of Trustees prior to such removal; (c) any Trustee who requests to be retired or who has become incapacitated by illness or injury may be retired by written instrument signed by a majority of the other Trustees; and (d) any Trustee may be removed at any special meeting of shareholders by a two-thirds vote of the outstanding voting securities of the trust. Each Trustee who is not an interested person (as defined in the 1940 Act) of the trust and the fund is referred to herein as an Independent Trustee. Each Independent Trustee shall retire not later than the last day of the calendar year in which his or her 75th birthday occurs. The Independent Trustees may waive this mandatory retirement age policy with respect to individual Trustees. Officers and Advisory Board Members hold office without limit in time, except that any officer or Advisory Board Member may resign or may be removed by a vote of a majority of the Trustees at any regular meeting or any special meeting of the Trustees. Except as indicated, each individual has held the office shown or other offices in the same company for the past five years.
The fund’s Statement of Additional Information (SAI) includes more information about the Trustees. To request a free copy, call Fidelity at 1-800-835-5092.
Experience, Skills, Attributes, and Qualifications of the Trustees. The Governance and Nominating Committee has adopted a statement of policy that describes the experience, qualifications, attributes, and skills that are necessary and desirable for potential Independent Trustee candidates (Statement of Policy). The Board believes that each Trustee satisfied at the time he or she was initially elected or appointed a Trustee, and continues to satisfy, the standards contemplated by the Statement of Policy. The Governance and Nominating Committee also engages professional search firms to help identify potential Independent Trustee candidates who have the experience, qualifications, attributes, and skills consistent with the Statement of Policy. From time to time, additional criteria based on the composition and skills of the current Independent Trustees, as well as experience or skills that may be appropriate in light of future changes to board composition, business conditions, and regulatory or other developments, have also been considered by the professional search firms and the Governance and Nominating Committee. In addition, the Board takes into account the Trustees' commitment and participation in Board and committee meetings, as well as their leadership of standing and ad hoc committees throughout their tenure.
In determining that a particular Trustee was and continues to be qualified to serve as a Trustee, the Board has considered a variety of criteria, none of which, in isolation, was controlling. The Board believes that, collectively, the Trustees have balanced and diverse experience, qualifications, attributes, and skills, which allow the Board to operate effectively in governing the fund and protecting the interests of shareholders. Information about the specific experience, skills, attributes, and qualifications of each Trustee, which in each case led to the Board's conclusion that the Trustee should serve (or continue to serve) as a trustee of the fund, is provided below.
Board Structure and Oversight Function. James C. Curvey is an interested person and currently serves as Chairman. The Trustees have determined that an interested Chairman is appropriate and benefits shareholders because an interested Chairman has a personal and professional stake in the quality and continuity of services provided to the fund. Independent Trustees exercise their informed business judgment to appoint an individual of their choosing to serve as Chairman, regardless of whether the Trustee happens to be independent or a member of management. The Independent Trustees have determined that they can act independently and effectively without having an Independent Trustee serve as Chairman and that a key structural component for assuring that they are in a position to do so is for the Independent Trustees to constitute a substantial majority for the Board. The Independent Trustees also regularly meet in executive session. Ned C. Lautenbach serves as Chairman of the Independent Trustees and as such (i) acts as a liaison between the Independent Trustees and management with respect to matters important to the Independent Trustees and (ii) with management prepares agendas for Board meetings.
Fidelity® funds are overseen by different Boards of Trustees. The fund's Board oversees Fidelity's high income and certain equity funds, and other Boards oversee Fidelity's investment-grade bond, money market, asset allocation, and sector funds. The asset allocation funds may invest in Fidelity® funds overseen by the fund's Board. The use of separate Boards, each with its own committee structure, allows the Trustees of each group of Fidelity® funds to focus on the unique issues of the funds they oversee, including common research, investment, and operational issues. On occasion, the separate Boards establish joint committees to address issues of overlapping consequences for the Fidelity® funds overseen by each Board.
The Trustees operate using a system of committees to facilitate the timely and efficient consideration of all matters of importance to the Trustees, the fund, and fund shareholders and to facilitate compliance with legal and regulatory requirements and oversight of the fund's activities and associated risks. The Board, acting through its committees, has charged FMR and its affiliates with (i) identifying events or circumstances the occurrence of which could have demonstrably adverse effects on the fund's business and/or reputation; (ii) implementing processes and controls to lessen the possibility that such events or circumstances occur or to mitigate the effects of such events or circumstances if they do occur; and (iii) creating and maintaining a system designed to evaluate continuously business and market conditions in order to facilitate the identification and implementation processes described in (i) and (ii) above. Because the day-to-day operations and activities of the fund are carried out by or through FMR, its affiliates, and other service providers, the fund's exposure to risks is mitigated but not eliminated by the processes overseen by the Trustees. While each of the Board's committees has responsibility for overseeing different aspects of the fund's activities, oversight is exercised primarily through the Operations, Audit, and Compliance Committees. In addition, the Independent Trustees have worked with FMR to enhance the Board's oversight of investment and financial risks, legal and regulatory risks, technology risks, and operational risks, including the development of additional risk reporting to the Board. For example, a working group comprised of Independent Trustees and FMR has worked and continues to work to review the Fidelity® funds' valuation-related activities, reporting and risk management. Appropriate personnel, including but not limited to the fund's Chief Compliance Officer (CCO), FMR's internal auditor, the independent accountants, the fund's Treasurer and portfolio management personnel, make periodic reports to the Board's committees, as appropriate, including an annual review of Fidelity's risk management program for the Fidelity® funds. The responsibilities of each standing committee, including their oversight responsibilities, are described further under "Standing Committees of the Trustees."
Interested Trustees*:
Correspondence intended for a Trustee who is an interested person may be sent to Fidelity Investments, 245 Summer Street, Boston, Massachusetts 02210.
Name, Year of Birth; Principal Occupations and Other Relevant Experience+
Jonathan Chiel (1957)
Year of Election or Appointment: 2016
Trustee
Mr. Chiel also serves as Trustee of other Fidelity funds. Mr. Chiel is Executive Vice President and General Counsel for FMR LLC (diversified financial services company, 2012-present). Previously, Mr. Chiel served as general counsel (2004-2012) and senior vice president and deputy general counsel (2000-2004) for John Hancock Financial Services; a partner with Choate, Hall & Stewart (1996-2000) (law firm); and an Assistant United States Attorney for the United States Attorney’s Office of the District of Massachusetts (1986-95), including Chief of the Criminal Division (1993-1995). Mr. Chiel is a director on the boards of the Boston Bar Foundation and the Maimonides School.
James C. Curvey (1935)
Year of Election or Appointment: 2007
Trustee
Chairman of the Board of Trustees
Mr. Curvey also serves as Trustee of other Fidelity® funds. Mr. Curvey is a Director of Fidelity Research & Analysis Co. (investment adviser firm, 2009-present), and Vice Chairman (2007-present) and Director of FMR LLC (diversified financial services company). In addition, Mr. Curvey serves as an Overseer for the Boston Symphony Orchestra and a member of the board of Artis-Naples, Naples, Florida, and as a Trustee for Brewster Academy, Wolfeboro, New Hampshire. Previously, Mr. Curvey served as a Director of Fidelity Investments Money Management, Inc. (investment adviser firm, 2009-2014) and a Director of FMR and FMR Co., Inc. (investment adviser firms, 2007-2014).
Charles S. Morrison (1960)
Year of Election or Appointment: 2014
Trustee
Mr. Morrison also serves as Trustee of other funds. He serves as President of Fidelity Management & Research Company (FMR) (investment adviser firm, 2016-present), a Director of Fidelity Investments Money Management, Inc. (FIMM) (investment adviser firm, 2014-present), Director of Fidelity SelectCo, LLC (investment adviser firm, 2014-present), President, Asset Management (2014-present), and is an employee of Fidelity Investments. Previously, Mr. Morrison served as Vice President of Fidelity's Fixed Income and Asset Allocation Funds (2012-2014), President, Fixed Income (2011-2014), Vice President of Fidelity's Money Market Funds (2005-2009), President, Money Market Group Leader of FMR (investment adviser firm, 2009), and Senior Vice President, Money Market Group of FMR (2004-2009). Mr. Morrison also served as Vice President of Fidelity's Bond Funds (2002-2005), certain Balanced Funds (2002-2005), and certain Asset Allocation Funds (2002-2007), and as Senior Vice President (2002-2005) of Fidelity's Bond Division.
* Determined to be an “Interested Trustee” by virtue of, among other things, his or her affiliation with the trust or various entities under common control with FMR.
+ The information includes the Trustee's principal occupation during the last five years and other information relating to the experience, attributes, and skills relevant to the Trustee's qualifications to serve as a Trustee, which led to the conclusion that the Trustee should serve as a Trustee for the fund.
Independent Trustees:
Correspondence intended for an Independent Trustee may be sent to Fidelity Investments, P.O. Box 55235, Boston, Massachusetts 02205-5235.
Name, Year of Birth; Principal Occupations and Other Relevant Experience+
Dennis J. Dirks (1948)
Year of Election or Appointment: 2005
Trustee
Mr. Dirks also serves as Trustee of other Fidelity® funds. Prior to his retirement in May 2003, Mr. Dirks was Chief Operating Officer and a member of the Board of The Depository Trust & Clearing Corporation (DTCC). He also served as President, Chief Operating Officer, and Board member of The Depository Trust Company (DTC) and President and Board member of the National Securities Clearing Corporation (NSCC). In addition, Mr. Dirks served as Chief Executive Officer and Board member of the Government Securities Clearing Corporation, Chief Executive Officer and Board member of the Mortgage-Backed Securities Clearing Corporation, as a Trustee and a member of the Finance Committee of Manhattan College (2005-2008), as a Trustee and a member of the Finance Committee of AHRC of Nassau County (2006-2008), as a member of the Independent Directors Council (IDC) Governing Council (2010-2015), and as a member of the Board of Directors for The Brookville Center for Children’s Services, Inc. (2009-2017). Mr. Dirks is a member of the Finance Committee (2016-present) and Board of Directors (2017-present) of the Asolo Repertory Theatre.
Alan J. Lacy (1953)
Year of Election or Appointment: 2008
Trustee
Mr. Lacy also serves as Trustee of other Fidelity® funds. Mr. Lacy serves as a Director of Bristol-Myers Squibb Company (global pharmaceuticals, 2008-present). He is a Trustee of the California Chapter of The Nature Conservancy (2015-present) and a Director of the Center for Advanced Study in the Behavioral Sciences at Stanford University (2015-present). In addition, Mr. Lacy served as Senior Adviser (2007-2014) of Oak Hill Capital Partners, L.P. (private equity) and also served as Chief Executive Officer (2005) and Vice Chairman (2005-2006) of Sears Holdings Corporation (retail) and Chief Executive Officer and Chairman of the Board of Sears, Roebuck and Co. (retail, 2000-2005). Previously, Mr. Lacy served as Chairman (2014-2017) and a member (2010-2017) of the Board of Directors of Dave & Buster’s Entertainment, Inc. (restaurant and entertainment complexes), as Chairman (2008-2011) and a member (2006-2015) of the Board of Trustees of the National Parks Conservation Association, and as a member of the Board of Directors for The Hillman Companies, Inc. (hardware wholesalers, 2010-2014), Earth Fare, Inc. (retail grocery, 2010-2014), and The Western Union Company (global money transfer, 2006-2011).
Ned C. Lautenbach (1944)
Year of Election or Appointment: 2000
Trustee
Chairman of the Independent Trustees
Mr. Lautenbach also serves as Trustee of other Fidelity® funds. Mr. Lautenbach currently serves as the Lead Director of the Eaton Corporation Board of Directors (diversified industrial, 1997-present). Mr. Lautenbach is Chairman of the Board of Directors of Artis-Naples in Naples, Florida (2012-present), a member of the Council on Foreign Relations (1994-present), and currently Vice Chair of the Board of Governors, State University System of Florida (2013-present). Previously, Mr. Lautenbach was a Partner and Advisory Partner at Clayton, Dubilier & Rice, LLC (private equity investment, 1998-2010), as well as a Director of Sony Corporation (2006-2007). Mr. Lautenbach also had a 30-year career with IBM (technology company) during which time he served as Senior Vice President and a member of the Corporate Executive Committee (1968-1998).
Joseph Mauriello (1944)
Year of Election or Appointment: 2008
Trustee
Mr. Mauriello also serves as Trustee of other Fidelity® funds. Prior to his retirement in January 2006, Mr. Mauriello served in numerous senior management positions including Deputy Chairman and Chief Operating Officer (2004-2005), and Vice Chairman of Financial Services (2002-2004) of KPMG LLP US (professional services, 1965-2005). Mr. Mauriello currently serves as a member of the Board of Directors of XL Group plc. (global insurance and re-insurance, 2006-present) and the Independent Directors Council (IDC) Governing Council (2015-present). Previously, Mr. Mauriello served as a Director of the Hamilton Funds of the Bank of New York (2006-2007) and of Arcadia Resources Inc. (health care services and products, 2007-2012).
Robert W. Selander (1950)
Year of Election or Appointment: 2011
Trustee
Mr. Selander also serves as Trustee of other Fidelity® funds. Mr. Selander serves as a Director of The Western Union Company (global money transfer, 2014-present) and a non-executive Chairman of Health Equity, Inc. (health savings custodian, 2015-present). Previously, Mr. Selander served as a Member of the Advisory Board of certain Fidelity® funds (2011), and Executive Vice Chairman (2010), Chief Executive Officer (2009-2010), and President and Chief Executive Officer (1997-2009) of Mastercard, Inc.
Cornelia M. Small (1944)
Year of Election or Appointment: 2005
Trustee
Ms. Small also serves as Trustee of other Fidelity® funds. Ms. Small is a member of the Board of Directors (2009-present) and Chair of the Investment Committee (2010-present) of the Teagle Foundation. Ms. Small also serves on the Investment Committee of the Berkshire Taconic Community Foundation (2008-present). Previously, Ms. Small served as Chairperson (2002-2008) and a member of the Investment Committee and Chairperson (2008-2012) and a member of the Board of Trustees of Smith College. In addition, Ms. Small served as Chief Investment Officer, Director of Global Equity Investments, and a member of the Board of Directors of Scudder, Stevens & Clark and Scudder Kemper Investments.
William S. Stavropoulos (1939)
Year of Election or Appointment: 2001
Trustee
Vice Chairman of the Independent Trustees
Mr. Stavropoulos also serves as Trustee of other Fidelity® funds. Mr. Stavropoulos serves as President and Founder of the Michigan Baseball Foundation, the Great Lakes Loons (2007-present). Mr. Stavropoulos is Chairman Emeritus of the Board of Directors of The Dow Chemical Company, where he previously served in numerous senior management positions, including President, CEO (1995-2000; 2002-2004), Chairman of the Executive Committee (2000-2006), and as a member of the Board of Directors (1990-2006). Currently, Mr. Stavropoulos is Chairman of the Board of Directors of Univar Inc. (global distributor of commodity and specialty chemicals), a Director of Teradata Corporation (data warehousing and technology solutions), and a member of the Advisory Board for Metalmark Capital LLC (private equity investment, 2005-present). Mr. Stavropoulos is an operating advisor to Clayton, Dubilier & Rice, LLC (private equity investment). In addition, Mr. Stavropoulos is a member of the University of Notre Dame Advisory Council for the College of Science, a Trustee of the Rollin L. Gerstacker Foundation, and a Director of Artis-Naples in Naples, Florida. Previously, Mr. Stavropoulos served as a Director of Chemical Financial Corporation (bank holding company, 1993-2012) and Tyco International, Ltd. (multinational manufacturing and services, 2007-2012).
David M. Thomas (1949)
Year of Election or Appointment: 2008
Trustee
Mr. Thomas also serves as Trustee of other Fidelity® funds. Mr. Thomas serves as Non-Executive Chairman of the Board of Directors of Fortune Brands Home and Security (home and security products, 2011-present), as a member of the Board of Directors (2004-present) and Presiding Director (2013-present) of Interpublic Group of Companies, Inc. (marketing communication), and as a member of the Board of Trustees of the University of Florida (2013-present). Previously, Mr. Thomas served as Executive Chairman (2005-2006) and Chairman and Chief Executive Officer (2000-2005) of IMS Health, Inc. (pharmaceutical and healthcare information solutions), and a Director of Fortune Brands, Inc. (consumer products, 2000-2011).
+ The information includes the Trustee's principal occupation during the last five years and other information relating to the experience, attributes, and skills relevant to the Trustee's qualifications to serve as a Trustee, which led to the conclusion that the Trustee should serve as a Trustee for the fund.
Advisory Board Members and Officers:
Correspondence intended for an officer or Peter S. Lynch may be sent to Fidelity Investments, 245 Summer Street, Boston, Massachusetts 02210. Officers appear below in alphabetical order.
Name, Year of Birth; Principal Occupation
Peter S. Lynch (1944)
Year of Election or Appointment: 2003
Member of the Advisory Board
Mr. Lynch also serves as Member of the Advisory Board of other Fidelity® funds. Mr. Lynch is Vice Chairman and a Director of FMR (investment adviser firm) and FMR Co., Inc. (investment adviser firm). In addition, Mr. Lynch serves as a Trustee of Boston College and as the Chairman of the Inner-City Scholarship Fund. Previously, Mr. Lynch served on the Special Olympics International Board of Directors (1997-2006).
Elizabeth Paige Baumann (1968)
Year of Election or Appointment: 2017
Anti-Money Laundering (AML) Officer
Ms. Baumann also serves as AML Officer of other funds. She is Chief AML Officer (2012-present) and Senior Vice President (2014-present) of FMR LLC (diversified financial services company) and is an employee of Fidelity Investments. Previously, Ms. Baumann served as AML Officer of the funds (2012-2016), and Vice President (2007-2014) and Deputy Anti-Money Laundering Officer (2007-2012) of FMR LLC.
Marc R. Bryant (1966)
Year of Election or Appointment: 2015
Secretary and Chief Legal Officer (CLO)
Mr. Bryant also serves as Secretary and CLO of other funds. Mr. Bryant serves as CLO, Secretary, and Senior Vice President of Fidelity Management & Research Company (investment adviser firm, 2015-present) and FMR Co., Inc. (investment adviser firm, 2015-present); Secretary of Fidelity SelectCo, LLC (investment adviser firm, 2015-present) and Fidelity Investments Money Management, Inc. (investment adviser firm, 2015-present); and CLO of Fidelity Management & Research (Hong Kong) Limited and FMR Investment Management (UK) Limited (investment adviser firms, 2015-present) and Fidelity Management & Research (Japan) Limited (investment adviser firm, 2016-present). He is Senior Vice President and Deputy General Counsel of FMR LLC (diversified financial services company). Previously, Mr. Bryant served as Secretary and CLO of Fidelity Rutland Square Trust II (2010-2014) and Assistant Secretary of Fidelity's Fixed Income and Asset Allocation Funds (2013-2015). Prior to joining Fidelity Investments, Mr. Bryant served as a Senior Vice President and the Head of Global Retail Legal for AllianceBernstein L.P. (2006-2010), and as the General Counsel for ProFund Advisors LLC (2001-2006).
Jeffrey S. Christian (1961)
Year of Election or Appointment: 2016
Assistant Treasurer
Mr. Christian also serves as Assistant Treasurer of other funds. Mr. Christian is an employee of Fidelity Investments (2003-present).
William C. Coffey (1969)
Year of Election or Appointment: 2009
Assistant Secretary
Mr. Coffey also serves as Assistant Secretary of other funds. He is Senior Vice President and Deputy General Counsel of FMR LLC (diversified financial services company, 2010-present), and is an employee of Fidelity Investments. Previously, Mr. Coffey served as Vice President and Associate General Counsel of FMR LLC (2005-2009).
Jonathan Davis (1968)
Year of Election or Appointment: 2010
Assistant Treasurer
Mr. Davis also serves as Assistant Treasurer of other funds, and is an employee of Fidelity Investments. Previously, Mr. Davis served as Vice President and Associate General Counsel of FMR LLC (diversified financial services company, 2003-2010).
Adrien E. Deberghes (1967)
Year of Election or Appointment: 2016
Assistant Treasurer
Mr. Deberghes also serves as an officer of other funds. He serves as Executive Vice President of Fidelity Investments Money Management, Inc. (FIMM) (investment adviser firm, 2016-present) and is an employee of Fidelity Investments (2008-present). Prior to joining Fidelity Investments, Mr. Deberghes was Senior Vice President of Mutual Fund Administration at State Street Corporation (2007-2008), Senior Director of Mutual Fund Administration at Investors Bank & Trust (2005-2007), and Director of Finance for Dunkin' Brands (2000-2005). Previously, Mr. Deberghes served in other fund officer roles.
Stephanie J. Dorsey (1969)
Year of Election or Appointment: 2010
Assistant Treasurer
Ms. Dorsey also serves as an officer of other funds. She is an employee of Fidelity Investments (2008-present) and has served in other fund officer roles. Prior to joining Fidelity Investments, Ms. Dorsey served as Treasurer (2004-2008) of the JPMorgan Mutual Funds and Vice President (2004-2008) of JPMorgan Chase Bank.
Howard J. Galligan III (1966)
Year of Election or Appointment: 2014
Chief Financial Officer
Mr. Galligan also serves as Chief Financial Officer of other funds. Mr. Galligan serves as President of Fidelity Pricing and Cash Management Services (FPCMS) (2014-present) and as a Director of Strategic Advisers, Inc. (investment adviser firm, 2008-present). Previously, Mr. Galligan served as Chief Administrative Officer of Asset Management (2011-2014) and Chief Operating Officer and Senior Vice President of Investment Support for Strategic Advisers, Inc. (2003-2011).
Scott C. Goebel (1968)
Year of Election or Appointment: 2015
Vice President
Mr. Goebel serves as Vice President of other funds and is an employee of Fidelity Investments (2001-present). Previously, Mr. Goebel served as Senior Vice President of Fidelity Management & Research Company (FMR) (investment adviser firm, 2016), Secretary of Fidelity SelectCo, LLC (investment adviser firm, 2013-2015), Fidelity Investments Money Management, Inc. (FIMM) (investment adviser firm, 2010-2015), and Fidelity Research and Analysis Company (FRAC) (investment adviser firm, 2010-2015); General Counsel, Secretary, and Senior Vice President of FMR (investment adviser firm, 2008-2015) and FMR Co., Inc. (investment adviser firm, 2008-2015); Assistant Secretary of Fidelity Management & Research (Japan) Limited (investment adviser firm, 2008-2015) and Fidelity Management & Research (U.K.) Inc. (investment adviser firm, 2008-2015); Chief Legal Officer (CLO) of Fidelity Management & Research (Hong Kong) Limited (investment adviser firm, 2008-2015); Secretary and CLO of certain Fidelity® funds (2008-2015); Assistant Secretary of FIMM (2008-2010), FRAC (2008-2010), and certain funds (2007-2008); and as Vice President and Secretary of Fidelity Distributors Corporation (FDC) (2005-2007).
Brian B. Hogan (1964)
Year of Election or Appointment: 2009
Vice President
Mr. Hogan also serves as Trustee or Vice President of other funds. Mr. Hogan serves as a Director of FMR Investment Management (UK) Limited (investment adviser firm, 2015-present) and Fidelity SelectCo, LLC (investment adviser firm, 2014-present) and President of the Equity Division of FMR (investment adviser firm, 2009-present). Previously, Mr. Hogan served as Senior Vice President, Equity Research of FMR (2006-2009) and as a portfolio manager. Mr. Brian B. Hogan is not related to Mr. Colm A. Hogan.
Colm A. Hogan (1973)
Year of Election or Appointment: 2016
Deputy Treasurer
Mr. Hogan also serves as an officer of other funds. Mr. Hogan is an employee of Fidelity Investments (2005-present). Mr. Colm A. Hogan is not related to Mr. Brian B. Hogan.
Chris Maher (1972)
Year of Election or Appointment: 2013
Assistant Treasurer
Mr. Maher serves as Assistant Treasurer of other funds. Mr. Maher is Vice President of Valuation Oversight and is an employee of Fidelity Investments. Previously, Mr. Maher served as Vice President of Asset Management Compliance (2013), Vice President of the Program Management Group of FMR (investment adviser firm, 2010-2013), and Vice President of Valuation Oversight (2008-2010).
Melissa M. Reilly (1971)
Year of Election or Appointment: 2014
Vice President of certain Equity Funds
Ms. Reilly also serves as Vice President of other funds. Ms. Reilly is an employee of Fidelity Investments (2004-present).
Kenneth B. Robins (1969)
Year of Election or Appointment: 2016
Chief Compliance Officer
Mr. Robins also serves as an officer of other funds. Mr. Robins serves as Compliance Officer of Fidelity Management & Research Company and FMR Co., Inc. (investment adviser firms, 2016-present) and is an employee of Fidelity Investments (2004-present). Previously, Mr. Robins served as Executive Vice President of Fidelity Investments Money Management, Inc. (investment adviser firm, 2013-2016) and served in other fund officer roles.
Stacie M. Smith (1974)
Year of Election or Appointment: 2016
President and Treasurer
Ms. Smith also serves as an officer of other funds. She is an employee of Fidelity Investments (2009-present) and has served in other fund officer roles. Prior to joining Fidelity Investments, Ms. Smith served as Senior Audit Manager of Ernst & Young LLP (accounting firm, 1996-2009). Previously, Ms. Smith served as Deputy Treasurer of certain Fidelity® funds (2013-2016).
Marc L. Spector (1972)
Year of Election or Appointment: 2016
Assistant Treasurer
Mr. Spector also serves as an officer of other funds. Mr. Spector is an employee of Fidelity Investments (2016-present). Prior to joining Fidelity Investments, Mr. Spector served as Director at the Siegfried Group (accounting firm, 2013-2016), and prior to Siegfried Group as audit senior manager at Deloitte & Touche (accounting firm, 2005-2013).
Renee Stagnone (1975)
Year of Election or Appointment: 2016
Assistant Treasurer
Ms. Stagnone also serves as an officer of other funds. Ms. Stagnone is an employee of Fidelity Investments (1997-present). Previously, Ms. Stagnone served as Deputy Treasurer of certain Fidelity® funds (2013-2016).
Shareholder Expense Example
As a shareholder of the Fund, you incur two types of costs: (1) transaction costs, including redemption fees and (2) ongoing costs, including management fees and other Fund expenses. This Example is intended to help you understand your ongoing costs (in dollars) of investing in the Fund and to compare these costs with the ongoing costs of investing in other mutual funds.
The Example is based on an investment of $1,000 invested at the beginning of the period and held for the entire period (November 1, 2016 to April 30, 2017).
Actual Expenses
The first line of the accompanying table for each class of the Fund provides information about actual account values and actual expenses. You may use the information in this line, together with the amount you invested, to estimate the expenses that you paid over the period. Simply divide your account value by $1,000.00 (for example, an $8,600 account value divided by $1,000.00 = 8.6), then multiply the result by the number in the first line for a class of the Fund under the heading entitled "Expenses Paid During Period" to estimate the expenses you paid on your account during this period. A small balance maintenance fee of $12.00 that is charged once a year may apply for certain accounts with a value of less than $2,000. This fee is not included in the table below. If it was, the estimate of expenses you paid during the period would be higher, and your ending account value lower, by this amount. In addition, the Fund, as a shareholder in the underlying Fidelity Central Funds, will indirectly bear its pro-rata share of the fees and expenses incurred by the underlying Fidelity Central Funds. These fees and expenses are not included in the Fund's annualized expense ratio used to calculate the expense estimate in the table below.
Hypothetical Example for Comparison Purposes
The second line of the accompanying table for each class of the Fund provides information about hypothetical account values and hypothetical expenses based on a Class' actual expense ratio and an assumed rate of return of 5% per year before expenses, which is not the Class' actual return. The hypothetical account values and expenses may not be used to estimate the actual ending account balance or expenses you paid for the period. You may use this information to compare the ongoing costs of investing in the Fund and other funds. To do so, compare this 5% hypothetical example with the 5% hypothetical examples that appear in the shareholder reports of the other funds. A small balance maintenance fee of $12.00 that is charged once a year may apply for certain accounts with a value of less than $2,000. This fee is not included in the table below. If it was, the estimate of expenses you paid during the period would be higher, and your ending account value lower, by this amount. In addition, the Fund, as a shareholder in the underlying Fidelity Central Funds, will indirectly bear its pro-rata share of the fees and expenses incurred by the underlying Fidelity Central Funds. These fees and expenses are not included in the Fund's annualized expense ratio used to calculate the expense estimate in the table below.
Please note that the expenses shown in the table are meant to highlight your ongoing costs only and do not reflect any transaction costs. Therefore, the second line of the table is useful in comparing ongoing costs only, and will not help you determine the relative total costs of owning different funds. In addition, if these transactional costs were included, your costs would have been higher.
| Annualized Expense Ratio-A | Beginning Account Value November 1, 2016 | Ending Account Value April 30, 2017 | Expenses Paid During Period-B November 1, 2016 to April 30, 2017 | |
| Mid-Cap Stock | .52% | |||
| Actual | $1,000.00 | $1,115.30 | $2.73 | |
| Hypothetical-C | $1,000.00 | $1,022.22 | $2.61 | |
| Class K | .41% | |||
| Actual | $1,000.00 | $1,115.70 | $2.15 | |
| Hypothetical-C | $1,000.00 | $1,022.76 | $2.06 |
A Annualized expense ratio reflects expenses net of applicable fee waivers.
B Expenses are equal to each Class' annualized expense ratio, multiplied by the average account value over the period, multiplied by 181/365 (to reflect the one-half year period).
C 5% return per year before expenses
Distributions (Unaudited)
The Board of Trustees of Fidelity Mid-Cap Stock Fund voted to pay to shareholders of record at the opening of business on record date, the following distributions per share derived from capital gains realized from sales of portfolio securities, and dividends derived from net investment income:
| Pay Date | Record Date | Dividends | Capital Gains | |
| Fidelity Mid-Cap Stock Fund | ||||
| Mid-Cap Stock Fund | 06/12/17 | 06/09/17 | $0.030 | $0.859 |
| Class K | 06/12/17 | 06/09/17 | $0.044 | $0.859 |
The fund hereby designates as a capital gain dividend with respect to the taxable year ended April 30 2017, $309,541,536, or, if subsequently determined to be different, the net capital gain of such year.
Mid-Cap Stock Fund designates 100% and 83%; Class K designates 96% and 76%; of the dividends distributed in June and December, respectively during the fiscal year as qualifying for the dividends–received deduction for corporate shareholders.
Mid-Cap Stock Fund designates 100% and 90%; Class K designates 98% and 82%; of the dividends distributed in June and December, respectively during the fiscal year as amounts which may be taken into account as a dividend for purposes of the maximum rate under section 1(h)(11) of the Internal Revenue Code.
The fund will notify shareholders in January 2018 of amounts for use in preparing 2017 income tax returns.
Board Approval of Investment Advisory Contracts and Management Fees
Fidelity Mid-Cap Stock Fund
On September 14, 2016, the Board of Trustees, including the Independent Trustees (together, the Board) voted to approve the management contract and sub-advisory agreements (collectively, the Advisory Contracts) for the fund in connection with reorganizing the fund from one Trust to another. In reaching this determination, the Board considered that the contractual terms of and the fees payable under the fund's Advisory Contracts are identical to those in the fund's current Advisory Contracts. The Board considered that the approval of the Advisory Contracts will not result in any changes to (i) the investment process or strategies employed in the management of the fund's assets; (ii) the nature, extent and quality of services provided under the fund's Advisory Contracts; or (iii) the day-to-day management of the fund or the persons primarily responsible for such management. The Board considered that it approved the Advisory Contracts for the fund at its July 2016 meeting and that it will again consider the renewal of the Advisory Contracts in July 2017.
Because the Board was approving Advisory Contracts with terms identical to the current Advisory Contracts, it did not consider the fund's investment performance, competitiveness of management fees and total expenses, costs of services and profitability, or economies of scale to be significant factors in its decision.
In connection with its consideration of future renewal of the fund's Advisory Contracts, the Board will consider: (i) the nature, extent and quality of services provided to the fund, including shareholder and administrative services and investment performance; (ii) the competitiveness of the fund's management fee and total expenses; (iii) the costs of the services and profitability, including the revenues earned and the expenses incurred by Fidelity conducting the business of developing, marketing, distributing, managing, administering, and servicing the fund and its shareholders, to the extent applicable; and (iv) whether there have been economies of scale in respect of the management of the Fidelity funds, whether the Fidelity funds (including the fund) have appropriately benefited from any such economies of scale, and whether there is potential for realization of any further economies.
Based on its evaluation of all of the conclusions noted above, and after considering all factors it believed relevant, the Board ultimately concluded that the advisory fee structures are fair and reasonable, and that the fund's Advisory Contracts should be approved, without modification, as part of the process of reorganizing the fund from one Trust to another.
![]()
Corporate Headquarters
245 Summer St.
Boston, MA 02210
www.fidelity.com
MCS-K-ANN-0617
1.863347.108
Fidelity® Event Driven Opportunities Fund Annual Report April 30, 2017 |
|
Contents
Board Approval of Investment Advisory Contracts and Management Fees |
To view a fund's proxy voting guidelines and proxy voting record for the 12-month period ended June 30, visit http://www.fidelity.com/proxyvotingresults or visit the Securities and Exchange Commission's (SEC) web site at http://www.sec.gov.
You may also call 1-800-544-8544 to request a free copy of the proxy voting guidelines.
Standard & Poor's, S&P and S&P 500 are registered service marks of The McGraw-Hill Companies, Inc. and have been licensed for use by Fidelity Distributors Corporation.
Other third-party marks appearing herein are the property of their respective owners.
All other marks appearing herein are registered or unregistered trademarks or service marks of FMR LLC or an affiliated company. © 2017 FMR LLC. All rights reserved.
This report and the financial statements contained herein are submitted for the general information of the shareholders of the Fund. This report is not authorized for distribution to prospective investors in the Fund unless preceded or accompanied by an effective prospectus.
A fund files its complete schedule of portfolio holdings with the SEC for the first and third quarters of each fiscal year on Form N-Q. Forms N-Q are available on the SEC’s web site at http://www.sec.gov. A fund's Forms N-Q may be reviewed and copied at the SEC’s Public Reference Room in Washington, DC. Information regarding the operation of the SEC's Public Reference Room may be obtained by calling 1-800-SEC-0330.
For a complete list of a fund's portfolio holdings, view the most recent holdings listing, semiannual report, or annual report on Fidelity's web site at http://www.fidelity.com, http://www.institutional.fidelity.com, or http://www.401k.com, as applicable.
NOT FDIC INSURED •MAY LOSE VALUE •NO BANK GUARANTEE
Neither the Fund nor Fidelity Distributors Corporation is a bank.
Performance: The Bottom Line
Average annual total return reflects the change in the value of an investment, assuming reinvestment of distributions from dividend income and capital gains (the profits earned upon the sale of securities that have grown in value, if any) and assuming a constant rate of performance each year. The hypothetical investment and the average annual total returns do not reflect the deduction of taxes that a shareholder would pay on fund distributions or the redemption of fund shares. During periods of reimbursement by Fidelity, a fund’s total return will be greater than it would be had the reimbursement not occurred. How a fund did yesterday is no guarantee of how it will do tomorrow.
Average Annual Total Returns
| For the periods ended April 30, 2017 | Past 1 year | Life of fundA |
| Fidelity® Event Driven Opportunities Fund | 28.57% | 11.90% |
A From December 12, 2013
$10,000 Over Life of Fund
Let's say hypothetically that $10,000 was invested in Fidelity® Event Driven Opportunities Fund on December 12, 2013, when the fund started.
The chart shows how the value of your investment would have changed, and also shows how the Russell 3000® Index performed over the same period.
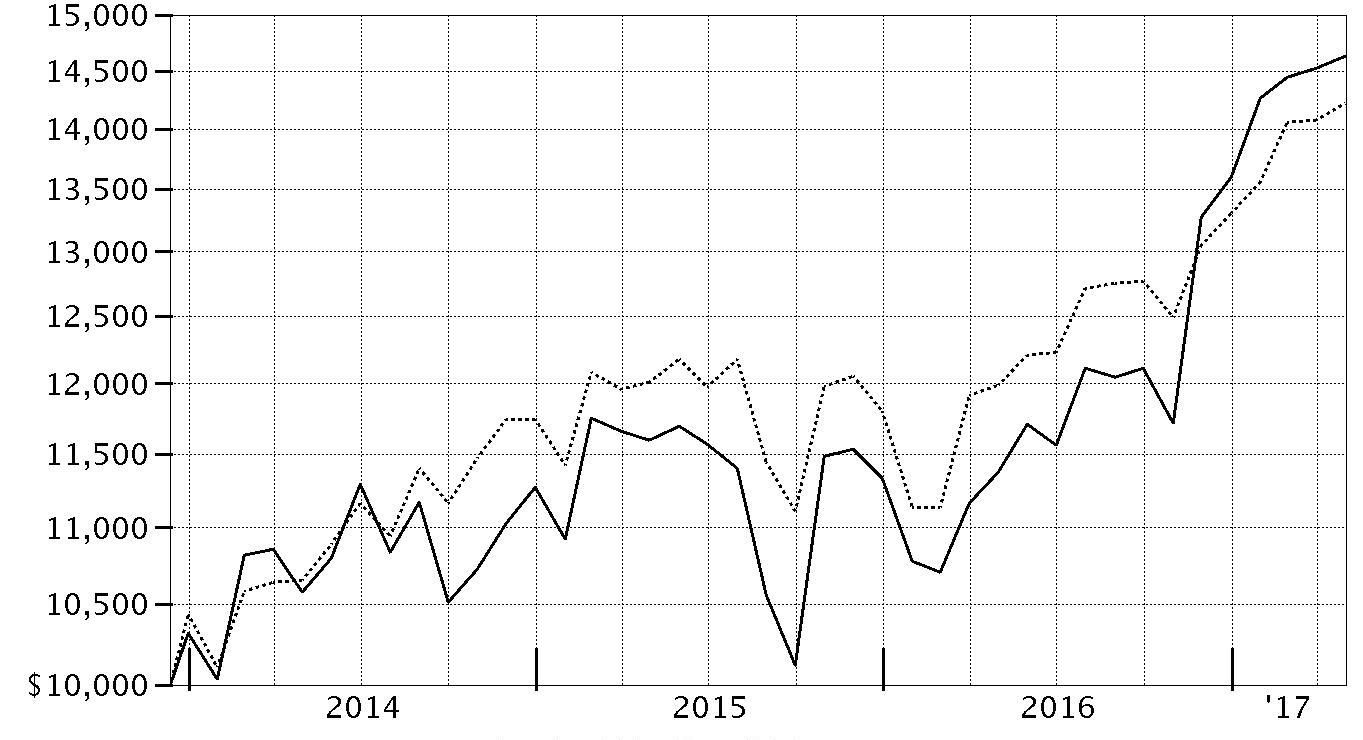
| Period Ending Values | ||
| $14,627 | Fidelity® Event Driven Opportunities Fund | |
| $14,220 | Russell 3000® Index | |
Management's Discussion of Fund Performance
Market Recap: The U.S. equity bellwether S&P 500® index gained 17.92% for the year ending April 30, 2017, rising sharply following the November election and continuing to gain ground through the end of February on optimism for President Trump’s pro-business agenda. Equity markets leveled off, however, as the fledgling administration faced the first test of its domestic agenda. Stocks reacted with uncertainty to efforts by Congress in March to repeal and replace the Affordable Care Act (ACA), and were relatively flat through April 30. In a stark reversal from 2016, growth-oriented stocks topped their value counterparts through the first third of 2017. Sector-wise, information technology (+35%) fared best, anchored by twin rallies in the June 2016 and March 2017 quarters as growth regained favor. Financials (+27%) also handily outperformed, riding an uptick in bond yields and a surge in banks, particularly post-election. Industrials (+19%) and materials (+16%) did well amid a call for increased infrastructure spending and a rise in commodity prices, respectively. Conversely, consumer staples (+9%), real estate (+5%) and telecommunication services (0%) were held back amid an improved backdrop for riskier assets that curbed demand for dividend-rich sectors, as well as the likelihood of one or two additional interest rate hikes later in 2017. Energy (+2%) also struggled this period.Comments from Portfolio Manager Arvind Navaratnam: For the year, the fund gained 28.57%, handily outperforming the 18.58% result of the Russell 3000® Index. The corporate events in which the fund was invested added value this period, with one stock in particular contributing about 800 basis points versus the benchmark: oil and natural-gas equipment and processing firm Exterran. The stock advanced 80% this period amid an improved environment for oil and natural gas. Brink's, a global leader in security-related services for banks, retailers and a variety of other commercial and governmental customers, was another large fund holding and contributor. Brink’s shares rallied nearly 15% in one day in February after the security-services firm reported improved results for the fourth quarter and full-year 2016. Turning to the negative, a large stake in Triumph Group was our biggest individual detractor. Triumph is a global leader in manufacturing and overhauling aerospace structures, systems and components. In July, the stock plunged when the firm reported its first quarterly results of its 2017 fiscal year, which disappointed investors. We sold our stake in Triumph before October 31.The views expressed above reflect those of the portfolio manager(s) only through the end of the period as stated on the cover of this report and do not necessarily represent the views of Fidelity or any other person in the Fidelity organization. Any such views are subject to change at any time based upon market or other conditions and Fidelity disclaims any responsibility to update such views. These views may not be relied on as investment advice and, because investment decisions for a Fidelity fund are based on numerous factors, may not be relied on as an indication of trading intent on behalf of any Fidelity fund.
Investment Summary (Unaudited)
Top Ten Stocks as of April 30, 2017
| % of fund's net assets | % of fund's net assets 6 months ago | |
| The Madison Square Garden Co. | 10.1 | 4.2 |
| Exterran Corp. | 9.1 | 10.0 |
| Twenty-First Century Fox, Inc. Class B | 6.9 | 2.2 |
| The Brink's Co. | 6.9 | 4.4 |
| Alliance Data Systems Corp. | 5.1 | 3.3 |
| Encore Capital Group, Inc. | 4.9 | 3.1 |
| Perrigo Co. PLC | 3.0 | 0.0 |
| Quality Care Properties, Inc. | 2.4 | 0.0 |
| ECN Capital Corp. | 2.3 | 1.3 |
| Donnelley Financial Solutions, Inc. | 2.3 | 1.5 |
| 53.0 |
Top Five Market Sectors as of April 30, 2017
| % of fund's net assets | % of fund's net assets 6 months ago | |
| Information Technology | 25.9 | 20.6 |
| Consumer Discretionary | 22.6 | 22.9 |
| Financials | 16.6 | 13.9 |
| Energy | 10.3 | 10.0 |
| Industrials | 6.9 | 10.0 |
Asset Allocation (% of fund's net assets)
| As of April 30, 2017* | ||
| Stocks and Equity Futures | 99.0% | |
| Short-Term Investments and Net Other Assets (Liabilities) | 1.0% | |

* Foreign investments - 11.2%
| As of October 31, 2016 * | ||
| Stocks and Equity Futures | 96.7% | |
| Short-Term Investments and Net Other Assets (Liabilities) | 3.3% | |

* Foreign investments - 5.6%
Percentages shown as 0.0% may reflect amounts less than 0.05%.
Investments April 30, 2017
Showing Percentage of Net Assets
| Common Stocks - 90.0% | |||
| Shares | Value | ||
| CONSUMER DISCRETIONARY - 22.6% | |||
| Internet & Direct Marketing Retail - 1.1% | |||
| Zooplus AG (a) | 21,711 | $4,059,487 | |
| Leisure Products - 0.3% | |||
| Vista Outdoor, Inc. (a) | 63,400 | 1,240,104 | |
| Media - 18.5% | |||
| Cable One, Inc. | 2,800 | 1,909,208 | |
| Gannett Co., Inc. | 121,100 | 1,012,396 | |
| NZME Ltd. | 3,549,368 | 2,120,187 | |
| The Madison Square Garden Co. (a) | 178,105 | 35,936,244 | |
| Twenty-First Century Fox, Inc. Class B | 824,300 | 24,613,598 | |
| 65,591,633 | |||
| Specialty Retail - 2.7% | |||
| Ascena Retail Group, Inc. (a)(b) | 1,094,326 | 4,278,815 | |
| Carpetright PLC (a) | 378,852 | 1,105,277 | |
| Guess?, Inc. | 24,620 | 274,759 | |
| Urban Outfitters, Inc. (a)(b) | 167,900 | 3,841,552 | |
| 9,500,403 | |||
| TOTAL CONSUMER DISCRETIONARY | 80,391,627 | ||
| CONSUMER STAPLES - 1.5% | |||
| Food Products - 1.5% | |||
| Mondelez International, Inc. | 29,600 | 1,332,888 | |
| SunOpta, Inc. (a) | 530,688 | 3,874,022 | |
| 5,206,910 | |||
| ENERGY - 10.3% | |||
| Energy Equipment & Services - 9.1% | |||
| Exterran Corp. (a) | 1,184,321 | 32,414,866 | |
| Oil, Gas & Consumable Fuels - 1.2% | |||
| International Seaways, Inc. (a) | 213,882 | 4,134,339 | |
| TOTAL ENERGY | 36,549,205 | ||
| FINANCIALS - 16.6% | |||
| Capital Markets - 2.9% | |||
| Associated Capital Group, Inc. | 68,169 | 2,293,887 | |
| Waddell & Reed Financial, Inc. Class A | 129,800 | 2,335,102 | |
| WisdomTree Investments, Inc. (b) | 693,300 | 5,789,055 | |
| 10,418,044 | |||
| Consumer Finance - 4.9% | |||
| Encore Capital Group, Inc. (a)(b) | 520,813 | 17,369,114 | |
| Diversified Financial Services - 4.6% | |||
| Donnelley Financial Solutions, Inc. (a) | 360,500 | 8,010,310 | |
| ECN Capital Corp. (b) | 2,977,900 | 8,115,298 | |
| 16,125,608 | |||
| Insurance - 4.2% | |||
| Genworth Financial, Inc. Class A (a) | 1,741,200 | 7,034,448 | |
| Stewart Information Services Corp. | 166,287 | 7,888,655 | |
| 14,923,103 | |||
| TOTAL FINANCIALS | 58,835,869 | ||
| HEALTH CARE - 3.4% | |||
| Health Care Providers& Services - 0.4% | |||
| Quorum Health Corp. (a) | 302,158 | 1,290,215 | |
| Pharmaceuticals - 3.0% | |||
| Perrigo Co. PLC | 145,930 | 10,790,064 | |
| TOTAL HEALTH CARE | 12,080,279 | ||
| INDUSTRIALS - 6.9% | |||
| Commercial Services & Supplies - 6.9% | |||
| The Brink's Co. | 398,429 | 24,463,541 | |
| INFORMATION TECHNOLOGY - 25.9% | |||
| Communications Equipment - 1.3% | |||
| Lumentum Holdings, Inc. (a) | 110,500 | 4,723,875 | |
| Internet Software & Services - 4.9% | |||
| CommerceHub, Inc. Series A (a) | 238,175 | 3,810,800 | |
| comScore, Inc. (a)(b) | 190,600 | 4,898,420 | |
| LogMeIn, Inc. | 36,800 | 4,158,400 | |
| WebMD Health Corp. (a) | 85,700 | 4,647,511 | |
| 17,515,131 | |||
| IT Services - 10.6% | |||
| Alliance Data Systems Corp. | 72,900 | 18,198,027 | |
| Conduent, Inc. (a) | 345,374 | 5,633,050 | |
| CSRA, Inc. | 161,500 | 4,696,420 | |
| DXC Technology Co. (a) | 48,003 | 3,616,546 | |
| PayPal Holdings, Inc. (a) | 116,700 | 5,568,924 | |
| 37,712,967 | |||
| Semiconductors & Semiconductor Equipment - 3.1% | |||
| Marvell Technology Group Ltd. | 382,200 | 5,740,644 | |
| Versum Materials, Inc. | 160,400 | 5,136,008 | |
| 10,876,652 | |||
| Software - 2.9% | |||
| CDK Global, Inc. | 83,100 | 5,402,331 | |
| TiVo Corp. | 240,700 | 4,753,825 | |
| 10,156,156 | |||
| Technology Hardware, Storage & Peripherals - 3.1% | |||
| Diebold Nixdorf, Inc. (b) | 165,500 | 4,667,100 | |
| Hewlett Packard Enterprise Co. | 206,800 | 3,852,684 | |
| Quantum Corp. (a) | 324,059 | 2,569,788 | |
| 11,089,572 | |||
| TOTAL INFORMATION TECHNOLOGY | 92,074,353 | ||
| REAL ESTATE - 2.8% | |||
| Equity Real Estate Investment Trusts (REITs) - 2.8% | |||
| Four Corners Property Trust, Inc. | 68,738 | 1,603,658 | |
| Quality Care Properties, Inc. (a) | 484,600 | 8,407,810 | |
| 10,011,468 | |||
| TOTAL COMMON STOCKS | |||
| (Cost $280,177,846) | 319,613,252 | ||
| Principal Amount | Value | ||
| U.S. Treasury Obligations - 0.5% | |||
| U.S. Treasury Bills, yield at date of purchase 0.49% to 0.81% 5/4/17 to 7/13/17 (c) | |||
| (Cost $1,838,786) | 1,840,000 | 1,838,789 | |
| Shares | Value | ||
| Money Market Funds - 18.4% | |||
| Fidelity Cash Central Fund, 0.85% (d) | 40,075,507 | $40,083,523 | |
| Fidelity Securities Lending Cash Central Fund 0.86% (d)(e) | 25,324,470 | 25,327,002 | |
| TOTAL MONEY MARKET FUNDS | |||
| (Cost $65,409,089) | 65,410,525 | ||
| TOTAL INVESTMENT PORTFOLIO - 108.9% | |||
| (Cost $347,425,721) | 386,862,566 | ||
| NET OTHER ASSETS (LIABILITIES) - (8.9)% | (31,470,680) | ||
| NET ASSETS - 100% | $355,391,886 |
| Futures Contracts | |||
| Expiration Date | Underlying Face Amount at Value | Unrealized Appreciation/(Depreciation) | |
| Purchased | |||
| Equity Index Contracts | |||
| 232 CME E-mini S&P 500 Index Contracts (United States) | June 2017 | 27,613,800 | $228,529 |
| 62 ICE Russell 2000 Index Contracts (United States) | June 2017 | 4,335,040 | 106,525 |
| TOTAL FUTURES CONTRACTS | $335,054 |
The face value of futures purchased as a percentage of Net Assets is 9.0%
For the period, the average monthly underlying face amount at value for futures contracts in the aggregate was $22,305,929.
Legend
(a) Non-income producing
(b) Security or a portion of the security is on loan at period end.
(c) Security or a portion of the security was pledged to cover margin requirements for futures contracts. At period end, the value of securities pledged amounted to $1,448,898.
(d) Affiliated fund that is generally available only to investment companies and other accounts managed by Fidelity Investments. The rate quoted is the annualized seven-day yield of the fund at period end. A complete unaudited listing of the fund's holdings as of its most recent quarter end is available upon request. In addition, each Fidelity Central Fund's financial statements, which are not covered by the Fund's Report of Independent Registered Public Accounting Firm, are available on the SEC's website or upon request.
(e) Investment made with cash collateral received from securities on loan.
Affiliated Central Funds
Information regarding fiscal year to date income earned by the Fund from investments in Fidelity Central Funds is as follows:
| Fund | Income earned |
| Fidelity Cash Central Fund | $152,625 |
| Fidelity Securities Lending Cash Central Fund | 221,396 |
| Total | $374,021 |
Investment Valuation
The following is a summary of the inputs used, as of April 30, 2017, involving the Fund's assets and liabilities carried at fair value. The inputs or methodology used for valuing securities may not be an indication of the risk associated with investing in those securities. For more information on valuation inputs, and their aggregation into the levels used below, please refer to the Investment Valuation section in the accompanying Notes to Financial Statements.
| Valuation Inputs at Reporting Date: | ||||
| Description | Total | Level 1 | Level 2 | Level 3 |
| Investments in Securities: | ||||
| Equities: | ||||
| Consumer Discretionary | $80,391,627 | $80,391,627 | $-- | $-- |
| Consumer Staples | 5,206,910 | 5,206,910 | -- | -- |
| Energy | 36,549,205 | 36,549,205 | -- | -- |
| Financials | 58,835,869 | 58,835,869 | -- | -- |
| Health Care | 12,080,279 | 12,080,279 | -- | -- |
| Industrials | 24,463,541 | 24,463,541 | -- | -- |
| Information Technology | 92,074,353 | 92,074,353 | -- | -- |
| Real Estate | 10,011,468 | 10,011,468 | -- | -- |
| U.S. Government and Government Agency Obligations | 1,838,789 | -- | 1,838,789 | -- |
| Money Market Funds | 65,410,525 | 65,410,525 | -- | -- |
| Total Investments in Securities: | $386,862,566 | $385,023,777 | $1,838,789 | $-- |
| Derivative Instruments: | ||||
| Assets | ||||
| Futures Contracts | $335,054 | $335,054 | $-- | $-- |
| Total Assets | $335,054 | $335,054 | $-- | $-- |
| Total Derivative Instruments: | $335,054 | $335,054 | $-- | $-- |
Value of Derivative Instruments
The following table is a summary of the Fund's value of derivative instruments by primary risk exposure as of April 30, 2017. For additional information on derivative instruments, please refer to the Derivative Instruments section in the accompanying Notes to Financial Statements.
| Primary Risk Exposure / Derivative Type | Value | |
| Asset | Liability | |
| Equity Risk | ||
| Futures Contracts(a) | $335,054 | $0 |
| Total Equity Risk | 335,054 | 0 |
| Total Value of Derivatives | $335,054 | $0 |
(a) Reflects gross cumulative appreciation (depreciation) on futures contracts as presented in the Schedule of Investments. In the Statement of Assets and Liabilities, the period end daily variation margin is included in receivable or payable for daily variation margin for derivative instruments, and the net cumulative appreciation (depreciation) is included in net unrealized appreciation (depreciation).
Other Information
Distribution of investments by country or territory of incorporation, as a percentage of Total Net Assets, is as follows (Unaudited):
| United States of America | 88.8% |
| Canada | 3.4% |
| Ireland | 3.0% |
| Bermuda | 1.6% |
| Marshall Islands | 1.2% |
| Germany | 1.1% |
| Others (Individually Less Than 1%) | 0.9% |
| 100.0% |
See accompanying notes which are an integral part of the financial statements.
Financial Statements
Statement of Assets and Liabilities
| April 30, 2017 | ||
| Assets | ||
| Investment in securities, at value (including securities loaned of $24,503,383) — See accompanying schedule: Unaffiliated issuers (cost $282,016,632) | $321,452,041 | |
| Fidelity Central Funds (cost $65,409,089) | 65,410,525 | |
| Total Investments (cost $347,425,721) | $386,862,566 | |
| Receivable for investments sold | 7,955,104 | |
| Receivable for fund shares sold | 1,656,754 | |
| Distributions receivable from Fidelity Central Funds | 46,273 | |
| Prepaid expenses | 116 | |
| Other receivables | 5,297 | |
| Total assets | �� | 396,526,110 |
| Liabilities | ||
| Payable for investments purchased | $15,150,661 | |
| Payable for fund shares redeemed | 173,645 | |
| Accrued management fee | 252,967 | |
| Payable for daily variation margin for derivative instruments | 129,130 | |
| Other affiliated payables | 59,631 | |
| Other payables and accrued expenses | 40,425 | |
| Collateral on securities loaned | 25,327,765 | |
| Total liabilities | 41,134,224 | |
| Net Assets | $355,391,886 | |
| Net Assets consist of: | ||
| Paid in capital | $312,261,037 | |
| Undistributed net investment income | 1,858 | |
| Accumulated undistributed net realized gain (loss) on investments and foreign currency transactions | 3,357,170 | |
| Net unrealized appreciation (depreciation) on investments and assets and liabilities in foreign currencies | 39,771,821 | |
| Net Assets, for 25,520,303 shares outstanding | $355,391,886 | |
| Net Asset Value, offering price and redemption price per share ($355,391,886 ÷ 25,520,303 shares) | $13.93 |
See accompanying notes which are an integral part of the financial statements.
Statement of Operations
| Year ended April 30, 2017 | ||
| Investment Income | ||
| Dividends | $2,075,486 | |
| Interest | 4,797 | |
| Income from Fidelity Central Funds (including $221,396 from security lending) | 374,021 | |
| Total income | 2,454,304 | |
| Expenses | ||
| Management fee | ||
| Basic fee | $1,880,827 | |
| Performance adjustment | (4,138) | |
| Transfer agent fees | 369,277 | |
| Accounting and security lending fees | 89,660 | |
| Custodian fees and expenses | 19,379 | |
| Independent trustees' fees and expenses | 857 | |
| Registration fees | 46,304 | |
| Audit | 45,524 | |
| Legal | 819 | |
| Miscellaneous | 1,628 | |
| Total expenses before reductions | 2,450,137 | |
| Expense reductions | (26,992) | 2,423,145 |
| Net investment income (loss) | 31,159 | |
| Realized and Unrealized Gain (Loss) | ||
| Net realized gain (loss) on: | ||
| Investment securities: | ||
| Unaffiliated issuers | 8,024,635 | |
| Fidelity Central Funds | 2,294 | |
| Foreign currency transactions | 9,465 | |
| Futures contracts | 3,630,074 | |
| Total net realized gain (loss) | 11,666,468 | |
| Change in net unrealized appreciation (depreciation) on: Investment securities | 38,784,677 | |
| Assets and liabilities in foreign currencies | 4 | |
| Futures contracts | 30,807 | |
| Total change in net unrealized appreciation (depreciation) | 38,815,488 | |
| Net gain (loss) | 50,481,956 | |
| Net increase (decrease) in net assets resulting from operations | $50,513,115 |
See accompanying notes which are an integral part of the financial statements.
Statement of Changes in Net Assets
| Year ended April 30, 2017 | Year ended April 30, 2016 | |
| Increase (Decrease) in Net Assets | ||
| Operations | ||
| Net investment income (loss) | $31,159 | $2,600,912 |
| Net realized gain (loss) | 11,666,468 | (3,074,020) |
| Change in net unrealized appreciation (depreciation) | 38,815,488 | (6,082,164) |
| Net increase (decrease) in net assets resulting from operations | 50,513,115 | (6,555,272) |
| Distributions to shareholders from net investment income | (1,337,191) | (1,081,800) |
| Distributions to shareholders from net realized gain | (2,090,856) | (945,437) |
| Total distributions | (3,428,047) | (2,027,237) |
| Share transactions | ||
| Proceeds from sales of shares | 220,202,286 | 75,489,091 |
| Reinvestment of distributions | 3,221,280 | 1,849,958 |
| Cost of shares redeemed | (83,728,778) | (93,533,688) |
| Net increase (decrease) in net assets resulting from share transactions | 139,694,788 | (16,194,639) |
| Total increase (decrease) in net assets | 186,779,856 | (24,777,148) |
| Net Assets | ||
| Beginning of period | 168,612,030 | 193,389,178 |
| End of period | $355,391,886 | $168,612,030 |
| Other Information | ||
| Undistributed net investment income end of period | $1,858 | $1,350,479 |
| Shares | ||
| Sold | 16,548,805 | 6,802,513 |
| Issued in reinvestment of distributions | 268,977 | 163,583 |
| Redeemed | (6,566,207) | (8,718,246) |
| Net increase (decrease) | 10,251,575 | (1,752,150) |
See accompanying notes which are an integral part of the financial statements.
Financial Highlights — Fidelity Event Driven Opportunities Fund
| Years ended April 30, | 2017 | 2016 | 2015 | 2014 A |
| Selected Per–Share Data | ||||
| Net asset value, beginning of period | $11.04 | $11.36 | $10.57 | $10.00 |
| Income from Investment Operations | ||||
| Net investment income (loss)B | – | .14C | .06 | .03D |
| Net realized and unrealized gain (loss) | 3.12 | (.35)E | .95F | .55G |
| Total from investment operations | 3.12 | (.21) | 1.01 | .58 |
| Distributions from net investment income | (.09)H | (.06) | (.06) | (.01) |
| Distributions from net realized gain | (.14)H | (.05) | (.16) | – |
| Total distributions | (.23) | (.11) | (.22) | (.01) |
| Net asset value, end of period | $13.93 | $11.04 | $11.36 | $10.57 |
| Total ReturnI,J | 28.57% | (1.89)%E | 9.64%F | 5.77%G |
| Ratios to Average Net AssetsK,L | ||||
| Expenses before reductions | 1.11% | 1.06% | 1.13% | 1.52%M |
| Expenses net of fee waivers, if any | 1.11% | 1.06% | 1.13% | 1.30%M |
| Expenses net of all reductions | 1.10% | 1.04% | 1.12% | 1.30%M |
| Net investment income (loss) | .01% | 1.31%C | .58% | .82%D,M |
| Supplemental Data | ||||
| Net assets, end of period (000 omitted) | $355,392 | $168,612 | $193,389 | $60,572 |
| Portfolio turnover rateN | 117% | 111% | 119% | 56%O |
A For the period December 12, 2013 (commencement of operations) to April 30, 2014.
B Calculated based on average shares outstanding during the period.
C Net Investment income per share reflects a large, non-recurring dividend which amounted to $.05 per share. Excluding this non-recurring dividend, the ratio of net investment income (loss) to average net assets would have been .82%.
D Net Investment income per share reflects a large, non-recurring dividend which amounted to $.02 per share. Excluding this non-recurring dividend, the ratio of net investment income (loss) to average net assets would have been .28%.
E Amount includes a reimbursement from the investment adviser for an operational error which amounted to less than $.01 per share. Excluding this reimbursement, the total return would have been (1.92)%.
F Amount includes a reimbursement from the investment adviser for an operational error which amounted to less than $.01 per share. Excluding this reimbursement, the total return would have been 9.57%.
G Amount includes a reimbursement from the investment adviser for an operational error which amounted to less than $.01 per share. Excluding this reimbursement, the total return would have been 5.67%.
H The amounts shown reflect certain reclassifications related to book to tax differences that were made in the year shown.
I Total returns for periods of less than one year are not annualized.
J Total returns would have been lower if certain expenses had not been reduced during the applicable periods shown.
K Fees and expenses of any underlying Fidelity Central Funds are not included in the Fund's expense ratio. The Fund indirectly bears its proportionate share of the expenses of any underlying Fidelity Central Funds.
L Expense ratios reflect operating expenses of the Fund. Expenses before reductions do not reflect amounts reimbursed by the investment adviser or reductions from brokerage service arrangements or reductions from other expense offset arrangements and do not represent the amount paid by the Fund during periods when reimbursements or reductions occur. Expense ratios before reductions for start-up periods may not be representative of longer term operating periods. Expenses net of fee waivers reflect expenses after reimbursement by the investment adviser but prior to reductions from brokerage service arrangements or other expense offset arrangements. Expenses net of all reductions represent the net expenses paid by the Fund.
M Annualized
N Amount does not include the portfolio activity of any underlying Fidelity Central Funds.
O Amount not annualized.
See accompanying notes which are an integral part of the financial statements.
Notes to Financial Statements
For the period ended April 30, 2017
1. Organization.
Fidelity Event Driven Opportunities Fund (the Fund) is a non-diversified fund of Fidelity Concord Street Trust (the Trust) (formerly a fund of Fidelity Commonwealth Trust) and is authorized to issue an unlimited number of shares. Share transactions on the Statement of Changes in Net Assets may contain exchanges between affiliated funds. The Trust is registered under the Investment Company Act of 1940, as amended (the 1940 Act), as an open-end management investment company organized as a Massachusetts business trust.
2. Investments in Fidelity Central Funds.
The Fund invests in Fidelity Central Funds, which are open-end investment companies generally available only to other investment companies and accounts managed by the investment adviser and its affiliates. The Fund's Schedule of Investments lists each of the Fidelity Central Funds held as of period end, if any, as an investment of the Fund, but does not include the underlying holdings of each Fidelity Central Fund. As an Investing Fund, the Fund indirectly bears its proportionate share of the expenses of the underlying Fidelity Central Funds.
The Money Market Central Funds seek preservation of capital and current income and are managed by Fidelity Investments Money Management, Inc. (FIMM), an affiliate of the investment adviser. Annualized expenses of the Money Market Central Funds as of their most recent shareholder report date are less than .005%.
A complete unaudited list of holdings for each Fidelity Central Fund is available upon request or at the Securities and Exchange Commission (the SEC) website at www.sec.gov. In addition, the financial statements of the Fidelity Central Funds, which are not covered by the Fund's Report of Independent Registered Public Accounting Firm, are available on the SEC website or upon request.
3. Significant Accounting Policies.
The Fund is an investment company and applies the accounting and reporting guidance of the Financial Accounting Standards Board (FASB) Accounting Standards Codification Topic 946 Financial Services – Investments Companies. The financial statements have been prepared in conformity with accounting principles generally accepted in the United States of America (GAAP), which require management to make certain estimates and assumptions at the date of the financial statements. Actual results could differ from those estimates. Subsequent events, if any, through the date that the financial statements were issued have been evaluated in the preparation of the financial statements. The following summarizes the significant accounting policies of the Fund:
Investment Valuation. Investments are valued as of 4:00 p.m. Eastern time on the last calendar day of the period. The Board of Trustees (the Board) has delegated the day to day responsibility for the valuation of the Fund's investments to the Fair Value Committee (the Committee) established by the Fund's investment adviser. In accordance with valuation policies and procedures approved by the Board, the Fund attempts to obtain prices from one or more third party pricing vendors or brokers to value its investments. When current market prices, quotations or currency exchange rates are not readily available or reliable, investments will be fair valued in good faith by the Committee, in accordance with procedures adopted by the Board. Factors used in determining fair value vary by investment type and may include market or investment specific events, changes in interest rates and credit quality. The frequency with which these procedures are used cannot be predicted and they may be utilized to a significant extent. The Committee oversees the Fund's valuation policies and procedures and reports to the Board on the Committee's activities and fair value determinations. The Board monitors the appropriateness of the procedures used in valuing the Fund's investments and ratifies the fair value determinations of the Committee.
The Fund categorizes the inputs to valuation techniques used to value its investments into a disclosure hierarchy consisting of three levels as shown below:
- Level 1 – quoted prices in active markets for identical investments
- Level 2 – other significant observable inputs (including quoted prices for similar investments, interest rates, prepayment speeds, etc.)
- Level 3 – unobservable inputs (including the Fund's own assumptions based on the best information available)
Valuation techniques used to value the Fund's investments by major category are as follows:
Equity securities, including restricted securities, for which market quotations are readily available, are valued at the last reported sale price or official closing price as reported by a third party pricing vendor on the primary market or exchange on which they are traded and are categorized as Level 1 in the hierarchy. In the event there were no sales during the day or closing prices are not available, securities are valued at the last quoted bid price or may be valued using the last available price and are generally categorized as Level 2 in the hierarchy. For foreign equity securities, when market or security specific events arise, comparisons to the valuation of American Depositary Receipts (ADRs), futures contracts, Exchange-Traded Funds (ETFs) and certain indexes as well as quoted prices for similar securities may be used and would be categorized as Level 2 in the hierarchy. Utilizing these techniques may result in transfers between Level 1 and Level 2. For equity securities, including restricted securities, where observable inputs are limited, assumptions about market activity and risk are used and these securities may be categorized as Level 3 in the hierarchy.
Debt securities, including restricted securities, are valued based on evaluated prices received from third party pricing vendors or from brokers who make markets in such securities. U.S. government and government agency obligations are valued by pricing vendors who utilize matrix pricing which considers yield or price of bonds of comparable quality, coupon, maturity and type or by broker-supplied prices. When independent prices are unavailable or unreliable, debt securities may be valued utilizing pricing methodologies which consider similar factors that would be used by third party pricing vendors. Debt securities are generally categorized as Level 2 in the hierarchy but may be Level 3 depending on the circumstances.
Futures contracts are valued at the settlement price established each day by the board of trade or exchange on which they are traded and are categorized as Level 1 in the hierarchy. Investments in open-end mutual funds, including the Fidelity Central Funds, are valued at their closing net asset value (NAV) each business day and are categorized as Level 1 in the hierarchy.
Changes in valuation techniques may result in transfers in or out of an assigned level within the disclosure hierarchy. The aggregate value of investments by input level as of April 30, 2017, is included at the end of the Fund's Schedule of Investments.
Foreign Currency. The Fund may use foreign currency contracts to facilitate transactions in foreign-denominated securities. Gains and losses from these transactions may arise from changes in the value of the foreign currency or if the counterparties do not perform under the contracts' terms.
Foreign-denominated assets, including investment securities, and liabilities are translated into U.S. dollars at the exchange rates at period end. Purchases and sales of investment securities, income and dividends received and expenses denominated in foreign currencies are translated into U.S. dollars at the exchange rate in effect on the transaction date.
The effects of exchange rate fluctuations on investments are included with the net realized and unrealized gain (loss) on investment securities. Other foreign currency transactions resulting in realized and unrealized gain (loss) are disclosed separately.
Investment Transactions and Income. For financial reporting purposes, the Fund's investment holdings and NAV include trades executed through the end of the last business day of the period. The NAV per share for processing shareholder transactions is calculated as of the close of business of the New York Stock Exchange (NYSE), normally 4:00 p.m. Eastern time and includes trades executed through the end of the prior business day. Gains and losses on securities sold are determined on the basis of identified cost. Dividend income is recorded on the ex-dividend date, except for certain dividends from foreign securities where the ex-dividend date may have passed, which are recorded as soon as the Fund is informed of the ex-dividend date. Non-cash dividends included in dividend income, if any, are recorded at the fair market value of the securities received. Income and capital gain distributions from Fidelity Central Funds, if any, are recorded on the ex-dividend date. Certain distributions received by the Fund represent a return of capital or capital gain. The Fund determines the components of these distributions subsequent to the ex-dividend date, based upon receipt of tax filings or other correspondence relating to the underlying investment. These distributions are recorded as a reduction of cost of investments and/or as a realized gain. Interest income is accrued as earned and includes coupon interest and amortization of premium and accretion of discount on debt securities as applicable. Investment income is recorded net of foreign taxes withheld where recovery of such taxes is uncertain.
Expenses. Expenses directly attributable to a fund are charged to that fund. Expenses attributable to more than one fund are allocated among the respective funds on the basis of relative net assets or other appropriate methods. Expense estimates are accrued in the period to which they relate and adjustments are made when actual amounts are known.
Income Tax Information and Distributions to Shareholders. Each year, the Fund intends to qualify as a regulated investment company under Subchapter M of the Internal Revenue Code, including distributing substantially all of its taxable income and realized gains. As a result, no provision for U.S. Federal income taxes is required. As of April 30, 2017, the Fund did not have any unrecognized tax benefits in the financial statements; nor is the Fund aware of any tax positions for which it is reasonably possible that the total amounts of unrecognized tax benefits will significantly change in the next twelve months. The Fund files a U.S. federal tax return, in addition to state and local tax returns as required. The Fund's federal income tax returns are subject to examination by the Internal Revenue Service (IRS) for a period of three fiscal years after they are filed. State and local tax returns may be subject to examination for an additional fiscal year depending on the jurisdiction. Foreign taxes are provided for based on the Fund's understanding of the tax rules and rates that exist in the foreign markets in which it invests.
Distributions are declared and recorded on the ex-dividend date. Income and capital gain distributions are determined in accordance with income tax regulations, which may differ from GAAP. These differences resulted in distribution reclassifications. In addition, the Fund claimed a portion of the payment made to redeeming shareholders as a distribution for income tax purposes.
Capital accounts within the financial statements are adjusted for permanent book-tax differences. These adjustments have no impact on net assets or the results of operations. Capital accounts are not adjusted for temporary book-tax differences which will reverse in a subsequent period.
Book-tax differences are primarily due to futures contracts, foreign currency transactions, market discount, capital loss carryforwards, and losses deferred due to wash sales.
The federal tax cost of investment securities and unrealized appreciation (depreciation) as of period end were as follows:
| Gross unrealized appreciation | $45,932,783 |
| Gross unrealized depreciation | (9,227,785) |
| Net unrealized appreciation (depreciation) on securities | $36,704,998 |
| Tax Cost | $350,157,568 |
The tax-based components of distributable earnings as of period end were as follows:
| Undistributed tax-exempt income | $– |
| Undistributed ordinary income | $4,359,324 |
| Undistributed long-term capital gain | $2,066,300 |
| Net unrealized appreciation (depreciation) on securities and other investments | $36,705,226 |
The tax character of distributions paid was as follows:
| April 30, 2017 | April 30, 2016 | |
| Ordinary Income | $3,428,047 | $ 1,081,800 |
| Long-term Capital Gains | – | 945,437 |
| Total | $3,428,047 | $ 2,027,237 |
4. Derivative Instruments.
Risk Exposures and the Use of Derivative Instruments. The Fund's investment objective allows the Fund to enter into various types of derivative contracts, including futures contracts. Derivatives are investments whose value is primarily derived from underlying assets, indices or reference rates and may be transacted on an exchange or over-the-counter (OTC). Derivatives may involve a future commitment to buy or sell a specified asset based on specified terms, to exchange future cash flows at periodic intervals based on a notional principal amount, or for one party to make one or more payments upon the occurrence of specified events in exchange for periodic payments from the other party.
The Fund used derivatives to increase returns and to manage exposure to certain risks as defined below. The success of any strategy involving derivatives depends on analysis of numerous economic factors, and if the strategies for investment do not work as intended, the Fund may not achieve its objectives.
The Fund's use of derivatives increased or decreased its exposure to the following risks:
| Equity Risk | Equity risk relates to the fluctuations in the value of financial instruments as a result of changes in market prices (other than those arising from interest rate risk or foreign exchange risk), whether caused by factors specific to an individual investment, its issuer, or all factors affecting all instruments traded in a market or market segment. |
The Fund is also exposed to additional risks from investing in derivatives, such as liquidity risk and counterparty credit risk. Liquidity risk is the risk that the Fund will be unable to close out the derivative in the open market in a timely manner. Counterparty credit risk is the risk that the counterparty will not be able to fulfill its obligation to the Fund. Counterparty credit risk related to exchange-traded futures contracts may be mitigated by the protection provided by the exchange on which they trade.
Investing in derivatives may involve greater risks than investing in the underlying assets directly and, to varying degrees, may involve risk of loss in excess of any initial investment and collateral received and amounts recognized in the Statement of Assets and Liabilities. In addition, there may be the risk that the change in value of the derivative contract does not correspond to the change in value of the underlying instrument.
Futures Contracts. A futures contract is an agreement between two parties to buy or sell a specified underlying instrument for a fixed price at a specified future date. The Fund used futures contracts to manage its exposure to the stock market.
Upon entering into a futures contract, a fund is required to deposit either cash or securities (initial margin) with a clearing broker in an amount equal to a certain percentage of the face value of the contract. Futures contracts are marked-to-market daily and subsequent daily payments (variation margin) are made or received by a fund depending on the daily fluctuations in the value of the futures contracts and are recorded as unrealized appreciation or (depreciation). This receivable and/or payable, if any, is included in daily variation margin for derivative instruments in the Statement of Assets and Liabilities. Realized gain or (loss) is recorded upon the expiration or closing of a futures contract.
Any open futures contracts at period end are presented in the Schedule of Investments under the caption "Futures Contracts". The underlying face amount at value reflects each contract's exposure to the underlying instrument or index at period end. Securities deposited to meet initial margin requirements are identified in the Schedule of Investments.
During the period the Fund recognized net realized gain (loss) of $3,630,074 and a change in net unrealized appreciation (depreciation) of $30,807 related to its investment in futures contracts. These amounts are included in the Statement of Operations.
5. Purchases and Sales of Investments.
Purchases and sales of securities, other than short-term securities, aggregated $361,796,174 and $232,382,714, respectively.
6. Fees and Other Transactions with Affiliates.
Management Fee. Fidelity Management & Research Company (the investment adviser) and its affiliates provide the Fund with investment management related services for which the Fund pays a monthly management fee. The management fee is the sum of an individual fund fee rate that is based on an annual rate of .60% of the Fund's average net assets and an annualized group fee rate that averaged .25% during the period. The group fee rate is based upon the average net assets of all the mutual funds advised by the investment adviser, including any mutual funds previously advised by the investment adviser that are currently advised by Fidelity SelectCo, LLC, an affiliate of the investment adviser. The group fee rate decreases as assets under management increase and increases as assets under management decrease. In addition, the management fee is subject to a performance adjustment (up to a maximum of +/- .10% of the Fund's average net assets over a 36 month performance period). The upward or downward adjustment to the management fee is based on the Fund's relative investment performance as compared to its benchmark index, the Russell 3000 Index, over the same 36 month performance period. For the reporting period, the total annual management fee rate, including the performance adjustment, was .85% of the Fund's average net assets. The performance adjustment included in the management fee rate may be higher or lower than the maximum performance adjustment rate due to the difference between the average net assets for the reporting and performance periods.
Transfer Agent Fees. Fidelity Investments Institutional Operations Company, Inc. (FIIOC), an affiliate of the investment adviser, is the Fund's transfer, dividend disbursing and shareholder servicing agent. FIIOC receives account fees and asset-based fees that vary according to account size and type of account. FIIOC pays for typesetting, printing and mailing of shareholder reports, except proxy statements. For the period, the transfer agent fees were equivalent to an annual rate of .17% of average net assets.
Accounting and Security Lending Fees. Fidelity Service Company, Inc. (FSC), an affiliate of the investment adviser, maintains the Fund's accounting records. The accounting fee is based on the level of average net assets for each month. Under a separate contract, FSC administers the security lending program. The security lending fee is based on the number and duration of lending transactions.
Brokerage Commissions. The Fund placed a portion of its portfolio transactions with brokerage firms which are affiliates of the investment adviser. Brokerage commissions are included in net realized gain (loss) and change in net unrealized appreciation (depreciation) in the Statement of Operations. The commissions paid to these affiliated firms were $18,494 for the period.
Interfund Trades. The Fund may purchase from or sell securities to other Fidelity Funds under procedures adopted by the Board. The procedures have been designed to ensure these interfund trades are executed in accordance with Rule 17a-7 of the 1940 Act. Interfund trades are included within the respective purchases and sales amounts shown in the Purchases and Sales of Investments note.
7. Committed Line of Credit.
The Fund participates with other funds managed by the investment adviser or an affiliate in a $4.25 billion credit facility (the "line of credit") to be utilized for temporary or emergency purposes to fund shareholder redemptions or for other short-term liquidity purposes. The Fund has agreed to pay commitment fees on its pro-rata portion of the line of credit, which amounted to $693 and is reflected in Miscellaneous expenses on the Statement of Operations. During the period, the Fund did not borrow on this line of credit.
8. Security Lending.
The Fund lends portfolio securities through a lending agent from time to time in order to earn additional income. For equity securities, a lending agent is used and may loan securities to certain qualified borrowers, including Fidelity Capital Markets (FCM), a broker-dealer affiliated with the Fund. On the settlement date of the loan, the Fund receives collateral (in the form of U.S. Treasury obligations, letters of credit and/or cash) against the loaned securities and maintains collateral in an amount not less than 100% of the market value of the loaned securities during the period of the loan. The market value of the loaned securities is determined at the close of business of the Fund and any additional required collateral is delivered to the Fund on the next business day. The Fund or borrower may terminate the loan at any time, and if the borrower defaults on its obligation to return the securities loaned because of insolvency or other reasons, the Fund may apply collateral received from the borrower against the obligation. The Fund may experience delays and costs in recovering the securities loaned. Any cash collateral received is invested in the Fidelity Securities Lending Cash Central Fund. The value of loaned securities and cash collateral at period end are disclosed on the Fund's Statement of Assets and Liabilities. The value of securities loaned to FCM at period end was $5,282,640. Security lending income represents the income earned on investing cash collateral, less rebates paid to borrowers and any lending agent fees associated with the loan, plus any premium payments received for lending certain types of securities. Security lending income is presented in the Statement of Operations as a component of income from Fidelity Central Funds, and includes $18,523 from securities loaned to FCM.
9. Expense Reductions.
Commissions paid to certain brokers with whom the investment adviser, or its affiliates, places trades on behalf of the Fund include an amount in addition to trade execution, which may be rebated back to the Fund to offset certain expenses. This amount totaled $25,175 for the period. In addition, through arrangements with the Fund's custodian, credits realized as a result of certain uninvested cash balances were used to reduce the Fund's expenses. During the period, these credits reduced the Fund's custody expenses by $166.
In addition, during the period the investment adviser reimbursed and/or waived a portion of operating expenses in the amount of $1,651.
10. Other.
The Fund's organizational documents provide former and current trustees and officers with a limited indemnification against liabilities arising in connection with the performance of their duties to the Fund. In the normal course of business, the Fund may also enter into contracts that provide general indemnifications. The Fund's maximum exposure under these arrangements is unknown as this would be dependent on future claims that may be made against the Fund. The risk of material loss from such claims is considered remote.
Report of Independent Registered Public Accounting Firm
To the Trustees of Fidelity Concord Street Trust and Shareholders of Fidelity Event Driven Opportunities Fund:
In our opinion, the accompanying statement of assets and liabilities, including the schedule of investments, and the related statements of operations and of changes in net assets and the financial highlights present fairly, in all material respects, the financial position of Fidelity Event Driven Opportunities Fund (a fund of Fidelity Concord Street Trust) as of April 30, 2017, the results of its operations for the year then ended, the changes in its net assets for each of the two years in the period then ended and the financial highlights for each of the periods indicated, in conformity with accounting principles generally accepted in the United States of America. These financial statements and financial highlights (hereafter referred to as “financial statements”) are the responsibility of the Fidelity Event Driven Opportunities Fund’s management. Our responsibility is to express an opinion on these financial statements based on our audits. We conducted our audits of these financial statements in accordance with the standards of the Public Company Accounting Oversight Board (United States). Those standards require that we plan and perform the audit to obtain reasonable assurance about whether the financial statements are free of material misstatement. An audit includes examining, on a test basis, evidence supporting the amounts and disclosures in the financial statements, assessing the accounting principles used and significant estimates made by management, and evaluating the overall financial statement presentation. Our procedures included confirmation of securities owned as of April 30, 2017 by correspondence with the custodian and brokers; when replies were not received from brokers, we performed other auditing procedures. We believe that our audits provide a reasonable basis for our opinion.
PricewaterhouseCoopers LLP
Boston, Massachusetts
June 19, 2017
Trustees and Officers
The Trustees, Members of the Advisory Board (if any), and officers of the trust and fund, as applicable, are listed below. The Board of Trustees governs the fund and is responsible for protecting the interests of shareholders. The Trustees are experienced executives who meet periodically throughout the year to oversee the fund's activities, review contractual arrangements with companies that provide services to the fund, oversee management of the risks associated with such activities and contractual arrangements, and review the fund's performance. Except for Jonathan Chiel, each of the Trustees oversees 189 funds. Mr. Chiel oversees 142 funds.
The Trustees hold office without limit in time except that (a) any Trustee may resign; (b) any Trustee may be removed by written instrument, signed by at least two-thirds of the number of Trustees prior to such removal; (c) any Trustee who requests to be retired or who has become incapacitated by illness or injury may be retired by written instrument signed by a majority of the other Trustees; and (d) any Trustee may be removed at any special meeting of shareholders by a two-thirds vote of the outstanding voting securities of the trust. Each Trustee who is not an interested person (as defined in the 1940 Act) of the trust and the fund is referred to herein as an Independent Trustee. Each Independent Trustee shall retire not later than the last day of the calendar year in which his or her 75th birthday occurs. The Independent Trustees may waive this mandatory retirement age policy with respect to individual Trustees. Officers and Advisory Board Members hold office without limit in time, except that any officer or Advisory Board Member may resign or may be removed by a vote of a majority of the Trustees at any regular meeting or any special meeting of the Trustees. Except as indicated, each individual has held the office shown or other offices in the same company for the past five years.
The fund’s Statement of Additional Information (SAI) includes more information about the Trustees. To request a free copy, call Fidelity at 1-800-544-8544.
Experience, Skills, Attributes, and Qualifications of the Trustees. The Governance and Nominating Committee has adopted a statement of policy that describes the experience, qualifications, attributes, and skills that are necessary and desirable for potential Independent Trustee candidates (Statement of Policy). The Board believes that each Trustee satisfied at the time he or she was initially elected or appointed a Trustee, and continues to satisfy, the standards contemplated by the Statement of Policy. The Governance and Nominating Committee also engages professional search firms to help identify potential Independent Trustee candidates who have the experience, qualifications, attributes, and skills consistent with the Statement of Policy. From time to time, additional criteria based on the composition and skills of the current Independent Trustees, as well as experience or skills that may be appropriate in light of future changes to board composition, business conditions, and regulatory or other developments, have also been considered by the professional search firms and the Governance and Nominating Committee. In addition, the Board takes into account the Trustees' commitment and participation in Board and committee meetings, as well as their leadership of standing and ad hoc committees throughout their tenure.
In determining that a particular Trustee was and continues to be qualified to serve as a Trustee, the Board has considered a variety of criteria, none of which, in isolation, was controlling. The Board believes that, collectively, the Trustees have balanced and diverse experience, qualifications, attributes, and skills, which allow the Board to operate effectively in governing the fund and protecting the interests of shareholders. Information about the specific experience, skills, attributes, and qualifications of each Trustee, which in each case led to the Board's conclusion that the Trustee should serve (or continue to serve) as a trustee of the fund, is provided below.
Board Structure and Oversight Function. James C. Curvey is an interested person and currently serves as Chairman. The Trustees have determined that an interested Chairman is appropriate and benefits shareholders because an interested Chairman has a personal and professional stake in the quality and continuity of services provided to the fund. Independent Trustees exercise their informed business judgment to appoint an individual of their choosing to serve as Chairman, regardless of whether the Trustee happens to be independent or a member of management. The Independent Trustees have determined that they can act independently and effectively without having an Independent Trustee serve as Chairman and that a key structural component for assuring that they are in a position to do so is for the Independent Trustees to constitute a substantial majority for the Board. The Independent Trustees also regularly meet in executive session. Ned C. Lautenbach serves as Chairman of the Independent Trustees and as such (i) acts as a liaison between the Independent Trustees and management with respect to matters important to the Independent Trustees and (ii) with management prepares agendas for Board meetings.
Fidelity® funds are overseen by different Boards of Trustees. The fund's Board oversees Fidelity's high income and certain equity funds, and other Boards oversee Fidelity's investment-grade bond, money market, asset allocation, and sector funds. The asset allocation funds may invest in Fidelity® funds overseen by the fund's Board. The use of separate Boards, each with its own committee structure, allows the Trustees of each group of Fidelity® funds to focus on the unique issues of the funds they oversee, including common research, investment, and operational issues. On occasion, the separate Boards establish joint committees to address issues of overlapping consequences for the Fidelity® funds overseen by each Board.
The Trustees operate using a system of committees to facilitate the timely and efficient consideration of all matters of importance to the Trustees, the fund, and fund shareholders and to facilitate compliance with legal and regulatory requirements and oversight of the fund's activities and associated risks. The Board, acting through its committees, has charged FMR and its affiliates with (i) identifying events or circumstances the occurrence of which could have demonstrably adverse effects on the fund's business and/or reputation; (ii) implementing processes and controls to lessen the possibility that such events or circumstances occur or to mitigate the effects of such events or circumstances if they do occur; and (iii) creating and maintaining a system designed to evaluate continuously business and market conditions in order to facilitate the identification and implementation processes described in (i) and (ii) above. Because the day-to-day operations and activities of the fund are carried out by or through FMR, its affiliates, and other service providers, the fund's exposure to risks is mitigated but not eliminated by the processes overseen by the Trustees. While each of the Board's committees has responsibility for overseeing different aspects of the fund's activities, oversight is exercised primarily through the Operations, Audit, and Compliance Committees. In addition, the Independent Trustees have worked with FMR to enhance the Board's oversight of investment and financial risks, legal and regulatory risks, technology risks, and operational risks, including the development of additional risk reporting to the Board. For example, a working group comprised of Independent Trustees and FMR has worked and continues to work to review the Fidelity® funds' valuation-related activities, reporting and risk management. Appropriate personnel, including but not limited to the fund's Chief Compliance Officer (CCO), FMR's internal auditor, the independent accountants, the fund's Treasurer and portfolio management personnel, make periodic reports to the Board's committees, as appropriate, including an annual review of Fidelity's risk management program for the Fidelity® funds. The responsibilities of each standing committee, including their oversight responsibilities, are described further under "Standing Committees of the Trustees."
Interested Trustees*:
Correspondence intended for a Trustee who is an interested person may be sent to Fidelity Investments, 245 Summer Street, Boston, Massachusetts 02210.
Name, Year of Birth; Principal Occupations and Other Relevant Experience+
Jonathan Chiel (1957)
Year of Election or Appointment: 2016
Trustee
Mr. Chiel also serves as Trustee of other Fidelity funds. Mr. Chiel is Executive Vice President and General Counsel for FMR LLC (diversified financial services company, 2012-present). Previously, Mr. Chiel served as general counsel (2004-2012) and senior vice president and deputy general counsel (2000-2004) for John Hancock Financial Services; a partner with Choate, Hall & Stewart (1996-2000) (law firm); and an Assistant United States Attorney for the United States Attorney’s Office of the District of Massachusetts (1986-95), including Chief of the Criminal Division (1993-1995). Mr. Chiel is a director on the boards of the Boston Bar Foundation and the Maimonides School.
James C. Curvey (1935)
Year of Election or Appointment: 2007
Trustee
Chairman of the Board of Trustees
Mr. Curvey also serves as Trustee of other Fidelity® funds. Mr. Curvey is a Director of Fidelity Research & Analysis Co. (investment adviser firm, 2009-present), and Vice Chairman (2007-present) and Director of FMR LLC (diversified financial services company). In addition, Mr. Curvey serves as an Overseer for the Boston Symphony Orchestra and a member of the board of Artis-Naples, Naples, Florida, and as a Trustee for Brewster Academy, Wolfeboro, New Hampshire. Previously, Mr. Curvey served as a Director of Fidelity Investments Money Management, Inc. (investment adviser firm, 2009-2014) and a Director of FMR and FMR Co., Inc. (investment adviser firms, 2007-2014).
Charles S. Morrison (1960)
Year of Election or Appointment: 2014
Trustee
Mr. Morrison also serves as Trustee of other funds. He serves as President of Fidelity Management & Research Company (FMR) (investment adviser firm, 2016-present), a Director of Fidelity Investments Money Management, Inc. (FIMM) (investment adviser firm, 2014-present), Director of Fidelity SelectCo, LLC (investment adviser firm, 2014-present), President, Asset Management (2014-present), and is an employee of Fidelity Investments. Previously, Mr. Morrison served as Vice President of Fidelity's Fixed Income and Asset Allocation Funds (2012-2014), President, Fixed Income (2011-2014), Vice President of Fidelity's Money Market Funds (2005-2009), President, Money Market Group Leader of FMR (investment adviser firm, 2009), and Senior Vice President, Money Market Group of FMR (2004-2009). Mr. Morrison also served as Vice President of Fidelity's Bond Funds (2002-2005), certain Balanced Funds (2002-2005), and certain Asset Allocation Funds (2002-2007), and as Senior Vice President (2002-2005) of Fidelity's Bond Division.
* Determined to be an “Interested Trustee” by virtue of, among other things, his or her affiliation with the trust or various entities under common control with FMR.
+ The information includes the Trustee's principal occupation during the last five years and other information relating to the experience, attributes, and skills relevant to the Trustee's qualifications to serve as a Trustee, which led to the conclusion that the Trustee should serve as a Trustee for the fund.
Independent Trustees:
Correspondence intended for an Independent Trustee may be sent to Fidelity Investments, P.O. Box 55235, Boston, Massachusetts 02205-5235.
Name, Year of Birth; Principal Occupations and Other Relevant Experience+
Dennis J. Dirks (1948)
Year of Election or Appointment: 2005
Trustee
Mr. Dirks also serves as Trustee of other Fidelity® funds. Prior to his retirement in May 2003, Mr. Dirks was Chief Operating Officer and a member of the Board of The Depository Trust & Clearing Corporation (DTCC). He also served as President, Chief Operating Officer, and Board member of The Depository Trust Company (DTC) and President and Board member of the National Securities Clearing Corporation (NSCC). In addition, Mr. Dirks served as Chief Executive Officer and Board member of the Government Securities Clearing Corporation, Chief Executive Officer and Board member of the Mortgage-Backed Securities Clearing Corporation, as a Trustee and a member of the Finance Committee of Manhattan College (2005-2008), as a Trustee and a member of the Finance Committee of AHRC of Nassau County (2006-2008), as a member of the Independent Directors Council (IDC) Governing Council (2010-2015), and as a member of the Board of Directors for The Brookville Center for Children’s Services, Inc. (2009-2017). Mr. Dirks is a member of the Finance Committee (2016-present) and Board of Directors (2017-present) of the Asolo Repertory Theatre.
Alan J. Lacy (1953)
Year of Election or Appointment: 2008
Trustee
Mr. Lacy also serves as Trustee of other Fidelity® funds. Mr. Lacy serves as a Director of Bristol-Myers Squibb Company (global pharmaceuticals, 2008-present). He is a Trustee of the California Chapter of The Nature Conservancy (2015-present) and a Director of the Center for Advanced Study in the Behavioral Sciences at Stanford University (2015-present). In addition, Mr. Lacy served as Senior Adviser (2007-2014) of Oak Hill Capital Partners, L.P. (private equity) and also served as Chief Executive Officer (2005) and Vice Chairman (2005-2006) of Sears Holdings Corporation (retail) and Chief Executive Officer and Chairman of the Board of Sears, Roebuck and Co. (retail, 2000-2005). Previously, Mr. Lacy served as Chairman (2014-2017) and a member (2010-2017) of the Board of Directors of Dave & Buster’s Entertainment, Inc. (restaurant and entertainment complexes), as Chairman (2008-2011) and a member (2006-2015) of the Board of Trustees of the National Parks Conservation Association, and as a member of the Board of Directors for The Hillman Companies, Inc. (hardware wholesalers, 2010-2014), Earth Fare, Inc. (retail grocery, 2010-2014), and The Western Union Company (global money transfer, 2006-2011).
Ned C. Lautenbach (1944)
Year of Election or Appointment: 2000
Trustee
Chairman of the Independent Trustees
Mr. Lautenbach also serves as Trustee of other Fidelity® funds. Mr. Lautenbach currently serves as the Lead Director of the Eaton Corporation Board of Directors (diversified industrial, 1997-present). Mr. Lautenbach is Chairman of the Board of Directors of Artis-Naples in Naples, Florida (2012-present), a member of the Council on Foreign Relations (1994-present), and currently Vice Chair of the Board of Governors, State University System of Florida (2013-present). Previously, Mr. Lautenbach was a Partner and Advisory Partner at Clayton, Dubilier & Rice, LLC (private equity investment, 1998-2010), as well as a Director of Sony Corporation (2006-2007). Mr. Lautenbach also had a 30-year career with IBM (technology company) during which time he served as Senior Vice President and a member of the Corporate Executive Committee (1968-1998).
Joseph Mauriello (1944)
Year of Election or Appointment: 2008
Trustee
Mr. Mauriello also serves as Trustee of other Fidelity® funds. Prior to his retirement in January 2006, Mr. Mauriello served in numerous senior management positions including Deputy Chairman and Chief Operating Officer (2004-2005), and Vice Chairman of Financial Services (2002-2004) of KPMG LLP US (professional services, 1965-2005). Mr. Mauriello currently serves as a member of the Board of Directors of XL Group plc. (global insurance and re-insurance, 2006-present) and the Independent Directors Council (IDC) Governing Council (2015-present). Previously, Mr. Mauriello served as a Director of the Hamilton Funds of the Bank of New York (2006-2007) and of Arcadia Resources Inc. (health care services and products, 2007-2012).
Robert W. Selander (1950)
Year of Election or Appointment: 2011
Trustee
Mr. Selander also serves as Trustee of other Fidelity® funds. Mr. Selander serves as a Director of The Western Union Company (global money transfer, 2014-present) and a non-executive Chairman of Health Equity, Inc. (health savings custodian, 2015-present). Previously, Mr. Selander served as a Member of the Advisory Board of certain Fidelity® funds (2011), and Executive Vice Chairman (2010), Chief Executive Officer (2009-2010), and President and Chief Executive Officer (1997-2009) of Mastercard, Inc.
Cornelia M. Small (1944)
Year of Election or Appointment: 2005
Trustee
Ms. Small also serves as Trustee of other Fidelity® funds. Ms. Small is a member of the Board of Directors (2009-present) and Chair of the Investment Committee (2010-present) of the Teagle Foundation. Ms. Small also serves on the Investment Committee of the Berkshire Taconic Community Foundation (2008-present). Previously, Ms. Small served as Chairperson (2002-2008) and a member of the Investment Committee and Chairperson (2008-2012) and a member of the Board of Trustees of Smith College. In addition, Ms. Small served as Chief Investment Officer, Director of Global Equity Investments, and a member of the Board of Directors of Scudder, Stevens & Clark and Scudder Kemper Investments.
William S. Stavropoulos (1939)
Year of Election or Appointment: 2001
Trustee
Vice Chairman of the Independent Trustees
Mr. Stavropoulos also serves as Trustee of other Fidelity® funds. Mr. Stavropoulos serves as President and Founder of the Michigan Baseball Foundation, the Great Lakes Loons (2007-present). Mr. Stavropoulos is Chairman Emeritus of the Board of Directors of The Dow Chemical Company, where he previously served in numerous senior management positions, including President, CEO (1995-2000; 2002-2004), Chairman of the Executive Committee (2000-2006), and as a member of the Board of Directors (1990-2006). Currently, Mr. Stavropoulos is Chairman of the Board of Directors of Univar Inc. (global distributor of commodity and specialty chemicals), a Director of Teradata Corporation (data warehousing and technology solutions), and a member of the Advisory Board for Metalmark Capital LLC (private equity investment, 2005-present). Mr. Stavropoulos is an operating advisor to Clayton, Dubilier & Rice, LLC (private equity investment). In addition, Mr. Stavropoulos is a member of the University of Notre Dame Advisory Council for the College of Science, a Trustee of the Rollin L. Gerstacker Foundation, and a Director of Artis-Naples in Naples, Florida. Previously, Mr. Stavropoulos served as a Director of Chemical Financial Corporation (bank holding company, 1993-2012) and Tyco International, Ltd. (multinational manufacturing and services, 2007-2012).
David M. Thomas (1949)
Year of Election or Appointment: 2008
Trustee
Mr. Thomas also serves as Trustee of other Fidelity® funds. Mr. Thomas serves as Non-Executive Chairman of the Board of Directors of Fortune Brands Home and Security (home and security products, 2011-present), as a member of the Board of Directors (2004-present) and Presiding Director (2013-present) of Interpublic Group of Companies, Inc. (marketing communication), and as a member of the Board of Trustees of the University of Florida (2013-present). Previously, Mr. Thomas served as Executive Chairman (2005-2006) and Chairman and Chief Executive Officer (2000-2005) of IMS Health, Inc. (pharmaceutical and healthcare information solutions), and a Director of Fortune Brands, Inc. (consumer products, 2000-2011).
+ The information includes the Trustee's principal occupation during the last five years and other information relating to the experience, attributes, and skills relevant to the Trustee's qualifications to serve as a Trustee, which led to the conclusion that the Trustee should serve as a Trustee for the fund.
Advisory Board Members and Officers:
Correspondence intended for an officer or Peter S. Lynch may be sent to Fidelity Investments, 245 Summer Street, Boston, Massachusetts 02210. Officers appear below in alphabetical order.
Name, Year of Birth; Principal Occupation
Peter S. Lynch (1944)
Year of Election or Appointment: 2003
Member of the Advisory Board
Mr. Lynch also serves as Member of the Advisory Board of other Fidelity® funds. Mr. Lynch is Vice Chairman and a Director of FMR (investment adviser firm) and FMR Co., Inc. (investment adviser firm). In addition, Mr. Lynch serves as a Trustee of Boston College and as the Chairman of the Inner-City Scholarship Fund. Previously, Mr. Lynch served on the Special Olympics International Board of Directors (1997-2006).
Elizabeth Paige Baumann (1968)
Year of Election or Appointment: 2017
Anti-Money Laundering (AML) Officer
Ms. Baumann also serves as AML Officer of other funds. She is Chief AML Officer (2012-present) and Senior Vice President (2014-present) of FMR LLC (diversified financial services company) and is an employee of Fidelity Investments. Previously, Ms. Baumann served as AML Officer of the funds (2012-2016), and Vice President (2007-2014) and Deputy Anti-Money Laundering Officer (2007-2012) of FMR LLC.
Marc R. Bryant (1966)
Year of Election or Appointment: 2015
Secretary and Chief Legal Officer (CLO)
Mr. Bryant also serves as Secretary and CLO of other funds. Mr. Bryant serves as CLO, Secretary, and Senior Vice President of Fidelity Management & Research Company (investment adviser firm, 2015-present) and FMR Co., Inc. (investment adviser firm, 2015-present); Secretary of Fidelity SelectCo, LLC (investment adviser firm, 2015-present) and Fidelity Investments Money Management, Inc. (investment adviser firm, 2015-present); and CLO of Fidelity Management & Research (Hong Kong) Limited and FMR Investment Management (UK) Limited (investment adviser firms, 2015-present) and Fidelity Management & Research (Japan) Limited (investment adviser firm, 2016-present). He is Senior Vice President and Deputy General Counsel of FMR LLC (diversified financial services company). Previously, Mr. Bryant served as Secretary and CLO of Fidelity Rutland Square Trust II (2010-2014) and Assistant Secretary of Fidelity's Fixed Income and Asset Allocation Funds (2013-2015). Prior to joining Fidelity Investments, Mr. Bryant served as a Senior Vice President and the Head of Global Retail Legal for AllianceBernstein L.P. (2006-2010), and as the General Counsel for ProFund Advisors LLC (2001-2006).
Jeffrey S. Christian (1961)
Year of Election or Appointment: 2016
Assistant Treasurer
Mr. Christian also serves as Assistant Treasurer of other funds. Mr. Christian is an employee of Fidelity Investments (2003-present).
William C. Coffey (1969)
Year of Election or Appointment: 2009
Assistant Secretary
Mr. Coffey also serves as Assistant Secretary of other funds. He is Senior Vice President and Deputy General Counsel of FMR LLC (diversified financial services company, 2010-present), and is an employee of Fidelity Investments. Previously, Mr. Coffey served as Vice President and Associate General Counsel of FMR LLC (2005-2009).
Jonathan Davis (1968)
Year of Election or Appointment: 2010
Assistant Treasurer
Mr. Davis also serves as Assistant Treasurer of other funds, and is an employee of Fidelity Investments. Previously, Mr. Davis served as Vice President and Associate General Counsel of FMR LLC (diversified financial services company, 2003-2010).
Adrien E. Deberghes (1967)
Year of Election or Appointment: 2016
Assistant Treasurer
Mr. Deberghes also serves as an officer of other funds. He serves as Executive Vice President of Fidelity Investments Money Management, Inc. (FIMM) (investment adviser firm, 2016-present) and is an employee of Fidelity Investments (2008-present). Prior to joining Fidelity Investments, Mr. Deberghes was Senior Vice President of Mutual Fund Administration at State Street Corporation (2007-2008), Senior Director of Mutual Fund Administration at Investors Bank & Trust (2005-2007), and Director of Finance for Dunkin' Brands (2000-2005). Previously, Mr. Deberghes served in other fund officer roles.
Stephanie J. Dorsey (1969)
Year of Election or Appointment: 2010
Assistant Treasurer
Ms. Dorsey also serves as an officer of other funds. She is an employee of Fidelity Investments (2008-present) and has served in other fund officer roles. Prior to joining Fidelity Investments, Ms. Dorsey served as Treasurer (2004-2008) of the JPMorgan Mutual Funds and Vice President (2004-2008) of JPMorgan Chase Bank.
Howard J. Galligan III (1966)
Year of Election or Appointment: 2014
Chief Financial Officer
Mr. Galligan also serves as Chief Financial Officer of other funds. Mr. Galligan serves as President of Fidelity Pricing and Cash Management Services (FPCMS) (2014-present) and as a Director of Strategic Advisers, Inc. (investment adviser firm, 2008-present). Previously, Mr. Galligan served as Chief Administrative Officer of Asset Management (2011-2014) and Chief Operating Officer and Senior Vice President of Investment Support for Strategic Advisers, Inc. (2003-2011).
Scott C. Goebel (1968)
Year of Election or Appointment: 2015
Vice President
Mr. Goebel serves as Vice President of other funds and is an employee of Fidelity Investments (2001-present). Previously, Mr. Goebel served as Senior Vice President of Fidelity Management & Research Company (FMR) (investment adviser firm, 2016), Secretary of Fidelity SelectCo, LLC (investment adviser firm, 2013-2015), Fidelity Investments Money Management, Inc. (FIMM) (investment adviser firm, 2010-2015), and Fidelity Research and Analysis Company (FRAC) (investment adviser firm, 2010-2015); General Counsel, Secretary, and Senior Vice President of FMR (investment adviser firm, 2008-2015) and FMR Co., Inc. (investment adviser firm, 2008-2015); Assistant Secretary of Fidelity Management & Research (Japan) Limited (investment adviser firm, 2008-2015) and Fidelity Management & Research (U.K.) Inc. (investment adviser firm, 2008-2015); Chief Legal Officer (CLO) of Fidelity Management & Research (Hong Kong) Limited (investment adviser firm, 2008-2015); Secretary and CLO of certain Fidelity® funds (2008-2015); Assistant Secretary of FIMM (2008-2010), FRAC (2008-2010), and certain funds (2007-2008); and as Vice President and Secretary of Fidelity Distributors Corporation (FDC) (2005-2007).
Brian B. Hogan (1964)
Year of Election or Appointment: 2009
Vice President
Mr. Hogan also serves as Trustee or Vice President of other funds. Mr. Hogan serves as a Director of FMR Investment Management (UK) Limited (investment adviser firm, 2015-present) and Fidelity SelectCo, LLC (investment adviser firm, 2014-present) and President of the Equity Division of FMR (investment adviser firm, 2009-present). Previously, Mr. Hogan served as Senior Vice President, Equity Research of FMR (2006-2009) and as a portfolio manager. Mr. Brian B. Hogan is not related to Mr. Colm A. Hogan.
Colm A. Hogan (1973)
Year of Election or Appointment: 2016
Deputy Treasurer
Mr. Hogan also serves as an officer of other funds. Mr. Hogan is an employee of Fidelity Investments (2005-present). Mr. Colm A. Hogan is not related to Mr. Brian B. Hogan.
Chris Maher (1972)
Year of Election or Appointment: 2013
Assistant Treasurer
Mr. Maher serves as Assistant Treasurer of other funds. Mr. Maher is Vice President of Valuation Oversight and is an employee of Fidelity Investments. Previously, Mr. Maher served as Vice President of Asset Management Compliance (2013), Vice President of the Program Management Group of FMR (investment adviser firm, 2010-2013), and Vice President of Valuation Oversight (2008-2010).
Melissa M. Reilly (1971)
Year of Election or Appointment: 2014
Vice President of certain Equity Funds
Ms. Reilly also serves as Vice President of other funds. Ms. Reilly is an employee of Fidelity Investments (2004-present).
Kenneth B. Robins (1969)
Year of Election or Appointment: 2016
Chief Compliance Officer
Mr. Robins also serves as an officer of other funds. Mr. Robins serves as Compliance Officer of Fidelity Management & Research Company and FMR Co., Inc. (investment adviser firms, 2016-present) and is an employee of Fidelity Investments (2004-present). Previously, Mr. Robins served as Executive Vice President of Fidelity Investments Money Management, Inc. (investment adviser firm, 2013-2016) and served in other fund officer roles.
Stacie M. Smith (1974)
Year of Election or Appointment: 2016
President and Treasurer
Ms. Smith also serves as an officer of other funds. She is an employee of Fidelity Investments (2009-present) and has served in other fund officer roles. Prior to joining Fidelity Investments, Ms. Smith served as Senior Audit Manager of Ernst & Young LLP (accounting firm, 1996-2009). Previously, Ms. Smith served as Deputy Treasurer of certain Fidelity® funds (2013-2016).
Marc L. Spector (1972)
Year of Election or Appointment: 2016
Assistant Treasurer
Mr. Spector also serves as an officer of other funds. Mr. Spector is an employee of Fidelity Investments (2016-present). Prior to joining Fidelity Investments, Mr. Spector served as Director at the Siegfried Group (accounting firm, 2013-2016), and prior to Siegfried Group as audit senior manager at Deloitte & Touche (accounting firm, 2005-2013).
Renee Stagnone (1975)
Year of Election or Appointment: 2016
Assistant Treasurer
Ms. Stagnone also serves as an officer of other funds. Ms. Stagnone is an employee of Fidelity Investments (1997-present). Previously, Ms. Stagnone served as Deputy Treasurer of certain Fidelity® funds (2013-2016).
Shareholder Expense Example
As a shareholder of the Fund, you incur two types of costs: (1) transaction costs, including redemption fees and (2) ongoing costs, including management fees and other Fund expenses. This Example is intended to help you understand your ongoing costs (in dollars) of investing in the Fund and to compare these costs with the ongoing costs of investing in other mutual funds.
The Example is based on an investment of $1,000 invested at the beginning of the period and held for the entire period (November 1, 2016 to April 30, 2017).
Actual Expenses
The first line of the accompanying table provides information about actual account values and actual expenses. You may use the information in this line, together with the amount you invested, to estimate the expenses that you paid over the period. Simply divide your account value by $1,000.00 (for example, an $8,600 account value divided by $1,000.00 = 8.6), then multiply the result by the number in the first line under the heading entitled "Expenses Paid During Period" to estimate the expenses you paid on your account during this period. A small balance maintenance fee of $12.00 that is charged once a year may apply for certain accounts with a value of less than $2,000. This fee is not included in the table below. If it was, the estimate of expenses you paid during the period would be higher, and your ending account value lower, by this amount. In addition, the Fund, as a shareholder in the underlying Fidelity Central Funds, will indirectly bear its pro-rata share of the fees and expenses incurred by the underlying Fidelity Central Funds. These fees and expenses are not included in the Fund's annualized expense ratio used to calculate the expense estimate in the table below.
Hypothetical Example for Comparison Purposes
The second line of the accompanying table provides information about hypothetical account values and hypothetical expenses based on the Fund's actual expense ratio and an assumed rate of return of 5% per year before expenses, which is not the Fund's actual return. The hypothetical account values and expenses may not be used to estimate the actual ending account balance or expenses you paid for the period. You may use this information to compare the ongoing costs of investing in the Fund and other funds. To do so, compare this 5% hypothetical example with the 5% hypothetical examples that appear in the shareholder reports of the other funds. A small balance maintenance fee of $12.00 that is charged once a year may apply for certain accounts with a value of less than $2,000. This fee is not included in the table below. If it was, the estimate of expenses you paid during the period would be higher, and your ending account value lower, by this amount. In addition, the Fund, as a shareholder in the underlying Fidelity Central Funds, will indirectly bear its pro-rata share of the fees and expenses incurred by the underlying Fidelity Central Funds. These fees and expenses are not included in the Fund's annualized expense ratio used to calculate the expense estimate in the table below.
Please note that the expenses shown in the table are meant to highlight your ongoing costs only and do not reflect any transaction costs. Therefore, the second line of the table is useful in comparing ongoing costs only, and will not help you determine the relative total costs of owning different funds.
| Annualized Expense Ratio-A | Beginning Account Value November 1, 2016 | Ending Account Value April 30, 2017 | Expenses Paid During Period-B November 1, 2016 to April 30, 2017 | |
| Actual | 1.14% | $1,000.00 | $1,248.40 | $6.36 |
| Hypothetical-C | $1,000.00 | $1,019.14 | $5.71 |
A Annualized expense ratio reflects expenses net of applicable fee waivers.
B Expenses are equal to the Fund's annualized expense ratio, multiplied by the average account value over the period, multiplied by 181/365 (to reflect the one-half year period).
C 5% return per year before expenses
Distributions (Unaudited)
The Board of Trustees of Fidelity Event Driven Opportunities Fund voted to pay on June 12, 2017, to shareholders of record at the opening of business on June 9, 2017, a distribution of $0.245 per share derived from capital gains realized from sales of portfolio securities.
The fund hereby designates as a capital gain dividend with respect to the taxable year ended April 30, 2017, $2,066,300, or, if subsequently determined to be different, the net capital gain of such year.
The fund designates 98%, and 57% of the dividends distributed in June and December, respectively during the fiscal year as qualifying for the dividends–received deduction for corporate shareholders.
The fund designates 99%, and 63% of the dividends distributed in June and December, respectively during the fiscal year as amounts which may be taken into account as a dividend for the purposes of the maximum rate under section 1(h)(11) of the Internal Revenue Code.
The fund will notify shareholders in January 2018 of amounts for use in preparing 2017 income tax returns.
Board Approval of Investment Advisory Contracts and Management Fees
Fidelity Event Driven Opportunities Fund
On September 14, 2016, the Board of Trustees, including the Independent Trustees (together, the Board) voted to approve the management contract and sub-advisory agreements (collectively, the Advisory Contracts) for the fund in connection with reorganizing the fund from one Trust to another. In reaching this determination, the Board considered that the contractual terms of and the fees payable under the fund's Advisory Contracts are identical to those in the fund's current Advisory Contracts. The Board considered that the approval of the Advisory Contracts will not result in any changes to (i) the investment process or strategies employed in the management of the fund's assets; (ii) the nature, extent and quality of services provided under the fund's Advisory Contracts; or (iii) the day-to-day management of the fund or the persons primarily responsible for such management. The Board considered that it approved the Advisory Contracts for the fund at its July 2016 meeting and that it will again consider the renewal of the Advisory Contracts in July 2017.
Because the Board was approving Advisory Contracts with terms identical to the current Advisory Contracts, it did not consider the fund's investment performance, competitiveness of management fees and total expenses, costs of services and profitability, or economies of scale to be significant factors in its decision.
In connection with its consideration of future renewal of the fund's Advisory Contracts, the Board will consider: (i) the nature, extent and quality of services provided to the fund, including shareholder and administrative services and investment performance; (ii) the competitiveness of the fund's management fee and total expenses; (iii) the costs of the services and profitability, including the revenues earned and the expenses incurred by Fidelity conducting the business of developing, marketing, distributing, managing, administering, and servicing the fund and its shareholders, to the extent applicable; and (iv) whether there have been economies of scale in respect of the management of the Fidelity funds, whether the Fidelity funds (including the fund) have appropriately benefited from any such economies of scale, and whether there is potential for realization of any further economies.
Based on its evaluation of all of the conclusions noted above, and after considering all factors it believed relevant, the Board ultimately concluded that the advisory fee structures are fair and reasonable, and that the fund's Advisory Contracts should be approved, without modification, as part of the process of reorganizing the fund from one Trust to another.
![]()
Corporate Headquarters
245 Summer St.
Boston, MA 02210
www.fidelity.com
EDO-ANN-0617
1.9585357.103
Fidelity® Small Cap Discovery Fund Annual Report April 30, 2017 |
|
Contents
Board Approval of Investment Advisory Contracts and Management Fees |
To view a fund's proxy voting guidelines and proxy voting record for the 12-month period ended June 30, visit http://www.fidelity.com/proxyvotingresults or visit the Securities and Exchange Commission's (SEC) web site at http://www.sec.gov.
You may also call 1-800-544-8544 to request a free copy of the proxy voting guidelines.
Standard & Poor's, S&P and S&P 500 are registered service marks of The McGraw-Hill Companies, Inc. and have been licensed for use by Fidelity Distributors Corporation.
Other third-party marks appearing herein are the property of their respective owners.
All other marks appearing herein are registered or unregistered trademarks or service marks of FMR LLC or an affiliated company. © 2017 FMR LLC. All rights reserved.
This report and the financial statements contained herein are submitted for the general information of the shareholders of the Fund. This report is not authorized for distribution to prospective investors in the Fund unless preceded or accompanied by an effective prospectus.
A fund files its complete schedule of portfolio holdings with the SEC for the first and third quarters of each fiscal year on Form N-Q. Forms N-Q are available on the SEC’s web site at http://www.sec.gov. A fund's Forms N-Q may be reviewed and copied at the SEC’s Public Reference Room in Washington, DC. Information regarding the operation of the SEC's Public Reference Room may be obtained by calling 1-800-SEC-0330.
For a complete list of a fund's portfolio holdings, view the most recent holdings listing, semiannual report, or annual report on Fidelity's web site at http://www.fidelity.com, http://www.institutional.fidelity.com, or http://www.401k.com, as applicable.
NOT FDIC INSURED •MAY LOSE VALUE •NO BANK GUARANTEE
Neither the Fund nor Fidelity Distributors Corporation is a bank.
Performance: The Bottom Line
Average annual total return reflects the change in the value of an investment, assuming reinvestment of distributions from dividend income and capital gains (the profits earned upon the sale of securities that have grown in value, if any) and assuming a constant rate of performance each year. The hypothetical investment and the average annual total returns do not reflect the deduction of taxes that a shareholder would pay on fund distributions or the redemption of fund shares. During periods of reimbursement by Fidelity, a fund’s total return will be greater than it would be had the reimbursement not occurred. How a fund did yesterday is no guarantee of how it will do tomorrow.
Average Annual Total Returns
| For the periods ended April 30, 2017 | Past 1 year | Past 5 years | Past 10 years |
| Fidelity® Small Cap Discovery Fund | 15.76% | 13.43% | 10.69% |
$10,000 Over 10 Years
Let's say hypothetically that $10,000 was invested in Fidelity® Small Cap Discovery Fund on April 30, 2007.
The chart shows how the value of your investment would have changed, and also shows how the Russell 2000® Index performed over the same period.
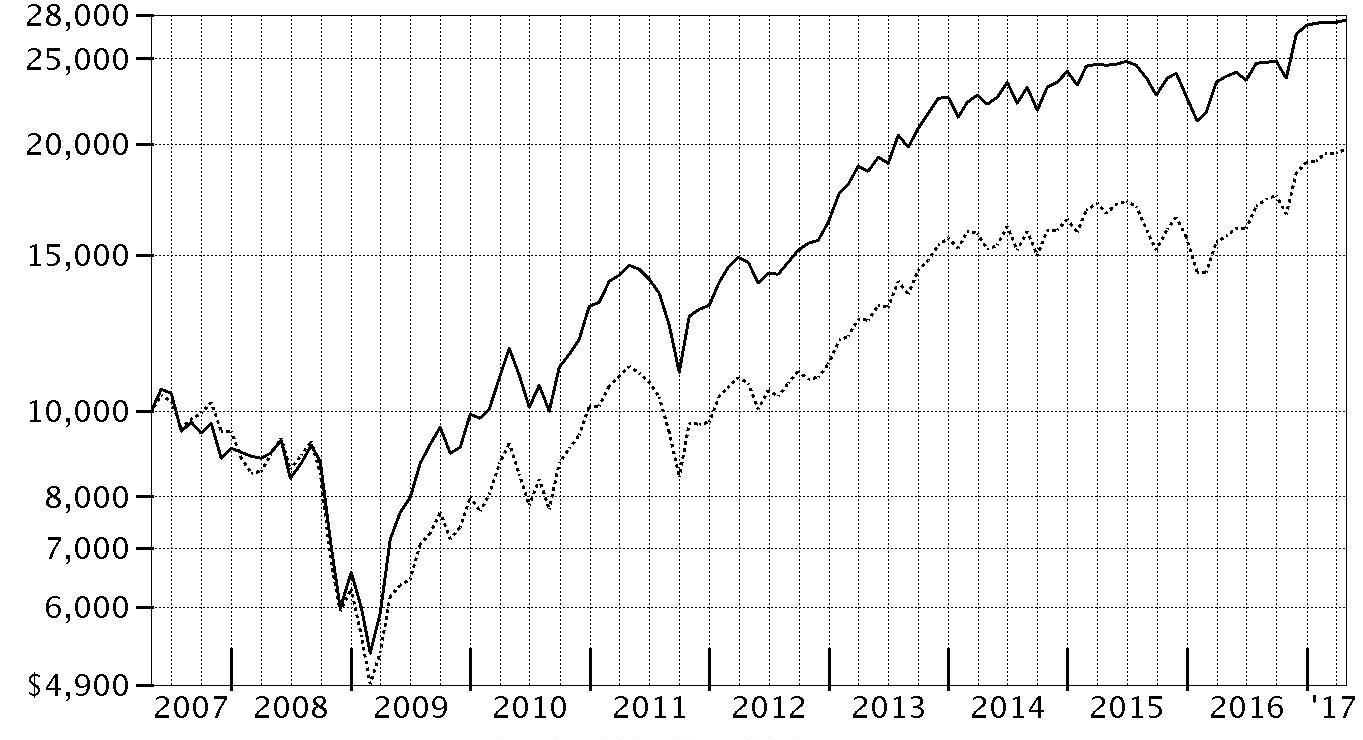
| Period Ending Values | ||
| $27,622 | Fidelity® Small Cap Discovery Fund | |
| $19,758 | Russell 2000® Index | |
Management's Discussion of Fund Performance
Market Recap: The U.S. equity bellwether S&P 500® index gained 17.92% for the year ending April 30, 2017, rising sharply following the November election and continuing to gain ground through the end of February on optimism for President Trump’s pro-business agenda. Equity markets leveled off, however, as the fledgling administration faced the first test of its domestic agenda. Stocks reacted with uncertainty to efforts by Congress in March to repeal and replace the Affordable Care Act (ACA), and were relatively flat through April 30. In a stark reversal from 2016, growth-oriented stocks topped their value counterparts through the first third of 2017. Sector-wise, information technology (+35%) fared best, anchored by twin rallies in the June 2016 and March 2017 quarters as growth regained favor. Financials (+27%) also handily outperformed, riding an uptick in bond yields and a surge in banks, particularly post-election. Industrials (+19 %) and materials (+16%) did well amid a call for increased infrastructure spending and a rise in commodity prices, respectively. Conversely, consumer staples (+9%), real estate (+5%) and telecommunication services (0%) were held back amid an improved backdrop for riskier assets that curbed demand for dividend-rich sectors, as well as the likelihood of one or two additional interest rate hikes later in 2017. Energy (+2%) also struggled this period.Comments from Lead Portfolio Manager Charles Myers: For the fiscal year, the fund gained 15.76%, significantly trailing the 25.63% advance of the benchmark Russell 2000® Index. Versus the benchmark, security selection was especially negative in the industrials, information technology, energy and health care sectors. Conversely, the fund benefited from minimal exposure to the lagging utilities and telecommunication services categories, as well as positioning among banks. The biggest individual detractor was AmSurg, an operator of ambulatory surgical centers and provider of physician services that saw its stock price adjust downward along with the company’s growth rate. AmSurg was acquired by another fund holding and an out-of-benchmark relative detractor this period, Envision Healthcare. Within financials, Federated Investors hurt, as our sizable stake in this asset manager was hampered by the market’s concern about mounting competition. Another source of difficulty was our timing with prison operator and real estate investment trust GEO Group, which we sold by April 30. In contrast, the top contributor was Hill-Rom Holdings, a maker of hospital beds and other medical equipment. This non-index position – one of our largest holdings on April 30 – returned about 58% for the fund. Another meaningful contributor was Cullen/Frost Bankers, a non-benchmark holding that was among the fund’s largest positions. The firm benefited from a favorable business backdrop.The views expressed above reflect those of the portfolio manager(s) only through the end of the period as stated on the cover of this report and do not necessarily represent the views of Fidelity or any other person in the Fidelity organization. Any such views are subject to change at any time based upon market or other conditions and Fidelity disclaims any responsibility to update such views. These views may not be relied on as investment advice and, because investment decisions for a Fidelity fund are based on numerous factors, may not be relied on as an indication of trading intent on behalf of any Fidelity fund.
Note to shareholders: On December 31, 2017, Co-Portfolio Manager Derek Janssen will assume sole responsibility for the fund.Investment Summary (Unaudited)
Top Ten Stocks as of April 30, 2017
| % of fund's net assets | % of fund's net assets 6 months ago | |
| Tech Data Corp. | 3.4 | 3.1 |
| Cullen/Frost Bankers, Inc. | 3.4 | 3.7 |
| j2 Global, Inc. | 3.2 | 2.8 |
| Aarons, Inc. Class A | 3.2 | 2.6 |
| Hill-Rom Holdings, Inc. | 3.1 | 1.9 |
| Post Holdings, Inc. | 3.0 | 3.0 |
| CalAtlantic Group, Inc. | 2.9 | 0.0 |
| Regal Beloit Corp. | 2.8 | 2.0 |
| WESCO International, Inc. | 2.7 | 3.0 |
| Carpenter Technology Corp. | 2.7 | 2.3 |
| 30.4 |
Top Five Market Sectors as of April 30, 2017
| % of fund's net assets | % of fund's net assets 6 months ago | |
| Financials | 19.0 | 22.0 |
| Information Technology | 16.7 | 19.2 |
| Consumer Discretionary | 14.7 | 11.8 |
| Industrials | 14.0 | 16.0 |
| Health Care | 11.9 | 14.4 |
Asset Allocation (% of fund's net assets)
| As of April 30, 2017* | ||
| Stocks | 97.7% | |
| Bonds | 0.1% | |
| Short-Term Investments and Net Other Assets (Liabilities) | 2.2% | |

* Foreign investments - 6.2%
| As of October 31, 2016* | ||
| Stocks | 99.1% | |
| Short-Term Investments and Net Other Assets (Liabilities) | 0.9% | |

* Foreign investments - 4.2%
Percentages shown as 0.0% may reflect amounts less than 0.05%.
Investments April 30, 2017
Showing Percentage of Net Assets
| Common Stocks - 97.7% | |||
| Shares | Value | ||
| CONSUMER DISCRETIONARY - 14.7% | |||
| Household Durables - 6.1% | |||
| CalAtlantic Group, Inc. (a) | 4,500,000 | $162,990,000 | |
| KB Home (a) | 4,500,000 | 92,700,000 | |
| Meritage Homes Corp. (b) | 1,956,880 | 76,220,476 | |
| TopBuild Corp. (b) | 237,167 | 12,140,579 | |
| 344,051,055 | |||
| Leisure Products - 2.0% | |||
| Brunswick Corp. | 2,000,000 | 113,500,000 | |
| Media - 2.8% | |||
| Cinemark Holdings, Inc. | 3,000,000 | 129,600,000 | |
| Emerald Expositions Events, Inc. | 1,428,634 | 27,858,363 | |
| 157,458,363 | |||
| Specialty Retail - 3.8% | |||
| Aarons, Inc. Class A (c) | 5,000,000 | 179,700,000 | |
| Genesco, Inc. (b) | 675,199 | 35,988,107 | |
| 215,688,107 | |||
| TOTAL CONSUMER DISCRETIONARY | 830,697,525 | ||
| CONSUMER STAPLES - 4.6% | |||
| Food & Staples Retailing - 1.6% | |||
| United Natural Foods, Inc. (b) | 2,250,000 | 93,442,500 | |
| Food Products - 3.0% | |||
| Post Holdings, Inc. (b) | 2,000,000 | 168,380,000 | |
| TOTAL CONSUMER STAPLES | 261,822,500 | ||
| ENERGY - 4.3% | |||
| Energy Equipment & Services - 4.3% | |||
| Oil States International, Inc. (b) | 1,911,185 | 56,857,754 | |
| ShawCor Ltd. Class A (c) | 5,000,000 | 125,453,280 | |
| Superior Energy Services, Inc. (b) | 4,783,400 | 57,783,472 | |
| 240,094,506 | |||
| FINANCIALS - 19.0% | |||
| Banks - 13.2% | |||
| Associated Banc-Corp. | 5,297,400 | 131,905,260 | |
| Cathay General Bancorp | 2,450,000 | 93,222,500 | |
| Cullen/Frost Bankers, Inc. | 2,000,000 | 188,780,000 | |
| First Citizen Bancshares, Inc. | 250,000 | 87,015,000 | |
| First Citizen Bancshares, Inc. Class A | 200,000 | 69,612,000 | |
| Hilltop Holdings, Inc. | 1,985,968 | 55,229,770 | |
| TCF Financial Corp. | 7,000,000 | 115,570,000 | |
| 741,334,530 | |||
| Capital Markets - 2.4% | |||
| Federated Investors, Inc. Class B (non-vtg.) | 5,000,000 | 134,100,000 | |
| Insurance - 1.0% | |||
| Amerisafe, Inc. (c) | 1,000,000 | 57,550,000 | |
| Thrifts & Mortgage Finance - 2.4% | |||
| Washington Federal, Inc. | 4,000,000 | 134,800,000 | |
| TOTAL FINANCIALS | 1,067,784,530 | ||
| HEALTH CARE - 11.9% | |||
| Health Care Equipment & Supplies - 5.4% | |||
| Hill-Rom Holdings, Inc. | 2,300,000 | 173,972,000 | |
| Integra LifeSciences Holdings Corp. (b) | 2,800,000 | 128,716,000 | |
| 302,688,000 | |||
| Health Care Providers & Services - 5.0% | |||
| Chemed Corp. | 350,000 | 70,483,000 | |
| Envision Healthcare Corp. (b) | 1,400,000 | 78,442,000 | |
| Owens & Minor, Inc. | 2,500,000 | 86,625,000 | |
| VCA, Inc. (b) | 500,000 | 45,785,000 | |
| 281,335,000 | |||
| Pharmaceuticals - 1.5% | |||
| Innoviva, Inc. (a)(b)(c) | 7,483,728 | 88,195,734 | |
| TOTAL HEALTH CARE | 672,218,734 | ||
| INDUSTRIALS - 13.9% | |||
| Commercial Services & Supplies - 0.8% | |||
| Essendant, Inc. | 568,697 | 9,497,240 | |
| HNI Corp. | 822,796 | 38,473,941 | |
| 47,971,181 | |||
| Electrical Equipment - 3.4% | |||
| Powell Industries, Inc. (c) | 950,000 | 32,765,500 | |
| Regal Beloit Corp. | 2,000,000 | 157,700,000 | |
| 190,465,500 | |||
| Machinery - 1.7% | |||
| Hillenbrand, Inc. | 1,512,589 | 55,814,534 | |
| Mueller Industries, Inc. | 1,231,900 | 39,470,076 | |
| 95,284,610 | |||
| Professional Services - 0.5% | |||
| FTI Consulting, Inc. (b) | 779,271 | 26,954,984 | |
| Road & Rail - 4.0% | |||
| Genesee & Wyoming, Inc. Class A (b) | 1,500,000 | 101,640,000 | |
| Swift Transporation Co. (a)(b) | 5,075,000 | 124,743,500 | |
| 226,383,500 | |||
| Trading Companies & Distributors - 3.5% | |||
| Diploma PLC | 3,000,000 | 43,091,304 | |
| WESCO International, Inc. (b)(c) | 2,500,000 | 152,375,000 | |
| 195,466,304 | |||
| TOTAL INDUSTRIALS | 782,526,079 | ||
| INFORMATION TECHNOLOGY - 16.7% | |||
| Electronic Equipment & Components - 5.4% | |||
| SYNNEX Corp. | 1,012,681 | 109,805,001 | |
| Tech Data Corp. (b)(c) | 2,000,000 | 191,300,001 | |
| 301,105,002 | |||
| Internet Software & Services - 5.4% | |||
| Cimpress NV (a)(b) | 1,500,000 | 123,120,000 | |
| j2 Global, Inc. | 2,000,000 | 180,480,000 | |
| 303,600,000 | |||
| IT Services - 4.5% | |||
| Booz Allen Hamilton Holding Corp. Class A | 3,500,000 | 125,755,000 | |
| CACI International, Inc. Class A (b) | 1,100,000 | 129,800,000 | |
| 255,555,000 | |||
| Software - 1.4% | |||
| SS&C Technologies Holdings, Inc. | 2,200,000 | 80,828,000 | |
| TOTAL INFORMATION TECHNOLOGY | 941,088,002 | ||
| MATERIALS - 8.0% | |||
| Chemicals - 0.2% | |||
| Tronox Ltd. Class A | 747,273 | 12,337,477 | |
| Construction Materials - 0.7% | |||
| Wienerberger AG | 1,672,614 | 39,172,536 | |
| Containers & Packaging - 2.7% | |||
| Silgan Holdings, Inc. | 2,500,000 | 151,550,000 | |
| Metals & Mining - 4.4% | |||
| Carpenter Technology Corp. (c) | 3,745,924 | 152,084,514 | |
| Compass Minerals International, Inc. (a) | 700,000 | 46,200,000 | |
| Haynes International, Inc. (c) | 1,100,000 | 46,519,000 | |
| 244,803,514 | |||
| TOTAL MATERIALS | 447,863,527 | ||
| REAL ESTATE - 3.6% | |||
| Equity Real Estate Investment Trusts (REITs) - 3.6% | |||
| CareTrust (REIT), Inc. | 3,000,000 | 51,060,000 | |
| Franklin Street Properties Corp. | 2,700,000 | 32,751,000 | |
| Store Capital Corp. | 5,000,000 | 119,950,000 | |
| 203,761,000 | |||
| UTILITIES - 1.0% | |||
| Electric Utilities - 1.0% | |||
| Portland General Electric Co. | 1,200,000 | 54,408,000 | |
| TOTAL COMMON STOCKS | |||
| (Cost $3,744,367,828) | 5,502,264,403 | ||
| Principal Amount | Value | ||
| Nonconvertible Bonds - 0.1% | |||
| INDUSTRIALS - 0.1% | |||
| Machinery - 0.1% | |||
| Mueller Industries, Inc. 6% 3/1/27 (Cost $6,159,000) | 6,159,000 | 6,159,000 | |
| Shares | Value | ||
| Money Market Funds - 5.6% | |||
| Fidelity Cash Central Fund, 0.85% (d) | 111,162,807 | 111,185,039 | |
| Fidelity Securities Lending Cash Central Fund 0.86% (d)(e) | 207,120,688 | 207,141,400 | |
| TOTAL MONEY MARKET FUNDS | |||
| (Cost $318,319,798) | 318,326,439 | ||
| TOTAL INVESTMENT PORTFOLIO - 103.4% | |||
| (Cost $4,068,846,626) | 5,826,749,842 | ||
| NET OTHER ASSETS (LIABILITIES) - (3.4)% | (193,776,413) | ||
| NET ASSETS - 100% | $5,632,973,429 |
Legend
(a) Security or a portion of the security is on loan at period end.
(b) Non-income producing
(c) Affiliated company
(d) Affiliated fund that is generally available only to investment companies and other accounts managed by Fidelity Investments. The rate quoted is the annualized seven-day yield of the fund at period end. A complete unaudited listing of the fund's holdings as of its most recent quarter end is available upon request. In addition, each Fidelity Central Fund's financial statements, which are not covered by the Fund's Report of Independent Registered Public Accounting Firm, are available on the SEC's website or upon request.
(e) Investment made with cash collateral received from securities on loan.
Affiliated Central Funds
Information regarding fiscal year to date income earned by the Fund from investments in Fidelity Central Funds is as follows:
| Fund | Income earned |
| Fidelity Cash Central Fund | $482,986 |
| Fidelity Securities Lending Cash Central Fund | 903,927 |
| Total | $1,386,913 |
Other Affiliated Issuers
An affiliated company is a company in which the Fund has ownership of at least 5% of the voting securities. Fiscal year to date transactions with companies which are or were affiliates are as follows:
| Affiliate | Value, beginning of period | Purchases | Sales Proceeds | Dividend Income | Value, end of period |
| Aarons, Inc. Class A | $141,534,000 | $-- | $13,856,382 | $561,500 | $179,700,000 |
| Amerisafe, Inc. | 53,880,000 | -- | -- | 3,990,000 | 57,550,000 |
| CACI International, Inc. Class A | 124,995,000 | -- | 25,259,233 | -- | -- |
| Carpenter Technology Corp. | 132,643,169 | -- | -- | 2,697,065 | 152,084,514 |
| EnerSys | 151,762,000 | -- | 177,840,889 | 1,015,000 | -- |
| Finish Line, Inc. Class A | 63,693,750 | -- | 55,925,259 | 1,034,480 | -- |
| FTI Consulting, Inc. | 120,900,000 | -- | 91,407,041 | -- | -- |
| Genesco, Inc. | 117,419,214 | -- | 56,934,496 | -- | -- |
| Haynes International, Inc. | 41,283,000 | -- | -- | 968,000 | 46,519,000 |
| Innoviva, Inc. | 94,548,192 | -- | 2,064,454 | -- | 88,195,734 |
| Powell Industries, Inc. | 37,344,000 | -- | 9,920,782 | 1,183,000 | 32,765,500 |
| ShawCor Ltd. Class A | 81,055,232 | 51,986,369 | -- | 1,354,788 | 125,453,280 |
| TCF Financial Corp. | 156,860,000 | -- | 79,230,639 | 3,037,500 | -- |
| Team Health Holdings, Inc. | 125,490,000 | 27,517,760 | 167,732,999 | -- | -- |
| Tech Data Corp. | 144,249,000 | -- | 9,111,097 | -- | 191,300,001 |
| Tidewater, Inc. | 40,953,000 | -- | 8,015,147 | -- | -- |
| Washington Federal, Inc. | 114,667,139 | -- | 23,682,579 | 3,176,627 | -- |
| WESCO International, Inc. | 170,342,263 | -- | 27,532,834 | -- | 152,375,000 |
| Total | $1,913,618,959 | $79,504,129 | $748,513,831 | $19,017,960 | $1,025,943,029 |
Investment Valuation
The following is a summary of the inputs used, as of April 30, 2017, involving the Fund's assets and liabilities carried at fair value. The inputs or methodology used for valuing securities may not be an indication of the risk associated with investing in those securities. For more information on valuation inputs, and their aggregation into the levels used below, please refer to the Investment Valuation section in the accompanying Notes to Financial Statements.
| Valuation Inputs at Reporting Date: | ||||
| Description | Total | Level 1 | Level 2 | Level 3 |
| Investments in Securities: | ||||
| Equities: | ||||
| Consumer Discretionary | $830,697,525 | $830,697,525 | $-- | $-- |
| Consumer Staples | 261,822,500 | 261,822,500 | -- | -- |
| Energy | 240,094,506 | 240,094,506 | -- | -- |
| Financials | 1,067,784,530 | 1,067,784,530 | -- | -- |
| Health Care | 672,218,734 | 672,218,734 | -- | -- |
| Industrials | 782,526,079 | 782,526,079 | -- | -- |
| Information Technology | 941,088,002 | 941,088,002 | -- | -- |
| Materials | 447,863,527 | 447,863,527 | -- | -- |
| Real Estate | 203,761,000 | 203,761,000 | -- | -- |
| Utilities | 54,408,000 | 54,408,000 | -- | -- |
| Corporate Bonds | 6,159,000 | -- | 6,159,000 | -- |
| Money Market Funds | 318,326,439 | 318,326,439 | -- | -- |
| Total Investments in Securities: | $5,826,749,842 | $5,820,590,842 | $6,159,000 | $-- |
See accompanying notes which are an integral part of the financial statements.
Financial Statements
Statement of Assets and Liabilities
| April 30, 2017 | ||
| Assets | ||
| Investment in securities, at value (including securities loaned of $196,644,972) — See accompanying schedule: Unaffiliated issuers (cost $2,915,305,582) | $4,482,480,374 | |
| Fidelity Central Funds (cost $318,319,798) | 318,326,439 | |
| Other affiliated issuers (cost $835,221,246) | 1,025,943,029 | |
| Total Investments (cost $4,068,846,626) | $5,826,749,842 | |
| Receivable for investments sold | 46,211,446 | |
| Receivable for fund shares sold | 3,454,969 | |
| Dividends receivable | 1,187,266 | |
| Interest receivable | 53,378 | |
| Distributions receivable from Fidelity Central Funds | 107,036 | |
| Prepaid expenses | 3,520 | |
| Other receivables | 27,626 | |
| Total assets | 5,877,795,083 | |
| Liabilities | ||
| Payable for investments purchased | $27,929,329 | |
| Payable for fund shares redeemed | 6,076,813 | |
| Accrued management fee | 2,733,173 | |
| Other affiliated payables | 886,879 | |
| Other payables and accrued expenses | 56,007 | |
| Collateral on securities loaned | 207,139,453 | |
| Total liabilities | 244,821,654 | |
| Net Assets | $5,632,973,429 | |
| Net Assets consist of: | ||
| Paid in capital | $3,657,633,028 | |
| Undistributed net investment income | 11,032,728 | |
| Accumulated undistributed net realized gain (loss) on investments and foreign currency transactions | 206,404,457 | |
| Net unrealized appreciation (depreciation) on investments | 1,757,903,216 | |
| Net Assets, for 175,764,235 shares outstanding | $5,632,973,429 | |
| Net Asset Value, offering price and redemption price per share ($5,632,973,429 ÷ 175,764,235 shares) | $32.05 |
See accompanying notes which are an integral part of the financial statements.
Statement of Operations
| Year ended April 30, 2017 | ||
| Investment Income | ||
| Dividends (including $19,017,960 earned from other affiliated issuers) | $82,784,359 | |
| Interest | 53,378 | |
| Income from Fidelity Central Funds | 1,386,913 | |
| Total income | 84,224,650 | |
| Expenses | ||
| Management fee | ||
| Basic fee | $38,406,829 | |
| Performance adjustment | (1,255,388) | |
| Transfer agent fees | 9,504,652 | |
| Accounting and security lending fees | 1,146,711 | |
| Custodian fees and expenses | 68,219 | |
| Independent trustees' fees and expenses | 22,785 | |
| Registration fees | 58,903 | |
| Audit | 60,445 | |
| Legal | 17,408 | |
| Miscellaneous | 49,099 | |
| Total expenses before reductions | 48,079,663 | |
| Expense reductions | (321,279) | 47,758,384 |
| Net investment income (loss) | 36,466,266 | |
| Realized and Unrealized Gain (Loss) | ||
| Net realized gain (loss) on: | ||
| Investment securities: | ||
| Unaffiliated issuers | 154,607,384 | |
| Fidelity Central Funds | 11,181 | |
| Other affiliated issuers | 66,317,858 | |
| Foreign currency transactions | 151,216 | |
| Total net realized gain (loss) | 221,087,639 | |
| Change in net unrealized appreciation (depreciation) on investment securities | 546,613,353 | |
| Net gain (loss) | 767,700,992 | |
| Net increase (decrease) in net assets resulting from operations | $804,167,258 |
See accompanying notes which are an integral part of the financial statements.
Statement of Changes in Net Assets
| Year ended April 30, 2017 | Year ended April 30, 2016 | |
| Increase (Decrease) in Net Assets | ||
| Operations | ||
| Net investment income (loss) | $36,466,266 | $29,333,142 |
| Net realized gain (loss) | 221,087,639 | 84,595,961 |
| Change in net unrealized appreciation (depreciation) | 546,613,353 | (307,146,825) |
| Net increase (decrease) in net assets resulting from operations | 804,167,258 | (193,217,722) |
| Distributions to shareholders from net investment income | (25,236,219) | (29,347,008) |
| Distributions to shareholders from net realized gain | – | (357,140,838) |
| Total distributions | (25,236,219) | (386,487,846) |
| Share transactions | ||
| Proceeds from sales of shares | 651,392,818 | 594,087,736 |
| Reinvestment of distributions | 23,112,912 | 358,786,583 |
| Cost of shares redeemed | (1,151,553,701) | (1,094,651,742) |
| Net increase (decrease) in net assets resulting from share transactions | (477,047,971) | (141,777,423) |
| Redemption fees | 274,790 | 219,477 |
| Total increase (decrease) in net assets | 302,157,858 | (721,263,514) |
| Net Assets | ||
| Beginning of period | 5,330,815,571 | 6,052,079,085 |
| End of period | $5,632,973,429 | $5,330,815,571 |
| Other Information | ||
| Undistributed net investment income end of period | $11,032,728 | $– |
| Shares | ||
| Sold | 21,647,025 | 21,550,144 |
| Issued in reinvestment of distributions | 745,578 | 12,343,775 |
| Redeemed | (38,304,876) | (39,847,068) |
| Net increase (decrease) | (15,912,273) | (5,953,149) |
See accompanying notes which are an integral part of the financial statements.
Financial Highlights — Fidelity Small Cap Discovery Fund
| Years ended April 30, | 2017 | 2016 | 2015 | 2014 | 2013 |
| Selected Per–Share Data | |||||
| Net asset value, beginning of period | $27.81 | $30.62 | $30.77 | $27.46 | $22.37 |
| Income from Investment Operations | |||||
| Net investment income (loss)A | .20 | .15 | .11 | .05 | .25 |
| Net realized and unrealized gain (loss) | 4.18 | (.99) | 3.00 | 5.10 | 5.55 |
| Total from investment operations | 4.38 | (.84) | 3.11 | 5.15 | 5.80 |
| Distributions from net investment income | (.14) | (.15) | (.08) | (.03) | (.22) |
| Distributions from net realized gain | – | (1.82) | (3.18) | (1.81) | (.49) |
| Total distributions | (.14) | (1.97) | (3.26) | (1.84) | (.72)B |
| Redemption fees added to paid in capitalA | –C | –C | –C | –C | .01 |
| Net asset value, end of period | $32.05 | $27.81 | $30.62 | $30.77 | $27.46 |
| Total ReturnD | 15.76% | (2.94)% | 10.62% | 19.26% | 26.69% |
| Ratios to Average Net AssetsE,F | |||||
| Expenses before reductions | .87% | 1.01% | 1.06% | 1.01% | 1.06% |
| Expenses net of fee waivers, if any | .87% | 1.01% | 1.06% | 1.01% | 1.06% |
| Expenses net of all reductions | .87% | 1.00% | 1.05% | 1.01% | 1.05% |
| Net investment income (loss) | .66% | .53% | .36% | .15% | 1.02% |
| Supplemental Data | |||||
| Net assets, end of period (000 omitted) | $5,632,973 | $5,330,816 | $6,052,079 | $6,457,900 | $5,651,563 |
| Portfolio turnover rateG | 18% | 25% | 13% | 17% | 26% |
A Calculated based on average shares outstanding during the period.
B Total distributions of $.72 per share is comprised of distributions from net investment income of $.223 and distributions from net realized gain of $.493 per share.
C Amount represents less than $.005 per share.
D Total returns would have been lower if certain expenses had not been reduced during the applicable periods shown.
E Fees and expenses of any underlying Fidelity Central Funds are not included in the Fund's expense ratio. The Fund indirectly bears its proportionate share of the expenses of any underlying Fidelity Central Funds.
F Expense ratios reflect operating expenses of the Fund. Expenses before reductions do not reflect amounts reimbursed by the investment adviser or reductions from brokerage service arrangements or reductions from other expense offset arrangements and do not represent the amount paid by the Fund during periods when reimbursements or reductions occur. Expenses net of fee waivers reflect expenses after reimbursement by the investment adviser but prior to reductions from brokerage service arrangements or other expense offset arrangements. Expenses net of all reductions represent the net expenses paid by the Fund.
G Amount does not include the portfolio activity of any underlying Fidelity Central Funds.
See accompanying notes which are an integral part of the financial statements.
Notes to Financial Statements
For the period ended April 30, 2017
1. Organization.
Fidelity Small Cap Discovery Fund (the Fund) is a fund of Fidelity Concord Street Trust (the Trust) (formerly a fund of Fidelity Commonwealth Trust) and is authorized to issue an unlimited number of shares. Share transactions on the Statement of Changes in Net Assets may contain exchanges between affiliated funds. The Trust is registered under the Investment Company Act of 1940, as amended (the 1940 Act), as an open-end management investment company organized as a Massachusetts business trust. The Fund is closed to new accounts with certain exceptions.
2. Investments in Fidelity Central Funds.
The Fund invests in Fidelity Central Funds, which are open-end investment companies generally available only to other investment companies and accounts managed by the investment adviser and its affiliates. The Fund's Schedule of Investments lists each of the Fidelity Central Funds held as of period end, if any, as an investment of the Fund, but does not include the underlying holdings of each Fidelity Central Fund. As an Investing Fund, the Fund indirectly bears its proportionate share of the expenses of the underlying Fidelity Central Funds.
The Money Market Central Funds seek preservation of capital and current income and are managed by Fidelity Investments Money Management, Inc. (FIMM), an affiliate of the investment adviser. Annualized expenses of the Money Market Central Funds as of their most recent shareholder report date are less than .005%.
A complete unaudited list of holdings for each Fidelity Central Fund is available upon request or at the Securities and Exchange Commission (the SEC) website at www.sec.gov. In addition, the financial statements of the Fidelity Central Funds, which are not covered by the Fund's Report of Independent Registered Public Accounting Firm, are available on the SEC website or upon request.
3. Significant Accounting Policies.
The Fund is an investment company and applies the accounting and reporting guidance of the Financial Accounting Standards Board (FASB) Accounting Standards Codification Topic 946 Financial Services – Investments Companies. The financial statements have been prepared in conformity with accounting principles generally accepted in the United States of America (GAAP), which require management to make certain estimates and assumptions at the date of the financial statements. Actual results could differ from those estimates. Subsequent events, if any, through the date that the financial statements were issued have been evaluated in the preparation of the financial statements. The following summarizes the significant accounting policies of the Fund:
Investment Valuation. Investments are valued as of 4:00 p.m. Eastern time on the last calendar day of the period. The Board of Trustees (the Board) has delegated the day to day responsibility for the valuation of the Fund's investments to the Fair Value Committee (the Committee) established by the Fund's investment adviser. In accordance with valuation policies and procedures approved by the Board, the Fund attempts to obtain prices from one or more third party pricing vendors or brokers to value its investments. When current market prices, quotations or currency exchange rates are not readily available or reliable, investments will be fair valued in good faith by the Committee, in accordance with procedures adopted by the Board. Factors used in determining fair value vary by investment type and may include market or investment specific events, changes in interest rates and credit quality. The frequency with which these procedures are used cannot be predicted and they may be utilized to a significant extent. The Committee oversees the Fund's valuation policies and procedures and reports to the Board on the Committee's activities and fair value determinations. The Board monitors the appropriateness of the procedures used in valuing the Fund's investments and ratifies the fair value determinations of the Committee.
The Fund categorizes the inputs to valuation techniques used to value its investments into a disclosure hierarchy consisting of three levels as shown below:
- Level 1 – quoted prices in active markets for identical investments
- Level 2 – other significant observable inputs (including quoted prices for similar investments, interest rates, prepayment speeds, etc.)
- Level 3 – unobservable inputs (including the Fund's own assumptions based on the best information available)
Valuation techniques used to value the Fund's investments by major category are as follows:
Equity securities, including restricted securities, for which market quotations are readily available, are valued at the last reported sale price or official closing price as reported by a third party pricing vendor on the primary market or exchange on which they are traded and are categorized as Level 1 in the hierarchy. In the event there were no sales during the day or closing prices are not available, securities are valued at the last quoted bid price or may be valued using the last available price and are generally categorized as Level 2 in the hierarchy. For foreign equity securities, when market or security specific events arise, comparisons to the valuation of American Depositary Receipts (ADRs), futures contracts, Exchange-Traded Funds (ETFs) and certain indexes as well as quoted prices for similar securities may be used and would be categorized as Level 2 in the hierarchy. Utilizing these techniques may result in transfers between Level 1 and Level 2. For equity securities, including restricted securities, where observable inputs are limited, assumptions about market activity and risk are used and these securities may be categorized as Level 3 in the hierarchy.
Debt securities, including restricted securities, are valued based on evaluated prices received from third party pricing vendors or from brokers who make markets in such securities. Corporate bonds are valued by pricing vendors who utilize matrix pricing which considers yield or price of bonds of comparable quality, coupon, maturity and type or by broker-supplied prices. When independent prices are unavailable or unreliable, debt securities may be valued utilizing pricing methodologies which consider similar factors that would be used by third party pricing vendors. Debt securities are generally categorized as Level 2 in the hierarchy but may be Level 3 depending on the circumstances.
Investments in open-end mutual funds, including the Fidelity Central Funds, are valued at their closing net asset value (NAV) each business day and are categorized as Level 1 in the hierarchy.
Changes in valuation techniques may result in transfers in or out of an assigned level within the disclosure hierarchy. The aggregate value of investments by input level as of April 30, 2017, is included at the end of the Fund's Schedule of Investments.
Foreign Currency. The Fund may use foreign currency contracts to facilitate transactions in foreign-denominated securities. Gains and losses from these transactions may arise from changes in the value of the foreign currency or if the counterparties do not perform under the contracts' terms.
Foreign-denominated assets, including investment securities, and liabilities are translated into U.S. dollars at the exchange rates at period end. Purchases and sales of investment securities, income and dividends received and expenses denominated in foreign currencies are translated into U.S. dollars at the exchange rate in effect on the transaction date.
The effects of exchange rate fluctuations on investments are included with the net realized and unrealized gain (loss) on investment securities. Other foreign currency transactions resulting in realized and unrealized gain (loss) are disclosed separately.
Investment Transactions and Income. For financial reporting purposes, the Fund's investment holdings and NAV include trades executed through the end of the last business day of the period. The NAV per share for processing shareholder transactions is calculated as of the close of business of the New York Stock Exchange (NYSE), normally 4:00 p.m. Eastern time and includes trades executed through the end of the prior business day. Gains and losses on securities sold are determined on the basis of identified cost and may include proceeds received from litigation. Dividend income is recorded on the ex-dividend date, except for certain dividends from foreign securities where the ex-dividend date may have passed, which are recorded as soon as the Fund is informed of the ex-dividend date. Non-cash dividends included in dividend income, if any, are recorded at the fair market value of the securities received. Income and capital gain distributions from Fidelity Central Funds, if any, are recorded on the ex-dividend date. Certain distributions received by the Fund represent a return of capital or capital gain. The Fund determines the components of these distributions subsequent to the ex-dividend date, based upon receipt of tax filings or other correspondence relating to the underlying investment. These distributions are recorded as a reduction of cost of investments and/or as a realized gain. Interest income is accrued as earned and includes coupon interest and amortization of premium and accretion of discount on debt securities as applicable. Investment income is recorded net of foreign taxes withheld where recovery of such taxes is uncertain.
Expenses. Expenses directly attributable to a fund are charged to that fund. Expenses attributable to more than one fund are allocated among the respective funds on the basis of relative net assets or other appropriate methods. Expense estimates are accrued in the period to which they relate and adjustments are made when actual amounts are known.
Income Tax Information and Distributions to Shareholders. Each year, the Fund intends to qualify as a regulated investment company under Subchapter M of the Internal Revenue Code, including distributing substantially all of its taxable income and realized gains. As a result, no provision for U.S. Federal income taxes is required. As of April 30, 2017, the Fund did not have any unrecognized tax benefits in the financial statements; nor is the Fund aware of any tax positions for which it is reasonably possible that the total amounts of unrecognized tax benefits will significantly change in the next twelve months. The Fund files a U.S. federal tax return, in addition to state and local tax returns as required. The Fund's federal income tax returns are subject to examination by the Internal Revenue Service (IRS) for a period of three fiscal years after they are filed. State and local tax returns may be subject to examination for an additional fiscal year depending on the jurisdiction. Foreign taxes are provided for based on the Fund's understanding of the tax rules and rates that exist in the foreign markets in which it invests.
Distributions are declared and recorded on the ex-dividend date. Income and capital gain distributions are determined in accordance with income tax regulations, which may differ from GAAP. In addition, the Fund claimed a portion of the payment made to redeeming shareholders as a distribution for income tax purposes.
Capital accounts within the financial statements are adjusted for permanent book-tax differences. These adjustments have no impact on net assets or the results of operations. Capital accounts are not adjusted for temporary book-tax differences which will reverse in a subsequent period.
Book-tax differences are primarily due to foreign currency transactions and losses deferred due to wash sales and excise tax regulations.
The federal tax cost of investment securities and unrealized appreciation (depreciation) as of period end were as follows:
| Gross unrealized appreciation | $1,889,489,875 |
| Gross unrealized depreciation | (131,971,066) |
| Net unrealized appreciation (depreciation) on securities | $1,757,518,809 |
| Tax Cost | $4,069,231,033 |
The tax-based components of distributable earnings as of period end were as follows:
| Undistributed ordinary income | $11,032,728 |
| Undistributed long-term capital gain | $ 206,788,865 |
| Net unrealized appreciation (depreciation) on securities and other investments | $1,757,518,809 |
The tax character of distributions paid was as follows:
| April 30, 2017 | April 30,2016 | |
| Ordinary Income | $25,236,219 | $ 32,887,970 |
| Long-term Capital Gains | – | 353,599,876 |
| Total | $25,236,219 | $ 386,487,846 |
Short-Term Trading (Redemption) Fees. Shares held by investors in the Fund less than 90 days may have been subject to a redemption fee equal to 1.50% of the NAV of shares redeemed. All redemption fees, which reduce the proceeds of the shareholder redemption, are retained by the Fund and accounted for as an addition to paid in capital.
4. Purchases and Sales of Investments.
Purchases and sales of securities, other than short-term securities, aggregated $986,353,052 and $1,208,064,453, respectively.
5. Fees and Other Transactions with Affiliates.
Management Fee. Fidelity Management & Research Company (the investment adviser) and its affiliates provide the Fund with investment management related services for which the Fund pays a monthly management fee. The management fee is the sum of an individual fund fee rate that is based on an annual rate of .45% of the Fund's average net assets and an annualized group fee rate that averaged .25% during the period. The group fee rate is based upon the average net assets of all the mutual funds advised by the investment adviser, including any mutual funds previously advised by the investment adviser that are currently advised by Fidelity SelectCo, LLC, an affiliate of the investment adviser. The group fee rate decreases as assets under management increase and increases as assets under management decrease. In addition, the management fee is subject to a performance adjustment (up to a maximum of +/- .20% of the Fund's average net assets over a 36 month performance period). The upward or downward adjustment to the management fee is based on the Fund's relative investment performance as compared to its benchmark index, the Russell 2000 Index, over the same 36 month performance period. For the reporting period, the total annual management fee rate, including the performance adjustment, was .67% of the Fund's average net assets. The performance adjustment included in the management fee rate may be higher or lower than the maximum performance adjustment rate due to the difference between the average net assets for the reporting and performance periods.
Transfer Agent Fees. Fidelity Investments Institutional Operations Company, Inc. (FIIOC), an affiliate of the investment adviser, is the Fund's transfer, dividend disbursing and shareholder servicing agent. FIIOC receives account fees and asset-based fees that vary according to account size and type of account. FIIOC pays for typesetting, printing and mailing of shareholder reports, except proxy statements. For the period, the transfer agent fees were equivalent to an annual rate of .17% of average net assets.
Accounting and Security Lending Fees. Fidelity Service Company, Inc. (FSC), an affiliate of the investment adviser, maintains the Fund's accounting records. The accounting fee is based on the level of average net assets for each month. Under a separate contract, FSC administers the security lending program. The security lending fee is based on the number and duration of lending transactions.
Brokerage Commissions. The Fund placed a portion of its portfolio transactions with brokerage firms which are affiliates of the investment adviser. Brokerage commissions are included in net realized gain (loss) and change in net unrealized appreciation (depreciation) in the Statement of Operations. The commissions paid to these affiliated firms were $41,615 for the period.
Interfund Trades. The Fund may purchase from or sell securities to other Fidelity Funds under procedures adopted by the Board. The procedures have been designed to ensure these interfund trades are executed in accordance with Rule 17a-7 of the 1940 Act. Interfund trades are included within the respective purchases and sales amounts shown in the Purchases and Sales of Investments note.
6. Committed Line of Credit.
The Fund participates with other funds managed by the investment adviser or an affiliate in a $4.25 billion credit facility (the "line of credit") to be utilized for temporary or emergency purposes to fund shareholder redemptions or for other short-term liquidity purposes. The Fund has agreed to pay commitment fees on its pro-rata portion of the line of credit, which amounted to $18,485 and is reflected in Miscellaneous expenses on the Statement of Operations. During the period, the Fund did not borrow on this line of credit.
7. Security Lending.
The Fund lends portfolio securities through a lending agent from time to time in order to earn additional income. For equity securities, a lending agent is used and may loan securities to certain qualified borrowers, including Fidelity Capital Markets (FCM), a broker-dealer affiliated with the Fund. On the settlement date of the loan, the Fund receives collateral (in the form of U.S. Treasury obligations, letters of credit and/or cash) against the loaned securities and maintains collateral in an amount not less than 100% of the market value of the loaned securities during the period of the loan. The market value of the loaned securities is determined at the close of business of the Fund and any additional required collateral is delivered to the Fund on the next business day. The Fund or borrower may terminate the loan at any time, and if the borrower defaults on its obligation to return the securities loaned because of insolvency or other reasons, the Fund may apply collateral received from the borrower against the obligation. The Fund may experience delays and costs in recovering the securities loaned. Any cash collateral received is invested in the Fidelity Securities Lending Cash Central Fund. At period end, there were no security loans outstanding with FCM. Security lending income represents the income earned on investing cash collateral, less rebates paid to borrowers and any lending agent fees associated with the loan, plus any premium payments received for lending certain types of securities. Security lending income is presented in the Statement of Operations as a component of income from Fidelity Central Funds. Total security lending income during the period amounted to $903,927, including $24,360 from securities loaned to FCM.
8. Expense Reductions.
Commissions paid to certain brokers with whom the investment adviser, or its affiliates, places trades on behalf of the Fund include an amount in addition to trade execution, which may be rebated back to the Fund to offset certain expenses. This amount totaled $275,688 for the period. In addition, through arrangements with the Fund's custodian, credits realized as a result of certain uninvested cash balances were used to reduce the Fund's expenses. During the period, these credits reduced the Fund's expenses by $166.
In addition, during the period the investment adviser reimbursed and/or waived a portion of operating expenses in the amount of $45,425.
9. Other.
The Fund's organizational documents provide former and current trustees and officers with a limited indemnification against liabilities arising in connection with the performance of their duties to the Fund. In the normal course of business, the Fund may also enter into contracts that provide general indemnifications. The Fund's maximum exposure under these arrangements is unknown as this would be dependent on future claims that may be made against the Fund. The risk of material loss from such claims is considered remote.
Report of Independent Registered Public Accounting Firm
To the Trustees of Fidelity Concord Street Trust and Shareholders of Fidelity Small Cap Discovery Fund:
We have audited the accompanying statement of assets and liabilities of Fidelity Small Cap Discovery Fund (the Fund), a fund of Fidelity Concord Street Trust, including the schedule of investments, as of April 30, 2017, and the related statement of operations for the then ended, the statement of changes in net assets for each of the two years in the period then ended, and the financial highlights for five years in the period then ended. These financial statements and financial highlights are the responsibility of the Fund's management. Our responsibility is to express an opinion on these financial statements and financial highlights based on our audits.
We conducted our audits in accordance with the standards of the Public Company Accounting Oversight Board (United States). Those standards require that we plan and perform the audit to obtain reasonable assurance about whether the financial statements and financial highlights are free of material misstatement. The Fund is not required to have, nor were we engaged to perform, an audit of its internal control over financial reporting. Our audits included consideration of internal control over financial reporting as a basis for designing audit procedures that are appropriate in the circumstances, but not for the purpose of expressing an opinion on the effectiveness of the Fund's internal control over financial reporting. Accordingly, we express no such opinion. An audit also includes examining, on a test basis, evidence supporting the amounts and disclosures in the financial statements, assessing the accounting principles used and significant estimates made by management, as well as evaluating the overall financial statement presentation. Our procedures included confirmation of securities owned as of April 30, 2017 by correspondence with the custodians and brokers; when replies were not received from brokers, we performed other auditing procedures. We believe that our audits provide a reasonable basis for our opinion.
In our opinion, such financial statements and financial highlights referred to above present fairly, in all material respects, the financial position of Fidelity Small Cap Discovery Fund as of April 30, 2017 the results of its operations for the then ended, the changes in its net assets for each of the two years in the period then ended, and the financial highlights for the five years in the period then ended in conformity with accounting principles generally accepted in the United States of America.
DELOITTE & TOUCHE LLP
Boston, Massachusetts
June 12, 2017
Trustees and Officers
The Trustees, Members of the Advisory Board (if any), and officers of the trust and fund, as applicable, are listed below. The Board of Trustees governs the fund and is responsible for protecting the interests of shareholders. The Trustees are experienced executives who meet periodically throughout the year to oversee the fund's activities, review contractual arrangements with companies that provide services to the fund, oversee management of the risks associated with such activities and contractual arrangements, and review the fund's performance. Except for Jonathan Chiel, each of the Trustees oversees 189 funds. Mr. Chiel oversees 142 funds.
The Trustees hold office without limit in time except that (a) any Trustee may resign; (b) any Trustee may be removed by written instrument, signed by at least two-thirds of the number of Trustees prior to such removal; (c) any Trustee who requests to be retired or who has become incapacitated by illness or injury may be retired by written instrument signed by a majority of the other Trustees; and (d) any Trustee may be removed at any special meeting of shareholders by a two-thirds vote of the outstanding voting securities of the trust. Each Trustee who is not an interested person (as defined in the 1940 Act) of the trust and the fund is referred to herein as an Independent Trustee. Each Independent Trustee shall retire not later than the last day of the calendar year in which his or her 75th birthday occurs. The Independent Trustees may waive this mandatory retirement age policy with respect to individual Trustees. Officers and Advisory Board Members hold office without limit in time, except that any officer or Advisory Board Member may resign or may be removed by a vote of a majority of the Trustees at any regular meeting or any special meeting of the Trustees. Except as indicated, each individual has held the office shown or other offices in the same company for the past five years.
The fund’s Statement of Additional Information (SAI) includes more information about the Trustees. To request a free copy, call Fidelity at 1-800-544-8544.
Experience, Skills, Attributes, and Qualifications of the Trustees. The Governance and Nominating Committee has adopted a statement of policy that describes the experience, qualifications, attributes, and skills that are necessary and desirable for potential Independent Trustee candidates (Statement of Policy). The Board believes that each Trustee satisfied at the time he or she was initially elected or appointed a Trustee, and continues to satisfy, the standards contemplated by the Statement of Policy. The Governance and Nominating Committee also engages professional search firms to help identify potential Independent Trustee candidates who have the experience, qualifications, attributes, and skills consistent with the Statement of Policy. From time to time, additional criteria based on the composition and skills of the current Independent Trustees, as well as experience or skills that may be appropriate in light of future changes to board composition, business conditions, and regulatory or other developments, have also been considered by the professional search firms and the Governance and Nominating Committee. In addition, the Board takes into account the Trustees' commitment and participation in Board and committee meetings, as well as their leadership of standing and ad hoc committees throughout their tenure.
In determining that a particular Trustee was and continues to be qualified to serve as a Trustee, the Board has considered a variety of criteria, none of which, in isolation, was controlling. The Board believes that, collectively, the Trustees have balanced and diverse experience, qualifications, attributes, and skills, which allow the Board to operate effectively in governing the fund and protecting the interests of shareholders. Information about the specific experience, skills, attributes, and qualifications of each Trustee, which in each case led to the Board's conclusion that the Trustee should serve (or continue to serve) as a trustee of the fund, is provided below.
Board Structure and Oversight Function. James C. Curvey is an interested person and currently serves as Chairman. The Trustees have determined that an interested Chairman is appropriate and benefits shareholders because an interested Chairman has a personal and professional stake in the quality and continuity of services provided to the fund. Independent Trustees exercise their informed business judgment to appoint an individual of their choosing to serve as Chairman, regardless of whether the Trustee happens to be independent or a member of management. The Independent Trustees have determined that they can act independently and effectively without having an Independent Trustee serve as Chairman and that a key structural component for assuring that they are in a position to do so is for the Independent Trustees to constitute a substantial majority for the Board. The Independent Trustees also regularly meet in executive session. Ned C. Lautenbach serves as Chairman of the Independent Trustees and as such (i) acts as a liaison between the Independent Trustees and management with respect to matters important to the Independent Trustees and (ii) with management prepares agendas for Board meetings.
Fidelity® funds are overseen by different Boards of Trustees. The fund's Board oversees Fidelity's high income and certain equity funds, and other Boards oversee Fidelity's investment-grade bond, money market, asset allocation, and sector funds. The asset allocation funds may invest in Fidelity® funds overseen by the fund's Board. The use of separate Boards, each with its own committee structure, allows the Trustees of each group of Fidelity® funds to focus on the unique issues of the funds they oversee, including common research, investment, and operational issues. On occasion, the separate Boards establish joint committees to address issues of overlapping consequences for the Fidelity® funds overseen by each Board.
The Trustees operate using a system of committees to facilitate the timely and efficient consideration of all matters of importance to the Trustees, the fund, and fund shareholders and to facilitate compliance with legal and regulatory requirements and oversight of the fund's activities and associated risks. The Board, acting through its committees, has charged FMR and its affiliates with (i) identifying events or circumstances the occurrence of which could have demonstrably adverse effects on the fund's business and/or reputation; (ii) implementing processes and controls to lessen the possibility that such events or circumstances occur or to mitigate the effects of such events or circumstances if they do occur; and (iii) creating and maintaining a system designed to evaluate continuously business and market conditions in order to facilitate the identification and implementation processes described in (i) and (ii) above. Because the day-to-day operations and activities of the fund are carried out by or through FMR, its affiliates, and other service providers, the fund's exposure to risks is mitigated but not eliminated by the processes overseen by the Trustees. While each of the Board's committees has responsibility for overseeing different aspects of the fund's activities, oversight is exercised primarily through the Operations, Audit, and Compliance Committees. In addition, the Independent Trustees have worked with FMR to enhance the Board's oversight of investment and financial risks, legal and regulatory risks, technology risks, and operational risks, including the development of additional risk reporting to the Board. For example, a working group comprised of Independent Trustees and FMR has worked and continues to work to review the Fidelity® funds' valuation-related activities, reporting and risk management. Appropriate personnel, including but not limited to the fund's Chief Compliance Officer (CCO), FMR's internal auditor, the independent accountants, the fund's Treasurer and portfolio management personnel, make periodic reports to the Board's committees, as appropriate, including an annual review of Fidelity's risk management program for the Fidelity® funds. The responsibilities of each standing committee, including their oversight responsibilities, are described further under "Standing Committees of the Trustees."
Interested Trustees*:
Correspondence intended for a Trustee who is an interested person may be sent to Fidelity Investments, 245 Summer Street, Boston, Massachusetts 02210.
Name, Year of Birth; Principal Occupations and Other Relevant Experience+
Jonathan Chiel (1957)
Year of Election or Appointment: 2016
Trustee
Mr. Chiel also serves as Trustee of other Fidelity funds. Mr. Chiel is Executive Vice President and General Counsel for FMR LLC (diversified financial services company, 2012-present). Previously, Mr. Chiel served as general counsel (2004-2012) and senior vice president and deputy general counsel (2000-2004) for John Hancock Financial Services; a partner with Choate, Hall & Stewart (1996-2000) (law firm); and an Assistant United States Attorney for the United States Attorney’s Office of the District of Massachusetts (1986-95), including Chief of the Criminal Division (1993-1995). Mr. Chiel is a director on the boards of the Boston Bar Foundation and the Maimonides School.
James C. Curvey (1935)
Year of Election or Appointment: 2007
Trustee
Chairman of the Board of Trustees
Mr. Curvey also serves as Trustee of other Fidelity® funds. Mr. Curvey is a Director of Fidelity Research & Analysis Co. (investment adviser firm, 2009-present), and Vice Chairman (2007-present) and Director of FMR LLC (diversified financial services company). In addition, Mr. Curvey serves as an Overseer for the Boston Symphony Orchestra and a member of the board of Artis-Naples, Naples, Florida, and as a Trustee for Brewster Academy, Wolfeboro, New Hampshire. Previously, Mr. Curvey served as a Director of Fidelity Investments Money Management, Inc. (investment adviser firm, 2009-2014) and a Director of FMR and FMR Co., Inc. (investment adviser firms, 2007-2014).
Charles S. Morrison (1960)
Year of Election or Appointment: 2014
Trustee
Mr. Morrison also serves as Trustee of other funds. He serves as President of Fidelity Management & Research Company (FMR) (investment adviser firm, 2016-present), a Director of Fidelity Investments Money Management, Inc. (FIMM) (investment adviser firm, 2014-present), Director of Fidelity SelectCo, LLC (investment adviser firm, 2014-present), President, Asset Management (2014-present), and is an employee of Fidelity Investments. Previously, Mr. Morrison served as Vice President of Fidelity's Fixed Income and Asset Allocation Funds (2012-2014), President, Fixed Income (2011-2014), Vice President of Fidelity's Money Market Funds (2005-2009), President, Money Market Group Leader of FMR (investment adviser firm, 2009), and Senior Vice President, Money Market Group of FMR (2004-2009). Mr. Morrison also served as Vice President of Fidelity's Bond Funds (2002-2005), certain Balanced Funds (2002-2005), and certain Asset Allocation Funds (2002-2007), and as Senior Vice President (2002-2005) of Fidelity's Bond Division.
* Determined to be an “Interested Trustee” by virtue of, among other things, his or her affiliation with the trust or various entities under common control with FMR.
+ The information includes the Trustee's principal occupation during the last five years and other information relating to the experience, attributes, and skills relevant to the Trustee's qualifications to serve as a Trustee, which led to the conclusion that the Trustee should serve as a Trustee for the fund.
Independent Trustees:
Correspondence intended for an Independent Trustee may be sent to Fidelity Investments, P.O. Box 55235, Boston, Massachusetts 02205-5235.
Name, Year of Birth; Principal Occupations and Other Relevant Experience+
Dennis J. Dirks (1948)
Year of Election or Appointment: 2005
Trustee
Mr. Dirks also serves as Trustee of other Fidelity® funds. Prior to his retirement in May 2003, Mr. Dirks was Chief Operating Officer and a member of the Board of The Depository Trust & Clearing Corporation (DTCC). He also served as President, Chief Operating Officer, and Board member of The Depository Trust Company (DTC) and President and Board member of the National Securities Clearing Corporation (NSCC). In addition, Mr. Dirks served as Chief Executive Officer and Board member of the Government Securities Clearing Corporation, Chief Executive Officer and Board member of the Mortgage-Backed Securities Clearing Corporation, as a Trustee and a member of the Finance Committee of Manhattan College (2005-2008), as a Trustee and a member of the Finance Committee of AHRC of Nassau County (2006-2008), as a member of the Independent Directors Council (IDC) Governing Council (2010-2015), and as a member of the Board of Directors for The Brookville Center for Children’s Services, Inc. (2009-2017). Mr. Dirks is a member of the Finance Committee (2016-present) and Board of Directors (2017-present) of the Asolo Repertory Theatre.
Alan J. Lacy (1953)
Year of Election or Appointment: 2008
Trustee
Mr. Lacy also serves as Trustee of other Fidelity® funds. Mr. Lacy serves as a Director of Bristol-Myers Squibb Company (global pharmaceuticals, 2008-present). He is a Trustee of the California Chapter of The Nature Conservancy (2015-present) and a Director of the Center for Advanced Study in the Behavioral Sciences at Stanford University (2015-present). In addition, Mr. Lacy served as Senior Adviser (2007-2014) of Oak Hill Capital Partners, L.P. (private equity) and also served as Chief Executive Officer (2005) and Vice Chairman (2005-2006) of Sears Holdings Corporation (retail) and Chief Executive Officer and Chairman of the Board of Sears, Roebuck and Co. (retail, 2000-2005). Previously, Mr. Lacy served as Chairman (2014-2017) and a member (2010-2017) of the Board of Directors of Dave & Buster’s Entertainment, Inc. (restaurant and entertainment complexes), as Chairman (2008-2011) and a member (2006-2015) of the Board of Trustees of the National Parks Conservation Association, and as a member of the Board of Directors for The Hillman Companies, Inc. (hardware wholesalers, 2010-2014), Earth Fare, Inc. (retail grocery, 2010-2014), and The Western Union Company (global money transfer, 2006-2011).
Ned C. Lautenbach (1944)
Year of Election or Appointment: 2000
Trustee
Chairman of the Independent Trustees
Mr. Lautenbach also serves as Trustee of other Fidelity® funds. Mr. Lautenbach currently serves as the Lead Director of the Eaton Corporation Board of Directors (diversified industrial, 1997-present). Mr. Lautenbach is Chairman of the Board of Directors of Artis-Naples in Naples, Florida (2012-present), a member of the Council on Foreign Relations (1994-present), and currently Vice Chair of the Board of Governors, State University System of Florida (2013-present). Previously, Mr. Lautenbach was a Partner and Advisory Partner at Clayton, Dubilier & Rice, LLC (private equity investment, 1998-2010), as well as a Director of Sony Corporation (2006-2007). Mr. Lautenbach also had a 30-year career with IBM (technology company) during which time he served as Senior Vice President and a member of the Corporate Executive Committee (1968-1998).
Joseph Mauriello (1944)
Year of Election or Appointment: 2008
Trustee
Mr. Mauriello also serves as Trustee of other Fidelity® funds. Prior to his retirement in January 2006, Mr. Mauriello served in numerous senior management positions including Deputy Chairman and Chief Operating Officer (2004-2005), and Vice Chairman of Financial Services (2002-2004) of KPMG LLP US (professional services, 1965-2005). Mr. Mauriello currently serves as a member of the Board of Directors of XL Group plc. (global insurance and re-insurance, 2006-present) and the Independent Directors Council (IDC) Governing Council (2015-present). Previously, Mr. Mauriello served as a Director of the Hamilton Funds of the Bank of New York (2006-2007) and of Arcadia Resources Inc. (health care services and products, 2007-2012).
Robert W. Selander (1950)
Year of Election or Appointment: 2011
Trustee
Mr. Selander also serves as Trustee of other Fidelity® funds. Mr. Selander serves as a Director of The Western Union Company (global money transfer, 2014-present) and a non-executive Chairman of Health Equity, Inc. (health savings custodian, 2015-present). Previously, Mr. Selander served as a Member of the Advisory Board of certain Fidelity® funds (2011), and Executive Vice Chairman (2010), Chief Executive Officer (2009-2010), and President and Chief Executive Officer (1997-2009) of Mastercard, Inc.
Cornelia M. Small (1944)
Year of Election or Appointment: 2005
Trustee
Ms. Small also serves as Trustee of other Fidelity® funds. Ms. Small is a member of the Board of Directors (2009-present) and Chair of the Investment Committee (2010-present) of the Teagle Foundation. Ms. Small also serves on the Investment Committee of the Berkshire Taconic Community Foundation (2008-present). Previously, Ms. Small served as Chairperson (2002-2008) and a member of the Investment Committee and Chairperson (2008-2012) and a member of the Board of Trustees of Smith College. In addition, Ms. Small served as Chief Investment Officer, Director of Global Equity Investments, and a member of the Board of Directors of Scudder, Stevens & Clark and Scudder Kemper Investments.
William S. Stavropoulos (1939)
Year of Election or Appointment: 2001
Trustee
Vice Chairman of the Independent Trustees
Mr. Stavropoulos also serves as Trustee of other Fidelity® funds. Mr. Stavropoulos serves as President and Founder of the Michigan Baseball Foundation, the Great Lakes Loons (2007-present). Mr. Stavropoulos is Chairman Emeritus of the Board of Directors of The Dow Chemical Company, where he previously served in numerous senior management positions, including President, CEO (1995-2000; 2002-2004), Chairman of the Executive Committee (2000-2006), and as a member of the Board of Directors (1990-2006). Currently, Mr. Stavropoulos is Chairman of the Board of Directors of Univar Inc. (global distributor of commodity and specialty chemicals), a Director of Teradata Corporation (data warehousing and technology solutions), and a member of the Advisory Board for Metalmark Capital LLC (private equity investment, 2005-present). Mr. Stavropoulos is an operating advisor to Clayton, Dubilier & Rice, LLC (private equity investment). In addition, Mr. Stavropoulos is a member of the University of Notre Dame Advisory Council for the College of Science, a Trustee of the Rollin L. Gerstacker Foundation, and a Director of Artis-Naples in Naples, Florida. Previously, Mr. Stavropoulos served as a Director of Chemical Financial Corporation (bank holding company, 1993-2012) and Tyco International, Ltd. (multinational manufacturing and services, 2007-2012).
David M. Thomas (1949)
Year of Election or Appointment: 2008
Trustee
Mr. Thomas also serves as Trustee of other Fidelity® funds. Mr. Thomas serves as Non-Executive Chairman of the Board of Directors of Fortune Brands Home and Security (home and security products, 2011-present), as a member of the Board of Directors (2004-present) and Presiding Director (2013-present) of Interpublic Group of Companies, Inc. (marketing communication), and as a member of the Board of Trustees of the University of Florida (2013-present). Previously, Mr. Thomas served as Executive Chairman (2005-2006) and Chairman and Chief Executive Officer (2000-2005) of IMS Health, Inc. (pharmaceutical and healthcare information solutions), and a Director of Fortune Brands, Inc. (consumer products, 2000-2011).
+ The information includes the Trustee's principal occupation during the last five years and other information relating to the experience, attributes, and skills relevant to the Trustee's qualifications to serve as a Trustee, which led to the conclusion that the Trustee should serve as a Trustee for the fund.
Advisory Board Members and Officers:
Correspondence intended for an officer or Peter S. Lynch may be sent to Fidelity Investments, 245 Summer Street, Boston, Massachusetts 02210. Officers appear below in alphabetical order.
Name, Year of Birth; Principal Occupation
Peter S. Lynch (1944)
Year of Election or Appointment: 2003
Member of the Advisory Board
Mr. Lynch also serves as Member of the Advisory Board of other Fidelity® funds. Mr. Lynch is Vice Chairman and a Director of FMR (investment adviser firm) and FMR Co., Inc. (investment adviser firm). In addition, Mr. Lynch serves as a Trustee of Boston College and as the Chairman of the Inner-City Scholarship Fund. Previously, Mr. Lynch served on the Special Olympics International Board of Directors (1997-2006).
Elizabeth Paige Baumann (1968)
Year of Election or Appointment: 2017
Anti-Money Laundering (AML) Officer
Ms. Baumann also serves as AML Officer of other funds. She is Chief AML Officer (2012-present) and Senior Vice President (2014-present) of FMR LLC (diversified financial services company) and is an employee of Fidelity Investments. Previously, Ms. Baumann served as AML Officer of the funds (2012-2016), and Vice President (2007-2014) and Deputy Anti-Money Laundering Officer (2007-2012) of FMR LLC.
Marc R. Bryant (1966)
Year of Election or Appointment: 2015
Secretary and Chief Legal Officer (CLO)
Mr. Bryant also serves as Secretary and CLO of other funds. Mr. Bryant serves as CLO, Secretary, and Senior Vice President of Fidelity Management & Research Company (investment adviser firm, 2015-present) and FMR Co., Inc. (investment adviser firm, 2015-present); Secretary of Fidelity SelectCo, LLC (investment adviser firm, 2015-present) and Fidelity Investments Money Management, Inc. (investment adviser firm, 2015-present); and CLO of Fidelity Management & Research (Hong Kong) Limited and FMR Investment Management (UK) Limited (investment adviser firms, 2015-present) and Fidelity Management & Research (Japan) Limited (investment adviser firm, 2016-present). He is Senior Vice President and Deputy General Counsel of FMR LLC (diversified financial services company). Previously, Mr. Bryant served as Secretary and CLO of Fidelity Rutland Square Trust II (2010-2014) and Assistant Secretary of Fidelity's Fixed Income and Asset Allocation Funds (2013-2015). Prior to joining Fidelity Investments, Mr. Bryant served as a Senior Vice President and the Head of Global Retail Legal for AllianceBernstein L.P. (2006-2010), and as the General Counsel for ProFund Advisors LLC (2001-2006).
Jeffrey S. Christian (1961)
Year of Election or Appointment: 2016
Assistant Treasurer
Mr. Christian also serves as Assistant Treasurer of other funds. Mr. Christian is an employee of Fidelity Investments (2003-present).
William C. Coffey (1969)
Year of Election or Appointment: 2009
Assistant Secretary
Mr. Coffey also serves as Assistant Secretary of other funds. He is Senior Vice President and Deputy General Counsel of FMR LLC (diversified financial services company, 2010-present), and is an employee of Fidelity Investments. Previously, Mr. Coffey served as Vice President and Associate General Counsel of FMR LLC (2005-2009).
Jonathan Davis (1968)
Year of Election or Appointment: 2010
Assistant Treasurer
Mr. Davis also serves as Assistant Treasurer of other funds, and is an employee of Fidelity Investments. Previously, Mr. Davis served as Vice President and Associate General Counsel of FMR LLC (diversified financial services company, 2003-2010).
Adrien E. Deberghes (1967)
Year of Election or Appointment: 2016
Assistant Treasurer
Mr. Deberghes also serves as an officer of other funds. He serves as Executive Vice President of Fidelity Investments Money Management, Inc. (FIMM) (investment adviser firm, 2016-present) and is an employee of Fidelity Investments (2008-present). Prior to joining Fidelity Investments, Mr. Deberghes was Senior Vice President of Mutual Fund Administration at State Street Corporation (2007-2008), Senior Director of Mutual Fund Administration at Investors Bank & Trust (2005-2007), and Director of Finance for Dunkin' Brands (2000-2005). Previously, Mr. Deberghes served in other fund officer roles.
Stephanie J. Dorsey (1969)
Year of Election or Appointment: 2010
Assistant Treasurer
Ms. Dorsey also serves as an officer of other funds. She is an employee of Fidelity Investments (2008-present) and has served in other fund officer roles. Prior to joining Fidelity Investments, Ms. Dorsey served as Treasurer (2004-2008) of the JPMorgan Mutual Funds and Vice President (2004-2008) of JPMorgan Chase Bank.
Howard J. Galligan III (1966)
Year of Election or Appointment: 2014
Chief Financial Officer
Mr. Galligan also serves as Chief Financial Officer of other funds. Mr. Galligan serves as President of Fidelity Pricing and Cash Management Services (FPCMS) (2014-present) and as a Director of Strategic Advisers, Inc. (investment adviser firm, 2008-present). Previously, Mr. Galligan served as Chief Administrative Officer of Asset Management (2011-2014) and Chief Operating Officer and Senior Vice President of Investment Support for Strategic Advisers, Inc. (2003-2011).
Scott C. Goebel (1968)
Year of Election or Appointment: 2015
Vice President
Mr. Goebel serves as Vice President of other funds and is an employee of Fidelity Investments (2001-present). Previously, Mr. Goebel served as Senior Vice President of Fidelity Management & Research Company (FMR) (investment adviser firm, 2016), Secretary of Fidelity SelectCo, LLC (investment adviser firm, 2013-2015), Fidelity Investments Money Management, Inc. (FIMM) (investment adviser firm, 2010-2015), and Fidelity Research and Analysis Company (FRAC) (investment adviser firm, 2010-2015); General Counsel, Secretary, and Senior Vice President of FMR (investment adviser firm, 2008-2015) and FMR Co., Inc. (investment adviser firm, 2008-2015); Assistant Secretary of Fidelity Management & Research (Japan) Limited (investment adviser firm, 2008-2015) and Fidelity Management & Research (U.K.) Inc. (investment adviser firm, 2008-2015); Chief Legal Officer (CLO) of Fidelity Management & Research (Hong Kong) Limited (investment adviser firm, 2008-2015); Secretary and CLO of certain Fidelity® funds (2008-2015); Assistant Secretary of FIMM (2008-2010), FRAC (2008-2010), and certain funds (2007-2008); and as Vice President and Secretary of Fidelity Distributors Corporation (FDC) (2005-2007).
Thomas C. Hense (1964)
Year of Election or Appointment: 2008, 2010, or 2015
Vice President
Mr. Hense serves as Vice President of Fidelity Advisor® Multi-Asset Income Fund (2015) and other funds (High Income (2008), Small Cap (2008), and Value (2010) funds), and is an employee of Fidelity Investments (1993-present). Previously, Mr. Hense served as a portfolio manager for Fidelity's Institutional Money Management Group (Pyramis) (2003-2008).
Brian B. Hogan (1964)
Year of Election or Appointment: 2009
Vice President
Mr. Hogan also serves as Trustee or Vice President of other funds. Mr. Hogan serves as a Director of FMR Investment Management (UK) Limited (investment adviser firm, 2015-present) and Fidelity SelectCo, LLC (investment adviser firm, 2014-present) and President of the Equity Division of FMR (investment adviser firm, 2009-present). Previously, Mr. Hogan served as Senior Vice President, Equity Research of FMR (2006-2009) and as a portfolio manager. Mr. Brian B. Hogan is not related to Mr. Colm A. Hogan.
Colm A. Hogan (1973)
Year of Election or Appointment: 2016
Deputy Treasurer
Mr. Hogan also serves as an officer of other funds. Mr. Hogan is an employee of Fidelity Investments (2005-present). Mr. Colm A. Hogan is not related to Mr. Brian B. Hogan.
Chris Maher (1972)
Year of Election or Appointment: 2013
Assistant Treasurer
Mr. Maher serves as Assistant Treasurer of other funds. Mr. Maher is Vice President of Valuation Oversight and is an employee of Fidelity Investments. Previously, Mr. Maher served as Vice President of Asset Management Compliance (2013), Vice President of the Program Management Group of FMR (investment adviser firm, 2010-2013), and Vice President of Valuation Oversight (2008-2010).
Kenneth B. Robins (1969)
Year of Election or Appointment: 2016
Chief Compliance Officer
Mr. Robins also serves as an officer of other funds. Mr. Robins serves as Compliance Officer of Fidelity Management & Research Company and FMR Co., Inc. (investment adviser firms, 2016-present) and is an employee of Fidelity Investments (2004-present). Previously, Mr. Robins served as Executive Vice President of Fidelity Investments Money Management, Inc. (investment adviser firm, 2013-2016) and served in other fund officer roles.
Stacie M. Smith (1974)
Year of Election or Appointment: 2016
President and Treasurer
Ms. Smith also serves as an officer of other funds. She is an employee of Fidelity Investments (2009-present) and has served in other fund officer roles. Prior to joining Fidelity Investments, Ms. Smith served as Senior Audit Manager of Ernst & Young LLP (accounting firm, 1996-2009). Previously, Ms. Smith served as Deputy Treasurer of certain Fidelity® funds (2013-2016).
Marc L. Spector (1972)
Year of Election or Appointment: 2016
Assistant Treasurer
Mr. Spector also serves as an officer of other funds. Mr. Spector is an employee of Fidelity Investments (2016-present). Prior to joining Fidelity Investments, Mr. Spector served as Director at the Siegfried Group (accounting firm, 2013-2016), and prior to Siegfried Group as audit senior manager at Deloitte & Touche (accounting firm, 2005-2013).
Renee Stagnone (1975)
Year of Election or Appointment: 2016
Assistant Treasurer
Ms. Stagnone also serves as an officer of other funds. Ms. Stagnone is an employee of Fidelity Investments (1997-present). Previously, Ms. Stagnone served as Deputy Treasurer of certain Fidelity® funds (2013-2016).
Shareholder Expense Example
As a shareholder of the Fund, you incur two types of costs: (1) transaction costs, including redemption fees and (2) ongoing costs, including management fees and other Fund expenses. This Example is intended to help you understand your ongoing costs (in dollars) of investing in the Fund and to compare these costs with the ongoing costs of investing in other mutual funds.
The Example is based on an investment of $1,000 invested at the beginning of the period and held for the entire period (November 1, 2016 to April 30, 2017).
Actual Expenses
The first line of the accompanying table provides information about actual account values and actual expenses. You may use the information in this line, together with the amount you invested, to estimate the expenses that you paid over the period. Simply divide your account value by $1,000.00 (for example, an $8,600 account value divided by $1,000.00 = 8.6), then multiply the result by the number in the first line under the heading entitled "Expenses Paid During Period" to estimate the expenses you paid on your account during this period. A small balance maintenance fee of $12.00 that is charged once a year may apply for certain accounts with a value of less than $2,000. This fee is not included in the table below. If it was, the estimate of expenses you paid during the period would be higher, and your ending account value lower, by this amount. In addition, the Fund, as a shareholder in the underlying Fidelity Central Funds, will indirectly bear its pro-rata share of the fees and expenses incurred by the underlying Fidelity Central Funds. These fees and expenses are not included in the Fund's annualized expense ratio used to calculate the expense estimate in the table below.
Hypothetical Example for Comparison Purposes
The second line of the accompanying table provides information about hypothetical account values and hypothetical expenses based on the Fund's actual expense ratio and an assumed rate of return of 5% per year before expenses, which is not the Fund's actual return. The hypothetical account values and expenses may not be used to estimate the actual ending account balance or expenses you paid for the period. You may use this information to compare the ongoing costs of investing in the Fund and other funds. To do so, compare this 5% hypothetical example with the 5% hypothetical examples that appear in the shareholder reports of the other funds. A small balance maintenance fee of $12.00 that is charged once a year may apply for certain accounts with a value of less than $2,000. This fee is not included in the table below. If it was, the estimate of expenses you paid during the period would be higher, and your ending account value lower, by this amount. In addition, the Fund, as a shareholder in the underlying Fidelity Central Funds, will indirectly bear its pro-rata share of the fees and expenses incurred by the underlying Fidelity Central Funds. These fees and expenses are not included in the Fund's annualized expense ratio used to calculate the expense estimate in the table below.
Please note that the expenses shown in the table are meant to highlight your ongoing costs only and do not reflect any transaction costs. Therefore, the second line of the table is useful in comparing ongoing costs only, and will not help you determine the relative total costs of owning different funds. In addition, if these transactional costs were included, your costs would have been higher.
| Annualized Expense Ratio-A | Beginning Account Value November 1, 2016 | Ending Account Value April 30, 2017 | Expenses Paid During Period-B November 1, 2016 to April 30, 2017 | |
| Actual | .86% | $1,000.00 | $1,162.20 | $4.61 |
| Hypothetical-C | $1,000.00 | $1,020.53 | $4.31 |
A Annualized expense ratio reflects expenses net of applicable fee waivers.
B Expenses are equal to the Fund's annualized expense ratio, multiplied by the average account value over the period, multiplied by 181/365 (to reflect the one-half year period).
C 5% return per year before expenses
Distributions (Unaudited)
The Board of Trustees of Fidelity Small Cap Discovery Fund voted to pay on June 12, 2017, to shareholders of record at the opening of business on June 09, 2017, a distribution of $1.212 per share derived from capital gains realized from sales of portfolio securities and a dividend of $.065 per share from net investment income.
The fund hereby designates as a capital gain dividend with respect to the taxable year ended April 30, 2017, $217,790,595, or, if subsequently determined to be different, the net capital gain of such year.
The fund designates 100% of the dividends distributed during the fiscal year as qualifying for the dividends–received deduction for corporate shareholders.
The fund designates 100% of the dividends distributed during the fiscal year as amounts which may be taken into account as a dividend for the purposes of the maximum rate under section 1(h)(11) of the Internal Revenue Code.
The fund will notify shareholders in January 2018 of amounts for use in preparing 2017 income tax returns.
Board Approval of Investment Advisory Contracts and Management Fees
Fidelity Small Cap Discovery Fund
On September 14, 2016, the Board of Trustees, including the Independent Trustees (together, the Board) voted to approve the management contract and sub-advisory agreements (collectively, the Advisory Contracts) for the fund in connection with reorganizing the fund from one Trust to another. In reaching this determination, the Board considered that the contractual terms of and the fees payable under the fund's Advisory Contracts are identical to those in the fund's current Advisory Contracts. The Board considered that the approval of the Advisory Contracts will not result in any changes to (i) the investment process or strategies employed in the management of the fund's assets; (ii) the nature, extent and quality of services provided under the fund's Advisory Contracts; or (iii) the day-to-day management of the fund or the persons primarily responsible for such management. The Board considered that it approved the Advisory Contracts for the fund at its July 2016 meeting and that it will again consider the renewal of the Advisory Contracts in July 2017.
Because the Board was approving Advisory Contracts with terms identical to the current Advisory
Contracts, it did not consider the fund's investment performance, competitiveness of management fees
and total expenses, costs of services and profitability, or economies of scale to be significant factors in its
decision.
In connection with its consideration of future renewal of the fund's Advisory Contracts, the Board will consider: (i) the nature, extent and quality of services provided to the fund, including shareholder and administrative services and investment performance; (ii) the competitiveness of the fund's management fee and total expenses; (iii) the costs of the services and profitability, including the revenues earned and the expenses incurred by Fidelity conducting the business of developing, marketing, distributing, managing, administering, and servicing the fund and its shareholders, to the extent applicable; and (iv) whether there have been economies of scale in respect of the management of the Fidelity funds, whether the Fidelity funds (including the fund) have appropriately benefited from any such economies of scale, and whether there is potential for realization of any further economies.
Based on its evaluation of all of the conclusions noted above, and after considering all factors it believed relevant, the Board ultimately concluded that the advisory fee structures are fair and reasonable, and that the fund's Advisory Contracts should be approved, without modification, as part of the process of reorganizing the fund from one Trust to another.
![]()
Corporate Headquarters
245 Summer St.
Boston, MA 02210
www.fidelity.com
SMR-ANN-0617
1.757239.116
Fidelity® Large Cap Stock Fund Annual Report April 30, 2017 |
|
Contents
Board Approval of Investment Advisory Contracts and Management Fees |
To view a fund's proxy voting guidelines and proxy voting record for the 12-month period ended June 30, visit http://www.fidelity.com/proxyvotingresults or visit the Securities and Exchange Commission's (SEC) web site at http://www.sec.gov.
You may also call 1-800-544-8544 to request a free copy of the proxy voting guidelines.
Standard & Poor's, S&P and S&P 500 are registered service marks of The McGraw-Hill Companies, Inc. and have been licensed for use by Fidelity Distributors Corporation.
Other third-party marks appearing herein are the property of their respective owners.
All other marks appearing herein are registered or unregistered trademarks or service marks of FMR LLC or an affiliated company. © 2017 FMR LLC. All rights reserved.
This report and the financial statements contained herein are submitted for the general information of the shareholders of the Fund. This report is not authorized for distribution to prospective investors in the Fund unless preceded or accompanied by an effective prospectus.
A fund files its complete schedule of portfolio holdings with the SEC for the first and third quarters of each fiscal year on Form N-Q. Forms N-Q are available on the SEC’s web site at http://www.sec.gov. A fund's Forms N-Q may be reviewed and copied at the SEC’s Public Reference Room in Washington, DC. Information regarding the operation of the SEC's Public Reference Room may be obtained by calling 1-800-SEC-0330.
For a complete list of a fund's portfolio holdings, view the most recent holdings listing, semiannual report, or annual report on Fidelity's web site at http://www.fidelity.com, http://www.institutional.fidelity.com, or http://www.401k.com, as applicable.
NOT FDIC INSURED •MAY LOSE VALUE •NO BANK GUARANTEE
Neither the Fund nor Fidelity Distributors Corporation is a bank.
Performance: The Bottom Line
Average annual total return reflects the change in the value of an investment, assuming reinvestment of distributions from dividend income and capital gains (the profits earned upon the sale of securities that have grown in value, if any) and assuming a constant rate of performance each year. The hypothetical investment and the average annual total returns do not reflect the deduction of taxes that a shareholder would pay on fund distributions or the redemption of fund shares. During periods of reimbursement by Fidelity, a fund’s total return will be greater than it would be had the reimbursement not occurred. How a fund did yesterday is no guarantee of how it will do tomorrow.
Average Annual Total Returns
| For the periods ended April 30, 2017 | Past 1 year | Past 5 years | Past 10 years |
| Fidelity® Large Cap Stock Fund | 20.37% | 14.03% | 7.90% |
$10,000 Over 10 Years
Let's say hypothetically that $10,000 was invested in Fidelity® Large Cap Stock Fund on April 30, 2007.
The chart shows how the value of your investment would have changed, and also shows how the S&P 500® Index performed over the same period.
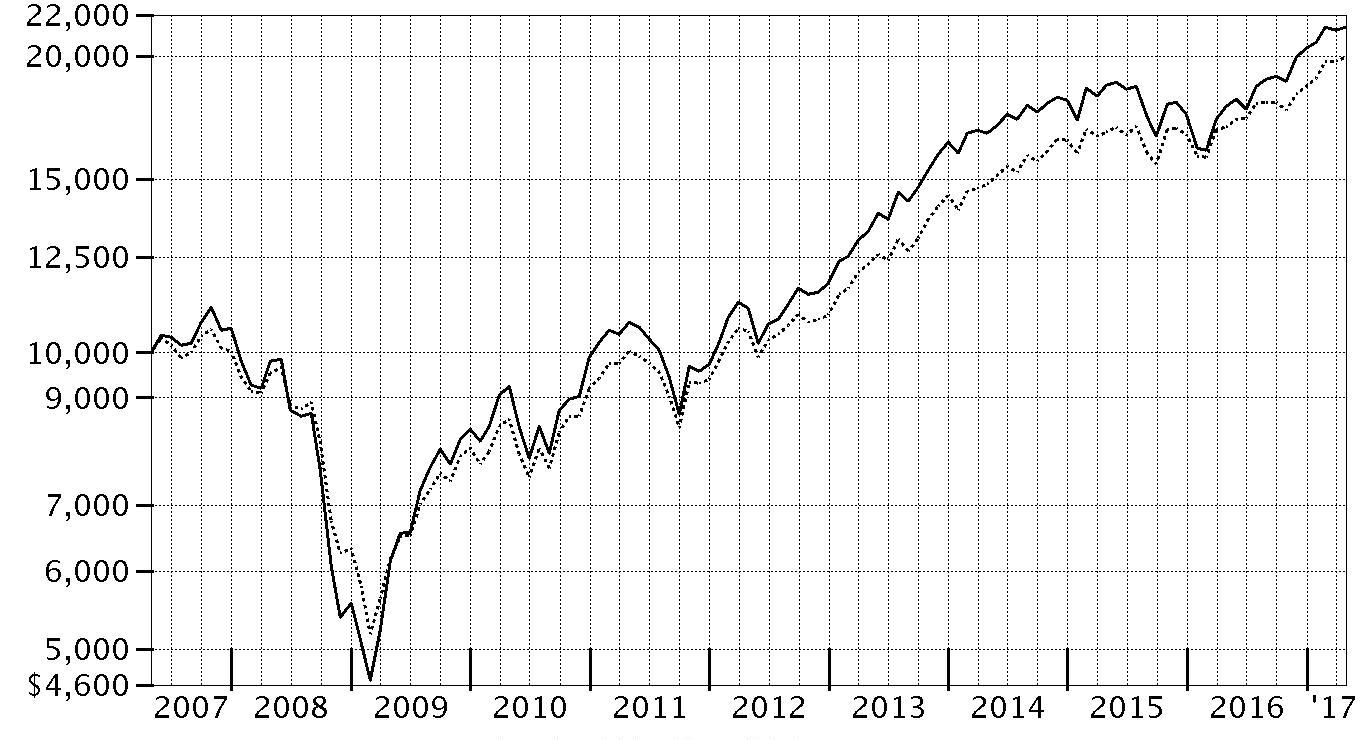
| Period Ending Values | ||
| $21,390 | Fidelity® Large Cap Stock Fund | |
| $19,955 | S&P 500® Index | |
Management's Discussion of Fund Performance
Market Recap: The U.S. equity bellwether S&P 500® index gained 17.92% for the year ending April 30, 2017, rising sharply following the November election and continuing to gain ground through the end of February on optimism for President Trump’s pro-business agenda. Equity markets leveled off, however, as the fledgling administration faced the first test of its domestic agenda. Stocks reacted with uncertainty to efforts by Congress in March to repeal and replace the Affordable Care Act (ACA), and were relatively flat through April 30. In a stark reversal from 2016, growth-oriented stocks topped their value counterparts through the first third of 2017. Sector-wise, information technology (+35%) fared best, anchored by twin rallies in the June 2016 and March 2017 quarters as growth regained favor. Financials (+27%) also handily outperformed, riding an uptick in bond yields and a surge in banks, particularly post-election. Industrials (+19%) and materials (+16%) did well amid a call for increased infrastructure spending and a rise in commodity prices, respectively. Conversely, consumer staples (+9%), real estate (+5%) and telecommunication services (0%) were held back amid an improved backdrop for riskier assets that curbed demand for dividend-rich sectors, as well as the likelihood of one or two additional interest rate hikes later in 2017. Energy (+2%) also struggled this period.Comments from Portfolio Manager Matthew Fruhan: For the fiscal year, the fund gained 20.37%, handily outpacing the benchmark S&P 500®. Our willingness to maintain a long-term focus and avoid making decisions based on short-term changes in the market – which is central to the fund’s investment approach – contributed to results. This was especially true in the financials sector, where the fund has been overweight for several years. Stock selection in financials was especially strong this period. Banks dominated, led by our overweights in Bank of America, JPMorgan Chase and Citigroup – all among the fund’s largest holdings and top contributors the past 12 months. Various regional banks also boosted the fund’s result, especially Regions Financial, Comerica and SunTrust Banks. I trimmed some of the banking positions by period end. Elsewhere, an overweight position in rail operator CSX contributed. In contrast, stock selection in health care was detrimental, especially a position in Teva Pharmaceutical Industries, an Israel-based drug manufacturer and out-of-benchmark stock that struggled due to industrywide concerns about generic-drug pricing, as well as management missteps. Also in health care, the fund’s out-of-index stake in Intercept Pharmaceuticals weighed on results, as worries about drug pricing along with the threat of future competition hurt the stock.The views expressed above reflect those of the portfolio manager(s) only through the end of the period as stated on the cover of this report and do not necessarily represent the views of Fidelity or any other person in the Fidelity organization. Any such views are subject to change at any time based upon market or other conditions and Fidelity disclaims any responsibility to update such views. These views may not be relied on as investment advice and, because investment decisions for a Fidelity fund are based on numerous factors, may not be relied on as an indication of trading intent on behalf of any Fidelity fund.
Investment Summary (Unaudited)
Top Ten Stocks as of April 30, 2017
| % of fund's net assets | % of fund's net assets 6 months ago | |
| Bank of America Corp. | 3.4 | 3.2 |
| JPMorgan Chase & Co. | 3.3 | 3.4 |
| Apple, Inc. | 3.2 | 3.3 |
| Microsoft Corp. | 3.1 | 3.0 |
| Citigroup, Inc. | 2.9 | 2.6 |
| General Electric Co. | 2.3 | 2.6 |
| Comcast Corp. Class A | 2.0 | 1.6 |
| State Street Corp. | 1.9 | 1.7 |
| Alphabet, Inc. Class A | 1.9 | 1.9 |
| ConocoPhillips Co. | 1.8 | 1.5 |
| 25.8 |
Top Five Market Sectors as of April 30, 2017
| % of fund's net assets | % of fund's net assets 6 months ago | |
| Financials | 22.2 | 21.8 |
| Information Technology | 18.2 | 20.6 |
| Health Care | 14.6 | 13.8 |
| Energy | 12.5 | 13.2 |
| Industrials | 10.8 | 11.4 |
Asset Allocation (% of fund's net assets)
| As of April 30, 2017 * | ||
| Stocks | 96.7% | |
| Other Investments | 0.1% | |
| Short-Term Investments and Net Other Assets (Liabilities) | 3.2% | |

* Foreign investments - 8.4%
| As of October 31, 2016 * | ||
| Stocks | 98.9% | |
| Short-Term Investments and Net Other Assets (Liabilities) | 1.1% | |

* Foreign investments - 9.4%
Investments April 30, 2017
Showing Percentage of Net Assets
| Common Stocks - 96.7% | |||
| Shares | Value (000s) | ||
| CONSUMER DISCRETIONARY - 7.8% | |||
| Automobiles - 0.1% | |||
| Fiat Chrysler Automobiles NV (a) | 286,800 | $3,246 | |
| General Motors Co. | 26,200 | 908 | |
| 4,154 | |||
| Distributors - 0.4% | |||
| LKQ Corp. (a) | 524,300 | 16,379 | |
| Hotels, Restaurants & Leisure - 0.0% | |||
| Las Vegas Sands Corp. | 37,500 | 2,212 | |
| Household Durables - 0.5% | |||
| KB Home | 789,000 | 16,253 | |
| Taylor Morrison Home Corp. (a) | 378,382 | 8,741 | |
| 24,994 | |||
| Leisure Products - 0.0% | |||
| NJOY, Inc. (a)(b) | 871,001 | 0 | |
| Media - 4.8% | |||
| AMC Networks, Inc. Class A (a) | 143,100 | 8,540 | |
| Comcast Corp. Class A | 2,400,426 | 94,073 | |
| Scripps Networks Interactive, Inc. Class A | 263,300 | 19,674 | |
| Sinclair Broadcast Group, Inc. Class A | 151,700 | 5,985 | |
| The Walt Disney Co. | 234,300 | 27,085 | |
| Time Warner, Inc. | 470,841 | 46,740 | |
| Viacom, Inc. Class B (non-vtg.) | 480,200 | 20,437 | |
| 222,534 | |||
| Multiline Retail - 0.7% | |||
| Target Corp. | 574,419 | 32,081 | |
| Specialty Retail - 1.3% | |||
| L Brands, Inc. | 155,400 | 8,207 | |
| Lowe's Companies, Inc. | 524,870 | 44,551 | |
| TJX Companies, Inc. | 110,200 | 8,666 | |
| 61,424 | |||
| Textiles, Apparel & Luxury Goods - 0.0% | |||
| Under Armour, Inc. Class C (non-vtg.) (c) | 75,000 | 1,456 | |
| TOTAL CONSUMER DISCRETIONARY | 365,234 | ||
| CONSUMER STAPLES - 5.7% | |||
| Beverages - 2.1% | |||
| Diageo PLC | 348,933 | 10,156 | |
| Dr. Pepper Snapple Group, Inc. | 100,700 | 9,229 | |
| Molson Coors Brewing Co. Class B | 235,800 | 22,611 | |
| The Coca-Cola Co. | 1,335,275 | 57,617 | |
| 99,613 | |||
| Food & Staples Retailing - 1.1% | |||
| Costco Wholesale Corp. | 70,600 | 12,533 | |
| CVS Health Corp. | 325,289 | 26,817 | |
| Kroger Co. | 450,400 | 13,354 | |
| 52,704 | |||
| Food Products - 0.1% | |||
| Amplify Snack Brands, Inc. (a) | 300,600 | 2,705 | |
| Household Products - 1.7% | |||
| Procter & Gamble Co. | 875,268 | 76,437 | |
| Personal Products - 0.4% | |||
| Coty, Inc. Class A | 504,600 | 9,007 | |
| Unilever NV (NY Reg.) (a) | 136,600 | 7,136 | |
| 16,143 | |||
| Tobacco - 0.3% | |||
| Altria Group, Inc. | 216,100 | 15,512 | |
| TOTAL CONSUMER STAPLES | 263,114 | ||
| ENERGY - 12.4% | |||
| Energy Equipment & Services - 1.2% | |||
| Baker Hughes, Inc. | 322,800 | 19,165 | |
| Ensco PLC Class A | 347,350 | 2,741 | |
| National Oilwell Varco, Inc. | 512,318 | 17,916 | |
| Oceaneering International, Inc. | 298,600 | 7,880 | |
| Schlumberger Ltd. | 75,845 | 5,506 | |
| 53,208 | |||
| Oil, Gas & Consumable Fuels - 11.2% | |||
| Amyris, Inc. (a)(c) | 1,588,818 | 860 | |
| Anadarko Petroleum Corp. | 246,800 | 14,073 | |
| Apache Corp. | 846,440 | 41,171 | |
| Cabot Oil & Gas Corp. | 1,043,500 | 24,251 | |
| Cenovus Energy, Inc. | 2,329,900 | 23,230 | |
| Chevron Corp. | 604,357 | 64,485 | |
| ConocoPhillips Co. | 1,774,800 | 85,031 | |
| Golar LNG Ltd. | 144,000 | 3,673 | |
| Imperial Oil Ltd. | 739,100 | 21,501 | |
| Kinder Morgan, Inc. | 1,804,200 | 37,221 | |
| Legacy Reserves LP (a) | 190,562 | 396 | |
| Noble Energy, Inc. | 58,400 | 1,888 | |
| PDC Energy, Inc. (a) | 32,900 | 1,817 | |
| Phillips 66 Co. | 12,000 | 955 | |
| SM Energy Co. | 295,500 | 6,675 | |
| Suncor Energy, Inc. | 2,551,000 | 79,947 | |
| Teekay Offshore Partners LP | 259,397 | 1,377 | |
| The Williams Companies, Inc. | 2,512,141 | 76,947 | |
| Williams Partners LP | 917,400 | 37,549 | |
| 523,047 | |||
| TOTAL ENERGY | 576,255 | ||
| FINANCIALS - 22.2% | |||
| Banks - 14.9% | |||
| Bank of America Corp. | 6,697,450 | 156,321 | |
| Citigroup, Inc. | 2,285,188 | 135,100 | |
| Comerica, Inc. | 214,700 | 15,179 | |
| JPMorgan Chase & Co. | 1,739,571 | 151,343 | |
| PNC Financial Services Group, Inc. | 282,020 | 33,772 | |
| Regions Financial Corp. | 1,674,800 | 23,029 | |
| SunTrust Banks, Inc. | 1,063,192 | 60,400 | |
| U.S. Bancorp | 929,085 | 47,643 | |
| Wells Fargo & Co. | 1,290,950 | 69,505 | |
| 692,292 | |||
| Capital Markets - 6.4% | |||
| CBOE Holdings, Inc. | 95,700 | 7,887 | |
| Charles Schwab Corp. | 854,786 | 33,208 | |
| Goldman Sachs Group, Inc. | 94,200 | 21,082 | |
| KKR & Co. LP | 705,998 | 13,400 | |
| Morgan Stanley | 1,258,207 | 54,568 | |
| Northern Trust Corp. | 502,806 | 45,253 | |
| State Street Corp. | 1,075,742 | 90,255 | |
| The Blackstone Group LP | 1,016,200 | 31,340 | |
| 296,993 | |||
| Diversified Financial Services - 0.1% | |||
| KKR Renaissance Co-Invest LP unit (a)(b) | 20,500 | 4,519 | |
| Insurance - 0.0% | |||
| MetLife, Inc. | 30,510 | 1,581 | |
| Thrifts & Mortgage Finance - 0.8% | |||
| MGIC Investment Corp. (a) | 827,992 | 8,727 | |
| Radian Group, Inc. | 1,695,990 | 28,628 | |
| 37,355 | |||
| TOTAL FINANCIALS | 1,032,740 | ||
| HEALTH CARE - 14.6% | |||
| Biotechnology - 3.9% | |||
| Alexion Pharmaceuticals, Inc. (a) | 226,400 | 28,929 | |
| Alnylam Pharmaceuticals, Inc. (a) | 33,100 | 1,774 | |
| Amgen, Inc. | 373,703 | 61,033 | |
| Biogen, Inc. (a) | 64,300 | 17,439 | |
| BioMarin Pharmaceutical, Inc. (a) | 106,900 | 10,245 | |
| Celldex Therapeutics, Inc. (a) | 9,800 | 33 | |
| Genocea Biosciences, Inc. (a) | 49,952 | 319 | |
| Gilead Sciences, Inc. | 215,700 | 14,786 | |
| Insmed, Inc. (a) | 132,544 | 2,445 | |
| Intercept Pharmaceuticals, Inc. (a) | 131,548 | 14,779 | |
| Myriad Genetics, Inc. (a)(c) | 121,500 | 2,234 | |
| Regeneron Pharmaceuticals, Inc. (a) | 14,800 | 5,750 | |
| Spark Therapeutics, Inc. (a) | 50,000 | 2,899 | |
| TESARO, Inc. (a) | 7,800 | 1,151 | |
| Trevena, Inc. (a) | 392,100 | 1,282 | |
| Vertex Pharmaceuticals, Inc. (a) | 128,000 | 15,142 | |
| 180,240 | |||
| Health Care Equipment & Supplies - 3.2% | |||
| Alere, Inc. (a) | 568,800 | 27,968 | |
| Boston Scientific Corp. (a) | 2,652,627 | 69,976 | |
| Medtronic PLC | 344,900 | 28,658 | |
| NxStage Medical, Inc. (a) | 327,400 | 9,786 | |
| Zimmer Biomet Holdings, Inc. | 115,500 | 13,820 | |
| 150,208 | |||
| Health Care Providers & Services - 2.2% | |||
| Aetna, Inc. | 34,800 | 4,700 | |
| Anthem, Inc. | 107,100 | 19,052 | |
| Cigna Corp. | 143,200 | 22,392 | |
| Express Scripts Holding Co. (a) | 155,767 | 9,555 | |
| Humana, Inc. | 67,700 | 15,028 | |
| McKesson Corp. | 170,904 | 23,634 | |
| UnitedHealth Group, Inc. | 49,400 | 8,639 | |
| 103,000 | |||
| Health Care Technology - 0.0% | |||
| Castlight Health, Inc. Class B (a) | 233,268 | 898 | |
| Life Sciences Tools & Services - 0.4% | |||
| Agilent Technologies, Inc. | 340,300 | 18,734 | |
| Pharmaceuticals - 4.9% | |||
| Allergan PLC | 43,413 | 10,587 | |
| Bayer AG | 8,200 | 1,015 | |
| Bristol-Myers Squibb Co. | 475,300 | 26,641 | |
| GlaxoSmithKline PLC sponsored ADR | 1,752,521 | 71,678 | |
| Jazz Pharmaceuticals PLC (a) | 169,293 | 26,965 | |
| Johnson & Johnson | 357,310 | 44,117 | |
| Novartis AG sponsored ADR | 3,100 | 239 | |
| Sanofi SA | 39,512 | 3,734 | |
| Teva Pharmaceutical Industries Ltd. sponsored ADR | 988,901 | 31,229 | |
| TherapeuticsMD, Inc. (a) | 1,828,800 | 9,327 | |
| 225,532 | |||
| TOTAL HEALTH CARE | 678,612 | ||
| INDUSTRIALS - 10.8% | |||
| Aerospace & Defense - 2.0% | |||
| General Dynamics Corp. | 27,300 | 5,290 | |
| Textron, Inc. | 216,500 | 10,102 | |
| The Boeing Co. | 127,237 | 23,517 | |
| United Technologies Corp. | 467,778 | 55,661 | |
| 94,570 | |||
| Air Freight & Logistics - 1.4% | |||
| C.H. Robinson Worldwide, Inc. | 184,000 | 13,377 | |
| FedEx Corp. | 63,600 | 12,065 | |
| United Parcel Service, Inc. Class B | 372,775 | 40,058 | |
| 65,500 | |||
| Commercial Services & Supplies - 0.2% | |||
| Stericycle, Inc. (a) | 119,000 | 10,155 | |
| Electrical Equipment - 1.0% | |||
| Acuity Brands, Inc. | 31,400 | 5,530 | |
| AMETEK, Inc. | 418,570 | 23,942 | |
| Hubbell, Inc. Class B | 75,300 | 8,519 | |
| Melrose Industries PLC | 3,097,089 | 9,487 | |
| 47,478 | |||
| Industrial Conglomerates - 2.3% | |||
| General Electric Co. | 3,711,498 | 107,596 | |
| Machinery - 0.9% | |||
| Aumann AG | 15,000 | 987 | |
| Colfax Corp. (a) | 62,100 | 2,513 | |
| Deere & Co. | 59,300 | 6,618 | |
| Flowserve Corp. | 393,600 | 20,022 | |
| Wabtec Corp. | 123,700 | 10,377 | |
| 40,517 | |||
| Professional Services - 0.4% | |||
| Acacia Research Corp. (a) | 24,000 | 131 | |
| IHS Markit Ltd. (a) | 179,740 | 7,801 | |
| Verisk Analytics, Inc. (a) | 110,330 | 9,136 | |
| 17,068 | |||
| Road & Rail - 2.6% | |||
| CSX Corp. | 890,099 | 45,253 | |
| Genesee & Wyoming, Inc. Class A (a) | 201,700 | 13,667 | |
| J.B. Hunt Transport Services, Inc. | 251,500 | 22,549 | |
| Norfolk Southern Corp. | 161,642 | 18,991 | |
| Old Dominion Freight Lines, Inc. | 109,300 | 9,675 | |
| Union Pacific Corp. | 93,800 | 10,502 | |
| 120,637 | |||
| TOTAL INDUSTRIALS | 503,521 | ||
| INFORMATION TECHNOLOGY - 18.2% | |||
| Communications Equipment - 1.6% | |||
| Cisco Systems, Inc. | 2,254,361 | 76,806 | |
| Internet Software & Services - 4.0% | |||
| Alphabet, Inc.: | |||
| Class A (a) | 95,187 | 88,002 | |
| Class C (a) | 81,178 | 73,544 | |
| Facebook, Inc. Class A (a) | 160,400 | 24,100 | |
| 185,646 | |||
| IT Services - 3.7% | |||
| Cognizant Technology Solutions Corp. Class A (a) | 131,416 | 7,915 | |
| First Data Corp. Class A (a) | 320,716 | 5,010 | |
| MasterCard, Inc. Class A | 415,200 | 48,296 | |
| Paychex, Inc. | 550,639 | 32,642 | |
| PayPal Holdings, Inc. (a) | 187,000 | 8,924 | |
| Unisys Corp. (a) | 684,895 | 7,739 | |
| Visa, Inc. Class A | 689,980 | 62,940 | |
| 173,466 | |||
| Semiconductors & Semiconductor Equipment - 1.6% | |||
| Qualcomm, Inc. | 1,374,050 | 73,841 | |
| Software - 4.0% | |||
| Adobe Systems, Inc. (a) | 123,290 | 16,489 | |
| Autodesk, Inc. (a) | 259,069 | 23,334 | |
| Microsoft Corp. | 2,110,696 | 144,498 | |
| 184,321 | |||
| Technology Hardware, Storage & Peripherals - 3.3% | |||
| Apple, Inc. | 1,037,329 | 149,012 | |
| Western Digital Corp. | 61,900 | 5,513 | |
| 154,525 | |||
| TOTAL INFORMATION TECHNOLOGY | 848,605 | ||
| MATERIALS - 3.2% | |||
| Chemicals - 2.6% | |||
| CF Industries Holdings, Inc. | 379,500 | 10,148 | |
| E.I. du Pont de Nemours & Co. | 113,538 | 9,055 | |
| Intrepid Potash, Inc. (a)(c) | 2,394,105 | 4,333 | |
| LyondellBasell Industries NV Class A | 218,395 | 18,511 | |
| Monsanto Co. | 352,673 | 41,125 | |
| Potash Corp. of Saskatchewan, Inc. | 1,046,100 | 17,641 | |
| W.R. Grace & Co. | 282,100 | 19,668 | |
| 120,481 | |||
| Containers & Packaging - 0.4% | |||
| WestRock Co. | 408,469 | 21,878 | |
| Metals & Mining - 0.2% | |||
| Freeport-McMoRan, Inc. (a) | 664,200 | 8,469 | |
| TOTAL MATERIALS | 150,828 | ||
| REAL ESTATE - 0.3% | |||
| Equity Real Estate Investment Trusts (REITs) - 0.3% | |||
| American Tower Corp. | 7,200 | 907 | |
| Crown Castle International Corp. | 44,700 | 4,229 | |
| Public Storage | 30,400 | 6,365 | |
| 11,501 | |||
| TELECOMMUNICATION SERVICES - 0.6% | |||
| Diversified Telecommunication Services - 0.6% | |||
| Verizon Communications, Inc. | 605,800 | 27,812 | |
| UTILITIES - 0.9% | |||
| Electric Utilities - 0.8% | |||
| Exelon Corp. | 1,017,000 | 35,219 | |
| PPL Corp. | 24,300 | 926 | |
| 36,145 | |||
| Independent Power and Renewable Electricity Producers - 0.1% | |||
| Dynegy, Inc. (a) | 1,165,300 | 7,481 | |
| TOTAL UTILITIES | 43,626 | ||
| TOTAL COMMON STOCKS | |||
| (Cost $3,724,030) | 4,501,848 | ||
| Principal Amount (000s) | Value (000s) | ||
| Convertible Bonds - 0.0% | |||
| ENERGY - 0.0% | |||
| Oil, Gas & Consumable Fuels - 0.0% | |||
| Amyris, Inc.: | |||
| 9.5% 4/15/19 pay-in-kind | 639 | 294 | |
| 10% 10/15/18 pay-in-kind(b)(d) | 1,272 | 926 | |
| (Cost $1,911) | 1,220 | ||
| Shares | Value (000s) | ||
| Other - 0.1% | |||
| ENERGY – 0.1% | |||
| Oil, Gas & Consumable Fuels - 0.1% | |||
| Utica Shale Drilling Program (non-operating revenue interest) (b)(e) | |||
| (Cost $4,645) | 4,645,172 | 4,645 | |
| Money Market Funds - 3.5% | |||
| Fidelity Cash Central Fund, 0.85% (f) | 159,912,211 | 159,944 | |
| Fidelity Securities Lending Cash Central Fund 0.86% (f)(g) | 3,490,792 | 3,491 | |
| TOTAL MONEY MARKET FUNDS | |||
| (Cost $163,434) | 163,435 | ||
| TOTAL INVESTMENT PORTFOLIO - 100.3% | |||
| (Cost $3,894,020) | 4,671,148 | ||
| NET OTHER ASSETS (LIABILITIES) - (0.3)% | (15,381) | ||
| NET ASSETS - 100% | $4,655,767 |
Values shown as $0 may reflect amounts less than $500.
Legend
(a) Non-income producing
(b) Restricted securities - Investment in securities not registered under the Securities Act of 1933 (excluding 144A issues). At the end of the period, the value of restricted securities (excluding 144A issues) amounted to $10,090,000 or 0.2% of net assets.
(c) Security or a portion of the security is on loan at period end.
(d) Coupon rates for floating and adjustable rate securities reflect the rates in effect at period end.
(e) Investment is owned by a wholly-owned subsidiary (Subsidiary) that is treated as a corporation for U.S. tax purposes.
(f) Affiliated fund that is generally available only to investment companies and other accounts managed by Fidelity Investments. The rate quoted is the annualized seven-day yield of the fund at period end. A complete unaudited listing of the fund's holdings as of its most recent quarter end is available upon request. In addition, each Fidelity Central Fund's financial statements, which are not covered by the Fund's Report of Independent Registered Public Accounting Firm, are available on the SEC's website or upon request.
(g) Investment made with cash collateral received from securities on loan.
Additional information on each restricted holding is as follows:
| Security | Acquisition Date | Acquisition Cost (000s) |
| Amyris, Inc. 10% 10/15/18 pay-in-kind | 10/16/13 - 4/15/17 | $1,273 |
| KKR Renaissance Co-Invest LP unit | 7/25/13 | $2,163 |
| NJOY, Inc. | 6/7/13 - 2/14/14 | $2,381 |
| Utica Shale Drilling Program (non-operating revenue interest) | 10/5/16 - 11/4/16 | $4,645 |
Affiliated Central Funds
Information regarding fiscal year to date income earned by the Fund from investments in Fidelity Central Funds is as follows:
| Fund | Income earned |
| (Amounts in thousands) | |
| Fidelity Cash Central Fund | $227 |
| Fidelity Securities Lending Cash Central Fund | 182 |
| Total | $409 |
Investment Valuation
The following is a summary of the inputs used, as of April 30, 2017, involving the Fund's assets and liabilities carried at fair value. The inputs or methodology used for valuing securities may not be an indication of the risk associated with investing in those securities. For more information on valuation inputs, and their aggregation into the levels used below, please refer to the Investment Valuation section in the accompanying Notes to Financial Statements.
| Valuation Inputs at Reporting Date: | ||||
| Description | Total | Level 1 | Level 2 | Level 3 |
| (Amounts in thousands) | ||||
| Investments in Securities: | ||||
| Equities: | ||||
| Consumer Discretionary | $365,234 | $365,234 | $-- | $-- |
| Consumer Staples | 263,114 | 252,958 | 10,156 | -- |
| Energy | 576,255 | 576,255 | -- | -- |
| Financials | 1,032,740 | 1,028,221 | 4,519 | -- |
| Health Care | 678,612 | 673,863 | 4,749 | -- |
| Industrials | 503,521 | 503,521 | -- | -- |
| Information Technology | 848,605 | 848,605 | -- | -- |
| Materials | 150,828 | 150,828 | -- | -- |
| Real Estate | 11,501 | 11,501 | -- | -- |
| Telecommunication Services | 27,812 | 27,812 | -- | -- |
| Utilities | 43,626 | 43,626 | -- | -- |
| Corporate Bonds | 1,220 | -- | 294 | 926 |
| Other | 4,645 | -- | -- | 4,645 |
| Money Market Funds | 163,435 | 163,435 | -- | -- |
| Total Investments in Securities: | $4,671,148 | $4,645,859 | $19,718 | $5,571 |
See accompanying notes which are an integral part of the financial statements.
Financial Statements
Statement of Assets and Liabilities
| Amounts in thousands (except per-share amount) | April 30, 2017 | |
| Assets | ||
| Investment in securities, at value (including securities loaned of $2,954) — See accompanying schedule: Unaffiliated issuers (cost $3,730,586) | $4,507,713 | |
| Fidelity Central Funds (cost $163,434) | 163,435 | |
| Total Investments (cost $3,894,020) | $4,671,148 | |
| Restricted cash | 43 | |
| Receivable for investments sold | 4,342 | |
| Receivable for fund shares sold | 4,632 | |
| Dividends receivable | 4,352 | |
| Interest receivable | 39 | |
| Distributions receivable from Fidelity Central Funds | 100 | |
| Prepaid expenses | 2 | |
| Other receivables | 140 | |
| Total assets | 4,684,798 | |
| Liabilities | ||
| Payable to custodian bank | $98 | |
| Payable for investments purchased | 19,019 | |
| Payable for fund shares redeemed | 4,240 | |
| Accrued management fee | 1,536 | |
| Other affiliated payables | 589 | |
| Other payables and accrued expenses | 54 | |
| Collateral on securities loaned | 3,495 | |
| Total liabilities | 29,031 | |
| Net Assets | $4,655,767 | |
| Net Assets consist of: | ||
| Paid in capital | $3,840,982 | |
| Undistributed net investment income | 5,060 | |
| Accumulated undistributed net realized gain (loss) on investments and foreign currency transactions | 32,605 | |
| Net unrealized appreciation (depreciation) on investments and assets and liabilities in foreign currencies | 777,120 | |
| Net Assets, for 150,938 shares outstanding | $4,655,767 | |
| Net Asset Value, offering price and redemption price per share ($4,655,767 ÷ 150,938 shares) | $30.85 |
See accompanying notes which are an integral part of the financial statements.
Statement of Operations
| Amounts in thousands | Year ended April 30, 2017 | |
| Investment Income | ||
| Dividends | $54,283 | |
| Interest | 316 | |
| Income from Fidelity Central Funds | 409 | |
| Total income | 55,008 | |
| Expenses | ||
| Management fee | ||
| Basic fee | $15,473 | |
| Performance adjustment | (4,004) | |
| Transfer agent fees | 4,953 | |
| Accounting and security lending fees | 826 | |
| Custodian fees and expenses | 73 | |
| Independent trustees' fees and expenses | 11 | |
| Registration fees | 170 | |
| Audit | 59 | |
| Legal | 16 | |
| Interest | 7 | |
| Miscellaneous | 24 | |
| Total expenses before reductions | 17,608 | |
| Expense reductions | (61) | 17,547 |
| Net investment income (loss) | 37,461 | |
| Realized and Unrealized Gain (Loss) | ||
| Net realized gain (loss) on: | ||
| Investment securities: | ||
| Unaffiliated issuers | 80,801 | |
| Fidelity Central Funds | (2) | |
| Foreign currency transactions | (10) | |
| Total net realized gain (loss) | 80,789 | |
| Change in net unrealized appreciation (depreciation) on: Investment securities | 391,417 | |
| Assets and liabilities in foreign currencies | (3) | |
| Total change in net unrealized appreciation (depreciation) | 391,414 | |
| Net gain (loss) | 472,203 | |
| Net increase (decrease) in net assets resulting from operations | $509,664 |
See accompanying notes which are an integral part of the financial statements.
Statement of Changes in Net Assets
| Amounts in thousands | Year ended April 30, 2017 | Year ended April 30, 2016 |
| Increase (Decrease) in Net Assets | ||
| Operations | ||
| Net investment income (loss) | $37,461 | $39,509 |
| Net realized gain (loss) | 80,789 | 78,527 |
| Change in net unrealized appreciation (depreciation) | 391,414 | (302,563) |
| Net increase (decrease) in net assets resulting from operations | 509,664 | (184,527) |
| Distributions to shareholders from net investment income | (37,973) | (33,715) |
| Distributions to shareholders from net realized gain | (60,336) | (103,844) |
| Total distributions | (98,309) | (137,559) |
| Share transactions | ||
| Proceeds from sales of shares | 2,315,375 | 560,790 |
| Reinvestment of distributions | 95,221 | 133,799 |
| Cost of shares redeemed | (745,911) | (1,000,244) |
| Net increase (decrease) in net assets resulting from share transactions | 1,664,685 | (305,655) |
| Total increase (decrease) in net assets | 2,076,040 | (627,741) |
| Net Assets | ||
| Beginning of period | 2,579,727 | 3,207,468 |
| End of period | $4,655,767 | $2,579,727 |
| Other Information | ||
| Undistributed net investment income end of period | $5,060 | $13,621 |
| Shares | ||
| Sold | 76,739 | 20,614 |
| Issued in reinvestment of distributions | 3,445 | 4,813 |
| Redeemed | (26,166) | (38,055) |
| Net increase (decrease) | 54,018 | (12,628) |
See accompanying notes which are an integral part of the financial statements.
Financial Highlights — Fidelity Large Cap Stock Fund
| Years ended April 30, | 2017 | 2016 | 2015 | 2014 | 2013 |
| Selected Per–Share Data | |||||
| Net asset value, beginning of period | $26.62 | $29.28 | $27.76 | $23.17 | $19.55 |
| Income from Investment Operations | |||||
| Net investment income (loss)A | .38 | .37 | .31 | .28 | .25 |
| Net realized and unrealized gain (loss) | 4.91 | (1.74) | 2.92 | 5.48 | 3.58 |
| Total from investment operations | 5.29 | (1.37) | 3.23 | 5.76 | 3.83 |
| Distributions from net investment income | (.41) | (.32) | (.27) | (.21) | (.20) |
| Distributions from net realized gain | (.65) | (.97) | (1.44) | (.96) | (.01) |
| Total distributions | (1.06) | (1.29) | (1.71) | (1.17) | (.21) |
| Net asset value, end of period | $30.85 | $26.62 | $29.28 | $27.76 | $23.17 |
| Total ReturnB | 20.37% | (4.82)% | 11.97% | 25.53% | 19.74% |
| Ratios to Average Net AssetsC,D | |||||
| Expenses before reductions | .62% | .78% | .88% | .88% | .85% |
| Expenses net of fee waivers, if any | .62% | .77% | .88% | .88% | .85% |
| Expenses net of all reductions | .62% | .77% | .88% | .88% | .84% |
| Net investment income (loss) | 1.33% | 1.38% | 1.10% | 1.08% | 1.21% |
| Supplemental Data | |||||
| Net assets, end of period (in millions) | $4,656 | $2,580 | $3,207 | $2,796 | $1,488 |
| Portfolio turnover rateE | 32% | 31% | 36%F | 31% | 53% |
A Calculated based on average shares outstanding during the period.
B Total returns would have been lower if certain expenses had not been reduced during the applicable periods shown.
C Fees and expenses of any underlying Fidelity Central Funds are not included in the Fund's expense ratio. The Fund indirectly bears its proportionate share of the expenses of any underlying Fidelity Central Funds.
D Expense ratios reflect operating expenses of the Fund. Expenses before reductions do not reflect amounts reimbursed by the investment adviser or reductions from brokerage service arrangements or reductions from other expense offset arrangements and do not represent the amount paid by the Fund during periods when reimbursements or reductions occur. Expenses net of fee waivers reflect expenses after reimbursement by the investment adviser but prior to reductions from brokerage service arrangements or other expense offset arrangements. Expenses net of all reductions represent the net expenses paid by the Fund.
E Amount does not include the portfolio activity of any underlying Fidelity Central Funds.
F Portfolio turnover rate excludes securities received or delivered in-kind.
See accompanying notes which are an integral part of the financial statements.
Notes to Financial Statements
For the period ended April 30, 2017
(Amounts in thousands except percentages)
1. Organization.
Fidelity Large Cap Stock Fund (the Fund) is a fund of Fidelity Concord Street Trust (the Trust) (formerly a fund of Fidelity Commonwealth Trust) and is authorized to issue an unlimited number of shares. Share transactions on the Statement of Changes in Net Assets may contain exchanges between affiliated funds. The Trust is registered under the Investment Company Act of 1940, as amended (the 1940 Act), as an open-end management investment company organized as a Massachusetts business trust.
2. Investments in Fidelity Central Funds.
The Fund invests in Fidelity Central Funds, which are open-end investment companies generally available only to other investment companies and accounts managed by the investment adviser and its affiliates. The Fund's Schedule of Investments lists each of the Fidelity Central Funds held as of period end, if any, as an investment of the Fund, but does not include the underlying holdings of each Fidelity Central Fund. As an Investing Fund, the Fund indirectly bears its proportionate share of the expenses of the underlying Fidelity Central Funds.
The Money Market Central Funds seek preservation of capital and current income and are managed by Fidelity Investments Money Management, Inc. (FIMM), an affiliate of the investment adviser. Annualized expenses of the Money Market Central Funds as of their most recent shareholder report date are less than .005%.
A complete unaudited list of holdings for each Fidelity Central Fund is available upon request or at the Securities and Exchange Commission (the SEC) website at www.sec.gov. In addition, the financial statements of the Fidelity Central Funds, which are not covered by the Fund's Report of Independent Registered Public Accounting Firm, are available on the SEC website or upon request.
3. Significant Accounting Policies.
The Fund is an investment company and applies the accounting and reporting guidance of the Financial Accounting Standards Board (FASB) Accounting Standards Codification Topic 946 Financial Services – Investments Companies. The financial statements have been prepared in conformity with accounting principles generally accepted in the United States of America (GAAP), which require management to make certain estimates and assumptions at the date of the financial statements. Actual results could differ from those estimates. Subsequent events, if any, through the date that the financial statements were issued have been evaluated in the preparation of the financial statements. The following summarizes the significant accounting policies of the Fund:
Investment Valuation. Investments are valued as of 4:00 p.m. Eastern time on the last calendar day of the period. The Board of Trustees (the Board) has delegated the day to day responsibility for the valuation of the Fund's investments to the Fair Value Committee (the Committee) established by the Fund's investment adviser. In accordance with valuation policies and procedures approved by the Board, the Fund attempts to obtain prices from one or more third party pricing vendors or brokers to value its investments. When current market prices, quotations or currency exchange rates are not readily available or reliable, investments will be fair valued in good faith by the Committee, in accordance with procedures adopted by the Board. Factors used in determining fair value vary by investment type and may include market or investment specific events, changes in interest rates and credit quality. The frequency with which these procedures are used cannot be predicted and they may be utilized to a significant extent. The Committee oversees the Fund's valuation policies and procedures and reports to the Board on the Committee's activities and fair value determinations. The Board monitors the appropriateness of the procedures used in valuing the Fund's investments and ratifies the fair value determinations of the Committee.
The Fund categorizes the inputs to valuation techniques used to value its investments into a disclosure hierarchy consisting of three levels as shown below:
- Level 1 – quoted prices in active markets for identical investments
- Level 2 – other significant observable inputs (including quoted prices for similar investments, interest rates, prepayment speeds, etc.)
- Level 3 – unobservable inputs (including the Fund's own assumptions based on the best information available)
Valuation techniques used to value the Fund's investments by major category are as follows:
Equity securities, including restricted securities, for which market quotations are readily available, are valued at the last reported sale price or official closing price as reported by a third party pricing vendor on the primary market or exchange on which they are traded and are categorized as Level 1 in the hierarchy. In the event there were no sales during the day or closing prices are not available, securities are valued at the last quoted bid price or may be valued using the last available price and are generally categorized as Level 2 in the hierarchy. For foreign equity securities, when market or security specific events arise, comparisons to the valuation of American Depositary Receipts (ADRs), futures contracts, Exchange-Traded Funds (ETFs) and certain indexes as well as quoted prices for similar securities may be used and would be categorized as Level 2 in the hierarchy. Utilizing these techniques may result in transfers between Level 1 and Level 2. For equity securities, including restricted securities, where observable inputs are limited, assumptions about market activity and risk are used and these securities may be categorized as Level 3 in the hierarchy.
Debt securities, including restricted securities, are valued based on evaluated prices received from third party pricing vendors or from brokers who make markets in such securities. Corporate bonds are valued by pricing vendors who utilize matrix pricing which considers yield or price of bonds of comparable quality, coupon, maturity and type or by broker-supplied prices. When independent prices are unavailable or unreliable, debt securities may be valued utilizing pricing methodologies which consider similar factors that would be used by third party pricing vendors. Debt securities are generally categorized as Level 2 in the hierarchy but may be Level 3 depending on the circumstances.
Investments in open-end mutual funds, including the Fidelity Central Funds, are valued at their closing net asset value (NAV) each business day and are categorized as Level 1 in the hierarchy.
Changes in valuation techniques may result in transfers in or out of an assigned level within the disclosure hierarchy. The aggregate value of investments by input level as of April 30, 2017 is included at the end of the Fund's Schedule of Investments.
Foreign Currency. The Fund may use foreign currency contracts to facilitate transactions in foreign-denominated securities. Gains and losses from these transactions may arise from changes in the value of the foreign currency or if the counterparties do not perform under the contracts' terms.
Foreign-denominated assets, including investment securities, and liabilities are translated into U.S. dollars at the exchange rates at period end. Purchases and sales of investment securities, income and dividends received and expenses denominated in foreign currencies are translated into U.S. dollars at the exchange rate in effect on the transaction date.
The effects of exchange rate fluctuations on investments are included with the net realized and unrealized gain (loss) on investment securities. Other foreign currency transactions resulting in realized and unrealized gain (loss) are disclosed separately.
Investment Transactions and Income. For financial reporting purposes, the Fund's investment holdings and NAV include trades executed through the end of the last business day of the period. The NAV per share for processing shareholder transactions is calculated as of the close of business of the New York Stock Exchange (NYSE), normally 4:00 p.m. Eastern time and includes trades executed through the end of the prior business day. Gains and losses on securities sold are determined on the basis of identified cost and may include proceeds received from litigation. Dividend income is recorded on the ex-dividend date, except for certain dividends from foreign securities where the ex-dividend date may have passed, which are recorded as soon as the Fund is informed of the ex-dividend date. Non-cash dividends included in dividend income, if any, are recorded at the fair market value of the securities received. Income and capital gain distributions from Fidelity Central Funds, if any, are recorded on the ex-dividend date. Certain distributions received by the Fund represent a return of capital or capital gain. The Fund determines the components of these distributions subsequent to the ex-dividend date, based upon receipt of tax filings or other correspondence relating to the underlying investment. These distributions are recorded as a reduction of cost of investments and/or as a realized gain. Interest income is accrued as earned and includes coupon interest and amortization of premium and accretion of discount on debt securities as applicable. Investment income is recorded net of foreign taxes withheld where recovery of such taxes is uncertain.
Expenses. Expenses directly attributable to a fund are charged to that fund. Expenses attributable to more than one fund are allocated among the respective funds on the basis of relative net assets or other appropriate methods. Expense estimates are accrued in the period to which they relate and adjustments are made when actual amounts are known.
Income Tax Information and Distributions to Shareholders. Each year, the Fund intends to qualify as a regulated investment company under Subchapter M of the Internal Revenue Code, including distributing substantially all of its taxable income and realized gains. As a result, no provision for U.S. Federal income taxes is required. As of April 30, 2017, the Fund did not have any unrecognized tax benefits in the financial statements; nor is the Fund aware of any tax positions for which it is reasonably possible that the total amounts of unrecognized tax benefits will significantly change in the next twelve months. The Fund files a U.S. federal tax return, in addition to state and local tax returns as required. The Fund's federal income tax returns are subject to examination by the Internal Revenue Service (IRS) for a period of three fiscal years after they are filed. State and local tax returns may be subject to examination for an additional fiscal year depending on the jurisdiction. Foreign taxes are provided for based on the Fund's understanding of the tax rules and rates that exist in the foreign markets in which it invests.
Distributions are declared and recorded on the ex-dividend date. Income and capital gain distributions are determined in accordance with income tax regulations, which may differ from GAAP. In addition, the Fund claimed a portion of the payment made to redeeming shareholders as a distribution for income tax purposes.
Capital accounts within the financial statements are adjusted for permanent book-tax differences. These adjustments have no impact on net assets or the results of operations. Capital accounts are not adjusted for temporary book-tax differences which will reverse in a subsequent period.
Book-tax differences are primarily due to foreign currency transactions, partnerships, deferred trustees expense and losses deferred due to wash sales.
The federal tax cost of investment securities and unrealized appreciation (depreciation) as of period end were as follows:
| Gross unrealized appreciation | $924,393 |
| Gross unrealized depreciation | (163,543) |
| Net unrealized appreciation (depreciation) on securities | $760,850 |
| Tax Cost | $3,910,298 |
The tax-based components of distributable earnings as of period end were as follows:
| Undistributed ordinary income | $19,013 |
| Undistributed long-term capital gain | $41,238 |
| Net unrealized appreciation (depreciation) on securities and other investments | $754,534 |
The tax character of distributions paid was as follows:
| April 30, 2017 | April 30, 2016 | |
| Ordinary Income | $49,312 | $ 33,715 |
| Long-term Capital Gains | 48,997 | 103,844 |
| Total | $98,309 | $ 137,559 |
Restricted Securities. The Fund may invest in securities that are subject to legal or contractual restrictions on resale. These securities generally may be resold in transactions exempt from registration or to the public if the securities are registered. Disposal of these securities may involve time-consuming negotiations and expense, and prompt sale at an acceptable price may be difficult. Information regarding restricted securities is included at the end of the Fund's Schedule of Investments.
Consolidated Subsidiary. The Fund invests in certain investments through a wholly-owned subsidiary ("Subsidiary"), which may be subject to federal and state taxes upon disposition.
As of period end, the Fund held an investment of $4,688 in this Subsidiary, representing .10% of the Fund's net assets. The financial statements have been consolidated and include accounts of the Fund and the Subsidiary. Accordingly, all inter-company transactions and balances have been eliminated.
Any cash held by the Subsidiary is restricted as to its use and is presented as Restricted cash in the Statement of Assets and Liabilities.
4. Purchases and Sales of Investments.
Purchases and sales of securities, other than short-term securities, aggregated $2,378,850 and $917,286, respectively.
5. Fees and Other Transactions with Affiliates.
Management Fee. Fidelity Management & Research Company (the investment adviser) and its affiliates provide the Fund with investment management related services for which the Fund pays a monthly management fee. The management fee is the sum of an individual fund fee rate that is based on an annual rate of .30% of the Fund's average net assets and an annualized group fee rate that averaged .25% during the period. The group fee rate is based upon the average net assets of all the mutual funds advised by the investment adviser, including any mutual funds previously advised by the investment adviser that are currently advised by Fidelity SelectCo, LLC, an affiliate of the investment adviser. The group fee rate decreases as assets under management increase and increases as assets under management decrease. In addition, the management fee is subject to a performance adjustment (up to a maximum of +/- .20% of the Fund's average net assets over a 36 month performance period). The upward or downward adjustment to the management fee is based on the Fund's relative investment performance as compared to its benchmark index, the S&P 500 Index, over the same 36 month performance period. For the reporting period, the total annual management fee rate, including the performance adjustment, was .41% of the Fund's average net assets. The performance adjustment included in the management fee rate may be higher or lower than the maximum performance adjustment rate due to the difference between the average net assets for the reporting and performance periods.
Transfer Agent Fees. Fidelity Investments Institutional Operations Company, Inc. (FIIOC), an affiliate of the investment adviser, is the Fund's transfer, dividend disbursing and shareholder servicing agent. FIIOC receives account fees and asset-based fees that vary according to account size and type of account. FIIOC pays for typesetting, printing and mailing of shareholder reports, except proxy statements. For the period, the transfer agent fees were equivalent to an annual rate of .18% of average net assets.
Accounting and Security Lending Fees. Fidelity Service Company, Inc. (FSC), an affiliate of the investment adviser, maintains the Fund's accounting records. The accounting fee is based on the level of average net assets for each month. Under a separate contract, FSC administers the security lending program. The security lending fee is based on the number and duration of lending transactions.
Brokerage Commissions. The Fund placed a portion of its portfolio transactions with brokerage firms which are affiliates of the investment adviser. Brokerage commissions are included in net realized gain (loss) and change in net unrealized appreciation (depreciation) in the Statement of Operations. The commissions paid to these affiliated firms were $50 for the period.
Interfund Lending Program. Pursuant to an Exemptive Order issued by the SEC, the Fund, along with other registered investment companies having management contracts with Fidelity Management & Research Company (FMR) or other affiliated entities of FMR, may participate in an interfund lending program. This program provides an alternative credit facility allowing the funds to borrow from, or lend money to, other participating affiliated funds. At period end, there were no interfund loans outstanding. The Fund's activity in this program during the period for which loans were outstanding was as follows:
| Borrower or Lender | Average Loan Balance | Weighted Average Interest Rate | Interest Expense |
| Borrower | $5,815 | .60% | $6 |
Interfund Trades. The Fund may purchase from or sell securities to other Fidelity Funds under procedures adopted by the Board. The procedures have been designed to ensure these interfund trades are executed in accordance with Rule 17a-7 of the 1940 Act. Interfund trades are included within the respective purchases and sales amounts shown in the Purchases and Sales of Investments note.
6. Committed Line of Credit.
The Fund participates with other funds managed by the investment adviser or an affiliate in a $4.25 billion credit facility (the "line of credit") to be utilized for temporary or emergency purposes to fund shareholder redemptions or for other short-term liquidity purposes. The Fund has agreed to pay commitment fees on its pro-rata portion of the line of credit, which amounted to $9 and is reflected in Miscellaneous expenses on the Statement of Operations. During the period, the Fund did not borrow on this line of credit.
7. Security Lending.
The Fund lends portfolio securities through a lending agent from time to time in order to earn additional income. For equity securities, a lending agent is used and may loan securities to certain qualified borrowers, including Fidelity Capital Markets (FCM), a broker-dealer affiliated with the Fund. On the settlement date of the loan, the Fund receives collateral (in the form of U.S. Treasury obligations, letters of credit and/or cash) against the loaned securities and maintains collateral in an amount not less than 100% of the market value of the loaned securities during the period of the loan. The market value of the loaned securities is determined at the close of business of the Fund and any additional required collateral is delivered to the Fund on the next business day. The Fund or borrower may terminate the loan at any time, and if the borrower defaults on its obligation to return the securities loaned because of insolvency or other reasons, the Fund may apply collateral received from the borrower against the obligation. The Fund may experience delays and costs in recovering the securities loaned. Any cash collateral received is invested in the Fidelity Securities Lending Cash Central Fund. The value of loaned securities and cash collateral at period end are disclosed on the Fund's Statement of Assets and Liabilities. Security lending income represents the income earned on investing cash collateral, less rebates paid to borrowers and any lending agent fees associated with the loan, plus any premium payments received for lending certain types of securities. Security lending income is presented in the Statement of Operations as a component of income from Fidelity Central Funds. Total security lending income during the period amounted to $182. During the period, there were no securities loaned to FCM.
8. Bank Borrowings.
The Fund is permitted to have bank borrowings for temporary or emergency purposes to fund shareholder redemptions or for other short-term liquidity requirements. The Fund has established borrowing arrangements with certain banks. The interest rate on the borrowings is the bank's base rate, as revised from time to time. The average loan balance during the period for which loans were outstanding amounted to $3,998. The weighted average interest rate was .86%. The interest expense amounted to $1 under the bank borrowing program. At period end, there were no bank borrowings outstanding.
9. Expense Reductions.
Commissions paid to certain brokers with whom the investment adviser, or its affiliates, places trades on behalf of the Fund include an amount in addition to trade execution, which may be rebated back to the Fund to offset certain expenses. This amount totaled $38 for the period.
In addition, during the period the investment adviser reimbursed and/or waived a portion of operating expenses in the amount of $23.
10. Other.
The Fund's organizational documents provide former and current trustees and officers with a limited indemnification against liabilities arising in connection with the performance of their duties to the Fund. In the normal course of business, the Fund may also enter into contracts that provide general indemnifications. The Fund's maximum exposure under these arrangements is unknown as this would be dependent on future claims that may be made against the Fund. The risk of material loss from such claims is considered remote.
Report of Independent Registered Public Accounting Firm
To the Trustees of Fidelity Concord Street Trust and Shareholders of Fidelity Large Cap Stock Fund:
We have audited the accompanying statement of assets and liabilities of Fidelity Large Cap Stock Fund (the Fund), a fund of Fidelity Concord Street Trust, including the schedule of investments, as of April 30, 2017, and the related statement of operations for the year then ended, the statement of changes in net assets for each of the two years in the period then ended, and the financial highlights for each of the five years in the period then ended. These financial statements and financial highlights are the responsibility of the Fund's management. Our responsibility is to express an opinion on these financial statements and financial highlights based on our audits.
We conducted our audits in accordance with the standards of the Public Company Accounting Oversight Board (United States). Those standards require that we plan and perform the audit to obtain reasonable assurance about whether the financial statements and financial highlights are free of material misstatement. The Fund is not required to have, nor were we engaged to perform, an audit of its internal control over financial reporting. Our audits included consideration of internal control over financial reporting as a basis for designing audit procedures that are appropriate in the circumstances, but not for the purpose of expressing an opinion on the effectiveness of the Fund's internal control over financial reporting. Accordingly, we express no such opinion. An audit also includes examining, on a test basis, evidence supporting the amounts and disclosures in the financial statements, assessing the accounting principles used and significant estimates made by management, as well as evaluating the overall financial statement presentation. Our procedures included confirmation of securities owned as of April 30, 2017, by correspondence with the custodians and brokers; when replies were not received from brokers, we performed other auditing procedures. We believe that our audits provide a reasonable basis for our opinion.
In our opinion, such financial statements and financial highlights referred to above present fairly, in all material respects, the financial position of Fidelity Large Cap Stock Fund as of April 30, 2017, the results of its operations for the year then ended, the changes in its net assets for each of the two years in the period then ended, and the financial highlights for each of the five years in the period then ended in conformity with accounting principles generally accepted in the United States of America.
DELOITTE & TOUCHE LLP
Boston, Massachusetts
June 14, 2017
Trustees and Officers
The Trustees, Members of the Advisory Board (if any), and officers of the trust and fund, as applicable, are listed below. The Board of Trustees governs the fund and is responsible for protecting the interests of shareholders. The Trustees are experienced executives who meet periodically throughout the year to oversee the fund's activities, review contractual arrangements with companies that provide services to the fund, oversee management of the risks associated with such activities and contractual arrangements, and review the fund's performance. Except for Jonathan Chiel, each of the Trustees oversees 189 funds. Mr. Chiel oversees 142 funds.
The Trustees hold office without limit in time except that (a) any Trustee may resign; (b) any Trustee may be removed by written instrument, signed by at least two-thirds of the number of Trustees prior to such removal; (c) any Trustee who requests to be retired or who has become incapacitated by illness or injury may be retired by written instrument signed by a majority of the other Trustees; and (d) any Trustee may be removed at any special meeting of shareholders by a two-thirds vote of the outstanding voting securities of the trust. Each Trustee who is not an interested person (as defined in the 1940 Act) of the trust and the fund is referred to herein as an Independent Trustee. Each Independent Trustee shall retire not later than the last day of the calendar year in which his or her 75th birthday occurs. The Independent Trustees may waive this mandatory retirement age policy with respect to individual Trustees. Officers and Advisory Board Members hold office without limit in time, except that any officer or Advisory Board Member may resign or may be removed by a vote of a majority of the Trustees at any regular meeting or any special meeting of the Trustees. Except as indicated, each individual has held the office shown or other offices in the same company for the past five years.
The fund’s Statement of Additional Information (SAI) includes more information about the Trustees. To request a free copy, call Fidelity at 1-800-544-8544.
Experience, Skills, Attributes, and Qualifications of the Trustees. The Governance and Nominating Committee has adopted a statement of policy that describes the experience, qualifications, attributes, and skills that are necessary and desirable for potential Independent Trustee candidates (Statement of Policy). The Board believes that each Trustee satisfied at the time he or she was initially elected or appointed a Trustee, and continues to satisfy, the standards contemplated by the Statement of Policy. The Governance and Nominating Committee also engages professional search firms to help identify potential Independent Trustee candidates who have the experience, qualifications, attributes, and skills consistent with the Statement of Policy. From time to time, additional criteria based on the composition and skills of the current Independent Trustees, as well as experience or skills that may be appropriate in light of future changes to board composition, business conditions, and regulatory or other developments, have also been considered by the professional search firms and the Governance and Nominating Committee. In addition, the Board takes into account the Trustees' commitment and participation in Board and committee meetings, as well as their leadership of standing and ad hoc committees throughout their tenure.
In determining that a particular Trustee was and continues to be qualified to serve as a Trustee, the Board has considered a variety of criteria, none of which, in isolation, was controlling. The Board believes that, collectively, the Trustees have balanced and diverse experience, qualifications, attributes, and skills, which allow the Board to operate effectively in governing the fund and protecting the interests of shareholders. Information about the specific experience, skills, attributes, and qualifications of each Trustee, which in each case led to the Board's conclusion that the Trustee should serve (or continue to serve) as a trustee of the fund, is provided below.
Board Structure and Oversight Function. James C. Curvey is an interested person and currently serves as Chairman. The Trustees have determined that an interested Chairman is appropriate and benefits shareholders because an interested Chairman has a personal and professional stake in the quality and continuity of services provided to the fund. Independent Trustees exercise their informed business judgment to appoint an individual of their choosing to serve as Chairman, regardless of whether the Trustee happens to be independent or a member of management. The Independent Trustees have determined that they can act independently and effectively without having an Independent Trustee serve as Chairman and that a key structural component for assuring that they are in a position to do so is for the Independent Trustees to constitute a substantial majority for the Board. The Independent Trustees also regularly meet in executive session. Ned C. Lautenbach serves as Chairman of the Independent Trustees and as such (i) acts as a liaison between the Independent Trustees and management with respect to matters important to the Independent Trustees and (ii) with management prepares agendas for Board meetings.
Fidelity® funds are overseen by different Boards of Trustees. The fund's Board oversees Fidelity's high income and certain equity funds, and other Boards oversee Fidelity's investment-grade bond, money market, asset allocation, and sector funds. The asset allocation funds may invest in Fidelity® funds overseen by the fund's Board. The use of separate Boards, each with its own committee structure, allows the Trustees of each group of Fidelity® funds to focus on the unique issues of the funds they oversee, including common research, investment, and operational issues. On occasion, the separate Boards establish joint committees to address issues of overlapping consequences for the Fidelity® funds overseen by each Board.
The Trustees operate using a system of committees to facilitate the timely and efficient consideration of all matters of importance to the Trustees, the fund, and fund shareholders and to facilitate compliance with legal and regulatory requirements and oversight of the fund's activities and associated risks. The Board, acting through its committees, has charged FMR and its affiliates with (i) identifying events or circumstances the occurrence of which could have demonstrably adverse effects on the fund's business and/or reputation; (ii) implementing processes and controls to lessen the possibility that such events or circumstances occur or to mitigate the effects of such events or circumstances if they do occur; and (iii) creating and maintaining a system designed to evaluate continuously business and market conditions in order to facilitate the identification and implementation processes described in (i) and (ii) above. Because the day-to-day operations and activities of the fund are carried out by or through FMR, its affiliates, and other service providers, the fund's exposure to risks is mitigated but not eliminated by the processes overseen by the Trustees. While each of the Board's committees has responsibility for overseeing different aspects of the fund's activities, oversight is exercised primarily through the Operations, Audit, and Compliance Committees. In addition, the Independent Trustees have worked with FMR to enhance the Board's oversight of investment and financial risks, legal and regulatory risks, technology risks, and operational risks, including the development of additional risk reporting to the Board. For example, a working group comprised of Independent Trustees and FMR has worked and continues to work to review the Fidelity® funds' valuation-related activities, reporting and risk management. Appropriate personnel, including but not limited to the fund's Chief Compliance Officer (CCO), FMR's internal auditor, the independent accountants, the fund's Treasurer and portfolio management personnel, make periodic reports to the Board's committees, as appropriate, including an annual review of Fidelity's risk management program for the Fidelity® funds. The responsibilities of each standing committee, including their oversight responsibilities, are described further under "Standing Committees of the Trustees."
Interested Trustees*:
Correspondence intended for a Trustee who is an interested person may be sent to Fidelity Investments, 245 Summer Street, Boston, Massachusetts 02210.
Name, Year of Birth; Principal Occupations and Other Relevant Experience+
Jonathan Chiel (1957)
Year of Election or Appointment: 2016
Trustee
Mr. Chiel also serves as Trustee of other Fidelity funds. Mr. Chiel is Executive Vice President and General Counsel for FMR LLC (diversified financial services company, 2012-present). Previously, Mr. Chiel served as general counsel (2004-2012) and senior vice president and deputy general counsel (2000-2004) for John Hancock Financial Services; a partner with Choate, Hall & Stewart (1996-2000) (law firm); and an Assistant United States Attorney for the United States Attorney’s Office of the District of Massachusetts (1986-95), including Chief of the Criminal Division (1993-1995). Mr. Chiel is a director on the boards of the Boston Bar Foundation and the Maimonides School.
James C. Curvey (1935)
Year of Election or Appointment: 2007
Trustee
Chairman of the Board of Trustees
Mr. Curvey also serves as Trustee of other Fidelity® funds. Mr. Curvey is a Director of Fidelity Research & Analysis Co. (investment adviser firm, 2009-present), and Vice Chairman (2007-present) and Director of FMR LLC (diversified financial services company). In addition, Mr. Curvey serves as an Overseer for the Boston Symphony Orchestra and a member of the board of Artis-Naples, Naples, Florida, and as a Trustee for Brewster Academy, Wolfeboro, New Hampshire. Previously, Mr. Curvey served as a Director of Fidelity Investments Money Management, Inc. (investment adviser firm, 2009-2014) and a Director of FMR and FMR Co., Inc. (investment adviser firms, 2007-2014).
Charles S. Morrison (1960)
Year of Election or Appointment: 2014
Trustee
Mr. Morrison also serves as Trustee of other funds. He serves as President of Fidelity Management & Research Company (FMR) (investment adviser firm, 2016-present), a Director of Fidelity Investments Money Management, Inc. (FIMM) (investment adviser firm, 2014-present), Director of Fidelity SelectCo, LLC (investment adviser firm, 2014-present), President, Asset Management (2014-present), and is an employee of Fidelity Investments. Previously, Mr. Morrison served as Vice President of Fidelity's Fixed Income and Asset Allocation Funds (2012-2014), President, Fixed Income (2011-2014), Vice President of Fidelity's Money Market Funds (2005-2009), President, Money Market Group Leader of FMR (investment adviser firm, 2009), and Senior Vice President, Money Market Group of FMR (2004-2009). Mr. Morrison also served as Vice President of Fidelity's Bond Funds (2002-2005), certain Balanced Funds (2002-2005), and certain Asset Allocation Funds (2002-2007), and as Senior Vice President (2002-2005) of Fidelity's Bond Division.
* Determined to be an “Interested Trustee” by virtue of, among other things, his or her affiliation with the trust or various entities under common control with FMR.
+ The information includes the Trustee's principal occupation during the last five years and other information relating to the experience, attributes, and skills relevant to the Trustee's qualifications to serve as a Trustee, which led to the conclusion that the Trustee should serve as a Trustee for the fund.
Independent Trustees:
Correspondence intended for an Independent Trustee may be sent to Fidelity Investments, P.O. Box 55235, Boston, Massachusetts 02205-5235.
Name, Year of Birth; Principal Occupations and Other Relevant Experience+
Dennis J. Dirks (1948)
Year of Election or Appointment: 2005
Trustee
Mr. Dirks also serves as Trustee of other Fidelity® funds. Prior to his retirement in May 2003, Mr. Dirks was Chief Operating Officer and a member of the Board of The Depository Trust & Clearing Corporation (DTCC). He also served as President, Chief Operating Officer, and Board member of The Depository Trust Company (DTC) and President and Board member of the National Securities Clearing Corporation (NSCC). In addition, Mr. Dirks served as Chief Executive Officer and Board member of the Government Securities Clearing Corporation, Chief Executive Officer and Board member of the Mortgage-Backed Securities Clearing Corporation, as a Trustee and a member of the Finance Committee of Manhattan College (2005-2008), as a Trustee and a member of the Finance Committee of AHRC of Nassau County (2006-2008), as a member of the Independent Directors Council (IDC) Governing Council (2010-2015), and as a member of the Board of Directors for The Brookville Center for Children’s Services, Inc. (2009-2017). Mr. Dirks is a member of the Finance Committee (2016-present) and Board of Directors (2017-present) of the Asolo Repertory Theatre.
Alan J. Lacy (1953)
Year of Election or Appointment: 2008
Trustee
Mr. Lacy also serves as Trustee of other Fidelity® funds. Mr. Lacy serves as a Director of Bristol-Myers Squibb Company (global pharmaceuticals, 2008-present). He is a Trustee of the California Chapter of The Nature Conservancy (2015-present) and a Director of the Center for Advanced Study in the Behavioral Sciences at Stanford University (2015-present). In addition, Mr. Lacy served as Senior Adviser (2007-2014) of Oak Hill Capital Partners, L.P. (private equity) and also served as Chief Executive Officer (2005) and Vice Chairman (2005-2006) of Sears Holdings Corporation (retail) and Chief Executive Officer and Chairman of the Board of Sears, Roebuck and Co. (retail, 2000-2005). Previously, Mr. Lacy served as Chairman (2014-2017) and a member (2010-2017) of the Board of Directors of Dave & Buster’s Entertainment, Inc. (restaurant and entertainment complexes), as Chairman (2008-2011) and a member (2006-2015) of the Board of Trustees of the National Parks Conservation Association, and as a member of the Board of Directors for The Hillman Companies, Inc. (hardware wholesalers, 2010-2014), Earth Fare, Inc. (retail grocery, 2010-2014), and The Western Union Company (global money transfer, 2006-2011).
Ned C. Lautenbach (1944)
Year of Election or Appointment: 2000
Trustee
Chairman of the Independent Trustees
Mr. Lautenbach also serves as Trustee of other Fidelity® funds. Mr. Lautenbach currently serves as the Lead Director of the Eaton Corporation Board of Directors (diversified industrial, 1997-present). Mr. Lautenbach is Chairman of the Board of Directors of Artis-Naples in Naples, Florida (2012-present), a member of the Council on Foreign Relations (1994-present), and currently Vice Chair of the Board of Governors, State University System of Florida (2013-present). Previously, Mr. Lautenbach was a Partner and Advisory Partner at Clayton, Dubilier & Rice, LLC (private equity investment, 1998-2010), as well as a Director of Sony Corporation (2006-2007). Mr. Lautenbach also had a 30-year career with IBM (technology company) during which time he served as Senior Vice President and a member of the Corporate Executive Committee (1968-1998).
Joseph Mauriello (1944)
Year of Election or Appointment: 2008
Trustee
Mr. Mauriello also serves as Trustee of other Fidelity® funds. Prior to his retirement in January 2006, Mr. Mauriello served in numerous senior management positions including Deputy Chairman and Chief Operating Officer (2004-2005), and Vice Chairman of Financial Services (2002-2004) of KPMG LLP US (professional services, 1965-2005). Mr. Mauriello currently serves as a member of the Board of Directors of XL Group plc. (global insurance and re-insurance, 2006-present) and the Independent Directors Council (IDC) Governing Council (2015-present). Previously, Mr. Mauriello served as a Director of the Hamilton Funds of the Bank of New York (2006-2007) and of Arcadia Resources Inc. (health care services and products, 2007-2012).
Robert W. Selander (1950)
Year of Election or Appointment: 2011
Trustee
Mr. Selander also serves as Trustee of other Fidelity® funds. Mr. Selander serves as a Director of The Western Union Company (global money transfer, 2014-present) and a non-executive Chairman of Health Equity, Inc. (health savings custodian, 2015-present). Previously, Mr. Selander served as a Member of the Advisory Board of certain Fidelity® funds (2011), and Executive Vice Chairman (2010), Chief Executive Officer (2009-2010), and President and Chief Executive Officer (1997-2009) of Mastercard, Inc.
Cornelia M. Small (1944)
Year of Election or Appointment: 2005
Trustee
Ms. Small also serves as Trustee of other Fidelity® funds. Ms. Small is a member of the Board of Directors (2009-present) and Chair of the Investment Committee (2010-present) of the Teagle Foundation. Ms. Small also serves on the Investment Committee of the Berkshire Taconic Community Foundation (2008-present). Previously, Ms. Small served as Chairperson (2002-2008) and a member of the Investment Committee and Chairperson (2008-2012) and a member of the Board of Trustees of Smith College. In addition, Ms. Small served as Chief Investment Officer, Director of Global Equity Investments, and a member of the Board of Directors of Scudder, Stevens & Clark and Scudder Kemper Investments.
William S. Stavropoulos (1939)
Year of Election or Appointment: 2001
Trustee
Vice Chairman of the Independent Trustees
Mr. Stavropoulos also serves as Trustee of other Fidelity® funds. Mr. Stavropoulos serves as President and Founder of the Michigan Baseball Foundation, the Great Lakes Loons (2007-present). Mr. Stavropoulos is Chairman Emeritus of the Board of Directors of The Dow Chemical Company, where he previously served in numerous senior management positions, including President, CEO (1995-2000; 2002-2004), Chairman of the Executive Committee (2000-2006), and as a member of the Board of Directors (1990-2006). Currently, Mr. Stavropoulos is Chairman of the Board of Directors of Univar Inc. (global distributor of commodity and specialty chemicals), a Director of Teradata Corporation (data warehousing and technology solutions), and a member of the Advisory Board for Metalmark Capital LLC (private equity investment, 2005-present). Mr. Stavropoulos is an operating advisor to Clayton, Dubilier & Rice, LLC (private equity investment). In addition, Mr. Stavropoulos is a member of the University of Notre Dame Advisory Council for the College of Science, a Trustee of the Rollin L. Gerstacker Foundation, and a Director of Artis-Naples in Naples, Florida. Previously, Mr. Stavropoulos served as a Director of Chemical Financial Corporation (bank holding company, 1993-2012) and Tyco International, Ltd. (multinational manufacturing and services, 2007-2012).
David M. Thomas (1949)
Year of Election or Appointment: 2008
Trustee
Mr. Thomas also serves as Trustee of other Fidelity® funds. Mr. Thomas serves as Non-Executive Chairman of the Board of Directors of Fortune Brands Home and Security (home and security products, 2011-present), as a member of the Board of Directors (2004-present) and Presiding Director (2013-present) of Interpublic Group of Companies, Inc. (marketing communication), and as a member of the Board of Trustees of the University of Florida (2013-present). Previously, Mr. Thomas served as Executive Chairman (2005-2006) and Chairman and Chief Executive Officer (2000-2005) of IMS Health, Inc. (pharmaceutical and healthcare information solutions), and a Director of Fortune Brands, Inc. (consumer products, 2000-2011).
+ The information includes the Trustee's principal occupation during the last five years and other information relating to the experience, attributes, and skills relevant to the Trustee's qualifications to serve as a Trustee, which led to the conclusion that the Trustee should serve as a Trustee for the fund.
Advisory Board Members and Officers:
Correspondence intended for an officer or Peter S. Lynch may be sent to Fidelity Investments, 245 Summer Street, Boston, Massachusetts 02210. Officers appear below in alphabetical order.
Name, Year of Birth; Principal Occupation
Peter S. Lynch (1944)
Year of Election or Appointment: 2003
Member of the Advisory Board
Mr. Lynch also serves as Member of the Advisory Board of other Fidelity® funds. Mr. Lynch is Vice Chairman and a Director of FMR (investment adviser firm) and FMR Co., Inc. (investment adviser firm). In addition, Mr. Lynch serves as a Trustee of Boston College and as the Chairman of the Inner-City Scholarship Fund. Previously, Mr. Lynch served on the Special Olympics International Board of Directors (1997-2006).
Elizabeth Paige Baumann (1968)
Year of Election or Appointment: 2017
Anti-Money Laundering (AML) Officer
Ms. Baumann also serves as AML Officer of other funds. She is Chief AML Officer (2012-present) and Senior Vice President (2014-present) of FMR LLC (diversified financial services company) and is an employee of Fidelity Investments. Previously, Ms. Baumann served as AML Officer of the funds (2012-2016), and Vice President (2007-2014) and Deputy Anti-Money Laundering Officer (2007-2012) of FMR LLC.
Marc R. Bryant (1966)
Year of Election or Appointment: 2015
Secretary and Chief Legal Officer (CLO)
Mr. Bryant also serves as Secretary and CLO of other funds. Mr. Bryant serves as CLO, Secretary, and Senior Vice President of Fidelity Management & Research Company (investment adviser firm, 2015-present) and FMR Co., Inc. (investment adviser firm, 2015-present); Secretary of Fidelity SelectCo, LLC (investment adviser firm, 2015-present) and Fidelity Investments Money Management, Inc. (investment adviser firm, 2015-present); and CLO of Fidelity Management & Research (Hong Kong) Limited and FMR Investment Management (UK) Limited (investment adviser firms, 2015-present) and Fidelity Management & Research (Japan) Limited (investment adviser firm, 2016-present). He is Senior Vice President and Deputy General Counsel of FMR LLC (diversified financial services company). Previously, Mr. Bryant served as Secretary and CLO of Fidelity Rutland Square Trust II (2010-2014) and Assistant Secretary of Fidelity's Fixed Income and Asset Allocation Funds (2013-2015). Prior to joining Fidelity Investments, Mr. Bryant served as a Senior Vice President and the Head of Global Retail Legal for AllianceBernstein L.P. (2006-2010), and as the General Counsel for ProFund Advisors LLC (2001-2006).
Jeffrey S. Christian (1961)
Year of Election or Appointment: 2016
Assistant Treasurer
Mr. Christian also serves as Assistant Treasurer of other funds. Mr. Christian is an employee of Fidelity Investments (2003-present).
William C. Coffey (1969)
Year of Election or Appointment: 2009
Assistant Secretary
Mr. Coffey also serves as Assistant Secretary of other funds. He is Senior Vice President and Deputy General Counsel of FMR LLC (diversified financial services company, 2010-present), and is an employee of Fidelity Investments. Previously, Mr. Coffey served as Vice President and Associate General Counsel of FMR LLC (2005-2009).
Jonathan Davis (1968)
Year of Election or Appointment: 2010
Assistant Treasurer
Mr. Davis also serves as Assistant Treasurer of other funds, and is an employee of Fidelity Investments. Previously, Mr. Davis served as Vice President and Associate General Counsel of FMR LLC (diversified financial services company, 2003-2010).
Adrien E. Deberghes (1967)
Year of Election or Appointment: 2016
Assistant Treasurer
Mr. Deberghes also serves as an officer of other funds. He serves as Executive Vice President of Fidelity Investments Money Management, Inc. (FIMM) (investment adviser firm, 2016-present) and is an employee of Fidelity Investments (2008-present). Prior to joining Fidelity Investments, Mr. Deberghes was Senior Vice President of Mutual Fund Administration at State Street Corporation (2007-2008), Senior Director of Mutual Fund Administration at Investors Bank & Trust (2005-2007), and Director of Finance for Dunkin' Brands (2000-2005). Previously, Mr. Deberghes served in other fund officer roles.
Stephanie J. Dorsey (1969)
Year of Election or Appointment: 2010
Assistant Treasurer
Ms. Dorsey also serves as an officer of other funds. She is an employee of Fidelity Investments (2008-present) and has served in other fund officer roles. Prior to joining Fidelity Investments, Ms. Dorsey served as Treasurer (2004-2008) of the JPMorgan Mutual Funds and Vice President (2004-2008) of JPMorgan Chase Bank.
Howard J. Galligan III (1966)
Year of Election or Appointment: 2014
Chief Financial Officer
Mr. Galligan also serves as Chief Financial Officer of other funds. Mr. Galligan serves as President of Fidelity Pricing and Cash Management Services (FPCMS) (2014-present) and as a Director of Strategic Advisers, Inc. (investment adviser firm, 2008-present). Previously, Mr. Galligan served as Chief Administrative Officer of Asset Management (2011-2014) and Chief Operating Officer and Senior Vice President of Investment Support for Strategic Advisers, Inc. (2003-2011).
Scott C. Goebel (1968)
Year of Election or Appointment: 2015
Vice President
Mr. Goebel serves as Vice President of other funds and is an employee of Fidelity Investments (2001-present). Previously, Mr. Goebel served as Senior Vice President of Fidelity Management & Research Company (FMR) (investment adviser firm, 2016), Secretary of Fidelity SelectCo, LLC (investment adviser firm, 2013-2015), Fidelity Investments Money Management, Inc. (FIMM) (investment adviser firm, 2010-2015), and Fidelity Research and Analysis Company (FRAC) (investment adviser firm, 2010-2015); General Counsel, Secretary, and Senior Vice President of FMR (investment adviser firm, 2008-2015) and FMR Co., Inc. (investment adviser firm, 2008-2015); Assistant Secretary of Fidelity Management & Research (Japan) Limited (investment adviser firm, 2008-2015) and Fidelity Management & Research (U.K.) Inc. (investment adviser firm, 2008-2015); Chief Legal Officer (CLO) of Fidelity Management & Research (Hong Kong) Limited (investment adviser firm, 2008-2015); Secretary and CLO of certain Fidelity® funds (2008-2015); Assistant Secretary of FIMM (2008-2010), FRAC (2008-2010), and certain funds (2007-2008); and as Vice President and Secretary of Fidelity Distributors Corporation (FDC) (2005-2007).
Thomas C. Hense (1964)
Year of Election or Appointment: 2008, 2010, or 2015
Vice President
Mr. Hense serves as Vice President of Fidelity Advisor® Multi-Asset Income Fund (2015) and other funds (High Income (2008), Small Cap (2008), and Value (2010) funds), and is an employee of Fidelity Investments (1993-present). Previously, Mr. Hense served as a portfolio manager for Fidelity's Institutional Money Management Group (Pyramis) (2003-2008).
Brian B. Hogan (1964)
Year of Election or Appointment: 2009
Vice President
Mr. Hogan also serves as Trustee or Vice President of other funds. Mr. Hogan serves as a Director of FMR Investment Management (UK) Limited (investment adviser firm, 2015-present) and Fidelity SelectCo, LLC (investment adviser firm, 2014-present) and President of the Equity Division of FMR (investment adviser firm, 2009-present). Previously, Mr. Hogan served as Senior Vice President, Equity Research of FMR (2006-2009) and as a portfolio manager. Mr. Brian B. Hogan is not related to Mr. Colm A. Hogan.
Colm A. Hogan (1973)
Year of Election or Appointment: 2016
Deputy Treasurer
Mr. Hogan also serves as an officer of other funds. Mr. Hogan is an employee of Fidelity Investments (2005-present). Mr. Colm A. Hogan is not related to Mr. Brian B. Hogan.
Chris Maher (1972)
Year of Election or Appointment: 2013
Assistant Treasurer
Mr. Maher serves as Assistant Treasurer of other funds. Mr. Maher is Vice President of Valuation Oversight and is an employee of Fidelity Investments. Previously, Mr. Maher served as Vice President of Asset Management Compliance (2013), Vice President of the Program Management Group of FMR (investment adviser firm, 2010-2013), and Vice President of Valuation Oversight (2008-2010).
Kenneth B. Robins (1969)
Year of Election or Appointment: 2016
Chief Compliance Officer
Mr. Robins also serves as an officer of other funds. Mr. Robins serves as Compliance Officer of Fidelity Management & Research Company and FMR Co., Inc. (investment adviser firms, 2016-present) and is an employee of Fidelity Investments (2004-present). Previously, Mr. Robins served as Executive Vice President of Fidelity Investments Money Management, Inc. (investment adviser firm, 2013-2016) and served in other fund officer roles.
Stacie M. Smith (1974)
Year of Election or Appointment: 2016
President and Treasurer
Ms. Smith also serves as an officer of other funds. She is an employee of Fidelity Investments (2009-present) and has served in other fund officer roles. Prior to joining Fidelity Investments, Ms. Smith served as Senior Audit Manager of Ernst & Young LLP (accounting firm, 1996-2009). Previously, Ms. Smith served as Deputy Treasurer of certain Fidelity® funds (2013-2016).
Marc L. Spector (1972)
Year of Election or Appointment: 2016
Assistant Treasurer
Mr. Spector also serves as an officer of other funds. Mr. Spector is an employee of Fidelity Investments (2016-present). Prior to joining Fidelity Investments, Mr. Spector served as Director at the Siegfried Group (accounting firm, 2013-2016), and prior to Siegfried Group as audit senior manager at Deloitte & Touche (accounting firm, 2005-2013).
Renee Stagnone (1975)
Year of Election or Appointment: 2016
Assistant Treasurer
Ms. Stagnone also serves as an officer of other funds. Ms. Stagnone is an employee of Fidelity Investments (1997-present). Previously, Ms. Stagnone served as Deputy Treasurer of certain Fidelity® funds (2013-2016).
Shareholder Expense Example
As a shareholder of the Fund, you incur two types of costs: (1) transaction costs and (2) ongoing costs, including management fees and other Fund expenses. This Example is intended to help you understand your ongoing costs (in dollars) of investing in the Fund and to compare these costs with the ongoing costs of investing in other mutual funds.
The Example is based on an investment of $1,000 invested at the beginning of the period and held for the entire period (November 1, 2016 to April 30, 2017).
Actual Expenses
The first line of the accompanying table provides information about actual account values and actual expenses. You may use the information in this line, together with the amount you invested, to estimate the expenses that you paid over the period. Simply divide your account value by $1,000.00 (for example, an $8,600 account value divided by $1,000.00 = 8.6), then multiply the result by the number in the first line under the heading entitled "Expenses Paid During Period" to estimate the expenses you paid on your account during this period. A small balance maintenance fee of $12.00 that is charged once a year may apply for certain accounts with a value of less than $2,000. This fee is not included in the table below. If it was, the estimate of expenses you paid during the period would be higher, and your ending account value lower, by this amount. In addition, the Fund, as a shareholder in the underlying Fidelity Central Funds, will indirectly bear its pro-rata share of the fees and expenses incurred by the underlying Fidelity Central Funds. These fees and expenses are not included in the Fund's annualized expense ratio used to calculate the expense estimate in the table below.
Hypothetical Example for Comparison Purposes
The second line of the accompanying table provides information about hypothetical account values and hypothetical expenses based on the Fund's actual expense ratio and an assumed rate of return of 5% per year before expenses, which is not the Fund's actual return. The hypothetical account values and expenses may not be used to estimate the actual ending account balance or expenses you paid for the period. You may use this information to compare the ongoing costs of investing in the Fund and other funds. To do so, compare this 5% hypothetical example with the 5% hypothetical examples that appear in the shareholder reports of the other funds. A small balance maintenance fee of $12.00 that is charged once a year may apply for certain accounts with a value of less than $2,000. This fee is not included in the table below. If it was, the estimate of expenses you paid during the period would be higher, and your ending account value lower, by this amount. In addition, the Fund, as a shareholder in the underlying Fidelity Central Funds, will indirectly bear its pro-rata share of the fees and expenses incurred by the underlying Fidelity Central Funds. These fees and expenses are not included in the Fund's annualized expense ratio used to calculate the expense estimate in the table below.
Please note that the expenses shown in the table are meant to highlight your ongoing costs only and do not reflect any transaction costs. Therefore, the second line of the table is useful in comparing ongoing costs only, and will not help you determine the relative total costs of owning different funds.
| Annualized Expense Ratio-A | Beginning Account Value November 1, 2016 | Ending Account Value April 30, 2017 | Expenses Paid During Period-B November 1, 2016 to April 30, 2017 | |
| Actual | .65% | $1,000.00 | $1,136.10 | $3.44 |
| Hypothetical-C | $1,000.00 | $1,021.57 | $3.26 |
A Annualized expense ratio reflects expenses net of applicable fee waivers.
B Expenses are equal to the Fund's annualized expense ratio, multiplied by the average account value over the period, multiplied by 181/365 (to reflect the one-half year period).
C 5% return per year before expenses
Distributions (Unaudited)
The Board of Trustees of Fidelity Large Cap Stock Fund voted to pay on June 12, 2017, to shareholders of record at the opening of business on June 9, 2017, a distribution of $0.324 per share derived from capital gains realized from sales of portfolio securities and a dividend of $0.077 per share from net investment income.
The fund hereby designates as a capital gain dividend with respect to the taxable year ended April 30, 2017, $61,919,688, or, if subsequently determined to be different, the net capital gain of such year.
The fund designates 99% and 84% of the dividends distributed in June and December, respectively during the fiscal year as qualifying for the dividends–received deduction for corporate shareholders.
The fund designates 100% and 95% of the dividends distributed in June and December, respectively during the fiscal year as amounts which may be taken into account as a dividend for the purposes of the maximum rate under section 1(h)(11) of the Internal Revenue Code.
The fund will notify shareholders in January 2018 of amounts for use in preparing 2017 income tax returns.
Board Approval of Investment Advisory Contracts and Management Fees
Fidelity Large Cap Stock Fund
On September 14, 2016, the Board of Trustees, including the Independent Trustees (together, the Board) voted to approve the management contract and sub-advisory agreements (collectively, the Advisory Contracts) for the fund in connection with reorganizing the fund from one Trust to another. In reaching this determination, the Board considered that the contractual terms of and the fees payable under the fund's Advisory Contracts are identical to those in the fund's current Advisory Contracts. The Board considered that the approval of the Advisory Contracts will not result in any changes to (i) the investment process or strategies employed in the management of the fund's assets; (ii) the nature, extent and quality of services provided under the fund's Advisory Contracts; or (iii) the day-to-day management of the fund or the persons primarily responsible for such management. The Board considered that it approved the Advisory Contracts for the fund at its July 2016 meeting and that it will again consider the renewal of the Advisory Contracts in July 2017.
Because the Board was approving Advisory Contracts with terms identical to the current Advisory Contracts, it did not consider the fund's investment performance, competitiveness of management fees and total expenses, costs of services and profitability, or economies of scale to be significant factors in its decision.
In connection with its consideration of future renewal of the fund's Advisory Contracts, the Board will consider: (i) the nature, extent and quality of services provided to the fund, including shareholder and administrative services and investment performance; (ii) the competitiveness of the fund's management fee and total expenses; (iii) the costs of the services and profitability, including the revenues earned and the expenses incurred by Fidelity conducting the business of developing, marketing, distributing, managing, administering, and servicing the fund and its shareholders, to the extent applicable; and (iv) whether there have been economies of scale in respect of the management of the Fidelity funds, whether the Fidelity funds (including the fund) have appropriately benefited from any such economies of scale, and whether there is potential for realization of any further economies.
Based on its evaluation of all of the conclusions noted above, and after considering all factors it believed relevant, the Board ultimately concluded that the advisory fee structures are fair and reasonable, and that the fund's Advisory Contracts should be approved, without modification, as part of the process of reorganizing the fund from one Trust to another.
![]()
Corporate Headquarters
245 Summer St.
Boston, MA 02210
www.fidelity.com
LCS-ANN-0617
1.703546.119
Fidelity® Series Small Cap Discovery Fund Fidelity® Series Small Cap Discovery Fund Annual Report April 30, 2017 |
|
Contents
Board Approval of Investment Advisory Contracts and Management Fees |
To view a fund's proxy voting guidelines and proxy voting record for the 12-month period ended June 30, visit http://www.fidelity.com/proxyvotingresults or visit the Securities and Exchange Commission's (SEC) web site at http://www.sec.gov.
You may also call 1-800-544-8544, or for Class F, call 1-800-835-5092, to request a free copy of the proxy voting guidelines.
Standard & Poor's, S&P and S&P 500 are registered service marks of The McGraw-Hill Companies, Inc. and have been licensed for use by Fidelity Distributors Corporation.
Other third-party marks appearing herein are the property of their respective owners.
All other marks appearing herein are registered or unregistered trademarks or service marks of FMR LLC or an affiliated company. © 2017 FMR LLC. All rights reserved.
This report and the financial statements contained herein are submitted for the general information of the shareholders of the Fund. This report is not authorized for distribution to prospective investors in the Fund unless preceded or accompanied by an effective prospectus.
A fund files its complete schedule of portfolio holdings with the SEC for the first and third quarters of each fiscal year on Form N-Q. Forms N-Q are available on the SEC’s web site at http://www.sec.gov. A fund's Forms N-Q may be reviewed and copied at the SEC’s Public Reference Room in Washington, DC. Information regarding the operation of the SEC's Public Reference Room may be obtained by calling 1-800-SEC-0330.
For a complete list of a fund's portfolio holdings, view the most recent holdings listing, semiannual report, or annual report on Fidelity's web site at http://www.fidelity.com, http://www.institutional.fidelity.com, or http://www.401k.com, as applicable.
NOT FDIC INSURED •MAY LOSE VALUE •NO BANK GUARANTEE
Neither the Fund nor Fidelity Distributors Corporation is a bank.
Performance: The Bottom Line
Average annual total return reflects the change in the value of an investment, assuming reinvestment of distributions from dividend income and capital gains (the profits earned upon the sale of securities that have grown in value, if any) and assuming a constant rate of performance each year. The hypothetical investment and the average annual total returns do not reflect the deduction of taxes that a shareholder would pay on fund distributions or the redemption of fund shares. During periods of reimbursement by Fidelity, a fund’s total return will be greater than it would be had the reimbursement not occurred. How a fund did yesterday is no guarantee of how it will do tomorrow.
Average Annual Total Returns
| For the periods ended April 30, 2017 | Past 1 year | Life of fundA |
| Fidelity® Series Small Cap Discovery Fund | 15.60% | 6.95% |
| Class F | 15.78% | 7.10% |
A From November 7, 2013
$10,000 Over Life of Fund
Let's say hypothetically that $10,000 was invested in Fidelity® Series Small Cap Discovery Fund, a class of the fund, on November 7, 2013, when the fund started.
The chart shows how the value of your investment would have changed, and also shows how the Russell 2000® Index performed over the same period.
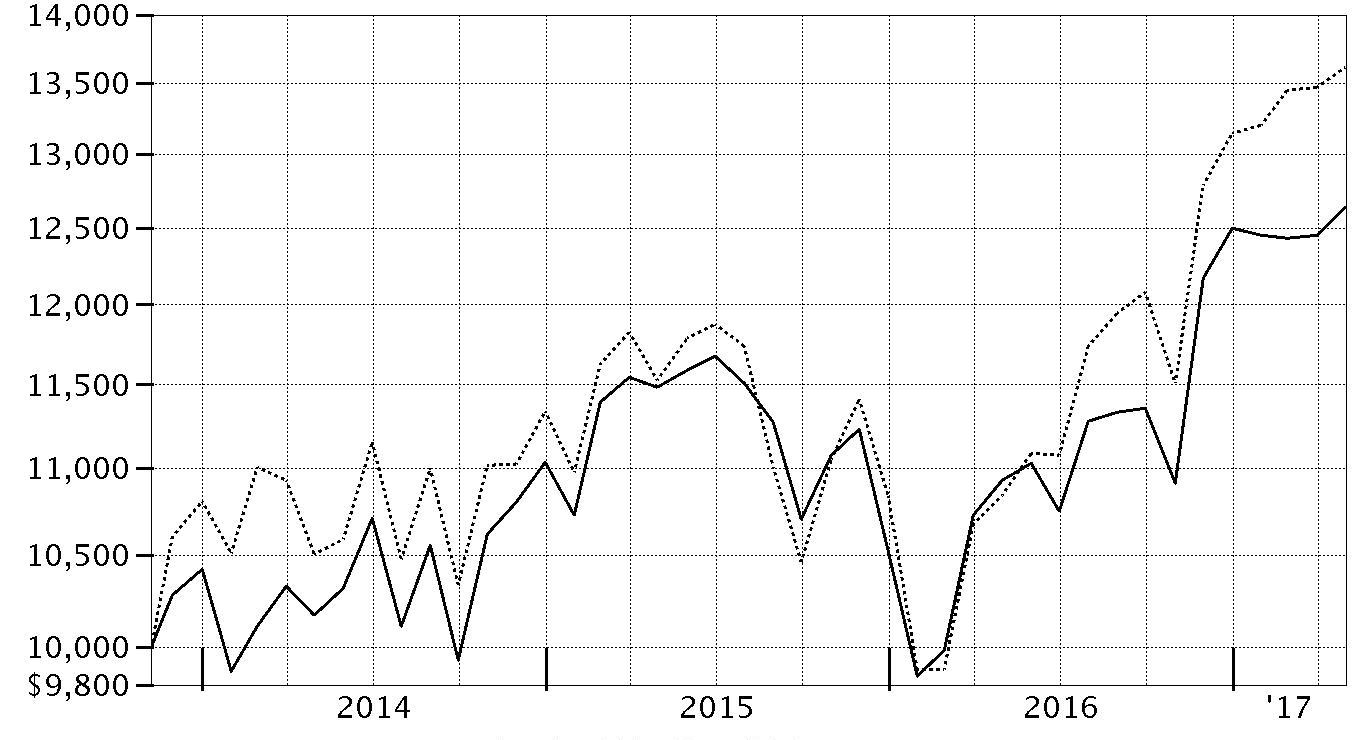
| Period Ending Values | ||
| $12,635 | Fidelity® Series Small Cap Discovery Fund | |
| $13,619 | Russell 2000® Index | |
Management's Discussion of Fund Performance
Market Recap: The U.S. equity bellwether S&P 500® index gained 17.92% for the year ending April 30, 2017, rising sharply following the November election and continuing to gain ground through the end of February on optimism for President Trump’s pro-business agenda. Equity markets leveled off, however, as the fledgling administration faced the first test of its domestic agenda. Stocks reacted with uncertainty to efforts by Congress in March to repeal and replace the Affordable Care Act (ACA), and were relatively flat through April 30. In a stark reversal from 2016, growth-oriented stocks topped their value counterparts through the first third of 2017. Sector-wise, information technology (+35%) fared best, anchored by twin rallies in the June 2016 and March 2017 quarters as growth regained favor. Financials (+27%) also handily outperformed, riding an uptick in bond yields and a surge in banks, particularly post-election. Industrials (+19%) and materials (+16%) did well amid a call for increased infrastructure spending and a rise in commodity prices, respectively. Conversely, consumer staples (+9%), real estate (+5%) and telecommunication services (0%) were held back amid an improved backdrop for riskier assets that curbed demand for dividend-rich sectors, as well as the likelihood of one or two additional interest rate hikes later in 2017. Energy (+2%) also struggled this period.Comments from Lead Portfolio Manager Charles Myers: For the fiscal year, the fund's share classes rose roughly 16%, significantly trailing the 25.63% return of the benchmark Russell 2000® Index. On a relative basis, security selection was especially negative in the energy, industrials, health care, information technology and materials sectors. Conversely, the fund benefited from stock selection in the consumer discretionary sector, an underweighting in the lagging real estate sector and positioning among banks. The fund’s biggest individual detractor was oil services company Tidewater, whose high degree of leverage weighed on the stock’s performance, as oil prices remained relatively weak. We sold the fund’s stake in Tidewater by period end. Also hampering results was AmSurg, an operator of ambulatory surgical centers and provider of physician services, which we sold from the fund, and Federated Investors, an asset manager and non-benchmark holding that was partly hurt by the market’s concern about mounting competition. In contrast, the top relative contributor was Hill-Rom Holdings, a maker of hospital beds and other medical equipment. This out-of-benchmark position – the fund’s largest holding on April 30 – returned about 58% for the fund. Also contributing was Cullen/Frost Bankers, a non-benchmark holding that was among the fund’s largest positions. The firm benefited from a more favorable business backdrop.The views expressed above reflect those of the portfolio manager(s) only through the end of the period as stated on the cover of this report and do not necessarily represent the views of Fidelity or any other person in the Fidelity organization. Any such views are subject to change at any time based upon market or other conditions and Fidelity disclaims any responsibility to update such views. These views may not be relied on as investment advice and, because investment decisions for a Fidelity fund are based on numerous factors, may not be relied on as an indication of trading intent on behalf of any Fidelity fund.
Note to shareholders: On December 31, 2017, Co-Portfolio Manager Derek Janssen will assume sole responsibility for the fund.Investment Summary (Unaudited)
Top Ten Stocks as of April 30, 2017
| % of fund's net assets | % of fund's net assets 6 months ago | |
| Hill-Rom Holdings, Inc. | 3.4 | 2.2 |
| Tech Data Corp. | 3.3 | 2.9 |
| j2 Global, Inc. | 3.2 | 2.8 |
| Regal Beloit Corp. | 3.1 | 2.5 |
| Meritage Homes Corp. | 3.0 | 2.6 |
| Cullen/Frost Bankers, Inc. | 3.0 | 3.6 |
| Aarons, Inc. Class A | 2.8 | 2.7 |
| First Citizen Bancshares, Inc. | 2.6 | 3.1 |
| CalAtlantic Group, Inc. | 2.6 | 0.0 |
| BOK Financial Corp. | 2.5 | 2.3 |
| 29.5 |
Top Five Market Sectors as of April 30, 2017
| % of fund's net assets | % of fund's net assets 6 months ago | |
| Financials | 22.0 | 25.3 |
| Industrials | 16.2 | 16.5 |
| Consumer Discretionary | 15.2 | 13.9 |
| Information Technology | 14.9 | 15.3 |
| Materials | 8.6 | 6.6 |
Asset Allocation (% of fund's net assets)
| As of April 30, 2017 * | ||
| Stocks | 97.9% | |
| Bonds | 0.2% | |
| Short-Term Investments and Net Other Assets (Liabilities) | 1.9% | |

* Foreign investments - 10.0%
| As of October 31, 2016 * | ||
| Stocks | 97.9% | |
| Short-Term Investments and Net Other Assets (Liabilities) | 2.1% | |

* Foreign investments - 7.2%
Percentages shown as 0.0% may reflect amounts less than 0.05%.
Investments April 30, 2017
Showing Percentage of Net Assets
| Common Stocks - 97.9% | |||
| Shares | Value | ||
| CONSUMER DISCRETIONARY - 15.2% | |||
| Hotels, Restaurants & Leisure - 1.1% | |||
| Cedar Fair LP (depositary unit) | 249,825 | $17,904,958 | |
| Household Durables - 10.3% | |||
| CalAtlantic Group, Inc. | 1,200,000 | 43,464,000 | |
| KB Home (a) | 2,000,000 | 41,200,000 | |
| Meritage Homes Corp. (b) | 1,300,000 | 50,635,000 | |
| Taylor Morrison Home Corp. (b) | 1,600,000 | 36,960,000 | |
| 172,259,000 | |||
| Media - 0.5% | |||
| Emerald Expositions Events, Inc. | 421,265 | 8,214,668 | |
| Specialty Retail - 3.3% | |||
| Aarons, Inc. Class A | 1,300,000 | 46,722,000 | |
| Genesco, Inc. (b) | 162,047 | 8,637,105 | |
| 55,359,105 | |||
| TOTAL CONSUMER DISCRETIONARY | 253,737,731 | ||
| CONSUMER STAPLES - 4.0% | |||
| Food & Staples Retailing - 1.5% | |||
| United Natural Foods, Inc. (b) | 600,000 | 24,918,000 | |
| Food Products - 2.5% | |||
| Post Holdings, Inc. (b) | 500,000 | 42,095,000 | |
| TOTAL CONSUMER STAPLES | 67,013,000 | ||
| ENERGY - 3.6% | |||
| Energy Equipment & Services - 2.5% | |||
| Oil States International, Inc. (b) | 570,900 | 16,984,275 | |
| ShawCor Ltd. Class A | 1,000,000 | 25,090,656 | |
| 42,074,931 | |||
| Oil, Gas & Consumable Fuels - 1.1% | |||
| World Fuel Services Corp. | 500,000 | 18,415,000 | |
| TOTAL ENERGY | 60,489,931 | ||
| FINANCIALS - 22.0% | |||
| Banks - 13.3% | |||
| Associated Banc-Corp. | 1,497,500 | 37,287,750 | |
| BOK Financial Corp. (a) | 500,000 | 42,145,000 | |
| Cullen/Frost Bankers, Inc. | 525,000 | 49,554,750 | |
| First Citizen Bancshares, Inc. | 125,000 | 43,507,500 | |
| Hilltop Holdings, Inc. | 572,249 | 15,914,245 | |
| TCF Financial Corp. | 2,000,000 | 33,020,000 | |
| 221,429,245 | |||
| Capital Markets - 4.7% | |||
| Federated Investors, Inc. Class B (non-vtg.) | 1,200,000 | 32,184,000 | |
| Monex Group, Inc. | 7,929,000 | 19,844,728 | |
| OM Asset Management Ltd. | 1,715,200 | 26,688,512 | |
| 78,717,240 | |||
| Insurance - 1.6% | |||
| Aspen Insurance Holdings Ltd. | 500,000 | 26,175,000 | |
| Thrifts & Mortgage Finance - 2.4% | |||
| Washington Federal, Inc. | 1,168,200 | 39,368,340 | |
| TOTAL FINANCIALS | 365,689,825 | ||
| HEALTH CARE - 8.4% | |||
| Health Care Equipment & Supplies - 4.5% | |||
| Hill-Rom Holdings, Inc. | 750,000 | 56,729,998 | |
| Integra LifeSciences Holdings Corp. (b) | 400,000 | 18,388,000 | |
| 75,117,998 | |||
| Health Care Providers & Services - 2.4% | |||
| Civitas Solutions, Inc. (b)(c) | 2,250,000 | 40,050,000 | |
| Pharmaceuticals - 1.5% | |||
| Innoviva, Inc. (b) | 2,120,639 | 24,991,731 | |
| TOTAL HEALTH CARE | 140,159,729 | ||
| INDUSTRIALS - 16.0% | |||
| Aerospace & Defense - 1.4% | |||
| Engility Holdings, Inc. (b) | 800,000 | 22,680,000 | |
| Commercial Services & Supplies - 1.7% | |||
| Essendant, Inc. | 229,440 | 3,831,648 | |
| Knoll, Inc. | 1,000,000 | 23,960,000 | |
| 27,791,648 | |||
| Electrical Equipment - 3.1% | |||
| Regal Beloit Corp. | 650,000 | 51,252,500 | |
| Machinery - 2.6% | |||
| Hillenbrand, Inc. | 480,000 | 17,712,000 | |
| Mueller Industries, Inc. | 800,000 | 25,632,000 | |
| 43,344,000 | |||
| Professional Services - 0.6% | |||
| FTI Consulting, Inc. (b) | 300,000 | 10,377,000 | |
| Road & Rail - 4.2% | |||
| Genesee & Wyoming, Inc. Class A (b) | 500,000 | 33,880,000 | |
| Swift Transporation Co. (a)(b) | 1,500,000 | 36,870,000 | |
| 70,750,000 | |||
| Trading Companies & Distributors - 2.4% | |||
| WESCO International, Inc. (b) | 650,000 | 39,617,500 | |
| TOTAL INDUSTRIALS | 265,812,648 | ||
| INFORMATION TECHNOLOGY - 14.9% | |||
| Electronic Equipment & Components - 4.9% | |||
| SYNNEX Corp. | 239,900 | 26,012,357 | |
| Tech Data Corp. (b) | 575,000 | 54,998,750 | |
| 81,011,107 | |||
| Internet Software & Services - 5.7% | |||
| Cimpress NV (a)(b) | 500,000 | 41,040,000 | |
| j2 Global, Inc. | 600,000 | 54,144,000 | |
| 95,184,000 | |||
| IT Services - 4.3% | |||
| Booz Allen Hamilton Holding Corp. Class A | 450,000 | 16,168,500 | |
| CACI International, Inc. Class A (b) | 300,000 | 35,400,000 | |
| Presidio, Inc. | 1,355,134 | 19,988,227 | |
| 71,556,727 | |||
| TOTAL INFORMATION TECHNOLOGY | 247,751,834 | ||
| MATERIALS - 8.6% | |||
| Chemicals - 0.2% | |||
| Tronox Ltd. Class A | 221,208 | 3,652,144 | |
| Construction Materials - 1.4% | |||
| Wienerberger AG | 1,000,000 | 23,419,950 | |
| Containers & Packaging - 2.4% | |||
| Silgan Holdings, Inc. | 650,000 | 39,403,000 | |
| Metals & Mining - 4.6% | |||
| Carpenter Technology Corp. | 912,092 | 37,030,935 | |
| Compass Minerals International, Inc. (a) | 400,558 | 26,436,828 | |
| Haynes International, Inc. | 300,000 | 12,687,000 | |
| 76,154,763 | |||
| TOTAL MATERIALS | 142,629,857 | ||
| REAL ESTATE - 3.8% | |||
| Equity Real Estate Investment Trusts (REITs) - 3.8% | |||
| CareTrust (REIT), Inc. | 1,000,000 | 17,020,000 | |
| Franklin Street Properties Corp. | 800,000 | 9,704,000 | |
| Store Capital Corp. | 1,500,000 | 35,985,000 | |
| 62,709,000 | |||
| UTILITIES - 1.4% | |||
| Gas Utilities - 1.4% | |||
| Southwest Gas Holdings, Inc. | 289,100 | 24,215,016 | |
| TOTAL COMMON STOCKS | |||
| (Cost $1,288,439,896) | 1,630,208,571 | ||
| Principal Amount | Value | ||
| Nonconvertible Bonds - 0.2% | |||
| INDUSTRIALS - 0.2% | |||
| Machinery - 0.2% | |||
| Mueller Industries, Inc. 6% 3/1/27 (Cost $4,000,000) | 4,000,000 | 4,000,000 | |
| Shares | Value | ||
| Money Market Funds - 7.7% | |||
| Fidelity Cash Central Fund, 0.85% (d) | 34,574,566 | 34,581,481 | |
| Fidelity Securities Lending Cash Central Fund 0.86% (d)(e) | 93,261,055 | 93,270,381 | |
| TOTAL MONEY MARKET FUNDS | |||
| (Cost $127,842,700) | 127,851,862 | ||
| TOTAL INVESTMENT PORTFOLIO - 105.8% | |||
| (Cost $1,420,282,596) | 1,762,060,433 | ||
| NET OTHER ASSETS (LIABILITIES) - (5.8)% | (96,425,472) | ||
| NET ASSETS - 100% | $1,665,634,961 |
Legend
(a) Security or a portion of the security is on loan at period end.
(b) Non-income producing
(c) Affiliated company
(d) Affiliated fund that is generally available only to investment companies and other accounts managed by Fidelity Investments. The rate quoted is the annualized seven-day yield of the fund at period end. A complete unaudited listing of the fund's holdings as of its most recent quarter end is available upon request. In addition, each Fidelity Central Fund's financial statements, which are not covered by the Fund's Report of Independent Registered Public Accounting Firm, are available on the SEC's website or upon request.
(e) Investment made with cash collateral received from securities on loan.
Affiliated Central Funds
Information regarding fiscal year to date income earned by the Fund from investments in Fidelity Central Funds is as follows:
| Fund | Income earned |
| Fidelity Cash Central Fund | $183,348 |
| Fidelity Securities Lending Cash Central Fund | 616,652 |
| Total | $800,000 |
Other Affiliated Issuers
An affiliated company is a company in which the Fund has ownership of at least 5% of the voting securities. Fiscal year to date transactions with companies which are or were affiliates are as follows:
| Affiliate | Value, beginning of period | Purchases | Sales Proceeds | Dividend Income | Value, end of period |
| Civitas Solutions, Inc. | $33,800,506 | $10,318,527 | $-- | $-- | $40,050,000 |
| Monster Worldwide, Inc. | 17,600,000 | -- | 18,732,091 | -- | -- |
| Tidewater, Inc. | 20,761,200 | -- | 4,063,311 | -- | -- |
| Total | $72,161,706 | $10,318,527 | $22,795,402 | $-- | $40,050,000 |
Investment Valuation
The following is a summary of the inputs used, as of April 30, 2017, involving the Fund's assets and liabilities carried at fair value. The inputs or methodology used for valuing securities may not be an indication of the risk associated with investing in those securities. For more information on valuation inputs, and their aggregation into the levels used below, please refer to the Investment Valuation section in the accompanying Notes to Financial Statements.
| Valuation Inputs at Reporting Date: | ||||
| Description | Total | Level 1 | Level 2 | Level 3 |
| Investments in Securities: | ||||
| Equities: | ||||
| Consumer Discretionary | $253,737,731 | $253,737,731 | $-- | $-- |
| Consumer Staples | 67,013,000 | 67,013,000 | -- | -- |
| Energy | 60,489,931 | 60,489,931 | -- | -- |
| Financials | 365,689,825 | 365,689,825 | -- | -- |
| Health Care | 140,159,729 | 140,159,729 | -- | -- |
| Industrials | 265,812,648 | 265,812,648 | -- | -- |
| Information Technology | 247,751,834 | 247,751,834 | -- | -- |
| Materials | 142,629,857 | 142,629,857 | -- | -- |
| Real Estate | 62,709,000 | 62,709,000 | -- | -- |
| Utilities | 24,215,016 | 24,215,016 | -- | -- |
| Corporate Bonds | 4,000,000 | -- | 4,000,000 | -- |
| Money Market Funds | 127,851,862 | 127,851,862 | -- | -- |
| Total Investments in Securities: | $1,762,060,433 | $1,758,060,433 | $4,000,000 | $-- |
The following is a summary of transfers between Level 1 and Level 2 for the period ended April 30, 2017. Transfers are assumed to have occurred at the beginning of the period, and are primarily attributable to the valuation techniques used for foreign equity securities, as discussed in the accompanying Notes to Financial Statements:
| Transfers | Total |
| Level 1 to Level 2 | $0 |
| Level 2 to Level 1 | $20,798,203 |
Other Information
Distribution of investments by country or territory of incorporation, as a percentage of Total Net Assets, is as follows (Unaudited):
| United States of America | 90.0% |
| Netherlands | 2.5% |
| United Kingdom | 1.6% |
| Bermuda | 1.6% |
| Canada | 1.5% |
| Austria | 1.4% |
| Japan | 1.2% |
| Others (Individually Less Than 1%) | 0.2% |
| 100.0% |
See accompanying notes which are an integral part of the financial statements.
Financial Statements
Statement of Assets and Liabilities
| April 30, 2017 | ||
| Assets | ||
| Investment in securities, at value (including securities loaned of $88,807,845) — See accompanying schedule: Unaffiliated issuers (cost $1,253,895,783) | $1,594,158,571 | |
| Fidelity Central Funds (cost $127,842,700) | 127,851,862 | |
| Other affiliated issuers (cost $38,544,113) | 40,050,000 | |
| Total Investments (cost $1,420,282,596) | $1,762,060,433 | |
| Receivable for investments sold | 15,046,902 | |
| Receivable for fund shares sold | 1,425,021 | |
| Dividends receivable | 484,567 | |
| Interest receivable | 34,541 | |
| Distributions receivable from Fidelity Central Funds | 42,646 | |
| Prepaid expenses | 1,029 | |
| Other receivables | 24,067 | |
| Total assets | 1,779,119,206 | |
| Liabilities | ||
| Payable for investments purchased | $19,080,403 | |
| Payable for fund shares redeemed | 165,316 | |
| Accrued management fee | 807,355 | |
| Other affiliated payables | 124,215 | |
| Other payables and accrued expenses | 46,382 | |
| Collateral on securities loaned | 93,260,574 | |
| Total liabilities | 113,484,245 | |
| Net Assets | $1,665,634,961 | |
| Net Assets consist of: | ||
| Paid in capital | $1,414,184,430 | |
| Undistributed net investment income | 7,627,797 | |
| Accumulated undistributed net realized gain (loss) on investments and foreign currency transactions | (97,954,352) | |
| Net unrealized appreciation (depreciation) on investments and assets and liabilities in foreign currencies | 341,777,086 | |
| Net Assets | $1,665,634,961 | |
| Series Small Cap Discovery: | ||
| Net Asset Value, offering price and redemption price per share ($652,817,704 ÷ 55,866,587 shares) | $11.69 | |
| Class F: | ||
| Net Asset Value, offering price and redemption price per share ($1,012,817,257 ÷ 86,608,051 shares) | $11.69 |
See accompanying notes which are an integral part of the financial statements.
Statement of Operations
| Year ended April 30, 2017 | ||
| Investment Income | ||
| Dividends | $19,284,092 | |
| Special dividends | 6,400,000 | |
| Interest | 34,637 | |
| Income from Fidelity Central Funds | 800,000 | |
| Total income | 26,518,729 | |
| Expenses | ||
| Management fee | ||
| Basic fee | $11,164,678 | |
| Performance adjustment | (434,639) | |
| Transfer agent fees | 986,285 | |
| Accounting and security lending fees | 522,289 | |
| Custodian fees and expenses | 25,311 | |
| Independent trustees' fees and expenses | 6,634 | |
| Audit | 59,492 | |
| Legal | 5,327 | |
| Interest | 178 | |
| Miscellaneous | 13,847 | |
| Total expenses before reductions | 12,349,402 | |
| Expense reductions | (124,370) | 12,225,032 |
| Net investment income (loss) | 14,293,697 | |
| Realized and Unrealized Gain (Loss) | ||
| Net realized gain (loss) on: | ||
| Investment securities: | ||
| Unaffiliated issuers | (5,731,295) | |
| Fidelity Central Funds | 9,354 | |
| Other affiliated issuers | (53,700,416) | |
| Foreign currency transactions | 279,379 | |
| Total net realized gain (loss) | (59,142,978) | |
| Change in net unrealized appreciation (depreciation) on: Investment securities | 282,779,668 | |
| Assets and liabilities in foreign currencies | (10,581) | |
| Total change in net unrealized appreciation (depreciation) | 282,769,087 | |
| Net gain (loss) | 223,626,109 | |
| Net increase (decrease) in net assets resulting from operations | $237,919,806 |
See accompanying notes which are an integral part of the financial statements.
Statement of Changes in Net Assets
| Year ended April 30, 2017 | Year ended April 30, 2016 | |
| Increase (Decrease) in Net Assets | ||
| Operations | ||
| Net investment income (loss) | $14,293,697 | $5,980,179 |
| Net realized gain (loss) | (59,142,978) | (11,317,796) |
| Change in net unrealized appreciation (depreciation) | 282,769,087 | (70,732,394) |
| Net increase (decrease) in net assets resulting from operations | 237,919,806 | (76,070,011) |
| Distributions to shareholders from net investment income | (9,005,114) | (4,499,268) |
| Distributions to shareholders from net realized gain | – | (78,812,351) |
| Total distributions | (9,005,114) | (83,311,619) |
| Share transactions - net increase (decrease) | (107,909,913) | 76,957,414 |
| Total increase (decrease) in net assets | 121,004,779 | (82,424,216) |
| Net Assets | ||
| Beginning of period | 1,544,630,182 | 1,627,054,398 |
| End of period | $1,665,634,961 | $1,544,630,182 |
| Other Information | ||
| Undistributed net investment income end of period | $7,627,797 | $2,083,310 |
See accompanying notes which are an integral part of the financial statements.
Financial Highlights — Fidelity Series Small Cap Discovery Fund
| Years ended April 30, | 2017 | 2016 | 2015 | 2014 A |
| Selected Per–Share Data | ||||
| Net asset value, beginning of period | $10.16 | $11.23 | $10.16 | $10.00 |
| Income from Investment Operations | ||||
| Net investment income (loss)B | .09C | .03 | .02 | .02 |
| Net realized and unrealized gain (loss) | 1.49 | (.54) | 1.28 | .15 |
| Total from investment operations | 1.58 | (.51) | 1.30 | .17 |
| Distributions from net investment income | (.05) | (.02) | (.02) | (.01) |
| Distributions from net realized gain | – | (.54) | (.21) | – |
| Total distributions | (.05) | (.56) | (.23) | (.01) |
| Net asset value, end of period | $11.69 | $10.16 | $11.23 | $10.16 |
| Total ReturnD,E | 15.60% | (4.82)% | 12.92% | 1.70% |
| Ratios to Average Net AssetsF,G | ||||
| Expenses before reductions | .87% | .96% | .97% | .97%H |
| Expenses net of fee waivers, if any | .87% | .96% | .97% | .97%H |
| Expenses net of all reductions | .86% | .95% | .97% | .96%H |
| Net investment income (loss) | .80%C | .29% | .17% | .35%H |
| Supplemental Data | ||||
| Net assets, end of period (000 omitted) | $652,818 | $614,362 | $659,747 | $572,515 |
| Portfolio turnover rateI | 24% | 35% | 28% | 29%J,K |
A For the period November 7, 2013 (commencement of operations) to April 30, 2014.
B Calculated based on average shares outstanding during the period.
C Net Investment income per share reflects a large, non-recurring dividend which amounted to $.04 per share. Excluding this non-recurring dividend, the ratio of net investment income (loss) to average net assets would have been .40%.
D Total returns for periods of less than one year are not annualized.
E Total returns would have been lower if certain expenses had not been reduced during the applicable periods shown.
F Fees and expenses of any underlying Fidelity Central Funds are not included in the Fund's expense ratio. The Fund indirectly bears its proportionate share of the expenses of any underlying Fidelity Central Funds.
G Expense ratios reflect operating expenses of the class. Expenses before reductions do not reflect amounts reimbursed by the investment adviser or reductions from brokerage service arrangements or reductions from other expense offset arrangements and do not represent the amount paid by the class during periods when reimbursements or reductions occur. Expense ratios before reductions for start-up periods may not be representative of longer-term operating periods. Expenses net of fee waivers reflect expenses after reimbursement by the investment adviser but prior to reductions from brokerage service arrangements or other expense offset arrangements. Expenses net of all reductions represent the net expenses paid by the class.
H Annualized
I Amount does not include the portfolio activity of any underlying Fidelity Central Funds.
J Portfolio turnover rate excludes securities received or delivered in-kind.
K Amount not annualized.
See accompanying notes which are an integral part of the financial statements.
Financial Highlights — Fidelity Series Small Cap Discovery Fund Class F
| Years ended April 30, | 2017 | 2016 | 2015 | 2014 A |
| Selected Per–Share Data | ||||
| Net asset value, beginning of period | $10.16 | $11.24 | $10.16 | $10.00 |
| Income from Investment Operations | ||||
| Net investment income (loss)B | .10C | .05 | .04 | .03 |
| Net realized and unrealized gain (loss) | 1.50 | (.56) | 1.28 | .14 |
| Total from investment operations | 1.60 | (.51) | 1.32 | .17 |
| Distributions from net investment income | (.07) | (.04) | (.04) | (.01) |
| Distributions from net realized gain | – | (.54) | (.21) | – |
| Total distributions | (.07) | (.57)D | (.24)E | (.01) |
| Net asset value, end of period | $11.69 | $10.16 | $11.24 | $10.16 |
| Total ReturnF,G | 15.78% | (4.76)% | 13.19% | 1.73% |
| Ratios to Average Net AssetsH,I | ||||
| Expenses before reductions | .71% | .80% | .80% | .79%J |
| Expenses net of fee waivers, if any | .71% | .80% | .80% | .79%J |
| Expenses net of all reductions | .70% | .79% | .80% | .79%J |
| Net investment income (loss) | .95%C | .45% | .33% | .52%J |
| Supplemental Data | ||||
| Net assets, end of period (000 omitted) | $1,012,817 | $930,268 | $967,308 | $794,307 |
| Portfolio turnover rateK | 24% | 35% | 28% | 29%L,M |
A For the period November 7, 2013 (commencement of operations) to April 30, 2014.
B Calculated based on average shares outstanding during the period.
C Net Investment income per share reflects a large, non-recurring dividend which amounted to $.04 per share. Excluding this non-recurring dividend, the ratio of net investment income (loss) to average net assets would have been .55%.
D Total distributions of $.57 per share is comprised of distributions from net investment income of $.037 and distributions from net realized gain of $.536 per share.
E Total distributions of $.24 per share is comprised of distributions from net investment income of $.036 and distributions from net realized gain of $.206 per share.
F Total returns for periods of less than one year are not annualized.
G Total returns would have been lower if certain expenses had not been reduced during the applicable periods shown.
H Fees and expenses of any underlying Fidelity Central Funds are not included in the Fund's expense ratio. The Fund indirectly bears its proportionate share of the expenses of any underlying Fidelity Central Funds.
I Expense ratios reflect operating expenses of the class. Expenses before reductions do not reflect amounts reimbursed by the investment adviser or reductions from brokerage service arrangements or reductions from other expense offset arrangements and do not represent the amount paid by the class during periods when reimbursements or reductions occur. Expense ratios before reductions for start-up periods may not be representative of longer-term operating periods. Expenses net of fee waivers reflect expenses after reimbursement by the investment adviser but prior to reductions from brokerage service arrangements or other expense offset arrangements. Expenses net of all reductions represent the net expenses paid by the class.
J Annualized
K Amount does not include the portfolio activity of any underlying Fidelity Central Funds.
L Portfolio turnover rate excludes securities received or delivered in-kind.
M Amount not annualized.
See accompanying notes which are an integral part of the financial statements.
Notes to Financial Statements
For the period ended April 30, 2017
1. Organization.
Fidelity Series Small Cap Discovery Fund (the Fund) is a fund of Fidelity Concord Street Trust (the Trust) (formerly a fund of Fidelity Commonwealth Trust) and is authorized to issue an unlimited number of shares. Shares of the Fund are only available for purchase by mutual funds for which Fidelity Management & Research Company (FMR) or an affiliate serves as an investment manager. The Trust is registered under the Investment Company Act of 1940, as amended (the 1940 Act), as an open-end management investment company organized as a Massachusetts business trust. The Fund offers Series Small Cap Discovery and Class F shares, each of which has equal rights as to assets and voting privileges. Each class has exclusive voting rights with respect to matters that affect that class.
2. Investments in Fidelity Central Funds.
The Fund invests in Fidelity Central Funds, which are open-end investment companies generally available only to other investment companies and accounts managed by the investment adviser and its affiliates. The Fund's Schedule of Investments lists each of the Fidelity Central Funds held as of period end, if any, as an investment of the Fund, but does not include the underlying holdings of each Fidelity Central Fund. As an Investing Fund, the Fund indirectly bears its proportionate share of the expenses of the underlying Fidelity Central Funds.
The Money Market Central Funds seek preservation of capital and current income and are managed by Fidelity Investments Money Management, Inc. (FIMM), an affiliate of the investment adviser. Annualized expenses of the Money Market Central Funds as of their most recent shareholder report date are less than .005%.
A complete unaudited list of holdings for each Fidelity Central Fund is available upon request or at the Securities and Exchange Commission (the SEC) website at www.sec.gov. In addition, the financial statements of the Fidelity Central Funds, which are not covered by the Fund's Report of Independent Registered Public Accounting Firm, are available on the SEC website or upon request.
3. Significant Accounting Policies.
The Fund is an investment company and applies the accounting and reporting guidance of the Financial Accounting Standards Board (FASB) Accounting Standards Codification Topic 946 Financial Services – Investments Companies. The financial statements have been prepared in conformity with accounting principles generally accepted in the United States of America (GAAP), which require management to make certain estimates and assumptions at the date of the financial statements. Actual results could differ from those estimates. Subsequent events, if any, through the date that the financial statements were issued have been evaluated in the preparation of the financial statements. The following summarizes the significant accounting policies of the Fund:
Investment Valuation. Investments are valued as of 4:00 p.m. Eastern time on the last calendar day of the period. The Board of Trustees (the Board) has delegated the day to day responsibility for the valuation of the Fund's investments to the Fair Value Committee (the Committee) established by the Fund's investment adviser. In accordance with valuation policies and procedures approved by the Board, the Fund attempts to obtain prices from one or more third party pricing vendors or brokers to value its investments. When current market prices, quotations or currency exchange rates are not readily available or reliable, investments will be fair valued in good faith by the Committee, in accordance with procedures adopted by the Board. Factors used in determining fair value vary by investment type and may include market or investment specific events, changes in interest rates and credit quality. The frequency with which these procedures are used cannot be predicted and they may be utilized to a significant extent. The Committee oversees the Fund's valuation policies and procedures and reports to the Board on the Committee's activities and fair value determinations. The Board monitors the appropriateness of the procedures used in valuing the Fund's investments and ratifies the fair value determinations of the Committee.
The Fund categorizes the inputs to valuation techniques used to value its investments into a disclosure hierarchy consisting of three levels as shown below:
- Level 1 – quoted prices in active markets for identical investments
- Level 2 – other significant observable inputs (including quoted prices for similar investments, interest rates, prepayment speeds, etc.)
- Level 3 – unobservable inputs (including the Fund's own assumptions based on the best information available)
Valuation techniques used to value the Fund's investments by major category are as follows:
Equity securities, including restricted securities, for which market quotations are readily available, are valued at the last reported sale price or official closing price as reported by a third party pricing vendor on the primary market or exchange on which they are traded and are categorized as Level 1 in the hierarchy. In the event there were no sales during the day or closing prices are not available, securities are valued at the last quoted bid price or may be valued using the last available price and are generally categorized as Level 2 in the hierarchy. For foreign equity securities, when market or security specific events arise, comparisons to the valuation of American Depositary Receipts (ADRs), futures contracts, Exchange-Traded Funds (ETFs) and certain indexes as well as quoted prices for similar securities may be used and would be categorized as Level 2 in the hierarchy. Utilizing these techniques may result in transfers between Level 1 and Level 2. For equity securities, including restricted securities, where observable inputs are limited, assumptions about market activity and risk are used and these securities may be categorized as Level 3 in the hierarchy.
Debt securities, including restricted securities, are valued based on evaluated prices received from third party pricing vendors or from brokers who make markets in such securities. Corporate bonds are valued by pricing vendors who utilize matrix pricing which considers yield or price of bonds of comparable quality, coupon, maturity and type or by broker-supplied prices.
When independent prices are unavailable or unreliable, debt securities may be valued utilizing pricing methodologies which consider similar factors that would be used by third party pricing vendors. Debt securities are generally categorized as Level 2 in the hierarchy but may be Level 3 depending on the circumstances.
Investments in open-end mutual funds, including the Fidelity Central Funds, are valued at their closing net asset value (NAV) each business day and are categorized as Level 1 in the hierarchy.
Changes in valuation techniques may result in transfers in or out of an assigned level within the disclosure hierarchy. The aggregate value of investments by input level as of April 30, 2017, including information on transfers between Levels 1 and 2 is included at the end of the Fund's Schedule of Investments.
Foreign Currency. The Fund may use foreign currency contracts to facilitate transactions in foreign-denominated securities. Gains and losses from these transactions may arise from changes in the value of the foreign currency or if the counterparties do not perform under the contracts' terms.
Foreign-denominated assets, including investment securities, and liabilities are translated into U.S. dollars at the exchange rates at period end. Purchases and sales of investment securities, income and dividends received and expenses denominated in foreign currencies are translated into U.S. dollars at the exchange rate in effect on the transaction date.
The effects of exchange rate fluctuations on investments are included with the net realized and unrealized gain (loss) on investment securities. Other foreign currency transactions resulting in realized and unrealized gain (loss) are disclosed separately.
Investment Transactions and Income. For financial reporting purposes, the Fund's investment holdings and NAV include trades executed through the end of the last business day of the period. The NAV per share for processing shareholder transactions is calculated as of the close of business of the New York Stock Exchange (NYSE), normally 4:00 p.m. Eastern time and includes trades executed through the end of the prior business day. Gains and losses on securities sold are determined on the basis of identified cost. Dividend income is recorded on the ex-dividend date, except for certain dividends from foreign securities where the ex-dividend date may have passed, which are recorded as soon as the Fund is informed of the ex-dividend date. Non-cash dividends included in dividend income, if any, are recorded at the fair market value of the securities received. Income and capital gain distributions from Fidelity Central Funds, if any, are recorded on the ex-dividend date. Certain distributions received by the Fund represent a return of capital or capital gain. The Fund determines the components of these distributions subsequent to the ex-dividend date, based upon receipt of tax filings or other correspondence relating to the underlying investment. These distributions are recorded as a reduction of cost of investments and/or as a realized gain. Large, non-recurring dividends recognized by the Fund are presented separately on the Statement of Operations as "Special Dividends" and the impact of these dividends is presented in the Financial Highlights. Interest income is accrued as earned and includes coupon interest and amortization of premium and accretion of discount on debt securities as applicable. Investment income is recorded net of foreign taxes withheld where recovery of such taxes is uncertain.
Class Allocations and Expenses. Investment income, realized and unrealized capital gains and losses, common expenses of the Fund, and certain fund-level expense reductions, if any, are allocated daily on a pro-rata basis to each class based on the relative net assets of each class to the total net assets of the Fund. Each class differs with respect to transfer agent fees incurred. Certain expense reductions may also differ by class. For the reporting period, the allocated portion of income and expenses to each class as a percent of its average net assets may vary due to the timing of recording these transactions in relation to fluctuating net assets of the classes. Expenses directly attributable to a fund are charged to that fund. Expenses attributable to more than one fund are allocated among the respective funds on the basis of relative net assets or other appropriate methods. Expense estimates are accrued in the period to which they relate and adjustments are made when actual amounts are known.
Income Tax Information and Distributions to Shareholders. Each year, the Fund intends to qualify as a regulated investment company under Subchapter M of the Internal Revenue Code, including distributing substantially all of its taxable income and realized gains. As a result, no provision for U.S. Federal income taxes is required. As of April 30, 2017, the Fund did not have any unrecognized tax benefits in the financial statements; nor is the Fund aware of any tax positions for which it is reasonably possible that the total amounts of unrecognized tax benefits will significantly change in the next twelve months. The Fund files a U.S. federal tax return, in addition to state and local tax returns as required. The Fund's federal income tax returns are subject to examination by the Internal Revenue Service (IRS) for a period of three fiscal years after they are filed. State and local tax returns may be subject to examination for an additional fiscal year depending on the jurisdiction. Foreign taxes are provided for based on the Fund's understanding of the tax rules and rates that exist in the foreign markets in which it invests.
Distributions are declared and recorded on the ex-dividend date. Income dividends and capital gain distributions are declared separately for each class. Income and capital gain distributions are determined in accordance with income tax regulations, which may differ from GAAP.
Capital accounts within the financial statements are adjusted for permanent book-tax differences. These adjustments have no impact on net assets or the results of operations. Capital accounts are not adjusted for temporary book-tax differences which will reverse in a subsequent period.
Book-tax differences are primarily due to foreign currency transactions, partnerships, losses deferred due to wash sales and excise tax regulations.
The federal tax cost of investment securities and unrealized appreciation (depreciation) as of period end were as follows:
| Gross unrealized appreciation | $384,824,468 |
| Gross unrealized depreciation | (42,976,094) |
| Net unrealized appreciation (depreciation) on securities | $341,848,374 |
| Tax Cost | $1,420,212,059 |
The tax-based components of distributable earnings as of period end were as follows:
| Undistributed ordinary income | $7,627,796 |
| Capital loss carryforward | $(98,024,890) |
| Net unrealized appreciation (depreciation) on securities and other investments | $341,847,623 |
Capital loss carryforwards are only available to offset future capital gains of the Fund to the extent provided by regulations and may be limited. Under the Regulated Investment Company Modernization Act of 2010 (the Act), the Fund is permitted to carry forward capital losses incurred in taxable years beginning after December 22, 2010 for an unlimited period and such capital losses are required to be used prior to any losses that expire. The capital loss carryforward information presented below, including any applicable limitation, is estimated as of fiscal period end and is subject to adjustment.
| No expiration | |
| Short-term | $ (3,546,113) |
| Long-term | (94,478,777) |
| Total capital loss carryforward | $(98,024,890) |
The tax character of distributions paid was as follows:
| April 30, 2017 | April 30, 2016 | |
| Ordinary Income | $9,005,114 | $ 14,035,298 |
| Long-term Capital Gains | -- | 69,276,321 |
| Total | $9,005,114 | $ 83,311,619 |
4. Purchases and Sales of Investments.
Purchases and sales of securities, other than short-term securities, aggregated $369,136,494 and $418,496,872, respectively.
5. Fees and Other Transactions with Affiliates.
Management Fee. Fidelity Management & Research Company (the investment adviser) and its affiliates provide the Fund with investment management related services for which the Fund pays a monthly management fee. The management fee is the sum of an individual fund fee rate that is based on an annual rate of .45% of the Fund's average net assets and an annualized group fee rate that averaged .25% during the period. The group fee rate is based upon the average net assets of all the mutual funds advised by the investment adviser, including any mutual funds previously advised by the investment adviser that are currently advised by Fidelity SelectCo, LLC, an affiliate of the investment adviser. The group fee rate decreases as assets under management increase and increases as assets under management decrease. In addition, the management fee is subject to a performance adjustment (up to a maximum of +/- .20% of the Fund's average net assets over a 36 month performance period). The upward or downward adjustment to the management fee is based on the relative investment performance of Series Small Cap Discovery as compared to its benchmark index, the Russell 2000 Index, over the same 36 month performance period. For the reporting period, the total annual management fee rate, including the performance adjustment, was .67% of the Fund's average net assets. The performance adjustment included in the management fee rate may be higher or lower than the maximum performance adjustment rate due to the difference between the average net assets for the reporting and performance periods.
The Board and shareholders approved a new management contract, effective June 1, 2017. Under the management contract, the Fund will not pay a management fee. In addition, the investment adviser will pay all ordinary operating expenses of the Fund, except custody fees, fees and expenses of the independent Trustees, and certain miscellaneous expenses such as proxy and shareholder meeting expenses.
Transfer Agent Fees. Fidelity Investments Institutional Operations Company, Inc., (FIIOC), an affiliate of the investment adviser, is the transfer, dividend disbursing and shareholder servicing agent for each class of the Fund. FIIOC receives account fees and asset-based fees that vary according to the account size and type of account of the shareholders of Series Small Cap Discovery. FIIOC receives no fees for providing transfer agency services to Class F. FIIOC pays for typesetting, printing and mailing of shareholder reports, except proxy statements.
For the period, transfer agent fees for each applicable class were as follows:
| Amount | % of Class-Level Average Net Assets | |
| Series Small Cap Discovery | $986,285 | .16 |
Accounting and Security Lending Fees. Fidelity Service Company, Inc. (FSC), an affiliate of the investment adviser, maintains the Fund's accounting records. The accounting fee is based on the level of average net assets for each month. Under a separate contract, FSC administers the security lending program. The security lending fee is based on the number and duration of lending transactions.
Brokerage Commissions. The Fund placed a portion of its portfolio transactions with brokerage firms which are affiliates of the investment adviser. Brokerage commissions are included in net realized gain (loss) and change in net unrealized appreciation (depreciation) in the Statement of Operations. The commissions paid to these affiliated firms were $16,413 for the period.
Interfund Lending Program. Pursuant to an Exemptive Order issued by the SEC, the Fund, along with other registered investment companies having management contracts with FMR or other affiliated entities of FMR, may participate in an interfund lending program. This program provides an alternative credit facility allowing the funds to borrow from, or lend money to, other participating affiliated funds. At period end, there were no interfund loans outstanding. The Fund's activity in this program during the period for which loans were outstanding was as follows:
| Borrower or Lender | Average Loan Balance | Weighted Average Interest Rate | Interest Expense |
| Borrower | $11,240,000 | .57% | $178 |
Interfund Trades. The Fund may purchase from or sell securities to other Fidelity Funds under procedures adopted by the Board. The procedures have been designed to ensure these interfund trades are executed in accordance with Rule 17a-7 of the 1940 Act. Interfund trades are included within the respective purchases and sales amounts shown in the Purchases and Sales of Investments note.
6. Committed Line of Credit.
The Fund participates with other funds managed by the investment adviser or an affiliate in a $4.25 billion credit facility (the "line of credit") to be utilized for temporary or emergency purposes to fund shareholder redemptions or for other short-term liquidity purposes. The Fund has agreed to pay commitment fees on its pro-rata portion of the line of credit, which amounted to $5,363 and is reflected in Miscellaneous expenses on the Statement of Operations. During the period, the Fund did not borrow on this line of credit.
7. Security Lending.
The Fund lends portfolio securities through a lending agent from time to time in order to earn additional income. For equity securities, a lending agent is used and may loan securities to certain qualified borrowers, including Fidelity Capital Markets (FCM), a broker-dealer affiliated with the Fund. On the settlement date of the loan, the Fund receives collateral (in the form of U.S. Treasury obligations, letters of credit and/or cash) against the loaned securities and maintains collateral in an amount not less than 100% of the market value of the loaned securities during the period of the loan. The market value of the loaned securities is determined at the close of business of the Fund and any additional required collateral is delivered to the Fund on the next business day. The Fund or borrower may terminate the loan at any time, and if the borrower defaults on its obligation to return the securities loaned because of insolvency or other reasons, the Fund may apply collateral received from the borrower against the obligation. The Fund may experience delays and costs in recovering the securities loaned. Any cash collateral received is invested in the Fidelity Securities Lending Cash Central Fund. The value of loaned securities and cash collateral at period end are disclosed on the Fund's Statement of Assets and Liabilities. Security lending income represents the income earned on investing cash collateral, less rebates paid to borrowers and any lending agent fees associated with the loan, plus any premium payments received for lending certain types of securities. Security lending income is presented in the Statement of Operations as a component of income from Fidelity Central Funds. Total security lending income during the period amounted to $616,652. During the period, there were no securities loaned to FCM.
8. Expense Reductions.
Commissions paid to certain brokers with whom the investment adviser, or its affiliates, places trades on behalf of the Fund include an amount in addition to trade execution, which may be rebated back to the Fund to offset certain expenses. This amount totaled $111,378 for the period. In addition, through arrangements with the Fund's custodian, credits realized as a result of certain uninvested cash balances were used to reduce the Fund's expenses. During the period, these credits reduced the Fund's custody expenses by $81.
In addition, during the period the investment adviser reimbursed and/or waived a portion of fund-level operating expense in the amount of $12,911.
Effective June 1, 2017, the investment adviser will contractually reimburse expenses of each class to the extent annual operating expenses exceed .014% of class-level average net assets. Fees and expenses of the independent Trustees and certain miscellaneous expenses such as proxy and shareholders meeting expenses will be excluded from this reimbursement.
9. Distributions to Shareholders.
Distributions to shareholders of each class were as follows:
| Year ended April 30, 2017 | Year ended April 30, 2016 | |
| From net investment income | ||
| Series Small Cap Discovery | $2,922,955 | $1,196,911 |
| Class F | 6,082,159 | 3,302,357 |
| Total | $9,005,114 | $4,499,268 |
| From net realized gain | ||
| Series Small Cap Discovery | $– | $31,931,177 |
| Class F | – | 46,881,174 |
| Total | $– | $78,812,351 |
10. Share Transactions.
Transactions for each class of shares were as follows:
| Shares | Shares | Dollars | Dollars | |
| Year ended April 30, 2017 | Year ended April 30, 2016 | Year ended April 30, 2017 | Year ended April 30, 2016 | |
| Series Small Cap Discovery | ||||
| Shares sold | 4,346,563 | 6,809,741 | $48,107,613 | $70,648,062 |
| Reinvestment of distributions | 266,338 | 3,063,716 | 2,922,955 | 33,128,088 |
| Shares redeemed | (9,234,025) | (8,142,224) | (101,329,647) | (84,403,016) |
| Net increase (decrease) | (4,621,124) | 1,731,233 | $(50,299,079) | $19,373,134 |
| Class F | ||||
| Shares sold | 12,252,330 | 15,260,748 | $133,443,472 | $155,435,426 |
| Reinvestment of distributions | 554,271 | 4,647,653 | 6,082,159 | 50,183,531 |
| Shares redeemed | (17,720,912) | (14,474,366) | (197,136,465) | (148,034,677) |
| Net increase (decrease) | (4,914,311) | 5,434,035 | $(57,610,834) | $57,584,280 |
11. Other.
The Fund's organizational documents provide former and current trustees and officers with a limited indemnification against liabilities arising in connection with the performance of their duties to the Fund. In the normal course of business, the Fund may also enter into contracts that provide general indemnifications. The Fund's maximum exposure under these arrangements is unknown as this would be dependent on future claims that may be made against the Fund. The risk of material loss from such claims is considered remote.
At the end of the period, mutual funds managed by the investment adviser or its affiliates were the owners of record of all of the outstanding shares of the fund.
Report of Independent Registered Public Accounting Firm
To the Trustees of Fidelity Concord Street Trust and Shareholders of Fidelity Series Small Cap Discovery Fund:
We have audited the accompanying statement of assets and liabilities of Fidelity Series Small Cap Discovery Fund (the Fund), a fund of Fidelity Concord Street Trust, including the schedule of investments, as of April 30, 2017, and the related statement of operations for the year then ended, the statement of changes in net assets for each of the two years in the period then ended, and the financial highlights for each of the three years in the period then ended and for the period November 7, 2013 (commencement of operations) to April 30, 2014. These financial statements and financial highlights are the responsibility of the Fund's management. Our responsibility is to express an opinion on these financial statements and financial highlights based on our audits.
We conducted our audits in accordance with the standards of the Public Company Accounting Oversight Board (United States). Those standards require that we plan and perform the audit to obtain reasonable assurance about whether the financial statements and financial highlights are free of material misstatement. The Fund is not required to have, nor were we engaged to perform, an audit of its internal control over financial reporting. Our audits included consideration of internal control over financial reporting as a basis for designing audit procedures that are appropriate in the circumstances, but not for the purpose of expressing an opinion on the effectiveness of the Fund's internal control over financial reporting. Accordingly, we express no such opinion. An audit also includes examining, on a test basis, evidence supporting the amounts and disclosures in the financial statements, assessing the accounting principles used and significant estimates made by management, as well as evaluating the overall financial statement presentation. Our procedures included confirmation of securities owned as of April 30, 2017, by correspondence with the custodians and brokers; when replies were not received from brokers, we performed other auditing procedures. We believe that our audits provide a reasonable basis for our opinion.
In our opinion, such financial statements and financial highlights referred to above present fairly, in all material respects, the financial position of Fidelity Series Small Cap Discovery Fund as of April 30, 2017, the results of its operations for the year then ended, the changes in its net assets for each of the three years in the period then ended, and the financial highlights for each of the two years in the period then ended and for the period from November 7, 2013 (commencement of operations) to April 30, 2014 in conformity with accounting principles generally accepted in the United States of America.
DELOITTE & TOUCHE LLP
Boston, Massachusetts
June 12, 2017
Trustees and Officers
The Trustees, Members of the Advisory Board (if any), and officers of the trust and fund, as applicable, are listed below. The Board of Trustees governs the fund and is responsible for protecting the interests of shareholders. The Trustees are experienced executives who meet periodically throughout the year to oversee the fund's activities, review contractual arrangements with companies that provide services to the fund, oversee management of the risks associated with such activities and contractual arrangements, and review the fund's performance. Except for Jonathan Chiel, each of the Trustees oversees 189 funds. Mr. Chiel oversees 142 funds.
The Trustees hold office without limit in time except that (a) any Trustee may resign; (b) any Trustee may be removed by written instrument, signed by at least two-thirds of the number of Trustees prior to such removal; (c) any Trustee who requests to be retired or who has become incapacitated by illness or injury may be retired by written instrument signed by a majority of the other Trustees; and (d) any Trustee may be removed at any special meeting of shareholders by a two-thirds vote of the outstanding voting securities of the trust. Each Trustee who is not an interested person (as defined in the 1940 Act) of the trust and the fund is referred to herein as an Independent Trustee. Each Independent Trustee shall retire not later than the last day of the calendar year in which his or her 75th birthday occurs. The Independent Trustees may waive this mandatory retirement age policy with respect to individual Trustees. Officers and Advisory Board Members hold office without limit in time, except that any officer or Advisory Board Member may resign or may be removed by a vote of a majority of the Trustees at any regular meeting or any special meeting of the Trustees. Except as indicated, each individual has held the office shown or other offices in the same company for the past five years.
The fund’s Statement of Additional Information (SAI) includes more information about the Trustees. To request a free copy, call Fidelity at 1-800-544-8544 for Fidelity® Series Small Cap Discovery Fund, or 1-800-835-5092 for Class F.
Experience, Skills, Attributes, and Qualifications of the Trustees. The Governance and Nominating Committee has adopted a statement of policy that describes the experience, qualifications, attributes, and skills that are necessary and desirable for potential Independent Trustee candidates (Statement of Policy). The Board believes that each Trustee satisfied at the time he or she was initially elected or appointed a Trustee, and continues to satisfy, the standards contemplated by the Statement of Policy. The Governance and Nominating Committee also engages professional search firms to help identify potential Independent Trustee candidates who have the experience, qualifications, attributes, and skills consistent with the Statement of Policy. From time to time, additional criteria based on the composition and skills of the current Independent Trustees, as well as experience or skills that may be appropriate in light of future changes to board composition, business conditions, and regulatory or other developments, have also been considered by the professional search firms and the Governance and Nominating Committee. In addition, the Board takes into account the Trustees' commitment and participation in Board and committee meetings, as well as their leadership of standing and ad hoc committees throughout their tenure.
In determining that a particular Trustee was and continues to be qualified to serve as a Trustee, the Board has considered a variety of criteria, none of which, in isolation, was controlling. The Board believes that, collectively, the Trustees have balanced and diverse experience, qualifications, attributes, and skills, which allow the Board to operate effectively in governing the fund and protecting the interests of shareholders. Information about the specific experience, skills, attributes, and qualifications of each Trustee, which in each case led to the Board's conclusion that the Trustee should serve (or continue to serve) as a trustee of the fund, is provided below.
Board Structure and Oversight Function. James C. Curvey is an interested person and currently serves as Chairman. The Trustees have determined that an interested Chairman is appropriate and benefits shareholders because an interested Chairman has a personal and professional stake in the quality and continuity of services provided to the fund. Independent Trustees exercise their informed business judgment to appoint an individual of their choosing to serve as Chairman, regardless of whether the Trustee happens to be independent or a member of management. The Independent Trustees have determined that they can act independently and effectively without having an Independent Trustee serve as Chairman and that a key structural component for assuring that they are in a position to do so is for the Independent Trustees to constitute a substantial majority for the Board. The Independent Trustees also regularly meet in executive session. Ned C. Lautenbach serves as Chairman of the Independent Trustees and as such (i) acts as a liaison between the Independent Trustees and management with respect to matters important to the Independent Trustees and (ii) with management prepares agendas for Board meetings.
Fidelity® funds are overseen by different Boards of Trustees. The fund's Board oversees Fidelity's high income and certain equity funds, and other Boards oversee Fidelity's investment-grade bond, money market, asset allocation, and sector funds. The asset allocation funds may invest in Fidelity® funds overseen by the fund's Board. The use of separate Boards, each with its own committee structure, allows the Trustees of each group of Fidelity® funds to focus on the unique issues of the funds they oversee, including common research, investment, and operational issues. On occasion, the separate Boards establish joint committees to address issues of overlapping consequences for the Fidelity® funds overseen by each Board.
The Trustees operate using a system of committees to facilitate the timely and efficient consideration of all matters of importance to the Trustees, the fund, and fund shareholders and to facilitate compliance with legal and regulatory requirements and oversight of the fund's activities and associated risks. The Board, acting through its committees, has charged FMR and its affiliates with (i) identifying events or circumstances the occurrence of which could have demonstrably adverse effects on the fund's business and/or reputation; (ii) implementing processes and controls to lessen the possibility that such events or circumstances occur or to mitigate the effects of such events or circumstances if they do occur; and (iii) creating and maintaining a system designed to evaluate continuously business and market conditions in order to facilitate the identification and implementation processes described in (i) and (ii) above. Because the day-to-day operations and activities of the fund are carried out by or through FMR, its affiliates, and other service providers, the fund's exposure to risks is mitigated but not eliminated by the processes overseen by the Trustees. While each of the Board's committees has responsibility for overseeing different aspects of the fund's activities, oversight is exercised primarily through the Operations, Audit, and Compliance Committees. In addition, the Independent Trustees have worked with FMR to enhance the Board's oversight of investment and financial risks, legal and regulatory risks, technology risks, and operational risks, including the development of additional risk reporting to the Board. For example, a working group comprised of Independent Trustees and FMR has worked and continues to work to review the Fidelity® funds' valuation-related activities, reporting and risk management. Appropriate personnel, including but not limited to the fund's Chief Compliance Officer (CCO), FMR's internal auditor, the independent accountants, the fund's Treasurer and portfolio management personnel, make periodic reports to the Board's committees, as appropriate, including an annual review of Fidelity's risk management program for the Fidelity® funds. The responsibilities of each standing committee, including their oversight responsibilities, are described further under "Standing Committees of the Trustees."
Interested Trustees*:
Correspondence intended for a Trustee who is an interested person may be sent to Fidelity Investments, 245 Summer Street, Boston, Massachusetts 02210.
Name, Year of Birth; Principal Occupations and Other Relevant Experience+
Jonathan Chiel (1957)
Year of Election or Appointment: 2016
Trustee
Mr. Chiel also serves as Trustee of other Fidelity funds. Mr. Chiel is Executive Vice President and General Counsel for FMR LLC (diversified financial services company, 2012-present). Previously, Mr. Chiel served as general counsel (2004-2012) and senior vice president and deputy general counsel (2000-2004) for John Hancock Financial Services; a partner with Choate, Hall & Stewart (1996-2000) (law firm); and an Assistant United States Attorney for the United States Attorney’s Office of the District of Massachusetts (1986-95), including Chief of the Criminal Division (1993-1995). Mr. Chiel is a director on the boards of the Boston Bar Foundation and the Maimonides School.
James C. Curvey (1935)
Year of Election or Appointment: 2007
Trustee
Chairman of the Board of Trustees
Mr. Curvey also serves as Trustee of other Fidelity® funds. Mr. Curvey is a Director of Fidelity Research & Analysis Co. (investment adviser firm, 2009-present), and Vice Chairman (2007-present) and Director of FMR LLC (diversified financial services company). In addition, Mr. Curvey serves as an Overseer for the Boston Symphony Orchestra and a member of the board of Artis-Naples, Naples, Florida, and as a Trustee for Brewster Academy, Wolfeboro, New Hampshire. Previously, Mr. Curvey served as a Director of Fidelity Investments Money Management, Inc. (investment adviser firm, 2009-2014) and a Director of FMR and FMR Co., Inc. (investment adviser firms, 2007-2014).
Charles S. Morrison (1960)
Year of Election or Appointment: 2014
Trustee
Mr. Morrison also serves as Trustee of other funds. He serves as President of Fidelity Management & Research Company (FMR) (investment adviser firm, 2016-present), a Director of Fidelity Investments Money Management, Inc. (FIMM) (investment adviser firm, 2014-present), Director of Fidelity SelectCo, LLC (investment adviser firm, 2014-present), President, Asset Management (2014-present), and is an employee of Fidelity Investments. Previously, Mr. Morrison served as Vice President of Fidelity's Fixed Income and Asset Allocation Funds (2012-2014), President, Fixed Income (2011-2014), Vice President of Fidelity's Money Market Funds (2005-2009), President, Money Market Group Leader of FMR (investment adviser firm, 2009), and Senior Vice President, Money Market Group of FMR (2004-2009). Mr. Morrison also served as Vice President of Fidelity's Bond Funds (2002-2005), certain Balanced Funds (2002-2005), and certain Asset Allocation Funds (2002-2007), and as Senior Vice President (2002-2005) of Fidelity's Bond Division.
* Determined to be an “Interested Trustee” by virtue of, among other things, his or her affiliation with the trust or various entities under common control with FMR.
+ The information includes the Trustee's principal occupation during the last five years and other information relating to the experience, attributes, and skills relevant to the Trustee's qualifications to serve as a Trustee, which led to the conclusion that the Trustee should serve as a Trustee for the fund.
Independent Trustees:
Correspondence intended for an Independent Trustee may be sent to Fidelity Investments, P.O. Box 55235, Boston, Massachusetts 02205-5235.
Name, Year of Birth; Principal Occupations and Other Relevant Experience+
Dennis J. Dirks (1948)
Year of Election or Appointment: 2005
Trustee
Mr. Dirks also serves as Trustee of other Fidelity® funds. Prior to his retirement in May 2003, Mr. Dirks was Chief Operating Officer and a member of the Board of The Depository Trust & Clearing Corporation (DTCC). He also served as President, Chief Operating Officer, and Board member of The Depository Trust Company (DTC) and President and Board member of the National Securities Clearing Corporation (NSCC). In addition, Mr. Dirks served as Chief Executive Officer and Board member of the Government Securities Clearing Corporation, Chief Executive Officer and Board member of the Mortgage-Backed Securities Clearing Corporation, as a Trustee and a member of the Finance Committee of Manhattan College (2005-2008), as a Trustee and a member of the Finance Committee of AHRC of Nassau County (2006-2008), as a member of the Independent Directors Council (IDC) Governing Council (2010-2015), and as a member of the Board of Directors for The Brookville Center for Children’s Services, Inc. (2009-2017). Mr. Dirks is a member of the Finance Committee (2016-present) and Board of Directors (2017-present) of the Asolo Repertory Theatre.
Alan J. Lacy (1953)
Year of Election or Appointment: 2008
Trustee
Mr. Lacy also serves as Trustee of other Fidelity® funds. Mr. Lacy serves as a Director of Bristol-Myers Squibb Company (global pharmaceuticals, 2008-present). He is a Trustee of the California Chapter of The Nature Conservancy (2015-present) and a Director of the Center for Advanced Study in the Behavioral Sciences at Stanford University (2015-present). In addition, Mr. Lacy served as Senior Adviser (2007-2014) of Oak Hill Capital Partners, L.P. (private equity) and also served as Chief Executive Officer (2005) and Vice Chairman (2005-2006) of Sears Holdings Corporation (retail) and Chief Executive Officer and Chairman of the Board of Sears, Roebuck and Co. (retail, 2000-2005). Previously, Mr. Lacy served as Chairman (2014-2017) and a member (2010-2017) of the Board of Directors of Dave & Buster’s Entertainment, Inc. (restaurant and entertainment complexes), as Chairman (2008-2011) and a member (2006-2015) of the Board of Trustees of the National Parks Conservation Association, and as a member of the Board of Directors for The Hillman Companies, Inc. (hardware wholesalers, 2010-2014), Earth Fare, Inc. (retail grocery, 2010-2014), and The Western Union Company (global money transfer, 2006-2011).
Ned C. Lautenbach (1944)
Year of Election or Appointment: 2000
Trustee
Chairman of the Independent Trustees
Mr. Lautenbach also serves as Trustee of other Fidelity® funds. Mr. Lautenbach currently serves as the Lead Director of the Eaton Corporation Board of Directors (diversified industrial, 1997-present). Mr. Lautenbach is Chairman of the Board of Directors of Artis-Naples in Naples, Florida (2012-present), a member of the Council on Foreign Relations (1994-present), and currently Vice Chair of the Board of Governors, State University System of Florida (2013-present). Previously, Mr. Lautenbach was a Partner and Advisory Partner at Clayton, Dubilier & Rice, LLC (private equity investment, 1998-2010), as well as a Director of Sony Corporation (2006-2007). Mr. Lautenbach also had a 30-year career with IBM (technology company) during which time he served as Senior Vice President and a member of the Corporate Executive Committee (1968-1998).
Joseph Mauriello (1944)
Year of Election or Appointment: 2008
Trustee
Mr. Mauriello also serves as Trustee of other Fidelity® funds. Prior to his retirement in January 2006, Mr. Mauriello served in numerous senior management positions including Deputy Chairman and Chief Operating Officer (2004-2005), and Vice Chairman of Financial Services (2002-2004) of KPMG LLP US (professional services, 1965-2005). Mr. Mauriello currently serves as a member of the Board of Directors of XL Group plc. (global insurance and re-insurance, 2006-present) and the Independent Directors Council (IDC) Governing Council (2015-present). Previously, Mr. Mauriello served as a Director of the Hamilton Funds of the Bank of New York (2006-2007) and of Arcadia Resources Inc. (health care services and products, 2007-2012).
Robert W. Selander (1950)
Year of Election or Appointment: 2011
Trustee
Mr. Selander also serves as Trustee of other Fidelity® funds. Mr. Selander serves as a Director of The Western Union Company (global money transfer, 2014-present) and a non-executive Chairman of Health Equity, Inc. (health savings custodian, 2015-present). Previously, Mr. Selander served as a Member of the Advisory Board of certain Fidelity® funds (2011), and Executive Vice Chairman (2010), Chief Executive Officer (2009-2010), and President and Chief Executive Officer (1997-2009) of Mastercard, Inc.
Cornelia M. Small (1944)
Year of Election or Appointment: 2005
Trustee
Ms. Small also serves as Trustee of other Fidelity® funds. Ms. Small is a member of the Board of Directors (2009-present) and Chair of the Investment Committee (2010-present) of the Teagle Foundation. Ms. Small also serves on the Investment Committee of the Berkshire Taconic Community Foundation (2008-present). Previously, Ms. Small served as Chairperson (2002-2008) and a member of the Investment Committee and Chairperson (2008-2012) and a member of the Board of Trustees of Smith College. In addition, Ms. Small served as Chief Investment Officer, Director of Global Equity Investments, and a member of the Board of Directors of Scudder, Stevens & Clark and Scudder Kemper Investments.
William S. Stavropoulos (1939)
Year of Election or Appointment: 2001
Trustee
Vice Chairman of the Independent Trustees
Mr. Stavropoulos also serves as Trustee of other Fidelity® funds. Mr. Stavropoulos serves as President and Founder of the Michigan Baseball Foundation, the Great Lakes Loons (2007-present). Mr. Stavropoulos is Chairman Emeritus of the Board of Directors of The Dow Chemical Company, where he previously served in numerous senior management positions, including President, CEO (1995-2000; 2002-2004), Chairman of the Executive Committee (2000-2006), and as a member of the Board of Directors (1990-2006). Currently, Mr. Stavropoulos is Chairman of the Board of Directors of Univar Inc. (global distributor of commodity and specialty chemicals), a Director of Teradata Corporation (data warehousing and technology solutions), and a member of the Advisory Board for Metalmark Capital LLC (private equity investment, 2005-present). Mr. Stavropoulos is an operating advisor to Clayton, Dubilier & Rice, LLC (private equity investment). In addition, Mr. Stavropoulos is a member of the University of Notre Dame Advisory Council for the College of Science, a Trustee of the Rollin L. Gerstacker Foundation, and a Director of Artis-Naples in Naples, Florida. Previously, Mr. Stavropoulos served as a Director of Chemical Financial Corporation (bank holding company, 1993-2012) and Tyco International, Ltd. (multinational manufacturing and services, 2007-2012).
David M. Thomas (1949)
Year of Election or Appointment: 2008
Trustee
Mr. Thomas also serves as Trustee of other Fidelity® funds. Mr. Thomas serves as Non-Executive Chairman of the Board of Directors of Fortune Brands Home and Security (home and security products, 2011-present), as a member of the Board of Directors (2004-present) and Presiding Director (2013-present) of Interpublic Group of Companies, Inc. (marketing communication), and as a member of the Board of Trustees of the University of Florida (2013-present). Previously, Mr. Thomas served as Executive Chairman (2005-2006) and Chairman and Chief Executive Officer (2000-2005) of IMS Health, Inc. (pharmaceutical and healthcare information solutions), and a Director of Fortune Brands, Inc. (consumer products, 2000-2011).
+ The information includes the Trustee's principal occupation during the last five years and other information relating to the experience, attributes, and skills relevant to the Trustee's qualifications to serve as a Trustee, which led to the conclusion that the Trustee should serve as a Trustee for the fund.
Advisory Board Members and Officers:
Correspondence intended for an officer or Peter S. Lynch may be sent to Fidelity Investments, 245 Summer Street, Boston, Massachusetts 02210. Officers appear below in alphabetical order.
Name, Year of Birth; Principal Occupation
Peter S. Lynch (1944)
Year of Election or Appointment: 2003
Member of the Advisory Board
Mr. Lynch also serves as Member of the Advisory Board of other Fidelity® funds. Mr. Lynch is Vice Chairman and a Director of FMR (investment adviser firm) and FMR Co., Inc. (investment adviser firm). In addition, Mr. Lynch serves as a Trustee of Boston College and as the Chairman of the Inner-City Scholarship Fund. Previously, Mr. Lynch served on the Special Olympics International Board of Directors (1997-2006).
Elizabeth Paige Baumann (1968)
Year of Election or Appointment: 2017
Anti-Money Laundering (AML) Officer
Ms. Baumann also serves as AML Officer of other funds. She is Chief AML Officer (2012-present) and Senior Vice President (2014-present) of FMR LLC (diversified financial services company) and is an employee of Fidelity Investments. Previously, Ms. Baumann served as AML Officer of the funds (2012-2016), and Vice President (2007-2014) and Deputy Anti-Money Laundering Officer (2007-2012) of FMR LLC.
Marc R. Bryant (1966)
Year of Election or Appointment: 2015
Secretary and Chief Legal Officer (CLO)
Mr. Bryant also serves as Secretary and CLO of other funds. Mr. Bryant serves as CLO, Secretary, and Senior Vice President of Fidelity Management & Research Company (investment adviser firm, 2015-present) and FMR Co., Inc. (investment adviser firm, 2015-present); Secretary of Fidelity SelectCo, LLC (investment adviser firm, 2015-present) and Fidelity Investments Money Management, Inc. (investment adviser firm, 2015-present); and CLO of Fidelity Management & Research (Hong Kong) Limited and FMR Investment Management (UK) Limited (investment adviser firms, 2015-present) and Fidelity Management & Research (Japan) Limited (investment adviser firm, 2016-present). He is Senior Vice President and Deputy General Counsel of FMR LLC (diversified financial services company). Previously, Mr. Bryant served as Secretary and CLO of Fidelity Rutland Square Trust II (2010-2014) and Assistant Secretary of Fidelity's Fixed Income and Asset Allocation Funds (2013-2015). Prior to joining Fidelity Investments, Mr. Bryant served as a Senior Vice President and the Head of Global Retail Legal for AllianceBernstein L.P. (2006-2010), and as the General Counsel for ProFund Advisors LLC (2001-2006).
Jeffrey S. Christian (1961)
Year of Election or Appointment: 2016
Assistant Treasurer
Mr. Christian also serves as Assistant Treasurer of other funds. Mr. Christian is an employee of Fidelity Investments (2003-present).
William C. Coffey (1969)
Year of Election or Appointment: 2009
Assistant Secretary
Mr. Coffey also serves as Assistant Secretary of other funds. He is Senior Vice President and Deputy General Counsel of FMR LLC (diversified financial services company, 2010-present), and is an employee of Fidelity Investments. Previously, Mr. Coffey served as Vice President and Associate General Counsel of FMR LLC (2005-2009).
Jonathan Davis (1968)
Year of Election or Appointment: 2010
Assistant Treasurer
Mr. Davis also serves as Assistant Treasurer of other funds, and is an employee of Fidelity Investments. Previously, Mr. Davis served as Vice President and Associate General Counsel of FMR LLC (diversified financial services company, 2003-2010).
Adrien E. Deberghes (1967)
Year of Election or Appointment: 2016
Assistant Treasurer
Mr. Deberghes also serves as an officer of other funds. He serves as Executive Vice President of Fidelity Investments Money Management, Inc. (FIMM) (investment adviser firm, 2016-present) and is an employee of Fidelity Investments (2008-present). Prior to joining Fidelity Investments, Mr. Deberghes was Senior Vice President of Mutual Fund Administration at State Street Corporation (2007-2008), Senior Director of Mutual Fund Administration at Investors Bank & Trust (2005-2007), and Director of Finance for Dunkin' Brands (2000-2005). Previously, Mr. Deberghes served in other fund officer roles.
Stephanie J. Dorsey (1969)
Year of Election or Appointment: 2010
Assistant Treasurer
Ms. Dorsey also serves as an officer of other funds. She is an employee of Fidelity Investments (2008-present) and has served in other fund officer roles. Prior to joining Fidelity Investments, Ms. Dorsey served as Treasurer (2004-2008) of the JPMorgan Mutual Funds and Vice President (2004-2008) of JPMorgan Chase Bank.
Howard J. Galligan III (1966)
Year of Election or Appointment: 2014
Chief Financial Officer
Mr. Galligan also serves as Chief Financial Officer of other funds. Mr. Galligan serves as President of Fidelity Pricing and Cash Management Services (FPCMS) (2014-present) and as a Director of Strategic Advisers, Inc. (investment adviser firm, 2008-present). Previously, Mr. Galligan served as Chief Administrative Officer of Asset Management (2011-2014) and Chief Operating Officer and Senior Vice President of Investment Support for Strategic Advisers, Inc. (2003-2011).
Scott C. Goebel (1968)
Year of Election or Appointment: 2015
Vice President
Mr. Goebel serves as Vice President of other funds and is an employee of Fidelity Investments (2001-present). Previously, Mr. Goebel served as Senior Vice President of Fidelity Management & Research Company (FMR) (investment adviser firm, 2016), Secretary of Fidelity SelectCo, LLC (investment adviser firm, 2013-2015), Fidelity Investments Money Management, Inc. (FIMM) (investment adviser firm, 2010-2015), and Fidelity Research and Analysis Company (FRAC) (investment adviser firm, 2010-2015); General Counsel, Secretary, and Senior Vice President of FMR (investment adviser firm, 2008-2015) and FMR Co., Inc. (investment adviser firm, 2008-2015); Assistant Secretary of Fidelity Management & Research (Japan) Limited (investment adviser firm, 2008-2015) and Fidelity Management & Research (U.K.) Inc. (investment adviser firm, 2008-2015); Chief Legal Officer (CLO) of Fidelity Management & Research (Hong Kong) Limited (investment adviser firm, 2008-2015); Secretary and CLO of certain Fidelity® funds (2008-2015); Assistant Secretary of FIMM (2008-2010), FRAC (2008-2010), and certain funds (2007-2008); and as Vice President and Secretary of Fidelity Distributors Corporation (FDC) (2005-2007).
Thomas C. Hense (1964)
Year of Election or Appointment: 2008, 2010, or 2015
Vice President
Mr. Hense serves as Vice President of Fidelity Advisor® Multi-Asset Income Fund (2015) and other funds (High Income (2008), Small Cap (2008), and Value (2010) funds), and is an employee of Fidelity Investments (1993-present). Previously, Mr. Hense served as a portfolio manager for Fidelity's Institutional Money Management Group (Pyramis) (2003-2008).
Brian B. Hogan (1964)
Year of Election or Appointment: 2009
Vice President
Mr. Hogan also serves as Trustee or Vice President of other funds. Mr. Hogan serves as a Director of FMR Investment Management (UK) Limited (investment adviser firm, 2015-present) and Fidelity SelectCo, LLC (investment adviser firm, 2014-present) and President of the Equity Division of FMR (investment adviser firm, 2009-present). Previously, Mr. Hogan served as Senior Vice President, Equity Research of FMR (2006-2009) and as a portfolio manager. Mr. Brian B. Hogan is not related to Mr. Colm A. Hogan.
Colm A. Hogan (1973)
Year of Election or Appointment: 2016
Deputy Treasurer
Mr. Hogan also serves as an officer of other funds. Mr. Hogan is an employee of Fidelity Investments (2005-present). Mr. Colm A. Hogan is not related to Mr. Brian B. Hogan.
Chris Maher (1972)
Year of Election or Appointment: 2013
Assistant Treasurer
Mr. Maher serves as Assistant Treasurer of other funds. Mr. Maher is Vice President of Valuation Oversight and is an employee of Fidelity Investments. Previously, Mr. Maher served as Vice President of Asset Management Compliance (2013), Vice President of the Program Management Group of FMR (investment adviser firm, 2010-2013), and Vice President of Valuation Oversight (2008-2010).
Kenneth B. Robins (1969)
Year of Election or Appointment: 2016
Chief Compliance Officer
Mr. Robins also serves as an officer of other funds. Mr. Robins serves as Compliance Officer of Fidelity Management & Research Company and FMR Co., Inc. (investment adviser firms, 2016-present) and is an employee of Fidelity Investments (2004-present). Previously, Mr. Robins served as Executive Vice President of Fidelity Investments Money Management, Inc. (investment adviser firm, 2013-2016) and served in other fund officer roles.
Stacie M. Smith (1974)
Year of Election or Appointment: 2016
President and Treasurer
Ms. Smith also serves as an officer of other funds. She is an employee of Fidelity Investments (2009-present) and has served in other fund officer roles. Prior to joining Fidelity Investments, Ms. Smith served as Senior Audit Manager of Ernst & Young LLP (accounting firm, 1996-2009). Previously, Ms. Smith served as Deputy Treasurer of certain Fidelity® funds (2013-2016).
Marc L. Spector (1972)
Year of Election or Appointment: 2016
Assistant Treasurer
Mr. Spector also serves as an officer of other funds. Mr. Spector is an employee of Fidelity Investments (2016-present). Prior to joining Fidelity Investments, Mr. Spector served as Director at the Siegfried Group (accounting firm, 2013-2016), and prior to Siegfried Group as audit senior manager at Deloitte & Touche (accounting firm, 2005-2013).
Renee Stagnone (1975)
Year of Election or Appointment: 2016
Assistant Treasurer
Ms. Stagnone also serves as an officer of other funds. Ms. Stagnone is an employee of Fidelity Investments (1997-present). Previously, Ms. Stagnone served as Deputy Treasurer of certain Fidelity® funds (2013-2016).
Shareholder Expense Example
As a shareholder of the Fund, you incur two types of costs: (1) transaction costs and (2) ongoing costs, including management fees and other Fund expenses. This Example is intended to help you understand your ongoing costs (in dollars) of investing in the Fund and to compare these costs with the ongoing costs of investing in other mutual funds.
The Example is based on an investment of $1,000 invested at the beginning of the period and held for the entire period (November 1, 2016 to April 30, 2017).
Actual Expenses
The first line of the accompanying table for each class of the Fund provides information about actual account values and actual expenses. You may use the information in this line, together with the amount you invested, to estimate the expenses that you paid over the period. Simply divide your account value by $1,000.00 (for example, an $8,600 account value divided by $1,000.00 = 8.6), then multiply the result by the number in the first line for a class of the Fund under the heading entitled "Expenses Paid During Period" to estimate the expenses you paid on your account during this period. In addition, the Fund, as a shareholder in the underlying Fidelity Central Funds, will indirectly bear its pro-rata share of the fees and expenses incurred by the underlying Fidelity Central Funds. These fees and expenses are not included in the Fund's annualized expense ratio used to calculate the expense estimate in the table below.
Hypothetical Example for Comparison Purposes
The second line of the accompanying table for each class of the Fund provides information about hypothetical account values and hypothetical expenses based on a Class' actual expense ratio and an assumed rate of return of 5% per year before expenses, which is not the Class' actual return. The hypothetical account values and expenses may not be used to estimate the actual ending account balance or expenses you paid for the period. You may use this information to compare the ongoing costs of investing in the Fund and other funds. To do so, compare this 5% hypothetical example with the 5% hypothetical examples that appear in the shareholder reports of the other funds. In addition, the Fund, as a shareholder in the underlying Fidelity Central Funds, will indirectly bear its pro-rata share of the fees and expenses incurred by the underlying Fidelity Central Funds. These fees and expenses are not included in the Fund's annualized expense ratio used to calculate the expense estimate in the table below.
Please note that the expenses shown in the table are meant to highlight your ongoing costs only and do not reflect any transaction costs. Therefore, the second line of the table is useful in comparing ongoing costs only, and will not help you determine the relative total costs of owning different funds.
| Annualized Expense Ratio-A | Beginning Account Value November 1, 2016 | Ending Account Value April 30, 2017 | Expenses Paid During Period-B November 1, 2016 to April 30, 2017 | |
| Series Small Cap Discovery | .86% | |||
| Actual | $1,000.00 | $1,158.00 | $4.60** | |
| Hypothetical-C | $1,000.00 | $1,020.53 | $4.31** | |
| Class F | .70% | |||
| Actual | $1,000.00 | $1,158.10 | $3.75** | |
| Hypothetical-C | $1,000.00 | $1,021.32 | $3.51** |
A Annualized expense ratio reflects expenses net of applicable fee waivers.
B Expenses are equal to each Class' annualized expense ratio, multiplied by the average account value over the period, multiplied by 181/365 (to reflect the one-half year period).
C 5% return per year before expenses
** If fees and changes to the class level expense contract and/or expense cap, effective June 1, 2017, had been in effect during the current period, the annualized expense ratio and the expenses paid in the actual and hypothetical examples above would have been as shown in table below:
| Annualized Expense Ratio-(a) | Expenses Paid | |
| Series Small Cap Discovery | .00% | |
| Actual | $.00 | |
| Hypothetical-(b) | $.00 | |
| Class F | .00% | |
| Actual | $.00 | |
| Hypothetical-(b) | $.00 |
(a) Annualized expense ratio reflects expenses net of applicable fee waivers.
(b) 5% return per year before expenses
Distributions (Unaudited)
The Board of Trustees of Fidelity Series Small Cap Discovery Fund voted to pay to shareholders of record at the opening of business on record date, the following distributions per share derived from capital gains realized from sales of portfolio securities, and dividends derived from net investment income:
| Pay Date | Record Date | Dividends | Capital Gains | |
| Fidelity® Series Small Cap Discovery Fund | 06/12/17 | 06/09/17 | $0.052 | $0.000 |
| Fidelity® Series Small Cap Discovery Fund: Class F | 06/12/17 | 06/09/17 | $0.058 | $0.000 |
Series Small Cap Discovery and Class F Fund designate 100% of the dividends distributed during the fiscal year as qualifying for the dividends–received deduction for corporate shareholders.
Series Small Cap Discovery and Class F designate 100% of the dividends distributed during the fiscal year as amounts which may be taken into account as a dividend for purposes of the maximum rate under section 1(h)(11) of the Internal Revenue Code.
The fund will notify shareholders in January 2018 of amounts for use in preparing 2017 income tax returns.
Board Approval of Investment Advisory Contracts and Management Fees
Fidelity Series Small Cap Discovery Fund
On September 14, 2016, the Board of Trustees, including the Independent Trustees (together, the Board) voted to approve the management contract and sub-advisory agreements (collectively, the Advisory Contracts) for the fund in connection with reorganizing the fund from one Trust to another. In reaching this determination, the Board considered that the contractual terms of and the fees payable under the fund's Advisory Contracts are identical to those in the fund's current Advisory Contracts. The Board considered that the approval of the Advisory Contracts will not result in any changes to (i) the investment process or strategies employed in the management of the fund's assets; (ii) the nature, extent and quality of services provided under the fund's Advisory Contracts; or (iii) the day-to-day management of the fund or the persons primarily responsible for such management. The Board considered that it approved the Advisory Contracts for the fund at its July 2016 meeting and that it will again consider the renewal of the Advisory Contracts in July 2017.
Because the Board was approving Advisory Contracts with terms identical to the current Advisory Contracts, it did not consider the fund's investment performance, competitiveness of management fees and total expenses, costs of services and profitability, or economies of scale to be significant factors in its decision.
In connection with its consideration of future renewal of the fund's Advisory Contracts, the Board will consider: (i) the nature, extent and quality of services provided to the fund, including shareholder and administrative services and investment performance; (ii) the competitiveness of the fund's management fee and total expenses; (iii) the costs of the services and profitability, including the revenues earned and the expenses incurred by Fidelity conducting the business of developing, marketing, distributing, managing, administering, and servicing the fund and its shareholders, to the extent applicable; and (iv) whether there have been economies of scale in respect of the management of the Fidelity funds, whether the Fidelity funds (including the fund) have appropriately benefited from any such economies of scale, and whether there is potential for realization of any further economies.
Based on its evaluation of all of the conclusions noted above, and after considering all factors it believed relevant, the Board ultimately concluded that the advisory fee structures are fair and reasonable, and that the fund's Advisory Contracts should be approved, without modification, as part of the process of reorganizing the fund from one Trust to another.
![]()
Corporate Headquarters
245 Summer St.
Boston, MA 02210
www.fidelity.com
XS4-ANN-0617
1.968029.103
Fidelity Advisor® Event Driven Opportunities Fund Class A, Class M (formerly Class T), Class C and Class I Annual Report April 30, 2017 |
|
Contents
Board Approval of Investment Advisory Contracts and Management Fees |
To view a fund's proxy voting guidelines and proxy voting record for the 12-month period ended June 30, visit http://www.fidelity.com/proxyvotingresults or visit the Securities and Exchange Commission's (SEC) web site at http://www.sec.gov.
You may also call 1-877-208-0098 to request a free copy of the proxy voting guidelines.
Standard & Poor's, S&P and S&P 500 are registered service marks of The McGraw-Hill Companies, Inc. and have been licensed for use by Fidelity Distributors Corporation.
Other third-party marks appearing herein are the property of their respective owners.
All other marks appearing herein are registered or unregistered trademarks or service marks of FMR LLC or an affiliated company. © 2017 FMR LLC. All rights reserved.
This report and the financial statements contained herein are submitted for the general information of the shareholders of the Fund. This report is not authorized for distribution to prospective investors in the Fund unless preceded or accompanied by an effective prospectus.
A fund files its complete schedule of portfolio holdings with the SEC for the first and third quarters of each fiscal year on Form N-Q. Forms N-Q are available on the SEC’s web site at http://www.sec.gov. A fund's Forms N-Q may be reviewed and copied at the SEC’s Public Reference Room in Washington, DC. Information regarding the operation of the SEC's Public Reference Room may be obtained by calling 1-800-SEC-0330.
For a complete list of a fund's portfolio holdings, view the most recent holdings listing, semiannual report, or annual report on Fidelity's web site at http://www.fidelity.com, http://www.institutional.fidelity.com, or http://www.401k.com, as applicable.
NOT FDIC INSURED •MAY LOSE VALUE •NO BANK GUARANTEE
Neither the Fund nor Fidelity Distributors Corporation is a bank.
Performance: The Bottom Line
Average annual total return reflects the change in the value of an investment, assuming reinvestment of distributions from dividend income and capital gains (the profits earned upon the sale of securities that have grown in value, if any) and assuming a constant rate of performance each year. The hypothetical investment and the average annual total returns do not reflect the deduction of taxes that a shareholder would pay on fund distributions or the redemption of fund shares. During periods of reimbursement by Fidelity, a fund’s total return will be greater than it would be had the reimbursement not occurred. How a fund did yesterday is no guarantee of how it will do tomorrow.
Average Annual Total Returns
| For the periods ended April 30, 2017 | Past 1 year | Life of fundA |
| Class A (incl. 5.75% sales charge) | 19.67% | 9.04% |
| Class M (incl. 3.50% sales charge) | 22.16% | 9.52% |
| Class C (incl. contingent deferred sales charge) | 24.96% | 10.12% |
| Class I | 27.33% | 11.24% |
A From December 12, 2013
Class C shares' contingent deferred sales charges included in the past one year and life of fund total return figures are 1% and 0%, respectively.
$10,000 Over Life of Fund
Let's say hypothetically that $10,000 was invested in Fidelity Advisor® Event Driven Opportunities Fund - Class A on December 12, 2013, when the fund started, and the current 5.75% sales charge was paid.
The chart shows how the value of your investment would have changed, and also shows how the Russell 3000® Index performed over the same period.
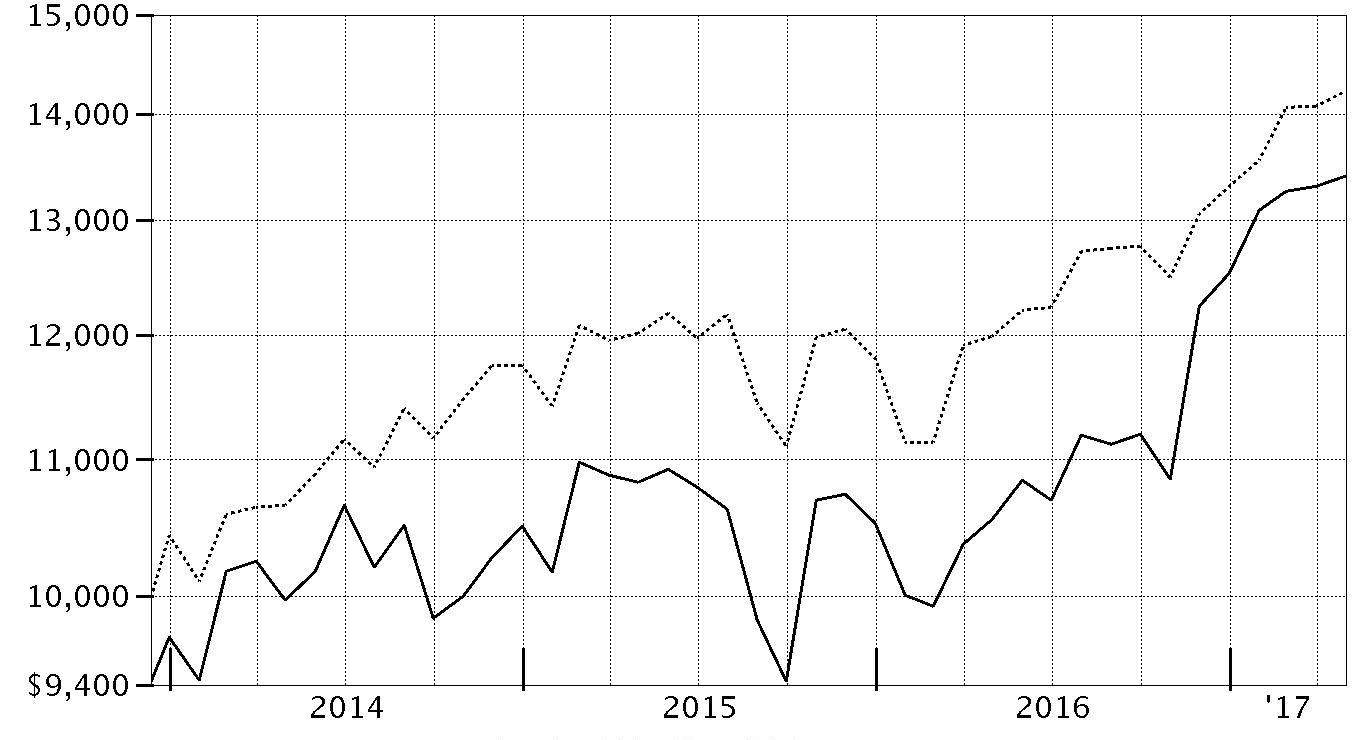
| Period Ending Values | ||
| $13,401 | Fidelity Advisor® Event Driven Opportunities Fund - Class A | |
| $14,220 | Russell 3000® Index | |
Management's Discussion of Fund Performance
Market Recap: The U.S. equity bellwether S&P 500® index gained 17.92% for the year ending April 30, 2017, rising sharply following the November election and continuing to gain ground through the end of February on optimism for President Trump’s pro-business agenda. Equity markets leveled off, however, as the fledgling administration faced the first test of its domestic agenda. Stocks reacted with uncertainty to efforts by Congress in March to repeal and replace the Affordable Care Act (ACA), and were relatively flat through April 30. In a stark reversal from 2016, growth-oriented stocks topped their value counterparts through the first third of 2017. Sector-wise, information technology (+35%) fared best, anchored by twin rallies in the June 2016 and March 2017 quarters as growth regained favor. Financials (+27%) also handily outperformed, riding an uptick in bond yields and a surge in banks, particularly post-election. Industrials (+19%) and materials (+16%) did well amid a call for increased infrastructure spending and a rise in commodity prices, respectively. Conversely, consumer staples (+9%), real estate (+5%) and telecommunication services (0%) were held back amid an improved backdrop for riskier assets that curbed demand for dividend-rich sectors, as well as the likelihood of one or two additional interest rate hikes later in 2017. Energy (+2%) also struggled this period.Comments from Portfolio Manager Arvind Navaratnam: For the year, the fund's share classes posted gains of about 27%, handily outperforming the 18.58% result of the Russell 3000® Index. The corporate events in which the fund was invested added value this period, with one stock in particular adding about 760 basis points versus the benchmark: oil and natural-gas equipment and processing firm Exterran, the fund’s biggest holding during the past year. The stock advanced 80% this period amid an improved environment for oil and natural gas. Brink's, a global leader in security-related services for banks, retailers and a variety of other commercial and governmental customers, was another large fund holding and contributor. Brink’s shares rallied nearly 15% in one day in February after the security-services firm reported improved results for the fourth quarter and full-year 2016. Turning to the negative, a large stake in Triumph Group was our biggest individual detractor. Triumph is a global leader in manufacturing and overhauling aerospace structures, systems and components. In July, the stock plunged when the firm reported its first quarterly results of its 2017 fiscal year, which disappointed investors. We sold our stake in Triumph before October 31.The views expressed above reflect those of the portfolio manager(s) only through the end of the period as stated on the cover of this report and do not necessarily represent the views of Fidelity or any other person in the Fidelity organization. Any such views are subject to change at any time based upon market or other conditions and Fidelity disclaims any responsibility to update such views. These views may not be relied on as investment advice and, because investment decisions for a Fidelity fund are based on numerous factors, may not be relied on as an indication of trading intent on behalf of any Fidelity fund.
Investment Summary (Unaudited)
Top Ten Stocks as of April 30, 2017
| % of fund's net assets | % of fund's net assets 6 months ago | |
| The Madison Square Garden Co. | 9.9 | 4.2 |
| Exterran Corp. | 8.7 | 10.1 |
| Twenty-First Century Fox, Inc. Class B | 6.8 | 2.3 |
| The Brink's Co. | 6.5 | 4.4 |
| Alliance Data Systems Corp. | 4.9 | 3.4 |
| Encore Capital Group, Inc. | 4.8 | 3.1 |
| Perrigo Co. PLC | 2.9 | 0.0 |
| Quality Care Properties, Inc. | 2.3 | 0.0 |
| ECN Capital Corp. | 2.2 | 1.3 |
| Donnelley Financial Solutions, Inc. | 2.2 | 1.5 |
| 51.2 |
Top Five Market Sectors as of April 30, 2017
| % of fund's net assets | % of fund's net assets 6 months ago | |
| Information Technology | 25.5 | 20.2 |
| Consumer Discretionary | 22.3 | 23.1 |
| Financials | 16.0 | 14.0 |
| Energy | 9.8 | 10.1 |
| Industrials | 6.5 | 10.0 |
Asset Allocation (% of fund's net assets)
| As of April 30, 2017 * | ||
| Stocks and Equity Futures | 97.6% | |
| Short-Term Investments and Net Other Assets (Liabilities) | 2.4% | |

* Foreign investments - 11.1%
| As of October 31, 2016* | ||
| Stocks and Equity Futures | 97.7% | |
| Short-Term Investments and Net Other Assets (Liabilities) | 2.3% | |

* Foreign investments - 5.7%
Percentages shown as 0.0% may reflect amounts less than 0.05%.
Investments April 30, 2017
Showing Percentage of Net Assets
| Common Stocks - 87.5% | |||
| Shares | Value | ||
| CONSUMER DISCRETIONARY - 22.3% | |||
| Internet & Direct Marketing Retail - 1.2% | |||
| Zooplus AG (a) | 1,600 | $299,165 | |
| Leisure Products - 0.3% | |||
| Vista Outdoor, Inc. (a) | 4,498 | 87,981 | |
| Media - 18.0% | |||
| Cable One, Inc. | 185 | 126,144 | |
| Gannett Co., Inc. | 8,042 | 67,231 | |
| NZME Ltd. | 242,634 | 144,935 | |
| The Madison Square Garden Co. (a) | 12,615 | 2,545,332 | |
| Twenty-First Century Fox, Inc. Class B | 58,828 | 1,756,604 | |
| 4,640,246 | |||
| Specialty Retail - 2.8% | |||
| Ascena Retail Group, Inc. (a) | 76,018 | 297,230 | |
| Carpetright PLC (a) | 43,202 | 126,039 | |
| Guess?, Inc. | 2,981 | 33,268 | |
| Urban Outfitters, Inc. (a) | 11,145 | 254,998 | |
| 711,535 | |||
| TOTAL CONSUMER DISCRETIONARY | 5,738,927 | ||
| CONSUMER STAPLES - 1.4% | |||
| Food Products - 1.4% | |||
| Mondelez International, Inc. | 1,965 | 88,484 | |
| SunOpta, Inc. (a) | 37,198 | 271,545 | |
| 360,029 | |||
| ENERGY - 9.8% | |||
| Energy Equipment & Services - 8.7% | |||
| Diamond Offshore Drilling, Inc. (a) | 689 | 9,935 | |
| Exterran Corp. (a) | 81,690 | 2,235,855 | |
| 2,245,790 | |||
| Oil, Gas & Consumable Fuels - 1.1% | |||
| International Seaways, Inc. (a) | 14,870 | 287,437 | |
| TOTAL ENERGY | 2,533,227 | ||
| FINANCIALS - 16.0% | |||
| Capital Markets - 2.8% | |||
| Associated Capital Group, Inc. | 4,775 | 160,679 | |
| Waddell & Reed Financial, Inc. Class A | 9,165 | 164,878 | |
| WisdomTree Investments, Inc. | 48,209 | 402,545 | |
| 728,102 | |||
| Consumer Finance - 4.8% | |||
| Encore Capital Group, Inc. (a) | 37,165 | 1,239,453 | |
| Diversified Financial Services - 4.4% | |||
| Donnelley Financial Solutions, Inc. (a) | 25,085 | 557,389 | |
| ECN Capital Corp. | 207,800 | 566,291 | |
| 1,123,680 | |||
| Insurance - 4.0% | |||
| Genworth Financial, Inc. Class A (a) | 121,089 | 489,200 | |
| Stewart Information Services Corp. | 11,642 | 552,296 | |
| 1,041,496 | |||
| TOTAL FINANCIALS | 4,132,731 | ||
| HEALTH CARE - 3.3% | |||
| Health Care Providers & Services - 0.4% | |||
| Quorum Health Corp. (a) | 21,483 | 91,732 | |
| Pharmaceuticals - 2.9% | |||
| Perrigo Co. PLC | 10,115 | 747,903 | |
| TOTAL HEALTH CARE | 839,635 | ||
| INDUSTRIALS - 6.5% | |||
| Commercial Services & Supplies - 6.5% | |||
| The Brink's Co. | 27,345 | 1,678,983 | |
| INFORMATION TECHNOLOGY - 25.5% | |||
| Communications Equipment - 1.3% | |||
| Lumentum Holdings, Inc. (a) | 7,756 | 331,569 | |
| Internet Software & Services - 5.3% | |||
| CommerceHub, Inc. Series A (a) | 25,557 | 408,912 | |
| comScore, Inc. (a) | 13,290 | 341,553 | |
| LogMeIn, Inc. | 2,568 | 290,184 | |
| WebMD Health Corp. (a) | 6,032 | 327,115 | |
| 1,367,764 | |||
| IT Services - 10.2% | |||
| Alliance Data Systems Corp. | 5,081 | 1,268,370 | |
| Conduent, Inc. (a) | 24,079 | 392,728 | |
| CSRA, Inc. | 11,222 | 326,336 | |
| DXC Technology Co. (a) | 3,359 | 253,067 | |
| PayPal Holdings, Inc. (a) | 8,125 | 387,725 | |
| 2,628,226 | |||
| Semiconductors & Semiconductor Equipment - 2.9% | |||
| Marvell Technology Group Ltd. | 26,566 | 399,021 | |
| Versum Materials, Inc. | 11,183 | 358,080 | |
| 757,101 | |||
| Software - 2.8% | |||
| CDK Global, Inc. | 5,848 | 380,178 | |
| TiVo Corp. | 16,797 | 331,741 | |
| 711,919 | |||
| Technology Hardware, Storage & Peripherals - 3.0% | |||
| Diebold Nixdorf, Inc. | 11,455 | 323,031 | |
| Hewlett Packard Enterprise Co. | 14,430 | 268,831 | |
| Quantum Corp. (a) | 22,883 | 181,462 | |
| 773,324 | |||
| TOTAL INFORMATION TECHNOLOGY | 6,569,903 | ||
| REAL ESTATE - 2.7% | |||
| Equity Real Estate Investment Trusts (REITs) - 2.7% | |||
| Four Corners Property Trust, Inc. | 4,648 | 108,438 | |
| Quality Care Properties, Inc. (a) | 33,809 | 586,586 | |
| 695,024 | |||
| TOTAL COMMON STOCKS | |||
| (Cost $20,194,902) | 22,548,459 | ||
| Principal Amount | Value | ||
| U.S. Treasury Obligations - 0.5% | |||
| U.S. Treasury Bills, yield at date of purchase 0.49% to 0.72% 5/4/17 to 6/15/17 (b) | |||
| (Cost $139,900) | 140,000 | 139,906 | |
| Shares | Value | ||
| Money Market Funds - 14.4% | |||
| Fidelity Cash Central Fund, 0.85% (c) | |||
| (Cost $3,709,346) | 3,708,684 | 3,709,426 | |
| Equity Funds - 0.4% | |||
| Domestic Equity Funds - 0.4% | |||
| iShares Russell 3000 Index ETF | |||
| (Cost $87,133) | 706 | 99,786 | |
| TOTAL INVESTMENT PORTFOLIO - 102.8% | |||
| (Cost $24,131,281) | 26,497,577 | ||
| NET OTHER ASSETS (LIABILITIES) - (2.8)% | (714,629) | ||
| NET ASSETS - 100% | $25,782,948 |
| Futures Contracts | |||
| Expiration Date | Underlying Face Amount at Value | Unrealized Appreciation/(Depreciation) | |
| Purchased | |||
| Equity Index Contracts | |||
| 18 CME E-mini S&P 500 Index Contracts (United States) | June 2017 | 2,142,450 | $18,770 |
| 5 ICE Russell 2000 Index Contracts (United States) | June 2017 | 349,600 | 7,808 |
| TOTAL FUTURES CONTRACTS | $26,578 |
The face value of futures purchased as a percentage of Net Assets is 9.7%
For the period, the average monthly underlying face amount at value for futures contracts in the aggregate was $1,276,891.
Security Type Abbreviations
ETF – Exchange-Traded Fund
Legend
(a) Non-income producing
(b) Security or a portion of the security was pledged to cover margin requirements for futures contracts. At period end, the value of securities pledged amounted to $139,906.
(c) Affiliated fund that is generally available only to investment companies and other accounts managed by Fidelity Investments. The rate quoted is the annualized seven-day yield of the fund at period end. A complete unaudited listing of the fund's holdings as of its most recent quarter end is available upon request. In addition, each Fidelity Central Fund's financial statements, which are not covered by the Fund's Report of Independent Registered Public Accounting Firm, are available on the SEC's website or upon request.
Affiliated Central Funds
Information regarding fiscal year to date income earned by the Fund from investments in Fidelity Central Funds is as follows:
| Fund | Income earned |
| Fidelity Cash Central Fund | $9,232 |
| Total | $9,232 |
Investment Valuation
The following is a summary of the inputs used, as of April 30, 2017, involving the Fund's assets and liabilities carried at fair value. The inputs or methodology used for valuing securities may not be an indication of the risk associated with investing in those securities. For more information on valuation inputs, and their aggregation into the levels used below, please refer to the Investment Valuation section in the accompanying Notes to Financial Statements.
| Valuation Inputs at Reporting Date: | ||||
| Description | Total | Level 1 | Level 2 | Level 3 |
| Investments in Securities: | ||||
| Equities: | ||||
| Consumer Discretionary | $5,738,927 | $5,738,927 | $-- | $-- |
| Consumer Staples | 360,029 | 360,029 | -- | -- |
| Energy | 2,533,227 | 2,533,227 | -- | -- |
| Financials | 4,132,731 | 4,132,731 | -- | -- |
| Health Care | 839,635 | 839,635 | -- | -- |
| Industrials | 1,678,983 | 1,678,983 | -- | -- |
| Information Technology | 6,569,903 | 6,569,903 | -- | -- |
| Real Estate | 695,024 | 695,024 | -- | -- |
| U.S. Government and Government Agency Obligations | 139,906 | -- | 139,906 | -- |
| Money Market Funds | 3,709,426 | 3,709,426 | -- | -- |
| Equity Funds | 99,786 | 99,786 | -- | -- |
| Total Investments in Securities: | $26,497,577 | $26,357,671 | $139,906 | $-- |
| Derivative Instruments: | ||||
| Assets | ||||
| Futures Contracts | $26,578 | $26,578 | $-- | $-- |
| Total Assets | $26,578 | $26,578 | $-- | $-- |
| Total Derivative Instruments: | $26,578 | $26,578 | $-- | $-- |
Value of Derivative Instruments
The following table is a summary of the Fund's value of derivative instruments by primary risk exposure as of April 30, 2017. For additional information on derivative instruments, please refer to the Derivative Instruments section in the accompanying Notes to Financial Statements.
| Primary Risk Exposure / Derivative Type | Value | |
| Asset | Liability | |
| Equity Risk | ||
| Futures Contracts(a) | $26,578 | $0 |
| Total Equity Risk | 26,578 | 0 |
| Total Value of Derivatives | $26,578 | $0 |
(a) Reflects gross cumulative appreciation (depreciation) on futures contracts as presented in the Schedule of Investments. In the Statement of Assets and Liabilities, the period end daily variation margin is included in receivable or payable for daily variation margin for derivative instruments, and the net cumulative appreciation (depreciation) is included in net unrealized appreciation (depreciation).
Other Information
Distribution of investments by country or territory of incorporation, as a percentage of Total Net Assets, is as follows (Unaudited):
| United States of America | 88.9% |
| Canada | 3.3% |
| Ireland | 2.9% |
| Bermuda | 1.5% |
| Germany | 1.2% |
| Marshall Islands | 1.1% |
| Others (Individually Less Than 1%) | 1.1% |
| 100.0% |
See accompanying notes which are an integral part of the financial statements.
Financial Statements
Statement of Assets and Liabilities
| April 30, 2017 | ||
| Assets | ||
| Investment in securities, at value — See accompanying schedule: Unaffiliated issuers (cost $20,421,935) | $22,788,151 | |
| Fidelity Central Funds (cost $3,709,346) | 3,709,426 | |
| Total Investments (cost $24,131,281) | $26,497,577 | |
| Receivable for investments sold | 531,938 | |
| Receivable for fund shares sold | 309,796 | |
| Distributions receivable from Fidelity Central Funds | 2,188 | |
| Prepaid expenses | 6 | |
| Receivable from investment adviser for expense reductions | 11,348 | |
| Other receivables | 247 | |
| Total assets | 27,353,100 | |
| Liabilities | ||
| Payable for investments purchased | $1,490,763 | |
| Payable for fund shares redeemed | 627 | |
| Accrued management fee | 17,098 | |
| Distribution and service plan fees payable | 5,099 | |
| Payable for daily variation margin for derivative instruments | 10,312 | |
| Other affiliated payables | 4,609 | |
| Other payables and accrued expenses | 41,644 | |
| Total liabilities | 1,570,152 | |
| Net Assets | $25,782,948 | |
| Net Assets consist of: | ||
| Paid in capital | $23,263,272 | |
| Undistributed net investment income | 173 | |
| Accumulated undistributed net realized gain (loss) on investments and foreign currency transactions | 126,622 | |
| Net unrealized appreciation (depreciation) on investments and assets and liabilities in foreign currencies | 2,392,881 | |
| Net Assets | $25,782,948 | |
| Calculation of Maximum Offering Price | ||
| Class A: | ||
| Net Asset Value and redemption price per share ($6,407,059 ÷ 478,515 shares) | $13.39 | |
| Maximum offering price per share (100/94.25 of $13.39) | $14.21 | |
| Class M: | ||
| Net Asset Value and redemption price per share ($2,567,716 ÷ 192,617 shares) | $13.33 | |
| Maximum offering price per share (100/96.50 of $13.33) | $13.81 | |
| Class C: | ||
| Net Asset Value and offering price per share ($3,663,254 ÷ 277,836 shares)(a) | $13.18 | |
| Class I: | ||
| Net Asset Value, offering price and redemption price per share ($13,144,919 ÷ 977,340 shares) | $13.45 |
(a) Redemption price per share is equal to net asset value less any applicable contingent deferred sales charge.
See accompanying notes which are an integral part of the financial statements.
Statement of Operations
| Year ended April 30, 2017 | ||
| Investment Income | ||
| Dividends | $120,173 | |
| Interest | 314 | |
| Income from Fidelity Central Funds | 9,232 | |
| Total income | 129,719 | |
| Expenses | ||
| Management fee | ||
| Basic fee | $109,709 | |
| Performance adjustment | (1,876) | |
| Transfer agent fees | 26,996 | |
| Distribution and service plan fees | 32,939 | |
| Accounting fees and expenses | 5,040 | |
| Custodian fees and expenses | 10,931 | |
| Independent trustees' fees and expenses | 49 | |
| Registration fees | 56,015 | |
| Audit | 51,316 | |
| Legal | 306 | |
| Miscellaneous | 211 | |
| Total expenses before reductions | 291,636 | |
| Expense reductions | (93,932) | 197,704 |
| Net investment income (loss) | (67,985) | |
| Realized and Unrealized Gain (Loss) | ||
| Net realized gain (loss) on: | ||
| Investment securities: | ||
| Unaffiliated issuers | 401,560 | |
| Fidelity Central Funds | 113 | |
| Foreign currency transactions | 481 | |
| Futures contracts | 196,586 | |
| Total net realized gain (loss) | 598,740 | |
| Change in net unrealized appreciation (depreciation) on: Investment securities | 2,219,737 | |
| Assets and liabilities in foreign currencies | 7 | |
| Futures contracts | (1,555) | |
| Total change in net unrealized appreciation (depreciation) | 2,218,189 | |
| Net gain (loss) | 2,816,929 | |
| Net increase (decrease) in net assets resulting from operations | $2,748,944 |
See accompanying notes which are an integral part of the financial statements.
Statement of Changes in Net Assets
| Year ended April 30, 2017 | Year ended April 30, 2016 | |
| Increase (Decrease) in Net Assets | ||
| Operations | ||
| Net investment income (loss) | $(67,985) | $49,270 |
| Net realized gain (loss) | 598,740 | 59,963 |
| Change in net unrealized appreciation (depreciation) | 2,218,189 | (332,806) |
| Net increase (decrease) in net assets resulting from operations | 2,748,944 | (223,573) |
| Distributions to shareholders from net investment income | (31,399) | – |
| Distributions to shareholders from net realized gain | (289,817) | (78,048) |
| Total distributions | (321,216) | (78,048) |
| Share transactions - net increase (decrease) | 15,225,962 | (365,630) |
| Total increase (decrease) in net assets | 17,653,690 | (667,251) |
| Net Assets | ||
| Beginning of period | 8,129,258 | 8,796,509 |
| End of period | $25,782,948 | $8,129,258 |
| Other Information | ||
| Undistributed net investment income end of period | $173 | $29,804 |
See accompanying notes which are an integral part of the financial statements.
Financial Highlights — Fidelity Advisor Event Driven Opportunities Fund Class A
| Years ended April 30, | 2017 | 2016 | 2015 | 2014 A |
| Selected Per–Share Data | ||||
| Net asset value, beginning of period | $10.87 | $11.26 | $10.58 | $10.00 |
| Income from Investment Operations | ||||
| Net investment income (loss)B | (.06) | .08C | .01 | .02D |
| Net realized and unrealized gain (loss) | 2.95 | (.36)E | .89F | .56G |
| Total from investment operations | 2.89 | (.28) | .90 | .58 |
| Distributions from net investment income | (.04) | – | (.01) | – |
| Distributions from net realized gain | (.32) | (.11) | (.20) | – |
| Total distributions | (.37)H | (.11) | (.22)I | – |
| Net asset value, end of period | $13.39 | $10.87 | $11.26 | $10.58 |
| Total ReturnJ,K,L | 26.97% | (2.49)%E | 8.55%F | 5.80%G |
| Ratios to Average Net AssetsM,N | ||||
| Expenses before reductions | 2.34% | 2.76% | 2.82% | 4.76%O |
| Expenses net of fee waivers, if any | 1.55% | 1.55% | 1.55% | 1.55%O |
| Expenses net of all reductions | 1.54% | 1.54% | 1.53% | 1.55%O |
| Net investment income (loss) | (.53)% | .74%C | .10% | .59%D,O |
| Supplemental Data | ||||
| Net assets, end of period (000 omitted) | $6,407 | $2,513 | $2,983 | $1,389 |
| Portfolio turnover rateP | 120% | 113% | 150% | 57%Q |
A For the period December 12, 2013 (commencement of operations) to April 30, 2014.
B Calculated based on average shares outstanding during the period.
C Net Investment income per share reflects a large, non-recurring dividend which amounted to $.06 per share. Excluding this non-recurring dividend, the ratio of net investment income (loss) to average net assets would have been .22%.
D Net Investment income per share reflects large, non-recurring dividends which amounted to $.03 per share. Excluding these non-recurring dividends, the ratio of net investment income (loss) to average net assets would have been (.25) %.
E Amount includes a reimbursement from the investment adviser for an operational error which amounted to less than $.01 per share. Excluding this reimbursement, the total return would have been (2.52)%.
F Amount includes a reimbursement from the investment adviser for an operational error which amounted to less than $.01 per share. Excluding this reimbursement, the total return would have been 8.47%.
G Amount includes a reimbursement from the investment adviser for an operational error which amounted to less than $.01 per share. Excluding this reimbursement, the total return would have been 5.70%.
H Total distributions of $.37 per share is comprised of distributions from net investment income of $.043 and distributions from net realized gain of $.323 per share.
I Total distributions of $.22 per share is comprised of distributions from net investment income of $.014 and distributions from net realized gain of $.201 per share.
J Total returns for periods of less than one year are not annualized.
K Total returns would have been lower if certain expenses had not been reduced during the applicable periods shown.
L Total returns do not include the effect of the sales charges.
M Fees and expenses of any underlying Fidelity Central Funds are not included in the Fund's expense ratio. The Fund indirectly bears its proportionate share of the expenses of any underlying Fidelity Central Funds.
N Expense ratios reflect operating expenses of the class. Expenses before reductions do not reflect amounts reimbursed by the investment adviser or reductions from brokerage service arrangements or reductions from other expense offset arrangements and do not represent the amount paid by the class during periods when reimbursements or reductions occur. Expense ratios before reductions for start-up periods may not be representative of longer-term operating periods. Expenses net of fee waivers reflect expenses after reimbursement by the investment adviser but prior to reductions from brokerage service arrangements or other expense offset arrangements. Expenses net of all reductions represent the net expenses paid by the class.
O Annualized
P Amount does not include the portfolio activity of any underlying Fidelity Central Funds.
Q Amount not annualized.
See accompanying notes which are an integral part of the financial statements.
Financial Highlights — Fidelity Advisor Event Driven Opportunities Fund Class M
| Years ended April 30, | 2017 | 2016 | 2015 | 2014 A |
| Selected Per–Share Data | ||||
| Net asset value, beginning of period | $10.83 | $11.25 | $10.57 | $10.00 |
| Income from Investment Operations | ||||
| Net investment income (loss)B | (.09) | .05C | (.02) | .01D |
| Net realized and unrealized gain (loss) | 2.93 | (.36)E | .89F | .56G |
| Total from investment operations | 2.84 | (.31) | .87 | .57 |
| Distributions from net investment income | (.03) | – | (.01) | – |
| Distributions from net realized gain | (.31) | (.11) | (.18) | – |
| Total distributions | (.34) | (.11) | (.19) | – |
| Net asset value, end of period | $13.33 | $10.83 | $11.25 | $10.57 |
| Total ReturnH,I,J | 26.59% | (2.76)%E | 8.35%F | 5.70%G |
| Ratios to Average Net AssetsK,L | ||||
| Expenses before reductions | 2.60% | 2.98% | 3.18% | 4.95%M |
| Expenses net of fee waivers, if any | 1.80% | 1.80% | 1.80% | 1.80%M |
| Expenses net of all reductions | 1.79% | 1.79% | 1.78% | 1.80%M |
| Net investment income (loss) | (.78)% | .49%C | (.15)% | .34%D,M |
| Supplemental Data | ||||
| Net assets, end of period (000 omitted) | $2,568 | $966 | $1,977 | $1,631 |
| Portfolio turnover rateN | 120% | 113% | 150% | 57%O |
A For the period December 12, 2013 (commencement of operations) to April 30, 2014.
B Calculated based on average shares outstanding during the period.
C Net Investment income per share reflects a large, non-recurring dividend which amounted to $.06 per share. Excluding this non-recurring dividend, the ratio of net investment income (loss) to average net assets would have been (.03) %.
D Net Investment income per share reflects large, non-recurring dividends which amounted to $.03 per share. Excluding these non-recurring dividends, the ratio of net investment income (loss) to average net assets would have been (.50) %.
E Amount includes a reimbursement from the investment adviser for an operational error which amounted to less than $.01 per share. Excluding this reimbursement, the total return would have been (2.79)%.
F Amount includes a reimbursement from the investment adviser for an operational error which amounted to less than $.01 per share. Excluding this reimbursement, the total return would have been 8.27%.
G Amount includes a reimbursement from the investment adviser for an operational error which amounted to less than $.01 per share. Excluding this reimbursement, the total return would have been 5.60%.
H Total returns for periods of less than one year are not annualized.
I Total returns would have been lower if certain expenses had not been reduced during the applicable periods shown.
J Total returns do not include the effect of the sales charges.
K Fees and expenses of any underlying Fidelity Central Funds are not included in the Fund's expense ratio. The Fund indirectly bears its proportionate share of the expenses of any underlying Fidelity Central Funds.
L Expense ratios reflect operating expenses of the class. Expenses before reductions do not reflect amounts reimbursed by the investment adviser or reductions from brokerage service arrangements or reductions from other expense offset arrangements and do not represent the amount paid by the class during periods when reimbursements or reductions occur. Expense ratios before reductions for start-up periods may not be representative of longer-term operating periods. Expenses net of fee waivers reflect expenses after reimbursement by the investment adviser but prior to reductions from brokerage service arrangements or other expense offset arrangements. Expenses net of all reductions represent the net expenses paid by the class.
M Annualized
N Amount does not include the portfolio activity of any underlying Fidelity Central Funds.
O Amount not annualized.
See accompanying notes which are an integral part of the financial statements.
Financial Highlights — Fidelity Advisor Event Driven Opportunities Fund Class C
| Years ended April 30, | 2017 | 2016 | 2015 | 2014 A |
| Selected Per–Share Data | ||||
| Net asset value, beginning of period | $10.72 | $11.19 | $10.55 | $10.00 |
| Income from Investment Operations | ||||
| Net investment income (loss)B | (.15) | –C,D | (.07) | (.01)E |
| Net realized and unrealized gain (loss) | 2.90 | (.36)F | .88G | .56H |
| Total from investment operations | 2.75 | (.36) | .81 | .55 |
| Distributions from net investment income | (.02) | – | – | – |
| Distributions from net realized gain | (.28) | (.11) | (.17) | – |
| Total distributions | (.29)I | (.11) | (.17) | – |
| Net asset value, end of period | $13.18 | $10.72 | $11.19 | $10.55 |
| Total ReturnJ,K,L | 25.96% | (3.23)%F | 7.75%G | 5.50%H |
| Ratios to Average Net AssetsM,N | ||||
| Expenses before reductions | 3.03% | 3.46% | 3.63% | 5.38%O |
| Expenses net of fee waivers, if any | 2.30% | 2.30% | 2.30% | 2.30%O |
| Expenses net of all reductions | 2.29% | 2.29% | 2.29% | 2.30%O |
| Net investment income (loss) | (1.28)% | (.01)%C | (.65)% | (.16)%E,O |
| Supplemental Data | ||||
| Net assets, end of period (000 omitted) | $3,663 | $1,046 | $1,846 | $3,011 |
| Portfolio turnover rateP | 120% | 113% | 150% | 57%Q |
A For the period December 12, 2013 (commencement of operations) to April 30, 2014.
B Calculated based on average shares outstanding during the period.
C Net Investment income per share reflects a large, non-recurring dividend which amounted to $.06 per share. Excluding this non-recurring dividend, the ratio of net investment income (loss) to average net assets would have been (.53) %.
D Amount represents less than $.005 per share.
E Net Investment income per share reflects large, non-recurring dividends which amounted to $.03 per share. Excluding these non-recurring dividends, the ratio of net investment income (loss) to average net assets would have been (1.00) %.
F Amount includes a reimbursement from the investment adviser for an operational error which amounted to less than $.01 per share. Excluding this reimbursement, the total return would have been (3.26)%.
G Amount includes a reimbursement from the investment adviser for an operational error which amounted to less than $.01 per share. Excluding this reimbursement, the total return would have been 7.67%.
H Amount includes a reimbursement from the investment adviser for an operational error which amounted to less than $.01 per share. Excluding this reimbursement, the total return would have been 5.40%.
I Total distributions of $.29 per share is comprised of distributions from net investment income of $.015 and distributions from net realized gain of $.275 per share.
J Total returns for periods of less than one year are not annualized.
K Total returns would have been lower if certain expenses had not been reduced during the applicable periods shown.
L Total returns do not include the effect of the contingent deferred sales charge.
M Fees and expenses of any underlying Fidelity Central Funds are not included in the Fund's expense ratio. The Fund indirectly bears its proportionate share of the expenses of any underlying Fidelity Central Funds.
N Expense ratios reflect operating expenses of the class. Expenses before reductions do not reflect amounts reimbursed by the investment adviser or reductions from brokerage service arrangements or reductions from other expense offset arrangements and do not represent the amount paid by the class during periods when reimbursements or reductions occur. Expense ratios before reductions for start-up periods may not be representative of longer-term operating periods. Expenses net of fee waivers reflect expenses after reimbursement by the investment adviser but prior to reductions from brokerage service arrangements or other expense offset arrangements. Expenses net of all reductions represent the net expenses paid by the class.
O Annualized
P Amount does not include the portfolio activity of any underlying Fidelity Central Funds.
Q Amount not annualized.
See accompanying notes which are an integral part of the financial statements.
Financial Highlights — Fidelity Advisor Event Driven Opportunities Fund Class I
| Years ended April 30, | 2017 | 2016 | 2015 | 2014 A |
| Selected Per–Share Data | ||||
| Net asset value, beginning of period | $10.91 | $11.28 | $10.59 | $10.00 |
| Income from Investment Operations | ||||
| Net investment income (loss)B | (.03) | .11C | .04 | .03D |
| Net realized and unrealized gain (loss) | 2.96 | (.37)E | .89 | .56F |
| Total from investment operations | 2.93 | (.26) | .93G | .59 |
| Distributions from net investment income | (.05) | – | (.03) | – |
| Distributions from net realized gain | (.34) | (.11) | (.21) | – |
| Total distributions | (.39) | (.11) | (.24) | – |
| Net asset value, end of period | $13.45 | $10.91 | $11.28 | $10.59 |
| Total ReturnH,I | 27.33% | (2.31)%E | 8.86%G | 5.90%F |
| Ratios to Average Net AssetsJ,K | ||||
| Expenses before reductions | 1.97% | 2.17% | 2.63% | 4.50%L |
| Expenses net of fee waivers, if any | 1.30% | 1.30% | 1.30% | 1.30%L |
| Expenses net of all reductions | 1.29% | 1.28% | 1.28% | 1.30%L |
| Net investment income (loss) | (.28)% | 1.00%C | .35% | .84%D,L |
| Supplemental Data | ||||
| Net assets, end of period (000 omitted) | $13,145 | $3,604 | $1,990 | $1,962 |
| Portfolio turnover rateM | 120% | 113% | 150% | 57%N |
A For the period December 12, 2013 (commencement of operations) to April 30, 2014.
B Calculated based on average shares outstanding during the period.
C Net Investment income per share reflects a large, non-recurring dividend which amounted to $.06 per share. Excluding this non-recurring dividend, the ratio of net investment income (loss) to average net assets would have been .47%.
D Net Investment income per share reflects large, non-recurring dividends which amounted to $.03 per share. Excluding these non-recurring dividends, the ratio of net investment income (loss) to average net assets would have been (.01) %.
E Amount includes a reimbursement from the investment adviser for an operational error which amounted to less than $.01 per share. Excluding this reimbursement, the total return would have been (2.34)%.
F Amount includes a reimbursement from the investment adviser for an operational error which amounted to less than $.01 per share. Excluding this reimbursement, the total return would have been 5.80%.
G Amount includes a reimbursement from the investment adviser for an operational error which amounted to less than $.01 per share. Excluding this reimbursement, the total return would have been 8.78%.
H Total returns for periods of less than one year are not annualized.
I Total returns would have been lower if certain expenses had not been reduced during the applicable periods shown.
J Fees and expenses of any underlying Fidelity Central Funds are not included in the Fund's expense ratio. The Fund indirectly bears its proportionate share of the expenses of any underlying Fidelity Central Funds.
K Expense ratios reflect operating expenses of the class. Expenses before reductions do not reflect amounts reimbursed by the investment adviser or reductions from brokerage service arrangements or reductions from other expense offset arrangements and do not represent the amount paid by the class during periods when reimbursements or reductions occur. Expense ratios before reductions for start-up periods may not be representative of longer-term operating periods. Expenses net of fee waivers reflect expenses after reimbursement by the investment adviser but prior to reductions from brokerage service arrangements or other expense offset arrangements. Expenses net of all reductions represent the net expenses paid by the class.
L Annualized
M Amount does not include the portfolio activity of any underlying Fidelity Central Funds.
N Amount not annualized.
See accompanying notes which are an integral part of the financial statements.
Notes to Financial Statements
For the period ended April 30, 2017
1. Organization.
Fidelity Advisor Event Driven Opportunities Fund (the Fund) is a non-diversified fund of Fidelity Concord Street Trust (the Trust) (formerly a fund of Fidelity Commonwealth Trust) and is authorized to issue an unlimited number of shares. The Trust is registered under the Investment Company Act of 1940, as amended (the 1940 Act), as an open-end management investment company organized as a Massachusetts business trust. The Fund offers Class A, Class M (formerly Class T), Class C and Class I shares, each of which has equal rights as to assets and voting privileges. Each class has exclusive voting rights with respect to matters that affect that class.
2. Investments in Fidelity Central Funds.
The Fund invests in Fidelity Central Funds, which are open-end investment companies generally available only to other investment companies and accounts managed by the investment adviser and its affiliates. The Fund's Schedule of Investments lists each of the Fidelity Central Funds held as of period end, if any, as an investment of the Fund, but does not include the underlying holdings of each Fidelity Central Fund. As an Investing Fund, the Fund indirectly bears its proportionate share of the expenses of the underlying Fidelity Central Funds.
The Money Market Central Funds seek preservation of capital and current income and are managed by Fidelity Investments Money Management, Inc. (FIMM), an affiliate of the investment adviser. Annualized expenses of the Money Market Central Funds as of their most recent shareholder report date are less than .005%.
A complete unaudited list of holdings for each Fidelity Central Fund is available upon request or at the Securities and Exchange Commission (the SEC) website at www.sec.gov. In addition, the financial statements of the Fidelity Central Funds, which are not covered by the Fund's Report of Independent Registered Public Accounting Firm, are available on the SEC website or upon request.
3. Significant Accounting Policies.
The Fund is an investment company and applies the accounting and reporting guidance of the Financial Accounting Standards Board (FASB) Accounting Standards Codification Topic 946 Financial Services – Investments Companies. The financial statements have been prepared in conformity with accounting principles generally accepted in the United States of America (GAAP), which require management to make certain estimates and assumptions at the date of the financial statements. Actual results could differ from those estimates. Subsequent events, if any, through the date that the financial statements were issued have been evaluated in the preparation of the financial statements. The following summarizes the significant accounting policies of the Fund:
Investment Valuation. Investments are valued as of 4:00 p.m. Eastern time on the last calendar day of the period. The Board of Trustees (the Board) has delegated the day to day responsibility for the valuation of the Fund's investments to the Fair Value Committee (the Committee) established by the Fund's investment adviser. In accordance with valuation policies and procedures approved by the Board, the Fund attempts to obtain prices from one or more third party pricing vendors or brokers to value its investments. When current market prices, quotations or currency exchange rates are not readily available or reliable, investments will be fair valued in good faith by the Committee, in accordance with procedures adopted by the Board. Factors used in determining fair value vary by investment type and may include market or investment specific events, changes in interest rates and credit quality. The frequency with which these procedures are used cannot be predicted and they may be utilized to a significant extent. The Committee oversees the Fund's valuation policies and procedures and reports to the Board on the Committee's activities and fair value determinations. The Board monitors the appropriateness of the procedures used in valuing the Fund's investments and ratifies the fair value determinations of the Committee.
The Fund categorizes the inputs to valuation techniques used to value its investments into a disclosure hierarchy consisting of three levels as shown below:
- Level 1 – quoted prices in active markets for identical investments
- Level 2 – other significant observable inputs (including quoted prices for similar investments, interest rates, prepayment speeds, etc.)
- Level 3 – unobservable inputs (including the Fund's own assumptions based on the best information available)
Valuation techniques used to value the Fund's investments by major category are as follows:
Equity securities, including restricted securities, for which market quotations are readily available, are valued at the last reported sale price or official closing price as reported by a third party pricing vendor on the primary market or exchange on which they are traded and are categorized as Level 1 in the hierarchy. In the event there were no sales during the day or closing prices are not available, securities are valued at the last quoted bid price or may be valued using the last available price and are generally categorized as Level 2 in the hierarchy. For foreign equity securities, when market or security specific events arise, comparisons to the valuation of American Depositary Receipts (ADRs), futures contracts, Exchange-Traded Funds (ETFs) and certain indexes as well as quoted prices for similar securities may be used and would be categorized as Level 2 in the hierarchy. Utilizing these techniques may result in transfers between Level 1 and Level 2. For equity securities, including restricted securities, where observable inputs are limited, assumptions about market activity and risk are used and these securities may be categorized as Level 3 in the hierarchy.
Debt securities, including restricted securities, are valued based on evaluated prices received from third party pricing vendors or from brokers who make markets in such securities. U.S. government and government agency obligations are valued by pricing vendors who utilize matrix pricing which considers yield or price of bonds of comparable quality, coupon, maturity and type or by broker-supplied prices. When independent prices are unavailable or unreliable, debt securities may be valued utilizing pricing methodologies which consider similar factors that would be used by third party pricing vendors. Debt securities are generally categorized as Level 2 in the hierarchy but may be Level 3 depending on the circumstances.
ETFs are valued at their last sale price or official closing price as reported by a third party pricing vendor on the primary market or exchange on which they are traded and are categorized as Level 1 in the hierarchy. In the event there were no sales during the day but the exchange reports a closing bid level, ETFs are valued at the closing bid and would be categorized as Level 1 in the hierarchy. In the event there was no closing bid, ETFs may be valued by another method that the Board believes reflects fair value in accordance with the Board's fair value pricing policies and may be categorized as Level 2 in the hierarchy.
Futures contracts are valued at the settlement price established each day by the board of trade or exchange on which they are traded and are categorized as Level 1 in the hierarchy. Investments in open-end mutual funds, including the Fidelity Central Funds, are valued at their closing net asset value (NAV) each business day and are categorized as Level 1 in the hierarchy.
Changes in valuation techniques may result in transfers in or out of an assigned level within the disclosure hierarchy. The aggregate value of investments by input level as of April 30, 2017 is included at the end of the Fund's Schedule of Investments.
Foreign Currency. The Fund may use foreign currency contracts to facilitate transactions in foreign-denominated securities. Gains and losses from these transactions may arise from changes in the value of the foreign currency or if the counterparties do not perform under the contracts' terms.
Foreign-denominated assets, including investment securities, and liabilities are translated into U.S. dollars at the exchange rates at period end. Purchases and sales of investment securities, income and dividends received and expenses denominated in foreign currencies are translated into U.S. dollars at the exchange rate in effect on the transaction date.
The effects of exchange rate fluctuations on investments are included with the net realized and unrealized gain (loss) on investment securities. Other foreign currency transactions resulting in realized and unrealized gain (loss) are disclosed separately.
Investment Transactions and Income. For financial reporting purposes, the Fund's investment holdings and NAV include trades executed through the end of the last business day of the period. The NAV per share for processing shareholder transactions is calculated as of the close of business of the New York Stock Exchange (NYSE), normally 4:00 p.m. Eastern time and includes trades executed through the end of the prior business day. Gains and losses on securities sold are determined on the basis of identified cost. Dividend income is recorded on the ex-dividend date, except for certain dividends from foreign securities where the ex-dividend date may have passed, which are recorded as soon as the Fund is informed of the ex-dividend date. Non-cash dividends included in dividend income, if any, are recorded at the fair market value of the securities received. Income and capital gain distributions from Fidelity Central Funds, if any, are recorded on the ex-dividend date. Certain distributions received by the Fund represent a return of capital or capital gain. The Fund determines the components of these distributions subsequent to the ex-dividend date, based upon receipt of tax filings or other correspondence relating to the underlying investment. These distributions are recorded as a reduction of cost of investments and/or as a realized gain. Interest income is accrued as earned and includes coupon interest and amortization of premium and accretion of discount on debt securities as applicable. Investment income is recorded net of foreign taxes withheld where recovery of such taxes is uncertain.
Class Allocations and Expenses. Investment income, realized and unrealized capital gains and losses, common expenses of the Fund, and certain fund-level expense reductions, if any, are allocated daily on a pro-rata basis to each class based on the relative net assets of each class to the total net assets of the Fund. Each class differs with respect to transfer agent and distribution and service plan fees incurred. Certain expense reductions may also differ by class. For the reporting period, the allocated portion of income and expenses to each class as a percent of its average net assets may vary due to the timing of recording these transactions in relation to fluctuating net assets of the classes. Expenses directly attributable to a fund are charged to that fund. Expenses attributable to more than one fund are allocated among the respective funds on the basis of relative net assets or other appropriate methods. Expense estimates are accrued in the period to which they relate and adjustments are made when actual amounts are known.
Income Tax Information and Distributions to Shareholders. Each year, the Fund intends to qualify as a regulated investment company under Subchapter M of the Internal Revenue Code, including distributing substantially all of its taxable income and realized gains. As a result, no provision for U.S. Federal income taxes is required. As of April 30, 2017, the Fund did not have any unrecognized tax benefits in the financial statements; nor is the Fund aware of any tax positions for which it is reasonably possible that the total amounts of unrecognized tax benefits will significantly change in the next twelve months. The Fund files a U.S. federal tax return, in addition to state and local tax returns as required. The Fund's federal income tax returns are subject to examination by the Internal Revenue Service (IRS) for a period of three fiscal years after they are filed. State and local tax returns may be subject to examination for an additional fiscal year depending on the jurisdiction. Foreign taxes are provided for based on the Fund's understanding of the tax rules and rates that exist in the foreign markets in which it invests.
Distributions are declared and recorded on the ex-dividend date. Income and capital gain distributions are determined in accordance with income tax regulations, which may differ from GAAP. In addition, the Fund claimed a portion of the payment made to redeeming shareholders as a distribution for income tax purposes.
Capital accounts within the financial statements are adjusted for permanent book-tax differences. These adjustments have no impact on net assets or the results of operations. Capital accounts are not adjusted for temporary book-tax differences which will reverse in a subsequent period.
Book-tax differences are primarily due to futures contracts, foreign currency transactions, market discount and losses deferred due to wash sales and excise tax regulations.
The federal tax cost of investment securities and unrealized appreciation (depreciation) as of period end were as follows:
| Gross unrealized appreciation | $2,818,435 |
| Gross unrealized depreciation | (628,747) |
| Net unrealized appreciation (depreciation) on securities | $2,189,688 |
| Tax Cost | $24,307,889 |
The tax-based components of distributable earnings as of period end were as follows:
| Undistributed ordinary income | $133,598 |
| Undistributed long-term capital gain | $196,338 |
| Net unrealized appreciation (depreciation) on securities and other investments | $2,189,740 |
The tax character of distributions paid was as follows:
| April 30, 2017 | April 30, 2016 | |
| Ordinary Income | $321,216 | $ - |
| Long-term Capital Gains | – | 78,048 |
| Total | $321,216 | $ 78,048 |
4. Derivative Instruments.
Risk Exposures and the Use of Derivative Instruments. The Fund's investment objective allows the Fund to enter into various types of derivative contracts, including futures contracts. Derivatives are investments whose value is primarily derived from underlying assets, indices or reference rates and may be transacted on an exchange or over-the-counter (OTC). Derivatives may involve a future commitment to buy or sell a specified asset based on specified terms, to exchange future cash flows at periodic intervals based on a notional principal amount, or for one party to make one or more payments upon the occurrence of specified events in exchange for periodic payments from the other party.
The Fund used derivatives to increase returns and to manage exposure to certain risks as defined below. The success of any strategy involving derivatives depends on analysis of numerous economic factors, and if the strategies for investment do not work as intended, the Fund may not achieve its objectives.
The Fund's use of derivatives increased or decreased its exposure to the following risk:
| Equity Risk | Equity risk relates to the fluctuations in the value of financial instruments as a result of changes in market prices (other than those arising from interest rate risk or foreign exchange risk), whether caused by factors specific to an individual investment, its issuer, or all factors affecting all instruments traded in a market or market segment. |
The Fund is also exposed to additional risks from investing in derivatives, such as liquidity risk and counterparty credit risk. Liquidity risk is the risk that the Fund will be unable to close out the derivative in the open market in a timely manner. Counterparty credit risk is the risk that the counterparty will not be able to fulfill its obligation to the Fund. Counterparty credit risk related to exchange-traded futures contracts may be mitigated by the protection provided by the exchange on which they trade.
Investing in derivatives may involve greater risks than investing in the underlying assets directly and, to varying degrees, may involve risk of loss in excess of any initial investment and collateral received and amounts recognized in the Statement of Assets and Liabilities. In addition, there may be the risk that the change in value of the derivative contract does not correspond to the change in value of the underlying instrument.
Futures Contracts. A futures contract is an agreement between two parties to buy or sell a specified underlying instrument for a fixed price at a specified future date. The Fund used futures contracts to manage its exposure to the stock market.
Upon entering into a futures contract, a fund is required to deposit either cash or securities (initial margin) with a clearing broker in an amount equal to a certain percentage of the face value of the contract. Futures contracts are marked-to-market daily and subsequent daily payments (variation margin) are made or received by a fund depending on the daily fluctuations in the value of the futures contracts and are recorded as unrealized appreciation or (depreciation). This receivable and/or payable, if any, is included in daily variation margin for derivative instruments in the Statement of Assets and Liabilities. Realized gain or (loss) is recorded upon the expiration or closing of a futures contract.
Any open futures contracts at period end are presented in the Schedule of Investments under the caption "Futures Contracts". The underlying face amount at value reflects each contract's exposure to the underlying instrument or index at period end. Securities deposited to meet initial margin requirements are identified in the Schedule of Investments.
During the period the Fund recognized net realized gain (loss) of $196,586 and a change in net unrealized appreciation (depreciation) of $(1,555) related to its investment in futures contracts. These amounts are included in the Statement of Operations.
5. Purchases and Sales of Investments.
Purchases and sales of securities other than short-term securities, aggregated $27,048,599 and $14,260,629, respectively.
6. Fees and Other Transactions with Affiliates.
Management Fee. Fidelity Management & Research Company (the investment adviser) and its affiliates provide the Fund with investment management related services for which the Fund pays a monthly management fee. The management fee is the sum of an individual fund fee rate that is based on an annual rate of .60% of the Fund's average net assets and an annualized group fee rate that averaged .25% during the period. The group fee rate is based upon the average net assets of all the mutual funds advised by the investment adviser, including any mutual funds previously advised by the investment adviser that are currently advised by Fidelity SelectCo, LLC, an affiliate of the investment adviser. The group fee rate decreases as assets under management increase and increases as assets under management decrease. In addition, the management fee is subject to a performance adjustment (up to a maximum of +/- .10% of the Fund's average net assets over a 36 month performance period). The upward or downward adjustment to the management fee is based on the relative investment performance of Class I of the Fund as compared to its benchmark index, the Russell 3000 Index, over the same 36 month performance period. For the reporting period, the total annual management fee rate, including the performance adjustment, was .84% of the Fund's average net assets. The performance adjustment included in the management fee rate may be higher or lower than the maximum performance adjustment rate due to the difference between the average net assets for the reporting and performance periods.
Distribution and Service Plan Fees. In accordance with Rule 12b-1 of the 1940 Act, the Fund has adopted separate Distribution and Service Plans for each class of shares. Certain classes pay Fidelity Distributors Corporation (FDC), an affiliate of the investment adviser, separate Distribution and Service Fees, each of which is based on an annual percentage of each class' average net assets. In addition, FDC may pay financial intermediaries for selling shares of the Fund and providing shareholder support services. For the period, the Distribution and Service Fee rates, total fees and amounts retained by FDC were as follows:
| Distribution Fee | Service Fee | Total Fees | Retained by FDC | |
| Class A | -% | .25% | $9,201 | $114 |
| Class M | .25% | .25% | 6,986 | 27 |
| Class C | .75% | .25% | 16,752 | 4,449 |
| $32,939 | $4,590 |
Sales Load. FDC may receive a front-end sales charge of up to 5.75% for selling Class A shares and 3.50% for selling Class M shares, some of which is paid to financial intermediaries for selling shares of the Fund. Depending on the holding period, FDC may receive contingent deferred sales charges levied on Class A, Class M, and Class C redemptions. The deferred sales charges are 1.00% for Class C shares, 1.00% for certain purchases of Class A shares and .25% for certain purchases of Class M shares.
For the period, sales charge amounts retained by FDC were as follows:
| Retained by FDC | |
| Class A | $12,309 |
| Class M | 1,418 |
| Class C(a) | 11 |
| $13,738 |
(a) When Class C shares are initially sold, FDC pays commissions from its own resources to financial intermediaries through which the sales are made.
Transfer Agent Fees. Fidelity Investments Institutional Operations Company, Inc., (FIIOC), an affiliate of the investment adviser, is the transfer, dividend disbursing and shareholder servicing agent for each class of the Fund. FIIOC receives account fees and asset-based fees that vary according to the account size and type of account of the shareholders of the respective classes of the Fund. FIIOC pays for typesetting, printing and mailing of shareholder reports, except proxy statements.
For the period, transfer agent fees for each class were as follows:
| Amount | % of Class-Level Average Net Assets | |
| Class A | $9,364 | .26 |
| Class M | 4,164 | .30 |
| Class C | 4,057 | .24 |
| Class I | 9,411 | .15 |
| $26,996 |
Accounting Fees. Fidelity Service Company, Inc. (FSC), an affiliate of the investment adviser, maintains the Fund's accounting records. The fee is based on the level of average net assets for each month.
Brokerage Commissions. The Fund placed a portion of its portfolio transactions with brokerage firms which are affiliates of the investment adviser. Brokerage commissions are included in net realized gain (loss) and change in net unrealized appreciation (depreciation) in the Statement of Operations. The commissions paid to these affiliated firms were $1,466 for the period.
Interfund Trades. The Fund may purchase from or sell securities to other Fidelity Funds under procedures adopted by the Board. The procedures have been designed to ensure these interfund trades are executed in accordance with Rule 17a-7 of the 1940 Act. Interfund trades are included within the respective purchases and sales amounts shown in the Purchases and Sales of Investments note.
7. Committed Line of Credit.
The Fund participates with other funds managed by the investment adviser or an affiliate in a $4.25 billion credit facility (the "line of credit") to be utilized for temporary or emergency purposes to fund shareholder redemptions or for other short-term liquidity purposes. The Fund has agreed to pay commitment fees on its pro-rata portion of the line of credit, which amounted to $39 and is reflected in Miscellaneous expenses on the Statement of Operations. During the period, the Fund did not borrow on this line of credit.
8. Expense Reductions.
The investment adviser contractually agreed to reimburse each class to the extent annual operating expenses exceeded certain levels of average net assets as noted in the table below. This reimbursement will remain in place through June 30, 2018. Some expenses, for example interest expense, including commitment fees, are excluded from this reimbursement.
The following classes were in reimbursement during the period:
| Expense Limitations | Reimbursement | |
| Class A | 1.55% | $28,770 |
| Class M | 1.80% | 11,001 |
| Class C | 2.30% | 12,024 |
| Class I | 1.30% | 40,829 |
| $92,624 |
Commissions paid to certain brokers with whom the investment adviser, or its affiliates, places trades on behalf of the Fund include an amount in addition to trade execution, which may be rebated back to the Fund to offset certain expenses. This amount totaled $1,178 for the period. Through arrangements with the Fund's custodian credits realized as a result of certain uninvested cash balances were used to reduce the Fund's expenses. During the period, these credits reduced the Fund's custody expenses by $48.
In addition, during the period the investment adviser reimbursed and/or waived a portion of fund-level operating expenses in the amount of $82.
9. Distributions to Shareholders.
Distributions to shareholders of each class were as follows:
| Year ended April 30, 2017 | Year ended April 30, 2016 | |
| From net investment income | ||
| Class A | $10,330 | $– |
| Class M | 2,826 | – |
| Class C | 1,451 | – |
| Class I | 16,792 | – |
| Total | $31,399 | $– |
| From net realized gain | ||
| Class A | $84,205 | $28,471 |
| Class M | 27,568 | 16,290 |
| Class C | 28,743 | 15,945 |
| Class I | 149,301 | 17,342 |
| Total | $289,817 | $78,048 |
10. Share Transactions.
Share transactions for each class were as follows and may contain automatic conversions between classes or exchanges between affiliated funds:
| Shares | Shares | Dollars | Dollars | |
| Year ended April 30, 2017 | Year ended April 30, 2016 | Year ended April 30, 2017 | Year ended April 30, 2016 | |
| Class A | ||||
| Shares sold | 329,237 | 70,567 | $4,248,581 | $758,382 |
| Reinvestment of distributions | 7,724 | 2,331 | 92,311 | 26,229 |
| Shares redeemed | (89,665) | (106,527) | (1,144,335) | (1,162,165) |
| Net increase (decrease) | 247,296 | (33,629) | $3,196,557 | $(377,554) |
| Class M | ||||
| Shares sold | 122,115 | 8,615 | $1,560,300 | $93,355 |
| Reinvestment of distributions | 2,549 | 1,449 | 30,394 | 16,290 |
| Shares redeemed | (21,285) | (96,589) | (253,056) | (1,049,955) |
| Net increase (decrease) | 103,379 | (86,525) | $1,337,638 | $(940,310) |
| Class C | ||||
| Shares sold | 211,525 | 32,297 | $2,717,355 | $350,788 |
| Reinvestment of distributions | 2,503 | 1,393 | 29,673 | 15,570 |
| Shares redeemed | (33,769) | (101,079) | (414,161) | (1,079,870) |
| Net increase (decrease) | 180,259 | (67,389) | $2,332,867 | $(713,512) |
| Class I | ||||
| Shares sold | 702,861 | 235,816 | $9,059,018 | $2,558,721 |
| Reinvestment of distributions | 11,485 | 1,488 | 137,676 | 16,789 |
| Shares redeemed | (67,262) | (83,510) | (837,794) | (909,764) |
| Net increase (decrease) | 647,084 | 153,794 | $8,358,900 | $1,665,746 |
11. Other.
The Fund's organizational documents provide former and current trustees and officers with a limited indemnification against liabilities arising in connection with the performance of their duties to the Fund. In the normal course of business, the Fund may also enter into contracts that provide general indemnifications. The Fund's maximum exposure under these arrangements is unknown as this would be dependent on future claims that may be made against the Fund. The risk of material loss from such claims is considered remote.
Report of Independent Registered Public Accounting Firm
To the Trustees of Fidelity Concord Street Trust and Shareholders of Fidelity Advisor Event Driven Opportunities Fund:
In our opinion, the accompanying statement of assets and liabilities, including the schedule of investments, and the related statements of operations and of changes in net assets and the financial highlights present fairly, in all material respects, the financial position of Fidelity Advisor Event Driven Opportunities Fund (a fund of Fidelity Concord Street Trust) as of April 30, 2017, the results of its operations for the year then ended, the changes in its net assets for each of the two years in the period then ended and the financial highlights for each of the periods indicated, in conformity with accounting principles generally accepted in the United States of America. These financial statements and financial highlights (hereafter referred to as “financial statements”) are the responsibility of the Fidelity Advisor Event Driven Opportunities Fund’s management. Our responsibility is to express an opinion on these financial statements based on our audits. We conducted our audits of these financial statements in accordance with the standards of the Public Company Accounting Oversight Board (United States). Those standards require that we plan and perform the audit to obtain reasonable assurance about whether the financial statements are free of material misstatement. An audit includes examining, on a test basis, evidence supporting the amounts and disclosures in the financial statements, assessing the accounting principles used and significant estimates made by management, and evaluating the overall financial statement presentation. Our procedures included confirmation of securities owned as of April 30, 2017 by correspondence with the custodian and brokers; when replies were not received from brokers, we performed other auditing procedures. We believe that our audits provide a reasonable basis for our opinion.
PricewaterhouseCoopers LLP
Boston, Massachusetts
June 19, 2017
Trustees and Officers
The Trustees, Members of the Advisory Board (if any), and officers of the trust and fund, as applicable, are listed below. The Board of Trustees governs the fund and is responsible for protecting the interests of shareholders. The Trustees are experienced executives who meet periodically throughout the year to oversee the fund's activities, review contractual arrangements with companies that provide services to the fund, oversee management of the risks associated with such activities and contractual arrangements, and review the fund's performance. Except for Jonathan Chiel, each of the Trustees oversees 189 funds. Mr. Chiel oversees 142 funds.
The Trustees hold office without limit in time except that (a) any Trustee may resign; (b) any Trustee may be removed by written instrument, signed by at least two-thirds of the number of Trustees prior to such removal; (c) any Trustee who requests to be retired or who has become incapacitated by illness or injury may be retired by written instrument signed by a majority of the other Trustees; and (d) any Trustee may be removed at any special meeting of shareholders by a two-thirds vote of the outstanding voting securities of the trust. Each Trustee who is not an interested person (as defined in the 1940 Act) of the trust and the fund is referred to herein as an Independent Trustee. Each Independent Trustee shall retire not later than the last day of the calendar year in which his or her 75th birthday occurs. The Independent Trustees may waive this mandatory retirement age policy with respect to individual Trustees. Officers and Advisory Board Members hold office without limit in time, except that any officer or Advisory Board Member may resign or may be removed by a vote of a majority of the Trustees at any regular meeting or any special meeting of the Trustees. Except as indicated, each individual has held the office shown or other offices in the same company for the past five years.
The fund’s Statement of Additional Information (SAI) includes more information about the Trustees. To request a free copy, call Fidelity at 1-877-208-0098.
Experience, Skills, Attributes, and Qualifications of the Trustees. The Governance and Nominating Committee has adopted a statement of policy that describes the experience, qualifications, attributes, and skills that are necessary and desirable for potential Independent Trustee candidates (Statement of Policy). The Board believes that each Trustee satisfied at the time he or she was initially elected or appointed a Trustee, and continues to satisfy, the standards contemplated by the Statement of Policy. The Governance and Nominating Committee also engages professional search firms to help identify potential Independent Trustee candidates who have the experience, qualifications, attributes, and skills consistent with the Statement of Policy. From time to time, additional criteria based on the composition and skills of the current Independent Trustees, as well as experience or skills that may be appropriate in light of future changes to board composition, business conditions, and regulatory or other developments, have also been considered by the professional search firms and the Governance and Nominating Committee. In addition, the Board takes into account the Trustees' commitment and participation in Board and committee meetings, as well as their leadership of standing and ad hoc committees throughout their tenure.
In determining that a particular Trustee was and continues to be qualified to serve as a Trustee, the Board has considered a variety of criteria, none of which, in isolation, was controlling. The Board believes that, collectively, the Trustees have balanced and diverse experience, qualifications, attributes, and skills, which allow the Board to operate effectively in governing the fund and protecting the interests of shareholders. Information about the specific experience, skills, attributes, and qualifications of each Trustee, which in each case led to the Board's conclusion that the Trustee should serve (or continue to serve) as a trustee of the fund, is provided below.
Board Structure and Oversight Function. James C. Curvey is an interested person and currently serves as Chairman. The Trustees have determined that an interested Chairman is appropriate and benefits shareholders because an interested Chairman has a personal and professional stake in the quality and continuity of services provided to the fund. Independent Trustees exercise their informed business judgment to appoint an individual of their choosing to serve as Chairman, regardless of whether the Trustee happens to be independent or a member of management. The Independent Trustees have determined that they can act independently and effectively without having an Independent Trustee serve as Chairman and that a key structural component for assuring that they are in a position to do so is for the Independent Trustees to constitute a substantial majority for the Board. The Independent Trustees also regularly meet in executive session. Ned C. Lautenbach serves as Chairman of the Independent Trustees and as such (i) acts as a liaison between the Independent Trustees and management with respect to matters important to the Independent Trustees and (ii) with management prepares agendas for Board meetings.
Fidelity® funds are overseen by different Boards of Trustees. The fund's Board oversees Fidelity's high income and certain equity funds, and other Boards oversee Fidelity's investment-grade bond, money market, asset allocation, and sector funds. The asset allocation funds may invest in Fidelity® funds overseen by the fund's Board. The use of separate Boards, each with its own committee structure, allows the Trustees of each group of Fidelity® funds to focus on the unique issues of the funds they oversee, including common research, investment, and operational issues. On occasion, the separate Boards establish joint committees to address issues of overlapping consequences for the Fidelity® funds overseen by each Board.
The Trustees operate using a system of committees to facilitate the timely and efficient consideration of all matters of importance to the Trustees, the fund, and fund shareholders and to facilitate compliance with legal and regulatory requirements and oversight of the fund's activities and associated risks. The Board, acting through its committees, has charged FMR and its affiliates with (i) identifying events or circumstances the occurrence of which could have demonstrably adverse effects on the fund's business and/or reputation; (ii) implementing processes and controls to lessen the possibility that such events or circumstances occur or to mitigate the effects of such events or circumstances if they do occur; and (iii) creating and maintaining a system designed to evaluate continuously business and market conditions in order to facilitate the identification and implementation processes described in (i) and (ii) above. Because the day-to-day operations and activities of the fund are carried out by or through FMR, its affiliates, and other service providers, the fund's exposure to risks is mitigated but not eliminated by the processes overseen by the Trustees. While each of the Board's committees has responsibility for overseeing different aspects of the fund's activities, oversight is exercised primarily through the Operations, Audit, and Compliance Committees. In addition, the Independent Trustees have worked with FMR to enhance the Board's oversight of investment and financial risks, legal and regulatory risks, technology risks, and operational risks, including the development of additional risk reporting to the Board. For example, a working group comprised of Independent Trustees and FMR has worked and continues to work to review the Fidelity® funds' valuation-related activities, reporting and risk management. Appropriate personnel, including but not limited to the fund's Chief Compliance Officer (CCO), FMR's internal auditor, the independent accountants, the fund's Treasurer and portfolio management personnel, make periodic reports to the Board's committees, as appropriate, including an annual review of Fidelity's risk management program for the Fidelity® funds. The responsibilities of each standing committee, including their oversight responsibilities, are described further under "Standing Committees of the Trustees."
Interested Trustees*:
Correspondence intended for a Trustee who is an interested person may be sent to Fidelity Investments, 245 Summer Street, Boston, Massachusetts 02210.
Name, Year of Birth; Principal Occupations and Other Relevant Experience+
Jonathan Chiel (1957)
Year of Election or Appointment: 2016
Trustee
Mr. Chiel also serves as Trustee of other Fidelity funds. Mr. Chiel is Executive Vice President and General Counsel for FMR LLC (diversified financial services company, 2012-present). Previously, Mr. Chiel served as general counsel (2004-2012) and senior vice president and deputy general counsel (2000-2004) for John Hancock Financial Services; a partner with Choate, Hall & Stewart (1996-2000) (law firm); and an Assistant United States Attorney for the United States Attorney’s Office of the District of Massachusetts (1986-95), including Chief of the Criminal Division (1993-1995). Mr. Chiel is a director on the boards of the Boston Bar Foundation and the Maimonides School.
James C. Curvey (1935)
Year of Election or Appointment: 2007
Trustee
Chairman of the Board of Trustees
Mr. Curvey also serves as Trustee of other Fidelity® funds. Mr. Curvey is a Director of Fidelity Research & Analysis Co. (investment adviser firm, 2009-present), and Vice Chairman (2007-present) and Director of FMR LLC (diversified financial services company). In addition, Mr. Curvey serves as an Overseer for the Boston Symphony Orchestra and a member of the board of Artis-Naples, Naples, Florida, and as a Trustee for Brewster Academy, Wolfeboro, New Hampshire. Previously, Mr. Curvey served as a Director of Fidelity Investments Money Management, Inc. (investment adviser firm, 2009-2014) and a Director of FMR and FMR Co., Inc. (investment adviser firms, 2007-2014).
Charles S. Morrison (1960)
Year of Election or Appointment: 2014
Trustee
Mr. Morrison also serves as Trustee of other funds. He serves as President of Fidelity Management & Research Company (FMR) (investment adviser firm, 2016-present), a Director of Fidelity Investments Money Management, Inc. (FIMM) (investment adviser firm, 2014-present), Director of Fidelity SelectCo, LLC (investment adviser firm, 2014-present), President, Asset Management (2014-present), and is an employee of Fidelity Investments. Previously, Mr. Morrison served as Vice President of Fidelity's Fixed Income and Asset Allocation Funds (2012-2014), President, Fixed Income (2011-2014), Vice President of Fidelity's Money Market Funds (2005-2009), President, Money Market Group Leader of FMR (investment adviser firm, 2009), and Senior Vice President, Money Market Group of FMR (2004-2009). Mr. Morrison also served as Vice President of Fidelity's Bond Funds (2002-2005), certain Balanced Funds (2002-2005), and certain Asset Allocation Funds (2002-2007), and as Senior Vice President (2002-2005) of Fidelity's Bond Division.
* Determined to be an “Interested Trustee” by virtue of, among other things, his or her affiliation with the trust or various entities under common control with FMR.
+ The information includes the Trustee's principal occupation during the last five years and other information relating to the experience, attributes, and skills relevant to the Trustee's qualifications to serve as a Trustee, which led to the conclusion that the Trustee should serve as a Trustee for the fund.
Independent Trustees:
Correspondence intended for an Independent Trustee may be sent to Fidelity Investments, P.O. Box 55235, Boston, Massachusetts 02205-5235.
Name, Year of Birth; Principal Occupations and Other Relevant Experience+
Dennis J. Dirks (1948)
Year of Election or Appointment: 2005
Trustee
Mr. Dirks also serves as Trustee of other Fidelity® funds. Prior to his retirement in May 2003, Mr. Dirks was Chief Operating Officer and a member of the Board of The Depository Trust & Clearing Corporation (DTCC). He also served as President, Chief Operating Officer, and Board member of The Depository Trust Company (DTC) and President and Board member of the National Securities Clearing Corporation (NSCC). In addition, Mr. Dirks served as Chief Executive Officer and Board member of the Government Securities Clearing Corporation, Chief Executive Officer and Board member of the Mortgage-Backed Securities Clearing Corporation, as a Trustee and a member of the Finance Committee of Manhattan College (2005-2008), as a Trustee and a member of the Finance Committee of AHRC of Nassau County (2006-2008), as a member of the Independent Directors Council (IDC) Governing Council (2010-2015), and as a member of the Board of Directors for The Brookville Center for Children’s Services, Inc. (2009-2017). Mr. Dirks is a member of the Finance Committee (2016-present) and Board of Directors (2017-present) of the Asolo Repertory Theatre.
Alan J. Lacy (1953)
Year of Election or Appointment: 2008
Trustee
Mr. Lacy also serves as Trustee of other Fidelity® funds. Mr. Lacy serves as a Director of Bristol-Myers Squibb Company (global pharmaceuticals, 2008-present). He is a Trustee of the California Chapter of The Nature Conservancy (2015-present) and a Director of the Center for Advanced Study in the Behavioral Sciences at Stanford University (2015-present). In addition, Mr. Lacy served as Senior Adviser (2007-2014) of Oak Hill Capital Partners, L.P. (private equity) and also served as Chief Executive Officer (2005) and Vice Chairman (2005-2006) of Sears Holdings Corporation (retail) and Chief Executive Officer and Chairman of the Board of Sears, Roebuck and Co. (retail, 2000-2005). Previously, Mr. Lacy served as Chairman (2014-2017) and a member (2010-2017) of the Board of Directors of Dave & Buster’s Entertainment, Inc. (restaurant and entertainment complexes), as Chairman (2008-2011) and a member (2006-2015) of the Board of Trustees of the National Parks Conservation Association, and as a member of the Board of Directors for The Hillman Companies, Inc. (hardware wholesalers, 2010-2014), Earth Fare, Inc. (retail grocery, 2010-2014), and The Western Union Company (global money transfer, 2006-2011).
Ned C. Lautenbach (1944)
Year of Election or Appointment: 2000
Trustee
Chairman of the Independent Trustees
Mr. Lautenbach also serves as Trustee of other Fidelity® funds. Mr. Lautenbach currently serves as the Lead Director of the Eaton Corporation Board of Directors (diversified industrial, 1997-present). Mr. Lautenbach is Chairman of the Board of Directors of Artis-Naples in Naples, Florida (2012-present), a member of the Council on Foreign Relations (1994-present), and currently Vice Chair of the Board of Governors, State University System of Florida (2013-present). Previously, Mr. Lautenbach was a Partner and Advisory Partner at Clayton, Dubilier & Rice, LLC (private equity investment, 1998-2010), as well as a Director of Sony Corporation (2006-2007). Mr. Lautenbach also had a 30-year career with IBM (technology company) during which time he served as Senior Vice President and a member of the Corporate Executive Committee (1968-1998).
Joseph Mauriello (1944)
Year of Election or Appointment: 2008
Trustee
Mr. Mauriello also serves as Trustee of other Fidelity® funds. Prior to his retirement in January 2006, Mr. Mauriello served in numerous senior management positions including Deputy Chairman and Chief Operating Officer (2004-2005), and Vice Chairman of Financial Services (2002-2004) of KPMG LLP US (professional services, 1965-2005). Mr. Mauriello currently serves as a member of the Board of Directors of XL Group plc. (global insurance and re-insurance, 2006-present) and the Independent Directors Council (IDC) Governing Council (2015-present). Previously, Mr. Mauriello served as a Director of the Hamilton Funds of the Bank of New York (2006-2007) and of Arcadia Resources Inc. (health care services and products, 2007-2012).
Robert W. Selander (1950)
Year of Election or Appointment: 2011
Trustee
Mr. Selander also serves as Trustee of other Fidelity® funds. Mr. Selander serves as a Director of The Western Union Company (global money transfer, 2014-present) and a non-executive Chairman of Health Equity, Inc. (health savings custodian, 2015-present). Previously, Mr. Selander served as a Member of the Advisory Board of certain Fidelity® funds (2011), and Executive Vice Chairman (2010), Chief Executive Officer (2009-2010), and President and Chief Executive Officer (1997-2009) of Mastercard, Inc.
Cornelia M. Small (1944)
Year of Election or Appointment: 2005
Trustee
Ms. Small also serves as Trustee of other Fidelity® funds. Ms. Small is a member of the Board of Directors (2009-present) and Chair of the Investment Committee (2010-present) of the Teagle Foundation. Ms. Small also serves on the Investment Committee of the Berkshire Taconic Community Foundation (2008-present). Previously, Ms. Small served as Chairperson (2002-2008) and a member of the Investment Committee and Chairperson (2008-2012) and a member of the Board of Trustees of Smith College. In addition, Ms. Small served as Chief Investment Officer, Director of Global Equity Investments, and a member of the Board of Directors of Scudder, Stevens & Clark and Scudder Kemper Investments.
William S. Stavropoulos (1939)
Year of Election or Appointment: 2001
Trustee
Vice Chairman of the Independent Trustees
Mr. Stavropoulos also serves as Trustee of other Fidelity® funds. Mr. Stavropoulos serves as President and Founder of the Michigan Baseball Foundation, the Great Lakes Loons (2007-present). Mr. Stavropoulos is Chairman Emeritus of the Board of Directors of The Dow Chemical Company, where he previously served in numerous senior management positions, including President, CEO (1995-2000; 2002-2004), Chairman of the Executive Committee (2000-2006), and as a member of the Board of Directors (1990-2006). Currently, Mr. Stavropoulos is Chairman of the Board of Directors of Univar Inc. (global distributor of commodity and specialty chemicals), a Director of Teradata Corporation (data warehousing and technology solutions), and a member of the Advisory Board for Metalmark Capital LLC (private equity investment, 2005-present). Mr. Stavropoulos is an operating advisor to Clayton, Dubilier & Rice, LLC (private equity investment). In addition, Mr. Stavropoulos is a member of the University of Notre Dame Advisory Council for the College of Science, a Trustee of the Rollin L. Gerstacker Foundation, and a Director of Artis-Naples in Naples, Florida. Previously, Mr. Stavropoulos served as a Director of Chemical Financial Corporation (bank holding company, 1993-2012) and Tyco International, Ltd. (multinational manufacturing and services, 2007-2012).
David M. Thomas (1949)
Year of Election or Appointment: 2008
Trustee
Mr. Thomas also serves as Trustee of other Fidelity® funds. Mr. Thomas serves as Non-Executive Chairman of the Board of Directors of Fortune Brands Home and Security (home and security products, 2011-present), as a member of the Board of Directors (2004-present) and Presiding Director (2013-present) of Interpublic Group of Companies, Inc. (marketing communication), and as a member of the Board of Trustees of the University of Florida (2013-present). Previously, Mr. Thomas served as Executive Chairman (2005-2006) and Chairman and Chief Executive Officer (2000-2005) of IMS Health, Inc. (pharmaceutical and healthcare information solutions), and a Director of Fortune Brands, Inc. (consumer products, 2000-2011).
+ The information includes the Trustee's principal occupation during the last five years and other information relating to the experience, attributes, and skills relevant to the Trustee's qualifications to serve as a Trustee, which led to the conclusion that the Trustee should serve as a Trustee for the fund.
Advisory Board Members and Officers:
Correspondence intended for an officer or Peter S. Lynch may be sent to Fidelity Investments, 245 Summer Street, Boston, Massachusetts 02210. Officers appear below in alphabetical order.
Name, Year of Birth; Principal Occupation
Peter S. Lynch (1944)
Year of Election or Appointment: 2003
Member of the Advisory Board
Mr. Lynch also serves as Member of the Advisory Board of other Fidelity® funds. Mr. Lynch is Vice Chairman and a Director of FMR (investment adviser firm) and FMR Co., Inc. (investment adviser firm). In addition, Mr. Lynch serves as a Trustee of Boston College and as the Chairman of the Inner-City Scholarship Fund. Previously, Mr. Lynch served on the Special Olympics International Board of Directors (1997-2006).
Elizabeth Paige Baumann (1968)
Year of Election or Appointment: 2017
Anti-Money Laundering (AML) Officer
Ms. Baumann also serves as AML Officer of other funds. She is Chief AML Officer (2012-present) and Senior Vice President (2014-present) of FMR LLC (diversified financial services company) and is an employee of Fidelity Investments. Previously, Ms. Baumann served as AML Officer of the funds (2012-2016), and Vice President (2007-2014) and Deputy Anti-Money Laundering Officer (2007-2012) of FMR LLC.
Marc R. Bryant (1966)
Year of Election or Appointment: 2015
Secretary and Chief Legal Officer (CLO)
Mr. Bryant also serves as Secretary and CLO of other funds. Mr. Bryant serves as CLO, Secretary, and Senior Vice President of Fidelity Management & Research Company (investment adviser firm, 2015-present) and FMR Co., Inc. (investment adviser firm, 2015-present); Secretary of Fidelity SelectCo, LLC (investment adviser firm, 2015-present) and Fidelity Investments Money Management, Inc. (investment adviser firm, 2015-present); and CLO of Fidelity Management & Research (Hong Kong) Limited and FMR Investment Management (UK) Limited (investment adviser firms, 2015-present) and Fidelity Management & Research (Japan) Limited (investment adviser firm, 2016-present). He is Senior Vice President and Deputy General Counsel of FMR LLC (diversified financial services company). Previously, Mr. Bryant served as Secretary and CLO of Fidelity Rutland Square Trust II (2010-2014) and Assistant Secretary of Fidelity's Fixed Income and Asset Allocation Funds (2013-2015). Prior to joining Fidelity Investments, Mr. Bryant served as a Senior Vice President and the Head of Global Retail Legal for AllianceBernstein L.P. (2006-2010), and as the General Counsel for ProFund Advisors LLC (2001-2006).
Jeffrey S. Christian (1961)
Year of Election or Appointment: 2016
Assistant Treasurer
Mr. Christian also serves as Assistant Treasurer of other funds. Mr. Christian is an employee of Fidelity Investments (2003-present).
William C. Coffey (1969)
Year of Election or Appointment: 2009
Assistant Secretary
Mr. Coffey also serves as Assistant Secretary of other funds. He is Senior Vice President and Deputy General Counsel of FMR LLC (diversified financial services company, 2010-present), and is an employee of Fidelity Investments. Previously, Mr. Coffey served as Vice President and Associate General Counsel of FMR LLC (2005-2009).
Jonathan Davis (1968)
Year of Election or Appointment: 2010
Assistant Treasurer
Mr. Davis also serves as Assistant Treasurer of other funds, and is an employee of Fidelity Investments. Previously, Mr. Davis served as Vice President and Associate General Counsel of FMR LLC (diversified financial services company, 2003-2010).
Adrien E. Deberghes (1967)
Year of Election or Appointment: 2016
Assistant Treasurer
Mr. Deberghes also serves as an officer of other funds. He serves as Executive Vice President of Fidelity Investments Money Management, Inc. (FIMM) (investment adviser firm, 2016-present) and is an employee of Fidelity Investments (2008-present). Prior to joining Fidelity Investments, Mr. Deberghes was Senior Vice President of Mutual Fund Administration at State Street Corporation (2007-2008), Senior Director of Mutual Fund Administration at Investors Bank & Trust (2005-2007), and Director of Finance for Dunkin' Brands (2000-2005). Previously, Mr. Deberghes served in other fund officer roles.
Stephanie J. Dorsey (1969)
Year of Election or Appointment: 2010
Assistant Treasurer
Ms. Dorsey also serves as an officer of other funds. She is an employee of Fidelity Investments (2008-present) and has served in other fund officer roles. Prior to joining Fidelity Investments, Ms. Dorsey served as Treasurer (2004-2008) of the JPMorgan Mutual Funds and Vice President (2004-2008) of JPMorgan Chase Bank.
Howard J. Galligan III (1966)
Year of Election or Appointment: 2014
Chief Financial Officer
Mr. Galligan also serves as Chief Financial Officer of other funds. Mr. Galligan serves as President of Fidelity Pricing and Cash Management Services (FPCMS) (2014-present) and as a Director of Strategic Advisers, Inc. (investment adviser firm, 2008-present). Previously, Mr. Galligan served as Chief Administrative Officer of Asset Management (2011-2014) and Chief Operating Officer and Senior Vice President of Investment Support for Strategic Advisers, Inc. (2003-2011).
Scott C. Goebel (1968)
Year of Election or Appointment: 2015
Vice President
Mr. Goebel serves as Vice President of other funds and is an employee of Fidelity Investments (2001-present). Previously, Mr. Goebel served as Senior Vice President of Fidelity Management & Research Company (FMR) (investment adviser firm, 2016), Secretary of Fidelity SelectCo, LLC (investment adviser firm, 2013-2015), Fidelity Investments Money Management, Inc. (FIMM) (investment adviser firm, 2010-2015), and Fidelity Research and Analysis Company (FRAC) (investment adviser firm, 2010-2015); General Counsel, Secretary, and Senior Vice President of FMR (investment adviser firm, 2008-2015) and FMR Co., Inc. (investment adviser firm, 2008-2015); Assistant Secretary of Fidelity Management & Research (Japan) Limited (investment adviser firm, 2008-2015) and Fidelity Management & Research (U.K.) Inc. (investment adviser firm, 2008-2015); Chief Legal Officer (CLO) of Fidelity Management & Research (Hong Kong) Limited (investment adviser firm, 2008-2015); Secretary and CLO of certain Fidelity® funds (2008-2015); Assistant Secretary of FIMM (2008-2010), FRAC (2008-2010), and certain funds (2007-2008); and as Vice President and Secretary of Fidelity Distributors Corporation (FDC) (2005-2007).
Brian B. Hogan (1964)
Year of Election or Appointment: 2009
Vice President
Mr. Hogan also serves as Trustee or Vice President of other funds. Mr. Hogan serves as a Director of FMR Investment Management (UK) Limited (investment adviser firm, 2015-present) and Fidelity SelectCo, LLC (investment adviser firm, 2014-present) and President of the Equity Division of FMR (investment adviser firm, 2009-present). Previously, Mr. Hogan served as Senior Vice President, Equity Research of FMR (2006-2009) and as a portfolio manager. Mr. Brian B. Hogan is not related to Mr. Colm A. Hogan.
Colm A. Hogan (1973)
Year of Election or Appointment: 2016
Deputy Treasurer
Mr. Hogan also serves as an officer of other funds. Mr. Hogan is an employee of Fidelity Investments (2005-present). Mr. Colm A. Hogan is not related to Mr. Brian B. Hogan.
Chris Maher (1972)
Year of Election or Appointment: 2013
Assistant Treasurer
Mr. Maher serves as Assistant Treasurer of other funds. Mr. Maher is Vice President of Valuation Oversight and is an employee of Fidelity Investments. Previously, Mr. Maher served as Vice President of Asset Management Compliance (2013), Vice President of the Program Management Group of FMR (investment adviser firm, 2010-2013), and Vice President of Valuation Oversight (2008-2010).
Melissa M. Reilly (1971)
Year of Election or Appointment: 2014
Vice President of certain Equity Funds
Ms. Reilly also serves as Vice President of other funds. Ms. Reilly is an employee of Fidelity Investments (2004-present).
Kenneth B. Robins (1969)
Year of Election or Appointment: 2016
Chief Compliance Officer
Mr. Robins also serves as an officer of other funds. Mr. Robins serves as Compliance Officer of Fidelity Management & Research Company and FMR Co., Inc. (investment adviser firms, 2016-present) and is an employee of Fidelity Investments (2004-present). Previously, Mr. Robins served as Executive Vice President of Fidelity Investments Money Management, Inc. (investment adviser firm, 2013-2016) and served in other fund officer roles.
Stacie M. Smith (1974)
Year of Election or Appointment: 2016
President and Treasurer
Ms. Smith also serves as an officer of other funds. She is an employee of Fidelity Investments (2009-present) and has served in other fund officer roles. Prior to joining Fidelity Investments, Ms. Smith served as Senior Audit Manager of Ernst & Young LLP (accounting firm, 1996-2009). Previously, Ms. Smith served as Deputy Treasurer of certain Fidelity® funds (2013-2016).
Marc L. Spector (1972)
Year of Election or Appointment: 2016
Assistant Treasurer
Mr. Spector also serves as an officer of other funds. Mr. Spector is an employee of Fidelity Investments (2016-present). Prior to joining Fidelity Investments, Mr. Spector served as Director at the Siegfried Group (accounting firm, 2013-2016), and prior to Siegfried Group as audit senior manager at Deloitte & Touche (accounting firm, 2005-2013).
Renee Stagnone (1975)
Year of Election or Appointment: 2016
Assistant Treasurer
Ms. Stagnone also serves as an officer of other funds. Ms. Stagnone is an employee of Fidelity Investments (1997-present). Previously, Ms. Stagnone served as Deputy Treasurer of certain Fidelity® funds (2013-2016).
Shareholder Expense Example
As a shareholder of the Fund, you incur two types of costs: (1) transaction costs, including sales charges (loads) on purchase payments or redemption proceeds and (2) ongoing costs, including management fees, distribution and/or service (12b-1) fees and other Fund expenses. This Example is intended to help you understand your ongoing costs (in dollars) of investing in the Fund and to compare these costs with the ongoing costs of investing in other mutual funds.
The Example is based on an investment of $1,000 invested at the beginning of the period and held for the entire period (November 1, 2016 to April 30, 2017).
Actual Expenses
The first line of the accompanying table for each class of the Fund provides information about actual account values and actual expenses. You may use the information in this line, together with the amount you invested, to estimate the expenses that you paid over the period. Simply divide your account value by $1,000.00 (for example, an $8,600 account value divided by $1,000.00 = 8.6), then multiply the result by the number in the first line for a class of the Fund under the heading entitled "Expenses Paid During Period" to estimate the expenses you paid on your account during this period. In addition, the Fund, as a shareholder in the underlying Fidelity Central Funds, will indirectly bear its pro-rata share of the fees and expenses incurred by the underlying Fidelity Central Funds. These fees and expenses are not included in the Fund's annualized expense ratio used to calculate the expense estimate in the table below.
Hypothetical Example for Comparison Purposes
The second line of the accompanying table for each class of the Fund provides information about hypothetical account values and hypothetical expenses based on a Class' actual expense ratio and an assumed rate of return of 5% per year before expenses, which is not the Class' actual return. The hypothetical account values and expenses may not be used to estimate the actual ending account balance or expenses you paid for the period. You may use this information to compare the ongoing costs of investing in the Fund and other funds. To do so, compare this 5% hypothetical example with the 5% hypothetical examples that appear in the shareholder reports of the other funds. In addition, the Fund, as a shareholder in the underlying Fidelity Central Funds, will indirectly bear its pro-rata share of the fees and expenses incurred by the underlying Fidelity Central Funds. These fees and expenses are not included in the Fund's annualized expense ratio used to calculate the expense estimate in the table below.
Please note that the expenses shown in the table are meant to highlight your ongoing costs only and do not reflect any transaction costs. Therefore, the second line of the table is useful in comparing ongoing costs only, and will not help you determine the relative total costs of owning different funds. In addition, if these transactional costs were included, your costs would have been higher.
| Annualized Expense Ratio-A | Beginning Account Value November 1, 2016 | Ending Account Value April 30, 2017 | Expenses Paid During Period-B November 1, 2016 to April 30, 2017 | |
| Class A | 1.55% | |||
| Actual | $1,000.00 | $1,235.30 | $8.59 | |
| Hypothetical-C | $1,000.00 | $1,017.11 | $7.75 | |
| Class M | 1.80% | |||
| Actual | $1,000.00 | $1,233.70 | $9.97 | |
| Hypothetical-C | $1,000.00 | $1,015.87 | $9.00 | |
| Class C | 2.30% | |||
| Actual | $1,000.00 | $1,230.30 | $12.72 | |
| Hypothetical-C | $1,000.00 | $1,013.39 | $11.48 | |
| Class I | 1.30% | |||
| Actual | $1,000.00 | $1,237.00 | $7.21 | |
| Hypothetical-C | $1,000.00 | $1,018.35 | $6.51 |
A Annualized expense ratio reflects expenses net of applicable fee waivers.
B Expenses are equal to each Class' annualized expense ratio, multiplied by the average account value over the period, multiplied by 181/365 (to reflect the one-half year period).
C 5% return per year before expenses
Distributions (Unaudited)
The Board of Trustees of Fidelity Advisor Event Driven Opportunities Fund voted to pay to shareholders of record at the opening of business on record date, the following distributions per share derived from capital gains realized from sales of portfolio securities:
| Pay Date | Record Date | Capital Gains | |
| Fidelity Advisor Event Driven Opportunities Fund | |||
| Class A | 06/12/17 | 06/09/17 | $0.158 |
| Class M | 06/12/17 | 06/09/17 | $0.146 |
| Class C | 06/12/17 | 06/09/17 | $0.134 |
| Class I | 06/12/17 | 06/09/17 | $0.167 |
The fund hereby designates as a capital gain dividend with respect to the taxable year ended April 30, 2017, $196,338, or, if subsequently determined to be different, the net capital gain of such year.
Class A designates 100% and 23%; Class M designates 100% and 24%; Class C designates 100% and 27%; and Class I designates 84% and 21%; of the dividends distributed in June and December, respectively during the fiscal year as qualifying for the dividends–received deduction for corporate shareholders.
Class A designates 100% and 25%; Class M designates 100% and 26%; Class C designates 100% and 29%; and Class I designates 85% and 24%; of the dividends distributed in June and December, respectively during the fiscal year as amounts which may be taken into account as a dividend for purposes of the maximum rate under section 1(h)(11) of the Internal Revenue Code.
The fund will notify shareholders in January 2018 of amounts for use in preparing 2017 income tax returns.
Board Approval of Investment Advisory Contracts and Management Fees
Fidelity Advisor Event Driven Opportunities Fund
On September 14, 2016, the Board of Trustees, including the Independent Trustees (together, the Board) voted to approve the management contract and sub-advisory agreements (collectively, the Advisory Contracts) for the fund in connection with reorganizing the fund from one Trust to another. In reaching this determination, the Board considered that the contractual terms of and the fees payable under the fund's Advisory Contracts are identical to those in the fund's current Advisory Contracts. The Board considered that the approval of the Advisory Contracts will not result in any changes to (i) the investment process or strategies employed in the management of the fund's assets; (ii) the nature, extent and quality of services provided under the fund's Advisory Contracts; or (iii) the day-to-day management of the fund or the persons primarily responsible for such management. The Board considered that it approved the Advisory Contracts for the fund at its July 2016 meeting and that it will again consider the renewal of the Advisory Contracts in July 2017.
Because the Board was approving Advisory Contracts with terms identical to the current Advisory Contracts, it did not consider the fund's investment performance, competitiveness of management fees and total expenses, costs of services and profitability, or economies of scale to be significant factors in its decision.
In connection with its consideration of future renewal of the fund's Advisory Contracts, the Board will consider: (i) the nature, extent and quality of services provided to the fund, including shareholder and administrative services and investment performance; (ii) the competitiveness of the fund's management fee and total expenses; (iii) the costs of the services and profitability, including the revenues earned and the expenses incurred by Fidelity conducting the business of developing, marketing, distributing, managing, administering, and servicing the fund and its shareholders, to the extent applicable; and (iv) whether there have been economies of scale in respect of the management of the Fidelity funds, whether the Fidelity funds (including the fund) have appropriately benefited from any such economies of scale, and whether there is potential for realization of any further economies.
Based on its evaluation of all of the conclusions noted above, and after considering all factors it believed relevant, the Board ultimately concluded that the advisory fee structures are fair and reasonable, and that the fund's Advisory Contracts should be approved, without modification, as part of the process of reorganizing the fund from one Trust to another.
![]()
AEDO-ANN-0617
1.9585367.103
Fidelity® Mid-Cap Stock Fund Annual Report April 30, 2017 |
|
Contents
Board Approval of Investment Advisory Contracts and Management Fees |
To view a fund's proxy voting guidelines and proxy voting record for the 12-month period ended June 30, visit http://www.fidelity.com/proxyvotingresults or visit the Securities and Exchange Commission's (SEC) web site at http://www.sec.gov.
You may also call 1-800-544-8544 to request a free copy of the proxy voting guidelines.
Standard & Poor's, S&P and S&P 500 are registered service marks of The McGraw-Hill Companies, Inc. and have been licensed for use by Fidelity Distributors Corporation.
Other third-party marks appearing herein are the property of their respective owners.
All other marks appearing herein are registered or unregistered trademarks or service marks of FMR LLC or an affiliated company. © 2017 FMR LLC. All rights reserved.
This report and the financial statements contained herein are submitted for the general information of the shareholders of the Fund. This report is not authorized for distribution to prospective investors in the Fund unless preceded or accompanied by an effective prospectus.
A fund files its complete schedule of portfolio holdings with the SEC for the first and third quarters of each fiscal year on Form N-Q. Forms N-Q are available on the SEC’s web site at http://www.sec.gov. A fund's Forms N-Q may be reviewed and copied at the SEC’s Public Reference Room in Washington, DC. Information regarding the operation of the SEC's Public Reference Room may be obtained by calling 1-800-SEC-0330.
For a complete list of a fund's portfolio holdings, view the most recent holdings listing, semiannual report, or annual report on Fidelity's web site at http://www.fidelity.com, http://www.institutional.fidelity.com, or http://www.401k.com, as applicable.
NOT FDIC INSURED •MAY LOSE VALUE •NO BANK GUARANTEE
Neither the Fund nor Fidelity Distributors Corporation is a bank.
Performance: The Bottom Line
Average annual total return reflects the change in the value of an investment, assuming reinvestment of distributions from dividend income and capital gains (the profits earned upon the sale of securities that have grown in value, if any) and assuming a constant rate of performance each year. The hypothetical investment and the average annual total returns do not reflect the deduction of taxes that a shareholder would pay on fund distributions or the redemption of fund shares. During periods of reimbursement by Fidelity, a fund’s total return will be greater than it would be had the reimbursement not occurred. How a fund did yesterday is no guarantee of how it will do tomorrow.
Average Annual Total Returns
| For the periods ended April 30, 2017 | Past 1 year | Past 5 years | Past 10 years |
| Fidelity® Mid-Cap Stock Fund | 16.80% | 12.26% | 6.75% |
$10,000 Over 10 Years
Let's say hypothetically that $10,000 was invested in Fidelity® Mid-Cap Stock Fund, a class of the fund, on April 30, 2007.
The chart shows how the value of your investment would have changed, and also shows how the S&P MidCap 400® Index performed over the same period.
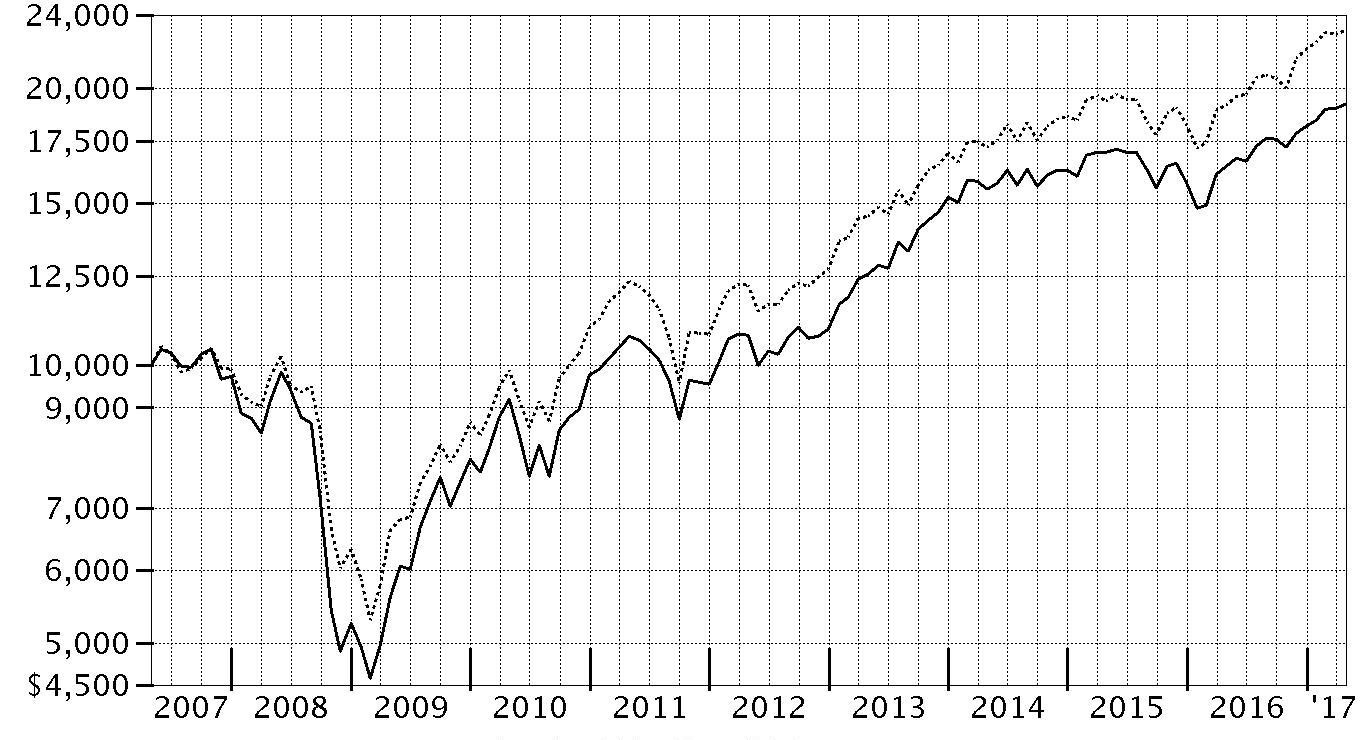
| Period Ending Values | ||
| $19,211 | Fidelity® Mid-Cap Stock Fund | |
| $23,091 | S&P MidCap 400® Index | |
Management's Discussion of Fund Performance
Market Recap: The U.S. equity bellwether S&P 500® index gained 17.92% for the year ending April 30, 2017, rising sharply following the November election and continuing to gain ground through the end of February on optimism for President Trump’s pro-business agenda. Equity markets leveled off, however, as the fledgling administration faced the first test of its domestic agenda. Stocks reacted with uncertainty to efforts by Congress in March to repeal and replace the Affordable Care Act (ACA), and were relatively flat through April 30. In a stark reversal from 2016, growth-oriented stocks topped their value counterparts through the first third of 2017. Sector-wise, information technology (+35%) fared best, anchored by twin rallies in the June 2016 and March 2017 quarters as growth regained favor. Financials (+27%) also handily outperformed, riding an uptick in bond yields and a surge in banks, particularly post-election. Industrials (+19%) and materials (+16%) did well amid a call for increased infrastructure spending and a rise in commodity prices, respectively. Conversely, consumer staples (+9%), real estate (+5%) and telecommunication services (0%) were held back amid an improved backdrop for riskier assets that curbed demand for dividend-rich sectors, as well as the likelihood of one or two additional interest rate hikes later in 2017. Energy (+2%) also struggled this period.Comments from Portfolio Manager John Roth: For the year, the fund's share classes gained about 17%, underperforming the 20.46% return of the benchmark S&P MidCap 400® Index. Versus the benchmark, the fund was poorly positioned amid a rally among more-cyclical stocks following the November U.S. presidential election. In particular, positioning in financials and picks in information technology weighed on the fund's results. Notably, the fund’s cash position of about 7%, on average, was a significant detractor amid a strong market. The fund’s largest individual detractor was an non-index stake in Allstar Co-Invest. Allstar represents a private investment in sporting-goods retailer Academy Sports + Outdoors. Our stake returned -61% the past year, as Academy struggled amid weak conditions for the sporting-goods industry. Elsewhere, we did not own chipmaker Advanced Micro Devices (AMD), which outperformed as investors grew excited about burgeoning opportunities in tech. Stock picking in energy helped, including a sizable out-of-benchmark stake in Williams Companies, the fund’s largest individual contributor and its biggest holding. Williams owns a majority stake in Williams Partners, a master limited partnership (MLP) and North American pipeline owner – and another big non-index fund position and contributor this period.The views expressed above reflect those of the portfolio manager(s) only through the end of the period as stated on the cover of this report and do not necessarily represent the views of Fidelity or any other person in the Fidelity organization. Any such views are subject to change at any time based upon market or other conditions and Fidelity disclaims any responsibility to update such views. These views may not be relied on as investment advice and, because investment decisions for a Fidelity fund are based on numerous factors, may not be relied on as an indication of trading intent on behalf of any Fidelity fund.
Investment Summary (Unaudited)
Top Ten Stocks as of April 30, 2017
| % of fund's net assets | % of fund's net assets 6 months ago | |
| The Williams Companies, Inc. | 2.1 | 2.2 |
| Eurofins Scientific SA | 2.1 | 2.0 |
| Boston Scientific Corp. | 1.6 | 1.4 |
| Williams Partners LP | 1.5 | 1.5 |
| ARAMARK Holdings Corp. | 1.5 | 1.3 |
| NVR, Inc. | 1.4 | 1.2 |
| First Data Corp. Class A | 1.4 | 1.3 |
| Aspen Technology, Inc. | 1.4 | 1.2 |
| Arch Capital Group Ltd. | 1.3 | 1.2 |
| First American Financial Corp. | 1.3 | 1.3 |
| 15.6 |
Top Five Market Sectors as of April 30, 2017
| % of fund's net assets | % of fund's net assets 6 months ago | |
| Information Technology | 18.2 | 18.0 |
| Financials | 15.5 | 13.1 |
| Industrials | 12.8 | 10.8 |
| Health Care | 11.5 | 9.9 |
| Consumer Discretionary | 11.0 | 11.6 |
Asset Allocation (% of fund's net assets)
| As of April 30, 2017 * | ||
| Stocks | 92.8% | |
| Bonds | 0.1% | |
| Convertible Securities | 0.1% | |
| Other Investments | 0.2% | |
| Short-Term Investments and Net Other Assets (Liabilities) | 6.8% | |

* Foreign investments - 13.0%
| As of October 31, 2016 * | ||
| Stocks | 90.2% | |
| Bonds | 0.1% | |
| Short-Term Investments and Net Other Assets (Liabilities) | 9.7% | |

* Foreign investments - 11.3%
Investments April 30, 2017
Showing Percentage of Net Assets
| Common Stocks - 92.7% | |||
| Shares | Value (000s) | ||
| CONSUMER DISCRETIONARY - 10.9% | |||
| Auto Components - 0.3% | |||
| Magna International, Inc. Class A (sub. vtg.) | 574,500 | $23,998 | |
| Automobiles - 0.5% | |||
| Fiat Chrysler Automobiles NV (a) | 3,522,500 | 40,051 | |
| Distributors - 0.9% | |||
| Pool Corp. | 592,501 | 70,875 | |
| Hotels, Restaurants & Leisure - 2.0% | |||
| ARAMARK Holdings Corp. | 3,206,840 | 117,114 | |
| Noodles & Co. (a)(b)(c) | 2,354,500 | 13,774 | |
| Whitbread PLC | 406,510 | 21,245 | |
| 152,133 | |||
| Household Durables - 3.3% | |||
| D.R. Horton, Inc. | 1,206,433 | 39,680 | |
| Lennar Corp. Class A | 583,900 | 29,487 | |
| NVR, Inc. (a) | 54,400 | 114,852 | |
| Toll Brothers, Inc. | 2,111,287 | 75,985 | |
| 260,004 | |||
| Leisure Products - 0.2% | |||
| New Academy Holding Co. LLC unit (a)(d)(e) | 294,000 | 17,675 | |
| Media - 0.3% | |||
| WME Entertainment Parent, LLC Class A (e)(f) | 8,324,258 | 18,813 | |
| Multiline Retail - 0.3% | |||
| Dollar General Corp. | 308,100 | 22,402 | |
| Specialty Retail - 2.4% | |||
| AutoZone, Inc. (a) | 47,100 | 32,602 | |
| Citi Trends, Inc. (c) | 887,653 | 16,679 | |
| Ross Stores, Inc. | 478,500 | 31,103 | |
| Sally Beauty Holdings, Inc. (a) | 889,900 | 16,926 | |
| Tiffany & Co., Inc. | 755,300 | 69,223 | |
| Ulta Beauty, Inc. (a) | 84,600 | 23,810 | |
| 190,343 | |||
| Textiles, Apparel & Luxury Goods - 0.7% | |||
| Brunello Cucinelli SpA (b) | 2,067,300 | 54,136 | |
| TOTAL CONSUMER DISCRETIONARY | 850,430 | ||
| CONSUMER STAPLES - 2.6% | |||
| Beverages - 0.8% | |||
| Molson Coors Brewing Co. Class B | 606,100 | 58,119 | |
| Food Products - 1.1% | |||
| Amira Nature Foods Ltd. (a)(b) | 1,783,275 | 9,255 | |
| Amplify Snack Brands, Inc. (a)(b) | 3,540,897 | 31,868 | |
| Greencore Group PLC | 3,913,584 | 11,557 | |
| The Hershey Co. | 301,400 | 32,611 | |
| 85,291 | |||
| Household Products - 0.4% | |||
| Church & Dwight Co., Inc. | 616,646 | 30,542 | |
| Personal Products - 0.3% | |||
| Coty, Inc. Class A | 1,454,800 | 25,968 | |
| TOTAL CONSUMER STAPLES | 199,920 | ||
| ENERGY - 9.0% | |||
| Energy Equipment & Services - 1.4% | |||
| Borr Drilling Ltd. (a) | 7,496,000 | 29,684 | |
| Helmerich & Payne, Inc. (b) | 220,000 | 13,341 | |
| Oceaneering International, Inc. | 1,734,900 | 45,784 | |
| TechnipFMC PLC (a) | 674,200 | 20,314 | |
| 109,123 | |||
| Oil, Gas & Consumable Fuels - 7.6% | |||
| Cabot Oil & Gas Corp. | 2,062,800 | 47,939 | |
| Cimarex Energy Co. | 414,500 | 48,364 | |
| Cobalt International Energy, Inc. (a)(b) | 3,085,300 | 1,207 | |
| Denbury Resources, Inc. (a)(b) | 4,034,200 | 8,956 | |
| Diamondback Energy, Inc. (a) | 522,000 | 52,116 | |
| Energy Transfer Equity LP | 1,017,000 | 18,977 | |
| GasLog Ltd. (b) | 1,850,477 | 25,907 | |
| Golar LNG Ltd. (b) | 1,428,800 | 36,449 | |
| Range Resources Corp. | 662,600 | 17,552 | |
| SM Energy Co. | 1,451,300 | 32,785 | |
| Southwestern Energy Co. (a) | 1,239,400 | 9,308 | |
| The Williams Companies, Inc. | 5,378,000 | 164,725 | |
| Whiting Petroleum Corp. (a) | 1,751,200 | 14,535 | |
| Williams Partners LP | 2,944,100 | 120,502 | |
| 599,322 | |||
| TOTAL ENERGY | 708,445 | ||
| FINANCIALS - 15.5% | |||
| Banks - 6.7% | |||
| First Republic Bank | 1,000,300 | 92,488 | |
| FNB Corp., Pennsylvania | 3,698,600 | 52,668 | |
| Huntington Bancshares, Inc. | 5,169,700 | 66,482 | |
| M&T Bank Corp. | 454,400 | 70,618 | |
| Prosperity Bancshares, Inc. | 592,900 | 39,843 | |
| Regions Financial Corp. | 5,797,524 | 79,716 | |
| SunTrust Banks, Inc. | 1,070,300 | 60,804 | |
| Texas Capital Bancshares, Inc. (a) | 245,400 | 18,675 | |
| UMB Financial Corp. | 631,300 | 45,763 | |
| 527,057 | |||
| Capital Markets - 1.0% | |||
| KKR & Co. LP | 4,039,184 | 76,664 | |
| Insurance - 6.0% | |||
| Arch Capital Group Ltd. (a) | 1,080,700 | 104,795 | |
| Brown & Brown, Inc. | 1,181,800 | 50,699 | |
| First American Financial Corp. | 2,404,000 | 104,358 | |
| FNF Group | 2,009,400 | 82,285 | |
| Progressive Corp. | 1,774,700 | 70,491 | |
| Willis Group Holdings PLC | 407,100 | 53,990 | |
| 466,618 | |||
| Thrifts & Mortgage Finance - 1.8% | |||
| MGIC Investment Corp. (a) | 5,946,709 | 62,678 | |
| Radian Group, Inc. | 4,783,944 | 80,753 | |
| 143,431 | |||
| TOTAL FINANCIALS | 1,213,770 | ||
| HEALTH CARE - 11.4% | |||
| Health Care Equipment & Supplies - 3.7% | |||
| Boston Scientific Corp. (a) | 4,733,400 | 124,867 | |
| DexCom, Inc. (a) | 292,900 | 22,834 | |
| Sartorius Stedim Biotech | 222,388 | 14,915 | |
| Teleflex, Inc. | 315,200 | 65,212 | |
| The Cooper Companies, Inc. | 307,165 | 61,534 | |
| 289,362 | |||
| Health Care Providers & Services - 3.1% | |||
| Acadia Healthcare Co., Inc. (a)(b) | 562,100 | 24,496 | |
| Amplifon SpA | 2,524,582 | 32,203 | |
| Henry Schein, Inc. (a) | 227,700 | 39,574 | |
| MEDNAX, Inc. (a) | 936,600 | 56,533 | |
| Premier, Inc. (a) | 580,400 | 19,618 | |
| Teladoc, Inc. (a)(b) | 465,100 | 11,534 | |
| Universal Health Services, Inc. Class B | 498,900 | 60,247 | |
| 244,205 | |||
| Health Care Technology - 1.0% | |||
| Cerner Corp. (a) | 446,400 | 28,904 | |
| HealthStream, Inc. (a) | 854,400 | 23,744 | |
| Medidata Solutions, Inc. (a) | 396,300 | 25,930 | |
| 78,578 | |||
| Life Sciences Tools & Services - 2.9% | |||
| Agilent Technologies, Inc. | 1,178,100 | 64,854 | |
| Eurofins Scientific SA | 332,300 | 163,649 | |
| 228,503 | |||
| Pharmaceuticals - 0.7% | |||
| Catalent, Inc. (a) | 1,770,050 | 51,827 | |
| TOTAL HEALTH CARE | 892,475 | ||
| INDUSTRIALS - 12.8% | |||
| Aerospace & Defense - 3.3% | |||
| Elbit Systems Ltd. (b) | 192,200 | 22,831 | |
| HEICO Corp. | 41,892 | 2,977 | |
| HEICO Corp. Class A | 299,500 | 18,359 | |
| KEYW Holding Corp. (a)(b)(c) | 4,531,636 | 43,005 | |
| Rockwell Collins, Inc. | 443,200 | 46,133 | |
| Space Exploration Technologies Corp. Class A (a)(e) | 124,710 | 13,095 | |
| Teledyne Technologies, Inc. (a) | 476,400 | 64,233 | |
| Textron, Inc. | 553,600 | 25,831 | |
| TransDigm Group, Inc. | 79,500 | 19,615 | |
| 256,079 | |||
| Air Freight & Logistics - 0.9% | |||
| C.H. Robinson Worldwide, Inc. | 495,600 | 36,030 | |
| Expeditors International of Washington, Inc. | 567,657 | 31,840 | |
| PostNL NV (b) | 1,093,527 | 5,416 | |
| 73,286 | |||
| Commercial Services & Supplies - 1.0% | |||
| KAR Auction Services, Inc. | 714,700 | 31,175 | |
| Stericycle, Inc. (a) | 324,600 | 27,701 | |
| U.S. Ecology, Inc. | 457,981 | 21,594 | |
| 80,470 | |||
| Construction & Engineering - 0.5% | |||
| Jacobs Engineering Group, Inc. | 638,800 | 35,083 | |
| Electrical Equipment - 2.1% | |||
| AMETEK, Inc. | 1,189,992 | 68,068 | |
| Generac Holdings, Inc. (a) | 817,700 | 28,759 | |
| Melrose Industries PLC | 11,264,617 | 34,505 | |
| Regal Beloit Corp. | 381,100 | 30,050 | |
| 161,382 | |||
| Machinery - 3.2% | |||
| Donaldson Co., Inc. | 1,200,800 | 55,573 | |
| Flowserve Corp. | 1,153,400 | 58,673 | |
| Kennametal, Inc. | 903,800 | 37,580 | |
| Pentair PLC | 910,800 | 58,756 | |
| Rational AG | 76,000 | 38,190 | |
| 248,772 | |||
| Marine - 0.1% | |||
| Goodbulk Ltd. (a)(c) | 906,187 | 9,884 | |
| Road & Rail - 0.7% | |||
| Genesee & Wyoming, Inc. Class A (a) | 806,600 | 54,655 | |
| Trading Companies & Distributors - 1.0% | |||
| Rush Enterprises, Inc. Class A (a) | 738,700 | 27,886 | |
| United Rentals, Inc. (a) | 490,173 | 53,752 | |
| 81,638 | |||
| TOTAL INDUSTRIALS | 1,001,249 | ||
| INFORMATION TECHNOLOGY - 18.2% | |||
| Communications Equipment - 0.3% | |||
| Juniper Networks, Inc. | 817,800 | 24,591 | |
| Electronic Equipment & Components - 4.4% | |||
| Amphenol Corp. Class A | 1,122,200 | 81,146 | |
| Arrow Electronics, Inc. (a) | 1,329,000 | 93,695 | |
| CDW Corp. | 550,700 | 32,541 | |
| Fabrinet (a) | 1,117,231 | 38,734 | |
| IPG Photonics Corp. (a) | 336,500 | 42,507 | |
| Keysight Technologies, Inc. (a) | 1,528,900 | 57,227 | |
| 345,850 | |||
| Internet Software & Services - 1.4% | |||
| Akamai Technologies, Inc. (a) | 566,200 | 34,504 | |
| Endurance International Group Holdings, Inc. (a) | 2,344,600 | 17,819 | |
| GoDaddy, Inc. (a) | 1,128,000 | 43,902 | |
| LogMeIn, Inc. | 128,281 | 14,496 | |
| 110,721 | |||
| IT Services - 5.8% | |||
| Fidelity National Information Services, Inc. | 663,186 | 55,834 | |
| First Data Corp. Class A (a) | 6,852,773 | 107,040 | |
| Fiserv, Inc. (a) | 534,800 | 63,716 | |
| FleetCor Technologies, Inc. (a) | 338,100 | 47,719 | |
| Leidos Holdings, Inc. | 1,423,200 | 74,946 | |
| Total System Services, Inc. | 624,100 | 35,767 | |
| WNS Holdings Ltd. sponsored ADR (a) | 2,005,300 | 64,210 | |
| 449,232 | |||
| Semiconductors & Semiconductor Equipment - 1.9% | |||
| Analog Devices, Inc. | 122,989 | 9,372 | |
| KLA-Tencor Corp. | 477,700 | 46,920 | |
| Maxim Integrated Products, Inc. | 756,400 | 33,395 | |
| Silicon Laboratories, Inc. (a) | 526,494 | 37,460 | |
| Xilinx, Inc. | 378,900 | 23,912 | |
| 151,059 | |||
| Software - 4.4% | |||
| ANSYS, Inc. (a) | 887,000 | 97,712 | |
| Aspen Technology, Inc. (a) | 1,716,800 | 105,566 | |
| Citrix Systems, Inc. (a) | 746,500 | 60,422 | |
| Mobileye NV (a) | 801,200 | 49,610 | |
| Red Hat, Inc. (a) | 371,300 | 32,704 | |
| 346,014 | |||
| TOTAL INFORMATION TECHNOLOGY | 1,427,467 | ||
| MATERIALS - 2.7% | |||
| Chemicals - 0.6% | |||
| Albemarle Corp. U.S. | 215,000 | 23,416 | |
| Potash Corp. of Saskatchewan, Inc. | 1,233,500 | 20,802 | |
| 44,218 | |||
| Construction Materials - 0.2% | |||
| Forterra, Inc. | 994,600 | 19,136 | |
| Containers & Packaging - 0.8% | |||
| WestRock Co. | 1,156,900 | 61,964 | |
| Metals & Mining - 1.1% | |||
| Franco-Nevada Corp. | 342,600 | 23,301 | |
| Freeport-McMoRan, Inc. (a) | 1,595,900 | 20,348 | |
| Newcrest Mining Ltd. | 1,286,984 | 20,392 | |
| Novagold Resources, Inc. (a)(b) | 5,118,176 | 21,222 | |
| 85,263 | |||
| TOTAL MATERIALS | 210,581 | ||
| REAL ESTATE - 4.1% | |||
| Equity Real Estate Investment Trusts (REITs) - 3.6% | |||
| Apartment Investment & Management Co. Class A | 912,500 | 39,913 | |
| Cousins Properties, Inc. | 5,242,791 | 44,511 | |
| Essex Property Trust, Inc. | 262,600 | 64,198 | |
| Healthcare Realty Trust, Inc. | 1,239,500 | 40,656 | |
| Healthcare Trust of America, Inc. | 1,110,600 | 35,417 | |
| National Retail Properties, Inc. | 357,700 | 15,102 | |
| Parkway, Inc. | 655,373 | 13,206 | |
| VEREIT, Inc. | 3,822,100 | 31,991 | |
| 284,994 | |||
| Real Estate Management & Development - 0.5% | |||
| Realogy Holdings Corp. | 1,136,000 | 34,705 | |
| TOTAL REAL ESTATE | 319,699 | ||
| TELECOMMUNICATION SERVICES - 0.2% | |||
| Diversified Telecommunication Services - 0.2% | |||
| Iridium Communications, Inc. (a)(b) | 1,809,500 | 19,181 | |
| UTILITIES - 5.3% | |||
| Electric Utilities - 3.8% | |||
| Alliant Energy Corp. | 2,027,400 | 79,717 | |
| IDACORP, Inc. | 948,433 | 80,162 | |
| OGE Energy Corp. | 2,171,600 | 75,528 | |
| Xcel Energy, Inc. | 1,346,882 | 60,677 | |
| 296,084 | |||
| Gas Utilities - 1.5% | |||
| Atmos Energy Corp. | 1,214,597 | 98,407 | |
| Spire, Inc. | 333,000 | 22,827 | |
| 121,234 | |||
| TOTAL UTILITIES | 417,318 | ||
| TOTAL COMMON STOCKS | |||
| (Cost $5,368,172) | 7,260,535 | ||
| Preferred Stocks - 0.2% | |||
| Convertible Preferred Stocks - 0.1% | |||
| CONSUMER DISCRETIONARY - 0.1% | |||
| Leisure Products - 0.1% | |||
| Peloton Interactive, Inc. Series E (e) | 439,714 | 9,525 | |
| Nonconvertible Preferred Stocks - 0.1% | |||
| HEALTH CARE - 0.1% | |||
| Health Care Equipment & Supplies - 0.1% | |||
| Sartorius AG (non-vtg.) | 95,836 | 8,775 | |
| TOTAL PREFERRED STOCKS | |||
| (Cost $16,979) | 18,300 | ||
| Principal Amount (000s) | Value (000s) | ||
| Nonconvertible Bonds - 0.1% | |||
| ENERGY - 0.1% | |||
| Energy Equipment & Services - 0.1% | |||
| Pacific Drilling SA 5.375% 6/1/20(g) | 26,110 | 12,533 | |
| (Cost $16,873) | |||
| Shares | Value (000s) | ||
| Other - 0.2% | |||
| ENERGY - 0.2% | |||
| Oil, Gas & Consumable Fuels - 0.2% | |||
| Utica Shale Drilling Program (non-operating revenue interest) (e)(f) | |||
| (Cost $13,599) | 13,598,556 | 13,599 | |
| Money Market Funds - 7.8% | |||
| Fidelity Cash Central Fund, 0.85% (h) | 488,294,972 | 488,393 | |
| Fidelity Securities Lending Cash Central Fund 0.86% (h)(i) | 122,879,828 | 122,892 | |
| TOTAL MONEY MARKET FUNDS | |||
| (Cost $611,198) | 611,285 | ||
| TOTAL INVESTMENT PORTFOLIO - 101.0% | |||
| (Cost $6,026,821) | 7,916,252 | ||
| NET OTHER ASSETS (LIABILITIES) - (1.0)% | (81,426) | ||
| NET ASSETS - 100% | $7,834,826 |
Legend
(a) Non-income producing
(b) Security or a portion of the security is on loan at period end.
(c) Affiliated company
(d) Investment is owned by an entity that is treated as a U.S. Corporation for tax purposes in which the Fund holds a percentage ownership.
(e) Restricted securities - Investment in securities not registered under the Securities Act of 1933 (excluding 144A issues). At the end of the period, the value of restricted securities (excluding 144A issues) amounted to $72,707,000 or 0.9% of net assets.
(f) Investment is owned by a wholly-owned subsidiary (Subsidiary) that is treated as a corporation for U.S. tax purposes.
(g) Security exempt from registration under Rule 144A of the Securities Act of 1933. These securities may be resold in transactions exempt from registration, normally to qualified institutional buyers. At the end of the period, the value of these securities amounted to $12,533,000 or 0.2% of net assets.
(h) Affiliated fund that is generally available only to investment companies and other accounts managed by Fidelity Investments. The rate quoted is the annualized seven-day yield of the fund at period end. A complete unaudited listing of the fund's holdings as of its most recent quarter end is available upon request. In addition, each Fidelity Central Fund's financial statements, which are not covered by the Fund's Report of Independent Registered Public Accounting Firm, are available on the SEC's website or upon request.
(i) Investment made with cash collateral received from securities on loan.
Additional information on each restricted holding is as follows:
| Security | Acquisition Date | Acquisition Cost (000s) |
| New Academy Holding Co. LLC unit | 8/1/11 | $30,988 |
| Peloton Interactive, Inc. Series E | 3/31/17 | $9,525 |
| Space Exploration Technologies Corp. Class A | 4/8/16 - 4/6/17 | $12,269 |
| Utica Shale Drilling Program (non-operating revenue interest) | 10/5/16 - 11/4/16 | $13,599 |
| WME Entertainment Parent, LLC Class A | 8/16/16 | $16,835 |
Affiliated Central Funds
Information regarding fiscal year to date income earned by the Fund from investments in Fidelity Central Funds is as follows:
| Fund | Income earned |
| (Amounts in thousands) | |
| Fidelity Cash Central Fund | $2,690 |
| Fidelity Securities Lending Cash Central Fund | 2,399 |
| Total | $5,089 |
Other Affiliated Issuers
An affiliated company is a company in which the Fund has ownership of at least 5% of the voting securities. Fiscal year to date transactions with companies which are or were affiliates are as follows:
| Affiliate (Amounts in thousands) | Value, beginning of period | Purchases | Sales Proceeds* | Dividend Income | Value, end of period |
| Citi Trends, Inc. | $16,152 | $-- | $197 | $214 | $16,679 |
| Goodbulk Ltd. | -- | 9,968 | -- | -- | 9,884 |
| KEYW Holding Corp. | 24,249 | 11,293 | 467 | -- | 43,005 |
| Noodles & Co. | 26,599 | -- | 233 | -- | 13,774 |
| Total | $67,000 | $21,261 | $897 | $214 | $83,342 |
* Includes the value of securities delivered through in-kind transactions, if applicable.
Investment Valuation
The following is a summary of the inputs used, as of April 30, 2017, involving the Fund's assets and liabilities carried at fair value. The inputs or methodology used for valuing securities may not be an indication of the risk associated with investing in those securities. For more information on valuation inputs, and their aggregation into the levels used below, please refer to the Investment Valuation section in the accompanying Notes to Financial Statements.
| Valuation Inputs at Reporting Date: | ||||
| Description | Total | Level 1 | Level 2 | Level 3 |
| (Amounts in thousands) | ||||
| Investments in Securities: | ||||
| Equities: | ||||
| Consumer Discretionary | $859,955 | $813,942 | $-- | $46,013 |
| Consumer Staples | 199,920 | 199,920 | -- | -- |
| Energy | 708,445 | 708,445 | -- | -- |
| Financials | 1,213,770 | 1,213,770 | -- | -- |
| Health Care | 901,250 | 901,250 | -- | -- |
| Industrials | 1,001,249 | 988,154 | -- | 13,095 |
| Information Technology | 1,427,467 | 1,427,467 | -- | -- |
| Materials | 210,581 | 210,581 | -- | -- |
| Real Estate | 319,699 | 319,699 | -- | -- |
| Telecommunication Services | 19,181 | 19,181 | -- | -- |
| Utilities | 417,318 | 417,318 | -- | -- |
| Corporate Bonds | 12,533 | -- | 12,533 | -- |
| Other | 13,599 | -- | -- | 13,599 |
| Money Market Funds | 611,285 | 611,285 | -- | -- |
| Total Investments in Securities: | $7,916,252 | $7,831,012 | $12,533 | $72,707 |
Other Information
Distribution of investments by country or territory of incorporation, as a percentage of Total Net Assets, is as follows (Unaudited):
| United States of America | 87.0% |
| Bermuda | 2.6% |
| Luxembourg | 2.2% |
| Netherlands | 1.2% |
| Canada | 1.2% |
| Italy | 1.1% |
| Ireland | 1.0% |
| Others (Individually Less Than 1%) | 3.7% |
| 100.0% |
See accompanying notes which are an integral part of the financial statements.
Financial Statements
Statement of Assets and Liabilities
| Amounts in thousands (except per-share amounts) | April 30, 2017 | |
| Assets | ||
| Investment in securities, at value (including securities loaned of $117,597) — See accompanying schedule: Unaffiliated issuers (cost $5,286,567) | $7,221,625 | |
| Fidelity Central Funds (cost $611,198) | 611,285 | |
| Other affiliated issuers (cost $129,056) | 83,342 | |
| Total Investments (cost $6,026,821) | $7,916,252 | |
| Restricted cash | 337 | |
| Foreign currency held at value (cost $406) | 406 | |
| Receivable for investments sold | 43,800 | |
| Receivable for fund shares sold | 3,343 | |
| Dividends receivable | 2,358 | |
| Interest receivable | 585 | |
| Distributions receivable from Fidelity Central Funds | 482 | |
| Prepaid expenses | 5 | |
| Other receivables | 489 | |
| Total assets | 7,968,057 | |
| Liabilities | ||
| Payable for investments purchased | $745 | |
| Payable for fund shares redeemed | 5,989 | |
| Accrued management fee | 2,196 | |
| Other affiliated payables | 934 | |
| Other payables and accrued expenses | 498 | |
| Collateral on securities loaned | 122,869 | |
| Total liabilities | 133,231 | |
| Net Assets | $7,834,826 | |
| Net Assets consist of: | ||
| Paid in capital | $5,771,596 | |
| Distributions in excess of net investment income | (9,883) | |
| Accumulated undistributed net realized gain (loss) on investments and foreign currency transactions | 183,667 | |
| Net unrealized appreciation (depreciation) on investments and assets and liabilities in foreign currencies | 1,889,446 | |
| Net Assets | $7,834,826 | |
| Mid-Cap Stock: | ||
| Net Asset Value, offering price and redemption price per share ($5,621,573 ÷ 153,515 shares) | $36.62 | |
| Class K: | ||
| Net Asset Value, offering price and redemption price per share ($2,213,253 ÷ 60,410 shares) | $36.64 |
See accompanying notes which are an integral part of the financial statements.
Statement of Operations
| Amounts in thousands | Year ended April 30, 2017 | |
| Investment Income | ||
| Dividends (including $214 earned from other affiliated issuers) | $82,318 | |
| Interest | 3,353 | |
| Income from Fidelity Central Funds | 5,089 | |
| Total income | 90,760 | |
| Expenses | ||
| Management fee | ||
| Basic fee | $40,733 | |
| Performance adjustment | (11,370) | |
| Transfer agent fees | 9,752 | |
| Accounting and security lending fees | 1,225 | |
| Custodian fees and expenses | 132 | |
| Independent trustees' fees and expenses | 31 | |
| Registration fees | 114 | |
| Audit | 79 | |
| Legal | 26 | |
| Miscellaneous | 67 | |
| Total expenses before reductions | 40,789 | |
| Expense reductions | (336) | 40,453 |
| Net investment income (loss) | 50,307 | |
| Realized and Unrealized Gain (Loss) | ||
| Net realized gain (loss) on: | ||
| Investment securities: | ||
| Unaffiliated issuers | 386,861 | |
| Fidelity Central Funds | (18) | |
| Other affiliated issuers | (209) | |
| Foreign currency transactions | 1 | |
| Total net realized gain (loss) | 386,635 | |
| Change in net unrealized appreciation (depreciation) on: Investment securities | 721,303 | |
| Assets and liabilities in foreign currencies | 6 | |
| Total change in net unrealized appreciation (depreciation) | 721,309 | |
| Net gain (loss) | 1,107,944 | |
| Net increase (decrease) in net assets resulting from operations | $1,158,251 |
See accompanying notes which are an integral part of the financial statements.
Statement of Changes in Net Assets
| Amounts in thousands | Year ended April 30, 2017 | Year ended April 30, 2016 |
| Increase (Decrease) in Net Assets | ||
| Operations | ||
| Net investment income (loss) | $50,307 | $46,833 |
| Net realized gain (loss) | 386,635 | 857,446 |
| Change in net unrealized appreciation (depreciation) | 721,309 | (1,201,757) |
| Net increase (decrease) in net assets resulting from operations | 1,158,251 | (297,478) |
| Distributions to shareholders from net investment income | (58,332) | (48,569) |
| Distributions to shareholders from net realized gain | (541,715) | (930,371) |
| Total distributions | (600,047) | (978,940) |
| Share transactions - net increase (decrease) | 152,647 | (61,224) |
| Redemption fees | 28 | 35 |
| Total increase (decrease) in net assets | 710,879 | (1,337,607) |
| Net Assets | ||
| Beginning of period | 7,123,947 | 8,461,554 |
| End of period | $7,834,826 | $7,123,947 |
| Other Information | ||
| Undistributed net investment income end of period | $– | $17,650 |
| Distributions in excess of net investment income end of period | $(9,883) | $– |
See accompanying notes which are an integral part of the financial statements.
Financial Highlights — Fidelity Mid-Cap Stock Fund
| Years ended April 30, | 2017 | 2016 | 2015 | 2014 | 2013 |
| Selected Per–Share Data | |||||
| Net asset value, beginning of period | $34.07 | $40.11 | $40.26 | $33.69 | $30.15 |
| Income from Investment Operations | |||||
| Net investment income (loss)A | .22 | .21 | .18 | .10 | .29 |
| Net realized and unrealized gain (loss) | 5.19 | (1.54) | 3.52 | 7.69 | 4.45 |
| Total from investment operations | 5.41 | (1.33) | 3.70 | 7.79 | 4.74 |
| Distributions from net investment income | (.27) | (.22) | (.09) | (.08) | (.33) |
| Distributions from net realized gain | (2.59) | (4.49) | (3.76) | (1.14) | (.87) |
| Total distributions | (2.86) | (4.71) | (3.85) | (1.22) | (1.20) |
| Redemption fees added to paid in capitalA,B | – | – | – | – | – |
| Net asset value, end of period | $36.62 | $34.07 | $40.11 | $40.26 | $33.69 |
| Total ReturnC | 16.80% | (3.44)% | 9.83% | 23.50% | 16.54% |
| Ratios to Average Net AssetsD,E | |||||
| Expenses before reductions | .58% | .72% | .73% | .78% | .65% |
| Expenses net of fee waivers, if any | .58% | .72% | .72% | .78% | .65% |
| Expenses net of all reductions | .58% | .72% | .72% | .78% | .63% |
| Net investment income (loss) | .64% | .59% | .46% | .25% | .95% |
| Supplemental Data | |||||
| Net assets, end of period (in millions) | $5,622 | $5,136 | $5,874 | $5,966 | $4,750 |
| Portfolio turnover rateF | 27%G | 23%G | 29% | 27% | 46% |
A Calculated based on average shares outstanding during the period.
B Amount represents less than $.005 per share.
C Total returns would have been lower if certain expenses had not been reduced during the applicable periods shown.
D Fees and expenses of any underlying Fidelity Central Funds are not included in the Fund's expense ratio. The Fund indirectly bears its proportionate share of the expenses of any underlying Fidelity Central Funds.
E Expense ratios reflect operating expenses of the class. Expenses before reductions do not reflect amounts reimbursed by the investment adviser or reductions from brokerage service arrangements or reductions from other expense offset arrangements and do not represent the amount paid by the class during periods when reimbursements or reductions occur. Expenses net of fee waivers reflect expenses after reimbursement by the investment adviser but prior to reductions from brokerage service arrangements or other expense offset arrangements. Expenses net of all reductions represent the net expenses paid by the class.
F Amount does not include the portfolio activity of any underlying Fidelity Central Funds.
G Portfolio turnover rate excludes securities received or delivered in-kind.
See accompanying notes which are an integral part of the financial statements.
Financial Highlights — Fidelity Mid-Cap Stock Fund Class K
| Years ended April 30, | 2017 | 2016 | 2015 | 2014 | 2013 |
| Selected Per–Share Data | |||||
| Net asset value, beginning of period | $34.08 | $40.12 | $40.27 | $33.68 | $30.15 |
| Income from Investment Operations | |||||
| Net investment income (loss)A | .26 | .25 | .22 | .15 | .33 |
| Net realized and unrealized gain (loss) | 5.20 | (1.54) | 3.51 | 7.69 | 4.45 |
| Total from investment operations | 5.46 | (1.29) | 3.73 | 7.84 | 4.78 |
| Distributions from net investment income | (.31) | (.26) | (.13) | (.12) | (.38) |
| Distributions from net realized gain | (2.59) | (4.49) | (3.76) | (1.14) | (.87) |
| Total distributions | (2.90) | (4.75) | (3.88)B | (1.25)C | (1.25) |
| Redemption fees added to paid in capitalA,D | – | – | – | – | – |
| Net asset value, end of period | $36.64 | $34.08 | $40.12 | $40.27 | $33.68 |
| Total ReturnE | 16.96% | (3.33)% | 9.92% | 23.67% | 16.72% |
| Ratios to Average Net AssetsF,G | |||||
| Expenses before reductions | .46% | .60% | .61% | .65% | .50% |
| Expenses net of fee waivers, if any | .46% | .60% | .61% | .65% | .50% |
| Expenses net of all reductions | .46% | .60% | .61% | .65% | .48% |
| Net investment income (loss) | .76% | .71% | .57% | .39% | 1.11% |
| Supplemental Data | |||||
| Net assets, end of period (in millions) | $2,213 | $1,988 | $2,588 | $2,927 | $2,447 |
| Portfolio turnover rateH | 27%I | 23%I | 29% | 27% | 46% |
A Calculated based on average shares outstanding during the period.
B Total distributions of $3.88 per share is comprised of distributions from net investment income of $.127 and distributions from net realized gain of $3.757 per share.
C Total distributions of $1.25 per share is comprised of distributions from net investment income of $.116 and distributions from net realized gain of $1.136 per share.
D Amount represents less than $.005 per share.
E Total returns would have been lower if certain expenses had not been reduced during the applicable periods shown.
F Fees and expenses of any underlying Fidelity Central Funds are not included in the Fund's expense ratio. The Fund indirectly bears its proportionate share of the expenses of any underlying Fidelity Central Funds.
G Expense ratios reflect operating expenses of the class. Expenses before reductions do not reflect amounts reimbursed by the investment adviser or reductions from brokerage service arrangements or reductions from other expense offset arrangements and do not represent the amount paid by the class during periods when reimbursements or reductions occur. Expenses net of fee waivers reflect expenses after reimbursement by the investment adviser but prior to reductions from brokerage service arrangements or other expense offset arrangements. Expenses net of all reductions represent the net expenses paid by the class.
H Amount does not include the portfolio activity of any underlying Fidelity Central Funds.
I Portfolio turnover rate excludes securities received or delivered in-kind.
See accompanying notes which are an integral part of the financial statements.
Notes to Financial Statements
For the period ended April 30, 2017
(Amounts in thousands except percentages)
1. Organization.
Fidelity Mid-Cap Stock Fund (the Fund) is a fund of Fidelity Concord Street Trust (the Trust) (formerly a fund of Fidelity Commonwealth Trust) and is authorized to issue an unlimited number of shares. The Trust is registered under the Investment Company Act of 1940, as amended (the 1940 Act), as an open-end management investment company organized as a Massachusetts business trust. The Fund offers Mid-Cap Stock and Class K shares, each of which has equal rights as to assets and voting privileges. Each class has exclusive voting rights with respect to matters that affect that class.
2. Investments in Fidelity Central Funds.
The Fund invests in Fidelity Central Funds, which are open-end investment companies generally available only to other investment companies and accounts managed by the investment adviser and its affiliates. The Fund's Schedule of Investments lists each of the Fidelity Central Funds held as of period end, if any, as an investment of the Fund, but does not include the underlying holdings of each Fidelity Central Fund. As an Investing Fund, the Fund indirectly bears its proportionate share of the expenses of the underlying Fidelity Central Funds.
The Money Market Central Funds seek preservation of capital and current income and are managed by Fidelity Investments Money Management, Inc. (FIMM), an affiliate of the investment adviser. Annualized expenses of the Money Market Central Funds as of their most recent shareholder report date are less than .005%.
A complete unaudited list of holdings for each Fidelity Central Fund is available upon request or at the Securities and Exchange Commission (the SEC) website at www.sec.gov. In addition, the financial statements of the Fidelity Central Funds, which are not covered by the Fund's Report of Independent Registered Public Accounting Firm, are available on the SEC website or upon request.
3. Significant Accounting Policies.
The Fund is an investment company and applies the accounting and reporting guidance of the Financial Accounting Standards Board (FASB) Accounting Standards Codification Topic 946 Financial Services – Investments Companies. The financial statements have been prepared in conformity with accounting principles generally accepted in the United States of America (GAAP), which require management to make certain estimates and assumptions at the date of the financial statements. Actual results could differ from those estimates. Subsequent events, if any, through the date that the financial statements were issued have been evaluated in the preparation of the financial statements. The following summarizes the significant accounting policies of the Fund:
Investment Valuation. Investments are valued as of 4:00 p.m. Eastern time on the last calendar day of the period. The Board of Trustees (the Board) has delegated the day to day responsibility for the valuation of the Fund's investments to the Fair Value Committee (the Committee) established by the Fund's investment adviser. In accordance with valuation policies and procedures approved by the Board, the Fund attempts to obtain prices from one or more third party pricing vendors or brokers to value its investments. When current market prices, quotations or currency exchange rates are not readily available or reliable, investments will be fair valued in good faith by the Committee, in accordance with procedures adopted by the Board. Factors used in determining fair value vary by investment type and may include market or investment specific events, changes in interest rates and credit quality. The frequency with which these procedures are used cannot be predicted and they may be utilized to a significant extent. The Committee oversees the Fund's valuation policies and procedures and reports to the Board on the Committee's activities and fair value determinations. The Board monitors the appropriateness of the procedures used in valuing the Fund's investments and ratifies the fair value determinations of the Committee.
The Fund categorizes the inputs to valuation techniques used to value its investments into a disclosure hierarchy consisting of three levels as shown below:
- Level 1 – quoted prices in active markets for identical investments
- Level 2 – other significant observable inputs (including quoted prices for similar investments, interest rates, prepayment speeds, etc.)
- Level 3 – unobservable inputs (including the Fund's own assumptions based on the best information available)
Valuation techniques used to value the Fund's investments by major category are as follows:
Equity securities, including restricted securities, for which market quotations are readily available, are valued at the last reported sale price or official closing price as reported by a third party pricing vendor on the primary market or exchange on which they are traded and are categorized as Level 1 in the hierarchy. In the event there were no sales during the day or closing prices are not available, securities are valued at the last quoted bid price or may be valued using the last available price and are generally categorized as Level 2 in the hierarchy. For foreign equity securities, when market or security specific events arise, comparisons to the valuation of American Depositary Receipts (ADRs), futures contracts, Exchange-Traded Funds (ETFs) and certain indexes as well as quoted prices for similar securities may be used and would be categorized as Level 2 in the hierarchy. Utilizing these techniques may result in transfers between Level 1 and Level 2. For equity securities, including restricted securities, where observable inputs are limited, assumptions about market activity and risk are used and these securities may be categorized as Level 3 in the hierarchy.
Debt securities, including restricted securities, are valued based on evaluated prices received from third party pricing vendors or from brokers who make markets in such securities. Corporate bonds are valued by pricing vendors who utilize matrix pricing which considers yield or price of bonds of comparable quality, coupon, maturity and type or by broker-supplied prices. When independent prices are unavailable or unreliable, debt securities may be valued utilizing pricing methodologies which consider similar factors that would be used by third party pricing vendors. Debt securities are generally categorized as Level 2 in the hierarchy but may be Level 3 depending on the circumstances.
Investments in open-end mutual funds, including the Fidelity Central Funds, are valued at their closing net asset value (NAV) each business day and are categorized as Level 1 in the hierarchy.
Changes in valuation techniques may result in transfers in or out of an assigned level within the disclosure hierarchy. The aggregate value of investments by input level as of April 30, 2017 is included at the end of the Fund's Schedule of Investments.
Foreign Currency. The Fund may use foreign currency contracts to facilitate transactions in foreign-denominated securities. Gains and losses from these transactions may arise from changes in the value of the foreign currency or if the counterparties do not perform under the contracts' terms.
Foreign-denominated assets, including investment securities, and liabilities are translated into U.S. dollars at the exchange rates at period end. Purchases and sales of investment securities, income and dividends received and expenses denominated in foreign currencies are translated into U.S. dollars at the exchange rate in effect on the transaction date.
The effects of exchange rate fluctuations on investments are included with the net realized and unrealized gain (loss) on investment securities. Other foreign currency transactions resulting in realized and unrealized gain (loss) are disclosed separately.
Investment Transactions and Income. For financial reporting purposes, the Fund's investment holdings and NAV include trades executed through the end of the last business day of the period. The NAV per share for processing shareholder transactions is calculated as of the close of business of the New York Stock Exchange (NYSE), normally 4:00 p.m. Eastern time and includes trades executed through the end of the prior business day. Gains and losses on securities sold are determined on the basis of identified cost and may include proceeds received from litigation. Dividend income is recorded on the ex-dividend date, except for certain dividends from foreign securities where the ex-dividend date may have passed, which are recorded as soon as the Fund is informed of the ex-dividend date. Non-cash dividends included in dividend income, if any, are recorded at the fair market value of the securities received. Income and capital gain distributions from Fidelity Central Funds, if any, are recorded on the ex-dividend date. Certain distributions received by the Fund represent a return of capital or capital gain. The Fund determines the components of these distributions subsequent to the ex-dividend date, based upon receipt of tax filings or other correspondence relating to the underlying investment. These distributions are recorded as a reduction of cost of investments and/or as a realized gain. Interest income is accrued as earned and includes coupon interest and amortization of premium and accretion of discount on debt securities as applicable. Investment income is recorded net of foreign taxes withheld where recovery of such taxes is uncertain.
Class Allocations and Expenses. Investment income, realized and unrealized capital gains and losses, common expenses of the Fund, and certain fund-level expense reductions, if any, are allocated daily on a pro-rata basis to each class based on the relative net assets of each class to the total net assets of the Fund. Each class differs with respect to transfer agent fees incurred. Certain expense reductions may also differ by class. For the reporting period, the allocated portion of income and expenses to each class as a percent of its average net assets may vary due to the timing of recording these transactions in relation to fluctuating net assets of the classes. Expenses directly attributable to a fund are charged to that fund. Expenses attributable to more than one fund are allocated among the respective funds on the basis of relative net assets or other appropriate methods. Expense estimates are accrued in the period to which they relate and adjustments are made when actual amounts are known.
Deferred Trustee Compensation. Under a Deferred Compensation Plan (the Plan), independent Trustees may elect to defer receipt of a portion of their annual compensation. Deferred amounts are invested in a cross-section of Fidelity funds, are marked-to-market and remain in the Fund until distributed in accordance with the Plan. The investment of deferred amounts and the offsetting payable to the Trustees are included in the accompanying Statement of Assets and Liabilities.
Income Tax Information and Distributions to Shareholders. Each year, the Fund intends to qualify as a regulated investment company under Subchapter M of the Internal Revenue Code, including distributing substantially all of its taxable income and realized gains. As a result, no provision for U.S. Federal income taxes is required. As of April 30, 2017, the Fund did not have any unrecognized tax benefits in the financial statements; nor is the Fund aware of any tax positions for which it is reasonably possible that the total amounts of unrecognized tax benefits will significantly change in the next twelve months. The Fund files a U.S. federal tax return, in addition to state and local tax returns as required. The Fund's federal income tax returns are subject to examination by the Internal Revenue Service (IRS) for a period of three fiscal years after they are filed. State and local tax returns may be subject to examination for an additional fiscal year depending on the jurisdiction. Foreign taxes are provided for based on the Fund's understanding of the tax rules and rates that exist in the foreign markets in which it invests.
Distributions are declared and recorded on the ex-dividend date. Income dividends and capital gain distributions are declared separately for each class. Income and capital gain distributions are determined in accordance with income tax regulations, which may differ from GAAP. In addition, the Fund claimed a portion of the payment made to redeeming shareholders as a distribution for income tax purposes.
Capital accounts within the financial statements are adjusted for permanent book-tax differences. These adjustments have no impact on net assets or the results of operations. Capital accounts are not adjusted for temporary book-tax differences which will reverse in a subsequent period.
Book-tax differences are primarily due to foreign currency transactions, partnerships, passive foreign investment companies (PFIC), market discount, redemptions in kind, deferred trustees compensation and losses deferred due to wash sales.
The federal tax cost of investment securities and unrealized appreciation (depreciation) as of period end were as follows:
| Gross unrealized appreciation | $2,275,881 |
| Gross unrealized depreciation | (381,970) |
| Net unrealized appreciation (depreciation) on securities | $1,893,911 |
| Tax Cost | $6,022,341 |
The tax-based components of distributable earnings as of period end were as follows:
| Undistributed ordinary income | $39,753 |
| Undistributed long-term capital gain | $148,858 |
| Net unrealized appreciation (depreciation) on securities and other investments | $1,875,049 |
The tax character of distributions paid was as follows:
| April 30, 2017 | April 30, 2016 | |
| Ordinary Income | $75,159 | $ 48,569 |
| Long-term Capital Gains | 524,888 | 930,371 |
| Total | $600,047 | $ 978,940 |
Short-Term Trading (Redemption) Fees. Shares held by investors in the Fund less than 30 days may have been subject to a redemption fee equal to .75% of the NAV of shares redeemed. All redemption fees, which reduce the proceeds of the shareholder redemption, are retained by the Fund and accounted for as an addition to paid in capital. In November 2016, the Board of Trustees approved the elimination of these redemption fees effective December 12, 2016.
Restricted Securities. The Fund may invest in securities that are subject to legal or contractual restrictions on resale. These securities generally may be resold in transactions exempt from registration or to the public if the securities are registered. Disposal of these securities may involve time-consuming negotiations and expense, and prompt sale at an acceptable price may be difficult. Information regarding restricted securities is included at the end of the Fund's Schedule of Investments.
Consolidated Subsidiary. The Fund invests in certain investments through a wholly-owned subsidiary ("Subsidiary"), which may be subject to federal and state taxes upon disposition.
As of period end, the Fund held an investment of $32,749 in these Subsidiaries, representing .42% of the Fund's net assets. The financial statements have been consolidated and include accounts of the Fund and each Subsidiary. Accordingly, all inter-company transactions and balances have been eliminated.
Any cash held by the Subsidiaries is restricted as to its use and is presented as Restricted cash in the Statement of Assets and Liabilities.
4. Purchases and Sales of Investments.
Purchases and sales of securities, other than short-term securities and in-kind transactions, aggregated $1,875,147 and $2,243,645, respectively.
Redemptions In-Kind. During the period, 2,668 shares of the Fund held by an unaffiliated entity were redeemed in-kind for investments and cash, including accrued interest, with a value of $91,425. The net realized gain of $26,420 on investments delivered through the in-kind redemptions is included in the accompanying Statement of Operations. The amount of the redemptions is included in share transactions activity shown in the accompanying Statement of Changes in Net Assets as well as the Notes to Financial Statements. The Fund recognized no gain or loss for federal income tax purposes.
Prior Fiscal Year Redemptions In-Kind. During the prior period, 7,169 shares of the Fund held by unaffiliated entities were redeemed in-kind for investments and cash, including accrued interest, with a value of $265,315. The Fund had a net realized gain of $85,469 on investments delivered through the in-kind redemptions. The amount the redemptions is included in share transactions activity shown in the accompanying Statement of Changes in Net Assets as well as the Notes to Financial Statements. The Fund recognized no gain or loss for federal income tax purposes.
5. Fees and Other Transactions with Affiliates.
Management Fee. Fidelity Management & Research Company (the investment adviser) and its affiliates provide the Fund with investment management related services for which the Fund pays a monthly management fee. The management fee is the sum of an individual fund fee rate that is based on an annual rate of .30% of the Fund's average net assets and an annualized group fee rate that averaged .25% during the period. The group fee rate is based upon the average net assets of all the mutual funds advised by the investment adviser, including any mutual funds previously advised by the investment adviser that are currently advised by Fidelity SelectCo, LLC, an affiliate of the investment adviser. The group fee rate decreases as assets under management increase and increases as assets under management decrease. In addition, the management fee is subject to a performance adjustment (up to a maximum of +/- .20% of the Fund's average net assets over a 36 month performance period). The upward or downward adjustment to the management fee is based on the relative investment performance of Mid-Cap Stock as compared to its benchmark index, the S&P MidCap 400 Index, over the same 36 month performance period. For the reporting period, the total annual management fee rate, including the performance adjustment, was .39% of the Fund's average net assets. The performance adjustment included in the management fee rate may be higher or lower than the maximum performance adjustment rate due to the difference between the average net assets for the reporting and performance periods.
Transfer Agent Fees. Fidelity Investments Institutional Operations Company, Inc., (FIIOC), an affiliate of the investment adviser, is the transfer, dividend disbursing and shareholder servicing agent for each class of the Fund. FIIOC receives account fees and asset-based fees that vary according to the account size and type of account of the shareholders of Mid-Cap Stock. FIIOC receives an asset-based fee of Class K's average net assets. FIIOC pays for typesetting, printing and mailing of shareholder reports, except proxy statements.
For the period, transfer agent fees for each class were as follows:
| Amount | % of Class-Level Average Net Assets | |
| Mid-Cap Stock | $8,778 | .16 |
| Class K | 974 | .05 |
| $9,752 |
Accounting and Security Lending Fees. Fidelity Service Company, Inc. (FSC), an affiliate of the investment adviser, maintains the Fund's accounting records. The accounting fee is based on the level of average net assets for each month. Under a separate contract, FSC administers the security lending program. The security lending fee is based on the number and duration of lending transactions.
Brokerage Commissions. The Fund placed a portion of its portfolio transactions with brokerage firms which are affiliates of the investment adviser. Brokerage commissions are included in net realized gain (loss) and change in net unrealized appreciation (depreciation) in the Statement of Operations. The commissions paid to these affiliated firms were $77 for the period.
Interfund Trades. The Fund may purchase from or sell securities to other Fidelity Funds under procedures adopted by the Board. The procedures have been designed to ensure these interfund trades are executed in accordance with Rule 17a-7 of the 1940 Act. Interfund trades are included within the respective purchases and sales amounts shown in the Purchases and Sales of Investments note.
6. Committed Line of Credit.
The Fund participates with other funds managed by the investment adviser or an affiliate in a $4.25 billion credit facility (the "line of credit") to be utilized for temporary or emergency purposes to fund shareholder redemptions or for other short-term liquidity purposes. The Fund has agreed to pay commitment fees on its pro-rata portion of the line of credit, which amounted to $25 and is reflected in Miscellaneous expenses on the Statement of Operations. During the period, the Fund did not borrow on this line of credit.
7. Security Lending.
The Fund lends portfolio securities through a lending agent from time to time in order to earn additional income. For equity securities, a lending agent is used and may loan securities to certain qualified borrowers, including Fidelity Capital Markets (FCM), a broker-dealer affiliated with the Fund. On the settlement date of the loan, the Fund receives collateral (in the form of U.S. Treasury obligations, letters of credit and/or cash) against the loaned securities and maintains collateral in an amount not less than 100% of the market value of the loaned securities during the period of the loan. The market value of the loaned securities is determined at the close of business of the Fund and any additional required collateral is delivered to the Fund on the next business day. The Fund or borrower may terminate the loan at any time, and if the borrower defaults on its obligation to return the securities loaned because of insolvency or other reasons, the Fund may apply collateral received from the borrower against the obligation. The Fund may experience delays and costs in recovering the securities loaned. Any cash collateral received is invested in the Fidelity Securities Lending Cash Central Fund. The value of loaned securities and cash collateral at period end are disclosed on the Fund's Statement of Assets and Liabilities. The value of securities loaned to FCM at period end was $7,550. Security lending income represents the income earned on investing cash collateral, less rebates paid to borrowers and any lending agent fees associated with the loan, plus any premium payments received for lending certain types of securities. Security lending income is presented in the Statement of Operations as a component of income from Fidelity Central Funds. Total security lending income during the period amounted to $2,399, including $142 from securities loaned to FCM.
8. Expense Reductions.
Commissions paid to certain brokers with whom the investment adviser, or its affiliates, places trades on behalf of the Fund include an amount in addition to trade execution, which may be rebated back to the Fund to offset certain expenses. This amount totaled $274 for the period.
In addition, through arrangements with the Fund's custodian, credits realized as a result of certain uninvested cash balances were used to reduce the Fund's expenses. During the period, these credits reduced the Fund's custody expenses by $1.
In addition, during the period the investment adviser reimbursed and/or waived a portion of fund-level operating expenses in the amount of $61.
9. Distributions to Shareholders.
Distributions to shareholders of each class were as follows:
| Year ended April 30, 2017 | Year ended April 30, 2016 | |
| From net investment income | ||
| Mid-Cap Stock | $40,418 | $32,540 |
| Class K | 17,914 | 16,029 |
| Total | $58,332 | $48,569 |
| From net realized gain | ||
| Mid-Cap Stock | $391,773 | $657,512 |
| Class K | 149,942 | 272,859 |
| Total | $541,715 | $930,371 |
10. Share Transactions.
Share transactions for each class were as follows and may contain automatic conversions between classes or exchanges between affiliated funds:
| Shares | Shares | Dollars | Dollars | |
| Year ended April 30, 2017 | Year ended April 30, 2016 | Year ended April 30, 2017 | Year ended April 30, 2016 | |
| Mid-Cap Stock | ||||
| Shares sold | 16,037 | 11,317 | $556,563 | $392,342 |
| Reinvestment of distributions | 12,275 | 18,581 | 412,221 | 658,782 |
| Shares redeemed | (25,541) | (25,606) | (885,025) | (889,201) |
| Net increase (decrease) | 2,771 | 4,292 | $83,759 | $161,923 |
| Class K | ||||
| Shares sold | 13,774 | 10,618 | $477,891 | $370,206 |
| Reinvestment of distributions | 4,995 | 8,154 | 167,856 | 288,888 |
| Shares redeemed | (16,690)(a) | (24,946)(b) | (576,859)(a) | (882,241)(b) |
| Net increase (decrease) | 2,079 | (6,174) | $68,888 | $(223,147) |
(a) Amount includes in-kind redemptions (see Note 4: Redemptions In-Kind).
(b) Amount includes in-kind redemptions (see Note 4: Prior Fiscal Year Redemptions In-Kind).
11. Other.
The Fund's organizational documents provide former and current trustees and officers with a limited indemnification against liabilities arising in connection with the performance of their duties to the Fund. In the normal course of business, the Fund may also enter into contracts that provide general indemnifications. The Fund's maximum exposure under these arrangements is unknown as this would be dependent on future claims that may be made against the Fund. The risk of material loss from such claims is considered remote.
Report of Independent Registered Public Accounting Firm
To the Trustees of Fidelity Concord Street Trust and Shareholders of Fidelity Mid-Cap Stock Fund:
We have audited the accompanying statement of assets and liabilities of Fidelity Mid-Cap Stock Fund (the Fund), a fund of Fidelity Concord Street Trust, including the schedule of investments, as of April 30, 2017, and the related statement of operations for the year then ended, the statement of changes in net assets for each of the two years in the period then ended, and the financial highlights for each of the five years in the period then ended. These financial statements and financial highlights are the responsibility of the Fund's management. Our responsibility is to express an opinion on these financial statements and financial highlights based on our audits.
We conducted our audits in accordance with the standards of the Public Company Accounting Oversight Board (United States). Those standards require that we plan and perform the audit to obtain reasonable assurance about whether the financial statements and financial highlights are free of material misstatement. The Fund is not required to have, nor were we engaged to perform, an audit of its internal control over financial reporting. Our audits included consideration of internal control over financial reporting as a basis for designing audit procedures that are appropriate in the circumstances, but not for the purpose of expressing an opinion on the effectiveness of the Fund's internal control over financial reporting. Accordingly, we express no such opinion. An audit also includes examining, on a test basis, evidence supporting the amounts and disclosures in the financial statements, assessing the accounting principles used and significant estimates made by management, as well as evaluating the overall financial statement presentation. Our procedures included confirmation of securities owned as of April 30, 2017, by correspondence with the custodians and brokers; when replies were not received from brokers, we performed other auditing procedures. We believe that our audits provide a reasonable basis for our opinion.
In our opinion, such financial statements and financial highlights referred to above present fairly, in all material respects, the financial position of Fidelity Mid-Cap Stock Fund as of April 30, 2017, the results of its operations for the year then ended, the changes in its net assets for each of the two years in the period then ended, and the financial highlights for each of the five years in the period then ended in conformity with accounting principles generally accepted in the United States of America.
DELOITTE & TOUCHE LLP
Boston, Massachusetts
June 14, 2017
Trustees and Officers
The Trustees, Members of the Advisory Board (if any), and officers of the trust and fund, as applicable, are listed below. The Board of Trustees governs the fund and is responsible for protecting the interests of shareholders. The Trustees are experienced executives who meet periodically throughout the year to oversee the fund's activities, review contractual arrangements with companies that provide services to the fund, oversee management of the risks associated with such activities and contractual arrangements, and review the fund's performance. Except for Jonathan Chiel, each of the Trustees oversees 189 funds. Mr. Chiel oversees 142 funds.
The Trustees hold office without limit in time except that (a) any Trustee may resign; (b) any Trustee may be removed by written instrument, signed by at least two-thirds of the number of Trustees prior to such removal; (c) any Trustee who requests to be retired or who has become incapacitated by illness or injury may be retired by written instrument signed by a majority of the other Trustees; and (d) any Trustee may be removed at any special meeting of shareholders by a two-thirds vote of the outstanding voting securities of the trust. Each Trustee who is not an interested person (as defined in the 1940 Act) of the trust and the fund is referred to herein as an Independent Trustee. Each Independent Trustee shall retire not later than the last day of the calendar year in which his or her 75th birthday occurs. The Independent Trustees may waive this mandatory retirement age policy with respect to individual Trustees. Officers and Advisory Board Members hold office without limit in time, except that any officer or Advisory Board Member may resign or may be removed by a vote of a majority of the Trustees at any regular meeting or any special meeting of the Trustees. Except as indicated, each individual has held the office shown or other offices in the same company for the past five years.
The fund’s Statement of Additional Information (SAI) includes more information about the Trustees. To request a free copy, call Fidelity at 1-800-544-8544.
Experience, Skills, Attributes, and Qualifications of the Trustees. The Governance and Nominating Committee has adopted a statement of policy that describes the experience, qualifications, attributes, and skills that are necessary and desirable for potential Independent Trustee candidates (Statement of Policy). The Board believes that each Trustee satisfied at the time he or she was initially elected or appointed a Trustee, and continues to satisfy, the standards contemplated by the Statement of Policy. The Governance and Nominating Committee also engages professional search firms to help identify potential Independent Trustee candidates who have the experience, qualifications, attributes, and skills consistent with the Statement of Policy. From time to time, additional criteria based on the composition and skills of the current Independent Trustees, as well as experience or skills that may be appropriate in light of future changes to board composition, business conditions, and regulatory or other developments, have also been considered by the professional search firms and the Governance and Nominating Committee. In addition, the Board takes into account the Trustees' commitment and participation in Board and committee meetings, as well as their leadership of standing and ad hoc committees throughout their tenure.
In determining that a particular Trustee was and continues to be qualified to serve as a Trustee, the Board has considered a variety of criteria, none of which, in isolation, was controlling. The Board believes that, collectively, the Trustees have balanced and diverse experience, qualifications, attributes, and skills, which allow the Board to operate effectively in governing the fund and protecting the interests of shareholders. Information about the specific experience, skills, attributes, and qualifications of each Trustee, which in each case led to the Board's conclusion that the Trustee should serve (or continue to serve) as a trustee of the fund, is provided below.
Board Structure and Oversight Function. James C. Curvey is an interested person and currently serves as Chairman. The Trustees have determined that an interested Chairman is appropriate and benefits shareholders because an interested Chairman has a personal and professional stake in the quality and continuity of services provided to the fund. Independent Trustees exercise their informed business judgment to appoint an individual of their choosing to serve as Chairman, regardless of whether the Trustee happens to be independent or a member of management. The Independent Trustees have determined that they can act independently and effectively without having an Independent Trustee serve as Chairman and that a key structural component for assuring that they are in a position to do so is for the Independent Trustees to constitute a substantial majority for the Board. The Independent Trustees also regularly meet in executive session. Ned C. Lautenbach serves as Chairman of the Independent Trustees and as such (i) acts as a liaison between the Independent Trustees and management with respect to matters important to the Independent Trustees and (ii) with management prepares agendas for Board meetings.
Fidelity® funds are overseen by different Boards of Trustees. The fund's Board oversees Fidelity's high income and certain equity funds, and other Boards oversee Fidelity's investment-grade bond, money market, asset allocation, and sector funds. The asset allocation funds may invest in Fidelity® funds overseen by the fund's Board. The use of separate Boards, each with its own committee structure, allows the Trustees of each group of Fidelity® funds to focus on the unique issues of the funds they oversee, including common research, investment, and operational issues. On occasion, the separate Boards establish joint committees to address issues of overlapping consequences for the Fidelity® funds overseen by each Board.
The Trustees operate using a system of committees to facilitate the timely and efficient consideration of all matters of importance to the Trustees, the fund, and fund shareholders and to facilitate compliance with legal and regulatory requirements and oversight of the fund's activities and associated risks. The Board, acting through its committees, has charged FMR and its affiliates with (i) identifying events or circumstances the occurrence of which could have demonstrably adverse effects on the fund's business and/or reputation; (ii) implementing processes and controls to lessen the possibility that such events or circumstances occur or to mitigate the effects of such events or circumstances if they do occur; and (iii) creating and maintaining a system designed to evaluate continuously business and market conditions in order to facilitate the identification and implementation processes described in (i) and (ii) above. Because the day-to-day operations and activities of the fund are carried out by or through FMR, its affiliates, and other service providers, the fund's exposure to risks is mitigated but not eliminated by the processes overseen by the Trustees. While each of the Board's committees has responsibility for overseeing different aspects of the fund's activities, oversight is exercised primarily through the Operations, Audit, and Compliance Committees. In addition, the Independent Trustees have worked with FMR to enhance the Board's oversight of investment and financial risks, legal and regulatory risks, technology risks, and operational risks, including the development of additional risk reporting to the Board. For example, a working group comprised of Independent Trustees and FMR has worked and continues to work to review the Fidelity® funds' valuation-related activities, reporting and risk management. Appropriate personnel, including but not limited to the fund's Chief Compliance Officer (CCO), FMR's internal auditor, the independent accountants, the fund's Treasurer and portfolio management personnel, make periodic reports to the Board's committees, as appropriate, including an annual review of Fidelity's risk management program for the Fidelity® funds. The responsibilities of each standing committee, including their oversight responsibilities, are described further under "Standing Committees of the Trustees."
Interested Trustees*:
Correspondence intended for a Trustee who is an interested person may be sent to Fidelity Investments, 245 Summer Street, Boston, Massachusetts 02210.
Name, Year of Birth; Principal Occupations and Other Relevant Experience+
Jonathan Chiel (1957)
Year of Election or Appointment: 2016
Trustee
Mr. Chiel also serves as Trustee of other Fidelity funds. Mr. Chiel is Executive Vice President and General Counsel for FMR LLC (diversified financial services company, 2012-present). Previously, Mr. Chiel served as general counsel (2004-2012) and senior vice president and deputy general counsel (2000-2004) for John Hancock Financial Services; a partner with Choate, Hall & Stewart (1996-2000) (law firm); and an Assistant United States Attorney for the United States Attorney’s Office of the District of Massachusetts (1986-95), including Chief of the Criminal Division (1993-1995). Mr. Chiel is a director on the boards of the Boston Bar Foundation and the Maimonides School.
James C. Curvey (1935)
Year of Election or Appointment: 2007
Trustee
Chairman of the Board of Trustees
Mr. Curvey also serves as Trustee of other Fidelity® funds. Mr. Curvey is a Director of Fidelity Research & Analysis Co. (investment adviser firm, 2009-present), and Vice Chairman (2007-present) and Director of FMR LLC (diversified financial services company). In addition, Mr. Curvey serves as an Overseer for the Boston Symphony Orchestra and a member of the board of Artis-Naples, Naples, Florida, and as a Trustee for Brewster Academy, Wolfeboro, New Hampshire. Previously, Mr. Curvey served as a Director of Fidelity Investments Money Management, Inc. (investment adviser firm, 2009-2014) and a Director of FMR and FMR Co., Inc. (investment adviser firms, 2007-2014).
Charles S. Morrison (1960)
Year of Election or Appointment: 2014
Trustee
Mr. Morrison also serves as Trustee of other funds. He serves as President of Fidelity Management & Research Company (FMR) (investment adviser firm, 2016-present), a Director of Fidelity Investments Money Management, Inc. (FIMM) (investment adviser firm, 2014-present), Director of Fidelity SelectCo, LLC (investment adviser firm, 2014-present), President, Asset Management (2014-present), and is an employee of Fidelity Investments. Previously, Mr. Morrison served as Vice President of Fidelity's Fixed Income and Asset Allocation Funds (2012-2014), President, Fixed Income (2011-2014), Vice President of Fidelity's Money Market Funds (2005-2009), President, Money Market Group Leader of FMR (investment adviser firm, 2009), and Senior Vice President, Money Market Group of FMR (2004-2009). Mr. Morrison also served as Vice President of Fidelity's Bond Funds (2002-2005), certain Balanced Funds (2002-2005), and certain Asset Allocation Funds (2002-2007), and as Senior Vice President (2002-2005) of Fidelity's Bond Division.
* Determined to be an “Interested Trustee” by virtue of, among other things, his or her affiliation with the trust or various entities under common control with FMR.
+ The information includes the Trustee's principal occupation during the last five years and other information relating to the experience, attributes, and skills relevant to the Trustee's qualifications to serve as a Trustee, which led to the conclusion that the Trustee should serve as a Trustee for the fund.
Independent Trustees:
Correspondence intended for an Independent Trustee may be sent to Fidelity Investments, P.O. Box 55235, Boston, Massachusetts 02205-5235.
Name, Year of Birth; Principal Occupations and Other Relevant Experience+
Dennis J. Dirks (1948)
Year of Election or Appointment: 2005
Trustee
Mr. Dirks also serves as Trustee of other Fidelity® funds. Prior to his retirement in May 2003, Mr. Dirks was Chief Operating Officer and a member of the Board of The Depository Trust & Clearing Corporation (DTCC). He also served as President, Chief Operating Officer, and Board member of The Depository Trust Company (DTC) and President and Board member of the National Securities Clearing Corporation (NSCC). In addition, Mr. Dirks served as Chief Executive Officer and Board member of the Government Securities Clearing Corporation, Chief Executive Officer and Board member of the Mortgage-Backed Securities Clearing Corporation, as a Trustee and a member of the Finance Committee of Manhattan College (2005-2008), as a Trustee and a member of the Finance Committee of AHRC of Nassau County (2006-2008), as a member of the Independent Directors Council (IDC) Governing Council (2010-2015), and as a member of the Board of Directors for The Brookville Center for Children’s Services, Inc. (2009-2017). Mr. Dirks is a member of the Finance Committee (2016-present) and Board of Directors (2017-present) of the Asolo Repertory Theatre.
Alan J. Lacy (1953)
Year of Election or Appointment: 2008
Trustee
Mr. Lacy also serves as Trustee of other Fidelity® funds. Mr. Lacy serves as a Director of Bristol-Myers Squibb Company (global pharmaceuticals, 2008-present). He is a Trustee of the California Chapter of The Nature Conservancy (2015-present) and a Director of the Center for Advanced Study in the Behavioral Sciences at Stanford University (2015-present). In addition, Mr. Lacy served as Senior Adviser (2007-2014) of Oak Hill Capital Partners, L.P. (private equity) and also served as Chief Executive Officer (2005) and Vice Chairman (2005-2006) of Sears Holdings Corporation (retail) and Chief Executive Officer and Chairman of the Board of Sears, Roebuck and Co. (retail, 2000-2005). Previously, Mr. Lacy served as Chairman (2014-2017) and a member (2010-2017) of the Board of Directors of Dave & Buster’s Entertainment, Inc. (restaurant and entertainment complexes), as Chairman (2008-2011) and a member (2006-2015) of the Board of Trustees of the National Parks Conservation Association, and as a member of the Board of Directors for The Hillman Companies, Inc. (hardware wholesalers, 2010-2014), Earth Fare, Inc. (retail grocery, 2010-2014), and The Western Union Company (global money transfer, 2006-2011).
Ned C. Lautenbach (1944)
Year of Election or Appointment: 2000
Trustee
Chairman of the Independent Trustees
Mr. Lautenbach also serves as Trustee of other Fidelity® funds. Mr. Lautenbach currently serves as the Lead Director of the Eaton Corporation Board of Directors (diversified industrial, 1997-present). Mr. Lautenbach is Chairman of the Board of Directors of Artis-Naples in Naples, Florida (2012-present), a member of the Council on Foreign Relations (1994-present), and currently Vice Chair of the Board of Governors, State University System of Florida (2013-present). Previously, Mr. Lautenbach was a Partner and Advisory Partner at Clayton, Dubilier & Rice, LLC (private equity investment, 1998-2010), as well as a Director of Sony Corporation (2006-2007). Mr. Lautenbach also had a 30-year career with IBM (technology company) during which time he served as Senior Vice President and a member of the Corporate Executive Committee (1968-1998).
Joseph Mauriello (1944)
Year of Election or Appointment: 2008
Trustee
Mr. Mauriello also serves as Trustee of other Fidelity® funds. Prior to his retirement in January 2006, Mr. Mauriello served in numerous senior management positions including Deputy Chairman and Chief Operating Officer (2004-2005), and Vice Chairman of Financial Services (2002-2004) of KPMG LLP US (professional services, 1965-2005). Mr. Mauriello currently serves as a member of the Board of Directors of XL Group plc. (global insurance and re-insurance, 2006-present) and the Independent Directors Council (IDC) Governing Council (2015-present). Previously, Mr. Mauriello served as a Director of the Hamilton Funds of the Bank of New York (2006-2007) and of Arcadia Resources Inc. (health care services and products, 2007-2012).
Robert W. Selander (1950)
Year of Election or Appointment: 2011
Trustee
Mr. Selander also serves as Trustee of other Fidelity® funds. Mr. Selander serves as a Director of The Western Union Company (global money transfer, 2014-present) and a non-executive Chairman of Health Equity, Inc. (health savings custodian, 2015-present). Previously, Mr. Selander served as a Member of the Advisory Board of certain Fidelity® funds (2011), and Executive Vice Chairman (2010), Chief Executive Officer (2009-2010), and President and Chief Executive Officer (1997-2009) of Mastercard, Inc.
Cornelia M. Small (1944)
Year of Election or Appointment: 2005
Trustee
Ms. Small also serves as Trustee of other Fidelity® funds. Ms. Small is a member of the Board of Directors (2009-present) and Chair of the Investment Committee (2010-present) of the Teagle Foundation. Ms. Small also serves on the Investment Committee of the Berkshire Taconic Community Foundation (2008-present). Previously, Ms. Small served as Chairperson (2002-2008) and a member of the Investment Committee and Chairperson (2008-2012) and a member of the Board of Trustees of Smith College. In addition, Ms. Small served as Chief Investment Officer, Director of Global Equity Investments, and a member of the Board of Directors of Scudder, Stevens & Clark and Scudder Kemper Investments.
William S. Stavropoulos (1939)
Year of Election or Appointment: 2001
Trustee
Vice Chairman of the Independent Trustees
Mr. Stavropoulos also serves as Trustee of other Fidelity® funds. Mr. Stavropoulos serves as President and Founder of the Michigan Baseball Foundation, the Great Lakes Loons (2007-present). Mr. Stavropoulos is Chairman Emeritus of the Board of Directors of The Dow Chemical Company, where he previously served in numerous senior management positions, including President, CEO (1995-2000; 2002-2004), Chairman of the Executive Committee (2000-2006), and as a member of the Board of Directors (1990-2006). Currently, Mr. Stavropoulos is Chairman of the Board of Directors of Univar Inc. (global distributor of commodity and specialty chemicals), a Director of Teradata Corporation (data warehousing and technology solutions), and a member of the Advisory Board for Metalmark Capital LLC (private equity investment, 2005-present). Mr. Stavropoulos is an operating advisor to Clayton, Dubilier & Rice, LLC (private equity investment). In addition, Mr. Stavropoulos is a member of the University of Notre Dame Advisory Council for the College of Science, a Trustee of the Rollin L. Gerstacker Foundation, and a Director of Artis-Naples in Naples, Florida. Previously, Mr. Stavropoulos served as a Director of Chemical Financial Corporation (bank holding company, 1993-2012) and Tyco International, Ltd. (multinational manufacturing and services, 2007-2012).
David M. Thomas (1949)
Year of Election or Appointment: 2008
Trustee
Mr. Thomas also serves as Trustee of other Fidelity® funds. Mr. Thomas serves as Non-Executive Chairman of the Board of Directors of Fortune Brands Home and Security (home and security products, 2011-present), as a member of the Board of Directors (2004-present) and Presiding Director (2013-present) of Interpublic Group of Companies, Inc. (marketing communication), and as a member of the Board of Trustees of the University of Florida (2013-present). Previously, Mr. Thomas served as Executive Chairman (2005-2006) and Chairman and Chief Executive Officer (2000-2005) of IMS Health, Inc. (pharmaceutical and healthcare information solutions), and a Director of Fortune Brands, Inc. (consumer products, 2000-2011).
+ The information includes the Trustee's principal occupation during the last five years and other information relating to the experience, attributes, and skills relevant to the Trustee's qualifications to serve as a Trustee, which led to the conclusion that the Trustee should serve as a Trustee for the fund.
Advisory Board Members and Officers:
Correspondence intended for an officer or Peter S. Lynch may be sent to Fidelity Investments, 245 Summer Street, Boston, Massachusetts 02210. Officers appear below in alphabetical order.
Name, Year of Birth; Principal Occupation
Peter S. Lynch (1944)
Year of Election or Appointment: 2003
Member of the Advisory Board
Mr. Lynch also serves as Member of the Advisory Board of other Fidelity® funds. Mr. Lynch is Vice Chairman and a Director of FMR (investment adviser firm) and FMR Co., Inc. (investment adviser firm). In addition, Mr. Lynch serves as a Trustee of Boston College and as the Chairman of the Inner-City Scholarship Fund. Previously, Mr. Lynch served on the Special Olympics International Board of Directors (1997-2006).
Elizabeth Paige Baumann (1968)
Year of Election or Appointment: 2017
Anti-Money Laundering (AML) Officer
Ms. Baumann also serves as AML Officer of other funds. She is Chief AML Officer (2012-present) and Senior Vice President (2014-present) of FMR LLC (diversified financial services company) and is an employee of Fidelity Investments. Previously, Ms. Baumann served as AML Officer of the funds (2012-2016), and Vice President (2007-2014) and Deputy Anti-Money Laundering Officer (2007-2012) of FMR LLC.
Marc R. Bryant (1966)
Year of Election or Appointment: 2015
Secretary and Chief Legal Officer (CLO)
Mr. Bryant also serves as Secretary and CLO of other funds. Mr. Bryant serves as CLO, Secretary, and Senior Vice President of Fidelity Management & Research Company (investment adviser firm, 2015-present) and FMR Co., Inc. (investment adviser firm, 2015-present); Secretary of Fidelity SelectCo, LLC (investment adviser firm, 2015-present) and Fidelity Investments Money Management, Inc. (investment adviser firm, 2015-present); and CLO of Fidelity Management & Research (Hong Kong) Limited and FMR Investment Management (UK) Limited (investment adviser firms, 2015-present) and Fidelity Management & Research (Japan) Limited (investment adviser firm, 2016-present). He is Senior Vice President and Deputy General Counsel of FMR LLC (diversified financial services company). Previously, Mr. Bryant served as Secretary and CLO of Fidelity Rutland Square Trust II (2010-2014) and Assistant Secretary of Fidelity's Fixed Income and Asset Allocation Funds (2013-2015). Prior to joining Fidelity Investments, Mr. Bryant served as a Senior Vice President and the Head of Global Retail Legal for AllianceBernstein L.P. (2006-2010), and as the General Counsel for ProFund Advisors LLC (2001-2006).
Jeffrey S. Christian (1961)
Year of Election or Appointment: 2016
Assistant Treasurer
Mr. Christian also serves as Assistant Treasurer of other funds. Mr. Christian is an employee of Fidelity Investments (2003-present).
William C. Coffey (1969)
Year of Election or Appointment: 2009
Assistant Secretary
Mr. Coffey also serves as Assistant Secretary of other funds. He is Senior Vice President and Deputy General Counsel of FMR LLC (diversified financial services company, 2010-present), and is an employee of Fidelity Investments. Previously, Mr. Coffey served as Vice President and Associate General Counsel of FMR LLC (2005-2009).
Jonathan Davis (1968)
Year of Election or Appointment: 2010
Assistant Treasurer
Mr. Davis also serves as Assistant Treasurer of other funds, and is an employee of Fidelity Investments. Previously, Mr. Davis served as Vice President and Associate General Counsel of FMR LLC (diversified financial services company, 2003-2010).
Adrien E. Deberghes (1967)
Year of Election or Appointment: 2016
Assistant Treasurer
Mr. Deberghes also serves as an officer of other funds. He serves as Executive Vice President of Fidelity Investments Money Management, Inc. (FIMM) (investment adviser firm, 2016-present) and is an employee of Fidelity Investments (2008-present). Prior to joining Fidelity Investments, Mr. Deberghes was Senior Vice President of Mutual Fund Administration at State Street Corporation (2007-2008), Senior Director of Mutual Fund Administration at Investors Bank & Trust (2005-2007), and Director of Finance for Dunkin' Brands (2000-2005). Previously, Mr. Deberghes served in other fund officer roles.
Stephanie J. Dorsey (1969)
Year of Election or Appointment: 2010
Assistant Treasurer
Ms. Dorsey also serves as an officer of other funds. She is an employee of Fidelity Investments (2008-present) and has served in other fund officer roles. Prior to joining Fidelity Investments, Ms. Dorsey served as Treasurer (2004-2008) of the JPMorgan Mutual Funds and Vice President (2004-2008) of JPMorgan Chase Bank.
Howard J. Galligan III (1966)
Year of Election or Appointment: 2014
Chief Financial Officer
Mr. Galligan also serves as Chief Financial Officer of other funds. Mr. Galligan serves as President of Fidelity Pricing and Cash Management Services (FPCMS) (2014-present) and as a Director of Strategic Advisers, Inc. (investment adviser firm, 2008-present). Previously, Mr. Galligan served as Chief Administrative Officer of Asset Management (2011-2014) and Chief Operating Officer and Senior Vice President of Investment Support for Strategic Advisers, Inc. (2003-2011).
Scott C. Goebel (1968)
Year of Election or Appointment: 2015
Vice President
Mr. Goebel serves as Vice President of other funds and is an employee of Fidelity Investments (2001-present). Previously, Mr. Goebel served as Senior Vice President of Fidelity Management & Research Company (FMR) (investment adviser firm, 2016), Secretary of Fidelity SelectCo, LLC (investment adviser firm, 2013-2015), Fidelity Investments Money Management, Inc. (FIMM) (investment adviser firm, 2010-2015), and Fidelity Research and Analysis Company (FRAC) (investment adviser firm, 2010-2015); General Counsel, Secretary, and Senior Vice President of FMR (investment adviser firm, 2008-2015) and FMR Co., Inc. (investment adviser firm, 2008-2015); Assistant Secretary of Fidelity Management & Research (Japan) Limited (investment adviser firm, 2008-2015) and Fidelity Management & Research (U.K.) Inc. (investment adviser firm, 2008-2015); Chief Legal Officer (CLO) of Fidelity Management & Research (Hong Kong) Limited (investment adviser firm, 2008-2015); Secretary and CLO of certain Fidelity® funds (2008-2015); Assistant Secretary of FIMM (2008-2010), FRAC (2008-2010), and certain funds (2007-2008); and as Vice President and Secretary of Fidelity Distributors Corporation (FDC) (2005-2007).
Brian B. Hogan (1964)
Year of Election or Appointment: 2009
Vice President
Mr. Hogan also serves as Trustee or Vice President of other funds. Mr. Hogan serves as a Director of FMR Investment Management (UK) Limited (investment adviser firm, 2015-present) and Fidelity SelectCo, LLC (investment adviser firm, 2014-present) and President of the Equity Division of FMR (investment adviser firm, 2009-present). Previously, Mr. Hogan served as Senior Vice President, Equity Research of FMR (2006-2009) and as a portfolio manager. Mr. Brian B. Hogan is not related to Mr. Colm A. Hogan.
Colm A. Hogan (1973)
Year of Election or Appointment: 2016
Deputy Treasurer
Mr. Hogan also serves as an officer of other funds. Mr. Hogan is an employee of Fidelity Investments (2005-present). Mr. Colm A. Hogan is not related to Mr. Brian B. Hogan.
Chris Maher (1972)
Year of Election or Appointment: 2013
Assistant Treasurer
Mr. Maher serves as Assistant Treasurer of other funds. Mr. Maher is Vice President of Valuation Oversight and is an employee of Fidelity Investments. Previously, Mr. Maher served as Vice President of Asset Management Compliance (2013), Vice President of the Program Management Group of FMR (investment adviser firm, 2010-2013), and Vice President of Valuation Oversight (2008-2010).
Melissa M. Reilly (1971)
Year of Election or Appointment: 2014
Vice President of certain Equity Funds
Ms. Reilly also serves as Vice President of other funds. Ms. Reilly is an employee of Fidelity Investments (2004-present).
Kenneth B. Robins (1969)
Year of Election or Appointment: 2016
Chief Compliance Officer
Mr. Robins also serves as an officer of other funds. Mr. Robins serves as Compliance Officer of Fidelity Management & Research Company and FMR Co., Inc. (investment adviser firms, 2016-present) and is an employee of Fidelity Investments (2004-present). Previously, Mr. Robins served as Executive Vice President of Fidelity Investments Money Management, Inc. (investment adviser firm, 2013-2016) and served in other fund officer roles.
Stacie M. Smith (1974)
Year of Election or Appointment: 2016
President and Treasurer
Ms. Smith also serves as an officer of other funds. She is an employee of Fidelity Investments (2009-present) and has served in other fund officer roles. Prior to joining Fidelity Investments, Ms. Smith served as Senior Audit Manager of Ernst & Young LLP (accounting firm, 1996-2009). Previously, Ms. Smith served as Deputy Treasurer of certain Fidelity® funds (2013-2016).
Marc L. Spector (1972)
Year of Election or Appointment: 2016
Assistant Treasurer
Mr. Spector also serves as an officer of other funds. Mr. Spector is an employee of Fidelity Investments (2016-present). Prior to joining Fidelity Investments, Mr. Spector served as Director at the Siegfried Group (accounting firm, 2013-2016), and prior to Siegfried Group as audit senior manager at Deloitte & Touche (accounting firm, 2005-2013).
Renee Stagnone (1975)
Year of Election or Appointment: 2016
Assistant Treasurer
Ms. Stagnone also serves as an officer of other funds. Ms. Stagnone is an employee of Fidelity Investments (1997-present). Previously, Ms. Stagnone served as Deputy Treasurer of certain Fidelity® funds (2013-2016).
Shareholder Expense Example
As a shareholder of the Fund, you incur two types of costs: (1) transaction costs, including redemption fees and (2) ongoing costs, including management fees and other Fund expenses. This Example is intended to help you understand your ongoing costs (in dollars) of investing in the Fund and to compare these costs with the ongoing costs of investing in other mutual funds.
The Example is based on an investment of $1,000 invested at the beginning of the period and held for the entire period (November 1, 2016 to April 30, 2017).
Actual Expenses
The first line of the accompanying table for each class of the Fund provides information about actual account values and actual expenses. You may use the information in this line, together with the amount you invested, to estimate the expenses that you paid over the period. Simply divide your account value by $1,000.00 (for example, an $8,600 account value divided by $1,000.00 = 8.6), then multiply the result by the number in the first line for a class of the Fund under the heading entitled "Expenses Paid During Period" to estimate the expenses you paid on your account during this period. A small balance maintenance fee of $12.00 that is charged once a year may apply for certain accounts with a value of less than $2,000. This fee is not included in the table below. If it was, the estimate of expenses you paid during the period would be higher, and your ending account value lower, by this amount. In addition, the Fund, as a shareholder in the underlying Fidelity Central Funds, will indirectly bear its pro-rata share of the fees and expenses incurred by the underlying Fidelity Central Funds. These fees and expenses are not included in the Fund's annualized expense ratio used to calculate the expense estimate in the table below.
Hypothetical Example for Comparison Purposes
The second line of the accompanying table for each class of the Fund provides information about hypothetical account values and hypothetical expenses based on a Class' actual expense ratio and an assumed rate of return of 5% per year before expenses, which is not the Class' actual return. The hypothetical account values and expenses may not be used to estimate the actual ending account balance or expenses you paid for the period. You may use this information to compare the ongoing costs of investing in the Fund and other funds. To do so, compare this 5% hypothetical example with the 5% hypothetical examples that appear in the shareholder reports of the other funds. A small balance maintenance fee of $12.00 that is charged once a year may apply for certain accounts with a value of less than $2,000. This fee is not included in the table below. If it was, the estimate of expenses you paid during the period would be higher, and your ending account value lower, by this amount. In addition, the Fund, as a shareholder in the underlying Fidelity Central Funds, will indirectly bear its pro-rata share of the fees and expenses incurred by the underlying Fidelity Central Funds. These fees and expenses are not included in the Fund's annualized expense ratio used to calculate the expense estimate in the table below.
Please note that the expenses shown in the table are meant to highlight your ongoing costs only and do not reflect any transaction costs. Therefore, the second line of the table is useful in comparing ongoing costs only, and will not help you determine the relative total costs of owning different funds. In addition, if these transactional costs were included, your costs would have been higher.
| Annualized Expense Ratio-A | Beginning Account Value November 1, 2016 | Ending Account Value April 30, 2017 | Expenses Paid During Period-B November 1, 2016 to April 30, 2017 | |
| Mid-Cap Stock | .52% | |||
| Actual | $1,000.00 | $1,115.30 | $2.73 | |
| Hypothetical-C | $1,000.00 | $1,022.22 | $2.61 | |
| Class K | .41% | |||
| Actual | $1,000.00 | $1,115.70 | $2.15 | |
| Hypothetical-C | $1,000.00 | $1,022.76 | $2.06 |
A Annualized expense ratio reflects expenses net of applicable fee waivers.
B Expenses are equal to each Class' annualized expense ratio, multiplied by the average account value over the period, multiplied by 181/365 (to reflect the one-half year period).
C 5% return per year before expenses
Distributions (Unaudited)
The Board of Trustees of Fidelity Mid-Cap Stock Fund voted to pay to shareholders of record at the opening of business on record date, the following distributions per share derived from capital gains realized from sales of portfolio securities, and dividends derived from net investment income:
| Pay Date | Record Date | Dividends | Capital Gains | |
| Fidelity Mid-Cap Stock Fund | ||||
| Mid-Cap Stock Fund | 06/12/17 | 06/09/17 | $0.030 | $0.859 |
| Class K | 06/12/17 | 06/09/17 | $0.044 | $0.859 |
The fund hereby designates as a capital gain dividend with respect to the taxable year ended April 30 2017, $309,541,536, or, if subsequently determined to be different, the net capital gain of such year.
Mid-Cap Stock Fund designates 100% and 83%; Class K designates 96% and 76%; of the dividends distributed in June and December, respectively during the fiscal year as qualifying for the dividends–received deduction for corporate shareholders.
Mid-Cap Stock Fund designates 100% and 90%; Class K designates 98% and 82%; of the dividends distributed in June and December, respectively during the fiscal year as amounts which may be taken into account as a dividend for purposes of the maximum rate under section 1(h)(11) of the Internal Revenue Code.
The fund will notify shareholders in January 2018 of amounts for use in preparing 2017 income tax returns.
Board Approval of Investment Advisory Contracts and Management Fees
Fidelity Mid-Cap Stock Fund
On September 14, 2016, the Board of Trustees, including the Independent Trustees (together, the Board) voted to approve the management contract and sub-advisory agreements (collectively, the Advisory Contracts) for the fund in connection with reorganizing the fund from one Trust to another. In reaching this determination, the Board considered that the contractual terms of and the fees payable under the fund's Advisory Contracts are identical to those in the fund's current Advisory Contracts. The Board considered that the approval of the Advisory Contracts will not result in any changes to (i) the investment process or strategies employed in the management of the fund's assets; (ii) the nature, extent and quality of services provided under the fund's Advisory Contracts; or (iii) the day-to-day management of the fund or the persons primarily responsible for such management. The Board considered that it approved the Advisory Contracts for the fund at its July 2016 meeting and that it will again consider the renewal of the Advisory Contracts in July 2017.
Because the Board was approving Advisory Contracts with terms identical to the current Advisory Contracts, it did not consider the fund's investment performance, competitiveness of management fees and total expenses, costs of services and profitability, or economies of scale to be significant factors in its decision.
In connection with its consideration of future renewal of the fund's Advisory Contracts, the Board will consider: (i) the nature, extent and quality of services provided to the fund, including shareholder and administrative services and investment performance; (ii) the competitiveness of the fund's management fee and total expenses; (iii) the costs of the services and profitability, including the revenues earned and the expenses incurred by Fidelity conducting the business of developing, marketing, distributing, managing, administering, and servicing the fund and its shareholders, to the extent applicable; and (iv) whether there have been economies of scale in respect of the management of the Fidelity funds, whether the Fidelity funds (including the fund) have appropriately benefited from any such economies of scale, and whether there is potential for realization of any further economies.
Based on its evaluation of all of the conclusions noted above, and after considering all factors it believed relevant, the Board ultimately concluded that the advisory fee structures are fair and reasonable, and that the fund's Advisory Contracts should be approved, without modification, as part of the process of reorganizing the fund from one Trust to another.
![]()
Corporate Headquarters
245 Summer St.
Boston, MA 02210
www.fidelity.com
MCS-ANN-0617
1.703594.119
Item 2.
Code of Ethics
As of the end of the period, April 30, 2017, Fidelity Concord Street Trust (the trust) has adopted a code of ethics, as defined in Item 2 of Form N-CSR, that applies to its President and Treasurer and its Chief Financial Officer. A copy of the code of ethics is filed as an exhibit to this Form N-CSR.
Item 3.
Audit Committee Financial Expert
The Board of Trustees of the trust has determined that Joseph Mauriello is an audit committee financial expert, as defined in Item 3 of Form N-CSR. Mr. Mauriello is independent for purposes of Item 3 of Form N-CSR.
Item 4.
Principal Accountant Fees and Services
Fees and Services
The following table presents fees billed by Deloitte & Touche LLP, the member firms of Deloitte Touche Tohmatsu, and their respective affiliates (collectively, “Deloitte Entities”) in each of the last two fiscal years for services rendered to Fidelity Large Cap Stock Fund, Fidelity Mid-Cap Stock Fund, Fidelity Small Cap Discovery Fund, Fidelity Small Cap Stock Fund and Fidelity Series Small Cap Discovery Fund (the “Funds”):
Services Billed by Deloitte Entities
April 30, 2017 FeesA
| Audit Fees | Audit-Related Fees | Tax Fees | All Other Fees |
Fidelity Large Cap Stock Fund | $46,000 | $100 | $5,300 | $1,300 |
Fidelity Mid-Cap Stock Fund | $56,000 | $100 | $9,100 | $1,400 |
Fidelity Small Cap Discovery Fund | $47,000 | $100 | $5,100 | $1,300 |
Fidelity Small Cap Stock Fund | $47,000 | $100 | $5,100 | $1,300 |
Fidelity Series Small Cap Discovery Fund | $46,000 | $100 | $5,100 | $1,300 |
April 30, 2016 FeesA,B
| Audit Fees | Audit-Related Fees | Tax Fees | All Other Fees |
Fidelity Large Cap Stock Fund | $44,000 | $100 | $5,200 | $1,300 |
Fidelity Mid-Cap Stock Fund | $52,000 | $100 | $8,200 | $2,000 |
Fidelity Small Cap Discovery Fund | $46,000 | $100 | $5,100 | $1,700 |
Fidelity Small Cap Stock Fund | $46,000 | $100 | $5,200 | $1,100 |
Fidelity Series Small Cap Discovery Fund | $45,000 | $100 | $5,400 | $1,100 |
A Amounts may reflect rounding.
B Certain amounts have been reclassified to align with current period presentation.
The following table presents fees billed by PricewaterhouseCoopers LLP (“PwC”) in each of the last two fiscal years for services rendered to Fidelity Advisor Event Driven Opportunities Fund and Fidelity Event Driven Opportunities Fund (the “Funds”):
Services Billed by PwC
April 30, 2017 FeesA
| Audit Fees | Audit-Related Fees | Tax Fees | All Other Fees |
Fidelity Advisor Event Driven Opportunities Fund | $41,000 | $4,000 | $3,300 | $1,900 |
Fidelity Event Driven Opportunities Fund | $36,000 | $3,500 | $2,800 | $1,700 |
|
|
|
|
|
April 30, 2016 FeesA,B
| Audit Fees | Audit-Related Fees | Tax Fees | All Other Fees |
Fidelity Advisor Event Driven Opportunities Fund | $39,000 | $3,000 | $3,900 | $1,900 |
Fidelity Event Driven Opportunities Fund | $35,000 | $2,900 | $2,800 | $1,900 |
|
|
|
|
|
A Amounts may reflect rounding.
B Certain amounts have been reclassified to align with current period presentation.
The following table presents fees billed by PwC and Deloitte Entities that were required to be approved by the Audit Committee for services that relate directly to the operations and financial reporting of the Funds and that are rendered on behalf of Fidelity Management & Research Company (“FMR”) and entities controlling, controlled by, or under common control with FMR (not including any sub-adviser whose role is primarily portfolio management and is subcontracted with or overseen by another investment adviser) that provide ongoing services to the Funds (“Fund Service Providers”):
Services Billed by Deloitte Entities
| April 30, 2017A | April 30, 2016A |
Audit-Related Fees | $- | $35,000 |
Tax Fees | $20,000 | $10,000 |
All Other Fees | $- | $- |
A Amounts may reflect rounding.
Services Billed by PwC
| April 30, 2017A | April 30, 2016A,B |
Audit-Related Fees | $6,090,000 | $5,470,000 |
Tax Fees | $120,000 | $- |
All Other Fees | $- | $- |
A Amounts may reflect rounding.
B Certain amounts have been reclassified to align with current period presentation.
“Audit-Related Fees” represent fees billed for assurance and related services that are reasonably related to the performance of the fund audit or the review of the fund's financial statements and that are not reported under Audit Fees.
“Tax Fees” represent fees billed for tax compliance, tax advice or tax planning that relate directly to the operations and financial reporting of the fund.
“All Other Fees” represent fees billed for services provided to the fund or Fund Service Provider, a significant portion of which are assurance related, that relate directly to the operations and financial reporting of the fund, excluding those services that are reported under Audit Fees, Audit-Related Fees or Tax Fees.
Assurance services must be performed by an independent public accountant.
* * *
The aggregate non-audit fees billed by PwC and Deloitte Entities for services rendered to the Funds, FMR (not including any sub-adviser whose role is primarily portfolio management and is subcontracted with or overseen by another investment adviser), and any Fund Service Provider for each of the last two fiscal years of the Funds are as follows:
Billed By | April 30, 2017 A | April 30, 2016 A,B |
PwC | $8,460,000 | $6,090,000 |
Deloitte Entities | $395,000 | $125,000 |
A Amounts may reflect rounding.
B Certain amounts have been reclassified to align with current period presentation.
The trust's Audit Committee has considered non-audit services that were not pre-approved that were provided by PwC and Deloitte Entities to Fund Service Providers to be compatible with maintaining the independence of PwC and Deloitte Entities in their audits of the Funds, taking into account representations from PwC and Deloitte Entities, in accordance with Public Company Accounting Oversight Board rules, regarding their independence from the Funds and their related entities and FMR’s review of the appropriateness and permissibility under applicable law of such non-audit services prior to their provision to the Fund Service Providers.
Audit Committee Pre-Approval Policies and Procedures
The trust’s Audit Committee must pre-approve all audit and non-audit services provided by a fund’s independent registered public accounting firm relating to the operations or financial reporting of the fund. Prior to the commencement of any audit or non-audit services to a fund, the Audit Committee reviews the services to determine whether they are appropriate and permissible under applicable law.
The Audit Committee has adopted policies and procedures to, among other purposes, provide a framework for the Committee’s consideration of non-audit services by the audit firms that audit the Fidelity funds. The policies and procedures require that any non-audit service provided by a fund audit firm to a Fidelity fund and any non-audit service provided by a fund auditor to a Fund Service Provider that relates directly to the operations and financial reporting of a Fidelity fund (“Covered Service”) are subject to approval by the Audit Committee before such service is provided.
All Covered Services must be approved in advance of provision of the service either: (i) by formal resolution of the Audit Committee, or (ii) by oral or written approval of the service by the Chair of the Audit Committee (or if the Chair is unavailable, such other member of the Audit Committee as may be designated by the Chair to act in the Chair’s absence). The approval contemplated by (ii) above is permitted where the Treasurer determines that action on such an engagement is necessary before the next meeting of the Audit Committee.
Non-audit services provided by a fund audit firm to a Fund Service Provider that do not relate directly to the operations and financial reporting of a Fidelity fund are reported to the Audit Committee on a periodic basis.
Non-Audit Services Approved Pursuant to Rule 2-01(c)(7)(i)(C) and (ii) of Regulation S-X (“De Minimis Exception”)
There were no non-audit services approved or required to be approved by the Audit Committee pursuant to the De Minimis Exception during the Funds’ last two fiscal years relating to services provided to (i) the Funds or (ii) any Fund Service Provider that relate directly to the operations and financial reporting of the Funds.
Item 5.
Audit Committee of Listed Registrants
Not applicable.
Item 6.
Investments
(a)
Not applicable.
(b)
Not applicable
Item 7.
Disclosure of Proxy Voting Policies and Procedures for Closed-End Management Investment Companies
Not applicable.
Item 8.
Portfolio Managers of Closed-End Management Investment Companies
Not applicable.
Item 9.
Purchase of Equity Securities by Closed-End Management Investment Company and Affiliated Purchasers
Not applicable.
Item 10.
Submission of Matters to a Vote of Security Holders
There were no material changes to the procedures by which shareholders may recommend nominees to the trust’s Board of Trustees.
Item 11.
Controls and Procedures
(a)(i) The President and Treasurer and the Chief Financial Officer have concluded that the trust’s disclosure controls and procedures (as defined in Rule 30a-3(c) under the Investment Company Act) provide reasonable assurances that material information relating to the trust is made known to them by the appropriate persons, based on their evaluation of these controls and procedures as of a date within 90 days of the filing date of this report.
(a)(ii) There was no change in the trust’s internal control over financial reporting (as defined in Rule 30a-3(d) under the Investment Company Act) that occurred during the second fiscal quarter of the period covered by this report that has materially affected, or is reasonably likely to materially affect, the trust’s internal control over financial reporting.
Item 12.
Exhibits
(a) | (1) | Code of Ethics pursuant to Item 2 of Form N-CSR is filed and attached hereto as EX-99.CODE ETH. |
(a) | (2) | Certification pursuant to Rule 30a-2(a) under the Investment Company Act of 1940 (17 CFR 270.30a-2(a)) is filed and attached hereto as Exhibit 99.CERT. |
(a) | (3) | Not applicable. |
(b) |
| Certification pursuant to Rule 30a-2(b) under the Investment Company Act of 1940 (17 CFR 270.30a-2(b)) is furnished and attached hereto as Exhibit 99.906CERT. |
SIGNATURES
Pursuant to the requirements of the Securities Exchange Act of 1934 and the Investment Company Act of 1940, the registrant has duly caused this report to be signed on its behalf by the undersigned, thereunto duly authorized.
Fidelity Concord Street Trust
By: | /s/Stacie M. Smith |
| Stacie M. Smith |
| President and Treasurer |
|
|
Date: | June 27, 2017 |
Pursuant to the requirements of the Securities Exchange Act of 1934 and the Investment Company Act of 1940, this report has been signed below by the following persons on behalf of the registrant and in the capacities and on the dates indicated.
By: | /s/Stacie M. Smith |
| Stacie M. Smith |
| President and Treasurer |
|
|
Date: | June 27, 2017 |
By: | /s/Howard J. Galligan III |
| Howard J. Galligan III |
| Chief Financial Officer |
|
|
Date: | June 27, 2017 |