Item 1: Report to Shareholders
 |
| Science & Technology Fund | June 30, 2007 |
The views and opinions in this report were current as of June 30, 2007. They are not guarantees of performance or investment results and should not be taken as investment advice. Investment decisions reflect a variety of factors, and the managers reserve the right to change their views about individual stocks, sectors, and the markets at any time. As a result, the views expressed should not be relied upon as a forecast of the fund’s future investment intent. The report is certified under the Sarbanes-Oxley Act, which requires mutual funds and other public companies to affirm that, to the best of their knowledge, the information in their financial reports is fairly and accurately stated in all material respects.
REPORTS ON THE WEB
Sign up for our E-mail Program, and you can begin to receive updated fund reports and prospectuses online rather than through the mail. Log in to your account at troweprice.com for more information.
Manager’s Letter
Fellow Shareholders
Science and technology stocks produced solid results in the first half of 2007. U.S. technology stocks performed better than their foreign counterparts. Economies around the world appeared healthy, boosting the demand for upgraded technology products and services. The start of some previously delayed product cycles should advance technology companies’ fortunes for the remainder of 2007 and well into 2008. When stock markets are strong, technology stocks generally outperform the overall market; when markets are weak, they generally underperform. It appears this pattern may be playing out again this year.
HIGHLIGHTS
• A healthy global economy and the start of several new product cycles helped science and technology stocks produce solid returns in the first half of 2007.
• For the six-month period, returns for the Science & Technology Fund generated strong returns outperforming the overall market and its Lipper peer group.
• We trimmed our semiconductor stocks and used the gains to add to our information services and media holdings.
• Improved fundamentals, new product cycles, and strong seasonal sales should support technology stock performance for the remainder of the year.

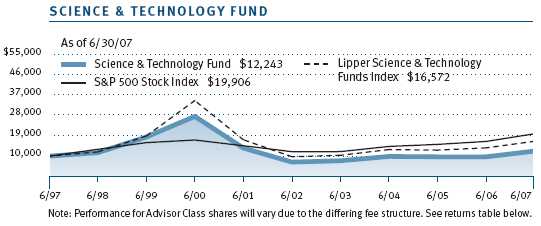
For the six months ended June 30, your fund returned 11.26%, beating the unmanaged S&P 500 Index and the Lipper Science & Technology Funds Index, as shown in the accompanying Performance Comparison table. (Advisor Class shares returned 11.17%, reflecting their different fee structure.) For the one-year period, the fund’s results bested the Lipper peer group and the S&P 500. With only a modest down-draft in the beginning of March, technology stocks have rallied more than 35% since the lows in July 2006, which is unusual because in eight of the past nine years, technology stocks have lagged the overall market during the first half of the year. Another interesting historical pattern is that in 17 of the last 20 years, the technology market has offered the opportunity to buy stocks during a correction between April and October. So far this year, technology stocks are not following their usual pattern.
MARKET ENVIRONMENT
Growth stocks outperformed value for the first time in eight years, and technology stocks experienced their best first-half performance since 2003. Despite broad economic issues that could have weighed on the technology market, investor sentiment and an improving outlook aided solid first-half returns. A number of factors have contributed to technology’s strong performance:
• The crisis in subprime mortgage lending has raised the specter of a consumer spending slowdown in the United States; however, demand remains robust in emerging markets. While emerging markets represent a small portion of actual technology spending, they represent a disproportionate amount of incremental growth, particularly for wireless handsets.
• Rising oil prices and interest rates did little to temper investor enthusiasm for stocks, unlike last year, when these very same issues led to a significant correction beginning in May.
• The exuberant private-equity spending has provided an underlying support to lower-valued technology stocks and galvanized management to focus on improving profitability.
• The semiconductor cycle (a barometer for industry supply and demand) has recovered from a reduced level of demand as the supply chain largely absorbed excess inventory.
The general market conditions that supported technology stocks during the first half should remain in place for the remainder of the year.
PORTFOLIO REVIEW
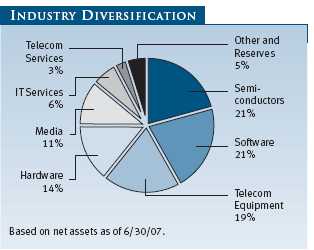
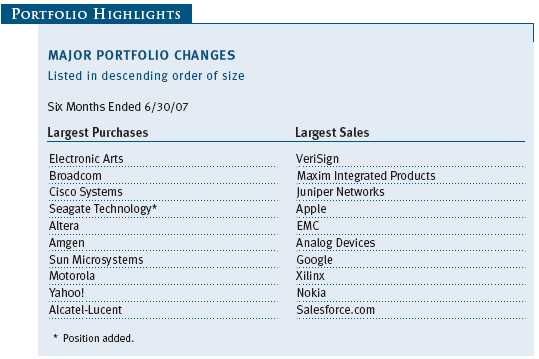
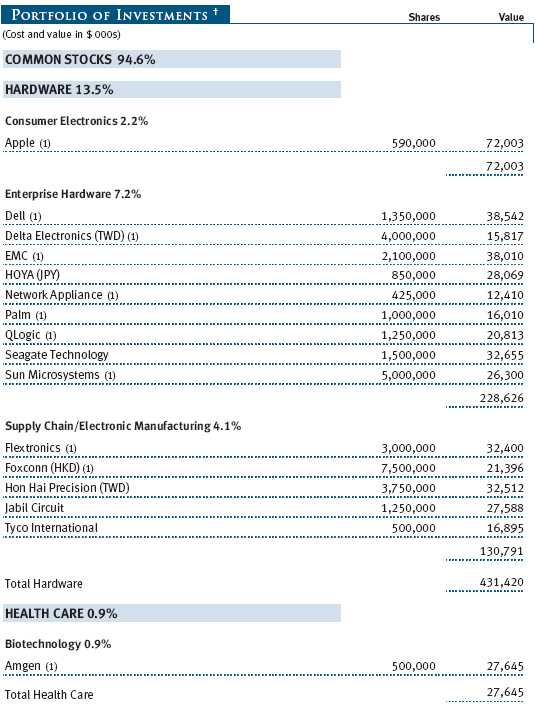
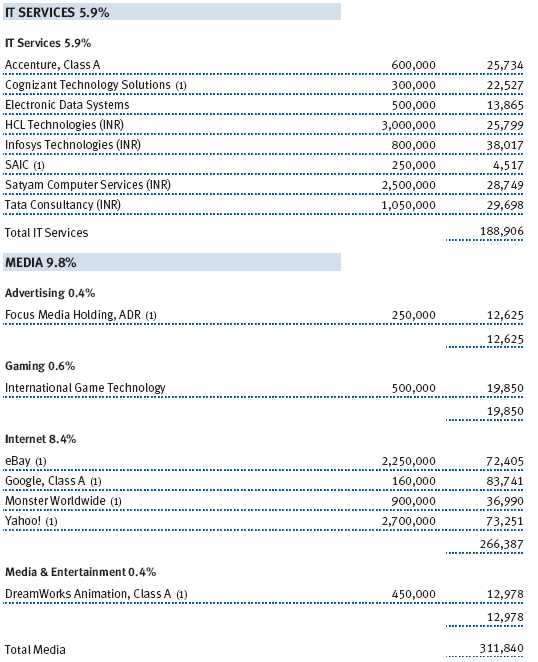
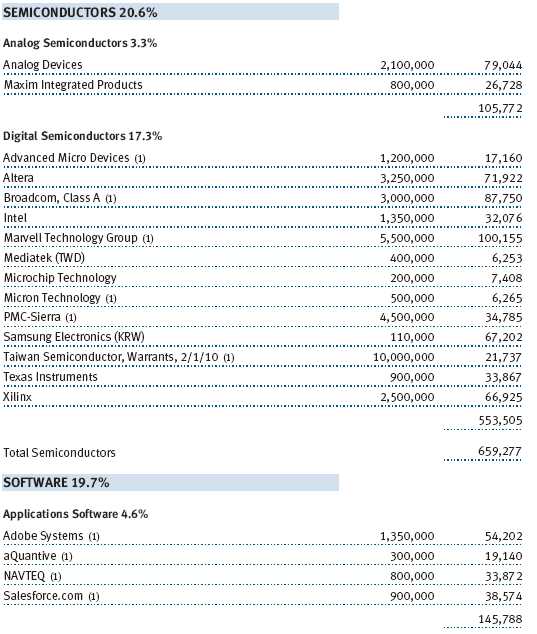
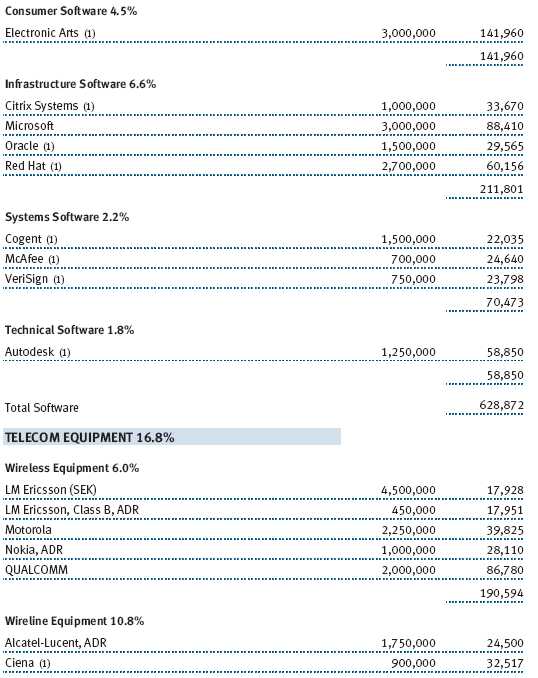
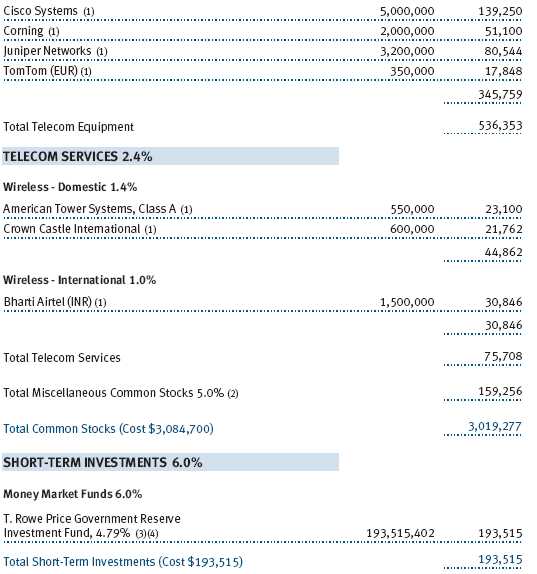
The fund remains broadly diversified across the principal segments of the science and technology sector. Stocks of software and semiconductor companies each accounted for 21% of the portfolio. Telecom equipment and hardware remained relatively constant over the last six months at 19% and 14%, respectively. During the past six months, we decreased our exposure to semiconductors by four percentage points and increased our exposure to IT services and media (principally through the purchase of Internet companies). With the strong move in the semiconductor stocks in the first six months of the year, our analysis indicated other technology sectors looked more attractive on a risk/reward basis. Our largest purchases were Electronic Arts, Broadcom, Cisco Systems, Seagate Technology, and Altera, while our largest sales included VeriSign, Maxim Integrated Products, Juniper Networks, Apple, and EMC. We continued to add to our Electronic Arts position during the last six months. Similar to the beginning of previous gaming console cycles, investors are questioning both the growth and profitability potential of the independent software providers. While we are disappointed by the stock’s recent performance, we are comfortable with our investment thesis and prefer to be early in establishing our positions rather than chase performance. Despite reducing our overweight in semiconductors, we purchased both Broadcom and Altera to shift the semiconductor focus from a broad cyclical recovery to a communications-centric theme. (Please see the portfolio of investments for a complete listing of holdings and the amount each represents in the portfolio.)
Among portfolio holdings, Juniper Networks, Apple, and Corning were the fund’s best contributors over the past six months, while laggards included Isilon Systems, Amgen, and Broadcom. Isilon Systems struggled to gain traction for its enterprise storage systems that are optimized for media, and we eliminated the stock. An adverse drug trial and an FDA label change caused Amgen to suffer a 20% correction in the first six months. Broadcom’s stock languished as investors worried about excess inventory in cable set-top boxes and Motorola cell phones (Broadcom supplies Bluetooth chips to Motorola).
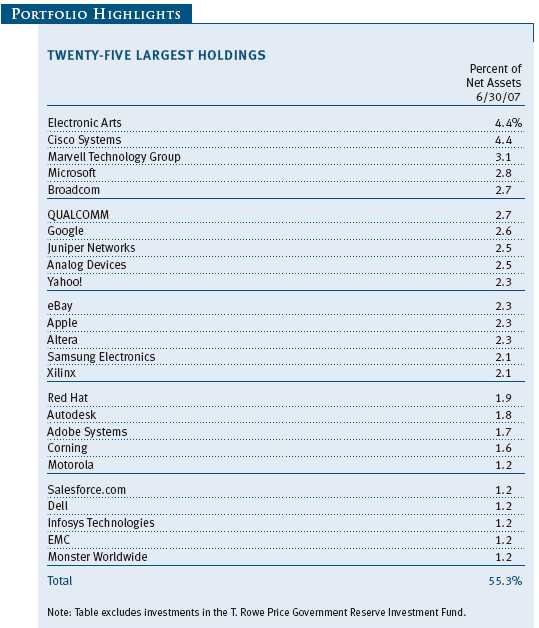
The fund’s 25 largest holdings, which included Electronic Arts, Cisco Systems, and Marvell Technology Group, represented 55.3% of net assets compared with 62.9% at the end of December 2006. With the continued strong relative performance, we continue to moderate our concentration. At the end of June, the average market capitalization for the fund was $14.7 billion, compared to $15.4 billion six months ago.
OUTLOOK
While the summer often proves to be a difficult period for technology stocks, we remain optimistic that the first-half performance can continue. The technology demand picture in the latter half of 2007 is healthier than in 2006. In last year’s semiannual report, we specifically highlighted the product transition headwinds associated with the release of Vista, Microsoft’s new operating system, and Sony’s PlayStation 3. Thus far, the response to both products has been tepid, but we expect them to show improvement in the coming months. Although improved technology fundamentals provide a tailwind, there are risks—primarily rising interest rates, slowing consumer spending, and inflationary energy prices. Finally, the recovery in technology spending over the last few years has allowed companies to improve operating margins to levels not seen since 2000. With such high margins, future stock performance will need to come from a combination of increasing valuation multiples and accelerating sales growth rather than operating leverage.
Our focus remains on companies with growing market share and strong management teams that are positioned to benefit from the opportunities offered by an improving economic and IT spending environment.
As always, we appreciate your continued support.
Respectfully submitted,

Michael F. Sola
President of the fund and chairman of its Investment Advisory Committee
July 24, 2007
The committee chairman has day-to-day responsibility for managing the portfolio and works with committee members in developing and executing the fund’s investment program.
RISKS OF INVESTING IN THE FUND
Funds that invest only in specific industries will experience greater volatility than funds investing in a broad range of industries. Technology stocks, historically, have experienced unusually wide price swings, both up and down. The potential for wide variation in performance reflects the special risks common to companies in the rapidly changing field of technology. For example, products or services that at first appear promising may not prove commercially successful and may become obsolete quickly. Earnings disappointments and intense competition for market share can result in sharp price declines.
GLOSSARY
Lipper Index: An index of mutual fund performance returns for specified periods in defined categories as tracked by Lipper Inc.
Price/earnings ratio: Calculated by dividing a stock’s market value per share by the company’s earnings per share for the past 12 months or by expected earnings for the coming year.
S&P 500 Stock Index: A market cap-weighted index of 500 widely held stocks often used as a proxy for the overall stock market. Performance is reported on a total return basis.
Performance and Expenses
| GROWTH OF $10,000 |
This chart shows the value of a hypothetical $10,000 investment in the fund over the past 10 fiscal year periods or since inception (for funds lacking 10-year records). The result is compared with benchmarks, which may include a broad-based market index and a peer group average or index. Market indexes do not include expenses, which are deducted from fund returns as well as mutual fund averages and indexes.
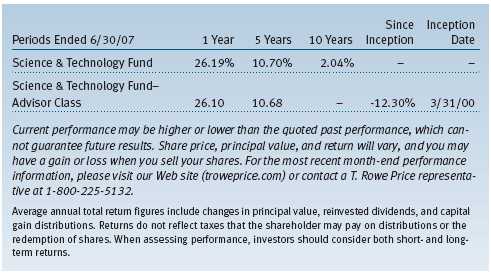
| AVERAGE ANNUAL COMPOUND TOTAL RETURN |
This table shows how the fund would have performed each year if its actual (or cumulative) returns for the periods shown had been earned at a constant rate.
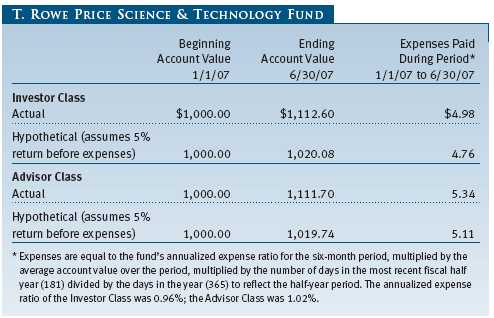
| FUND EXPENSE EXAMPLE |
As a mutual fund shareholder, you may incur two types of costs: (1) transaction costs, such as redemption fees or sales loads, and (2) ongoing costs, including management fees, distribution and service (12b-1) fees, and other fund expenses. The following example is intended to help you understand your ongoing costs (in dollars) of investing in the fund and to compare these costs with the ongoing costs of investing in other mutual funds. The example is based on an investment of $1,000 invested at the beginning of the most recent six-month period and held for the entire period.
Please note that the fund has two share classes: The original share class (“investor class”) charges no distribution and service (12b-1) fee. Advisor Class shares are offered only through unaffiliated brokers and other financial intermediaries and charge a 0.25% 12b-1 fee. Each share class is presented separately in the table.
Actual Expenses
The first line of the following table (“Actual”) provides information about actual account values and expenses based on the fund’s actual returns. You may use the information in this line, together with your account balance, to estimate the expenses that you paid over the period. Simply divide your account value by $1,000 (for example, an $8,600 account value divided by $1,000 = 8.6), then multiply the result by the number in the first line under the heading “Expenses Paid During Period” to estimate the expenses you paid on your account during this period.
Hypothetical Example for Comparison Purposes
The information on the second line of the table (“Hypothetical”) is based on hypothetical account values and expenses derived from the fund’s actual expense ratio and an assumed 5% per year rate of return before expenses (not the fund’s actual return). You may compare the ongoing costs of investing in the fund with other funds by contrasting this 5% hypothetical example and the 5% hypothetical examples that appear in the shareholder reports of the other funds. The hypothetical account values and expenses may not be used to estimate the actual ending account balance or expenses you paid for the period.
Note: T. Rowe Price charges an annual small-account maintenance fee of $10, generally for accounts with less than $2,000 ($500 for UGMA/UTMA). The fee is waived for any investor whose T. Rowe Price mutual fund accounts total $25,000 or more, accounts employing automatic investing, and IRAs and other retirement plan accounts that utilize a prototype plan sponsored by T. Rowe Price (although a separate custodial or administrative fee may apply to such accounts). This fee is not included in the accompanying table. If you are subject to the fee, keep it in mind when you are estimating the ongoing expenses of investing in the fund and when comparing the expenses of this fund with other funds.
You should also be aware that the expenses shown in the table highlight only your ongoing costs and do not reflect any transaction costs, such as redemption fees or sales loads. Therefore, the second line of the table is useful in comparing ongoing costs only and will not help you determine the relative total costs of owning different funds. To the extent a fund charges transaction costs, however, the total cost of owning that fund is higher.
Unaudited

The accompanying notes are an integral part of these financial statements.
Unaudited
The accompanying notes are an integral part of these financial statements.
Unaudited
The accompanying notes are an integral part of these financial statements.
Unaudited
The accompanying notes are an integral part of these financial statements.
Unaudited
The accompanying notes are an integral part of these financial statements.
Unaudited
The accompanying notes are an integral part of these financial statements.
Unaudited
| NOTES TO FINANCIAL STATEMENTS |
NOTE 1 - SIGNIFICANT ACCOUNTING POLICIES
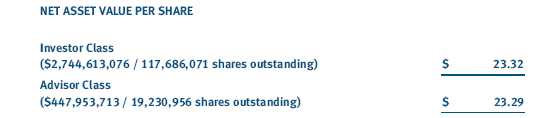
T. Rowe Price Science & Technology Fund, Inc. (the fund), is registered under the Investment Company Act of 1940 (the 1940 Act) as a diversified, open-end management investment company. The fund seeks to provide long-term capital appreciation. The fund has two classes of shares: the Science & Technology Fund original share class, referred to in this report as the Investor Class, offered since September 30, 1987, and Science & Technology Fund—Advisor Class (Advisor Class), offered since March 1, 2000. Advisor Class shares are sold only through unaffiliated brokers and other unaffiliated financial intermediaries that are compensated by the class for distribution, shareholder servicing, and/or certain administrative services under a Board-approved Rule 12b-1 plan. Each class has exclusive voting rights on matters related solely to that class, separate voting rights on matters that relate to both classes, and, in all other respects, the same rights and obligations as the other class.
The accompanying financial statements were prepared in accordance with accounting principles generally accepted in the United States of America, which require the use of estimates made by fund management. Fund management believes that estimates and security valuations are appropriate; however, actual results may differ from those estimates, and the security valuations reflected in the financial statements may differ from the value the fund ultimately realizes upon sale of the securities.
Valuation The fund values its investments and computes its net asset value per share at the close of the New York Stock Exchange (NYSE), normally 4 p.m. ET, each day that the NYSE is open for business. Equity securities listed or regularly traded on a securities exchange or in the over-the-counter (OTC) market are valued at the last quoted sale price or, for certain markets, the official closing price at the time the valuations are made, except for OTC Bulletin Board securities, which are valued at the mean of the latest bid and asked prices. A security that is listed or traded on more than one exchange is valued at the quotation on the exchange determined to be the primary market for such security. Listed securities not traded on a particular day are valued at the mean of the latest bid and asked prices for domestic securities and the last quoted sale price for international securities.
Investments in mutual funds are valued at the mutual fund’s closing net asset value per share on the day of valuation. Purchased and written options are valued at the mean of the closing bid and asked prices.
Other investments, including restricted securities, and those for which the above valuation procedures are inappropriate or are deemed not to reflect fair value are stated at fair value as determined in good faith by the T. Rowe Price Valuation Committee, established by the fund’s Board of Directors.
Most foreign markets close before the close of trading on the NYSE. If the fund determines that developments between the close of a foreign market and the close of the NYSE will, in its judgment, materially affect the value of some or all of its portfolio securities, which in turn will affect the fund’s share price, the fund will adjust the previous closing prices to reflect the fair value of the securities as of the close of the NYSE, as determined in good faith by the T. Rowe Price Valuation Committee, established by the fund’s Board of Directors. A fund may also fair value securities in other situations, such as when a particular foreign market is closed but the fund is open. In deciding whether to make fair value adjustments, the fund reviews a variety of factors, including developments in foreign markets, the performance of U.S. securities markets, and the performance of instruments trading in U.S. markets that represent foreign securities and baskets of foreign securities. The fund uses outside pricing services to provide it with closing market prices and information used for adjusting those prices. The fund cannot predict when and how often it will use closing prices and when it will adjust those prices to reflect fair value. As a means of evaluating its fair value process, the fund routinely compares closing market prices, the next day’s opening prices in the same markets, and adjusted prices.
Currency Translation Assets, including investments, and liabilities denominated in foreign currencies are translated into U.S. dollar values each day at the prevailing exchange rate, using the mean of the bid and asked prices of such currencies against U.S. dollars as quoted by a major bank. Purchases and sales of securities, income, and expenses are translated into U.S. dollars at the prevailing exchange rate on the date of the transaction. The effect of changes in foreign currency exchange rates on realized and unrealized security gains and losses is reflected as a component of security gains and losses.
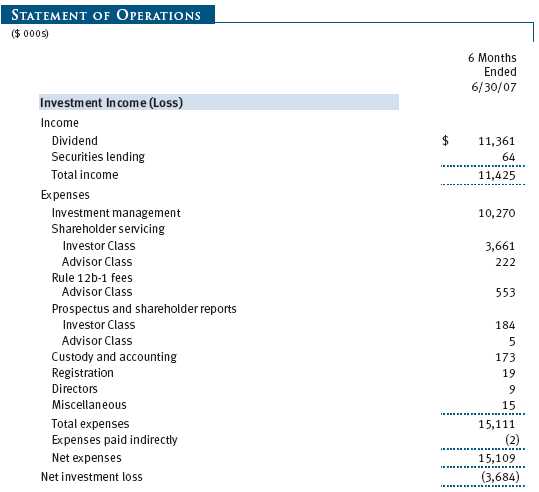
Class Accounting The Advisor Class pays distribution, shareholder servicing, and/or certain administrative expenses in the form of Rule 12b-1 fees, in an amount not exceeding 0.25% of the class’s average daily net assets. Shareholder servicing, prospectus, and shareholder report expenses incurred by each class are charged directly to the class to which they relate. Expenses common to both classes, investment income, and realized and unrealized gains and losses are allocated to the classes based upon the relative daily net assets of each class.
Rebates and Credits Subject to best execution, the fund may direct certain security trades to brokers who have agreed to rebate a portion of the related brokerage commission to the fund in cash. Commission rebates are reflected as realized gain on securities in the accompanying financial statements and totaled $134,000 for the six months ended June 30, 2007. Additionally, the fund earns credits on temporarily uninvested cash balances at the custodian that reduce the fund’s custody charges. Custody expense in the accompanying financial statements is presented before reduction for credits, which are reflected as expenses paid indirectly.
Investment Transactions, Investment Income, and Distributions Income and expenses are recorded on the accrual basis. Dividends received from mutual fund investments are reflected as dividend income; capital gain distributions are reflected as realized gain/loss. Dividend income and capital gain distributions are recorded on the ex-dividend date. Any income tax-related interest and penalties would be classified as income tax expense. Investment transactions are accounted for on the trade date. Realized gains and losses are reported on the identified cost basis. Distributions to shareholders are recorded on the ex-dividend date. Income distributions are declared and paid by each class on an annual basis. Capital gain distributions, if any, are declared and paid by the fund, typically on an annual basis.
New Accounting Pronouncements Effective June 29, 2007, the fund adopted Financial Accounting Standards Board (“FASB”) Interpretation No. 48 (“FIN 48”), Accounting for Uncertainty in Income Taxes, a clarification of FASB Statement No. 109, Accounting for Income Taxes. FIN 48 establishes financial accounting and disclosure requirements for recognition and measurement of tax positions taken or expected to be taken on an income tax return. The adoption of FIN 48 had no impact on the fund’s net assets or results of operations.
In September 2006, the FASB released the Statement of Financial Accounting Standard No. 157 (“FAS 157”), Fair Value Measurements. FAS 157 clarifies the definition of fair value and establishes the framework for measuring fair value, as well as proper disclosure of this methodology in the financial statements. It will be effective for the fund’s fiscal year beginning January 1, 2008. Management is evaluating the effects of FAS 157; however, it is not expected to have a material impact on the fund’s net assets or results of operations.
NOTE 2 - INVESTMENT TRANSACTIONS
Consistent with its investment objective, the fund engages in the following practices to manage exposure to certain risks or to enhance performance. The investment objective, policies, program, and risk factors of the fund are described more fully in the fund’s prospectus and Statement of Additional Information.
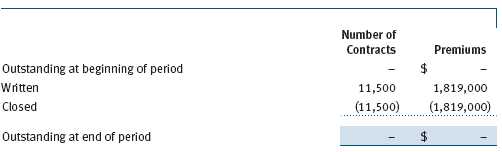
Options Call and put options give the holder the right to purchase or sell, respectively, a security at a specified price on a certain date. Risks arise from possible illiquidity of the options market and from movements in security values. Written options are reflected in the accompanying Statement of Assets and Liabilities at market value. Transactions in options written and related premiums received during the six months ended June 30, 2007, were as follows:
Securities Lending The fund lends its securities to approved brokers to earn additional income. It receives as collateral cash and U.S. government securities valued at 102% to 105% of the value of the securities on loan. Cash collateral is invested in a money market pooled trust managed by the fund’s lending agent in accordance with investment guidelines approved by fund management. Collateral is maintained over the life of the loan in an amount not less than the value of loaned securities, as determined at the close of fund business each day; any additional collateral required due to changes in security values is delivered to the fund the next business day. Although risk is mitigated by the collateral, the fund could experience a delay in recovering its securities and a possible loss of income or value if the borrower fails to return the securities. Securities lending revenue recognized by the fund consists of earnings on invested collateral and borrowing fees, net of any rebates to the borrower and compensation to the lending agent. At June 30, 2007, there were no securities on loan.
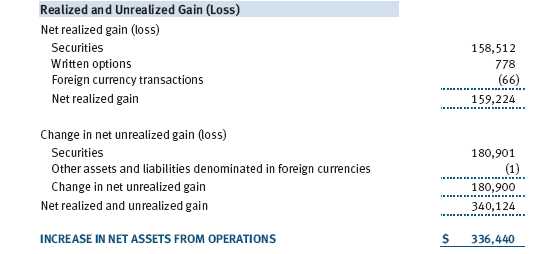
Other Purchases and sales of portfolio securities, other than short-term securities, aggregated $969,878,000 and $1,480,773,000, respectively, for the six months ended June 30, 2007.
NOTE 3 - FEDERAL INCOME TAXES
No provision for federal income taxes is required since the fund intends to continue to qualify as a regulated investment company under Subchapter M of the Internal Revenue Code and distribute to shareholders all of its taxable income and gains. Federal income tax regulations differ from generally accepted accounting principles; therefore, distributions determined in accordance with tax regulations may differ in amount or character from net investment income and realized gains for financial reporting purposes. Financial reporting records are adjusted for permanent book/tax differences to reflect tax character. Financial records are not adjusted for temporary differences. The amount and character of tax-basis distributions and composition of net assets are finalized at fiscal year-end; accordingly, tax-basis balances have not been determined as of June 30, 2007.
The fund intends to retain realized gains to the extent of available capital loss carryforwards. As of December 31, 2006, the fund had $5,323,578,000 of unused capital loss carryforwards, of which $3,289,937,000 expire in 2009, $1,904,219,000 expire in 2010, and $129,422,000 expire 2011.
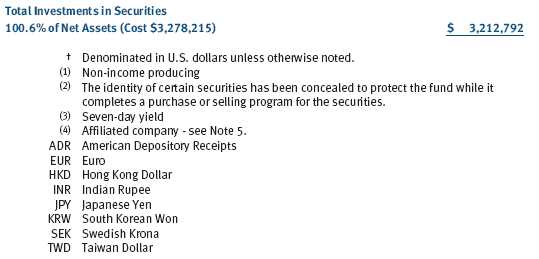
At June 30, 2007, the cost of investments for federal income tax purposes was $3,278,215,000. Net unrealized loss aggregated $65,423,000 at period-end, of which $265,047,000 related to appreciated investments and $330,470,000 related to depreciated investments.
NOTE 4 - FOREIGN TAXES
The fund is subject to foreign income taxes imposed by certain countries in which it invests. Additionally, capital gains realized by the fund upon disposition of securities issued in or by certain foreign countries are subject to capital gains tax imposed by those countries. Similarly, a tax on net profits, including interest income and realized and unrealized capital gains, is imposed by certain other countries. All taxes are computed in accordance with the applicable foreign tax law, and, to the extent permitted, capital losses are used to offset capital gains. Tax expense attributable to income is accrued by the fund as a reduction of income. Current and deferred tax expense attributable to net capital gains is reflected as a component of realized and/or change in unrealized gain/loss on securities in the accompanying financial statements. At June 30, 2007, the fund had a tax refund receivable of $112,000 attributable to foreign securities, no deferred tax liability attributable to foreign securities, and no foreign capital loss carryforwards.
NOTE 5 - RELATED PARTY TRANSACTIONS
The fund is managed by T. Rowe Price Associates, Inc. (the manager or Price Associates), a wholly owned subsidiary of T. Rowe Price Group, Inc. The investment management agreement between the fund and the manager provides for an annual investment management fee, which is computed daily and paid monthly. The fee consists of an individual fund fee, equal to 0.35% of the fund’s average daily net assets, and a group fee. The group fee rate is calculated based on the combined net assets of certain mutual funds sponsored by Price Associates (the group) applied to a graduated fee schedule, with rates ranging from 0.48% for the first $1 billion of assets to 0.285% for assets in excess of $220 billion. The fund’s group fee is determined by applying the group fee rate to the fund’s average daily net assets. At June 30, 2007, the effective annual group fee rate was 0.30%.
In addition, the fund has entered into service agreements with Price Associates and two wholly owned subsidiaries of Price Associates (collectively, Price). Price Associates computes the daily share prices and provides certain other administrative services to the fund. T. Rowe Price Services, Inc., provides shareholder and administrative services in its capacity as the fund’s transfer and dividend disbursing agent. T. Rowe Price Retirement Plan Services, Inc., provides subaccounting and recordkeeping services for certain retirement accounts invested in the Investor Class. For the six months ended June 30, 2007, expenses incurred pursuant to these service agreements were $69,000 for Price Associates, $2,152,000 for T. Rowe Price Services, Inc., and $733,000 for T. Rowe Price Retirement Plan Services, Inc. The total amount payable at period-end pursuant to these service agreements is reflected as Due to Affiliates in the accompanying financial statements.
Additionally, the fund is one of several mutual funds in which certain college savings plans managed by Price Associates may invest. As approved by the fund’s Board of Directors, shareholder servicing costs associated with each college savings plan are borne by the fund in proportion to the average daily value of its shares owned by the college savings plan. For the six months ended June 30, 2007, the fund was charged $25,000 for shareholder servicing costs related to the college savings plans, of which $19,000 was for services provided by Price. The amount payable at period-end pursuant to this agreement is reflected as Due to Affiliates in the accompanying financial statements. At June 30, 2007, approximately 1% of the outstanding shares of the Investor Class were held by college savings plans.
The fund may invest in the T. Rowe Price Reserve Investment Fund and the T. Rowe Price Government Reserve Investment Fund (collectively, the T. Rowe Price Reserve Investment Funds), open-end management investment companies managed by Price Associates and affiliates of the fund. The T. Rowe Price Reserve Investment Funds are offered as cash management options to mutual funds, trusts, and other accounts managed by Price Associates and/or its affiliates, and are not available for direct purchase by members of the public. The T. Rowe Price Reserve Investment Funds pay no investment management fees. During the six months ended June 30, 2007, dividend income from the T. Rowe Price Reserve Investment Funds totaled $3,382,000, and the value of shares of the T. Rowe Price Reserve Investment Funds held at June 30, 2007, and December 31, 2006, was $193,515,000 and $80,457,000, respectively.
As of June 30, 2007, T. Rowe Price Group, Inc., and/or its wholly owned subsidiaries owned 510,520 shares of the Investor Class, aggregating less than 1% of the fund’s net assets.
NOTE 6 - INTERFUND BORROWING
Pursuant to its prospectus, the fund may borrow up to 33% of its total assets. The fund is party to an interfund borrowing agreement between itself and other T. Rowe Price-sponsored mutual funds, which permits it to borrow or lend cash at rates beneficial to both the borrowing and lending funds. Loans totaling 10% or more of a borrowing fund’s total assets are collateralized at 102% of the value of the loan; loans of less than 10% are unsecured. During the six months ended June 30, 2007, the fund had outstanding borrowings on eight days, in the average amount of $13,688,000, and at an average annual rate of 5.50%.
| INFORMATION ON PROXY VOTING POLICIES, PROCEDURES, AND RECORDS |
A description of the policies and procedures used by T. Rowe Price funds and portfolios to determine how to vote proxies relating to portfolio securities is available in each fund’s Statement of Additional Information, which you may request by calling 1-800-225-5132 or by accessing the SEC’s Web site, www.sec.gov. The description of our proxy voting policies and procedures is also available on our Web site, www.troweprice.com. To access it, click on the words “Company Info” at the top of our homepage for individual investors. Then, in the window that appears, click on the “Proxy Voting Policy” navigation button in the top left corner.
Each fund’s most recent annual proxy voting record is available on our Web site and through the SEC’s Web site. To access it through our Web site, follow the directions above, then click on the words “Proxy Voting Record” at the bottom of the Proxy Voting Policy page.
| HOW TO OBTAIN QUARTERLY PORTFOLIO HOLDINGS |
The fund files a complete schedule of portfolio holdings with the Securities and Exchange Commission for the first and third quarters of each fiscal year on Form N-Q. The fund’s Form N-Q is available electronically on the SEC’s Web site (www.sec.gov); hard copies may be reviewed and copied at the SEC’s Public Reference Room, 450 Fifth St. N.W., Washington, DC 20549. For more information on the Public Reference Room, call 1-800-SEC-0330.
| APPROVAL OF INVESTMENT MANAGEMENT AGREEMENT |
On March 7, 2007, the fund’s Board of Directors (Board) unanimously approved the investment advisory contract (Contract) between the fund and its investment manager, T. Rowe Price Associates, Inc. (Manager). The Board considered a variety of factors in connection with its review of the Contract, also taking into account information provided by the Manager during the course of the year, as discussed below:
Services Provided by the Manager
The Board considered the nature, quality, and extent of the services provided to the fund by the Manager. These services included, but were not limited to, management of the fund’s portfolio and a variety of related activities, as well as financial and administrative services, reporting, and communications. The Board also reviewed the background and experience of the Manager’s senior management team and investment personnel involved in the management of the fund. The Board concluded that it was satisfied with the nature, quality, and extent of the services provided by the Manager.
Investment Performance of the Fund
The Board reviewed the fund’s average annual total return over the 1-, 3-, 5-, and 10-year periods as well as the fund’s year-by-year returns and compared these returns with previously agreed upon comparable performance measures and market data, including those supplied by Lipper and Morningstar, which are independent providers of mutual fund data. On the basis of this evaluation and the Board’s ongoing review of investment results, the Board concluded that the fund’s results for certain time periods were less than satisfactory. The Manager provided its assessment of the fund’s investment results and the Board concluded that the Manager’s response was satisfactory.
Costs, Benefits, Profits, and Economies of Scale
The Board reviewed detailed information regarding the revenues received by the Manager under the Contract and other benefits that the Manager (and its affiliates) may have realized from its relationship with the fund, including research received under “soft dollar” agreements. The Board noted that soft dollars were not used to pay for third-party, non-broker research. The Board also received information on the estimated costs incurred and profits realized by the Manager and its affiliates from advising T. Rowe Price mutual funds, as well as estimates of the gross profits realized from managing the fund in particular. The Board concluded that the Manager’s profits were reasonable in light of the services provided to the fund. The Board also considered whether the fund or other funds benefit under the fee levels set forth in the Contract from any economies of scale realized by the Manager. Under the Contract, the fund pays a fee to the Manager composed of two components—a group fee rate based on the aggregate assets of certain T. Rowe Price mutual funds (including the fund) that declines at certain asset levels and an individual fund fee rate that is assessed on the assets of the fund. The Board concluded that the advisory fee structure for the fund continued to provide for a reasonable sharing of benefits from any economies of scale with the fund’s investors.
Fees
The Board reviewed the fund’s management fee rate, operating expenses, and total expense ratio for the Investor Class and the Advisor Class and compared them with fees and expenses of other comparable funds based on information and data supplied by Lipper. The information provided to the Board indicated that the fund’s management fee rate was generally at or below the median for comparable funds. The information also indicated that the fund’s expense ratio (for both classes) was below the median for comparable funds. The Board also reviewed the fee schedules for comparable privately managed accounts of the Manager and its affiliates. Management informed the Board that the Manager’s responsibilities for privately managed accounts are more limited than its responsibilities for the fund and other T. Rowe Price mutual funds that it or its affiliates advise. On the basis of the information provided, the Board concluded that the fees paid by the fund under the Contract were reasonable.
Approval of the Contract
As noted, the Board approved the continuation of the Contract. No single factor was considered in isolation or to be determinative to the decision. Rather, the Board concluded, in light of a weighting and balancing of all factors considered, that it was in the best interests of the fund to approve the continuation of the Contract, including the fees to be charged for services thereunder.
Item 2. Code of Ethics.
A code of ethics, as defined in Item 2 of Form N-CSR, applicable to its principal executive officer, principal financial officer, principal accounting officer or controller, or persons performing similar functions is filed as an exhibit to the registrant’s annual Form N-CSR. No substantive amendments were approved or waivers were granted to this code of ethics during the registrant’s most recent fiscal half-year.
Item 3. Audit Committee Financial Expert.
Disclosure required in registrant’s annual Form N-CSR.
Item 4. Principal Accountant Fees and Services.
Disclosure required in registrant’s annual Form N-CSR.
Item 5. Audit Committee of Listed Registrants.
Not applicable.
Item 6. Schedule of Investments.
Not applicable. The complete schedule of investments is included in Item 1 of this Form N-CSR.
Item 7. Disclosure of Proxy Voting Policies and Procedures for Closed-End Management Investment Companies.
Not applicable.
Item 8. Portfolio Managers of Closed-End Management Investment Companies.
Not applicable.
Item 9. Purchases of Equity Securities by Closed-End Management Investment Company and Affiliated Purchasers.
Not applicable.
Item 10. Submission of Matters to a Vote of Security Holders.
Not applicable.
Item 11. Controls and Procedures.
(a) The registrant’s principal executive officer and principal financial officer have evaluated the registrant’s disclosure controls and procedures within 90 days of this filing and have concluded that the registrant’s disclosure controls and procedures were effective, as of that date, in ensuring that information required to be disclosed by the registrant in this Form N-CSR was recorded, processed, summarized, and reported timely.
(b) The registrant’s principal executive officer and principal financial officer are aware of no change in the registrant’s internal control over financial reporting that occurred during the registrant’s second fiscal quarter covered by this report that has materially affected, or is reasonably likely to materially affect, the registrant’s internal control over financial reporting.
Item 12. Exhibits.(a)(1) The registrant’s code of ethics pursuant to Item 2 of Form N-CSR is filed with the registrant’s annual Form N-CSR.
(2) Separate certifications by the registrant's principal executive officer and principal financial officer, pursuant to Section 302 of the Sarbanes-Oxley Act of 2002 and required by Rule 30a-2(a) under the Investment Company Act of 1940, are attached.
(3) Written solicitation to repurchase securities issued by closed-end companies: not applicable.
(b) A certification by the registrant's principal executive officer and principal financial officer, pursuant to Section 906 of the Sarbanes-Oxley Act of 2002 and required by Rule 30a-2(b) under the Investment Company Act of 1940, is attached.
SIGNATURES | |
| Pursuant to the requirements of the Securities Exchange Act of 1934 and the Investment | |
| Company Act of 1940, the registrant has duly caused this report to be signed on its behalf by the | |
| undersigned, thereunto duly authorized. | |
| T. Rowe Price Science & Technology Fund, Inc. | |
| By | /s/ Edward C. Bernard |
| Edward C. Bernard | |
| Principal Executive Officer | |
| Date | August 17, 2007 |
| Pursuant to the requirements of the Securities Exchange Act of 1934 and the Investment | |
| Company Act of 1940, this report has been signed below by the following persons on behalf of | |
| the registrant and in the capacities and on the dates indicated. | |
| By | /s/ Edward C. Bernard |
| Edward C. Bernard | |
| Principal Executive Officer | |
| Date | August 17, 2007 |
| By | /s/ Joseph A. Carrier |
| Joseph A. Carrier | |
| Principal Financial Officer | |
| Date | August 17, 2007 |