| UNITED STATES |
| SECURITIES AND EXCHANGE COMMISSION |
| Washington, D.C. 20549 |
FORM N-CSR |
CERTIFIED SHAREHOLDER REPORT OF REGISTERED |
MANAGEMENT INVESTMENT COMPANIES |
| Investment Company Act File Number: 811-5299 |
| T. Rowe Price Science & Technology Fund, Inc. |
| (Exact name of registrant as specified in charter) |
| 100 East Pratt Street, Baltimore, MD 21202 |
| (Address of principal executive offices) |
| David Oestreicher |
| 100 East Pratt Street, Baltimore, MD 21202 |
| (Name and address of agent for service) |
| Registrant’s telephone number, including area code: (410) 345-2000 |
| Date of fiscal year end: December 31 |
| Date of reporting period: June 30, 2009 |
Item 1: Report to Shareholders
 |
| Science & Technology Fund | June 30, 2009 |
The views and opinions in this report were current as of June 30, 2009. They are not guarantees of performance or investment results and should not be taken as investment advice. Investment decisions reflect a variety of factors, and the managers reserve the right to change their views about individual stocks, sectors, and the markets at any time. As a result, the views expressed should not be relied upon as a forecast of the fund’s future investment intent. The report is certified under the Sarbanes-Oxley Act, which requires mutual funds and other public companies to affirm that, to the best of their knowledge, the information in their financial reports is fairly and accurately stated in all material respects.
REPORTS ON THE WEB
Sign up for our E-mail Program, and you can begin to receive updated fund reports and prospectuses online rather than through the mail. Log in to your account at troweprice.com for more information.
Manager’s Letter
Fellow Shareholders
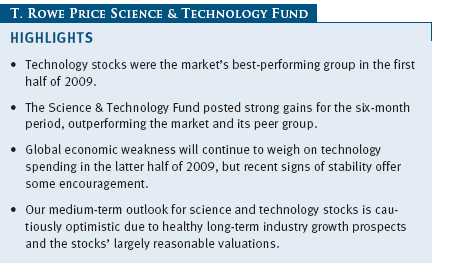
Science and technology stocks as a whole posted solid gains and outpaced the broader market in the first half of 2009, a reversal of the steep declines of 2008. Technology stocks were the standout, delivering strong appreciation despite continued weakness in technology spending. At the start of the year, technology stocks faced considerable macroeconomic uncertainties but carried low expectations and undemanding valuations. After falling with the broader market through early March, the group moved sharply higher driven by signs of economic stabilization and better-than-expected technology spending. During the period, the Science & Technology Fund posted sizable gains.
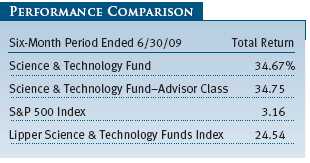
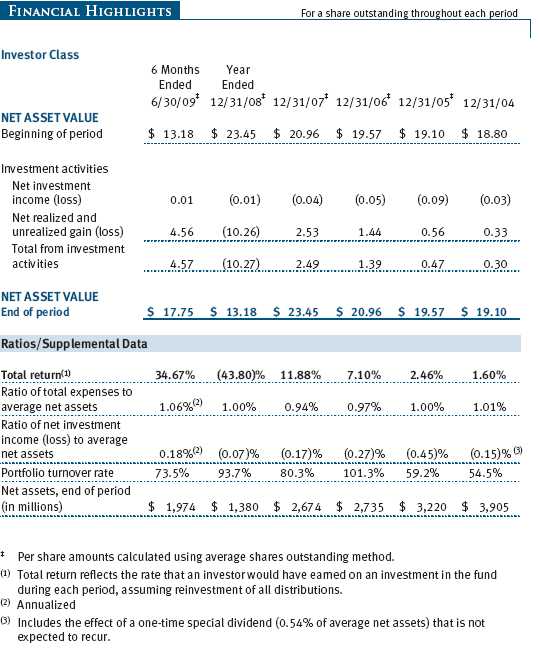
For the six-month period ended June 30, 2009, your fund returned 34.67%, outpacing the unmanaged S&P 500 Index and its Lipper peer group. (Returns for the Advisor Class shares reflected a different fee structure.) Stock selection in technology hardware, telecommunication services, and IT services was the primary contributor to our favorable results for the period.
MARKET ENVIRONMENT
In the first half of 2009, science and technology stocks staged a strong rebound from the large declines they endured in the second half of 2008. Despite the depressed levels of technology spending resulting from weak global economic conditions, technology stocks markedly outpaced the broader market. At the beginning of the year, tech stocks’ valuations were by and large quite low, reflecting investors’ extremely low expectations for the group. But even as the market fell to multi-year lows in March, several factors made technology stocks relatively resilient. Companies aggressively reduced costs to protect earnings and cash flow, and the credit crisis shed positive light on their cash-rich balance sheets. Technology industry revenue, while very weak, was not as bad as widely feared. In fact, for many companies—most notably semiconductor providers—whose revenue declines in late 2008 were amplified by inventory reductions, inventory stabilization enabled improved revenue and earnings trends. As signs of economic stability began to appear, technology stocks gained favor for their inexpensive valuations and prospects for strong earnings rebounds in an eventual economic recovery. While spending on technology products and services remains weak and highly uncertain in the medium term, we believe that in an eventual economic recovery industry, revenue will improve markedly. With better revenue, earnings improvement should be even greater given that many technology companies’ business models have considerable margin leverage.
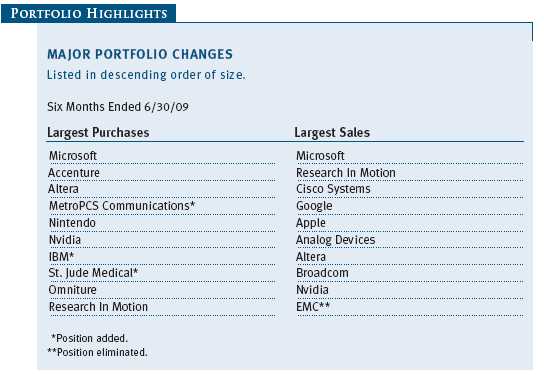
PORTFOLIO REVIEW
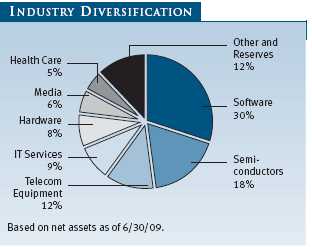
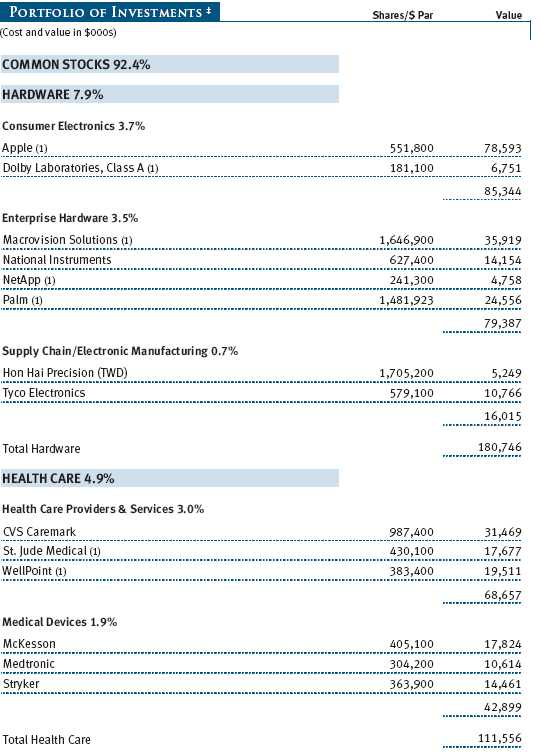
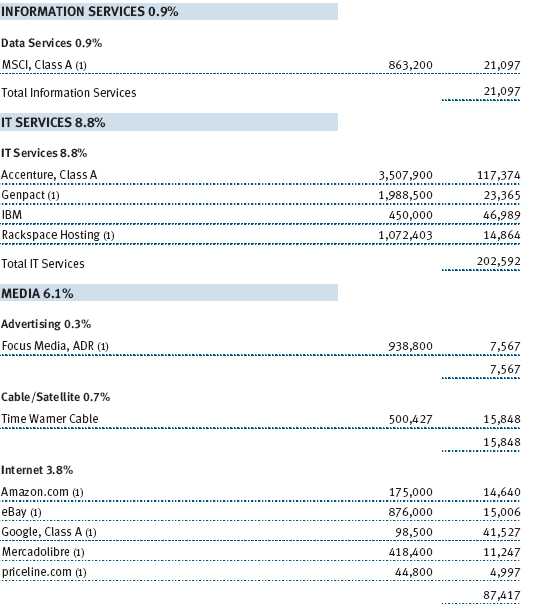
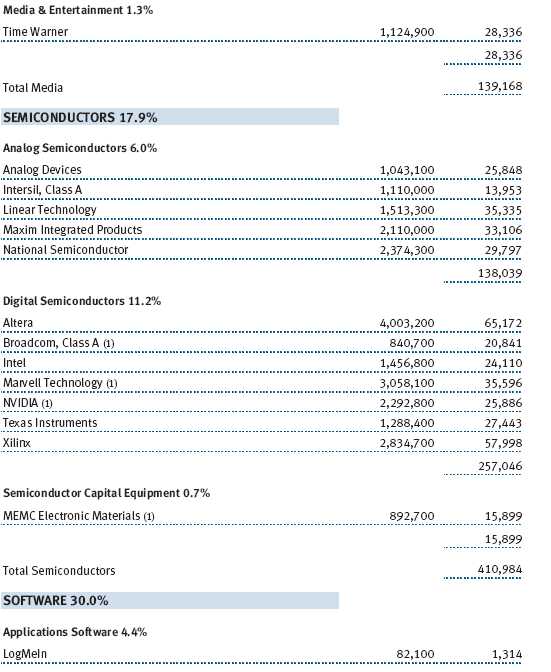
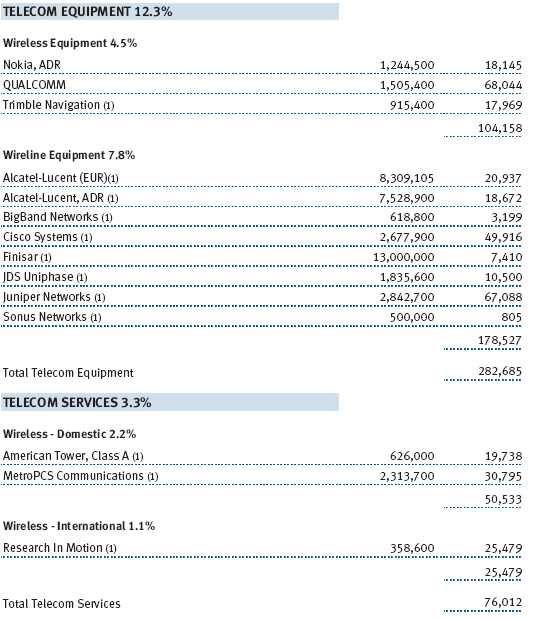
The fund remains broadly diversified across the principal segments of science and technology. At the end of the period, software accounted for 30% of the portfolio. Other major components included semiconductors at 18%, telecommunication equipment at 12%, and IT services at 9%. Since our last report, we have increased our weights in software, health care, and IT services and decreased weights in semiconductors, hardware, and telecommunication equipment.
Entering 2009, we were concerned about economic challenges and weak technology business trends but optimistic about the outlook for science and technology stocks given attractive valuations and low expectations. We believed that many of the stocks owned in your fund could deliver strong returns from the levels at which they were trading. For the year’s first half, many of our technology holdings enjoyed substantial appreciation, with several producing outsized gains. The health care stocks we opportunistically established positions in during the period were positive contributors as a result of favorable stock picking amid a broad health care group that lagged for most of the period.
Our best contributors during the first half of the year were Microsoft, Apple, Palm, and Research In Motion. Apple, Palm, and Research In Motion all benefited from the rapid adoption of smartphones, handheld devices that combine phone, e-mail, Web browsing, and other computing capabilities. Our investments in these companies are based on our confidence in the growth of smartphones as well as the individual merits of each company. Apple’s iPhone has become a consumer phenomenon and a major driver of earnings. The company continues to innovate and deliver solid results with its Mac computers and iPod line of media devices. Palm’s launch of its much anticipated Pre smartphone in early June was an important milestone for the company and our investment. The Pre is Palm’s first device based on webOS, the company’s innovative new operating system that we believe makes the Pre—and possibly Palm’s future smartphones—among the most appealing in the marketplace. On the strength of the Pre’s favorable early reviews, a successful launch, and high levels of interest in the device from carriers, Palm was your fund’s biggest percentage gainer in the first half. Research In Motion saw continued rapid consumer adoption of its Blackberry devices that offset weaker trends in the corporate side of its business to make it the fastest-growing large technology company. Improved execution and favorable product mix led to a rebound in gross margins, alleviating an investor concern that had weighed heavily on the stock. The fund benefited from adding to our Research In Motion position at the start of the year and moderating the size of the position following strong appreciation. (Please see the portfolio of investments for a complete listing of holdings and the amount each represents in the portfolio.)
Our largest holding, Microsoft, was also the largest contributor to your fund’s appreciation in the first half. The stock’s weakness early in the year gave us an appealing opportunity to make it a large position ahead of a period of strong performance. We believe the confluence of the October launch of Windows 7 and improved cost controls will fuel rapid earnings growth from current cyclically depressed levels. While this view has of late become more widely shared—benefiting the stock—we continue to think Microsoft’s growth prospects are better than the stock price reflects.
Red Hat was a strong performer, continuing the sharp recovery that began at the end of 2008. The company delivered impressive growth as the low-cost value proposition of its open-source operating systems and middleware resonated especially well with technology buyers in this tight budgetary environment. Management’s heightened focus on cost containment fueled improved margins at a time when most technology companies have seen margin contraction.
Another top contributor in the period was Macrovision Solutions (since renamed “Rovi” in a corporate rebranding), which licenses a variety of digital entertainment technologies to cable and satellite providers and consumer electronics manufacturers. Through strong execution and successful divesting of ancillary businesses, Macrovision demonstrated the attractiveness of its core business. The stock benefited from both higher earnings and higher valuation multiples. We continue to believe that Macrovision will benefit from the increasing adoption of digital entertainment worldwide.
Rackspace Hosting participates in the fast-growing managed hosting industry, managing applications such as e-mail for businesses. Rackspace has been gaining market share and has earned a reputation for differentiated customer service. The stock fell sharply after its initial public offering last year, giving us an opportunity to take a position ahead of outsized gains in the stock. Revenue growth has been solid, driven by relative resilience of the trend toward outsourcing management of software applications to hosting providers, and the company has achieved much better margins than was reflected in the stock at the time of our purchase.
Several of our semiconductor holdings enjoyed sizable rebounds from last year’s precipitous declines. Mixed-signal chip company Marvell Technology Group was the standout among these holdings as the company’s revenue and earnings began to rebound from depressed levels, aided by relative resilience in its hard disk drive and smartphone end markets, stabilization in inventories, and aggressive cost reduction. These favorable developments led to a significant rally in Marvell’s stock.
Health care stocks as a group lagged technology stocks by a wide margin, particularly early in the year, which gave us several opportunities in these stocks. We saw particular value in orthopedic device provider Stryker and St. Jude Medical, a leader in cardiac rhythm management. Both stocks had fallen to historically low valuations on fears that their businesses would be affected by economic weakness, contraction in hospital capital budgets, and health care reform. The stocks enjoyed solid rebounds, with Stryker delivering healthy earnings despite revenue weakness and St. Jude Medical continuing to gain market share in implantable cardioverter defibrillators. Health care stocks compose a modest part of the portfolio, but we continue to see opportunities in these stocks.
Video game hardware and software company Nintendo was the largest detractor to your fund’s performance in the first half of the year. Following outstanding growth in the past few years, Nintendo’s business trends weakened due to slower consumer spending, higher penetration of its Wii gaming console, and a slow period for new games. Earnings were further dampened by strength in the Japanese yen. All of these challenges amplified the conventional wisdom that this stage of the gaming cycle is not conducive to positive performance in Nintendo’s stock. We believe Nintendo holds a unique and valuable position in the gaming market, expect improved business trends in the second half, and believe the stock holds the potential for strong appreciation.
Leading design software provider Autodesk was a poor performer as its business proved to be even more sensitive to economic weakness than was expected, particularly in the construction industry, a major end market. We underestimated the magnitude of earnings weakness and the severity of its impact on the stock. Autodesk’s stock rebounded strongly in the second quarter on cost cutting and signs of bottoming in revenue but finished the period below where it started the year. We continue to view Autodesk as an appealing investment for its differentiated market position, its highly profitable business model, and its growth opportunity in three-dimensional design products. In an economic recovery, we expect that Autodesk’s earnings will rebound sharply, and we believe the stock will appreciate ahead of this earnings improvement.
STRATEGY REVIEW AND OUTLOOK
Given the challenging global economic outlook, technology spending—and thus the financial performance of most technology companies—is likely to remain weak in the second half of 2009. Against this difficult fundamental backdrop, our medium-term outlook for science and technology stocks is cautiously optimistic. Valuations generally remain reasonable and, for the most part, reflect an expected difficult medium-term business outlook. While economic challenges are significant, the underlying health of the technology industry is generally sound. By and large, technology companies boast strong balance sheets and attractive business models, and in this tough revenue environment, their reduced expense bases are providing decent earnings protection. Further, we expect industry consolidation to accelerate—providing attractive acquisition premiums for many small- and mid-cap companies—as large, cash-rich companies target smaller ones with valuable products and customer bases.
Our focus remains on identifying stocks with potential for strong appreciation as well as palatable levels of risk. In this effort, we conduct in-depth company research and continually evaluate technology spending trends and the implications of these for the companies and their stocks. While technology is no longer a young industry, technological advancement is alive and well, as evidenced by the extraordinary innovation and adoption of smartphones such as the iPhone and the Palm Pre.
In addition to smartphones, we expect strong medium-term spending growth on online advertising and commerce and on software and computing resources delivered over the Internet. We believe Microsoft’s release of its Windows 7 operating system in October will be a catalyst for individuals and companies to buy more computers, benefiting Microsoft and possibly others in the personal computing universe.
The first half of 2009 was a period of extreme macroeconomic uncertainty, particularly in the financial markets. In science and technology stocks, this uncertainty provided considerable opportunity and led to solid appreciation that has been supported in the past several months by signs of economic stabilization. We’re encouraged by your fund’s gains and its performance relative to the relevant benchmarks in the first half, but we remain attentive to the difficult economic backdrop in assessing the opportunities and risks in the stocks in which your fund is invested. That said, we’re continuing to find appealing companies and attractive stocks, and we remain of the view that challenging economic conditions don’t preclude healthy returns for stocks.
Amid ongoing economic uncertainties, we will continue to focus our efforts on making intensively researched and well-considered investments. We remain confident that the breadth and depth of T. Rowe Price’s research capabilities will serve our fellow shareholders well in the years ahead.
Thank you for your continued support.
Respectfully submitted,

Kennard W. Allen
President of the fund and chairman of its Investment Advisory Committee
July 16, 2009
The committee chairman has day-to-day responsibility for managing the portfolio and works with committee members in developing and executing the fund’s investment program.
RISKS OF INVESTING IN THE FUND
Funds that invest only in specific industries will experience greater volatility than funds investing in a broad range of industries. Technology stocks, historically, have experienced unusually wide price swings, both up and down. The potential for wide variation in performance reflects the special risks common to companies in the rapidly changing field of technology. For example, products or services that at first appear promising may not prove commercially successful and may become obsolete quickly. Earnings disappointments and intense competition for market share can result in sharp price declines.
GLOSSARY
Lipper index: An index of mutual fund performance returns for specified periods in defined categories as tracked by Lipper Inc.
Lipper Science & Technology Funds Index: An index of science and technology mutual fund performance returns for specified periods as tracked by Lipper Inc.
Price/earnings ratio: Calculated by dividing a stock’s market value per share by the company’s earnings per share for the past 12 months or by expected earnings for the coming year.
S&P 500 Stock Index: A market cap-weighted index of 500 widely held stocks often used as a proxy for the overall stock market. Performance is reported on a total return basis.
Performance and Expenses
| GROWTH OF $10,000 |
This chart shows the value of a hypothetical $10,000 investment in the fund over the past 10 fiscal year periods or since inception (for funds lacking 10-year records). The result is compared with benchmarks, which may include a broad-based market index and a peer group average or index. Market indexes do not include expenses, which are deducted from fund returns as well as mutual fund averages and indexes.

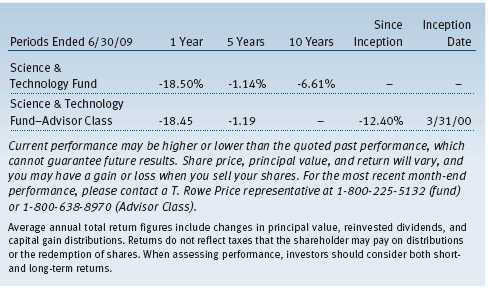
| AVERAGE ANNUAL COMPOUND TOTAL RETURN |
This table shows how the fund would have performed each year if its actual (or cumulative) returns had been earned at a constant rate.
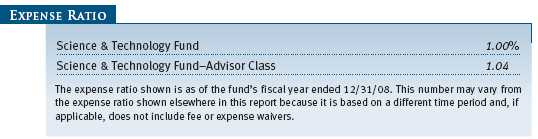
| FUND EXPENSE EXAMPLE |
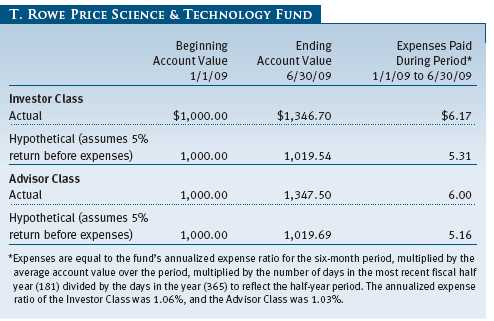
As a mutual fund shareholder, you may incur two types of costs: (1) transaction costs, such as redemption fees or sales loads, and (2) ongoing costs, including management fees, distribution and service (12b-1) fees, and other fund expenses. The following example is intended to help you understand your ongoing costs (in dollars) of investing in the fund and to compare these costs with the ongoing costs of investing in other mutual funds. The example is based on an investment of $1,000 invested at the beginning of the most recent six-month period and held for the entire period.
Please note that the fund has two share classes: The original share class (“investor class”) charges no distribution and service (12b-1) fee, and the Advisor Class shares are offered only through unaffiliated brokers and other financial intermediaries and charge a 0.25% 12b-1 fee. Each share class is presented separately in the table.
Actual Expenses
The first line of the following table (“Actual”) provides information about actual account values and expenses based on the fund’s actual returns. You may use the information in this line, together with your account balance, to estimate the expenses that you paid over the period. Simply divide your account value by $1,000 (for example, an $8,600 account value divided by $1,000 = 8.6), then multiply the result by the number in the first line under the heading “Expenses Paid During Period” to estimate the expenses you paid on your account during this period.
Hypothetical Example for Comparison Purposes
The information on the second line of the table (“Hypothetical”) is based on hypothetical account values and expenses derived from the fund’s actual expense ratio and an assumed 5% per year rate of return before expenses (not the fund’s actual return). You may compare the ongoing costs of investing in the fund with other funds by contrasting this 5% hypothetical example and the 5% hypothetical examples that appear in the shareholder reports of the other funds. The hypothetical account values and expenses may not be used to estimate the actual ending account balance or expenses you paid for the period.
Note: T. Rowe Price charges an annual small-account maintenance fee of $10, generally for accounts with less than $2,000 ($500 for UGMA/UTMA). The fee is waived for any investor whose T. Rowe Price mutual fund accounts total $25,000 or more, accounts employing automatic investing, and IRAs and other retirement plan accounts that utilize a prototype plan sponsored by T. Rowe Price (although a separate custodial or administrative fee may apply to such accounts). This fee is not included in the accompanying table. If you are subject to the fee, keep it in mind when you are estimating the ongoing expenses of investing in the fund and when comparing the expenses of this fund with other funds.
You should also be aware that the expenses shown in the table highlight only your ongoing costs and do not reflect any transaction costs, such as redemption fees or sales loads. Therefore, the second line of the table is useful in comparing ongoing costs only and will not help you determine the relative total costs of owning different funds. To the extent a fund charges transaction costs, however, the total cost of owning that fund is higher.
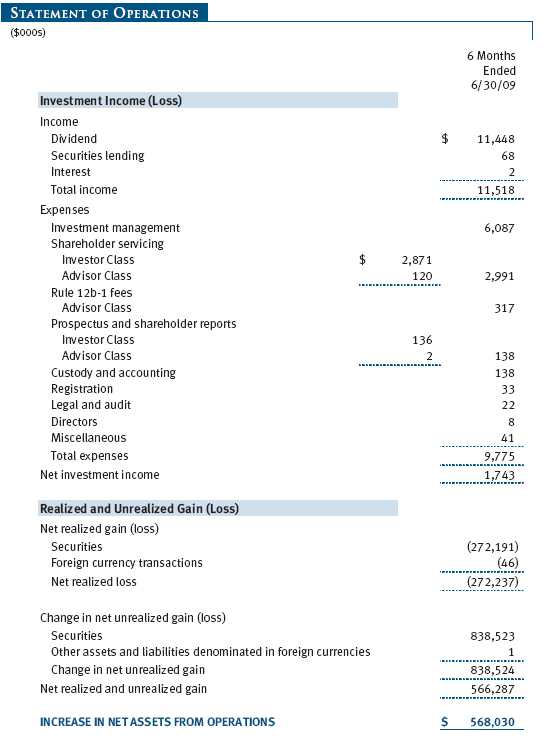
Unaudited
The accompanying notes are an integral part of these financial statements.
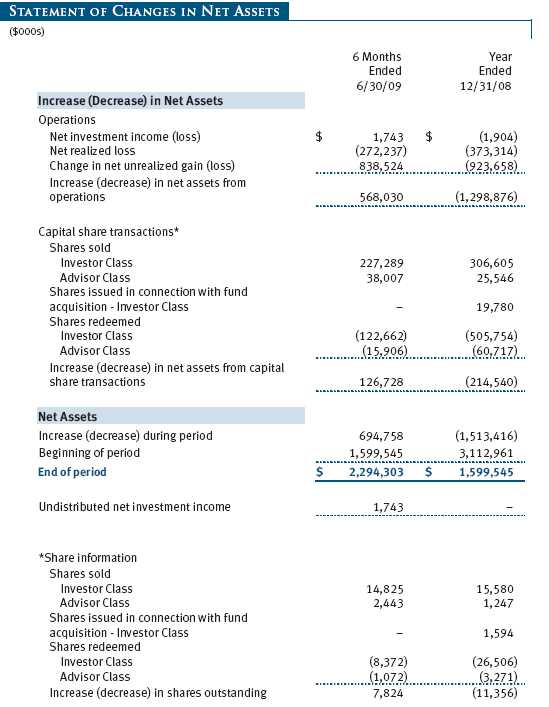
Unaudited

The accompanying notes are an integral part of these financial statements.
Unaudited
The accompanying notes are an integral part of these financial statements.
Unaudited
The accompanying notes are an integral part of these financial statements.
Unaudited
The accompanying notes are an integral part of these financial statements.
Unaudited
The accompanying notes are an integral part of these financial statements.
Unaudited
| NOTES TO FINANCIAL STATEMENTS |
T. Rowe Price Science & Technology Fund, Inc. (the fund), is registered under the Investment Company Act of 1940 (the 1940 Act) as a diversified, open-end management investment company. The fund seeks to provide long-term capital appreciation. The fund has two classes of shares: the Science & Technology Fund original share class, referred to in this report as the Investor Class, offered since September 30, 1987, and Science & Technology Fund—Advisor Class (Advisor Class), offered since March 31, 2000. Advisor Class shares are sold only through unaffiliated brokers and other unaffiliated financial intermediaries that are compensated by the class for distribution, shareholder servicing, and/or certain administrative services under a Board-approved Rule 12b-1 plan. Each class has exclusive voting rights on matters related solely to that class, separate voting rights on matters that relate to both classes, and, in all other respects, the same rights and obligations as the other class.
NOTE 1 - SIGNIFICANT ACCOUNTING POLICIES
Basis of Preparation The accompanying financial statements were prepared in accordance with accounting principles generally accepted in the United States of America, which require the use of estimates made by fund management. Fund management believes that estimates and security valuations are appropriate; however, actual results may differ from those estimates, and the security valuations reflected in the financial statements may differ from the value the fund ultimately realizes upon sale of the securities. Further, fund management believes no events have occurred between June 30, 2009 and August 20, 2009, the date of issuance of the financial statements, that require adjustment of, or disclosure in, the accompanying financial statements.
Investment Transactions, Investment Income, and Distributions Income and expenses are recorded on the accrual basis. Dividends received from mutual fund investments are reflected as dividend income; capital gain distributions are reflected as realized gain/loss. Dividend income and capital gain distributions are recorded on the ex-dividend date. Income tax-related interest and penalties, if incurred, would be recorded as income tax expense. Investment transactions are accounted for on the trade date. Realized gains and losses are reported on the identified cost basis. Distributions to shareholders are recorded on the ex-dividend date. Income distributions are declared by each class on an annual basis. Capital gain distributions, if any, are declared and paid by the fund, typically on an annual basis.
Currency Translation Assets, including investments, and liabilities denominated in foreign currencies are translated into U.S. dollar values each day at the prevailing exchange rate, using the mean of the bid and asked prices of such currencies against U.S. dollars as quoted by a major bank. Purchases and sales of securities, income, and expenses are translated into U.S. dollars at the prevailing exchange rate on the date of the transaction. The effect of changes in foreign currency exchange rates on realized and unrealized security gains and losses is reflected as a component of security gains and losses.
Class Accounting The Advisor Class pays distribution, shareholder servicing, and/or certain administrative expenses in the form of Rule 12b-1 fees, in an amount not exceeding 0.25% of the class’s average daily net assets. Shareholder servicing, prospectus, and shareholder report expenses incurred by each class are charged directly to the class to which they relate. Expenses common to both classes, investment income, and realized and unrealized gains and losses are allocated to the classes based upon the relative daily net assets of each class.
Rebates and Credits Subject to best execution, the fund may direct certain security trades to brokers who have agreed to rebate a portion of the related brokerage commission to the fund in cash. Commission rebates are reflected as realized gain on securities in the accompanying financial statements and totaled $90,000 for the six months ended June 30, 2009. Additionally, the fund earns credits on temporarily uninvested cash balances held at the custodian which reduce the fund’s custody charges. Custody expense in the accompanying financial statements is presented before reduction for credits.
New Accounting Pronouncement On January 1, 2009, the fund adopted Statement of Financial Accounting Standards No. 161 (FAS 161), Disclosures about Derivative Instruments and Hedging Activities. FAS 161 requires enhanced disclosures about derivative and hedging activities, including how such activities are accounted for and their effect on financial position, performance and cash flows. Adoption of FAS 161 had no impact on the fund’s net assets or results of operations.
NOTE 2 - VALUATION
The fund’s investments are reported at fair value as defined under Statement of Financial Accounting Standards No. 157 (FAS 157), Fair Value Measurements. The fund values its investments and computes its net asset value per share at the close of the New York Stock Exchange (NYSE), normally 4 p.m. ET, each day that the NYSE is open for business.
Valuation Methods Equity securities listed or regularly traded on a securities exchange or in the over-the-counter (OTC) market are valued at the last quoted sale price or, for certain markets, the official closing price at the time the valuations are made, except for OTC Bulletin Board securities, which are valued at the mean of the latest bid and asked prices. A security that is listed or traded on more than one exchange is valued at the quotation on the exchange determined to be the primary market for such security. Listed securities not traded on a particular day are valued at the mean of the latest bid and asked prices for domestic securities and the last quoted sale price for international securities.
Investments in mutual funds are valued at the mutual fund’s closing net asset value per share on the day of valuation.
Other investments, including restricted securities, and those for which the above valuation procedures are inappropriate or are deemed not to reflect fair value are stated at fair value as determined in good faith by the T. Rowe Price Valuation Committee, established by the fund’s Board of Directors.
For valuation purposes, the last quoted prices of non-U.S. equity securities may be adjusted under the circumstances described below. If the fund determines that developments between the close of a foreign market and the close of the NYSE will, in its judgment, materially affect the value of some or all of its portfolio securities, the fund will adjust the previous closing prices to reflect what it believes to be the fair value of the securities as of the close of the NYSE. In deciding whether it is necessary to adjust closing prices to reflect fair value, the fund reviews a variety of factors, including developments in foreign markets, the performance of U.S. securities markets, and the performance of instruments trading in U.S. markets that represent foreign securities and baskets of foreign securities. A fund may also fair value securities in other situations, such as when a particular foreign market is closed but the fund is open. The fund uses outside pricing services to provide it with closing prices and information to evaluate and/or adjust those prices. The fund cannot predict how often it will use closing prices and how often it will determine it necessary to adjust those prices to reflect fair value. As a means of evaluating its security valuation process, the fund routinely compares closing prices, the next day’s opening prices in the same markets, and adjusted prices.
Valuation Inputs Various inputs are used to determine the value of the fund’s investments. These inputs are summarized in the three broad levels listed below:
Level 1 – quoted prices in active markets for identical securities
Level 2 – observable inputs other than Level 1 quoted prices (including, but not limited to, quoted prices for similar securities, interest rates, prepayment speeds, credit risk)
Level 3 – unobservable inputs
Observable inputs are those based on market data obtained from sources independent of the fund, and unobservable inputs reflect the fund’s own assumptions based on the best information available. The input levels are not necessarily an indication of the risk or liquidity associated with investments at that level. For example, non-U.S. equity securities actively traded in foreign markets generally are reflected in Level 2 despite the availability of closing prices because the fund evaluates and determines whether those closing prices reflect fair value at the close of the NYSE or require adjustment, as described above. The following table summarizes the fund’s investments, based on the inputs used to determine their values on June 30, 2009:
![]()
NOTE 3 - OTHER INVESTMENT TRANSACTIONS
Consistent with its investment objective, the fund engages in the following practices to manage exposure to certain risks or to enhance performance. The investment objective, policies, program, and risk factors of the fund are described more fully in the fund’s prospectus and Statement of Additional Information.
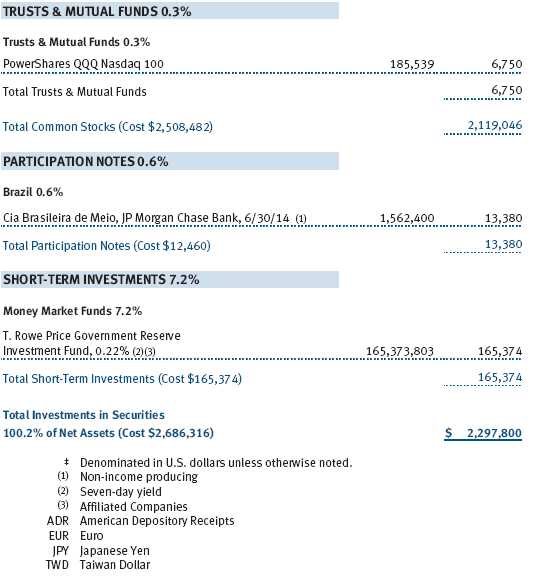
Participation Notes During the six months ended June 30, 2009, the fund was a party to participation notes through which it gains exposure to common stock in markets where direct investment by the fund is not possible. Participation notes provide the economic benefit of common stock ownership to the fund, while legal ownership is retained by the counterparty. Although each participation note is structured with a defined maturity date, early redemption may be possible. Risks associated with participation notes include the possible failure of a counterparty to perform in accordance with the terms of the agreement and possible delays or an inability to redeem before maturity under certain market conditions.
Securities Lending The fund lends its securities to approved brokers to earn additional income. It receives as collateral cash and U.S. government securities valued at 102% to 105% of the value of the securities on loan. Cash collateral is invested by the fund’s lending agent(s) in accordance with investment guidelines approved by fund management. Although risk is mitigated by the collateral, the fund could experience a delay in recovering its securities and a possible loss of income or value if the borrower fails to return the securities or if collateral investments decline in value. Securities lending revenue recognized by the fund consists of earnings on invested collateral and borrowing fees, net of any rebates to the borrower and compensation to the lending agent. At June 30, 2009, there were no securities on loan.
Other Purchases and sales of portfolio securities other than short-term securities aggregated $1,299,357,000 and $1,297,236,000, respectively, for the six months ended June 30, 2009.
NOTE 4 - FEDERAL INCOME TAXES
No provision for federal income taxes is required since the fund intends to continue to qualify as a regulated investment company under Subchapter M of the Internal Revenue Code and distribute to shareholders all of its taxable income and gains. Distributions are determined in accordance with Federal income tax regulations, which differ from generally accepted accounting principles, and, therefore, may differ in amount or character from net investment income and realized gains for financial reporting purposes. Financial reporting records are adjusted for permanent book/tax differences to reflect tax character but are not adjusted for temporary differences. The amount and character of tax-basis distributions and composition of net assets are finalized at fiscal year-end; accordingly, tax-basis balances have not been determined as of June 30, 2009.
In accordance with federal tax regulations, the fund deferred recognition of certain capital loss amounts previously recognized in the prior fiscal year for financial reporting purposes until the current fiscal period for tax purposes. Such deferrals amounted to $172,898,000 and related to net capital losses realized between November 1 and the fund’s fiscal year-end date. Further, the fund intends to retain realized gains to the extent of available capital loss carryforwards. As of December 31, 2008, the fund had $5,134,295,000 of unused capital loss carryforwards, of which $2,880,910,000 expire in fiscal 2009, $1,904,219,000 expire in fiscal 2010, $129,421,000 expire in fiscal 2011, $7,359,000 expire in fiscal 2015, and $212,386,000 expire in fiscal 2016. Additionally, $6,516,000 of the fund’s unused capital loss carryforwards may be subject to certain limitations on amount and/or timing of use related to being acquired through tax-free reorganizations.
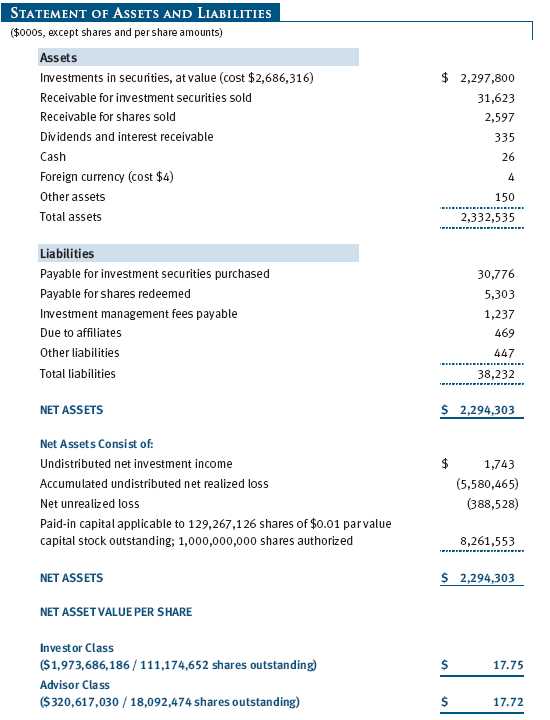
At June 30, 2009, the cost of investments for federal income tax purposes was $2,686,316,000. Net unrealized loss aggregated $388,528,000 at period-end, of which $180,134,000 related to appreciated investments and $568,662,000 related to depreciated investments.
NOTE 5 - RELATED PARTY TRANSACTIONS
The fund is managed by T. Rowe Price Associates, Inc. (the manager or Price Associates), a wholly owned subsidiary of T. Rowe Price Group, Inc. The investment management agreement between the fund and the manager provides for an annual investment management fee, which is computed daily and paid monthly. The fee consists of an individual fund fee, equal to 0.35% of the fund’s average daily net assets, and a group fee. The group fee rate is calculated based on the combined net assets of certain mutual funds sponsored by Price Associates (the group) applied to a graduated fee schedule, with rates ranging from 0.48% for the first $1 billion of assets to 0.285% for assets in excess of $220 billion. The fund’s group fee is determined by applying the group fee rate to the fund’s average daily net assets. At June 30, 2009, the effective annual group fee rate was 0.31%.
In addition, the fund has entered into service agreements with Price Associates and two wholly owned subsidiaries of Price Associates (collectively, Price). Price Associates computes the daily share prices and provides certain other administrative services to the fund. T. Rowe Price Services, Inc., provides shareholder and administrative services in its capacity as the fund’s transfer and dividend disbursing agent. T. Rowe Price Retirement Plan Services, Inc., provides subaccounting and recordkeeping services for certain retirement accounts invested in the Investor Class. For the six months ended June 30, 2009, expenses incurred pursuant to these service agreements were $87,000 for Price Associates, $1,652,000 for T. Rowe Price Services, Inc., and $525,000 for T. Rowe Price Retirement Plan Services, Inc. The total amount payable at period-end pursuant to these service agreements is reflected as Due to Affiliates in the accompanying financial statements.
Additionally, the fund is one of several mutual funds in which certain college savings plans managed by Price Associates may invest. As approved by the fund’s Board of Directors, shareholder servicing costs associated with each college savings plan are borne by the fund in proportion to the average daily value of its shares owned by the college savings plan. For the six months ended June 30, 2009, the fund was charged $19,000 for shareholder servicing costs related to the college savings plans, of which $12,000 was for services provided by Price. The amount payable at period-end pursuant to this agreement is reflected as Due to Affiliates in the accompanying financial statements. At June 30, 2009, approximately 1% of the outstanding shares of the Investor Class were held by college savings plans.
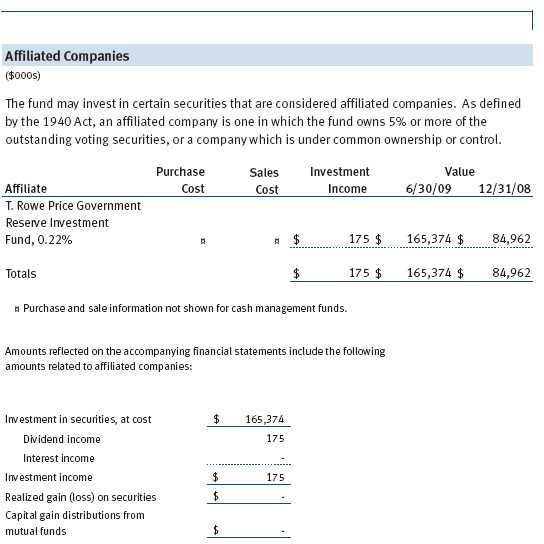
The fund may invest in the T. Rowe Price Reserve Investment Fund and the T. Rowe Price Government Reserve Investment Fund (collectively, the T. Rowe Price Reserve Investment Funds), open-end management investment companies managed by Price Associates and considered affiliates of the fund. The T. Rowe Price Reserve Investment Funds are offered as cash management options to mutual funds, trusts, and other accounts managed by Price Associates and/or its affiliates and are not available for direct purchase by members of the public. The T. Rowe Price Reserve Investment Funds pay no investment management fees.
As of June 30, 2009, T. Rowe Price Group, Inc., and/or its wholly owned subsidiaries owned 637,630 shares of the fund, representing less than 1% of the fund’s net assets.
| INFORMATION ON PROXY VOTING POLICIES, PROCEDURES, AND RECORDS |
A description of the policies and procedures used by T. Rowe Price funds and portfolios to determine how to vote proxies relating to portfolio securities is available in each fund’s Statement of Additional Information, which you may request by calling 1-800-225-5132 or by accessing the SEC’s Web site, www.sec.gov. The description of our proxy voting policies and procedures is also available on our Web site, www.troweprice.com. To access it, click on the words “Our Company” at the top of our corporate homepage. Then, when the next page appears, click on the words “Proxy Voting Policies” on the left side of the page.
Each fund’s most recent annual proxy voting record is available on our Web site and through the SEC’s Web site. To access it through our Web site, follow the directions above, then click on the words “Proxy Voting Records” on the right side of the Proxy Voting Policies page.
| HOW TO OBTAIN QUARTERLY PORTFOLIO HOLDINGS |
The fund files a complete schedule of portfolio holdings with the Securities and Exchange Commission for the first and third quarters of each fiscal year on Form N-Q. The fund’s Form N-Q is available electronically on the SEC’s Web site (www.sec.gov); hard copies may be reviewed and copied at the SEC’s Public Reference Room, 450 Fifth St. N.W., Washington, DC 20549. For more information on the Public Reference Room, call 1-800-SEC-0330.
| APPROVAL OF INVESTMENT MANAGEMENT AGREEMENT |
On March 10, 2009, the fund’s Board of Directors (Board) unanimously approved the investment advisory contract (Contract) between the fund and its investment manager, T. Rowe Price Associates, Inc. (Manager). The Board considered a variety of factors in connection with its review of the Contract, also taking into account information provided by the Manager during the course of the year, as discussed below:
Services Provided by the Manager
The Board considered the nature, quality, and extent of the services provided to the fund by the Manager. These services included, but were not limited to, management of the fund’s portfolio and a variety of related activities, as well as financial and administrative services, reporting, and communications. The Board also reviewed the background and experience of the Manager’s senior management team and investment personnel involved in the management of the fund. The Board concluded that it was satisfied with the nature, quality, and extent of the services provided by the Manager.
Investment Performance of the Fund
The Board reviewed the fund’s average annual total returns over the 1-, 3-, 5-, and 10-year periods as well as the fund’s year-by-year returns and compared these returns with previously agreed upon comparable performance measures and market data, including those supplied by Lipper and Morningstar, which are independent providers of mutual fund data. On the basis of this evaluation and the Board’s ongoing review of investment results, the Board concluded that the fund’s results for certain time periods were less than satisfactory. The Manager provided its assessment of the fund’s investment results and reviewed steps taken to address issues raised by the Board. The Board concluded that the Manager’s response was appropriate.
Costs, Benefits, Profits, and Economies of Scale
The Board reviewed detailed information regarding the revenues received by the Manager under the Contract and other benefits that the Manager (and its affiliates) may have realized from its relationship with the fund, including research received under “soft dollar” agreements. The Board noted that soft dollars were not used to pay for third-party, non-broker research during 2008. The Board also received information on the estimated costs incurred and profits realized by the Manager and its affiliates from advising T. Rowe Price mutual funds, as well as estimates of the gross profits realized from managing the fund in particular. The Board concluded that the Manager’s profits were reasonable in light of the services provided to the fund. The Board also considered whether the fund or other funds benefit under the fee levels set forth in the Contract from any economies of scale realized by the Manager. Under the Contract, the fund pays a fee to the Manager composed of two components—a group fee rate based on the aggregate assets of certain T. Rowe Price mutual funds (including the fund) that declines at certain asset levels and an individual fund fee rate that is assessed on the assets of the fund. The Board concluded that the advisory fee structure for the fund continued to provide for a reasonable sharing of benefits from any economies of scale with the fund’s investors.
Fees
The Board reviewed the fund’s management fee rate, operating expenses, and total expense ratio for the Investor Class and the Advisor Class and compared them with fees and expenses of other comparable funds based on information and data supplied by Lipper. The information provided to the Board indicated that the fund’s management fee rate for the Investor Class was above the median for certain groups of comparable funds but at or below the median for other groups of comparable funds, and the management fee rate for the Advisor Class was at or below the median for comparable funds. The information also indicated that the expense ratio for the Investor Class was above the median for certain groups of comparable funds but below the median for other groups of comparable funds, and the expense ratio for the Advisor Class was below the median for comparable funds. The Board also reviewed the fee schedules for comparable privately managed accounts of the Manager and its affiliates. Management informed the Board that the Manager’s responsibilities for privately managed accounts are more limited than its responsibilities for the fund and other T. Rowe Price mutual funds that it or its affiliates advise. On the basis of the information provided, the Board concluded that the fees paid by the fund under the Contract were reasonable.
Approval of the Contract
As noted, the Board approved the continuation of the Contract. No single factor was considered in isolation or to be determinative to the decision. Rather, the Board concluded, in light of a weighting and balancing of all factors considered, that it was in the best interests of the fund to approve the continuation of the Contract, including the fees to be charged for services thereunder.
Item 2. Code of Ethics.
A code of ethics, as defined in Item 2 of Form N-CSR, applicable to its principal executive officer, principal financial officer, principal accounting officer or controller, or persons performing similar functions is filed as an exhibit to the registrant’s annual Form N-CSR. No substantive amendments were approved or waivers were granted to this code of ethics during the registrant’s most recent fiscal half-year.
Item 3. Audit Committee Financial Expert.
Disclosure required in registrant’s annual Form N-CSR.
Item 4. Principal Accountant Fees and Services.
Disclosure required in registrant’s annual Form N-CSR.
Item 5. Audit Committee of Listed Registrants.
Not applicable.
Item 6. Investments.
(a) Not applicable. The complete schedule of investments is included in Item 1 of this Form N-CSR.
(b) Not applicable.
Item 7. Disclosure of Proxy Voting Policies and Procedures for Closed-End Management Investment Companies.
Not applicable.
Item 8. Portfolio Managers of Closed-End Management Investment Companies.
Not applicable.
Item 9. Purchases of Equity Securities by Closed-End Management Investment Company and Affiliated Purchasers.
Not applicable.
Item 10. Submission of Matters to a Vote of Security Holders.
Not applicable.
Item 11. Controls and Procedures.
(a) The registrant’s principal executive officer and principal financial officer have evaluated the registrant’s disclosure controls and procedures within 90 days of this filing and have concluded that the registrant’s disclosure controls and procedures were effective, as of that date, in ensuring that information required to be disclosed by the registrant in this Form N-CSR was recorded, processed, summarized, and reported timely.
(b) The registrant’s principal executive officer and principal financial officer are aware of no change in the registrant’s internal control over financial reporting that occurred during the registrant’s second fiscal quarter covered by this report that has materially affected, or is reasonably likely to materially affect, the registrant’s internal control over financial reporting.
Item 12. Exhibits.
(a)(1) The registrant’s code of ethics pursuant to Item 2 of Form N-CSR is filed with the registrant’s annual Form N-CSR.
(2) Separate certifications by the registrant's principal executive officer and principal financial officer, pursuant to Section 302 of the Sarbanes-Oxley Act of 2002 and required by Rule 30a-2(a) under the Investment Company Act of 1940, are attached.
(3) Written solicitation to repurchase securities issued by closed-end companies: not applicable.
(b) A certification by the registrant's principal executive officer and principal financial officer, pursuant to Section 906 of the Sarbanes-Oxley Act of 2002 and required by Rule 30a-2(b) under the Investment Company Act of 1940, is attached.
SIGNATURES | |
| Pursuant to the requirements of the Securities Exchange Act of 1934 and the Investment | |
| Company Act of 1940, the registrant has duly caused this report to be signed on its behalf by the | |
| undersigned, thereunto duly authorized. | |
| T. Rowe Price Science & Technology Fund, Inc. | |
| By | /s/ Edward C. Bernard |
| Edward C. Bernard | |
| Principal Executive Officer | |
| Date | August 20, 2009 |
| Pursuant to the requirements of the Securities Exchange Act of 1934 and the Investment | |
| Company Act of 1940, this report has been signed below by the following persons on behalf of | |
| the registrant and in the capacities and on the dates indicated. | |
| By | /s/ Edward C. Bernard |
| Edward C. Bernard | |
| Principal Executive Officer | |
| Date | August 20, 2009 |
| By | /s/ Gregory K. Hinkle |
| Gregory K. Hinkle | |
| Principal Financial Officer | |
| Date | August 20, 2009 |