| UNITED STATES |
| SECURITIES AND EXCHANGE COMMISSION |
| Washington, D.C. 20549 |
FORM N-CSR |
CERTIFIED SHAREHOLDER REPORT OF REGISTERED |
MANAGEMENT INVESTMENT COMPANIES |
| Investment Company Act File Number: 811-5299 |
| T. Rowe Price Science & Technology Fund, Inc. |
| (Exact name of registrant as specified in charter) |
| 100 East Pratt Street, Baltimore, MD 21202 |
| (Address of principal executive offices) |
| David Oestreicher |
| 100 East Pratt Street, Baltimore, MD 21202 |
| (Name and address of agent for service) |
| Registrant’s telephone number, including area code: (410) 345-2000 |
| Date of fiscal year end: December 31 |
| Date of reporting period: June 30, 2010 |
Item 1: Report to Shareholders
 |
| Science & Technology Fund | June 30, 2010 |
The views and opinions in this report were current as of June 30, 2010. They are not guarantees of performance or investment results and should not be taken as investment advice. Investment decisions reflect a variety of factors, and the managers reserve the right to change their views about individual stocks, sectors, and the markets at any time. As a result, the views expressed should not be relied upon as a forecast of the fund’s future investment intent. The report is certified under the Sarbanes-Oxley Act, which requires mutual funds and other public companies to affirm that, to the best of their knowledge, the information in their financial reports is fairly and accurately stated in all material respects.
REPORTS ON THE WEB
Sign up for our E-mail Program, and you can begin to receive updated fund reports and prospectuses online rather than through the mail. Log in to your account at troweprice.com for more information.
Manager’s Letter
Fellow Shareholders
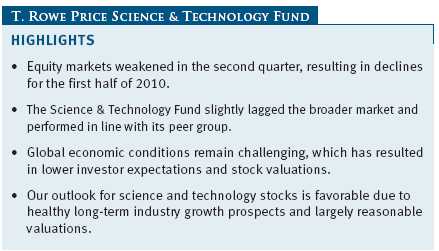
After a historic rebound in 2009, the first half of 2010 was turbulent for equity markets, with the S&P 500 falling almost 7% in the period after being up nearly 10% through late April. Broadly favorable corporate earnings were overshadowed by the faltering global economic recovery. Although technology earnings for the first quarter were particularly strong, showing dramatic improvement from a year ago, stocks in the sector were hurt in the second quarter by negative economic sentiment. After rising more than 67% in 2009, your fund experienced a decline in the first half of this year.
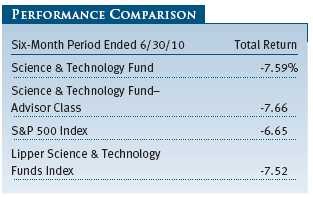
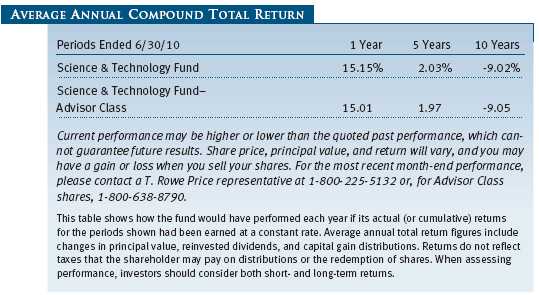
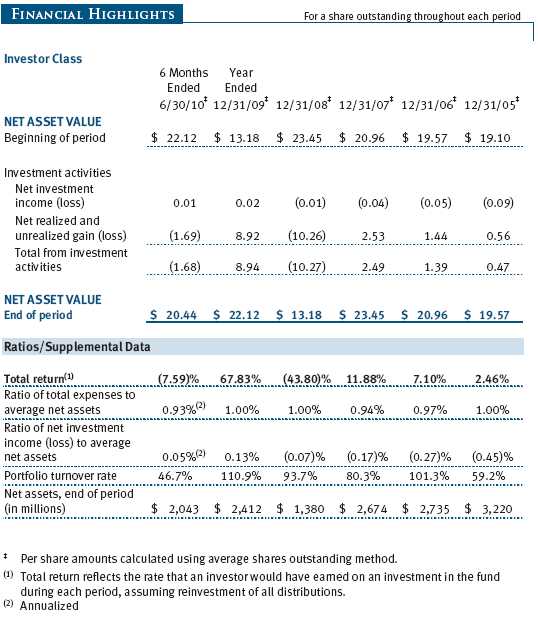
For the six months ended June 30, 2010, your fund returned -7.59%, in line with its Lipper peer group and down slightly more than the unmanaged S&P 500 Index. (Returns for the Advisor Class shares were slightly lower, reflecting its different cost structure.) The period was marked by broad weakness in technology stocks as cautious investors shunned assets perceived as more risky. We are disappointed by the recent declines but believe we are well positioned for the year’s second half.
MARKET ENVIRONMENT
Entering 2010, equity markets were coming off a dramatic rebound from the recession-driven lows of early 2009. Corporate earnings had begun rebounding, stocks were up dramatically, and investors were generally more optimistic about the economy. Technology stocks had performed particularly well, reflective of better-than-expected earnings performance and investor optimism that the favorable earnings climate would continue.
Last spring, widespread uncertainty contributed to increased risk aversion and a sizable stock market sell-off. Mixed economic news, particularly in Europe, commanded a disproportionate amount of the market’s focus during the period. Despite significant earnings improvements over the last two quarters, technology stocks couldn’t escape the stock market downdraft. This isn’t altogether surprising since technology spending and industry earnings typically are hurt by lower economic growth.
With corporate earnings largely continuing to improve, stocks in many industries are now trading near the low end of historical valuation ranges. This is true of technology, where many good businesses trade at high single-digit multiples of their free cash flows. This change reflects the heightened risk aversion and has made for a challenging year so far. But with valuations and investor expectations again quite low and healthy long-term spending trends in place, we think medium-term prospects for science and technology stocks are favorable.
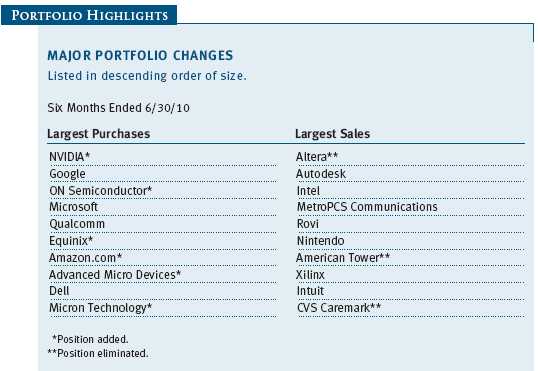
PORTFOLIO REVIEW
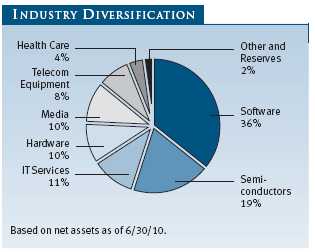
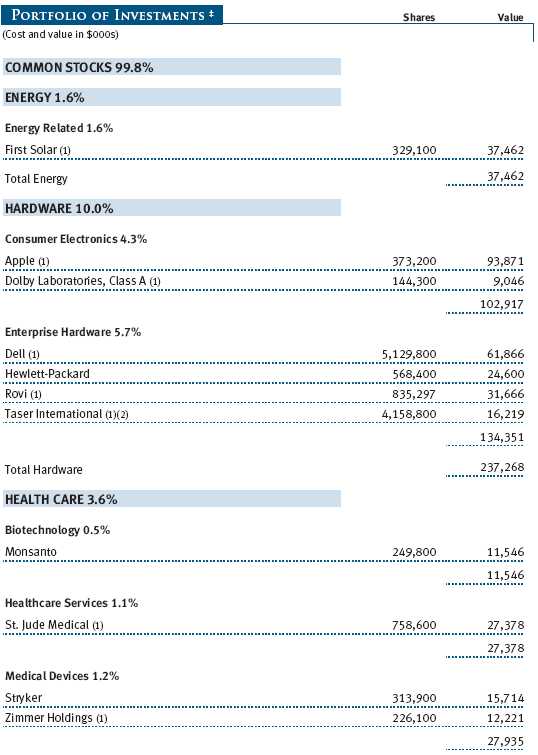
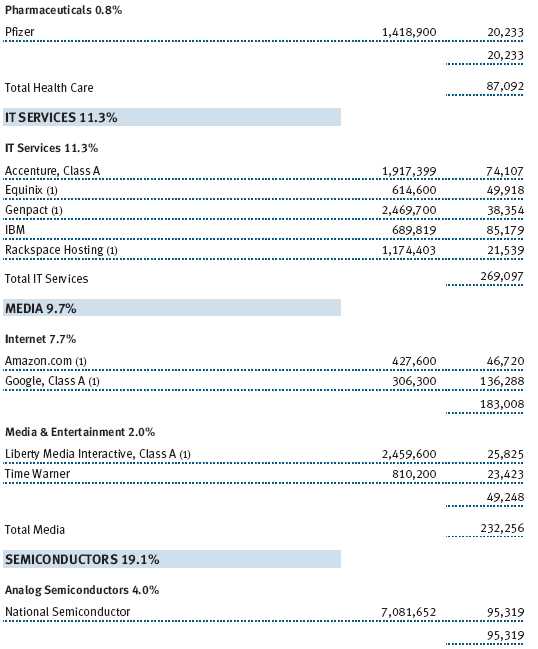
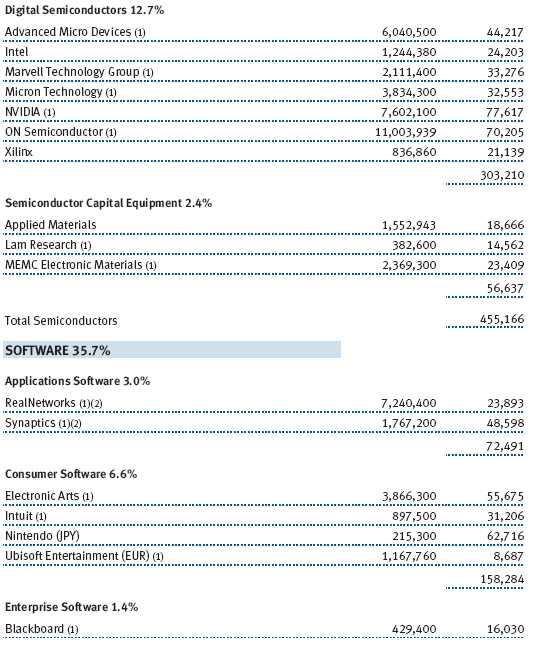
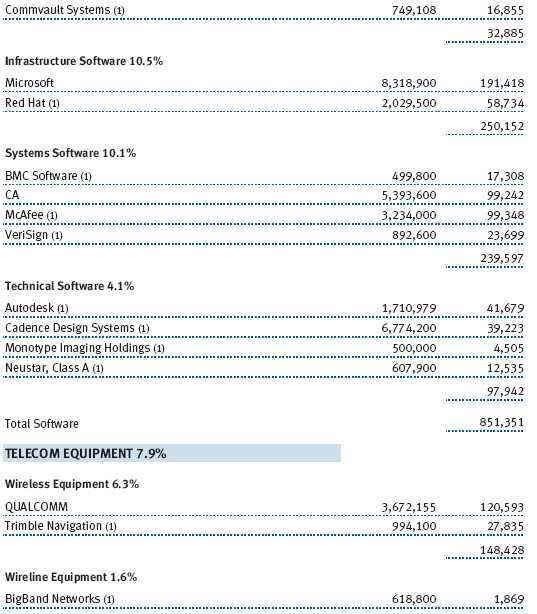
The fund remains broadly diversified across the principal segments of science and technology. Since year-end, we have increased our weights in media, software, and semiconductors and decreased our allocations in health care, telecommunication services, and telecommunication equipment. At the end of June, software accounted for 36% of the portfolio. Other major components included semiconductors at 19%, telecommunication equipment at 8%, and IT services at 11%. For the first half of the year, telecommunication services stocks were our best performers and semiconductors and media were our worst.
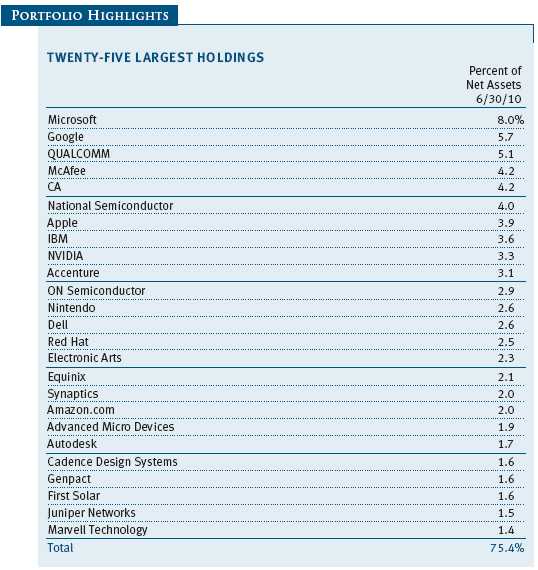
Our best contributor during the first half of the year was Nintendo, which rebounded from a very weak 2009. Nintendo’s stock appreciated following its better-than-expected holiday sales—especially for the Wii gaming console—and the announcement of its next-generation DS handheld gaming device, the 3DS. We trimmed the position on strength, but it remains a sizable holding as we believe that its games franchises and ability to innovate remain underappreciated by the market. (Please refer to the portfolio of investments for a complete listing of holdings and the amount each represents in the portfolio.)
Digital entertainment licensing company Rovi continued its strong appreciation begun at the end of 2008. Since early 2009, Rovi has executed very well on its core digital entertainment licensing business, which has driven consistent increases in earnings expectations. In addition, Rovi is developing an innovative program guide for television and consumer electronics that, if successful, could fuel continued fast growth.
Intuit, which we added to the portfolio late last year, was a very strong performer due to market share gains in its tax preparation software business and signs of improved sales of its small business accounting offerings. We continue to view Intuit as one of the more sustainable growers in the technology industry but view the stock as less likely to see large appreciation from the higher levels at which it now trades.
Early in the year, we added substantially to our holdings in Apple, given our expectation that its iPad tablet computing device would experience better adoption than investors anticipated. The iPad’s early sales have been even better than we forecast as its intuitive touch screen navigation has been a hit with consumers. The iPad’s early success has driven strong appreciation in Apple’s stock price, and it should help Apple continue its impressive growth. Apple has been one of our largest positions, but it is regrettable that the position wasn’t even larger given the stock’s outstanding gains.
We benefited from MSCI’s acquisition of risk management and corporate governance solutions provider RiskMetrics Group, announced in March. RiskMetrics garnered a price more than 35% higher than the stock traded at the beginning of the year. We expect continued acquisition activity in the broad universe in which your fund invests. Given the difficulty in divining acquisitions, we typically do not own a stock solely for the potential for it to be acquired. However, we do occasionally hold larger positions in companies that we think may be acquired.
Our largest detractor, NVIDIA, was a new position in the fund. We bought NVIDIA due to its leadership in graphics semiconductors and promising upcoming product cycles. Unfortunately, despite reporting favorable results, NVIDIA issued a cautious outlook based on uncertainty in the outlook for consumer PC sales, as well as for the broader economy. Additionally, the rollout of its new family of chips was slowed by supply constraints and the need to improve the chips’ power consumption. We continue to like NVIDIA’s market position and growth opportunity, both in PC graphics and in its newer offerings for smart-phones and supercomputers, and think the stock will have a much better second half.
Software peers CA and McAfee were poor performers in the first half of the year. CA is a leader in management software, particularly for mainframe computers, while McAfee is a top provider of security technologies for businesses and individuals. We view both stocks as modest but durable revenue growers with appealing cash flow generation relative to their valuations. Both stocks were punished, though, for weak first-quarter results. We were disappointed by these results but think the market has overreacted. We are confident that CA and McAfee will show improved performance in the coming quarters, befiting the durability of their businesses.
Despite favorable December and March quarter-end results and improved earnings expectations, Microsoft’s stock has been buffeted by continued compression of its valuation multiple. We believe that market negativity about Microsoft, particularly its positioning relative to the industry trend toward cloud computing, gives too little credit to the company’s merits and the stock’s extremely low valuation. We expect continued strong earnings performance driven by improved sales of business PCs and the recent release of Office 2010. Additionally, Microsoft has a promising new consumer product in its Kinect natural interface offering for the Xbox 360 gaming console, which will be released later this year.
STRATEGY REVIEW AND OUTLOOK
We noted six months ago that science and technology stocks in aggregate didn’t appear as appealing as they were entering 2009. Valuations were higher, investors’ expectations had increased, and markets were anticipating continued improvement in the economy and earnings. While corporate earnings have been largely favorable, troubling economic data have resulted in greater risk aversion and lower stock prices.
While we’re concerned about economic challenges and uncertainty, we’re encouraged by healthy technology spending and generally low valuations and investor expectations. We believe many of our holdings could see outstanding returns and that the fund overall is well positioned for the second half of the year. We continue to emphasize intensive research to assess companies’ business prospects in the context of industry trends and the stocks’ valuations and market expectations.
We prefer to own great businesses with robust growth prospects, but we think it is also important that the stocks we invest in are attractively valued. This is reflected in the trajectory of our Google position, which we nearly doubled in the first half of the year. The decline in the stock’s valuation resulted in it becoming as attractive as the business and the online advertising trend the company is riding.
We think science and technology stocks hold considerable opportunity, and we are intently focused on capitalizing on these. Our efforts continue to be driven by the industry expertise and collaboration of our global research team. We are confident that the breadth and depth of these capabilities will serve you well in the years ahead. Thank you for your continued trust and support.
Respectfully submitted,

Kennard W. Allen
President of the fund and chairman of its Investment Advisory Committee
July 15, 2010
The committee chairman has day-to-day responsibility for managing the portfolio and works with committee members in developing and executing the fund’s investment program.
RISKS OF INVESTING IN THE FUND
Funds that invest only in specific industries will experience greater volatility than funds investing in a broad range of industries. Technology stocks historically have experienced unusually wide price swings, both up and down. The potential for wide variation in performance reflects the special risks common to companies in the rapidly changing field of technology. For example, products or services that at first appear promising may not prove commercially successful and may become obsolete quickly. Earnings disappointments and intense competition for market share can result in sharp price declines.
GLOSSARY
Lipper index: An index of mutual fund performance returns for specified periods in defined categories as tracked by Lipper Inc.
S&P 500 Index: A market cap-weighted index of 500 widely held stocks often used as a proxy for the overall stock market. Performance is reported on a total return basis.
Performance and Expenses
| GROWTH OF $10,000 |
This chart shows the value of a hypothetical $10,000 investment in the fund over the past 10 fiscal year periods or since inception (for funds lacking 10-year records). The result is compared with benchmarks, which may include a broad-based market index and a peer group average or index. Market indexes do not include expenses, which are deducted from fund returns as well as mutual fund averages and indexes.
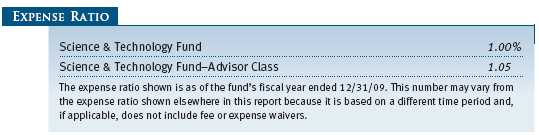
| FUND EXPENSE EXAMPLE |
As a mutual fund shareholder, you may incur two types of costs: (1) transaction costs, such as redemption fees or sales loads, and (2) ongoing costs, including management fees, distribution and service (12b-1) fees, and other fund expenses. The following example is intended to help you understand your ongoing costs (in dollars) of investing in the fund and to compare these costs with the ongoing costs of investing in other mutual funds. The example is based on an investment of $1,000 invested at the beginning of the most recent six-month period and held for the entire period.
Please note that the fund has two share classes: The original share class (“investor class”) charges no distribution and service (12b-1) fee, and the Advisor Class shares are offered only through unaffiliated brokers and other financial intermediaries and charge a 0.25% 12b-1 fee. Each share class is presented separately in the table.
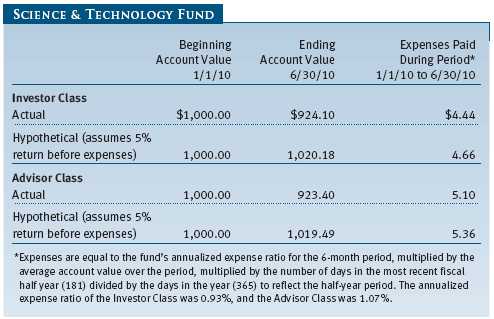
Actual Expenses
The first line of the following table (“Actual”) provides information about actual account values and expenses based on the fund’s actual returns. You may use the information in this line, together with your account balance, to estimate the expenses that you paid over the period. Simply divide your account value by $1,000 (for example, an $8,600 account value divided by $1,000 = 8.6), then multiply the result by the number in the first line under the heading “Expenses Paid During Period” to estimate the expenses you paid on your account during this period.
Hypothetical Example for Comparison Purposes
The information on the second line of the table (“Hypothetical”) is based on hypothetical account values and expenses derived from the fund’s actual expense ratio and an assumed 5% per year rate of return before expenses (not the fund’s actual return). You may compare the ongoing costs of investing in the fund with other funds by contrasting this 5% hypothetical example and the 5% hypothetical examples that appear in the shareholder reports of the other funds. The hypothetical account values and expenses may not be used to estimate the actual ending account balance or expenses you paid for the period.
Note: T. Rowe Price charges an annual small-account maintenance fee of $10, generally for accounts with less than $2,000 ($500 for UGMA/UTMA). The fee is waived for any investor whose T. Rowe Price mutual fund accounts total $25,000 or more, accounts employing automatic investing, and IRAs and other retirement plan accounts that utilize a prototype plan sponsored by T. Rowe Price (although a separate custodial or administrative fee may apply to such accounts). This fee is not included in the accompanying table. If you are subject to the fee, keep it in mind when you are estimating the ongoing expenses of investing in the fund and when comparing the expenses of this fund with other funds.
You should also be aware that the expenses shown in the table highlight only your ongoing costs and do not reflect any transaction costs, such as redemption fees or sales loads. Therefore, the second line of the table is useful in comparing ongoing costs only and will not help you determine the relative total costs of owning different funds. To the extent a fund charges transaction costs, however, the total cost of owning that fund is higher.
Unaudited
The accompanying notes are an integral part of these financial statements.
Unaudited

The accompanying notes are an integral part of these financial statements.
Unaudited
The accompanying notes are an integral part of these financial statements.
Unaudited
The accompanying notes are an integral part of these financial statements.
Unaudited
The accompanying notes are an integral part of these financial statements.
Unaudited
The accompanying notes are an integral part of these financial statements.
Unaudited
| NOTES TO FINANCIAL STATEMENTS |
T. Rowe Price Science & Technology Fund, Inc. (the fund), is registered under the Investment Company Act of 1940 (the 1940 Act) as a diversified, open-end management investment company. The fund seeks to provide long-term capital appreciation. The fund has two classes of shares: the Science & Technology Fund original share class, referred to in this report as the Investor Class, offered since September 30, 1987, and the Science & Technology Fund—Advisor Class (Advisor Class), offered since March 31, 2000. Advisor Class shares are sold only through unaffiliated brokers and other unaffiliated financial intermediaries that are compensated by the class for distribution, shareholder servicing, and/or certain administrative services under a Board-approved Rule 12b-1 plan. Each class has exclusive voting rights on matters related solely to that class; separate voting rights on matters that relate to both classes; and, in all other respects, the same rights and obligations as the other class.
NOTE 1 - SIGNIFICANT ACCOUNTING POLICIES
Basis of Preparation The accompanying financial statements were prepared in accordance with accounting principles generally accepted in the United States of America (GAAP), which require the use of estimates made by fund management. Fund management believes that estimates and valuations are appropriate; however, actual results may differ from those estimates, and the valuations reflected in the accompanying financial statements may differ from the value ultimately realized upon sale of securities.
Investment Transactions, Investment Income, and Distributions Income and expenses are recorded on the accrual basis. Dividends received from mutual fund investments are reflected as dividend income; capital gain distributions are reflected as realized gain/loss. Dividend income and capital gain distributions are recorded on the ex-dividend date. Income tax-related interest and penalties, if incurred, would be recorded as income tax expense. Investment transactions are accounted for on the trade date. Realized gains and losses are reported on the identified cost basis. Distributions to shareholders are recorded on the ex-dividend date. Income distributions are declared and paid by each class annually. Capital gain distributions, if any, are generally declared and paid by the fund annually.
Currency Translation Assets, including investments, and liabilities denominated in foreign currencies are translated into U.S. dollar values each day at the prevailing exchange rate, using the mean of the bid and asked prices of such currencies against U.S. dollars as quoted by a major bank. Purchases and sales of securities, income, and expenses are translated into U.S. dollars at the prevailing exchange rate on the date of the transaction. The effect of changes in foreign currency exchange rates on realized and unrealized security gains and losses is reflected as a component of security gains and losses.
Class Accounting The Advisor Class pays distribution, shareholder servicing, and/or certain administrative expenses in the form of Rule 12b-1 fees, in an amount not exceeding 0.25% of the class’s average daily net assets. Shareholder servicing, prospectus, and shareholder report expenses incurred by each class are charged directly to the class to which they relate. Expenses common to both classes, investment income, and realized and unrealized gains and losses are allocated to the classes based upon the relative daily net assets of each class.
Rebates and Credits Subject to best execution, the fund may direct certain security trades to brokers who have agreed to rebate a portion of the related brokerage commission to the fund in cash. Commission rebates are reflected as realized gain on securities in the accompanying financial statements and totaled $84,000 for the six months ended June 30, 2010. Additionally, the fund earns credits on temporarily uninvested cash balances held at the custodian, which reduce the fund’s custody charges. Custody expense in the accompanying financial statements is presented before reduction for credits.
New Accounting Pronouncement On January 1, 2010, the fund adopted new accounting guidance that requires enhanced disclosures about fair value measurements in the financial statements. Adoption of this guidance had no impact on the fund’s net assets or results of operations.
NOTE 2 - VALUATION
The fund’s investments are reported at fair value as defined by GAAP. The fund determines the values of its assets and liabilities and computes its net asset value per share at the close of the New York Stock Exchange (NYSE), normally 4 p.m. ET, each day that the NYSE is open for business.
Valuation Methods Equity securities listed or regularly traded on a securities exchange or in the over-the-counter (OTC) market are valued at the last quoted sale price or, for certain markets, the official closing price at the time the valuations are made, except for OTC Bulletin Board securities, which are valued at the mean of the latest bid and asked prices. A security that is listed or traded on more than one exchange is valued at the quotation on the exchange determined to be the primary market for such security. Listed securities not traded on a particular day are valued at the mean of the latest bid and asked prices for domestic securities and the last quoted sale price for international securities.
Investments in mutual funds are valued at the mutual fund’s closing net asset value per share on the day of valuation.
Other investments, including restricted securities, and those financial instruments for which the above valuation procedures are inappropriate or are deemed not to reflect fair value are stated at fair value as determined in good faith by the T. Rowe Price Valuation Committee, established by the fund’s Board of Directors.
For valuation purposes, the last quoted prices of non-U.S. equity securities may be adjusted under the circumstances described below. If the fund determines that developments between the close of a foreign market and the close of the NYSE will, in its judgment, materially affect the value of some or all of its portfolio securities, the fund will adjust the previous closing prices to reflect what it believes to be the fair value of the securities as of the close of the NYSE. In deciding whether it is necessary to adjust closing prices to reflect fair value, the fund reviews a variety of factors, including developments in foreign markets, the performance of U.S. securities markets, and the performance of instruments trading in U.S. markets that represent foreign securities and baskets of foreign securities. A fund may also fair value securities in other situations, such as when a particular foreign market is closed but the fund is open. The fund uses outside pricing services to provide it with closing prices and information to evaluate and/or adjust those prices. The fund cannot predict how often it will use closing prices and how often it will determine it necessary to adjust those prices to reflect fair value. As a means of evaluating its security valuation process, the fund routinely compares closing prices, the next day’s opening prices in the same markets, and adjusted prices.
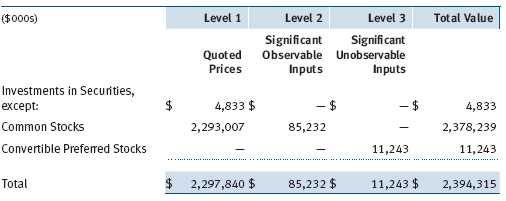
Valuation Inputs Various inputs are used to determine the value of the fund’s financial instruments. These inputs are summarized in the three broad levels listed below:
Level 1 – quoted prices in active markets for identical financial instruments
Level 2 – observable inputs other than Level 1 quoted prices (including, but not limited to, quoted prices for similar financial instruments, interest rates, prepayment speeds, and credit risk)
Level 3 – unobservable inputs
Observable inputs are those based on market data obtained from sources independent of the fund, and unobservable inputs reflect the fund’s own assumptions based on the best information available. The input levels are not necessarily an indication of the risk or liquidity associated with financial instruments at that level. For example, non-U.S. equity securities actively traded in foreign markets generally are reflected in Level 2 despite the availability of closing prices because the fund evaluates and determines whether those closing prices reflect fair value at the close of the NYSE or require adjustment, as described above. The following table summarizes the fund’s financial instruments, based on the inputs used to determine their values on June 30, 2010:
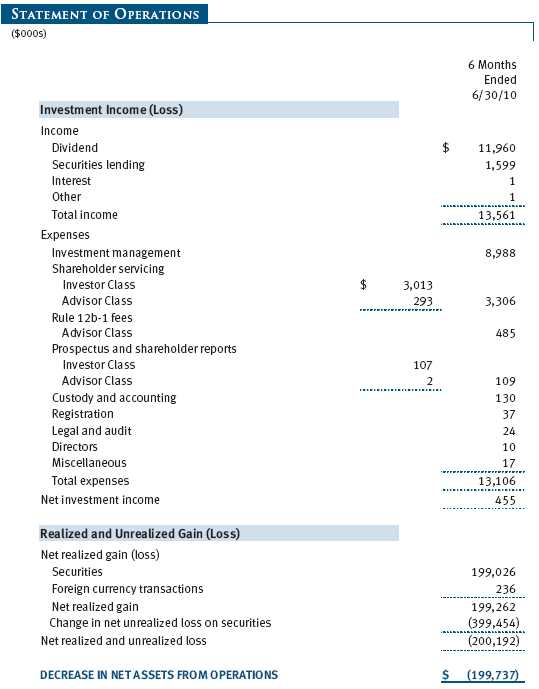
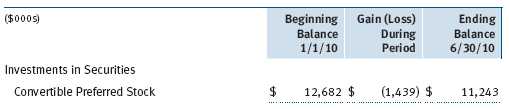
Following is a reconciliation of the fund’s Level 3 holdings for the six months ended June 30, 2010. Gain (loss) reflects both realized and change in unrealized gain (loss) on Level 3 holdings during the period, if any, and is included on the accompanying Statement of Operations. The change in unrealized gain/loss on Level 3 instruments held at June 30, 2010, totaled $(1,439,000) for the six months ended June 30, 2010.
NOTE 3 - OTHER INVESTMENT TRANSACTIONS
Consistent with its investment objective, the fund engages in the following practices to manage exposure to certain risks and/or to enhance performance. The investment objective, policies, program, and risk factors of the fund are described more fully in the fund’s prospectus and Statement of Additional Information.
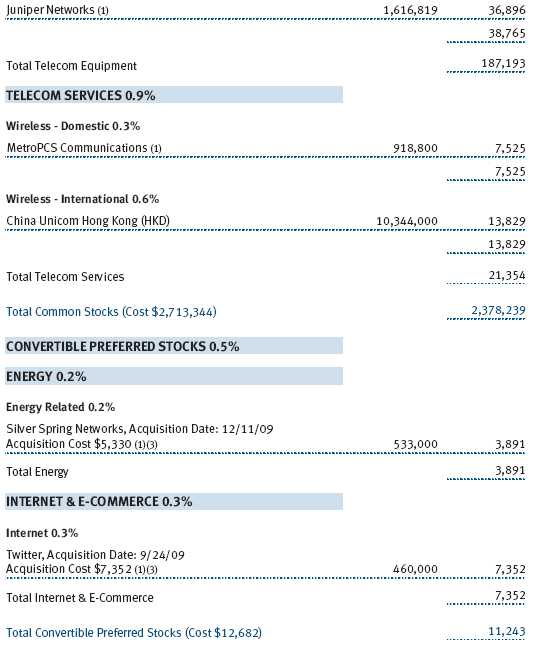
Restricted Securities The fund may invest in securities that are subject to legal or contractual restrictions on resale. Prompt sale of such securities at an acceptable price may be difficult and may involve substantial delays and additional costs.
Securities Lending The fund lends its securities to approved brokers to earn additional income. It receives as collateral cash and U.S. government securities valued at 102% to 105% of the value of the securities on loan. Cash collateral is invested by the fund’s lending agent(s) in accordance with investment guidelines approved by fund management. Although risk is mitigated by the collateral, the fund could experience a delay in recovering its securities and a possible loss of income or value if the borrower fails to return the securities or if collateral investments decline in value. Securities lending revenue recognized by the fund consists of earnings on invested collateral and borrowing fees, net of any rebates to the borrower and compensation to the lending agent. At June 30, 2010, there were no securities on loan.
Other Purchases and sales of portfolio securities other than short-term securities aggregated $1,235,454,000 and $1,277,213,000, respectively, for the six months ended June 30, 2010.
NOTE 4 - FEDERAL INCOME TAXES
No provision for federal income taxes is required since the fund intends to continue to qualify as a regulated investment company under Subchapter M of the Internal Revenue Code and distribute to shareholders all of its taxable income and gains. Distributions determined in accordance with federal income tax regulations may differ in amount or character from net investment income and realized gains for financial reporting purposes. Financial reporting records are adjusted for permanent book/tax differences to reflect tax character but are not adjusted for temporary differences. The amount and character of tax-basis distributions and composition of net assets are finalized at fiscal year-end; accordingly, tax-basis balances have not been determined as of the date of this report.
In accordance with federal tax regulations, the fund recognized capital losses in the current period for tax purposes that had been recognized in the prior fiscal year for financial reporting purposes. Such deferrals relate to net capital losses realized between November 1, 2009 and December 31, 2009, and totaled $30,025,000. The fund intends to retain realized gains to the extent of available capital loss carryforwards. As of December 31, 2009, the fund had $2,556,610,000 of unused capital loss carryforwards, which expire: $1,904,219,000 in fiscal 2010, $129,421,000 in fiscal 2011, and $7,359,000 in fiscal 2015, $212,386,000 in fiscal 2016, and $303,225,000 in fiscal 2017. Additionally, $17,404,000 of the fund’s unused capital loss carryforwards acquired through tax-free reorganizations may be subject to certain limitations on amount and/or timing of use.
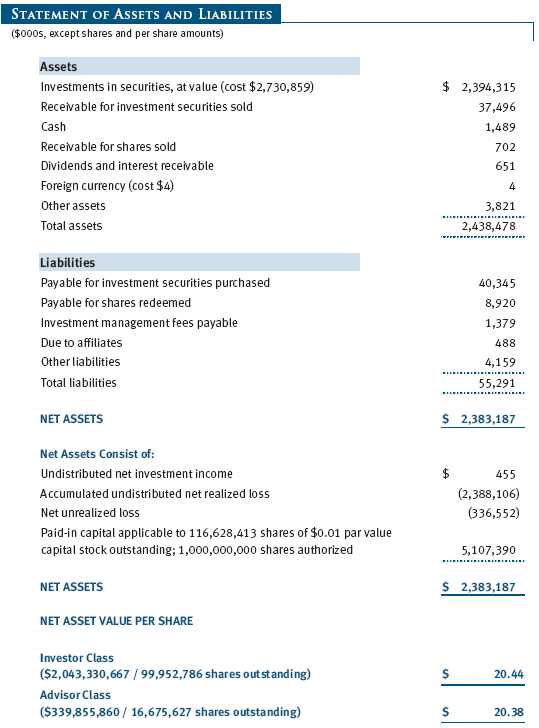
At June 30, 2010, the cost of investments for federal income tax purposes was $2,730,859,000. Net unrealized loss aggregated $336,552,000 at period-end, of which $113,682,000 related to appreciated investments and $450,234,000 related to depreciated investments.
NOTE 5 - RELATED PARTY TRANSACTIONS
The fund is managed by T. Rowe Price Associates, Inc. (the manager or Price Associates), a wholly owned subsidiary of T. Rowe Price Group, Inc. The investment management agreement between the fund and the manager provides for an annual investment management fee, which is computed daily and paid monthly. The fee consists of an individual fund fee, equal to 0.35% of the fund’s average daily net assets, and a group fee. The group fee rate is calculated based on the combined net assets of certain mutual funds sponsored by Price Associates (the group) applied to a graduated fee schedule, with rates ranging from 0.48% for the first $1 billion of assets to 0.285% for assets in excess of $220 billion. The fund’s group fee is determined by applying the group fee rate to the fund’s average daily net assets. At June 30, 2010, the effective annual group fee rate was 0.30%.
In addition, the fund has entered into service agreements with Price Associates and two wholly owned subsidiaries of Price Associates (collectively, Price). Price Associates computes the daily share prices and provides certain other administrative services to the fund. T. Rowe Price Services, Inc., provides shareholder and administrative services in its capacity as the fund’s transfer and dividend disbursing agent. T. Rowe Price Retirement Plan Services, Inc., provides subaccounting and recordkeeping services for certain retirement accounts invested in the Investor Class. For the six months ended June 30, 2010, expenses incurred pursuant to these service agreements were $65,000 for Price Associates; $1,529,000 for T. Rowe Price Services, Inc.; and $612,000 for T. Rowe Price Retirement Plan Services, Inc. The total amount payable at period-end pursuant to these service agreements is reflected as Due to Affiliates in the accompanying financial statements.
Additionally, the fund is one of several mutual funds in which certain college savings plans managed by Price Associates may invest. As approved by the fund’s Board of Directors, shareholder servicing costs associated with each college savings plan are borne by the fund in proportion to the average daily value of its shares owned by the college savings plan. For the six months ended June 30, 2010, the fund was charged $20,000 for shareholder servicing costs related to the college savings plans, of which $14,000 was for services provided by Price. The amount payable at period-end pursuant to this agreement is reflected as Due to Affiliates in the accompanying financial statements. At June 30, 2010, approximately 1% of the outstanding shares of the Investor Class were held by college savings plans.
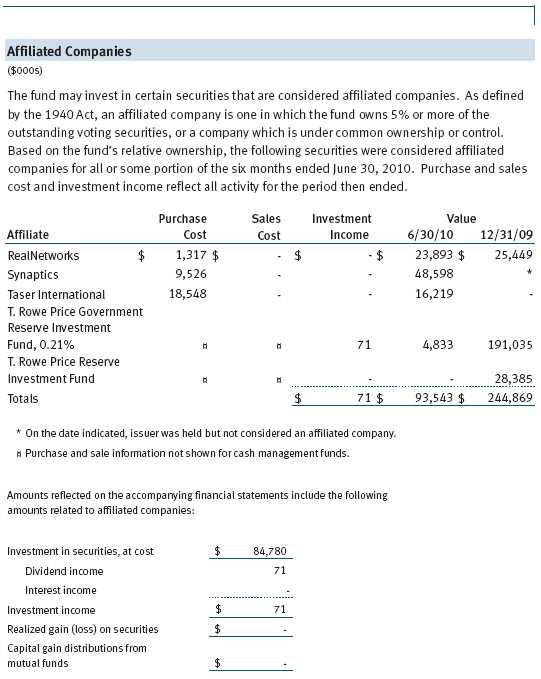
The fund may invest in the T. Rowe Price Reserve Investment Fund and the T. Rowe Price Government Reserve Investment Fund (collectively, the T. Rowe Price Reserve Investment Funds), open-end management investment companies managed by Price Associates and considered affiliates of the fund. The T. Rowe Price Reserve Investment Funds are offered as cash management options to mutual funds, trusts, and other accounts managed by Price Associates and/or its affiliates and are not available for direct purchase by members of the public. The T. Rowe Price Reserve Investment Funds pay no investment management fees.
As of June 30, 2010, T. Rowe Price Group, Inc., and/or its wholly owned subsidiaries owned 637,630 shares of the Investor Class, representing 1% of the fund’s net assets.
NOTE 6 - INTERFUND BORROWING PROGRAM
Pursuant to its prospectus, the fund may borrow up to 33 1/3% of its total assets. The manager has developed a program that provides temporary liquidity under an interfund borrowing agreement between the fund and other T. Rowe Price-sponsored mutual funds. The program permits the borrowing and lending of cash at rates beneficial to both the borrowing and lending funds. Pursuant to program guidelines, loans totaling 10% or more of a borrowing fund’s total assets require collateralization at 102% of the value of the loan; loans of less than 10% are unsecured. During the six months ended June 30, 2010, the fund incurred $1,000 in interest expense related to outstanding borrowings on two days in the average amount of $21,800,000 and at an average annual rate of 1.23%. At June 30, 2010, there were no borrowings outstanding.
| INFORMATION ON PROXY VOTING POLICIES, PROCEDURES, AND RECORDS |
A description of the policies and procedures used by T. Rowe Price funds and portfolios to determine how to vote proxies relating to portfolio securities is available in each fund’s Statement of Additional Information, which you may request by calling 1-800-225-5132 or by accessing the SEC’s Web site, www.sec.gov. The description of our proxy voting policies and procedures is also available on our Web site, www.troweprice.com. To access it, click on the words “Our Company” at the top of our corporate homepage. Then, when the next page appears, click on the words “Proxy Voting Policies” on the left side of the page.
Each fund’s most recent annual proxy voting record is available on our Web site and through the SEC’s Web site. To access it through our Web site, follow the directions above, then click on the words “Proxy Voting Records” on the right side of the Proxy Voting Policies page.
| HOW TO OBTAIN QUARTERLY PORTFOLIO HOLDINGS |
The fund files a complete schedule of portfolio holdings with the Securities and Exchange Commission for the first and third quarters of each fiscal year on Form N-Q. The fund’s Form N-Q is available electronically on the SEC’s Web site (www.sec.gov); hard copies may be reviewed and copied at the SEC’s Public Reference Room, 450 Fifth St. N.W., Washington, DC 20549. For more information on the Public Reference Room, call 1-800-SEC-0330.
| APPROVAL OF INVESTMENT MANAGEMENT AGREEMENT |
On March 9, 2010, the fund’s Board of Directors (Board) unanimously approved the continuation of the investment advisory contract (Contract) between the fund and its investment manager, T. Rowe Price Associates, Inc. (Adviser). The Board considered a variety of factors in connection with its review of the Contract, also taking into account information provided by the Adviser during the course of the year, as discussed below:
Services Provided by the Adviser
The Board considered the nature, quality, and extent of the services provided to the fund by the Adviser. These services included, but were not limited to, management of the fund’s portfolio and a variety of related activities, as well as financial and administrative services, reporting, and communications. The Board also reviewed the background and experience of the Adviser’s senior management team and investment personnel involved in the management of the fund. The Board concluded that it was satisfied with the nature, quality, and extent of the services provided by the Adviser.
Investment Performance of the Fund
The Board reviewed the fund’s average annual total returns over the 1-, 3-, 5-, and 10-year periods, as well as the fund’s year-by-year returns, and compared these returns with a wide variety of previously agreed upon comparable performance measures and market data, including those supplied by Lipper and Morningstar, which are independent providers of mutual fund data. On the basis of this evaluation and the Board’s ongoing review of investment results, and factoring in the severity of the market turmoil during 2008 and 2009, the Board concluded that the fund’s performance was satisfactory.
Costs, Benefits, Profits, and Economies of Scale
The Board reviewed detailed information regarding the revenues received by the Adviser under the Contract and other benefits that the Adviser (and its affiliates) may have realized from its relationship with the fund, including research received under “soft dollar” agreements and commission-sharing arrangements with broker-dealers. The Board considered that the Adviser may receive some benefit from its soft-dollar arrangements pursuant to which it receives research from broker-dealers that execute the applicable fund’s portfolio transactions. The Board also received information on the estimated costs incurred and profits realized by the Adviser and its affiliates from advising T. Rowe Price mutual funds, as well as estimates of the gross profits realized from managing the fund in particular. The Board concluded that the Adviser’s profits were reasonable in light of the services provided to the fund. The Board also considered whether the fund or other funds benefit under the fee levels set forth in the Contract from any economies of scale realized by the Adviser. Under the Contract, the fund pays a fee to the Adviser composed of two components—a group fee rate based on the aggregate assets of certain T. Rowe Price mutual funds (including the fund) that declines at certain asset levels and an individual fund fee rate that is assessed on the assets of the fund. The Board concluded that the advisory fee structure for the fund continued to provide for a reasonable sharing of benefits from any economies of scale with the fund’s investors.
Fees
The Board reviewed the fund’s management fee rate, operating expenses, and total expense ratio (for the Investor Class and Advisor Class) and compared them with fees and expenses of other comparable funds based on information and data supplied by Lipper. The information provided to the Board indicated that the fund’s management fee rate was above the median for certain groups of comparable funds but at or below the median for other groups of comparable funds. The information also indicated that the fund’s total expense ratio for the Investor Class was above the median for certain groups of comparable funds but below the median for other groups of comparable funds, and the total expense ratio for the Advisor Class was below the median for comparable funds. The Board also reviewed the fee schedules for institutional accounts of the Adviser and its affiliates with smaller mandates. Management informed the Board that the Adviser’s responsibilities for institutional accounts are more limited than its responsibilities for the fund and other T. Rowe Price mutual funds that it or its affiliates advise and that the Adviser performs significant additional services and assumes greater risk for the fund and other T. Rowe Price mutual funds that it advises than it does for institutional accounts. On the basis of the information provided, the Board concluded that the fees paid by the fund under the Contract were reasonable.
Approval of the Contract
As noted, the Board approved the continuation of the Contract. No single factor was considered in isolation or to be determinative to the decision. Rather, the Board was assisted by the advice of independent legal counsel and concluded, in light of a weighting and balancing of all factors considered, that it was in the best interests of the fund to approve the continuation of the Contract, including the fees to be charged for services thereunder.
Item 2. Code of Ethics.
A code of ethics, as defined in Item 2 of Form N-CSR, applicable to its principal executive officer, principal financial officer, principal accounting officer or controller, or persons performing similar functions is filed as an exhibit to the registrant’s annual Form N-CSR. No substantive amendments were approved or waivers were granted to this code of ethics during the registrant’s most recent fiscal half-year.
Item 3. Audit Committee Financial Expert.
Disclosure required in registrant’s annual Form N-CSR.
Item 4. Principal Accountant Fees and Services.
Disclosure required in registrant’s annual Form N-CSR.
Item 5. Audit Committee of Listed Registrants.
Not applicable.
Item 6. Investments.
(a) Not applicable. The complete schedule of investments is included in Item 1 of this Form N-CSR.
(b) Not applicable.
Item 7. Disclosure of Proxy Voting Policies and Procedures for Closed-End Management Investment Companies.
Not applicable.
Item 8. Portfolio Managers of Closed-End Management Investment Companies.
Not applicable.
Item 9. Purchases of Equity Securities by Closed-End Management Investment Company and Affiliated Purchasers.
Not applicable.
Item 10. Submission of Matters to a Vote of Security Holders.
Not applicable.
Item 11. Controls and Procedures.
(a) The registrant’s principal executive officer and principal financial officer have evaluated the registrant’s disclosure controls and procedures within 90 days of this filing and have concluded that the registrant’s disclosure controls and procedures were effective, as of that date, in ensuring that information required to be disclosed by the registrant in this Form N-CSR was recorded, processed, summarized, and reported timely.
(b) The registrant’s principal executive officer and principal financial officer are aware of no change in the registrant’s internal control over financial reporting that occurred during the registrant’s second fiscal quarter covered by this report that has materially affected, or is reasonably likely to materially affect, the registrant’s internal control over financial reporting.
Item 12. Exhibits.
(a)(1) The registrant’s code of ethics pursuant to Item 2 of Form N-CSR is filed with the registrant’s annual Form N-CSR.
(2) Separate certifications by the registrant's principal executive officer and principal financial officer, pursuant to Section 302 of the Sarbanes-Oxley Act of 2002 and required by Rule 30a-2(a) under the Investment Company Act of 1940, are attached.
(3) Written solicitation to repurchase securities issued by closed-end companies: not applicable.
(b) A certification by the registrant's principal executive officer and principal financial officer, pursuant to Section 906 of the Sarbanes-Oxley Act of 2002 and required by Rule 30a-2(b) under the Investment Company Act of 1940, is attached.
SIGNATURES | |
| Pursuant to the requirements of the Securities Exchange Act of 1934 and the Investment | |
| Company Act of 1940, the registrant has duly caused this report to be signed on its behalf by the | |
| undersigned, thereunto duly authorized. | |
| T. Rowe Price Science & Technology Fund, Inc. | |
| By | /s/ Edward C. Bernard |
| Edward C. Bernard | |
| Principal Executive Officer | |
| Date | August 17, 2010 |
| Pursuant to the requirements of the Securities Exchange Act of 1934 and the Investment | |
| Company Act of 1940, this report has been signed below by the following persons on behalf of | |
| the registrant and in the capacities and on the dates indicated. | |
| By | /s/ Edward C. Bernard |
| Edward C. Bernard | |
| Principal Executive Officer | |
| Date | August 17, 2010 |
| By | /s/ Gregory K. Hinkle |
| Gregory K. Hinkle | |
| Principal Financial Officer | |
| Date | August 17, 2010 |