UNITED STATES
SECURITIES AND EXCHANGE COMMISSION
Washington, D.C. 20549
FORM N-CSR
CERTIFIED SHAREHOLDER REPORT OF REGISTERED MANAGEMENT
INVESTMENT COMPANIES
Investment Company Act file number | 811-05202 |
| |
| The Dreyfus/Laurel Funds, Inc. | |
| (Exact name of Registrant as specified in charter) | |
| | |
| c/o The Dreyfus Corporation 200 Park Avenue New York, New York 10166 | |
| (Address of principal executive offices) (Zip code) | |
| | |
| Bennett A. MacDougall, Esq. 200 Park Avenue New York, New York 10166 | |
| (Name and address of agent for service) | |
|
Registrant's telephone number, including area code: | (212) 922-6000 |
| |
Date of fiscal year end: | 10/31 | |
Date of reporting period: | 10/31/15 | |
| | | | | | | |
The following N-CSR relates only to the Registrant’s series listed below and does not affect the other series of the Registrant, which have a different fiscal year end and, therefore, different N-CSR reporting requirements. A separate N-CSR will be filed for each series as appropriate.
Dreyfus BASIC S&P 500 Stock Index Fund
Dreyfus Bond Market Index Fund
Dreyfus Disciplined Stock Fund
Dreyfus Money Market Reserves
Dreyfus Opportunistic Fixed Income Fund
Dreyfus Tax Managed Growth Fund
General AMT-Free Municipal Money Market Fund
General Treasury and Agency Money Market Fund
FORM N-CSR
Item 1. Reports to Stockholders.
Dreyfus BASIC S&P 500 Stock Index Fund
| | | |

| | ANNUAL REPORT
October 31, 2015 |
| |
Save time. Save paper. View your next shareholder report online as soon as it’s available. Log into www.dreyfus.com and sign up for Dreyfus eCommunications. It’s simple and only takes a few minutes. |
| |
The views expressed in this report reflect those of the portfolio manager only through the end of the period covered and do not necessarily represent the views of Dreyfus or any other person in the Dreyfus organization. Any such views are subject to change at any time based upon market or other conditions and Dreyfus disclaims any responsibility to update such views. These views may not be relied on as investment advice and, because investment decisions for a Dreyfus fund are based on numerous factors, may not be relied on as an indication of trading intent on behalf of any Dreyfus fund. |
| |
Not FDIC-Insured • Not Bank-Guaranteed • May Lose Value |
Contents
THE FUND
FOR MORE INFORMATION
Back Cover
| | | | |
| |
Dreyfus BASIC S&P 500 Stock Index Fund
| | The Fund |
A LETTER FROM THE PRESIDENT
Dear Shareholder:
We are pleased to present this annual report for Dreyfus BASIC S&P 500 Stock Index Fund, covering the 12-month period from November 1, 2014, through October 31, 2015. For information about how the fund performed during the reporting period, as well as general market perspectives, we provide a Discussion of Fund Performance on the pages that follow.
Financial markets proved volatile over the reporting period amid choppy U.S. and global economic growth. U.S. stocks advanced over the final months of 2014 and the spring of 2015, with some broad measures of market performance setting new record highs. Those gains were largely erased over the summer when global economic instability undermined investor sentiment, but a renewed rally in October enabled most broad stock indices to end the reporting period in positive territory. In contrast, international stocks generally lost a degree of value, with developed markets faring far better than emerging markets amid falling commodity prices and depreciating currency values. U.S. bonds generally produced modestly positive total returns, with municipal bonds and longer term U.S. government securities faring better, on average, than corporate-backed bonds.
We expect market volatility to persist over the near term until investors see greater clarity regarding short-term U.S. interest rates and global economic conditions. Our investment strategists and portfolio managers are monitoring developments carefully, keeping a close watch on credit spreads, currency values, commodity prices, corporate profits, economic trends in the emerging markets, and other developments that could influence investor sentiment. Over the longer term, we remain confident that markets are likely to benefit as investors increasingly recognize that inflation is likely to stay low, economic growth expectations are stabilizing, and monetary policies remain accommodative in most regions of the world. In our view, investors will continue to be well served under these circumstances by a long-term perspective and a disciplined investment approach.
Thank you for your continued confidence and support.
Sincerely,

J. Charles Cardona
President
The Dreyfus Corporation
November 16, 2015
2
DISCUSSION OF FUND PERFORMANCE
For the period of November 1, 2014, through October 31, 2015, as provided by Thomas J. Durante, CFA, Karen Q. Wong, CFA, and Richard A. Brown, CFA, Portfolio Managers
Fund and Market Performance Overview
For the 12-month period ended October 31, 2015, Dreyfus BASIC S&P 500 Index Fund produced a total return of 5.02%.1 In comparison, the Standard & Poor’s 500® Composite Stock Price Index (“S&P 500 Index”), the fund’s benchmark, returned 5.21% for the same period.2,3
Moderately positive stock market results for the reporting period masked heightened volatility stemming from shifting economic sentiment. The difference in returns between the fund and the S&P 500 Index was primarily the result of transaction costs and operating expenses that are not reflected in the S&P 500 Index’s results.
The Fund’s Investment Approach
The fund seeks to match the total return of the S&P 500 Index by generally investing in all 500 stocks in the S&P 500 Index in proportion to their respective weightings. Often considered a barometer for the stock market in general, the S&P 500 Index is made up of 500 widely held common stocks across 10 economic sectors. Each stock is weighted by its float-adjusted market capitalization; that is, larger companies have greater representation in the S&P 500 Index than smaller ones.
The fund employed futures contracts during the reporting period in its efforts to replicate the returns of the S&P 500 Index.
Global Economic Concerns Sparked Market Turmoil
After experiencing sharp declines in the early fall, the stock market began the reporting period in the midst of a rally driven by robust employment gains and improved consumer and business confidence. The S&P 500 Index climbed through the end of February 2015 despite ongoing global economic weakness and plummeting prices of oil and other commodities.
Investors responded negatively in March to sluggish domestic economic growth stemming from severe winter weather and an appreciating U.S. dollar. Indeed, U.S. GDP expanded at an anemic 0.6% annualized rate during the first quarter of 2015, but stocks resumed their advance and the S&P 500 Index set new record highs in May as the U.S. economy regained traction with a 3.9% annualized growth rate for the second quarter.
Uncertainty regarding a debt crisis in Greece and slowing economic growth in China again sent U.S. stock prices lower over the summer. In mid-August, the Chinese central bank unexpectedly devalued the country’s currency, intensifying concerns that the world’s second largest economy could be slowing more than anticipated, sending commodity prices lower. In fact, the impact of global economic headwinds on U.S. exports was cited as a primary factor behind a deceleration of U.S. economic growth to an annualized 1.5% rate for the third quarter. Stocks briefly dipped into negative territory as investors grew more risk-averse, but a strong rally in October enabled the S&P 500 Index to end the reporting period with a moderate gain after several large companies reported better-than-expected financial results.
3
DISCUSSION OF FUND PERFORMANCE (continued)
Consumer Discretionary Stocks Led Markets Higher
Although the S&P 500 Index posted a single-digit gain for the reporting period overall, the economic sectors that comprise the S&P 500 Index delivered widely disparate results. The consumer discretionary sector led the market’s advance, driven higher by gains from Internet retailers such as Amazon.com. Meanwhile, home improvement retailers’ including The Home Depot and Lowe’s benefited from recovering housing markets, and more affordable fuel prices boosted business for hotels and restaurants.
The information technology sector gained value amid the ongoing trend toward cloud computing, which has enabled businesses across a variety of industries to enhance their technology capabilities at an affordable cost. Increased adoption of smartphones helped boost earnings for providers of electronic components and mobile software. Some of the sector’s top performers included technology giants Apple, Facebook, Alphabet (formerly Google), and Microsoft. The health care sector continued to see rising spending on medical services from an aging population, and the industry group increasingly sought to control costs and achieve economies of scale through mergers and acquisitions.
In contrast, the energy sector lost considerable value over the reporting period. A glut of supply of crude oil was met with tepid demand, causing petroleum prices to fall sharply. Offshore drillers were hit especially hard during the downturn when their contracts with major energy producers were canceled. The materials sector also was hurt by declining commodity prices stemming mainly from reduced demand from the emerging markets, which weighed on earnings for metals-and-mining companies. Finally, results from the telecommunications services sector were undermined by heightened competitive pressures affecting traditional telephone companies.
Replicating the Performance of the S&P 500 Index
Although we do not actively manage the fund’s investments in response to macroeconomic trends, it is worth noting that the U.S. economic recovery appears to remain on track and aggressively accommodative monetary policies are at work in international markets. As always, we have continued to monitor the factors considered by the fund’s investment model in light of current market conditions.
November 16, 2015
Equity funds are subject generally to market, market sector, market liquidity, issuer, and investment style risks, among other factors, to varying degrees, all of which are more fully described in the fund’s prospectus.
¹ Total return includes reinvestment of dividends and any capital gains paid. Past performance is no guarantee of future results. Share price and investment return fluctuate such that upon redemption, fund shares may be worth more or less than their original cost.
² SOURCE: Lipper Inc. — Reflects reinvestment of dividends and, where applicable, capital gain distributions. The Standard & Poor’s 500 Composite Stock Price Index is a widely accepted, unmanaged index of U.S. stock market performance. Investors cannot invest directly in any index.
³ “Standard & Poor’s®,” “S&P®,” “Standard & Poor’s® 500,” and “S&P 500®” are registered trademarks of Standard & Poor’s Financial Services LLC, and have been licensed for use on behalf of the fund. The fund is not sponsored, managed, advised, sold, or promoted by Standard & Poor’s and its affiliates, and Standard & Poor’s and its affiliates make no representation regarding the advisability of investing in the fund.
invest directly in any index.
4
FUND PERFORMANCE
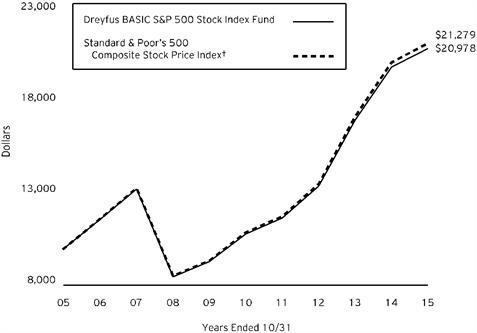
Comparison of change in value of $10,000 investment in Dreyfus BASIC S&P 500 Stock Index Fund and the Standard & Poor’s 500 Composite Stock Price Index
| | | | |
Average Annual Total Returns as of 10/31/15 | |
| 1 Year | 5 Years | 10 Years |
Fund | 5.02% | 14.13% | 7.69% |
Standard & Poor’s 500 Composite Stock Price Index | 5.21% | 14.32% | 7.84% |
† Source: Lipper Inc.
Past performance is not predictive of future performance. The fund’s performance shown in the graph and table does not reflect the deduction of taxes that a shareholder would pay on fund distributions or the redemption of fund shares.
The above graph compares a $10,000 investment made in Dreyfus BASIC S&P 500 Stock Index Fund on 10/31/05 to a $10,000 investment made in the Standard & Poor’s 500 Composite Stock Price Index (the “Index”) on that date. All dividends and capital gain distributions are reinvested.
The fund’s performance shown in the line graph above takes into account all applicable fees and expenses. The Index is a widely accepted, unmanaged index of U.S. stock market performance. Unlike a mutual fund, the Index is not subject to charges, fees and other expenses. Investors cannot invest directly in any index. Further information relating to fund performance, including expense reimbursements, if applicable, is contained in the Financial Highlights section of the prospectus and elsewhere in this report.
5
UNDERSTANDING YOUR FUND’S EXPENSES (Unaudited)
As a mutual fund investor, you pay ongoing expenses, such as management fees and other expenses. Using the information below, you can estimate how these expenses affect your investment and compare them with the expenses of other funds. You also may pay one-time transaction expenses, including sales charges (loads) and redemption fees, which are not shown in this section and would have resulted in higher total expenses. For more information, see your fund’s prospectus or talk to your financial adviser.
Review your fund’s expenses
The table below shows the expenses you would have paid on a $1,000 investment in Dreyfus BASIC S&P 500 Stock Index Fund from May 1, 2015 to October 31, 2015. It also shows how much a $1,000 investment would be worth at the close of the period, assuming actual returns and expenses.
| | | | | | | | | | |
Expenses and Value of a $1,000 Investment |
assuming actual returns for the six months ended October 31, 2015 | | |
| | | | | | | | | |
Expenses paid per $1,000† | | | | $ 1.01 | | | |
Ending value (after expenses) | | | | $ 1,006.90 | | | |
COMPARING YOUR FUND’S EXPENSES
WITH THOSE OF OTHER FUNDS (Unaudited)
Using the SEC’s method to compare expenses
The Securities and Exchange Commission (SEC) has established guidelines to help investors assess fund expenses. Per these guidelines, the table below shows your fund’s expenses based on a $1,000 investment, assuming a hypothetical 5% annualized return. You can use this information to compare the ongoing expenses (but not transaction expenses or total cost) of investing in the fund with those of other funds. All mutual fund shareholder reports will provide this information to help you make this comparison. Please note that you cannot use this information to estimate your actual ending account balance and expenses paid during the period.
| | | | | | | | | | |
Expenses and Value of a $1,000 Investment |
assuming a hypothetical 5% annualized return for the six months ended October 31, 2015 |
| | | | | | | | | |
Expenses paid per $1,000† | | | | $1.02 | | | |
Ending value (after expenses) | | | | $ 1,024.20 | | | |
† Expenses are equal to the fund’s annualized expense ratio of .20%, multiplied by the average account value over the period, multiplied by 184/365 (to reflect the one-half year period).
6
STATEMENT OF INVESTMENTS
October 31, 2015
| | | | | | |
Common Stocks - 97.9% | | Shares | | Value ($) | |
Automobiles & Components - 1.0% | | | | | |
BorgWarner | | 26,843 | | 1,149,417 | |
Delphi Automotive | | 32,413 | | 2,696,437 | |
Ford Motor | | 446,813 | | 6,617,301 | |
General Motors | | 166,557 | | 5,814,505 | |
Goodyear Tire & Rubber | | 30,189 | | 991,407 | |
Harley-Davidson | | 23,272 | | 1,150,800 | |
Johnson Controls | | 74,705 | | 3,375,172 | |
| | | | | 21,795,039 | |
Banks - 5.8% | | | | | |
Bank of America | | 1,203,525 | | 20,195,150 | |
BB&T | | 89,919 | | 3,340,491 | |
Citigroup | | 345,990 | | 18,396,288 | |
Comerica | | 20,289 | | 880,543 | |
Fifth Third Bancorp | | 91,213 | | 1,737,608 | |
Hudson City Bancorp | | 52,545 | | 531,755 | |
Huntington Bancshares | | 93,928 | | 1,030,390 | |
JPMorgan Chase & Co. | | 425,298 | | 27,325,397 | |
KeyCorp | | 98,906 | | 1,228,413 | |
M&T Bank | | 15,285 | a | 1,831,907 | |
People's United Financial | | 34,529 | | 550,738 | |
PNC Financial Services Group | | 59,548 | | 5,374,802 | |
Regions Financial | | 149,873 | | 1,401,313 | |
SunTrust Banks | | 58,853 | | 2,443,577 | |
U.S. Bancorp | | 189,974 | | 8,013,103 | |
Wells Fargo & Co. | | 537,265 | | 29,087,527 | |
Zions Bancorporation | | 24,204 | | 696,349 | |
| | | | | 124,065,351 | |
Capital Goods - 7.1% | | | | | |
3M | | 71,750 | | 11,279,818 | |
Allegion | | 10,780 | | 702,533 | |
AMETEK | | 28,653 | | 1,570,757 | |
Boeing | | 73,343 | | 10,859,898 | |
Caterpillar | | 69,007 | a | 5,036,821 | |
Cummins | | 19,113 | a | 1,978,387 | |
Danaher | | 68,168 | | 6,360,756 | |
Deere & Co. | | 36,219 | a | 2,825,082 | |
Dover | | 17,599 | | 1,133,904 | |
Eaton | | 53,484 | | 2,990,290 | |
7
STATEMENT OF INVESTMENTS (continued)
| | | | | | |
Common Stocks - 97.9% (continued) | | Shares | | Value ($) | |
Capital Goods - 7.1% (continued) | | | | | |
Emerson Electric | | 76,257 | | 3,601,618 | |
Fastenal | | 31,970 | a | 1,251,945 | |
Flowserve | | 15,388 | | 713,388 | |
Fluor | | 16,122 | | 770,793 | |
General Dynamics | | 35,199 | | 5,229,867 | |
General Electric | | 1,161,259 | | 33,583,610 | |
Honeywell International | | 89,737 | | 9,268,037 | |
Illinois Tool Works | | 37,641 | | 3,460,714 | |
Ingersoll-Rand | | 30,794 | | 1,824,852 | |
Jacobs Engineering Group | | 15,149 | b | 608,081 | |
L-3 Communications Holdings | | 9,201 | | 1,163,006 | |
Lockheed Martin | | 30,759 | | 6,761,751 | |
Masco | | 39,942 | | 1,158,318 | |
Northrop Grumman | | 21,743 | | 4,082,248 | |
PACCAR | | 41,328 | | 2,175,919 | |
Parker Hannifin | | 15,718 | | 1,645,675 | |
Pentair | | 21,062 | | 1,177,787 | |
Precision Castparts | | 15,807 | | 3,648,414 | |
Quanta Services | | 24,974 | a,b | 502,227 | |
Raytheon | | 34,723 | | 4,076,480 | |
Rockwell Automation | | 15,737 | | 1,717,851 | |
Rockwell Collins | | 15,220 | | 1,319,878 | |
Roper Technologies | | 11,548 | | 2,151,970 | |
Snap-on | | 6,617 | | 1,097,694 | |
Stanley Black & Decker | | 17,395 | | 1,843,522 | |
Textron | | 32,229 | | 1,359,097 | |
United Rentals | | 11,104 | b | 831,245 | |
United Technologies | | 95,076 | | 9,356,429 | |
W.W. Grainger | | 6,727 | a | 1,412,670 | |
Xylem | | 21,090 | | 767,887 | |
| | | | | 153,301,219 | |
Commercial & Professional Services - .7% | | | | | |
ADT | | 18,786 | a | 620,689 | |
Cintas | | 10,379 | | 966,181 | |
Dun & Bradstreet | | 4,525 | | 515,262 | |
Equifax | | 13,874 | | 1,478,552 | |
Nielsen Holdings | | 41,861 | | 1,988,816 | |
Pitney Bowes | | 24,190 | | 499,524 | |
Republic Services | | 27,901 | | 1,220,390 | |
8
| | | | | | |
Common Stocks - 97.9% (continued) | | Shares | | Value ($) | |
Commercial & Professional Services - .7% (continued) | | | | | |
Robert Half International | | 15,698 | | 826,657 | |
Stericycle | | 9,843 | b | 1,194,645 | |
Tyco International | | 48,302 | | 1,760,125 | |
Verisk Analytics, Cl. A | | 17,845 | b | 1,277,880 | |
Waste Management | | 47,941 | | 2,577,308 | |
| | | | | 14,926,029 | |
Consumer Durables & Apparel - 1.5% | | | | | |
Coach | | 33,321 | | 1,039,615 | |
D.R. Horton | | 36,768 | | 1,082,450 | |
Fossil Group | | 5,457 | b | 296,915 | |
Garmin | | 14,555 | | 516,266 | |
Hanesbrands | | 45,911 | a | 1,466,397 | |
Harman International Industries | | 8,350 | | 918,166 | |
Hasbro | | 12,682 | | 974,358 | |
Leggett & Platt | | 15,178 | | 683,465 | |
Lennar, Cl. A | | 20,922 | | 1,047,565 | |
Mattel | | 40,810 | | 1,003,110 | |
Michael Kors Holdings | | 22,104 | b | 854,099 | |
Mohawk Industries | | 7,156 | b | 1,398,998 | |
Newell Rubbermaid | | 30,159 | | 1,279,646 | |
NIKE, Cl. B | | 77,838 | | 10,199,113 | |
PulteGroup | | 37,301 | | 683,727 | |
PVH | | 9,580 | | 871,301 | |
Ralph Lauren | | 7,023 | | 777,938 | |
Under Armour, Cl. A | | 20,822 | b | 1,979,756 | |
VF | | 38,852 | | 2,623,287 | |
Whirlpool | | 9,101 | | 1,457,434 | |
| | | | | 31,153,606 | |
Consumer Services - 1.9% | | | | | |
Carnival | | 53,581 | | 2,897,661 | |
Chipotle Mexican Grill | | 3,529 | b | 2,259,372 | |
Darden Restaurants | | 13,247 | | 819,857 | |
H&R Block | | 31,558 | | 1,175,851 | |
Marriott International, Cl. A | | 23,157 | | 1,777,994 | |
McDonald's | | 108,174 | | 12,142,532 | |
Royal Caribbean Cruises | | 19,834 | | 1,950,674 | |
Starbucks | | 170,429 | | 10,663,743 | |
Starwood Hotels & Resorts Worldwide | | 19,697 | c | 1,573,199 | |
Wyndham Worldwide | | 13,886 | | 1,129,626 | |
9
STATEMENT OF INVESTMENTS (continued)
| | | | | | |
Common Stocks - 97.9% (continued) | | Shares | | Value ($) | |
Consumer Services - 1.9% (continued) | | | | | |
Wynn Resorts | | 9,432 | a | 659,768 | |
Yum! Brands | | 49,621 | | 3,518,625 | |
| | | | | 40,568,902 | |
Diversified Financials - 4.8% | | | | | |
Affiliated Managers Group | | 6,246 | b | 1,125,904 | |
American Express | | 97,651 | | 7,153,912 | |
Ameriprise Financial | | 20,690 | | 2,386,798 | |
Bank of New York Mellon | | 126,766 | | 5,279,804 | |
Berkshire Hathaway, Cl. B | | 215,467 | b | 29,307,821 | |
BlackRock | | 14,713 | | 5,178,535 | |
Capital One Financial | | 62,808 | | 4,955,551 | |
Charles Schwab | | 138,540 | | 4,228,241 | |
CME Group | | 39,044 | | 3,688,487 | |
Discover Financial Services | | 50,559 | | 2,842,427 | |
E*TRADE Financial | | 34,244 | b | 976,296 | |
Franklin Resources | | 45,607 | | 1,858,941 | |
Goldman Sachs Group | | 46,311 | | 8,683,313 | |
Intercontinental Exchange | | 12,764 | | 3,221,634 | |
Invesco | | 50,417 | | 1,672,332 | |
Legg Mason | | 11,158 | | 499,321 | |
Leucadia National | | 37,062 | | 741,611 | |
McGraw-Hill Financial | | 31,634 | | 2,930,574 | |
Moody's | | 19,820 | | 1,905,891 | |
Morgan Stanley | | 176,761 | | 5,827,810 | |
Nasdaq | | 13,597 | | 787,130 | |
Navient | | 46,431 | | 612,425 | |
Northern Trust | | 24,849 | | 1,749,121 | |
State Street | | 46,627 | | 3,217,263 | |
T. Rowe Price Group | | 29,152 | | 2,204,474 | |
| | | | | 103,035,616 | |
Energy - 7.0% | | | | | |
Anadarko Petroleum | | 58,083 | | 3,884,591 | |
Apache | | 42,948 | | 2,024,139 | |
Baker Hughes | | 50,736 | | 2,672,772 | |
Cabot Oil & Gas | | 47,872 | | 1,039,301 | |
Cameron International | | 22,711 | b | 1,544,575 | |
Chesapeake Energy | | 61,871 | a | 441,140 | |
Chevron | | 216,303 | | 19,657,617 | |
Cimarex Energy | | 10,285 | | 1,214,247 | |
10
| | | | | | |
Common Stocks - 97.9% (continued) | | Shares | | Value ($) | |
Energy - 7.0% (continued) | | | | | |
Columbia Pipeline Group | | 36,295 | | 753,847 | |
ConocoPhillips | | 141,484 | | 7,548,171 | |
CONSOL Energy | | 27,460 | a | 182,884 | |
Devon Energy | | 44,051 | | 1,847,058 | |
Diamond Offshore Drilling | | 8,441 | a | 167,807 | |
Ensco | | 27,245 | | 453,084 | |
EOG Resources | | 63,076 | | 5,415,075 | |
EQT | | 17,778 | | 1,174,592 | |
Exxon Mobil | | 479,630 | | 39,684,586 | |
FMC Technologies | | 27,452 | b | 928,701 | |
Halliburton | | 99,430 | | 3,816,123 | |
Helmerich & Payne | | 12,589 | a | 708,383 | |
Hess | | 28,215 | | 1,585,965 | |
Kinder Morgan | | 207,932 | | 5,686,940 | |
Marathon Oil | | 77,687 | | 1,427,887 | |
Marathon Petroleum | | 62,216 | | 3,222,789 | |
Murphy Oil | | 17,722 | | 503,836 | |
National Oilwell Varco | | 44,681 | | 1,681,793 | |
Newfield Exploration | | 19,198 | b | 771,568 | |
Noble Energy | | 49,007 | | 1,756,411 | |
Occidental Petroleum | | 88,393 | | 6,588,814 | |
ONEOK | | 24,641 | | 835,823 | |
Phillips 66 | | 55,686 | | 4,958,838 | |
Pioneer Natural Resources | | 17,359 | | 2,380,613 | |
Range Resources | | 20,148 | a | 613,305 | |
Schlumberger | | 145,329 | | 11,358,915 | |
Southwestern Energy | | 46,073 | b | 508,646 | |
Spectra Energy | | 76,362 | | 2,181,662 | |
Tesoro | | 13,933 | | 1,489,856 | |
Transocean | | 39,660 | a | 627,818 | |
Valero Energy | | 56,827 | | 3,746,036 | |
Williams | | 78,712 | | 3,104,401 | |
| | | | | 150,190,609 | |
Food & Staples Retailing - 2.2% | | | | | |
Costco Wholesale | | 50,578 | | 7,997,393 | |
CVS Health | | 128,045 | | 12,648,285 | |
Kroger | | 112,421 | | 4,249,514 | |
Sysco | | 64,289 | | 2,651,921 | |
Walgreens Boots Alliance | | 100,303 | | 8,493,658 | |
11
STATEMENT OF INVESTMENTS (continued)
| | | | | | |
Common Stocks - 97.9% (continued) | | Shares | | Value ($) | |
Food & Staples Retailing - 2.2% (continued) | | | | | |
Wal-Mart Stores | | 182,095 | | 10,423,118 | |
Whole Foods Market | | 41,845 | | 1,253,676 | |
| | | | | 47,717,565 | |
Food, Beverage & Tobacco - 5.4% | | | | | |
Altria Group | | 225,269 | | 13,622,016 | |
Archer-Daniels-Midland | | 71,020 | | 3,242,773 | |
Brown-Forman, Cl. B | | 12,427 | | 1,319,499 | |
Campbell Soup | | 20,199 | a | 1,025,907 | |
Coca-Cola | | 450,072 | | 19,060,549 | |
Coca-Cola Enterprises | | 23,773 | | 1,220,506 | |
ConAgra Foods | | 50,297 | | 2,039,543 | |
Constellation Brands, Cl. A | | 19,579 | | 2,639,249 | |
Dr. Pepper Snapple Group | | 22,372 | | 1,999,386 | |
General Mills | | 68,502 | | 3,980,651 | |
Hershey | | 16,562 | | 1,468,884 | |
Hormel Foods | | 15,988 | | 1,079,989 | |
J.M. Smucker | | 13,773 | | 1,616,812 | |
Kellogg | | 29,086 | | 2,051,145 | |
Keurig Green Mountain | | 13,572 | a | 688,779 | |
Kraft Heinz | | 68,102 | | 5,309,913 | |
McCormick & Co. | | 13,466 | | 1,130,875 | |
Mead Johnson Nutrition | | 23,004 | | 1,886,328 | |
Molson Coors Brewing, Cl. B | | 18,440 | | 1,624,564 | |
Mondelez International, Cl. A | | 184,908 | | 8,535,353 | |
Monster Beverage | | 17,152 | b | 2,338,161 | |
PepsiCo | | 168,847 | | 17,254,475 | |
Philip Morris International | | 178,809 | | 15,806,716 | |
Reynolds American | | 96,281 | | 4,652,298 | |
Tyson Foods, Cl. A | | 34,951 | | 1,550,426 | |
| | | | | 117,144,797 | |
Health Care Equipment & Services - 4.7% | | | | | |
Abbott Laboratories | | 171,511 | | 7,683,693 | |
Aetna | | 40,114 | | 4,604,285 | |
AmerisourceBergen | | 23,799 | | 2,296,841 | |
Anthem | | 30,386 | | 4,228,212 | |
Baxter International | | 62,861 | | 2,350,373 | |
Becton Dickinson & Co. | | 24,384 | | 3,475,208 | |
Boston Scientific | | 155,091 | b | 2,835,063 | |
C.R. Bard | | 8,676 | | 1,616,773 | |
12
| | | | | | |
Common Stocks - 97.9% (continued) | | Shares | | Value ($) | |
Health Care Equipment & Services - 4.7% (continued) | | | | | |
Cardinal Health | | 38,194 | | 3,139,547 | |
Cerner | | 34,880 | b | 2,312,195 | |
Cigna | | 29,960 | | 4,015,838 | |
DaVita HealthCare Partners | | 20,214 | b | 1,566,787 | |
DENTSPLY International | | 15,632 | | 951,207 | |
Edwards Lifesciences | | 12,178 | b | 1,913,773 | |
Express Scripts Holding | | 78,226 | b | 6,757,162 | |
HCA Holdings | | 36,839 | b | 2,534,155 | |
Henry Schein | | 9,161 | b | 1,389,815 | |
Humana | | 16,920 | | 3,022,420 | |
Intuitive Surgical | | 4,302 | b | 2,136,373 | |
Laboratory Corporation of America Holdings | | 11,964 | b | 1,468,461 | |
McKesson | | 26,735 | | 4,780,218 | |
Medtronic | | 162,437 | | 12,007,343 | |
Patterson | | 10,307 | | 488,552 | |
Quest Diagnostics | | 17,250 | | 1,172,138 | |
St. Jude Medical | | 31,889 | | 2,034,837 | |
Stryker | | 36,579 | | 3,497,684 | |
Tenet Healthcare | | 12,295 | b | 385,694 | |
UnitedHealth Group | | 109,562 | | 12,904,212 | |
Universal Health Services, Cl. B | | 10,793 | | 1,317,717 | |
Varian Medical Systems | | 11,046 | a,b | 867,442 | |
Zimmer Biomet Holdings | | 19,570 | | 2,046,435 | |
| | | | | 101,800,453 | |
Household & Personal Products - 1.8% | | | | | |
Clorox | | 14,934 | | 1,821,052 | |
Colgate-Palmolive | | 104,069 | | 6,904,978 | |
Estee Lauder, Cl. A | | 25,952 | | 2,088,098 | |
Kimberly-Clark | | 41,717 | | 4,993,942 | |
Procter & Gamble | | 311,924 | | 23,824,755 | |
| | | | | 39,632,825 | |
Insurance - 2.7% | | | | | |
ACE | | 37,600 | | 4,269,104 | |
Aflac | | 49,598 | | 3,161,873 | |
Allstate | | 46,467 | | 2,875,378 | |
American International Group | | 148,522 | | 9,365,797 | |
Aon | | 32,721 | | 3,053,197 | |
Assurant | | 7,812 | | 636,912 | |
Chubb | | 26,272 | | 3,398,283 | |
13
STATEMENT OF INVESTMENTS (continued)
| | | | | | |
Common Stocks - 97.9% (continued) | | Shares | | Value ($) | |
Insurance - 2.7% (continued) | | | | | |
Cincinnati Financial | | 17,367 | | 1,046,014 | |
Genworth Financial, Cl. A | | 58,302 | b | 272,853 | |
Hartford Financial Services Group | | 48,146 | | 2,227,234 | |
Lincoln National | | 28,636 | | 1,532,312 | |
Loews | | 32,365 | | 1,180,028 | |
Marsh & McLennan | | 60,557 | | 3,375,447 | |
MetLife | | 128,063 | | 6,451,814 | |
Principal Financial Group | | 32,261 | | 1,618,212 | |
Progressive | | 67,664 | | 2,241,708 | |
Prudential Financial | | 51,603 | | 4,257,248 | |
Torchmark | | 12,983 | | 753,144 | |
Travelers | | 36,117 | | 4,077,248 | |
Unum Group | | 28,832 | | 999,029 | |
XL Group | | 35,702 | | 1,359,532 | |
| | | | | 58,152,367 | |
Materials - 2.9% | | | | | |
Air Products & Chemicals | | 22,298 | | 3,098,976 | |
Airgas | | 7,861 | | 755,914 | |
Alcoa | | 151,205 | | 1,350,261 | |
Avery Dennison | | 10,206 | | 663,084 | |
Ball | | 15,642 | | 1,071,477 | |
CF Industries Holdings | | 26,299 | | 1,335,200 | |
Dow Chemical | | 133,834 | | 6,915,203 | |
E.I. du Pont de Nemours & Co. | | 104,135 | | 6,602,159 | |
Eastman Chemical | | 17,153 | | 1,237,932 | |
Ecolab | | 30,357 | | 3,653,465 | |
FMC | | 15,231 | | 620,054 | |
Freeport-McMoRan | | 122,215 | | 1,438,471 | |
International Flavors & Fragrances | | 9,381 | | 1,088,759 | |
International Paper | | 47,463 | | 2,026,195 | |
LyondellBasell Industries | | 43,281 | | 4,021,238 | |
Martin Marietta Materials | | 7,739 | | 1,200,706 | |
Monsanto | | 53,574 | | 4,994,168 | |
Mosaic | | 38,953 | | 1,316,222 | |
Newmont Mining | | 58,698 | | 1,142,263 | |
Nucor | | 37,434 | | 1,583,458 | |
Owens-Illinois | | 19,542 | b | 421,130 | |
PPG Industries | | 31,132 | | 3,245,822 | |
Praxair | | 32,744 | | 3,637,531 | |
14
| | | | | | |
Common Stocks - 97.9% (continued) | | Shares | | Value ($) | |
Materials - 2.9% (continued) | | | | | |
Sealed Air | | 23,903 | | 1,174,115 | |
Sherwin-Williams | | 9,029 | | 2,409,208 | |
Sigma-Aldrich | | 13,939 | | 1,947,557 | |
Vulcan Materials | | 15,250 | | 1,472,845 | |
WestRock | | 30,470 | | 1,638,053 | |
| | | | | 62,061,466 | |
Media - 3.2% | | | | | |
Cablevision Systems (NY Group), Cl. A | | 25,190 | | 820,942 | |
CBS, Cl. B | | 51,721 | | 2,406,061 | |
Comcast, Cl. A | | 243,012 | | 15,217,411 | |
Comcast, Cl. A (Special) | | 42,703 | a | 2,677,905 | |
Discovery Communications, Cl. A | | 18,024 | a,b | 530,627 | |
Discovery Communications, Cl. C | | 28,975 | b | 797,392 | |
Interpublic Group of Companies | | 49,140 | | 1,126,780 | |
News Corp., Cl. A | | 44,486 | | 685,084 | |
News Corp., Cl. B | | 11,741 | | 181,751 | |
Omnicom Group | | 27,607 | | 2,068,316 | |
Scripps Networks Interactive | | 10,422 | a | 626,154 | |
TEGNA | | 26,530 | | 717,371 | |
Time Warner | | 93,532 | | 7,046,701 | |
Time Warner Cable | | 32,597 | | 6,173,872 | |
Twenty-First Century Fox, Cl. A | | 141,601 | | 4,345,735 | |
Twenty-First Century Fox, Cl. B | | 50,009 | | 1,544,278 | |
Viacom, Cl. B | | 40,765 | | 2,010,122 | |
Walt Disney | | 178,513 | | 20,304,069 | |
| | | | | 69,280,571 | |
Pharmaceuticals, Biotechnology & Life Sciences - 9.5% | | | | | |
AbbVie | | 190,099 | | 11,320,395 | |
Agilent Technologies | | 39,191 | | 1,479,852 | |
Alexion Pharmaceuticals | | 26,050 | b | 4,584,800 | |
Allergan | | 45,221 | b | 13,949,322 | |
Amgen | | 87,109 | | 13,778,902 | |
Baxalta | | 62,868 | | 2,166,431 | |
Biogen | | 25,665 | b | 7,455,939 | |
Bristol-Myers Squibb | | 192,349 | | 12,685,417 | |
Celgene | | 90,778 | b | 11,139,368 | |
Eli Lilly & Co. | | 112,566 | | 9,182,009 | |
Endo International | | 23,578 | b | 1,414,444 | |
Gilead Sciences | | 168,694 | | 18,240,882 | |
15
STATEMENT OF INVESTMENTS (continued)
| | | | | | |
Common Stocks - 97.9% (continued) | | Shares | | Value ($) | |
Pharmaceuticals, Biotechnology & Life Sciences - 9.5% (continued) | | | | | |
Johnson & Johnson | | 318,505 | | 32,178,560 | |
Mallinckrodt | | 13,363 | b | 877,548 | |
Merck & Co. | | 323,746 | | 17,695,956 | |
Mylan | | 47,497 | b | 2,094,143 | |
PerkinElmer | | 13,441 | | 694,093 | |
Perrigo Company | | 17,072 | | 2,692,937 | |
Pfizer | | 709,176 | | 23,984,332 | |
Regeneron Pharmaceuticals | | 8,957 | b | 4,992,542 | |
Thermo Fisher Scientific | | 46,050 | | 6,022,419 | |
Vertex Pharmaceuticals | | 28,006 | b | 3,493,468 | |
Waters | | 9,728 | b | 1,243,238 | |
Zoetis | | 53,316 | | 2,293,121 | |
| | | | | 205,660,118 | |
Real Estate - 2.6% | | | | | |
American Tower | | 48,455 | c | 4,953,555 | |
Apartment Investment & Management, Cl. A | | 17,285 | c | 677,399 | |
AvalonBay Communities | | 15,060 | c | 2,632,940 | |
Boston Properties | | 17,647 | c | 2,220,875 | |
CBRE Group, Cl. A | | 32,852 | b | 1,224,723 | |
Crown Castle International | | 38,975 | c | 3,330,804 | |
Equinix | | 6,480 | c | 1,922,486 | |
Equity Residential | | 42,043 | c | 3,250,765 | |
Essex Property Trust | | 7,672 | c | 1,691,216 | |
General Growth Properties | | 67,938 | c | 1,966,805 | |
HCP | | 53,012 | a,c | 1,972,046 | |
Host Hotels & Resorts | | 86,991 | c | 1,507,554 | |
Iron Mountain | | 21,486 | c | 658,331 | |
Kimco Realty | | 49,384 | c | 1,322,010 | |
Macerich | | 15,634 | c | 1,324,825 | |
Plum Creek Timber | | 20,941 | c | 853,136 | |
Prologis | | 59,596 | c | 2,546,537 | |
Public Storage | | 16,778 | c | 3,849,880 | |
Realty Income | | 27,077 | a,c | 1,339,228 | |
Simon Property Group | | 35,489 | c | 7,149,614 | |
SL Green Realty | | 11,872 | c | 1,408,257 | |
Ventas | | 38,544 | c | 2,070,584 | |
Vornado Realty Trust | | 20,722 | c | 2,083,597 | |
Welltower | | 40,754 | c | 2,643,712 | |
16
| | | | | | |
Common Stocks - 97.9% (continued) | | Shares | | Value ($) | |
Real Estate - 2.6% (continued) | | | | | |
Weyerhaeuser | | 60,403 | c | 1,771,620 | |
| | | | | 56,372,499 | |
Retailing - 5.3% | | | | | |
Advance Auto Parts | | 8,475 | | 1,681,694 | |
Amazon.com | | 44,101 | b | 27,602,816 | |
AutoNation | | 9,326 | b | 589,310 | |
AutoZone | | 3,522 | b | 2,762,692 | |
Bed Bath & Beyond | | 19,817 | a,b | 1,181,688 | |
Best Buy | | 34,613 | | 1,212,493 | |
CarMax | | 23,546 | b | 1,389,449 | |
Dollar General | | 33,896 | | 2,297,132 | |
Dollar Tree | | 26,490 | b | 1,734,830 | |
Expedia | | 11,886 | | 1,620,062 | |
GameStop, Cl. A | | 12,037 | a | 554,545 | |
Gap | | 27,665 | a | 753,041 | |
Genuine Parts | | 17,168 | | 1,558,168 | |
Home Depot | | 147,607 | | 18,250,130 | |
Kohl's | | 22,283 | | 1,027,692 | |
L Brands | | 28,973 | | 2,780,829 | |
Lowe's | | 106,155 | | 7,837,424 | |
Macy's | | 38,370 | | 1,956,103 | |
Netflix | | 48,800 | b | 5,288,944 | |
Nordstrom | | 16,043 | | 1,046,164 | |
O'Reilly Automotive | | 11,535 | b | 3,186,659 | |
Priceline Group | | 5,817 | b | 8,459,314 | |
Ross Stores | | 48,189 | | 2,437,400 | |
Signet Jewelers | | 9,281 | | 1,400,874 | |
Staples | | 77,162 | | 1,002,334 | |
Target | | 72,039 | | 5,559,970 | |
The TJX Companies | | 78,177 | | 5,721,775 | |
Tiffany & Co. | | 13,053 | | 1,076,089 | |
Tractor Supply | | 15,588 | | 1,440,175 | |
TripAdvisor | | 12,968 | b | 1,086,459 | |
Urban Outfitters | | 12,196 | b | 348,806 | |
| | | | | 114,845,061 | |
Semiconductors & Semiconductor Equipment - 2.4% | | | | | |
Altera | | 35,489 | | 1,864,947 | |
Analog Devices | | 36,842 | | 2,214,941 | |
Applied Materials | | 139,330 | | 2,336,564 | |
17
STATEMENT OF INVESTMENTS (continued)
| | | | | | |
Common Stocks - 97.9% (continued) | | Shares | | Value ($) | |
Semiconductors & Semiconductor Equipment - 2.4% (continued) | | | | | |
Avago Technologies | | 29,986 | | 3,692,176 | |
Broadcom, Cl. A | | 64,725 | | 3,326,865 | |
First Solar | | 8,967 | b | 511,747 | |
Intel | | 546,439 | | 18,502,425 | |
KLA-Tencor | | 17,650 | | 1,184,668 | |
Lam Research | | 18,252 | a | 1,397,921 | |
Linear Technology | | 27,564 | | 1,224,393 | |
Microchip Technology | | 23,286 | a | 1,124,481 | |
Micron Technology | | 124,511 | b | 2,061,902 | |
NVIDIA | | 57,960 | | 1,644,325 | |
Qorvo | | 17,338 | b | 761,658 | |
Skyworks Solutions | | 21,998 | | 1,699,126 | |
Texas Instruments | | 117,658 | | 6,673,562 | |
Xilinx | | 29,917 | | 1,424,648 | |
| | | | | 51,646,349 | |
Software & Services - 11.7% | | | | | |
Accenture, Cl. A | | 72,086 | | 7,727,619 | |
Activision Blizzard | | 57,984 | | 2,015,524 | |
Adobe Systems | | 57,524 | b | 5,100,078 | |
Akamai Technologies | | 20,708 | b | 1,259,461 | |
Alliance Data Systems | | 7,049 | b | 2,095,738 | |
Alphabet, Cl. A | | 33,332 | b | 24,578,684 | |
Alphabet, Cl. C | | 34,008 | b | 24,173,227 | |
Autodesk | | 26,646 | b | 1,470,593 | |
Automatic Data Processing | | 53,866 | | 4,685,803 | |
CA | | 35,200 | | 975,392 | |
Citrix Systems | | 18,409 | b | 1,511,379 | |
Cognizant Technology Solutions, Cl. A | | 69,779 | b | 4,752,648 | |
Computer Sciences | | 16,208 | | 1,079,291 | |
eBay | | 127,271 | b | 3,550,861 | |
Electronic Arts | | 36,174 | b | 2,607,060 | |
Facebook, Cl. A | | 259,851 | b | 26,497,006 | |
Fidelity National Information Services | | 32,822 | | 2,393,380 | |
Fiserv | | 26,946 | b | 2,600,558 | |
International Business Machines | | 103,571 | | 14,508,226 | |
Intuit | | 32,004 | | 3,118,150 | |
MasterCard Cl. A | | 114,618 | | 11,346,036 | |
Microsoft | | 920,118 | | 48,435,012 | |
Oracle | | 373,691 | | 14,514,158 | |
18
| | | | | | |
Common Stocks - 97.9% (continued) | | Shares | | Value ($) | |
Software & Services - 11.7% (continued) | | | | | |
Paychex | | 36,499 | | 1,882,618 | |
PayPal Holdings | | 127,293 | | 4,583,821 | |
Red Hat | | 21,665 | b | 1,713,918 | |
salesforce.com | | 71,887 | b | 5,586,339 | |
Symantec | | 79,284 | | 1,633,250 | |
Teradata | | 16,677 | b | 468,790 | |
Total System Services | | 19,635 | | 1,029,856 | |
VeriSign | | 11,155 | a,b | 899,093 | |
Visa, Cl. A | | 224,285 | | 17,400,030 | |
Western Union | | 59,569 | | 1,146,703 | |
Xerox | | 116,659 | | 1,095,428 | |
Yahoo! | | 98,871 | b | 3,521,785 | |
| | | | | 251,957,515 | |
Technology Hardware & Equipment - 6.3% | | | | | |
Amphenol Cl. A | | 36,053 | | 1,954,794 | |
Apple | | 656,231 | | 78,419,604 | |
Cisco Systems | | 584,533 | | 16,863,777 | |
Corning | | 142,281 | | 2,646,427 | |
EMC | | 223,322 | | 5,855,503 | |
F5 Networks | | 7,971 | b | 878,404 | |
FLIR Systems | | 17,368 | | 463,205 | |
Harris | | 14,295 | | 1,131,163 | |
Hewlett-Packard | | 207,789 | | 5,601,991 | |
Juniper Networks | | 41,277 | | 1,295,685 | |
Motorola Solutions | | 18,417 | | 1,288,637 | |
NetApp | | 34,861 | | 1,185,274 | |
QUALCOMM | | 180,418 | | 10,720,438 | |
SanDisk | | 23,060 | | 1,775,620 | |
Seagate Technology | | 35,076 | a | 1,334,993 | |
TE Connectivity | | 45,934 | | 2,959,987 | |
Western Digital | | 26,636 | | 1,779,818 | |
| | | | | 136,155,320 | |
Telecommunication Services - 2.3% | | | | | |
AT&T | | 707,320 | | 23,702,293 | |
CenturyLink | | 63,863 | | 1,801,575 | |
Frontier Communications | | 133,798 | | 687,722 | |
Level 3 Communications | | 32,948 | b | 1,678,701 | |
Verizon Communications | | 467,469 | | 21,914,947 | |
| | | | | 49,785,238 | |
19
STATEMENT OF INVESTMENTS (continued)
| | | | | | |
Common Stocks - 97.9% (continued) | | Shares | | Value ($) | |
Transportation - 2.2% | | | | | |
American Airlines Group | | 77,986 | | 3,604,513 | |
C.H. Robinson Worldwide | | 16,471 | | 1,142,758 | |
CSX | | 114,733 | | 3,096,644 | |
Delta Air Lines | | 92,290 | | 4,692,024 | |
Expeditors International of Washington | | 22,241 | | 1,107,379 | |
FedEx | | 30,071 | | 4,692,580 | |
J.B. Hunt Transport Services | | 10,765 | | 822,123 | |
Kansas City Southern | | 12,984 | | 1,074,556 | |
Norfolk Southern | | 34,382 | | 2,751,591 | |
Ryder System | | 6,135 | | 440,370 | |
Southwest Airlines | | 76,522 | | 3,542,203 | |
Union Pacific | | 99,612 | | 8,900,332 | |
United Continential Holdings | | 44,216 | b | 2,666,667 | |
United Parcel Service, Cl. B | | 80,748 | | 8,318,659 | |
| | | | | 46,852,399 | |
Utilities - 2.9% | | | | | |
AES | | 75,191 | | 823,341 | |
AGL Resources | | 13,304 | | 831,500 | |
Ameren | | 27,371 | | 1,195,565 | |
American Electric Power | | 57,144 | | 3,237,208 | |
CenterPoint Energy | | 51,128 | | 948,424 | |
CMS Energy | | 31,421 | | 1,133,355 | |
Consolidated Edison | | 33,686 | | 2,214,855 | |
Dominion Resources | | 68,846 | | 4,917,670 | |
DTE Energy | | 20,362 | | 1,661,336 | |
Duke Energy | | 79,493 | | 5,681,365 | |
Edison International | | 37,128 | | 2,246,987 | |
Entergy | | 20,304 | | 1,383,921 | |
Eversource Energy | | 36,039 | | 1,835,827 | |
Exelon | | 99,458 | | 2,776,867 | |
FirstEnergy | | 49,591 | | 1,547,239 | |
NextEra Energy | | 53,263 | | 5,467,980 | |
NiSource | | 36,295 | | 695,412 | |
NRG Energy | | 40,292 | | 519,364 | |
Pepco Holdings | | 29,972 | | 798,154 | |
PG&E | | 55,532 | | 2,965,409 | |
Pinnacle West Capital | | 12,503 | | 794,066 | |
PPL | | 76,004 | | 2,614,538 | |
Public Service Enterprise Group | | 57,661 | | 2,380,823 | |
20
| | | | | | |
Common Stocks - 97.9% (continued) | | Shares | | Value ($) | |
Utilities - 2.9% (continued) | | | | | |
SCANA | | 16,490 | | 976,538 | |
Sempra Energy | | 26,729 | | 2,737,317 | |
Southern | | 104,194 | | 4,699,149 | |
TECO Energy | | 25,552 | | 689,904 | |
WEC Energy Group | | 35,882 | | 1,850,076 | |
Xcel Energy | | 57,714 | | 2,056,350 | |
| | | | | 61,680,540 | |
Total Common Stocks (cost $1,137,011,549) | | | | 2,109,781,454 | |
Short-Term Investments - .1% | | | | | |
U.S. Treasury Bills | | | | | |
0.02%, 3/17/16 | | 1,480,000 | d | 1,479,441 | |
0.03%, 2/25/16 | | 670,000 | d | 669,834 | |
(cost $2,149,791) | | | | 2,149,275 | |
Other Investments - 1.9% | | | | | |
Registered Investment Company; | | | | | |
Dreyfus Institutional Preferred Plus Money Market Fund | | 41,848,978 | e | 41,848,978 | |
(cost $41,848,978) | | | | | |
Investment of Cash Collateral for Securities Loaned - .3% | | | | | |
Registered Investment Company; | | | | | |
Dreyfus Institutional Cash Advantage Fund | | 5,459,735 | e | 5,459,735 | |
(cost $5,459,735) | | | | | |
Total Investments (cost $1,186,470,053) | | 100.2% | | 2,159,239,442 | |
Liabilities, Less Cash and Receivables | | (0.2%) | | (3,474,948) | |
Net Assets | | 100.0% | | 2,155,764,494 | |
a Security, or portion thereof, on loan. At October 31, 2015, the value of the fund's securities on loan was $36,705,004 and the value of the collateral held by the fund was $37,377,164 consisting of cash collateral of $5,459,735 and U.S. Government & Agency securities valued at $31,917,429.
b Non-income producing security.
c Investment in real estate investment trust.
d Held by a broker in a segregated account as collateral for open financial futures positions.
e Investment in affiliated money market mutual fund.
21
STATEMENT OF INVESTMENTS (continued)
| | |
Portfolio Summary (Unaudited) † | Value (%) |
Software & Services | 11.7 |
Pharmaceuticals, Biotechnology & Life Sciences | 9.5 |
Capital Goods | 7.1 |
Energy | 7.0 |
Technology Hardware & Equipment | 6.3 |
Banks | 5.8 |
Food, Beverage & Tobacco | 5.4 |
Retailing | 5.3 |
Diversified Financials | 4.8 |
Health Care Equipment & Services | 4.7 |
Media | 3.2 |
Materials | 2.9 |
Utilities | 2.9 |
Insurance | 2.7 |
Real Estate | 2.6 |
Semiconductors & Semiconductor Equipment | 2.4 |
Short-Term/Money Markets Investments | 2.3 |
Telecommunication Services | 2.3 |
Food & Staples Retailing | 2.2 |
Transportation | 2.2 |
Consumer Services | 1.9 |
Household & Personal Products | 1.8 |
Consumer Durables & Apparel | 1.5 |
Automobiles & Components | 1.0 |
Commercial & Professional Services | .7 |
| | 100.2 |
†Based on net assets.
See notes to financial statements.
22
STATEMENT OF FINANCIAL FUTURES
October 31, 2015
| | | | | | |
| | Contracts | Market Value Covered by Contracts ($) | Expiration | Unrealized Appreciation at 10/31/2015 ($) | |
| | | | | | |
Financial Futures Long | | | | | |
Standard & Poor's 500 E-mini | 447 | 46,347,195 | December 2015 | 2,604,497 | |
Gross Unrealized Appreciation | | | | 2,604,497 | |
See notes to financial statements.
23
STATEMENT OF ASSETS AND LIABILITIES
October 31, 2015
| | | | | | | | | |
| | | | | | |
| | | Cost | | Value | |
Assets ($): | | | | |
Investments in securities—See Statement of Investments
(including securities on loan, valued at $36,705,004)—Note 1(b): | | | | |
Unaffiliated issuers | | 1,139,161,340 | | 2,111,930,729 | |
Affiliated issuers | | 47,308,713 | | 47,308,713 | |
Cash | | | | | 787,069 | |
Dividends and securities lending income receivable | | | | | 2,440,636 | |
Receivable for investment securities sold | | | | | 425,064 | |
Receivable for shares of Common Stock subscribed | | | | | 280,500 | |
Other receivable | | | | | 22,002 | |
| | | | | 2,163,194,713 | |
Liabilities ($): | | | | |
Due to The Dreyfus Corporation and affiliates—Note 3(b) | | | | | 344,075 | |
Liability for securities on loan—Note 1(b) | | | | | 5,459,735 | |
Payable for shares of Common Stock redeemed | | | | | 1,414,546 | |
Payable for futures variation margin—Note 4 | | | | | 206,051 | |
Interest payable—Note 2 | | | | | 2,512 | |
Accrued expenses | | | | | 3,300 | |
| | | | | 7,430,219 | |
Net Assets ($) | | | 2,155,764,494 | |
Composition of Net Assets ($): | | | | |
Paid-in capital | | | | | 1,182,192,126 | |
Accumulated undistributed investment income—net | | | | | 12,451,777 | |
Accumulated net realized gain (loss) on investments | | | | | (14,253,295) | |
Accumulated net unrealized appreciation (depreciation)
on investments (including $2,604,497 net unrealized
appreciation on financial futures) | | | | | 975,373,886 | |
Net Assets ($) | | | 2,155,764,494 | |
Shares Outstanding | | |
(150 million shares of $.001 par value Common Stock authorized) | | 50,285,399 | |
Net Asset Value Per Share ($) | | 42.87 | |
See notes to financial statements.
24
STATEMENT OF OPERATIONS
Year Ended October 31, 2015
| | | | | | | |
| | | | | | |
| | | | | | |
Investment Income ($): | | | | |
Income: | | | | |
Interest | | | 637 | |
Cash dividends (net of $4,723 foreign taxes withheld at source): | | | | |
Unaffiliated issuers | | | 45,908,874 | |
Affiliated issuers | | | 32,002 | |
Income from securities lending—Note 1(b) | | | 120,971 | |
Total Income | | | 46,062,484 | |
Expenses: | | | | |
Management fee—Note 3(a) | | | 4,427,103 | |
Directors’ fees—Note 3(a,c) | | | 145,964 | |
Loan commitment fees—Note 2 | | | 23,021 | |
Interest expense—Note 2 | | | 3,213 | |
Total Expenses | | | 4,599,301 | |
Less—Directors’ fees reimbursed by Dreyfus—Note 3(a) | | | (145,964) | |
Net Expenses | | | 4,453,337 | |
Investment Income—Net | | | 41,609,147 | |
Realized and Unrealized Gain (Loss) on Investments—Note 4 ($): | | |
Net realized gain (loss) on investments | 9,305,277 | |
Net realized gain (loss) on financial futures | | | 2,138,413 | |
Net Realized Gain (Loss) | | | 11,443,690 | |
Net unrealized appreciation (depreciation) on investments | | | 52,543,349 | |
Net unrealized appreciation (depreciation) on financial futures | | | 1,096,023 | |
Net Unrealized Appreciation (Depreciation) | | | 53,639,372 | |
Net Realized and Unrealized Gain (Loss) on Investments | | | 65,083,062 | |
Net Increase in Net Assets Resulting from Operations | | 106,692,209 | |
See notes to financial statements.
25
STATEMENT OF CHANGES IN NET ASSETS
| | | | | | | | | | |
| | | | | | | | | | |
| | | | Year Ended October 31, |
| | | | 2015 | | | | 2014 | |
Operations ($): | | | | | | | | |
Investment income—net | | | 41,609,147 | | | | 36,598,588 | |
Net realized gain (loss) on investments | | 11,443,690 | | | | (2,486,317) | |
Net unrealized appreciation (depreciation)
on investments | | 53,639,372 | | | | 284,231,556 | |
Net Increase (Decrease) in Net Assets
Resulting from Operations | 106,692,209 | | | | 318,343,827 | |
Dividends to Shareholders from ($): | | | | | | | | |
Investment income—net | | | (40,112,534) | | | | (35,006,286) | |
Net realized gain on investments | | | - | | | | (1,397,376) | |
Total Dividends | | | (40,112,534) | | | | (36,403,662) | |
Capital Stock Transactions ($): | | | | | | | | |
Net proceeds from shares sold | | | 428,627,232 | | | | 453,083,463 | |
Dividends reinvested | | | 30,056,590 | | | | 28,442,126 | |
Cost of shares redeemed | | | (543,341,892) | | | | (458,453,852) | |
Increase (Decrease) in Net Assets
from Capital Stock Transactions | (84,658,070) | | | | 23,071,737 | |
Total Increase (Decrease) in Net Assets | (18,078,395) | | | | 305,011,902 | |
Net Assets ($): | | | | | | | | |
Beginning of Period | | | 2,173,842,889 | | | | 1,868,830,987 | |
End of Period | | | 2,155,764,494 | | | | 2,173,842,889 | |
Undistributed investment income—net | 12,451,777 | | | | 11,340,729 | |
Capital Share Transactions (Shares): | | | | | | | | |
Shares sold | | | 10,174,081 | | | | 11,780,839 | |
Shares issued for dividends reinvested | | | 705,358 | | | | 747,402 | |
Shares redeemed | | | (12,894,112) | | | | (11,890,511) | |
Net Increase (Decrease) in Shares Outstanding | (2,014,673) | | | | 637,730 | |
See notes to financial statements.
26
FINANCIAL HIGHLIGHTS
The following table describes the performance for the fiscal periods indicated. Total return shows how much your investment in the fund would have increased (or decreased) during each period, assuming you had reinvested all dividends and distributions. These figures have been derived from the fund’s financial statements.
| | | | | | | | |
| | | | | |
| | Year Ended October 31, |
| | | 2015 | 2014 | 2013 | 2012 | 2011 |
Per Share Data ($): | | | | | | |
Net asset value, beginning of period | 41.56 | 36.17 | 29.06 | 25.75 | 24.29 |
Investment Operations: | | | | | | |
Investment income—neta | .80 | .70 | .65 | .55 | .48 |
Net realized and unrealized gain (loss) on investments | 1.28 | 5.39 | 7.08 | 3.27 | 1.45 |
Total from Investment Operations | 2.08 | 6.09 | 7.73 | 3.82 | 1.93 |
Distributions: | | | | | | |
Dividends from investment income—net | | (.77) | (.67) | (.62) | (.51) | (.47) |
Dividends from net realized gain on investments | - | (.03) | - | - | - |
Total Distributions | (.77) | (.70) | (.62) | (.51) | (.47) |
Net asset value, end of period | 42.87 | 41.56 | 36.17 | 29.06 | 25.75 |
Total Return (%) | 5.02 | 17.03 | 26.96 | 15.00 | 7.94 |
Ratios/Supplemental Data (%): | | | | | |
Ratio of total expenses to average net assets | .21 | .21 | .21 | .21 | .21 |
Ratio of net expenses to average net assets | | .20 | .20 | .20 | .20 | .20 |
Ratio of net investment income to average net assets | 1.88 | 1.81 | 2.01 | 1.97 | 1.84 |
Portfolio Turnover Rate | 8.71 | 5.41 | 3.45 | 3.28 | 2.12 |
Net Assets, end of period ($ x 1,000) | 2,155,764 | 2,173,843 | 1,868,831 | 1,369,234 | 1,115,441 |
a Based on average shares outstanding.
See notes to financial statements.
27
NOTES TO FINANCIAL STATEMENTS
NOTE 1—Significant Accounting Policies:
Dreyfus BASIC S&P 500 Stock Index Fund (the “fund”) is a separate diversified series of The Dreyfus/Laurel Funds, Inc. (the “Company”), which is registered under the Investment Company Act of 1940, as amended (the “Act”), as an open-end management investment company and operates as a series company currently offering ten series, including the fund. The fund’s investment objective is to seek to match the total return of the Standard & Poor’s 500® Composite Stock Price Index. The Dreyfus Corporation (the “Manager” or “Dreyfus”), a wholly-owned subsidiary of The Bank of New York Mellon Corporation (“BNY Mellon”), serves as the fund’s investment adviser. MBSC Securities Corporation (the “Distributor”), a wholly-owned subsidiary of Dreyfus, is the distributor of the fund’s shares, which are sold to the public without a sales charge.
The Company accounts separately for the assets, liabilities and operations of each series. Expenses directly attributable to each series are charged to that series’ operations; expenses which are applicable to all series are allocated among them on a pro rata basis.
The Financial Accounting Standards Board (“FASB”) Accounting Standards Codification (“ASC”) is the exclusive reference of authoritative U.S. generally accepted accounting principles (“GAAP”) recognized by the FASB to be applied by nongovernmental entities. Rules and interpretive releases of the Securities and Exchange Commission (“SEC”) under authority of federal laws are also sources of authoritative GAAP for SEC registrants. The fund’s financial statements are prepared in accordance with GAAP, which may require the use of management estimates and assumptions. Actual results could differ from those estimates.
(a) Portfolio valuation: The fair value of a financial instrument is the amount that would be received to sell an asset or paid to transfer a liability in an orderly transaction between market participants at the measurement date (i.e., the exit price). GAAP establishes a fair value hierarchy that prioritizes the inputs of valuation techniques used to measure fair value. This hierarchy gives the highest priority to unadjusted quoted prices in active markets for identical assets or liabilities (Level 1 measurements) and the lowest priority to unobservable inputs (Level 3 measurements).
Additionally, GAAP provides guidance on determining whether the volume and activity in a market has decreased significantly and whether such a decrease in activity results in transactions that are not orderly.
28
GAAP requires enhanced disclosures around valuation inputs and techniques used during annual and interim periods.
Various inputs are used in determining the value of the fund’s investments relating to fair value measurements. These inputs are summarized in the three broad levels listed below:
Level 1—unadjusted quoted prices in active markets for identical investments.
Level 2—other significant observable inputs (including quoted prices for similar investments, interest rates, prepayment speeds, credit risk, etc.).
Level 3—significant unobservable inputs (including the fund’s own assumptions in determining the fair value of investments).
The inputs or methodology used for valuing securities are not necessarily an indication of the risk associated with investing in those securities.
Changes in valuation techniques may result in transfers in or out of an assigned level within the disclosure hierarchy. Valuation techniques used to value the fund’s investments are as follows:
Investments in securities are valued at the last sales price on the securities exchange or national securities market on which such securities are primarily traded. Securities listed on the National Market System for which market quotations are available are valued at the official closing price or, if there is no official closing price that day, at the last sales price. For open short positions, asked prices are used for valuation purposes. Bid price is used when no asked price is available. Registered investment companies that are not traded on an exchange are valued at their net asset value. All of the preceding securities are generally categorized within Level 1 of the fair value hierarchy.
Securities not listed on an exchange or the national securities market, or securities for which there were no transactions, are valued at the average of the most recent bid and asked prices. U.S. Treasury Bills are valued at the mean price between quoted bid prices and asked prices by an independent pricing service (the “Service”) approved by the Company’s Board of Directors (the “Board”). These securities are generally categorized within Level 2 of the fair value hierarchy.
The Service’s procedures are reviewed by Dreyfus under the general supervision of the Board.
Fair valuing of securities may be determined with the assistance of a pricing service using calculations based on indices of domestic securities
29
NOTES TO FINANCIAL STATEMENTS (continued)
and other appropriate indicators, such as prices of relevant American Depository Receipts and financial futures. Utilizing these techniques may result in transfers between Level 1 and Level 2 of the fair value hierarchy.
When market quotations or official closing prices are not readily available, or are determined not to reflect accurately fair value, such as when the value of a security has been significantly affected by events after the close of the exchange or market on which the security is principally traded (for example, a foreign exchange or market), but before the fund calculates its net asset value, the fund may value these investments at fair value as determined in accordance with the procedures approved by the Board. Certain factors may be considered when fair valuing investments such as: fundamental analytical data, the nature and duration of restrictions on disposition, an evaluation of the forces that influence the market in which the securities are purchased and sold, and public trading in similar securities of the issuer or comparable issuers. These securities are either categorized within Level 2 or 3 of the fair value hierarchy depending on the relevant inputs used.
For restricted securities where observable inputs are limited, assumptions about market activity and risk are used and are generally categorized within Level 3 of the fair value hierarchy.
Financial futures, which are traded on an exchange, are valued at the last sales price on the securities exchange on which such securities are primarily traded or at the last sales price on the national securities market on each business day and are generally categorized within Level 1 of the fair value hierarchy.
The following is a summary of the inputs used as of October 31, 2015 in valuing the fund’s investments:
30
| | | | | |
| | Level 1 - Unadjusted
Quoted Prices | Level 2 - Other
Significant Observable Inputs | Level 3 -Significant
Unobservable Inputs | Total |
Assets ($) | | | | |
Investments in Securities: | | |
Equity Securities—Domestic Common Stocks† | 2,103,381,221 | - | - | 2,103,381,221 |
Equity Securities—Foreign Common Stocks† | 6,400,233 | - | - | 6,400,233 |
Mutual Funds | 47,308,713 | - | - | 47,308,713 |
U.S. Treasury | - | 2,149,275 | - | 2,149,275 |
Other Financial Instruments: | | | | |
Financial Futures†† | 2,604,497 | - | - | 2,604,497 |
† See Statement of Investments for additional detailed categorizations.
†† Amount shown represents unrealized appreciation at period end.
At October 31, 2015, there were no transfers between Level 1, Level 2 and Level 3 of the fair value hierarchy.
(b) Securities transactions and investment income: Securities transactions are recorded on a trade date basis. Realized gains and losses from securities transactions are recorded on the identified cost basis. Dividend income is recognized on the ex-dividend date and interest income, including, where applicable, accretion of discount and amortization of premium on investments, is recognized on the accrual basis.
Pursuant to a securities lending agreement with The Bank of New York Mellon, a subsidiary of BNY Mellon and an affiliate of Dreyfus, the fund may lend securities to qualified institutions. It is the fund’s policy that, at origination, all loans are secured by collateral of at least 102% of the value of U.S. securities loaned and 105% of the value of foreign securities loaned. Collateral equivalent to at least 100% of the market value of securities on loan is maintained at all times. Collateral is either in the form of cash, which can be invested in certain money market mutual funds managed by Dreyfus, or U.S. Government and Agency securities. The fund is entitled to receive all dividends, interest and distributions on securities loaned, in addition to income earned as a result of the lending transaction. Should a borrower fail to return the securities in a timely manner, The Bank of New York Mellon is required to replace the securities for the benefit of the fund or credit the fund with the market value of the unreturned securities and is subrogated to the fund’s rights against the
31
NOTES TO FINANCIAL STATEMENTS (continued)
borrower and the collateral. During the period ended October 31, 2015, The Bank of New York Mellon earned $29,278 from lending portfolio securities, pursuant to the securities lending agreement.
(c) Affiliated issuers: Investments in other investment companies advised by Dreyfus are defined as “affiliated” under the Act. Investments in affiliated investment companies during the period ended October 31, 2015 were as follows:
| | | | | | |
Affiliated Investment Company | Value 10/31/2014 ($) | Purchases ($) | Sales ($) | Value 10/31/2015 ($) | Net Assets (%) |
Dreyfus Institutional Preferred Plus Money Market Fund | 73,331,726 | 317,905,450 | 349,388,198 | 41,848,978 | 1.9 |
Dreyfus Institutional Cash Advantage Fund | 11,208,670 | 89,227,942 | 94,976,877 | 5,459,735 | .3 |
Total | 84,540,396 | 407,133,392 | 444,365,075 | 47,308,713 | 2.2 |
(d) Dividends to shareholders: Dividends are recorded on the ex-dividend date. Dividends from investment income-net are normally declared and paid quarterly. Dividends from net realized capital gains, if any, are normally declared and paid annually, but the fund may make distributions on a more frequent basis to comply with the distribution requirements of the Internal Revenue Code of 1986, as amended (the “Code”). To the extent that net realized capital gains can be offset by capital loss carryovers, it is the policy of the fund not to distribute such gains. Income and capital gain distributions are determined in accordance with income tax regulations, which may differ from GAAP.
(e) Federal income taxes: It is the policy of the fund to continue to qualify as a regulated investment company, if such qualification is in the best interests of its shareholders, by complying with the applicable provisions of the Code, and to make distributions of taxable income sufficient to relieve it from substantially all federal income and excise taxes.
As of and during the period ended October 31, 2015, the fund did not have any liabilities for any uncertain tax positions. The fund recognizes interest and penalties, if any, related to uncertain tax positions as income tax expense in the Statement of Operations. During the period ended October 31, 2015, the fund did not incur any interest or penalties.
32
Each tax year in the four-year period ended October 31, 2015 remains subject to examination by the Internal Revenue Service and state taxing authorities.
At October 31, 2015, the components of accumulated earnings on a tax basis were as follows: undistributed ordinary income $14,279,018, undistributed capital gains $12,098,171 and unrealized appreciation $947,195,179.
The tax character of distributions paid to shareholders during the fiscal periods ended October 31, 2015 and October 31, 2014 were as follows: ordinary income $40,112,534 and $35,009,329, and long-term capital gains $0 and $1,394,333, respectively.
During the period ended October 31, 2015, as a result of permanent book to tax differences, primarily due to the tax treatment for real estate investment trusts, the fund decreased accumulated undistributed investment income-net by $385,565 and increased accumulated net realized gain (loss) on investments by the same amount. Net assets and net asset value per share were not affected by this reclassification.
NOTE 2—Bank Lines of Credit:
The fund participates with other Dreyfus-managed funds in a $480 million unsecured credit facility led by Citibank, N.A. and a $300 million unsecured credit facility provided by The Bank of New York Mellon (each, a “Facility”), each to be utilized primarily for temporary or emergency purposes, including the financing of redemptions. Prior to October 7, 2015, the unsecured credit facility with Citibank, N.A. was $430 million. In connection therewith, the fund has agreed to pay its pro rata portion of commitment fees for each Facility. Interest is charged to the fund based on rates determined pursuant to the terms of the respective Facility at the time of borrowing.
The average amount of borrowings outstanding under the Facilities during the period ended October 31, 2015 was approximately $284,700 with a related weighted average annualized interest rate of 1.13%.
NOTE 3—Investment Management Fee and Other Transactions with Affiliates:
(a) Pursuant to an investment management agreement with Dreyfus, Dreyfus provides or arranges for one or more third parties and/or affiliates to provide investment advisory, administrative, custody, fund accounting and transfer agency services to the fund. Dreyfus also directs the investments of the fund in accordance with its investment objective, policies and limitations. For these services, the fund is contractually
33
NOTES TO FINANCIAL STATEMENTS (continued)
obligated to pay Dreyfus a fee, calculated daily and paid monthly, at an annual rate of .20% of the value of the fund’s average daily net assets. Out of its fee, Dreyfus pays all of the expenses of the fund except brokerage fees, taxes, interest expenses, commitment fees on borrowings, fees and expenses of non-interested Directors (including counsel fees) and extraordinary expenses. In addition, Dreyfus is required to reduce its fee in an amount equal to the fund’s allocable portion of fees and expenses of the non-interested Directors (including counsel fees). During the period ended October 31, 2015, fees reimbursed by Dreyfus amounted to $145,964.
(b) The components of “Due to The Dreyfus Corporation and affiliates” in the Statement of Assets and Liabilities consist of: management fees $355,257, which are offset against an expense reimbursement currently in effect in the amount of $11,182.
(c) Each Board member also serves as a Board member of other funds within the Dreyfus complex. Annual retainer fees and attendance fees are allocated to each fund based on net assets.
NOTE 4—Securities Transactions:
The aggregate amount of purchases and sales of investment securities, excluding short-term securities and financial futures, during the period ended October 31, 2015, amounted to $188,568,916 and $230,841,565, respectively.
Derivatives: A derivative is a financial instrument whose performance is derived from the performance of another asset. Each type of derivative instrument that was held by the fund during the period ended October 31, 2015 is discussed below.
Financial Futures: In the normal course of pursuing its investment objective, the fund is exposed to market risk, including equity price risk as a result of changes in value of underlying financial instruments. The fund invests in financial futures in order to manage its exposure to or protect against changes in the market. A financial futures contract represents a commitment for the future purchase or a sale of an asset at a specified date. Upon entering into such contracts, these investments require initial margin deposits with a counterparty, which consist of cash or cash equivalents. The amount of these deposits is determined by the exchange or Board of Trade on which the contract is traded and is subject to change. Accordingly, variation margin payments are received or made to reflect daily unrealized gains or losses which are recorded in the Statement of Operations. When the contracts are closed, the fund recognizes a realized gain or loss which is reflected in the Statement of Operations. There is minimal counterparty credit risk to the fund with financial futures since
34
they are exchange traded, and the exchange guarantees the financial futures against default. Financial futures open at October 31, 2015 are set forth in the Statement of Financial Futures.
The following summarizes the average market value of derivatives outstanding during the period ended October 31, 2015:
| | | | | |
| | | | | Average Market Value ($) |
Equity financial futures | | | | 37,511,039 |
At October 31, 2015, the cost of investments for federal income tax purposes was $1,212,044,263; accordingly, accumulated net unrealized appreciation on investments was $947,195,179, consisting of $1,006,532,726 gross unrealized appreciation and $59,337,547 gross unrealized depreciation.
NOTE 5—Pending Legal Matters:
The fund and many other entities have been named as defendants in numerous pending litigations as a result of their participation in the leveraged buyout transaction (“LBO”) of the Tribune Company (“Tribune”). The cases allege that Tribune took on billions of dollars of debt in the LBO to purchase its own stock from shareholders at $34 per share. The LBO was closed in a two-step transaction with shares being repurchased by Tribune in a tender offer in June 2007 and in a go private merger in December 2007. In 2008, approximately one year after the LBO was concluded, Tribune filed for bankruptcy protection under Chapter 11. Thereafter, in approximately June 2011, certain Tribune creditors filed dozens of complaints in various courts throughout the country alleging that the payments made to shareholders in the LBO were “fraudulent conveyances” under state and/or federal law, and that the shareholders must return the payments they received for their shares to satisfy the plaintiffs’ unpaid claims. These cases have been consolidated for coordinated pre-trial proceedings in a multi-district litigation in the United States District Court for the Southern District of New York titled In re Tribune Company Fraudulent Conveyance Litigation (S.D.N.Y. Nos. 11-md-2296 and 12-mc-2296 (RJS) (“Tribune MDL”)). On March 27, 2013, the Tribune MDL was reassigned from Judge William H. Pauley to Judge Richard J. Sullivan. No explanation was given for the reassignment.
In addition, there was a case pending in United States Bankruptcy Court for the District of Delaware brought by the Unsecured Creditors Committee of the Tribune Company that has since been transferred to the Tribune MDL (formerly The Official Committee of Unsecured Creditors of Tribune Co. v. FitzSimons, et al., Bankr. D. Del. Adv. Pro. No. 10-54010 (KJC))
35
NOTES TO FINANCIAL STATEMENTS (continued)
(“FitzSimons case”). The case was originally filed on November 1, 2010. In a Fourth Amended Complaint filed in November 2012, among other claims, the Creditors Committee sought recovery under the Bankruptcy Code for alleged “fraudulent conveyances” from more than 5,000 Tribune shareholders (“Shareholder Defendants”), including the fund, and a defendants’ class of all shareholders who tendered their Tribune stock in the LBO and received cash in exchange. There were 35 other counts in the Fourth Amended Complaint that did not relate to claims against Shareholder Defendants, but instead were brought against parties directly involved in approval or execution of the leveraged buyout. On January 10, 2013, pursuant to the Tribune bankruptcy plan, Mark S. Kirchner, as Litigation Trustee for the Tribune Litigation Trust, became the successor plaintiff to the Creditors Committee in this case. The case is now proceeding as: Mark S. Kirchner, as Litigation Trustee for the Tribune Litigation Trust v. FitzSimons, et al., S.D.N.Y. No. 12-cv-2652 (RJS). On August 1, 2013, the plaintiff filed a Fifth Amended Complaint with the Court. The Fifth Amended Complaint contains more detailed allegations regarding the steps Tribune took in consideration and execution of the LBO, but does not change the legal basis for the claim previously alleged against the Shareholder Defendants.
On November 6, 2012, a motion to dismiss was filed in the Tribune MDL. Oral argument on the motion to dismiss was held on May 23, 2013. On September 23, 2013 Judge Sullivan granted the motion to dismiss on standing grounds, after rejecting defendants’ preemption arguments. By granting the motion, Judge Sullivan dismissed nearly 50 cases in the Tribune MDL. The fund was a defendant in at least one of the dismissed cases. The motion had no effect on the FitzSimons case, which had been stayed.
On September 30, 2013, plaintiffs appealed the motion to dismiss decision to the U.S. Court of Appeals for the Second Circuit. On October 28, 2013, certain defendants cross-appealed from Judge Sullivan’s decision, seeking review of the arguments that Judge Sullivan rejected in his decision. Briefing on the appeal and cross appeal was completed in April 2014. Oral argument before the Second Circuit took place on November 5, 2014.
On November 11, 2013, Judge Sullivan entered Master Case Order No. 4 in the Tribune MDL. Master Case Order No. 4 addressed numerous procedural and administrative tasks for the cases that remain in the Tribune MDL, including the FitzSimons case. Pursuant to Master Case Order No. 4, the parties – through their executive committees and liaison counsel – attempted to negotiate a protocol for motions to dismiss and other procedural issues, and submitted rival proposals to the Court. On
36
April 24, 2014 the Court entered an order setting a schedule for the first motions to dismiss in the FitzSimons case. Pursuant to that schedule, a “global” motion to dismiss the fraudulent transfer claim asserted against the Shareholder Defendants, which applies equally to all Shareholder Defendants including the fund, was filed on May 23, 2014. Plaintiffs’ response brief was filed on June 23, 2014, and the reply brief was filed on July 3, 2014. No date for oral argument has been scheduled. The Court also preserved Shareholder Defendants’ rights to file nineteen motions to dismiss enumerated in their proposal and motions pursuant to Rules 12(b)(2)-(5) of the Federal Rules of Civil Procedure. If these various motions are necessary after the Court decides the global motion to dismiss, the Court will set further guidelines and briefing schedules.
At this stage in the proceedings, it is not possible to assess with any reasonable certainty the probable outcomes of the pending litigations. Consequently, at this time, management is unable to estimate the possible loss that may result.
37
REPORT OF INDEPENDENT REGISTERED
PUBLIC ACCOUNTING FIRM
The Board of Directors and Shareholders of
The Dreyfus/Laurel Funds, Inc.
We have audited the accompanying statement of assets and liabilities of Dreyfus BASIC S&P 500 Stock Index Fund (the “Fund”), a series of The Dreyfus/Laurel Funds, Inc., including the statements of investments and financial futures, as of October 31, 2015, the related statement of operations for the year then ended, the statements of changes in net assets for each of the years in the two-year period then ended, and the financial highlights for each of the years in the five-year period then ended. These financial statements and financial highlights are the responsibility of the Fund’s management. Our responsibility is to express an opinion on these financial statements and financial highlights based on our audits.
We conducted our audits in accordance with the standards of the Public Company Accounting Oversight Board (United States). Those standards require that we plan and perform the audit to obtain reasonable assurance about whether the financial statements and financial highlights are free of material misstatement. An audit includes examining, on a test basis, evidence supporting the amounts and disclosures in the financial statements. Our procedures included confirmation of securities owned as of October 31, 2015, by correspondence with the custodian and brokers or by other appropriate auditing procedures. An audit also includes assessing the accounting principles used and significant estimates made by management, as well as evaluating the overall financial statement presentation. We believe that our audits provide a reasonable basis for our opinion.
In our opinion, the financial statements and financial highlights referred to above present fairly, in all material respects, the financial position of Dreyfus BASIC S&P 500 Stock Index Fund as of October 31, 2015, the results of its operations for the year then ended, the changes in its net assets for each of the years in the two-year period then ended, and the financial highlights for each of the years in the five-year period then ended, in conformity with U.S. generally accepted accounting principles.

New York, New York
December 30, 2015
38
IMPORTANT TAX INFORMATION (Unaudited)
For federal tax purposes, the fund reports the maximum amount allowable, but not less than $40,112,534 as ordinary income dividends paid during the year ended October 31, 2015 as qualified dividend income in accordance with Section 854(b)(1)(B) of the Internal Revenue Code. Also, the fund reports the maximum amount allowable but not less than 100% of ordinary income dividends paid during the year ended October 31, 2015 as eligible for the corporate dividends received deduction provided under Section 243 of the Internal Revenue Code in accordance with Section 854(b)(1)(A) of the Internal Revenue Code. Shareholders will receive notification in early 2016 of the percentage applicable to the preparation of their 2015 income tax returns.
39
BOARD MEMBERS INFORMATION (Unaudited)
INDEPENDENT BOARD MEMBERS
Joseph S. DiMartino (72)
Chairman of the Board (1999)
Principal Occupation During Past 5 Years:
· Corporate Director and Trustee (1995-present)
Other Public Company Board Memberships During Past 5 Years:
· CBIZ (formerly, Century Business Services, Inc.), a provider of outsourcing functions for small and medium size companies, Director (1997-present)
· The Newark Group, a provider of a national market of paper recovery facilities, paperboard mills and paperboard converting plants, Director (2000-2010)
No. of Portfolios for which Board Member Serves: 140
———————
Francine J. Bovich (64)
Board Member (2012)
Principal Occupation During Past 5 Years:
· Trustee, The Bradley Trusts, private trust funds (2011-present)
· Managing Director, Morgan Stanley Investment Management (1993-2010)
Other Public Company Board Memberships During Past 5 Years:
· Annaly Capital Management, Inc., Board Member (May 2014-present)
No. of Portfolios for which Board Member Serves: 79
———————
Kenneth A. Himmel (69)
Board Member (1994)
Principal Occupation During Past 5 Years:
· Managing Partner, Gulf Related, an international real estate development company (2010-present)
· President and CEO, Related Urban Development, a real estate development company (1996-present)
· President and CEO, Himmel & Company, a real estate development company (1980-present)
· CEO, American Food Management, a restaurant company (1983-present)
No. of Portfolios for which Board Member Serves: 29
———————
40
Stephen J. Lockwood (68)
Board Member (1994)
Principal Occupation During Past 5 Years:
· Chairman of the Board, Stephen J. Lockwood and Company LLC, a real estate investment company (2000-present)
No. of Portfolios for which Board Member Serves: 29
———————
Roslyn M. Watson (66)
Board Member (1994)
Principal Occupation During Past 5 Years:
· Principal, Watson Ventures, Inc., a real estate investment company (1993-present)
No. of Portfolios for which Board Member Serves: 65
———————
Benaree Pratt Wiley (69)
Board Member (1998)
Principal Occupation During Past 5 Years:
· Principal, The Wiley Group, a firm specializing in strategy and business development (2005-present)
Other Public Company Board Memberships During Past 5 Years:
· CBIZ (formerly, Century Business Services, Inc.), a provider of outsourcing functions for small and medium size companies, Director (2008-present)
No. of Portfolios for which Board Member Serves: 65
———————
Once elected all Board Members serve for an indefinite term, but achieve Emeritus status upon reaching age 80. The address of the Board Members and Officers is c/o The Dreyfus Corporation, 200 Park Avenue, New York, New York 10166. Additional information about the Board Members is available in the fund’s Statement of Additional Information which can be obtained from Dreyfus free of charge by calling this toll free number: 1-800-DREYFUS.
James M. Fitzgibbons, Emeritus Board Member
J. Tomlinson Fort, Emeritus Board Member
41
OFFICERS OF THE FUND (Unaudited)
BRADLEY J. SKAPYAK, President since January 2010.
Chief Operating Officer and a director of the Manager since June 2009, Chairman of Dreyfus Transfer, Inc., an affiliate of the Manager and the transfer agent of the funds, since May 2011 and Executive Vice President of the Distributor since June 2007. From April 2003 to June 2009, Mr. Skapyak was the head of the Investment Accounting and Support Department of the Manager. He is an officer of 66 investment companies (comprised of 140 portfolios) managed by the Manager. He is 56 years old and has been an employee of the Manager since February 1988.
BENNETT A. MACDOUGALL, Chief Legal Officer since October 2015
Chief Legal Officer of the Manager since June 2015; from June 2005 to June 2015, Director and Associate General Counsel of Deutsche Bank – Asset & Wealth Management Division, and Chief Legal Officer of Deutsche Investment Management Americas Inc. He is an officer of 67 investment companies (comprised of 165 portfolios) managed by the Manager. He is 44 years old and has been an employee of the Manager since June 2015.
JANETTE E. FARRAGHER, Vice President and Secretary since December 2011.
Assistant General Counsel of BNY Mellon, and an officer of 67 investment companies (comprised of 165 portfolios) managed by the Manager. She is 52 years old and has been an employee of the Manager since February 1984.
JAMES BITETTO, Vice President and Assistant Secretary since August 2005.
Managing Counsel of BNY Mellon and Secretary of the Manager, and an officer of 67 investment companies (comprised of 165 portfolios) managed by the Manager. He is 49 years old and has been an employee of the Manager since December 1996.
JONI LACKS CHARATAN, Vice President and Assistant Secretary since August 2005.
Managing Counsel of BNY Mellon, and an officer of 67 investment companies (comprised of 165 portfolios) managed by the Manager. She is 59 years old and has been an employee of the Manager since October 1988.
JOSEPH M. CHIOFFI, Vice President and Assistant Secretary since August 2005.
Managing Counsel of BNY Mellon, and an officer of 67 investment companies (comprised of 165 portfolios) managed by the Manager. He is 53 years old and has been an employee of the Manager since June 2000.
JOHN B. HAMMALIAN, Vice President and Assistant Secretary since August 2005.
Senior Managing Counsel of BNY Mellon, and an officer of 67 investment companies (comprised of 165 portfolios) managed by the Manager. He is 52 years old and has been an employee of the Manager since February 1991.
MAUREEN E. KANE, Vice President and Assistant Secretary since April 2015.
Managing Counsel of BNY Mellon since July 2014; from October 2004 until July 2014, General Counsel, and from May 2009 until July 2014, Chief Compliance Officer of Century Capital Management. She is an officer of 67 investment companies (comprised of 165 portfolios) managed by the Manager. She is 53 years old and has been an employee of the Manager since July 2014.
SARAH S. KELLEHER, Vice President and Assistant Secretary since April 2014.
Senior Counsel of BNY Mellon, and an officer of 67 investment companies (comprised of 165 portfolios) managed by the Manager; from August 2005 to March 2013, Associate General Counsel of Third Avenue Management. She is 40 years old and has been an employee of the Manager since March 2013.
JEFF PRUSNOFSKY, Vice President and Assistant Secretary since August 2005.
Senior Managing Counsel of BNY Mellon, and an officer of 67 investment companies (comprised of 165 portfolios) managed by the Manager. He is 50 years old and has been an employee of the Manager since October 1990.
JAMES WINDELS, Treasurer since November 2001.
Director – Mutual Fund Accounting of the Manager, and an officer of 67 investment companies (comprised of 165 portfolios) managed by the Manager. He is 57 years old and has been an employee of the Manager since April 1985.
42
RICHARD CASSARO, Assistant Treasurer since January 2008.
Senior Accounting Manager – Money Market and Municipal Bond Funds of the Manager, and an officer of 67 investment companies (comprised of 165 portfolios) managed by the Manager. He is 56 years old and has been an employee of the Manager since September 1982.
GAVIN C. REILLY, Assistant Treasurer since December 2005.
Tax Manager of the Investment Accounting and Support Department of the Manager, and an officer of 67 investment companies (comprised of 165 portfolios) managed by the Manager. He is 47 years old and has been an employee of the Manager since April 1991.
ROBERT S. ROBOL, Assistant Treasurer since December 2002.
Senior Accounting Manager – Fixed Income Funds of the Manager, and an officer of 67 investment companies (comprised of 165 portfolios) managed by the Manager. He is 51 years old and has been an employee of the Manager since October 1988.
ROBERT SALVIOLO, Assistant Treasurer since July 2007.
Senior Accounting Manager – Equity Funds of the Manager, and an officer of 67 investment companies (comprised of 165 portfolios) managed by the Manager. He is 48 years old and has been an employee of the Manager since June 1989.
ROBERT SVAGNA, Assistant Treasurer since December 2002.
Senior Accounting Manager – Equity Funds of the Manager, and an officer of 67 investment companies (comprised of 165 portfolios) managed by the Manager. He is 48 years old and has been an employee of the Manager since November 1990.
JOSEPH W. CONNOLLY, Chief Compliance Officer since October 2004.
Chief Compliance Officer of the Manager and The Dreyfus Family of Funds (67 investment companies, comprised of 165 portfolios). He is 58 years old and has served in various capacities with the Manager since 1980, including manager of the firm’s Fund Accounting Department from 1997 through October 2001.
43
NOTES
44
NOTES
45
Dreyfus BASIC S&P 500 Stock Index Fund
200 Park Avenue
New York, NY 10166
Manager
The Dreyfus Corporation
200 Park Avenue
New York, NY 10166
Custodian
The Bank of New York Mellon
225 Liberty Street
New York, NY 10286
Transfer Agent &
Dividend Disbursing Agent
Dreyfus Transfer, Inc.
200 Park Avenue
New York, NY 10166
Distributor
MBSC Securities Corporation
200 Park Avenue
New York, NY 10166
Telephone Call your financial representative or 1-800-DREYFUS
Mail The Dreyfus Family of Funds, 144 Glenn Curtiss Boulevard, Uniondale, NY 11556-0144
E-mail Send your request to info@dreyfus.com
Internet Information can be viewed online or downloaded at www.dreyfus.com
The fund files its complete schedule of portfolio holdings with the Securities and Exchange Commission (“SEC”) for the first and third quarters of each fiscal year on Form N-Q. The fund’s Forms N-Q are available on the SEC’s website at www.sec.gov and may be reviewed and copied at the SEC’s Public Reference Room in Washington, DC. (phone 1-800-SEC-0330 for information).
A description of the policies and procedures that the fund uses to determine how to vote proxies relating to portfolio securities and information regarding how the fund voted these proxies for the most recent 12-month period ended June 30 is available at www.dreyfus.com and on the SEC’s website at www.sec.gov and without charge, upon request, by calling 1-800-DREYFUS.
| | |
© 2015 MBSC Securities Corporation
0713AR1015 | 
|
Dreyfus Bond Market Index Fund
| | | |

| | ANNUAL REPORT
October 31, 2015 |
| |
Save time. Save paper. View your next shareholder report online as soon as it’s available. Log into www.dreyfus.com and sign up for Dreyfus eCommunications. It’s simple and only takes a few minutes. |
| |
The views expressed in this report reflect those of the portfolio manager only through the end of the period covered and do not necessarily represent the views of Dreyfus or any other person in the Dreyfus organization. Any such views are subject to change at any time based upon market or other conditions and Dreyfus disclaims any responsibility to update such views. These views may not be relied on as investment advice and, because investment decisions for a Dreyfus fund are based on numerous factors, may not be relied on as an indication of trading intent on behalf of any Dreyfus fund. |
| |
Not FDIC-Insured • Not Bank-Guaranteed • May Lose Value |
Contents
THE FUND
FOR MORE INFORMATION
Back Cover
| | | | |
| |
Dreyfus Bond Market Index Fund
| | The Fund |
A LETTER FROM THE PRESIDENT
Dear Shareholder:
We are pleased to present this annual report for Dreyfus Bond Market Index Fund, covering the 12-month period from November 1, 2014, through October 31, 2015. For information about how the fund performed during the reporting period, as well as general market perspectives, we provide a Discussion of Fund Performance on the pages that follow.
Financial markets proved volatile over the reporting period amid choppy U.S. and global economic growth. U.S. stocks advanced over the final months of 2014 and the spring of 2015, with some broad measures of market performance setting new record highs. Those gains were largely erased over the summer when global economic instability undermined investor sentiment, but a renewed rally in October enabled most broad stock indices to end the reporting period in positive territory. In contrast, international stocks generally lost a degree of value, with developed markets faring far better than emerging markets amid falling commodity prices and depreciating currency values. U.S. bonds generally produced modestly positive total returns, with municipal bonds and longer term U.S. government securities faring better, on average, than corporate-backed bonds.
We expect market volatility to persist over the near term until investors see greater clarity regarding short-term U.S. interest rates and global economic conditions. Our investment strategists and portfolio managers are monitoring developments carefully, keeping a close watch on credit spreads, currency values, commodity prices, corporate profits, economic trends in the emerging markets, and other developments that could influence investor sentiment. Over the longer term, we remain confident that markets are likely to benefit as investors increasingly recognize that inflation is likely to stay low, economic growth expectations are stabilizing, and monetary policies remain accommodative in most regions of the world. In our view, investors will continue to be well served under these circumstances by a long-term perspective and a disciplined investment approach.
Thank you for your continued confidence and support.
Sincerely,

J. Charles Cardona
President
The Dreyfus Corporation
November 16, 2015
2
DISCUSSION OF FUND PERFORMANCE
For the period of November 1, 2014, through October 31, 2015, as provided by Nancy G. Rogers, Portfolio Manager
Fund and Market Performance Overview
For the 12-month period ended October 31, 2015, Dreyfus Bond Market Index Fund’s Investor shares produced a total return of 1.54%, and its BASIC shares produced a total return of 1.79%.1 In comparison, the Barclays U.S. Aggregate Bond Index (the “Index”) achieved a total return of 1.96% for the same period.2
Fixed-income securities produced mildly positive returns in the midst of changing economic sentiment during the reporting period. The difference in returns between the fund and the Index was primarily the result of operating expenses that are not reflected in the Index’s results.
The Fund’s Investment Approach
The fund seeks to match the total return of the Index. To pursue this goal, the fund normally invests at least 80% of its assets in bonds that are included in the Index (or other instruments with similar characteristics). To maintain liquidity, the fund may invest up to 20% of its assets in various short-term, fixed-income securities and money market instruments.
While the fund seeks to mirror the returns of the Index, it does not hold the same number of bonds. Instead, the fund holds approximately 1800 securities as compared to approximately 9400 securities in the Index. The fund’s average duration—a measure of sensitivity to changing interest rates—generally remains neutral to the Index. As of October 31, 2015, the average duration of the fund was approximately 5.6 years.
Monetary Policy Actions Drove U.S. and Global Bond Markets
The reporting period began during a U.S. bond market rally in which slowing global economic growth and falling commodity prices prompted central banks in Japan and China to adopt more accommodative monetary policies. The European Central Bank implemented its own larger-than-expected quantitative easing program in January 2015 amid disappointing regional growth. These policy actions sent yields of high-quality sovereign bonds sharply lower and global investors flocked to higher yielding alternatives in the United States. Consequently, yields of 10-year U.S. Treasury securities, which began the reporting period at 2.35%, declined to 1.68% by the beginning of February 2015.
Investor demand soon began to normalize, and robust employment gains briefly sent long-term U.S. bond yields higher until investors responded to weaker-than-expected data in other areas of the economy. In fact, U.S. GDP expanded at an anemic 0.6% annualized rate over the first quarter of 2015 due to a strengthening U.S. dollar and severe winter weather. The economy regained traction in the spring, posting a 3.9% annualized growth rate for the second quarter, and rising long-term interest rates erased previous price gains when yields of 10-year Treasuries climbed to 2.50% in mid-June.
However, renewed worries about economic instability in China and other emerging markets sparked a renewed flight to quality over the summer, causing long-term bond yields to fall
3
DISCUSSION OF FUND PERFORMANCE (continued)
again. Meanwhile, U.S. economic growth decelerated to a more moderate 1.5% annualized rate for the third quarter, and the Federal Reserve Board (the “Fed”) cited global economic instability when it refrained from raising short-term interest rates at its October meeting. In addition, the European Central Bank suggested that it was not done with its quantitative easing program, and China reduced interest rates again. Yields of 10-year Treasuries ended the reporting period at 2.16%.
High Quality Bonds Outperformed Lower Rated Securities
All of the market sectors represented in the Index produced positive absolute returns over the reporting period. Commercial mortgage-backed securities, which comprise a relatively small portion of the Index, produced the highest total returns. U.S. Treasury securities also gained significant value, supported by robust demand from risk-averse global investors. Mortgage-backed securities backed by U.S. government agencies tended to lag their nominal Treasury counterparts, in part due to the impact of reduced mortgage insurance premiums on prepayment rates. Investment-grade corporate bonds fared relatively poorly as credit spreads widened, particularly among securities backed by energy and materials companies struggling with falling commodity prices. Bonds issued by companies with significant international exposure also trailed market averages as the U.S. dollar strengthened against most currencies. In contrast, high-grade corporate bonds from the financials sector fared relatively well.
Replicating the Index’s Composition
As an index fund, we attempt to match closely the returns of the Index by approximating its composition. Still, it is worth noting that investors currently expect the Fed to begin raising short-term interest rates, perhaps as soon as its December meeting.
As of October 31, 2015, approximately 28.6% of the fund’s assets were invested in mortgage-backed securities, 2% in commercial mortgage-backed securities, 30.8% in credit bonds and asset-backed securities, and 38.6% in U.S. Treasury and Agency securities. Moreover, all of the fund’s corporate securities were rated at least BBB- or better, and the fund has maintained an overall credit quality and duration posture that is closely aligned with that of the Index.
November 16, 2015
Bond funds are subject generally to interest rate, credit, liquidity, and market risks, to varying degrees, all of which are more fully described in the fund’s prospectus. Generally, all other factors being equal, bond prices are inversely related to interest-rate changes, and rate increases can cause price declines.
Indexing does not attempt to manage market volatility, use defensive strategies, or reduce the effects of any long-term periods of poor index performance. The correlation between fund and index performance may be affected by the fund’s expenses and use of sampling techniques, changes in securities markets, changes in the composition of the index, and the timing of purchases and redemptions of fund shares.
¹ Total return includes reinvestment of dividends and any capital gains paid. Past performance is no guarantee of future results. Share price, yield, and investment return fluctuate such that upon redemption, fund shares may be worth more or less than their original cost.
² SOURCE: Lipper Inc. — Reflects reinvestment of dividends and, where applicable, capital gain distributions. The Barclays U.S. Aggregate Bond Index is a widely accepted, unmanaged total return index of corporate, U.S. government and U.S. government agency debt instruments, mortgage-backed securities, and asset-backed securities with an average maturity of 1-10 years. Index returns do not reflect fees and expenses associated with operating a mutual fund.
4
FUND PERFORMANCE
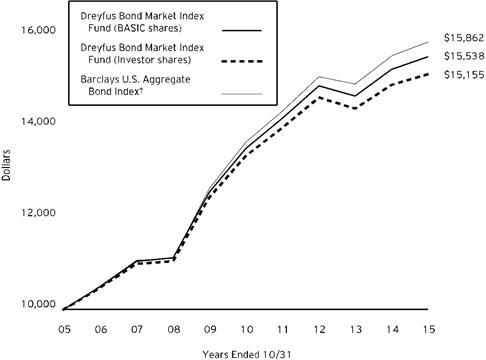
Comparison of change in value of $10,000 investment in Dreyfus Bond Market Index Fund BASIC shares and Investor shares and the Barclays U. S. Aggregate Bond Index
| | | | |
Average Annual Total Returns as of 10/31/15 |
| 1 Year | 5 Years | 10 Years |
BASIC shares | 1.79% | 2.81% | 4.51% |
Investor shares | 1.54% | 2.54% | 4.25% |
Barclays U.S. Aggregate Bond Index | 1.96% | 3.03% | 4.72% |
† Source: Lipper Inc.
Past performance is not predictive of future performance. The fund’s performance shown in the graph and table does not reflect the deduction of taxes that a shareholder would pay on fund distributions or the redemption of fund shares.
The above graph compares a $10,000 investment made in each of the BASIC and Investor shares of Dreyfus Bond Market Index Fund on 10/31/05 to a $10,000 investment made in the Barclays U.S. Aggregate Bond Index (the “Index”) on that date. All dividends and capital gain distributions are reinvested.
The fund’s performance shown in the line graph above takes into account all applicable fees and expenses for BASIC and Investor shares. The Index is a widely accepted, unmanaged index of corporate, U.S. government and U.S. government agency debt instruments, mortgage-backed securities and asset-backed securities. Unlike a mutual fund, the Index is not subject to charges, fees and other expenses. Investors cannot invest directly in any index. Further information relating to fund performance, including expense reimbursements, if applicable, is contained in the Financial Highlights section of the prospectus and elsewhere in this report.
5
UNDERSTANDING YOUR FUND’S EXPENSES (Unaudited)
As a mutual fund investor, you pay ongoing expenses, such as management fees and other expenses. Using the information below, you can estimate how these expenses affect your investment and compare them with the expenses of other funds. You also may pay one-time transaction expenses, including sales charges (loads) and redemption fees, which are not shown in this section and would have resulted in higher total expenses. For more information, see your fund’s prospectus or talk to your financial adviser.
Review your fund’s expenses
The table below shows the expenses you would have paid on a $1,000 investment in Dreyfus Bond Market Index Fund from May 1, 2015 to October 31, 2015. It also shows how much a $1,000 investment would be worth at the close of the period, assuming actual returns and expenses.
| | | | | | |
Expenses and Value of a $1,000 Investment | | |
assuming actual returns for the six months ended October 31, 2015 | |
| | | | Investor Shares | BASIC Shares |
Expenses paid per $1,000† | | $ 2.01 | $ .76 |
Ending value (after expenses) | | $ 996.60 | $ 997.90 |
COMPARING YOUR FUND’S EXPENSES
WITH THOSE OF OTHER FUNDS (Unaudited)
Using the SEC’s method to compare expenses
The Securities and Exchange Commission (SEC) has established guidelines to help investors assess fund expenses. Per these guidelines, the table below shows your fund’s expenses based on a $1,000 investment, assuming a hypothetical 5% annualized return. You can use this information to compare the ongoing expenses (but not transaction expenses or total cost) of investing in the fund with those of other funds. All mutual fund shareholder reports will provide this information to help you make this comparison. Please note that you cannot use this information to estimate your actual ending account balance and expenses paid during the period.
| | | | | | |
Expenses and Value of a $1,000 Investment | | |
assuming a hypothetical 5% return for the six months ended October 31, 2015 | |
| | | | Investor Shares | BASIC Shares |
Expenses paid per $1,000† | | $ 2.04 | $ .77 |
Ending value (after expenses) | | $ 1,023.19 | $1,024.45 |
† Expenses are equal to the fund’s annualized expense ratio of .40% for Investor shares and .15% for BASIC shares, multiplied by the average account value over the period, multiplied by 184/365 (to reflect the one-half year period).
6
STATEMENT OF INVESTMENTS
October 31, 2015
| | | | | | | | | | | |
Bonds and Notes - 99.9% | | Coupon
Rate (%) | | Maturit1y
Date | | Principal
Amount ($) | | Value ($) | |
Asset-Backed Ctfs./Auto Receivables - .3% | | | | | |
AmeriCredit Automobile Receivables Trust,
Ser. 2013-5, Cl. A3 | | 0.90 | | 9/10/18 | | 759,452 | | 759,408 | |
AmeriCredit Automobile Receivables Trust,
Ser. 2014-2, Cl. A3 | | 0.94 | | 2/8/19 | | 1,170,000 | | 1,167,717 | |
AmeriCredit Automobile Receivables Trust,
Ser. 2014-2, Cl. D | | 1.38 | | 11/15/19 | | 1,300,000 | | 1,304,767 | |
AmeriCredit Automobile Receivables Trust,
Ser. 2014-4, Cl. A3 | | 1.27 | | 7/8/19 | | 1,000,000 | | 996,883 | |
Carmax Auto Owner Trust,
Ser. 2013-2, Cl. A4 | | 0.84 | | 11/15/18 | | 650,000 | | 646,054 | |
Fifth Third Auto Trust,
Ser. 2014-3, Cl. A4 | | 1.47 | | 5/17/21 | | 800,000 | | 798,018 | |
Ford Credit Auto Owner Trust,
Ser. 2012-B, Cl. A4 | | 1.00 | | 9/15/17 | | 233,539 | | 233,747 | |
World Omni Auto Receivables Trust,
Ser. 2013-B, Cl. A3 | | 0.83 | | 8/15/18 | | 732,658 | | 732,564 | |
| | 6,639,158 | |
Asset-Backed Ctfs./Credit Cards - .3% | | | | | |
American Express Credit Account Master Trust,
Ser. 2014-3, Cl. A | | 1.49 | | 4/15/20 | | 1,050,000 | | 1,055,690 | |
Capital One Multi-Asset Execution Trust,
Ser. 2007-A7, Cl. A7 | | 5.75 | | 7/15/20 | | 565,000 | | 611,911 | |
Capital One Multi-Asset Execution Trust,
Ser. 2015-A1, Cl. A | | 1.39 | | 1/15/21 | | 2,000,000 | | 2,001,488 | |
Chase Issuance Trust,
Ser. 2013-A8, Cl. A8 | | 1.01 | | 10/15/18 | | 1,000,000 | | 1,001,222 | |
Citibank Credit Card Issuance Trust,
Ser. 2004-A8, Cl. A8 | | 1.73 | | 4/9/20 | | 1,500,000 | | 1,514,656 | |
Citibank Credit Card Issuance Trust,
Ser. 2007-A8, Cl. A8 | | 5.65 | | 9/20/19 | | 500,000 | | 540,310 | |
| | 6,725,277 | |
Commercial Mortgage Pass-Through Ctfs. - 1.4% | | | | | |
Banc of America Commercial Mortgage Trust,
Ser. 2007-1, Cl. A4 | | 5.45 | | 1/15/49 | | 881,466 | | 914,861 | |
Banc of America Commercial Mortgage Trust,
Ser. 2007-4, Cl. A4 | | 5.93 | | 2/10/51 | | 208,452 | a | 220,613 | |
Bear Stearns Commercial Mortgage Securities Trust,
Ser. 2006-PW14, Cl. A4 | | 5.20 | | 12/11/38 | | 965,162 | | 992,602 | |
Citigroup Commercial Mortgage Trust,
Ser. 2006-C4, Cl. A3 | | 5.99 | | 3/15/49 | | 171,148 | a | 172,345 | |
Citigroup Commercial Mortgage Trust,
Ser. 2008-C7, Cl. A4 | | 6.35 | | 12/10/49 | | 1,002,538 | a | 1,064,183 | |
Citigroup Commercial Mortgage Trust,
Ser. 2014-GC19, Cl. A2 | | 2.79 | | 3/10/47 | | 1,250,000 | | 1,283,512 | |
Citigroup Commercial Mortgage Trust,
Ser. 2014-GC23, Cl. A4 | | 3.62 | | 7/10/47 | | 1,000,000 | | 1,042,612 | |
Citigroup/Deutsche Bank Commercial Mortgage Trust,
Ser. 2006-CD2, Cl. A4 | | 5.55 | | 1/15/46 | | 38,966 | a | 38,933 | |
7
STATEMENT OF INVESTMENTS (continued)
| | | | | | | | | | | | | | | | |
Bonds and Notes - 99.9% (continued) | | Coupon
Rate (%) | | Maturity
Date | | Principal
Amount ($) | | Value ($) | |
Commercial Mortgage Pass-Through Ctfs. - 1.4% (continued) | | | | | |
COBALT CMBS Commercial Mortgage Trust,
Ser. 2007-C3, Cl. A4 | | 5.96 | | 5/15/46 | | 866,363 | a | 915,096 | |
Commercial Mortgage Trust,
Ser. 2012-CR4, Cl. A3 | | 2.85 | | 10/15/45 | | 1,000,000 | | 1,009,793 | |
Commercial Mortgage Trust,
Ser. 2013-CR11, Cl. B | | 5.33 | | 10/10/46 | | 750,000 | a | 838,819 | |
Commercial Mortgage Trust,
Ser. 2014-CR16, Cl. A4 | | 4.05 | | 4/10/47 | | 1,200,000 | | 1,289,897 | |
Commercial Mortgage Trust,
Ser. 2014-LC15, Cl. A2 | | 2.84 | | 4/10/47 | | 2,000,000 | | 2,054,150 | |
Commercial Mortgage Trust,
Ser. 2015-LC19, Cl. A4 | | 3.18 | | 2/10/48 | | 2,025,000 | | 2,041,629 | |
GS Mortgage Securities Trust,
Ser. 2007-GG10, Cl. A4 | | 5.99 | | 8/10/45 | | 896,595 | a | 938,729 | |
GS Mortgage Securities Trust,
Ser. 2014-GC18, Cl. A3 | | 3.80 | | 1/10/47 | | 500,000 | | 531,174 | |
J.P. Morgan Chase Commercial Mortgage Securities Trust,
Ser. 2006-CB14, Cl. A4 | | 5.48 | | 12/12/44 | | 51,741 | a | 51,727 | |
J.P. Morgan Chase Commercial Mortgage Securities Trust,
Ser. 2007-CB18, Cl. A4 | | 5.44 | | 6/12/47 | | 328,637 | | 336,378 | |
J.P. Morgan Chase Commercial Mortgage Securities Trust,
Ser. 2007-CB20, Cl. A4 | | 5.79 | | 2/12/51 | | 897,185 | a | 949,487 | |
J.P. Morgan Chase Commercial Mortgage Securities Trust,
Ser. 2007-LDPX, Cl. A3 | | 5.42 | | 1/15/49 | | 59,347 | | 61,379 | |
J.P.Morgan Chase Commercial Mortgage Securities Corp.,
Ser. 2012-LC9, Cl. A5 | | 2.84 | | 12/15/47 | | 1,000,000 | | 1,005,323 | |
JPMBB Commercial Mortgage Securities Trust,
Ser. 2013-C15, Cl. A5 | | 4.13 | | 11/15/45 | | 500,000 | | 540,716 | |
JPMBB Commercial Mortgage Securities Trust,
Ser. 2014-C24, Cl. A5 | | 3.64 | | 11/15/47 | | 1,725,000 | | 1,793,602 | |
LB-UBS Commercial Mortgage Trust,
Ser. 2007-C2, Cl. A3 | | 5.43 | | 2/15/40 | | 976,231 | | 1,012,526 | |
Merrill Lynch Mortgage Trust,
Ser. 2006-C2, Cl. A4 | | 5.74 | | 8/12/43 | | 844,380 | a | 861,928 | |
Merrill Lynch Mortgage Trust,
Ser. 2007-C1, Cl. A4 | | 6.03 | | 6/12/50 | | 1,000,000 | a | 1,040,745 | |
Merrill Lynch/Countrywide Commercial Mortgage Trust,
Ser. 2006-2, Cl. A4 | | 6.07 | | 6/12/46 | | 29,968 | a | 30,288 | |
Merrill Lynch/Countrywide Commercial Mortgage Trust,
Ser. 2007-7, Cl. A4 | | 5.81 | | 6/12/50 | | 1,114,279 | a | 1,168,417 | |
Morgan Stanley Bank of America Merrill Lynch Trust,
Ser. 2013-C10, Cl. A1 | | 1.39 | | 7/15/46 | | 46,517 | | 46,634 | |
Morgan Stanley Bank of America Merrill Lynch Trust,
Ser. 2013-C8, Cl. A4 | | 3.13 | | 12/15/48 | | 1,000,000 | | 1,020,290 | |
8
| | | | | | | | | | | | | | | | | | | |
Bonds and Notes - 99.9% (continued) | | Coupon
Rate (%) | | Maturity
Date | | Principal
Amount ($) | | Value ($) | |
Commercial Mortgage Pass-Through Ctfs. - 1.4% (continued) | | | | | |
Morgan Stanley Bank of America Merrill Lynch Trust,
Ser. 2013-C9, Cl. A1 | | 0.83 | | 5/15/46 | | 289,646 | | 288,947 | |
Morgan Stanley Bank of America Merrill Lynch Trust,
Ser. 2015-C20, Cl. A4 | | 3.25 | | 2/15/48 | | 1,175,000 | | 1,186,000 | |
Morgan Stanley Capital I Trust,
Ser. 2007-IQ14, Cl. A4 | | 5.69 | | 4/15/49 | | 1,300,000 | a | 1,352,737 | |
Morgan Stanley Capital I Trust,
Ser. 2007-T25, Cl. A3 | | 5.51 | | 11/12/49 | | 963,146 | a | 993,638 | |
UBS Commercial Mortgage Trust,
Ser. 2012-C1, Cl. A3 | | 3.40 | | 5/10/45 | | 500,000 | | 520,635 | |
UBS-Barclays Commercial Mortgage Trust,
Ser. 2012-C3, Cl. A4 | | 3.09 | | 8/10/49 | | 500,000 | | 512,161 | |
UBS-Barclays Commercial Mortgage Trust,
Ser. 2012-C4, Cl. A5 | | 2.85 | | 12/10/45 | | 500,000 | | 499,224 | |
UBS-Barclays Commercial Mortgage Trust,
Ser. 2013-C6, Cl. A4 | | 3.24 | | 4/10/46 | | 1,412,000 | | 1,447,503 | |
WF-RBS Commercial Mortgage Trust,
Ser. 2012-C7, Cl. A1 | | 2.30 | | 6/15/45 | | 842,897 | | 850,309 | |
WF-RBS Commercial Mortgage Trust,
Ser. 2013-C14, Cl. ASB | | 2.98 | | 6/15/46 | | 1,500,000 | | 1,540,111 | |
WF-RBS Commercial Mortgage Trust,
Ser. 2014-C20, Cl. A2 | | 3.04 | | 5/15/47 | | 1,000,000 | | 1,034,682 | |
| | 35,494,335 | |
Consumer Discretionary - 2.6% | | | | | |
21st Century Fox America,
Gtd. Debs. | | 8.25 | | 8/10/18 | | 150,000 | | 175,159 | |
21st Century Fox America,
Gtd. Debs. | | 7.75 | | 12/1/45 | | 100,000 | | 134,853 | |
21st Century Fox America,
Gtd. Notes | | 3.70 | | 10/15/25 | | 500,000 | b | 501,086 | |
21st Century Fox America,
Gtd. Notes | | 6.20 | | 12/15/34 | | 250,000 | | 287,971 | |
21st Century Fox America,
Gtd. Notes | | 6.65 | | 11/15/37 | | 360,000 | | 433,497 | |
21st Century Fox America,
Gtd. Notes | | 4.75 | | 9/15/44 | | 500,000 | | 504,001 | |
21st Century Fox America,
Gtd. Notes, Ser. WI | | 3.70 | | 9/15/24 | | 750,000 | | 758,779 | |
Alibaba Group Holding,
Gtd. Notes | | 3.13 | | 11/28/21 | | 290,000 | b | 286,223 | |
Alibaba Group Holding,
Gtd. Notes | | 3.60 | | 11/28/24 | | 750,000 | b | 729,300 | |
Amazon.com,
Sr. Unscd. Notes | | 2.60 | | 12/5/19 | | 1,000,000 | | 1,024,786 | |
Autonation,
Gtd. Notes | | 6.75 | | 4/15/18 | | 300,000 | | 332,425 | |
Autozone,
Sr. Unscd. Notes | | 1.30 | | 1/13/17 | | 1,000,000 | | 999,930 | |
Bed Bath & Beyond,
Sr. Unscd. Notes | | 3.75 | | 8/1/24 | | 1,000,000 | | 981,496 | |
BorgWarner,
Sr. Unscd. Notes | | 3.38 | | 3/15/25 | | 1,000,000 | | 971,451 | |
California Institute of Technology,
Unscd. Bonds | | 4.32 | | 8/1/45 | | 110,000 | | 112,925 | |
9
STATEMENT OF INVESTMENTS (continued)
| | | | | | | | | | | | | | | | | | | |
Bonds and Notes - 99.9% (continued) | | Coupon
Rate (%) | | Maturity
Date | | Principal
Amount ($) | | Value ($) | |
Consumer Discretionary - 2.6% (continued) | | | | | |
Carnival,
Gtd. Notes | | 3.95 | | 10/15/20 | | 300,000 | | 313,779 | |
CBS,
Gtd. Debs. | | 7.88 | | 7/30/30 | | 300,000 | | 387,442 | |
CBS,
Gtd. Notes | | 5.50 | | 5/15/33 | | 250,000 | | 249,859 | |
CBS,
Gtd. Notes | | 4.90 | | 8/15/44 | | 240,000 | | 223,899 | |
CCO Safari II,
Sr. Scd. Notes | | 4.91 | | 7/23/25 | | 910,000 | b | 926,393 | |
CCO Safari II,
Sr. Scd. Notes | | 6.48 | | 10/23/45 | | 500,000 | b | 519,882 | |
CCO Safari II,
Sr. Scd. Notes | | 6.83 | | 10/23/55 | | 530,000 | b | 538,892 | |
CDK Global,
Sr. Unscd. Notes | | 3.30 | | 10/15/19 | | 1,000,000 | | 1,001,189 | |
Colgate-Palmolive,
Sr. Unscd. Notes | | 2.45 | | 11/15/21 | | 1,000,000 | | 1,011,593 | |
Comcast,
Gtd. Bonds | | 4.75 | | 3/1/44 | | 500,000 | | 527,912 | |
Comcast,
Gtd. Notes | | 6.50 | | 1/15/17 | | 1,000,000 | | 1,065,700 | |
Comcast,
Gtd. Notes | | 5.70 | | 7/1/19 | | 500,000 | | 566,993 | |
Comcast,
Gtd. Notes | | 2.85 | | 1/15/23 | | 300,000 | | 302,127 | |
Comcast,
Gtd. Notes | | 3.38 | | 8/15/25 | | 730,000 | | 743,837 | |
Comcast,
Gtd. Notes | | 4.25 | | 1/15/33 | | 500,000 | | 501,227 | |
Comcast,
Gtd. Notes | | 4.40 | | 8/15/35 | | 340,000 | | 345,358 | |
Comcast,
Gtd. Notes | | 6.45 | | 3/15/37 | | 650,000 | | 816,796 | |
Comcast,
Gtd. Notes | | 4.60 | | 8/15/45 | | 410,000 | | 425,707 | |
Comcast Cable Communications Holdings,
Gtd. Notes | | 9.46 | | 11/15/22 | | 304,000 | | 422,945 | |
Costco Wholesale,
Sr. Unscd. Notes | | 5.50 | | 3/15/17 | | 500,000 | | 531,316 | |
Costco Wholesale,
Sr. Unscd. Notes | | 2.25 | | 2/15/22 | | 500,000 | | 492,466 | |
CVS Health,
Sr. Unscd. Bonds | | 2.25 | | 8/12/19 | | 1,000,000 | c | 1,008,786 | |
CVS Health,
Sr. Unscd. Notes | | 5.75 | | 6/1/17 | | 30,000 | | 32,084 | |
CVS Health,
Sr. Unscd. Notes | | 2.80 | | 7/20/20 | | 680,000 | | 692,271 | |
CVS Health,
Sr. Unscd. Notes | | 6.13 | | 9/15/39 | | 1,000,000 | | 1,203,099 | |
CVS Health,
Sr. Unscd. Notes | | 5.13 | | 7/20/45 | | 480,000 | | 516,608 | |
Daimler Finance North America,
Gtd. Notes | | 8.50 | | 1/18/31 | | 200,000 | | 289,483 | |
DirecTV Holdings/Financing,
Gtd. Notes | | 6.00 | | 8/15/40 | | 800,000 | | 832,247 | |
10
| | | | | | | | | | | | | | | | |
Bonds and Notes - 99.9% (continued) | | Coupon
Rate (%) | | Maturity
Date | | Principal
Amount ($) | | Value ($) | |
Consumer Discretionary - 2.6% (continued) | | | | | |
Discovery Communications,
Gtd. Notes | | 6.35 | | 6/1/40 | | 700,000 | | 743,382 | |
Dollar General,
Sr. Unscd. Notes | | 1.88 | | 4/15/18 | | 1,000,000 | | 996,865 | |
Ford Motor,
Sr. Unscd. Notes | | 4.75 | | 1/15/43 | | 500,000 | | 497,397 | |
General Motors,
Sr. Unscd. Notes | | 5.20 | | 4/1/45 | | 340,000 | | 337,869 | |
Grupo Televisa,
Sr. Unscd. Notes | | 5.00 | | 5/13/45 | | 750,000 | | 680,155 | |
Hasbro,
Sr. Unscd. Notes | | 3.15 | | 5/15/21 | | 750,000 | | 754,660 | |
Home Depot,
Sr. Unscd. Notes | | 5.88 | | 12/16/36 | | 1,150,000 | | 1,425,696 | |
Home Depot,
Sr. Unscd. Notes | | 5.40 | | 9/15/40 | | 437,000 | | 518,263 | |
Home Depot,
Sr. Unscd. Notes | | 4.88 | | 2/15/44 | | 500,000 | | 556,191 | |
Interpublic Group,
Sr. Unscd. Notes | | 4.20 | | 4/15/24 | | 500,000 | | 499,661 | |
Kohl's,
Sr. Unscd. Notes | | 4.75 | | 12/15/23 | | 500,000 | | 524,649 | |
Kroger,
Sr. Unscd. Notes | | 3.30 | | 1/15/21 | | 300,000 | | 308,600 | |
Lowe's Cos.,
Sr. Unscd. Notes | | 3.88 | | 9/15/23 | | 500,000 | | 527,967 | |
Lowe's Cos.,
Sr. Unscd. Notes | | 3.13 | | 9/15/24 | | 1,500,000 | | 1,494,058 | |
Lowe's Cos.,
Sr. Unscd. Notes | | 4.38 | | 9/15/45 | | 500,000 | | 510,095 | |
Marriott International,
Sr. Unscd. Notes | | 3.13 | | 10/15/21 | | 1,000,000 | | 1,008,998 | |
Massachusetts Institute of Technology,
Notes | | 5.60 | | 7/1/11 | | 190,000 | | 234,832 | |
Mattel,
Sr. Unscd. Notes | | 2.35 | | 5/6/19 | | 500,000 | | 499,007 | |
McDonald's,
Sr. Unscd. Notes | | 5.35 | | 3/1/18 | | 1,050,000 | | 1,140,075 | |
NBCUniversal Media,
Gtd. Notes | | 5.15 | | 4/30/20 | | 1,500,000 | | 1,695,172 | |
Newell Rubbermaid,
Sr. Unscd. Notes | | 2.88 | | 12/1/19 | | 500,000 | | 504,026 | |
Nike,
Sr. Unscd. Notes | | 2.25 | | 5/1/23 | | 300,000 | | 293,309 | |
Nike,
Sr. Unscd. Notes | | 3.63 | | 5/1/43 | | 300,000 | | 280,148 | |
Nordstrom,
Sr. Unscd. Bonds | | 4.75 | | 5/1/20 | | 500,000 | | 549,176 | |
Omnicom Group,
Gtd. Notes | | 3.63 | | 5/1/22 | | 500,000 | | 507,831 | |
Philip Morris International,
Sr. Unscd. Notes | | 2.50 | | 8/22/22 | | 1,100,000 | | 1,084,684 | |
Procter & Gamble,
Sr. Unscd. Notes | | 5.55 | | 3/5/37 | | 300,000 | | 367,813 | |
QVC,
Sr. Scd. Notes | | 5.45 | | 8/15/34 | | 500,000 | | 446,832 | |
11
STATEMENT OF INVESTMENTS (continued)
| | | | | | | | | | | | | | | | | | | |
Bonds and Notes - 99.9% (continued) | | Coupon
Rate (%) | | Maturity
Date | | Principal
Amount ($) | | Value ($) | |
Consumer Discretionary - 2.6% (continued) | | | | | |
Signet UK Finance,
Gtd. Bonds | | 4.70 | | 6/15/24 | | 500,000 | | 502,384 | |
Stanley Black & Decker,
Gtd. Notes | | 3.40 | | 12/1/21 | | 400,000 | | 412,009 | |
Staples,
Sr. Unscd. Notes | | 4.38 | | 1/12/23 | | 250,000 | c | 244,054 | |
Starbucks,
Sr. Unscd. Notes | | 4.30 | | 6/15/45 | | 500,000 | | 511,085 | |
Target,
Sr. Unscd. Notes | | 5.38 | | 5/1/17 | | 400,000 | | 426,588 | |
Target,
Sr. Unscd. Notes | | 2.30 | | 6/26/19 | | 1,000,000 | | 1,020,994 | |
Target,
Sr. Unscd. Notes | | 7.00 | | 1/15/38 | | 228,000 | | 313,425 | |
Thomson Reuters,
Gtd. Notes | | 6.50 | | 7/15/18 | | 800,000 | | 892,992 | |
Thomson Reuters,
Sr. Unscd. Notes | | 3.95 | | 9/30/21 | | 300,000 | | 314,803 | |
Time Warner,
Gtd. Notes | | 4.75 | | 3/29/21 | | 1,500,000 | | 1,643,787 | |
Time Warner,
Gtd. Notes | | 7.63 | | 4/15/31 | | 1,100,000 | | 1,408,794 | |
Time Warner Cable,
Gtd. Debs. | | 6.55 | | 5/1/37 | | 350,000 | | 351,721 | |
Time Warner Cable,
Gtd. Debs. | | 7.30 | | 7/1/38 | | 495,000 | | 537,750 | |
Time Warner Cable,
Gtd. Debs. | | 4.50 | | 9/15/42 | | 500,000 | | 406,422 | |
Time Warner Cable,
Gtd. Notes | | 8.25 | | 4/1/19 | | 1,000,000 | | 1,166,557 | |
Time Warner Cos.,
Gtd. Debs. | | 6.95 | | 1/15/28 | | 325,000 | | 400,647 | |
Toyota Motor Credit,
Sr. Unscd. Notes | | 2.15 | | 3/12/20 | | 500,000 | | 502,152 | |
University of Southern California,
Sr. Unscd. Notes | | 5.25 | | 10/1/11 | | 40,000 | | 46,342 | |
Viacom,
Sr. Unscd. Notes | | 2.75 | | 12/15/19 | | 655,000 | | 653,450 | |
Viacom,
Sr. Unscd. Notes | | 6.88 | | 4/30/36 | | 235,000 | | 245,610 | |
Viacom,
Sr. Unscd. Notes | | 4.38 | | 3/15/43 | | 1,250,000 | | 949,172 | |
Walgreens Boots Alliance,
Gtd. Notes | | 1.75 | | 11/17/17 | | 300,000 | | 299,929 | |
Walgreens Boots Alliance,
Gtd. Notes | | 3.30 | | 11/18/21 | | 400,000 | | 400,290 | |
Walgreens Boots Alliance,
Gtd. Notes | | 4.50 | | 11/18/34 | | 400,000 | | 371,904 | |
Wal-Mart Stores,
Sr. Unscd. Notes | | 3.63 | | 7/8/20 | | 1,600,000 | | 1,724,243 | |
Wal-Mart Stores,
Sr. Unscd. Notes | | 5.25 | | 9/1/35 | | 600,000 | | 692,120 | |
Wal-Mart Stores,
Sr. Unscd. Notes | | 6.50 | | 8/15/37 | | 635,000 | | 830,404 | |
Wal-Mart Stores,
Sr. Unscd. Notes | | 4.30 | | 4/22/44 | | 1,000,000 | c | 1,016,090 | |
12
| | | | | | | | | | | | | | | | | | | |
Bonds and Notes - 99.9% (continued) | | Coupon
Rate (%) | | Maturity
Date | | Principal
Amount ($) | | Value ($) | |
Consumer Discretionary - 2.6% (continued) | | | | | |
Walt Disney,
Sr. Unscd. Notes | | 3.75 | | 6/1/21 | | 500,000 | | 538,126 | |
Walt Disney,
Sr. Unscd. Notes, Ser. B | | 7.00 | | 3/1/32 | | 150,000 | | 207,606 | |
WPP Finance 2010,
Gtd. Notes | | 3.75 | | 9/19/24 | | 750,000 | | 755,275 | |
Wyndham Worldwide,
Sr. Unscd. Notes | | 2.50 | | 3/1/18 | | 500,000 | | 500,977 | |
Wyndham Worldwide,
Sr. Unscd. Notes | | 3.90 | | 3/1/23 | | 500,000 | | 482,217 | |
Xerox,
Sr. Unscd. Notes | | 6.75 | | 2/1/17 | | 750,000 | | 791,866 | |
Xerox,
Sr. Unscd. Notes | | 3.80 | | 5/15/24 | | 500,000 | c | 459,627 | |
Yale University,
Sr. Unscd. Notes | | 2.09 | | 4/15/19 | | 300,000 | | 304,006 | |
| | 66,036,601 | |
Consumer Staples - 1.2% | | | | | |
Altria Group,
Gtd. Notes | | 2.85 | | 8/9/22 | | 500,000 | | 495,007 | |
Altria Group,
Gtd. Notes | | 4.00 | | 1/31/24 | | 230,000 | | 242,434 | |
Altria Group,
Gtd. Notes | | 4.25 | | 8/9/42 | | 1,000,000 | | 947,618 | |
Anheuser-Busch,
Gtd. Notes | | 1.13 | | 1/27/17 | | 1,000,000 | | 996,962 | |
Anheuser-Busch,
Gtd. Notes | | 5.50 | | 1/15/18 | | 145,000 | | 156,994 | |
Anheuser-Busch Inbev Finance,
Gtd. Notes | | 2.63 | | 1/17/23 | | 500,000 | | 475,408 | |
Anheuser-Busch Inbev Finance,
Gtd. Notes | | 3.70 | | 2/1/24 | | 1,000,000 | | 1,014,660 | |
Anheuser-Busch Inbev Finance,
Gtd. Notes | | 4.00 | | 1/17/43 | | 700,000 | | 623,330 | |
Anheuser-Busch Inbev Worldwide,
Gtd. Notes | | 5.38 | | 1/15/20 | | 1,000,000 | | 1,113,516 | |
Archer-Daniels-Midland,
Sr. Unscd. Notes | | 5.45 | | 3/15/18 | | 92,000 | | 100,050 | |
Campbell Soup,
Sr. Unscd. Notes | | 3.30 | | 3/19/25 | | 750,000 | | 736,609 | |
Clorox,
Sr. Unscd. Notes | | 3.80 | | 11/15/21 | | 200,000 | | 211,087 | |
Coca-Cola,
Sr. Unscd. Notes | | 3.30 | | 9/1/21 | | 1,500,000 | | 1,579,374 | |
Coca-Cola Femsa,
Gtd. Bonds | | 2.38 | | 11/26/18 | | 400,000 | | 404,600 | |
ConAgra Foods,
Sr. Unscd. Notes | | 1.90 | | 1/25/18 | | 500,000 | | 497,596 | |
ConAgra Foods,
Sr. Unscd. Notes | | 3.20 | | 1/25/23 | | 210,000 | | 200,546 | |
ConAgra Foods,
Sr. Unscd. Notes | | 7.00 | | 10/1/28 | | 350,000 | | 420,114 | |
ConAgra Foods,
Sr. Unscd. Notes | | 4.65 | | 1/25/43 | | 198,000 | | 177,862 | |
Diageo Capital,
Gtd. Notes | | 5.75 | | 10/23/17 | | 720,000 | | 780,399 | |
13
STATEMENT OF INVESTMENTS (continued)
| | | | | | | | | | | | | | | | |
Bonds and Notes - 99.9% (continued) | | Coupon
Rate (%) | | Maturity
Date | | Principal
Amount ($) | | Value ($) | |
Consumer Staples - 1.2% (continued) | | | | | |
Diageo Investment,
Gtd. Notes | | 4.25 | | 5/11/42 | | 500,000 | | 496,836 | |
Dr. Pepper Snapple Group,
Gtd. Notes | | 6.82 | | 5/1/18 | | 200,000 | | 223,434 | |
General Mills,
Sr. Unscd. Notes | | 5.70 | | 2/15/17 | | 1,300,000 | | 1,374,324 | |
HJ Heinz,
Gtd. Notes | | 3.95 | | 7/15/25 | | 360,000 | b | 369,328 | |
JM Smucker,
Gtd. Notes | | 1.75 | | 3/15/18 | | 400,000 | | 400,958 | |
JM Smucker,
Gtd. Notes | | 2.50 | | 3/15/20 | | 500,000 | | 500,199 | |
Kellogg,
Sr. Unscd. Debs., Ser. B | | 7.45 | | 4/1/31 | | 340,000 | | 438,187 | |
Kellogg,
Sr. Unscd. Notes | | 4.15 | | 11/15/19 | | 400,000 | | 426,966 | |
Kimberly-Clark,
Sr. Unscd. Notes | | 3.70 | | 6/1/43 | | 500,000 | | 466,234 | |
Kraft Foods Group,
Gtd. Notes | | 2.25 | | 6/5/17 | | 490,000 | | 496,428 | |
Kraft Foods Group,
Gtd. Notes | | 3.50 | | 6/6/22 | | 490,000 | | 500,435 | |
Kraft Foods Group,
Gtd. Notes | | 5.00 | | 6/4/42 | | 400,000 | | 413,248 | |
Kraft Heinz Foods,
Gtd. Notes | | 2.80 | | 7/2/20 | | 390,000 | b | 391,936 | |
Kraft Heinz Foods,
Gtd. Notes | | 6.75 | | 3/15/32 | | 525,000 | | 609,003 | |
Kraft Heinz Foods,
Gtd. Notes | | 5.20 | | 7/15/45 | | 270,000 | b | 287,349 | |
Kroger,
Gtd. Notes | | 7.50 | | 4/1/31 | | 800,000 | | 1,025,339 | |
Mondelez International,
Sr. Unscd. Notes | | 4.00 | | 2/1/24 | | 1,000,000 | | 1,045,697 | |
Mondelez International,
Sr. Unscd. Notes | | 6.50 | | 2/9/40 | | 253,000 | | 309,396 | |
Pepsi Bottling Group,
Gtd. Notes, Ser. B | | 7.00 | | 3/1/29 | | 800,000 | c | 1,082,946 | |
PepsiCo,
Sr. Unscd. Notes | | 7.90 | | 11/1/18 | | 1,000,000 | | 1,181,634 | |
PepsiCo,
Sr. Unscd. Notes | | 2.15 | | 10/14/20 | | 810,000 | | 810,121 | |
PepsiCo,
Sr. Unscd. Notes | | 3.50 | | 7/17/25 | | 500,000 | | 517,406 | |
PepsiCo,
Sr. Unscd. Notes | | 4.88 | | 11/1/40 | | 500,000 | | 541,768 | |
PepsiCo,
Sr. Unscd. Notes | | 4.45 | | 4/14/46 | | 210,000 | | 215,524 | |
Philip Morris International,
Sr. Unscd. Notes | | 5.65 | | 5/16/18 | | 760,000 | | 838,418 | |
Philip Morris International,
Sr. Unscd. Notes | | 4.50 | | 3/20/42 | | 650,000 | | 669,494 | |
Procter & Gamble,
Sr. Unscd. Bonds | | 6.45 | | 1/15/26 | | 1,046,000 | | 1,344,737 | |
Reynolds American,
Gtd. Notes | | 2.30 | | 6/12/18 | | 510,000 | | 517,707 | |
14
| | | | | | | | | | | | | | | | |
Bonds and Notes - 99.9% (continued) | | Coupon
Rate (%) | | Maturity
Date | | Principal
Amount ($) | | Value ($) | |
Consumer Staples - 1.2% (continued) | | | | | |
Reynolds American,
Gtd. Notes | | 4.85 | | 9/15/23 | | 650,000 | | 704,579 | |
Reynolds American,
Gtd. Notes | | 5.70 | | 8/15/35 | | 240,000 | | 263,331 | |
Reynolds American,
Gtd. Notes | | 5.85 | | 8/15/45 | | 510,000 | | 567,842 | |
Sysco,
Gtd. Notes | | 5.38 | | 9/21/35 | | 350,000 | | 394,554 | |
Tyson Foods,
Gtd. Bonds | | 5.15 | | 8/15/44 | | 500,000 | | 525,893 | |
| | 31,125,417 | |
Energy - 2.6% | | | | | |
Anadarko Petroleum,
Sr. Unscd. Notes | | 5.95 | | 9/15/16 | | 350,000 | | 362,953 | |
Anadarko Petroleum,
Sr. Unscd. Notes | | 3.45 | | 7/15/24 | | 1,000,000 | | 978,178 | |
Anadarko Petroleum,
Sr. Unscd. Notes | | 6.45 | | 9/15/36 | | 150,000 | | 169,257 | |
Apache,
Sr. Unscd. Notes | | 6.00 | | 1/15/37 | | 380,000 | | 411,607 | |
Apache,
Sr. Unscd. Notes | | 4.75 | | 4/15/43 | | 1,000,000 | | 928,140 | |
Baker Hughes,
Sr. Unscd. Notes, Ser. WI | | 3.20 | | 8/15/21 | | 1,000,000 | | 998,125 | |
BP Capital Markets,
Gtd. Notes | | 1.85 | | 5/5/17 | | 1,250,000 | c | 1,262,425 | |
BP Capital Markets,
Gtd. Notes | | 3.25 | | 5/6/22 | | 1,200,000 | | 1,217,630 | |
BP Capital Markets,
Gtd. Notes | | 2.50 | | 11/6/22 | | 800,000 | | 774,758 | |
Buckeye Partners,
Sr. Unscd. Notes | | 2.65 | | 11/15/18 | | 250,000 | | 242,113 | |
Cameron International,
Sr. Unscd. Notes | | 1.40 | | 6/15/17 | | 500,000 | | 496,314 | |
Cameron International,
Sr. Unscd. Notes | | 5.13 | | 12/15/43 | | 175,000 | | 182,190 | |
Canadian Natural Resources,
Sr. Unscd. Notes | | 3.90 | | 2/1/25 | | 500,000 | | 475,445 | |
Canadian Natural Resources,
Sr. Unscd. Notes | | 6.25 | | 3/15/38 | | 430,000 | | 451,412 | |
Cenovus Energy,
Sr. Unscd. Notes | | 3.80 | | 9/15/23 | | 1,000,000 | | 953,450 | |
Chevron,
Sr. Unscd. Notes | | 1.72 | | 6/24/18 | | 1,000,000 | | 1,010,724 | |
Chevron,
Sr. Unscd. Notes | | 3.19 | | 6/24/23 | | 400,000 | | 409,337 | |
CNOOC Finance 2013,
Gtd. Notes | | 3.00 | | 5/9/23 | | 500,000 | | 474,468 | |
Columbia Pipeline Group,
Gtd. Notes | | 3.30 | | 6/1/20 | | 1,000,000 | b | 998,542 | |
ConocoPhillips,
Gtd. Notes | | 2.20 | | 5/15/20 | | 1,000,000 | | 998,555 | |
ConocoPhillips,
Gtd. Notes | | 2.40 | | 12/15/22 | | 1,000,000 | | 956,672 | |
ConocoPhillips,
Gtd. Notes | | 4.15 | | 11/15/34 | | 750,000 | | 722,086 | |
15
STATEMENT OF INVESTMENTS (continued)
| | | | | | | | | | | | | | | | |
Bonds and Notes - 99.9% (continued) | | Coupon
Rate (%) | | Maturity
Date | | Principal
Amount ($) | | Value ($) | |
Energy - 2.6% (continued) | | | | | |
ConocoPhillips,
Gtd. Notes | | 6.50 | | 2/1/39 | | 500,000 | | 614,310 | |
ConocoPhillips Holding,
Sr. Unscd. Notes | | 6.95 | | 4/15/29 | | 125,000 | | 158,167 | |
Continental Resources,
Gtd. Notes | | 4.50 | | 4/15/23 | | 500,000 | | 442,435 | |
Continental Resources,
Gtd. Notes | | 3.80 | | 6/1/24 | | 500,000 | c | 419,212 | |
Devon Energy,
Sr. Unscd. Notes | | 5.60 | | 7/15/41 | | 650,000 | | 631,426 | |
Devon Financing,
Gtd. Debs. | | 7.88 | | 9/30/31 | | 275,000 | | 338,221 | |
Ecopetrol,
Sr. Unscd. Notes | | 7.38 | | 9/18/43 | | 1,000,000 | | 955,000 | |
Enable Midstream Partners,
Gtd. Notes | | 5.00 | | 5/15/44 | | 500,000 | b | 353,159 | |
Enbridge Energy Partners,
Sr. Unscd. Notes | | 5.88 | | 10/15/25 | | 500,000 | | 504,707 | |
Enbridge Energy Partners,
Sr. Unscd. Notes | | 5.50 | | 9/15/40 | | 720,000 | | 603,511 | |
Encana,
Sr. Unscd. Bonds | | 7.20 | | 11/1/31 | | 625,000 | | 621,196 | |
Energy Transfer Partners,
Sr. Unscd. Notes | | 3.60 | | 2/1/23 | | 1,000,000 | | 885,536 | |
Energy Transfer Partners,
Sr. Unscd. Notes | | 4.90 | | 2/1/24 | | 500,000 | | 472,324 | |
Energy Transfer Partners,
Sr. Unscd. Notes | | 5.15 | | 2/1/43 | | 500,000 | | 397,337 | |
Enterprise Products Operating,
Gtd. Bonds, Ser. L | | 6.30 | | 9/15/17 | | 1,000,000 | | 1,082,615 | |
Enterprise Products Operating,
Gtd. Notes | | 3.35 | | 3/15/23 | | 600,000 | | 583,733 | |
Enterprise Products Operating,
Gtd. Notes | | 3.70 | | 2/15/26 | | 200,000 | | 190,499 | |
Enterprise Products Operating,
Gtd. Notes | | 4.45 | | 2/15/43 | | 750,000 | | 647,013 | |
Enterprise Products Operating,
Gtd. Notes | | 4.90 | | 5/15/46 | | 1,000,000 | | 920,014 | |
EOG Resources,
Sr. Unscd. Notes | | 3.90 | | 4/1/35 | | 750,000 | | 723,371 | |
Halliburton,
Sr. Unscd. Bonds | | 6.15 | | 9/15/19 | | 1,200,000 | | 1,360,112 | |
Hess,
Sr. Unscd. Bonds | | 8.13 | | 2/15/19 | | 1,200,000 | | 1,394,808 | |
Hess,
Sr. Unscd. Bonds | | 7.88 | | 10/1/29 | | 175,000 | | 209,395 | |
Kerr-McGee,
Gtd. Notes | | 6.95 | | 7/1/24 | | 600,000 | | 704,660 | |
Kinder Morgan,
Gtd. Notes | | 5.30 | | 12/1/34 | | 1,000,000 | | 844,409 | |
Kinder Morgan Energy Partners,
Gtd. Notes | | 4.15 | | 3/1/22 | | 1,000,000 | | 954,526 | |
Kinder Morgan Energy Partners,
Gtd. Notes | | 3.50 | | 9/1/23 | | 500,000 | | 436,122 | |
Kinder Morgan Energy Partners,
Gtd. Notes | | 7.40 | | 3/15/31 | | 350,000 | | 354,614 | |
16
| | | | | | | | | | | |
Bonds and Notes - 99.9% (continued) | | Coupon
Rate (%) | | Maturity
Date | | Principal
Amount ($) | | Value ($) | |
Energy - 2.6% (continued) | | | | | |
Kinder Morgan Energy Partners,
Gtd. Notes | | 5.00 | | 3/1/43 | | 300,000 | | 236,088 | |
Marathon Oil,
Sr. Unscd. Notes | | 5.90 | | 3/15/18 | | 500,000 | | 543,446 | |
Marathon Oil,
Sr. Unscd. Notes | | 6.60 | | 10/1/37 | | 550,000 | | 565,127 | |
Marathon Petroleum,
Sr. Unscd. Notes | | 4.75 | | 9/15/44 | | 500,000 | | 455,155 | |
Nabors Industries,
Gtd. Notes | | 2.35 | | 9/15/16 | | 450,000 | | 447,885 | |
Nexen Energy,
Gtd. Notes | | 5.88 | | 3/10/35 | | 125,000 | | 141,153 | |
Noble Energy,
Sr. Unscd. Notes | | 4.15 | | 12/15/21 | | 539,000 | | 545,858 | |
Noble Energy,
Sr. Unscd. Notes | | 3.90 | | 11/15/24 | | 1,000,000 | c | 953,661 | |
Noble Holding International,
Gtd. Notes | | 3.95 | | 3/15/22 | | 1,000,000 | | 750,664 | |
Occidental Petroleum,
Sr. Unscd. Notes, Ser. 1 | | 4.10 | | 2/1/21 | | 1,700,000 | | 1,826,028 | |
ONEOK Partners,
Gtd. Notes | | 6.15 | | 10/1/16 | | 545,000 | | 561,748 | |
ONEOK Partners,
Gtd. Notes | | 5.00 | | 9/15/23 | | 500,000 | | 478,754 | |
ONEOK Partners,
Gtd. Notes | | 6.85 | | 10/15/37 | | 60,000 | | 55,799 | |
Phillips 66,
Gtd. Notes | | 2.95 | | 5/1/17 | | 590,000 | | 603,547 | |
Phillips 66,
Gtd. Notes | | 4.88 | | 11/15/44 | | 202,000 | | 201,564 | |
Pioneer Natural Resources,
Sr. Unscd. Notes | | 3.95 | | 7/15/22 | | 1,000,000 | | 996,093 | |
Plains All American Pipeline,
Sr. Unscd. Notes | | 6.13 | | 1/15/17 | | 525,000 | | 549,416 | |
Plains All American Pipeline,
Sr. Unscd. Notes | | 3.85 | | 10/15/23 | | 750,000 | | 719,921 | |
Pride International,
Gtd. Notes | | 6.88 | | 8/15/20 | | 1,000,000 | c | 985,889 | |
Regency Energy Partners,
Gtd. Notes | | 4.50 | | 11/1/23 | | 750,000 | | 689,486 | |
Shell International Finance,
Gtd. Notes | | 4.30 | | 9/22/19 | | 1,600,000 | | 1,737,629 | |
Shell International Finance,
Gtd. Notes | | 3.25 | | 5/11/25 | | 560,000 | | 560,306 | |
Shell International Finance,
Gtd. Notes | | 4.13 | | 5/11/35 | | 260,000 | | 260,674 | |
Shell International Finance,
Gtd. Notes | | 6.38 | | 12/15/38 | | 500,000 | | 634,040 | |
Shell International Finance,
Gtd. Notes | | 4.38 | | 5/11/45 | | 620,000 | | 622,989 | |
Southwestern Energy,
Sr. Unscd. Notes | | 4.95 | | 1/23/25 | | 500,000 | c | 436,982 | |
Spectra Energy Capital,
Gtd. Notes | | 8.00 | | 10/1/19 | | 225,000 | | 258,841 | |
Spectra Energy Partners,
Sr. Unscd. Notes | | 5.95 | | 9/25/43 | | 400,000 | | 415,652 | |
17
STATEMENT OF INVESTMENTS (continued)
| | | | | | | | | | | | | | | | | | | |
Bonds and Notes - 99.9% (continued) | | Coupon
Rate (%) | | Maturity
Date | | Principal
Amount ($) | | Value ($) | |
Energy - 2.6% (continued) | | | | | |
Statoil,
Gtd. Notes | | 5.25 | | 4/15/19 | | 1,600,000 | | 1,775,483 | |
Statoil,
Gtd. Notes | | 2.65 | | 1/15/24 | | 1,000,000 | | 964,359 | |
Suncor Energy,
Sr. Unscd. Notes | | 6.50 | | 6/15/38 | | 950,000 | | 1,148,021 | |
Sunoco Logistics Partners Operations,
Gtd. Notes | | 3.45 | | 1/15/23 | | 200,000 | | 177,020 | |
Sunoco Logistics Partners Operations,
Gtd. Notes | | 4.95 | | 1/15/43 | | 200,000 | | 152,096 | |
Talisman Energy,
Sr. Unscd. Notes | | 6.25 | | 2/1/38 | | 200,000 | | 158,414 | |
Tennessee Gas Pipeline,
Gtd. Debs. | | 7.00 | | 10/15/28 | | 390,000 | | 431,198 | |
Tennessee Gas Pipeline,
Gtd. Debs. | | 7.63 | | 4/1/37 | | 70,000 | | 73,100 | |
Total Capital,
Gtd. Notes | | 2.13 | | 8/10/18 | | 1,500,000 | | 1,526,716 | |
Total Capital,
Gtd. Notes | | 4.45 | | 6/24/20 | | 1,400,000 | | 1,539,227 | |
Total Capital International,
Gtd. Notes | | 2.75 | | 6/19/21 | | 500,000 | | 507,484 | |
Total Capital International,
Gtd. Notes | | 3.75 | | 4/10/24 | | 340,000 | | 356,122 | |
TransCanada Pipelines,
Sr. Unscd. Notes | | 3.75 | | 10/16/23 | | 500,000 | | 501,072 | |
TransCanada Pipelines,
Sr. Unscd. Notes | | 5.85 | | 3/15/36 | | 200,000 | | 216,595 | |
TransCanada Pipelines,
Sr. Unscd. Notes | | 6.20 | | 10/15/37 | | 75,000 | | 84,694 | |
TransCanada Pipelines,
Sr. Unscd. Notes | | 7.63 | | 1/15/39 | | 660,000 | | 867,621 | |
Valero Energy,
Gtd. Notes | | 7.50 | | 4/15/32 | | 170,000 | | 203,823 | |
Valero Energy,
Sr. Unscd. Notes | | 6.63 | | 6/15/37 | | 615,000 | | 682,323 | |
Weatherford International,
Gtd. Notes | | 6.75 | | 9/15/40 | | 1,000,000 | | 709,375 | |
Williams Companies,
Sr. Unscd. Notes | | 4.55 | | 6/24/24 | | 500,000 | | 419,186 | |
Williams Partners,
Sr. Unscd. Notes | | 4.13 | | 11/15/20 | | 1,000,000 | | 999,246 | |
Williams Partners,
Sr. Unscd. Notes | | 4.00 | | 9/15/25 | | 100,000 | | 85,269 | |
Williams Partners,
Sr. Unscd. Notes | | 6.30 | | 4/15/40 | | 800,000 | | 712,272 | |
XTO Energy,
Gtd. Notes | | 6.75 | | 8/1/37 | | 625,000 | | 870,281 | |
| | 65,672,205 | |
Financials - 8.6% | | | | | |
Abbey National Treasury Service,
Gtd. Notes | | 3.05 | | 8/23/18 | | 800,000 | | 826,904 | |
Abbey National Treasury Service,
Gtd. Notes | | 2.38 | | 3/16/20 | | 750,000 | | 751,693 | |
Ace Ina Holdings,
Gtd. Notes | | 3.35 | | 5/15/24 | | 250,000 | | 252,558 | |
18
| | | | | | | | | | | | | | | | | | | |
Bonds and Notes - 99.9% (continued) | | Coupon
Rate (%) | | Maturity
Date | | Principal
Amount ($) | | Value ($) | |
Financials - 8.6% (continued) | | | | | |
AEP Texas Central Transition Funding,
Sr. Scd. Bonds, Ser. A-4 | | 5.17 | | 1/1/20 | | 217,533 | | 227,681 | |
Affiliated Managers Group,
Sr. Unscd. Notes | | 3.50 | | 8/1/25 | | 500,000 | | 480,937 | |
Aflac,
Sr. Unscd. Notes | | 3.63 | | 6/15/23 | | 600,000 | | 613,503 | |
Air Lease,
Sr. Unscd. Notes | | 2.13 | | 1/15/18 | | 500,000 | | 495,250 | |
Air Lease,
Sr. Unscd. Notes | | 3.38 | | 1/15/19 | | 350,000 | c | 357,875 | |
Air Lease,
Sr. Unscd. Notes | | 3.75 | | 2/1/22 | | 100,000 | | 99,111 | |
Alexandria Real Estate Equities,
Gtd. Notes | | 2.75 | | 1/15/20 | | 500,000 | | 496,186 | |
Allstate,
Sub. Debs. | | 5.75 | | 8/15/53 | | 300,000 | a | 312,938 | |
American Express,
Sr. Unscd. Notes | | 6.15 | | 8/28/17 | | 700,000 | | 756,974 | |
American Express,
Sr. Unscd. Notes | | 7.00 | | 3/19/18 | | 500,000 | | 561,615 | |
American Express,
Sr. Unscd. Notes | | 1.55 | | 5/22/18 | | 1,750,000 | | 1,744,645 | |
American Express,
Sub. Notes | | 3.63 | | 12/5/24 | | 500,000 | | 500,905 | |
American Express Credit,
Sr. Unscd. Notes | | 1.55 | | 9/22/17 | | 500,000 | | 500,978 | |
American Express Credit,
Sr. Unscd. Notes | | 2.25 | | 8/15/19 | | 750,000 | | 753,441 | |
American Honda Finance,
Sr. Unscd. Bonds | | 2.15 | | 3/13/20 | | 750,000 | | 744,912 | |
American International Group,
Sr. Unscd. Notes | | 4.88 | | 6/1/22 | | 1,400,000 | | 1,559,135 | |
American International Group,
Sr. Unscd. Notes | | 6.25 | | 5/1/36 | | 750,000 | | 902,551 | |
American International Group,
Sr. Unscd. Notes | | 4.80 | | 7/10/45 | | 480,000 | | 497,100 | |
American Tower,
Sr. Unscd. Notes | | 4.50 | | 1/15/18 | | 500,000 | | 525,191 | |
American Tower,
Sr. Unscd. Notes | | 3.40 | | 2/15/19 | | 580,000 | | 599,929 | |
AON,
Gtd. Notes | | 4.60 | | 6/14/44 | | 1,000,000 | | 966,297 | |
Australia & New Zealand Banking Group of New York,
Sr. Unscd. Bonds | | 1.25 | | 6/13/17 | | 1,000,000 | | 1,000,364 | |
AvalonBay Communities,
Sr. Unscd. Notes | | 4.20 | | 12/15/23 | | 750,000 | | 787,068 | |
AXA,
Sub. Bonds | | 8.60 | | 12/15/30 | | 165,000 | | 226,773 | |
Bank of America,
Sr. Unscd. Notes | | 1.13 | | 11/14/16 | | 250,000 | | 250,642 | |
Bank of America,
Sr. Unscd. Notes | | 1.25 | | 2/14/17 | | 1,500,000 | | 1,503,928 | |
Bank of America,
Sr. Unscd. Notes | | 6.40 | | 8/28/17 | | 1,665,000 | | 1,804,437 | |
19
STATEMENT OF INVESTMENTS (continued)
| | | | | | | | | | | |
Bonds and Notes - 99.9% (continued) | | Coupon
Rate (%) | | Maturity
Date | | Principal
Amount ($) | | Value ($) | |
Financials - 8.6% (continued) | | | | | |
Bank of America,
Sr. Unscd. Notes | | 5.65 | | 5/1/18 | | 965,000 | | 1,050,430 | |
Bank of America,
Sr. Unscd. Notes | | 1.95 | | 5/12/18 | | 1,000,000 | | 1,003,578 | |
Bank of America,
Sr. Unscd. Notes | | 5.63 | | 7/1/20 | | 800,000 | | 902,082 | |
Bank of America,
Sr. Unscd. Notes | | 3.30 | | 1/11/23 | | 1,000,000 | | 998,689 | |
Bank of America,
Sr. Unscd. Notes | | 4.13 | | 1/22/24 | | 1,000,000 | | 1,043,157 | |
Bank of America,
Sr. Unscd. Notes | | 5.00 | | 1/21/44 | | 500,000 | | 532,461 | |
Bank of America,
Sr. Unscd. Notes, Ser. L | | 1.35 | | 11/21/16 | | 250,000 | | 250,284 | |
Bank of America,
Sr. Unscd. Notes, Ser. L | | 2.60 | | 1/15/19 | | 400,000 | | 405,028 | |
Bank of America,
Sub. Notes | | 4.20 | | 8/26/24 | | 800,000 | | 805,858 | |
Bank of America,
Sub. Notes | | 3.95 | | 4/21/25 | | 900,000 | | 887,308 | |
Bank of America,
Sub. Notes | | 4.75 | | 4/21/45 | | 500,000 | | 489,983 | |
Bank of Montreal,
Sr. Unscd. Notes | | 2.50 | | 1/11/17 | | 1,000,000 | | 1,017,775 | |
Bank of Nova Scotia,
Sr. Unscd. Notes | | 1.10 | | 12/13/16 | | 750,000 | | 751,741 | |
Bank of Nova Scotia,
Sr. Unscd. Notes | | 1.30 | | 7/21/17 | | 1,000,000 | | 999,553 | |
Barclays,
Sr. Unscd. Notes | | 3.65 | | 3/16/25 | | 750,000 | | 727,219 | |
Barclays Bank,
Sr. Unscd. Notes | | 6.75 | | 5/22/19 | | 1,300,000 | | 1,501,217 | |
BB&T,
Sr. Unscd. Notes | | 2.45 | | 1/15/20 | | 1,000,000 | | 1,007,705 | |
BB&T,
Sub. Notes | | 4.90 | | 6/30/17 | | 150,000 | | 157,810 | |
Bear Stearns,
Sr. Unscd. Notes | | 7.25 | | 2/1/18 | | 1,770,000 | | 1,980,678 | |
Bear Stearns,
Sub. Notes | | 5.55 | | 1/22/17 | | 500,000 | | 524,034 | |
Berkshire Hathaway,
Sr. Unscd. Notes | | 2.10 | | 8/14/19 | | 1,000,000 | | 1,014,544 | |
Berkshire Hathaway Finance,
Gtd. Notes | | 5.75 | | 1/15/40 | | 675,000 | | 807,342 | |
Blackrock,
Sr. Unscd. Notes | | 3.50 | | 3/18/24 | | 500,000 | | 513,545 | |
Blackrock,
Sr. Unscd. Notes, Ser. 2 | | 5.00 | | 12/10/19 | | 500,000 | | 557,966 | |
BNP Paribas,
Gtd. Notes | | 5.00 | | 1/15/21 | | 1,400,000 | | 1,568,435 | |
Boston Properties,
Sr. Unscd. Bonds | | 5.63 | | 11/15/20 | | 1,000,000 | | 1,129,174 | |
BPCE,
Gtd. Notes | | 2.50 | | 7/15/19 | | 1,000,000 | | 1,011,442 | |
BPCE,
Gtd. Notes | | 4.00 | | 4/15/24 | | 200,000 | c | 208,634 | |
20
| | | | | | | | | | | | | | | | | | | |
Bonds and Notes - 99.9% (continued) | | Coupon
Rate (%) | | Maturity
Date | | Principal
Amount ($) | | Value ($) | |
Financials - 8.6% (continued) | | | | | |
Branch Banking & Trust,
Sr. Unscd. Notes | | 1.35 | | 10/1/17 | | 500,000 | | 500,042 | |
Brookfield Asset Management,
Sr. Unscd. Notes | | 4.00 | | 1/15/25 | | 500,000 | | 495,560 | |
Capital One Bank USA,
Sr. Unscd. Notes | | 1.15 | | 11/21/16 | | 500,000 | | 498,793 | |
Capital One Bank USA,
Sr. Unscd. Notes | | 1.20 | | 2/13/17 | | 750,000 | | 746,162 | |
Capital One Financial,
Sr. Unscd. Notes | | 2.45 | | 4/24/19 | | 1,000,000 | | 1,001,735 | |
Capital One Financial,
Sr. Unscd. Notes | | 4.75 | | 7/15/21 | | 730,000 | | 801,679 | |
CBL & Associates,
Gtd. Notes | | 5.25 | | 12/1/23 | | 200,000 | | 205,164 | |
Chubb,
Sr. Unscd. Notes | | 6.00 | | 5/11/37 | | 540,000 | | 670,184 | |
Citigroup,
Sr. Unscd. Bonds | | 1.30 | | 11/15/16 | | 400,000 | | 400,942 | |
Citigroup,
Sr. Unscd. Notes | | 6.13 | | 11/21/17 | | 2,135,000 | | 2,322,906 | |
Citigroup,
Sr. Unscd. Notes | | 2.15 | | 7/30/18 | | 940,000 | | 944,173 | |
Citigroup,
Sr. Unscd. Notes | | 8.50 | | 5/22/19 | | 760,000 | | 918,268 | |
Citigroup,
Sr. Unscd. Notes | | 5.38 | | 8/9/20 | | 300,000 | | 337,715 | |
Citigroup,
Sr. Unscd. Notes | | 2.65 | | 10/26/20 | | 1,000,000 | | 998,756 | |
Citigroup,
Sr. Unscd. Notes | | 3.88 | | 10/25/23 | | 400,000 | | 414,360 | |
Citigroup,
Sr. Unscd. Notes | | 3.75 | | 6/16/24 | | 1,000,000 | | 1,021,955 | |
Citigroup,
Sr. Unscd. Notes | | 6.63 | | 1/15/28 | | 100,000 | | 122,229 | |
Citigroup,
Sr. Unscd. Notes | | 4.95 | | 11/7/43 | | 1,000,000 | | 1,061,348 | |
Citigroup,
Sub. Notes | | 4.05 | | 7/30/22 | | 1,750,000 | | 1,799,870 | |
Citigroup,
Sub. Notes | | 5.50 | | 9/13/25 | | 500,000 | | 549,143 | |
Citizens Bank,
Sr. Unscd. Notes | | 2.45 | | 12/4/19 | | 1,000,000 | | 993,483 | |
CME Group,
Sr. Unscd. Notes | | 3.00 | | 3/15/25 | | 500,000 | | 497,746 | |
Comerica,
Sub. Notes | | 3.80 | | 7/22/26 | | 1,000,000 | | 993,482 | |
Commonwealth Bank of Australia New York,
Sr. Unscd. Bonds | | 1.40 | | 9/8/17 | | 500,000 | | 500,717 | |
Commonwealth Bank of Australia New York,
Sr. Unscd. Notes | | 2.50 | | 9/20/18 | | 650,000 | | 663,783 | |
Credit Suisse,
Sr. Unscd. Notes | | 4.38 | | 8/5/20 | | 1,000,000 | | 1,088,839 | |
Credit Suisse Group Fund,
Gtd. Notes | | 4.88 | | 5/15/45 | | 280,000 | b | 281,170 | |
21
STATEMENT OF INVESTMENTS (continued)
| | | | | | | | | | | | | | | | | | | |
Bonds and Notes - 99.9% (continued) | | Coupon
Rate (%) | | Maturity
Date | | Principal
Amount ($) | | Value ($) | |
Financials - 8.6% (continued) | | | | | |
Credit Suisse New York,
Sr. Unscd. Notes | | 3.63 | | 9/9/24 | | 500,000 | | 504,266 | |
Credit Suisse New York,
Sub. Notes | | 6.00 | | 2/15/18 | | 1,000,000 | | 1,083,352 | |
DDR,
Sr. Unscd. Notes | | 3.38 | | 5/15/23 | | 1,000,000 | | 953,476 | |
Deutsche Bank,
Sub. Notes | | 4.50 | | 4/1/25 | | 1,000,000 | | 973,504 | |
Deutsche Bank London,
Sr. Unscd. Notes | | 6.00 | | 9/1/17 | | 845,000 | | 908,261 | |
Deutsche Bank London,
Sr. Unscd. Notes | | 2.50 | | 2/13/19 | | 750,000 | | 756,129 | |
Discover Bank,
Sr. Unscd. Bonds | | 2.00 | | 2/21/18 | | 500,000 | | 496,530 | |
Discover Bank,
Sr. Unscd. Notes | | 4.25 | | 3/13/26 | | 800,000 | | 810,892 | |
ERP Operating,
Sr. Unscd. Notes | | 2.38 | | 7/1/19 | | 1,000,000 | | 1,008,816 | |
Federal Realty Investment,
Sr. Unscd. Notes | | 4.50 | | 12/1/44 | | 750,000 | | 746,287 | |
Fidelity National Information Services,
Gtd. Notes | | 2.00 | | 4/15/18 | | 500,000 | | 493,004 | |
Fidelity National Information Services,
Sr. Unscd. Notes | | 3.63 | | 10/15/20 | | 450,000 | | 458,508 | |
Fidelity National Information Services,
Sr. Unscd. Notes | | 5.00 | | 10/15/25 | | 350,000 | | 362,565 | |
Fifth Third Bancorp,
Sr. Unscd. Notes | | 3.50 | | 3/15/22 | | 1,000,000 | | 1,019,920 | |
First American Financial,
Sr. Unscd. Notes | | 4.60 | | 11/15/24 | | 500,000 | | 510,481 | |
First Republic Bank,
Sr. Unscd. Bonds | | 2.38 | | 6/17/19 | | 500,000 | | 499,490 | |
First Tennessee Bank,
Sr. Unscd. Notes | | 2.95 | | 12/1/19 | | 500,000 | | 501,874 | |
Fiserv,
Gtd. Notes | | 4.63 | | 10/1/20 | | 400,000 | | 431,433 | |
Ford Motor Credit,
Sr. Unscd. Notes | | 2.38 | | 1/16/18 | | 500,000 | | 502,891 | |
Ford Motor Credit,
Sr. Unscd. Notes | | 2.24 | | 6/15/18 | | 1,070,000 | | 1,067,155 | |
Ford Motor Credit,
Sr. Unscd. Notes | | 8.13 | | 1/15/20 | | 971,000 | | 1,164,065 | |
Ford Motor Credit,
Sr. Unscd. Notes | | 4.38 | | 8/6/23 | | 1,250,000 | | 1,321,950 | |
General Electric Capital,
Gtd. Bonds | | 5.63 | | 9/15/17 | | 1,000,000 | | 1,079,659 | |
General Electric Capital,
Gtd. Bonds | | 2.20 | | 1/9/20 | | 500,000 | | 505,244 | |
General Electric Capital,
Gtd. Notes | | 2.30 | | 4/27/17 | | 1,000,000 | | 1,018,845 | |
General Electric Capital,
Gtd. Notes | | 1.25 | | 5/15/17 | | 1,225,000 | | 1,229,774 | |
General Electric Capital,
Gtd. Notes | | 5.63 | | 5/1/18 | | 1,335,000 | | 1,467,449 | |
General Electric Capital,
Gtd. Notes | | 5.55 | | 5/4/20 | | 500,000 | | 570,900 | |
22
| | | | | | | | | | | | | | | | |
Bonds and Notes - 99.9% (continued) | | Coupon
Rate (%) | | Maturity
Date | | Principal
Amount ($) | | Value ($) | |
Financials - 8.6% (continued) | | | | | |
General Electric Capital,
Gtd. Notes | | 4.65 | | 10/17/21 | | 1,400,000 | | 1,563,261 | |
General Electric Capital,
Gtd. Notes | | 3.10 | | 1/9/23 | | 1,000,000 | | 1,013,203 | |
General Electric Capital,
Gtd. Notes | | 5.88 | | 1/14/38 | | 1,000,000 | | 1,236,670 | |
General Electric Capital,
Gtd. Notes, Ser. A | | 6.75 | | 3/15/32 | | 2,000,000 | | 2,627,116 | |
General Motors Financial,
Gtd. Notes | | 2.40 | | 4/10/18 | | 910,000 | | 901,688 | |
General Motors Financial,
Gtd. Notes | | 3.20 | | 7/13/20 | | 500,000 | | 496,577 | |
General Motors Financial,
Gtd. Notes | | 4.38 | | 9/25/21 | | 500,000 | | 519,415 | |
General Motors Financial,
Gtd. Notes | | 4.30 | | 7/13/25 | | 500,000 | | 509,824 | |
Goldman Sachs Group,
Sr. Unscd. Notes | | 6.25 | | 9/1/17 | | 190,000 | | 206,271 | |
Goldman Sachs Group,
Sr. Unscd. Notes | | 5.95 | | 1/18/18 | | 1,000,000 | | 1,091,515 | |
Goldman Sachs Group,
Sr. Unscd. Notes | | 6.15 | | 4/1/18 | | 680,000 | | 748,806 | |
Goldman Sachs Group,
Sr. Unscd. Notes | | 7.50 | | 2/15/19 | | 1,000,000 | | 1,166,001 | |
Goldman Sachs Group,
Sr. Unscd. Notes | | 2.55 | | 10/23/19 | | 1,000,000 | | 1,007,968 | |
Goldman Sachs Group,
Sr. Unscd. Notes | | 5.38 | | 3/15/20 | | 1,000,000 | | 1,117,600 | |
Goldman Sachs Group,
Sr. Unscd. Notes | | 2.60 | | 4/23/20 | | 500,000 | | 502,361 | |
Goldman Sachs Group,
Sr. Unscd. Notes | | 2.75 | | 9/15/20 | | 500,000 | | 502,510 | |
Goldman Sachs Group,
Sr. Unscd. Notes | | 3.63 | | 1/22/23 | | 1,000,000 | | 1,022,053 | |
Goldman Sachs Group,
Sr. Unscd. Notes | | 3.75 | | 5/22/25 | | 1,000,000 | | 1,008,438 | |
Goldman Sachs Group,
Sr. Unscd. Notes | | 6.13 | | 2/15/33 | | 475,000 | | 571,805 | |
Goldman Sachs Group,
Sr. Unscd. Notes | | 6.25 | | 2/1/41 | | 1,000,000 | | 1,212,367 | |
Goldman Sachs Group,
Sub. Notes | | 4.25 | | 10/21/25 | | 130,000 | | 130,211 | |
Goldman Sachs Group,
Sub. Notes | | 6.75 | | 10/1/37 | | 1,500,000 | | 1,813,264 | |
Goldman Sachs Group,
Sub. Notes | | 5.15 | | 5/22/45 | | 750,000 | | 755,692 | |
HCP,
Sr. Unscd. Notes | | 4.25 | | 11/15/23 | | 400,000 | | 402,401 | |
HCP,
Sr. Unscd. Notes | | 4.20 | | 3/1/24 | | 750,000 | | 752,298 | |
Health Care REIT,
Sr. Unscd. Notes | | 4.95 | | 1/15/21 | | 600,000 | | 650,431 | |
Host Hotels & Resorts,
Sr. Unscd. Notes | | 6.00 | | 10/1/21 | | 500,000 | | 558,524 | |
HSBC Holdings,
Sr. Unscd. Notes | | 5.10 | | 4/5/21 | | 1,500,000 | | 1,678,261 | |
23
STATEMENT OF INVESTMENTS (continued)
| | | | | | | | | | | | | | | | | | | |
Bonds and Notes - 99.9% (continued) | | Coupon
Rate (%) | | Maturity
Date | | Principal
Amount ($) | | Value ($) | |
Financials - 8.6% (continued) | | | | | |
HSBC Holdings,
Sub. Notes | | 4.25 | | 3/14/24 | | 500,000 | | 505,753 | |
HSBC Holdings,
Sub. Notes | | 6.50 | | 5/2/36 | | 1,350,000 | | 1,634,823 | |
HSBC Holdings,
Sub. Notes | | 6.50 | | 9/15/37 | | 555,000 | | 678,021 | |
Industrial & Commercial Bank of China,
Sr. Unscd. Notes | | 2.35 | | 11/13/17 | | 500,000 | | 504,005 | |
Intercontinental Exchange Group,
Gtd. Notes | | 4.00 | | 10/15/23 | | 350,000 | | 362,205 | |
Intesa Sanpaolo,
Gtd. Bonds | | 5.25 | | 1/12/24 | | 400,000 | | 435,649 | |
Invesco Finance,
Gtd. Notes | | 4.00 | | 1/30/24 | | 250,000 | | 261,267 | |
Jefferies Group,
Sr. Unscd. Debs. | | 6.45 | | 6/8/27 | | 35,000 | | 36,649 | |
Jefferies Group,
Sr. Unscd. Notes | | 5.13 | | 1/20/23 | | 500,000 | | 501,149 | |
John Deere Capital,
Sr. Unscd. Notes | | 1.13 | | 6/12/17 | | 115,000 | | 115,046 | |
John Deere Capital,
Sr. Unscd. Notes | | 1.55 | | 12/15/17 | | 750,000 | | 754,522 | |
John Deere Capital,
Sr. Unscd. Notes | | 1.35 | | 1/16/18 | | 400,000 | | 399,975 | |
John Deere Capital,
Sr. Unscd. Notes | | 3.15 | | 10/15/21 | | 1,900,000 | | 1,954,361 | |
JPMorgan Chase & Co.,
Sr. Unscd. Notes | | 6.00 | | 1/15/18 | | 500,000 | | 545,822 | |
JPMorgan Chase & Co.,
Sr. Unscd. Notes | | 6.30 | | 4/23/19 | | 1,500,000 | | 1,706,106 | |
JPMorgan Chase & Co.,
Sr. Unscd. Notes | | 4.25 | | 10/15/20 | | 500,000 | | 535,875 | |
JPMorgan Chase & Co.,
Sr. Unscd. Notes | | 3.20 | | 1/25/23 | | 1,000,000 | | 998,123 | |
JPMorgan Chase & Co.,
Sr. Unscd. Notes | | 3.13 | | 1/23/25 | | 1,500,000 | | 1,458,973 | |
JPMorgan Chase & Co.,
Sr. Unscd. Notes | | 3.90 | | 7/15/25 | | 750,000 | | 768,895 | |
JPMorgan Chase & Co.,
Sr. Unscd. Notes | | 6.40 | | 5/15/38 | | 650,000 | | 825,231 | |
JPMorgan Chase & Co.,
Sr. Unscd. Notes | | 4.85 | | 2/1/44 | | 1,150,000 | | 1,228,102 | |
JPMorgan Chase & Co.,
Sub. Notes | | 3.88 | | 9/10/24 | | 1,000,000 | | 1,000,793 | |
JPMorgan Chase & Co.,
Sub. Notes | | 4.13 | | 12/15/26 | | 500,000 | | 504,361 | |
JPMorgan Chase Bank,
Sub. Notes | | 6.00 | | 10/1/17 | | 150,000 | | 162,383 | |
KeyBank,
Sr. Unscd. Notes | | 3.30 | | 6/1/25 | | 400,000 | | 397,599 | |
KeyBank,
Sub. Notes | | 6.95 | | 2/1/28 | | 100,000 | | 126,583 | |
Kimco Realty,
Sr. Unscd. Notes | | 3.20 | | 5/1/21 | | 250,000 | | 252,122 | |
Kimco Realty,
Sr. Unscd. Notes | | 3.13 | | 6/1/23 | | 250,000 | | 242,677 | |
24
| | | | | | | | | | | |
Bonds and Notes - 99.9% (continued) | | Coupon
Rate (%) | | Maturity
Date | | Principal
Amount ($) | | Value ($) | |
Financials - 8.6% (continued) | | | | | |
Lazard Group,
Sr. Unscd. Notes | | 4.25 | | 11/14/20 | | 250,000 | | 261,818 | |
Legg Mason,
Sr. Unscd. Notes | | 5.63 | | 1/15/44 | | 400,000 | | 416,826 | |
Lexington Realty Trust,
Gtd. Notes | | 4.40 | | 6/15/24 | | 500,000 | | 500,885 | |
Lincoln National,
Sr. Unscd. Notes | | 6.15 | | 4/7/36 | | 575,000 | | 674,083 | |
Lloyds Bank,
Gtd. Notes | | 1.75 | | 3/16/18 | | 500,000 | | 501,477 | |
Lloyds Bank,
Gtd. Notes | | 2.35 | | 9/5/19 | | 500,000 | | 501,401 | |
Lloyds Bank,
Gtd. Notes | | 2.40 | | 3/17/20 | | 500,000 | | 500,285 | |
Loews,
Sr. Unscd. Notes | | 2.63 | | 5/15/23 | | 250,000 | | 239,256 | |
Manufacturers & Traders Trust Co.,
Sr. Unscd. Notes | | 2.10 | | 2/6/20 | | 500,000 | | 494,846 | |
Marsh & McLennan Cos.,
Sr. Unscd. Notes | | 2.35 | | 3/6/20 | | 500,000 | | 502,128 | |
Marsh & McLennan Cos.,
Sr. Unscd. Notes | | 5.88 | | 8/1/33 | | 275,000 | | 321,502 | |
Mastercard,
Sr. Unscd. Notes | | 2.00 | | 4/1/19 | | 500,000 | | 504,626 | |
McGraw Hill Financial,
Gtd. Notes | | 4.40 | | 2/15/26 | | 230,000 | b | 235,885 | |
Merrill Lynch & Co.,
Sr. Unscd. Notes | | 6.88 | | 4/25/18 | | 2,640,000 | | 2,948,355 | |
Merrill Lynch & Co.,
Sr. Unscd. Notes | | 6.88 | | 11/15/18 | | 150,000 | | 170,739 | |
MetLife,
Sr. Unscd. Debs. | | 1.90 | | 12/15/17 | | 1,000,000 | | 1,004,264 | |
MetLife,
Sr. Unscd. Notes | | 3.60 | | 4/10/24 | | 250,000 | | 257,294 | |
MetLife,
Sr. Unscd. Notes | | 6.38 | | 6/15/34 | | 700,000 | | 876,859 | |
MetLife,
Sr. Unscd. Notes | | 4.05 | | 3/1/45 | | 750,000 | | 711,717 | |
Mid-America Apartments,
Sr. Unscd. Notes | | 4.30 | | 10/15/23 | | 400,000 | | 407,154 | |
Morgan Stanley,
Sr. Unscd. Notes | | 5.75 | | 10/18/16 | | 875,000 | | 914,844 | |
Morgan Stanley,
Sr. Unscd. Notes | | 5.45 | | 1/9/17 | | 1,100,000 | | 1,152,442 | |
Morgan Stanley,
Sr. Unscd. Notes | | 6.63 | | 4/1/18 | | 1,200,000 | | 1,333,488 | |
Morgan Stanley,
Sr. Unscd. Notes | | 2.13 | | 4/25/18 | | 1,000,000 | | 1,008,390 | |
Morgan Stanley,
Sr. Unscd. Notes | | 7.30 | | 5/13/19 | | 1,300,000 | | 1,516,833 | |
Morgan Stanley,
Sr. Unscd. Notes | | 5.50 | | 1/26/20 | | 1,000,000 | | 1,115,626 | |
Morgan Stanley,
Sr. Unscd. Notes | | 3.75 | | 2/25/23 | | 500,000 | | 515,969 | |
Morgan Stanley,
Sr. Unscd. Notes | | 4.00 | | 7/23/25 | | 500,000 | | 514,794 | |
25
STATEMENT OF INVESTMENTS (continued)
| | | | | | | | | | | | | | | | | | | |
Bonds and Notes - 99.9% (continued) | | Coupon
Rate (%) | | Maturity
Date | | Principal
Amount ($) | | Value ($) | |
Financials - 8.6% (continued) | | | | | |
Morgan Stanley,
Sr. Unscd. Notes | | 7.25 | | 4/1/32 | | 300,000 | | 395,946 | |
Morgan Stanley,
Sr. Unscd. Notes | | 6.38 | | 7/24/42 | | 700,000 | | 881,914 | |
Morgan Stanley,
Sub. Notes | | 4.10 | | 5/22/23 | | 1,000,000 | | 1,017,751 | |
Morgan Stanley,
Sub. Notes | | 3.95 | | 4/23/27 | | 1,000,000 | | 974,924 | |
MUFG Americas Holdings Corp.,
Sr. Unscd. Notes | | 1.63 | | 2/9/18 | | 500,000 | | 499,169 | |
MUFG Union Bank,
Sr. Unscd. Notes | | 2.63 | | 9/26/18 | | 500,000 | | 508,749 | |
Nasdaq,
Sr. Unscd. Notes | | 4.25 | | 6/1/24 | | 500,000 | | 508,904 | |
National Australia Bank,
Sr. Unscd. Notes | | 2.63 | | 7/23/20 | | 260,000 | | 263,214 | |
National City,
Sub. Notes | | 6.88 | | 5/15/19 | | 600,000 | | 688,759 | |
National Retail Properties,
Sr. Unscd. Notes | | 3.90 | | 6/15/24 | | 500,000 | | 500,239 | |
National Rural Utilities Cooperative Finance,
Coll. Trust Bonds | | 5.45 | | 2/1/18 | | 1,100,000 | | 1,190,411 | |
Nomura Holdings,
Sr. Unscd. Notes | | 6.70 | | 3/4/20 | | 700,000 | | 815,884 | |
Northern Trust,
Sub. Notes | | 3.95 | | 10/30/25 | | 846,000 | | 887,356 | |
OeKB,
Gov't Gtd. Notes | | 1.63 | | 3/12/19 | | 500,000 | | 504,411 | |
OeKB,
Gov't Gtd. Notes | | 1.50 | | 10/21/20 | | 1,280,000 | | 1,262,228 | |
Omega Healthcare Investors,
Gtd. Notes | | 4.50 | | 1/15/25 | | 300,000 | | 294,082 | |
PartnerRe Finance,
Gtd. Notes | | 5.50 | | 6/1/20 | | 159,000 | | 175,882 | |
PNC Bank,
Sr. Unscd. Notes | | 2.60 | | 7/21/20 | | 1,000,000 | | 1,011,589 | |
PNC Bank,
Sub. Notes | | 3.80 | | 7/25/23 | | 1,000,000 | | 1,036,068 | |
Principal Financial Group,
Gtd. Notes | | 6.05 | | 10/15/36 | | 225,000 | | 261,978 | |
ProAssurance,
Sr. Unscd. Notes | | 5.30 | | 11/15/23 | | 350,000 | | 375,129 | |
Progressive,
Sr. Unscd. Notes | | 6.63 | | 3/1/29 | | 100,000 | | 129,040 | |
Progressive,
Sr. Unscd. Notes | | 4.35 | | 4/25/44 | | 500,000 | | 506,306 | |
ProLogis,
Gtd. Notes | | 6.88 | | 3/15/20 | | 505,000 | | 582,882 | |
Prudential Financial,
Sr. Unscd. Notes | | 4.60 | | 5/15/44 | | 1,250,000 | | 1,274,176 | |
Rabobank Nederland,
Gtd. Notes | | 3.38 | | 1/19/17 | | 2,250,000 | | 2,310,615 | |
Rabobank Nederland,
Gtd. Notes | | 3.95 | | 11/9/22 | | 1,000,000 | | 1,012,558 | |
26
| | | | | | | | | | | | | | | | |
Bonds and Notes - 99.9% (continued) | | Coupon
Rate (%) | | Maturity
Date | | Principal
Amount ($) | | Value ($) | |
Financials - 8.6% (continued) | | | | | |
Rabobank Nederland,
Gtd. Notes | | 5.25 | | 5/24/41 | | 500,000 | | 567,745 | |
Realty Income,
Sr. Unscd. Notes | | 2.00 | | 1/31/18 | | 200,000 | | 201,040 | |
Realty Income,
Sr. Unscd. Notes | | 3.88 | | 7/15/24 | | 500,000 | | 497,597 | |
Regency Centers,
Gtd. Notes | | 5.88 | | 6/15/17 | | 200,000 | | 212,499 | |
Regions Financial,
Sr. Unscd. Notes | | 2.00 | | 5/15/18 | | 585,000 | | 584,914 | |
Reinsurance Group of America,
Sr. Unscd. Notes | | 4.70 | | 9/15/23 | | 350,000 | | 373,759 | |
Royal Bank of Canada,
Sr. Unscd. Bonds | | 1.25 | | 6/16/17 | | 500,000 | | 500,560 | |
Royal Bank of Canada,
Sr. Unscd. Bonds | | 2.15 | | 3/6/20 | | 750,000 | | 748,355 | |
Royal Bank of Canada,
Sr. Unscd. Notes | | 1.20 | | 1/23/17 | | 110,000 | | 110,352 | |
Royal Bank of Canada,
Sr. Unscd. Notes | | 1.40 | | 10/13/17 | | 1,000,000 | | 999,017 | |
Royal Bank of Canada,
Sr. Unscd. Notes | | 1.80 | | 7/30/18 | | 250,000 | | 250,769 | |
Royal Bank of Scotland,
Gtd. Notes | | 6.13 | | 1/11/21 | | 1,000,000 | | 1,159,243 | |
Santander Bank,
Sr. Unscd. Notes | | 2.00 | | 1/12/18 | | 500,000 | | 498,131 | |
Santander UK Group Holdings,
Sr. Unscd. Notes | | 2.88 | | 10/16/20 | | 1,000,000 | | 1,001,470 | |
Simon Property Group,
Sr. Unscd. Notes | | 2.20 | | 2/1/19 | | 500,000 | | 504,778 | |
Simon Property Group,
Sr. Unscd. Notes | | 6.75 | | 2/1/40 | | 500,000 | | 665,075 | |
State Street,
Sr. Unscd. Notes | | 2.55 | | 8/18/20 | | 310,000 | | 313,402 | |
State Street,
Sr. Unscd. Notes | | 3.70 | | 11/20/23 | | 250,000 | | 261,279 | |
State Street,
Sr. Unscd. Notes | | 3.55 | | 8/18/25 | | 290,000 | | 298,109 | |
State Street Bank & Trust,
Sub. Notes | | 5.25 | | 10/15/18 | | 200,000 | | 220,435 | |
Sumitomo Mitsui Banking,
Gtd. Bonds | | 3.00 | | 1/18/23 | | 290,000 | | 287,529 | |
Sumitomo Mitsui Banking,
Gtd. Notes | | 1.35 | | 7/11/17 | | 500,000 | | 497,750 | |
Sumitomo Mitsui Banking,
Gtd. Notes | | 1.50 | | 1/18/18 | | 390,000 | | 388,102 | |
Sumitomo Mitsui Banking,
Gtd. Notes | | 3.40 | | 7/11/24 | | 500,000 | | 500,140 | |
SunTrust Bank,
Sr. Unscd. Notes | | 2.75 | | 5/1/23 | | 500,000 | | 482,568 | |
SunTrust Banks,
Sr. Unscd. Notes | | 2.35 | | 11/1/18 | | 500,000 | | 503,233 | |
Svenska Handelsbanken,
Gtd. Notes | | 2.25 | | 6/17/19 | | 1,000,000 | | 1,007,916 | |
Synchrony Financial,
Sr. Unscd. Notes | | 4.25 | | 8/15/24 | | 1,000,000 | | 1,005,461 | |
27
STATEMENT OF INVESTMENTS (continued)
| | | | | | | | | | | | | | | | | | | |
Bonds and Notes - 99.9% (continued) | | Coupon
Rate (%) | | Maturity
Date | | Principal
Amount ($) | | Value ($) | |
Financials - 8.6% (continued) | | | | | |
Tanger Properties,
Sr. Unscd. Notes | | 3.75 | | 12/1/24 | | 500,000 | | 495,732 | |
TD Ameritrade Holding,
Sr. Unscd. Notes | | 2.95 | | 4/1/22 | | 500,000 | | 498,452 | |
Toronto-Dominion Bank,
Sr. Unscd. Bonds | | 2.63 | | 9/10/18 | | 750,000 | | 770,797 | |
Toronto-Dominion Bank,
Sr. Unscd. Notes | | 1.63 | | 3/13/18 | | 1,000,000 | | 1,003,304 | |
Toyota Motor Credit,
Sr. Unscd. Notes | | 1.13 | | 5/16/17 | | 500,000 | | 501,304 | |
Toyota Motor Credit,
Sr. Unscd. Notes | | 1.45 | | 1/12/18 | | 500,000 | c | 501,053 | |
Toyota Motor Credit,
Sr. Unscd. Notes | | 2.63 | | 1/10/23 | | 1,000,000 | | 987,377 | |
Travelers Cos.,
Sr. Unscd. Notes | | 5.90 | | 6/2/19 | | 500,000 | | 569,671 | |
Travelers Cos.,
Sr. Unscd. Notes | | 3.90 | | 11/1/20 | | 1,000,000 | | 1,073,481 | |
U.S. Bancorp,
Sr. Unscd. Notes | | 3.00 | | 3/15/22 | | 1,400,000 | | 1,426,526 | |
U.S. Bank,
Sr. Unscd. Notes | | 1.10 | | 1/30/17 | | 1,000,000 | | 1,002,477 | |
UBS AG Stamford,
Sr. Unscd. Notes | | 1.38 | | 8/14/17 | | 500,000 | | 499,139 | |
UBS AG/Stamford,
Sr. Unscd. Notes | | 5.88 | | 12/20/17 | | 442,000 | | 479,244 | |
UBS AG/Stamford,
Sr. Unscd. Notes | | 5.75 | | 4/25/18 | | 320,000 | | 349,324 | |
UBS AG/Stamford,
Sr. Unscd. Notes | | 4.88 | | 8/4/20 | | 293,000 | | 325,957 | |
Unilever Capital,
Gtd. Notes | | 2.20 | | 3/6/19 | | 500,000 | | 508,919 | |
Unilever Capital,
Gtd. Notes | | 5.90 | | 11/15/32 | | 250,000 | | 324,308 | |
Ventas Realty,
Gtd. Notes | | 2.70 | | 4/1/20 | | 1,000,000 | | 992,765 | |
Voya Financial,
Gtd. Notes | | 5.50 | | 7/15/22 | | 750,000 | | 850,386 | |
Wachovia,
Sr. Unscd. Debs. | | 5.75 | | 6/15/17 | | 1,850,000 | | 1,980,029 | |
Wachovia,
Sr. Unscd. Notes | | 5.75 | | 2/1/18 | | 1,100,000 | | 1,199,273 | |
Weingarten Realty Investors,
Sr. Unscd. Notes | | 3.38 | | 10/15/22 | | 250,000 | | 245,145 | |
Wells Fargo & Co.,
Sr. Unscd. Notes | | 1.15 | | 6/2/17 | | 950,000 | | 950,917 | |
Wells Fargo & Co.,
Sr. Unscd. Notes | | 5.63 | | 12/11/17 | | 840,000 | | 912,060 | |
Wells Fargo & Co.,
Sr. Unscd. Notes | | 1.50 | | 1/16/18 | | 500,000 | | 501,966 | |
Wells Fargo & Co.,
Sr. Unscd. Notes | | 2.15 | | 1/15/19 | | 1,250,000 | | 1,263,190 | |
Wells Fargo & Co.,
Sr. Unscd. Notes | | 3.00 | | 2/19/25 | | 980,000 | | 948,612 | |
Wells Fargo & Co.,
Sub. Notes | | 4.10 | | 6/3/26 | | 500,000 | | 510,191 | |
28
| | | | | | | | | | | | | | | | | | | |
Bonds and Notes - 99.9% (continued) | | Coupon
Rate (%) | | Maturity
Date | | Principal
Amount ($) | | Value ($) | |
Financials - 8.6% (continued) | | | | | |
Wells Fargo & Co.,
Sub. Notes | | 5.38 | | 11/2/43 | | 500,000 | | 548,841 | |
Wells Fargo & Co.,
Sub. Notes | | 4.65 | | 11/4/44 | | 1,000,000 | | 989,739 | |
Wells Fargo & Co.,
Sub. Notes, Ser. M | | 3.45 | | 2/13/23 | | 500,000 | | 501,934 | |
Westpac Banking,
Sr. Unscd. Notes | | 4.88 | | 11/19/19 | | 700,000 | | 772,786 | |
Westpac Banking,
Sub. Bonds | | 4.63 | | 6/1/18 | | 500,000 | | 531,335 | |
Weyerhaeuser,
Sr. Unscd. Debs. | | 7.38 | | 3/15/32 | | 500,000 | | 625,988 | |
XLIT,
Gtd. Notes | | 6.38 | | 11/15/24 | | 1,400,000 | | 1,659,449 | |
| | 214,806,567 | |
Foreign/Governmental - 4.6% | | | | | |
African Development Bank,
Sr. Unscd. Notes | | 1.38 | | 2/12/20 | | 500,000 | | 496,695 | |
African Development Bank,
Sr. Unscd. Notes | | 2.38 | | 9/23/21 | | 1,000,000 | | 1,026,524 | |
AID-Israel,
Gtd. Bonds | | 5.50 | | 9/18/23 | | 450,000 | | 546,405 | |
Asian Development Bank,
Sr. Unscd. Bonds | | 2.13 | | 3/19/25 | | 500,000 | | 493,053 | |
Asian Development Bank,
Sr. Unscd. Notes | | 1.88 | | 10/23/18 | | 1,750,000 | | 1,786,535 | |
Asian Development Bank,
Sr. Unscd. Notes | | 2.00 | | 1/22/25 | | 1,000,000 | | 975,461 | |
Brazilian Government,
Sr. Unscd. Bonds | | 8.88 | | 4/15/24 | | 250,000 | | 300,000 | |
Brazilian Government,
Sr. Unscd. Bonds | | 5.63 | | 1/7/41 | | 650,000 | | 534,625 | |
Brazilian Government,
Sr. Unscd. Notes | | 5.88 | | 1/15/19 | | 1,000,000 | c | 1,068,500 | |
Brazilian Government,
Sr. Unscd. Notes | | 4.25 | | 1/7/25 | | 1,000,000 | c | 887,500 | |
Brazilian Government,
Unscd. Bonds | | 10.13 | | 5/15/27 | | 500,000 | | 656,875 | |
Canadian Government,
Sr. Unscd. Bonds | | 1.63 | | 2/27/19 | | 1,000,000 | | 1,012,361 | |
Chilean Government,
Sr. Unscd. Notes | | 3.13 | | 3/27/25 | | 1,000,000 | c | 1,010,000 | |
Colombian Government,
Sr. Unscd. Bonds | | 4.00 | | 2/26/24 | | 1,000,000 | | 984,000 | |
Colombian Government,
Sr. Unscd. Bonds | | 8.13 | | 5/21/24 | | 500,000 | | 619,500 | |
Colombian Government,
Sr. Unscd. Bonds | | 6.13 | | 1/18/41 | | 500,000 | | 516,250 | |
Colombian Government,
Sr. Unscd. Bonds | | 5.00 | | 6/15/45 | | 500,000 | | 446,250 | |
Colombian Government,
Sr. Unscd. Notes | | 7.38 | | 3/18/19 | | 1,500,000 | | 1,719,750 | |
Corporacion Andina de Fomento,
Sr. Unscd. Notes | | 8.13 | | 6/4/19 | | 1,000,000 | | 1,202,000 | |
Council of Europe,
Sr. Unscd. Notes | | 1.50 | | 6/19/17 | | 1,000,000 | | 1,010,522 | |
29
STATEMENT OF INVESTMENTS (continued)
| | | | | | | | | | | | | | | | | | | |
Bonds and Notes - 99.9% (continued) | | Coupon
Rate (%) | | Maturity
Date | | Principal
Amount ($) | | Value ($) | |
Foreign/Governmental - 4.6% (continued) | | | | | |
Council of Europe,
Sr. Unscd. Notes | | 1.75 | | 11/14/19 | | 500,000 | | 505,450 | |
European Bank for Reconstruction and Development,
Sr. Unscd. Notes | | 1.00 | | 2/16/17 | | 2,000,000 | | 2,010,880 | |
European Bank for Reconstruction and Development,
Sr. Unscd. Notes | | 1.75 | | 6/14/19 | | 500,000 | | 506,651 | |
European Investment Bank,
Sr. Unscd. Bonds | | 5.13 | | 5/30/17 | | 2,700,000 | | 2,881,348 | |
European Investment Bank,
Sr. Unscd. Bonds | | 1.00 | | 8/17/17 | | 2,000,000 | | 2,004,376 | |
European Investment Bank,
Sr. Unscd. Bonds | | 2.88 | | 9/15/20 | | 2,000,000 | | 2,109,522 | |
European Investment Bank,
Sr. Unscd. Notes | | 1.75 | | 3/15/17 | | 1,250,000 | | 1,267,474 | |
European Investment Bank,
Sr. Unscd. Notes | | 1.00 | | 12/15/17 | | 1,000,000 | | 1,000,278 | |
European Investment Bank,
Sr. Unscd. Notes | | 1.25 | | 5/15/18 | | 750,000 | | 752,666 | |
European Investment Bank,
Sr. Unscd. Notes | | 1.88 | | 3/15/19 | | 1,000,000 | | 1,017,732 | |
European Investment Bank,
Sr. Unscd. Notes | | 1.75 | | 6/17/19 | | 1,500,000 | | 1,517,863 | |
European Investment Bank,
Sr. Unscd. Notes | | 1.88 | | 2/10/25 | | 1,000,000 | | 964,271 | |
Export Development Canada,
Sr. Unscd. Bonds | | 1.75 | | 8/19/19 | | 400,000 | | 405,478 | |
Export Development Canada,
Sr. Unscd. Notes | | 0.63 | | 12/15/16 | | 500,000 | | 499,936 | |
Export-Import Bank of Korea,
Sr. Unscd. Bonds | | 2.88 | | 9/17/18 | | 1,000,000 | | 1,025,904 | |
Export-Import Bank of Korea,
Sr. Unscd. Notes | | 4.00 | | 1/14/24 | | 1,500,000 | | 1,605,472 | |
Finnish Government,
Sr. Unscd. Bonds | | 6.95 | | 2/15/26 | | 25,000 | | 33,881 | |
FMS Wertmanagement,
Gov't Gtd. Notes | | 1.75 | | 3/17/20 | | 750,000 | | 755,355 | |
Inter-American Development Bank,
Notes | | 0.88 | | 11/15/16 | | 1,000,000 | | 1,003,265 | |
Inter-American Development Bank,
Sr. Unscd. Notes | | 0.88 | | 3/15/18 | | 500,000 | | 498,695 | |
Inter-American Development Bank,
Sr. Unscd. Notes | | 1.75 | | 10/15/19 | | 1,000,000 | | 1,013,567 | |
Inter-American Development Bank,
Sr. Unsub. Notes | | 3.88 | | 9/17/19 | | 2,000,000 | | 2,180,980 | |
Inter-American Development Bank,
Unscd. Notes | | 4.25 | | 9/10/18 | | 540,000 | | 586,667 | |
International Bank for Reconstruction and Development,
Sr. Unscd. Notes | | 0.63 | | 5/2/17 | | 1,500,000 | | 1,494,631 | |
International Bank for Reconstruction and Development,
Sr. Unscd. Notes | | 1.13 | | 7/18/17 | | 500,000 | | 503,610 | |
30
| | | | | | | | | | | | | | | | | | | |
Bonds and Notes - 99.9% (continued) | | Coupon
Rate (%) | | Maturity
Date | | Principal
Amount ($) | | Value ($) | |
Foreign/Governmental - 4.6% (continued) | | | | | |
International Bank for Reconstruction and Development,
Sr. Unscd. Notes | | 1.00 | | 11/15/17 | | 2,540,000 | | 2,547,744 | |
International Bank for Reconstruction and Development,
Sr. Unscd. Notes | | 1.38 | | 4/10/18 | | 500,000 | | 504,988 | |
International Bank for Reconstruction and Development,
Sr. Unscd. Notes | | 1.00 | | 10/5/18 | | 730,000 | | 726,534 | |
International Bank for Reconstruction and Development,
Sr. Unscd. Notes | | 1.88 | | 3/15/19 | | 500,000 | | 509,911 | |
International Bank for Reconstruction and Development,
Sr. Unscd. Notes | | 1.88 | | 10/7/22 | | 350,000 | | 346,498 | |
International Bank for Reconstruction and Development,
Sr. Unscd. Notes | | 2.50 | | 7/29/25 | | 1,000,000 | | 1,019,111 | |
International Bank for Reconstruction and Development,
Sr. Unsub. Bonds | | 7.63 | | 1/19/23 | | 700,000 | | 958,446 | |
International Finance,
Sr. Unscd. Notes | | 0.63 | | 11/15/16 | | 500,000 | | 499,757 | |
International Finance,
Sr. Unscd. Notes | | 2.13 | | 11/17/17 | | 2,100,000 | | 2,149,988 | |
Italian Government,
Sr. Unscd. Notes | | 5.38 | | 6/12/17 | | 1,450,000 | | 1,536,005 | |
KFW,
Gov't Gtd. Bonds | | 4.50 | | 7/16/18 | | 3,600,000 | | 3,915,677 | |
KFW,
Gov't Gtd. Bonds | | 4.00 | | 1/27/20 | | 2,500,000 | | 2,749,410 | |
KFW,
Gov't Gtd. Bonds | | 2.50 | | 11/20/24 | | 500,000 | | 509,121 | |
KFW,
Gov't Gtd. Notes | | 4.88 | | 1/17/17 | | 1,240,000 | | 1,301,784 | |
KFW,
Gov't Gtd. Notes | | 0.75 | | 3/17/17 | | 1,500,000 | | 1,499,670 | |
KFW,
Gov't Gtd. Notes | | 1.00 | | 1/26/18 | | 500,000 | | 499,897 | |
KFW,
Gov't Gtd. Notes | | 1.13 | | 11/16/18 | | 1,000,000 | | 996,486 | |
KFW,
Gov't Gtd. Notes | | 4.88 | | 6/17/19 | | 1,000,000 | | 1,120,452 | |
KFW,
Gov't Gtd. Notes | | 1.75 | | 10/15/19 | | 1,000,000 | | 1,009,285 | |
KFW,
Gov't Gtd. Notes | | 2.00 | | 5/2/25 | | 1,100,000 | | 1,069,574 | |
Korea Development Bank,
Sr. Unscd. Notes | | 3.88 | | 5/4/17 | | 1,250,000 | | 1,291,297 | |
Korea Finance,
Sr. Unscd. Notes | | 2.88 | | 8/22/18 | | 500,000 | | 512,785 | |
Landwirtschaftliche Rentenbank,
Gov't Gtd. Bonds | | 5.13 | | 2/1/17 | | 950,000 | | 1,001,167 | |
Landwirtschaftliche Rentenbank,
Gov't Gtd. Notes | | 1.88 | | 9/17/18 | | 1,000,000 | | 1,019,292 | |
31
STATEMENT OF INVESTMENTS (continued)
| | | | | | | | | | | | | | | | | | | |
Bonds and Notes - 99.9% (continued) | | Coupon
Rate (%) | | Maturity
Date | | Principal
Amount ($) | | Value ($) | |
Foreign/Governmental - 4.6% (continued) | | | | | |
Landwirtschaftliche Rentenbank,
Gov't Gtd. Notes | | 2.38 | | 6/10/25 | | 500,000 | | 501,003 | |
Mexican Government,
Sr. Unscd. Notes | | 5.95 | | 3/19/19 | | 950,000 | | 1,069,462 | |
Mexican Government,
Sr. Unscd. Notes | | 3.63 | | 3/15/22 | | 500,000 | | 513,250 | |
Mexican Government,
Sr. Unscd. Notes | | 3.60 | | 1/30/25 | | 250,000 | | 249,375 | |
Mexican Government,
Sr. Unscd. Notes | | 6.75 | | 9/27/34 | | 1,340,000 | | 1,654,900 | |
Mexican Government,
Sr. Unscd. Notes | | 5.55 | | 1/21/45 | | 850,000 | | 904,187 | |
Mexican Government,
Sr. Unscd. Notes | | 4.60 | | 1/23/46 | | 1,000,000 | | 931,250 | |
Nordic Investment Bank,
Sr. Unscd. Notes | | 1.13 | | 3/19/18 | | 750,000 | | 752,356 | |
Panamanian Government,
Sr. Unscd. Bonds | | 5.20 | | 1/30/20 | | 200,000 | | 219,500 | |
Panamanian Government,
Sr. Unscd. Bonds | | 3.75 | | 3/16/25 | | 500,000 | | 496,250 | |
Panamanian Government,
Sr. Unscd. Bonds | | 6.70 | | 1/26/36 | | 700,000 | | 869,750 | |
Peruvian Government,
Sr. Unscd. Bonds | | 7.35 | | 7/21/25 | | 1,000,000 | | 1,292,500 | |
Peruvian Government,
Sr. Unscd. Bonds | | 6.55 | | 3/14/37 | | 370,000 | | 448,625 | |
Petroleos Mexicanos,
Gtd. Bonds | | 6.63 | | 6/15/35 | | 1,000,000 | | 988,750 | |
Petroleos Mexicanos,
Gtd. Bonds | | 5.50 | | 6/27/44 | | 500,000 | | 428,600 | |
Petroleos Mexicanos,
Gtd. Notes | | 6.00 | | 3/5/20 | | 500,000 | | 544,220 | |
Petroleos Mexicanos,
Gtd. Notes | | 4.88 | | 1/18/24 | | 1,000,000 | | 1,001,700 | |
Petroleos Mexicanos,
Gtd. Notes | | 5.50 | | 6/27/44 | | 1,000,000 | b | 857,200 | |
Petroleos Mexicanos,
Gtd. Notes | | 5.63 | | 1/23/46 | | 750,000 | b | 649,537 | |
Philippine Government,
Sr. Unscd. Bonds | | 6.50 | | 1/20/20 | | 400,000 | | 474,124 | |
Philippine Government,
Sr. Unscd. Bonds | | 10.63 | | 3/16/25 | | 800,000 | | 1,281,939 | |
Philippine Government,
Sr. Unscd. Bonds | | 9.50 | | 2/2/30 | | 800,000 | | 1,293,344 | |
Philippine Government,
Sr. Unscd. Bonds | | 5.00 | | 1/13/37 | | 500,000 | | 598,125 | |
Polish Government,
Sr. Unscd. Notes | | 6.38 | | 7/15/19 | | 1,450,000 | | 1,685,509 | |
Polish Government,
Sr. Unscd. Notes | | 5.00 | | 3/23/22 | | 1,400,000 | | 1,580,390 | |
Province of British Columbia Canada,
Sr. Unscd. Bonds, Ser. USD2 | | 6.50 | | 1/15/26 | | 925,000 | | 1,215,628 | |
Province of Manitoba Canada,
Unscd. Debs. | | 8.88 | | 9/15/21 | | 450,000 | | 601,573 | |
Province of Manitoba Canada,
Unscd. Debs., Ser. CB | | 8.80 | | 1/15/20 | | 10,000 | | 12,608 | |
32
| | | | | | | | | | | | | | | | | | | |
Bonds and Notes - 99.9% (continued) | | Coupon
Rate (%) | | Maturity
Date | | Principal
Amount ($) | | Value ($) | |
Foreign/Governmental - 4.6% (continued) | | | | | |
Province of Ontario Canada,
Sr. Unscd. Bonds | | 4.00 | | 10/7/19 | | 2,300,000 | | 2,488,467 | |
Province of Ontario Canada,
Sr. Unscd. Notes | | 4.95 | | 11/28/16 | | 1,000,000 | | 1,044,944 | |
Province of Quebec Canada,
Bonds, Ser. NJ | | 7.50 | | 7/15/23 | | 200,000 | | 265,405 | |
Province of Quebec Canada,
Sr. Unscd. Debs., Ser. PD | | 7.50 | | 9/15/29 | | 550,000 | | 806,371 | |
Province of Quebec Canada,
Unscd. Notes | | 5.13 | | 11/14/16 | | 725,000 | | 757,542 | |
Republic of Korea,
Sr. Unscd. Notes | | 7.13 | | 4/16/19 | | 1,000,000 | | 1,176,630 | |
República Orient Uruguay,
Sr. Unscd. Notes | | 4.38 | | 10/27/27 | | 1,000,000 | | 997,500 | |
South African Government,
Sr. Unscd. Notes | | 6.88 | | 5/27/19 | | 1,100,000 | | 1,228,810 | |
South African Government,
Sr. Unscd. Notes | | 4.67 | | 1/17/24 | | 1,000,000 | c | 1,012,500 | |
Swedish Export Credit,
Sr. Unscd. Notes | | 1.88 | | 6/17/19 | | 400,000 | | 405,481 | |
Turkish Government,
Sr. Unscd. Bonds | | 4.25 | | 4/14/26 | | 1,450,000 | c | 1,395,610 | |
Turkish Government,
Sr. Unscd. Notes | | 7.00 | | 3/11/19 | | 500,000 | | 558,937 | |
Turkish Government,
Sr. Unscd. Notes | | 3.25 | | 3/23/23 | | 800,000 | | 745,368 | |
Turkish Government,
Sr. Unscd. Notes | | 8.00 | | 2/14/34 | | 600,000 | | 769,620 | |
Turkish Government,
Sr. Unscd. Notes | | 4.88 | | 4/16/43 | | 1,000,000 | | 902,800 | |
Turkish Government,
Unscd. Notes | | 6.63 | | 2/17/45 | | 900,000 | | 1,037,025 | |
Uruguayan Government,
Sr. Unscd. Bonds | | 7.63 | | 3/21/36 | | 300,000 | | 381,000 | |
Uruguayan Government,
Sr. Unscd. Notes | | 4.50 | | 8/14/24 | | 750,000 | c | 781,875 | |
| | 114,605,177 | |
Health Care - 2.4% | | | | | |
Abbott Laboratories,
Sr. Unscd. Notes | | 4.13 | | 5/27/20 | | 500,000 | | 543,092 | |
AbbVie,
Sr. Unscd. Notes | | 1.80 | | 5/14/18 | | 1,140,000 | | 1,141,617 | |
AbbVie,
Sr. Unscd. Notes | | 2.90 | | 11/6/22 | | 1,500,000 | | 1,453,856 | |
AbbVie,
Sr. Unscd. Notes | | 3.60 | | 5/14/25 | | 170,000 | | 167,449 | |
AbbVie,
Sr. Unscd. Notes | | 4.40 | | 11/6/42 | | 1,000,000 | | 913,710 | |
Actavis Funding,
Gtd. Notes | | 1.85 | | 3/1/17 | | 750,000 | | 752,781 | |
Actavis Funding,
Gtd. Notes | | 3.00 | | 3/12/20 | | 795,000 | | 799,680 | |
Actavis Funding,
Gtd. Notes | | 3.45 | | 3/15/22 | | 750,000 | | 746,215 | |
Actavis Funding,
Gtd. Notes | | 4.85 | | 6/15/44 | | 500,000 | | 482,432 | |
33
STATEMENT OF INVESTMENTS (continued)
| | | | | | | | | | | | | | | | | | | |
Bonds and Notes - 99.9% (continued) | | Coupon
Rate (%) | | Maturity
Date | | Principal
Amount ($) | | Value ($) | |
Health Care - 2.4% (continued) | | | | | |
Actavis Funding,
Gtd. Notes | | 4.75 | | 3/15/45 | | 750,000 | | 720,009 | |
Aetna,
Sr. Unscd. Notes | | 3.95 | | 9/1/20 | | 1,000,000 | | 1,063,909 | |
Aetna,
Sr. Unscd. Notes | | 6.63 | | 6/15/36 | | 300,000 | | 369,587 | |
Aetna,
Sr. Unscd. Notes | | 4.75 | | 3/15/44 | | 500,000 | | 519,097 | |
AmerisourceBergen,
Sr. Unscd. Notes | | 1.15 | | 5/15/17 | | 650,000 | | 647,018 | |
Amgen,
Sr. Unscd. Notes | | 5.85 | | 6/1/17 | | 400,000 | | 427,682 | |
Amgen,
Sr. Unscd. Notes | | 4.10 | | 6/15/21 | | 2,000,000 | | 2,143,978 | |
Amgen,
Sr. Unscd. Notes | | 5.15 | | 11/15/41 | | 600,000 | | 621,902 | |
Amgen,
Sr. Unscd. Notes | | 4.40 | | 5/1/45 | | 410,000 | | 381,226 | |
Anthem,
Sr. Unscd. Notes | | 5.88 | | 6/15/17 | | 65,000 | | 69,386 | |
Anthem,
Sr. Unscd. Notes | | 2.30 | | 7/15/18 | | 750,000 | | 754,207 | |
Anthem,
Sr. Unscd. Notes | | 3.13 | | 5/15/22 | | 1,700,000 | | 1,687,430 | |
AstraZeneca,
Sr. Unscd. Notes | | 6.45 | | 9/15/37 | | 520,000 | | 681,320 | |
Baxalta,
Sr. Unscd. Notes | | 2.88 | | 6/23/20 | | 240,000 | b | 239,986 | |
Becton Dickinson,
Sr. Unscd. Notes | | 3.13 | | 11/8/21 | | 1,000,000 | | 1,006,717 | |
Becton Dickinson,
Sr. Unscd. Notes | | 3.88 | | 5/15/24 | | 650,000 | | 669,942 | |
Biogen,
Sr. Unscd. Notes | | 5.20 | | 9/15/45 | | 240,000 | | 242,952 | |
Boston Scientific,
Sr. Unscd. Notes | | 6.00 | | 1/15/20 | | 950,000 | | 1,065,045 | |
Bristol-Myers Squibb,
Sr. Unscd. Notes | | 2.00 | | 8/1/22 | | 750,000 | | 731,134 | |
Cardinal Health,
Sr. Unscd. Notes | | 1.70 | | 3/15/18 | | 600,000 | | 600,973 | |
Cardinal Health,
Sr. Unscd. Notes | | 3.20 | | 3/15/23 | | 500,000 | | 495,136 | |
Cardinal Health,
Sr. Unscd. Notes | | 4.60 | | 3/15/43 | | 300,000 | | 296,902 | |
Celgene,
Sr. Unscd. Notes | | 2.25 | | 5/15/19 | | 500,000 | | 502,741 | |
Celgene,
Sr. Unscd. Notes | | 4.00 | | 8/15/23 | | 750,000 | | 775,616 | |
Celgene,
Sr. Unscd. Notes | | 3.88 | | 8/15/25 | | 190,000 | | 190,878 | |
Celgene,
Sr. Unscsd. Notes | | 5.00 | | 8/15/45 | | 450,000 | | 453,324 | |
Cigna,
Sr. Unscd. Notes | | 4.50 | | 3/15/21 | | 1,150,000 | | 1,236,832 | |
Covidien International Finance,
Gtd. Notes | | 6.00 | | 10/15/17 | | 590,000 | | 642,692 | |
34
| | | | | | | | | | | | | | | | | | | |
Bonds and Notes - 99.9% (continued) | | Coupon
Rate (%) | | Maturity
Date | | Principal
Amount ($) | | Value ($) | |
Health Care - 2.4% (continued) | | | | | |
Dignity Health,
Scd. Bonds | | 2.64 | | 11/1/19 | | 1,000,000 | | 1,012,683 | |
Eli Lilly & Co.,
Sr. Unscd. Notes | | 5.55 | | 3/15/37 | | 750,000 | | 903,748 | |
Gilead Sciences,
Sr. Unscd. Notes | | 3.05 | | 12/1/16 | | 1,500,000 | | 1,536,847 | |
Gilead Sciences,
Sr. Unscd. Notes | | 4.50 | | 4/1/21 | | 1,000,000 | | 1,096,135 | |
Gilead Sciences,
Sr. Unscd. Notes | | 4.60 | | 9/1/35 | | 190,000 | | 193,268 | |
Gilead Sciences,
Sr. Unscd. Notes | | 4.80 | | 4/1/44 | | 500,000 | | 505,954 | |
Gilead Sciences,
Sr. Unscd. Notes | | 4.75 | | 3/1/46 | | 500,000 | | 507,001 | |
GlaxoSmithKline Capital,
Gtd. Bonds | | 5.65 | | 5/15/18 | | 740,000 | | 818,231 | |
GlaxoSmithKline Capital,
Gtd. Notes | | 2.80 | | 3/18/23 | | 628,000 | | 627,648 | |
GlaxoSmithKline Capital,
Gtd. Notes | | 4.20 | | 3/18/43 | | 500,000 | | 508,743 | |
Johnson & Johnson,
Sr. Unscd. Debs. | | 4.95 | | 5/15/33 | | 170,000 | | 195,446 | |
Johnson & Johnson,
Sr. Unscd. Notes | | 5.95 | | 8/15/37 | | 470,000 | | 608,594 | |
Laboratory Corp of America Holdings,
Sr. Unscd. Notes | | 4.00 | | 11/1/23 | | 750,000 | | 761,254 | |
McKesson,
Sr. Unscd. Notes | | 4.75 | | 3/1/21 | | 500,000 | | 546,688 | |
McKesson,
Sr. Unscd. Notes | | 4.88 | | 3/15/44 | | 500,000 | | 509,030 | |
Medco Health Solutions,
Gtd. Notes | | 7.13 | | 3/15/18 | | 1,500,000 | | 1,676,296 | |
Medtronic,
Gtd. Notes | | 3.50 | | 3/15/25 | | 1,050,000 | | 1,076,480 | |
Medtronic,
Gtd. Notes | | 4.63 | | 3/15/44 | | 1,000,000 | | 1,045,583 | |
Medtronic,
Gtd. Notes | | 4.63 | | 3/15/45 | | 1,000,000 | | 1,053,845 | |
Memorial Sloan-Kettering,
Sr. Unscd. Notes | | 4.20 | | 7/1/55 | | 500,000 | | 475,882 | |
Merck & Co.,
Gtd. Notes | | 6.50 | | 12/1/33 | | 680,000 | | 899,705 | |
Merck & Co.,
Sr. Unscd. Notes | | 1.30 | | 5/18/18 | | 914,000 | | 916,404 | |
Merck & Co.,
Sr. Unscd. Notes | | 2.75 | | 2/10/25 | | 500,000 | | 491,182 | |
Merck & Co.,
Sr. Unscd. Notes | | 3.70 | | 2/10/45 | | 350,000 | | 321,306 | |
Merck Sharp & Dohme,
Gtd. Debs. | | 6.40 | | 3/1/28 | | 150,000 | | 190,267 | |
Mylan,
Gtd. Notes | | 1.35 | | 11/29/16 | | 300,000 | | 297,586 | |
Mylan,
Gtd. Notes | | 5.40 | | 11/29/43 | | 300,000 | | 291,876 | |
Novartis Capital,
Gtd. Notes | | 4.40 | | 5/6/44 | | 940,000 | | 1,016,080 | |
35
STATEMENT OF INVESTMENTS (continued)
| | | | | | | | | | | | | | | | | | | | | |
Bonds and Notes - 99.9% (continued) | | Coupon
Rate (%) | | Maturity
Date | | Principal
Amount ($) | | Value ($) | |
Health Care - 2.4% (continued) | | | | | |
Perrigo,
Gtd. Notes | | 1.30 | | 11/8/16 | | 500,000 | | 494,693 | |
Perrigo,
Sr. Unscd. Notes | | 2.30 | | 11/8/18 | | 1,000,000 | | 985,755 | |
Pfizer,
Sr. Unscd. Notes | | 6.20 | | 3/15/19 | | 1,650,000 | | 1,879,276 | |
Pfizer,
Sr. Unscd. Notes | | 2.10 | | 5/15/19 | | 1,000,000 | | 1,006,244 | |
Pfizer,
Sr. Unscd. Notes | | 4.30 | | 6/15/43 | | 500,000 | | 495,644 | |
Pfizer,
Sr. Unscd. Notes | | 4.40 | | 5/15/44 | | 500,000 | | 502,634 | |
Quest Diagnostics,
Sr. Unscd. Notes | | 4.25 | | 4/1/24 | | 300,000 | | 307,154 | |
Quest Diagnostics,
Sr. Unscd. Notes | | 3.50 | | 3/30/25 | | 500,000 | | 484,815 | |
Sanofi,
Sr. Unscd. Notes | | 4.00 | | 3/29/21 | | 900,000 | | 972,716 | |
St. Jude Medical,
Sr. Unscd. Notes | | 3.25 | | 4/15/23 | | 500,000 | | 494,930 | |
Stryker,
Sr. Unscd. Bonds | | 4.38 | | 5/15/44 | | 500,000 | | 503,255 | |
Teva Pharmaceutical Finance,
Gtd. Notes | | 6.15 | | 2/1/36 | | 5,000 | | 5,513 | |
Teva Pharmaceutical Finance IV,
Gtd. Notes | | 2.25 | | 3/18/20 | | 500,000 | | 489,668 | |
UnitedHealth Group,
Sr. Unscd. Notes | | 2.88 | | 12/15/21 | | 350,000 | | 356,870 | |
UnitedHealth Group,
Sr. Unscd. Notes | | 3.75 | | 7/15/25 | | 330,000 | | 344,514 | |
UnitedHealth Group,
Sr. Unscd. Notes | | 6.88 | | 2/15/38 | | 810,000 | | 1,089,129 | |
UnitedHealth Group,
Sr. Unscd. Notes | | 4.75 | | 7/15/45 | | 280,000 | | 298,365 | |
Wyeth,
Gtd. Notes | | 6.50 | | 2/1/34 | | 200,000 | | 251,845 | |
Zimmer Holdings,
Sr. Unscd. Notes | | 2.00 | | 4/1/18 | | 500,000 | | 500,442 | |
Zimmer Holdings,
Sr. Unscd. Notes | | 3.55 | | 4/1/25 | | 500,000 | | 492,973 | |
Zimmer Holdings,
Sr. Unscd. Notes | | 4.25 | | 8/15/35 | | 500,000 | | 474,009 | |
Zoetis,
Sr. Unscd. Notes | | 1.88 | | 2/1/18 | | 500,000 | | 497,930 | |
| | 59,250,589 | |
Industrials - 1.6% | | | | | |
3M,
Sr. Unscd. Notes | | 5.70 | | 3/15/37 | | 750,000 | | 935,230 | |
Boeing,
Sr. Unscd. Notes | | 6.00 | | 3/15/19 | | 1,500,000 | | 1,705,203 | |
Burlington Northern Santa Fe,
Sr. Unscd. Debs. | | 7.00 | | 12/15/25 | | 100,000 | | 126,887 | |
Burlington Northern Santa Fe,
Sr. Unscd. Debs. | | 7.95 | | 8/15/30 | | 100,000 | | 140,646 | |
Burlington Northern Santa Fe,
Sr. Unscd. Debs. | | 6.15 | | 5/1/37 | | 650,000 | | 776,459 | |
36
| | | | | | | | | | | | | | | | | | | |
Bonds and Notes - 99.9% (continued) | | Coupon
Rate (%) | | Maturity
Date | | Principal
Amount ($) | | Value ($) | |
Industrials - 1.6% (continued) | | | | | |
Burlington Northern Santa Fe,
Sr. Unscd. Debs. | | 4.55 | | 9/1/44 | | 750,000 | | 745,425 | |
Canadian National Railway,
Sr. Unscd. Notes | | 6.71 | | 7/15/36 | | 650,000 | | 883,624 | |
Canadian Pacific Railway,
Sr. Unscd. Notes | | 4.50 | | 1/15/22 | | 1,000,000 | | 1,077,976 | |
Canadian Pacific Railway,
Sr. Unscd. Notes | | 6.13 | | 9/15/2115 | | 220,000 | | 237,859 | |
Caterpillar,
Sr. Unscd. Bonds | | 6.05 | | 8/15/36 | | 237,000 | | 281,770 | |
Caterpillar,
Sr. Unscd. Notes | | 2.60 | | 6/26/22 | | 2,300,000 | | 2,244,703 | |
Caterpillar,
Sr. Unscd. Notes | | 4.30 | | 5/15/44 | | 500,000 | | 490,201 | |
Corning,
Sr. Unscd. Notes | | 3.70 | | 11/15/23 | | 400,000 | | 408,288 | |
CSX,
Sr. Unscd. Notes | | 3.70 | | 11/1/23 | | 500,000 | | 520,354 | |
CSX,
Sr. Unscd. Notes | | 4.75 | | 5/30/42 | | 250,000 | | 253,890 | |
CSX,
Sr. Unscd. Notes | | 4.50 | | 8/1/54 | | 500,000 | | 465,167 | |
Eaton,
Gtd. Notes | | 1.50 | | 11/2/17 | | 500,000 | | 500,723 | |
Eaton,
Gtd. Notes | | 4.15 | | 11/2/42 | | 400,000 | | 375,495 | |
Emerson Electric,
Sr. Unscd. Notes | | 2.63 | | 2/15/23 | | 260,000 | | 256,213 | |
FedEx,
Gtd. Notes | | 2.30 | | 2/1/20 | | 500,000 | | 505,163 | |
FedEx,
Gtd. Notes | | 4.00 | | 1/15/24 | | 750,000 | | 783,732 | |
FedEx,
Gtd. Notes | | 4.75 | | 11/15/45 | | 750,000 | | 742,819 | |
General Electric,
Sr. Unscd. Notes | | 5.25 | | 12/6/17 | | 1,000,000 | | 1,079,620 | |
General Electric,
Sr. Unscd. Notes | | 4.50 | | 3/11/44 | | 500,000 | | 519,889 | |
Harris,
Sr. Unscd. Notes | | 5.05 | | 4/27/45 | | 700,000 | c | 688,354 | |
Honeywell International,
Sr. Unscd. Notes | | 5.30 | | 3/15/17 | | 1,000,000 | | 1,058,548 | |
Illinois Tool Works,
Sr. Unscd. Notes | | 3.90 | | 9/1/42 | | 500,000 | | 483,500 | |
Ingersoll-Rand Global Holding,
Gtd. Notes | | 2.88 | | 1/15/19 | | 225,000 | | 228,773 | |
Kansas City Southern Railway,
Gtd. Notes | | 4.95 | | 8/15/45 | | 300,000 | | 301,736 | |
Keysight Technologies,
Gtd. Notes | | 3.30 | | 10/30/19 | | 1,000,000 | b | 990,950 | |
Koninklijke Philips Electronics,
Sr. Unscd. Notes | | 5.75 | | 3/11/18 | | 500,000 | | 542,189 | |
L-3 Communications,
Gtd. Notes | | 3.95 | | 11/15/16 | | 1,000,000 | | 1,020,533 | |
L-3 Communications,
Gtd. Notes | | 1.50 | | 5/28/17 | | 750,000 | | 739,245 | |
37
STATEMENT OF INVESTMENTS (continued)
| | | | | | | | | | | | | | | | | | | | | |
Bonds and Notes - 99.9% (continued) | | Coupon
Rate (%) | | Maturity
Date | | Principal
Amount ($) | | Value ($) | |
Industrials - 1.6% (continued) | | | | | |
Lender Processing Services,
Gtd. Notes | | 5.75 | | 4/15/23 | | 328,000 | | 345,738 | |
Lockheed Martin,
Sr. Unscd. Bonds | | 3.60 | | 3/1/35 | | 500,000 | | 453,606 | |
Lockheed Martin,
Sr. Unscd. Notes | | 4.07 | | 12/15/42 | | 1,000,000 | | 932,197 | |
Lockheed Martin,
Sr. Unscd. Notes, Ser. B | | 6.15 | | 9/1/36 | | 455,000 | | 551,969 | |
Moody's,
Sr. Unscd. Notes | | 2.75 | | 7/15/19 | | 1,000,000 | | 1,019,697 | |
Norfolk Southern,
Sr. Unscd. Bonds, Ser. WI | | 4.84 | | 10/1/41 | | 1,200,000 | | 1,235,519 | |
Norfolk Southern,
Sr. Unscd. Notes | | 3.85 | | 1/15/24 | | 300,000 | | 310,214 | |
Norfolk Southern,
Sr. Unscd. Notes | | 5.59 | | 5/17/25 | | 2,000 | | 2,283 | |
Northrop Grumman Systems,
Gtd. Notes | | 7.75 | | 2/15/31 | | 500,000 | | 668,184 | |
Raytheon,
Sr. Unscd. Debs. | | 7.20 | | 8/15/27 | | 150,000 | | 201,669 | |
Republic Services,
Gtd. Notes | | 3.80 | | 5/15/18 | | 500,000 | | 523,041 | |
Republic Services,
Gtd. Notes | | 6.20 | | 3/1/40 | | 750,000 | | 882,871 | |
Rockwell Automation,
Sr. Unscd. Notes | | 2.05 | | 3/1/20 | | 500,000 | | 499,230 | |
Ryder System,
Sr. Unscd. Notes | | 2.35 | | 2/26/19 | | 500,000 | | 497,698 | |
Thermo Fisher Scientific,
Sr. Unscd. Notes | | 1.30 | | 2/1/17 | | 500,000 | | 499,627 | |
Thermo Fisher Scientific,
Sr. Unscd. Notes | | 5.30 | | 2/1/44 | | 500,000 | | 540,498 | |
Tyco International Finance,
Gtd. Notes | | 5.13 | | 9/14/45 | | 100,000 | | 105,492 | |
Union Pacific,
Sr. Unscd. Notes | | 2.75 | | 4/15/23 | | 400,000 | | 396,325 | |
Union Pacific,
Sr. Unscd. Notes | | 4.75 | | 12/15/43 | | 140,000 | | 154,214 | |
Union Pacific,
Sr. Unscd. Notes | | 4.82 | | 2/1/44 | | 325,000 | | 362,256 | |
United Airlines 2013-1 PTT,
Pass Thru Certs., Ser.A | | 4.30 | | 2/15/27 | | 951,987 | | 986,496 | |
United Airlines 2014-2 PTT,
Pass Thru Certs., Ser.A | | 3.75 | | 3/3/28 | | 300,000 | | 302,625 | |
United Parcel Service,
Sr. Unscd. Notes | | 3.13 | | 1/15/21 | | 1,600,000 | c | 1,677,165 | |
United Parcel Service of America,
Sr. Unscd. Debs. | | 8.38 | | 4/1/30 | | 10,000 | a | 14,286 | |
United Technologies,
Sr. Unscd. Notes | | 8.75 | | 3/1/21 | | 50,000 | | 65,326 | |
United Technologies,
Sr. Unscd. Notes | | 3.10 | | 6/1/22 | | 2,100,000 | | 2,157,177 | |
United Technologies,
Sr. Unscd. Notes | | 6.70 | | 8/1/28 | | 50,000 | | 64,453 | |
United Technologies,
Sr. Unscd. Notes | | 5.70 | | 4/15/40 | | 650,000 | | 775,066 | |
38
| | | | | | | | | | | | | | | | | | | | | | | |
Bonds and Notes - 99.9% (continued) | | Coupon
Rate (%) | | Maturity
Date | | Principal
Amount ($) | | Value ($) | |
Industrials - 1.6% (continued) | | | | | |
United Technologies,
Sr. Unscd. Notes | | 4.50 | | 6/1/42 | | 380,000 | | 389,210 | |
Waste Management,
Gtd. Notes | | 3.50 | | 5/15/24 | | 500,000 | | 508,197 | |
| | 39,233,493 | |
Information Technology - 1.2% | | | | | |
Apple,
Sr. Unscd. Notes | | 1.05 | | 5/5/17 | | 500,000 | | 501,754 | |
Apple,
Sr. Unscd. Notes | | 1.00 | | 5/3/18 | | 500,000 | | 498,759 | |
Apple,
Sr. Unscd. Notes | | 2.00 | | 5/6/20 | | 510,000 | | 511,772 | |
Apple,
Sr. Unscd. Notes | | 2.85 | | 5/6/21 | | 800,000 | | 824,442 | |
Apple,
Sr. Unscd. Notes | | 2.40 | | 5/3/23 | | 500,000 | | 489,675 | |
Apple,
Sr. Unscd. Notes | | 3.45 | | 5/6/24 | | 500,000 | | 519,104 | |
Apple,
Sr. Unscd. Notes | | 3.20 | | 5/13/25 | | 510,000 | | 518,803 | |
Apple,
Sr. Unscd. Notes | | 4.45 | | 5/6/44 | | 500,000 | | 505,495 | |
Apple,
Sr. Unscd. Notes | | 4.38 | | 5/13/45 | | 540,000 | | 539,357 | |
Applied Materials,
Sr. Unscd. Notes | | 3.90 | | 10/1/25 | | 1,000,000 | | 1,001,772 | |
Arrow Electronics,
Sr. Unscd. Notes | | 3.00 | | 3/1/18 | | 500,000 | | 503,483 | |
Arrow Electronics,
Sr. Unscd. Notes | | 4.50 | | 3/1/23 | | 500,000 | | 510,225 | |
Autodesk,
Sr. Unscd. Notes | | 4.38 | | 6/15/25 | | 1,000,000 | | 1,003,201 | |
Baidu,
Sr. Unscd. Notes | | 2.75 | | 6/9/19 | | 750,000 | | 749,752 | |
eBay,
Sr. Unscd. Notes | | 4.00 | | 7/15/42 | | 700,000 | | 544,629 | |
EMC,
Sr. Unscd. Notes | | 1.88 | | 6/1/18 | | 1,000,000 | | 956,334 | |
Google,
Sr. Unscd. Notes | | 3.63 | | 5/19/21 | | 300,000 | | 322,826 | |
Hewlett-Packard,
Sr. Unscd. Notes | | 6.00 | | 9/15/41 | | 750,000 | | 723,541 | |
HP Enterprise,
Gtd. Notes | | 2.85 | | 10/5/18 | | 650,000 | b | 651,821 | |
HP Enterprise,
Gtd. Notes | | 3.60 | | 10/15/20 | | 640,000 | b | 645,289 | |
HP Enterprise,
Gtd. Notes | | 4.90 | | 10/15/25 | | 1,000,000 | b | 990,070 | |
HP Enterprise,
Gtd. Notes | | 6.35 | | 10/15/45 | | 210,000 | b | 204,097 | |
Intel,
Sr. Unscd. Notes | | 3.30 | | 10/1/21 | | 2,100,000 | | 2,203,102 | |
Intel,
Sr. Unscd. Notes | | 3.10 | | 7/29/22 | | 300,000 | | 308,981 | |
International Business Machines,
Sr. Unscd. Debs. | | 7.00 | | 10/30/25 | | 425,000 | | 550,268 | |
39
STATEMENT OF INVESTMENTS (continued)
| | | | | | | | | | | | | | | | | | | |
Bonds and Notes - 99.9% (continued) | | Coupon
Rate (%) | | Maturity
Date | | Principal
Amount ($) | | Value ($) | |
Information Technology - 1.2% (continued) | | | | | |
International Business Machines,
Sr. Unscd. Notes | | 1.25 | | 2/6/17 | | 1,000,000 | | 1,005,338 | |
International Business Machines,
Sr. Unscd. Notes | | 5.70 | | 9/14/17 | | 600,000 | | 650,695 | |
International Business Machines,
Sr. Unscd. Notes | | 8.38 | | 11/1/19 | | 300,000 | | 372,454 | |
International Business Machines,
Sr. Unscd. Notes | | 5.60 | | 11/30/39 | | 605,000 | c | 687,424 | |
Microsoft,
Sr. Unscd. Notes | | 4.20 | | 6/1/19 | | 1,000,000 | | 1,089,730 | |
Microsoft,
Sr. Unscd. Notes | | 5.20 | | 6/1/39 | | 688,000 | | 785,285 | |
Microsoft,
Sr. Unscd. Notes | | 3.75 | | 2/12/45 | | 1,000,000 | | 924,236 | |
Oracle,
Sr. Unscd. Notes | | 5.75 | | 4/15/18 | | 150,000 | | 165,666 | |
Oracle,
Sr. Unscd. Notes | | 5.00 | | 7/8/19 | | 1,200,000 | | 1,329,431 | |
Oracle,
Sr. Unscd. Notes | | 2.80 | | 7/8/21 | | 600,000 | | 610,285 | |
Oracle,
Sr. Unscd. Notes | | 3.40 | | 7/8/24 | | 1,250,000 | | 1,277,045 | |
Oracle,
Sr. Unscd. Notes | | 3.90 | | 5/15/35 | | 480,000 | | 457,923 | |
Oracle,
Sr. Unscd. Notes | | 6.50 | | 4/15/38 | | 500,000 | | 638,231 | |
Oracle,
Sr. Unscd. Notes | | 4.38 | | 5/15/55 | | 680,000 | | 638,935 | |
Qualcomm,
Sr. Unscd. Notes | | 2.25 | | 5/20/20 | | 500,000 | | 497,687 | |
Qualcomm,
Sr. Unscd. Notes | | 3.45 | | 5/20/25 | | 360,000 | | 346,147 | |
Qualcomm,
Sr. Unscd. Notes | | 4.65 | | 5/20/35 | | 140,000 | | 129,726 | |
Qualcomm,
Sr. Unscd. Notes | | 4.80 | | 5/20/45 | | 210,000 | | 182,039 | |
Seagate HDD,
Gtd. Bonds | | 4.75 | | 6/1/23 | | 800,000 | | 743,450 | |
Texas Instruments,
Sr. Unscd. Notes | | 2.75 | | 3/12/21 | | 400,000 | | 404,586 | |
Xilinx,
Sr. Unscd. Notes | | 3.00 | | 3/15/21 | | 500,000 | | 505,766 | |
| | 30,220,631 | |
Materials - 1.0% | | | | | |
Agrium,
Sr. Unscd. Debs. | | 5.25 | | 1/15/45 | | 500,000 | | 501,086 | |
Airgas,
Sr. Unscd. Notes | | 2.38 | | 2/15/20 | | 500,000 | | 493,616 | |
Avery Dennison,
Sr. Unscd. Notes | | 3.35 | | 4/15/23 | | 1,000,000 | | 969,372 | |
Barrick PD Australia Finance,
Gtd. Notes | | 5.95 | | 10/15/39 | | 1,300,000 | | 1,122,958 | |
BHP Billiton Finance USA,
Gtd. Notes | | 6.50 | | 4/1/19 | | 1,700,000 | | 1,932,019 | |
BHP Billiton Finance USA,
Gtd. Notes | | 4.13 | | 2/24/42 | | 500,000 | | 466,202 | |
40
| | | | | | | | | | | | | | | | | | | |
Bonds and Notes - 99.9% (continued) | | Coupon
Rate (%) | | Maturity
Date | | Principal
Amount ($) | | Value ($) | |
Materials - 1.0% (continued) | | | | | |
CF Industries,
Gtd. Notes | | 3.45 | | 6/1/23 | | 500,000 | | 478,530 | |
CF Industries,
Gtd. Notes | | 4.95 | | 6/1/43 | | 500,000 | | 468,041 | |
Cytec Industries,
Sr. Unscd. Notes | | 3.95 | | 5/1/25 | | 100,000 | | 97,874 | |
Dow Chemical,
Sr. Unscd. Notes | | 8.55 | | 5/15/19 | | 1,700,000 | | 2,046,118 | |
Dow Chemical,
Sr. Unscd. Notes | | 4.25 | | 11/15/20 | | 775,000 | | 834,678 | |
E.I. du Pont de Nemours & Co.,
Sr. Unscd. Notes | | 6.00 | | 7/15/18 | | 560,000 | | 619,991 | |
E.I. du Pont de Nemours & Co.,
Sr. Unscd. Notes | | 2.80 | | 2/15/23 | | 500,000 | | 482,540 | |
E.I. du Pont de Nemours & Co.,
Sr. Unscd. Notes | | 4.15 | | 2/15/43 | | 300,000 | | 274,040 | |
Eastman Chemical,
Sr. Unscd. Notes | | 3.80 | | 3/15/25 | | 500,000 | | 498,280 | |
Freeport-McMoRan,
Gtd. Notes | | 3.10 | | 3/15/20 | | 1,500,000 | c | 1,325,700 | |
Freeport-McMoRan,
Gtd. Notes | | 5.45 | | 3/15/43 | | 600,000 | | 431,250 | |
Glencore Canada,
Gtd. Notes | | 5.50 | | 6/15/17 | | 165,000 | | 163,412 | |
Goldcorp,
Sr. Unscd. Notes | | 3.63 | | 6/9/21 | | 500,000 | | 490,934 | |
International Paper,
Sr. Unscd. Notes | | 4.80 | | 6/15/44 | | 600,000 | | 559,847 | |
LYB International Finance,
Gtd. Bonds | | 4.00 | | 7/15/23 | | 1,200,000 | | 1,219,337 | |
Methanex,
Sr. Unscd. Notes | | 3.25 | | 12/15/19 | | 465,000 | | 450,084 | |
Methanex,
Sr. Unscd. Notes | | 4.25 | | 12/1/24 | | 500,000 | c | 475,477 | |
Monsanto,
Sr. Unscd. Notes | | 2.13 | | 7/15/19 | | 1,000,000 | | 995,524 | |
Mosaic,
Sr. Unscd. Notes | | 4.25 | | 11/15/23 | | 300,000 | | 304,906 | |
Newmont Mining,
Gtd. Notes | | 6.25 | | 10/1/39 | | 1,000,000 | | 931,080 | |
Owens Corning,
Gtd. Notes | | 7.00 | | 12/1/36 | | 235,000 | | 267,947 | |
Potash Corp of Saskatchewan,
Sr. Unscd. Bonds | | 3.63 | | 3/15/24 | | 500,000 | | 496,579 | |
Praxair,
Sr. Unscd. Notes | | 2.45 | | 2/15/22 | | 1,000,000 | | 983,644 | |
Rio Tinto Alcan,
Sr. Unscd. Debs. | | 7.25 | | 3/15/31 | | 350,000 | | 429,305 | |
Rio Tinto Finance USA,
Gtd. Notes | | 6.50 | | 7/15/18 | | 20,000 | | 22,169 | |
Rio Tinto Finance USA,
Gtd. Notes | | 3.50 | | 11/2/20 | | 600,000 | | 626,135 | |
Rio Tinto Finance USA,
Gtd. Notes | | 5.20 | | 11/2/40 | | 1,000,000 | | 1,004,898 | |
Sigma-Aldrich,
Sr. Unscd. Notes | | 3.38 | | 11/1/20 | | 500,000 | | 513,290 | |
41
STATEMENT OF INVESTMENTS (continued)
| | | | | | | | | | | | | | | | | | | |
Bonds and Notes - 99.9% (continued) | | Coupon
Rate (%) | | Maturity
Date | | Principal
Amount ($) | | Value ($) | |
Materials - 1.0% (continued) | | | | | |
Southern Copper,
Sr. Unscd. Notes | | 5.25 | | 11/8/42 | | 1,000,000 | | 814,768 | |
Vale Canada,
Sr. Unscd. Bonds | | 7.20 | | 9/15/32 | | 100,000 | | 81,444 | |
Vale Overseas,
Gtd. Notes | | 4.38 | | 1/11/22 | | 700,000 | c | 640,150 | |
Vale Overseas,
Gtd. Notes | | 6.88 | | 11/21/36 | | 900,000 | c | 737,190 | |
Valspar,
Sr. Unscd. Notes | | 3.95 | | 1/15/26 | | 500,000 | | 506,546 | |
| | 25,756,961 | |
Municipal Bonds - .8% | | | | | |
American Municipal Power Inc.,
Combined Hydroelectic Projects Revenue (Build America Bonds) | | 8.08 | | 2/15/50 | | 100,000 | | 143,559 | |
Bay Area Toll Authority,
San Francisco Bay Area Subordinate Toll Bridge Revenue (Build America Bonds) | | 6.79 | | 4/1/30 | | 695,000 | | 864,663 | |
Bay Area Toll Authority,
San Francisco Bay Area Toll Bridge Revenue (Build America Bonds) | | 6.26 | | 4/1/49 | | 1,000,000 | | 1,336,500 | |
California,
GO (Various Purpose) | | 7.50 | | 4/1/34 | | 1,000,000 | | 1,416,860 | |
California,
GO (Various Purpose) | | 7.55 | | 4/1/39 | | 1,600,000 | | 2,363,168 | |
Florida Hurricane Catastrophe Fund Finance Corporation,
Revenue | | 2.11 | | 7/1/18 | | 500,000 | | 505,795 | |
Illinois,
GO (Pension Funding Series) | | 5.10 | | 6/1/33 | | 2,130,000 | | 1,967,055 | |
Los Angeles Unified School District,
GO (Build America Bonds) | | 5.75 | | 7/1/34 | | 1,600,000 | | 1,917,344 | |
Metropolitan Transportation Authority,
Dedicated Tax Funds Bonds | | 7.34 | | 11/15/39 | | 650,000 | | 945,009 | |
Municipal Electric Authority of Georgia,
GO (Plant Vogtle Units 3 and 4 Project J Bonds) (Build America Bonds) | | 6.64 | | 4/1/57 | | 1,000,000 | | 1,190,610 | |
New Jersey Turnpike Authority,
Turnpike Revenue (Build America Bonds) | | 7.41 | | 1/1/40 | | 780,000 | | 1,091,735 | |
New York City Municipal Water Finance Authority,
Water and Sewer System Second General Resolution Revenue (Build America Bonds) | | 5.95 | | 6/15/42 | | 545,000 | | 691,550 | |
New York State Dormitory Authority,
State Personal Income Tax Revenue (General Purpose) (Build America Bonds) | | 5.29 | | 3/15/33 | | 1,000,000 | | 1,160,330 | |
Port Authority of New York and New Jersey,
(Consolidated Bonds, 165th Series) | | 5.65 | | 11/1/40 | | 680,000 | | 808,962 | |
Port Authority of New York and New Jersey,
(Consolidated Bonds, 192nd Series) | | 4.81 | | 10/15/65 | | 500,000 | | 513,200 | |
42
| | | | | | | | | | | | | | | | | | | |
Bonds and Notes - 99.9% (continued) | | Coupon
Rate (%) | | Maturity
Date | | Principal
Amount ($) | | Value ($) | |
Municipal Bonds - .8% (continued) | | | | | |
Public Utilities Commission of the City and County of San Francisco,
San Francisco Water Revenue (Build America Bonds) | | 6.00 | | 11/1/40 | | 550,000 | | 664,774 | |
San Diego County Water Authority Financing Agency,
Water Revenue (Build America Bonds) | | 6.14 | | 5/1/49 | | 620,000 | | 776,556 | |
University of California Regents,
General Revenue | | 1.80 | | 7/1/19 | | 480,000 | | 483,850 | |
University of California Regents,
General Revenue | | 4.77 | | 5/15/44 | | 500,000 | | 506,465 | |
| | 19,347,985 | |
Telecommunications - 1.5% | | | | | |
America Movil SAB de CV,
Gtd. Notes | | 6.38 | | 3/1/35 | | 100,000 | | 116,250 | |
America Movil SAB de CV,
Gtd. Notes | | 6.13 | | 3/30/40 | | 1,200,000 | | 1,370,696 | |
AT&T,
Gtd. Notes | | 8.25 | | 11/15/31 | | 470,000 | | 636,130 | |
AT&T,
Sr. Unscd. Bonds | | 5.50 | | 2/1/18 | | 950,000 | | 1,028,392 | |
AT&T,
Sr. Unscd. Notes | | 1.70 | | 6/1/17 | | 1,000,000 | | 1,005,261 | |
AT&T,
Sr. Unscd. Notes | | 2.30 | | 3/11/19 | | 1,000,000 | | 1,006,133 | |
AT&T,
Sr. Unscd. Notes | | 2.45 | | 6/30/20 | | 500,000 | | 495,655 | |
AT&T,
Sr. Unscd. Notes | | 3.00 | | 2/15/22 | | 495,000 | | 489,283 | |
AT&T,
Sr. Unscd. Notes | | 3.00 | | 6/30/22 | | 500,000 | | 491,173 | |
AT&T,
Sr. Unscd. Notes | | 3.40 | | 5/15/25 | | 1,000,000 | | 972,336 | |
AT&T,
Sr. Unscd. Notes | | 4.50 | | 5/15/35 | | 1,000,000 | | 938,316 | |
AT&T,
Sr. Unscd. Notes | | 5.35 | | 9/1/40 | | 1,500,000 | | 1,500,156 | |
AT&T,
Sr. Unscd. Notes | | 4.75 | | 5/15/46 | | 1,000,000 | | 921,700 | |
British Telecommunications,
Sr. Unscd. Notes | | 1.25 | | 2/14/17 | | 250,000 | | 249,968 | |
British Telecommunications,
Sr. Unscd. Notes | | 5.95 | | 1/15/18 | | 580,000 | | 633,221 | |
British Telecommunications,
Sr. Unscd. Notes | | 9.63 | | 12/15/30 | | 175,000 | | 264,474 | |
Cisco Systems,
Sr. Unscd. Notes | | 4.45 | | 1/15/20 | | 2,000,000 | | 2,198,066 | |
Cisco Systems,
Sr. Unscd. Notes | | 5.50 | | 1/15/40 | | 900,000 | | 1,059,824 | |
Deutsche Telekom International Finance,
Gtd. Bonds | | 8.75 | | 6/15/30 | | 900,000 | | 1,279,220 | |
GTE,
Gtd. Notes | | 6.94 | | 4/15/28 | | 100,000 | | 120,451 | |
Juniper Networks,
Sr. Unscd. Notes | | 4.35 | | 6/15/25 | | 200,000 | | 199,394 | |
43
STATEMENT OF INVESTMENTS (continued)
| | | | | | | | | | | | | | | | |
Bonds and Notes - 99.9% (continued) | | Coupon
Rate (%) | | Maturity
Date | | Principal
Amount ($) | | Value ($) | |
Telecommunications - 1.5% (continued) | | | | | |
Koninklijke KPN,
Sr. Unscd. Bonds | | 8.38 | | 10/1/30 | | 250,000 | | 324,393 | |
Motorola Solutions,
Sr. Unscd. Notes | | 3.50 | | 9/1/21 | | 1,000,000 | | 939,775 | |
Orange,
Sr. Unscd. Notes | | 9.00 | | 3/1/31 | | 945,000 | | 1,376,436 | |
Qwest,
Sr. Unscd. Debs. | | 6.88 | | 9/15/33 | | 275,000 | | 273,547 | |
Rogers Communications,
Gtd. Notes | | 7.50 | | 8/15/38 | | 125,000 | | 164,811 | |
Telefonica Emisiones,
Gtd. Notes | | 3.19 | | 4/27/18 | | 1,000,000 | | 1,026,259 | |
Telefonica Emisiones,
Gtd. Notes | | 7.05 | | 6/20/36 | | 500,000 | | 600,567 | |
Verizon Communications,
Sr. Unscd. Notes | | 2.00 | | 11/1/16 | | 600,000 | | 605,794 | |
Verizon Communications,
Sr. Unscd. Notes | | 1.35 | | 6/9/17 | | 500,000 | | 500,732 | |
Verizon Communications,
Sr. Unscd. Notes | | 2.63 | | 2/21/20 | | 2,395,000 | | 2,421,240 | |
Verizon Communications,
Sr. Unscd. Notes | | 3.45 | | 3/15/21 | | 750,000 | | 774,363 | |
Verizon Communications,
Sr. Unscd. Notes | | 3.50 | | 11/1/21 | | 900,000 | | 928,963 | |
Verizon Communications,
Sr. Unscd. Notes | | 5.15 | | 9/15/23 | | 1,650,000 | | 1,842,108 | |
Verizon Communications,
Sr. Unscd. Notes | | 7.75 | | 12/1/30 | | 690,000 | | 938,120 | |
Verizon Communications,
Sr. Unscd. Notes | | 5.85 | | 9/15/35 | | 560,000 | | 620,109 | |
Verizon Communications,
Sr. Unscd. Notes | | 3.85 | | 11/1/42 | | 500,000 | | 420,454 | |
Verizon Communications,
Sr. Unscd. Notes | | 6.55 | | 9/15/43 | | 2,700,000 | | 3,243,302 | |
Verizon Communications,
Sr. Unscd. Notes | | 4.86 | | 8/21/46 | | 1,000,000 | c | 961,036 | |
Verizon Communications,
Sr. Unscd. Notes | | 5.01 | | 8/21/54 | | 90,000 | | 83,534 | |
Vodafone Group,
Sr. Unscd. Bonds | | 6.15 | | 2/27/37 | | 250,000 | | 271,065 | |
Vodafone Group,
Sr. Unscd. Notes | | 5.63 | | 2/27/17 | | 555,000 | | 584,626 | |
Vodafone Group,
Sr. Unscd. Notes | | 7.88 | | 2/15/30 | | 125,000 | | 156,888 | |
Vodefone Group,
Sr. Unscd. Notes | | 1.50 | | 2/19/18 | | 500,000 | | 497,668 | |
| | 36,531,889 | |
U.S. Government Agencies - 2.8% | | | | | |
Federal Farm Credit Bank,
Bonds | | 0.54 | | 11/7/16 | | 500,000 | | 499,334 | |
Federal Home Loan Bank,
Bonds | | 0.63 | | 11/23/16 | | 1,700,000 | | 1,701,970 | |
Federal Home Loan Bank,
Bonds | | 4.75 | | 12/16/16 | | 1,000,000 | | 1,047,521 | |
Federal Home Loan Bank,
Bonds | | 1.00 | | 6/21/17 | | 1,400,000 | | 1,406,964 | |
44
| | | | | | | | | | | | | | | | | | | |
Bonds and Notes - 99.9% (continued) | | Coupon
Rate (%) | | Maturity
Date | | Principal
Amount ($) | | Value ($) | |
U.S. Government Agencies - 2.8% (continued) | | | | | |
Federal Home Loan Bank,
Bonds | | 5.00 | | 11/17/17 | | 2,600,000 | | 2,819,840 | |
Federal Home Loan Bank,
Bonds | | 1.13 | | 4/25/18 | | 1,000,000 | | 1,005,222 | |
Federal Home Loan Bank,
Bonds | | 1.75 | | 12/14/18 | | 1,000,000 | | 1,018,462 | |
Federal Home Loan Bank,
Bonds | | 4.13 | | 3/13/20 | | 1,000,000 | | 1,109,031 | |
Federal Home Loan Bank,
Bonds | | 5.63 | | 6/11/21 | | 1,200,000 | | 1,445,010 | |
Federal Home Loan Bank,
Bonds | | 5.50 | | 7/15/36 | | 480,000 | | 638,824 | |
Federal Home Loan Bank,
Bonds, Ser. 1 | | 4.88 | | 5/17/17 | | 2,000,000 | | 2,128,442 | |
Federal Home Loan Mortgage Corp.,
Notes | | 5.00 | | 2/16/17 | | 825,000 | d | 871,728 | |
Federal Home Loan Mortgage Corp.,
Notes | | 0.88 | | 2/22/17 | | 4,500,000 | d | 4,517,662 | |
Federal Home Loan Mortgage Corp.,
Notes | | 1.00 | | 9/29/17 | | 1,000,000 | d | 1,003,543 | |
Federal Home Loan Mortgage Corp.,
Notes | | 5.13 | | 11/17/17 | | 650,000 | d | 706,501 | |
Federal Home Loan Mortgage Corp.,
Notes | | 1.03 | | 11/28/17 | | 500,000 | d | 500,229 | |
Federal Home Loan Mortgage Corp.,
Notes | | 0.88 | | 3/7/18 | | 1,000,000 | d | 999,076 | |
Federal Home Loan Mortgage Corp.,
Notes | | 1.02 | | 4/30/18 | | 1,050,000 | d | 1,051,654 | |
Federal Home Loan Mortgage Corp.,
Notes | | 1.20 | | 6/12/18 | | 785,000 | d | 784,199 | |
Federal Home Loan Mortgage Corp.,
Notes | | 4.88 | | 6/13/18 | | 1,250,000 | d | 1,374,459 | |
Federal Home Loan Mortgage Corp.,
Notes | | 3.75 | | 3/27/19 | | 1,600,000 | d | 1,733,134 | |
Federal Home Loan Mortgage Corp.,
Notes | | 1.25 | | 10/2/19 | | 2,500,000 | d | 2,483,185 | |
Federal Home Loan Mortgage Corp.,
Notes | | 2.38 | | 1/13/22 | | 2,600,000 | d | 2,663,674 | |
Federal Home Loan Mortgage Corp.,
Notes | | 3.06 | | 6/14/28 | | 135,000 | d | 131,936 | |
Federal Home Loan Mortgage Corp.,
Notes | | 6.75 | | 9/15/29 | | 400,000 | d | 580,182 | |
Federal Home Loan Mortgage Corp.,
Notes | | 6.25 | | 7/15/32 | | 1,000,000 | d | 1,422,678 | |
Federal Home Loan Mortgage Corp.,
Notes, Ser. 1 | | 0.75 | | 1/12/18 | | 2,400,000 | d | 2,394,110 | |
Federal National Mortgage Association,
Bonds | | 7.00 | | 2/1/32 | | 887 | d | 897 | |
Federal National Mortgage Association,
Notes | | 1.25 | | 1/30/17 | | 2,000,000 | d | 2,017,012 | |
Federal National Mortgage Association,
Notes | | 5.00 | | 5/11/17 | | 1,200,000 | d | 1,278,793 | |
Federal National Mortgage Association,
Notes | | 0.00 | | 6/1/17 | | 2,400,000 | d,e | 2,370,994 | |
Federal National Mortgage Association,
Notes | | 1.07 | | 7/28/17 | | 925,000 | d | 929,156 | |
45
STATEMENT OF INVESTMENTS (continued)
| | | | | | | | | | | | | | | | | | | | |
Bonds and Notes - 99.9% (continued) | | Coupon
Rate (%) | | Maturity
Date | | PrincipalAmount ($) | | Value ($) | |
U.S. Government Agencies - 2.8% (continued) | | | | | |
Federal National Mortgage Association,
Notes | | 0.88 | | 10/26/17 | | 1,600,000 | d | 1,602,811 | |
Federal National Mortgage Association,
Notes | | 0.88 | | 12/20/17 | | 2,300,000 | d | 2,302,171 | |
Federal National Mortgage Association,
Notes | | 0.88 | | 12/27/17 | | 700,000 | d | 700,556 | |
Federal National Mortgage Association,
Notes | | 1.00 | | 12/28/17 | | 750,000 | d | 750,296 | |
Federal National Mortgage Association,
Notes | | 0.88 | | 2/8/18 | | 1,500,000 | d | 1,500,259 | |
Federal National Mortgage Association,
Notes | | 1.00 | | 2/15/18 | | 700,000 | d | 700,171 | |
Federal National Mortgage Association,
Notes | | 1.13 | | 3/28/18 | | 415,000 | d | 414,222 | |
Federal National Mortgage Association,
Notes | | 1.13 | | 4/30/18 | | 2,000,000 | d | 2,004,002 | |
Federal National Mortgage Association,
Notes | | 1.88 | | 9/18/18 | | 2,000,000 | c,d | 2,047,186 | |
Federal National Mortgage Association,
Notes | | 1.88 | | 2/19/19 | | 500,000 | d | 510,915 | |
Federal National Mortgage Association,
Notes | | 1.75 | | 11/26/19 | | 1,500,000 | d | 1,517,629 | |
Federal National Mortgage Association,
Notes | | 2.63 | | 9/6/24 | | 1,100,000 | d | 1,126,951 | |
Federal National Mortgage Association,
Notes | | 6.25 | | 5/15/29 | | 1,340,000 | d | 1,851,190 | |
Federal National Mortgage Association,
Notes | | 6.63 | | 11/15/30 | | 1,000,000 | d | 1,444,175 | |
Federal National Mortgage Association,
Notes | | 5.50 | | 4/1/34 | | 54,490 | d | 60,869 | |
Federal National Mortgage Association,
Notes | | 6.00 | | 4/18/36 | | 1,300,000 | d | 1,332,618 | |
Federal National Mortgage Association,
Notes | | 7.00 | | 7/1/37 | | 40,641 | d | 45,400 | |
Federal National Mortgage Association,
Notes, Ser. 1 | | 1.00 | | 4/30/18 | | 1,000,000 | d | 992,308 | |
Federal National Mortgage Association,
Sub. Debs. | | 0.00 | | 10/9/19 | | 2,000,000 | d,e | 1,861,490 | |
Financing (FICO),
Scd. Bonds | | 8.60 | | 9/26/19 | | 40,000 | | 50,587 | |
Financing (FICO),
Scd. Bonds, Ser. E | | 9.65 | | 11/2/18 | | 510,000 | | 635,650 | |
Tennessee Valley Authority,
Sr. Unscd. Bonds | | 5.88 | | 4/1/36 | | 650,000 | | 854,097 | |
Tennessee Valley Authority,
Sr. Unscd. Bonds | | 6.15 | | 1/15/38 | | 165,000 | | 227,030 | |
Tennessee Valley Authority,
Sr. Unscd. Bonds | | 5.25 | | 9/15/39 | | 1,200,000 | | 1,476,467 | |
| | 70,644,472 | |
U.S. Government Agencies/Mortgage-Backed - 29.7% | | | | | |
Federal Home Loan Mortgage Corp. | | | |
2.50% | | | | 2,400,000 | d,f | 2,441,953 | |
46
| | | | | | | | | | | | | | | |
Bonds and Notes - 99.9% (continued) | | Coupon
Rate (%) | | Maturity
Date | | Principal
Amount ($) | | Value ($) | |
U.S. Government Agencies/Mortgage-Backed - 29.7% (continued) | | | | | |
3.00% | | | | 8,600,000 | d,f | 8,754,943 | |
3.50% | | | | 21,075,000 | d,f | 21,893,973 | |
4.00% | | | | 10,500,000 | d,f | 11,155,019 | |
4.50% | | | | 1,250,000 | d,f | 1,351,953 | |
5.00% | | | | 500,000 | d,f | 547,793 | |
2.00%, 8/1/28-8/1/29 | | | | 1,623,800 | d | 1,627,935 | |
Ser. K714, Cl. A1, 2.08%, 12/25/19 | | | | 660,766 | d | 671,256 | |
2.15%, 8/1/43 | | | | 561,638 | a,d | 571,028 | |
2.23%, 7/1/43 | | | | 407,719 | a,d | 415,547 | |
2.38%, 4/1/33-6/1/35 | | | | 9,187 | a,d | 9,661 | |
2.39%, 12/1/34 | | | | 12,605 | a,d | 13,392 | |
2.41%, 10/1/43 | | | | 444,189 | a,d | 454,564 | |
2.44%, 3/1/36 | | | | 7,050 | a,d | 7,532 | |
2.50%, 10/1/27-11/1/42 | | | | 12,133,133 | a,d | 12,428,556 | |
2.52%, 6/1/36 | | | | 7,555 | a,d | 7,652 | |
2.70%, 11/1/33 | | | | 3,312 | a,d | 3,528 | |
2.87%, 12/25/21 | | | | 850,000 | d | 883,290 | |
3.00%, 12/1/25-7/1/45 | | | | 36,052,366 | d | 36,787,568 | |
3.02%, 2/25/23 | | | | 528,298 | d | 554,511 | |
3.06%, 7/25/23 | | | | 1,000,000 | a,d | 1,040,510 | |
3.06%, 12/25/24 | | | | 648,000 | d | 667,789 | |
3.31%, 5/25/23 | | | | 1,250,000 | a,d | 1,322,984 | |
3.50%, 1/1/21-9/1/45 | | | | 29,488,960 | d | 30,791,638 | |
3.87%, 4/25/21 | | | | 1,800,000 | d | 1,964,156 | |
4.00%, 5/1/18-8/1/45 | | | | 23,928,232 | d | 25,488,533 | |
4.19%, 12/25/20 | | | | 1,284,000 | a,d | 1,419,139 | |
4.50%, 2/1/18-9/1/44 | | | | 17,027,830 | d | 18,428,232 | |
5.00%, 11/1/18-1/1/40 | | | | 10,579,137 | d | 11,555,824 | |
5.50%, 8/1/16-1/1/40 | | | | 5,608,050 | d | 6,238,150 | |
6.00%, 5/1/16-7/1/39 | | | | 2,820,040 | d | 3,198,787 | |
6.50%, 4/1/16-3/1/39 | | | | 1,555,638 | d | 1,780,768 | |
7.00%, 10/1/17-7/1/37 | | | | 149,853 | d | 171,595 | |
7.50%, 2/1/23-11/1/33 | | | | 31,098 | d | 35,261 | |
8.00%, 2/1/17-10/1/31 | | | | 32,165 | d | 37,095 | |
8.50%, 10/1/18-6/1/30 | | | | 1,017 | d | 1,187 | |
Federal National Mortgage Association | | | |
2.50% | | | | 9,475,000 | d,f | 9,644,884 | |
47
STATEMENT OF INVESTMENTS (continued)
| | | | | | | | | | | | | | | | | |
Bonds and Notes - 99.9% (continued) | | Coupon
Rate (%) | | Maturity
Date | | Principal
Amount ($) | | Value ($) | |
U.S. Government Agencies/Mortgage-Backed - 29.7% (continued) | | | | | |
3.00% | | | | 11,175,000 | d,f | 11,362,976 | |
3.50% | | | | 35,400,000 | d,f | 36,837,533 | |
4.00% | | | | 26,625,000 | d,f | 28,340,406 | |
4.50% | | | | 1,325,000 | d,f | 1,435,782 | |
5.00% | | | | 500,000 | d,f | 551,172 | |
2.00%, 7/1/28-5/1/30 | | | | 2,491,204 | d | 2,490,712 | |
2.05%, 2/1/37 | | | | 3,189 | a,d | 3,379 | |
2.17%, 5/1/43 | | | | 471,178 | a,d | 480,301 | |
2.20%, 1/1/35 | | | | 5,797 | a,d | 6,075 | |
2.21%, 12/1/35 | | | | 6,886 | a,d | 7,210 | |
2.36%, 3/1/37 | | | | 48,481 | a,d | 51,695 | |
2.38%, 10/1/34 | | | | 14,250 | a,d | 14,990 | |
2.44%, 12/1/36 | | | | 10,087 | a,d | 10,376 | |
2.50%, 7/1/27-8/1/43 | | | | 11,462,857 | d | 11,662,011 | |
Ser. 2013-M3, Cl. A2, 2.51%, 11/25/22 | | | | 1,500,000 | a,d | 1,520,205 | |
2.52%, 5/1/33-9/1/33 | | | | 9,904 | a,d | 10,204 | |
2.59%, 4/25/23 | | | | 1,145,894 | a,d | 1,166,573 | |
2.59%, 6/1/35 | | | | 290 | a,d | 294 | |
2.65%, 11/1/32 | | | | 11,069 | a,d | 11,776 | |
2.67%, 11/1/36 | | | | 21,446 | a,d | 22,676 | |
2.69%, 9/1/33 | | | | 14,857 | a,d | 15,924 | |
2.70%, 11/1/43 | | | | 196,866 | a,d | 202,924 | |
2.94%, 5/1/42 | | | | 304,274 | a,d | 314,518 | |
3.00%, 10/1/26-9/1/45 | | | | 60,986,319 | d | 62,380,090 | |
3.03%, 12/1/41 | | | | 422,895 | a,d | 444,814 | |
3.22%, 8/25/24 | | | | 993,084 | a,d | 1,044,735 | |
3.35%, 11/1/35 | | | | 387 | a,d | 408 | |
3.46%, 1/25/24 | | | | 800,000 | a,d | 845,000 | |
3.50%, 1/20/25-8/1/45 | | | | 47,163,003 | d | 49,365,352 | |
3.66%, 11/25/20 | | | | 949,455 | d | 1,027,280 | |
4.00%, 2/1/24-2/1/45 | | | | 38,818,585 | d | 41,405,414 | |
4.50%, 4/1/18-11/1/44 | | | | 29,646,259 | d | 32,157,760 | |
5.00%, 11/1/17-11/1/44 | | | | 15,302,748 | d | 16,830,112 | |
5.50%, 1/1/17-2/1/42 | | | | 10,887,955 | d | 12,182,666 | |
6.00%, 8/1/16-11/1/38 | | | | 4,915,904 | d | 5,581,755 | |
6.50%, 8/1/16-9/1/38 | | | | 1,184,841 | d | 1,357,186 | |
7.00%, 2/1/16-3/1/38 | | | | 257,112 | d | 293,434 | |
7.50%, 4/1/26-6/1/31 | | | | 62,384 | d | 70,358 | |
8.00%, 3/1/22-8/1/30 | | | | 13,115 | d | 15,336 | |
8.50%, 2/1/25-7/1/30 | | | | 2,009 | d | 2,150 | |
9.00%, 10/1/30 | | | | 2,004 | d | 2,105 | |
Government National Mortgage Association | | | |
3.00% | | | | 1,600,000 | f | 1,630,987 | |
48
| | | | | | | | | | | | | | | | | | | | |
Bonds and Notes - 99.9% (continued) | | Coupon
Rate (%) | | Maturity
Date | | Principal
Amount ($) | | Value ($) | |
U.S. Government Agencies/Mortgage-Backed - 29.7% (continued) | | | | | |
3.50% | | | | 525,000 | f | 549,339 | |
4.00% | | | | 200,000 | f | 213,034 | |
2.50%, 2/15/28-3/15/43 | | | | 1,774,573 | | 1,805,003 | |
3.00%, 9/15/42-8/15/45 | | | | 3,461,183 | | 3,537,514 | |
3.50%, 2/15/26-11/15/42 | | | | 4,584,688 | | 4,804,962 | |
4.00%, 2/15/41-6/15/45 | | | | 6,281,585 | | 6,778,634 | |
4.50%, 1/15/19-2/15/41 | | | | 8,261,346 | | 8,957,482 | |
5.00%, 1/15/17-4/15/40 | | | | 8,593,034 | | 9,522,431 | |
5.50%, 9/15/20-11/15/38 | | | | 2,506,965 | | 2,819,883 | |
6.00%, 2/15/17-4/15/39 | | | | 3,353,095 | | 3,837,537 | |
6.50%, 2/15/24-2/15/39 | | | | 686,866 | | 789,876 | |
7.00%, 10/15/27-8/15/32 | | | | 78,746 | | 90,040 | |
7.50%, 12/15/23-11/15/30 | | | | 70,249 | | 78,085 | |
8.00%, 8/15/24-3/15/32 | | | | 15,803 | | 19,086 | |
8.25%, 6/15/27 | | | | 1,400 | | 1,593 | |
8.50%, 10/15/26 | | | | 8,986 | | 10,201 | |
9.00%, 2/15/22-2/15/23 | | | | 7,756 | | 7,874 | |
Government National Mortgage Association II | | | |
3.00% | | | | 20,575,000 | f | 21,015,135 | |
3.50% | | | | 44,075,000 | f | 46,175,391 | |
4.00% | | | | 20,075,000 | f | 21,364,684 | |
4.50% | | | | 5,500,000 | f | 5,920,235 | |
2.50%, 4/20/28-11/20/43 | | | | 2,304,139 | | 2,327,731 | |
3.00%, 11/20/27-8/20/45 | | | | 15,553,754 | a | 16,022,089 | |
3.50%, 9/20/28-5/20/45 | | | | 13,221,643 | | 13,889,532 | |
4.00%, 9/20/43-1/20/45 | | | | 10,599,938 | | 11,307,812 | |
4.50%, 7/20/41-7/20/45 | | | | 9,452,076 | | 10,229,372 | |
5.00%, 3/20/37-8/20/44 | | | | 6,316,244 | | 6,924,135 | |
5.50%, 10/20/31-10/20/44 | | | | 3,615,639 | | 4,041,677 | |
6.50%, 2/20/28 | | | | 714 | | 836 | |
8.50%, 7/20/25 | | | | 514 | | 581 | |
| | 740,566,624 | |
U.S. Government Securities - 35.4% | | | | | |
U.S. Treasury Bonds | | 8.75 | | 5/15/17 | | 2,395,000 | | 2,692,224 | |
U.S. Treasury Bonds | | 8.88 | | 8/15/17 | | 1,725,000 | | 1,976,472 | |
U.S. Treasury Bonds | | 8.88 | | 2/15/19 | | 720,000 | | 901,289 | |
U.S. Treasury Bonds | | 8.75 | | 8/15/20 | | 1,000,000 | | 1,334,284 | |
U.S. Treasury Bonds | | 8.13 | | 5/15/21 | | 420,000 | | 563,716 | |
U.S. Treasury Bonds | | 8.00 | | 11/15/21 | | 970,000 | | 1,318,246 | |
U.S. Treasury Bonds | | 7.25 | | 8/15/22 | | 2,500,000 | | 3,363,315 | |
U.S. Treasury Bonds | | 6.00 | | 2/15/26 | | 970,000 | | 1,314,073 | |
U.S. Treasury Bonds | | 6.63 | | 2/15/27 | | 430,000 | | 618,842 | |
U.S. Treasury Bonds | | 6.13 | | 11/15/27 | | 2,150,000 | | 3,020,638 | |
U.S. Treasury Bonds | | 5.25 | | 11/15/28 | | 2,000,000 | | 2,646,966 | |
U.S. Treasury Bonds | | 6.13 | | 8/15/29 | | 1,000,000 | | 1,437,604 | |
U.S. Treasury Bonds | | 6.25 | | 5/15/30 | | 240,000 | | 352,519 | |
U.S. Treasury Bonds | | 4.50 | | 2/15/36 | | 4,395,000 | c | 5,714,731 | |
U.S. Treasury Bonds | | 4.75 | | 2/15/37 | | 870,000 | | 1,170,331 | |
U.S. Treasury Bonds | | 5.00 | | 5/15/37 | | 1,940,000 | | 2,697,258 | |
U.S. Treasury Bonds | | 3.50 | | 2/15/39 | | 4,200,000 | | 4,716,470 | |
U.S. Treasury Bonds | | 4.50 | | 8/15/39 | | 873,000 | | 1,133,428 | |
U.S. Treasury Bonds | | 4.38 | | 11/15/39 | | 452,000 | | 576,535 | |
U.S. Treasury Bonds | | 4.63 | | 2/15/40 | | 2,066,000 | | 2,728,990 | |
U.S. Treasury Bonds | | 4.38 | | 5/15/40 | | 1,360,000 | | 1,734,169 | |
U.S. Treasury Bonds | | 3.88 | | 8/15/40 | | 3,830,000 | | 4,532,066 | |
49
STATEMENT OF INVESTMENTS (continued)
| | | | | | | | | | | | | | | | | | | |
Bonds and Notes - 99.9% (continued) | | Coupon
Rate (%) | | Maturity
Date | | Principal
Amount ($) | | Value ($) | |
U.S. Government Securities - 35.4% (continued) | | | | | |
U.S. Treasury Bonds | | 4.25 | | 11/15/40 | | 2,760,000 | | 3,456,613 | |
U.S. Treasury Bonds | | 4.75 | | 2/15/41 | | 3,180,000 | | 4,282,401 | |
U.S. Treasury Bonds | | 4.38 | | 5/15/41 | | 970,000 | | 1,241,877 | |
U.S. Treasury Bonds | | 3.75 | | 8/15/41 | | 1,700,000 | | 1,980,755 | |
U.S. Treasury Bonds | | 3.13 | | 11/15/41 | | 3,750,000 | | 3,929,051 | |
U.S. Treasury Bonds | | 3.13 | | 2/15/42 | | 4,320,000 | | 4,522,755 | |
U.S. Treasury Bonds | | 3.00 | | 5/15/42 | | 2,870,000 | | 2,927,997 | |
U.S. Treasury Bonds | | 2.75 | | 8/15/42 | | 2,440,000 | c | 2,364,004 | |
U.S. Treasury Bonds | | 2.75 | | 11/15/42 | | 2,182,000 | | 2,109,778 | |
U.S. Treasury Bonds | | 3.13 | | 2/15/43 | | 2,990,000 | | 3,109,794 | |
U.S. Treasury Bonds | | 2.88 | | 5/15/43 | | 9,457,000 | c | 9,354,306 | |
U.S. Treasury Bonds | | 3.63 | | 8/15/43 | | 2,885,000 | | 3,297,091 | |
U.S. Treasury Bonds | | 3.75 | | 11/15/43 | | 4,995,000 | | 5,838,491 | |
U.S. Treasury Bonds | | 3.63 | | 2/15/44 | | 5,030,000 | | 5,743,370 | |
U.S. Treasury Bonds | | 3.38 | | 5/15/44 | | 5,330,000 | | 5,803,176 | |
U.S. Treasury Bonds | | 3.13 | | 8/15/44 | | 6,215,000 | | 6,448,187 | |
U.S. Treasury Bonds | | 3.00 | | 11/15/44 | | 4,810,000 | c | 4,866,022 | |
U.S. Treasury Bonds | | 2.50 | | 2/15/45 | | 8,805,000 | c | 8,021,610 | |
U.S. Treasury Bonds | | 3.00 | | 5/15/45 | | 4,950,000 | c | 5,009,781 | |
U.S. Treasury Bonds | | 2.88 | | 8/15/45 | | 4,720,000 | | 4,664,781 | |
U.S. Treasury Notes | | 0.50 | | 11/30/16 | | 2,795,000 | | 2,795,601 | |
U.S. Treasury Notes | | 2.75 | | 11/30/16 | | 3,700,000 | | 3,790,550 | |
U.S. Treasury Notes | | 0.63 | | 12/15/16 | | 594,000 | | 594,955 | |
U.S. Treasury Notes | | 0.63 | | 12/31/16 | | 6,490,000 | | 6,500,183 | |
U.S. Treasury Notes | | 0.88 | | 12/31/16 | | 6,355,000 | | 6,383,261 | |
U.S. Treasury Notes | | 3.25 | | 12/31/16 | | 4,700,000 | c | 4,850,057 | |
U.S. Treasury Notes | | 0.50 | | 1/31/17 | | 3,575,000 | c | 3,573,999 | |
U.S. Treasury Notes | | 0.88 | | 1/31/17 | | 3,325,000 | | 3,340,262 | |
U.S. Treasury Notes | | 3.13 | | 1/31/17 | | 4,180,000 | | 4,315,603 | |
U.S. Treasury Notes | | 0.63 | | 2/15/17 | | 3,870,000 | | 3,874,536 | |
U.S. Treasury Notes | | 4.63 | | 2/15/17 | | 1,300,000 | | 1,367,818 | |
U.S. Treasury Notes | | 0.50 | | 2/28/17 | | 6,545,000 | | 6,539,888 | |
U.S. Treasury Notes | | 0.88 | | 2/28/17 | | 6,280,000 | | 6,307,638 | |
U.S. Treasury Notes | | 3.00 | | 2/28/17 | | 3,900,000 | | 4,026,446 | |
U.S. Treasury Notes | | 0.75 | | 3/15/17 | | 6,500,000 | | 6,515,951 | |
U.S. Treasury Notes | | 0.50 | | 3/31/17 | | 3,585,000 | | 3,581,544 | |
U.S. Treasury Notes | | 1.00 | | 3/31/17 | | 5,000,000 | | 5,028,970 | |
U.S. Treasury Notes | | 3.25 | | 3/31/17 | | 4,131,000 | | 4,285,954 | |
U.S. Treasury Notes | | 0.50 | | 4/30/17 | | 3,610,000 | | 3,603,960 | |
U.S. Treasury Notes | | 0.88 | | 4/30/17 | | 3,810,000 | c | 3,824,783 | |
U.S. Treasury Notes | | 3.13 | | 4/30/17 | | 4,360,000 | | 4,523,500 | |
U.S. Treasury Notes | | 0.88 | | 5/15/17 | | 1,885,000 | c | 1,892,229 | |
U.S. Treasury Notes | | 4.50 | | 5/15/17 | | 2,000,000 | | 2,118,658 | |
U.S. Treasury Notes | | 0.63 | | 5/31/17 | | 10,500,000 | | 10,498,225 | |
U.S. Treasury Notes | | 2.75 | | 5/31/17 | | 2,230,000 | | 2,304,145 | |
U.S. Treasury Notes | | 0.63 | | 6/30/17 | | 3,595,000 | c | 3,593,713 | |
U.S. Treasury Notes | | 0.75 | | 6/30/17 | | 4,817,000 | c | 4,824,592 | |
U.S. Treasury Notes | | 2.50 | | 6/30/17 | | 3,500,000 | | 3,605,752 | |
U.S. Treasury Notes | | 0.88 | | 7/15/17 | | 3,540,000 | | 3,552,146 | |
U.S. Treasury Notes | | 0.50 | | 7/31/17 | | 4,640,000 | c | 4,626,586 | |
U.S. Treasury Notes | | 0.63 | | 7/31/17 | | 5,565,000 | | 5,561,232 | |
U.S. Treasury Notes | | 2.38 | | 7/31/17 | | 3,820,000 | | 3,931,964 | |
U.S. Treasury Notes | | 0.88 | | 8/15/17 | | 3,570,000 | c | 3,581,320 | |
U.S. Treasury Notes | | 4.75 | | 8/15/17 | | 2,387,000 | | 2,558,582 | |
U.S. Treasury Notes | | 0.63 | | 8/31/17 | | 7,636,000 | | 7,624,867 | |
U.S. Treasury Notes | | 1.88 | | 8/31/17 | | 3,140,000 | | 3,206,398 | |
50
| | | | | | | | | | | | | | | | | | | |
Bonds and Notes - 99.9% (continued) | | Coupon
Rate (%) | | Maturity
Date | | Principal
Amount ($) | | Value ($) | |
U.S. Government Securities - 35.4% (continued) | | | | | |
U.S. Treasury Notes | | 1.00 | | 9/15/17 | | 3,235,000 | c | 3,251,450 | |
U.S. Treasury Notes | | 0.63 | | 9/30/17 | | 10,473,000 | c | 10,451,007 | |
U.S. Treasury Notes | | 1.88 | | 9/30/17 | | 3,130,000 | | 3,197,736 | |
U.S. Treasury Notes | | 0.75 | | 10/31/17 | | 2,420,000 | c | 2,419,528 | |
U.S. Treasury Notes | | 1.88 | | 10/31/17 | | 2,910,000 | | 2,974,375 | |
U.S. Treasury Notes | | 0.88 | | 11/15/17 | | 3,590,000 | | 3,596,171 | |
U.S. Treasury Notes | | 0.63 | | 11/30/17 | | 470,000 | | 468,369 | |
U.S. Treasury Notes | | 2.25 | | 11/30/17 | | 5,240,000 | | 5,397,268 | |
U.S. Treasury Notes | | 1.00 | | 12/15/17 | | 3,435,000 | | 3,449,022 | |
U.S. Treasury Notes | | 0.75 | | 12/31/17 | | 3,950,000 | | 3,944,087 | |
U.S. Treasury Notes | | 2.75 | | 12/31/17 | | 1,643,000 | c | 1,711,277 | |
U.S. Treasury Notes | | 0.88 | | 1/15/18 | | 3,300,000 | | 3,302,171 | |
U.S. Treasury Notes | | 0.88 | | 1/31/18 | | 3,410,000 | | 3,412,176 | |
U.S. Treasury Notes | | 2.63 | | 1/31/18 | | 1,520,000 | | 1,580,008 | |
U.S. Treasury Notes | | 1.00 | | 2/15/18 | | 3,265,000 | c | 3,274,671 | |
U.S. Treasury Notes | | 3.50 | | 2/15/18 | | 1,600,000 | | 1,695,646 | |
U.S. Treasury Notes | | 0.75 | | 2/28/18 | | 8,175,000 | c | 8,150,998 | |
U.S. Treasury Notes | | 2.75 | | 2/28/18 | | 2,040,000 | | 2,128,095 | |
U.S. Treasury Notes | | 1.00 | | 3/15/18 | | 3,310,000 | | 3,318,556 | |
U.S. Treasury Notes | | 0.75 | | 3/31/18 | | 7,905,000 | c | 7,877,412 | |
U.S. Treasury Notes | | 2.88 | | 3/31/18 | | 5,080,000 | | 5,322,026 | |
U.S. Treasury Notes | | 0.75 | | 4/15/18 | | 7,760,000 | | 7,728,828 | |
U.S. Treasury Notes | | 0.63 | | 4/30/18 | | 8,729,000 | c | 8,663,192 | |
U.S. Treasury Notes | | 1.00 | | 5/15/18 | | 3,325,000 | | 3,329,655 | |
U.S. Treasury Notes | | 3.88 | | 5/15/18 | | 2,000,000 | c | 2,149,428 | |
U.S. Treasury Notes | | 1.00 | | 5/31/18 | | 3,540,000 | | 3,544,195 | |
U.S. Treasury Notes | | 2.38 | | 5/31/18 | | 1,000,000 | | 1,036,758 | |
U.S. Treasury Notes | | 1.13 | | 6/15/18 | | 3,315,000 | | 3,328,446 | |
U.S. Treasury Notes | | 1.38 | | 6/30/18 | | 2,665,000 | | 2,693,438 | |
U.S. Treasury Notes | | 2.38 | | 6/30/18 | | 2,000,000 | | 2,073,776 | |
U.S. Treasury Notes | | 0.88 | | 7/15/18 | | 3,290,000 | c | 3,280,660 | |
U.S. Treasury Notes | | 1.38 | | 7/31/18 | | 2,780,000 | | 2,809,754 | |
U.S. Treasury Notes | | 1.00 | | 8/15/18 | | 3,290,000 | | 3,289,701 | |
U.S. Treasury Notes | | 4.00 | | 8/15/18 | | 5,800,000 | | 6,287,258 | |
U.S. Treasury Notes | | 1.50 | | 8/31/18 | | 4,905,000 | | 4,972,763 | |
U.S. Treasury Notes | | 1.00 | | 9/15/18 | | 4,300,000 | | 4,297,089 | |
U.S. Treasury Notes | | 1.38 | | 9/30/18 | | 7,468,000 | c | 7,543,994 | |
U.S. Treasury Notes | | 0.88 | | 10/15/18 | | 3,280,000 | | 3,265,040 | |
U.S. Treasury Notes | | 1.25 | | 10/31/18 | | 3,168,000 | | 3,186,666 | |
U.S. Treasury Notes | | 1.75 | | 10/31/18 | | 2,300,000 | c | 2,348,410 | |
U.S. Treasury Notes | | 3.75 | | 11/15/18 | | 3,000,000 | | 3,242,910 | |
U.S. Treasury Notes | | 1.25 | | 11/30/18 | | 3,976,000 | | 3,996,838 | |
U.S. Treasury Notes | | 1.38 | | 11/30/18 | | 1,341,000 | | 1,353,135 | |
U.S. Treasury Notes | | 1.38 | | 12/31/18 | | 1,920,000 | | 1,935,650 | |
U.S. Treasury Notes | | 1.50 | | 12/31/18 | | 2,850,000 | | 2,884,399 | |
U.S. Treasury Notes | | 1.25 | | 1/31/19 | | 2,090,000 | | 2,097,267 | |
U.S. Treasury Notes | | 1.50 | | 1/31/19 | | 2,534,000 | | 2,563,199 | |
U.S. Treasury Notes | | 2.75 | | 2/15/19 | | 4,170,000 | | 4,385,205 | |
U.S. Treasury Notes | | 1.38 | | 2/28/19 | | 3,998,000 | | 4,025,406 | |
U.S. Treasury Notes | | 1.50 | | 2/28/19 | | 3,910,000 | | 3,952,842 | |
U.S. Treasury Notes | | 1.63 | | 3/31/19 | | 5,000,000 | | 5,072,105 | |
U.S. Treasury Notes | | 1.63 | | 4/30/19 | | 3,500,000 | | 3,548,468 | |
U.S. Treasury Notes | | 3.13 | | 5/15/19 | | 5,000,000 | | 5,325,750 | |
U.S. Treasury Notes | | 1.50 | | 5/31/19 | | 4,800,000 | | 4,842,720 | |
U.S. Treasury Notes | | 1.63 | | 6/30/19 | | 4,000,000 | | 4,050,312 | |
U.S. Treasury Notes | | 0.88 | | 7/31/19 | | 1,290,000 | | 1,270,238 | |
51
STATEMENT OF INVESTMENTS (continued)
| | | | | | | | | | | | | | | | | | | |
Bonds and Notes - 99.9% (continued) | | Coupon
Rate (%) | | Maturity
Date | | Principal
Amount ($) | | Value ($) | |
U.S. Government Securities - 35.4% (continued) | | | | | |
U.S. Treasury Notes | | 1.63 | | 7/31/19 | | 2,910,000 | | 2,944,766 | |
U.S. Treasury Notes | | 3.63 | | 8/15/19 | | 3,210,000 | | 3,484,879 | |
U.S. Treasury Notes | | 1.63 | | 8/31/19 | | 4,500,000 | | 4,553,086 | |
U.S. Treasury Notes | | 1.00 | | 9/30/19 | | 375,000 | | 370,198 | |
U.S. Treasury Notes | | 1.75 | | 9/30/19 | | 5,500,000 | | 5,587,263 | |
U.S. Treasury Notes | | 1.25 | | 10/31/19 | | 2,000,000 | | 1,993,046 | |
U.S. Treasury Notes | | 1.50 | | 10/31/19 | | 3,320,000 | | 3,338,004 | |
U.S. Treasury Notes | | 3.38 | | 11/15/19 | | 5,630,000 | | 6,074,719 | |
U.S. Treasury Notes | | 1.00 | | 11/30/19 | | 1,900,000 | | 1,871,352 | |
U.S. Treasury Notes | | 1.50 | | 11/30/19 | | 4,660,000 | | 4,682,419 | |
U.S. Treasury Notes | | 1.13 | | 12/31/19 | | 2,290,000 | c | 2,264,595 | |
U.S. Treasury Notes | | 1.63 | | 12/31/19 | | 4,310,000 | | 4,348,889 | |
U.S. Treasury Notes | | 1.25 | | 1/31/20 | | 3,800,000 | | 3,773,651 | |
U.S. Treasury Notes | | 1.38 | | 1/31/20 | | 3,350,000 | | 3,343,283 | |
U.S. Treasury Notes | | 3.63 | | 2/15/20 | | 5,430,000 | | 5,926,231 | |
U.S. Treasury Notes | | 1.25 | | 2/29/20 | | 5,680,000 | | 5,634,850 | |
U.S. Treasury Notes | | 1.38 | | 2/29/20 | | 5,500,000 | | 5,488,829 | |
U.S. Treasury Notes | | 1.13 | | 3/31/20 | | 1,800,000 | | 1,775,110 | |
U.S. Treasury Notes | | 1.38 | | 3/31/20 | | 6,215,000 | | 6,194,080 | |
U.S. Treasury Notes | | 1.13 | | 4/30/20 | | 4,490,000 | | 4,425,631 | |
U.S. Treasury Notes | | 1.38 | | 4/30/20 | | 7,810,000 | | 7,779,190 | |
U.S. Treasury Notes | | 3.50 | | 5/15/20 | | 4,050,000 | | 4,405,825 | |
U.S. Treasury Notes | | 1.38 | | 5/31/20 | | 3,060,000 | | 3,044,939 | |
U.S. Treasury Notes | | 1.50 | | 5/31/20 | | 3,110,000 | | 3,115,993 | |
U.S. Treasury Notes | | 1.63 | | 6/30/20 | | 3,835,000 | | 3,858,071 | |
U.S. Treasury Notes | | 1.88 | | 6/30/20 | | 1,300,000 | | 1,322,361 | |
U.S. Treasury Notes | | 1.63 | | 7/31/20 | | 7,600,000 | | 7,643,396 | |
U.S. Treasury Notes | | 2.00 | | 7/31/20 | | 3,360,000 | | 3,434,857 | |
U.S. Treasury Notes | | 2.63 | | 8/15/20 | | 5,000,000 | c | 5,251,985 | |
U.S. Treasury Notes | | 1.38 | | 8/31/20 | | 6,100,000 | | 6,067,353 | |
U.S. Treasury Notes | | 2.13 | | 8/31/20 | | 3,190,000 | | 3,278,306 | |
U.S. Treasury Notes | | 1.38 | | 9/30/20 | | 3,095,000 | c | 3,074,226 | |
U.S. Treasury Notes | | 2.00 | | 9/30/20 | | 6,745,000 | | 6,894,125 | |
U.S. Treasury Notes | | 1.38 | | 10/31/20 | | 3,310,000 | | 3,286,628 | |
U.S. Treasury Notes | | 1.75 | | 10/31/20 | | 8,220,000 | | 8,295,188 | |
U.S. Treasury Notes | | 2.63 | | 11/15/20 | | 6,700,000 | | 7,037,090 | |
U.S. Treasury Notes | | 2.00 | | 11/30/20 | | 2,868,000 | | 2,927,600 | |
U.S. Treasury Notes | | 2.38 | | 12/31/20 | | 3,025,000 | | 3,143,123 | |
U.S. Treasury Notes | | 2.13 | | 1/31/21 | | 2,800,000 | | 2,872,918 | |
U.S. Treasury Notes | | 3.63 | | 2/15/21 | | 6,900,000 | | 7,598,804 | |
U.S. Treasury Notes | | 2.00 | | 2/28/21 | | 4,357,000 | | 4,442,040 | |
U.S. Treasury Notes | | 2.25 | | 3/31/21 | | 3,265,000 | | 3,368,582 | |
U.S. Treasury Notes | | 2.25 | | 4/30/21 | | 2,685,000 | | 2,769,798 | |
U.S. Treasury Notes | | 3.13 | | 5/15/21 | | 7,000,000 | | 7,535,297 | |
U.S. Treasury Notes | | 2.00 | | 5/31/21 | | 4,490,000 | | 4,567,933 | |
U.S. Treasury Notes | | 2.13 | | 6/30/21 | | 6,000,000 | | 6,141,600 | |
U.S. Treasury Notes | | 2.25 | | 7/31/21 | | 6,100,000 | | 6,284,549 | |
U.S. Treasury Notes | | 2.13 | | 8/15/21 | | 4,805,000 | | 4,910,984 | |
U.S. Treasury Notes | | 2.00 | | 8/31/21 | | 935,000 | | 949,006 | |
U.S. Treasury Notes | | 2.13 | | 9/30/21 | | 5,500,000 | | 5,617,089 | |
U.S. Treasury Notes | | 2.00 | | 10/31/21 | | 3,485,000 | | 3,532,013 | |
U.S. Treasury Notes | | 2.00 | | 11/15/21 | | 4,030,000 | | 4,083,760 | |
U.S. Treasury Notes | | 1.88 | | 11/30/21 | | 4,000,000 | | 4,022,004 | |
U.S. Treasury Notes | | 2.13 | | 12/31/21 | | 3,705,000 | | 3,776,544 | |
U.S. Treasury Notes | | 1.50 | | 1/31/22 | | 6,785,000 | | 6,659,681 | |
U.S. Treasury Notes | | 2.00 | | 2/15/22 | | 5,000,000 | | 5,061,750 | |
52
| | | | | | | | | | | | | | | | | | | |
Bonds and Notes - 99.9% (continued) | | Coupon
Rate (%) | | Maturity
Date | | Principal
Amount ($) | | Value ($) | |
U.S. Government Securities - 35.4% (continued) | | | | | |
U.S. Treasury Notes | | 1.75 | | 2/28/22 | | 2,040,000 | | 2,031,022 | |
U.S. Treasury Notes | | 1.75 | | 3/31/22 | | 4,000,000 | | 3,978,776 | |
U.S. Treasury Notes | | 1.75 | | 4/30/22 | | 4,025,000 | | 4,000,761 | |
U.S. Treasury Notes | | 1.75 | | 5/15/22 | | 2,690,000 | | 2,673,134 | |
U.S. Treasury Notes | | 1.88 | | 5/31/22 | | 4,020,000 | | 4,025,053 | |
U.S. Treasury Notes | | 2.13 | | 6/30/22 | | 4,010,000 | | 4,077,589 | |
U.S. Treasury Notes | | 2.00 | | 7/31/22 | | 3,980,000 | | 4,013,141 | |
U.S. Treasury Notes | | 1.63 | | 8/15/22 | | 5,000,000 | | 4,921,320 | |
U.S. Treasury Notes | | 1.88 | | 8/31/22 | | 3,980,000 | | 3,979,403 | |
U.S. Treasury Notes | | 1.75 | | 9/30/22 | | 3,980,000 | | 3,945,278 | |
U.S. Treasury Notes | | 1.88 | | 10/31/22 | | 3,965,000 | | 3,962,601 | |
U.S. Treasury Notes | | 1.63 | | 11/15/22 | | 3,050,000 | | 2,995,930 | |
U.S. Treasury Notes | | 2.00 | | 2/15/23 | | 5,465,000 | | 5,496,489 | |
U.S. Treasury Notes | | 1.75 | | 5/15/23 | | 6,941,000 | | 6,833,269 | |
U.S. Treasury Notes | | 2.50 | | 8/15/23 | | 5,146,000 | | 5,341,255 | |
U.S. Treasury Notes | | 2.75 | | 11/15/23 | | 7,707,000 | | 8,137,659 | |
U.S. Treasury Notes | | 2.75 | | 2/15/24 | | 4,555,000 | | 4,803,480 | |
U.S. Treasury Notes | | 2.50 | | 5/15/24 | | 8,830,000 | c | 9,127,492 | |
U.S. Treasury Notes | | 2.38 | | 8/15/24 | | 10,160,000 | c | 10,389,860 | |
U.S. Treasury Notes | | 2.25 | | 11/15/24 | | 13,035,000 | | 13,177,486 | |
U.S. Treasury Notes | | 2.00 | | 2/15/25 | | 10,535,000 | | 10,414,764 | |
U.S. Treasury Notes | | 2.13 | | 5/15/25 | | 11,475,000 | | 11,452,807 | |
U.S. Treasury Notes | | 2.00 | | 8/15/25 | | 8,640,000 | | 8,526,263 | |
| | 884,353,739 | |
Utilities - 1.9% | | | | | |
AGL Capital,
Gtd. Notes | | 3.50 | | 9/15/21 | | 193,000 | | 197,049 | |
Alabama Power,
Sr. Unscd. Notes | | 3.75 | | 3/1/45 | | 500,000 | | 458,914 | |
American Water Capital,
Sr. Unscd. Notes | | 3.85 | | 3/1/24 | | 250,000 | | 264,475 | |
Atmos Energy,
Sr. Unscd. Notes | | 4.13 | | 10/15/44 | | 1,000,000 | | 977,313 | |
Berkshire Hathaway Energy,
Sr. Unscd. Bonds | | 6.13 | | 4/1/36 | | 500,000 | | 602,117 | |
Berkshire Hathaway Energy,
Sr. Unscd. Notes | | 5.15 | | 11/15/43 | | 250,000 | | 273,211 | |
Commonwealth Edison,
First Mortgage Bonds | | 2.15 | | 1/15/19 | | 750,000 | | 752,824 | |
Commonwealth Edison,
First Mortgage Bonds | | 5.90 | | 3/15/36 | | 471,000 | | 580,631 | |
Connecticut Light & Power,
First Mortgage Bonds | | 4.30 | | 4/15/44 | | 500,000 | | 510,545 | |
Consolidated Edison of New York,
Sr. Unscd. Debs., Ser. 05-A | | 5.30 | | 3/1/35 | | 475,000 | | 542,645 | |
Consolidated Edison of New York,
Sr. Unscd. Debs., Ser. 06-B | | 6.20 | | 6/15/36 | | 200,000 | | 245,608 | |
Consolidated Edison of New York,
Sr. Unscd. Debs., Ser. 08-A | | 5.85 | | 4/1/18 | | 600,000 | | 659,117 | |
Consumers Energy,
First Mortgage Bonds | | 4.35 | | 8/31/64 | | 700,000 | | 670,673 | |
Dominion Resources,
Sr. Unscd. Notes, Ser. B | | 2.75 | | 9/15/22 | | 1,500,000 | c | 1,458,636 | |
Dominion Resources,
Sr. Unscd. Notes, Ser. E | | 6.30 | | 3/15/33 | | 100,000 | | 117,988 | |
53
STATEMENT OF INVESTMENTS (continued)
| | | | | | | | | | | |
Bonds and Notes - 99.9% (continued) | | Coupon
Rate (%) | | Maturity
Date | | Principal
Amount ($) | | Value ($) | |
Utilities - 1.9% (continued) | | | | | |
DTE Electric,
Mortgage Bonds | | 3.38 | | 3/1/25 | | 500,000 | | 512,884 | |
DTE Electric,
Sr. Scd. Notes | | 3.45 | | 10/1/20 | | 700,000 | | 737,129 | |
DTE Electric,
Sr. Scd. Notes, Ser. A | | 6.63 | | 6/1/36 | | 160,000 | | 211,640 | |
Duke Energy,
Sr. Unscd. Notes | | 3.75 | | 4/15/24 | | 500,000 | | 517,295 | |
Duke Energy,
Sr. Unscd. Notes | | 3.75 | | 12/1/24 | | 750,000 | | 734,611 | |
Duke Energy Carolinas,
First Mortgage Bonds | | 3.90 | | 6/15/21 | | 800,000 | | 857,433 | |
Duke Energy Carolinas,
First Mortgage Bonds | | 6.00 | | 1/15/38 | | 1,000,000 | | 1,244,011 | |
Duke Energy Carolinas,
First Mortgage Bonds | | 4.00 | | 9/30/42 | | 500,000 | | 493,722 | |
Duke Energy Florida,
First Mortgage Bonds | | 6.40 | | 6/15/38 | | 150,000 | | 195,758 | |
Duke Energy Indiana,
Sr. Unscd. Debs. | | 6.12 | | 10/15/35 | | 1,000,000 | | 1,226,594 | |
Duke Energy Progress,
First Mortgage Bonds | | 4.15 | | 12/1/44 | | 500,000 | | 502,861 | |
Empresa Nacional de Electricidad,
Sr. Unscd. Notes | | 4.25 | | 4/15/24 | | 500,000 | | 512,035 | |
Exelon Generation,
Sr. Unscd. Notes | | 5.20 | | 10/1/19 | | 1,000,000 | | 1,085,201 | |
Exelon Generation,
Sr. Unscd. Notes | | 6.25 | | 10/1/39 | | 750,000 | | 801,736 | |
Georgia Power,
Sr. Unscd. Note | | 4.30 | | 3/15/42 | | 1,300,000 | | 1,203,827 | |
Hydro-Quebec,
Gov't Gtd. Debs., Ser. HH | | 8.50 | | 12/1/29 | | 1,200,000 | | 1,833,283 | |
Hydro-Quebec,
Gov't Gtd. Debs., Ser. HK | | 9.38 | | 4/15/30 | | 20,000 | | 32,984 | |
Indiana Michigan Power,
Sr. Unscd. Notes | | 6.05 | | 3/15/37 | | 800,000 | | 931,279 | |
Nevada Power,
Mortgage Notes | | 7.13 | | 3/15/19 | | 2,300,000 | | 2,666,477 | |
Nevada Power,
Mortgage Notes, Ser. R | | 6.75 | | 7/1/37 | | 750,000 | | 979,818 | |
Nextera Energy Capital Holdings,
Gtd. Debs. | | 2.40 | | 9/15/19 | | 500,000 | | 496,447 | |
NiSource Finance,
Gtd. Notes | | 6.40 | | 3/15/18 | | 677,000 | | 748,826 | |
Oklahoma Gas & Electric,
Sr. Unscd. Notes | | 4.00 | | 12/15/44 | | 150,000 | | 143,295 | |
Oncor Electric Delivery,
Sr. Scd. Debs. | | 7.00 | | 9/1/22 | | 170,000 | | 206,867 | |
Oncor Electric Delivery,
Sr. Scd. Notes | | 5.00 | | 9/30/17 | | 500,000 | | 531,393 | |
Oncor Electric Delivery,
Sr. Scd. Notes | | 7.00 | | 5/1/32 | | 250,000 | | 316,637 | |
Pacific Gas & Electric,
Sr. Unscd. Bonds | | 6.05 | | 3/1/34 | | 465,000 | | 563,943 | |
Pacific Gas & Electric,
Sr. Unscd. Notes | | 6.25 | | 3/1/39 | | 750,000 | | 932,683 | |
54
| | | | | | | | | | | | | | | | | | | |
Bonds and Notes - 99.9% (continued) | | Coupon
Rate (%) | | Maturity
Date | | Principal
Amount ($) | | Value ($) | |
Utilities - 1.9% (continued) | | | | | |
Pacific Gas & Electric,
Sr. Unscd. Notes | | 4.75 | | 2/15/44 | | 500,000 | | 531,048 | |
PECO Energy,
First Mortgage Bonds | | 4.80 | | 10/15/43 | | 500,000 | | 539,631 | |
Pennsylvania Electric,
Sr. Unscd. Notes | | 5.20 | | 4/1/20 | | 500,000 | | 542,398 | |
Piedmont Natural Gas,
Sr. Unscd. Notes | | 4.10 | | 9/18/34 | | 500,000 | | 491,934 | |
PPL Capital Funding,
Gtd. Notes | | 3.40 | | 6/1/23 | | 400,000 | | 400,830 | |
PPL Capital Funding,
Gtd. Notes | | 4.70 | | 6/1/43 | | 400,000 | | 408,532 | |
PPL Electric Utilities,
First Mortgage Bonds | | 4.75 | | 7/15/43 | | 500,000 | | 546,990 | |
Progress Energy,
Sr. Unscd. Notes | | 7.75 | | 3/1/31 | | 480,000 | | 652,407 | |
PSEG Power,
Gtd. Notes | | 2.45 | | 11/15/18 | | 180,000 | | 180,977 | |
Public Service Company of Colorado,
First Mortgage Bonds | | 3.20 | | 11/15/20 | | 1,500,000 | | 1,564,068 | |
Public Service Electric & Gas,
First Mortgage Notes | | 3.15 | | 8/15/24 | | 1,200,000 | | 1,221,234 | |
Public Service Electric & Gas,
Sr. Scd. Notes, Ser. D | | 5.25 | | 7/1/35 | | 230,000 | | 263,098 | |
San Diego Gas & Electric,
First Mortgage Bonds, Ser. NNN | | 3.60 | | 9/1/23 | | 400,000 | | 419,298 | |
Sempra Energy,
Sr. Unscd. Notes | | 2.88 | | 10/1/22 | | 1,000,000 | | 979,833 | |
South Carolina Electric & Gas,
First Mortgage Bonds | | 6.63 | | 2/1/32 | | 200,000 | | 250,533 | |
South Carolina Electric & Gas,
First Mortgage Bonds | | 4.50 | | 6/1/64 | | 500,000 | | 472,444 | |
Southern California Edison,
First Mortgage Bonds | | 3.88 | | 6/1/21 | | 1,400,000 | | 1,493,965 | |
Southern California Edison,
First Mortgage Notes, Ser. 08-A | | 5.95 | | 2/1/38 | | 70,000 | | 87,522 | |
Southern California Edison,
Sr. Unscd. Notes | | 6.65 | | 4/1/29 | | 450,000 | | 574,537 | |
Southern California Gas,
First Mortgage Bonds | | 3.15 | | 9/15/24 | | 500,000 | | 508,147 | |
Southern California Gas,
First Mortgage Bonds, Ser. HH | | 5.45 | | 4/15/18 | | 100,000 | | 109,954 | |
Southwestern Electric Power,
Sr. Unscd. Notes, Ser. F | | 5.88 | | 3/1/18 | | 150,000 | | 163,968 | |
Tampa Electric,
Sr. Unscd. Notes | | 4.35 | | 5/15/44 | | 500,000 | | 503,405 | |
Toledo Edison,
Sr. Scd. Notes | | 6.15 | | 5/15/37 | | 750,000 | | 861,312 | |
Union Electric,
Sr. Scd. Notes | | 6.40 | | 6/15/17 | | 1,000,000 | | 1,074,414 | |
Virginia Electric & Power,
Sr. Unscd. Notes | | 1.20 | | 1/15/18 | | 1,000,000 | | 993,492 | |
Virginia Electric & Power,
Sr. Unscd. Notes | | 4.00 | | 1/15/43 | | 500,000 | | 491,232 | |
Wisconsin Energy,
Sr. Unscd. Bonds | | 3.55 | | 6/15/25 | | 140,000 | | 142,752 | |
55
STATEMENT OF INVESTMENTS (continued)
| | | | | | | | | | | | | | | | | | | | |
Bonds and Notes - 99.9% (continued) | | Coupon
Rate (%) | | Maturity
Date | | Principal
Amount ($) | | Value ($) | |
Utilities - 1.9% (continued) | | | | | |
Wisconsin Power & Light,
Sr. Unscd. Debs. | | 4.10 | | 10/15/44 | | 800,000 | | 790,349 | |
Xcel Energy,
Sr. Unscd. Notes | | 6.50 | | 7/1/36 | | 630,000 | | 785,086 | |
| | 47,577,805 | |
Total Bonds and Notes
(cost $2,458,443,888) | | 2,494,588,925 | |
Other Investment - 8.9% | | | | | | Shares | | Value ($) | |
Registered Investment Company | | | | | |
Dreyfus Institutional Preferred Plus Money Market Fund
(cost $222,668,516) | | | | | | 222,668,516 | g | 222,668,516 | |
Investment of Cash Collateral for Securities Loaned - .7% | | | | | | Shares | | Value ($) | |
Registered Investment Company; - .7% | | | | | |
Dreyfus Institutional Cash Advantage Fund
(cost $16,826,379) | | | | | | 16,826,379 | g | 16,826,379 | |
Total Investments (cost $2,697,938,783) | | 109.5% | 2,734,083,820 | |
Liabilities, Less Cash and Receivables | | (9.5%) | (236,649,406) | |
Net Assets | | 100.0% | 2,497,434,414 | |
GO—General Obligation
REIT—Real Estate Investment Trust
USD—United States Dollar
a Variable rate security--interest rate subject to periodic change.
b Security exempt from registration pursuant to Rule 144A under the Securities Act of 1933. These securities may be resold in transactions exempt from registration, normally to qualified institutional buyers. At October 31, 2015, these securities were valued at $11,648,095, or 0.44% of net assets.
c Security, or portion thereof, on loan. At October 31, 2015, the value of the fund’s securities on loan was $139,559,613 and the value of the collateral held by the fund was $154,540,137, consisting of cash collateral of $16,826,379 and U.S. Government & Agency securities valued at $137,713,758.
d The Federal Housing Finance Agency ("FHFA") placed the Federal Home Loan Mortgage Corporation and Federal National Mortgage Association into conservatorship with FHFA as the conservator. As such, the FHFA oversees the continuing affairs of these companies.
e Security issued with a zero coupon. Income is recognized through the accretion of discount.
f Purchased on a forward commitment basis.
g Investment in affiliated money market mutual fund.
56
| | |
Portfolio Summary (Unaudited) † | Value (%) |
U.S. Government & Agencies | 67.9 |
Corporate Bonds | 24.6 |
Money Market Investments | 9.6 |
Foreign/Governmental | 4.6 |
Commercial Mortgage-Backed | 1.4 |
Municipal Bonds | .8 |
Asset-Backed | .6 |
| | 109.5 |
† Based on net assets.
See notes to financial statements.
57
TBA Sale Commitments
October 31, 2015
| | | | | | |
| | | | | | |
| | | Principal Amount ($) | | Value ($) | |
Federal Home Loan Mortgage Corp.: | | | | | |
4.50%, 11/1/18 | | 600,000 | a,b | 620,813 | |
5%, 11/19/22 | | 1,200,000 | a,b | 1,242,937 | |
Total Federal Home Loan Mortgage Corp. | | 1,800,000 | a,b | 1,863,750 | |
| | | | | | |
Federal National Mortgage Association: | | | | | |
3.50%, 11/17/30 | | 500,000 | a,b | 527,930 | |
4%, 11/18/29 | | 3,650,000 | a,b | 3,812,875 | |
4.50%, 11/18/29 | | 1,600,000 | a,b | 1,656,376 | |
5%, 11/1/17 | | 300,000 | a,b | 311,039 | |
5.50%, 11/1/29 | | 500,000 | a,b | 520,586 | |
Total Federal National Mortgage Association | | 6,550,000 | | 6,828,806 | |
| | | | | | |
Government National Mortgage Association: | | | | | |
5%, 11/1/33 | | 5,600,000 | b | 6,148,406 | |
5.50%, 11/15/32 | | 1,100,000 | b | 1,228,683 | |
Total Government National Mortgage Association | | 6,700,000 | | 7,377,089 | |
Total Sale Commitments (proceeds $16,064,922) | | | | 16,069,645 | |
a The Federal Housing Finance Agency (“FHFA”) placed Federal National Mortgage Association and Federal Home Loan Mortgage Corporation into conservatorship with FHFA as the conservator. As such, the FHFA oversees the continuing affairs of these companies.
b Sold on a delayed delivery basis.
58
STATEMENT OF ASSETS AND LIABILITIES
October 31, 2015
| | | | | | | |
| | | | | | |
| | | Cost | | Value | |
Assets ($): | | | | |
Investments in securities—See Statement of Investments
(including securities on loan, valued at $139,559,613)—Note 1(b): | | | | |
Unaffiliated issuers | | 2,458,443,888 | | 2,494,588,925 | |
Affiliated issuers | | 239,494,895 | | 239,494,895 | |
Cash | | | | | 4,325,916 | |
Receivable for investment securities sold | | | | | 83,913,383 | |
Receivable for TBA sale commitments—Note 4 | | | | | 16,064,922 | |
Dividends, interest and securities lending income receivable | | | | | 15,458,028 | |
Receivable for shares of Common Stock subscribed | | | | | 1,580,414 | |
| | | | | 2,855,426,483 | |
Liabilities ($): | | | | |
Due to The Dreyfus Corporation and affiliates—Note 3(b) | | | | | 536,068 | |
Payable for investment securities purchased | | | | | 162,027,463 | |
Payable for open mortgage dollar roll transactions—Note 4 | | | | | 159,805,385 | |
Liability for securities on loan—Note 1(b) | | | | | 16,826,379 | |
TBA commitment, at value (proceeds $16,064,922)—See
Statement of TBA commitments—Note 4 | | | | | 16,069,645 | |
Payable for shares of Common Stock redeemed | | | | | 2,677,426 | |
Accrued expenses | | | | | 49,703 | |
| | | | | 357,992,069 | |
Net Assets ($) | | | 2,497,434,414 | |
Composition of Net Assets ($): | | | | |
Paid-in capital | | | | | 2,449,784,293 | |
Accumulated undistributed investment income—net | | | | | 2,835,959 | |
Accumulated net realized gain (loss) on investments | | | | | 8,673,848 | |
Accumulated net unrealized appreciation (depreciation)
on investments | | | | | 36,140,314 | |
Net Assets ($) | | | 2,497,434,414 | |
| | | | |
Net Asset Value Per Share | Investor Shares | BASIC Shares | |
Net Assets ($) | 1,040,129,094 | 1,457,305,320 | |
Shares Outstanding | 99,528,565 | 139,365,976 | |
Net Asset Value Per Share ($) | 10.45 | 10.46 | |
See notes to financial statements.
59
STATEMENT OF OPERATIONS
Year Ended October 31, 2015
| | | | | | | |
| | | | | | |
| | | | | | |
Investment Income ($): | | | | |
Income: | | | | |
Interest | | | 58,820,010 | |
Dividends from affiliated issuers | | | 220,755 | |
Income from securities lending—Note 1(b) | | | 184,591 | |
Total Income | | | 59,225,356 | |
Expenses: | | | | |
Management fee—Note 3(a) | | | 3,707,419 | |
Distribution fees—Note 3(b) | | | 2,922,351 | |
Directors' fees—Note 3(a,c) | | | 194,416 | |
Loan commitment fees—Note 2 | | | 26,641 | |
Total Expenses | | | 6,850,827 | |
Less—Directors' fees reimbursed by Dreyfus—Note 3(a) | | | (194,416) | |
Net Expenses | | | 6,656,411 | |
Investment Income—Net | | | 52,568,945 | |
Realized and Unrealized Gain (Loss) on Investments—Note 4 ($): | | |
Net realized gain (loss) on investments | 14,771,564 | |
Net unrealized appreciation (depreciation) on investments | | | (27,242,861) | |
Net Realized and Unrealized Gain (Loss) on Investments | | | (12,471,297) | |
Net Increase in Net Assets Resulting from Operations | | 40,097,648 | |
See notes to financial statements.
60
STATEMENT OF CHANGES IN NET ASSETS
| | | | | | | | | | |
| | | | | | | | | | |
| | | | Year Ended October 31, |
| | | | 2015 | | | | 2014 | |
| | | | | | | | | |
Operations ($): | | | | | | | | |
Investment income—net | | | 52,568,945 | | | | 51,633,894 | |
Net realized gain (loss) on investments | | 14,771,564 | | | | 22,902,556 | |
Net unrealized appreciation (depreciation)
on investments | | (27,242,861) | | | | 8,616,363 | |
Net Increase (Decrease) in Net Assets
Resulting from Operations | 40,097,648 | | | | 83,152,813 | |
Dividends to Shareholders from ($): | | | | | | | | |
Investment income—net: | | | | | | | | |
Investor Shares | | | (25,290,429) | | | | (21,289,213) | |
BASIC Shares | | | (31,390,119) | | | | (33,708,941) | |
Net realized gain on investments: | | | | | | | | |
Investor Shares | | | (9,303,421) | | | | (11,929,675) | |
BASIC Shares | | | (9,799,390) | | | | (16,594,600) | |
Total Dividends | | | (75,783,359) | | | | (83,522,429) | |
Capital Stock Transactions ($): | | | | | | | | |
Net proceeds from shares sold: | | | | | | | | |
Investor Shares | | | 385,489,054 | | | | 591,861,829 | |
BASIC Shares | | | 498,054,862 | | | | 434,531,737 | |
Dividends reinvested: | | | | | | | | |
Investor Shares | | | 33,898,706 | | | | 32,932,622 | |
BASIC Shares | | | 36,591,224 | | | | 44,839,901 | |
Cost of shares redeemed: | | | | | | | | |
Investor Shares | | | (554,163,604) | | | | (338,025,004) | |
BASIC Shares | | | (278,371,987) | | | | (508,208,499) | |
Increase (Decrease) in Net Assets
from Capital Stock Transactions | 121,498,255 | | | | 257,932,586 | |
Total Increase (Decrease) in Net Assets | 85,812,544 | | | | 257,562,970 | |
Net Assets ($): | | | | | | | | |
Beginning of Period | | | 2,411,621,870 | | | | 2,154,058,900 | |
End of Period | | | 2,497,434,414 | | | | 2,411,621,870 | |
Undistributed investment income—net | 2,835,959 | | | | 2,329,198 | |
Capital Share Transactions (Shares): | | | | | | | | |
Investor Shares | | | | | | | | |
Shares sold | | | 36,538,910 | | | | 56,139,224 | |
Shares issued for dividends reinvested | | | 3,213,122 | | | | 3,148,438 | |
Shares redeemed | | | (52,562,708) | | | | (32,176,189) | |
Net Increase (Decrease) in Shares Outstanding | (12,810,676) | | | | 27,111,473 | |
BASIC Shares | | | | | | | | |
Shares sold | | | 47,243,451 | | | | 41,298,790 | |
Shares issued for dividends reinvested | | | 3,466,427 | | | | 4,283,160 | |
Shares redeemed | | | (26,412,350) | | | | (48,124,947) | |
Net Increase (Decrease) in Shares Outstanding | 24,297,528 | | | | (2,542,997) | |
See notes to financial statements.
61
FINANCIAL HIGHLIGHTS
The following tables describe the performance for each share class for the fiscal periods indicated. All information (except portfolio turnover rate) reflects financial results for a single fund share. Total return shows how much your investment in the fund would have increased (or decreased) during each period, assuming you had reinvested all dividends and distributions. These figures have been derived from the fund’s financial statements.
| | | | | | | |
| | | |
| | | |
| | Year Ended October 31, |
Investor Shares | 2015 | 2014 | 2013 | 2012 | 2011 |
Per Share Data ($): | | | | | | |
Net asset value, beginning of period | | 10.60 | 10.62 | 11.11 | 10.93 | 10.80 |
Investment Operations: | | | | | | |
Investment income—neta | | .21 | .23 | .24 | .30 | .34 |
Net realized and unrealized
gain (loss) on investments | | (.05) | .14 | (.42) | .21 | .14 |
Total from Investment Operations | | .16 | .37 | (.18) | .51 | .48 |
Distributions: | | | | | | |
Dividends from
investment income—net | | (.23) | (.25) | (.28) | (.33) | (.35) |
Dividends from net realized
gain on investments | | (.08) | (.14) | (.03) | - | - |
Total Distributions | | (.31) | (.39) | (.31) | (.33) | (.35) |
Net asset value, end of period | | 10.45 | 10.60 | 10.62 | 11.11 | 10.93 |
Total Return (%)b | | 1.54 | 3.62 | (1.66) | 4.75 | 4.58 |
Ratios/Supplemental Data (%): | | | | | |
Ratio of total expenses
to average net assets | | .41 | .41 | .41 | .41 | .40 |
Ratio of net expenses
to average net assets | | .40 | .40 | .40 | .40 | .40 |
Ratio of net investment income
to average net assets | | 2.00 | 2.22 | 2.25 | 2.67 | 3.24 |
Portfolio Turnover Rate | | 150.80b | 145.11b | 94.21b | 30.42 | 30.02 |
Net Assets, end of period ($ x 1,000) | | 1,040,129 | 1,190,994 | 904,779 | 1,032,597 | 896,293 |
a Based on average shares outstanding.
b The portfolio turnover rates excluding mortgage dollar roll transactions for the periods ended October 31, 2015, 2014 and 2013 were 79.15%, 89.76% and 67.47%, respectively.
See notes to financial statements.
62
| | | | | | | |
| | | |
| | | |
| | Year Ended October 31, |
BASIC Shares | 2015 | 2014 | 2013 | 2012 | 2011 |
Per Share Data ($): | | | | | | |
Net asset value, beginning of period | | 10.61 | 10.62 | 11.12 | 10.94 | 10.80 |
Investment Operations: | | | | | | |
Investment income—neta | | .24 | .26 | .27 | .32 | .36 |
Net realized and unrealized
gain (loss) on investments | | (.06) | .15 | (.43) | .22 | .16 |
Total from Investment Operations | | .18 | .41 | (.16) | .54 | .52 |
Distributions: | | | | | | |
Dividends from
investment income—net | | (.25) | (.28) | (.31) | (.36) | (.38) |
Dividends from net realized
gain on investments | | (.08) | (.14) | (.03) | - | - |
Total Distributions | | (.33) | (.42) | (.34) | (.36) | (.38) |
Net asset value, end of period | | 10.46 | 10.61 | 10.62 | 11.12 | 10.94 |
Total Return (%)b | | 1.79 | 3.97 | (1.50) | 5.01 | 4.94 |
Ratios/Supplemental Data (%): | | | | | |
Ratio of total expenses
to average net assets | | .16 | .16 | .16 | .16 | .15 |
Ratio of net expenses
to average net assets | | .15 | .15 | .15 | .15 | .15 |
Ratio of net investment income
to average net assets | | 2.24 | 2.47 | 2.50 | 2.92 | 3.31 |
Portfolio Turnover Rate | | 150.80b | 145.11b | 94.21b | 30.42 | 30.02 |
Net Assets, end of period ($ x 1,000) | | 1,457,305 | 1,220,628 | 1,249,280 | 1,486,179 | 1,427,047 |
a Based on average shares outstanding.
b The portfolio turnover rates excluding mortgage dollar roll transactions for the periods ended October 31, 2015, 2014 and 2013 were 79.15%, 89.76% and 67.47%, respectively.
See notes to financial statements.
63
NOTES TO FINANCIAL STATEMENTS
NOTE 1—Significant Accounting Policies:
Dreyfus Bond Market Index Fund (the “fund”) is a separate diversified series of The Dreyfus/Laurel Funds, Inc. (the “Company”), which is registered under the Investment Company Act of 1940, as amended (the “Act”), as an open-end management investment company and operates as a series company currently offering ten series, including the fund. The fund’s investment objective is to seek to match the total return of the Barclays U.S. Aggregate Index. The Dreyfus Corporation (the “Manager” or “Dreyfus”), a wholly-owned subsidiary of The Bank of New York Mellon Corporation (“BNY Mellon”), serves as the fund’s investment adviser.
MBSC Securities Corporation (the “Distributor”), a wholly-owned subsidiary of Dreyfus, is the distributor of the fund’s shares, which are sold to the public without a sales charge. The fund is authorized to issue 500 million shares of $.001 par value Common Stock in each of the following classes of shares: Investor and BASIC. Investor shares and BASIC shares are offered to any investor. Differences between the two classes include the services offered to and the expenses borne by each class, as well as their minimum purchase and account balance requirements. Income, expenses (other than expenses attributable to a specific class), and realized and unrealized gains or losses on investments are allocated to each class of shares based on its relative net assets.
The Company accounts separately for the assets, liabilities and operations of each series. Expenses directly attributable to each series are charged to that series’ operations; expenses which are applicable to all series are allocated among them on a pro rata basis.
The Financial Accounting Standards Board (“FASB”) Accounting Standards Codification (“ASC”) is the exclusive reference of authoritative U.S. generally accepted accounting principles (“GAAP”) recognized by the FASB to be applied by nongovernmental entities. Rules and interpretive releases of the Securities and Exchange Commission (“SEC”) under authority of federal laws are also sources of authoritative GAAP for SEC registrants. The fund’s financial statements are prepared in accordance with GAAP, which may require the use of management estimates and assumptions. Actual results could differ from those estimates.
(a) Portfolio valuation: The fair value of a financial instrument is the amount that would be received to sell an asset or paid to transfer a liability in an orderly transaction between market participants at the measurement date (i.e., the exit price). GAAP establishes a fair value hierarchy that prioritizes the inputs of valuation techniques used to measure fair value.
64
This hierarchy gives the highest priority to unadjusted quoted prices in active markets for identical assets or liabilities (Level 1 measurements) and the lowest priority to unobservable inputs (Level 3 measurements).
Additionally, GAAP provides guidance on determining whether the volume and activity in a market has decreased significantly and whether such a decrease in activity results in transactions that are not orderly. GAAP requires enhanced disclosures around valuation inputs and techniques used during annual and interim periods.
Various inputs are used in determining the value of the fund’s investments relating to fair value measurements. These inputs are summarized in the three broad levels listed below:
Level 1—unadjusted quoted prices in active markets for identical investments.
Level 2—other significant observable inputs (including quoted prices for similar investments, interest rates, prepayment speeds, credit risk, etc.).
Level 3—significant unobservable inputs (including the fund’s own assumptions in determining the fair value of investments).
The inputs or methodology used for valuing securities are not necessarily an indication of the risk associated with investing in those securities.
Changes in valuation techniques may result in transfers in or out of an assigned level within the disclosure hierarchy. Valuation techniques used to value the fund’s investments are as follows:
Registered investment companies that are not traded on an exchange are valued at their net asset value and are generally categorized within Level 1 of the fair value hierarchy.
Investments in securities, excluding short-term investments (other than U.S. Treasury Bills), are valued each business day by an independent pricing service (the “Service”) approved by the Company’s Board of Directors (the “Board”). Investments for which quoted bid prices are readily available and are representative of the bid side of the market in the judgment of the Service are valued at the mean between the quoted bid prices (as obtained by the Service from dealers in such securities) and asked prices (as calculated by the Service based upon its evaluation of the market for such securities). Other investments (which constitute a majority of the portfolio securities) are valued as determined by the Service, based on methods which include consideration of the following: yields or prices of securities of comparable quality, coupon, maturity and type; indications
65
NOTES TO FINANCIAL STATEMENTS (continued)
as to values from dealers; and general market conditions. These securities are generally categorized within Level 2 of the fair value hierarchy.
The Service’s procedures are reviewed by Dreyfus under the general supervision of the Board.
When market quotations or official closing prices are not readily available, or are determined not to reflect accurately fair value, such as when the value of a security has been significantly affected by events after the close of the exchange or market on which the security is principally traded (for example, a foreign exchange or market), but before the fund calculates its net asset value, the fund may value these investments at fair value as determined in accordance with the procedures approved by the Board. Certain factors may be considered when fair valuing investments such as: fundamental analytical data, the nature and duration of restrictions on disposition, an evaluation of the forces that influence the market in which the securities are purchased and sold, and public trading in similar securities of the issuer or comparable issuers. These securities are either categorized within Level 2 or 3 of the fair value hierarchy depending on the relevant inputs used.
For restricted securities where observable inputs are limited, assumptions about market activity and risk are used and are generally categorized within Level 3 of the fair value hierarchy.
The following is a summary of the inputs used as of October 31, 2015 in valuing the fund’s investments:
| | | | | |
| Level 1 - Unadjusted
Quoted Prices | Level 2 - Other
Significant Observable Inputs | Level 3 -Significant
Unobservable Inputs | Total |
Assets ($) | | | | |
Investments in Securities: | | | | |
Asset-Backed | - | 13,364,435 | - | 13,364,435 |
Commercial Mortgage-Backed | - | 35,494,335 | - | 35,494,335 |
Corporate Bonds† | - | 616,212,158 | - | 616,212,158 |
Foreign Government | - | 114,605,177 | - | 114,605,177 |
Municipal Bonds† | - | 19,347,985 | - | 19,347,985 |
Mutual Funds | 239,494,895 | - | - | 239,494,895 |
U.S. Government Agencies/
Mortgage-Backed | - | 811,211,096 | - | 811,211,096 |
U.S. Treasury | - | 884,353,739 | - | 884,353,739 |
66
| | | | | |
| Level 1 - Unadjusted
Quoted Prices | Level 2 - Other
Significant Observable Inputs | Level 3 -Significant
Unobservable Inputs | Total |
Liabilities ($) | | | | |
Other Financial Instruments: | | | | |
TBA Sales Commitments | - | (16,069,645) | - | (16,069,645) |
† See Statement of Investments for additional detailed categorizations.
At October 31, 2015, there were no transfers between Level 1, Level 2 and Level 3 of the fair value hierarchy.
(b) Securities transactions and investment income: Securities transactions are recorded on a trade date basis. Realized gains and losses from securities transactions are recorded on the identified cost basis. Dividend income is recognized on the ex-dividend date and interest income, including, where applicable, accretion of discount and amortization of premium on investments, is recognized on the accrual basis.
Pursuant to a securities lending agreement with The Bank of New York Mellon, a subsidiary of BNY Mellon and an affiliate of Dreyfus, the fund may lend securities to qualified institutions. It is the fund’s policy that, at origination, all loans are secured by collateral of at least 102% of the value of U.S. securities loaned and 105% of the value of foreign securities loaned. Collateral equivalent to at least 100% of the market value of securities on loan is maintained at all times. Collateral is either in the form of cash, which can be invested in certain money market mutual funds managed by Dreyfus, or U.S. Government and Agency securities. The fund is entitled to receive all dividends, interest and distributions on securities loaned, in addition to income earned as a result of the lending transaction. Should a borrower fail to return the securities in a timely manner, The Bank of New York Mellon is required to replace the securities for the benefit of the fund or credit the fund with the market value of the unreturned securities and is subrogated to the fund’s rights against the borrower and the collateral. During the period ended October 31, 2015, The Bank of New York Mellon earned $46,172 from lending portfolio securities, pursuant to the securities lending agreement.
(c) Affiliated issuers: Investments in other investment companies advised by Dreyfus are defined as “affiliated” under the Act. Investments in affiliated investment companies during the period ended October 31, 2015 were as follows:
67
NOTES TO FINANCIAL STATEMENTS (continued)
| | | | | | |
Affiliated Investment Company | Value 10/31/2014 ($) | Purchases ($) | Sales ($) | Value 10/31/2015 ($) | Net
Assets (%) |
Dreyfus Institutional Preferred Plus Money Market Fund | 202,017,347 | 509,241,067 | 488,589,898 | 222,668,516 | 8.9 |
Dreyfus Institutional Cash Advantage Fund | 17,606,936 | 179,279,045 | 180,059,602 | 16,826,379 | 0.7 |
Total | 219,624,283 | 688,520,112 | 668,649,500 | 239,494,895 | 9.6 |
(d) Risk: The fund invests primarily in debt securities. Failure of an issuer of the debt securities to make timely interest or principal payments, or a decline or the perception of a decline in the credit quality of a debt security, can cause the debt security’s price to fall, potentially lowering the fund’s share price. In addition, the value of debt securities may decline due to general market conditions that are not specifically related to a particular issuer, such as real or perceived adverse economic conditions, changes in outlook for corporate earnings, changes in interest or currency rates or adverse investor sentiment. They may also decline because of factors that affect a particular industry.
(e) Dividends to shareholders: It is the policy of the fund to declare dividends daily from investment income-net. Such dividends are paid monthly. Dividends from net realized capital gains, if any, are normally declared and paid annually, but the fund may make distributions on a more frequent basis to comply with the distribution requirements of the Internal Revenue Code of 1986, as amended (the “Code”). To the extent that net realized capital gains can be offset by capital loss carryovers, it is the policy of the fund not to distribute such gains. Income and capital gain distributions are determined in accordance with income tax regulations, which may differ from GAAP.
(f) Federal income taxes: It is the policy of the fund to continue to qualify as a regulated investment company, if such qualification is in the best interests of its shareholders, by complying with the applicable provisions of the Code, and to make distributions of taxable income sufficient to relieve it from substantially all federal income and excise taxes.
68
As of and during the period ended October 31, 2015, the fund did not have any liabilities for any uncertain tax positions. The fund recognizes interest and penalties, if any, related to uncertain tax positions as income tax expense in the Statement of Operations. During the period ended October 31, 2015, the fund did not incur any interest or penalties.
Each tax year in the four-year period ended October 31, 2015 remains subject to examination by the Internal Revenue Service and state taxing authorities.
At October 31, 2015, the components of accumulated earnings on a tax basis were as follows: undistributed ordinary income $10,562,347, undistributed capital gains $1,628,724 and unrealized appreciation $35,459,050.
The tax character of distributions paid to shareholders during the fiscal periods ended October 31, 2015 and October 31, 2014 were as follows: ordinary income $64,339,909 and $55,998,444, and long-term capital gains $11,443,450 and $27,523,985, respectively.
During the period ended October 31, 2015, as a result of permanent book to tax differences, primarily due to the tax treatment for paydown gains and losses on mortgage backed securities, amortization of premiums and consent fees, the fund increased accumulated undistributed investment income-net by $4,618,364 and decreased accumulated net realized gain (loss) on investments by the same amount. Net assets and net asset value per share were not affected by this reclassification.
NOTE 2—Bank Lines of Credit:
The fund participates with other Dreyfus-managed funds in a $480 million unsecured credit facility led by Citibank, N.A. and a $300 million unsecured credit facility provided by The Bank of New York Mellon (each, a “Facility”), each to be utilized primarily for temporary or emergency purposes, including the financing of redemptions. Prior to October 7, 2015, the unsecured credit facility with Citibank, N.A. was $430 million. In connection therewith, the fund has agreed to pay its pro rata portion of commitment fees for each Facility. Interest is charged to the fund based on rates determined pursuant to the terms of the respective Facility at the time of borrowing. During the period ended October 31, 2015, the fund did not borrow under the Facilities.
NOTE 3—Investment Management Fee and Other Transactions with Affiliates:
(a) Pursuant to an investment management agreement with Dreyfus, Dreyfus provides or arranges for one or more third parties and/or affiliates
69
NOTES TO FINANCIAL STATEMENTS (continued)
to provide investment advisory, administrative, custody, fund accounting and transfer agency services to the fund. Dreyfus also directs the investments of the fund in accordance with its investment objective, policies and limitations. For these services, the fund is contractually obligated to pay Dreyfus a fee, calculated daily and paid monthly, at the annual rate of .15% of the value of the fund’s average daily net assets. Out of its fee Dreyfus pays all of the expenses of the fund except brokerage fees, taxes, interest expenses, commitment fees on borrowings, Distribution Plan fees, fees and expenses of non-interested Directors (including counsel fees) and extraordinary expenses. In addition Dreyfus is required to reduce its fee in an amount equal to the fund’s allocable portion of fees and expenses of the non-interested Directors (including counsel fees). During the period ended October 31, 2015, fees reimbursed by Dreyfus amounted to $194,416.
(b) Under the Distribution Plan adopted pursuant to Rule 12b-1 under the Act, Investor shares may pay annually up to .25% of the value of its average daily net assets to compensate the Distributor for shareholder servicing activities primarily intended to result in the sale of Investor shares. The BASIC shares bear no Distribution Plan fee. During the period ended October 31, 2015, Investor shares were charged $2,922,351 pursuant to the Distribution Plan.
Under its terms, the Distribution Plan shall remain in effect from year to year, provided such continuance is approved annually by a vote of a majority of those Directors who are not “interested persons” of the Company and who have no direct or indirect financial interest in the operation of or in any agreement related to the Distribution Plan.
The components of “Due to The Dreyfus Corporation and affiliates” in the Statement of Assets and Liabilities consist of: management fees $315,689 and Distribution Plan fees $233,490, which are offset against an expense reimbursement currently in effect in the amount of $13,111.
(c) Each Board member also serves as a Board member of other funds within the Dreyfus complex. Annual retainer fees and attendance fees are allocated to each fund based on net assets.
NOTE 4—Securities Transactions:
The aggregate amount of purchases and sales (including paydowns) of investment securities, excluding short-term securities, during the period ended October 31, 2015, amounted to $3,825,389,830 and $3,720,522,720, respectively, in addition to $1,764,006,604 in purchases and $1,767,856,616 in sales were from mortgage dollar transactions.
70
Mortgage Dollar Rolls: A mortgage dollar roll transaction involves a sale by the fund of mortgage related securities that it holds with an agreement by the fund to repurchase similar securities at an agreed upon price and date. The securities purchased will bear the same interest rate as those sold, but generally will be collateralized by pools of mortgages with different prepayment histories than those securities sold. The fund accounts for mortgage dollar rolls as purchases and sales transactions.
To-Be-Announced (“TBA”) Securities: During the period ended October 31, 2015, the fund transacted in TBA securities that involved buying or selling mortgage-backed securities on a forward commitment basis. A TBA transaction typically does not designate the actual security to be delivered and only includes an approximate principal amount; however, delivered securities must meet specified terms defined by industry guidelines, including issuer, rate and current principal amount outstanding on underling mortgage pools. TBA securities subject to a forward commitment to sell at period end are included at the end of the fund’s Statement of Investments under the caption “TBA Sale Commitments.” The proceeds and value of these commitments are reflected in the fund’s Statement of Assets and Liabilities as Receivable for TBA sale commitments and TBA sale commitments, at value, respectively.
At October 31, 2015, the cost of investments for federal income tax purposes was $2,698,620,047; accordingly, accumulated net unrealized appreciation on investments was $35,463,773, consisting of $53,614,898 gross unrealized appreciation and $18,151,125 gross unrealized depreciation.
71
REPORT OF INDEPENDENT REGISTERED
PUBLIC ACCOUNTING FIRM
The Board of Directors and Shareholders of
The Dreyfus/Laurel Funds, Inc.
We have audited the accompanying statement of assets and liabilities of Dreyfus Bond Market Index Fund (the “Fund”), a series of The Dreyfus/Laurel Funds, Inc., including the statements of investments and TBA Sale Commitments, as of October 31, 2015, the related statement of operations for the year then ended, the statements of changes in net assets for each of the years in the two-year period then ended, and the financial highlights for each of the years in the five-year period then ended. These financial statements and financial highlights are the responsibility of the Fund’s management. Our responsibility is to express an opinion on these financial statements and financial highlights based on our audits.
We conducted our audits in accordance with the standards of the Public Company Accounting Oversight Board (United States). Those standards require that we plan and perform the audit to obtain reasonable assurance about whether the financial statements and financial highlights are free of material misstatement. An audit includes examining, on a test basis, evidence supporting the amounts and disclosures in the financial statements. Our procedures included confirmation of securities owned as of October 31, 2015, by correspondence with the custodian and brokers or by other appropriate auditing procedures. An audit also includes assessing the accounting principles used and significant estimates made by management, as well as evaluating the overall financial statement presentation. We believe that our audits provide a reasonable basis for our opinion.
In our opinion, the financial statements and financial highlights referred to above present fairly, in all material respects, the financial position of Dreyfus Bond Market Index Fund as of October 31, 2015, the results of its operations for the year then ended, the changes in its net assets for each of the years in the two-year period then ended, and the financial highlights for each of the years in the five-year period then ended, in conformity with U.S. generally accepted accounting principles.

New York, New York
December 30, 2015
72
IMPORTANT TAX INFORMATION (Unaudited)
For federal tax purposes, the fund reports the maximum amount allowable but not less than 88.41% as interest-related dividends in accordance with Sections 871(k)(1) and 881(e) of the Internal Revenue Code. Also, the fund reports the maximum amount allowable but not less than $.0502 per share as a capital gain dividend in accordance with Section 852(b)(3)(C) of the Internal Revenue Code. Also, the fund reports the maximum amount allowable but not less than $.0336 as a short-term capital gain dividend paid on December 22, 2014 in accordance with Sections 871(k)(2) and 881(e) of the Internal Revenue Code.
73
BOARD MEMBERS INFORMATION (Unaudited)
INDEPENDENT BOARD MEMBERS
Joseph S. DiMartino (72)
Chairman of the Board (1999)
Principal Occupation During Past 5 Years:
· Corporate Director and Trustee (1995-present)
Other Public Company Board Memberships During Past 5 Years:
· CBIZ (formerly, Century Business Services, Inc.), a provider of outsourcing functions for small and medium size companies, Director (1997-present)
· The Newark Group, a provider of a national market of paper recovery facilities, paperboard mills and paperboard converting plants, Director (2000-2010)
No. of Portfolios for which Board Member Serves: 140
———————
Francine J. Bovich (64)
Board Member (2012)
Principal Occupation During Past 5 Years:
· Trustee, The Bradley Trusts, private trust funds (2011-present)
· Managing Director, Morgan Stanley Investment Management (1993-2010)
Other Public Company Board Memberships During Past 5 Years:
· Annaly Capital Management, Inc., Board Member (May 2014-present)
No. of Portfolios for which Board Member Serves: 79
———————
Kenneth A. Himmel (69)
Board Member (1994)
Principal Occupation During Past 5 Years:
· Managing Partner, Gulf Related, an international real estate development company (2010-present)
· President and CEO, Related Urban Development, a real estate development company (1996-present)
· President and CEO, Himmel & Company, a real estate development company (1980-present)
· CEO, American Food Management, a restaurant company (1983-present)
No. of Portfolios for which Board Member Serves: 29
———————
74
Stephen J. Lockwood (68)
Board Member (1994)
Principal Occupation During Past 5 Years:
· Chairman of the Board, Stephen J. Lockwood and Company LLC, a real estate investment company (2000-present)
No. of Portfolios for which Board Member Serves: 29
———————
Roslyn M. Watson (66)
Board Member (1994)
Principal Occupation During Past 5 Years:
· Principal, Watson Ventures, Inc., a real estate investment company (1993-present)
No. of Portfolios for which Board Member Serves: 65
———————
Benaree Pratt Wiley (69)
Board Member (1998)
Principal Occupation During Past 5 Years:
· Principal, The Wiley Group, a firm specializing in strategy and business development (2005-present)
Other Public Company Board Memberships During Past 5 Years:
· CBIZ (formerly, Century Business Services, Inc.), a provider of outsourcing functions for small and medium size companies, Director (2008-present)
No. of Portfolios for which Board Member Serves: 65
———————
Once elected all Board Members serve for an indefinite term, but achieve Emeritus status upon reaching age 80. The address of the Board Members and Officers is c/o The Dreyfus Corporation, 200 Park Avenue, New York, New York 10166. Additional information about the Board Members is available in the fund’s Statement of additional Information which can be obtained from Dreyfus free of charge by calling this toll free number: 1-800-DREYFUS
James M. Fitzgibbons, Emeritus Board Member
J. Tomlinson Fort, Emeritus Board Member
75
OFFICERS OF THE FUND (Unaudited)
BRADLEY J. SKAPYAK, President since January 2010.
Chief Operating Officer and a director of the Manager since June 2009, Chairman of Dreyfus Transfer, Inc., an affiliate of the Manager and the transfer agent of the funds, since May 2011 and Executive Vice President of the Distributor since June 2007. From April 2003 to June 2009, Mr. Skapyak was the head of the Investment Accounting and Support Department of the Manager. He is an officer of 66 investment companies (comprised of 140 portfolios) managed by the Manager. He is 56 years old and has been an employee of the Manager since February 1988.
BENNETT A. MACDOUGALL, Chief Legal Officer since October 2015
Chief Legal Officer of the Manager since June 2015; from June 2005 to June 2015, Director and Associate General Counsel of Deutsche Bank – Asset & Wealth Management Division, and Chief Legal Officer of Deutsche Investment Management Americas Inc. He is an officer of 67 investment companies (comprised of 165 portfolios) managed by the Manager. He is 44 years old and has been an employee of the Manager since June 2015.
JANETTE E. FARRAGHER, Vice President and Secretary since December 2011.
Assistant General Counsel of BNY Mellon, and an officer of 67 investment companies (comprised of 165 portfolios) managed by the Manager. She is 52 years old and has been an employee of the Manager since February 1984.
JAMES BITETTO, Vice President and Assistant Secretary since August 2005.
Managing Counsel of BNY Mellon and Secretary of the Manager, and an officer of 67 investment companies (comprised of 165 portfolios) managed by the Manager. He is 49 years old and has been an employee of the Manager since December 1996.
JONI LACKS CHARATAN, Vice President and Assistant Secretary since August 2005.
Managing Counsel of BNY Mellon, and an officer of 67 investment companies (comprised of 165 portfolios) managed by the Manager. She is 59 years old and has been an employee of the Manager since October 1988.
JOSEPH M. CHIOFFI, Vice President and Assistant Secretary since August 2005.
Managing Counsel of BNY Mellon, and an officer of 67 investment companies (comprised of 165 portfolios) managed by the Manager. He is 53 years old and has been an employee of the Manager since June 2000.
JOHN B. HAMMALIAN, Vice President and Assistant Secretary since August 2005.
Senior Managing Counsel of BNY Mellon, and an officer of 67 investment companies (comprised of 165 portfolios) managed by the Manager. He is 52 years old and has been an employee of the Manager since February 1991.
MAUREEN E. KANE, Vice President and Assistant Secretary since April 2015.
Managing Counsel of BNY Mellon since July 2014; from October 2004 until July 2014, General Counsel, and from May 2009 until July 2014, Chief Compliance Officer of Century Capital Management. She is an officer of 67 investment companies (comprised of 165 portfolios) managed by the Manager. She is 53 years old and has been an employee of the Manager since July 2014.
SARAH S. KELLEHER, Vice President and Assistant Secretary since April 2014.
Senior Counsel of BNY Mellon, and an officer of 67 investment companies (comprised of 165 portfolios) managed by the Manager; from August 2005 to March 2013, Associate General Counsel of Third Avenue Management. She is 40 years old and has been an employee of the Manager since March 2013.
JEFF PRUSNOFSKY, Vice President and Assistant Secretary since August 2005.
Senior Managing Counsel of BNY Mellon, and an officer of 67 investment companies (comprised of 165 portfolios) managed by the Manager. He is 50 years old and has been an employee of the Manager since October 1990.
JAMES WINDELS, Treasurer since November 2001.
Director – Mutual Fund Accounting of the Manager, and an officer of 67 investment companies (comprised of 165 portfolios) managed by the Manager. He is 57 years old and has been an employee of the Manager since April 1985.
76
RICHARD CASSARO, Assistant Treasurer since January 2008.
Senior Accounting Manager – Money Market and Municipal Bond Funds of the Manager, and an officer of 67 investment companies (comprised of 165 portfolios) managed by the Manager. He is 56 years old and has been an employee of the Manager since September 1982.
GAVIN C. REILLY, Assistant Treasurer since December 2005.
Tax Manager of the Investment Accounting and Support Department of the Manager, and an officer of 67 investment companies (comprised of 165 portfolios) managed by the Manager. He is 47 years old and has been an employee of the Manager since April 1991.
ROBERT S. ROBOL, Assistant Treasurer since August 2005.
Senior Accounting Manager – Fixed Income Funds of the Manager, and an officer of 67 investment companies (comprised of 165 portfolios) managed by the Manager. He is 51 years old and has been an employee of the Manager since October 1988.
ROBERT SALVIOLO, Assistant Treasurer since July 2007.
Senior Accounting Manager – Equity Funds of the Manager, and an officer of 67 investment companies (comprised of 165 portfolios) managed by the Manager. He is 48 years old and has been an employee of the Manager since June 1989.
ROBERT SVAGNA, Assistant Treasurer since December 2002.
Senior Accounting Manager – Equity Funds of the Manager, and an officer of 67 investment companies (comprised of 165 portfolios) managed by the Manager. He is 48 years old and has been an employee of the Manager since November 1990.
JOSEPH W. CONNOLLY, Chief Compliance Officer since October 2004.
Chief Compliance Officer of the Manager and The Dreyfus Family of Funds (67 investment companies, comprised of 165 portfolios). He is 58 years old and has served in various capacities with the Manager since 1980, including manager of the firm’s Fund Accounting Department from 1997 through October 2001.
77
Dreyfus Bond Market Index Fund
200 Park Avenue
New York, NY 10166
Manager
The Dreyfus Corporation
200 Park Avenue
New York, NY 10166
Custodian
The Bank of New York Mellon
225 Liberty Street
New York, NY 10286
Transfer Agent &
Dividend Disbursing Agent
Dreyfus Transfer, Inc.
200 Park Avenue
New York, NY 10166
Distributor
MBSC Securities Corporation
200 Park Avenue
New York, NY 10166
| | |
Ticker Symbols: | Investor: DBMIX BASIC: DBIRX |
Telephone Call your financial representative or 1-800-DREYFUS
Mail The Dreyfus Family of Funds, 144 Glenn Curtiss Boulevard, Uniondale, NY 11556-0144
E-mail Send your request to info@dreyfus.com
Internet Information can be viewed online or downloaded at www.dreyfus.com
The fund files its complete schedule of portfolio holdings with the Securities and Exchange Commission (“SEC”) for the first and third quarters of each fiscal year on Form N-Q. The fund’s Forms N-Q are available on the SEC’s website at www.sec.gov and may be reviewed and copied at the SEC’s Public Reference Room in Washington, DC. (phone 1-800-SEC-0330 for information).
A description of the policies and procedures that the fund uses to determine how to vote proxies relating to portfolio securities and information regarding how the fund voted these proxies for the most recent 12-month period ended June 30 is available at www.dreyfus.com and on the SEC’s website at www.sec.gov and without charge, upon request, by calling 1-800-DREYFUS.
| | |
© 2015 MBSC Securities Corporation
0310AR1015 | 
|
Dreyfus Disciplined Stock Fund
| | | |

| | ANNUAL REPORT
October 31, 2015 |
| |
Save time. Save paper. View your next shareholder report online as soon as it’s available. Log into www.dreyfus.com and sign up for Dreyfus eCommunications. It’s simple and only takes a few minutes. |
| |
The views expressed in this report reflect those of the portfolio manager only through the end of the period covered and do not necessarily represent the views of Dreyfus or any other person in the Dreyfus organization. Any such views are subject to change at any time based upon market or other conditions and Dreyfus disclaims any responsibility to update such views. These views may not be relied on as investment advice and, because investment decisions for a Dreyfus fund are based on numerous factors, may not be relied on as an indication of trading intent on behalf of any Dreyfus fund. |
| |
Not FDIC-Insured • Not Bank-Guaranteed • May Lose Value |
Contents
THE FUND
FOR MORE INFORMATION
Back Cover
| | | | |
| |
Dreyfus Disciplined Stock Fund
| | The Fund |
A LETTER FROM THE PRESIDENT
Dear Shareholder:
We are pleased to present this annual report for Dreyfus Disciplined Stock Fund, covering the 12-month period from November 1, 2014, through October 31, 2015. For information about how the fund performed during the reporting period, as well as general market perspectives, we provide a Discussion of Fund Performance on the pages that follow.
Financial markets proved volatile over the reporting period amid choppy U.S. and global economic growth. U.S. stocks advanced over the final months of 2014 and the spring of 2015, with some broad measures of market performance setting new record highs. Those gains were largely erased over the summer when global economic instability undermined investor sentiment, but a renewed rally in October enabled most broad stock indices to end the reporting period in positive territory. In contrast, international stocks generally lost a degree of value, with developed markets faring far better than emerging markets amid falling commodity prices and depreciating currency values. U.S. bonds generally produced modestly positive total returns, with municipal bonds and longer term U.S. government securities faring better, on average, than corporate-backed bonds.
We expect market volatility to persist over the near term until investors see greater clarity regarding short-term U.S. interest rates and global economic conditions. Our investment strategists and portfolio managers are monitoring developments carefully, keeping a close watch on credit spreads, currency values, commodity prices, corporate profits, economic trends in the emerging markets, and other developments that could influence investor sentiment. Over the longer term, we remain confident that markets are likely to benefit as investors increasingly recognize that inflation is likely to stay low, economic growth expectations are stabilizing, and monetary policies remain accommodative in most regions of the world. In our view, investors will continue to be well served under these circumstances by a long-term perspective and a disciplined investment approach.
Thank you for your continued confidence and support.
Sincerely,

J. Charles Cardona
President
The Dreyfus Corporation
November 16, 2015
2
DISCUSSION OF FUND PERFORMANCE
For the reporting period of November 1, 2014, through October 31, 2015, as provided by John Bailer, Portfolio Manager
Fund and Market Performance Overview
For the 12-month period ended October 31, 2015, Dreyfus Disciplined Stock Fund produced a total return of 6.62%.1 In comparison, the Standard & Poor’s 500 Composite Stock Price Index (“S&P 500 Index”), the fund’s benchmark, returned 5.21% for the same period.2
Despite a variety of macroeconomic headwinds and heightened market volatility, U.S. stocks generally posted moderate gains for the reporting period overall. The fund outperformed its benchmark largely on the strength of strong individual stock selections in the information technology, consumer staples, and materials sectors.
The Fund’s Investment Approach
The fund seeks capital appreciation. To pursue its goal, the fund normally invests at least 80% of its net assets in stocks, with a focus on large-cap companies. The fund invests in a diversified portfolio of growth and value stocks, with sector weightings and risk characteristics generally similar to those in the S&P 500 Index. We choose stocks through a disciplined investment process that combines computer modeling techniques, fundamental analysis, and risk management. The result is a portfolio of carefully selected stocks, with overall performance determined by a large number of securities.
Financial Markets Buffeted by Volatility
Although the U.S. economy continued to recover during the reporting period, the expansion initially proved uneven in the face of severe winter weather. Economic growth regained momentum in the spring of 2015, but investors remained concerned about weakness in international markets, while the increasing value of the U.S. dollar against most other currencies undermined revenues for U.S. exporters. A steep decline in petroleum prices generated challenges for many energy producers, but certain other industries and consumers benefited from lower energy prices.
These conditions contributed to high levels of volatility in U.S. equity markets. Stocks gradually recovered from early weakness, trending higher from February through May 2015, then fell over the summer amid contentious negotiations about the debt crisis in Greece and the Chinese Central Bank’s devaluation of the country’s currency, which exacerbated fears about slowing Chinese economic growth. Equity prices rebounded in October, driving most broad measures of U.S. stock market performance back into positive territory. However, geopolitical and macroeconomic uncertainties continued to unsettle investors, as did mixed signals from the Federal Reserve Board regarding the timing of expected short-term interest rate hikes.
Strong Stock Selections Bolstered Performance
The fund’s sector allocations detracted slightly from relative performance, largely due to underweighted exposure to the consumer discretionary sector and overweighted exposure to
3
DISCUSSION OF FUND PERFORMANCE (continued)
energy stocks. However, good individual stock selections more than made up for these minor allocation shortfalls. The fund achieved its strongest returns compared to the benchmark in the information technology sector, led by networking giant Cisco Systems, which derived better-than-expected earnings from users upgrading to new products; and information services provider Alphabet (formerly Google), which reorganized its management structure while continuing to generate strong revenues. A few holdings in the consumer staples sector, such as bottler Coca-Cola Enterprises and beverage maker Molson Coors Brewing, benefited from intensifying mergers-and-acquisitions activity, while others, such as PepsiCo, were spurred to gains by activist investors forcing a shift in business strategy. Drug store chain CVS Health rose in the midst of increasing health care utilization rates. Construction aggregate producers Martin Marietta Materials and Vulcan Materials gained ground due to improve construction spending trends and a favorable pricing environment.
On the other hand, a few holdings detracted from relative returns. In the consumer discretionary sector, discount retailer Dollar Tree faced increased competition and lower sales than expected, while media company Viacom faced pressure on advertising revenues as more television viewers shifted to online sources of content. In the health care sector, gains among managed care providers, such as UnitedHealth Group and Omnicare, were offset by pullbacks in biotechnology holdings, such as AbbVie and Gilead Sciences, amid concerns over drug pricing issues. Finally, among financial companies, several capital markets firms and money center banks were hurt by low bond yields and by the market’s sporadic aversion to risk.
Positioning the Fund for Further Growth
With interest rates low, energy more affordable, and inflation under control, we believe the U.S. economy is well positioned for continued growth. As of the end of the reporting period, we have found a relatively large number of investments that appear well positioned to prosper in this environment in the energy, financials, information technology, materials, and telecommunications services sectors. Recently increased investments in telecommunications companies, where valuations appear attractive amid a stabilizing business environment, represent a significant recent shift in the fund’s allocation of assets. In contrast, we have trimmed the fund’s exposures to the consumer staples and health care sectors from overweighted to mildly underweighted positions, and the fund holds relatively little exposure to the consumer discretionary, industrials, and utilities sectors.
November 16, 2015
Please note, the position in any security highlighted with italicized typeface was sold during the reporting period.
Equity funds are subject generally to market, market sector, market liquidity, issuer, and investment style risks, among other factors, to varying degrees, all of which are more fully described in the fund’s prospectus.
1 Total return includes reinvestment of dividends and any capital gains paid. Past performance is no guarantee of future results. Share price and investment return fluctuate such that upon redemption, fund shares may be worth more or less than their original cost.
2 SOURCE: Lipper Inc. — Reflects the monthly reinvestment of dividends and, where applicable, capital gain distributions. The Standard & Poor’s 500 Composite Stock Price Index is a widely accepted, unmanaged index of U.S. stock market performance. Investors cannot invest directly in any index.
4
FUND PERFORMANCE
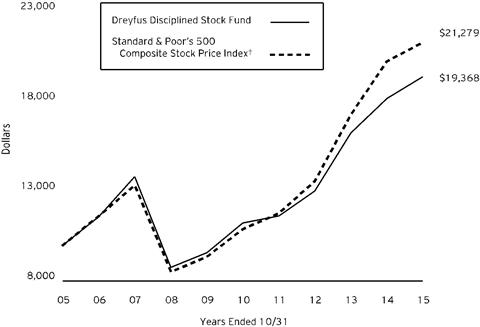
Comparison of change in value of $10,000 investment in Dreyfus Disciplined Stock Fund and the Standard & Poor’s 500 Composite Stock Price Index
| | | | |
Average Annual Total Returns as of 10/31/15 | |
| 1 Year | 5 Years | 10 Years |
Fund | 6.62% | 11.52% | 6.83% |
Standard & Poor’s 500 Composite Stock Price Index | 5.21% | 14.32% | 7.84% |
† Source: Lipper Inc.
Past performance is not predictive of future performance. The fund’s performance shown in the graph and table does not reflect the deduction of taxes that a shareholder would pay on fund distributions or the redemption of fund shares.
The above graph compares a $10,000 investment made in Dreyfus Disciplined Stock Fund on 10/31/05 to a $10,000 investment made in the Standard & Poor’s 500 Composite Stock Price Index (the “Index”) on that date. All dividends and capital gain distributions are reinvested.
The fund’s performance shown in the line graph above takes into account all applicable fees and expenses. The Index is a widely accepted, unmanaged index of U.S. stock market performance. Unlike a mutual fund, the Index is not subject to charges, fees and other expenses. Investors cannot invest directly in any index. Further information relating to fund performance, including expense reimbursements, if applicable, is contained in the Financial Highlights section of the prospectus and elsewhere in this report.
5
UNDERSTANDING YOUR FUND’S EXPENSES (Unaudited)
As a mutual fund investor, you pay ongoing expenses, such as management fees and other expenses. Using the information below, you can estimate how these expenses affect your investment and compare them with the expenses of other funds. You also may pay one-time transaction expenses, including sales charges (loads) and redemption fees, which are not shown in this section and would have resulted in higher total expenses. For more information, see your fund’s prospectus or talk to your financial adviser.
Review your fund’s expenses
The table below shows the expenses you would have paid on a $1,000 investment in Dreyfus Disciplined Stock Fund from May 1, 2015 to October 31, 2015. It also shows how much a $1,000 investment would be worth at the close of the period, assuming actual returns and expenses.
| | | | | | | | | | |
Expenses and Value of a $1,000 Investment |
assuming actual returns for the six months ended October 31, 2015 | | |
| | | | | | | | | |
Expenses paid per $1,000† | | | | $ 5.10 | | | |
Ending value (after expenses) | | | | $ 1,022.20 | | | |
COMPARING YOUR FUND’S EXPENSES
WITH THOSE OF OTHER FUNDS (Unaudited)
Using the SEC’s method to compare expenses
The Securities and Exchange Commission (SEC) has established guidelines to help investors assess fund expenses. Per these guidelines, the table below shows your fund’s expenses based on a $1,000 investment, assuming a hypothetical 5% annualized return. You can use this information to compare the ongoing expenses (but not transaction expenses or total cost) of investing in the fund with those of other funds. All mutual fund shareholder reports will provide this information to help you make this comparison. Please note that you cannot use this information to estimate your actual ending account balance and expenses paid during the period.
| | | | | | | | | | | |
Expenses and Value of a $1,000 Investment |
assuming a hypothetical 5% annualized return for the six months ended October 31, 2015 |
| | | | | | | | | |
Expenses paid per $1,000† | | | | $ 5.09 | | | |
Ending value (after expenses) | | | | $ 1,020.16 | | | |
† Expenses are equal to the fund’s annualized expense ratio of 1.00%, multiplied by the average account value over the period, multiplied by 184/365 (to reflect the one-half year period).
6
STATEMENT OF INVESTMENTS
October 31, 2015
| | | | | | |
Common Stocks - 99.7% | | Shares | | Value ($) | |
Banks - 8.6% | | | | | |
Citigroup | | 208,650 | | 11,093,920 | |
JPMorgan Chase & Co. | | 360,884 | | 23,186,797 | |
PNC Financial Services Group | | 68,715 | | 6,202,216 | |
Wells Fargo & Co. | | 151,735 | | 8,214,933 | |
| | | | | 48,697,866 | |
Capital Goods - 4.9% | | | | | |
Honeywell International | | 54,181 | | 5,595,814 | |
Owens Corning | | 112,135 | | 5,105,507 | |
Raytheon | | 51,395 | | 6,033,773 | |
United Technologies | | 113,802 | | 11,199,255 | |
| | | | | 27,934,349 | |
Consumer Services - 2.0% | | | | | |
Carnival | | 209,415 | | 11,325,163 | |
Diversified Financials - 5.4% | | | | | |
Capital One Financial | | 77,800 | | 6,138,420 | |
Charles Schwab | | 185,798 | | 5,670,555 | |
Goldman Sachs Group | | 15,002 | | 2,812,875 | |
Morgan Stanley | | 171,435 | | 5,652,212 | |
Voya Financial | | 252,137 | | 10,229,198 | |
| | | | | 30,503,260 | |
Energy - 8.4% | | | | | |
EOG Resources | | 161,536 | | 13,867,866 | |
Marathon Oil | | 161,228 | | 2,963,371 | |
Occidental Petroleum | | 250,200 | | 18,649,908 | |
Phillips 66 | | 66,421 | | 5,914,790 | |
Schlumberger | | 80,712 | | 6,308,450 | |
| | | | | 47,704,385 | |
Food & Staples Retailing - 1.0% | | | | | |
CVS Health | | 57,275 | | 5,657,624 | |
Food, Beverage & Tobacco - 7.5% | | | | | |
ConAgra Foods | | 189,693 | | 7,692,051 | |
Kellogg | | 102,978 | | 7,262,009 | |
Molson Coors Brewing, Cl. B | | 86,388 | | 7,610,783 | |
Mondelez International, Cl. A | | 59,712 | | 2,756,306 | |
PepsiCo | | 114,061 | | 11,655,894 | |
Philip Morris International | | 63,518 | | 5,614,991 | |
| | | | | 42,592,034 | |
7
STATEMENT OF INVESTMENTS (continued)
| | | | | | |
Common Stocks - 99.7% (continued) | | Shares | | Value ($) | |
Health Care Equipment & Services - 7.0% | | | | | |
Boston Scientific | | 316,174 | a | 5,779,661 | |
Cardinal Health | | 70,113 | | 5,763,288 | |
Express Scripts Holding | | 63,501 | a | 5,485,216 | |
Medtronic | | 144,248 | | 10,662,812 | |
UnitedHealth Group | | 101,428 | | 11,946,190 | |
| | | | | 39,637,167 | |
Insurance - 4.8% | | | | | |
American International Group | | 136,410 | | 8,602,015 | |
Hartford Financial Services Group | | 146,595 | | 6,781,485 | |
Prudential Financial | | 140,085 | | 11,557,012 | |
| | | | | 26,940,512 | |
Materials - 3.8% | | | | | |
Dow Chemical | | 137,626 | | 7,111,135 | |
Mosaic | | 78,759 | | 2,661,267 | |
Vulcan Materials | | 119,341 | | 11,525,954 | |
| | | | | 21,298,356 | |
Media - 5.3% | | | | | |
Interpublic Group of Companies | | 535,766 | | 12,285,114 | |
Omnicom Group | �� | 151,191 | | 11,327,230 | |
Viacom, Cl. B | | 131,812 | | 6,499,650 | |
| | | | | 30,111,994 | |
Pharmaceuticals, Biotechnology & Life Sciences - 7.5% | | | | | |
Biogen | | 20,052 | a | 5,825,306 | |
Bristol-Myers Squibb | | 93,229 | | 6,148,453 | |
Eli Lilly & Co. | | 37,516 | | 3,060,180 | |
Merck & Co. | | 170,636 | | 9,326,964 | |
Pfizer | | 525,409 | | 17,769,332 | |
| | | | | 42,130,235 | |
Real Estate - .4% | | | | | |
Communications Sales & Leasing | | 115,702 | | 2,324,453 | |
Retailing - 3.6% | | | | | |
Amazon.com | | 12,056 | a | 7,545,850 | |
Home Depot | | 62,675 | | 7,749,137 | |
Ulta Salon Cosmetics & Fragrance | | 29,693 | a | 5,165,394 | |
| | | | | 20,460,381 | |
Semiconductors & Semiconductor Equipment - 4.3% | | | | | |
Applied Materials | | 277,780 | | 4,658,371 | |
Microchip Technology | | 129,867 | | 6,271,278 | |
Texas Instruments | | 235,426 | | 13,353,363 | |
| | | | | 24,283,012 | |
8
| | | | | | |
Common Stocks - 99.7% (continued) | | Shares | | Value ($) | |
Software & Services - 12.3% | | | | | |
Accenture, Cl. A | | 121,847 | | 13,061,998 | |
Alphabet, Cl. A | | 12,454 | a | 9,183,455 | |
Alphabet, Cl. C | | 28,376 | a | 20,169,945 | |
Citrix Systems | | 57,198 | a | 4,695,956 | |
Facebook, Cl. A | | 78,696 | a | 8,024,631 | |
salesforce.com | | 78,535 | a | 6,102,955 | |
Visa, Cl. A | | 107,572 | | 8,345,436 | |
| | | | | 69,584,376 | |
Technology Hardware & Equipment - 8.4% | | | | | |
Apple | | 232,778 | | 27,816,971 | |
Cisco Systems | | 670,039 | | 19,330,625 | |
| | | | | 47,147,596 | |
Telecommunication Services - 3.4% | | | | | |
AT&T | | 564,608 | | 18,920,014 | |
Transportation - 1.1% | | | | | |
Delta Air Lines | | 117,717 | | 5,984,732 | |
Total Common Stocks (cost $479,363,697) | | | | 563,237,509 | |
Other Investments - .3% | | | | | |
Registered Investment Company; | | | | | |
Dreyfus Institutional Preferred Plus Money Market Fund | | 1,832,404 | b | 1,832,404 | |
(cost $1,832,404) | | | | | |
Total Investments (cost $481,196,101) | | 100.0% | | 565,069,913 | |
Liabilities, Less Cash and Receivables | | .0% | | (105,816) | |
Net Assets | | 100.0% | | 564,964,097 | |
a Non-income producing security.
b Investment in affiliated money market mutual fund.
9
STATEMENT OF INVESTMENTS (continued)
| | |
Portfolio Summary (Unaudited) † | Value (%) |
Software & Services | 12.3 |
Banks | 8.6 |
Energy | 8.4 |
Technology Hardware & Equipment | 8.4 |
Food, Beverage & Tobacco | 7.5 |
Pharmaceuticals, Biotech & Life Sciences | 7.5 |
Health Care Equipment & Services | 7.0 |
Diversified Financials | 5.4 |
Media | 5.3 |
Capital Goods | 4.9 |
Insurance | 4.8 |
Semiconductors & Semiconductor Equipment | 4.3 |
Materials | 3.8 |
Retailing | 3.6 |
Telecommunication Services | 3.4 |
Consumer Services | 2.0 |
Transportation | 1.1 |
Food & Staples Retailing | 1.0 |
Real Estate | .4 |
Money Market Investment | .3 |
| | 100.0 |
†Based on net assets.
See notes to financial statements.
10
STATEMENT OF ASSETS AND LIABILITIES
October 31, 2015
| | | | | | | | | |
| | | | | | |
| | | Cost | | Value | |
Assets ($): | | | | |
Investments in securities—See Statement of Investments: | | | | |
Unaffiliated issuers | | 479,363,697 | | 563,237,509 | |
Affiliated issuers | | 1,832,404 | | 1,832,404 | |
Dividends and interest receivable | | | | | 913,408 | |
Receivable for shares of Common Stock subscribed | | | | | 625 | |
| | | | | 565,983,946 | |
Liabilities ($): | | | | |
Due to The Dreyfus Corporation and affiliates—Note 3(b) | | | | | 455,398 | |
Cash overdraft due to Custodian | | | | | 80,402 | |
Payable for investment securities purchased | | | | | 455,471 | |
Payable for shares of Common Stock redeemed | | | | | 28,406 | |
Interest payable—Note 2 | | | | | 172 | |
| | | | | 1,019,849 | |
Net Assets ($) | | | 564,964,097 | |
Composition of Net Assets ($): | | | | |
Paid-in capital | | | | | 422,604,112 | |
Accumulated undistributed investment income—net | | | | | 1,722,148 | |
Accumulated net realized gain (loss) on investments | | | | | 56,764,025 | |
Accumulated net unrealized appreciation (depreciation)
on investments | | | | | 83,873,812 | |
Net Assets ($) | | | 564,964,097 | |
Shares Outstanding | | |
(245 million shares of $.001 par value Common Stock authorized) | | 15,809,813 | |
Net Asset Value Per Share ($) | | 35.74 | |
See notes to financial statements.
11
STATEMENT OF OPERATIONS
Year Ended October 31, 2015
| | | | | | | |
| | | | | | |
| | | | | | |
Investment Income ($): | | | | |
Income: | | | | |
Cash dividends (net of $13,085 foreign taxes withheld at source): | | | | |
Unaffiliated issuers | | | 10,996,030 | |
Affiliated issuers | | | 3,343 | |
Income from securities lending—Note 1(b) | | | 8,042 | |
Total Income | | | 11,007,415 | |
Expenses: | | | | |
Management fee—Note 3(a) | | | 5,208,494 | |
Distribution fees—Note 3(b) | | | 578,721 | |
Directors' fees—Note 3(a,c) | | | 45,229 | |
Loan commitment fees—Note 2 | | | 6,069 | |
Interest expense—Note 2 | | | 682 | |
Total Expenses | | | 5,839,195 | |
Less—Directors' fees reimbursed by Dreyfus—Note 3(a) | | | (45,229) | |
Net Expenses | | | 5,793,966 | |
Investment Income—Net | | | 5,213,449 | |
Realized and Unrealized Gain (Loss) on Investments—Note 4 ($): | | |
Net realized gain (loss) on investments | 57,046,728 | |
Net unrealized appreciation (depreciation) on investments | | | (25,663,507) | |
Net Realized and Unrealized Gain (Loss) on Investments | | | 31,383,221 | |
Net Increase in Net Assets Resulting from Operations | | 36,596,670 | |
See notes to financial statements.
12
STATEMENT OF CHANGES IN NET ASSETS
| | | | | | | | | | |
| | | | | | | | | | |
| | | | Year Ended October 31, |
| | | | 2015 | | | | 2014 | |
Operations ($): | | | | | | | | |
Investment income—net | | | 5,213,449 | | | | 3,841,246 | |
Net realized gain (loss) on investments | | 57,046,728 | | | | 60,135,736 | |
Net unrealized appreciation (depreciation)
on investments | | (25,663,507) | | | | 1,923,059 | |
Net Increase (Decrease) in Net Assets
Resulting from Operations | 36,596,670 | | | | 65,900,041 | |
Dividends to Shareholders from ($): | | | | | | | | |
Investment income—net | | | (4,792,211) | | | | (3,662,778) | |
Net realized gain on investments | | | (60,119,282) | | | | (93,094,069) | |
Total Dividends | | | (64,911,493) | | | | (96,756,847) | |
Capital Stock Transactions ($): | | | | | | | | |
Net proceeds from shares sold | | | 13,247,735 | | | | 10,292,272 | |
Dividends reinvested | | | 62,207,630 | | | | 92,470,836 | |
Cost of shares redeemed | | | (71,088,155) | | | | (67,019,608) | |
Increase (Decrease) in Net Assets
from Capital Stock Transactions | 4,367,210 | | | | 35,743,500 | |
Total Increase (Decrease) in Net Assets | (23,947,613) | | | | 4,886,694 | |
Net Assets ($): | | | | | | | | |
Beginning of Period | | | 588,911,710 | | | | 584,025,016 | |
End of Period | | | 564,964,097 | | | | 588,911,710 | |
Undistributed investment income—net | 1,722,148 | | | | 1,300,910 | |
Capital Share Transactions (Shares): | | | | | | | | |
Shares sold | | | 377,080 | | | | 282,183 | |
Shares issued for dividends reinvested | | | 1,817,819 | | | | 2,699,912 | |
Shares redeemed | | | (2,036,240) | | | | (1,846,421) | |
Net Increase (Decrease) in Shares Outstanding | 158,659 | | | | 1,135,674 | |
See notes to financial statements.
13
FINANCIAL HIGHLIGHTS
The following table describes the performance for the fiscal periods indicated. Total return shows how much your investment in the fund would have increased (or decreased) during each period, assuming you had reinvested all dividends and distributions. These figures have been derived from the fund’s financial statements.
| | | | | | | | |
| | | | | |
| | Year Ended October 31, |
| | | 2015 | 2014 | 2013 | 2012 | 2011 |
Per Share Data ($): | | | | | | |
Net asset value, beginning of period | 37.63 | 40.23 | 32.56 | 29.35 | 28.54 |
Investment Operations: | | | | | | |
Investment income—neta | .32 | .24 | .32 | .27 | .23 |
Net realized and unrealized gain (loss) on investments | 1.96 | 3.86 | 7.67 | 3.22 | .79 |
Total from Investment Operations | 2.28 | 4.10 | 7.99 | 3.49 | 1.02 |
Distributions: | | | | | | |
Dividends from investment income—net | | (.30) | (.24) | (.32) | (.28) | (.21) |
Dividends from net realized gain on investments | (3.87) | (6.46) | – | – | – |
Total Distributions | (4.17) | (6.70) | (.32) | (.28) | (.21) |
Net asset value, end of period | 35.74 | 37.63 | 40.23 | 32.56 | 29.35 |
Total Return (%) | 6.62 | 11.91 | 24.72 | 11.95 | 3.56 |
Ratios/Supplemental Data (%): | | | | | |
Ratio of total expenses to average net assets | 1.01 | 1.01 | 1.01 | 1.01 | 1.01 |
Ratio of net expenses to average net assets | | 1.00 | 1.00 | 1.00 | 1.00 | 1.00 |
Ratio of net investment income to average net assets | .90 | .65 | .90 | .85 | .76 |
Portfolio Turnover Rate | 65.96 | 69.22 | 118.87 | 70.82 | 84.19 |
Net Assets, end of period ($ x 1,000) | 564,964 | 588,912 | 584,025 | 522,560 | 516,493 |
a Based on average shares outstanding.
See notes to financial statements.
14
NOTES TO FINANCIAL STATEMENTS
NOTE 1—Significant Accounting Policies:
Dreyfus Disciplined Stock Fund (the “fund”) is a separate diversified series of The Dreyfus/Laurel Funds, Inc. (the “Company”), which is registered under the Investment Company Act of 1940, as amended (the “Act”), as an open-end management investment company and operates as a series company currently offering ten series, including the fund. The fund’s investment objective is to seek capital appreciation. The Dreyfus Corporation (the “Manager” or “Dreyfus”), a wholly-owned subsidiary of The Bank of New York Mellon Corporation (“BNY Mellon”), serves as the fund’s investment adviser. MBSC Securities Corporation (the “Distributor”), a wholly-owned subsidiary of Dreyfus, is the distributor of the fund’s shares, which are sold to the public without a sales charge.
The Company accounts separately for the assets, liabilities and operations of each series. Expenses directly attributable to each series are charged to that series’ operations; expenses which are applicable to all series are allocated among them on a pro rata basis.
The Financial Accounting Standards Board (“FASB”) Accounting Standards Codification (“ASC”) is the exclusive reference of authoritative U.S. generally accepted accounting principles (“GAAP”) recognized by the FASB to be applied by nongovernmental entities. Rules and interpretive releases of the Securities and Exchange Commission (“SEC”) under authority of federal laws are also sources of authoritative GAAP for SEC registrants. The fund’s financial statements are prepared in accordance with GAAP, which may require the use of management estimates and assumptions. Actual results could differ from those estimates.
(a) Portfolio valuation: The fair value of a financial instrument is the amount that would be received to sell an asset or paid to transfer a liability in an orderly transaction between market participants at the measurement date (i.e., the exit price). GAAP establishes a fair value hierarchy that prioritizes the inputs of valuation techniques used to measure fair value. This hierarchy gives the highest priority to unadjusted quoted prices in active markets for identical assets or liabilities (Level 1 measurements) and the lowest priority to unobservable inputs (Level 3 measurements).
Additionally, GAAP provides guidance on determining whether the volume and activity in a market has decreased significantly and whether such a decrease in activity results in transactions that are not orderly. GAAP requires enhanced disclosures around valuation inputs and techniques used during annual and interim periods.
15
NOTES TO FINANCIAL STATEMENTS (continued)
Various inputs are used in determining the value of the fund’s investments relating to fair value measurements. These inputs are summarized in the three broad levels listed below:
Level 1—unadjusted quoted prices in active markets for identical investments.
Level 2—other significant observable inputs (including quoted prices for similar investments, interest rates, prepayment speeds, credit risk, etc.).
Level 3—significant unobservable inputs (including the fund’s own assumptions in determining the fair value of investments).
The inputs or methodology used for valuing securities are not necessarily an indication of the risk associated with investing in those securities.
Changes in valuation techniques may result in transfers in or out of an assigned level within the disclosure hierarchy. Valuation techniques used to value the fund’s investments are as follows:
Investments in securities are valued at the last sales price on the securities exchange or national securities market on which such securities are primarily traded. Securities listed on the National Market System for which market quotations are available are valued at the official closing price or, if there is no official closing price that day, at the last sales price. For open short positions, asked prices are used for valuation purposes. Bid price is used when no asked price is available. Registered investment companies that are not traded on an exchange are valued at their net asset value. All of the preceding securities are generally categorized within Level 1 of the fair value hierarchy.
Securities not listed on an exchange or the national securities market, or securities for which there were no transactions, are valued at the average of the most recent bid and asked prices. These securities are generally categorized within Level 2 of the fair value hierarchy.
Fair valuing of securities may be determined with the assistance of a pricing service using calculations based on indices of domestic securities and other appropriate indicators, such as prices of relevant American Depository Receipts and financial futures. Utilizing these techniques may result in transfers between Level 1 and Level 2 of the fair value hierarchy.
When market quotations or official closing prices are not readily available, or are determined not to reflect accurately fair value, such as when the value of a security has been significantly affected by events after the close of the exchange or market on which the security is principally traded (for
16
example, a foreign exchange or market), but before the fund calculates its net asset value, the fund may value these investments at fair value as determined in accordance with the procedures approved by the the Company’s Board of Directors (the “Board”). Certain factors may be considered when fair valuing investments such as: fundamental analytical data, the nature and duration of restrictions on disposition, an evaluation of the forces that influence the market in which the securities are purchased and sold, and public trading in similar securities of the issuer or comparable issuers. These securities are either categorized within Level 2 or 3 of the fair value hierarchy depending on the relevant inputs used.
For restricted securities where observable inputs are limited, assumptions about market activity and risk are used and are generally categorized within Level 3 of the fair value hierarchy.
The following is a summary of the inputs used as of October 31, 2015 in valuing the fund’s investments:
| | | | | |
| | Level 1 - Unadjusted
Quoted Prices | Level 2 - Other
Significant Observable Inputs | Level 3 -Significant
Unobservable Inputs | Total |
Assets ($) | | | | |
Investments in Securities: | | |
Equity Securities—Domestic Common Stocks† | 563,237,509 | – | – | 563,237,509 |
Mutual Funds | 1,832,404 | – | – | 1,832,404 |
† See Statement of Investments for additional detailed categorizations.
At October 31, 2015, there were no transfers between Level 1, Level 2 and Level 3 of the fair value hierarchy.
(b) Securities transactions and investment income: Securities transactions are recorded on a trade date basis. Realized gains and losses from securities transactions are recorded on the identified cost basis. Dividend income is recognized on the ex-dividend date and interest income, including, where applicable, accretion of discount and amortization of premium on investments, is recognized on the accrual basis.
Pursuant to a securities lending agreement with The Bank of New York Mellon, a subsidiary of BNY Mellon and an affiliate of Dreyfus, the fund may lend securities to qualified institutions. It is the fund’s policy that, at origination, all loans are secured by collateral of at least 102% of the value of U.S. securities loaned and 105% of the value of foreign securities
17
NOTES TO FINANCIAL STATEMENTS (continued)
loaned. Collateral equivalent to at least 100% of the market value of securities on loan is maintained at all times. Collateral is either in the form of cash, which can be invested in certain money market mutual funds managed by Dreyfus, or U.S. Government and Agency securities. The fund is entitled to receive all dividends, interest and distributions on securities loaned, in addition to income earned as a result of the lending transaction. Should a borrower fail to return the securities in a timely manner, The Bank of New York Mellon is required to replace the securities for the benefit of the fund or credit the fund with the market value of the unreturned securities and is subrogated to the fund’s rights against the borrower and the collateral. During the period ended October 31, 2015, The Bank of New York Mellon earned $2,238 from lending portfolio securities, pursuant to the securities lending agreement.
(c) Affiliated issuers: Investments in other investment companies advised by Dreyfus are defined as “affiliated” under the Act. Investments in affiliated investment companies during the period ended October 31, 2015 were as follows:
| | | | | | |
Affiliated Investment Company | Value 10/31/2014 ($) | Purchases ($) | Sales ($) | Value 10/31/2015 ($) | Net Assets (%) |
Dreyfus Institutional Preferred Plus Money Market Fund | 1,266,457 | 131,025,979 | 130,460,032 | 1,832,404 | .3 |
Dreyfus Institutional Cash Advantage Fund | 1,195,744 | 27,078,915 | 28,274,659 | – | – |
Total | 2,462,201 | 158,104,894 | 158,734,691 | 1,832,404 | .3 |
(d) Dividends to shareholders: Dividends are recorded on the ex-dividend date. Dividends from investment income-net are normally declared and paid quarterly. Dividends from net realized capital gains, if any, are normally declared and paid annually, but the fund may make distributions on a more frequent basis to comply with the distribution requirements of the Internal Revenue Code of 1986, as amended (the “Code”). To the extent that net realized capital gains can be offset by capital loss carryovers, it is the policy of the fund not to distribute such gains. Income and capital gain distributions are determined in accordance with income tax regulations, which may differ from GAAP.
(e) Federal income taxes: It is the policy of the fund to continue to qualify as a regulated investment company, if such qualification is in the best interests of its shareholders, by complying with the applicable
18
provisions of the Code, and to make distributions of taxable income sufficient to relieve it from substantially all federal income and excise taxes.
As of and during the period ended October 31, 2015, the fund did not have any liabilities for any uncertain tax positions. The fund recognizes interest and penalties, if any, related to uncertain tax positions as income tax expense in the Statement of Operations. During the period ended October 31, 2015, the fund did not incur any interest or penalties.
Each tax year in the four-year period ended October 31, 2015 remains subject to examination by the Internal Revenue Service and state taxing authorities.
At October 31, 2015, the components of accumulated earnings on a tax basis were as follows: undistributed ordinary income $1,766,847, undistributed capital gains $57,313,391 and unrealized appreciation $83,279,747.
The tax character of distributions paid to shareholders during the fiscal periods ended October 31, 2015 and October 31, 2014 were as follows: ordinary income $23,960,430 and $4,557,893, and long-term capital gains $40,951,063 and $92,198,954, respectively.
NOTE 2—Bank Lines of Credit:
The fund participates with other Dreyfus-managed funds in a $480 million unsecured credit facility led by Citibank, N.A. and a $300 million unsecured credit facility provided by The Bank of New York Mellon (each, a “Facility”), each to be utilized primarily for temporary or emergency purposes, including the financing of redemptions. Prior to October 7, 2015, the unsecured credit facility with Citibank, N.A. was $430 million. In connection therewith, the fund has agreed to pay its pro rata portion of commitment fees for each Facility. Interest is charged to the fund based on rates determined pursuant to the terms of the respective Facility at the time of borrowing.
The average amount of borrowings outstanding under the Facilities during the period ended October 31, 2015 was approximately $57,300 with a related weighted average annualized interest rate of 1.19%.
NOTE 3—Investment Management Fee and Other Transactions with Affiliates:
(a) Pursuant to an investment management agreement with Dreyfus, Dreyfus provides or arranges for one or more third parties and/or affiliates to provide investment advisory, administrative, custody, fund accounting and transfer agency services to the fund. Dreyfus also directs the
19
NOTES TO FINANCIAL STATEMENTS (continued)
investments of the fund in accordance with its investment objective, policies and limitations. For these services, the fund is contractually obligated to pay Dreyfus a fee, calculated daily and paid monthly, at the annual rate of .90% of the value of the fund’s average daily net assets. Out of its fee, Dreyfus pays all of the expenses of the fund except brokerage fees, taxes, interest expenses, commitment fees on borrowings, Distribution Plan fees, fees and expenses of non-interested Directors (including counsel fees) and extraordinary expenses. In addition, Dreyfus is required to reduce its fee in an amount equal to the fund’s allocable portion of fees and expenses of the non-interested Directors (including counsel fees). During the period ended October 31, 2015, fees reimbursed by Dreyfus amounted to $45,229.
(b) Under the Distribution Plan adopted pursuant to Rule 12b-1 under the Act, the fund may pay annually up to .10% of the value of its average daily net assets to compensate BNY Mellon and Dreyfus for shareholder servicing activities and the Distributor for shareholder servicing activities and expenses primarily intended to result in the sale of fund shares. During the period ended October 31, 2015, the fund was charged $578,721 pursuant to the Distribution Plan.
Under its terms, the Distribution Plan shall remain in effect from year to year, provided such continuance is approved annually by a vote of a majority of those Directors who are not “interested persons” of the Company and who have no direct or indirect financial interest in the operation of or in any agreement related to the Distribution Plan.
The components of “Due to The Dreyfus Corporation and affiliates” in the Statement of Assets and Liabilities consist of: management fees $420,023 and Distribution Plan fees $46,669, which are offset against an expense reimbursement currently in effect in the amount of $11,294.
(c) Each Board member also serves as a Board member of other funds within the Dreyfus complex. Annual retainer fees and attendance fees are allocated to each fund based on net assets.
NOTE 4—Securities Transactions:
The aggregate amount of purchases and sales of investment securities, excluding short-term securities, during the period ended October 31, 2015, amounted to $378,497,248 and $430,706,742, respectively.
At October 31, 2015, the cost of investments for federal income tax purposes was $481,790,166; accordingly, accumulated net unrealized appreciation on investments was $83,279,747, consisting of $94,986,725 gross unrealized appreciation and $11,706,978 gross unrealized depreciation.
20
21
REPORT OF INDEPENDENT REGISTERED
PUBLIC ACCOUNTING FIRM
The Board of Directors and Shareholders of
The Dreyfus/Laurel Funds, Inc.
We have audited the accompanying statement of assets and liabilities of Dreyfus Disciplined Stock Fund (the “Fund”), a series of The Dreyfus/Laurel Funds, Inc., including the statement of investments, as of October 31, 2015, the related statement of operations for the year then ended, the statements of changes in net assets for each of the years in the two-year period then ended, and the financial highlights for each of the years in the five-year period then ended. These financial statements and financial highlights are the responsibility of the Fund’s management. Our responsibility is to express an opinion on these financial statements and financial highlights based on our audits.
We conducted our audits in accordance with the standards of the Public Company Accounting Oversight Board (United States). Those standards require that we plan and perform the audit to obtain reasonable assurance about whether the financial statements and financial highlights are free of material misstatement. An audit includes examining, on a test basis, evidence supporting the amounts and disclosures in the financial statements. Our procedures included confirmation of securities owned as of October 31, 2015, by correspondence with the custodian and brokers or by other appropriate auditing procedures. An audit also includes assessing the accounting principles used and significant estimates made by management, as well as evaluating the overall financial statement presentation. We believe that our audits provide a reasonable basis for our opinion.
In our opinion, the financial statements and financial highlights referred to above present fairly, in all material respects, the financial position of Dreyfus Disciplined Stock Fund as of October 31, 2015, the results of its operations for the year then ended, the changes in its net assets for each of the years in the two-year period then ended, and the financial highlights for each of the years in the five-year period then ended, in conformity with U.S. generally accepted accounting principles.

New York, New York
December 30, 2015
22
IMPORTANT TAX INFORMATION (Unaudited)
For federal tax purposes, the fund reports the maximum amount allowable, but not less than $10,463,659 as ordinary income dividends paid during the year ended October 31, 2015 as qualified dividend income in accordance with Section 854(b)(1)(B) of the Internal Revenue Code. Also, the fund reports the maximum amount allowable but not less than 47.86% of ordinary income dividends paid during the year ended October 31, 2015 as eligible for the corporate dividends received deduction provided under Section 243 of the Internal Revenue Code in accordance with Section 854(b)(1)(A) of the Internal Revenue Code. Shareholders will receive notification in early 2016 of the percentage applicable to the preparation of their 2015 income tax returns. Also the fund reports the maximum amount allowable but not less than $2.6344 per share as a capital gain dividend in accordance with Section 852(b)(3)(C) of the Internal Revenue Code. Also, the fund reports the maximum amount allowable but not less than $1.2331 as a short-term capital gain dividend paid on December 11, 2014 in accordance with Sections 871(k)(2) and 881(e) of the Internal Revenue Code.
23
BOARD MEMBERS INFORMATION (Unaudited)
INDEPENDENT BOARD MEMBERS
Joseph S. DiMartino (72)
Chairman of the Board (1999)
Principal Occupation During Past 5 Years:
· Corporate Director and Trustee (1995-present)
Other Public Company Board Memberships During Past 5 Years:
· CBIZ (formerly, Century Business Services, Inc.), a provider of outsourcing functions for small and medium size companies, Director (1997-present)
· The Newark Group, a provider of a national market of paper recovery facilities, paperboard mills and paperboard converting plants, Director (2000-2010)
No. of Portfolios for which Board Member Serves: 140
———————
Francine J. Bovich (64)
Board Member (2012)
Principal Occupation During Past 5 Years:
· Trustee, The Bradley Trusts, private trust funds (2011-present)
· Managing Director, Morgan Stanley Investment Management (1993-2010)
Other Public Company Board Memberships During Past 5 Years:
· Annaly Capital Management, Inc., Board Member (May 2014-present)
No. of Portfolios for which Board Member Serves: 79
———————
Kenneth A. Himmel (69)
Board Member (1994)
Principal Occupation During Past 5 Years:
· Managing Partner, Gulf Related, an international real estate development company (2010-present)
· President and CEO, Related Urban Development, a real estate development company (1996-present)
· President and CEO, Himmel & Company, a real estate development company (1980-present)
· CEO, American Food Management, a restaurant company (1983-present)
No. of Portfolios for which Board Member Serves: 29
———————
24
Stephen J. Lockwood (68)
Board Member (1994)
Principal Occupation During Past 5 Years:
· Chairman of the Board, Stephen J. Lockwood and Company LLC, a real estate investment company (2000-present)
No. of Portfolios for which Board Member Serves: 29
———————
Roslyn M. Watson (66)
Board Member (1994)
Principal Occupation During Past 5 Years:
· Principal, Watson Ventures, Inc., a real estate investment company (1993-present)
No. of Portfolios for which Board Member Serves: 65
———————
Benaree Pratt Wiley (69)
Board Member (1998)
Principal Occupation During Past 5 Years:
· Principal, The Wiley Group, a firm specializing in strategy and business development (2005-present)
Other Public Company Board Memberships During Past 5 Years:
· CBIZ (formerly, Century Business Services, Inc.), a provider of outsourcing functions for small and medium size companies, Director (2008-present)
No. of Portfolios for which Board Member Serves: 65
———————
Once elected all Board Members serve for an indefinite term, but achieve Emeritus status upon reaching age 80. The address of the Board Members and Officers is c/o The Dreyfus Corporation, 200 Park Avenue, New York, New York 10166. Additional information about the Board Members is available in the fund's Statement of Additional Information which can be obtained from Dreyfus free of charge by calling this toll free number: 1-800-DREYFUS.
James M. Fitzgibbons, Emeritus Board Member
J. Tomlinson Fort Emeritus Board Member
25
OFFICERS OF THE FUND (Unaudited)
BRADLEY J. SKAPYAK, President since January 2010.
Chief Operating Officer and a director of the Manager since June 2009, Chairman of Dreyfus Transfer, Inc., an affiliate of the Manager and the transfer agent of the funds, since May 2011 and Executive Vice President of the Distributor since June 2007. From April 2003 to June 2009, Mr. Skapyak was the head of the Investment Accounting and Support Department of the Manager. He is an officer of 66 investment companies (comprised of 140 portfolios) managed by the Manager. He is 56 years old and has been an employee of the Manager since February 1988.
BENNETT A. MACDOUGALL, Chief Legal Officer since October 2015
Chief Legal Officer of the Manager since June 2015; from June 2005 to June 2015, Director and Associate General Counsel of Deutsche Bank – Asset & Wealth Management Division, and Chief Legal Officer of Deutsche Investment Management Americas Inc. He is an officer of 67 investment companies (comprised of 165 portfolios) managed by the Manager. He is 44 years old and has been an employee of the Manager since June 2015.
JANETTE E. FARRAGHER, Vice President and Secretary since December 2011.
Assistant General Counsel of BNY Mellon, and an officer of 67 investment companies (comprised of 165 portfolios) managed by the Manager. She is 52 years old and has been an employee of the Manager since February 1984.
JAMES BITETTO, Vice President and Assistant Secretary since August 2005.
Managing Counsel of BNY Mellon and Secretary of the Manager, and an officer of 67 investment companies (comprised of 165 portfolios) managed by the Manager. He is 49 years old and has been an employee of the Manager since December 1996.
JONI LACKS CHARATAN, Vice President and Assistant Secretary since August 2005.
Managing Counsel of BNY Mellon, and an officer of 67 investment companies (comprised of 165 portfolios) managed by the Manager. She is 59 years old and has been an employee of the Manager since October 1988.
JOSEPH M. CHIOFFI, Vice President and Assistant Secretary since August 2005.
Managing Counsel of BNY Mellon, and an officer of 67 investment companies (comprised of 165 portfolios) managed by the Manager. He is 53 years old and has been an employee of the Manager since June 2000.
JOHN B. HAMMALIAN, Vice President and Assistant Secretary since August 2005.
Senior Managing Counsel of BNY Mellon, and an officer of 67 investment companies (comprised of 165 portfolios) managed by the Manager. He is 52 years old and has been an employee of the Manager since February 1991.
MAUREEN E. KANE, Vice President and Assistant Secretary since April 2015.
Managing Counsel of BNY Mellon since July 2014; from October 2004 until July 2014, General Counsel, and from May 2009 until July 2014, Chief Compliance Officer of Century Capital Management. She is an officer of 67 investment companies (comprised of 165 portfolios) managed by the Manager. She is 53 years old and has been an employee of the Manager since July 2014.
SARAH S. KELLEHER, Vice President and Assistant Secretary since April 2014.
Senior Counsel of BNY Mellon, and an officer of 67 investment companies (comprised of 165 portfolios) managed by the Manager; from August 2005 to March 2013, Associate General Counsel of Third Avenue Management. She is 40 years old and has been an employee of the Manager since March 2013.
JEFF PRUSNOFSKY, Vice President and Assistant Secretary since August 2005.
Senior Managing Counsel of BNY Mellon, and an officer of 67 investment companies (comprised of 165 portfolios) managed by the Manager. He is 50 years old and has been an employee of the Manager since October 1990.
JAMES WINDELS, Treasurer since November 2001.
Director – Mutual Fund Accounting of the Manager, and an officer of 67 investment companies (comprised of 165 portfolios) managed by the Manager. He is 57 years old and has been an employee of the Manager since April 1985.
26
RICHARD CASSARO, Assistant Treasurer since January 2008.
Senior Accounting Manager – Money Market and Municipal Bond Funds of the Manager, and an officer of 67 investment companies (comprised of 165 portfolios) managed by the Manager. He is 56 years old and has been an employee of the Manager since September 1982.
GAVIN C. REILLY, Assistant Treasurer since December 2005.
Tax Manager of the Investment Accounting and Support Department of the Manager, and an officer of 67 investment companies (comprised of 165 portfolios) managed by the Manager. He is 47 years old and has been an employee of the Manager since April 1991.
ROBERT S. ROBOL, Assistant Treasurer since December 2002.
Senior Accounting Manager – Fixed Income Funds of the Manager, and an officer of 67 investment companies (comprised of 165 portfolios) managed by the Manager. He is 51 years old and has been an employee of the Manager since October 1988.
ROBERT SALVIOLO, Assistant Treasurer since July 2007.
Senior Accounting Manager – Equity Funds of the Manager, and an officer of 67 investment companies (comprised of 165 portfolios) managed by the Manager. He is 48 years old and has been an employee of the Manager since June 1989.
ROBERT SVAGNA, Assistant Treasurer since December 2002.
Senior Accounting Manager – Equity Funds of the Manager, and an officer of 67 investment companies (comprised of 165 portfolios) managed by the Manager. He is 48 years old and has been an employee of the Manager since November 1990.
JOSEPH W. CONNOLLY, Chief Compliance Officer since October 2004.
Chief Compliance Officer of the Manager and The Dreyfus Family of Funds (67 investment companies, comprised of 165 portfolios). He is 58 years old and has served in various capacities with the Manager since 1980, including manager of the firm’s Fund Accounting Department from 1997 through October 2001.
27
NOTES
28
NOTES
29
Dreyfus Disciplined Stock Fund
200 Park Avenue
New York, NY 10166
Manager
The Dreyfus Corporation
200 Park Avenue
New York, NY 10166
Custodian
The Bank of New York Mellon
225 Liberty Street
New York, NY 10286
Transfer Agent &
Dividend Disbursing Agent
Dreyfus Transfer, Inc.
200 Park Avenue
New York, NY 10166
Distributor
MBSC Securities Corporation
200 Park Avenue
New York, NY 10166
Telephone Call your financial representative or 1-800-DREYFUS
Mail The Dreyfus Family of Funds, 144 Glenn Curtiss Boulevard, Uniondale, NY 11556-0144
E-mail Send your request to info@dreyfus.com
Internet Information can be viewed online or downloaded at www.dreyfus.com
The fund files its complete schedule of portfolio holdings with the Securities and Exchange Commission (“SEC”) for the first and third quarters of each fiscal year on Form N-Q. The fund’s Forms N-Q are available on the SEC’s website at www.sec.gov and may be reviewed and copied at the SEC’s Public Reference Room in Washington, DC. (phone 1-800-SEC-0330 for information).
A description of the policies and procedures that the fund uses to determine how to vote proxies relating to portfolio securities and information regarding how the fund voted these proxies for the most recent 12-month period ended June 30 is available at www.dreyfus.com and on the SEC’s website at www.sec.gov and without charge, upon request, by calling 1-800-DREYFUS.
| | |
© 2015 MBSC Securities Corporation
0728AR1015A | 
|
Dreyfus Money Market Reserves
| | | |

| | ANNUAL REPORT
October 31, 2015 |
| |
Save time. Save paper. View your next shareholder report online as soon as it’s available. Log into www.dreyfus.com and sign up for Dreyfus eCommunications. It’s simple and only takes a few minutes. |
| |
The views expressed in this report reflect those of the portfolio manager only through the end of the period covered and do not necessarily represent the views of Dreyfus or any other person in the Dreyfus organization. Any such views are subject to change at any time based upon market or other conditions and Dreyfus disclaims any responsibility to update such views. These views may not be relied on as investment advice and, because investment decisions for a Dreyfus fund are based on numerous factors, may not be relied on as an indication of trading intent on behalf of any Dreyfus fund. |
| |
Not FDIC-Insured • Not Bank-Guaranteed • May Lose Value |
Contents
THE FUND
FOR MORE INFORMATION
Back Cover
| | | | |
| |
Dreyfus Money Market Reserves
| | The Fund |
A LETTER FROM THE PRESIDENT
Dear Shareholder:
We are pleased to present this annual report for Dreyfus Money Market Reserves, covering the 12-month period from November 1, 2014, through October 31, 2015. For information about how the fund performed during the reporting period, as well as general market perspectives, we provide a Discussion of Fund Performance on the pages that follow.
Financial markets proved volatile over the reporting period amid choppy U.S. and global economic growth. U.S. stocks advanced over the final months of 2014 and the spring of 2015, with some broad measures of market performance setting new record highs. Those gains were largely erased over the summer when global economic instability undermined investor sentiment, but a renewed rally in October enabled most broad stock indices to end the reporting period in positive territory. In contrast, international stocks generally lost a degree of value, with developed markets faring far better than emerging markets amid falling commodity prices and depreciating currency values. U.S. bonds generally produced modestly positive total returns, with municipal bonds and longer term U.S. government securities faring better, on average, than corporate-backed bonds.
We expect market volatility to persist over the near term until investors see greater clarity regarding short-term U.S. interest rates and global economic conditions. Our investment strategists and portfolio managers are monitoring developments carefully, keeping a close watch on credit spreads, currency values, commodity prices, corporate profits, economic trends in the emerging markets, and other developments that could influence investor sentiment. Over the longer term, we remain confident that markets are likely to benefit as investors increasingly recognize that inflation is likely to stay low, economic growth expectations are stabilizing, and monetary policies remain accommodative in most regions of the world. In our view, investors will continue to be well served under these circumstances by a long-term perspective and a disciplined investment approach.
Thank you for your continued confidence and support.
Sincerely,

J. Charles Cardona
President
The Dreyfus Corporation
November 16, 2015
2
DISCUSSION OF FUND PERFORMANCE
For the period of November 1, 2014, through October 31, 2015, as provided by Patricia A. Larkin, Portfolio Manager
Fund and Market Performance Overview
For the 12-month period ended October 31, 2015, Dreyfus Money Market Reserves’ Investor shares produced a yield of 0.00%, and Class R shares yielded 0.00%. Taking into account the effects of compounding, the fund’s Investor shares and Class R shares produced effective yields of 0.00% and 0.00%, respectively.1
The Federal Reserve Board (the “Fed”) left the federal funds rate unchanged, and money market yields remained near historical lows.
The Fund’s Investment Approach
The fund seeks a high level of current income consistent with stability of principal. To pursue its goal, the fund invests in a diversified portfolio of high-quality, short-term dollar-denominated debt securities, including: securities issued or guaranteed as to principal and interest by the U.S. government or its agencies and instrumentalities; certificates of deposit, time deposits, bankers’ acceptances, and other short-term securities issued by domestic or foreign banks or thrifts or their subsidiaries or branches; repurchase agreements, including tri-party agreements; asset-backed securities; domestic and foreign commercial paper; and other short-term corporate obligations, including those with floating or variable rates of interest.
Uneven U.S. Economic Recovery Continued
U.S. GDP grew at a 2.1% annualized rate during the fourth quarter of 2014 when labor markets strengthened and consumer and business sentiment improved, but growth moderated to an anemic 0.6% annualized rate during the first quarter of 2015. Economic activity was weighed down, in part, by an appreciating U.S. dollar sparked by central banks’ responses to global economic instability and plummeting commodity prices. Severe winter weather also contributed to the slowdown. Nonetheless, job creation generally remained robust, and the unemployment rate fell from 5.7% at the start of the reporting period to 5.5% at the end of March 2015.
The recovery accelerated in the spring. The unemployment rate dipped to 5.4% in April, and 187,000 new jobs were created. In May, employers created 260,000 jobs and average hourly wages rose 0.3%, yet the unemployment rate ticked higher to 5.5%. Meanwhile, stabilizing currency exchange rates enabled the U.S. trade deficit to shrink significantly. Fuel prices rebounded, sending the inflation rate higher. Sentiment in the financial markets deteriorated in June during a debt crisis in Greece, but the U.S. economy continued to gain traction. 245,000 new jobs were added during the month, the unemployment rate fell to 5.3%, and consumer spending rose. The U.S. economy grew at a 3.9% annualized rate over the second quarter.
July brought more good economic news when 223,000 jobs were added and the unemployment rate stayed steady. Average hourly wages increased, as did retail sales. Meanwhile, both the manufacturing and service sectors continued to expand. On the other
3
DISCUSSION OF FUND PERFORMANCE (continued)
hand, U.S. equity markets reacted negatively to greater-than-expected economic weakness in China.
While the unemployment rate fell to 5.1% in August, only 153,000 jobs were added. Economic instability in China continued to roil the financial markets after the country’s central bank depreciated its currency. Commodity prices fell in response, giving back previous gains. On a brighter note, U.S. wages and personal incomes grew at a healthy pace.
Disappointing job creation continued in September with 137,000 positions added. Average hourly wages declined slightly. The unemployment rate stayed steady at 5.1% due to workers leaving the labor force. Although the manufacturing sector expanded for the 33rd straight month, the rate of increase was the lowest in more than two years. On the other hand, activity in the service sector continued to grow strongly, personal incomes rose, and real personal consumption expenditures climbed. U.S. GDP growth decelerated to an estimated 1.5% annualized rate during the third quarter, reflecting high business inventory levels and lower exports.
October brought generally good economic news. An estimated 271,000 jobs were created, and the unemployment rate fell to 5.0%, its lowest level since April 2008. Meanwhile, average annual wages increased at a 4.3% rate compared to September. Retail sales moved mildly higher, and fuel prices continued to decline. In contrast, housing starts fell sharply, ending the month below year-ago levels.
Fed Expected to Raise Rates Gradually
At its October meeting, the Fed again refrained from implementing the first in a series of widely expected rate hikes. Monetary policymakers noted that “economic activity has been expanding at a moderate pace,” but they left the federal funds rate unchanged “to support continued progress toward maximum employment and price stability.” While many analysts expect rate hikes to begin as soon as the Fed’s next meeting in December, those increases are likely to be modest and gradual.
Therefore, we intend for now to maintain the fund’s weighted average maturity in a range we consider to be in line with industry averages, but we are prepared to adjust our strategies quickly as market conditions change. As always, we remain focused on well-established issuers with good quality and liquidity characteristics.
November 16, 2015
The Board of Directors of The Dreyfus/Laurel Funds, Inc. has approved the liquidation of Dreyfus Money Market Reserves, a series of the Company, effective on or about February 26, 2016.
An investment in the fund is not insured or guaranteed by the FDIC or any other government agency. Although the fund seeks to preserve the value of your investment at $1.00 per share, it is possible to lose money by investing in the fund.
Short-term corporate, asset-backed securities holdings, and municipal securities holdings (as applicable), while rated in the highest rating category by one or more NRSROs (or unrated, if deemed of comparable quality by Dreyfus), involve credit and liquidity risks and risk of principal loss.
1 Effective yield is based upon dividends declared daily and reinvested monthly. Past performance is no guarantee of future results. Yields fluctuate. Yields provided reflect the absorption of certain fund expenses by The Dreyfus Corporation pursuant to an undertaking in effect that may be extended, terminated, or modified at any time. Had these expenses not been absorbed, the fund’s yields would have been lower, and in some cases, 7-day yields during the reporting period would have been negative absent the expense absorption.
4
UNDERSTANDING YOUR FUND’S EXPENSES (Unaudited)
As a mutual fund investor, you pay ongoing expenses, such as management fees and other expenses. Using the information below, you can estimate how these expenses affect your investment and compare them with the expenses of other funds. You also may pay one-time transaction expenses, including sales charges (loads) and redemption fees, which are not shown in this section and would have resulted in higher total expenses. For more information, see your fund’s prospectus or talk to your financial adviser.
Review your fund’s expenses
The table below shows the expenses you would have paid on a $1,000 investment in Dreyfus Money Market Reserves from May 1, 2015 to October 31, 2015. It also shows how much a $1,000 investment would be worth at the close of the period, assuming actual returns and expenses.
| | | | | | |
Expenses and Value of a $1,000 Investment | | |
assuming actual returns for the six months ended October 31, 2015 | |
| | | | Investor Shares | Class R Shares |
Expenses paid per $1,000† | | $ 1.11 | $ 1.11 |
Ending value (after expenses) | | $ 1,000.00 | $ 1,000.00 |
COMPARING YOUR FUND’S EXPENSES
WITH THOSE OF OTHER FUNDS (Unaudited)
Using the SEC’s method to compare expenses
The Securities and Exchange Commission (SEC) has established guidelines to help investors assess fund expenses. Per these guidelines, the table below shows your fund’s expenses based on a $1,000 investment, assuming a hypothetical 5% annualized return. You can use this information to compare the ongoing expenses (but not transaction expenses or total cost) of investing in the fund with those of other funds. All mutual fund shareholder reports will provide this information to help you make this comparison. Please note that you cannot use this information to estimate your actual ending account balance and expenses paid during the period.
| | | | | | |
Expenses and Value of a $1,000 Investment | | |
assuming a hypothetical 5% return for the six months ended October 31, 2015 | |
| | | | Investor Shares | Class R Shares |
Expenses paid per $1,000† | | $ 1.12 | $ 1.12 |
Ending value (after expenses) | | $ 1,024.10 | $1,024.10 |
† Expenses are equal to the fund’s annualized expense ratio of .22% for Investor shares and .22% for Class R shares, multiplied by the average account value over the period, multiplied by 184/365 (to reflect the one-half year period).
5
STATEMENT OF INVESTMENTS
October 31, 2015
| | | | | | |
Negotiable Bank Certificates of Deposit - 12.4% | | Principal
Amount ($) | | Value ($) | |
Bank of Tokyo-Mitsubishi Ltd. (Yankee) | | | | | |
0.30%, 12/21/15 | | 5,000,000 | | 5,000,000 | |
Mizuho Bank Ltd/NY (Yankee) | | | | | |
0.32%, 11/19/15 | | 5,000,000 | a | 5,000,000 | |
Sumitomo Mitsui Trust Bank (Yankee) | | | | | |
0.34%, 12/18/15 | | 5,000,000 | a | 5,000,000 | |
Wells Fargo Bank, NA | | | | | |
0.31%, 11/2/15 | | 5,000,000 | b | 5,000,000 | |
Total Negotiable Bank Certificates of Deposit
(cost $20,000,000) | | | |
20,000,000
| |
| |
Commercial Paper - 29.0% | | | | | |
| | | | | | |
Bank of Nova Scotia | | | | | |
0.32%, 11/2/15 | | 5,000,000 | a,b | 5,000,000 | |
BNP Paribas | | | | | |
0.34%, 12/17/15 | | 5,000,000 | a | 4,997,860 | |
Caisse Centrale Desjardins | | | | | |
0.24%, 11/20/15 | | 6,000,000 | a | 5,999,240 | |
Commonwealth Bank of Australia | | | | | |
0.35%, 11/13/15 | | 5,000,000 | a,b | 5,000,000 | |
Erste Abwicklungsanstalt | | | | | |
0.33%, 2/18/16 | | 5,000,000 | a | 4,995,004 | |
General Electric Capital Corp. | | | | | |
0.25%, 12/1/15 | | 5,000,000 | | 4,998,958 | |
HSBC Bank PLC | | | | | |
0.35%, 11/23/15 | | 5,000,000 | a,b | 5,000,000 | |
Sumitomo Mitsui Banking Corp. | | | | | |
0.31%, 11/30/15 | | 5,000,000 | a | 4,998,751 | |
Westpac Banking Corp. | | | | | |
0.33%, 11/9/15 | | 6,000,000 | a,b | 6,000,000 | |
Total Commercial Paper
(cost $46,989,813) | | | |
46,989,813
| |
| |
Asset-Backed Commercial Paper - 7.4% | | | | | |
| | | | | | |
Antalis S.A. | | | | | |
0.23%, 11/3/15 | | 7,000,000 | a | 6,999,911 | |
Collateralized Commercial Paper II Co., LLC | | | | | |
0.31%, 11/6/15 | | 5,000,000 | a | 4,999,785 | |
Total Asset-Backed Commercial Paper
(cost $11,999,696) | | | |
11,999,696
| |
| |
Time Deposits - 22.2% | | | | | |
| | | | | | |
Australia and New Zealand Banking Group Ltd. (Grand Cayman) | | | | | |
0.10%, 11/2/15 | | 7,000,000 | | 7,000,000 | |
Credit Agricole (Grand Cayman) | | | | | |
0.07%, 11/2/15 | | 7,000,000 | | 7,000,000 | |
6
| | | | | | |
Time Deposits - 22.2% (continued) | | Principal
Amount ($) | | Value ($) | |
DnB Bank (Grand Cayman) | | | | | |
0.05%, 11/2/15 | | 7,000,000 | | 7,000,000 | |
Natixis New York (Grand Cayman) | | | | | |
0.06%, 11/2/15 | | 8,000,000 | | 8,000,000 | |
Swedbank | | | | | |
0.04%, 11/2/15 | | 7,000,000 | | 7,000,000 | |
Total Time Deposits
(cost $36,000,000) | | | |
36,000,000
| |
| |
U.S. Government Agency - 12.4% | | | | | |
| | | | | | |
Federal Home Loan Bank | | | | | |
0.18% - 0.26%, 3/14/16 - 4/27/16 | | | | | |
(cost $19,980,581) | | 20,000,000 | | 19,980,581 | |
| |
Repurchase Agreement - 15.4% | | | | | |
| | | | | | |
Credit Agricole CIB | | | | | |
0.07%, dated 10/30/15, due 11/2/15 in the amount of $25,000,146 (fully collateralized by $326,284 U. S. Treasury Bills, due 11/19/15-8/18/16, value $326,115, $3,406,928 U.S. Treasury Bonds, 2.50%-9.88%, due 11/15/15-8/15/45, value $4,246,963, $29,989 U.S. Treasury Floating Rate Notes, 0.07%-0.09%, due 4/30/16-10/31/16, value $29,989, $8,081,806 U.S. Treasury Inflation Protected Securities, 0.13%-2.63%, due 1/15/16-2/15/45, value $8,627,731 and $12,200,372 U.S. Treasury Notes, 0.25%-5.13%, due 10/31/15-8/15/25, value $12,269,202) | | | | | |
(cost $25,000,000) | | 25,000,000 | | 25,000,000 | |
| |
Total Investments (cost $159,970,090) | | 98.8% | | 159,970,090 | |
Cash and Receivables (Net) | | 1.2% | | 1,994,453 | |
Net Assets | | 100.0% | | 161,964,543 | |
a Securities exempt from registration pursuant to Rule 144A under the Securities Act of 1933. These securities may be resold in transactions exempt from registration, normally to qualified institutional buyers. At October 31, 2015, these securities amounted to $63,990,551 or 39.5% of net assets.
b Variable rate security--interest rate subject to periodic change.
| | |
Portfolio Summary (Unaudited) † | |
| | Value (%) |
| | |
Banking | 60.5 |
Repurchase Agreements | 15.4 |
U.S. Government Agency | 12.4 |
Asset-Backed/Financial Services | 4.3 |
Asset-Backed/Banking | 3.1 |
Finance | 3.1 |
| | 98.8 |
† Based on net assets.
See notes to financial statements.
7
STATEMENT OF ASSETS AND LIABILITIES
October 31, 2015
| | | | | | | |
| | | | | | |
| | | Cost | | Value | |
Assets ($): | | | | |
Investments in securities—See Statement of Investments
(including repurchase agreements of $25,000,000)—Note 1(b) | | 159,970,090 | | 159,970,090 | |
Cash | | | | | 1,991,111 | |
Interest receivable | | | | | 18,231 | |
Receivable for shares of Common Stock subscribed | | | | | 76 | |
| | | | | 161,979,508 | |
Liabilities ($): | | | | |
Due to The Dreyfus Corporation and affiliates—Note 2(b) | | | | | 14,965 | |
| | | | | 14,965 | |
Net Assets ($) | | | 161,964,543 | |
Composition of Net Assets ($): | | | | |
Paid-in capital | | | | | 161,964,543 | |
Net Assets ($) | | | 161,964,543 | |
| | | | |
Net Asset Value Per Share | Investor Shares | Class R | |
Net Assets ($) | 142,818,979 | 19,145,564 | |
Shares Outstanding | 142,818,950 | 19,145,564 | |
Net Asset Value Per Share ($) | 1.00 | 1.00 | |
See notes to financial statements.
8
STATEMENT OF OPERATIONS
Year Ended October 31, 2015
| | | | | | | |
| | | | | | |
| | | | | | |
Investment Income ($): | | | | |
Interest Income | | | 340,839 | |
Expenses: | | | | |
Management fee—Note 2(a) | | | 879,193 | |
Distribution fees—Note 2(b) | | | 301,537 | |
Directors’ fees—Note 2(a,c) | | | 20,392 | |
Total Expenses | | | 1,201,122 | |
Less—reduction in expenses due to undertaking—Note 2(a) | | | (839,944) | |
Less—Directors’ fees reimbursed by Dreyfus—Note 2(a) | | | (20,392) | |
Net Expenses | | | 340,786 | |
Investment Income—Net ,representing net increase in
net assets resulting from operations | | | 53 | |
See notes to financial statements.
9
STATEMENT OF CHANGES IN NET ASSETS
| | | | | | | | | | |
| | | | | | | | | | |
| | | | Year Ended October 31, |
| | | | 2015 | | | | 2014 | |
Operations ($): | | | | | | | | |
Investment income—net | | | 53 | | | | 70 | |
Net realized gain (loss) on investments | | - | | | | 634 | |
Net Increase (Decrease) in Net Assets
Resulting from Operations | 53 | | | | 704 | |
Dividends to Shareholders from ($): | | | | | | | | |
Investment income—net: | | | | | | | | |
Investor Shares | | | (311) | | | | (55) | |
Class R | | | (48) | | | | (15) | |
Total Dividends | | | (359) | | | | (70) | |
Capital Stock Transactions ($1.00 per share): | | | | | | | |
Net proceeds from shares sold: | | | | | | | | |
Investor Shares | | | 133,236,479 | | | | 182,967,163 | |
Class R | | | 286,797,122 | | | | 170,274,717 | |
Dividends reinvested: | | | | | | | | |
Investor Shares | | | 303 | | | | 55 | |
Class R | | | 31 | | | | 4 | |
Cost of shares redeemed: | | | | | | | | |
Investor Shares | | | (140,743,441) | | | | (210,349,839) | |
Class R | | | (313,865,308) | | | | (185,373,041) | |
Increase (Decrease) in Net Assets
from Capital Stock Transactions | (34,574,814) | | | | (42,480,941) | |
Total Increase (Decrease) in Net Assets | (34,575,120) | | | | (42,480,307) | |
Net Assets ($): | | | | | | | | |
Beginning of Period | | | 196,539,663 | | | | 239,019,970 | |
End of Period | | | 161,964,543 | | | | 196,539,663 | |
See notes to financial statements.
10
FINANCIAL HIGHLIGHTS
The following tables describe the performance for each share class for the fiscal periods indicated. All information reflects financial results for a single fund share. Total return shows how much your investment in the fund would have increased (or decreased) during each period, assuming you had reinvested all dividends and distributions. These figures have been derived from the fund’s financial statements.
| | | | | | | |
| | | |
| | | |
| | Year Ended October 31, |
Investor Shares | 2015 | 2014 | 2013 | 2012 | 2011 |
Per Share Data ($): | | | | | | |
Net asset value, beginning of period | | 1.00 | 1.00 | 1.00 | 1.00 | 1.00 |
Investment Operations: | | | | | | |
Investment income—neta | | .000 | .000 | .000 | .000 | .000 |
Distributions: | | | | | | |
Dividends from
investment income—neta | | (.000) | (.000) | (.000) | (.000) | (.000) |
Net asset value, end of period | | 1.00 | 1.00 | 1.00 | 1.00 | 1.00 |
Total Return (%)b | | .00 | .00 | .00 | .00 | .00 |
Ratios/Supplemental Data (%): | | | | | |
Ratio of total expenses
to average net assets | | .71 | .71 | .71 | .71 | .71 |
Ratio of net expenses
to average net assets | | .19 | .15 | .18 | .25 | .24 |
Ratio of net investment income
to average net assetsb | | .00 | .00 | .00 | .00 | .00 |
Net Assets, end of period ($ x 1,000) | | 142,819 | 150,326 | 177,708 | 174,659 | 208,675 |
a Amount represents less than $.001 per share.
b Amount represents less than .01%.
See notes to financial statements.
11
FINANCIAL HIGHLIGHTS (continued)
| | | | | | | |
| | | |
| | | |
| | Year Ended October 31, |
Class R Shares | 2015 | 2014 | 2013 | 2012 | 2011 |
Per Share Data ($): | | | | | | |
Net asset value, beginning of period | | 1.00 | 1.00 | 1.00 | 1.00 | 1.00 |
Investment Operations: | | | | | | |
Investment income—neta | | .000 | .000 | .000 | .000 | .000 |
Distributions: | | | | | | |
Dividends from
investment income—neta | | (.000) | (.000) | (.000) | (.000) | (.000) |
Net asset value, end of period | | 1.00 | 1.00 | 1.00 | 1.00 | 1.00 |
Total Return (%)b | | .00 | .00 | .00 | .00 | .00 |
Ratios/Supplemental Data (%): | | | | | |
Ratio of total expenses
to average net assets | | .51 | .51 | .51 | .51 | .51 |
Ratio of net expenses
to average net assets | | .19 | .15 | .18 | .25 | .24 |
Ratio of net investment income
to average net assetsb | | .00 | .00 | .00 | .00 | .00 |
Net Assets, end of period ($ x 1,000) | | 19,146 | 46,214 | 61,312 | 95,408 | 80,785 |
a Amount represents less than $.001 per share.
b Amount represents less than .01%.
See notes to financial statements.
12
NOTES TO FINANCIAL STATEMENTS
NOTE 1—Significant Accounting Policies:
Dreyfus Money Market Reserves (the “fund”) is a separate diversified series of The Dreyfus/Laurel Funds, Inc. (the “Company”), which is registered under the Investment Company Act of 1940, as amended (the “Act”), as an open-end management investment company and operates as a series company currently offering ten series, including the fund. The fund’s investment objective is to seek a high level of current income consistent with stability of principal. The Dreyfus Corporation (the “Manager” or “Dreyfus”), a wholly-owned subsidiary of The Bank of New York Mellon Corporation (“BNY Mellon”), serves as the fund’s investment adviser.
MBSC Securities Corporation (the “Distributor”), a wholly-owned subsidiary of Dreyfus, is the distributor of the fund’s shares, which are sold without a sales charge. The fund is authorized to issue 2 billion shares of $.001 par value Common Stock in each of the following classes of shares: Investor and Class R. Investor shares are sold primarily to retail investors through financial intermediaries and bear a Distribution Plan fee. Class R shares are sold primarily to bank trust departments and other financial service providers (including The Bank of New York Mellon, a subsidiary of BNY Mellon and an affiliate of Dreyfus, and its affiliates), acting on behalf of customers having a qualified trust or an investment account or relationship at such institution, and bear no Distribution Plan fee. Other differences between the classes include the services offered to and the expenses borne by each class, and certain voting rights. Income, expenses (other than expenses attributable to a specific class), and realized and unrealized gains or losses on investments are allocated to each class of shares based on its relative net assets.
It is the fund’s policy to maintain a continuous net asset value per share of $1.00; the fund has adopted certain investment, portfolio valuation and dividend and distribution policies to enable it to do so. There is no assurance, however, that the fund will be able to maintain a stable net asset value per share of $1.00.
The Company accounts separately for the assets, liabilities and operations of each series. Expenses directly attributable to each series are charged to that series’ operations; expenses which are applicable to all series are allocated among them on a pro rata basis.
The Financial Accounting Standards Board (“FASB”) Accounting Standards Codification (“ASC”) is the exclusive reference of authoritative U.S. generally accepted accounting principles (“GAAP”) recognized by the FASB to be applied by nongovernmental entities. Rules and interpretive
13
NOTES TO FINANCIAL STATEMENTS (continued)
releases of the Securities and Exchange Commission (“SEC”) under authority of federal laws are also sources of authoritative GAAP for SEC registrants. The fund’s financial statements are prepared in accordance with GAAP, which may require the use of management estimates and assumptions. Actual results could differ from those estimates.
(a) Portfolio valuation: Investments in securities are valued at amortized cost in accordance with Rule 2a-7 under the Act. If amortized cost is determined not to approximate market value, the fair value of the portfolio securities will be determined by procedures established by and under the general supervision of the Company’s Board of Directors (the “Board”).
The fair value of a financial instrument is the amount that would be received to sell an asset or paid to transfer a liability in an orderly transaction between market participants at the measurement date (i.e., the exit price). GAAP establishes a fair value hierarchy that prioritizes the inputs of valuation techniques used to measure fair value. This hierarchy gives the highest priority to unadjusted quoted prices in active markets for identical assets or liabilities (Level 1 measurements) and the lowest priority to unobservable inputs (Level 3 measurements).
Additionally, GAAP provides guidance on determining whether the volume and activity in a market has decreased significantly and whether such a decrease in activity results in transactions that are not orderly. GAAP requires enhanced disclosures around valuation inputs and techniques used during annual and interim periods.
Various inputs are used in determining the value of the fund’s investments relating to fair value measurements. These inputs are summarized in the three broad levels listed below:
Level 1—unadjusted quoted prices in active markets for identical investments.
Level 2—other significant observable inputs (including quoted prices for similar investments, interest rates, prepayment speeds, credit risk, etc.).
Level 3—significant unobservable inputs (including the fund’s own assumptions in determining the fair value of investments).
The inputs or methodology used for valuing securities are not necessarily an indication of the risk associated with investing in those securities. For example, money market securities are valued using amortized cost, in accordance with rules under the Act. Generally, amortized cost approximates the current fair value of a security, but since the value is not
14
obtained from a quoted price in an active market, such securities are reflected within Level 2 of the fair value hierarchy.
The following is a summary of the inputs used as of October 31, 2015 in valuing the fund’s investments:
| | |
Valuation Inputs | Short-Term Investments ($)† |
Level 1 - Unadjusted Quoted Prices | - |
Level 2 - Other Significant Observable Inputs | 159,970,090 |
Level 3 - Significant Unobservable Inputs | - |
Total | 159,970,090 |
† See Statement of Investments for additional detailed categorizations. |
At October 31, 2015, there were no transfers between Level 1, Level 2 and Level 3 of the fair value hierarchy.
(b) Securities transactions and investment income: Securities transactions are recorded on a trade date basis. Interest income, adjusted for accretion of discount and amortization of premium on investments, is earned from settlement date and is recognized on the accrual basis. Realized gains and losses from securities transactions are recorded on the identified cost basis. Cost of investments represents amortized cost.
The fund may enter into repurchase agreements with financial institutions, deemed to be creditworthy by Dreyfus, subject to the seller’s agreement to repurchase and the fund’s agreement to resell such securities at a mutually agreed upon price. Pursuant to the terms of the repurchase agreement, such securities must have an aggregate market value greater than or equal to the terms of the repurchase price plus accrued interest at all times. If the value of the underlying securities falls below the value of the repurchase price plus accrued interest, the fund will require the seller to deposit additional collateral by the next business day. If the request for additional collateral is not met, or the seller defaults on its repurchase obligation, the fund maintains its right to sell the underlying securities at market value and may claim any resulting loss against the seller. The fund may also jointly enter into one or more repurchase agreements with other Dreyfus-managed funds in accordance with an exemptive order granted by the SEC pursuant to section 17(d) and Rule 17d-1 under the Act. Any joint repurchase agreements must be collateralized fully by U.S. Government securities.
15
NOTES TO FINANCIAL STATEMENTS (continued)
(c) Dividends to shareholders: It is the policy of the fund to declare dividends daily from investment income-net. Such dividends are paid monthly. Dividends from net realized capital gains, if any, are normally declared and paid annually, but the fund may make distributions on a more frequent basis to comply with the distribution requirements of the Internal Revenue Code of 1986, as amended (the “Code”). To the extent that net realized capital gains can be offset by capital loss carryovers, it is the policy of the fund not to distribute such gains.
(d) Federal income taxes: It is the policy of the fund to continue to qualify as a regulated investment company, if such qualification is in the best interests of its shareholders, by complying with the applicable provisions of the Code, and to make distributions of taxable income sufficient to relieve it from substantially all federal income and excise taxes.
As of and during the period ended October 31, 2015, the fund did not have any liabilities for any uncertain tax positions. The fund recognizes interest and penalties, if any, related to uncertain tax positions as income tax expense in the Statement of Operations. During the period ended October 31, 2015, the fund did not incur any interest or penalties.
Each tax year in the four-year period ended October 31, 2015 remains subject to examination by the Internal Revenue Service and state taxing authorities.
At October 31, 2015, the components of accumulated earnings on a tax basis were substantially the same as for financial reporting purposes.
The tax character of distributions paid to shareholders during the fiscal periods ended October 31, 2015 and October 31, 2014 were all ordinary income.
During the period ended October 31, 2015, as a result of permanent book to tax differences, primarily due to the tax treatment for dividend reclassification, the fund increased accumulated undistributed investment income-net by $306 and decreased accumulated net realized gain (loss) on investments by the same amount. Net assets and net asset value per share were not affected by this reclassification.
At October 31, 2015, the cost of investments for federal income tax purposes was substantially the same as the cost for financial reporting purposes (see the Statement of Investments).
16
NOTE 2—Investment Management Fee and Other Transactions with Affiliates:
(a) Pursuant to an investment management agreement with Dreyfus, Dreyfus provides or arranges for one or more third parties and/or affiliates to provide investment advisory, administrative, custody, fund accounting and transfer agency services to the fund. Dreyfus also directs the investments of the fund in accordance with its investment objective, policies and limitations. For these services, the fund is contractually obligated to pay Dreyfus a fee, calculated daily and paid monthly, at an annual rate of .50% of the value of the fund’s average daily net assets. Out of its fee, Dreyfus pays all of the expenses of the fund except brokerage fees, taxes, Distribution Plan fees, fees and expenses of non-interested Directors (including counsel fees) and extraordinary expenses. In addition, Dreyfus is required to reduce its fee in an amount equal to the fund’s allocable portion of fees and expenses of the non-interested Directors (including counsel fees). During the period ended October 31, 2015, fees reimbursed by Dreyfus amounted to $20,392.
Dreyfus has undertaken to waive receipt of the management fee and/or reimburse operating expenses in order to facilitate a daily yield at or above a certain level which may change from time to time. This undertaking is voluntary and not contractual, and may be terminated at any time. The reduction in expenses, pursuant to the undertaking, amounted to $839,944 during the period ended October 31, 2015.
(b) Under the Distribution Plan adopted pursuant to Rule 12b-1 under the Act, Investor shares may pay annually up to .25% (currently limited by the Board to .20%) of the value of the average daily net assets attributable to its Investor shares to compensate the Distributor for shareholder servicing activities and expenses primarily intended to result in the sale of Investor shares. During the period ended October 31, 2015, Investor shares were charged $301,537 pursuant to the Distribution Plan.
Under its terms, the Distribution Plan shall remain in effect from year to year, provided such continuance is approved annually by a vote of a majority of those Directors who are not “interested persons” of the Company and who have no direct or indirect financial interest in the operation of or in any agreement related to the Distribution Plan.
The components of “Due to The Dreyfus Corporation and affiliates” in the Statement of Assets and Liabilities consist of: management fees $52,641 and Distribution Plan fees $23,964, which are offset against an expense reimbursement currently in effect in the amount of $61,640.
17
NOTES TO FINANCIAL STATEMENTS (continued)
(c) Each Board member also serves as a Board member of other funds within the Dreyfus complex. Annual retainer fees and attendance fees are allocated to each fund based on net assets.
NOTE 3—Regulatory Developments:
On July 23, 2014, the SEC adopted amendments to the rules that govern money market mutual funds. In part, the amendments will require structural changes to most types of money market funds to one extent or another; however, the SEC provided for an extended two-year transition period to comply with such structural requirements. At this time, management is evaluating the reforms adopted and the manner for implementing these reforms over time and its impact on the financial statements.
NOTE 4—Pending Liquidation:
At a Board meeting held on October 28-29, 2015, the Board approved the liquidation of the fund, effective on or about February 26, 2016. Effective November 30, 2015, the fund closed to any investments for new accounts, with certain exceptions.
18
REPORT OF INDEPENDENT REGISTERED
PUBLIC ACCOUNTING FIRM
The Board of Directors and Shareholders of
The Dreyfus/Laurel Funds, Inc.
We have audited the accompanying statement of assets and liabilities of Dreyfus Money Market Reserves (the “Fund”), a series of The Dreyfus/Laurel Funds, Inc., including the statement of investments, as of October 31, 2015, the related statement of operations for the year then ended, the statements of changes in net assets for each of the years in the two-year period then ended, and the financial highlights for each of the years in the five-year period then ended. These financial statements and financial highlights are the responsibility of the Fund’s management. Our responsibility is to express an opinion on these financial statements and financial highlights based on our audits.
We conducted our audits in accordance with the standards of the Public Company Accounting Oversight Board (United States). Those standards require that we plan and perform the audit to obtain reasonable assurance about whether the financial statements and financial highlights are free of material misstatement. An audit includes examining, on a test basis, evidence supporting the amounts and disclosures in the financial statements. Our procedures included confirmation of securities owned as of October 31, 2015, by correspondence with the custodian and brokers or by other appropriate auditing procedures. An audit also includes assessing the accounting principles used and significant estimates made by management, as well as evaluating the overall financial statement presentation. We believe that our audits provide a reasonable basis for our opinion.
In our opinion, the financial statements and financial highlights referred to above present fairly, in all material respects, the financial position of Dreyfus Money Market Reserves as of October 31, 2015, the results of its operations for the year then ended, the changes in its net assets for each of the years in the two-year period then ended, and the financial highlights for each of the years in the five-year period then ended, in conformity with U.S. generally accepted accounting principles.
As disclosed in Note 4 to the financial statements, the Board of Directors of the Fund approved the liquidation of the Fund effective on or about February 26, 2016.

New York, New York
December 30, 2015
19
IMPORTANT TAX INFORMATION (Unaudited)
For federal tax purposes, the fund designates the maximum amount allowable but not less than 89.58% as interest-related dividends in accordance with Sections 871(k)(1) and 881(e) of the Internal Revenue Code.
20
BOARD MEMBERS INFORMATION (Unaudited)
INDEPENDENT BOARD MEMBERS
Joseph S. DiMartino (72)
Chairman of the Board (1999)
Principal Occupation During Past 5 Years:
· Corporate Director and Trustee (1995-present)
Other Public Company Board Memberships During Past 5 Years:
· CBIZ (formerly, Century Business Services, Inc.), a provider of outsourcing functions for small and medium size companies, Director (1997-present)
· The Newark Group, a provider of a national market of paper recovery facilities, paperboard mills and paperboard converting plants, Director (2000-2010)
No. of Portfolios for which Board Member Serves: 140
———————
Francine J. Bovich (64)
Board Member (2012)
Principal Occupation During Past 5 Years:
· Trustee, The Bradley Trusts, private trust funds (2011-present)
· Managing Director, Morgan Stanley Investment Management (1993-2010)
Other Public Company Board Memberships During Past 5 Years:
· Annaly Capital Management, Inc., Board Member (May 2014-present)
No. of Portfolios for which Board Member Serves: 79
———————
Kenneth A. Himmel (69)
Board Member (1994)
Principal Occupation During Past 5 Years:
· Managing Partner, Gulf Related, an international real estate development company (2010-present)
· President and CEO, Related Urban Development, a real estate development company (1996-present)
· President and CEO, Himmel & Company, a real estate development company (1980-present)
· CEO, American Food Management, a restaurant company (1983-present)
No. of Portfolios for which Board Member Serves: 29
———————
21
BOARD MEMBERS INFORMATION (Unaudited) (continued)
INDEPENDENT BOARD MEMBERS (continued)
Stephen J. Lockwood (68)
Board Member (1994)
Principal Occupation During Past 5 Years:
· Chairman of the Board, Stephen J. Lockwood and Company LLC, a real estate investment company (2000-present)
No. of Portfolios for which Board Member Serves: 29
———————
Roslyn M. Watson (66)
Board Member (1994)
Principal Occupation During Past 5 Years:
· Principal, Watson Ventures, Inc., a real estate investment company (1993-present)
No. of Portfolios for which Board Member Serves: 65
———————
Benaree Pratt Wiley (69)
Board Member (1998)
Principal Occupation During Past 5 Years:
· Principal, The Wiley Group, a firm specializing in strategy and business development (2005-present)
Other Public Company Board Memberships During Past 5 Years:
· CBIZ (formerly, Century Business Services, Inc.), a provider of outsourcing functions for small and medium size companies, Director (2008-present)
No. of Portfolios for which Board Member Serves: 65
———————
Once elected all Board Members serve for an indefinite term, but achieve Emeritus status upon reaching age 80. The address of the Board Members and Officers is c/o The Dreyfus Corporation, 200 Park Avenue, New York, New York 10166. Additional information about the Board Members is available in the fund’s Statement of additional Information which can be obtained from Dreyfus free of charge by calling this toll free number: 1-800-DREYFUS
James M. Fitzgibbons, Emeritus Board Member
J. Tomlinson Fort, Emeritus Board Member
22
OFFICERS OF THE FUND (Unaudited)
BRADLEY J. SKAPYAK, President since January 2010.
Chief Operating Officer and a director of the Manager since June 2009, Chairman of Dreyfus Transfer, Inc., an affiliate of the Manager and the transfer agent of the funds, since May 2011 and Executive Vice President of the Distributor since June 2007. From April 2003 to June 2009, Mr. Skapyak was the head of the Investment Accounting and Support Department of the Manager. He is an officer of 66 investment companies (comprised of 140 portfolios) managed by the Manager. He is 56 years old and has been an employee of the Manager since February 1988.
BENNETT A. MACDOUGALL, Chief Legal Officer since October 2015
Chief Legal Officer of the Manager since June 2015; from June 2005 to June 2015, Director and Associate General Counsel of Deutsche Bank – Asset & Wealth Management Division, and Chief Legal Officer of Deutsche Investment Management Americas Inc. He is an officer of 67 investment companies (comprised of 165 portfolios) managed by the Manager. He is 44 years old and has been an employee of the Manager since June 2015.
JANETTE E. FARRAGHER, Vice President and Secretary since December 2011.
Assistant General Counsel of BNY Mellon, and an officer of 67 investment companies (comprised of 165 portfolios) managed by the Manager. She is 52 years old and has been an employee of the Manager since February 1984.
JAMES BITETTO, Vice President and Assistant Secretary since August 2005.
Managing Counsel of BNY Mellon and Secretary of the Manager, and an officer of 67 investment companies (comprised of 165 portfolios) managed by the Manager. He is 49 years old and has been an employee of the Manager since December 1996.
JONI LACKS CHARATAN, Vice President and Assistant Secretary since August 2005.
Managing Counsel of BNY Mellon, and an officer of 67 investment companies (comprised of 165 portfolios) managed by the Manager. She is 59 years old and has been an employee of the Manager since October 1988.
JOSEPH M. CHIOFFI, Vice President and Assistant Secretary since August 2005.
Managing Counsel of BNY Mellon, and an officer of 67 investment companies (comprised of 165 portfolios) managed by the Manager. He is 53 years old and has been an employee of the Manager since June 2000.
JOHN B. HAMMALIAN, Vice President and Assistant Secretary since August 2005.
Senior Managing Counsel of BNY Mellon, and an officer of 67 investment companies (comprised of 165 portfolios) managed by the Manager. He is 52 years old and has been an employee of the Manager since February 1991.
MAUREEN E. KANE, Vice President and Assistant Secretary since April 2015.
Managing Counsel of BNY Mellon since July 2014; from October 2004 until July 2014, General Counsel, and from May 2009 until July 2014, Chief Compliance Officer of Century Capital Management. She is an officer of 67 investment companies (comprised of 165 portfolios) managed by the Manager. She is 53 years old and has been an employee of the Manager since July 2014.
SARAH S. KELLEHER, Vice President and Assistant Secretary since April 2014.
Senior Counsel of BNY Mellon, and an officer of 67 investment companies (comprised of 165 portfolios) managed by the Manager; from August 2005 to March 2013, Associate General Counsel of Third Avenue Management. She is 40 years old and has been an employee of the Manager since March 2013.
JEFF PRUSNOFSKY, Vice President and Assistant Secretary since August 2005.
Senior Managing Counsel of BNY Mellon, and an officer of 67 investment companies (comprised of 165 portfolios) managed by the Manager. He is 50 years old and has been an employee of the Manager since October 1990.
JAMES WINDELS, Treasurer since November 2001.
Director – Mutual Fund Accounting of the Manager, and an officer of 67 investment companies (comprised of 165 portfolios) managed by the Manager. He is 57 years old and has been an employee of the Manager since April 1985.
23
OFFICERS OF THE FUND (Unaudited) (continued)
RICHARD CASSARO, Assistant Treasurer since January 2008.
Senior Accounting Manager – Money Market and Municipal Bond Funds of the Manager, and an officer of 67 investment companies (comprised of 165 portfolios) managed by the Manager. He is 56 years old and has been an employee of the Manager since September 1982.
GAVIN C. REILLY, Assistant Treasurer since December 2005.
Tax Manager of the Investment Accounting and Support Department of the Manager, and an officer of 67 investment companies (comprised of 165 portfolios) managed by the Manager. He is 47 years old and has been an employee of the Manager since April 1991.
ROBERT S. ROBOL, Assistant Treasurer since December 2002.
Senior Accounting Manager – Fixed Income Funds of the Manager, and an officer of 67 investment companies (comprised of 165 portfolios) managed by the Manager. He is 51 years old and has been an employee of the Manager since October 1988.
ROBERT SALVIOLO, Assistant Treasurer since July 2007.
Senior Accounting Manager – Equity Funds of the Manager, and an officer of 67 investment companies (comprised of 165 portfolios) managed by the Manager. He is 48 years old and has been an employee of the Manager since June 1989.
ROBERT SVAGNA, Assistant Treasurer since December 2002.
Senior Accounting Manager – Equity Funds of the Manager, and an officer of 67 investment companies (comprised of 165 portfolios) managed by the Manager. He is 48 years old and has been an employee of the Manager since November 1990.
JOSEPH W. CONNOLLY, Chief Compliance Officer since October 2004.
Chief Compliance Officer of the Manager and The Dreyfus Family of Funds (67 investment companies, comprised of 165 portfolios). He is 58 years old and has served in various capacities with the Manager since 1980, including manager of the firm’s Fund Accounting Department from 1997 through October 2001.
24
NOTES
25
Dreyfus Money Market Reserves
200 Park Avenue
New York, NY 10166
Manager
The Dreyfus Corporation
200 Park Avenue
New York, NY 10166
Custodian
The Bank of New York Mellon
225 Liberty Street
New York, NY 10286
Transfer Agent &
Dividend Disbursing Agent
Dreyfus Transfer, Inc.
200 Park Avenue
New York, NY 10166
Distributor
MBSC Securities Corporation
200 Park Avenue
New York, NY 10166
| | |
Ticker Symbols: | Investor: DPIXX Class R: DPOXX |
Telephone Call your financial representative or 1-800-DREYFUS
Mail The Dreyfus Family of Funds, 144 Glenn Curtiss Boulevard, Uniondale, NY 1556-0144
E-mail Send your request to info@dreyfus.com
Internet Information can be viewed online or downloaded at www.dreyfus.com
The fund will disclose daily, on www.dreyfus.com, the fund’s complete schedule of holdings as of the end of the previous business day. The schedule of holdings will remain on the website until the fund files its Form N-Q or Form N-SCR for the period that includes the date of the posted holdings.
The fund files its complete schedule of portfolio holdings with the Securities and Exchange Commission (“SEC”) for the first and third quarters of each fiscal year on Form N-Q. The fund’s Forms N-Q are available on the SEC’s website at www.sec.gov and may be reviewed and copied at the SEC’s Public Reference Room in Washington, DC. (phone 1-800-SEC-0330 for information).
Information regarding how the fund voted proxies related to portfolio securities for the most recent 12-month period ended June 30 is available at www.dreyfus.com and on the SEC’s website at www.sec.gov and without charge, upon request, by calling 1-800-DREYFUS.
| | |
© 2015 MBSC Securities Corporation
0317AR1015 | 
|
Dreyfus Opportunistic Fixed Income Fund
| | | |
| | ANNUAL REPORT
October 31, 2015 |
| |
Save time. Save paper. View your next shareholder report online as soon as it’s available. Log into www.dreyfus.com and sign up for Dreyfus eCommunications. It’s simple and only takes a few minutes. |
| |
The views expressed in this report reflect those of the portfolio manager only through the end of the period covered and do not necessarily represent the views of Dreyfus or any other person in the Dreyfus organization. Any such views are subject to change at any time based upon market or other conditions and Dreyfus disclaims any responsibility to update such views. These views may not be relied on as investment advice and, because investment decisions for a Dreyfus fund are based on numerous factors, may not be relied on as an indication of trading intent on behalf of any Dreyfus fund. |
| |
Not FDIC-Insured • Not Bank-Guaranteed • May Lose Value |
Contents
THE FUND
FOR MORE INFORMATION
Back Cover
| | | | |
| |
Dreyfus Opportunistic Fixed Income Fund
| | The Fund |
A LETTER FROM THE PRESIDENT
Dear Shareholder:
We are pleased to present this annual report for Dreyfus Opportunistic Fixed Income Fund, covering the 12-month period from November 1, 2014, through October 31, 2015. For information about how the fund performed during the reporting period, as well as general market perspectives, we provide a Discussion of Fund Performance on the pages that follow.
Financial markets proved volatile over the reporting period amid choppy U.S. and global economic growth. U.S. stocks advanced over the final months of 2014 and the spring of 2015, with some broad measures of market performance setting new record highs. Those gains were largely erased over the summer when global economic instability undermined investor sentiment, but a renewed rally in October enabled most broad stock indices to end the reporting period in positive territory. In contrast, international stocks generally lost a degree of value, with developed markets faring far better than emerging markets amid falling commodity prices and depreciating currency values. U.S. bonds generally produced modestly positive total returns, with municipal bonds and longer term U.S. government securities faring better, on average, than corporate-backed bonds.
We expect market volatility to persist over the near term until investors see greater clarity regarding short-term U.S. interest rates and global economic conditions. Our investment strategists and portfolio managers are monitoring developments carefully, keeping a close watch on credit spreads, currency values, commodity prices, corporate profits, economic trends in the emerging markets, and other developments that could influence investor sentiment. Over the longer term, we remain confident that markets are likely to benefit as investors increasingly recognize that inflation is likely to stay low, economic growth expectations are stabilizing, and monetary policies remain accommodative in most regions of the world. In our view, investors will continue to be well served under these circumstances by a long-term perspective and a disciplined investment approach.
Thank you for your continued confidence and support.
Sincerely,

J. Charles Cardona
President
The Dreyfus Corporation
November 16, 2015
2
DISCUSSION OF FUND PERFORMANCE
For the period of November 1, 2014, through October 31, 2015, as provided by David Leduc, CFA, and David Horsfall, CFA, Portfolio Managers
Fund and Market Performance Overview
For the 12-month period ended October 31, 2015, Dreyfus Opportunistic Fixed Income Fund’s Class A shares produced a total return of -2.93%, Class C shares returned -3.66%, Class I shares returned -2.65%, and Class Y shares returned -2.59%.1 In comparison, the Citibank 30-day Treasury Bill Index (the “Index”) achieved a total return of 0.01% for the same period.2
Fixed-income securities produced disparate returns over the reporting period, with longer term U.S. government securities outperforming riskier high yield bonds. The fund lagged its benchmark, mainly due to its exposure to lower rated market sectors.
The Fund’s Investment Approach
The fund seeks to maximize total return through capital appreciation and income. To pursue its goal, we typically allocate the fund’s assets across four sectors of the fixed-income market: U.S. high yield bonds rated below investment grade; U.S. government, investment grade corporate and mortgage-backed securities; foreign debt securities of developed markets; and foreign debt securities of emerging markets.
Our analysis of top-down quantitative and macroeconomic factors guides the allocation of assets among market sectors, industries, and positioning along the yield curve. Using fundamental analysis, we seek to identify individual securities with high current income, as well as appreciation potential, based on relative value, credit upgrade probability, and extensive research into the credit history and current financial strength of the securities’ issuers.
Volatility Roiled Bond Markets
The reporting period began during a U.S. bond market rally in which aggressively accommodative monetary policies in Europe and Japan sent yields of sovereign bonds sharply lower, and intensifying demand from global investors seeking higher yielding alternatives sent longer term U.S. interest rates lower. Investor demand began to normalize in early 2015, and robust employment gains briefly sent long-term bond yields higher until investors responded to weaker-than-expected data stemming from a strengthening U.S. dollar and severe winter weather. The economy regained strength in the spring, and rising long-term U.S. Treasury yields erased previous price gains. However, renewed worries about economic instability in China again sparked a flight to quality over the summer, causing long-term bond yields to fall and prices to rise.
U.S. government securities produced some of the market’s higher returns in this turbulent environment, and investment-grade corporate bonds generally provided mildly positive total returns. In contrast, high yield securities lost value as credit spreads widened. Emerging-markets debt securities fared particularly poorly due to persistent economic concerns and plummeting commodity prices. Volatility among higher yielding, lower rated bonds were especially severe in August and September 2015.
3
DISCUSSION OF FUND PERFORMANCE (continued)
High Yield Exposure Dampened Fund Results
The fund’s underperformance compared to its benchmark was due, in large part, to its exposure to high yield securities, particularly those from issuers in the energy sector. Energy-related bonds were hit especially hard late in the reporting period by falling commodity prices and renewed concerns about global economic growth. Investment-grade corporate bonds detracted more mildly from relative results, mainly due to weakness exhibited by one holding from a major metals-and-mining company. To a lesser degree, the fund’s relative performance also was hampered by the impact of a strengthening U.S. dollar on some currency positions, including the Mexican peso and Norwegian krone, and by weakness among emerging-markets bonds denominated in U.S. dollars.
The fund achieved more positive results from asset-backed securities and commercial mortgage-backed securities, which fared relatively well amid robust demand for higher income in the recovering U.S. economy. Sovereign bonds from Australia and the peripheral nations of Europe also added value over the reporting period. As for our interest rate strategies, an emphasis on two- and 30-year maturities enabled the fund to benefit from narrowing yield differences across the market’s maturity spectrum, but our duration management strategy had little material influence on relative results.
During the reporting period, we employed swap options, credit default swaps, interest-rate futures contracts, and currency forward contracts to establish our strategies.
Finding Value in Dislocated Markets
We currently expect heightened fixed-income market volatility to persist over the near term. The Federal Reserve Board is widely expected to begin raising short-term interest rates, perhaps as soon as December 2015. In contrast, central banks in Europe, Japan, and China appear set to adopt more accommodative monetary policies.
In anticipation of these developments, we have maintained a more cautiously constructive investment posture. As of the reporting period’s end, the fund’s largest allocation was to asset-backed and commercial mortgage-backed securities, which we believe can provide attractive levels of income and stability. Although we recently reduced the fund’s exposure to high yield securities, we have maintained a significant allocation to the asset class, focusing on shorter maturities in areas where we have identified attractive values. We also have maintained a modest position in overseas securities in markets where interest rates appear likely to fall.
November 16, 2015
Bond funds are subject generally to interest rate, credit, liquidity, and market risks, to varying degrees, all of which are more fully described in the fund’s prospectus. Generally, all other factors being equal, bond prices are inversely related to interest-rate changes, and rate increases can cause price declines.
High yield bonds are subject to increased credit risk and are considered speculative in terms of the issuer’s perceived ability to continue making interest payments on a timely basis and to repay principal upon maturity.
Foreign bonds are subject to special risks including exposure to currency fluctuations, changing political and economic conditions, and potentially less liquidity. These risks are generally greater with emerging market countries than with more economically and politically established foreign countries.
Investments in foreign currencies are subject to the risk that those currencies will decline in value relative to the U.S. dollar, or, in the case of hedged positions, that the U.S. dollar will decline relative to the currency being hedged. Currency rates in foreign countries may fluctuate significantly over short periods of time. A decline in the value of foreign currencies relative to the U.S. dollar will reduce the value of securities held by the fund and denominated in those currencies. The use of leverage may magnify the fund’s gains or losses.
4
For derivatives with a leveraging component, adverse changes in the value or level of the underlying asset can result in a loss that is much greater than the original investment in the derivative.
The fund may use derivative instruments, such as options, futures and options on futures, forward contracts, swaps (including credit default swaps on corporate bonds and asset-backed securities), options on swaps, and other credit derivatives. A small investment in derivatives could have a potentially large impact on the fund’s performance. The use of derivatives involves risks different from, or possibly greater than, the risks associated with investing directly in the underlying assets.
1 Total return includes reinvestment of dividends and any capital gains paid, and does not take into consideration the maximum initial sales charge in the case of Class A shares, or the applicable contingent deferred sales charge imposed on redemptions in the case of Class C shares. Had these charges been reflected, returns would have been lower. Past performance is no guarantee of future results. Class I and Class Y shares are not subject to any initial or deferred sales charges. Share price, yield, and investment return fluctuate such that upon redemption, fund shares may be worth more or less than their original cost. Return figures provided reflect the absorption of certain fund expenses by the Dreyfus Corporation pursuant to an agreement in effect through March 1, 2016, at which time it may be extended, modified, or terminated. Had these expenses not been absorbed, the fund’s returns would have been lower.
² SOURCE: Lipper, Inc. - U.S. Treasury Bill Indices. These indices measure return equivalents of yield averages that are not marked to market. For example, the U.S. 1-Month and 3-Month Treasury Bill Indices consist of the last one-month and three-month Treasury bill month-end rates, respectively. Returns for these indices are calculated on a monthly basis only.
5
FUND PERFORMANCE
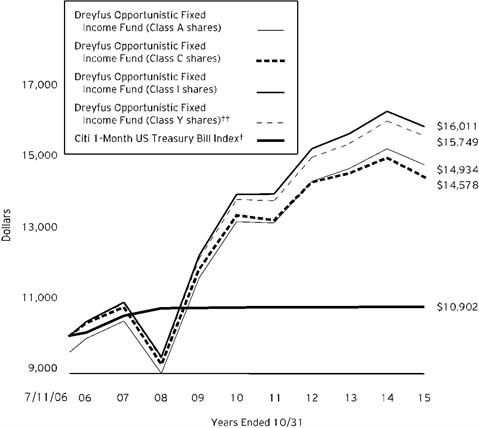
Comparison of change in value of $10,000 investment in Dreyfus Opportunistic Fixed Income Fund Class A shares, Class C shares, Class I shares and Class Y shares and the Citi 1-Month US Treasury Bill Index
† Source: Lipper Inc.
†† The total return figures presented for Class Yshares of the fund reflect the performance of the fund’s Class A shares for the period prior to 7/1/13 (the inception date for Class Y shares), not reflecting the applicable sales charges for Class A shares.
Past performance is not predictive of future performance.
The above graph compares a $10,000 investment made in each of the Class A, Class C, Class I and Class Y shares of Dreyfus Opportunistic fixed Income Fund on 7/11/6 (inception date) to a $10,000 investment made in the Citi 1-Month US Treasury Bill Index (the “Index”) on that date. All dividends and capital gain distributions are reinvested.
The fund invests primarily in fixed-income securities. The fund’s performance shown in the line graph above takes into account the maximum initial sales charge on Class A shares and all other applicable fees and expenses on all classes. The Index is a market value-weighted index of public obligations of the U.S. Treasury with maturities of 30 days. Unlike a mutual fund, the Index is not subject to charges, fees and other expenses. Investors cannot invest directly in any index. Further information relating to fund performance, including expense reimbursements, if applicable, is contained in the Financial Highlights section of the prospectus and elsewhere in this report.
6
| | | | | | | |
Average Annual Total Returns as of 10/31/15 | | |
| Inception | 1 Year | 5 Years | | From |
Date | Inception |
Class A shares | | | | |
with maximum sales charge (4.5%) | 7/11/06 | -7.32% | 1.39% | | 4.40% | |
without sales charge | 7/11/06 | -2.93% | 2.32% | | 4.92% | |
Class C shares | | | | |
with applicable redemption charge † | 7/11/06 | -4.59% | 1.56% | | 4.13% | |
without redemption | 7/11/06 | -3.66% | 1.56% | | 4.13% | |
Class I shares | 7/11/06 | -2.65% | 2.59% | | 5.19% | |
Class Y shares | 7/1/13 | -2.59% | 2.47% | †† | 5.00% | †† |
Citi 1-Month US Treasury Bill Index | 6/30/06 | 0.01% | 0.04% | | 0.93% | ††† |
Past performance is not predictive of future performance. The fund’s performance shown in the graph and table does not reflect the deduction of taxes that a shareholder would pay on fund distributions or the redemption of fund shares. In addition to the performance of Class A shares shown with and without a maximum sales charge, the fund’s performance shown in the table takes into account all other applicable fees and expenses on all classes.
† The maximum contingent deferred sales charge for Class C shares is 1% for shares redeemed within one year of the date of purchase.
†† The total return performance figures presented for Class Y shares of the fund reflect the performance of the fund’s Class A shares for the period prior to 7/1/13 (the inception date for Class Y shares), not reflecting the applicable sales charges for Class A.
††† For comparative purposes, the value of the Index as of 6/30/06 is used as the beginning value on 7/11/06.
7
UNDERSTANDING YOUR FUND’S EXPENSES (Unaudited)
As a mutual fund investor, you pay ongoing expenses, such as management fees and other expenses. Using the information below, you can estimate how these expenses affect your investment and compare them with the expenses of other funds. You also may pay one-time transaction expenses, including sales charges (loads)and redemption fees, which are not shown in this section and would have resulted in higher total expenses. For more information, see your fund’s prospectus or talk to your financial adviser.
Review your fund’s expenses
The table below shows the expenses you would have paid on a $1,000 investment in Dreyfus Opportunistic Fixed Income Fund from May 1, 2015 to October 31, 2015. It also shows how much a $1,000 investment would be worth at the close of the period, assuming actual returns and expenses.
| | | | | | | | | | | | |
Expenses and Value of a $1,000 Investment | | |
assuming actual returns for the six months ended October 31, 2015 |
| | | | | | | | |
| | | | Class A | Class C | Class I | Class Y |
Expenses paid per $1,000† | | $ 4.37 | | $ 8.07 | | $ 3.11 | | $ 2.86 |
Ending value (after expenses) | | $ 950.10 | | $ 952.30 | | $ 957.40 | | $ 957.60 |
COMPARING YOUR FUND’S EXPENSES
WITH THOSE OF OTHER FUNDS (Unaudited)
Using the SEC’s method to compare expenses
The Securities and Exchange Commission (SEC) has established guidelines to help investors assess fund expenses. Per these guidelines, the table below shows your fund’s expenses based on a $1,000 investment, assuming a hypothetical 5% annualized return. You can use this information to compare the ongoing expenses (but not transaction expenses or total cost) of investing in the fund with those of other funds. All mutual fund shareholder reports will provide this information to help you make this comparison. Please note that you cannot use this information to estimate your actual ending account balance and expenses paid during the period.
| | | | | | | | | | | | |
Expenses and Value of a $1,000 Investment | | |
assuming a hypothetical 5% annualized return for the six months ended October 31, 2015 |
| | | | | | | | |
| | | | Class A | Class C | Class I | Class Y |
Expenses paid per $1,000† | | $ 4.53 | | $ 8.34 | | $ 3.21 | | $ 2.96 |
Ending value (after expenses) | | $ 1,020.72 | | $ 1,016.94 | | $ 1,022.03 | | $ 1,022.28 |
† Expenses are equal to the fund’s annualized expense ratio of .89% for Class A, 1.64% for Class C, .63% for Class I and .58% for Class Y, multiplied by the average account value over the period, multiplied by 184/365 (to reflect the one-half year period).
8
STATEMENT OF INVESTMENTS
October 31, 2015
| | | | | | | | | | | |
Bonds and Notes - 93.7% | | Coupon
Rate (%) | | Maturity
Date | | Principal
Amount ($) | a | Value ($) | |
Asset-Backed Certificates - 5.7% | | | | | |
CIT Equipment Collateral,
Ser. 2014-VT1, Cl. C | | 2.65 | | 2/20/20 | | 1,475,000 | b | 1,491,506 | |
DB Master Finance LLC,
Ser. 2015-1A, Cl. A2I | | 3.26 | | 2/20/45 | | 3,855,625 | b | 3,869,875 | |
Dell Equipment Finance Trust,
Ser. 2014-1, Cl. D | | 2.68 | | 6/22/20 | | 3,402,000 | b | 3,410,794 | |
Dell Equipment Finance Trust,
Ser. 2015-1, Cl. D | | 2.84 | | 9/22/20 | | 3,723,000 | b | 3,684,937 | |
IndyMac Residential Asset-Backed Trust,
Ser. 05-D, Cl. AII4 | | 0.55 | | 3/25/36 | | 4,225,000 | c | 3,732,682 | |
OneMain Financial Issuance Trust,
Ser. 2014-1A, Cl. B | | 3.24 | | 6/18/24 | | 4,000,000 | b | 4,018,156 | |
Popular ABS Mortgage Pass-Through Trust,
Ser. 2007-A, Cl. A2 | | 0.45 | | 6/25/47 | | 4,361,000 | c | 3,802,299 | |
Securitized Asset Backed Receivables Trust,
Ser. 2005-FR3, Cl. M1 | | 0.90 | | 4/25/35 | | 106,671 | c | 106,351 | |
Springleaf Funding Trust,
Ser. 2013-BA, Cl. A | | 3.92 | | 1/16/23 | | 2,710,000 | b | 2,714,634 | |
Springleaf Funding Trust,
Ser. 2015-AA, Cl. A | | 3.16 | | 11/15/24 | | 4,425,000 | b | 4,461,284 | |
Springleaf Funding Trust,
Ser. 2015-AA, Cl. B | | 3.62 | | 11/15/24 | | 1,925,000 | b | 1,928,042 | |
Trafigura Securitisation Finance,
Ser. 2014-1A, Cl. B | | 2.45 | | 10/15/21 | | 1,560,000 | b,c | 1,563,494 | |
Wendys Funding,
Ser. 2015-1A, Cl. A2II | | 4.08 | | 6/15/45 | | 3,100,000 | b | 3,124,809 | |
| | 37,908,863 | |
Asset-Backed Ctfs./Auto Receivables - 8.2% | | | | | |
Capital Auto Receivables Asset Trust,
Ser. 2014-3, Cl. D | | 3.14 | | 2/20/20 | | 1,250,000 | | 1,253,232 | |
Chrysler Capital Auto Receivables Trust,
Ser. 2014-BA, Cl. D | | 3.44 | | 8/16/21 | | 3,236,000 | b | 3,278,210 | |
DT Auto Owner Trust,
Ser. 2013-1A, Cl. D | | 3.74 | | 5/15/20 | | 2,885,000 | b | 2,906,076 | |
DT Auto Owner Trust,
Ser. 2013-2A, Cl. D | | 4.18 | | 6/15/20 | | 2,575,000 | b | 2,606,022 | |
DT Auto Owner Trust,
Ser. 2014-1A, Cl. D | | 3.98 | | 1/15/21 | | 5,245,000 | b | 5,277,903 | |
DT Auto Owner Trust,
Ser. 2014-2A, Cl. C | | 2.46 | | 1/15/20 | | 955,000 | b | 955,138 | |
DT Auto Owner Trust,
Ser. 2014-3A, Cl. D | | 4.47 | | 11/15/21 | | 3,400,000 | b | 3,417,150 | |
DT Auto Owner Trust,
Ser. 2015-2A, Cl. D | | 4.25 | | 2/15/22 | | 2,470,000 | b | 2,465,295 | |
DT Auto Owner Trust,
Ser. 2015-3A, Cl. D | | 4.53 | | 10/17/22 | | 5,280,000 | b | 5,307,600 | |
Exeter Automobile Receivables Trust,
Ser. 2013-1A, Cl. C | | 3.52 | | 2/15/19 | | 3,680,000 | b | 3,704,515 | |
Exeter Automobile Receivables Trust,
Ser. 2013-2A, Cl. C | | 4.35 | | 1/15/19 | | 2,350,000 | b | 2,391,623 | |
GM Financial Automobile Leasing Trust,
Ser. 2014-1A, Cl. D | | 2.51 | | 3/20/19 | | 3,500,000 | b | 3,497,761 | |
9
STATEMENT OF INVESTMENTS (continued)
| | | | | | | | | | | | | | | | | |
Bonds and Notes - 93.7% (continued) | | Coupon
Rate (%) | | Maturity
Date | | Principal
Amount ($) | a | Value ($) | |
Asset-Backed Ctfs./Auto Receivables - 8.2% (continued) | | | | | |
GM Financial Automobile Leasing Trust,
Ser. 2015-1, Cl. D | | 3.01 | | 3/20/20 | | 1,650,000 | | 1,639,852 | |
GO Financial Auto Securitization Trust,
Ser. 2015-1, Cl. B | | 3.59 | | 10/15/20 | | 2,850,000 | b | 2,852,628 | |
Santander Drive Auto Receivables Trust,
Ser. 2014-1, Cl. D | | 2.91 | | 4/15/20 | | 1,225,000 | | 1,234,584 | |
Santander Drive Auto Receivables Trust,
Ser. 2014-4, Cl. D | | 3.10 | | 11/16/20 | | 2,970,000 | | 2,958,870 | |
Santander Drive Auto Receivables Trust,
Ser. 2014-5, Cl. D | | 3.21 | | 1/15/21 | | 5,650,000 | | 5,702,042 | |
Santander Drive Auto Receivables Trust,
Ser. 2015-1, Cl. D | | 3.24 | | 4/15/21 | | 1,825,000 | | 1,824,336 | |
Westlake Automobile Receivables Trust,
Ser. 2014-2A, Cl. D | | 2.86 | | 7/15/21 | | 1,875,000 | b | 1,849,871 | |
| | 55,122,708 | |
Asset-Backed Ctfs./Home Equity Loans - 6.9% | | | | | |
ACE Securities Corp. Home Equity Loan Trust,
Ser. 2005-ASP1, Cl. M1 | | 0.88 | | 9/25/35 | | 3,924,188 | c | 3,159,464 | |
ACE Securities Corp. Home Equity Loan Trust,
Ser. 2006-ASAP3, Cl. A1 | | 0.34 | | 6/25/36 | | 3,827,489 | c | 3,183,868 | |
ACE Securities Corp. Home Equity Loan Trust,
Ser. 2006-HE2, Cl. A2C | | 0.36 | | 5/25/36 | | 808,397 | c | 728,949 | |
Argent Securities Trust,
Ser. 2006-M1, Cl. A2B | | 0.29 | | 7/25/36 | | 9,863,441 | c | 4,186,585 | |
Asset Backed Funding Certificates Trust,
Ser. 2006-OPT3, Cl. A3B | | 0.36 | | 11/25/36 | | 297,340 | c | 166,854 | |
Asset Backed Securities Corporation Home Equity Loan Trust,
Ser. 2007-HE1, Cl. A4 | | 0.34 | | 12/25/36 | | 3,917,457 | c | 3,193,409 | |
Carrington Mortgage Loan Trust,
Ser. 2006-NC5, Cl. A2 | | 0.31 | | 1/25/37 | | 4,845,315 | c | 3,559,700 | |
Carrington Mortgage Loan Trust,
Ser. 2007-HE1 | | 0.35 | | 6/25/37 | | 6,495,441 | c | 5,947,171 | |
Colony American Homes,
Ser. 2015-1A, Cl. F | | 3.85 | | 7/17/32 | | 5,585,000 | b,c | 5,233,129 | |
Countrywide Asset-Backed Certificates,
Ser. 2004-1, Cl. M5 | | 1.77 | | 1/25/34 | | 1,891,199 | c | 1,771,961 | |
HSI Asset Securitization Corp. Trust,
Ser. 2005-I1, Cl. 2A3 | | 0.49 | | 11/25/35 | | 1,836,191 | c | 1,735,800 | |
HSI Asset Securitization Corp. Trust,
Ser. 2007-WF1, Cl. 2A3 | | 0.37 | | 5/25/37 | | 2,551,001 | c | 2,453,520 | |
JP Morgan Mortgage Acquisition Corp.,
Ser. 2006-FRE1, Cl. A3 | | 0.39 | | 5/25/35 | | 284,580 | c | 280,605 | |
JP Morgan Mortgage Acquisition Trust,
Ser. 2007-CH1, Cl. AF6 | | 4.57 | | 11/25/36 | | 777,111 | c | 783,293 | |
MASTR Asset Backed Securities Trust,
Ser. 2006-AM2, Cl. A3 | | 0.37 | | 6/25/36 | | 1,269,093 | c | 1,011,375 | |
Morgan Stanley ABS Capital I Trust,
Ser. 2006-NC4, Cl. A2C | | 0.35 | | 6/25/36 | | 424,162 | c | 383,429 | |
Morgan Stanley Home Equity Loan Trust,
Ser. 2006-3, Cl. A3 | | 0.36 | | 4/25/36 | | 462,326 | c | 327,229 | |
New Century Home Equity Loan Trust,
Ser. 2006-1, Cl. A2B | | 0.38 | | 5/25/36 | | 1,290,594 | c | 962,834 | |
10
| | | | | | | | | | | |
Bonds and Notes - 93.7% (continued) | | Coupon
Rate (%) | | Maturity
Date | | Principal
Amount ($) | a | Value ($) | |
Asset-Backed Ctfs./Home Equity Loans - 6.9% (continued) | | | | | |
NovaStar Mortgage Funding Trust,
Ser. 2006-4, Cl. A2D | | 0.45 | | 9/25/36 | | 859,831 | c | 459,044 | |
Residential Asset Mortgage Products Trust,
Ser. 2007-RZ1, Cl. A2 | | 0.36 | | 2/25/37 | | 1,126,898 | c | 1,035,476 | |
Saxon Asset Securities Trust,
Ser. 2007-3, Cl. 2A2 | | 0.52 | | 9/25/47 | | 4,850,000 | c | 4,387,599 | |
Structured Asset Securities Corp.,
Ser. 2002-BC1, Cl. M2 | | 3.65 | | 8/25/32 | | 987,364 | c | 958,033 | |
| | 45,909,327 | |
Casinos - 1.3% | | | | | |
International Game Technology,
Sr. Scd. Notes | | 6.25 | | 2/15/22 | | 4,000,000 | b | 3,920,000 | |
Scientific Games International,
Gtd. Notes | | 10.00 | | 12/1/22 | | 5,235,000 | | 4,659,150 | |
| | 8,579,150 | |
Commercial Mortgage Pass-Through Ctfs. - 11.6% | | | | | |
A10 Term Asset Financing,
Ser. 2013-2, Cl. A | | 2.62 | | 11/15/27 | | 585,440 | b | 589,270 | |
Banc of America Commercial Mortgage Trust,
Ser. 2007-2, Cl. AJ | | 5.63 | | 4/10/49 | | 5,930,000 | c | 5,964,087 | |
Bear Stearns Commercial Mortgage Securities Trust,
Ser. 2006-PWR14, Cl. AJ | | 5.27 | | 12/11/38 | | 4,433,000 | | 4,425,186 | |
Bear Stearns Commercial Mortgage Securities Trust,
Ser. 2007-PWR16, Cl. AJ | | 5.70 | | 6/11/40 | | 4,550,000 | c | 4,625,463 | |
Bear Stearns Commercial Mortgage Securities Trust,
Ser. 2007-PWR17, Cl. AJ | | 5.88 | | 6/11/50 | | 1,725,000 | c | 1,769,324 | |
Bear Stearns Commercial Mortgage Securities Trust,
Ser. 2007-PWR18, Cl. AJ | | 6.18 | | 6/11/50 | | 1,025,000 | c | 1,038,050 | |
Citigroup Commercial Mortgage Trust,
Ser. 2007-C6, Cl. AJ | | 5.71 | | 12/10/49 | | 2,900,000 | c | 2,665,522 | |
Citigroup Commercial Mortgage Trust,
Ser. 2013-375P, Cl. E | | 3.52 | | 5/10/35 | | 200,000 | b,c | 183,366 | |
Commercial Mortgage Trust,
Ser. 2006-C8, Cl. AJ | | 5.38 | | 12/10/46 | | 8,640,000 | | 8,593,464 | |
Commercial Mortgage Trust,
Ser. 2015-CR23, Cl. CMD | | 3.68 | | 5/10/48 | | 4,100,000 | b,c | 3,973,870 | |
Credit Suisse Mortgage Trust,
Ser. 2014-USA, Cl. E | | 4.37 | | 9/15/37 | | 2,835,000 | b | 2,603,198 | |
JP Morgan Chase Commercial Mortgage Securities Trust,
Ser. 2006-CB17, Cl. AM | | 5.46 | | 12/12/43 | | 730,000 | | 739,419 | |
JP Morgan Chase Commercial Mortgage Securities Trust,
Ser. 2007-LD12, Cl. AJ | | 6.01 | | 2/15/51 | | 6,405,000 | c | 6,492,348 | |
JP Morgan Chase Commercial Mortgage Securities Trust,
Ser. 2007-LDPX, Cl. AM | | 5.46 | | 1/15/49 | | 4,175,000 | c | 4,284,529 | |
JP Morgan Chase Commercial Mortgage Securities Trust,
Ser. 2014-INN, Cl. E | | 3.80 | | 6/15/29 | | 3,375,000 | b,c | 3,352,502 | |
11
STATEMENT OF INVESTMENTS (continued)
| | | | | | | | | | | | | | | | | | | | |
Bonds and Notes - 93.7% (continued) | | Coupon
Rate (%) | | Maturity
Date | | Principal
Amount ($)a | | Value ($) | |
Commercial Mortgage Pass-Through Ctfs. - 11.6% (continued) | | | | | |
LB-UBS Commercial Mortgage Trust,
Ser. 2007-C6, Cl. AJ | | 6.12 | | 7/15/40 | | 1,573,000 | c | 1,622,153 | |
Merrill Lynch Mortgage Trust,
Ser. 2006-C1, Cl. AJ | | 5.67 | | 5/12/39 | | 2,740,000 | c | 2,755,361 | |
ML-CFC Commercial Mortgage Trust,
Ser. 2006-4, Cl. AJ | | 5.24 | | 12/12/49 | | 4,600,000 | | 4,590,301 | |
ML-CFC Commercial Mortgage Trust,
Ser. 2007-9, Cl. AJ | | 6.19 | | 9/12/49 | | 1,310,000 | c | 1,315,554 | |
Morgan Stanley Capital I Trust,
Ser. 2007-IQ14, Cl. AM | | 5.68 | | 4/15/49 | | 2,400,000 | c | 2,477,359 | |
Wachovia Bank Commercial Mortgage Trust,
Ser. 2006-C24, Cl. AJ | | 5.66 | | 3/15/45 | | 4,175,000 | c | 4,188,784 | |
Wachovia Bank Commercial Mortgage Trust,
Ser. 2006-C29, Cl. AJ | | 5.37 | | 11/15/48 | | 5,125,000 | c | 5,090,268 | |
Wachovia Bank Commercial Mortgage Trust,
Ser. 2007-C32, Cl. AJ | | 5.71 | | 6/15/49 | | 3,950,000 | c | 4,034,322 | |
| | 77,373,700 | |
Consumer Discretionary - 1.6% | | | | | |
Acosta,
Sr. Unscd. Notes | | 7.75 | | 10/1/22 | | 3,640,000 | b | 3,530,800 | |
General Motors,
Sr. Unscd. Notes | | 5.20 | | 4/1/45 | | 2,970,000 | | 2,951,387 | |
Volkswagen International Finance,
Gtd. Notes | | 1.60 | | 11/20/17 | | 2,325,000 | b | 2,259,361 | |
Volkswagen International Finance,
Notes | | 2.38 | | 3/22/17 | | 2,025,000 | b | 2,014,344 | |
| | 10,755,892 | |
Consumer Staples - 1.2% | | | | | |
JBS USA Finance,
Sr. Unscd. Notes | | 5.75 | | 6/15/25 | | 5,665,000 | b | 5,509,212 | |
Kraft Heinz Foods,
Scd. Notes | | 4.88 | | 2/15/25 | | 1,670,000 | b | 1,797,174 | |
Walgreens Boots Alliance,
Gtd. Notes | | 3.80 | | 11/18/24 | | 750,000 | | 745,791 | |
| | 8,052,177 | |
Energy - 11.1% | | | | | |
Antero Resources,
Gtd. Notes | | 6.00 | | 12/1/20 | | 2,750,000 | | 2,653,750 | |
Antero Resources,
Gtd. Notes | | 5.38 | | 11/1/21 | | 625,000 | d | 578,125 | |
Antero Resources,
Gtd. Notes | | 5.63 | | 6/1/23 | | 1,550,000 | b | 1,433,750 | |
Bonanza Creek Energy,
Gtd. Notes | | 5.75 | | 2/1/23 | | 4,500,000 | | 3,037,500 | |
Carrizo Oil & Gas,
Gtd. Notes | | 6.25 | | 4/15/23 | | 3,505,000 | | 3,351,656 | |
Chesapeake Energy,
Gtd. Notes | | 6.50 | | 8/15/17 | | 1,665,000 | | 1,538,044 | |
Chesapeake Energy,
Gtd. Notes | | 6.63 | | 8/15/20 | | 3,375,000 | d | 2,303,437 | |
Cimarex Energy,
Gtd. Notes | | 5.88 | | 5/1/22 | | 1,055,000 | | 1,114,354 | |
12
| | | | | | | | | | | | | | | | | | | | |
Bonds and Notes - 93.7% (continued) | | Coupon
Rate (%) | | Maturity
Date | | Principal
Amount ($)a | | Value ($) | |
Energy - 11.1% (continued) | | | | | |
Continental Resources,
Gtd. Notes | | 5.00 | | 9/15/22 | | 735,000 | | 661,500 | |
Continental Resources,
Gtd. Notes | | 3.80 | | 6/1/24 | | 1,025,000 | | 859,384 | |
Freeport-McMoran Oil & Gas,
Gtd. Notes | | 6.88 | | 2/15/23 | | 6,501,000 | | 5,737,132 | |
Genesis Energy,
Gtd. Notes | | 6.75 | | 8/1/22 | | 2,500,000 | | 2,450,000 | |
Kinder Morgan,
Gtd. Notes | | 5.30 | | 12/1/34 | | 1,230,000 | | 1,038,623 | |
Kinder Morgan,
Gtd. Notes | | 5.55 | | 6/1/45 | | 1,425,000 | | 1,203,593 | |
Kinder Morgan,
Sr. Unscd. Notes | | 7.80 | | 8/1/31 | | 2,325,000 | | 2,360,931 | |
Laredo Petroleum,
Gtd. Notes | | 5.63 | | 1/15/22 | | 2,500,000 | d | 2,362,500 | |
Lukoil International Finance,
Gtd. Notes | | 6.13 | | 11/9/20 | | 1,100,000 | | 1,141,250 | |
MMC Norilsk Nickel,
Sr. Unscd Notes | | 4.38 | | 4/30/18 | | 3,400,000 | d | 3,430,546 | |
Newfield Exploration,
Sr. Unscd. Notes | | 5.75 | | 1/30/22 | | 2,600,000 | | 2,652,000 | |
Noble Energy,
Sr. Unscd. Notes | | 5.25 | | 11/15/43 | | 650,000 | | 600,834 | |
Noble Energy,
Sr. Unscd. Notes | | 5.05 | | 11/15/44 | | 1,000,000 | | 918,271 | |
Northern Oil and Gas,
Sr. Unscd. Notes | | 8.00 | | 6/1/20 | | 1,980,000 | d | 1,647,360 | |
Northern Oil and Gas,
Sr. Unscd. Notes | | 8.00 | | 6/1/20 | | 2,225,000 | | 1,851,200 | |
NRG Energy,
Gtd. Notes | | 6.25 | | 7/15/22 | | 4,425,000 | | 4,093,125 | |
NRG Energy,
Gtd. Notes | | 6.25 | | 5/1/24 | | 2,400,000 | | 2,160,000 | |
Odebrecht Offshore Drilling Finance,
Sr. Scd. Notes | | 6.63 | | 10/1/23 | | 186,840 | | 63,059 | |
Odebrecht Offshore Drilling Finance,
Sr. Scd. Notes | | 6.75 | | 10/1/23 | | 4,371,932 | d | 1,506,131 | |
Pacific Rubiales Energy,
Gtd. Notes | | 5.38 | | 1/26/19 | | 3,150,000 | d | 1,386,000 | |
Petrobras Global Finance,
Gtd. Notes | | 2.00 | | 5/20/16 | | 2,380,000 | | 2,351,440 | |
Petrobras International Finance,
Gtd. Notes | | 6.13 | | 10/6/16 | | 4,995,000 | d | 5,049,945 | |
Sanchez Energy,
Gtd. Notes | | 7.75 | | 6/15/21 | | 745,000 | d | 596,000 | |
Transocean,
Gtd. Notes | | 3.00 | | 10/15/17 | | 5,255,000 | c | 4,837,227 | |
Unit,
Gtd. Notes | | 6.63 | | 5/15/21 | | 4,225,000 | | 3,401,125 | |
YPF,
Sr. Unscd. Notes | | 8.50 | | 7/28/25 | | 4,000,000 | d | 3,952,000 | |
| | 74,321,792 | |
Financials - 18.1% | | | | | |
Allianz,
Jr. Sub. Bonds | EUR | 3.38 | | 9/29/49 | | 1,400,000 | | 1,527,755 | |
13
STATEMENT OF INVESTMENTS (continued)
| | | | | | | | | | | | | | | | | |
Bonds and Notes - 93.7% (continued) | | Coupon
Rate (%) | | Maturity
Date | | Principal
Amount ($) | a | Value ($) | |
Financials - 18.1% (continued) | | | | | |
Allianz Finance II,
Gtd. Notes | EUR | 5.75 | | 7/8/41 | | 1,500,000 | | 1,920,624 | |
Ally Financial,
Gtd. Notes | | 8.00 | | 11/1/31 | | 2,950,000 | | 3,587,937 | |
Ally Financial,
Sr. Unscd. Notes | | 3.60 | | 5/21/18 | | 1,820,000 | | 1,847,300 | |
American International Group,
Jr. Sub. Debs., Ser. A3 | EUR | 4.88 | | 3/15/67 | | 7,900,000 | | 8,947,855 | |
ARC Properties Operating Partnership,
Gtd. Notes | | 2.00 | | 2/6/17 | | 12,790,000 | | 12,639,078 | |
AXA,
Jr. Sub. Notes | EUR | 5.78 | | 7/29/49 | | 3,895,000 | | 4,410,570 | |
Bank of America,
Sub. Notes | | 6.11 | | 1/29/37 | | 1,475,000 | | 1,715,005 | |
China Cinda Finance 2015,
Gtd. Notes | | 3.13 | | 4/23/20 | | 3,460,000 | b | 3,403,529 | |
Citigroup,
Sub. Notes | | 4.45 | | 9/29/27 | | 11,370,000 | | 11,385,850 | |
CNO Financial Group,
Sr. Unscd. Notes | | 5.25 | | 5/30/25 | | 3,775,000 | | 4,025,094 | |
Credit Suisse Group,
Sub. Notes | | 6.50 | | 8/8/23 | | 1,600,000 | b | 1,755,520 | |
General Electric Capital,
Sub. Debs. | | 6.38 | | 11/15/67 | | 8,150,000 | c | 8,724,575 | |
General Motors Financial,
Gtd. Notes | | 3.10 | | 1/15/19 | | 1,925,000 | | 1,932,842 | |
General Motors Financial,
Gtd. Notes | | 1.88 | | 1/15/20 | | 3,575,000 | c | 3,536,547 | |
Goldman Sachs Group,
Sub. Notes | | 5.15 | | 5/22/45 | | 2,555,000 | | 2,574,390 | |
HSBC Holdings,
Jr. Sub. Bonds | | 6.38 | | 12/29/49 | | 2,750,000 | c | 2,722,500 | |
HSBC Holdings,
Jr. Sub. Bonds | | 5.63 | | 12/29/49 | | 2,110,000 | c,d | 2,111,319 | |
Hub Holdings,
Sr. Unscd. Notes | | 8.13 | | 7/15/19 | | 1,425,000 | b | 1,392,938 | |
HUB International,
Sr. Unscd. Notes | | 7.88 | | 10/1/21 | | 3,890,000 | b | 3,890,000 | |
Icahn Enterprises,
Gtd. Notes | | 5.88 | | 2/1/22 | | 2,210,000 | d | 2,284,587 | |
ING Groep,
Jr. Sub. Notes | | 6.50 | | 12/29/49 | | 2,515,000 | c | 2,470,987 | |
Intesa Sanpaolo,
Gtd. Bonds | | 5.25 | | 1/12/24 | | 2,000,000 | | 2,178,244 | |
Liberty Mutual Group,
Gtd. Bonds | | 4.85 | | 8/1/44 | | 2,200,000 | b | 2,177,353 | |
Lloyds Banking Group,
Jr. Sub. Bonds | | 7.50 | | 4/30/49 | | 2,373,000 | c,d | 2,527,245 | |
Lloyds Banking Group,
Sub. Notes | | 4.50 | | 11/4/24 | | 3,075,000 | d | 3,132,961 | |
Quicken Loans,
Gtd. Notes | | 5.75 | | 5/1/25 | | 525,000 | b | 523,031 | |
Royal Bank of Scotland Group,
Jr. Sub. Bonds | | 7.50 | | 12/29/49 | | 3,425,000 | c | 3,553,437 | |
Royal Bank of Scotland Group,
Jr. Sub. Bonds | | 8.00 | | 12/29/49 | | 3,350,000 | c,d | 3,509,125 | |
14
| | | | | | | | | | | | | | | | | | | | |
Bonds and Notes - 93.7% (continued) | | Coupon
Rate (%) | | Maturity
Date
| | Principal
Amount ($)a | | Value ($) | |
Financials - 18.1% (continued) | | | | | |
Volkswagen Group of America,
Gtd. Notes | | 1.25 | | 5/23/17 | | 2,125,000 | b | 2,070,793 | |
Wells Fargo & Co.,
Sub. Notes | | 4.65 | | 11/4/44 | | 5,200,000 | | 5,146,643 | |
ZFS Finance (USA) Trust V,
Jr. Sub. Cap. Secs. | | 6.50 | | 5/9/67 | | 6,837,000 | b,c | 7,007,925 | |
| | 120,633,559 | |
Foreign/Governmental - 8.4% | | | | | |
Argentine Government,
Sr. Unscd. Bonds | | 0.00 | | 12/15/35 | | 15,000,000 | c | 1,499,250 | |
Argentine Government,
Sr. Unscd. Notes | ARS | 5.83 | | 12/31/33 | | 5,772,000 | | 2,697,820 | |
Brazil Minas,
Govt. Gtd. Notes | | 5.33 | | 2/15/28 | | 3,725,000 | | 3,049,844 | |
Dominican Republic Government,
Sr. Unscd. Bonds | | 5.50 | | 1/27/25 | | 3,700,000 | | 3,672,250 | |
Ghanaian Government,
Sr. Unscd. Bonds | | 8.50 | | 10/4/17 | | 5,125,000 | | 5,183,015 | |
Jamaican Government,
Sr. Unscd. Notes | | 6.75 | | 4/28/28 | | 1,955,000 | | 1,994,100 | |
Jamaican Government ,
Sr. Unscd. Notes | | 7.88 | | 7/28/45 | | 1,800,000 | | 1,822,500 | |
Mexican Government,
Bonds, Ser. M 20 | MXN | 10.00 | | 12/5/24 | | 240,000,000 | | 18,634,675 | |
Polish Government,
Bonds, Ser. 0725 | PLN | 3.25 | | 7/25/25 | | 49,600,000 | | 13,487,552 | |
Turkish Government,
Bonds | TRY | 8.00 | | 3/12/25 | | 12,200,000 | | 3,797,592 | |
| | 55,838,598 | |
Health Care - 1.4% | | | | | |
Endo Finance,
Gtd. Notes | | 6.00 | | 7/15/23 | | 5,390,000 | b | 5,416,950 | |
Tenet Healthcare,
Sr. Unscd. Notes | | 6.75 | | 6/15/23 | | 3,825,000 | d | 3,815,437 | |
| | 9,232,387 | |
Industrials - .6% | | | | | |
United Rentals North America,
Gtd. Notes | | 5.50 | | 7/15/25 | | 3,800,000 | | 3,804,750 | |
Information Technology - 2.2% | | | | | |
Ensemble S Merger Sub,
Sr. Notes | | 9.00 | | 9/30/23 | | 4,050,000 | b | 4,075,312 | |
First Data,
Gtd. Notes | | 7.00 | | 12/1/23 | | 1,900,000 | b | 1,942,750 | |
HP Enterprise,
Gtd. Notes | | 6.35 | | 10/15/45 | | 1,600,000 | b | 1,555,026 | |
Infor Software Parent,
Gtd. Notes | | 7.13 | | 5/1/21 | | 4,060,000 | b,d | 3,529,642 | |
Infor US,
Gtd. Notes | | 6.50 | | 5/15/22 | | 1,990,000 | b | 1,890,500 | |
Microsoft,
Sr. Unscd. Notes | | 4.45 | | 11/3/45 | | 1,950,000 | | 1,988,789 | |
| | 14,982,019 | |
15
STATEMENT OF INVESTMENTS (continued)
| | | | | | | | | | | |
Bonds and Notes - 93.7% (continued) | | Coupon
Rate (%) | | Maturity
Date | | Principal
Amount ($) | a | Value ($) | |
Materials - 5.3% | | | | | |
ArcelorMittal,
Sr. Unscd. Bonds | | 5.13 | | 6/1/20 | | 3,400,000 | d | 3,275,696 | |
Ardagh Packaging Finance,
Gtd. Notes | | 6.75 | | 1/31/21 | | 3,800,000 | b,d | 3,914,000 | |
Ardagh Packaging Finance,
Sr. Scd. Notes | | 3.34 | | 12/15/19 | | 1,315,000 | b,c | 1,298,563 | |
Beverage Packaging Holdings II,
Gtd. Notes | | 6.00 | | 6/15/17 | | 3,800,000 | b | 3,833,250 | |
BWAY Holding,
Sr. Unscd. Notes | | 9.13 | | 8/15/21 | | 3,450,000 | b | 3,372,375 | |
Freeport-McMoRan,
Gtd. Notes | | 4.55 | | 11/14/24 | | 2,400,000 | d | 1,932,000 | |
Glencore Finance Canada,
Gtd. Notes | | 2.70 | | 10/25/17 | | 2,850,000 | b,c | 2,654,593 | |
Glencore Finance Canada,
Gtd. Notes | | 5.55 | | 10/25/42 | | 330,000 | b,c | 258,188 | |
Glencore Funding,
Gtd. Notes | | 2.13 | | 4/16/18 | | 425,000 | b | 371,026 | |
Glencore Funding,
Gtd. Notes | | 4.00 | | 4/16/25 | | 1,325,000 | b,d | 1,028,787 | |
Teck Resources,
Gtd. Notes | | 3.85 | | 8/15/17 | | 2,635,000 | | 2,450,550 | |
Teck Resources,
Gtd. Notes | | 2.50 | | 2/1/18 | | 2,825,000 | d | 2,422,437 | |
Vedanta Resources,
Sr. Unscd. Notes | | 6.75 | | 6/7/16 | | 8,750,000 | d | 8,706,250 | |
| | 35,517,715 | |
Municipal Bonds - 1.1% | | | | | |
Georgetown University,
GO (Insured; National Public Finance Guarantee Corp.) | | 0.33 | | 4/1/29 | | 7,700,000 | | 7,084,000 | |
Residential Mortgage Pass-Through Ctfs. - 2.2% | | | | | |
Bear Stearns ALT-A Trust,
Ser. 2005-4, Cl. 24A1 | | 2.54 | | 5/25/35 | | 1,471,625 | c | 1,449,074 | |
Connecticut Avenue Securities,
Ser. 2014-C02, Cl. 1M2 | | 2.80 | | 5/25/24 | | 3,640,000 | c | 3,177,125 | |
Connecticut Avenue Securities,
Ser. 2015-C03, Cl. 1M2 | | 5.20 | | 7/25/25 | | 2,100,000 | c | 2,094,863 | |
CS First Boston Commercial Mortgage Trust,
Ser. 2005-8, Cl. 9A4 | | 5.50 | | 9/25/35 | | 764,730 | | 704,832 | |
GSR Mortgage Loan Trust,
Ser. 2005-8F, Cl. 2A6 | | 5.50 | | 11/25/35 | | 4,475,199 | | 4,438,669 | |
Residential Asset Securitization Trust,
Ser. 05-A4, Cl. A1 | | 0.65 | | 4/25/35 | | 1,594,452 | c | 1,210,134 | |
Residential Funding Mortgage Securities Trust,
Ser. 2005-S9, Cl. A9 | | 5.50 | | 12/25/35 | | 756,352 | | 743,844 | |
Structured Asset Securities Corp. Mortgage Pass-through Certificates,
Ser. 2004-11XS, Cl. 1A5A | | 6.25 | | 6/25/34 | | 180,000 | c | 184,538 | |
Wells Fargo Mortgage Backed Securities Trust,
Ser. 2005-AR12, Cl. 2A11 | | 2.68 | | 6/25/35 | | 720,030 | c | 726,481 | |
| | 14,729,560 | |
16
| | | | | | | | | | | | | | | | | | | | |
Bonds and Notes - 93.7% (continued) | | Coupon
Rate (%) | | Maturity
Date | | Principal
Amount ($) a | | Value ($) | |
Telecommunications - 4.7% | | | | | |
Alcatel-Lucent USA,
Sr. Unscd. Notes | | 6.45 | | 3/15/29 | | 580,000 | | 614,800 | |
Altice,
Gtd. Notes | | 7.75 | | 5/15/22 | | 4,090,000 | b | 3,946,850 | |
Altice Financing,
Sr. Scd. Notes | | 6.63 | | 2/15/23 | | 450,000 | b | 452,250 | |
Digicel,
Gtd. Notes | | 6.75 | | 3/1/23 | | 2,050,000 | b | 1,855,250 | |
Digicel Group,
Sr. Unscd. Notes | | 8.25 | | 9/30/20 | | 12,227,000 | b | 10,882,030 | |
Frontier Communications,
Sr. Unscd. Notes | | 6.25 | | 9/15/21 | | 2,320,000 | | 2,083,360 | |
Frontier Communications,
Sr. Unscd. Notes | | 10.50 | | 9/15/22 | | 1,800,000 | b | 1,872,000 | |
Intelsat Luxembourg,
Gtd. Bonds | | 7.75 | | 6/1/21 | | 1,150,000 | | 684,250 | |
Interoute Finco,
Sr. Scd. Bonds | EUR | 7.38 | | 10/15/20 | | 2,675,000 | b | 3,116,882 | |
Sprint,
Gtd. Notes | | 7.88 | | 9/15/23 | | 1,900,000 | | 1,762,250 | |
T-Mobile USA,
Gtd. Notes | | 6.63 | | 4/1/23 | | 2,025,000 | | 2,073,722 | |
Wind Acquisition Finance,
Scd. Notes | | 7.38 | | 4/23/21 | | 2,165,000 | b | 2,186,650 | |
| | 31,530,294 | |
U.S. Government Agencies/Mortgage-Backed - .2% | | | | | |
Government National Mortgage Association,
Ser. 2011-53 (Interest Only) | | 0.50 | | 5/16/51 | | 553,676 | c,e | 21,081 | |
Government National Mortgage Association,
Ser. 2011-77 (Interest Only) | | 0.79 | | 4/16/42 | | 591,251 | c,e | 22,400 | |
Government National Mortgage Association,
Ser. 2012-125 (Interest Only) | | 0.57 | | 2/16/53 | | 24,471,950 | c,e | 1,200,650 | |
| | 1,244,131 | |
Utilities - 1.9% | | | | | |
Calpine,
Sr. Unscd. Notes | | 5.50 | | 2/1/24 | | 665,000 | | 635,075 | |
Calpine,
Sr. Unscd. Notes | | 5.75 | | 1/15/25 | | 4,350,000 | | 4,137,937 | |
Dynegy,
Gtd. Notes | | 6.75 | | 11/1/19 | | 450,000 | | 451,125 | |
Dynegy,
Gtd. Notes | | 7.38 | | 11/1/22 | | 3,940,000 | | 3,969,550 | |
Dynegy,
Gtd. Notes | | 7.63 | | 11/1/24 | | 1,875,000 | d | 1,889,063 | |
Majapahit Holding,
Gtd. Notes | | 7.75 | | 1/20/20 | | 1,550,000 | | 1,753,050 | |
| | 12,835,800 | |
Total Bonds and Notes
(cost $642,692,138) | | 625,456,422 | |
17
STATEMENT OF INVESTMENTS (continued)
| | | | | | | | | | | |
Floating Rate Loan Interests - 4.6% | | Coupon
Rate (%) | | Maturity
Date | | Principal
Amount ($) | | Value ($) | |
Consumer Discretionary - .9% | | | | | |
Dollar Tree,
Term Loan | | 3.50 | | 3/9/22 | | 1,915,200 | c | 1,921,453 | |
Hilton Worldwide Finance,
Initial Term Loan | | 3.50 | | 9/23/20 | | 1,546,263 | c | 1,551,258 | |
Univar,
New Term Loan | | 4.25 | | 6/24/22 | | 2,675,000 | c | 2,643,716 | |
| | 6,116,427 | |
Energy - .4% | | | | | |
Templar Energy,
Second Lien Term Loan | | 8.50 | | 11/25/20 | | 6,154,833 | c | 2,695,294 | |
Financials - .6% | | | | | |
Capital Automotive,
Tranche B-1 Term Loan | | 4.00 | | 4/10/19 | | 3,856,868 | c | 3,870,849 | |
Health Care - 1.6% | | | | | |
Carestream,
New Term Loan | | 5.00 | | 6/7/19 | | 3,812,062 | c | 3,635,221 | |
Catalent Pharma Solutions,
Dollar Term Loan | | 4.25 | | 5/7/21 | | 3,840,557 | c | 3,840,097 | |
Endo Luxembourg Finance,
Term Loan | | 3.75 | | 6/24/22 | | 1,375,000 | c | 1,355,021 | |
Valeant Pharmaceuticals International,
Term D2 Loan | | 3.50 | | 2/13/19 | | 1,134,269 | c | 1,060,258 | |
Valeant Pharmaceuticals International,
Term Loan | | 4.00 | | 3/11/22 | | 650,951 | c | 607,217 | |
| | 10,497,814 | |
Information Technology - .8% | | | | | |
Avago Technologies,
Term Loan | | 3.75 | | 4/16/21 | | 1,764,722 | c | 1,766,805 | |
First Data,
Term Loan | | 3.70 | | 3/24/17 | | 3,885,000 | c | 3,883,174 | |
| | 5,649,979 | |
Materials - .3% | | | | | |
Ineos,
Dollar Term Loan | | 3.75 | | 12/15/20 | | 1,790,985 | c | 1,750,688 | |
Total Floating Rate Loan Interests
(cost $34,300,821) | | 30,581,051 | |
Options Purchased - .0% | | | | | | Face Amount Covered by Contracts ($) | | Value ($) | |
Put Options - .0% | | | | | |
1 Year Eurodollar,
December 2015 @ 98.50 | | | | | | 3,930,000 | | 19,650 | |
10 Year USD LIBOR-BBA,
November 2015 @ 5.80 | | | | | | 1,500,000 | | 0 | |
Total Options Purchased
(cost $633,859) | | 19,650 | |
Short-Term Investments - 1.2% | | Coupo
Rate (%) | | Maturity
Date | | Principal
Amount ($) | | Value ($) | |
U.S. Treasury Bills | | 0.13 | | 3/31/16 | | 2,145,000 | | 2,143,785 | |
U.S. Treasury Bills | | 0.16 | | 2/11/16 | | 5,965,000 | | 5,963,789 | |
Total Short-Term Investments
(cost $8,106,003) | | 8,107,574 | |
18
| | | | | | | | | | | |
Other Investment - .1% | | | | | | Shares | | Value ($) | |
Registered Investment Company;-.1% | | | | | |
Dreyfus Institutional Preferred Plus Money Market Fund
(cost $577,631) | | | | | | 577,631 | f | 577,631 | |
Investment of Cash Collateral for Securities Loaned - 7.7% | | | | | | Shares | | Value ($) | |
Registered Investment Company; - 7.7% | | | | | |
Dreyfus Institutional Cash Advantage Fund
(cost $51,796,551) | | | | | | 51,796,551 | f | 51,796,551 | |
Total Investments (cost $738,107,003) | | 107.3% | 716,538,879 | |
Liabilities, Less Cash and Receivables | | (7.3%) | (49,023,604) | |
Net Assets | | 100.0% | 667,515,275 | |
BBA—British Bankers Association | | | | |
LIBOR—London Interbank Offered Rate | | | | |
USD—United States Dollar | | | | |
a Principal amount stated in U.S. dollars unless otherwise noted.
ARS—Argentine Peso
EUR—Euro
MXN—Mexican Peso
PLN—Polish Zloty
TRY—Turkish Lira
b Security exempt from registration pursuant to Rule 144A under the Securities Act of 1933. These securities may be resold in transactions exempt from registration, normally to qualified institutional buyers. At October 31, 2015, these securities were valued at $188,851,262 or 28.3% of net assets.
c Variable rate security--interest rate subject to periodic change.
d Security, or portion thereof, on loan. At October 31, 2015, the value of the fund’s securities on loan was $45,256,667 and the value of the collateral held by the fund was $57,628,140 consisting of cash collateral of $51,796,551 and U.S. Government & Agency securities valued at $5,831,589.
e Notional face amount shown.
f Investment in affiliated money market mutual fund.
| | |
Portfolio Summary (Unaudited) † | Value (%) |
Corporate Bonds | 49.4 |
Asset-Backed | 20.8 |
Commercial Mortgage-Backed | 11.6 |
Short-Term/Money Market Investments | 9.0 |
Foreign/Governmental | 8.4 |
Floating Rate Loan Interests | 4.6 |
Residental Mortgage-Backed | 2.2 |
Municipal Bonds | 1.1 |
U. S. Government | .2 |
Options Purchased | .0 |
| | 107.3 |
†Based on net assets.
See notes to financial statements.
19
STATEMENT OF FINANCIAL FUTURES
October 31, 2015
| | | | | | |
| | Contracts | Market Value Covered by Contracts ($) | Expiration | Unrealized Appreciation (Depreciation) at 10/31/2015 ($) | |
| | | | | | |
Financial Futures Long | | | | | |
Australian 10 Year Bond | 364 | 33,578,150 | December 2015 | 322,078 | |
Australian 3 Year Bond | 310 | 24,826,443 | December 2015 | 23,658 | |
Euro BTP Italian Government Bond | 242 | 36,974,070 | December 2015 | 489,669 | |
U.S. Treasury Long Bond | 73 | 11,419,938 | December 2015 | (115,445) | |
Financial Futures Short | | | | | |
EuroDollar | 708 | (175,212,300) | December 2016 | 104,317 | |
EuroDollar | 707 | (175,256,462) | September 2016 | 86,494 | |
EuroDollar | 706 | (175,290,975) | June 2016 | 59,897 | |
U.S. Treasury 10 Year Notes | 68 | (8,682,750) | December 2015 | 42,207 | |
U.S. Treasury 5 Year Notes | 13 | (1,557,055) | December 2015 | 4,956 | |
U.S. Treasury Ultra Long Bond | 42 | (6,709,500) | December 2015 | (5,936) | |
Gross Unrealized Appreciation | | | | 1,133,276 | |
Gross Unrealized Depreciation | | | | (121,381) | |
See notes to financial statements.
20
STATEMENT OF OPTIONS WRITTEN
October 31, 2015
| | | | |
| | Face Amount Covered by Contracts $ | Value ($) | |
Call Options: | | | |
Colombian Peso, | | | |
January 2016 @ COP 3200 | 6,800,000 | (57,846) | |
Colombian Peso, | | | |
December 2015 @ COP 3500 | 7,400,000 | (857) | |
Hungarian Forint, | | | |
December 2015 @ HUF 295 | 10,900,000 | (64,258) | |
Malaysian Ringgit, | | | |
January 2016 @ MYR 4.4 | 6,800,000 | (156,957) | |
New Zealand Dollar, | | | |
January 2016 @ NZD 1.12 | 9,520,000 | (10,168) | |
Norwegian Krone, | | | |
December 2015 @ NOK 9.3 | 13,200,000 | (251,379) | |
South African Rand, | | | |
January 2016 @ ZAR 14.5 | 6,800,000 | (140,023) | |
South African Rand, | | | |
December 2015 @ ZAR 15 | 7,300,000 | (40,913) | |
South Korean Won, | | | |
November 2015 @ KRW 1230 | 7,700,000 | (966) | |
Swedish Krona | | | |
February 2016 @ SEK 9.5 | 6,220,000 | (67,388) | |
Turkish Lira, | | | |
January 2016 @ TRY 3.1 | 6,800,000 | (71,883) | |
Put Options: | | | |
Brazilian Real, | | | |
December 2015 @ BRL 3.5 | 7,400,000 | (5,380) | |
Chilean Peso, | | | |
January 2016 @ CLP 650 | 6,800,000 | (23,183) | |
Colombian Peso, | | | |
December 2015 @ COP 2900 | 7,400,000 | (157,011) | |
EuroDollar, | | | |
December 2015 @ $98.25 | 3,930,000 | (9,825) | |
Mexican Peso, | | | |
January 2016 @ MXN 16.1 | 6,800,000 | (50,483) | |
New Zealand Dollar, | | | |
January 2016 @ NZD 1.05 | 9,520,000 | (93,048) | |
South African Rand, | | | |
December 2015 @ ZAR 12.5 | 7,300,000 | (4,582) | |
21
STATEMENT OF OPTIONS WRITTEN (continued)
| | | | |
| | Face Amount Covered by Contracts $ | Value ($) | |
South Korean Won, | | | |
January 2016 @ KRW 1100 | 6,800,000 | (45,962) | |
Total Options Written (premiums received $1,784,780) | | (1,252,112) | |
| | | | |
BRL—Brazilian Real | | | |
CLP—Chilean Peso | | | |
COP—Colombian Peso | | | |
HUF—Hungarian Forint | | | |
KRW—South Korean Won | | | |
MXN—Mexican Peso | | | |
MYR—Malaysian Ringgit | | | |
NOK—Norwegian Krone | | | |
NZD—New Zealand Dollar | | | |
SEK—Swedish Krona | | | |
TRY—Turkish Lira | | | |
ZAR—South African Rand | | | |
See notes to financial statements.
22
STATEMENT OF ASSETS AND LIABILITIES
October 31, 2015
| | | | | | | |
| | | | | | |
| | | Cost | | Value | |
Assets ($): | | | | |
Investments in securities—See Statement of Investments
(including securities on loan, valued at $45,256,667)—Note 1(c): | | | | |
Unaffiliated issuers | | 685,732,821 | | 664,164,697 | |
Affiliated issuers | | 52,374,182 | | 52,374,182 | |
Cash denominated in foreign currency | | | 14,646 | | 5,671 | |
Receivable for investment securities sold | | | | | 18,952,963 | |
Dividends, interest and securities lending income receivable | | | | | 7,213,864 | |
Cash collateral—Note 4 | | | | | 3,640,745 | |
Unrealized appreciation on forward foreign
currency exchange contracts—Note 4 | | | | | 3,174,727 | |
Receivable for shares of Common Stock subscribed | | | | | 1,149,595 | |
Receivable for futures variation margin—Note 4 | | | | | 621,718 | |
Unrealized appreciation on swap agreements—Note 4 | | | | | 168,497 | |
Prepaid expenses | | | | | 32,824 | |
| | | | | 751,499,483 | |
Liabilities ($): | | | | |
Due to The Dreyfus Corporation and affiliates—Note 3(c) | | | | | 471,594 | |
Cash overdraft due to Custodian | | | | | 1,872,865 | |
Liability for securities on loan—Note 1(c) | | | | | 51,796,551 | |
Payable for investment securities purchased | | | | | 16,413,777 | |
Payable for shares of Common Stock redeemed | | | | | 6,625,179 | |
Unrealized depreciation on forward foreign
currency exchange contracts—Note 4 | | | | | 2,432,954 | |
Unrealized depreciation on swap agreements—Note 4 | | | | | 1,881,656 | |
Outstanding options written, at value (premiums received
$1,784,780)—See Statement of Options Written—Note 4 | | | | | 1,252,112 | |
Payable for swap variation margin—Note 4 | | | | | 775,552 | |
Swap premium received—Note 4 | | | | | 273,820 | |
Accrued expenses | | | | | 188,148 | |
| | | | | 83,984,208 | |
Net Assets ($) | | | 667,515,275 | |
Composition of Net Assets ($): | | | | |
Paid-in capital | | | | | 725,348,873 | |
Accumulated undistributed investment income—net | | | | | 17,515,241 | |
Accumulated net realized gain (loss) on investments | | | | | (49,806,145) | |
Accumulated net unrealized appreciation (depreciation)
on investments, options transactions, swap transactions and
foreign currency transactions ( including $1,011,895 net
unrealized appreciation on financial futures) and ($4,637,404)
net unrealized (depreciation) on centrally cleared swap
transactions | | | | | (25,542,694) | |
Net Assets ($) | | | 667,515,275 | |
| | | | | | |
Net Asset Value Per Share | Class A | Class C | Class I | Class Y | |
Net Assets ($) | 195,629,251 | 64,586,725 | 320,030,505 | 87,268,794 | |
Shares Outstanding | 15,889,884 | 5,261,891 | 26,015,707 | 7,094,752 | |
Net Asset Value Per Share ($) | 12.31 | 12.27 | 12.30 | 12.30 | |
See notes to financial statements.
23
STATEMENT OF OPERATIONS
Year Ended October 31, 2015
| | | | | | | |
| | | | | | |
| | | | | | |
Investment Income ($): | | | | |
Income: | | | | |
Interest (net of $623,500 foreign taxes withheld at source) | | | 31,981,863 | |
Dividends from affiliated issuers | | | 22,277 | |
Income from securities lending—Note 1(c) | | | 170,431 | |
Total Income | | | 32,174,571 | |
Expenses: | | | | |
Management fee—Note 3(a) | | | 3,508,020 | |
Shareholder servicing costs—Note 3(c) | | | 1,069,237 | |
Distribution fees—Note 3(b) | | | 503,466 | |
Custodian fees—Note 3(c) | | | 195,217 | |
Registration fees | | | 77,294 | |
Professional fees | | | 75,703 | |
Prospectus and shareholders’ reports | | | 58,459 | |
Directors’ fees and expenses—Note 3(d) | | | 45,647 | |
Loan commitment fees—Note 2 | | | 8,288 | |
Miscellaneous | | | 78,503 | |
Total Expenses | | | 5,619,834 | |
Less—reduction in fees due to earnings credits—Note 3(c) | | | (38) | |
Net Expenses | | | 5,619,796 | |
Investment Income—Net | | | 26,554,775 | |
Realized and Unrealized Gain (Loss) on Investments—Note 4 ($): | | |
Net realized gain (loss) on investments and foreign currency transactions | (41,523,859) | |
Net realized gain (loss) on options transactions | | | 1,369,050 | |
Net realized gain (loss) on financial futures | | | (2,706,641) | |
Net realized gain (loss) on swap transactions | | | (10,860,265) | |
Net realized gain (loss) on forward foreign currency exchange contracts | 18,828,039 | |
Net Realized Gain (Loss) | | | (34,893,676) | |
Net unrealized appreciation (depreciation) on investments
and foreign currency transactions | | | (14,325,123) | |
Net unrealized appreciation (depreciation) on options transactions | | | 416,120 | |
Net unrealized appreciation (depreciation) on financial futures | | | 1,704,165 | |
Net unrealized appreciation (depreciation) on swap transactions | | | (2,864,047) | |
Net unrealized appreciation (depreciation) on
forward foreign currency exchange contracts | | | (1,723,575) | |
Net Unrealized Appreciation (Depreciation) | | | (16,792,460) | |
Net Realized and Unrealized Gain (Loss) on Investments | | | (51,686,136) | |
Net (Decrease) in Net Assets Resulting from Operations | | (25,131,361) | |
See notes to financial statements.
24
STATEMENT OF CHANGES IN NET ASSETS
| | | | | | | | | | |
| | | | | | | | | | |
| | | | Year Ended October 31, |
| | | | 2015 | | | | 2014 | |
Operations ($): | | | | | | | | |
Investment income—net | | | 26,554,775 | | | | 10,314,793 | |
Net realized gain (loss) on investments | | (34,893,676) | | | | 4,703,572 | |
Net unrealized appreciation (depreciation)
on investments | | (16,792,460) | | | | (9,360,594) | |
Net Increase (Decrease) in Net Assets
Resulting from Operations | (25,131,361) | | | | 5,657,771 | |
Dividends to Shareholders from ($): | | | | | | | | |
Investment income—net: | | | | | | | | |
Class A | | | (9,340,283) | | | | (2,776,837) | |
Class C | | | (2,497,339) | | | | (428,450) | |
Class I | | | (19,169,864) | | | | (3,205,118) | |
Class Y | | | (1,256,164) | | | | (44,825) | |
Total Dividends | | | (32,263,650) | | | | (6,455,230) | |
Capital Stock Transactions ($): | | | | | | | | |
Net proceeds from shares sold: | | | | | | | | |
Class A | | | 130,299,805 | | | | 167,123,694 | |
Class C | | | 29,495,217 | | | | 48,170,319 | |
Class I | | | 249,680,391 | | | | 342,775,789 | |
Class Y | | | 94,022,382 | | | | 5,748,119 | |
Dividends reinvested: | | | | | | | | |
Class A | | | 7,970,824 | | | | 2,213,251 | |
Class C | | | 1,554,479 | | | | 269,135 | |
Class I | | | 12,630,837 | | | | 1,769,442 | |
Class Y | | | 550,966 | | | | 40,136 | |
Cost of shares redeemed: | | | | | | | | |
Class A | | | (110,966,407) | | | | (71,523,550) | |
Class C | | | (19,872,824) | | | | (6,019,894) | |
Class I | | | (260,287,029) | | | | (50,209,616) | |
Class Y | | | (8,936,195) | | | | (1,893) | |
Increase (Decrease) in Net Assets
from Capital Stock Transactions | 126,142,446 | | | | 440,354,932 | |
Total Increase (Decrease) in Net Assets | 68,747,435 | | | | 439,557,473 | |
Net Assets ($): | | | | | | | | |
Beginning of Period | | | 598,767,840 | | | | 159,210,367 | |
End of Period | | | 667,515,275 | | | | 598,767,840 | |
Undistributed investment income—net | 17,515,241 | | | | 10,239,528 | |
25
STATEMENT OF CHANGES IN NET ASSETS (continued)
| | | | | | | | | | |
| | | | | | | | | | |
| | | | Year Ended October 31, |
| | | | 2015 | | | | 2014 | |
Capital Share Transactions: | | | | | | | | |
Class A | | | | | | | | |
Shares sold | | | 10,059,054 | | | | 12,519,432 | |
Shares issued for dividends reinvested | | | 620,070 | | | | 166,121 | |
Shares redeemed | | | (8,677,350) | | | | (5,351,645) | |
Net Increase (Decrease) in Shares Outstanding | 2,001,774 | | | | 7,333,908 | |
Class C | | | | | | | | |
Shares sold | | | 2,273,947 | | | | 3,607,867 | |
Shares issued for dividends reinvested | | | 121,184 | | | | 20,233 | |
Shares redeemed | | | (1,561,750) | | | | (454,167) | |
Net Increase (Decrease) in Shares Outstanding | 833,381 | | | | 3,173,933 | |
Class Ia | | | | | | | | |
Shares sold | | | 19,204,904 | | | | 25,614,464 | |
Shares issued for dividends reinvested | | | 981,897 | | | | 132,473 | |
Shares redeemed | | | (20,521,056) | | | | (3,767,211) | |
Net Increase (Decrease) in Shares Outstanding | (334,255) | | | | 21,979,726 | |
Class Ya | | | | | | | | |
Shares sold | | | 7,336,363 | | | | 428,240 | |
Shares issued for dividends reinvested | | | 43,562 | | | | 2,995 | |
Shares redeemed | | | (716,343) | | | | (142) | |
Net Increase (Decrease) in Shares Outstanding | 6,663,582 | | | | 431,093 | |
| | | | | | | | | | |
a During the period ended October 31, 2014, 344,609 Class I shares representing $4,641,890 were exchanged for 344,866 Class Y shares. | |
See notes to financial statements.
26
FINANCIAL HIGHLIGHTS
The following tables describe the performance for each share class for the fiscal periods indicated. All information (except portfolio turnover rate) reflects financial results for a single fund share. Total return shows how much your investment in the fund would have increased (or decreased) during each period, assuming you had reinvested all dividends and distributions. These figures have been derived from the fund’s financial statements.
| | | | | | | | | | |
| | | | | |
| | Year Ended October 31, |
Class A Shares | 2015 | | 2014 | | 2013 | 2012 | 2011 | |
Per Share Data ($): | | | | | | |
Net asset value, beginning of period | 13.29 | | 13.08 | | 13.38 | 12.84 | 13.44 | |
Investment Operations: | | | | | | |
Investment income—neta | .48 | | .43 | | .36 | .46 | .51 | |
Net realized and unrealized gain (loss) on investments | (.85) | | .06 | | (.02) | .64 | (.54) | |
Total from Investment Operations | (.37) | | .49 | | .34 | 1.10 | (.03) | |
Distributions: | | | | | | |
Dividends from investment income—net | (.61) | | (.28) | | (.37) | (.51) | (.57) | |
Dividends from net realized gain on investments | — | | — | | (.27) | (.05) | — | |
Total Distributions | (.61) | | (.28) | | (.64) | (.56) | (.57) | |
Net asset value, end of period | 12.31 | | 13.29 | | 13.08 | 13.38 | 12.84 | |
Total Return (%)b | (2.93) | | 3.77 | | 2.54 | 8.85 | (.24) | |
Ratios/Supplemental Data (%): | | | | | |
Ratio of total expenses to average net assets | .89 | | .98 | | 1.23 | 1.51 | 1.44 | |
Ratio of net expenses to average net assets | .89 | | .97 | | 1.10 | 1.10 | 1.10 | |
Ratio of net investment income to average net assets | 3.70 | | 3.25 | | 2.78 | 3.58 | 3.88 | |
Portfolio Turnover Rate | 182.35 | | 230.83 | | 304.46 | 267.60 | 309.54 | c |
Net Assets, end of period ($ x 1,000) | 195,629 | | 184,506 | | 85,719 | 24,830 | 27,735 | |
a Based on average shares outstanding.
b Exclusive of sales charge.
c The portfolio turnover rate excluding mortgage dollar roll transactions for the period ended October 31, 2011 was 303.56%.
See notes to financial statements.
27
FINANCIAL HIGHLIGHTS (continued)
| | | | | | | | | | |
| | | | | |
| | Year Ended October 31, |
Class C Shares | 2015 | | 2014 | | 2013 | 2012 | 2011 | |
Per Share Data ($): | | | | | | |
Net asset value, beginning of period | 13.24 | | 13.03 | | 13.34 | 12.79 | 13.39 | |
Investment Operations: | | | | | | |
Investment income—neta | .38 | | .33 | | .25 | .36 | .42 | |
Net realized and unrealized gain (loss) on investments | (.85) | | .06 | | (.02) | .64 | (.55) | |
Total from Investment Operations | (.47) | | .39 | | .23 | 1.00 | (.13) | |
Distributions: | | | | | | |
Dividends from investment income—net | (.50) | | (.18) | | (.27) | (.40) | (.47) | |
Dividends from net realized gain on investments | — | | — | | (.27) | (.05) | — | |
Total Distributions | (.50) | | (.18) | | (.54) | (.45) | (.47) | |
Net asset value, end of period | 12.27 | | 13.24 | | 13.03 | 13.34 | 12.79 | |
Total Return (%)b | (3.66) | | 3.02 | | 1.72 | 8.08 | (1.00) | |
Ratios/Supplemental Data (%): | | | | | |
Ratio of total expenses to average net assets | 1.65 | | 1.72 | | 2.01 | 2.30 | 2.22 | |
Ratio of net expenses to average net assets | 1.65 | | 1.70 | | 1.85 | 1.85 | 1.85 | |
Ratio of net investment income to average net assets | 2.94 | | 2.52 | | 1.98 | 2.84 | 3.15 | |
Portfolio Turnover Rate | 182.35 | | 230.83 | | 304.46 | 267.60 | 309.54 | c |
Net Assets, end of period ($ x 1,000) | 64,587 | | 58,623 | | 16,352 | 4,277 | 4,746 | |
a Based on average shares outstanding.
b Exclusive of sales charge.
c The portfolio turnover rate excluding mortgage dollar roll transactions for the period ended October 31, 2011 was 303.56%.
See notes to financial statements.
28
| | | | | | | | | | |
| | | | | |
| | Year Ended October 31, |
Class I Shares | 2015 | | 2014 | | 2013 | 2012 | 2011 | |
Per Share Data ($): | | | | | | |
Net asset value, beginning of period | 13.28 | | 13.07 | | 13.38 | 12.84 | 13.44 | |
Investment Operations: | | | | | | |
Investment income—neta | .52 | | .46 | | .36 | .49 | .51 | |
Net realized and unrealized gain (loss) on investments | (.85) | | .07 | | — | .64 | (.50) | |
Total from Investment Operations | (.33) | | .53 | | .36 | 1.13 | .01 | |
Distributions: | | | | | | |
Dividends from investment income—net | (.65) | | (.32) | | (.40) | (.54) | (.61) | |
Dividends from net realized gain on investments | — | | — | | (.27) | (.05) | — | |
Total Distributions | (.65) | | (.32) | | (.67) | (.59) | (.61) | |
Net asset value, end of period | 12.30 | | 13.28 | | 13.07 | 13.38 | 12.84 | |
Total Return (%) | (2.65) | | 4.06 | | 2.74 | 9.13 | .03 | |
Ratios/Supplemental Data (%): | | | | | |
Ratio of total expenses to average net assets | .63 | | .72 | | .96 | 1.20 | 1.23 | |
Ratio of net expenses to average net assets | .63 | | .69 | | .85 | .85 | .85 | |
Ratio of net investment income to average net assets | 3.96 | | 3.53 | | 2.91 | 3.83 | 3.87 | |
Portfolio Turnover Rate | 182.35 | | 230.83 | | 304.46 | 267.60 | 309.54 | b |
Net Assets, end of period ($ x 1,000) | 320,031 | | 349,915 | | 57,138 | 8,329 | 7,095 | |
a Based on average shares outstanding.
b The portfolio turnover rate excluding mortgage dollar roll transactions for the period ended October 31, 2011 was 303.56%.
See notes to financial statements.
29
FINANCIAL HIGHLIGHTS (continued)
| | | | | | | | | | | |
| | | | | | | |
| | Year Ended October 31, |
Class Y Shares | | | | 2015 | 2014 | 2013 | a |
Per Share Data ($): | | | | | | |
Net asset value, beginning of period | | | | 13.28 | 13.07 | 13.07 | |
Investment Operations: | | | | | | |
Investment income—netb | | | | .50 | .47 | .13 | |
Net realized and unrealized
gain (loss) on investments | | | | (.83) | .07 | (.07) | |
Total from Investment Operations | | | | (.33) | .54 | .06 | |
Distributions: | | | | | | | |
Dividends from investment income—net | | | | (.65) | (.33) | (.06) | |
Net asset value, end of period | | | | 12.30 | 13.28 | 13.07 | |
Total Return (%) | | | | (2.59) | 4.13 | .42 | c |
Ratios/Supplemental Data (%): | | | | | | |
Ratio of total expenses to average net assets | | | | .58 | .61 | .85 | d |
Ratio of net expenses to average net assets | | | | .58 | .60 | .85 | d |
Ratio of net investment income
to average net assets | | | | 4.00 | 3.61 | 2.88 | d |
Portfolio Turnover Rate | | | | 182.35 | 230.83 | 304.46 | |
Net Assets, end of period ($ x 1,000) | | | | 87,269 | 5,724 | 1 | |
a From July 1, 2013 (commencement of initial offering) to October 31, 2013.
b Based on average shares outstanding.
c Not annualized.
d Annualized.
See notes to financial statements.
30
NOTES TO FINANCIAL STATEMENTS
NOTE 1—Significant Accounting Policies:
Dreyfus Opportunistic Fixed Income Fund (the “fund”) is a separate non-diversified series of The Dreyfus/Laurel Funds, Inc. (the “Company”), which is registered under the Investment Company Act of 1940, as amended (the “Act”), as an open-end management investment company and operates as a series company currently offering ten series, including the fund. The fund’s investment objective is to seek to maximize total return through capital appreciation and income. The Dreyfus Corporation (the “Manager” or “Dreyfus”), a wholly-owned subsidiary of The Bank of New York Mellon Corporation (“BNY Mellon”), serves as the fund’s investment adviser.
MBSC Securities Corporation (the “Distributor”), a wholly-owned subsidiary of Dreyfus, is the distributor of the fund’s shares. The fund is authorized to issue 100 million shares of $.001 par value Common Stock in each of the following classes of shares: Class A, Class C, Class I and Class Y. Class A and Class C shares are sold primarily to retail investors through financial intermediaries and bear Distribution and/or Shareholder Services Plan fees. Class A shares generally are subject to a sales charge imposed at the time of purchase. Class C shares are subject to a contingent deferred sales charge (“CDSC”) imposed on Class C shares redeemed within one year of purchase. Class I shares are sold primarily to bank trust departments and other financial service providers (including The Bank of New York Mellon, a subsidiary of BNY Mellon and an affiliate of Dreyfus, and its affiliates), acting on behalf of customers having a qualified trust or an investment account or relationship at such institution, and bear no Distribution or Shareholder Services Plan fees. Class Y shares are sold at net asset value per share generally to institutional investors, and bear no Distribution or Shareholder Services Plan fees. Class I and Class Y shares are offered without a front-end sales charge or CDSC. Other differences between the classes include the services offered to and the expenses borne by each class, the allocation of certain transfer agency costs, and certain voting rights. Income, expenses (other than expenses attributable to a specific class), and realized and unrealized gains or losses on investments are allocated to each class of shares based on its relative net assets.
The Company accounts separately for the assets, liabilities and operations of each series. Expenses directly attributable to each series are charged to that series’ operations; expenses which are applicable to all series are allocated among them on a pro rata basis.
The Financial Accounting Standards Board (“FASB”) Accounting Standards Codification (“ASC”) is the exclusive reference of authoritative
31
NOTES TO FINANCIAL STATEMENTS (continued)
U.S. generally accepted accounting principles (“GAAP”) recognized by the FASB to be applied by nongovernmental entities. Rules and interpretive releases of the Securities and Exchange Commission (“SEC”) under authority of federal laws are also sources of authoritative GAAP for SEC registrants. The fund’s financial statements are prepared in accordance with GAAP, which may require the use of management estimates and assumptions. Actual results could differ from those estimates.
(a) Portfolio valuation: The fair value of a financial instrument is the amount that would be received to sell an asset or paid to transfer a liability in an orderly transaction between market participants at the measurement date (i.e., the exit price). GAAP establishes a fair value hierarchy that prioritizes the inputs of valuation techniques used to measure fair value. This hierarchy gives the highest priority to unadjusted quoted prices in active markets for identical assets or liabilities (Level 1 measurements) and the lowest priority to unobservable inputs (Level 3 measurements).
Additionally, GAAP provides guidance on determining whether the volume and activity in a market has decreased significantly and whether such a decrease in activity results in transactions that are not orderly. GAAP requires enhanced disclosures around valuation inputs and techniques used during annual and interim periods.
Various inputs are used in determining the value of the fund’s investments relating to fair value measurements. These inputs are summarized in the three broad levels listed below:
Level 1—unadjusted quoted prices in active markets for identical investments.
Level 2—other significant observable inputs (including quoted prices for similar investments, interest rates, prepayment speeds, credit risk, etc.).
Level 3—significant unobservable inputs (including the fund’s own assumptions in determining the fair value of investments).
The inputs or methodology used for valuing securities are not necessarily an indication of the risk associated with investing in those securities.
Changes in valuation techniques may result in transfers in or out of an assigned level within the disclosure hierarchy. Valuation techniques used to value the fund’s investments are as follows:
Registered investment companies that are not traded on an exchange are valued at their net asset value and are generally categorized within Level 1 of the fair value hierarchy.
32
Investments in securities, floating rate loan interests and other securities, excluding short-term investments (other than U.S. Treasury Bills), financial futures, options and forward foreign currency exchange contracts (“forward contracts”) are valued each business day by an independent pricing service (the “Service”) approved by the Company’s Board of Directors (the “Board”). Investments for which quoted bid prices are readily available and are representative of the bid side of the market in the judgment of the Service are valued at the mean between the quoted bid prices (as obtained by the Service from dealers in such securities) and asked prices (as calculated by the Service based upon its evaluation of the market for such securities). Other investments (which constitute a majority of the portfolio securities) are valued as determined by the Service, based on methods which include consideration of the following: yields or prices of securities of comparable quality, coupon, maturity and type; indications as to values from dealers; and general market conditions. These securities are generally categorized within Level 2 of the fair value hierarchy.
U.S. Treasury Bills are valued at the mean price between quoted bid prices and asked prices by the Service. These securities are generally categorized within Level 2 of the fair value hierarchy.
The Service’s procedures are reviewed by Dreyfus under the general supervision of the Board.
When market quotations or official closing prices are not readily available, or are determined not to reflect accurately fair value, such as when the value of a security has been significantly affected by events after the close of the exchange or market on which the security is principally traded (for example, a foreign exchange or market), but before the fund calculates its net asset value, the fund may value these investments at fair value as determined in accordance with the procedures approved by the Board. Certain factors may be considered when fair valuing investments such as: fundamental analytical data, the nature and duration of restrictions on disposition, an evaluation of the forces that influence the market in which the securities are purchased and sold, and public trading in similar securities of the issuer or comparable issuers. These securities are either categorized within Level 2 or 3 of the fair value hierarchy depending on the relevant inputs used.
For restricted securities where observable inputs are limited, assumptions about market activity and risk are used and are generally categorized within Level 3 of the fair value hierarchy.
Investments denominated in foreign currencies are translated to U.S. dollars at the prevailing rates of exchange.
33
NOTES TO FINANCIAL STATEMENTS (continued)
Financial futures and options, which are traded on an exchange, are valued at the last sales price on the securities exchange on which such securities are primarily traded or at the last sales price on the national securities market on each business day and are generally categorized within Level 1 of the fair value hierarchy. Options traded over-the-counter (“OTC”) are valued at the mean between the bid and asked price and are generally categorized within Level 2 of the fair value hierarchy. Investments in swap transactions are valued each business day by the Service. Swaps are valued by the Service by using a swap pricing model which incorporates among other factors, default probabilities, recovery rates, credit curves of the underlying issuer and swap spreads on interest rates and are generally categorized within Level 2 of the fair value hierarchy. Forward contracts are valued at the forward rate and are generally categorized within Level 2 of the fair value hierarchy.
The following is a summary of the inputs used as of October 31, 2015 in valuing the fund’s investments:
| | | | | |
| Level 1 - Unadjusted
Quoted Prices | Level 2 - Other
Significant Observable Inputs | Level 3 -Significant
Unobservable Inputs | Total |
Assets ($) | | | | |
Investments in Securities: | | | | |
Asset-Backed | — | 138,940,898 | — | 138,940,898 |
Commercial Mortgage-Backed | — | 77,373,700 | — | 77,373,700 |
Corporate Bonds† | — | 330,245,535 | — | 330,245,535 |
Floating Rate Loan Interests | — | 30,581,051 | — | 30,581,051 |
Foreign Government | — | 55,838,598 | — | 55,838,598 |
Municipal Bonds† | — | 7,084,000 | — | 7,084,000 |
Mutual Funds | 52,374,182 | — | — | 52,374,182 |
Residential Mortgage-Backed | — | 14,729,560 | — | 14,729,560 |
U.S. Government Agencies/Mortgage-Backed | — | 1,244,131 | — | 1,244,131 |
U.S. Treasury | — | 8,107,574 | — | 8,107,574 |
Other Financial Instruments: | | | | |
Financial Futures†† | 1,133,276 | — | — | 1,133,276 |
34
| | | | | |
| Level 1 - Unadjusted
Quoted Prices | Level 2 - Other
Significant Observable Inputs | Level 3 -Significant
Unobservable Inputs | Total |
Forward Foreign Currency Exchange Contracts†† | — | 3,174,727 | — | 3,174,727 |
Options Purchased | 19,650 | — | — | 19,650 |
Swaps†† | — | 420,108 | — | 420,108 |
Liabilities ($) | | | | |
Other Financial Instruments: | | | | |
Financial Futures†† | (121,381) | — | — | (121,381) |
Forward Foreign Currency Exchange Contracts†† | — | (2,432,954) | — | (2,432,954) |
Options Written | — | (1,252,112) | — | (1,252,112) |
Swaps†† | — | (6,770,672) | — | (6,770,672) |
† See Statement of Investments for additional detailed categorizations.
†† Amount shown represents unrealized appreciation (depreciation) at period end.
At October 31, 2015, there were no transfers between Level 1, Level 2 and Level 3 of the fair value hierarchy.
(b) Foreign currency transactions: The fund does not isolate that portion of the results of operations resulting from changes in foreign exchange rates on investments from the fluctuations arising from changes in the market prices of securities held. Such fluctuations are included with the net realized and unrealized gain or loss on investments.
Net realized foreign exchange gains or losses arise from sales of foreign currencies, currency gains or losses realized on securities transactions between trade and settlement date, and the difference between the amounts of dividends, interest and foreign withholding taxes recorded on the fund’s books and the U.S. dollar equivalent of the amounts actually received or paid. Net unrealized foreign exchange gains and losses arise from changes in the value of assets and liabilities other than investments resulting from changes in exchange rates. Foreign currency gains and losses on foreign currency transactions are also included with net realized and unrealized gain or loss on investments.
(c) Securities transactions and investment income: Securities transactions are recorded on a trade date basis. Realized gains and losses from securities transactions are recorded on the identified cost basis. Dividend income is recognized on the ex-dividend date and interest income, including, where applicable, accretion of discount and
35
NOTES TO FINANCIAL STATEMENTS (continued)
amortization of premium on investments, is recognized on the accrual basis.
Pursuant to a securities lending agreement with The Bank of New York Mellon, the fund may lend securities to qualified institutions. It is the fund’s policy that, at origination, all loans are secured by collateral of at least 102% of the value of U.S. securities loaned and 105% of the value of foreign securities loaned. Collateral equivalent to at least 100% of the market value of securities on loan is maintained at all times. Collateral is either in the form of cash, which can be invested in certain money market mutual funds managed by Dreyfus, or U.S. Government and Agency securities. The fund is entitled to receive all dividends, interest and distributions on securities loaned, in addition to income earned as a result of the lending transaction. Should a borrower fail to return the securities in a timely manner, The Bank of New York Mellon is required to replace the securities for the benefit of the fund or credit the fund with the market value of the unreturned securities and is subrogated to the fund’s rights against the borrower and the collateral. During the period ended October 31, 2015, The Bank of New York Mellon earned $38,903 from lending portfolio securities, pursuant to the securities lending agreement.
(d) Affiliated issuers: Investments in other investment companies advised by Dreyfus are defined as “affiliated” under the Act. Investments in affiliated investment companies during the period ended October 31, 2015 were as follows:
| | | | | | |
Affiliated Investment Company | Value
10/31/2014 ($) | Purchases ($) | Sales ($) | Value
10/31/2015 ($) | Net
Assets
(%) |
Dreyfus Institutional Preferred Plus Money Market Fund | 5,172,509 | 729,068,691 | 733,663,569 | 577,631 | .1 |
Dreyfus Institutional Cash Advantage Fund | 21,907,460 | 273,459,343 | 243,570,252 | 51,796,551 | 7.7 |
Total | 27,079,969 | 1,002,528,034 | 977,233,821 | 52,374,182 | 7.8 |
(e) Risk: The fund invests primarily in debt securities. Failure of an issuer of the debt securities to make timely interest or principal payments, or a decline or the perception of a decline in the credit quality of a debt security, can cause the debt security’s price to fall, potentially lowering the fund’s share price. In addition, the value of debt securities may decline due
36
to general market conditions that are not specifically related to a particular issuer, such as real or perceived adverse economic conditions, changes in outlook for corporate earnings, changes in interest or currency rates or adverse investor sentiment. They may also decline because of factors that affect a particular industry.
The fund invests in floating rate loan interests. The floating rate loans in which the fund invests typically are below investment grade securities, and inherently speculative. In the event of the bankruptcy of a borrower, the fund could experience delays or limitations imposed by insolvency laws with respect to its ability to realize the benefits of any collateral securing the borrower’s loan.
(f) Dividends to shareholders: Dividends are recorded on the ex-dividend date. Dividends from investment income-net are normally declared and paid on a monthly basis. Dividends from net realized capital gains, if any, are normally declared and paid annually, but the fund may make distributions on a more frequent basis to comply with the distribution requirements of the Internal Revenue Code of 1986, as amended (the “Code”). To the extent that net realized capital gains can be offset by capital loss carryovers, it is the policy of the fund not to distribute such gains. Income and capital gain distributions are determined in accordance with income tax regulations, which may differ from GAAP.
On October 30, 2015, the Board declared a cash dividend of $.051, $.043, $.054 and $.054 per share from undistributed investment income-net for Class A, Class C, Class I and Class Y shares, respectively, payable on November 2, 2015 (ex-dividend date), to shareholders of record as of the close of business on October 30, 2015.
(g) Federal income taxes: It is the policy of the fund to continue to qualify as a regulated investment company, if such qualification is in the best interests of its shareholders, by complying with the applicable provisions of the Code, and to make distributions of taxable income sufficient to relieve it from substantially all federal income and excise taxes.
As of and during the period ended October 31, 2015, the fund did not have any liabilities for any uncertain tax positions. The fund recognizes interest and penalties, if any, related to uncertain tax positions as income tax expense in the Statement of Operations. During the period ended October 31, 2015, the fund did not incur any interest or penalties.
Each tax year in the four-year period ended October 31, 2015 remains subject to examination by the Internal Revenue Service and state taxing authorities.
37
NOTES TO FINANCIAL STATEMENTS (continued)
At October 31, 2015, the components of accumulated earnings on a tax basis were as follows: undistributed ordinary income $16,874,993, accumulated capital losses $46,112,298 and unrealized depreciation $28,596,293.
Under the Regulated Investment Company Modernization Act of 2010, the fund is permitted to carry forward capital losses for an unlimited period. Furthermore, capital loss carryovers retain their character as either short-term or long-term capital losses.
The accumulated capital loss carryover is available for federal income tax purposes to be applied against future net realized capital gains, if any, realized subsequent to October 31, 2015. The fund has $30,011,299 of short-term capital losses and $16,100,999 of long-term capital losses which can be carried forward for an unlimited period.
The tax character of distributions paid to shareholders during the fiscal periods ended October 31, 2015 and October 31, 2014 were as follows: ordinary income $32,263,650 and $6,455,230, respectively.
During the period ended October 31, 2015, as a result of permanent book to tax differences, primarily due to the tax treatment for paydown gains and losses, foreign currency transactions, swap periodic payments and consent fees, the fund increased accumulated undistributed investment income-net by $12,984,588 and decreased accumulated net realized gain (loss) on investments by the same amount. Net assets and net asset value per share were not affected by this reclassification.
NOTE 2—Bank Lines of Credit:
The fund participates with other Dreyfus-managed funds in a $480 million unsecured credit facility led by Citibank, N.A. and a $300 million unsecured credit facility provided by The Bank of New York Mellon (each, a “Facility”), each to be utilized primarily for temporary or emergency purposes, including the financing of redemptions. Prior to October 7, 2015, the unsecured credit facility with Citibank, N.A. was $430 million. In connection therewith, the fund has agreed to pay its pro rata portion of commitment fees for each Facility. Interest is charged to the fund based on rates determined pursuant to the terms of the respective Facility at the time of borrowing. During the period ended October 31, 2015, the fund did not borrow under the Facilities.
NOTE 3—Management Fee and Other Transactions with Affiliates:
(a) Pursuant to a management agreement with Dreyfus, the management fee was computed at the annual rate of .50% of the value of the fund's
38
average daily net assets and is payable monthly. Dreyfus has contractually agreed, from November 1, 2015 through March 1, 2016, to waive receipt of its fees and/or assume the direct expenses of the fund, so that the expenses of Class A, Class C, Class I and Class Y shares (excluding Rule 12b-1 Distribution Plan fees, Shareholder Services Plan fees, taxes, interest expense, brokerage commissions, commitment fees on borrowings and extraordinary expenses) do not exceed .65%, .65%, .65% and .60% of the value of the respective class' average daily net assets. During the period ended October 31, 2015, there was no reduction in expenses pursuant to the undertaking.
During the period ended October 31, 2015, the Distributor retained $16,118 from commissions earned on sales of the fund's Class A shares and $17,303 from CDSCs on redemptions of the fund's Class C shares.
(b) Under the Distribution Plan adopted pursuant to Rule 12b-1 under the Act, Class C shares pay the Distributor for distributing its shares at an annual rate of .75% of the value of its average daily net assets. During the period ended October 31, 2015, Class C shares were charged $503,466 pursuant to the Distribution Plan.
(c) Under the Shareholder Services Plan, Class A and Class C shares pay the Distributor at an annual rate of .25% of the value of their average daily net assets for the provision of certain services. The services provided may include personal services relating to shareholder accounts, such as answering shareholder inquiries regarding the fund and providing reports and other information, and services related to the maintenance of shareholder accounts. The Distributor may make payments to Service Agents (securities dealers, financial institutions or other industry professionals) with respect to these services. The Distributor determines the amounts to be paid to Service Agents. During the period ended October 31, 2015, Class A and Class C shares were charged $513,518 and $167,822, respectively, pursuant to the Shareholder Services Plan.
Under its terms, the Distribution Plan and Shareholder Services Plan shall remain in effect from year to year, provided such continuance is approved annually by a vote of a majority of those Directors who are not “interested persons” of the Company and who have no direct or indirect financial interest in the operation of or in any agreement related to the Distribution Plan or Shareholder Services Plan.
The fund has arrangements with the transfer agent and the custodian whereby the fund may receive earnings credits when positive cash balances are maintained, which are used to offset transfer agency and custody fees.
39
NOTES TO FINANCIAL STATEMENTS (continued)
For financial reporting purposes, the fund includes net earnings credits as an expense offset in the Statement of Operations.
The fund compensates Dreyfus Transfer, Inc., a wholly-owned subsidiary of Dreyfus, under a transfer agency agreement for providing transfer agency and cash management services for the fund. The majority of transfer agency fees are comprised of amounts paid on a per account basis, while cash management fees are related to fund subscriptions and redemptions. During the period ended October 31, 2015, the fund was charged $10,024 for transfer agency services and $671 for cash management services. These fees are included in Shareholder servicing costs in the Statement of Operations. Cash management fees were partially offset by earnings credits of $38.
The fund compensates The Bank of New York Mellon under a custody agreement for providing custodial services for the fund. These fees are determined based on net assets, geographic region and transaction activity. During the period ended October 31, 2015, the fund was charged $195,217 pursuant to the custody agreement.
During the period ended October 31, 2015, the fund was charged $11,159 for services performed by the Chief Compliance Officer and his staff.
The components of “Due to The Dreyfus Corporation and affiliates” in the Statement of Assets and Liabilities consist of: management fees $288,312, Distribution Plan fees $41,126, Shareholder Services Plan fees $55,267, custodian fees $84,231, Chief Compliance Officer fees $882 and transfer agency fees $1,776.
(d) Each Board member also serves as a Board member of other funds within the Dreyfus complex. Annual retainer fees and attendance fees are allocated to each fund based on net assets.
NOTE 4—Securities Transactions:
The aggregate amount of purchases and sales (including paydowns) of investment securities, excluding short-term securities, forward contracts, financial futures, options transactions and swap transactions during the period ended October 31, 2015, amounted to $1,346,855,968 and $1,208,571,321, respectively.
Floating Rate Loan Interests: Floating rate instruments are loans and other securities with interest rates that adjust or “float” periodically. Floating rate loans are made by banks and other financial institutions to their corporate clients. The rates of interest on the loans adjust periodically by reference to a base lending rate, such as the London Interbank Offered Rate (“LIBOR”) plus a premium or credit spread. Floating rate loans reset
40
on periodic set dates, typically 30 to 90 days, but not to exceed one year. The fund may invest in multiple series or tranches of a loan. A different series or tranche may have varying terms and carry different associated risks.
Derivatives: A derivative is a financial instrument whose performance is derived from the performance of another asset. The fund enters into International Swaps and Derivatives Association, Inc. Master Agreements or similar agreements (collectively, “Master Agreements”) with its OTC derivative contract counterparties in order to, among other things, reduce its credit risk to counterparties. Master Agreements include provisions for general obligations, representations, collateral and events of default or termination. Under a Master Agreement, the fund may offset with the counterparty certain derivative financial instrument’s payables and/or receivables with collateral held and/or posted and create one single net payment in the event of default or termination.
Each type of derivative instrument that was held by the fund during the period ended October 31, 2015 is discussed below.
Financial Futures: In the normal course of pursuing its investment objective, the fund is exposed to market risk, including interest rate risk, as a result of changes in value of underlying financial instruments. The fund invests in financial futures in order to manage its exposure to or protect against changes in the market. A financial futures contract represents a commitment for the future purchase or a sale of an asset at a specified date. Upon entering into such contracts, these investments require initial margin deposits with a counterparty, which consist of cash or cash equivalents. The amount of these deposits is determined by the exchange or Board of Trade on which the contract is traded and is subject to change. Accordingly, variation margin payments are received or made to reflect daily unrealized gains or losses which are recorded in the Statement of Operations. When the contracts are closed, the fund recognizes a realized gain or loss which is reflected in the Statement of Operations. There is minimal counterparty credit risk to the fund with financial futures since they are exchange traded, and the exchange guarantees the financial futures against default. Financial futures open at October 31, 2015 are set forth in the Statement of Financial Futures.
Options Transactions: The fund purchases and writes (sells) put and call options to hedge against changes in interest rates and foreign currencies, or as a substitute for an investment. The fund is subject to market risk, interest rate risk and currency risk in the course of pursuing its investment objectives through its investments in options contracts. A call option gives the purchaser of the option the right (but not the obligation) to buy, and
41
NOTES TO FINANCIAL STATEMENTS (continued)
obligates the writer to sell, the underlying financial instrument at the exercise price at any time during the option period, or at a specified date. Conversely, a put option gives the purchaser of the option the right (but not the obligation) to sell, and obligates the writer to buy the underlying financial instrument at the exercise price at any time during the option period, or at a specified date.
As a writer of call options, the fund receives a premium at the outset and then bears the market risk of unfavorable changes in the price of the financial instrument underlying the option. Generally, the fund realizes a gain, to the extent of the premium, if the price of the underlying financial instrument decreases between the date the option is written and the date on which the option is terminated. Generally, the fund incurs a loss if the price of the financial instrument increases between those dates.
As a writer of put options, the fund receives a premium at the outset and then bears the market risk of unfavorable changes in the price of the financial instrument underlying the option. Generally, the fund realizes a gain, to the extent of the premium, if the price of the underlying financial instrument increases between the date the option is written and the date on which the option is terminated. Generally, the fund incurs a loss if the price of the financial instrument decreases between those dates.
As a writer of an option, the fund has no control over whether the underlying financial instrument may be sold (call) or purchased (put) and as a result bears the market risk of an unfavorable change in the price of the financial instrument underlying the written option. There is a risk of loss from a change in value of such options which may exceed the related premiums received. This risk is mitigated by Master Agreements between the fund and the counterparty and the posting of collateral, if any, by the counterparty to the fund to cover the fund’s exposure to the counterparty. The Statement of Operations reflects any unrealized gains or losses which occurred during the period as well as any realized gains or losses which occurred upon the expiration or closing of the option transaction.
The following summarizes the fund’s call/put options written during the period ended October 31, 2015:
42
| | | | | |
| | Face Amount | | Options Terminated |
| | Covered by | Premiums | | Net Realized |
Options Written: | Contracts ($) | Received ($) | Cost ($) | Gain (Loss)($) |
Contracts outstanding | | | | |
October 31, 2014 | 99,542,000 | 2,082,863 | | |
Contracts written | 2,229,639,000 | 12,365,460 | | |
Contracts terminated: | | | | |
Contracts closed | 1,199,907,000 | 6,262,191 | 6,817,754 | (555,563) |
Contracts expired | 983,884,000 | 6,401,352 | — | 6,401,352 |
Total contracts | | | | |
terminated | 2,183,791,000 | 12,663,543 | 6,817,754 | 5,845,789 |
Contracts outstanding | | | | |
October 31, 2015 | 145,390,000 | 1,784,780 | | |
Forward Foreign Currency Exchange Contracts: The fund enters into forward contracts in order to hedge its exposure to changes in foreign currency exchange rates on its foreign portfolio holdings, to settle foreign currency transactions or as a part of its investment strategy. When executing forward contracts, the fund is obligated to buy or sell a foreign currency at a specified rate on a certain date in the future. With respect to sales of forward contracts, the fund incurs a loss if the value of the contract increases between the date the forward contract is opened and the date the forward contract is closed. The fund realizes a gain if the value of the contract decreases between those dates. With respect to purchases of forward contracts, the fund incurs a loss if the value of the contract decreases between the date the forward contract is opened and the date the forward contract is closed. The fund realizes a gain if the value of the contract increases between those dates. Any realized or unrealized gains or losses which occurred during the period are reflected in the Statement of Operations. The fund is exposed to foreign currency risk as a result of changes in value of underlying financial instruments. The fund is also exposed to credit risk associated with counterparty nonperformance on these forward contracts, which is generally limited to the unrealized gain on each open contract. This risk may be mitigated by Master Agreements, if any, between the fund and the counterparty and the posting of collateral, if any, by the counterparty to the fund to cover the fund’s exposure to the counterparty. The following summarizes open forward contracts at October 31, 2015:
43
NOTES TO FINANCIAL STATEMENTS (continued)
| | | | | |
Forward Foreign Currency Exchange Contracts | Foreign Currency
Amounts | Cost/
Proceeds ($) | Value ($) | Unrealized
Appreciation
(Depreciation)($) |
Purchases: | | | |
Bank of America | | | |
Australian Dollar, | | | | |
Expiring | | | | |
11/25/2015 | 2,100,000 | 1,516,277 | 1,495,514 | (20,763) |
Euro, | | | | |
Expiring | | | | |
11/25/2015 | 7,410,000 | 8,142,782 | 8,151,035 | 8,253 |
Indonesian Rupiah, | | | | |
Expiring | | | | |
11/25/2015 | 211,592,530,000 | 13,994,215 | 15,343,403 | 1,349,188 |
Peruvian New Sol, | | | | |
Expiring | | | | |
12/7/2015 | 8,405,000 | 2,562,500 | 2,544,939 | (17,561) |
Citigroup | | | |
Indian Rupee, | | | | |
Expiring | | | | |
11/24/2015 | 1,711,760,000 | 25,720,074 | 26,076,706 | 356,632 |
Credit Suisse International | | | |
Indian Rupee, | | | | |
Expiring | | | | |
11/24/2015 | 27,015,000 | 415,167 | 411,543 | (3,624) |
Goldman Sachs International | | | |
Japanese Yen, | | | | |
Expiring | | | | |
11/25/2015 | 1,650,000,000 | 13,628,141 | 13,676,764 | 48,623 |
Peruvian New Sol, | | | | |
Expiring | | | | |
12/7/2015 | 13,075,000 | 4,018,132 | 3,958,962 | (59,170) |
HSBC | | | |
Mexican New Peso, | | | | |
Expiring | | | | |
11/25/2015 | 422,185,000 | 24,695,247 | 25,509,031 | 813,784 |
Peruvian New Sol, | | | | |
Expiring | | | | |
12/7/2015 | 1,300,000 | 396,221 | 393,625 | (2,596) |
JP Morgan Chase Bank | | | |
Indian Rupee, | | | | |
Expiring | | | | |
11/24/2015 | 272,880,000 | 4,193,122 | 4,157,015 | (36,107) |
44
| | | | | | | | |
Forward Foreign Currency Exchange Contracts | Foreign Currency
Amounts | Cost/
Proceeds ($) | Value ($) | Unrealized Appreciation (Depreciation)($) |
Purchases: (continued) | | | |
JP Morgan Chase Bank (continued) | | | |
Mexican New Peso, | | | | |
Expiring | | | | |
11/25/2015 | 176,410,000 | 10,640,914 | 10,658,948 | 18,034 |
Peruvian New Sol, | | | | |
Expiring | | | | |
12/7/2015 | 22,285,000 | 6,792,137 | 6,747,646 | (44,491) |
12/18/2015 | 4,885,000 | 1,498,466 | 1,476,582 | (21,884) |
Turkish Lira, | | | | |
Expiring | | | | |
11/4/2015 | 11,174,355 | 3,828,145 | 3,832,872 | 4,727 |
Morgan Stanley Capital Services | | | |
Chilean Peso, | | | | |
Expiring | | | | |
11/25/2015 | 7,579,770,000 | 10,733,938 | 10,932,879 | 198,941 |
UBS | | | |
Indian Rupee, | | | | |
Expiring | | | | |
11/24/2015 | 138,105,000 | 2,122,733 | 2,103,872 | (18,861) |
Norwegian Krone, | | | | |
Expiring | | | | |
11/25/2015 | 109,540,000 | 13,107,967 | 12,886,362 | (221,605) |
Sales: | | | |
Bank of America | | | |
Euro, | | | | |
Expiring | | | | |
11/2/2015 | 3,408,616 | 3,740,956 | 3,748,286 | (7,330) |
11/3/2015 | 4,003,321 | 4,401,651 | 4,402,253 | (602) |
Mexican New Peso, | | | | |
Expiring | | | | |
11/25/2015 | 6,720,000 | 394,482 | 406,032 | (11,550) |
South Korean Won, | | | | |
Expiring | | | | |
11/25/2015 | 8,511,565,000 | 7,153,778 | 7,459,423 | (305,645) |
Barclays Bank | | | |
Euro, | | | | |
Expiring | | | | |
11/25/2015 | 16,030,000 | 17,696,799 | 17,633,077 | 63,722 |
Citigroup | | | |
Euro, | | | | |
Expiring | | | | |
11/25/2015 | 8,651,000 | 9,549,666 | 9,516,141 | 33,525 |
45
NOTES TO FINANCIAL STATEMENTS (continued)
| | | | | | | | |
Forward Foreign Currency Exchange Contracts | Foreign Currency
Amounts | Cost/
Proceeds ($) | Value ($) | Unrealized Appreciation (Depreciation)($) |
Sales: (continued) | | | |
Citigroup (continued) | | | |
South African Rand, | | | | |
Expiring | | | | |
11/25/2015 | 145,815,000 | 10,404,804 | 10,489,441 | (84,637) |
Goldman Sachs International | | | |
Euro, | | | | |
Expiring | | | | |
11/25/2015 | 23,015,000 | 25,314,727 | 25,316,610 | (1,883) |
New Zealand Dollar, | | | | |
Expiring | | | | |
11/25/2015 | 19,900,000 | 13,336,622 | 13,449,271 | (112,649) |
HSBC | | | |
New Zealand Dollar, | | | | |
Expiring | | | | |
11/25/2015 | 31,935,000 | 21,604,666 | 21,583,038 | 21,628 |
JP Morgan Chase Bank | | | |
Canadian Dollar, | | | | |
Expiring | | | | |
11/25/2015 | 14,685,000 | 11,165,008 | 11,228,621 | (63,613) |
Colombian Peso, | | | | |
Expiring | | | | |
11/25/2015 | 31,949,590,000 | 10,194,671 | 10,993,883 | (799,212) |
Euro, | | | | |
Expiring | | | | |
11/25/2015 | 11,896,000 | 13,131,846 | 13,085,657 | 46,189 |
Hungarian Forint, | | | | |
Expiring | | | | |
11/25/2015 | 953,220,000 | 3,403,749 | 3,371,333 | 32,416 |
Indonesian Rupiah, | | | | |
Expiring | | | | |
11/25/2015 | 211,592,530,000 | 15,376,526 | 15,343,403 | 33,123 |
Malaysian Ringgit, | | | | |
Expiring | | | | |
11/25/2015 | 29,855,000 | 6,905,285 | 6,935,564 | (30,279) |
Polish Zloty, | | | | |
Expiring | | | | |
11/25/2015 | 52,905,000 | 13,583,481 | 13,678,895 | (95,414) |
Taiwan Dollar, | | | | |
Expiring | | | | |
11/25/2015 | 600,000,000 | 18,223,235 | 18,483,051 | (259,816) |
46
| | | | | | | | |
Forward Foreign Currency Exchange Contracts | Foreign Currency
Amounts | Cost/
Proceeds ($) | Value ($) | Unrealized Appreciation (Depreciation)($) |
Sales: (continued) | | | |
JP Morgan Chase Bank (continued) | | | |
Turkish Lira, | | | | |
Expiring | | | | |
11/25/2015 | 13,740,000 | 4,630,275 | 4,676,955 | (46,680) |
Morgan Stanley Capital Services | | | |
Peruvian New Sol, | | | | |
Expiring | | | | |
12/18/2015 | 35,125,000 | 10,660,091 | 10,617,182 | 42,909 |
Standard Chartered Bank | | | |
Peruvian New Sol, | | | | |
Expiring | | | | |
12/7/2015 | 59,700,000 | 18,140,383 | 18,076,484 | 63,899 |
UBS | | | |
Euro, | | | | |
Expiring | | | | |
11/25/2015 | 9,373,000 | 10,349,479 | 10,310,345 | 39,134 |
Mexican New Peso, | | | | |
Expiring | | | | |
11/25/2015 | 339,385,000 | 20,339,153 | 20,506,135 | (166,982) |
Gross Unrealized Appreciation | | | 3,174,727 |
Gross Unrealized Depreciation | | | (2,432,954) |
Swap Transactions: The fund enters into swap agreements to exchange the interest rate on, or return generated by, one nominal instrument for the return generated by another nominal instrument. Swap agreements are privately negotiated in the OTC market or centrally cleared. The fund enters into these agreements to hedge certain market or interest rate risks, to manage the interest rate sensitivity (sometimes called duration) of fixed income securities, to provide a substitute for purchasing or selling particular securities or to increase potential returns.
For OTC swaps, the fund accrues for the interim payments on a daily basis, with the net amount recorded within unrealized appreciation (depreciation) on swap agreements in the Statement of Assets and Liabilities. Once the interim payments are settled in cash, the net amount is recorded as a realized gain (loss) on swaps, in addition to realized gain (loss) recorded upon the termination of swap transactions in the Statement of Operations. Upfront payments made and/or received by the fund, are recorded as an asset and/or liability in the Statement of Assets and Liabilities and are recorded as a realized gain or loss ratably over the
47
NOTES TO FINANCIAL STATEMENTS (continued)
agreement’s term/event with the exception of forward starting interest rate swaps which are recorded as realized gains or losses on the termination date.
Upon entering into centrally cleared swap agreements, an initial margin deposit is required with a counterparty, which consists of cash or cash equivalents. The amount of these deposits is determined by the exchange on which the agreement is traded and is subject to change. The change in valuation of centrally cleared swaps is recorded as a receivable or payable for variation margin in the Statement of Assets and Liabilities. Payments received from (paid to) the counterparty, including upon termination, are recorded as realized gain (loss) in the Statement of Operations.
Fluctuations in the value of swap agreements are recorded for financial statement purposes as unrealized appreciation or depreciation on swap transactions.
Interest Rate Swaps: Interest rate swaps involve the exchange of commitments to pay and receive interest based on a notional principal amount. The fund may elect to pay a fixed rate and receive a floating rate, or receive a fixed rate and pay a floating rate on a notional principal amount. The net interest received or paid on interest rate swap agreements is included within realized gain (loss) on swap transactions in the Statement of Operations. Interest rate swap agreements are subject to general market risk, liquidity risk, counterparty risk and interest rate risk.
For OTC swaps, the fund’s maximum risk of loss from counterparty risk is the discounted value of the cash flows to be received from the counterparty over the agreement’s remaining life, to the extent that the amount is positive. This risk may be mitigated by Master Agreements, if any, between the fund and the counterparty and the posting of collateral, if any, by the counterparty to the fund to cover the fund’s exposure to the counterparty. There is minimal counterparty risk to the fund with centrally cleared swaps since they are settled through an exchange and the exchange guarantees these swap against default. The following summarizes open interest rate swaps entered into by the fund at October 31, 2015:
48
| | | | | | |
OTC Interest Rate Swaps | | | | |
| | | | | | |
Notional
Amount ($) | Currency/ Floating Rate | Counterparty | (Pay) Receive Fixed Rate (%) | Expiration | Unrealized Appreciation (Depreciation) ($) |
250,000,000 | AUD - 6 MONTH LIBOR | Goldman Sachs International | 2.05 | 9/30/2018 | (472,490) |
38,000,000 | USD - 1 YEAR US CPI URBAN CONSUMERS NSA | Goldman Sachs International | 1.41 | 10/5/2020 | 47,141 |
25,000,000 | USD - 1 YEAR US CPI URBAN CONSUMERS NSA | Goldman Sachs International | 1.33 | 10/2/2020 | 121,356 |
| | | | | | |
Gross Unrealized Appreciation | | | | 168,497 |
Gross Unrealized Depreciation | | | | (472,490) |
| | | | | | |
Centrally Cleared Interest Rate Swaps | | | |
| | | | | | |
Notional Amount ($)† | Currency/ Floating Rate | Counterparty | (Pay) Receive Fixed Rate (%) | Expiration | Unrealized (Depreciation) ($) |
100,000,000 | USD - 6 MONTH LIBOR | JP Morgan Chase Bank | 0.91 | 7/29/2017 | (467,351) |
24,700,000 | USD - 6 MONTH LIBOR | JP Morgan Chase Bank | 2.55 | 6/12/2025 | (1,358,940) |
147,000,000 | USD - 6 MONTH LIBOR | JP Morgan Chase Bank | 0.98 | 6/12/2017 | (1,065,885) |
43,000,000 | USD - 6 MONTH LIBOR | Bank of America | 1.1315 | 4/14/2018 | (186,438) |
95,000,000 | USD - 6 MONTH LIBOR | Morgan Stanley Capital Services | 0.83 | 8/27/2017 | (131,766) |
75,000,000 | USD - 6 MONTH LIBOR | Goldman Sachs International | 1.83 | 7/22/2020 | (1,678,635) |
Gross Unrealized Depreciation | | | | (4,889,015) |
† Clearing House-Chicago Mercantile Exchange
49
NOTES TO FINANCIAL STATEMENTS (continued)
Credit Default Swaps: Credit default swaps involve commitments to pay a fixed interest rate in exchange for payment if a credit event affecting a third party (the referenced obligation or index) occurs. Credit events may include a failure to pay interest or principal, bankruptcy, or restructuring. The fund enters into these agreements to manage its exposure to the market or certain sectors of the market, to reduce its risk exposure to defaults of corporate and sovereign issuers, or to create exposure to corporate or sovereign issuers to which it is not otherwise exposed. For those credit default swaps in which the fund is paying a fixed rate, the fund is buying credit protection on the instrument. In the event of a credit event, the fund would receive the full notional amount for the reference obligation. For those credit default swaps in which the fund is receiving a fixed rate, the fund is selling credit protection on the underlying instrument. The maximum payouts for these agreements are limited to the notional amount of each swap. Credit default swaps may involve greater risks than if the fund had invested in the reference obligation directly and are subject to general market risk, liquidity risk, counterparty risk and credit risk. This risk may be mitigated by Master Agreements, if any, between the fund and the counterparty and the posting of collateral, if any, by the counterparty to the fund to cover the fund’s exposure to the counterparty.
The maximum potential amount of future payments (undiscounted) that a fund as a seller of protection could be required to make under a credit default swap agreement would be an amount equal to the notional amount of the agreement which may exceed the amount of unrealized appreciation or depreciation reflected in the Statement of Assets and Liabilities. Notional amounts of all credit default swap agreements are disclosed in the following chart, which summarizes open credit default swaps on index issues entered into by the fund. These potential amounts would be partially offset by any recovery values of the respective referenced obligations, underlying securities comprising the referenced index, upfront payments received upon entering into the agreement, or net amounts received from the settlement of buy protection credit default swap agreements entered into by the fund for the same referenced entity or entities. The following summarizes open credit default swaps entered into by the fund at October 31, 2015:
50
| | | | | | | |
OTC Credit Default Swaps | | | | | |
| | | | | | | |
Reference
Obligation ($) | Notional Amount($)1 | (Pay) Receive Fixed Rate (%) | Implied Credit Spread
(%)2 | Market Value ($) | Upfront Premiums Received (Paid) ($) | Unrealized (Depreciation) ($) |
Sales Contracts:3 | | | | | |
Credit Suisse International | | | | | |
Markit CMBX.NA. BBB Series 7 | | | | | | |
1/17/2047† | 48,700,000 | 3.00 | 3.9418 | (1,648,737) | (636,548) | (1,012,189) |
Deutsche Bank | | | | | |
Markit CMBX.NA. BBB Series 7 | | | | | | |
1/17/2047† | 19,100,000 | 3.00 | 3.9418 | (646,630) | (249,652) | (396,978) |
Gross Unrealized Depreciation | | | | | (1,409,167) |
† Expiration Date
1 The maximum potential amount the fund could be required to pay as a seller of credit protection or receive as a buyer of credit protection if a credit event occurs as defined under the terms of the swap agreement.
2 Implied credit spreads, represented in absolute terms, utilized in determining the market value as of the period end serve as an indicator of the current status of the payment/performance risk and represent the likelihood of risk of default for the credit derivative. The credit spread of a particular referenced entity reflects the cost of buying/selling protection and may include upfront payments required to be made to enter into the agreement. Wider credit spreads represent a deterioration of the referenced entity's credit soundness and a greater likelihood of risk of default or other credit event occurring as defined under the terms of the agreement. A credit spread identified as "Defaulted" indicates a credit event has occurred for the referenced entity. Credit spreads are unaudited.
3 If the fund is a seller of protection and a credit event occurs, as defined under the terms of the swap agreement, the fund will either (i) pay to the buyer of protection an amount equal to the notional amount of the swap and take delivery of the reference obligation or (ii) pay a net settlement amount in the form of cash or securities equal to the notional amount of the swap less the recovery value of the reference obligation.
51
NOTES TO FINANCIAL STATEMENTS (continued)
| | | | | | | |
Centrally Cleared Credit Default Swaps | | | | |
| | | | | | | |
Reference
Obligation ($)† | Notional Amount($) 1 | (Pay) Receive Fixed Rate (%) | Implied Credit Spread(%) 2 | Market Value ($) | Upfront Premiums Received (Paid) ($) | Unrealized Appreciation ($) |
Sales Contracts:3 | | | | | |
Bank of America | | | | | |
DOW JONES CDX.NA.HY.22 INDEX | | | | | | |
6/20/2020†† | 13,662,000 | 5.00 | 3.5884 | 863,991 | 612,380 | 251,611 |
Gross Unrealized Appreciation | | | | | 251,611 |
† Clearing House-Chicago Mercantile Exchange
†† Expiration Date
1 The maximum potential amount the fund could be required to pay as a seller of credit protection or receive as a buyer of credit protection if a credit event occurs as defined under the terms of the swap agreement.
2 Implied credit spreads, represented in absolute terms, utilized in determining the market value as of the period end serve as an indicator of the current status of the payment/performance risk and represent the likelihood of risk of default for the credit derivative. The credit spread of a particular referenced entity reflects the cost of buying/selling protection and may include upfront payments required to be made to enter into the agreement. Wider credit spreads represent a deterioration of the referenced entity's credit soundness and a greater likelihood of risk of default or other credit event occurring as defined under the terms of the agreement. A credit spread identified as "Defaulted" indicates a credit event has occurred for the referenced entity. Credit spreads are unaudited.
3 If the fund is a seller of protection and a credit event occurs, as defined under the terms of the swap agreement, the fund will either (i) pay to the buyer of protection an amount equal to the notional amount of the swap and take delivery of the reference obligation or (ii) pay a net settlement amount in the form of cash or securities equal to the notional amount of the swap less the recovery value of the reference obligation.
GAAP requires disclosure for (i) the nature and terms of the credit derivative, reasons for entering into the credit derivative, the events or circumstances that would require the seller to perform under the credit derivative, and the current status of the payment/performance risk of the credit derivative, (ii) the maximum potential amount of future payments (undiscounted) the seller could be required to make under the credit derivative, (iii) the fair value of the credit derivative, and (iv) the nature of any recourse provisions and assets held either as collateral or by third parties. All required disclosures have been made and are incorporated within the current period as part of the Notes to the Statement of Investments and disclosures within this Note.
52
The following tables show the fund’s exposure to different types of market risk as it relates to the Statement of Assets and Liabilities and the Statement of Operations, respectively.
Fair value of derivative instruments as of October 31, 2015 is shown below:
| | | | |
| Derivative Assets ($) | | Derivative Liabilities ($) |
Interest rate risk 1,2,3 | 1,321,423 | Interest rate risk 1,3,4 | (5,492,712) |
Foreign exchange risk 4 | 3,174,727 | Foreign exchange risk 4,5 | (3,675,241) |
Credit risk 3 | 251,611 | Credit risk3 | (1,409,166) |
Gross fair value of derivatives contracts | 4,747,761 | | (10,577,119) |
Statement of Assets and Liabilities location:
1 Includes cumulative appreciation (depreciation) on financial futures as reported in the Statement of Financial Futures, but only the unpaid variation margin is reported in the Statement of Assets and Liabilities.
2 Options purchased are included in Investments in securities--Unaffiliated issuers, at value.
3 Includes cumulative appreciation (depreciation) on swap agreements as reported in the swap tables in Note 4. Unrealized appreciation (depreciation) on OTC swap agreements and only unpaid variation margin on cleared swap agreements, are reported in the Statement of Assets and Liabilities.
4 Outstanding options written, at value.
5 Unrealized appreciation (depreciation) on forward foreign currency exchange contracts.
The effect of derivative instruments in the Statement of Operations during the period ended October 31, 2015 is shown below:
| | | | | | | | | |
Amount of realized gain (loss) on derivatives recognized in income ($) |
Underlying risk | Financial Futures 6 | Options Transactions 7 | Forward Contracts 8 | Swap Transactions 9 | Total |
Interest rate | (2,706,641) | (458,177) | - | (11,702,491) | (14,867,309) |
Foreign exchange | - | 1,827,227 | 18,828,039 | - | 20,655,266 |
Credit | - | - | - | 842,226 | 842,226 |
Total | (2,706,641) | 1,369,050 | 18,828,039 | (10,860,265) | 6,630,183 |
| | | | | | |
|
|
Change in unrealized appreciation (depreciation) on derivatives recognized in income ($) |
Underlying risk | Financial Futures 10 | Options Transactions 11 | Forward Contracts 12 | Swap Transactions 13 | Total |
Interest rate | 1,704,165 | 114,487 | - | (1,502,942) | 315,710 |
Foreign exchange | - | 301,633 | (1,723,575) | - | (1,421,942) |
Credit | - | - | - | (1,361,105) | (1,361,105) |
Total | 1,704,165 | 416,120 | (1,723,575) | (2,864,047) | (2,467,337) |
Statement of Operations location:
6 Net realized gain (loss) on financial futures.
7 Net realized gain (loss) on options transactions.
53
NOTES TO FINANCIAL STATEMENTS (continued)
8 Net realized gain (loss) on forward foreign currency exchange contracts.
9 Net realized gain (loss) on swap transactions.
10 Net unrealized appreciation (depreciation) on financial futures.
11 Net unrealized appreciation (depreciation) on options transactions.
12 Net unrealized appreciation (depreciation) on forward foreign currency exchange contracts.
13 Net unrealized appreciation (depreciation) on swap transactions.
The provisions of ASC Topic 210 “Disclosures about Offsetting Assets and Liabilities” require disclosure on the offsetting of financial assets and liabilities. These disclosures are required for certain investments, including derivative financial instruments subject to Master Agreements which are eligible for offsetting in the Statement of Assets and Liabilities and require the fund to disclose both gross and net information with respect to such investments. For financial reporting purposes, the fund does not offset derivative assets and derivative liabilities that are subject to Master Agreements in the Statement of Assets and Liabilities.
At October 31, 2015, derivative assets and liabilities (by type) on a gross basis are as follows:
| | | | | | |
Derivative Financial Instruments: | | Assets ($) | | Liabilities ($) | |
Financial futures | | 1,133,276 | | (121,381) | |
Options | | 19,650 | | (1,252,112) | |
Forward contracts | | 3,174,727 | | (2,432,954) | |
Swaps | | 420,108 | | (6,770,672) | |
Total gross amount of derivative | | | | | |
assets and liabilities in the | | | | | |
Statement of Assets and Liabilities | | 4,747,761 | | (10,577,119) | |
Derivatives not subject to | | | | | |
Master Agreements | | (1,404,537) | | 6,036,034 | |
Total gross amount of assets | | | | | |
and liabilities subject to | | | | | |
Master Agreements | | 3,343,224 | | (4,541,085) | |
The following tables present derivative assets and liabilities net of amounts available for offsetting under Master Agreements and net of related collateral received or pledged, if any, as of October 31, 2015:
54
| | | | | | | |
| | | | Financial | | | |
| | | | Instruments | | | |
| | | | and Derivatives | | | |
| | Gross Amount of | | Available | Collateral | | Net Amount of |
Counterparty | Assets ($) | 1 | for Offset ($) | Received ($) | 2 | Assets ($) |
Bank of America | 1,357,441 | | (363,451) | - | | 993,990 |
Barclays Bank | 63,722 | | (63,722) | - | | - |
Citigroup | 390,157 | | (390,157) | - | | - |
Goldman Sachs
International | 217,120 | | (217,120) | - | | - |
HSBC | 835,412 | | (2,596) | - | | 832,816 |
JP Morgan
Chase Bank | 134,489 | | (134,489) | - | | - |
Morgan Stanley
Capital Services | 241,850 | | - | (241,850) | | - |
Standard Chartered
Bank | 63,899 | | - | - | | 63,899 |
UBS | 39,134 | | (39,134) | - | | - |
Total | 3,343,224 | | (1,210,669) | (241,850) | | 1,890,705 |
| | | | | | | |
| | | | Financial | | | |
| | | | Instruments | | | |
| | | | and Derivatives | | | |
| | Gross Amount of | | Available | Collateral | | Net Amount of |
Counterparty | Liabilities ($) | 1 | for Offset ($) | Pledged ($) | 2 | Liabilities ($) |
Bank of America | (363,451) | | 363,451 | - | | - |
Barclays Bank | (156,957) | | 63,722 | - | | (93,235) |
Citigroup | (585,747) | | 390,157 | 195,590 | | - |
Deutsche Bank | (396,978) | | - | 396,978 | | - |
Goldman Sachs
International | (1,075,729) | | 217,120 | 410,000 | | (448,609) |
HSBC | (2,596) | | 2,596 | - | | - |
JP Morgan
Chase Bank | (1,552,179) | | 134,489 | 366.000 | | (1,051,690) |
UBS | (407,448) | | 39,134 | 362,000 | | (6,314) |
Total | (4,541,085) | | 1,210,669 | 1,364,568 | | (1,599,848) |
| | | | | | | |
1 Absent a default event or early termination, OTC derivative assets and liabilities are presented
at gross amounts and are not offset in the Statement of Assets and Liabilities. |
2 In some instances, the actual collateral received and/or pledged may be more than the amount
shown due to overcollateralization. |
The following summarizes the average market value of derivatives outstanding during the period ended October 31, 2015:
| | | | | | |
| | | | | Average Market Value ($) |
Interest rate financial futures | | | 400,882,606 |
Interest rate options contracts | | | 1,985,992 |
Foreign currency options contracts | | 1,032,081 |
Forward contracts | | | | 563,388,752 |
55
NOTES TO FINANCIAL STATEMENTS (continued)
The following summarizes the average notional value of swap agreements outstanding during the period ended October 31, 2015:
| | | | | | |
| | | | | | |
| | | | | | Average Notional Value ($) |
Interest rate swap agreements | | 923,002,798 |
Credit default swap agreements | | 65,601,231 |
At October 31, 2015, the cost of investments for federal income tax purposes was $741,541,902; accordingly, accumulated net unrealized depreciation on investments was $25,003,023, consisting of $5,331,974 gross unrealized appreciation and $30,334,997 gross unrealized depreciation.
56
REPORT OF INDEPENDENT REGISTERED
PUBLIC ACCOUNTING FIRM
The Board of Directors and Shareholders
The Dreyfus/Laurel Funds, Inc.
We have audited the accompanying statement of assets and liabilities of Dreyfus Opportunistic Fixed Income Fund (the “Fund”), a series of The Dreyfus/Laurel Funds, Inc., including the statements of investments, financial futures and options written, as of October 31, 2015, the related statement of operations for the year then ended, the statements of changes in net assets for each of the years in the two-year period then ended, and the financial highlights for each of the years or period in the five-year period then ended. These financial statements and financial highlights are the responsibility of the Fund’s management. Our responsibility is to express an opinion on these financial statements and financial highlights based on our audits.
We conducted our audits in accordance with the standards of the Public Company Accounting Oversight Board (United States). Those standards require that we plan and perform the audit to obtain reasonable assurance about whether the financial statements and financial highlights are free of material misstatement. An audit includes examining, on a test basis, evidence supporting the amounts and disclosures in the financial statements. Our procedures included confirmation of securities owned as of October 31, 2015, by correspondence with the custodian and brokers or by other appropriate auditing procedures. An audit also includes assessing the accounting principles used and significant estimates made by management, as well as evaluating the overall financial statement presentation. We believe that our audits provide a reasonable basis for our opinion.
In our opinion, the financial statements and financial highlights referred to above present fairly, in all material respects, the financial position of Dreyfus Opportunistic Fixed Income Fund as of October 31, 2015, the results of its operations for the year then ended, the changes in its net assets for each of the years in the two-year period then ended, and the financial highlights for each of the years or period in the five-year period then ended, in conformity with U.S. generally accepted accounting principles.

New York, New York
December 30, 2015
57
IMPORTANT TAX INFORMATION (Unaudited)
For federal tax purposes, the fund designates the maximum amount allowable but not less than 62.50% as interest-related dividends in accordance with Sections 871(k)(1) and 881(e) of the Internal Revenue Code.
58
BOARD MEMBERS INFORMATION (Unaudited)
INDEPENDENT BOARD MEMBERS
Joseph S. DiMartino (72)
Chairman of the Board (1999)
Principal Occupation During Past 5 Years:
· Corporate Director and Trustee (1995-present)
Other Public Company Board Memberships During Past 5 Years:
· CBIZ (formerly, Century Business Services, Inc.), a provider of outsourcing functions for small and medium size companies, Director (1997-present)
· The Newark Group, a provider of a national market of paper recovery facilities, paperboard mills and paperboard converting plants, Director (2000-2010)
No. of Portfolios for which Board Member Serves: 140
———————
Francine J. Bovich (64)
Board Member (2012)
Principal Occupation During Past 5 Years:
· Trustee, The Bradley Trusts, private trust funds (2011-present)
· Managing Director, Morgan Stanley Investment Management (1993-2010)
Other Public Company Board Memberships During Past 5 Years:
· Annaly Capital Management, Inc., Board Member (May 2014-present)
No. of Portfolios for which Board Member Serves: 79
———————
Kenneth A. Himmel (69)
Board Member (1994)
Principal Occupation During Past 5 Years:
· Managing Partner, Gulf Related, an international real estate development company (2010-present)
· President and CEO, Related Urban Development, a real estate development company (1996-present)
· President and CEO, Himmel & Company, a real estate development company (1980-present)
· CEO, American Food Management, a restaurant company (1983-present)
No. of Portfolios for which Board Member Serves: 29
———————
59
BOARD MEMBERS INFORMATION (Unaudited) (continued)
INDEPENDENT BOARD MEMBERS (continued)
Stephen J. Lockwood (68)
Board Member (1994)
Principal Occupation During Past 5 Years:
· Chairman of the Board, Stephen J. Lockwood and Company LLC, a real estate investment company (2000-present)
No. of Portfolios for which Board Member Serves: 29
———————
Roslyn M. Watson (66)
Board Member (1994)
Principal Occupation During Past 5 Years:
· Principal, Watson Ventures, Inc., a real estate investment company (1993-present)
No. of Portfolios for which Board Member Serves: 65
———————
Benaree Pratt Wiley (69)
Board Member (1998)
Principal Occupation During Past 5 Years:
· Principal, The Wiley Group, a firm specializing in strategy and business development (2005-present)
Other Public Company Board Memberships During Past 5 Years:
· CBIZ (formerly, Century Business Services, Inc.), a provider of outsourcing functions for small and medium size companies, Director (2008-present)
No. of Portfolios for which Board Member Serves: 65
———————
Once elected all Board Members serve for an indefinite term, but achieve Emeritus status upon reaching age 80. The address of the Board Members and Officers is c/o The Dreyfus Corporation, 200 Park Avenue, New York, New York 10166. Additional information about the Board Members is available in the fund’s Statement of Additional Information which can be obtained from Dreyfus free of charge by calling this toll free number: 1-800-DREYFUS.
James M. Fitzgibbons, Emeritus Board Member
J. Tomlinson Fort, Emeritus Board Member
60
OFFICERS OF THE FUND (Unaudited)
BRADLEY J. SKAPYAK, President since January 2010.
Chief Operating Officer and a director of the Manager since June 2009, Chairman of Dreyfus Transfer, Inc., an affiliate of the Manager and the transfer agent of the funds, since May 2011 and Executive Vice President of the Distributor since June 2007. From April 2003 to June 2009, Mr. Skapyak was the head of the Investment Accounting and Support Department of the Manager. He is an officer of 66 investment companies (comprised of 140 portfolios) managed by the Manager. He is 56 years old and has been an employee of the Manager since February 1988.
BENNETT A. MACDOUGALL, Chief Legal Officer since October 2015
Chief Legal Officer of the Manager since June 2015; from June 2005 to June 2015, Director and Associate General Counsel of Deutsche Bank – Asset & Wealth Management Division, and Chief Legal Officer of Deutsche Investment Management Americas Inc. He is an officer of 67 investment companies (comprised of 165 portfolios) managed by the Manager. He is 44 years old and has been an employee of the Manager since June 2015.
JANETTE E. FARRAGHER, Vice President and Secretary since December 2011.
Assistant General Counsel of BNY Mellon, and an officer of 67 investment companies (comprised of 165 portfolios) managed by the Manager. She is 52 years old and has been an employee of the Manager since February 1984.
JAMES BITETTO, Vice President and Assistant Secretary since August 2005.
Managing Counsel of BNY Mellon and Secretary of the Manager, and an officer of 67 investment companies (comprised of 165 portfolios) managed by the Manager. He is 49 years old and has been an employee of the Manager since December 1996.
JONI LACKS CHARATAN, Vice President and Assistant Secretary since August 2005.
Managing Counsel of BNY Mellon, and an officer of 67 investment companies (comprised of 165 portfolios) managed by the Manager. She is 59 years old and has been an employee of the Manager since October 1988.
JOSEPH M. CHIOFFI, Vice President and Assistant Secretary since August 2005.
Managing Counsel of BNY Mellon, and an officer of 67 investment companies (comprised of 165 portfolios) managed by the Manager. He is 53 years old and has been an employee of the Manager since June 2000.
JOHN B. HAMMALIAN, Vice President and Assistant Secretary since August 2005.
Senior Managing Counsel of BNY Mellon, and an officer of 67 investment companies (comprised of 165 portfolios) managed by the Manager. He is 52 years old and has been an employee of the Manager since February 1991.
MAUREEN E. KANE, Vice President and Assistant Secretary since April 2015.
Managing Counsel of BNY Mellon since July 2014; from October 2004 until July 2014, General Counsel, and from May 2009 until July 2014, Chief Compliance Officer of Century Capital Management. She is an officer of 67 investment companies (comprised of 165 portfolios) managed by the Manager. She is 53 years old and has been an employee of the Manager since July 2014.
SARAH S. KELLEHER, Vice President and Assistant Secretary since April 2014.
Senior Counsel of BNY Mellon, and an officer of 67 investment companies (comprised of 165 portfolios) managed by the Manager; from August 2005 to March 2013, Associate General Counsel of Third Avenue Management. She is 40 years old and has been an employee of the Manager since March 2013.
JEFF PRUSNOFSKY, Vice President and Assistant Secretary since August 2005.
Senior Managing Counsel of BNY Mellon, and an officer of 67 investment companies (comprised of 165 portfolios) managed by the Manager. He is 50 years old and has been an employee of the Manager since October 1990.
JAMES WINDELS, Treasurer since November 2001.
Director – Mutual Fund Accounting of the Manager, and an officer of 67 investment companies (comprised of 165 portfolios) managed by the Manager. He is 57 years old and has been an employee of the Manager since April 1985.
61
OFFICERS OF THE FUND (Unaudited) (continued)
RICHARD CASSARO, Assistant Treasurer since January 2008.
Senior Accounting Manager – Money Market and Municipal Bond Funds of the Manager, and an officer of 67 investment companies (comprised of 165 portfolios) managed by the Manager. He is 56 years old and has been an employee of the Manager since September 1982.
GAVIN C. REILLY, Assistant Treasurer since December 2005.
Tax Manager of the Investment Accounting and Support Department of the Manager, and an officer of 67 investment companies (comprised of 165 portfolios) managed by the Manager. He is 47 years old and has been an employee of the Manager since April 1991.
ROBERT S. ROBOL, Assistant Treasurer since August 2005.
Senior Accounting Manager – Fixed Income Funds of the Manager, and an officer of 67 investment companies (comprised of 165 portfolios) managed by the Manager. He is 51 years old and has been an employee of the Manager since October 1988.
ROBERT SALVIOLO, Assistant Treasurer since July 2007.
Senior Accounting Manager – Equity Funds of the Manager, and an officer of 67 investment companies (comprised of 165 portfolios) managed by the Manager. He is 48 years old and has been an employee of the Manager since June 1989.
ROBERT SVAGNA, Assistant Treasurer since December 2002.
Senior Accounting Manager – Equity Funds of the Manager, and an officer of 67 investment companies (comprised of 165 portfolios) managed by the Manager. He is 48 years old and has been an employee of the Manager since November 1990.
JOSEPH W. CONNOLLY, Chief Compliance Officer since October 2004.
Chief Compliance Officer of the Manager and The Dreyfus Family of Funds (67 investment companies, comprised of 165 portfolios). He is 58 years old and has served in various capacities with the Manager since 1980, including manager of the firm’s Fund Accounting Department from 1997 through October 2001.
62
NOTES
63
NOTES
64
NOTES
65
Dreyfus Opportunistic Fixed Income Fund
200 Park Avenue
New York, NY 10166
Manager
The Dreyfus Corporation
200 Park Avenue
New York, NY 10166
Custodian
The Bank of New York Mellon
225 Liberty Street
New York, NY 10286
Transfer Agent &
Dividend Disbursing Agent
Dreyfus Transfer, Inc.
200 Park Avenue
New York, NY 10166
Distributor
MBSC Securities Corporation
200 Park Avenue
New York, NY 10166
| | |
Ticker Symbols: | Class A: DSTAX Class C: DSTCX Class I: DSTRX Class Y: DSTYX |
Telephone Call your financial representative or 1-800-DREYFUS
Mail The Dreyfus Family of Funds, 144 Glenn Curtiss Boulevard, Uniondale, NY 11556-0144
E-mail Send your request to info@dreyfus.com
Internet Information can be viewed online or downloaded at www.dreyfus.com
The fund files its complete schedule of portfolio holdings with the Securities and Exchange Commission (“SEC”) for the first and third quarters of each fiscal year on Form N-Q. The fund’s Forms N-Q are available on the SEC’s website at www.sec.gov and may be reviewed and copied at the SEC’s Public Reference Room in Washington, DC. (phone 1-800-SEC-0330 for information).
A description of the policies and procedures that the fund uses to determine how to vote proxies relating to portfolio securities and information regarding how the fund voted these proxies for the most recent 12-month period ended June 30 is available at www.dreyfus.com and on the SEC’s website at www.sec.gov and without charge, upon request, by calling 1-800-DREYFUS.
| | |
© 2015 MBSC Securities Corporation
6148AR1015 | 
|
Dreyfus Tax Managed Growth Fund
| | | |

| | ANNUAL REPORT
October 31, 2015 |
| |
Save time. Save paper. View your next shareholder report online as soon as it’s available. Log into www.dreyfus.com and sign up for Dreyfus eCommunications. It’s simple and only takes a few minutes. |
| |
The views expressed in this report reflect those of the portfolio manager only through the end of the period covered and do not necessarily represent the views of Dreyfus or any other person in the Dreyfus organization. Any such views are subject to change at any time based upon market or other conditions and Dreyfus disclaims any responsibility to update such views. These views may not be relied on as investment advice and, because investment decisions for a Dreyfus fund are based on numerous factors, may not be relied on as an indication of trading intent on behalf of any Dreyfus fund. |
| |
Not FDIC-Insured • Not Bank-Guaranteed • May Lose Value |
Contents
THE FUND
FOR MORE INFORMATION
Back Cover
| | | | |
| |
Dreyfus Tax Managed Growth Fund
| | The Fund |
A LETTER FROM THE PRESIDENT
Dear Shareholder:
We are pleased to present this annual report for Dreyfus Tax Managed Growth Fund, covering the 12-month period from November 1, 2014, through October 31, 2015. For information about how the fund performed during the reporting period, as well as general market perspectives, we provide a Discussion of Fund Performance on the pages that follow.
Financial markets proved volatile over the reporting period amid choppy U.S. and global economic growth. U.S. stocks advanced over the final months of 2014 and the spring of 2015, with some broad measures of market performance setting new record highs. Those gains were largely erased over the summer when global economic instability undermined investor sentiment, but a renewed rally in October enabled most broad stock indices to end the reporting period in positive territory. In contrast, international stocks generally lost a degree of value, with developed markets faring far better than emerging markets amid falling commodity prices and depreciating currency values. U.S. bonds generally produced modestly positive total returns, with municipal bonds and longer term U.S. government securities faring better, on average, than corporate-backed bonds.
We expect market volatility to persist over the near term until investors see greater clarity regarding short-term U.S. interest rates and global economic conditions. Our investment strategists and portfolio managers are monitoring developments carefully, keeping a close watch on credit spreads, currency values, commodity prices, corporate profits, economic trends in the emerging markets, and other developments that could influence investor sentiment. Over the longer term, we remain confident that markets are likely to benefit as investors increasingly recognize that inflation is likely to stay low, economic growth expectations are stabilizing, and monetary policies remain accommodative in most regions of the world. In our view, investors will continue to be well served under these circumstances by a long-term perspective and a disciplined investment approach.
Thank you for your continued confidence and support.
Sincerely,

J. Charles Cardona
President
The Dreyfus Corporation
November 16, 2015
2
DISCUSSION OF FUND PERFORMANCE
For the period of November 1, 2014, through October 31, 2015, as provided by Fayez Sarofim, Portfolio Manager of Fayez Sarofim & Co., Sub-Investment Adviser
Fund and Market Performance Overview
For the 12-month period ended October 31, 2015, Dreyfus Tax Managed Growth Fund’s Class A shares produced a total return of -0.65%, Class C shares returned -1.42%, and Class I shares returned -0.43%.1 In comparison, the Standard & Poor’s 500® Composite Stock Price Index (“S&P 500 Index”), the fund’s benchmark, returned 5.21% for the same period.2
Moderate gains from the S&P 500 Index for the reporting period overall masked heightened volatility stemming from global economic concerns. The fund’s emphasis on industry leaders with international operations weighed on the fund’s performance compared to its benchmark.
The Fund’s Investment Approach
The fund invests primarily in well-established, multinational companies that we believe are well positioned to weather difficult economic climates and thrive during favorable times. We focus on purchasing large-cap, blue-chip stocks at a price we consider to be justified by a company’s fundamentals. The result is a portfolio of stocks selected for what we consider to be sustained patterns of profitability, strong balance sheets, expanding global presence, and above-average earnings growth potential. At the same time, we manage the fund in a manner cognizant of the concerns of tax-conscious investors. We typically buy and sell relatively few stocks during the course of the year, which may help reduce investors’ tax liabilities.
Global Economic Concerns Sparked Market Turmoil
The S&P 500 Index traced a choppy course over the 12-month reporting period. Despite a series of short-lived sell-offs in late 2014 and early 2015, the Index pressed to a new, all-time high in May before retreating amid growing worries about overseas developments and an approaching inflection point in U.S. monetary policy. Greece’s contentious debt standoff with the European Union rattled equity markets in late June. Then, more dramatically, the plunge in Chinese stocks and the surprise devaluation of the yuan helped push the Index into a steep decline in August. At its August low point, the S&P 500 Index had corrected more than 12% from the May peak.
The reporting period’s low would be tested in September before a rapid rebound in October recovered lost ground. For the reporting period overall, the S&P 500 Index posted a mid-single digit return, although the dispersion of returns among market sectors was quite broad. The consumer discretionary, information technology, and consumer staples sectors led the S&P 500 Index, while the energy and materials sectors, both of which tend to be very sensitive to commodity prices and emerging market demand, were the weakest.
International Exposure Weighed on Relative Performance
The fund’s relative performance strengthened amid the heightened volatility of the reporting period’s final three months, but its results lagged the S&P 500 Index for the 12-month reporting period overall. Our emphasis on industry leaders with international exposure generally restrained relative performance at a time when investors favored domestically
3
DISCUSSION OF FUND PERFORMANCE (continued)
oriented businesses. In particular, our stock focus in the industrials and health care sectors proved detrimental. In the health care sector, managed care stocks outperformed the major pharmaceutical developers, which the fund emphasized. Underweighted exposure to the stronger consumer discretionary sector also hurt relative performance. With the persistent weakness in oil prices, an overweighted allocation to the energy sector undercut results, but this impact was reduced by our focus on major integrated oil companies and the avoidance of more cyclical oil service companies and gas utilities.
Factors that added value relative to the S&P 500 Index included overweighted exposure to the consumer staples sector, where stable, everyday businesses fared relatively well. An underweighted position in the materials sector also was beneficial, as was the lack of exposure to the weak telecom and utilities sectors.
Individual stocks making the largest positive contributions to the fund’s returns included Apple, Altria Group, Walgreens Boots Alliance, Walt Disney, NovoNordisk, and McDonald’s. The greatest detractors from returns were Chevron, Canadian Pacific Railway, Exxon Mobil, Franklin Resources, Imperial Oil, and QUALCOMM.
Positioned for Interest-Rate Normalization
Investors generally favored stocks of smaller and domestically-oriented companies when markets were awash with excess liquidity and monetary policies were extremely accommodative. Now conditions seem to be developing that would support a large-cap, high-quality portfolio bias. Historically, when interest rates begin to rise, particularly in a sluggish economic environment, stocks of large, high-quality companies tend to outperform. These companies generally have more options to protect their margins and absorb higher labor and interest costs. With their strong balance sheets and stable cash flows, they can continue to pursue their growth initiatives as rates rise, while giving cash back to shareholders through dividend payments and share repurchases. The fund’s investment approach focuses on such companies. The quality metrics of industry-leading companies can offer a degree of protection as markets adjust to the prospect of more normal interest rates. Furthermore, any evidence of stabilization abroad is likely to prompt greater recognition of the value of their prominent, worldwide franchises.
November 16, 2015
Equity funds are subject generally to market, market sector, market liquidity, issuer, and investment style risks, among other factors, to varying degrees, all of which are more fully described in the fund’s prospectus.
1 Total return includes reinvestment of dividends and any capital gains paid, and does not take into consideration the maximum initial sales charge in the case of Class A shares or the applicable contingent deferred sales charge imposed on redemptions in the case of Class C shares. Had these charges been reflected, returns would have been lower. Past performance is no guarantee of future results. Share price and investment return fluctuate such that upon redemption, fund shares may be worth more or less than their original cost.
2 SOURCE: Lipper Inc. – Reflects monthly reinvestment of dividends and, where applicable, capital gain distributions. The Standard & Poor’s 500® Composite Stock Price Index is a widely accepted, unmanaged index of U.S. stock market performance. Investors cannot invest directly in any index.
4
FUND PERFORMANCE

Comparison of change in value of $10,000 investment in Dreyfus Tax Managed Growth Fund Class A shares, Class C shares and Class I shares and the Standard & Poor's 500 Composite Stock Price Index
† Source: Lipper Inc.
Past performance is not predictive of future performance.
The above graph compares a $10,000 investment made in each of the Class A, Class C and Class I shares of Dreyfus Tax Managed Growth Fund on 10/31/05 to a $10,000 investment made in the Standard & Poor’s 500 Composite Stock Price Index (the “Index”) on that date. All dividends and capital gain distributions are reinvested.
The fund’s performance shown in the line graph above takes into account the maximum initial sales charge on Class A shares and all other applicable fees and expenses on all classes. The Index is a widely accepted, unmanaged index of U.S. stock market performance. Unlike a mutual fund, the Index is not subject to charges, fees and other expenses. Investors cannot invest directly in any index. Further information relating to fund performance, including expense reimbursements, if applicable, is contained in the Financial Highlights section of the prospectus and elsewhere in this report.
5
FUND PERFORMANCE (continued)
| | | | |
Average Annual Total Returns as of 10/31/15 |
| | 1 Year | 5 Years | 10 Years |
Class A shares | | | |
with maximum sales charge (5.75%) | -6.37% | 8.66% | 5.67% |
without sales charge | -0.65% | 9.96% | 6.30% |
Class C shares | | | |
with applicable redemption charge † | -2.38% | 9.14% | 5.50% |
without redemption | -1.42% | 9.14% | 5.50% |
Class I shares | -0.43% | 10.23% | 6.55% |
Standard & Poor's 500 Composite Stock Price Index | 5.21% | 14.32% | 7.84% |
Past performance is not predictive of future performance. The fund’s performance shown in the graph and table does not reflect the deduction of taxes that a shareholder would pay on fund distributions or the redemption of fund shares. In addition to the performance of Class A shares shown with and without a maximum sales charge, the fund’s performance shown in the table takes into account all other applicable fees and expenses on all classes.
† The maximum contingent deferred sales charge for Class C shares is 1% for shares redeemed within one year of the date of purchase.
6
UNDERSTANDING YOUR FUND’S EXPENSES (Unaudited)
As a mutual fund investor, you pay ongoing expenses, such as management fees and other expenses. Using the information below, you can estimate how these expenses affect your investment and compare them with the expenses of other funds. You also may pay one-time transaction expenses, including sales charges (loads) and redemption fees, which are not shown in this section and would have resulted in higher total expenses. For more information, see your fund’s prospectus or talk to your financial adviser.
Review your fund’s expenses
The table below shows the expenses you would have paid on a $1,000 investment in Dreyfus Tax Managed Growth Fund from May 1, 2015 to October 31, 2015. It also shows how much a $1,000 investment would be worth at the close of the period, assuming actual returns and expenses.
| | | | | | | | | | | | | | | |
Expenses and Value of a $1,000 Investment | | |
assuming actual returns for the six months ended October 31, 2015 |
| | | | | | | | |
| | | | Class A | Class C | Class I | |
Expenses paid per $1,000† | | $ 6.73 | | $ 10.45 | | $ 5.49 | |
Ending value (after expenses) | | $ 978.10 | | $ 974.00 | | $ 979.00 | |
COMPARING YOUR FUND’S EXPENSES
WITH THOSE OF OTHER FUNDS (Unaudited)
Using the SEC’s method to compare expenses
The Securities and Exchange Commission (SEC) has established guidelines to help investors assess fund expenses. Per these guidelines, the table below shows your fund’s expenses based on a $1,000 investment, assuming a hypothetical 5% annualized return. You can use this information to compare the ongoing expenses (but not transaction expenses or total cost) of investing in the fund with those of other funds. All mutual fund shareholder reports will provide this information to help you make this comparison. Please note that you cannot use this information to estimate your actual ending account balance and expenses paid during the period.
| | | | | | | | | | | | | | |
Expenses and Value of a $1,000 Investment | | |
assuming a hypothetical 5% annualized return for the six months ended October 31, 2015 |
| | | | | | | | |
| | | | Class A | Class C | Class I | |
Expenses paid per $1,000† | | $ 6.87 | | $ 10.66 | | $ 5.60 | |
Ending value (after expenses) | | $ 1,018.40 | | $ 1,014.62 | | $ 1,019.66 | |
† Expenses are equal to the fund's annualized expense ratio of 1.35% for Class A, 2.10% for Class C and 1.10% for Class I, multiplied by the average account value over the period, multiplied by 184/365 (to reflect the one-half year period).
7
STATEMENT OF INVESTMENTS
October 31, 2015
| | | | | | |
Common Stocks - 99.5% | | Shares | | Value ($) | |
Banks - 4.0% | | | | | |
JPMorgan Chase & Co. | | 75,300 | | 4,838,025 | |
Wells Fargo & Co. | | 42,700 | | 2,311,778 | |
| | | | | 7,149,803 | |
Capital Goods - 1.3% | | | | | |
United Technologies | | 23,400 | | 2,302,794 | |
Consumer Durables & Apparel - .8% | | | | | |
NIKE, Cl. B | | 11,130 | | 1,458,364 | |
Consumer Services - 1.7% | | | | | |
McDonald's | | 27,150 | | 3,047,588 | |
Diversified Financials - 6.5% | | | | | |
American Express | | 33,700 | | 2,468,862 | |
BlackRock | | 10,600 | | 3,730,882 | |
Franklin Resources | | 52,800 | | 2,152,128 | |
Intercontinental Exchange | | 6,000 | | 1,514,400 | |
State Street | | 25,400 | | 1,752,600 | |
| | | | | 11,618,872 | |
Energy - 12.2% | | | | | |
Chevron | | 59,600 | | 5,416,448 | |
ConocoPhillips | | 37,800 | a | 2,016,630 | |
EOG Resources | | 13,400 | | 1,150,390 | |
Exxon Mobil | | 101,912 | | 8,432,199 | |
Imperial Oil | | 7,900 | a | 262,675 | |
Occidental Petroleum | | 59,700 | | 4,450,038 | |
| | | | | 21,728,380 | |
Food & Staples Retailing - 2.8% | | | | | |
Walgreens Boots Alliance | | 46,400 | | 3,929,152 | |
Whole Foods Market | | 36,000 | | 1,078,560 | |
| | | | | 5,007,712 | |
Food, Beverage & Tobacco - 21.4% | | | | | |
Altria Group | | 101,900 | | 6,161,893 | |
Coca-Cola | | 147,700 | | 6,255,095 | |
Diageo, ADR | | 16,100 | | 1,852,788 | |
Nestle, ADR | | 74,150 | | 5,651,713 | |
PepsiCo | | 40,300 | | 4,118,257 | |
Philip Morris International | | 122,300 | | 10,811,320 | |
SABMiller | | 51,850 | | 3,193,265 | |
| | | | | 38,044,331 | |
8
| | | | | | |
Common Stocks - 99.5% (continued) | | Shares | | Value ($) | |
Health Care Equipment & Services - 1.8% | | | | | |
Abbott Laboratories | | 71,100 | | 3,185,280 | |
Household & Personal Products - 4.5% | | | | | |
Estee Lauder, Cl. A | | 44,600 | | 3,588,516 | |
Procter & Gamble | | 57,100 | | 4,361,298 | |
| | | | | 7,949,814 | |
Insurance - 2.2% | | | | | |
ACE | | 34,700 | | 3,939,838 | |
Materials - 1.2% | | | | | |
Praxair | | 19,500 | | 2,166,255 | |
Media - 5.7% | | | | | |
Comcast, Cl. A | | 51,400 | | 3,218,668 | |
Twenty-First Century Fox, Cl. A | | 36,000 | | 1,104,840 | |
Twenty-First Century Fox, Cl. B | | 50,000 | | 1,544,000 | |
Walt Disney | | 37,900 | | 4,310,746 | |
| | | | | 10,178,254 | |
Pharmaceuticals, Biotechnology & Life Sciences - 12.1% | | | | | |
AbbVie | | 71,100 | | 4,234,005 | |
Alexion Pharmaceuticals | | 8,790 | b | 1,547,040 | |
Celgene | | 13,000 | b | 1,595,230 | |
Gilead Sciences | | 20,000 | | 2,162,600 | |
Novartis, ADR | | 28,600 | | 2,586,298 | |
Novo Nordisk, ADR | | 99,500 | | 5,291,410 | |
Roche Holding, ADR | | 123,400 | | 4,184,494 | |
| | | | | 21,601,077 | |
Semiconductors & Semiconductor Equipment - 3.7% | | | | | |
ASML Holding | | 18,500 | a | 1,716,615 | |
Texas Instruments | | 71,000 | | 4,027,120 | |
Xilinx | | 17,100 | | 814,302 | |
| | | | | 6,558,037 | |
Software & Services - 8.4% | | | | | |
Alphabet, Cl. C | | 2,655 | b | 1,887,200 | |
Automatic Data Processing | | 10,840 | | 942,972 | |
Facebook, Cl. A | | 25,000 | b | 2,549,250 | |
International Business Machines | | 24,900 | | 3,487,992 | |
Microsoft | | 28,270 | | 1,488,133 | |
Oracle | | 57,500 | | 2,233,300 | |
VeriSign | | 11,000 | a,b | 886,600 | |
Visa, Cl. A | | 19,000 | | 1,474,020 | |
| | | | | 14,949,467 | |
9
STATEMENT OF INVESTMENTS (continued)
| | | | | | |
Common Stocks - 99.5% (continued) | | Shares | | Value ($) | |
Technology Hardware & Equipment - 7.0% | | | | | |
Apple | | 87,200 | | 10,420,400 | |
QUALCOMM | | 33,500 | | 1,990,570 | |
| | | | | 12,410,970 | |
Transportation - 2.2% | | | | | |
Canadian Pacific Railway | | 18,900 | | 2,655,450 | |
Union Pacific | | 15,000 | | 1,340,250 | |
| | | | | 3,995,700 | |
Total Common Stocks (cost $115,463,529) | | | | 177,292,536 | |
Other Investment - .5% | | Number of Contracts | | Value ($) | |
Registered Investment Company; | | | | | |
Dreyfus Institutional Preferred Plus Money Market Fund | | 792,153 | c | 792,153 | |
(cost $792,153) | | | | | |
Investment of Cash Collateral for Securities Loaned - 1.4% | | | | | |
Registered Investment Company; | | | | | |
Dreyfus Institutional Cash Advantage Fund | | 2,556,892 | c | 2,556,892 | |
(cost $2,556,892) | | | | | |
Total Investments (cost $118,812,574) | | 101.4% | | 180,641,581 | |
Liabilities, Less Cash and Receivables | | (1.4%) | | (2,524,114) | |
Net Assets | | 100.0% | | 178,117,467 | |
ADR—American Depository Receipt
a Security, or portion thereof, on loan. At October 31, 2015, the value of the fund's securities on loan was $3,677,180 and the value of the collateral held by the fund was $3,750,361, consisting of cash collateral of $2,556,892 and U.S. Government & Agency securities valued at $1,193,469.
b Non-income producing security.
c Investment in affiliated money market mutual fund.
10
| | |
Portfolio Summary (Unaudited) † | Value (%) |
Food, Beverage & Tobacco | 21.4 |
Energy | 12.2 |
Pharmaceuticals, Biotechnology & Life Sciences | 12.1 |
Software & Services | 8.4 |
Technology Hardware & Equipment | 7.0 |
Diversified Financials | 6.5 |
Media | 5.7 |
Household & Personal Products | 4.5 |
Banks | 4.0 |
Semiconductors & Semiconductor Equipment | 3.7 |
Food & Staples Retailing | 2.8 |
Transportation | 2.2 |
Insurance | 2.2 |
Money Market Investments | 1.9 |
Health Care Equipment & Services | 1.8 |
Consumer Services | 1.7 |
Capital Goods | 1.3 |
Materials | 1.2 |
Consumer Durables & Apparel | .8 |
| | 101.4 |
†Based on net assets.
See notes to financial statements.
11
STATEMENT OF ASSETS AND LIABILITIES
October 31, 2015
| | | | | | | |
| | | | | | |
| | | Cost | | Value | |
Assets ($): | | | | |
Investments in securities—See Statement of Investments
(including securities on loan, valued at $3,677,180)—Note 1(b): | | | | |
Unaffiliated issuers | | 115,463,529 | | 177,292,536 | |
Affiliated issuers | | 3,349,045 | | 3,349,045 | |
Cash | | | | | 9,012 | |
Dividends and securities lending income receivable | | | | | 254,511 | |
Receivable for shares of Common Stock subscribed | | | | | 11,841 | |
| | | | | 180,916,945 | |
Liabilities ($): | | | | |
Due to The Dreyfus Corporation and affiliates—Note 3(b) | | | | | 204,185 | |
Liability for securities on loan—Note 1(b) | | | | | 2,556,892 | |
Payable for shares of Common Stock redeemed | | | | | 38,276 | |
Accrued expenses | | | | | 125 | |
| | | | | 2,799,478 | |
Net Assets ($) | | | 178,117,467 | |
Composition of Net Assets ($): | | | | |
Paid-in capital | | | | | 106,656,788 | |
Accumulated undistributed investment income—net | | | | | 512,614 | |
Accumulated net realized gain (loss) on investments | | | | | 9,119,058 | |
Accumulated net unrealized appreciation (depreciation)
on investments | | | | | 61,829,007 | |
Net Assets ($) | | | 178,117,467 | |
| | | | | |
Net Asset Value Per Share | Class A | Class C | Class I | |
Net Assets ($) | 74,091,223 | 32,241,312 | 71,784,932 | |
Shares Outstanding | 2,903,798 | 1,333,849 | 2,807,183 | |
Net Asset Value Per Share ($) | 25.52 | 24.17 | 25.57 | |
See notes to financial statements.
12
STATEMENT OF OPERATIONS
Year Ended October 31, 2015
| | | | | | | |
| | | | | | |
| | | | | | |
Investment Income ($): | | | | |
Income: | | | | |
Cash dividends (net of $75,286 foreign taxes withheld at source): | | | | |
Unaffiliated issuers | | | 4,679,684 | |
Affiliated issuers | | | 896 | |
Income from securities lending—Note 1(b) | | | 4,697 | |
Total Income | | | 4,685,277 | |
Expenses: | | | | |
Management fee—Note 3(a) | | | 2,022,204 | |
Distribution/Service Plan fees—Note 3(b) | | | 538,194 | |
Directors' fees—Note 3(a,c) | | | 12,012 | |
Loan commitment fees—Note 2 | | | 1,929 | |
Interest expense—Note 2 | | | 112 | |
Total Expenses | | | 2,574,451 | |
Less—Directors' fees reimbursed by Dreyfus—Note 3(a) | | | (12,012) | |
Net Expenses | | | 2,562,439 | |
Investment Income—Net | | | 2,122,838 | |
Realized and Unrealized Gain (Loss) on Investments—Note 4 ($): | | |
Net realized gain (loss) on investments | 9,119,227 | |
Net unrealized appreciation (depreciation) on investments | | | (12,576,327) | |
Net Realized and Unrealized Gain (Loss) on Investments | | | (3,457,100) | |
Net (Decrease) in Net Assets Resulting from Operations | | (1,334,262) | |
See notes to financial statements.
13
STATEMENT OF CHANGES IN NET ASSETS
| | | | | | | | | | |
| | | | Year Ended October 31, |
| | | | 2015 | | | | 2014 | |
Operations ($): | | | | | | | | |
Investment income—net | | | 2,122,838 | | | | 2,216,114 | |
Net realized gain (loss) on investments | | 9,119,227 | | | | 5,646,286 | |
Net unrealized appreciation (depreciation)
on investments | | (12,576,327) | | | | 13,663,583 | |
Net Increase (Decrease) in Net Assets
Resulting from Operations | (1,334,262) | | | | 21,525,983 | |
Dividends to Shareholders from ($): | | | | | | | | |
Investment income—net: | | | | | | | | |
Class A | | | (973,165) | | | | (1,673,385) | |
Class C | | | (175,990) | | | | (210,320) | |
Class I | | | (1,024,818) | | | | (393,158) | |
Net realized gain on investments: | | | | | | | | |
Class A | | | (2,133,022) | | | | - | |
Class C | | | (920,756) | | | | - | |
Class I | | | (1,736,330) | | | | - | |
Total Dividends | | | (6,964,081) | | | | (2,276,863) | |
Capital Stock Transactions ($): | | | | | | | | |
Net proceeds from shares sold: | | | | | | | | |
Class A | | | 3,569,042 | | | | 11,671,447 | |
Class C | | | 2,076,095 | | | | 3,667,230 | |
Class I | | | 14,400,275 | | | | 63,932,939 | |
Dividends reinvested: | | | | | | | | |
Class A | | | 2,629,098 | | | | 1,503,509 | |
Class C | | | 670,735 | | | | 132,504 | |
Class I | | | 2,657,591 | | | | 355,412 | |
Cost of shares redeemed: | | | | | | | | |
Class A | | | (16,019,872) | | | | (85,863,612) | |
Class C | | | (4,484,106) | | | | (5,648,728) | |
Class I | | | (12,538,617) | | | | (10,835,103) | |
Increase (Decrease) in Net Assets
from Capital Stock Transactions | (7,039,759) | | | | (21,084,402) | |
Total Increase (Decrease) in Net Assets | (15,338,102) | | | | (1,835,282) | |
Net Assets ($): | | | | | | | | |
Beginning of Period | | | 193,455,569 | | | | 195,290,851 | |
End of Period | | | 178,117,467 | | | | 193,455,569 | |
Undistributed investment income—net | 512,614 | | | | 563,749 | |
14
| | | | | | | | | | |
| | | | Year Ended October 31, |
| | | | 2015 | | | | 2014 | |
Capital Share Transactions: | | | | | | | | |
Class A | | | | | | | | |
Shares sold | | | 138,453 | | | | 471,566 | |
Shares issued for dividends reinvested | | | 100,555 | | | | 60,583 | |
Shares redeemed | | | (619,740) | | | | (3,321,920) | |
Net Increase (Decrease) in Shares Outstanding | (380,732) | | | | (2,789,771) | |
Class C | | | | | | | | |
Shares sold | | | 84,492 | | | | 154,387 | |
Shares issued for dividends reinvested | | | 26,990 | | | | 5,595 | |
Shares redeemed | | | (183,442) | | | | (235,473) | |
Net Increase (Decrease) in Shares Outstanding | (71,960) | | | | (75,491) | |
Class I | | | | | | | | |
Shares sold | | | 560,041 | | | | 2,430,540 | |
Shares issued for dividends reinvested | | | 101,531 | | | | 14,009 | |
Shares redeemed | | | (487,342) | | | | (434,481) | |
Net Increase (Decrease) in Shares Outstanding | 174,230 | | | | 2,010,068 | |
See notes to financial statements.
15
FINANCIAL HIGHLIGHTS
The following tables describe the performance for each share class for the fiscal periods indicated. All information (except portfolio turnover rate) reflects financial results for a single fund share. Total return shows how much your investment in the fund would have increased (or decreased) during each period, assuming you had reinvested all dividends and distributions. These figures have been derived from the fund’s financial statements.
| | | | | | | |
| | | | |
| | Year Ended October 31, |
Class A Shares | | 2015 | 2014 | 2013 | 2012 | 2011 |
Per Share Data ($): | | | | | | |
Net asset value, beginning of period | | 26.65 | 24.09 | 21.27 | 19.34 | 17.47 |
Investment Operations: | | | | | | |
Investment income—neta | | .31 | .33 | .34 | .27 | .27 |
Net realized and unrealized
gain (loss) on investments | | (.47) | 2.54 | 2.80 | 2.03 | 1.85 |
Total from Investment Operations | | (.16) | 2.87 | 3.14 | 2.30 | 2.12 |
Distributions: | | | | | | |
Dividends from investment income—net | | (.31) | (.31) | (.32) | (.37) | (.25) |
Dividends from net realized
gain on investments | | (.66) | - | - | - | - |
Total Distributions | | (.97) | (.31) | (.32) | (.37) | (.25) |
Net asset value, end of period | | 25.52 | 26.65 | 24.09 | 21.27 | 19.34 |
Total Return (%)b | | (.65) | 12.00 | 14.91 | 12.10 | 12.13 |
Ratios/Supplemental Data (%): | | | | | | |
Ratio of total expenses to average net assets | | 1.36 | 1.36 | 1.36 | 1.36 | 1.36 |
Ratio of net expenses to average net assets | | 1.35 | 1.35 | 1.35 | 1.35 | 1.32 |
Ratio of net investment income
to average net assets | | 1.20 | 1.30 | 1.49 | 1.28 | 1.42 |
Portfolio Turnover Rate | | 11.02 | 2.44 | 6.47 | 11.15 | 15.10 |
Net Assets, end of period ($ x 1,000) | | 74,091 | 87,549 | 146,333 | 132,387 | 100,740 |
a Based on average shares outstanding.
b Exclusive of sales charge.
See notes to financial statements.
16
| | | | | | | |
| | | | |
| | Year Ended October 31, |
Class C Shares | | 2015 | 2014 | 2013 | 2012 | 2011 |
Per Share Data ($): | | | | | | |
Net asset value, beginning of period | | 25.30 | 22.90 | 20.23 | 18.36 | 16.60 |
Investment Operations: | | | | | | |
Investment income—neta | | .11 | .12 | .16 | .10 | .12 |
Net realized and unrealized
gain (loss) on investments | | (.45) | 2.42 | 2.68 | 1.94 | 1.76 |
Total from Investment Operations | | (.34) | 2.54 | 2.84 | 2.04 | 1.88 |
Distributions: | | | | | | |
Dividends from investment income—net | | (.13) | (.14) | (.17) | (.17) | (.12) |
Dividends from net realized
gain on investments | | (.66) | - | - | - | - |
Total Distributions | | (.79) | (.14) | (.17) | (.17) | (.12) |
Net asset value, end of period | | 24.17 | 25.30 | 22.90 | 20.23 | 18.36 |
Total Return (%)b | | (1.42) | 11.16 | 14.11 | 11.19 | 11.38 |
Ratios/Supplemental Data (%): | | | | | | |
Ratio of total expenses to average net assets | | 2.11 | 2.11 | 2.11 | 2.11 | 2.11 |
Ratio of net expenses to average net assets | | 2.10 | 2.10 | 2.10 | 2.10 | 2.07 |
Ratio of net investment income
to average net assets | | .45 | .48 | .75 | .51 | .68 |
Portfolio Turnover Rate | | 11.02 | 2.44 | 6.47 | 11.15 | 15.10 |
Net Assets, end of period ($ x 1,000) | | 32,241 | 35,570 | 33,915 | 29,304 | 20,386 |
a Based on average shares outstanding.
b Exclusive of sales charge.
See notes to financial statements.
17
FINANCIAL HIGHLIGHTS (continued)
| | | | | | | | | | |
| | | | | | | |
| | Year Ended October 31, |
Class I Shares | | 2015 | 2014 | 2013 | 2012 | 2011 |
Per Share Data ($): | | | | | | |
Net asset value, beginning of period | | 26.71 | 24.15 | 21.32 | 19.40 | 17.53 |
Investment Operations: | | | | | | |
Investment income—neta | | .37 | .32 | .40 | .32 | .30 |
Net realized and unrealized
gain (loss) on investments | | (.47) | 2.62 | 2.81 | 2.04 | 1.86 |
Total from Investment Operations | | (.10) | 2.94 | 3.21 | 2.36 | 2.16 |
Distributions: | | | | | | |
Dividends from investment income—net | | (.38) | (.38) | (.38) | (.44) | (.29) |
Dividends from net realized
gain on investments | | (.66) | - | - | - | - |
Total Distributions | | (1.04) | (.38) | (.38) | (.44) | (.29) |
Net asset value, end of period | | 25.57 | 26.71 | 24.15 | 21.32 | 19.40 |
Total Return (%) | | (.43) | 12.29 | 15.21 | 12.33 | 12.47 |
Ratios/Supplemental Data (%): | | | | | | |
Ratio of total expenses to average net assets | | 1.11 | 1.11 | 1.11 | 1.11 | 1.11 |
Ratio of net expenses to average net assets | | 1.10 | 1.10 | 1.10 | 1.10 | 1.08 |
Ratio of net investment income
to average net assets | | 1.44 | 1.24 | 1.78 | 1.51 | 1.62 |
Portfolio Turnover Rate | | 11.02 | 2.44 | 6.47 | 11.15 | 15.10 |
Net Assets, end of period ($ x 1,000) | | 71,785 | 70,336 | 15,043 | 18,253 | 6,284 |
a Based on average shares outstanding.
See notes to financial statements.
18
NOTES TO FINANCIAL STATEMENTS
NOTE 1—Significant Accounting Policies:
Dreyfus Tax Managed Growth Fund (the “fund”) is a separate diversified series of The Dreyfus/Laurel Funds, Inc. (the “Company”), which is registered under the Investment Company Act of 1940, as amended (the “Act”), as an open-end management investment company and operates as a series company currently offering ten series, including the fund. The fund’s investment objective is to seek long-term capital appreciation consistent with minimizing realized capital gains and taxable current income. The Dreyfus Corporation (the “Manager” or “Dreyfus”), a wholly-owned subsidiary of The Bank of New York Mellon Corporation (“BNY Mellon”), serves as the fund’s investment adviser. Fayez Sarofim & Co. (“Sarofim & Co.”), serves as the fund’s sub-investment adviser.
MBSC Securities Corporation (the “Distributor”), a wholly-owned subsidiary of Dreyfus, is the distributor of the fund’s shares. The fund is authorized to issue 500 million shares of $.001 par value Common Stock. The fund currently offers three classes of shares: Class A (300 million shares authorized), Class C (100 million shares authorized) and Class I (100 million shares authorized). Class A and Class C shares are sold primarily to retail investors through financial intermediaries and bear Distribution fees and/or Service Plan fees. Class A shares generally are subject to a sales charge imposed at the time of purchase. Class C shares are subject to a contingent deferred sales charge (“CDSC”) imposed on Class C shares redeemed within one year of purchase. Class I shares are sold primarily to bank trust departments and other financial service providers (including The Bank of New York Mellon, a subsidiary of BNY Mellon and an affiliate of Dreyfus, and its affiliates), acting on behalf of customers having a qualified trust or an investment account or relationship at such institution, and bear no Distribution or Service Plan fees. Class I shares are offered without a front-end sales charge or CDSC. Other differences between the classes include the services offered to and the expenses borne by each class, and certain voting rights. Income, expenses (other than expenses attributable to a specific class), and realized and unrealized gains or losses on investments are allocated to each class of shares based on its relative net assets.
The Company accounts separately for the assets, liabilities and operations of each series. Expenses directly attributable to each series are charged to that series’ operations; expenses which are applicable to all series are allocated among them on a pro rata basis.
19
NOTES TO FINANCIAL STATEMENTS (continued)
The Financial Accounting Standards Board (“FASB”) Accounting Standards Codification (“ASC”) is the exclusive reference of authoritative U.S. generally accepted accounting principles (“GAAP”) recognized by the FASB to be applied by nongovernmental entities. Rules and interpretive releases of the Securities and Exchange Commission (“SEC”) under authority of federal laws are also sources of authoritative GAAP for SEC registrants. The fund’s financial statements are prepared in accordance with GAAP, which may require the use of management estimates and assumptions. Actual results could differ from those estimates.
(a) Portfolio valuation: The fair value of a financial instrument is the amount that would be received to sell an asset or paid to transfer a liability in an orderly transaction between market participants at the measurement date (i.e., the exit price). GAAP establishes a fair value hierarchy that prioritizes the inputs of valuation techniques used to measure fair value. This hierarchy gives the highest priority to unadjusted quoted prices in active markets for identical assets or liabilities (Level 1 measurements) and the lowest priority to unobservable inputs (Level 3 measurements).
Additionally, GAAP provides guidance on determining whether the volume and activity in a market has decreased significantly and whether such a decrease in activity results in transactions that are not orderly. GAAP requires enhanced disclosures around valuation inputs and techniques used during annual and interim periods.
Various inputs are used in determining the value of the fund’s investments relating to fair value measurements. These inputs are summarized in the three broad levels listed below:
Level 1—unadjusted quoted prices in active markets for identical investments.
Level 2—other significant observable inputs (including quoted prices for similar investments, interest rates, prepayment speeds, credit risk, etc.).
Level 3—significant unobservable inputs (including the fund’s own assumptions in determining the fair value of investments).
The inputs or methodology used for valuing securities are not necessarily an indication of the risk associated with investing in those securities.
Changes in valuation techniques may result in transfers in or out of an assigned level within the disclosure hierarchy. Valuation techniques used to value the fund’s investments are as follows:
20
Investments in securities are valued at the last sales price on the securities exchange or national securities market on which such securities are primarily traded. Securities listed on the National Market System for which market quotations are available are valued at the official closing price or, if there is no official closing price that day, at the last sales price. For open short positions, asked prices are used for valuation purposes. Bid price is used when no asked price is available. Registered investment companies that are not traded on an exchange are valued at their net asset value. All of the preceding securities are generally categorized within Level 1 of the fair value hierarchy.
Securities not listed on an exchange or the national securities market, or securities for which there were no transactions, are valued at the average of the most recent bid and asked prices. These securities are generally categorized within Level 2 of the fair value hierarchy.
Fair valuing of securities may be determined with the assistance of a pricing service using calculations based on indices of domestic securities and other appropriate indicators, such as prices of relevant ADRs and financial futures. Utilizing these techniques may result in transfers between Level 1 and Level 2 of the fair value hierarchy.
When market quotations or official closing prices are not readily available, or are determined not to reflect accurately fair value, such as when the value of a security has been significantly affected by events after the close of the exchange or market on which the security is principally traded (for example, a foreign exchange or market), but before the fund calculates its net asset value, the fund may value these investments at fair value as determined in accordance with the procedures approved by the Company’s Board of Directors (the “Board”). Certain factors may be considered when fair valuing investments such as: fundamental analytical data, the nature and duration of restrictions on disposition, an evaluation of the forces that influence the market in which the securities are purchased and sold, and public trading in similar securities of the issuer or comparable issuers. These securities are either categorized within Level 2 or 3 of the fair value hierarchy depending on the relevant inputs used.
For restricted securities where observable inputs are limited, assumptions about market activity and risk are used and are generally categorized within Level 3 of the fair value hierarchy.
The following is a summary of the inputs used as of October 31, 2015 in valuing the fund’s investments:
21
NOTES TO FINANCIAL STATEMENTS (continued)
| | | | | | |
| | Level 1 - Unadjusted
Quoted Prices | Level 2 - Other
Significant Observable Inputs | | Level 3 -Significant
Unobservable Inputs | Total |
Assets ($) | | | | |
Investments in Securities: | | | | |
Equity Securities - Domestic Common Stocks† | 149,897,828 | - | | - | 149,897,828 |
Equity Securities - Foreign Common Stocks† | 27,394,708 | - | | - | 27,394,708 |
Mutual Funds | 3,349,045 | - | | - | 3,349,045 |
† See Statement of Investments for additional detailed categorizations.
At October 31, 2014, $2,928,492 of exchange traded foreign equity securities were classified within Level 2 of the fair value hierarchy pursuant to the fund’s fair valuation procedures.
(b) Securities transactions and investment income: Securities transactions are recorded on a trade date basis. Realized gains and losses from securities transactions are recorded on the identified cost basis. Dividend income is recognized on the ex-dividend date and interest income, including, where applicable, accretion of discount and amortization of premium on investments, is recognized on the accrual basis.
Pursuant to a securities lending agreement with The Bank of New York Mellon, the fund may lend securities to qualified institutions. It is the fund’s policy that, at origination, all loans are secured by collateral of at least 102% of the value of U.S. securities loaned and 105% of the value of foreign securities loaned. Collateral equivalent to at least 100% of the market value of securities on loan is maintained at all times. Collateral is either in the form of cash, which can be invested in certain money market mutual funds managed by Dreyfus, or U.S. Government and Agency securities. The fund is entitled to receive all dividends, interest and distributions on securities loaned, in addition to income earned as a result of the lending transaction. Should a borrower fail to return the securities in a timely manner, The Bank of New York Mellon is required to replace the securities for the benefit of the fund or credit the fund with the market value of the unreturned securities and is subrogated to the fund’s rights against the borrower and the collateral. During the period ended October 31, 2015, The Bank of New York Mellon earned $1,186 from lending portfolio securities, pursuant to the securities lending agreement.
22
(c) Affiliated issuers: Investments in other investment companies advised by Dreyfus are defined as “affiliated” under the Act. Investments in affiliated investment companies during the period ended October 31, 2015 were as follows:
| | | | | | |
Affiliated Investment Company | Value
10/31/2014 ($) | Purchases ($) | Sales ($) | Value
10/31/2015 ($) | Net
Assets (%) |
Dreyfus Institutional Preferred Plus Money Market Fund | 801,064 | 22,030,193 | 22,039,104 | 792,153 | .5 |
Dreyfus Institutional Cash Advantage Fund | - | 22,671,378 | 20,114,486 | 2,556,892 | 1.4 |
Total | 801,064 | 44,701,571 | 42,153,590 | 3,349,045 | 1.9 |
(d) Dividends to shareholders: Dividends are recorded on the ex-dividend date. Dividends from investment income-net are normally declared and paid quarterly. Dividends from net realized capital gains, if any, are normally declared and paid annually, but the fund may make distributions on a more frequent basis to comply with the distribution requirements of the Internal Revenue Code of 1986, as amended (the “Code”). To the extent that net realized capital gains can be offset by capital loss carryovers, it is the policy of the fund not to distribute such gains. Income and capital gain distributions are determined in accordance with income tax regulations, which may differ from GAAP.
(e) Federal income taxes: It is the policy of the fund to continue to qualify as a regulated investment company, if such qualification is in the best interests of its shareholders, by complying with the applicable provisions of the Code, and to make distributions of taxable income sufficient to relieve it from substantially all federal income and excise taxes.
As of and during the period ended October 31, 2015, the fund did not have any liabilities for any uncertain tax positions. The fund recognizes interest and penalties, if any, related to uncertain tax positions as income tax expense in the Statement of Operations. During the period ended October 31, 2015, the fund did not incur any interest or penalties.
Each tax year in the four-year period ended October 31, 2015 remains subject to examination by the Internal Revenue Service and state taxing authorities.
23
NOTES TO FINANCIAL STATEMENTS (continued)
At October 31, 2015, the components of accumulated earnings on a tax basis were as follows: undistributed ordinary income $618,790, undistributed capital gains $9,012,882 and unrealized appreciation $61,829,007.
The tax character of distributions paid to shareholders during the fiscal periods ended October 31, 2015 and October 31, 2014 were as follows: ordinary income $2,173,973 and $2,276,863, and long-term capital gains $4,790,108 and $0, respectively.
NOTE 2—Bank Lines of Credit:
The fund participates with other Dreyfus-managed funds in a $480 million unsecured credit facility led by Citibank, N.A. and a $300 million unsecured credit facility provided by The Bank of New York Mellon (each, a “Facility”), each to be utilized primarily for temporary or emergency purposes, including the financing of redemptions. Prior to October 7, 2015, the unsecured credit facility with Citibank, N.A. was $430 million.In connection therewith, the fund has agreed to pay its pro rata portion of commitment fees for each Facility. Interest is charged to the fund based on rates determined pursuant to the terms of the respective Facility at the time of borrowing.
The average amount of borrowings outstanding under the Facilities during the period ended October 31, 2015, was approximately $10,100 with a related weighted average annualized interest rate of 1.10%.
NOTE 3—Investment Management Fee, Sub-Investment Advisory Fee and Other Transactions with Affiliates:
(a) Pursuant to a Investment management agreement with Dreyfus, Dreyfus provides or arranges for one or more third parties and/ or affiliates to provide investment management, administrative, custody, fund accounting and transfer agency services to the fund. Dreyfus also directs the investments of the fund in accordance with its investment objective, policies and limitations. For these services, the fund is contractually obligated to pay Dreyfus a fee, calculated daily and paid monthly, at the annual rate of 1.10% of the value of the fund’s average daily net assets. Out of its fee, Dreyfus pays all of the expenses of the fund except brokage fees, taxes, interest expenses, commitment fees on borrowings, Distribution Plan fees and Service Plan fees, fees and expenses of the non-interested Directors (including counsel fees) and extraordinary expenses. In addition, Dreyfus is required to reduce its fee in an amount equal to the fund’s allocable portion of fees and expenses of the non-interested Directors (including counsel fees). During the period ended October 31, 2015, fees reimbursed by Dreyfus amount to $12,012.
24
Pursuant to a sub-investment advisory agreement between Dreyfus and Sarofim & Co., Dreyfus pays Sarofim & Co. a monthly fee at an annual rate of .2175% of the value of the fund’s average daily net assets.
During the period ended October 31, 2015, the Distributor retained $3,858 from commissions earned on sales of the fund’s Class A shares and $3,014 CDSC on redemptions of the fund's Class C shares.
(b) Under the Distribution Plans adopted pursuant to Rule 12b-1 (the “Distribution Plans”) under the Act, Class A shares pay annually up to .25% of the value of its average daily net assets to compensate the Distributor for shareholder servicing activities and expenses primarily intended to result in the sale of Class A shares. Class C shares pay the Distributor for distributing its shares at an aggregate annual rate of .75% of the value of the average daily net assets of Class C shares. Class C shares are also subject to a service plan adopted pursuant to Rule 12b-1 (the “Service Plan”), under which Class C shares pay the Distributor for providing certain services to the holders of their shares, a fee at the annual rate of .25% of the value of the average daily net assets of Class C shares. During the period ended October 31, 2015, Class A and Class C shares were charged $198,558 and $254,727, respectively, pursuant to their Distribution Plans. During the period ended October 31, 2015, Class C shares were charge $84,909 pursuant to the Service Plan.
Under its terms, the Distribution Plans and Service Plan shall remain in effect from year to year, provided such continuance is approved annually by a vote of a majority of those Directors who are not “interested persons” of the Company and who have no direct or indirect financial interest in the operation of or in any agreement related to the Distribution Plans or Service Plan.
The components of “Due to The Dreyfus Corporation and affiliates” in the Statement of Assets and Liabilities consist of: management fees $162,777, Distribution Plans fees $35,584 and Service Plan fees $6,716, which are offset against an expense reimbursement currently in effect in the amount of $892.
(c) Each Board member also serves as a Board member of other funds within the Dreyfus complex. Annual retainer fees and attendance fees are allocated to each fund based on net assets.
NOTE 4—Securities Transactions:
The aggregate amount of purchases and sales of investment securities, excluding short-term securities, during the period ended October 31, 2015, amounted to $20,090,188 and $31,972,906, respectively.
25
NOTES TO FINANCIAL STATEMENTS (continued)
At October 31, 2015, the cost of investments for federal income tax purposes was $118,812,574; accordingly, accumulated net unrealized appreciation on investments was $61,829,007, consisting of $64,711,355 gross unrealized appreciation and $2,882,348 gross unrealized depreciation.
26
REPORT OF INDEPENDENT REGISTERED
PUBLIC ACCOUNTING FIRM
The Board of Directors and Shareholders of
The Dreyfus/Laurel Funds, Inc.
We have audited the accompanying statement of assets and liabilities of Dreyfus Tax Managed Growth Fund (the “Fund”), a series of The Dreyfus/Laurel Funds, Inc., including the statement of investments, as of October 31, 2015, and the related statement of operations for the year then ended, the statements of changes in net assets for each of the years in the two-year period then ended, and the financial highlights for each of the years in the five-year period then ended. These financial statements and financial highlights are the responsibility of the Fund’s management. Our responsibility is to express an opinion on these financial statements and financial highlights based on our audits.
We conducted our audits in accordance with the standards of the Public Company Accounting Oversight Board (United States). Those standards require that we plan and perform the audit to obtain reasonable assurance about whether the financial statements and financial highlights are free of material misstatement. An audit includes examining, on a test basis, evidence supporting the amounts and disclosures in the financial statements. Our procedures included confirmation of securities owned as of October 31, 2015, by correspondence with the custodian and brokers or by other appropriate auditing procedures. An audit also includes assessing the accounting principles used and significant estimates made by management, as well as evaluating the overall financial statement presentation. We believe that our audits provide a reasonable basis for our opinion.
In our opinion, the financial statements and financial highlights referred to above present fairly, in all material respects, the financial position of Dreyfus Tax Managed Growth Fund as of October 31, 2015, the results of its operations for the year then ended, the changes in its net assets for each of the years in the two-year period then ended, and the financial highlights for each of the years in the five-year period then ended, in conformity with U.S. generally accepted accounting principles.

New York, New York
December 30, 2015
27
IMPORTANT TAX INFORMATION (Unaudited)
For federal tax purposes, the fund reports the maximum amount allowable, but not less than $2,173,973 as ordinary income dividends paid during the year ended October 31, 2015 as qualified dividend income in accordance with Section 854(b)(1)(B) of the Internal Revenue Code. Also, the fund reports the maximum amount allowable but not less than 100% of ordinary income dividends paid during the year ended October 31, 2015 as eligible for the corporate dividends received deduction provided under Section 243 of the Internal Revenue Code in accordance with Section 854(b)(1)(A) of the Internal Revenue Code. Shareholders will receive notification in early 2016 of the percentage applicable to the preparation of their 2015 income tax returns. Also the fund reports the maximum amount allowable but not less than $.6614 per share as a capital gain dividend in accordance with Section 852(b)(3)(C) of the Internal Revenue Code.
28
BOARD MEMBERS INFORMATION (Unaudited)
INDEPENDENT BOARD MEMBERS
Joseph S. DiMartino (72)
Chairman of the Board (1999)
Principal Occupation During Past 5 Years:
· Corporate Director and Trustee (1995-present)
Other Public Company Board Memberships During Past 5 Years:
· CBIZ (formerly, Century Business Services, Inc.), a provider of outsourcing functions for small and medium size companies, Director (1997-present)
· The Newark Group, a provider of a national market of paper recovery facilities, paperboard mills and paperboard converting plants, Director (2000-2010)
No. of Portfolios for which Board Member Serves: 140
———————
Francine J. Bovich (64)
Board Member (2012)
Principal Occupation During Past 5 Years:
· Trustee, The Bradley Trusts, private trust funds (2011-present)
· Managing Director, Morgan Stanley Investment Management (1993-2010)
Other Public Company Board Memberships During Past 5 Years:
· Annaly Capital Management, Inc., Board Member (May 2014-present)
No. of Portfolios for which Board Member Serves: 79
———————
Kenneth A. Himmel (69)
Board Member (1994)
Principal Occupation During Past 5 Years:
· Managing Partner, Gulf Related, an international real estate development company (2010-present)
· President and CEO, Related Urban Development, a real estate development company (1996-present)
· President and CEO, Himmel & Company, a real estate development company (1980-present)
· CEO, American Food Management, a restaurant company (1983-present)
No. of Portfolios for which Board Member Serves: 29
———————
29
BOARD MEMBERS INFORMATION (Unaudited) (continued)
INDEPENDENT BOARD MEMBERS (continued)
Stephen J. Lockwood (68)
Board Member (1994)
Principal Occupation During Past 5 Years:
· Chairman of the Board, Stephen J. Lockwood and Company LLC, a real estate investment company (2000-present)
No. of Portfolios for which Board Member Serves: 29
———————
Roslyn M. Watson (66)
Board Member (1994)
Principal Occupation During Past 5 Years:
· Principal, Watson Ventures, Inc., a real estate investment company (1993-present)
No. of Portfolios for which Board Member Serves: 65
———————
Benaree Pratt Wiley (69)
Board Member (1998)
Principal Occupation During Past 5 Years:
· Principal, The Wiley Group, a firm specializing in strategy and business development (2005-present)
Other Public Company Board Memberships During Past 5 Years:
· CBIZ (formerly, Century Business Services, Inc.), a provider of outsourcing functions for small and medium size companies, Director (2008-present)
No. of Portfolios for which Board Member Serves: 65
———————
Once elected all Board Members serve for an indefinite term, but achieve Emeritus status upon reaching age 80. The address of the Board Members and Officers is c/o The Dreyfus Corporation, 200 Park Avenue, New York, New York 10166. Additional information about the Board Members is available in the fund’s Statement of Additional Information which can be obtained from Dreyfus free of charge by calling this toll free number: 1-800-DREYFUS.
James M. Fitzgibbons, Emeritus Board Member
J. Tomlinson Fort, Emeritus Board Member
30
OFFICERS OF THE FUND (Unaudited)
BRADLEY J. SKAPYAK, President since January 2010.
Chief Operating Officer and a director of the Manager since June 2009, Chairman of Dreyfus Transfer, Inc., an affiliate of the Manager and the transfer agent of the funds, since May 2011 and Executive Vice President of the Distributor since June 2007. From April 2003 to June 2009, Mr. Skapyak was the head of the Investment Accounting and Support Department of the Manager. He is an officer of 66 investment companies (comprised of 140 portfolios) managed by the Manager. He is 56 years old and has been an employee of the Manager since February 1988.
BENNETT A. MACDOUGALL, Chief Legal Officer since October 2015
Chief Legal Officer of the Manager since June 2015; from June 2005 to June 2015, Director and Associate General Counsel of Deutsche Bank – Asset & Wealth Management Division, and Chief Legal Officer of Deutsche Investment Management Americas Inc. He is an officer of 67 investment companies (comprised of 165 portfolios) managed by the Manager. He is 44 years old and has been an employee of the Manager since June 2015.
JANETTE E. FARRAGHER, Vice President and Secretary since December 2011.
Assistant General Counsel of BNY Mellon, and an officer of 67 investment companies (comprised of 165 portfolios) managed by the Manager. She is 52 years old and has been an employee of the Manager since February 1984.
JAMES BITETTO, Vice President and Assistant Secretary since August 2005.
Managing Counsel of BNY Mellon and Secretary of the Manager, and an officer of 67 investment companies (comprised of 165 portfolios) managed by the Manager. He is 49 years old and has been an employee of the Manager since December 1996.
JONI LACKS CHARATAN, Vice President and Assistant Secretary since August 2005.
Managing Counsel of BNY Mellon, and an officer of 67 investment companies (comprised of 165 portfolios) managed by the Manager. She is 59 years old and has been an employee of the Manager since October 1988.
JOSEPH M. CHIOFFI, Vice President and Assistant Secretary since August 2005.
Managing Counsel of BNY Mellon, and an officer of 67 investment companies (comprised of 165 portfolios) managed by the Manager. He is 53 years old and has been an employee of the Manager since June 2000.
JOHN B. HAMMALIAN, Vice President and Assistant Secretary since August 2005.
Senior Managing Counsel of BNY Mellon, and an officer of 67 investment companies (comprised of 165 portfolios) managed by the Manager. He is 52 years old and has been an employee of the Manager since February 1991.
MAUREEN E. KANE, Vice President and Assistant Secretary since April 2015.
Managing Counsel of BNY Mellon since July 2014; from October 2004 until July 2014, General Counsel, and from May 2009 until July 2014, Chief Compliance Officer of Century Capital Management. She is an officer of 67 investment companies (comprised of 165 portfolios) managed by the Manager. She is 53 years old and has been an employee of the Manager since July 2014.
SARAH S. KELLEHER, Vice President and Assistant Secretary since April 2014.
Senior Counsel of BNY Mellon, and an officer of 67 investment companies (comprised of 165 portfolios) managed by the Manager; from August 2005 to March 2013, Associate General Counsel of Third Avenue Management. She is 40 years old and has been an employee of the Manager since March 2013.
JEFF PRUSNOFSKY, Vice President and Assistant Secretary since August 2005.
Senior Managing Counsel of BNY Mellon, and an officer of 67 investment companies (comprised of 165 portfolios) managed by the Manager. He is 50 years old and has been an employee of the Manager since October 1990.
JAMES WINDELS, Treasurer since November 2001.
Director – Mutual Fund Accounting of the Manager, and an officer of 67 investment companies (comprised of 165 portfolios) managed by the Manager. He is 57 years old and has been an employee of the Manager since April 1985.
31
OFFICERS OF THE FUND (Unaudited) (continued)
RICHARD CASSARO, Assistant Treasurer since January 2008.
Senior Accounting Manager – Money Market and Municipal Bond Funds of the Manager, and an officer of 67 investment companies (comprised of 165 portfolios) managed by the Manager. He is 56 years old and has been an employee of the Manager since September 1982.
GAVIN C. REILLY, Assistant Treasurer since December 2005.
Tax Manager of the Investment Accounting and Support Department of the Manager, and an officer of 67 investment companies (comprised of 165 portfolios) managed by the Manager. He is 47 years old and has been an employee of the Manager since April 1991.
ROBERT S. ROBOL, Assistant Treasurer since December 2002.
Senior Accounting Manager – Fixed Income Funds of the Manager, and an officer of 67 investment companies (comprised of 165 portfolios) managed by the Manager. He is 51 years old and has been an employee of the Manager since October 1988.
ROBERT SALVIOLO, Assistant Treasurer since July 2007.
Senior Accounting Manager – Equity Funds of the Manager, and an officer of 67 investment companies (comprised of 165 portfolios) managed by the Manager. He is 48 years old and has been an employee of the Manager since June 1989.
ROBERT SVAGNA, Assistant Treasurer since December 2002.
Senior Accounting Manager – Equity Funds of the Manager, and an officer of 67 investment companies (comprised of 165 portfolios) managed by the Manager. He is 48 years old and has been an employee of the Manager since November 1990.
JOSEPH W. CONNOLLY, Chief Compliance Officer since October 2004.
Chief Compliance Officer of the Manager and The Dreyfus Family of Funds (67 investment companies, comprised of 165 portfolios). He is 58 years old and has served in various capacities with the Manager since 1980, including manager of the firm’s Fund Accounting Department from 1997 through October 2001.
32
NOTES
33
Dreyfus Tax Managed Growth Fund
200 Park Avenue
New York, NY 10166
Manager
The Dreyfus Corporation
200 Park Avenue
New York, NY 10166
Sub-Investment Adviser
Fayez Sarofim & Co.
Two Houston Center
Suite 2907
909 Fannin Street
Houston, TX 77010
Custodian
The Bank of New York Mellon
225 Liberty Street
New York, NY 10286
Transfer Agent &
Dividend Disbursing Agent
Dreyfus Transfer, Inc.
200 Park Avenue
New York, NY 10166
Distributor
MBSC Securities Corporation
200 Park Avenue
New York, NY 10166
| | |
Ticker Symbols: | Class A: DTMGX Class C: DPTAX Class I: DPTRX |
Telephone Call your financial representative or 1-800-DREYFUS
Mail The Dreyfus Family of Funds, 144 Glenn Curtiss Boulevard, Uniondale, NY 11556-0144
E-mail Send your request to info@dreyfus.com
Internet Information can be viewed online or downloaded at www.dreyfus.com
The fund files its complete schedule of portfolio holdings with the Securities and Exchange Commission (“SEC”) for the first and third quarters of each fiscal year on Form N-Q. The fund’s Forms N-Q are available on the SEC’s website at www.sec.gov and may be reviewed and copied at the SEC’s Public Reference Room in Washington, DC. (phone 1-800-SEC-0330 for information).
A description of the policies and procedures that the fund uses to determine how to vote proxies relating to portfolio securities and information regarding how the fund voted these proxies for the most recent 12-month period ended June 30 is available at www.dreyfus.com and on the SEC’s website at www.sec.gov and without charge, upon request, by calling 1-800-DREYFUS.
| | |
© 2015 MBSC Securities Corporation
0149AR1015 | 
|
General AMT-Free Municipal Money Market Fund
| | | |

| | ANNUAL REPORT
October 31, 2015 |
| |
Save time. Save paper. View your next shareholder report online as soon as it’s available. Log into www.dreyfus.com and sign up for Dreyfus eCommunications. It’s simple and only takes a few minutes. |
| |
The views expressed in this report reflect those of the portfolio manager only through the end of the period covered and do not necessarily represent the views of Dreyfus or any other person in the Dreyfus organization. Any such views are subject to change at any time based upon market or other conditions and Dreyfus disclaims any responsibility to update such views. These views may not be relied on as investment advice and, because investment decisions for a Dreyfus fund are based on numerous factors, may not be relied on as an indication of trading intent on behalf of any Dreyfus fund. |
| |
Not FDIC-Insured • Not Bank-Guaranteed • May Lose Value |
Contents
THE FUND
FOR MORE INFORMATION
Back Cover
| | | | |
| |
General AMT-Free Municipal Money Market Fund
| | The Fund |
A LETTER FROM THE PRESIDENT
Dear Shareholder:
We are pleased to present this annual report for General AMT-Free Municipal Money Market Fund, covering the 12-month period from November 1, 2014, through October 31, 2015. For information about how the fund performed during the reporting period, as well as general market perspectives, we provide a Discussion of Fund Performance on the pages that follow.
Financial markets proved volatile over the reporting period amid choppy U.S. and global economic growth. U.S. stocks advanced over the final months of 2014 and the spring of 2015, with some broad measures of market performance setting new record highs. Those gains were largely erased over the summer when global economic instability undermined investor sentiment, but a renewed rally in October enabled most broad stock indices to end the reporting period in positive territory. In contrast, international stocks generally lost a degree of value, with developed markets faring far better than emerging markets amid falling commodity prices and depreciating currency values. U.S. bonds generally produced modestly positive total returns, with municipal bonds and longer term U.S. government securities faring better, on average, than corporate-backed bonds.
We expect market volatility to persist over the near term until investors see greater clarity regarding short-term U.S. interest rates and global economic conditions. Our investment strategists and portfolio managers are monitoring developments carefully, keeping a close watch on credit spreads, currency values, commodity prices, corporate profits, economic trends in the emerging markets, and other developments that could influence investor sentiment. Over the longer term, we remain confident that markets are likely to benefit as investors increasingly recognize that inflation is likely to stay low, economic growth expectations are stabilizing, and monetary policies remain accommodative in most regions of the world. In our view, investors will continue to be well served under these circumstances by a long-term perspective and a disciplined investment approach.
Thank you for your continued confidence and support.
Sincerely,

J. Charles Cardona
President
The Dreyfus Corporation
November 16, 2015
2
DISCUSSION OF FUND PERFORMANCE
For the period of November 1, 2014 through October 31, 2015, as provided by Bill Vasiliou, Portfolio Manager
Fund and Market Performance Overview
For the 12-month period ended October 31, 2015, General AMT-Free Municipal Money Market Fund’s Dreyfus shares for each class produced a yield of 0.01%. Taking into consideration the effects of compounding, the fund’s shares for each class produced effective yields of 0.01% for the same period.1
The Federal Reserve Board (the “Fed”) left the federal funds rate unchanged throughout the reporting period during a choppy economic recovery, keeping yields of municipal money market instruments low.
Effective September 1, 2015, the fund’s name changed from Dreyfus AMT-Free Municipal Reserves to General AMT-Free Municipal Money Market Fund. Its BASIC shares and Investor shares were redesignated as Dreyfus shares and Class A shares, respectively.
The Fund’s Investment Approach
The fund seeks a high level of current income, consistent with stability of principal, which is exempt from federal income tax. The fund also seeks to provide income exempt from the federal alternative minimum tax. To pursue its goal, the fund normally invests substantially all of its assets in short-term, high-quality municipal obligations that provide income exempt from federal personal income tax and the federal alternative minimum tax. Among these are municipal notes, short-term municipal bonds, tax-exempt commercial paper, and municipal leases. The fund also may invest in high-quality, short-term structured notes, which are derivative instruments whose value is tied to underlying municipal obligations.
Uneven Economic Recovery Continues
The reporting period began in the midst of a sustained economic recovery characterized by falling unemployment, robust job creation, and improved consumer and business confidence. Although long-term interest rates typically rise in a growing economy, bond yields declined in late 2014 when global investors seeking more competitive yields flocked to U.S. Treasury securities. This trend began to reverse in early 2015 as investor demand normalized, and longer term interest rates drifted higher.
The economic recovery stumbled during the winter of 2015, posting a 0.6% annualized growth rate for the first quarter due to harsh weather and a strengthening U.S. dollar. The soft patch proved temporary, and U.S. GDP reaccelerated at a 3.9% annualized rate over the second quarter when labor markets resumed their gains and housing markets strengthened. Longer term interest rates moved higher through much of the spring and summer, until economic instability and currency devaluations in China sparked renewed risk aversion among investors. In spite of volatility among longer term interest rates, short-term rates remained steady as the Fed maintained the overnight federal funds rate in a range between 0% and 0.25%.
Issuance continued to be a main driver of the municipal money markets. Issuance fell in 2015 as the need for short-term financing diminished and tax receipts stayed strong,
3
DISCUSSION OF FUND PERFORMANCE (continued)
supporting better financial conditions for many municipalities and keeping short-term yields anchored near record lows. Robust demand for a limited supply of variable rate demand notes (VRDNs) put downward pressure on yields of variable-rate instruments. However, the outlook for higher interest rates, combined with money market reform and a well-received 2015 note issuance season, has driven the one-year note index above historical lows.
Municipal credit quality generally has continued to improve. Many states and municipalities have seen tax revenues climb beyond pre-recession levels, enabling them to balance their budgets and replenish reserves. The degree of recovery by region, however, remains varied.
Focus on Quality and Liquidity
Careful and well-researched credit selection has remained key to the fund’s management. We have focused mainly on instruments with strong liquidity characteristics, including VRDNs, and we have maintained broad diversification across municipal issuers and instruments backed by third parties. More specifically, we have identified stable credits meeting our investment criteria among state general obligation bonds; essential service revenue bonds issued by water, sewer, and electric enterprises; certain local credits with strong financial positions and stable tax bases; and various healthcare and education issuers. We have continued to maintain the fund’s weighted average maturity in line with industry averages.
Fed Expected to Raise Rates Gradually
At its October meeting, the Fed again refrained from implementing long-awaited rate hikes. Monetary policymakers noted that “economic activity has been expanding at a moderate pace,” and they left the federal funds rate unchanged “to support continued progress toward maximum employment and price stability.” While many analysts expect a series of rate hikes to begin as soon as the Fed’s next meeting in December, those increases are likely to be modest and gradual.
Nonetheless, as noted above, yields of one-year municipal notes have already begun to move somewhat higher. While we will monitor the market for further evidence of this trend, we continue to believe that an emphasis on preservation of capital and liquidity remains the prudent course for fund management.
November 16, 2015
An investment in the fund is not insured or guaranteed by the FDIC or any other government agency. Although the fund seeks to preserve the value of your investment at $1.00 per share, it is possible to lose money by investing in the fund.
Municipal securities holdings (as applicable), while rated in the highest rating category by one or more National Recognized Statistical Rating Organizations (NRSROs) (or unrated, if deemed of comparable quality by Dreyfus), involve credit and liquidity risks and risk of principal loss.
1 Effective yield is based upon dividends declared daily and reinvested monthly. Past performance is no guarantee of future results. Yields fluctuate. Yield provided reflects the absorption of certain fund expenses by The Dreyfus Corporation pursuant to an undertaking in effect that may be extended, terminated, or modified at any time. Had these expenses not been absorbed, fund yields would have been lower, and in some cases, 7-day yields during the reporting period would have been negative absent the expense absorption.
4
UNDERSTANDING YOUR FUND’S EXPENSES (Unaudited)
As a mutual fund investor, you pay ongoing expenses, such as management fees and other expenses. Using the information below, you can estimate how these expenses affect your investment and compare them with the expenses of other funds. You also may pay one-time transaction expenses, including sales charges (loads) and redemption fees, which are not shown in this section and would have resulted in higher total expenses. For more information, see your fund’s prospectus or talk to your financial adviser.
Review your fund’s expenses
The table below shows the expenses you would have paid on a $1,000 investment in General AMT-Free Municipal Money Market Fund from May 1, 2015 to October 31, 2015. It also shows how much a $1,000 investment would be worth at the close of the period, assuming actual returns and expenses.
| | | | | | | | |
Expenses and Value of a $1,000 Investment | | |
assuming actual returns for the six months ended October 31, 2015 | |
| | |
Class A
| Class B | Dreyfus
Class | Class R |
Expenses paid per $1,000† | $ .86 | $ .86 | $ .86 | $ .86 |
Ending value (after expenses) | $ 1,000.00 | $ 1,000.00 | $ 1,000.00 | $ 1,000.00 |
COMPARING YOUR FUND’S EXPENSES
WITH THOSE OF OTHER FUNDS (Unaudited)
Using the SEC’s method to compare expenses
The Securities and Exchange Commission (SEC) has established guidelines to help investors assess fund expenses. Per these guidelines, the table below shows your fund’s expenses based on a $1,000 investment, assuming a hypothetical 5% annualized return. You can use this information to compare the ongoing expenses (but not transaction expenses or total cost) of investing in the fund with those of other funds. All mutual fund shareholder reports will provide this information to help you make this comparison. Please note that you cannot use this information to estimate your actual ending account balance and expenses paid during the period.
| | | | | | | | |
Expenses and Value of a $1,000 Investment | | |
assuming a hypothetical 5% annualized return for the six months ended October 31, 2015 | |
| | |
Class A
| Class B | Dreyfus
Class | Class R |
Expenses paid per $1,000† | $ .87 | $ .87 | $ .87 | $ .87 |
Ending value (after expenses) | $ 1,024.35 | $ 1,024.35 | $ 1,024.35 | $ 1,024.35 |
† Expenses are equal to the fund’s annualized expense ratio of .17% for Class A, .17 for Class B, .17 for Dreyfus Class and .17% for Class R Shares, multiplied by the average account value over the period, multiplied by 184/365 (to reflect the one-half year period).
5
STATEMENT OF INVESTMENTS
October 31, 2015
| | | | | | | | | | | | | |
Short-Term Investments - 99.5% | | Coupon
Rate (%) | | Maturity
Date | | Principal
Amount ($) | | Value ($) | |
Alabama - 3.6% | |
Chatom Industrial Development Board, | | | | | | | | | | | |
Gulf Opportunity Zone Revenue (PowerSouth Energy Cooperative Projects) (LOC; National Rural Utilities Cooperative Finance Corporation) | | | | 0.17 | | 11/7/15 | | 5,000,000 | a | 5,000,000 | |
Mobile County Industrial Development Authority, | | | | | | | | | | | |
Gulf Opportunity Zone Revenue (SSAB Alabama Inc.) (LOC; Swedbank) | | | | 0.03 | | 11/7/15 | | 3,000,000 | a | 3,000,000 | |
| | | 8,000,000 | |
Arizona - 3.7% | |
Phoenix Industrial Development Authority, | | | | | | | | | | | |
Facilities Revenue (Southwest Human Development Project) (LOC; Wells Fargo Bank) | | | | 0.12 | | 11/7/15 | | 1,075,000 | a | 1,075,000 | |
Yavapai County Industrial Development Authority, | | | | | | | | | | | |
Revenue (Skanon Investments, Inc. - Drake Cement Project) (LOC; Citibank NA) | | | | 0.04 | | 11/7/15 | | 7,000,000 | a | 7,000,000 | |
| | | 8,075,000 | |
Colorado - 6.3% | |
Colorado Educational and Cultural Facilities Authority, | | | | | | | | | | | |
Educational Facilities Revenue (Trinity School of Durham and Chapel Hill Project) (LOC; Branch Banking and Trust Co.) | | | | 0.05 | | 11/7/15 | | 930,000 | a | 930,000 | |
Colorado Educational and Cultural Facilities Authority, | | | | | | | | | | | |
Revenue (Denver Seminary Project) (LOC; Wells Fargo Bank) | | | | 0.12 | | 11/7/15 | | 2,425,000 | a | 2,425,000 | |
Colorado Educational and Cultural Facilities Authority, | | | | | | | | | | | |
Revenue, Refunding (Boulder Country Day School Project) (LOC; Wells Fargo Bank) | | | | 0.12 | | 11/7/15 | | 1,510,000 | a | 1,510,000 | |
Colorado Health Facilities Authority, | | | | | | | | | | | |
Revenue (Arapahoe House Project) (LOC; Wells Fargo Bank) | | | | 0.12 | | 11/7/15 | | 1,000,000 | a | 1,000,000 | |
Colorado Postsecondary Educational Facilities Authority, | | | | | | | | | | | |
Revenue (Mullen High School Project) (LOC; Wells Fargo Bank) | | | | 0.17 | | 11/7/15 | | 205,000 | a | 205,000 | |
Gateway Regional Metropolitan District, | | | | | | | | | | | |
Limited Tax Improvement GO Notes, Refunding (LOC; Wells Fargo Bank) | | | | 0.07 | | 11/7/15 | | 2,565,000 | a | 2,565,000 | |
Lafayette, Exempla Improvement District, Special Improvement District Number 02-01, | | | | | | | | | | | |
Special Assessment and Improvement Revenue, Refunding (LOC; Wells Fargo Bank) | | | | 0.05 | | 11/7/15 | | 500,000 | a | 500,000 | |
6
| | | | | | | | | | | | | | | | | | | |
Short-Term Investments - 99.5% (continued) | | Coupon
Rate (%) | | Maturity
Date | | Principal
Amount ($) | | Value ($) | |
Colorado - 6.3% (continued) | |
Sheridan Redevelopment Agency, | | | | | | | | | | | |
Tax Increment Revenue, Refunding (South Santa Fe Drive Corridor Redevelopment Project) (LOC; JPMorgan Chase Bank) | | | | 0.04 | | 11/7/15 | | 4,865,000 | a | 4,865,000 | |
| | | 14,000,000 | |
Connecticut - 4.9% | |
Connecticut, | | | | | | | | | | | |
Special Tax Obligation Revenue (Transportation Infrastructure Purposes) | | | | 5.00 | | 11/1/15 | | 500,000 | | 500,064 | |
Connecticut Health and Educational Facilities Authority, | | | | | | | | | | | |
Revenue (Eagle Hill School Issue) (LOC; JPMorgan Chase Bank) | | | | 0.04 | | 11/7/15 | | 4,695,000 | a | 4,695,000 | |
Fairfield, | | | | | | | | | | | |
GO Notes, Refunding | | | | 5.00 | | 7/1/16 | | 300,000 | | 309,239 | |
Shelton Housing Authority, | | | | | | | | | | | |
Revenue (Crosby Commons Project) (LOC; M&T Trust) | | | | 0.06 | | 11/7/15 | | 5,275,000 | a | 5,275,000 | |
| | | 10,779,303 | |
Florida - 5.3% | |
Alachua County Housing Finance Authority, | | | | | | | | | | | |
MFHR (Santa Fe Apartments II Project) (LOC; FNMA) | | | | 0.03 | | 11/7/15 | | 1,100,000 | a | 1,100,000 | |
Brevard County, | | | | | | | | | | | |
Revenue (Holy Trinity Episcopal Academy Project) (LOC; Wells Fargo Bank) | | | | 0.17 | | 11/7/15 | | 525,000 | a | 525,000 | |
Collier County Industrial Development Authority, | | | | | | | | | | | |
Revenue (Redlands Christian Migrant Association, Inc. Project) (LOC; Bank of America) | | | | 0.15 | | 11/7/15 | | 2,780,000 | a | 2,780,000 | |
Hillsborough County, | | | | | | | | | | | |
IDR (The Museum of Science & Industry and The Institute for Business & Home Safety Project) (LOC; Branch Banking and Trust Co.) | | | | 0.05 | | 11/7/15 | | 945,000 | a | 945,000 | |
Hillsborough County Industrial Development Authority, | | | | | | | | | | | |
Revenue (Independent Day School Project) (LOC; Bank of America) | | | | 0.15 | | 11/7/15 | | 1,100,000 | a | 1,100,000 | |
Jacksonville, | | | | | | | | | | | |
Educational Facilities Revenue (Edward Waters College Project) (LOC; Wells Fargo Bank) | | | | 0.12 | | 11/7/15 | | 3,300,000 | a | 3,300,000 | |
Jacksonville, | | | | | | | | | | | |
Educational Facilities Revenue (Edward Waters College Project) (LOC; Wells Fargo Bank) | | | | 0.12 | | 11/7/15 | | 590,000 | a | 590,000 | |
7
STATEMENT OF INVESTMENTS (continued)
| | | | | | | | | | | | | | | | | | | |
Short-Term Investments - 99.5% (continued) | | Coupon
Rate (%) | | Maturity
Date | | Principal
Amount ($) | | Value ($) | |
Florida - 5.3% (continued) | |
Palm Beach County, | | | | | | | | | | | |
IDR (Boca Raton Jewish Community Day School, Inc. Project) (LOC; Wells Fargo Bank) | | | | 0.12 | | 11/7/15 | | 1,355,000 | a | 1,355,000 | |
| | | 11,695,000 | |
Georgia - 3.2% | |
Cobb County Development Authority, | | | | | | | | | | | |
Revenue (American Heart Association, Inc. Project) (LOC; Wells Fargo Bank) | | | | 0.12 | | 11/7/15 | | 735,000 | a | 735,000 | |
Cobb County Development Authority, | | | | | | | | | | | |
Revenue (Dominion Christian High School, Inc. Project) (LOC; Branch Banking and Trust Co.) | | | | 0.06 | | 11/7/15 | | 3,710,000 | a | 3,710,000 | |
Douglas County Development Authority, | | | | | | | | | | | |
Revenue (Colonial Hills School Property, LLC Project) (LOC; Branch Banking and Trust Co.) | | | | 0.05 | | 11/7/15 | | 1,740,000 | a | 1,740,000 | |
Macon-Bibb County Industrial Authority, | | | | | | | | | | | |
IDR (I-75 Business Park and Airport South Industrial Park Projects) (LOC; Wells Fargo Bank) | | | | 0.12 | | 11/7/15 | | 760,000 | a | 760,000 | |
| | | 6,945,000 | |
Idaho - .0% | |
Coeur D'Alene Tribe, | | | | | | | | | | | |
Revenue (LOC; Bank of America) | | | | 0.03 | | 11/7/15 | | 100,000 | a | 100,000 | |
Illinois - 5.5% | |
Chicago Heights, | | | | | | | | | | | |
Revenue (Chicago Heights Fitness, L.L.C. Project) (LOC; JPMorgan Chase Bank) | | | | 0.11 | | 11/7/15 | | 500,000 | a | 500,000 | |
DuPage County, | | | | | | | | | | | |
Revenue (The Morton Arboretum Project) (LOC; Northern Trust Company) | | | | 0.02 | | 11/7/15 | | 5,000,000 | a | 5,000,000 | |
Illinois Educational Facilities Authority, | | | | | | | | | | | |
Revenue (The Lincoln Park Society) (LOC; Citibank NA) | | | | 0.03 | | 11/7/15 | | 2,600,000 | a | 2,600,000 | |
Illinois Finance Authority, | | | | | | | | | | | |
Revenue (Cristo Rey Jesuit High School Project) (LOC; JPMorgan Chase Bank) | | | | 0.13 | | 11/7/15 | | 1,765,000 | a | 1,765,000 | |
Illinois Finance Authority, | | | | | | | | | | | |
Revenue (Northwestern Memorial Hospital) (Liquidity Facility; Northern Trust Company) | | | | 0.01 | | 11/2/15 | | 1,700,000 | a | 1,700,000 | |
Naperville, | | | | | | | | | | | |
GO Notes, Refunding | | | | 3.00 | | 12/1/15 | | 525,000 | | 526,135 | |
| | | 12,091,135 | |
Indiana - 1.0% | |
Huntington, | | | | | | | | | | | |
EDR, Refunding (Huntington University Project) (LOC; Wells Fargo Bank) | | | | 0.12 | | 11/7/15 | | 800,000 | a | 800,000 | |
Indiana Health Facility Financing Authority, | | | | | | | | | | | |
Revenue, Refunding (Pathfinder Services, Inc. Project) (LOC; Wells Fargo Bank) | | | | 0.12 | | 11/7/15 | | 845,000 | a | 845,000 | |
8
| | | | | | | | | | | | | | | | | | | |
Short-Term Investments - 99.5% (continued) | | Coupon
Rate (%) | | Maturity
Date | | Principal
Amount ($) | | Value ($) | |
Indiana - 1.0% (continued) | |
Indianapolis Local Public Improvement Bond Bank, | | | | | | | | | | | |
Revenue | | | | 5.00 | | 1/15/16 | | 650,000 | | 656,118 | |
| | | 2,301,118 | |
Iowa - .9% | |
Iowa Higher Education Loan Authority, | | | | | | | | | | | |
Private College Facility Revenue, Refunding (Grinnell College Project) | | | | 5.00 | | 12/1/15 | | 650,000 | | 652,478 | |
Woodbury County, | | | | | | | | | | | |
Educational Facility Revenue (Siouxland Medical Education Foundation, Inc. Project) (LOC; U.S. Bank NA) | | | | 0.12 | | 11/7/15 | | 1,250,000 | a | 1,250,000 | |
| | | 1,902,478 | |
Kentucky - .7% | |
Lexington-Fayette Urban County Government, | | | | | | | | | | | |
Industrial Building Revenue (Community Action Council Project) (LOC; PNC Bank NA) | | | | 0.06 | | 11/7/15 | | 1,485,000 | a | 1,485,000 | |
Maine - .3% | |
South Portland, | | | | | | | | | | | |
GO Notes | | | | 4.00 | | 7/15/16 | | 625,000 | | 640,993 | |
Maryland - 3.6% | |
Maryland Department of Transportation, | | | | | | | | | | | |
Consolidated Transportation Revenue | | | | 5.00 | | 2/15/16 | | 575,000 | | 582,787 | |
Maryland Economic Development Corporation, | | | | | | | | | | | |
EDR (Blind Industries and Services of Maryland Project) (LOC; Bank of America) | | | | 0.13 | | 11/7/15 | | 5,410,000 | a | 5,410,000 | |
Maryland Economic Development Corporation, | | | | | | | | | | | |
EDR (Maryland Science Center Project) (LOC; Bank of America) | | | | 0.07 | | 11/7/15 | | 1,965,000 | a | 1,965,000 | |
| | | 7,957,787 | |
Massachusetts - .2% | |
Attleboro, | | | | | | | | | | | |
GO Notes (Municipal Purpose Loan) | | | | 2.00 | | 3/15/16 | | 500,000 | | 503,134 | |
Minnesota - 5.3% | |
Cohasset, | | | | | | | | | | | |
Revenue, Refunding (Minnesota Power and Light Company Project) (LOC; JPMorgan Chase Bank) | | | | 0.06 | | 11/7/15 | | 3,630,000 | a | 3,630,000 | |
Minneapolis, | | | | | | | | | | | |
Housing Development Revenue, Refunding (One Ten Grant Project) (LOC; FNMA) | | | | 0.02 | | 11/7/15 | | 1,835,000 | a | 1,835,000 | |
Minneapolis, | | | | | | | | | | | |
MFHR (Seven Corners Apartments Project) (LOC; Wells Fargo Bank) | | | | 0.12 | | 11/7/15 | | 1,295,000 | a | 1,295,000 | |
Minnesota Rural Water Finance Authority, | | | | | | | | | | | |
Public Projects Construction Notes | | | | 1.00 | | 12/1/15 | | 3,250,000 | | 3,251,999 | |
9
STATEMENT OF INVESTMENTS (continued)
| | | | | | | | | | | | | | | | | | | |
Short-Term Investments - 99.5% (continued) | | Coupon
Rate (%) | | Maturity
Date | | Principal
Amount ($) | | Value ($) | |
Minnesota - 5.3% (continued) | |
Saint Paul Housing and Redevelopment Authority, | | | | | | | | | | | |
Revenue (Goodwill/Easter Seals Project) (LOC; U.S. Bank NA) | | | | 0.14 | | 11/7/15 | | 1,600,000 | a | 1,600,000 | |
| | | 11,611,999 | |
Mississippi - 3.1% | |
Mississippi Business Finance Corporation, | | | | | | | | | | | |
Gulf Opportunity Zone IDR (Chevron U.S.A. Inc. Project) | | | | 0.01 | | 11/2/15 | | 6,850,000 | a | 6,850,000 | |
Missouri - 5.7% | |
Columbia School District, | | | | | | | | | | | |
GO Notes, Refunding | | | | 2.00 | | 3/1/16 | | 2,250,000 | | 2,262,624 | |
Kirkwood Industrial Development Authority, | | | | | | | | | | | |
Revenue (Concordia Lutheran Church Community Recreational Facilities Project) (LOC; Bank of America) | | | | 0.15 | | 11/7/15 | | 1,640,000 | a | 1,640,000 | |
Missouri Environmental Improvement and Energy Resources Authority, | | | | | | | | | | | |
Water Pollution Control and Drinking Water Revenue (State Revolving Funds Programs) | | | | 2.00 | | 1/1/16 | | 1,210,000 | | 1,213,564 | |
Saint Louis Industrial Development Authority, | | | | | | | | | | | |
MFHR (Hamilton Place Apartments) (LOC; FHLMC) | | | | 0.03 | | 11/7/15 | | 4,635,000 | a | 4,635,000 | |
Saint Louis Parking Commission Finance Corporation, | | | | | | | | | | | |
Parking Revenue (Cupples Garage Project) (LOC; Bank of America) | | | | 0.12 | | 11/7/15 | | 1,380,000 | a | 1,380,000 | |
Springfield Industrial Development Authority, | | | | | | | | | | | |
MFHR, Refunding (Pebblecreek Apartments Project) (LOC; FHLB) | | | | 0.12 | | 11/7/15 | | 270,000 | a | 270,000 | |
Springfield Industrial Development Authority, | | | | | | | | | | | |
Revenue (DMP Properties, LLC Project) (LOC; FHLB) | | | | 0.05 | | 11/7/15 | | 1,260,000 | a | 1,260,000 | |
| | | 12,661,188 | |
New Jersey - 11.3% | |
Brigantine, | | | | | | | | | | | |
GO Notes, BAN | | | | 1.00 | | 12/9/15 | | 3,000,000 | | 3,001,428 | |
Guttenberg, | | | | | | | | | | | |
GO Notes, BAN | | | | 1.00 | | 3/18/16 | | 5,000,000 | | 5,007,507 | |
Little Egg Harbor Township, | | | | | | | | | | | |
GO Notes, BAN | | | | 1.00 | | 2/3/16 | | 4,264,306 | | 4,268,666 | |
Long Beach Township, | | | | | | | | | | | |
GO Notes, BAN | | | | 1.50 | | 3/22/16 | | 2,000,000 | | 2,007,395 | |
Newton, | | | | | | | | | | | |
GO Notes, BAN | | | | 1.50 | | 8/26/16 | | 3,000,000 | | 3,021,675 | |
Pennsauken Township, | | | | | | | | | | | |
GO Notes, BAN | | | | 1.00 | | 6/23/16 | | 2,000,000 | | 2,004,455 | |
Ringwood Borough, | | | | | | | | | | | |
GO Notes, BAN | | | | 1.00 | | 4/14/16 | | 2,630,425 | | 2,637,505 | |
10
| | | | | | | | | | | | | | | | | | | |
Short-Term Investments - 99.5% (continued) | | Coupon
Rate (%) | | Maturity
Date | | Principal
Amount ($) | | Value ($) | |
New Jersey - 11.3% (continued) | |
Wood-Ridge Borough, | | | | | | | | | | | |
GO Notes, BAN | | | | 1.00 | | 2/11/16 | | 3,000,000 | | 3,004,754 | |
| | | 24,953,385 | |
New Mexico - .3% | |
New Mexico Finance Authority, | | | | | | | | | | | |
Subordinate Lien Public Project Revolving Fund Revenue, Refunding | | | | 4.00 | | 6/15/16 | | 530,000 | | 541,962 | |
New York - 2.3% | |
New York City Industrial Development Agency, | | | | | | | | | | | |
Civic Facility Revenue (Jewish Community Center on the Upper West Side, Inc. Project) (LOC; M&T Trust) | | | | 0.06 | | 11/7/15 | | 4,000,000 | a | 4,000,000 | |
New York City Municipal Water Finance Authority, | | | | | | | | | | | |
Water and Sewer System Second General Resolution Revenue (Liquidity Facility; Bank of Nova Scotia) | | | | 0.01 | | 11/2/15 | | 1,000,000 | a | 1,000,000 | |
| | | 5,000,000 | |
North Carolina - 1.0% | |
North Carolina Capital Facilities Finance Agency, | | | | | | | | | | | |
CP (Duke University) | | | | 0.06 | | 12/3/15 | | 2,237,000 | | 2,237,000 | |
Ohio - 2.1% | |
Hamilton County, | | | | | | | | | | | |
EDR (Boys/Girls Clubs of Greater Cincinnati, Inc. Project) (LOC; PNC Bank NA) | | | | 0.04 | | 11/7/15 | | 1,775,000 | a | 1,775,000 | |
Stark County Port Authority, | | | | | | | | | | | |
Revenue (Canton Country Day School Project) (LOC; PNC Bank NA) | | | | 0.11 | | 11/7/15 | | 735,000 | a | 735,000 | |
Union Township, | | | | | | | | | | | |
GO Notes, BAN (Various Purpose) | | | | 1.50 | | 9/8/16 | | 2,000,000 | | 2,016,104 | |
| | | 4,526,104 | |
Oklahoma - .9% | |
Oklahoma Turnpike Authority, | | | | | | | | | | | |
Turnpike System Second Senior Revenue, Refunding (Citigroup ROCS, Series RR II R-11985) (Liquidity Facility; Citibank NA) | | | | 0.04 | | 11/7/15 | | 2,000,000 | a,b,c | 2,000,000 | |
Pennsylvania - 4.5% | |
Delaware County Industrial Development Authority, | | | | | | | | | | | |
Airport Facilities Revenue, Refunding (United Parcel Service Project) | | | | 0.01 | | 11/2/15 | | 3,000,000 | a | 3,000,000 | |
Montgomery County Industrial Development Authority, | | | | | | | | | | | |
Revenue (Big Little Associates Project) (LOC; Wells Fargo Bank) | | | | 0.20 | | 11/7/15 | | 360,000 | a | 360,000 | |
Northampton County Industrial Development Authority, | | | | | | | | | | | |
Revenue (Moravian Academy) (LOC; Wells Fargo Bank) | | | | 0.16 | | 11/7/15 | | 600,000 | a | 600,000 | |
11
STATEMENT OF INVESTMENTS (continued)
| | | | | | | | | | | | | | | | | | | |
Short-Term Investments - 99.5% (continued) | | Coupon
Rate (%) | | Maturity
Date | | Principal
Amount ($) | | Value ($) | |
Pennsylvania - 4.5% (continued) | |
Pennsylvania Economic Development Financing Authority, | | | | | | | | | | | |
EDR (Philadelphia Area Independent School Business Officers Association Financing Program - Plymouth Meeting Friends School Project) (LOC; PNC Bank NA) | | | | 0.11 | | 11/7/15 | | 500,000 | a | 500,000 | |
Pennsylvania Economic Development Financing Authority, | | | | | | | | | | | |
Recovery Zone Facility Revenue (Hawley Silk Mill, LLC Project) (LOC; PNC Bank NA) | | | | 0.11 | | 11/7/15 | | 900,000 | a | 900,000 | |
Philadelphia Authority for Industrial Development, | | | | | | | | | | | |
Revenue (The Philadelphia Protestant Home Project) (LOC; Bank of America) | | | | 0.11 | | 11/7/15 | | 1,600,000 | a | 1,600,000 | |
Upper Dauphin Industrial Development Authority, | | | | | | | | | | | |
Revenue (Pennsylvania Independent Colleges and University Research Center Project) (LOC; M&T Trust) | | | | 0.14 | | 11/7/15 | | 500,000 | a | 500,000 | |
York Redevelopment Authority, | | | | | | | | | | | |
Revenue (LOC; M&T Trust) | | | | 0.11 | | 11/7/15 | | 2,460,000 | a | 2,460,000 | |
| | | 9,920,000 | |
South Carolina - 3.5% | |
Charleston County, | | | | | | | | | | | |
GO Notes | | | | 5.00 | | 11/1/15 | | 400,000 | | 400,051 | |
South Carolina Jobs-Economic Development Authority, | | | | | | | | | | | |
EDR (Anderson Area YMCA, Inc. Project) (LOC; Branch Banking and Trust Co.) | | | | 0.07 | | 11/7/15 | | 4,570,000 | a | 4,570,000 | |
South Carolina Jobs-Economic Development Authority, | | | | | | | | | | | |
EDR (Carolina Children's Home Project) (LOC; Branch Banking and Trust Co.) | | | | 0.05 | | 11/7/15 | | 2,805,000 | a | 2,805,000 | |
| | | 7,775,051 | |
Tennessee - .7% | |
Cleveland Health and Educational Facilities Board, | | | | | | | | | | | |
Revenue (Lee University Project) (LOC; Branch Banking and Trust Co.) | | | | 0.04 | | 11/7/15 | | 1,500,000 | a | 1,500,000 | |
Texas - 12.5% | |
Atascosa County Industrial Development Corporation, | | | | | | | | | | | |
PCR, Refunding (San Miguel Electric Cooperative, Inc. Project) (LOC; National Rural Utilities Cooperative Finance Corporation) | | | | 0.03 | | 11/7/15 | | 11,700,000 | a | 11,700,000 | |
Brazos County Health Facilities Development Corporation, | | | | | | | | | | | |
Revenue, Refunding (Burleson Saint Joseph Manor) (LOC; Wells Fargo Bank) | | | | 0.12 | | 11/7/15 | | 6,165,000 | a | 6,165,000 | |
12
| | | | | | | | | | | | | | | | | | | |
Short-Term Investments - 99.5% (continued) | | Coupon
Rate (%) | | Maturity
Date | | Principal
Amount ($) | | Value ($) | |
Texas - 12.5% (continued) | |
Humble Independent School District, | | | | | | | | | | | |
GO Notes, Refunding (LOC; Permanent School Fund Guarantee Program) | | | | 3.63 | | 2/15/16 | | 250,000 | | 252,412 | |
Lancaster Independent School District, | | | | | | | | | | | |
GO Notes (LOC; Permanent School Fund Guarantee Program) | | | | 1.50 | | 2/15/16 | | 575,000 | | 576,988 | |
Lovejoy Independent School District, | | | | | | | | | | | |
GO Notes (LOC; Permanent School Fund Guarantee Program) | | | | 1.50 | | 2/15/16 | | 585,000 | | 586,940 | |
Mission Economic Development Corporation, | | | | | | | | | | | |
SWDR (IESI TX Corporation Project) (LOC; Bank of America) | | | | 0.06 | | 11/7/15 | | 1,500,000 | a | 1,500,000 | |
Plano Independent School District, | | | | | | | | | | | |
GO Notes, Refunding (LOC; Permanent School Fund Guarantee Program) | | | | 5.00 | | 2/15/16 | | 165,000 | | 167,191 | |
Port Arthur Navigation District Industrial Development Corporation, | | | | | | | | | | | |
Exempt Facilities Revenue (Air Products Project) | | | | 0.01 | | 11/2/15 | | 3,000,000 | a | 3,000,000 | |
Richardson Independent School District, | | | | | | | | | | | |
GO Notes, Refunding (LOC; Permanent School Fund Guarantee Program) | | | | 2.00 | | 2/15/16 | | 535,000 | | 537,231 | |
Rockwall Independent School District, | | | | | | | | | | | |
GO Notes, Refunding (LOC; Permanent School Fund Guarantee Program) | | | | 2.00 | | 2/15/16 | | 520,000 | | 522,142 | |
Splendora Higher Education Facilities Corporation, | | | | | | | | | | | |
Revenue (Fellowship Christian Academy Project) (LOC; Bank of America) | | | | 0.15 | | 11/7/15 | | 1,900,000 | a | 1,900,000 | |
Texas Public Finance Authority, | | | | | | | | | | | |
Unemployment Compensation Obigation Assessment Revenue | | | | 4.00 | | 1/1/16 | | 235,000 | | 236,457 | |
Texas Water Development Board, | | | | | | | | | | | |
State Revolving Fund Subordinate Lien Revenue | | | | 5.00 | | 7/15/16 | | 450,000 | | 464,788 | |
| | | 27,609,149 | |
Utah - .9% | |
Ogden City Redevelopment Agency, | | | | | | | | | | | |
Tax Increment Revenue (LOC; Wells Fargo Bank) | | | | 0.12 | | 11/7/15 | | 575,000 | a | 575,000 | |
Salt Lake County, | | | | | | | | | | | |
GO Notes, Refunding | | | | 5.00 | | 12/15/15 | | 1,000,000 | | 1,005,845 | |
Salt Lake County, | | | | | | | | | | | |
Training Facilities Revenue (Community Foundation for the Disabled, Inc. Project) (LOC; Wells Fargo Bank) | | | | 0.17 | | 11/7/15 | | 500,000 | a | 500,000 | |
| | | 2,080,845 | |
Virginia - .9% | |
Greene County Economic Development Authority, | | | | | | | | | | | |
Educational Facilities Revenue (The Blue Ridge School, Inc.) (LOC; Branch Banking and Trust Co.) | | | | 0.04 | | 11/7/15 | | 500,000 | a | 500,000 | |
13
STATEMENT OF INVESTMENTS (continued)
| | | | | | | | | | | | | | | | | | | |
Short-Term Investments - 99.5% (continued) | | Coupon
Rate (%) | | Maturity
Date | | Principal
Amount ($) | | Value ($) | |
Virginia - .9% (continued) | |
Norfolk Redevelopment and Housing Authority, | | | | | | | | | | | |
Revenue (E2F Student Housing I, LLC Project) (LOC; Bank of America) | | | | 0.06 | | 11/7/15 | | 705,000 | a | 705,000 | |
Virginia College Building Authority, | | | | | | | | | | | |
Educational Facilities Revenue (21st Century College and Equipment Programs) | | | | 5.00 | | 2/1/16 | | 550,000 | | 556,484 | |
Virginia Resources Authority, | | | | | | | | | | | |
Infrastructure Revenue (Virginia Pooled Financing Program) | | | | 5.00 | | 11/1/15 | | 300,000 | | 300,037 | |
| | | 2,061,521 | |
Washington - 1.4% | |
Washington Housing Finance Commission, | | | | | | | | | | | |
Nonprofit Housing Revenue (Nikkei Manor Project) (LOC; Bank of America) | | | | 0.15 | | 11/7/15 | | 1,250,000 | a | 1,250,000 | |
Washington Housing Finance Commission, | | | | | | | | | | | |
Nonprofit Housing Revenue (Pioneer Human Services Projects) (LOC; U.S. Bank NA) | | | | 0.04 | | 11/7/15 | | 1,085,000 | a | 1,085,000 | |
Washington Housing Finance Commission, | | | | | | | | | | | |
Nonprofit Revenue (The Evergreen School Project) (LOC; Wells Fargo Bank) | | | | 0.12 | | 11/7/15 | | 745,000 | a | 745,000 | |
| | | 3,080,000 | |
Wisconsin - 3.9% | |
Wisconsin Health and Educational Facilities Authority, | | | | | | | | | | | |
Revenue (Jewish Home and Care Center, Inc.) (LOC; JPMorgan Chase Bank) | | | | 0.03 | | 11/7/15 | | 2,000,000 | a | 2,000,000 | |
Wisconsin Health and Educational Facilities Authority, | | | | | | | | | | | |
Revenue (Madison Family Medicine Residency Corporation, Inc. Project) (LOC; JPMorgan Chase Bank) | | | | 0.11 | | 11/7/15 | | 2,315,000 | a | 2,315,000 | |
Wisconsin Health and Educational Facilities Authority, | | | | | | | | | | | |
Revenue (Sinsinawa Nursing, Inc. Project) (LOC; JPMorgan Chase Bank) | | | | 0.11 | | 11/7/15 | | 920,000 | a | 920,000 | |
Wisconsin Health and Educational Facilities Authority, | | | | | | | | | | | |
Revenue (University of Wisconsin Medical Foundation, Inc.) (LOC; JPMorgan Chase Bank) | | | | 0.03 | | 11/7/15 | | 2,145,000 | a | 2,145,000 | |
Wisconsin Health and Educational Facilities Authority, | | | | | | | | | | | |
Revenue (Valley Packaging Industries, Inc.) (LOC; JPMorgan Chase Bank) | | | | 0.04 | | 11/7/15 | | 1,320,000 | a | 1,320,000 | |
| | | 8,700,000 | |
Total Investments (cost $219,584,152) | | 99.5% | | 219,584,152 | |
Cash and Receivables (Net) | | .5% | | 1,153,929 | |
Net Assets | | 100.0% | | 220,738,081 | |
14
a Variable rate demand note - rate shown is the interest rate in effect at October 31, 2015. Maturity date represents the next demand date, or the ultimate maturity date if earlier.
b Security exempt from registration pursuant to Rule 144A under the Securities Act of 1933. This security may be resold in transactions exempt from registration, normally to qualified institutional buyers. At October 31, 2015, this security amounted to $2,000,000 or 0.9% of net assets.
c The fund does not directly own the municipal security indicated; the fund owns an interest in a special purpose entity that, in turn, owns the underlying municipal security. The special purpose entity permits the fund to own interests in underlying assets, but in a manner structured to provide certain advantages not inherent in the underlying bonds (e.g., enhanced liquidity, yields linked to short-term rates).
| | |
Portfolio Summary (Unaudited) † | Value (%) |
Industrial | 21.0 |
Education | 15.9 |
City | 13.0 |
Housing | 10.8 |
Health Care | 10.5 |
Utility-Electric | 6.9 |
Utility-Water & Sewer | 3.5 |
Special Tax | 3.0 |
State/Territory | 2.2 |
County | 1.8 |
Transportation Services | 1.2 |
Resource Recovery | .7 |
Pollution Control | .5 |
Other | 8.5 |
| | 99.5 |
† Based on net assets.
See notes to financial statements.
15
| | | | |
| |
Summary of Abbreviations |
| |
ABAG | Association of Bay Area
Governments | ACA | American Capital Access |
AGC | ACE Guaranty Corporation | AGIC | Asset Guaranty Insurance Company |
AMBAC | American Municipal Bond
Assurance Corporation | ARRN | Adjustable Rate
Receipt Notes |
BAN | Bond Anticipation Notes | BPA | Bond Purchase Agreement |
CIFG | CDC Ixis Financial Guaranty | COP | Certificate of Participation |
CP | Commercial Paper | DRIVERS | Derivative Inverse
Tax-Exempt Receipts |
EDR | Economic Development
Revenue | EIR | Environmental Improvement
Revenue |
FGIC | Financial Guaranty
Insurance Company | FHA | Federal Housing Administration |
FHLB | Federal Home
Loan Bank | FHLMC | Federal Home Loan Mortgage
Corporation |
FNMA | Federal National
Mortgage Association | GAN | Grant Anticipation Notes |
GIC | Guaranteed Investment
Contract | GNMA | Government National Mortgage
Association |
GO | General Obligation | HR | Hospital Revenue |
IDB | Industrial Development Board | IDC | Industrial Development Corporation |
IDR | Industrial Development
Revenue | LIFERS | Long Inverse Floating
Exempt Receipts |
LOC | Letter of Credit | LOR | Limited Obligation Revenue |
LR | Lease Revenue | MERLOTS | Municipal Exempt Receipts
Liquidity Option Tender |
MFHR | Multi-Family Housing Revenue | MFMR | Multi-Family Mortgage Revenue |
PCR | Pollution Control Revenue | PILOT | Payment in Lieu of Taxes |
P-FLOATS | Puttable Floating Option
Tax-Exempt Receipts | PUTTERS | Puttable Tax-Exempt Receipts |
RAC | Revenue Anticipation Certificates | RAN | Revenue Anticipation Notes |
RAW | Revenue Anticipation Warrants | RIB | Residual Interest Bonds |
ROCS | Reset Options Certificates | RRR | Resources Recovery Revenue |
SAAN | State Aid Anticipation Notes | SBPA | Standby Bond Purchase Agreement |
SFHR | Single Family Housing Revenue | SFMR | Single Family Mortgage Revenue |
SONYMA | State of New York
Mortgage Agency | SPEARS | Short Puttable Exempt
Adjustable Receipts |
SWDR | Solid Waste Disposal Revenue | TAN | Tax Anticipation Notes |
TAW | Tax Anticipation Warrants | TRAN | Tax and Revenue Anticipation Notes |
XLCA | XL Capital Assurance | | |
See notes to financial statements.
16
STATEMENT OF ASSETS AND LIABILITIES
October 31, 2015
| | | | | | | |
| | | | | | |
| | | Cost | | Value | |
Assets ($): | | | | |
Investments in securities—See Statement of Investments | | 219,584,152 | | 219,584,152 | |
Cash | | | | | 4,293,165 | |
Interest receivable | | | | | 308,253 | |
| | | | | 224,185,570 | |
Liabilities ($): | | | | |
Due to The Dreyfus Corporation and affiliates—Note 2(c) | | | | | 24,005 | |
Payable for investment securities purchased | | | | | 3,415,742 | |
Payable for shares of Common Stock redeemed | | | | | 7,742 | |
| | | | | 3,447,489 | |
Net Assets ($) | | | 220,738,081 | |
Composition of Net Assets ($): | | | | |
Paid-in capital | | | | | 220,719,345 | |
Accumulated net realized gain (loss) on investments | | | | | 18,736 | |
Net Assets ($) | | | 220,738,081 | |
| | | | | | |
Net Asset Value Per Share | Class A | Class B | Dreyfus Class | Class R | |
Net Assets ($) | 17,082,623 | 173,382,957 | 9,005,011 | 21,267,490 | |
Shares Outstanding | 17,080,780 | 173,370,577 | 9,004,176 | 21,265,525 | |
Net Asset Value Per Share ($) | 1.00 | 1.00 | 1.00 | 1.00 | |
See notes to financial statements.
17
STATEMENT OF OPERATIONS
Year Ended October 31, 2015
| | | | | | | |
| | | | | | |
| | | | | | |
Investment Income ($): | | | | |
Interest Income | | | 367,858 | |
Expenses: | | | | |
Management fee—Note 2(a) | | | 1,199,421 | |
Distribution fees—Note 2(b) | | | 475,853 | |
Shareholder servicing costs—Note 2(c) | | | 437,199 | |
Directors’ fees—Note 2(a,d) | | | 16,453 | |
Total Expenses | | | 2,128,926 | |
Less—reduction in expenses due to undertaking—Note 2(a) | | | (1,744,697) | |
Less—Directors’ fees reimbursed by Dreyfus—Note 2(a) | | | (16,453) | |
Net Expenses | | | 367,776 | |
Investment Income—Net | | | 82 | |
Realized Gain (Loss) on Investments—Note 1(b) ($) | 18,736 | |
Net Increase in Net Assets Resulting from Operations | | 18,818 | |
See notes to financial statements.
18
STATEMENT OF CHANGES IN NET ASSETS
| | | | | | | | | | |
| | | | | | | | | | |
| | | | Year Ended October 31, |
| | | | 2015 | | | | 2014 | |
Operations ($): | | | | | | | | |
Investment income—net | | | 82 | | | | 92 | |
Net realized gain (loss) on investments | | 18,736 | | | | 17,339 | |
Net Increase (Decrease) in Net Assets
Resulting from Operations | 18,818 | | | | 17,431 | |
Dividends to Shareholders from ($): | | | | | | | | |
Investment income—net: | | | | | | | | |
Class A | | | (1,387) | | | | (2,384) | |
Class B | | | (12,638) | | | | (19,798) | |
Dreyfus Class | | | (722) | | | | (1,660) | |
Class R | | | (2,674) | | | | (6,464) | |
Total Dividends | | | (17,421) | | | | (30,306) | |
Capital Stock Transactions ($1.00 per share): | | | | | | | |
Net proceeds from shares sold: | | | | | | | | |
Class A | | | 25,267,613 | | | | 70,503,067 | |
Class B | | | 426,624,351 | | | | 482,346,837 | |
Dreyfus Class | | | 35,377,266 | | | | 10,021,816 | |
Class R | | | 283,027,454 | | | | 232,479,657 | |
Dividends reinvested: | | | | | | | | |
Class A | | | 1,382 | | | | 2,367 | |
Class B | | | 12,625 | | | | 19,661 | |
Dreyfus Class | | | 707 | | | | 1,653 | |
Class R | | | 633 | | | | 442 | |
Cost of shares redeemed: | | | | | | | | |
Class A | | | (25,845,327) | | | | (76,637,703) | |
Class B | | | (434,441,661) | | | | (482,958,878) | |
Dreyfus Class | | | (37,968,937) | | | | (13,146,714) | |
Class R | | | (292,502,461) | | | | (256,882,931) | |
Increase (Decrease) in Net Assets
from Capital Stock Transactions | (20,446,355) | | | | (34,250,726) | |
Total Increase (Decrease) in Net Assets | (20,444,958) | | | | (34,263,601) | |
Net Assets ($): | | | | | | | | |
Beginning of Period | | | 241,183,039 | | | | 275,446,640 | |
End of Period | | | 220,738,081 | | | | 241,183,039 | |
See notes to financial statements.
19
FINANCIAL HIGHLIGHTS
The following tables describe the performance for each share class for the fiscal periods indicated. All information reflects financial results for a single fund share. Total return shows how much your investment in the fund would have increased (or decreased) during each period, assuming you had reinvested all dividends and distributions. These figures have been derived from the fund’s financial statements.
| | | | | | | |
| | | |
| | | |
| | Year Ended October 31, |
Class A Shares | 2015 | 2014 | 2013 | 2012 | 2011 |
Per Share Data ($): | | | | | | |
Net asset value, beginning of period | | 1.00 | 1.00 | 1.00 | 1.00 | 1.00 |
Investment Operations: | | | | | | |
Investment income—neta | | .000 | .000 | .000 | .000 | .000 |
Distributions: | | | | | | |
Dividends from
investment income—neta | | (.000) | (.000) | (.000) | (.000) | (.000) |
Net asset value, end of period | | 1.00 | 1.00 | 1.00 | 1.00 | 1.00 |
Total Return (%) | | .00b | .01 | .00b | .00b | .00b |
Ratios/Supplemental Data (%): | | | | | |
Ratio of total expenses
to average net assets | | .71 | .71 | .71 | .71 | .71 |
Ratio of net expenses
to average net assets | | .15 | .16 | .23 | .28 | .38 |
Ratio of net investment income
to average net assetsb | | .00 | .00 | .00 | .00 | .00 |
Net Assets, end of period ($ x 1,000) | | 17,083 | 17,659 | 23,792 | 27,625 | 30,764 |
a Amount represents less than $.001 per share.
b Amount represents less than .01%.
See notes to financial statements.
20
| | | | | | | |
| | | |
| | | |
| | Year Ended October 31, |
Class B Shares | 2015 | 2014 | 2013 | 2012 | 2011 |
Per Share Data ($): | | | | | | |
Net asset value, beginning of period | | 1.00 | 1.00 | 1.00 | 1.00 | 1.00 |
Investment Operations: | | | | | | |
Investment income—neta | | .000 | .000 | .000 | .000 | .000 |
Distributions: | | | | | | |
Dividends from
investment income—neta | | (.000) | (.000) | (.000) | (.000) | (.000) |
Net asset value, end of period | | 1.00 | 1.00 | 1.00 | 1.00 | 1.00 |
Total Return (%) | | .00b | .01 | .00b | .00b | .00b |
Ratios/Supplemental Data (%): | | | | | |
Ratio of total expenses
to average net assets | | 1.01 | 1.01 | 1.01 | 1.01 | 1.01 |
Ratio of net expenses
to average net assets | | .15 | .16 | .23 | .29 | .37 |
Ratio of net investment income
to average net assetsb | | .00 | .00 | .00 | .00 | .00 |
Net Assets, end of period ($ x 1,000) | | 173,383 | 181,187 | 181,787 | 248,951 | 229,126 |
a Amount represents less than $.001 per share.
b Amount represents less than .01%.
See notes to financial statements.
21
FINANCIAL HIGHLIGHTS (continued)
| | | | | | | |
| | | |
| | | |
| | Year Ended October 31, |
Dreyfus Class Shares | 2015 | 2014 | 2013 | 2012 | 2011 |
Per Share Data ($): | | | | | | |
Net asset value, beginning of period | | 1.00 | 1.00 | 1.00 | 1.00 | 1.00 |
Investment Operations: | | | | | | |
Investment income—neta | | .000 | .000 | .000 | .000 | .000 |
Distributions: | | | | | | |
Dividends from
investment income—neta | | (.000) | (.000) | (.000) | (.000) | (.000) |
Net asset value, end of period | | 1.00 | 1.00 | 1.00 | 1.00 | 1.00 |
Total Return (%) | | .00b | .01 | .00b | .00b | .00b |
Ratios/Supplemental Data (%): | | | | | |
Ratio of total expenses
to average net assets | | .51 | .51 | .51 | .51 | .51 |
Ratio of net expenses
to average net assets | | .16 | .17 | .23 | .28 | .38 |
Ratio of net investment income
to average net assetsb | | .00 | .00 | .00 | .00 | .00 |
Net Assets, end of period ($ x 1,000) | | 9,005 | 11,596 | 14,720 | 14,017 | 26,003 |
a Amount represents less than $.001 per share.
b Amount represents less than .01%.
See notes to financial statements.
22
| | | | | | | |
| | | |
| | | |
| | Year Ended October 31, |
Class R Shares | 2015 | 2014 | 2013 | 2012 | 2011 |
Per Share Data ($): | | | | | | |
Net asset value, beginning of period | | 1.00 | 1.00 | 1.00 | 1.00 | 1.00 |
Investment Operations: | | | | | | |
Investment income—neta | | .000 | .000 | .000 | .000 | .000 |
Distributions: | | | | | | |
Dividends from
investment income—neta | | (.000) | (.000) | (.000) | (.000) | (.000) |
Net asset value, end of period | | 1.00 | 1.00 | 1.00 | 1.00 | 1.00 |
Total Return (%) | | .00b | .01 | .00b | .00b | .00b |
Ratios/Supplemental Data (%): | | | | | |
Ratio of total expenses
to average net assets | | .51 | .51 | .51 | .51 | .51 |
Ratio of net expenses
to average net assets | | .15 | .16 | .24 | .29 | .38 |
Ratio of net investment income
to average net assetsb | | .00 | .00 | .00 | .00 | .00 |
Net Assets, end of period ($ x 1,000) | | 21,267 | 30,742 | 55,149 | 77,098 | 48,390 |
a Amount represents less than $.001 per share.
b Amount represents less than .01%.
See notes to financial statements.
23
NOTES TO FINANCIAL STATEMENTS
NOTE 1—Significant Accounting Policies:
General AMT-Free Municipal Money Market Fund (the “fund”) is a separate diversified series of The Dreyfus/Laurel Funds, Inc. (the “Company”), which is registered under the Investment Company Act of 1940, as amended (the “Act”), as an open-end management investment company and operates as a series company currently offering ten series, including the fund. The fund’s investment objective is to seek a high level of current income, consistent with stability of principal, that is exempt from federal income taxes. The Dreyfus Corporation (the “Manager” or “Dreyfus”), a wholly-owned subsidiary of The Bank of New York Mellon Corporation (“BNY Mellon”), serves as the fund’s investment adviser.
The Company’s Board of Directors (the “Board”) approved, effective September 1, 2015, a change in the fund’s name from “Dreyfus AMT-Free Municipal Reserves” to “General AMT-Free Municipal Money Market Fund.” The fund’s Investor shares and BASIC shares have been redesignated as Class A and Dreyfus Class, respectively. The Board approved, effective November 1, 2015, a change in the fund’s fiscal year end from October 31 to November 30.
MBSC Securities Corporation (the “Distributor”), a wholly-owned subsidiary of Dreyfus, is the distributor of the fund’s shares, which are sold without a sales charge. The fund is authorized to issue 1 billion shares of $.001 par value Common Stock in each of the following classes of shares: Class A, Class B, Dreyfus Class and Class R. Class A and Class B shares are sold primarily to clients of financial institutions that have entered into selling agreements with the Distributor, and bear a Distribution Plan fee. Class B shares also bear a Shareholder Services Plan fee. Dreyfus Class are sold to any investor and bear no Distribution Plan or Shareholder Services Plan fees. Class R shares are sold primarily to bank trust departments and other financial service providers (including The Bank of New York Mellon, a subsidiary of BNY Mellon and an affiliate of Dreyfus, and its affiliates), acting on behalf of customers having a qualified trust or an investment account or relationship at such institution, and bear no Distribution or Shareholder Services Plan fees. Other differences between the classes include the services offered to and the expenses borne by each class, and certain voting rights. Income, expenses (other than expenses attributable to a specific class), and realized and unrealized gains or losses on investments are allocated to each class of shares based on its relative net assets.
It is the fund’s policy to maintain a continuous net asset value per share of $1.00; the fund has adopted certain investment, portfolio valuation and dividend and distribution policies to enable it to do so. There is no
24
assurance, however, that the fund will be able to maintain a stable net asset value per share of $1.00.
The Company accounts separately for the assets, liabilities and operations of each series. Expenses directly attributable to each series are charged to that series’ operations; expenses which are applicable to all series are allocated among them on a pro rata basis.
The Financial Accounting Standards Board (“FASB”) Accounting Standards Codification (“ASC”) is the exclusive reference of authoritative U.S. generally accepted accounting principles (“GAAP”) recognized by the FASB to be applied by nongovernmental entities. Rules and interpretive releases of the Securities and Exchange Commission (“SEC”) under authority of federal laws are also sources of authoritative GAAP for SEC registrants. The fund’s financial statements are prepared in accordance with GAAP, which may require the use of management estimates and assumptions. Actual results could differ from those estimates.
(a) Portfolio valuation: Investments in securities are valued at amortized cost in accordance with Rule 2a-7 under the Act. If amortized cost is determined not to approximate market value, the fair value of the portfolio securities will be determined by procedures established by and under the general supervision of the Board.
The fair value of a financial instrument is the amount that would be received to sell an asset or paid to transfer a liability in an orderly transaction between market participants at the measurement date (i.e., the exit price). GAAP establishes a fair value hierarchy that prioritizes the inputs of valuation techniques used to measure fair value. This hierarchy gives the highest priority to unadjusted quoted prices in active markets for identical assets or liabilities (Level 1 measurements) and the lowest priority to unobservable inputs (Level 3 measurements).
Additionally, GAAP provides guidance on determining whether the volume and activity in a market has decreased significantly and whether such a decrease in activity results in transactions that are not orderly. GAAP requires enhanced disclosures around valuation inputs and techniques used during annual and interim periods.
Various inputs are used in determining the value of the fund’s investments relating to fair value measurements. These inputs are summarized in the three broad levels listed below:
Level 1—unadjusted quoted prices in active markets for identical investments.
25
NOTES TO FINANCIAL STATEMENTS (continued)
Level 2—other significant observable inputs (including quoted prices for similar investments, interest rates, prepayment speeds, credit risk, etc.).
Level 3—significant unobservable inputs (including the fund’s own assumptions in determining the fair value of investments).
The inputs or methodology used for valuing securities are not necessarily an indication of the risk associated with investing in those securities. For example, money market securities are valued using amortized cost, in accordance with rules under the Act. Generally, amortized cost approximates the current fair value of a security, but since the value is not obtained from a quoted price in an active market, such securities are reflected within Level 2 of the fair value hierarchy.
The following is a summary of the inputs used as of October 31, 2015 in valuing the fund’s investments:
| | |
Valuation Inputs | Short-Term Investments ($)† |
Level 1 - Unadjusted Quoted Prices | - |
Level 2 - Other Significant Observable Inputs | 219,584,152 |
Level 3 - Significant Unobservable Inputs | - |
Total | 219,584,152 |
† See Statement of Investments for additional detailed categorizations. |
At October 31, 2015, there were no transfers between Level 1, Level 2 and Level 3 of the fair value hierarchy.
(b) Securities transactions and investment income: Securities transactions are recorded on a trade date basis. Interest income, adjusted for accretion of discount and amortization of premium on investments, is earned from settlement date and is recognized on the accrual basis. Realized gains and losses from securities transactions are recorded on the identified cost basis. Cost of investments represents amortized cost.
(c) Dividends to shareholders: It is the policy of the fund to declare dividends daily from investment income-net. Such dividends are paid monthly. Dividends from net realized capital gains, if any, are normally declared and paid annually, but the fund may make distributions on a more frequent basis to comply with the distribution requirements of the Internal Revenue Code of 1986, as amended (the “Code”). To the extent that net realized capital gains can be offset by capital loss carryovers, it is the policy of the fund not to distribute such gains.
26
(d) Federal income taxes: It is the policy of the fund to continue to qualify as a regulated investment company, if such qualification is in the best interests of its shareholders, by complying with the applicable provisions of the Code, and to make distributions of taxable income sufficient to relieve it from substantially all federal income and excise taxes.
As of and during the period ended October 31, 2015, the fund did not have any liabilities for any uncertain tax positions. The fund recognizes interest and penalties, if any, related to uncertain tax positions as income tax expense in the Statement of Operations. During the period ended October 31, 2015, the fund did not incur any interest or penalties.
Each tax year in the four-year period ended October 31, 2015 remains subject to examination by the Internal Revenue Service and state taxing authorities.
At October 31, 2015, the components of accumulated earnings on a tax basis were substantially the same as for financial reporting purposes.
The tax character of distributions paid to shareholders during the fiscal periods ended October 31, 2015 and October 31, 2014 were as follows: tax-exempt income $82 and $92, ordinary income $0 and $30,214, and long-term capital gains $17,339 and $0, respectively.
During the period ended October 31, 2015, as a result of permanent book to tax differences, primarily due to the tax treatment for dividend reclassification, the fund increased accumulated undistributed investment income-net by $17,339 and decreased accumulated net realized gain (loss) on investments by the same amount. Net assets and net asset value per share were not affected by this reclassification.
At October 31, 2015, the cost of investments for federal income tax purposes was substantially the same as the cost for financial reporting purposes (see the Statement of Investments).
NOTE 2—Investment Management Fee and Other Transactions with Affiliates:
(a) Pursuant to an investment management agreement with Dreyfus, Dreyfus provides or arranges for one or more third parties and/or affiliates to provide investment advisory, administrative, custody, fund accounting and transfer agency services to the fund. Dreyfus also directs the investments of the fund in accordance with its investment objective, policies and limitations. For these services, the fund is contractually obligated to pay Dreyfus a fee, calculated daily and paid monthly, at an annual rate of .50% of the value of the fund’s average daily net assets. Out of its fee, Dreyfus pays all of the expenses of the fund except brokerage
27
NOTES TO FINANCIAL STATEMENTS (continued)
fees, taxes, Distribution Plan fees, Shareholder Services Plan fees and expenses, fees and expenses of non-interested Directors (including counsel fees) and extraordinary expenses. In addition, Dreyfus is required to reduce its fee in an amount equal to the fund’s allocable portion of fees and expenses of the non-interested Directors (including counsel fees). During the period ended October 31, 2015, fees reimbursed by Dreyfus amounted to $16,453.
Dreyfus has undertaken to waive receipt of the management fee and/or reimburse operating expenses in order to facilitate a daily yield at or above a certain level which may change from time to time. This undertaking is voluntary and not contractual, and may be terminated at any time. The reduction in expenses, pursuant to the undertaking, amounted to $1,744,697 during the period ended October 31, 2015.
(b) Under the Distribution Plan adopted pursuant to Rule 12b-1 under the Act, Class A shares and Class B shares may pay annually up to .25% of the value of their average daily net assets (Class A shares are currently limited by the Board to .20%) attributable to Class A shares and Class B shares to compensate the Distributor for shareholder servicing activities and activities primarily intended to result in the sale of Class A shares and Class B shares. During the period ended October 31, 2015, Class A shares and Class B shares were charged $38,654 and $437,199, respectively, pursuant to the Distribution Plan.
(c) Under the Shareholder Services Plan subject to Rule 12b-1 under the Act, pursuant to which the fund pays the Distributor for the provision of certain services to the holders of its Class B shares a fee at an annual rate of .25% of the value of the fund’s average daily net assets for the provision of certain services. The services provided may include personal services relating to shareholder accounts, such as answering shareholder inquiries regarding the fund and providing reports and other information, and services related to the maintenance of such shareholder accounts. Under the Shareholder Services Plan, the Distributor may enter into Shareholder Services Agreements (the “Agreements”) with Service Agents and make payments to Service Agents with respect to these services. During the period ended October 31, 2015, Class B shares were charged $437,199, pursuant to the Shareholder Services Plan.
The Company and the Distributor may suspend or reduce payments under the Shareholder Services Plan at any time, and payments are subject to the continuation of the Shareholder Services Plan and the Agreements described above. From time to time, the Service Agents, the Distributor and the Company may agree to voluntarily reduce the maximum fees payable under the Shareholder Services Plan.
28
Under its terms, the Distribution Plan and Shareholder Services Plan shall remain in effect from year to year, provided such continuance is approved annually by a vote of a majority of those Directors who are not “interested persons” of the Company and who have no direct or indirect financial interest in the operation of or in any agreement related to the Distribution Plan or Shareholder Services Plan.
The components of “Due to The Dreyfus Corporation and affiliates” in the Statement of Assets and Liabilities consist of: management fees $93,897 and Distribution Plan fees $40,349 and Shareholder Services Plan fees $37,358, which are offset against an expense reimbursement currently in effect in the amount of $147,599.
(d) Each Board member also serves as a Board member of other funds within the Dreyfus complex. Annual retainer fees and attendance fees are allocated to each fund based on net assets.
NOTE 3—Securities Transactions:
The fund is permitted to purchase or sell securities from or to certain affiliated funds under specified conditions outlined in procedures adopted by the Board. The procedures have been designed to ensure that any purchase or sale of securities by the fund from or to another fund or portfolio that are, or could be, considered an affiliate by virtue of having a common investment adviser (or affiliated investment adviser), common Directors and/or common officers, complies with Rule 17a-7 under the Act. During the period ended October 31, 2015, the fund engaged in purchases and sales of securities pursuant to Rule 17a-7 under the Act amounting to $96,430,000 and $99,810,000 respectively.
NOTE 4—Regulatory Developments:
On July 23, 2014, the SEC adopted amendments to the rules that govern money market mutual funds. In part, the amendments will require structural changes to most types of money market funds to one extent or another; however, the SEC provided for an extended two-year transition period to comply with such structural requirements. At this time, management is evaluating the reforms adopted and the manner for implementing these reforms over time and its impact on the financial statements.
29
REPORT OF INDEPENDENT REGISTERED
PUBLIC ACCOUNTING FIRM
The Board of Directors and Shareholders of
The Dreyfus/Laurel Funds, Inc.
We have audited the accompanying statement of assets and liabilities of General AMT-Free Municipal Money Market Fund (the “Fund”) (formerly known as Dreyfus AMT-Free Municipal Reserves), a series of The Dreyfus/Laurel Funds, Inc., including the statement of investments, as of October 31, 2015, the related statement of operations for the year then ended, the statements of changes in net assets for each of the years in the two-year period then ended, and the financial highlights for each of the years in the five-year period then ended. These financial statements and financial highlights are the responsibility of the Fund’s management. Our responsibility is to express an opinion on these financial statements and financial highlights based on our audits.
We conducted our audits in accordance with the standards of the Public Company Accounting Oversight Board (United States). Those standards require that we plan and perform the audit to obtain reasonable assurance about whether the financial statements and financial highlights are free of material misstatement. An audit includes examining, on a test basis, evidence supporting the amounts and disclosures in the financial statements. Our procedures included confirmation of securities owned as of October 31, 2015, by correspondence with the custodian and brokers or by other appropriate auditing procedures. An audit also includes assessing the accounting principles used and significant estimates made by management, as well as evaluating the overall financial statement presentation. We believe that our audits provide a reasonable basis for our opinion.
In our opinion, the financial statements and financial highlights referred to above present fairly, in all material respects, the financial position of General AMT-Free Municipal Money Market Fund as of October 31, 2015, the results of its operations for the year then ended, the changes in its net assets for each of the years in the two-year period then ended, and the financial highlights for each of the years in the five-year period then ended, in conformity with U.S. generally accepted accounting principles.

New York, New York
December 30, 2015
30
IMPORTANT TAX INFORMATION (Unaudited)
In accordance with federal tax law, the fund hereby reports all the dividends paid from investment income-net during its fiscal year ended October 31, 2015 as “exempt-interest dividends” (not generally subject to regular federal income tax), except $17,339 that is being designated as a long-term capital distribution for reporting purposes. Where required by federal tax law rules, shareholders will receive notification of their portion of the fund’s tax-exempt dividends paid for the 2015 calendar year on Form 1099-DIV, which will be mailed in early 2016.
31
BOARD MEMBERS INFORMATION (Unaudited)
INDEPENDENT BOARD MEMBERS
Joseph S. DiMartino (72)
Chairman of the Board (1999)
Principal Occupation During Past 5 Years:
· Corporate Director and Trustee (1995-present)
Other Public Company Board Memberships During Past 5 Years:
· CBIZ (formerly, Century Business Services, Inc.), a provider of outsourcing functions for small and medium size companies, Director (1997-present)
· The Newark Group, a provider of a national market of paper recovery facilities, paperboard mills and paperboard converting plants, Director (2000-2010)
No. of Portfolios for which Board Member Serves: 140
———————
Francine J. Bovich (64)
Board Member (2012)
Principal Occupation During Past 5 Years:
· Trustee, The Bradley Trusts, private trust funds (2011-present)
· Managing Director, Morgan Stanley Investment Management (1993-2010)
Other Public Company Board Memberships During Past 5 Years:
· Annaly Capital Management, Inc., Board Member (May 2014-present)
No. of Portfolios for which Board Member Serves: 79
———————
Kenneth A. Himmel (69)
Board Member (1994)
Principal Occupation During Past 5 Years:
· Managing Partner, Gulf Related, an international real estate development company (2010-present)
· President and CEO, Related Urban Development, a real estate development company (1996-present)
· President and CEO, Himmel & Company, a real estate development company (1980-present)
· CEO, American Food Management, a restaurant company (1983-present)
No. of Portfolios for which Board Member Serves: 29
———————
32
Stephen J. Lockwood (68)
Board Member (1994)
Principal Occupation During Past 5 Years:
· Chairman of the Board, Stephen J. Lockwood and Company LLC, a real estate investment company (2000-present)
No. of Portfolios for which Board Member Serves: 29
———————
Roslyn M. Watson (66)
Board Member (1994)
Principal Occupation During Past 5 Years:
· Principal, Watson Ventures, Inc., a real estate investment company (1993-present)
No. of Portfolios for which Board Member Serves: 65
———————
Benaree Pratt Wiley (69)
Board Member (1998)
Principal Occupation During Past 5 Years:
· Principal, The Wiley Group, a firm specializing in strategy and business development (2005-present)
Other Public Company Board Memberships During Past 5 Years:
· CBIZ (formerly, Century Business Services, Inc.), a provider of outsourcing functions for small and medium size companies, Director (2008-present)
No. of Portfolios for which Board Member Serves: 65
———————
Once elected all Board Members serve for an indefinite term, but achieve Emeritus status upon reaching age 80. The address of the Board Members and Officers is c/o The Dreyfus Corporation, 200 Park Avenue, New York, New York 10166. Additional information about the Board Members is available in the fund’s Statement of additional Information which can be obtained from Dreyfus free of charge by calling this toll free number: 1-800-DREYFUS
James M. Fitzgibbons, Emeritus Board Member
J. Tomlinson Fort, Emeritus Board Member
33
OFFICERS OF THE FUND (Unaudited)
BRADLEY J. SKAPYAK, President since January 2010.
Chief Operating Officer and a director of the Manager since June 2009, Chairman of Dreyfus Transfer, Inc., an affiliate of the Manager and the transfer agent of the funds, since May 2011 and Executive Vice President of the Distributor since June 2007. From April 2003 to June 2009, Mr. Skapyak was the head of the Investment Accounting and Support Department of the Manager. He is an officer of 66 investment companies (comprised of 140 portfolios) managed by the Manager. He is 56 years old and has been an employee of the Manager since February 1988.
BENNETT A. MACDOUGALL, Chief Legal Officer since October 2015
Chief Legal Officer of the Manager since June 2015; from June 2005 to June 2015, Director and Associate General Counsel of Deutsche Bank – Asset & Wealth Management Division, and Chief Legal Officer of Deutsche Investment Management Americas Inc. He is an officer of 67 investment companies (comprised of 165 portfolios) managed by the Manager. He is 44 years old and has been an employee of the Manager since June 2015.
JANETTE E. FARRAGHER, Vice President and Secretary since December 2011.
Assistant General Counsel of BNY Mellon, and an officer of 67 investment companies (comprised of 165 portfolios) managed by the Manager. She is 52 years old and has been an employee of the Manager since February 1984.
JAMES BITETTO, Vice President and Assistant Secretary since August 2005.
Managing Counsel of BNY Mellon and Secretary of the Manager, and an officer of 67 investment companies (comprised of 165 portfolios) managed by the Manager. He is 49 years old and has been an employee of the Manager since December 1996.
JONI LACKS CHARATAN, Vice President and Assistant Secretary since August 2005.
Managing Counsel of BNY Mellon, and an officer of 67 investment companies (comprised of 165 portfolios) managed by the Manager. She is 59 years old and has been an employee of the Manager since October 1988.
JOSEPH M. CHIOFFI, Vice President and Assistant Secretary since August 2005.
Managing Counsel of BNY Mellon, and an officer of 67 investment companies (comprised of 165 portfolios) managed by the Manager. He is 53 years old and has been an employee of the Manager since June 2000.
JOHN B. HAMMALIAN, Vice President and Assistant Secretary since August 2005.
Senior Managing Counsel of BNY Mellon, and an officer of 67 investment companies (comprised of 165 portfolios) managed by the Manager. He is 52 years old and has been an employee of the Manager since February 1991.
MAUREEN E. KANE, Vice President and Assistant Secretary since April 2015.
Managing Counsel of BNY Mellon since July 2014; from October 2004 until July 2014, General Counsel, and from May 2009 until July 2014, Chief Compliance Officer of Century Capital Management. She is an officer of 67 investment companies (comprised of 165 portfolios) managed by the Manager. She is 53 years old and has been an employee of the Manager since July 2014.
SARAH S. KELLEHER, Vice President and Assistant Secretary since April 2014.
Senior Counsel of BNY Mellon, and an officer of 67 investment companies (comprised of 165 portfolios) managed by the Manager; from August 2005 to March 2013, Associate General Counsel of Third Avenue Management. She is 40 years old and has been an employee of the Manager since March 2013.
JEFF PRUSNOFSKY, Vice President and Assistant Secretary since August 2005.
Senior Managing Counsel of BNY Mellon, and an officer of 67 investment companies (comprised of 165 portfolios) managed by the Manager. He is 50 years old and has been an employee of the Manager since October 1990.
JAMES WINDELS, Treasurer since November 2001.
Director – Mutual Fund Accounting of the Manager, and an officer of 67 investment companies (comprised of 165 portfolios) managed by the Manager. He is 57 years old and has been an employee of the Manager since April 1985.
34
RICHARD CASSARO, Assistant Treasurer since January 2008.
Senior Accounting Manager – Money Market and Municipal Bond Funds of the Manager, and an officer of 67 investment companies (comprised of 165 portfolios) managed by the Manager. He is 56 years old and has been an employee of the Manager since September 1982.
GAVIN C. REILLY, Assistant Treasurer since December 2005.
Tax Manager of the Investment Accounting and Support Department of the Manager, and an officer of 67 investment companies (comprised of 165 portfolios) managed by the Manager. He is 47 years old and has been an employee of the Manager since April 1991.
ROBERT S. ROBOL, Assistant Treasurer since December 2002.
Senior Accounting Manager – Fixed Income Funds of the Manager, and an officer of 67 investment companies (comprised of 165 portfolios) managed by the Manager. He is 51 years old and has been an employee of the Manager since October 1988.
ROBERT SALVIOLO, Assistant Treasurer since July 2007.
Senior Accounting Manager – Equity Funds of the Manager, and an officer of 67 investment companies (comprised of 165 portfolios) managed by the Manager. He is 48 years old and has been an employee of the Manager since June 1989.
ROBERT SVAGNA, Assistant Treasurer since December 2002.
Senior Accounting Manager – Equity Funds of the Manager, and an officer of 67 investment companies (comprised of 165 portfolios) managed by the Manager. He is 48 years old and has been an employee of the Manager since November 1990.
JOSEPH W. CONNOLLY, Chief Compliance Officer since October 2004.
Chief Compliance Officer of the Manager and The Dreyfus Family of Funds (67 investment companies, comprised of 165 portfolios). He is 58 years old and has served in various capacities with the Manager since 1980, including manager of the firm’s Fund Accounting Department from 1997 through October 2001.
35
NOTES
36
NOTES
37
General AMT-Free Municipal Money Market Fund
200 Park Avenue
New York, NY 10166
Manager
The Dreyfus Corporation
200 Park Avenue
New York, NY 10166
Custodian
The Bank of New York Mellon
225 Liberty Street
New York, NY 10286
Transfer Agent &
Dividend Disbursing Agent
Dreyfus Transfer, Inc.
200 Park Avenue
New York, NY 10166
Distributor
MBSC Securities Corporation
200 Park Avenue
New York, NY 10166
| | |
Ticker Symbols: | Class A: DLTXX Class B: DMBXX Dreyfus Class: DLRXX Class R: DTMXX |
Telephone Call your financial representative or 1-800-DREYFUS
Mail The Dreyfus Family of Funds, 144 Glenn Curtiss Boulevard, Uniondale, NY 1556-0144
E-mail Send your request to info@dreyfus.com
Internet Information can be viewed online or downloaded at www.dreyfus.com
The fund will disclose daily, on www.dreyfus.com, the fund’s complete schedule of holdings as of the end of the previous business day. The schedule of holdings will remain on the website until the fund files its Form N-Q or Form N-SCR for the period that includes the date of the posted holdings.
The fund files its complete schedule of portfolio holdings with the Securities and Exchange Commission (“SEC”) for the first and third quarters of each fiscal year on Form N-Q. The fund’s Forms N-Q are available on the SEC’s website at www.sec.gov and may be reviewed and copied at the SEC’s Public Reference Room in Washington, DC. (phone 1-800-SEC-0330 for information).
Information regarding how the fund voted proxies related to portfolio securities for the most recent 12-month period ended June 30 is available at www.dreyfus.com and on the SEC’s website at www.sec.gov and without charge, upon request, by calling 1-800-DREYFUS.
| | |
© 2015 MBSC Securities Corporation
0324AR1015 | 
|
General Treasury and Agency Money Market Fund
| | | |
| | ANNUAL REPORT
October 31, 2015 |
| |
Save time. Save paper. View your next shareholder report online as soon as it’s available. Log into www.dreyfus.com and sign up for Dreyfus eCommunications. It’s simple and only takes a few minutes. |
| |
The views expressed in this report reflect those of the portfolio manager only through the end of the period covered and do not necessarily represent the views of Dreyfus or any other person in the Dreyfus organization. Any such views are subject to change at any time based upon market or other conditions and Dreyfus disclaims any responsibility to update such views. These views may not be relied on as investment advice and, because investment decisions for a Dreyfus fund are based on numerous factors, may not be relied on as an indication of trading intent on behalf of any Dreyfus fund. |
| |
Not FDIC-Insured • Not Bank-Guaranteed • May Lose Value |
Contents
THE FUND
FOR MORE INFORMATION
Back Cover
| | | | |
| |
General Treasury and Agency Money Market Fund
| | The Fund |
A LETTER FROM THE PRESIDENT
Dear Shareholder:
We are pleased to present this annual report for General Treasury & Agency Money Market Fund, covering the 12-month period from November 1, 2014, through October 31, 2015. For information about how the fund performed during the reporting period, as well as general market perspectives, we provide a Discussion of Fund Performance on the pages that follow.
Financial markets proved volatile over the reporting period amid choppy U.S. and global economic growth. U.S. stocks advanced over the final months of 2014 and the spring of 2015, with some broad measures of market performance setting new record highs. Those gains were largely erased over the summer when global economic instability undermined investor sentiment, but a renewed rally in October enabled most broad stock indices to end the reporting period in positive territory. In contrast, international stocks generally lost a degree of value, with developed markets faring far better than emerging markets amid falling commodity prices and depreciating currency values. U.S. bonds generally produced modestly positive total returns, with municipal bonds and longer term U.S. government securities faring better, on average, than corporate-backed bonds.
We expect market volatility to persist over the near term until investors see greater clarity regarding short-term U.S. interest rates and global economic conditions. Our investment strategists and portfolio managers are monitoring developments carefully, keeping a close watch on credit spreads, currency values, commodity prices, corporate profits, economic trends in the emerging markets, and other developments that could influence investor sentiment. Over the longer term, we remain confident that markets are likely to benefit as investors increasingly recognize that inflation is likely to stay low, economic growth expectations are stabilizing, and monetary policies remain accommodative in most regions of the world. In our view, investors will continue to be well served under these circumstances by a long-term perspective and a disciplined investment approach.
Thank you for your continued confidence and support.
Sincerely,

J. Charles Cardona
President
The Dreyfus Corporation
November 16, 2015
2
DISCUSSION OF FUND PERFORMANCE
For the period of November 1, 2014, through October 31, 2015, as provided by Patricia A. Larkin, Portfolio Manager
Fund and Market Performance Overview
For the 12-month period ended October 31, 2015, General Treasury and Agency Money Market Fund’s Class A shares produced a yield of 0.00%, and Class R shares yielded 0.00%. Taking into account the effects of compounding, the fund’s Class A shares and Class R shares produced effective yields of 0.00% and 0.00%, respectively.1
The Federal Reserve Board (the “Fed”) left the federal funds rate unchanged, and yields of U.S. government obligations remained near historical lows.
Effective September 1, 2015, the fund’s name changed from Dreyfus U.S. Treasury Reserves to General Treasury and Agency Money Market Fund, and its Investor shares were redesignated as Class A shares.
The Fund’s Investment Approach
The fund seeks a high level of current income consistent with stability of principal. We attempt to provide shareholders with an investment vehicle that is made up of direct U.S. government obligations with remaining maturities of 13 months or less, as well as repurchase agreements with securities dealers, which are backed by U.S. government securities. To pursue its goal, the fund normally invests exclusively in securities backed by the full faith and credit of the U.S. government and repurchase agreements (including tri-party repurchase agreements) in respect to such securities.
Uneven U.S. Economic Recovery Continued
U.S. GDP grew at a 2.1% annualized rate during the fourth quarter of 2014 when labor markets strengthened and consumer and business sentiment improved, but growth moderated to an anemic 0.6% annualized rate during the first quarter of 2015. Economic activity was weighed down, in part, by an appreciating U.S. dollar sparked by central banks’ responses to global economic instability and plummeting commodity prices. Severe winter weather also contributed to the slowdown. Nonetheless, job creation generally remained robust, and the unemployment rate fell from 5.7% at the start of the reporting period to 5.5% at the end of March 2015.
The recovery accelerated in the spring. The unemployment rate dipped to 5.4% in April, and 187,000 new jobs were created. In May, employers created 260,000 jobs and average hourly wages rose 0.3%, yet the unemployment rate ticked higher to 5.5%. Meanwhile, stabilizing currency exchange rates enabled the U.S. trade deficit to shrink significantly. Fuel prices rebounded, sending inflation higher. Sentiment in the financial markets deteriorated in June during a debt crisis in Greece, but the U.S. economy continued to gain traction. 245,000 new jobs were added during the month, the unemployment rate fell to 5.3%, and consumer spending rose. The U.S. economy grew at a 3.9% annualized rate over the second quarter.
July brought more good news when 223,000 jobs were added and the unemployment rate stayed steady. Average hourly wages increased, as did retail sales. Both the manufacturing
3
DISCUSSION OF FUND PERFORMANCE (continued)
and service sectors continued to expand. On the other hand, equity markets reacted negatively to greater-than-expected economic weakness in China.
While the unemployment rate fell to 5.1% in August, only 153,000 jobs were added. Economic instability in China continued to roil the financial markets after the country’s central bank depreciated its currency. Commodity prices fell in response, giving back previous gains. On a brighter note, U.S. wages and personal incomes grew at a healthy pace.
Disappointing job creation continued in September with 137,000 new positions. Average hourly wages declined slightly. The unemployment rate stayed at 5.1% due to workers leaving the labor force. Although the manufacturing sector expanded for the 33rd straight month, the rate of increase was the lowest in more than two years. On the other hand, activity in the service sector continued to grow strongly, personal incomes rose, and real personal consumption expenditures climbed. U.S. GDP growth decelerated to an estimated 1.5% annualized rate during the third quarter, reflecting high business inventory levels and lower exports.
October brought generally good economic news. An estimated 271,000 jobs were created, and the unemployment rate fell to 5.0%, its lowest level since April 2008. Meanwhile, average annual wages increased at a 4.3% rate compared to September. Retail sales moved mildly higher, and fuel prices continued to decline. In contrast, housing starts fell sharply, ending the month below year-ago levels.
Fed Expected to Raise Rates Gradually
At its October meeting, the Fed again refrained from implementing the first in a series of widely expected rate hikes. Monetary policymakers noted that “economic activity has been expanding at a moderate pace,” but they left the federal funds rate unchanged “to support continued progress toward maximum employment and price stability.” While many analysts expect rate hikes to begin as soon as the Fed’s next meeting in December, those increases are likely to be modest and gradual.
Therefore, we intend for now to maintain the fund’s weighted average maturity in a range we consider to be in line with industry averages, but we are prepared to adjust our strategies quickly as market conditions change.
November 16, 2015
An investment in the fund is not insured or guaranteed by the FDIC or any other government agency. Although the fund seeks to preserve the value of your investment at $1.00 per share, it is possible to lose money by investing in the fund.
1 Effective yield is based upon dividends declared daily and reinvested monthly. Past performance is no guarantee of future results. Yields fluctuate. Yields provided reflect the absorption of certain fund expenses by The Dreyfus Corporation pursuant to an undertaking in effect that may be extended, terminated, or modified at any time. Had these expenses not been absorbed, the fund’s yields would have been lower, and in some cases, 7-day yields during the reporting period would have been negative absent the expense absorption.
4
UNDERSTANDING YOUR FUND’S EXPENSES (Unaudited)
As a mutual fund investor, you pay ongoing expenses, such as management fees and other expenses. Using the information below, you can estimate how these expenses affect your investment and compare them with the expenses of other funds. You also may pay one-time transaction expenses, including sales charges (loads) and redemption fees, which are not shown in this section and would have resulted in higher total expenses. For more information, see your fund’s prospectus or talk to your financial adviser.
Review your fund’s expenses
The table below shows the expenses you would have paid on a $1,000 investment in General Treasury and Agency Money Market Fund from May 1, 2015 to October 31, 2015. It also shows how much a $1,000 investment would be worth at the close of the period, assuming actual returns and expenses.
| | | | | | |
Expenses and Value of a $1,000 Investment | | |
assuming actual returns for the six months ended October 31, 2015 | |
| | | | Class A | Class R |
Expenses paid per $1,000† | | $ .45 | $ .45 |
Ending value (after expenses) | | $ 1,000.00 | $ 1,000.00 |
COMPARING YOUR FUND’S EXPENSES
WITH THOSE OF OTHER FUNDS (Unaudited)
Using the SEC’s method to compare expenses
The Securities and Exchange Commission (SEC) has established guidelines to help investors assess fund expenses. Per these guidelines, the table below shows your fund’s expenses based on a $1,000 investment, assuming a hypothetical 5% annualized return. You can use this information to compare the ongoing expenses (but not transaction expenses or total cost) of investing in the fund with those of other funds. All mutual fund shareholder reports will provide this information to help you make this comparison. Please note that you cannot use this information to estimate your actual ending account balance and expenses paid during the period.
| | | | | | |
Expenses and Value of a $1,000 Investment | | |
assuming a hypothetical 5% return for the six months ended October 31, 2015 | |
| | | | Class A | Class R |
Expenses paid per $1,000† | | $ .46 | $ .46 |
Ending value (after expenses) | | $ 1,024.75 | $1,024.75 |
† Expenses are equal to the fund’s annualized expense ratio of .09% for Class A and .09% for Class R, multiplied by the average account value over the period, multiplied by 184/365 (to reflect the one-half year period).
5
STATEMENT OF INVESTMENTS
October 31, 2015
| | | | | | | | |
U.S. Treasury Bills - 39.0% | Annualized Yield on Date of Purchase (%) | | Principal Amount ($) | | Value ($) | |
1/14/16 | | 0.08 | | 35,000,000 | | 34,994,400 | |
1/21/16 | | 0.13 | | 50,000,000 | | 49,985,375 | |
2/4/16 | | 0.17 | | 25,000,000 | | 24,988,785 | |
4/28/16 | | 0.20 | | 25,000,000 | | 24,975,139 | |
Total U.S. Treasury Bills (cost $134,943,699) | | | | | | 134,943,699 | |
| | | | | | | | |
Repurchase Agreements - 70.7% | | | | | | |
BNP Paribas | | 0.07 | | 40,000,000 | | 40,000,000 | |
dated 10/30/15, due 11/2/15 in the amount of $40,000,233 (fully collateralized by $5,802,000 U.S. Treasury Bills, due 1/7/16, value $5,801,304, $34,112,900 U.S. Treasury Bonds, 2.50%, due 2/15/45, value $31,048,301, $1,177,200 U.S. Treasury Inflation Protected Securities, 0.13%-3.88%, due 1/15/22-4/15/29, value $2,289,388, $976,100 U.S. Treasury Notes, 0.75%-1.25%, due 2/28/18-11/30/18, value $985,986 and $1,597,290 U.S. Treasury Strips, due 11/15/43-11/15/44, value $675,021) | | | | | | | |
Citigroup Global Markets Holdings Inc. | | 0.08 | | 65,000,000 | | 65,000,000 | |
dated 10/30/15, due 11/2/15 in the amount of $65,000,433 (fully collateralized by $2,995,400 U.S. Treasury Bills, due 2/4/16, value $2,994,831, $41,174,100 U.S. Treasury Bonds, 7.63%, due 11/15/22, value $58,324,298, $220,500 U.S. Treasury Inflation Protected Securities, 0.13%, due 4/15/17, value $231,090 and $4,608,900 U.S. Treasury Notes, 2.13%, due 1/31/21, value $4,749,784) | | | | | | | |
6
| | | | | | | | |
Repurchase Agreements - 70.7% (continued) | Annualized Yield on Date of Purchase (%) | | Principal Amount ($) | | Value ($) | |
Credit Agricole CIB | | 0.07 | | 20,000,000 | | 20,000,000 | |
dated 10/30/15, due 11/2/15 in the amount of $20,000,117 (fully collateralized by $261,027 U.S. Treasury Bills, due 11/19/15-8/18/16, value $260,892, $2,725,542 U.S. Treasury Bonds, 2.50%-9.88%, due 11/15/15-8/15/45, value $3,397,570, $23,991 U.S. Treasury Floating Rate Notes, 0.07%-0.09%, due 4/30/16-10/31/16, value $23,991, $6,465,445 U.S. Treasury Inflation Protected Securities, 0.13%-2.63%, due 1/15/16-2/15/45, value $6,902,185 and $9,760,298 U.S. Treasury Notes, 0.25%-5.13%, due 10/31/15-8/15/25, value $9,815,362) | | | | | | | |
HSBC USA Inc. | | 0.06 | | 50,000,000 | | 50,000,000 | |
dated 10/30/15, due 11/2/15 in the amount of $50,000,250 (fully collateralized by $52,430,000 U.S. Treasury Bonds, 2.75%, due 11/15/42, value $51,004,655) | | | | | | | |
JPMorgan Chase & Co. | | 0.07 | | 70,000,000 | | 70,000,000 | |
dated 10/30/15, due 11/2/15 in the amount of $70,000,408 (fully collateralized by $71,450,000 U.S. Treasury Notes, 0.50%, due 3/31/17, value $71,403,546) | | | | | | | |
Total Repurchase Agreements (cost $245,000,000) | | | | | | 245,000,000 | |
| | | | | | | | |
Total Investments (cost $379,943,699) | | | | 109.7% | | 379,943,699 | |
Liabilities, Less Cash and Receivables | | | | (9.7%) | | (33,696,796) | |
Net Assets | | | | 100.0% | | 346,246,903 | |
| | |
Portfolio Summary (Unaudited) † | Value (%) |
Repurchase Agreements | 70.7 |
U.S. Treasury Bills | 39.0 |
| | 109.7 |
†Based on net assets.
See notes to financial statements.
7
STATEMENT OF ASSETS AND LIABILITIES
October 31, 2015
| | | | | | | |
| | | | | | |
| | | Cost | | Value | |
Assets ($): | | | | |
Investments in securities—See Statement of Investments
(including repurchase agreements of $245,000,000)—Note 1 (b) | | 379,943,699 | | 379,943,699 | |
Cash | | | | | 1,310,091 | |
Interest receivable | | | | | 961 | |
| | | | | 381,254,751 | |
Liabilities ($): | | | | |
Due to The Dreyfus Corporation and affiliates—Note 2(b) | | | | | 13,448 | |
Payable for investment securities purchased | | | | | 34,994,400 | |
| | | | | 35,007,848 | |
Net Assets ($) | | | 346,246,903 | |
Composition of Net Assets ($): | | | | |
Paid-in capital | | | | | 346,246,103 | |
Accumulated net realized gain (loss) on investments | | | | | 800 | |
Net Assets ($) | | | 346,246,903 | |
| | | | |
Net Asset Value Per Share | Class A | Class R | |
Net Assets ($) | 170,251,504 | 175,995,399 | |
Shares Outstanding | 170,250,892 | 175,995,211 | |
Net Asset Value Per Share ($) | 1.00 | 1.00 | |
See notes to financial statements.
8
STATEMENT OF OPERATIONS
Year Ended October 31, 2015
| | | | | | | |
| | | | | | |
| | | | | | |
Investment Income ($): | | | | |
Interest Income | | | 306,682 | |
Expenses: | | | | |
Management fee—Note 2(a) | | | 1,986,693 | |
Distribution fees—Note 2(b) | | | 280,741 | |
Directors’ fees—Note 2(a,c) | | | 36,407 | |
Total Expenses | | | 2,303,841 | |
Less—reduction in expenses due to undertaking—Note 2(a) | | | (1,960,925) | |
Less—Directors’ fees reimbursed by Dreyfus—Note 2(a) | | | (36,407) | |
Net Expenses | | | 306,509 | |
Investment Income—Net | | | 173 | |
Realized Gain (Loss) on Investments—Note 1(b) ($) | 800 | |
Net Increase in Net Assets Resulting from Operations | | 973 | |
See notes to financial statements.
9
STATEMENT OF CHANGES IN NET ASSETS
| | | | | | | | | | |
| | | | | | | | | | |
| | | | Year Ended October 31, |
| | | | 2015 | | | | 2014 | |
Operations ($): | | | | | | | | |
Investment income—net | | | 173 | | | | 117 | |
Net realized gain (loss) on investments | | 800 | | | | 1,112 | |
Net Increase (Decrease) in Net Assets
Resulting from Operations | 973 | | | | 1,229 | |
Dividends to Shareholders from ($): | | | | | | | | |
Investment income—net: | | | | | | | | |
Class A | | | (417) | | | | (51) | |
Class R | | | (868) | | | | (66) | |
Total Dividends | | | (1,285) | | | | (117) | |
Capital Stock Transactions ($1.00 per share): | | | | | | | |
Net proceeds from shares sold: | | | | | | | | |
Class A | | | 126,278,266 | | | | 88,084,148 | |
Class R | | | 436,832,145 | | | | 524,399,309 | |
Dividends reinvested: | | | | | | | | |
Class A | | | 410 | | | | 51 | |
Class R | | | 4 | | | | - | |
Cost of shares redeemed: | | | | | | | | |
Class A | | | (78,563,781) | | | | (121,394,764) | |
Class R | | | (592,432,301) | | | | (379,459,480) | |
Increase (Decrease) in Net Assets
from Capital Stock Transactions | (107,885,257) | | | | 111,629,264 | |
Total Increase (Decrease) in Net Assets | (107,885,569) | | | | 111,630,376 | |
Net Assets ($): | | | | | | | | |
Beginning of Period | | | 454,132,472 | | | | 342,502,096 | |
End of Period | | | 346,246,903 | | | | 454,132,472 | |
See notes to financial statements.
10
FINANCIAL HIGHLIGHTS
The following tables describe the performance for each share class for the fiscal periods indicated. All information reflects financial results for a single fund share. Total return shows how much your investment in the fund would have increased (or decreased) during each period, assuming you had reinvested all dividends and distributions. These figures have been derived from the fund’s financial statements.
| | | | | | | |
| | | |
| | | |
| | Year Ended October 31, |
Class A Shares | 2015 | 2014 | 2013 | 2012 | 2011 |
Per Share Data ($): | | | | | | |
Net asset value, beginning of period | | 1.00 | 1.00 | 1.00 | 1.00 | 1.00 |
Investment Operations: | | | | | | |
Investment income—neta | | .000 | .000 | .000 | .000 | .000 |
Distributions: | | | | | | |
Dividends from
investment income—neta | | (.000) | (.000) | (.000) | (.000) | (.000) |
Net asset value, end of period | | 1.00 | 1.00 | 1.00 | 1.00 | 1.00 |
Total Return (%)b | | .00 | .00 | .00 | .00 | .00 |
Ratios/Supplemental Data (%): | | | | | |
Ratio of total expenses
to average net assets | | .71 | .71 | .71 | .71 | .71 |
Ratio of net expenses
to average net assets | | .08 | .05 | .09 | .10 | .12 |
Ratio of net investment income
to average net assetsb | | .00 | .00 | .00 | .00 | .00 |
Net Assets, end of period ($ x 1,000) | | 170,252 | 122,537 | 155,847 | 122,029 | 125,984 |
a Amount represents less than $.001 per share.
b Amount represents less than .01%.
See notes to financial statements.
11
FINANCIAL HIGHLIGHTS (continued)
| | | | | | | |
| | | |
| | | |
| | Year Ended October 31, |
Class R Shares | 2015 | 2014 | 2013 | 2012 | 2011 |
Per Share Data ($): | | | | | | |
Net asset value, beginning of period | | 1.00 | 1.00 | 1.00 | 1.00 | 1.00 |
Investment Operations: | | | | | | |
Investment income—neta | | .000 | .000 | .000 | .000 | .000 |
Distributions: | | | | | | |
Dividends from
investment income—neta | | (.000) | (.000) | (.000) | (.000) | (.000) |
Net asset value, end of period | | 1.00 | 1.00 | 1.00 | 1.00 | 1.00 |
Total Return (%)b | | .00 | .00 | .00 | .00 | .00 |
Ratios/Supplemental Data (%): | | | | | |
Ratio of total expenses
to average net assets | | .51 | .51 | .51 | .51 | .50 |
Ratio of net expenses
to average net assets | | .08 | .05 | .09 | .11 | .12 |
Ratio of net investment income
to average net assetsb | | .00 | .00 | .00 | .00 | .00 |
Net Assets, end of period ($ x 1,000) | | 175,995 | 331,596 | 186,655 | 214,391 | 153,112 |
a Amount represents less than $.001 per share.
b Amount represents less than .01%.
See notes to financial statements.
12
NOTES TO FINANCIAL STATEMENTS
NOTE 1—Significant Accounting Policies:
General Treasury and Agency Money Market Fund (the “fund”) is a separate diversified series of The Dreyfus/Laurel Funds, Inc. (the “Company”), which is registered under the Investment Company Act of 1940, as amended (the “Act”), as an open-end management investment company and operates as a series company currently offering ten series, including the fund. The fund’s investment objective is to seek a high level of current income consistent with stability of principal. The Dreyfus Corporation (the “Manager” or “Dreyfus”), a wholly-owned subsidiary of The Bank of New York Mellon Corporation (“BNY Mellon”), serves as the fund’s investment adviser.
The Company’s Board of Directors (the “Board”) approved, effective September 1, 2015, a change in the fund’s name from “Dreyfus U.S. Treasury Reserves” to “General Treasury and Agency Money Market Fund.” Investor shares of the fund have been redesignated as Class A shares. The Board approved, effective November 1, 2015, a change in the fund’s fiscal year end from October 31 to November 30.
MBSC Securities Corporation (the “Distributor”), a wholly-owned subsidiary of Dreyfus, is the distributor of the fund’s shares, which are sold without a sales charge. The fund is authorized to issue 1 billion shares of $.001 par value Common Stock in each of the following classes of shares: Class A and Class R. Class A shares are sold primarily to retail investors through financial intermediaries and bear a Distribution Plan fee. Class R shares are sold primarily to bank trust departments and other financial service providers (including The Bank of New York Mellon, a subsidiary of BNY Mellon and an affiliate of Dreyfus, and its affiliates), acting on behalf of customers having a qualified trust or an investment account or relationship at such institution, and bear no Distribution Plan fee. Other differences between the classes include the services offered to and the expenses borne by each class, and certain voting rights. Income, expenses (other than expenses attributable to a specific class), and realized and unrealized gains or losses on investments are allocated to each class of shares based on its relative net assets.
It is the fund’s policy to maintain a continuous net asset value per share of $1.00; the fund has adopted certain investment, portfolio valuation and dividend and distribution policies to enable it to do so. There is no assurance, however, that the fund will be able to maintain a stable net asset value per share of $1.00.
The Company accounts separately for the assets, liabilities and operations of each series. Expenses directly attributable to each series are charged to
13
NOTES TO FINANCIAL STATEMENTS (continued)
that series’ operations; expenses which are applicable to all series are allocated among them on a pro rata basis.
The Financial Accounting Standards Board (“FASB”) Accounting Standards Codification (“ASC”) is the exclusive reference of authoritative U.S. generally accepted accounting principles (“GAAP”) recognized by the FASB to be applied by nongovernmental entities. Rules and interpretive releases of the Securities and Exchange Commission (“SEC”) under authority of federal laws are also sources of authoritative GAAP for SEC registrants. The fund’s financial statements are prepared in accordance with GAAP, which may require the use of management estimates and assumptions. Actual results could differ from those estimates.
(a) Portfolio valuation: Investments in securities are valued at amortized cost in accordance with Rule 2a-7 under the Act. If amortized cost is determined not to approximate market value, the fair value of the portfolio securities will be determined by procedures established by and under the general supervision of the Board.
The fair value of a financial instrument is the amount that would be received to sell an asset or paid to transfer a liability in an orderly transaction between market participants at the measurement date (i.e., the exit price). GAAP establishes a fair value hierarchy that prioritizes the inputs of valuation techniques used to measure fair value. This hierarchy gives the highest priority to unadjusted quoted prices in active markets for identical assets or liabilities (Level 1 measurements) and the lowest priority to unobservable inputs (Level 3 measurements).
Additionally, GAAP provides guidance on determining whether the volume and activity in a market has decreased significantly and whether such a decrease in activity results in transactions that are not orderly. GAAP requires enhanced disclosures around valuation inputs and techniques used during annual and interim periods.
Various inputs are used in determining the value of the fund’s investments relating to fair value measurements. These inputs are summarized in the three broad levels listed below:
Level 1—unadjusted quoted prices in active markets for identical investments.
Level 2—other significant observable inputs (including quoted prices for similar investments, interest rates, prepayment speeds, credit risk, etc.).
Level 3—significant unobservable inputs (including the fund’s own assumptions in determining the fair value of investments).
14
The inputs or methodology used for valuing securities are not necessarily an indication of the risk associated with investing in those securities. For example, money market securities are valued using amortized cost, in accordance with rules under the Act. Generally, amortized cost approximates the current fair value of a security, but since the value is not obtained from a quoted price in an active market, such securities are reflected within Level 2 of the fair value hierarchy.
The following is a summary of the inputs used as of October 31, 2015 in valuing the fund’s investments:
| | |
Valuation Inputs | Short-Term Investments ($)† |
Level 1 - Unadjusted Quoted Prices | - |
Level 2 - Other Significant Observable Inputs | 379,943,699 |
Level 3 - Significant Unobservable Inputs | - |
Total | 379,943,699 |
† See Statement of Investments for additional detailed categorizations. |
At October 31, 2015, there were no transfers between Level 1, Level 2 and Level 3 of the fair value hierarchy.
(b) Securities transactions and investment income: Securities transactions are recorded on a trade date basis. Interest income, adjusted for accretion of discount and amortization of premium on investments, is earned from settlement date and is recognized on the accrual basis. Realized gains and losses from securities transactions are recorded on the identified cost basis. Cost of investments represents amortized cost.
The fund may enter into repurchase agreements with financial institutions, deemed to be creditworthy by Dreyfus, subject to the seller’s agreement to repurchase and the fund’s agreement to resell such securities at a mutually agreed upon price. Pursuant to the terms of the repurchase agreement, such securities must have an aggregate market value greater than or equal to the terms of the repurchase price plus accrued interest at all times. If the value of the underlying securities falls below the value of the repurchase price plus accrued interest, the fund will require the seller to deposit additional collateral by the next business day. If the request for additional collateral is not met, or the seller defaults on its repurchase obligation, the fund maintains its right to sell the underlying securities at market value and may claim any resulting loss against the seller. The fund may also jointly enter into one or more repurchase agreements with other Dreyfus-managed funds in accordance with an exemptive order granted by the SEC
15
NOTES TO FINANCIAL STATEMENTS (continued)
pursuant to section 17(d) and Rule 17d-1 under the Act. Any joint repurchase agreements must be collateralized fully by U.S. Government securities.
(c) Dividends to shareholders: It is the policy of the fund to declare dividends daily from investment income-net. Such dividends are paid monthly. Dividends from net realized capital gains, if any, are normally declared and paid annually, but the fund may make distributions on a more frequent basis to comply with the distribution requirements of the Internal Revenue Code of 1986, as amended (the “Code”). To the extent that net realized capital gains can be offset by capital loss carryovers, it is the policy of the fund not to distribute such gains.
(d) Federal income taxes: It is the policy of the fund to continue to qualify as a regulated investment company, if such qualification is in the best interests of its shareholders, by complying with the applicable provisions of the Code, and to make distributions of taxable income sufficient to relieve it from substantially all federal income and excise taxes.
As of and during the period ended October 31, 2015, the fund did not have any liabilities for any uncertain tax positions. The fund recognizes interest and penalties, if any, related to uncertain tax positions as income tax expense in the Statement of Operations. During the period ended October 31, 2015, the fund did not incur any interest or penalties.
Each tax year in the four-year period ended October 31, 2015 remains subject to examination by the Internal Revenue Service and state taxing authorities.
At October 31, 2015, the components of accumulated earnings on a tax basis were substantially the same as for financial reporting purposes.
The tax character of distributions paid to shareholders during the fiscal periods ended October 31, 2015 and October 31, 2014 were all ordinary income.
During the period ended October 31, 2015, as a result of permanent book to tax differences, primarily due to the tax treatment for dividend reclassification, the fund increased accumulated undistributed investment income-net by $1,112 and decreased accumulated net realized gain (loss) on investments by the same amount. Net assets and net asset value per share were not affected by this reclassification.
At October 31, 2015, the cost of investments for federal income tax purposes was substantially the same as the cost for financial reporting purposes (see the Statement of Investments).
16
NOTE 2—Investment Management Fee and Other Transactions with Affiliates:
(a) Pursuant to an investment management agreement with Dreyfus, Dreyfus provides or arranges for one or more third parties and/or affiliates to provide investment advisory, administrative, custody, fund accounting and transfer agency services to the fund. Dreyfus also directs the investments of the fund in accordance with its investment objective, policies and limitations. For these services, the fund is contractually obligated to pay Dreyfus a fee, calculated daily and paid monthly, at an annual rate of .50% of the value of the fund’s average daily net assets. Out of its fee, Dreyfus pays all of the expenses of the fund except brokerage fees, taxes, Distribution Plan fees, fees and expenses of non-interested Directors (including counsel fees) and extraordinary expenses. In addition, Dreyfus is required to reduce its fee in an amount equal to the fund’s allocable portion of fees and expenses of the non-interested Directors (including counsel fees). During the period ended October 31, 2015, fees reimbursed by Dreyfus amounted to $36,407.
Dreyfus has undertaken to waive receipt of the management fee and/or reimburse operating expenses in order to facilitate a daily yield at or above a certain level which may change from time to time. This undertaking is voluntary and not contractual, and may be terminated at any time. The reduction in expenses, pursuant to the undertaking, amounted to $1,960,925 during the period ended October 31, 2015.
(b) Under the Distribution Plan adopted pursuant to Rule 12b-1 under the Act, Class A shares may pay annually up to .25% (currently limited by the Board to .20%) of the value of the average daily net assets attributable to its Class A shares to compensate the Distributor for shareholder servicing activities and expenses primarily intended to result in the sale of Class A shares. During the period ended October 31, 2015, Class A shares were charged $280,741 pursuant to the Distribution Plan.
Under its terms, the Distribution Plan shall remain in effect from year to year, provided such continuance is approved annually by a vote of a majority of those Directors who are not “interested persons” of the Company and who have no direct or indirect financial interest in the operation of or in any agreement related to the Distribution Plan.
The components of “Due to The Dreyfus Corporation and affiliates” in the Statement of Assets and Liabilities consist of: management fees $137,431 and Distribution Plan fees $28,902, which are offset against an expense reimbursement currently in effect in the amount of $152,885.
17
NOTES TO FINANCIAL STATEMENTS (continued)
(c) Each Board member also serves as a Board member of other funds within the Dreyfus complex. Annual retainer fees and attendance fees are allocated to each fund based on net assets.
NOTE 3—Regulatory Developments:
On July 23, 2014, the SEC adopted amendments to the rules that govern money market mutual funds. In part, the amendments will require structural changes to most types of money market funds to one extent or another; however, the SEC provided for an extended two-year transition period to comply with such structural requirements. At this time, management is evaluating the reforms adopted and the manner for implementing these reforms over time and its impact on the financial statements.
18
REPORT OF INDEPENDENT REGISTERED
PUBLIC ACCOUNTING FIRM
The Board of Directors and Shareholders of
The Dreyfus/Laurel Funds, Inc.
We have audited the accompanying statement of assets and liabilities of General Treasury and Agency Money Market Fund (the “Fund”) (formerly known as Dreyfus U.S. Treasury Reserves), a series of The Dreyfus/Laurel Funds, Inc., including the statement of investments, as of October 31, 2015, the related statement of operations for the year then ended, the statements of changes in net assets for each of the years in the two-year period then ended, and the financial highlights for each of the years in the five-year period then ended. These financial statements and financial highlights are the responsibility of the Fund’s management. Our responsibility is to express an opinion on these financial statements and financial highlights based on our audits.
We conducted our audits in accordance with the standards of the Public Company Accounting Oversight Board (United States). Those standards require that we plan and perform the audit to obtain reasonable assurance about whether the financial statements and financial highlights are free of material misstatement. An audit includes examining, on a test basis, evidence supporting the amounts and disclosures in the financial statements. Our procedures included confirmation of securities owned as of October 31, 2015, by correspondence with the custodian and brokers or by other appropriate auditing procedures. An audit also includes assessing the accounting principles used and significant estimates made by management, as well as evaluating the overall financial statement presentation. We believe that our audits provide a reasonable basis for our opinion.
In our opinion, the financial statements and financial highlights referred to above present fairly, in all material respects, the financial position of General Treasury and Agency Money Market Fund as of October 31, 2015, the results of its operations for the year then ended, the changes in its net assets for each of the years in the two-year period then ended, and the financial highlights for each of the years in the five-year period then ended, in conformity with U.S. generally accepted accounting principles.

New York, New York
December 30, 2015
19
IMPORTANT TAX INFORMATION (Unaudited)
For federal tax purposes, the fund designates the maximum amount allowable but not less than 100% as interest-related dividends in accordance with Sections 871(k)(1) and 881(e) of the Internal Revenue Code.
20
BOARD MEMBERS INFORMATION (Unaudited)
INDEPENDENT BOARD MEMBERS
Joseph S. DiMartino (72)
Chairman of the Board (1999)
Principal Occupation During Past 5 Years:
· Corporate Director and Trustee (1995-present)
Other Public Company Board Memberships During Past 5 Years:
· CBIZ (formerly, Century Business Services, Inc.), a provider of outsourcing functions for small and medium size companies, Director (1997-present)
· The Newark Group, a provider of a national market of paper recovery facilities, paperboard mills and paperboard converting plants, Director (2000-2010)
No. of Portfolios for which Board Member Serves: 140
———————
Francine J. Bovich (64)
Board Member (2012)
Principal Occupation During Past 5 Years:
· Trustee, The Bradley Trusts, private trust funds (2011-present)
· Managing Director, Morgan Stanley Investment Management (1993-2010)
Other Public Company Board Memberships During Past 5 Years:
· Annaly Capital Management, Inc., Board Member (May 2014-present)
No. of Portfolios for which Board Member Serves: 79
———————
Kenneth A. Himmel (69)
Board Member (1994)
Principal Occupation During Past 5 Years:
· Managing Partner, Gulf Related, an international real estate development company (2010-present)
· President and CEO, Related Urban Development, a real estate development company (1996-present)
· President and CEO, Himmel & Company, a real estate development company (1980-present)
· CEO, American Food Management, a restaurant company (1983-present)
No. of Portfolios for which Board Member Serves: 29
———————
21
BOARD MEMBERS INFORMATION (Unaudited) (continued)
INDEPENDENT BOARD MEMBERS (continued)
Stephen J. Lockwood (68)
Board Member (1994)
Principal Occupation During Past 5 Years:
· Chairman of the Board, Stephen J. Lockwood and Company LLC, a real estate investment company (2000-present)
No. of Portfolios for which Board Member Serves: 29
———————
Roslyn M. Watson (66)
Board Member (1994)
Principal Occupation During Past 5 Years:
· Principal, Watson Ventures, Inc., a real estate investment company (1993-present)
No. of Portfolios for which Board Member Serves: 65
———————
Benaree Pratt Wiley (69)
Board Member (1998)
Principal Occupation During Past 5 Years:
· Principal, The Wiley Group, a firm specializing in strategy and business development (2005-present)
Other Public Company Board Memberships During Past 5 Years:
· CBIZ (formerly, Century Business Services, Inc.), a provider of outsourcing functions for small and medium size companies, Director (2008-present)
No. of Portfolios for which Board Member Serves: 65
———————
Once elected all Board Members serve for an indefinite term, but achieve Emeritus status upon reaching age 80. The address of the Board Members and Officers is c/o The Dreyfus Corporation, 200 Park Avenue, New York, New York 10166. Additional information about the Board Members is available in the fund’s Statement of additional Information which can be obtained from Dreyfus free of charge by calling this toll free number: 1-800-DREYFUS
James M. Fitzgibbons, Emeritus Board Member
J. Tomlinson Fort, Emeritus Board Member
22
OFFICERS OF THE FUND (Unaudited)
BRADLEY J. SKAPYAK, President since January 2010.
Chief Operating Officer and a director of the Manager since June 2009, Chairman of Dreyfus Transfer, Inc., an affiliate of the Manager and the transfer agent of the funds, since May 2011 and Executive Vice President of the Distributor since June 2007. From April 2003 to June 2009, Mr. Skapyak was the head of the Investment Accounting and Support Department of the Manager. He is an officer of 66 investment companies (comprised of 140 portfolios) managed by the Manager. He is 56 years old and has been an employee of the Manager since February 1988.
BENNETT A. MACDOUGALL, Chief Legal Officer since October 2015
Chief Legal Officer of the Manager since June 2015; from June 2005 to June 2015, Director and Associate General Counsel of Deutsche Bank – Asset & Wealth Management Division, and Chief Legal Officer of Deutsche Investment Management Americas Inc. He is an officer of 67 investment companies (comprised of 165 portfolios) managed by the Manager. He is 44 years old and has been an employee of the Manager since June 2015.
JANETTE E. FARRAGHER, Vice President and Secretary since December 2011.
Assistant General Counsel of BNY Mellon, and an officer of 67 investment companies (comprised of 165 portfolios) managed by the Manager. She is 52 years old and has been an employee of the Manager since February 1984.
JAMES BITETTO, Vice President and Assistant Secretary since August 2005.
Managing Counsel of BNY Mellon and Secretary of the Manager, and an officer of 67 investment companies (comprised of 165 portfolios) managed by the Manager. He is 49 years old and has been an employee of the Manager since December 1996.
JONI LACKS CHARATAN, Vice President and Assistant Secretary since August 2005.
Managing Counsel of BNY Mellon, and an officer of 67 investment companies (comprised of 165 portfolios) managed by the Manager. She is 59 years old and has been an employee of the Manager since October 1988.
JOSEPH M. CHIOFFI, Vice President and Assistant Secretary since August 2005.
Managing Counsel of BNY Mellon, and an officer of 67 investment companies (comprised of 165 portfolios) managed by the Manager. He is 53 years old and has been an employee of the Manager since June 2000.
JOHN B. HAMMALIAN, Vice President and Assistant Secretary since August 2005.
Senior Managing Counsel of BNY Mellon, and an officer of 67 investment companies (comprised of 165 portfolios) managed by the Manager. He is 52 years old and has been an employee of the Manager since February 1991.
MAUREEN E. KANE, Vice President and Assistant Secretary since April 2015.
Managing Counsel of BNY Mellon since July 2014; from October 2004 until July 2014, General Counsel, and from May 2009 until July 2014, Chief Compliance Officer of Century Capital Management. She is an officer of 67 investment companies (comprised of 165 portfolios) managed by the Manager. She is 53 years old and has been an employee of the Manager since July 2014.
SARAH S. KELLEHER, Vice President and Assistant Secretary since April 2014.
Senior Counsel of BNY Mellon, and an officer of 67 investment companies (comprised of 165 portfolios) managed by the Manager; from August 2005 to March 2013, Associate General Counsel of Third Avenue Management. She is 40 years old and has been an employee of the Manager since March 2013.
JEFF PRUSNOFSKY, Vice President and Assistant Secretary since August 2005.
Senior Managing Counsel of BNY Mellon, and an officer of 67 investment companies (comprised of 165 portfolios) managed by the Manager. He is 50 years old and has been an employee of the Manager since October 1990.
JAMES WINDELS, Treasurer since November 2001.
Director – Mutual Fund Accounting of the Manager, and an officer of 67 investment companies (comprised of 165 portfolios) managed by the Manager. He is 57 years old and has been an employee of the Manager since April 1985.
23
OFFICERS OF THE FUND (Unaudited) (continued)
RICHARD CASSARO, Assistant Treasurer since January 2008.
Senior Accounting Manager – Money Market and Municipal Bond Funds of the Manager, and an officer of 67 investment companies (comprised of 165 portfolios) managed by the Manager. He is 56 years old and has been an employee of the Manager since September 1982.
GAVIN C. REILLY, Assistant Treasurer since December 2005.
Tax Manager of the Investment Accounting and Support Department of the Manager, and an officer of 67 investment companies (comprised of 165 portfolios) managed by the Manager. He is 47 years old and has been an employee of the Manager since April 1991.
ROBERT S. ROBOL, Assistant Treasurer since December 2002.
Senior Accounting Manager – Fixed Income Funds of the Manager, and an officer of 67 investment companies (comprised of 165 portfolios) managed by the Manager. He is 51 years old and has been an employee of the Manager since October 1988.
ROBERT SALVIOLO, Assistant Treasurer since July 2007.
Senior Accounting Manager – Equity Funds of the Manager, and an officer of 67 investment companies (comprised of 165 portfolios) managed by the Manager. He is 48 years old and has been an employee of the Manager since June 1989.
ROBERT SVAGNA, Assistant Treasurer since December 2002.
Senior Accounting Manager – Equity Funds of the Manager, and an officer of 67 investment companies (comprised of 165 portfolios) managed by the Manager. He is 48 years old and has been an employee of the Manager since November 1990.
JOSEPH W. CONNOLLY, Chief Compliance Officer since October 2004.
Chief Compliance Officer of the Manager and The Dreyfus Family of Funds (67 investment companies, comprised of 165 portfolios). He is 58 years old and has served in various capacities with the Manager since 1980, including manager of the firm’s Fund Accounting Department from 1997 through October 2001.
24
NOTES
25
General Treasury and Agency Money Market Fund
200 Park Avenue
New York, NY 10166
Manager
The Dreyfus Corporation
200 Park Avenue
New York, NY 10166
Custodian
The Bank of New York Mellon
225 Liberty Street
New York, NY 10286
Transfer Agent &
Dividend Disbursing Agent
Dreyfus Transfer, Inc.
200 Park Avenue
New York, NY 10166
Distributor
MBSC Securities Corporation
200 Park Avenue
New York, NY 10166
| | |
Ticker Symbols: | Class A: DUIXX Class R: DUTXX |
Telephone Call your financial representative or 1-800-DREYFUS
Mail The Dreyfus Family of Funds, 144 Glenn Curtiss Boulevard, Uniondale, NY 1556-0144
E-mail Send your request to info@dreyfus.com
Internet Information can be viewed online or downloaded at www.dreyfus.com
The fund will disclose daily, on www.dreyfus.com, the fund’s complete schedule of holdings as of the end of the previous business day. The schedule of holdings will remain on the website until the fund files its Form N-Q or Form N-SCR for the period that includes the date of the posted holdings.
The fund files its complete schedule of portfolio holdings with the Securities and Exchange Commission (“SEC”) for the first and third quarters of each fiscal year on Form N-Q. The fund’s Forms N-Q are available on the SEC’s website at www.sec.gov and may be reviewed and copied at the SEC’s Public Reference Room in Washington, DC. (phone 1-800-SEC-0330 for information).
Information regarding how the fund voted proxies related to portfolio securities for the most recent 12-month period ended June 30 is available at www.dreyfus.com and on the SEC’s website at www.sec.gov and without charge, upon request, by calling 1-800-DREYFUS.
| | |
© 2015 MBSC Securities Corporation
0326AR1015 | 
|
Item 2. Code of Ethics.
The Registrant has adopted a code of ethics that applies to the Registrant's principal executive officer, principal financial officer, principal accounting officer or controller, or persons performing similar functions. There have been no amendments to, or waivers in connection with, the Code of Ethics during the period covered by this Report.
Item 3. Audit Committee Financial Expert.
The Registrant's Board has determined that Joseph S. DiMartino, a member of the Audit Committee of the Board, is an audit committee financial expert as defined by the Securities and Exchange Commission (the "SEC"). Mr. DiMartino is "independent" as defined by the SEC for purposes of audit committee financial expert determinations.
Item 4. Principal Accountant Fees and Services.
(a) Audit Fees. The aggregate fees billed for each of the last two fiscal years (the "Reporting Periods") for professional services rendered by the Registrant's principal accountant (the "Auditor") for the audit of the Registrant's annual financial statements or services that are normally provided by the Auditor in connection with the statutory and regulatory filings or engagements for the Reporting Periods, were $302,840 in 2014 and $268,800 in 2015.
(b) Audit-Related Fees. The aggregate fees billed in the Reporting Periods for assurance and related services by the Auditor that are reasonably related to the performance of the audit of the Registrant's financial statements and are not reported under paragraph (a) of this Item 4 were $34,020 in 2014 and $29,920 in 2015. These services consisted of one or more of the following: (i) agreed upon procedures related to compliance with Internal Revenue Code section 817(h), (ii) security counts required by Rule 17f-2 under the Investment Company Act of 1940, as amended, (iii) advisory services as to the accounting or disclosure treatment of Registrant transactions or events and (iv) advisory services to the accounting or disclosure treatment of the actual or potential impact to the Registrant of final or proposed rules, standards or interpretations by the Securities and Exchange Commission, the Financial Accounting Standards Boards or other regulatory or standard-setting bodies.
The aggregate fees billed in the Reporting Periods for non-audit assurance and related services by the Auditor to the Registrant's investment adviser (not including any sub-investment adviser whose role is primarily portfolio management and is subcontracted with or overseen by another investment adviser), and any entity controlling, controlled by or under common control with the investment adviser that provides ongoing services to the Registrant ("Service Affiliates"), that were reasonably related to the performance of the annual audit of the Service Affiliate, which required pre-approval by the Audit Committee were $0 in 2014 and $0 in 2015.
(c) Tax Fees. The aggregate fees billed in the Reporting Periods for professional services rendered by the Auditor for tax compliance, tax advice, and tax planning ("Tax Services") were $21,600 in 2014 and $19,570 in 2015. These services consisted of the review or preparation of U.S. federal, state, local and excise tax returns. The aggregate fees billed in the Reporting Periods for Tax Services by the Auditor to Service Affiliates, which required pre-approval by the Audit Committee were $0 in 2014 and $0 in 2015.
(d) All Other Fees. The aggregate fees billed in the Reporting Periods for products and services provided by the Auditor, other than the services reported in paragraphs (a) through (c) of this Item, were $0 in 2014 and $0 in 2015.
The aggregate fees billed in the Reporting Periods for Non-Audit Services by the Auditor to Service Affiliates, other than the services reported in paragraphs (b) through (c) of this Item, which required pre-approval by the Audit Committee, were $0 in 2014 and $0 in 2015.
(e)(1) Audit Committee Pre-Approval Policies and Procedures. The Registrant's Audit Committee has established policies and procedures (the "Policy") for pre-approval (within specified fee limits) of the Auditor's engagements for non-audit services to the Registrant and Service Affiliates without specific case-by-case consideration. The pre-approved services in the Policy can include pre-approved audit services, pre-approved audit-related services, pre-approved tax services and pre-approved all other services. Pre-approval considerations include whether the proposed services are compatible with maintaining the Auditor's independence. Pre-approvals pursuant to the Policy are considered annually.
(e)(2) Note: None of the services described in paragraphs (b) through (d) of this Item 4 were approved by the Audit Committee pursuant to paragraph (c)(7)(i)(C) of Rule 2-01 of Regulation S-X.
(f) None of the hours expended on the principal accountant's engagement to audit the registrant's financial statements for the most recent fiscal year were attributed to work performed by persons other than the principal account's full-time, permanent employees.
Non-Audit Fees. The aggregate non-audit fees billed by the Auditor for services rendered to the Registrant, and rendered to Service Affiliates, for the Reporting Periods were $15,598,229 in 2014 and $14,933,643 in 2015.
Auditor Independence. The Registrant's Audit Committee has considered whether the provision of non-audit services that were rendered to Service Affiliates, which were not pre-approved (not requiring pre-approval), is compatible with maintaining the Auditor's independence.
Item 5. Audit Committee of Listed Registrants.
Not applicable.
Item 6. Investments.
(a) Not applicable.
Item 7. Disclosure of Proxy Voting Policies and Procedures for Closed-End Management Investment Companies.
Not applicable.
Item 8. Portfolio Managers of Closed-End Management Investment Companies.
Not applicable.
Item 9. Purchases of Equity Securities by Closed-End Management Investment Companies and Affiliated Purchasers.
Not applicable.
Item 10. Submission of Matters to a Vote of Security Holders.
There have been no material changes to the procedures applicable to Item 10.
Item 11. Controls and Procedures.
(a) The Registrant's principal executive and principal financial officers have concluded, based on their evaluation of the Registrant's disclosure controls and procedures as of a date within 90 days of the filing date of this report, that the Registrant's disclosure controls and procedures are reasonably designed to ensure that information required to be disclosed by the Registrant on Form N-CSR is recorded, processed, summarized and reported within the required time periods and that information required to be disclosed by the Registrant in the reports that it files or submits on Form N-CSR is accumulated and communicated to the Registrant's management, including its principal executive and principal financial officers, as appropriate to allow timely decisions regarding required disclosure.
(b) There were no changes to the Registrant's internal control over financial reporting that occurred during the second fiscal quarter of the period covered by this report that have materially affected, or are reasonably likely to materially affect, the Registrant's internal control over financial reporting.
Item 12. Exhibits.
(a)(1) Code of ethics referred to in Item 2.
(a)(2) Certifications of principal executive and principal financial officers as required by Rule 30a-2(a) under the Investment Company Act of 1940.
(a)(3) Not applicable.
(b) Certification of principal executive and principal financial officers as required by Rule 30a-2(b) under the Investment Company Act of 1940.
SIGNATURES
Pursuant to the requirements of the Securities Exchange Act of 1934 and the Investment Company Act of 1940, the Registrant has duly caused this Report to be signed on its behalf by the undersigned, thereunto duly authorized.
The Dreyfus/Laurel Funds, Inc.
By: /s/Bradley J. Skapyak
Bradley J. Skapyak,
President
Date: December 22, 2015
Pursuant to the requirements of the Securities Exchange Act of 1934 and the Investment Company Act of 1940, this Report has been signed below by the following persons on behalf of the Registrant and in the capacities and on the dates indicated.
By: /s/Bradley J. Skapyak
Bradley J. Skapyak,
President
Date: December 22, 2015
By: James Windels
James Windels,
Treasurer
Date: December 22, 2015
EXHIBIT INDEX
(a)(1) Code of ethics referred to in Item 2.
(a)(2) Certifications of principal executive and principal financial officers as required by Rule 30a-2(a) under the Investment Company Act of 1940. (EX-99.CERT)
(b) Certification of principal executive and principal financial officers as required by Rule 30a-2(b) under the Investment Company Act of 1940. (EX-99.906CERT)