UNITED STATES
SECURITIES AND EXCHANGE COMMISSION
Washington, D.C. 20549
FORM N-CSR
CERTIFIED SHAREHOLDER REPORT OF REGISTERED MANAGEMENT
INVESTMENT COMPANIES
Investment Company Act file number | 811-05202 |
| |
| The Dreyfus/Laurel Funds, Inc. | |
| (Exact name of Registrant as specified in charter) | |
| | |
| c/o The Dreyfus Corporation 200 Park Avenue New York, New York 10166 | |
| (Address of principal executive offices) (Zip code) | |
| | |
| John Pak, Esq. 200 Park Avenue New York, New York 10166 | |
| (Name and address of agent for service) | |
|
Registrant's telephone number, including area code: | (212) 922-6000 |
| |
Date of fiscal year end: | 8/31 | |
Date of reporting period: | 8/31/14 | |
| | | | | | | |
The following Form N-CSR relates only to Dreyfus Core Equity Fund and Dreyfus Floating Rate Income Fund, each a series of the Registrant, and does not affect the other series of the Registrant, which have a different fiscal year end and, therefore, different Form N-CSR reporting requirements. A separate Form N-CSR will be filed for those series, as appropriate.
FORM N-CSR
Item 1. Reports to Stockholders.
ANNUAL REPORT August 31, 2014

Save time. Save paper. View your next shareholder report online as soon as it’s available. Log into www.dreyfus.com and sign up for Dreyfus eCommunications. It’s simple and only takes a few minutes.
The views expressed in this report reflect those of the portfolio manager only through the end of the period covered and do not necessarily represent the views of Dreyfus or any other person in the Dreyfus organization. Any such views are subject to change at any time based upon market or other conditions and Dreyfus disclaims any responsibility to update such views.These views may not be relied on as investment advice and, because investment decisions for a Dreyfus fund are based on numerous factors, may not be relied on as an indication of trading intent on behalf of any Dreyfus fund.
|
| Not FDIC-Insured • Not Bank-Guaranteed • May Lose Value |
| | Contents |
| | THE FUND |
| 2 | A Letter from the President |
| 3 | Discussion of Fund Performance |
| 6 | Fund Performance |
| 8 | Understanding Your Fund’s Expenses |
| 8 | Comparing Your Fund’s Expenses With Those of Other Funds |
| 9 | Statement of Investments |
| 13 | Statement of Assets and Liabilities |
| 14 | Statement of Operations |
| 15 | Statement of Changes in Net Assets |
| 17 | Financial Highlights |
| 20 | Notes to Financial Statements |
| 30 | Report of Independent Registered Public Accounting Firm |
| 31 | Important Tax Information |
| 32 | Board Members Information |
| 34 | Officers of the Fund |
| | FOR MORE INFORMATION |
| | Back Cover |
Dreyfus
Core Equity Fund
The Fund
A LETTER FROM THE PRESIDENT
Dear Shareholder:
We are pleased to present this annual report for Dreyfus Core Equity Fund, covering the 12-month period from September 1, 2013, through August 31, 2014. For information about how the fund performed during the reporting period, as well as general market perspectives, we provide a Discussion of Fund Performance on the pages that follow.
Despite occasional bouts of heightened volatility, U.S. stocks generally gained ground steadily over the reporting period as the domestic economy rebounded. As a result, most broad measures of equity market performance established a series of new record highs over the past 12 months. Growth-oriented and more economically sensitive stocks generally fared well over the reporting period’s first half, but value-oriented stocks rallied more strongly over the second half.
We remain cautiously optimistic regarding the U.S. stock market’s prospects. We currently expect the economy to continue to accelerate as several long-standing drags, including tight fiscal policies and private sector deleveraging, fade from the scene. Of course, a number of risks remain, including the possibilities of higher short-term interest rates and intensifying geopolitical turmoil.Therefore, we suggest you talk regularly with your financial advisor to assess the potential impact of these and other macroeconomic developments on your investments.
Thank you for your continued confidence and support.

J. Charles Cardona
President
The Dreyfus Corporation
September 15, 2014
2
DISCUSSION OF FUND PERFORMANCE
For the period of September 1, 2013, through August 31, 2014, as provided by Fayez Sarofim, Portfolio Manager of Fayez Sarofim & Co., Sub-Investment Adviser
Fund and Market Performance Overview
For the 12-month period ended August 31, 2014, Dreyfus Core Equity Fund’s Class A shares produced a total return of 20.28%, Class C shares returned 19.35% and Class I shares returned 20.56%.1 For the same period, the fund’s benchmark, the Standard & Poor’s 500 Composite Stock Price Index (“S&P 500 Index”), produced a 25.21% total return.2
Despite weather-related weakness during the first quarter of 2014, improved U.S. economic conditions generally helped support stock market gains over the reporting period.The fund produced lower returns than its benchmark, mainly due to our focus on less economically sensitive industry groups and high-quality, large-cap stocks.
The Fund’s Investment Approach
The fund seeks long-term capital appreciation.To pursue its goal, the fund normally invests at least 80% of its net assets in common stocks of U.S. and foreign companies with market capitalizations exceeding $5 billion at the time of purchase, including multinational companies.
In choosing stocks, the fund first identifies economic sectors that it believes will expand over the next three to five years or longer. Using fundamental analysis, the fund then seeks companies within these sectors that have dominant positions in their industries and that have demonstrated sustained patterns of profitability, strong balance sheets, and expanding global presence and the potential to achieve predictable, above-average earnings growth.The fund is also alert to companies that it considers undervalued in terms of current earnings, assets or growth prospects.
The fund employs a “buy-and-hold” investment strategy, which generally has resulted in an annual portfolio turnover of below 15%.3 As a result, the fund invests for long-term growth rather than short-term profits.
The Fund 3
DISCUSSION OF FUND PERFORMANCE (continued)
Recovering Economy Fueled Market’s Gains
The S&P 500 Index advanced to a series of record highs over the reporting period despite bouts of market weakness in January and July. Indeed, by the end of August, the benchmark had crossed the 2,000 threshold for the first time in its history.
U.S. equities advanced despite a host of macroeconomic concerns, including a U.S. government shutdown in October 2013, the gradual reduction of the Federal Reserve Board’s (the “Fed”) quantitative easing program, an economic contraction during the first quarter of 2014, and a flare-up of geopolitical tensions in various parts of the developing world.The market’s more economically sensitive sectors and smaller, momentum-driven stocks led the market in late 2013, reflecting relatively aggressive sentiment among investors. By the spring of 2014, however, investors had adopted a more conservative posture, and higher quality, larger cap stocks began to lead the market’s advance.
Conservative Positioning Weighed on Relative Results
While the fund trailed its benchmark for the reporting period overall, its relative performance strengthened considerably over the second half when investors began to shift their focus to less aggressive investments.
Nonetheless, the fund’s relative results for the full reporting period were constrained by its longstanding focus on higher quality, large-cap companies. Most notably, an emphasis on relatively stable businesses in the traditionally defensive consumer staples sector weighed heavily on the fund’s returns compared to its benchmark. Another impediment was limited and selectively focused representation in the information technology sector, which ranked as the benchmark’s best performing segment. An overweighted allocation to the energy sector and an emphasis on major international oil producers also hindered relative performance.
The fund achieved better relative results through our security selection strategy in the financials and industrials sectors. Lack of exposure to the utilities and telecommunications services sectors also proved constructive.
Individual stocks making the greatest absolute contributions to returns over the reporting period included Apple, Exxon Mobil, Canadian Pacific Railway, Walt Disney, and Altria Group. On the other hand, laggards included Whole Foods Market, Target, Diageo, Xilinx, and Intuitive Surgical.
4
Anticipating a Tilt toward Quality
Low interest rates, muted inflation and slow-but-persistent economic growth have continued to support a favorable market environment for equities. However, stocks have become more richly valued, and the market already seems to reflect further economic growth. Market volatility has begun to increase and, in our view, may become more pronounced as the Fed takes the next steps in its ongoing shift to a less stimulative monetary policy. However, if interest rates move gradually higher in response to a stronger economy, the implications for equities could be positive. Renewed economic weakness in Europe and intensifying geopolitical tensions in other regions also are likely to foster a greater awareness of risk among investors.
In this environment, we believe that higher quality industry leaders could have added appeal for investors.Well-established companies have the competitive advantages and financial resources to continue to increase their earnings and dividends and to extend their proven records of creating shareholder value.
September 15, 2014
Please note, the position in any security highlighted with italicized typeface was sold during the reporting period. Equity funds are subject generally to market, market sector, market liquidity, issuer and investment style risks, among other factors, to varying degrees, all of which are more fully described in the fund’s prospectus.
|
| 1 Total return includes reinvestment of dividends and any capital gains paid, and does not take into consideration the |
| maximum initial sales charge in the case of Class A shares, or the applicable contingent deferred sales charge imposed |
| on redemptions in the case of Class C shares. Had these charges been reflected, returns would have been lower. Past |
| performance is no guarantee of future results. Share price and investment return fluctuate such that upon redemption |
| fund shares may be worth more or less than their original cost. |
| 2 SOURCE: LIPPER INC. — Reflects monthly reinvestment of dividends and, where applicable, capital gain |
| distributions.The Standard & Poor’s 500® Composite Stock Price Index is a widely accepted, unmanaged index of |
| U.S. stock market performance. Investors cannot invest directly in any index. |
| 3 Portfolio turnover rates are subject to change. Portfolio turnover rates alone do not automatically result in high or low |
| distribution levels.There can be no guarantee that the fund will generate any specific level of distributions annually. |
FUND PERFORMANCE

|
| † Source: Lipper Inc. |
| Past performance is not predictive of future performance. |
| The above graph compares a $10,000 investment made in each of the Class A, Class C and Class I shares of Dreyfus |
| Core Equity Fund on 8/31/04 to a $10,000 investment made in the Standard & Poor’s 500 Composite Stock Price |
| Index (the “Index”) on that date.All dividends and capital gain distributions are reinvested. |
| The fund’s performance shown in the line graph above takes into account the maximum initial sales charge on Class A |
| shares and all other applicable fees and expenses on all classes.The Index is a widely accepted, unmanaged index of U. |
| stock market performance. Unlike a mutual fund, the Index is not subject to charges, fees and other expenses. Investors |
| cannot invest directly in any index. Further information relating to fund performance, including expense reimbursements, |
| if applicable, is contained in the Financial Highlights section of the prospectus and elsewhere in this report. |
6
| | | | | | |
| Average Annual Total Returns as of 8/31/14 | | | | | | |
| | 1 Year | | 5 Years | | 10 Years | |
| Class A shares | | | | | | |
| with maximum sales charge (5.75%) | 13.36 | % | 12.66 | % | 6.14 | % |
| without sales charge | 20.28 | % | 14.00 | % | 6.77 | % |
| Class C shares | | | | | | |
| with applicable redemption charge† | 18.35 | % | 13.15 | % | 5.97 | % |
| without redemption | 19.35 | % | 13.15 | % | 5.97 | % |
| Class I shares | 20.56 | % | 14.29 | % | 7.20 | % |
| Standard & Poor’s 500 | | | | | | |
| Composite Stock Price Index | 25.21 | % | 16.87 | % | 8.37 | % |
Past performance is not predictive of future performance.The fund’s performance shown in the graph and table does not reflect the deduction of taxes that a shareholder would pay on fund distributions or the redemption of fund shares. In addition to the performance of Class A shares shown with and without a maximum sales charge, the fund’s performance shown in the table takes into account all other applicable fees and expenses on all classes.
|
| † The maximum contingent deferred sales charge for Class C shares is 1% for shares redeemed within one year of the |
| date of purchase. |
The Fund 7
UNDERSTANDING YOUR FUND’S EXPENSES (Unaudited)
As a mutual fund investor, you pay ongoing expenses, such as management fees and other expenses. Using the information below, you can estimate how these expenses affect your investment and compare them with the expenses of other funds.You also may pay one-time transaction expenses, including sales charges (loads) and redemption fees, which are not shown in this section and would have resulted in higher total expenses. For more information, see your fund’s prospectus or talk to your financial adviser.
Review your fund’s expenses
The table below shows the expenses you would have paid on a $1,000 investment in Dreyfus Core Equity Fund from March 1, 2014 to August 31, 2014. It also shows how much a $1,000 investment would be worth at the close of the period, assuming actual returns and expenses.
Expenses and Value of a $1,000 Investment
assuming actual returns for the six months ended August 31, 2014
| | | | | | |
| | | Class A | | Class C | | Class I |
| Expenses paid per $1,000† | $ | 7.10 | $ | 11.02 | $ | 5.79 |
| Ending value (after expenses) | $ | 1,086.70 | $ | 1,082.40 | $ | 1,088.10 |
COMPARING YOUR FUND’S EXPENSES
WITH THOSE OF OTHER FUNDS (Unaudited)
Using the SEC’s method to compare expenses
The Securities and Exchange Commission (SEC) has established guidelines to help investors assess fund expenses. Per these guidelines, the table below shows your fund’s expenses based on a $1,000 investment, assuming a hypothetical 5% annualized return. You can use this information to compare the ongoing expenses (but not transaction expenses or total cost) of investing in the fund with those of other funds. All mutual fund shareholder reports will provide this information to help you make this comparison. Please note that you cannot use this information to estimate your actual ending account balance and expenses paid during the period.
Expenses and Value of a $1,000 Investment
assuming a hypothetical 5% annualized return for the six months ended August 31, 2014
| | | | | | |
| | | Class A | | Class C | | Class I |
| Expenses paid per $1,000† | $ | 6.87 | $ | 10.66 | $ | 5.60 |
| Ending value (after expenses) | $ | 1,018.40 | $ | 1,014.62 | $ | 1,019.66 |
|
| † Expenses are equal to the fund’s annualized expense ratio of 1.35% for Class A, 2.10% for Class C and 1.10% |
| for Class I, multiplied by the average account value over the period, multiplied by 184/365 (to reflect the one-half |
| year period). |
8
|
| STATEMENT OF INVESTMENTS |
| August 31, 2014 |
| | | |
| Common Stocks—100.6% | Shares | | Value ($) |
| Banks—1.3% | | | |
| Wells Fargo & Co. | 93,500 | | 4,809,640 |
| Capital Goods—.6% | | | |
| United Technologies | 20,900 | | 2,256,782 |
| Consumer Services—2.1% | | | |
| McDonald’s | 77,700 | | 7,282,044 |
| Diversified Financials—8.2% | | | |
| American Express | 59,800 | | 5,355,090 |
| BlackRock | 20,100 | | 6,643,653 |
| Franklin Resources | 122,500 | | 6,923,700 |
| JPMorgan Chase & Co. | 168,500 | | 10,017,325 |
| | | | 28,939,768 |
| Energy—19.0% | | | |
| Chevron | 125,600 | | 16,258,920 |
| ConocoPhillips | 88,800 | | 7,212,336 |
| EOG Resources | 26,300 | | 2,889,844 |
| Exxon Mobil | 199,460 | | 19,838,292 |
| Imperial Oil | 91,800 | a | 4,888,350 |
| Occidental Petroleum | 112,800 | | 11,700,744 |
| Phillips 66 | 52,300 | | 4,551,146 |
| Total, ADR | 3,627 | | 239,237 |
| | | | 67,578,869 |
| Food & Staples Retailing—1.9% | | | |
| Walgreen | 91,300 | | 5,525,476 |
| Whole Foods Market | 27,300 | | 1,068,522 |
| | | | 6,593,998 |
| Food, Beverage & Tobacco—22.2% | | | |
| Altria Group | 219,700 | | 9,464,676 |
| Coca-Cola | 434,300 | | 18,118,996 |
| Diageo, ADR | 27,700 | | 3,320,399 |
| Kraft Foods Group | 17,133 | | 1,009,134 |
| Mondelez International, Cl. A | 78,200 | | 2,830,058 |
| Nestle, ADR | 161,025 | | 12,490,709 |
The Fund 9
STATEMENT OF INVESTMENTS (continued)
| | | |
| Common Stocks (continued) | Shares | | Value ($) |
| Food, Beverage & Tobacco (continued) | | | |
| PepsiCo | 73,400 | | 6,788,766 |
| Philip Morris International | 233,200 | | 19,957,256 |
| SABMiller | 85,600 | | 4,722,239 |
| | | | 78,702,233 |
| Health Care Equipment | | | |
| & Services—1.7% | | | |
| Abbott Laboratories | 146,400 | | 6,183,936 |
| Household & Personal Products—4.9% | | | |
| Estee Lauder, Cl. A | 94,300 | | 7,245,069 |
| Procter & Gamble | 122,500 | | 10,180,975 |
| | | | 17,426,044 |
| Insurance—.7% | | | |
| ACE | 23,400 | | 2,488,122 |
| Materials—2.3% | | | |
| Freeport-McMoRan | 78,400 | | 2,851,408 |
| Praxair | 39,300 | | 5,169,915 |
| | | | 8,021,323 |
| Media—5.6% | | | |
| Comcast, Cl. A | 71,900 | | 3,935,087 |
| McGraw-Hill Financial | 34,800 | | 2,823,324 |
| News Corp., Cl. A | 38,925 | b | 686,053 |
| Twenty-First Century Fox, Cl. A | 155,700 | | 5,514,894 |
| Walt Disney | 77,100 | | 6,929,748 |
| | | | 19,889,106 |
| Pharmaceuticals, Biotech & | | | |
| Life Sciences—11.2% | | | |
| AbbVie | 146,400 | | 8,092,992 |
| Gilead Sciences | 28,600 | b | 3,076,788 |
| Johnson & Johnson | 107,700 | | 11,171,721 |
| Novo Nordisk, ADR | 182,800 | | 8,401,488 |
10
| | | |
| Common Stocks (continued) | Shares | | Value ($) |
| Pharmaceuticals, Biotech & | | | |
| Life Sciences (continued) | | | |
| Roche Holding, ADR | 247,000 | | 9,017,970 |
| | | | 39,760,959 |
| Retailing—1.8% | | | |
| Wal-Mart Stores | 86,500 | | 6,530,750 |
| Semiconductors & Semiconductor | | | |
| Equipment—3.8% | | | |
| Intel | 150,000 | | 5,238,000 |
| Texas Instruments | 137,000 | | 6,600,660 |
| Xilinx | 43,000 | | 1,816,750 |
| | | | 13,655,410 |
| Software & Services—5.3% | | | |
| Automatic Data Processing | 70,100 | | 5,851,948 |
| International Business Machines | 45,500 | | 8,749,650 |
| Oracle | 102,600 | | 4,260,978 |
| | | | 18,862,576 |
| Technology Hardware & Equipment—6.2% | | | |
| Apple | 174,300 | | 17,865,750 |
| QUALCOMM | 54,700 | | 4,162,670 |
| | | | 22,028,420 |
| Transportation—1.8% | | | |
| Canadian Pacific Railway | 32,400 | | 6,499,440 |
| Total Common Stocks | | | |
| (cost $200,863,818) | | | 357,509,420 |
| |
| Other Investment—.2% | | | |
| Registered Investment Company; | | | |
| Dreyfus Institutional Preferred | | | |
| Plus Money Market Fund | | | |
| (cost $526,199) | 526,199 | c | 526,199 |
The Fund 11
STATEMENT OF INVESTMENTS (continued)
| | | | |
| Investment of Cash Collateral | | | | |
| for Securities Loaned—.0% | Shares | | Value ($) | |
| Registered Investment Company; | | | | |
| Dreyfus Institutional Cash | | | | |
| Advantage Fund | | | | |
| (cost $32,400) | 32,400 | c | 32,400 | |
| Total Investments (cost $201,422,417) | 100.8 | % | 358,068,019 | |
| Cash and Receivables (Net) | (.8 | %) | (2,955,252 | ) |
| Net Assets | 100.0 | % | 355,112,767 | |
ADR—American Depository Receipts
|
| a Security, or portion thereof, on loan.At August 31, 2014, the value of the fund’s securities on loan was $31,950 and |
| the value of the collateral held by the fund was $32,400. |
| b Non-income producing security. |
| c Investment in affiliated money market mutual fund. |
| | | |
| Portfolio Summary (Unaudited)† | | |
| |
| | Value (%) | | Value (%) |
| Food, Beverage & Tobacco | 22.2 | Materials | 2.3 |
| Energy | 19.0 | Consumer Services | 2.1 |
| Pharmaceuticals, Biotech & | | Food & Staples Retailing | 1.9 |
| Life Sciences | 11.2 | Retailing | 1.8 |
| Diversified Financials | 8.2 | Transportation | 1.8 |
| Technology Hardware & Equipment | 6.2 | Health Care Equipment & Services | 1.7 |
| Media | 5.6 | Banks | 1.3 |
| Software & Services | 5.3 | Insurance | .7 |
| Household & Personal Products | 4.9 | Capital Goods | .6 |
| Semiconductors & Semiconductor | | Money Market Investments | .2 |
| Equipment | 3.8 | | 100.8 |
| |
| † Based on net assets. | | | |
| See notes to financial statements. | | | |
12
|
| STATEMENT OF ASSETS AND LIABILITIES |
| August 31, 2014 |
| | | |
| | | Cost | Value |
| Assets ($): | | | |
| Investments in securities—See Statement of Investments | | |
| (including securities on loan, valued at $31,950)—Note 1(c): | | |
| Unaffiliated issuers | | 200,863,818 | 357,509,420 |
| Affiliated issuers | | 558,599 | 558,599 |
| Cash | | | 134,218 |
| Dividends and securities lending income receivable | | | 936,341 |
| Receivable for investment securities sold | | | 402,900 |
| Receivable for shares of Capital Stock subscribed | | | 61,937 |
| | | | 359,603,415 |
| Liabilities ($): | | | |
| Due to The Dreyfus Corporation and affiliates—Note 3(b) | | 474,500 |
| Payable for shares of Capital Stock redeemed | | | 3,981,641 |
| Liability for securities on loan—Note 1(c) | | | 32,400 |
| Interest payable—Note 2 | | | 129 |
| Accrued expenses | | | 1,978 |
| | | | 4,490,648 |
| Net Assets ($) | | | 355,112,767 |
| Composition of Net Assets ($): | | | |
| Paid-in capital | | | 182,827,397 |
| Accumulated undistributed investment income—net | | 497,361 |
| Accumulated net realized gain (loss) on investments | | 15,142,407 |
| Accumulated net unrealized appreciation | | | |
| (depreciation) on investments | | | 156,645,602 |
| Net Assets ($) | | | 355,112,767 |
| |
| |
| Net Asset Value Per Share | | | |
| | Class A | Class C | Class I |
| Net Assets ($) | 131,033,025 | 140,690,323 | 83,389,419 |
| Shares Outstanding | 5,688,291 | 6,229,570 | 3,544,696 |
| Net Asset Value Per Share ($) | 23.04 | 22.58 | 23.53 |
| See notes to financial statements. | | | |
|
| STATEMENT OF OPERATIONS |
| Year Ended August 31, 2014 |
| | |
| Investment Income ($): | | |
| Income: | | |
| Cash dividends: (net of $248,358 foreign taxes withheld at source): | | |
| Unaffiliated issuers | 9,982,105 | |
| Affiliated issuers | 243 | |
| Income from securities lending 1(c) | 15,526 | |
| Total Income | 9,997,874 | |
| Expenses: | | |
| Management fee—Note 3(a) | 4,292,460 | |
| Distribution/Service Plan fees—Note 3(b) | 1,904,524 | |
| Directors’ fees and expenses—Note 3(a,c) | 29,822 | |
| Interest expense—Note 2 | 6,752 | |
| Loan commitment fees—Note 2 | 3,834 | |
| Total Expenses | 6,237,392 | |
| Less—Directors’ fees reimbursed by the Manager—Note 3(a) | (29,822 | ) |
| Net Expenses | 6,207,570 | |
| Investment Income—Net | 3,790,304 | |
| Realized and Unrealized Gain (Loss) on Investments—Note 4 ($): | | |
| Net realized gain (loss) on investments and foreign currency transactions | 15,144,008 | |
| Net unrealized appreciation (depreciation) on investments | 52,316,832 | |
| Net Realized and Unrealized Gain (Loss) on Investments | 67,460,840 | |
| Net Increase in Net Assets Resulting from Operations | 71,251,144 | |
| See notes to financial statements. | | |
14
STATEMENT OF CHANGES IN NET ASSETS
| | | | |
| | Year Ended August 31, | |
| | 2014 | | 2013 | |
| Operations ($): | | | | |
| Investment income—net | 3,790,304 | | 5,354,306 | |
| Net realized gain (loss) on investments | 15,144,008 | | 11,324,402 | |
| Net unrealized appreciation | | | | |
| (depreciation) on investments | 52,316,832 | | 12,057,960 | |
| Net Increase (Decrease) in Net Assets | | | | |
| Resulting from Operations | 71,251,144 | | 28,736,668 | |
| Dividends to Shareholders from ($): | | | | |
| Investment income—net: | | | | |
| Class A | (2,253,152 | ) | (2,646,179 | ) |
| Class C | (932,081 | ) | (1,080,436 | ) |
| Class I | (1,196,664 | ) | (1,237,170 | ) |
| Net realized gain on investments: | | | | |
| Class A | (2,247,758 | ) | — | |
| Class C | (1,969,710 | ) | — | |
| Class I | (975,838 | ) | — | |
| Total Dividends | (9,575,203 | ) | (4,963,785 | ) |
| Capital Stock Transactions ($): | | | | |
| Net proceeds from shares sold: | | | | |
| Class A | 19,832,108 | | 35,146,176 | |
| Class C | 11,890,622 | | 21,452,998 | |
| Class I | 28,972,918 | | 35,917,032 | |
| Dividends reinvested: | | | | |
| Class A | 3,648,090 | | 2,139,116 | |
| Class C | 1,251,666 | | 468,300 | |
| Class I | 1,415,679 | | 826,861 | |
| Cost of shares redeemed: | | | | |
| Class A | (95,321,391 | ) | (57,170,438 | ) |
| Class C | (43,532,579 | ) | (27,702,188 | ) |
| Class I | (32,920,580 | ) | (36,801,486 | ) |
| Increase (Decrease) in Net Assets | | | | |
| from Capital Stock Transactions | (104,763,467 | ) | (25,723,629 | ) |
| Total Increase (Decrease) in Net Assets | (43,087,526 | ) | (1,950,746 | ) |
| Net Assets ($): | | | | |
| Beginning of Period | 398,200,293 | | 400,151,039 | |
| End of Period | 355,112,767 | | 398,200,293 | |
| Undistributed investment income—net | 497,361 | | 1,089,118 | |
The Fund 15
STATEMENT OF CHANGES IN NET ASSETS (continued)
| | | | |
| | Year Ended August 31, | |
| | 2014 | | 2013 | |
| Capital Share Transactions: | | | | |
| Class Aa | | | | |
| Shares sold | 934,201 | | 1,832,117 | |
| Shares issued for dividends reinvested | 172,834 | | 111,863 | |
| Shares redeemed | (4,408,792 | ) | (2,961,737 | ) |
| Net Increase (Decrease) in Shares Outstanding | (3,301,757 | ) | (1,017,757 | ) |
| Class Ca | | | | |
| Shares sold | 567,877 | | 1,134,517 | |
| Shares issued for dividends reinvested | 60,511 | | 24,815 | |
| Shares redeemed | (2,049,542 | ) | (1,459,601 | ) |
| Net Increase (Decrease) in Shares Outstanding | (1,421,154 | ) | (300,269 | ) |
| Class I | | | | |
| Shares sold | 1,293,813 | | 1,834,370 | |
| Shares issued for dividends reinvested | 65,644 | | 42,422 | |
| Shares redeemed | (1,498,115 | ) | (1,892,531 | ) |
| Net Increase (Decrease) in Shares Outstanding | (138,658 | ) | (15,739 | ) |
|
| a During the period ended August 31, 2013, 833 Class C shares representing $16,824 were exchanged for 817 |
| Class A shares. |
See notes to financial statements.
16
FINANCIAL HIGHLIGHTS
The following tables describe the performance for each share class for the fiscal periods indicated. All information (except portfolio turnover rate) reflects financial results for a single fund share.Total return shows how much your investment in the fund would have increased (or decreased) during each period, assuming you had reinvested all dividends and distributions.These figures have been derived from the fund’s financial statements.
| | | | | | | | | | |
| | | | Year Ended August 31, | | | |
| Class A Shares | 2014 | | 2013 | | 2012 | | 2011 | | 2010 | |
| Per Share Data ($): | | | | | | | | | | |
| Net asset value, beginning of period | 19.66 | | 18.54 | | 16.47 | | 13.69 | | 13.03 | |
| Investment Operations: | | | | | | | | | | |
| Investment income—neta | .26 | | .30 | | .23 | | .21 | | .20 | |
| Net realized and unrealized | | | | | | | | | | |
| gain (loss) on investments | 3.67 | | 1.09 | | 2.15 | | 2.76 | | .68 | |
| Total from Investment Operations | 3.93 | | 1.39 | | 2.38 | | 2.97 | | .88 | |
| Distributions: | | | | | | | | | | |
| Dividends from investment income—net | (.29 | ) | (.27 | ) | (.31 | ) | (.19 | ) | (.22 | ) |
| Dividends from net realized | | | | | | | | | | |
| gain on investments | (.26 | ) | — | | — | | — | | — | |
| Total Distributions | (.55 | ) | (.27 | ) | (.31 | ) | (.19 | ) | (.22 | ) |
| Net asset value, end of period | 23.04 | | 19.66 | | 18.54 | | 16.47 | | 13.69 | |
| Total Return (%)b | 20.28 | | 7.57 | | 14.59 | | 21.74 | | 6.67 | |
| Ratios/Supplemental Data (%): | | | | | | | | | | |
| Ratio of total expenses | | | | | | | | | | |
| to average net assets | 1.36 | | 1.36 | | 1.36 | | 1.36 | | 1.36 | |
| Ratio of net expenses | | | | | | | | | | |
| to average net assets | 1.35 | | 1.35 | | 1.35 | | 1.32 | | 1.25 | |
| Ratio of net investment income | | | | | | | | | | |
| to average net assets | 1.21 | | 1.53 | | 1.28 | | 1.31 | | 1.44 | |
| Portfolio Turnover Rate | .62 | | 7.63 | | .65 | | 4.08 | | 2.09 | |
| Net Assets, end of period ($ x 1,000) | 131,033 | | 176,742 | | 185,523 | | 112,103 | | 68,009 | |
| |
| a | Based on average shares outstanding. |
| b | Exclusive of sales charge. |
See notes to financial statements.
The Fund 17
FINANCIAL HIGHLIGHTS (continued)
| | | | | | | | | | |
| | | | Year Ended August 31, | | | |
| Class C Shares | 2014 | | 2013 | | 2012 | | 2011 | | 2010 | |
| Per Share Data ($): | | | | | | | | | | |
| Net asset value, beginning of period | 19.28 | | 18.19 | | 16.13 | | 13.42 | | 12.79 | |
| Investment Operations: | | | | | | | | | | |
| Investment income—neta | .10 | | .15 | | .09 | | .09 | | .10 | |
| Net realized and unrealized | | | | | | | | | | |
| gain (loss) on investments | 3.59 | | 1.08 | | 2.10 | | 2.71 | | .66 | |
| Total from Investment Operations | 3.69 | | 1.23 | | 2.19 | | 2.80 | | .76 | |
| Distributions: | | | | | | | | | | |
| Dividends from investment income—net | (.13 | ) | (.14 | ) | (.13 | ) | (.09 | ) | (.13 | ) |
| Dividends from net realized | | | | | | | | | | |
| gain on investments | (.26 | ) | — | | — | | — | | — | |
| Total Distributions | (.39 | ) | (.14 | ) | (.13 | ) | (.09 | ) | (.13 | ) |
| Net asset value, end of period | 22.58 | | 19.28 | | 18.19 | | 16.13 | | 13.42 | |
| Total Return (%)b | 19.35 | | 6.83 | | 13.66 | | 20.88 | | 5.88 | |
| Ratios/Supplemental Data (%): | | | | | | | | | | |
| Ratio of total expenses | | | | | | | | | | |
| to average net assets | 2.11 | | 2.11 | | 2.11 | | 2.11 | | 2.11 | |
| Ratio of net expenses | | | | | | | | | | |
| to average net assets | 2.10 | | 2.10 | | 2.10 | | 2.07 | | 2.00 | |
| Ratio of net investment income | | | | | | | | | | |
| to average net assets | .46 | | .78 | | .54 | | .56 | | .70 | |
| Portfolio Turnover Rate | .62 | | 7.63 | | .65 | | 4.08 | | 2.09 | |
| Net Assets, end of period ($ x 1,000) | 140,690 | | 147,544 | | 144,658 | | 96,429 | | 66,280 | |
| |
| a | Based on average shares outstanding. |
| b | Exclusive of sales charge. |
See notes to financial statements.
18
| | | | | | | | | | |
| | | | Year Ended August 31, | | | |
| Class I Shares | 2014 | | 2013 | | 2012 | | 2011 | | 2010 | |
| Per Share Data ($): | | | | | | | | | | |
| Net asset value, beginning of period | 20.07 | | 18.92 | | 16.81 | | 13.97 | | 13.28 | |
| Investment Operations: | | | | | | | | | | |
| Investment income—neta | .32 | | .35 | | .28 | | .26 | | .26 | |
| Net realized and unrealized | | | | | | | | | | |
| gain (loss) on investments | 3.74 | | 1.12 | | 2.20 | | 2.80 | | .68 | |
| Total from Investment Operations | 4.06 | | 1.47 | | 2.48 | | 3.06 | | .94 | |
| Distributions: | | | | | | | | | | |
| Dividends from investment income—net | (.34 | ) | (.32 | ) | (.37 | ) | (.22 | ) | (.25 | ) |
| Dividends from net realized | | | | | | | | | | |
| gain on investments | (.26 | ) | — | | — | | — | | — | |
| Total Distributions | (.60 | ) | (.32 | ) | (.37 | ) | (.22 | ) | (.25 | ) |
| Net asset value, end of period | 23.53 | | 20.07 | | 18.92 | | 16.81 | | 13.97 | |
| Total Return (%) | 20.56 | | 7.83 | | 14.89 | | 22.00 | | 7.01 | |
| Ratios/Supplemental Data (%): | | | | | | | | | | |
| Ratio of total expenses | | | | | | | | | | |
| to average net assets | 1.11 | | 1.11 | | 1.11 | | 1.11 | | 1.12 | |
| Ratio of net expenses | | | | | | | | | | |
| to average net assets | 1.10 | | 1.10 | | 1.10 | | 1.09 | | 1.01 | |
| Ratio of net investment income | | | | | | | | | | |
| to average net assets | 1.45 | | 1.78 | | 1.57 | | 1.59 | | 1.77 | |
| Portfolio Turnover Rate | .62 | | 7.63 | | .65 | | 4.08 | | 2.09 | |
| Net Assets, end of period ($ x 1,000) | 83,389 | | 73,915 | | 69,970 | | 31,181 | | 4,985 | |
| a Based on average shares outstanding. | | | | | | | | | | |
| See notes to financial statements. | | | | | | | | | | |
The Fund 19
NOTES TO FINANCIAL STATEMENTS
NOTE 1—Significant Accounting Policies:
Dreyfus Core Equity Fund (the “fund”) is a separate diversified series of The Dreyfus/Laurel Funds, Inc. (the “Company”), which is registered under the Investment Company Act of 1940, as amended (the “Act”), as an open-end management investment company and operates as a series company currently offering eleven series, including the fund.The fund’s investment objective is to seek long-term capital appreciation. The Dreyfus Corporation (the “Manager” or “Dreyfus”), a wholly-owned subsidiary of The Bank of New York Mellon Corporation (“BNY Mellon”), serves as the fund’s investment adviser. Fayez Sarofim & Co. (“Sarofim & Co.”), serves as the fund’s sub-investment adviser.
MBSC Securities Corporation (the “Distributor”), a wholly-owned subsidiary of Dreyfus, is the distributor of the fund’s shares. The fund is authorized to issue 500 million shares of $.001 par value Capital Stock. The fund currently offers three classes of shares: Class A (300 million shares authorized), Class C (100 million shares authorized) and Class I (100 million shares authorized). Class A and Class C shares are sold primarily to retail investors through financial intermediaries and bear Distribution and/or Service Plan fees. Class A shares generally are subject to a sales charge imposed at the time of purchase. Class C shares are subject to a contingent deferred sales charge (“CDSC”) imposed on Class C shares redeemed within one year of purchase. Class I shares are sold primarily to bank trust departments and other financial service providers (including The Bank of New York Mellon, a subsidiary of BNY Mellon and an affiliate of Dreyfus, and its affiliates), acting on behalf of customers having a qualified trust or an investment account or relationship at such institution, and bear no Distribution or Services Plan fees. Class I shares are offered without a front-end sales charge or CDSC. Other differences between the classes include the services offered to and the expenses borne by each class and certain voting rights. Income, expenses (other than expenses
20
attributable to a specific class), and realized and unrealized gains or losses on investments are allocated to each class of shares based on its relative net assets.
The Company accounts separately for the assets, liabilities and operations of each series. Expenses directly attributable to each series are charged to that series’ operations; expenses which are applicable to all series are allocated among them on a pro rata basis.
The Financial Accounting Standards Board (“FASB”) Accounting Standards Codification is the exclusive reference of authoritative U.S. generally accepted accounting principles (“GAAP”) recognized by the FASB to be applied by nongovernmental entities. Rules and interpretive releases of the Securities and Exchange Commission (“SEC”) under authority of federal laws are also sources of authoritative GAAP for SEC registrants. The fund’s financial statements are prepared in accordance with GAAP, which may require the use of management estimates and assumptions. Actual results could differ from those estimates.
(a) Portfolio valuation: The fair value of a financial instrument is the amount that would be received to sell an asset or paid to transfer a liability in an orderly transaction between market participants at the measurement date (i.e., the exit price). GAAP establishes a fair value hierarchy that prioritizes the inputs of valuation techniques used to measure fair value. This hierarchy gives the highest priority to unadjusted quoted prices in active markets for identical assets or liabilities (Level 1 measurements) and the lowest priority to unobservable inputs (Level 3 measurements).
Additionally, GAAP provides guidance on determining whether the volume and activity in a market has decreased significantly and whether such a decrease in activity results in transactions that are not orderly. GAAP requires enhanced disclosures around valuation inputs and techniques used during annual and interim periods.
The Fund 21
NOTES TO FINANCIAL STATEMENTS (continued)
Various inputs are used in determining the value of the fund’s investments relating to fair value measurements.These inputs are summarized in the three broad levels listed below:
Level 1—unadjusted quoted prices in active markets for identical investments.
Level 2—other significant observable inputs (including quoted prices for similar investments, interest rates, prepayment speeds, credit risk, etc.).
Level 3—significant unobservable inputs (including the fund’s own assumptions in determining the fair value of investments).
The inputs or methodology used for valuing securities are not necessarily an indication of the risk associated with investing in those securities.
Changes in valuation techniques may result in transfers in or out of an assigned level within the disclosure hierarchy. Valuation techniques used to value the fund’s investments are as follows:
Investments in securities are valued at the last sales price on the securities exchange or national securities market on which such securities are primarily traded. Securities listed on the National Market System for which market quotations are available are valued at the official closing price or, if there is no official closing price that day, at the last sales price. Securities not listed on an exchange or the national securities market, or securities for which there were no transactions, are valued at the average of the most recent bid and asked prices, except for open short positions, where the asked price is used for valuation purposes. Bid price is used when no asked price is available. Registered investment companies that are not traded on an exchange are valued at their net asset value.All of the preceding securities are generally categorized within Level 1 of the fair value hierarchy.
Fair valuing of securities may be determined with the assistance of a pricing service using calculations based on indices of domestic securities and other appropriate indicators, such as prices of relevant ADRs and financial futures. Utilizing these techniques may result in transfers between Level 1 and Level 2 of the fair value hierarchy.
22
When market quotations or official closing prices are not readily available, or are determined not to reflect accurately fair value, such as when the value of a security has been significantly affected by events after the close of the exchange or market on which the security is principally traded (for example, a foreign exchange or market), but before the fund calculates its net asset value, the fund may value these investments at fair value as determined in accordance with the procedures approved by the Company’s Board of Directors (the “Board”). Certain factors may be considered when fair valuing investments such as: fundamental analytical data, the nature and duration of restrictions on disposition, an evaluation of the forces that influence the market in which the securities are purchased and sold, and public trading in similar securities of the issuer or comparable issuers. These securities are either categorized within Level 2 or 3 of the fair value hierarchy depending on the relevant inputs used.
For restricted securities where observable inputs are limited, assumptions about market activity and risk are used and are generally categorized within Level 3 of the fair value hierarchy.
Investments denominated in foreign currencies are translated to U.S. dollars at the prevailing rates of exchange.
The following is a summary of the inputs used as of August 31, 2014 in valuing the fund’s investments:
| | | | |
| | | Level 2—Other | Level 3— | |
| | Level 1— | Significant | Significant | |
| | Unadjusted | Observable | Unobservable | |
| | Quoted Prices | Inputs | Inputs | Total |
| Assets ($) | | | | |
| Investments in Securities: | | | |
| Equity Securities— | | | | |
| Domestic | | | | |
| Common Stocks† | 307,929,588 | — | — | 307,929,588 |
| Equity Securities— | | | | |
| Foreign | | | | |
| Common Stocks† | 49,579,832 | — | — | 49,579,832 |
| Mutual Funds | 558,599 | — | — | 558,599 |
| |
| † | See Statement of Investments for additional detailed categorizations. |
The Fund 23
NOTES TO FINANCIAL STATEMENTS (continued)
At August 31, 2014, there were no transfers between Level 1 and Level 2 of the fair value hierarchy.
(b) Foreign currency transactions: The fund does not isolate that portion of the results of operations resulting from changes in foreign exchange rates on investments from the fluctuations arising from changes in the market prices of securities held. Such fluctuations are included with the net realized and unrealized gain or loss on investments.
Net realized foreign exchange gains or losses arise from sales of foreign currencies, currency gains or losses realized on securities transactions between trade and settlement date, and the difference between the amounts of dividends, interest and foreign withholding taxes recorded on the fund’s books and the U.S. dollar equivalent of the amounts actually received or paid. Net unrealized foreign exchange gains and losses arise from changes in the value of assets and liabilities other than investments resulting from changes in exchange rates. Foreign currency gains and losses on foreign currency transactions are also included with net realized and unrealized gain or loss on investments.
(c) Securities transactions and investment income: Securities transactions are recorded on a trade date basis. Realized gains and losses from securities transactions are recorded on the identified cost basis. Dividend income is recognized on the ex-dividend date and interest income, including, where applicable, accretion of discount and amortization of premium on investments, is recognized on the accrual basis.
Pursuant to a securities lending agreement with The Bank of New York Mellon, the fund may lend securities to qualified institutions. It is the fund’s policy that, at origination, all loans are secured by collateral of at least 102% of the value of U.S. securities loaned and 105% of the value of foreign securities loaned. Collateral equivalent to at least 100% of the market value of securities on loan is maintained at all times. Collateral is either in the form of cash, which can be invested in certain money market mutual funds managed by Dreyfus or U.S. Government and Agency securities.The fund is entitled to receive all dividends, interest and distributions on securities loaned, in addition to
24
income earned as a result of the lending transaction. Should a borrower fail to return the securities in a timely manner, The Bank of New York Mellon is required to replace the securities for the benefit of the fund or credit the fund with the market value of the unreturned securities and is subrogated to the fund’s rights against the borrower and the collateral. During the period ended August 31, 2014, The Bank of New York Mellon earned $3,350 from lending portfolio securities, pursuant to the securities lending agreement.
(d) Affiliated issuers: Investments in other investment companies advised by Dreyfus are defined as “affiliated” under the Act. Investments in affiliated investment companies during the period ended August 31, 2014 were as follows:
| | | | |
| Affiliated | | | | |
| Investment | Value | | | Value |
| Company | 8/31/2013 ($) | Purchases ($) | Sales ($) | 8/31/2014 ($) |
| Dreyfus | | | | |
| Institutional | | | | |
| Preferred | | | | |
| Plus Money | | | | |
| Market | | | | |
| Fund | 448,367 24,051,197 | | 23,973,365 | 526,199 |
| Dreyfus | | | | |
| Institutional | | | | |
| Cash | | | | |
| Advantage | | | | |
| Fund | 492,081 | 101,929,674 | 102,389,355 | 32,400 |
| Total | 940,448 125, | 980,871 | 126,362,720 | 558,599 |
(e) Dividends to shareholders: Dividends are recorded on the ex-dividend date. Dividends from investment income-net are normally declared and paid quarterly. Dividends from net realized capital gains, if any, are normally declared and paid annually, but the fund may make distributions on a more frequent basis to comply with the distribution requirements of the Internal Revenue Code of 1986, as amended (the “Code”). To the extent that net realized capital gains can be offset by capital loss carryovers, it is the policy of the fund not to distribute such gains. Income and capital gain distributions are determined in accordance with income tax regulations, which may differ from GAAP.
The Fund 25
NOTES TO FINANCIAL STATEMENTS (continued)
(f) Federal income taxes: It is the policy of the fund to continue to qualify as a regulated investment company, if such qualification is in the best interests of its shareholders, by complying with the applicable provisions of the Code, and to make distributions of taxable income sufficient to relieve it from substantially all federal income and excise taxes.
As of and during the period ended August 31, 2014, the fund did not have any liabilities for any uncertain tax positions.The fund recognizes interest and penalties, if any, related to uncertain tax positions as income tax expense in the Statement of Operations. During the period ended August 31, 2014, the fund did not incur any interest or penalties.
Each tax year in the four-year period ended August 31, 2014 remains subject to examination by the Internal Revenue Service and state taxing authorities.
At August 31, 2014, the components of accumulated earnings on a tax basis were as follows: undistributed ordinary income $1,085,748, undistributed capital gains $14,554,020 and unrealized appreciation $156,645,602.
The tax character of distributions paid to shareholders during the fiscal periods ended August 31, 2014 and August 31, 2013 were as follows: ordinary income $4,381,897 and $4,963,785, and long-term capital gains $5,193,306 and $0, respectively.
During the period ended August 31, 2014, as a result of permanent book to tax differences, primarily due to the tax treatment for foreign currency gains and losses, the fund decreased accumulated undistributed investment income-net by $164 and increased accumulated net realized gain (loss) on investments by the same amount. Net assets and net asset value per share were not affected by this reclassification.
NOTE 2—Bank Lines of Credit:
The fund participates with other Dreyfus-managed funds in a $265 million unsecured credit facility led by Citibank, N.A. and a $300 million unsecured credit facility provided by The Bank of New York Mellon (each a “Facility”), each to be utilized primarily for temporary
26
or emergency purposes, including the financing of redemptions. Prior to October 9, 2013, the unsecured credit facility with Citibank, N.A. was $210 million. In connection therewith, the fund has agreed to pay its pro rata portion of commitment fees for each Facility. Interest is charged to the fund based on rates determined pursuant to the terms of the respective Facility at the time of borrowing.
The average amount of borrowings outstanding under the Facilities during the period ended August 31, 2014 was approximately $618,400 with a related weighted average annualized interest rate of 1.09%.
NOTE 3—Investment Management Fee, Sub-Investment Advisory Fee and Other Transactions with Affiliates:
(a) Pursuant to an investment management agreement with Dreyfus, Dreyfus provides or arranges for one or more third parties and/or affiliates to provide investment advisory, administrative, custody, fund accounting and transfer agency services to the fund. Dreyfus also directs the investments of the fund in accordance with its investment objective, policies and limitations. For these services, the fund is contractually obligated to pay Dreyfus a fee, calculated daily and paid monthly, at the annual rate of 1.10% of the value of the fund’s average daily net assets. Out of its fee, Dreyfus pays all of the expenses of the fund except brokerage fees, taxes, interest expenses, commitment fees on borrowings, Distribution Plan fees and Service Plan fees, fees and expenses of non-interested Directors (including counsel fees) and extraordinary expenses. In addition, Dreyfus is required to reduce its fee in an amount equal to the fund’s allocable portion of fees and expenses of the non-interested Directors (including counsel fees). During the period ended August 31, 2014, fees reimbursed by Dreyfus amount to $29,822.
Pursuant to a sub-investment advisory agreement between Dreyfus and Sarofim & Co., Dreyfus pays Sarofim & Co. a monthly fee at an annual rate of .2175% of the value of the fund’s average daily net assets.
The Fund 27
NOTES TO FINANCIAL STATEMENTS (continued)
During the period ended August 31, 2014, the Distributor retained $29,675 from commissions earned on sales of the fund’s Class A shares and $43,007 from CDSCs on redemptions of the fund’s Class C shares.
(b) Under separate Distribution Plans adopted pursuant to Rule 12b-1 (the “Distribution Plans”) under the Act, Class A shares may pay annually up to .25% of the value of their average daily net assets to compensate the Distributor for shareholder servicing activities and expenses primarily intended to result in the sale of Class A shares. Class C shares pay the Distributor for distributing their shares at an aggregate annual rate of .75% of the value of the average daily net assets of Class C shares. Class C shares are also subject to a service plan adopted pursuant to Rule 12b-1 (the “Service Plan”), under which Class C shares pay the Distributor for providing certain services to the holders of their shares a fee at the annual rate of .25% of the value of the average daily net assets of Class C shares. During the period ended August 31, 2014, Class A and Class C shares were charged $409,755 and $1,121,077, respectively, pursuant to their Distribution Plans. During the period ended August 31, 2014, Class C shares were charged $373,692 pursuant to the Service Plan.
Under their terms, the Distribution Plans and Service Plan shall remain in effect from year to year, provided such continuance is approved annually by a vote of a majority of those Directors who are not “interested persons” of the Company and who have no direct or indirect financial interest in the operation of or in any agreement related to the Distribution Plans or Service Plan.
The components of “Due to The Dreyfus Corporation and affiliates” in the Statement of Assets and Liabilities consist of: management fees $329,836, Distribution Plans fees $117,004 and Service Plan fees $29,663, which are offset against an expense reimbursement currently in effect in the amount of $2,003.
(c) Each Board member also serves as a Board member of other funds within the Dreyfus complex. Annual retainer fees and attendance fees are allocated to each fund based on net assets.
28
NOTE 4—Securities Transactions:
The aggregate amount of purchases and sales of investment securities, excluding short-term securities, during the period ended August 31, 2014, amounted to $2,399,751 and $109,306,820, respectively.
At August 31, 2014, the cost of investments for federal income tax purposes was $201,422,417; accordingly, accumulated net unrealized appreciation on investments was $156,645,602, consisting of $157,064,288 gross unrealized appreciation and $418,686 gross unrealized depreciation.
The Fund 29
|
| REPORT OF INDEPENDENT REGISTERED |
| PUBLIC ACCOUNTING FIRM |
The Board of Directors and Shareholders The Dreyfus/Laurel Funds, Inc.
We have audited the accompanying statement of assets and liabilities of Dreyfus Core Equity Fund (the “Fund”), a series of The Dreyfus/Laurel Funds, Inc., including the statement of investments, as of August 31, 2014, and the related statement of operations for the year then ended, the statements of changes in net assets for each of the years in the two-year period then ended, and the financial highlights for each of the years in the five-year period then ended. These financial statements and financial highlights are the responsibility of the Fund’s management. Our responsibility is to express an opinion on these financial statements and financial highlights based on our audits.
We conducted our audits in accordance with the standards of the Public Company Accounting Oversight Board (United States). Those standards require that we plan and perform the audit to obtain reasonable assurance about whether the financial statements and financial highlights are free of material misstatement. An audit includes examining, on a test basis, evidence supporting the amounts and disclosures in the financial statements. Our procedures included confirmation of securities owned as of August 31, 2014, by correspondence with the custodian and brokers or by other appropriate auditing procedures.An audit also includes assessing the accounting principles used and significant estimates made by management, as well as evaluating the overall financial statement presentation. We believe that our audits provide a reasonable basis for our opinion.
In our opinion, the financial statements and financial highlights referred to above present fairly, in all material respects, the financial position of Dreyfus Core Equity Fund as of August 31, 2014, the results of its operations for the year then ended, the changes in its net assets for each of the years in the two-year period then ended, and the financial highlights for each of the years in the five-year period then ended, in conformity with U.S. generally accepted accounting principles.

New York, New York
October 30, 2014
30
IMPORTANT TAX INFORMATION (Unaudited)
For federal tax purposes the fund reports the maximum amount allowable but not less than 100% of ordinary income dividends paid during the fiscal year ended August 31, 2014 as eligible for the corporate dividends received deduction provided under Section 243 of the Internal Revenue Code in accordance with Section 854(b)(1)(A) of the Internal Revenue Code.Also, the fund reports the maximum amount allowable but not less than $4,381,897 as ordinary income dividends paid during the fiscal year ended August 31, 2014 as qualified dividend income in accordance with Section 854(b)(1)(B) of the Internal Revenue Code. Shareholders will receive notification in early 2015 of the percentage applicable to the preparation of their 2014 income tax returns.Also, the fund reports the maximum amount allowable but not less than $.2644 per share as a capital gain dividend paid on December 5, 2013 in accordance with Section 852(b)(3)(C) of the Internal Revenue Code.
The Fund 31
|
| BOARD MEMBERS INFORMATION (Unaudited) |
| INDEPENDENT BOARD MEMBERS |
|
| Joseph S. DiMartino (70) |
| Chairman of the Board (1999) |
| Principal Occupation During Past 5Years: |
| • Corporate Director and Trustee (1995-present) |
| Other Public Company Board Memberships During Past 5Years: |
| • CBIZ (formerly, Century Business Services, Inc.), a provider of outsourcing functions for small |
| and medium size companies, Director (1997-present) |
| • The Newark Group, a provider of a national market of paper recovery facilities, paperboard |
| mills and paperboard converting plants, Director (2000-2010) |
| • Sunair Services Corporation, a provider of certain outdoor-related services to homes and |
| businesses, Director (2005-2009) |
| No. of Portfolios for which Board Member Serves: 142 |
| ——————— |
| Francine J. Bovich (63) |
| Board Member (1994) |
| Principal Occupation During Past 5Years: |
| • Trustee,The Bradley Trusts, private trust funds (2011-present) |
| • Managing Director, Morgan Stanley Investment Management (1993-2010) |
| Other Public Company Board Membership During Past 5Years: |
| • Annaly Capital Management, Inc., Board Member (May 2014-present) |
| No. of Portfolios for which Board Member Serves: 45 |
| ——————— |
| James M. Fitzgibbons (79) |
| Board Member (1994) |
| Principal Occupation During Past 5Years: |
| • Corporate Director and Trustee |
| Other Public Company Board Membership During Past 5Years: |
| • Bill Barrett Corporation, an oil and natural gas exploration company, Director (2004-2012) |
| No. of Portfolios for which Board Member Serves: 31 |
| ——————— |
| Kenneth A. Himmel (68) |
| Board Member (1994) |
| Principal Occupation During Past 5Years: |
| • President and CEO, Related Urban Development, a real estate development company (1996-present) |
| • President and CEO, Himmel & Company, a real estate development company (1980-present) |
| • CEO,American Food Management, a restaurant company (1983-present) |
| No. of Portfolios for which Board Member Serves: 31 |
32
|
| Stephen J. Lockwood (67) |
| Board Member (1994) |
| Principal Occupation During Past 5Years: |
| • Chairman of the Board, Stephen J. Lockwood and Company LLC, a real estate investment |
| company (2000-present) |
| No. of Portfolios for which Board Member Serves: 31 |
| ——————— |
| Roslyn M. Watson (64) |
| Board Member (1994) |
| Principal Occupation During Past 5Years: |
| • Principal,Watson Ventures, Inc., a real estate investment company (1993-present) |
| No. of Portfolios for which Board Member Serves: 64 |
| ——————— |
| Benaree Pratt Wiley (68) |
| Board Member (1998) |
| Principal Occupation During Past 5Years: |
| • Principal,TheWiley Group, a firm specializing in strategy and business development (2005-present) |
| Other Public Company Board Membership During Past 5Years: |
| • CBIZ (formerly, Century Business Services, Inc.), a provider of outsourcing functions for small |
| and medium size companies, Director (2008-present) |
| No. of Portfolios for which Board Member Serves: 66 |
| ——————— |
| Once elected all Board Members serve for an indefinite term, but achieve Emeritus status upon reaching age 80.The |
| address of the Board Members and Officers is c/o The Dreyfus Corporation, 200 Park Avenue, NewYork, NewYork |
| 10166.Additional information about the Board Members is available in the fund’s Statement of Additional Information |
| which can be obtained from Dreyfus free of charge by calling this toll free number: 1-800-DREYFUS. |
| J.Tomlinson Fort, Emeritus Board Member |
The Fund 33
OFFICERS OF THE FUND (Unaudited)
BRADLEY J. SKAPYAK, President since January 2010.
Chief Operating Officer and a director of the Manager since June 2009, Chairman of Dreyfus Transfer, Inc., an affiliate of the Manager and the transfer agent of the funds, since May 2011 and Executive Vice President of the Distributor since June 2007. From April 2003 to June 2009, Mr. Skapyak was the head of the Investment Accounting and Support Department of the Manager. He is an officer of 69 investment companies (comprised of 142 portfolios) managed by the Manager. He is 55 years old and has been an employee of the Manager since February 1988.
JOHN PAK, Chief Legal Officer since March 2013.
Deputy General Counsel, Investment Management, of BNY Mellon since August 2014; Chief Legal Officer of the Manager since August 2012; from March 2005 to July 2012, Managing Director of Deutsche Bank, Deputy Global Head of Deutsche Asset Management Legal and Regional Head of Deutsche Asset Management Americas Legal. He is an officer of 70 investment companies (comprised of 167 portfolios) managed by the Manager. He is 45 years old and has been an employee of the Manager since August 2012.
JANETTE E. FARRAGHER, Vice President and Secretary since December 2011.
Assistant General Counsel of BNY Mellon, and an officer of 70 investment companies (comprised of 167 portfolios) managed by the Manager. She is 51 years old and has been an employee of the Manager since February 1984.
KIESHA ASTWOOD, Vice President and Assistant Secretary since January 2010.
Counsel of BNY Mellon, and an officer of 70 investment companies (comprised of 167 portfolios) managed by the Manager. She is 41 years old and has been an employee of the Manager since July 1995.
JAMES BITETTO, Vice President and Assistant Secretary since August 2005.
Managing Counsel of BNY Mellon and Secretary of the Manager, and an officer of 70 investment companies (comprised of 167 portfolios) managed by the Manager. He is 48 years old and has been an employee of the Manager since December 1996.
JONI LACKS CHARATAN, Vice President and Assistant Secretary since August 2005.
Managing Counsel of BNY Mellon, and an officer of 70 investment companies (comprised of 167 portfolios) managed by the Manager. She is 58 years old and has been an employee of the Manager since October 1988.
JOSEPH M. CHIOFFI, Vice President and Assistant Secretary since August 2005.
Managing Counsel of BNY Mellon, and an officer of 70 investment companies (comprised of 167 portfolios) managed by the Manager. He is 52 years old and has been an employee of the Manager since June 2000.
JOHN B. HAMMALIAN, Vice President and Assistant Secretary since August 2005.
Senior Managing Counsel of BNY Mellon, and an officer of 70 investment companies (comprised of 167 portfolios) managed by the Manager. He is 51 years old and has been an employee of the Manager since February 1991.
SARAH S. KELLEHER, Vice President and Assistant Secretary since April 2014.
Senior Counsel of BNY Mellon, and an officer of 70 investment companies (comprised of 167 portfolios) managed by the Manager; from August 2005 to March 2013, Associate General Counsel of Third Avenue Management. She is 38 years old and has been an employee of the Manager since March 2013.
34
JEFF PRUSNOFSKY, Vice President and Assistant Secretary since August 2005.
Senior Managing Counsel of BNY Mellon, and an officer of 70 investment companies (comprised of 167 portfolios) managed by the Manager. He is 49 years old and has been an employee of the Manager since October 1990.
JAMES WINDELS, Treasurer since November 2001.
Director – Mutual Fund Accounting of the Manager, and an officer of 70 investment companies (comprised of 167 portfolios) managed by the Manager. He is 55 years old and has been an employee of the Manager since April 1985.
RICHARD CASSARO, Assistant Treasurer since January 2008.
Senior Accounting Manager – Money Market and Municipal Bond Funds of the Manager, and an officer of 70 investment companies (comprised of 167 portfolios) managed by the Manager. He is 55 years old and has been an employee of the Manager since September 1982.
GAVIN C. REILLY, Assistant Treasurer since December 2005.
Tax Manager of the Investment Accounting and Support Department of the Manager, and an officer of 70 investment companies (comprised of 167 portfolios) managed by the Manager. He is 46 years old and has been an employee of the Manager since April 1991.
ROBERT S. ROBOL, Assistant Treasurer since August 2005.
Senior Accounting Manager – Fixed Income Funds of the Manager, and an officer of 70 investment companies (comprised of 167 portfolios) managed by the Manager. He is 50 years old and has been an employee of the Manager since October 1988.
ROBERT SALVIOLO, Assistant Treasurer since July 2007.
Senior Accounting Manager – Equity Funds of the Manager, and an officer of 70 investment companies (comprised of 167 portfolios) managed by the Manager. He is 47 years old and has been an employee of the Manager since June 1989.
ROBERT SVAGNA, Assistant Treasurer since August 2005.
Senior Accounting Manager – Equity Funds of the Manager, and an officer of 70 investment companies (comprised of 167 portfolios) managed by the Manager. He is 47 years old and has been an employee of the Manager since November 1990.
JOSEPH W. CONNOLLY, Chief Compliance Officer since October 2004.
Chief Compliance Officer of the Manager and The Dreyfus Family of Funds (70 investment companies, comprised of 167 portfolios).
He is 57 years old and has served in various capacities with the Manager since 1980, including manager of the firm’s Fund Accounting Department from 1997 through October 2001.
MATTHEW D. CONNOLLY, Anti-Money Laundering Compliance Officer since April 2012.
Anti-Money Laundering Compliance Officer of the Distributor since October 2011; from March 2010 to September 2011, Global Head, KYC Reviews and Director of UBS Investment Bank; until March 2010, AML Compliance Officer and Senior Vice President of Citi Global Wealth Management. He is an officer of 65 investment companies (comprised of 162 portfolios) managed by the Manager. He is 42 years old and has been an employee of the Distributor since October 2011.
TheFund 35
For More Information

Telephone Call your financial representative or 1-800-DREYFUS
Mail The Dreyfus Family of Funds, 144 Glenn Curtiss Boulevard, Uniondale, NY 11556-0144
The fund files its complete schedule of portfolio holdings with the Securities and Exchange Commission (“SEC”) for the first and third quarters of each fiscal year on Form N-Q. The fund’s Forms N-Q are available on the SEC’s website at http://www.sec.gov and may be reviewed and copied at the SEC’s Public Reference Room in Washington, DC. Information on the operation of the Public Reference Room may be obtained by calling 1-800-SEC-0330.
A description of the policies and procedures that the fund uses to determine how to vote proxies relating to portfolio securities, and information regarding how the fund voted these proxies for the most recent 12-month period ended June 30 is available at http://www.dreyfus.com and on the SEC’s website at http://www.sec.gov. The description of the policies and procedures is also available without charge, upon request, by calling 1-800-DREYFUS.

|
| Dreyfus |
| Floating Rate |
| Income Fund |
ANNUAL REPORT August 31, 2014

Save time. Save paper. View your next shareholder report online as soon as it’s available. Log into www.dreyfus.com and sign up for Dreyfus eCommunications. It’s simple and only takes a few minutes.
The views expressed in this report reflect those of the portfolio manager only through the end of the period covered and do not necessarily represent the views of Dreyfus or any other person in the Dreyfus organization. Any such views are subject to change at any time based upon market or other conditions and Dreyfus disclaims any responsibility to update such views.These views may not be relied on as investment advice and, because investment decisions for a Dreyfus fund are based on numerous factors, may not be relied on as an indication of trading intent on behalf of any Dreyfus fund.
|
| Not FDIC-Insured • Not Bank-Guaranteed • May Lose Value |
| | Contents |
| | THE FUND |
| 2 | A Letter from the President |
| 3 | Discussion of Fund Performance |
| 6 | Fund Performance |
| 8 | Understanding Your Fund’s Expenses |
| 8 | Comparing Your Fund’s Expenses With Those of Other Funds |
| 9 | Statement of Investments |
| 34 | Statement of Assets and Liabilities |
| 35 | Statement of Operations |
| 36 | Statement of Changes in Net Assets |
| 38 | Financial Highlights |
| 39 | Notes to Financial Statements |
| 53 | Report of Independent Registered Public Accounting Firm |
| 54 | Important Tax Information |
| 55 | Board Members Information |
| 57 | Officers of the Fund |
| | FOR MORE INFORMATION |
| | Back Cover |
Dreyfus
Floating Rate
Income Fund
The Fund
A LETTER FROM THE PRESIDENT
Dear Shareholder:
We are pleased to present this annual report for Dreyfus Floating Rate Income Fund, covering the 12-month period from September 27, 2013, through August 31, 2014. For information about how the fund performed during the reporting period, as well as general market perspectives, we provide a Discussion of Fund Performance on the pages that follow.
Despite bouts of heightened volatility during the final months of 2013, when the Fed’s tapering talk and accelerating economic growth caused long-term interest rates to rise, U.S. fixed-income securities generally gained ground during the reporting period overall. Long-term interest rates moderated early in 2014 due to geopolitical and economic concerns, driving down yields of long-term U.S. government securities. Meanwhile, improving business conditions and robust investor demand for higher yields supported returns of corporate-backed bonds.
While we remain cautiously optimistic regarding the U.S. bond market’s prospects, we believe that selectivity is likely to become more important to investment success in the asset class. Long-term rates could rise if, as we anticipate, the economy continues to accelerate. On the other hand, a number of factors could dampen the impact of the domestic economic recovery, including intensifying geopolitical turmoil. Therefore, we suggest you talk regularly with your financial advisor to assess the potential impact of these and other macroeconomic developments on your investments.
Thank you for your continued confidence and support.

J. Charles Cardona
President
The Dreyfus Corporation
September 15, 2014
2
DISCUSSION OF FUND PERFORMANCE
For the period of September 27, 2013, through August 31, 2014, as provided by William Lemberg and Chris Barris, Primary Portfolio Managers
Fund and Market Performance Overview
Between its inception on September 27, 2013, and the end of its fiscal year on August 31, 2014, Dreyfus Floating Rate Income Fund’s Class A shares produced a total return of 3.39%, Class C shares returned 2.73%, Class I shares returned 3.59%, and Class Y shares returned 3.59%.1 The fund’s benchmark, the S&P LSTA Leveraged Loan Index (the “Index”), produced a total return of 4.45% for the one period ended August 31, 2014.2
Leveraged bank loans fared relatively well over the reporting period amid a recovering U.S. economy and robust demand for income-oriented investments. The fund produced lower returns than its benchmark, primarily due to a relatively defensive investment posture, including lack of exposure to a distressed loan from an issuer undergoing bankruptcy reorganization.
The Fund’s Investment Approach
The fund seeks high current income. To pursue its goal, the fund normally invests at least 80% of its net assets, plus any borrowings for investment purposes, in floating rate loans and other floating rate securities. The fund currently intends to invest principally in floating rate loans and securities of U.S. issuers, but may invest up to 20% of its net assets in securities of foreign issuers.
We buy and sell loans and securities through a value-oriented, bottom up research process that incorporates a macroeconomic overlay. We use fundamental credit analysis to identify favorable and unfavorable risk/reward opportunities across sectors, industries, and structures while seeking to mitigate credit risk. Fundamental analysis is complemented by our macroeconomic outlook as it relates to observed default trends, performance drivers, and capital market liquidity. We seek to mitigate credit risk through a disciplined approach to credit investment selection and evaluation.
The Fund 3
DISCUSSION OF FUND PERFORMANCE (continued)
Robust Demand Drove Loan Market Performance
A sustained economic recovery over the fall of 2013 and the Federal Reserve Board (the “Fed”)’s decision to begin reducing its quantitative easing program drove yields of 10-year U.S. Treasury securities above 3% for the first time in more than two years. However, the Fed made clear that short-term interest rates were likely to remain low for some time, and renewed global economic concerns at the start of 2014 subsequently caused Treasury yields to moderate.
Meanwhile, harsh winter weather dampened domestic economic activity as U.S. GDP contracted at a 2.1% annualized rate during the first quarter of 2014, but investors were relieved when economic growth rebounded at a 4.6% annualized rate during the second quarter. Despite the resumption of growth, robust demand for U.S. government securities kept their yields low. In contrast, high yield bonds gave back some of their previous price gains during the summer of 2014, causing yields of lower rated corporate bonds and leveraged loans to rise.
Low yields on U.S.Treasury securities increasingly drove income-oriented investors to lower rated alternatives with better income characteristics, including high yield bonds and leveraged bank loans. Loans and bonds rated toward the top of the below-investment-grade credit quality spectrum benefited from investors’ reach for income, particularly those with BB ratings. Bonds and loans with CCC-ratings also fared relatively well, but those with B-ratings lagged market averages.
Conservative Posture Dampened Fund Results
While the fund generally fared well over the reporting period, its performance compared to its benchmark was constrained by our relatively cautious investment posture.The fund did not hold one of the benchmark’s top-performing components, a loan from a Texas utility. Because the issuer is in bankruptcy, the defaulted loan did not meet our investment criteria. The fund also held underweighted exposure to the volatile publishing industry, which fared relatively well despite a number of long-term fundamental challenges. In addition, the fund maintained overweighted exposure to B-rated loans at a time when they generally underperformed other rating tiers. However, a more modestly overweighted position in higher yielding CCC-rated loans offset some of the weakness among their B-rated counterparts.
4
The fund also achieved better relative results through our security selection strategy in the health care sector. Several economically sensitive industry groups added value, including loans from chemicals, plastics, and automotive companies. We allocated a portion of the fund’s assets to high yield bonds with good liquidity characteristics, and these securities gained value as yield differences narrowed along the market’s credit quality range.The fund’s non-U.S. holdings, which comprised approximately 15% of assets, also contributed positively to relative performance. At times, the fund employed futures contracts to hedge its foreign currency exposure.
Adopting a More Constructive Positioning
The U.S. economic recovery appears to be solidly back on track, and above-trend growth seems likely to persist into 2015.This development increases the likelihood of rising interest rates, an environment in which floating-rate bank loans historically have tended to thrive.We recently adopted a less conservative stance as we identified some lower rated loans that, in our view, represented attractive values after the summer market downturn.
September 15, 2014
Floating-rate loans are subject generally to interest rate, credit, liquidity, and market risks, to varying degrees, all of which are more fully described in the fund’s prospectus.
The fund may use derivative instruments, such as options, futures and options on futures, forward contracts, and swaps. A small investment in derivatives could have a potentially large impact on the fund’s performance.The use of derivatives involves risks different from, or possibly greater than, the risks associated with investing directly in the underlying assets.
High yield bonds are subject to increased credit risk and are considered speculative in terms of the issuer’s perceived ability to continue making interest payments on a timely basis and to repay principal upon maturity.
|
| 1 Total return includes reinvestment of dividends and any capital gains paid, and does not take into consideration the |
| maximum initial sales charge in the case of Class A shares, or the applicable contingent deferred sales charge imposed |
| on redemptions in the case of Class C shares. Had these charges been reflected, returns would have been lower. Past |
| performance is no guarantee of future results. Share price, yield, and investment return fluctuate such that upon |
| redemption, fund shares may be worth more or less than their original cost. |
| 2 SOURCE: LIPPER INC. – The S&P LSTA Leveraged Loan Index reflects the market-weighted performance of |
| institutional leveraged loans in the U.S. market based upon real-time market weightings, spreads, and interest |
| payments. For comparison purposes, the value of the Index on 9/30/13 is used as the beginning value on 9/27/13. |
| Index returns do not reflect the fees and expenses associated with operating a mutual fund. Investors cannot invest |
| directly in any index. |
The Fund 5
FUND PERFORMANCE
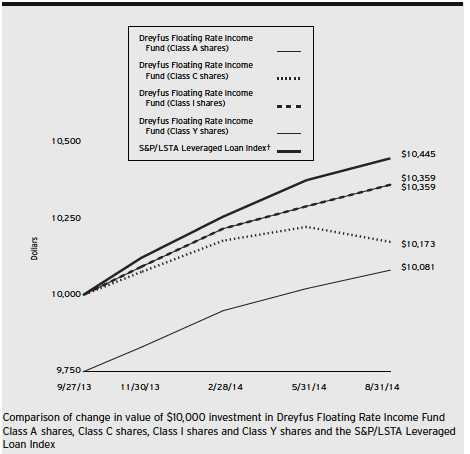
|
| † Source: Lipper Inc. |
| Past performance is not predictive of future performance. |
| The above graph compares a $10,000 investment made in each of the Class A, Class C, Class I and ClassY shares of |
| Dreyfus Floating Rate Income Fund on 9/27/13 (inception date) to a $10,000 investment made in the S&P/LSTA |
| Leveraged Loan Index (the “Index”) on that date.All dividends and capital gain distributions are reinvested. |
| On September 17, 2013, the Board authorized the fund to offer ClassY shares, as a new class of shares, to certain |
| investors, including certain institutional investors. On September 27, 2013, ClassY shares were offered at net asset value |
| and are not subject to certain fees, including Distribution Plan and Shareholder Services Plan fees. |
| The fund’s performance shown in the line graph above takes into account the maximum initial sales charge on Class A |
| shares, the applicable contingent deferred sales charge on Class C shares and all other applicable fees and expenses on all |
| classes.The Index is a broad index designed to reflect the performance of U.S. dollar facilities in the leverage loan market |
| Unlike a mutual fund, the Index is not subject to charges, fees and other expenses. Investors cannot invest directly in any |
| index. Further information relating to fund performance, including expense reimbursements, if applicable, is contained in |
| the Expense section of the prospectus and elsewhere in this report. |
6
| | | |
| Actual Aggregate Total Returns as of 8/31/14 | | |
| | Inception | From | |
| | Date | Inception | |
| Class A shares | | | |
| with maximum sales charge (2.50%) | 9/27/13 | 0.81 | % |
| without sales charge | 9/27/13 | 3.39 | % |
| Class C shares | | | |
| with applicable redemption charge† | 9/27/13 | 1.73 | % |
| without redemption | 9/27/13 | 2.73 | % |
| Class I shares | 9/27/13 | 3.59 | % |
| Class Y shares | 9/27/13 | 3.59 | % |
| S&P/LSTA Leveraged Loan Index | 9/30/13 | 4.45 | %†† |
Past performance is not predictive of future performance.The fund’s performance shown in the graph and table does not reflect the deduction of taxes that a shareholder would pay on fund distributions or the redemption of fund shares. In addition to the performance of Class A shares shown with and without a maximum sales charge, the fund’s performance shown in the table takes into account all other applicable fees and expenses on all classes.
| |
| † | The maximum contingent deferred sales charge for Class C shares is 1% for shares redeemed within one year of the |
| | date of purchase. |
| †† | For comparative purposes, the value of the Index on 9/30/13 is used as the beginning value on 9/27/13. |
The Fund 7
UNDERSTANDING YOUR FUND’S EXPENSES (Unaudited)
As a mutual fund investor, you pay ongoing expenses, such as management fees and other expenses. Using the information below, you can estimate how these expenses affect your investment and compare them with the expenses of other funds.You also may pay one-time transaction expenses, including sales charges (loads) and redemption fees, which are not shown in this section and would have resulted in higher total expenses. For more information, see your fund’s prospectus or talk to your financial adviser.
Review your fund’s expenses
The table below shows the expenses you would have paid on a $1,000 investment in Dreyfus Floating Rate Income Fund from March 1, 2014 to August 31, 2014. It also shows how much a $1,000 investment would be worth at the close of the period, assuming actual returns and expenses.
Expenses and Value of a $1,000 Investment
assuming actual returns for the six months ended August 31, 2014
| | | | | | | | |
| | | Class A | | Class C | | Class I | | Class Y |
| Expenses paid per $1,000† | $ | 5.13 | $ | 9.12 | $ | 4.01 | $ | 4.01 |
| Ending value (after expenses) | $ | 1,013.20 | $ | 1,009.40 | $ | 1,013.90 | $ | 1,013.90 |
COMPARING YOUR FUND’S EXPENSES
WITH THOSE OF OTHER FUNDS (Unaudited)
Using the SEC’s method to compare expenses
The Securities and Exchange Commission (SEC) has established guidelines to help investors assess fund expenses. Per these guidelines, the table below shows your fund’s expenses based on a $1,000 investment, assuming a hypothetical 5% annualized return. You can use this information to compare the ongoing expenses (but not transaction expenses or total cost) of investing in the fund with those of other funds. All mutual fund shareholder reports will provide this information to help you make this comparison. Please note that you cannot use this information to estimate your actual ending account balance and expenses paid during the period.
Expenses and Value of a $1,000 Investment
assuming a hypothetical 5% annualized return for the six months ended August 31, 2014
| | | | | | | | |
| | | Class A | | Class C | | Class I | | Class Y |
| Expenses paid per $1,000† | $ | 5.14 | $ | 9.15 | $ | 4.02 | $ | 4.02 |
| Ending value (after expenses) | $ | 1,020.11 | $ | 1,016.13 | $ | 1,021.22 | $ | 1,021.22 |
|
| † Expenses are equal to the fund’s annualized expense ratio of 1.01% for Class A, 1.80% for Class C, .79% for |
| Class I and .79% for Class Y, multiplied by the average account value over the period, multiplied by 184/365 (to |
| reflect the one-half year period). |
8
|
| STATEMENT OF INVESTMENTS |
| August 31, 2014 |
| | | | | | |
| | | Coupon | Maturity | Principal | | |
| Bonds and Notes—12.5% | | Rate (%) | Date | Amount ($)a | Value ($) |
| Collateralized Loan | | | | | | |
| Obligations—3.5% | | | | | | |
| Cadogan Square, | | | | | | |
| Ser. 1, Cl. E | EUR | 5.06 | 2/1/22 | 800,000 | b | 1,004,948 |
| Cairn, | | | | | | |
| Ser. 2007-2A, Cl. E | EUR | 5.43 | 10/15/22 | 1,000,000 | b,c | 1,262,174 |
| CIFC Funding, | | | | | | |
| Ser. 2014-2A, Cl. B2L | | 4.85 | 5/24/26 | 1,000,000 | b,c | 907,620 |
| CIFC Funding, | | | | | | |
| Ser. 2007-3A, Cl. D | | 5.49 | 7/26/21 | 1,000,000 | b,c | 1,000,559 |
| Denali Capital, | | | | | | |
| Ser. 2007-1A, Cl. B2L | | 4.48 | 1/22/22 | 500,000 | b,c | 476,564 |
| Galaxy, | | | | | | |
| Ser. 2012-12A, Cl. E | | 5.73 | 5/19/23 | 1,000,000 | b,c | 973,269 |
| Halcyon SAM European, | | | | | | |
| Ser. 2008-1X, Cl. D | EUR | 7.81 | 6/20/23 | 500,000 | b | 658,962 |
| Herbert Park, | | | | | | |
| Ser. 1A, Cl. D | EUR | 5.53 | 10/20/26 | 1,000,000 | b,c | 1,227,149 |
| Kingsland, | | | | | | |
| Ser. 2013-6A, Cl. E | | 5.24 | 10/28/24 | 1,000,000 | b,c | 913,429 |
| LCM, | | | | | | |
| Ser. 14A, Cl. E | | 4.88 | 7/15/25 | 1,000,000 | b,c | 910,464 |
| LightPoint Pan-European, | | | | | | |
| Ser. 2007-1X, Cl. E | EUR | 5.81 | 2/5/26 | 831,699 | b | 1,078,526 |
| Marathon, | | | | | | |
| Ser. 2013-5A, Cl. D | | 5.93 | 2/21/25 | 1,116,000 | b,c | 1,075,121 |
| OZLM Funding, | | | | | | |
| Ser. 2013-4A, Cl. D | | 4.89 | 7/22/25 | 1,500,000 | b,c | 1,357,195 |
| OZLM, | | | | | | |
| Ser. 2014-8A, Cl. D | | 5.19 | 10/17/26 | 2,000,000 | b,c | 1,830,058 |
| Regatta III Funding, | | | | | | |
| Ser. 2014-1A, Cl. D | | 5.15 | 4/15/26 | 1,500,000 | b,c | 1,377,748 |
| Sound Point, | | | | | | |
| Ser. 2012-1A, Cl. E | | 6.23 | 10/20/23 | 1,030,000 | b,c | 1,011,383 |
| Windmill, | | | | | | |
| Ser. 2007-1X, Cl. E | EUR | 6.83 | 12/16/29 | 1,000,000 | b | 1,314,769 |
| | | | | | | 18,379,938 |
The Fund 9
STATEMENT OF INVESTMENTS (continued)
| | | | | | |
| | | Coupon | Maturity | Principal | | |
| Bonds and Notes (continued) | Rate (%) | Date | Amount ($)a | Value ($) |
| Corporate Bonds—9.0% | | | | | | |
| Aerospace & Defense—.1% | | | | | | |
| TransDigm, | | | | | | |
| Gtd. Notes | | 5.50 | 10/15/20 | 500,000 | | 502,500 |
| Automotive—.6% | | | | | | |
| Chrysler Group, | | | | | | |
| Scd. Notes | | 8.00 | 6/15/19 | 1,350,000 | | 1,458,877 |
| Gates Global, | | | | | | |
| Gtd. Notes | | 6.00 | 7/15/22 | 1,000,000 | c | 995,000 |
| Goodyear Tire & Rubber, | | | | | | |
| Gtd. Notes | | 8.25 | 8/15/20 | 750,000 | | 819,375 |
| | | | | | | 3,273,252 |
| Cable & Satellite Television—.1% | | | | | |
| Numericable Group, | | | | | | |
| Sr. Scd. Bonds | | 6.00 | 5/15/22 | 525,000 | c | 541,406 |
| Chemicals & Plastics—1.1% | | | | | | |
| Axalta Coating Systems/Dutch, | | | | | |
| Gtd. Notes | | 7.38 | 5/1/21 | 750,000 | c | 821,250 |
| Griffon, | | | | | | |
| Gtd. Notes | | 5.25 | 3/1/22 | 1,250,000 | | 1,242,187 |
| Huntsman International, | | | | | | |
| Gtd. Notes | | 8.63 | 3/15/20 | 500,000 | | 538,125 |
| Novacap International, | | | | | | |
| Sr. Scd. Notes | EUR | 5.21 | 5/1/19 | 700,000 | b | 928,967 |
| Signode Industrial Group, | | | | | | |
| Sr. Unscd. Notes | | 6.38 | 5/1/22 | 2,550,000 | c | 2,543,625 |
| | | | | | | 6,074,154 |
| Containers & Glass Products—.7% | | | | | |
| Ardagh Packaging Finance, | | | | | | |
| Gtd. Notes | | 6.75 | 1/31/21 | 500,000 | c | 511,250 |
| Ardagh Packaging Finance, | | | | | | |
| Gtd. Notes | | 9.13 | 10/15/20 | 750,000 | c | 825,000 |
| Beverage Packaging Holdings, | | | | | |
| Gtd. Notes | | 5.63 | 12/15/16 | 500,000 | c | 510,000 |
| Beverage Packaging Holdings, | | | | | |
| Gtd. Notes | | 6.00 | 6/15/17 | 1,300,000 | c | 1,322,750 |
| Sealed Air, | | | | | | |
| Gtd. Notes | | 8.13 | 9/15/19 | 500,000 | c | 548,750 |
| | | | | | | 3,717,750 |
10
| | | | | | |
| | | Coupon | Maturity | Principal | | |
| Bonds and Notes (continued) | Rate (%) | Date | Amount ($)a | Value ($) |
| Electronics & Electrical Equipment—.7% | | | | |
| Alcatel-Lucent USA, | | | | | | |
| Gtd. Notes | | 4.63 | 7/1/17 | 1,000,000 | c | 1,020,000 |
| Micron Technology, | | | | | | |
| Sr. Unscd. Notes | | 5.88 | 2/15/22 | 1,000,000 | c | 1,073,750 |
| West, | | | | | | |
| Gtd. Notes | | 5.38 | 7/15/22 | 1,475,000 | c | 1,438,125 |
| | | | | | | 3,531,875 |
| Financial Intermediaries—.1% | | | | | |
| First Data, | | | | | | |
| Gtd. Notes | | 11.25 | 1/15/21 | 308,000 | b | 358,820 |
| Food & Beverages—.4% | | | | | | |
| Boparan Finance, | | | | | | |
| Sr. Unscd. Bonds | GBP | 5.50 | 7/15/21 | 1,250,000 | c | 1,979,406 |
| Health Care—.7% | | | | | | |
| Capsugel, | | | | | | |
| Sr. Unscd. Notes | | 7.00 | 5/15/19 | 500,000 | c | 512,187 |
| CHS/Community Health Systems, | | | | | |
| Gtd. Notes | | 6.88 | 2/1/22 | 1,000,000 | c | 1,067,500 |
| Valeant Pharmaceuticals | | | | | | |
| International, Gtd. Notes | | 6.75 | 8/15/18 | 1,890,000 | c | 2,027,025 |
| | | | | | | 3,606,712 |
| Homebuilding—.2% | | | | | | |
| Weyerhauser Real Estate, | | | | | | |
| Sr. Unscd. Notes | | 5.88 | 6/15/24 | 900,000 | c | 921,375 |
| Lodging & Casinos—.0% | | | | | | |
| Pinnacle Entertainment, | | | | | | |
| Gtd. Notes | | 8.75 | 5/15/20 | 250,000 | | 269,375 |
| Oil & Gas—.2% | | | | | | |
| Halcon Resources, | | | | | | |
| Gtd. Notes | | 9.75 | 7/15/20 | 600,000 | | 649,500 |
| Newfield Exploration, | | | | | | |
| Sr. Sub. Notes | | 6.88 | 2/1/20 | 500,000 | | 527,500 |
| | | | | | | 1,177,000 |
| Radio & Television—.6% | | | | | | |
| Clear Channel Worldwide Holdings, | | | | | |
| Gtd. Notes, Ser. B | | 7.63 | 3/15/20 | 1,000,000 | | 1,075,000 |
| DISH DBS, | | | | | | |
| Gtd. Notes | | 6.75 | 6/1/21 | 1,250,000 | | 1,401,500 |
The Fund 11
STATEMENT OF INVESTMENTS (continued)
| | | | | |
| | Coupon | Maturity | Principal | | |
| Bonds and Notes (continued) | Rate (%) | Date | Amount ($)a | Value ($) |
| Radio & Television (continued) | | | | | |
| DreamWorks Animation, | | | | | |
| Gtd. Notes | 6.88 | 8/15/20 | 300,000 | c | 319,500 |
| Gray Television, | | | | | |
| Gtd. Notes | 7.50 | 10/1/20 | 500,000 | | 530,000 |
| | | | | | 3,326,000 |
| Telecommunications—2.6% | | | | | |
| Altice, | | | | | |
| Sr. Scd. Notes | 7.75 | 5/15/22 | 1,000,000 | c | 1,065,000 |
| CenturyLink, | | | | | |
| Sr. Unscd. Notes, Ser. V | 5.63 | 4/1/20 | 1,500,000 | | 1,591,875 |
| Digicel Group, | | | | | |
| Sr. Unscd. Notes | 8.25 | 9/30/20 | 1,000,000 | c | 1,085,000 |
| Icahn Enterprises, | | | | | |
| Gtd. Notes | 6.00 | 8/1/20 | 1,000,000 | | 1,072,500 |
| Intelsat, | | | | | |
| Gtd. Bonds | 6.75 | 6/1/18 | 1,350,000 | | 1,420,875 |
| Intelsat Luxembourg, | | | | | |
| Gtd. Bonds | 7.75 | 6/1/21 | 1,000,000 | | 1,058,750 |
| Sprint, | | | | | |
| Gtd. Notes | 7.25 | 9/15/21 | 1,000,000 | c | 1,062,500 |
| Sprint Communications, | | | | | |
| Gtd. Notes | 9.00 | 11/15/18 | 500,000 | c | 595,625 |
| T-Mobile USA, | | | | | |
| Gtd. Notes | 6.46 | 4/28/19 | 1,350,000 | | 1,410,750 |
| T-Mobile USA, | | | | | |
| Gtd. Notes | 6.63 | 4/1/23 | 1,000,000 | | 1,057,500 |
| Wind Acquisition Finance, | | | | | |
| Sr. Scd. Notes | 6.50 | 4/30/20 | 1,000,000 | c | 1,073,750 |
| Wind Acquisition Finance, | | | | | |
| Gtd. Notes | 7.38 | 4/23/21 | 1,450,000 | c | 1,533,375 |
| | | | | | 14,027,500 |
| Utilities—.9% | | | | | |
| Calpine, | | | | | |
| Sr. Unscd. Notes | 5.75 | 1/15/25 | 2,000,000 | | 2,022,500 |
| Calpine, | | | | | |
| Sr. Scd. Notes | 6.00 | 1/15/22 | 1,250,000 | c | 1,353,125 |
| CommScope, | | | | | |
| Gtd. Notes | 5.50 | 6/15/24 | 350,000 | c | 357,875 |
12
| | | | | |
| | Coupon | Maturity | Principal | | |
| Bonds and Notes (continued) | Rate (%) | Date | Amount ($)a | Value ($) |
| Utilities (continued) | | | | | |
| NRG Energy, | | | | | |
| Gtd. Notes | 6.25 | 7/15/22 | 1,000,000 | c | 1,052,500 |
| | | | | | 4,786,000 |
| Total Bonds and Notes | | | | | |
| (cost $66,200,720) | | | | | 66,473,063 |
| |
| Floating Rate Loan Interests—83.1% | | | | |
| Aerospace & Defense—.6% | | | | | |
| Accelya International, | | | | | |
| Facility A1 Term Loan | 5.08 | 2/19/20 | 743,158 | b | 738,513 |
| Accelya Holding World, | | | | | |
| Facility A2 Term Loan | 5.08 | 3/6/20 | 256,842 | b | 255,237 |
| SI Organization, | | | | | |
| First Lien Delayed Draw | | | | | |
| Term Loan | 3.50 | 11/23/19 | 122,498 | b,d | 123,290 |
| SI Organization, | | | | | |
| First Lien Initial Term Loan | 5.75 | 11/23/19 | 926,087 | b | 932,069 |
| Transdigm, | | | | | |
| Tranche C Term Loan | 3.75 | 2/25/20 | 991,197 | b | 986,860 |
| | | | | | 3,035,969 |
| Air Transport—.9% | | | | | |
| Air Canada, | | | | | |
| Term Loan | 5.50 | 9/20/19 | 250,000 | b | 253,854 |
| American Airlines, | | | | | |
| Class B Term Loan | 3.75 | 6/27/19 | 992,481 | b | 988,139 |
| Sabre, | | | | | |
| Term B Loan | 4.00 | 2/19/19 | 2,234,893 | b | 2,228,613 |
| United AirLines, | | | | | |
| Class B Term Loan | 3.50 | 4/1/19 | 496,231 | b | 493,449 |
| US Airways, | | | | | |
| Tranche B-1 Term Loan | 3.50 | 5/23/19 | 742,500 | b | 737,132 |
| | | | | | 4,701,187 |
| Automotive—3.2% | | | | | |
| Affinia Group, | | | | | |
| Tranche B-2 Term Loan | 4.75 | 4/25/20 | 409,146 | b | 411,704 |
| American Tire Distributors, | | | | | |
| Initial Term Loan | 5.75 | 6/19/18 | 2,744,732 | b | 2,755,025 |
The Fund 13
STATEMENT OF INVESTMENTS (continued)
| | | | | |
| Floating Rate | Coupon | Maturity | Principal | | |
| Loan Interests (continued) | Rate (%) | Date | Amount ($)a | Value ($) |
| Automotive (continued) | | | | | |
| Chrysler Group, | | | | | |
| Tranche B Term Loan | 3.25 | 12/5/18 | 1,496,250 | b | 1,485,028 |
| Federal-Mogul, | | | | | |
| Tranche C Term Loan | 4.75 | 4/15/21 | 3,248,029 | b | 3,246,292 |
| FPC Holdings, | | | | | |
| First Lien Initial Term Loan | 5.25 | 11/19/19 | 2,739,909 | b | 2,721,921 |
| FPC Holdings, | | | | | |
| Second Lien Initial Term Loan | 9.25 | 5/19/20 | 1,000,000 | b | 987,505 |
| Gates Global, | | | | | |
| Initial Dollar Term Loan | 4.25 | 6/11/21 | 1,250,000 | b | 1,242,856 |
| KAR Auction Services, | | | | | |
| Tranche B-1 Term Loan | 2.75 | 3/10/17 | 497,252 | b | 496,631 |
| Key Safety Systems, | | | | | |
| 1st Lien Term Loan | 3.75 | 7/23/21 | 1,500,000 | b | 1,506,570 |
| Visteon, | | | | | |
| Initial Term Loan | 3.50 | 4/9/21 | 2,000,000 | b | 1,988,750 |
| | | | | | 16,842,282 |
| Beverages & Tobacco—1.4% | | | | | |
| AdvancePierre Foods, | | | | | |
| First Lien Term Loan | 5.75 | 7/10/17 | 2,216,101 | b | 2,229,265 |
| Aramark, | | | | | |
| US Term E Loan | 3.25 | 9/7/19 | 997,500 | b | 990,019 |
| Aramark, | | | | | |
| US Term F Loan | 3.25 | 2/21/21 | 2,244,375 | b | 2,223,794 |
| DS Waters of America, | | | | | |
| First Lien Term B Loan | 5.25 | 8/30/20 | 992,500 | b | 998,703 |
| Landry’s, | | | | | |
| B Term Loan | 4.00 | 4/24/18 | 950,783 | b | 951,082 |
| | | | | | 7,392,863 |
| Building & Development—1.2% | | | | | |
| Capital Automotive, | | | | | |
| Tranche B-1 Term Loan | 4.00 | 4/10/19 | 730,281 | b | 730,281 |
| Ply Gem Industries, | | | | | |
| Term Loan B | 4.00 | 1/17/21 | 1,496,250 | b | 1,473,806 |
| Quikrete Holdings, | | | | | |
| First Lien Initial Loan | 4.00 | 9/18/20 | 1,491,237 | b | 1,485,332 |
| ServiceMaster Company, | | | | | |
| Initial Term Loan | 4.25 | 6/25/21 | 2,450,000 | b | 2,435,606 |
| | | | | | 6,125,025 |
14
| | | | | |
| Floating Rate | Coupon | Maturity | Principal | | |
| Loan Interests (continued) | Rate (%) | Date | Amount ($)a | Value ($) |
| Business Equipment & Services—3.0% | | | | | |
| BMC Software Finance, | | | | | |
| Initial US Term Loan | 5.00 | 9/10/20 | 1,391,443 | b | 1,389,265 |
| Bureau Van Dijk, | | | | | |
| Term Loan D3 | 4.48 | 11/13/20 | 1,000,000 | b | 1,004,845 |
| GCA Services Group, | | | | | |
| Term Loan | 5.50 | 11/1/19 | 1,376,600 | b | 1,372,587 |
| GXS Group, | | | | | |
| Term Loan | 3.25 | 12/18/20 | 995,000 | b | 992,761 |
| Hyland Software, | | | | | |
| Senior Secured Initial Term Loan | 4.75 | 2/18/22 | 1,097,250 | b | 1,101,710 |
| Kronos, | | | | | |
| Incremental Term Loan | 4.50 | 4/10/19 | 1,042,328 | b | 1,045,210 |
| Magic Newco, | | | | | |
| First Lien USD Term Loan | 5.00 | 12/12/18 | 994,930 | b | 1,000,437 |
| Maxim Crane Works, | | | | | |
| Second Lien Initial Term Loan | 3.75 | 7/17/17 | 496,250 | b | 496,766 |
| Maxim Crane Works, | | | | | |
| Second Lien Initial Term Loan | 10.25 | 11/20/18 | 500,000 | b | 511,875 |
| Mitchell International, | | | | | |
| First Lien Initial Term Loan | 4.50 | 10/1/20 | 1,741,250 | b | 1,742,704 |
| New Breed, | | | | | |
| Term Loan | 6.00 | 9/29/17 | 988,245 | b | 989,480 |
| Presidio, | | | | | |
| Term Loan | 5.00 | 3/31/17 | 966,731 | b | 968,181 |
| SourceHOV, | | | | | |
| First Lien Term B Loan | 5.25 | 4/30/18 | 992,481 | b | 998,481 |
| WASH Multifamily Laundry Systems, | | | | | |
| US Term Loan | 4.50 | 2/21/19 | 1,240,578 | b | 1,239,809 |
| WP CPP Holdings, | | | | | |
| Term B-2 Loan | 4.75 | 12/28/19 | 1,240,554 | b | 1,244,177 |
| | | | | | 16,098,288 |
| Cable & Satellite Television—2.5% | | | | | |
| Cequel Communications, | | | | | |
| Term Loan | 3.50 | 2/14/19 | 1,445,074 | b | 1,439,409 |
| Metro-Goldwyn-Mayer, | | | | | |
| Second Lien Term Loan | 5.13 | 6/26/20 | 1,500,000 | b | 1,508,130 |
| Numericable US, | | | | | |
| Dollar Denominated | | | | | |
| Tranche B-2 Loan | 4.50 | 4/23/20 | 1,391,538 | b | 1,398,719 |
The Fund 15
STATEMENT OF INVESTMENTS (continued)
| | | | | | |
| Floating Rate | | Coupon | Maturity | Principal | | |
| Loan Interests (continued) | | Rate (%) | Date | Amount ($)a | Value ($) |
| Cable & Satellite Television (continued) | | | | | |
| Numericable US, | | | | | | |
| Dollar Denominated | | | | | | |
| Tranche B-1Loan | | 4.50 | 4/23/20 | 1,608,462 | b | 1,616,761 |
| UPC Financing Partnership, | | | | | | |
| Facility AH Term Loan | | 3.25 | 6/30/21 | 500,000 | b | 492,720 |
| Virgin Media Finance, | | | | | | |
| B Facility Term Loan | | 3.50 | 2/15/20 | 1,000,000 | b | 988,080 |
| WideOpenWest Finance, | | | | | | |
| Term B Loan | | 4.75 | 3/28/19 | 1,241,209 | b | 1,246,795 |
| Yankee Cable Acquisition, | | | | | | |
| Term Loan | | 4.50 | 3/1/20 | 2,423,706 | b | 2,430,274 |
| Ziggo, | | | | | | |
| Term Loan B1 | EUR | 3.50 | 1/15/22 | 434,250 | b | 566,107 |
| Ziggo, | | | | | | |
| Term Loan B2 | EUR | 3.50 | 1/15/22 | 279,750 | b,d | 364,694 |
| Ziggo, | | | | | | |
| Delayed Draw Term Loan B3 | EUR | 3.50 | 1/15/22 | 460,500 | b,d | 600,327 |
| Ziggo, | | | | | | |
| Delayed Draw Term Loan B4 | EUR | 3.50 | 1/15/22 | 325,500 | b,d | 424,336 |
| | | | | | | 13,076,352 |
| Chemicals—6.9% | | | | | | |
| American Pacific, | | | | | | |
| Initial Term Loan | | 7.00 | 2/27/19 | 997,500 | b | 1,006,228 |
| Arysta LifeScience, | | | | | | |
| First Lien Initial Term Loan | | 4.50 | 5/29/20 | 994,974 | b | 995,491 |
| AZ Chem US, | | | | | | |
| First Lien Initial Term Loan | | 4.50 | 6/11/21 | 1,250,000 | b | 1,257,200 |
| Cyanco Intermediate, | | | | | | |
| Initial Term Loan | | 5.50 | 5/1/20 | 1,742,462 | b | 1,747,907 |
| Emerald Performance | | | | | | |
| Materials, Second Lien | | | | | | |
| Initial Term Loan | | 6.75 | 7/22/22 | 1,000,000 | b | 1,000,000 |
| Flint Group Holdings, | | | | | | |
| New Term Loan C | | 3.75 | 5/3/21 | 212,791 | b | 212,880 |
| Flint Group Holdings, | | | | | | |
| New Term Loan B | | 3.75 | 5/3/21 | 1,287,209 | b | 1,287,750 |
| Flint Group Holdings, | | | | | | |
| Tranche B5—US Term Loan | | 4.25 | 12/31/14 | 496,688 | b | 501,034 |
| Flint Group Holdings, | | | | | | |
| Tranche C5—US Term Loan | | 4.25 | 12/31/14 | 497,394 | b | 501,747 |
16
| | | | | | |
| Floating Rate | | Coupon | Maturity | Principal | | |
| Loan Interests (continued) | | Rate (%) | Date | Amount ($)a | Value ($) |
| Chemicals (continued) | | | | | | |
| Gemini HDPE, | | | | | | |
| Advance Term Loan | | 4.75 | 8/4/21 | 1,870,000 | b | 1,874,675 |
| Goodpack, | | | | | | |
| First Lien Term Loan | | 3.75 | 8/5/21 | 2,500,000 | b | 2,498,450 |
| Greenfield Specialty Alcohols, | | | | | | |
| Term Loan | | 7.50 | 11/27/18 | 925,000 | b | 929,625 |
| Ineos US Finance, | | | | | | |
| Dollar Term Loan | | 3.75 | 5/4/18 | 1,488,716 | b | 1,481,741 |
| Kronos Worldwide, | | | | | | |
| Initial Term Loan | | 4.75 | 2/12/20 | 1,496,250 | b | 1,502,482 |
| Macdermid, | | | | | | |
| First Lien Tranche B Term Loan | | 4.00 | 6/7/20 | 992,481 | b | 990,417 |
| Minerals Technologies, | | | | | | |
| Initial Term Loan | | 4.00 | 4/14/21 | 1,500,000 | b | 1,502,348 |
| Orion Engineered Carbons, | | | | | | |
| Initial Euro Term Loan | EUR | 4.00 | 7/25/21 | 1,500,000 | b | 1,978,326 |
| Oxea Finance & Cy, | | | | | | |
| Second Lien Term Loan | | 8.25 | 6/6/20 | 500,000 | b | 503,542 |
| Ravago Holdings America, | | | | | | |
| Term Loan | | 5.50 | 12/18/20 | 1,795,500 | b | 1,806,165 |
| Road Infrastructure Investment, | | | | | | |
| First Lien Term Loan | | 4.25 | 3/19/21 | 997,500 | b | 988,981 |
| Road Infrastructure Investment, | | | | | | |
| Second Lien Term Loan | | 7.75 | 9/21/21 | 1,500,000 | b | 1,486,875 |
| Royal Adhesives & Sealants, | | | | | | |
| First Lien Term B Loan | | 5.50 | 7/31/18 | 1,000,000 | b | 1,004,585 |
| Signode Industrial Group, | | | | | | |
| Initial Term B Loan | | 4.00 | 4/8/21 | 711,111 | b | 706,372 |
| Solenis International, | | | | | | |
| Initial Euro Term Loan | EUR | 4.50 | 7/2/21 | 1,500,000 | b | 1,973,399 |
| Solenis International, | | | | | | |
| Second Lien Initial Term Loan | | 7.75 | 7/2/22 | 1,000,000 | b | 995,375 |
| Taminco Global Chemical, | | | | | | |
| Initial Tranche B-3 Dollar | | | | | | |
| Term Loan | | 3.25 | 2/15/19 | 796,681 | b | 791,515 |
| Tronox Pigments, | | | | | | |
| New Term Loan | | 4.00 | 3/19/20 | 2,489,945 | b | 2,490,256 |
| Univar, | | | | | | |
| Term B Loan | | 5.00 | 6/30/17 | 2,487,788 | b | 2,495,313 |
| | | | | | | 36,510,679 |
The Fund 17
STATEMENT OF INVESTMENTS (continued)
| | | | | |
| Floating Rate | Coupon | Maturity | Principal | | |
| Loan Interests (continued) | Rate (%) | Date | Amount ($)a | Value ($) |
| Containers & Glass Products—1.5% | | | | | |
| Anchor Glass Container, | | | | | |
| Term B Loan | 4.25 | 5/14/21 | 1,250,000 | b | 1,249,475 |
| Ardagh Group, | | | | | |
| Delayed Draw Term Loan | 4.00 | 12/17/19 | 997,500 | b | 994,178 |
| Berry Plastics, | | | | | |
| Term D Loan | 3.50 | 2/8/20 | 743,103 | b | 730,924 |
| Libbey Glass, | | | | | |
| Senior Secured Initial Loan | 3.75 | 4/9/21 | 1,000,000 | b | 995,835 |
| Multi Packaging Solutions, | | | | | |
| Initial Dollar Tranche B | | | | | |
| Term Loan | 4.25 | 9/20/19 | 997,500 | b | 996,877 |
| Ranpak, | | | | | |
| Second Lien USD Term Loan | 8.50 | 4/23/20 | 1,000,000 | b | 1,020,000 |
| Reynolds Group Holdings, | | | | | |
| Incremental US Term Loan | 4.00 | 12/1/18 | 1,491,247 | b | 1,490,531 |
| TricorBraun, | | | | | |
| Term Loan | 4.00 | 5/3/18 | 481,540 | b | 481,242 |
| | | | | | 7,959,062 |
| Cosmetics/Toiletries—.4% | | | | | |
| Vogue International, | | | | | |
| First Lien Initial Tranche B | | | | | |
| Term Loan | 5.25 | 2/7/20 | 1,995,000 | b | 2,002,481 |
| Drugs—.3% | | | | | |
| Akorn, | | | | | |
| Term Loan | 4.50 | 11/13/20 | 1,000,000 | b | 1,004,165 |
| Generic Drug Holdings, | | | | | |
| Term B-1 Loan | 5.00 | 10/29/19 | 495,000 | b | 496,237 |
| | | | | | 1,500,402 |
| Electronics & Electrical Equipment—4.7% | | | | |
| Applied Systems, | | | | | |
| First Lien Initial Term Loan | 4.25 | 1/15/21 | 1,243,750 | b | 1,243,595 |
| Applied Systems, | | | | | |
| Second Lien Initial Term Loan | 7.50 | 1/14/22 | 500,000 | b | 505,250 |
| Aricent Technologies, | | | | | |
| First Lien Initial Term Loan | 5.50 | 4/14/21 | 2,000,000 | b | 2,012,500 |
| Aricent Technologies, | | | | | |
| Second Lien Initial Term Loan | 9.50 | 4/14/22 | 325,000 | b | 325,678 |
| Avago Technologies, | | | | | |
| Term Loan | 3.75 | 4/16/21 | 2,000,000 | b | 2,000,460 |
18
| | | | | | |
| Floating Rate | | Coupon | Maturity | Principal | | |
| Loan Interests (continued) | Rate (%) | Date | Amount ($)a | Value ($) |
| Electronics & Electrical | | | | | | |
| Equipment (continued) | | | | | | |
| Blue Coat Systems, | | | | | | |
| Term Loan | | 4.00 | 2/15/18 | 2,083,229 | b | 2,070,219 |
| Connolly, | | | | | | |
| First Lien Initial Term Loan | | 5.00 | 5/12/21 | 450,000 | b | 453,377 |
| Dell International, | | | | | | |
| Term B Loan | | 4.50 | 3/24/20 | 2,484,359 | b | 2,495,079 |
| Deltek, | | | | | | |
| First Lien Term Loan | | 4.50 | 10/10/18 | 2,486,121 | b | 2,485,188 |
| Flexera Software, | | | | | | |
| First Lien Term Loan | | 4.50 | 4/2/20 | 1,000,000 | b | 996,250 |
| Freescale Semiconductor, | | | | | | |
| Tranche B-4 Term Loan | | 4.25 | 3/20/20 | 1,487,506 | b | 1,484,583 |
| MItel Networks, | | | | | | |
| Term Loan B | | 5.25 | 1/31/20 | 856,655 | b | 860,673 |
| Ion Trading Technologies, | | | | | | |
| First Lien Term Loan | EUR | 4.50 | 6/4/21 | 1,500,000 | b | 1,977,272 |
| Monitronics International, | | | | | | |
| Term B Loan | | 4.25 | 3/23/18 | 496,222 | b | 497,385 |
| P2 Lower Acquisition, | | | | | | |
| Term Loan | | 5.50 | 10/16/20 | 1,205,546 | b | 1,209,566 |
| Peak 10, | | | | | | |
| First Lien Term Loan | | 5.00 | 6/10/21 | 2,000,000 | b | 2,012,500 |
| Protection One, | | | | | | |
| Term Loan | | 4.25 | 3/21/19 | 496,202 | b | 496,823 |
| Rocket Software, | | | | | | |
| First Lien Term Loan | | 5.75 | 2/8/18 | 975,397 | b | 978,446 |
| West, | | | | | | |
| Term Loan B10 | | 3.25 | 6/30/18 | 873,312 | b | 865,434 |
| | | | | | | 24,970,278 |
| Environmental & Facilities Services—1.3% | | | | |
| ADS Waste Holdings, | | | | | | |
| Tranche B-2 Term Loan | | 3.75 | 10/9/19 | 1,238,684 | b | 1,222,816 |
| EnergySolutions, | | | | | | |
| Term Advance Loan | | 6.75 | 5/22/20 | 2,000,000 | b | 2,032,510 |
| Environmental Resource Management, | | | | | |
| First Lien Term Loan | | 4.00 | 5/7/21 | 2,000,000 | b | 2,010,000 |
| Environmental Resource Management, | | | | | |
| 2nd Lien Term Loan | | 7.00 | 5/9/22 | 500,000 | b | 500,000 |
The Fund 19
STATEMENT OF INVESTMENTS (continued)
| | | | | |
| Floating Rate | Coupon | Maturity | Principal | | |
| Loan Interests (continued) | Rate (%) | Date | Amount ($)a | Value ($) |
| Environmental & Facilities | | | | | |
| Services (continued) | | | | | |
| W3, | | | | | |
| First Lien Term Loan | 5.75 | 3/1/20 | 994,962 | b | 991,231 |
| | | | | | 6,756,557 |
| Equipment Leasing—.5% | | | | | |
| Delos Finance Sarl, | | | | | |
| Term Loan | 3.50 | 2/26/21 | 700,000 | b | 696,608 |
| Neff Rental, | | | | | |
| Second Lien Term Loan | 7.25 | 5/21/21 | 1,000,000 | b | 1,003,755 |
| North American Lifting Holdings, | | | | | |
| First Lien Term Loan | 5.50 | 11/26/20 | 497,500 | b | 501,542 |
| North American Lifting Holdings, | | | | | |
| Second Lien Initial Loan | 10.00 | 11/26/21 | 300,000 | b | 302,250 |
| | | | | | 2,504,155 |
| Farming/Agriculture—.5% | | | | | |
| Allflex Holdings III, | | | | | |
| First Lien Initial Term Loan | 4.25 | 7/17/20 | 993,744 | b | 994,678 |
| Allflex Holdings III, | | | | | |
| Second Lien Initial Term Loan | 8.00 | 7/19/21 | 1,500,000 | b | 1,507,500 |
| Pinnacle Operating, | | | | | |
| First Lien Term B Loan | 4.75 | 11/15/18 | 248,116 | b | 247,805 |
| | | | | | 2,749,983 |
| Financial Intermediaries—6.7% | | | | | |
| Affinion Group, | | | | | |
| Tranche B Term Loan | 6.75 | 10/9/16 | 257,841 | b | 256,231 |
| Affinion Group, | | | | | |
| Initial Second Lien Term Loan | 8.50 | 10/31/18 | 139,186 | b | 138,316 |
| American Capital, | | | | | |
| New Term Loan | 3.50 | 8/22/17 | 990,000 | b | 988,144 |
| Armor Holding II, | | | | | |
| First Lien Term Loan | 5.75 | 6/26/20 | 488,420 | b | 487,401 |
| AssuredPartners Capital, | | | | | |
| First Lien Initial Term Loan | 4.50 | 4/2/21 | 1,050,000 | b | 1,048,688 |
| Bats Global Markets, | | | | | |
| Term Loan | 5.00 | 1/17/20 | 2,437,500 | b | 2,410,078 |
| Citco III, | | | | | |
| Term Loan | 4.25 | 6/18/29 | 1,763,550 | b | 1,766,857 |
| Clarke American, | | | | | |
| Extended Term B2 Loan | 7.00 | 4/26/18 | 1,000,000 | b | 1,004,165 |
20
| | | | | | |
| Floating Rate | | Coupon | Maturity | Principal | | |
| Loan Interests (continued) | Rate (%) | Date | Amount ($)a | Value ($) |
| Financial Intermediaries (continued) | | | | | |
| First Data, | | | | | | |
| 2018 New Dollar Term Loan | 3.66 | 3/23/18 | 3,500,000 | b | 3,471,563 |
| First Data, | | | | | | |
| 2021 Extended Term Loan | | 4.16 | 3/24/21 | 1,250,000 | b | 1,249,612 |
| HarbourVest Partners, | | | | | | |
| Term Loan | | 3.25 | 2/4/21 | 626,565 | b | 620,691 |
| Harland Clarke, | | | | | | |
| Term Loan B4 | | 6.00 | 8/30/19 | 984,395 | b | 997,684 |
| HUB International, | | | | | | |
| Initial Term Loan | | 4.25 | 9/18/20 | 1,491,262 | b | 1,483,180 |
| Hyperion Finance, | | | | | | |
| Term Loan | | 5.75 | 10/4/19 | 497,500 | b | 499,987 |
| Nuveen Investments, | | | | | | |
| Tranche B First Lien Term Loan | 4.16 | 5/13/17 | 2,250,000 | b | 2,248,796 |
| NVA Holdings, | | | | | | |
| First Lien Term Loan | | 4.75 | 8/6/21 | 3,000,000 | b | 3,015,000 |
| PGA Holdings, | | | | | | |
| First Lien New Term Loan | | 4.25 | 4/20/18 | 1,522,206 | b | 1,520,775 |
| Progressive Solutions, | | | | | | |
| Second Lien Initial Term Loan | 9.50 | 10/18/21 | 600,000 | b | 602,124 |
| Quintiles Transnational, | | | | | | |
| Term B-3 Loan | | 3.75 | 6/8/18 | 1,250,000 | b | 1,242,969 |
| RCS Capital, | | | | | | |
| First Lien Term Loan | | 6.50 | 3/29/19 | 1,100,000 | b | 1,114,663 |
| RCS Capital, | | | | | | |
| Second Lien Term Loan | | 10.50 | 3/31/21 | 750,000 | b | 767,812 |
| SAM Finance, | | | | | | |
| Dollar Term Loan | | 4.25 | 11/26/20 | 995,000 | b | 996,866 |
| Scitor, | | | | | | |
| Term Loan | | 5.00 | 2/15/17 | 1,300,365 | b | 1,295,496 |
| Sedgwick Claims Management | | | | | |
| Services, First Lien Initial | | | | | | |
| Term Loan | | 3.75 | 2/11/21 | 1,496,250 | b | 1,474,592 |
| Sedgwick Claims Management | | | | | |
| Services, Second Lien Initial Loan | 6.75 | 2/11/22 | 1,000,000 | b | 997,500 |
| Ship Luxco 3 Sarl-Ship US Bidco, | | | | | |
| Facility D Term Loan | | 4.50 | 10/11/20 | 496,250 | b | 497,491 |
| Skrill, | | | | | | |
| Term Loan B | EUR | 5.00 | 9/30/20 | 1,000,000 | b | 1,321,821 |
The Fund 21
STATEMENT OF INVESTMENTS (continued)
| | | | | |
| Floating Rate | Coupon | Maturity | Principal | | |
| Loan Interests (continued) | Rate (%) | Date | Amount ($)a | Value ($) |
| Financial Intermediaries (continued) | | | | | |
| Trans Union, | | | | | |
| Replacement Term Loan | 4.00 | 3/19/21 | 1,995,000 | b | 1,990,431 |
| | | | | | 35,508,933 |
| Food & Drug Retail—1.5% | | | | | |
| Albertson’s, | | | | | |
| Term B-3 Loan | 4.00 | 8/9/19 | 2,000,000 | b | 2,003,000 |
| Albertson’s, | | | | | |
| Incremental Term Loan B2 | 4.75 | 3/21/19 | 1,493,756 | b | 1,500,605 |
| CEC Entertainment, | | | | | |
| First Lien Term B Loan | 4.25 | 2/12/21 | 1,995,000 | b | 1,980,037 |
| Rite Aid, | | | | | |
| Tranche 7 Term Loan | 3.50 | 2/21/20 | 1,156,627 | b | 1,152,290 |
| Smart & Final Stores, | | | | | |
| First Lien Term Loan | 4.75 | 11/15/19 | 1,239,323 | b | 1,239,323 |
| | | | | | 7,875,255 |
| Food Products—2.3% | | | | | |
| Bellisio, | | | | | |
| Term Loan | 4.50 | 12/16/17 | 963,371 | b | 954,340 |
| Del Monte Foods, | | | | | |
| First Lien Initial Loan | 4.25 | 1/26/21 | 995,000 | b | 986,189 |
| Del Monte Foods, | | | | | |
| Second Lien Initial Loan | 8.25 | 7/26/21 | 1,000,000 | b | 962,500 |
| Diamond Foods, | | | | | |
| Term Loan | 4.25 | 8/10/18 | 1,492,500 | b | 1,485,978 |
| Hearthside Group Holdings, | | | | | |
| Term Loan | 4.50 | 8/17/21 | 1,220,000 | b | 1,223,819 |
| H.J. Heinz, | | | | | |
| Term B-2 Loan | 3.50 | 6/5/20 | 3,722,437 | b | 3,725,006 |
| Pinnacle Foods Finance, | | | | | |
| Tranche G Term Loan | 3.25 | 4/29/20 | 651,860 | b | 645,204 |
| Windsor Quality Foods, | | | | | |
| Term Loan B | 5.00 | 12/23/20 | 2,476,241 | b | 2,446,835 |
| | | | | | 12,429,871 |
| Food Service—.8% | | | | | |
| Advantage Sales & Marketing, | | | | | |
| Delayed Draw Term Loan | 4.25 | 7/23/21 | 51,613 | b,d | 51,194 |
| Advantage Sales & Marketing, | | | | | |
| First Lien Initial Term Loan | 4.25 | 7/21/21 | 1,548,387 | b | 1,535,830 |
22
| | | | | |
| Floating Rate | Coupon | Maturity | Principal | | |
| Loan Interests (continued) | Rate (%) | Date | Amount ($)a | Value ($) |
| Food Service (continued) | | | | | |
| Advantage Sales & Marketing, | | | | | |
| Second Lien Initial Term Loan | 6.73 | 7/21/22 | 500,000 | b | 502,240 |
| Checkout Holding, | | | | | |
| First Lien Term B Loan | 4.50 | 4/3/21 | 1,500,000 | b | 1,478,910 |
| Checkout Holding, | | | | | |
| Second Lien Initial Loan | 7.75 | 4/1/22 | 750,000 | b | 741,330 |
| | | | | | 4,309,504 |
| Forest Products—.2% | | | | | |
| Osmose Holdings, | | | | | |
| Term Loan | 4.25 | 7/23/21 | 1,250,000 | b | 1,243,750 |
| Health Care—7.7% | | | | | |
| Accellent, | | | | | |
| First Lien Initial Term Loan | 4.50 | 2/19/21 | 1,496,250 | b | 1,482,597 |
| Accellent, | | | | | |
| Second Lien Initial Term Loan | 7.50 | 2/21/22 | 500,000 | b | 490,312 |
| Catalent Pharma Solutions, | | | | | |
| Senior Unsecured Term Loan | 4.50 | 12/31/17 | 291,818 | b | 294,372 |
| Catalent Pharma Solutions, | | | | | |
| Dollar Term Loan | 4.50 | 5/7/21 | 3,000,000 | b | 3,010,635 |
| CHG Healthcare Services, | | | | | |
| First Lien Term Loan | 4.25 | 11/20/20 | 994,295 | b | 994,603 |
| CHS/Community Health Systems, | | | | | |
| 2017 Term E Loan | 3.48 | 1/25/17 | 203,597 | b | 203,753 |
| CHS/Community Health Systems, | | | | | |
| 2021 Term D Loan | 4.25 | 1/27/21 | 2,532,653 | b | 2,542,733 |
| DaVita HealthCare Partners, | | | | | |
| Term B Loan | 3.50 | 6/18/21 | 3,000,000 | b | 2,997,930 |
| Drumm Investors, | | | | | |
| Term Loan | 6.75 | 5/4/18 | 658,303 | b | 662,746 |
| Endo Luxembourg Finance Company, | | | | | |
| Term B Loan | 3.25 | 12/11/20 | 748,125 | b | 745,088 |
| HCA, | | | | | |
| Tranche B-4 Term Loan | 2.98 | 5/1/18 | 746,241 | b | 745,192 |
| Iasis Healthcare, | | | | | |
| Term B-2 Loan | 4.50 | 5/3/20 | 991,197 | b | 994,914 |
| Envision Acquisition | | | | | |
| Company, First Lien Initial | | | | | |
| Term Loan | 5.75 | 9/23/20 | 2,240,600 | b | 2,257,404 |
The Fund 23
STATEMENT OF INVESTMENTS (continued)
| | | | | |
| Floating Rate | Coupon | Maturity | Principal | | |
| Loan Interests (continued) | Rate (%) | Date | Amount ($)a | Value ($) |
| Health Care (continued) | | | | | |
| JLL, | | | | | |
| Initial Dollar Term Loan | 4.25 | 1/22/21 | 1,500,000 | b | 1,491,330 |
| Kindred Healthcare, | | | | | |
| Term Loan | 4.00 | 3/26/21 | 3,993,728 | b | 3,965,013 |
| Kinetic Concepts, | | | | | |
| Dollar Term E-1 Loan | 4.00 | 5/4/18 | 2,234,384 | b | 2,229,200 |
| Mallinckrodt International | | | | | |
| Finance, Initial Term B Loan | 3.50 | 3/5/21 | 997,500 | b | 994,882 |
| MPH Acquisition Holdings, | | | | | |
| Tranche B Term Loan | 4.00 | 3/19/21 | 1,945,455 | b | 1,937,430 |
| Par Pharmaceutical, | | | | | |
| Term B-2 Loan | 4.00 | 9/30/19 | 1,895,636 | b | 1,883,788 |
| PharMEDium Healthcare, | | | | | |
| First Lien Initial Term Loan | 4.25 | 1/22/21 | 1,701,875 | b | 1,680,602 |
| RPI Finance Trust, | | | | | |
| Term B-2 Loan | 3.25 | 5/9/18 | 982,888 | b | 985,139 |
| Onex Carestream Finance, | | | | | |
| First Lien Term Loan | 5.00 | 6/7/19 | 691,098 | b | 693,545 |
| Onex Carestream Finance, | | | | | |
| Second Lien | | | | | |
| Term Loan | 9.50 | 12/5/19 | 486,322 | b | 494,224 |
| Salix Pharmaceuticals, | | | | | |
| Term Loan | 4.25 | 12/17/19 | 2,937,342 | b | 2,946,932 |
| Surgery Center Holdings, | | | | | |
| Term Loan | 4.25 | 7/24/20 | 1,000,000 | b | 1,001,250 |
| Surgical Care Affiliates, | | | | | |
| Class B Term Loan | 4.23 | 12/29/17 | 1,017,427 | b | 1,018,699 |
| Valeant Pharmaceuticals | | | | | |
| International, | | | | | |
| Series E-1 Tranche B | | | | | |
| Term Loan | 3.75 | 6/26/20 | 1,665,884 | b | 1,663,702 |
| VWR Funding, | | | | | |
| Amendment No. 2 Dollar | | | | | |
| Term Loan | 3.41 | 4/3/17 | 472,984 | b | 471,464 |
| | | | | | 40,879,479 |
| Home Furnishing—.9% | | | | | |
| Mattress Holding, | | | | | |
| Term B-2 Loan | 3.66 | 1/18/16 | 2,377,527 | b | 2,376,041 |
| Spin Holdco, | | | | | |
| Initial Term Loan | 4.25 | 11/14/19 | 1,492,503 | b | 1,483,735 |
24
| | | | | |
| Floating Rate | Coupon | Maturity | Principal | | |
| Loan Interests (continued) | Rate (%) | Date | Amount ($)a | Value ($) |
| Home Furnishing (continued) | | | | | |
| Tempur Sealy International, | | | | | |
| Term B Loan | 3.50 | 3/18/20 | 975,209 | b | 971,957 |
| | | | | | 4,831,733 |
| Industrial Equipment—4.2% | | | | | |
| Ameriforge Group, | | | | | |
| First Lien Term Loan | 5.00 | 7/18/19 | 1,242,506 | b | 1,249,495 |
| Ameriforge Group, | | | | | |
| Second Lien Term Loan | 8.75 | 12/21/20 | 1,500,000 | b | 1,531,875 |
| CPI International, | | | | | |
| Term B Loan | 4.25 | 4/1/21 | 1,995,000 | b | 1,991,758 |
| Crosby US Acquisition, | | | | | |
| First Lien Initial Term Loan | 3.75 | 11/6/20 | 1,243,750 | b | 1,240,641 |
| Doncasters US, | | | | | |
| First Lien Term B Loan | 4.50 | 4/9/20 | 1,496,219 | b | 1,497,550 |
| Filtration Group, | | | | | |
| First Lien Initial Term Loan | 4.50 | 11/13/20 | 1,492,500 | b | 1,498,470 |
| Filtration Group, | | | | | |
| Second Lien Initial Term Loan | 8.25 | 11/15/21 | 250,000 | b | 253,000 |
| Hudson Products Holdings, | | | | | |
| Term Loan | 5.00 | 3/17/19 | 648,375 | b | 649,996 |
| Interline Brands, | | | | | |
| First Lien Term Loan | 4.00 | 3/12/21 | 1,496,250 | b | 1,483,629 |
| Lineage Logistics, | | | | | |
| Term Loan | 4.50 | 3/31/21 | 2,244,375 | b | 2,214,211 |
| MX Mercury Beteiligungen, | | | | | |
| Senior Secured Facility B1 | | | | | |
| Term Loan | 4.50 | 8/14/20 | 974,003 | b | 977,855 |
| RGIS Services, | | | | | |
| Tranche C Term Loan | 5.50 | 10/18/17 | 2,486,662 | b | 2,481,229 |
| Silver II US Holdings, | | | | | |
| Refinancing Term Loan | 4.00 | 12/15/19 | 972,901 | b | 970,834 |
| Veyance Technologies, | | | | | |
| Term Loan | 5.25 | 9/8/17 | 1,402,774 | b | 1,403,938 |
| Virtuoso US, | | | | | |
| Initial Term Loan | 4.75 | 1/28/21 | 2,795,000 | b | 2,800,828 |
| | | | | | 22,245,309 |
| Leisure Goods/Activities/Movies—2.6% | | | | | |
| 24 Hour Fitness Worldwide, | | | | | |
| Term Loan | 4.75 | 5/20/21 | 2,000,000 | b | 2,010,000 |
The Fund 25
STATEMENT OF INVESTMENTS (continued)
| | | | | |
| Floating Rate | Coupon | Maturity | Principal | | |
| Loan Interests (continued) | Rate (%) | Date | Amount ($)a | Value ($) |
| Leisure Goods/Activities/ | | | | | |
| Movies (continued) | | | | | |
| Activision Blizzard, | | | | | |
| Term Loan B | 3.25 | 9/18/20 | 1,271,250 | b | 1,273,163 |
| Alpha, | | | | | |
| First Lien Term Loan | 4.75 | 7/30/21 | 2,416,348 | b | 2,410,815 |
| Alpha, | | | | | |
| Second Lien Term Loan | 7.75 | 7/29/22 | 1,000,000 | b | 1,010,830 |
| Centerplate, | | | | | |
| Term Loan A | 4.75 | 11/27/19 | 995,000 | b | 997,801 |
| Deluxe Entertainment Services | | | | | |
| Group, Initial Term Loan | 6.50 | 2/25/20 | 1,929,086 | b | 1,692,773 |
| Intrawest Operations Group, | | | | | |
| Initial Term Loan | 5.50 | 11/26/20 | 497,500 | b | 502,475 |
| Tech Finance, | | | | | |
| US Term Loan | 5.50 | 7/11/20 | 2,462,500 | b | 2,477,213 |
| William Morris Endeavor | | | | | |
| Entertainment, First Lien | | | | | |
| Term Loan | 5.25 | 3/19/21 | 1,465,000 | b | 1,454,474 |
| | | | | | 13,829,544 |
| Lodging & Casinos—3.5% | | | | | |
| American Casino & Entertainment | | | | | |
| Properties, Term Loan | 4.50 | 7/3/19 | 997,481 | b | 1,001,222 |
| Boyd Gaming, | | | | | |
| Term B Loan | 4.00 | 8/14/20 | 483,849 | b | 481,550 |
| CityCenter Holdings, | | | | | |
| Term B Loan | 4.25 | 10/9/20 | 1,591,213 | b | 1,592,407 |
| Fitness International, | | | | | |
| Term B Loan | 5.50 | 6/24/20 | 3,000,000 | b | 2,996,250 |
| Four Seasons Holdings, | | | | | |
| First Lien Term Loan | 3.50 | 6/27/20 | 992,500 | b | 986,297 |
| Hilton Worldwide Finance, | | | | | |
| Initial Term Loan | 3.50 | 9/23/20 | 3,392,526 | b | 3,376,632 |
| La Quinta Intermediate Holdings, | | | | | |
| Initial Term Loan | 4.00 | 2/19/21 | 1,298,571 | b | 1,299,110 |
| Las Vegas Sands, | | | | | |
| Term B Loan | 3.25 | 12/17/20 | 1,492,500 | b | 1,490,866 |
| MotorCity, | | | | | |
| Term Loan | 3.50 | 7/30/21 | 1,500,000 | b | 1,499,535 |
26
| | | | | |
| Floating Rate | Coupon | Maturity | Principal | | |
| Loan Interests (continued) | Rate (%) | Date | Amount ($)a | Value ($) |
| Lodging & Casinos (continued) | | | | | |
| Orbitz Worldwide, | | | | | |
| Tranche C Term Loan | 4.50 | 4/9/21 | 2,491,231 | b | 2,496,687 |
| Pinnacle Entertainment, | | | | | |
| Tranche B-2 Term Loan | 3.75 | 8/13/20 | 1,186,260 | b | 1,183,508 |
| | | | | | 18,404,064 |
| Metals & Mining—1.9% | | | | | |
| Bway Holding, | | | | | |
| Initial Term Loan | 5.50 | 8/7/20 | 3,000,000 | b | 3,021,255 |
| Fortescue Metals Group, | | | | | |
| Term B Loan | 3.75 | 6/30/19 | 3,226,866 | b | 3,219,202 |
| Novelis, | | | | | |
| Term Loan | 3.75 | 3/10/17 | 991,666 | b | 990,675 |
| Oxbow Carbon, | | | | | |
| First Lien Tranche B Term Loan | 4.25 | 7/18/19 | 718,513 | b | 721,433 |
| Oxbow Carbon, | | | | | |
| Second Lien Initial Term Loan | 8.00 | 1/18/20 | 250,000 | b | 254,792 |
| TMS International, | | | | | |
| Term B Loan | 4.50 | 10/2/20 | 1,840,675 | b | 1,842,681 |
| | | | | | 10,050,038 |
| Oil & Gas—2.6% | | | | | |
| Alfred Fueling Systems, | | | | | |
| First Lien Initial Term Loan | 4.75 | 6/18/21 | 1,750,000 | b | 1,750,000 |
| Brand Energy & Infrastructure | | | | | |
| Services, Initial Term Loan | 4.75 | 11/20/20 | 1,492,500 | b | 1,494,604 |
| Cactus Wellhead, | | | | | |
| Tranche B Term Loan | 7.00 | 7/30/20 | 2,000,000 | b | 1,980,000 |
| Expro Holdings UK 3, | | | | | |
| Term Loan | 4.75 | 8/12/21 | 2,000,000 | b | 2,008,340 |
| FR Dixie Acquisition, | | | | | |
| Initial Term Loan | 5.75 | 1/22/21 | 2,343,250 | b | 2,350,936 |
| Offshore Group Investment, | | | | | |
| Term Loan | 5.00 | 10/25/17 | 832,632 | b | 832,240 |
| Offshore Group Investment, | | | | | |
| Second Term Loan | 5.75 | 3/28/19 | 2,396,212 | b | 2,390,725 |
| Templar Energy, | | | | | |
| Second Lien Term Loan | 8.00 | 11/25/20 | 2,500,000 | b | 2,462,500 |
| | | | | | 13,519,345 |
The Fund 27
STATEMENT OF INVESTMENTS (continued)
| | | | | | |
| Floating Rate | | Coupon | Maturity | Principal | | |
| Loan Interests (continued) | Rate (%) | Date | Amount ($)a | Value ($) |
| Printing & Publishing—2.1% | | | | | | |
| BarBri, | | | | | | |
| Initial Term Loan | | 4.50 | 6/19/17 | 1,196,875 | b | 1,196,875 |
| Getty Images, | | | | | | |
| Initial Term Loan | | 4.75 | 10/18/19 | 496,222 | b | 470,542 |
| Information Resources, | | | | | | |
| Term Loan | | 4.75 | 9/26/20 | 992,500 | b | 994,674 |
| Interactive Data, | | | | | | |
| Term Loan | | 4.75 | 4/23/21 | 1,250,000 | b | 1,255,731 |
| Laureate Education, | | | | | | |
| Ser. 2018, Extended Term Loan | 5.00 | 6/16/18 | 1,487,299 | b | 1,448,726 |
| Pre-Paid Legal Services, | | | | | | |
| First Lien Term Loan | | 6.25 | 7/1/19 | 974,269 | b | 984,319 |
| Penton Media, | | | | | | |
| First Lien Term B Loan | | 5.50 | 10/1/19 | 745,619 | b | 751,681 |
| Redtop Acquisitions, | | | | | | |
| First Lien Euro Term Loan | EUR | 4.75 | 12/22/20 | 1,000,000 | b | 1,322,721 |
| Redtop Acquisitions, | | | | | | |
| Second Lien Term Loan | | 8.25 | 7/22/21 | 248,750 | b | 254,969 |
| SESAC Holdco II, | | | | | | |
| First Lien Term Loan | | 5.00 | 2/7/19 | 1,996,902 | b | 1,996,902 |
| SNL Financial, | | | | | | |
| Term Loan B | | 4.50 | 10/23/18 | 483,252 | b | 485,217 |
| | | | | | | 11,162,357 |
| Professional & Business Services—.6% | | | | | |
| Vantiv, | | | | | | |
| Term B Loan | | 3.75 | 6/11/21 | 1,800,000 | b | 1,803,375 |
| WP Mustang Holdings, | | | | | | |
| First Lien Term Loan | | 5.50 | 5/28/21 | 1,550,000 | b | 1,567,445 |
| | | | | | | 3,370,820 |
| Radio & Television—2.1% | | | | | | |
| AVSC Holding, | | | | | | |
| First Lien Initial Term Loan | | 4.50 | 1/22/21 | 1,995,000 | b | 1,996,995 |
| Clear Channel Communications, | | | | | |
| Tranche B Term Loan | | 3.81 | 1/30/16 | 538,526 | b | 536,130 |
| Clear Channel Communications, | | | | | |
| Tranche D Term Loan | | 6.91 | 1/30/19 | 750,000 | b | 740,779 |
| Clear Channel Communications, | | | | | |
| Tranche E Term Loan | | 7.66 | 1/30/19 | 711,474 | b | 710,965 |
28
| | | | | | |
| Floating Rate | | Coupon | Maturity | Principal | | |
| Loan Interests (continued) | Rate (%) | Date | Amount ($)a | Value ($) |
| Radio & Television (continued) | | | | | |
| Cumulus Media Holdings, | | | | | | |
| Term Loan | | 4.25 | 12/18/20 | 1,476,944 | b | 1,475,556 |
| Ion Media Networks, | | | | | | |
| Term Loan | | 5.00 | 12/17/20 | 1,741,250 | b | 1,751,045 |
| MTL Publishing, | | | | | | |
| Term B-1 Loan | | 3.75 | 6/29/18 | 712,733 | b | 708,948 |
| Tribune, | | | | | | |
| Term Loan B | | 4.00 | 11/20/20 | 1,844,227 | b | 1,844,919 |
| Tyrol Acquisition 2, | | | | | | |
| Extended Facility A-2 | | | | | | |
| Term Loan | EUR | 3.26 | 1/29/16 | 1,000,000 | b | 1,274,702 |
| | | | | | | 11,040,039 |
| Retailers—3.5% | | | | | | |
| 99 Cents Only Stores, | | | | | | |
| Tranche B-2 Loan | | 4.50 | 1/11/19 | 744,375 | b | 744,907 |
| CWGS Group, | | | | | | |
| Term Loan | | 5.75 | 2/20/20 | 2,221,875 | b | 2,241,316 |
| General Nutrition | | | | | | |
| Centers, Tranche B | | | | | | |
| Term Loan | | 3.25 | 3/2/18 | 998,088 | b | 988,421 |
| Hudson’s Bay, | | | | | | |
| First Lien Initial Term Loan | | 4.75 | 10/7/20 | 2,543,750 | b | 2,568,132 |
| J Crew Group, | | | | | | |
| Initial Loan | | 4.00 | 3/5/21 | 748,125 | b | 735,343 |
| Michaels Stores, | | | | | | |
| Term B Loan | | 3.75 | 1/28/20 | 989,975 | b | 980,956 |
| Neiman Marcus Group, | | | | | | |
| Term Loan | | 4.25 | 10/25/20 | 2,236,266 | b | 2,222,937 |
| Nine West Holdings, | | | | | | |
| Initial Loan | | 4.75 | 9/5/19 | 2,885,000 | b | 2,895,819 |
| Nine West Holdings, | | | | | | |
| Initial Loan | | 6.25 | 1/8/20 | 500,000 | b | 499,375 |
| Nord Anglia Education Finance, | | | | | |
| Initial Term Loan | | 4.50 | 3/19/21 | 448,875 | b | 448,597 |
| Olli’s Bragain | | | | | | |
| Term Loan B | | 4.75 | 9/28/19 | 706,351 | b | 707,233 |
| Serta Simmons Holdings, | | | | | | |
| Term Loan | | 4.25 | 10/1/19 | 1,976,926 | b | 1,979,081 |
The Fund 29
STATEMENT OF INVESTMENTS (continued)
| | | | | | |
| Floating Rate | | Coupon | Maturity | Principal | | |
| Loan Interests (continued) | Rate (%) | Date | Amount ($)a | Value ($) |
| Retailers (continued) | | | | | | |
| TGI Fridays, | | | | | | |
| First Lien Initial Term Loan | | 5.25 | 6/24/20 | 1,750,000 | b | 1,754,375 |
| | | | | | | 18,766,492 |
| Surface Transport—2.1% | | | | | | |
| Hertz, | | | | | | |
| Tranche B-2 Term Loan | | 3.00 | 3/11/18 | 746,222 | b | 734,428 |
| Omnitracs, | | | | | | |
| First Lien Term Loan | | 4.75 | 10/29/20 | 1,991,247 | b | 1,995,399 |
| OSG Bulk Ships, | | | | | | |
| First Lien Term Loan | | 5.25 | 7/22/19 | 2,500,000 | b | 2,517,975 |
| Scandlines, | | | | | | |
| Facility B Term Loan | EUR | 4.50 | 11/4/20 | 1,000,000 | b | 1,325,323 |
| Stena International, | | | | | | |
| Term Loan | | 4.00 | 2/24/21 | 1,496,250 | b | 1,493,445 |
| Travelport, | | | | | | |
| Term B Loan | | 5.00 | 8/13/21 | 2,500,000 | b | 2,517,188 |
| Travelport, | | | | | | |
| First Lien Term Loan | | 6.25 | 6/26/19 | 780,485 | b | 794,144 |
| | | | | | | 11,377,902 |
| Telecommunications—5.6% | | | | | | |
| Asurion, | | | | | | |
| Incremental Tranche B-2 | | | | | | |
| Term Loan | | 4.25 | 7/8/20 | 997,481 | b | 996,389 |
| Asurion, | | | | | | |
| Incremental Tranche B-1 | | | | | | |
| Term Loan | | 5.00 | 5/24/19 | 2,710,154 | b | 2,722,864 |
| Asurion, | | | | | | |
| Second Lien Term Loan | | 8.50 | 2/19/21 | 500,000 | b | 517,625 |
| Avaya, | | | | | | |
| Extended Term B-3 Loan | | 4.66 | 10/26/17 | 1,497,073 | b | 1,455,589 |
| Avaya, | | | | | | |
| Term B-6 Loan | | 6.50 | 3/31/18 | 720,769 | b | 724,283 |
| Birch Communications, | | | | | | |
| Term Loan | | 7.75 | 7/17/20 | 1,500,000 | b | 1,470,000 |
30
| | | | | |
| Floating Rate | Coupon | Maturity | Principal | | |
| Loan Interests (continued) | Rate (%) | Date | Amount ($)a | Value ($) |
| Telecommunications (continued) | | | | | |
| Consolidated Communications, | | | | | |
| Initial Term Loan | 4.25 | 12/18/20 | 1,243,750 | b | 1,247,836 |
| Crown Castle Operating Company, | | | | | |
| Extended Incremental Tranche | | | | | |
| B-2 Term Loan | 3.00 | 1/29/21 | 1,741,250 | b | 1,734,537 |
| EZE Software Group, | | | | | |
| First Lien Term B-1 Loan | 4.00 | 4/4/20 | 1,241,255 | b | 1,233,497 |
| Intelsat Jackson Holdings, | | | | | |
| Tranche B-2 Term Loan | 3.75 | 6/30/19 | 1,733,086 | b | 1,727,306 |
| IPC Systems, | | | | | |
| First Lien Term Loan | 6.00 | 11/2/20 | 2,250,000 | b | 2,268,293 |
| Level 3 Financing, | | | | | |
| Tranche B 2020 Term Loan | 4.00 | 1/15/20 | 1,250,000 | b | 1,246,487 |
| Nextgen Finance, | | | | | |
| Term B Loan | 5.00 | 5/28/21 | 2,700,000 | b | 2,681,437 |
| SBA Senior Finance II, | | | | | |
| Incremental Tranche B-1 | | | | | |
| Term Loan | 3.25 | 3/24/21 | 2,750,000 | b | 2,728,096 |
| Syniverse Holdings, | | | | | |
| Tranche B Term Loan | 4.00 | 4/23/19 | 500,000 | b | 496,485 |
| Transaction Network Services, | | | | | |
| First Lien Initial Term Loan | 5.00 | 2/15/20 | 482,219 | b | 483,424 |
| Transaction Network Services, | | | | | |
| Second Lien Initial Term Loan | 9.00 | 8/14/20 | 2,000,000 | b | 1,995,000 |
| Windstream, | | | | | |
| Tranche B-5 Term Loan | 3.50 | 8/26/19 | 995,000 | b | 998,005 |
| Windstream, | | | | | |
| Tranche B-4 Term Loan | 3.50 | 1/23/20 | 1,241,184 | b | 1,238,472 |
| Zayo Group, | | | | | |
| Term Loan | 4.00 | 7/2/19 | 1,737,981 | b | 1,734,479 |
| | | | | | 29,700,104 |
| Textiles & Apparel—.1% | | | | | |
| ABG Intermediate Holdings 2, | | | | | |
| First Lien Term Loan | 5.50 | 5/27/21 | 498,750 | b | 499,373 |
The Fund 31
STATEMENT OF INVESTMENTS (continued)
| | | | | |
| Floating Rate | Coupon | Maturity | Principal | | |
| Loan Interests (continued) | Rate (%) | Date | Amount ($)a | Value ($) |
| Utilities—3.2% | | | | | |
| Brock Holdings III, | | | | | |
| First Lien Tranche B | | | | | |
| Term Loan | 6.00 | 3/16/17 | 1,495,906 | b | 1,498,951 |
| Brock Holdings III, | | | | | |
| Second Lien Initial Loan | 10.00 | 3/16/18 | 1,333,333 | b | 1,320,000 |
| Calpine, | | | | | |
| Term Loan | 4.00 | 10/30/20 | 995,000 | b | 993,756 |
| Commscope, | | | | | |
| Tranche B-4 Term Loan | 3.25 | 1/14/18 | 2,846,562 | b | 2,846,576 |
| EFS Cogen Holdings, | | | | | |
| Term B Advance Loan | 3.75 | 12/17/20 | 1,148,278 | b | 1,148,278 |
| EquiPower Resources Holdings, | | | | | |
| First Lien Term B Advance Loan | 4.25 | 11/21/19 | 1,625,000 | b | 1,626,219 |
| EquiPower Resources Holdings, | | | | | |
| First Lien Term C Advance Loan | 4.25 | 12/31/19 | 1,488,727 | b | 1,489,844 |
| GIM Channelview Cogeneration, | | | | | |
| Term Loan | 4.25 | 5/8/20 | 636,449 | b | 638,438 |
| Murray Energy, | | | | | |
| Term Loan | 5.25 | 11/21/19 | 1,995,000 | b | 2,012,446 |
| Sandy Creek Energy Associates, | | | | | |
| Term Loan | 5.00 | 11/6/20 | 1,954,878 | b | 1,969,540 |
| TPF Generation Holdings, | | | | | |
| Term Loan | 4.75 | 11/9/17 | 1,237,500 | b | 1,203,469 |
| | | | | | 16,747,517 |
| Total Floating Rate Loan Interests | | | | | |
| (cost $442,595,847) | | | | | 441,766,992 |
32
| | | | |
| Other Investment—6.7% | Shares | | Value ($) | |
| Registered Investment Company; | | | | |
| Dreyfus Institutional Preferred | | | | |
| Plus Money Market Fund | | | | |
| (cost $35,593,025) | 35,593,025 | e | 35,593,025 | |
| Total Investments (cost $544,389,592) | 102.3 | % | 543,833,080 | |
| Liabilities, Less Cash and Receivables | (2.3 | %) | (12,084,292 | ) |
| Net Assets | 100.0 | % | 531,748,788 | |
|
| a Principal amount stated in U.S. Dollars unless otherwise noted. |
| EUR—Euro |
| GBP—British Pound |
| b Variable rate security—interest rate subject to periodic change. |
| c Securities exempt from registration pursuant to Rule 144A under the Securities Act of 1933.These securities may be |
| resold in transactions exempt from registration, normally to qualified institutional buyers.At August 31, 2014, these |
| securities were valued at $42,479,382 or 8.0% of net assets. |
| d Investment, or portion of investment, represents an unfunded floating rate loan interest outstanding. |
| e Investment in affiliated money market mutual fund. |
| | | |
| Portfolio Summary (Unaudited)† | | |
| |
| | Value (%) | | Value (%) |
| Bank Loans | 83.1 | Asset-Backed | 3.5 |
| Corporate Bonds | 9.0 | | |
| Money Market Investment | 6.7 | | 102.3 |
| |
| † Based on net assets. | | | |
| See notes to financial statements. | | | |
The Fund 33
|
| STATEMENT OF ASSETS AND LIABILITIES |
| August 31, 2014 |
| | | | | |
| | | | Cost | Value | |
| Assets ($): | | | | | |
| Investments in securities—See Statement of Investments: | | | |
| Unaffiliated issuers | | | 508,796,567 | 508,240,055 | |
| Affiliated issuers | | | 35,593,025 | 35,593,025 | |
| Cash | | | | 2,780,977 | |
| Cash denominated in foreign currencies | | | 424,119 | 418,034 | |
| Receivable for investment securities sold | | | 19,321,644 | |
| Interest and dividends receivable | | | | 3,308,097 | |
| Receivable for shares of Capital Stock subscribed | | | 662,770 | |
| Unrealized appreciation on forward foreign | | | | |
| currency exchange contracts—Note 4 | | | | 48,815 | |
| Prepaid expenses | | | | 49,481 | |
| | | | | 570,422,898 | |
| Liabilities ($): | | | | | |
| Due to The Dreyfus Corporation and affiliates—Note 3(c) | | | 311,841 | |
| Payable for investment securities purchased | | | 36,710,038 | |
| Payable for unfunded floating rate interest loans | | | 1,268,703 | |
| Payable for shares of Capital Stock redeemed | | | 190,643 | |
| Unrealized depreciation on forward foreign | | | | |
| currency exchange contracts—Note 4 | | | | 3,029 | |
| Accrued expenses | | | | 189,856 | |
| | | | | 38,674,110 | |
| Net Assets ($) | | | | 531,748,788 | |
| Composition of Net Assets ($): | | | | | |
| Paid-in capital | | | | 530,503,607 | |
| Accumulated undistributed investment income—net | | | 1,773,855 | |
| Accumulated net realized gain (loss) on investments | | | (133,897 | ) |
| Accumulated net unrealized appreciation (depreciation) | | | | |
| on investments and foreign currency transactions | | | (394,777 | ) |
| Net Assets ($) | | | | 531,748,788 | |
| |
| |
| Net Asset Value Per Share | | | | | |
| | Class A | Class C | Class I | Class Y | |
| Net Assets ($) | 4,402,117 | 474,527 | 6,875,675 | 519,996,469 | |
| Shares Outstanding | 348,371 | 37,581 | 544,665 | 41,186,248 | |
| Net Asset Value Per Share ($) | 12.64 | 12.63 | 12.62 | 12.63 | |
| See notes to financial statements. | | | | | |
34
|
| STATEMENT OF OPERATIONS |
| From September 27, 2013 (commencement of operations) to August 31, 2014 |
| | |
| Investment Income ($): | | |
| Income: | | |
| Interest | 13,852,418 | |
| Dividends; | | |
| Affiliated issuers | 44,753 | |
| Total Income | 13,897,171 | |
| Expenses: | | |
| Management fee—Note 3(a) | 2,152,510 | |
| Prospectus, proxy and shareholders’ reports | 151,945 | |
| Registration fees | 134,731 | |
| Professional fees | 92,575 | |
| Shareholder servicing costs—Note 3(c) | 44,934 | |
| Custodian fees—Note 3(c) | 34,087 | |
| Directors’ fees and expenses—Note 3(d) | 29,012 | |
| Loan commitment fees—Note 2 | 2,777 | |
| Distribution fees—Note 3(b) | 2,404 | |
| Miscellaneous | 217,287 | |
| Total Expenses | 2,862,262 | |
| Less—reduction in expenses due to undertaking—Note 3(a) | (194,025 | ) |
| Less—reduction in fees due to earnings credits—Note 3(c) | (7 | ) |
| Net Expenses | 2,668,230 | |
| Investment Income—Net | 11,228,941 | |
| Realized and Unrealized Gain (Loss) on Investments—Note 4 ($): | | |
| Net realized gain (loss) on investments and foreign currency transactions | (242,867 | ) |
| Net realized gain (loss) on forward foreign currency exchange contracts | 611,705 | |
| Net Realized Gain (Loss) | 368,838 | |
| Net unrealized appreciation (depreciation) on | | |
| investments and foreign currency transactions | (440,563 | ) |
| Net unrealized appreciation (depreciation) on | | |
| forward foreign currency contracts | 45,786 | |
| Net Unrealized Appreciation (Depreciation) | (394,777 | ) |
| Net Realized and Unrealized Gain (Loss) on Investments | (25,939 | ) |
| Net Increase in Net Assets Resulting from Operations | 11,203,002 | |
| See notes to financial statements. | | |
The Fund 35
|
| STATEMENT OF CHANGES IN NET ASSETS |
| From September 27, 2013 (commencement of operations) to August 31,2014 |
| | |
| Operations ($): | | |
| Investment income—net | 11,228,941 | |
| Net realized gain (loss) on investments | 368,838 | |
| Net unrealized appreciation | | |
| (depreciation) on investments | (394,777 | ) |
| Net Increase (Decrease) in Net Assets | | |
| Resulting from Operations | 11,203,002 | |
| Dividends to Shareholders from ($): | | |
| Investment income—net: | | |
| Class A | (414,039 | ) |
| Class C | (6,367 | ) |
| Class I | (6,794,894 | ) |
| Class Y | (2,755,568 | ) |
| Total Dividends | (9,970,868 | ) |
| Capital Stock Transactions ($): | | |
| Net proceeds from shares sold: | | |
| Class A | 21,761,718 | |
| Class C | 578,984 | |
| Class I | 479,022,149 | |
| Class Y | 559,614,183 | |
| Dividends reinvested: | | |
| Class A | 69,967 | |
| Class C | 4,429 | |
| Class I | 1,649,707 | |
| Class Y | 1,442,596 | |
| Cost of shares redeemed: | | |
| Class A | (17,582,118 | ) |
| Class C | (110,592 | ) |
| Class I | (475,368,914 | ) |
| Class Y | (40,565,455 | ) |
| Increase (Decrease) in Net Assets | | |
| from Capital Stock Transactions | 530,516,654 | |
| Total Increase (Decrease) in Net Assets | 531,748,788 | |
| Net Assets ($): | | |
| Beginning of Period | — | |
| End of Period | 531,748,788 | |
| Undistributed investment income—net | 1,773,855 | |
36
| | |
| Capital Share Transactions: | | |
| Class A | | |
| Shares sold | 1,737,952 | |
| Shares issued for dividends reinvested | 5,546 | |
| Shares redeemed | (1,395,127 | ) |
| Net Increase (Decrease) in Shares Outstanding | 348,371 | |
| Class C | | |
| Shares sold | 45,974 | |
| Shares issued for dividends reinvested | 351 | |
| Shares redeemed | (8,744 | ) |
| Net Increase (Decrease) in Shares Outstanding | 37,581 | |
| Class Ia | | |
| Shares sold | 37,998,192 | |
| Shares issued for dividends reinvested | 130,741 | |
| Shares redeemed | (37,584,268 | ) |
| Net Increase (Decrease) in Shares Outstanding | 544,665 | |
| Class Ya | | |
| Shares sold | 44,288,645 | |
| Shares issued for dividends reinvested | 114,537 | |
| Shares redeemed | (3,216,934 | ) |
| Net Increase (Decrease) in Shares Outstanding | 41,186,248 | |
|
| a During the period ended August 31, 2014, 33,340,363 Class I shares representing $421,755,588 were |
| exchnaged for 33,340,363 Class Y shares |
See notes to financial statements.
FINANCIAL HIGHLIGHTS
The following table describes the performance for each share class for the period from September 27, 2013 (commencement of operations) to August 31, 2014.All information (except portfolio turnover rate) reflects financial results for a single fund share. Total return shows how much your investment in the fund would have increased (or decreased) during each period, assuming you had reinvested all dividends and distributions.These figures have been derived from the fund’s financial statements.
| | | | | | | | |
| | Class A | | Class C | | Class I | | Class Y | |
| | Shares | | Shares | | Shares | | Shares | |
| Per Share Data ($): | | | | | | | | |
| Net asset value, beginning of period | 12.50 | | 12.50 | | 12.50 | | 12.50 | |
| Investment Operations: | | | | | | | | |
| Investment income—neta | .38 | | .28 | | .43 | | .36 | |
| Net realized and unrealized | | | | | | | | |
| gain (loss) on investments | .05 | | .06 | | .01 | | .09 | |
| Total from Investment Operations | .43 | | .34 | | .44 | | .45 | |
| Distributions: | | | | | | | | |
| Dividends from investment income—net | (.29 | ) | (.21 | ) | (.32 | ) | (.32 | ) |
| Net asset value, end of period | 12.64 | | 12.63 | | 12.62 | | 12.63 | |
| Total Return (%)b | 3.39 | c | 2.73 | c | 3.59 | | 3.59 | |
| Ratios/Supplemental Data (%): | | | | | | | | |
| Ratio of total expenses | | | | | | | | |
| to average net assetsd | 1.13 | | 1.98 | | .85 | | .86 | |
| Ratio of net expenses | | | | | | | | |
| to average net assetsd | 1.03 | | 1.80 | | .79 | | .79 | |
| Ratio of net investment income | | | | | | | | |
| to average net assetsd | 3.17 | | 2.40 | | 3.40 | | 3.41 | |
| Portfolio Turnover Rateb | 51.30 | | 51.30 | | 51.30 | | 51.30 | |
| Net Assets, end of period ($ x 1,000) | 4,402 | | 475 | | 6,876 | | 519,996 | |
| |
| a | Based on average shares outstanding. |
| b | Not annualized. |
| c | Exclusive of sales charge. |
| d | Annualized. |
See notes to financial statements.
38
NOTES TO FINANCIAL STATEMENTS
NOTE 1—Significant Accounting Policies:
Dreyfus Floating Rate Income Fund (the “fund”) is a separate non-diversified series of The Dreyfus/Laurel Funds, Inc. (the “Company”), which is registered under the Investment Company Act of 1940, as amended (the “Act”), as an open-end management investment company and operates as a series company currently offering eleven series, including the fund, which commenced operations on September 27, 2013.The fund’s investment objective is to seek high current income. The Dreyfus Corporation (the “Manager” or “Dreyfus”), a wholly-owned subsidiary of The Bank of New York Mellon Corporation (“BNY Mellon”), serves as the fund’s investment adviser. Alcentra NY, LLC (“Alcentra”), a subsidiary of BNY Mellon and an affiliate of Dreyfus, serves as the fund’s sub-investment adviser.
MBSC Securities Corporation (the “Distributor”), a wholly-owned subsidiary of Dreyfus, is the distributor of the fund’s shares. The fund is authorized to issue 100 million shares of $.001 par value Capital Stock in each of the following classes of shares: Class A, Class C, Class I and Class Y. Class A and Class C shares are sold primarily to retail investors through financial intermediaries and bear Distribution and/or Shareholder Services Plan fees. Class A shares generally are subject to a sales charge imposed at the time of purchase. Class C shares are subject to a contingent deferred sales charge (“CDSC”) imposed on Class C shares redeemed within one year of purchase. Class I shares are sold primarily to bank trust departments and other financial service providers (including The Bank of New York Mellon, a subsidiary of BNY Mellon and an affiliate of Dreyfus, and its affiliates), acting on behalf of customers having a qualified trust or investment account or relationship at such institution, and bear no Distribution or Shareholder Services Plan fees. Class Y shares are sold at net asset value per share generally to institutional investors, and bear no Distribution or Shareholder Services Plan fees. Class I and Class Y shares are offered without a front-end sales charge or CDSC. Other
NOTES TO FINANCIAL STATEMENTS (continued)
differences between the classes include the services offered to and the expenses borne by each class, the allocation of certain transfer agency costs, and certain voting rights. Income, expenses (other than expenses attributable to a specific class), and realized and unrealized gains or losses on investments are allocated to each class of shares based on its relative net assets.
As of August 31, 2014, MBC Investments Corp., an indirect subsidiary of BNY Mellon, held 8,000 Class C shares of the fund.
The Company accounts separately for the assets, liabilities and operations of each series. Expenses directly attributable to each series are charged to that series’ operations; expenses which are applicable to all series are allocated among them on a pro rata basis.
The Financial Accounting Standards Board (“FASB”) Accounting Standards Codification is the exclusive reference of authoritative U.S. generally accepted accounting principles (“GAAP”) recognized by the FASB to be applied by nongovernmental entities. Rules and interpretive releases of the Securities and Exchange Commission (“SEC”) under authority of federal laws are also sources of authoritative GAAP for SEC registrants. The fund’s financial statements are prepared in accordance with GAAP, which may require the use of management estimates and assumptions. Actual results could differ from those estimates.
(a) Portfolio valuation: The fair value of a financial instrument is the amount that would be received to sell an asset or paid to transfer a liability in an orderly transaction between market participants at the measurement date (i.e., the exit price). GAAP establishes a fair value hierarchy that prioritizes the inputs of valuation techniques used to measure fair value. This hierarchy gives the highest priority to unadjusted quoted prices in active markets for identical assets or liabilities (Level 1 measurements) and the lowest priority to unobservable inputs (Level 3 measurements).
40
Additionally, GAAP provides guidance on determining whether the volume and activity in a market has decreased significantly and whether such a decrease in activity results in transactions that are not orderly. GAAP requires enhanced disclosures around valuation inputs and techniques used during annual and interim periods.
Various inputs are used in determining the value of the fund’s investments relating to fair value measurements.These inputs are summarized in the three broad levels listed below:
Level 1—unadjusted quoted prices in active markets for identical investments.
Level 2—other significant observable inputs (including quoted prices for similar investments, interest rates, prepayment speeds, credit risk, etc.).
Level 3—significant unobservable inputs (including the fund’s own assumptions in determining the fair value of investments).
The inputs or methodology used for valuing securities are not necessarily an indication of the risk associated with investing in those securities.
Changes in valuation techniques may result in transfers in or out of an assigned level within the disclosure hierarchy. Valuation techniques used to value the fund’s investments are as follows:
Registered investment companies that are not traded on an exchange are valued at their net asset value and are generally categorized within Level 1 of the fair value hierarchy.
Investments in debt securities, floating rate loan interests and other securities, excluding short-term investments (other than U.S.Treasury Bills) and forward foreign currency exchange contracts (“forward contracts”) are valued each business day by an independent pricing service (the “Service”) approved by the Company’s Board of Directors (the
The Fund 41
NOTES TO FINANCIAL STATEMENTS (continued)
“Board”). Investments for which quoted bid prices are readily available and are representative of the bid side of the market in the judgment of the Service are valued at the mean between the quoted bid prices (as obtained by the Service from dealers in such securities) and asked prices (as calculated by the Service based upon its evaluation of the market for such securities). Other investments (which constitute a majority of the portfolio securities) are valued as determined by the Service, based on methods which include consideration of the following: yields or prices of securities of comparable quality, coupon, maturity and type; indications as to values from dealers; and general market conditions. These securities are generally categorized within Level 2 of the fair value hierarchy.
The Service’s procedures are reviewed by Dreyfus under the general supervision of the Board.
When market quotations or official closing prices are not readily available, or are determined not to reflect accurately fair value, such as when the value of a security has been significantly affected by events after the close of the exchange or market on which the security is principally traded (for example, a foreign exchange or market), but before the fund calculates its net asset value, the fund may value these investments at fair value as determined in accordance with the procedures approved by the Board. Certain factors may be considered when fair valuing investments such as: fundamental analytical data, the nature and duration of restrictions on disposition, an evaluation of the forces that influence the market in which the securities are purchased and sold, and public trading in similar securities of the issuer or comparable issuers. These securities are either categorized within Level 2 or 3 of the fair value hierarchy depending on the relevant inputs used.
For restricted securities where observable inputs are limited, assumptions about market activity and risk are used and are generally categorized within Level 3 of the fair value hierarchy.
42
Investments denominated in foreign currencies are translated to U.S. dollars at the prevailing rates of exchange.
Forward contracts are valued at the forward rate and are generally categorized within Level 2 of the fair value hierarchy.
The following is a summary of the inputs used as of August 31, 2014 in valuing the fund’s investments:
| | | | | | |
| | | Level 2—Other | | Level 3— | | |
| | Level 1— | Significant | | Significant | | |
| | Unadjusted | Observable | | Unobservable | | |
| | Quoted Prices | Inputs | | Inputs | Total | |
| Assets ($) | | | | | | |
| Investments in Securities: | | | | | |
| Collateralized | | | | | | |
| Loan Obligations | — | 18,379,938 | | — | 18,379,938 | |
| Floating Rate | | | | | | |
| Loan Interests† | — | 441,766,992 | | — | 441,766,992 | |
| Corporate Bonds† | — | 48,093,125 | | — | 48,093,125 | |
| Mutual Funds | 35,593,025 | — | | — | 35,593,025 | |
| Other Financial | | | | | | |
| Instruments: | | | | | | |
| Forward Foreign | | | | | | |
| Currency Exchange | | | | | | |
| Contracts†† | — | 48,815 | | — | 48,815 | |
| Liabilities ($) | | | | | | |
| Other Financial | | | | | | |
| Instruments: | | | | | | |
| Forward Foreign | | | | | | |
| Currency Exchange | | | | | | |
| Contracts†† | — | (3,029 | ) | — | (3,029 | ) |
| |
| † | See Statement of Investments for additional detailed categorizations. |
| †† | Amount shown represents unrealized appreciation (depreciation) at period end. |
At August 31, 2014, there were no transfers between Level 1 and Level 2 of the fair value hierarchy.
(b) Foreign currency transactions: The fund does not isolate that portion of the results of operations resulting from changes in foreign
The Fund 43
NOTES TO FINANCIAL STATEMENTS (continued)
exchange rates on investments from the fluctuations arising from changes in the market prices of securities held. Such fluctuations are included with the net realized and unrealized gain or loss on investments.
Net realized foreign exchange gains or losses arise from sales of foreign currencies, currency gains or losses realized on securities transactions between trade and settlement date, and the difference between the amounts of dividends, interest and foreign withholding taxes recorded on the fund’s books and the U.S. dollar equivalent of the amounts actually received or paid. Net unrealized foreign exchange gains and losses arise from changes in the value of assets and liabilities other than investments resulting from changes in exchange rates. Foreign currency gains and losses on foreign currency transactions are also included with net realized and unrealized gain or loss on investments.
(c) Securities transactions and investment income: Securities transactions are recorded on a trade date basis. Realized gains and losses from securities transactions are recorded on the identified cost basis. Dividend income is recognized on the ex-dividend date and interest income, including, where applicable, accretion of discount and amortization of premium on investments, is recognized on the accrual basis.
(d) Affiliated issuers: Investments in other investment companies advised by Dreyfus are defined as “affiliated” under the Act. Investments in affiliated investment companies during the period ended August 31, 2014 were as follows:
| | | | | | | |
| Affiliated | | | | | | | |
| Investment | Value | | | | Value | | Net |
| Company | 9/27/2013 | ($) | Purchases ($) | Sales ($) | 8/31/2014 | ($) | Assets (%) |
| Dreyfus | | | | | | | |
| Institutional | | | | | | | |
| Preferred | | | | | | | |
| Plus Money | | | | | | | |
| Market Fund | — | | 306,675,000 | 271,081,975 | 35,593,025 | | 6.7 |
(e) Risk: The fund invests primarily in floating rate loan interests.The floating rate loans in which the fund invests typically are below investment grade securities, and inherently speculative. In the event of the bankruptcy of a borrower, the fund could experience delays or limita-
44
tions imposed by insolvency laws with respect to its ability to realize the benefits of any collateral securing the borrower’s loan.
The fund invests in debt securities. Failure of an issuer of the debt securities to make timely interest or principal payments, or a decline or the perception of a decline in the credit quality of a debt security, can cause the debt security’s price to fall, potentially lowering the fund’s share price. In addition, the value of debt securities may decline due to general market conditions that are not specifically related to a particular issuer, such as real or perceived adverse economic conditions, changes in outlook for corporate earnings, changes in interest or currency rates or adverse investor sentiment. They may also decline because of factors that affect a particular industry.
(f) Dividends to shareholders: Dividends are recorded on the ex-dividend date. Dividends from investment income-net are normally declared and paid monthly. Dividends from net realized capital gains, if any, are normally declared and paid annually, but the fund may make distributions on a more frequent basis to comply with the distribution requirements of the Internal Revenue Code of 1986, as amended (the “Code”). To the extent that net realized capital gains can be offset by capital loss carryovers, it is the policy of the fund not to distribute such gains. Income and capital gain distributions are determined in accordance with income tax regulations, which may differ from GAAP.
On August 29, 2014, the Board declared a cash dividend of $.037, $.028, $.041 and $.041 per share from undistributed investment income-net for Class A, Class C, Class I and ClassY shares, respectively, payable on September 2, 2014 (ex-dividend date), to shareholders of record as of the close of business on August 29, 2014.
(g) Federal income taxes: It is the policy of the fund to continue to qualify as a regulated investment company, if such qualification is in the best interests of its shareholders, by complying with the applicable provisions of the Code, and to make distributions of taxable income sufficient to relieve it from substantially all federal income and excise taxes.
The Fund 45
NOTES TO FINANCIAL STATEMENTS (continued)
As of and during the period ended August 31, 2014, the fund did not have any liabilities for any uncertain tax positions.The fund recognizes interest and penalties, if any, related to uncertain tax positions as income tax expense in the Statement of Operations. During the period ended August 31, 2014, the fund did not incur any interest or penalties.
The tax period ended August 31, 2014 remains subject to examination by the Internal Revenue Service and state taxing authorities.
At August 31, 2014, the components of accumulated earnings on a tax basis were as follows: undistributed ordinary income $1,773,855, undistributed capital gains $271,911 and unrealized depreciation $800,585.
The tax character of distributions paid to shareholders during the fiscal period ended August 31, 2014 was as follows: ordinary income $9,970,868.
During the period ended August 31, 2014, as a result of permanent book to tax differences, primarily due to the tax treatment for registration fees, Rule 12b-1 Distribution Plan fees, amortization adjustments, foreign currency transactions, paydown gains and losses and consent fees, the fund increased accumulated undistributed investment income-net by $515,782, decreased accumulated net realized gain (loss) on investments by $502,735 and decreased paid-in capital by $13,047. Net assets and net asset value per share were not affected by this reclassification.
NOTE 2—Bank Lines of Credit:
The fund participates with other Dreyfus-managed funds in a $265 million unsecured credit facility led by Citibank, N.A. and a $300 million unsecured credit facility provided by The Bank of New York Mellon (each, a “Facility”), each to be utilized primarily for temporary or emergency purposes, including the financing of redemptions. Prior to October 9, 2013, the unsecured credit facility with Citibank, N.A. was $210 million. In connection therewith, the fund has agreed to pay its pro rata portion of commitment fees for each Facility. Interest is
46
charged to the fund based on rates determined pursuant to the terms of the respective Facility at the time of borrowing. During the period ended August 31, 2014, the fund did not borrow under the Facilities.
NOTE 3—Management Fee, Sub-Investment Advisory Fee and Other Transactions with Affiliates:
(a) Pursuant to a management agreement with Dreyfus, the management fee is computed at the annual rate of .65% of the value of the fund’s average daily net assets and is payable monthly. Dreyfus has contractually agreed, from September 27, 2013 through October 1, 2015, to waive receipt of its fees and/or assume the direct expenses of the fund, so that the expenses of none of the classes (excluding Rule 12b-1 Distribution Plan fees, Shareholder Services Plan fees, taxes, interest expense, brokerage commissions, commitment fees on borrowings and extraordinary expenses) exceed .80% of the value of the fund’s average daily net assets. The reduction in expenses, pursuant to the undertaking, amounted to $194,025 during the period ended August 31, 2014.
Pursuant to a Sub-Investment Advisory Agreement between Dreyfus and Alcentra, Alcentra serves as the fund’s sub-adviser responsible for the day-to–day management of a portion of the fund’s portfolio. Dreyfus pays Alcentra a monthly fee at an annual percentage of the value of the fund’s average daily net assets. Dreyfus has obtained an exemptive order from the SEC, upon which the fund may rely, to use a manager of managers approach that permits Dreyfus, subject to certain conditions and approval by the Board, to enter into and materially amend sub-investment advisory agreements with one or more subad-visers who are either unaffiliated with Dreyfus or are wholly-owned subsidiaries (as defined under the Act) of Dreyfus’ ultimate parent company, BNY Mellon, without obtaining shareholder approval.The order also relieves the fund from disclosing the sub-investment advisory fee paid by Dreyfus to an unaffiliated subadviser in documents filed with the SEC and provided to shareholders. In addition, pursuant to the
The Fund 47
NOTES TO FINANCIAL STATEMENTS (continued)
order, it is not necessary to disclose the sub-investment advisory fee payable by Dreyfus separately to a subadviser that is a wholly-owned subsidiary of BNY Mellon in documents filed with the SEC and provided to shareholders; such fees are to be aggregated with fees payable to Dreyfus. Dreyfus has ultimate responsibility (subject to oversight by the Board) to supervise any subadviser and recommend the hiring, termination, and replacement of any subadviser to the Board.
During the period ended August 31, 2014, the Distributor retained $780 from commissions earned on sales of the fund’s Class A shares.
(b) Under the Distribution Plan adopted pursuant to Rule 12b-1 under the Act, Class C shares pay the Distributor for distributing its shares at an annual rate of .75% of the value of its average daily net assets. During the period ended August 31, 2014, Class C shares were charged $2,404 pursuant to the Distribution Plan.
(c) Under the Shareholder Services Plan, Class A and Class C shares pay the Distributor at an annual rate of .25% of the value of their average daily net assets for the provision of certain services.These services provided may include personal services relating to shareholder accounts, such as answering shareholder inquiries regarding the fund and providing reports and other information, and services related to the maintenance of shareholder accounts. The Distributor may make payments to Service Agents (securities dealers, financial institutions or other industry professionals) with respect to these services. The Distributor determines the amounts to be paid to Service Agents. During the period ended August 31, 2014, Class A and Class C shares were charged $40,892 and $801, respectively, pursuant to the Shareholder Services Plan.
Under its terms, the Distribution Plan and Shareholder Services Plan shall remain in effect from year to year, provided such continuance is approved annually by a vote of a majority of those Directors who are not “interested persons” of the Company and who have no direct or indirect financial interest in the operation of or in any agreement related to the Distribution Plan or Shareholder Services Plan.
48
The fund has arrangements with the transfer agent and the custodian whereby the fund may receive earnings credits when positive cash balances are maintained, which are used to offset transfer agency and custody fees. For financial reporting purposes, the fund includes net earnings credits as an expense offset in the Statement of Operations.
The fund compensates Dreyfus Transfer, Inc., a wholly-owned subsidiary of Dreyfus, under a transfer agency agreement for providing transfer agency and cash management services for the fund. The majority of transfer agency fees are comprised of amounts paid on a per account basis, while cash management fees are related to fund subscriptions and redemptions. During the period ended August 31, 2014, the fund was charged $1,643 for transfer agency services and $94 for cash management services.These fees are included in Shareholder servicing costs in the Statement of Operations. Cash management fees were partially offset by earnings credits of $7.
The fund compensates The Bank of New York Mellon under a custody agreement for providing custodial services for the fund. These fees are determined based on net assets, geographic region and transaction activity. During the period ended August 31, 2014, the fund was charged $34,087 pursuant to the custody agreement.
During the period ended August 31, 2014, the fund was charged $8,296 for services performed by the Chief Compliance Officer and his staff.
The components of “Due to The Dreyfus Corporation and affiliates” in the Statement of Assets and Liabilities consist of: management fees $293,278, Distribution Plan fees $301, Shareholder Services Plan fees $2,157, custodian fees $14,543, Chief Compliance Officer fees $1,154 and transfer agency fees $436, which are offset against an expense reimbursement currently in effect in the amount of $28.
(d) Each Board member also serves as a Board member of other funds within the Dreyfus complex. Annual retainer fees and attendance fees are allocated to each fund based on net assets.
The Fund 49
NOTES TO FINANCIAL STATEMENTS (continued)
NOTE 4—Securities Transactions:
The aggregate amount of purchases and sales of investment securities, excluding short-term securities and forward contracts, during the period ended August 31, 2014, amounted to $681,337,836 and $172,038,101, respectively.
Floating Rate Loan Interests: Floating rate instruments are loans and other securities with interest rates that adjust or “float” periodically. Floating rate loans are made by banks and other financial institutions to their corporate clients.The rates of interest on the loans adjust periodically by reference to a base lending rate, such as the London Interbank Offered Rate (LIBOR) plus a premium or credit spread. Floating rate loans reset on periodic set dates, typically every 30 to 90 days, but not to exceed one year.The fund may invest in multiple series or tranches of a loan. A different series or tranche may have varying terms and carry different associated risks.
The fund may enter into certain credit agreements all or a portion of which may be unfunded.The fund is obligated to fund these commitments at the borrower’s discretion.The commitments are disclosed in the accompanying Statement of Investments. At August 31, 2014, the fund had sufficient cash and/or securities to cover these commitments.
Derivatives: A derivative is a financial instrument whose performance is derived from the performance of another asset. Each type of derivative instrument that was held by the fund during the period ended August 31, 2014 is discussed below.
Forward Foreign Currency Exchange Contracts: The fund enters into forward contracts in order to hedge its exposure to changes in foreign currency exchange rates on its foreign portfolio holdings, to settle foreign currency transactions or as a part of its investment strategy. When executing forward contracts, the fund is obligated to buy or sell a foreign currency at a specified rate on a certain date in the future.
50
With respect to sales of forward contracts, the fund incurs a loss if the value of the contract increases between the date the forward contract is opened and the date the forward contract is closed.The fund realizes a gain if the value of the contract decreases between those dates. With respect to purchases of forward contracts, the fund incurs a loss if the value of the contract decreases between the date the forward contract is opened and the date the forward contract is closed.The fund realizes a gain if the value of the contract increases between those dates. Any realized or unrealized gains or losses which occurred during the period are reflected in the Statement of Operations. The fund is exposed to foreign currency risk as a result of changes in value of underlying financial instruments.The fund is also exposed to credit risk associated with counterparty nonperformance on these forward contracts, which is generally limited to the unrealized gain on each open contract.The following summarizes open forward contracts at August 31, 2014:
| | | | | |
| | Foreign | | | Unrealized | |
| Forward Foreign Currency | Currency | | | Appreciation | |
| Exchange Contracts | Amounts | Proceeds ($) | Value ($) | (Depreciation) ($) | |
| Sales: | | | | | |
| British Pound, | | | | | |
| Expiring | | | | | |
| 9/30/2014 a | 1,212,000 | 2,008,587 | 2,011,616 | (3,029 | ) |
| Euro, | | | | | |
| Expiring | | | | | |
| 9/30/2014 a | 12,791,000 | 16,858,538 | 16,809,723 | 48,815 | |
| Gross Unrealized | | | | | |
| Appreciation | | | | 48,815 | |
| Gross Unrealized | | | | | |
| Depreciation | | | | (3,029 | ) |
|
| Counterparty: |
| a Credit Suisse |
For financial reporting purposes, the fund does not offset derivative assets and derivative liabilities that are subject to master netting arrangements (“MNA”) in the Statement of Assets and Liabilities.
The Fund 51
NOTES TO FINANCIAL STATEMENTS (continued)
At August 31, 2014, derivative assets and liabilities (by type) on a gross basis are as follows:
| | | | |
| Derivative Financial Instruments: | Assets ($) | | Liabilities ($) | |
| Forward contracts | 48,815 | | (3,029 | ) |
| Total gross amount of derivative | | | | |
| assets and liabilities in the | | | | |
| Statement of Assets and Liabilities | 48,815 | | (3,029 | ) |
| Derivatives not subject to MNA or | | | | |
| similar agreements | (48,815 | ) | 3,029 | |
| Total gross amount of assets and liabilities | | | | |
| subject to MNA or similar agreements | — | | — | |
The following tables present derivative assets and liabilities net of amounts available for offsetting under MNA and net of related collateral received or pledged, if any, as of August 31, 2014:
| | | | | | |
| | | | Financial | | | |
| | | | Instruments | | | |
| | | | and | | | |
| | | | Derivatives | | | |
| | Gross Amount of | | Available | Collateral | Net Amount of | |
| Counterparty | Assets ($)1 | | for Offset ($) | Received ($) | Assets ($) | |
| Credit Suisse | 48,815 | | — | — | 48,815 | |
| |
| | | | Financial | | | |
| | | | Instruments | | | |
| | | | and | | | |
| | | | Derivatives | | | |
| | Gross Amount of | | Available | Collateral | Net Amount of | |
| Counterparty | Liabilities ($)1 | | for Offset ($) | Pledged ($) | Assets ($) | |
| Credit Suisse | (3,029 | ) | — | — | (3,029 | ) |
| |
| 1 | Absent a default event or early termination, over-the-counter derivative assets and liabilities are |
| | presented at gross amounts and are not offset in the Statement of Assets and Liabilities. |
The following summarizes the average market value of derivatives outstanding during the period ended August 31, 2014:
| |
| | Average Market Value ($) |
| Forward contracts | 8,427,639 |
At August 31, 2014, the cost of investments for federal income tax purposes was $544,749,614; accordingly, accumulated net unrealized depreciation on investments was $916,534, consisting of $2,319,355 gross unrealized appreciation and $3,235,889 gross unrealized depreciation.
52
|
| REPORT OF INDEPENDENT REGISTERED |
| PUBLIC ACCOUNTING FIRM |
The Board of Directors and Shareholders The Dreyfus/Laurel Funds, Inc.
We have audited the accompanying statement of assets and liabilities of Dreyfus Floating Rate Income Fund (the “Fund”), a series of The Dreyfus/Laurel Funds, Inc., including the statement of investments, as of August 31, 2014, and the related statements of operations and changes in net assets, and the financial highlights for the period from September 27, 2013 (commencement of operations) through August 31, 2014. These financial statements and financial highlights are the responsibility of the Fund’s management. Our responsibility is to express an opinion on these financial statements and financial highlights based on our audit.
We conducted our audit in accordance with the standards of the Public Company Accounting Oversight Board (United States). Those standards require that we plan and perform the audit to obtain reasonable assurance about whether the financial statements and financial highlights are free of material misstatement. An audit includes examining, on a test basis, evidence supporting the amounts and disclosures in the financial statements. Our procedures included confirmation of securities owned as of August 31, 2014, by correspondence with the custodian and brokers or by other appropriate auditing procedures.An audit also includes assessing the accounting principles used and significant estimates made by management, as well as evaluating the overall financial statement presentation. We believe that our audit provides a reasonable basis for our opinion.
In our opinion, the financial statements and financial highlights referred to above present fairly, in all material respects, the financial position of Dreyfus Floating Rate Income Fund as of August 31, 2014, and the results of its operations, the changes in its net assets, and the financial highlights for the period from September 27, 2013 (commencement of operations) through August 31, 2014, in conformity with U.S. generally accepted accounting principles.

New York, New York
October 30, 2014
The Fund 53
IMPORTANT TAX INFORMATION (Unaudited)
For federal tax purposes, the fund designates the maximum amount allowable but not less than 79.97% as interest-related dividends in accordance with Sections 871(k) (1) and 881(e) of the Internal Revenue Code. Where required by federal tax law rules, shareholders will receive notification of their portion of the fund’s taxable ordinary dividends and capital gains distributions, if any, paid for the 2014 calendar year on Form 1099-DIV which will be mailed in early 2015.
54
BOARD MEMBERS INFORMATION (Unaudited)
INDEPENDENT BOARD MEMBERS
|
| Joseph S. DiMartino (70) |
| Chairman of the Board (1999) |
| Principal Occupation During Past 5Years: |
| • Corporate Director and Trustee (1995-present) |
| Other Public Company Board Memberships During Past 5Years: |
| • CBIZ (formerly, Century Business Services, Inc.), a provider of outsourcing functions for small |
| and medium size companies, Director (1997-present) |
| • The Newark Group, a provider of a national market of paper recovery facilities, paperboard |
| mills and paperboard converting plants, Director (2000-2010) |
| • Sunair Services Corporation, a provider of certain outdoor-related services to homes and |
| businesses, Director (2005-2009) |
| No. of Portfolios for which Board Member Serves: 142 |
| ——————— |
| Francine J. Bovich (63) |
| Board Member (2012) |
| Principal Occupation During Past 5Years: |
| • Trustee,The Bradley Trusts, private trust funds (2011-present) |
| • Managing Director, Morgan Stanley Investment Management (1993-2010) |
| Other Public Company Board Membership During Past 5Years: |
| • Annaly Capital Management, Inc., Board Member (May 2014-present) |
| No. of Portfolios for which Board Member Serves: 45 |
| ——————— |
| James M. Fitzgibbons (79) |
| Board Member (1994) |
| Principal Occupation During Past 5Years: |
| • Corporate Director and Trustee |
| Other Public Company Board Membership During Past 5Years: |
| • Bill Barrett Corporation, an oil and natural gas exploration company, Director (2004-2012) |
| No. of Portfolios for which Board Member Serves: 31 |
| ——————— |
| Kenneth A. Himmel (68) |
| Board Member (1994) |
| Principal Occupation During Past 5Years: |
| • President and CEO, Related Urban Development, a real estate development company (1996-present) |
| • President and CEO, Himmel & Company, a real estate development company (1980-present) |
| • CEO,American Food Management, a restaurant company (1983-present) |
| No. of Portfolios for which Board Member Serves: 31 |
The Fund 55
|
| BOARD MEMBERS INFORMATION (Unaudited) (continued) |
| INDEPENDENT BOARD MEMBERS (continued) |
|
| Stephen J. Lockwood (67) |
| Board Member (1994) |
| Principal Occupation During Past 5Years: |
| • Chairman of the Board, Stephen J. Lockwood and Company LLC, a real estate investment |
| company (2000-present) |
| No. of Portfolios for which Board Member Serves: 31 |
| ——————— |
| Roslyn M. Watson (64) |
| Board Member (1994) |
| Principal Occupation During Past 5Years: |
| • Principal,Watson Ventures, Inc., a real estate investment company (1993-present) |
| No. of Portfolios for which Board Member Serves: 64 |
| ——————— |
| Benaree Pratt Wiley (68) |
| Board Member (1998) |
| Principal Occupation During Past 5Years: |
| • Principal,TheWiley Group, a firm specializing in strategy and business development (2005-present) |
| Other Public Company Board Membership During Past 5Years: |
| • CBIZ (formerly, Century Business Services, Inc.), a provider of outsourcing functions for small |
| and medium size companies, Director (2008-present) |
| No. of Portfolios for which Board Member Serves: 66 |
| ——————— |
|
| Once elected all Board Members serve for an indefinite term, but achieve Emeritus status upon reaching age 80.The |
| address of the Board Members and Officers is c/o The Dreyfus Corporation, 200 Park Avenue, NewYork, NewYork |
| 10166.Additional information about the Board Members is available in the fund’s Statement of Additional Information |
| which can be obtained from Dreyfus free of charge by calling this toll free number: 1-800-DREYFUS. |
| J.Tomlinson Fort, Emeritus Board Member |
56
OFFICERS OF THE FUND (Unaudited)
BRADLEY J. SKAPYAK, President since January 2010.
Chief Operating Officer and a director of the Manager since June 2009, Chairman of Dreyfus Transfer, Inc., an affiliate of the Manager and the transfer agent of the funds, since May 2011 and Executive Vice President of the Distributor since June 2007. From April 2003 to June 2009, Mr. Skapyak was the head of the Investment Accounting and Support Department of the Manager. He is an officer of 69 investment companies (comprised of 142 portfolios) managed by the Manager. He is 55 years old and has been an employee of the Manager since February 1988.
JOHN PAK, Chief Legal Officer since March 2013.
Deputy General Counsel, Investment Management, of BNY Mellon since August 2014; Chief Legal Officer of the Manager since August 2012; from March 2005 to July 2012, Managing Director of Deutsche Bank, Deputy Global Head of Deutsche Asset Management Legal and Regional Head of Deutsche Asset Management Americas Legal. He is an officer of 70 investment companies (comprised of 167 portfolios) managed by the Manager. He is 45 years old and has been an employee of the Manager since August 2012.
JANETTE E. FARRAGHER, Vice President and Secretary since December 2011.
Assistant General Counsel of BNY Mellon, and an officer of 70 investment companies (comprised of 167 portfolios) managed by the Manager. She is 51 years old and has been an employee of the Manager since February 1984.
KIESHA ASTWOOD, Vice President and Assistant Secretary since January 2010.
Counsel of BNY Mellon, and an officer of 70 investment companies (comprised of 167 portfolios) managed by the Manager. She is 41 years old and has been an employee of the Manager since July 1995.
JAMES BITETTO, Vice President and Assistant Secretary since August 2005.
Managing Counsel of BNY Mellon and Secretary of the Manager, and an officer of 70 investment companies (comprised of 167 portfolios) managed by the Manager. He is 48 years old and has been an employee of the Manager since December 1996.
JONI LACKS CHARATAN, Vice President and Assistant Secretary since August 2005.
Managing Counsel of BNY Mellon, and an officer of 70 investment companies (comprised of 167 portfolios) managed by the Manager. She is 58 years old and has been an employee of the Manager since October 1988.
JOSEPH M. CHIOFFI, Vice President and Assistant Secretary since August 2005.
Managing Counsel of BNY Mellon, and an officer of 70 investment companies (comprised of 167 portfolios) managed by the Manager. He is 52 years old and has been an employee of the Manager since June 2000.
JOHN B. HAMMALIAN, Vice President and Assistant Secretary since August 2005.
Senior Managing Counsel of BNY Mellon, and an officer of 70 investment companies (comprised of 167 portfolios) managed by the Manager. He is 51 years old and has been an employee of the Manager since February 1991.
SARAH S. KELLEHER, Vice President and Assistant Secretary since April 2014.
Senior Counsel of BNY Mellon, and an officer of 70 investment companies (comprised of 167 portfolios) managed by the Manager; from August 2005 to March 2013, Associate General Counsel of Third Avenue Management. She is 38 years old and has been an employee of the Manager since March 2013.
The Fund 57
OFFICERS OF THE FUND (Unaudited) (continued)
JEFF PRUSNOFSKY, Vice President and Assistant Secretary since August 2005.
Senior Managing Counsel of BNY Mellon, and an officer of 70 investment companies (comprised of 167 portfolios) managed by the Manager. He is 49 years old and has been an employee of the Manager since October 1990.
JAMES WINDELS, Treasurer since November 2001.
Director – Mutual Fund Accounting of the Manager, and an officer of 70 investment companies (comprised of 167 portfolios) managed by the Manager. He is 55 years old and has been an employee of the Manager since April 1985.
RICHARD CASSARO, Assistant Treasurer since January 2008.
Senior Accounting Manager – Money Market and Municipal Bond Funds of the Manager, and an officer of 70 investment companies (comprised of 167 portfolios) managed by the Manager. He is 55 years old and has been an employee of the Manager since September 1982.
GAVIN C. REILLY, Assistant Treasurer since December 2005.
Tax Manager of the Investment Accounting and Support Department of the Manager, and an officer of 70 investment companies (comprised of 167 portfolios) managed by the Manager. He is 46 years old and has been an employee of the Manager since April 1991.
ROBERT S. ROBOL, Assistant Treasurer since August 2005.
Senior Accounting Manager – Fixed Income Funds of the Manager, and an officer of 70 investment companies (comprised of 167 portfolios) managed by the Manager. He is 50 years old and has been an employee of the Manager since October 1988.
ROBERT SALVIOLO, Assistant Treasurer since July 2007.
Senior Accounting Manager – Equity Funds of the Manager, and an officer of 70 investment companies (comprised of 167 portfolios) managed by the Manager. He is 47 years old and has been an employee of the Manager since June 1989.
ROBERT SVAGNA, Assistant Treasurer since August 2005.
Senior Accounting Manager – Equity Funds of the Manager, and an officer of 70 investment companies (comprised of 167 portfolios) managed by the Manager. He is 47 years old and has been an employee of the Manager since November 1990.
JOSEPH W. CONNOLLY, Chief Compliance Officer since October 2004.
Chief Compliance Officer of the Manager and The Dreyfus Family of Funds (70 investment companies, comprised of 167 portfolios).
He is 57 years old and has served in various capacities with the Manager since 1980, including manager of the firm’s Fund Accounting Department from 1997 through October 2001.
MATTHEW D. CONNOLLY, Anti-Money Laundering Compliance Officer since April 2012.
Anti-Money Laundering Compliance Officer of the Distributor since October 2011; from March 2010 to September 2011, Global Head, KYC Reviews and Director of UBS Investment Bank; until March 2010, AML Compliance Officer and Senior Vice President of Citi Global Wealth Management. He is an officer of 65 investment companies (comprised of 162 portfolios) managed by the Manager. He is 42 years old and has been an employee of the Distributor since October 2011.
58
For More Information
Telephone Call your financial representative or 1-800-DREYFUS
Mail The Dreyfus Family of Funds, 144 Glenn Curtiss Boulevard, Uniondale, NY 11556-0144
The fund files its complete schedule of portfolio holdings with the Securities and Exchange Commission (“SEC”) for the first and third quarters of each fiscal year on Form N-Q. The fund’s Forms N-Q are available on the SEC’s website at http://www.sec.gov and may be reviewed and copied at the SEC’s Public Reference Room in Washington, DC. Information on the operation of the Public Reference Room may be obtained by calling 1-800-SEC-0330.
A description of the policies and procedures that the fund uses to determine how to vote proxies relating to portfolio securities, and information regarding how the fund voted these proxies for the most recent 12-month period ended June 30 is available at http://www.dreyfus.com and on the SEC’s website at http://www.sec.gov. The description of the policies and procedures is also available without charge, upon request, by calling 1-800-DREYFUS.

Item 2. Code of Ethics.
The Registrant has adopted a code of ethics that applies to the Registrant's principal executive officer, principal financial officer, principal accounting officer or controller, or persons performing similar functions. There have been no amendments to, or waivers in connection with, the Code of Ethics during the period covered by this Report.
Item 3. Audit Committee Financial Expert.
The Registrant's Board has determined that Joseph DiMartino, a member of the Audit Committee of the Board, is an audit committee financial expert as defined by the Securities and Exchange Commission (the "SEC"). Joseph DiMartino is "independent" as defined by the SEC for purposes of audit committee financial expert determinations.
Item 4. Principal Accountant Fees and Services.
(a) Audit Fees. The aggregate fees billed for each of the last two fiscal years (the "Reporting Periods") for professional services rendered by the Registrant's principal accountant (the "Auditor") for the audit of the Registrant's annual financial statements or services that are normally provided by the Auditor in connection with the statutory and regulatory filings or engagements for the Reporting Periods, were $30,110 in 2013 and $82,740 in 2014.
(b) Audit-Related Fees. The aggregate fees billed in the Reporting Periods for assurance and related services by the Auditor that are reasonably related to the performance of the audit of the Registrant's financial statements and are not reported under paragraph (a) of this Item 4 were $4,620 in 2013 and $9,540 in 2014. These services consisted of one or more of the following: (i) agreed upon procedures related to compliance with Internal Revenue Code section 817(h), (ii) security counts required by Rule 17f-2 under the Investment Company Act of 1940, as amended, (iii) advisory services as to the accounting or disclosure treatment of Registrant transactions or events and (iv) advisory services to the accounting or disclosure treatment of the actual or potential impact to the Registrant of final or proposed rules, standards or interpretations by the Securities and Exchange Commission, the Financial Accounting Standards Boards or other regulatory or standard-setting bodies.
The aggregate fees billed in the Reporting Periods for non-audit assurance and related services by the Auditor to the Registrant's investment adviser (not including any sub-investment adviser whose role is primarily portfolio management and is subcontracted with or overseen by another investment adviser), and any entity controlling, controlled by or under common control with the investment adviser that provides ongoing services to the Registrant ("Service Affiliates"), that were reasonably related to the performance of the annual audit of the Service Affiliate, which required pre-approval by the Audit Committee were $0 in 2013 and $0 in 2014.
(c) Tax Fees. The aggregate fees billed in the Reporting Periods for professional services rendered by the Auditor for tax compliance, tax advice, and tax planning ("Tax Services") were $2,340 in 2013 and $6,890 in 2014. These services consisted of: (i) review or preparation of U.S. federal, state, local and excise tax returns. The aggregate fees billed in the Reporting Periods for Tax Services by the Auditor to Service Affiliates, which required pre-approval by the Audit Committee were $0 in 2013 and $0 in 2014.
(d) All Other Fees. The aggregate fees billed in the Reporting Periods for products and services provided by the Auditor, other than the services reported in paragraphs (a) through (c) of this Item, were $0 in 2013 and $0 in 2014.
The aggregate fees billed in the Reporting Periods for Non-Audit Services by the Auditor to Service Affiliates, other than the services reported in paragraphs (b) through (c) of this Item, which required pre-approval by the Audit Committee, were $0 in 2013 and $0 in 2014.
(e)(1) Audit Committee Pre-Approval Policies and Procedures. The Registrant's Audit Committee has established policies and procedures (the "Policy") for pre-approval (within specified fee limits) of the Auditor's engagements for non-audit services to the Registrant and Service Affiliates without specific case-by-case consideration. The pre-approved services in the Policy can include pre-approved audit services, pre-approved audit-related services, pre-approved tax services and pre-approved all other services. Pre-approval considerations include whether the proposed services are compatible with maintaining the Auditor's independence. Pre-approvals pursuant to the Policy are considered annually.
(e)(2) Note: None of the services described in paragraphs (b) through (d) of this Item 4 were approved by the Audit Committee pursuant to paragraph (c)(7)(i)(C) of Rule 2-01 of Regulation S-X.
(f) None of the hours expended on the principal accountant's engagement to audit the registrant's financial statements for the most recent fiscal year were attributed to work performed by persons other than the principal account's full-time, permanent employees.
Non-Audit Fees. The aggregate non-audit fees billed by the Auditor for services rendered to the Registrant, and rendered to Service Affiliates, for the Reporting Periods were $13,902,636 in 2013 and $15,801,381 in 2014.
Auditor Independence. The Registrant's Audit Committee has considered whether the provision of non-audit services that were rendered to Service Affiliates, which were not pre-approved (not requiring pre-approval), is compatible with maintaining the Auditor's independence.
Item 5. Audit Committee of Listed Registrants.
Not applicable. [CLOSED-END FUNDS ONLY]
Item 6. Investments.
(a) Not applicable.
Item 7. Disclosure of Proxy Voting Policies and Procedures for Closed-End Management Investment Companies.
Not applicable. [CLOSED-END FUNDS ONLY]
Item 8. Portfolio Managers of Closed-End Management Investment Companies.
Not applicable. [CLOSED-END FUNDS ONLY, beginning with reports for periods ended on and after December 31, 2005]
Item 9. Purchases of Equity Securities by Closed-End Management Investment Companies and Affiliated Purchasers.
Not applicable. [CLOSED-END FUNDS ONLY]
Item 10. Submission of Matters to a Vote of Security Holders.
There have been no material changes to the procedures applicable to Item 10.
Item 11. Controls and Procedures.
(a) The Registrant's principal executive and principal financial officers have concluded, based on their evaluation of the Registrant's disclosure controls and procedures as of a date within 90 days of the filing date of this report, that the Registrant's disclosure controls and procedures are reasonably designed to ensure that information required to be disclosed by the Registrant on Form N-CSR is recorded, processed, summarized and reported within the required time periods and that information required to be disclosed by the Registrant in the reports that it files or submits on Form N-CSR is accumulated and communicated to the Registrant's management, including its principal executive and principal financial officers, as appropriate to allow timely decisions regarding required disclosure.
(b) There were no changes to the Registrant's internal control over financial reporting that occurred during the second fiscal quarter of the period covered by this report that have materially affected, or are reasonably likely to materially affect, the Registrant's internal control over financial reporting.
Item 12. Exhibits.
(a)(1) Code of ethics referred to in Item 2.
(a)(2) Certifications of principal executive and principal financial officers as required by Rule 30a-2(a) under the Investment Company Act of 1940.
(a)(3) Not applicable.
(b) Certification of principal executive and principal financial officers as required by Rule 30a-2(b) under the Investment Company Act of 1940.
SIGNATURES
Pursuant to the requirements of the Securities Exchange Act of 1934 and the Investment Company Act of 1940, the Registrant has duly caused this Report to be signed on its behalf by the undersigned, thereunto duly authorized.
The Dreyfus/Laurel Funds, Inc.
By: /s/ Bradley J. Skapyak
Bradley J. Skapyak,
President
Date: October 23, 2014
Pursuant to the requirements of the Securities Exchange Act of 1934 and the Investment Company Act of 1940, this Report has been signed below by the following persons on behalf of the Registrant and in the capacities and on the dates indicated.
By: /s/ Bradley J. Skapyak
Bradley J. Skapyak,
President
Date: October 23, 2014
By: /s/ James Windels
James Windels,
Treasurer
Date: October 23, 2014
EXHIBIT INDEX
(a)(1) Code of ethics referred to in Item 2.
(a)(2) Certifications of principal executive and principal financial officers as required by Rule 30a-2(a) under the Investment Company Act of 1940. (EX-99.CERT)
(b) Certification of principal executive and principal financial officers as required by Rule 30a-2(b) under the Investment Company Act of 1940. (EX-99.906CERT)