UNITED STATES
SECURITIES AND EXCHANGE COMMISSION
Washington, D.C. 20549
FORM N-CSR
CERTIFIED SHAREHOLDER REPORT OF REGISTERED MANAGEMENT
INVESTMENT COMPANIES
Investment Company Act file number | 811-05202 |
| |
| The Dreyfus/Laurel Funds, Inc. | |
| (Exact name of Registrant as specified in charter) | |
| | |
| c/o The Dreyfus Corporation 200 Park Avenue New York, New York 10166 | |
| (Address of principal executive offices) (Zip code) | |
| | |
| John Pak, Esq. 200 Park Avenue New York, New York 10166 | |
| (Name and address of agent for service) | |
|
Registrant's telephone number, including area code: | (212) 922-6000 |
| |
Date of fiscal year end: | 10/31 | |
Date of reporting period: | 10/31/13 | |
| | | | | | | |
The following N-CSR relates only to the Registrant’s series listed below and does not affect Dreyfus Core Equity Fund and Dreyfus Floating Rate Income Fund, each a series of the Registrant with a fiscal year end of August 31. A separate N-CSR will be filed for each series as appropriate.
Dreyfus Disciplined Stock Fund
Dreyfus Money Market Reserves
Dreyfus AMT-Free Municipal Reserves
Dreyfus Bond Market Index Fund
Dreyfus Tax Managed Growth Fund
Dreyfus BASIC S&P 500 Stock Index Fund
Dreyfus U.S. Treasury Reserves
Dreyfus Opportunistic Fixed Income Fund
Dreyfus Opportunistic Emerging Markets Debt Fund
FORM N-CSR
Item 1. Reports to Stockholders.
|
| Dreyfus |
| Bond Market |
| Index Fund |
ANNUAL REPORT October 31, 2013

Save time. Save paper. View your next shareholder report online as soon as it’s available. Log into www.dreyfus.com and sign up for Dreyfus eCommunications. It’s simple and only takes a few minutes.
The views expressed in this report reflect those of the portfolio manager only through the end of the period covered and do not necessarily represent the views of Dreyfus or any other person in the Dreyfus organization. Any such views are subject to change at any time based upon market or other conditions and Dreyfus disclaims any responsibility to update such views.These views may not be relied on as investment advice and, because investment decisions for a Dreyfus fund are based on numerous factors, may not be relied on as an indication of trading intent on behalf of any Dreyfus fund.
|
| Not FDIC-Insured • Not Bank-Guaranteed • May Lose Value |
| | Contents |
| | THE FUND |
| 2 | A Letter from the President |
| 3 | Discussion of Fund Performance |
| 6 | Fund Performance |
| 7 | Understanding Your Fund’s Expenses |
| 7 | Comparing Your Fund’s Expenses With Those of Other Funds |
| 8 | Statement of Investments |
| 57 | TBA Sale Commitments |
| 58 | Statement of Assets and Liabilities |
| 59 | Statement of Operations |
| 60 | Statement of Changes in Net Assets |
| 62 | Financial Highlights |
| 64 | Notes to Financial Statements |
| 73 | Report of Independent Registered Public Accounting Firm |
| 74 | Important Tax Information |
| 75 | Board Members Information |
| 77 | Officers of the Fund |
| | FOR MORE INFORMATION |
| | Back Cover |
Dreyfus
Bond Market Index Fund
The Fund
A LETTER FROM THE PRESIDENT
Dear Shareholder:
We are pleased to present this annual report for Dreyfus Bond Market Index Fund, covering the 12-month period from November 1, 2012, through October 31, 2013. For information about how the fund performed during the reporting period, as well as general market perspectives, we provide a Discussion of Fund Performance on the pages that follow.
The reporting period produced a challenging environment for many fixed-income securities, as a gradually strengthening U.S. economy and expectations of more moderately stimulative monetary policies drove longer term interest rates higher and bond prices lower. In this environment, corporate-backed bonds generally held up better than their government- and agency-issued counterparts, eking out mildly positive returns, on average, as default rates remained low and issuers’ business prospects improved along with the economy.
We currently expect U.S. and global economic conditions to continue to improve in 2014, with accelerating growth supported by the fading drags of tighter federal fiscal policies and downsizing on the state and local levels. Moreover, inflation is likely to remain muted, so monetary policy can remain stimulative. Globally, we anticipate stronger growth in developed countries due to past and continuing monetary ease, while emerging markets seem poised for moderate economic expansion despite recently negative investor sentiment. For more information on how these observations may affect your investments, we encourage you to speak with your financial advisor.
Thank you for your continued confidence and support.

J. Charles Cardona
President
The Dreyfus Corporation
November 15, 2013
2
DISCUSSION OF FUND PERFORMANCE
For the period of November 1, 2012, through October 31, 2013, as provided by Nancy G. Rogers, Portfolio Manager
Fund and Market Performance Overview
For the 12-month period ended October 31, 2013, Dreyfus Bond Market Index Fund’s Investor shares produced a total return of –1.66%, and its BASIC shares produced a total return of –1.50%.1 In comparison, the Barclays U.S. Aggregate Bond Index (the “Index”) achieved a total return of –1.08% for the same period.2
The U.S. bond market encountered heightened volatility during the reporting period when investors reacted to stronger economic growth, causing long-term interest rates to climb in anticipation of a more moderately accommodative monetary policy from the Federal Reserve Board (the “Fed”).The difference in returns between the fund and the Index was primarily the result of transaction costs and other operating expenses that are not reflected in the Index’s results.
The Fund’s Investment Approach
The fund seeks to match the total return of the Index.To pursue this goal, the fund normally invests at least 80% of its assets in bonds that are included in the Index.To maintain liquidity, the fund may invest up to 20% of its assets in various short-term, fixed-income securities and money market instruments.
While the fund seeks to mirror the returns of the Index, it does not hold the same number of bonds. Instead, the fund holds approximately 1,700 securities as compared to approximately 8,000 securities in the Index.The fund’s average duration—a measure of sensitivity to changing interest rates—generally remains neutral to the Index. As of October 31, 2013, the average duration of the fund was approximately 5.48 years.
Rising Long-Term Interest Rates Roiled Bond Market
After an extended period of strong fixed-income performance, the reporting period began in the midst of heightened market volatility as investors responded nervously to stronger U.S. economic growth. Despite concerns stemming from political
DISCUSSION OF FUND PERFORMANCE (continued)
infighting about the federal budget, new releases of economic data showed sustained improvements in employment and housing market trends. As a result, long-term interest rates began to move higher and bond market volatility intensified during the first quarter of 2013.The bond market’s more interest rate-sensitive sectors, such as U.S. government securities, suffered price declines when investors anticipated future increases in intermediate- and long-term interest rates. In contrast, corporate- and asset-backed securities held up relatively well as issuers’ underlying business fundamentals strengthened along with economic conditions.
The market’s worries regarding higher interest rates intensified in late May, when relatively hawkish remarks by Fed chairman Ben Bernanke were interpreted as a signal that the central bank would back away from its ongoing quantitative easing program sooner than many analysts had expected. Consequently, prices in most bond market sectors, including corporate-backed securities, fell sharply in June.The market generally stabilized over the summer, and bonds rallied in September when the Fed refrained from tapering its ongoing quantitative easing program. Interest rate-sensitive bonds also gained a degree of value in October, when the effects of a 16-day U.S. government shutdown prompted investors to reduce their expectations of economic growth over the near to intermediate term.
Corporate-Backed Securities Fared Relatively Well
U.S. Treasury securities were particularly hard hit in this challenging environment, with pronounced weakness among longer-term securities. Mortgage-backed securities from U.S. government agencies declined less severely, as the mortgage sector remained supported by the Fed’s massive bond buying program.
Corporate-backed securities ranked among the better performing sectors of the bond market, with strength particularly evident among lower-rated corporate bonds whose issuers appeared likely to benefit from stronger economic growth and persistently low default rates. Bonds issued by the financials sector fared particularly well over the reporting period. However, the fund and the Index are composed primarily of higher quality bonds and did not participate to a significant degree in the strength exhibited by lower rated securities.
4
The U.S. bond market was not alone in encountering difficulty over the past year. The European market also struggled with the impact of rising long-term interest rates as the region came out of recession and appeared to put the worst of its recent financial crisis behind it.
Replicating the Index’s Composition
As an index fund, we attempt to match closely the returns of the Index by approximating its composition. As of October 31, 2013, approximately 29% of the fund’s assets were invested in mortgage-backed securities, 2% in commercial mortgage-backed securities, 28% in corporate bonds and asset-backed securities, 37% in U.S. Treasury securities, and 4% in U.S. government agency bonds. Moreover, all of the fund’s corporate securities were rated at least BBB- or better, and the fund has maintained an overall credit quality and duration posture that is closely aligned with that of the Index.
November 15, 2013
Bond funds are subject generally to interest rate, credit, liquidity and market risks, to varying degrees, all of which are more fully described in the fund’s prospectus. Generally, all other factors being equal, bond prices are inversely related to interest-rate changes, and rate increases can cause price declines.
Indexing does not attempt to manage market volatility, use defensive strategies or reduce the effects of any long-term periods of poor index performance.The correlation between fund and index performance may be affected by the fund’s expenses and use of sampling techniques, changes in securities markets, changes in the composition of the index and the timing of purchases and redemptions of fund shares.
|
| 1 Total return includes reinvestment of dividends and any capital gains paid. Past performance is no guarantee of future |
| results. Share price, yield and investment return fluctuate such that upon redemption, fund shares may be worth more |
| or less than their original cost. |
| 2 SOURCE: LIPPER INC. — Reflects reinvestment of dividends and, where applicable, capital gain distributions.The |
| Barclays U.S.Aggregate Bond Index is a widely accepted, unmanaged total return index of corporate, U.S. government |
| and U.S. government agency debt instruments, mortgage-backed securities and asset-backed securities with an average |
| maturity of 1-10 years. Index returns do not reflect fees and expenses associated with operating a mutual fund. |
FUND PERFORMANCE

| | | | | | |
| Average Annual Total Returns as of 10/31/13 | | | | | | |
| | 1 Year | | 5 Years | | 10 Years | |
| BASIC shares | –1.50 | % | 5.69 | % | 4.55 | % |
| Investor shares | –1.66 | % | 5.43 | % | 4.30 | % |
| Barclays U.S. Aggregate Bond Index | –1.08 | % | 6.09 | % | 4.78 | % |
|
| † Source: Lipper Inc. |
| Past performance is not predictive of future performance.The fund’s performance shown in the graph and table does not |
| reflect the deduction of taxes that a shareholder would pay on fund distributions or the redemption of fund shares. |
| The above graph compares a $10,000 investment made in each of the BASIC and Investor shares of Dreyfus Bond |
| Market Index Fund on 10/31/03 to a $10,000 investment made in the Barclays U.S.Aggregate Bond Index (the |
| “Index”) on that date.All dividends and capital gain distributions are reinvested. |
| The fund’s performance shown in the line graph above takes into account all applicable fees and expenses for BASIC |
| and Investor shares.The Index is a widely accepted, unmanaged index of corporate, U.S. government and U.S. |
| government agency debt instruments, mortgage-backed securities, and asset-backed securities. Unlike a mutual fund, the |
| Index is not subject to charges, fees and other expenses. Investors cannot invest directly in any index. Further information |
| relating to fund performance, including expense reimbursements, if applicable, is contained in the Financial Highlights |
| section of the prospectus and elsewhere in this report. |
6
UNDERSTANDING YOUR FUND’S EXPENSES (Unaudited)
As a mutual fund investor, you pay ongoing expenses, such as management fees and other expenses. Using the information below, you can estimate how these expenses affect your investment and compare them with the expenses of other funds.You also may pay one-time transaction expenses, including sales charges (loads) and redemption fees, which are not shown in this section and would have resulted in higher total expenses. For more information, see your fund’s prospectus or talk to your financial adviser.
Review your fund’s expenses
The table below shows the expenses you would have paid on a $1,000 investment in Dreyfus Bond Market Index Fund from May 1, 2013 to October 31, 2013. It also shows how much a $1,000 investment would be worth at the close of the period, assuming actual returns and expenses.
Expenses and Value of a $1,000 Investment
assuming actual returns for the six months ended October 31, 2013
| | |
| | Investor Shares | BASIC Shares |
| Expenses paid per $1,000† | $1.99 | $.75 |
| Ending value (after expenses) | $977.90 | $979.10 |
COMPARING YOUR FUND’S EXPENSES
WITH THOSE OF OTHER FUNDS (Unaudited)
Using the SEC’s method to compare expenses
The Securities and Exchange Commission (SEC) has established guidelines to help investors assess fund expenses. Per these guidelines, the table below shows your fund’s expenses based on a $1,000 investment, assuming a hypothetical 5% annualized return. You can use this information to compare the ongoing expenses (but not transaction expenses or total cost) of investing in the fund with those of other funds.All mutual fund shareholder reports will provide this information to help you make this comparison. Please note that you cannot use this information to estimate your actual ending account balance and expenses paid during the period.
Expenses and Value of a $1,000 Investment
assuming a hypothetical 5% annualized return for the six months ended October 31, 2013
| | |
| | Investor Shares | BASIC Shares |
| Expenses paid per $1,000† | $2.04 | $.77 |
| Ending value (after expenses) | $1,023.19 | $1,024.45 |
|
| † Expenses are equal to the fund’s annualized expense ratio of .40% for Investor shares and .15% for BASIC shares, |
| multiplied by the average account value over the period, multiplied by 184/365 (to reflect the one-half year period). |
|
| STATEMENT OF INVESTMENTS |
| October 31, 2013 |
| | | | | |
| | Coupon | Maturity | Principal | | |
| Bonds and Notes—101.7% | Rate (%) | Date | Amount ($) | | Value ($) |
| Asset-Backed Ctfs./ | | | | | |
| Auto Receivables—.2% | | | | | |
| Ally Auto Receivables Trust, | | | | | |
| Ser. 2012-3, Cl. A4 | 1.06 | 2/15/17 | 500,000 | | 502,704 |
| Ally Auto Receivables Trust, | | | | | |
| Ser. 2012-1, Cl. A4 | 1.21 | 7/15/16 | 1,000,000 | | 1,009,367 |
| Ford Credit Auto Owner Trust, | | | | | |
| Ser. 2012-B, Cl. A4 | 1.00 | 9/15/17 | 400,000 | | 402,587 |
| Mercedes-Benz Auto Lease Trust, | | | | | |
| Ser. 2013-A, Cl. A3 | 0.59 | 2/15/16 | 1,000,000 | | 1,001,014 |
| Nissan Auto Lease Trust, | | | | | |
| Ser. 2013-A, Cl. A3 | 0.61 | 4/15/16 | 750,000 | | 749,249 |
| | | | | | 3,664,921 |
| Asset-Backed Ctfs./Credit Cards—.2% | | | | | |
| Capital One Multi-Asset Execution | | | | | |
| Trust, Ser. 2007-A7, Cl. A7 | 5.75 | 7/15/20 | 565,000 | | 657,027 |
| Chase Issuance Trust, | | | | | |
| Ser. 2012-A8, Cl. A8 | 0.54 | 10/16/17 | 1,250,000 | | 1,249,156 |
| Citibank Credit Card Issuance | | | | | |
| Trust, Ser. 2007-A8, Cl. A8 | 5.65 | 9/20/19 | 3,000,000 | | 3,477,949 |
| | | | | | 5,384,132 |
| Casinos—.0% | | | | | |
| Carnival, | | | | | |
| Gtd. Notes | 3.95 | 10/15/20 | 300,000 | | 304,766 |
| Commercial Mortgage | | | | | |
| Pass-Through Ctfs.—1.7% | | | | | |
| Banc of America Commercial | | | | | |
| Mortgage, Ser. 2007-1, Cl. A4 | 5.45 | 1/15/49 | 1,000,000 | | 1,102,420 |
| Banc of America Commercial | | | | | |
| Mortgage, Ser. 2007-4, Cl. A4 | 5.94 | 2/10/51 | 300,000 | a | 336,363 |
| Banc of America Merrill Lynch | | | | | |
| Commercial Mortgage, | | | | | |
| Ser. 2005-3, Cl. A4 | 4.67 | 7/10/43 | 1,000,000 | | 1,052,329 |
| Banc of America Merrill Lynch | | | | | |
| Commercial Mortgage, | | | | | |
| Ser. 2005-4, Cl. A5B | 5.00 | 7/10/45 | 1,800,000 | a | 1,914,889 |
| Bear Stearns Commercial Mortgage | | | | | |
| Securities, Ser. 2005-PWR8, Cl. A4 | 4.67 | 6/11/41 | 262,076 | | 274,390 |
8
| | | | | |
| | Coupon | Maturity | Principal | | |
| Bonds and Notes (continued) | Rate (%) | Date | Amount ($) | | Value ($) |
| Commercial Mortgage | | | | | |
| Pass-Through Ctfs. (continued) | | | | | |
| Bear Stearns Commercial Mortgage | | | | | |
| Securities, Ser. 2005-PWR9, | | | | | |
| Cl. A4A | 4.87 | 9/11/42 | 900,000 | | 949,941 |
| Bear Stearns Commercial Mortgage | | | | | |
| Securities, Ser. 2006-PW14, Cl. A4 | 5.20 | 12/11/38 | 1,000,000 | | 1,102,387 |
| Bear Stearns Commercial Mortgage | | | | | |
| Securities, Ser. 2005-PW10, Cl. A4 | 5.41 | 12/11/40 | 185,000 | a | 197,414 |
| Bear Stearns Commercial Mortgage | | | | | |
| Securities, Ser. 2006-PW12, Cl. A4 | 5.90 | 9/11/38 | 850,000 | a | 933,648 |
| Citigroup Commercial Mortgage | | | | | |
| Trust, Ser. 2006-C4, Cl. A3 | 5.78 | 3/15/49 | 225,000 | a | 245,932 |
| Citigroup Commercial Mortgage | | | | | |
| Trust, Ser. 2008-C7, Cl. A4 | 6.13 | 12/10/49 | 1,100,000 | a | 1,260,696 |
| Citigroup/Deutsche Bank Commercial | | | | | |
| Mortgage Trust, | | | | | |
| Ser. 2005-CD1, Cl. A4 | 5.22 | 7/15/44 | 1,900,000 | a | 2,027,030 |
| Citigroup/Deutsche Bank Commercial | | | | | |
| Mortgage Trust, | | | | | |
| Ser. 2006-CD2, Cl. A4 | 5.30 | 1/15/46 | 85,000 | a | 91,659 |
| Commercial Mortgage Trust, | | | | | |
| Ser. 2012-CR4, Cl. A3 | 2.85 | 10/15/45 | 1,000,000 | | 960,561 |
| Credit Suisse Commercial Mortgage | | | | | |
| Trust, Ser. 2006-C3, Cl. A3 | 5.79 | 6/15/38 | 1,482,420 | a | 1,623,246 |
| CWCapital Cobalt, | | | | | |
| Ser. 2007-C3, Cl. A4 | 5.77 | 5/15/46 | 1,000,000 | a | 1,120,192 |
| GS Mortgage Securities II, | | | | | |
| Ser. 2007-GG10, Cl. A4 | 5.80 | 8/10/45 | 1,000,000 | a,b | 1,111,332 |
| J.P. Morgan Chase Commercial | | | | | |
| Mortgage Securities, | | | | | |
| Ser. 2005-LDP3, Cl. A4A | 4.94 | 8/15/42 | 600,000 | a | 634,455 |
| J.P. Morgan Chase Commercial | | | | | |
| Mortgage Securities, | | | | | |
| Ser. 2007-LDPX, Cl. A3 | 5.42 | 1/15/49 | 1,200,000 | | 1,332,550 |
| J.P. Morgan Chase Commercial | | | | | |
| Mortgage Securities, | | | | | |
| Ser. 2007-CB18, Cl. A4 | 5.44 | 6/12/47 | 350,000 | | 388,253 |
STATEMENT OF INVESTMENTS (continued)
| | | | | |
| | Coupon | Maturity | Principal | | |
| Bonds and Notes (continued) | Rate (%) | Date | Amount ($) | | Value ($) |
| Commercial Mortgage | | | | | |
| Pass-Through Ctfs. (continued) | | | | | |
| J.P. Morgan Chase Commercial | | | | | |
| Mortgage Securities, | | | | | |
| Ser. 2006-CB14, Cl. A4 | 5.48 | 12/12/44 | 500,000 | a | 538,041 |
| J.P. Morgan Chase Commercial | | | | | |
| Mortgage Securities, | | | | | |
| Ser. 2007-CB20, Cl. A4 | 5.79 | 2/12/51 | 1,000,000 | a | 1,134,200 |
| LB-UBS Commercial Mortgage Trust, | | | | | |
| Ser. 2005-C3, Cl. AJ | 4.84 | 7/15/40 | 500,000 | | 519,840 |
| LB-UBS Commercial Mortgage Trust, | | | | | |
| Ser. 2007-C2, Cl. A3 | 5.43 | 2/15/40 | 995,597 | | 1,101,198 |
| Merrill Lynch Mortgage Trust, | | | | | |
| Ser. 2005-CKI1, Cl. A6 | 5.46 | 11/12/37 | 346,576 | a | 368,729 |
| Merrill Lynch Mortgage Trust, | | | | | |
| Ser. 2006-C2, Cl. A4 | 5.74 | 8/12/43 | 987,868 | a | 1,083,992 |
| Merrill Lynch Mortgage Trust, | | | | | |
| Ser. 2007-C1, Cl. A4 | 5.85 | 6/12/50 | 1,000,000 | a | 1,121,644 |
| Merrill Lynch/Countrywide | | | | | |
| Commercial Mortgage, | | | | | |
| Ser. 2007-7, Cl. ASB | 5.74 | 6/12/50 | 504,857 | a | 521,763 |
| Merrill Lynch/Countrywide | | | | | |
| Commercial Mortgage, | | | | | |
| Ser. 2007-7, Cl. A4 | 5.74 | 6/12/50 | 1,200,000 | a | 1,342,340 |
| Morgan Stanley Bank of America | | | | | |
| Merrill Lynch Trust, | | | | | |
| Ser. 2013-C9, Cl. A1 | 0.83 | 5/15/46 | 939,125 | | 933,204 |
| Morgan Stanley Bank of America | | | | | |
| Merrill Lynch Trust, | | | | | |
| Ser. 2013-C10, Cl. A1 | 1.39 | 7/15/46 | 86,305 | | 86,781 |
| Morgan Stanley Bank of America | | | | | |
| Merrill Lynch Trust, | | | | | |
| Ser. 2013-C8, Cl. A4 | 3.13 | 12/15/48 | 1,000,000 | | 982,293 |
| Morgan Stanley Capital I, | | | | | |
| Ser. 2007-IQ14, Cl. A4 | 5.69 | 4/15/49 | 1,300,000 | a | 1,446,852 |
| Morgan Stanley Capital I, | | | | | |
| Ser. 2006-HQ9, Cl. A4 | 5.73 | 7/12/44 | 444,609 | a | 488,058 |
| UBS Commercial Mortgage Trust, | | | | | |
| Ser. 2012-C1, Cl. A3 | 3.40 | 5/10/45 | 500,000 | | 503,296 |
| UBS-Barclays Commercial Mortgage | | | | | |
| Trust, Ser. 2012-C4, Cl. A5 | 2.85 | 12/10/45 | 500,000 | | 477,474 |
10
| | | | | |
| | Coupon | Maturity | Principal | | |
| Bonds and Notes (continued) | Rate (%) | Date | Amount ($) | | Value ($) |
| Commercial Mortgage | | | | | |
| Pass-Through Ctfs. (continued) | | | | | |
| UBS-Barclays Commercial Mortgage | | | | | |
| Trust, Ser. 2013-C6, Cl. A4 | 3.24 | 4/10/46 | 1,412,000 | | 1,387,333 |
| Wachovia Bank Commercial Mortgage | | | | | |
| Trust, Ser. 2005-C20, Cl. A7 | 5.12 | 7/15/42 | 800,000 | a | 847,675 |
| Wachovia Bank Commercial Mortgage | | | | | |
| Trust, Ser. 2006-C23, Cl. A4 | 5.42 | 1/15/45 | 952,447 | a | 1,020,995 |
| Wachovia Bank Commercial Mortgage | | | | | |
| Trust, Ser. 2006-C27, Cl. A3 | 5.77 | 7/15/45 | 974,625 | a | 1,053,366 |
| | | | | | 35,618,761 |
| Consumer Discretionary—2.3% | | | | | |
| Avon Products, | | | | | |
| Sr. Unscd. Notes | 4.20 | 7/15/18 | 250,000 | | 262,858 |
| CBS, | | | | | |
| Gtd. Debs | 7.88 | 7/30/30 | 300,000 | | 374,181 |
| CBS, | | | | | |
| Gtd. Notes | 5.50 | 5/15/33 | 250,000 | | 254,467 |
| Comcast, | | | | | |
| Gtd. Notes | 2.85 | 1/15/23 | 300,000 | b | 289,863 |
| Comcast, | | | | | |
| Gtd. Notes | 5.70 | 7/1/19 | 1,000,000 | | 1,175,483 |
| Comcast, | | | | | |
| Gtd. Notes | 6.45 | 3/15/37 | 1,150,000 | | 1,403,377 |
| Comcast, | | | | | |
| Gtd. Notes | 6.50 | 1/15/17 | 1,000,000 | | 1,161,965 |
| Comcast Cable Communications | | | | | |
| Holdings, Gtd. Notes | 9.46 | 11/15/22 | 304,000 | | 432,373 |
| Costco Wholesale, | | | | | |
| Sr. Unscd. Notes | 5.50 | 3/15/17 | 500,000 | | 571,216 |
| COX Communications, | | | | | |
| Sr. Unscd. Bonds | 5.50 | 10/1/15 | 450,000 | | 485,700 |
| CVS Caremark, | | | | | |
| Sr. Unscd. Notes | 5.75 | 6/1/17 | 49,000 | | 56,224 |
| CVS Caremark, | | | | | |
| Sr. Unscd. Notes | 5.75 | 5/15/41 | 630,000 | | 701,108 |
| Daimler Finance North America, | | | | | |
| Gtd. Notes | 8.50 | 1/18/31 | 200,000 | | 292,264 |
| DirecTV Holdings/Financing, | | | | | |
| Gtd. Notes | 3.50 | 3/1/16 | 2,500,000 | | 2,620,025 |
STATEMENT OF INVESTMENTS (continued)
| | | | |
| | Coupon | Maturity | Principal | |
| Bonds and Notes (continued) | Rate (%) | Date | Amount ($) | Value ($) |
| Consumer Discretionary (continued) | | | | |
| DirecTV Holdings/Financing, | | | | |
| Gtd. Notes | 6.00 | 8/15/40 | 800,000 | 790,331 |
| Discovery Communications, | | | | |
| Gtd. Notes | 6.35 | 6/1/40 | 700,000 | 799,588 |
| Dollar General, | | | | |
| Sr. Unscd. Notes | 1.88 | 4/15/18 | 1,000,000 | 977,327 |
| Ford Motor, | | | | |
| Sr. Unscd. Notes | 4.75 | 1/15/43 | 500,000 | 466,984 |
| Home Depot, | | | | |
| Sr. Unscd. Notes | 5.40 | 3/1/16 | 2,550,000 | 2,823,610 |
| Home Depot, | | | | |
| Sr. Unscd. Notes | 5.88 | 12/16/36 | 650,000 | 759,853 |
| Johnson Controls, | | | | |
| Sr. Unscd. Notes | 5.50 | 1/15/16 | 2,800,000 | 3,064,984 |
| Kohl’s, | | | | |
| Sr. Unscd. Notes | 4.75 | 12/15/23 | 500,000 | 522,935 |
| Lowe’s Cos., | | | | |
| Sr. Unscd. Notes | 3.88 | 9/15/23 | 500,000 | 515,669 |
| Lowe’s Cos., | | | | |
| Sr. Unscd. Notes | 6.65 | 9/15/37 | 850,000 | 1,052,160 |
| Macy’s Retail Holdings, | | | | |
| Gtd. Notes | 5.90 | 12/1/16 | 500,000 | 564,339 |
| Macy’s Retail Holdings, | | | | |
| Gtd. Notes | 6.38 | 3/15/37 | 830,000 | 924,653 |
| McDonald’s, | | | | |
| Sr. Unscd. Notes | 5.35 | 3/1/18 | 1,050,000 | 1,210,645 |
| NBCUniversal Media, | | | | |
| Gtd. Notes | 5.15 | 4/30/20 | 1,500,000 | 1,717,476 |
| News America, | | | | |
| Gtd. Debs | 7.75 | 12/1/45 | 100,000 | 126,470 |
| News America, | | | | |
| Gtd. Notes | 6.20 | 12/15/34 | 250,000 | 280,373 |
| News America, | | | | |
| Gtd. Notes | 6.40 | 12/15/35 | 1,000,000 | 1,146,290 |
| News America, | | | | |
| Gtd. Notes | 6.65 | 11/15/37 | 360,000 | 426,079 |
| News America, | | | | |
| Gtd. Notes | 8.25 | 8/10/18 | 150,000 | 191,245 |
| Nike, | | | | |
| Sr. Unscd. Notes | 2.25 | 5/1/23 | 300,000 | 278,042 |
12
| | | | |
| | Coupon | Maturity | Principal | |
| Bonds and Notes (continued) | Rate (%) | Date | Amount ($) | Value ($) |
| Consumer | | | | |
| Discretionary (continued) | | | | |
| Nike, | | | | |
| Sr. Unscd. Notes | 3.63 | 5/1/43 | 300,000 | 264,452 |
| Procter & Gamble, | | | | |
| Sr. Unscd. Notes | 5.55 | 3/5/37 | 300,000 | 350,898 |
| Starbucks, | | | | |
| Sr. Unscd. Bonds | 6.25 | 8/15/17 | 750,000 | 876,850 |
| Target, | | | | |
| Sr. Unscd. Notes | 5.38 | 5/1/17 | 400,000 | 456,217 |
| Target, | | | | |
| Sr. Unscd. Notes | 7.00 | 1/15/38 | 228,000 | 297,689 |
| Thomson Reuters, | | | | |
| Gtd. Notes | 6.50 | 7/15/18 | 800,000 | 942,974 |
| Time Warner, | | | | |
| Gtd. Notes | 4.75 | 3/29/21 | 1,500,000 | 1,629,585 |
| Time Warner, | | | | |
| Gtd. Notes | 7.63 | 4/15/31 | 1,100,000 | 1,395,878 |
| Time Warner Cable, | | | | |
| Gtd. Debs | 6.55 | 5/1/37 | 350,000 | 328,480 |
| Time Warner Cable, | | | | |
| Gtd. Debs | 7.30 | 7/1/38 | 495,000 | 500,534 |
| Time Warner Cable, | | | | |
| Gtd. Notes | 8.25 | 4/1/19 | 3,000,000 | 3,520,806 |
| Time Warner Cos., | | | | |
| Gtd. Debs | 6.95 | 1/15/28 | 325,000 | 397,115 |
| Viacom, | | | | |
| Sr. Unscd. Notes | 6.88 | 4/30/36 | 235,000 | 266,792 |
| Wal-Mart Stores, | | | | |
| Sr. Unscd. Notes | 3.63 | 7/8/20 | 4,100,000 | 4,369,288 |
| Wal-Mart Stores, | | | | |
| Sr. Unscd. Notes | 5.25 | 9/1/35 | 600,000 | 656,699 |
| Wal-Mart Stores, | | | | |
| Sr. Unscd. Notes | 6.50 | 8/15/37 | 635,000 | 798,486 |
| Walt Disney, | | | | |
| Sr. Unscd. Notes, | | | | |
| Ser. B | 7.00 | 3/1/32 | 150,000 | 198,893 |
| Wyndham Worldwide, | | | | |
| Sr. Unscd. Notes | 2.50 | 3/1/18 | 500,000 | 500,685 |
| Wyndham Worldwide, | | | | |
| Sr. Unscd. Notes | 3.90 | 3/1/23 | 500,000 | 484,064 |
STATEMENT OF INVESTMENTS (continued)
| | | | |
| | Coupon | Maturity | Principal | |
| Bonds and Notes (continued) | Rate (%) | Date | Amount ($) | Value ($) |
| Consumer Discretionary (continued) | | | | |
| Xerox, | | | | |
| Sr. Unscd. Notes | 6.75 | 2/1/17 | 750,000 | 860,753 |
| Yum! Brands, | | | | |
| Sr. Unscd. Notes | 6.88 | 11/15/37 | 650,000 | 780,043 |
| | | | | 48,597,338 |
| Consumer Staples—1.3% | | | | |
| Altria Group, | | | | |
| Gtd. Notes | 9.70 | 11/10/18 | 1,850,000 | 2,486,881 |
| Anheuser-Busch Cos., | | | | |
| Gtd. Bonds | 5.00 | 1/15/15 | 1,000,000 | 1,053,242 |
| Anheuser-Busch Cos., | | | | |
| Gtd. Notes | 5.50 | 1/15/18 | 145,000 | 167,556 |
| Anheuser-Busch Inbev Finance, | | | | |
| Gtd. Notes | 0.80 | 1/15/16 | 500,000 | 501,182 |
| Anheuser-Busch Inbev Finance, | | | | |
| Gtd. Notes | 2.63 | 1/17/23 | 500,000 | 473,460 |
| Anheuser-Busch Inbev Finance, | | | | |
| Gtd. Notes | 4.00 | 1/17/43 | 300,000 | 278,444 |
| Anheuser-Busch Inbev Worldwide | | | | |
| Gtd. Notes | 5.38 | 1/15/20 | 2,500,000 | 2,893,173 |
| Archer-Daniels-Midland, | | | | |
| Sr. Unscd. Notes | 5.45 | 3/15/18 | 130,000 | 150,133 |
| Coca-Cola, | | | | |
| Sr. Unscd. Notes | 3.30 | 9/1/21 | 2,000,000 | 2,052,992 |
| ConAgra Foods, | | | | |
| Sr. Unscd. Notes | 1.30 | 1/25/16 | 500,000 | 501,954 |
| ConAgra Foods, | | | | |
| Sr. Unscd. Notes | 1.90 | 1/25/18 | 500,000 | 497,057 |
| ConAgra Foods, | | | | |
| Sr. Unscd. Notes | 3.20 | 1/25/23 | 290,000 | 277,250 |
| ConAgra Foods, | | | | |
| Sr. Unscd. Notes | 4.65 | 1/25/43 | 300,000 | 283,444 |
| ConAgra Foods, | | | | |
| Sr. Unscd. Notes | 7.00 | 10/1/28 | 350,000 | 432,637 |
| Diageo Capital, | | | | |
| Gtd. Notes | 5.75 | 10/23/17 | 720,000 | 833,913 |
| Diageo Finance, | | | | |
| Gtd. Notes | 5.30 | 10/28/15 | 125,000 | 136,362 |
| Diageo Investment, | | | | |
| Gtd. Notes | 4.25 | 5/11/42 | 1,000,000 | 941,490 |
14
| | | | |
| | Coupon | Maturity | Principal | |
| Bonds and Notes (continued) | Rate (%) | Date | Amount ($) | Value ($) |
| Consumer Staples (continued) | | | | |
| Dr. Pepper Snapple Group, | | | | |
| Gtd. Notes | 6.82 | 5/1/18 | 200,000 | 239,611 |
| General Mills, | | | | |
| Sr. Unscd. Notes | 5.70 | 2/15/17 | 1,300,000 | 1,477,730 |
| Kellogg, | | | | |
| Sr. Unscd. Debs., Ser. B | 7.45 | 4/1/31 | 340,000 | 436,455 |
| Kimberly-Clark, | | | | |
| Sr. Unscd. Notes | 3.70 | 6/1/43 | 1,000,000 | 883,107 |
| Kraft Foods Group, | | | | |
| Sr. Unscd. Notes | 2.25 | 6/5/17 | 490,000 | 501,978 |
| Kraft Foods Group, | | | | |
| Sr. Unscd. Notes | 3.50 | 6/6/22 | 490,000 | 488,251 |
| Kraft Foods Group, | | | | |
| Sr. Unscd. Notes | 5.00 | 6/4/42 | 400,000 | 403,561 |
| Kroger, | | | | |
| Gtd. Notes | 7.50 | 4/1/31 | 800,000 | 995,138 |
| Mondelez International, | | | | |
| Sr. Unscd. Notes | 6.13 | 2/1/18 | 975,000 | 1,133,072 |
| Mondelez International, | | | | |
| Sr. Unscd. Notes | 6.50 | 2/9/40 | 365,000 | 435,993 |
| Nabisco, | | | | |
| Sr. Unscd. Debs | 7.55 | 6/15/15 | 640,000 | 708,108 |
| Pepsi Bottling Group, | | | | |
| Gtd. Notes, Ser. B | 7.00 | 3/1/29 | 800,000 | 1,028,092 |
| PepsiCo, | | | | |
| Sr. Unscd. Notes | 0.70 | 8/13/15 | 1,000,000 | 1,002,603 |
| PepsiCo, | | | | |
| Sr. Unscd. Notes | 7.90 | 11/1/18 | 1,000,000 | 1,275,205 |
| Philip Morris International, | | | | |
| Sr. Unscd. Notes | 4.50 | 3/20/42 | 650,000 | 622,712 |
| Philip Morris International, | | | | |
| Sr. Unscd. Notes | 5.65 | 5/16/18 | 760,000 | 885,095 |
| Reynolds American, | | | | |
| Gtd. Notes | 4.85 | 9/15/23 | 650,000 | 689,279 |
| SYSCO, | | | | |
| Gtd. Notes | 5.38 | 9/21/35 | 350,000 | 390,181 |
| | | | | 27,557,341 |
| Energy—2.8% | | | | |
| Anadarko Petroleum, | | | | |
| Sr. Unscd. Notes | 5.95 | 9/15/16 | 350,000 | 395,650 |
STATEMENT OF INVESTMENTS (continued)
| | | | | |
| | Coupon | Maturity | Principal | | |
| Bonds and Notes (continued) | Rate (%) | Date | Amount ($) | | Value ($) |
| Energy (continued) | | | | | |
| Anadarko Petroleum, | | | | | |
| Sr. Unscd. Notes | 6.45 | 9/15/36 | 150,000 | | 177,110 |
| Apache, | | | | | |
| Sr. Unscd. Notes | 6.00 | 1/15/37 | 380,000 | | 434,000 |
| Baker Hughes, | | | | | |
| Sr. Unscd. Notes | 5.13 | 9/15/40 | 1,000,000 | | 1,088,372 |
| BP Capital Markets, | | | | | |
| Gtd. Notes | 2.50 | 11/6/22 | 800,000 | | 741,124 |
| BP Capital Markets, | | | | | |
| Gtd. Notes | 3.20 | 3/11/16 | 1,000,000 | | 1,052,369 |
| BP Capital Markets, | | | | | |
| Gtd. Notes | 3.25 | 5/6/22 | 1,200,000 | | 1,186,513 |
| Canadian Natural Resources, | | | | | |
| Sr. Unscd. Notes | 4.90 | 12/1/14 | 350,000 | | 365,588 |
| Canadian Natural Resources, | | | | | |
| Sr. Unscd. Notes | 6.25 | 3/15/38 | 430,000 | | 495,774 |
| Cenovus Energy, | | | | | |
| Sr. Unscd. Notes | 3.80 | 9/15/23 | 1,000,000 | | 1,006,616 |
| Chevron, | | | | | |
| Sr. Unscd. Notes | 1.72 | 6/24/18 | 1,000,000 | | 1,002,707 |
| Chevron, | | | | | |
| Sr. Unscd. Notes | 3.19 | 6/24/23 | 400,000 | | 396,798 |
| CNOOC Finance 2013, | | | | | |
| Gtd. Notes | 1.13 | 5/9/16 | 500,000 | | 497,339 |
| CNOOC Finance 2013, | | | | | |
| Gtd. Notes | 3.00 | 5/9/23 | 500,000 | | 456,362 |
| ConocoPhillips, | | | | | |
| Gtd. Notes | 6.50 | 2/1/39 | 1,000,000 | | 1,283,439 |
| ConocoPhillips Holding, | | | | | |
| Sr. Unscd. Notes | 6.95 | 4/15/29 | 125,000 | | 161,086 |
| Devon Energy, | | | | | |
| Sr. Unscd. Notes | 5.60 | 7/15/41 | 650,000 | | 688,425 |
| Devon Financing, | | | | | |
| Gtd. Debs | 7.88 | 9/30/31 | 275,000 | | 359,584 |
| Enbridge Energy Partners, | | | | | |
| Sr. Unscd. Notes | 5.50 | 9/15/40 | 720,000 | | 720,827 |
| EnCana, | | | | | |
| Sr. Unscd. Bonds | 7.20 | 11/1/31 | 625,000 | | 724,645 |
| Energy Transfer Partners, | | | | | |
| Sr. Unscd. Notes | 3.60 | 2/1/23 | 1,000,000 | b | 956,004 |
16
| | | | | |
| | Coupon | Maturity | Principal | | |
| Bonds and Notes (continued) | Rate (%) | Date | Amount ($) | | Value ($) |
| Energy (continued) | | | | | |
| Energy Transfer Partners, | | | | | |
| Sr. Unscd. Notes | 4.90 | 2/1/24 | 500,000 | | 523,006 |
| Energy Transfer Partners, | | | | | |
| Sr. Unscd. Notes | 5.15 | 2/1/43 | 500,000 | | 470,419 |
| Enterprise Products Operating, | | | | | |
| Gtd. Bonds, Ser. L | 6.30 | 9/15/17 | 1,925,000 | | 2,237,591 |
| Enterprise Products Operating, | | | | | |
| Gtd. Notes | 4.45 | 2/15/43 | 750,000 | | 682,463 |
| Halliburton, | | | | | |
| Sr. Unscd. Notes | 6.15 | 9/15/19 | 1,200,000 | | 1,444,925 |
| Hess, | | | | | |
| Sr. Unscd. Bonds | 7.88 | 10/1/29 | 175,000 | | 225,418 |
| Hess, | | | | | |
| Sr. Unscd. Notes | 8.13 | 2/15/19 | 1,200,000 | | 1,513,702 |
| Kerr-McGee, | | | | | |
| Gtd. Notes | 6.95 | 7/1/24 | 600,000 | | 725,099 |
| Kinder Morgan Energy Partners, | | | | | |
| Sr. Unscd. Notes | 3.50 | 9/1/23 | 500,000 | b | 474,434 |
| Kinder Morgan Energy Partners, | | | | | |
| Sr. Unscd. Notes | 4.15 | 3/1/22 | 1,000,000 | | 1,019,123 |
| Kinder Morgan Energy Partners, | | | | | |
| Sr. Unscd. Notes | 5.00 | 3/1/43 | 300,000 | | 284,048 |
| Kinder Morgan Energy Partners, | | | | | |
| Sr. Unscd. Notes | 6.95 | 1/15/38 | 1,075,000 | | 1,264,126 |
| Kinder Morgan Energy Partners, | | | | | |
| Sr. Unscd. Notes | 7.40 | 3/15/31 | 350,000 | | 420,160 |
| Marathon Oil, | | | | | |
| Sr. Unscd. Notes | 5.90 | 3/15/18 | 500,000 | | 576,605 |
| Marathon Oil, | | | | | |
| Sr. Unscd. Notes | 6.60 | 10/1/37 | 350,000 | | 429,762 |
| Nabors Industries, | | | | | |
| Gtd. Notes | 2.35 | 9/15/16 | 450,000 | c | 456,347 |
| Nexen, | | | | | |
| Gtd. Notes | 5.88 | 3/10/35 | 125,000 | | 134,425 |
| Nexen, | | | | | |
| Gtd. Notes | 7.50 | 7/30/39 | 1,000,000 | | 1,294,898 |
| Occidental Petroleum, | | | | | |
| Sr. Unscd. Notes, Ser. 1 | 4.10 | 2/1/21 | 1,700,000 | | 1,817,570 |
| ONEOK, | | | | | |
| Sr. Unscd. Notes | 5.20 | 6/15/15 | 200,000 | | 212,320 |
STATEMENT OF INVESTMENTS (continued)
| | | | |
| | Coupon | Maturity | Principal | |
| Bonds and Notes (continued) | Rate (%) | Date | Amount ($) | Value ($) |
| Energy (continued) | | | | |
| ONEOK Partners, | | | | |
| Gtd. Notes | 5.00 | 9/15/23 | 500,000 | 535,405 |
| ONEOK Partners, | | | | |
| Gtd. Notes | 6.15 | 10/1/16 | 545,000 | 614,434 |
| ONEOK Partners, | | | | |
| Gtd. Notes | 6.85 | 10/15/37 | 60,000 | 69,026 |
| Pemex Project Funding Master | | | | |
| Trust, Gtd. Bonds | 6.63 | 6/15/35 | 1,760,000 | 1,918,400 |
| Pemex Project Funding Master | | | | |
| Trust, Gtd. Notes | 7.38 | 12/15/14 | 400,000 | 430,000 |
| Petrobras Global Finance, | | | | |
| Gtd. Notes | 2.00 | 5/20/16 | 550,000 | 547,911 |
| Petrobras Global Finance, | | | | |
| Gtd. Notes | 3.00 | 1/15/19 | 500,000 | 477,046 |
| Petrobras Global Finance, | | | | |
| Gtd. Notes | 5.63 | 5/20/43 | 500,000 | 429,959 |
| Petrobras International Finance, | | | | |
| Gtd. Notes | 2.88 | 2/6/15 | 500,000 | 509,449 |
| Petrobras International Finance, | | | | |
| Gtd. Notes | 5.38 | 1/27/21 | 2,500,000 | 2,554,432 |
| Petrobras International Finance, | | | | |
| Gtd. Notes | 5.88 | 3/1/18 | 625,000 | 678,789 |
| Phillips 66, | | | | |
| Gtd. Notes | 2.95 | 5/1/17 | 590,000 | 614,553 |
| Plains All American Pipeline, | | | | |
| Sr. Unscd. Notes | 3.85 | 10/15/23 | 750,000 | 754,869 |
| Plains All American Pipeline, | | | | |
| Sr. Unscd. Notes | 6.13 | 1/15/17 | 525,000 | 599,280 |
| Shell International Finance, | | | | |
| Gtd. Notes | 4.30 | 9/22/19 | 2,600,000 | 2,889,575 |
| Shell International Finance, | | | | |
| Gtd. Notes | 6.38 | 12/15/38 | 500,000 | 627,733 |
| Spectra Energy Capital, | | | | |
| Sr. Unscd. Notes | 8.00 | 10/1/19 | 225,000 | 274,611 |
| Spetra Energy Partners, | | | | |
| Sr. Unscd. Notes | 5.95 | 9/25/43 | 400,000 | 437,914 |
| Statoil, | | | | |
| Gtd. Notes | 2.65 | 1/15/24 | 1,000,000 | 933,457 |
18
| | | | |
| | Coupon | Maturity | Principal | |
| Bonds and Notes (continued) | Rate (%) | Date | Amount ($) | Value ($) |
| Energy (continued) | | | | |
| Statoil, | | | | |
| Gtd. Notes | 3.95 | 5/15/43 | 500,000 | 454,452 |
| Statoil, | | | | |
| Gtd. Notes | 5.25 | 4/15/19 | 1,600,000 | 1,845,005 |
| Suncor Energy, | | | | |
| Sr. Unscd. Notes | 6.50 | 6/15/38 | 950,000 | 1,133,516 |
| Sunoco | | | | |
| Logistics Partners | | | | |
| Operations, Gtd. Notes | 3.45 | 1/15/23 | 200,000 | 189,112 |
| Sunoco Logistics Partners | | | | |
| Operations, Gtd. Notes | 4.95 | 1/15/43 | 200,000 | 183,782 |
| Talisman Energy, | | | | |
| Sr. Unscd. Notes | 6.25 | 2/1/38 | 200,000 | 194,598 |
| Tennessee Gas Pipeline, | | | | |
| Sr. Unscd. Debs | 7.00 | 10/15/28 | 390,000 | 485,396 |
| Tennessee Gas Pipeline, | | | | |
| Sr. Unscd Debs | 7.63 | 4/1/37 | 70,000 | 92,410 |
| Total Capital, | | | | |
| Gtd. Notes | 4.45 | 6/24/20 | 1,400,000 | 1,550,744 |
| TransCanada Pipelines, | | | | |
| Sr. Unscd. Notes | 7.63 | 1/15/39 | 660,000 | 897,004 |
| Trans-Canada Pipelines, | | | | |
| Sr. Unscd. Notes | 3.75 | 10/16/23 | 500,000 | 504,194 |
| Trans-Canada Pipelines, | | | | |
| Sr. Unscd. Notes | 5.85 | 3/15/36 | 200,000 | 224,129 |
| Trans-Canada Pipelines, | | | | |
| Sr. Unscd. Notes | 6.20 | 10/15/37 | 75,000 | 87,234 |
| Transocean, | | | | |
| Gtd. Notes | 7.50 | 4/15/31 | 875,000 | 991,020 |
| Valero Energy, | | | | |
| Gtd. Notes | 6.63 | 6/15/37 | 1,115,000 | 1,284,305 |
| Valero Energy, | | | | |
| Gtd. Notes | 7.50 | 4/15/32 | 170,000 | 207,485 |
| Weatherford | | | | |
| International, | | | | |
| Gtd. Notes | 6.75 | 9/15/40 | 1,000,000 | 1,078,116 |
| Williams Partners, | | | | |
| Sr. Unscd. Notes | 6.30 | 4/15/40 | 800,000 | 886,078 |
STATEMENT OF INVESTMENTS (continued)
| | | | |
| | Coupon | Maturity | Principal | |
| Bonds and Notes (continued) | Rate (%) | Date | Amount ($) | Value ($) |
| Energy (continued) | | | | |
| XTO Energy, | | | | |
| Sr. Unscd. Notes | 6.75 | 8/1/37 | 625,000 | 847,762 |
| | | | | 59,429,958 |
| Financial—7.3% | | | | |
| Abbey National Treasury Service, | | | | |
| Bank Gtd. Notes | 3.05 | 8/23/18 | 800,000 | 829,098 |
| Aflac, | | | | |
| Sr. Unscd. Notes | 3.63 | 6/15/23 | 600,000 | 594,535 |
| American Express, | | | | |
| Sr. Unscd. Notes | 1.55 | 5/22/18 | 1,750,000 | 1,726,750 |
| American Express, | | | | |
| Sr. Unscd. Notes | 6.15 | 8/28/17 | 700,000 | 817,869 |
| American Express, | | | | |
| Sr. Unscd. Notes | 7.00 | 3/19/18 | 500,000 | 605,645 |
| American Honda Finance, | | | | |
| Sr. Unscd. Notes | 1.13 | 10/7/16 | 400,000 | 402,460 |
| American International Group, | | | | |
| Sr. Unscd. Notes | 4.88 | 6/1/22 | 1,400,000 | 1,535,131 |
| American International Group, | | | | |
| Sr. Unscd. Notes | 5.60 | 10/18/16 | 600,000 | 673,124 |
| American International Group, | | | | |
| Sr. Unscd. Notes | 5.85 | 1/16/18 | 1,000,000 | 1,156,365 |
| American International Group, | | | | |
| Sr. Unscd. Notes | 8.25 | 8/15/18 | 2,100,000 | 2,662,071 |
| AXA, | | | | |
| Sub. Bonds | 8.60 | 12/15/30 | 165,000 | 201,257 |
| Bank of America, | | | | |
| Sr. Unscd. Notes | 1.25 | 1/11/16 | 1,000,000 | 1,003,413 |
| Bank of America, | | | | |
| Sr. Unscd. Notes | 2.60 | 1/15/19 | 400,000 | 403,189 |
| Bank of America, | | | | |
| Sr. Unscd. Notes | 3.30 | 1/11/23 | 1,000,000 | 961,635 |
| Bank of America, | | | | |
| Sr. Unscd. Notes | 3.70 | 9/1/15 | 1,000,000 | 1,048,212 |
| Bank of America, | | | | |
| Sr. Unscd. Notes | 5.63 | 10/14/16 | 575,000 | 644,923 |
| Bank of America, | | | | |
| Sr. Unscd. Notes, Ser. L | 5.65 | 5/1/18 | 965,000 | 1,101,860 |
20
| | | | |
| | Coupon | Maturity | Principal | |
| Bonds and Notes (continued) | Rate (%) | Date | Amount ($) | Value ($) |
| Financial (continued) | | | | |
| Bank of America, | | | | |
| Sub. Notes | 7.80 | 9/15/16 | 235,000 | 272,773 |
| Bank of Montreal, | | | | |
| Sr. Unscd. Notes | 2.50 | 1/11/17 | 1,000,000 | 1,040,285 |
| Bank of Nova Scotia, | | | | |
| Sr. Unscd. Notes | 1.38 | 7/15/16 | 1,000,000 | 1,012,313 |
| Barclays Bank, | | | | |
| Sr. Unscd. Notes | 6.75 | 5/22/19 | 1,300,000 | 1,573,562 |
| BB&T, | | | | |
| Sub. Notes | 4.90 | 6/30/17 | 150,000 | 166,668 |
| BB&T, | | | | |
| Sub. Notes | 5.20 | 12/23/15 | 300,000 | 325,713 |
| Bear Stearns, | | | | |
| Sr. Unscd. Notes | 5.30 | 10/30/15 | 100,000 | 108,265 |
| Bear Stearns, | | | | |
| Sr. Unscd. Notes | 7.25 | 2/1/18 | 270,000 | 325,906 |
| Bear Stearns, | | | | |
| Sub. Notes | 5.55 | 1/22/17 | 500,000 | 557,850 |
| Berkshire Hathaway Finance, | | | | |
| Gtd. Notes | 4.85 | 1/15/15 | 1,850,000 | 1,947,711 |
| Berkshire Hathaway Finance, | | | | |
| Gtd. Notes | 5.75 | 1/15/40 | 675,000 | 770,939 |
| Blackrock, | | | | |
| Sr. Unscd. Notes, Ser. 2 | 5.00 | 12/10/19 | 500,000 | 573,747 |
| BNP Paribas, | | | | |
| Bank Gtd. Notes | 5.00 | 1/15/21 | 1,400,000 | 1,545,747 |
| Boston Properties, | | | | |
| Sr. Unscd. Bonds | 5.63 | 11/15/20 | 1,400,000 | 1,608,505 |
| Boston Properties, | | | | |
| Sr. Unscd. Notes | 5.00 | 6/1/15 | 500,000 | 532,887 |
| Branch Banking & Trust, | | | | |
| Sr. Unscd. Notes | 1.45 | 10/3/16 | 750,000 | 759,201 |
| Capital One Financial Company, | | | | |
| Sr. Unscd. Notes | 4.75 | 7/15/21 | 730,000 | 787,052 |
| Chubb, | | | | |
| Sr. Unscd. Notes | 6.00 | 5/11/37 | 540,000 | 652,233 |
| Citigroup, | | | | |
| Sr. Unscd. Notes | 3.88 | 10/25/23 | 400,000 | 400,874 |
STATEMENT OF INVESTMENTS (continued)
| | | | |
| | Coupon | Maturity | Principal | |
| Bonds and Notes (continued) | Rate (%) | Date | Amount ($) | Value ($) |
| Financial (continued) | | | | |
| Citigroup, | | | | |
| Sr. Unscd. Notes | 4.59 | 12/15/15 | 900,000 | 964,086 |
| Citigroup, | | | | |
| Sr. Unscd. Notes | 6.13 | 11/21/17 | 3,635,000 | 4,223,041 |
| Citigroup, | | | | |
| Sr. Unscd. Notes | 6.63 | 1/15/28 | 100,000 | 117,281 |
| Citigroup, | | | | |
| Sr. Unscd. Notes | 6.88 | 3/5/38 | 225,000 | 286,185 |
| Citigroup, | | | | |
| Sr. Unscd. Notes | 8.50 | 5/22/19 | 760,000 | 984,483 |
| Citigroup, | | | | |
| Sub. Notes | 4.05 | 7/30/22 | 500,000 | 495,680 |
| Citigroup, | | | | |
| Sub. Notes | 6.13 | 8/25/36 | 575,000 | 607,337 |
| CNA Financial, | | | | |
| Sr. Unscd. Notes | 6.50 | 8/15/16 | 100,000 | 113,167 |
| Commonwealth Bank Australia, | | | | |
| Sr. Unscd. Notes | 2.50 | 9/20/18 | 650,000 | 664,836 |
| DDR, | | | | |
| Sr. Unscd. Notes | 3.38 | 5/15/23 | 1,000,000 | 935,885 |
| Deutsche Bank AG London, | | | | |
| Sr. Unscd. Notes | 6.00 | 9/1/17 | 845,000 | 975,972 |
| Discover Bank, | | | | |
| Sr. Unscd. Notes | 2.00 | 2/21/18 | 500,000 | 494,986 |
| ERP Operating, | | | | |
| Sr. Unscd. Notes | 5.38 | 8/1/16 | 95,000 | 105,677 |
| Fifth Third Bank, | | | | |
| Sub. Notes | 8.25 | 3/1/38 | 1,000,000 | 1,356,845 |
| Ford Motor Credit, | | | | |
| Sr. Unscd. Notes | 2.38 | 1/16/18 | 500,000 | 503,363 |
| Ford Motor Credit, | | | | |
| Sr. Unscd. Notes | 2.50 | 1/15/16 | 900,000 | 924,245 |
| Ford Motor Credit, | | | | |
| Sr. Unscd. Notes | 4.38 | 8/6/23 | 1,250,000 | 1,287,654 |
| Ford Motor Credit, | | | | |
| Sr. Unscd. Notes | 5.88 | 8/2/21 | 1,500,000 | 1,721,231 |
| General Electric Capital, | | | | |
| Sr. Unscd. Notes | 1.00 | 1/8/16 | 1,000,000 | 1,004,923 |
| General Electric Capital, | | | | |
| Sr. Unscd. Notes | 3.10 | 1/9/23 | 1,000,000 | 965,875 |
22
| | | | |
| | Coupon | Maturity | Principal | |
| Bonds and Notes (continued) | Rate (%) | Date | Amount ($) | Value ($) |
| Financial (continued) | | | | |
| General Electric Capital, | | | | |
| Sr. Unscd. Notes | 3.50 | 6/29/15 | 560,000 | 586,317 |
| General Electric Capital, | | | | |
| Sr. Unscd. Notes | 4.65 | 10/17/21 | 1,400,000 | 1,535,472 |
| General Electric Capital, | | | | |
| Sr. Unscd. Notes | 5.00 | 1/8/16 | 375,000 | 408,537 |
| General Electric Capital, | | | | |
| Sr. Unscd. Notes | 5.63 | 9/15/17 | 1,000,000 | 1,149,456 |
| General Electric Capital, | | | | |
| Sr. Unscd. Notes | 5.63 | 5/1/18 | 1,335,000 | 1,550,126 |
| General Electric Capital, | | | | |
| Sr. Unscd. Notes | 5.88 | 1/14/38 | 1,000,000 | 1,132,402 |
| General Electric Capital, | | | | |
| Sr. Unscd. Notes | 6.15 | 8/7/37 | 850,000 | 991,323 |
| General Electric Capital, | | | | |
| Sr. Unscd. Notes, Ser. A | 6.75 | 3/15/32 | 1,000,000 | 1,227,602 |
| Genworth Holdings, | | | | |
| Gtd. Notes | 4.90 | 8/15/23 | 1,000,000 | 1,043,488 |
| Goldman Sachs Capital I, | | | | |
| Gtd. Cap. Secs | 6.35 | 2/15/34 | 350,000 | 351,299 |
| Goldman Sachs Group, | | | | |
| Sr. Unscd. Notes | 3.63 | 1/22/23 | 1,000,000 | 977,456 |
| Goldman Sachs Group, | | | | |
| Sr. Unscd. Notes | 3.70 | 8/1/15 | 6,000,000 | 6,269,778 |
| Goldman Sachs Group, | | | | |
| Sr. Unscd. Notes | 6.13 | 2/15/33 | 475,000 | 535,439 |
| Goldman Sachs Group, | | | | |
| Sr. Unscd. Notes | 6.15 | 4/1/18 | 680,000 | 788,889 |
| Goldman Sachs Group, | | | | |
| Sr. Unscd. Notes | 6.25 | 9/1/17 | 190,000 | 219,976 |
| Goldman Sachs Group, | | | | |
| Sr. Unscd. Notes | 7.50 | 2/15/19 | 1,000,000 | 1,229,271 |
| Goldman Sachs Group, | | | | |
| Sub. Notes | 6.75 | 10/1/37 | 2,000,000 | 2,191,374 |
| Host Hotels & Resorts, | | | | |
| Sr. Unscd. Notes | 6.00 | 10/1/21 | 500,000 | 554,325 |
| HSBC Finance, | | | | |
| Sr. Unscd. Notes | 5.50 | 1/19/16 | 1,125,000 | 1,229,155 |
| HSBC Holdings, | | | | |
| Sr. Unscd. Notes | 5.10 | 4/5/21 | 1,500,000 | 1,673,346 |
STATEMENT OF INVESTMENTS (continued)
| | | | |
| | Coupon | Maturity | Principal | |
| Bonds and Notes (continued) | Rate (%) | Date | Amount ($) | Value ($) |
| Financial (continued) | | | | |
| HSBC Holdings, | | | | |
| Sub. Notes | 6.50 | 5/2/36 | 1,350,000 | 1,596,896 |
| HSBC Holdings, | | | | |
| Sub. Notes | 6.50 | 9/15/37 | 555,000 | 659,665 |
| ING US, | | | | |
| Gtd. Notes | 5.50 | 7/15/22 | 750,000 | 825,041 |
| IntercontinentalExchange Group, | | | | |
| Gtd. Notes | 4.00 | 10/15/23 | 350,000 | 357,831 |
| Intesa Sanpaolo, | | | | |
| Bank Gtd. Notes | 3.13 | 1/15/16 | 500,000 | 510,156 |
| Jefferies Group, | | | | |
| Sr. Unscd. Debs | 6.25 | 1/15/36 | 200,000 | 196,042 |
| Jefferies Group, | | | | |
| Sr. Unscd. Debs | 6.45 | 6/8/27 | 35,000 | 36,668 |
| Jefferies Group, | | | | |
| Sr. Unscd. Notes | 5.13 | 1/20/23 | 500,000 | 507,800 |
| John Deere Capital, | | | | |
| Sr. Unscd. Notes | 3.15 | 10/15/21 | 1,900,000 | 1,921,563 |
| JPMorgan Chase & Co., | | | | |
| Sr. Unscd. Notes | 3.15 | 7/5/16 | 1,500,000 | 1,576,475 |
| JPMorgan Chase & Co., | | | | |
| Sr. Unscd. Notes | 3.20 | 1/25/23 | 1,000,000 | 962,084 |
| JPMorgan Chase & Co., | | | | |
| Sr. Unscd. Notes | 3.70 | 1/20/15 | 700,000 | 725,373 |
| JPMorgan Chase & Co., | | | | |
| Sr. Unscd. Notes | 6.00 | 1/15/18 | 500,000 | 578,844 |
| JPMorgan Chase & Co., | | | | |
| Sr. Unscd. Notes | 6.30 | 4/23/19 | 1,500,000 | 1,779,768 |
| JPMorgan Chase & Co., | | | | |
| Sr. Unscd. Notes | 6.40 | 5/15/38 | 650,000 | 786,029 |
| JPMorgan Chase & Co., | | | | |
| Sub. Notes | 5.15 | 10/1/15 | 3,950,000 | 4,243,635 |
| JPMorgan Chase Bank, | | | | |
| Sub. Notes | 6.00 | 10/1/17 | 150,000 | 173,066 |
| KeyBank, | | | | |
| Sub. Notes | 6.95 | 2/1/28 | 100,000 | 121,192 |
| Keycorp, | | | | |
| Sr. Unscd. Notes | 3.75 | 8/13/15 | 1,000,000 | 1,050,490 |
| Kimco Realty, | | | | |
| Sr. Unscd. Notes | 3.13 | 6/1/23 | 250,000 | 232,393 |
24
| | | | | |
| | Coupon | Maturity | Principal | | |
| Bonds and Notes (continued) | Rate (%) | Date | Amount ($) | | Value ($) |
| Financial (continued) | | | | | |
| Leucadia National, | | | | | |
| Sr. Unscd. Notes | 6.63 | 10/23/43 | 400,000 | | 394,544 |
| Lincoln National, | | | | | |
| Sr. Unscd. Notes | 6.15 | 4/7/36 | 950,000 | | 1,104,562 |
| Loews, | | | | | |
| Sr. Unscd. Notes | 2.63 | 5/15/23 | 250,000 | | 231,860 |
| Marsh & McLennan Cos., | | | | | |
| Sr. Unscd. Notes | 5.88 | 8/1/33 | 275,000 | | 299,813 |
| Merrill Lynch & Co., | | | | | |
| Sr. Unscd. Notes | 6.40 | 8/28/17 | 1,665,000 | | 1,936,508 |
| Merrill Lynch & Co., | | | | | |
| Sr. Unscd. Notes | 6.88 | 4/25/18 | 2,640,000 | | 3,138,625 |
| Merrill Lynch & Co., | | | | | |
| Sr. Unscd. Notes | 6.88 | 11/15/18 | 150,000 | | 179,913 |
| Merrill Lynch & Co., | | | | | |
| Sub. Notes | 6.05 | 5/16/16 | 575,000 | | 636,071 |
| MetLife, | | | | | |
| Sr. Unscd. Notes | 6.38 | 6/15/34 | 1,400,000 | | 1,719,756 |
| Mid-America Apt., | | | | | |
| Sr. Unscd. Notes | 4.30 | 10/15/23 | 400,000 | | 402,269 |
| Morgan Stanley, | | | | | |
| Notes | 5.45 | 1/9/17 | 1,100,000 | | 1,226,474 |
| Morgan Stanley, | | | | | |
| Notes | 6.63 | 4/1/18 | 2,700,000 | | 3,169,692 |
| Morgan Stanley, | | | | | |
| Sr. Unscd. Notes | 1.75 | 2/25/16 | 500,000 | | 505,191 |
| Morgan Stanley, | | | | | |
| Sr. Unscd. Notes | 3.75 | 2/25/23 | 500,000 | b | 494,622 |
| Morgan Stanley, | | | | | |
| Sub. Notes | 4.10 | 5/22/23 | 1,000,000 | b | 967,831 |
| Morgan Stanley, | | | | | |
| Sr. Unscd. Notes | 5.75 | 10/18/16 | 175,000 | | 196,449 |
| Morgan Stanley, | | | | | |
| Sr. Unscd. Notes | 7.25 | 4/1/32 | 300,000 | | 376,760 |
| Morgan Stanley, | | | | | |
| Sr. Unscd. Notes | 7.30 | 5/13/19 | 1,300,000 | | 1,589,485 |
| National Australia Bank, | | | | | |
| Sr. Unscd. Notes | 2.00 | 3/9/15 | 490,000 | | 499,887 |
| National City, | | | | | |
| Sub. Notes | 6.88 | 5/15/19 | 600,000 | | 720,796 |
STATEMENT OF INVESTMENTS (continued)
| | | | |
| | Coupon | Maturity | Principal | |
| Bonds and Notes (continued) | Rate (%) | Date | Amount ($) | Value ($) |
| Financial (continued) | | | | |
| National Rural Utilities | | | | |
| Cooperative Finance, Coll. | | | | |
| Trust Bonds | 5.45 | 2/1/18 | 1,100,000 | 1,262,348 |
| Nomura Holdings, | | | | |
| Sr. Unscd. Notes | 6.70 | 3/4/20 | 1,600,000 | 1,847,285 |
| Oesterreichische Kontrollbank, | | | | |
| Govt. Gtd. Notes | 4.88 | 2/16/16 | 1,500,000 | 1,647,162 |
| PNC Bank, | | | | |
| Sr. Unscd. Notes | 1.30 | 10/3/16 | 1,250,000 | 1,259,332 |
| PNC Bank, | | | | |
| Sub. Notes | 3.80 | 7/25/23 | 1,000,000 | 996,872 |
| PNC Funding, | | | | |
| Bank Gtd. Notes | 5.25 | 11/15/15 | 225,000 | 243,805 |
| Principal Financial Group, | | | | |
| Gtd. Notes | 6.05 | 10/15/36 | 225,000 | 264,157 |
| Progressive, | | | | |
| Sr. Unscd. Notes | 6.63 | 3/1/29 | 100,000 | 121,572 |
| ProLogis, | | | | |
| Gtd. Notes | 6.88 | 3/15/20 | 505,000 | 603,039 |
| Rabobank Nederland, | | | | |
| Bank Gtd. Notes | 3.38 | 1/19/17 | 5,000,000 | 5,333,435 |
| Realty Income, | | | | |
| Sr. Unscd. Notes | 5.95 | 9/15/16 | 100,000 | 111,992 |
| Regency Centers, | | | | |
| Gtd. Notes | 5.88 | 6/15/17 | 200,000 | 223,780 |
| Reinsurance Group of America, | | | | |
| Sr. Unscd. Notes | 4.70 | 9/15/23 | 350,000 | 366,353 |
| Royal Bank of Canada, | | | | |
| Sr. Unscd. Notes | 2.63 | 12/15/15 | 1,000,000 | 1,040,864 |
| Royal Bank of Scotland Group, | | | | |
| Sr. Unscd. Notes | 2.55 | 9/18/15 | 1,000,000 | 1,024,648 |
| Ryder System, | | | | |
| Sr. Unscd. Notes | 2.35 | 2/26/19 | 500,000 | 493,440 |
| Simon Property Group, | | | | |
| Sr. Unscd. Notes | 5.25 | 12/1/16 | 2,000,000 | 2,236,720 |
| State Street Bank & Trust, | | | | |
| Sub. Notes | 5.25 | 10/15/18 | 200,000 | 227,664 |
| Sumitomo Mitsui Banking, | | | | |
| Bank Gtd. Notes | 0.90 | 1/18/16 | 500,000 | 499,768 |
26
| | | | | |
| | Coupon | Maturity | Principal | | |
| Bonds and Notes (continued) | Rate (%) | Date | Amount ($) | | Value ($) |
| Financial (continued) | | | | | |
| Sumitomo Mitsui Banking, | | | | | |
| Bank Gtd. Notes | 1.50 | 1/18/18 | 390,000 | b | 382,855 |
| Sumitomo Mitsui Banking, | | | | | |
| Bank Gtd. Notes | 3.00 | 1/18/23 | 290,000 | | 276,500 |
| Suntrust Bank, | | | | | |
| Sr. Unscd. Notes | 2.75 | 5/1/23 | 500,000 | | 459,694 |
| Suntrust Banks, | | | | | |
| Sr. Unscd. Notes | 2.35 | 11/1/18 | 500,000 | | 502,613 |
| Toronto-Dominion Bank, | | | | | |
| Sr. Unscd. Bonds | 2.63 | 9/10/18 | 750,000 | | 775,551 |
| Toyota Motor Credit, | | | | | |
| Sr. Unscd. Notes | 0.88 | 7/17/15 | 1,000,000 | | 1,007,492 |
| Toyota Motor Credit, | | | | | |
| Sr. Unscd. Notes | 2.63 | 1/10/23 | 1,000,000 | | 950,838 |
| Travelers Cos., | | | | | |
| Sr. Unscd. Notes | 5.50 | 12/1/15 | 960,000 | | 1,053,956 |
| U.S. Bancorp, | | | | | |
| Sr. Unscd. Notes | 3.00 | 3/15/22 | 1,400,000 | | 1,387,861 |
| UBS AG/Stamford, | | | | | |
| Sr. Unscd. Notes | 4.88 | 8/4/20 | 293,000 | | 330,164 |
| UBS AG/Stamford, | | | | | |
| Sr. Unscd. Notes | 5.75 | 4/25/18 | 320,000 | | 372,940 |
| UBS AG/Stamford, | | | | | |
| Sr. Unscd. Notes | 5.88 | 12/20/17 | 442,000 | | 512,982 |
| UBS AG/Stamford, | | | | | |
| Sub. Notes | 5.88 | 7/15/16 | 75,000 | | 83,650 |
| Unilever Capital, | | | | | |
| Gtd. Notes | 2.20 | 3/6/19 | 500,000 | | 508,185 |
| Unilever Capital, | | | | | |
| Gtd. Notes | 5.90 | 11/15/32 | 250,000 | | 313,575 |
| Union Bank, | | | | | |
| Sr. Unscd. Notes | 2.63 | 9/26/18 | 500,000 | | 512,268 |
| Ventas Realty, | | | | | |
| Gtd. Notes | 2.70 | 4/1/20 | 1,000,000 | | 971,586 |
| Wachovia, | | | | | |
| Sr. Unscd. Notes | 5.75 | 6/15/17 | 1,850,000 | | 2,131,259 |
| Wachovia, | | | | | |
| Sr. Unscd. Notes | 5.75 | 2/1/18 | 1,100,000 | | 1,285,060 |
STATEMENT OF INVESTMENTS (continued)
| | | | | |
| | Coupon | Maturity | Principal | | |
| Bonds and Notes (continued) | Rate (%) | Date | Amount ($) | | Value ($) |
| Financial (continued) | | | | | |
| Wachovia Bank, | | | | | |
| Sub. Notes | 6.60 | 1/15/38 | 415,000 | | 519,719 |
| Wells Fargo & Co., | | | | | |
| Sr. Unscd. Notes | 1.50 | 1/16/18 | 500,000 | | 498,662 |
| Wells Fargo & Co., | | | | | |
| Sr. Unscd. Notes | 5.63 | 12/11/17 | 2,340,000 | | 2,708,658 |
| Wells Fargo & Co., | | | | | |
| Sub. Notes, Ser. M | 3.45 | 2/13/23 | 500,000 | | 476,670 |
| Wells Fargo Bank, | | | | | |
| Sub. Notes | 5.75 | 5/16/16 | 875,000 | | 976,936 |
| Westpac Banking, | | | | | |
| Sr. Unscd. Notes | 4.88 | 11/19/19 | 1,700,000 | | 1,923,365 |
| Westpac Banking, | | | | | |
| Sub. Notes | 4.63 | 6/1/18 | 500,000 | | 542,761 |
| XL Group, | | | | | |
| Sr. Unscd. Notes | 6.38 | 11/15/24 | 1,400,000 | | 1,623,789 |
| | | | | | 157,233,495 |
| Foreign/Governmental—4.6% | | | | | |
| African Development Bank, | | | | | |
| Sr. Unscd. Notes | 0.75 | 10/18/16 | 330,000 | | 331,973 |
| Asian Development Bank, | | | | | |
| Sr. Unscd. Notes | 1.88 | 10/23/18 | 1,750,000 | | 1,784,136 |
| Asian Development Bank, | | | | | |
| Sr. Unscd. Notes | 2.50 | 3/15/16 | 1,500,000 | | 1,571,855 |
| Brazilian Government, | | | | | |
| Sr. Unscd. Bonds | 4.88 | 1/22/21 | 500,000 | | 545,000 |
| Brazilian Government, | | | | | |
| Sr. Unscd. Bonds | 5.63 | 1/7/41 | 650,000 | b | 666,250 |
| Brazilian Government, | | | | | |
| Sr. Unscd. Bonds | 6.00 | 1/17/17 | 2,270,000 | | 2,567,370 |
| Brazilian Government, | | | | | |
| Sr. Unscd. Bonds | 7.13 | 1/20/37 | 575,000 | b | 692,875 |
| Brazilian Government, | | | | | |
| Unscd. Bonds | 10.13 | 5/15/27 | 500,000 | | 787,500 |
| Colombian Government, | | | | | |
| Sr. Unscd. Bonds | 6.13 | 1/18/41 | 500,000 | | 570,000 |
| Colombian Government, | | | | | |
| Sr. Unscd. Notes | 7.38 | 3/18/19 | 2,000,000 | | 2,455,000 |
28
| | | | | |
| | Coupon | Maturity | Principal | | |
| Bonds and Notes (continued) | Rate (%) | Date | Amount ($) | | Value ($) |
| Foreign/Governmental | | | | | |
| (continued) | | | | | |
| Ecopetrol, | | | | | |
| Sr. Unscd. Notes | 7.38 | 9/18/43 | 1,000,000 | | 1,148,750 |
| European Bank for Reconstruction | | | | | |
| and Development, Sr. Unscd. Notes | 1.00 | 2/16/17 | 2,000,000 | | 2,011,542 |
| European Investment Bank, | | | | | |
| Sr. Unscd. Bonds | 4.63 | 10/20/15 | 350,000 | | 378,767 |
| European Investment Bank, | | | | | |
| Sr. Unscd. Bonds | 5.13 | 5/30/17 | 3,700,000 | | 4,235,934 |
| European Investment Bank, | | | | | |
| Sr. Unscd. Notes | 1.63 | 9/1/15 | 2,400,000 | | 2,456,546 |
| European Investment Bank, | | | | | |
| Sr. Unscd. Notes | 1.75 | 3/15/17 | 1,250,000 | | 1,286,719 |
| European Investment Bank, | | | | | |
| Sr. Unscd. Notes | 2.25 | 3/15/16 | 2,750,000 | | 2,861,650 |
| European Investment Bank, | | | | | |
| Sr. Unscd. Notes | 2.88 | 9/15/20 | 2,000,000 | b | 2,063,402 |
| Export-Import Bank of Korea, | | | | | |
| Sr. Unscd. Bonds | 2.88 | 9/17/18 | 1,000,000 | | 1,019,982 |
| Finnish Government, | | | | | |
| Sr. Unscd. Bonds | 6.95 | 2/15/26 | 25,000 | | 33,255 |
| FMS Wertmanagement, | | | | | |
| Gtd. Notes | 1.13 | 10/14/16 | 1,000,000 | | 1,012,314 |
| Inter-American Development Bank, | | | | | |
| Notes | 0.88 | 11/15/16 | 1,000,000 | | 1,006,934 |
| Inter-American Development Bank, | | | | | |
| Sr. Unsub. Notes | 3.88 | 9/17/19 | 2,000,000 | | 2,226,314 |
| Inter-American Development Bank, | | | | | |
| Sr. Unscd. Notes | 5.13 | 9/13/16 | 150,000 | | 168,845 |
| Inter-American Development Bank, | | | | | |
| Unscd. Notes | 4.25 | 9/10/18 | 540,000 | | 613,620 |
| International Bank for | | | | | |
| Reconstruction and | | | | | |
| Development, Sr. Unsub. Bonds | 7.63 | 1/19/23 | 700,000 | | 979,679 |
| International Bank for | | | | | |
| Reconstruction | | | | | |
| and Development, | | | | | |
| Sr. Unscd. Notes | 1.13 | 7/18/17 | 500,000 | | 505,019 |
STATEMENT OF INVESTMENTS (continued)
| | | | |
| | Coupon | Maturity | Principal | |
| Bonds and Notes (continued) | Rate (%) | Date | Amount ($) | Value ($) |
| Foreign/Governmental | | | | |
| (continued) | | | | |
| International Bank for | | | | |
| Reconstruction and | | | | |
| Development, Sr. Unscd. Notes | 2.13 | 3/15/16 | 2,400,000 | 2,494,529 |
| International Bank for | | | | |
| Reconstruction and | | | | |
| Development, Sr. Unscd. Notes | 5.00 | 4/1/16 | 700,000 | 775,237 |
| International Finance, | | | | |
| Sr. Unscd. Notes | 2.13 | 11/17/17 | 2,100,000 | 2,186,066 |
| Italian Government, | | | | |
| Sr. Unscd. Notes | 4.50 | 1/21/15 | 50,000 | 52,149 |
| Italian Government, | | | | |
| Sr. Unscd. Notes | 5.25 | 9/20/16 | 155,000 | 168,335 |
| Italian Government, | | | | |
| Sr. Unscd. Notes | 5.38 | 6/12/17 | 1,450,000 | 1,590,366 |
| Italian Government, | | | | |
| Sr. Unscd. Notes | 5.38 | 6/15/33 | 550,000 | 585,401 |
| Italian Government, | | | | |
| Sr. Unscd. Notes | 6.88 | 9/27/23 | 610,000 | 746,281 |
| Japan Bank for International | | | | |
| Cooperation, Gov’t Gtd. Notes | 2.50 | 5/18/16 | 2,800,000 | 2,925,658 |
| KFW, | | | | |
| Gov’t Gtd. Bonds | 4.00 | 1/27/20 | 2,500,000 | 2,794,232 |
| KFW, | | | | |
| Gov’t Gtd. Bonds | 4.50 | 7/16/18 | 3,600,000 | 4,102,636 |
| KFW, | | | | |
| Gov’t Gtd. Bonds | 5.13 | 3/14/16 | 625,000 | 693,687 |
| KFW, | | | | |
| Gov’t Gtd. Notes | 4.88 | 1/17/17 | 1,240,000 | 1,399,896 |
| KFW, | | | | |
| Gov’t Gtd. Notes | 4.88 | 6/17/19 | 2,000,000 | 2,329,906 |
| Korea Development Bank, | | | | |
| Sr. Unscd. Notes | 3.88 | 5/4/17 | 1,250,000 | 1,337,984 |
| Korea Finance, | | | | |
| Sr. Unscd. Notes | 2.88 | 8/22/18 | 500,000 | 508,737 |
| Landwirtschaftliche Rentenbank, | | | | |
| Govt. Gtd. Bonds | 5.13 | 2/1/17 | 950,000 | 1,074,398 |
| Landwirtschaftliche Rentenbank, | | | | |
| Govt. Gtd. Notes | 1.88 | 9/17/18 | 2,100,000 | 2,136,288 |
30
| | | | | |
| | Coupon | Maturity | Principal | | |
| Bonds and Notes (continued) | Rate (%) | Date | Amount ($) | | Value ($) |
| Foreign/Governmental | | | | | |
| (continued) | | | | | |
| Mexican Government, | | | | | |
| Sr. Unscd. Notes | 5.63 | 1/15/17 | 2,000,000 | | 2,249,000 |
| Mexican Government, | | | | | |
| Sr. Unscd. Notes | 5.95 | 3/19/19 | 1,200,000 | b | 1,399,800 |
| Mexican Government, | | | | | |
| Sr. Unscd. Notes, Ser. A | 6.75 | 9/27/34 | 1,340,000 | | 1,648,200 |
| Panamanian Government, | | | | | |
| Sr. Unscd. Bonds | 6.70 | 1/26/36 | 700,000 | | 831,250 |
| Peruvian Government, | | | | | |
| Sr. Unscd. Bonds | 6.55 | 3/14/37 | 870,000 | | 1,040,955 |
| Petroleos Mexicanos, | | | | | |
| Gtd. Bonds | 5.50 | 6/27/44 | 500,000 | | 470,000 |
| Petroleos Mexicanos, | | | | | |
| Gtd. Notes | 4.88 | 3/15/15 | 500,000 | | 527,500 |
| Petroleos Mexicanos, | | | | | |
| Gtd. Notes | 6.00 | 3/5/20 | 500,000 | | 563,750 |
| Philippine Government, | | | | | |
| Sr. Unscd. Bonds | 5.00 | 1/13/37 | 500,000 | b | 544,375 |
| Philippine Government, | | | | | |
| Sr. Unscd. Bonds | 6.50 | 1/20/20 | 400,000 | | 481,500 |
| Philippine Government, | | | | | |
| Sr. Unscd. Bonds | 8.88 | 3/17/15 | 400,000 | | 442,500 |
| Philippine Government, | | | | | |
| Sr. Unscd. Bonds | 9.38 | 1/18/17 | 400,000 | | 494,000 |
| Philippine Government, | | | | | |
| Sr. Unscd. Bonds | 9.50 | 2/2/30 | 800,000 | b | 1,229,000 |
| Philippine Government, | | | | | |
| Sr. Unscd. Bonds | 10.63 | 3/16/25 | 800,000 | | 1,268,000 |
| Polish Government, | | | | | |
| Sr. Unscd. Notes | 5.00 | 3/23/22 | 1,400,000 | | 1,534,750 |
| Polish Government, | | | | | |
| Sr. Unscd. Notes | 6.38 | 7/15/19 | 1,450,000 | | 1,713,175 |
| Province of British Columbia | | | | | |
| Canada, Sr. Unscd. Bonds, | | | | | |
| Ser. USD2 | 6.50 | 1/15/26 | 925,000 | | 1,199,725 |
| Province of Manitoba Canada, | | | | | |
| Unscd. Debs., Ser. CB | 8.80 | 1/15/20 | 10,000 | | 13,553 |
STATEMENT OF INVESTMENTS (continued)
| | | | | |
| | Coupon | Maturity | Principal | | |
| Bonds and Notes (continued) | Rate (%) | Date | Amount ($) | | Value ($) |
| Foreign/Governmental | | | | | |
| (continued) | | | | | |
| Province of Manitoba Canada, | | | | | |
| Unscd. Debs | 8.88 | 9/15/21 | 450,000 | | 631,259 |
| Province of Ontario Canada, | | | | | |
| Sr. Unscd. Bonds | 4.00 | 10/7/19 | 2,300,000 | | 2,519,376 |
| Province of Ontario Canada, | | | | | |
| Sr. Unscd. Notes | 4.75 | 1/19/16 | 990,000 | | 1,080,167 |
| Province of Ontario Canada, | | | | | |
| Sr. Unscd. Notes | 4.95 | 11/28/16 | 1,000,000 | b | 1,122,208 |
| Province of Quebec Canada, | | | | | |
| Sr. Unscd. Notes | 4.60 | 5/26/15 | 700,000 | | 745,657 |
| Province of Quebec Canada, | | | | | |
| Debs., Ser. NJ | 7.50 | 7/15/23 | 200,000 | | 264,507 |
| Province of Quebec Canada, | | | | | |
| Sr. Unscd. Debs., Ser. PD | 7.50 | 9/15/29 | 550,000 | | 759,618 |
| Province of Quebec Canada, | | | | | |
| Unscd. Notes | 5.13 | 11/14/16 | 725,000 | | 816,277 |
| Republic of Korea, | | | | | |
| Sr. Unscd. Notes | 7.13 | 4/16/19 | 1,000,000 | | 1,248,132 |
| South African Government, | | | | | |
| Sr. Unscd. Notes | 6.88 | 5/27/19 | 2,100,000 | | 2,436,000 |
| Swedish Export Credit, | | | | | |
| Sr. Unscd. Notes | 0.63 | 5/31/16 | 600,000 | | 599,361 |
| Turkish Government, | | | | | |
| Sr. Unscd. Notes | 3.25 | 3/23/23 | 800,000 | | 707,000 |
| Turkish Government, | | | | | |
| Sr. Unscd. Notes | 4.88 | 4/16/43 | 1,000,000 | | 868,750 |
| Turkish Government, | | | | | |
| Sr. Unscd. Notes | 7.00 | 9/26/16 | 200,000 | | 223,340 |
| Turkish Government, | | | | | |
| Sr. Unscd. Notes | 7.00 | 3/11/19 | 500,000 | | 572,500 |
| Turkish Government, | | | | | |
| Sr. Unscd. Notes | 7.25 | 3/15/15 | 300,000 | | 321,000 |
| Turkish Government, | | | | | |
| Sr. Unscd. Notes | 8.00 | 2/14/34 | 600,000 | | 743,460 |
| Uruguayan Government, | | | | | |
| Sr. Unscd. Bonds | 7.63 | 3/21/36 | 300,000 | | 386,250 |
| Uruguayan Government, | | | | | |
| Sr. Unscd. Notes | 4.50 | 8/14/24 | 750,000 | b | 776,250 |
| | | | | | 98,355,162 |
32
| | | | |
| | Coupon | Maturity | Principal | |
| Bonds and Notes (continued) | Rate (%) | Date | Amount ($) | Value ($) |
| Health Care—2.3% | | | | |
| Abbvie, | | | | |
| Gtd. Notes | 1.20 | 11/6/15 | 1,000,000 | 1,007,490 |
| Abbvie, | | | | |
| Gtd. Notes | 2.90 | 11/6/22 | 3,000,000 | 2,869,125 |
| Aetna, | | | | |
| Sr. Unscd. Notes | 3.95 | 9/1/20 | 1,000,000 | 1,057,025 |
| Aetna, | | | | |
| Sr. Unscd. Notes | 6.63 | 6/15/36 | 300,000 | 369,243 |
| Amgen, | | | | |
| Sr. Unscd. Notes | 4.10 | 6/15/21 | 2,000,000 | 2,093,384 |
| Amgen, | | | | |
| Sr. Unscd. Notes | 5.15 | 11/15/41 | 600,000 | 606,961 |
| Amgen, | | | | |
| Sr. Unscd. Notes | 5.85 | 6/1/17 | 400,000 | 458,102 |
| Astrazeneca, | | | | |
| Sr. Unscd. Notes | 6.45 | 9/15/37 | 520,000 | 646,107 |
| Baxter International, | | | | |
| Sr. Unscd. Notes | 3.20 | 6/15/23 | 400,000 | 394,502 |
| Baxter International, | | | | |
| Sr. Unsub. Notes | 6.25 | 12/1/37 | 200,000 | 245,012 |
| Becton Dickinson, | | | | |
| Sr. Unscd. Notes | 3.13 | 11/8/21 | 1,900,000 | 1,898,220 |
| Boston Scientific, | | | | |
| Sr. Unscd. Notes | 6.00 | 1/15/20 | 1,700,000 | 1,984,345 |
| Bristol-Myers Squibb, | | | | |
| Sr. Unscd. Notes | 5.88 | 11/15/36 | 425,000 | 503,397 |
| Cardinal Health, | | | | |
| Sr. Unscd. Notes | 1.70 | 3/15/18 | 600,000 | 588,911 |
| Cardinal Health, | | | | |
| Sr. Unscd. Notes | 3.20 | 3/15/23 | 500,000 | 475,844 |
| Cardinal Health, | | | | |
| Sr. Unscd. Notes | 4.60 | 3/15/43 | 300,000 | 283,763 |
| Celgene, | | | | |
| Sr. Unscd. Notes | 4.00 | 8/15/23 | 750,000 | 757,325 |
| Cigna, | | | | |
| Sr. Unscd. Notes | 4.50 | 3/15/21 | 1,900,000 | 2,059,708 |
| Covidien International Finance, | | | | |
| Gtd. Notes | 6.00 | 10/15/17 | 590,000 | 686,485 |
| Eli Lilly & Co., | | | | |
| Sr. Unscd. Notes | 5.55 | 3/15/37 | 750,000 | 854,671 |
STATEMENT OF INVESTMENTS (continued)
| | | | | |
| | Coupon | Maturity | Principal | | |
| Bonds and Notes (continued) | Rate (%) | Date | Amount ($) | | Value ($) |
| Health Care (continued) | | | | | |
| Eli Lilly & Co., | | | | | |
| Sr. Unscd. Notes | 7.13 | 6/1/25 | 200,000 | | 264,262 |
| Express Scripts, | | | | | |
| Gtd. Notes | 3.13 | 5/15/16 | 2,400,000 | | 2,520,134 |
| GlaxoSmithKline Capital, | | | | | |
| Gtd. Bonds | 5.65 | 5/15/18 | 740,000 | | 863,485 |
| GlaxoSmithKline Capital, | | | | | |
| Gtd. Bonds | 6.38 | 5/15/38 | 1,000,000 | | 1,262,618 |
| Health Care REIT, | | | | | |
| Sr. Unscd. Notes | 5.25 | 1/15/22 | 1,400,000 | | 1,519,300 |
| Johnson & Johnson, | | | | | |
| Sr. Unscd. Debs | 4.95 | 5/15/33 | 170,000 | | 188,287 |
| Johnson & Johnson, | | | | | |
| Sr. Unscd. Notes | 5.95 | 8/15/37 | 470,000 | | 579,800 |
| Medco Health Solutions, | | | | | |
| Sr. Unscd. Notes | 7.13 | 3/15/18 | 1,500,000 | | 1,807,908 |
| Medtronic, | | | | | |
| Sr. Unscd. Notes, Ser. B | 4.75 | 9/15/15 | 360,000 | | 387,801 |
| Merck & Co., | | | | | |
| Gtd. Notes | 6.50 | 12/1/33 | 680,000 | a | 869,969 |
| Merck & Co., | | | | | |
| Sr. Unscd. Debs | 6.40 | 3/1/28 | 150,000 | | 189,737 |
| Merck & Co., | | | | | |
| Sr. Unscd. Notes | 0.70 | 5/18/16 | 1,000,000 | | 1,000,973 |
| Novartis | | | | | |
| Securities Investment, | | | | | |
| Gtd. Notes | 5.13 | 2/10/19 | 1,400,000 | | 1,614,792 |
| Pfizer, | | | | | |
| Sr. Unscd. Notes | 6.20 | 3/15/19 | 2,400,000 | | 2,903,707 |
| Quest Diagnostic, | | | | | |
| Gtd. Notes | 3.20 | 4/1/16 | 2,500,000 | | 2,604,777 |
| Quest Diagnostic, | | | | | |
| Gtd. Notes | 5.45 | 11/1/15 | 500,000 | | 540,999 |
| Quest Diagnostic, | | | | | |
| Gtd. Notes | 6.95 | 7/1/37 | 50,000 | | 56,084 |
| Sanofi, | | | | | |
| Sr. Unscd. Notes | 4.00 | 3/29/21 | 1,400,000 | | 1,503,964 |
| St. Jude Medical, | | | | | |
| Sr. Unscd. Notes | 3.25 | 4/15/23 | 500,000 | | 482,261 |
34
| | | | |
| | Coupon | Maturity | Principal | |
| Bonds and Notes (continued) | Rate (%) | Date | Amount ($) | Value ($) |
| Health Care (continued) | | | | |
| Teva Pharmaceutical Finance, | | | | |
| Gtd. Notes | 6.15 | 2/1/36 | 85,000 | 97,758 |
| Teva Pharmaceutical Finance II, | | | | |
| Gtd. Notes | 3.00 | 6/15/15 | 3,400,000 | 3,517,698 |
| UnitedHealth Group, | | | | |
| Sr. Unscd. Notes | 6.88 | 2/15/38 | 810,000 | 1,039,536 |
| Wellpoint, | | | | |
| Sr. Unscd. Notes | 3.13 | 5/15/22 | 1,700,000 | 1,632,875 |
| WellPoint, | | | | |
| Sr. Unscd. Notes | 5.00 | 12/15/14 | 1,000,000 | 1,048,164 |
| WellPoint, | | | | |
| Sr. Unscd. Notes | 5.25 | 1/15/16 | 375,000 | 409,148 |
| WellPoint, | | | | |
| Sr. Unscd. Notes | 5.88 | 6/15/17 | 65,000 | 74,303 |
| Wyeth, | | | | |
| Gtd. Notes | 5.95 | 4/1/37 | 200,000 | 238,400 |
| Wyeth, | | | | |
| Gtd. Notes | 6.50 | 2/1/34 | 200,000 | 249,951 |
| Zoetis, | | | | |
| Sr. Unscd. Notes | 1.15 | 2/1/16 | 500,000 | 502,276 |
| Zoetis, | | | | |
| Sr. Unscd. Notes | 1.88 | 2/1/18 | 500,000 | 499,031 |
| | | | | 50,309,618 |
| Industrial—1.2% | | | | |
| 3M, | | | | |
| Sr. Unscd. Notes | 5.70 | 3/15/37 | 750,000 | 888,780 |
| Boeing, | | | | |
| Sr. Unscd. Notes | 6.00 | 3/15/19 | 2,000,000 | 2,386,090 |
| Burlington Northern Santa Fe, | | | | |
| Sr. Unscd. Debs | 6.15 | 5/1/37 | 650,000 | 752,506 |
| Burlington Northern Santa Fe, | | | | |
| Sr. Unscd. Debs | 7.00 | 12/15/25 | 100,000 | 127,479 |
| Burlington Northern Santa Fe, | | | | |
| Sr. Unscd. Debs | 7.95 | 8/15/30 | 100,000 | 132,934 |
| Burlington Northern Santa Fe, | | | | |
| Sr. Unscd. Notes | 4.45 | 3/15/43 | 600,000 | 558,940 |
| Canadian National Railway, | | | | |
| Sr. Unscd. Notes | 6.90 | 7/15/28 | 100,000 | 133,063 |
STATEMENT OF INVESTMENTS (continued)
| | | | | |
| | Coupon | Maturity | Principal | | |
| Bonds and Notes (continued) | Rate (%) | Date | Amount ($) | | Value ($) |
| Industrial (continued) | | | | | |
| Caterpillar, | | | | | |
| Sr. Unscd. Debs | 6.05 | 8/15/36 | 375,000 | | 444,049 |
| Caterpillar, | | | | | |
| Sr. Unscd. Notes | 2.60 | 6/26/22 | 2,300,000 | | 2,188,383 |
| CSX, | | | | | |
| Sr. Unscd. Notes | 4.75 | 5/30/42 | 1,200,000 | | 1,177,644 |
| CSX, | | | | | |
| Sr. Unscd. Notes | 6.25 | 4/1/15 | 35,000 | | 37,685 |
| Emerson Electric, | | | | | |
| Sr. Unscd. Notes | 2.63 | 2/15/23 | 260,000 | | 250,953 |
| General Electric, | | | | | |
| Sr. Unscd. Notes | 5.25 | 12/6/17 | 1,000,000 | | 1,144,827 |
| Illinois Tool Works, | | | | | |
| Sr. Unscd. Notes | 3.90 | 9/1/42 | 1,000,000 | | 884,251 |
| Koninklijke Philips Electronics, | | | | | |
| Sr. Unscd. Notes | 5.75 | 3/11/18 | 500,000 | | 581,220 |
| Lockheed Martin, | | | | | |
| Sr. Unscd. Notes, Ser. B | 6.15 | 9/1/36 | 455,000 | | 530,420 |
| Norfolk Southern, | | | | | |
| Sr. Unscd. Bonds, Ser. WI | 4.84 | 10/1/41 | 1,200,000 | | 1,195,529 |
| Norfolk Southern, | | | | | |
| Sr. Unscd. Notes | 5.59 | 5/17/25 | 2,000 | | 2,278 |
| Northrop Grumman Systems, | | | | | |
| Gtd. Notes | 7.75 | 2/15/31 | 1,100,000 | | 1,428,821 |
| Raytheon, | | | | | |
| Sr. Unscd. Debs | 7.20 | 8/15/27 | 150,000 | | 189,666 |
| Republic Services, | | | | | |
| Gtd. Notes | 6.20 | 3/1/40 | 750,000 | | 873,406 |
| Union Pacific, | | | | | |
| Sr. Unscd. Notes | 2.75 | 4/15/23 | 400,000 | | 376,715 |
| Union Pacific, | | | | | |
| Sr. Unscd. Notes | 4.75 | 12/15/43 | 140,000 | | 140,180 |
| Union Pacific, | | | | | |
| Sr. Unscd. Notes | 4.82 | 2/1/44 | 325,000 | c | 332,295 |
| United Air 2013-1 Cl. A , | | | | | |
| 1st Lien Notes | 4.30 | 8/15/25 | 1,000,000 | | 982,500 |
| United Parcel Service, | | | | | |
| Sr. Unscd. Notes | 3.13 | 1/15/21 | 1,600,000 | | 1,638,010 |
| United Parcel Service, | | | | | |
| Sr. Unscd. Notes | 6.20 | 1/15/38 | 425,000 | | 531,454 |
36
| | | | | |
| | Coupon | Maturity | Principal | | |
| Bonds and Notes (continued) | Rate (%) | Date | Amount ($) | | Value ($) |
| Industrial (continued) | | | | | |
| United Parcel | | | | | |
| Service of America, | | | | | |
| Sr. Unscd. Debs | 8.38 | 4/1/30 | 10,000 | a | 13,600 |
| United Technologies, | | | | | |
| Sr. Unscd. Debs | 8.75 | 3/1/21 | 50,000 | | 67,989 |
| United Technologies, | | | | | |
| Sr. Unscd. Notes | 3.10 | 6/1/22 | 2,100,000 | | 2,078,378 |
| United Technologies, | | | | | |
| Sr. Unscd. Notes | 4.88 | 5/1/15 | 1,750,000 | | 1,863,640 |
| United Technologies, | | | | | |
| Sr. Unscd. Notes | 5.70 | 4/15/40 | 650,000 | | 760,798 |
| United Technologies, | | | | | |
| Sr. Unscd. Notes | 6.70 | 8/1/28 | 50,000 | | 64,800 |
| Waste Management, | | | | | |
| Gtd. Notes | 6.38 | 3/11/15 | 1,600,000 | | 1,715,634 |
| Waste Management, | | | | | |
| Gtd. Notes | 7.00 | 7/15/28 | 150,000 | | 187,794 |
| | | | | | 26,662,711 |
| Information Technology—.8% | | | | | |
| Apple, | | | | | |
| Sr. Unscd. Notes | 0.45 | 5/3/16 | 500,000 | b | 498,131 |
| Apple, | | | | | |
| Sr. Unscd. Notes | 1.00 | 5/3/18 | 500,000 | | 486,063 |
| Apple, | | | | | |
| Sr. Unscd. Notes | 2.40 | 5/3/23 | 500,000 | | 457,866 |
| Arrow Electronics, | | | | | |
| Sr. Unscd. Notes | 3.00 | 3/1/18 | 500,000 | | 509,843 |
| Arrow Electronics, | | | | | |
| Sr. Unscd. Notes | 4.50 | 3/1/23 | 500,000 | | 498,153 |
| Ebay, | | | | | |
| Sr. Unscd. Notes | 4.00 | 7/15/42 | 700,000 | | 609,152 |
| Google, | | | | | |
| Sr. Unscd. Notes | 3.63 | 5/19/21 | 300,000 | | 318,427 |
| Hewlett-Packard, | | | | | |
| Sr. Unscd. Notes | 2.35 | 3/15/15 | 1,000,000 | | 1,016,124 |
| Hewlett-Packard, | | | | | |
| Sr. Unscd. Notes | 3.00 | 9/15/16 | 1,000,000 | | 1,035,539 |
| Hewlett-Packard, | | | | | |
| Sr. Unscd. Notes | 5.50 | 3/1/18 | 560,000 | | 625,092 |
STATEMENT OF INVESTMENTS (continued)
| | | | | |
| | Coupon | Maturity | Principal | | |
| Bonds and Notes (continued) | Rate (%) | Date | Amount ($) | | Value ($) |
| Information Technology (continued) | | | | | |
| Hewlett-Packard, | | | | | |
| Sr. Unscd. Notes | 6.00 | 9/15/41 | 750,000 | | 733,923 |
| Intel, | | | | | |
| Sr. Unscd. Notes | 3.30 | 10/1/21 | 2,100,000 | | 2,122,100 |
| International Business Machines, | | | | | |
| Sr. Unscd. Debs | 7.00 | 10/30/25 | 225,000 | | 295,120 |
| International Business Machines, | | | | | |
| Sr. Unscd. Notes | 0.75 | 5/11/15 | 2,000,000 | | 2,011,418 |
| International Business Machines, | | | | | |
| Sr. Unscd. Notes | 5.60 | 11/30/39 | 605,000 | | 697,196 |
| International Business Machines, | | | | | |
| Sr. Unscd. Notes | 5.70 | 9/14/17 | 600,000 | | 698,383 |
| International Business Machines, | | | | | |
| Sr. Unscd. Notes | 8.38 | 11/1/19 | 300,000 | | 402,097 |
| Leidos Holdings, | | | | | |
| Gtd. Notes, Ser. 1 | 5.95 | 12/1/40 | 700,000 | | 696,118 |
| Leidos Holdings, | | | | | |
| Sr. Unscd. Notes | 6.50 | 4/15/38 | 500,000 | | 623,092 |
| Microsoft, | | | | | |
| Sr. Unscd. Notes | 4.20 | 6/1/19 | 1,000,000 | | 1,112,881 |
| Microsoft, | | | | | |
| Sr. Unscd. Notes | 5.20 | 6/1/39 | 688,000 | | 736,587 |
| Oracle, | | | | | |
| Sr. Unscd. Notes | 5.00 | 7/8/19 | 1,200,000 | | 1,373,755 |
| Oracle, | | | | | |
| Sr. Unscd. Notes | 5.75 | 4/15/18 | 150,000 | | 175,575 |
| Seagate Technology HDD, | | | | | |
| Gtd. Notes | 6.80 | 10/1/16 | 125,000 | | 142,187 |
| | | | | | 17,874,822 |
| Materials—1.2% | | | | | |
| Airgas, | | | | | |
| Sr. Unscd. Notes | 2.38 | 2/15/20 | 500,000 | | 483,112 |
| Alcoa, | | | | | |
| Sr. Unscd. Notes | 5.40 | 4/15/21 | 500,000 | b | 512,655 |
| Alcoa, | | | | | |
| Sr. Unscd. Notes | 5.72 | 2/23/19 | 612,000 | | 651,383 |
| Avery Dennison, | | | | | |
| Sr. Unscd. Notes | 3.35 | 4/15/23 | 1,000,000 | | 949,403 |
| Barrick PD Australia Finance, | | | | | |
| Gtd. Notes | 5.95 | 10/15/39 | 1,300,000 | | 1,143,084 |
38
| | | | |
| | Coupon | Maturity | Principal | |
| Bonds and Notes (continued) | Rate (%) | Date | Amount ($) | Value ($) |
| Materials (continued) | | | | |
| BHP Billiton Finance USA, | | | | |
| Gtd. Notes | 6.50 | 4/1/19 | 1,700,000 | 2,052,675 |
| CF Industries, | | | | |
| Gtd. Notes | 3.45 | 6/1/23 | 500,000 | 477,593 |
| CF Industries, | | | | |
| Gtd. Notes | 4.95 | 6/1/43 | 500,000 | 474,615 |
| Dow Chemical, | | | | |
| Sr. Unscd. Notes | 8.55 | 5/15/19 | 1,700,000 | 2,202,826 |
| E.I. du Pont de Nemours & Co., | | | | |
| Sr. Unscd. Notes | 2.80 | 2/15/23 | 500,000 | 474,817 |
| E.I. du Pont de Nemours & Co., | | | | |
| Sr. Unscd. Notes | 4.15 | 2/15/43 | 300,000 | 275,168 |
| E.I. du Pont de Nemours & Co., | | | | |
| Sr. Unscd. Notes | 5.25 | 12/15/16 | 1,900,000 | 2,144,152 |
| E.I. du Pont de Nemours & Co., | | | | |
| Sr. Unscd. Notes | 6.00 | 7/15/18 | 560,000 | 663,575 |
| Ecolab, | | | | |
| Sr. Unscd. Notes | 5.50 | 12/8/41 | 650,000 | 718,546 |
| Freeport-McMoRan Copper & Gold, | | | | |
| Gtd. Notes | 3.10 | 3/15/20 | 1,500,000 | 1,449,501 |
| Freeport-McMoRan Copper & Gold, | | | | |
| Sr. Unscd. Notes | 5.45 | 3/15/43 | 600,000 | 563,185 |
| Glencore Canada, | | | | |
| Gtd. Notes | 5.50 | 6/15/17 | 165,000 | 181,291 |
| International Paper, | | | | |
| Sr. Unscd. Notes | 7.95 | 6/15/18 | 1,600,000 | 1,984,114 |
| LYB International Finance, | | | | |
| Gtd. Notes | 4.00 | 7/15/23 | 1,200,000 | 1,210,686 |
| Newmont Mining, | | | | |
| Gtd. Notes | 6.25 | 10/1/39 | 1,000,000 | 910,663 |
| Rio Tinto Alcan, | | | | |
| Sr. Unscd. Debs | 7.25 | 3/15/31 | 350,000 | 438,708 |
| Rio Tinto Finance USA, | | | | |
| Gtd. Notes | 5.20 | 11/2/40 | 1,000,000 | 1,020,297 |
| Rio Tinto Finance USA, | | | | |
| Gtd. Notes | 6.50 | 7/15/18 | 20,000 | 23,918 |
| Teck Resources, | | | | |
| Gtd. Notes | 6.25 | 7/15/41 | 1,300,000 | 1,291,176 |
| Vale Canada, | | | | |
| Sr. Unscd. Bonds | 7.20 | 9/15/32 | 100,000 | 107,068 |
STATEMENT OF INVESTMENTS (continued)
| | | | |
| | Coupon | Maturity | Principal | |
| Bonds and Notes (continued) | Rate (%) | Date | Amount ($) | Value ($) |
| Materials (continued) | | | | |
| Vale Overseas, | | | | |
| Gtd. Notes | 4.38 | 1/11/22 | 1,200,000 | 1,180,222 |
| Vale Overseas, | | | | |
| Gtd. Notes | 6.25 | 1/23/17 | 510,000 | 575,642 |
| Vale Overseas, | | | | |
| Gtd. Notes | 6.88 | 11/21/36 | 900,000 | 940,509 |
| | | | | 25,100,584 |
| Municipal Bonds—.8% | | | | |
| Bay Area Toll Authority, | | | | |
| San Francisco Bay Area Toll Bridge | | | | |
| Revenue (Build America Bonds) | 6.26 | 4/1/49 | 1,000,000 | 1,228,680 |
| Bay Area Toll Authority, | | | | |
| San Francisco Bay Area | | | | |
| Subordinate Toll Bridge | | | | |
| Revenue (Build America Bonds) | 6.79 | 4/1/30 | 695,000 | 827,175 |
| California, | | | | |
| GO (Various Purpose) | 3.95 | 11/1/15 | 400,000 | 424,896 |
| California, | | | | |
| GO (Various Purpose) | 7.50 | 4/1/34 | 1,000,000 | 1,312,790 |
| California, | | | | |
| GO (Various Purpose) | 7.55 | 4/1/39 | 1,600,000 | 2,165,632 |
| Florida Hurricane Catastrophe Fund | | | | |
| Finance Corporation, Revenue | 2.11 | 7/1/18 | 500,000 | 492,360 |
| Illinois, | | | | |
| GO (Pension Funding Series) | 5.10 | 6/1/33 | 3,630,000 | 3,290,123 |
| Los Angeles Unified School District, | | | | |
| GO (Build America Bonds) | 5.75 | 7/1/34 | 1,600,000 | 1,803,104 |
| Metropolitan Transportation | | | | |
| Authority, Dedicated | | | | |
| Tax Funds Bonds | 7.34 | 11/15/39 | 650,000 | 862,700 |
| New Jersey Turnpike Authority, | | | | |
| Turnpike Revenue (Build | | | | |
| America Bonds) | 7.41 | 1/1/40 | 780,000 | 1,041,440 |
| New York State Dormitory | | | | |
| Authority, State Personal | | | | |
| Income Tax Revenue (General | | | | |
| Purpose) (Build America Bonds) | 5.29 | 3/15/33 | 2,000,000 | 2,163,100 |
| Port Authority of New York and | | | | |
| New Jersey (Consolidated Bonds, | | | | |
| 164th Series) | 5.65 | 11/1/40 | 680,000 | 737,834 |
40
| | | | | |
| | Coupon | Maturity | Principal | | |
| Bonds and Notes (continued) | Rate (%) | Date | Amount ($) | | Value ($) |
| Municipal Bonds (continued) | | | | | |
| University of California Regents, | | | | | |
| General Revenue | 1.80 | 7/1/19 | 480,000 | | 470,093 |
| | | | | | 16,819,927 |
| Telecommunications—1.6% | | | | | |
| America Movil, | | | | | |
| Gtd. Notes | 2.38 | 9/8/16 | 1,000,000 | | 1,029,913 |
| America Movil, | | | | | |
| Gtd. Notes | 6.13 | 3/30/40 | 1,200,000 | | 1,295,441 |
| America Movil, | | | | | |
| Gtd. Notes | 6.38 | 3/1/35 | 100,000 | | 110,353 |
| AT&T, | | | | | |
| Gtd. Notes | 8.00 | 11/15/31 | 470,000 | a | 643,706 |
| AT&T, | | | | | |
| Sr. Unscd. Notes | 2.50 | 8/15/15 | 2,000,000 | | 2,058,372 |
| AT&T, | | | | | |
| Sr. Unscd. Notes | 4.35 | 6/15/45 | 600,000 | | 497,770 |
| AT&T, | | | | | |
| Sr. Unscd. Notes | 5.35 | 9/1/40 | 1,500,000 | | 1,466,201 |
| AT&T, | | | | | |
| Sr. Unscd. Notes | 6.30 | 1/15/38 | 1,500,000 | | 1,631,507 |
| BellSouth, | | | | | |
| Sr. Unscd. Bonds | 6.55 | 6/15/34 | 100,000 | | 109,055 |
| BellSouth Telecommunications, | | | | | |
| Sr. Unscd. Debs | 6.38 | 6/1/28 | 550,000 | | 611,356 |
| British Telecommunications, | | | | | |
| Sr. Unscd. Notes | 5.95 | 1/15/18 | 580,000 | | 668,383 |
| British Telecommunications, | | | | | |
| Sr. Unscd. Notes | 9.63 | 12/15/30 | 175,000 | a | 261,739 |
| Cellco Partnership/Verizon | | | | | |
| Wireless Capital, | | | | | |
| Sr. Unscd. Notes | 8.50 | 11/15/18 | 850,000 | | 1,094,843 |
| Cisco Systems, | | | | | |
| Sr. Unscd. Notes | 4.45 | 1/15/20 | 1,000,000 | | 1,110,119 |
| Cisco Systems, | | | | | |
| Sr. Unscd. Notes | 5.50 | 2/22/16 | 500,000 | | 554,942 |
| Cisco Systems, | | | | | |
| Sr. Unscd. Notes | 5.50 | 1/15/40 | 400,000 | | 447,162 |
| Deutsche Telekom International | | | | | |
| Finance, Gtd. Bonds | 8.75 | 6/15/30 | 900,000 | a | 1,290,470 |
STATEMENT OF INVESTMENTS (continued)
| | | | | |
| | Coupon | Maturity | Principal | | |
| Bonds and Notes (continued) | Rate (%) | Date | Amount ($) | | Value ($) |
| Telecommunications (continued) | | | | | |
| GTE, | | | | | |
| Gtd. Debs | 6.94 | 4/15/28 | 100,000 | | 117,312 |
| Koninklijke KPN, | | | | | |
| Sr. Unscd. Bonds | 8.38 | 10/1/30 | 250,000 | | 315,881 |
| Motorola Solutions, | | | | | |
| Sr. Unscd. Debs | 7.50 | 5/15/25 | 1,450,000 | | 1,769,203 |
| Omnicom Group, | | | | | |
| Gtd. Notes | 3.63 | 5/1/22 | 500,000 | | 489,140 |
| Orange SA, | | | | | |
| Sr. Unscd. Notes | 8.75 | 3/1/31 | 945,000 | a | 1,305,958 |
| Pacific-Bell Telephone, | | | | | |
| Gtd. Debs | 7.13 | 3/15/26 | 310,000 | | 375,671 |
| Qwest, | | | | | |
| Sr. Unscd. Debs | 6.88 | 9/15/33 | 330,000 | | 321,750 |
| Seagate HDD, | | | | | |
| Gtd. Notes | 4.75 | 6/1/23 | 800,000 | c | 782,000 |
| Telecom Italia Capital, | | | | | |
| Gtd. Notes | 6.38 | 11/15/33 | 200,000 | | 184,302 |
| Telefonica Emisiones, | | | | | |
| Gtd. Notes | 3.19 | 4/27/18 | 1,000,000 | | 1,015,712 |
| Telefonica Emisiones, | | | | | |
| Gtd. Notes | 7.05 | 6/20/36 | 1,145,000 | | 1,269,505 |
| Verizon Communications, | | | | | |
| Sr. Unscd. Notes | 3.50 | 11/1/21 | 900,000 | | 899,481 |
| Verizon Communications, | | | | | |
| Sr. Unscd. Notes | 3.65 | 9/14/18 | 1,300,000 | | 1,384,162 |
| Verizon Communications, | | | | | |
| Sr. Unscd. Notes | 5.15 | 9/15/23 | 1,650,000 | | 1,793,720 |
| Verizon Communications, | | | | | |
| Sr. Unscd. Notes | 5.50 | 2/15/18 | 1,500,000 | | 1,709,808 |
| Verizon Communications, | | | | | |
| Sr. Unscd. Notes | 5.85 | 9/15/35 | 560,000 | | 594,204 |
| Verizon Communications, | | | | | |
| Sr. Unscd. Notes | 6.40 | 9/15/33 | 1,250,000 | | 1,419,004 |
| Verizon Communications, | | | | | |
| Sr. Unscd. Notes | 6.55 | 9/15/43 | 1,950,000 | | 2,270,442 |
| Verizon Communications, | | | | | |
| Sr. Unscd. Notes | 7.75 | 12/1/30 | 690,000 | | 865,647 |
| Vodafone Group, | | | | | |
| Sr. Unscd. Bonds | 6.15 | 2/27/37 | 250,000 | | 280,709 |
42
| | | | | |
| | Coupon | Maturity | Principal | | |
| Bonds and Notes (continued) | Rate (%) | Date | Amount ($) | | Value ($) |
| Telecommunications (continued) | | | | | |
| Vodafone Group, | | | | | |
| Sr. Unscd. Notes | 1.50 | 2/19/18 | 500,000 | | 491,471 |
| Vodafone Group, | | | | | |
| Sr. Unscd. Notes | 5.63 | 2/27/17 | 555,000 | | 626,441 |
| Vodafone Group, | | | | | |
| Sr. Unscd. Notes | 7.88 | 2/15/30 | 125,000 | | 162,198 |
| | | | | | 35,325,053 |
| U.S. Government | | | | | |
| Agencies—4.3% | | | | | |
| Federal Farm Credit Bank, | | | | | |
| Bonds | 0.54 | 11/7/16 | 500,000 | | 497,643 |
| Federal Farm Credit Bank, | | | | | |
| Bonds | 0.73 | 8/15/16 | 205,000 | | 205,014 |
| Federal Farm Credit Bank, | | | | | |
| Bonds | 5.13 | 8/25/16 | 1,200,000 | | 1,351,417 |
| Federal Home Loan Bank | | | | | |
| Bonds | 0.38 | 6/24/16 | 1,500,000 | | 1,498,764 |
| Federal Home Loan Bank, | | | | | |
| Bonds | 0.45 | 12/28/15 | 500,000 | | 500,004 |
| Federal Home Loan Bank, | | | | | |
| Bonds | 1.13 | 6/26/17 | 500,000 | | 500,390 |
| Federal Home Loan Bank, | | | | | |
| Bonds | 1.25 | 2/28/18 | 570,000 | | 564,554 |
| Federal Home Loan Bank, | | | | | |
| Bonds | 2.75 | 3/13/15 | 2,800,000 | | 2,896,704 |
| Federal Home Loan Bank, | | | | | |
| Bonds | 4.75 | 12/16/16 | 1,000,000 | | 1,127,674 |
| Federal Home Loan Bank, | | | | | |
| Bonds, Ser. 917 | 4.88 | 5/17/17 | 2,000,000 | b | 2,283,636 |
| Federal Home Loan Bank, | | | | | |
| Bonds, Ser. 1069 | 5.00 | 11/17/17 | 2,600,000 | | 3,005,314 |
| Federal Home Loan Bank, | | | | | |
| Bonds, Ser. 656 | 5.38 | 5/18/16 | 320,000 | | 359,772 |
| Federal Home Loan Bank, | | | | | |
| Bonds | 5.50 | 7/15/36 | 480,000 | | 576,889 |
| Federal Home Loan Bank, | | | | | |
| Bonds | 5.63 | 6/11/21 | 1,200,000 | | 1,448,242 |
| Federal Home Loan Mortgage Corp., | | | | | |
| Notes | 0.32 | 4/29/15 | 1,500,000 | d | 1,500,248 |
STATEMENT OF INVESTMENTS (continued)
| | | | | |
| | Coupon | Maturity | Principal | | |
| Bonds and Notes (continued) | Rate (%) | Date | Amount ($) | | Value ($) |
| U.S. Government | | | | | |
| Agencies (continued) | | | | | |
| Federal Home Loan Mortgage Corp., | | | | | |
| Notes | 0.42 | 9/18/15 | 850,000 | d | 851,573 |
| Federal Home Loan Mortgage Corp., | | | | | |
| Notes | 0.70 | 10/25/16 | 1,150,000 | d | 1,148,415 |
| Federal Home Loan Mortgage Corp., | | | | | |
| Notes | 1.00 | 9/29/17 | 3,000,000 | d | 2,992,779 |
| Federal Home Loan Mortgage Corp., | | | | | |
| Notes | 1.03 | 11/28/17 | 500,000 | d | 492,919 |
| Federal Home Loan Mortgage Corp., | | | | | |
| Notes | 1.20 | 6/12/18 | 785,000 | d | 772,819 |
| Federal Home Loan Mortgage Corp., | | | | | |
| Notes | 2.00 | 8/25/16 | 2,000,000 | d | 2,078,378 |
| Federal Home Loan Mortgage Corp., | | | | | |
| Notes | 2.25 | 3/13/20 | 715,000 | d | 715,028 |
| Federal Home Loan Mortgage Corp., | | | | | |
| Notes | 2.38 | 1/13/22 | 2,600,000 | b,d | 2,553,543 |
| Federal Home Loan Mortgage Corp., | | | | | |
| Notes | 2.88 | 2/9/15 | 5,500,000 | b,d | 5,685,713 |
| Federal Home Loan Mortgage Corp., | | | | | |
| Notes | 3.06 | 6/14/28 | 135,000 | d | 123,702 |
| Federal Home Loan Mortgage Corp., | | | | | |
| Notes | 3.75 | 3/27/19 | 1,600,000 | d | 1,775,710 |
| Federal Home Loan Mortgage Corp., | | | | | |
| Notes | 4.38 | 7/17/15 | 1,985,000 | d | 2,124,331 |
| Federal Home Loan Mortgage Corp., | | | | | |
| Notes | 4.50 | 10/1/40 | 6,009,091 | d | 6,426,684 |
| Federal Home Loan Mortgage Corp., | | | | | |
| Notes | 4.88 | 6/13/18 | 1,250,000 | b,d | 1,447,540 |
| Federal Home Loan Mortgage Corp., | | | | | |
| Notes | 5.00 | 2/16/17 | 825,000 | d | 938,164 |
| Federal Home Loan Mortgage Corp., | | | | | |
| Notes | 5.13 | 10/18/16 | 750,000 | b,d | 849,137 |
| Federal Home Loan Mortgage Corp., | | | | | |
| Notes | 5.13 | 11/17/17 | 650,000 | b,d | 753,644 |
| Federal Home Loan Mortgage Corp., | | | | | |
| Notes | 5.25 | 4/18/16 | 2,100,000 | d | 2,344,843 |
| Federal Home Loan Mortgage Corp., | | | | | |
| Notes | 6.25 | 7/15/32 | 1,000,000 | d | 1,307,295 |
44
| | | | | |
| | Coupon | Maturity | Principal | | |
| Bonds and Notes (continued) | Rate (%) | Date | Amount ($) | | Value ($) |
| U.S. Government | | | | | |
| Agencies (continued) | | | | | |
| Federal Home Loan Mortgage Corp., | | | | | |
| Bonds | 6.75 | 9/15/29 | 400,000 | b,d | 544,471 |
| Federal National Mortgage | | | | | |
| Association, Notes | 0.00 | 6/1/17 | 2,400,000 | d,e | 2,295,919 |
| Federal National Mortgage | | | | | |
| Association, Notes | 0.38 | 12/21/15 | 2,500,000 | b,d | 2,499,388 |
| Federal National Mortgage | | | | | |
| Association, Notes | 0.50 | 10/22/15 | 500,000 | d | 500,886 |
| Federal National Mortgage | | | | | |
| Association, Notes | 0.50 | 11/27/15 | 1,800,000 | d | 1,800,482 |
| Federal National Mortgage | | | | | |
| Association, Notes | 0.50 | 3/28/16 | 500,000 | d | 500,053 |
| Federal National Mortgage | | | | | |
| Association, Notes | 0.52 | 2/26/16 | 750,000 | d | 750,429 |
| Federal National Mortgage | | | | | |
| Association, Notes | 0.52 | 5/27/16 | 1,250,000 | d | 1,249,166 |
| Federal National Mortgage | | | | | |
| Association, Notes | 0.55 | 2/27/15 | 1,000,000 | d | 1,001,395 |
| Federal National Mortgage | | | | | |
| Association, Notes | 0.57 | 4/18/16 | 1,000,000 | d | 999,822 |
| Federal National Mortgage | | | | | |
| Association, Notes | 0.88 | 2/8/18 | 3,000,000 | b,d | 2,955,945 |
| Federal National Mortgage | | | | | |
| Association, Notes | 1.00 | 12/28/17 | 750,000 | d | 740,104 |
| Federal National Mortgage | | | | | |
| Association, Notes | 1.00 | 2/15/18 | 700,000 | d | 687,832 |
| Federal National Mortgage | | | | | |
| Association, Notes, Ser. 1 | 1.00 | 4/30/18 | 1,000,000 | d | 981,037 |
| Federal National Mortgage | | | | | |
| Association, Notes | 1.05 | 8/26/16 | 250,000 | d | 250,587 |
| Federal National Mortgage | | | | | |
| Association, Notes | 1.13 | 3/28/18 | 415,000 | d | 409,163 |
| Federal National Mortgage | | | | | |
| Association, Notes | 1.25 | 1/30/17 | 2,000,000 | d | 2,033,314 |
| Federal National Mortgage | | | | | |
| Association, Notes | 1.63 | 10/26/15 | 2,700,000 | d | 2,768,510 |
| Federal National Mortgage | | | | | |
| Association, Notes | 2.63 | 11/20/14 | 4,800,000 | b,d | 4,926,221 |
STATEMENT OF INVESTMENTS (continued)
| | | | | | |
| | Coupon | Maturity | Principal | | | |
| Bonds and Notes (continued) | Rate (%) | Date | Amount ($) | | | Value ($) |
| U.S. Government | | | | | | |
| Agencies (continued) | | | | | | |
| Federal National Mortgage | | | | | | |
| Association, Notes | 4.38 | 10/15/15 | 850,000 | d | 916,860 |
| Federal National Mortgage | | | | | | |
| Association, Notes | 5.00 | 4/15/15 | 200,000 | d | 213,834 |
| Federal National Mortgage | | | | | | |
| Association, Notes | 5.00 | 3/15/16 | 1,240,000 | d | 1,372,155 |
| Federal National Mortgage | | | | | | |
| Association, Notes | 5.00 | 5/11/17 | 1,200,000 | d | 1,370,494 |
| Federal National Mortgage | | | | | | |
| Association, Notes | 5.25 | 9/15/16 | 1,225,000 | d | 1,388,088 |
| Federal National Mortgage | | | | | | |
| Association, Notes | 6.00 | 4/18/36 | 1,300,000 | d | 1,439,391 |
| Federal National Mortgage | | | | | | |
| Association, Bonds | 6.25 | 5/15/29 | 1,340,000 | d | 1,730,550 |
| Financing (FICO), | | | | | | |
| Scd. Bonds | 8.60 | 9/26/19 | 40,000 | | 54,295 |
| Financing (FICO), | | | | | | |
| Scd. Bonds, Ser. E | 9.65 | 11/2/18 | 510,000 | | 704,938 |
| Tennessee Valley Authority, | | | | | | |
| Bonds | 5.88 | 4/1/36 | 650,000 | | 783,358 |
| Tennessee Valley Authority, | | | | | | |
| Bonds | 6.15 | 1/15/38 | 165,000 | | 207,238 |
| Tennessee Valley Authority, | | | | | | |
| Notes | 5.25 | 9/15/39 | 1,200,000 | | 1,325,573 |
| | | | | | | 93,099,980 |
| U.S. Government Agencies/ | | | | | | |
| Mortgage-Backed—31.9% | | | | | | |
| Federal Home Loan Mortgage Corp.: | | | | | | |
| 2.50% | | | 5,800,000 | d,f | 5,833,063 |
| 3.00% | | | 5,100,000 | d,f | 5,002,547 |
| 5.00% | | | 1,500,000 | d,f | 1,588,643 |
| 2.14%, 8/1/43 | | | 1,494,896 | a,d | 1,511,121 |
| 2.46%, 10/1/43 | | | 599,453 | a,d | 612,612 |
| 2.50%, 10/1/27—10/1/28 | | | 9,179,069 | d | 9,300,241 |
| 3.00%, 12/1/25—8/1/43 | | | 34,603,168 | d | 34,794,361 |
| 3.50%, 6/1/19—8/1/42 | | | 31,365,195 | d | 32,364,329 |
| 4.00%, 11/1/14—1/1/42 | | | 22,944,946 | d | 24,159,843 |
| 4.50%, 2/1/18—4/1/41 | | | 24,991,563 | d | 26,678,872 |
| 5.00%, 12/1/17—1/1/40 | | | 19,680,105 | d | 21,222,635 |
46
| | | | | |
| | | Principal | | |
| Bonds and Notes (continued) | | Amount ($) | | Value ($) |
| U.S. Government Agencies/Mortgage-Backed (continued) | | | | | |
| Federal Home Loan Mortgage Corp. (continued): | | | | | |
| 5.50%, 8/1/16—1/1/40 | | 15,236,686 | d | 16,532,266 |
| 6.00%, 12/1/13—7/1/39 | | 6,873,236 | d | 7,513,766 |
| 6.50%, 3/1/14—3/1/39 | | 3,849,788 | d | 4,264,012 |
| 7.00%, 9/1/15—7/1/37 | | 204,202 | d | 231,000 |
| 7.50%, 8/1/16—11/1/33 | | 65,911 | d | 75,909 |
| 8.00%, 2/1/17—10/1/31 | | 48,880 | d | 56,471 |
| 8.50%, 10/1/18—6/1/30 | | 1,646 | d | 1,880 |
| Federal National Mortgage Association: | | | | | |
| 2.50% | | 15,100,000 | d,f | 15,108,063 |
| 3.00% | | 19,500,000 | d,f | 19,309,361 |
| 3.50% | | 8,600,000 | d,f | 8,821,281 |
| 4.00% | | 1,000,000 | d,f | 1,050,625 |
| 4.50% | | 1,400,000 | d,f | 1,499,094 |
| 5.50% | | 500,000 | d,f | 545,703 |
| 2.50%, 7/1/27—7/1/33 | | 8,439,867 | d | 8,536,163 |
| 3.00%, 10/1/26—8/1/43 | | 40,655,998 | d | 40,863,235 |
| 3.05%, 12/1/41 | | 699,637 | a,d | 732,170 |
| 3.50%, 1/20/25—9/1/43 | | 46,719,029 | d | 48,333,936 |
| 4.00%, 9/1/18—2/1/42 | | 52,377,910 | d | 55,461,505 |
| 4.50%, 4/1/18—11/1/40 | | 38,702,701 | d | 41,482,405 |
| 5.00%, 11/1/17—6/1/40 | | 28,242,279 | d | 30,687,728 |
| 5.50%, 2/1/14—12/1/38 | | 18,032,228 | d | 19,681,030 |
| 6.00%, 3/1/14—11/1/38 | | 10,291,440 | d | 11,289,969 |
| 6.50%, 10/1/14—9/1/38 | | 2,765,970 | d | 3,065,283 |
| 7.00%, 3/1/14—3/1/38 | | 566,500 | d | 624,413 |
| 7.50%, 8/1/15—6/1/31 | | 95,157 | d | 108,390 |
| 8.00%, 6/1/15—8/1/30 | | 23,194 | d | 26,733 |
| 8.50%, 9/1/15—7/1/30 | | 8,787 | d | 9,178 |
| 9.00%, 10/1/30 | | 2,117 | d | 2,255 |
| Government National Mortgage Association I: | | | | | |
| 3.00% | | 22,300,000 | f | 22,249,454 |
| 3.50% | | 22,400,000 | f | 23,272,844 |
| 4.00% | | 8,400,000 | f | 8,957,484 |
| 4.50% | | 8,000,000 | f | 8,668,750 |
| 2.00%, 10/20/42—6/20/43 | | 2,448,749 | | 2,513,950 |
| 2.50%, 2/15/28—1/20/43 | | 2,550,798 | | 2,600,027 |
| 3.00%, 7/20/42 | | 1,347,112 | a | 1,410,043 |
| 3.50%, 3/20/41—2/15/42 | | 17,395,703 | | 18,127,428 |
| 4.00%, 2/15/41—3/15/41 | | 16,876,814 | | 18,108,441 |
| 4.50%, 1/15/19—2/15/41 | | 19,914,485 | | 21,544,325 |
| 5.00%, 1/15/17—4/15/40 | | 18,600,322 | | 20,334,749 |
STATEMENT OF INVESTMENTS (continued)
| | | | |
| | Principal | | |
| Bonds and Notes (continued) | Amount ($) | | Value ($) |
| U.S. Government Agencies/Mortgage-Backed (continued) | | | | |
| Government National Mortgage Association I (continued): | | | | |
| 5.50%, 9/15/20—11/15/38 | 6,296,194 | | 6,904,478 |
| 6.00%, 1/15/14—4/15/39 | 6,217,672 | | 6,893,005 |
| 6.50%, 2/15/24—2/15/39 | 1,333,331 | | 1,504,463 |
| 7.00%, 2/15/22—8/15/32 | 129,416 | | 145,558 |
| 7.50%, 10/15/14—11/15/30 | 83,307 | | 94,384 |
| 8.00%, 2/15/17—3/15/32 | 22,705 | | 27,142 |
| 8.25%, 6/15/27 | 2,054 | | 2,214 |
| 8.50%, 10/15/26 | 10,166 | | 11,861 |
| 9.00%, 2/15/22—2/15/23 | 9,450 | | 9,711 |
| Government National Mortgage Association II: | | | | |
| 2.50%, 5/20/43—9/20/43 | 1,000,000 | | 946,171 |
| 3.00%, 11/20/27—8/20/43 | 12,568,702 | | 12,713,990 |
| 3.50%, 5/20/34—4/20/43 | 3,881,634 | | 4,039,595 |
| 4.50%, 7/20/41—6/20/43 | 3,205,116 | | 3,482,714 |
| 5.50%, 7/20/38—11/20/42 | 850,647 | | 933,971 |
| 6.50%, 2/20/28 | 1,029 | | 1,206 |
| 8.50%, 7/20/25 | 928 | | 1,078 |
| Federal Home Loan Mortgage Corp.: | | | | |
| 2.18%, 2/1/35 | 406,660 | a,d | 428,039 |
| 2.25%, 6/1/35 | 5,232 | a,d | 5,549 |
| 2.25%, 8/1/37 | 77,572 | a,d | 82,965 |
| 2.38%, 4/1/36 | 152,666 | a,d | 160,066 |
| 2.40%, 6/1/36 | 8,325 | a,d | 8,363 |
| 2.43%, 2/1/34 | 210,048 | a,d | 221,910 |
| 2.51%, 3/1/37 | 104,057 | a,d | 111,015 |
| 2.55%, 12/1/34 | 33,720 | a,d | 35,844 |
| 2.63%, 4/1/33 | 13,080 | a,d | 13,918 |
| 2.72%, 3/1/36 | 7,773 | a,d | 8,325 |
| 2.74%, 12/1/34 | 17,787 | a,d | 18,885 |
| 2.89%, 8/1/35 | 149,058 | a,d | 157,725 |
| 4.69%, 6/1/34 | 6,220 | a,d | 6,657 |
| 5.19%, 8/1/34 | 4,241 | a,d | 4,490 |
| 5.24%, 11/1/33 | 4,625 | a,d | 4,790 |
| Federal National Mortgage Association: | | | | |
| 2.19%, 12/1/35 | 7,381 | a,d | 7,741 |
| 2.25%, 6/1/34 | 197,954 | a,d | 210,343 |
| 2.25%, 11/1/36 | 142,301 | a,d | 149,910 |
| 2.32%, 12/1/36 | 26,931 | a,d | 27,363 |
| 2.34%, 2/1/37 | 3,866 | a,d | 4,102 |
| 2.39%, 5/1/33 | 6,456 | a,d | 6,603 |
48
| | | | |
| | Principal | | |
| Bonds and Notes (continued) | Amount ($) | | Value ($) |
| U.S. Government Agencies/ | | | | |
| Mortgage-Backed (continued) | | | | |
| Federal National Mortgage Association (continued): | | | | |
| 2.39%, 9/1/33 | 6,927 | a,d | 7,272 |
| 2.40%, 11/1/32 | 12,253 | a,d | 12,986 |
| 2.41%, 10/1/34 | 17,063 | a,d | 18,010 |
| 2.41%, 1/1/35 | 207,515 | a,d | 222,067 |
| 2.44%, 11/1/36 | 32,231 | a,d | 33,865 |
| 2.50%, 8/1/35 | 66,410 | a,d | 70,541 |
| 2.52%, 3/1/34 | 209,418 | a,d | 223,420 |
| 2.56%, 9/1/33 | 20,973 | a,d | 22,237 |
| 2.58%, 6/1/34 | 57,578 | a,d | 61,598 |
| 2.61%, 3/1/37 | 55,983 | a,d | 59,745 |
| 2.65%, 9/1/35 | 360,972 | a,d | 385,064 |
| 2.65%, 2/1/37 | 129,687 | a,d | 138,717 |
| 4.96%, 1/1/35 | 9,840 | a,d | 10,389 |
| 5.21%, 6/1/35 | 20,766 | a,d | 22,340 |
| 5.23%, 11/1/35 | 3,615 | a,d | 3,893 |
| | | | | 687,447,874 |
| U.S. Government Securities—35.5% | | | | |
| U.S. Treasury Bonds: | | | | |
| 2.75%, 8/15/42 | 3,200,000 | b | 2,684,499 |
| 2.75%, 11/15/42 | 7,377,000 | b | 6,177,662 |
| 2.88%, 5/15/43 | 9,000,000 | b | 7,723,125 |
| 3.00%, 5/15/42 | 3,500,000 | b | 2,999,234 |
| 3.13%, 11/15/41 | 7,750,000 | | 7,071,875 |
| 3.13%, 2/15/42 | 8,020,000 | b | 7,306,348 |
| 3.13%, 2/15/43 | 8,850,000 | b | 8,016,852 |
| 3.63%, 8/15/43 | 2,085,000 | b | 2,082,719 |
| 3.75%, 8/15/41 | 4,915,000 | b | 5,025,429 |
| 4.25%, 5/15/39 | 1,000,000 | | 1,123,125 |
| 4.38%, 11/15/39 | 4,000,000 | | 4,580,000 |
| 4.38%, 5/15/40 | 29,000 | b | 33,191 |
| 4.38%, 5/15/41 | 4,800,000 | | 5,488,123 |
| 4.50%, 2/15/36 | 670,000 | | 782,225 |
| 4.75%, 2/15/41 | 1,528,000 | b | 1,851,507 |
| 6.00%, 2/15/26 | 470,000 | | 625,284 |
| 6.13%, 11/15/27 | 6,644,000 | | 9,029,090 |
| 6.25%, 8/15/23 | 314,000 | b | 417,767 |
| 6.50%, 11/15/26 | 1,200,000 | | 1,671,563 |
| 6.63%, 2/15/27 | 800,000 | | 1,127,438 |
| 6.88%, 8/15/25 | 300,000 | | 425,086 |
STATEMENT OF INVESTMENTS (continued)
| | | |
| | Principal | | |
| Bonds and Notes (continued) | Amount ($) | | Value ($) |
| U.S. Government Securities (continued) | | | |
| U.S. Treasury Bonds (continued): | | | |
| 7.13%, 2/15/23 | 1,690,000 | | 2,361,048 |
| 7.25%, 8/15/22 | 1,000,000 | | 1,397,891 |
| 7.88%, 2/15/21 | 585,000 | | 822,131 |
| 8.00%, 11/15/21 | 3,770,000 | | 5,412,894 |
| 8.13%, 5/15/21 | 1,500,000 | | 2,145,645 |
| 8.75%, 5/15/17 | 2,395,000 | | 3,059,986 |
| 8.75%, 5/15/20 | 2,000,000 | | 2,873,124 |
| 8.88%, 8/15/17 | 2,725,000 | | 3,537,709 |
| 9.00%, 11/15/18 | 660,000 | | 908,996 |
| U.S. Treasury Notes: | | | |
| 0.25%, 12/15/14 | 26,760,000 | b | 26,789,275 |
| 0.25%, 5/15/15 | 4,610,000 | | 4,611,803 |
| 0.25%, 7/15/15 | 7,440,000 | b | 7,439,130 |
| 0.25%, 8/15/15 | 6,900,000 | b | 6,897,978 |
| 0.25%, 9/15/15 | 7,944,000 | | 7,938,106 |
| 0.25%, 10/15/15 | 6,400,000 | | 6,393,747 |
| 0.25%, 10/31/15 | 4,000,000 | | 3,995,468 |
| 0.25%, 12/15/15 | 8,500,000 | | 8,485,057 |
| 0.25%, 4/15/16 | 8,125,000 | | 8,091,038 |
| 0.25%, 5/15/16 | 7,945,000 | | 7,907,754 |
| 0.38%, 11/15/14 | 2,000,000 | | 2,004,804 |
| 0.38%, 4/15/15 | 7,604,000 | b | 7,622,120 |
| 0.38%, 6/15/15 | 8,000,000 | | 8,017,184 |
| 0.38%, 8/31/15 | 4,435,000 | b | 4,442,970 |
| 0.38%, 11/15/15 | 7,900,000 | | 7,908,335 |
| 0.38%, 1/15/16 | 7,160,000 | b | 7,162,800 |
| 0.38%, 2/15/16 | 7,840,000 | | 7,839,083 |
| 0.38%, 3/15/16 | 6,770,000 | | 6,766,033 |
| 0.50%, 6/15/16 | 7,985,000 | | 7,991,548 |
| 0.50%, 7/31/17 | 4,990,000 | | 4,918,853 |
| 0.63%, 7/15/16 | 7,740,000 | | 7,766,301 |
| 0.63%, 8/15/16 | 4,175,000 | | 4,186,577 |
| 0.63%, 10/15/16 | 3,800,000 | | 3,806,384 |
| 0.63%, 8/31/17 | 3,700,000 | | 3,658,808 |
| 0.63%, 9/30/17 | 7,800,000 | b | 7,703,717 |
| 0.63%, 11/30/17 | 40,000 | | 39,377 |
| 0.63%, 4/30/18 | 8,694,000 | b | 8,494,308 |
| 0.75%, 6/30/17 | 7,387,000 | | 7,360,163 |
50
| | | | |
| | Principal | |
| Bonds and Notes (continued) | Amount ($) | Value ($) |
| U.S. Government Securities (continued) | | | | |
| U.S. Treasury Notes (continued): | | | | |
| 0.75%, 10/31/17 | 7,220,000 | | 7,154,284 |
| 0.75%, 12/31/17 | 100,000 | | 98,797 |
| 0.75%, 2/28/18 | 7,320,000 | | 7,212,484 |
| 0.75%, 3/31/18 | 7,300,000 | | 7,179,097 |
| 0.88%, 1/31/18 | 776,000 | | 769,483 |
| 1.00%, 8/31/16 | 3,600,000 | | 3,645,702 |
| 1.00%, 9/30/16 | 7,801,000 | b | 7,898,512 |
| 1.00%, 10/31/16 | 986,000 | | 997,824 |
| 1.00%, 3/31/17 | 7,000,000 b | 7,057,421 |
| 1.00%, 5/31/18 | 8,400,000 | | 8,333,388 |
| 1.00%, 8/31/19 | 400,000 | b | 386,438 |
| 1.00%, 9/30/19 | 5,000,000 | | 4,822,655 |
| 1.00%, 11/30/19 | 7,300,000 | b | 7,012,563 |
| 1.13%, 3/31/20 | 5,000,000 | | 4,794,530 |
| 1.13%, 4/30/20 | 5,000,000 | | 4,783,985 |
| 1.25%, 8/31/15 | 8,017,000 | b | 8,159,334 |
| 1.25%, 9/30/15 | 9,000,000 | | 9,164,529 |
| 1.25%, 10/31/15 | 7,856,000 | b | 8,002,687 |
| 1.25%, 10/31/18 | 4,430,000 | | 4,415,292 |
| 1.25%, 1/31/19 | 5,295,000 | | 5,257,771 |
| 1.38%, 11/30/15 | 5,820,000 | b | 5,946,405 |
| 1.38%, 6/30/18 | 7,415,000 | b | 7,469,745 |
| 1.38%, 7/31/18 | 7,210,000 | | 7,257,600 |
| 1.38%, 9/30/18 | 10,070,000 | b | 10,110,512 |
| 1.38%, 11/30/18 | 4,341,000 | b | 4,350,155 |
| 1.38%, 12/31/18 | 6,100,000 | b | 6,104,764 |
| 1.38%, 2/28/19 | 500,000 | | 498,828 |
| 1.50%, 8/31/18 | 10,405,000 | b | 10,523,274 |
| 1.63%, 11/15/22 | 5,690,000 | b | 5,313,038 |
| 1.75%, 5/31/16 | 3,500,000 | | 3,615,801 |
| 1.75%, 10/31/18 | 5,400,000 | | 5,517,493 |
| 1.75%, 10/31/20 | 3,600,000 | | 3,551,062 |
| 1.75%, 5/15/22 | 4,299,000 | b | 4,105,545 |
| 1.75%, 5/15/23 | 12,571,000 | b | 11,742,596 |
| 1.88%, 8/31/17 | 4,180,000 | | 4,329,239 |
| 1.88%, 9/30/17 | 5,570,000 | b | 5,765,384 |
| 2.00%, 1/31/16 | 6,825,000 | | 7,075,341 |
| 2.00%, 4/30/16 | 8,625,000 | | 8,960,228 |
STATEMENT OF INVESTMENTS (continued)
| | | |
| | Principal | | |
| Bonds and Notes (continued) | Amount ($) | | Value ($) |
| U.S. Government Securities (continued) | | | |
| U.S. Treasury Notes (continued): | | | |
| 2.00%, 9/30/20 | 3,700,000 | b | 3,718,211 |
| 2.00%, 11/15/21 | 2,430,000 | b | 2,392,410 |
| 2.00%, 2/15/22 | 6,920,000 | | 6,779,711 |
| 2.00%, 2/15/23 | 13,210,000 | b | 12,686,765 |
| 2.13%, 11/30/14 | 2,690,000 | | 2,747,109 |
| 2.13%, 5/31/15 | 7,494,000 | | 7,716,482 |
| 2.13%, 2/29/16 | 3,000,000 | | 3,121,992 |
| 2.13%, 8/31/20 | 3,780,000 | | 3,835,521 |
| 2.13%, 8/15/21 | 10,605,000 | | 10,590,089 |
| 2.25%, 1/31/15 | 21,391,000 | b | 21,944,150 |
| 2.25%, 3/31/16 | 60,000 | | 62,679 |
| 2.38%, 2/28/15 | 1,260,000 | | 1,296,225 |
| 2.38%, 3/31/16 | 1,753,000 | | 1,835,994 |
| 2.50%, 3/31/15 | 5,423,000 | | 5,597,556 |
| 2.50%, 4/30/15 | 8,650,000 | b | 8,944,982 |
| 2.50%, 6/30/17 | 6,520,000 | | 6,905,599 |
| 2.50%, 8/15/23 | 5,573,000 | b | 5,552,971 |
| 2.63%, 12/31/14 | 19,400,000 | b | 19,952,822 |
| 2.63%, 8/15/20 | 8,270,000 | b | 8,677,364 |
| 2.63%, 11/15/20 | 7,011,000 | | 7,333,345 |
| 2.75%, 5/31/17 | 8,430,000 | b | 9,004,951 |
| 3.00%, 8/31/16 | 2,700,000 | | 2,886,257 |
| 3.00%, 9/30/16 | 4,560,000 | b | 4,879,556 |
| 3.00%, 2/28/17 | 1,500,000 | | 1,611,562 |
| 3.13%, 10/31/16 | 5,000,000 | b | 5,374,220 |
| 3.13%, 1/31/17 | 1,800,000 | | 1,939,781 |
| 3.13%, 4/30/17 | 2,830,000 | | 3,057,727 |
| 3.13%, 5/15/21 | 9,750,000 | | 10,481,630 |
| 3.25%, 5/31/16 | 1,083,000 | | 1,161,094 |
| 3.25%, 6/30/16 | 4,600,000 | | 4,938,174 |
| 3.25%, 7/31/16 | 5,100,000 | b | 5,482,898 |
| 3.25%, 12/31/16 | 4,700,000 | b | 5,079,671 |
| 3.25%, 3/31/17 | 3,000,000 | | 3,251,718 |
| 3.50%, 5/15/20 | 9,120,000 | b | 10,103,610 |
| 3.63%, 2/15/20 | 6,200,000 | b | 6,920,025 |
| 3.63%, 2/15/21 | 6,680,000 | | 7,428,628 |
| 4.00%, 2/15/15 | 12,200,000 | b | 12,796,653 |
| 4.13%, 5/15/15 | 1,065,000 | | 1,128,609 |
| 4.25%, 8/15/15 | 1,305,000 | b | 1,397,727 |
52
| | | | | | | |
| | | Coupon | Maturity | Principal | | |
| | Bonds and Notes (continued) | Rate (%) | Date | Amount ($) | | Value ($) |
| | U.S. Government Securities (continued) | | | | | |
| | U.S. Treasury Notes (continued): | | | | | | |
| | 4.50%, 11/15/15 | | | 220,000 | b | 238,734 |
| | 4.50%, 2/15/16 | | | 425,000 | | 465,109 |
| | 4.50%, 5/15/17 | | | 1,800,000 | | 2,031,750 |
| | 4.63%, 11/15/16 | | | 2,000,000 | | 2,240,704 |
| | 4.63%, 2/15/17 | | | 2,252,000 | | 2,537,547 |
| | 4.75%, 8/15/17 | | | 2,387,000 | b | 2,731,623 |
| | 4.88%, 8/15/16 | | | 90,000 | | 100,877 |
| | | | | | | | 765,346,885 |
| | Utilities—1.7% | | | | | | |
| | AEP Texas Central Transition | | | | | | |
| | Funding, Sr. Scd. Bonds, | | | | | | |
| Ser. A-4 | 5.17 | 1/1/20 | 250,000 | | 279,394 |
| | Commonwealth Edison, | | | | | | |
| | First Mortgage Bonds | 5.90 | 3/15/36 | 971,000 | | 1,139,885 |
| | Consolidated Edison of New York, | | | | | | |
| | Sr. Unscd. Debs., Ser. 05-A | 5.30 | 3/1/35 | 175,000 | | 191,741 |
| | Consolidated Edison of New York, | | | | | | |
| | Sr. Unscd. Debs., Ser. 08-A | 5.85 | 4/1/18 | 600,000 | | 705,362 |
| | Consolidated Edison of New York, | | | | | | |
| | Sr. Unscd. Debs., Ser. 06-B | 6.20 | 6/15/36 | 200,000 | | 240,193 |
| | Consumers Energy, | | | | | | |
| | First Mortgage Bonds, Ser. P | 5.50 | 8/15/16 | 200,000 | | 224,175 |
| | Dominion Resources, | | | | | | |
| | Sr. Unscd. Notes, Ser. C | 5.15 | 7/15/15 | 2,075,000 | | 2,224,682 |
| | Dominion Resources, | | | | | | |
| | Sr. Unscd. Notes, Ser. E | 6.30 | 3/15/33 | 100,000 | | 117,772 |
| | Duke Energy Carolinas, | | | | | | |
| | First Mortgage Bonds | 4.00 | 9/30/42 | 500,000 | | 464,264 |
| | Duke Energy Carolinas, | | | | | | |
| | First Mortgage Bonds | 5.30 | 2/15/40 | 1,700,000 | | 1,907,891 |
| | Duke Energy Florida | | | | | | |
| | First Mortgage Bonds | 6.40 | 6/15/38 | 1,000,000 | | 1,256,371 |
| | Florida Power & Light, | | | | | | |
| | First Mortgage Bonds | 5.63 | 4/1/34 | 1,100,000 | | 1,273,501 |
| | Georgia Power, | | | | | | |
| | Sr. Unscd. Note | 4.30 | 3/15/42 | 1,300,000 | | 1,197,665 |
STATEMENT OF INVESTMENTS (continued)
| | | | |
| | Coupon | Maturity | Principal | |
| Bonds and Notes (continued) | Rate (%) | Date | Amount ($) | Value ($) |
| Utilities (continued) | | | | |
| Hydro-Quebec, | | | | |
| Gov’t Gtd. Debs., Ser. HH | 8.50 | 12/1/29 | 1,200,000 | 1,784,380 |
| Hydro-Quebec, | | | | |
| Gov’t Gtd. Debs., Ser. HK | 9.38 | 4/15/30 | 20,000 | 30,722 |
| Indiana Michigan Power, | | | | |
| Sr. Unscd. Notes | 6.05 | 3/15/37 | 800,000 | 896,976 |
| MidAmerican Energy Holdings, | | | | |
| Sr. Unscd. Bonds | 6.13 | 4/1/36 | 500,000 | 568,581 |
| Nevada Power, | | | | |
| Mortgage Notes | 7.13 | 3/15/19 | 2,300,000 | 2,862,424 |
| NiSource Finance, | | | | |
| Gtd. Notes | 6.40 | 3/15/18 | 1,700,000 | 1,984,823 |
| Oncor Electric Delivery, | | | | |
| Sr. Scd. Debs | 7.00 | 9/1/22 | 170,000 | 209,174 |
| Oncor Electric Delivery, | | | | |
| Sr. Scd. Notes | 7.00 | 5/1/32 | 250,000 | 308,099 |
| Pacific Gas & Electric, | | | | |
| Sr. Unscd. Bonds | 6.05 | 3/1/34 | 465,000 | 525,456 |
| Pacific Gas & Electric, | | | | |
| Sr. Unscd. Notes | 6.25 | 3/1/39 | 750,000 | 872,841 |
| Pacificorp, | | | | |
| First Mortgage Bonds | 5.75 | 4/1/37 | 1,035,000 | 1,202,612 |
| Peco Energy, | | | | |
| First Mortgage Bonds | 4.80 | 10/15/43 | 500,000 | 521,023 |
| PPL Capital Funding, | | | | |
| Gtd. Notes | 3.40 | 6/1/23 | 400,000 | 378,362 |
| PPL Capital Funding, | | | | |
| Gtd. Notes | 4.70 | 6/1/43 | 400,000 | 362,065 |
| PPL Electric Utilities, | | | | |
| First Mortgage Bonds | 4.75 | 7/15/43 | 1,000,000 | 1,033,785 |
| Progress Energy, | | | | |
| Sr. Unscd. Notes | 7.75 | 3/1/31 | 480,000 | 623,721 |
| Public Service Colorado, | | | | |
| First Mortgage Bonds | 3.20 | 11/15/20 | 1,500,000 | 1,545,933 |
| Public Service Electric & Gas, | | | | |
| Sr. Scd. Notes, Ser. D | 5.25 | 7/1/35 | 230,000 | 255,691 |
54
| | | | | |
| | Coupon | Maturity | Principal | | |
| Bonds and Notes (continued) | Rate (%) | Date | Amount ($) | | Value ($) |
| Utilities (continued) | | | | | |
| San Diego Gas & Electric, | | | | | |
| First Mortgage Bonds | 3.60 | 9/1/23 | 400,000 | | 412,080 |
| South Carolina Electric & Gas, | | | | | |
| First Mortgage Bonds | 6.63 | 2/1/32 | 200,000 | | 244,251 |
| Southern California Edison, | | | | | |
| First Mortgage Bonds | 3.88 | 6/1/21 | 1,400,000 | | 1,500,220 |
| Southern California Edison, | | | | | |
| First Mortgage Notes, Ser. 08-A | 5.95 | 2/1/38 | 70,000 | | 83,816 |
| Southern California Edison, | | | | | |
| Sr. Unscd. Notes | 6.65 | 4/1/29 | 450,000 | | 551,486 |
| Southern California Gas, | | | | | |
| First Mortgage Bonds, Ser. HH | 5.45 | 4/15/18 | 100,000 | | 115,448 |
| Southern Power, | | | | | |
| Sr. Unscd. Notes, Ser. D | 4.88 | 7/15/15 | 2,000,000 | | 2,134,338 |
| SouthWestern Electric Power, | | | | | |
| Sr. Unscd. Notes, Ser. F | 5.88 | 3/1/18 | 150,000 | | 170,507 |
| Union Electric, | | | | | |
| Sr. Scd. Notes | 6.40 | 6/15/17 | 1,500,000 | | 1,748,980 |
| Virginia Electric & Power, | | | | | |
| Sr. Unscd. Notes | 1.20 | 1/15/18 | 1,000,000 | | 981,991 |
| Virginia Electric & Power, | | | | | |
| Sr. Unscd. Notes | 4.00 | 1/15/43 | 500,000 | | 457,200 |
| Virginia Electric & Power, | | | | | |
| Sr. Unscd. Notes, Ser. A | 5.40 | 1/15/16 | 500,000 | | 549,336 |
| Xcel Energy, | | | | | |
| Sr. Unscd. Notes | 6.50 | 7/1/36 | 630,000 | | 762,917 |
| | | | | | 36,902,134 |
| Total Bonds and Notes | | | | | |
| (cost $2,135,950,689) | | | | | 2,191,035,462 |
| |
| Other Investment—3.2% | | | Shares | | Value ($) |
| Registered Investment Company; | | | | | |
| Dreyfus Institutional Preferred | | | | | |
| Plus Money Market Fund | | | | | |
| (cost $68,659,201) | | | 68,659,201 | g | 68,659,201 |
STATEMENT OF INVESTMENTS (continued)
| | | | |
| Investment of Cash Collateral | | | | |
| for Securities Loaned—.5% | Shares | | Value ($) | |
| Registered Investment Company; | | | | |
| Dreyfus Institutional Cash | | | | |
| Advantage Fund | | | | |
| (cost $9,749,007) | 9,749,007 | g | 9,749,007 | |
| |
| Total Investments (cost $2,214,358,897) | 105.4 | % | 2,269,443,670 | |
| Liabilities, Less Cash and Receivables | (5.4 | %) | (115,384,770 | ) |
| Net Assets | 100.0 | % | 2,154,058,900 | |
GO—General Obligation
REIT—Real Estate Investment Trust
|
| a Variable rate security—interest rate subject to periodic change. |
| b Security, or portion thereof, on loan.At October 31, 2013, the value of the fund’s securities on loan was |
| $339,043,237 and the value of the collateral held by the fund was $362,189,268, consisting of cash collateral of |
| $9,749,007 and U.S. Government and Agency securities valued at $352,440,261. |
| c Securities exempt from registration pursuant to Rule 144A under the Securities Act of 1933.These securities may be |
| resold in transactions exempt from registration, normally to qualified institutional buyers.At October 31, 2013, these |
| securities were valued at $1,570,642 or 0.1% of net assets. |
| d The Federal Housing Finance Agency (“FHFA”) placed Federal Home Loan Mortgage Corporation and Federal |
| National Mortgage Association into conservatorship with FHFA as the conservator.As such, the FHFA oversees the |
| continuing affairs of these companies. |
| e Security issued with a zero coupon. Income is recognized through the accretion of discount. |
| f This security is traded on a To-Be-Announed (“TBA”) basis. (See Note 4). |
| g Investment in affiliated money market mutual fund. |
| | | |
| Portfolio Summary (Unaudited)† | | |
| |
| | Value (%) | | Value (%) |
| U.S. Government & Agencies | 71.7 | Commercial Mortgage-Backed | 1.7 |
| Corporate Bonds | 22.5 | Municipal Bonds | .8 |
| Foreign/Governmental | 4.6 | Asset-Backed | .4 |
| Money Market Investments | 3.7 | | 105.4 |
| |
| † Based on net assets. | | | |
| See notes to financial statements. | | | |
56
|
| TBA SALE COMMITMENTS |
| October 31, 2013 |
| | |
| | Principal | |
| | Amount ($) | Value ($) |
| Federal Home Loan Mortgage Corp. | | |
| 3%, 11/1/2043 | 4,100,000 | 4,247,344 |
| 3.5% 11/1/2043 | 2,100,000 | 2,198,191 |
| 4%, 11/1/2043 | 700,000 | 734,781 |
| 4.5% 11/1/2043 | 7,000,000 | 7,475,781 |
| 5%, 11/1/2043 | 2,800,000 | 2,996,559 |
| 5.5% 11/1/2043 | 5,000,000 | 5,415,627 |
| Total Federal Home Loan Mortgage Corp. | 21,700,000 | 23,068,283 |
| Federal National Mortgage Association | | |
| 3.5% 11/1/2043 | 500,000 | 527,969 |
| 4%, 11/1/2043 | 8,500,000 | 9,020,625 |
| 4.5% 11/1/2043 | 2,850,000 | 3,027,680 |
| 5%, 11/1/2043 | 4,100,000 | 4,458,751 |
| Total Federal National Mortgage Association | 15,950,000 | 17,035,025 |
| Government National Mortgage Association | | |
| 3.5% 11/1/2043 | 5,300,000 | 5,494,609 |
| 4%, 11/1/2043 | 2,500,000 | 2,658,984 |
| 4.5% 11/1/2043 | 3,400,000 | 3,665,094 |
| 5%, 11/1/2043 | 1,000,000 | 1,088,633 |
| 5.5% 11/1/2043 | 1,500,000 | 1,638,633 |
| Total Government | | |
| National Mortgage Association | 13,700,000 | 14,545,953 |
| Total TBA Sale Commitments | | |
| (proceeds $54,331,300) | | 54,649,261 |
| |
| See notes to financial statements. | | |
|
| STATEMENT OF ASSETS AND LIABILITIES |
| October 31, 2013 |
| | |
| | Cost | Value |
| Assets ($): | | |
| Investments in securities—See Statement of Investments (including | |
| securities on loan, valued at $339,043,237)—Note 1(b): | | |
| Unaffiliated issuers | 2,135,950,689 | 2,191,035,462 |
| Affiliated issuers | 78,408,208 | 78,408,208 |
| Cash | | 3,189,282 |
| Receivable for TBA sale commitments | | 54,331,300 |
| Receivable for investment securities sold | | 37,102,841 |
| Dividends, interest and securities lending income receivable | | 13,802,963 |
| Receivable for shares of Capital Stock subscribed | | 2,360,963 |
| | | 2,380,231,019 |
| Liabilities ($): | | |
| Due to The Dreyfus Corporation and affiliates—Note 3(b) | | 453,007 |
| Payable for investment securities purchased | | 87,614,853 |
| Payable for open mortgage dollar roll transactions—Note 4 | | 70,173,385 |
| TBA sales commitment, at value (proceeds | | |
| $54,331,300)—see TBA Sales Commitments—Note 4 | | 54,649,261 |
| Liability for securities on loan—Note 1(b) | | 9,749,007 |
| Payable for shares of Capital Stock redeemed | | 3,506,678 |
| Accrued expenses | | 25,928 |
| | | 226,172,119 |
| Net Assets ($) | | 2,154,058,900 |
| Composition of Net Assets ($): | | |
| Paid-in capital | | 2,070,353,452 |
| Accumulated undistributed investment income—net | | 2,011,773 |
| Accumulated net realized gain (loss) on investments | | 26,926,863 |
| Accumulated net unrealized appreciation | | |
| (depreciation) on investments | | 54,766,812 |
| Net Assets ($) | | 2,154,058,900 |
| |
| |
| Net Asset Value Per Share | | |
| | Investor Shares | BASIC Shares |
| Net Assets ($) | 904,778,723 | 1,249,280,177 |
| Shares Outstanding | 85,227,768 | 117,611,445 |
| Net Asset Value Per Share ($) | 10.62 | 10.62 |
| |
| See notes to financial statements. | | |
58
|
| STATEMENT OF OPERATIONS |
| Year Ended October 31, 2013 |
| | |
| Investment Income ($): | | |
| Income: | | |
| Interest | 59,946,786 | |
| Income from securities lending—Note 1(b) | 299,351 | |
| Dividends; | | |
| Affliated issuers | 43,300 | |
| Total Income | 60,289,437 | |
| Expenses: | | |
| Management fee—Note 3(a) | 3,413,935 | |
| Distribution Plan fees (Investor Shares)—Note 3(b) | 2,466,349 | |
| Directors’ fees—Note 3(a) | 169,566 | |
| Loan commitment fees—Note 2 | 21,212 | |
| Total Expenses | 6,071,062 | |
| Less—Directors’ fees reimbursed by the Manager—Note 3(a) | (169,566 | ) |
| Net Expenses | 5,901,496 | |
| Investment Income—Net | 54,387,941 | |
| Realized and Unrealized Gain (Loss) on Investments—Note 4 ($): | | |
| Net realized gain (loss) on investments | 36,177,404 | |
| Net unrealized appreciation (depreciation) on investments | (128,007,187 | ) |
| Net Realized and Unrealized Gain (Loss) on Investments | (91,829,783 | ) |
| Net (Decrease) in Net Assets Resulting from Operations | (37,441,842 | ) |
| |
| See notes to financial statements. | | |
STATEMENT OF CHANGES IN NET ASSETS
| | | | |
| | Year Ended October 31, | |
| | 2013 | | 2012 | |
| Operations ($): | | | | |
| Investment income—net | 54,387,941 | | 68,119,403 | |
| Net realized gain (loss) on investments | 36,177,404 | | 18,314,159 | |
| Net unrealized appreciation | | | | |
| (depreciation) on investments | (128,007,187 | ) | 28,436,071 | |
| Net Increase (Decrease) in Net Assets | | | | |
| Resulting from Operations | (37,441,842 | ) | 114,869,633 | |
| Dividends to Shareholders from ($): | | | | |
| Investment income—net: | | | | |
| Investor Shares | (25,808,556 | ) | (29,767,411 | ) |
| BASIC Shares | (36,949,929 | ) | (46,556,696 | ) |
| Net realized gain on investments: | | | | |
| Investor Shares | (2,369,554 | ) | — | |
| BASIC Shares | (3,192,239 | ) | — | |
| Total Dividends | (68,320,278 | ) | (76,324,107 | ) |
| Capital Stock Transactions ($): | | | | |
| Net proceeds from shares sold: | | | | |
| Investor Shares | 331,081,540 | | 406,277,765 | |
| BASIC Shares | 428,646,545 | | 521,655,197 | |
| Dividends reinvested: | | | | |
| Investor Shares | 27,685,258 | | 28,975,057 | |
| BASIC Shares | 35,691,797 | | 40,627,309 | |
| Cost of shares redeemed: | | | | |
| Investor Shares | (440,721,801 | ) | (315,021,065 | ) |
| BASIC Shares | (641,338,922 | ) | (525,623,352 | ) |
| Increase (Decrease) in Net Assets | | | | |
| from Capital Stock Transactions | (258,955,583 | ) | 156,890,911 | |
| Total Increase (Decrease) in Net Assets | (364,717,703 | ) | 195,436,437 | |
| Net Assets ($): | | | | |
| Beginning of Period | 2,518,776,603 | | 2,323,340,166 | |
| End of Period | 2,154,058,900 | | 2,518,776,603 | |
| Undistributed investment income—net | 2,011,773 | | 1,319,339 | |
60
| | | | |
| | Year Ended October 31, | |
| | 2013 | | 2012 | |
| Capital Share Transactions: | | | | |
| Investor Shares | | | | |
| Shares sold | 30,599,851 | | 36,914,957 | |
| Shares issued for dividends reinvested | 2,559,322 | | 2,623,519 | |
| Shares redeemed | (40,873,438 | ) | (28,588,573 | ) |
| Net Increase (Decrease) in Shares Outstanding | (7,714,265 | ) | 10,949,903 | |
| BASIC Shares | | | | |
| Shares sold | 39,632,326 | | 47,337,409 | |
| Shares issued for dividends reinvested | 3,298,055 | | 3,679,850 | |
| Shares redeemed | (59,009,178 | ) | (47,803,019 | ) |
| Net Increase (Decrease) in Shares Outstanding | (16,078,797 | ) | 3,214,240 | |
| |
| See notes to financial statements. | | | | |
FINANCIAL HIGHLIGHTS
The following tables describe the performance for each share class for the fiscal periods indicated.All information (except portfolio turnover rate) reflects financial results for a single fund share.Total return shows how much your investment in the fund would have increased (or decreased) during each period, assuming you had reinvested all dividends and distributions.These figures have been derived from the fund’s financial statements.
| | | | | | | | | | |
| | | | Year Ended October 31, | | | |
| Investor Shares | 2013 | | 2012 | | 2011 | | 2010 | | 2009 | |
| Per Share Data ($): | | | | | | | | | | |
| Net asset value, beginning of period | 11.11 | | 10.93 | | 10.80 | | 10.42 | | 9.62 | |
| Investment Operations: | | | | | | | | | | |
| Investment income—neta | .24 | | .30 | | .34 | | .35 | | .39 | |
| Net realized and unrealized | | | | | | | | | | |
| gain (loss) on investments | (.42 | ) | .21 | | .14 | | .39 | | .81 | |
| Total from Investment Operations | (.18 | ) | .51 | | .48 | | .74 | | 1.20 | |
| Distributions: | | | | | | | | | | |
| Dividends from | | | | | | | | | | |
| investment income—net | (.28 | ) | (.33 | ) | (.35 | ) | (.36 | ) | (.40 | ) |
| Dividends from net realized | | | | | | | | | | |
| gain on investments | (.03 | ) | — | | — | | — | | — | |
| Total Distributions | (.31 | ) | (.33 | ) | (.35 | ) | (.36 | ) | (.40 | ) |
| Net asset value, end of period | 10.62 | | 11.11 | | 10.93 | | 10.80 | | 10.42 | |
| Total Return (%) | (1.66 | ) | 4.75 | | 4.58 | | 7.28 | | 12.70 | |
| Ratios/Supplemental Data (%): | | | | | | | | | | |
| Ratio of total expenses | | | | | | | | | | |
| to average net assets | .41 | | .41 | | .40 | | .41 | | .41 | |
| Ratio of net expenses | | | | | | | | | | |
| to average net assets | .40 | | .40 | | .40 | | .40 | | .40 | |
| Ratio of net investment income | | | | | | | | | | |
| to average net assets | 2.25 | | 2.67 | | 3.24 | | 3.27 | | 3.81 | |
| Portfolio Turnover Rate | 94.21 | b | 30.42 | | 30.02 | | 32.15 | | 24.78 | |
| Net Assets, end of period | | | | | | | | | | |
| ($ x 1,000) | 904,779 | | 1,032,597 | | 896,293 | | 996,131 | | 899,701 | |
|
| a Based on average shares outstanding at each month end. |
| b The portfolio turnover rate excluding mortgage dollar roll transactions for the period October 31, 2013 was 67.47%. |
See notes to financial statements.
62
| | | | | | | | | | |
| | | | | | Year Ended October 31, | | | |
| BASIC Shares | 2013 | | 2012 | | 2011 | | 2010 | | 2009 | |
| Per Share Data ($): | | | | | | | | | | |
| Net asset value, | | | | | | | | | | |
| beginning of period | 11.12 | | 10.94 | | 10.80 | | 10.42 | | 9.62 | |
| Investment Operations: | | | | | | | | | | |
| Investment income—neta | .27 | | .32 | | .36 | | .37 | | .41 | |
| Net realized and unrealized | | | | | | | | | | |
| gain (loss) on investments | (.43 | ) | .22 | | .16 | | .40 | | .82 | |
| Total from Investment Operations | (.16 | ) | .54 | | .52 | | .77 | | 1.23 | |
| Distributions: | | | | | | | | | | |
| Dividends from | | | | | | | | | | |
| investment income—net | (.31 | ) | (.36 | ) | (.38 | ) | (.39 | ) | (.43 | ) |
| Dividends from net realized | | | | | | | | | | |
| gain on investments | (.03 | ) | — | | — | | — | | — | |
| Total Distributions | (.34 | ) | (.36 | ) | (.38 | ) | (.39 | ) | (.43 | ) |
| Net asset value, end of period | 10.62 | | 11.12 | | 10.94 | | 10.80 | | 10.42 | |
| Total Return (%) | (1.50 | ) | 5.01 | | 4.94 | | 7.55 | | 12.99 | |
| Ratios/Supplemental Data (%): | | | | | | | | | | |
| Ratio of total expenses | | | | | | | | | | |
| to average net assets | .16 | | .16 | | .15 | | .16 | | .16 | |
| Ratio of net expenses | | | | | | | | | | |
| to average net assets | .15 | | .15 | | .15 | | .15 | | .15 | |
| Ratio of net investment income | | | | | | | | | | |
| to average net assets | 2.50 | | 2.92 | | 3.31 | | 3.52 | | 4.05 | |
| Portfolio Turnover Rate | 94.21 | b | 30.42 | | 30.02 | | 32.15 | | 24.78 | |
| Net Assets, end of period | | | | | | | | | | |
| ($ x 1,000) | 1,249,280 | | 1,486,179 | | 1,427,047 | | 1,249,324 | | 932,049 | |
|
| a Based on average shares outstanding at each month end. |
| b The portfolio turnover rate excluding mortgage dollar roll transactions for the period October 31, 2013 was 64.47%. |
See notes to financial statements.
NOTES TO FINANCIAL STATEMENTS
NOTE 1—Significant Accounting Policies:
Dreyfus Bond Market Index Fund (the “fund”) is a separate diversified series of The Dreyfus/Laurel Funds, Inc. (the “Company”), which is registered under the Investment Company Act of 1940, as amended (the “Act”), as an open-end management investment company and operates as a series company currently offering eleven series, including the fund. The fund’s investment objective seeks to match the total return of the Barclays U.S.Aggregate Index.The Dreyfus Corporation (the “Manager” or “Dreyfus”), a wholly-owned subsidiary of The Bank of New York Mellon Corporation (“BNY Mellon”), serves as the fund’s investment adviser.
MBSC Securities Corporation (the “Distributor”), a wholly-owned subsidiary of the Manager, is the distributor of the fund’s shares.The fund is authorized to issue 500 million shares of $.001 par value Capital Stock in each of the following classes of shares: Investor and BASIC. Investor shares and BASIC shares are offered to any investor. Differences between the two classes include the services offered to and the expenses borne by each class, as well as their minimum purchase and account balance requirements. Income, expenses (other than expenses attributable to a specific class), and realized and unrealized gains or losses on investments are allocated to each class of shares based on its relative net assets.
The Company accounts separately for the assets, liabilities and operations of each series. Expenses directly attributable to each series are charged to that series’ operations; expenses which are applicable to all series are allocated among them on a pro rata basis.
The Financial Accounting Standards Board (“FASB”) Accounting Standards Codification is the exclusive reference of authoritative U.S. generally accepted accounting principles (“GAAP”) recognized by the FASB to be applied by nongovernmental entities. Rules and interpretive releases of the Securities and Exchange Commission (“SEC”) under authority of federal laws are also sources of authoritative GAAP for SEC registrants. The fund’s financial statements are prepared in accordance
64
with GAAP, which may require the use of management estimates and assumptions.Actual results could differ from those estimates.
(a) Portfolio valuation: The fair value of a financial instrument is the amount that would be received to sell an asset or paid to transfer a liability in an orderly transaction between market participants at the measurement date (i.e., the exit price). GAAP establishes a fair value hierarchy that prioritizes the inputs of valuation techniques used to measure fair value. This hierarchy gives the highest priority to unadjusted quoted prices in active markets for identical assets or liabilities (Level 1 measurements) and the lowest priority to unobservable inputs (Level 3 measurements).
Additionally, GAAP provides guidance on determining whether the volume and activity in a market has decreased significantly and whether such a decrease in activity results in transactions that are not orderly. GAAP requires enhanced disclosures around valuation inputs and techniques used during annual and interim periods.
Various inputs are used in determining the value of the fund’s investments relating to fair value measurements.These inputs are summarized in the three broad levels listed below:
Level 1—unadjusted quoted prices in active markets for identical investments.
Level 2—other significant observable inputs (including quoted prices for similar investments, interest rates, prepayment speeds, credit risk, etc.).
Level 3—significant unobservable inputs (including the fund’s own assumptions in determining the fair value of investments).
The inputs or methodology used for valuing securities are not necessarily an indication of the risk associated with investing in those securities.
Changes in valuation techniques may result in transfers in or out of an assigned level within the disclosure hierarchy. Valuation techniques used to value the fund’s investments are as follows:
NOTES TO FINANCIAL STATEMENTS (continued)
Registered investment companies that are not traded on an exchange are valued at their net asset value and are categorized within Level 1 of the fair value hierarchy.
Investments in securities, excluding short-term investments (other than U.S.Treasury Bills), are valued each business day by an independent pricing service (the “Service”) approved by the Company’s Board of Directors (the “Board”). Investments for which quoted bid prices are readily available and are representative of the bid side of the market in the judgment of the Service are valued at the mean between the quoted bid prices (as obtained by the Service from dealers in such securities) and asked prices (as calculated by the Service based upon its evaluation of the market for such securities). Other investments (which constitute a majority of the portfolio securities) are valued as determined by the Service, based on methods which include consideration of the following: yields or prices of securities of comparable quality, coupon, maturity and type; indications as to values from dealers; and general market conditions.These securities are generally categorized within Level 2 of the fair value hierarchy.
The Service’s procedures are reviewed by Dreyfus under the general supervision of the Board.
When market quotations or official closing prices are not readily available, or are determined not to reflect accurately fair value, such as when the value of a security has been significantly affected by events after the close of the exchange or market on which the security is principally traded (for example, a foreign exchange or market), but before the fund calculates its net asset value, the fund may value these investments at fair value as determined in accordance with the procedures approved by the Board. Certain factors may be considered when fair valuing investments such as: fundamental analytical data, the nature and duration of restrictions on disposition, an evaluation of the forces that influence the market in which the securities are purchased and sold, and public trading in similar securities of the issuer or comparable issuers. These securities are either categorized within Level 2 or 3 of the fair value hierarchy depending on the relevant inputs used.
66
For restricted securities where observable inputs are limited, assumptions about market activity and risk are used and are categorized within Level 3 of the fair value hierarchy.
The following is a summary of the inputs used as of October 31, 2013 in valuing the fund’s investments:
| | | | | | | |
| | | | Level 2—Other | | Level 3— | | |
| | | Level 1— | Significant | | Significant | | |
| | | Unadjusted | Observable | | Unobservable | | |
| | Quoted Prices | Inputs | | Inputs | Total | |
| Assets ($) | | | | | | | |
| Investments in Securities: | | | | | |
| Asset-Backed | | — | 9,049,053 | | — | 9,049,053 | |
| Commercial | | | | | | | |
| Mortgage-Backed | | — | 35,618,761 | | — | 35,618,761 | |
| Corporate Bonds† | | — | 485,297,820 | | — | 485,297,820 | |
| Foreign Government | | — | 98,355,162 | | — | 98,355,162 | |
| Municipal Bonds | | — | 16,819,927 | | — | 16,819,927 | |
| Mutual Funds | 78,408,208 | — | | — | 78,408,208 | |
| U.S. Government | | | | | | | |
| Agencies/ | | | | | | | |
| Mortgage-Backed | | — | 780,547,854 | | — | 780,547,854 | |
| U.S. Treasury | | — | 765,346,885 | | — | 765,346,885 | |
| Other Financial | | | | | | | |
| Instruments: | | | | | | | |
| TBA Sales Commitments | — | (54,649,261 | ) | — | (54,649,261 | ) |
| † See Statement of Investments for additional detailed categorizations. | | |
At October 31, 2013, there were no transfers between Level 1 and Level 2 of the fair value hierarchy.
(b) Securities transactions and investment income: Securities transactions are recorded on a trade date basis. Realized gains and losses from securities transactions are recorded on the identified cost basis. Dividend income is recognized on the ex-dividend date and interest income, including, where applicable, accretion of discount and amortization of premium on investments, is recognized on the accrual basis.
Pursuant to a securities lending agreement with The Bank of New York Mellon, a subsidiary of BNY Mellon and an affiliate of Dreyfus,
NOTES TO FINANCIAL STATEMENTS (continued)
and its affiliates, the fund may lend securities to qualified institutions. It is the fund’s policy that, at origination, all loans are secured by collateral of at least 102% of the value of U.S. securities loaned and 105% of the value of foreign securities loaned. Collateral equivalent to at least 100% of the market value of securities on loan is maintained at all times. Collateral is either in the form of cash, which can be invested in certain money market mutual funds managed by the Manager or U.S. Government and Agency securities.The fund is entitled to receive all dividends, interest and distributions on securities loaned, in addition to income earned as a result of the lending transaction. Should a borrower fail to return the securities in a timely manner, The Bank of New York Mellon is required to replace the securities for the benefit of the fund or credit the fund with the market value of the unreturned securities and is subrogated to the fund’s rights against the borrower and the collateral. During the period ended October 31, 2013, The Bank of New York Mellon earned $87,807 from lending portfolio securities, pursuant to the securities lending agreement.
(c) Affiliated issuers: Investments in other investment companies advised by Dreyfus are defined as “affiliated” under the Act. Investments in affiliated investment companies during the period ended October 31, 2013 were as follows:
| | | | | |
| Affiliated | | | | | |
| Investment | Value | | | Value | Net |
| Company | 10/31/2012 ($) | Purchases ($) | Sales ($) | 10/31/2013 ($) | Assets (%) |
| Dreyfus | | | | | |
| Institutional | | | | | |
| Preferred | | | | | |
| Plus Money | | | | | |
| Market | | | | | |
| Fund | 42,790,597 | 688,598,281 | 662,729,677 | 68,659,201 | 3.2 |
| Dreyfus | | | | | |
| Institutional | | | | | |
| Cash | | | | | |
| Advantage | | | | | |
| Fund | 7,465,277 | 85,779,610 | 83,495,880 | 9,749,007 | .5 |
| Total | 50,255,874 | 774,377,891 | 746,225,557 | 78,408,208 | 3.7 |
(d) Risk: The fund invests primarily in debt securities. Failure of an issuer of the debt securities to make timely interest or principal pay-
68
ments, or a decline or the perception of a decline in the credit quality of a debt security, can cause the debt security’s price to fall, potentially lowering the fund’s share price. In addition, the value of debt securities may decline due to general market conditions that are not specifically related to a particular issuer, such as real or perceived adverse economic conditions, changes in outlook for corporate earnings, changes in interest or currency rates or adverse investor sentiment.They may also decline because of factors that affect a particular industry.
(e) Dividends to shareholders: It is the policy of the fund to declare dividends daily from investment income-net. Such dividends are paid monthly. Dividends from net realized capital gains, if any, are normally declared and paid annually, but the fund may make distributions on a more frequent basis to comply with the distribution requirements of the Internal Revenue Code of 1986, as amended (the “Code”).To the extent that net realized capital gains can be offset by capital loss carryovers, it is the policy of the fund not to distribute such gains. Income and capital gain distributions are determined in accordance with income tax regulations, which may differ from GAAP.
(f) Federal income taxes: It is the policy of the fund to continue to qualify as a regulated investment company, if such qualification is in the best interests of its shareholders, by complying with the applicable provisions of the Code, and to make distributions of taxable income sufficient to relieve it from substantially all federal income and excise taxes.
As of and during the period ended October 31, 2013, the fund did not have any liabilities for any uncertain tax positions.The fund recognizes interest and penalties, if any, related to uncertain tax positions as income tax expense in the Statement of Operations. During the period ended October 31, 2013, the fund did not incur any interest or penalties.
Each tax year in the four-year period ended October 31, 2013 remains subject to examination by the Internal Revenue Service and state taxing authorities.
NOTES TO FINANCIAL STATEMENTS (continued)
At October 31, 2013, the components of accumulated earnings on a tax basis were as follows: undistributed ordinary income $2,011,773, undistributed capital gains $27,523,984 and unrealized appreciation $54,169,691.
The tax character of distributions paid to shareholders during the fiscal periods ended October 31, 2013 and October 31, 2012 were as follows: ordinary income $62,758,485 and $76,324,107, and long-term capital gains $5,561,793 and $0, respectively.
During the period ended October 31, 2013, as a result of permanent book to tax differences, primarily due to the tax treatment for paydown gains and losses on mortgage backed securities, amortization of premiums and consent fees, the fund increased accumulated undistributed investment income-net by $9,062,978 and decreased accumulated net realized gain (loss) on investments by the same amount. Net assets and net asset value per share were not affected by this reclassification.
NOTE 2—Bank Lines of Credit:
The fund participates with other Dreyfus-managed funds in a $265 million unsecured credit facility led by Citibank, N.A. and a $300 million unsecured credit facility provided by The Bank of New York Mellon (each, a “Facility”), each to be utilized primarily for temporary or emergency purposes, including the financing of redemptions. Prior to October 9, 2013, the unsecured credit facility with Citibank, N.A. was $210 million. In connection therewith, the fund has agreed to pay its pro rata portion of commitment fees for each Facility. Interest is charged to the fund based on rates determined pursuant to the terms of the respective Facility at the time of borrowing. During the period ended October 31, 2013, the fund did not borrow under the Facilities.
NOTE 3—Investment Management Fee and Other Transactions With Affiliates:
(a) Pursuant to an investment management agreement with the Manager, the Manager provides or arranges for one or more third parties and/or affiliates to provide investment advisory, administrative,
70
custody, fund accounting and transfer agency services to the fund.The Manager also directs the investments of the fund in accordance with its investment objective, policies and limitations. For these services, the fund is contractually obligated to pay the Manager a fee, calculated daily and paid monthly, at the annual rate of .15% of the value of the fund’s average daily net assets. Out of its fee, the Manager pays all of the expenses of the fund except brokerage fees, taxes, interest expenses, commitment fees on borrowings, Distribution Plan fees, fees and expenses of non-interested Directors (including counsel fees) and extraordinary expenses. In addition, the Manager is required to reduce its fee in an amount equal to the fund’s allocable portion of fees and expenses of the non-interested Directors (including counsel fees). During the period ended October 31, 2013, fees reimbursed by the Manager amounted to $169,566.
(b) Under the Distribution Plan adopted pursuant to Rule 12b-1 under the Act, Investor shares may pay annually up to .25% of the value of its average daily net assets to compensate the Distributor for shareholder servicing activities primarily intended to result in the sale of Investor shares. The BASIC shares bear no Distribution Plan fee. During the period ended October 31, 2013, Investor shares were charged $2,466,349 pursuant to the Distribution Plan.
Under its terms, the Distribution Plan shall remain in effect from year to year, provided such continuance is approved annually by a vote of majority of those Directors who are not “interested persons” of the Company and who have no direct or indirect financial interest in the operation or in any agreement related to the Distribution Plan.
The components of “Due to The Dreyfus Corporation and affiliates” in the Statement of Assets and Liabilities consist of: management fees $274,175 and Distribution Plan fees $193,576, which are offset against an expense reimbursement currently in effect in the amount of $14,744.
(c) Each Board member also serves as a Board member of other funds within the Dreyfus complex. Annual retainer fees and attendance fees are allocated to each fund based on net assets.
NOTES TO FINANCIAL STATEMENTS (continued)
NOTE 4—Securities Transactions:
The aggregate amount of purchases and sales (including paydowns) of investment securities, excluding short-term securities, during the period ended October 31, 2013, amounted to $2,150,684,038 and $2,342,390,805, respectively, of which $607,456,023 in purchases and $608,755,043 in sales were from mortgage dollar transactions.
Mortgage Dollar Rolls: A mortgage dollar roll transaction involves a sale by the fund of mortgage related securities that it holds with an agreement by the fund to repurchase similar securities at an agreed upon price and date.The securities purchased will bear the same interest rate as those sold, but generally will be collateralized by pools of mortgages with different prepayment histories than those securities sold.The fund accounts for mortgage dollar rolls as purchases and sales transactions.
To-Be-Announced (“TBA”) Securities: During the period ended October 31, 2013, the fund transacted in TBA securities that involved buying or selling mortgage-backed securities on a forward commitment basis. A TBA transaction typically does not designate the actual security to be delivered and only includes an approximate principal amount; however delivered securities must meet specified terms defined by industry guidelines, including issuer, rate and current principal amount outstanding on underling mortgage pools. TBA securities subject to a forward commitment to sell at period end are included at the end of the fund’s Statement of Investments under the caption “TBA Sale Commitments.” The proceeds and value of these commitments are reflected in the fund’s Statement of Assets and Liabilities as Receivable for TBA sale commitments and TBA sale commitments, at value, respectively.
At October 31, 2013, the cost of investments for federal income tax purposes was $2,214,956,018; accordingly, accumulated net unrealized appreciation on investments was $54,487,652, consisting of $75,621,478 gross unrealized appreciation and $21,133,826 gross unrealized depreciation.
72
|
| REPORT OF INDEPENDENT REGISTERED |
| PUBLIC ACCOUNTING FIRM |
The Board of Directors and Shareholders The Dreyfus/Laurel Funds, Inc.
We have audited the accompanying statement of assets and liabilities of Dreyfus Bond Market Index Fund (the “Fund”), a series of The Dreyfus/Laurel Funds, Inc., including the statement of investments and TBA Sale Commitments, as of October 31, 2013, the related statement of operations for the year then ended, the statements of changes in net assets for each of the years in the two-year period then ended, and the financial highlights for each of the years in the five-year period then ended. These financial statements and financial highlights are the responsibility of the Fund’s management. Our responsibility is to express an opinion on these financial statements and financial highlights based on our audits.
We conducted our audits in accordance with the standards of the Public Company Accounting Oversight Board (United States).Those standards require that we plan and perform the audit to obtain reasonable assurance about whether the financial statements and financial highlights are free of material misstatement. An audit includes examining, on a test basis, evidence supporting the amounts and disclosures in the financial statements. Our procedures included confirmation of securities owned as of October 31, 2013, by correspondence with the custodian and brokers or by other appropriate auditing procedures.An audit also includes assessing the accounting principles used and significant estimates made by management, as well as evaluating the overall financial statement presentation. We believe that our audits provide a reasonable basis for our opinion.
In our opinion, the financial statements and financial highlights referred to above present fairly, in all material respects, the financial position of Dreyfus Bond Market Index Fund as of October 31, 2013, the results of its operations for the year then ended, the changes in its net assets for each of the years in the two-year period then ended, and the financial highlights for each of the years in the five-year period then ended, in conformity with U.S. generally accepted accounting principles.

New York, New York
December 30, 2013
IMPORTANT TAX INFORMATION (Unaudited)
For federal tax purposes the fund reports the maximum amount allowable but not less than 90.61% as intertest-related dividends in accordance with Sections 871(k)(1) and 881(e) of the Internal Revenue Code.Also the fund reports the maximum amount allowable but not less than $.0250 per share as a capital gain dividend in accordance with Section 852(b)(3)(C) of the Internal Revenue Code.
74
BOARD MEMBERS INFORMATION (Unaudited)
|
| Joseph S. DiMartino (70) |
| Chairman of the Board (1999) |
| Principal Occupation During Past 5Years: |
| • Corporate Director and Trustee |
| Other Public Company Board Memberships During Past 5Years: |
| • CBIZ (formerly, Century Business Services, Inc.), a provider of outsourcing functions for small |
| and medium size companies, Director (1997-present) |
| • The Newark Group, a provider of a national market of paper recovery facilities, paperboard |
| mills and paperboard converting plants, Director (2000-2010) |
| • Sunair Services Corporation, a provider of certain outdoor-related services to homes and |
| businesses, Director (2005-2009) |
| No. of Portfolios for which Board Member Serves: 141 |
| ——————— |
| Francine J. Bovich (62) |
| Board Member (2012) |
| Principal Occupation During Past 5Years: |
| • Trustee,The Bradley Trusts, private trust funds (2011-present) |
| • Managing Director, Morgan Stanley Investment Management (1993-2010) |
| No. of Portfolios for which Board Member Serves: 40 |
| ——————— |
| James M. Fitzgibbons (79) |
| Board Member (1994) |
| Principal Occupation During Past 5Years: |
| • Corporate Director and Trustee |
| Other Public Company Board Memberships During Past 5Years: |
| • Bill Barrett Corporation, an oil and natural gas exploration company, Director (2004-2012) |
| No. of Portfolios for which Board Member Serves: 26 |
| ——————— |
| Kenneth A. Himmel (67) |
| Board Member (1994) |
| Principal Occupation During Past 5Years: |
| • President and CEO, Related Urban Development, a real estate development company (1996-present) |
| • President and CEO, Himmel & Company, a real estate development company (1980-present) |
| • CEO,American Food Management, a restaurant company (1983-present) |
| No. of Portfolios for which Board Member Serves: 26 |
BOARD MEMBERS INFORMATION (Unaudited) (continued)
|
| Stephen J. Lockwood (66) |
| Board Member (1994) |
| Principal Occupation During Past 5Years: |
| • Chairman of the Board, Stephen J. Lockwood and Company LLC, a real estate investment |
| company (2000-present) |
| No. of Portfolios for which Board Member Serves: 26 |
| ——————— |
| Roslyn M. Watson (64) |
| Board Member (1994) |
| Principal Occupation During Past 5Years: |
| • Principal,Watson Ventures, Inc., a real estate investment company (1993-present) |
| No. of Portfolios for which Board Member Serves: 36 |
| ——————— |
| Benaree Pratt Wiley (67) |
| Board Member (1998) |
| Principal Occupation During Past 5Years: |
| • Principal,TheWiley Group, a firm specializing in strategy and business development (2005-present) |
| Other Public Company Board Memberships During Past 5Years: |
| • CBIZ (formerly, Century Business Services, Inc.), a provider of outsourcing functions |
| for small and medium size companies, Director (2008-present) |
| No. of Portfolios for which Board Member Serves: 61 |
| ——————— |
Once elected all Board Members serve for an indefinite term, but achieve Emeritus status upon reaching age 80.The address of the Board Members and Officers is c/o The Dreyfus Corporation, 200 Park Avenue, NewYork, NewYork 10166. Additional information about the Board Members is available in the fund’s Statement of Additional Information which can be obtained from Dreyfus free of charge by calling this toll free number: 1-800-DREYFUS.
J.Tomlinson Fort, Emeritus Broad Member
76
OFFICERS OF THE FUND (Unaudited)
BRADLEY J. SKAPYAK, President since January 2010.
Chief Operating Officer and a director of the Manager since June 2009, Chairman of Dreyfus Transfer, Inc., an affiliate of the Manager and the transfer agent of the funds, since May 2011 and Executive Vice President of the Distributor since June 2007. From April 2003 to June 2009, Mr. Skapyak was the head of the Investment Accounting and Support Department of the Manager. He is an officer of 68 investment companies (comprised of 141 portfolios) managed by the Manager. He is 55 years old and has been an employee of the Manager since February 1988.
JOHN PAK, Chief Legal Officer since March 2013.
Chief Legal Officer of the Manager and Associate General Counsel and Managing Director of BNY Mellon since August 2012; from March 2005 to July 2012, Managing Director of Deutsche Bank, Deputy Global Head of Deutsche Asset Management Legal and Regional Head of Deutsche Asset Management Americas Legal. He is an officer of 69 investment companies (comprised of 166 portfolios) managed by the Manager. He is 45 years old and has been an employee of the Manager since August 2012.
JANETTE E. FARRAGHER, Vice President and Secretary since December 2011.
Assistant General Counsel of BNY Mellon, and an officer of 69 investment companies (comprised of 166 portfolios) managed by the Manager. She is 50 years old and has been an employee of the Manager since February 1984.
KIESHA ASTWOOD, Vice President and Assistant Secretary since January 2010.
Counsel of BNY Mellon, and an officer of 69 investment companies (comprised of 166 portfolios) managed by the Manager. She is 40 years old and has been an employee of the Manager since July 1995.
JAMES BITETTO, Vice President and Assistant Secretary since August 2005.
Senior Counsel of BNY Mellon and Secretary of the Manager, and an officer of 69 investment companies (comprised of 166 portfolios) managed by the Manager. He is 47 years old and has been an employee of the Manager since December 1996.
JONI LACKS CHARATAN, Vice President and Assistant Secretary since August 2005.
Senior Counsel of BNY Mellon, and an officer of 69 investment companies (comprised of 166 portfolios) managed by the Manager. She is 58 years old and has been an employee of the Manager since October 1988.
JOSEPH M. CHIOFFI, Vice President and Assistant Secretary since August 2005.
Senior Counsel of BNY Mellon, and an officer of 69 investment companies (comprised of 166 portfolios) managed by the Manager. He is 52 years old and has been an employee of the Manager since June 2000.
JOHN B. HAMMALIAN, Vice President and Assistant Secretary since August 2005.
Senior Managing Counsel of BNY Mellon, and an officer of 69 investment companies (comprised of 166 portfolios) managed by the Manager. He is 50 years old and has been an employee of the Manager since February 1991.
ROBERT R. MULLERY, Vice President and Assistant Secretary since August 2005.
Managing Counsel of BNY Mellon, and an officer of 69 investment companies (comprised of 166 portfolios) managed by the Manager. He is 61 years old and has been an employee of the Manager since May 1986.
OFFICERS OF THE FUND (Unaudited) (continued)
JEFF PRUSNOFSKY, Vice President and Assistant Secretary since August 2005.
Senior Managing Counsel of BNY Mellon, and an officer of 69 investment companies (comprised of 166 portfolios) managed by the Manager. He is 48 years old and has been an employee of the Manager since October 1990.
JAMES WINDELS, Treasurer since November 2001.
Director – Mutual Fund Accounting of the Manager, and an officer of 69 investment companies (comprised of 166 portfolios) managed by the Manager. He is 55 years old and has been an employee of the Manager since April 1985.
RICHARD CASSARO, Assistant Treasurer since January 2008.
Senior Accounting Manager – Money Market and Municipal Bond Funds of the Manager, and an officer of 69 investment companies (comprised of 166 portfolios) managed by the Manager. He is 54 years old and has been an employee of the Manager since September 1982.
GAVIN C. REILLY, Assistant Treasurer since December 2005.
Tax Manager of the Investment Accounting and Support Department of the Manager, and an officer of 69 investment companies (comprised of 166 portfolios) managed by the Manager. He is 45 years old and has been an employee of the Manager since April 1991.
ROBERT S. ROBOL, Assistant Treasurer since August 2005.
Senior Accounting Manager – Fixed Income Funds of the Manager, and an officer of 69 investment companies (comprised of 166 portfolios) managed by the Manager. He is 49 years old and has been an employee of the Manager since October 1988.
ROBERT SALVIOLO, Assistant Treasurer since July 2007.
Senior Accounting Manager – Equity Funds of the Manager, and an officer of 69 investment companies (comprised of 166 portfolios) managed by the Manager. He is 46 years old and has been an employee of the Manager since June 1989.
ROBERT SVAGNA, Assistant Treasurer since December 2002.
Senior Accounting Manager – Equity Funds of the Manager, and an officer of 69 investment companies (comprised of 166 portfolios) managed by the Manager. He is 46 years old and has been an employee of the Manager since November 1990.
JOSEPH W. CONNOLLY, Chief Compliance Officer since October 2004.
Chief Compliance Officer of the Manager and The Dreyfus Family of Funds (69 investment companies, comprised of 166 portfolios). He is 56 years old and has served in various capacities with the Manager since 1980, including manager of the firm’s Fund Accounting Department from 1997 through October 2001.
MATTHEW D. CONNOLLY, Anti-Money Laundering Compliance Officer since April 2012.
Anti-Money Laundering Compliance Officer of the Distributor since October 2011; from March 2010 to September 2011, Global Head, KYC Reviews and Director, UBS Investment Bank; until March 2010, AML Compliance Officer and Senior Vice President, Citi Global Wealth Management. He is an officer of 64 investment companies (comprised of 161 portfolios) managed by the Manager. He is 41 years old and has been an employee of the Distributor since October 2011.
78
For More Information

Telephone 1-800-DREYFUS
Mail The Dreyfus Family of Funds, 144 Glenn Curtiss Boulevard, Uniondale, NY 11556-0144 E-mail Send your request to info@dreyfus.com Internet Information can be viewed online or downloaded at: http://www.dreyfus.com
The fund files its complete schedule of portfolio holdings with the Securities and Exchange Commission (“SEC”) for the first and third quarters of each fiscal year on Form N-Q. The fund’s Forms N-Q are available on the SEC’s website at http://www.sec.gov and may be reviewed and copied at the SEC’s Public Reference Room in Washington, DC. Information on the operation of the Public Reference Room may be obtained by calling 1-800-SEC-0330.
A description of the policies and procedures that the fund uses to determine how to vote proxies relating to portfolio securities, and information regarding how the fund voted these proxies for the most recent 12-month period ended June 30 is available at http://www.dreyfus.com and on the SEC’s website at http://www.sec.gov. The description of the policies and procedures is also available without charge, upon request, by calling 1-800-DREYFUS.

|
| Dreyfus Disciplined |
| Stock Fund |
ANNUAL REPORT October 31, 2013

Save time. Save paper. View your next shareholder report online as soon as it’s available. Log into www.dreyfus.com and sign up for Dreyfus eCommunications. It’s simple and only takes a few minutes.
The views expressed in this report reflect those of the portfolio manager only through the end of the period covered and do not necessarily represent the views of Dreyfus or any other person in the Dreyfus organization. Any such views are subject to change at any time based upon market or other conditions and Dreyfus disclaims any responsibility to update such views.These views may not be relied on as investment advice and, because investment decisions for a Dreyfus fund are based on numerous factors, may not be relied on as an indication of trading intent on behalf of any Dreyfus fund.
|
| Not FDIC-Insured • Not Bank-Guaranteed • May Lose Value |
| | Contents |
| | THE FUND |
| 2 | A Letter from the President |
| 3 | Discussion of Fund Performance |
| 6 | Fund Performance |
| 7 | Understanding Your Fund’s Expenses |
| 7 | Comparing Your Fund’s Expenses With Those of Other Funds |
| 8 | Statement of Investments |
| 13 | Statement of Assets and Liabilities |
| 14 | Statement of Operations |
| 15 | Statement of Changes in Net Assets |
| 16 | Financial Highlights |
| 17 | Notes to Financial Statements |
| 25 | Report of Independent Registered Public Accounting Firm |
| 26 | Important Tax Information |
| 27 | Board Members Information |
| 29 | Officers of the Fund |
| | FOR MORE INFORMATION |
| | Back Cover |
Dreyfus
Disciplined Stock Fund
The Fund
A LETTER FROM THE PRESIDENT
Dear Shareholder:
We are pleased to present this annual report for Dreyfus Disciplined Stock Fund, covering the 12-month period from November 1, 2012, through October 31, 2013. For information about how the fund performed during the reporting period, as well as general market perspectives, we provide a Discussion of Fund Performance on the pages that follow.
Although expectations of higher long-term interest rates and a more moderately stimulative monetary policy sparked volatility in the U.S stock market at times during the reporting period, improved U.S. economic conditions drove stock prices substantially higher for the reporting period overall. Even the 16-day U.S. government shutdown in October failed to derail the market’s advance, enabling some broad measures of stock market performance to reach new record highs by the end of the month. Stocks across most capitalization ranges and investment styles produced strong results.
We currently expect U.S. economic conditions to continue to improve in 2014, with accelerating growth supported by the fading drags of tighter federal fiscal policies and downsizing on the state and local levels. Moreover, inflation is likely to remain muted, so monetary policy can remain stimulative. Globally, we anticipate stronger growth in many developed countries due to past and continuing monetary ease, while emerging markets seem poised for moderate economic expansion despite recently negative investor sentiment. For more information on how these observations may affect your investments, we encourage you to speak with your financial advisor.
Thank you for your continued confidence and support.

J. Charles Cardona
President
The Dreyfus Corporation
November 15, 2013
2
DISCUSSION OF FUND PERFORMANCE
For the reporting period of November 1, 2012, through October 31, 2013, as provided by Sean P. Fitzgibbon and Jeffrey McGrew, Portfolio Managers
Fund and Market Performance Overview
For the 12-month period ended October 31, 2013, Dreyfus Disciplined Stock Fund produced a total return of 24.72%.1 In comparison, the Standard & Poor’s 500 Composite Stock Price Index (“S&P 500 Index”), the fund’s benchmark, returned 27.16% for the same period.2
U.S. stocks responded positively to continued economic growth, restrained inflation, and favorable interest rates. While the fund participated in the market’s rise to a significant degree, its performance trailed the benchmark due to shortfalls in the information technology sector and, to a lesser degree, the consumer staples sector.
The Fund’s Investment Approach
The fund seeks capital appreciation.To pursue its goal, the fund normally invests at least 80% of its net assets in stocks, with a focus on large-cap companies.The fund invests in a diversified portfolio of growth and value stocks, with sector weightings and risk characteristics generally similar to those in the S&P 500 Index. We choose stocks through a disciplined investment process that combines computer modeling techniques, fundamental analysis and risk management.The result is a portfolio of carefully selected stocks, with overall performance determined by a large number of securities.
Recovering Economy Fueled Market Gains
The reporting period began soon after the start of a sustained stock market rally driven by improved U.S. employment and housing markets. Investors were particularly encouraged by a new round of quantitative easing from the Federal Reserve Board (the “Fed”). Improving conditions in overseas markets also contributed to greater investor optimism.
DISCUSSION OF FUND PERFORMANCE (continued)
Economic data continued to improve, and stocks generally continued to rally, through the spring of 2013. However, in late May, relatively hawkish remarks by Fed chairman Ben Bernanke were widely interpreted as a signal that U.S. monetary policymakers would back away from their quantitative easing program sooner than expected, sparking volatility that erased some of the market’s previous gains. Equity markets generally stabilized over the summer, and stocks advanced strongly in September when the Fed refrained from tapering its bond purchasing program. The S&P 500 Index pushed through the 16-day U.S. government shutdown in October, reaching a new record high by the end of the reporting period.
Gains Undermined by Technology Disappointments
Although the fund delivered strong absolute returns, its relative performance lagged due to disappointments in the information technology sector. The fund avoided technology stocks with unimpressive fundamentals, many of which rebounded from depressed valuations. Instead, we emphasized attractively valued industry leaders with catalysts for growth, but such stocks lagged market averages. For example, data storage company EMC suffered when corporations postponed capital spending plans due to prevailing economic uncertainty.The fund also was hurt by unfortunate timing in adjustments to the fund’s position in consumer electronics giant Apple. Consumer staples holdings, including household goods seller Unilever and tobacco producer Philip Morris International, were hurt by weakness in European and emerging markets.
On a more positive note, the fund fared well in several sectors.The fund benefited from overweighted exposure and strong stock selections in the consumer discretionary sector. Electronics retailer Best Buy ranked as the fund’s top performer, more than doubling in value amid efforts to reduce costs and increase store traffic. Media content providers CBS and The Walt Disney Company rallied due to strong cash flow generation and compelling excess capital return to shareholders momentum. In the materials sector, the fund avoided hard-hit metals-and-mining companies, focusing instead on companies—such as chemicals manufacturer LyondellBasell Industries—that were poised to benefit from lower domestic natural gas prices. Significantly underweighted exposure to the struggling utilities and telecommunications sectors further bolstered relative performance.
4
Anticipating Continued U.S. Growth
We believe that the United States is likely to remain the leading driver of domestic and global growth for the foreseeable future.While we are cautious with regard to certain product cycles, we believe that companies leveraged to the recovering U.S. economy and pent up enterprise demand are well positioned for potential gains.We do not anticipate the European recovery to be a straight line up, and, as such not all countries and sectors will recover equally; however, we are cautiously optimistic. Meanwhile, the emerging markets appear to have stabilized, and China’s transition to a consumer-based economy from an industrial build-out phase portends well for keeping global inflationary pressures under control.
As of the end of the reporting period, the fund held overweighted exposure to the consumer discretionary sector, with an emphasis on companies likely, in our view, to benefit from continued growth in retail and housing. The fund also maintained overweighted exposure to industrial companies, as well as to financial institutions that tend to fare well when interest rates rise. The fund held underweighted exposure to the energy sector, which is faced with improving supply of U.S. oil and gas amid moderating global demand.The fund held no exposure to the utilities and telecommunications sectors, which we believe lack near-term catalysts for future growth.
November 15, 2013
Please note, the position in any security highlighted with italicized typeface was sold during the reporting period. Equity funds are subject generally to market, market sector, market liquidity, issuer and investment style risks, among other factors, to varying degrees, all of which are more fully described in the fund’s prospectus.
|
| 1 Total return includes reinvestment of dividends and any capital gains paid. Past performance is no guarantee of future |
| results. Share price and investment return fluctuate such that upon redemption, fund shares may be worth more or less |
| than their original cost. |
| 2 SOURCE: LIPPER INC. — Reflects the monthly reinvestment of dividends and, where applicable, capital gain |
| distributions.The Standard & Poor’s 500 Composite Stock Price Index is a widely accepted, unmanaged index of |
| U.S. stock market performance. Investors cannot invest directly in any index. |
FUND PERFORMANCE
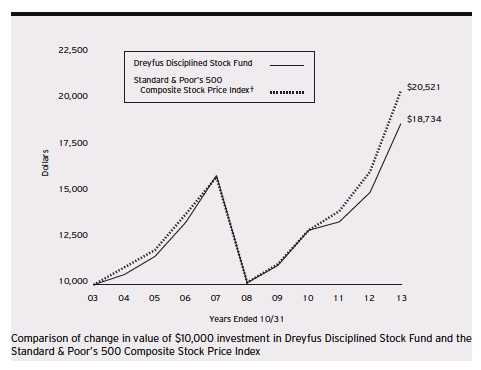
| | | | | | |
| Average Annual Total Returns as of 10/31/13 | | | | | |
| | 1 Year | | 5 Years | | 10 Years | |
| Fund | 24.72 | % | 13.12 | % | 6.48 | % |
| Standard & Poor’s 500 | | | | | | |
| Composite Stock Price Index | 27.16 | % | 15.16 | % | 7.45 | % |
† Source: Lipper Inc.
Past performance is not predictive of future performance.The fund’s performance shown in the graph and table does not reflect the deduction of taxes that a shareholder would pay on fund distributions or the redemption of fund shares. The above graph compares a $10,000 investment made in Dreyfus Disciplined Stock Fund on 10/31/03 to a $10,000 investment made in the Standard & Poor’s 500 Composite Stock Price Index (the “Index) on that date. All dividends and capital gain distributions are reinvested.
The fund’s performance shown in the line graph above takes into account all applicable fees and expenses.The Index is a widely accepted, unmanaged index of U.S. stock market performance. Unlike a mutual fund, the Index is not subject to charges, fees and other expenses. Investors cannot invest directly in any index. Further information relating to fund performance, including expense reimbursements, if applicable, is contained in the Financial Highlights section of the prospectus and elsewhere in this report.
6
As a mutual fund investor, you pay ongoing expenses, such as management fees and other expenses. Using the information below, you can estimate how these expenses affect your investment and compare them with the expenses of other funds.You also may pay one-time transaction expenses, including sales charges (loads) and redemption fees, which are not shown in this section and would have resulted in higher total expenses. For more information, see your fund’s prospectus or talk to your financial adviser.
Review your fund’s expenses
The table below shows the expenses you would have paid on a $1,000 investment in Dreyfus Disciplined Stock Fund from May 1, 2013 to October 31, 2013. It also shows how much a $1,000 investment would be worth at the close of the period, assuming actual returns and expenses.
Expenses and Value of a $1,000 Investment
assuming actual returns for the six months ended October 31, 2013
| | |
| Expenses paid per $1,000† | | $5.35 |
| Ending value (after expenses) | | $1,124.40 |
COMPARING YOUR FUND’S EXPENSES
WITH THOSE OF OTHER FUNDS (Unaudited)
Using the SEC’s method to compare expenses
The Securities and Exchange Commission (SEC) has established guidelines to help investors assess fund expenses. Per these guidelines, the table below shows your fund’s expenses based on a $1,000 investment, assuming a hypothetical 5% annualized return. You can use this information to compare the ongoing expenses (but not transaction expenses or total cost) of investing in the fund with those of other funds.All mutual fund shareholder reports will provide this information to help you make this comparison. Please note that you cannot use this information to estimate your actual ending account balance and expenses paid during the period.
UNDERSTANDING YOUR FUND’S EXPENSES (Unaudited)
Expenses and Value of a $1,000 Investment
assuming a hypothetical 5% annualized return for the six months ended October 31, 2013
| | |
| Expenses paid per $1,000† | | $5.09 |
| Ending value (after expenses) | | $1,020.16 |
|
| † Expenses are equal to the fund’s annualized expense ratio of 1.00%, multiplied by the average account value over |
| the period, multiplied by 184/365 (to reflect the one-half year period). |
|
| STATEMENT OF INVESTMENTS |
| October 31, 2013 |
| | | |
| Common Stocks—99.6% | Shares | | Value ($) |
| Automobiles & Components—.4% | | | |
| BorgWarner | 22,300 | | 2,299,799 |
| Banks—2.7% | | | |
| Regions Financial | 565,780 | | 5,448,461 |
| Wells Fargo & Co. | 238,830 | | 10,195,653 |
| | | | 15,644,114 |
| Capital Goods—8.9% | | | |
| Cummins | 46,060 | | 5,850,542 |
| Danaher | 104,710 | | 7,548,544 |
| Eaton | 126,170 | | 8,902,555 |
| Fluor | 72,980 | | 5,416,576 |
| Illinois Tool Works | 96,910 | | 7,635,539 |
| Ingersoll-Rand | 108,320 | | 7,314,850 |
| Precision Castparts | 35,960 | | 9,114,062 |
| | | | 51,782,668 |
| Commercial & Professional | | | |
| Services—.9% | | | |
| Robert Half International | 138,030 | | 5,318,296 |
| Consumer Durables & Apparel—3.3% | | | |
| NIKE, Cl. B | 100,060 | | 7,580,546 |
| PVH | 50,740 | | 6,320,682 |
| Whirlpool | 37,930 | | 5,538,159 |
| | | | 19,439,387 |
| Consumer Services—.9% | | | |
| Starbucks | 62,770 | | 5,087,508 |
| Diversified Financials—11.3% | | | |
| Affiliated Managers Group | 16,412 | a | 3,240,385 |
| Ameriprise Financial | 55,640 | | 5,594,046 |
| Bank of America | 743,400 | | 10,377,864 |
| Capital One Financial | 74,300 | | 5,102,181 |
| Charles Schwab | 171,710 | | 3,889,232 |
| Citigroup | 199,310 | | 9,722,342 |
8
| | |
| Common Stocks (continued) | Shares | Value ($) |
| Diversified Financials (continued) | | |
| ING US | 189,170 | 5,868,053 |
| JPMorgan Chase & Co. | 272,040 | 14,020,942 |
| NASDAQ OMX Group | 225,580 | 7,992,299 |
| | | 65,807,344 |
| Energy—10.1% | | |
| Anadarko Petroleum | 65,140 | 6,207,191 |
| Apache | 45,980 | 4,083,024 |
| ConocoPhillips | 141,430 | 10,366,819 |
| EOG Resources | 27,730 | 4,947,032 |
| National Oilwell Varco | 55,960 | 4,542,833 |
| Noble Energy | 78,250 | 5,863,272 |
| Occidental Petroleum | 97,860 | 9,402,389 |
| Schlumberger | 144,520 | 13,544,414 |
| | | 58,956,974 |
| Exchange-Traded Funds—1.1% | | |
| Standard & Poor’s Depository | | |
| Receipts S&P 500 ETF Trust | 35,690 | 6,273,945 |
| Food & Staples Retailing—3.7% | | |
| Costco Wholesale | 113,920 | 13,442,560 |
| CVS Caremark | 128,700 | 8,012,862 |
| | | 21,455,422 |
| Food, Beverage & Tobacco—4.1% | | |
| Archer-Daniels-Midland | 186,010 | 7,607,809 |
| Lorillard | 138,670 | 7,073,557 |
| Mondelez International, Cl. A | 281,660 | 9,475,042 |
| | | 24,156,408 |
| Health Care Equipment & | | |
| Services—2.4% | | |
| McKesson | 44,760 | 6,997,778 |
| Medtronic | 126,840 | 7,280,616 |
| | | 14,278,394 |
STATEMENT OF INVESTMENTS (continued)
| | | |
| Common Stocks (continued) | Shares | | Value ($) |
| Insurance—3.2% | | | |
| American International Group | 115,370 | | 5,958,860 |
| Hartford Financial Services Group | 212,410 | | 7,158,217 |
| Prudential Financial | 69,060 | | 5,620,793 |
| | | | 18,737,870 |
| Materials—4.2% | | | |
| Ecolab | 71,380 | | 7,566,280 |
| LyondellBasell Industries, Cl. A | 55,390 | | 4,132,094 |
| Owens-Illinois | 159,090 | a | 5,057,471 |
| Praxair | 63,800 | | 7,956,498 |
| | | | 24,712,343 |
| Media—3.3% | | | |
| CBS, Cl. B | 104,810 | | 6,198,463 |
| Twenty-First Century Fox, Cl. A | 125,750 | | 4,285,560 |
| Walt Disney | 128,370 | | 8,804,898 |
| | | | 19,288,921 |
| Pharmaceuticals, Biotech & | | | |
| Life Sciences—10.7% | | | |
| AbbVie | 195,590 | | 9,476,335 |
| Agilent Technologies | 88,160 | | 4,475,002 |
| Bristol-Myers Squibb | 148,820 | | 7,816,026 |
| Celgene | 44,160 | a | 6,557,318 |
| Gilead Sciences | 118,800 | a | 8,433,612 |
| Mylan | 133,420 | a | 5,052,615 |
| Pfizer | 679,414 | | 20,844,422 |
| | | | 62,655,330 |
| Real Estate—1.2% | | | |
| CBRE Group, Cl. A | 308,720 | a | 7,171,566 |
| Retailing—7.6% | | | |
| Amazon.com | 26,290 | a | 9,570,349 |
| Best Buy | 129,190 | | 5,529,332 |
10
| | | |
| Common Stocks (continued) | Shares | | Value ($) |
| Retailing (continued) | | | |
| Kohl’s | 118,790 | | 6,747,272 |
| Lowe’s | 163,320 | | 8,130,070 |
| Macy’s | 140,930 | | 6,498,282 |
| Ross Stores | 101,000 | | 7,812,350 |
| | | | 44,287,655 |
| Semiconductors & Semiconductor | | | |
| Equipment—2.9% | | | |
| Applied Materials | 289,950 | | 5,175,607 |
| Texas Instruments | 118,310 | | 4,978,485 |
| Xilinx | 151,040 | | 6,860,237 |
| | | | 17,014,329 |
| Software & Services—7.5% | | | |
| Alliance Data Systems | 34,780 | a | 8,244,947 |
| Google, Cl. A | 16,830 | a | 17,344,661 |
| International Business Machines | 24,550 | | 4,399,605 |
| Microsoft | 161,730 | | 5,717,156 |
| Visa, Cl. A | 39,850 | | 7,837,300 |
| | | | 43,543,669 |
| Technology Hardware & Equipment—7.2% | | | |
| Amphenol, Cl. A | 66,350 | | 5,327,242 |
| Apple | 14,980 | | 7,824,803 |
| Cisco Systems | 277,810 | | 6,250,725 |
| EMC | 499,990 | | 12,034,759 |
| QUALCOMM | 95,810 | | 6,655,921 |
| Seagate Technology | 82,420 | | 4,012,206 |
| | | | 42,105,656 |
| Transportation—2.0% | | | |
| FedEx | 88,120 | | 11,543,720 |
| Total Common Stocks | | | |
| (cost $473,947,058) | | | 581,561,318 |
STATEMENT OF INVESTMENTS (continued)
| | | | |
| Other Investment—.7% | Shares | | Value ($) | |
| Registered Investment Company; | | | | |
| Dreyfus Institutional Preferred | | | | |
| Plus Money Market Fund | | | | |
| (cost $4,002,619) | 4,002,619 | b | 4,002,619 | |
| |
| Total Investments (cost $477,949,677) | 100.3 | % | 585,563,937 | |
| Liabilities, Less Cash and Receivables | (.3 | %) | (1,538,921 | ) |
| Net Assets | 100.0 | % | 584,025,016 | |
| |
| ETF—Exchange Traded Funds |
| a | Non-income producing security. |
| b | Investment in affiliated money market mutual fund. |
| | | |
| Portfolio Summary (Unaudited)† | | |
| |
| | Value (%) | | Value (%) |
| Diversified Financials | 11.3 | Insurance | 3.2 |
| Pharmaceuticals, | | Semiconductors & | |
| Biotech & Life Sciences | 10.7 | Semiconductor Equipment | 2.9 |
| Energy | 10.1 | Banks | 2.7 |
| Capital Goods | 8.9 | Health Care Equipment & Services | 2.4 |
| Retailing | 7.6 | Transportation | 2.0 |
| Software & Services | 7.5 | Real Estate | 1.2 |
| Technology Hardware & Equipment | 7.2 | Exchange-Traded Funds | 1.1 |
| Materials | 4.2 | Commercial & Professional Services | .9 |
| Food, Beverage & Tobacco | 4.1 | Consumer Services | .9 |
| Food & Staples Retailing | 3.7 | Money Market Investment | .7 |
| Consumer Durables & Apparel | 3.3 | Automobiles & Components | .4 |
| Media | 3.3 | | 100.3 |
|
| † Based on net assets. |
| See notes to financial statements. |
12
|
| STATEMENT OF ASSETS AND LIABILITIES |
| October 31, 2013 |
| | |
| | Cost | Value |
| Assets ($): | | |
| Investments in securities—See Statement of Investments: | | |
| Unaffiliated issuers | 473,947,058 | 581,561,318 |
| Affiliated issuers | 4,002,619 | 4,002,619 |
| Cash | | 68,407 |
| Receivable for investment securities sold | | 18,262,592 |
| Dividends income receivable | | 408,449 |
| Receivable for shares of Capital Stock subscribed | | 32 |
| Other receivables | | 23,782 |
| | | 604,327,199 |
| Liabilities ($): | | |
| Due to The Dreyfus Corporation and affiliates—Note 3(b) | | 487,777 |
| Payable for investment securities purchased | | 19,619,194 |
| Payable for shares of Capital Stock redeemed | | 193,989 |
| Accrued expenses | | 1,223 |
| | | 20,302,183 |
| Net Assets ($) | | 584,025,016 |
| Composition of Net Assets ($): | | |
| Paid-in capital | | 382,493,402 |
| Accumulated undistributed investment income—net | | 1,122,442 |
| Accumulated net realized gain (loss) on investments | | 92,794,912 |
| Accumulated net unrealized appreciation | | |
| (depreciation) on investments | | 107,614,260 |
| Net Assets ($) | | 584,025,016 |
| Shares Outstanding | | |
| (245 million shares of $.001 par value Capital Stock authorized) | | 14,515,480 |
| Net Asset Value, offering and redemption price per share ($) | | 40.23 |
| |
| See notes to financial statements. | | |
|
| STATEMENT OF OPERATIONS |
| Year Ended October 31, 2013 |
| | |
| Investment Income ($): | | |
| Income: | | |
| Cash dividends (net of $45,136 foreign taxes withheld at source): | | |
| Unaffiliated issuers | 10,418,133 | |
| Affiliated issuers | 1,720 | |
| Income from securities lending—Note 1(b) | 45,190 | |
| Total Income | 10,465,043 | |
| Expenses: | | |
| Management fee—Note 3(a) | 4,951,958 | |
| Distribution fees—Note 3(b) | 550,217 | |
| Directors’ fees—Note 3(a,c) | 36,916 | |
| Loan commitment fees—Note 2 | 5,047 | |
| Interest expense —Note 2 | 856 | |
| Total Expenses | 5,544,994 | |
| Less—Directors’ fees reimbursed by the Manager—Note 3(a) | (36,916 | ) |
| Net Expenses | 5,508,078 | |
| Investment Income—Net | 4,956,965 | |
| Realized and Unrealized Gain (Loss) on Investments—Note 4 ($): | | |
| Net realized gain (loss) on investments | 103,987,540 | |
| Net unrealized appreciation (depreciation) on investments | 12,865,227 | |
| Net Realized and Unrealized Gain (Loss) on Investments | 116,852,767 | |
| Net Increase in Net Assets Resulting from Operations | 121,809,732 | |
| |
| See notes to financial statements. | | |
14
STATEMENT OF CHANGES IN NET ASSETS
| | | | |
| | Year Ended October 31, | |
| | 2013 | | 2012 | |
| Operations ($): | | | | |
| Investment income—net | 4,956,965 | | 4,451,248 | |
| Net realized gain (loss) on investments | 103,987,540 | | 19,367,107 | |
| Net unrealized appreciation | | | | |
| (depreciation) on investments | 12,865,227 | | 34,726,015 | |
| Net Increase (Decrease) in Net Assets | | | | |
| Resulting from Operations | 121,809,732 | | 58,544,370 | |
| Dividends to Shareholders from ($): | | | | |
| Investment income—net | (5,061,683 | ) | (4,696,883 | ) |
| Capital Stock Transactions ($): | | | | |
| Net proceeds from shares sold | 15,463,686 | | 13,769,346 | |
| Dividends reinvested | 4,724,966 | | 4,373,033 | |
| Cost of shares redeemed | (75,471,704 | ) | (65,922,395 | ) |
| Increase (Decrease) in Net Assets | | | | |
| from Capital Stock Transactions | (55,283,052 | ) | (47,780,016 | ) |
| Total Increase (Decrease) in Net Assets | 61,464,997 | | 6,067,471 | |
| Net Assets ($): | | | | |
| Beginning of Period | 522,560,019 | | 516,492,548 | |
| End of Period | 584,025,016 | | 522,560,019 | |
| Undistributed investment income—net | 1,122,442 | | 1,227,160 | |
| Capital Share Transactions (Shares): | | | | |
| Shares sold | 435,384 | | 441,814 | |
| Shares issued for dividends reinvested | 136,994 | | 144,824 | |
| Shares redeemed | (2,105,519 | ) | (2,134,169 | ) |
| Net Increase (Decrease) in Shares Outstanding | (1,533,141 | ) | (1,547,531 | ) |
| |
| See notes to financial statements. | | | | |
FINANCIAL HIGHLIGHTS
The following table describes the performance for the fiscal periods indicated. Total return shows how much your investment in the fund would have increased (or decreased) during each period, assuming you had reinvested all dividends and distributions.These figures have been derived from the fund’s financial statements.
| | | | | | | | | | |
| | | | Year Ended October 31, | | | |
| | 2013 | | 2012 | | 2011 | | 2010 | | 2009 | |
| Per Share Data ($): | | | | | | | | | | |
| Net asset value, beginning of period | 32.56 | | 29.35 | | 28.54 | | 24.51 | | 22.77 | |
| Investment Operations: | | | | | | | | | | |
| Investment income—neta | .32 | | .27 | | .23 | | .18 | | .25 | |
| Net realized and unrealized | | | | | | | | | | |
| gain (loss) on investments | 7.67 | | 3.22 | | .79 | | 4.01 | | 1.83 | |
| Total from Investment Operations | 7.99 | | 3.49 | | 1.02 | | 4.19 | | 2.08 | |
| Distributions: | | | | | | | | | | |
| Dividends from investment income—net | (.32 | ) | (.28 | ) | (.21 | ) | (.16 | ) | (.34 | ) |
| Net asset value, end of period | 40.23 | | 32.56 | | 29.35 | | 28.54 | | 24.51 | |
| Total Return (%) | 24.72 | | 11.95 | | 3.56 | | 17.13 | | 9.38 | |
| Ratios/Supplemental Data (%): | | | | | | | | | | |
| Ratio of total expenses | | | | | | | | | | |
| to average net assets | 1.01 | | 1.01 | | 1.01 | | 1.01 | | 1.01 | |
| Ratio of net expenses | | | | | | | | | | |
| to average net assets | 1.00 | | 1.00 | | 1.00 | | 1.00 | | 1.00 | |
| Ratio of net investment income | | | | | | | | | | |
| to average net assets | .90 | | .85 | | .76 | | .65 | | 1.18 | |
| Portfolio Turnover Rate | 118.87 | | 70.82 | | 84.19 | | 78.04 | | 103.96 | |
| Net Assets, end of period ($ x 1,000) | 584,025 | | 522,560 | | 516,493 | | 586,726 | | 535,164 | |
| |
| a Based on average shares outstanding at each month end. | | | | | | | | | |
| See notes to financial statements. | | | | | | | | | | |
16
NOTES TO FINANCIAL STATEMENTS
NOTE 1—Significant Accounting Policies:
Dreyfus Disciplined Stock Fund (the “fund”) is a separate diversified series ofThe Dreyfus/Laurel Funds, Inc. (the “Company”), which is registered under the Investment Company Act of 1940, as amended (the “Act”), as an open-end management investment company and operates as a series company currently offering eleven series, including the fund. The fund’s investment objective is to seek capital appreciation. The Dreyfus Corporation (the “Manager” or “Dreyfus”), a wholly-owned subsidiary of The Bank of New York Mellon Corporation (“BNY Mellon”), serves as the fund’s investment adviser. MBSC Securities Corporation (the “Distributor”), a wholly-owned subsidiary of the Manager, is the distributor of the fund’s shares, which are sold to the public without a sales charge.
The Company accounts separately for the assets, liabilities and operations of each series. Expenses directly attributable to each series are charged to that series’ operations; expenses which are applicable to all series are allocated among them on a pro rata basis.
The Financial Accounting Standards Board (“FASB”) Accounting Standards Codification is the exclusive reference of authoritative U.S. generally accepted accounting principles (“GAAP”) recognized by the FASB to be applied by nongovernmental entities. Rules and interpretive releases of the Securities and Exchange Commission (“SEC”) under authority of federal laws are also sources of authoritative GAAP for SEC registrants. The fund’s financial statements are prepared in accordance with GAAP, which may require the use of management estimates and assumptions.Actual results could differ from those estimates.
(a) Portfolio valuation: The fair value of a financial instrument is the amount that would be received to sell an asset or paid to transfer a liability in an orderly transaction between market participants at the measurement date (i.e., the exit price). GAAP establishes a fair value hierarchy that prioritizes the inputs of valuation techniques used to measure fair value. This hierarchy gives the highest priority to unad-
NOTES TO FINANCIAL STATEMENTS (continued)
justed quoted prices in active markets for identical assets or liabilities (Level 1 measurements) and the lowest priority to unobservable inputs (Level 3 measurements).
Additionally, GAAP provides guidance on determining whether the volume and activity in a market has decreased significantly and whether such a decrease in activity results in transactions that are not orderly. GAAP requires enhanced disclosures around valuation inputs and techniques used during annual and interim periods.
Various inputs are used in determining the value of the fund’s investments relating to fair value measurements.These inputs are summarized in the three broad levels listed below:
Level 1—unadjusted quoted prices in active markets for identical investments.
Level 2—other significant observable inputs (including quoted prices for similar investments, interest rates, prepayment speeds, credit risk, etc.).
Level 3—significant unobservable inputs (including the fund’s own assumptions in determining the fair value of investments).
The inputs or methodology used for valuing securities are not necessarily an indication of the risk associated with investing in those securities.
Changes in valuation techniques may result in transfers in or out of an assigned level within the disclosure hierarchy. Valuation techniques used to value the fund’s investments are as follows:
Investments in securities are valued at the last sales price on the securities exchange or national securities market on which such securities are primarily traded. Securities listed on the National Market System for which market quotations are available are valued at the official closing price or, if there is no official closing price that day, at the last sales
18
price. Securities not listed on an exchange or the national securities market, or securities for which there were no transactions, are valued at the average of the most recent bid and asked prices, except for open short positions, where the asked price is used for valuation purposes. Bid price is used when no asked price is available. Registered investment companies that are not traded on an exchange are valued at their net asset value. All of the preceding securities are categorized within Level 1 of the fair value hierarchy.
Fair valuing of securities may be determined with the assistance of a pricing service using calculations based on indices of domestic securities and other appropriate indicators, such as prices of relevant American Depository Receipts and financial futures. Utilizing these techniques may result in transfers between Level 1 and Level 2 of the fair value hierarchy.
When market quotations or official closing prices are not readily available, or are determined not to reflect accurately fair value, such as when the value of a security has been significantly affected by events after the close of the exchange or market on which the security is principally traded (for example, a foreign exchange or market), but before the fund calculates its net asset value, the fund may value these investments at fair value as determined in accordance with the procedures approved by the Company’s Board of Directors (the “Board”). Certain factors may be considered when fair valuing investments such as: fundamental analytical data, the nature and duration of restrictions on disposition, an evaluation of the forces that influence the market in which the securities are purchased and sold, and public trading in similar securities of the issuer or comparable issuers. These securities are either categorized within Level 2 or 3 of the fair value hierarchy depending on the relevant inputs used.
NOTES TO FINANCIAL STATEMENTS (continued)
For restricted securities where observable inputs are limited, assumptions about market activity and risk are used and are categorized within Level 3 of the fair value hierarchy.
The following is a summary of the inputs used as of October 31, 2013 in valuing the fund’s investments.
| | | | |
| | | Level 2—Other | Level 3— | |
| | Level 1— | Significant | Significant | |
| | Unadjusted | Observable | Unobservable | |
| | Quoted Prices | Inputs | Inputs | Total |
| Assets ($) | | | | |
| Investments in Securities: | | | |
| Equity Securities— | | | | |
| Domestic | | | | |
| Common Stocks† | 575,287,373 | — | — | 575,287,373 |
| Exchange-Traded | | | | |
| Funds | 6,273,945 | — | — | 6,273,945 |
| Mutual Funds | 4,002,619 | — | — | 4,002,619 |
| |
| † See Statement of Investments for additional detailed categorizations. | |
At October 31, 2013, there were no transfers between Level 1 and Level 2 of the fair value hierarchy.
(b) Securities transactions and investment income: Securities transactions are recorded on a trade date basis. Realized gains and losses from securities transactions are recorded on the identified cost basis. Dividend income is recognized on the ex-dividend date and interest income, including, where applicable, accretion of discount and amortization of premium on investments, is recognized on the accrual basis.
Pursuant to a securities lending agreement with The Bank of NewYork Mellon, a subsidiary of BNY Mellon and an affiliate of Dreyfus and its affiliates, the fund may lend securities to qualified institutions. It is the fund’s policy that, at origination, all loans are secured by collateral of at least 102% of the value of U.S. securities loaned and 105% of the value of foreign securities loaned. Collateral equivalent to at least 100% of the market value of securities on loan is maintained at all times. Collateral is either in the form of cash, which can be invested in certain money
20
market mutual funds managed by the Manager or U.S. Government and Agency securities.The fund is entitled to receive all dividends, interest and distributions on securities loaned, in addition to income earned as a result of the lending transaction. Should a borrower fail to return the securities in a timely manner,The Bank of NewYork Mellon is required to replace the securities for the benefit of the fund or credit the fund with the market value of the unreturned securities and is subrogated to the fund’s rights against the borrower and the collateral. During the period ended October 31, 2013,The Bank of NewYork Mellon earned $14,312 from lending portfolio securities, pursuant to the securities lending agreement.
(c) Affiliated issuers: Investments in other investment companies advised by Dreyfus are defined as “affiliated” under the Act. Investments in affiliated investment companies during the period ended October 31, 2013 were as follows:
| | | | | |
| Affiliated | | | | | |
| Investment | Value | | | Value | Net |
| Company | 10/31/2012 ($) | Purchases ($) | Sales ($) | 10/31/2013 ($) | Assets (%) |
| Dreyfus | | | | | |
| Institutional | | | | | |
| Preferred | | | | | |
| Plus Money | | | | | |
| Market | | | | | |
| Fund | 1,077,932 | 120,546,676 | 117,621,989 | 4,002,619 | .7 |
| Dreyfus | | | | | |
| Institutional | | | | | |
| Cash | | | | | |
| Advantage | | | | | |
| Fund | 10,122,012 | 92,185,202 | 102,307,214 | — | — |
| Total | 11,199,944 | 212,731,878 | 219,929,203 | 4,002,619 | .7 |
(d) Dividends to shareholders: Dividends are recorded on the ex-dividend date. Dividends from investment income-net are normally declared and paid quarterly. Dividends from net realized capital gains, if any, are normally declared and paid annually, but the fund may make distributions on a more frequent basis to comply with the distribution requirements of the Internal Revenue Code of 1986, as amended (the
NOTES TO FINANCIAL STATEMENTS (continued)
“Code”).To the extent that net realized capital gains can be offset by capital loss carryovers, it is the policy of the fund not to distribute such gains. Income and capital gain distributions are determined in accordance with income tax regulations, which may differ from GAAP.
(e) Federal income taxes: It is the policy of the fund to continue to qualify as a regulated investment company, if such qualification is in the best interests of its shareholders, by complying with the applicable provisions of the Code, and to make distributions of taxable income sufficient to relieve it from substantially all federal income and excise taxes.
As of and during the period ended October 31, 2013, the fund did not have any liabilities for any uncertain tax positions.The fund recognizes interest and penalties, if any, related to uncertain tax positions as income tax expense in the Statement of Operations. During the period ended October 31, 2013, the fund did not incur any interest or penalties.
Each tax year in the four-year period ended October 31, 2013 remains subject to examination by the Internal Revenue Service and state taxing authorities.
At October 31, 2013, the components of accumulated earnings on a tax basis were as follows: undistributed ordinary income $2,017,165, undistributed capital gains $92,191,410 and unrealized appreciation $107,323,039.
The tax character of distributions paid to shareholders during the fiscal periods ended October 31, 2013 and October 31, 2012 were as follows: ordinary income $5,061,683 and $4,696,883, respectively.
NOTE 2—Bank Lines of Credit:
The fund participates with other Dreyfus-managed funds in a $265 million unsecured credit facility led by Citibank, N.A. and a $300 million unsecured credit facility provided by The Bank of New York Mellon (each, a “Facility”), each to be utilized primarily for temporary
22
or emergency purposes, including the financing of redemptions. Prior to October 9, 2013, the unsecured credit facility with Citibank, N.A. was $210 million. In connection therewith, the fund has agreed to pay its pro rata portion of commitment fees for each Facility. Interest is charged to the fund based on rates determined pursuant to the terms of the respective Facility at the time of borrowing.
The average amount of borrowings outstanding under the Facilities during the period ended October 31, 2013 was approximately $76,500 with a related weighted average annualized interest rate of 1.12%.
NOTE 3—Investment Management Fee and Other Transactions With Affiliates:
(a) Pursuant to an investment management agreement with the Manager, the Manager provides or arranges for one or more third parties and/or affiliates to provide investment advisory, administrative, custody, fund accounting and transfer agency services to the fund.The Manager also directs the investments of the fund in accordance with its investment objective, policies and limitations. For these services, the fund is contractually obligated to pay the Manager a fee, calculated daily and paid monthly, at the annual rate of .90% of the value of the fund’s average daily net assets. Out of its fee, the Manager pays all of the expenses of the fund except brokerage fees, taxes, interest expenses, commitment fees on borrowings, Distribution Plan fees, fees and expenses of non-interested Directors (including counsel fees) and extraordinary expenses. In addition, the Manager is required to reduce its fee in an amount equal to the fund’s allocable portion of fees and expenses of the non-interested Directors (including counsel fees). During the period ended October 31, 2013, fees reimbursed by the Manager amounted to $36,916.
(b) Under the Distribution Plan adopted pursuant to Rule 12b-1 under the Act, the fund may pay annually up to .10% of the value of its average daily net assets to compensate BNY Mellon and the Manager
NOTES TO FINANCIAL STATEMENTS (continued)
for shareholder servicing activities and the Distributor for shareholder servicing activities and expenses primarily intended to result in the sale of fund shares. During the period ended October 31, 2013, the fund was charged $550,217 pursuant to the Distribution Plan.
Under its terms, the Distribution Plan shall remain in effect from year to year, provided such continuance is approved annually by a vote of a majority of those Directors who are not “interested persons” of the Company and who have no direct or indirect financial interest in the operation of or in any agreement related to the Distribution Plan.
The components of “Due to The Dreyfus Corporation and affiliates” in the Statement of Assets and Liabilities consist of: management fees $438,999 and Distribution Plan fees $48,778.
(c) Each Board member also serves as a Board member of other funds within the Dreyfus complex. Annual retainer fees and attendance fees are allocated to each fund based on net assets.
NOTE 4—Securities Transactions:
The aggregate amount of purchases and sales of investment securities, excluding short-term securities, during the period ended October 31, 2013, amounted to $648,049,870 and $705,553,691, respectively.
At October 31, 2013, the cost of investments for federal income tax purposes was $478,240,898; accordingly, accumulated net unrealized appreciation on investments was $107,323,039, consisting of $108,772,289 gross unrealized appreciation and $1,449,250 gross unrealized depreciation.
24
|
| REPORT OF INDEPENDENT REGISTERED |
| PUBLIC ACCOUNTING FIRM |
The Board of Directors and Shareholders The Dreyfus/Laurel Funds, Inc.
We have audited the accompanying statement of assets and liabilities of Dreyfus Disciplined Stock Fund (the “Fund”), a series of The Dreyfus/Laurel Funds, Inc., including the statement of investments, as of October 31, 2013, the related statement of operations for the year then ended, the statements of changes in net assets for each of the years in the two-year period then ended, and the financial highlights for each of the years in the five-year period then ended. These financial statements and financial highlights are the responsibility of the Fund’s management. Our responsibility is to express an opinion on these financial statements and financial highlights based on our audits.
We conducted our audits in accordance with the standards of the Public Company Accounting Oversight Board (United States).Those standards require that we plan and perform the audit to obtain reasonable assurance about whether the financial statements and financial highlights are free of material misstatement. An audit includes examining, on a test basis, evidence supporting the amounts and disclosures in the financial statements. Our procedures included confirmation of securities owned as of October 31, 2013, by correspondence with the custodian and brokers or by other appropriate auditing procedures.An audit also includes assessing the accounting principles used and significant estimates made by management, as well as evaluating the overall financial statement presentation. We believe that our audits provide a reasonable basis for our opinion.
In our opinion, the financial statements and financial highlights referred to above present fairly, in all material respects, the financial position of Dreyfus Disciplined Stock Fund as of October 31, 2013, the results of its operations for the year then ended, the changes in its net assets for each of the years in the two-year period then ended, and the financial highlights for each of the years in the five-year period then ended, in conformity with U.S. generally accepted accounting principles.

New York, New York
December 30, 2013
IMPORTANT TAX INFORMATION (Unaudited)
For federal tax purposes, the fund reports the maximum amount allowable, but not less than $5,061,683 as ordinary income dividends paid during the year ended October 31, 2013 as qualified dividend income in accordance with Section 854(b)(1)(B) of the Internal Revenue Code. Also, the fund reports the maximum amount allowable but not less than 100% of ordinary income dividends paid during the year ended October 31, 2013 as eligible for the corporate dividends received deduction provided under Section 243 of the Internal Revenue Code in accordance with Section 854(b)(1)(A) of the Internal Revenue Code. Shareholders will receive notification in early 2014 of the percentage applicable to the preparation of their 2013 income tax returns.
26
BOARD MEMBERS INFORMATION (Unaudited)
|
| Joseph S. DiMartino (70) |
| Chairman of the Board (1999) |
| Principal Occupation During Past 5Years: |
| • Corporate Director and Trustee |
| Other Public Company Board Memberships During Past 5Years: |
| • CBIZ (formerly, Century Business Services, Inc.), a provider of outsourcing functions for small |
| and medium size companies, Director (1997-present) |
| • The Newark Group, a provider of a national market of paper recovery facilities, paperboard |
| mills and paperboard converting plants, Director (2000-2010) |
| • Sunair Services Corporation, a provider of certain outdoor-related services to homes and |
| businesses, Director (2005-2009) |
| No. of Portfolios for which Board Member Serves: 141 |
| ——————— |
| Francine J. Bovich (62) |
| Board Member (2012) |
| Principal Occupation During Past 5Years: |
| • Trustee,The Bradley Trusts, private trust funds (2011-present) |
| • Managing Director, Morgan Stanley Investment Management (1993-2010) |
| No. of Portfolios for which Board Member Serves: 40 |
| ——————— |
| James M. Fitzgibbons (79) |
| Board Member (1994) |
| Principal Occupation During Past 5Years: |
| • Corporate Director and Trustee |
| Other Public Company Board Memberships During Past 5Years: |
| • Bill Barrett Corporation, an oil and natural gas exploration company, Director (2004-2012) |
| No. of Portfolios for which Board Member Serves: 26 |
| ——————— |
| Kenneth A. Himmel (67) |
| Board Member (1994) |
| Principal Occupation During Past 5Years: |
| • President and CEO, Related Urban Development, a real estate development company (1996-present) |
| • President and CEO, Himmel & Company, a real estate development company (1980-present) |
| • CEO,American Food Management, a restaurant company (1983-present) |
| No. of Portfolios for which Board Member Serves: 26 |
BOARD MEMBERS INFORMATION (Unaudited) (continued)
|
| Stephen J. Lockwood (66) |
| Board Member (1994) |
| Principal Occupation During Past 5Years: |
| • Chairman of the Board, Stephen J. Lockwood and Company LLC, a real estate investment |
| company (2000-present) |
| No. of Portfolios for which Board Member Serves: 26 |
| ——————— |
| Roslyn M. Watson (64) |
| Board Member (1994) |
| Principal Occupation During Past 5Years: |
| • Principal,Watson Ventures, Inc., a real estate investment company (1993-present) |
| No. of Portfolios for which Board Member Serves: 36 |
| ——————— |
| Benaree Pratt Wiley (67) |
| Board Member (1998) |
| Principal Occupation During Past 5Years: |
| • Principal,TheWiley Group, a firm specializing in strategy and business development (2005-present) |
| Other Public Company Board Memberships During Past 5Years: |
| • CBIZ (formerly, Century Business Services, Inc.), a provider of outsourcing functions for small |
| and medium size companies, Director (2008-present) |
| No. of Portfolios for which Board Member Serves: 61 |
| ——————— |
Once elected all Board Members serve for an indefinite term, but achieve Emeritus status upon reaching age 80.The address of the Board Members and Officers is c/o The Dreyfus Corporation, 200 Park Avenue, NewYork, NewYork 10166. Additional information about the Board Members is available in the fund’s Statement of Additional Information which can be obtained from Dreyfus free of charge by calling this toll free number: 1-800-DREYFUS.
J.Tomlinson Fort, Emeritus Board Member
28
OFFICERS OF THE FUND (Unaudited)
BRADLEY J. SKAPYAK, President since January 2010.
Chief Operating Officer and a director of the Manager since June 2009, Chairman of Dreyfus Transfer, Inc., an affiliate of the Manager and the transfer agent of the funds, since May 2011 and Executive Vice President of the Distributor since June 2007. From April 2003 to June 2009, Mr. Skapyak was the head of the Investment Accounting and Support Department of the Manager. He is an officer of 68 investment companies (comprised of 141 portfolios) managed by the Manager. He is 55 years old and has been an employee of the Manager since February 1988.
JOHN PAK, Chief Legal Officer since March 2013.
Chief Legal Officer of the Manager and Associate General Counsel and Managing Director of BNY Mellon since August 2012; from March 2005 to July 2012, Managing Director of Deutsche Bank, Deputy Global Head of Deutsche Asset Management Legal and Regional Head of Deutsche Asset Management Americas Legal. He is an officer of 69 investment companies (comprised of 166 portfolios) managed by the Manager. He is 45 years old and has been an employee of the Manager since August 2012.
JANETTE E. FARRAGHER, Vice President and Secretary since December 2011.
Assistant General Counsel of BNY Mellon, and an officer of 69 investment companies (comprised of 166 portfolios) managed by the Manager. She is 50 years old and has been an employee of the Manager since February 1984.
KIESHA ASTWOOD, Vice President and Assistant Secretary since January 2010.
Counsel of BNY Mellon, and an officer of 69 investment companies (comprised of 166 portfolios) managed by the Manager. She is 40 years old and has been an employee of the Manager since July 1995.
JAMES BITETTO, Vice President and Assistant Secretary since August 2005.
Senior Counsel of BNY Mellon and Secretary of the Manager, and an officer of 69 investment companies (comprised of 166 portfolios) managed by the Manager. He is 47 years old and has been an employee of the Manager since December 1996.
JONI LACKS CHARATAN, Vice President and Assistant Secretary since August 2005.
Senior Counsel of BNY Mellon, and an officer of 69 investment companies (comprised of 166 portfolios) managed by the Manager. She is 58 years old and has been an employee of the Manager since October 1988.
JOSEPH M. CHIOFFI, Vice President and Assistant Secretary since August 2005.
Senior Counsel of BNY Mellon, and an officer of 69 investment companies (comprised of 166 portfolios) managed by the Manager. He is 52 years old and has been an employee of the Manager since June 2000.
JOHN B. HAMMALIAN, Vice President and Assistant Secretary since August 2005.
Senior Managing Counsel of BNY Mellon, and an officer of 69 investment companies (comprised of 166 portfolios) managed by the Manager. He is 50 years old and has been an employee of the Manager since February 1991.
ROBERT R. MULLERY, Vice President and Assistant Secretary since August 2005.
Managing Counsel of BNY Mellon, and an officer of 69 investment companies (comprised of 166 portfolios) managed by the Manager. He is 61 years old and has been an employee of the Manager since May 1986.
OFFICERS OF THE FUND (Unaudited) (continued)
JEFF PRUSNOFSKY, Vice President and Assistant Secretary since August 2005.
Senior Managing Counsel of BNY Mellon, and an officer of 69 investment companies (comprised of 166 portfolios) managed by the Manager. He is 48 years old and has been an employee of the Manager since October 1990.
JAMES WINDELS, Treasurer since November 2001.
Director – Mutual Fund Accounting of the Manager, and an officer of 69 investment companies (comprised of 166 portfolios) managed by the Manager. He is 55 years old and has been an employee of the Manager since April 1985.
RICHARD CASSARO, Assistant Treasurer since January 2008.
Senior Accounting Manager – Money Market and Municipal Bond Funds of the Manager, and an officer of 69 investment companies (comprised of 166 portfolios) managed by the Manager. He is 54 years old and has been an employee of the Manager since September 1982.
GAVIN C. REILLY, Assistant Treasurer since December 2005.
Tax Manager of the Investment Accounting and Support Department of the Manager, and an officer of 69 investment companies (comprised of 166 portfolios) managed by the Manager. He is 45 years old and has been an employee of the Manager since April 1991.
ROBERT S. ROBOL, Assistant Treasurer since December 2002.
Senior Accounting Manager – Fixed Income Funds of the Manager, and an officer of 69 investment companies (comprised of 166 portfolios) managed by the Manager. He is 49 years old and has been an employee of the Manager since October 1988.
ROBERT SALVIOLO, Assistant Treasurer since July 2007.
Senior Accounting Manager – Equity Funds of the Manager, and an officer of 69 investment companies (comprised of 166 portfolios) managed by the Manager. He is 46 years old and has been an employee of the Manager since June 1989.
ROBERT SVAGNA, Assistant Treasurer since December 2002.
Senior Accounting Manager – Equity Funds of the Manager, and an officer of 69 investment companies (comprised of 166 portfolios) managed by the Manager. He is 46 years old and has been an employee of the Manager since November 1990.
JOSEPH W. CONNOLLY, Chief Compliance Officer since October 2004.
Chief Compliance Officer of the Manager and The Dreyfus Family of Funds (69 investment companies, comprised of 166 portfolios). He is 56 years old and has served in various capacities with the Manager since 1980, including manager of the firm’s Fund Accounting Department from 1997 through October 2001.
MATTHEW D. CONNOLLY, Anti-Money Laundering Compliance Officer since April 2012.
Anti-Money Laundering Compliance Officer of the Distributor since October 2011; from March 2010 to September 2011, Global Head, KYC Reviews and Director, UBS Investment Bank; until March 2010, AML Compliance Officer and Senior Vice President, Citi Global Wealth Management. He is an officer of 64 investment companies (comprised of 161 portfolios) managed by the Manager. He is 41 years old and has been an employee of the Distributor since October 2011.
30
For More Information
| |
| Dreyfus | Transfer Agent & |
| Disciplined Stock Fund | Dividend Disbursing Agent |
| 200 Park Avenue | Dreyfus Transfer, Inc. |
| New York, NY 10166 | 200 Park Avenue |
| Manager | New York, NY 10166 |
| The Dreyfus Corporation | Distributor |
| 200 Park Avenue | MBSC Securities Corporation |
| New York, NY 10166 | 200 Park Avenue |
| Custodian | New York, NY 10166 |
| The Bank of New York Mellon | |
| One Wall Street | |
| New York, NY 10286 | |
Ticker Symbol: DDSTX
Telephone 1-800-DREYFUS
Mail The Dreyfus Family of Funds, 144 Glenn Curtiss Boulevard, Uniondale, NY 11556-0144 E-mail Send your request to info@dreyfus.com Internet Information can be viewed online or downloaded at: http://www.dreyfus.com
The fund files its complete schedule of portfolio holdings with the Securities and Exchange Commission (“SEC”) for the first and third quarters of each fiscal year on Form N-Q. The fund’s Forms N-Q are available on the SEC’s website at http://www.sec.gov and may be reviewed and copied at the SEC’s Public Reference Room in Washington, DC. Information on the operation of the Public Reference Room may be obtained by calling 1-800-SEC-0330.
A description of the policies and procedures that the fund uses to determine how to vote proxies relating to portfolio securities, and information regarding how the fund voted these proxies for the most recent 12-month period ended June 30 is available at http://www.dreyfus.com and on the SEC’s website at http://www.sec.gov. The description of the policies and procedures is also available without charge, upon request, by calling 1-800-DREYFUS.


The views expressed in this report reflect those of the portfolio manager only through the end of the period covered and do not necessarily represent the views of Dreyfus or any other person in the Dreyfus organization. Any such views are subject to change at any time based upon market or other conditions and Dreyfus disclaims any responsibility to update such views.These views may not be relied on as investment advice and, because investment decisions for a Dreyfus fund are based on numerous factors, may not be relied on as an indication of trading intent on behalf of any Dreyfus fund.
| | Contents |
| | THE FUND |
| 2 | A Letter from the President |
| 3 | Discussion of Fund Performance |
| 6 | Understanding Your Fund’s Expenses |
| 6 | Comparing Your Fund’s Expenses With Those of Other Funds |
| 7 | Statement of Investments |
| 10 | Statement of Assets and Liabilities |
| 11 | Statement of Operations |
| 12 | Statement of Changes in Net Assets |
| 13 | Financial Highlights |
| 15 | Notes to Financial Statements |
| 22 | Report of Independent Registered Public Accounting Firm |
| 23 | Important Tax Information |
| 24 | Board Members Information |
| 26 | Officers of the Fund |
| | FOR MORE INFORMATION |
| | Back Cover |
Dreyfus
Money Market Reserves
The Fund
A LETTER FROM THE PRESIDENT
Dear Shareholder:
We are pleased to present this annual report for Dreyfus Money Market Reserves, covering the 12-month period from November 1, 2012, through October 31, 2013. For information about how the fund performed during the reporting period, as well as general market perspectives, we provide a Discussion of Fund Performance on the pages that follow.
The reporting period proved challenging for most income-oriented investments, as a gradually strengthening U.S. economy and expectations of less aggressively stimulative monetary policies drove longer term interest rates higher and bond prices lower. However, as they have been for the past several years, short-term interest rates and yields of money market instruments remained anchored near historical lows by an unchanged overnight federal funds rate.
We currently expect U.S. and global economic conditions to continue to improve in 2014, with accelerating growth supported by the fading drags of tighter federal fiscal policies and downsizing on the state and local levels. However, inflation is likely to remain muted, so monetary policy can remain stimulative, and short-term interest rates appear likely to remain near current levels for some time to come. For more information on how these observations may affect your investments, we encourage you to speak with your financial advisor.
Thank you for your continued confidence and support.
Sincerely,

J. Charles Cardona
President
The Dreyfus Corporation
November 15, 2013
2
DISCUSSION OF FUND PERFORMANCE
For the period of November 1, 2012, through October 31, 2013, as provided by Patricia A. Larkin, Portfolio Manager
Fund and Market Performance Overview
For the 12-month period ended October 31, 2013, Dreyfus Money Market Reserves’ Investor shares produced a yield of 0.00%, and Class R shares produced a yield of 0.00%.Taking into account the effects of compounding, the fund’s Investor shares and Class R shares also produced effective yields of 0.00% and 0.00%, respectively.1
Although a sustained economic recovery and anticipation of an end to the Federal Reserve Board’s (the “Fed”) quantitative easing program drove long-term interest rates higher during the reporting period, money market yields remained anchored by an unchanged federal funds rate between 0% and 0.25%.
The Fund’s Investment Approach
The fund seeks a high level of current income consistent with stability of principal.To pursue its goal, the fund invests in a diversified portfolio of high-quality, short-term dollar-denominated debt securities, including: securities issued or guaranteed as to principal and interest by the U.S. government or its agencies and instrumentalities; certificates of deposit, time deposits, bankers’ acceptances, and other short-term securities issued by domestic or foreign banks or thrifts or their subsidiaries or branches; repurchase agreements, including tri-party agreements; asset-backed securities; domestic and foreign commercial paper; and other short-term corporate obligations, including those with floating or variable rates of interest.
U.S. Economic Recovery Gained Traction
The reporting period began in November 2012 in the midst of improved economic news, as the unemployment rate fell to 7.8% and pending home sales increased.The unemployment rate remained steady in December, but retailers reported sluggish holiday sales, contributing to an annualized U.S. GDP growth of only 0.1% for the fourth quarter of 2012.
The Fund 3
DISCUSSION OF FUND PERFORMANCE (continued)
January 2013 also portrayed a sluggish recovery with the addition of 157,000 jobs, but the unemployment rate climbed to 7.9%.The uptick was reversed in February, when the unemployment rate slid to 7.7% and 236,000 new jobs were created. Just 88,000 new jobs were added in March while the unemployment rate edged lower to 7.6%.The economy achieved only a 1.1% annualized growth rate during the first quarter of 2013, mainly due to lower government spending.
The gradual economic recovery persisted in April as 165,000 jobs were added and the unemployment rate fell to 7.5%. In late May, remarks by Fed Chairman Ben Bernanke signaled that the central bank would begin to curtail its quantitative easing program sooner than expected. The Fed’s more hawkish stance seemed to be at odds with subsequent releases of economic data, which showed a decline in U.S. manufacturing activity and an increase in the unemployment rate to 7.6%. Nonetheless, in June, heightened investor uncertainty drove longer term interest rates higher despite robust increases in home and automobile sales, expansions of the manufacturing and service sectors, and the creation of 195,000 jobs with no change in the unemployment rate. For the second quarter, the U.S. economy grew at a more respectable 2.5% annualized rate.
July brought welcome evidence of market stabilization when investors realized that imminent increases in short-term rates were unlikely. The labor market continued to strengthen with 162,000 new jobs and a decline in the unemployment rate to 7.4%. In August, the manufacturing sector expanded at its fastest pace since June 2011, 169,000 jobs were added, and the unemployment rate dipped to 7.3%.
Financial markets rallied in September when the Fed refrained from tapering its quantitative easing program. In addition, manufacturing activity posted its fourth consecutive month of expansion, and the service sector grew for the 45th straight month. However, only146,000 jobs were added in September even as the unemployment rate inched lower to 7.2%. It later was estimated that U.S. economic activity accelerated to a 2.8% annualized growth rate during the third quarter.
4
In spite of a 16-day U.S. government shutdown, October saw 204,000 new jobs, but temporary layoffs of government workers drove the unemployment rate to 7.3%. The private sector posted employment gains in the leisure and hospitality, retail trade, professional and technical services, manufacturing, and health care sectors. Other data, such as a decline in pending home sales, demonstrated that economic headwinds remain, and the Fed again refrained from reducing its bond purchases at its October meeting.
No Change Expected for Short-Term Rates
Despite the accelerating economic recovery and higher long-term interest rates, yields of money market instruments remained near zero percent throughout the reporting period, and yield differences along the market’s maturity spectrum stayed relatively narrow. Therefore, as we have for some time, we maintained the fund’s weighted average maturity in a market-neutral position, and we remained focused on well-established issuers with good liquidity characteristics.
November 15, 2013
|
| An investment in the fund is not insured or guaranteed by the FDIC or any other government agency. Although |
| the fund seeks to preserve the value of your investment at $1.00 per share, it is possible to lose money by investing |
| in the fund. |
| Short-term corporate, asset-backed securities holdings and municipal securities holdings (as applicable), while rated in |
| the highest rating category by one or more NRSROs (or unrated, if deemed of comparable quality by Dreyfus), |
| involve credit and liquidity risks and risk of principal loss. |
| 1 Effective yield is based upon dividends declared daily and reinvested monthly. Past performance is no guarantee of future |
| results.Yields fluctuate.Yields provided reflect the absorption of certain fund expenses by The Dreyfus Corporation |
| pursuant to an undertaking in effect that may be extended, terminated or modified at any time. Had these expenses |
| not been absorbed, the fund’s yields would have been lower, and in some cases, 7-day yields during the reporting period |
| would have been negative absent the expense absorption. |
The Fund 5
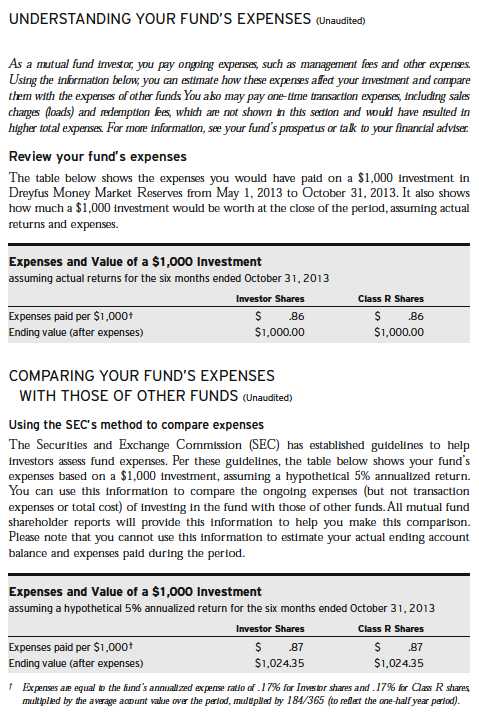
6
STATEMENT OF INVESTMENTS
October 31, 2013
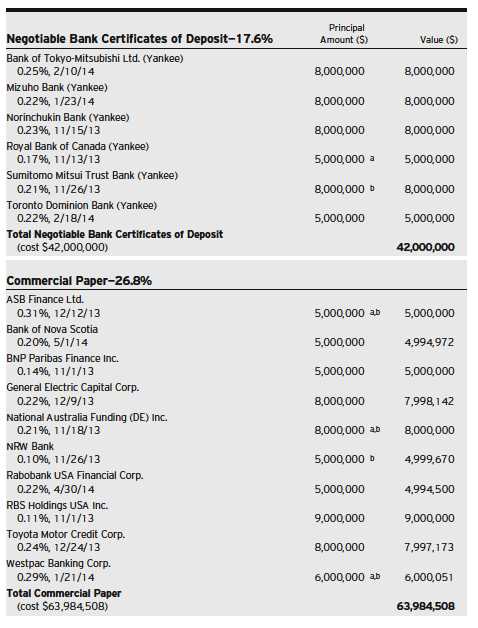
The Fund 7
STATEMENT OF INVESTMENTS (continued)
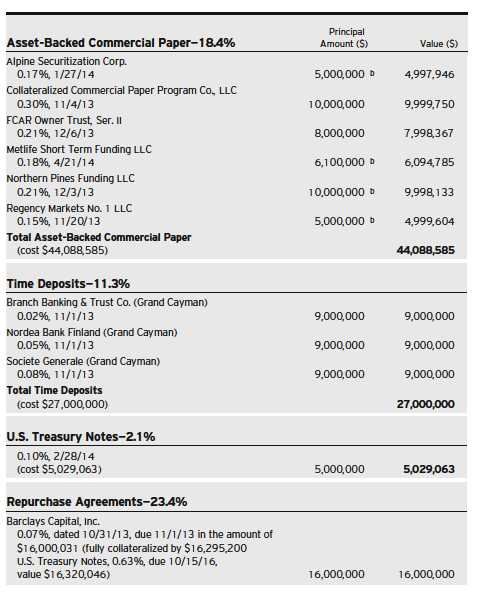
8
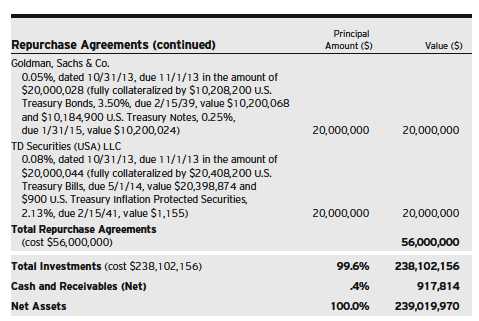
|
| a Variable rate security—interest rate subject to periodic change. |
| b Securities exempt from registration pursuant to Rule 144A under the Securities Act of 1933.These securities may be |
| resold in transactions exempt from registration, normally to qualified institutional buyers.At October 31, 2013, these |
| securities amounted to $58,090,189 or 24.3% of net assets. |
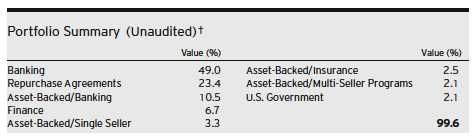
|
| † Based on net assets. |
| See notes to financial statements. |
The Fund 9
STATEMENT OF ASSETS AND LIABILITIES
October 31, 2013
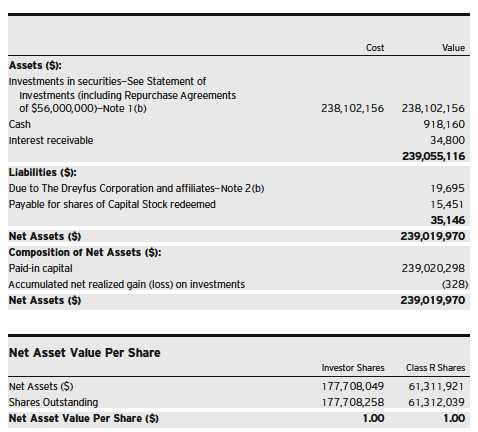
|
| See notes to financial statements. |
10
STATEMENT OF OPERATIONS
Year Ended October 31, 2013
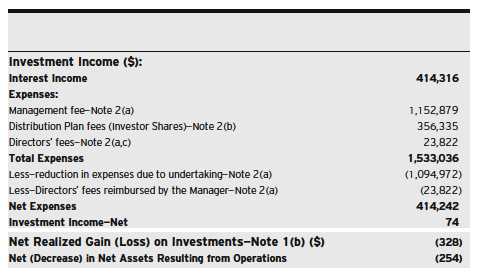
|
| See notes to financial statements. |
The Fund 11
STATEMENT OF CHANGES IN NET ASSETS
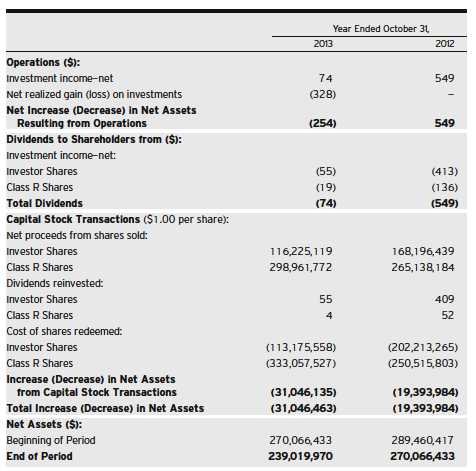
|
| See notes to financial statements. |
12
FINANCIAL HIGHLIGHTS
The following tables describe the performance for each share class for the fiscal periods indicated. All information reflects financial results for a single fund share. Total return shows how much your investment in the fund would have increased (or decreased) during each period, assuming you had reinvested all dividends and distributions.These figures have been derived from the fund’s financial statements.
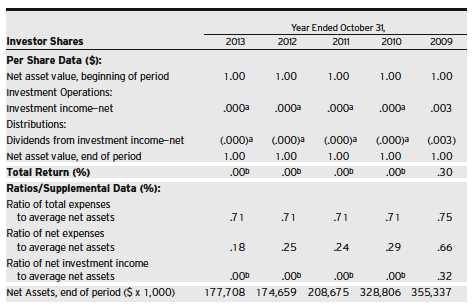
| |
| a | Amount represents less than $.001 per share. |
| b | Amount represents less than .01%. |
| See notes to financial statements. |
The Fund 13
FINANCIAL HIGHLIGHTS (continued)
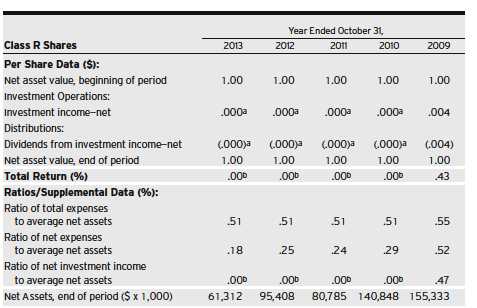
| |
| a | Amount represents less than $.001 per share. |
| b | Amount represents less than .01%. |
| See notes to financial statements. |
14
NOTES TO FINANCIAL STATEMENTS
NOTE 1—Significant Accounting Policies:
Dreyfus Money Market Reserves (the “fund”) is a separate diversified series of The Dreyfus/Laurel Funds, Inc. (the “Company”), which is registered under the Investment Company Act of 1940, as amended (the “Act”), as an open-end management investment company and operates as a series company currently offering eleven series, including the fund.The fund’s investment objective is to seek a high level of current income consistent with stability of principal. The Dreyfus Corporation (the “Manager” or “Dreyfus”), a wholly-owned subsidiary of The Bank of New York Mellon Corporation (“BNY Mellon”), serves as the fund’s investment adviser.
MBSC Securities Corporation (the “Distributor”), a wholly-owned subsidiary of the Manager, is the distributor of the fund’s shares, which are sold without a sales charge.The fund is authorized to issue 2 billion shares of $.001 par value Capital Stock in each of the following classes of shares: Investor and Class R. Investor shares are sold primarily to retail investors through financial intermediaries and bear Distribution Plan fees. Class R shares are sold primarily to bank trust departments and other financial service providers (including The Bank of NewYork Mellon, a subsidiary of BNY Mellon and an affiliate of Dreyfus, and its affiliates), acting on behalf of customers having a qualified trust or an investment account or relationship at such institution, and bear no Distribution Plan fees. Other differences between the classes include the services offered to and the expenses borne by each class, the allocation of certain transfer agency costs and certain voting rights. Income, expenses (other than expenses attributable to a specific class), and realized and unrealized gains or losses on investments are allocated to each class of shares based on its relative net assets.
It is the fund’s policy to maintain a continuous net asset value per share of $1.00; the fund has adopted certain investment, portfolio valuation and dividend and distribution policies to enable it to do so.There is no assurance, however, that the fund will be able to maintain a stable net asset value per share of $1.00.
The Fund 15
NOTES TO FINANCIAL STATEMENTS (continued)
The Company accounts separately for the assets, liabilities and operations of each series. Expenses directly attributable to each series are charged to that series’ operations; expenses which are applicable to all series are allocated among them on a pro rata basis.
The Financial Accounting Standards Board (“FASB”) Accounting Standards Codification is the exclusive reference of authoritative U.S. generally accepted accounting principles (“GAAP”) recognized by the FASB to be applied by nongovernmental entities. Rules and interpretive releases of the Securities and Exchange Commission (“SEC”) under authority of federal laws are also sources of authoritative GAAP for SEC registrants. The fund’s financial statements are prepared in accordance with GAAP, which may require the use of management estimates and assumptions.Actual results could differ from those estimates.
(a) Portfolio valuation: Investments in securities are valued at amortized cost in accordance with Rule 2a-7 under the Act. If amortized cost is determined not to approximate market value, the fair value of the portfolio securities will be determined by procedures established by and under the general supervision of the Company’s Board of Directors (the “Board”).
The fair value of a financial instrument is the amount that would be received to sell an asset or paid to transfer a liability in an orderly transaction between market participants at the measurement date (i.e., the exit price). GAAP establishes a fair value hierarchy that prioritizes the inputs of valuation techniques used to measure fair value.This hierarchy gives the highest priority to unadjusted quoted prices in active markets for identical assets or liabilities (Level 1 measurements) and the lowest priority to unobservable inputs (Level 3 measurements).
Additionally, GAAP provides guidance on determining whether the volume and activity in a market has decreased significantly and whether such a decrease in activity results in transactions that are not orderly. GAAP requires enhanced disclosures around valuation inputs and techniques used during annual and interim periods.
16
Various inputs are used in determining the value of the fund’s investments relating to fair value measurements.These inputs are summarized in the three broad levels listed below:
Level 1—unadjusted quoted prices in active markets for identical investments.
Level 2—other significant observable inputs (including quoted prices for similar investments, interest rates, prepayment speeds, credit risk, etc.).
Level 3—significant unobservable inputs (including the fund’s own assumptions in determining the fair value of investments).
The inputs or methodology used for valuing securities are not necessarily an indication of the risk associated with investing in those securities. For example, money market securities are valued using amortized cost, in accordance with rules under the Act. Generally, amortized cost approximates the current fair value of a security, but since the value is not obtained from a quoted price in an active market, such securities are reflected within Level 2 of the fair value hierarchy.
The following is a summary of the inputs used as of October 31, 2013 in valuing the fund’s investments:
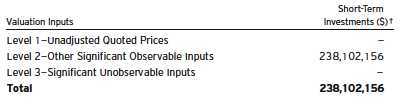
| |
| † | See Statement of Investments for additional detailed categorizations. |
At October 31, 2013, there were no transfers between Level 1 and Level 2 of the fair value hierarchy.
(b) Securities transactions and investment income: Securities transactions are recorded on a trade date basis. Interest income, adjusted for accretion of discount and amortization of premium on investments, is
The Fund 17
NOTES TO FINANCIAL STATEMENTS (continued)
earned from settlement date and is recognized on the accrual basis. Realized gains and losses from securities transactions are recorded on the identified cost basis. Cost of investments represents amortized cost.
The fund may enter into repurchase agreements with financial institutions, deemed to be creditworthy by the Manager, subject to the seller’s agreement to repurchase and the fund’s agreement to resell such securities at a mutually agreed upon price. Pursuant to the terms of the repurchase agreement, such securities must have an aggregate market value greater than or equal to the terms of the repurchase price plus accrued interest at all times. If the value of the underlying securities falls below the value of the repurchase price plus accrued interest, the fund will require the seller to deposit additional collateral by the next business day. If the request for additional collateral is not met, or the seller defaults on its repurchase obligation, the fund maintains its right to sell the underlying securities at market value and may claim any resulting loss against the seller. At October 31, 2013, the fund had investments in repurchase agreements with a gross value of $56,000,000 in the Statement of Assets and Liabilities.The value of related collateral exceeded the value of repurchase agreements. See the Statement of Investments for detailed collateral information.
(c) Dividends to shareholders: It is the policy of the fund to declare dividends daily from investment income-net. Such dividends are paid monthly. Dividends from net realized capital gains, if any, are normally declared and paid annually, but the fund may make distributions on a more frequent basis to comply with the distribution requirements of the Internal Revenue Code of 1986, as amended (the “Code”).To the extent that net realized capital gains can be offset by capital loss carryovers, it is the policy of the fund not to distribute such gains.
(d) Federal income taxes: It is the policy of the fund to continue to qualify as a regulated investment company, if such qualification is in the best interest of its shareholders, by complying with the applicable provisions of the Code, and to make distributions of taxable income sufficient to relieve it from substantially all federal income and excise taxes.
18
As of and during the period ended October 31, 2013, the fund did not have any liabilities for any uncertain tax positions.The fund recognizes interest and penalties, if any, related to uncertain tax positions as income tax expense in the Statement of Operations. During the period ended October 31, 2013, the fund did not incur any interest or penalties.
Each tax year in the four-year period ended October 31, 2013 remains subject to examination by the Internal Revenue Service and state taxing authorities.
At October 31, 2013, the components of accumulated earnings on a tax basis were substantially the same as for financial reporting purposes.
Under the Regulated Investment Company Modernization Act of 2010 (the “2010 Act”), the fund is permitted to carry forward capital losses incurred in taxable years beginning after December 22, 2010 (“post-enactment losses”) for an unlimited period. Furthermore, post-enactment capital loss carryovers retain their character as either short-term or long-term capital losses rather than short-term as they were under previous statute.
The accumulated capital loss carryover is available for federal income tax purposes to be applied against future net realized capital gains, if any, realized subsequent to October 31, 2013. The fund has $328 of post-enactment short-term capital losses which can be carried forward for an unlimited period.
The tax character of distributions paid to shareholders during the fiscal periods ended October 31, 2013 and October 31, 2012 were all ordinary income.
At October 31, 2013, the cost of investments for federal income tax purposes was substantially the same as the cost for financial reporting purposes (see the Statement of Investments).
The Fund 19
NOTES TO FINANCIAL STATEMENTS (continued)
NOTE 2—Investment Management Fee and Other Transactions With Affiliates:
(a) Pursuant to an investment management agreement with the Manager, the Manager provides or arranges for one or more third parties and/or affiliates to provide investment advisory, administrative, custody, fund accounting and transfer agency services to the fund.The Manager also directs the investments of the fund in accordance with its investment objective, policies and limitations. For these services, the fund is contractually obligated to pay the Manager a fee, calculated daily and paid monthly, at an annual rate of .50% of the value of the fund’s average daily net assets. Out of its fee, the Manager pays all of the expenses of the fund except brokerage fees, taxes, Distribution Plan fees, fees and expenses of non-interested Directors (including counsel fees) and extraordinary expenses. In addition, the Manager is required to reduce its fee in an amount equal to the fund’s allocable portion of fees and expenses of the non-interested Directors (including counsel fees). During the period ended October 31, 2013, fees reimbursed by the Manager amounted to $23,822.
The Manager has undertaken to waive receipt of the management fee and/or reimburse operating expenses in order to facilitate a daily yield at or above a certain level which may change from time to time.This undertaking is voluntary and not contractual, and may be terminated at any time. The reduction in expenses, pursuant to the undertaking, amounted to $926,952 for Investor shares and $168,020 for Class R shares during the period ended October 31, 2013.
(b) Under the Distribution Plan adopted pursuant to Rule 12b-1 under the Act, Investor shares may pay annually up to .25% (currently limited by the Board to .20%) of the value of the average daily net assets attributable to its Investor shares to compensate the Distributor for shareholder servicing activities and expenses primarily intended to result in the sale of Investor shares. During the period ended October 31, 2013, Investor shares were charged $356,335 pursuant to the Distribution Plan.
20
Under its terms, the Distribution Plan shall remain in effect from year to year, provided such continuance is approved annually by a vote of a majority of those Directors who are not “interested persons” of the Company and who have no direct or indirect financial interest in the operation of or in any agreement related to the Distribution Plan.
The components of “Due to The Dreyfus Corporation and affiliates” in the Statement of Assets and Liabilities consist of: management fees $91,599 and Distribution Plan fees $30,816, which are offset against an expense reimbursement currently in effect in the amount of $102,720.
(c) Each Board member also serves as a Board member of other funds within the Dreyfus complex. Annual retainer fees and attendance fees are allocated to each fund based on net assets.
The Fund 21
REPORT OF INDEPENDENT REGISTERED
PUBLIC ACCOUNTING FIRM
The Board of Directors and Shareholders
The Dreyfus/Laurel Funds, Inc.
We have audited the accompanying statement of assets and liabilities of Dreyfus Money Market Reserves (the “Fund”), a series of The Dreyfus/Laurel Funds, Inc., including the statement of investments, as of October 31, 2013, the related statement of operations for the year then ended, the statements of changes in net assets for each of the years in the two-year period then ended, and the financial highlights for each of the years in the five-year period then ended.These financial statements and financial highlights are the responsibility of the Fund’s management. Our responsibility is to express an opinion on these financial statements and financial highlights based on our audits.
We conducted our audits in accordance with the standards of the Public Company Accounting Oversight Board (United States).Those standards require that we plan and perform the audit to obtain reasonable assurance about whether the financial statements and financial highlights are free of material misstatement. An audit includes examining, on a test basis, evidence supporting the amounts and disclosures in the financial statements. Our procedures included confirmation of securities owned as of October 31, 2013, by correspondence with the custodian and brokers or by other appropriate auditing procedures. An audit also includes assessing the accounting principles used and significant estimates made by management, as well as evaluating the overall financial statement presentation.We believe that our audits provide a reasonable basis for our opinion.
In our opinion, the financial statements and financial highlights referred to above present fairly, in all material respects, the financial position of Dreyfus Money Market Reserves as of October 31, 2013, the results of its operations for the year then ended, the changes in its net assets for each of the years in the two-year period then ended, and the financial highlights for each of the years in the five-year period then ended, in conformity with U.S. generally accepted accounting principles.

New York, New York
December 30, 2013
22
IMPORTANT TAX INFORMATION (Unaudited)
For federal tax purposes, the fund designates the maximum amount allowable but not less than 91.74% as interest-related dividends in accordance with Sections 871(k)(1) and 881(e) of the Internal Revenue Code.
The Fund 23
BOARD MEMBERS INFORMATION (Unaudited)
24
The Fund 25
OFFICERS OF THE FUND (Unaudited)
26
The Fund 27
|
| Dreyfus |
| AMT-Free |
| Municipal Reserves |
ANNUAL REPORT October 31, 2013

Save time. Save paper. View your next shareholder report online as soon as it’s available. Log into www.dreyfus.com and sign up for Dreyfus eCommunications. It’s simple and only takes a few minutes.
The views expressed in this report reflect those of the portfolio manager only through the end of the period covered and do not necessarily represent the views of Dreyfus or any other person in the Dreyfus organization. Any such views are subject to change at any time based upon market or other conditions and Dreyfus disclaims any responsibility to update such views.These views may not be relied on as investment advice and, because investment decisions for a Dreyfus fund are based on numerous factors, may not be relied on as an indication of trading intent on behalf of any Dreyfus fund.
Not FDIC-Insured • Not Bank-Guaranteed • May Lose Value
| | Contents |
| | THE FUND |
| 2 | A Letter from the President |
| 3 | Discussion of Fund Performance |
| 6 | Understanding Your Fund’s Expenses |
| 6 | Comparing Your Fund’s Expenses With Those of Other Funds |
| 7 | Statement of Investments |
| 20 | Statement of Assets and Liabilities |
| 21 | Statement of Operations |
| 22 | Statement of Changes in Net Assets |
| 23 | Financial Highlights |
| 27 | Notes to Financial Statements |
| 34 | Report of Independent Registered Public Accounting Firm |
| 35 | Important Tax Information |
| 36 | Board Members Information |
| 38 | Officers of the Fund |
| | FOR MORE INFORMATION |
| | Back Cover |
Dreyfus
AMT-Free
Municipal Reserves
The Fund
A LETTER FROM THE PRESIDENT
Dear Shareholder:
We are pleased to present this annual report for Dreyfus AMT-Free Municipal Reserves, covering the 12-month period from November 1, 2012, through October 31, 2013. For information about how the fund performed during the reporting period, as well as general market perspectives, we provide a Discussion of Fund Performance on the pages that follow.
The reporting period proved challenging for most income-oriented investments, as a gradually strengthening U.S. economy and expectations of less aggressively stimulative monetary policies drove longer term interest rates higher and bond prices lower. However, as they have been for the past several years, short-term interest rates and yields of money market instruments remained anchored near historical lows by an unchanged overnight federal funds rate.
We currently expect U.S. and global economic conditions to continue to improve in 2014, with accelerating growth supported by the fading drags of tighter federal fiscal policies and downsizing on the state and local levels. However, inflation is likely to remain muted, so monetary policy can remain stimulative, and short-term interest rates appear likely to remain near current levels for some time to come. For more information on how these observations may affect your investments, we encourage you to speak with your financial advisor.
Thank you for your continued confidence and support.

J. Charles Cardona
President
The Dreyfus Corporation
November 15, 2013
2
DISCUSSION OF FUND PERFORMANCE
For the period of November 1, 2012, through October 31, 2013, as provided by BillVasiliou, Portfolio Manager
Fund and Market Performance Overview
For the 12-month period ended October 31, 2013, Dreyfus AMT-Free Municipal Reserves’ BASIC shares, Class B shares, Class R shares, and Investor shares each produced a yield of 0.00%.Taking into consideration the effects of compounding, the fund’s BASIC shares, Class B shares, Class R shares, and Investor shares each produced effective yields of 0.00% for the same period.1
Yields of municipal money market instruments stayed near historical lows throughout the reporting period. Despite rising long-term interest rates and more robust economic growth, short-term interest rates remained anchored by an overnight federal funds rate between 0% and 0.25%.
The Fund’s Investment Approach
The fund seeks a high level of current income, consistent with stability of principal, that is exempt from federal income tax. The fund also seeks to provide income exempt from the federal alternative minimum tax. To pursue its goal, the fund normally invests substantially all of its assets in short-term, high-quality municipal obligations that provide income exempt from federal personal income tax and the federal alternative minimum tax. Among these are municipal notes, short-term municipal bonds, tax-exempt commercial paper and municipal leases. The fund also may invest in high-quality, short-term structured notes, which are derivative instruments whose value is tied to underlying municipal obligations.
Gradual Economic Recovery Continues
The reporting period began in an improving economic environment as U.S. GDP accelerated from a 0.1% annualized rate in the fourth quarter of 2012 to 1.1% for the first quarter of 2013 and 2.5% during the second quarter. Recovering labor and housing markets drove the domestic economy’s mild advance, but the positive impact of these factors was offset by significant cuts in government spending. The U.S.
DISCUSSION OF FUND PERFORMANCE (continued)
economy grew at an estimated 2.8% annualized rate during the third quarter, fueled by gains in consumer spending, export activity, and real estate markets. In addition, the unemployment rate declined from 7.9% to 7.3% over the reporting period.
Longer term interest rates climbed over the reporting period’s second half as the recovery gained traction, but the Federal Reserve Board’s (the “Fed”) target for the overnight federal funds rate remained near historical lows, and the Fed indicated that rates were unlikely to change until the unemployment rate falls below 6.5%. However, the central bank adopted a more hawkish posture in May, when remarks by Chairman Ben Bernanke were widely interpreted as a signal that the Fed would back away from its ongoing quantitative easing program sooner than expected.
In this environment, demand from individual investors remained focused on higher yielding, longer term municipal bonds. Demand for municipal securities also remained strong among nontraditional buyers, such as separately managed accounts and intermediate bond funds, due to attractive tax-exempt yields compared to taxable securities and narrow yield differences across the one- to three-year maturity spectrum. Nonetheless, yields of high-quality, one-year municipal notes remained near historical lows over the reporting period. Moreover, rates on variable rate demand notes (“VRDNs”) remained steady amid robust demand from taxable money market funds seeking to comply with more stringent liquidity requirements from regulators.
Despite a bankruptcy filing by the city of Detroit over the summer, municipal credit quality generally continued to improve as most states and local governments recovered gradually from the recession.Tax revenues have increased for many states and municipalities, and issuers of revenue-backed municipal securities generally have reported higher revenues.
Credit Selection Remains Paramount
Most tax-exempt money market funds have maintained relatively short weighted average maturities compared to historical averages. Due to narrow yield differences along the money market’s maturity spectrum, as well as ongoing regulatory uncertainty, it has made little sense for fund managers to extend their weighted average maturities. The fund was no exception, and we maintained its weighted average maturity in a range that was consistent with industry averages.
4
In addition, careful and well-researched credit selection has remained paramount.We have continue to favor state general obligation bonds; essential service revenue bonds backed by revenues from water, sewer, and electric facilities; certain local credits with strong financial positions and stable tax bases; and health care and education issuers with stable credit characteristics.
Low Rates Likely to Persist
We remain cautiously optimistic regarding U.S. economic prospects as domestic and overseas markets continue to recover from recession and various financial crises. While the Fed has indicated that it may begin to taper its ongoing, open-ended quantitative easing program later this year, it also has made clear that short-term interest rates are likely to remain low for some time to come. Consequently, we believe that the prudent course continues to be an emphasis on preservation of capital and liquidity.
November 15, 2013
An investment in the fund is not insured or guaranteed by the FDIC or any other government agency. Although the fund seeks to preserve the value of your investment at $1.00 per share, it is possible to lose money by investing in the fund.
Municipal securities holdings (as applicable), while rated in the highest rating category by one or more National Recognized Statistical Rating Organizations (NRSROs) (or unrated, if deemed of comparable quality by Dreyfus), involve credit and liquidity risks and risk of principal loss.
|
| 1 Effective yield is based upon dividends declared daily and reinvested monthly. Past performance is no guarantee of |
| future results.Yields fluctuate.Yield provided reflects the absorption of certain fund expenses by The Dreyfus |
| Corporation pursuant to an undertaking in effect that may be extended, terminated or modified at any time. Had |
| these expenses not been absorbed, fund yields would have been lower, and in some cases, 7-day yields during the |
| reporting period would have been negative absent the expense absorption. |
UNDERSTANDING YOUR FUND’S EXPENSES (Unaudited)
As a mutual fund investor, you pay ongoing expenses, such as management fees and other expenses. Using the information below, you can estimate how these expenses affect your investment and compare them with the expenses of other funds.You also may pay one-time transaction expenses, including sales charges (loads) and redemption fees, which are not shown in this section and would have resulted in higher total expenses. For more information, see your fund’s prospectus or talk to your financial adviser.
Review your fund’s expenses
The table below shows the expenses you would have paid on a $1,000 investment in Dreyfus AMT-Free Municipal Reserves from May 1, 2013 to October 31, 2013. It also shows how much a $1,000 investment would be worth at the close of the period, assuming actual returns and expenses.
Expenses and Value of a $1,000 Investment
assuming actual returns for the six months ended October 31, 2013
| | | | |
| | Investor Shares | Class R Shares | BASIC Shares | Class B Shares |
| Expenses paid per $1,000† | $1.06 | $1.06 | $1.06 | $1.06 |
| Ending value (after expenses) | $1,000.00 | $1,000.00 | $1,000.00 | $1,000.00 |
COMPARING YOUR FUND’S EXPENSES
WITH THOSE OF OTHER FUNDS (Unaudited)
Using the SEC’s method to compare expenses
The Securities and Exchange Commission (SEC) has established guidelines to help investors assess fund expenses. Per these guidelines, the table below shows your fund’s expenses based on a $1,000 investment, assuming a hypothetical 5% annualized return. You can use this information to compare the ongoing expenses (but not transaction expenses or total cost) of investing in the fund with those of other funds.All mutual fund shareholder reports will provide this information to help you make this comparison. Please note that you cannot use this information to estimate your actual ending account balance and expenses paid during the period.
Expenses and Value of a $1,000 Investment
assuming a hypothetical 5% annualized return for the six months ended October 31, 2013
| | | | |
| | Investor Shares | Class R Shares | BASIC Shares | Class B Shares |
| Expenses paid per $1,000† | $1.07 | $1.07 | $1.07 | $1.07 |
| Ending value (after expenses) | $1,024.15 | $1,024.15 | $1,024.15 | $1,024.15 |
|
| † Expenses are equal to the fund’s annualized expense ratio of .21% for Investor Shares, .21% for Class R Shares, |
| .21% for BASIC Shares and .21% for Class B Shares, multiplied by the average account value over the period, |
| multiplied by 184/365 (to reflect the one-half year period). |
6
STATEMENT OF INVESTMENTS
October 31, 2013
| | | | | |
| ShortTerm | Coupon | Maturity | Principal | | |
| Investments—100.9% | Rate (%) | Date | Amount ($) | | Value ($) |
| Alabama—2.5% | | | | | |
| Chatom Industrial Development | | | | | |
| Board, Gulf Opportunity Zone | | | | | |
| Revenue (PowerSouth Energy | | | | | |
| Cooperative Projects) | 0.23 | 11/7/13 | 5,000,000 | a | 5,000,000 |
| Mobile County Industrial | | | | | |
| Development Authority, Gulf | | | | | |
| Opportunity Zone Revenue (SSAB | | | | | |
| Alabama Inc.) (LOC; Swedbank) | 0.14 | 11/7/13 | 2,000,000 | a | 2,000,000 |
| Alaska—.3% | | | | | |
| Alaska Municipal Bond Bank, | | | | | |
| GO Notes | 3.00 | 12/1/13 | 765,000 | | 766,739 |
| Arizona—3.6% | | | | | |
| Yavapai County Industrial | | | | | |
| Development Authority, Revenue | | | | | |
| (Skanon Investments, Inc.—Drake | | | | | |
| Cement Project) (LOC; Citibank NA) | 0.11 | 11/7/13 | 10,050,000 | a | 10,050,000 |
| Colorado—2.6% | | | | | |
| Colorado Educational and Cultural | | | | | |
| Facilities Authority, Revenue | | | | | |
| (Naropa University Project) | | | | | |
| (LOC; Wells Fargo Bank) | 0.18 | 11/7/13 | 955,000 | a,b | 955,000 |
| Colorado Educational and Cultural | | | | | |
| Facilities Authority, Revenue | | | | | |
| (National Jewish Federation Bond | | | | | |
| Program) (LOC; U.S. Bank NA) | 0.09 | 11/1/13 | 1,680,000 | a | 1,680,000 |
| Colorado Educational and Cultural | | | | | |
| Facilities Authority, Revenue, | | | | | |
| Refunding (Boulder Country | | | | | |
| Day School Project) | | | | | |
| (LOC; Wells Fargo Bank) | 0.18 | 11/7/13 | 1,425,000 | a,b | 1,425,000 |
| Colorado Postsecondary Educational | | | | | |
| Facilities Authority, Revenue | | | | | |
| (Mullen High School Project) | | | | | |
| (LOC; Wells Fargo Bank) | 0.23 | 11/7/13 | 855,000 | a,b | 855,000 |
| Gateway Regional Metropolitan | | | | | |
| District, Limited Tax Improvement | | | | | |
| GO Notes, Refunding (LOC; | | | | | |
| Wells Fargo Bank) | 0.18 | 11/7/13 | 2,140,000 | a | 2,140,000 |
STATEMENT OF INVESTMENTS (continued)
| | | | | |
| ShortTerm | Coupon | Maturity | Principal | | |
| Investments (continued) | Rate (%) | Date | Amount ($) | | Value ($) |
| Connecticut—6.5% | | | | | |
| Connecticut Health and Educational | | | | | |
| Facilities Authority, Revenue | | | | | |
| (Eagle Hill School Issue) | | | | | |
| (LOC; JPMorgan Chase Bank) | 0.16 | 11/7/13 | 5,000,000 | a,b | 5,000,000 |
| Connecticut Health and Educational | | | | | |
| Facilities Authority, Revenue | | | | | |
| (Taft School Issue) (LOC; | | | | | |
| Wells Fargo Bank) | 0.13 | 11/7/13 | 1,600,000 | a,b | 1,600,000 |
| Connecticut Health and Educational | | | | | |
| Facilities Authority, Revenue | | | | | |
| (The Children’s School Issue) | | | | | |
| (LOC; JPMorgan Chase Bank) | 0.16 | 11/7/13 | 5,625,000 | a,b | 5,625,000 |
| Shelton Housing Authority, | | | | | |
| Revenue (Crosby Commons | | | | | |
| Project) (LOC; M&T Trust) | 0.13 | 11/7/13 | 5,685,000 | a | 5,685,000 |
| District of Columbia—.5% | | | | | |
| District of Columbia, | | | | | |
| Revenue (Hogar Hispano, Inc. | | | | | |
| Issue) (LOC; Bank of America) | 0.13 | 11/7/13 | 1,300,000 | a | 1,300,000 |
| Florida—7.6% | | | | | |
| Brevard County, | | | | | |
| Revenue (Holy Trinity | | | | | |
| Episcopal Academy Project) | | | | | |
| (LOC; Wells Fargo Bank) | 0.23 | 11/7/13 | 730,000 | a,b | 730,000 |
| Collier County Industrial | | | | | |
| Development Authority, Revenue | | | | | |
| (Redlands Christian Migrant | | | | | |
| Association, Inc. Project) | | | | | |
| (LOC; Bank of America) | 0.22 | 11/7/13 | 2,950,000 | a | 2,950,000 |
| Florida Water Pollution Control | | | | | |
| Financing Corporation, Water | | | | | |
| Pollution Control Revenue | 5.25 | 1/15/14 | 500,000 | | 505,074 |
| Hillsborough County Industrial | | | | | |
| Development Authority, Revenue | | | | | |
| (Independent Day School | | | | | |
| Project) (LOC; Bank of America) | 0.31 | 11/7/13 | 1,300,000 | a,b | 1,300,000 |
| Palm Beach County, | | | | | |
| IDR (Boca Raton Jewish | | | | | |
| Community Day School, Inc. | | | | | |
| Project) (LOC; Wells Fargo Bank) | 0.18 | 11/7/13 | 1,115,000 | a,b | 1,115,000 |
8
| | | | | |
| ShortTerm | Coupon | Maturity | Principal | | |
| Investments (continued) | Rate (%) | Date | Amount ($) | | Value ($) |
| Florida (continued) | | | | | |
| Palm Beach County, | | | | | |
| IDR (Gulfstream Goodwill | | | | | |
| Industries, Inc. Project) | | | | | |
| (LOC; Wells Fargo Bank) | 0.18 | 11/7/13 | 440,000 | a | 440,000 |
| Palm Beach County, | | | | | |
| Public Improvement Revenue | | | | | |
| (Biomedical Research Park | | | | | |
| Project) (Deutsche Bank | | | | | |
| Spears/Lifers Trust (Series | | | | | |
| DB-184) (Liquidity Facility; | | | | | |
| Deutsche Bank AG and LOC; | | | | | |
| Deutsche Bank AG) | 0.18 | 11/7/13 | 3,935,000 | a,c,d | 3,935,000 |
| Sarasota County Health Facilities | | | | | |
| Authority, Health Care | | | | | |
| Facilities Revenue (Bay | | | | | |
| Village of Sarasota, Inc. | | | | | |
| Project) (LOC; Bank of America) | 0.25 | 11/7/13 | 5,000,000 | a | 5,000,000 |
| Sarasota County Public Hospital | | | | | |
| District, HR, Refunding (Sarasota | | | | | |
| Memorial Hospital Project) (LOC: | | | | | |
| Northern Trust Company) | 0.06 | 11/1/13 | 5,000,000 | a | 5,000,000 |
| Georgia—.7% | | | | | |
| Cobb County Development Authority, | | | | | |
| Revenue (Dominion Christian | | | | | |
| High School, Inc. Project) | | | | | |
| (LOC; Branch Banking | | | | | |
| and Trust Company) | 0.13 | 11/7/13 | 1,950,000 | a,b | 1,950,000 |
| Idaho—3.0% | | | | | |
| Idaho Housing and Finance | | | | | |
| Association, MFHR (Traditions | | | | | |
| at Boise Apartments Project) | | | | | |
| (LOC; FHLB) | 0.09 | 11/7/13 | 8,400,000 | a | 8,400,000 |
| Illinois—3.7% | | | | | |
| Illinois Educational Facilities | | | | | |
| Authority, Revenue (The Lincoln | | | | | |
| Park Society) (LOC; Citibank NA) | 0.20 | 11/7/13 | 2,900,000 | a | 2,900,000 |
| Illinois Finance Authority, | | | | | |
| Revenue (Cristo Rey Jesuit | | | | | |
| High School Project) (LOC; | | | | | |
| JPMorgan Chase Bank) | 0.17 | 11/7/13 | 1,765,000 | a,b | 1,765,000 |
STATEMENT OF INVESTMENTS (continued)
| | | | | |
| ShortTerm | Coupon | Maturity | Principal | | |
| Investments (continued) | Rate (%) | Date | Amount ($) | | Value ($) |
| Illinois (continued) | | | | | |
| Illinois Finance Authority, | | | | | |
| Revenue (Holy Family | | | | | |
| Ministries Center) | | | | | |
| (LOC; PNC Bank NA) | 0.17 | 11/7/13 | 2,765,000 | a | 2,765,000 |
| Lake Villa, | | | | | |
| Revenue (The Allendale | | | | | |
| Association Project) (LOC; | | | | | |
| Wells Fargo Bank) | 0.12 | 11/7/13 | 2,760,000 | a | 2,760,000 |
| Indiana—3.9% | | | | | |
| East Porter County School | | | | | |
| Building Corporation, First Mortgage | | | | | |
| Bonds, Refunding (Deutsche | | | | | |
| Bank Spears/Lifers Trust | | | | | |
| Series DB-144) (Liquidity | | | | | |
| Facility; Deutsche Bank AG and | | | | | |
| LOC; Deutsche Bank AG) | 0.18 | 11/7/13 | 5,065,000 | a,b,c,d | 5,065,000 |
| Indiana Municipal Power Agency, | | | | | |
| Power Supply System Revenue, | | | | | |
| Refunding (LOC; Citibank NA) | 0.09 | 11/7/13 | 5,660,000 | a | 5,660,000 |
| Iowa—.7% | | | | | |
| Des Moines, | | | | | |
| GO Refunding Capital Loan Notes | 5.00 | 6/1/14 | 2,000,000 | | 2,055,104 |
| Kansas—.2% | | | | | |
| Wamego, | | | | | |
| PCR, Refunding (UtiliCorp | | | | | |
| United Inc. Project) (LOC; | | | | | |
| Bank of America) | 0.19 | 11/7/13 | 500,000 | a | 500,000 |
| Kentucky—1.0% | | | | | |
| Breckinridge County, | | | | | |
| Lease Program Revenue | | | | | |
| (Kentucky Association of | | | | | |
| Counties Leasing Trust) | | | | | |
| (LOC; U.S. Bank NA) | 0.10 | 11/7/13 | 2,225,000 | a | 2,225,000 |
| Mason County, | | | | | |
| PCR (East Kentucky Power | | | | | |
| Cooperative, Inc. Project) | | | | | |
| (Liquidity Facility; National | | | | | |
| Rural Utilities Cooperative | | | | | |
| Finance Corporation) | 0.30 | 11/7/13 | 450,000 | a | 450,000 |
10
| | | | | |
| ShortTerm | Coupon | Maturity | Principal | | |
| Investments (continued) | Rate (%) | Date | Amount ($) | | Value ($) |
| Louisiana—1.3% | | | | | |
| Louisiana Local Government | | | | | |
| Environmental Facilities and | | | | | |
| Community Development | | | | | |
| Authority, Revenue (Kenner | | | | | |
| Theatres, L.L.C. Project) | | | | | |
| (LOC; FHLB) | 0.15 | 11/7/13 | 3,650,000 | a | 3,650,000 |
| Maryland—3.4% | | | | | |
| Baltimore County, | | | | | |
| Revenue, Refunding (Shade Tree | | | | | |
| Trace Apartments Facility) | | | | | |
| (LOC; M&T Trust) | 0.15 | 11/7/13 | 3,255,000 | a | 3,255,000 |
| Maryland Department of | | | | | |
| Transportation, Consolidated | | | | | |
| Transportation Revenue | 5.50 | 2/1/14 | 170,000 | | 172,169 |
| Maryland Economic Development | | | | | |
| Corporation, EDR (Blind Industries | | | | | |
| and Services of Maryland Project) | | | | | |
| (LOC; Bank of America) | 0.22 | 11/7/13 | 5,910,000 | a | 5,910,000 |
| Massachusetts—1.7% | | | | | |
| Massachusetts Department of | | | | | |
| Transportation, Metropolitan | | | | | |
| Highway System Senior Revenue | | | | | |
| (LOC; Citibank NA) | 0.15 | 11/7/13 | 1,950,000 | a | 1,950,000 |
| Springfield, | | | | | |
| GO Notes, BAN | 1.00 | 2/14/14 | 2,837,644 | | 2,842,634 |
| Minnesota—.6% | | | | | |
| Saint Paul Housing and | | | | | |
| Redevelopment Authority, | | | | | |
| Revenue (Goodwill/Easter Seals | | | | | |
| Project) (LOC; U.S. Bank NA) | 0.20 | 11/7/13 | 1,700,000 | a | 1,700,000 |
| Mississippi—5.7% | | | | | |
| Mississippi Business Finance | | | | | |
| Corporation, Gulf Opportunity Zone | | | | | |
| IDR (Chevron U.S.A. Inc. Project) | 0.05 | 11/1/13 | 9,795,000 | a | 9,795,000 |
| Mississippi Business Finance | | | | | |
| Corporation, Revenue (Chrome | | | | | |
| Deposit Corporation Project) | | | | | |
| (LOC; PNC Bank NA) | 0.09 | 11/7/13 | 5,895,000 | a | 5,895,000 |
STATEMENT OF INVESTMENTS (continued)
| | | | | |
| ShortTerm | Coupon | Maturity | Principal | | |
| Investments (continued) | Rate (%) | Date | Amount ($) | | Value ($) |
| Missouri—4.2% | | | | | |
| Independence Industrial | | | | | |
| Development Authority, | | | | | |
| Industrial Revenue (The Groves | | | | | |
| and Graceland College Nursing | | | | | |
| Arts Center Projects) (LOC; | | | | | |
| Bank of America) | 0.25 | 11/7/13 | 345,000 | a | 345,000 |
| Kirkwood Industrial Development | | | | | |
| Authority, Revenue (Concordia | | | | | |
| Lutheran Church Community | | | | | |
| Recreational Facilities Project) | | | | | |
| (LOC; Bank of America) | 0.29 | 11/7/13 | 1,140,000 | a | 1,140,000 |
| Missouri Development Finance | | | | | |
| Board, Cultural Facilities | | | | | |
| Revenue (Kauffman Center for | | | | | |
| the Preforming Arts Project) | | | | | |
| (Liquidity Facility; Northern | | | | | |
| Trust Company) | 0.09 | 11/1/13 | 4,065,000 | a | 4,065,000 |
| Saint Louis Industrial Development | | | | | |
| Authority, MFHR (Hamilton | | | | | |
| Place Apartments) (LOC; FHLMC) | 0.12 | 11/7/13 | 4,750,000 | a | 4,750,000 |
| Saint Louis Parking Commission | | | | | |
| Finance Corporation, Parking | | | | | |
| Revenue (Cupples Garage | | | | | |
| Project) (LOC; Bank of America) | 0.25 | 11/7/13 | 1,165,000 | a | 1,165,000 |
| Nevada—1.7% | | | | | |
| Clark County, | | | | | |
| Airport System Junior | | | | | |
| Subordinate Lien Revenue | 2.00 | 7/1/14 | 1,200,000 | | 1,213,088 |
| Deutsche Bank Spears/Lifers | | | | | |
| Trust (Series DBE-668) | | | | | |
| (Clark County School | | | | | |
| District, Limited Tax Building | | | | | |
| Bonds GO) (Liquidity Facility; | | | | | |
| Deutsche Bank AG and | | | | | |
| LOC; Deutsche Bank AG) | 0.21 | 11/7/13 | 3,400,000 | a,b,c,d | 3,400,000 |
| New Hampshire—.5% | | | | | |
| New Hampshire Business Finance | | | | | |
| Authority, Revenue (Huggins | | | | | |
| Hospital Issue) (LOC; TD Bank) | 0.08 | 11/1/13 | 1,300,000 | a | 1,300,000 |
12
| | | | | |
| ShortTerm | Coupon | Maturity | Principal | | |
| Investments (continued) | Rate (%) | Date | Amount ($) | | Value ($) |
| New Jersey—3.9% | | | | | |
| Little Ferry Borough, | | | | | |
| Special Emergency Note | 1.00 | 11/15/13 | 3,000,000 | | 3,000,285 |
| New Jersey Economic Development | | | | | |
| Authority, Revenue (Oak Hill | | | | | |
| Academy Project) (LOC; | | | | | |
| Wells Fargo Bank) | 0.18 | 11/7/13 | 1,310,000 | a,b | 1,310,000 |
| North Wildwood, | | | | | |
| GO Notes, BAN | 1.00 | 8/27/14 | 4,000,000 | | 4,010,059 |
| Pompton Lakes Borough, | | | | | |
| GO Notes, TAN | 1.25 | 2/21/14 | 2,500,000 | | 2,505,675 |
| New Mexico—.9% | | | | | |
| Santa Fe County, | | | | | |
| Education Facility Revenue | | | | | |
| (Archdiocese of Santa Fe School | | | | | |
| Project) (LOC; U.S. Bank NA) | 0.23 | 11/7/13 | 2,400,000 | a,b | 2,400,000 |
| New York—7.3% | | | | | |
| Chappaqua Central School District, | | | | | |
| GO Notes, TAN | 1.00 | 6/27/14 | 4,000,000 | b | 4,012,938 |
| East Rockaway Union Free School | | | | | |
| District, GO Notes, TAN | 1.25 | 6/20/14 | 1,000,000 | b | 1,004,093 |
| Monroe County Industrial | | | | | |
| Development Agency, Civic | | | | | |
| Facility Revenue (YMCA of | | | | | |
| Greater Rochester Project) | | | | | |
| (LOC; M&T Trust) | 0.13 | 11/7/13 | 8,105,000 | a | 8,105,000 |
| New York City Industrial | | | | | |
| Development Agency, Civic | | | | | |
| Facility Revenue (Jewish | | | | | |
| Community Center on the | | | | | |
| Upper West Side, Inc. Project) | | | | | |
| (LOC; M&T Trust) | 0.13 | 11/7/13 | 4,200,000 | a | 4,200,000 |
| Northern Adirondack Central School | | | | | |
| District at Ellenburg, GO | | | | | |
| Notes, BAN | 2.00 | 6/26/14 | 2,750,866 | b | 2,777,023 |
| North Carolina—.4% | | | | | |
| North Carolina Capital Facilities | | | | | |
| Finance Agency, Revenue (Elon | | | | | |
| College) (LOC; U.S. Bank NA) | 0.13 | 11/7/13 | 1,075,000 | a,b | 1,075,000 |
STATEMENT OF INVESTMENTS (continued)
| | | | | |
| ShortTerm | Coupon | Maturity | Principal | | |
| Investments (continued) | Rate (%) | Date | Amount ($) | | Value ($) |
| Ohio—4.6% | | | | | |
| Dayton City School District, | | | | | |
| School Facilities Construction | | | | | |
| and Improvement Unlimited Tax | | | | | |
| Refunding Notes | 1.25 | 10/15/14 | 2,500,000 | b | 2,522,572 |
| Ohio Higher Educational | | | | | |
| Facility Commission, | | | | | |
| Revenue (Ohio Dominican | | | | | |
| University Project) (LOC; | | | | | |
| JPMorgan Chase Bank) | 0.10 | 11/7/13 | 6,900,000 | a,b | 6,900,000 |
| Union Township, | | | | | |
| GO Notes, BAN (Various Purpose) | 1.50 | 9/10/14 | 3,300,000 | | 3,329,568 |
| Pennsylvania—7.2% | | | | | |
| Allegheny County Industrial | | | | | |
| Development Authority, | | | | | |
| Revenue (Sewickley Academy) | | | | | |
| (LOC; PNC Bank NA) | 0.10 | 11/7/13 | 1,615,000 | a,b | 1,615,000 |
| Allegheny County Industrial | | | | | |
| Development Authority, | | | | | |
| Revenue (The Bradley Center) | | | | | |
| (LOC; PNC Bank NA) | 0.17 | 11/7/13 | 425,000 | a | 425,000 |
| Butler County Industrial | | | | | |
| Development Authority, IDR, | | | | | |
| Refunding (Wetterau | | | | | |
| Finance Company Project) | | | | | |
| (LOC; U.S. Bank NA) | 0.10 | 11/7/13 | 1,940,000 | a | 1,940,000 |
| Deutsche Bank Spears/Lifers Trust | | | | | |
| (Series DBE-1021) | | | | | |
| (Pennsylvania Higher Education | | | | | |
| Facilities Authority, Revenue | | | | | |
| (Student Association, Inc. | | | | | |
| Student Housing Project at | | | | | |
| California University of | | | | | |
| Pennsylvania)) (Liquidity | | | | | |
| Facility; Deutsche Bank AG and | | | | | |
| LOC; Deutsche Bank AG) | 0.18 | 11/7/13 | 4,890,000 | a,b,c,d | 4,890,000 |
14
| | | | | |
| ShortTerm | Coupon | Maturity | Principal | | |
| Investments (continued) | Rate (%) | Date | Amount ($) | | Value ($) |
| Pennsylvania (continued) | | | | | |
| Erie County Hospital Authority, | | | | | |
| Revenue (Mercy Terrace | | | | | |
| Apartments Project) | | | | | |
| (LOC; PNC Bank NA) | 0.17 | 11/7/13 | 475,000 | a | 475,000 |
| Montgomery County Industrial | | | | | |
| Development Authority, Revenue | | | | | |
| (Big Little Associates Project) | | | | | |
| (LOC; Wells Fargo Bank) | 0.28 | 11/7/13 | 435,000 | a | 435,000 |
| Northampton County Industrial | | | | | |
| Development Authority, Revenue | | | | | |
| (Moravian Academy) (LOC; | | | | | |
| Wells Fargo Bank) | 0.17 | 11/7/13 | 875,000 | a,b | 875,000 |
| Pennsylvania Economic Development | | | | | |
| Financing Authority, Recovery | | | | | |
| Zone Facility Revenue (Hawley | | | | | |
| Silk Mill, LLC Project) | | | | | |
| (LOC; PNC Bank NA) | 0.17 | 11/7/13 | 1,000,000 | a | 1,000,000 |
| Philadelphia Authority for | | | | | |
| Industrial Development, | | | | | |
| Educational Facilities Revenue | | | | | |
| (Chestnut Hill College Project) | | | | | |
| (LOC; Wells Fargo Bank) | 0.18 | 11/7/13 | 500,000 | a,b | 500,000 |
| Philadelphia Authority for | | | | | |
| Industrial Development, | | | | | |
| Revenue (Friends Select School | | | | | |
| Project) (LOC; PNC Bank NA) | 0.10 | 11/7/13 | 2,300,000 | a,b | 2,300,000 |
| Philadelphia Authority for | | | | | |
| Industrial Development, | | | | | |
| Revenue (The Philadelphia | | | | | |
| Protestant Home Project) | | | | | |
| (LOC; Bank of America) | 0.21 | 11/7/13 | 1,800,000 | a | 1,800,000 |
| Philadelphia Hospitals and Higher | | | | | |
| Education Facilities Authority, HR | | | | | |
| (Thomas Jefferson University | | | | | |
| Hospital Project) (LOC; TD Bank) | 0.18 | 11/7/13 | 785,000 | a | 785,000 |
STATEMENT OF INVESTMENTS (continued)
| | | | | |
| ShortTerm | Coupon | Maturity | Principal | | |
| Investments (continued) | Rate (%) | Date | Amount ($) | | Value ($) |
| Pennsylvania (continued) | | | | | |
| York Redevelopment Authority, | | | | | |
| Revenue (LOC; M&T Trust) | 0.20 | 11/7/13 | 2,725,000 | a | 2,725,000 |
| Tennessee—.9% | | | | | |
| Cleveland Health and Educational | | | | | |
| Facilities Board, Revenue (Lee | | | | | |
| University Project) (LOC; Branch | | | | | |
| Banking and Trust Company) | 0.11 | 11/7/13 | 2,600,000 | a,b | 2,600,000 |
| Texas—13.7% | | | | | |
| Atascosa County Industrial | | | | | |
| Development Corporation, PCR, | | | | | |
| Refunding (San Miguel Electric | | | | | |
| Cooperative, Inc. Project) | | | | | |
| (LOC; National Rural Utilities | | | | | |
| Cooperative Finance Corporation) | 0.14 | 11/7/13 | 8,000,000 | a | 8,000,000 |
| Deutsche Bank Spears/Lifers Trust | | | | | |
| (Series DBE-482) (Red River | | | | | |
| Education Financing Corporation, | | | | | |
| Higher Education Revenue | | | | | |
| (Texas Christian University Project)) | | | | | |
| (Liquidity Facility; Deutsche Bank AG | | | | | |
| and LOC; Deutsche Bank AG) | 0.18 | 11/7/13 | 3,000,000 | a,b,c,d | 3,000,000 |
| Deutsche Bank Spears/Lifers Trust | | | | | |
| (Series DBE-548) (Austin, | | | | | |
| Revenue, Refunding (Town Lake | | | | | |
| Park Community Events Center | | | | | |
| Venue Project)) (Liquidity | | | | | |
| Facility; Deutsche Bank AG and | | | | | |
| LOC; Deutsche Bank AG) | 0.18 | 11/7/13 | 5,080,000 | a,c,d | 5,080,000 |
| Harris County Cultural Education | | | | | |
| Facilities Finance Corporation, HR | | | | | |
| (Texas Children’s Hospital Project) | | | | | |
| (Citigroup ROCS, Series RR II | | | | | |
| R-11821) (Liquidity Facility; | | | | | |
| Citibank NA) | 0.14 | 11/7/13 | 5,250,000 | a,c,d | 5,250,000 |
16
| | | | | |
| ShortTerm | Coupon | Maturity | Principal | | |
| Investments (continued) | Rate (%) | Date | Amount ($) | | Value ($) |
| Texas (continued) | | | | | |
| Jefferson County Industrial | | | | | |
| Development Corporation, | | | | | |
| Hurricane Ike Disaster Area | | | | | |
| Revenue (Jefferson Refinery, | | | | | |
| L.L.C. Project) (LOC; Branch | | | | | |
| Banking and Trust Co.) | 0.45 | 12/19/13 | 6,900,000 | | 6,900,000 |
| Jefferson County Industrial | | | | | |
| Development Corporation, | | | | | |
| Hurricane Ike Disaster Area | | | | | |
| Revenue (Jefferson Refinery, | | | | | |
| L.L.C. Project) (LOC; Branch | | | | | |
| Banking and Trust Co.) | 0.45 | 12/19/13 | 1,000,000 | | 1,000,000 |
| Splendora Higher Education | | | | | |
| Facilities Corporation, | | | | | |
| Revenue (Fellowship | | | | | |
| Christian Academy Project) | | | | | |
| (LOC; Bank of America) | 0.22 | 11/7/13 | 4,200,000 | a,b | 4,200,000 |
| Texas, | | | | | |
| TRAN | 2.00 | 8/28/14 | 4,000,000 | | 4,059,198 |
| Washington—.6% | | | | | |
| Squaxin Island Tribe, | | | | | |
| Tribal Infrastructure Revenue | | | | | |
| (LOC; Bank of America) | 0.20 | 11/7/13 | 1,400,000 | a | 1,400,000 |
| Washington Health Care Facilities | | | | | |
| Authority, Revenue (Providence | | | | | |
| Health and Services) (Liquidity | | | | | |
| Facility; U.S. Bank NA) | 0.10 | 11/7/13 | 200,000 | a | 200,000 |
| Wisconsin—5.5% | | | | | |
| Wisconsin Health and Educational | | | | | |
| Facilities Authority, Revenue | | | | | |
| (16th Street Community | | | | | |
| Health Center, Inc.) (LOC; | | | | | |
| JPMorgan Chase Bank) | 0.12 | 11/7/13 | 3,400,000 | a | 3,400,000 |
STATEMENT OF INVESTMENTS (continued)
| | | | | | | |
| ShortTerm | Coupon | Maturity | Principal | | | | |
| Investments (continued) | Rate (%) | Date | Amount ($) | | | Value ($) | |
| Wisconsin Health and Educational | | | | | | | |
| Facilities Authority, Revenue | | | | | | | |
| (Madison Family Medicine Residency | | | | | | | |
| Corporation, Inc. Project) | | | | | | | |
| (LOC; JPMorgan Chase Bank) | 0.20 | 11/7/13 | 3,025,000 | a | | 3,025,000 | |
| Wisconsin Health and Educational | | | | | | | |
| Facilities Authority, Revenue | | | | | | | |
| (Sinsinawa Nursing, Inc. Project) | | | | | | | |
| (LOC; JPMorgan Chase Bank) | 0.20 | 11/7/13 | 665,000 | a | | 665,000 | |
| Wisconsin Health and Educational | | | | | | | |
| Facilities Authority, Revenue | | | | | | | |
| (Upland Hills Health, Inc.) | | | | | | | |
| (LOC; U.S. Bank NA) | 0.10 | 11/7/13 | 8,000,000 | a | | 8,000,000 | |
| |
| Total Investments (cost $277,796,219) | | | 100.9 | % | | 277,796,219 | |
| Liabilities, Less Cash and Receivables | | | (.9 | %) | | (2,349,579 | ) |
| Net Assets | | | 100.0 | % | | 275,446,640 | |
|
| a Variable rate demand note—rate shown is the interest rate in effect at October 31, 2013. Maturity date represents |
| the next demand date, or the ultimate maturity date if earlier. |
| b At October 31, 2013, the fund had $72,766,626 or 26.4% of net assets invested in securities whose payment of |
| principal and interest is dependent upon revenues generated from education. |
| c Securities exempt from registration pursuant to Rule 144A under the Securities Act of 1933.These securities may be |
| resold in transactions exempt from registration, normally to qualified institutional buyers.At October 31, 2013, these |
| securities amounted to $30,620,000 or 11.1% of net assets. |
| d The fund does not directly own the municipal security indicated; the fund owns an interest in a special purpose entity |
| that, in turn, owns the underlying municipal security.The special purpose entity permits the fund to own interests in |
| underlying assets, but in a manner structured to provide certain advantages not inherent in the underlying bonds (e.g., |
| enhanced liquidity, yields linked to short-term rates). |
| | | |
| Portfolio Summary (Unaudited)† | | |
| |
| | Value (%) | | Value (%) |
| Education | 26.4 | State/Territory | 2.2 |
| Industrial | 18.0 | Transportation Services | 1.2 |
| Health Care | 12.5 | Health Care and Related Products | .2 |
| Housing | 10.2 | Pollution Control | .2 |
| City | 5.2 | Utility-Water and Sewer | .2 |
| Utility-Electric | 5.0 | Other | 14.1 |
| Resource Recovery | 2.9 | | |
| County | 2.6 | | 100.9 |
| |
| † Based on net assets. | | | |
| See notes to financial statements. | | | |
18
| | | |
| Summary of Abbreviations | | |
| |
| ABAG | Association of Bay Area | ACA | American Capital Access |
| | Governments | | |
| AGC | ACE Guaranty Corporation | AGIC | Asset Guaranty Insurance Company |
| AMBAC | American Municipal Bond | ARRN | Adjustable Rate |
| | Assurance Corporation | | Receipt Notes |
| BAN | Bond Anticipation Notes | BPA | Bond Purchase Agreement |
| CIFG | CDC Ixis Financial Guaranty | COP | Certificate of Participation |
| CP | Commercial Paper | DRIVERS | Derivative Inverse |
| | | | Tax-Exempt Receipts |
| EDR | Economic Development | EIR | Environmental Improvement |
| | Revenue | | Revenue |
| FGIC | Financial Guaranty | FHA | Federal Housing |
| | Insurance Company | | Administration |
| FHLB | Federal Home | FHLMC | Federal Home Loan Mortgage |
| | Loan Bank | | Corporation |
| FNMA | Federal National | GAN | Grant Anticipation Notes |
| | Mortgage Association | | |
| GIC | Guaranteed Investment | GNMA | Government National Mortgage |
| | Contract | | Association |
| GO | General Obligation | HR | Hospital Revenue |
| IDB | Industrial Development Board | IDC | Industrial Development Corporation |
| IDR | Industrial Development | LIFERS | Long Inverse Floating |
| | Revenue | | Exempt Receipts |
| LOC | Letter of Credit | LOR | Limited Obligation Revenue |
| LR | Lease Revenue | MERLOTS | Municipal Exempt Receipts |
| | | | Liquidity Option Tender |
| MFHR | Multi-Family Housing Revenue | MFMR | Multi-Family Mortgage Revenue |
| PCR | Pollution Control Revenue | PILOT | Payment in Lieu of Taxes |
| P-FLOATS | Puttable Floating Option | PUTTERS | Puttable Tax-Exempt Receipts |
| | Tax-Exempt Receipts | | |
| RAC | Revenue Anticipation Certificates | RAN | Revenue Anticipation Notes |
| RAW | Revenue Anticipation Warrants | RIB | Residual Interest Bonds |
| ROCS | Reset Options Certificates | RRR | Resources Recovery Revenue |
| SAAN | State Aid Anticipation Notes | SBPA | Standby Bond Purchase Agreement |
| SFHR | Single Family Housing Revenue | SFMR | Single Family Mortgage Revenue |
| SONYMA | State of New York | SPEARS | Short Puttable Exempt |
| | Mortgage Agency | | Adjustable Receipts |
| SWDR | Solid Waste Disposal Revenue | TAN | Tax Anticipation Notes |
| TAW | Tax Anticipation Warrants | TRAN | Tax and Revenue Anticipation Notes |
| XLCA | XL Capital Assurance | | |
|
| STATEMENT OF ASSETS AND LIABILITIES |
| October 31, 2013 |
| | | | |
| | | | Cost | Value |
| Assets ($): | | | | |
| Investments in securities—See Statement of Investments | 277,796,219 | 277,796,219 |
| Cash | | | | 246,240 |
| Interest receivable | | | | 212,780 |
| | | | | 278,255,239 |
| Liabilities ($): | | | | |
| Due to The Dreyfus Corporation and affiliates—Note 2(c) | | 43,196 |
| Payable for investment securities purchased | | | 2,765,000 |
| Payable for shares of Capital Stock redeemed | | | 401 |
| Dividend payable | | | | 2 |
| | | | | 2,808,599 |
| Net Assets ($) | | | | 275,446,640 |
| Composition of Net Assets ($): | | | | |
| Paid-in capital | | | | 275,416,426 |
| Accumulated net realized gain (loss) on investments | | | 30,214 |
| Net Assets ($) | | | | 275,446,640 |
| |
| |
| Net Asset Value Per Share | | | | |
| | Investor | Class R | BASIC | Class B |
| | Shares | Shares | Shares | Shares |
| Net Assets ($) | 23,791,699 | 55,148,632 | 14,719,785 | 181,786,524 |
| Shares Outstanding | 23,789,381 | 55,142,731 | 14,718,385 | 181,767,642 |
| Net Asset Value Per Share ($) | 1.00 | 1.00 | 1.00 | 1.00 |
| |
| See notes to financial statements. | | | | |
20
|
| STATEMENT OF OPERATIONS |
| Year Ended October 31, 2013 |
| | |
| Investment Income ($): | | |
| Interest Income | 762,074 | |
| Expenses: | | |
| Management fee—Note 2(a) | 1,628,233 | |
| Distribution Plan fees (Investor Shares and Class B Shares)—Note 2(b) | 545,190 | |
| Shareholder servicing costs (Class B Shares)—Note 2(c) | 494,305 | |
| Directors’ fees—Note 2(a,c) | 23,343 | |
| Total Expenses | 2,691,071 | |
| Less—reduction in expenses due to undertaking—Note 2(a) | (1,905,766 | ) |
| Less—Directors’ fees reimbursed by the Manager—Note 2(a) | (23,343 | ) |
| Net Expenses | 761,962 | |
| Investment Income—Net | 112 | |
| Net Realized Gain (Loss) on Investments—Note 1(b) ($) | 32,445 | |
| Net Increase in Net Assets Resulting from Operations | 32,557 | |
| |
| See notes to financial statements. | | |
STATEMENT OF CHANGES IN NET ASSETS
| | | | |
| | Year Ended October 31, | |
| | 2013 | | 2012 | |
| Operations ($): | | | | |
| Investment income—net | 112 | | 122 | |
| Net realized gain (loss) on investments | 32,445 | | — | |
| Net Increase (Decrease) in Net Assets | | | | |
| Resulting from Operations | 32,557 | | 122 | |
| Dividends to Shareholders from ($): | | | | |
| Investment income—net: | | | | |
| Investor Shares | (9 | ) | (11 | ) |
| Class R Shares | (31 | ) | (23 | ) |
| Class B Shares | (72 | ) | (88 | ) |
| Total Dividends | (112 | ) | (122 | ) |
| Capital Stock Transactions ($1.00 per share): | | | | |
| Net proceeds from shares sold: | | | | |
| Investor Shares | 71,676,696 | | 61,905,787 | |
| Class R Shares | 216,681,901 | | 186,903,467 | |
| BASIC Shares | 16,447,341 | | 7,870,535 | |
| Class B Shares | 546,447,290 | | 660,520,233 | |
| Dividends reinvested: | | | | |
| Investor Shares | 9 | | 11 | |
| Class R Shares | 1 | | 1 | |
| Class B Shares | 72 | | 88 | |
| Cost of shares redeemed: | | | | |
| Investor Shares | (75,514,245 | ) | (65,044,223 | ) |
| Class R Shares | (238,638,274 | ) | (158,194,981 | ) |
| BASIC Shares | (15,745,839 | ) | (19,856,884 | ) |
| Class B Shares | (613,631,961 | ) | (640,695,187 | ) |
| Increase (Decrease) in Net Assets | | | | |
| from Capital Stock Transactions | (92,277,009 | ) | 33,408,847 | |
| Total Increase (Decrease) in Net Assets | (92,244,564 | ) | 33,408,847 | |
| Net Assets ($): | | | | |
| Beginning of Period | 367,691,204 | | 334,282,357 | |
| End of Period | 275,446,640 | | 367,691,204 | |
| |
| See notes to financial statements. | | | | |
22
FINANCIAL HIGHLIGHTS
The following tables describe the performance for each share class for the fiscal periods indicated. All information reflects financial results for a single fund share. Total return shows how much your investment in the fund would have increased (or decreased) during each period, assuming you had reinvested all dividends and distributions.These figures have been derived from the fund’s financial statements.
| | | | | | | | | | |
| | | | Year Ended October 31, | | | |
| Investor Shares | 2013 | | 2012 | | 2011 | | 2010 | | 2009 | |
| Per Share Data ($): | | | | | | | | | | |
| Net asset value, beginning of period | 1.00 | | 1.00 | | 1.00 | | 1.00 | | 1.00 | |
| Investment Operations: | | | | | | | | | | |
| Investment income—net | .000 | a | .000 | a | .000 | a | .000 | a | .006 | |
| Distributions: | | | | | | | | | | |
| Dividends from investment income—net | (.000 | )a | (.000 | )a | (.000 | )a | (.000 | )a | (.006 | ) |
| Net asset value, end of period | 1.00 | | 1.00 | | 1.00 | | 1.00 | | 1.00 | |
| Total Return (%) | .00 | b | .00 | b | .00 | b | .00 | b | .65 | |
| Ratios/Supplemental Data (%): | | | | | | | | | | |
| Ratio of total expenses | | | | | | | | | | |
| to average net assets | .71 | | .71 | | .71 | | .71 | | .73 | |
| Ratio of net expenses | | | | | | | | | | |
| to average net assets | .23 | | .28 | | .38 | | .45 | | .71 | |
| Ratio of net investment income | | | | | | | | | | |
| to average net assets | .00 | b | .00 | b | .00 | b | .00 | b | .69 | |
| Net Assets, end of period ($ x 1,000) | 23,792 | | 27,625 | | 30,764 | | 40,202 | | 54,974 | |
| |
| a | Amount represents less than $.001 per share. |
| b | Amount represents less than .01%. |
See notes to financial statements.
FINANCIAL HIGHLIGHTS (continued)
| | | | | | | | | | |
| | | | Year Ended October 31, | | | |
| Class R Shares | 2013 | | 2012 | | 2011 | | 2010 | | 2009 | |
| Per Share Data ($): | | | | | | | | | | |
| Net asset value, beginning of period | 1.00 | | 1.00 | | 1.00 | | 1.00 | | 1.00 | |
| Investment Operations: | | | | | | | | | | |
| Investment income—net | .000 | a | .000 | a | .000 | a | .000 | a | .008 | |
| Distributions: | | | | | | | | | | |
| Dividends from investment income—net | (.000 | )a | (.000 | )a | (.000 | )a | (.000 | )a | (.008 | ) |
| Net asset value, end of period | 1.00 | | 1.00 | | 1.00 | | 1.00 | | 1.00 | |
| Total Return (%) | .00 | b | .00 | b | .00 | b | .01 | | .83 | |
| Ratios/Supplemental Data (%): | | | | | | | | | | |
| Ratio of total expenses | | | | | | | | | | |
| to average net assets | .51 | | .51 | | .51 | | .51 | | .53 | |
| Ratio of net expenses | | | | | | | | | | |
| to average net assets | .24 | | .29 | | .38 | | .45 | | .52 | |
| Ratio of net investment income | | | | | | | | | | |
| to average net assets | .00 | b | .00 | b | .00 | b | .01 | | .78 | |
| Net Assets, end of period ($ x 1,000) | 55,149 | | 77,098 | | 48,390 | | 97,824 | | 57,658 | |
| |
| a | Amount represents less than $.001 per share. |
| b | Amount represents less than .01%. |
See notes to financial statements.
24
| | | | | | | | | | |
| | | | Year Ended October 31, | | | |
| BASIC Shares | 2013 | | 2012 | | 2011 | | 2010 | | 2009 | |
| Per Share Data ($): | | | | | | | | | | |
| Net asset value, beginning of period | 1.00 | | 1.00 | | 1.00 | | 1.00 | | 1.00 | |
| Investment Operations: | | | | | | | | | | |
| Investment income—net | .000 | a | .000 | a | .000 | a | .000 | a | .008 | |
| Distributions: | | | | | | | | | | |
| Dividends from investment income—net | (.000 | )a | (.000 | )a | (.000 | )a | (.000 | )a | (.008 | ) |
| Net asset value, end of period | 1.00 | | 1.00 | | 1.00 | | 1.00 | | 1.00 | |
| Total Return (%) | .00 | b | .00 | b | .00 | b | .01 | | .83 | |
| Ratios/Supplemental Data (%): | | | | | | | | | | |
| Ratio of total expenses | | | | | | | | | | |
| to average net assets | .51 | | .51 | | .51 | | .51 | | .53 | |
| Ratio of net expenses | | | | | | | | | | |
| to average net assets | .23 | | .28 | | .38 | | .45 | | .52 | |
| Ratio of net investment income | | | | | | | | | | |
| to average net assets | .00 | b | .00 | b | .00 | b | .01 | | .72 | |
| Net Assets, end of period ($ x 1,000) | 14,720 | | 14,017 | | 26,003 | | 32,297 | | 50,418 | |
| |
| a | Amount represents less than $.001 per share. |
| b | Amount represents less than .01%. |
See notes to financial statements.
FINANCIAL HIGHLIGHTS (continued)
| | | | | | | | | | |
| | | | Year Ended October 31, | | | |
| Class B Shares | 2013 | | 2012 | | 2011 | | 2010 | | 2009 | |
| Per Share Data ($): | | | | | | | | | | |
| Net asset value, beginning of period | 1.00 | | 1.00 | | 1.00 | | 1.00 | | 1.00 | |
| Investment Operations: | | | | | | | | | | |
| Investment income—net | .000 | a | .000 | a | .000 | a | .000 | a | .004 | |
| Distributions: | | | | | | | | | | |
| Dividends from investment income—net | (.000 | )a | (.000 | )a | (.000 | )a | (.000 | )a | (.004 | ) |
| Net asset value, end of period | 1.00 | | 1.00 | | 1.00 | | 1.00 | | 1.00 | |
| Total Return (%) | .00 | b | .00 | b | .00 | b | .00 | b | .41 | |
| Ratios/Supplemental Data (%): | | | | | | | | | | |
| Ratio of total expenses | | | | | | | | | | |
| to average net assets | 1.01 | | 1.01 | | 1.01 | | 1.01 | | 1.03 | |
| Ratio of net expenses | | | | | | | | | | |
| to average net assets | .23 | | .29 | | .37 | | .45 | | .89 | |
| Ratio of net investment income | | | | | | | | | | |
| to average net assets | .00 | b | .00 | b | .00 | b | .00 | b | .29 | |
| Net Assets, end of period ($ x 1,000) | 181,787 | | 248,951 | | 229,126 | | 227,987 | | 296,029 | |
| |
| a | Amount represents less than $.001 per share. |
| b | Amount represents less than .01%. |
See notes to financial statements.
26
NOTES TO FINANCIAL STATEMENTS
NOTE 1—Significant Accounting Policies:
Dreyfus AMT-Free Municipal Reserves (the “fund”) is a separate diversified series of The Dreyfus/Laurel Funds, Inc. (the “Company”), which is registered under the Investment Company Act of 1940, as amended (the “Act”), as an open-end management investment company and operates as a series company currently offering eleven series including the fund.The fund’s investment objective is to seek a high level of current income, consistent with stability of principal, that is exempt from federal income tax.The Dreyfus Corporation (the “Manager” or “Dreyfus”), a wholly-owned subsidiary ofThe Bank of NewYork Mellon Corporation (“BNY Mellon”), serves as the fund’s investment adviser.
MBSC Securities Corporation (the “Distributor”), a wholly-owned subsidiary of the Manager, is the distributor of the fund’s shares, which are sold without a sales charge.The fund is authorized to issue 1 billion shares of $.001 par value Capital Stock in each of the following classes of shares: Investor, Class R, BASIC and Class B. Investor shares and Class B shares are offered primarily to clients of financial institutions that have entered into selling agreements with the Distributor, and bear Distribution Plan fee. Class B shares also bear a Shareholder Services Plan fee. BASIC shares are offered to any investor and bear no Distribution Plan or Shareholder Services Plan fees. Class R shares are sold primarily to bank trust departments and other financial service providers (including The Bank of New York Mellon, a subsidiary of BNY Mellon and an affiliate of Dreyfus, and its affiliates), acting on behalf of customers having a qualified trust or an investment account or relationship at such institution, and bear no Distribution or Shareholder Services Plan fees. Other differences between the classes include the services offered to and the expenses borne by each class, the allocation of certain transfer agency costs and voting rights. Income, expenses (other than expense attributable to a specific class), and realized and unrealized gains or losses on investments are allocated to each class of shares based on its relative net assets.
NOTES TO FINANCIAL STATEMENTS (continued)
It is the fund’s policy to maintain a continuous net asset value per share of $1.00; the fund has adopted certain investment, portfolio valuation and dividend and distribution policies to enable it to do so.There is no assurance, however, that the fund will be able to maintain a stable net asset value per share of $1.00.
The Company accounts separately for the assets, liabilities and operations of each series. Expenses directly attributable to each series are charged to that series’ operations; expenses which are applicable to all series are allocated among them on a pro rata basis.
The Financial Accounting Standards Board (“FASB”) Accounting Standards Codification is the exclusive reference of authoritative U.S. generally accepted accounting principles (“GAAP”) recognized by the FASB to be applied by nongovernmental entities. Rules and interpretive releases of the Securities and Exchange Commission (“SEC”) under authority of federal laws are also sources of authoritative GAAP for SEC registrants. The fund’s financial statements are prepared in accordance with GAAP, which may require the use of management estimates and assumptions.Actual results could differ from those estimates.
(a) Portfolio valuation: Investments in securities are valued at amortized cost in accordance with Rule 2a-7 under the Act. If amortized cost is determined not to approximate market value, the fair value of the portfolio securities will be determined by procedures established by and under the general supervision of the Company’s Board of Directors (the “Board”).
The fair value of a financial instrument is the amount that would be received to sell an asset or paid to transfer a liability in an orderly transaction between market participants at the measurement date (i.e., the exit price). GAAP establishes a fair value hierarchy that prioritizes the inputs of valuation techniques used to measure fair value.This hierarchy gives the highest priority to unadjusted quoted prices in active markets for identical assets or liabilities (Level 1 measurements) and the lowest priority to unobservable inputs (Level 3 measurements).
28
Additionally, GAAP provides guidance on determining whether the volume and activity in a market has decreased significantly and whether such a decrease in activity results in transactions that are not orderly. GAAP requires enhanced disclosures around valuation inputs and techniques used during annual and interim periods.
Various inputs are used in determining the value of the fund’s investments relating to fair value measurements.These inputs are summarized in the three broad levels listed below:
Level 1—unadjusted quoted prices in active markets for identical investments.
Level 2—other significant observable inputs (including quoted prices for similar investments, interest rates, prepayment speeds, credit risk, etc.).
Level 3—significant unobservable inputs (including the fund’s own assumptions in determining the fair value of investments).
The inputs or methodology used for valuing securities are not necessarily an indication of the risk associated with investing in those securities. For example, money market securities are valued using amortized cost, in accordance with rules under the Act. Generally, amortized cost approximates the current fair value of a security, but since the value is not obtained from a quoted price in an active market, such securities are reflected within Level 2 of the fair value hierarchy.
The following is a summary of the inputs used as of October 31, 2013 in valuing the fund’s investments:
| |
| | Short-Term |
| Valuation Inputs | Investments ($)† |
| Level 1—Unadjusted Quoted Prices | — |
| Level 2—Other Significant Observable Inputs | 277,796,219 |
| Level 3—Significant Unobservable Inputs | — |
| Total | 277,796,219 |
|
| † See Statement of Investments for additional detailed categorizations. |
NOTES TO FINANCIAL STATEMENTS (continued)
At October 31, 2013, there were no transfers between Level 1 and Level 2 of the fair value hierarchy.
(b) Securities transactions and investment income: Securities transactions are recorded on a trade date basis. Interest income, adjusted for accretion of discount and amortization of premium on investments, is earned from settlement date and is recognized on the accrual basis. Realized gains and losses from securities transactions are recorded on the identified cost basis. Cost of investments represents amortized cost.
(c) Dividends to shareholders: It is the policy of the fund to declare dividends daily from investment income-net. Such dividends are paid monthly. Dividends from net realized capital gains, if any, are normally declared and paid annually, but the fund may make distributions on a more frequent basis to comply with the distribution requirements of the Internal Revenue Code of 1986, as amended (the “Code”).To the extent that net realized capital gains can be offset by capital loss carryovers, it is the policy of the fund not to distribute such gains.
(d) Federal income taxes: It is the policy of the fund to continue to qualify as a regulated investment company, which can distribute tax-exempt dividends, by complying with the applicable provisions of the Code, and to make distributions of income and net realized capital gain sufficient to relieve it from substantially all federal income and excise taxes.
As of and during the period ended October 31, 2013, the fund did not have any liabilities for any uncertain tax positions.The fund recognizes interest and penalties, if any, related to uncertain tax positions as income tax expense in the Statement of Operations. During the period ended October 31, 2013, the fund did not incur any interest or penalties.
Each tax year in the four-year period ended October 31, 2013 remains subject to examination by the Internal Revenue Service and state taxing authorities.
30
At October 31, 2013, the components of accumulated earnings on a tax basis were substantially the same as for financial reporting purposes.
The tax character of distributions paid to shareholders during the fiscal periods ended October 31, 2013 and October 31, 2012 were all tax-exempt income.
At October 31, 2013, the cost of investments for federal income tax purposes was substantially the same as the cost for financial reporting purposes (see the Statement of Investments).
NOTE 2—Investment Management Fee and Other Transactions With Affiliates:
(a) Pursuant to an investment management agreement with the Manager, the Manager provides or arranges for one or more third parties and/or affiliates to provide investment advisory, administrative, custody, fund accounting and transfer agency services to the fund.The Manager also directs the investments of the fund in accordance with its investment objective, policies and limitations. For these services, the fund is contractually obligated to pay the Manager a fee, calculated daily and paid monthly, at an annual rate of .50% of the value of the fund’s average daily net assets. Out of its fee, the Manager pays all of the expenses of the fund except brokerage fees, taxes, Distribution Plan fees, Shareholder Services Plan fees and expenses, fees and expenses of non-interested Directors (including counsel fees) and extraordinary expenses. In addition, the Manager is required to reduce its fee in an amount equal to the fund’s allocable portion of fees and expenses of the non-interested Directors (including counsel fees). During the period ended October 31, 2013, fees reimbursed by the Manager amounted to $23,343.
The Manager has undertaken to waive receipt of the management fee and/or reimburse operating expenses in order to facilitate a daily yield at or above a certain level which may change from time to time.This
NOTES TO FINANCIAL STATEMENTS (continued)
undertaking is voluntary and not contractual, and may be terminated at any time. The reduction in expenses, pursuant to the undertaking, amounted to $118,706 for Investor shares, $233,137 for Class R shares, $38,213 for BASIC shares and $1,515,710 for Class B shares during the period ended October 31, 2013.
(b) Under the Distribution Plan adopted pursuant to Rule 12b-1 under the Act, Investor shares and Class B shares may pay annually up to .25% of the value of their average daily net assets (Investor shares are currently limited by the Board to .20%) attributable to Investor shares and Class B shares to compensate the Distributor for shareholder servicing activities and activities primarily intended to result in the sale of Investor shares and Class B shares. During the period ended October 31, 2013, Investor shares and Class B shares were charged $50,884 and $494,306, respectively, pursuant to the Distribution Plan.
(c) Under the Shareholder Services Plan subject to Rule 12b-1 under the Act, pursuant to which the fund pays the Distributor for the provision of certain services to the holders of its Class B shares a fee at an annual rate of .25% of the value of the fund’s average daily net assets attributable to Class B shares. The services provided may include personal services relating to shareholder accounts, such as answering shareholder inquiries regarding the fund and providing reports and other information, and services related to the maintenance of such shareholder accounts. Under the Shareholder Services Plan, the Distributor may enter into Shareholder Services Agreements (the “Agreements”) with Service Agents and make payments to Service Agents with respect to these services. During the period ended October 31, 2013, Class B shares were charged $494,305, pursuant to the Shareholder Services Plan.
The Company and the Distributor may suspend or reduce payments under the Shareholder Services Plan at any time, and payments are subject to the continuation of the Shareholder Services Plan and the Agreements described above. From time to time, the Service Agents, the Distributor and the Company may agree to voluntarily reduce the maximum fees payable under the Shareholder Services Plan.
32
Under its terms, the Distribution Plan and Shareholder Services Plan shall remain in effect from year to year, provided such continuance is approved annually by a vote of a majority of those Directors who are not “interested persons” of the Company and who have no direct or indirect financial interest in the operation of or in any agreement related to the Distribution Plan and Shareholder Services Plan.
The components of “Due to The Dreyfus Corporation and affiliates” in the Statement of Assets and Liabilities consist of: management fees $116,585, Distribution Plan fees $42,140 and Shareholder Services Plan fees $38,152, which are offset against an expense reimbursement currently in effect in the amount of $153,681.
(d) Each Board member also serves as a Board member of other funds within the Dreyfus complex. Annual retainer fees and attendance fees are allocated to each fund based on net assets.
NOTE 3—Securities Transactions:
The fund is permitted to purchase or sell securities from or to certain affiliated funds under specified conditions outlined in procedures adopted by the Board. The procedures have been designed to ensure that any purchase or sale of securities by the fund from or to another fund or portfolio that are, or could be, considered an affiliate by virtue of having a common investment adviser (or affiliated investment adviser), common Directors and/or common officers, complies with Rule 17a-7 under the Act. During the period ended October 31, 2013, the fund engaged in purchases and sales of securities pursuant to Rule 17a-7 under the Act amounting to $101,595,000 and $141,120,000, respectively.
|
| REPORT OF INDEPENDENT REGISTERED |
| PUBLIC ACCOUNTING FIRM |
The Board of Directors and Shareholders The Dreyfus/Laurel Funds, Inc.
We have audited the accompanying statement of assets and liabilities of Dreyfus AMT-Free Municipal Reserves (the “Fund”), a series of The Dreyfus/Laurel Funds, Inc., including the statement of investments, as of October 31, 2013, the related statement of operations for the year then ended, the statements of changes in net assets for each of the years in the two-year period then ended, and the financial highlights for each of the years in the five-year period then ended.These financial statements and financial highlights are the responsibility of the Fund’s management. Our responsibility is to express an opinion on these financial statements and financial highlights based on our audits.
We conducted our audits in accordance with the standards of the Public Company Accounting Oversight Board (United States).Those standards require that we plan and perform the audit to obtain reasonable assurance about whether the financial statements and financial highlights are free of material misstatement. An audit includes examining, on a test basis, evidence supporting the amounts and disclosures in the financial statements. Our procedures included confirmation of securities owned as of October 31, 2013, by correspondence with the custodian and brokers or by other appropriate auditing procedures.An audit also includes assessing the accounting principles used and significant estimates made by management, as well as evaluating the overall financial statement presentation. We believe that our audits provide a reasonable basis for our opinion.
In our opinion, the financial statements and financial highlights referred to above present fairly, in all material respects, the financial position of Dreyfus AMT-Free Municipal Reserves as of October 31, 2013, the results of its operations for the year then ended, the changes in its net assets for each of the years in the two-year period then ended, and the financial highlights for each of the years in the five-year period then ended, in conformity with U.S. generally accepted accounting principles.

New York, New York
December 30, 2013
34
IMPORTANT TAX INFORMATION (Unaudited)
In accordance with federal tax law, the fund hereby reports all the dividends paid from investment income-net during its fiscal year ended October 31, 2013 as “exempt-interest dividends” (not generally subject to regular federal income tax).Where required by federal tax law rules, shareholders will receive notification of their portion of the fund’s tax-exempt dividends paid for the 2013 calendar year on Form 1099-DIV, which will be mailed in early 2014.
BOARD MEMBERS INFORMATION (Unaudited)
|
| Joseph S. DiMartino (70) |
| Chairman of the Board (1999) |
| Principal Occupation During Past 5Years: |
| • Corporate Director and Trustee |
| Other Public Company Board Memberships During Past 5Years: |
| • CBIZ (formerly, Century Business Services, Inc.), a provider of outsourcing functions for small |
| and medium size companies, Director (1997-present) |
| • The Newark Group, a provider of a national market of paper recovery facilities, paperboard |
| mills and paperboard converting plants, Director (2000-2010) |
| • Sunair Services Corporation, a provider of certain outdoor-related services to homes and |
| businesses, Director (2005-2009) |
| No. of Portfolios for which Board Member Serves: 141 |
| ——————— |
| Francine J. Bovich (62) |
| Board Member (2012) |
| Principal Occupation During Past 5Years: |
| • Trustee,The Bradley Trusts, private trust funds (2011-present) |
| • Managing Director, Morgan Stanley Investment Management (1993-2010) |
| No. of Portfolios for which Board Member Serves: 40 |
| ——————— |
| James M. Fitzgibbons (79) |
| Board Member (1994) |
| Principal Occupation During Past 5Years: |
| • Corporate Director and Trustee |
| Other Public Company Board Memberships During Past 5Years: |
| • Bill Barrett Corporation, an oil and natural gas exploration company, Director (2004-2012) |
| No. of Portfolios for which Board Member Serves: 26 |
| ——————— |
| Kenneth A. Himmel (67) |
| Board Member (1994) |
| Principal Occupation During Past 5Years: |
| • President and CEO, Related Urban Development, a real estate development company (1996-present) |
| • President and CEO, Himmel & Company, a real estate development company (1980-present) |
| • CEO,American Food Management, a restaurant company (1983-present) |
| No. of Portfolios for which Board Member Serves: 26 |
36
|
| Stephen J. Lockwood (66) |
| Board Member (1994) |
| Principal Occupation During Past 5Years: |
| • Chairman of the Board, Stephen J. Lockwood and Company LLC, a real estate investment |
| company (2000-present) |
| No. of Portfolios for which Board Member Serves: 26 |
| ——————— |
| Roslyn M. Watson (64) |
| Board Member (1994) |
| Principal Occupation During Past 5Years: |
| • Principal,Watson Ventures, Inc., a real estate investment company (1993-present) |
| No. of Portfolios for which Board Member Serves: 36 |
| ——————— |
| Benaree Pratt Wiley (67) |
| Board Member (1998) |
| Principal Occupation During Past 5Years: |
| • Principal,TheWiley Group, a firm specializing in strategy and business development (2005-present) |
| Other Public Company Board Memberships During Past 5Years: |
| • CBIZ (formerly, Century Business Services, Inc.), a provider of outsourcing functions for small |
| and medium size companies, Director (2008-present) |
| No. of Portfolios for which Board Member Serves: 61 |
| ——————— |
Once elected all Board Members serve for an indefinite term, but achieve Emeritus status upon reaching age 80.The address of the Board Members and Officers is c/o The Dreyfus Corporation, 200 Park Avenue, NewYork, NewYork 10166. Additional information about the Board Members is available in the fund’s Statement of Additional Information which can be obtained from Dreyfus free of charge by calling this toll free number: 1-800-DREYFUS.
|
| J.Tomlinson Fort, Emeritus Board Member |
OFFICERS OF THE FUND (Unaudited)
BRADLEY J. SKAPYAK, President since January 2010.
Chief Operating Officer and a director of the Manager since June 2009, Chairman of Dreyfus Transfer, Inc., an affiliate of the Manager and the transfer agent of the funds, since May 2011 and Executive Vice President of the Distributor since June 2007. From April 2003 to June 2009, Mr. Skapyak was the head of the Investment Accounting and Support Department of the Manager. He is an officer of 68 investment companies (comprised of 141 portfolios) managed by the Manager. He is 55 years old and has been an employee of the Manager since February 1988.
JOHN PAK, Chief Legal Officer since March 2013.
Chief Legal Officer of the Manager and Associate General Counsel and Managing Director of BNY Mellon since August 2012; from March 2005 to July 2012, Managing Director of Deutsche Bank, Deputy Global Head of Deutsche Asset Management Legal and Regional Head of Deutsche Asset Management Americas Legal. He is an officer of 69 investment companies (comprised of 166 portfolios) managed by the Manager. He is 45 years old and has been an employee of the Manager since August 2012.
JANETTE E. FARRAGHER, Vice President and Secretary since December 2011.
Assistant General Counsel of BNY Mellon, and an officer of 69 investment companies (comprised of 166 portfolios) managed by the Manager. She is 50 years old and has been an employee of the Manager since February 1984.
KIESHA ASTWOOD, Vice President and Assistant Secretary since January 2010.
Counsel of BNY Mellon, and an officer of 69 investment companies (comprised of 166 portfolios) managed by the Manager. She is 40 years old and has been an employee of the Manager since July 1995.
JAMES BITETTO, Vice President and Assistant Secretary since August 2005.
Senior Counsel of BNY Mellon and Secretary of the Manager, and an officer of 69 investment companies (comprised of 166 portfolios) managed by the Manager. He is 47 years old and has been an employee of the Manager since December 1996.
JONI LACKS CHARATAN, Vice President and Assistant Secretary since August 2005.
Senior Counsel of BNY Mellon, and an officer of 69 investment companies (comprised of 166 portfolios) managed by the Manager. She is 58 years old and has been an employee of the Manager since October 1988.
JOSEPH M. CHIOFFI, Vice President and Assistant Secretary since August 2005.
Senior Counsel of BNY Mellon, and an officer of 69 investment companies (comprised of 166 portfolios) managed by the Manager. He is 52 years old and has been an employee of the Manager since June 2000.
JOHN B. HAMMALIAN, Vice President and Assistant Secretary since August 2005.
Senior Managing Counsel of BNY Mellon, and an officer of 69 investment companies (comprised of 166 portfolios) managed by the Manager. He is 50 years old and has been an employee of the Manager since February 1991.
ROBERT R. MULLERY, Vice President and Assistant Secretary since August 2005.
Managing Counsel of BNY Mellon, and an officer of 69 investment companies (comprised of 166 portfolios) managed by the Manager. He is 61 years old and has been an employee of the Manager since May 1986.
38
JEFF PRUSNOFSKY, Vice President and Assistant Secretary since August 2005.
Senior Managing Counsel of BNY Mellon, and an officer of 69 investment companies (comprised of 166 portfolios) managed by the Manager. He is 48 years old and has been an employee of the Manager since October 1990.
JAMES WINDELS, Treasurer since November 2001.
Director – Mutual Fund Accounting of the Manager, and an officer of 69 investment companies (comprised of 166 portfolios) managed by the Manager. He is 55 years old and has been an employee of the Manager since April 1985.
RICHARD CASSARO, Assistant Treasurer since January 2008.
Senior Accounting Manager – Money Market and Municipal Bond Funds of the Manager, and an officer of 69 investment companies (comprised of 166 portfolios) managed by the Manager. He is 54 years old and has been an employee of the Manager since September 1982.
GAVIN C. REILLY, Assistant Treasurer since December 2005.
Tax Manager of the Investment Accounting and Support Department of the Manager, and an officer of 69 investment companies (comprised of 166 portfolios) managed by the Manager. He is 45 years old and has been an employee of the Manager since April 1991.
ROBERT S. ROBOL, Assistant Treasurer since December 2002.
Senior Accounting Manager – Fixed Income Funds of the Manager, and an officer of 69 investment companies (comprised of 166 portfolios) managed by the Manager. He is 49 years old and has been an employee of the Manager since October 1988.
ROBERT SALVIOLO, Assistant Treasurer since July 2007.
Senior Accounting Manager – Equity Funds of the Manager, and an officer of 69 investment companies (comprised of 166 portfolios) managed by the Manager. He is 46 years old and has been an employee of the Manager since June 1989.
ROBERT SVAGNA, Assistant Treasurer since December 2002.
Senior Accounting Manager – Equity Funds of the Manager, and an officer of 69 investment companies (comprised of 166 portfolios) managed by the Manager. He is 46 years old and has been an employee of the Manager since November 1990.
JOSEPH W. CONNOLLY, Chief Compliance Officer since October 2004.
Chief Compliance Officer of the Manager and The Dreyfus Family of Funds (69 investment companies, comprised of 166 portfolios). He is 56 years old and has served in various capacities with the Manager since 1980, including manager of the firm’s Fund Accounting Department from 1997 through October 2001.
MATTHEW D. CONNOLLY, Anti-Money Laundering Compliance Officer since April 2012.
Anti-Money Laundering Compliance Officer of the Distributor since October 2011; from March 2010 to September 2011, Global Head, KYC Reviews and Director, UBS Investment Bank; until March 2010, AML Compliance Officer and Senior Vice President, Citi Global Wealth Management. He is an officer of 64 investment companies (comprised of 161 portfolios) managed by the Manager. He is 41 years old and has been an employee of the Distributor since October 2011.
For More Information
Telephone 1-800-DREYFUS
Mail The Dreyfus Family of Funds, 144 Glenn Curtiss Boulevard, Uniondale, NY 11556-0144 E-mail Send your request to info@dreyfus.com Internet Information can be viewed online or downloaded at: http://www.dreyfus.com
The fund will disclose daily, on www.dreyfus.com, the fund’s complete schedule of holdings as of the end of the previous business day. The schedule of holdings will remain on the website until the fund files its Form N-Q or Form N-CSR for the period that includes the date of the posted holdings.
The fund files its complete schedule of portfolio holdings with the Securities and Exchange Commission (“SEC”) for the first and third quarters of each fiscal year on Form N-Q. The fund’s Forms N-Q are available on the SEC’s website at http://www.sec.gov and may be reviewed and copied at the SEC’s Public Reference Room in Washington, DC. Information on the operation of the Public Reference Room may be obtained by calling 1-800-SEC-0330.
Information regarding how the fund voted proxies relating to portfolio securities for the most recent 12-month period ended June 30 is available on the SEC’s website at http://www.sec.gov and without charge, upon request, by calling 1-800-DREYFUS.

| |
| Dreyfus |
| Tax Managed |
| Growth Fund |
ANNUAL REPORT October 31, 2013

Save time. Save paper. View your next shareholder report online as soon as it’s available. Log into www.dreyfus.com and sign up for Dreyfus eCommunications. It’s simple and only takes a few minutes.
The views expressed in this report reflect those of the portfolio manager only through the end of the period covered and do not necessarily represent the views of Dreyfus or any other person in the Dreyfus organization. Any such views are subject to change at any time based upon market or other conditions and Dreyfus disclaims any responsibility to update such views.These views may not be relied on as investment advice and, because investment decisions for a Dreyfus fund are based on numerous factors, may not be relied on as an indication of trading intent on behalf of any Dreyfus fund.
| |
| Not FDIC-Insured • Not Bank-Guaranteed • May Lose Value |
| | Contents |
| | THE FUND |
| 2 | A Letter from the President |
| 3 | Discussion of Fund Performance |
| 6 | Fund Performance |
| 8 | Understanding Your Fund’s Expenses |
| 8 | Comparing Your Fund’s Expenses With Those of Other Funds |
| 9 | Statement of Investments |
| 13 | Statement of Assets and Liabilities |
| 14 | Statement of Operations |
| 15 | Statement of Changes in Net Assets |
| 17 | Financial Highlights |
| 20 | Notes to Financial Statements |
| 30 | Report of Independent Registered Public Accounting Firm |
| 31 | Important Tax Information |
| 32 | Board Members Information |
| 34 | Officers of the Fund |
| | FOR MORE INFORMATION |
| | Back Cover |
Dreyfus
Tax Managed
Growth Fund
The Fund
A LETTER FROM THE PRESIDENT
Dear Shareholder:
We are pleased to present this annual report for Dreyfus Tax Managed Growth Fund, covering the 12-month period from November 1, 2012, through October 31, 2013. For information about how the fund performed during the reporting period, as well as general market perspectives, we provide a Discussion of Fund Performance on the pages that follow.
Although expectations of higher long-term interest rates and a more moderately stimulative monetary policy sparked volatility in the U.S stock market at times during the reporting period, improved U.S. economic conditions drove stock prices substantially higher for the reporting period overall. Even the 16-day U.S. government shutdown in October failed to derail the market’s advance, enabling some broad measures of stock market performance to reach new record highs by the end of the month. Stocks across most capitalization ranges and investment styles produced strong results.
We currently expect U.S. economic conditions to continue to improve in 2014, with accelerating growth supported by the fading drags of tighter federal fiscal policies and downsizing on the state and local levels. Moreover, inflation is likely to remain muted, so monetary policy can remain stimulative. Globally, we anticipate stronger growth in many developed countries due to past and continuing monetary ease, while emerging markets seem poised for moderate economic expansion despite recently negative investor sentiment. For more information on how these observations may affect your investments, we encourage you to speak with your financial advisor.
Thank you for your continued confidence and support.

J. Charles Cardona
President
The Dreyfus Corporation
November 15, 2013
2
DISCUSSION OF FUND PERFORMANCE
For the reporting period of November 1, 2012, through October 31, 2013, as provided by Fayez Sarofim, Portfolio Manager of Fayez Sarofim & Co., Sub-Investment Adviser
Fund and Market Performance Overview
For the 12-month period ended October 31, 2013, Dreyfus Tax Managed Growth Fund’s Class A shares produced a total return of 14.91%, Class C shares returned 14.11%, and Class I shares returned 15.21%.1 In comparison, the Standard & Poor’s 500 Composite Stock Price Index (“S&P 500 Index”), the fund’s benchmark, returned 27.16% for the same period.2
Equities responded positively to a recovering global economy.While the fund produced double-digit returns, its performance underperformed the benchmark as the higher quality stocks on which the fund focuses fell out of favor among investors.
The Fund’s Investment Approach
The fund invests primarily in well-established, multinational companies that we believe are well positioned to weather difficult economic climates and thrive during favorable times. We focus on purchasing large-cap, blue-chip stocks at a price we consider to be justified by a company’s fundamentals. The result is a portfolio of stocks selected for what we consider to be sustained patterns of profitability, strong balance sheets, expanding global presence and above-average earnings growth potential.At the same time, we manage the fund in a manner cognizant of the concerns of tax-conscious investors. We typically buy and sell relatively few stocks during the course of the year, which may help reduce investors’ tax liabilities.
Recovering Economy Fueled Market Gains
The reporting period began soon after the start of a sustained stock market rally driven by improved U.S. employment and housing markets. Investors were particularly encouraged by a new round of quantitative easing from the Federal Reserve Board (the “Fed”). Improving conditions in overseas markets also contributed to greater investor optimism.
DISCUSSION OF FUND PERFORMANCE (continued)
Economic data continued to improve, and stocks generally continued to rally, through the spring of 2013. However, in late May, remarks by Fed chairman Ben Bernanke were widely interpreted as a signal that U.S. monetary policymakers would back away from their quantitative easing program sooner than expected, sparking volatility that erased some of the market’s previous gains. Equity markets generally stabilized over the summer, and stocks advanced strongly in September when the Fed refrained from tapering its bond purchasing program. Even a 16-day federal government shutdown in October failed to derail the rally, enabling the S&P 500 Index to reach record highs by the reporting period’s end.
Focus on Quality Dampened Relative Results
The fund’s emphasis on high-quality, globally dominant companies undermined relative performance during the reporting period when smaller, riskier companies fared better. In addition, economically sensitive companies led the market’s advance, but the fund focused on companies whose earnings tend to be less sensitive to economic conditions. This strategic positioning led to overweighted exposure to the lagging consumer staples sector which was penalized by weak global economic conditions.An overweighted position in the energy sector, particularly large integrated oil producers, also hurt results. For example, Norway’s Statoil, ADR suffered from limited access to new reserves of shale oil and gas. Other weak performers included metals-and-mining companies Freeport-McMoRan Copper & Gold and Rio Tinto ADR, which struggled with sluggish demand in the emerging markets. In the information technology sector, consumer electronics giant Apple suffered earnings shortfalls amid intensifying competitive pressures, and International Business Machines reported disappointing results in its software and services segments.
The fund achieved better results from its stock selections in the financials sector, led by robust gains in wealth management company BlackRock. However, the positive impact of our stock selections was undercut by underweighted exposure to the financials sector. Conversely, the fund benefited from lack of exposure to the telecommunications services and utilities sectors, which ranked as the weakest segments of the S&P 500 Index. Top performers in the health care sector included pharmaceutical developers Johnson & Johnson, Roche Holding ADR, and AbbVie,
4
which rebounded from previously depressed levels due to attractive valuations and improved research-and-development efforts. Among consumer staples companies, pharmacy chain Walgreen resolved a dispute with a major pharmacy benefits provider and reported progress in its global expansion.
We made a number of changes to the fund’s portfolio over the reporting period, eliminating three holdings that failed to meet our expectations and adding seven new positions in companies that we believe are poised for growth.
A Constructive Outlook for Multinationals
Despite some persistent headwinds, most regions of the world have exhibited encouraging signs of renewed economic strength. A firming world economy would provide welcome support for corporate profits in 2014 and could be a catalyst for higher stock prices. In our analysis, the industry-leading multinationals in which the fund invests are well positioned for a stronger world backdrop. With their solid balance sheets and strong, recurring cash flows, multinational companies have ample financial resources to fund growth while returning cash to shareholders.Therefore, we have maintained the fund’s emphasis on large companies with a robust international presence, low debt levels, and dominant brands.
November 15, 2013
Please note, the position in any security highlighted with italicized typeface was sold during the reporting period. Equity funds are subject generally to market, market sector, market liquidity, issuer, and investment style risks, among other factors, to varying degrees, all of which are more fully described in the fund’s prospectus.
| |
| 1 Total return includes reinvestment of dividends and any capital gains paid, and does not take into consideration the |
| maximum initial sales charge in the case of Class A shares, or the applicable contingent deferred sales charge imposed |
| on redemptions in the case of Class C shares. Had these charges been reflected, returns would have been lower. Past |
| performance is no guarantee of future results. Share price and investment return fluctuate such that upon redemption, |
| fund shares may be worth more or less than their original cost. |
| 2 SOURCE: LIPPER INC. – Reflects monthly reinvestment of dividends and, where applicable, capital gain |
| distributions.The Standard & Poor’s 500 Composite Stock Price Index is a widely accepted, unmanaged index of |
| U.S. stock market performance. Investors cannot invest directly in any index. |
FUND PERFORMANCE
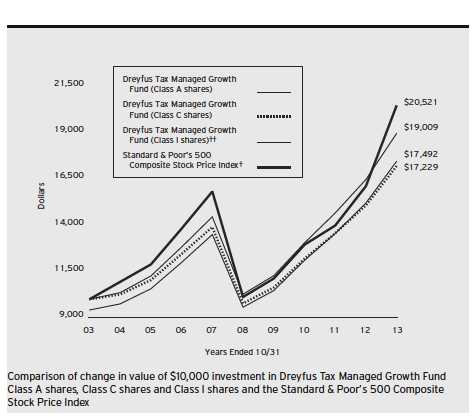
| | |
| † | Source: Lipper Inc. |
| †† | The total return figures presented for Class I shares of the fund reflect the performance of the fund’s Class A shares |
| | for the period prior to May 14, 2004 (the inception date for Class I shares). |
| Past performance is not predictive of future performance. |
| The above graph compares a $10,000 investment made in each of the Class A, Class C and Class I shares of Dreyfus |
| Tax Managed Growth Fund on 10/31/03 to a $10,000 investment made in the Standard & Poor’s 500 Composite |
| Stock Price Index (the “Index”) on that date.All dividends and capital gain distributions are reinvested. |
| The fund’s performance shown in the line graph above takes into account the maximum initial sales charge on Class A |
| shares and all other applicable fees and expenses on all classes.The Index is a widely accepted, unmanaged index of U.S. |
| stock market performance. Unlike a mutual fund, the Index is not subject to charges, fees and other expenses. Investors |
| cannot invest directly in any index. Further information relating to fund performance, including expense reimbursements, |
| if applicable, is contained in the Financial Highlights section of the prospectus and elsewhere in this report. |
6
| | | | | | | | |
| Average Annual Total Returns as of 10/31/13 | | | | | | |
| |
| | Inception | | | | | | |
| | Date | 1 Year | | 5 Years | | 10 Years | |
| Class A shares | | | | | | | |
| with maximum sales charge (5.75%) | 11/4/97 | 8.29 | % | 11.48 | % | 5.75 | % |
| without sales charge | 11/4/97 | 14.91 | % | 12.82 | % | 6.38 | % |
| Class C shares | | | | | | | |
| with applicable redemption charge † | 11/4/97 | 13.11 | % | 11.98 | % | 5.59 | % |
| without redemption | 11/4/97 | 14.11 | % | 11.98 | % | 5.59 | % |
| Class I shares | 5/14/04 | 15.21 | % | 13.09 | % | 6.63 | %†† |
| Standard & Poor’s 500 | | | | | | | |
| Composite Stock Price Index | | 27.16 | % | 15.16 | % | 7.45 | % |
Past performance is not predictive of future performance.The fund’s performance shown in the graph and table does not reflect the deduction of taxes that a shareholder would pay on fund distributions or the redemption of fund shares.
| | |
| † | The maximum contingent deferred sales charge for Class C shares is 1% for shares redeemed within one year of the |
| | date of purchase. |
| †† | The total return performance figures presented for Class I shares of the fund reflect the performance of the fund’s |
| | Class A shares for the period prior to May 14, 2004 (the inception date for Class I shares). |
UNDERSTANDING YOUR FUND’S EXPENSES (Unaudited)
As a mutual fund investor, you pay ongoing expenses, such as management fees and other expenses. Using the information below, you can estimate how these expenses affect your investment and compare them with the expenses of other funds.You also may pay one-time transaction expenses, including sales charges (loads) and redemption fees, which are not shown in this section and would have resulted in higher total expenses. For more information, see your fund’s prospectus or talk to your financial adviser.
Review your fund’s expenses
The table below shows the expenses you would have paid on a $1,000 investment in Dreyfus Tax Managed Growth Fund from May 1, 2013 to October 31, 2013. It also shows how much a $1,000 investment would be worth at the close of the period, assuming actual returns and expenses.
Expenses and Value of a $1,000 Investment
assuming actual returns for the six months ended October 31, 2013
| | | | | | | |
| | | Class A | | Class C | | Class I |
| Expenses paid per $1,000† | $ | 6.98 | $ | 10.84 | $ | 5.70 |
| Ending value (after expenses) | $ | 1,052.60 | $ | 1,048.80 | $ | 1,054.20 |
COMPARING YOUR FUND’S EXPENSES
WITH THOSE OF OTHER FUNDS (Unaudited)
Using the SEC’s method to compare expenses
The Securities and Exchange Commission (SEC) has established guidelines to help investors assess fund expenses. Per these guidelines, the table below shows your fund’s expenses based on a $1,000 investment, assuming a hypothetical 5% annualized return. You can use this information to compare the ongoing expenses (but not transaction expenses or total cost) of investing in the fund with those of other funds.All mutual fund shareholder reports will provide this information to help you make this comparison. Please note that you cannot use this information to estimate your actual ending account balance and expenses paid during the period.
Expenses and Value of a $1,000 Investment
assuming a hypothetical 5% annualized return for the six months ended October 31, 2013
| | | | | | | |
| | | Class A | | Class C | | Class I |
| Expenses paid per $1,000† | $ | 6.87 | $ | 10.66 | $ | 5.60 |
| Ending value (after expenses) | $ | 1,018.40 | $ | 1,014.62 | $ | 1,019.66 |
| |
| † Expenses are equal to the fund’s annualized expense ratio of 1.35% for Class A, 2.10% for Class C and 1.10% |
| for Class I, multiplied by the average account value over the period, multiplied by 184/365 (to reflect the one-half |
| year period). |
8
| |
| STATEMENT OF INVESTMENTS |
| October 31, 2013 |
| | | | |
| Common Stocks—104.8% | Shares | | Value ($) |
| Banks—1.0% | | | |
| Wells Fargo & Co. | 45,000 | | 1,921,050 |
| Capital Goods—4.0% | | | |
| Caterpillar | 25,000 | | 2,084,000 |
| General Electric | 98,000 | | 2,561,720 |
| United Technologies | 30,000 | | 3,187,500 |
| | | | 7,833,220 |
| Consumer Services—3.1% | | | |
| McDonald’s | 63,000 | | 6,080,760 |
| Diversified Financials—6.8% | | | |
| American Express | 25,000 | | 2,045,000 |
| BlackRock | 11,000 | | 3,308,910 |
| Franklin Resources | 62,000 | | 3,339,320 |
| JPMorgan Chase & Co. | 90,000 | | 4,638,600 |
| | | | 13,331,830 |
| Energy—18.2% | | | |
| Chevron | 65,000 | | 7,797,400 |
| ConocoPhillips | 40,000 | | 2,932,000 |
| EOG Resources | 7,000 | | 1,248,800 |
| Exxon Mobil | 107,512 | | 9,635,225 |
| Imperial Oil | 50,000 | | 2,182,500 |
| Occidental Petroleum | 60,000 | | 5,764,800 |
| Royal Dutch Shell, Cl. A, ADR | 50,500 | | 3,366,330 |
| Total, ADR | 41,000 | a | 2,508,380 |
| | | | 35,435,435 |
| Food & Staples Retailing—2.8% | | | |
| Walgreen | 50,000 | | 2,962,000 |
| Whole Foods Market | 38,000 | | 2,398,940 |
| | | | 5,360,940 |
| Food, Beverage & Tobacco—22.3% | | | |
| Altria Group | 115,000 | | 4,281,450 |
| Coca-Cola | 238,000 | | 9,417,660 |
| Diageo, ADR | 18,000 | | 2,296,620 |
| Kraft Foods Group | 23,423 | | 1,273,743 |
| Mondelez International, Cl. A | 72,271 | | 2,431,196 |
| Nestle, ADR | 78,750 | | 5,702,288 |
STATEMENT OF INVESTMENTS (continued)
| | | |
| Common Stocks (continued) | Shares | Value ($) |
| Food, Beverage & Tobacco (continued) | | |
| PepsiCo | 42,500 | 3,573,825 |
| Philip Morris International | 129,000 | 11,496,480 |
| SABMiller | 60,000 | 3,130,502 |
| | | 43,603,764 |
| Health Care Equipment & | | |
| Services—1.4% | | |
| Abbott Laboratories | 75,000 | 2,741,250 |
| Household & Personal Products—4.7% | | |
| Estee Lauder, Cl. A | 47,000 | 3,335,120 |
| Procter & Gamble | 73,000 | 5,894,750 |
| | | 9,229,870 |
| Insurance—.5% | | |
| ACE | 11,000 | 1,049,840 |
| Materials—3.5% | | |
| Air Products & Chemicals | 18,000 | 1,962,180 |
| Freeport-McMoRan Copper & Gold | 65,000 | 2,389,400 |
| Praxair | 20,500 | 2,556,555 |
| | | 6,908,135 |
| Media—4.6% | | |
| Comcast, Cl. A | 50,000 | 2,379,000 |
| News Corp., Cl. A | 9,500 | 167,200 |
| Time Warner Cable | 20,000 | 2,403,000 |
| Twenty-First Century Fox, Cl. A | 38,000 | 1,295,040 |
| Walt Disney | 40,000 | 2,743,600 |
| | | 8,987,840 |
| Pharmaceuticals, Biotech & | | |
| Life Sciences—10.8% | | |
| AbbVie | 75,000 | 3,633,750 |
| Johnson & Johnson | 70,000 | 6,482,700 |
| Merck & Co. | 18,000 | 811,620 |
| Novartis, ADR | 30,000 | 2,326,500 |
| Novo Nordisk, ADR | 20,000 | 3,333,400 |
10
| | | | |
| Common Stocks (continued) | Shares | | Value ($) |
| Pharmaceuticals, Biotech & | | | |
| Life Sciences (continued) | | | |
| Roche Holding, ADR | 65,000 | | 4,507,100 |
| | | | 21,095,070 |
| Retailing—3.7% | | | |
| Target | 59,000 | | 3,822,610 |
| Wal-Mart Stores | 45,000 | | 3,453,750 |
| | | | 7,276,360 |
| Semiconductors & Semiconductor | | | |
| Equipment—4.1% | | | |
| Intel | 160,000 | | 3,908,800 |
| Texas Instruments | 78,000 | | 3,282,240 |
| Xilinx | 18,000 | | 817,560 |
| | | | 8,008,600 |
| Software & Services—5.2% | | | |
| Automatic Data Processing | 35,000 | | 2,623,950 |
| International Business Machines | 30,000 | | 5,376,300 |
| Oracle | 65,000 | | 2,177,500 |
| | | | 10,177,750 |
| Technology Hardware & Equipment—6.6% | | | |
| Apple | 19,200 | | 10,029,120 |
| QUALCOMM | 39,500 | | 2,744,065 |
| | | | 12,773,185 |
| Transportation—1.5% | | | |
| Canadian Pacific Railway | 20,000 | | 2,861,400 |
| Total Common Stocks | | | |
| (cost $143,934,548) | | | 204,676,299 |
| |
| Other Investment—.3% | | | |
| Registered Investment Company; | | | |
| Dreyfus Institutional Preferred | | | |
| Plus Money Market Fund | | | |
| (cost $647,085) | 647,085 | b | 647,085 |
STATEMENT OF INVESTMENTS (continued)
| | | | | |
| Investment of Cash Collateral | | | | |
| for Securities Loaned—.8% | Shares | | Value ($) | |
| Registered Investment Company; | | | | |
| Dreyfus Institutional Cash Advantage Fund | | | | |
| (cost $1,456,960) | 1,456,960 | b | 1,456,960 | |
| Total Investments (cost $146,038,593) | 105.9 | % | 206,780,344 | |
| Liabilities, Less Cash and Receivables | (5.9 | %) | (11,489,493 | ) |
| Net Assets | 100.0 | % | 195,290,851 | |
ADR—American Depository Receipts
| |
| a Security, or portion thereof, on loan.At October 31, 2013, the value of the fund’s securities on loan was $1,419,376 |
| and the value of the collateral held by the fund was $1,456,960. |
| b Investment in affiliated money market mutual fund. |
| | | | |
| Portfolio Summary (Unaudited)† | | |
| |
| | Value (%) | | Value (%) |
| Food, Beverage & Tobacco | 22.3 | Capital Goods | 4.0 |
| Energy | 18.2 | Retailing | 3.7 |
| Pharmaceuticals, | | Materials | 3.5 |
| Biotech & Life Sciences | 10.8 | Consumer Services | 3.1 |
| Diversified Financials | 6.8 | Food & Staples Retailing | 2.8 |
| Technology Hardware & Equipment | 6.6 | Transportation | 1.5 |
| Software & Services | 5.2 | Health Care Equipment & Services | 1.4 |
| Household & Personal Products | 4.7 | Money Market Investments | 1.1 |
| Media | 4.6 | Banks | 1.0 |
| Semiconductors & | | Insurance | .5 |
| Semiconductor Equipment | 4.1 | | 105.9 |
| |
| † Based on net assets. | | | |
| See notes to financial statements. | | | |
12
| |
| STATEMENT OF ASSETS AND LIABILITIES |
| October 31, 2013 |
| | | | | |
| | | Cost | Value | |
| Assets ($): | | | | |
| Investments in securities—See Statement of Investments (including | | | |
| securities on loan, valued at $1,419,376)—Note 1(c): | | | |
| Unaffiliated issuers | | 143,934,548 | 204,676,299 | |
| Affiliated issuers | | 2,104,045 | 2,104,045 | |
| Cash | | | 125,814 | |
| Dividends and securities lending income receivable | | | 193,861 | |
| Receivable for shares of Capital Stock subscribed | | | 136,802 | |
| | | | 207,236,821 | |
| Liabilities ($): | | | | |
| Due to The Dreyfus Corporation and affiliates—Note 3(b) | | 248,913 | |
| Payable for shares of Capital Stock redeemed | | | 10,239,010 | |
| Liability for securities on loan—Note 1(c) | | | 1,456,960 | |
| Accrued expenses | | | 1,087 | |
| | | | 11,945,970 | |
| Net Assets ($) | | | 195,290,851 | |
| Composition of Net Assets ($): | | | | |
| Paid-in capital | | | 134,780,949 | |
| Accumulated undistributed investment income—net | | | 624,585 | |
| Accumulated net realized gain (loss) on investments | | (856,434 | ) |
| Accumulated net unrealized appreciation | | | | |
| (depreciation) on investments | | | 60,741,751 | |
| Net Assets ($) | | | 195,290,851 | |
| |
| |
| Net Asset Value Per Share | | | | |
| | Class A | Class C | Class I | |
| Net Assets ($) | 146,332,976 | 33,914,568 | 15,043,307 | |
| Shares Outstanding | 6,074,301 | 1,481,300 | 622,885 | |
| Net Asset Value Per Share ($) | 24.09 | 22.90 | 24.15 | |
| |
| See notes to financial statements. | | | | |
| |
| STATEMENT OF OPERATIONS |
| Year Ended October 31, 2013 |
| | | |
| Investment Income ($): | | |
| Income: | | |
| Cash dividends (net of $103,838 foreign taxes withheld at source): | | |
| Unaffiliated issuers | 5,495,093 | |
| Affiliated issuers | 3,883 | |
| Income from securities lending—Note 1(c) | 36,971 | |
| Total Income | 5,535,947 | |
| Expenses: | | |
| Management fee—Note 3(a) | 2,141,620 | |
| Disbribution/Service Plan fees—Note 3(b) | 687,350 | |
| Directors’ fees—Note 3(a,c) | 13,621 | |
| Loan commitment fees—Note 2 | 1,776 | |
| Total Expenses | 2,844,367 | |
| Less—Directors’ fees reimbursed by the Manager—Note 3(a) | (13,621 | ) |
| Net Expenses | 2,830,746 | |
| Investment Income—Net | 2,705,201 | |
| Realized and Unrealized Gain (Loss) on Investments—Note 4 ($): | | |
| Net realized gain (loss) on investments and foreign currency transactions | 1,681,290 | |
| Net unrealized appreciation (depreciation) on investments | 22,702,384 | |
| Net Realized and Unrealized Gain (Loss) on Investments | 24,383,674 | |
| Net Increase in Net Assets Resulting from Operations | 27,088,875 | |
| |
| See notes to financial statements. | | |
14
STATEMENT OF CHANGES IN NET ASSETS
| | | | | |
| | Year Ended October 31, | |
| | 2013 | | 2012 | a |
| Operations ($): | | | | |
| Investment income—net | 2,705,201 | | 1,947,581 | |
| Net realized gain (loss) on investments | 1,681,290 | | 7,878,425 | |
| Net unrealized appreciation | | | | |
| (depreciation) on investments | 22,702,384 | | 8,396,097 | |
| Net Increase (Decrease) in Net Assets | | | | |
| Resulting from Operations | 27,088,875 | | 18,222,103 | |
| Dividends to Shareholders from ($): | | | | |
| Investment income—net: | | | | |
| Class A | (2,065,321 | ) | (2,125,871 | ) |
| Class B | — | | (339 | ) |
| Class C | (252,618 | ) | (210,882 | ) |
| Class I | (283,960 | ) | (208,937 | ) |
| Total Dividends | (2,601,899 | ) | (2,546,029 | ) |
| Capital Stock Transactions ($): | | | | |
| Net proceeds from shares sold: | | | | |
| Class A | 33,286,220 | | 60,837,656 | |
| Class B | — | | 12,652 | |
| Class C | 5,911,937 | | 9,019,382 | |
| Class I | 5,359,531 | | 15,778,956 | |
| Dividends reinvested: | | | | |
| Class A | 1,861,750 | | 1,875,867 | |
| Class B | — | | 267 | |
| Class C | 160,437 | | 133,931 | |
| Class I | 214,395 | | 138,872 | |
| Cost of shares redeemed: | | | | |
| Class A | (39,609,239 | ) | (43,228,649 | ) |
| Class B | — | | (864,101 | ) |
| Class C | (5,500,780 | ) | (2,577,996 | ) |
| Class I | (10,824,566 | ) | (5,061,945 | ) |
| Increase (Decrease) in Net Assets | | | | |
| from Capital Stock Transactions | (9,140,315 | ) | 36,064,892 | |
| Total Increase (Decrease) in Net Assets | 15,346,661 | | 51,740,966 | |
| Net Assets ($): | | | | |
| Beginning of Period | 179,944,190 | | 128,203,224 | |
| End of Period | 195,290,851 | | 179,944,190 | |
| Undistributed investment income—net | 624,585 | | 520,861 | |
STATEMENT OF CHANGES IN NET ASSETS (continued)
| | | | | |
| | Year Ended October 31, | |
| | 2013 | | 2012 | a |
| Capital Share Transactions: | | | | |
| Class Ab,c | | | | |
| Shares sold | 1,498,038 | | 2,980,420 | |
| Shares issued for dividends reinvested | 83,869 | | 93,844 | |
| Shares redeemed | (1,731,695 | ) | (2,060,373 | ) |
| Net Increase (Decrease) in Shares Outstanding | (149,788 | ) | 1,013,891 | |
| Class Bc | | | | |
| Shares sold | — | | 635 | |
| Shares issued for dividends reinvested | — | | 14 | |
| Shares redeemed | — | | (43,014 | ) |
| Net Increase (Decrease) in Shares Outstanding | — | | (42,365 | ) |
| Class Cb | | | | |
| Shares sold | 281,842 | | 461,847 | |
| Shares issued for dividends reinvested | 7,577 | | 7,029 | |
| Shares redeemed | (256,363 | ) | (131,219 | ) |
| Net Increase (Decrease) in Shares Outstanding | 33,056 | | 337,657 | |
| Class I | | | | |
| Shares sold | 241,055 | | 769,554 | |
| Shares issued for dividends reinvested | 9,665 | | 6,807 | |
| Shares redeemed | (483,900 | ) | (244,249 | ) |
| Net Increase (Decrease) in Shares Outstanding | (233,180 | ) | 532,112 | |
| |
| a Effective as of the close of business on March 13, 2012, the fund no longer offers Class B shares. |
| b During the period ended October 31, 2013, 25,087 Class C shares representing $560,943 were exchanged for |
| 23,890 Class A shares. |
| c During the period ended October 31, 2012, 17,661 Class B shares representing $357,105 were automatically |
| converted to 17,223 Class A shares |
See notes to financial statements.
16
FINANCIAL HIGHLIGHTS
The following tables describe the performance for each share class for the fiscal periods indicated.All information (except portfolio turnover rate) reflects financial results for a single fund share.Total return shows how much your investment in the fund would have increased (or decreased) during each period, assuming you had reinvested all dividends and distributions.These figures have been derived from the fund’s financial statements.
| | | | | | | | | | | |
| | | | Year Ended October 31, | | | |
| Class A Shares | 2013 | | 2012 | | 2011 | | 2010 | | 2009 | |
| Per Share Data ($): | | | | | | | | | | |
| Net asset value, beginning of period | 21.27 | | 19.34 | | 17.47 | | 15.40 | | 14.35 | |
| Investment Operations: | | | | | | | | | | |
| Investment income—neta | .34 | | .27 | | .27 | | .25 | | .27 | |
| Net realized and unrealized | | | | | | | | | | |
| gain (loss) on investments | 2.80 | | 2.03 | | 1.85 | | 2.10 | | 1.05 | |
| Total from Investment Operations | 3.14 | | 2.30 | | 2.12 | | 2.35 | | 1.32 | |
| Distributions: | | | | | | | | | | |
| Dividends from investment income—net | (.32 | ) | (.37 | ) | (.25 | ) | (.28 | ) | (.27 | ) |
| Net asset value, end of period | 24.09 | | 21.27 | | 19.34 | | 17.47 | | 15.40 | |
| Total Return (%)b | 14.91 | | 12.10 | | 12.13 | | 15.53 | | 9.53 | |
| Ratios/Supplemental Data (%): | | | | | | | | | | |
| Ratio of total expenses | | | | | | | | | | |
| to average net assets | 1.36 | | 1.36 | | 1.36 | | 1.36 | | 1.36 | |
| Ratio of net expenses | | | | | | | | | | |
| to average net assets | 1.35 | | 1.35 | | 1.32 | | 1.25 | | 1.25 | |
| Ratio of net investment income | | | | | | | | | | |
| to average net assets | 1.49 | | 1.28 | | 1.42 | | 1.54 | | 2.04 | |
| Portfolio Turnover Rate | 6.47 | | 11.15 | | 15.10 | | 3.00 | | — | |
| Net Assets, end of period ($ x 1,000) | 146,333 | | 132,387 | | 100,740 | | 76,318 | | 61,270 | |
| | |
| a | Based on average shares outstanding at each month end. |
| b | Exclusive of sales charge. |
See notes to financial statements.
FINANCIAL HIGHLIGHTS (continued)
| | | | | | | | | | | |
| | | | Year Ended October 31, | | | |
| Class C Shares | 2013 | | 2012 | | 2011 | | 2010 | | 2009 | |
| Per Share Data ($): | | | | | | | | | | |
| Net asset value, beginning of period | 20.23 | | 18.36 | | 16.60 | | 14.65 | | 13.63 | |
| Investment Operations: | | | | | | | | | | |
| Investment income—neta | .16 | | .10 | | .12 | | .12 | | .17 | |
| Net realized and unrealized | | | | | | | | | | |
| gain (loss) on investments | 2.68 | | 1.94 | | 1.76 | | 2.01 | | .99 | |
| Total from Investment Operations | 2.84 | | 2.04 | | 1.88 | | 2.13 | | 1.16 | |
| Distributions: | | | | | | | | | | |
| Dividends from investment income—net | (.17 | ) | (.17 | ) | (.12 | ) | (.18 | ) | (.14 | ) |
| Net asset value, end of period | 22.90 | | 20.23 | | 18.36 | | 16.60 | | 14.65 | |
| Total Return (%)b | 14.11 | | 11.19 | | 11.38 | | 14.63 | | 8.68 | |
| Ratios/Supplemental Data (%): | | | | | | | | | | |
| Ratio of total expenses | | | | | | | | | | |
| to average net assets | 2.11 | | 2.11 | | 2.11 | | 2.11 | | 2.11 | |
| Ratio of net expenses | | | | | | | | | | |
| to average net assets | 2.10 | | 2.10 | | 2.07 | | 2.00 | | 2.00 | |
| Ratio of net investment income | | | | | | | | | | |
| to average net assets | .75 | | .51 | | .68 | | .80 | | 1.29 | |
| Portfolio Turnover Rate | 6.47 | | 11.15 | | 15.10 | | 3.00 | | — | |
| Net Assets, end of period ($ x 1,000) | 33,915 | | 29,304 | | 20,386 | | 18,714 | | 19,323 | |
| | |
| a | Based on average shares outstanding at each month end. |
| b | Exclusive of sales charge. |
See notes to financial statements.
18
| | | | | | | | | | | |
| | | | Year Ended October 31, | | | |
| Class I Shares | 2013 | | 2012 | | 2011 | | 2010 | | 2009 | |
| Per Share Data ($): | | | | | | | | | | |
| Net asset value, beginning of period | 21.32 | | 19.40 | | 17.53 | | 15.44 | | 14.41 | |
| Investment Operations: | | | | | | | | | | |
| Investment income—neta | .40 | | .32 | | .30 | | .28 | | .30 | |
| Net realized and unrealized | | | | | | | | | | |
| gain (loss) on investments | 2.81 | | 2.04 | | 1.86 | | 2.13 | | 1.05 | |
| Total from Investment Operations | 3.21 | | 2.36 | | 2.16 | | 2.41 | | 1.35 | |
| Distributions: | | | | | | | | | | |
| Dividends from investment income—net | (.38 | ) | (.44 | ) | (.29 | ) | (.32 | ) | (.32 | ) |
| Net asset value, end of period | 24.15 | | 21.32 | | 19.40 | | 17.53 | | 15.44 | |
| Total Return (%) | 15.21 | | 12.33 | | 12.47 | | 15.81 | | 9.74 | |
| Ratios/Supplemental Data (%): | | | | | | | | | | |
| Ratio of total expenses | | | | | | | | | | |
| to average net assets | 1.11 | | 1.11 | | 1.11 | | 1.11 | | 1.12 | |
| Ratio of net expenses | | | | | | | | | | |
| to average net assets | 1.10 | | 1.10 | | 1.08 | | 1.00 | | 1.00 | |
| Ratio of net investment income | | | | | | | | | | |
| to average net assets | 1.78 | | 1.51 | | 1.62 | | 1.72 | | 2.10 | |
| Portfolio Turnover Rate | 6.47 | | 11.15 | | 15.10 | | 3.00 | | — | |
| Net Assets, end of period ($ x 1,000) | 15,043 | | 18,253 | | 6,284 | | 1,785 | | 223 | |
| a Based on average shares outstanding at each month end. | | | | | | | | | |
| See notes to financial statements. | | | | | | | | | | |
NOTES TO FINANCIAL STATEMENTS
NOTE 1—Significant Accounting Policies:
Dreyfus Tax Managed Growth Fund (the “fund”) is a separate diversified series of The Dreyfus/Laurel Funds, Inc. (the “Company”), which is registered under the Investment Company Act of 1940, as amended (the “Act”), as an open-end management investment company and operates as a series company currently offering eleven series, including the fund. The fund’s investment objective is to seek long-term capital appreciation consistent with minimizing realized capital gains and taxable current income. The Dreyfus Corporation (the “Manager” or “Dreyfus”), a wholly-owned subsidiary ofThe Bank of NewYork Mellon Corporation (“BNY Mellon”), serves as the fund’s investment adviser. Fayez Sarofim & Co. (“Sarofim & Co.”) serves as the fund’s sub-investment adviser.
MBSC Securities Corporation (the “Distributor”), a wholly-owned subsidiary of Dreyfus, is the distributor of the fund’s shares.The fund is authorized to issue 500 million shares of $.001 par value Capital Stock. The fund currently offers three classes of shares: Class A (300 million shares authorized), Class C (100 million shares authorized) and Class I (100 million shares authorized). Class A and Class C shares are sold primarily to retail investors through financial intermediaries and bear Distribution and/or Service Plan fees. Class A shares generally are subject to a sales charge imposed at the time of purchase. Class C shares are subject to a contingent deferred sales charge (“CDSC”) imposed on Class C shares redeemed within one year of purchase. Class I shares are sold primarily to bank trust departments and other financial service providers (including The Bank of New York Mellon, a subsidiary of BNY Mellon and an affiliate of Dreyfus, and its affiliates), acting on behalf of customers having a qualified trust or an investment account or relationship at such institution, and bear no Distribution or Service Plan fees. Class I shares are offered without a front-end sales charge or CDSC. Other differences between the classes include the services offered to and the expenses borne by each class, the allocation of certain transfer agency costs and certain voting rights. Income, expenses
20
(other than expenses attributable to a specific class), and realized and unrealized gains or losses on investments are allocated to each class of shares based on its relative net assets.
The Company accounts separately for the assets, liabilities and operations of each series. Expenses directly attributable to each series are charged to that series’ operations; expenses which are applicable to all series are allocated among them on a pro rata basis.
The Financial Accounting Standards Board (“FASB”) Accounting Standards Codification is the exclusive reference of authoritative U.S. generally accepted accounting principles (“GAAP”) recognized by the FASB to be applied by nongovernmental entities. Rules and interpretive releases of the Securities and Exchange Commission (“SEC”) under authority of federal laws are also sources of authoritative GAAP for SEC registrants. The fund’s financial statements are prepared in accordance with GAAP, which may require the use of management estimates and assumptions.Actual results could differ from those estimates.
(a) Portfolio valuation: The fair value of a financial instrument is the amount that would be received to sell an asset or paid to transfer a liability in an orderly transaction between market participants at the measurement date (i.e., the exit price). GAAP establishes a fair value hierarchy that prioritizes the inputs of valuation techniques used to measure fair value. This hierarchy gives the highest priority to unadjusted quoted prices in active markets for identical assets or liabilities (Level 1 measurements) and the lowest priority to unobservable inputs (Level 3 measurements).
Additionally, GAAP provides guidance on determining whether the volume and activity in a market has decreased significantly and whether such a decrease in activity results in transactions that are not orderly. GAAP requires enhanced disclosures around valuation inputs and techniques used during annual and interim periods.
NOTES TO FINANCIAL STATEMENTS (continued)
Various inputs are used in determining the value of the fund’s investments relating to fair value measurements.These inputs are summarized in the three broad levels listed below:
Level 1—unadjusted quoted prices in active markets for identical investments.
Level 2—other significant observable inputs (including quoted prices for similar investments, interest rates, prepayment speeds, credit risk, etc.).
Level 3—significant unobservable inputs (including the fund’s own assumptions in determining the fair value of investments).
The inputs or methodology used for valuing securities are not necessarily an indication of the risk associated with investing in those securities.
Changes in valuation techniques may result in transfers in or out of an assigned level within the disclosure hierarchy. Valuation techniques used to value the fund’s investments are as follows:
Investments in securities are valued at the last sales price on the securities exchange or national securities market on which such securities are primarily traded. Securities listed on the National Market System for which market quotations are available are valued at the official closing price or, if there is no official closing price that day, at the last sales price. Securities not listed on an exchange or the national securities market, or securities for which there were no transactions, are valued at the average of the most recent bid and asked prices, except for open short positions, where the asked price is used for valuation purposes. Bid price is used when no asked price is available. Registered investment companies that are not traded on an exchange are valued at their net asset value. All of the preceding securities are categorized within Level 1 of the fair value hierarchy.
Fair valuing of securities may be determined with the assistance of a pricing service using calculations based on indices of domestic securities and other appropriate indicators, such as prices of relevant ADRs and financial futures. Utilizing these techniques may result in transfers between Level 1 and Level 2 of the fair value hierarchy.
22
When market quotations or official closing prices are not readily available, or are determined not to reflect accurately fair value, such as when the value of a security has been significantly affected by events after the close of the exchange or market on which the security is principally traded (for example, a foreign exchange or market), but before the fund calculates its net asset value, the fund may value these investments at fair value as determined in accordance with the procedures approved by the Company’s Board of Directors (the “Board”). Certain factors may be considered when fair valuing investments such as: fundamental analytical data, the nature and duration of restrictions on disposition, an evaluation of the forces that influence the market in which the securities are purchased and sold, and public trading in similar securities of the issuer or comparable issuers.These securities are either categorized within Level 2 or 3 of the fair value hierarchy depending on the relevant inputs used.
For restricted securities where observable inputs are limited, assumptions about market activity and risk are used and are categorized within Level 3 of the fair value hierarchy.
Investments denominated in foreign currencies are translated to U.S. dollars at the prevailing rates of exchange.
The following is a summary of the inputs used as of October 31, 2013 in valuing the fund’s investments:
| | | | | |
| | | Level 2—Other | Level 3— | |
| | Level 1— | Significant | Significant | |
| | Unadjusted | Observable | Unobservable | |
| | Quoted Prices | Inputs | Inputs | Total |
| Assets ($) | | | | |
| Investments in Securities: | | | |
| Equity Securities— | | | | |
| Domestic† | 172,461,279 | — | — | 172,461,279 |
| Equity Securities— | | | | |
| Foreign† | 32,215,020 | — | — | 32,215,020 |
| Mutual Funds | 2,104,045 | — | — | 2,104,045 |
| | |
| † | See Statement of Investments for additional detailed categorizations. |
NOTES TO FINANCIAL STATEMENTS (continued)
At October 31, 2013, there were no transfers between Level 1 and Level 2 of the fair value hierarchy.
(b) Foreign currency transactions: The fund does not isolate that portion of the results of operations resulting from changes in foreign exchange rates on investments from the fluctuations arising from changes in the market prices of securities held. Such fluctuations are included with the net realized and unrealized gain or loss on investments.
Net realized foreign exchange gains or losses arise from sales of foreign currencies, currency gains or losses realized on securities transactions between trade and settlement date, and the difference between the amounts of dividends, interest and foreign withholding taxes recorded on the fund’s books and the U.S. dollar equivalent of the amounts actually received or paid. Net unrealized foreign exchange gains and losses arise from changes in the value of assets and liabilities other than investments resulting from changes in exchange rates. Foreign currency gains and losses on foreign currency transactions are also included with net realized and unrealized gain or loss on investments.
(c) Securities transactions and investment income: Securities transactions are recorded on a trade date basis. Realized gains and losses from securities transactions are recorded on the identified cost basis. Dividend income is recognized on the ex-dividend date and interest income, including, where applicable, accretion of discount and amortization of premium on investments, is recognized on the accrual basis.
Pursuant to a securities lending agreement with The Bank of New York Mellon, the fund may lend securities to qualified institutions. It is the fund’s policy that, at origination, all loans are secured by collateral of at least 102% of the value of U.S. securities loaned and 105% of the value of foreign securities loaned. Collateral equivalent to at least 100% of the market value of securities on loan is maintained at all times. Collateral is either in the form of cash, which can be invested in certain money market mutual funds managed by Dreyfus or U.S. Government and Agency securities.The fund is entitled to receive all dividends, interest and distributions on securities loaned, in addition to
24
income earned as a result of the lending transaction. Should a borrower fail to return the securities in a timely manner, The Bank of New York Mellon is required to replace the securities for the benefit of the fund or credit the fund with the market value of the unreturned securities and is subrogated to the fund’s rights against the borrower and the collateral. During the period ended October 31, 2013, The Bank of New York Mellon earned $10,777 from lending portfolio securities, pursuant to the securities lending agreement.
(d) Affiliated issuers: Investments in other investment companies advised by Dreyfus are defined as “affiliated” under the Act. Investments in affiliated investment companies during the period ended October 31, 2013 were as follows:
| | | | | | | |
| Affiliated | | | | | | |
| Investment | Value | | | | Value | Net |
| Company | 10/31/2012 ($) | | Purchases ($) | Sales ($) | 10/31/2013 ($) | Assets (%) |
| Dreyfus | | | | | | |
| Institutional | | | | | | |
| Preferred | | | | | | |
| Plus Money | | | | | | |
| Market Fund | 3,661,788 | | 21,195,171 | 24,209,874 | 647,085 | .3 |
| Dreyfus | | | | | | |
| Institutional | | | | | | |
| Cash | | | | | | |
| Advantage | | | | | | |
| Fund | 4,965,750 | | 62,439,022 | 65,947,812 | 1,456,960 | .8 |
| Total | 8,627,538 | | 83,634,193 | 90,157,686 | 2,104,045 | 1.1 |
(e) Dividends to shareholders: Dividends are recorded on the ex-dividend date. Dividends from investment income-net are normally declared and paid quarterly. Dividends from net realized capital gains, if any, are normally declared and paid annually, but the fund may make distributions on a more frequent basis to comply with the distribution requirements of the Internal Revenue Code of 1986, as amended (the “Code”).To the extent that net realized capital gains can be offset by capital loss carryovers, it is the policy of the fund not to distribute such gains. Income and capital gain distributions are determined in accordance with income tax regulations, which may differ from GAAP.
NOTES TO FINANCIAL STATEMENTS (continued)
(f) Federal income taxes: It is the policy of the fund to continue to qualify as a regulated investment company, if such qualification is in the best interests of its shareholders, by complying with the applicable provisions of the Code, and to make distributions of taxable income sufficient to relieve it from substantially all federal income and excise taxes.
As of and during the period ended October 31, 2013, the fund did not have any liabilities for any uncertain tax positions.The fund recognizes interest and penalties, if any, related to uncertain tax positions as income tax expense in the Statement of Operations. During the period ended October 31, 2013, the fund did not incur any interest or penalties.
Each tax year in the four-year period ended October 31, 2013 remains subject to examination by the Internal Revenue Service and state taxing authorities.
At October 31, 2013, the components of accumulated earnings on a tax basis were as follows: undistributed ordinary income $624,585, accumulated capital losses $856,434 and unrealized appreciation $60,741,751.
Under the Regulated Investment Company Modernization Act of 2010 (the “2010 Act”), the fund is permitted to carry forward capital losses incurred in taxable years beginning after December 22, 2010 (“post-enactment losses”) for an unlimited period. Furthermore, post-enactment capital loss carryovers retain their character as either short-term or long-term capital losses rather than short-term as they were under previous statute.The 2010 Act requires post-enactment losses to be utilized before the utilization of losses incurred in taxable years prior to the effective date of the 2010 Act (“pre-enactment losses”).As a result of this ordering rule, pre-enactment losses may be more likely to expire unused.
The accumulated capital loss carryover is available for federal income tax purposes to be applied against future net realized capital gains, if any, realized subsequent to October 31, 2013. If not applied, the carryover expires in fiscal year 2018.
26
The tax character of distributions paid to shareholders during the fiscal periods ended October 31, 2013 and October 31, 2012 were as follows: ordinary income $2,601,899 and $2,546,029, respectively.
During the period ended October 31, 2013, as a result of permanent book to tax differences, primarily due to the tax treatment for foreign currency gains and losses, the fund increased accumulated undistributed investment income-net by $422 and decreased accumulated net realized gain (loss) on investments by the same amount. Net assets and net asset value per share were not affected by this reclassification.
NOTE 2—Bank Lines of Credit:
The fund participates with other Dreyfus-managed funds in a $265 million unsecured credit facility led by Citibank, N.A. and a $300 million unsecured credit facility provided by The Bank of New York Mellon (each, a “Facility”), each to be utilized primarily for temporary or emergency purposes, including the financing of redemptions. Prior to October 9, 2013, the unsecured credit facility with Citibank, N.A. was $210 million. In connection therewith, the fund has agreed to pay its pro rata portion of commitment fees for each Facility. Interest is charged to the fund based on rates determined pursuant to the terms of the respective Facility at the time of borrowing. During the period ended October 31, 2013, the fund did not borrow under the Facilities.
NOTE 3—Investment Management Fee, Sub-Investment Advisory Fee and Other Transactions With Affiliates:
(a) Pursuant to an investment management agreement with Dreyfus, Dreyfus provides or arranges for one or more third parties and/or affiliates to provide investment advisory, administrative, custody, fund accounting and transfer agency services to the fund. Dreyfus also directs the investments of the fund in accordance with its investment objective, policies and limitations. For these services, the fund is con-
NOTES TO FINANCIAL STATEMENTS (continued)
tractually obligated to pay Dreyfus a fee, calculated daily and paid monthly, at the annual rate of 1.10% of the value of the fund’s average daily net assets. Out of its fee, Dreyfus pays all of the expenses of the fund except brokerage fees, taxes, interest expenses, commitment fees on borrowings, Distribution Plan and Service Plan fees, fees and expenses of non-interested Directors (including counsel fees) and extraordinary expenses. In addition, Dreyfus is required to reduce its fee in an amount equal to the fund’s allocable portion of fees and expenses of the non-interested Directors (including counsel fees). During the period ended October 31, 2013, fees reimbursed by Dreyfus amounted to $13,621.
Pursuant to a sub-investment advisory agreement between Dreyfus and Sarofim & Co., Dreyfus pays Sarofim & Co. a monthly fee at an annual rate of .2175% of the value of the fund’s average daily net assets.
During the period ended October 31, 2013, the Distributor retained $9,498 from commissions earned on sales of the fund’s Class A shares and $4,989 from CDSCs on redemptions of the fund’s class C shares.
(b) Under separate Distribution Plans adopted pursuant to Rule 12b-1 (the “Distribution Plans”) under the Act, Class A shares may pay annually up to .25% of the value of its average daily net assets to compensate the Distributor for shareholder servicing activities and expenses primarily intended to result in the sale of Class A shares. Class C shares pay the Distributor for distributing its shares at an aggregate annual rate of .75% of the value of its average daily net assets. Class C shares are also subject to a service plan adopted pursuant to Rule 12b-1 (the “Service Plan”), under which Class C shares pay the Distributor for providing certain services to the holders of their shares a fee at the annual rate of .25% of the value of the average daily net assets of Class C shares. During the period ended October 31, 2013, Class A and Class C shares were charged $364,633 and $242,038, respectively, pursuant to their Distribution Plans. During the period ended October 31, 2013, Class C shares were charged $80,679, pursuant to the Service Plan.
28
Under its terms, the Distribution Plans and Service Plan shall remain in effect from year to year, provided such continuance is approved annually by a vote of majority of those Directors who are not “interested persons” of the Company and who have no direct or indirect financial interest in the operation of or in any agreement related to the Distribution Plans or Service Plan.
The components of “Due to The Dreyfus Corporation and affiliates” in the Statement of Assets and Liabilities consist of: management fees $188,915, Distribution Plans fees $53,943 and Service Plan fees $7,107, which are offset against an expense reimbursement currently in effect in the amount of $1,052.
(c) Each Board member also serves as a Board member of other funds within the Dreyfus complex. Annual retainer fees and attendance fees are allocated to each fund based on net assets.
NOTE 4—Securities Transactions:
The aggregate amount of purchases and sales of investment securities, excluding short-term securities, during the period ended October 31, 2013, amounted to $17,510,042 and $12,271,261, respectively.
At October 31, 2013, the cost of investments for federal income tax purposes was $146,038,593; accordingly, accumulated net unrealized appreciation on investments was $60,741,751, consisting of $63,467,240 gross unrealized appreciation and $2,725,489 gross unrealized depreciation.
| |
| REPORT OF INDEPENDENT REGISTERED |
| PUBLIC ACCOUNTING FIRM |
The Board of Directors and Shareholders The Dreyfus/Laurel Funds, Inc.
We have audited the accompanying statement of assets and liabilities of Dreyfus Tax Managed Growth Fund (the “Fund”), a series of The Dreyfus/Laurel Funds, Inc., including the statement of investments, as of October 31, 2013, the related statement of operations for the year then ended, the statements of changes in net assets for each of the years in the two-year period then ended, and the financial highlights for each of the years in the five-year period then ended. These financial statements and financial highlights are the responsibility of the Fund’s management. Our responsibility is to express an opinion on these financial statements and financial highlights based on our audits.
We conducted our audits in accordance with the standards of the Public Company Accounting Oversight Board (United States).Those standards require that we plan and perform the audit to obtain reasonable assurance about whether the financial statements and financial highlights are free of material misstatement. An audit includes examining, on a test basis, evidence supporting the amounts and disclosures in the financial statements. Our procedures included confirmation of securities owned as of October 31, 2013, by correspondence with the custodian and brokers or by other appropriate auditing procedures. An audit also includes assessing the accounting principles used and significant estimates made by management, as well as evaluating the overall financial statement presentation.We believe that our audits provide a reasonable basis for our opinion.
In our opinion, the financial statements and financial highlights referred to above present fairly, in all material respects, the financial position of Dreyfus Tax Managed Growth Fund as of October 31, 2013, the results of its operations for the year then ended, the changes in its net assets for each of the years in the two-year period then ended, and the financial highlights for each of the years in the five-year period then ended, in conformity with U.S. generally accepted accounting principles.

New York, New York
December 30, 2013
30
IMPORTANT TAX INFORMATION (Unaudited)
For federal tax purposes, the fund reports the maximum amount allowable, but not less than $2,601,899 as ordinary income dividends paid during the year ended October 31, 2013 as qualified dividend income in accordance with Section 854(b)(1)(B) of the Internal Revenue Code. Also, the fund reports the maximum amount allowable but not less than 100% of ordinary income dividends paid during the year ended October 31, 2013 as eligible for the corporate dividends received deduction provided under Section 243 of the Internal Revenue Code in accordance with Section 854(b)(1)(A) of the Internal Revenue Code. Shareholders will receive notification in early 2014 of the percentage applicable to the preparation of their 2013 income tax returns.
BOARD MEMBERS INFORMATION (Unaudited)
| |
| Joseph S. DiMartino (70) |
| Chairman of the Board (1999) |
| Principal Occupation During Past 5Years: |
| • Corporate Director and Trustee |
| Other Public Company Board Memberships During Past 5Years: |
| • CBIZ (formerly, Century Business Services, Inc.), a provider of outsourcing functions for small |
| and medium size companies, Director (1997-present) |
| • The Newark Group, a provider of a national market of paper recovery facilities, paperboard |
| mills and paperboard converting plants, Director (2000-2010) |
| • Sunair Services Corporation, a provider of certain outdoor-related services to homes and |
| businesses, Director (2005-2009) |
| No. of Portfolios for which Board Member Serves: 141 |
| ——————— |
| Francine J. Bovich (62) |
| Board Member (2012) |
| Principal Occupation During Past 5Years: |
| • Trustee,The Bradley Trusts, private trust funds (2011-present) |
| • Managing Director, Morgan Stanley Investment Management (1993-2010) |
| No. of Portfolios for which Board Member Serves: 40 |
| ——————— |
| James M. Fitzgibbons (79) |
| Board Member (1994) |
| Principal Occupation During Past 5Years: |
| • Corporate Director and Trustee |
| Other Public Company Board Memberships During Past 5Years: |
| • Bill Barrett Corporation, an oil and natural gas exploration company, Director (2004-2012) |
| No. of Portfolios for which Board Member Serves: 26 |
| ——————— |
| Kenneth A. Himmel (67) |
| Board Member (1994) |
| Principal Occupation During Past 5Years: |
| • President and CEO, Related Urban Development, a real estate development company (1996-present) |
| • President and CEO, Himmel & Company, a real estate development company (1980-present) |
| • CEO,American Food Management, a restaurant company (1983-present) |
| No. of Portfolios for which Board Member Serves: 26 |
32
| |
| Stephen J. Lockwood (66) |
| Board Member (1994) |
| Principal Occupation During Past 5Years: |
| • Chairman of the Board, Stephen J. Lockwood and Company LLC, a real estate investment |
| company (2000-present) |
| No. of Portfolios for which Board Member Serves: 26 |
| ——————— |
| Roslyn M. Watson (64) |
| Board Member (1994) |
| Principal Occupation During Past 5Years: |
| • Principal,Watson Ventures, Inc., a real estate investment company (1993-present) |
| No. of Portfolios for which Board Member Serves: 36 |
| ——————— |
| Benaree Pratt Wiley (67) |
| Board Member (1998) |
| Principal Occupation During Past 5Years: |
| • Principal,TheWiley Group, a firm specializing in strategy and business development (2005-present) |
| Other Public Company Board Memberships During Past 5Years: |
| • CBIZ (formerly, Century Business Services, Inc.), a provider of outsourcing functions for small |
| and medium size companies, Director (2008-present) |
| No. of Portfolios for which Board Member Serves: 61 |
| ——————— |
Once elected all Board Members serve for an indefinite term, but achieve Emeritus status upon reaching age 80.The address of the Board Members and Officers is c/o The Dreyfus Corporation, 200 Park Avenue, NewYork, NewYork 10166. Additional information about the Board Members is available in the fund’s Statement of Additional Information which can be obtained from Dreyfus free of charge by calling this toll free number: 1-800-DREYFUS.
| |
| J.Tomlinson Fort, Emeritus Board Member |
OFFICERS OF THE FUND (Unaudited)
BRADLEY J. SKAPYAK, President since January 2010.
Chief Operating Officer and a director of the Manager since June 2009, Chairman of Dreyfus Transfer, Inc., an affiliate of the Manager and the transfer agent of the funds, since May 2011 and Executive Vice President of the Distributor since June 2007. From April 2003 to June 2009, Mr. Skapyak was the head of the Investment Accounting and Support Department of the Manager. He is an officer of 68 investment companies (comprised of 141 portfolios) managed by the Manager. He is 55years old and has been an employee of the Manager since February 1988.
JOHN PAK, Chief Legal Officer since March 2013.
Chief Legal Officer of the Manager and Associate General Counsel and Managing Director of BNY Mellon since August 2012; from March 2005 to July 2012, Managing Director of Deutsche Bank, Deputy Global Head of Deutsche Asset Management Legal and Regional Head of Deutsche Asset Management Americas Legal. He is an officer of 69 investment companies (comprised of 166 portfolios) managed by the Manager. He is 45 years old and has been an employee of the Manager since August 2012.
JANETTE E. FARRAGHER, Vice President and Secretary since December 2011.
Assistant General Counsel of BNY Mellon, and an officer of 69 investment companies (comprised of 166 portfolios) managed by the Manager. She is 50 years old and has been an employee of the Manager since February 1984.
KIESHA ASTWOOD, Vice President and Assistant Secretary since January 2010.
Counsel of BNY Mellon, and an officer of 69 investment companies (comprised of 166 portfolios) managed by the Manager. She is 40 years old and has been an employee of the Manager since July 1995.
JAMES BITETTO, Vice President and Assistant Secretary since August 2005.
Senior Counsel of BNY Mellon and Secretary of the Manager, and an officer of 69 investment companies (comprised of 166 portfolios) managed by the Manager. He is 47 years old and has been an employee of the Manager since December 1996.
JONI LACKS CHARATAN, Vice President and Assistant Secretary since August 2005.
Senior Counsel of BNY Mellon, and an officer of 69 investment companies (comprised of 166 portfolios) managed by the Manager. She is 58 years old and has been an employee of the Manager since October 1988.
JOSEPH M. CHIOFFI, Vice President and Assistant Secretary since August 2005.
Senior Counsel of BNY Mellon, and an officer of 69 investment companies (comprised of 166 portfolios) managed by the Manager. He is 52 years old and has been an employee of the Manager since June 2000.
JOHN B. HAMMALIAN, Vice President and Assistant Secretary since August 2005.
Senior Managing Counsel of BNY Mellon, and an officer of 69 investment companies (comprised of 166 portfolios) managed by the Manager. He is 50 years old and has been an employee of the Manager since February 1991.
ROBERT R. MULLERY, Vice President and Assistant Secretary since August 2005.
Managing Counsel of BNY Mellon, and an officer of 69 investment companies (comprised of 166 portfolios) managed by the Manager. He is 61 years old and has been an employee of the Manager since May 1986.
34
JEFF PRUSNOFSKY, Vice President and Assistant Secretary since August 2005.
Senior Managing Counsel of BNY Mellon, and an officer of 69 investment companies (comprised of 166 portfolios) managed by the Manager. He is 48 years old and has been an employee of the Manager since October 1990.
JAMES WINDELS, Treasurer since November 2001.
Director – Mutual Fund Accounting of the Manager, and an officer of 69 investment companies (comprised of 166 portfolios) managed by the Manager. He is 55 years old and has been an employee of the Manager since April 1985.
RICHARD CASSARO, Assistant Treasurer since January 2008.
Senior Accounting Manager – Money Market and Municipal Bond Funds of the Manager, and an officer of 69 investment companies (comprised of 166 portfolios) managed by the Manager. He is 54 years old and has been an employee of the Manager since September 1982.
GAVIN C. REILLY, Assistant Treasurer since December 2005.
Tax Manager of the Investment Accounting and Support Department of the Manager, and an officer of 69 investment companies (comprised of 166 portfolios) managed by the Manager. He is 45 years old and has been an employee of the Manager since April 1991.
ROBERT S. ROBOL, Assistant Treasurer since December 2002.
Senior Accounting Manager – Fixed Income Funds of the Manager, and an officer of 69 investment companies (comprised of 166 portfolios) managed by the Manager. He is 49 years old and has been an employee of the Manager since October 1988.
ROBERT SALVIOLO, Assistant Treasurer since July 2007.
Senior Accounting Manager – Equity Funds of the Manager, and an officer of 69 investment companies (comprised of 166 portfolios) managed by the Manager. He is 46 years old and has been an employee of the Manager since June 1989.
ROBERT SVAGNA, Assistant Treasurer since December 2002.
Senior Accounting Manager – Equity Funds of the Manager, and an officer of 69 investment companies (comprised of 166 portfolios) managed by the Manager. He is 46 years old and has been an employee of the Manager since November 1990.
JOSEPH W. CONNOLLY, Chief Compliance Officer since October 2004.
Chief Compliance Officer of the Manager and The Dreyfus Family of Funds (69 investment companies, comprised of 166 portfolios). He is 56 years old and has served in various capacities with the Manager since 1980, including manager of the firm’s Fund Accounting Department from 1997 through October 2001.
MATTHEW D. CONNOLLY, Anti-Money Laundering Compliance Officer since April 2012.
Anti-Money Laundering Compliance Officer of the Distributor since October 2011; from March 2010 to September 2011, Global Head, KYC Reviews and Director, UBS Investment Bank; until March 2010, AML Compliance Officer and Senior Vice President, Citi Global Wealth Management. He is an officer of 64 investment companies (comprised of 161 portfolios) managed by the Manager. He is 41 years old and has been an employee of the Distributor since October 2011.
For More Information
Telephone Call your financial representative or 1-800-DREYFUS
Mail The Dreyfus Family of Funds, 144 Glenn Curtiss Boulevard, Uniondale, NY 11556-0144
The fund files its complete schedule of portfolio holdings with the Securities and Exchange Commission (“SEC”) for the first and third quarters of each fiscal year on Form N-Q. The fund’s Forms N-Q are available on the SEC’s website at http://www.sec.gov and may be reviewed and copied at the SEC’s Public Reference Room in Washington, DC. Information on the operation of the Public Reference Room may be obtained by calling 1-800-SEC-0330.
|
| Dreyfus |
| BASIC S&P 500 |
| Stock Index Fund |
ANNUAL REPORT October 31, 2013

Save time. Save paper. View your next shareholder report online as soon as it’s available. Log into www.dreyfus.com and sign up for Dreyfus eCommunications. It’s simple and only takes a few minutes.
The views expressed in this report reflect those of the portfolio manager only through the end of the period covered and do not necessarily represent the views of Dreyfus or any other person in the Dreyfus organization. Any such views are subject to change at any time based upon market or other conditions and Dreyfus disclaims any responsibility to update such views.These views may not be relied on as investment advice and, because investment decisions for a Dreyfus fund are based on numerous factors, may not be relied on as an indication of trading intent on behalf of any Dreyfus fund.
|
| Not FDIC-Insured • Not Bank-Guaranteed • May Lose Value |
| | Contents |
| | THE FUND |
| 2 | A Letter from the President |
| 3 | Discussion of Fund Performance |
| 6 | Fund Performance |
| 7 | Understanding Your Fund’s Expenses |
| 7 | Comparing Your Fund’s Expenses With Those of Other Funds |
| 8 | Statement of Investments |
| 25 | Statement of Financial Futures |
| 26 | Statement of Assets and Liabilities |
| 27 | Statement of Operations |
| 28 | Statement of Changes in Net Assets |
| 29 | Financial Highlights |
| 30 | Notes to Financial Statements |
| 42 | Report of Independent Registered Public Accounting Firm |
| 43 | Important Tax Information |
| 44 | Board Members Information |
| 46 | Officers of the Fund |
| | FOR MORE INFORMATION |
| | Back Cover |
Dreyfus BASIC
S&P 500 Stock Index Fund
The Fund
A LETTER FROM THE PRESIDENT
Dear Shareholder:
We are pleased to present this annual report for Dreyfus BASIC S&P 500 Stock Index Fund, covering the 12-month period from November 1, 2012, through October 31, 2013. For information about how the fund performed during the reporting period, as well as general market perspectives, we provide a Discussion of Fund Performance on the pages that follow.
Although expectations of higher long-term interest rates and a more moderately stimulative monetary policy sparked volatility in the U.S stock market at times during the reporting period, improved U.S. economic conditions drove stock prices substantially higher for the reporting period overall. Even the 16-day U.S. government shutdown in October failed to derail the market’s advance, enabling some broad measures of stock market performance to reach new record highs by the end of the month. Stocks across most capitalization ranges and investment styles produced strong results.
We currently expect U.S. economic conditions to continue to improve in 2014, with accelerating growth supported by the fading drags of tighter federal fiscal policies and downsizing on the state and local levels. Moreover, inflation is likely to remain muted, so monetary policy can remain stimulative. Globally, we anticipate stronger growth in many developed countries due to past and continuing monetary ease, while emerging markets seem poised for moderate economic expansion despite recently negative investor sentiment. For more information on how these observations may affect your investments, we encourage you to speak with your financial advisor.
Thank you for your continued confidence and support.

J. Charles Cardona
President
The Dreyfus Corporation
November 15, 2013
2
DISCUSSION OF FUND PERFORMANCE
For the period of November 1, 2012, through October 31, 2013, as provided by Thomas J. Durante, CFA, Richard A. Brown, CFA, and Karen Q.Wong, CFA, Portfolio Managers
Fund and Market Performance Overview
For the 12-month period ended October 31, 2013, Dreyfus BASIC S&P 500® Stock Index Fund produced a total return of 26.96%.1 In comparison, the Standard & Poor’s 500 Composite Stock Price Index (“S&P 500 Index”), the fund’s benchmark, returned 27.16% for the same period.2,3
U.S. stocks responded positively during the reporting period to recovering global and domestic economies.The difference in returns between the fund and the S&P 500 Index was primarily the result of transaction costs and operating expenses that are not reflected in the S&P 500 Index’s results.
The Fund’s Investment Approach
The fund seeks to match the total return of the S&P 500 Index by generally investing in all 500 stocks in the S&P 500 Index in proportion to their respective weightings. Often considered a barometer for the stock market in general, the S&P 500 Index is made up of 500 widely held common stocks across 10 economic sectors. Each stock is weighted by its float-adjusted market capitalization; that is, larger companies have greater representation in the S&P 500 Index than smaller ones.
The fund employed futures contracts during the reporting period in its efforts to replicate the returns of the S&P 500 Index.
Recovering U.S. and Global Economies Fueled Market Gains
The reporting period began soon after the start of a sustained stock market rally driven by improved U.S. employment and housing markets. Investors were particularly encouraged by a new round of quantitative easing from the Federal Reserve Board (the “Fed”) involving massive monthly purchases of U.S. government securities. Improving conditions in overseas markets also contributed to greater optimism as investors responded positively to the potential for improved earnings among U.S.-based multinationals and more robust export activity to overseas markets.
DISCUSSION OF FUND PERFORMANCE (continued)
Economic data continued to improve, and stocks generally continued to rally, through the spring of 2013. However, in late May, relatively hawkish remarks by Fed chairman Ben Bernanke were widely interpreted as a signal that U.S. monetary policymakers would back away from their quantitative easing program sooner than many analysts had expected, sparking volatility that erased some of the market’s previous gains.The S&P 500 Index generally stabilized over the summer, and stocks advanced strongly in September when the Fed refrained from tapering its bond purchasing program. Even a 16-day federal government shutdown in October failed to derail the rally, enabling the S&P 500 Index to reach record highs by the reporting period’s end.
The Financials Sector Led the Market’s Advance
All of the economic sectors represented in the S&P 500 Index produced double-digit gains over the reporting period, reflecting broad-based support for U.S. equities. The financials sector led the market rally as large, diversified financial institutions rebounded from previously depressed levels in the wake of the 2007–2009 U.S. financial crisis. Big banks particularly benefited from widening net interest margins and greater mortgage refinancing activity as the U.S. economic recovery gained traction and long-term interest rates moved higher. In the insurance industry, financial results were bolstered by higher premiums at a time when relatively few domestic natural disasters kept claims low. Capital markets-oriented companies advanced along with the financial markets. However, large cap real estate investment trusts lagged sector averages by a wide margin when investors turned away from income-oriented stocks and toward their more growth-oriented counterparts.
In the consumer discretionary sector, media companies advanced strongly amid more robust spending by consumers on activities such as movies and visits to theme parks. Specialty retailers also gained value, including home improvement chains benefiting from recovering housing markets. Internet retailers exhibited strong earnings growth over the reporting period, with some Internet-related stocks doubling and tripling in value. Finally, in the industrials sector, aerospace and defense companies posted strong gains despite the potentially negative implications of reduced government spending stemming from protracted budget disagreements in Congress.
4
The fund received less favorable contributions from the materials sector, where metals-and-mining companies struggled with lower commodity prices due to waning demand for construction materials in the emerging markets. In addition, coal producers in the energy sector were hurt by intensifying competition from lower cost natural gas.
Replicating the Performance of the S&P 500 Index
Although we do not actively manage the fund’s investments in response to macroeconomic trends, it is worth noting that recent evidence of sustained domestic and global growth has the potential to fuel further gains in U.S. equity markets.As always, we have continued to monitor the factors considered by the fund’s investment model in light of current market conditions.
November 15, 2013
Equity funds are subject generally to market, market sector, market liquidity, issuer and investment style risks, among other factors, to varying degrees, all of which are more fully described in the fund’s prospectus.
| |
| 1 | Total return includes reinvestment of dividends and any capital gains paid. Past performance is no guarantee of future |
| | results. Share price and investment return fluctuate such that upon redemption, fund shares may be worth more or less |
| | than their original cost. |
| 2 | SOURCE: LIPPER INC. — Reflects reinvestment of dividends and, where applicable, capital gain distributions. |
| | The Standard & Poor’s 500 Composite Stock Price Index is a widely accepted, unmanaged index of U.S. stock |
| | market performance. Investors cannot invest directly in any index. |
| 3 | “Standard & Poor’s®,” “S&P®,” “Standard & Poor’s® 500” and “S&P 500®” are registered trademarks of |
| | Standard & Poor’s Financial Services LLC, and have been licensed for use on behalf of the fund.The fund is not |
| | sponsored, managed, advised, sold or promoted by Standard & Poor’s and its affiliates and Standard & Poor’s and its |
| | affiliates make no representation regarding the advisability of investing in the fund. |
FUND PERFORMANCE
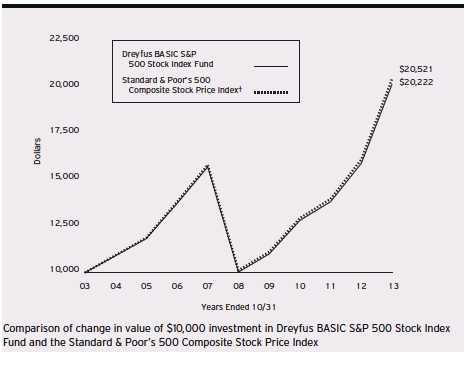
| | | | | | |
| Average Annual Total Returns as of 10/31/13 | | | | | |
| | 1 Year | | 5 Years | | 10 Years | |
| Fund | 26.96% | | 15.04 % | | 7.30 | % |
| Standard & Poor’s 500 | | | | | | |
| Composite Stock Price Index | 27.16% | | 15.16 % | | 7.45 | % |
|
| † Source: Lipper Inc. |
| Past performance is not predictive of future performance.The fund’s performance shown in the graph and table does not |
| reflect the deduction of taxes that a shareholder would pay on fund distributions or the redemption of fund shares. |
| The above graph compares a $10,000 investment made in Dreyfus BASIC S&P 500 Stock Index Fund on |
| 10/31/03 to a $10,000 investment made in the Standard & Poor’s 500 Composite Stock Price Index (the “Index”) |
| on that date.All dividends and capital gain distributions are reinvested. |
| The fund’s performance shown in the line graph above takes into account all applicable fees and expenses.The Index is a |
| widely accepted, unmanaged index of U.S. stock market performance. Unlike a mutual fund, the Index is not subject to |
| charges, fees and other expenses. Investors cannot invest directly in any index. Further information relating to fund |
| performance, including expense reimbursements, if applicable, is contained in the Financial Highlights section of the |
| prospectus and elsewhere in this report. |
6
UNDERSTANDING YOUR FUND’S EXPENSES (Unaudited)
As a mutual fund investor, you pay ongoing expenses, such as management fees and other expenses. Using the information below, you can estimate how these expenses affect your investment and compare them with the expenses of other funds.You also may pay one-time transaction expenses, including sales charges (loads) and redemption fees, which are not shown in this section and would have resulted in higher total expenses. For more information, see your fund’s prospectus or talk to your financial adviser.
Review your fund’s expenses
The table below shows the expenses you would have paid on a $1,000 investment in Dreyfus BASIC S&P 500 Stock Index Fund from May 1, 2013 to October 31, 2013. It also shows how much a $1,000 investment would be worth at the close of the period, assuming actual returns and expenses.
Expenses and Value of a $1,000 Investment
assuming actual returns for the six months ended October 31, 2013
| |
| Expenses paid per $1,000† | $1.06 |
| Ending value (after expenses) | $1,110.40 |
COMPARING YOUR FUND’S EXPENSES
WITH THOSE OF OTHER FUNDS (Unaudited)
Using the SEC’s method to compare expenses
The Securities and Exchange Commission (SEC) has established guidelines to help investors assess fund expenses. Per these guidelines, the table below shows your fund’s expenses based on a $1,000 investment, assuming a hypothetical 5% annualized return. You can use this information to compare the ongoing expenses (but not transaction expenses or total cost) of investing in the fund with those of other funds.All mutual fund shareholder reports will provide this information to help you make this comparison. Please note that you cannot use this information to estimate your actual ending account balance and expenses paid during the period.
Expenses and Value of a $1,000 Investment
assuming a hypothetical 5% annualized return for the six months ended October 31, 2013
| |
| Expenses paid per $1,000† | $1.02 |
| Ending value (after expenses) | $1,024.20 |
|
| † Expenses are equal to the fund’s annualized expense ratio of .20%, multiplied by the average account value over the |
| period, multiplied by 184/365 (to reflect the one-half year period). |
|
| STATEMENT OF INVESTMENTS |
| October 31, 2013 |
| | | |
| Common Stocks—96.9% | Shares | | Value ($) |
| Automobiles & Components—1.1% | | | |
| BorgWarner | 13,138 | | 1,354,922 |
| Delphi Automotive | 33,647 | | 1,924,608 |
| Ford Motor | 456,808 | | 7,815,985 |
| General Motors | 108,937 | a | 4,025,222 |
| Goodyear Tire & Rubber | 27,230 | | 571,285 |
| Harley-Davidson | 26,526 | | 1,698,725 |
| Johnson Controls | 79,288 | | 3,659,141 |
| | | | 21,049,888 |
| Banks—2.7% | | | |
| BB&T | 81,116 | | 2,755,511 |
| Comerica | 22,721 | | 983,819 |
| Fifth Third Bancorp | 101,360 | | 1,928,881 |
| Hudson City Bancorp | 51,363 | | 461,240 |
| Huntington Bancshares | 99,736 | | 877,677 |
| KeyCorp | 107,080 | | 1,341,712 |
| M&T Bank | 15,068 | | 1,695,602 |
| People’s United Financial | 38,785 | | 559,668 |
| PNC Financial Services Group | 61,376 | | 4,512,977 |
| Regions Financial | 164,134 | | 1,580,610 |
| SunTrust Banks | 62,731 | | 2,110,271 |
| U.S. Bancorp | 213,306 | | 7,969,112 |
| Wells Fargo & Co. | 560,416 | | 23,924,159 |
| Zions Bancorporation | 21,321 | | 604,877 |
| | | | 51,306,116 |
| Capital Goods—7.9% | | | |
| 3M | 75,276 | | 9,473,485 |
| AMETEK | 28,038 | | 1,341,058 |
| Boeing | 80,473 | | 10,501,726 |
| Caterpillar | 73,800 | | 6,151,968 |
| Cummins | 20,562 | | 2,611,785 |
| Danaher | 69,350 | | 4,999,441 |
| Deere & Co. | 44,745 | | 3,661,931 |
| Dover | 19,871 | | 1,823,959 |
| Eaton | 54,753 | | 3,863,372 |
| Emerson Electric | 82,815 | | 5,546,121 |
| Fastenal | 31,329 | | 1,560,184 |
8
| | | | |
| Common Stocks (continued) | Shares | | | Value ($) |
| Capital Goods (continued) | | | | |
| Flowserve | 16,654 | | 1,156,953 |
| Fluor | 18,843 | | 1,398,527 |
| General Dynamics | 38,545 | | 3,339,153 |
| General Electric | 1,181,096 | | 30,873,849 |
| Honeywell International | 91,068 | | 7,898,328 |
| Illinois Tool Works | 48,541 | | 3,824,545 |
| Ingersoll-Rand | 31,594 | | 2,133,543 |
| Jacobs Engineering Group | 14,807 | a | 900,562 |
| Joy Global | 11,790 | b | 669,083 |
| L-3 Communications Holdings | 10,418 | | 1,046,488 |
| Lockheed Martin | 30,905 | | 4,120,873 |
| Masco | 41,502 | | 876,937 |
| Northrop Grumman | 26,701 | | 2,870,625 |
| PACCAR | 40,682 | | 2,261,919 |
| Pall | 13,443 | | 1,082,430 |
| Parker Hannifin | 17,217 | | 2,009,568 |
| Pentair | 23,420 | | 1,571,248 |
| Precision Castparts | 16,937 | | 4,292,683 |
| Quanta Services | 24,420 | a | 737,728 |
| Raytheon | 37,619 | | 3,098,677 |
| Rockwell Automation | 16,119 | | 1,779,699 |
| Rockwell Collins | 16,531 | | 1,154,360 |
| Roper Industries | 11,421 | | 1,448,297 |
| Snap-on | 6,474 | | 673,749 |
| Stanley Black & Decker | 18,567 | | 1,468,464 |
| Textron | 31,551 | | 908,353 |
| United Technologies | 97,529 | | 10,362,456 |
| W.W. Grainger | 7,038 | 1,893,011 |
| Xylem | 20,641 | | 712,115 |
| | | | | 148,099,253 |
| Commercial & Professional Services—.7% | | | | |
| ADT | 23,225 | b | 1,007,268 |
| Cintas | 12,571 | | 675,943 |
| Dun & Bradstreet | 5,145 | | 559,725 |
| Equifax | 13,570 | | 877,572 |
| Iron Mountain | 19,124 | | 507,551 |
STATEMENT OF INVESTMENTS (continued)
| | | |
| Common Stocks (continued) | Shares | | Value ($) |
| Commercial & Professional Services (continued) | | | |
| Nielsen Holdings | 24,234 | | 955,789 |
| Pitney Bowes | 21,441 | b | 457,551 |
| Republic Services | 33,460 | | 1,119,906 |
| Robert Half International | 17,032 | | 656,243 |
| Stericycle | 9,632 | a | 1,119,238 |
| Tyco International | 53,000 | | 1,937,150 |
| Waste Management | 50,604 | | 2,203,298 |
| | | | 12,077,234 |
| Consumer Durables & Apparel—1.2% | | | |
| Coach | 32,640 | | 1,654,195 |
| D.R. Horton | 32,446 | | 614,852 |
| Fossil Group | 5,913 | a | 750,596 |
| Garmin | 14,253 | b | 666,328 |
| Harman International Industries | 8,185 | | 663,149 |
| Hasbro | 13,437 | b | 694,021 |
| Leggett & Platt | 16,536 | | 491,781 |
| Lennar, Cl. A | 18,800 | | 668,340 |
| Mattel | 39,970 | | 1,773,469 |
| Newell Rubbermaid | 33,889 | | 1,004,131 |
| NIKE, Cl. B | 86,694 | | 6,567,937 |
| PulteGroup | 39,732 | | 701,270 |
| PVH | 9,377 | | 1,168,093 |
| Ralph Lauren | 6,868 | | 1,137,616 |
| VF | 10,107 | | 2,173,005 |
| Whirlpool | 8,906 | | 1,300,365 |
| | | | 22,029,148 |
| Consumer Services—1.8% | | | |
| Carnival | 50,564 | | 1,752,043 |
| Chipotle Mexican Grill | 3,615 | a | 1,904,997 |
| Darden Restaurants | 14,413 | | 742,702 |
| H&R Block | 33,302 | | 947,109 |
| International Game Technology | 28,677 | | 539,128 |
| Marriott International, Cl. A | 26,396 | | 1,189,932 |
| McDonald’s | 116,041 | | 11,200,277 |
| Starbucks | 86,461 | | 7,007,664 |
10
| | | | |
| Common Stocks (continued) | Shares | | | Value ($) |
| Consumer Services (continued) | | | | |
| Starwood Hotels & Resorts Worldwide | 22,717c | | 1,672,426 |
| Wyndham Worldwide | 15,430 | | | 1,024,552 |
| Wynn Resorts | 9,233 | | | 1,534,986 |
| Yum! Brands | 51,581 | | | 3,487,907 |
| | | | | 33,003,723 |
| Diversified Financials—8.0% | | | | |
| American Express | 107,623 | | | 8,803,561 |
| Ameriprise Financial | 23,234 | | | 2,335,946 |
| Bank of America | 1,248,830 | | | 17,433,667 |
| Bank of New York Mellon | 133,429 | | | 4,243,042 |
| Berkshire Hathaway, Cl. B | 208,747a | | 24,022,605 |
| BlackRock | 14,604 | | | 4,393,029 |
| Capital One Financial | 67,380 | | | 4,626,985 |
| Charles Schwab | 134,029 | | | 3,035,757 |
| Citigroup | 352,209 | | | 17,180,755 |
| CME Group | 35,555 | | | 2,638,537 |
| Discover Financial Services | 57,301 | | | 2,972,776 |
| E*TRADE Financial | 27,106 | a | | 458,362 |
| Franklin Resources | 48,113 | | | 2,591,366 |
| Goldman Sachs Group | 48,449 | | | 7,793,506 |
| IntercontinentalExchange | 8,333 | a | | 1,606,019 |
| Invesco | 51,561 | | | 1,740,184 |
| JPMorgan Chase & Co. | 437,795 | | | 22,563,954 |
| Legg Mason | 14,453 | | | 556,007 |
| Leucadia National | 36,317 | | | 1,029,224 |
| McGraw-Hill Financial | 31,691 | | | 2,208,229 |
| Moody’s | 22,303 | | | 1,575,930 |
| Morgan Stanley | 160,706 | | | 4,617,083 |
| NASDAQ OMX Group | 15,059 | | | 533,540 |
| Northern Trust | 25,444 | | | 1,435,550 |
| NYSE Euronext | 29,115 | | | 1,281,642 |
| SLM | 51,626 | | | 1,309,752 |
| State Street | 51,727 | | | 3,624,511 |
| T. Rowe Price Group | 29,868 | | | 2,312,082 |
| | | | | 148,923,601 |
STATEMENT OF INVESTMENTS (continued)
| | | | |
| Common Stocks (continued) | Shares | | | Value ($) |
| Energy—10.2% | | | | |
| Anadarko Petroleum | 57,942 | | | 5,521,293 |
| Apache | 46,813 | | | 4,156,994 |
| Baker Hughes | 51,015 | | | 2,963,461 |
| Cabot Oil & Gas | 49,012 | | | 1,731,104 |
| Cameron International | 28,486 | a | | 1,562,742 |
| Chesapeake Energy | 60,587 | | | 1,694,013 |
| Chevron | 224,376 | | | 26,916,145 |
| ConocoPhillips | 140,931 | | | 10,330,242 |
| CONSOL Energy | 25,386 | | | 926,589 |
| Denbury Resources | 44,264 | a | | 840,573 |
| Devon Energy | 43,720 | | | 2,763,978 |
| Diamond Offshore Drilling | 8,272 | b | | 512,285 |
| Ensco, Cl. A | 26,673 | | | 1,537,698 |
| EOG Resources | 31,288 | | | 5,581,779 |
| EQT | 17,407 | | | 1,490,213 |
| Exxon Mobil | 510,468 | | | 45,748,142 |
| FMC Technologies | 26,863 a | | 1,357,925 |
| Halliburton | 98,075 | | | 5,200,917 |
| Helmerich & Payne | 12,323 | | | 955,649 |
| Hess | 33,460 | | | 2,716,952 |
| Kinder Morgan | 78,029 | | | 2,755,204 |
| Marathon Oil | 81,124 | | | 2,860,432 |
| Marathon Petroleum | 36,325 | | | 2,603,050 |
| Murphy Oil | 21,403 | | | 1,291,029 |
| Nabors Industries | 32,764 | | | 572,715 |
| National Oilwell Varco | 49,443 | | | 4,013,783 |
| Newfield Exploration | 15,347 a | | 467,316 |
| Noble | 29,586 | | | 1,115,392 |
| Noble Energy | 41,419 | | | 3,103,526 |
| Occidental Petroleum | 93,059 | | | 8,941,109 |
| Peabody Energy | 30,244 | | | 589,153 |
| Phillips 66 | 71,490 | | | 4,606,101 |
| Pioneer Natural Resources | 15,882 | | | 3,252,316 |
| QEP Resources | 20,485 | | | 677,234 |
| Range Resources | 18,984 | | | 1,437,279 |
| Rowan, Cl. A | 14,515 | a | | 523,701 |
12
| | | | |
| Common Stocks (continued) | Shares | | | Value ($) |
| Energy (continued) | | | | |
| Schlumberger | 153,352 | | | 14,372,149 |
| Southwestern Energy | 40,486 a | | 1,506,889 |
| Spectra Energy | 77,447 | | | 2,754,790 |
| Tesoro | 15,398 | | | 752,808 |
| Transocean | 38,918 | | | 1,831,870 |
| Valero Energy | 63,477 | | | 2,613,348 |
| Williams | 78,076 | | | 2,788,094 |
| WPX Energy | 21,944 a | | | 485,840 |
| | | | | 190,423,822 |
| Food & Staples Retailing—2.3% | | | | |
| Costco Wholesale | 50,542 | | | 5,963,956 |
| CVS Caremark | 141,804 | | | 8,828,717 |
| Kroger | 60,423 | | | 2,588,521 |
| Safeway | 27,819 | | | 970,883 |
| Sysco | 68,683 | | | 2,221,208 |
| Wal-Mart Stores | 188,766 | | | 14,487,791 |
| Walgreen | 100,802 | | | 5,971,510 |
| Whole Foods Market | 43,163 | | | 2,724,880 |
| | | | | 43,757,466 |
| Food, Beverage & Tobacco—5.3% | | | | |
| Altria Group | 232,139 | | | 8,642,535 |
| Archer-Daniels-Midland | 75,776 | | | 3,099,238 |
| Beam | 18,244 | | | 1,227,821 |
| Brown-Forman, Cl. B | 18,828 | | | 1,374,067 |
| Campbell Soup | 19,759 | | | 841,141 |
| Coca-Cola | 443,089 | | | 17,533,032 |
| Coca-Cola Enterprises | 30,366 | | | 1,267,173 |
| ConAgra Foods | 47,387 | | | 1,507,380 |
| Constellation Brands, Cl. A | 19,211 a | | 1,254,478 |
| Dr. Pepper Snapple Group | 24,740 | | | 1,171,439 |
| General Mills | 75,065 | | | 3,784,777 |
| Hershey | 17,141 | | | 1,701,073 |
| Hormel Foods | 15,659 b | | 680,540 |
| J.M. Smucker | 12,163 | | | 1,352,647 |
| Kellogg | 28,815 | | | 1,822,549 |
| Kraft Foods Group | 68,327 | | | 3,715,622 |
STATEMENT OF INVESTMENTS (continued)
| | | |
| Common Stocks (continued) | Shares | | Value ($) |
| Food, Beverage & Tobacco (continued) | | | |
| Lorillard | 43,927 | | 2,240,716 |
| McCormick & Co. | 15,260 | | 1,055,229 |
| Mead Johnson Nutrition | 23,489 | | 1,918,112 |
| Molson Coors Brewing, Cl. B | 18,047 | | 974,538 |
| Mondelez International, Cl. A | 206,543 | | 6,948,107 |
| Monster Beverage | 15,742 | a | 900,915 |
| PepsiCo | 178,991 | | 15,051,353 |
| Philip Morris International | 187,707 | | 16,728,448 |
| Reynolds American | 37,590 | | 1,930,998 |
| Tyson Foods, Cl. A | 33,645 | | 930,957 |
| | | | 99,654,885 |
| Health Care Equipment & Services—4.1% | | | |
| Abbott Laboratories | 181,433 | | 6,631,376 |
| Aetna | 43,853 | | 2,749,583 |
| AmerisourceBergen | 26,425 | | 1,726,345 |
| Baxter International | 63,167 | | 4,160,810 |
| Becton Dickinson & Co. | 22,298 | | 2,344,189 |
| Boston Scientific | 153,123 | a | 1,790,008 |
| C.R. Bard | 9,033 | | 1,230,475 |
| Cardinal Health | 39,556 | | 2,320,355 |
| CareFusion | 25,323 | a | 981,773 |
| Cerner | 33,813 | a | 1,894,542 |
| Cigna | 33,114 | | 2,549,116 |
| Covidien | 53,997 | | 3,461,748 |
| DaVita HealthCare Partners | 19,780 | a | 1,111,834 |
| DENTSPLY International | 16,652 | | 784,309 |
| Edwards Lifesciences | 13,373 | a | 871,786 |
| Express Scripts Holding | 94,049 | a | 5,879,943 |
| Humana | 18,705 | | 1,723,666 |
| Intuitive Surgical | 4,648 | a | 1,726,732 |
| Laboratory Corp. of America Holdings | 10,455 | a | 1,054,910 |
| McKesson | 26,286 | | 4,109,553 |
| Medtronic | 115,683 | | 6,640,204 |
| Patterson | 10,092 | | 429,011 |
| Quest Diagnostics | 18,376 | | 1,100,906 |
| St. Jude Medical | 32,851 | | 1,885,319 |
14
| | | |
| Common Stocks (continued) | Shares | | Value ($) |
| Health Care Equipment & Services (continued) | | | |
| Stryker | 33,610 | | 2,482,435 |
| Tenet Healthcare | 12,045 | a | 568,404 |
| UnitedHealth Group | 118,274 | | 8,073,383 |
| Varian Medical Systems | 12,661 | a | 918,935 |
| WellPoint | 34,478 | | 2,923,734 |
| Zimmer Holdings | 19,984 | | 1,748,000 |
| | | | 75,873,384 |
| Household & Personal Products—2.2% | | | |
| Avon Products | 50,205 | | 878,587 |
| Clorox | 15,233 | | 1,373,864 |
| Colgate-Palmolive | 101,644 | | 6,579,416 |
| Estee Lauder, Cl. A | 29,632 | | 2,102,687 |
| Kimberly-Clark | 44,780 | | 4,836,240 |
| Procter & Gamble | 317,239 | | 25,617,049 |
| | | | 41,387,843 |
| Insurance—2.9% | | | |
| ACE | 39,200 | | 3,741,248 |
| Aflac | 54,307 | | 3,528,869 |
| Allstate | 53,756 | | 2,852,293 |
| American International Group | 170,984 | | 8,831,324 |
| Aon | 36,127 | | 2,857,284 |
| Assurant | 9,063 | | 530,004 |
| Chubb | 29,773 | | 2,741,498 |
| Cincinnati Financial | 17,007 | | 850,350 |
| Genworth Financial, Cl. A | 57,088 | a | 829,489 |
| Hartford Financial Services Group | 52,743 | | 1,777,439 |
| Lincoln National | 31,421 | | 1,426,828 |
| Loews | 36,189 | | 1,748,291 |
| Marsh & McLennan | 62,736 | | 2,873,309 |
| MetLife | 129,825 | | 6,142,021 |
| Principal Financial Group | 31,595 | | 1,499,499 |
| Progressive | 65,042 | | 1,689,141 |
| Prudential Financial | 53,611 | | 4,363,399 |
| Torchmark | 11,328 | | 825,358 |
| Travelers | 43,493 | | 3,753,446 |
| Unum Group | 30,590 | | 970,927 |
STATEMENT OF INVESTMENTS (continued)
| | | |
| Common Stocks (continued) | Shares | | Value ($) |
| Insurance (continued) | | | |
| XL Group | 34,140 | | 1,043,660 |
| | | | 54,875,677 |
| Materials—3.4% | | | |
| Air Products & Chemicals | 24,263 | | 2,644,910 |
| Airgas | 7,696 | | 839,403 |
| Alcoa | 123,658 | | 1,146,310 |
| Allegheny Technologies | 12,302 | | 407,196 |
| Avery Dennison | 11,389 | | 536,650 |
| Ball | 17,551 | | 858,068 |
| Bemis | 11,478 | | 457,972 |
| CF Industries Holdings | 6,890 | | 1,485,484 |
| Cliffs Natural Resources | 16,289 | b | 418,302 |
| Dow Chemical | 140,000 | | 5,525,800 |
| E.I. du Pont de Nemours & Co. | 106,633 | | 6,525,940 |
| Eastman Chemical | 17,960 | | 1,415,068 |
| Ecolab | 31,445 | | 3,333,170 |
| FMC | 16,238 | | 1,181,477 |
| Freeport-McMoRan Copper & Gold | 119,842 | | 4,405,392 |
| International Flavors & Fragrances | 9,179 | | 758,644 |
| International Paper | 51,484 | | 2,296,701 |
| LyondellBasell Industries, Cl. A | 51,875 | | 3,869,875 |
| MeadWestvaco | 20,116 | | 701,043 |
| Monsanto | 61,837 | | 6,485,465 |
| Mosaic | 39,432 | | 1,807,957 |
| Newmont Mining | 57,527 | | 1,568,186 |
| Nucor | 36,652 | | 1,897,474 |
| Owens-Illinois | 19,129 | a | 608,111 |
| PPG Industries | 16,535 | | 3,018,960 |
| Praxair | 34,275 | | 4,274,435 |
| Sealed Air | 22,316 | | 673,497 |
| Sherwin-Williams | 10,022 | | 1,884,136 |
| Sigma-Aldrich | 13,646 | | 1,179,424 |
| United States Steel | 16,728 | b | 416,360 |
| Vulcan Materials | 14,932 | | 799,609 |
| | | | 63,421,019 |
16
| | | | |
| Common Stocks (continued) | Shares | | Value ($) |
| Media—3.6% | | | | |
| Cablevision Systems (NY Group), Cl. A | 24,698 | | 384,054 |
| CBS, Cl. B | 65,245 | | 3,858,589 |
| Comcast, Cl. A | 303,312 | | 14,431,585 |
| DIRECTV | 59,261 | a | 3,703,220 |
| Discovery Communications, Cl. A | 26,785 | a | 2,381,722 |
| Gannett | 25,974 | | 718,701 |
| Interpublic Group of Cos | 48,090 | | 807,912 |
| News Corp., Cl. A | 57,720 | a | 1,015,872 |
| Omnicom Group | 30,224 | | 2,058,557 |
| Scripps Networks Interactive, Cl. A | 12,664 | | 1,019,452 |
| Time Warner | 106,702 | | 7,334,695 |
| Time Warner Cable | 33,729 | | 4,052,539 |
| Twenty-First Century Fox, Cl. A | 230,881 | | 7,868,424 |
| Viacom, Cl. B | 50,342 | | 4,192,985 |
| Walt Disney | 192,814 | | 13,225,112 |
| Washington Post, Cl. B | 566 | | 364,119 |
| | | | | 67,417,538 |
| Pharmaceuticals, Biotech & | | | | |
| Life Sciences—8.6% | | | | |
| AbbVie | 183,613 | | 8,896,050 |
| Actavis | 20,090 | a | 3,105,512 |
| Agilent Technologies | 38,377 | | 1,948,017 |
| Alexion Pharmaceuticals | 22,557 | a | 2,773,383 |
| Allergan | 34,372 | | 3,114,447 |
| Amgen | 87,353 | | 10,132,948 |
| Biogen Idec | 27,419 | a | 6,695,446 |
| Bristol-Myers Squibb | 190,123 | | 9,985,260 |
| Celgene | 47,698 | a | 7,082,676 |
| Eli Lilly & Co. | 115,397 | | 5,749,079 |
| Forest Laboratories | 27,190 | a | 1,278,746 |
| Gilead Sciences | 176,556 | a | 12,533,710 |
| Hospira | 18,784 | a | 761,128 |
| Johnson & Johnson | 326,773 | | 30,262,448 |
| Life Technologies | 20,387 | a | 1,535,345 |
| Merck & Co. | 339,454 | | 15,305,981 |
STATEMENT OF INVESTMENTS (continued)
| | | | |
| Common Stocks (continued) | Shares | | | Value ($) |
| Pharmaceuticals, Biotech & | | | | |
| Life Sciences (continued) | | | | |
| Mylan | 45,731 | a | 1,731,833 |
| PerkinElmer | 13,167 | | 500,873 |
| Perrigo | 10,906 | b | 1,503,828 |
| Pfizer | 767,754 | | 23,554,693 |
| Regeneron Pharmaceuticals | 8,810 | a | 2,533,756 |
| Thermo Fisher Scientific | 41,542 | | 4,061,977 |
| Vertex Pharmaceuticals | 26,727 | a | 1,906,704 |
| Waters | 10,329 | a | 1,042,403 |
| Zoetis | 57,959 | | | 1,834,982 |
| | | | | 159,831,225 |
| Real Estate—1.9% | | | | |
| American Tower | 45,330 | c | 3,596,935 |
| Apartment Investment & Management, Cl. A | 16,932 | c | 473,757 |
| AvalonBay Communities | 14,067 | c | 1,759,078 |
| Boston Properties | 17,443 | c | 1,805,351 |
| CBRE Group, Cl. A | 32,190 | a | 747,774 |
| Equity Residential | 38,844 | c | 2,033,872 |
| HCP | 52,423 | c | 2,175,555 |
| Health Care | 32,443 | c | 2,103,929 |
| Host Hotels & Resorts | 86,166 | c | 1,598,379 |
| Kimco Realty | 45,691 | c | 981,443 |
| Macerich | 15,857 | c | 938,893 |
| Plum Creek Timber | 18,356 | c | 833,362 |
| Prologis | 57,621 | c | 2,301,959 |
| Public Storage | 16,547 | c | 2,762,853 |
| Simon Property Group | 36,172 | c | 5,590,383 |
| Ventas | 33,642 | c | 2,194,804 |
| Vornado Realty Trust | 19,668 | c | 1,751,632 |
| Weyerhaeuser | 67,675 | c | 2,057,320 |
| | | | | 35,707,279 |
| Retailing—4.4% | | | | |
| Abercrombie & Fitch, Cl. A | 10,036 | | 376,149 |
| Amazon.com | 42,907 | a | 15,619,435 |
| AutoNation | 7,436 | a | 358,638 |
| AutoZone | 4,121 | a | 1,791,357 |
18
| | | | |
| Common Stocks (continued) | Shares | | Value ($) |
| Retailing (continued) | | | | |
| Bed Bath & Beyond | 25,402 | a | 1,964,083 |
| Best Buy | 30,940 | | 1,324,232 |
| CarMax | 25,600 | a | 1,202,944 |
| Dollar General | 34,910 | a | 2,017,100 |
| Dollar Tree | 25,436 | a | 1,485,462 |
| Expedia | 12,440 | | 732,467 |
| Family Dollar Stores | 11,285 | | 777,311 |
| GameStop, Cl. A | 13,573 | | 744,072 |
| Gap | 32,012 | | 1,184,124 |
| Genuine Parts | 17,814 | | 1,404,278 |
| Home Depot | 166,141 | | 12,940,722 |
| J.C. Penney | 22,190 | a,b | 166,425 |
| Kohl’s | 23,685 | | 1,345,308 |
| L Brands | 28,389 | | 1,777,435 |
| Lowe’s | 121,992 | | 6,072,762 |
| Macy’s | 43,647 | | 2,012,563 |
| Netflix | 6,829 | a | 2,202,216 |
| Nordstrom | 17,712 | | 1,071,045 |
| O’Reilly Automotive | 12,878 | a | 1,594,425 |
| PetSmart | 12,511 | | 910,300 |
| priceline.com | 5,987 | a | 6,309,280 |
| Ross Stores | 26,051 | | 2,015,045 |
| Staples | 79,268 | b | 1,277,800 |
| Target | 73,198 | | 4,742,498 |
| The TJX Companies | 83,249 | | 5,060,707 |
| Tiffany & Co. | 12,775 | | 1,011,397 |
| TripAdvisor | 12,694 | a | 1,049,921 |
| Urban Outfitters | 11,917 | a | 451,416 |
| | | | | 82,992,917 |
| Semiconductors & Semiconductor | | | | |
| Equipment—2.0% | | | | |
| Altera | 37,276 | | 1,252,474 |
| Analog Devices | 34,931 | | 1,722,098 |
| Applied Materials | 136,713 | | 2,440,327 |
| Broadcom, Cl. A | 63,744 | | 1,703,240 |
| First Solar | 7,687 | a,b | 386,425 |
STATEMENT OF INVESTMENTS (continued)
| | | |
| Common Stocks (continued) | Shares | | Value ($) |
| Semiconductors & Semiconductor | | | |
| Equipment (continued) | | | |
| Intel | 575,383 | | 14,056,607 |
| KLA-Tencor | 18,662 | | 1,224,227 |
| Lam Research | 18,864 | a | 1,022,995 |
| Linear Technology | 26,987 | | 1,110,245 |
| LSI | 64,061 | | 543,237 |
| Microchip Technology | 22,816 | b | 980,175 |
| Micron Technology | 117,734 | a | 2,081,537 |
| NVIDIA | 70,747 | b | 1,073,939 |
| Teradyne | 22,312 | a,b | 390,237 |
| Texas Instruments | 128,490 | | 5,406,859 |
| Xilinx | 29,742 | | 1,350,882 |
| | | | 36,745,504 |
| Software & Services—9.1% | | | |
| Accenture, Cl. A | 75,241 | | 5,530,213 |
| Adobe Systems | 54,202 | a | 2,937,748 |
| Akamai Technologies | 21,258 | a | 951,083 |
| Autodesk | 26,096 | a | 1,041,491 |
| Automatic Data Processing | 56,364 | | 4,225,609 |
| CA | 37,335 | | 1,185,760 |
| Citrix Systems | 21,695 | a | 1,231,842 |
| Cognizant Technology Solutions, Cl. A | 34,663 | a | 3,013,255 |
| Computer Sciences | 17,998 | | 886,581 |
| eBay | 134,527 | a | 7,090,918 |
| Electronic Arts | 36,996 | a | 971,145 |
| Fidelity National Information Services | 33,567 | | 1,636,391 |
| Fiserv | 15,475 | a | 1,620,697 |
| Google, Cl. A | 32,426 | a | 33,417,587 |
| International Business Machines | 119,419 | | 21,401,079 |
| Intuit | 34,408 | | 2,457,075 |
| MasterCard, Cl. A | 12,111 | | 8,684,798 |
| Microsoft | 878,939 | | 31,070,494 |
| Oracle | 413,619 | | 13,856,237 |
| Paychex | 37,731 | b | 1,594,512 |
| Red Hat | 22,540 | a | 975,306 |
| salesforce.com | 63,569 | a | 3,392,042 |
20
| | | |
| Common Stocks (continued) | Shares | | Value ($) |
| Software & Services (continued) | | | |
| Symantec | 80,617 | | 1,833,231 |
| Teradata | 19,673 | a | 866,989 |
| Total System Services | 19,231 | | 573,661 |
| VeriSign | 15,680 | a | 851,110 |
| Visa, Cl. A | 59,848 | | 11,770,306 |
| Western Union | 65,853 | | 1,120,818 |
| Yahoo! | 112,279 | a | 3,697,347 |
| | | | 169,885,325 |
| Technology Hardware & | | | |
| Equipment—6.2% | | | |
| Amphenol, Cl. A | 18,509 | | 1,486,088 |
| Apple | 105,384 | | 55,047,332 |
| Cisco Systems | 621,705 | | 13,988,362 |
| Corning | 172,936 | | 2,955,476 |
| EMC | 242,890 | | 5,846,362 |
| F5 Networks | 9,160 | a | 746,632 |
| FLIR Systems | 17,012 | | 484,502 |
| Harris | 13,218 | | 818,987 |
| Hewlett-Packard | 225,540 | | 5,496,410 |
| Jabil Circuit | 21,158 | | 441,356 |
| JDS Uniphase | 27,367 | a | 358,234 |
| Juniper Networks | 59,406 | a | 1,107,328 |
| Molex | 16,286 | | 628,640 |
| Motorola Solutions | 27,481 | | 1,718,112 |
| NetApp | 41,011 | | 1,591,637 |
| QUALCOMM | 198,935 | | 13,820,014 |
| SanDisk | 27,537 | | 1,913,822 |
| Seagate Technology | 36,966 | | 1,799,505 |
| TE Connectivity | 47,834 | | 2,462,973 |
| Western Digital | 24,717 | | 1,721,045 |
| Xerox | 134,420 | | 1,336,135 |
| | | | 115,768,952 |
| Telecommunication Services—2.4% | | | |
| AT&T | 615,952 | | 22,297,462 |
| CenturyLink | 69,678 | | 2,359,297 |
| Crown Castle International | 38,156 | a | 2,900,619 |
STATEMENT OF INVESTMENTS (continued)
| | | |
| Common Stocks (continued) | Shares | | Value ($) |
| Telecommunication Services (continued) | | | |
| Frontier Communications | 111,693 | b | 492,566 |
| Verizon Communications | 331,175 | | 16,727,649 |
| Windstream Holdings | 65,334 | b | 558,606 |
| | | | 45,336,199 |
| Transportation—1.9% | | | |
| C.H. Robinson Worldwide | 18,312 | | 1,093,959 |
| CSX | 119,246 | | 3,107,551 |
| Delta Air Lines | 97,905 | | 2,582,734 |
| Expeditors International of Washington | 23,731 | | 1,074,777 |
| FedEx | 33,948 | | 4,447,188 |
| Kansas City Southern | 12,711 | | 1,544,641 |
| Norfolk Southern | 37,042 | | 3,186,353 |
| Ryder System | 6,008 | | 395,507 |
| Southwest Airlines | 84,296 | | 1,451,577 |
| Union Pacific | 53,911 | | 8,162,125 |
| United Parcel Service, Cl. B | 83,761 | | 8,228,681 |
| | | | 35,275,093 |
| Utilities—3.0% | | | |
| AES | 73,698 | | 1,038,405 |
| AGL Resources | 13,011 | | 622,706 |
| Ameren | 27,134 | | 981,708 |
| American Electric Power | 56,263 | | 2,635,359 |
| CenterPoint Energy | 50,073 | | 1,231,796 |
| CMS Energy | 30,747 | | 844,313 |
| Consolidated Edison | 33,393 | | 1,944,140 |
| Dominion Resources | 66,502 | | 4,239,502 |
| DTE Energy | 19,923 | | 1,377,476 |
| Duke Energy | 81,645 | | 5,856,396 |
| Edison International | 37,654 | | 1,846,176 |
| Entergy | 20,150 | | 1,304,108 |
| Exelon | 97,874 | | 2,793,324 |
| FirstEnergy | 48,563 | | 1,839,081 |
| Integrys Energy Group | 8,916 | | 523,191 |
22
| | | | |
| | Common Stocks (continued) | Shares | | Value ($) |
| | Utilities (continued) | | | |
| | NextEra Energy | 49,023 | | 4,154,699 |
| | NiSource | 35,811 | | 1,128,763 |
| | Northeast Utilities | 35,573 | | 1,525,726 |
| | NRG Energy | 37,309 | | 1,064,426 |
| | ONEOK | 24,136 | | 1,363,684 |
| | Pepco Holdings | 27,041 | | 521,350 |
| | PG&E | 50,602 | | 2,117,694 |
| | Pinnacle West Capital | 12,232 | | 685,359 |
| | PPL | 73,208 | | 2,242,361 |
| | Public Service Enterprise Group | 58,443 | | 1,957,841 |
| | SCANA | 16,143 | | 752,748 |
| | Sempra Energy | 26,117 | | 2,380,303 |
| | Southern | 100,570 | | 4,114,319 |
| | TECO Energy | 24,970 | | 428,735 |
| | Wisconsin Energy | 26,531 | | 1,117,220 |
| | Xcel Energy | 56,369 | | 1,626,809 |
| | | | | 56,259,718 |
| | Total Common Stocks | | | |
| | (cost $1,175,442,300) | | | 1,811,102,809 |
| | | Principal | | |
| Short-Term Investments—.2% | Amount ($) | | Value ($) |
| | U.S. Treasury Bills: | | | |
| | 0.01%, 12/5/13 | 1,320,000 | | 1,319,960 |
| | 0.05%, 3/13/14 | 1,425,000 | | 1,424,712 |
| | Total Short-Term Investments | | | |
| | (cost $2,744,741) | | | 2,744,672 |
| |
| | Other Investment—2.8% | Shares | | Value ($) |
| | Registered Investment Company; | | | |
| | Dreyfus | | | |
| | Institutional Preferred | | | |
| | Plus Money Market Fund | | | |
| | (cost $51,700,177) | 51,700,177 | d | 51,700,177 |
STATEMENT OF INVESTMENTS (continued)
| | | | |
| Investment of Cash Collateral | | | | |
| for Securities Loaned—.3% | Shares | | Value ($) | |
| Registered Investment Company; | | | | |
| Dreyfus Institutional Cash Advantage Fund | | | | |
| (cost $6,186,032) | 6,186,032 | d | 6,186,032 | |
| Total Investments (cost $1,236,073,250) | 100.2 | % | 1,871,733,690 | |
| Liabilities, Less Cash and Receivables | (.2 | %) | (2,902,703 | ) |
| Net Assets | 100.0 | % | 1,868,830,987 | |
|
| a Non-income producing security. |
| b Security, or portion thereof, on loan.At October 31, 2013 the value of the fund’s securities on loan was $9,212,562 |
| and the value of the collateral held by the fund was $9,379,500, consisting of cash collateral of $6,186,032 and |
| U.S. Government & Agency securities valued at $3,193,468. |
| c Investment in real estate investment trust. |
| d Investment in affiliated money market mutual fund. |
| | | |
| Portfolio Summary (Unaudited)† | | |
| |
| | Value (%) | | Value (%) |
| Energy | 10.2 | Insurance | 2.9 |
| Software & Services | 9.1 | Banks | 2.7 |
| Pharmaceuticals, | | Telecommunication Services | 2.4 |
| Biotech & Life Sciences | 8.6 | Food & Staples Retailing | 2.3 |
| Diversified Financials | 8.0 | Household & Personal Products | 2.2 |
| Capital Goods | 7.9 | Semiconductors & | |
| Technology Hardware & Equipment | 6.2 | Semiconductor Equipment | 2.0 |
| Food, Beverage & Tobacco | 5.3 | Real Estate | 1.9 |
| Retailing | 4.4 | Transportation | 1.9 |
| Health Care Equipment & Services | 4.1 | Consumer Services | 1.8 |
| Media | 3.6 | Consumer Durables & Apparel | 1.2 |
| Materials | 3.4 | Automobiles & Components | 1.1 |
| Short-Term/ | | Commercial & Professional Services | .7 |
| Money Market Investments | 3.3 | | |
| Utilities | 3.0 | | 100.2 |
| |
| † Based on net assets. | | | |
| See notes to financial statements. | | | |
24
|
| STATEMENT OF FINANCIAL FUTURES |
| October 31, 2013 |
| | | | | |
| | | Market Value | | Unrealized | |
| | | Covered by | | Appreciation | |
| | Contracts | Contracts ($) | Expiration | at 10/31/2013 | ($) |
| Financial Futures Long | | | | | |
| Standard & Poor’s 500 E-mini | 650 | 56,907,500 | December 2013 | 1,842,518 | |
| |
| See notes to financial statements. | | | | | |
|
| STATEMENT OF ASSETS AND LIABILITIES |
| October 31, 2013 |
| | | |
| | Cost | Value | |
| Assets ($): | | | |
| Investments in securities—See Statement of Investments (including | | | |
| securities on loan, valued at $9,212,562)—Note 1(b): | | | |
| Unaffiliated issuers | 1,178,187,041 | 1,813,847,481 | |
| Affiliated issuers | 57,886,209 | 57,886,209 | |
| Cash | | 1,930,545 | |
| Dividends and securities lending income receivable | | 1,871,533 | |
| Receivable for shares of Capital Stock subscribed | | 471,068 | |
| Other receivables | | 6,450 | |
| | | 1,876,013,286 | |
| Liabilities ($): | | | |
| Due to The Dreyfus Corporation and affiliates—Note 3(a) | | 298,913 | |
| Liability for securities on loan—Note 1(b) | | 6,186,032 | |
| Payable for shares of Capital Stock redeemed | | 381,489 | |
| Payable for futures variation margin—Note 4 | | 311,765 | |
| Accrued expenses | | 4,100 | |
| | | 7,182,299 | |
| Net Assets ($) | | 1,868,830,987 | |
| Composition of Net Assets ($): | | | |
| Paid-in capital | | 1,243,778,459 | |
| Accumulated undistributed investment income—net | | 10,191,133 | |
| Accumulated net realized gain (loss) on investments | | (22,641,563 | ) |
| Accumulated net unrealized appreciation (depreciation) | | | |
| on investments (including $1,842,518 net unrealized | | | |
| appreciation on financial futures) | | 637,502,958 | |
| Net Assets ($) | | 1,868,830,987 | |
| Shares Outstanding | | | |
| (150 millon shares of $.001 par value Capital Stock authorized) | | 51,662,342 | |
| Net Asset Value, offering and redemption price per share ($) | | 36.17 | |
| |
| See notes to financial statements. | | | |
26
|
| STATEMENT OF OPERATIONS |
| Year Ended October 31, 2013 |
| | |
| Investment Income ($): | | |
| Income: | | |
| Cash dividends (net of $21,552 foreign taxes withheld at source): | | |
| Unaffiliated issuers | 34,778,624 | |
| Affiliated issuers | 26,099 | |
| Income from securities lending—Note 1(b) | 76,160 | |
| Interest | 724 | |
| Total Income | 34,881,607 | |
| Expenses: | | |
| Management fee—Note 3(a) | 3,149,183 | |
| Directors’ fees—Note 3(a,b) | 103,849 | |
| Loan commitment fees—Note 2 | 14,548 | |
| Interest expense—Note 2 | 38 | |
| Total Expenses | 3,267,618 | |
| Less—Directors’ fees reimbursed by the Manager—Note 3(a) | (103,849 | ) |
| Net Expenses | 3,163,769 | |
| Investment Income—Net | 31,717,838 | |
| Realized and Unrealized Gain (Loss) on Investments—Note 4 ($): | | |
| Net realized gain (loss) on investments | 4,063,948 | |
| Net realized gain (loss) on financial futures | 4,830,150 | |
| Net Realized Gain (Loss) | 8,894,098 | |
| Net unrealized appreciation (depreciation) on investments | 329,607,171 | |
| Net unrealized appreciation (depreciation) on financial futures | 2,464,631 | |
| Net Unrealized Appreciation (Depreciation) | 332,071,802 | |
| Net Realized and Unrealized Gain (Loss) on Investments | 340,965,900 | |
| Net Increase in Net Assets Resulting from Operations | 372,683,738 | |
| |
| See notes to financial statements. | | |
STATEMENT OF CHANGES IN NET ASSETS
| | | | |
| | Year Ended October 31, | |
| | 2013 | | 2012 | |
| Operations ($): | | | | |
| Investment income—net | 31,717,838 | | 24,450,612 | |
| Net realized gain (loss) on investments | 8,894,098 | | 16,984,335 | |
| Net unrealized appreciation | | | | |
| (depreciation) on investments | 332,071,802 | | 127,060,228 | |
| Net Increase (Decrease) in Net Assets | | | | |
| Resulting from Operations | 372,683,738 | | 168,495,175 | |
| Dividends to Shareholders from ($): | | | | |
| Investment income—net | (29,508,079 | ) | (22,363,506 | ) |
| Capital Stock Transactions ($): | | | | |
| Net proceeds from shares sold | 580,773,076 | | 348,665,208 | |
| Dividends reinvested | 24,806,123 | | 19,038,337 | |
| Cost of shares redeemed | (449,157,920 | ) | (260,041,940 | ) |
| Increase (Decrease) in Net Assets | | | | |
| from Capital Stock Transactions | 156,421,279 | | 107,661,605 | |
| Total Increase (Decrease) in Net Assets | 499,596,938 | | 253,793,274 | |
| Net Assets ($): | | | | |
| Beginning of Period | 1,369,234,049 | | 1,115,440,775 | |
| End of Period | 1,868,830,987 | | 1,369,234,049 | |
| Undistributed investment income—net | 10,191,133 | | 8,189,072 | |
| Capital Share Transactions (Shares): | | | | |
| Shares sold | 17,725,183 | | 12,512,466 | |
| Shares issued for dividends reinvested | 795,878 | | 708,644 | |
| Shares redeemed | (13,980,478 | ) | (9,422,849 | ) |
| Net Increase (Decrease) in Shares Outstanding | 4,540,583 | | 3,798,261 | |
| |
| See notes to financial statements. | | | | |
28
FINANCIAL HIGHLIGHTS
The following table describes the performance for the fiscal periods indicated. Total return shows how much your investment in the fund would have increased (or decreased) during each period, assuming you had reinvested all dividends and distributions.These figures have been derived from the fund’s financial statements.
| | | | | | | | | | |
| | | | | | Year Ended October 31, | | | |
| | 2013 | | 2012 | | 2011 | | 2010 | | 2009 | |
| Per Share Data ($): | | | | | | | | | | |
| Net asset value, | | | | | | | | | | |
| beginning of period | 29.06 | | 25.75 | | 24.29 | | 21.26 | | 20.18 | |
| Investment Operations: | | | | | | | | | | |
| Investment income—neta | .65 | | .55 | | .48 | | .43 | | .44 | |
| Net realized and unrealized | | | | | | | | | | |
| gain (loss) on investments | 7.08 | | 3.27 | | 1.45 | | 3.02 | | 1.42 | |
| Total from Investment Operations | 7.73 | | 3.82 | | 1.93 | | 3.45 | | 1.86 | |
| Distributions: | | | | | | | | | | |
| Dividends from | | | | | | | | | | |
| investment income—net | (.62 | ) | (.51 | ) | (.47 | ) | (.42 | ) | (.46 | ) |
| Dividends from net realized | | | | | | | | | | |
| gain on investments | — | | — | | — | | — | | (.32 | ) |
| Total Distributions | (.62 | ) | (.51 | ) | (.47 | ) | (.42 | ) | (.78 | ) |
| Net asset value, end of period | 36.17 | | 29.06 | | 25.75 | | 24.29 | | 21.26 | |
| Total Return (%) | 26.96 | | 15.00 | | 7.94 | | 16.39 | | 9.84 | |
| Ratios/Supplemental Data (%): | | | | | | | | | | |
| Ratio of total expenses | | | | | | | | | | |
| to average net assets | .21 | | .21 | | .21 | | .21 | | .21 | |
| Ratio of net expenses | | | | | | | | | | |
| to average net assets | .20 | | .20 | | .20 | | .20 | | .20 | |
| Ratio of net investment income | | | | | | | | | | |
| to average net assets | 2.01 | | 1.97 | | 1.84 | | 1.85 | | 2.38 | |
| Portfolio Turnover Rate | 3.45 | | 3.28 | | 2.12 | | 7.64 | | 4.99 | |
| Net Assets, end of period | | | | | | | | | | |
| ($ x 1,000) | 1,868,831 | | 1,369,234 | | 1,115,441 | | 923,496 | | 855,312 | |
| |
| a Based on average shares outstanding at each month end. | | | | | | | | | |
| See notes to financial statements. | | | | | | | | | | |
NOTES TO FINANCIAL STATEMENTS
NOTE 1—Significant Accounting Policies:
Dreyfus BASIC S&P 500 Stock Index Fund (the “fund”) is a separate diversified series of The Dreyfus/Laurel Funds, Inc. (the “Company”), which is registered under the Investment Company Act of 1940, as amended (the “Act”), as an open-end management investment company and operates as a series company currently offering eleven series including the fund.The fund’s investment objective seeks to match the total return of the Standard & Poor’s 500® Composite Stock Price Index. The Dreyfus Corporation (the “Manager” or “Dreyfus”), a wholly-owned subsidiary of The Bank of New York Mellon Corporation (“BNY Mellon”), serves as the fund’s investment adviser. MBSC Securities Corporation (the “Distributor”), a wholly-owned subsidiary of the Manager, is the distributor of the fund’s shares, which are sold to the public without a sales charge.
The Company accounts separately for the assets, liabilities and operations of each series. Expenses directly attributable to each series are charged to that series’ operations; expenses which are applicable to all series are allocated among them on a pro rata basis.
The Financial Accounting Standards Board (“FASB”) Accounting Standards Codification is the exclusive reference of authoritative U.S. generally accepted accounting principles (“GAAP”) recognized by the FASB to be applied by nongovernmental entities. Rules and interpretive releases of the Securities and Exchange Commission (“SEC”) under authority of federal laws are also sources of authoritative GAAP for SEC registrants. The fund’s financial statements are prepared in accordance with GAAP, which may require the use of management estimates and assumptions.Actual results could differ from those estimates.
(a) Portfolio valuation: The fair value of a financial instrument is the amount that would be received to sell an asset or paid to transfer a liability in an orderly transaction between market participants at the measurement date (i.e., the exit price). GAAP establishes a fair value hierarchy that prioritizes the inputs of valuation techniques used to measure fair value. This hierarchy gives the highest priority to unad-
30
justed quoted prices in active markets for identical assets or liabilities (Level 1 measurements) and the lowest priority to unobservable inputs (Level 3 measurements).
Additionally, GAAP provides guidance on determining whether the volume and activity in a market has decreased significantly and whether such a decrease in activity results in transactions that are not orderly. GAAP requires enhanced disclosures around valuation inputs and techniques used during annual and interim periods.
Various inputs are used in determining the value of the fund’s investments relating to fair value measurements.These inputs are summarized in the three broad levels listed below:
Level 1—unadjusted quoted prices in active markets for identical investments.
Level 2—other significant observable inputs (including quoted prices for similar investments, interest rates, prepayment speeds, credit risk, etc.).
Level 3—significant unobservable inputs (including the fund’s own assumptions in determining the fair value of investments).
The inputs or methodology used for valuing securities are not necessarily an indication of the risk associated with investing in those securities.
Changes in valuation techniques may result in transfers in or out of an assigned level within the disclosure hierarchy. Valuation techniques used to value the fund’s investments are as follows:
Investments in securities are valued at the last sales price on the securities exchange or national securities market on which such securities are primarily traded. Securities listed on the National Market System for which market quotations are available are valued at the official closing price or, if there is no official closing price that day, at the last sales price. Securities not listed on an exchange or the national securities market, or securities for which there were no transactions, are valued at the average of the most recent bid and asked prices, except for open short positions, where the asked price is used for valuation purposes. Bid
NOTES TO FINANCIAL STATEMENTS (continued)
price is used when no asked price is available. Registered investment companies that are not traded on an exchange are valued at their net asset value. All of the preceding securities are categorized within Level 1 of the fair value hierarchy.
U.S. Treasury Bills are valued at the mean price between quoted bid prices and asked prices by an independent pricing service (the “Service”) approved by the Company’s Board of Directors (the “Board”).These securities are generally categorized within Level 2 of the fair value hierarchy.
The Service’s procedures are reviewed by Dreyfus under the general supervision of the Board.
Fair valuing of securities may be determined with the assistance of a pricing service using calculations based on indices of domestic securities and other appropriate indicators, such as prices of relevant American Depository Receipts and financial futures. Utilizing these techniques may result in transfers between Level 1 and Level 2 of the fair value hierarchy.
When market quotations or official closing prices are not readily available, or are determined not to reflect accurately fair value, such as when the value of a security has been significantly affected by events after the close of the exchange or market on which the security is principally traded (for example, a foreign exchange or market), but before the fund calculates its net asset value, the fund may value these investments at fair value as determined in accordance with the procedures approved by the Board. Certain factors may be considered when fair valuing investments such as: fundamental analytical data, the nature and duration of restrictions on disposition, an evaluation of the forces that influence the market in which the securities are purchased and sold, and public trading in similar securities of the issuer or comparable issuers. These securities are either categorized within Level 2 or 3 of the fair value hierarchy depending on the relevant inputs used.
For restricted securities where observable inputs are limited, assumptions about market activity and risk are used and are categorized within Level 3 of the fair value hierarchy.
32
Financial futures, which are traded on an exchange, are valued at the last sales price on the securities exchange on which such securities are primarily traded or at the last sales price on the national securities market on each business day and are generally categorized within Level 1 of the fair value hierarchy.
The following is a summary of the inputs used as of October 31, 2013 in valuing the fund's investments:
| | | | |
| | | Level 2—Other | Level 3— | |
| | Level 1— | Significant | Significant | |
| | Unadjusted | Observable Unobservable | |
| | Quoted Prices | Inputs | Inputs | Total |
| Assets ($) | | | | |
| Investments in Securities: | | | |
| Equity Securities— | | | | |
| Domestic | | | | |
| Common Stocks† | 1,809,565,111 | — | — | 1,809,565,111 |
| Equity Securities— | | | | |
| Foreign | | | | |
| Common Stocks† | 1,537,698 | — | — | 1,537,698 |
| Mutual Funds | 57,886,209 | — | — | 57,886,209 |
| U.S. Treasury | — | 2,744,672 | — | 2,744,672 |
| Other Financial | | | | |
| Instruments: | | | | |
| Financial Futures†† | 1,842,518 | — | — | 1,842,518 |
| |
| † | See Statement of Investments for additional detailed categorizations. |
| †† | Amount shown represents unrealized appreciation at period end. |
At October 31, 2013, there were no transfers between Level 1 and Level 2 of the fair value hierarchy.
(b) Securities transactions and investment income: Securities transactions are recorded on a trade date basis. Realized gains and losses from securities transactions are recorded on the identified cost basis. Dividend income is recognized on the ex-dividend date and interest income, including, where applicable, accretion of discount and amortization of premium on investments, is recognized on the accrual basis.
Pursuant to a securities lending agreement with The Bank of New York Mellon, a subsidiary of BNY Mellon and an affiliate of Dreyfus,
NOTES TO FINANCIAL STATEMENTS (continued)
the fund may lend securities to qualified institutions. It is the fund’s policy that, at origination, all loans are secured by collateral of at least 102% of the value of U.S. securities loaned and 105% of the value of foreign securities loaned. Collateral equivalent to at least 100% of the market value of securities on loan is maintained at all times. Collateral is either in the form of cash, which can be invested in certain money market mutual funds managed by the Manager or U.S. Government and Agency securities. The fund is entitled to receive all dividends, interest and distributions on securities loaned, in addition to income earned as a result of the lending transaction. Should a borrower fail to return the securities in a timely manner, The Bank of New York Mellon is required to replace the securities for the benefit of the fund or credit the fund with the market value of the unreturned securities and is subrogated to the fund’s rights against the borrower and the collateral. During the period ended October 31, 2013, The Bank of New York Mellon earned $23,138 from lending portfolio securities, pursuant to the securities lending agreement.
(c) Affiliated issuers: Investments in other investment companies advised by Dreyfus are defined as “affiliated” under the Act. Investments in affiliated investment companies during the period ended October 31, 2013 were as follows:
| | | | | |
| Affiliated | | | | | |
| Investment | Value | | | Value | Net |
| Company | 10/31/2012 ($) | Purchases ($) | Sales ($) | 10/31/2013 ($) | Assets (%) |
| Dreyfus | | | | | |
| Institutional | | | | | |
| Preferred | | | | | |
| Plus Money | | | | | |
| Market | | | | | |
| Fund | 24,195,395 | 335,855,915 | 308,351,133 | 51,700,177 | 2.8 |
| Dreyfus | | | | | |
| Institutional | | | | | |
| Cash | | | | | |
| Advantage | | | | | |
| Fund | 10,338,697 | 90,063,512 | 94,216,177 | 6,186,032 | .3 |
| Total | 34,534,092 | 425,919,427 | 402,567,310 | 57,886,209 | 3.1 |
34
(d) Dividends to shareholders: Dividends are recorded on the ex-dividend date. Dividends from investment income-net are declared and paid on a quarterly basis. Dividends from net realized capital gains, if any, are normally declared and paid annually, but the fund may make distributions on a more frequent basis to comply with the distribution requirements of the Internal Revenue Code of 1986, as amended (the “Code”).To the extent that net realized capital gains can be offset by capital loss carryovers, it is the policy of the fund not to distribute such gains. Income and capital gain distributions are determined in accordance with income tax regulations, which may differ from GAAP.
(e) Federal income taxes: It is the policy of the fund to continue to qualify as a regulated investment company, if such qualification is in the best interests of its shareholders, by complying with the applicable pro visions of the Code, and to make distributions of taxable income sufficient to relieve it from substantially all federal income and excise taxes.
As of and during the period ended October 31, 2013, the fund did not have any liabilities for any uncertain tax positions.The fund recognizes interest and penalties, if any, related to uncertain tax positions as income tax expense in the Statement of Operations. During the period ended October 31, 2013, the fund did not incur any interest or penalties.
Each tax year in the four-year period ended October 31, 2013 remains subject to examination by the Internal Revenue Service and state taxing authorities.
At October 31, 2013, the components of accumulated earnings on a tax basis were as follows: undistributed ordinary income $9,917,944, undistributed capital gains $1,394,333 and unrealized appreciation $613,740,251.
The tax character of distributions paid to shareholders during the fiscal periods ended October 31, 2013 and October 31, 2012 were as follows: ordinary income $29,508,079 and $22,363,506, respectively.
NOTES TO FINANCIAL STATEMENTS (continued)
During the period ended October 31, 2013, as a result of permanent book to tax differences, primarily due to the tax treatment for real estate investment trusts, the fund decreased accumulated undistributed investment income-net by $207,698 and increased accumulated net realized gain (loss) on investments by the same amount. Net assets and net asset value per share were not affected by this reclassification.
(f) Accounting Pronouncement: In January 2013, FASB issued Accounting Standards Update No. 2013-01 (“ASU 2013-01”), “Clarifying the Scope of Disclosures about Offsetting Assets and Liabilities”, which replaced Accounting Standards Update No. 2011-11 (“ASU 2011-11”), “Disclosures about Offsetting Assets and Liabilities”. ASU 2013-01 is effective for fiscal years beginning on or after January 1, 2013, and interim periods within those annual periods.ASU 2011-11 was intended to enhance disclosure requirements on the offsetting of financial assets and liabilities. ASU 2013-01 limits the scope of the new balance sheet offsetting disclosures to derivatives, repurchase agreements, and securities lending transactions to the extent that they are (1) offset in the financial statements or (2) subject to enforceable master netting arrangements (“MNA”) or similar agreements. Management is currently evaluating the application of ASU 2013-01 and its impact on the fund’s financial statements.
NOTE 2—Bank Lines of Credit:
The fund participates with other Dreyfus-managed funds in a $265 million unsecured credit facility led by Citibank, N.A. and a $300 million unsecured credit facility provided by The Bank of New York Mellon (each, a “Facility”), each to be utilized primarily for temporary or emergency purposes, including the financing of redemptions. Prior to October 9, 2013, the unsecured credit facility with Citibank, N.A. was $210 million. In connection therewith, the fund has agreed to pay its pro rata portion of commitment fees for each Facility. Interest is charged to the fund based on rates determined pursuant to the terms of the respective Facility at the time of borrowing.
36
The average amount of borrowings outstanding under the Facilities during the period ended October 31, 2013 was approximately $3,300 with a related weighted average annualized interest rate of 1.14%.
NOTE 3—Investment Management Fee And Other Transactions with Affiliates:
(a) Pursuant to an investment management agreement with the Manager, the Manager provides or arranges for one or more third parties and/or affiliates to provide investment advisory, administrative, custody, fund accounting and transfer agency services to the fund.The Manager also directs the investments of the fund in accordance with its investment objective, policies and limitations. For these services, the fund is contractually obligated to pay the Manager a fee, calculated daily and paid monthly, at an annual rate of .20% of the value of the fund’s average daily net assets. Out of its fee, the Manager pays all of the expenses of the fund except brokerage fees, taxes, interest expenses, commitment fees on borrowings, fees and expenses of non-interested Directors (including counsel fees) and extraordinary expenses. In addition, the Manager is required to reduce its fee in an amount equal to the fund’s allocable portion of fees and expenses of the non-interested Directors (including counsel fees). During the period ended October 31, 2013, fees reimbursed by the Manager amounted to $103,849.
The components of “Due to The Dreyfus Corporation and affiliates” in the Statement of Assets and Liabilities consist of: management fees $309,033, which are offset against an expense reimbursement currently in effect in the amount of $10,120.
(b) Each Board member also serves as a Board member of other funds within the Dreyfus complex. Annual retainer fees and attendance fees are allocated to each fund based on net assets.
NOTES TO FINANCIAL STATEMENTS (continued)
NOTE 4—Securities Transactions:
The aggregate amount of purchases and sales of investment securities, excluding short-term securities and financial futures, during the period ended October 31, 2013, amounted to $192,000,064 and $52,983,463, respectively.
Derivatives: A derivative is a financial instrument whose performance is derived from the performance of another asset. Each type of derivative instrument that was held by the fund during the period ended October 31, 2013 is discussed below.
Financial Futures: In the normal course of pursuing its investment objective, the fund is exposed to market risk, including equity price risk, as a result of changes in value of underlying financial instruments. The fund invests in financial futures in order to manage its exposure to or protect against changes in the market. A financial futures contract represents a commitment for the future purchase or a sale of an asset at a specified date. Upon entering into such contracts, these investments require initial margin deposits with a counterparty, which consist of cash or cash equivalents.The amount of these deposits is determined by the exchange or Board of Trade on which the contract is traded and is subject to change.Accordingly, variation margin payments are received or made to reflect daily unrealized gains or losses which are recorded in the Statement of Operations.When the contracts are closed, the fund recognizes a realized gain or loss which is reflected in the Statement of Operations.There is minimal counterparty credit risk to the fund with financial futures since they are exchange traded, and the exchange guarantees the financial futures against default. Financial futures open at October 31, 2013 are set forth in the Statement of Financial Futures.
The following summarizes the average market value of derivatives outstanding during the period ended October 31, 2013:
| |
| | Average Market Value ($) |
| Equity financial futures | 34,646,458 |
38
At October 31, 2013, the cost of investments for federal income tax purposes was $1,257,993,439; accordingly, accumulated net unrealized appreciation on investments was $613,740,251, consisting of $689,483,022 gross unrealized appreciation and $75,742,771 gross unrealized depreciation.
NOTE 5—Pending Legal Matters:
The fund and many other entities have been named as defendants in numerous pending litigations as a result of their participation in the leveraged buyout transaction (“LBO”) of the Tribune Company (“Tribune”).The cases allege that Tribune took on billions of dollars of debt in the LBO to purchase its own stock from shareholders at $34 per share.The LBO was closed in a two-step transaction with shares being repurchased by Tribune in a tender offer in June 2007 (“Step One”) and in a go-private merger in December 2007 (“Step Two”). In 2008, approximately one year after the LBO was concluded,Tribune filed for bankruptcy protection under Chapter 11. Thereafter, in approximately June 2011, certain Tribune creditors filed dozens of complaints in various courts throughout the country alleging that the payments made to shareholders in the LBO were “fraudulent conveyances” under state and/or federal law, and that the shareholders must return the payments they received for their shares to satisfy the plaintiffs’ unpaid claims.These cases have been consolidated for coordinated pre-trial proceedings in a multi-district litigation in the United States District Court for the Southern District of New York titled In re Tribune Company Fraudulent Conveyance Litigation (S.D.N.Y. Nos. 11-md-2296 and 12-mc-2296 (RJS) (“Tribune MDL”)). On March 27, 2013, the Tribune MDL was reassigned from Judge William H. Pauley to Judge Richard J. Sullivan. No explanation was given for the reassignment.
In addition, there was a case pending in United States Bankruptcy Court for the District of Delaware brought by the Unsecured Creditors Committee of the Tribune Company that has since been
NOTES TO FINANCIAL STATEMENTS (continued)
transferred to the Tribune MDL (formerly The Official Committee of Unsecured Creditors of Tribune Co. v. FitzSimons, et al., Bankr. D. Del.Adv. Pro. No. 10-54010 (KJC)).The case was originally filed on November 1, 2010. In a Fourth Amended Complaint filed in November 2012, among other claims, the Creditors Committee sought recovery under the Bankruptcy Code for alleged “fraudulent conveyances” from more than 5,000 Tribune shareholders (“Shareholder Defendants”), including the fund, and a defendants’ class of all shareholders who tendered their Tribune stock in the LBO and received cash in exchange.There were 35 other counts in the Fourth Amended Complaint that did not relate to claims against Shareholder Defendants, but instead were brought against parties directly involved in approval or execution of the leveraged buyout. On January 10, 2013, pursuant to the Tribune bankruptcy plan, Mark S. Kirchner, as Litigation Trustee for the Tribune Litigation Trust, became the successor plaintiff to the Creditors Committee in this case.The case is now proceeding as: Mark S. Kirchner, as LitigationTrustee for theTribune LitigationTrust v. FitzSimons, et al., S.D.N.Y. No. 12-cv-2652 (RJS). On August 1, 2013, the plaintiff filed a Fifth Amended Complaint with the Court.The Fifth Amended Complaint contains more detailed allegations regarding the steps Tribune took in consideration and execution of the LBO, but does not change the legal basis for the claim previously alleged against the Shareholder Defendants.
On November 6, 2012, a motion to dismiss was filed in the Tribune MDL. Oral argument on the motion to dismiss was held on May 23, 2013. On September 23, 2013 Judge Sullivan granted the motion to dismiss on standing grounds, after rejecting defendants’ preemption arguments. By granting the motion, Judge Sullivan dismissed nearly 50 cases in the Tribune MDL, including all cases with Deutsche Bank Trust Company Americas or William A. Niese as the lead plaintiff.The fund was a defendant in at least one of the dismissed cases.The motion had no effect on the FitzSimons case, which had been stayed.
40
On September 30, 2013, plaintiffs appealed the motion to dismiss decision to the U.S. Court of Appeals for the Second Circuit. On October 28, 2013, certain defendants cross-appealed from Judge Sullivan’s decision, seeking review of the arguments that Judge Sullivan rejected in his decision. Briefing on the appeal and cross appeal is scheduled for completion in April 2014.
On November 11, 2013, Judge Sullivan entered Master Case Order No. 4 in the Tribune MDL. Master Case Order No. 4 addressed numerous procedural and administrative tasks for the cases that remain in the Tribune MDL, including the FitzSimons case. Under Master Case Order No. 4, the parties – through their executive committees and liaison counsel – are to attempt to negotiate a protocol for motions to dismiss and other procedural issues in December 2013 and January 2014. No answers to the Fifth Amended Complaint in the FitzSimons case may be filed at this time, and no briefing schedule for any further motions has been set.
At this stage in the proceedings, it is not possible to assess with any reasonable certainty the probable outcomes of the pending litigations. Consequently, at this time, management is unable to estimate the possible loss that may result.
|
| REPORT OF INDEPENDENT REGISTERED |
| PUBLIC ACCOUNTING FIRM |
The Board of Directors and Shareholders of The Dreyfus/Laurel Funds, Inc.
We have audited the accompanying statement of assets and liabilities of Dreyfus BASIC S&P 500 Stock Index Fund (the “Fund”), a series of The Dreyfus/Laurel Funds, Inc., including the statements of investments and financial futures, as of October 31, 2013, and the related statement of operations for the year then ended, the statements of changes in net assets for each of the years in the two-year period then ended, and the financial highlights for each of the years in the five-year period then ended.These financial statements and financial highlights are the responsibility of the Fund’s management. Our responsibility is to express an opinion on these financial statements and financial highlights based on our audits.
We conducted our audits in accordance with the standards of the Public Company Accounting Oversight Board (United States).Those standards require that we plan and perform the audit to obtain reasonable assurance about whether the financial statements and financial highlights are free of material misstatement. An audit includes examining, on a test basis, evidence supporting the amounts and disclosures in the financial statements. Our procedures included confirmation of securities owned as of October 31, 2013, by correspondence with the custodian and brokers or by other appropriate auditing procedures. An audit also includes assessing the accounting principles used and significant estimates made by management, as well as evaluating the overall financial statement presentation.We believe that our audits provide a reasonable basis for our opinion.
In our opinion, the financial statements and financial highlights referred to above present fairly, in all material respects, the financial position of Dreyfus BASIC S&P 500 Stock Index Fund as of October 31, 2013, the results of its operations for the year then ended, the changes in its net assets for each of the years in the two-year period then ended, and the financial highlights for each of the years in the five-year period then ended, in conformity with U.S. generally accepted accounting principles.

New York, New York
December 30, 2013
42
IMPORTANT TAX INFORMATION (Unaudited)
For federal tax purposes, the fund reports the maximum amount allowable, but not less than $29,508,079 as ordinary income dividends paid during the year ended October 31, 2013 as qualified dividend income in accordance with Section 854(b)(1)(B) of the Internal Revenue Code. Also, the fund reports the maximum amount allowable but not less than 100% of ordinary income dividends paid during the year ended October 31, 2013 as eligible for the corporate dividends received deduction provided under Section 243 of the Internal Revenue Code in accordance with Section 854(b)(1)(A) of the Internal Revenue Code. Shareholders will receive notification in early 2014 of the percentage applicable to the preparation of their 2013 income tax returns.
BOARD MEMBERS INFORMATION (Unaudited)
|
| Joseph S. DiMartino (70) |
| Chairman of the Board (1999) |
| Principal Occupation During Past 5Years: |
| • Corporate Director and Trustee |
| Other Public Company Board Memberships During Past 5Years: |
| • CBIZ (formerly, Century Business Services, Inc.), a provider of outsourcing functions for small |
| and medium size companies, Director (1997-present) |
| • The Newark Group, a provider of a national market of paper recovery facilities, paperboard |
| mills and paperboard converting plants, Director (2000-2010) |
| • Sunair Services Corporation, a provider of certain outdoor-related services to homes and |
| businesses, Director (2005-2009) |
| No. of Portfolios for which Board Member Serves: 141 |
| ——————— |
| Francine J. Bovich (62) |
| Board Member (2012) |
| Principal Occupation During Past 5Years: |
| • Trustee,The Bradley Trusts, private trust funds (2011-present) |
| • Managing Director, Morgan Stanley Investment Management (1993-2010) |
| No. of Portfolios for which Board Member Serves: 40 |
| ——————— |
| James M. Fitzgibbons (79) |
| Board Member (1994) |
| Principal Occupation During Past 5Years: |
| • Corporate Director and Trustee |
| Other Public Company Board Memberships During Past 5Years: |
| • Bill Barrett Corporation, an oil and natural gas exploration company, Director (2004-2012) |
| No. of Portfolios for which Board Member Serves: 26 |
| ——————— |
| Kenneth A. Himmel (67) |
| Board Member (1994) |
| Principal Occupation During Past 5Years: |
| • President and CEO, Related Urban Development, a real estate development company (1996-present) |
| • President and CEO, Himmel & Company, a real estate development company (1980-present) |
| • CEO,American Food Management, a restaurant company (1983-present) |
| No. of Portfolios for which Board Member Serves: 26 |
44
|
| Stephen J. Lockwood (66) |
| Board Member (1994) |
| Principal Occupation During Past 5Years: |
| • Chairman of the Board, Stephen J. Lockwood and Company LLC, a real estate investment |
| company (2000-present) |
| No. of Portfolios for which Board Member Serves: 26 |
| ——————— |
| Roslyn M. Watson (64) |
| Board Member (1994) |
| Principal Occupation During Past 5Years: |
| • Principal,Watson Ventures, Inc., a real estate investment company (1993-present) |
| No. of Portfolios for which Board Member Serves: 36 |
| ——————— |
| Benaree Pratt Wiley (67) |
| Board Member (1998) |
| Principal Occupation During Past 5Years: |
| • Principal,TheWiley Group, a firm specializing in strategy and business development (2005-present) |
| Other Public Company Board Memberships During Past 5Years: |
| • CBIZ (formerly, Century Business Services, Inc.), a provider of outsourcing functions for small |
| and medium size companies, Director (2008-present) |
| No. of Portfolios for which Board Member Serves: 61 |
| ——————— |
Once elected all Board Members serve for an indefinite term, but achieve Emeritus status upon reaching age 80.The address of the Board Members and Officers is c/o The Dreyfus Corporation, 200 Park Avenue, NewYork, NewYork 10166. Additional information about the Board Members is available in the fund’s Statement of Additional Information which can be obtained from Dreyfus free of charge by calling this toll free number: 1-800-DREYFUS.
|
| J.Tomlinson Fort, Emeritus Board Member |
OFFICERS OF THE FUND (Unaudited)
BRADLEY J. SKAPYAK, President since January 2010.
Chief Operating Officer and a director of the Manager since June 2009, Chairman of Dreyfus Transfer, Inc., an affiliate of the Manager and the transfer agent of the funds, since May 2011 and Executive Vice President of the Distributor since June 2007. From April 2003 to June 2009, Mr. Skapyak was the head of the Investment Accounting and Support Department of the Manager. He is an officer of 68 investment companies (comprised of 141 portfolios) managed by the Manager. He is 55years old and has been an employee of the Manager since February 1988.
JOHN PAK, Chief Legal Officer since March 2013.
Chief Legal Officer of the Manager and Associate General Counsel and Managing Director of BNY Mellon since August 2012; from March 2005 to July 2012, Managing Director of Deutsche Bank, Deputy Global Head of Deutsche Asset Management Legal and Regional Head of Deutsche Asset Management Americas Legal. He is an officer of 69 investment companies (comprised of 166 portfolios) managed by the Manager. He is 45 years old and has been an employee of the Manager since August 2012.
JANETTE E. FARRAGHER, Vice President and Secretary since December 2011.
Assistant General Counsel of BNY Mellon, and an officer of 69 investment companies (comprised of 166 portfolios) managed by the Manager. She is 50 years old and has been an employee of the Manager since February 1984.
KIESHA ASTWOOD, Vice President and Assistant Secretary since January 2010.
Counsel of BNY Mellon, and an officer of 69 investment companies (comprised of 166 portfolios) managed by the Manager. She is 40 years old and has been an employee of the Manager since July 1995.
JAMES BITETTO, Vice President and Assistant Secretary since August 2005.
Senior Counsel of BNY Mellon and Secretary of the Manager, and an officer of 69 investment companies (comprised of 166 portfolios) managed by the Manager. He is 47 years old and has been an employee of the Manager since December 1996.
JONI LACKS CHARATAN, Vice President and Assistant Secretary since August 2005.
Senior Counsel of BNY Mellon, and an officer of 69 investment companies (comprised of 166 portfolios) managed by the Manager. She is 58 years old and has been an employee of the Manager since October 1988.
JOSEPH M. CHIOFFI, Vice President and Assistant Secretary since August 2005.
Senior Counsel of BNY Mellon, and an officer of 69 investment companies (comprised of 166 portfolios) managed by the Manager. He is 52 years old and has been an employee of the Manager since June 2000.
JOHN B. HAMMALIAN, Vice President and Assistant Secretary since August 2005.
Senior Managing Counsel of BNY Mellon, and an officer of 69 investment companies (comprised of 166 portfolios) managed by the Manager. He is 50 years old and has been an employee of the Manager since February 1991.
ROBERT R. MULLERY, Vice President and Assistant Secretary since August 2005.
Managing Counsel of BNY Mellon, and an officer of 69 investment companies (comprised of 166 portfolios) managed by the Manager. He is 61 years old and has been an employee of the Manager since May 1986.
46
JEFF PRUSNOFSKY, Vice President and Assistant Secretary since August 2005.
Senior Managing Counsel of BNY Mellon, and an officer of 69 investment companies (comprised of 166 portfolios) managed by the Manager. He is 48 years old and has been an employee of the Manager since October 1990.
JAMES WINDELS, Treasurer since November 2001.
Director – Mutual Fund Accounting of the Manager, and an officer of 69 investment companies (comprised of 166 portfolios) managed by the Manager. He is 55 years old and has been an employee of the Manager since April 1985.
RICHARD CASSARO, Assistant Treasurer since January 2008.
Senior Accounting Manager – Money Market and Municipal Bond Funds of the Manager, and an officer of 69 investment companies (comprised of 166 portfolios) managed by the Manager. He is 54 years old and has been an employee of the Manager since September 1982.
GAVIN C. REILLY, Assistant Treasurer since December 2005.
Tax Manager of the Investment Accounting and Support Department of the Manager, and an officer of 69 investment companies (comprised of 166 portfolios) managed by the Manager. He is 45 years old and has been an employee of the Manager since April 1991.
ROBERT S. ROBOL, Assistant Treasurer since December 2002.
Senior Accounting Manager – Fixed Income Funds of the Manager, and an officer of 69 investment companies (comprised of 166 portfolios) managed by the Manager. He is 49 years old and has been an employee of the Manager since October 1988.
ROBERT SALVIOLO, Assistant Treasurer since July 2007.
Senior Accounting Manager – Equity Funds of the Manager, and an officer of 69 investment companies (comprised of 166 portfolios) managed by the Manager. He is 46 years old and has been an employee of the Manager since June 1989.
ROBERT SVAGNA, Assistant Treasurer since December 2002.
Senior Accounting Manager – Equity Funds of the Manager, and an officer of 69 investment companies (comprised of 166 portfolios) managed by the Manager. He is 46 years old and has been an employee of the Manager since November 1990.
JOSEPH W. CONNOLLY, Chief Compliance Officer since October 2004.
Chief Compliance Officer of the Manager and The Dreyfus Family of Funds (69 investment companies, comprised of 166 portfolios). He is 56 years old and has served in various capacities with the Manager since 1980, including manager of the firm’s Fund Accounting Department from 1997 through October 2001.
MATTHEW D. CONNOLLY, Anti-Money Laundering Compliance Officer since April 2012.
Anti-Money Laundering Compliance Officer of the Distributor since October 2011; from March 2010 to September 2011, Global Head, KYC Reviews and Director, UBS Investment Bank; until March 2010, AML Compliance Officer and Senior Vice President, Citi Global Wealth Management. He is an officer of 64 investment companies (comprised of 161 portfolios) managed by the Manager. He is 41 years old and has been an employee of the Distributor since October 2011.
For More Information
Ticker Symbol: DSPIX
Telephone 1-800-DREYFUS
Mail The Dreyfus Family of Funds, 144 Glenn Curtiss Boulevard, Uniondale, NY 11556-0144 E-mail Send your request to info@dreyfus.com Internet Information can be viewed online or downloaded at: http://www.dreyfus.com
The fund files its complete schedule of portfolio holdings with the Securities and Exchange Commission (“SEC”) for the first and third quarters of each fiscal year on Form N-Q. The fund’s Forms N-Q are available on the SEC’s website at http://www.sec.gov and may be reviewed and copied at the SEC’s Public Reference Room in Washington, DC. Information on the operation of the Public Reference Room may be obtained by calling 1-800-SEC-0330.
A description of the policies and procedures that the fund uses to determine how to vote proxies relating to portfolio securities, and information regarding how the fund voted these proxies for the most recent 12-month period ended June 30 is available at http://www.dreyfus.com and on the SEC’s website at http://www.sec.gov. The description of the policies and procedures is also available without charge, upon request, by calling 1-800-DREYFUS.

| |
| Dreyfus |
| U.S. Treasury |
| Reserves |
ANNUAL REPORT October 31, 2013

Save time. Save paper. View your next shareholder report online as soon as it’s available. Log into www.dreyfus.com and sign up for Dreyfus eCommunications. It’s simple and only takes a few minutes.
The views expressed in this report reflect those of the portfolio manager only through the end of the period covered and do not necessarily represent the views of Dreyfus or any other person in the Dreyfus organization. Any such views are subject to change at any time based upon market or other conditions and Dreyfus disclaims any responsibility to update such views.These views may not be relied on as investment advice and, because investment decisions for a Dreyfus fund are based on numerous factors, may not be relied on as an indication of trading intent on behalf of any Dreyfus fund.
| |
| Not FDIC-Insured • Not Bank-Guaranteed • May Lose Value |
| | Contents |
| | THE FUND |
| 2 | A Letter from the President |
| 3 | Discussion of Fund Performance |
| 6 | Understanding Your Fund’s Expenses |
| 6 | Comparing Your Fund’s Expenses With Those of Other Funds |
| 7 | Statement of Investments |
| 9 | Statement of Assets and Liabilities |
| 10 | Statement of Operations |
| 11 | Statement of Changes in Net Assets |
| 12 | Financial Highlights |
| 14 | Notes to Financial Statements |
| 20 | Report of Independent Registered Public Accounting Firm |
| 21 | Important Tax Information |
| 22 | Board Members Information |
| 24 | Officers of the Fund |
| | FOR MORE INFORMATION |
| | Back Cover |
Dreyfus
U.S. Treasury Reserves
The Fund
A LETTER FROM THE PRESIDENT
Dear Shareholder:
We are pleased to present this annual report for Dreyfus U.S. Treasury Reserves, covering the 12-month period from November 1, 2012, through October 31, 2013. For information about how the fund performed during the reporting period, as well as general market perspectives, we provide a Discussion of Fund Performance on the pages that follow.
The reporting period proved challenging for most income-oriented investments, as a gradually strengthening U.S. economy and expectations of less aggressively stimulative monetary policies drove longer term interest rates higher and bond prices lower. However, as they have been for the past several years, short-term interest rates and yields of money market instruments remained anchored near historical lows by an unchanged overnight federal funds rate.
We currently expect U.S. and global economic conditions to continue to improve in 2014, with accelerating growth supported by the fading drags of tighter federal fiscal policies and downsizing on the state and local levels. However, inflation is likely to remain muted, so monetary policy can remain stimulative, and short-term interest rates appear likely to remain near current levels for some time to come. For more information on how these observations may affect your investments, we encourage you to speak with your financial advisor.
Thank you for your continued confidence and support.
Sincerely,
J. Charles Cardona
President
The Dreyfus Corporation
November 15, 2013
2
DISCUSSION OF FUND PERFORMANCE
For the period of November 1, 2012, through October 31, 2013, as provided by Patricia A. Larkin, Portfolio Manager
Fund and Market Performance Overview
For the 12-month period ended October 31, 2013, Dreyfus U.S.Treasury Reserves’ Investor shares produced a yield of 0.00%, and Class R shares produced a yield of 0.00%. Taking into account the effects of compounding, the fund’s Investor shares and Class R shares also produced effective yields of 0.00% and 0.00%, respectively.1
Although a sustained economic recovery and anticipation of an end to the Federal Reserve Board’s (the “Fed”) quantitative easing program caused long-term interest rates to rise during the reporting period, yields of short-term U.S.Treasury obligations remained anchored near historical lows by an unchanged target for the federal funds rate between 0% and 0.25%.
The Fund’s Investment Approach
The fund seeks a high level of current income consistent with stability of principal.As a U.S. Treasury money market fund, we attempt to provide shareholders with an investment vehicle that is made up of direct U.S.Treasury obligations with remaining maturities of 13 months or less, as well as repurchase agreements with securities dealers, which are backed by U.S. Treasuries. To pursue its goal, the fund normally invests only in direct obligations of the U.S. Treasury and in repurchase agreements secured by these obligations.
U.S. Economic Recovery Gained Traction
The reporting period began in November 2012 in the midst of improved economic news, as the unemployment rate fell to 7.8% and pending home sales increased.The unemployment rate remained steady in December, but retailers reported sluggish holiday sales, contributing to an annualized U.S. GDP growth of just 0.1% for the fourth quarter of 2012.
DISCUSSION OF FUND PERFORMANCE (continued)
January 2013 also portrayed a sluggish recovery with the addition of 157,000 jobs, but the unemployment rate inched upwards to 7.9%. The uptick was reversed in February, when the unemployment rate slid to 7.7% and 236,000 new jobs were created. Just 88,000 new jobs were added in March while the unemployment rate edged lower to 7.6%. The economy achieved only a 1.1% annualized growth rate during the first quarter of 2013, mainly due to lower government spending.
The gradual economic recovery persisted in April as 165,000 jobs were added and the unemployment rate fell to 7.5%. In late May, remarks by Fed Chairman Ben Bernanke signaled that the central bank would begin to curtail its quantitative easing program sooner than expected.The Fed’s more hawkish stance seemed to be at odds with subsequent releases of economic data, which showed a decline in U.S. manufacturing activity and an increase in the unemployment rate to 7.6%. Nonetheless, in June, heightened investor uncertainty drove longer term interest rates higher despite robust increases in home and automobile sales, expansions of the manufacturing and service sectors, and the creation of 195,000 jobs with no change in the unemployment rate. For the second quarter, the U.S. economy grew at a more respectable 2.5% annualized rate.
July brought welcome evidence of market stabilization when investors realized that imminent increases in short-term rates were unlikely. The labor market continued to strengthen with 162,000 new jobs and a decline in the unemployment rate to 7.4%. In August, the manufacturing sector expanded at its fastest pace since June 2011, 169,000 jobs were added, and the unemployment rate dipped to 7.3%.
Financial markets rallied in September when the Fed refrained from tapering its quantitative easing program. In addition, manufacturing activity posted its fourth consecutive month of expansion, and the service sector grew for the 45th straight month. However, a relatively disappointing 146,000 jobs were added in September while the unemployment rate inched lower to 7.2%. It later was announced U.S. economic activity accelerated to a 2.8% annualized growth rate during the third quarter.
4
In spite of a 16-day U.S. government shutdown, October saw 204,000 new jobs, even as temporary layoffs of government workers drove the unemployment rate to 7.3%. The private sector posted employment gains in the leisure and hospitality, retail trade, professional and technical services, manufacturing, and health care sectors. Other data released in October, such as a decline in pending home sales, demonstrated that economic headwinds remain, and the Fed again refrained from reducing its bond purchases at its October meeting.
No Change Expected for Short-Term Rates
Despite the accelerating economic recovery and higher long-term interest rates, yields of U.S. Treasury bills remained near zero percent throughout the reporting period, and yield differences along the market’s maturity spectrum stayed relatively narrow. Therefore, as we have for some time, we maintained the fund’s weighted average maturity in a market-neutral position.
November 15, 2013
An investment in the fund is not insured or guaranteed by the FDIC or any other government agency. Although the fund seeks to preserve the value of your investment at $1.00 per share, it is possible to lose money by investing in the fund.
| |
| 1 Effective yield is based upon dividends declared daily and reinvested monthly. Past performance is no guarantee of |
| future results.Yields fluctuate.Yields provided reflect the absorption of certain fund expenses by The Dreyfus |
| Corporation pursuant to an undertaking in effect that may be extended, terminated or modified at any time. Had |
| these expenses not been absorbed, the fund’s yields would have been lower, and in some cases, 7-day yields during the |
| reporting period would have been negative absent the expense absorption. |
UNDERSTANDING YOUR FUND’S EXPENSES (Unaudited)
As a mutual fund investor, you pay ongoing expenses, such as management fees and other expenses. Using the information below, you can estimate how these expenses affect your investment and compare them with the expenses of other funds.You also may pay one-time transaction expenses, including sales charges (loads) and redemption fees, which are not shown in this section and would have resulted in higher total expenses. For more information, see your fund’s prospectus or talk to your financial adviser.
Review your fund’s expenses
The table below shows the expenses you would have paid on a $1,000 investment in Dreyfus U.S.Treasury Reserves from May 1, 2013 to October 31, 2013. It also shows how much a $1,000 investment would be worth at the close of the period, assuming actual returns and expenses.
Expenses and Value of a $1,000 Investment
assuming actual returns for the six months ended October 31, 2013
| | | |
| | Investor Shares | Class R Shares |
| Expenses paid per $1,000† | $.30 | $.30 |
| Ending value (after expenses) | $1,000.00 | $1,000.00 |
COMPARING YOUR FUND’S EXPENSES
WITH THOSE OF OTHER FUNDS (Unaudited)
Using the SEC’s method to compare expenses
The Securities and Exchange Commission (SEC) has established guidelines to help investors assess fund expenses. Per these guidelines, the table below shows your fund’s expenses based on a $1,000 investment, assuming a hypothetical 5% annualized return. You can use this information to compare the ongoing expenses (but not transaction expenses or total cost) of investing in the fund with those of other funds.All mutual fund shareholder reports will provide this information to help you make this comparison. Please note that you cannot use this information to estimate your actual ending account balance and expenses paid during the period.
Expenses and Value of a $1,000 Investment
assuming a hypothetical 5% annualized return for the six months ended October 31, 2013
| | | |
| | Investor Shares | Class R Shares |
| Expenses paid per $1,000† | $.31 | $.31 |
| Ending value (after expenses) | $1,024.90 | $1,024.90 |
| |
| † Expenses are equal to the fund’s annualized expense ratio of .06% for Investor shares and .06% for Class R shares, |
| multiplied by the average account value over the period, multiplied by 184/365 (to reflect the one-half year period). |
6
| |
| STATEMENT OF INVESTMENTS |
| October 31, 2013 |
| | | | |
| | Annualized | | |
| | Yield on | | |
| | Date of | Principal | |
| U.S. Treasury Bills—17.5% | Purchase (%) | Amount ($) | Value ($) |
| 12/5/13 | 0.02 | 35,000,000 | 34,999,339 |
| 3/27/14 | 0.04 | 25,000,000 | 24,995,944 |
| Total U.S. Treasury Bills | | | |
| (cost $59,995,283) | | | 59,995,283 |
| |
| |
| U.S. Treasury Notes—33.6% | | | |
| 11/15/13 | 0.05 | 25,000,000 | 25,039,925 |
| 11/30/13 | 0.08 | 45,000,000 | 45,006,438 |
| 2/28/14 | 0.22 | 10,000,000 | 10,055,122 |
| 3/31/14 | 0.09 | 25,000,000 | 25,016,685 |
| 5/31/14 | 0.06 | 10,000,000 | 10,124,159 |
| Total U.S. Treasury Notes | | | |
| (cost $115,242,329) | | | 115,242,329 |
| |
| |
| Repurchase Agreements—48.5% | | | |
| Citigroup Global Markets Holdings Inc. | | | |
| dated 10/31/13, due 11/1/13 in the amount | | | |
| of $55,000,122 (fully collateralized by | | | |
| $56,949,600 U.S. Treasury Notes, | | | |
| 0.25%-1.13%, due 2/15/15-4/30/20, | | | |
| value $56,100,086) | 0.08 | 55,000,000 | 55,000,000 |
| Goldman, Sachs & Co. | | | |
| dated 10/31/13, due 11/1/13 in the amount | | | |
| of $56,000,078 (fully collateralized by | | | |
| $67,468,500 U.S. Treasury Inflation | | | |
| Protected Securities, 0.63%, | | | |
| due 2/15/43, value $57,120,101) | 0.05 | 56,000,000 | 56,000,000 |
STATEMENT OF INVESTMENTS (continued)
| | | | | |
| | Annualized | | | |
| | Yield on | | | |
| | Date of | Principal | | |
| Repurchase Agreements (continued) | Purchase (%) | Amount ($) | | Value ($) |
| JPMorgan Chase & Co. | | | | |
| dated 10/31/13, due 11/1/13 in the amount | | | | |
| of $55,000,138 (fully collateralized by | | | | |
| $51,321,500 U.S. Treasury Inflation | | | | |
| Protected Securities, 0.13%-2.63%, | | | | |
| due 7/15/17-1/15/22, value $56,104,290) | 0.09 | 55,000,000 | | 55,000,000 |
| Total Repurchase Agreements | | | | |
| (cost $166,000,000) | | | | 166,000,000 |
| |
| Total Investments (cost $341,237,612) | | 99.6 | % | 341,237,612 |
| |
| Cash and Receivables (Net) | | .4 | % | 1,264,484 |
| |
| Net Assets | | 100.0 | % | 342,502,096 |
| | | | |
| Portfolio Summary (Unaudited)† | | |
| | Value (%) | | Value (%) |
| Repurchase Agreements | 48.5 | U.S. Treasury Bills | 17.5 |
| U.S. Treasury Notes | 33.6 | | 99.6 |
| |
| † Based on net assets. |
| See notes to financial statements. |
8
| |
| STATEMENT OF ASSETS AND LIABILITIES |
| October 31, 2013 |
| | | |
| | Cost | Value |
| Assets ($): | | |
| Investments in securities—See Statement of | | |
| Investments (including Repurchase Agreements | | |
| of $166,000,000)—Note 1(b) | 341,237,612 | 341,237,612 |
| Cash | | 604,500 |
| Interest receivable | | 668,449 |
| | | 342,510,561 |
| Liabilities ($): | | |
| Due to The Dreyfus Corporation and affiliates—Note 2(b) | | 8,465 |
| Net Assets ($) | | 342,502,096 |
| Composition of Net Assets ($): | | |
| Paid-in capital | | 342,502,096 |
| Net Assets ($) | | 342,502,096 |
| |
| |
| Net Asset Value Per Share | | |
| | Investor Shares | Class R Shares |
| Net Assets ($) | 155,846,690 | 186,655,406 |
| Shares Outstanding | 155,846,562 | 186,655,534 |
| Net Asset Value Per Share ($) | 1.00 | 1.00 |
| |
| See notes to financial statements. | | |
| |
| STATEMENT OF OPERATIONS |
| Year Ended October 31, 2013 |
| | | |
| Investment Income ($): | | |
| Interest Income | 310,614 | |
| Expenses: | | |
| Management fee—Note 2(a) | 1,745,517 | |
| Distribution Plan fees (Investor Shares)—Note 2(b) | 274,601 | |
| Directors’ fees—Note 2(a,c) | 32,546 | |
| Total Expenses | 2,052,664 | |
| Less—reduction in expenses due to undertaking—Note 2(a) | (1,709,630 | ) |
| Less—Directors’ fees reimbursed by the Manager—Note 2(a) | (32,546 | ) |
| Net Expenses | 310,488 | |
| Investment Income—Net, representing net increase | | |
| in net assets resulting from operations | 126 | |
| |
| See notes to financial statements. | | |
10
STATEMENT OF CHANGES IN NET ASSETS
| | | | | |
| | Year Ended October 31, | |
| | 2013 | | 2012 | |
| Operations ($): | | | | |
| Investment Income-Net, representing net increase | | | | |
| in net assets resulting from operations | 126 | | 112 | |
| Dividends to Shareholders from ($): | | | | |
| Investment income—net: | | | | |
| Investor Shares | (48 | ) | (1,958 | ) |
| Class R Shares | (78 | ) | (2,544 | ) |
| Total Dividends | (126 | ) | (4,502 | ) |
| Capital Stock Transactions ($1.00 per share): | | | | |
| Net proceeds from shares sold: | | | | |
| Investor Shares | 135,319,858 | | 67,867,906 | |
| Class R Shares | 362,758,319 | | 603,265,823 | |
| Dividends reinvested: | | | | |
| Investor Shares | 48 | | 1,928 | |
| Class R Shares | — | | 28 | |
| Cost of shares redeemed: | | | | |
| Investor Shares | (101,501,793 | ) | (71,823,080 | ) |
| Class R Shares | (390,493,559 | ) | (541,985,227 | ) |
| Increase (Decrease) in Net Assets | | | | |
| from Capital Stock Transactions | 6,082,873 | | 57,327,378 | |
| Total Increase (Decrease) in Net Assets | 6,082,873 | | 57,322,988 | |
| Net Assets ($): | | | | |
| Beginning of Period | 336,419,223 | | 279,096,235 | |
| End of Period | 342,502,096 | | 336,419,223 | |
| |
| See notes to financial statements. | | | | |
FINANCIAL HIGHLIGHTS
The following tables describe the performance for each share class for the fiscal periods indicated. All information reflects financial results for a single fund share. Total return shows how much your investment in the fund would have increased (or decreased) during each period, assuming you had reinvested all dividends and distributions.These figures have been derived from the fund’s financial statements.
| | | | | | | | | | | |
| | | | Year Ended October 31, | | | |
| Investor Shares | 2013 | | 2012 | | 2011 | | 2010 | | 2009 | |
| Per Share Data ($): | | | | | | | | | | |
| Net asset value, beginning of period | 1.00 | | 1.00 | | 1.00 | | 1.00 | | 1.00 | |
| Investment Operations: | | | | | | | | | | |
| Investment income—neta | .000 | | .000 | | .000 | | .000 | | .000 | |
| Distributions: | | | | | | | | | | |
| Dividends from | | | | | | | | | | |
| investment income—neta | (.000 | ) | (.000 | ) | (.000 | ) | (.000 | ) | (.000 | ) |
| Net asset value, end of period | 1.00 | | 1.00 | | 1.00 | | 1.00 | | 1.00 | |
| Total Return (%) | .00 | b | .00 | b | .00 | b | .00 | b | .01 | |
| Ratios/Supplemental Data (%): | | | | | | | | | | |
| Ratio of total expenses | | | | | | | | | | |
| to average net assets | .71 | | .71 | | .71 | | .71 | | .73 | |
| Ratio of net expenses | | | | | | | | | | |
| to average net assets | .09 | | .10 | | .12 | | .21 | | .39 | |
| Ratio of net investment income | | | | | | | | | | |
| to average net assets | .00 | b | .00 | b | .00 | b | .00 | b | .01 | |
| Net Assets, end of period ($ x 1,000) | 155,847 | | 122,029 | | 125,984 | | 116,980 | | 125,821 | |
| | |
| a | Amount represents less than $.001 per share. |
| b | Amount represents less than .01%. |
See notes to financial statements.
12
| | | | | | | | | | | |
| | | | Year Ended October 31, | | | |
| Class R Shares | 2013 | | 2012 | | 2011 | | 2010 | | 2009 | |
| Per Share Data ($): | | | | | | | | | | |
| Net asset value, beginning of period | 1.00 | | 1.00 | | 1.00 | | 1.00 | | 1.00 | |
| Investment Operations: | | | | | | | | | | |
| Investment income—neta | .000 | | .000 | | .000 | | .000 | | .000 | |
| Distributions: | | | | | | | | | | |
| Dividends from | | | | | | | | | | |
| investment income—neta | (.000 | ) | (.000 | ) | (.000 | ) | (.000 | ) | (.000 | ) |
| Net asset value, end of period | 1.00 | | 1.00 | | 1.00 | | 1.00 | | 1.00 | |
| Total Return (%) | .00 | b | .00 | b | .00 | b | .00 | b | .01 | |
| Ratios/Supplemental Data (%): | | | | | | | | | | |
| Ratio of total expenses | | | | | | | | | | |
| to average net assets | .51 | | .51 | | .50 | | .51 | | .53 | |
| Ratio of net expenses | | | | | | | | | | |
| to average net assets | .09 | | .11 | | .12 | | .21 | | .38 | |
| Ratio of net investment income | | | | | | | | | | |
| to average net assets | .00 | b | .00 | b | .00 | b | .00 | b | .01 | |
| Net Assets, end of period ($ x 1,000) | 186,655 | | 214,391 | | 153,112 | | 196,629 | | 400,154 | |
| | |
| a | Amount represents less than $.001 per share. |
| b | Amount represents less than .01%. |
See notes to financial statements.
NOTES TO FINANCIAL STATEMENTS
NOTE 1—Significant Accounting Policies:
Dreyfus U.S. Treasury Reserves (the “fund”) is a separate diversified series of The Dreyfus/Laurel Funds, Inc. (the “Company”), which is registered under the Investment Company Act of 1940, as amended (the “Act”), as an open-end management investment company and operates as a series company currently offering eleven series, including the fund. The fund’s investment objective is to seek a high level of current income consistent with stability of principal. The Dreyfus Corporation (the “Manager” or “Dreyfus”), a wholly-owned subsidiary of The Bank of New York Mellon Corporation (“BNY Mellon”), serves as the fund’s investment adviser.
MBSC Securities Corporation (the “Distributor”), a wholly-owned subsidiary of the Manager, is the distributor of the fund’s shares, which are sold without a sales charge.The fund is authorized to issue 1 billion shares of $.001 par value Capital Stock in each of the following classes of shares: Investor and Class R. Investor shares are sold primarily to retail investors through financial intermediaries and bear Distribution Plan fees. Class R shares are sold primarily to bank trust departments and other financial service providers (including The Bank of NewYork Mellon, a subsidiary of BNY Mellon and an affiliate of Dreyfus, and its affiliates), acting on behalf of customers having a qualified trust or an investment account or relationship at such institution, and bear no Distribution Plan fees. Other differences between the classes include the services offered to and the expenses borne by each class, the allocation of certain transfer agency costs and certain voting rights. Income, expenses (other than expenses attributable to a specific class), and realized and unrealized gains or losses on investments are allocated to each class of shares based on its relative net assets.
It is the fund’s policy to maintain a continuous net asset value per share of $1.00; the fund has adopted certain investment, portfolio valuation and dividend and distribution policies to enable it to do so.There is no assurance, however, that the fund will be able to maintain a stable net asset value per share of $1.00.
14
The Company accounts separately for the assets, liabilities and operations of each series. Expenses directly attributable to each series are charged to that series’ operations; expenses which are applicable to all series are allocated among them on a pro rata basis.
The Financial Accounting Standards Board (“FASB”) Accounting Standards Codification is the exclusive reference of authoritative U.S. generally accepted accounting principles (“GAAP”) recognized by the FASB to be applied by nongovernmental entities. Rules and interpretive releases of the Securities and Exchange Commission (“SEC”) under authority of federal laws are also sources of authoritative GAAP for SEC registrants. The fund’s financial statements are prepared in accordance with GAAP, which may require the use of management estimates and assumptions.Actual results could differ from those estimates.
(a) Portfolio valuation: Investments in securities are valued at amortized cost in accordance with Rule 2a-7 under the Act. If amortized cost is determined not to approximate market value, the fair value of the portfolio securities will be determined by procedures established by and under the general supervision of the Company’s Board of Directors (the “Board”).
The fair value of a financial instrument is the amount that would be received to sell an asset or paid to transfer a liability in an orderly transaction between market participants at the measurement date (i.e., the exit price). GAAP establishes a fair value hierarchy that prioritizes the inputs of valuation techniques used to measure fair value.This hierarchy gives the highest priority to unadjusted quoted prices in active markets for identical assets or liabilities (Level 1 measurements) and the lowest priority to unobservable inputs (Level 3 measurements).
Additionally, GAAP provides guidance on determining whether the volume and activity in a market has decreased significantly and whether such a decrease in activity results in transactions that are not orderly. GAAP requires enhanced disclosures around valuation inputs and techniques used during annual and interim periods.
NOTES TO FINANCIAL STATEMENTS (continued)
Various inputs are used in determining the value of the fund’s investments relating to fair value measurements.These inputs are summarized in the three broad levels listed below:
Level 1—unadjusted quoted prices in active markets for identical investments.
Level 2—other significant observable inputs (including quoted prices for similar investments, interest rates, prepayment speeds, credit risk, etc.).
Level 3—significant unobservable inputs (including the fund’s own assumptions in determining the fair value of investments).
The inputs or methodology used for valuing securities are not necessarily an indication of the risk associated with investing in those securities. For example, money market securities are valued using amortized cost, in accordance with rules under the Act. Generally, amortized cost approximates the current fair value of a security, but since the value is not obtained from a quoted price in an active market, such securities are reflected within Level 2 of the fair value hierarchy.
The following is a summary of the inputs used as of October 31, 2013 in valuing the fund’s investments:
| | |
| | Short-Term |
| Valuation Inputs | Investments ($)† |
| Level 1—Unadjusted Quoted Prices | — |
| Level 2—Other Significant Observable Inputs | 341,237,612 |
| Level 3—Significant Unobservable Inputs | — |
| Total | 341,237,612 |
| † See Statement of Investments for additional detailed categorizations. | |
At October 31, 2013, there were no transfers between Level 1 and Level 2 of the fair value hierarchy.
(b) Securities transactions and investment income: Securities transactions are recorded on a trade date basis. Interest income, adjusted for accretion of discount and amortization of premium on investments, is earned from settlement date and is recognized on the accrual basis.
16
Realized gains and losses from securities transactions are recorded on the identified cost basis. Cost of investments represents amortized cost.
The fund may enter into repurchase agreements with financial institutions, deemed to be creditworthy by the Manager, subject to the seller’s agreement to repurchase and the fund’s agreement to resell such securities at a mutually agreed upon price. Pursuant to the terms of the repurchase agreement, such securities must have an aggregate market value greater than or equal to the terms of the repurchase price plus accrued interest at all times. If the value of the underlying securities falls below the value of the repurchase price plus accrued interest, the fund will require the seller to deposit additional collateral by the next business day. If the request for additional collateral is not met, or the seller defaults on its repurchase obligation, the fund maintains its right to sell the underlying securities at market value and may claim any resulting loss against the seller.At October 31, 2013, the fund had investments in repurchase agreements with a gross value of $166,000,000 in the Statement of Assets and Liabilities. The value of related collateral exceeded the value of repurchase agreements. See the Statement of Investments for detailed collateral information.
(c) Dividends to shareholders: It is the policy of the fund to declare dividends daily from investment income-net. Such dividends are paid monthly. Dividends from net realized capital gains, if any, are normally declared and paid annually, but the fund may make distributions on a more frequent basis to comply with the distribution requirements of the Internal Revenue Code of 1986, as amended (the “Code”).To the extent that net realized capital gains can be offset by capital loss carryovers, it is the policy of the fund not to distribute such gains.
(d) Federal income taxes: It is the policy of the fund to continue to qualify as a regulated investment company, if such qualification is in the best interests of its shareholders, by complying with the applicable provisions of the Code, and to make distributions of taxable income sufficient to relieve it from substantially all federal income and excise taxes.
NOTES TO FINANCIAL STATEMENTS (continued)
As of and during the period ended October 31, 2013, the fund did not have any liabilities for any uncertain tax positions.The fund recognizes interest and penalties, if any, related to uncertain tax positions as income tax expense in the Statement of Operations. During the period ended October 31, 2013, the fund did not incur any interest or penalties.
Each tax year in the four-year period ended October 31, 2013 remains subject to examination by the Internal Revenue Service and state taxing authorities.
At October 31, 2013, the components of accumulated earnings on a tax basis were substantially the same as for financial reporting purposes.
The tax character of distributions paid to shareholders during the fiscal periods ended October 31, 2013 and October 31, 2012 were all ordinary income.
At October 31, 2013, the cost of investments for federal income tax purposes was substantially the same as the cost for financial reporting purposes (see the Statement of Investments).
NOTE 2—Investment Management Fee and Other Transactions with Affiliates:
(a) Pursuant to an investment management agreement with the Manager, the Manager provides or arranges for one or more third parties and/or affiliates to provide investment advisory, administrative, custody, fund accounting and transfer agency services to the fund. The Manager also directs the investments of the fund in accordance with its investment objective, policies and limitations. For these services, the fund is contractually obligated to pay the Manager a fee, calculated daily and paid monthly, at the annual rate of .50% of the value of the fund’s average daily net assets. Out of its fee, the Manager pays all of the expenses of the fund except brokerage fees, taxes, Distribution Plan fees, fees and expenses of non-interested Directors (including counsel fees) and extraordinary expenses. In addition, the Manager is required to reduce its fee in an amount equal to the fund’s allocable portion of
18
fees and expenses of the non-interested Directors (including counsel fees). During the period ended October 31, 2013, fees reimbursed by the Manager amounted to $32,546.
The Manager has undertaken to waive receipt of the management fee and/or reimburse operating expenses in order to facilitate a daily yield at or above a certain level which may change from time to time.This undertaking is voluntary and not contractual, and may be terminated at any time. The reduction in expenses, pursuant to the undertaking, amounted to $841,956 for Investor shares and $867,674 for Class R shares during the period ended October 31, 2013.
(b) Under the Distribution Plan adopted pursuant to Rule 12b-1 under the Act, Investor shares may pay annually up to .25% (currently limited by the Board to .20%) of the value of the average daily net assets attributable to its Investor shares to compensate the Distributor for shareholder servicing activities and expenses primarily intended to result in the sale of Investor shares. During the period ended October 31, 2013, Investor shares were charged $274,601 pursuant to the Distribution Plan.
Under its terms, the Distribution Plan shall remain in effect from year to year, provided such continuance is approved annually by a vote of a majority of those Directors who are not “interested persons” of the Company and who have no direct or indirect financial interest in the operation of or in any agreement related to the Distribution Plan.
The components of “Due to The Dreyfus Corporation and affiliates” in the Statement of Assets and Liabilities consist of: management fees $140,323 and Distribution Plan fees $28,073, which are offset against an expense reimbursement currently in effect in the amount of $159,931.
(c) Each Board member also serves as a Board member of other funds within the Dreyfus complex. Annual retainer fees and attendance fees are allocated to each fund based on net assets.
| |
| REPORT OF INDEPENDENT REGISTERED |
| PUBLIC ACCOUNTING FIRM |
The Board of Directors and Shareholders The Dreyfus/Laurel Funds, Inc.
We have audited the accompanying statement of assets and liabilities of Dreyfus U.S. Treasury Reserves (the “Fund”), a series of The Dreyfus/Laurel Funds, Inc., including the statement of investments, as of October 31, 2013, the related statement of operations for the year then ended, the statements of changes in net assets for each of the years in the two-year period then ended, and the financial highlights for each of the years in the five-year period then ended. These financial statements and financial highlights are the responsibility of the Fund’s management. Our responsibility is to express an opinion on these financial statements and financial highlights based on our audits.
We conducted our audits in accordance with the standards of the Public Company Accounting Oversight Board (United States).Those standards require that we plan and perform the audit to obtain reasonable assurance about whether the financial statements and financial highlights are free of material misstatement. An audit includes examining, on a test basis, evidence supporting the amounts and disclosures in the financial statements. Our procedures included confirmation of securities owned as of October 31, 2013, by correspondence with the custodian and brokers or by other appropriate auditing procedures.An audit also includes assessing the accounting principles used and significant estimates made by management, as well as evaluating the overall financial statement presentation. We believe that our audits provide a reasonable basis for our opinion.
In our opinion, the financial statements and financial highlights referred to above present fairly, in all material respects, the financial position of Dreyfus U.S.Treasury Reserves as of October 31, 2013, the results of its operations for the year then ended, the changes in its net assets for each of the years in the two-year period then ended, and the financial highlights for each of the years in the five-year period then ended, in conformity with U.S. generally accepted accounting principles.

New York, New York
December 30, 2013
20
IMPORTANT TAX INFORMATION (Unaudited)
For federal tax purposes, the fund designates the maximum amount allowable but not less than 100% as interest-related dividends in accordance with Sections 871(k)(1) and 881(e) of the Internal Revenue Code.
BOARD MEMBERS INFORMATION (Unaudited)
| |
| Joseph S. DiMartino (70) |
| Chairman of the Board (1999) |
| Principal Occupation During Past 5Years: |
| • Corporate Director and Trustee |
| Other Public Company Board Memberships During Past 5Years: |
| • CBIZ (formerly, Century Business Services, Inc.), a provider of outsourcing functions for small |
| and medium size companies, Director (1997-present) |
| • The Newark Group, a provider of a national market of paper recovery facilities, paperboard |
| mills and paperboard converting plants, Director (2000-2010) |
| • Sunair Services Corporation, a provider of certain outdoor-related services to homes and |
| businesses, Director (2005-2009) |
| No. of Portfolios for which Board Member Serves: 141 |
| ——————— |
| Francine J. Bovich (62) |
| Board Member (2012) |
| Principal Occupation During Past 5Years: |
| • Trustee,The Bradley Trusts, private trust funds (2011-present) |
| • Managing Director, Morgan Stanley Investment Management (1993-2010) |
| No. of Portfolios for which Board Member Serves: 40 |
| ——————— |
| James M. Fitzgibbons (79) |
| Board Member (1994) |
| Principal Occupation During Past 5Years: |
| • Corporate Director and Trustee |
| Other Public Company Board Memberships During Past 5Years: |
| • Bill Barrett Corporation, an oil and natural gas exploration company, Director (2004-2012) |
| No. of Portfolios for which Board Member Serves: 26 |
| ——————— |
| Kenneth A. Himmel (67) |
| Board Member (1994) |
| Principal Occupation During Past 5Years: |
| • President and CEO, Related Urban Development, a real estate development company (1996-present) |
| • President and CEO, Himmel & Company, a real estate development company (1980-present) |
| • CEO,American Food Management, a restaurant company (1983-present) |
| No. of Portfolios for which Board Member Serves: 26 |
22
| |
| Stephen J. Lockwood (66) |
| Board Member (1994) |
| Principal Occupation During Past 5Years: |
| • Chairman of the Board, Stephen J. Lockwood and Company LLC, a real estate investment |
| company (2000-present) |
| No. of Portfolios for which Board Member Serves: 26 |
| ——————— |
| Roslyn M. Watson (64) |
| Board Member (1994) |
| Principal Occupation During Past 5Years: |
| • Principal,Watson Ventures, Inc., a real estate investment company (1993-present) |
| No. of Portfolios for which Board Member Serves: 36 |
| ——————— |
| Benaree Pratt Wiley (67) |
| Board Member (1998) |
| Principal Occupation During Past 5Years: |
| • Principal,TheWiley Group, a firm specializing in strategy and business development (2005-present) |
| Other Public Company Board Memberships During Past 5Years: |
| • CBIZ (formerly, Century Business Services, Inc.), a provider of outsourcing functions for small |
| and medium size companies, Director (2008-present) |
| No. of Portfolios for which Board Member Serves: 61 |
| ——————— |
Once elected all Board Members serve for an indefinite term, but achieve Emeritus status upon reaching age 80.The address of the Board Members and Officers is c/o The Dreyfus Corporation, 200 Park Avenue, NewYork, NewYork 10166. Additional information about the Board Members is available in the fund’s Statement of Additional Information which can be obtained from Dreyfus free of charge by calling this toll free number: 1-800-DREYFUS.
| |
| J.Tomlinson Fort, Emeritus Board Member |
OFFICERS OF THE FUND (Unaudited)
BRADLEY J. SKAPYAK, President since January 2010.
Chief Operating Officer and a director of the Manager since June 2009, Chairman of Dreyfus Transfer, Inc., an affiliate of the Manager and the transfer agent of the funds, since May 2011 and Executive Vice President of the Distributor since June 2007. From April 2003 to June 2009, Mr. Skapyak was the head of the Investment Accounting and Support Department of the Manager. He is an officer of 68 investment companies (comprised of 141 portfolios) managed by the Manager. He is 55 years old and has been an employee of the Manager since February 1988.
JOHN PAK, Chief Legal Officer since March 2013.
Chief Legal Officer of the Manager and Associate General Counsel and Managing Director of BNY Mellon since August 2012; from March 2005 to July 2012, Managing Director of Deutsche Bank, Deputy Global Head of Deutsche Asset Management Legal and Regional Head of Deutsche Asset Management Americas Legal. He is an officer of 69 investment companies (comprised of 166 portfolios) managed by the Manager. He is 45 years old and has been an employee of the Manager since August 2012.
JANETTE E. FARRAGHER, Vice President and Secretary since December 2011.
Assistant General Counsel of BNY Mellon, and an officer of 69 investment companies (comprised of 166 portfolios) managed by the Manager. She is 50 years old and has been an employee of the Manager since February 1984.
KIESHA ASTWOOD, Vice President and Assistant Secretary since January 2010.
Counsel of BNY Mellon, and an officer of 69 investment companies (comprised of 166 portfolios) managed by the Manager. She is 40 years old and has been an employee of the Manager since July 1995.
JAMES BITETTO, Vice President and Assistant Secretary since August 2005.
Senior Counsel of BNY Mellon and Secretary of the Manager, and an officer of 69 investment companies (comprised of 166 portfolios) managed by the Manager. He is 47 years old and has been an employee of the Manager since December 1996.
JONI LACKS CHARATAN, Vice President and Assistant Secretary since August 2005.
Senior Counsel of BNY Mellon, and an officer of 69 investment companies (comprised of 166 portfolios) managed by the Manager. She is 58 years old and has been an employee of the Manager since October 1988.
JOSEPH M. CHIOFFI, Vice President and Assistant Secretary since August 2005.
Senior Counsel of BNY Mellon, and an officer of 69 investment companies (comprised of 166 portfolios) managed by the Manager. He is 52 years old and has been an employee of the Manager since June 2000.
JOHN B. HAMMALIAN, Vice President and Assistant Secretary since August 2005.
Senior Managing Counsel of BNY Mellon, and an officer of 69 investment companies (comprised of 166 portfolios) managed by the Manager. He is 50 years old and has been an employee of the Manager since February 1991.
ROBERT R. MULLERY, Vice President and Assistant Secretary since August 2005.
Managing Counsel of BNY Mellon, and an officer of 69 investment companies (comprised of 166 portfolios) managed by the Manager. He is 61 years old and has been an employee of the Manager since May 1986.
24
JEFF PRUSNOFSKY, Vice President and Assistant Secretary since August 2005.
Senior Managing Counsel of BNY Mellon, and an officer of 69 investment companies (comprised of 166 portfolios) managed by the Manager. He is 48 years old and has been an employee of the Manager since October 1990.
JAMES WINDELS, Treasurer since November 2001.
Director – Mutual Fund Accounting of the Manager, and an officer of 69 investment companies (comprised of 166 portfolios) managed by the Manager. He is 55 years old and has been an employee of the Manager since April 1985.
RICHARD CASSARO, Assistant Treasurer since January 2008.
Senior Accounting Manager – Money Market and Municipal Bond Funds of the Manager, and an officer of 69 investment companies (comprised of 166 portfolios) managed by the Manager. He is 54 years old and has been an employee of the Manager since September 1982.
GAVIN C. REILLY, Assistant Treasurer since December 2005.
Tax Manager of the Investment Accounting and Support Department of the Manager, and an officer of 69 investment companies (comprised of 166 portfolios) managed by the Manager. He is 45 years old and has been an employee of the Manager since April 1991.
ROBERT S. ROBOL, Assistant Treasurer since December 2002.
Senior Accounting Manager – Fixed Income Funds of the Manager, and an officer of 69 investment companies (comprised of 166 portfolios) managed by the Manager. He is 49 years old and has been an employee of the Manager since October 1988.
ROBERT SALVIOLO, Assistant Treasurer since July 2007.
Senior Accounting Manager – Equity Funds of the Manager, and an officer of 69 investment companies (comprised of 166 portfolios) managed by the Manager. He is 46 years old and has been an employee of the Manager since June 1989.
ROBERT SVAGNA, Assistant Treasurer since December 2002.
Senior Accounting Manager – Equity Funds of the Manager, and an officer of 69 investment companies (comprised of 166 portfolios) managed by the Manager. He is 46 years old and has been an employee of the Manager since November 1990.
JOSEPH W. CONNOLLY, Chief Compliance Officer since October 2004.
Chief Compliance Officer of the Manager and The Dreyfus Family of Funds (69 investment companies, comprised of 166 portfolios). He is 56 years old and has served in various capacities with the Manager since 1980, including manager of the firm’s Fund Accounting Department from 1997 through October 2001.
MATTHEW D. CONNOLLY, Anti-Money Laundering Compliance Officer since April 2012.
Anti-Money Laundering Compliance Officer of the Distributor since October 2011; from March 2010 to September 2011, Global Head, KYC Reviews and Director, UBS Investment Bank; until March 2010, AML Compliance Officer and Senior Vice President, Citi Global Wealth Management. He is an officer of 64 investment companies (comprised of 161 portfolios) managed by the Manager. He is 41 years old and has been an employee of the Distributor since October 2011.
For More Information
Telephone 1-800-DREYFUS
Mail The Dreyfus Family of Funds, 144 Glenn Curtiss Boulevard, Uniondale, NY 11556-0144 E-mail Send your request to info@dreyfus.com Internet Information can be viewed online or downloaded at: http://www.dreyfus.com
The fund will disclose daily, on www.dreyfus.com, the fund’s complete schedule of holdings as of the end of the previous business day. The schedule of holdings will remain on the website until the fund files its Form N-Q or Form N-CSR for the period that includes the date of the posted holdings.
The fund files its complete schedule of portfolio holdings with the Securities and Exchange Commission (“SEC”) for the first and third quarters of each fiscal year on Form N-Q. The fund’s Forms N-Q are available on the SEC’s website at http://www.sec.gov and may be reviewed and copied at the SEC’s Public Reference Room in Washington, DC. Information on the operation of the Public Reference Room may be obtained by calling 1-800-SEC-0330.
Information regarding how the fund voted proxies relating to portfolio securities for the most recent 12-month period ended June 30 is available on the SEC’s website at http://www.sec.gov and without charge, upon request, by calling 1-800-DREYFUS.

The views expressed in this report reflect those of the portfolio manager only through the end of the period covered and do not necessarily represent the views of Dreyfus or any other person in the Dreyfus organization. Any such views are subject to change at any time based upon market or other conditions and Dreyfus disclaims any responsibility to update such views.These views may not be relied on as investment advice and, because investment decisions for a Dreyfus fund are based on numerous factors, may not be relied on as an indication of trading intent on behalf of any Dreyfus fund.
| | Contents |
| | THE FUND |
| 2 | A Letter from the President |
| 3 | Discussion of Fund Performance |
| 6 | Fund Performance |
| 8 | Understanding Your Fund’s Expenses |
| 8 | Comparing Your Fund’s Expenses With Those of Other Funds |
| 9 | Statement of Investments |
| 25 | Statement of Financial Futures |
| 26 | Statement of Options Written |
| 27 | Statement of Assets and Liabilities |
| 28 | Statement of Operations |
| 29 | Statement of Changes in Net Assets |
| 31 | Financial Highlights |
| 35 | Notes to Financial Statements |
| 61 | Report of Independent Registered Public Accounting Firm |
| 62 | Important Tax Information |
| 63 | Board Members Information |
| 65 | Officers of the Fund |
| | FOR MORE INFORMATION |
| | Back Cover |
Dreyfus
Opportunistic Fixed
Income Fund
The Fund
A LETTER FROM THE PRESIDENT
Dear Shareholder:
We are pleased to present this annual report for Dreyfus Opportunistic Fixed Income Fund, covering the 12-month period from November 1, 2012, through October 31, 2013. For information about how the fund performed during the reporting period, as well as general market perspectives, we provide a Discussion of Fund Performance on the pages that follow.
The reporting period produced a challenging environment for many fixed-income securities, as a gradually strengthening U.S. economy and expectations of more moderately stimulative monetary policies drove longer term interest rates higher and bond prices lower. In this environment, corporate-backed bonds generally held up better than their government- and agency-issued counterparts, eking out mildly positive returns, on average, as default rates remained low and issuers’ business prospects improved along with the economy.
We currently expect U.S. and global economic conditions to continue to improve in 2014, with accelerating growth supported by the fading drags of tighter federal fiscal policies and downsizing on the state and local levels. Moreover, inflation is likely to remain muted, so monetary policy can remain stimulative. Globally, we anticipate stronger growth in developed countries due to past and continuing monetary ease, while emerging markets seem poised for moderate economic expansion despite recently negative investor sentiment. For more information on how these observations may affect your investments, we encourage you to speak with your financial advisor.
Thank you for your continued confidence and support.
Sincerely,

J. Charles Cardona
President
The Dreyfus Corporation
November 15, 2013
2
DISCUSSION OF FUND PERFORMANCE
For the period of November 1, 2012, through October 31, 2013, as provided by David Leduc, CFA, and David Horsfall, CFA, Portfolio Managers
Fund and Market Performance Overview
For the 12-month period ended October 31, 2013, Dreyfus Opportunistic Fixed Income Fund’s Class A shares produced a total return of 2.54%, Class C shares returned 1.72%, Class I shares returned 2.74%, and Class Y shares returned 0.42%.1 In comparison, the Citibank 30-day Treasury Bill Index (the “Index”) achieved a total return of 0.04% for the same period.2
The U.S. bond market encountered heightened volatility during the reporting period when investors reacted to stronger economic growth, causing long-term interest rates to climb in anticipation of a more moderately accommodative monetary policy from the Federal Reserve Board (the “Fed”). The fund produced higher returns than its benchmark, mainly due to positions in fixed-income markets that are not represented in the Index.
The Fund’s Investment Approach
The fund seeks to maximize total return through capital appreciation and income.To pursue its goal, we typically allocate the fund’s assets across four sectors of the fixed-income market: U.S. high yield bonds rated below investment grade; U.S. government, investment grade corporate and mortgage-backed securities; foreign debt securities of developed markets; and foreign debt securities of emerging markets.
Our analysis of top-down quantitative and macroeconomic factors guides the allocation of assets among market sectors, industries, and positioning along the yield curve. Using fundamental analysis, we seek to identify individual securities with high current income, as well as appreciation potential, based on relative value, credit upgrade probability, and extensive research into the credit history and current financial strength of the securities’ issuers.
Rising Long-Term Interest Rates Roiled Bond Market
The reporting period began in the midst of heightened market volatility as fixed-income investors responded nervously to stronger U.S. economic conditions. Despite concerns stemming from political infighting about the federal budget, new releases of economic data showed sustained improvements in employment and housing market
The Fund 3
DISCUSSION OF FUND PERFORMANCE (continued)
trends.As a result, long-term interest rates began to move higher during the first quarter of 2013. U.S. government securities and other interest rate-sensitive sectors suffered when investors anticipated future increases in intermediate- and long-term interest rates. In contrast, corporate- and asset-backed securities held up relatively well as issuers’ underlying business fundamentals strengthened.
The market’s worries regarding higher interest rates intensified in late May, when relatively hawkish remarks by Fed chairman Ben Bernanke were interpreted as a signal that the central bank would back away from its ongoing quantitative easing program sooner than expected. Consequently, most bond market sectors fell sharply in June. The market generally stabilized over the summer, and bonds rallied in September when the Fed refrained from tapering its ongoing quantitative easing program. Interest rate-sensitive bonds also gained a degree of value in October, when the effects of a 16-day U.S. government shutdown prompted investors to reduce their expectations of economic growth over the near to intermediate term.
Out-of-Index Positions Supported Fund Performance
Although the fund was affected negatively by the challenging fixed-income investment environment, it fared better than its benchmark due to holdings that are not part of the Index. For example, commercial mortgage-backed securities and asset-backed securities fared particularly well in the strengthening economy.The fund also held a small position in sovereign bonds from previously hard hit European countries, including Spain, Italy, and Portugal, which rallied from depressed levels. High yield corporate bonds, which are rated below investment grade, also contributed positively to the fund’s performance. Dollar-denominated bonds from the emerging markets also helped buoy relative results, as did currency positions that favored the U.S. dollar over the euro and yen.
The fund held few residential mortgage-backed securities, which helped bolster performance early in the reporting period but later detracted. We set the fund’s average duration in a position that was shorter than market averages, which proved to be a mild drag on relative performance. Our interest rate strategies included overweighted exposure to the short and long ends of the market’s maturity spectrum in anticipation of narrowing yield differences, but this positioning had little material impact on relative results.
At times during the reporting period, we purchased put and call options on U.S. Treasury securities.These strategies generally proved supportive of returns compared to the benchmark.
4
Maintaining a Lower Risk Profile
Although we have been encouraged by the bond market’s recent resiliency amid uncertainty regarding the timing of changes in Fed policy, in August we adopted a more defensive investment posture in anticipation of more robust economic growth in 2014. Most notably, we have eliminated most of the fund’s currency positions, except that we added some local currency-denominated emerging-markets bonds as a hedge against unexpected developments. We added to the fund’s holdings of investment-grade corporate bonds, which tend to be less sensitive to changing interest rates than other market sectors.We also added to the fund’s European sovereign bond holdings amid expectations of a continuation of the region’s accommodative monetary policies.
November 15, 2013
|
| Bond funds are subject generally to interest rate, credit, liquidity and market risks, to varying degrees, all of which are |
| more fully described in the fund’s prospectus. Generally, all other factors being equal, bond prices are inversely related |
| to interest-rate changes, and rate increases can cause price declines. |
| High yield bonds are subject to increased credit risk and are considered speculative in terms of the issuer’s perceived |
| ability to continue making interest payments on a timely basis and to repay principal upon maturity. |
| Foreign bonds are subject to special risks including exposure to currency fluctuations, changing political and economic |
| conditions, and potentially less liquidity.These risks are generally greater with emerging market countries than with |
| more economically and politically established foreign countries. |
| Investments in foreign currencies are subject to the risk that those currencies will decline in value relative to the U.S. |
| dollar, or, in the case of hedged positions, that the U.S. dollar will decline relative to the currency being hedged. |
| Currency rates in foreign countries may fluctuate significantly over short periods of time.A decline in the value of |
| foreign currencies relative to the U.S. dollar will reduce the value of securities held by the fund and denominated in |
| those currencies.The use of leverage may magnify the fund’s gains or losses. For derivatives with a leveraging |
| component, adverse changes in the value or level of the underlying asset can result in a loss that is much greater than |
| the original investment in the derivative. |
| The fund may use derivative instruments, such as options, futures and options on futures, forward contracts, swaps |
| (including credit default swaps on corporate bonds and asset-backed securities), options on swaps and other credit |
| derivatives.A small investment in derivatives could have a potentially large impact on the fund’s performance.The use |
| of derivatives involves risks different from, or possibly greater than, the risks associated with investing directly in the |
| underlying assets. |
| 1 Total return includes reinvestment of dividends and any capital gains paid, and does not take into consideration the |
| maximum initial sales charge in the case of Class A shares, or the applicable contingent deferred sales charge imposed |
| on redemptions in the case of Class C shares. Had these charges been reflected, returns would have been lower. Past |
| performance is no guarantee of future results. Class I and ClassY shares are not subject to any initial or deferred sales |
| changes. Share price, yield and investment return fluctuate such that upon redemption, fund shares may be worth more |
| or less than their original cost. Return figures provided reflect the absorption of certain fund expenses by the Dreyfus |
| Corporation pursuant to an agreement in effect through July 4, 2014, at which time it may be extended, modified or |
| terminated. Had these expenses not been absorbed, the fund’s returns would have been lower. |
| 2 SOURCE: CITI. US Treasury Bill Indices—These indices measure return equivalents of yield averages that are not |
| marked to market. For example, the US One-Month and Three-Month Treasury Bill Indices consist of the last one |
| one-month and three three-month Treasury bill month-end rates, respectively. Returns for these indices are calculated |
| on a monthly basis only. |
The Fund 5
FUND PERFORMANCE
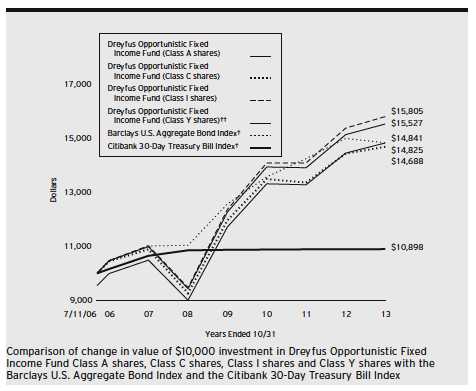
| |
| † | Source: Lipper Inc. |
| †† | The total return figures presented for ClassY shares of the fund reflect the performance of the fund’s Class A shares |
| | for the period prior to 7/1/13 (the inception date for ClassY shares). |
| Past performance is not predictive of future performance. |
| The above graph compares a $10,000 investment made in each of the Class A, Class C, Class I and ClassY shares of |
| Dreyfus Opportunistic Fixed Income Fund on 7/11/06 (the fund’s inception date) to a $10,000 investment made in |
| the Barclays U.S.Aggregate Bond Index (the “Former Index”) and the Citibank 30-Day Treasury Bill Index (the |
| “New Index”) on that date.All dividends and capital gain distributions are reinvested. |
| On April 24, 2013, the Board authorized the fund to offer ClassY shares, as a new class of shares, to certain investors, |
| including certain institutional investors. On July 1, 2013, ClassY shares were offered at net asset value and are not |
| subject to certain fees, including Distribution Plan and Shareholder Services Plan fees. |
| On July 1, 2013, the fund changed its benchmark from the “Former Index” to the “New Index” because the “Former |
| Index” is no longer an appropriate index for comparative purposes. Effective July 1, 2013, the fund is not managed to a |
| benchmark index. Rather than managing to track a benchmark index, the fund seeks to provide returns that are largely |
| independent of market moves.The “New Index” serves as a baseline performance index.The fund’s next annual report |
| will only include performance of the “New Index,” not the “Former Index.” |
| The fund invests primarily in fixed-income securities.The fund’s performance shown in the line graph above takes into |
| account the maximum initial sales charge on Class A shares and all other applicable fees and expenses on all classes.The |
| Barclays U.S.Aggregate Bond Index is a widely accepted, unmanaged total return index of corporate, U.S. government and |
| U.S. government agency debt instruments, mortgage-backed securities and asset-backed securities with an average maturity |
| of 1-10 years.The Citibank 30-Day Treasury Bill Index is a market value-weighted index of public obligations of the |
| U.S.Treasury with maturities of 30 days. Unlike a mutual fund, the indices are not subject to charges, fees and other |
| expenses. Investors cannot invest directly in any index. Further information relating to fund performance, including expense |
| reimbursements, if applicable, is contained in the Financial Highlights section of the prospectus and elsewhere in this report. |
6
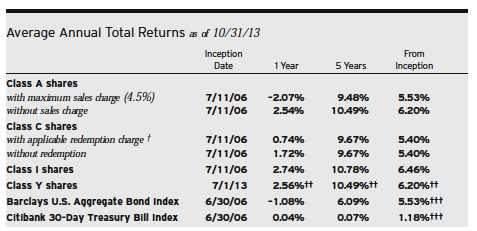
| |
| Past performance is not predictive of future performance.The fund’s performance shown in the graph and table does not |
| reflect the deduction of taxes that a shareholder would pay on fund distributions or the redemption of fund shares. |
| † | The maximum contingent deferred sales charge for Class C shares is 1% for shares redeemed within one year of the |
| | date of purchase. |
| †† | The total return performance figures presented for ClassY shares of the fund reflect the performance of the fund’s |
| | Class A shares for the period prior to 7/1/13 (the inception date for ClassY shares). |
| ††† | For comparative purposes, the value of each Index as of 6/30/06 is used as the beginning value on 7/11/06. |
The Fund 7
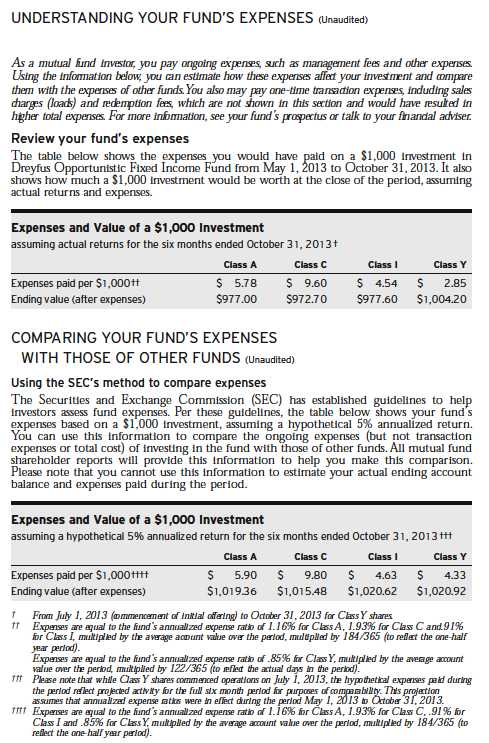
8
STATEMENT OF INVESTMENTS
October 31, 2013
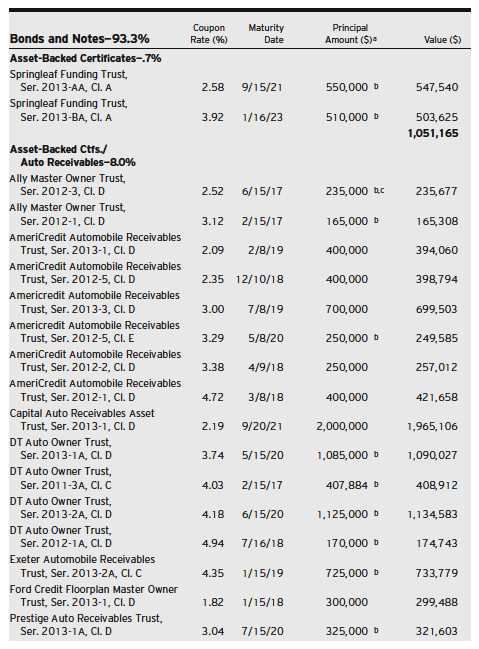
The Fund 9
STATEMENT OF INVESTMENTS (continued)
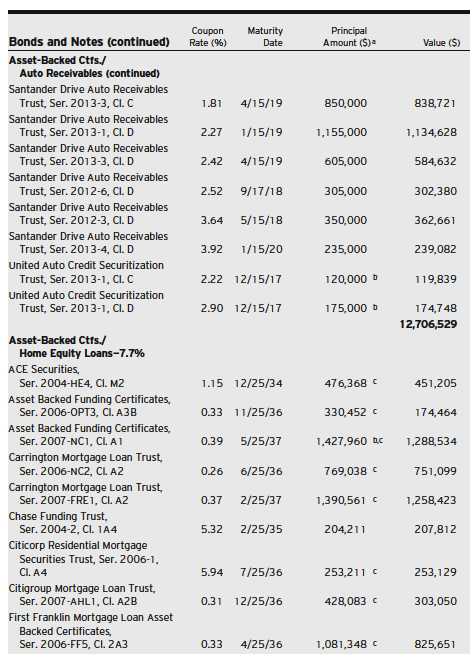
10
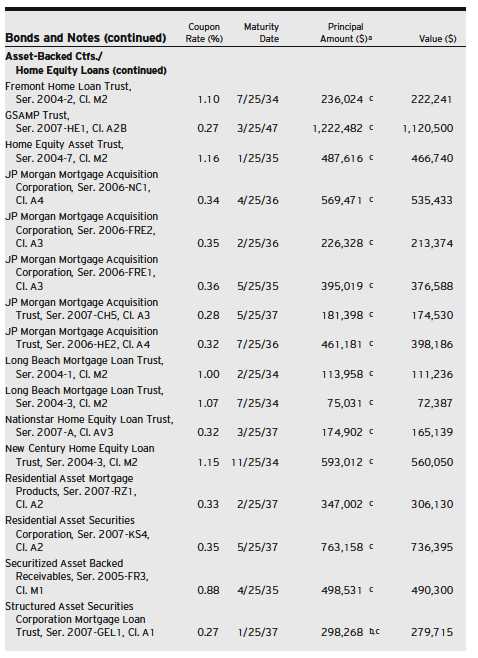
The Fund 11
STATEMENT OF INVESTMENTS (continued)
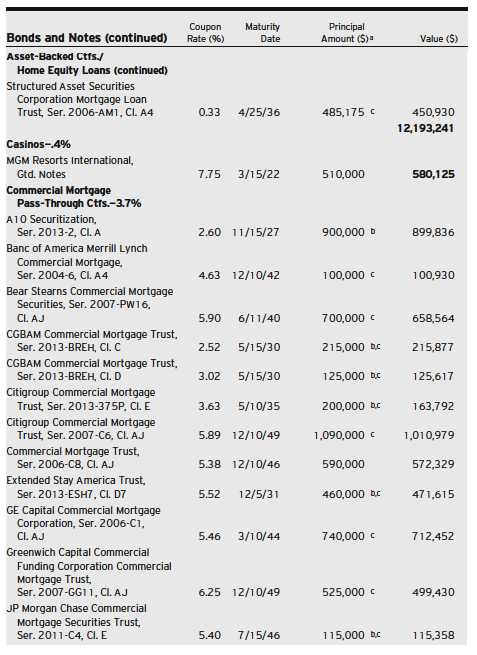
12
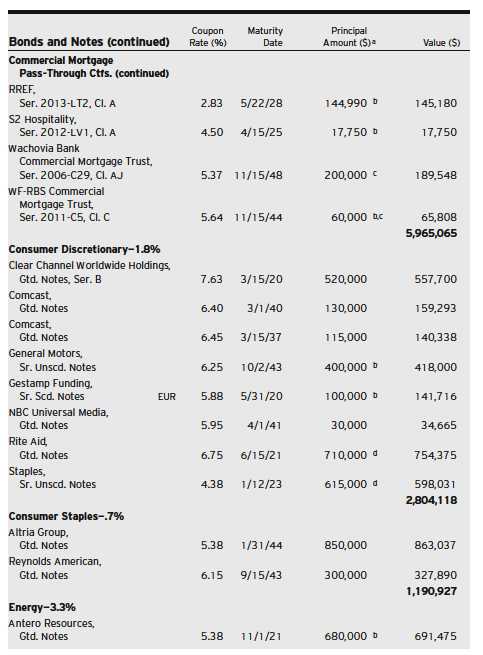
The Fund 13
STATEMENT OF INVESTMENTS (continued)
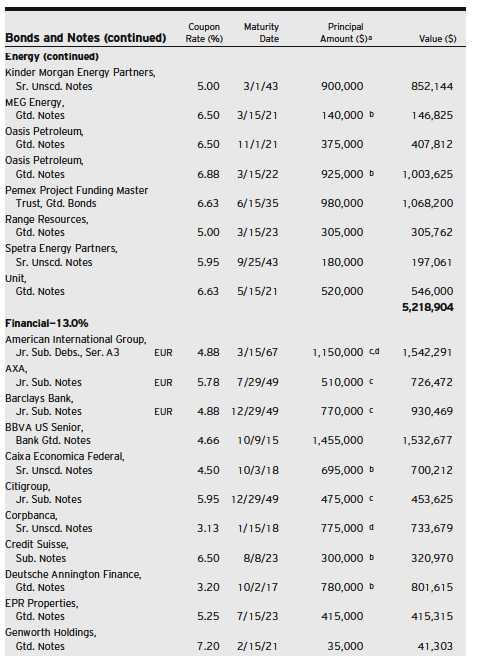
14
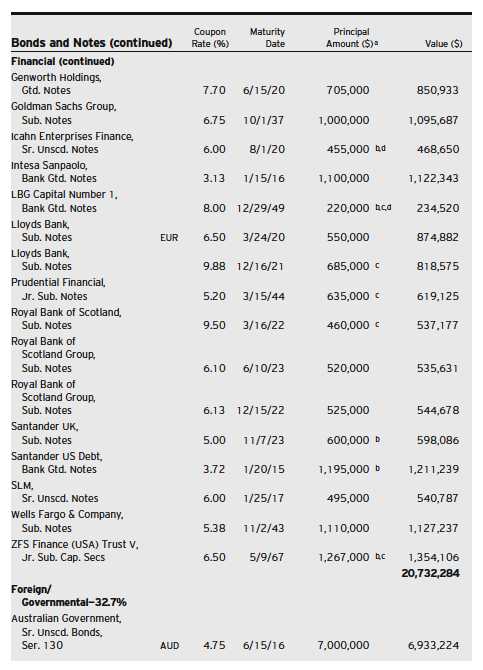
The Fund 15
STATEMENT OF INVESTMENTS (continued)
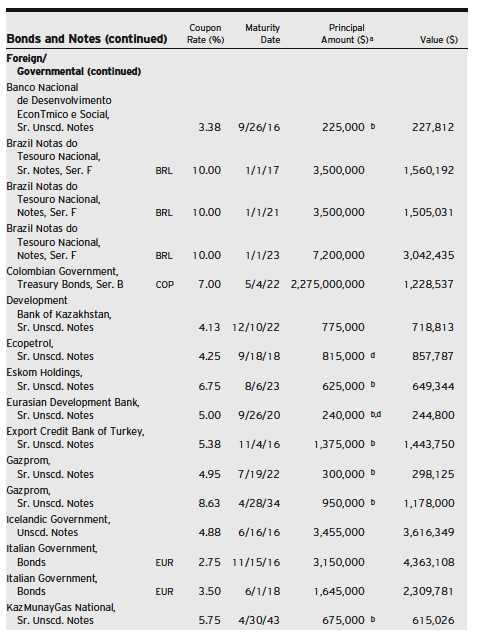
16
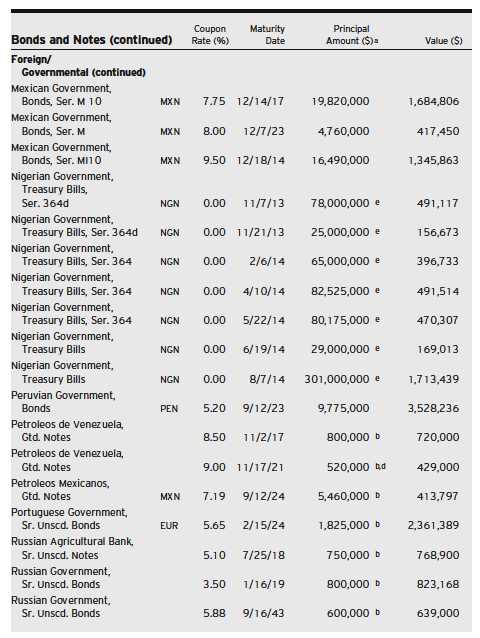
The Fund 17
STATEMENT OF INVESTMENTS (continued)
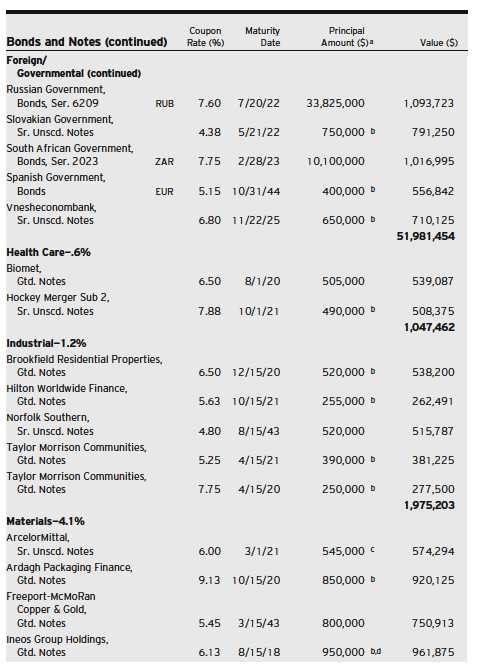
18
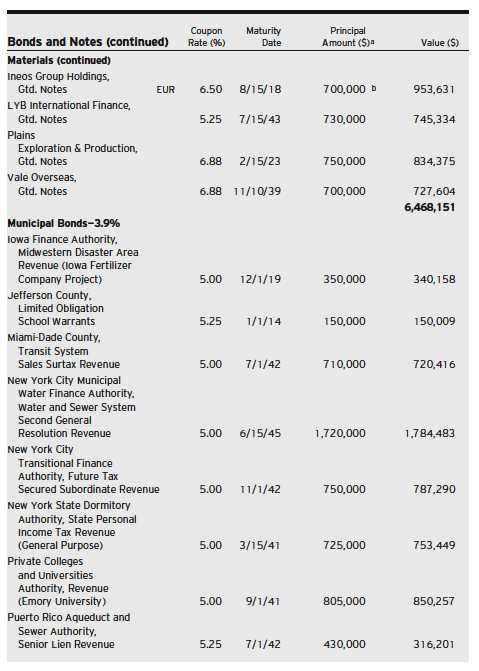
The Fund 19
STATEMENT OF INVESTMENTS (continued)
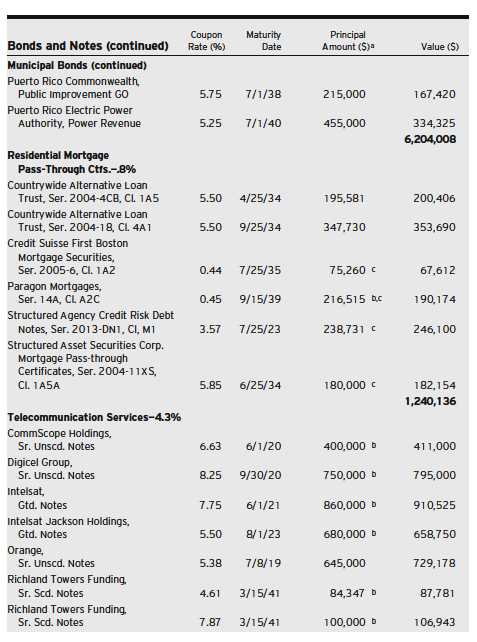
20
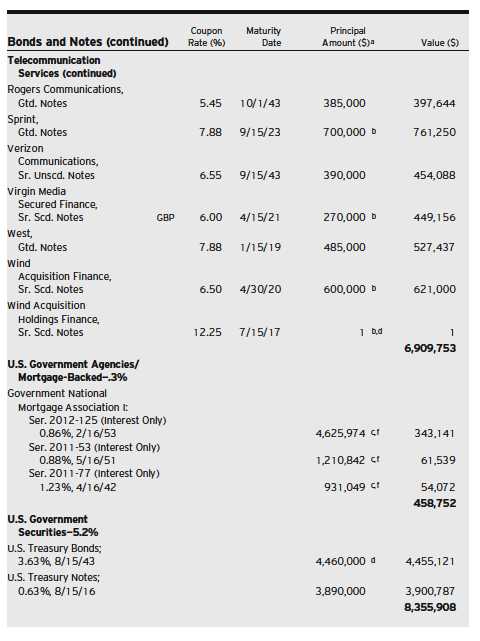
The Fund 21
STATEMENT OF INVESTMENTS (continued)
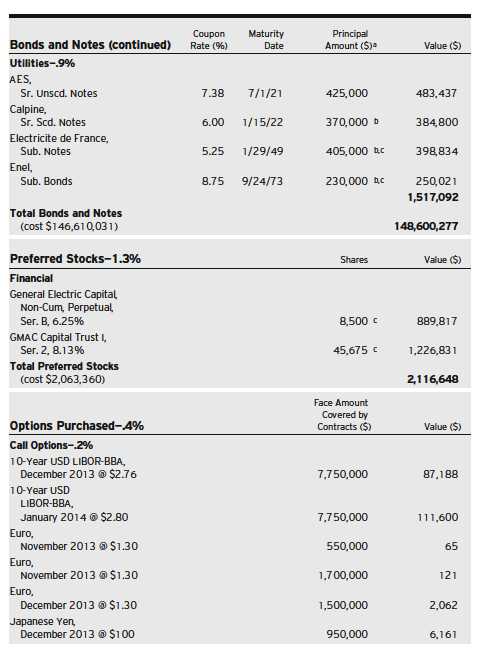
22
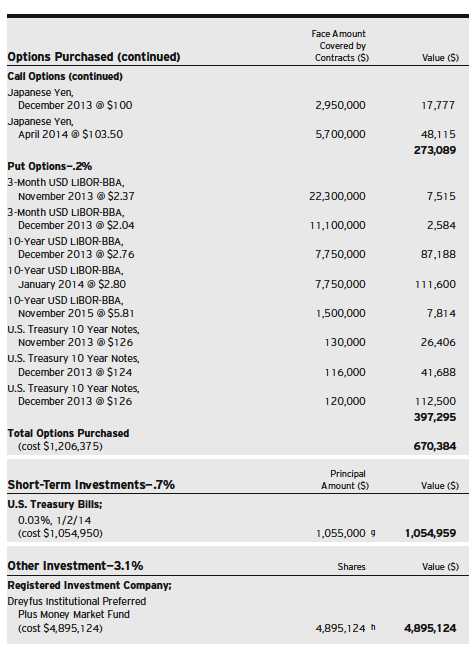
The Fund 23
STATEMENT OF INVESTMENTS (continued)
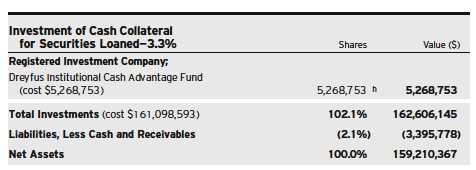
|
| BBA—British Bankers Association |
| GO—General Obligation |
| LIBOR—London Interbank Offered Rate |
| USD—US Dollar |
| a Principal amount stated in U.S. Dollars unless otherwise noted. |
| AUD—Australian Dollar |
| BRL—Brazilian Real |
| COP—Colombian Peso |
| EUR—Euro |
| GBP—British Pound |
| MXN—Mexican New Peso |
| NGN—Nigerian Naira |
| PEN—Peruvian Nuevo Sol |
| RUB—Russian Ruble |
| ZAR—South African Rand |
| b Securities exempt from registration pursuant to Rule 144A under the Securities Act of 1933.These securities may be |
| resold in transactions exempt from registration, normally to qualified institutional buyers.At October 31, 2013, these |
| securities were valued at $41,439,075 or 26.0% of net assets. |
| c Variable rate security—interest rate subject to periodic change. |
| d Security, or portion thereof, on loan.At October 31, 2013, the value of the fund’s securities on loan was $8,712,931 |
| and the value of the collateral held by the fund was $9,016,928, consisting of cash collateral of $5,268,753 and |
| U.S. Government & Agency securities valued at $3,748,175. |
| e Security issued with a zero coupon. Income is recognized through the accretion of discount. |
| f Notional face amount shown. |
| g Held by or on behalf of a counterparty for open financial futures contracts. |
| h Investment in affiliated money market mutual fund. |
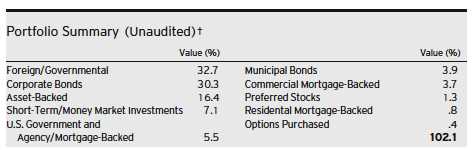
|
| † Based on net assets. |
| See notes to financial statements. |
24
STATEMENT OF FINANCIAL FUTURES
October 31, 2013
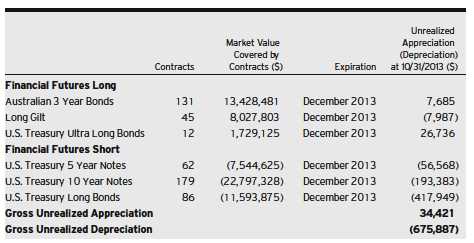
|
| See notes to financial statements. |
The Fund 25
STATEMENT OF OPTIONS WRITTEN
October 31, 2013
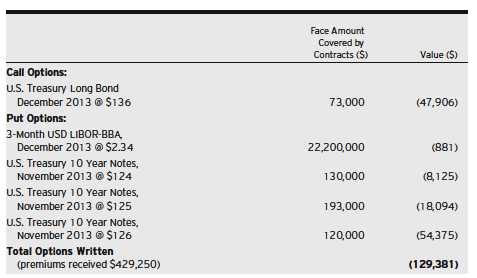
|
| BBA—British Bankers Association |
| LIBOR—London Interbank Offered Rate |
| USD—US Dollar |
| See notes to financial statements. |
26
STATEMENT OF ASSETS AND LIABILITIES
October 31, 2013
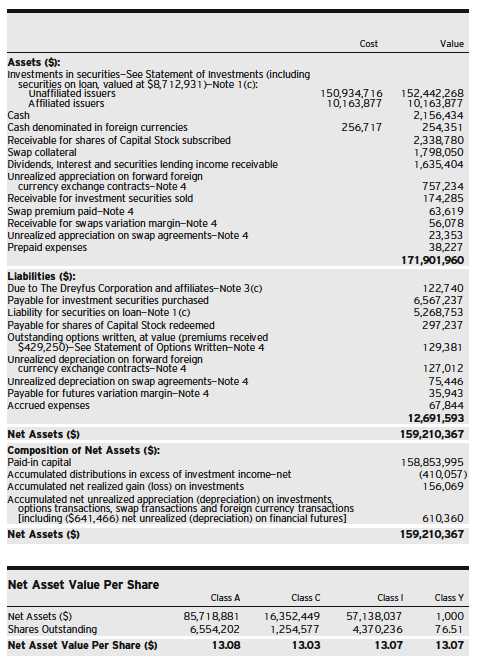
|
| See notes to financial statements. |
The Fund 27
STATEMENT OF OPERATIONS
Year Ended October 31, 2013
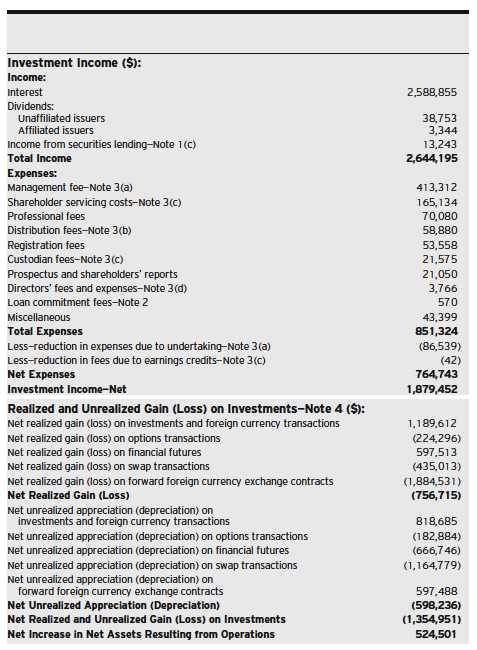
|
| See notes to financial statements. |
28
STATEMENT OF CHANGES IN NET ASSETS
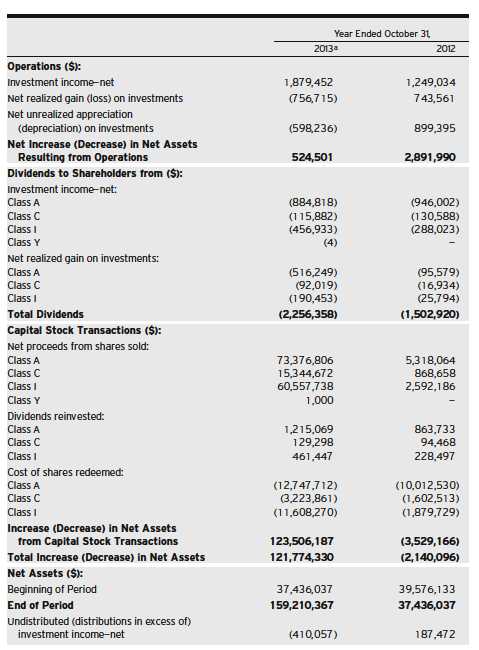
The Fund 29
STATEMENT OF CHANGES IN NET ASSETS (continued)
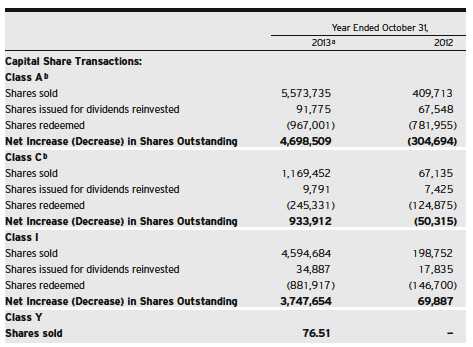
| |
| a | Effective July 1, 2013, the fund commenced offering ClassY shares. |
| b | During the period ended October 31, 2013, 1,897 Class C shares representing $25,779 were exchanged for 1,893 |
| | Class A shares. |
| See notes to financial statements. |
30
FINANCIAL HIGHLIGHTS
The following tables describe the performance for each share class for the fiscal periods indicated.All information (except portfolio turnover rate) reflects financial results for a single fund share.Total return shows how much your investment in the fund would have increased (or decreased) during each period, assuming you had reinvested all dividends and distributions.These figures have been derived from the fund’s financial statements.
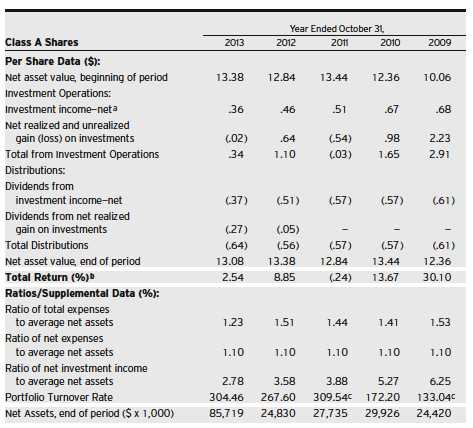
| |
| a | Based on average shares outstanding at each month end. |
| b | Exclusive of sales charge. |
| c | The portfolio turnover rates excluding mortgage dollar roll transactions for the periods ended October 31, 2011 and |
| | 2009, were 303.56% and 123.39%, respectively. |
| See notes to financial statements. |
The Fund 31
FINANCIAL HIGHLIGHTS (continued)
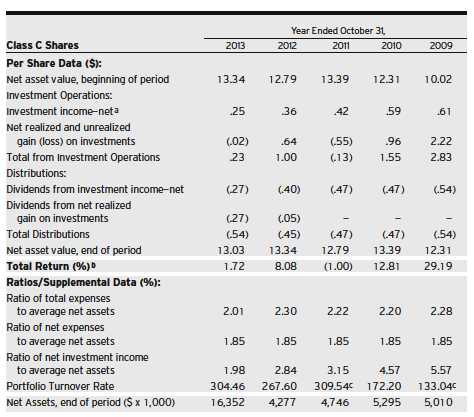
| |
| a | Based on average shares outstanding at each month end. |
| b | Exclusive of sales charge. |
| c | The portfolio turnover rates excluding mortgage dollar roll transactions for the periods ended October 31, 2011 and |
| | 2009, were 303.56% and 123.39%, respectively. |
| See notes to financial statements. |
32
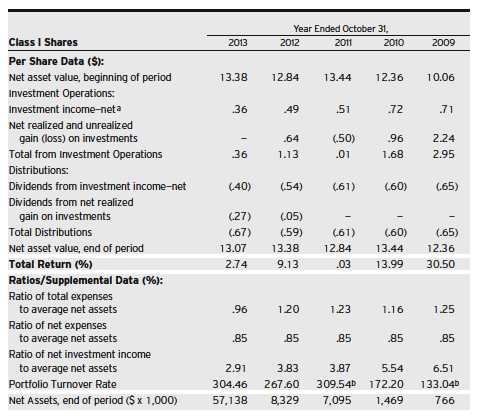
| |
| a | Based on average shares outstanding at each month end. |
| b | The portfolio turnover rates excluding mortgage dollar roll transactions for the periods ended October 31, 2011 and |
| | 2009, were 303.56% and 123.39%, respectively. |
| See notes to financial statements. |
The Fund 33
FINANCIAL HIGHLIGHTS (continued)
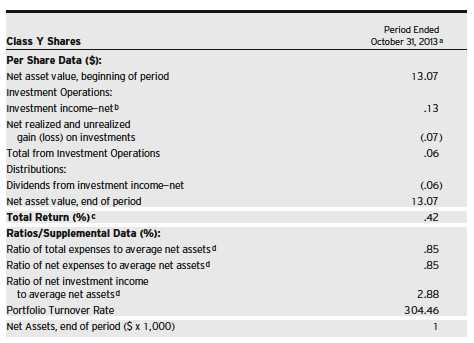
| |
| a | From July 1, 2013 (commencement of initial offering) to October 31, 2013. |
| b | Based on average shares outstanding at each month end. |
| c | Not annualized. |
| d | Annualized. |
| See notes to financial statements. |
34
NOTES TO FINANCIAL STATEMENTS
NOTE 1—Significant Accounting Policies:
Dreyfus Opportunistic Fixed Income Fund (the “fund”) is a separate non-diversified series of The Dreyfus/Laurel Funds, Inc. (the “Company”), which is registered under the Investment Company Act of 1940, as amended (the “Act”), as an open-end management investment company and operates as a series company currently offering eleven series, including the fund.The fund’s investment objective seeks to maximize total return through capital appreciation and income.The Dreyfus Corporation (the “Manager” or “Dreyfus”), a wholly-owned subsidiary of The Bank of New York Mellon Corporation (“BNY Mellon”), serves as the fund’s investment adviser.
At a meeting held on April 24-25, 2013, the Company’s Board of Directors (the “Board”) approved, effective July 1, 2013: (a) for the fund to offer ClassY shares, and (b) an increase in the authorized shares of the fund from 300 million to 400 million and authorized 100 million Class Y shares.
MBSC Securities Corporation (the “Distributor”), a wholly-owned subsidiary of the Manager, is the distributor of the fund’s shares. The fund is authorized to issue 100 million shares of $.001 par value Capital Stock in each of the following classes of shares: Class A, Class C, Class I and Class Y. Class A and Class C shares are sold primarily to retail investors through financial intermediaries and bear Distribution and/or Shareholder Services Plan fees. Class A shares generally are subject to a sales charge imposed at the time of purchase. Class C shares are subject to a contingent deferred sales charge (“CDSC”) imposed on Class C shares redeemed within one year of purchase. Class I shares are sold primarily to bank trust departments and other financial service providers (including The Bank of New York Mellon, a subsidiary of BNY Mellon and an affiliate of Dreyfus, and its affiliates), acting on behalf of customers having a qualified trust or an investment account or relationship at such institution, and bear no Distribution or Shareholder Services Plan fees. Class I shares are offered without a front-end sales charge or CDSC. Class Y shares are sold at net asset
The Fund 35
NOTES TO FINANCIAL STATEMENTS (continued)
value per share to certain investors, including certain institutional investors. Other differences between the classes include the services offered to and the expenses borne by each class, the allocation of certain transfer agency costs and certain voting rights. Income, expenses (other than expenses attributable to a specific class), and realized and unrealized gains or losses on investments are allocated to each class of shares based on its relative net assets.
As of October 31, 2013, MBC Investments Corp., an indirect subsidiary of BNY Mellon, held all of the outstanding ClassY shares of the fund.
The Financial Accounting Standards Board (“FASB”) Accounting Standards Codification is the exclusive reference of authoritative U.S. generally accepted accounting principles (“GAAP”) recognized by the FASB to be applied by nongovernmental entities. Rules and interpretive releases of the Securities and Exchange Commission (“SEC”) under authority of federal laws are also sources of authoritative GAAP for SEC registrants. The fund’s financial statements are prepared in accordance with GAAP, which may require the use of management estimates and assumptions.Actual results could differ from those estimates.
(a) Portfolio valuation: The fair value of a financial instrument is the amount that would be received to sell an asset or paid to transfer a liability in an orderly transaction between market participants at the measurement date (i.e., the exit price). GAAP establishes a fair value hierarchy that prioritizes the inputs of valuation techniques used to measure fair value. This hierarchy gives the highest priority to unadjusted quoted prices in active markets for identical assets or liabilities (Level 1 measurements) and the lowest priority to unobservable inputs (Level 3 measurements).
Additionally, GAAP provides guidance on determining whether the volume and activity in a market has decreased significantly and whether such a decrease in activity results in transactions that are not orderly. GAAP requires enhanced disclosures around valuation inputs and techniques used during annual and interim periods.
36
Various inputs are used in determining the value of the fund’s investments relating to fair value measurements.These inputs are summarized in the three broad levels listed below:
Level 1—unadjusted quoted prices in active markets for identical investments.
Level 2—other significant observable inputs (including quoted prices for similar investments, interest rates, prepayment speeds, credit risk, etc.).
Level 3—significant unobservable inputs (including the fund’s own assumptions in determining the fair value of investments).
The inputs or methodology used for valuing securities are not necessarily an indication of the risk associated with investing in those securities.
Changes in valuation techniques may result in transfers in or out of an assigned level within the disclosure hierarchy. Valuation techniques used to value the fund’s investments are as follows:
Registered investment companies that are not traded on an exchange are valued at their net asset value and are categorized within Level 1 of the fair value hierarchy.
Investments in securities, excluding short-term investments (other than U.S.Treasury Bills), financial futures, options and forward foreign currency exchange contracts (“forward contracts”) are valued each business day by an independent pricing service (the “Service”) approved by the Board. Investments for which quoted bid prices are readily available and are representative of the bid side of the market in the judgment of the Service are valued at the mean between the quoted bid prices (as obtained by the Service from dealers in such securities) and asked prices (as calculated by the Service based upon its evaluation of the market for such securities). Other investments (which constitute a majority of the portfolio securities) are valued as determined by the Service, based on methods which include consideration of the following: yields or prices of securities of comparable quality,
The Fund 37
NOTES TO FINANCIAL STATEMENTS (continued)
coupon, maturity and type; indications as to values from dealers; and general market conditions. These securities are generally categorized within Level 2 of the fair value hierarchy.
U.S. Treasury Bills are valued at the mean price between quoted bid prices and asked prices by the Service. These securities are generally categorized within Level 2 of the fair value hierarchy.
The Service’s procedures are reviewed by Dreyfus under the general supervision of the Board.
When market quotations or official closing prices are not readily available, or are determined not to reflect accurately fair value, such as when the value of a security has been significantly affected by events after the close of the exchange or market on which the security is principally traded (for example, a foreign exchange or market), but before the fund calculates its net asset value, the fund may value these investments at fair value as determined in accordance with the procedures approved by the Board. Certain factors may be considered when fair valuing investments such as: fundamental analytical data, the nature and duration of restrictions on disposition, an evaluation of the forces that influence the market in which the securities are purchased and sold, and public trading in similar securities of the issuer or comparable issuers. These securities are either categorized within Level 2 or 3 of the fair value hierarchy depending on the relevant inputs used.
For restricted securities where observable inputs are limited, assumptions about market activity and risk are used and are categorized within Level 3 of the fair value hierarchy.
Investments denominated in foreign currencies are translated to U.S. dollars at the prevailing rates of exchange.
Financial futures and options, which are traded on an exchange, are valued at the last sales price on the securities exchange on which such securities are primarily traded or at the last sales price on the national securities market on each business day and are generally categorized within Level 1 of the fair value hierarchy. Options traded over-the-
38
counter are valued at the mean between the bid and asked price and are generally categorized within Level 2 of the fair value hierarchy. Investments in swap transactions are valued each business day by the Service. Swaps are valued by the Service by using a swap pricing model which incorporates among other factors, default probabilities, recovery rates, credit curves of the underlying issuer and swap spreads on interest rates and are generally categorized within Level 2 of the fair value hierarchy. Forward contracts are valued at the forward rate and are generally categorized within Level 2 of the fair value hierarchy.
The following is a summary of the inputs used as of October 31, 2013 in valuing the fund’s investments:
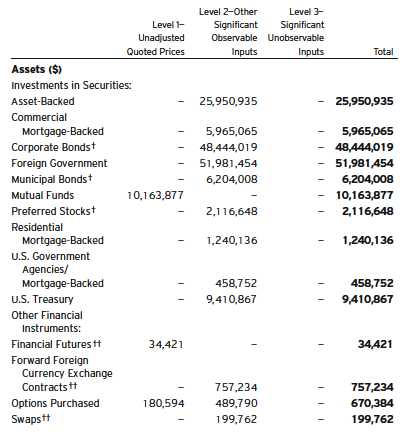
The Fund 39
NOTES TO FINANCIAL STATEMENTS (continued)
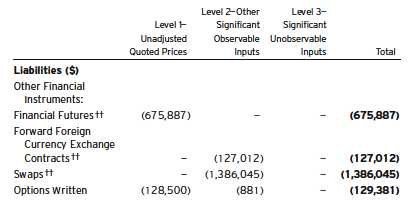
| |
| † | See Statement of Investments for additional detailed categorizations. - |
| †† | Amount shown represents unrealized appreciation (depreciation) at period end. |
At October 31, 2013, there were no transfers between Level 1 and Level 2 of the fair value hierarchy.
(b) Foreign currency transactions: The fund does not isolate that portion of the results of operations resulting from changes in foreign exchange rates on investments from the fluctuations arising from changes in the market prices of securities held. Such fluctuations are included with the net realized and unrealized gain or loss on investments.
Net realized foreign exchange gains or losses arise from sales of foreign currencies, currency gains or losses realized on securities transactions between trade and settlement date, and the difference between the amounts of dividends, interest and foreign withholding taxes recorded on the fund’s books and the U.S. dollar equivalent of the amounts actually received or paid. Net unrealized foreign exchange gains and losses arise from changes in the value of assets and liabilities other than investments resulting from changes in exchange rates. Foreign currency gains and losses on foreign currency transactions are also included with net realized and unrealized gain or loss on investment.
(c) Securities transactions and investment income: Securities transactions are recorded on a trade date basis. Realized gains and losses from securities transactions are recorded on the identified cost basis. Dividend income is recognized on the ex-dividend date and interest
40
income, including, where applicable, accretion of discount and amortization of premium on investments, is recognized on the accrual basis.
Pursuant to a securities lending agreement withThe Bank of NewYork Mellon, the fund may lend securities to qualified institutions. It is the fund’s policy that, at origination, all loans are secured by collateral of at least 102% of the value of U.S. securities loaned and 105% of the value of foreign securities loaned. Collateral equivalent to at least 100% of the market value of securities on loan is maintained at all times. Collateral is either in the form of cash, which can be invested in certain money market mutual funds managed by the Manager or U.S. Government and Agency securities. The fund is entitled to receive all dividends, interest and distributions on securities loaned, in addition to income earned as a result of the lending transaction. Should a borrower fail to return the securities in a timely manner,The Bank of NewYork Mellon is required to replace the securities for the benefit of the fund or credit the fund with the market value of the unreturned securities and is subrogated to the fund’s rights against the borrower and the collateral. During the period ended October 31, 2013, The Bank of New York Mellon earned $3,013 from lending portfolio securities, pursuant to the securities lending agreement.
(d) Affiliated issuers: Investments in other investment companies advised by Dreyfus are defined as “affiliated” under the Act. Investments in affiliated investment companies during the period ended October 31, 2013 were as follows:
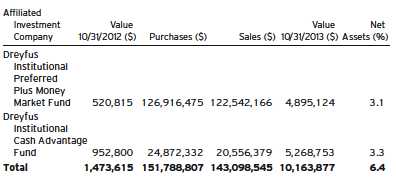
The Fund 41
NOTES TO FINANCIAL STATEMENTS (continued)
(e) Risk: The fund invests primarily in debt securities. Failure of an issuer of the debt securities to make timely interest or principal payments, or a decline or the perception of a decline in the credit quality of a debt security, can cause the debt security’s price to fall, potentially lowering the fund’s share price. In addition, the value of debt securities may decline due to general market conditions that are not specifically related to a particular issuer, such as real or perceived adverse economic conditions, changes in outlook for corporate earnings, changes in interest or currency rates or adverse investor sentiment. They may also decline because of factors that affect a particular industry.
(f) Dividends to shareholders: Dividends are recorded on the ex-dividend date. Dividends from investment income-net are declared and paid on a monthly basis. Dividends from net realized capital gains, if any, are normally declared and paid annually, but the fund may make distributions on a more frequent basis to comply with the distribution requirements of the Internal Revenue Code of 1986, as amended (the “Code”).To the extent that net realized capital gains can be offset by capital loss carryovers, it is the policy of the fund not to distribute such gains. Income and capital gain distributions are determined in accordance with income tax regulations, which may differ from GAAP.
On October 31, 2013, the Board declared a cash dividend of $.012, $.004 $.015 and $.015 per share from undistributed investment income-net for Class A, Class C, Class I and ClassY shares, respectively, payable on November 1, 2013 (ex-dividend date), to shareholders of record as of the close of business on October 31, 2013.
(g) Federal income taxes: It is the policy of the fund to continue to qualify as a regulated investment company, if such qualification is in the best interests of its shareholders, by complying with the applicable provisions of the Code, and to make distributions of taxable income sufficient to relieve it from substantially all federal income and excise taxes.
As of and during the period ended October 31, 2013, the fund did not have any liabilities for any uncertain tax positions.The fund recognizes interest and penalties, if any, related to uncertain tax positions as income
42
tax expense in the Statement of Operations. During the period ended October 31, 2013, the fund did not incur any interest or penalties.
Each tax year in the four-year period ended October 31, 2013 remains subject to examination by the Internal Revenue Service and state taxing authorities.
At October 31, 2013, the components of accumulated earnings on a tax basis were as follows: undistributed ordinary income $144,986, accumulated capital losses $311,865 and unrealized appreciation $523,251.
Under the Regulated Investment Company Modernization Act of 2010 (the “2010 Act”), the fund is permitted to carry forward capital losses incurred in taxable years beginning after December 22, 2010 (“post-enactment losses”) for an unlimited period. Furthermore, post-enactment capital loss carryovers retain their character as either short-term or long-term capital losses rather than short-term as they were under previous statute.
The accumulated capital loss carryover is available for federal income tax purposes to be applied against future net realized capital gains, if any, realized subsequent to October 31, 2013. The fund has $311,865 of post-enactment short-term capital losses which can be carried forward for an unlimited period.
The tax character of distributions paid to shareholders during the fiscal year ended October 31, 2013 and October 31, 2012 were as follows: ordinary income $2,173,863 and $1,364,613 and long-term capital gains $82,495 and $138,307, respectively.
During the period ended October 31, 2013, as a result of permanent book to tax differences, primarily due to the tax treatment for paydown gains and losses, foreign currency transactions, swap periodic payments and consent fees, the fund decreased accumulated undistributed investment income-net by $1,019,344 and increased accumulated net realized gain (loss) on investments by the same amount. Net assets and net asset value per share were not affected by this reclassification.
The Fund 43
NOTES TO FINANCIAL STATEMENTS (continued)
(h) New Accounting Pronouncement: In January 2013, FASB issued Accounting Standards Update No. 2013-01 (“ASU 2013-01”), “Clarifying the Scope of Disclosures about Offsetting Assets and Liabilities”, which replaced Accounting Standards Update No. 2011-11 (“ASU 2011-11”), “Disclosures about Offsetting Assets and Liabilities”. ASU 2013-01 is effective for fiscal years beginning on or after January 1, 2013, and interim periods within those annual periods.ASU 2011-11 was intended to enhance disclosure requirements on the offsetting of financial assets and liabilities.ASU 2013-01 limits the scope of the new balance sheet offsetting disclosures to derivatives, repurchase agreements, and securities lending transactions to the extent that they are (1) offset in the financial statements or (2) subject to enforceable master netting arrangements (“MNA”) or similar agreements. Management is currently evaluating the application of ASU 2013-01 and its impact on the fund’s financial statements.
NOTE 2—Bank Lines of Credit:
The fund participates with other Dreyfus-managed funds in a $265 million unsecured credit facility led by Citibank, N.A. and a $300 million unsecured credit facility provided by The Bank of New York Mellon (each, a “Facility”), each to be utilized primarily for temporary or emergency purposes, including the financing of redemptions. Prior to October 9, 2013, the unsecured credit facility with Citibank, N.A. was $210 million. In connection therewith, the fund has agreed to pay its pro rata portion of commitment fees for each Facility. Interest is charged to the fund based on rates determined pursuant to the terms of the respective Facility at the time of borrowing. During the period ended October 31, 2013, the fund did not borrow under the Facilities.
NOTE 3—Management Fee and Other Transactions with Affiliates:
(a) Pursuant to a management agreement with the Manager, the management fee is computed at the annual rate of .60% of the value of the fund’s average daily net assets and is payable monthly.The Manager has
44
contractually agreed, to waive receipt of its fees and/or assume the expenses of the fund, from November 1, 2012 through July 1, 2014, so that the annual direct operating expenses of this fund (excluding Rule 12b-1 Distribution Plan fees, Shareholder Services Plan fees, taxes, interest expense, brokerage commissions, commitment fees on borrowings and extraordinary expenses) do not exceed .85% of the value of the fund’s average daily net assets.The reduction in expenses, pursuant to the undertaking, amounted to $86,539 during the period ended October 31, 2013.
During the period ended October 31, 2013, the Distributor retained $6,682 from commissions earned on sales of the fund’s Class A shares and $845 from CDSCs on redemptions of the fund’s Class C shares.
(b) Under the Distribution Plan adopted pursuant to Rule 12b-1 under the Act, Class C shares pay the Distributor for distributing its shares at an annual rate of .75% of the value of its average daily net assets. During the period ended October 31, 2013, Class C shares were charged $58,880 pursuant to the Distribution Plan.
(c) Under the Shareholder Services Plan, Class A and Class C shares pay the Distributor at an annual rate of .25% of the value of their average daily net assets for the provision of certain services.The services provided may include personal services relating to shareholder accounts, such as answering shareholder inquiries regarding the fund and providing reports and other information, and services related to the maintenance of shareholder accounts.The Distributor may make payments to Service Agents (securities dealers, financial institutions or other industry professionals) with respect to these services. The Distributor determines the amounts to be paid to Service Agents. During the period ended October 31, 2013, Class A and Class C shares were charged $100,141 and $19,627, respectively, pursuant to the Shareholder Services Plan.
Under its terms, the Distribution Plan and Shareholder Services Plan shall remain in effect from year to year, provided such continuance is approved annually by a vote of a majority of those Directors who are
The Fund 45
NOTES TO FINANCIAL STATEMENTS (continued)
not “interested persons” of the Company and who have no direct or indirect financial interest in the operation of or in any agreement related to the Distribution Plan or Shareholder Services Plan.
The fund has arrangements with the transfer agent and the custodian whereby the fund may receive earnings credits when positive cash balances are maintained, which are used to offset transfer agency and custody fees. For financial reporting purposes, the fund includes net earnings credits as an expense offset in the Statement of Operations.
The fund compensates DreyfusTransfer, Inc., a wholly-owned subsidiary of the Manager, under a transfer agency agreement for providing transfer agency and cash management services for the fund. The majority of transfer agency fees are comprised of amounts paid on a per account basis, while cash management fees are related to fund subscriptions and redemptions. During the period ended October 31, 2013, the fund was charged $7,422 for transfer agency services and $345 for cash management services.These fees are included in Shareholder servicing costs in the Statement of Operations. Cash management fees were partially offset by earnings credits of $42.
The fund compensates The Bank of NewYork Mellon under a custody agreement for providing custodial services for the fund.These fees are determined based on net assets, geographic region and transaction activity. During the period ended October 31, 2013, the fund was charged $21,575 pursuant to the custody agreement.
The fund compensated The Bank of New York Mellon under a cash management agreement that was in effect until September 30, 2013 for performing certain cash management services related to fund subscriptions and redemptions. During the period ended October 31, 2013, the fund was charged $167 pursuant to the cash management agreement, which is included in Shareholder servicing costs in the Statement of Operations.
During the period ended October 31, 2013, the fund was charged $8,887 for services performed by the Chief Compliance Officer and his staff.
46
The components of “Due to The Dreyfus Corporation and affiliates” in the Statement of Assets and Liabilities consist of: management fees $77,865 , Distribution Plan fees $9,864, Shareholder Services Plan fees $19,970, custodian fees $6,065, Chief Compliance Officer fees $7,445 and transfer agency fees $1,531.
(d) Each Board member also serves as a Board member of other funds within the Dreyfus complex. Annual retainer fees and attendance fees are allocated to each fund based on net assets.
NOTE 4—Securities Transactions:
The aggregate amount of purchases and sales (including paydowns) of investment securities, excluding short-term securities, forward contracts, financial futures, options transactions and swap transactions, during the period ended October 31, 2013, amounted to $315,356,993 and $201,408,324, respectively.
Derivatives: A derivative is a financial instrument whose performance is derived from the performance of another asset. Each type of derivative instrument that was held by the fund during the period ended October 31, 2013 is discussed below.
Financial Futures: In the normal course of pursuing its investment objective, the fund is exposed to market risk, including interest rate risk, as a result of changes in value of underlying financial instruments.The fund invests in financial futures in order to manage its exposure to or protect against changes in the market. A financial futures contract represents a commitment for the future purchase or a sale of an asset at a specified date. Upon entering into such contracts, these investments require initial margin deposits with a counterparty, which consist of cash or cash equivalents.The amount of these deposits is determined by the exchange or Board of Trade on which the contract is traded and is subject to change.Accordingly, variation margin payments are received or made to reflect daily unrealized gains or losses which are recorded in
The Fund 47
NOTES TO FINANCIAL STATEMENTS (continued)
the Statement of Operations.When the contracts are closed, the fund recognizes a realized gain or loss which is reflected in the Statement of Operations.There is minimal counterparty credit risk to the fund with financial futures since they are exchange traded, and the exchange’s clearinghouse guarantees the financial futures against default. Financial futures open at October 31, 2013 are set forth in the Statement of Financial Futures.
Options Transactions: The fund purchases and writes (sells) put and call options to hedge against changes in interest rates and foreign currencies, or as a substitute for an investment.The fund is subject market risk, interest rate risk and currency risk in the course of pursuing its investment objectives through its investments in options contracts. A call option gives the purchaser of the option the right (but not the obligation) to buy, and obligates the writer to sell, the underlying security or securities at the exercise price at any time during the option period, or at a specified date. Conversely, a put option gives the purchaser of the option the right (but not the obligation) to sell, and obligates the writer to buy the underlying security or securities at the exercise price at any time during the option period, or at a specified date.
As a writer of call options, the fund receives a premium at the outset and then bears the market risk of unfavorable changes in the price of the financial instrument underlying the option. Generally, the fund realizes a gain, to the extent of the premium, if the price of the underlying financial instrument decreases between the date the option is written and the date on which the option is terminated. Generally, the fund incurs a loss if the price of the financial instrument increases between those dates.
As a writer of put options, the fund receives a premium at the outset and then bears the market risk of unfavorable changes in the price of the financial instrument underlying the option. Generally, the fund realizes a gain, to the extent of the premium, if the price of the underlying financial instrument increases between the date the option is written and the
48
date on which the option is terminated. Generally, the fund incurs a loss if the price of the financial instrument decreases between those dates.
As a writer of an option, the fund has no control over whether the underlying securities may be sold (call) or purchased (put) and as a result bears the market risk of an unfavorable change in the price of the security underlying the written option.There is a risk of loss from a change in value of such options which may exceed the related premiums received. The Statement of Operations reflects the following: any unrealized gains or losses which occurred during the period as well as any realized gains or losses which occurred upon the expiration or closing of the option transaction.
The following summarizes the fund’s call/put options written during the period ended October 31, 2013:
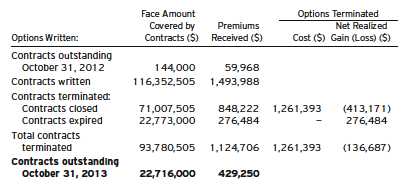
Forward Foreign Currency Exchange Contracts: The fund enters into forward contracts in order to hedge its exposure to changes in foreign currency exchange rates on its foreign portfolio holdings, to settle foreign currency transactions or as a part of its investment strategy. When executing forward contracts, the fund is obligated to buy or sell a foreign currency at a specified rate on a certain date in the future. With respect to sales of forward contracts, the fund incurs a loss if the
The Fund 49
NOTES TO FINANCIAL STATEMENTS (continued)
value of the contract increases between the date the forward contract is opened and the date the forward contract is closed.The fund realizes a gain if the value of the contract decreases between those dates.With respect to purchases of forward contracts, the fund incurs a loss if the value of the contract decreases between the date the forward contract is opened and the date the forward contract is closed.The fund realizes a gain if the value of the contract increases between those dates. Any realized or unrealized gains or losses which occurred during the period are reflected in the Statement of Operations. The fund is exposed to foreign currency risk as a result of changes in value of underlying financial instruments.The fund is also exposed to credit risk associated with counterparty nonperformance on these forward contracts, which is generally limited to the unrealized gain on each open contract.The following summarizes open forward contracts at October 31, 2013.
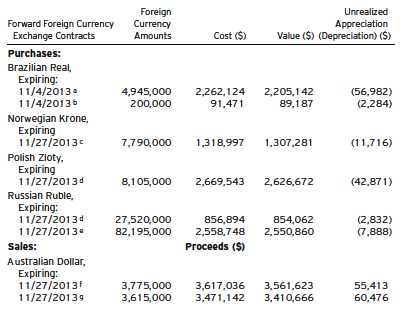
50
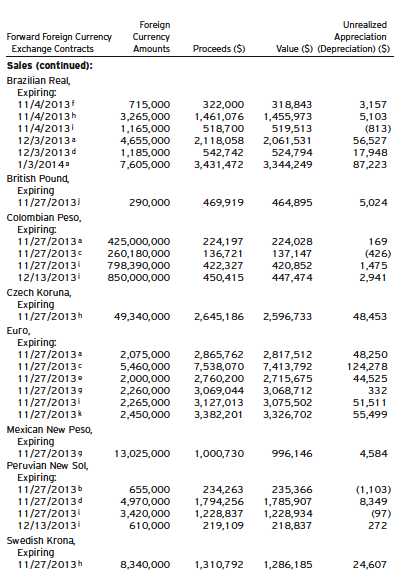
The Fund 51
NOTES TO FINANCIAL STATEMENTS (continued)
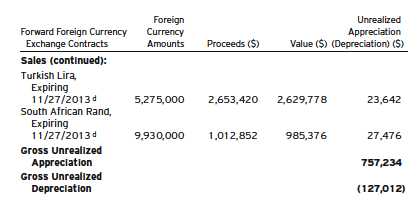
| |
| Counterparties: |
| a | Morgan Stanley Capital Services |
| b | Standard Chartered Bank |
| c | UBS |
| d | Deutsche Bank |
| e | Credit Suisse |
| f | Bank of America |
| g | Goldman Sachs International |
| h | Barclays Bank |
| i | Citigroup |
| j | Commonwealth Bank of Australia |
| k | Royal Bank of Scotland |
Swap Transactions: The fund enters into swap agreements to exchange the interest rate on, or return generated by, one nominal instrument for the return generated by another nominal instrument. Swap agreements are privately negotiated in the over-the-counter (“OTC”) market or centrally cleared.The fund enters into these agreements to hedge certain market or interest rate risks, to manage the interest rate sensitivity (sometimes called duration) of fixed income securities, to provide a substitute for purchasing or selling particular securities or to increase potential returns.
For OTC swaps, the fund accrues for the interim payments on a daily basis, with the net amount recorded within unrealized appreciation (depreciation) on swap agreements in the Statement of Assets and Liabilities. Once the interim payments are settled in cash, the net amount is recorded as a realized gain (loss) on swaps, in addition to realized gain (loss) recorded upon the termination of swap transactions
52
in the Statement of Operations. Upfront payments made and/or received by the fund, are recorded as an asset and/or liability in the Statement of Assets and Liabilities and are recorded as a realized gain or loss ratably over the agreement’s term/event with the exception of forward starting interest rate swaps which are recorded as realized gains or losses on the termination date.
Upon entering into centrally cleared swap agreements, an initial margin deposit is required with a counterparty, which consists of cash or cash equivalents.The amount of these deposits is determined by the exchange on which the agreements is traded and is subject to change.The change in valuation of centrally cleared swaps is recorded as a receivable or payable for variation margin in the Statement of Assets and Liabilities. Payments received from (paid to) the counterparty, including upon termination, are recorded as realized gain (loss) in the Statement of Operations.
Fluctuations in the value of swap agreements are recorded for financial statement purposes as unrealized appreciation or depreciation on swap transactions.
Interest Rate Swaps: Interest rate swaps involve the exchange of commitments to pay and receive interest based on a notional principal amount. The fund may elect to pay a fixed rate and receive a floating rate, or receive a fixed rate and pay a floating rate on a notional principal amount. The net interest received or paid on interest rate swap agreements is included within realized gain (loss) on swap agreements in the Statement of Operations. Interest rate swap agreements are subject to general market risk, liquidity risk, counterparty risk and interest rate risk.
For OTC swaps, the fund’s maximum risk of loss from counterparty risk is the discounted value of the cash flows to be received from the counterparty over the agreement’s remaining life, to the extent that the amount is positive. This risk is mitigated by MNA between the fund and the counterparty and the posting of collateral by the coun-terparty to the fund to cover the fund’s exposure to the counterparty. There is minimal counterparty risk to the fund with centrally cleared swaps since they are exchange traded, and the exchange guarantees
The Fund 53
NOTES TO FINANCIAL STATEMENTS (continued)
these swaps against default. The following summarizes open interest rate swaps entered into by the fund at October 31, 2013:
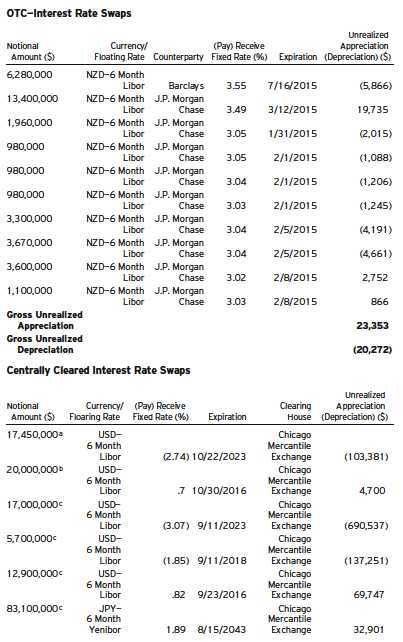
54
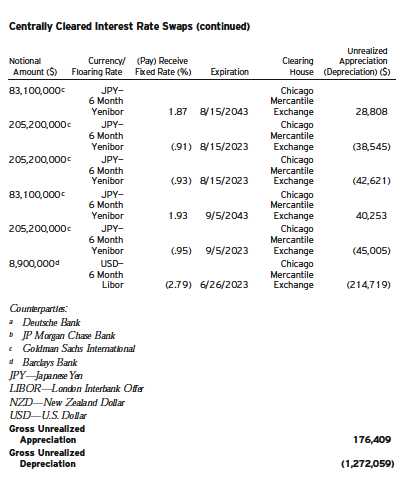
Credit Default Swaps: Credit default swaps involve commitments to pay a fixed interest rate in exchange for payment if a credit event affecting a third party (the referenced company, obligation or index) occurs. Credit events may include a failure to pay interest or principal, bankruptcy, or restructuring.The fund enters into these agreements to manage its exposure to the market or certain sectors of the market, to reduce its risk exposure to defaults of corporate and sovereign issuers, or to create exposure to corporate or sovereign issuers to which it is not otherwise
The Fund 55
NOTES TO FINANCIAL STATEMENTS (continued)
exposed. For those credit default swaps in which the fund is paying a fixed rate, the fund is buying credit protection on the instrument. In the event of a credit event, the fund would receive the full notional amount for the reference obligation. For those credit default swaps in which the fund is receiving a fixed rate, the fund is selling credit protection on the underlying instrument.The maximum payouts for these agreements are limited to the notional amount of each swap. Credit default swaps may involve greater risks than if the fund had invested in the reference obligation directly and are subject to general market risk, liquidity risk, counterparty risk and credit risk.This risk is mitigated by MNA between the fund and the counterparty and the posting of collateral by the counterparty to the fund to cover the fund’s exposure to the counterparty.
The maximum potential amount of future payments (undiscounted) that a fund as a seller of protection could be required to make under a credit default swap agreement would be an amount equal to the notional amount of the agreement which may exceed the amount of unrealized appreciation or depreciation reflected in the Statement of Assets and Liabilities. Notional amounts of all credit default swap agreements are disclosed in the following chart, which summarizes open credit default swaps on index issues entered into by the fund. These potential amounts would be partially offset by any recovery values of the respective referenced obligations, underlying securities comprising the referenced index, upfront payments received upon entering into the agreement, or net amounts received from the settlement of buy protection credit default swap agreements entered into by the fund for the same referenced entity or entities.The following summarizes open credit default swaps entered into by the fund at October 31, 2013:

56
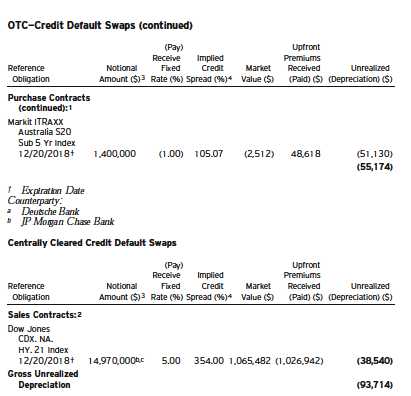
| |
| † | Expiration Date |
| Counterparty; |
| b | J.P. Morgan Chase |
| Clearinghouse; |
| c | Chicago Mercantile Exchange |
| 1 | If the fund is a buyer of protection and a credit event occurs, as defined under the terms of the |
| | swap agreement, the fund will either (i) receive from the seller of protection an amount equal to the |
| | notional amount of the swap and delivery the reference obligation or (ii) receive a net settlement |
| | amount in the form of cash or securities equal to the notional amount of the swap less the recovery |
| | value of the reference obligation. |
| 2 | If the fund is a seller of protection and a credit event occurs, as defined under the terms of the swap |
| | agreement, the fund will either (i) pay to the buyer of protection an amount equal to the notional |
| | amount of the swap and take delivery of the reference obligation or (ii) pay a net settlement |
| | amount in the form of cash or securities equal to the notional amount of the swap less the recovery |
| | value of the reference obligation. |
| 3 | The maximum potential amount the fund could be required to pay as a seller of credit protection |
| | or receive as a buyer of credit protection if a credit event occurs as defined under the terms of the |
| | swap agreement. |
| 4 | Implied credit spreads, represented in absolute terms, utilized in determining the market value as of |
| | the period end serve as an indicator of the current status of the payment/performance risk and |
| | represent the likelihood of risk of default for the credit derivative.The credit spread of a particular |
| | referenced entity reflects the cost of buying/selling protection and may include upfront payments |
| | required to be made to enter into the agreement.Wider credit spreads represent a deterioration of |
| | the referenced entity's credit soundness and a greater likelihood of risk of default or other credit |
| | event occurring as defined under the terms of the agreement.A credit spread identified as Defaulted |
| | indicates a credit event has occurred for the referenced entity. |
The Fund 57
NOTES TO FINANCIAL STATEMENTS (continued)
GAAP requires disclosure for (i) the nature and terms of the credit derivative, reasons for entering into the credit derivative, the events or circumstances that would require the seller to perform under the credit derivative, and the current status of the payment/performance risk of the credit derivative, (ii) the maximum potential amount of future payments (undiscounted) the seller could be required to make under the credit derivative, (iii) the fair value of the credit derivative, and (iv) the nature of any recourse provisions and assets held either as collateral or by third parties.All required disclosures have been made and are incorporated within the current period as part of the Notes to the Statement of Investments and disclosures within this Note.
The following tables show the fund’s exposure to different types of market risk as it relates to the Statement of Assets and Liabilities and the Statement of Operations, respectively.
Fair value of derivative instruments as of October 31, 2013 is shown below:
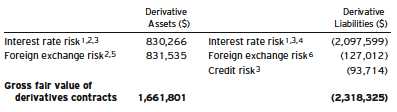
| |
| Statement of Assets and Liabilities location: |
| 1 | Includes cumulative appreciation (depreciation) on financial futures as reported in the Statement of |
| | Financial Futures, but only the unpaid variation margin is reported in the Statement of Assets |
| | and Liabilities. |
| 2 | Options purchased are included in Investments in securities-Unaffiliated issuers, at value. |
| 3 | Includes cumulative appreciation (depreciation) on swap agreements as reported in the swap tables in |
| | Note 4. Unrealized appreciation (depreciation) on OTC swap agreements and only unpaid |
| | variation margin on cleared swap agreements, is reported in the Statement of Assets and Liabilities. |
| 4 | Outstanding options written, at value. |
| 5 | Unrealized appreciation on forward foreign currency exchange contracts. |
| 6 | Unrealized depreciation on forward foreign currency exchange contracts. |
58
The effective of derivative instruments in the Statement of Operation during the period ended October 31, 2013 is shown below:
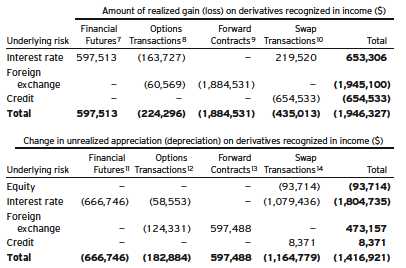
| |
| Statement of Operations location: |
| 7 | Net realized gain (loss) on financial futures. |
| 8 | Net realized gain (loss) on options transactions. |
| 9 | Net realized gain (loss) on forward foreign currency exchange contracts. |
| 10 Net realized gain (loss) on swap transactions. |
| 11 Net unrealized appreciation (depreciation) on financial futures. |
| 12 Net unrealized appreciation (depreciation) on options transactions. |
| 13 Net unrealized appreciation (depreciation) on forward foreign currency exchange contracts. |
| 14 Net unrealized appreciation (depreciation) on swap transactions. |
The following summarizes the average market value of derivatives outstanding during the period ended October 31, 2013:
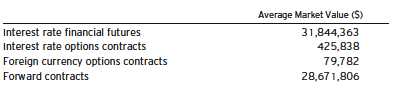
The Fund 59
NOTES TO FINANCIAL STATEMENTS (continued)
The following summarizes the average notional value of swap agreements outstanding during the period ended October 31, 2013:
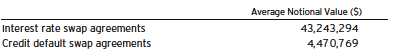
At October 31, 2013, the cost of investments for federal income tax purposes was $161,341,599; accordingly, accumulated net unrealized appreciation on investments was $1,264,546, consisting of $2,559,691 gross unrealized appreciation and $1,295,145 gross unrealized depreciation.
60
REPORT OF INDEPENDENT REGISTERED
PUBLIC ACCOUNTING FIRM
The Board of Directors and Shareholders
The Dreyfus/Laurel Funds, Inc.
We have audited the accompanying statement of assets and liabilities of Dreyfus Opportunistic Fixed Income Fund (the “Fund”), a series of The Dreyfus/Laurel Funds, Inc., including the statements of investments, financial futures and options written, as of October 31, 2013, the related statement of operations for the year then ended, the statements of changes in net assets for each of the years in the two-year period then ended, and the financial highlights for each of the years or period in the five-year period then ended. These financial statements and financial highlights are the responsibility of the Fund’s management. Our responsibility is to express an opinion on these financial statements and financial highlights based on our audits.
We conducted our audits in accordance with the standards of the Public Company Accounting Oversight Board (United States).Those standards require that we plan and perform the audit to obtain reasonable assurance about whether the financial statements and financial highlights are free of material misstatement. An audit includes examining, on a test basis, evidence supporting the amounts and disclosures in the financial statements. Our procedures included confirmation of securities owned as of October 31, 2013, by correspondence with the custodian and brokers or by other appropriate auditing procedures.An audit also includes assessing the accounting principles used and significant estimates made by management, as well as evaluating the overall financial statement presentation. We believe that our audits provide a reasonable basis for our opinion.
In our opinion, the financial statements and financial highlights referred to above present fairly, in all material respects, the financial position of Dreyfus Opportunistic Fixed Income Fund as of October 31, 2013, the results of its operations for the year then ended, the changes in its net assets for each of the years in the two-year period then ended, and the financial highlights for each of the years or period in the five-year period then ended, in conformity with U.S. generally accepted accounting principles.

New York, New York
December 30, 2013
The Fund 61
IMPORTANT TAX INFORMATION (Unaudited)
For federal tax purposes, the fund designates the maximum amount allowable but not less than 38.67% as interest-related dividends in accordance with Sections 871(k)(1) and 881(e) of the Internal Revenue Code. Also, the fund reports the maximum amount allowable but not less than $.0280 per share as a capital gain dividend in accordance with Section 852(b)(3)(C) of the Internal Revenue Code. Also, the fund reports the maximum amount allowable but not less than $.2429 as a short-term capital gain dividend paid on December 27, 2012 in accordance with Sections 871(k)(2) and 881(e) of the Internal Revenue Code.
62
BOARD MEMBERS INFORMATION (Unaudited)
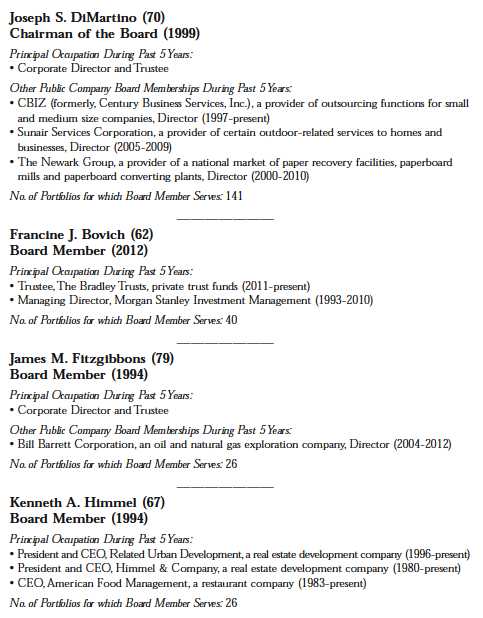
The Fund 63
BOARD MEMBERS INFORMATION (Unaudited) (continued)
64
OFFICERS OF THE FUND (Unaudited)
The Fund 65
OFFICERS OF THE FUND (Unaudited) (continued)
66
The views expressed in this report reflect those of the portfolio manager only through the end of the period covered and do not necessarily represent the views of Dreyfus or any other person in the Dreyfus organization. Any such views are subject to change at any time based upon market or other conditions and Dreyfus disclaims any responsibility to update such views.These views may not be relied on as investment advice and, because investment decisions for a Dreyfus fund are based on numerous factors, may not be relied on as an indication of trading intent on behalf of any Dreyfus fund.
| | Contents |
| | THE FUND |
| 2 | A Letter from the President |
| 3 | Discussion of Fund Performance |
| 6 | Understanding Your Fund’s Expenses |
| 6 | Comparing Your Fund’s Expenses With Those of Other Funds |
| 7 | Statement of Investments |
| 14 | Statement of Options Written |
| 15 | Statement of Assets and Liabilities |
| 16 | Statement of Operations |
| 17 | Statement of Changes in Net Assets |
| 18 | Financial Highlights |
| 19 | Notes to Financial Statements |
| 39 | Report of Independent Registered Public Accounting Firm |
| 40 | Important Tax Information |
| 41 | Information About the Approval of the Fund’s Management and Sub-Investment Advisory Agreements |
| 45 | Board Members Information |
| 47 | Officers of the Fund |
| | FOR MORE INFORMATION |
| | Back Cover |
Dreyfus
Opportunistic Emerging
Markets Debt Fund
The Fund
A LETTER FROM THE PRESIDENT
Dear Shareholder:
We are pleased to present this annual report for Dreyfus Opportunistic Emerging Markets Debt Fund, covering the period from the fund’s inception on June 17, 2013, through October 31, 2013. For information about how the fund performed during the reporting period, as well as general market perspectives, we provide a Discussion of Fund Performance on the pages that follow.
The reporting period produced a challenging environment for many fixed-income securities, as a gradually strengthening U.S. economy and expectations of more moderately stimulative monetary policies drove longer term interest rates higher and bond prices lower. In this environment, corporate-backed bonds generally held up better than their government- and agency-issued counterparts, eking out mildly positive returns, on average, as default rates remained low and issuers’ business prospects improved along with the economy.
We currently expect U.S. and global economic conditions to continue to improve in 2014, with accelerating growth supported by the fading drags of tighter federal fiscal policies and downsizing on the state and local levels. Moreover, inflation is likely to remain muted, so monetary policy can remain stimulative. Globally, we anticipate stronger growth in developed countries due to past and continuing monetary ease, while emerging markets seem poised for moderate economic expansion despite recently negative investor sentiment. For more information on how these observations may affect your investments, we encourage you to speak with your financial advisor.
Thank you for your continued confidence and support.
Sincerely,

J. Charles Cardona
President
The Dreyfus Corporation
November 15, 2013
2
DISCUSSION OF FUND PERFORMANCE
For the period of June 17, 2013, through October 31, 2013, as provided by Alexander Kozhemiakin and Javier Murcio, Primary Portfolio Managers
Fund and Market Performance Overview
For the period from the fund’s inception on June 17, 2013, through the end of its annual reporting period on October 31, 2013, Dreyfus Opportunistic Emerging Markets Debt Fund’s Class A shares produced a total return of –0.44%, Class C shares returned –0.71%, and Class I shares returned –0.38%. From the inception of Class Y shares on July 1, 2013, through October 31, 2013, the fund’s Class Y shares returned 2.59%.1 In comparison, the fund’s benchmark, the JPMorgan Emerging Markets Global Bond Index (the “Index”), produced a 3.56%2 total return for the same period.3
Emerging-markets bonds encountered heightened volatility early in the reporting period amid economic and liquidity concerns.The fund lagged its benchmark due to its exposure to local currency denominated bonds. In contrast, the Index is composed exclusively of U.S. dollar-denominated debt instruments in emerging market countries.
The Fund’s Investment Approach
The fund seeks to maximize total return. To pursue its goal, the fund normally invests at least 80% of its net assets in debt instruments of emerging market issuers, including those issued by corporations, governments, central banks or supranational organizations.The fund’s investments may be denominated in U.S. dollars, European euros, Japanese yen or the local currency of issue.
Our investment process uses in-depth fundamental country, issuer, and currency analysis disciplined by proprietary quantitative valuation models. A “top down” analysis of macroeconomic, financial, and political variables guides country, issuer, and currency allocation.We look for shifts in country fundamentals and consider the risk-adjusted attractiveness of currency, issuer, and duration returns for each emerging market country. Using these inputs, we seek to identify the best opportunities on a risk-adjusted basis across emerging market debt instruments, currencies, and local interest rates.
Emerging Markets Encountered Heightened Volatility
The fund began operations in the midst of heightened market volatility stemming from remarks by Federal Reserve Board (the “Fed”) Chairman Ben Bernanke that U.S.
The Fund 3
DISCUSSION OF FUND PERFORMANCE (continued)
monetary policymakers would begin backing away from their massive quantitative easing program sooner than expected. Bernanke’s unexpectedly hawkish comments sparked shifts in investment capital from the emerging markets to more developed nations, causing emerging-markets bond prices to fall and currency exchange rates to decline against the U.S. dollar. Concerns intensified regarding economic slowdowns in some markets, including China, India, and Brazil. Widening current account deficits and budget deficits in countries such as Indonesia, Turkey, and South Africa also weighed on investor sentiment.
Markets generally stabilized in July and rallied from August through October when the Fed refrained from tapering its quantitative easing program and some countries considered financial reforms. Local institutional investors took advantage of attractive valuations after the sell-off, and foreign investors soon followed their lead. However, investors proved highly selective, favoring countries with current account surpluses and balanced budgets. Investors also weighed the credibility of individual nations’ central banks, avoiding nations that do not appear to be handling inflationary pressures effectively.
Issuer Selection Strategy Buoyed Fund Results
The fund’s returns compared to its benchmark were undermined by its exposure to debt instruments denominated in local currencies, which lagged the U.S. dollar-denominated securities that comprise the Index.
Otherwise, our investment strategy proved relatively successful in cushioning the impact of weakening emerging markets currencies against the U.S. dollar. Over most of the reporting period, we avoided some of the harder-hit emerging markets currencies, including the Indonesian rupiah and Turkish lira. When markets later stabilized, we increased the fund’s local currency exposure to approximately 53% of assets.We focused mainly on currencies from countries with current account surpluses, such as the Russian ruble and Nigerian naira; countries enacting structural reforms, such as the Mexican peso; and countries whose currencies were punished more severely than warranted by underlying fundamentals, including the Brazilian real.
Our issuer selection strategy led the fund to overweighted exposure to emerging markets corporate bonds, especially among Latin American countries such as Columbia, Peru, Chile, and Mexico.We also favored bonds from the Russian oil-and-gas industry.We found a number of opportunities among bonds from “quasi-sovereign” issuers that are owned or controlled by their national governments. We maintained generally underweighted exposure to sovereign debt, especially securities denominated in local currencies.
4
During the reporting period, the fund employed interest-rate futures contracts and currency forward contracts to manage certain risks.
Finding Opportunities in Attractively Valued Markets
Although heightened volatility may persist over the near term, we believe that some emerging markets already have priced in the effects of a less robust U.S. quantitative easing program and higher interest rates in a recovering global economy. Indeed, after current uncertainties are resolved, we expect many emerging markets to respond positively to stronger economic growth among their major trading partners in the United States and Europe.Therefore, we expect to identify trading opportunities as valuations normalize and yield spreads narrow between U.S. and emerging markets bonds.
November 15, 2013
|
| Bond funds are subject generally to interest rate, credit, liquidity and market risks, to varying degrees, all of which are |
| more fully described in the fund’s prospectus. Generally, all other factors being equal, bond prices are inversely related |
| to interest-rate changes, and rate increases can cause price declines. |
| Foreign bonds are subject to special risks including exposure to currency fluctuations, changing political and economic |
| conditions, and potentially less liquidity. Investments in foreign currencies are subject to the risk that those currencies |
| will decline in value relative to the U.S. dollar. Foreign currencies are also subject to risks caused by inflation, interest |
| rates, budget deficits and low savings rate, political factors and government control.The fixed income securities of |
| issuers located in emerging markets can be more volatile and less liquid than those of issuers in more mature |
| economies and emerging markets generally have less diverse and less mature economic structures and less stable |
| political systems than those of developed countries.The securities of issuers located or doing substantial business in |
| emerging markets are often subject to rapid and large changes in price. |
| The fund may use derivative instruments, such as options, futures and options on futures, forward contracts, swaps |
| (including credit default swaps on corporate bonds and asset-backed securities), options on swaps and other credit |
| derivatives.A small investment in derivatives could have a potentially large impact on the fund’s performance. |
| 1 Total return includes reinvestment of dividends and any capital gains paid, and does not take into consideration the |
| maximum initial sales charge in the case of Class A shares, or the applicable contingent deferred sales charge imposed |
| on redemptions in the case of Class C shares. Had these charges been reflected, returns would have been lower. Past |
| performance is no guarantee of future results. Share price and investment return fluctuate such that upon redemption, |
| fund shares may be worth more or less than their original cost. Return figures provided reflect the absorption of certain |
| fund expenses by The Dreyfus Corporation pursuant to an agreement in effect until July 1, 2016. Had these |
| expenses not been absorbed, the fund’s returns would have been lower. |
| 2 Index return figures are from June 30, 2013, to October 31, 2013. |
| 3 SOURCE: FACTSET - The J.P. Morgan EMBI Global/EMBI Global Diversified series is comprised of USD |
| denominated Brady bonds, Eurobonds and Traded loans issued by sovereign and quasi sovereign entities.The |
| Diversified version limits the weights of the index countries by only including a specified portion of those countries |
| eligible current face amounts of debt outstanding.This provides a more even distribution of weights within the |
| countries in the index.The EMBI+ series also tracks the universe of emerging markets bonds but places a stricter |
| liquidity requirement rule for inclusion. In addition quasi-sovereigns are not included in the EMBI+.The Returns |
| and Statistics are available from December 1993. |
The Fund 5
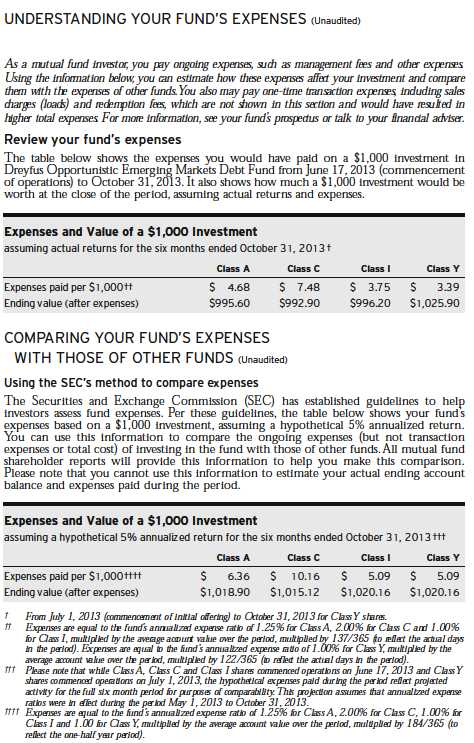
6
STATEMENT OF INVESTMENTS
October 31, 2013
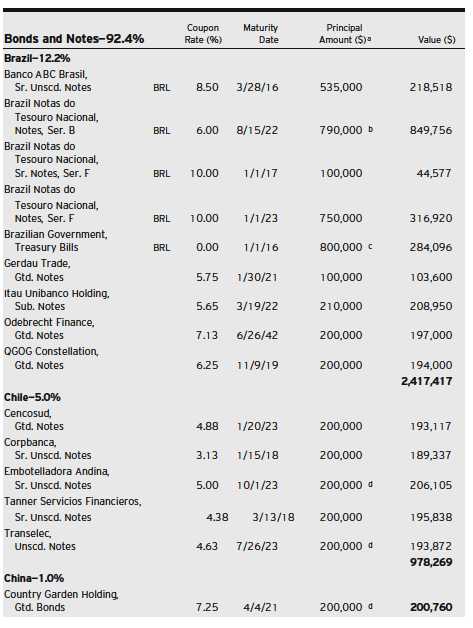
The Fund 7
STATEMENT OF INVESTMENTS (continued)
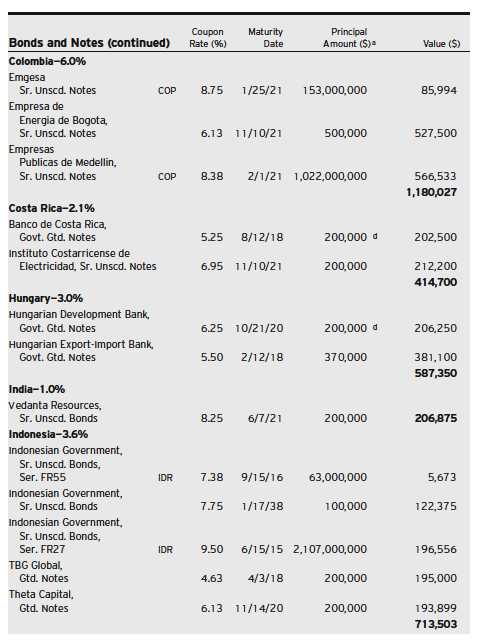
8
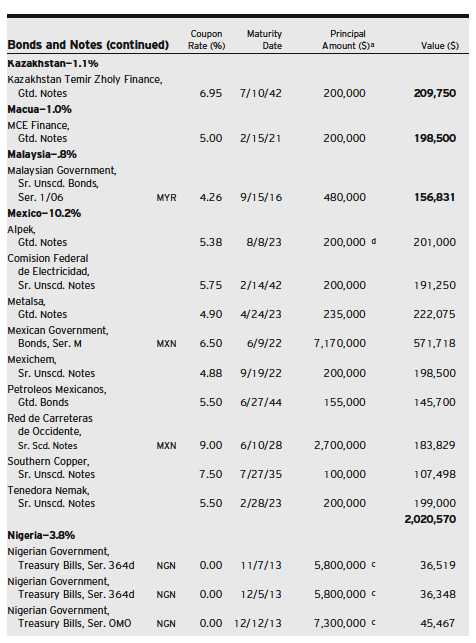
The Fund 9
STATEMENT OF INVESTMENTS (continued)
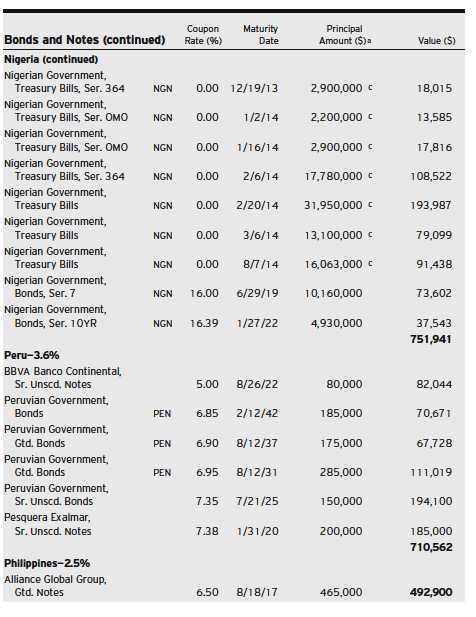
10
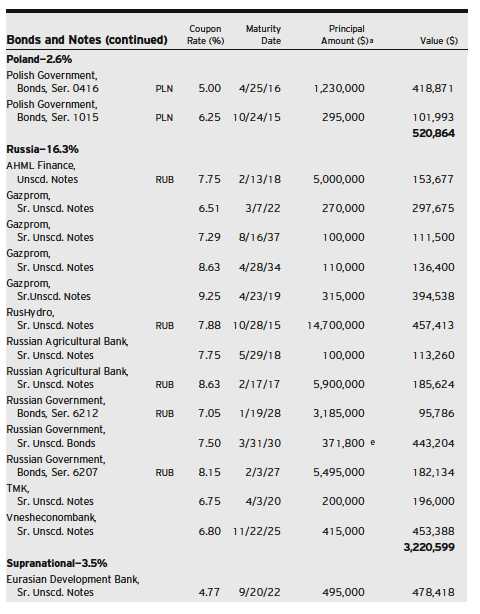
The Fund 11
STATEMENT OF INVESTMENTS (continued)
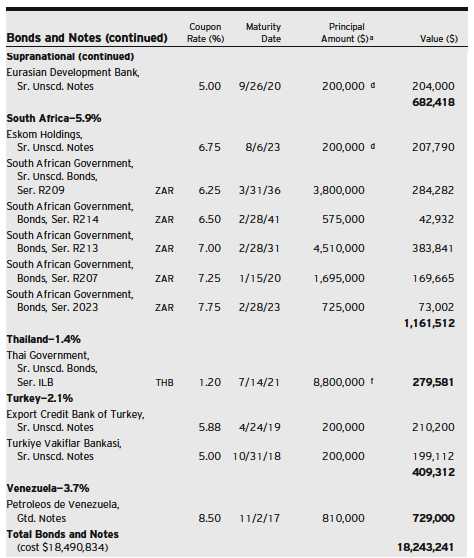
12
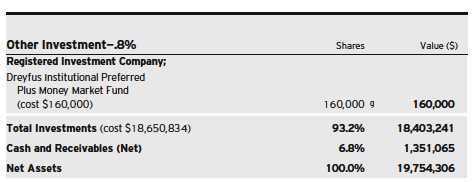
|
| a Principal amount stated in U.S. Dollars unless otherwise noted. |
| BRL—Brazilian Real |
| COP—Colombian Peso |
| IDR—Indonesian Rupiah |
| MXN—Mexican New Peso |
| MYR—Malaysian Ringgit |
| NGN—Nigerian Naira |
| PEN—Peruvian New Sol |
| PLN—Polish Zloty |
| RUB—Russian Ruble |
| THB—Thai Baht |
| ZAR—South African Rand |
| b Principal amount for accrual purposes is periodically adjusted based on changes in the Brazilian Consumer Price Index. |
| c Security issued with a zero coupon. Income is recognized through the accretion of discount. |
| d Securities exempt from registration pursuant to Rule 144A under the Securities Act of 1933.These securities may be |
| resold in transactions exempt from registration, normally to qualified institutional buyers.At October 31, 2013, these |
| securities were valued at $1,622,277 or 8.2% of net assets. |
| e Variable rate security—interest rate subject to periodic change. |
| f Principal amount for accrual purposes is periodically adjusted based on changes in the Thai Consumer Price Index. |
| g Investment in affiliated money market mutual fund. |

|
| † Based on net assets. |
| See notes to financial statements. |
The Fund 13
STATEMENT OF OPTIONS WRITTEN
October 31, 2013
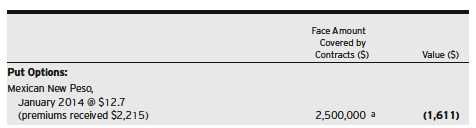
|
| a Non-income producing security. |
| See notes to financial statements. |
14
STATEMENT OF ASSETS AND LIABILITIES
October 31, 2013
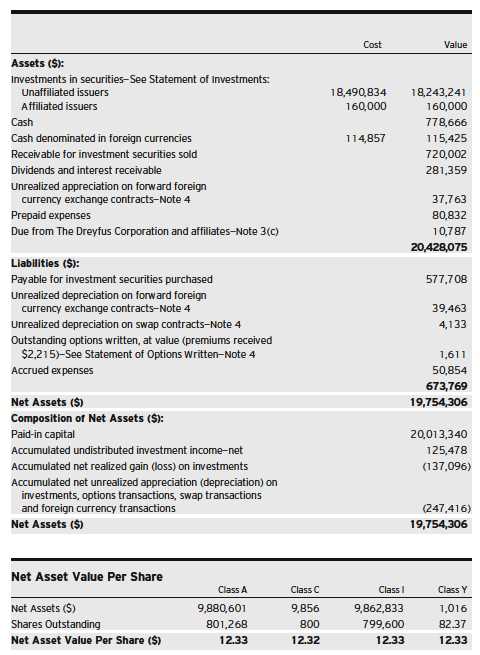
|
| See notes to financial statements. |
The Fund 15
STATEMENT OF OPERATIONS
From June 17, 2013 (commencement of operations) to October 31, 2013
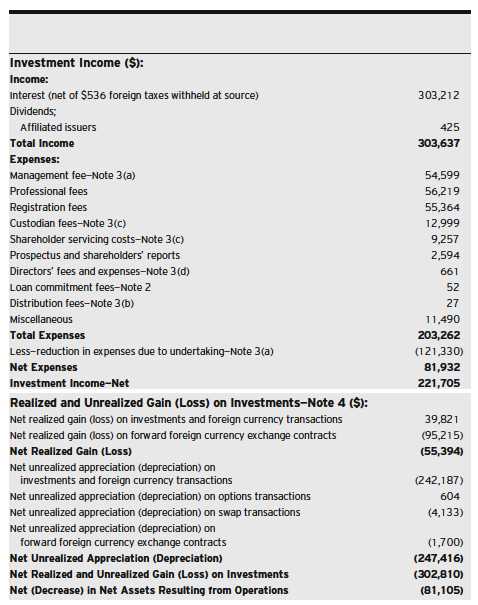
|
| See notes to financial statements. |
16
STATEMENT OF CHANGES IN NET ASSETS
From June 17, 2013 (commencement of operations) to October 31, 2013 a
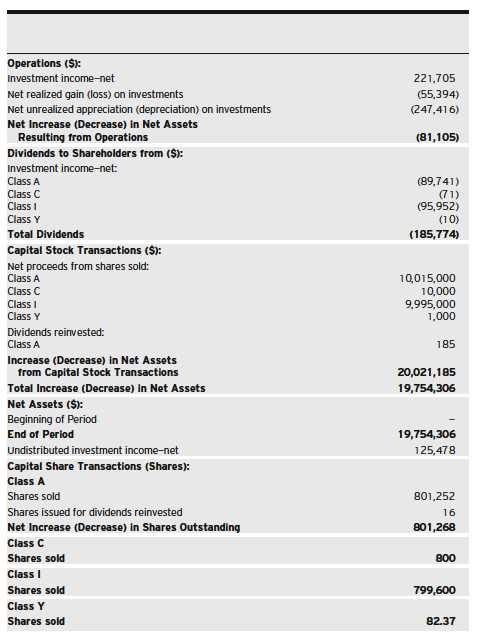
|
| a Effective July 1, 2013, the fund commenced offering ClassY shares. |
| See notes to financial statements. |
The Fund 17
FINANCIAL HIGHLIGHTS
The following table describes the performance for each share class for the period from June 17, 2013 (commencement of operations) to October 31, 2013. All information (except portfolio turnover rate) reflects financial results for a single fund share.Total return shows how much your investment in the fund would have increased (or decreased) during each period, assuming you had reinvested all dividends and distributions.These figures have been derived from the fund’s financial statements.
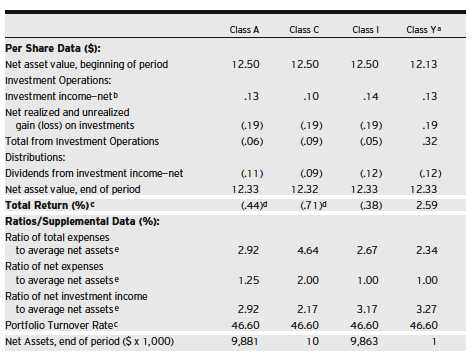
| |
| a | From July 1, 2013 (commencement of initial offering) to October 31, 2013. |
| b | Based on average shares outstanding at each month end. |
| c | Not annualized. |
| d | Exclusive of sales charge. |
| e | Annualized. |
| See notes to financial statements. |
18
NOTES TO FINANCIAL STATEMENTS
NOTE 1—Significant Accounting Policies:
Dreyfus Opportunistic Emerging Markets Debt Fund (the “fund”) is a separate non-diversified series of The Dreyfus/Laurel Funds, Inc. (the “Company”), which is registered under the Investment Company Act of 1940, as amended (the “Act”), as an open-end management investment company and operates as a series company currently offering eleven series, including the fund, which commenced operations on June 17, 2013.The fund’s investment objective seeks to maximize total return.The Dreyfus Corporation (the “Manager” or “Dreyfus”), a wholly-owned subsidiary of The Bank of New York Mellon Corporation (“BNY Mellon”), serves as the fund’s investment adviser. Standish Mellon Asset Management Company LLC (“Standish”), a wholly-owned subsidiary of BNY Mellon and an affiliate of Dreyfus, serves as the fund’s sub-investment adviser.
At a meeting held on April 24-25, 2013, the Company’s Board of Directors (the “Board”) approved, effective July 1, 2013 for the fund to offer Class Y shares.
MBSC Securities Corporation (the “Distributor”), a wholly-owned subsidiary of Dreyfus, is the distributor of the fund’s shares.The fund is authorized to issue 100 million shares of $.001 par value Capital Stock in each of the following classes of shares: Class A, Class C Class I and Class Y. Class A and Class C shares are sold primarily to retail investors through financial intermediaries and bear Distribution and/or Shareholder Services Plan fees. Class A shares generally are subject to a sales charge imposed at the time of purchase. Class C shares are subject to a contingent deferred sales charge (“CDSC”) imposed on Class C shares redeemed within one year of purchase. Class I shares are sold primarily to bank trust departments and other financial service providers (including The Bank of New York Mellon, a subsidiary of BNY Mellon and an affiliate of Dreyfus, and its affiliates), acting on behalf of customers having a qualified trust or investment account or relationship at such institution, and bear no Distribution or Shareholder Services Plan fees. Class I shares are offered without a front-end sales
The Fund 19
NOTES TO FINANCIAL STATEMENTS (continued)
charge or CDSC. Class Y shares are sold at net asset value per share to certain investors, including certain institutional investors. Other differences between the classes include the services offered to and the expenses borne by each class, the allocation of certain transfer agency costs and certain voting rights. Income, expenses (other than expenses attributable to a specific class), and realized and unrealized gains or losses on investments are allocated to each class of shares based on its relative net assets.
As of October 31, 2013, MBC Investments Corp., an indirect subsidiary of BNY Mellon, held 799,600 of Class A and all of the outstanding Class C, Class I and Class Y shares of the fund.
The Company accounts separately for the assets, liabilities and operations of each series. Expenses directly attributable to each series are charged to that series’ operations; expenses which are applicable to all series are allocated among them on a pro rata basis.
The Financial Accounting Standards Board (“FASB”) Accounting Standards Codification is the exclusive reference of authoritative U.S. generally accepted accounting principles (“GAAP”) recognized by the FASB to be applied by nongovernmental entities. Rules and interpretive releases of the Securities and Exchange Commission (“SEC”) under authority of federal laws are also sources of authoritative GAAP for SEC registrants. The fund’s financial statements are prepared in accordance with GAAP, which may require the use of management estimates and assumptions.Actual results could differ from those estimates.
(a) Portfolio valuation: The fair value of a financial instrument is the amount that would be received to sell an asset or paid to transfer a liability in an orderly transaction between market participants at the measurement date (i.e., the exit price). GAAP establishes a fair value hierarchy that prioritizes the inputs of valuation techniques used to measure fair value. This hierarchy gives the highest priority to unadjusted quoted prices in active markets for identical assets or liabilities (Level 1 measurements) and the lowest priority to unobservable inputs (Level 3 measurements).
20
Additionally, GAAP provides guidance on determining whether the volume and activity in a market has decreased significantly and whether such a decrease in activity results in transactions that are not orderly. GAAP requires enhanced disclosures around valuation inputs and techniques used during annual and interim periods.
Various inputs are used in determining the value of the fund’s investments relating to fair value measurements.These inputs are summarized in the three broad levels listed below:
Level 1—unadjusted quoted prices in active markets for identical investments.
Level 2—other significant observable inputs (including quoted prices for similar investments, interest rates, prepayment speeds, credit risk, etc.).
Level 3—significant unobservable inputs (including the fund’s own assumptions in determining the fair value of investments).
The inputs or methodology used for valuing securities are not necessarily an indication of the risk associated with investing in those securities.
Changes in valuation techniques may result in transfers in or out of an assigned level within the disclosure hierarchy. Valuation techniques used to value the fund’s investments are as follows:
Registered investment companies that are not traded on an exchange are valued at their net asset value and are categorized within Level 1 of the fair value hierarchy.
Investments in securities, excluding short-term investments (other than U.S. Treasury Bills), options and forward foreign currency exchange contracts (“forward contracts”) are valued each business day by an independent pricing service (the “Service”) approved by the Board. Investments for which quoted bid prices are readily available and are representative of the bid side of the market in the judgment of the Service are valued at the mean between the quoted bid prices (as obtained by the Service from dealers in such securities) and asked prices
The Fund 21
NOTES TO FINANCIAL STATEMENTS (continued)
(as calculated by the Service based upon its evaluation of the market for such securities). Other investments (which constitute a majority of the portfolio securities) are valued as determined by the Service, based on methods which include consideration of the following: yields or prices of securities of comparable quality, coupon, maturity and type; indications as to values from dealers; and general market conditions. These securities are generally categorized within Level 2 of the fair value hierarchy.
The Service’s procedures are reviewed by Dreyfus under the general supervision of the Board.
When market quotations or official closing prices are not readily available, or are determined not to reflect accurately fair value, such as when the value of a security has been significantly affected by events after the close of the exchange or market on which the security is principally traded (for example, a foreign exchange or market), but before the fund calculates its net asset value, the fund may value these investments at fair value as determined in accordance with the procedures approved by the Board. Certain factors may be considered when fair valuing investments such as: fundamental analytical data, the nature and duration of restrictions on disposition, an evaluation of the forces that influence the market in which the securities are purchased and sold, and public trading in similar securities of the issuer or comparable issuers. These securities are either categorized within Level 2 or 3 of the fair value hierarchy depending on the relevant inputs used.
For restricted securities where observable inputs are limited, assumptions about market activity and risk are used and are categorized within Level 3 of the fair value hierarchy.
Investments denominated in foreign currencies are translated to U.S. dollars at the prevailing rates of exchange.
Options, which are traded on an exchange, are valued at the last sales price on the securities exchange on which such securities are primarily traded or at the last sales price on the national securities market on
22
each business day and are generally categorized within Level 1 of the fair value hierarchy. Options traded over-the-counter are valued at the mean between the bid and asked price and are generally categorized within Level 2 of the fair value hierarchy. Investments in swap transactions are valued each business day by the Service. Swaps are valued by the Service by using a swap pricing model which incorporates among other factors, default probabilities, recovery rates, credit curves of the underlying issuer and swap spreads on interest rates and are generally categorized within Level 2 of the fair value hierarchy. Forward contracts are valued at the forward rate and are generally categorized within Level 2 of the fair value hierarchy.
The following is a summary of the inputs used as of October 31, 2013 in valuing the fund’s investments:
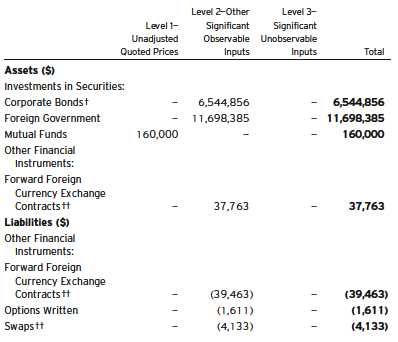
| |
| † | See Statement of Investments for additional detailed categorizations. |
| †† | Amount shown represents unrealized appreciation (depreciation) at period end. |
The Fund 23
NOTES TO FINANCIAL STATEMENTS (continued)
(b) Foreign currency transactions: The fund does not isolate that portion of the results of operations resulting from changes in foreign exchange rates on investments from the fluctuations arising from changes in the market prices of securities held. Such fluctuations are included with the net realized and unrealized gain or loss on investments.
Net realized foreign exchange gains or losses arise from sales of foreign currencies, currency gains or losses realized on securities transactions between trade and settlement date, and the difference between the amounts of dividends, interest and foreign withholding taxes recorded on the fund’s books and the U.S. dollar equivalent of the amounts actually received or paid. Net unrealized foreign exchange gains and losses arise from changes in the value of assets and liabilities other than investments resulting from changes in exchange rates. Foreign currency gains and losses on foreign currency transactions are also included with net realized and unrealized gain or loss on investments.
(c) Securities transactions and investment income: Securities transactions are recorded on a trade date basis. Realized gains and losses from securities transactions are recorded on the identified cost basis. Dividend income is recognized on the ex-dividend date and interest income, including, where applicable, accretion of discount and amortization of premium on investments, is recognized on the accrual basis.
(d) Affiliated issuers: Investments in other investment companies advised by Dreyfus are defined as “affiliated” under the Act. Investments in affiliated investment companies during the period ended October 31, 2013 were as follows:
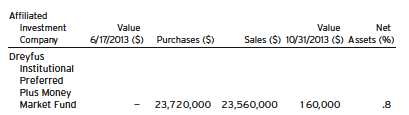
(e) Risk: The fund invests primarily in debt securities. Failure of an issuer of the debt securities to make timely interest or principal pay-
24
ments, or a decline or the perception of a decline in the credit quality of a debt security, can cause the debt security’s price to fall, potentially lowering the fund’s share price. In addition, the value of debt securities may decline due to general market conditions that are not specifically related to a particular issuer, such as real or perceived adverse economic conditions, changes in outlook for corporate earnings, changes in interest or currency rates or adverse investor sentiment. They may also decline because of factors that affect a particular industry or country.
Investing in foreign markets may involve special risks and considerations not typically associated with investing in the U.S. These risks include revaluation of currencies, high rates of inflation, repatriation restrictions on income and capital, and adverse political and economic developments. Moreover, securities issued in these markets may be less liquid, subject to government ownership controls and delayed settlements, and their prices may be more volatile than those of comparable securities in the U.S.
(f) Dividends to shareholders: Dividends are recorded on ex-dividend date. Dividends from investment income-net are normally declared and paid quarterly. Dividends from net realized capital gains, if any, are normally declared and paid annually, but the fund may make distributions on a more frequent basis to comply with the distribution requirements of the Internal Revenue Code of 1986, as amended (the “Code”).To the extent that net realized capital gains can be offset by capital loss carryovers, it is the policy of the fund not to distribute such gains. Income and capital gain distributions are determined in accordance with income tax regulations, which may differ from GAAP.
(g) Federal income taxes: It is the policy of the fund to continue to qualify as a regulated investment company, if such qualification is in the best interests of its shareholders, by complying with the applicable provisions of the Code, and to make distributions of taxable income sufficient to relieve it from substantially all federal income and excise taxes.
As of and during the period ended October 31, 2013, the fund did not have any liabilities for any uncertain tax positions.The fund recognizes
The Fund 25
NOTES TO FINANCIAL STATEMENTS (continued)
interest and penalties, if any, related to uncertain tax positions as income tax expense in the Statement of Operations. During the period ended October 31, 2013, the fund did not incur any interest or penalties.
The tax year for the period ended October 31, 2013 remains subject to examination by the Internal Revenue Service and state taxing authorities.
At October 31, 2013, the components of accumulated earnings on a tax basis were as follows: undistributed ordinary income $186,065, accumulated capital losses $143,997 and unrealized depreciation $301,102.
Under the Regulated Investment Company Modernization Act of 2010 (the “2010 Act”), the fund is permitted to carry forward capital losses incurred in taxable years beginning after December 22, 2010 (“post-enactment losses”) for an unlimited period. Furthermore, post-enactment capital loss carryovers retain their character as either short-term or long-term capital losses rather than short-term as they were under previous statute.
The accumulated capital loss carryover is available for federal income tax purposes to be applied against future net realized capital gains, if any, realized subsequent to October 31, 2013.The fund has $143,997 of post-enactment short-term capital losses which can be carried forward for an unlimited period.
The tax character of distributions paid to shareholders during the fiscal period ended October 31, 2013 was as follows: ordinary income $185,774.
During the period ended October 31, 2013, as a result of permanent book to tax differences, primarily due to the tax treatment for registration fees, Rule 12b-1 Distribution Plan fees, amortization adjustments, foreign currency transactions, swap periodic payments and foreign Consumer Price Index adjustments, the fund increased accumulated undistributed investment income-net by $89,547, decreased accumulated net realized gain (loss) on investments by $81,702 and decreased paid-in capital by $7,845. Net assets and net asset value per share were not affected by this reclassification.
26
NOTE 2—Bank Lines of Credit:
The fund participates with other Dreyfus-managed funds in a $265 million unsecured credit facility led by Citibank, N.A. and a $300 million unsecured credit facility provided by The Bank of New York Mellon (each, a “Facility”), each to be utilized primarily for temporary or emergency purposes, including the financing of redemptions. Prior to October 9, 2013, the unsecured credit facility with Citibank, N.A. was $210 million. In connection therewith, the fund has agreed to pay its pro rata portion of commitment fees for each Facility. Interest is charged to the fund based on rates determined pursuant to the terms of the respective Facility at the time of borrowing. During the period ended October 31, 2013, the fund did not borrow under the Facilities.
NOTE 3—Management Fee, Sub-Investment Advisory Fee and Other Transactions with Affiliates:
(a) Pursuant to a management agreement with Dreyfus, the management fee is computed at the annual rate of .75% of the value of the fund’s average daily net assets and is payable monthly. Dreyfus has contractually agreed, from June 17, 2013 through July 1, 2014 for Class A, Class C and Class I shares and from July 1, 2013 through July 1, 2014 for Class Y shares to waive receipt of its fees and/or assume the expenses of the fund, so that the expenses of none of the classes (excluding Rule 12b-1 Distribution Plan fees, Shareholder Services Plan fees, taxes, interest expense, brokerage commissions, commitment fees on borrowings and extraordinary expenses) exceed 1.00% of the value of the average daily net assets.The reduction in expenses, pursuant to the undertaking, amounted to $121,330 during the period ended October 31, 2013.
(b) Under the Distribution Plan adopted pursuant to Rule 12b-1 under the Act, Class C shares pay the Distributor for distributing its shares at an annual rate of .75% of the value of the average daily net assets. During the period ended October 31, 2013, Class C shares were charged $27 pursuant to the Distribution Plan.
The Fund 27
NOTES TO FINANCIAL STATEMENTS (continued)
(c) Under the Shareholder Services Plan, Class A and Class C shares pay the Distributor at an annual rate of .25% of the value of their average daily net assets for the provision of certain services.These services provided may include personal services relating to shareholder accounts, such as answering shareholder inquiries regarding the fund and providing reports and other information, and services related to the maintenance of shareholder accounts. The Distributor may make payments to Service Agents (securities dealers, financial institutions or other industry professionals) with respect to these services. The Distributor determines the amounts to be paid to Service Agents. During the period ended October 31, 2013, Class A and Class C shares were charged $9,097 and $9, respectively, pursuant to the Shareholder Services Plan.
Under its terms, the Distribution Plan and Shareholder Services Plan shall remain in effect from year to year, provided such continuance is approved annually by a vote of a majority of those Directors who are not “interested persons” of the Company and who have no direct or indirect financial interest in the operation of or in any agreement related to the Distribution Plan or Shareholder Services Plan.
The fund has arrangements with the transfer agent and the custodian whereby the fund may receive earnings credits when positive cash balances are maintained, which are used to offset transfer agency and custody fees. For financial reporting purposes, the fund includes net earnings credits as an expense offset in the Statement of Operations.
The fund compensates Dreyfus Transfer, Inc., a wholly-owned subsidiary of the Dreyfus, under a transfer agency agreement for providing transfer agency and cash management services for the fund.The majority of transfer agency fees are comprised of amounts paid on a per account basis, while cash management fees are related to fund subscriptions and redemptions. During the period ended October 31, 2013, the fund was charged $20 for transfer agency services and $3
28
for cash management services.These fees are included in Shareholder servicing costs in the Statement of Operations.
The fund compensates The Bank of NewYork Mellon under a custody agreement for providing custodial services for the fund.These fees are determined based on net assets, geographic region and transaction activity. During the period ended October 31, 2013, the fund was charged $12,999 pursuant to the custody agreement.
The fund compensated The Bank of New York Mellon under a cash management agreement that was in effect until September 30, 2013 for performing certain cash management services related to fund subscriptions and redemptions. During the period ended October 31, 2013, the fund was charged $1 pursuant to the cash management agreement, which is included in Shareholder servicing costs in the Statement of Operations.
During the period ended October 31, 2013, the fund was charged $2,951 for services performed by the Chief Compliance Officer and his staff.
The components of “Due from The Dreyfus Corporation and affiliates” in the Statement of Assets and Liabilities consist of: management fees $12,494, Distribution Plan fees $6, Shareholder Services Plan fees $2,085, custodian fees $10,400, Chief Compliance Officer fees $2,951 and transfer agency fees $20, which are offset against an expense reimbursement currently in effect in the amount of $38,743.
(d) Each Board member also serves as a Board member of other funds within the Dreyfus complex. Annual retainer fees and attendance fees are allocated to each fund based on net assets.
(e) A 2% redemption fee is charged and retained by the fund on certain shares redeemed within sixty days following the date of issuance subject to certain exceptions, including redemptions made through the use of the fund’s exchange privilege.
The Fund 29
NOTES TO FINANCIAL STATEMENTS (continued)
NOTE 4—Securities Transactions:
The aggregate amount of purchases and sales of investment securities, excluding short-term securities, forward contracts, options and swaps transactions, during the period ended October 31, 2013, amounted to $27,157,179 and $8,428,423, respectively.
Derivatives: A derivative is a financial instrument whose performance is derived from the performance of another asset. Each type of derivative instrument that was held by the fund during the period ended October 31, 2013 is discussed below.
Options Transactions: The fund purchases and writes (sells) put and call options to hedge against changes in foreign currencies, or as a substitute for an investment. The fund is subject to market risk and currency risk in the course of pursuing its investment objectives through its investments in options contracts. A call option gives the purchaser of the option the right (but not the obligation) to buy, and obligates the writer to sell, the underlying security or securities at the exercise price at any time during the option period, or at a specified date. Conversely, a put option gives the purchaser of the option the right (but not the obligation) to sell, and obligates the writer to buy the underlying security or securities at the exercise price at any time during the option period, or at a specified date.
As a writer of call options, the fund receives a premium at the outset and then bears the market risk of unfavorable changes in the price of the financial instrument underlying the option. Generally, the fund realizes a gain, to the extent of the premium, if the price of the underlying financial instrument decreases between the date the option is written and the date on which the option is terminated. Generally, the fund incurs a loss if the price of the financial instrument increases between those dates.
As a writer of put options, the fund receives a premium at the outset and then bears the market risk of unfavorable changes in the price of the financial instrument underlying the option. Generally, the fund realizes a gain, to the extent of the premium, if the price of the underlying finan-
30
cial instrument increases between the date the option is written and the date on which the option is terminated. Generally, the fund incurs a loss if the price of the financial instrument decreases between those dates.
As a writer of an option, the fund has no control over whether the underlying securities may be sold (call) or purchased (put) and as a result bears the market risk of an unfavorable change in the price of the security underlying the written option. There is a risk of loss from a change in value of such options which may exceed the related premiums received.The Statement of Operations reflects the following: any unrealized gains or losses which occurred during the period as well as any realized gains or losses which occurred upon the expiration or closing of the option transaction.
The following summarizes the fund’s call/put options written during the period ended October 31, 2013:
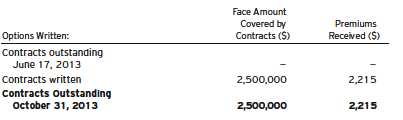
Forward Foreign Currency Exchange Contracts: The fund enters into forward contracts in order to hedge its exposure to changes in foreign currency exchange rates on its foreign portfolio holdings, to settle foreign currency transactions or as a part of its investment strategy.When executing forward contracts, the fund is obligated to buy or sell a foreign currency at a specified rate on a certain date in the future. With respect to sales of forward contracts, the fund incurs a loss if the value of the contract increases between the date the forward contract is opened and the date the forward contract is closed.The fund realizes a gain if the value of the contract decreases between those dates.With respect to purchases of forward contracts, the fund incurs a loss if the value of the
The Fund 31
NOTES TO FINANCIAL STATEMENTS (continued)
contract decreases between the date the forward contract is opened and the date the forward contract is closed. The fund realizes a gain if the value of the contract increases between those dates. Any realized or unrealized gains or losses which occurred during the period are reflected in the Statement of Operations.The fund is exposed to foreign currency risk as a result of changes in value of underlying financial instruments. The fund is also exposed to credit risk associated with counterparty nonperformance on these forward contracts, which is generally limited to the unrealized gain on each open contract.The following summarizes open forward contracts at October 31, 2013:
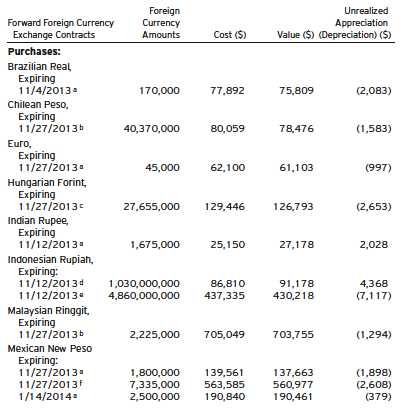
32
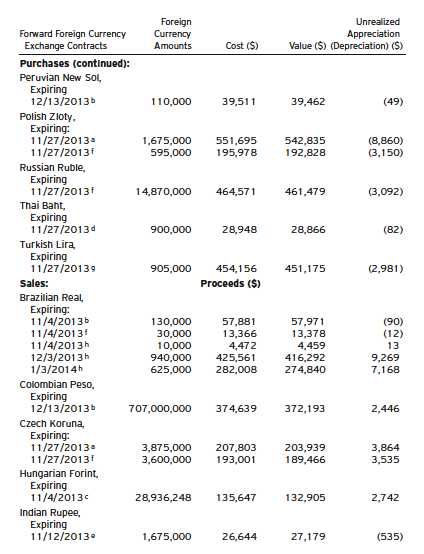
The Fund 33
NOTES TO FINANCIAL STATEMENTS (continued)
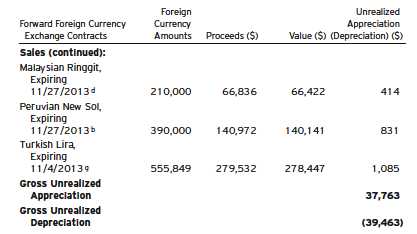
| |
| Counterparties: |
| a | Deutsche Bank |
| b | Citigroup |
| c | Goldman Sachs International |
| d | JP Morgan Chase Bank |
| e | Standard Chartered Bank |
| f | Barclays Bank |
| g | Credit Suisse |
| h | Morgan Stanley Capital Services |
Swap Transactions: The fund enters into swap agreements to exchange the interest rate on, or return generated by, one nominal instrument for the return generated by another nominal instrument. Swap agreements are privately negotiated in the over-the-counter (“OTC”) market or centrally cleared.The fund enters into these agreements to hedge certain market or interest rate risks, to manage the interest rate sensitivity (sometimes called duration) of fixed income securities, to provide a substitute for purchasing or selling particular securities or to increase potential returns.
For OTC swaps, the fund accrues for the interim payments on a daily basis, with the net amount recorded within unrealized appreciation (depreciation) on swap agreements in the Statement of Assets and Liabilities. Once the interim payments are settled in cash, the net amount is recorded as a realized gain (loss) on swaps, in addition to real-
34
ized gain (loss) recorded upon the termination of swap agreements in the Statement of Operations. Upfront payments made and/or received by the fund, are recorded as an asset and/or liability in the Statement of Assets and Liabilities and are recorded as a realized gain or loss ratably over the agreement’s term/event with the exception of forward starting interest rate swaps which are recorded as realized gains or losses on the termination date.
Fluctuations in the value of swap agreements are recorded for financial statement purposes as unrealized appreciation or depreciation on swap transactions.
Interest Rate Swaps: Interest rate swaps involve the exchange of commitments to pay and receive interest based on a notional principal amount.The fund may elect to pay a fixed rate and receive a floating rate, or receive a fixed rate and pay a floating rate on a notional principal amount. The net interest received or paid on interest rate swap agreements is included within realized gain (loss) on swap agreements in the Statement of Operations. Interest rate swap agreements are subject to general market risk, liquidity risk, counterparty risk and interest rate risk.
For OTC swaps, the fund’s maximum risk of loss from counterparty risk is the discounted value of the cash flows to be received from the counterparty over the agreement’s remaining life, to the extent that the amount is positive. This risk is mitigated by MNA between the fund and the counterparty and the posting of collateral by the coun-terparty to the fund to cover the fund’s exposure to the counterparty. The following summarizes open interest rate swaps entered into by the fund at October 31, 2013:
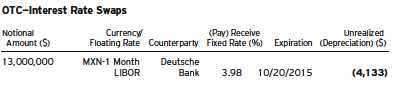
The Fund 35
NOTES TO FINANCIAL STATEMENTS (continued)
The following tables show the fund’s exposure to different types of market risk as it relates to the Statement of Assets and Liabilities and the Statement of Operations, respectively.
Fair value of derivative instruments as of October 31, 2013 is shown below:
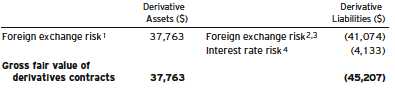
| |
| Statement of Assets and Liabilities location: |
| 1 | Unrealized appreciation on forward foreign currency exchange contracts. |
| 2 | Outstanding options written, at value. |
| 3 | Unrealized depreciation on forward foreign currency exchange contracts. |
| 4 | Unrealized depreciation on swap agreements. |
The effect of derivative instruments in the Statement of Operations during the period ended October 31, 2013 is shown below:
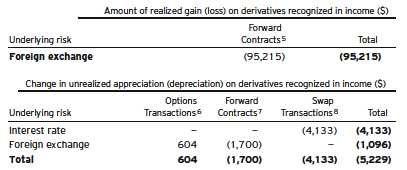
| |
| Statement of Operations location: |
| 5 | Net realized gain (loss) on forward foreign currency exchange contracts. |
| 6 | Net unrealized appreciation (depreciation) on options transactions. |
| 7 | Net unrealized appreciation (depreciation) on forward foreign currency exchange contracts. |
| 8 | Net unrealized appreciation (depreciation) on swap transactions. |
In December 2011, with clarification in January 2013, FASB issued guidance that expands disclosure requirements with respect to the offsetting of certain assets and liabilities.The fund adopted these disclosure provisions during the current reporting period.These disclosures are required for certain investments, including derivative financial instruments subject
36
to master netting arrangements (“MNA”) or similar agreements which are eligible for offsetting in the Statement of Assets and Liabilities and require the fund to disclose both gross and net information with respect to such investments. For financial reporting purposes, the fund does not offset derivative assets and derivative liabilities that are subject to MNA in the Statement of Assets and Liabilities.
At October 31, 2013, derivative assets and liabilities (by type) on a gross basis are as follows:
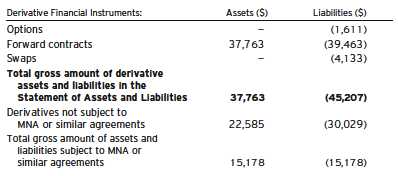
The following tables present derivative assets and liabilities net of amounts available for offsetting under MNA and net of related collateral received or pledged, if any, as of October 31, 2013:
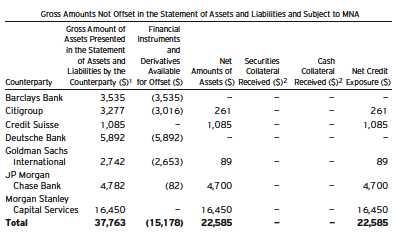
The Fund 37
NOTES TO FINANCIAL STATEMENTS (continued)
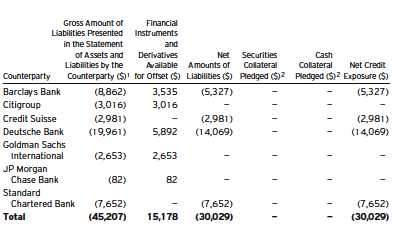
| |
| 1 | Absent a default event or early termination, over-the-counter derivative assets and liabilities are |
| | presented at gross amounts and are not offset in the Statement of Assets and Liabilities. |
| 2 | In some instances, the actual collateral received and/or pledged may be more than the amount |
| | shown due to overcollateralization. |
The following summarizes the average market value of derivatives outstanding during the period ended October 31, 2013:
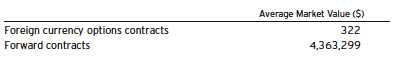
The following summarizes the average notional value of swap agreements outstanding during the period ended October 31, 2013:
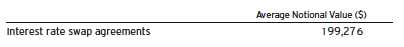
At October 31, 2013, the cost of investments for federal income tax purposes was $18,704,836; accordingly, accumulated net unrealized depreciation on investments was $301,595, consisting of $145,242 gross unrealized appreciation and $446,837 gross unrealized depreciation.
38
REPORT OF INDEPENDENT REGISTERED
PUBLIC ACCOUNTING FIRM
The Board of Directors and Shareholders
The Dreyfus/Laurel Funds, Inc.
We have audited the accompanying statement of assets and liabilities of Dreyfus Opportunistic Emerging Markets Debt Fund (the “Fund”), a series of The Dreyfus/Laurel Funds, Inc., including the statements of investments and options written, as of October 31, 2013, and the related statement of operations, the statement of changes in net assets, and the financial highlights for the period from June 17, 2013 (commencement of operations) through October 31, 2013.These financial statements and financial highlights are the responsibility of the Fund’s management. Our responsibility is to express an opinion on these financial statements and financial highlights based on our audit.
We conducted our audit in accordance with the standards of the Public Company Accounting Oversight Board (United States).Those standards require that we plan and perform the audit to obtain reasonable assurance about whether the financial statements and financial highlights are free of material misstatement. An audit includes examining, on a test basis, evidence supporting the amounts and disclosures in the financial statements. Our procedures included confirmation of securities owned as of October 31, 2013, by correspondence with the custodian and brokers or by other appropriate auditing procedures. An audit also includes assessing the accounting principles used and significant estimates made by management, as well as evaluating the overall financial statement presentation.We believe that our audit provides a reasonable basis for our opinion.
In our opinion, the financial statements and financial highlights referred to above present fairly, in all material respects, the financial position of Dreyfus Opportunistic Emerging Markets Debt Fund as of October 31, 2013, and the results of its operations, the changes in its net assets, and the financial highlights for the period from June 17, 2013 through October 31, 2013, in conformity with U.S. generally accepted accounting principles.

New York, New York
December 30, 2013
The Fund 39
IMPORTANT TAX INFORMATION (Unaudited)
For federal tax purposes the fund designates the maximum amount allowable but not less than 6.04% as intertest-related dividends in accordance with Sections 871(k) (1) and 881(e) of the Internal Revenue Code.
40
INFORMATION ABOUT THE APPROVAL OF THE
FUND’S MANAGEMENT AND SUB-INVESTMENT
ADVISORY AGREEMENTS (Unaudited)
At a meeting of the fund’s Board of Directors held on April 24-25, 2013, the Board considered the approval of the fund’s Management Agreement pursuant to which Dreyfus will provide the fund with investment advisory and administrative services (the “Agreement”), and the Sub-Investment Advisory Agreement (together, the “Agreements”), pursuant to which Standish Mellon Asset Management, LLC (the “Sub-Adviser”), an affiliate of Dreyfus, will provide day-to-day management of the fund’s investments. The Board members, none of whom are “interested persons” (as defined in the Investment Company Act of 1940, as amended) of the fund, were assisted in their review by independent legal counsel and met with counsel in executive session separate from representatives of Dreyfus and the Sub-Adviser. In considering the approval of the Agreements, the Board considered all factors that it believed to be relevant, including those discussed below.The Board did not identify any one factor as dispositive, and each Board member may have attributed different weights to the factors considered.
Analysis of Nature, Extent, and Quality of Services Provided to the Fund. The Board considered information provided to them at the meeting and in previous presentations from Dreyfus representatives regarding the nature, extent, and quality of the services provided to funds in the Dreyfus fund complex. Dreyfus also had previously provided information regarding the diverse intermediary relationships and distribution channels of funds in the Dreyfus fund complex (such as retail direct or intermediary, in which intermediaries typically are paid by the fund and/or Dreyfus) and Dreyfus’ corresponding need for broad, deep, and diverse resources to be able to provide ongoing shareholder services to each intermediary or distribution channel, as applicable to the fund.
The Board also considered research support available to, and portfolio management capabilities of, the fund’s portfolio management personnel and that Dreyfus also provides oversight of day-to-day fund operations, including fund accounting and administration and assistance in meeting legal and regulatory requirements.The Board also considered Dreyfus’ extensive administrative, accounting, and compliance infrastructures, as well as Dreyfus’ supervisory activities over the Sub-Adviser.
The Fund 41
INFORMATION ABOUT THE APPROVAL OF THE FUND’S MANAGEMENT AND
SUB-INVESTMENT ADVISORY AGREEMENTS (Unaudited) (continued)
Comparative Analysis of the Fund’s Performance and Management Fee and Expense Ratio. As the fund had not yet commenced operations, the Board was not able to review the fund’s performance. The Board discussed with representatives of Dreyfus and the Sub-Adviser the portfolio management team and the investment strategies to be employed in the management of the fund’s assets.The Board noted the reputation and experience of Dreyfus and the Sub-Adviser.
The Board reviewed comparisons of the fund’s proposed management fee and anticipated expense ratio and reviewed the management fees and expense ratios of funds in the fund’s anticipated Lipper, Inc. (“Lipper”) category (the “Category”) and the average and median management fee ranges in the Category, as well as management fees and expense ratios of a group of funds independently prepared by Lipper (the “Comparison Group”). The Board noted that the fund’s contractual management fee was slightly below the average and slightly above the median effective management fees for the funds in the Category and within the contractual management fee range of the funds in the Category. The fund’s contractual management fee was above the average and median effective management fees, and slightly below the average and median contractual management fees, for the funds in the Comparison Group.The fund’s estimated total expenses (as limited through at least July 1, 2014 by agreement with Dreyfus to waive receipt of its fees and/or assume the expenses of the fund so that annual fund operating expenses (excluding Rule 12b-1 fees, shareholder services fees, taxes, interest, brokerage commissions, commitment fees on borrowings and extraordinary expenses) do not exceed 1.00% of the fund’s average daily net assets) were below the average and median expense ratios of the funds in the Comparison Group.
Dreyfus representatives reviewed with the Board the management or investment advisory fees (1) paid by funds advised or administered by Dreyfus that are in the same Lipper category as the fund and (2) paid to Dreyfus or the Sub-Adviser for advising any separate accounts and/or other types of client portfolios that are considered to have similar investment strategies and policies as the fund (the “Similar
42
Clients”), and explained the nature of the Similar Clients. They discussed differences in fees paid and the relationship of the fees paid in light of any differences in the services provided and other relevant factors. The Board considered the relevance of the fee information provided for the Similar Clients to evaluate the appropriateness and reasonableness of the fund’s management fee.
The Board considered the fee to be paid to the Sub-Adviser in relation to the fee to be paid to Dreyfus by the fund and the respective services to be provided by the Sub-Adviser and Dreyfus. The Board also noted the Sub-Adviser’s fee will be paid by Dreyfus (out of its fee from the fund) and not the fund.
Analysis of Profitability and Economies of Scale. As the fund had not yet commenced operations, Dreyfus representatives were not able to review the dollar amount of expenses allocated and profit received by Dreyfus, or any economies of scale. The Board considered potential benefits to Dreyfus from acting as investment adviser.The Board also considered the uncertainty of the estimated asset levels and the renewal requirements for advisory agreements and their ability to review the management fee annually after the initial term of the Agreements.
At the conclusion of these discussions, the Board agreed that it had been furnished with sufficient information to make an informed business decision with respect to the approval of the Agreements. Based on the discussions and considerations as described above, the Board concluded and determined as follows.
• The Board concluded that the nature, extent and quality of the services to be provided by Dreyfus and the Sub-Adviser are adequate and appropriate.
• The Board concluded that since the fund had not yet commenced operations, its performance could not be measured and was not a factor.
• The Board concluded that the fee to be paid to Dreyfus and the Sub-Adviser were reasonable in light of the considerations described above.
The Fund 43
INFORMATION ABOUT THE APPROVAL OF THE FUND’S MANAGEMENT AND
SUB-INVESTMENT ADVISORY AGREEMENTS (Unaudited) (continued)
• The Board determined that because the fund had not yet commenced operations, economies of scale were not a factor, but, to the extent in the future it were determined that material economies of scale had not been shared with the fund, the Board would seek to have those economies of scale shared with the fund in connection with future renewals.
In evaluating the Agreements, the Board considered these conclusions and determinations and also relied on its knowledge, gained through meetings and other interactions with Dreyfus and its affiliates and the Sub-Adviser, of other funds advised by Dreyfus. It should be noted that the Board’s consideration of the contractual fee arrangements for this fund had the benefit of a number of years of reviews of similar agreements during which lengthy discussions took place between the Board and Dreyfus representatives. Certain aspects of the Board’s conclusions may be based, in part, on their consideration of similar arrangements in prior years. The Board determined that approval of the Agreements was in the best interests of the fund and its shareholders.
44
BOARD MEMBERS INFORMATION (Unaudited)
The Fund 45
BOARD MEMBERS INFORMATION (Unaudited) (continued)
46
OFFICERS OF THE FUND (Unaudited)
The Fund 47
OFFICERS OF THE FUND (Unaudited) (continued)
48
Item 2. Code of Ethics.
The Registrant has adopted a code of ethics that applies to the Registrant's principal executive officer, principal financial officer, principal accounting officer or controller, or persons performing similar functions. There have been no amendments to, or waivers in connection with, the Code of Ethics during the period covered by this Report.
Item 3. Audit Committee Financial Expert.
The Registrant's Board has determined that Joseph S. DiMartino, a member of the Audit Committee of the Board, is an audit committee financial expert as defined by the Securities and Exchange Commission (the "SEC"). Mr. DiMartino is "independent" as defined by the SEC for purposes of audit committee financial expert determinations.
Item 4. Principal Accountant Fees and Services.
(a) Audit Fees. The aggregate fees billed for each of the last two fiscal years (the "Reporting Periods") for professional services rendered by the Registrant's principal accountant (the "Auditor") for the audit of the Registrant's annual financial statements or services that are normally provided by the Auditor in connection with the statutory and regulatory filings or engagements for the Reporting Periods, were $281,830 in 2012 and $297,425 in 2013.
(b) Audit-Related Fees. The aggregate fees billed in the Reporting Periods for assurance and related services by the Auditor that are reasonably related to the performance of the audit of the Registrant's financial statements and are not reported under paragraph (a) of this Item 4 were $33,180 in 2012 and $29,350 in 2013. These services consisted of one or more of the following: (i) agreed upon procedures related to compliance with Internal Revenue Code section 817(h), (ii) security counts required by Rule 17f-2 under the Investment Company Act of 1940, as amended, (iii) advisory services as to the accounting or disclosure treatment of Registrant transactions or events and (iv) advisory services to the accounting or disclosure treatment of the actual or potential impact to the Registrant of final or proposed rules, standards or interpretations by the Securities and Exchange Commission, the Financial Accounting Standards Boards or other regulatory or standard-setting bodies.
The aggregate fees billed in the Reporting Periods for non-audit assurance and related services by the Auditor to the Registrant's investment adviser (not including any sub-investment adviser whose role is primarily portfolio management and is subcontracted with or overseen by another investment adviser), and any entity controlling, controlled by or under common control with the investment adviser that provides ongoing services to the Registrant ("Service Affiliates"), that were reasonably related to the performance of the annual audit of the Service Affiliate, which required pre-approval by the Audit Committee were $0 in 2012 and $0 in 2013.
(c) Tax Fees. The aggregate fees billed in the Reporting Periods for professional services rendered by the Auditor for tax compliance, tax advice, and tax planning ("Tax Services") were $20,790 in 2012 and $18,800 in 2013. These services consisted of the review or preparation of U.S. federal, state, local and excise tax returns. The aggregate fees billed in the Reporting Periods for Tax Services by the Auditor to Service Affiliates, which required pre-approval by the Audit Committee were $0 in 2012 and $0 in 2013.
(d) All Other Fees. The aggregate fees billed in the Reporting Periods for products and services provided by the Auditor, other than the services reported in paragraphs (a) through (c) of this Item, were $0 in 2012 and $0 in 2013.
The aggregate fees billed in the Reporting Periods for Non-Audit Services by the Auditor to Service Affiliates, other than the services reported in paragraphs (b) through (c) of this Item, which required pre-approval by the Audit Committee, were $0 in 2012 and $0 in 2013.
(e)(1) Audit Committee Pre-Approval Policies and Procedures. The Registrant's Audit Committee has established policies and procedures (the "Policy") for pre-approval (within specified fee limits) of the Auditor's engagements for non-audit services to the Registrant and Service Affiliates without specific case-by-case consideration. The pre-approved services in the Policy can include pre-approved audit services, pre-approved audit-related services, pre-approved tax services and pre-approved all other services. Pre-approval considerations include whether the proposed services are compatible with maintaining the Auditor's independence. Pre-approvals pursuant to the Policy are considered annually.
(e)(2) Note: None of the services described in paragraphs (b) through (d) of this Item 4 were approved by the Audit Committee pursuant to paragraph (c)(7)(i)(C) of Rule 2-01 of Regulation S-X.
(f) None of the hours expended on the principal accountant's engagement to audit the registrant's financial statements for the most recent fiscal year were attributed to work performed by persons other than the principal account's full-time, permanent employees.
Non-Audit Fees. The aggregate non-audit fees billed by the Auditor for services rendered to the Registrant, and rendered to Service Affiliates, for the Reporting Periods were $11,571,150 in 2012 and $13,945,381 in 2013.
Auditor Independence. The Registrant's Audit Committee has considered whether the provision of non-audit services that were rendered to Service Affiliates, which were not pre-approved (not requiring pre-approval), is compatible with maintaining the Auditor's independence.
Item 5. Audit Committee of Listed Registrants.
Not applicable.
Item 6. Investments.
(a) Not applicable.
Item 7. Disclosure of Proxy Voting Policies and Procedures for Closed-End Management Investment Companies.
Not applicable.
Item 8. Portfolio Managers of Closed-End Management Investment Companies.
Not applicable.
Item 9. Purchases of Equity Securities by Closed-End Management Investment Companies and Affiliated Purchasers.
Not applicable.
Item 10. Submission of Matters to a Vote of Security Holders.
There have been no material changes to the procedures applicable to Item 10.
Item 11. Controls and Procedures.
(a) The Registrant's principal executive and principal financial officers have concluded, based on their evaluation of the Registrant's disclosure controls and procedures as of a date within 90 days of the filing date of this report, that the Registrant's disclosure controls and procedures are reasonably designed to ensure that information required to be disclosed by the Registrant on Form N-CSR is recorded, processed, summarized and reported within the required time periods and that information required to be disclosed by the Registrant in the reports that it files or submits on Form N-CSR is accumulated and communicated to the Registrant's management, including its principal executive and principal financial officers, as appropriate to allow timely decisions regarding required disclosure.
(b) There were no changes to the Registrant's internal control over financial reporting that occurred during the second fiscal quarter of the period covered by this report that have materially affected, or are reasonably likely to materially affect, the Registrant's internal control over financial reporting.
Item 12. Exhibits.
(a)(1) Code of ethics referred to in Item 2.
(a)(2) Certifications of principal executive and principal financial officers as required by Rule 30a-2(a) under the Investment Company Act of 1940.
(a)(3) Not applicable.
(b) Certification of principal executive and principal financial officers as required by Rule 30a-2(b) under the Investment Company Act of 1940.
SIGNATURES
Pursuant to the requirements of the Securities Exchange Act of 1934 and the Investment Company Act of 1940, the Registrant has duly caused this Report to be signed on its behalf by the undersigned, thereunto duly authorized.
The Dreyfus/Laurel Funds, Inc.
By: /s/ Bradley J. Skapyak |
Bradley J. Skapyak President |
Date: | December 18, 2013 |
|
Pursuant to the requirements of the Securities Exchange Act of 1934 and the Investment Company Act of 1940, this Report has been signed below by the following persons on behalf of the Registrant and in the capacities and on the dates indicated. |
|
By: /s/ Bradley J. Skapyak |
Bradley J. Skapyak President |
Date: | December 18, 2013 |
|
By: /s/ James Windels |
James Windels Treasurer |
Date: | December 18, 2013 |
|
EXHIBIT INDEX
(a)(1) Code of ethics referred to in Item 2.
(a)(2) Certifications of principal executive and principal financial officers as required by Rule 30a-2(a) under the Investment Company Act of 1940. (EX-99.CERT)
(b) Certification of principal executive and principal financial officers as required by Rule 30a-2(b) under the Investment Company Act of 1940. (EX-99.906CERT)