UNITED STATES
SECURITIES AND EXCHANGE COMMISSION
Washington, D.C. 20549
FORM N-CSR
CERTIFIED SHAREHOLDER REPORT OF REGISTERED MANAGEMENT
INVESTMENT COMPANIES
Investment Company Act file number | 811-05202 |
| |
| The Dreyfus/Laurel Funds, Inc. | |
| (Exact name of Registrant as specified in charter) | |
| | |
| c/o The Dreyfus Corporation 200 Park Avenue New York, New York 10166 | |
| (Address of principal executive offices) (Zip code) | |
| | |
| John Pak, Esq. 200 Park Avenue New York, New York 10166 | |
| (Name and address of agent for service) | |
|
Registrant's telephone number, including area code: | (212) 922-6000 |
| |
Date of fiscal year end: | 8/31 | |
Date of reporting period: | 8/31/13 | |
| | | | | | | |
The following Form N-CSR relates only to Dreyfus Core Equity Fund, a series of the Registrant, and does not affect the other series of the Registrant, which have a different fiscal year end and, therefore, different Form N-CSR reporting requirements. A separate Form N-CSR will be filed for those series, as appropriate.
FORM N-CSR
Item 1. Reports to Stockholders.
ANNUAL REPORT August 31, 2013

Save time. Save paper. View your next shareholder report online as soon as it’s available. Log into www.dreyfus.com and sign up for Dreyfus eCommunications. It’s simple and only takes a few minutes.
The views expressed in this report reflect those of the portfolio manager only through the end of the period covered and do not necessarily represent the views of Dreyfus or any other person in the Dreyfus organization. Any such views are subject to change at any time based upon market or other conditions and Dreyfus disclaims any responsibility to update such views.These views may not be relied on as investment advice and, because investment decisions for a Dreyfus fund are based on numerous factors, may not be relied on as an indication of trading intent on behalf of any Dreyfus fund.
|
| Not FDIC-Insured • Not Bank-Guaranteed • May Lose Value |
| |
| Contents |
| |
| | THE FUND |
| 2 | A Letter from the President |
| 3 | Discussion of Fund Performance |
| 6 | Fund Performance |
| 8 | Understanding Your Fund’s Expenses |
| 8 | Comparing Your Fund’s Expenses |
| With Those of Other Funds |
| 9 | Statement of Investments |
| 13 | Statement of Assets and Liabilities |
| 14 | Statement of Operations |
| 15 | Statement of Changes in Net Assets |
| 17 | Financial Highlights |
| 20 | Notes to Financial Statements |
| 30 | Report of Independent Registered |
| | Public Accounting Firm |
| 31 | Important Tax Information |
| 32 | Board Members Information |
| 34 | Officers of the Fund |
| |
| FOR MORE INFORMATION |
|
| | Back Cover |
Dreyfus
Core Equity Fund
The Fund
A LETTER FROM THE PRESIDENT
Dear Shareholder:
We are pleased to present this annual report for Dreyfus Core Equity Fund, covering the 12-month period from September 1, 2012, through August 31, 2013. For information about how the fund performed during the reporting period, as well as general market perspectives, we provide a Discussion of Fund Performance on the pages that follow.
U.S. equities fared quite well over the past year, weathering periodic bouts of volatility after setting new record highs in the spring for many broad measures of stock market performance. Low interest rates, muted inflationary pressures, and a strong U.S. dollar helped fuel the market’s gains, as did a declining unemployment rate, rebounding housing markets, and increased production of domestic oil and natural gas.
In our analysis, the U.S. economy is nearing an inflection point to a somewhat faster growth rate.We expect a reduced fiscal drag in 2014 and beyond, and the stimulative monetary policy of the past five years should continue to support economic expansion, particularly in interest rate-sensitive industry groups. For information on how these developments may affect your investments, we urge you to discuss these matters with your financial advisor.
Thank you for your continued confidence and support.
Sincerely,
J. Charles Cardona
President
The Dreyfus Corporation
September 16, 2013
2
DISCUSSION OF FUND PERFORMANCE
For the period of September 1, 2012, through August 31, 2013, as provided by Fayez Sarofim, Portfolio Manager of Fayez Sarofim & Co., Sub-Investment Adviser
Fund and Market Performance Overview
For the 12-month period ended August 31, 2013, Dreyfus Core Equity Fund’s Class A shares produced a total return of 7.57%, Class C shares returned 6.83% and Class I shares returned 7.83%.1 For the same period, the fund’s benchmark, the Standard & Poor’s 500® Composite Stock Price Index (“S&P® 500 Index”), produced an 18.70% total return.2
Stocks generally rallied over the reporting period when economic data improved. The fund underperformed its benchmark, mainly due to its emphasis on high-quality, multinational corporations at a time when lower quality, domestically focused stocks fared better.
The Fund’s Investment Approach
The fund seeks long-term capital appreciation.To pursue its goal, the fund normally invests at least 80% of its net assets in common stocks of U.S. and foreign companies with market capitalizations exceeding $5 billion at the time of purchase, including multinational companies.
In choosing stocks, the fund first identifies economic sectors that it believes will expand over the next three to five years or longer. Using fundamental analysis, the fund then seeks companies within these sectors that have dominant positions in their industries and that have demonstrated sustained patterns of profitability, strong balance sheets, and expanding global presence and the potential to achieve predictable, above-average earnings growth.The fund is also alert to companies which it considers undervalued in terms of current earnings, assets, or growth prospects.
The fund employs a “buy-and-hold” investment strategy, which generally has resulted in an annual portfolio turnover of below 15%.3 As a result, the fund invests for long-term growth rather than short-term profits.
The Fund 3
DISCUSSION OF FUND PERFORMANCE (continued)
Recovering Economy Fueled Equity Market’s Gains
The reporting period began near the outset of a sustained stock market rally driven primarily by improved U.S. employment and housing market data. Investors also were encouraged by the launch of a new round of quantitative easing by the Federal Reserve Board (the “Fed”). While economic conditions in overseas markets also showed signs of improvement, their recoveries generally lagged the United States.
U.S. economic data continued to improve, and domestic stocks generally continued to rally through the spring of 2013. By mid-May, several broad measures of stock market performance reached new record highs. In late May, remarks by Fed chairman Ben Bernanke were widely interpreted as a signal that the Fed would back away from its quantitative easing program sooner than expected, sparking heightened volatility in June that erased some of the stock market’s previous gains. Equity markets generally stabilized in July and August when investors returned their focus to company and market fundamentals.
Quality Bias Weighed on Fund Results
The fund’s longstanding emphasis on large, dividend-paying, multinational companies proved counterproductive during the reporting period when investors favored smaller, domestically focused stocks. Relative results were negatively impacted by holdings in the traditionally defensive consumer staples sector, where investors focused primarily on U.S.-centric and lower-quality companies they believed to be takeover candidates rather than globally dominant fund holdings. Likewise, the fund’s focus on large, integrated oil producers in the energy sector undermined relative results as well as relative weakness in key holdings in the consumer discretionary sector. Other laggards during the reporting period included Apple Inc., medical robotics developer Intuitive Surgical, metals producer Freeport-McMoRan Copper & Gold, and technology services provider International Business Machines. Among the factors that added value relative to the S&P® 500 Index was the lack of representation in utilities and telecom, two underperforming sectors.The fund achieved better results from individual holdings in a diverse array of industry groups. Leading stocks in the fund for the past year were Twenty-First Century Fox, BlackRock, Canadian Pacific Railway and Roche Holding,ADR.
4
A Constructive Outlook for Multinationals
We have been encouraged by recent improvements in U.S. and global economic data, and many large, multinational companies appear poised to rally from attractive valuations. Indeed, in our analysis a shift toward less accommodative monetary and fiscal policies worldwide could drive investors to the relative safety of higher quality stocks. Therefore, we have maintained our focus on high-quality, multinational companies with strong balance sheets, dominant brands, and above-average earnings and dividend growth characteristics.
September 16, 2013
|
| Equity funds are subject generally to market, market sector, market liquidity, issuer and investment style risks, among |
| other factors, to varying degrees, all of which are more fully described in the fund’s prospectus. |
| 1 Total return includes reinvestment of dividends and any capital gains paid, and does not take into consideration the |
| maximum initial sales charge in the case of Class A shares, or the applicable contingent deferred sales charge imposed |
| on redemptions in the case of Class C shares. Had these charges been reflected, returns would have been lower. Past |
| performance is no guarantee of future results. Share price and investment return fluctuate such that upon redemption |
| fund shares may be worth more or less than their original cost. |
| 2 SOURCE: LIPPER INC. — Reflects monthly reinvestment of dividends and, where applicable, capital gain |
| distributions.The Standard & Poor’s 500® Composite Stock Price Index is a widely accepted, unmanaged index of |
| U.S. stock market performance. Investors cannot invest directly in any index. |
| 3 Portfolio turnover rates are subject to change. Portfolio turnover rates alone do not automatically result in high or low |
| distribution levels.There can be no guarantee that the fund will generate any specific level of distributions annually. |
The Fund 5
FUND PERFORMANCE
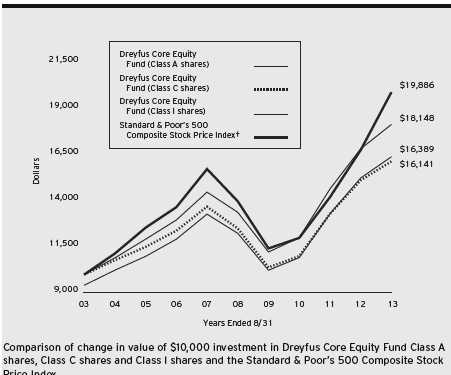
|
| † Source: Lipper Inc. |
| Past performance is not predictive of future performance. |
| The above graph compares a $10,000 investment made in each of the Class A, Class C and Class I shares of Dreyfus |
| Core Equity Fund on 8/31/03 to a $10,000 investment made in the Standard & Poor’s 500 Composite Stock Price |
| Index (the “Index”) on that date.All dividends and capital gain distributions are reinvested. |
| The fund’s performance shown in the line graph above takes into account the maximum initial sales charge on Class A |
| shares and all other applicable fees and expenses on all classes.The Index is a widely accepted, unmanaged index of U.S. |
| stock market performance. Unlike a mutual fund, the Index is not subject to charges, fees and other expenses. Investors |
| cannot invest directly in any index. Further information relating to fund performance, including expense reimbursements, |
| if applicable, is contained in the Financial Highlights section of the prospectus and elsewhere in this report. |
6
| | | | | | |
| Average Annual Total Returns as of 8/31/13 | | | | | | |
| | 1 Year | | 5 Years | | 10 Years | |
| Class A shares | | | | | | |
| with maximum sales charge (5.75%) | 1.39 | % | 4.78 | % | 5.06 | % |
| without sales charge | 7.57 | % | 6.02 | % | 5.69 | % |
| Class C shares | | | | | | |
| with applicable redemption charge † | 5.83 | % | 5.23 | % | 4.90 | % |
| without redemption | 6.83 | % | 5.23 | % | 4.90 | % |
| Class I shares | 7.83 | % | 6.29 | % | 6.14 | % |
| Standard & Poor’s 500 | | | | | | |
| Composite Stock Price Index | 18.70 | % | 7.31 | % | 7.12 | % |
|
| Past performance is not predictive of future performance.The fund’s performance shown in the graph and table does not |
| reflect the deduction of taxes that a shareholder would pay on fund distributions or the redemption of fund shares. |
| † The maximum contingent deferred sales charge for Class C shares is 1% for shares redeemed within one year of the |
| date of purchase. |
UNDERSTANDING YOUR FUND’S EXPENSES (Unaudited)
As a mutual fund investor, you pay ongoing expenses, such as management fees and other expenses. Using the information below, you can estimate how these expenses affect your investment and compare them with the expenses of other funds.You also may pay one-time transaction expenses, including sales charges (loads) and redemption fees, which are not shown in this section and would have resulted in higher total expenses. For more information, see your fund’s prospectus or talk to your financial adviser.
Review your fund’s expenses
The table below shows the expenses you would have paid on a $1,000 investment in Dreyfus Core Equity Fund from March 1, 2013 to August 31, 2013. It also shows how much a $1,000 investment would be worth at the close of the period, assuming actual returns and expenses.
Expenses and Value of a $1,000 Investment
assuming actual returns for the six months ended August 31, 2013
| | | | | | |
| | | Class A | | Class C | | Class I |
| Expenses paid per $1,000† | $ | 6.91 | $ | 10.73 | $ | 5.64 |
| Ending value (after expenses) | $ | 1,031.30 | $ | 1,027.70 | $ | 1,032.40 |
COMPARING YOUR FUND’S EXPENSES
WITH THOSE OF OTHER FUNDS (Unaudited)
Using the SEC’s method to compare expenses
The Securities and Exchange Commission (SEC) has established guidelines to help investors assess fund expenses. Per these guidelines, the table below shows your fund’s expenses based on a $1,000 investment, assuming a hypothetical 5% annualized return. You can use this information to compare the ongoing expenses (but not transaction expenses or total cost) of investing in the fund with those of other funds.All mutual fund shareholder reports will provide this information to help you make this comparison. Please note that you cannot use this information to estimate your actual ending account balance and expenses paid during the period.
Expenses and Value of a $1,000 Investment
assuming a hypothetical 5% annualized return for the six months ended August 31, 2013
| | | | | | |
| | | Class A | | Class C | | Class I |
| Expenses paid per $1,000† | $ | 6.87 | $ | 10.66 | $ | 5.60 |
| Ending value (after expenses) | $ | 1,018.40 | $ | 1,014.62 | $ | 1,019.66 |
|
| † Expenses are equal to the fund’s annualized expense ratio of 1.35% for Class A, 2.10% for Class C and 1.10% |
| for Class I, multiplied by the average account value over the period, multiplied by 184/365 (to reflect the one-half |
| year period). |
8
STATEMENT OF INVESTMENTS
August 31, 2013
| | | |
| Common Stocks—99.7% | Shares | | Value ($) |
| Banks—1.7% | | | |
| HSBC Holdings, ADR | 48,583 | | 2,546,721 |
| Wells Fargo & Co. | 100,000 | | 4,108,000 |
| | | | 6,654,721 |
| Capital Goods—4.1% | | | |
| Caterpillar | 63,500 | | 5,241,290 |
| General Electric | 189,500 | | 4,385,030 |
| United Technologies | 67,300 | | 6,736,730 |
| | | | 16,363,050 |
| Consumer Services—2.8% | | | |
| McDonald’s | 116,900 | | 11,030,684 |
| Diversified Financials—6.7% | | | |
| American Express | 66,000 | | 4,746,060 |
| BlackRock | 22,500 | | 5,857,200 |
| Franklin Resources | 130,900 | | 6,042,344 |
| JPMorgan Chase & Co. | 196,000 | | 9,903,880 |
| | | | 26,549,484 |
| Energy—18.7% | | | |
| Chevron | 136,500 | | 16,438,695 |
| ConocoPhillips | 95,000 | | 6,298,500 |
| EOG Resources | 14,000 | | 2,198,700 |
| Exxon Mobil | 222,560 | | 19,398,330 |
| Imperial Oil | 98,000 | | 4,095,420 |
| Occidental Petroleum | 127,500 | | 11,246,775 |
| Phillips 66 | 68,400 | | 3,905,640 |
| Royal Dutch Shell, Cl. A, ADR | 104,400 | | 6,743,196 |
| Total, ADR | 78,400 | a | 4,336,304 |
| | | | 74,661,560 |
| Food & Staples Retailing—1.6% | | | |
| Walgreen | 97,600 | | 4,691,632 |
| Whole Foods Market | 29,200 | | 1,540,300 |
| | | | 6,231,932 |
| Food, Beverage & Tobacco—19.8% | | | |
| Altria Group | 235,000 | | 7,961,800 |
| Coca-Cola | 464,500 | | 17,734,610 |
| Diageo, ADR | 29,500 | | 3,619,060 |
STATEMENT OF INVESTMENTS (continued)
| | | | |
| Common Stocks (continued) | Shares | | Value ($) |
| Food, Beverage & Tobacco (continued) | | | | |
| Kraft Foods Group | 42,333 | | 2,191,579 |
| Mondelez International, Cl. A | 127,500 | | 3,910,425 |
| Nestle, ADR | 172,125 | | 11,265,581 |
| PepsiCo | 78,500 | | 6,258,805 |
| Philip Morris International | 249,500 | | 20,818,280 |
| SABMiller | 107,600 | | 5,125,795 |
| | | | | 78,885,935 |
| Health Care Equipment & Services—1.8% | | | | |
| Abbott Laboratories | 156,500 | | 5,216,145 |
| Intuitive Surgical | 4,800 | b | 1,855,296 |
| | | | | 7,071,441 |
| Household & Personal Products—4.5% | | | | |
| Estee Lauder, Cl. A | 103,000 | | 6,732,080 |
| Procter & Gamble | 143,000 | | 11,138,270 |
| | | | | 17,870,350 |
| Insurance—.6% | | | | |
| ACE | 25,000 | | 2,193,000 |
| Materials—2.9% | | | | |
| Air Products & Chemicals | 25,500 | | 2,604,570 |
| Freeport-McMoRan Copper & Gold | 137,000 | | 4,140,140 |
| Praxair | 42,000 | | 4,930,800 |
| | | | | 11,675,510 |
| Media—6.0% | | | | |
| Comcast, Cl. A | 94,500 | | 3,977,505 |
| McGraw-Hill Financial | 57,200 | | 3,338,764 |
| News Corp., Cl. A | 41,625 | b | 653,512 |
| Time Warner Cable | 44,000 | | 4,723,400 |
| Twenty-First Century Fox | 166,500 | | 5,216,445 |
| Walt Disney | 97,800 | | 5,949,174 |
| | | | | 23,858,800 |
| Pharmaceuticals, Biotech & | | | | |
| Life Sciences—8.8% | | | | |
| AbbVie | 156,500 | | 6,668,465 |
| Johnson & Johnson | 122,500 | | 10,585,225 |
10
| | | |
| Common Stocks (continued) | Shares | | Value ($) |
| Pharmaceuticals, Biotech & | | | |
| Life Sciences (continued) | | | |
| Merck & Co. | 68,400 | | 3,234,636 |
| Novo Nordisk, ADR | 39,100 | a | 6,527,354 |
| Roche Holding, ADR | 132,000 | | 8,218,320 |
| | | | 35,234,000 |
| Retailing—3.7% | | | |
| Target | 123,000 | | 7,787,130 |
| Wal-Mart Stores | 92,500 | | 6,750,650 |
| | | | 14,537,780 |
| Semiconductors & Semiconductor | | | |
| Equipment—3.8% | | | |
| Intel | 308,500 | | 6,780,830 |
| Texas Instruments | 166,500 | | 6,360,300 |
| Xilinx | 48,900 | | 2,123,238 |
| | | | 15,264,368 |
| Software & Services—5.2% | | | |
| Automatic Data Processing | 78,500 | | 5,586,060 |
| International Business Machines | 61,600 | | 11,227,832 |
| Oracle | 127,800 | | 4,071,708 |
| | | | 20,885,600 |
| Technology Hardware & Equipment—6.0% | | | |
| Apple | 39,100 | | 19,043,655 |
| QUALCOMM | 73,500 | | 4,871,580 |
| | | | 23,915,235 |
| Transportation—1.0% | | | |
| Canadian Pacific Railway | 34,500 | | 4,072,035 |
| Total Common Stocks | | | |
| (cost $292,626,715) | | | 396,955,485 |
| |
| Other Investment—.1% | | | |
| Registered Investment Company; | | | |
| Dreyfus Institutional Preferred | | | |
| Plus Money Market Fund | | | |
| (cost $448,367) | 448,367 | c | 448,367 |
STATEMENT OF INVESTMENTS (continued)
| | | |
| Investment of Cash Collateral | | | |
| for Securities Loaned—.1% | Shares | | Value ($) |
| Registered Investment Company; | | | |
| Dreyfus Institutional Cash Advantage Fund | | | |
| (cost $492,081) | 492,081 | c | 492,081 |
| Total Investments (cost $293,567,163) | 99.9 | % | 397,895,933 |
| Cash and Receivables (Net) | .1 | % | 304,360 |
| Net Assets | 100.0 | % | 398,200,293 |
ADR—American Depository Receipts
|
| a Security, or portion thereof, on loan.At August 31, 2013, the value of the fund’s securities on loan was $475,802 |
| and the value of the collateral held by the fund was $492,081. |
| b Non-income producing security. |
| c Investment in affiliated money market mutual fund. |
| | | |
| Portfolio Summary (Unaudited)† | | |
| |
| | Value (%) | | Value (%) |
| Food, Beverage & Tobacco | 19.8 | Retailing | 3.7 |
| Energy | 18.7 | Materials | 2.9 |
| Pharmaceuticals, | | Consumer Services | 2.8 |
| Biotech & Life Sciences | 8.8 | Health Care | |
| Diversified Financials | 6.7 | Equipment & Services | 1.8 |
| Media | 6.0 | Banks | 1.7 |
| Technology Hardware & Equipment | 6.0 | Food & Staples Retailing | 1.6 |
| Software & Services | 5.2 | Transportation | 1.0 |
| Household & Personal Products | 4.5 | Insurance | .6 |
| Capital Goods | 4.1 | Money Market Investments | .2 |
| Semiconductors & | | | |
| Semiconductor Equipment | 3.8 | | 99.9 |
| |
| † Based on net assets. | | | |
| See notes to financial statements. | | | |
12
STATEMENT OF ASSETS AND LIABILITIES
August 31, 2013
| | | |
| | | Cost | Value |
| Assets ($): | | | |
| Investments in securities—See Statement of Investments (including | | |
| securities on loan, valued at $475,802)—Note 1(c): | | |
| Unaffiliated issuers | | 292,626,715 | 396,955,485 |
| Affiliated issuers | | 940,448 | 940,448 |
| Cash | | | 203,964 |
| Dividends and securities lending income receivable | | | 1,173,291 |
| Receivable for shares of Capital Stock subscribed | | | 318,056 |
| | | | 399,591,244 |
| Liabilities ($): | | | |
| Due to The Dreyfus Corporation and affiliates—Note 3(b) | | 546,467 |
| Liability for securities on loan—Note 1(c) | | | 492,081 |
| Payable for shares of Capital Stock redeemed | | | 352,333 |
| Accrued expenses | | | 70 |
| | | | 1,390,951 |
| Net Assets ($) | | | 398,200,293 |
| Composition of Net Assets ($): | | | |
| Paid-in capital | | | 287,590,864 |
| Accumulated undistributed investment income—net | | | 1,089,118 |
| Accumulated net realized gain (loss) on investments | | 5,191,541 |
| Accumulated net unrealized appreciation | | | |
| (depreciation) on investments | | | 104,328,770 |
| Net Assets ($) | | | 398,200,293 |
| |
| |
| Net Asset Value Per Share | | | |
| | Class A | Class C | Class I |
| Net Assets ($) | 176,741,876 | 147,543,805 | 73,914,612 |
| Shares Outstanding | 8,990,048 | 7,650,724 | 3,683,354 |
| Net Asset Value Per Share ($) | 19.66 | 19.28 | 20.07 |
| |
| See notes to financial statements. | | | |
The Fund 13
STATEMENT OF OPERATIONS
Year Ended August 31, 2013
| | |
| Investment Income ($): | | |
| Income: | | |
| Cash dividends (net of $295,127 foreign taxes withheld at source): | | |
| Unaffiliated issuers | 11,754,109 | |
| Affiliated issuers | 4,702 | |
| Income from securities lending—Note 1(c) | 80,762 | |
| Total Income | 11,839,573 | |
| Expenses: | | |
| Management fee—Note 3 (a) | 4,521,921 | |
| Distribution/ Service Plan fees—Note 3 (b) | 1,957,987 | |
| Directors’ fees—Note 3 (a,c) | 29,558 | |
| Loan commitment fees—Note 2 | 3,480 | |
| Interest expense—Note 2 | 1,879 | |
| Total Expenses | 6,514,825 | |
| Less—Directors’ fees reimbursed by the Manager—Note 3 (a) | (29,558 | ) |
| Net Expenses | 6,485,267 | |
| Investment Income—Net | 5,354,306 | |
| Realized and Unrealized Gain (Loss) on Investments—Note 4 ($): | | |
| Net realized gain (loss) on investments and foreign currency transactions | 11,324,402 | |
| Net unrealized appreciation (depreciation) on investments | 12,057,960 | |
| Net Realized and Unrealized Gain (Loss) on Investments | 23,382,362 | |
| Net Increase in Net Assets Resulting from Operations | 28,736,668 | |
| |
| See notes to financial statements. | | |
14
STATEMENT OF CHANGES IN NET ASSETS
| | | | |
| | Year Ended August 31, | |
| | 2013 | | 2012 | a |
| Operations ($): | | | | |
| Investment income—net | 5,354,306 | | 3,398,679 | |
| Net realized gain (loss) on investments | 11,324,402 | | 144,540 | |
| Net unrealized appreciation | | | | |
| (depreciation) on investments | 12,057,960 | | 39,644,624 | |
| Net Increase (Decrease) in Net Assets | | | | |
| Resulting from Operations | 28,736,668 | | 43,187,843 | |
| Dividends to Shareholders from ($): | | | | |
| Investment income—net: | | | | |
| Class A | (2,646,179 | ) | (2,623,103 | ) |
| Class C | (1,080,436 | ) | (935,756 | ) |
| Class I | (1,237,170 | ) | (1,007,293 | ) |
| Total Dividends | (4,963,785 | ) | (4,566,152 | ) |
| Capital Stock Transactions ($): | | | | |
| Net proceeds from shares sold: | | | | |
| Class A | 35,146,176 | | 101,335,152 | |
| Class B | — | | 29,548 | |
| Class C | 21,452,998 | | 50,800,906 | |
| Class I | 35,917,032 | | 58,643,286 | |
| Dividends reinvested: | | | | |
| Class A | 2,139,116 | | 2,033,421 | |
| Class C | 468,300 | | 403,878 | |
| Class I | 826,861 | | 794,902 | |
| Cost of shares redeemed: | | | | |
| Class A | (57,170,438 | ) | (48,133,327 | ) |
| Class B | — | | (1,264,812 | ) |
| Class C | (27,702,188 | ) | (17,787,684 | ) |
| Class I | (36,801,486 | ) | (26,180,067 | ) |
| Increase (Decrease) in Net Assets | | | | |
| from Capital Stock Transactions | (25,723,629 | ) | 120,675,203 | |
| Total Increase (Decrease) in Net Assets | (1,950,746 | ) | 159,296,894 | |
| Net Assets ($): | | | | |
| Beginning of Period | 400,151,039 | | 240,854,145 | |
| End of Period | 398,200,293 | | 400,151,039 | |
| Undistributed investment income—net | 1,089,118 | | 697,835 | |
The Fund 15
STATEMENT OF CHANGES IN NET ASSETS (continued)
| | | | |
| | Year Ended August 31, | |
| | 2013 | | 2012 | a |
| Capital Share Transactions: | | | | |
| Class Ab,c | | | | |
| Shares sold | 1,832,117 | | 5,828,872 | |
| Shares issued for dividends reinvested | 111,863 | | 116,917 | |
| Shares redeemed | (2,961,737 | ) | (2,744,171 | ) |
| Net Increase (Decrease) in Shares Outstanding | (1,017,757 | ) | 3,201,618 | |
| Class Bb | | | | |
| Shares sold | — | | 1,731 | |
| Shares issued for dividends reinvested | — | | — | |
| Shares redeemed | — | | (71,275 | ) |
| Net Increase (Decrease) in Shares Outstanding | — | | (69,544 | ) |
| Class C | | | | |
| Shares sold | 1,134,517 | | 2,979,138 | |
| Shares issued for dividends reinvested | 24,815 | | 23,590 | |
| Shares redeemed | (1,459,601 | ) | (1,031,723 | ) |
| Net Increase (Decrease) in Shares Outstanding | (300,269 | ) | 1,971,005 | |
| Class I | | | | |
| Shares sold | 1,834,370 | | 3,244,402 | |
| Shares issued for dividends reinvested | 42,422 | | 44,743 | |
| Shares redeemed | (1,892,531 | ) | (1,445,050 | ) |
| Net Increase (Decrease) in Shares Outstanding | (15,739 | ) | 1,844,095 | |
|
| a Effective as of the close of business on March 13, 2012, the fund no longer offers Class B shares. |
| b During the period ended August 31, 2012, 39,285 Class B shares representing $721,305 were automatically |
| converted to 39,419 Class A shares. |
| c During the period ended August 31, 2013, 833 Class C shares representing $16,824 were exchanged for 817 |
| Class A shares. |
See notes to financial statements.
16
FINANCIAL HIGHLIGHTS
The following tables describe the performance for each share class for the fiscal periods indicated.All information (except portfolio turnover rate) reflects financial results for a single fund share.Total return shows how much your investment in the fund would have increased (or decreased) during each period, assuming you had reinvested all dividends and distributions.These figures have been derived from the fund’s financial statements.
| | | | | | | | | | |
| | | | Year Ended August 31, | | | |
| Class A Shares | 2013 | | 2012 | | 2011 | | 2010 | | 2009 | |
| Per Share Data ($): | | | | | | | | | | |
| Net asset value, beginning of period | 18.54 | | 16.47 | | 13.69 | | 13.03 | | 15.81 | |
| Investment Operations: | | | | | | | | | | |
| Investment income—neta | .30 | | .23 | | .21 | | .20 | | .23 | |
| Net realized and unrealized | | | | | | | | | | |
| gain (loss) on investments | 1.09 | | 2.15 | | 2.76 | | .68 | | (2.84 | ) |
| Total from Investment Operations | 1.39 | | 2.38 | | 2.97 | | .88 | | (2.61 | ) |
| Distributions: | | | | | | | | | | |
| Dividends from investment income—net | (.27 | ) | (.31 | ) | (.19 | ) | (.22 | ) | (.17 | ) |
| Dividends from net realized | | | | | | | | | | |
| gain on investments | — | | — | | — | | — | | — | |
| Total Distributions | (.27 | ) | (.31 | ) | (.19 | ) | (.22 | ) | (.17 | ) |
| Net asset value, end of period | 19.66 | | 18.54 | | 16.47 | | 13.69 | | 13.03 | |
| Total Return (%)b | 7.57 | | 14.59 | | 21.74 | | 6.67 | | (16.33 | ) |
| Ratios/Supplemental Data (%): | | | | | | | | | | |
| Ratio of total expenses | | | | | | | | | | |
| to average net assets | 1.36 | | 1.36 | | 1.36 | | 1.36 | | 1.36 | |
| Ratio of net expenses | | | | | | | | | | |
| to average net assets | 1.35 | | 1.35 | | 1.32 | | 1.25 | | 1.25 | |
| Ratio of net investment income | | | | | | | | | | |
| to average net assets | 1.53 | | 1.28 | | 1.31 | | 1.44 | | 1.90 | |
| Portfolio Turnover Rate | 7.63 | | .65 | | 4.08 | | 2.09 | | 6.99 | |
| Net Assets, end of period ($ x 1,000) | 176,742 | | 185,523 | | 112,103 | | 68,009 | | 66,857 | |
| |
| a | Based on average shares outstanding at each month end. |
| b | Exclusive of sales charge. |
See notes to financial statements.
The Fund 17
FINANCIAL HIGHLIGHTS (continued)
| | | | | | | | | | |
| | | | Year Ended August 31, | | | |
| Class C Shares | 2013 | | 2012 | | 2011 | | 2010 | | 2009 | |
| Per Share Data ($): | | | | | | | | | | |
| Net asset value, beginning of period | 18.19 | | 16.13 | | 13.42 | | 12.79 | | 15.49 | |
| Investment Operations: | | | | | | | | | | |
| Investment income—neta | .15 | | .09 | | .09 | | .10 | | .13 | |
| Net realized and unrealized | | | | | | | | | | |
| gain (loss) on investments | 1.08 | | 2.10 | | 2.71 | | .66 | | (2.77 | ) |
| Total from Investment Operations | 1.23 | | 2.19 | | 2.80 | | .76 | | (2.64 | ) |
| Distributions: | | | | | | | | | | |
| Dividends from investment income—net | (.14 | ) | (.13 | ) | (.09 | ) | (.13 | ) | (.06 | ) |
| Dividends from net realized | | | | | | | | | | |
| gain on investments | — | | — | | — | | — | | — | |
| Total Distributions | (.14 | ) | (.13 | ) | (.09 | ) | (.13 | ) | (.06 | ) |
| Net asset value, end of period | 19.28 | | 18.19 | | 16.13 | | 13.42 | | 12.79 | |
| Total Return (%)b | 6.83 | | 13.66 | | 20.88 | | 5.88 | | (16.96 | ) |
| Ratios/Supplemental Data (%): | | | | | | | | | | |
| Ratio of total expenses | | | | | | | | | | |
| to average net assets | 2.11 | | 2.11 | | 2.11 | | 2.11 | | 2.11 | |
| Ratio of net expenses | | | | | | | | | | |
| to average net assets | 2.10 | | 2.10 | | 2.07 | | 2.00 | | 2.00 | |
| Ratio of net investment income | | | | | | | | | | |
| to average net assets | .78 | | .54 | | .56 | | .70 | | 1.15 | |
| Portfolio Turnover Rate | 7.63 | | .65 | | 4.08 | | 2.09 | | 6.99 | |
| Net Assets, end of period ($ x 1,000) | 147,544 | | 144,658 | | 96,429 | | 66,280 | | 60,123 | |
| |
| a | Based on average shares outstanding at each month end. |
| b | Exclusive of sales charge. |
See notes to financial statements.
18
| | | | | | | | | | |
| | | | Year Ended August 31, | | | |
| Class I Shares | 2013 | | 2012 | | 2011 | | 2010 | | 2009 | |
| Per Share Data ($): | | | | | | | | | | |
| Net asset value, beginning of period | 18.92 | | 16.81 | | 13.97 | | 13.28 | | 16.12 | |
| Investment Operations: | | | | | | | | | | |
| Investment income—neta | .35 | | .28 | | .26 | | .26 | | .25 | |
| Net realized and unrealized | | | | | | | | | | |
| gain (loss) on investments | 1.12 | | 2.20 | | 2.80 | | .68 | | (2.88 | ) |
| Total from Investment Operations | 1.47 | | 2.48 | | 3.06 | | .94 | | (2.63 | ) |
| Distributions: | | | | | | | | | | |
| Dividends from investment income—net | (.32 | ) | (.37 | ) | (.22 | ) | (.25 | ) | (.21 | ) |
| Dividends from net realized | | | | | | | | | | |
| gain on investments | — | | — | | — | | — | | — | |
| Total Distributions | (.32 | ) | (.37 | ) | (.22 | ) | (.25 | ) | (.21 | ) |
| Net asset value, end of period | 20.07 | | 18.92 | | 16.81 | | 13.97 | | 13.28 | |
| Total Return (%) | 7.83 | | 14.89 | | 22.00 | | 7.01 | | (16.11 | ) |
| Ratios/Supplemental Data (%): | | | | | | | | | | |
| Ratio of total expenses | | | | | | | | | | |
| to average net assets | 1.11 | | 1.11 | | 1.11 | | 1.12 | | 1.12 | |
| Ratio of net expenses | | | | | | | | | | |
| to average net assets | 1.10 | | 1.10 | | 1.09 | | 1.01 | | 1.01 | |
| Ratio of net investment income | | | | | | | | | | |
| to average net assets | 1.78 | | 1.57 | | 1.59 | | 1.77 | | 2.09 | |
| Portfolio Turnover Rate | 7.63 | | .65 | | 4.08 | | 2.09 | | 6.99 | |
| Net Assets, end of period ($ x 1,000) | 73,915 | | 69,970 | | 31,181 | | 4,985 | | 758 | |
| a Based on average shares outstanding at each month end. | | | | | | | | | |
| See notes to financial statements. | | | | | | | | | | |
The Fund 19
NOTES TO FINANCIAL STATEMENTS
NOTE 1—Significant Accounting Policies:
Dreyfus Core Equity Fund (the “fund”) is a separate diversified series of The Dreyfus/Laurel Funds, Inc. (the “Company”), which is registered under the Investment Company Act of 1940, as amended (the “Act”), as an open-end management investment company and operates as a series company currently offering ten series, including the fund. The fund’s investment objective is to seek long-term capital appreciation. The Dreyfus Corporation (the “Manager” or “Dreyfus”), a wholly-owned subsidiary of The Bank of New York Mellon Corporation (“BNY Mellon”), serves as the fund’s investment adviser. Fayez Sarofim & Co. (“Sarofim & Co.”), serves as the fund’s sub-investment adviser.
MBSC Securities Corporation (the “Distributor”), a wholly-owned subsidiary of Dreyfus, is the distributor of the fund’s shares.The fund is authorized to issue 500 million shares of $.001 par value Capital Stock. The fund currently offers three classes of shares: Class A (300 million shares authorized), Class C (100 million shares authorized) and Class I (100 million shares authorized). Class A and Class C shares are sold primarily to retail investors through financial intermediaries and bear a Distribution and/or Service Plan fees. Class A shares generally are subject to a sales charge imposed at the time of purchase. Class C shares are subject to a contingent deferred sales charge (“CDSC”) imposed on Class C shares redeemed within one year of purchase. Class I shares are sold primarily to bank trust departments and other financial service providers (including The Bank of New York Mellon, a subsidiary of BNY Mellon and an affiliate of Dreyfus, and its affiliates), acting on behalf of customers having a qualified trust or an investment account or relationship at such institution, and bear no Distribution or Services Plan fees. Class I shares are offered without a front-end sales charge or CDSC. Other differences between the classes include the services offered to and the expenses borne by each class, the allocation of certain transfer agency costs and certain voting rights. Income, expenses (other than expenses attributable to a specific class),
20
and realized and unrealized gains or losses on investments are allocated to each class of shares based on its relative net assets.
The sales charge may be reduced or waived for certain purchases of Class A shares. Effective April 1, 2013, pursuant to new/modified front-end sales charge waivers, Class A shares of the fund may be purchased at net asset value without payment of a sales charge by (a) investors who participate in a self-directed investment brokerage account program offered by financial intermediaries that have entered into an agreement with the fund’s Distributor (financial intermediaries offering self directed investment brokerage accounts may or may not charge their customers a transaction fee) and (b) investors who purchase Class A shares directly through the fund’s Distributor, and either (i) have, or whose spouse or minor children have, beneficially owned shares and continuously maintained an open account with the Distributor in a Dreyfus-managed fund since on or before February 28, 2006, or (ii) such purchase is for a self-directed investment account that may or may not be subject to a transaction fee.
The Company accounts separately for the assets, liabilities and operations of each series. Expenses directly attributable to each series are charged to that series’ operations; expenses which are applicable to all series are allocated among them on a pro rata basis.
The Financial Accounting Standards Board (“FASB”) Accounting Standards Codification is the exclusive reference of authoritative U.S. generally accepted accounting principles (“GAAP”) recognized by the FASB to be applied by nongovernmental entities. Rules and interpretive releases of the Securities and Exchange Commission (“SEC”) under authority of federal laws are also sources of authoritative GAAP for SEC registrants. The fund’s financial statements are prepared in accordance with GAAP, which may require the use of management estimates and assumptions.Actual results could differ from those estimates.
The Fund 21
NOTES TO FINANCIAL STATEMENTS (continued)
(a) Portfolio valuation: The fair value of a financial instrument is the amount that would be received to sell an asset or paid to transfer a liability in an orderly transaction between market participants at the measurement date (i.e., the exit price). GAAP establishes a fair value hierarchy that prioritizes the inputs of valuation techniques used to measure fair value.This hierarchy gives the highest priority to unadjusted quoted prices in active markets for identical assets or liabilities (Level 1 measurements) and the lowest priority to unobservable inputs (Level 3 measurements).
Additionally, GAAP provides guidance on determining whether the volume and activity in a market has decreased significantly and whether such a decrease in activity results in transactions that are not orderly. GAAP requires enhanced disclosures around valuation inputs and techniques used during annual and interim periods.
Various inputs are used in determining the value of the fund’s investments relating to fair value measurements.These inputs are summarized in the three broad levels listed below:
Level 1—unadjusted quoted prices in active markets for identical investments.
Level 2—other significant observable inputs (including quoted prices for similar investments, interest rates, prepayment speeds, credit risk, etc.).
Level 3—significant unobservable inputs (including the fund’s own assumptions in determining the fair value of investments).
The inputs or methodology used for valuing securities are not necessarily an indication of the risk associated with investing in those securities.
Changes in valuation techniques may result in transfers in or out of an assigned level within the disclosure hierarchy. Valuation techniques used to value the fund’s investments are as follows:
Investments in securities are valued at the last sales price on the securities exchange or national securities market on which such securities
22
are primarily traded. Securities listed on the National Market System for which market quotations are available are valued at the official closing price or, if there is no official closing price that day, at the last sales price. Securities not listed on an exchange or the national securities market, or securities for which there were no transactions, are valued at the average of the most recent bid and asked prices, except for open short positions, where the asked price is used for valuation purposes. Bid price is used when no asked price is available. Registered investment companies that are not traded on an exchange are valued at their net asset value. All of the preceding securities are categorized within Level 1 of the fair value hierarchy.
Fair valuing of securities may be determined with the assistance of a pricing service using calculations based on indices of domestic securities and other appropriate indicators, such as prices of relevant ADRs and financial futures. Utilizing these techniques may result in transfers between Level 1 and Level 2 of the fair value hierarchy.
When market quotations or official closing prices are not readily available, or are determined not to reflect accurately fair value, such as when the value of a security has been significantly affected by events after the close of the exchange or market on which the security is principally traded (for example, a foreign exchange or market), but before the fund calculates its net asset value, the fund may value these investments at fair value as determined in accordance with the procedures approved by the Company’s Board of Directors (the “Board”). Certain factors may be considered when fair valuing investments such as: fundamental analytical data, the nature and duration of restrictions on disposition, an evaluation of the forces that influence the market in which the securities are purchased and sold, and public trading in similar securities of the issuer or comparable issuers. These securities are either categorized within Level 2 or 3 of the fair value hierarchy depending on the relevant inputs used.
The Fund 23
NOTES TO FINANCIAL STATEMENTS (continued)
For restricted securities where observable inputs are limited, assumptions about market activity and risk are used and are categorized within Level 3 of the fair value hierarchy.
Investment denominated in foreign currencies are translated to U.S. dollars at the prevailing rates of exchange.
The following is a summary of the inputs used as of August 31, 2013 in valuing the fund’s investments:
| | | | |
| | | Level 2—Other | Level 3— | |
| | Level 1— | Significant | Significant | |
| | Unadjusted | Observable | Unobservable | |
| | Quoted Prices | Inputs | Inputs | Total |
| Assets ($) | | | | |
| Investments in Securities: | | | |
| Equity Securities— | | | | |
| Domestic | | | | |
| Common Stocks† | 340,405,699 | — | — | 340,405,699 |
| Equity Securities— | | | | |
| Foreign | | | | |
| Common Stocks† | 56,549,786 | — | — | 56,549,786 |
| Mutual Funds | 940,448 | — | — | 940,448 |
| |
| † See Statement of Investments for additional detailed categorizations. | |
At August 31, 2013, there were no transfers between Level 1 and Level 2 of the fair value hierarchy.
(b) Foreign currency transactions: The fund does not isolate that portion of the results of operations resulting from changes in foreign exchange rates on investments from the fluctuations arising from changes in the market prices of securities held. Such fluctuations are included with the net realized and unrealized gain or loss on investments.
Net realized foreign exchange gains or losses arise from sales of foreign currencies, currency gains or losses realized on securities transactions between trade and settlement date, and the difference between the amounts of dividends, interest and foreign withholding taxes recorded on the fund’s books and the U.S. dollar equivalent of the amounts actually received or paid. Net unrealized foreign exchange gains and losses
24
arise from changes in the value of assets and liabilities other than investments resulting from changes in exchange rates. Foreign currency gains and losses on foreign currency transactions are also included with net realized and unrealized gain or loss on investments.
(c) Securities transactions and investment income: Securities transactions are recorded on a trade date basis. Realized gains and losses from securities transactions are recorded on the identified cost basis. Dividend income is recognized on the ex-dividend date and interest income, including, where applicable, accretion of discount and amortization of premium on investments, is recognized on the accrual basis.
Pursuant to a securities lending agreement with The Bank of New York Mellon, a subsidiary of BNY Mellon and an affiliate of Dreyfus, the fund may lend securities to qualified institutions. It is the fund’s policy that, at origination, all loans are secured by collateral of at least 102% of the value of U.S. securities loaned and 105% of the value of foreign securities loaned. Collateral equivalent to at least 100% of the market value of securities on loan is maintained at all times. Collateral is either in the form of cash, which can be invested in certain money market mutual funds managed by the Manager or U.S. Government and Agency securities. The fund is entitled to receive all dividends, interest and distributions on securities loaned, in addition to income earned as a result of the lending transaction. Should a borrower fail to return the securities in a timely manner, The Bank of New York Mellon is required to replace the securities for the benefit of the fund or credit the fund with the market value of the unreturned securities and is subrogated to the fund’s rights against the borrower and the collateral. During the period ended August 31, 2013, The Bank of New York Mellon earned $25,945 from lending portfolio securities, pursuant to the securities lending agreement.
(d) Affiliated issuers: Investments in other investment companies advised by Dreyfus are defined as “affiliated” under the Act. Investments
The Fund 25
NOTES TO FINANCIAL STATEMENTS (continued)
in affiliated investment companies during the period ended August 31, 2013 were as follows:
| | | | | |
| Affiliated | | | | | |
| Investment | Value | | | Value | Net |
| Company | 8/31/2012 ($) | Purchases ($) | Sales ($) | 8/31/2013 ($) | Assets (%) |
| Dreyfus | | | | | |
| Institutional | | | | | |
| Preferred | | | | | |
| Plus Money | | | | | |
| Market | | | | | |
| Fund | 17,533,701 | 40,492,550 | 57,577,884 | 448,367 | .1 |
| Dreyfus | | | | | |
| Institutional | | | | | |
| Cash | | | | | |
| Advantage | | | | | |
| Fund | 6,179,381 | 142,697,736 | 148,385,036 | 492,081 | .1 |
| Total | 23,713,082 | 183,190,286 | 205,962,920 | 940,448 | .2 |
(e) Dividends to shareholders: Dividends are recorded on the ex-dividend date. Dividends from investment income-net are normally declared and paid quarterly. Dividends from net realized capital gains, if any, are normally declared and paid annually, but the fund may make distributions on a more frequent basis to comply with the distribution requirements of the Internal Revenue Code of 1986, as amended (the “Code”).To the extent that net realized capital gains can be offset by capital loss carryovers, it is the policy of the fund not to distribute such gains. Income and capital gain distributions are determined in accordance with income tax regulations, which may differ from GAAP.
(f) Federal income taxes: It is the policy of the fund to continue to qualify as a regulated investment company, if such qualification is in the best interests of its shareholders, by complying with the applicable provisions of the Code, and to make distributions of taxable income sufficient to relieve it from substantially all federal income and excise taxes.
As of and during the period ended August 31, 2013, the fund did not have any liabilities for any uncertain tax positions.The fund recognizes interest and penalties, if any, related to uncertain tax positions as income tax expense in the Statement of Operations. During the period, the fund did not incur any interest or penalties.
26
Each tax year in the four-year period ended August 31, 2013 remains subject to examination by the Internal Revenue Service and state taxing authorities.
At August 31, 2013, the components of accumulated earnings on a tax basis were as follows: undistributed ordinary income $1,089,118, undistributed capital gains $5,191,541 and unrealized appreciation $104,328,770.
The tax character of distributions paid to shareholders during the fiscal periods ended August 31, 2013 and August 31, 2012 were as follows: ordinary income $4,963,785 and $4,566,152, respectively.
During the period ended August 31, 2013, as a result of permanent book to tax differences, primarily due to the tax treatment for foreign currency gains and losses, the fund increased accumulated undistributed investment income-net by $762 and decreased accumulated net realized gain (loss) on investments by the same amount. Net assets and net asset value per share were not affected by this reclassification.
NOTE 2—Bank Lines of Credit:
The fund participates with other Dreyfus-managed funds in a $210 million unsecured credit facility led by Citibank, N.A. and a $300 million unsecured credit facility provided by The Bank of New York Mellon (each, a “Facility”), each to be utilized primarily for temporary or emergency purposes, including the financing of redemptions. Prior to October 10, 2012, the unsecured credit facility with Citibank, N.A. was $225 million. In connection therewith, the fund has agreed to pay its pro rata portion of commitment fees for each Facility. Interest is charged to the fund based on rates determined pursuant to the terms of the respective Facility at the time of borrowing.
The average amount of borrowings outstanding under the Facilities during the period ended August 31, 2013 was approximately $165,200 with a related weighted average annualized interest rate of 1.14%.
The Fund 27
NOTES TO FINANCIAL STATEMENTS (continued)
NOTE 3—Investment Management Fee, Sub-Investment Advisory Fee and Other Transactions With Affiliates:
(a) Pursuant to an investment management agreement with Dreyfus, Dreyfus provides or arranges for one or more third parties and/or affiliates to provide investment advisory, administrative, custody, fund accounting and transfer agency services to the fund. Dreyfus also directs the investments of the fund in accordance with its investment objective, policies and limitations. For these services, the fund is contractually obligated to pay Dreyfus a fee, calculated daily and paid monthly, at the annual rate of 1.10% of the value of the fund’s average daily net assets. Out of its fee, Dreyfus pays all of the expenses of the fund except brokerage fees, taxes, interest expenses, commitment fees borrowings, Distribution Plan fees and Service Plan fees, fees and expenses of non-interested Directors (including counsel fees) and extraordinary expenses. In addition, Dreyfus is required to reduce its fee in an amount equal to the fund’s allocable portion of fees and expenses of the non-interested Directors (including counsel fees). During the period ended August 31, 2013, fees reimbursed by Dreyfus amount to $29,558.
Pursuant to a sub-investment advisory agreement between Dreyfus and Sarofim & Co., Dreyfus pays Sarofim & Co. a monthly fee at an annual rate of .2175% of the value of the fund’s average daily net assets.
During the period ended August 31, 2013, the Distributor retained $35,209 from commissions earned on sales of the fund’s Class A shares and $25,385 from CDSCs on redemptions of the fund’s Class C shares.
(b) Under separate Distribution Plans adopted pursuant to Rule 12b-1 (the “Distribution Plans”) under the Act, Class A shares may pay annually up to .25% of the value of its average daily net assets to compensate the Distributor for shareholder servicing activities and expenses primarily intended to result in the sale of Class A shares. Class C shares pay the Distributor for distributing their shares at an aggregate annual rate of .75% of the value of the average daily net assets of Class C shares. Class C shares are also subject to a service plan adopted pursuant to Rule 12b-1 (the “Service Plan”), under which
28
Class C shares pay the Distributor for providing certain services to the holders of their shares a fee at the annual rate of .25% of the value of the average daily net assets of Class C shares. During the period ended August 31, 2013, Class A and Class C shares were charged $467,187 and $1,118,100, respectively, pursuant to their Distribution Plans. During the period ended August 31, 2013, Class C shares were charged $372,700 pursuant to the Service Plan.
Under their terms, the Distribution Plans and Service Plan shall remain in effect from year to year, provided such continuance is approved annually by a vote of majority of those Directors who are not “interested persons” of the Company and who have no direct or indirect financial interest in the operation of or in any agreement related to the Distribution Plans or Service Plan.
The components of “Due to The Dreyfus Corporation and affiliates” in the Statement of Assets and Liabilities consist of: management fees $382,846, Distribution Plans fees $135,395 and Service Plan fees $32,239, which are offset against an expense reimbursement currently in effect in the amount of $4,013.
(c) Each Board member also serves as a Board member of other funds within the Dreyfus complex. Annual retainer fees and attendance fees are allocated to each fund based on net assets.
NOTE 4—Securities Transactions:
The aggregate amount of purchases and sales of investment securities, excluding short-term securities, during the period ended August 31, 2013, amounted to $30,820,710 and $45,198,260, respectively.
At August 31, 2013, the cost of investments for federal income tax purposes was $293,567,163; accordingly, accumulated net unrealized appreciation on investments was $104,328,770, consisting of $111,022,707 gross unrealized appreciation and $6,693,937 gross unrealized depreciation.
The Fund 29
REPORT OF INDEPENDENT REGISTERED
PUBLIC ACCOUNTING FIRM
The Board of Directors and Shareholders The Dreyfus/Laurel Funds Inc.
We have audited the accompanying statement of assets and liabilities of Dreyfus Core Equity Fund (the “Fund”), a series of The Dreyfus/Laurel Funds, Inc., including the statement of investments, as of August 31, 2013, and the related statement of operations for the year then ended, the statements of changes in net assets for each of the years in the two-year period then ended, and the financial highlights for each of the years in the five-year period then ended.These financial statements and financial highlights are the responsibility of the Fund’s management. Our responsibility is to express an opinion on these financial statements and financial highlights based on our audits.
We conducted our audits in accordance with the standards of the Public Company Accounting Oversight Board (United States).Those standards require that we plan and perform the audit to obtain reasonable assurance about whether the financial statements and financial highlights are free of material misstatement. An audit includes examining, on a test basis, evidence supporting the amounts and disclosures in the financial statements. Our procedures included confirmation of securities owned as of August 31, 2013, by correspondence with the custodian and brokers or by other appropriate auditing procedures.An audit also includes assessing the accounting principles used and significant estimates made by management, as well as evaluating the overall financial statement presentation. We believe that our audits provide a reasonable basis for our opinion.
In our opinion, the financial statements and financial highlights referred to above present fairly, in all material respects, the financial position of Dreyfus Core Equity Fund as of August 31, 2013, the results of its operations for the year then ended, the changes in its net assets for each of the years in the two-year period then ended, and the financial highlights for each of the years in the five-year period then ended, in conformity with U.S. generally accepted accounting principles.

New York, New York
October 28, 2013
30
IMPORTANT TAX INFORMATION (Unaudited)
For federal tax purposes, the fund reports the maximum amount allowable, but not less than $4,963,785 as ordinary income dividends paid during the year ended August 31, 2013 as qualified dividend income in accordance with Section 854(b)(1)(B) of the Internal Revenue Code. Also, the fund reports the maximum amount allowable but not less than 100% of ordinary income dividends paid during the year ended August 31, 2013 as eligible for the corporate dividends received deduction provided under Section 243 of the Internal Revenue Code in accordance with Section 854(b)(1)(A) of the Internal Revenue Code. Shareholders will receive notification in early 2014 of the percentage applicable to the preparation of their 2013 income tax returns.
The Fund 31
BOARD MEMBERS INFORMATION (Unaudited)
|
| Joseph S. DiMartino (69) |
| Chairman of the Board (1999) |
| Principal Occupation During Past 5Years: |
| • Corporate Director and Trustee |
| Other Public Company Board Memberships During Past 5Years: |
| • CBIZ (formerly, Century Business Services, Inc.), a provider of outsourcing functions for small |
| and medium size companies, Director (1997-present) |
| • Sunair Services Corporation, a provider of certain outdoor-related services to homes and |
| businesses, Director (2005-2009) |
| • The Newark Group, a provider of a national market of paper recovery facilities, paperboard |
| mills and paperboard converting plants, Director (2000-2010) |
| No. of Portfolios for which Board Member Serves: 140 |
| ——————— |
| Francine J. Bovich (61) |
| Board Member (1994) |
| Principal Occupation During Past 5Years: |
| • Trustee,The Bradley Trusts, private trust funds (2011-present) |
| • Managing Director, Morgan Stanley Investment Management (1993-2010) |
| No. of Portfolios for which Board Member Serves: 39 |
| ——————— |
| James M. Fitzgibbons (78) |
| Board Member (1994) |
| Principal Occupation During Past 5Years: |
| • Corporate Director and Trustee |
| Other Public Company Board Memberships During Past 5Years: |
| • Bill Barrett Corporation, an oil and natural gas exploration company, Director (2004-2012) |
| No. of Portfolios for which Board Member Serves: 25 |
| ——————— |
| Kenneth A. Himmel (67) |
| Board Member (1994) |
| Principal Occupation During Past 5Years: |
| • President and CEO, Related Urban Development, a real estate development company (1996-present) |
| • President and CEO, Himmel & Company, a real estate development company (1980-present) |
| • CEO,American Food Management, a restaurant company (1983-present) |
| No. of Portfolios for which Board Member Serves: 25 |
32
|
| Stephen J. Lockwood (66) |
| Board Member (1994) |
| Principal Occupation During Past 5Years: |
| • Chairman of the Board, Stephen J. Lockwood and Company LLC, a real estate investment |
| company (2000-present) |
| No. of Portfolios for which Board Member Serves: 25 |
| ——————— |
| Roslyn M. Watson (63) |
| Board Member (1994) |
| Principal Occupation During Past 5Years: |
| • Principal,Watson Ventures, Inc., a real estate investment company (1993-present) |
| No. of Portfolios for which Board Member Serves: 35 |
| ——————— |
| Benaree Pratt Wiley (67) |
| Board Member (1998) |
| Principal Occupation During Past 5Years: |
| • Principal,TheWiley Group, a firm specializing in strategy and business development (2005-present) |
| Other Public Company Board Memberships During Past 5Years: |
| • CBIZ (formerly, Century Business Services, Inc.), a provider of outsourcing functions for small |
| and medium size companies, Director (2008-present) |
| No. of Portfolios for which Board Member Serves: 60 |
| ——————— |
Once elected all Board Members serve for an indefinite term, but achieve Emeritus status upon reaching age 80.The address of the Board Members and Officers is c/o The Dreyfus Corporation, 200 Park Avenue, NewYork, NewYork 10166.Additional information about the Board Members is available in the fund’s Statement of Additional Information which can be obtained from Dreyfus free of charge by calling this toll free number: 1-800-DREYFUS.
The Fund 33
OFFICERS OF THE FUND (Unaudited)
BRADLEY J. SKAPYAK, President since January 2010.
Chief Operating Officer and a director of the Manager since June 2009, Chairman of Dreyfus Transfer, Inc., an affiliate of the Manager and the transfer agent of the funds, since May 2011 and Executive Vice President of the Distributor since June 2007. From April 2003 to June 2009, Mr. Skapyak was the head of the Investment Accounting and Support Department of the Manager. He is an officer of 68 investment companies (comprised of 140 portfolios) managed by the Manager. He is 54 years old and has been an employee of the Manager since February 1988.
JOHN PAK, Chief Legal Officer since March 2013.
Chief Legal Officer of the Manager and Associate General Counsel and Managing Director of BNY Mellon since August 2012; from March 2005 to July 2012, Managing Director of Deutsche Bank, Deputy Global Head of Deutsche Asset Management Legal and Regional Head of Deutsche Asset Management Americas Legal. He is an officer of 69 investment companies (comprised of 165 portfolios) managed by the Manager. He is 44 years old and has been an employee of the Manager since August 2012.
JANETTE E. FARRAGHER, Vice President and Secretary since December 2011.
Assistant General Counsel of BNY Mellon, and an officer of 69 investment companies (comprised of 165 portfolios) managed by the Manager. She is 50 years old and has been an employee of the Manager since February 1984.
KIESHA ASTWOOD, Vice President and Assistant Secretary since January 2010.
Counsel of BNY Mellon, and an officer of 69 investment companies (comprised of 165 portfolios) managed by the Manager. She is 40 years old and has been an employee of the Manager since July 1995.
JAMES BITETTO, Vice President and Assistant Secretary since August 2005.
Senior Counsel of BNY Mellon and Secretary of the Manager, and an officer of 69 investment companies (comprised of 165 portfolios) managed by the Manager. He is 47 years old and has been an employee of the Manager since December 1996.
JONI LACKS CHARATAN, Vice President and Assistant Secretary since August 2005.
Senior Counsel of BNY Mellon, and an officer of 69 investment companies (comprised of 165 portfolios) managed by the Manager. She is 57 years old and has been an employee of the Manager since October 1988.
JOSEPH M. CHIOFFI, Vice President and Assistant Secretary since August 2005.
Senior Counsel of BNY Mellon, and an officer of 69 investment companies (comprised of 165 portfolios) managed by the Manager. He is 51 years old and has been an employee of the Manager since June 2000.
JOHN B. HAMMALIAN, Vice President and Assistant Secretary since August 2005.
Senior Managing Counsel of BNY Mellon, and an officer of 69 investment companies (comprised of 165 portfolios) managed by the Manager. He is 50 years old and has been an employee of the Manager since February 1991.
ROBERT R. MULLERY, Vice President and Assistant Secretary since August 2005.
Managing Counsel of BNY Mellon, and an officer of 69 investment companies (comprised of 165 portfolios) managed by the Manager. He is 61 years old and has been an employee of the Manager since May 1986.
34
JEFF PRUSNOFSKY, Vice President and Assistant Secretary since August 2005.
Senior Managing Counsel of BNY Mellon, and an officer of 69 investment companies (comprised of 165 portfolios) managed by the Manager. He is 48 years old and has been an employee of the Manager since October 1990.
JAMES WINDELS, Treasurer since November 2001.
Director – Mutual Fund Accounting of the Manager, and an officer of 69 investment companies (comprised of 165 portfolios) managed by the Manager. He is 54 years old and has been an employee of the Manager since April 1985.
RICHARD CASSARO, Assistant Treasurer since January 2008.
Senior Accounting Manager – Money Market and Municipal Bond Funds of the Manager, and an officer of 69 investment companies (comprised of 165 portfolios) managed by the Manager. He is 54 years old and has been an employee of the Manager since September 1982.
GAVIN C. REILLY, Assistant Treasurer since December 2005.
Tax Manager of the Investment Accounting and Support Department of the Manager, and an officer of 69 investment companies (comprised of 165 portfolios) managed by the Manager. He is 45 years old and has been an employee of the Manager since April 1991.
ROBERT S. ROBOL, Assistant Treasurer since December 2002.
Senior Accounting Manager – Fixed Income Funds of the Manager, and an officer of 69 investment companies (comprised of 165 portfolios) managed by the Manager. He is 49 years old and has been an employee of the Manager since October 1988.
ROBERT SALVIOLO, Assistant Treasurer since July 2007.
Senior Accounting Manager – Equity Funds of the Manager, and an officer of 69 investment companies (comprised of 165 portfolios) managed by the Manager. He is 46 years old and has been an employee of the Manager since June 1989.
ROBERT SVAGNA, Assistant Treasurer since December 2002.
Senior Accounting Manager – Equity Funds of the Manager, and an officer of 69 investment companies (comprised of 165 portfolios) managed by the Manager. He is 46 years old and has been an employee of the Manager since November 1990.
JOSEPH W. CONNOLLY, Chief Compliance Officer since October 2004.
Chief Compliance Officer of the Manager and The Dreyfus Family of Funds (69 investment companies, comprised of 165 portfolios). He is 56 years old and has served in various capacities with the Manager since 1980, including manager of the firm’s Fund Accounting Department from 1997 through October 2001.
MATTHEW D. CONNOLLY, Anti-Money Laundering Compliance Officer since April 2012.
Anti-Money Laundering Compliance Officer of the Distributor since October 2011; from March 2010 to September 2011, Global Head, KYC Reviews and Director, UBS Investment Bank; until March 2010,AML Compliance Officer and Senior Vice President, Citi Global Wealth Management. He is an officer of 64 investment companies (comprised of 160 portfolios) managed by the Manager. He is 41 years old and has been an employee of the Distributor since October 2011.
The Fund 35
For More Information
Telephone Call your financial representative or 1-800-DREYFUS
Mail The Dreyfus Family of Funds, 144 Glenn Curtiss Boulevard, Uniondale, NY 11556-0144
The fund files its complete schedule of portfolio holdings with the Securities and Exchange Commission (“SEC”) for the first and third quarters of each fiscal year on Form N-Q. The fund’s Forms N-Q are available on the SEC’s website at http://www.sec.gov and may be reviewed and copied at the SEC’s Public Reference Room in Washington, DC. Information on the operation of the Public Reference Room may be obtained by calling 1-800-SEC-0330.
A description of the policies and procedures that the fund uses to determine how to vote proxies relating to portfolio securities, and information regarding how the fund voted these proxies for the most recent 12-month period ended June 30 is available at http://www.dreyfus.com and on the SEC’s website at http://www.sec.gov. The description of the policies and procedures is also available without charge, upon request, by calling 1-800-DREYFUS.

Item 2. Code of Ethics.
The Registrant has adopted a code of ethics that applies to the Registrant's principal executive officer, principal financial officer, principal accounting officer or controller, or persons performing similar functions. There have been no amendments to, or waivers in connection with, the Code of Ethics during the period covered by this Report.
Item 3. Audit Committee Financial Expert.
The Registrant's Board has determined that Mr. DiMartino a member of the Audit Committee of the Board, is an audit committee financial expert as defined by the Securities and Exchange Commission (the "SEC"). Mr. DiMartino is "independent" as defined by the SEC for purposes of audit committee financial expert determinations.
Item 4. Principal Accountant Fees and Services.
(a) Audit Fees. The aggregate fees billed for each of the last two fiscal years (the "Reporting Periods") for professional services rendered by the Registrant's principal accountant (the "Auditor") for the audit of the Registrant's annual financial statements or services that are normally provided by the Auditor in connection with the statutory and regulatory filings or engagements for the Reporting Periods, were $ 29,590 in 2012 and $30,110 in 2013.
(b) Audit-Related Fees. The aggregate fees billed in the Reporting Periods for assurance and related services by the Auditor that are reasonably related to the performance of the audit of the Registrant's financial statements and are not reported under paragraph (a) of this Item 4 were $ 4,460 in 2012 and $4,620 in 2013. These services consisted of one or more of the following: (i) agreed upon procedures related to compliance with Internal Revenue Code section 817(h), (ii) security counts required by Rule 17f-2 under the Investment Company Act of 1940, as amended, (iii) advisory services as to the accounting or disclosure treatment of Registrant transactions or events and (iv) advisory services to the accounting or disclosure treatment of the actual or potential impact to the Registrant of final or proposed rules, standards or interpretations by the Securities and Exchange Commission, the Financial Accounting Standards Boards or other regulatory or standard-setting bodies.
The aggregate fees billed in the Reporting Periods for non-audit assurance and related services by the Auditor to the Registrant's investment adviser (not including any sub-investment adviser whose role is primarily portfolio management and is subcontracted with or overseen by another investment adviser), and any entity controlling, controlled by or under common control with the investment adviser that provides ongoing services to the Registrant ("Service Affiliates"), that were reasonably related to the performance of the annual audit of the Service Affiliate, which required pre-approval by the Audit Committee were $0 in 2012 and $0 in 2013.
(c) Tax Fees. The aggregate fees billed in the Reporting Periods for professional services rendered by the Auditor for tax compliance, tax advice, and tax planning ("Tax Services") were $ 2,310 in 2012 and $2,340 in 2013. These services consisted of the review or preparation of U.S. federal, state, local and excise tax returns. The aggregate fees billed in the Reporting Periods for Tax Services by the Auditor to Service Affiliates, which required pre-approval by the Audit Committee were $0 in 2012 and $0 in 2013.
(d) All Other Fees. The aggregate fees billed in the Reporting Periods for products and services provided by the Auditor, other than the services reported in paragraphs (a) through (c) of this Item, were $0 in 2012 and $0 in 2013.
The aggregate fees billed in the Reporting Periods for Non-Audit Services by the Auditor to Service Affiliates, other than the services reported in paragraphs (b) through (c) of this Item, which required pre-approval by the Audit Committee, were $0 in 2012 and $0 in 2013.
(e)(1) Audit Committee Pre-Approval Policies and Procedures. The Registrant's Audit Committee has established policies and procedures (the "Policy") for pre-approval (within specified fee limits) of the Auditor's engagements for non-audit services to the Registrant and Service Affiliates without specific case-by-case consideration. The pre-approved services in the Policy can include pre-approved audit services, pre-approved audit-related services, pre-approved tax services and pre-approved all other services. Pre-approval considerations include whether the proposed services are compatible with maintaining the Auditor's independence. Pre-approvals pursuant to the Policy are considered annually.
(e)(2) Note: None of the services described in paragraphs (b) through (d) of this Item 4 were approved by the Audit Committee pursuant to paragraph (c)(7)(i)(C) of Rule 2-01 of Regulation S-X.
(f) None of the hours expended on the principal accountant's engagement to audit the registrant's financial statements for the most recent fiscal year were attributed to work performed by persons other than the principal account's full-time, permanent employees.
Non-Audit Fees. The aggregate non-audit fees billed by the Auditor for services rendered to the Registrant, and rendered to Service Affiliates, for the Reporting Periods were $11,572,646 in 2012 and $13,902,636 in 2013.
Auditor Independence. The Registrant's Audit Committee has considered whether the provision of non-audit services that were rendered to Service Affiliates, which were not pre-approved (not requiring pre-approval), is compatible with maintaining the Auditor's independence.
Item 5. Audit Committee of Listed Registrants.
Not applicable.
Item 6. Investments.
(a) Not applicable.
Item 7. Disclosure of Proxy Voting Policies and Procedures for Closed-End Management Investment Companies.
Not applicable.
Item 8. Portfolio Managers of Closed-End Management Investment Companies.
Not applicable.
Item 9. Purchases of Equity Securities by Closed-End Management Investment Companies and Affiliated Purchasers.
Not applicable.
Item 10. Submission of Matters to a Vote of Security Holders.
There have been no material changes to the procedures applicable to Item 10.
Item 11. Controls and Procedures.
(a) The Registrant's principal executive and principal financial officers have concluded, based on their evaluation of the Registrant's disclosure controls and procedures as of a date within 90 days of the filing date of this report, that the Registrant's disclosure controls and procedures are reasonably designed to ensure that information required to be disclosed by the Registrant on Form N-CSR is recorded, processed, summarized and reported within the required time periods and that information required to be disclosed by the Registrant in the reports that it files or submits on Form N-CSR is accumulated and communicated to the Registrant's management, including its principal executive and principal financial officers, as appropriate to allow timely decisions regarding required disclosure.
(b) There were no changes to the Registrant's internal control over financial reporting that occurred during the second fiscal quarter of the period covered by this report that have materially affected, or are reasonably likely to materially affect, the Registrant's internal control over financial reporting.
Item 12. Exhibits.
(a)(1) Code of ethics referred to in Item 2.
(a)(2) Certifications of principal executive and principal financial officers as required by Rule 30a-2(a) under the Investment Company Act of 1940.
(a)(3) Not applicable.
(b) Certification of principal executive and principal financial officers as required by Rule 30a-2(b) under the Investment Company Act of 1940.
SIGNATURES
Pursuant to the requirements of the Securities Exchange Act of 1934 and the Investment Company Act of 1940, the Registrant has duly caused this Report to be signed on its behalf by the undersigned, thereunto duly authorized.
The Dreyfus/Laurel Funds, Inc.
By: /s/ Bradley J. Skapyak |
Bradley J. Skapyak, President |
Date: | October 22, 2013 |
|
Pursuant to the requirements of the Securities Exchange Act of 1934 and the Investment Company Act of 1940, this Report has been signed below by the following persons on behalf of the Registrant and in the capacities and on the dates indicated. |
|
By: /s/ Bradley J. Skapyak |
Bradley J. Skapyak, President |
Date: | October 22, 2013 |
|
By: /s/ James Windels |
James Windels, Treasurer |
Date: | October 22, 2013 |
|
EXHIBIT INDEX
(a)(1) Code of ethics referred to in Item 2.
(a)(2) Certifications of principal executive and principal financial officers as required by Rule 30a-2(a) under the Investment Company Act of 1940. (EX-99.CERT)
(b) Certification of principal executive and principal financial officers as required by Rule 30a-2(b) under the Investment Company Act of 1940. (EX-99.906CERT)