UNITED STATES
SECURITIES AND EXCHANGE COMMISSION
Washington, D.C. 20549
FORM N-CSR
CERTIFIED SHAREHOLDER REPORT OF REGISTERED MANAGEMENT
INVESTMENT COMPANIES
Investment Company Act file number | 811-05202 |
| |
| The Dreyfus/Laurel Funds, Inc. | |
| (Exact name of Registrant as specified in charter) | |
| | |
| c/o The Dreyfus Corporation 200 Park Avenue New York, New York 10166 | |
| (Address of principal executive offices) (Zip code) | |
| | |
| Michael A. Rosenberg, Esq. 200 Park Avenue New York, New York 10166 | |
| (Name and address of agent for service) | |
|
Registrant's telephone number, including area code: | (212) 922-6000 |
| |
Date of fiscal year end: | 10/31 | |
Date of reporting period: | 10/31/11 | |
| | | | | | | |
The following N-CSR relates only to the Registrant’s series listed below and does not affect Dreyfus Core Equity Fund, a series of the Registrant with a fiscal year end of August 31. A separate N-CSR will be filed for that series as appropriate.
Dreyfus Bond Market Index Fund
Dreyfus Disciplined Stock Fund
Dreyfus Money Market Reserves
Dreyfus AMT-Free Municipal Reserves
Dreyfus Tax Managed Growth Fund
Dreyfus BASIC S&P 500 Stock Index Fund
Dreyfus U.S. Treasury Reserves
Dreyfus Small Cap Fund
Dreyfus Opportunistic Fixed Income Fund
FORM N-CSR
Item 1. Reports to Stockholders.
Save time. Save paper. View your next shareholder report online as soon as it’s available. Log into www.dreyfus.com and sign up for Dreyfus eCommunications. It’s simple and only takes a few minutes.
The views expressed in this report reflect those of the portfolio manager only through the end of the period covered and do not necessarily represent the views of Dreyfus or any other person in the Dreyfus organization. Any such views are subject to change at any time based upon market or other conditions and Dreyfus disclaims any responsibility to update such views.These views may not be relied on as investment advice and, because investment decisions for a Dreyfus fund are based on numerous factors, may not be relied on as an indication of trading intent on behalf of any Dreyfus fund.
Not FDIC-Insured • Not Bank-Guaranteed • May Lose Value
| | Contents |
| | THE FUND |
| 2 | A Letter from the Chairman and CEO |
| 3 | Discussion of Fund Performance |
| 6 | Fund Performance |
| 7 | Understanding Your Fund’s Expenses |
| 7 | Comparing Your Fund’s Expenses With Those of Other Funds |
| 8 | Statement of Investments |
| 52 | Statement of Assets and Liabilities |
| 53 | Statement of Operations |
| 54 | Statement of Changes in Net Assets |
| 56 | Financial Highlights |
| 58 | Notes to Financial Statements |
| 69 | Report of Independent Registered Public Accounting Firm |
| 70 | Important Tax Information |
| 71 | Board Members Information |
| 73 | Officers of the Fund |
| | FOR MORE INFORMATION |
| | Back Cover |
Dreyfus
Bond Market Index Fund
The Fund

A LETTER FROM THE CHAIRMAN AND CEO
Dear Shareholder:
We are pleased to present this annual report for Dreyfus Bond Market Index Fund, covering the 12-month period from November 1, 2010, through October 31, 2011. For information about how the fund performed during the reporting period, as well as general market perspectives, we provide a Discussion of Fund Performance on the pages that follow.
Investors were encouraged by expectations of a more robust economic recovery during the final months of 2010, but sentiment deteriorated sharply in 2011 due to disappointing global economic data, rising commodity prices, an escalating sovereign debt crisis in Europe and a contentious debate regarding taxes, spending and borrowing in the United States. International bond markets proved sensitive to these macroeconomic developments, as increasingly risk-averse investors flocked to traditional “safe havens,” such as U.S.Treasury securities and other high-quality developed nation sovereign debt. In contrast, bonds in emerging markets generally suffered, seemingly regardless of underlying credit fundamentals.
The economic outlook currently remains clouded by market turbulence and political infighting, but we believe that a continued subpar global expansion is more likely than a return to recession. Although Europe continues to struggle with a debt crisis, inflationary pressures appear to be waning in most countries as energy prices recently have retreated from their highs. In the United States, moderately low core inflation and an accommodative monetary policy could help support near-trend growth despite ongoing deleveraging activity in the private sector, potentially supporting a renewed rally among corporate-backed bonds.To assess the impact of these and other developments on your investments, we encourage you, as always, to speak with your financial advisor.
Thank you for your continued confidence and support.

Jonathan R. Baum
Chairman and Chief Executive Officer
The Dreyfus Corporation
November 15, 2011
2

DISCUSSION OF FUND PERFORMANCE
For the period of November 1, 2010, through October 31, 2011, as provided by Nancy G. Rogers and Dawn Guffey, Portfolio Managers
Fund and Market Performance Overview
For the 12-month period ended October 31, 2011, Dreyfus Bond Market Index Fund’s Investor shares produced a total return of 4.58%, and its BASIC shares produced a total return of 4.94%.1 In comparison, the Barclays Capital U.S. Aggregate Bond Index (the “Index”) achieved a total return of 5.00% for the same period.2
Fixed-income markets proved volatile during the reporting period amid shifting investor perceptions of economic conditions.The difference in returns between the fund and the Index was primarily the result of transaction costs and other operating expenses that are not reflected in the Index’s results.
The Fund’s Investment Approach
The fund seeks to match the total return of the Index.To pursue this goal, the fund normally invests at least 80% of its net assets in bonds that are included in the Index. To maintain liquidity, the fund may invest up to 20% of its assets in various short-term, fixed-income securities and money market instruments.
While the fund seeks to mirror the returns of the Index, it does not hold the same number of bonds. Instead, the fund holds approximately 1,600 securities as compared to approximately 7,800 securities in the Index. The fund’s average duration — a measure of sensitivity to changing interest rates — generally remains neutral to the Index. As of October 31, 2011, the average duration of the fund was approximately 5.08 years.
Shifting Sentiment Sparked Heightened Market Volatility
Positive economic momentum supported higher yielding bonds, such as corporate bonds and mortgage-backed securities, early in the reporting period, while lower yielding U.S. government securities generally lost value. However, the rally among riskier assets was interrupted in February 2011 when political unrest in the Middle East led
DISCUSSION OF FUND PERFORMANCE (continued)
to sharply rising energy prices, and again in March when natural and nuclear disasters in Japan disrupted the global industrial supply chain. Nonetheless, investors proved resilient, and most financial assets rebounded quickly from these unexpected shocks.
Investor sentiment began to deteriorate in earnest in late April when Greece teetered on the brink of default and pressures mounted on the banking systems of several other European nations. In addition, investors reacted cautiously to disappointing economic data in the United States and a contentious political debate regarding government spending and borrowing.As a result, newly risk-averse investors shifted their focus away from higher yielding market sectors to traditionally defensive investments, such as U.S.Treasury securities. Market volatility was especially severe in August and September, after a major credit-rating agency downgraded its assessment of long-term U.S. government debt. Ironically, U.S. Treasuries gained value in a renewed “flight to quality” after the announcement. In contrast, riskier assets rebounded and traditional safe havens declined in October when some macroeconomic worries seemed to ease.
Despite these swings in economic sentiment, and as it has since December 2008, the Federal Reserve Board (the “Fed”) left short-term interest rates unchanged in a historically low range between 0% and 0.25%.The Fed attempted to boost economic growth and bond market liquidity through a quantitative easing program involving the purchase of $600 billion of U.S. Treasury securities. After that program’s expiration in June, the Fed launched Operation Twist, in which it will sell $400 billion of short-term Treasuries and redeploy the proceeds to longer-term Treasuries.The Federal Reserve will also reinvest principal paydowns into agency mortgage-backed securities. Operation Twist helped produce narrower yield differences along the bond market’s maturity spectrum.
U.S. Government Bonds Buoyed Performance
In this highly volatile market environment, the Index’s positive absolute results were driven primarily by the rally among U.S.Treasury securities over the second half of the reporting period. U.S. government agency securities also fared well, but to a lesser degree than Treasuries.
4
In higher yielding market sectors, commercial mortgage-backed securities produced above-average results, primarily due to expectations of economic recovery early in the reporting period. However, residential mortgage-backed securities generally underperformed broader market averages despite support from the Fed’s OperationTwist. Finally, corporate-backed bonds lost value when investor sentiment deteriorated. Bonds from issuers in the financials sector declined especially sharply amid concerns of a potential spread of the European debt crisis to banks in other regions.
Replicating the Index’s Composition
As an index fund, we attempt to match closely the returns of the Barclays Capital U.S. Aggregate Bond Index by approximating its composition.As of October 31, 2011, approximately 33% of the fund’s assets were invested in mortgage-backed securities, 2% in commercial mortgage-backed securities, 19% in corporate bonds and asset-backed securities, 34% in U.S.Treasury securities and 11% in U.S. government agency bonds. In addition, all of the fund’s corporate securities were rated at least BBB- or better, and the fund has maintained an overall credit quality that is closely aligned with that of the Index. In addition to direct investments in fixed-income securities, we may employ derivative instruments to establish the fund’s positions.
November 15, 2011
| |
| | Bond funds are subject generally to interest rate, credit, liquidity and market risks, to varying |
| | degrees, all of which are more fully described in the fund’s prospectus. Generally, all other factors |
| | being equal, bond prices are inversely related to interest-rate changes, and rate increases can cause |
| | price declines. |
| 1 | Total return includes reinvestment of dividends and any capital gains paid. Past performance is no |
| | guarantee of future results. Share price, yield and investment return fluctuate such that upon |
| | redemption, fund shares may be worth more or less than their original cost. Return figures |
| | provided reflect the absorption of certain fund expenses by The Dreyfus Corporation. Had these |
| | expenses not been absorbed, returns would have been lower. |
| 2 | SOURCE: LIPPER INC. — Reflects reinvestment of dividends and, where applicable, |
| | capital gain distributions.The Barclays Capital U.S.Aggregate Bond Index is a widely accepted, |
| | unmanaged total return index of corporate, U.S. government and U.S. government agency debt |
| | instruments, mortgage-backed securities and asset-backed securities with an average maturity of |
| | 1-10 years. Index returns do not reflect fees and expenses associated with operating a mutual fund. |
| | | | | | |
| Average Annual Total Returns as of 10/31/11 | | | |
| | 1Year | 5 Years | 10 Years |
| BASIC shares | 4.94% | 6.20% | 5.25% |
| Investor shares | 4.58% | 5.94% | 4.99% |
| Barclays Capital U.S. Aggregate Bond Index | 5.00% | 6.41% | 5.46% |
† Source: Lipper Inc.
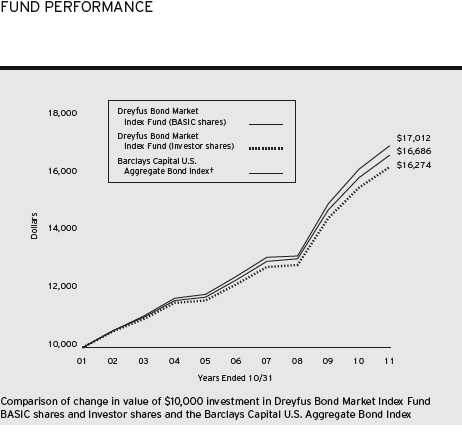
Past performance is not predictive of future performance.The fund’s performance shown in the graph and table does not reflect the deduction of taxes that a shareholder would pay on fund distributions or the redemption of fund shares.
The above graph compares a $10,000 investment made in both the BASIC shares and Investor shares of Dreyfus Bond Market Index Fund on 10/31/01 to a $10,000 investment made in the Barclays Capital U.S.Aggregate Bond Index (the “Index”) on that date.All dividends and capital gain distributions are reinvested.
The fund’s performance shown in the line graph above takes into account all applicable fees and expenses on both BASIC and Investor shares.The Index is a widely accepted, unmanaged index of corporate, U.S. government and U.S. government agency debt instruments, mortgage-backed securities, and asset-backed securities. Unlike a mutual fund, the Index is not subject to charges, fees and other expenses. Investors cannot invest directly in any index. Further information relating to fund performance, including expense reimbursements, if applicable, is contained in the Financial Highlights section of the prospectus and elsewhere in this report.
6
UNDERSTANDING YOUR FUND’S EXPENSES (Unaudited)
As a mutual fund investor, you pay ongoing expenses, such as management fees and other expenses. Using the information below, you can estimate how these expenses affect your investment and compare them with the expenses of other funds.You also may pay one-time transaction expenses, including sales charges (loads) and redemption fees, which are not shown in this section and would have resulted in higher total expenses. For more information, see your fund’s prospectus or talk to your financial adviser.
Review your fund’s expenses
The table below shows the expenses you would have paid on a $1,000 investment in Dreyfus Bond Market Index Fund from May 1, 2011 to October 31, 2011. It also shows how much a $1,000 investment would be worth at the close of the period, assuming actual returns and expenses.
| | | | |
| Expenses and Value of a $1,000 Investment | | |
| assuming actual returns for the six months ended October 31, 2011 | | |
| | | Investor Shares | BASIC Shares | |
| Expenses paid per $1,000† | $ | 2.06 | $ .78 | |
| Ending value (after expenses) | $ | 1,048.00 | $ 1,050.30 | |
COMPARING YOUR FUND’S EXPENSES WITH THOSE OF OTHER FUNDS (Unaudited)
Using the SEC’s method to compare expenses
The Securities and Exchange Commission (SEC) has established guidelines to help investors assess fund expenses. Per these guidelines, the table below shows your fund’s expenses based on a $1,000 investment, assuming a hypothetical 5% annualized return. You can use this information to compare the ongoing expenses (but not transaction expenses or total cost) of investing in the fund with those of other funds.All mutual fund shareholder reports will provide this information to help you make this comparison. Please note that you cannot use this information to estimate your actual ending account balance and expenses paid during the period.
| | | | | |
| Expenses and Value of a $1,000 Investment | | | |
| assuming a hypothetical 5% annualized return for the six months ended October 31, 2011 |
| | | Investor Shares | | BASIC Shares |
| Expenses paid per $1,000† | $ | 2.04 | | $ .77 | |
| Ending value (after expenses) | $ | 1,023.19 | | $1,024.45 |
† Expenses are equal to the fund’s annualized expense ratio of .40% for Investor shares and .15% for BASIC shares, multiplied by the average account value over the period, multiplied by 184/365 (to reflect the one-half year period).
|
| STATEMENT OF INVESTMENTS |
| October 31, 2011 |
| | | | |
| | Coupon | Maturity | Principal | |
| Bonds and Notes—98.8% | Rate (%) | Date | Amount ($) | Value ($) |
| Aerospace & Defense—.4% | | | | |
| Boeing, | | | | |
| Sr. Unscd. Notes | 6.00 | 3/15/19 | 2,000,000 | 2,426,244 |
| Boeing, | | | | |
| Sr. Unscd. Bonds | 7.25 | 6/15/25 | 150,000 | 201,738 |
| General Dynamics, | | | | |
| Gtd. Notes | 4.25 | 5/15/13 | 125,000 | 131,880 |
| Lockheed Martin, | | | | |
| Sr. Unscd. Notes, Ser. B | 6.15 | 9/1/36 | 455,000 | 558,246 |
| Northrop Grumman Systems, | | | | |
| Gtd. Debs | 7.75 | 2/15/31 | 1,100,000 | 1,572,658 |
| Raytheon, | | | | |
| Sr. Unscd. Debs | 7.20 | 8/15/27 | 150,000 | 204,779 |
| United Technologies, | | | | |
| Sr. Unscd. Notes | 4.88 | 5/1/15 | 2,750,000 | 3,086,300 |
| United Technologies, | | | | |
| Sr. Unscd. Notes | 6.70 | 8/1/28 | 50,000 | 64,876 |
| United Technologies, | | | | |
| Sr. Unscd. Debs | 8.75 | 3/1/21 | 50,000 | 70,978 |
| | | | | 8,317,699 |
| Agriculture—.3% | | | | |
| Altria Group, | | | | |
| Gtd. Notes | 9.70 | 11/10/18 | 1,850,000 | 2,489,806 |
| Archer-Daniels-Midland, | | | | |
| Sr. Unscd. Notes | 5.45 | 3/15/18 | 130,000 | 153,277 |
| Philip Morris International, | | | | |
| Sr. Unscd. Notes | 5.65 | 5/16/18 | 760,000 | 903,526 |
| Philip Morris International, | | | | |
| Sr. Unscd. Notes | 6.88 | 3/17/14 | 3,200,000 | 3,644,304 |
| Reynolds American, | | | | |
| Gtd. Notes | 7.63 | 6/1/16 | 170,000 | 202,709 |
| | | | | 7,393,622 |
| Asset—Backed Certificates—.0% | | | | |
| AEP Texas Central Transition | | | | |
| Funding, Ser. 2002-1, Cl. A4 | 5.96 | 7/15/15 | 334,386 | 351,831 |
| Asset-Backed Ctfs./ | | | | |
| Auto Receivables—.0% | | | | |
| Ford Credit Auto Owner Trust, | | | | |
| Ser. 2009-A, Cl. A4 | 6.07 | 5/15/14 | 1,000,000 | 1,041,252 |
8
| | | | | |
| | Coupon | Maturity | Principal | | |
| Bonds and Notes (continued) | Rate (%) | Date | Amount ($) | | Value ($) |
| Asset-Backed Ctfs./Credit Cards—.1% | | | | | |
| Bank One Issuance Trust, | | | | | |
| Ser. 2003-C3, Cl. C3 | 4.77 | 2/16/16 | 200,000 | | 208,864 |
| Capital One Multi-Asset Execution | | | | | |
| Trust, Ser. 2007-A7, Cl. A7 | 5.75 | 7/15/20 | 565,000 | | 664,690 |
| Citibank Credit Card Issuance | | | | | |
| Trust, Ser. 2005-A4, Cl. A4 | 4.40 | 6/20/14 | 500,000 | | 512,150 |
| Citibank Credit Card Issuance | | | | | |
| Trust, Ser. 2003-A10, Cl. A10 | 4.75 | 12/10/15 | 500,000 | | 542,218 |
| | | | | | 1,927,922 |
| Asset-Backed Ctfs./ | | | | | |
| Home Equity Loans—.0% | | | | | |
| Centex Home Equity, | | | | | |
| Ser. 2005-C, Cl. AF5 | 5.05 | 6/25/35 | 186,837 | a | 184,093 |
| Automobile Manufacturers—.0% | | | | | |
| Daimler Finance North America, | | | | | |
| Gtd. Notes | 6.50 | 11/15/13 | 225,000 | | 246,793 |
| Daimler Finance North America, | | | | | |
| Gtd. Notes | 7.30 | 1/15/12 | 400,000 | | 405,130 |
| Daimler Finance North America, | | | | | |
| Gtd. Notes | 8.50 | 1/18/31 | 200,000 | | 287,146 |
| | | | | | 939,069 |
| Automotive, Trucks & Parts—.1% | | | | | |
| Johnson Controls, | | | | | |
| Sr. Unscd. Notes | 5.50 | 1/15/16 | 2,800,000 | | 3,136,980 |
| Banks—2.3% | | | | | |
| Bank of America, | | | | | |
| Sr. Unscd. Notes | 5.13 | 11/15/14 | 350,000 | | 355,220 |
| Bank of America, | | | | | |
| Sr. Unscd. Notes | 5.38 | 6/15/14 | 250,000 | | 255,999 |
| Bank of America, | | | | | |
| Sr. Unscd. Notes | 5.63 | 10/14/16 | 575,000 | | 573,753 |
| Bank of America, | | | | | |
| Sr. Unscd. Debs., Ser. L | 5.65 | 5/1/18 | 965,000 | | 967,593 |
| Bank of America, | | | | | |
| Sr. Unscd. Notes | 5.75 | 12/1/17 | 2,450,000 | | 2,441,810 |
| Bank of America, | | | | | |
| Sub. Notes | 7.80 | 9/15/16 | 235,000 | | 248,897 |
STATEMENT OF INVESTMENTS (continued)
| | | | |
| | Coupon | Maturity | Principal | |
| Bonds and Notes (continued) | Rate (%) | Date | Amount ($) | Value ($) |
| Banks (continued) | | | | |
| Bank One, | | | | |
| Sub. Notes | 5.90 | 11/15/11 | 500,000 | 500,933 |
| Barclays Bank, | | | | |
| Sr. Unscd. Debs | 6.75 | 5/22/19 | 1,300,000 | 1,492,607 |
| BB&T, | | | | |
| Sr. Unscd. Notes | 3.38 | 9/25/13 | 3,400,000 | 3,533,062 |
| BB&T, | | | | |
| Sub. Notes | 4.75 | 10/1/12 | 325,000 | 336,081 |
| BB&T, | | | | |
| Sub. Notes | 4.90 | 6/30/17 | 150,000 | 160,808 |
| BNP Paribas, | | | | |
| Gtd. Notes | 5.00 | 1/15/21 | 1,400,000 | 1,410,167 |
| Citigroup, | | | | |
| Sr. Unscd. Notes | 5.50 | 4/11/13 | 4,400,000 | 4,566,989 |
| Cooperatieve Centrale | | | | |
| Raiffeisen-Boerenleenbank, | | | | |
| Bank Gtd. Debs | 5.25 | 5/24/41 | 1,150,000 | 1,354,187 |
| Credit Suisse New York, | | | | |
| Sr. Unscd. Notes | 5.30 | 8/13/19 | 2,000,000 | 2,152,804 |
| Credit Suisse New York, | | | | |
| Sub. Debs | 6.00 | 2/15/18 | 1,400,000 | 1,444,121 |
| Deutsche Bank AG London, | | | | |
| Sr. Unscd. Notes | 6.00 | 9/1/17 | 845,000 | 959,501 |
| Dresdner Bank AG New York, | | | | |
| Sub. Debs | 7.25 | 9/15/15 | 145,000 | 143,233 |
| Fifth Third Bank, | | | | |
| Sub. Debs | 8.25 | 3/1/38 | 1,000,000 | 1,221,160 |
| First Tennessee Bank, | | | | |
| Sub. Notes | 5.65 | 4/1/16 | 250,000 | 257,795 |
| Golden West Financial, | | | | |
| Sr. Unscd. Notes | 4.75 | 10/1/12 | 1,000,000 | 1,035,180 |
| HSBC Holdings, | | | | |
| Sub. Notes | 6.50 | 5/2/36 | 1,350,000 | 1,440,395 |
| HSBC Holdings, | | | | |
| Sub. Notes | 6.50 | 9/15/37 | 555,000 | 588,449 |
| JP Morgan Chase, | | | | |
| Sub. Notes | 6.00 | 10/1/17 | 150,000 | 161,759 |
| JPMorgan Chase & Co., | | | | |
| Sr. Unscd. Notes | 3.15 | 7/5/16 | 1,500,000 | 1,504,167 |
10
| | | | | |
| | Coupon | Maturity | Principal | |
| Bonds and Notes (continued) | Rate (%) | Date | Amount ($) | Value ($) |
| Banks (continued) | | | | |
| KeyBank, | | | | |
| Sub. Notes | 6.95 | 2/1/28 | 100,000 | 108,390 |
| Korea Development Bank, | | | | |
| Sr. Unscd. Notes | 5.50 | 11/13/12 | 350,000 | 363,559 |
| Landwirtschaftliche Rentenbank, | | | | |
| Gov’t Gtd. Bonds | 5.13 | 2/1/17 | 950,000 | 1,119,205 |
| Mercantile Bankshares, | | | | |
| Sub. Notes, Ser. B | 4.63 | 4/15/13 | 200,000 | 207,521 |
| Morgan Stanley, | | | | |
| Sr. Unscd. Debs | 7.30 | 5/13/19 | 1,300,000 | 1,397,067 |
| National City, | | | | |
| Sub. Notes | 6.88 | 5/15/19 | 1,800,000 | 2,118,337 |
| Oesterreichische Kontrollbank, | | | | |
| Govt. Gtd. Notes | 4.88 | 2/16/16 | 1,500,000 | 1,721,517 |
| PNC Funding, | | | | |
| Bank Gtd. Notes | 5.25 | 11/15/15 | 225,000 | 244,496 |
| Royal Bank of Scotland Group, | | | | |
| Sub. Notes | 5.00 | 10/1/14 | 175,000 | 163,769 |
| Royal Bank of Scotland, | | | | |
| Bank Gtd. Notes | 3.95 | 9/21/15 | 4,200,000 | 4,144,094 |
| SouthTrust, | | | | |
| Sub. Notes | 5.80 | 6/15/14 | 500,000 | 537,680 |
| State Street Bank & Trust, | | | | |
| Sub. Notes | 5.25 | 10/15/18 | 200,000 | 221,573 |
| Suntrust Capital VIII, | | | | |
| Gtd. Debs | 6.10 | 12/1/66 | 335,000a | 331,023 |
| UBS AG/Stamford, | | | | |
| Sr. Unscd. Notes | 4.88 | 8/4/20 | 1,300,000 | 1,337,706 |
| UBS AG/Stamford, | | | | |
| Sr. Sub. Debs | 5.88 | 7/15/16 | 75,000 | 77,557 |
| UBS AG/Stamford, | | | | |
| Sr. Unscd. Notes | 5.88 | 12/20/17 | 760,000 | 833,079 |
| US Bank NA/Cincinnati, | | | | |
| Sub. Notes | 4.95 | 10/30/14 | 45,000 | 49,121 |
| Wachovia Bank, | | | | |
| Sub. Notes | 5.00 | 8/15/15 | 250,000 | 266,133 |
| Wachovia Bank, | | | | |
| Sub. Notes | 6.60 | 1/15/38 | 415,000 | 484,606 |
STATEMENT OF INVESTMENTS (continued)
| | | | | |
| | Coupon | Maturity | Principal | | |
| Bonds and Notes (continued) | Rate (%) | Date | Amount ($) | | Value ($) |
| Banks (continued) | | | | | |
| Wachovia, | | | | | |
| Sub. Notes | 5.25 | 8/1/14 | 200,000 | | 213,439 |
| Wachovia, | | | | | |
| Sr. Unscd. Debs | 5.75 | 6/15/17 | 1,850,000 | | 2,136,437 |
| Wachovia, | | | | | |
| Sr. Unscd. Notes | 5.75 | 2/1/18 | 1,100,000 | | 1,250,898 |
| Wells Fargo & Co., | | | | | |
| Sr. Unscd. Notes | 5.63 | 12/11/17 | 2,340,000 | | 2,697,915 |
| Wells Fargo Bank, | | | | | |
| Sub. Notes | 5.75 | 5/16/16 | 875,000 | | 971,040 |
| Westpac Banking, | | | | | |
| Sub. Notes | 4.63 | 6/1/18 | 500,000 | | 520,839 |
| | | | | | 52,623,671 |
| Building & Construction—.0% | | | | | |
| CRH America, | | | | | |
| Gtd. Notes | 5.30 | 10/15/13 | 500,000 | | 522,329 |
| Chemicals—.4% | | | | | |
| Dow Chemical, | | | | | |
| Sr. Unscd. Notes | 6.00 | 10/1/12 | 2,200,000 | | 2,295,715 |
| Dow Chemical, | | | | | |
| Sr. Unscd. Notes | 8.55 | 5/15/19 | 1,700,000 | | 2,211,680 |
| E.I. Du Pont De Nemours, | | | | | |
| Sr. Unscd. Notes | 5.25 | 12/15/16 | 1,900,000 | | 2,225,601 |
| E.I. Du Pont De Nemours, | | | | | |
| Sr. Unscd. Debs | 6.00 | 7/15/18 | 560,000 | | 686,005 |
| Lubrizol, | | | | | |
| Gtd. Notes | 5.50 | 10/1/14 | 150,000 | | 167,975 |
| Potash of Saskatchewan, | | | | | |
| Sr. Unscd. Notes | 5.63 | 12/1/40 | 1,200,000 | | 1,427,363 |
| Praxair, | | | | | |
| Sr. Unscd. Notes | 6.38 | 4/1/12 | 100,000 | | 102,381 |
| | | | | | 9,116,720 |
| Commercial Mortgage | | | | | |
| Pass-Through Ctfs.—2.2% | | | | | |
| Banc of America Commercial | | | | | |
| Mortgage, Ser. 2005-3, Cl. A4 | 4.67 | 7/10/43 | 1,000,000 | | 1,081,160 |
| Banc of America Commercial | | | | | |
| Mortgage, Ser. 2005-4, Cl. A5B | 5.00 | 7/10/45 | 1,800,000 | a | 1,779,483 |
12
| | | | | |
| | Coupon | Maturity | Principal | | |
| Bonds and Notes (continued) | Rate (%) | Date | Amount ($) | | Value ($) |
| Commercial Mortgage | | | | | |
| Pass-Through Ctfs. (continued) | | | | | |
| Banc of America Commercial | | | | | |
| Mortgage, Ser. 2007-1, Cl. A4 | 5.45 | 1/15/49 | 1,000,000 | | 1,077,990 |
| Banc of America Commercial | | | | | |
| Mortgage, Ser. 2007-4, Cl. A4 | 5.73 | 2/10/51 | 300,000 | a | 323,525 |
| Bear Stearns Commercial Mortgage | | | | | |
| Securities, Ser. 2003-T12, Cl. A4 | 4.68 | 8/13/39 | 350,000 | a | 368,562 |
| Bear Stearns Commercial Mortgage | | | | | |
| Securities, Ser. 2003-T10, Cl. A2 | 4.74 | 3/13/40 | 400,000 | | 416,093 |
| Bear Stearns Commercial Mortgage | | | | | |
| Securities, Ser. 2005-PWR9, Cl. A4A | 4.87 | 9/11/42 | 900,000 | | 994,678 |
| Bear Stearns Commercial Mortgage | | | | | |
| Securities, Ser. 2006-PW12, Cl. A4 | 5.72 | 9/11/38 | 850,000 | a | 958,057 |
| Bear Stearns Commercial Mortgage | | | | | |
| Securities, Ser. 2002-TOP6, Cl. A2 | 6.46 | 10/15/36 | 74,715 | | 75,289 |
| Citigroup Commercial Mortgage | | | | | |
| Trust, Ser. 2006-C4, Cl. A3 | 5.73 | 3/15/49 | 225,000 | a | 249,697 |
| Citigroup Commercial Mortgage | | | | | |
| Trust, Ser. 2008-C7, Cl. A4 | 6.27 | 12/10/49 | 1,100,000 | a | 1,219,092 |
| Citigroup/Deutsche Bank Commercial | | | | | |
| Mortgage Trust, Ser. 2005-CD1, | | | | | |
| Cl. A4 | 5.23 | 7/15/44 | 1,900,000 | a | 2,088,365 |
| Citigroup/Deutsche Bank Commercial | | | | | |
| Mortgage Trust, Ser. 2006-CD2, | | | | | |
| Cl. A4 | 5.34 | 1/15/46 | 85,000 | a | 91,870 |
| Commercial Mortgage Pass Through | | | | | |
| Certificates, Ser. 2004-LB4A, | | | | | |
| Cl. A5 | 4.84 | 10/15/37 | 4,000,000 | | 4,232,128 |
| Commercial Mortgage Pass-Through | | | | | |
| Certificates, Ser. 2005-LP5, Cl. A2 | 4.63 | 5/10/43 | 223,751 | | 224,553 |
| Credit Suisse First Boston | | | | | |
| Mortgage Securities, | | | | | |
| Ser. 2004-C3, Cl. A5 | 5.11 | 7/15/36 | 1,245,000 | a | 1,346,223 |
| Credit Suisse First Boston | | | | | |
| Mortgage Securities, | | | | | |
| Ser. 2002-CKP1, Cl. A3 | 6.44 | 12/15/35 | 159,859 | | 161,272 |
| Credit Suisse Mortgage Capital | | | | | |
| Certificates, Ser. 2006-C3, Cl. A3 | 5.82 | 6/15/38 | 1,500,000 | a,b | 1,642,805 |
STATEMENT OF INVESTMENTS (continued)
| | | | | |
| | Coupon | Maturity | Principal | | |
| Bonds and Notes (continued) | Rate (%) | Date | Amount ($) | | Value ($) |
| Commercial Mortgage | | | | | |
| Pass-Through Ctfs. (continued) | | | | | |
| CWCapital Cobalt, | | | | | |
| Ser. 2007-C3, Cl. A4 | 5.82 | 5/15/46 | 1,000,000 | a | 1,066,247 |
| GE Capital Commercial Mortgage, | | | | | |
| Ser. 2002-1A, Cl. A3 | 6.27 | 12/10/35 | 772,739 | | 779,758 |
| GS Mortgage Securities II, | | | | | |
| Ser. 2005-GG4, Cl. A3 | 4.61 | 7/10/39 | 775,000 | | 782,674 |
| GS Mortgage Securities II, | | | | | |
| Ser. 2007-GG10, Cl. A4 | 5.79 | 8/10/45 | 1,000,000 | a,b | 1,069,197 |
| J.P. Morgan Chase Commercial | | | | | |
| Mortgage Securities, | | | | | |
| Ser. 2004-CB8, Cl. A4 | 4.40 | 1/12/39 | 1,000,000 | | 1,058,826 |
| J.P. Morgan Chase Commercial | | | | | |
| Mortgage Securities, | | | | | |
| Ser. 2005-LDP3, Cl. A4A | 4.94 | 8/15/42 | 600,000 | a | 663,325 |
| J.P. Morgan Chase Commercial | | | | | |
| Mortgage Securities, | | | | | |
| Ser. 2004-LN2, Cl. A2 | 5.12 | 7/15/41 | 150,000 | | 160,118 |
| J.P. Morgan Chase Commercial | | | | | |
| Mortgage Securities, | | | | | |
| Ser. 2007-LDPX, Cl. A3 | 5.42 | 1/15/49 | 1,200,000 | | 1,280,200 |
| J.P. Morgan Chase Commercial | | | | | |
| Mortgage Securities, | | | | | |
| Ser. 2007-CB18, Cl. A4 | 5.44 | 6/12/47 | 350,000 | | 370,174 |
| J.P. Morgan Chase Commercial | | | | | |
| Mortgage Securities, | | | | | |
| Ser. 2006-LDP8, Cl. A3B | 5.45 | 5/15/45 | 225,000 | | 244,845 |
| J.P. Morgan Chase Commercial | | | | | |
| Mortgage Securities, | | | | | |
| Ser. 2006-CB14, Cl. A4 | 5.48 | 12/12/44 | 500,000 | a | 540,460 |
| J.P. Morgan Chase Commercial | | | | | |
| Mortgage Securities, | | | | | |
| Ser. 2007-CB20, Cl. A4 | 5.79 | 2/12/51 | 1,000,000 | a | 1,092,516 |
| LB-UBS Commercial Mortgage Trust, | | | | | |
| Ser. 2003-C3, Cl. A4 | 4.17 | 5/15/32 | 475,000 | | 494,571 |
| LB-UBS Commercial Mortgage Trust, | | | | | |
| Ser. 2004-C7, Cl. A6 | 4.79 | 10/15/29 | 4,028,000 | a | 4,345,723 |
| LB-UBS Commercial Mortgage Trust, | | | | | |
| Ser. 2005-C3, Cl. AJ | 4.84 | 7/15/40 | 500,000 | | 452,361 |
14
| | | | | |
| | Coupon | Maturity | Principal | | |
| Bonds and Notes (continued) | Rate (%) | Date | Amount ($) | | Value ($) |
| Commercial Mortgage | | | | | |
| Pass-Through Ctfs. (continued) | | | | | |
| LB-UBS Commercial Mortgage Trust, | | | | | |
| Ser. 2004-C6, Cl. A6 | 5.02 | 8/15/29 | 275,000 | a | 293,874 |
| LB-UBS Commercial Mortgage Trust, | | | | | |
| Ser. 2007-C2, Cl. A3 | 5.43 | 2/15/40 | 1,200,000 | | 1,265,304 |
| Merrill Lynch Mortgage Trust, | | | | | |
| Ser. 2005-CKI1, Cl. A6 | 5.22 | 11/12/37 | 375,000 | a | 420,372 |
| Merrill Lynch Mortgage Trust, | | | | | |
| Ser. 2003-KEY1, Cl. A4 | 5.24 | 11/12/35 | 500,000 | a | 530,527 |
| Merrill Lynch Mortgage Trust, | | | | | |
| Ser. 2007-C1, Cl. A4 | 5.83 | 6/12/50 | 1,000,000 | a | 1,090,957 |
| Merrill Lynch/Countrywide | | | | | |
| Commercial Mortgage, | | | | | |
| Ser. 2007-7, Cl. ASB | 5.74 | 6/12/50 | 692,000 | a | 723,768 |
| Merrill Lynch/Countrywide | | | | | |
| Commercial Mortgage, | | | | | |
| Ser. 2007-7, Cl. A4 | 5.74 | 6/12/50 | 1,200,000 | a | 1,264,835 |
| Morgan Stanley Capital I, | | | | | |
| Ser. 2004-T13, Cl. A4 | 4.66 | 9/13/45 | 1,000,000 | | 1,066,956 |
| Morgan Stanley Capital I, | | | | | |
| Ser. 2004-T15, Cl. A4 | 5.27 | 6/13/41 | 3,160,000 | a | 3,437,998 |
| Morgan Stanley Capital I, | | | | | |
| Ser. 2007-IQ14, Cl. A4 | 5.69 | 4/15/49 | 1,300,000 | a | 1,368,091 |
| Morgan Stanley Capital I, | | | | | |
| Ser. 2006-HQ9, Cl. A4 | 5.73 | 7/12/44 | 500,000 | a | 555,885 |
| Morgan Stanley Dean Witter Capital | | | | | |
| I, Ser. 2003-HQ2, Cl. A2 | 4.92 | 3/12/35 | 500,000 | | 518,610 |
| Wachovia Bank Commercial Mortgage | | | | | |
| Trust, Ser. 2005-C20, Cl. A7 | 5.12 | 7/15/42 | 800,000 | a | 890,466 |
| Wachovia Bank Commercial Mortgage | | | | | |
| Trust, Ser. 2004-C11, Cl. A5 | 5.22 | 1/15/41 | 800,000 | a | 863,399 |
| Wachovia Bank Commercial Mortgage | | | | | |
| Trust, Ser. 2007-C31, Cl. A4 | 5.51 | 4/15/47 | 2,500,000 | | 2,608,441 |
| Wachovia Bank Commercial Mortgage | | | | | |
| Trust, Ser. 2006-C28, Cl. A3 | 5.68 | 10/15/48 | 150,000 | | 165,774 |
| Wachovia Bank Commercial Mortgage | | | | | |
| Trust, Ser. 2006-C27, Cl. A3 | 5.77 | 7/15/45 | 1,150,000 | a | 1,271,543 |
| | | | | | 51,068,637 |
STATEMENT OF INVESTMENTS (continued)
| | | | |
| | Coupon | Maturity | Principal | |
| Bonds and Notes (continued) | Rate (%) | Date | Amount ($) | Value ($) |
| Consumer Products—.2% | | | | |
| Avon Products, | | | | |
| Sr. Unscd. Notes | 4.20 | 7/15/18 | 250,000 | 263,723 |
| Procter & Gamble, | | | | |
| Sr. Unscd. Notes | 4.95 | 8/15/14 | 2,625,000 | 2,930,702 |
| Procter & Gamble, | | | | |
| Sr. Unscd. Notes | 5.55 | 3/5/37 | 300,000 | 388,045 |
| | | | | 3,582,470 |
| Diversified Financial Services—3.8% | | | | |
| AEP Texas Central Transition | | | | |
| Funding, Sr. Scd. Bonds, Ser. A-4 | 5.17 | 1/1/20 | 250,000 | 291,895 |
| American Express, | | | | |
| Sr. Unscd. Notes | 6.15 | 8/28/17 | 700,000 | 806,208 |
| American Express, | | | | |
| Sr. Unscd. Notes | 8.15 | 3/19/38 | 1,100,000 | 1,582,226 |
| Bear Stearns, | | | | |
| Sr. Unscd. Notes | 5.30 | 10/30/15 | 100,000 | 108,181 |
| Bear Stearns, | | | | |
| Sub. Notes | 5.55 | 1/22/17 | 500,000 | 525,686 |
| Bear Stearns, | | | | |
| Sr. Unscd. Notes | 6.40 | 10/2/17 | 540,000 | 624,074 |
| Bear Stearns, | | | | |
| Sr. Unscd. Notes | 7.25 | 2/1/18 | 270,000 | 318,368 |
| Blackrock, | | | | |
| Sr. Unscd. Notes, Ser. 2 | 5.00 | 12/10/19 | 500,000 | 547,329 |
| Capital One Bank, | | | | |
| Sr. Unscd. Notes | 5.13 | 2/15/14 | 200,000 | 213,797 |
| Capital One Capital III, | | | | |
| Gtd. Debs | 7.69 | 8/15/36 | 200,000 | 199,250 |
| Capital One Capital V, | | | | |
| Gtd. Notes | 10.25 | 8/15/39 | 1,000,000 | 1,041,250 |
| Caterpillar Financial Services, | | | | |
| Sr. Unscd. Notes | 6.13 | 2/17/14 | 2,600,000 | 2,897,786 |
| Citigroup Funding, | | | | |
| Gtd. Notes | 1.88 | 10/22/12 | 4,900,000 | 4,982,119 |
| Citigroup, | | | | |
| Sub. Notes | 5.00 | 9/15/14 | 3,230,000 | 3,293,521 |
| Citigroup, | | | | |
| Sr. Unscd. Notes | 6.00 | 2/21/12 | 1,075,000 | 1,089,158 |
16
| | | | |
| | Coupon | Maturity | Principal | |
| Bonds and Notes (continued) | Rate (%) | Date | Amount ($) | Value ($) |
| Diversified Financial | | | | |
| Services (continued) | | | | |
| Citigroup, | | | | |
| Sr. Unscd. Debs | 6.13 | 11/21/17 | 885,000 | 975,907 |
| Citigroup, | | | | |
| Sub. Notes | 6.13 | 8/25/36 | 575,000 | 561,968 |
| Citigroup, | | | | |
| Sr. Unscd. Debs | 6.63 | 1/15/28 | 100,000 | 112,457 |
| Citigroup, | | | | |
| Sr. Unscd. Debs | 6.88 | 3/5/38 | 700,000 | 865,215 |
| Citigroup, | | | | |
| Unscd. Notes | 8.50 | 5/22/19 | 760,000 | 941,803 |
| Credit Suisse USA, | | | | |
| Bank Gtd. Notes | 5.38 | 3/2/16 | 200,000 | 214,896 |
| Credit Suisse USA, | | | | |
| Bank Gtd. Notes | 5.50 | 8/15/13 | 1,000,000 | 1,054,715 |
| General Electric Capital, | | | | |
| Gtd. Notes | 2.13 | 12/21/12 | 4,000,000 | 4,084,752 |
| General Electric Capital, | | | | |
| Sr. Unscd. Notes | 5.00 | 1/8/16 | 375,000 | 409,565 |
| General Electric Capital, | | | | |
| Notes | 5.25 | 10/19/12 | 5,700,000 | 5,939,138 |
| General Electric Capital, | | | | |
| Sr. Unscd. Notes, Ser. A | 5.45 | 1/15/13 | 650,000 | 683,788 |
| General Electric Capital, | | | | |
| Notes | 5.63 | 9/15/17 | 1,000,000 | 1,114,298 |
| General Electric Capital, | | | | |
| Sr. Unscd. Notes | 5.63 | 5/1/18 | 1,335,000 | 1,478,097 |
| General Electric Capital, | | | | |
| Sr. Unscd. Notes | 5.88 | 1/14/38 | 2,000,000 | 2,153,954 |
| General Electric Capital, | | | | |
| Sr. Unscd. Notes | 6.15 | 8/7/37 | 850,000 | 938,555 |
| General Electric Capital, | | | | |
| Sr. Unscd. Notes, | | | | |
| Ser. A | 6.75 | 3/15/32 | 1,000,000 | 1,172,861 |
| Goldman Sachs Capital I, | | | | |
| Gtd. Debs | 6.35 | 2/15/34 | 350,000 | 325,909 |
| Goldman Sachs Group, | | | | |
| Sr. Unscd. Notes | 4.75 | 7/15/13 | 2,800,000 | 2,885,820 |
STATEMENT OF INVESTMENTS (continued)
| | | | | |
| | Coupon | Maturity | Principal | | |
| Bonds and Notes (continued) | Rate (%) | Date | Amount ($) | | Value ($) |
| Diversified Financial | | | | | |
| Services (continued) | | | | | |
| Goldman Sachs Group, | | | | | |
| Sr. Unscd. Notes | 5.95 | 1/18/18 | 15,000 | | 15,792 |
| Goldman Sachs Group, | | | | | |
| Sr. Unscd. Notes | 6.13 | 2/15/33 | 475,000 | | 481,688 |
| Goldman Sachs Group, | | | | | |
| Sr. Unscd. Notes | 6.15 | 4/1/18 | 680,000 | | 727,019 |
| Goldman Sachs Group, | | | | | |
| Sr. Unscd. Notes | 6.25 | 9/1/17 | 190,000 | | 205,701 |
| Goldman Sachs Group, | | | | | |
| Sub. Notes | 6.75 | 10/1/37 | 2,000,000 | | 1,927,478 |
| Goldman Sachs Group, | | | | | |
| Sr. Unscd. Notes | 7.50 | 2/15/19 | 1,000,000 | | 1,131,388 |
| HSBC Finance, | | | | | |
| Sr. Unscd. Notes | 4.75 | 7/15/13 | 700,000 | | 730,085 |
| HSBC Finance, | | | | | |
| Sr. Unscd. Notes | 5.50 | 1/19/16 | 2,625,000 | | 2,753,733 |
| Jefferies Group, | | | | | |
| Sr. Unscd. Debs | 6.25 | 1/15/36 | 200,000 | | 172,528 |
| Jefferies Group, | | | | | |
| Sr. Unscd. Debs | 6.45 | 6/8/27 | 35,000 | | 33,010 |
| JP Morgan Chase Capital XVII, | | | | | |
| Gtd. Debs., Ser. Q | 5.85 | 8/1/35 | 310,000 | | 306,985 |
| JP Morgan Chase Capital XX, | | | | | |
| Gtd. Notes, Ser. T | 6.55 | 9/29/36 | 50,000 | | 51,598 |
| JPMorgan Chase & Co., | | | | | |
| Sub. Notes | 5.13 | 9/15/14 | 2,525,000 | | 2,689,716 |
| JPMorgan Chase & Co., | | | | | |
| Sub. Notes | 5.15 | 10/1/15 | 3,950,000 | | 4,198,803 |
| JPMorgan Chase & Co., | | | | | |
| Sr. Unscd. Notes | 6.00 | 1/15/18 | 2,000,000 | | 2,240,886 |
| JPMorgan Chase & Co., | | | | | |
| Sr. Unscd. Notes | 6.30 | 4/23/19 | 1,500,000 | | 1,702,267 |
| JPMorgan Chase & Co., | | | | | |
| Sr. Unscd. Debs | 6.40 | 5/15/38 | 650,000 | | 785,512 |
| Merrill Lynch & Co., | | | | | |
| Sr. Unscd. Notes | 5.45 | 7/15/14 | 565,000 | b | 577,137 |
| Merrill Lynch & Co., | | | | | |
| Sr. Unscd. Notes | 6.05 | 8/15/12 | 1,235,000 | b | 1,252,615 |
18
| | | | | |
| | Coupon | Maturity | Principal | | |
| Bonds and Notes (continued) | Rate (%) | Date | Amount ($) | | Value ($) |
| Diversified Financial | | | | | |
| Services (continued) | | | | | |
| Merrill Lynch & Co., | | | | | |
| Sub. Notes | 6.05 | 5/16/16 | 575,000 | | 566,612 |
| Merrill Lynch & Co., | | | | | |
| Sr. Unscd. Notes | 6.40 | 8/28/17 | 1,665,000 | | 1,690,198 |
| Merrill Lynch & Co., | | | | | |
| Sr. Unscd. Notes | 6.88 | 4/25/18 | 4,750,000 | | 4,885,731 |
| Merrill Lynch & Co., | | | | | |
| Sr. Unscd. Notes | 6.88 | 11/15/18 | 150,000 | | 154,407 |
| Morgan Stanley, | | | | | |
| Gtd. Debs | 1.95 | 6/20/12 | 2,000,000 | | 2,021,888 |
| Morgan Stanley, | | | | | |
| Sub. Notes | 4.75 | 4/1/14 | 1,580,000 | | 1,588,439 |
| Morgan Stanley, | | | | | |
| Sr. Unscd. Notes | 5.45 | 1/9/17 | 1,100,000 | | 1,108,045 |
| Morgan Stanley, | | | | | |
| Sr. Unscd. Debs | 5.75 | 10/18/16 | 175,000 | | 179,654 |
| Morgan Stanley, | | | | | |
| Sr. Unscd. Notes | 6.63 | 4/1/18 | 2,700,000 | | 2,817,671 |
| Morgan Stanley, | | | | | |
| Sr. Unscd. Notes | 7.25 | 4/1/32 | 300,000 | | 332,238 |
| National Rural Utilities | | | | | |
| Cooperative Finance, Coll. | | | | | |
| Trust Bonds | 5.45 | 2/1/18 | 1,100,000 | | 1,255,735 |
| Nomura Holdings, | | | | | |
| Sr. Unscd. Notes | 6.70 | 3/4/20 | 1,600,000 | b | 1,789,218 |
| SLM, | | | | | |
| Sr. Unscd. Notes, Ser. A | 5.00 | 10/1/13 | 100,000 | | 100,001 |
| SLM, | | | | | |
| Sr. Unscd. Notes, Ser. A | 5.00 | 4/15/15 | 450,000 | b | 436,840 |
| SLM, | | | | | |
| Sr. Unscd. Notes | 8.00 | 3/25/20 | 760,000 | | 792,300 |
| Unilever Capital, | | | | | |
| Gtd. Notes | 5.90 | 11/15/32 | 1,000,000 | | 1,322,033 |
| | | | | | 87,459,497 |
| Diversified Metals & | | | | | |
| Mining—.5% | | | | | |
| Alcoa, | | | | | |
| Sr. Unscd. Notes | 5.72 | 2/23/19 | 612,000 | | 614,477 |
STATEMENT OF INVESTMENTS (continued)
| | | | | |
| | Coupon | Maturity | Principal | | |
| Bonds and Notes (continued) | Rate (%) | Date | Amount ($) | | Value ($) |
| Diversified Metals & | | | | | |
| Mining (continued) | | | | | |
| Arcelormittal, | | | | | |
| Sr. Unscd. Notes | 7.00 | 10/15/39 | 600,000 | | 600,994 |
| Arcelormittal, | | | | | |
| Sr. Unscd. Bonds | 9.85 | 6/1/19 | 1,200,000 | | 1,425,578 |
| BHP Billiton Finance USA, | | | | | |
| Gtd. Debs | 6.50 | 4/1/19 | 1,700,000 | | 2,080,042 |
| BHP-Billiton Finance USA, | | | | | |
| Gtd. Notes | 4.80 | 4/15/13 | 1,175,000 | | 1,246,366 |
| Freeport-McMoRan Copper & Gold, | | | | | |
| Sr. Unscd. Notes | 8.38 | 4/1/17 | 895,000 | | 958,693 |
| Newmont Mining, | | | | | |
| Gtd. Notes | 6.25 | 10/1/39 | 1,000,000 | | 1,256,739 |
| Rio Tinto Alcan, | | | | | |
| Sr. Unscd. Debs | 7.25 | 3/15/31 | 350,000 | | 470,436 |
| Rio Tinto Finance USA, | | | | | |
| Gtd. Notes | 6.50 | 7/15/18 | 1,820,000 | | 2,186,797 |
| Vale Canada, | | | | | |
| Sr. Unscd. Bonds | 7.20 | 9/15/32 | 100,000 | | 113,440 |
| Vale Overseas, | | | | | |
| Gtd. Notes | 6.25 | 1/23/17 | 510,000 | | 573,112 |
| Vale Overseas, | | | | | |
| Gtd. Notes | 6.88 | 11/21/36 | 900,000 | | 1,031,671 |
| Xstrata Canada, | | | | | |
| Gtd. Notes | 5.50 | 6/15/17 | 165,000 | | 178,756 |
| | | | | | 12,737,101 |
| Electric Utilities—1.6% | | | | | |
| Cleveland Electric Illuminating, | | | | | |
| Sr. Unscd. Notes | 5.70 | 4/1/17 | 150,000 | | 165,862 |
| Commonwealth Edison, | | | | | |
| First Mortgage Bonds | 5.90 | 3/15/36 | 971,000 | | 1,178,083 |
| Consolidated Edison of New York, | | | | | |
| Sr. Unscd. Debs., Ser. 05-A | 5.30 | 3/1/35 | 175,000 | b | 201,844 |
| Consolidated Edison of New York, | | | | | |
| Sr. Unscd. Debs., Ser. 08-A | 5.85 | 4/1/18 | 600,000 | | 722,311 |
| Consolidated Edison of New York, | | | | | |
| Sr. Unscd. Debs., Ser. 06-B | 6.20 | 6/15/36 | 200,000 | | 257,136 |
| Constellation Energy Group, | | | | | |
| Sr. Unscd. Notes | 7.60 | 4/1/32 | 250,000 | | 301,512 |
20
| | | | |
| | Coupon | Maturity | Principal | |
| Bonds and Notes (continued) | Rate (%) | Date | Amount ($) | Value ($) |
| Electric Utilities (continued) | | | | |
| Consumers Energy, | | | | |
| First Mortgage Bonds, Ser. P | 5.50 | 8/15/16 | 200,000 | 228,484 |
| Dominion Resources, | | | | |
| Sr. Unscd. Notes, Ser. C | 5.15 | 7/15/15 | 2,075,000 | 2,323,871 |
| Dominion Resources, | | | | |
| Sr. Unscd. Notes, Ser. E | 6.30 | 3/15/33 | 100,000 | 122,096 |
| Duke Energy Carolinas, | | | | |
| First Mortgage Bonds | 6.00 | 1/15/38 | 1,710,000 | 2,210,346 |
| Duke Energy Carolinas, | | | | |
| Sr. Unscd. Notes | 6.25 | 1/15/12 | 75,000 | 75,807 |
| Duke Energy Ohio, | | | | |
| Sr. Unscd. Bonds | 5.70 | 9/15/12 | 185,000 | 192,833 |
| Exelon, | | | | |
| Sr. Unscd. Notes | 4.90 | 6/15/15 | 2,500,000 | 2,725,638 |
| FirstEnergy, | | | | |
| Sr. Unscd. Notes, Ser. B | 6.45 | 11/15/11 | 7,000 | 7,011 |
| FirstEnergy, | | | | |
| Sr. Unscd. Notes, Ser. C | 7.38 | 11/15/31 | 555,000 | 699,599 |
| Florida Power & Light, | | | | |
| First Mortgage Bonds | 5.63 | 4/1/34 | 1,100,000 | 1,352,452 |
| Florida Power & Light, | | | | |
| First Mortgage Debs | 5.65 | 2/1/35 | 25,000 | 30,531 |
| Florida Power, | | | | |
| First Mortgage Bonds | 6.40 | 6/15/38 | 1,000,000 | 1,349,303 |
| Hydro-Quebec, | | | | |
| Gov’t Gtd. Debs., Ser. HH | 8.50 | 12/1/29 | 1,200,000 | 1,922,946 |
| Hydro-Quebec, | | | | |
| Gov’t Gtd. Debs., Ser. HK | 9.38 | 4/15/30 | 20,000 | 34,138 |
| Indiana Michigan Power, | | | | |
| Sr. Unscd. Debs | 6.05 | 3/15/37 | 800,000 | 964,942 |
| MidAmerican Energy Holdings, | | | | |
| Sr. Unscd. Notes | 5.88 | 10/1/12 | 950,000 | 992,904 |
| MidAmerican Energy Holdings, | | | | |
| Sr. Unscd. Bonds | 6.13 | 4/1/36 | 1,250,000 | 1,558,466 |
| NiSource Finance, | | | | |
| Gtd. Notes | 5.40 | 7/15/14 | 150,000 | 162,621 |
| NiSource Finance, | | | | |
| Gtd. Notes | 6.40 | 3/15/18 | 1,700,000 | 1,989,671 |
STATEMENT OF INVESTMENTS (continued)
| | | | |
| | Coupon | Maturity | Principal | |
| Bonds and Notes (continued) | Rate (%) | Date | Amount ($) | Value ($) |
| Electric Utilities (continued) | | | | |
| Northern States Power, | | | | |
| First Mortgage Bonds | 6.25 | 6/1/36 | 750,000 | 1,004,449 |
| Ohio Power, | | | | |
| Sr. Unscd. Notes, Ser. F | 5.50 | 2/15/13 | 1,500,000 | 1,570,306 |
| Oncor Electric Delivery, | | | | |
| Sr. Scd. Debs | 7.00 | 9/1/22 | 170,000 | 217,038 |
| Oncor Electric Delivery, | | | | |
| Sr. Scd. Notes | 7.00 | 5/1/32 | 250,000 | 330,836 |
| Pacific Gas & Electric, | | | | |
| Sr. Unscd. Bonds | 4.80 | 3/1/14 | 100,000 | 108,017 |
| Pacific Gas & Electric, | | | | |
| Sr. Unscd. Bonds | 6.05 | 3/1/34 | 465,000 | 572,900 |
| Pacific Gas & Electric, | | | | |
| Sr. Unscd. Notes | 6.25 | 3/1/39 | 750,000 | 968,435 |
| Pacificorp, | | | | |
| First Mortgage Bonds | 5.75 | 4/1/37 | 1,035,000 | 1,282,962 |
| Progress Energy, | | | | |
| Sr. Unscd. Notes | 7.75 | 3/1/31 | 480,000 | 664,077 |
| Public Service Company of | | | | |
| Colorado, First Mortgage | | | | |
| Bonds, Ser. 10 | 7.88 | 10/1/12 | 350,000 | 372,808 |
| Public Service Electric & Gas, | | | | |
| Scd. Notes, Ser. D | 5.25 | 7/1/35 | 230,000 | 267,654 |
| South Carolina Electric & Gas, | | | | |
| First Mortgage Bonds | 6.63 | 2/1/32 | 200,000 | 259,024 |
| Southern California Edison, | | | | |
| First Mortgage Bonds | 5.50 | 3/15/40 | 1,000,000 | 1,232,265 |
| Southern California Edison, | | | | |
| First Mortgage Debs., Ser. 08-A | 5.95 | 2/1/38 | 70,000 | 91,017 |
| Southern California Edison, | | | | |
| Sr. Unscd. Notes | 6.65 | 4/1/29 | 450,000 | 577,624 |
| Southern California Gas, | | | | |
| First Mortgage Bonds, Ser. HH | 5.45 | 4/15/18 | 100,000 | 119,111 |
| Southern Power, | | | | |
| Sr. Unscd. Notes, Ser. D | 4.88 | 7/15/15 | 2,000,000 | 2,193,902 |
| SouthWestern Electric Power, | | | | |
| Sr. Unscd. Notes, Ser. F | 5.88 | 3/1/18 | 150,000 | 169,602 |
| Union Electric, | | | | |
| Sr. Scd. Notes | 6.40 | 6/15/17 | 1,500,000 | 1,780,081 |
22
| | | | | |
| | Coupon | Maturity | Principal | | |
| Bonds and Notes (continued) | Rate (%) | Date | Amount ($) | | Value ($) |
| Electric Utilities (continued) | | | | | |
| Virginia Electric & Power, | | | | | |
| Sr. Unscd. Notes, Ser. A | 5.40 | 1/15/16 | 500,000 | | 578,301 |
| | | | | | 36,130,816 |
| Food & Beverages—1.0% | | | | | |
| Anheuser-Busch Cos., | | | | | |
| Gtd. Bonds | 5.00 | 1/15/15 | 1,000,000 | b | 1,114,510 |
| Anheuser-Busch Cos., | | | | | |
| Gtd. Notes | 5.50 | 1/15/18 | 145,000 | | 170,107 |
| Anheuser-Busch Inbev Worldwide | | | | | |
| Gtd. Notes | 5.38 | 1/15/20 | 2,500,000 | | 2,964,607 |
| Bottling Group, | | | | | |
| Gtd. Notes | 4.63 | 11/15/12 | 350,000 | | 364,827 |
| Coca-Cola, | | | | | |
| Sr. Notes | 3.30 | 9/1/21 | 2,000,000 | c | 2,076,582 |
| ConAgra Foods, | | | | | |
| Sr. Unscd. Notes | 7.00 | 10/1/28 | 350,000 | | 402,839 |
| Diageo Capital, | | | | | |
| Gtd. Notes | 5.75 | 10/23/17 | 720,000 | | 850,597 |
| Diageo Finance, | | | | | |
| Gtd. Notes | 5.30 | 10/28/15 | 125,000 | | 142,246 |
| Dr. Pepper Snapple Group, | | | | | |
| Gtd. Notes | 6.82 | 5/1/18 | 1,700,000 | | 2,097,560 |
| General Mills, | | | | | |
| Sr. Unscd. Notes | 5.70 | 2/15/17 | 1,300,000 | | 1,516,195 |
| General Mills, | | | | | |
| Sr. Unscd. Notes | 6.00 | 2/15/12 | 125,000 | | 126,852 |
| H.J. Heinz, | | | | | |
| Sr. Unscd. Debs | 6.38 | 7/15/28 | 100,000 | | 119,147 |
| Hershey, | | | | | |
| Sr. Unscd. Debs | 8.80 | 2/15/21 | 30,000 | | 42,802 |
| Kellogg, | | | | | |
| Sr. Unscd. Debs., Ser. B | 7.45 | 4/1/31 | 340,000 | | 485,321 |
| Kraft Foods, | | | | | |
| Sr. Unscd. Debs | 6.13 | 2/1/18 | 2,975,000 | | 3,513,656 |
| Kraft Foods, | | | | | |
| Sr. Unscd. Notes | 6.25 | 6/1/12 | 83,000 | | 85,633 |
| Kraft Foods, | | | | | |
| Sr. Unscd. Notes | 6.50 | 2/9/40 | 1,000,000 | | 1,282,493 |
STATEMENT OF INVESTMENTS (continued)
| | | | | |
| | Coupon | Maturity | Principal | | |
| Bonds and Notes (continued) | Rate (%) | Date | Amount ($) | | Value ($) |
| Food & Beverages (continued) | | | | | |
| Kroger, | | | | | |
| Gtd. Notes | 7.50 | 4/1/31 | 800,000 | | 1,044,677 |
| Nabisco, | | | | | |
| Sr. Unscd. Debs | 7.55 | 6/15/15 | 640,000 | | 754,111 |
| Pepsi Bottling Group, | | | | | |
| Gtd. Notes, Ser. B | 7.00 | 3/1/29 | 800,000 | | 1,115,695 |
| Pepsico, | | | | | |
| Sr. Unscd. Debs | 7.90 | 11/1/18 | 1,000,000 | | 1,336,956 |
| Safeway, | | | | | |
| Sr. Unscd. Notes | 5.80 | 8/15/12 | 210,000 | | 217,408 |
| SYSCO, | | | | | |
| Gtd. Notes | 5.38 | 9/21/35 | 350,000 | | 425,042 |
| | | | | | 22,249,863 |
| Foreign/Governmental—4.0% | | | | | |
| Asian Development Bank, | | | | | |
| Sr. Unscd. Notes | 2.75 | 5/21/14 | 3,500,000 | | 3,691,548 |
| Asian Development Bank, | | | | | |
| Sr. Unscd. Notes | 4.50 | 9/4/12 | 1,750,000 | | 1,808,494 |
| Brazilian Government, | | | | | |
| Sr. Unscd. Bonds | 6.00 | 1/17/17 | 2,270,000 | | 2,650,225 |
| Brazilian Government, | | | | | |
| Sr. Unscd. Bonds | 7.13 | 1/20/37 | 575,000 | | 771,937 |
| Brazilian Government, | | | | | |
| Unscd. Bonds | 8.25 | 1/20/34 | 1,000,000 | | 1,460,000 |
| Brazilian Government, | | | | | |
| Unscd. Bonds | 10.13 | 5/15/27 | 500,000 | b | 810,000 |
| Chilean Government, | | | | | |
| Sr. Unscd. Bonds | 5.50 | 1/15/13 | 625,000 | | 658,625 |
| European Investment Bank, | | | | | |
| Sr. Unscd. Debs | 2.88 | 9/15/20 | 2,000,000 | b | 2,074,692 |
| European Investment Bank, | | | | | |
| Sr. Unscd. Debs | 3.25 | 5/15/13 | 2,600,000 | | 2,707,318 |
| European Investment Bank, | | | | | |
| Sr. Unscd. Notes | 4.63 | 5/15/14 | 500,000 | | 549,031 |
| European Investment Bank, | | | | | |
| Sr. Unscd. Bonds | 4.63 | 10/20/15 | 350,000 | | 397,795 |
| European Investment Bank, | | | | | |
| Sr. Unscd. Bonds | 4.88 | 1/17/17 | 2,750,000 | b | 3,207,779 |
24
| | | | | |
| | Coupon | Maturity | Principal | | |
| Bonds and Notes (continued) | Rate (%) | Date | Amount ($) | | Value ($) |
| Foreign/Governmental (continued) | | | | | |
| European Investment Bank, | | | | | |
| Sr. Unscd. Bonds | 5.13 | 5/30/17 | 3,700,000 | | 4,391,852 |
| Finland Government, | | | | | |
| Sr. Unscd. Bonds | 6.95 | 2/15/26 | 25,000 | | 35,324 |
| Hungarian Government, | | | | | |
| Sr. Unscd. Notes | 4.75 | 2/3/15 | 125,000 | b | 122,187 |
| Inter-American Development Bank, | | | | | |
| Sr. Unsub. Notes | 3.88 | 9/17/19 | 2,000,000 | b | 2,264,342 |
| Inter-American Development Bank, | | | | | |
| Notes | 4.25 | 9/10/18 | 540,000 | | 624,979 |
| Inter-American Development Bank, | | | | | |
| Sr. Unscd. Notes | 4.38 | 9/20/12 | 1,530,000 | | 1,583,989 |
| Inter-American Development Bank, | | | | | |
| Sr. Unscd. Notes | 5.13 | 9/13/16 | 150,000 | | 176,350 |
| International Bank for | | | | | |
| Reconstruction & Development, | | | | | |
| Sr. Unscd. Notes | 5.00 | 4/1/16 | 700,000 | | 811,527 |
| International Bank for | | | | | |
| Reconstruction & Development, | | | | | |
| Unsub. Bonds | 7.63 | 1/19/23 | 700,000 | | 1,014,717 |
| International Bank of | | | | | |
| Reconstruction and | | | | | |
| Development, | | | | | |
| Sr. Unscd. Notes | 2.13 | 3/15/16 | 2,400,000 | | 2,504,138 |
| Italian Government, | | | | | |
| Sr. Unscd. Notes | 4.50 | 1/21/15 | 50,000 | | 48,911 |
| Italian Government, | | | | | |
| Sr. Unscd. Notes | 5.25 | 9/20/16 | 155,000 | | 152,151 |
| Italian Government, | | | | | |
| Sr. Unscd. Notes | 5.38 | 6/12/17 | 1,450,000 | | 1,411,643 |
| Italian Government, | | | | | |
| Sr. Unscd. Notes | 5.38 | 6/15/33 | 550,000 | | 481,105 |
| Italian Government, | | | | | |
| Sr. Unscd. Notes | 6.88 | 9/27/23 | 610,000 | | 610,540 |
| Japan Finance, | | | | | |
| Sr. Unscd. Notes | 2.50 | 5/18/16 | 4,800,000 | | 5,002,358 |
| KFW, | | | | | |
| Gov’t Gtd. Bonds | 4.00 | 10/15/13 | 1,400,000 | | 1,493,619 |
STATEMENT OF INVESTMENTS (continued)
| | | | | |
| | Coupon | Maturity | Principal | | |
| Bonds and Notes (continued) | Rate (%) | Date | Amount ($) | | Value ($) |
| Foreign/Governmental (continued) | | | | | |
| KFW, | | | | | |
| Gov’t Gtd. Bonds | 4.00 | 1/27/20 | 2,500,000 | b | 2,825,065 |
| KFW, | | | | | |
| Gov’t Gtd. Bonds | 4.13 | 10/15/14 | 1,200,000 | | 1,312,666 |
| KFW, | | | | | |
| Gov’t Gtd. Bonds | 4.50 | 7/16/18 | 1,800,000 | | 2,088,886 |
| KFW, | | | | | |
| Gov’t Gtd. Notes | 4.88 | 1/17/17 | 1,240,000 | | 1,446,088 |
| KFW, | | | | | |
| Gov’t Gtd. Bonds | 5.13 | 3/14/16 | 625,000 | | 728,158 |
| Mexican Government, | | | | | |
| Sr. Unscd. Notes | 5.63 | 1/15/17 | 4,000,000 | | 4,580,000 |
| Mexican Government, | | | | | |
| Sr. Unscd. Notes | 5.95 | 3/19/19 | 1,200,000 | | 1,411,800 |
| Mexican Government, | | | | | |
| Sr. Unscd. Notes, Ser. A | 6.75 | 9/27/34 | 1,340,000 | | 1,678,350 |
| Polish Government, | | | | | |
| Sr. Unscd. Notes | 5.25 | 1/15/14 | 250,000 | | 264,062 |
| Polish Government, | | | | | |
| Sr. Unscd. Notes | 6.38 | 7/15/19 | 1,450,000 | | 1,630,525 |
| Province of British Columbia | | | | | |
| Canada, Sr. Unscd. Bonds, | | | | | |
| Ser. USD2 | 6.50 | 1/15/26 | 925,000 | | 1,268,169 |
| Province of Manitoba Canada, | | | | | |
| Sr. Unscd. Debs | 2.13 | 4/22/13 | 8,000,000 | | 8,188,960 |
| Province of Manitoba Canada, | | | | | |
| Debs., Ser. CB | 8.80 | 1/15/20 | 10,000 | | 14,466 |
| Province of Manitoba Canada, | | | | | |
| Debs | 8.88 | 9/15/21 | 450,000 | b | 672,844 |
| Province of Ontario Canada, | | | | | |
| Sr. Unscd. Bonds | 4.00 | 10/7/19 | 2,300,000 | | 2,516,366 |
| Province of Ontario Canada, | | | | | |
| Sr. Unscd. Bonds | 4.10 | 6/16/14 | 3,000,000 | | 3,251,874 |
| Province of Ontario Canada, | | | | | |
| Sr. Unscd. Notes | 4.95 | 11/28/16 | 1,000,000 | b | 1,147,982 |
| Province of Quebec Canada, | | | | | |
| Unscd. Notes | 4.60 | 5/26/15 | 700,000 | | 780,768 |
| Province of Quebec Canada, | | | | | |
| Bonds | 5.13 | 11/14/16 | 3,725,000 | | 4,324,203 |
26
| | | | | |
| | Coupon | Maturity | Principal | | |
| Bonds and Notes (continued) | Rate (%) | Date | Amount ($) | | Value ($) |
| Foreign/Governmental (continued) | | | | | |
| Province of Quebec Canada, | | | | | |
| Debs., Ser. NJ | 7.50 | 7/15/23 | 200,000 | | 283,367 |
| Province of Quebec Canada, | | | | | |
| Unscd. Debs., Ser. PD | 7.50 | 9/15/29 | 250,000 | | 381,726 |
| Province of Saskatchewan Canada, | | | | | |
| Debs | 7.38 | 7/15/13 | 500,000 | | 553,991 |
| Republic of Colombia, | | | | | |
| Sr. Unscd. Notes | 7.38 | 3/18/19 | 2,000,000 | | 2,530,000 |
| Republic of Korea, | | | | | |
| Sr. Unscd. Notes | 4.88 | 9/22/14 | 200,000 | | 216,389 |
| Republic of Korea, | | | | | |
| Sr. Unscd. Notes | 7.13 | 4/16/19 | 1,000,000 | b | 1,250,260 |
| Republic of Peru, | | | | | |
| Sr. Unscd. Bonds | 6.55 | 3/14/37 | 1,540,000 | | 1,925,000 |
| Republic of South Africa, | | | | | |
| Sr. Unscd. Notes | 6.50 | 6/2/14 | 170,000 | | 188,479 |
| South African Government, | | | | | |
| Sr. Unscd. Notes | 6.88 | 5/27/19 | 2,100,000 | | 2,548,875 |
| | | | | | 93,526,495 |
| Health Care—1.6% | | | | | |
| Abbott Laboratories, | | | | | |
| Sr. Unscd. Notes | 5.13 | 4/1/19 | 1,500,000 | | 1,744,993 |
| Abbott Laboratories, | | | | | |
| Sr. Unscd. Notes | 5.88 | 5/15/16 | 170,000 | b | 200,229 |
| Aetna, | | | | | |
| Sr. Unscd. Notes | 6.63 | 6/15/36 | 300,000 | | 378,251 |
| Amgen, | | | | | |
| Sr. Unscd. Notes | 5.85 | 6/1/17 | 400,000 | | 477,742 |
| Amgen, | | | | | |
| Sr. Unscd. Notes | 6.40 | 2/1/39 | 570,000 | | 752,527 |
| Astrazeneca, | | | | | |
| Sr. Unscd. Notes | 6.45 | 9/15/37 | 520,000 | | 703,881 |
| Baxter International, | | | | | |
| Sr. Unsub. Notes | 6.25 | 12/1/37 | 700,000 | | 932,012 |
| Bristol-Myers Squibb, | | | | | |
| Sr. Unscd. Notes | 5.88 | 11/15/36 | 425,000 | | 541,902 |
| Cigna, | | | | | |
| Sr. Unscd. Notes | 4.50 | 3/15/21 | 1,900,000 | | 1,966,014 |
STATEMENT OF INVESTMENTS (continued)
| | | | | |
| | Coupon | Maturity | Principal | | |
| Bonds and Notes (continued) | Rate (%) | Date | Amount ($) | | Value ($) |
| Health Care (continued) | | | | | |
| Covidien International Finance, | | | | | |
| Gtd. Notes | 6.00 | 10/15/17 | 590,000 | | 710,191 |
| Eli Lilly & Co., | | | | | |
| Sr. Unscd. Notes | 5.55 | 3/15/37 | 750,000 | | 906,240 |
| Eli Lilly & Co., | | | | | |
| Sr. Unscd. Notes | 7.13 | 6/1/25 | 200,000 | | 268,750 |
| Express Scripts, | | | | | |
| Gtd. Notes | 3.13 | 5/15/16 | 2,400,000 | | 2,457,156 |
| GlaxoSmithKline Capital, | | | | | |
| Gtd. Notes | 4.38 | 4/15/14 | 3,200,000 | | 3,487,763 |
| GlaxoSmithKline Capital, | | | | | |
| Gtd. Bonds | 5.65 | 5/15/18 | 740,000 | | 888,087 |
| Johnson & Johnson, | | | | | |
| Unscd. Debs | 4.95 | 5/15/33 | 170,000 | | 198,406 |
| Johnson & Johnson, | | | | | |
| Sr. Unscd. Notes | 5.95 | 8/15/37 | 470,000 | | 634,572 |
| Medco Health Solutions, | | | | | |
| Sr. Unscd. Debs | 7.13 | 3/15/18 | 1,500,000 | | 1,788,957 |
| Merck & Co., | | | | | |
| Sr. Unscd. Notes | 5.30 | 12/1/13 | 1,000,000 | a | 1,094,999 |
| Merck & Co., | | | | | |
| Sr. Unscd. Debs | 6.40 | 3/1/28 | 150,000 | | 193,354 |
| Merck & Co., | | | | | |
| Gtd. Notes | 6.50 | 12/1/33 | 680,000 | a | 933,116 |
| Novartis Securities Investment, | | | | | |
| Gtd. Debs | 5.13 | 2/10/19 | 1,400,000 | | 1,647,936 |
| Pfizer, | | | | | |
| Sr. Unscd. Debs | 6.20 | 3/15/19 | 2,400,000 | | 3,012,360 |
| Quest Diagnostic, | | | | | |
| Gtd. Notes | 3.20 | 4/1/16 | 2,500,000 | | 2,600,772 |
| Quest Diagnostic, | | | | | |
| Gtd. Notes | 5.45 | 11/1/15 | 500,000 | | 566,215 |
| Quest Diagnostic, | | | | | |
| Gtd. Notes | 6.95 | 7/1/37 | 50,000 | | 62,848 |
| Teva Pharmaceutical Finance, | | | | | |
| Gtd. Debs | 3.00 | 6/15/15 | 3,400,000 | | 3,568,422 |
| Teva Pharmaceutical Finance, | | | | | |
| Gtd. Notes | 6.15 | 2/1/36 | 85,000 | | 103,331 |
28
| | | | |
| | Coupon | Maturity | Principal | |
| Bonds and Notes (continued) | Rate (%) | Date | Amount ($) | Value ($) |
| Health Care (continued) | | | | |
| UnitedHealth Group, | | | | |
| Sr. Unscd. Notes | 5.00 | 8/15/14 | 300,000 | 328,002 |
| UnitedHealth Group, | | | | |
| Sr. Unscd. Debs | 6.88 | 2/15/38 | 810,000 | 1,071,824 |
| WellPoint, | | | | |
| Sr. Unscd. Notes | 5.00 | 12/15/14 | 1,000,000 | 1,101,601 |
| WellPoint, | | | | |
| Sr. Unscd. Notes | 5.25 | 1/15/16 | 375,000 | 421,997 |
| WellPoint, | | | | |
| Sr. Unscd. Notes | 5.88 | 6/15/17 | 65,000 | 75,009 |
| WellPoint, | | | | |
| Sr. Unscd. Notes | 6.80 | 8/1/12 | 300,000 | 313,473 |
| Wyeth, | | | | |
| Gtd. Notes | 5.50 | 2/1/14 | 150,000 | 165,500 |
| Wyeth, | | | | |
| Gtd. Notes | 5.95 | 4/1/37 | 200,000 | 257,086 |
| Wyeth, | | | | |
| Gtd. Notes | 6.50 | 2/1/34 | 200,000 | 265,500 |
| | | | | 36,821,018 |
| Industrial—.2% | | | | |
| Continental Airlines, | | | | |
| Pass-Through Certificates, | | | | |
| Ser. 974A | 6.90 | 7/2/19 | 162,492 | 168,180 |
| Koninklijke Philips Electronics, | | | | |
| Sr. Unscd. Notes | 5.75 | 3/11/18 | 2,000,000 | 2,332,380 |
| Republic Services, | | | | |
| Gtd. Notes | 6.20 | 3/1/40 | 750,000 | 924,286 |
| Waste Management, | | | | |
| Gtd. Debs | 6.38 | 3/11/15 | 1,600,000 | 1,831,661 |
| Waste Management, | | | | |
| Sr. Unscd. Notes | 7.00 | 7/15/28 | 150,000 | 186,689 |
| | | | | 5,443,196 |
| Machinery—.1% | | | | |
| Caterpillar, | | | | |
| Sr. Unscd. Debs | 6.05 | 8/15/36 | 375,000 | 491,883 |
| Caterpillar, | | | | |
| Sr. Unscd. Debs | 7.30 | 5/1/31 | 125,000 | 177,363 |
STATEMENT OF INVESTMENTS (continued)
| | | | | |
| | Coupon | Maturity | Principal | | |
| Bonds and Notes (continued) | Rate (%) | Date | Amount ($) | | Value ($) |
| Machinery (continued) | | | | | |
| Deere & Co., | | | | | |
| Sr. Unscd. Notes | 5.38 | 10/16/29 | 1,200,000 | b | 1,487,800 |
| Deere & Co., | | | | | |
| Sr. Unscd. Notes | 6.95 | 4/25/14 | 775,000 | | 888,110 |
| | | | | | 3,045,156 |
| Manufacturing—.4% | | | | | |
| 3M, | | | | | |
| Sr. Unscd. Notes | 5.70 | 3/15/37 | 750,000 | | 982,690 |
| General Electric, | | | | | |
| Sr. Unscd. Notes | 5.00 | 2/1/13 | 500,000 | | 524,493 |
| General Electric, | | | | | |
| Sr. Unscd. Debs | 5.25 | 12/6/17 | 1,000,000 | b | 1,140,819 |
| Honeywell International, | | | | | |
| Sr. Unscd. Notes | 3.88 | 2/15/14 | 2,656,000 | | 2,858,175 |
| Honeywell International, | | | | | |
| Sr. Unscd. Notes | 4.25 | 3/1/13 | 1,300,000 | | 1,362,573 |
| Honeywell International, | | | | | |
| Sr. Unscd. Notes | 6.13 | 11/1/11 | 175,000 | | 175,000 |
| Tyco International Finance, | | | | | |
| Gtd. Notes | 6.88 | 1/15/21 | 1,235,000 | | 1,529,603 |
| | | | | | 8,573,353 |
| Media—1.2% | | | | | |
| CBS, | | | | | |
| Gtd. Notes | 5.50 | 5/15/33 | 250,000 | | 261,101 |
| CBS, | | | | | |
| Gtd. Debs | 7.88 | 7/30/30 | 80,000 | | 105,928 |
| Comcast Cable Communications | | | | | |
| Holdings, Gtd. Notes | 8.38 | 3/15/13 | 4,000,000 | | 4,392,580 |
| Comcast Cable Communications | | | | | |
| Holdings, Gtd. Notes | 9.46 | 11/15/22 | 304,000 | | 437,842 |
| Comcast, | | | | | |
| Gtd. Notes | 6.45 | 3/15/37 | 1,900,000 | | 2,279,168 |
| COX Communications, | | | | | |
| Sr. Unscd. Bonds | 5.50 | 10/1/15 | 450,000 | | 505,620 |
| COX Communications, | | | | | |
| Unscd. Notes | 7.13 | 10/1/12 | 275,000 | | 290,012 |
| DirecTV Holdings, | | | | | |
| Gtd. Notes | 6.00 | 8/15/40 | 800,000 | | 915,138 |
30
| | | | | |
| | Coupon | Maturity | Principal | | |
| Bonds and Notes (continued) | Rate (%) | Date | Amount ($) | | Value ($) |
| Media (continued) | | | | | |
| Discovery Communications, | | | | | |
| Gtd. Debs | 6.35 | 6/1/40 | 700,000 | | 850,718 |
| NBC Universal Media, | | | | | |
| Sr. Unscd. Notes | 5.15 | 4/30/20 | 1,500,000 | | 1,688,668 |
| News America, | | | | | |
| Gtd. Notes | 6.20 | 12/15/34 | 250,000 | | 272,860 |
| News America, | | | | | |
| Gtd. Notes | 6.40 | 12/15/35 | 1,000,000 | | 1,128,614 |
| News America, | | | | | |
| Gtd. Notes | 6.65 | 11/15/37 | 360,000 | | 416,600 |
| News America, | | | | | |
| Gtd. Debs | 7.75 | 12/1/45 | 100,000 | | 120,947 |
| News America, | | | | | |
| Gtd. Debs | 8.25 | 8/10/18 | 150,000 | | 186,459 |
| Thomson Reuters, | | | | | |
| Gtd. Notes | 6.50 | 7/15/18 | 800,000 | | 959,625 |
| Time Warner Cable, | | | | | |
| Gtd. Notes | 5.40 | 7/2/12 | 2,500,000 | | 2,573,977 |
| Time Warner Cable, | | | | | |
| Gtd. Debs | 6.55 | 5/1/37 | 350,000 | | 413,210 |
| Time Warner Cable, | | | | | |
| Gtd. Debs | 7.30 | 7/1/38 | 495,000 | | 640,888 |
| Time Warner Cable, | | | | | |
| Gtd. Notes | 8.25 | 4/1/19 | 3,000,000 | | 3,826,107 |
| Time Warner Cos., | | | | | |
| Gtd. Debs | 6.95 | 1/15/28 | 325,000 | | 393,303 |
| Time Warner, | | | | | |
| Gtd. Debs | 6.50 | 11/15/36 | 200,000 | b | 235,349 |
| Time Warner, | | | | | |
| Gtd. Notes | 7.63 | 4/15/31 | 1,100,000 | | 1,418,183 |
| Viacom, | | | | | |
| Sr. Unscd. Notes | 5.63 | 9/15/19 | 1,500,000 | | 1,724,143 |
| Viacom, | | | | | |
| Sr. Unscd. Notes | 6.88 | 4/30/36 | 235,000 | | 300,935 |
| Walt Disney, | | | | | |
| Sr. Unscd. Notes, Ser. B | 6.38 | 3/1/12 | 100,000 | | 101,903 |
| Walt Disney, | | | | | |
| Sr. Unscd. Notes, Ser. B | 7.00 | 3/1/32 | 150,000 | b | 213,355 |
STATEMENT OF INVESTMENTS (continued)
| | | | |
| | Coupon | Maturity | Principal | |
| Bonds and Notes (continued) | Rate (%) | Date | Amount ($) | Value ($) |
| Media (continued) | | | | |
| Walt Disney, | | | | |
| Sr. Unscd. Debs | 7.55 | 7/15/93 | 100,000 | 125,028 |
| | | | | 26,778,261 |
| Minerals—.1% | | | | |
| Teck Resources, | | | | |
| Gtd. Notes | 6.25 | 7/15/41 | 1,300,000 | 1,503,896 |
| Municipal Bonds—.6% | | | | |
| Bay Area Toll Authority, | | | | |
| San Francisco Bay Area Toll | | | | |
| Bridge Revenue (Build | | | | |
| America Bonds) | 6.26 | 4/1/49 | 1,000,000 | 1,242,270 |
| Bay Area Toll Authority, | | | | |
| San Francisco Bay Area | | | | |
| Subordinate Toll Bridge | | | | |
| Revenue (Build America Bonds) | 6.79 | 4/1/30 | 695,000 | 824,506 |
| California, | | | | |
| GO (Various Purpose) | 7.50 | 4/1/34 | 1,000,000 | 1,198,840 |
| California, | | | | |
| GO (Various Purpose) | 7.55 | 4/1/39 | 1,600,000 | 1,951,392 |
| Illinois, | | | | |
| GO (Pension Funding Series) | 5.10 | 6/1/33 | 3,630,000 | 3,256,074 |
| Los Angeles Unified School | | | | |
| District, GO (Build America Bonds) | 5.75 | 7/1/34 | 1,600,000 | 1,753,120 |
| Metropolitan Transportation | | | | |
| Authority, Dedicated Tax | | | | |
| Funds Bonds | 7.34 | 11/15/39 | 650,000 | 871,357 |
| New Jersey Turnpike Authority, | | | | |
| Turnpike Revenue (Build | | | | |
| America Bonds) | 7.41 | 1/1/40 | 780,000 | 1,058,858 |
| Port Authority of New York and | | | | |
| New Jersey (Consolidated | | | | |
| Bonds, 164th Series) | 5.65 | 11/1/40 | 1,530,000 | 1,694,077 |
| | | | | 13,850,494 |
| Oil & Gas—1.9% | | | | |
| Anadarko Petroleum, | | | | |
| Sr. Unscd. Notes | 5.95 | 9/15/16 | 350,000 | 402,657 |
| Anadarko Petroleum, | | | | |
| Sr. Unscd. Notes | 6.45 | 9/15/36 | 150,000 | 174,453 |
| Apache, | | | | |
| Sr. Unscd. Notes | 6.00 | 1/15/37 | 380,000 | 490,189 |
32
| | | | |
| | Coupon | Maturity | Principal | |
| Bonds and Notes (continued) | Rate (%) | Date | Amount ($) | Value ($) |
| Oil & Gas (continued) | | | | |
| BP Capital Markets, | | | | |
| Gtd. Debs | 5.25 | 11/7/13 | 2,500,000 | 2,704,912 |
| Canadian Natural Resources, | | | | |
| Sr. Unscd. Notes | 4.90 | 12/1/14 | 350,000 | 386,304 |
| Canadian Natural Resources, | | | | |
| Sr. Unscd. Notes | 6.25 | 3/15/38 | 1,180,000 | 1,484,892 |
| Cenovus Energy, | | | | |
| Sr. Unscd. Notes | 6.75 | 11/15/39 | 1,000,000 | 1,316,412 |
| ConocoPhillips Holding, | | | | |
| Sr. Unscd. Notes | 6.95 | 4/15/29 | 125,000 | 170,881 |
| ConocoPhillips, | | | | |
| Gtd. Notes | 5.90 | 10/15/32 | 500,000 | 609,260 |
| ConocoPhillips, | | | | |
| Gtd. Notes | 6.50 | 2/1/39 | 1,000,000 | 1,371,874 |
| Devon Financing, | | | | |
| Gtd. Debs | 7.88 | 9/30/31 | 275,000 | 400,105 |
| EnCana, | | | | |
| Sr. Unscd. Bonds | 7.20 | 11/1/31 | 625,000 | 759,277 |
| Energy Transfer Partners, | | | | |
| Sr. Unscd. Bonds | 7.50 | 7/1/38 | 1,055,000 | 1,214,952 |
| Enterprise Products Operating, | | | | |
| Gtd. Notes, Ser. G | 5.60 | 10/15/14 | 995,000 | 1,097,647 |
| Enterprise Products Operating, | | | | |
| Gtd. Bonds, Ser. L | 6.30 | 9/15/17 | 1,925,000 | 2,261,486 |
| Halliburton, | | | | |
| Sr. Unscd. Notes | 6.15 | 9/15/19 | 1,200,000 | 1,482,023 |
| Hess, | | | | |
| Sr. Unscd. Bonds | 7.88 | 10/1/29 | 175,000 | 238,747 |
| Hess, | | | | |
| Sr. Unscd. Notes | 8.13 | 2/15/19 | 1,200,000 | 1,546,852 |
| Kerr-McGee, | | | | |
| Gtd. Debs | 6.95 | 7/1/24 | 600,000 | 727,029 |
| Kinder Morgan | | | | |
| Energy Partners, | | | | |
| Sr. Unscd. Notes | 6.95 | 1/15/38 | 1,075,000 | 1,252,313 |
| Kinder Morgan | | | | |
| Energy Partners, | | | | |
| Sr. Unscd. Notes | 7.40 | 3/15/31 | 350,000 | 424,521 |
| Marathon Oil, | | | | |
| Sr. Unscd. Notes | 6.60 | 10/1/37 | 350,000 | 431,652 |
STATEMENT OF INVESTMENTS (continued)
| | | | | |
| | Coupon | Maturity | Principal | |
| Bonds and Notes (continued) | Rate (%) | Date | Amount ($) | Value ($) |
| Oil & Gas (continued) | | | | |
| Mobil, | | | | |
| Sr. Unscd. Bonds | 8.63 | 8/15/21 | 15,000 | 22,349 |
| Nabors Industries, | | | | |
| Gtd. Notes | 9.25 | 1/15/19 | 1,250,000 | 1,576,401 |
| Nexen, | | | | |
| Sr. Unscd. Notes | 5.88 | 3/10/35 | 125,000 | 127,696 |
| Nexen, | | | | |
| Sr. Unscd. Notes | 7.50 | 7/30/39 | 1,000,000 | 1,214,487 |
| Occidental Petroleum, | | | | |
| Sr. Unscd. Notes, Ser. 1 | 4.10 | 2/1/21 | 1,700,000b | 1,864,324 |
| ONEOK Partners, | | | | |
| Gtd. Notes | 6.15 | 10/1/16 | 545,000 | 629,973 |
| ONEOK Partners, | | | | |
| Gtd. Notes | 6.85 | 10/15/37 | 60,000 | 73,952 |
| ONEOK, | | | | |
| Sr. Unscd. Notes | 5.20 | 6/15/15 | 200,000 | 220,855 |
| Pemex Project Funding Master | | | | |
| Trust, Gtd. Bonds | 6.63 | 6/15/35 | 1,760,000 | 1,936,000 |
| Pemex Project Funding Master | | | | |
| Trust, Gtd. Notes | 7.38 | 12/15/14 | 400,000 | 451,000 |
| Petrobras International Finance, | | | | |
| Gtd. Notes | 5.75 | 1/20/20 | 2,200,000 | 2,384,708 |
| Petrobras International Finance, | | | | |
| Gtd. Debs | 5.88 | 3/1/18 | 625,000 | 675,000 |
| Petro-Canada, | | | | |
| Sr. Unscd. Notes | 4.00 | 7/15/13 | 450,000 | 469,138 |
| Plains All America Pipeline, | | | | |
| Gtd. Notes | 6.13 | 1/15/17 | 525,000 | 598,401 |
| Sempra Energy, | | | | |
| Sr. Unscd. Notes | 6.00 | 10/15/39 | 1,100,000 | 1,380,214 |
| Shell International Finance, | | | | |
| Gtd. Notes | 6.38 | 12/15/38 | 500,000 | 688,589 |
| Spectra Energy Capital, | | | | |
| Sr. Unscd. Notes | 8.00 | 10/1/19 | 225,000 | 283,070 |
| Statoil, | | | | |
| Gtd. Notes | 5.25 | 4/15/19 | 1,600,000 | 1,881,914 |
| Suncor Energy, | | | | |
| Sr. Unscd. Notes | 6.50 | 6/15/38 | 950,000 | 1,181,870 |
34
| | | | |
| | Coupon | Maturity | Principal | |
| Bonds and Notes (continued) | Rate (%) | Date | Amount ($) | Value ($) |
| Oil & Gas (continued) | | | | |
| Talisman Energy, | | | | |
| Sr. Unscd. Notes | 6.25 | 2/1/38 | 200,000 | 237,751 |
| Tennessee Gas Pipeline, | | | | |
| Sr. Unscd. Debs | 7.00 | 10/15/28 | 390,000 | 449,758 |
| Tennessee Gas Pipeline, | | | | |
| Sr. Unscd Debs | 7.63 | 4/1/37 | 70,000 | 84,239 |
| Trans-Canada Pipelines, | | | | |
| Sr. Unscd. Notes | 5.85 | 3/15/36 | 200,000 | 243,210 |
| Trans-Canada Pipelines, | | | | |
| Sr. Unscd. Debs | 6.20 | 10/15/37 | 75,000 | 94,998 |
| Trans-Canada Pipelines, | | | | |
| Sr. Unscd. Debs | 7.63 | 1/15/39 | 660,000 | 947,202 |
| Transocean, | | | | |
| Gtd. Notes | 7.50 | 4/15/31 | 875,000 | 960,933 |
| Valero Energy, | | | | |
| Gtd. Notes | 6.63 | 6/15/37 | 115,000 | 126,000 |
| Valero Energy, | | | | |
| Gtd. Notes | 7.50 | 4/15/32 | 170,000 | 207,701 |
| Weatherford International, | | | | |
| Gtd. Debs | 6.75 | 9/15/40 | 1,000,000 | 1,170,635 |
| Williams Partners, | | | | |
| Sr. Unscd. Notes | 6.30 | 4/15/40 | 800,000 | 970,037 |
| XTO Energy, | | | | |
| Sr. Unscd. Notes | 6.75 | 8/1/37 | 625,000 | 955,542 |
| | | | | 45,056,385 |
| Paper & Forest Products—.1% | | | | |
| International Paper, | | | | |
| Sr. Unscd. Debs | 7.95 | 6/15/18 | 1,600,000 | 1,922,890 |
| Property & Casualty Insurance—.9% | | | | |
| Aegon, | | | | |
| Sr. Unscd. Notes | 4.75 | 6/1/13 | 375,000 | 385,692 |
| Allstate, | | | | |
| Sr. Unscd. Notes | 5.00 | 8/15/14 | 125,000 | 137,449 |
| Allstate, | | | | |
| Sr. Unscd. Notes | 5.55 | 5/9/35 | 175,000 | 191,656 |
| Allstate, | | | | |
| Sr. Unscd. Debs | 6.75 | 5/15/18 | 350,000 | 404,417 |
STATEMENT OF INVESTMENTS (continued)
| | | | |
| | Coupon | Maturity | Principal | |
| Bonds and Notes (continued) | Rate (%) | Date | Amount ($) | Value ($) |
| Property & Casualty | | | | |
| Insurance (continued) | | | | |
| Allstate, | | | | |
| Sr. Unscd. Debs | 7.45 | 5/16/19 | 1,850,000 | 2,303,971 |
| American International Group, | | | | |
| Sr. Unscd. Notes | 5.60 | 10/18/16 | 600,000 | 605,483 |
| American International Group, | | | | |
| Sr. Unscd. Debs | 5.85 | 1/16/18 | 1,000,000 | 1,008,945 |
| AXA, | | | | |
| Sub. Bonds | 8.60 | 12/15/30 | 165,000 | 177,876 |
| Berkshire Hathaway Finance, | | | | |
| Gtd. Notes | 4.85 | 1/15/15 | 1,850,000 | 2,043,808 |
| Chubb, | | | | |
| Sr. Unscd. Notes | 6.00 | 5/11/37 | 540,000 | 649,545 |
| CNA Financial, | | | | |
| Sr. Unscd. Notes | 6.50 | 8/15/16 | 100,000 | 108,580 |
| Hartford Financial Services Group, | | | | |
| Sr. Unscd. Notes | 6.30 | 3/15/18 | 580,000 | 606,175 |
| Lincoln National, | | | | |
| Sr. Unscd. Notes | 6.15 | 4/7/36 | 950,000 | 961,258 |
| Lion Connecticut Holdings, | | | | |
| Gtd. Debs | 7.63 | 8/15/26 | 50,000 | 58,696 |
| Marsh & McLennan Cos., | | | | |
| Sr. Unscd. Notes | 5.88 | 8/1/33 | 275,000 | 304,480 |
| MetLife, | | | | |
| Sr. Unscd. Notes | 5.00 | 11/24/13 | 225,000 | 240,281 |
| MetLife, | | | | |
| Sr. Unscd. Notes | 6.13 | 12/1/11 | 260,000 | 261,104 |
| MetLife, | | | | |
| Sr. Unscd. Debs | 6.38 | 6/15/34 | 1,400,000 | 1,711,874 |
| Nationwide Financial Services, | | | | |
| Sr. Unscd. Notes | 6.25 | 11/15/11 | 350,000 | 350,369 |
| Principal Financial Group, | | | | |
| Gtd. Notes | 6.05 | 10/15/36 | 225,000 | 241,489 |
| Progressive, | | | | |
| Sr. Unscd. Notes | 6.63 | 3/1/29 | 100,000 | 122,556 |
| Prudential Financial, | | | | |
| Sr. Unscd. Notes, Ser. B | 4.75 | 4/1/14 | 350,000 | 372,310 |
| Prudential Financial, | | | | |
| Sr. Unscd. Notes, Ser. B | 5.10 | 9/20/14 | 250,000 | 269,309 |
36
| | | | | |
| | Coupon | Maturity | Principal | | |
| Bonds and Notes (continued) | Rate (%) | Date | Amount ($) | | Value ($) |
| Property & Casualty | | | | | |
| Insurance (continued) | | | | | |
| Prudential Financial, | | | | | |
| Sr. Unscd. Notes, Ser. D | 7.38 | 6/15/19 | 2,800,000 | | 3,404,772 |
| Swiss Re Solutions Holding, | | | | | |
| Sr. Unscd. Notes | 7.00 | 2/15/26 | 150,000 | | 163,933 |
| Travelers Cos., | | | | | |
| Sr. Unscd. Notes | 5.50 | 12/1/15 | 960,000 | | 1,093,962 |
| Travelers Property & Casualty, | | | | | |
| Gtd. Notes | 5.00 | 3/15/13 | 250,000 | | 262,461 |
| Willis North America, | | | | | |
| Gtd. Debs | 6.20 | 3/28/17 | 335,000 | | 367,324 |
| XL Group, | | | | | |
| Sr. Unscd. Notes | 6.38 | 11/15/24 | 1,400,000 | | 1,512,875 |
| | | | | | 20,322,650 |
| Real Estate—.3% | | | | | |
| Boston Properties, | | | | | |
| Sr. Unscd. Notes | 5.00 | 6/1/15 | 500,000 | | 540,112 |
| Boston Properties, | | | | | |
| Sr. Unscd. Bonds | 5.63 | 11/15/20 | 1,400,000 | | 1,532,140 |
| Brandywine | | | | | |
| Operating Partnership, | | | | | |
| Gtd. Notes | 5.75 | 4/1/12 | 37,000 | | 37,375 |
| ERP Operating, | | | | | |
| Sr. Unscd. Notes | 5.20 | 4/1/13 | 600,000 | | 626,941 |
| ERP Operating, | | | | | |
| Sr. Unscd. Notes | 5.38 | 8/1/16 | 95,000 | | 104,661 |
| Prologis, | | | | | |
| Gtd. Notes | 6.88 | 3/15/20 | 1,400,000 | b | 1,552,333 |
| Realty Income, | | | | | |
| Sr. Unscd. Notes | 5.95 | 9/15/16 | 100,000 | | 110,706 |
| Regency Centers, | | | | | |
| Gtd. Notes | 5.88 | 6/15/17 | 200,000 | | 219,901 |
| Simon Property Group, | | | | | |
| Sr. Unscd. Notes | 5.25 | 12/1/16 | 1,400,000 | | 1,539,611 |
| | | | | | 6,263,780 |
| Retail—.8% | | | | | |
| Costco Wholesale, | | | | | |
| Sr. Unscd. Notes | 5.50 | 3/15/17 | 500,000 | b | 597,474 |
STATEMENT OF INVESTMENTS (continued)
| | | | | |
| | Coupon | Maturity | Principal | | |
| Bonds and Notes (continued) | Rate (%) | Date | Amount ($) | | Value ($) |
| Retail (continued) | | | | | |
| CVS Caremark, | | | | | |
| Sr. Unscd. Notes | 4.88 | 9/15/14 | 2,200,000 | | 2,437,523 |
| CVS Caremark, | | | | | |
| Sr. Unscd. Notes | 5.75 | 6/1/17 | 100,000 | | 116,906 |
| CVS Caremark, | | | | | |
| Sr. Unscd. Notes | 6.25 | 6/1/27 | 500,000 | | 603,107 |
| Home Depot, | | | | | |
| Sr. Unscd. Notes | 5.40 | 3/1/16 | 2,550,000 | | 2,912,773 |
| Lowe’s Cos., | | | | | |
| Sr. Unscd. Notes | 6.65 | 9/15/37 | 850,000 | | 1,103,278 |
| Macy’s Retail Holdings, | | | | | |
| Gtd. Notes | 6.38 | 3/15/37 | 830,000 | b | 921,809 |
| McDonald’s, | | | | | |
| Sr. Unscd. Debs | 5.35 | 3/1/18 | 1,050,000 | | 1,254,619 |
| Starbucks, | | | | | |
| Sr. Unscd. Bonds | 6.25 | 8/15/17 | 750,000 | | 901,207 |
| Target, | | | | | |
| Sr. Unscd. Notes | 5.38 | 5/1/17 | 400,000 | | 471,396 |
| Target, | | | | | |
| Unscd. Notes | 5.88 | 3/1/12 | 100,000 | | 101,776 |
| Target, | | | | | |
| Sr. Unscd. Debs | 7.00 | 7/15/31 | 125,000 | | 166,996 |
| Target, | | | | | |
| Sr. Unscd. Notes | 7.00 | 1/15/38 | 1,280,000 | | 1,767,900 |
| Wal-Mart Stores, | | | | | |
| Sr. Unscd. Notes | 5.25 | 9/1/35 | 600,000 | | 701,647 |
| Wal-Mart Stores, | | | | | |
| Sr. Unscd. Notes | 6.50 | 8/15/37 | 2,270,000 | | 3,049,502 |
| Xerox, | | | | | |
| Sr. Unscd. Notes | 6.75 | 2/1/17 | 750,000 | | 866,394 |
| | | | | | 17,974,307 |
| Technology—.4% | | | | | |
| Dell, | | | | | |
| Sr. Unscd. Notes | 6.50 | 4/15/38 | 1,000,000 | b | 1,278,784 |
| Google, | | | | | |
| Sr. Unscd. Notes | 3.63 | 5/19/21 | 1,600,000 | | 1,733,590 |
| Hewlett Packard, | | | | | |
| Sr. Unscd. Notes | 5.50 | 3/1/18 | 560,000 | | 639,078 |
38
| | | | | |
| | Coupon | Maturity | Principal | | |
| Bonds and Notes (continued) | Rate (%) | Date | Amount ($) | | Value ($) |
| Technology (continued) | | | | | |
| HP Enterprise Services, | | | | | |
| Sr. Unscd. Notes, Ser. B | 6.00 | 8/1/13 | 125,000 | a | 134,901 |
| International Business Machines, | | | | | |
| Sr. Unscd. Debs | 5.60 | 11/30/39 | 605,000 | | 764,262 |
| International Business Machines, | | | | | |
| Sr. Unscd. Notes | 5.70 | 9/14/17 | 600,000 | | 728,351 |
| International Business Machines, | | | | | |
| Sr. Unscd. Debs | 7.00 | 10/30/25 | 225,000 | | 313,058 |
| International Business Machines, | | | | | |
| Sr. Unscd. Debs., Ser. A | 7.50 | 6/15/13 | 75,000 | | 83,007 |
| International Business Machines, | | | | | |
| Sr. Unscd. Notes | 8.38 | 11/1/19 | 300,000 | | 421,683 |
| Microsoft, | | | | | |
| Sr. Unscd. Debs | 5.20 | 6/1/39 | 688,000 | | 837,471 |
| Oracle, | | | | | |
| Sr. Unscd. Notes | 5.00 | 7/8/19 | 1,200,000 | | 1,402,030 |
| Oracle, | | | | | |
| Sr. Unscd. Notes | 5.75 | 4/15/18 | 150,000 | | 180,157 |
| Oracle, | | | | | |
| Sr. Unscd. Notes | 6.50 | 4/15/38 | 500,000 | | 677,070 |
| | | | | | 9,193,442 |
| Telecommunications—1.3% | | | | | |
| America Movil SAB de CV, | | | | | |
| Gtd. Notes | 6.38 | 3/1/35 | 100,000 | | 120,096 |
| AT&T, | | | | | |
| Sr. Unscd. Notes | 5.10 | 9/15/14 | 250,000 | | 277,975 |
| AT&T, | | | | | |
| Sr. Unscd. Notes | 5.35 | 9/1/40 | 1,500,000 | | 1,643,916 |
| AT&T, | | | | | |
| Sr. Unscd. Notes | 5.88 | 8/15/12 | 775,000 | | 806,041 |
| AT&T, | | | | | |
| Sr. Unscd. Notes | 6.30 | 1/15/38 | 1,500,000 | | 1,808,885 |
| AT&T, | | | | | |
| Gtd. Notes | 8.00 | 11/15/31 | 470,000 | a | 671,738 |
| BellSouth Telecommunications, | | | | | |
| Sr. Unscd. Debs | 6.38 | 6/1/28 | 550,000 | | 634,114 |
| BellSouth, | | | | | |
| Sr. Unscd. Bonds | 6.55 | 6/15/34 | 100,000 | | 119,231 |
STATEMENT OF INVESTMENTS (continued)
| | | | | |
| | Coupon | Maturity | Principal | | |
| Bonds and Notes (continued) | Rate (%) | Date | Amount ($) | | Value ($) |
| Telecommunications (continued) | | | | | |
| British Telecommunications, | | | | | |
| Sr. Unscd. Notes | 5.95 | 1/15/18 | 580,000 | | 644,885 |
| British Telecommunications, | | | | | |
| Sr. Unscd. Notes | 9.88 | 12/15/30 | 175,000 | a | 256,839 |
| Cellco Partnership/Verizon | | | | | |
| Wireless Capital, Sr. Unscd. Notes | 8.50 | 11/15/18 | 850,000 | | 1,150,874 |
| Cisco Systems, | | | | | |
| Sr. Unscd. Notes | 5.50 | 2/22/16 | 500,000 | | 580,644 |
| Cisco Systems, | | | | | |
| Sr. Unscd. Notes | 5.90 | 2/15/39 | 1,630,000 | | 2,044,558 |
| Deutsche Telekom International | | | | | |
| Finance, Gtd. Bonds | 8.75 | 6/15/30 | 900,000 | a | 1,271,807 |
| Embarq, | | | | | |
| Sr. Unscd. Notes | 8.00 | 6/1/36 | 150,000 | | 159,035 |
| France Telecom, | | | | | |
| Sr. Unscd. Notes | 8.50 | 3/1/31 | 220,000 | a | 321,902 |
| GTE, | | | | | |
| Gtd. Debs | 6.94 | 4/15/28 | 100,000 | b | 124,723 |
| KPN, | | | | | |
| Sr. Unscd. Bonds | 8.38 | 10/1/30 | 250,000 | | 321,416 |
| Motorola Solutions, | | | | | |
| Sr. Unscd. Debs | 7.50 | 5/15/25 | 1,450,000 | | 1,693,836 |
| New Cingular Wireless Services, | | | | | |
| Gtd. Notes | 8.13 | 5/1/12 | 250,000 | | 259,251 |
| New Cingular Wireless Services, | | | | | |
| Sr. Unscd. Notes | 8.75 | 3/1/31 | 720,000 | | 1,068,872 |
| Pacific-Bell Telephone, | | | | | |
| Gtd. Bonds | 7.13 | 3/15/26 | 310,000 | | 387,864 |
| Qwest, | | | | | |
| Sr. Unscd. Debs | 6.88 | 9/15/33 | 330,000 | | 329,588 |
| Rogers Communications, | | | | | |
| Gtd. Notes | 6.38 | 3/1/14 | 760,000 | | 846,799 |
| Telecom Italia Capital, | | | | | |
| Gtd. Notes | 4.95 | 9/30/14 | 3,000,000 | | 2,956,689 |
| Telecom Italia Capital, | | | | | |
| Gtd. Notes | 5.25 | 11/15/13 | 900,000 | | 905,369 |
| Telecom Italia Capital, | | | | | |
| Gtd. Notes | 5.25 | 10/1/15 | 100,000 | | 97,465 |
| Telecom Italia Capital, | | | | | |
| Gtd. Notes | 6.38 | 11/15/33 | 200,000 | | 178,751 |
40
| | | | |
| | Coupon | Maturity | Principal | |
| Bonds and Notes (continued) | Rate (%) | Date | Amount ($) | Value ($) |
| Telecommunications (continued) | | | | |
| Telefonica Emisiones, | | | | |
| Gtd. Debs | 7.05 | 6/20/36 | 1,145,000 | 1,257,616 |
| Verizon Communications, | | | | |
| Sr. Unscd. Debs | 5.50 | 2/15/18 | 1,500,000 | 1,743,053 |
| Verizon Communications, | | | | |
| Sr. Unscd. Notes | 5.85 | 9/15/35 | 560,000 | 672,102 |
| Verizon Communications, | | | | |
| Sr. Unscd. Notes | 7.75 | 12/1/30 | 690,000 | 968,876 |
| Verizon Communications, | | | | |
| Sr. Unscd. Notes | 8.95 | 3/1/39 | 1,000,000 | 1,594,296 |
| Verizon Global Funding, | | | | |
| Sr. Unscd. Notes | 7.38 | 9/1/12 | 500,000 | 526,902 |
| Verizon New Jersery, | | | | |
| Sr. Unscd. Debs | 8.00 | 6/1/22 | 25,000 | 31,455 |
| Vodafone Group, | | | | |
| Sr. Unscd. Notes | 5.63 | 2/27/17 | 555,000 | 652,760 |
| Vodafone Group, | | | | |
| Sr. Unscd. Bonds | 6.15 | 2/27/37 | 1,000,000 | 1,264,428 |
| Vodafone Group, | | | | |
| Sr. Unscd. Notes | 7.88 | 2/15/30 | 125,000 | 181,048 |
| | | | | 30,575,699 |
| Transportation—.3% | | | | |
| Burlington Northern Santa Fe, | | | | |
| Sr. Unscd. Debs | 7.00 | 12/15/25 | 100,000 | 134,707 |
| Burlington Northern Santa Fe, | | | | |
| Sr. Unscd. Debs | 7.95 | 8/15/30 | 100,000 | 142,043 |
| Canadian | | | | |
| National Railway, | | | | |
| Sr. Unscd. Notes | 6.90 | 7/15/28 | 100,000 | 132,943 |
| CSX, | | | | |
| Sr. Unscd. Notes | 6.15 | 5/1/37 | 1,100,000 | 1,343,785 |
| Federal Express, | | | | |
| Sr. Unscd. Notes | 9.65 | 6/15/12 | 225,000 | 236,709 |
| Norfolk Southern, | | | | |
| Sr. Unscd. Notes | 5.59 | 5/17/25 | 10,000 | 11,593 |
| Norfolk Southern, | | | | |
| Sr. Unscd. Notes | 7.05 | 5/1/37 | 825,000 | 1,111,903 |
| Norfolk Southern, | | | | |
| Sr. Unscd. Notes | 7.80 | 5/15/27 | 250,000 | 351,003 |
STATEMENT OF INVESTMENTS (continued)
| | | | | |
| | Coupon | Maturity | Principal | | |
| Bonds and Notes (continued) | Rate (%) | Date | Amount ($) | | Value ($) |
| Transportation (continued) | | | | | |
| Union Pacific, | | | | | |
| Sr. Unscd. Debs | 6.63 | 2/1/29 | 325,000 | | 413,741 |
| United Parcel Service of America, | | | | | |
| Sr. Unscd. Debs | 8.38 | 4/1/30 | 10,000 | a | 14,711 |
| United Parcel Service, | | | | | |
| Sr. Unscd. Notes | 3.13 | 1/15/21 | 1,600,000 | | 1,668,301 |
| United Parcel Service, | | | | | |
| Sr. Unscd. Notes | 6.20 | 1/15/38 | 425,000 | | 566,985 |
| | | | | | 6,128,424 |
| U.S. Government Agencies—6.0% | | | | | |
| Federal Farm Credit Banks, | | | | | |
| Bonds | 5.13 | 8/25/16 | 2,700,000 | | 3,191,627 |
| Federal Home Loan Banks, | | | | | |
| Bonds | 3.63 | 10/18/13 | 8,000,000 | | 8,497,768 |
| Federal Home Loan Banks, | | | | | |
| Bonds, Ser. 421 | 3.88 | 6/14/13 | 2,500,000 | b | 2,641,578 |
| Federal Home Loan Banks, | | | | | |
| Bonds, Ser. 363 | 4.50 | 11/15/12 | 6,800,000 | b | 7,089,585 |
| Federal Home Loan Banks, | | | | | |
| Bonds | 4.75 | 12/16/16 | 1,000,000 | | 1,166,327 |
| Federal Home Loan Banks, | | | | | |
| Bonds, Ser. 1 | 4.88 | 5/17/17 | 2,000,000 | b | 2,363,116 |
| Federal Home Loan Banks, | | | | | |
| Bonds | 5.00 | 11/17/17 | 2,600,000 | b | 3,109,428 |
| Federal Home Loan Banks, | | | | | |
| Bonds | 5.13 | 8/14/13 | 1,260,000 | b | 1,367,000 |
| Federal Home Loan Banks, | | | | | |
| Bonds, Ser. 656 | 5.38 | 5/18/16 | 320,000 | | 380,311 |
| Federal Home Loan Banks, | | | | | |
| Bonds | 5.50 | 8/13/14 | 300,000 | | 340,215 |
| Federal Home Loan Banks, | | | | | |
| Bonds | 5.50 | 7/15/36 | 480,000 | | 566,112 |
| Federal Home Loan Banks, | | | | | |
| Bonds | 5.63 | 6/11/21 | 1,200,000 | | 1,493,148 |
| Federal Home Loan Mortgage Corp., | | | | | |
| Notes | 1.38 | 2/25/14 | 9,000,000 | d | 9,182,322 |
| Federal Home Loan Mortgage Corp., | | | | | |
| Notes | 2.50 | 4/23/14 | 4,800,000 | d | 5,030,342 |
42
| | | | | |
| | Coupon | Maturity | Principal | | |
| Bonds and Notes (continued) | Rate (%) | Date | Amount ($) | | Value ($) |
| U.S. Government Agencies (continued) | | | | | |
| Federal Home Loan Mortgage Corp., | | | | | |
| Notes | 2.88 | 2/9/15 | 5,500,000 | d | 5,865,508 |
| Federal Home Loan Mortgage Corp., | | | | | |
| Notes | 4.13 | 9/27/13 | 3,800,000 | d | 4,070,184 |
| Federal Home Loan Mortgage Corp., | | | | | |
| Notes | 4.38 | 7/17/15 | 1,985,000 | d | 2,236,091 |
| Federal Home Loan Mortgage Corp., | | | | | |
| Notes | 4.50 | 1/15/13 | 3,200,000 | d | 3,362,621 |
| Federal Home Loan Mortgage Corp., | | | | | |
| Notes | 4.50 | 1/15/14 | 1,400,000 | d | 1,523,441 |
| Federal Home Loan Mortgage Corp., | | | | | |
| Notes | 4.50 | 10/1/40 | 11,500,000 | d | 12,150,693 |
| Federal Home Loan Mortgage Corp., | | | | | |
| Notes | 4.88 | 11/15/13 | 1,000,000 | b,d | 1,091,433 |
| Federal Home Loan Mortgage Corp., | | | | | |
| Notes | 4.88 | 6/13/18 | 1,250,000 | b,d | 1,487,451 |
| Federal Home Loan Mortgage Corp., | | | | | |
| Notes | 5.00 | 2/16/17 | 825,000 | d | 976,032 |
| Federal Home Loan Mortgage Corp., | | | | | |
| Notes | 5.13 | 7/15/12 | 1,125,000 | d | 1,164,617 |
| Federal Home Loan Mortgage Corp., | | | | | |
| Notes | 5.13 | 10/18/16 | 750,000 | d | 888,489 |
| Federal Home Loan Mortgage Corp., | | | | | |
| Notes | 5.13 | 11/17/17 | 650,000 | d | 782,279 |
| Federal Home Loan Mortgage Corp., | | | | | |
| Notes | 5.25 | 4/18/16 | 2,100,000 | d | 2,476,200 |
| Federal Home Loan Mortgage Corp., | | | | | |
| Notes | 6.25 | 7/15/32 | 1,000,000 | d | 1,404,056 |
| Federal Home Loan Mortgage Corp., | | | | | |
| Bonds | 6.75 | 9/15/29 | 400,000 | b,d | 574,383 |
| Federal National Mortgage | | | | | |
| Association, Notes | 0.00 | 6/1/17 | 2,400,000 | d | 2,188,685 |
| Federal National Mortgage | | | | | |
| Association, Notes | 1.63 | 10/26/15 | 5,700,000 | d | 5,852,019 |
| Federal National Mortgage | | | | | |
| Association, Notes | 2.63 | 11/20/14 | 6,800,000 | d | 7,208,714 |
| Federal National Mortgage | | | | | |
| Association, Notes | 2.75 | 3/13/14 | 4,500,000 | d | 4,742,856 |
STATEMENT OF INVESTMENTS (continued)
| | | | | |
| | Coupon | Maturity | Principal | | |
| Bonds and Notes (continued) | Rate (%) | Date | Amount ($) | | Value ($) |
| U.S. Government Agencies (continued) | | | | | |
| Federal National Mortgage | | | | | |
| Association, Notes | 4.38 | 3/15/13 | 7,605,000 | d | 8,029,891 |
| Federal National Mortgage | | | | | |
| Association, Notes | 4.38 | 10/15/15 | 850,000 | d | 961,533 |
| Federal National Mortgage | | | | | |
| Association, Notes | 4.63 | 10/15/13 | 1,400,000 | d | 1,516,039 |
| Federal National Mortgage | | | | | |
| Association, Notes | 4.63 | 10/15/14 | 1,500,000 | d | 1,675,446 |
| Federal National Mortgage | | | | | |
| Association, Notes | 5.00 | 4/15/15 | 200,000 | d | 228,279 |
| Federal National Mortgage | | | | | |
| Association, Notes | 5.00 | 3/15/16 | 6,240,000 | d | 7,281,331 |
| Federal National Mortgage | | | | | |
| Association, Bonds | 5.00 | 5/11/17 | 1,200,000 | d | 1,421,436 |
| Federal National Mortgage | | | | | |
| Association, Sub. Notes | 5.13 | 1/2/14 | 365,000 | d | 397,334 |
| Federal National Mortgage | | | | | |
| Association, Sr. Sub. Notes | 5.25 | 8/1/12 | 1,000,000 | d | 1,035,992 |
| Federal National Mortgage | | | | | |
| Association, Notes | 5.25 | 9/15/16 | 1,225,000 | d | 1,458,268 |
| Federal National Mortgage | | | | | |
| Association, Notes | 6.00 | 4/18/36 | 1,300,000 | d | 1,500,203 |
| Federal National Mortgage | | | | | |
| Association, Bonds | 6.25 | 5/15/29 | 1,340,000 | d | 1,831,686 |
| Financing (FICO), | | | | | |
| Scd. Bonds | 8.60 | 9/26/19 | 40,000 | | 58,032 |
| Financing (FICO), | | | | | |
| Scd. Bonds, Ser. E | 9.65 | 11/2/18 | 510,000 | | 758,032 |
| Tennessee Valley Authority, | | | | | |
| Notes, Ser. C | 4.75 | 8/1/13 | 750,000 | | 805,739 |
| Tennessee Valley Authority, | | | | | |
| Notes | 5.25 | 9/15/39 | 1,200,000 | | 1,477,031 |
| Tennessee Valley Authority, | | | | | |
| Bonds | 5.88 | 4/1/36 | 650,000 | | 853,154 |
| Tennessee Valley Authority, | | | | | |
| Bonds, Ser. C | 6.00 | 3/15/13 | 1,750,000 | | 1,885,007 |
| Tennessee Valley Authority, | | | | | |
| Bonds | 6.15 | 1/15/38 | 165,000 | | 227,401 |
| | | | | | 139,866,465 |
44
| | | | |
| | Principal | |
| Bonds and Notes (continued) | Amount ($) | Value ($) |
| U.S. Government Agencies/ | | |
| Mortgage-Backed—31.9% | | |
| Federal Home Loan Mortgage Corp.: | | |
| 2.25%, 2/1/35 | 531,760a,d | 546,507 |
| 2.50%, 4/1/33 | 17,844a,d | 18,673 |
| 2.50%, 2/1/34 | 295,723a,d | 310,557 |
| 2.51%, 12/1/34 | 32,789a,d | 34,212 |
| 2.54%, 8/1/35 | 311,671a,d | 328,894 |
| 2.80%, 3/1/36 | 11,477a,d | 12,042 |
| 3.50%, 6/1/19—5/1/26 | 12,496,465d | 12,983,169 |
| 4.00%, 8/1/18—1/1/41 | 36,315,683d | 37,839,299 |
| 4.02%, 6/1/36 | 9,225a,d | 9,285 |
| 4.50%, 2/1/18—4/1/41 | 53,986,240d | 57,104,337 |
| 4.68%, 6/1/34 | 19,234a,d | 20,398 |
| 5.00%, 12/1/17—1/1/40 | 32,562,056d | 35,016,149 |
| 5.01%, 6/1/35 | 9,433a,d | 9,966 |
| 5.03%, 12/1/34 | 43,590a,d | 45,073 |
| 5.15%, 8/1/34 | 12,475a,d | 13,359 |
| 5.23%, 11/1/33 | 11,733a,d | 12,539 |
| 5.34%, 3/1/37 | 158,131a,d | 167,993 |
| 5.49%, 2/1/37 | 506,402a,d | 536,471 |
| 5.50%, 8/1/16—1/1/40 | 39,808,097d | 43,099,779 |
| 5.62%, 4/1/36 | 395,945a,d | 423,133 |
| 5.82%, 8/1/37 | 118,489a,d | 125,924 |
| 6.00%, 12/1/13—10/1/38 | 18,147,373d | 19,869,186 |
| 6.50%, 12/1/12—3/1/39 | 9,616,725d | 10,707,097 |
| 7.00%, 12/1/12—7/1/37 | 318,063d | 366,356 |
| 7.50%, 8/1/16—11/1/33 | 127,884d | 148,744 |
| 8.00%, 2/1/17—10/1/31 | 67,789d | 80,110 |
| 8.50%, 10/1/18—6/1/30 | 2,563d | 2,983 |
| Federal National Mortgage Association: | | |
| 4.50% | 22,000,000d,e | 23,268,439 |
| 2.33%, 12/1/35 | 16,882a,d | 17,704 |
| 2.38%, 3/1/34 | 357,246a,d | 375,002 |
| 2.38%, 6/1/34 | 260,358a,d | 273,205 |
| 2.39%, 9/1/33 | 13,481a,d | 14,098 |
| 2.43%, 10/1/34 | 24,142a,d | 25,365 |
| 2.46%, 1/1/35 | 389,353a,d | 408,260 |
| 2.53%, 11/1/32 | 16,834a,d | 17,351 |
| 2.55%, 8/1/35 | 93,838a,d | 99,346 |
| 2.56%, 9/1/33 | 30,453a,d | 32,098 |
| 2.56%, 6/1/34 | 82,466a,d | 87,167 |
| 2.65%, 9/1/35 | 604,713a,d | 641,274 |
STATEMENT OF INVESTMENTS (continued)
| | | | |
| | Principal | |
| Bonds and Notes (continued) | Amount ($) | Value ($) |
| U.S. Government Agencies/ | | |
| Mortgage-Backed (continued) | | |
| Federal National Mortgage Association (continued): | | |
| 3.50%, 1/20/25—1/1/41 | 15,930,738d | 16,386,520 |
| 4.00%, 9/1/18—10/1/41 | 70,683,244d | 73,983,132 |
| 4.50%, 4/1/18—9/1/40 | 94,201,452d | 100,042,631 |
| 4.74%, 11/1/36 | 229,871a,d | 242,221 |
| 4.78%, 5/1/33 | 6,905a,d | 7,287 |
| 4.97%, 1/1/35 | 18,525a,d | 19,764 |
| 5.00%, 11/1/17—6/1/40 | 63,565,368d | 68,482,647 |
| 5.21%, 6/1/35 | 70,188a,d | 75,013 |
| 5.27%, 11/1/35 | 13,409a,d | 14,412 |
| 5.38%, 2/1/37 | 393,294a,d | 417,264 |
| 5.50%, 2/1/14—12/1/38 | 46,686,747d | 50,760,538 |
| 5.66%, 3/1/37 | 77,219a,d | 82,077 |
| 5.94%, 11/1/36 | 49,162a,d | 52,347 |
| 5.96%, 2/1/37 | 5,067a,d | 5,419 |
| 5.99%, 12/1/36 | 36,335a,d | 38,034 |
| 6.00%, 3/1/14—11/1/38 | 28,338,122d | 31,171,363 |
| 6.50%, 12/1/12—9/1/38 | 7,479,613d | 8,316,838 |
| 7.00%, 3/1/14—3/1/38 | 1,122,198d | 1,283,084 |
| 7.50%, 8/1/15—6/1/31 | 136,221d | 158,482 |
| 8.00%, 2/1/13—8/1/30 | 43,413d | 49,491 |
| 8.50%, 9/1/15—7/1/30 | 19,227d | 21,379 |
| 9.00%, 4/1/16—10/1/30 | 3,082d | 3,653 |
| Government National Mortgage Association I: | | |
| 4.00% | 8,000,000e | 8,535,000 |
| 4.00%, 2/15/41 | 13,988,820 | 14,957,806 |
| 4.50%, 1/15/19—2/15/41 | 34,236,087 | 37,343,779 |
| 5.00%, 1/15/17—4/15/40 | 48,049,180 | 52,894,335 |
| 5.50%, 9/15/20—11/15/38 | 14,614,187 | 16,247,240 |
| 6.00%, 10/15/13—4/15/39 | 11,026,701 | 12,337,172 |
| 6.50%, 2/15/24—2/15/39 | 2,606,890 | 2,939,615 |
| 7.00%, 2/15/22—8/15/32 | 182,736 | 213,442 |
| 7.50%, 10/15/14—10/15/32 | 123,798 | 143,965 |
| 8.00%, 2/15/17—3/15/32 | 32,109 | 37,338 |
| 8.25%, 6/15/27 | 3,528 | 4,202 |
| 8.50%, 10/15/26 | 11,147 | 12,466 |
| 9.00%, 2/15/22—2/15/23 | 10,850 | 12,947 |
| Government National Mortgage Association II: | | |
| 3.50%, 5/20/34 | 26,802 | 27,858 |
| 6.50%, 2/20/28 | 1,550 | 1,768 |
| 8.50%, 7/20/25 | 1,126 | 1,340 |
| | | 742,415,413 |
46
| | | |
| | Principal | |
| Bonds and Notes (continued) | Amount ($) | Value ($) |
| U.S. Government Securities—33.8% | | |
| U.S. Treasury Bonds: | | |
| 3.50%, 2/15/39 | 2,500,000 | 2,644,533 |
| 3.75%, 8/15/41 | 4,500,000b | 4,973,202 |
| 3.88%, 8/15/40 | 5,600,000b | 6,317,500 |
| 4.25%, 5/15/39 | 5,200,000 | 6,237,561 |
| 4.25%, 11/15/40 | 7,200,000b | 8,651,254 |
| 4.38%, 2/15/38 | 2,000,000 | 2,442,812 |
| 4.38%, 11/15/39 | 6,200,000b | 7,590,158 |
| 4.38%, 5/15/40 | 5,475,000b | 6,707,729 |
| 4.38%, 5/15/41 | 6,300,000b | 7,734,233 |
| 4.50%, 2/15/36 | 3,800,000b | 4,712,593 |
| 4.50%, 5/15/38 | 2,900,000 | 3,611,860 |
| 4.50%, 8/15/39 | 5,600,000 | 6,985,126 |
| 4.63%, 2/15/40 | 6,300,000 | 8,019,705 |
| 4.75%, 2/15/37 | 1,800,000 | 2,316,375 |
| 4.75%, 2/15/41 | 5,100,000b | 6,630,796 |
| 5.00%, 5/15/37 | 2,055,000 | 2,740,856 |
| 5.25%, 11/15/28 | 1,440,000 | 1,902,825 |
| 5.25%, 2/15/29 | 1,200,000 | 1,587,937 |
| 5.38%, 2/15/31 | 1,405,000 | 1,911,240 |
| 5.50%, 8/15/28 | 2,175,000 | 2,946,786 |
| 6.00%, 2/15/26 | 1,600,000b | 2,229,750 |
| 6.13%, 11/15/27 | 2,700,000 | 3,863,954 |
| 6.13%, 8/15/29 | 1,350,000 | 1,961,298 |
| 6.25%, 8/15/23 | 2,610,000b | 3,634,018 |
| 6.25%, 5/15/30 | 1,400,000 | 2,074,188 |
| 6.38%, 8/15/27 | 1,300,000 | 1,899,828 |
| 6.50%, 11/15/26 | 770,000 | 1,128,170 |
| 6.63%, 2/15/27 | 800,000 | 1,188,375 |
| 6.88%, 8/15/25 | 1,000,000 | 1,493,281 |
| 7.13%, 2/15/23 | 1,575,000 | 2,322,879 |
| 7.25%, 5/15/16 | 2,300,000 | 2,957,296 |
| 7.25%, 8/15/22 | 870,000 | 1,285,561 |
| 7.50%, 11/15/24 | 1,900,000b | 2,948,266 |
| 7.63%, 2/15/25 | 660,000 | 1,036,922 |
| 7.88%, 2/15/21 | 805,000 | 1,204,859 |
| 8.00%, 11/15/21 | 2,670,000b | 4,084,683 |
| 8.13%, 8/15/19 | 2,050,000 | 3,011,899 |
| 8.13%, 5/15/21 | 1,500,000 | 2,287,853 |
| 8.75%, 5/15/17 | 775,000 | 1,091,902 |
| 8.75%, 5/15/20 | 775,000 | 1,196,770 |
| 8.75%, 8/15/20 | 2,000,000 | 3,105,312 |
| 8.88%, 8/15/17 | 2,725,000 | 3,895,259 |
STATEMENT OF INVESTMENTS (continued)
| | | |
| | Principal | |
| Bonds and Notes (continued) | Amount ($) | Value ($) |
| U.S. Government Securities (continued) | | |
| U.S. Treasury Bonds (continued): | | |
| 8.88%, 2/15/19 | 1,000,000b | 1,502,344 |
| 9.00%, 11/15/18 | 660,000b | 989,949 |
| U.S. Treasury Notes: | | |
| 0.13%, 8/31/13 | 23,000,000b | 22,951,493 |
| 0.50%, 11/15/13 | 7,700,000 | 7,734,288 |
| 0.63%, 7/15/14 | 15,300,000b | 15,402,770 |
| 0.75%, 12/15/13 | 15,600,000b | 15,753,566 |
| 1.00%, 7/15/13 | 11,200,000 | 11,346,574 |
| 1.00%, 8/31/16 | 3,600,000b | 3,607,333 |
| 1.13%, 12/15/12 | 9,500,000b | 9,601,679 |
| 1.25%, 8/31/15 | 10,000,000b | 10,235,940 |
| 1.38%, 1/15/13 | 7,300,000b | 7,405,792 |
| 1.38%, 2/15/13 | 6,700,000 | 6,802,336 |
| 1.38%, 3/15/13 | 7,000,000b | 7,113,722 |
| 1.38%, 5/15/13 | 26,300,000b | 26,769,613 |
| 1.38%, 11/30/15 | 4,100,000 | 4,206,985 |
| 1.50%, 12/31/13 | 6,800,000 | 6,976,909 |
| 1.50%, 8/31/18 | 10,400,000 | 10,354,500 |
| 1.75%, 4/15/13 | 11,000,000 | 11,247,456 |
| 1.75%, 1/31/14 | 4,900,000 | 5,058,868 |
| 1.75%, 3/31/14 | 3,200,000b | 3,309,750 |
| 1.75%, 5/31/16 | 9,100,000b | 9,456,875 |
| 1.88%, 2/28/14 | 2,900,000 | 3,005,577 |
| 1.88%, 4/30/14 | 8,915,000 | 9,254,189 |
| 1.88%, 8/31/17 | 3,800,000 | 3,927,657 |
| 1.88%, 9/30/17 | 5,570,000b | 5,750,156 |
| 2.00%, 4/30/16 | 9,100,000 | 9,564,974 |
| 2.13%, 11/30/14 | 2,650,000 | 2,785,399 |
| 2.13%, 5/31/15 | 8,700,000b | 9,180,553 |
| 2.13%, 8/15/21 | 11,600,000b | 11,551,118 |
| 2.25%, 5/31/14 | 3,500,000b | 3,670,079 |
| 2.25%, 1/31/15 | 17,000,000 | 17,966,875 |
| 2.25%, 3/31/16 | 18,390,000b | 19,536,543 |
| 2.38%, 8/31/14 | 5,500,000b | 5,804,651 |
| 2.38%, 10/31/14 | 13,000,000 | 13,750,555 |
| 2.38%, 2/28/15 | 8,500,000b | 9,025,275 |
| 2.38%, 3/31/16 | 4,000,000b | 4,268,440 |
48
| | | |
| | Principal | |
| Bonds and Notes (continued) | Amount ($) | Value ($) |
| U.S. Government Securities (continued) | | |
| U.S. Treasury Notes (continued): | | |
| 2.50%, 3/31/13 | 2,600,000 | 2,684,297 |
| 2.50%, 3/31/15 | 6,500,000b | 6,936,189 |
| 2.50%, 4/30/15 | 8,650,000 | 9,234,550 |
| 2.50%, 6/30/17 | 7,300,000 | 7,812,139 |
| 2.63%, 6/30/14 | 9,000,000 | 9,538,596 |
| 2.63%, 7/31/14 | 5,000,000 | 5,305,860 |
| 2.63%, 12/31/14 | 4,400,000 | 4,697,343 |
| 2.63%, 2/29/16 | 300,000 | 323,297 |
| 2.63%, 8/15/20 | 9,800,000b | 10,312,207 |
| 2.63%, 11/15/20 | 5,200,000b | 5,455,533 |
| 2.75%, 5/31/17 | 6,400,000 | 6,939,501 |
| 2.75%, 2/28/18 | 3,000,000 | 3,246,093 |
| 2.75%, 2/15/19 | 8,200,000b | 8,809,235 |
| 2.88%, 1/31/13 | 3,495,000 | 3,612,684 |
| 2.88%, 3/31/18 | 2,200,000b | 2,395,593 |
| 3.00%, 8/31/16 | 5,700,000 | 6,249,965 |
| 3.00%, 9/30/16 | 5,500,000b | 6,034,105 |
| 3.00%, 2/28/17 | 9,500,000 | 10,424,768 |
| 3.13%, 4/30/13 | 6,600,000 | 6,888,493 |
| 3.13%, 9/30/13 | 3,000,000 | 3,164,064 |
| 3.13%, 10/31/16 | 5,000,000b | 5,513,675 |
| 3.13%, 1/31/17 | 5,800,000 | 6,402,202 |
| 3.13%, 4/30/17 | 6,600,000 | 7,290,426 |
| 3.13%, 5/15/19 | 7,900,000b | 8,688,151 |
| 3.13%, 5/15/21 | 8,500,000b | 9,241,761 |
| 3.25%, 5/31/16 | 2,500,000 | 2,767,775 |
| 3.25%, 6/30/16 | 4,600,000b | 5,097,734 |
| 3.25%, 7/31/16 | 2,500,000 | 2,770,313 |
| 3.25%, 12/31/16 | 4,700,000 | 5,216,633 |
| 3.25%, 3/31/17 | 3,000,000 | 3,332,343 |
| 3.38%, 11/30/12 | 790,000 | 817,311 |
| 3.38%, 6/30/13 | 3,425,000 | 3,604,278 |
| 3.38%, 7/31/13 | 6,500,000b | 6,855,472 |
| 3.38%, 11/15/19 | 11,000,000b | 12,289,926 |
| 3.50%, 5/31/13 | 2,370,000 | 2,492,389 |
| 3.50%, 5/15/20 | 9,100,000b | 10,250,295 |
| 3.63%, 5/15/13 | 2,700,000 | 2,841,118 |
STATEMENT OF INVESTMENTS (continued)
| | | |
| | Principal | |
| Bonds and Notes (continued) | Amount ($) | Value ($) |
| U.S. Government Securities (continued) | | |
| U.S. Treasury Notes (continued): | | |
| 3.63%, 8/15/19 | 9,400,000 | 10,673,409 |
| 3.63%, 2/15/20 | 7,700,000b | 8,749,726 |
| 3.63%, 2/15/21 | 8,700,000b | 9,853,429 |
| 3.75%, 11/15/18 | 5,000,000 | 5,721,095 |
| 3.88%, 2/15/13 | 1,150,000 | 1,204,580 |
| 4.00%, 2/15/14 | 2,700,000 | 2,926,760 |
| 4.00%, 2/15/15 | 3,600,000 | 4,009,781 |
| 4.00%, 8/15/18 | 3,500,000b | 4,060,000 |
| 4.13%, 8/31/12 | 1,200,000 | 1,239,703 |
| 4.13%, 5/15/15 | 2,000,000 | 2,250,312 |
| 4.25%, 9/30/12 | 800,000 | 829,844 |
| 4.25%, 8/15/13 | 2,800,000b | 2,999,500 |
| 4.25%, 11/15/13 | 3,921,000b | 4,236,825 |
| 4.25%, 8/15/14 | 2,700,000 | 2,989,197 |
| 4.25%, 11/15/14 | 7,400,000b | 8,247,529 |
| 4.25%, 8/15/15 | 1,305,000 | 1,481,277 |
| 4.25%, 11/15/17 | 2,530,000 | 2,962,868 |
| 4.38%, 8/15/12 | 225,000 | 232,506 |
| 4.50%, 11/15/15 | 3,800,000 | 4,370,893 |
| 4.50%, 2/15/16 | 425,000 | 491,340 |
| 4.50%, 5/15/17 | 1,800,000 | 2,122,735 |
| 4.63%, 11/15/16 | 2,000,000b | 2,355,470 |
| 4.63%, 2/15/17 | 2,252,000 | 2,661,583 |
| 4.75%, 5/15/14 | 2,400,000 | 2,666,626 |
| 4.75%, 8/15/17 | 2,300,000b | 2,752,454 |
| 4.88%, 8/15/16 | 2,530,000 | 2,998,445 |
| 5.13%, 5/15/16 | 1,350,000 | 1,607,238 |
| | | 785,669,626 |
| Total Bonds and Notes | | |
| (cost $2,139,376,594) | | 2,293,714,522 |
| |
| |
| Other Investment—2.1% | Shares | Value ($) |
| Registered Investment Company; | | |
| Dreyfus Institutional Preferred | | |
| Plus Money Market Fund | | |
| (cost $49,544,765) | 49,544,765f | 49,544,765 |
50
| | | | |
| Investment of Cash Collateral | | |
| for Securities Loaned—1.5% | Shares | Value ($) |
| Registered Investment Company; | | |
| Dreyfus Institutional Cash | | |
| Advantage Fund | | |
| (cost $35,341,432) | 35,341,432f | 35,341,432 |
| |
| Total Investments (cost $2,224,262,791) | 102.4% | 2,378,600,719 |
| Liabilities, Less Cash and Receivables | (2.4%) | (55,260,553) |
| Net Assets | 100.00% | 2,323,340,166 |
|
| GO—General Obligation |
| a Variable rate security—interest rate subject to periodic change. |
| b Security, or portion thereof, on loan.At October 31, 2011, the value of the fund’s securities on loan was |
| $394,556,702 and the value of the collateral held by the fund was $402,879,696, consisting of cash collateral of |
| $35,341,432 and U.S. Government Agencies securities valued at $367,538,264. |
| c Security exempt from registration under Rule 144A of the Securities Act of 1933.This security may be resold in |
| transactions exempt from registration, normally to qualified institutional buyers.At October 31, 2011, this security |
| was valued at $2,076,582 or .09% of net assets. |
| d The Federal Housing Finance Agency (“FHFA”) placed Federal Home Loan Mortgage Corporation and Federal |
| National Mortgage Association into conservatorship with FHFA as the conservator.As such, the FHFA oversees the |
| continuing affairs of these companies. |
| e Purchased on a forward commitment basis. |
| f Investment in affiliated money market mutual fund. |
| | | |
| Portfolio Summary (Unaudited)†�� | | |
| |
| | Value (%) | | Value (%) |
| U.S. Government & Agencies | 71.7 | Asset/Mortgage-Backed | 2.3 |
| Corporate Bonds | 20.2 | Municipal Bonds | .6 |
| Foreign/Governmental | 4.0 | | |
| Money Market Investments | 3.6 | | 102.4 |
| |
| † Based on net assets. | | | |
| See notes to financial statements. | | | |
|
| STATEMENT OF ASSETS AND LIABILITIES |
| October 31, 2011 |
| | | |
| | Cost | Value |
| Assets ($): | | |
| Investments in securities—See Statement of Investments (including | | |
| securities on loan, valued at $394,556,702)—Note 1(b): | | |
| Unaffiliated issuers | 2,139,376,594 | 2,293,714,522 |
| Affiliated issuers | 84,886,197 | 84,886,197 |
| Cash | | 3,471,485 |
| Dividends, interest and securities lending income receivable | | 16,740,456 |
| Receivable for shares of Capital Stock subscribed | | 4,998,787 |
| | | 2,403,811,447 |
| Liabilities ($): | | |
| Due to The Dreyfus Corporation and affiliates—Note 3(b) | | 479,996 |
| Payable for investment securities purchased | | 43,601,617 |
| Liability for securities on loan—Note 1(b) | | 35,341,432 |
| Payable for shares of Capital Stock redeemed | | 1,048,236 |
| | | 80,471,281 |
| Net Assets ($) | | 2,323,340,166 |
| Composition of Net Assets ($): | | |
| Paid-in capital | | 2,172,418,124 |
| Accumulated undistributed investment income—net | | 1,525,287 |
| Accumulated net realized gain (loss) on investments | | (4,941,173) |
| Accumulated net unrealized appreciation | | |
| (depreciation) on investments | | 154,337,928 |
| Net Assets ($) | | 2,323,340,166 |
| |
| |
| Net Asset Value Per Share | | |
| | Investor Shares | BASIC Shares |
| Net Assets ($) | 896,293,168 | 1,427,046,998 |
| Shares Outstanding | 81,992,130 | 130,476,002 |
| Net Asset Value Per Share ($) | 10.93 | 10.94 |
| |
| See notes to financial statements. | | |
52
|
| STATEMENT OF OPERATIONS |
| Year Ended October 31, 2011 |
| | |
| Investment Income ($): | |
| Income: | |
| Interest | 78,895,914 |
| Income from securities lending—Note 1(b) | 64,673 |
| Cash dividends; | |
| Affiliated issuers | 37,884 |
| Total Income | 78,998,471 |
| Expenses: | |
| Management fee—Note 3(a) | 3,352,295 |
| Distribution fees (Investor Shares)—Note 3(b) | 2,254,800 |
| Directors’ fees—Note 3(a) | 143,999 |
| Loan commitment fees—Note 2 | 30,861 |
| Total Expenses | 5,781,955 |
| Less—Directors’ fees reimbursed by the Manager—Note 3(a) | (143,999) |
| Net Expenses | 5,637,956 |
| Investment Income—Net | 73,360,515 |
| Realized and Unrealized Gain (Loss) on Investments—Note 4 ($): | |
| Net realized gain (loss) on investments | 9,793,037 |
| Net unrealized appreciation (depreciation) on investments | 21,394,406 |
| Net Realized and Unrealized Gain (Loss) on Investments | 31,187,443 |
| Net Increase in Net Assets Resulting from Operations | 104,547,958 |
| |
| See notes to financial statements. | |
STATEMENT OF CHANGES IN NET ASSETS
| | | | |
| | Year Ended October 31, |
| | 2011 | 2010 |
| Operations ($): | | |
| Investment income—net | 73,360,515 | 70,919,421 |
| Net realized gain (loss) on investments | 9,793,037 | 3,584,736 |
| Net unrealized appreciation | | |
| (depreciation) on investments | 21,394,406 | 75,226,188 |
| Net Increase (Decrease) in Net Assets | | |
| Resulting from Operations | 104,547,958 | 149,730,345 |
| Dividends to Shareholders from ($): | | |
| Investment income—net: | | |
| Investor Shares | (29,695,768) | (35,029,544) |
| BASIC Shares | (47,174,400) | (39,687,979) |
| Total Dividends | (76,870,168) | (74,717,523) |
| Capital Stock Transactions ($): | | |
| Net proceeds from shares sold: | | |
| Investor Shares | 352,497,499 | 637,118,965 |
| BASIC Shares | 558,020,830 | 633,660,510 |
| Dividends reinvested: | | |
| Investor Shares | 28,810,677 | 33,949,087 |
| BASIC Shares | 40,741,002 | 33,172,100 |
| Cost of shares redeemed: | | |
| Investor Shares | (488,180,168) | (609,162,406) |
| BASIC Shares | (441,682,777) | (390,045,749) |
| Increase (Decrease) in Net Assets | | |
| from Capital Stock Transactions | 50,207,063 | 338,692,507 |
| Total Increase (Decrease) in Net Assets | 77,884,853 | 413,705,329 |
| Net Assets ($): | | |
| Beginning of Period | 2,245,455,313 | 1,831,749,984 |
| End of Period | 2,323,340,166 | 2,245,455,313 |
| Undistributed investment income—net | 1,525,287 | 807,848 |
54
| | | | |
| | Year Ended October 31, |
| | 2011 | 2010 |
| Capital Share Transactions: | | |
| Investor Shares | | |
| Shares sold | 32,939,071 | 60,707,445 |
| Shares issued for dividends reinvested | 2,696,743 | 3,216,627 |
| Shares redeemed | (45,885,490) | (58,051,333) |
| Net Increase (Decrease) in Shares Outstanding | (10,249,676) | 5,872,739 |
| BASIC Shares | | |
| Shares sold | 52,255,187 | 60,120,317 |
| Shares issued for dividends reinvested | 3,807,512 | 3,134,942 |
| Shares redeemed | (41,213,214) | (37,048,425) |
| Net Increase (Decrease) in Shares Outstanding | 14,849,485 | 26,206,834 |
| |
| See notes to financial statements. | | |
FINANCIAL HIGHLIGHTS
The following tables describe the performance for each share class for the fiscal periods indicated.All information (except portfolio turnover rate) reflects financial results for a single fund share.Total return shows how much your investment in the fund would have increased (or decreased) during each period, assuming you had reinvested all dividends and distributions.These figures have been derived from the fund’s financial statements.
| | | | | | | | | | |
| | | Year Ended October 31, | |
| Investor Shares | 2011 | 2010 | 2009 | 2008 | 2007 |
| Per Share Data ($): | | | | | |
| Net asset value, beginning of period | 10.80 | 10.42 | 9.62 | 10.03 | 10.02 |
| Investment Operations: | | | | | |
| Investment income—neta | .34 | .35 | .39 | .47 | .47 |
| Net realized and unrealized | | | | | |
| gain (loss) on investments | .14 | .39 | .81 | (.41) | .02 |
| Total from Investment Operations | .48 | .74 | 1.20 | .06 | .49 |
| Distributions: | | | | | |
| Dividends from investment income—net | (.35) | (.36) | (.40) | (.47) | (.48) |
| Net asset value, end of period | 10.93 | 10.80 | 10.42 | 9.62 | 10.03 |
| Total Return (%) | 4.58 | 7.28 | 12.70 | .51 | 4.99 |
| Ratios/Supplemental Data (%): | | | | | |
| Ratio of total expenses | | | | | |
| to average net assets | .40 | .41 | .41 | .41 | .41 |
| Ratio of net expenses | | | | | |
| to average net assets | .40 | .40 | .40 | .40 | .40 |
| Ratio of net investment income | | | | | |
| to average net assets | 3.24 | 3.27 | 3.81 | 4.64 | 4.73 |
| Portfolio Turnover Rate | 30.02 | 32.15 | 24.78 | 25.41 | 42.83b |
| Net Assets, end of period ($ x 1,000) | 896,293 | 996,131 | 899,701 | 428,768 | 297,998 |
| |
| a | Based on average shares outstanding at each month end. |
| b | The portfolio turnover rate excluding mortgage dollar roll transactions for the period ended October 31, 2007 |
| | was 41.80%. |
| See notes to financial statements. |
56
| | | | | | | | | | |
| | | Year Ended October 31, | |
| BASIC Shares | 2011 | 2010 | 2009 | 2008 | 2007 |
| Per Share Data ($): | | | | | |
| Net asset value, beginning of period | 10.80 | 10.42 | 9.62 | 10.04 | 10.03 |
| Investment Operations: | | | | | |
| Investment income—neta | .36 | .37 | .41 | .48 | .50 |
| Net realized and unrealized | | | | | |
| gain (loss) on investments | .16 | .40 | .82 | (.40) | .01 |
| Total from Investment Operations | .52 | .77 | 1.23 | .08 | .51 |
| Distributions: | | | | | |
| Dividends from investment income—net | (.38) | (.39) | (.43) | (.50) | (.50) |
| Net asset value, end of period | 10.94 | 10.80 | 10.42 | 9.62 | 10.04 |
| Total Return (%) | 4.94 | 7.55 | 12.99 | .67 | 5.25 |
| Ratios/Supplemental Data (%): | | | | | |
| Ratio of total expenses | | | | | |
| to average net assets | .15 | .16 | .16 | .16 | .16 |
| Ratio of net expenses | | | | | |
| to average net assets | .15 | .15 | .15 | .15 | .15 |
| Ratio of net investment income | | | | | |
| to average net assets | 3.31 | 3.52 | 4.05 | 4.89 | 4.99 |
| Portfolio Turnover Rate | 30.02 | 32.15 | 24.78 | 25.41 | 42.83b |
| Net Assets, end of period | | | | | |
| ($ x 1,000) | 1,427,047 | 1,249,324 | 932,049 | 422,319 | 246,724 |
| |
| a | Based on average shares outstanding at each month end. |
| b | The portfolio turnover rate excluding mortgage dollar roll transactions for the period ended October 31, 2007 |
| was 41.80%. |
| See notes to financial statements. |
NOTES TO FINANCIAL STATEMENTS
NOTE 1—Significant Accounting Policies:
Dreyfus Bond Market Index Fund (the “fund”) is a separate diversified series of The Dreyfus/Laurel Funds, Inc. (the “Company”), which is registered under the Investment Company Act of 1940, as amended (the “Act”), as an open-end management investment company and operates as a series company currently offering ten series, including the fund.The fund’s investment objective seeks to match the total return of the Barclays Capital U.S. Aggregate Index. The Dreyfus Corporation (the “Manager” or “Dreyfus”), a wholly-owned subsidiary of The Bank of New York Mellon Corporation (“BNY Mellon”), serves as the fund’s investment adviser.
MBSC Securities Corporation (the “Distributor”), a wholly-owned subsidiary of the Manager, is the distributor of the fund’s shares. The fund is authorized to issue 500 million shares of $.001 par value Capital Stock in each of the following classes of shares: Investor and BASIC. Investor shares and BASIC shares are offered to any investor. Differences between the two classes include the services offered to and the expenses borne by each class, as well as their minimum purchase and account balance requirements. Income, expenses (other than expenses attributable to a specific class), and realized and unrealized gains or losses on investments are allocated to each class of shares based on its relative net assets.
The Financial Accounting Standards Board (“FASB”) Accounting Standards Codification (“ASC”) is the exclusive reference of authoritative U.S. generally accepted accounting principles (“GAAP”) recognized by the FASB to be applied by nongovernmental entities. Rules and interpretive releases of the Securities and Exchange Commission (“SEC”) under authority of federal laws are also sources of authoritative GAAP for SEC registrants. The fund’s financial statements are prepared in accordance with GAAP, which may require the use of management estimates and assumptions.Actual results could differ from those estimates.
58
(a) Portfolio valuation: The fair value of a financial instrument is the amount that would be received to sell an asset or paid to transfer a liability in an orderly transaction between market participants at the measurement date (i.e. the exit price). GAAP establishes a fair value hierarchy that prioritizes the inputs of valuation techniques used to measure fair value.This hierarchy gives the highest priority to unadjusted quoted prices in active markets for identical assets or liabilities (Level 1 measurements) and the lowest priority to unobservable inputs (Level 3 measurements).
Additionally, GAAP provides guidance on determining whether the volume and activity in a market has decreased significantly and whether such a decrease in activity results in transactions that are not orderly. GAAP requires enhanced disclosures around valuation inputs and techniques used during annual and interim periods.
Various inputs are used in determining the value of the fund’s investments relating to fair value measurements.These inputs are summarized in the three broad levels listed below:
Level 1—unadjusted quoted prices in active markets for identical investments.
Level 2—other significant observable inputs (including quoted prices for similar investments, interest rates, prepayment speeds, credit risk, etc.).
Level 3—significant unobservable inputs (including the fund’s own assumptions in determining the fair value of investments).
The inputs or methodology used for valuing securities are not necessarily an indication of the risk associated with investing in those securities.
Changes in valuation techniques may result in transfers in or out of an assigned level within the disclosure hierarchy. Valuation techniques used to value the fund’s investments are as follows:
NOTES TO FINANCIAL STATEMENTS (continued)
Registered investment companies that are not traded on an exchange are valued at their net asset value and are categorized within Level 1 of the fair value hierarchy.
Investments in securities excluding short-term investments (other than U.S. Treasury Bills), are valued each business day by an independent pricing service (the “Service”) approved by the Board of Directors. Investments for which quoted bid prices are readily available and are representative of the bid side of the market in the judgment of the Service are valued at the mean between the quoted bid prices (as obtained by the Service from dealers in such securities) and asked prices (as calculated by the Service based upon its evaluation of the market for such securities). Other investments (which constitute a majority of the portfolio securities) are valued as determined by the Service, based on methods which include consideration of: yields or prices of securities of comparable quality, coupon, maturity and type; indications as to values from dealers; and general market conditions.These securities are generally categorized within Level 2 of the fair value hierarchy.
When market quotations or official closing prices are not readily available, or are determined not to reflect accurately fair value, such as when the value of a security has been significantly affected by events after the close of the exchange or market on which the security is principally traded (for example, a foreign exchange or market), but before the fund calculates its net asset value, the fund may value these investments at fair value as determined in accordance with the procedures approved by the Board of Directors. Certain factors may be considered when fair valuing investments such as: fundamental analytical data, the nature and duration of restrictions on disposition, an evaluation of the forces that influence the market in which the securities are purchased and sold, and public trading in similar securities of the issuer or comparable issuers.These securities are either categorized as Level 2 or 3 depending on the relevant inputs used.
60
For restricted securities where observable inputs are limited, assumptions about market activity and risk are used and are categorized within Level 3 of the fair value hierarchy.
The following is a summary of the inputs used as of October 31, 2011 in valuing the fund’s investments:
| | | | |
| | | Level 2—Other | Level 3— | |
| | Level 1— | Significant | Significant | |
| | Unadjusted | Observable | Unobservable | |
| | Quoted Prices | Inputs | Inputs | Total |
| Assets ($) | | | | |
| Investments in Securities: | | | |
| Asset-Backed | — | 3,505,098 | — | 3,505,098 |
| Commercial | | | | |
| Mortgage-Backed | — | 51,068,637 | — | 51,068,637 |
| Corporate Bonds† | — | 463,812,294 | — | 463,812,294 |
| Foreign Government | — | 93,526,495 | — | 93,526,495 |
| Municipal Bonds | — | 13,850,494 | — | 13,850,494 |
| Mutual Funds | 84,886,197 | — | — | 84,886,197 |
| U.S. Government | | | | |
| Agencies/ | | | | |
| Mortgage-Backed | — | 882,281,878 | — | 882,281,878 |
| U.S. Treasury | — | 785,669,626 | — | 785,669,626 |
† See Statement of Investments for additional detailed categorizations.
In May 2011, FASB issued Accounting Standards Update (“ASU”) No. 2011-04 “Amendments to Achieve Common Fair Value Measurement and Disclosure Requirements in GAAP and International Financial Reporting Standards (“IFRS”)” (“ASU 2011-04”). ASU 2011-04 includes common requirements for measurement of and disclosure about fair value between GAAP and IFRS. ASU 2011-04 will require reporting entities to disclose the following information for fair value measurements categorized within Level 3 of the fair value hierarchy: quantitative information about the unobservable inputs used in the fair value measurement, the valuation processes used by the reporting entity
NOTES TO FINANCIAL STATEMENTS (continued)
and a narrative description of the sensitivity of the fair value measurement to changes in unobservable inputs and the interrelationships between those unobservable inputs. In addition, ASU 2011-04 will require reporting entities to make disclosures about amounts and reasons for all transfers in and out of Level 1 and Level 2 fair value mea-surements.The new and revised disclosures are effective for interim and annual reporting periods beginning after December 15, 2011. At this time, management is evaluating the implications of ASU 2011-04 and its impact on the financial statements.
(b) Securities transactions and investment income: Securities transactions are recorded on a trade date basis. Realized gains and losses from securities transactions are recorded on the identified cost basis. Interest income, including where applicable, accretion of discount and amortization of premium on investments, is recognized on the accrual basis.
Pursuant to a securities lending agreement with The Bank of New York Mellon, a subsidiary of BNY Mellon and an affiliate of Dreyfus, the fund may lend securities to qualified institutions. It is the fund’s policy that, at origination, all loans are secured by collateral of at least 102% of the value of U.S. securities loaned and 105% of the value of foreign securities loaned. Collateral equivalent to at least 100% of the market value of securities on loan is maintained at all times. Collateral is either in the form of cash, which can be invested in certain money market mutual funds managed by the Manager, U.S. Government and Agency securities or letters of credit.The fund is entitled to receive all income on securities loaned, in addition to income earned as a result of the lending transaction. Although each security loaned is fully collateralized, the fund bears the risk of delay in recovery of, or loss of rights in, the securities loaned should a borrower fail to return the securities in a timely manner. During the period ended October 31, 2011, The Bank of New York Mellon earned $34,824 from lending portfolio securities, pursuant to the securities lending agreement.
(c) Affiliated issuers: Investments in other investment companies advised by Dreyfus are defined as “affiliated” in the Act.
62
The fund may invest in shares of certain affiliated investment companies also advised or managed by Dreyfus. Investments in affiliated investment companies for the period ended October 31, 2011 were as follows:
| | | | | |
| Affiliated | | | | | |
| Investment | | Value | | Value | Net |
| Company | 10/31/2010($) |
Purchases ($) | Sales($) | 10/31/2011 ($) | Assets (%) |
| Dreyfus | | | | | |
| Institutional | | | | | |
| Preferred | | | | | |
| Plus Money | | | | | |
| Market | | | | | |
| Fund | 24,449,000 | 652,116,329 | 627,020,564 | 49,544,765 | 2.1 |
| Dreyfus | | | | | |
| Institutional | | | | | |
| Cash | | | | | |
| Advantage | | | | | |
| Fund+ | 31,631,447 | 202,474,319 | 198,764,334 | 35,341,432 | 1.5 |
| Total | 56,080,447 | 854,590,648 | 825,784,898 | 84,886,197 | 3.6 |
| |
| † | On June 7, 2011, Dreyfus Institutional Cash Advantage Plus Fund was acquired by Dreyfus |
| | Institutional Cash Advantage Fund, resulting in a transfer of shares. |
(d) Dividends to shareholders: It is policy of the fund to declare dividends daily from investment income-net; such dividends are paid monthly. Dividends from net realized capital gains, if any, are normally declared and paid annually, but the fund may make distributions on a more frequent basis to comply with the distribution requirements of the Internal Revenue Code of 1986, as amended (the “Code”). To the extent that net realized capital gains can be offset by capital loss carryovers, it is the policy of the fund not to distribute such gains. Income and capital gain distributions are determined in accordance with income tax regulations, which may differ from GAAP.
(e) Federal income taxes: It is the policy of the fund to continue to qualify as a regulated investment company, if such qualification is in the best interests of its shareholders, by complying with the applicable provisions of the Code, and to make distributions of taxable income sufficient to relieve it from substantially all federal income and excise taxes.
NOTES TO FINANCIAL STATEMENTS (continued)
As of and during the period ended October 31, 2011, the fund did not have any liabilities for any uncertain tax positions.The fund recognizes interest and penalties, if any, related to uncertain tax positions as income tax expense in the Statement of Operations. During the period, the fund did not incur any interest or penalties.
Each of the tax years in the four-year period ended October 31, 2011 remains subject to examination by the Internal Revenue Service and state taxing authorities.
At October 31, 2011, the components of accumulated earnings on a tax basis were as follows: undistributed ordinary income $1,525,287, accumulated capital losses $4,756,932 and unrealized appreciation $154,153,687.
The accumulated capital loss carryover is available for federal income tax purposes to be applied against future net securities profits, if any, realized subsequent to October 31, 2011. If not applied, $227,970 of the carryover expires in fiscal 2015, $973,609 expires in fiscal 2016, $2,759,735 expires in fiscal 2017 and $795,618 expires in fiscal 2018.
Under the recently enacted Regulated Investment Company Modernization Act of 2010 (the “2010 Act”), the fund will be permitted to carry forward capital losses incurred in taxable years beginning after December 22, 2010 (“post-enactment losses”) for an unlimited period. However, the 2010 Act requires any post-enactment losses to be utilized before the utilization of losses incurred in taxable years prior to the effective date of the 2010 Act.As a result of this ordering rule, capital loss carryovers related to taxable years beginning prior to the effective date of the 2010 Act may be more likely to expire unused.
The tax character of distributions paid to shareholders during the fiscal periods ended October 31, 2011 and October 31, 2010 were as follows: ordinary income $76,870,168 and $74,717,523, respectively.
During the period ended October 31, 2011, as a result of permanent book to tax differences, primarily due to the tax treatment for paydown gains and losses on mortgage backed securities, amortization of premi-
64
ums and consent fees, the fund increased accumulated undistributed investment income-net by $4,227,092 and decreased accumulated net realized gain (loss) on investments by the same amount. Net assets and net asset value per share were not affected by this reclassification.
NOTE 2—Bank Lines of Credit:
The fund participates with other Dreyfus-managed funds in a $225 million unsecured credit facility led by Citibank, N.A. and a $300 million unsecured credit facility provided by The Bank of New York Mellon (each, a “Facility”), each to be utilized primarily for temporary or emergency purposes, including the financing of redemptions. In connection therewith, the fund has agreed to pay its pro rata portion of commitment fees for each Facility. Interest is charged to the fund based on rates determined pursuant to the terms of the respective Facility at the time of borrowing. During the period ended on October 31, 2011, the fund did not borrow under the Facilities.
NOTE 3—Investment Management Fee and Other Transactions With Affiliates:
(a) Pursuant to an investment management agreement with the Manager, the Manager provides or arranges for one or more third parties and/or affiliates to provide investment advisory, administrative, custody, fund accounting and transfer agency services to the fund.The Manager also directs the investments of the fund in accordance with its investment objective, policies and limitations. For these services, the fund is contractually obligated to pay the Manager a fee, calculated daily and paid monthly, at the annual rate of .15% of the value of the fund’s average daily net assets. Out of its fee, the Manager pays all of the expenses of the fund except brokerage fees, taxes, interest, commitment fees, Rule 12b-1 distribution fees and expenses, service fees, fees and expenses of non-interested Directors (including counsel fees) and extraordinary expenses. In addition, the Manager is required to reduce its fee in an amount equal to the fund’s allocable portion of fees and expenses of the non-interested Directors (including counsel fees). Each Board member
NOTES TO FINANCIAL STATEMENTS (continued)
who is not an “interested person” of the Company (as defined in the Act) receives $60,000 per annum, plus $7,000 per joint Board meeting of the Company, Dreyfus Investment Funds,The Dreyfus/Laurel Funds Trust, The Dreyfus/Laurel Tax-Free Municipal Funds and Dreyfus Funds, Inc. (collectively, the“Board Group Open-End Funds”) attended, $2,500 for separate in-person committee meetings attended which are not held in conjunction with a regularly scheduled Board meeting and $2,000 for Board meetings and separate committee meetings attended that are conducted by telephone.The Board Group Open-End Funds also reimburse each Board member who is not an “interested person” of the Company (as defined in the Act) for travel and out-of-pocket expenses.With respect to Board meetings, the Chairman of the Board receives an additional 25% of such compensation (with the exception of reimbursable amounts). The Chair of each of the Board’s committees, unless the Chair also serves as Chair of the Board, receives $1,350 per applicable committee meeting. In the event that there is an in-person joint committee meeting or a joint telephone meeting of the Board Group Open-End Funds and Dreyfus High Yield Strategies Fund (“DHF”), a $2,500 fee is allocated between the Board Group Open-End Funds and DHF.The Company’s portion of these fees and expenses are charged and allocated to each series based on net assets. Amounts required to be paid by the Company directly to the non-interested Directors, that would be applied to offset a portion of the management fee payable to the Manager, are in fact paid directly by the Manager to the non-interested Directors.
Effective January 1, 2012, the Board Group Open-End Funds and DHF (collectively, the “Board Group Funds”) will pay each Board member their respective allocated portions of an annual retainer of $85,000 and a fee of $10,000 for each regularly scheduled Board meeting attended ($75,000 and $8,000, respectively, in the aggregate, prior to January 1, 2012). With respect to the annual retainer and Board meetings of the Board Group Funds, the Chair of the Board will receive an additional 25% of such compensation (with the exception of reimbursable
66
amounts). Each Board member will receive $2,500 for any separate in-person committee meetings attended, which are not held in conjunction with a regularly scheduled Board meeting, such amount to be allocated among the Board Group Funds, as applicable. In the event that there is a joint telephone meeting of the Board Group Funds, a fee of $2,000 will be allocated among the applicable Board Group Funds, accordingly (prior to January 1, 2012, the fee allocated was $2,500 if the meeting included DHF).The Chair of each of the Board’s committees, unless the Chair also serves as Chair of the Board, will receive $1,500 per applicable committee meeting. Each Emeritus Board member is entitled to receive an annual retainer of one-half the amount paid as a retainer at the time the Board member became Emeritus and a per meeting attended fee of one-half the amount paid to Board members. The Board Group Funds also reimburse each Independent Board member and Emeritus Board members for travel and out-of-pocket expenses.
(b) Under the Distribution Plan (the “Plan”) adopted pursuant to Rule 12b-1 under the Act, Investor shares may pay annually up to .25% of the value of its average daily net assets to compensate the Distributor for shareholder servicing activities primarily intended to result in the sale of Investor shares. The BASIC shares bear no distribution fee. During the period ended October 31, 2011, Investor shares were charged $2,254,800 pursuant to the Plan.
Under its terms, the Plan shall remain in effect from year to year, provided such continuance is approved annually by a vote of majority of those Directors who are not “interested persons” of the Company and who have no direct or indirect financial interest in the operation or in any agreement related to the Plan.
The components of “Due to The Dreyfus Corporation and affiliates” in the Statement of Assets and Liabilities consist of: management fees $292,257 and Rule 12b-1 distribution plan fees $187,739.
NOTES TO FINANCIAL STATEMENTS (continued)
NOTE 4—Securities Transactions:
The aggregate amount of purchases and sales (including paydowns) of investment securities, excluding short-term securities, during the period ended October 31, 2011, amounted to $714,729,912 and $661,897,014, respectively.
At October 31, 2011, the cost of investments for federal income tax purposes was $2,224,447,032; accordingly, accumulated net unrealized appreciation on investments was $154,153,687, consisting of $155,773,797 gross unrealized appreciation and $1,620,110 gross unrealized depreciation.
NOTE 5—Other Matters:
At the October 27, 2011 Board meeting, the Board of the Company approved a proposal to have shareholders consider the election of Francine J. Bovich as an additional Board member of the Company, and also consider the election of Joseph S. DiMartino and Benaree Pratt Wiley, current Board members of the Company not previously proposed to shareholders of the fund.A proxy statement was mailed, on December 1, 2011, to shareholders of record as of the close of business on November 1, 2011 asking shareholders to consider these elections at a special joint meeting of shareholders to be held on Wednesday, February 8, 2012.
68
|
| REPORT OF INDEPENDENT REGISTERED |
| PUBLIC ACCOUNTING FIRM |
The Board of Directors and Shareholders of The Dreyfus/Laurel Funds, Inc.
We have audited the accompanying statement of assets and liabilities of Dreyfus Bond Market Index Fund, a series of The Dreyfus/Laurel Funds, Inc. (the “Fund”), including the statement of investments, as of October 31, 2011, and the related statement of operations for the year then ended, the statements of changes in net assets for each of the years in the two-year period then ended, and the financial highlights for each of the years in the five-year period then ended. These financial statements and financial highlights are the responsibility of the Fund’s management. Our responsibility is to express an opinion on these financial statements and financial highlights based on our audits.
We conducted our audits in accordance with the standards of the Public Company Accounting Oversight Board (United States).Those standards require that we plan and perform the audit to obtain reasonable assurance about whether the financial statements and financial highlights are free of material misstatement. An audit includes examining, on a test basis, evidence supporting the amounts and disclosures in the financial statements. Our procedures included confirmation of securities owned as of October 31, 2011, by correspondence with the custodian and brokers or by other appropriate auditing procedures where replies from brokers were not received. An audit also includes assessing the accounting principles used and significant estimates made by management, as well as evaluating the overall financial statement presentation.We believe that our audits provide a reasonable basis for our opinion.
In our opinion, the financial statements and financial highlights referred to above present fairly, in all material respects, the financial position of Dreyfus Bond Market Index Fund as of October 31, 2011, the results of its operations for the year then ended, the changes in its net assets for each of the years in the two-year period then ended, and the financial highlights for each of the years in the five-year period then ended, in conformity with U.S. generally accepted accounting principles.

New York, New York
December 22, 2011
IMPORTANT TAX INFORMATION (Unaudited)
For federal tax purposes the fund designates the maximum amount allowable but not less than 99.95% as interest-related dividends in accordance with Sections 871(k)(1) and 881(e) of the Internal Revenue Code.
70
OFFICERS OF THE FUND (Unaudited)
BRADLEY J. SKAPYAK, President since January 2010.
Chief Operating Officer and a director of the Manager since June 2009. From April 2003 to June 2009, Mr. Skapyak was the head of the Investment Accounting and Support Department of the Manager. He is an officer of 75 investment companies (comprised of 167 portfolios) managed by the Manager. He is 52 years old and has been an employee of the Manager since February 1988.
MICHAEL A. ROSENBERG, Vice President and Secretary since August 2005.
Assistant General Counsel of BNY Mellon, and an officer of 76 investment companies (comprised of 192 portfolios) managed by the Manager. He is 51 years old and has been an employee of the Manager since October 1991.
KIESHA ASTWOOD, Vice President and Assistant Secretary since January 2010.
Counsel of BNY Mellon, and an officer of 76 investment companies (comprised of 192 portfolios) managed by the Manager. She is 38 years old and has been an employee of the Manager since July 1995.
JAMES BITETTO, Vice President and Assistant Secretary since August 2005.
Senior Counsel of BNY Mellon and Secretary of the Manager, and an officer of 76 investment companies (comprised of 192 portfolios) managed by the Manager. He is 45 years old and has been an employee of the Manager since December 1996.
JONI LACKS CHARATAN, Vice President and Assistant Secretary since August 2005.
Senior Counsel of BNY Mellon, and an officer of 76 investment companies (comprised of 192 portfolios) managed by the Manager. She is 55 years old and has been an employee of the Manager since October 1988.
JOSEPH M. CHIOFFI, Vice President and Assistant Secretary since August 2005.
Senior Counsel of BNY Mellon, and an officer of 76 investment companies (comprised of 192 portfolios) managed by the Manager. He is 49 years old and has been an employee of the Manager since June 2000.
KATHLEEN DENICHOLAS, Vice President and Assistant Secretary since January 2010.
Senior Counsel of BNY Mellon, and an officer of 76 investment companies (comprised of 192 portfolios) managed by the Manager. She is 37 years old and has been an employee of the Manager since February 2001.
JANETTE E. FARRAGHER, Vice President and Assistant Secretary since August 2005.
Assistant General Counsel of BNY Mellon, and an officer of 76 investment companies (comprised of 192 portfolios) managed by the Manager. She is 48 years old and has been an employee of the Manager since February 1984.
JOHN B. HAMMALIAN, Vice President and Assistant Secretary since August 2005.
Managing Counsel of BNY Mellon, and an officer of 76 investment companies (comprised of 192 portfolios) managed by the Manager. He is 48 years old and has been an employee of the Manager since February 1991.
M. CRISTINA MEISER, Vice President and Assistant Secretary since January 2010.
Senior Counsel of BNY Mellon, and an officer of 76 investment companies (comprised of 192 portfolios) managed by the Manager. She is 41 years old and has been an employee of the Manager since August 2001.
OFFICERS OF THE FUND (Unaudited) (continued)
ROBERT R. MULLERY, Vice President and Assistant Secretary since August 2005.
Managing Counsel of BNY Mellon, and an officer of 76 investment companies (comprised of 192 portfolios) managed by the Manager. He is 59 years old and has been an employee of the Manager since May 1986.
JEFF PRUSNOFSKY, Vice President and Assistant Secretary since August 2005.
Managing Counsel of BNY Mellon, and an officer of 76 investment companies (comprised of 192 portfolios) managed by the Manager. He is 46 years old and has been an employee of the Manager since October 1990.
JAMES WINDELS, Treasurer since November 2001.
Director – Mutual Fund Accounting of the Manager, and an officer of 76 investment companies (comprised of 192 portfolios) managed by the Manager. He is 53 years old and has been an employee of the Manager since April 1985.
RICHARD CASSARO, Assistant Treasurer since January 2008.
Senior Accounting Manager – Money Market and Municipal Bond Funds of the Manager, and an officer of 76 investment companies (comprised of 192 portfolios) managed by the Manager. He is 52 years old and has been an employee of the Manager since September 1982.
GAVIN C. REILLY, Assistant Treasurer since December 2005.
Tax Manager of the Investment Accounting and Support Department of the Manager, and an officer of 76 investment companies (comprised of 192 portfolios) managed by the Manager. He is 43 years old and has been an employee of the Manager since April 1991.
ROBERT ROBOL, Assistant Treasurer since December 2002.
Senior Accounting Manager – Fixed Income Funds of the Manager, and an officer of 76 investment companies (comprised of 192 portfolios) managed by the Manager. He is 47 years old and has been an employee of the Manager since October 1988.
ROBERT SALVIOLO, Assistant Treasurer since July 2007.
Senior Accounting Manager – Equity Funds of the Manager, and an officer of 76 investment companies (comprised of 192 portfolios) managed by the Manager. He is 44 years old and has been an employee of the Manager since June 1989.
ROBERT SVAGNA, Assistant Treasurer since December 2002.
Senior Accounting Manager – Equity Funds of the Manager, and an officer of 76 investment companies (comprised of 192 portfolios) managed by the Manager. He is 44 years old and has been an employee of the Manager since November 1990.
74
JOSEPH W. CONNOLLY, Chief Compliance Officer since October 2004.
Chief Compliance Officer of the Manager and The Dreyfus Family of Funds (76 investment companies, comprised of 192 portfolios). From November 2001 through March 2004, Mr. Connolly was first Vice-President, Mutual Fund Servicing for Mellon Global Securities Services. In that capacity, Mr. Connolly was responsible for managing Mellon’s Custody, Fund Accounting and Fund Administration services to third-party mutual fund clients. He is 54 years old and has served in various capacities with the Manager since 1980, including manager of the firm’s Fund Accounting Department from 1997 through October 2001.
STEPHEN J. STOREN, Anti-Money Laundering Compliance Officer since May 2011.
Chief Compliance Officer of the Distributor, and the Anti-Money Laundering Compliance Officer of 72 investment companies (comprised of 188 portfolios) managed by the Manager. He is 57 years old and has been an employee of the Distributor since October 1999.
Save time. Save paper. View your next shareholder report online as soon as it’s available. Log into www.dreyfus.com and sign up for Dreyfus eCommunications. It’s simple and only takes a few minutes.
The views expressed in this report reflect those of the portfolio manager only through the end of the period covered and do not necessarily represent the views of Dreyfus or any other person in the Dreyfus organization. Any such views are subject to change at any time based upon market or other conditions and Dreyfus disclaims any responsibility to update such views.These views may not be relied on as investment advice and, because investment decisions for a Dreyfus fund are based on numerous factors, may not be relied on as an indication of trading intent on behalf of any Dreyfus fund.
Not FDIC-Insured • Not Bank-Guaranteed • May Lose Value
| | Contents |
| | THE FUND |
| 2 | A Letter from the Chairman and CEO |
| 3 | Discussion of Fund Performance |
| 6 | Fund Performance |
| 7 | Understanding Your Fund’s Expenses |
| 7 | Comparing Your Fund’s Expenses With Those of Other Funds |
| 8 | Statement of Investments |
| 12 | Statement of Assets and Liabilities |
| 13 | Statement of Operations |
| 14 | Statement of Changes in Net Assets |
| 15 | Financial Highlights |
| 16 | Notes to Financial Statements |
| 27 | Report of Independent Registered Public Accounting Firm |
| 28 | Important Tax Information |
| 29 | Board Members Information |
| 31 | Officers of the Fund |
| | FOR MORE INFORMATION |
| | Back Cover |
Dreyfus
Disciplined Stock Fund
The Fund

A LETTER FROM THE CHAIRMAN AND CEO
Dear Shareholder:
We present to you this annual report for Dreyfus Disciplined Stock Fund, covering the 12-month period from November 1, 2010, through October 31, 2011. For information about how the fund performed during the reporting period, as well as general market perspectives, we provide a Discussion of Fund Performance on the pages that follow.
Investors were encouraged by expectations of a more robust economic recovery into the first quarter of 2011, but sentiment subsequently deteriorated due to disappointing economic data, rising commodity prices, an escalating sovereign debt crisis in Europe and a contentious debate regarding taxes, spending and borrowing in the United States. Stocks have been sensitive to these macroeconomic developments, often regardless of underlying company fundamentals. Indeed, market declines were particularly severe during August and September after a major credit rating agency downgraded U.S. long-term debt, while October ranked as one of the best months of the past decade.
The economic outlook currently remains clouded by market turbulence and political infighting, but we believe that a continued subpar global expansion is more likely than a return to recession. Although Europe continues to struggle with a debt crisis, inflationary pressures appear to be waning in most countries as energy prices recently have retreated from their highs. In the United States, moderately low core inflation and an accommodative monetary policy could help support near-trend growth despite ongoing deleveraging activity in the private sector.To assess the potential impact of these and other developments on your investments, we encourage you, as always, to speak with your financial advisor.
Thank you for your continued confidence and support.

Jonathan R. Baum
Chairman and Chief Executive Officer
The Dreyfus Corporation
November 15, 2011
2

DISCUSSION OF FUND PERFORMANCE
For the reporting period of November 1, 2010, through October 31, 2011, as provided by Sean P. Fitzgibbon and Jeffrey McGrew, Portfolio Managers
Fund and Market Performance Overview
For the 12-month ended October 31, 2011, Dreyfus Disciplined Stock Fund produced a total return of 3.56%.1 In comparison, the Standard & Poor’s 500 Composite Stock Price Index (“S&P 500 Index”), the fund’s benchmark, returned 8.07% for the same period.2
The slow pace of the U.S. economic recovery, along with concerns regarding the global impact of financial instability in Europe, constrained the market’s gains during the reporting period. The fund produced a lower return than its benchmark, largely due to disappointing performance in the consumer discretionary, health care and financial sectors.
The Fund’s Investment Approach
The fund seeks capital appreciation.To pursue its goal, the fund normally invests at least 80% of its net assets in stocks focusing on large-cap companies. The fund invests in a diversified portfolio of growth and value stocks, with sector weightings and risk characteristics generally similar to those in the S&P 500 Index.We choose stocks through a disciplined investment process that combines computer modeling techniques, fundamental analysis and risk management.The result is a broadly diversified portfolio of carefully selected stocks, with overall performance determined by a large number of securities.
Global Economic Concerns Weighed on Markets
Gains in employment, consumer spending and corporate earnings supported a stock market rally over the first several months of the reporting period. However, the rally was interrupted in February 2011 when political unrest in the Middle East led to sharply rising crude oil prices, and again in March when catastrophic natural and nuclear disasters in Japan disrupted the global industrial supply chain. Nonetheless, investors proved resilient, and stocks rebounded quickly from these unexpected shocks.
DISCUSSION OF FUND PERFORMANCE (continued)
Investor sentiment began to deteriorate in earnest in late April when Greece appeared headed for default on its sovereign debt and pressures mounted on the banking systems of other European nations. In addition, U.S. economic data proved more disappointing than expected, and investors reacted cautiously to a contentious political debate regarding U.S. government spending and borrowing. Stocks suffered bouts of heightened volatility when newly risk-averse investors shifted their focus from economically sensitive industry groups and relatively speculative companies to those that historically have held up well under uncertain economic conditions.Volatility was particularly severe in August and September, after a major credit-rating agency downgraded its assessment of long-term U.S. government debt. In contrast, the market rebounded strongly in October when some macroeconomic worries seemed to ease.
Adopting an Increasingly Cautious Investment Posture
The fund began the reporting period with an emphasis on companies we believed were poised to benefit from the next phase of U.S. economic growth.This strategy proved beneficial to relative performance as markets rose into the first quarter of 2011, but the fund gave back those gains and underperformed the benchmark when stocks later turned sharply lower.
In the health care sector, biotechnology firms Dendreon and Human Genome Sciences were hurt by product-related disappointments, while medical equipment and service providers suffered when cost-conscious consumers delayed elective procedures in the faltering economy. The fund also lost ground in the financials sector, where major banking institutions Citigroup and Bank of America undermined relative returns. In addition, insurer Lincoln National was hurt by low interest rates and weak equity markets. However, the fund cushioned its losses in the financials sector with exposure to property-and-casualty insurers that benefited from an improving pricing environment. Underweighted exposure to hard-hit investment banks and asset managers also bolstered the fund’s results.
The fund took a variety of steps to reposition its holdings as economic conditions deteriorated. For example, we sought attractively valued stocks with catalysts for growth among traditionally defensive
4
utilities, such as PPL, and consumer staples companies, such as Unilever.We also reduced exposure to the industrials sector in order to limit the fund’s economic sensitivity, which helped cushion losses despite weakness in holdings such as Newell Rubbermaid, Ford Motor and Carnival. Relative performance proved even stronger in the information technology sector, where the fund avoided struggling computer hardware maker Hewlett-Packard in favor of companies such as networking specialist F5 Networks and data warehouse Teradata, which benefited from trends toward cloud computing, and electronics innovator Apple, which introduced upgrades to its popular smartphone and tablet computer products.
Positioned for Continued Uncertainty
As of the end of the reporting period, the U.S. economy has continued to show signs of resilience despite persistent areas of weakness.We have positioned the fund cautiously, awaiting a resolution of the European credit crisis. Consequently, the fund held overweighted positions in the traditionally defensive utilities and health care sectors, as well as in the information technology sector where many companies are benefiting from long-term secular trends. In contrast, the fund maintained underweighted exposure to the more economically sensitive financials, industrials and materials sectors.
November 15, 2011
| |
| | Please note, the position in any security highlighted in italicized typeface was sold during the |
| | reporting period. |
| | Equity funds are subject generally to market, market sector, market liquidity, issuer and investment |
| | style risks, among other factors, to varying degrees, all of which are more fully described in the |
| | fund’s prospectus. |
| 1 | Total return includes reinvestment of dividends and any capital gains paid. Past performance is no |
| | guarantee of future results. Share price and investment return fluctuate such that upon redemption, |
| | fund shares may be worth more or less than their original cost. |
| 2 | SOURCE: LIPPER INC. — Reflects the monthly reinvestment of dividends and, where |
| | applicable, capital gain distributions.The Standard & Poor’s 500 Composite Stock Price Index is |
| | a widely accepted, unmanaged index of U.S. stock market performance. Investors cannot invest |
| | directly in any index. |
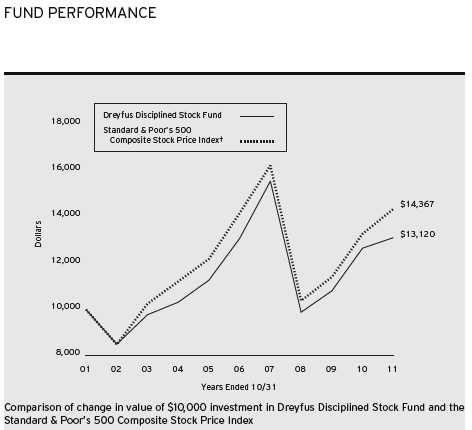
| | | | | | |
| Average Annual Total Returns as of 10/31/11 | | |
| | 1Year | 5 Years | 10 Years |
| Fund | 3.56% | 0.04% | 2.75% |
| Standard & Poor’s 500 | | | |
| Composite Stock Price Index | 8.07% | 0.25% | 3.69% |
|
| † Source: Lipper Inc. |
| Past performance is not predictive of future performance.The fund’s performance shown in the graph and table does not |
| reflect the deduction of taxes that a shareholder would pay on fund distributions or the redemption of fund shares. |
| The above graph compares a $10,000 investment made in Dreyfus Disciplined Stock Fund on 10/31/01 to a |
| $10,000 investment made in the Standard & Poor’s 500 Composite Stock Price Index (the “Index) on that date.All |
| dividends and capital gain distributions are reinvested. |
| The fund’s performance shown in the line graph above takes into account all applicable fees and expenses.The Index is a |
| widely accepted, unmanaged index of U.S. stock market performance. Unlike a mutual fund, the Index is not subject to |
| charges, fees and other expenses. Investors cannot invest directly in any index. Further information relating to fund |
| performance, including expense reimbursements, if applicable, is contained in the Financial Highlights section of the |
| prospectus and elsewhere in this report. |
6
UNDERSTANDING YOUR FUND’S EXPENSES (Unaudited)
As a mutual fund investor, you pay ongoing expenses, such as management fees and other expenses. Using the information below, you can estimate how these expenses affect your investment and compare them with the expenses of other funds.You also may pay one-time transaction expenses, including sales charges (loads) and redemption fees, which are not shown in this section and would have resulted in higher total expenses. For more information, see your fund’s prospectus or talk to your financial adviser.
Review your fund’s expenses
The table below shows the expenses you would have paid on a $1,000 investment in Dreyfus Disciplined Stock Fund from May 1, 2011 to October 31, 2011. It also shows how much a $1,000 investment would be worth at the close of the period, assuming actual returns and expenses.
| | |
| Expenses and Value of a $1,000 Investment |
| assuming actual returns for the six months ended October 31, 2011 |
| |
| Expenses paid per $1,000† | $ | 4.73 |
| Ending value (after expenses) | $ | 878.30 |
|
| COMPARING YOUR FUND’S EXPENSES |
| WITH THOSE OF OTHER FUNDS (Unaudited) |
Using the SEC’s method to compare expenses
The Securities and Exchange Commission (SEC) has established guidelines to help investors assess fund expenses. Per these guidelines, the table below shows your fund’s expenses based on a $1,000 investment, assuming a hypothetical 5% annualized return. You can use this information to compare the ongoing expenses (but not transaction expenses or total cost) of investing in the fund with those of other funds.All mutual fund shareholder reports will provide this information to help you make this comparison. Please note that you cannot use this information to estimate your actual ending account balance and expenses paid during the period.
| | |
| Expenses and Value of a $1,000 Investment |
| assuming a hypothetical 5% annualized return for the six months ended October 31, 2011 |
| |
| Expenses paid per $1,000† | $ | 5.09 |
| Ending value (after expenses) | $ | 1,020.16 |
† Expenses are equal to the fund’s annualized expense ratio of 1.00%, multiplied by the average account value over the period, multiplied by 184/365 (to reflect the one-half year period).
|
| STATEMENT OF INVESTMENTS |
| October 31, 2011 |
| | | |
| Common Stocks—99.9% | Shares | Value ($) |
| Consumer Discretionary—11.7% | | |
| Amazon.com | 38,310a | 8,179,568 |
| Carnival | 103,790 | 3,654,446 |
| CBS, Cl. B | 238,850 | 6,164,719 |
| Deckers Outdoor | 37,380a | 4,307,671 |
| DIRECTV, Cl. A | 158,090a | 7,186,771 |
| Macy’s | 125,340 | 3,826,630 |
| McDonald’s | 84,880 | 7,881,108 |
| Melco Crown Entertainment, ADR | 450,220a,b | 5,164,023 |
| Omnicom Group | 217,240b | 9,662,835 |
| PVH | 58,290 | 4,337,359 |
| | | 60,365,130 |
| Consumer Staples—10.5% | | |
| Coca-Cola Enterprises | 203,330 | 5,453,311 |
| ConAgra Foods | 231,730 | 5,869,721 |
| Hansen Natural | 56,000a | 4,989,040 |
| Lorillard | 51,310 | 5,677,965 |
| Philip Morris International | 145,510 | 10,166,784 |
| Ralcorp Holdings | 83,920a | 6,784,093 |
| Unilever, ADR | 455,200b | 15,317,480 |
| | | 54,258,394 |
| Energy—11.7% | | |
| Anadarko Petroleum | 89,520 | 7,027,320 |
| Apache | 48,340 | 4,816,114 |
| Chevron | 155,670 | 16,353,133 |
| ENSCO, ADR | 110,090 | 5,467,069 |
| Hess | 100,010 | 6,256,626 |
| National Oilwell Varco | 143,320 | 10,223,016 |
| Occidental Petroleum | 55,950 | 5,199,993 |
| TransCanada | 118,480b | 5,099,379 |
| | | 60,442,650 |
| Exchange Traded Funds—1.4% | | |
| Standard & Poor’s Depository | | |
| Receipts S&P 500 ETF Trust | 59,410b | 7,455,955 |
8
| | | | |
| Common Stocks (continued) | Shares | | | Value ($) |
| Financial—11.7% | | | | |
| American Express | 133,730 | | | 6,769,413 |
| Bank of America | 420,300 | | | 2,870,649 |
| Capital One Financial | 60,550 | b | 2,764,713 |
| Chubb | 57,440 | | | 3,851,352 |
| Citigroup | 207,190 | | | 6,545,132 |
| Discover Financial Services | 117,800 | | | 2,775,368 |
| Hartford Financial Services Group | 216,910 | b | 4,175,517 |
| IntercontinentalExchange | 41,380 | a | | 5,374,434 |
| JPMorgan Chase & Co. | 122,580 | | | 4,260,881 |
| Lincoln National | 152,170 | | | 2,898,839 |
| Nasdaq OMX Group | 211,800 | a | 5,305,590 |
| Wells Fargo & Co. | 501,950 | | | 13,005,525 |
| | | | | 60,597,413 |
| Health Care—14.9% | | | | |
| Baxter International | 201,900 | | | 11,100,462 |
| CIGNA | 167,350 | | | 7,420,299 |
| Covidien | 170,660 | | | 8,027,846 |
| McKesson | 71,200 | | | 5,806,360 |
| Pfizer | 631,854 | | | 12,169,508 |
| Sanofi, ADR | 306,710 | | | 10,964,883 |
| St. Jude Medical | 114,240 | | | 4,455,360 |
| Vertex Pharmaceuticals | 62,290 | a | | 2,466,061 |
| Warner Chilcott, Cl. A | 248,370 | a | 4,500,464 |
| Watson Pharmaceuticals | 62,850 | a | | 4,221,006 |
| Zimmer Holdings | 110,260 | a | 5,802,984 |
| | | | | 76,935,233 |
| Industrial—7.9% | | | | |
| Caterpillar | 29,490 | | | 2,785,625 |
| Cummins | 52,600 | | | 5,230,018 |
| Dover | 92,030 | | | 5,110,426 |
| Eaton | 69,730 | | | 3,125,299 |
| FedEx | 44,580 | | | 3,647,981 |
| General Electric | 839,260 | | | 14,024,035 |
STATEMENT OF INVESTMENTS (continued)
| | | |
| Common Stocks (continued) | Shares | Value ($) |
| Industrial (continued) | | |
| Thomas & Betts | 62,780a | 3,119,538 |
| Tyco International | 79,410 | 3,617,126 |
| | | 40,660,048 |
| Information Technology—22.0% | | |
| Alliance Data Systems | 27,580a,b | 2,825,295 |
| Apple | 62,750a | 25,399,945 |
| Cognizant Technology Solutions, Cl. A | 93,100a | 6,773,025 |
| Electronic Arts | 298,050a | 6,959,467 |
| EMC | 309,020a | 7,574,080 |
| F5 Networks | 41,750a | 4,339,912 |
| Informatica | 74,950a | 3,410,225 |
| International Business Machines | 44,030 | 8,129,259 |
| Intuit | 103,250 | 5,541,428 |
| NetApp | 281,670a | 11,537,203 |
| Oracle | 271,420 | 8,894,433 |
| QUALCOMM | 153,430 | 7,916,988 |
| Riverbed Technology | 139,090a | 3,836,102 |
| Teradata | 125,460a | 7,484,944 |
| VMware, Cl. A | 32,098a | 3,137,580 |
| | | 113,759,886 |
| Telecommunication Services—2.6% | | |
| AT&T | 454,360 | 13,317,292 |
| Utilities—5.5% | | |
| Exelon | 128,880 | 5,720,983 |
| NextEra Energy | 217,310b | 12,256,284 |
| PPL | 356,120 | 10,459,244 |
| | | 28,436,511 |
| Total Common Stocks | | |
| (cost $456,205,494) | | 516,228,512 |
10
| | | | |
| Other Investment—.3% | Shares | Value ($) |
| Registered Investment Company; | | |
| Dreyfus Institutional Preferred | | |
| Plus Money Market Fund | | |
| (cost $1,353,440) | 1,353,440c | 1,353,440 |
| |
| Investment of Cash Collateral | | |
| for Securities Loaned—9.0% | | |
| Registered Investment Company; | | |
| Dreyfus Institutional Cash Advantage Fund | | |
| (cost $46,661,418) | 46,661,418c | 46,661,418 |
| |
| Total Investments (cost $504,220,352) | 109.2% | 564,243,370 |
| Liabilities, Less Cash and Receivables | (9.2%) | (47,750,822) |
| Net Assets | 100.0% | 516,492,548 |
|
| ADR—American Depository Receipts |
| a Non-income producing security. |
| b Security, or portion thereof, on loan.At October 31, 2011, the value of the fund’s securities on loan was |
| $44,600,077 and the value of the collateral held by the fund was $46,661,418. |
| c Investment in affiliated money market mutual fund. |
| | | |
| Portfolio Summary (Unaudited)† | | |
| |
| | Value (%) | | Value (%) |
| Information Technology | 22.0 | Money Market Investments | 9.3 |
| Health Care | 14.9 | Industrial | 7.9 |
| Consumer Discretionary | 11.7 | Utilities | 5.5 |
| Energy | 11.7 | Telecommunication Services | 2.6 |
| Financial | 11.7 | Exchange Traded Funds | 1.4 |
| Consumer Staples | 10.5 | | 109.2 |
| |
| † Based on net assets. | | | |
| See notes to financial statements. | | | |
|
| STATEMENT OF ASSETS AND LIABILITIES |
| October 31, 2011 |
| | | |
| | Cost | Value |
| Assets ($): | | |
| Investments in securities—See Statement of Investments (including | | |
| securities on loan, valued at $44,600,077)—Note 1(b): | | |
| Unaffiliated issuers | 456,205,494 | 516,228,512 |
| Affiliated issuers | 48,014,858 | 48,014,858 |
| Cash | | 63,606 |
| Receivable for investment securities sold | | 6,198,586 |
| Dividends and securities lending income receivable | | 385,156 |
| Receivable for shares of Capital Stock subscribed | | 37,986 |
| | | 570,928,704 |
| Liabilities ($): | | |
| Due to The Dreyfus Corporation and affiliates—Note 3(b) | | 425,720 |
| Liability for securities on loan—Note 1(b) | | 46,661,418 |
| Payable for investment securities purchased | | 7,047,784 |
| Payable for shares of Capital Stock redeemed | | 300,172 |
| Interest payable—Note 2 | | 1,062 |
| | | 54,436,156 |
| Net Assets ($) | | 516,492,548 |
| Composition of Net Assets ($): | | |
| Paid-in capital | | 485,556,470 |
| Accumulated undistributed investment income—net | | 1,472,795 |
| Accumulated net realized gain (loss) on investments | | (30,559,735) |
| Accumulated net unrealized appreciation | | |
| (depreciation) on investments | | 60,023,018 |
| Net Assets ($) | | 516,492,548 |
| Shares Outstanding | | |
| (245 million shares of $.001 par value Capital Stock authorized) | | 17,596,152 |
| Net Asset Value, offering and redemption price per share ($) | | 29.35 |
| |
| See notes to financial statements. | | |
12
|
| STATEMENT OF OPERATIONS |
| Year Ended October 31, 2011 |
| | |
| Investment Income ($): | |
| Income: | |
| Cash dividends (net of $84,297 foreign taxes withheld at source): | |
| Unaffiliated issuers | 10,275,349 |
| Affiliated issuers | 2,787 |
| Income from securities lending—Note 1(b) | 54,102 |
| Total Income | 10,332,238 |
| Expenses: | |
| Management fee—Note 3(a) | 5,270,849 |
| Distribution fees—Note 3(b) | 585,650 |
| Directors’ fees—Note 3(a) | 32,166 |
| Loan commitment fees—Note 2 | 7,899 |
| Interest expense—Note 2 | 4,750 |
| Total Expenses | 5,901,314 |
| Less—Directors’ fees reimbursed by the Manager—Note 3(a) | (32,166) |
| Net Expenses | 5,869,148 |
| Investment Income—Net | 4,463,090 |
| Realized and Unrealized Gain (Loss) on Investments—Note 4 ($): | |
| Net realized gain (loss) on investments | 51,141,907 |
| Net unrealized appreciation (depreciation) on investments | (32,847,242) |
| Net Realized and Unrealized Gain (Loss) on Investments | 18,294,665 |
| Net Increase in Net Assets Resulting from Operations | 22,757,755 |
| |
| See notes to financial statements. | |
STATEMENT OF CHANGES IN NET ASSETS
| | | | |
| | Year Ended October 31, |
| | 2011 | 2010 |
| Operations ($): | | |
| Investment income—net | 4,463,090 | 3,674,333 |
| Net realized gain (loss) on investments | 51,141,907 | 57,140,422 |
| Net unrealized appreciation | | |
| (depreciation) on investments | (32,847,242) | 28,718,517 |
| Net Increase (Decrease) in Net Assets | | |
| Resulting from Operations | 22,757,755 | 89,533,272 |
| Dividends to Shareholders from ($): | | |
| Investment income—net | (4,114,223) | (3,285,029) |
| Capital Stock Transactions ($): | | |
| Net proceeds from shares sold | 17,818,234 | 34,023,036 |
| Dividends reinvested | 3,844,558 | 3,065,431 |
| Cost of shares redeemed | (110,539,384) | (71,775,303) |
| Increase (Decrease) in Net Assets | | |
| from Capital Stock Transactions | (88,876,592) | (34,686,836) |
| Total Increase (Decrease) in Net Assets | (70,233,060) | 51,561,407 |
| Net Assets ($): | | |
| Beginning of Period | 586,725,608 | 535,164,201 |
| End of Period | 516,492,548 | 586,725,608 |
| Undistributed investment income—net | 1,472,795 | 1,131,353 |
| Capital Share Transactions (Shares): | | |
| Shares sold | 580,698 | 1,285,619 |
| Shares issued for dividends reinvested | 127,857 | 116,591 |
| Shares redeemed | (3,670,428) | (2,677,574) |
| Net Increase (Decrease) in Shares Outstanding | (2,961,873) | (1,275,364) |
| |
| See notes to financial statements. | | |
14
FINANCIAL HIGHLIGHTS
The following table describes the performance for the fiscal periods indicated. Total return shows how much your investment in the fund would have increased (or decreased) during each period, assuming you had reinvested all dividends and distributions.These figures have been derived from the fund’s financial statements.
| | | | | | | | | | |
| | | Year Ended October 31, | |
| | 2011 | 2010 | 2009 | 2008 | 2007 |
| Per Share Data ($): | | | | | |
| Net asset value, beginning of period | 28.54 | 24.51 | 22.77 | 40.24 | 37.35 |
| Investment Operations: | | | | | |
| Investment income—neta | .23 | .18 | .25 | .35 | .26 |
| Net realized and unrealized | | | | | |
| gain (loss) on investments | .79 | 4.01 | 1.83 | (13.57) | 6.31 |
| Total from Investment Operations | 1.02 | 4.19 | 2.08 | (13.22) | 6.57 |
| Distributions: | | | | | |
| Dividends from investment income—net | (.21) | (.16) | (.34) | (.34) | (.23) |
| Dividends from net realized | | | | | |
| gain on investments | — | — | — | (3.91) | (3.45) |
| Total Distributions | (.21) | (.16) | (.34) | (4.25) | (3.68) |
| Net asset value, end of period | 29.35 | 28.54 | 24.51 | 22.77 | 40.24 |
| Total Return (%) | 3.56 | 17.13 | 9.38 | (36.51) | 18.98 |
| Ratios/Supplemental Data (%): | | | | | |
| Ratio of total expenses | | | | | |
| to average net assets | 1.01 | 1.01 | 1.01 | 1.01 | 1.01 |
| Ratio of net expenses | | | | | |
| to average net assets | 1.00 | 1.00 | 1.00 | 1.00 | .98 |
| Ratio of net investment income | | | | | |
| to average net assets | .76 | .65 | 1.18 | 1.12 | .69 |
| Portfolio Turnover Rate | 84.19 | 78.04 | 103.96 | 70.11 | 49.43 |
| Net Assets, end of period ($ x 1,000) | 516,493 | 586,726 | 535,164 | 532,697 | 945,819 |
| |
| a Based on average shares outstanding at each month end. | | | | |
| See notes to financial statements. | | | | | |
NOTES TO FINANCIAL STATEMENTS
NOTE 1—Significant Accounting Policies:
Dreyfus Disciplined Stock Fund (the “fund”) is a separate diversified series of The Dreyfus/Laurel Funds, Inc. (the “Company”) which is registered under the Investment Company Act of 1940, as amended (the “Act”), as an open-end management investment company and operates as a series company currently offering ten series, including the fund. The fund’s investment objective is to seek capital appreciation. The Dreyfus Corporation (the “Manager” or “Dreyfus”), a wholly-owned subsidiary of The Bank of New York Mellon Corporation (“BNY Mellon”), serves as the fund’s investment adviser. MBSC Securities Corporation (the “Distributor”), a wholly-owned subsidiary of the Manager, is the distributor of the fund’s shares, which are sold to the public without a sales charge.
The Financial Accounting Standards Board (“FASB”) Accounting Standards Codification (“ASC”) is the exclusive reference of authoritative U.S. generally accepted accounting principles (“GAAP”) recognized by the FASB to be applied by nongovernmental entities. Rules and interpretive releases of the Securities and Exchange Commission (“SEC”) under authority of federal laws are also sources of authoritative GAAP for SEC registrants. The fund’s financial statements are prepared in accordance with GAAP, which may require the use of management estimates and assumptions.Actual results could differ from those estimates.
(a) Portfolio valuation: The fair value of a financial instrument is the amount that would be received to sell an asset or paid to transfer a liability in an orderly transaction between market participants at the measurement date (i.e. the exit price). GAAP establishes a fair value hierarchy that prioritizes the inputs of valuation techniques used to measure fair value.This hierarchy gives the highest priority to unadjusted quoted prices in active markets for identical assets or liabilities (Level 1 measurements) and the lowest priority to unobservable inputs (Level 3 measurements).
16
Additionally, GAAP provides guidance on determining whether the volume and activity in a market has decreased significantly and whether such a decrease in activity results in transactions that are not orderly. GAAP requires enhanced disclosures around valuation inputs and techniques used during annual and interim periods.
Various inputs are used in determining the value of the fund’s investments relating to fair value measurements.These inputs are summarized in the three broad levels listed below:
Level 1—unadjusted quoted prices in active markets for identical investments.
Level 2—other significant observable inputs (including quoted prices for similar investments, interest rates, prepayment speeds, credit risk, etc.).
Level 3—significant unobservable inputs (including the fund’s own assumptions in determining the fair value of investments).
The inputs or methodology used for valuing securities are not necessarily an indication of the risk associated with investing in those securities.
Changes in valuation techniques may result in transfers in or out of an assigned level within the disclosure hierarchy. Valuation techniques used to value the fund’s investments are as follows:
Investments in securities are valued at the last sales price on the securities exchange or national securities market on which such securities are primarily traded. Securities listed on the National Market System for which market quotations are available are valued at the official closing price or, if there is no official closing price that day, at the last sales price. Securities not listed on an exchange or the national securities market, or securities for which there were no transactions, are valued at the average of the most recent bid and asked prices, except for open short
NOTES TO FINANCIAL STATEMENTS (continued)
positions, where the asked price is used for valuation purposes. Bid price is used when no asked price is available. Registered investment companies that are not traded on an exchange are valued at their net asset value.All preceding securities are categorized within Level 1 of the fair value hierarchy.
Fair valuing of securities may be determined with the assistance of a pricing service using calculations based on indices of domestic securities and other appropriate indicators, such as prices of relevant ADRs and futures contracts. Utilizing these techniques may result in transfers between Level 1 and Level 2 of the fair value hierarchy.
When market quotations or official closing prices are not readily available, or are determined not to reflect accurately fair value, such as when the value of a security has been significantly affected by events after the close of the exchange or market on which the security is principally traded (for example, a foreign exchange or market), but before the fund calculates its net asset value, the fund may value these investments at fair value as determined in accordance with the procedures approved by the Board of Directors. Certain factors may be considered when fair valuing investments such as: fundamental analytical data, the nature and duration of restrictions on disposition, an evaluation of the forces that influence the market in which the securities are purchased and sold, and public trading in similar securities of the issuer or comparable issuers. These securities are either categorized as Level 2 or 3 depending on the relevant inputs used.
For restricted securities where observable inputs are limited, assumptions about market activity and risk are used and are categorized within Level 3 of the fair value hierarchy.
18
The following is a summary of the inputs used as of October 31, 2011 in valuing the fund’s investments:
| | | | |
| | | Level 2—Other | Level 3— | |
| | Level 1— | Significant | Significant | |
| | Unadjusted | Observable | Unobservable | |
| | Quoted Prices | Inputs | Inputs | Total |
| Assets ($) | | | | |
| Investments in Securities: | | | |
| Equity Securities— | | | | |
| Domestic† | 471,859,102 | — | — | 471,859,102 |
| Equity Securities— | | | | |
| Foreign† | 36,913,455 | — | — | 36,913,455 |
| Mutual Funds/ | | | | |
| Exchange Traded | | | | |
| Funds | 55,470,813 | — | — | 55,470,813 |
| |
| † See Statement of Investments for additional detailed categorizations. | |
In May 2011, FASB issued Accounting Standards Update (“ASU”) No. 2011-04 “Amendments to Achieve Common FairValue Measurement and Disclosure Requirements in GAAP and International Financial Reporting Standards (“IFRS”)” (“ASU 2011-04”). ASU 2011-04 includes common requirements for measurement of and disclosure about fair value between GAAP and IFRS. ASU 2011-04 will require reporting entities to disclose the following information for fair value measurements categorized within Level 3 of the fair value hierarchy: quantitative information about the unobservable inputs used in the fair value measurement, the valuation processes used by the reporting entity and a narrative description of the sensitivity of the fair value measurement to changes in unobservable inputs and the interrelationships between those unobservable inputs. In addition, ASU 2011-04 will
NOTES TO FINANCIAL STATEMENTS (continued)
require reporting entities to make disclosures about amounts and reasons for all transfers in and out of Level 1 and Level 2 fair value mea-surements.The new and revised disclosures are effective for interim and annual reporting periods beginning after December 15, 2011. At this time, management is evaluating the implications of ASU 2011-04 and its impact on the financial statements.
(b) Securities transactions and investment income: Securities transactions are recorded on a trade date basis. Realized gains and losses from securities transactions are recorded on the identified cost basis. Dividend income is recognized on the ex-dividend date and interest income, including, where applicable, accretion of discount and amortization of premium on investments is recognized on the accrual basis.
Pursuant to a securities lending agreement withThe Bank of NewYork Mellon, a subsidiary of BNY Mellon and an affiliate of Dreyfus, the fund may lend securities to qualified institutions. It is the fund’s policy that, at origination, all loans are secured by collateral of at least 102% of the value of U.S. securities loaned and 105% of the value of foreign securities loaned. Collateral equivalent to at least 100% of the market value of securities on loan is maintained at all times. Collateral is either in the form of cash, which can be invested in certain money market mutual funds managed by the Manager, U.S. Government and Agency securities or letters of credit.The fund is entitled to receive all income on securities loaned, in addition to income earned as a result of the lending transaction. Although each security loaned is fully collateralized, the fund bears the risk of delay in recovery of, or loss of rights in, the securities loaned should a borrower fail to return the securities in a timely manner. During the period ended October 31, 2011,The Bank of NewYork Mellon earned $23,186 from lending portfolio securities, pursuant to the securities lending agreement.
(c) Affiliated issuers: Investments in other investment companies advised by Dreyfus are defined as “affiliated” in the Act.
20
The fund may invest in shares of certain affiliated investment companies also advised or managed by Dreyfus. Investments in affiliated investment companies for the period ended October 31, 2011 were as follows:
| | | | | | | |
| Affiliated | | | | | | | |
| Investment | Value | | | | Value | | Net |
| Company | 10/31/2010 | ($) | Purchases ($) | Sales ($) | 10/31/2011 | ($) | Assets (%) |
| Dreyfus | | | | | | | |
| Institutional | | | | | | | |
| Preferred | | | | | | | |
| Plus Money | | | | | | | |
| Market Fund | 572,000 | | 134,818,589 | 134,037,149 | 1,353,440 | | .3 |
| Dreyfus | | | | | | | |
| Institutional | | | | | | | |
| Cash | | | | | | | |
| Advantage | | | | | | | |
| Fund | 1,987,425 | | 593,415,393 | 548,741,400 | 46,661,418 | | 9.0 |
| Total | 2,559,425 | | 728,233,982 | 682,778,549 | 48,014,858 | | 9.3 |
(d) Dividends to shareholders: Dividends are recorded on the ex-dividend date. Dividends from investment income-net and dividends from net realized capital gains, if any, are normally declared and paid annually, but the fund may make distributions on a more frequent basis to comply with the distribution requirements of the Internal Revenue Code of 1986, as amended (the “Code”).To the extent that net realized capital gains can be offset by capital loss carryovers, it is the policy of the fund not to distribute such gains. Income and capital gain distributions are determined in accordance with income tax regulations, which may differ from GAAP.
(e) Federal income taxes: It is the policy of the fund to continue to qualify as a regulated investment company, if such qualification is in the best interests of its shareholders, by complying with the applicable provisions of the Code, and to make distributions of taxable income sufficient to relieve it from substantially all federal income and excise taxes.
As of and during the period ended October 31, 2011, the fund did not have any liabilities for any uncertain tax positions.The fund recognizes
NOTES TO FINANCIAL STATEMENTS (continued)
interest and penalties, if any, related to uncertain tax positions as income tax expense in the Statement of Operations. During the period, the fund did not incur any interest or penalties.
Each of the tax years in the four-year period ended October 31, 2011 remains subject to examination by the Internal Revenue Service and state taxing authorities.
At October 31, 2011, the components of accumulated earnings on tax basis were as follows: undistributed ordinary income $1,472,795, accumulated capital losses $30,010,248 and unrealized appreciation $59,473,531.
The accumulated capital loss carryover is available for federal income tax purposes to be applied against future net securities profits, if any, realized subsequent to October 31, 2011. If not applied, the carryover expires in fiscal 2017.
Under the recently enacted Regulated Investment Company Modernization Act of 2010 (the “2010 Act”), the fund will be permitted to carry forward capital losses incurred in taxable years beginning after December 22, 2010 (“post-enactment losses”) for an unlimited period. However, the 2010 Act requires post-enactment losses to be utilized before the utilization of losses incurred in taxable years prior to the effective date of the 2010 Act. As a result of this ordering rule, capital loss carryovers related to taxable years beginning prior to the effective date of the 2010 Act may be more likely to expire unused.
The tax character of distributions paid to shareholders during the fiscal periods ended October 31, 2011 and October 31, 2010 were was as follows: ordinary income $4,114,223 and $3,285,029, respectively.
During the period ended October 31, 2011, as a result of permanent book to tax differences, primarily due to the tax treatment for a prior year return of capital adjustment, the fund decreased accumulated undistributed investment income-net by $7,425 and increased accumulated net realized gain (loss) on investments by the same amount. Net assets and net asset value per share were not affected by this reclassification.
22
NOTE 2—Bank Lines of Credit:
The fund participates with other Dreyfus-managed funds in a $225 million unsecured credit facility led by Citibank, N.A. and a $300 million unsecured credit facility provided by The Bank of New York Mellon (each, a “Facility”), each to be utilized primarily for temporary or emergency purposes, including the financing of redemptions. In connection therewith, the fund has agreed to pay its pro rata portion of commitment fees for each Facility. Interest is charged to the fund based on rates determined pursuant to the terms of the respective Facility at the time of borrowing.
The average amount of borrowings outstanding under the Facilities during the period ended October 31, 2011, was approximately $338,900 with a related weighted average annualized interest rate of 1.40%.
NOTE 3—Investment Management Fee and Other Transactions With Affiliates:
(a) Pursuant to an investment management agreement with Dreyfus, Dreyfus provides or arranges for one or more third parties and/or affiliates to provide investment advisory, administrative, custody, fund accounting and transfer agency services to the fund. Dreyfus also directs the investments of the fund in accordance with its investment objective, policies and limitations. For these services, the fund is contractually obligated to pay Dreyfus a fee, calculated daily and paid monthly, at the annual rate of .90% of the value of the fund’s average daily net assets. Out of its fee, Dreyfus pays all of the expenses of the fund except brokerage fees, taxes, interest, commitment fees, Rule 12b-1 distribution fees and expenses, service fees, expenses of non-interested Directors (including counsel fees) and extraordinary expenses. In addition, Dreyfus is required to reduce its fee in an amount equal to the fund’s allocable portion of fees and expenses of the non-interested Directors (including counsel fees). Each Board member who is not an “interested person” of the Company
NOTES TO FINANCIAL STATEMENTS (continued)
(as defined in the Act) receives $60,000 per annum, plus $7,000 per joint Board meeting of the Company, Dreyfus Investment Funds, The Dreyfus/Laurel Funds Trust, The Dreyfus/Laurel Tax-Free Municipal Funds and Dreyfus Funds, Inc. (collectively, the “Board Group Open-End Funds”) attended, $2,500 for separate in-person committee meetings attended which are not held in conjunction with a regularly scheduled Board meeting and $2,000 for Board meetings and separate committee meetings attended that are conducted by telephone. The Board Group Open-End Funds also reimburse each Board member who is not an “interested person” of the Company (as defined in the Act) for travel and out-of-pocket expenses.With respect to Board meetings, the Chairman of the Board receives an additional 25% of such compensation (with the exception of reimbursable amounts). The Chair of each of the Board’s committees, unless the Chair also serves as Chair of the Board, receives $1,350 per applicable committee meeting. In the event that there is an in-person joint committee meeting or a joint telephone meeting of the Board Group Open-End Funds and Dreyfus HighYield Strategies Fund (“DHF”), a $2,500 fee is allocated between the Board Group Open-End Funds and DHF.Amounts required to be paid by the Company directly to the non-interested Directors, that would be applied to offset a portion of the management fee payable to Dreyfus, are in fact paid directly by Dreyfus to the non-interested Directors.
Effective January 1, 2012, the Board Group Open-End Funds and DHF (collectively, the “Board Group Funds”) will pay each Board member their respective allocated portions of an annual retainer of $85,000 and a fee of $10,000 for each regularly scheduled Board meeting attended ($75,000 and $8,000, respectively, in the aggregate, prior to January 1, 2012). With respect to the annual retainer and Board meetings of the Board Group Funds, the Chair of the Board will receive an additional 25% of such compensation (with the exception of reimbursable amounts). Each Board member will receive $2,500 for
24
any separate in-person committee meetings attended, which are not held in conjunction with a regularly scheduled Board meeting, such amount to be allocated among the Board Group Funds, as applicable. In the event that there is a joint telephone meeting of the Board Group Funds, a fee of $2,000 will be allocated among the applicable Board Group Funds, accordingly (prior to January 1, 2012, the fee allocated was $2,500 if the meeting included DHF).The Chair of each of the Board’s committees, unless the Chair also serves as Chair of the Board, will receive $1,500 per applicable committee meeting. Each Emeritus Board member is entitled to receive an annual retainer of one-half the amount paid as a retainer at the time the Board member became Emeritus and a per meeting attended fee of one-half the amount paid to Board members.The Board Group Funds also reimburse each Independent Board member and Emeritus Board members for travel and out-of-pocket expenses.
(b) Under the Distribution Plan (the “Plan”) adopted pursuant to Rule 12b-1 under the Act, the fund may pay annually up to .10% of the value of the fund’s average daily net assets to compensate BNY Mellon and the Manager for shareholder servicing activities and the Distributor for shareholder servicing activities and expenses primarily intended to result in the sale of fund shares. During the period ended October 31, 2011, the fund was charged $585,650 pursuant to the Plan.
Under its terms, the Plan shall remain in effect from year to year, provided such continuance is approved annually by a vote of a majority of those Directors who are not “interested persons” of the Company and who have no direct or indirect financial interest in the operation of or in any agreement related to the Plan.
The components of “Due to The Dreyfus Corporation and affiliates” in the Statement of Assets and Liabilities consist of: management fees $383,221 and Rule 12b-1 distribution plan fees $42,499.
NOTES TO FINANCIAL STATEMENTS (continued)
NOTE 4—Securities Transactions:
The aggregate amount of purchases and sales of investment securities, excluding short-term securities, during the period ended October 31, 2011, amounted to $492,163,719 and $579,594,647, respectively.
At October 31, 2011, the cost of investments for federal income tax purposes was $504,769,839; accordingly, accumulated net unrealized appreciation on investments was $59,473,531, consisting of $76,823,094 gross unrealized appreciation and $17,349,563 gross unrealized depreciation.
NOTE 5—Other Matters:
At the October 27, 2011 Board meeting, the Board of the Company approved a proposal to have shareholders consider the election of Francine J. Bovich as an additional Board member of the Company, and also consider the election of Joseph S. DiMartino and Benaree Pratt Wiley, current Board members of the Company not previously proposed to shareholders of the fund. A proxy statement was mailed, on December 1, 2011, to shareholders of record as of the close of business on November 1, 2011 asking shareholders to consider these elections at a special joint meeting of shareholders to be held on Wednesday, February 8, 2012.
26
|
| REPORT OF INDEPENDENT REGISTERED |
| PUBLIC ACCOUNTING FIRM |
The Board of Directors and Shareholders of The Dreyfus/Laurel Funds, Inc.
We have audited the accompanying statement of assets and liabilities of Dreyfus Disciplined Stock Fund, a series of The Dreyfus/Laurel Funds, Inc. (the “Fund”), including the statement of investments, as of October 31, 2011, and the related statement of operations for the year then ended, the statements of changes in net assets for each of the years in the two-year period then ended, and the financial highlights for each of the years in the five-year period then ended.These financial statements and financial highlights are the responsibility of the Fund’s management. Our responsibility is to express an opinion on these financial statements and financial highlights based on our audits.
We conducted our audits in accordance with the standards of the Public Company Accounting Oversight Board (United States).Those standards require that we plan and perform the audit to obtain reasonable assurance about whether the financial statements and financial highlights are free of material misstatement. An audit includes examining, on a test basis, evidence supporting the amounts and disclosures in the financial statements. Our procedures included confirmation of securities owned as of October 31, 2011, by correspondence with the custodian and brokers or by other appropriate auditing procedures where replies from brokers were not received. An audit also includes assessing the accounting principles used and significant estimates made by management, as well as evaluating the overall financial statement presentation.We believe that our audits provide a reasonable basis for our opinion.
In our opinion, the financial statements and financial highlights referred to above present fairly, in all material respects, the financial position of Dreyfus Disciplined Stock Fund as of October 31, 2011, the results of its operations for the year then ended, the changes in its net assets for each of the years in the two-year period then ended, and the financial highlights for each of the years in the five-year period then ended, in conformity with U.S. generally accepted accounting principles.

New York, New York
December 22, 2011
IMPORTANT TAX INFORMATION (Unaudited)
For federal tax purposes, the fund designates $4,114,223 as ordinary income dividends paid during the year ended October 31, 2011 as qualified dividend income in accordance with Section 854(b)(1)(B) of the Internal Revenue Code. Also, the fund designates 100% of ordinary income dividends paid during the year ended October 31, 2011 as eligible for the corporate dividends received deduction provided under Section 243 of the Internal Revenue Code in accordance with Section 854(b)(1)(A) of the Internal Revenue Code. Shareholders will receive notification in early 2012 of the percentage applicable to the preparation of their 2011 income tax returns.
28
OFFICERS OF THE FUND (Unaudited)
BRADLEY J. SKAPYAK, President since January 2010.
Chief Operating Officer and a director of the Manager since June 2009. From April 2003 to June 2009, Mr. Skapyak was the head of the Investment Accounting and Support Department of the Manager. He is an officer of 75 investment companies (comprised of 167 portfolios) managed by the Manager. He is 52 years old and has been an employee of the Manager since February 1988.
MICHAEL A. ROSENBERG, Vice President and Secretary since August 2005.
Assistant General Counsel of BNY Mellon, and an officer of 76 investment companies (comprised of 192 portfolios) managed by the Manager. He is 51 years old and has been an employee of the Manager since October 1991.
KIESHA ASTWOOD, Vice President and Assistant Secretary since January 2010.
Counsel of BNY Mellon, and an officer of 76 investment companies (comprised of 192 portfolios) managed by the Manager. She is 38 years old and has been an employee of the Manager since July 1995.
JAMES BITETTO, Vice President and Assistant Secretary since August 2005.
Senior Counsel of BNY Mellon and Secretary of the Manager, and an officer of 76 investment companies (comprised of 192 portfolios) managed by the Manager. He is 45 years old and has been an employee of the Manager since December 1996.
JONI LACKS CHARATAN, Vice President and Assistant Secretary since August 2005.
Senior Counsel of BNY Mellon, and an officer of 76 investment companies (comprised of 192 portfolios) managed by the Manager. She is 55 years old and has been an employee of the Manager since October 1988.
JOSEPH M. CHIOFFI, Vice President and Assistant Secretary since August 2005.
Senior Counsel of BNY Mellon, and an officer of 76 investment companies (comprised of 192 portfolios) managed by the Manager. He is 49 years old and has been an employee of the Manager since June 2000.
KATHLEEN DENICHOLAS, Vice President and Assistant Secretary since January 2010.
Senior Counsel of BNY Mellon, and an officer of 76 investment companies (comprised of 192 portfolios) managed by the Manager. She is 37 years old and has been an employee of the Manager since February 2001.
JANETTE E. FARRAGHER, Vice President and Assistant Secretary since August 2005.
Assistant General Counsel of BNY Mellon, and an officer of 76 investment companies (comprised of 192 portfolios) managed by the Manager. She is 48 years old and has been an employee of the Manager since February 1984.
JOHN B. HAMMALIAN, Vice President and Assistant Secretary since August 2005.
Managing Counsel of BNY Mellon, and an officer of 76 investment companies (comprised of 192 portfolios) managed by the Manager. He is 48 years old and has been an employee of the Manager since February 1991.
M. CRISTINA MEISER, Vice President and Assistant Secretary since January 2010.
Senior Counsel of BNY Mellon, and an officer of 76 investment companies (comprised of 192 portfolios) managed by the Manager. She is 41 years old and has been an employee of the Manager since August 2001.
OFFICERS OF THE FUND (Unaudited) (continued)
ROBERT R. MULLERY, Vice President and Assistant Secretary since August 2005.
Managing Counsel of BNY Mellon, and an officer of 76 investment companies (comprised of 192 portfolios) managed by the Manager. He is 59 years old and has been an employee of the Manager since May 1986.
JEFF PRUSNOFSKY, Vice President and Assistant Secretary since August 2005.
Managing Counsel of BNY Mellon, and an officer of 76 investment companies (comprised of 192 portfolios) managed by the Manager. He is 46 years old and has been an employee of the Manager since October 1990.
JAMES WINDELS, Treasurer since November 2001.
Director – Mutual Fund Accounting of the Manager, and an officer of 76 investment companies (comprised of 192 portfolios) managed by the Manager. He is 53 years old and has been an employee of the Manager since April 1985.
RICHARD CASSARO, Assistant Treasurer since January 2008.
Senior Accounting Manager – Money Market and Municipal Bond Funds of the Manager, and an officer of 76 investment companies (comprised of 192 portfolios) managed by the Manager. He is 52 years old and has been an employee of the Manager since September 1982.
GAVIN C. REILLY, Assistant Treasurer since December 2005.
Tax Manager of the Investment Accounting and Support Department of the Manager, and an officer of 76 investment companies (comprised of 192 portfolios) managed by the Manager. He is 43 years old and has been an employee of the Manager since April 1991.
ROBERT ROBOL, Assistant Treasurer since December 2002.
Senior Accounting Manager – Fixed Income Funds of the Manager, and an officer of 76 investment companies (comprised of 192 portfolios) managed by the Manager. He is 47 years old and has been an employee of the Manager since October 1988.
ROBERT SALVIOLO, Assistant Treasurer since July 2007.
Senior Accounting Manager – Equity Funds of the Manager, and an officer of 76 investment companies (comprised of 192 portfolios) managed by the Manager. He is 44 years old and has been an employee of the Manager since June 1989.
ROBERT SVAGNA, Assistant Treasurer since December 2002.
Senior Accounting Manager – Equity Funds of the Manager, and an officer of 76 investment companies (comprised of 192 portfolios) managed by the Manager. He is 44 years old and has been an employee of the Manager since November 1990.
32
JOSEPH W. CONNOLLY, Chief Compliance Officer since October 2004.
Chief Compliance Officer of the Manager and The Dreyfus Family of Funds (76 investment companies, comprised of 192 portfolios). From November 2001 through March 2004, Mr. Connolly was first Vice-President, Mutual Fund Servicing for Mellon Global Securities Services. In that capacity, Mr. Connolly was responsible for managing Mellon’s Custody, Fund Accounting and Fund Administration services to third-party mutual fund clients. He is 54 years old and has served in various capacities with the Manager since 1980, including manager of the firm’s Fund Accounting Department from 1997 through October 2001.
STEPHEN J. STOREN, Anti-Money Laundering Compliance Officer since May 2011.
Chief Compliance Officer of the Distributor, and the Anti-Money Laundering Compliance Officer of 72 investment companies (comprised of 188 portfolios) managed by the Manager. He is 57 years old and has been an employee of the Distributor since October 1999.

Save time. Save paper. View your next shareholder report online as soon as it’s available. Log into www.dreyfus.com and sign up for Dreyfus eCommunications. It’s simple and only takes a few minutes.
The views expressed in this report reflect those of the portfolio manager only through the end of the period covered and do not necessarily represent the views of Dreyfus or any other person in the Dreyfus organization. Any such views are subject to change at any time based upon market or other conditions and Dreyfus disclaims any responsibility to update such views.These views may not be relied on as investment advice and, because investment decisions for a Dreyfus fund are based on numerous factors, may not be relied on as an indication of trading intent on behalf of any Dreyfus fund.
Not FDIC-Insured • Not Bank-Guaranteed • May Lose Value
| | Contents |
| | THE FUND |
| 2 | A Letter from the Chairman and CEO |
| 3 | Discussion of Fund Performance |
| 6 | Understanding Your Fund’s Expenses |
| 6 | Comparing Your Fund’s Expenses With Those of Other Funds |
| 7 | Statement of Investments |
| 9 | Statement of Assets and Liabilities |
| 10 | Statement of Operations |
| 11 | Statement of Changes in Net Assets |
| 12 | Financial Highlights |
| 14 | Notes to Financial Statements |
| 23 | Report of Independent Registered Public Accounting Firm |
| 24 | Important Tax Information |
| 25 | Board Members Information |
| 27 | Officers of the Fund |
| | FOR MORE INFORMATION |
| | Back Cover |
Dreyfus
Money Market Reserves
The Fund

A LETTER FROM THE CHAIRMAN AND CEO
Dear Shareholder:
We present to you this annual report for Dreyfus Money Market Reserves, covering the 12-month period from November 1, 2010, through October 31, 2011. For information about how the fund performed during the reporting period, as well as general market perspectives, we provide a Discussion of Fund Performance on the pages that follow.
The reporting period was mostly characterized by intensifying macroeconomic concerns amid fluctuating U.S. economic data, volatile commodity prices, the ongoing sovereign debt crisis in Europe and a contentious debate regarding taxes, spending and borrowing in the United States.Toward the end of the reporting period, in the wake of the downgrade of U.S. long-term debt over the summer, October proved to be one of the strongest months of stock market performance of the past decade.
The economic outlook currently remains clouded by market turbulence and political infighting, but we believe that a continued subpar global expansion is more likely than a return to recession. Although Europe continues to struggle with a debt crisis, inflationary pressures appear to be waning in most countries as energy prices recently have retreated from their highs. In the United States, moderately low core inflation and an accommodative monetary policy could help support near-trend growth despite ongoing deleveraging activity in the private sector.To assess the potential impact of these and other developments on your investments, as well as to assess your liquid asset allocations, we encourage you, as always, to speak with your financial advisor.
Thank you for your continued confidence and support.

Jonathan R. Baum
Chairman and Chief Executive Officer
The Dreyfus Corporation
November 15, 2011
2

DISCUSSION OF FUND PERFORMANCE
For the period of November 1, 2010, through October 31, 2011, as provided by Patricia A. Larkin, Senior Portfolio Manager
Fund and Market Performance Overview
For the 12-month period ended October 31, 2011, Dreyfus Money Market Reserves’ Investor shares produced a yield of 0.00%, and Class R shares produced a yield of 0.00%.Taking into account the effects of compounding, the fund’s Investor shares and Class R shares also produced effective yields of 0.00% and 0.00%, respectively.1
Yields of money market instruments hovered near historically low levels throughout the reporting period as the Federal Reserve Board (the “Fed”) left short-term interest rates within a historically low range between 0% and 0.25%.
The Fund’s Investment Approach
The fund seeks a high level of current income consistent with stability of principal.To pursue its goal, the fund invests in a diversified portfolio of high-quality, short-term debt securities, including: securities issued or guaranteed by the U.S. government or its agencies and instrumentalities; certificates of deposit, time deposits, bankers’ acceptances and other short-term securities issued by domestic or foreign banks or their subsidiaries or branches; repurchase agreements; asset-backed securities; domestic and dollar-denominated foreign commercial paper; and other short-term corporate obligations, including those with floating or variable rates of interest.
Mixed Economic Data Sparked Shifts in Market Sentiment
Although a U.S. economic recovery seemed to gain momentum over the opening months of the reporting period, economic headwinds intensified in February, when energy prices surged higher amid unrest in the Middle East, and in March when devastating natural and nuclear disasters in Japan disrupted the global industrial supply chain. Indeed, these factors helped produce an annualized U.S. gross domestic product growth rate of just 0.4% for the first quarter of 2011.
DISCUSSION OF FUND PERFORMANCE (continued)
In late April, a European sovereign debt crisis worsened as Greece teetered on the brink of default, and a contentious debate about government spending, borrowing and taxes dominated headlines in the United States. May saw mixed economic data. While industrial production picked up, the unemployment rate climbed to 9.1% in May from 8.8% in March. The U.S. housing market continued to deteriorate, posting declines in existing home sales and housing starts.
The Fed ended its massive quantitative easing program in June, and investors were relieved when the program’s termination had relatively little immediate impact on the financial markets. Meanwhile, energy prices moderated even as manufacturing activity increased. These positive developments were largely offset by declining consumer confidence, weakness in U.S. housing markets and sluggish job creation. In fact, the unemployment rate crept higher to 9.2% in June, and it later was announced that U.S. gross domestic product grew at a sluggish 1.3% annualized rate during the second quarter of 2011.
July saw heightened turmoil in the financial markets when Greece moved closer to insolvency, and an unprecedented default on U.S. government debt loomed as the U.S. Congress continued to engage in a rancorous debate about federal budget deficits. Some of these worries came to a head in early August, when Congress passed legislation raising the U.S. debt ceiling and Standard & Poor’s downgraded its credit rating on long-term U.S. debt securities.The rating on short-term government debt, including securities purchased by many money market funds, was unchanged. Later in the month, hurricanes, drought and wildfires inflicted additional damage on an already battered economy.
September brought more market turbulence when investors apparently believed that the U.S. economy was headed for recession. However, the data seemed to tell a somewhat different story, as the unemployment rate moderated to 9.0%, existing-home sales moved higher and U.S. households reduced their debt-service burdens to a level not seen since 1994. In spite of the data, investors remained fixated on the European sovereign debt crisis and the possibility that the region’s problems might spread to other parts of the world.
Economic sentiment changed dramatically in October, when new data suggested that the U.S. economy continued to show resilience and it
4
appeared that European officials had finally agreed on measures to address the debt crisis. Meanwhile, the U.S. industrial and manufacturing sectors continued to improve, and housing starts surged to their highest level in nearly 18 months.While these developments provided no guarantee that a return to recession had been avoided, they sparked strong rebounds among investments that had been severely punished during the summer downturn. It later was announced that U.S. gross domestic product grew at an annualized rate of 2.0% during the third quarter.
Outlook Clouded by Macroeconomic Developments
Yields of money market instruments remained near zero percent throughout the reporting period and yield differences along the market’s maturity spectrum remained relatively narrow, so it made little sense to incur the additional risks that longer-dated securities typically entail. Therefore, we maintained the fund’s weighted average maturity in a range that was roughly in line with industry averages.
Despite the glimmers of economic improvement late in the reporting period, the outlook remains cloudy and the Fed has signaled its intention to keep short-term interest rates near historical lows “at least through mid-2013.”Therefore, we intend to maintain the fund’s focus on quality and liquidity.
November 15, 2011
| |
| | An investment in the fund is not insured or guaranteed by the FDIC or any other government |
| | agency.Although the fund seeks to preserve the value of your investment at $1.00 per share, it is |
| | possible to lose money by investing in the fund. |
| | Short-term corporate, asset-backed securities holdings and municipal securities holdings (as applicable), |
| | while rated in the highest rating category by one or more NRSRO (or unrated, if deemed of |
| | comparable quality by Dreyfus), involve credit and liquidity risks and risk of principal loss. |
| 1 | Effective yield is based upon dividends declared daily and reinvested monthly. Past performance is |
| | no guarantee of future results.Yields fluctuate.Yields provided reflect the absorption of certain fund |
| | expenses by The Dreyfus Corporation pursuant to an undertaking in effect that may be extended, |
| | terminated or modified at any time. Had these expenses not been absorbed, the fund’s yields |
| | would have been lower, and in some cases, 7-day yields during the reporting period would have |
| | been negative absent the expense absorption. |
UNDERSTANDING YOUR FUND’S EXPENSES (Unaudited)
As a mutual fund investor, you pay ongoing expenses, such as management fees and other expenses. Using the information below, you can estimate how these expenses affect your investment and compare them with the expenses of other funds.You also may pay one-time transaction expenses, including sales charges (loads) and redemption fees, which are not shown in this section and would have resulted in higher total expenses. For more information, see your fund’s prospectus or talk to your financial adviser.
Review your fund’s expenses
The table below shows the expenses you would have paid on a $1,000 investment in Dreyfus Money Market Reserves from May 1, 2011 to October 31, 2011. It also shows how much a $1,000 investment would be worth at the close of the period, assuming actual returns and expenses.
| | | | |
| Expenses and Value of a $1,000 Investment | | |
| assuming actual returns for the six months ended October 31, 2011 | | |
| | | Investor Shares | | Class R Shares |
| Expenses paid per $1,000† | $ | 1.01 | $ | 1.01 |
| Ending value (after expenses) | $ | 1,000.00 | $ | 1,000.00 |
|
| COMPARING YOUR FUND’S EXPENSES |
| WITH THOSE OF OTHER FUNDS (Unaudited) |
Using the SEC’s method to compare expenses
The Securities and Exchange Commission (SEC) has established guidelines to help investors assess fund expenses. Per these guidelines, the table below shows your fund’s expenses based on a $1,000 investment, assuming a hypothetical 5% annualized return. You can use this information to compare the ongoing expenses (but not transaction expenses or total cost) of investing in the fund with those of other funds.All mutual fund shareholder reports will provide this information to help you make this comparison. Please note that you cannot use this information to estimate your actual ending account balance and expenses paid during the period.
| | | | |
| Expenses and Value of a $1,000 Investment | | |
| assuming a hypothetical 5% annualized return for the six months ended October 31, 2011 |
| | | Investor Shares | | Class R Shares |
| Expenses paid per $1,000† | $ | 1.02 | $ | 1.02 |
| Ending value (after expenses) | $ | 1,024.20 | $ | 1,024.20 |
Expenses are equal to the fund’s annualized expense ratio of .20% for Investor shares and .20% for Class R shares, multiplied by the average account value over the period, multiplied by 184/365 (to reflect the one-half year period).
6
|
| STATEMENT OF INVESTMENTS |
| October 31, 2011 |
| | | |
| | Principal | | |
| Negotiable Bank Certificates of Deposit—19.7% | Amount ($) | | Value ($) |
| Barclays Bank | | | |
| 0.64%, 11/3/11 | 15,000,000 | a | 15,000,000 |
| Canadian Imperial Bank of Commerce | | | |
| 0.17%, 11/1/11 | 10,000,000 | a | 10,000,726 |
| Credit Suisse (Yankee) | | | |
| 0.35%, 12/22/11 | 12,000,000 | | 12,000,000 |
| Nordea Bank Finland (Yankee) | | | |
| 0.30%, 12/22/11 | 10,000,000 | | 10,000,000 |
| UBS (Yankee) | | | |
| 0.44%, 1/13/12 | 10,000,000 | | 10,000,000 |
| Total Negotiable Bank Certificates of Deposit | | | |
| (cost $57,000,726) | | | 57,000,726 |
| | | |
| Commercial Paper—3.5% | | | |
| Mizuho Funding LLC | | | |
| 0.36%, 1/12/12 | | | |
| (cost $9,992,800) | 10,000,000 | b | 9,992,800 |
| | | |
| Asset-Backed Commercial Paper—3.5% | | | |
| Grampian Funding LLC | | | |
| 0.27%, 11/16/11 | | | |
| (cost $9,998,875) | 10,000,000 | b | 9,998,875 |
| | |
| Time Deposits—28.2% | | |
| Bank of Tokyo-Mitsubishi Ltd. (Grand Cayman) | | |
| 0.06%, 11/1/11 | 12,000,000 | 12,000,000 |
| DnB NOR Bank ASA (Grand Cayman) | | |
| 0.06%, 11/1/11 | 12,000,000 | 12,000,000 |
| KBC Bank (Grand Cayman) | | |
| 0.05%, 11/1/11 | 10,000,000 | 10,000,000 |
| National Australia Bank (Grand Cayman) | | |
| 0.04%, 11/1/11 | 12,000,000 | 12,000,000 |
| Northern Trust Co. (Grand Cayman) | | |
| 0.03%, 11/1/11 | 12,000,000 | 12,000,000 |
| Royal Bank of Canada (Grand Cayman) | | |
| 0.03%, 11/1/11 | 12,000,000 | 12,000,000 |
| Swedbank (ForeningsSparbanken AB) (Grand Cayman) | | |
| 0.08%, 11/1/11 | 12,000,000 | 12,000,000 |
| Total Time Deposits | | |
| (cost $82,000,000) | | 82,000,000 |
STATEMENT OF INVESTMENTS (continued)
| | | |
| | Principal | | |
| U.S. Government Agency—8.6% | Amount ($) | | Value ($) |
| Federal National Mortgage Association | | | |
| 0.15%-0.40%, 1/17/12 | | | |
| (cost $24,995,188) | 25,000,000 | a,c | 24,995,188 |
| |
| U.S. Treasury Bills—17.3% | | | |
| U.S. Treasury Bills | | | |
| 0.00%, 11/17/11 | | | |
| (cost $50,000,000) | 50,000,000 | | 50,000,000 |
| |
| Repurchase Agreement—19.0% | | | |
| Goldman, Sachs & Co. | | | |
| 0.09%, dated 10/31/11, due 11/1/11 | | | |
| in the amount of $55,000,138 (fully | | | |
| collateralized by $152,589,386 Government | | | |
| National Mortgage Association, 3%-6.44%, | | | |
| due 4/20/39-10/20/41, value $56,100,001) | | | |
| (cost $55,000,000) | 55,000,000 | | 55,000,000 |
| |
| Total Investments (cost $288,987,589) | 99.8 | % | 288,987,589 |
| Cash and Receivables (Net) | .2 | % | 472,828 |
| Net Assets | 100.0 | % | 289,460,417 |
|
| a Variable rate security—interest rate subject to periodic change. |
| b Securities exempt from registration under Rule 144A of the Securities Act of 1933.These securities may be resold in |
| transactions exempt from registration, normally to qualified institutional buyers.At October 31, 2011, these securities |
| amounted to $19,991,675 or 6.9% of net assets. |
| c The Federal Housing Finance Agency (“FHFA”) placed Federal Home Loan Mortgage Corporation and Federal |
| National Mortgage Association into conservatorship with FHFA as the conservator.As such, the FHFA oversees the |
| continuing affairs of these companies. |
| | | |
| Portfolio Summary (Unaudited)† | | |
| |
| | Value (%) | | Value (%) |
| Banking | 51.4 | Asset-Backed/Banking | 3.5 |
| U.S. Government/Agency | 25.9 | | |
| Repurchase Agreement | 19.0 | | 99.8 |
| |
| † Based on net assets. | | | |
| See notes to financial statements. | | | |
8
|
| STATEMENT OF ASSETS AND LIABILITIES |
| October 31, 2011 |
| | |
| | Cost | Value |
| Assets ($): | | |
| Investments in securities—See Statement of | | |
| Investments (including Repurchase | | |
| Agreement of $55,000,000)—Note 1(b) | 288,987,589 | 288,987,589 |
| Cash | | 497,388 |
| Interest receivable | | 34,954 |
| | | 289,519,931 |
| Liabilities ($): | | |
| Due to The Dreyfus Corporation and affiliates—Note 2(b) | | 42,177 |
| Payable for shares of Capital Stock redeemed | | 17,328 |
| Dividend payable | | 9 |
| | | 59,514 |
| Net Assets ($) | | 289,460,417 |
| Composition of Net Assets ($): | | |
| Paid-in capital | | 289,460,417 |
| Net Assets ($) | | 289,460,417 |
| |
| |
| Net Asset Value Per Share | | |
| | Investor Shares | Class R Shares |
| Net Assets ($) | 208,675,060 | 80,785,357 |
| Shares Outstanding | 208,675,059 | 80,785,357 |
| Net Asset Value Per Share ($) | 1.00 | 1.00 |
| |
| See notes to financial statements. | | |
|
| STATEMENT OF OPERATIONS |
| Year Ended October 31, 2011 |
| | |
| Investment Income ($): | |
| Interest Income | 833,979 |
| Expenses: | |
| Management fee—Note 2(a) | 1,740,505 |
| Distribution fees (Investor Shares)—Note 2(b) | 476,227 |
| Directors’ fees—Note 2(a) | 18,016 |
| Total Expenses | 2,234,748 |
| Less—reduction in expenses due to undertaking—Note 2(a) | (1,382,908) |
| Less—Directors’ fees reimbursed by the Manager—Note 2(a) | (18,016) |
| Net Expenses | 833,824 |
| Investment Income—Net, representing net increase | |
| in net assets resulting from operations | 155 |
| |
| See notes to financial statements. | |
10
STATEMENT OF CHANGES IN NET ASSETS
| | | | |
| | Year Ended October 31, |
| | 2011 | 2010 |
| Operations ($): | | |
| Investment income—net | 155 | 162 |
| Net realized gain (loss) on investments | — | 1,540 |
| Net Increase (Decrease) in Net Assets | | |
| Resulting from Operations | 155 | 1,702 |
| Dividends to Shareholders from ($): | | |
| Investment income—net: | | |
| Investors Shares | (1,025) | (110) |
| Class R Shares | (670) | (52) |
| Total Dividends | (1,695) | (162) |
| Capital Stock Transactions ($1.00 per share): | | |
| Net proceeds from shares sold: | | |
| Investors Shares | 320,251,450 | 408,796,488 |
| Class R Shares | 338,499,672 | 364,332,286 |
| Dividends reinvested: | | |
| Investors Shares | 1,162 | 110 |
| Class R Shares | 484 | 38 |
| Cost of shares redeemed: | | |
| Investors Shares | (440,382,061) | (435,329,323) |
| Class R Shares | (398,562,474) | (378,817,805) |
| Increase (Decrease) in Net Assets | | |
| from Capital Stock Transactions | (180,191,767) | (41,018,206) |
| Total Increase (Decrease) in Net Assets | (180,193,307) | (41,016,666) |
| Net Assets ($): | | |
| Beginning of Period | 469,653,724 | 510,670,390 |
| End of Period | 289,460,417 | 469,653,724 |
| |
| See notes to financial statements. | | |
FINANCIAL HIGHLIGHTS
The following tables describe the performance for each share class for the fiscal periods indicated. All information reflects financial results for a single fund share. Total return shows how much your investment in the fund would have increased (or decreased) during each period, assuming you had reinvested all dividends and distributions.These figures have been derived from the fund’s financial statements.
| | | | | | | | | | |
| | | Year Ended October 31, | |
| Investor Shares | 2011 | 2010 | 2009 | 2008 | 2007 |
| Per Share Data ($): | | | | | |
| Net asset value, beginning of period | 1.00 | 1.00 | 1.00 | 1.00 | 1.00 |
| Investment Operations: | | | | | |
| Investment income—net | .000a | .000a | .003 | .028 | .046 |
| Distributions: | | | | | |
| Dividends from investment income—net | (.000)a | (.000)a | (.003) | (.028) | (.046) |
| Net asset value, end of period | 1.00 | 1.00 | 1.00 | 1.00 | 1.00 |
| Total Return (%) | .00b | .00b | .30 | 2.87 | 4.75 |
| Ratios/Supplemental Data (%): | | | | | |
| Ratio of total expenses | | | | | |
| to average net assets | .71 | .71 | .75 | .71 | .71 |
| Ratio of net expenses | | | | | |
| to average net assets | .24 | .29 | .66 | .70 | .70 |
| Ratio of net investment income | | | | | |
| to average net assets | .00b | .00b | .32 | 2.80 | 4.65 |
| Net Assets, end of period ($ x 1,000) | 208,675 | 328,806 | 355,337 | 408,547 | 352,108 |
| |
| a | Amount represents less than $.001 per share. |
| b | Amount represents less than .01%. |
| See notes to financial statements. |
12
| | | | | | | | | | |
| | | Year Ended October 31, | |
| Class R Shares | 2011 | 2010 | 2009 | 2008 | 2007 |
| Per Share Data ($): | | | | | |
| Net asset value, beginning of period | 1.00 | 1.00 | 1.00 | 1.00 | 1.00 |
| Investment Operations: | | | | | |
| Investment income—net | .000a | .000a | .004 | .030 | .048 |
| Distributions: | | | | | |
| Dividends from investment income—net | (.000)a | (.000)a | (.004) | (.030) | (.048) |
| Net asset value, end of period | 1.00 | 1.00 | 1.00 | 1.00 | 1.00 |
| Total Return (%) | .00b | .00b | .43 | 3.07 | 4.96 |
| Ratios/Supplemental Data (%): | | | | | |
| Ratio of total expenses | | | | | |
| to average net assets | .51 | .51 | .55 | .51 | .51 |
| Ratio of net expenses | | | | | |
| to average net assets | .24 | .29 | .52 | .50 | .50 |
| Ratio of net investment income | | | | | |
| to average net assets | .00b | .00b | .47 | 3.03 | 4.85 |
| Net Assets, end of period ($ x 1,000) | 80,785 | 140,848 | 155,333 | 186,972 | 162,075 |
| |
| a | Amount represents less than $.001 per share. |
| b | Amount represents less than .01%. |
| See notes to financial statements. |
NOTES TO FINANCIAL STATEMENTS
NOTE 1—Significant Accounting Policies:
Dreyfus Money Market Reserves (the “fund”) is a separate diversified series of The Dreyfus/Laurel Funds, Inc. (the “Company”), which is registered under the Investment Company Act of 1940, as amended (the “Act”), as an open-end management investment company and operates as a series company currently offering ten series including the fund.The fund’s investment objective is to seek a high level of current income consistent with stability of principal.The Dreyfus Corporation (the “Manager” or “Dreyfus”), a wholly-owned subsidiary ofThe Bank of New York Mellon Corporation (“BNY Mellon”), serves as the fund’s investment adviser.
MBSC Securities Corporation (the “Distributor”), a wholly-owned subsidiary of the Manager, is the distributor of the fund’s shares, which are sold without a sales charge.The fund is authorized to issue 2 billion shares of $.001 par value Capital Stock in each of the following classes of shares: Investor and Class R. Investor shares are sold primarily to retail investors and bear a distribution fee. Class R shares are sold primarily to bank trust departments and other financial service providers (includingThe Bank of NewYork Mellon, a subsidiary of BNY Mellon and an affiliate of Dreyfus) acting on behalf of customers having a qualified trust or investment account or relationship at such institution, and bear no distribution fee. Each class of shares has identical rights and privileges, except with respect to the distribution fee and voting rights on matters affecting a single class. Income, expenses (other than expenses attributable to a specific class), and realized and unrealized gains or losses on investments are allocated to each class of shares based on its relative net assets.
It is the fund’s policy to maintain a continuous net asset value per share of $1.00 for the fund; the fund has adopted certain investment, portfolio valuation and dividend and distribution policies to enable it
14
to do so.There is no assurance, however, that the fund will be able to maintain a stable net asset value per share of $1.00.
The Financial Accounting Standards Board (“FASB”) Accounting Standards Codification (“ASC”) is the exclusive reference of authoritative U.S. generally accepted accounting principles (“GAAP”) recognized by the FASB to be applied by nongovernmental entities. Rules and interpretive releases of the Securities and Exchange Commission (“SEC”) under authority of federal laws are also sources of authoritative GAAP for SEC registrants. The fund’s financial statements are prepared in accordance with GAAP, which may require the use of management estimates and assumptions.Actual results could differ from those estimates.
(a) Portfolio valuation: Investments in securities are valued at amortized cost in accordance with Rule 2a-7 of the Act, which has been determined by the Board of Directors to represent the fair value of the fund’s investments.
The fair value of a financial instrument is the amount that would be received to sell an asset or paid to transfer a liability in an orderly transaction between market participants at the measurement date (i.e. the exit price). GAAP establishes a fair value hierarchy that prioritizes the inputs of valuation techniques used to measure fair value.This hierarchy gives the highest priority to unadjusted quoted prices in active markets for identical assets or liabilities (Level 1 measurements) and the lowest priority to unobservable inputs (Level 3 measurements).
Additionally, GAAP provides guidance on determining whether the volume and activity in a market has decreased significantly and whether such a decrease in activity results in transactions that are not orderly. GAAP requires enhanced disclosures around valuation inputs and techniques used during annual and interim periods.
NOTES TO FINANCIAL STATEMENTS (continued)
Various inputs are used in determining the value of the fund’s investments relating to fair value measurements.These inputs are summarized in the three broad levels listed below:
Level 1—unadjusted quoted prices in active markets for identical investments.
Level 2—other significant observable inputs (including quoted prices for similar investments, interest rates, prepayment speeds, credit risk, etc.).
Level 3—significant unobservable inputs (including the fund’s own assumptions in determining the fair value of investments).
The inputs or methodology used for valuing securities are not necessarily an indication of the risk associated with investing in those securities. For example, money market securities are valued using amortized cost, in accordance with rules under the Act. Generally, amortized cost approximates the current fair value of a security, but since the value is not obtained from a quoted price in an active market, such securities are reflected within Level 2 of the fair value hierarchy.
The following is a summary of the inputs used as of October 31, 2011 in valuing the fund’s investments:
| |
| | Short-Term |
| Valuation Inputs | Investments ($)† |
| Level 1—Unadjusted Quoted Prices | — |
| Level 2—Other Significant Observable Inputs | 288,987,589 |
| Level 3—Significant Unobservable Inputs | — |
| Total | 288,987,589 |
| † See Statement of Investments for additional detailed categorizations. | |
In May 2011, FASB issued Accounting Standards Update (“ASU”) No. 2011-04 “Amendments to Achieve Common Fair Value Measurement and Disclosure Requirements in GAAP and International Financial Reporting Standards (“IFRS”)” (“ASU 2011-04”). ASU 2011-04 includes common requirements for measurement of and disclosure about fair value between GAAP and IFRS. ASU 2011-04 will require reporting entities to disclose the following information for fair value
16
measurements categorized within Level 3 of the fair value hierarchy: quantitative information about the unobservable inputs used in the fair value measurement, the valuation processes used by the reporting entity and a narrative description of the sensitivity of the fair value measurement to changes in unobservable inputs and the interrelationships between those unobservable inputs. In addition, ASU 2011-04 will require reporting entities to make disclosures about amounts and reasons for all transfers in and out of Level 1 and Level 2 fair value measurements.The new and revised disclosures are effective for interim and annual reporting periods beginning after December 15, 2011. At this time, management is evaluating the implications of ASU 2011-04 and its impact on the financial statements.
(b) Securities transactions and investment income: Securities transactions are recorded on a trade date basis. Realized gains and losses from securities transactions are recorded on the identified cost basis. Interest income, adjusted for accretion of discount and amortization of premium on investments, is earned from settlement date and recognized on the accrual basis. Cost of investments represents amortized cost.
The fund may engage in repurchase agreement transactions. Under the terms of a typical repurchase agreement, the fund, through its custodian and sub-custodian, takes possession of an underlying debt obligation subject to an obligation of the seller to repurchase, and the fund to resell, the obligation at an agreed-upon price and time, thereby determining the yield during the fund’s holding period.This arrangement results in a fixed rate of return that is not subject to market fluctuations during the fund’s holding period. The value of the collateral is at least equal, at all times, to the total amount of the repurchase obligation, including interest. In the event of a counter-party default, the fund has the right to use the collateral to offset losses incurred. There is potential loss to the fund in the event the fund is delayed or prevented from exercising its rights to dispose of the collateral securities, including the risk of a possible decline in the value of the underlying securities during the period while the fund
NOTES TO FINANCIAL STATEMENTS (continued)
seeks to assert its rights.The Manager, acting under the supervision of the Board of Directors, reviews the value of the collateral and the creditworthiness of those banks and dealers with which the fund enters into repurchase agreements to evaluate potential risks.
(c) Dividends to shareholders: It is the policy of the fund to declare dividends daily from investment income-net; such dividends are paid monthly. Dividends from net realized capital gains, if any, are normally declared and paid annually, but the fund may make distributions on a more frequent basis to comply with the distribution requirements of the Internal Revenue Code of 1986, as amended (the “Code”).To the extent that net realized capital gains can be offset by capital loss carryovers, it is the policy of the fund not to distribute such gains.
(d) Federal income taxes: It is the policy of the fund to continue to qualify as a regulated investment company, if such qualification is in the best interest of its shareholders, by complying with the applicable provisions of the Code, and to make distributions of taxable income sufficient to relieve it from substantially all federal income and excise taxes.
As of and during the period ended October 31, 2011, the fund did not have any liabilities for any uncertain tax positions.The fund recognizes interest and penalties, if any, related to uncertain tax positions as income tax expense in the Statement of Operations. During the period, the fund did not incur any interest or penalties.
Each of the tax years in the four-year period ended October 31, 2011 remains subject to examination by the Internal Revenue Service and state taxing authorities.
At October 31, 2011, the components of accumulated earnings on a tax basis were substantially the same as for financial reporting purposes.
The tax character of distributions paid to shareholders during the fiscal periods ended October 31, 2011 and October 31, 2010 were all ordinary income.
During the period ended October 31, 2011, as a result of permanent book to tax differences, primarily due to dividend reclassification, the
18
fund increased accumulated undistributed investment income-net by $1,540 and decreased accumulated net realized gain (loss) on investment by the same amount. Net assets and net asset value per share were not affected by this reclassification.
At October 31, 2011, the cost of investments for federal income tax purposes was substantially the same as the cost for financial reporting purposes (see the Statement of Investments).
NOTE 2—Investment Management Fee and Other Transactions With Affiliates:
(a) Pursuant to an investment management agreement with the Manager, the Manager provides or arranges for one or more third parties and/or affiliates to provide investment advisory, administrative, custody, fund accounting and transfer agency services to the fund.The Manager also directs the investments of the fund in accordance with its investment objective, policies and limitations. For these services, the fund is contractually obligated to pay the Manager a fee, calculated daily and paid monthly, at the annual rate of .50% of the value of the fund’s average daily net assets. Out of its fee, the Manager pays all of the expenses of the fund except brokerage fees, taxes, interest, Rule 12b-1 distribution fees, servicing fees and expenses, fees and expenses of non-interested Directors (including counsel fees) and extraordinary expenses. In addition, the Manager is required to reduce its fee in an amount equal to the fund’s allocable portion of fees and expenses of the non-interested Directors (including counsel fees). Each Board member who is not an “interested person” of the Company (as defined in the Act) receives $60,000 per annum, plus $7,000 per joint Board meeting of the Company, Dreyfus Investment Funds, The Dreyfus/Laurel Funds Trust, The Dreyfus/Laurel Tax-Free Municipal Funds and Dreyfus Funds, Inc. (collectively, the “Board Group Open-End Funds”) attended, $2,500 for separate in-person committee meetings attended which are not held in conjunction with a regularly scheduled Board meeting and $2,000 for Board meetings and separate committee meetings attended
NOTES TO FINANCIAL STATEMENTS (continued)
that are conducted by telephone.The Board Group Open-End Funds also reimburse each Board member who is not an “interested person” of the Company (as defined in the Act) for travel and out-of-pocket expenses. With respect to Board meetings, the Chairman of the Board receives an additional 25% of such compensation (with the exception of reimbursable amounts). The Chair of each of the Board’s committees, unless the Chair also serves as Chair of the Board, receives $1,350 per applicable committee meeting. In the event that there is an in-person joint committee meeting or a joint telephone meeting of the Board Group Open-End Funds and Dreyfus High Yield Strategies Fund (“DHF”), a $2,500 fee is allocated between the Board Group Open-End Funds and DHF. The Company’s portion of these fees and expenses are charged and allocated to each series based on net assets.Amounts required to be paid by the Company directly to the non-interested Directors, that would be applied to offset a portion of the management fee payable to the Manager, are in fact paid directly by the Manager to the non-interested Directors.
Effective January 1, 2012, the Board Group Open-End Funds and DHF (collectively, the “Board Group Funds”) will pay each Board member their respective allocated portions of an annual retainer of $85,000 and a fee of $10,000 for each regularly scheduled Board meeting attended ($75,000 and $8,000, respectively, in the aggregate, prior to January 1, 2012). With respect to the annual retainer and Board meetings of the Board Group Funds, the Chair of the Board will receive an additional 25% of such compensation (with the exception of reimbursable amounts). Each Board member will receive $2,500 for any separate in-person committee meetings attended, which are not held in conjunction with a regularly scheduled Board meeting, such amount to be allocated among the Board Group Funds, as applicable. In the event that there is a joint telephone meeting of the Board Group Funds, a fee of $2,000 will be allocated among the applicable Board Group Funds, accordingly (prior to January 1, 2012, the fee allocated was $2,500 if the meeting included DHF).The Chair of each of the Board’s committees, unless the Chair also serves as
20
Chair of the Board, will receive $1,500 per applicable committee meeting. Each Emeritus Board member is entitled to receive an annual retainer of one-half the amount paid as a retainer at the time the Board member became Emeritus and a per meeting attended fee of one-half the amount paid to Board members. The Board Group Funds also reimburse each Independent Board member and Emeritus Board members for travel and out-of-pocket expenses.
The Manager has undertaken to waive receipt of the management fee and/or reimburse operating expenses in order to facilitate a daily yield at or above a certain level which may change from time to time.This undertaking is voluntary and not contractual, and may be terminated at any time.The reduction in expenses, pursuant to the undertaking, amounted to $1,098,640 for Investor shares and $284,268 for Class R shares during the period ended October 31, 2011.
(b) Under the Distribution Plan (the “Plan”) adopted pursuant to Rule 12b-1 under the Act, Investor shares may pay annually up to .25% (currently limited by the Company’s Board of Directors to .20%) of the value of the average daily net assets attributable to its Investor shares to compensate the Distributor for shareholder servicing activities and expenses primarily intended to result in the sale of Investor shares. During the period ended October 31, 2011, Investor shares were charged $467,227 pursuant to the Plan.
Under its terms, the Plan shall remain in effect from year to year, provided such continuance is approved annually by a vote of a majority of those Directors who are not “interested persons” of the Company and who have no direct or indirect financial interest in the operation of or in any agreement related to the Plan.
The components of “Due to The Dreyfus Corporation and affiliates” in the Statement of Assets and Liabilities consist of: management fees $124,092 and Rule 12b-1 distribution plan fees $35,773, which are offset against an expense reimbursement currently in effect in the amount of $117,688.
NOTES TO FINANCIAL STATEMENTS (continued)
NOTE 3—Other Matters:
At the October 27, 2011 Board meeting, the Board of the Company approved a proposal to have shareholders consider the election of Francine J. Bovich as an additional Board member of the Company, and also consider the election of Joseph S. DiMartino and Benaree Pratt Wiley, current Board members of the Company not previously proposed to shareholders of the fund. A proxy statement was mailed, on December 1, 2011, to shareholders of record as of the close of business on November 1, 2011 asking shareholders to consider these elections at a special joint meeting of shareholders to be held on Wednesday, February 8, 2012.
22
|
| REPORT OF INDEPENDENT REGISTERED |
| PUBLIC ACCOUNTING FIRM |
The Board of Directors and Shareholders of The Dreyfus/Laurel Funds, Inc.
We have audited the accompanying statement of assets and liabilities of Dreyfus Money Market Reserves, a series of The Dreyfus/Laurel Funds, Inc. (the “Fund”), including the statement of investments, as of October 31, 2011, and the related statement of operations for the year then ended, the statements of changes in net assets for each of the years in the two-year period then ended, and the financial highlights for each of the years in the five-year period then ended. These financial statements and financial highlights are the responsibility of the Fund’s management. Our responsibility is to express an opinion on these financial statements and financial highlights based on our audits.
We conducted our audits in accordance with the standards of the Public Company Accounting Oversight Board (United States).Those standards require that we plan and perform the audit to obtain reasonable assurance about whether the financial statements and financial highlights are free of material misstatement. An audit includes examining, on a test basis, evidence supporting the amounts and disclosures in the financial statements. Our procedures included confirmation of securities owned as of October 31, 2011, by correspondence with the custodian and brokers or by other appropriate auditing procedures where replies from brokers were not received. An audit also includes assessing the accounting principles used and significant estimates made by management, as well as evaluating the overall financial statement presentation.We believe that our audits provide a reasonable basis for our opinion.
In our opinion, the financial statements and financial highlights referred to above present fairly, in all material respects, the financial position of Dreyfus Money Market Reserves as of October 31, 2011, the results of its operations for the year then ended, the changes in its net assets for each of the years in the two-year period then ended, and the financial highlights for each of the years in the five-year period then ended, in conformity with U.S. generally accepted accounting principles.

New York, New York
December 22, 2011
IMPORTANT TAX INFORMATION (Unaudited)
For federal tax purposes the fund designates the maximum amount allowable but not less than 94.51% as interest-related dividends in accordance with Sections 871(k)(1) and 881(e) of the Internal Revenue Code. Also, the fund designates the maximum amount allowable but not less than $1,540 as a short-term capital gain dividend in accordance with Sections 871(k)(2) and 881(e) of the Internal Revenue Code.
24
OFFICERS OF THE FUND (Unaudited)
BRADLEY J. SKAPYAK, President since January 2010.
Chief Operating Officer and a director of the Manager since June 2009. From April 2003 to June 2009, Mr. Skapyak was the head of the Investment Accounting and Support Department of the Manager. He is an officer of 75 investment companies (comprised of 167 portfolios) managed by the Manager. He is 52 years old and has been an employee of the Manager since February 1988.
MICHAEL A. ROSENBERG, Vice President and Secretary since August 2005.
Assistant General Counsel of BNY Mellon, and an officer of 76 investment companies (comprised of 192 portfolios) managed by the Manager. He is 51 years old and has been an employee of the Manager since October 1991.
KIESHA ASTWOOD, Vice President and Assistant Secretary since January 2010.
Counsel of BNY Mellon, and an officer of 76 investment companies (comprised of 192 portfolios) managed by the Manager. She is 38 years old and has been an employee of the Manager since July 1995.
JAMES BITETTO, Vice President and Assistant Secretary since August 2005.
Senior Counsel of BNY Mellon and Secretary of the Manager, and an officer of 76 investment companies (comprised of 192 portfolios) managed by the Manager. He is 45 years old and has been an employee of the Manager since December 1996.
JONI LACKS CHARATAN, Vice President and Assistant Secretary since August 2005.
Senior Counsel of BNY Mellon, and an officer of 76 investment companies (comprised of 192 portfolios) managed by the Manager. She is 55 years old and has been an employee of the Manager since October 1988.
JOSEPH M. CHIOFFI, Vice President and Assistant Secretary since August 2005.
Senior Counsel of BNY Mellon, and an officer of 76 investment companies (comprised of 192 portfolios) managed by the Manager. He is 49 years old and has been an employee of the Manager since June 2000.
KATHLEEN DENICHOLAS, Vice President and Assistant Secretary since January 2010.
Senior Counsel of BNY Mellon, and an officer of 76 investment companies (comprised of 192 portfolios) managed by the Manager. She is 37 years old and has been an employee of the Manager since February 2001.
JANETTE E. FARRAGHER, Vice President and Assistant Secretary since August 2005.
Assistant General Counsel of BNY Mellon, and an officer of 76 investment companies (comprised of 192 portfolios) managed by the Manager. She is 48 years old and has been an employee of the Manager since February 1984.
JOHN B. HAMMALIAN, Vice President and Assistant Secretary since August 2005.
Managing Counsel of BNY Mellon, and an officer of 76 investment companies (comprised of 192 portfolios) managed by the Manager. He is 48 years old and has been an employee of the Manager since February 1991.
M. CRISTINA MEISER, Vice President and Assistant Secretary since January 2010.
Senior Counsel of BNY Mellon, and an officer of 76 investment companies (comprised of 192 portfolios) managed by the Manager. She is 41 years old and has been an employee of the Manager since August 2001.
OFFICERS OF THE FUND (Unaudited) (continued)
ROBERT R. MULLERY, Vice President and Assistant Secretary since August 2005.
Managing Counsel of BNY Mellon, and an officer of 76 investment companies (comprised of 192 portfolios) managed by the Manager. He is 59 years old and has been an employee of the Manager since May 1986.
JEFF PRUSNOFSKY, Vice President and Assistant Secretary since August 2005.
Managing Counsel of BNY Mellon, and an officer of 76 investment companies (comprised of 192 portfolios) managed by the Manager. He is 46 years old and has been an employee of the Manager since October 1990.
JAMES WINDELS, Treasurer since November 2001.
Director – Mutual Fund Accounting of the Manager, and an officer of 76 investment companies (comprised of 192 portfolios) managed by the Manager. He is 53 years old and has been an employee of the Manager since April 1985.
RICHARD CASSARO, Assistant Treasurer since January 2008.
Senior Accounting Manager – Money Market and Municipal Bond Funds of the Manager, and an officer of 76 investment companies (comprised of 192 portfolios) managed by the Manager. He is 52 years old and has been an employee of the Manager since September 1982.
GAVIN C. REILLY, Assistant Treasurer since December 2005.
Tax Manager of the Investment Accounting and Support Department of the Manager, and an officer of 76 investment companies (comprised of 192 portfolios) managed by the Manager. He is 43 years old and has been an employee of the Manager since April 1991.
ROBERT ROBOL, Assistant Treasurer since December 2002.
Senior Accounting Manager – Fixed Income Funds of the Manager, and an officer of 76 investment companies (comprised of 192 portfolios) managed by the Manager. He is 47 years old and has been an employee of the Manager since October 1988.
ROBERT SALVIOLO, Assistant Treasurer since July 2007.
Senior Accounting Manager – Equity Funds of the Manager, and an officer of 76 investment companies (comprised of 192 portfolios) managed by the Manager. He is 44 years old and has been an employee of the Manager since June 1989.
ROBERT SVAGNA, Assistant Treasurer since December 2002.
Senior Accounting Manager – Equity Funds of the Manager, and an officer of 76 investment companies (comprised of 192 portfolios) managed by the Manager. He is 44 years old and has been an employee of the Manager since November 1990.
28
JOSEPH W. CONNOLLY, Chief Compliance Officer since October 2004.
Chief Compliance Officer of the Manager and The Dreyfus Family of Funds (76 investment companies, comprised of 192 portfolios). From November 2001 through March 2004, Mr. Connolly was first Vice-President, Mutual Fund Servicing for Mellon Global Securities Services. In that capacity, Mr. Connolly was responsible for managing Mellon’s Custody, Fund Accounting and Fund Administration services to third-party mutual fund clients. He is 54 years old and has served in various capacities with the Manager since 1980, including manager of the firm’s Fund Accounting Department from 1997 through October 2001.
STEPHEN J. STOREN, Anti-Money Laundering Compliance Officer since May 2011.
Chief Compliance Officer of the Distributor, and the Anti-Money Laundering Compliance Officer of 72 investment companies (comprised of 188 portfolios) managed by the Manager. He is 57 years old and has been an employee of the Distributor since October 1999.
Save time. Save paper. View your next shareholder report online as soon as it’s available. Log into www.dreyfus.com and sign up for Dreyfus eCommunications. It’s simple and only takes a few minutes.
The views expressed in this report reflect those of the portfolio manager only through the end of the period covered and do not necessarily represent the views of Dreyfus or any other person in the Dreyfus organization. Any such views are subject to change at any time based upon market or other conditions and Dreyfus disclaims any responsibility to update such views.These views may not be relied on as investment advice and, because investment decisions for a Dreyfus fund are based on numerous factors, may not be relied on as an indication of trading intent on behalf of any Dreyfus fund.
Not FDIC-Insured • Not Bank-Guaranteed • May Lose Value
| | Contents |
| | THE FUND |
| 2 | A Letter from the Chairman and CEO |
| 3 | Discussion of Fund Performance |
| 6 | Understanding Your Fund’s Expenses |
| 6 | Comparing Your Fund’s Expenses With Those of Other Funds |
| 7 | Statement of Investments |
| 19 | Statement of Assets and Liabilities |
| 20 | Statement of Operations |
| 21 | Statement of Changes in Net Assets |
| 22 | Financial Highlights |
| 26 | Notes to Financial Statements |
| 36 | Report of Independent Registered Public Accounting Firm |
| 37 | Important Tax Information |
| 38 | Board Members Information |
| 40 | Officers of the Fund |
| | FOR MORE INFORMATION |
| | Back Cover |
Dreyfus
AMT-Free
Municipal Reserves
The Fund

A LETTER FROM THE CHAIRMAN AND CEO
Dear Shareholder:
We present to you this annual report for Dreyfus AMT-Free Municipal Reserves, covering the 12-month period from November 1, 2010, through October 31, 2011. For information about how the fund performed during the reporting period, as well as general market perspectives, we provide a Discussion of Fund Performance on the pages that follow.
The reporting period was mostly characterized by intensifying macroeconomic concerns amid fluctuating U.S. economic data, volatile commodity prices, the ongoing sovereign debt crisis in Europe and a contentious debate regarding taxes, spending and borrowing in the United States.Toward the end of the reporting period, in the wake of the downgrade of U.S. long-term debt over the summer, October proved to be one of the strongest months of stock market performance of the past decade.
The economic outlook currently remains clouded by market turbulence and political infighting, but we believe that a continued subpar global expansion is more likely than a return to recession. Although Europe continues to struggle with a debt crisis, inflationary pressures appear to be waning in most countries as energy prices recently have retreated from their highs. In the United States, moderately low core inflation and an accommodative monetary policy could help support near-trend growth despite ongoing deleveraging activity in the private sector. To assess the potential impact of these and other developments on your investments, as well as to assess your liquid asset allocations, we encourage you, as always, to speak with your financial advisor.
Thank you for your continued confidence and support.

Jonathan R. Baum
Chairman and Chief Executive Officer
The Dreyfus Corporation
November 15, 2011
2

DISCUSSION OF FUND PERFORMANCE
For the period of November 1, 2010, through October 31, 2011, as provided by Joseph Irace, Senior Portfolio Manager
Fund and Market Performance Overview
For the 12-month period ended October 31, 2011, Dreyfus AMT-Free Municipal Reserves’ BASIC shares produced a yield of 0.00%, Class B shares produced a yield of 0.00%, Class R shares produced a yield of 0.00% and Investor shares produced a yield of 0.00%.Taking into consideration the effects of compounding, the fund’s BASIC shares, Class B shares, Class R shares and Investor shares produced effective yields of 0.00%, 0.00%, 0.00% and 0.00%, respectively, for the same period.1
Despite heightened volatility among stocks and bonds during the reporting period, tax-exempt money market yields remained stable at historically low levels as short-term interest rates were unchanged in a faltering U.S. economy.
The Fund’s Investment Approach
The fund seeks a high level of current income, consistent with stability of principal, that is exempt from federal income tax. The fund also seeks to provide income exempt from the federal alternative minimum tax.To pursue its goal, the fund normally invests substantially all of its assets in short-term, high-quality municipal obligations that provide income exempt from federal personal income tax and the federal alternative minimum tax. Among these are municipal notes, short-term municipal bonds, tax-exempt commercial paper and municipal leases. The fund also may invest in high-quality short-term structured notes, which are derivative instruments whose value is tied to underlying municipal obligations.
Yields Stay Steady Despite Shifting Economic Sentiment
The start of the reporting period coincided with a shift in investor sentiment from optimism to worries about renewed economic weakness. Of particular concern was the resurgence of a sovereign debt crisis in
DISCUSSION OF FUND PERFORMANCE (continued)
Europe, in which Greece appeared headed for default on its sovereign debt and pressure mounted on banking systems in other members of the European Union. In the United States, stubbornly high unemployment and persistently weak housing markets threatened to derail an economic recovery, and a contentious political debate regarding U.S. government spending and borrowing intensified as the federal government neared the upper limit of its debt authorization.
Volatility in the stock and bond markets was especially severe in August and September, after Standard & Poor’s downgraded its credit rating on long-term U.S. debt securities, sparking sharp declines in higher yielding bonds. Ironically, U.S. government securities rallied strongly during a “flight to quality” in the wake of the credit-rating downgrade. October saw a partial reversal of this move, as higher yielding securities that were punished in late summer rebounded and traditional safe havens gave back some of their previous gains when some macroeconomic concerns seemed to ease.
Throughout a reporting period characterized by deteriorating economic sentiment, and as it has since December 2008, the Federal Reserve Board (the “Fed”) maintained an aggressively accommodative policy stance, leaving the overnight federal funds rate in a range between 0% and 0.25%. Consequently, municipal money market yields remained near zero percent.
The supply of newly issued municipal money market instruments trended downward during the reporting period, in part due to political pressure to reduce government spending and borrowing. Meanwhile, demand for municipal money market instruments remained robust from individuals seeking to shelter income from rising state taxes and institutional investors searching for alternatives to low yielding taxable money market instruments.
From a credit-quality perspective, many states and municipalities have reduced spending to address ballooning budget deficits.Although revenues generally have remained below prerecession levels, tax receipts have trended up, and several banks have initiated programs providing municipal issuers with credit. These positive developments appear likely to continue.
4
Maintaining a Credit-Conscious Investment Posture
We have maintained the fund’s conservative investment posture, emphasizing direct, high-quality municipal obligations and commercial paper deemed creditworthy by our analysts.We also have favored instruments backed by pledged tax appropriations or dedicated rev-enues.We generally have shied away from general obligation debt and instruments issued by localities that depend heavily on state aid. Finally, we have maintained the fund’s weighted average maturity in a range that is roughly in line with industry averages, as it has made little sense to us to incur the interest-rate risks that longer-dated instruments typically entail.
Outlook Clouded by Macroeconomic Events
The U.S. economy has continued to grow despite investors’ concerns about a potential return to recession, but the outlook for the remainder of 2011 and beyond remains cloudy due to the unknown ramifications of the European debt crisis and uncertainty regarding U.S. fiscal policy. However, the Fed has signaled that it is prepared to keep monetary policy aggressively accommodative, including maintaining short-term interest rates near historical lows “at least through mid-2013.” This suggests to us that money market yields will likely remain near historical lows for some time.Therefore, we believe the prudent course continues to be an emphasis on preservation of capital and liquidity.
November 15, 2011
| |
| | An investment in the fund is not insured or guaranteed by the FDIC or any other government |
| | agency.Although the fund seeks to preserve the value of your investment at $1.00 per share, it is |
| | possible to lose money by investing in the fund. |
| | Municipal securities holdings (as applicable), while rated in the highest rating category by one or |
| | more National Recognized Statistical Rating Organizations (NRSRO) (or unrated, if deemed of |
| | comparable quality by Dreyfus), involve credit and liquidity risks and risk of principal loss. |
| 1 | Effective yield is based upon dividends declared daily and reinvested monthly. Past performance is |
| | no guarantee of future results.Yields fluctuate.Yield provided reflects the absorption of certain fund |
| | expenses by The Dreyfus Corporation pursuant to an undertaking in effect that may be extended, |
| | terminated or modified at any time. Had these expenses not been absorbed, fund yields would |
| | have been lower, and in some cases, 7-day yields during the reporting period would have been |
| | negative absent the expense absorption. |
UNDERSTANDING YOUR FUND’S EXPENSES (Unaudited)
As a mutual fund investor, you pay ongoing expenses, such as management fees and other expenses. Using the information below, you can estimate how these expenses affect your investment and compare them with the expenses of other funds.You also may pay one-time transaction expenses, including sales charges (loads) and redemption fees, which are not shown in this section and would have resulted in higher total expenses. For more information, see your fund’s prospectus or talk to your financial adviser.
Review your fund’s expenses
The table below shows the expenses you would have paid on a $1,000 investment in Dreyfus AMT-Free Municipal Reserves from May 1, 2011 to October 31, 2011. It also shows how much a $1,000 investment would be worth at the close of the period, assuming actual returns and expenses.
| | | | | |
| Expenses and Value of a $1,000 Investment | | | |
| assuming actual returns for the six months ended October 31, 2011 | | |
| | Investor Shares | Class R Shares | BASIC Shares | Class B Shares |
| Expenses paid per $1,000† | 1.46 | $ 1.46 | | $ 1.46 | $ 1.41 |
| Ending value (after expenses) | 1,000.00 | $1,000.00 | $ 1,000.00 | $ 1,000.00 |
|
| COMPARING YOUR FUND’S EXPENSES |
| WITH THOSE OF OTHER FUNDS (Unaudited) |
Using the SEC’s method to compare expenses
The Securities and Exchange Commission (SEC) has established guidelines to help investors assess fund expenses. Per these guidelines, the table below shows your fund’s expenses based on a $1,000 investment, assuming a hypothetical 5% annualized return. You can use this information to compare the ongoing expenses (but not transaction expenses or total cost) of investing in the fund with those of other funds.All mutual fund shareholder reports will provide this information to help you make this comparison. Please note that you cannot use this information to estimate your actual ending account balance and expenses paid during the period.
| | | | | | | | | | | |
| Expenses and Value of a $1,000 Investment | | | | | | | |
| assuming a hypothetical 5% annualized return for the six months ended October 31, 2011 |
| | | Investor Shares | | Class R Shares | | BASIC Shares | | Class B Shares |
| Expenses paid per $1,000† | $ | 1.48 | | $ | 1.48 | | $ | 1.48 | | $ | 1.43 |
| Ending value (after expenses) | $ | 1,023.74 | $ | 1,023.74 | $ | 1,023.74 | $ | 1,023.79 |
† Expenses are equal to the fund’s annualized expense ratio of .29% for Investor Shares, .29% for Class R Shares, .29% for BASIC Shares and .28% for Class B Shares, multiplied by the average account value over the period, multiplied by 184/365 (to reflect the one-half year period).
6
|
| STATEMENT OF INVESTMENTS |
| October 31, 2011 |
| | | | | |
| Short-Term | Coupon | Maturity | Principal | | |
| Investments—99.9% | Rate (%) | Date | Amount ($) | | Value ($) |
| Arizona—4.3% | | | | | |
| Puttable Floating Option Tax | | | | | |
| Exempt Receipts (Arizona | | | | | |
| Health Facilities Authority, | | | | | |
| HR (Phoenix Children’s | | | | | |
| Hospital)) (Liquidity | | | | | |
| Facility; Bank of America and | | | | | |
| LOC; Bank of America) | 0.32 | 11/7/11 | 14,440,000 | a,b,c,d 14,440,000 |
| Connecticut—10.1% | | | | | |
| Bridgeport, | | | | | |
| GO Notes, TAN | 2.00 | 2/10/12 | 3,000,000 | | 3,013,433 |
| Connecticut Health and Educational | | | | | |
| Facilities Authority, Revenue | | | | | |
| (Eagle Hill School Issue) | | | | | |
| (LOC; JPMorgan Chase Bank) | 0.20 | 11/7/11 | 5,275,000 | a | 5,275,000 |
| Connecticut Health and Educational | | | | | |
| Facilities Authority, Revenue | | | | | |
| (The Children’s School Issue) | | | | | |
| (LOC; JPMorgan Chase Bank) | 0.20 | 11/7/11 | 2,000,000 | a | 2,000,000 |
| Connecticut Housing Finance | | | | | |
| Authority, Revenue (Housing | | | | | |
| Mortgage Finance Program) | | | | | |
| (Liquidity Facility; Bank of | | | | | |
| Tokyo-Mitsubishi UFJ) | 0.14 | 11/7/11 | 3,380,000 | a | 3,380,000 |
| Connecticut Housing Finance | | | | | |
| Authority, Revenue (Housing | | | | | |
| Mortgage Finance Program) | | | | | |
| (Liquidity Facility; Bank of | | | | | |
| Tokyo-Mitsubishi UFJ) | 0.14 | 11/7/11 | 13,915,000 | a | 13,915,000 |
| Shelton Housing Authority, | | | | | |
| Revenue (Crosby Commons | | | | | |
| Project) (LOC; M&T Bank) | 0.19 | 11/7/11 | 6,055,000 | a | 6,055,000 |
| Delaware—.4% | | | | | |
| Delaware Health Facilities | | | | | |
| Authority, Revenue (Christiana | | | | | |
| Care Health Services) | 0.12 | 11/1/11 | 1,350,000 | a,c | 1,350,000 |
| District of Columbia—.4% | | | | | |
| District of Columbia, | | | | | |
| Revenue (American Public | | | | | |
| Health Association Issue) | | | | | |
| (LOC; Bank of America) | 0.35 | 11/7/11 | 1,480,000 | a,c | 1,480,000 |
STATEMENT OF INVESTMENTS (continued)
| | | | | |
| Short-Term | Coupon | Maturity | Principal | | |
| Investments (continued) | Rate (%) | Date | Amount ($) | | Value ($) |
| Florida—3.8% | | | | | |
| Brevard County, | | | | | |
| Revenue (Holy Trinity | | | | | |
| Episcopal Academy Project) | | | | | |
| (LOC; Wells Fargo Bank) | 0.28 | 11/7/11 | 800,000 | a | 800,000 |
| Dade County Industrial Development | | | | | |
| Authority, IDR (Spectrum | | | | | |
| Programs, Inc. Project) (LOC; | | | | | |
| Bank of America) | 0.60 | 11/7/11 | 300,000 | a | 300,000 |
| Orange County Industrial | | | | | |
| Development Authority, Revenue | | | | | |
| (Trinity Preparatory School of | | | | | |
| Florida, Inc. Project) (LOC; | | | | | |
| Wells Fargo Bank) | 0.28 | 11/7/11 | 655,000 | a | 655,000 |
| Orange County Industrial | | | | | |
| Development Authority, Revenue | | | | | |
| (Trinity Preparatory School of | | | | | |
| Florida, Inc. Project) (LOC; | | | | | |
| Wells Fargo Bank) | 0.28 | 11/7/11 | 440,000 | a | 440,000 |
| Palm Beach County, | | | | | |
| IDR (Boca Raton Jewish | | | | | |
| Community Day School, Inc. | | | | | |
| Project) (LOC; Wells Fargo Bank) | 0.23 | 11/7/11 | 1,215,000 | a | 1,215,000 |
| Palm Beach County, | | | | | |
| IDR (Gulfstream Goodwill | | | | | |
| Industies, Inc. Project) (LOC; | | | | | |
| Wells Fargo Bank) | 0.23 | 11/7/11 | 440,000 | a | 440,000 |
| Palm Beach County, | | | | | |
| Revenue (The Palm Beach Jewish | | | | | |
| Community Campus Corporation | | | | | |
| Project) (LOC; Northern Trust Co.) | 0.24 | 11/7/11 | 100,000 | a | 100,000 |
| Pinellas County Industry Council, | | | | | |
| Revenue (Chi Chi Rodriguez | | | | | |
| Youth Foundation Project) | | | | | |
| (LOC; Bank of America) | 1.35 | 11/7/11 | 10,000 | a | 10,000 |
| Pinellas County Industry Council, | | | | | |
| Revenue (Lutheran Church of | | | | | |
| the Cross Day School Project) | | | | | |
| (LOC; Wells Fargo Bank) | 0.28 | 11/7/11 | 1,110,000 | a | 1,110,000 |
| Sarasota County, | | | | | |
| IDR (Sarasota Military | | | | | |
| Academy, Inc. Project) | | | | | |
| (LOC; Wells Fargo Bank) | 0.28 | 11/7/11 | 1,560,000 | a | 1,560,000 |
8
| | | | | |
| Short-Term | Coupon | Maturity | Principal | | |
| Investments (continued) | Rate (%) | Date | Amount ($) | | Value ($) |
| Florida (continued) | | | | | |
| Sarasota County Public Hospital | | | | | |
| District, HR, Refunding | | | | | |
| (Sarasota Memorial | | | | | |
| Hospital Project) (LOC: | | | | | |
| Northern Trust Co.) | 0.11 | 11/1/11 | 6,200,000 | a,c | 6,200,000 |
| Illinois—1.8% | | | | | |
| Galesburg, | | | | | |
| Revenue (Knox College Project) | | | | | |
| (LOC; Bank of America) | 0.40 | 11/7/11 | 3,100,000 | a | 3,100,000 |
| Illinois Finance Authority, | | | | | |
| Revenue (Northwestern | | | | | |
| Memorial Hospital) (Liquidity | | | | | |
| Facility; Northern | | | | | |
| Trust Company) | 0.14 | 11/1/11 | 3,000,000 | a,c | 3,000,000 |
| Iowa—1.5% | | | | | |
| Iowa Finance Authority, | | | | | |
| Educational Facilities Revenue | | | | | |
| (Graceland University Project) | | | | | |
| (LOC; Bank of America) | 0.20 | 11/7/11 | 2,460,000 | a | 2,460,000 |
| Iowa Finance Authority, | | | | | |
| Revenue (YMCA and | | | | | |
| Rehabilitation Center Project) | | | | | |
| (LOC; Bank of America) | 0.20 | 11/7/11 | 2,500,000 | a,c | 2,500,000 |
| Kentucky—2.0% | | | | | |
| Jefferson County, | | | | | |
| Retirement Home Revenue | | | | | |
| (Nazareth Literary and | | | | | |
| Benevolent Institution Project) | | | | | |
| (LOC; JPMorgan Chase Bank) | 0.21 | 11/7/11 | 4,300,000 | a,c | 4,300,000 |
| Kentucky Economic Development | | | | | |
| Finance Authority, HR | | | | | |
| (Baptist Healthcare System | | | | | |
| Obligated Group) (LOC; | | | | | |
| JPMorgan Chase Bank) | 0.16 | 11/1/11 | 2,300,000 | a,c | 2,300,000 |
| Louisiana—1.1% | | | | | |
| Louisiana Local Government | | | | | |
| Environmental Facilities and | | | | | |
| Community Development | | | | | |
| Authority, Revenue (Kenner | | | | | |
| Theatres, L.L.C. Project) | | | | | |
| (LOC; FHLB) | 0.21 | 11/7/11 | 3,650,000 | a | 3,650,000 |
STATEMENT OF INVESTMENTS (continued)
| | | | | |
| Short-Term | Coupon | Maturity | Principal | | |
| Investments (continued) | Rate (%) | Date | Amount ($) | | Value ($) |
| Maryland—2.4% | | | | | |
| Baltimore County, | | | | | |
| Revenue, Refunding (Shade Tree | | | | | |
| Trace Apartments Facility) | | | | | |
| (LOC; M&T Trust) | 0.19 | 11/7/11 | 3,570,000 | a | 3,570,000 |
| Maryland Economic Development | | | | | |
| Corporation, EDR (Blind | | | | | |
| Industries and Services of | | | | | |
| Maryland Project) (LOC; | | | | | |
| Bank of America) | 0.45 | 11/7/11 | 4,584,000 | a | 4,584,000 |
| Massachusetts—2.9% | | | | | |
| Massachusetts Health and | | | | | |
| Educational Facilities | | | | | |
| Authority, Revenue (The Henry | | | | | |
| Heywood Memorial Hospital | | | | | |
| Issue) (LOC; TD Bank) | 0.12 | 11/1/11 | 2,595,000 | a,c | 2,595,000 |
| Massachusetts Health and | | | | | |
| Educational Facilities | | | | | |
| Authority, Revenue (Tufts | | | | | |
| University Issue) (Liquidity | | | | | |
| Facility; JPMorgan Chase Bank) | 0.15 | 11/1/11 | 7,000,000 | a | 7,000,000 |
| Minnesota—2.1% | | | | | |
| Cohasset, | | | | | |
| Revenue, Refunding (Minnesota | | | | | |
| Power and Light Company | | | | | |
| Project) (LOC; Bank of America) | 0.25 | 11/7/11 | 200,000 | a | 200,000 |
| Puttable Floating Option Tax | | | | | |
| Exempt Receipts (Saint Paul | | | | | |
| Port Authority, MFHR | | | | | |
| (Burlington Apartments | | | | | |
| Project)) (Liquidity Facility; | | | | | |
| FHLMC and LOC; FHLMC) | 0.27 | 11/7/11 | 5,015,000 | a,b,d | 5,015,000 |
| Saint Paul Housing and | | | | | |
| Redevelopment Authority, | | | | | |
| Revenue (Goodwill/Easter Seals | | | | | |
| Project) (LOC; U.S. Bank NA) | 0.27 | 11/7/11 | 1,800,000 | a | 1,800,000 |
| Missouri—.6% | | | | | |
| Missouri Development Finance | | | | | |
| Board, LR (Missouri | | | | | |
| Association of Municipal | | | | | |
| Utilities Lease Financing | | | | | |
| Program) (LOC: U.S. Bank NA) | 0.12 | 11/1/11 | 2,000,000 | a | 2,000,000 |
10
| | | | | |
| Short-Term | Coupon | Maturity | Principal | | |
| Investments (continued) | Rate (%) | Date | Amount ($) | | Value ($) |
| New Hampshire—5.8% | | | | | |
| New Hampshire Business Finance | | | | | |
| Authority, Revenue (Huggins | | | | | |
| Hospital Issue) (LOC; TD Bank) | 0.18 | 11/1/11 | 1,800,000 | a,c | 1,800,000 |
| New Hampshire Health and Education | | | | | |
| Facilities Authority, Revenue | | | | | |
| (University System of New | | | | | |
| Hampshire Issue) (Liquidity | | | | | |
| Facility; JPMorgan Chase Bank) | 0.15 | 11/1/11 | 9,900,000 | a | 9,900,000 |
| New Hampshire Health and Education | | | | | |
| Facilities Authority, Revenue | | | | | |
| (University System of New | | | | | |
| Hampshire Issue) (Liquidity | | | | | |
| Facility; U.S. Bank NA) | 0.15 | 11/1/11 | 2,100,000 | a | 2,100,000 |
| New Hampshire Health and Education | | | | | |
| Facilities Authority, Revenue | | | | | |
| (Wentworth-Douglass Hospital | | | | | |
| Issue) (LOC; TD Bank) | 0.13 | 11/1/11 | 5,500,000 | a,c | 5,500,000 |
| New Jersey—10.8% | | | | | |
| Burlington County, | | | | | |
| GO Notes | 2.00 | 10/1/12 | 520,000 | | 526,147 |
| Camden County, | | | | | |
| GO Notes, Refunding | 1.00 | 10/1/12 | 145,000 | | 145,528 |
| East Brunswick Township, | | | | | |
| GO Notes, BAN | 2.00 | 1/6/12 | 9,000,000 | | 9,015,013 |
| East Brunswick Township, | | | | | |
| GO Notes, BAN | 2.00 | 4/13/12 | 3,600,000 | | 3,619,504 |
| East Brunswick Township, | | | | | |
| GO Notes, BAN | 1.00 | 9/28/12 | 2,000,000 | | 2,001,783 |
| Hopewell Village Regional School | | | | | |
| District Board of Education. | | | | | |
| GO Notes, Refunding | 4.00 | 8/15/12 | 150,000 | | 153,972 |
| Kearny Board of Education, | | | | | |
| GO Notes, GAN | 1.50 | 10/12/12 | 3,000,000 | | 3,014,020 |
| Livingston Township Board of | | | | | |
| Education, GO Notes, GAN | 1.50 | 9/27/12 | 3,000,000 | | 3,020,186 |
| Middlesex County, | | | | | |
| GO Notes (County | | | | | |
| Vocational-Technical | | | | | |
| School Bonds and General | | | | | |
| Improvement Bonds) | 3.25 | 6/1/12 | 100,000 | | 101,534 |
STATEMENT OF INVESTMENTS (continued)
| | | | | |
| Short-Term | Coupon | Maturity | Principal | | |
| Investments (continued) | Rate (%) | Date | Amount ($) | | Value ($) |
| New Jersey (continued) | | | | | |
| New Jersey Economic Development | | | | | |
| Authority, Revenue (Somerset Hills | | | | | |
| YMCA Project) (LOC; TD Bank) | 0.18 | 11/7/11 | 1,460,000 | a | 1,460,000 |
| New Jersey Health Care Facilities | | | | | |
| Financing Authority, Revenue, | | | | | |
| Refunding (Christian Health | | | | | |
| Care Center Issue) (LOC; | | | | | |
| Valley National Bank) | 0.32 | 11/7/11 | 6,165,000 | a,c | 6,165,000 |
| New Jersey Transportation | | | | | |
| Trust Fund Authority | | | | | |
| (Transportation System) | 5.25 | 12/15/11 | 310,000 | | 311,732 |
| Passaic County, | | | | | |
| GO Notes, Refunding | 5.00 | 5/1/12 | 640,000 | | 654,151 |
| Rahway, | | | | | |
| GO Notes, BAN | 1.00 | 10/3/12 | 3,900,000 | | 3,907,094 |
| Washington Township, | | | | | |
| GO Notes | 2.00 | 10/1/12 | 220,000 | | 222,701 |
| Wayne Township Board of Education, | | | | | |
| GO Notes | 4.00 | 7/15/12 | 200,000 | | 204,548 |
| West Milford Township, | | | | | |
| GO Notes, BAN | 1.00 | 10/5/12 | 1,562,000 | | 1,565,579 |
| New York—7.9% | | | | | |
| New York City Industrial | | | | | |
| Development Agency, Civic | | | | | |
| Facility Revenue (Jewish | | | | | |
| Community Center on the | | | | | |
| Upper West Side, Inc. Project) | | | | | |
| (LOC; M&T Trust) | 0.19 | 11/7/11 | 4,400,000 | a | 4,400,000 |
| New York City Municipal Water | | | | | |
| Finance Authority, Water and | | | | | |
| Sewer System Second General | | | | | |
| Resolution Revenue (Liquidity | | | | | |
| Facility; California State | | | | | |
| Teachers Retirement System) | 0.11 | 11/1/11 | 12,000,000 | a | 12,000,000 |
| New York Liberty Development | | | | | |
| Corporation, Liberty Revenue, | | | | | |
| Refunding (World Trade | | | | | |
| Center Project) | 0.33 | 5/8/12 | 10,000,000 | | 10,000,000 |
| Ohio—1.1% | | | | | |
| Union Township, | | | | | |
| GO Notes, BAN (Various Purpose) | 1.13 | 9/12/12 | 3,650,000 | | 3,664,852 |
12
| | | | | |
| Short-Term | Coupon | Maturity | Principal | | |
| Investments (continued) | Rate (%) | Date | Amount ($) | | Value ($) |
| Oklahoma—.6% | | | | | |
| Oklahoma Water Resources Board, | | | | | |
| State Loan Program Revenue | | | | | |
| (Liquidity Facility; State | | | | | |
| Street Bank and Trust Co.) | 0.50 | 12/1/11 | 2,055,000 | | 2,055,000 |
| Oregon—3.5% | | | | | |
| Oregon, | | | | | |
| GO Veterans’ Welfare | | | | | |
| Bonds (Liquidity Facility; | | | | | |
| U.S. Bank NA) | 0.13 | 11/1/11 | 11,820,000 | a | 11,820,000 |
| Pennsylvania—9.1% | | | | | |
| Allegheny County Industrial | | | | | |
| Development Authority, | | | | | |
| Commercial Development | | | | | |
| Revenue, Refunding (Two | | | | | |
| Marquis Plaza Project) | | | | | |
| (LOC; PNC Bank NA) | 0.17 | 11/7/11 | 1,510,000 | a | 1,510,000 |
| Allegheny County Industrial | | | | | |
| Development Authority, | | | | | |
| Revenue (Sewickley Academy) | | | | | |
| (LOC; PNC Bank NA) | 0.17 | 11/7/11 | 280,000 | a | 280,000 |
| Berks County Industrial | | | | | |
| Development Authority, | | | | | |
| Revenue (Kutztown Resource | | | | | |
| Management, Inc. Project) | | | | | |
| (LOC; Wells Fargo Bank) | 0.28 | 11/7/11 | 3,540,000 | a | 3,540,000 |
| Berks County Municipal Authority, | | | | | |
| Revenue (The Reading Hospital | | | | | |
| and Medical Center Project) | 0.31 | 1/19/12 | 4,615,000 | c | 4,615,000 |
| Cumberland County Municipal | | | | | |
| Authority, Revenue | | | | | |
| (Presbyterian Homes, Inc. | | | | | |
| Project) (LOC; M&T Trust) | 0.16 | 11/7/11 | 7,840,000 | a | 7,840,000 |
| Emmaus General Authority, | | | | | |
| Revenue (LOC; U.S. Bank NA) | 0.13 | 11/7/11 | 2,200,000 | a | 2,200,000 |
| Erie County Hospital Authority, | | | | | |
| Health Facilities Revenue | | | | | |
| (Saint Mary’s Home of Erie | | | | | |
| Project) (LOC; Bank of America) | 0.22 | 11/7/11 | 2,145,000 | a,c | 2,145,000 |
| Lancaster Industrial Development | | | | | |
| Authority, Revenue (Ensco | | | | | |
| Limited Project) (LOC; M&T Bank) | 0.17 | 11/7/11 | 410,000 | a | 410,000 |
STATEMENT OF INVESTMENTS (continued)
| | | | | |
| Short-Term | Coupon | Maturity | Principal | | |
| Investments (continued) | Rate (%) | Date | Amount ($) | | Value ($) |
| Pennsylvania (continued) | | | | | |
| Montgomery County Industrial | | | | | |
| Development Authority, Revenue | | | | | |
| (Abington Friends School Project) | | | | | |
| (LOC; Wells Fargo Bank) | 0.13 | 11/7/11 | 970,000 | a | 970,000 |
| Montgomery County Industrial | | | | | |
| Development Authority, Revenue | | | | | |
| (Big Little Associates Project) | | | | | |
| (LOC; Wells Fargo Bank) | 0.33 | 11/7/11 | 525,000 | a | 525,000 |
| Montgomery County Industrial | | | | | |
| Development Authority, Revenue | | | | | |
| (Independent Support Systems, | | | | | |
| Inc. Project) (LOC; Wells | | | | | |
| Fargo Bank) | 0.28 | 11/7/11 | 100,000 | a | 100,000 |
| New Castle Area Hospital | | | | | |
| Authority, HR (Jameson | | | | | |
| Memorial Hospital) (Insured; | | | | | |
| Assured Guaranty Municipal | | | | | |
| Corp. and Liquidity Facility; | | | | | |
| PNC Bank NA) | 0.18 | 11/7/11 | 2,285,000 | a,c | 2,285,000 |
| North Lebanon Township Municipal | | | | | |
| Authority, Revenue (The Penn | | | | | |
| Laurel Girl Scout Council, | | | | | |
| Inc. Project) (LOC; Wells | | | | | |
| Fargo Bank) | 0.28 | 11/7/11 | 360,000 | a | 360,000 |
| Northampton County Industrial | | | | | |
| Development Authority, Revenue | | | | | |
| (Bardot Plastics Inc. Project) | | | | | |
| (LOC; Wells Fargo Bank) | 0.48 | 11/7/11 | 140,000 | a | 140,000 |
| Philadelphia Authority for | | | | | |
| Industrial Development, | | | | | |
| Educational Facilities Revenue | | | | | |
| (Chestnut Hill College Project) | | | | | |
| (LOC; Wells Fargo Bank) | 0.24 | 11/7/11 | 500,000 | a | 500,000 |
| York Redevelopment Authority, | | | | | |
| Revenue (LOC; M&T Trust) | 0.24 | 11/7/11 | 2,960,000 | a | 2,960,000 |
| South Carolina—.5% | | | | | |
| Saint Peters Parish/Jasper County | | | | | |
| Public Facilities Corporation, | | | | | |
| Instalment Purchase | | | | | |
| Revenue, BAN (County | | | | | |
| Office Building Projects) | 2.00 | 11/1/11 | 1,735,000 | | 1,735,000 |
14
| | | | | |
| Short-Term | Coupon | Maturity | Principal | | |
| Investments (continued) | Rate (%) | Date | Amount ($) | | Value ($) |
| Tennessee—3.8% | | | | | |
| Blount County Public Building | | | | | |
| Authority, Local Government | | | | | |
| Public Improvement Revenue | | | | | |
| (Liquidity Facility; Branch | | | | | |
| Banking and Trust Co.) | 0.15 | 11/7/11 | 12,550,000 | a | 12,550,000 |
| Texas—16.5% | | | | | |
| Harris County, | | | | | |
| GO Notes, TAN | 1.50 | 2/29/12 | 10,000,000 | | 10,043,547 |
| Harris County Cultural | | | | | |
| Education Facilities Finance | | | | | |
| Corporation, Revenue (The | | | | | |
| Methodist Hospital System) | 0.12 | 11/1/11 | 12,900,000 | a,c | 12,900,000 |
| Harris County Health Facilities | | | | | |
| Development Corporation, | | | | | |
| Revenue, Refunding (The | | | | | |
| Methodist Hospital System) | 0.12 | 11/1/11 | 4,000,000 | a,c | 4,000,000 |
| Jefferson County Industrial | | | | | |
| Development Corporation, | | | | | |
| Hurricane Ike Disaster Area | | | | | |
| Revenue (Jefferson Refinery, | | | | | |
| L.L.C. Project) (LOC; Branch | | | | | |
| Banking and Trust Co.) | 0.35 | 11/17/11 | 1,000,000 | | 1,000,000 |
| Jefferson County Industrial | | | | | |
| Development Corporation, | | | | | |
| Hurricane Ike Disaster Area | | | | | |
| Revenue (Jefferson Refinery, | | | | | |
| L.L.C. Project) (LOC; Branch | | | | | |
| Banking and Trust Co.) | 0.50 | 12/29/11 | 6,900,000 | | 6,900,000 |
| JPMorgan Chase Putters/Drivers | | | | | |
| Trust (Texas, GO Notes, TRAN) | | | | | |
| (Liquidity Facility; JPMorgan | | | | | |
| Chase Bank) | 0.15 | 11/1/11 | 17,000,000 | a,b,d | 17,000,000 |
| Puttable Floating Option Tax | | | | | |
| Exempt Receipts (Brazos | | | | | |
| County Health Facilities | | | | | |
| Development Corporation, | | | | | |
| Revenue (Franciscan Services | | | | | |
| Corporation Obligated | | | | | |
| Group)) (Liquidity Facility; | | | | | |
| Bank of America and | | | | | |
| LOC; Bank of America) | 0.27 | 11/7/11 | 3,335,000 | a,b,c,d | 3,335,000 |
STATEMENT OF INVESTMENTS (continued)
| | | | | |
| Short-Term | Coupon | Maturity | Principal | | |
| Investments (continued) | Rate (%) | Date | Amount ($) | | Value ($) |
| Virginia—.2% | | | | | |
| Williamsburg Industrial | | | | | |
| Development Authority, Museum | | | | | |
| Revenue (The Colonial | | | | | |
| Williamsburg Foundation) | | | | | |
| (LOC; Bank of America) | 0.50 | 11/7/11 | 650,000 | a | 650,000 |
| Wisconsin—2.2% | | | | | |
| Wisconsin Health and Educational | | | | | |
| Facilities Authority, Revenue | | | | | |
| (Bay Area Medical Center, | | | | | |
| Inc.) (LOC; BMO Harris Bank) | 0.14 | 11/1/11 | 7,245,000 | a,c | 7,245,000 |
| U.S. Related—4.5% | | | | | |
| Puerto Rico Sales Tax Financing | | | | | |
| Corporation, Sales Tax Revenue | | | | | |
| (Liquidity Facility; Citibank NA) | 0.14 | 11/7/11 | 15,000,000 | a,b,d | 15,000,000 |
| |
| Total Investments (cost $333,879,324) | | | 99.9 | % | 333,879,324 |
| Cash and Receivables (Net) | | | .1 | % | 403,033 |
| Net Assets | | | 100.0 | % | 334,282,357 |
|
| a Variable rate demand note—rate shown is the interest rate in effect at October 31, 2011. Maturity date represents |
| the next demand date, or the ultimate maturity date if earlier. |
| b Securities exempt from registration under Rule 144A of the Securities Act of 1933.These securities may be resold in |
| transactions exempt from registration, normally to qualified institutional buyers.At October 31, 2011, these securities |
| amounted to $54,790,000 or 16.4% of net assets. |
| c At October 31, 2011, the fund had $88,155,000 or 26.4% of net assets invested in securities whose payment of |
| principal and interest is dependent upon revenues generated from health care. |
| d The fund does not directly own the municipal security indicated; the fund owns an interest in a special purpose entity |
| that, in turn, owns the underlying municipal security.The special purpose entity permits the fund to own interests in |
| underlying assets, but in a manner structured to provide certain advantages not inherent in the underlying bonds (e.g., |
| enhanced liquidity, yields linked to short-term rates). |
16
| | | |
| Summary of Abbreviations | | |
| |
| ABAG | Association of Bay Area Governments | ACA | American Capital Access |
| AGC | ACE Guaranty Corporation | AGIC | Asset Guaranty Insurance Company |
| AMBAC | American Municipal Bond | ARRN | Adjustable Rate Receipt Notes |
| | Assurance Corporation | | |
| BAN | Bond Anticipation Notes | BPA | Bond Purchase Agreement |
| CIFG | CDC Ixis Financial Guaranty | COP | Certificate of Participation |
| CP | Commercial Paper | EDR | Economic Development Revenue |
| EIR | Environmental Improvement Revenue | FGIC | Financial Guaranty Insurance |
| | | | Company |
| FHA | Federal Housing Administration | FHLB | Federal Home Loan Bank |
| FHLMC | Federal Home Loan Mortgage | FNMA | Federal National |
| | Corporation | | Mortgage Association |
| GAN | Grant Anticipation Notes | GIC | Guaranteed Investment Contract |
| GNMA | Government National | GO | General Obligation |
| | Mortgage Association | | |
| HR | Hospital Revenue | IDB | Industrial Development Board |
| IDC | Industrial Development Corporation | IDR | Industrial Development Revenue |
| LOC | Letter of Credit | LOR | Limited Obligation Revenue |
| LR | Lease Revenue | MFHR | Multi-Family Housing Revenue |
| MFMR | Multi-Family Mortgage Revenue | PCR | Pollution Control Revenue |
| PILOT | Payment in Lieu of Taxes | PUTTERS | Puttable Tax-Exempt Receipts |
| RAC | Revenue Anticipation Certificates | RAN | Revenue Anticipation Notes |
| RAW | Revenue Anticipation Warrants | RRR | Resources Recovery Revenue |
| SAAN | State Aid Anticipation Notes | SBPA | Standby Bond Purchase Agreement |
| SFHR | Single Family Housing Revenue | SFMR | Single Family Mortgage Revenue |
| SONYMA | State of New York Mortgage Agency | SWDR | Solid Waste Disposal Revenue |
| TAN | Tax Anticipation Notes | TAW | Tax Anticipation Warrants |
| TRAN | Tax and Revenue Anticipation Notes | XLCA | XL Capital Assurance |
STATEMENT OF INVESTMENTS (continued)
| | | | | | |
| Summary of Combined Ratings (Unaudited) | |
| |
| Fitch | | or | Moody’s | or | Standard & Poor’s | Value (%)† |
| F1 | +,F1 | | VMIG1,MIG1,P1 | | SP1+,SP1,A1+,A1 | 79.4 |
| AAA,AA,Ae | | | Aaa,Aa,Ae | | AAA,AA,Ae | 6.1 |
| Not Ratedf | | | Not Ratedf | | Not Ratedf | 14.5 |
| | | | | | | 100.0 |
| |
| † | Based on total investments. |
| e | Notes which are not F, MIG and SP rated are represented by bond ratings of the issuers. |
| f | Securities which, while not rated by Fitch, Moody’s and Standard & Poor’s, have been determined by the Manager to |
| | be of comparable quality to those rated securities in which the fund may invest. |
| See notes to financial statements. |
18
|
| STATEMENT OF ASSETS AND LIABILITIES |
| October 31, 2011 |
| | | | | |
| | | | Cost | Value |
| Assets ($): | | | | |
| Investments in securities—See Statement of Investments | 333,879,324 | 333,879,324 |
| Cash | | | | 693,472 |
| Interest receivable | | | | 363,599 |
| | | | | 334,936,395 |
| Liabilities ($): | | | | |
| Due to The Dreyfus Corporation and affiliates—Note 2(c) | | 71,738 |
| Dividend payable | | | | 10 |
| Payable for investment securities purchased | | | 500,000 |
| Payable for shares of Capital Stock redeemed | | | 82,290 |
| | | | | 654,038 |
| Net Assets ($) | | | | 334,282,357 |
| Composition of Net Assets ($): | | | | |
| Paid-in capital | | | | 334,284,588 |
| Accumulated net realized gain (loss) on investments | | | (2,231) |
| Net Assets ($) | | | | 334,282,357 |
| |
| |
| Net Asset Value Per Share | | | | |
| | Investor | Class R | BASIC | Class B |
| | Shares | Shares | Shares | Shares |
| Net Assets ($) | 30,763,765 | 48,389,794 | 26,002,854 | 229,125,944 |
| Shares Outstanding | 30,765,346 | 48,390,616 | 26,003,232 | 229,127,107 |
| Net Asset Value Per Share ($) | 1.00 | 1.00 | 1.00 | 1.00 |
| |
| See notes to financial statements. | | | | |
|
| STATEMENT OF OPERATIONS |
| Year Ended October 31, 2011 |
| | |
| Investment Income ($): | |
| Interest Income | 1,393,208 |
| Expenses: | |
| Management fee—Note 2(a) | 1,863,885 |
| Distribution fees (Investor Shares and Class B Shares)—Note 2(b) | 636,711 |
| Shareholder servicing costs (Class B Shares)—Note 2(c) | 554,847 |
| Directors’ fees—Note 2(a) | 20,813 |
| Total Expenses | 3,076,256 |
| Less—reduction in expenses due to undertaking—Note 2(a) | (1,662,361) |
| Less—Directors’ fees reimbursed by the Manager—Note 2(a) | (20,813) |
| Net Expenses | 1,393,082 |
| Investment Income—Net, representing net increase | |
| in net assets resulting from operations | 126 |
| |
| See notes to financial statements. | |
20
STATEMENT OF CHANGES IN NET ASSETS
| | | | |
| | Year Ended October 31, |
| | 2011 | 2010 |
| Operations ($): | | |
| Investment income—net | 126 | 6,937 |
| Net realized gain (loss) on investments | — | 1,261 |
| Net Increase (Decrease) in Net Assets | | |
| Resulting from Operations | 126 | 8,198 |
| Dividends to Shareholders from ($): | | |
| Investment income—net: | | |
| Investor Shares | (14) | (18) |
| Class R Shares | (28) | (4,672) |
| BASIC Shares | (3) | (2,152) |
| Class B Shares | (81) | (95) |
| Total Dividends | (126) | (6,937) |
| Capital Stock Transactions ($1.00 per share): | | |
| Net proceeds from shares sold: | | |
| Investor Shares | 111,102,688 | 178,329,878 |
| Class R Shares | 354,187,726 | 202,962,456 |
| BASIC Shares | 10,209,016 | 17,005,513 |
| Class B Shares | 637,122,926 | 685,183,016 |
| Dividends reinvested: | | |
| Investor Shares | 14 | 18 |
| Class R Shares | 2 | 437 |
| BASIC Shares | 3 | 2,041 |
| Class B Shares | 81 | 95 |
| Cost of shares redeemed: | | |
| Investor Shares | (120,540,616) | (193,102,046) |
| Class R Shares | (403,621,740) | (162,797,585) |
| BASIC Shares | (16,503,223) | (35,128,541) |
| Class B Shares | (635,983,618) | (753,226,037) |
| Increase (Decrease) in Net Assets | | |
| from Capital Stock Transactions | (64,026,741) | (60,770,755) |
| Total Increase (Decrease) in Net Assets | (64,026,741) | (60,769,494) |
| Net Assets ($): | | |
| Beginning of Period | 398,309,098 | 459,078,592 |
| End of Period | 334,282,357 | 398,309,098 |
| |
| See notes to financial statements. | | |
FINANCIAL HIGHLIGHTS
The following tables describe the performance for each share class for the fiscal periods indicated. All information reflects financial results for a single fund share. Total return shows how much your investment in the fund would have increased (or decreased) during each period, assuming you had reinvested all dividends and distributions.These figures have been derived from the fund’s financial statements.
| | | | | | | | | | |
| | | Year Ended October 31, | |
| Investor Shares | 2011 | 2010 | 2009 | 2008 | 2007 |
| Per Share Data ($): | | | | | |
| Net asset value, beginning of period | 1.00 | 1.00 | 1.00 | 1.00 | 1.00 |
| Investment Operations: | | | | | |
| Investment income—net | .000a | .000a | .006 | .023 | .030 |
| Distributions: | | | | | |
| Dividends from investment income—net | (.000)a | (.000)a | (.006) | (.023) | (.030) |
| Net asset value, end of period | 1.00 | 1.00 | 1.00 | 1.00 | 1.00 |
| Total Return (%) | .00b | .00b | .65 | 2.35 | 3.05 |
| Ratios/Supplemental Data (%): | | | | | |
| Ratio of total expenses | | | | | |
| to average net assets | .71 | .71 | .73 | .71 | .71 |
| Ratio of net expenses | | | | | |
| to average net assets | .38 | .45 | .71 | .70 | .70 |
| Ratio of net investment income | | | | | |
| to average net assets | .00b | .00b | .69 | 2.18 | 3.01 |
| Net Assets, end of period ($ x 1,000) | 30,764 | 40,202 | 54,974 | 54,469 | 19,885 |
| |
| a | Amount represents less than $.001 per share. |
| b | Amount represents less than .01%. |
| See notes to financial statements. |
22
| | | | | | | | | | |
| | | Year Ended October 31, | |
| Class R Shares | 2011 | 2010 | 2009 | 2008 | 2007 |
| Per Share Data ($): | | | | | |
| Net asset value, beginning of period | 1.00 | 1.00 | 1.00 | 1.00 | 1.00 |
| Investment Operations: | | | | | |
| Investment income—net | .000a | .000a | .008 | .025 | .032 |
| Distributions: | | | | | |
| Dividends from investment income—net | (.000)a | (.000)a | (.008) | (.025) | (.032) |
| Net asset value, end of period | 1.00 | 1.00 | 1.00 | 1.00 | 1.00 |
| Total Return (%) | .00b | .01 | .83 | 2.56 | 3.26 |
| Ratios/Supplemental Data (%): | | | | | |
| Ratio of total expenses | | | | | |
| to average net assets | .51 | .51 | .53 | .51 | .51 |
| Ratio of net expenses | | | | | |
| to average net assets | .38 | .45 | .52 | .50 | .50 |
| Ratio of net investment income | | | | | |
| to average net assets | .00b | .01 | .78 | 2.48 | 3.20 |
| Net Assets, end of period ($ x 1,000) | 48,390 | 97,824 | 57,658 | 56,859 | 76,056 |
| |
| a | Amount represents less than $.001 per share. |
| b | Amount represents less than .01%. |
| See notes to financial statements. |
FINANCIAL HIGHLIGHTS (continued)
| | | | | | | | | | |
| | | Year Ended October 31, | |
| BASIC Shares | 2011 | 2010 | 2009 | 2008 | 2007a |
| Per Share Data ($): | | | | | |
| Net asset value, beginning of period | 1.00 | 1.00 | 1.00 | 1.00 | 1.00 |
| Investment Operations: | | | | | |
| Investment income—net | .000b | .000b | .008 | .025 | .011 |
| Distributions: | | | | | |
| Dividends from investment income—net | (.000)b | (.000)b | (.008) | (.025) | (.011) |
| Net asset value, end of period | 1.00 | 1.00 | 1.00 | 1.00 | 1.00 |
| Total Return (%) | .00c | .01 | .83 | 2.56 | 3.26d |
| Ratios/Supplemental Data (%): | | | | | |
| Ratio of total expenses | | | | | |
| to average net assets | .51 | .51 | .53 | .51 | .52d |
| Ratio of net expenses | | | | | |
| to average net assets | .38 | .45 | .52 | .50 | .50d |
| Ratio of net investment income | | | | | |
| to average net assets | .00c | .01 | .72 | 2.40 | 3.26d |
| Net Assets, end of period ($ x 1,000) | 26,003 | 32,297 | 50,418 | 29,900 | 8,852 |
| |
| a | From July 2, 2007 (commencement of operations) to October 31, 2007. |
| b | Amount represents less than $.001 per share. |
| c | Amount represents less than .01%. |
| d | Annualized. |
| See notes to financial statements. |
24
| | | | | | | | | | |
| | | Year Ended October 31, | |
| Class B Shares | 2011 | 2010 | 2009 | 2008 | 2007a |
| Per Share Data ($): | | | | | |
| Net asset value, beginning of period | 1.00 | 1.00 | 1.00 | 1.00 | 1.00 |
| Investment Operations: | | | | | |
| Investment income—net | .000b | .000b | .004 | .020 | .009 |
| Distributions: | | | | | |
| Dividends from investment income—net | (.000)b | (.000)b | (.004) | (.020) | (.009) |
| Net asset value, end of period | 1.00 | 1.00 | 1.00 | 1.00 | 1.00 |
| Total Return (%) | .00c | .00c | .41 | 2.05 | 2.75d |
| Ratios/Supplemental Data (%): | | | | | |
| Ratio of total expenses | | | | | |
| to average net assets | 1.01 | 1.01 | 1.03 | 1.02 | 1.03d |
| Ratio of net expenses | | | | | |
| to average net assets | .37 | .45 | .89 | 1.00 | 1.00d |
| Ratio of net investment income | | | | | |
| to average net assets | .00c | .00c | .29 | 1.81 | 2.69d |
| Net Assets, end of period ($ x 1,000) | 229,126 | 227,987 | 296,029 | 111,226 | 1 |
| |
| a | From July 2, 2007 (commencement of operations) to October 31, 2007. |
| b | Amount represents less than $.001 per share. |
| c | Amount represents less than .01%. |
| d | Annualized. |
| See notes to financial statements. |
NOTES TO FINANCIAL STATEMENTS
NOTE 1—Significant Accounting Policies:
Dreyfus AMT-Free Municipal Reserves (the “fund”) is a separate diversified series ofThe Dreyfus/Laurel Funds, Inc. (the “Company”), which is registered under the Investment Company Act of 1940, as amended (the “Act”), as an open-end management investment company and operates as a series company currently offering ten series including the fund.The fund’s investment objective is to seek a high level of current income consistent with stability of principal, that is exempt from federal income tax.The Dreyfus Corporation (the “Manager” or “Dreyfus”), a wholly-owned subsidiary of The Bank of New York Mellon Corporation (“BNY Mellon”), serves as the fund’s investment adviser.
MBSC Securities Corporation (the “Distributor”), a wholly-owned subsidiary of the Manager, is the distributor of the fund’s shares, which are sold without a sales charge.The fund is authorized to issue 1 billion shares of $.001 par value Capital Stock in each of the following classes of shares: Investor, Class R, BASIC and Class B. Investor shares and Class B shares are offered primarily to clients of financial institutions that have entered into selling agreements with the Distributor, and bear a distribution fee. Class B shares also bear a shareholder services fee. BASIC shares are offered to any investor and bear no distribution or shareholder services fee. Class R shares are sold primarily to bank trust departments and other financial service providers (including The Bank of NewYork Mellon, a subsidiary of BNY Mellon and an affiliate of Dreyfus) acting on behalf of customers having a qualified trust or investment account or relationship at such institution, and bear no distribution or shareholder services fee. Each class of shares has identical rights and privileges, except with respect to the distribution fee, shareholder services fee and voting rights on matters affecting a single class. Income, expenses (other than expense attributable to a specific class), and realized and unrealized gains or losses on investments are allocated to each class of shares based on its relative net assets.
26
It is the fund’s policy to maintain a continuous net asset value per share of $1.00 for the fund; the fund has adopted certain investment, portfolio valuation and dividend and distribution policies to enable it to do so. There is no assurance, however, that the fund will be able to maintain a stable net asset value per share of $1.00.
The Financial Accounting Standards Board (“FASB”) Accounting Standards Codification (“ASC”) is the exclusive reference of authoritative U.S. generally accepted accounting principles (“GAAP”) recognized by the FASB to be applied by nongovernmental entities. Rules and interpretive releases of the Securities and Exchange Commission (“SEC”) under authority of federal laws are also sources of authoritative GAAP for SEC registrants. The fund’s financial statements are prepared in accordance with GAAP, which may require the use of management estimates and assumptions.Actual results could differ from those estimates.
(a) Portfolio valuation: Investments in securities are valued at amortized cost in accordance with Rule 2a-7 of the Act, which has been determined by the Board of Directors to represent the fair value of the fund’s investments.
The fair value of a financial instrument is the amount that would be received to sell an asset or paid to transfer a liability in an orderly transaction between market participants at the measurement date (i.e. the exit price). GAAP establishes a fair value hierarchy that prioritizes the inputs of valuation techniques used to measure fair value.This hierarchy gives the highest priority to unadjusted quoted prices in active markets for identical assets or liabilities (Level 1 measurements) and the lowest priority to unobservable inputs (Level 3 measurements).
Additionally, GAAP provides guidance on determining whether the volume and activity in a market has decreased significantly and whether such a decrease in activity results in transactions that are not
NOTES TO FINANCIAL STATEMENTS (continued)
orderly. GAAP requires enhanced disclosures around valuation inputs and techniques used during annual and interim periods.
Various inputs are used in determining the value of the fund’s investments relating to fair value measurements.These inputs are summarized in the three broad levels listed below:
Level 1—unadjusted quoted prices in active markets for identical investments.
Level 2—other significant observable inputs (including quoted prices for similar investments, interest rates, prepayment speeds, credit risk, etc.).
Level 3—significant unobservable inputs (including the fund’s own assumptions in determining the fair value of investments).
The inputs or methodology used for valuing securities are not necessarily an indication of the risk associated with investing in those securities. For example, money market securities are valued using amortized cost, in accordance with rules under the Act. Generally, amortized cost approximates the current fair value of a security, but since the value is not obtained from a quoted price in an active market, such securities are reflected within Level 2 of the fair value hierarchy.
The following is a summary of the inputs used as of October 31, 2011 in valuing the fund’s investments:
| |
| | Short-Term |
| Valuation Inputs | Investments ($)† |
| Level 1—Unadjusted Quoted Prices | — |
| Level 2—Other Significant Observable Inputs | 333,879,324 |
| Level 3—Significant Unobservable Inputs | — |
| Total | 333,879,324 |
| † See Statement of Investments for additional detailed categorizations. | |
In May 2011, FASB issued Accounting Standards Update (“ASU”) No. 2011-04 “Amendments to Achieve Common FairValue Measurement and Disclosure Requirements in GAAP and International Financial
28
Reporting Standards (“IFRS”)” (“ASU 2011-04”). ASU 2011-04 includes common requirements for measurement of and disclosure about fair value between GAAP and IFRS. ASU 2011-04 will require reporting entities to disclose the following information for fair value measurements categorized within Level 3 of the fair value hierarchy: quantitative information about the unobservable inputs used in the fair value measurement, the valuation processes used by the reporting entity and a narrative description of the sensitivity of the fair value measurement to changes in unobservable inputs and the interrelationships between those unobservable inputs. In addition, ASU 2011-04 will require reporting entities to make disclosures about amounts and reasons for all transfers in and out of Level 1 and Level 2 fair value measurements. The new and revised disclosures are effective for interim and annual reporting periods beginning after December 15, 2011. At this time, management is evaluating the implications of ASU 2011-04 and its impact on the financial statements.
(b) Securities transactions and investment income: Securities transactions are recorded on a trade date basis. Realized gains and losses from securities transactions are recorded on the identified cost basis. Interest income, adjusted for accretion of discount and amortization of premium on investments, is earned from settlement date and is recognized on the accrual basis. Cost of investments represents amortized cost.
(c) Dividends to shareholders: It is the policy of the fund to declare dividends daily from investment income-net; such dividends are paid monthly. Dividends from net realized capital gains, if any, are normally declared and paid annually, but the fund may make distributions on a more frequent basis to comply with the distribution requirements of the Internal Revenue Code of 1986, as amended (the “Code”).To the extent that net realized capital gains can be offset by capital loss carryovers, it is the policy of the fund not to distribute such gains.
NOTES TO FINANCIAL STATEMENTS (continued)
(d) Federal income taxes: It is the policy of the fund to continue to qualify as a regulated investment company, which can distribute tax exempt dividends, by complying with the applicable provisions of the Code, and to make distributions of income and net realized capital gain sufficient to relieve it from substantially all federal income and excise taxes.
As of and during the period ended October 31, 2011, the fund did not have any liabilities for any uncertain tax positions.The fund recognizes interest and penalties, if any, related to uncertain tax positions as income tax expense in the Statement of Operations. During the period, the fund did not incur any interest or penalties.
Each of the tax years in the four-year period ended October 31, 2011 remains subject to examination by the Internal Revenue Service and state taxing authorities.
At October 31, 2011, the components of accumulated earnings on a tax basis were substantially the same as for financial reporting purposes.
The accumulated capital loss carryover of $2,231 is available for federal income tax purposes to be applied against future net securities profits, if any, realized subsequent to October 31, 2011. If not applied, $1,565 of the carryover expires in fiscal 2015 and $666 expires in fiscal 2016.
Under the recently enacted Regulated Investment Company Modernization Act of 2010 (the “2010 Act”), the fund will be permitted to carry forward capital losses incurred in taxable years beginning after December 22, 2010 (“post-enactment losses”) for an unlimited period. However, the 2010 Act requires any post-enactment losses to be utilized before the utilization of losses incurred in taxable years prior to the effective date of the 2010 Act.As a result of this ordering rule, capital loss carryovers related to taxable years beginning prior to the effective date of the 2010 Act may be more likely to expire unused.
The tax character of distributions paid to shareholders during the fiscal periods ended October 31, 2011 and October 31, 2010 were all tax-exempt income.
30
At October 31, 2011, the cost of investments for federal income tax purposes was substantially the same as the cost for financial reporting purposes (see the Statement of Investments).
NOTE 2—Investment Management Fee and Other Transactions With Affiliates:
(a) Pursuant to an investment management agreement with the Manager, the Manager provides or arranges for one or more third parties and/or affiliates to provide investment advisory, administrative, custody, fund accounting and transfer agency services to the fund. The Manager also directs the investments of the fund in accordance with its investment objective, policies and limitations. For these services, the fund is contractually obligated to pay the Manager a fee, calculated daily and paid monthly, at the annual rate of .50% of the value of the fund’s average daily net assets. Out of its fee, the Manager pays all of the expenses of the fund except brokerage fees, taxes, interest, Rule 12b-1 distribution fees, service fees and expenses, fees and expenses of non-interested Directors (including counsel fees) and extraordinary expenses. In addition, the Manager is required to reduce its fee in an amount equal to the fund’s allocable portion of fees and expenses of the non-interested Directors (including counsel fees). Each Board member who is not an “interested person” of the Company (as defined in the Act) receives $60,000 per annum, plus $7,000 per joint Board meeting of the Company, Dreyfus Investment Funds,The Dreyfus/Laurel Funds Trust, The Dreyfus/Laurel Tax-Free Municipal Funds and Dreyfus Funds, Inc. (collectively, the “Board Group Open-End Funds”) attended, $2,500 for separate in-person committee meetings attended which are not held in conjunction with a regularly scheduled Board meeting and $2,000 for Board meetings and separate committee meetings attended that are conducted by telephone. The Board Group Open-End Funds also reimburse each Board member who is not an “interested person” of the Company (as defined in the Act) for travel and out-of-pocket expenses. With respect to Board meetings, the
NOTES TO FINANCIAL STATEMENTS (continued)
Chairman of the Board receives an additional 25% of such compensation (with the exception of reimbursable amounts).The Chair of each of the Board’s committees, unless the Chair also serves as Chair of the Board, receives $1,350 per applicable committee meeting. In the event that there is an in-person joint committee meeting or a joint telephone meeting of the Board Group Open-End Funds and Dreyfus HighYield Strategies Fund (“DHF”), a $2,500 fee is allocated between the Board Group Open-End Funds and DHF. The Company’s portion of these fees and expenses are charged and allocated to each series based on net assets. Amounts required to be paid by the Company directly to the non-interested Directors, that would be applied to offset a portion of the management fee payable to the Manager, are in fact paid directly by the Manager to the non-interested Directors.
Effective January 1, 2012, the Board Group Open-End Funds and DHF (collectively, the “Board Group Funds”) will pay each Board member their respective allocated portions of an annual retainer of $85,000 and a fee of $10,000 for each regularly scheduled Board meeting attended ($75,000 and $8,000, respectively, in the aggregate, prior to January 1, 2012). With respect to the annual retainer and Board meetings of the Board Group Funds, the Chair of the Board will receive an additional 25% of such compensation (with the exception of reimbursable amounts). Each Board member will receive $2,500 for any separate in-person committee meetings attended, which are not held in conjunction with a regularly scheduled Board meeting, such amount to be allocated among the Board Group Funds, as applicable. In the event that there is a joint telephone meeting of the Board Group Funds, a fee of $2,000 will be allocated among the applicable Board Group Funds, accordingly (prior to January 1, 2012, the fee allocated was $2,500 if the meeting included DHF).The Chair of each of the Board’s committees, unless the Chair also serves as Chair of the Board, will receive $1,500 per applicable committee meeting. Each Emeritus Board member is entitled to receive an annual retainer of one-half the amount paid as a retainer at the time the Board member became Emeritus and a per meeting attended fee of one-half the amount paid to Board members.The Board Group Funds also reim-
32
burse each Independent Board member and Emeritus Board members for travel and out-of-pocket expenses.
The Manager has undertaken to waive receipt of the management fee and/or reimburse operating expenses in order to facilitate a daily yield at or above a certain level which may change from time to time.This undertaking is voluntary and not contractual, and may be terminated at any time. The reduction in expenses, pursuant to the undertaking, amounted to $130,348 for Investor shares, $93,840 for Class R shares, $35,559 for BASIC shares and $1,402,614 for Class B shares, respectively, during the period ended October 31, 2011.
(b) Under the Distribution Plan (the “Plan”) adopted pursuant to Rule 12b-1 under the Act (the “Rule”), Investor shares and Class B shares may pay annually up to .25% of the value of the average daily net assets (Investor shares are currently limited by the Company’s Board of Directors to .20%) attributable to its Investor shares and Class B shares to compensate the Distributor for shareholder servicing activities and activities primarily intended to result in the sale of Investor shares and Class B shares. During the period ended October 31, 2011, Investor shares and Class B shares were charged $81,864 and $554,847, respectively, pursuant to the Plan.
(c) Under the Shareholder Services Plan (the “Service Plan”) subject to the Rule, pursuant to which the fund pays the Distributor for the provision of certain services to the holders of its Class B shares a fee at an annual rate of .25% of the value of the fund’s average daily net assets attributable to Class B shares.The services provided may include personal services relating to shareholder accounts, such as answering shareholder inquiries regarding the fund and providing reports and other information, and services related to the maintenance of such shareholder accounts. Under the Service Plan, the Distributor may enter into Shareholder Services Agreements with Service Agents and make payments to Service Agents in respect of these services. During the period ended October 31, 2011, Class B shares were charged $554,847, pursuant to the Service Plan.
NOTES TO FINANCIAL STATEMENTS (continued)
The Company and the Distributor may suspend or reduce payments under the Service Plan at any time, and payments are subject to the continuation of the Service Plan and the Agreements described above. From time to time, the Service Agents, the Distributor and the Company may agree to voluntarily reduce the maximum fees payable under the Service Plan.
Under its terms, the Plan and Service Plan shall remain in effect from year to year, provided such continuance is approved annually by a vote of a majority of those Directors who are not “interested persons” of the Company and who have no direct or indirect financial interest in the operation of or in any agreement related to the Plan and Service Plan.
The components of “Due to The Dreyfus Corporation and affiliates” in the Statement of Assets and Liabilities consist of: management fees $150,664, Rule 12b-1 distribution plan fees $54,754 and shareholder services plan fees $49,184, which are offset against an expense reimbursement currently in effect in the amount of $182,864.
NOTE 3—Securities Transactions:
The fund is permitted to purchase or sell securities from or to certain related affiliated funds under specified conditions outlined in procedures adopted by the Board of Directors of the Company. The procedures have been designed to ensure that any purchase or sale of securities by the fund from or to another fund or portfolio that are, or could be, considered an affiliate by virtue of having a common investment adviser (or affiliated investment adviser), common Director and/or common officers, complies with Rule 17a-7 of the Act. During the period ended October 31, 2011, the fund engaged in purchases and sales of securities pursuant to Rule 17a-7 of the Act amounting to $332,110,000 and $431,981,000, respectively.
34
NOTE 4—Other Matters:
At the October 27, 2011 Board meeting, the Board of the Company approved a proposal to have shareholders consider the election of Francine J. Bovich as an additional Board member of the Company, and also consider the election of Joseph S. DiMartino and Benaree Pratt Wiley, current Board members of the Company not previously proposed to shareholders of the fund. A proxy statement was mailed, on December 1, 2011, to shareholders of record as of the close of business on November 1, 2011 asking shareholders to consider these elections at a special joint meeting of shareholders to be held on Wednesday, February 8, 2012.
|
| REPORT OF INDEPENDENT REGISTERED |
| PUBLIC ACCOUNTING FIRM |
The Board of Directors and Shareholders of The Dreyfus/Laurel Funds, Inc.
We have audited the accompanying statement of assets and liabilities of Dreyfus AMT-Free Municipal Reserves, a series of The Dreyfus/Laurel Funds, Inc. (the “Fund”), including the statement of investments, as of October 31, 2011, and the related statement of operations for the year then ended, the statements of changes in net assets for each of the years in the two-year period then ended, and the financial highlights for each of the years in the five-year period then ended.These financial statements and financial highlights are the responsibility of the Fund’s management. Our responsibility is to express an opinion on these financial statements and financial highlights based on our audits.
We conducted our audits in accordance with the standards of the Public Company Accounting Oversight Board (United States).Those standards require that we plan and perform the audit to obtain reasonable assurance about whether the financial statements and financial highlights are free of material misstatement. An audit includes examining, on a test basis, evidence supporting the amounts and disclosures in the financial statements. Our procedures included confirmation of securities owned as of October 31, 2011, by correspondence with the custodian and brokers or by other appropriate auditing procedures where replies from brokers were not received. An audit also includes assessing the accounting principles used and significant estimates made by management, as well as evaluating the overall financial statement presentation.We believe that our audits provide a reasonable basis for our opinion.
In our opinion, the financial statements and financial highlights referred to above present fairly, in all material respects, the financial position of Dreyfus AMT-Free Municipal Reserves as of October 31, 2011, the results of its operations for the year then ended, the changes in its net assets for each of the years in the two-year period then ended, and the financial highlights for each of the years in the five-year period then ended, in conformity with U.S. generally accepted accounting principles.

New York, New York
December 22, 2011
36
IMPORTANT TAX INFORMATION (Unaudited)
In accordance with federal tax law, the fund hereby designates all the dividends paid from investment income-net during its fiscal year ended October 31, 2011 as “exempt-interest dividends” (not generally subject to regular federal income tax). Where required by federal tax law rules, shareholders will receive notification of their portion of the fund’s tax-exempt dividends paid for the 2011 calendar year on Form 1099-INT, which will be mailed in early 2012.
OFFICERS OF THE FUND (Unaudited)
BRADLEY J. SKAPYAK, President since January 2010.
Chief Operating Officer and a director of the Manager since June 2009. From April 2003 to June 2009, Mr. Skapyak was the head of the Investment Accounting and Support Department of the Manager. He is an officer of 75 investment companies (comprised of 167 portfolios) managed by the Manager. He is 52 years old and has been an employee of the Manager since February 1988.
MICHAEL A. ROSENBERG, Vice President and Secretary since August 2005.
Assistant General Counsel of BNY Mellon, and an officer of 76 investment companies (comprised of 192 portfolios) managed by the Manager. He is 51 years old and has been an employee of the Manager since October 1991.
KIESHA ASTWOOD, Vice President and Assistant Secretary since January 2010.
Counsel of BNY Mellon, and an officer of 76 investment companies (comprised of 192 portfolios) managed by the Manager. She is 38 years old and has been an employee of the Manager since July 1995.
JAMES BITETTO, Vice President and Assistant Secretary since August 2005.
Senior Counsel of BNY Mellon and Secretary of the Manager, and an officer of 76 investment companies (comprised of 192 portfolios) managed by the Manager. He is 45 years old and has been an employee of the Manager since December 1996.
JONI LACKS CHARATAN, Vice President and Assistant Secretary since August 2005.
Senior Counsel of BNY Mellon, and an officer of 76 investment companies (comprised of 192 portfolios) managed by the Manager. She is 55 years old and has been an employee of the Manager since October 1988.
JOSEPH M. CHIOFFI, Vice President and Assistant Secretary since August 2005.
Senior Counsel of BNY Mellon, and an officer of 76 investment companies (comprised of 192 portfolios) managed by the Manager. He is 49 years old and has been an employee of the Manager since June 2000.
KATHLEEN DENICHOLAS, Vice President and Assistant Secretary since January 2010.
Senior Counsel of BNY Mellon, and an officer of 76 investment companies (comprised of 192 portfolios) managed by the Manager. She is 37 years old and has been an employee of the Manager since February 2001.
JANETTE E. FARRAGHER, Vice President and Assistant Secretary since August 2005.
Assistant General Counsel of BNY Mellon, and an officer of 76 investment companies (comprised of 192 portfolios) managed by the Manager. She is 48 years old and has been an employee of the Manager since February 1984.
JOHN B. HAMMALIAN, Vice President and Assistant Secretary since August 2005.
Managing Counsel of BNY Mellon, and an officer of 76 investment companies (comprised of 192 portfolios) managed by the Manager. He is 48 years old and has been an employee of the Manager since February 1991.
M. CRISTINA MEISER, Vice President and Assistant Secretary since January 2010.
Senior Counsel of BNY Mellon, and an officer of 76 investment companies (comprised of 192 portfolios) managed by the Manager. She is 41 years old and has been an employee of the Manager since August 2001.
40
ROBERT R. MULLERY, Vice President and Assistant Secretary since August 2005.
Managing Counsel of BNY Mellon, and an officer of 76 investment companies (comprised of 192 portfolios) managed by the Manager. He is 59 years old and has been an employee of the Manager since May 1986.
JEFF PRUSNOFSKY, Vice President and Assistant Secretary since August 2005.
Managing Counsel of BNY Mellon, and an officer of 76 investment companies (comprised of 192 portfolios) managed by the Manager. He is 46 years old and has been an employee of the Manager since October 1990.
JAMES WINDELS, Treasurer since November 2001.
Director – Mutual Fund Accounting of the Manager, and an officer of 76 investment companies (comprised of 192 portfolios) managed by the Manager. He is 53 years old and has been an employee of the Manager since April 1985.
RICHARD CASSARO, Assistant Treasurer since January 2008.
Senior Accounting Manager – Money Market and Municipal Bond Funds of the Manager, and an officer of 76 investment companies (comprised of 192 portfolios) managed by the Manager. He is 52 years old and has been an employee of the Manager since September 1982.
GAVIN C. REILLY, Assistant Treasurer since December 2005.
Tax Manager of the Investment Accounting and Support Department of the Manager, and an officer of 76 investment companies (comprised of 192 portfolios) managed by the Manager. He is 43 years old and has been an employee of the Manager since April 1991.
ROBERT ROBOL, Assistant Treasurer since December 2002.
Senior Accounting Manager – Fixed Income Funds of the Manager, and an officer of 76 investment companies (comprised of 192 portfolios) managed by the Manager. He is 47 years old and has been an employee of the Manager since October 1988.
ROBERT SALVIOLO, Assistant Treasurer since July 2007.
Senior Accounting Manager – Equity Funds of the Manager, and an officer of 76 investment companies (comprised of 192 portfolios) managed by the Manager. He is 44 years old and has been an employee of the Manager since June 1989.
ROBERT SVAGNA, Assistant Treasurer since December 2002.
Senior Accounting Manager – Equity Funds of the Manager, and an officer of 76 investment companies (comprised of 192 portfolios) managed by the Manager. He is 44 years old and has been an employee of the Manager since November 1990.
OFFICERS OF THE FUND (Unaudited) (continued)
JOSEPH W. CONNOLLY, Chief Compliance Officer since October 2004.
Chief Compliance Officer of the Manager and The Dreyfus Family of Funds (76 investment companies, comprised of 192 portfolios). From November 2001 through March 2004, Mr. Connolly was first Vice-President, Mutual Fund Servicing for Mellon Global Securities Services. In that capacity, Mr. Connolly was responsible for managing Mellon’s Custody, Fund Accounting and Fund Administration services to third-party mutual fund clients. He is 54 years old and has served in various capacities with the Manager since 1980, including manager of the firm’s Fund Accounting Department from 1997 through October 2001.
STEPHEN J. STOREN, Anti-Money Laundering Compliance Officer since May 2011.
Chief Compliance Officer of the Distributor, and the Anti-Money Laundering Compliance Officer of 72 investment companies (comprised of 188 portfolios) managed by the Manager. He is 57 years old and has been an employee of the Distributor since October 1999.
42
Save time. Save paper. View your next shareholder report online as soon as it’s available. Log into www.dreyfus.com and sign up for Dreyfus eCommunications. It’s simple and only takes a few minutes.
The views expressed in this report reflect those of the portfolio manager only through the end of the period covered and do not necessarily represent the views of Dreyfus or any other person in the Dreyfus organization. Any such views are subject to change at any time based upon market or other conditions and Dreyfus disclaims any responsibility to update such views.These views may not be relied on as investment advice and, because investment decisions for a Dreyfus fund are based on numerous factors, may not be relied on as an indication of trading intent on behalf of any Dreyfus fund.
Not FDIC-Insured • Not Bank-Guaranteed • May Lose Value
| | Contents |
| | THE FUND |
| 2 | A Letter from the Chairman and CEO |
| 3 | Discussion of Fund Performance |
| 6 | Fund Performance |
| 8 | Understanding Your Fund’s Expenses |
| 8 | Comparing Your Fund’s Expenses With Those of Other Funds |
| 9 | Statement of Investments |
| 12 | Statement of Assets and Liabilities |
| 13 | Statement of Operations |
| 14 | Statement of Changes in Net Assets |
| 16 | Financial Highlights |
| 20 | Notes to Financial Statements |
| 32 | Report of Independent Registered Public Accounting Firm |
| 33 | Important Tax Information |
| 34 | Board Members Information |
| 36 | Officers of the Fund |
| | FOR MORE INFORMATION |
| | Back Cover |
Dreyfus
Tax Managed
Growth Fund
The Fund

A LETTER FROM THE CHAIRMAN AND CEO
Dear Shareholder:
We present to you this annual report for Dreyfus Tax Managed Growth Fund, covering the 12-month period from November 1, 2010, through October 31, 2011. For information about how the fund performed during the reporting period, as well as general market perspectives, we provide a Discussion of Fund Performance on the pages that follow.
Investors were encouraged by expectations of a more robust economic recovery into the first quarter of 2011, but sentiment subsequently deteriorated due to disappointing economic data, rising commodity prices, an escalating sovereign debt crisis in Europe and a contentious debate regarding taxes, spending and borrowing in the United States. Stocks have been sensitive to these macroeconomic developments, often regardless of underlying company fundamentals. Indeed, market declines were particularly severe during August and September after a major credit rating agency downgraded U.S. long-term debt, while October ranked as one of the best months of the past decade.
The economic outlook currently remains clouded by market turbulence and political infighting, but we believe that a continued subpar global expansion is more likely than a return to recession. Although Europe continues to struggle with a debt crisis, inflationary pressures appear to be waning in most countries as energy prices recently have retreated from their highs. In the United States, moderately low core inflation and an accommodative monetary policy could help support near-trend growth despite ongoing deleveraging activity in the private sector.To assess the potential impact of these and other developments on your investments, we encourage you, as always, to speak with your financial advisor.
Thank you for your continued confidence and support.

Jonathan R. Baum
Chairman and Chief Executive Officer
The Dreyfus Corporation
November 15, 2011
2

DISCUSSION OF FUND PERFORMANCE
For the period of November 1, 2010, through October 31, 2011, as provided by Fayez Sarofim, Portfolio Manager of Fayez Sarofim & Co., Sub-Investment Adviser
Fund and Market Performance Overview
For the 12-month period ended October 31, 2011, Dreyfus Tax Managed Growth Fund’s Class A shares produced a total return of 12.13%, Class B shares returned 11.37%, Class C shares returned 11.38% and Class I shares returned 12.47%.1 For the same period, the fund’s benchmark, the Standard & Poor’s 500 Composite Stock Price Index (“S&P 500 Index”), produced an 8.07% total return.2
Large-cap stocks generally rallied through the first quarter of 2011 amid expectations of continued economic recovery. However, several macroeconomic disappointments later erased many of the market’s previous gains.The fund produced higher returns than its benchmark as investors favored large, multinational companies during turbulent market conditions, particularly over the reporting period’s second half.
The Fund’s Investment Approach
The fund invests primarily in well-established, multinational companies that we believe are well positioned to weather difficult economic climates and thrive during favorable times. We focus on purchasing large-cap, blue-chip stocks at a price we consider to be justified by a company’s fundamentals.The result is a portfolio of stocks selected for what we consider to be sustained patterns of profitability, strong balance sheets, expanding global presence and above-average earnings growth potential. At the same time, we manage the fund in a manner cognizant of the concerns of tax-conscious investors.We typically buy and sell relatively few stocks during the course of the year, which may help reduce investors’ tax liabilities.
Shifting Sentiment Sparked Heightened Market Volatility
Gains in employment, consumer spending and corporate earnings supported a stock market rally over the first several months of the reporting period. However, the rally was interrupted in February when political
DISCUSSION OF FUND PERFORMANCE (continued)
unrest in the Middle East led to sharply rising crude oil prices, and again in March when catastrophic natural and nuclear disasters in Japan disrupted the global industrial supply chain. Nonetheless, investors proved resilient, and stocks rebounded quickly from these unexpected shocks.
Sentiment began to deteriorate in earnest in late April when Greece appeared headed for default and pressures mounted on the banking systems of other European nations. In addition, U.S. economic data proved more disappointing than expected, and investors reacted cautiously to a contentious political debate about U.S. government spending and borrowing. Stocks suffered bouts of heightened volatility when newly risk-averse investors shifted their focus from economically sensitive industry groups and relatively speculative companies to those that historically have held up well under uncertain economic conditions.Volatility was particularly severe in August and September, after a major credit-rating agency downgraded its assessment of long-term U.S. government debt. In contrast, the market rebounded strongly in October when some macroeconomic worries seemed to ease.
Quality Bias Supported Fund Performance
Our longstanding focus on blue-chip companies with globally diversified markets, healthy balance sheets and strong income characteristics enabled the fund to outperform market averages during the reporting period. The fund benefited from overweighted exposure to the consumer staples sector, where investors’ preference for traditionally defensive industry groups lifted stock prices, and a number of globally dominant companies continued to make inroads into the emerging markets. The fund’s stock selections in the information technology sector produced attractive results. Finally, the fund held substantially underweighted exposure to the financials sector, which helped it avoid weakness among banks affected by Europe’s sovereign debt crisis.
The fund’s top performing individual holdings included grocer Whole Foods Market, which saw increased spending by its relatively affluent clientele. Luxury goods purveyor Estee Lauder also encountered a recovery in consumer spending, and the company also achieved savings in its cost structure while gaining greater penetration of the emerging markets. Electronics innovator Apple continued to gain value due to the success of its smartphone and tablet computer products. Energy
4
giant Chevron advanced after twice raising its dividend during the reporting period. Finally, technology leader International Business Machines continued to grow its global consulting business.
Laggards during the reporting period included metals-and-mining companies Freeport-McMoRan Copper & Gold and Rio Tinto, which suffered amid falling industrial commodity prices. Technology firm Cisco Systems missed earnings targets when smaller rivals proved better able to capture opportunities related to cloud computing and server virtualization. In the financials sector, investment managers Franklin Resources and BlackRock were hurt by deteriorating investor sentiment.
New Opportunities in a Subpar Economic Recovery
We expect the global economic rebound to persist fitfully amid significant headwinds, especially in Europe, leading us to conclude that investors are likely to continue to favor large, multinational companies with solid business fundamentals and generous dividend yields. Indeed, corporate earnings in 2011 so far generally have remained robust despite the economic downturn.When adjusting to the changing market environment, we identified a number of new opportunities among multinational companies with healthy balance sheets, ample cash reserves and a presence in growing markets.
November 15, 2011
| |
| | Equity funds are subject generally to market, market sector, market liquidity, issuer, and investment |
| | style risks, among other factors, to varying degrees, all of which are more fully described in the |
| | fund’s prospectus. |
| 1 | Total return includes reinvestment of dividends and any capital gains paid, and does not take into |
| | consideration the maximum initial sales charge in the case of Class A shares, or the applicable |
| | contingent deferred sales charges imposed on redemptions in the case of Class B and Class C |
| | shares. Had these charges been reflected, returns would have been lower. Past performance is no |
| | guarantee of future results. Share price and investment return fluctuate such that upon redemption, |
| | fund shares may be worth more or less than their original cost. Return figures provided reflect the |
| | absorption of certain fund expenses by The Dreyfus Corporation pursuant to an agreement in |
| | effect. Had these expenses not been absorbed, the fund’s returns would have been lower. |
| 2 | SOURCE: LIPPER INC. — Reflects monthly reinvestment of dividends and, where |
| | applicable, capital gain distributions.The Standard & Poor’s 500 Composite Stock Price Index is |
| | a widely accepted, unmanaged index of U.S. stock market performance. Investors cannot invest |
| | directly in any index. |
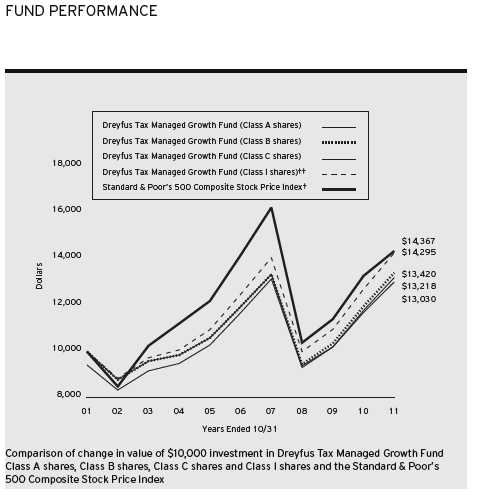
| |
| † | Source: Lipper Inc. |
| †† | The total return figures presented for Class I shares of the fund reflect the performance of the fund’s Class A shares |
| | for the period prior to May 14, 2004 (the inception date for Class I shares). |
| Past performance is not predictive of future performance. |
| The above graph compares a $10,000 investment made in each of the Class A, Class B, Class C and Class I shares of |
| Dreyfus Tax Managed Growth Fund on 10/31/01 to a $10,000 investment made in the Standard & Poor’s 500 |
| Composite Stock Price Index (the “Index”) on that date.All dividends and capital gain distributions are reinvested. |
| The fund’s performance shown in the line graph above takes into account the maximum initial sales charge on Class A |
| shares and all other applicable fees and expenses on all classes. Performance for Class B shares assumes the conversion of |
| Class B shares to Class A shares at the end of the sixth year following the date of purchase.The Index is a widely |
| accepted, unmanaged index of U.S. stock market performance. Unlike a mutual fund, the Index is not subject to charges, |
| fees and other expenses. Investors cannot invest directly in any index. Further information relating to fund performance, |
| including expense reimbursements, if applicable, is contained in the Financial Highlights section of the prospectus and |
| elsewhere in this report. |
6
| | | | | | | |
| Average Annual Total Returns as of 10/31/11 | | | |
| |
| | Inception | | | |
| | Date | 1Year | 5 Years | 10 Years |
| Class A shares | | | | |
| with maximum sales charge (5.75%) | 11/4/97 | 5.66% | 1.29% | 2.83% |
| without sales charge | 11/4/97 | 12.13% | 2.49% | 3.44% |
| Class B shares | | | | |
| with applicable redemption charge † | 11/4/97 | 7.37% | 1.34% | 2.99% |
| without redemption | 11/4/97 | 11.37% | 1.72% | 2.99% |
| Class C shares | | | | |
| with applicable redemption charge †† | 11/4/97 | 10.38% | 1.73% | 2.68% |
| without redemption | 11/4/97 | 11.38% | 1.73% | 2.68% |
| Class I shares | 5/14/04 | 12.47% | 2.74% | 3.64%††† |
| Standard & Poor’s 500 | | | | |
| Composite Stock Price Index | | 8.07% | 0.25% | 3.69% |
| |
| Past performance is not predictive of future performance.The fund’s performance shown in the graph and table does not |
| reflect the deduction of taxes that a shareholder would pay on fund distributions or the redemption of fund shares. |
| † | The maximum contingent deferred sales charge for Class B shares is 4%.After six years Class B shares convert to |
| | Class A shares. |
| †† | The maximum contingent deferred sales charge for Class C shares is 1% for shares redeemed within one year of the |
| | date of purchase. |
| ††† | The total return performance figures presented for Class I shares of the fund reflect the performance of the fund’s |
| | Class A shares for the period prior to May 14, 2004 (the inception date for Class I shares). |
UNDERSTANDING YOUR FUND’S EXPENSES (Unaudited)
As a mutual fund investor, you pay ongoing expenses, such as management fees and other expenses. Using the information below, you can estimate how these expenses affect your investment and compare them with the expenses of other funds.You also may pay one-time transaction expenses, including sales charges (loads) and redemption fees, which are not shown in this section and would have resulted in higher total expenses. For more information, see your fund’s prospectus or talk to your financial adviser.
Review your fund’s expenses
The table below shows the expenses you would have paid on a $1,000 investment in Dreyfus Tax Managed Growth Fund from May 1, 2011 to October 31, 2011. It also shows how much a $1,000 investment would be worth at the close of the period, assuming actual returns and expenses.
| | | | | | | | |
| Expenses and Value of a $1,000 Investment | | | | | | |
| assuming actual returns for the six months ended October 31, 2011 | | | | |
| | | Class A | | Class B | | Class C | | Class I |
| Expenses paid per $1,000† | $ | 6.70 | $ | 10.41 | $ | 10.41 | $ | 5.46 |
| Ending value (after expenses) | $ | 969.40 | $ | 965.90 | $ | 965.80 | $ | 971.00 |
|
| COMPARING YOUR FUND’S EXPENSES |
| WITH THOSE OF OTHER FUNDS (Unaudited) |
Using the SEC’s method to compare expenses
The Securities and Exchange Commission (SEC) has established guidelines to help investors assess fund expenses. Per these guidelines, the table below shows your fund’s expenses based on a $1,000 investment, assuming a hypothetical 5% annualized return. You can use this information to compare the ongoing expenses (but not transaction expenses or total cost) of investing in the fund with those of other funds.All mutual fund shareholder reports will provide this information to help you make this comparison. Please note that you cannot use this information to estimate your actual ending account balance and expenses paid during the period.
| | | | | | | | |
| Expenses and Value of a $1,000 Investment | | | | | | |
| assuming a hypothetical 5% annualized return for the six months ended October 31, 2011 |
| | | Class A | | Class B | | Class C | | Class I |
| Expenses paid per $1,000† | $ | 6.87 | $ | 10.66 | $ | 10.66 | $ | 5.60 |
| Ending value (after expenses) | $ | 1,018.40 | $ | 1,014.62 | $ | 1,014.62 | $ | 1,019.66 |
|
| † Expenses are equal to the fund’s annualized expense ratio of 1.35% for Class A, 2.10% for Class B, 2.10% for |
| Class C and 1.10% for Class I, multiplied by the average account value over the period, multiplied by 184/365 (to |
| reflect the one-half year period). |
8
|
| STATEMENT OF INVESTMENTS |
| October 31, 2011 |
| | |
| Common Stocks—93.3% | Shares | Value ($) |
| Consumer Discretionary—11.2% | | |
| Arcos Dorados Holdings, Cl. A | 35,000 | 819,000 |
| McDonald’s | 50,000 | 4,642,500 |
| McGraw-Hill | 28,000 | 1,190,000 |
| News, Cl. A | 38,000 | 665,760 |
| Target | 46,000 | 2,518,500 |
| Time Warner Cable | 10,000 | 636,900 |
| Wal-Mart Stores | 47,000 | 2,665,840 |
| Walt Disney | 34,000 | 1,185,920 |
| | | 14,324,420 |
| Consumer Staples—28.7% | | |
| Altria Group | 100,000 | 2,755,000 |
| Coca-Cola | 114,000 | 7,788,480 |
| Estee Lauder, Cl. A | 17,500 | 1,722,875 |
| Kraft Foods, Cl. A | 20,271 | 713,134 |
| Nestle, ADR | 70,750 | 4,086,520 |
| PepsiCo | 42,500 | 2,675,375 |
| Philip Morris International | 129,000 | 9,013,230 |
| Procter & Gamble | 65,000 | 4,159,350 |
| Walgreen | 75,000 | 2,490,000 |
| Whole Foods Market | 19,000 | 1,370,280 |
| | | 36,774,244 |
| Energy—20.6% | | |
| Apache | 8,000 | 797,040 |
| Chevron | 52,000 | 5,462,600 |
| ConocoPhillips | 50,000 | 3,482,500 |
| Exxon Mobil | 88,512 | 6,911,902 |
| Occidental Petroleum | 38,000 | 3,531,720 |
| Royal Dutch Shell, Cl. A, ADR | 44,000 | 3,120,040 |
| Total, ADR | 60,000 | 3,138,000 |
| | | 26,443,802 |
| Financial—3.1% | | |
| BlackRock | 4,000 | 631,160 |
| Franklin Resources | 10,000 | 1,066,300 |
| JPMorgan Chase & Co. | 65,000 | 2,259,400 |
| | | 3,956,860 |
STATEMENT OF INVESTMENTS (continued)
| | | |
| Common Stocks (continued) | Shares | Value ($) |
| Health Care—6.2% | | |
| Abbott Laboratories | 41,000 | 2,208,670 |
| Johnson & Johnson | 54,500 | 3,509,255 |
| Merck & Co. | 18,000 | 621,000 |
| Novo Nordisk, ADR | 15,000 | 1,594,500 |
| | | 7,933,425 |
| Industrial—4.9% | | |
| Caterpillar | 27,000 | 2,550,420 |
| General Dynamics | 3,500 | 224,665 |
| General Electric | 98,000 | 1,637,580 |
| United Technologies | 24,000 | 1,871,520 |
| | | 6,284,185 |
| Information Technology—13.9% | | |
| Apple | 15,000a | 6,071,700 |
| Automatic Data Processing | 25,000 | 1,308,250 |
| Cisco Systems | 55,000 | 1,019,150 |
| Intel | 160,000 | 3,926,400 |
| International Business Machines | 15,000 | 2,769,450 |
| QUALCOMM | 20,500 | 1,057,800 |
| Texas Instruments | 55,000 | 1,690,150 |
| | | 17,842,900 |
| Materials—4.7% | | |
| Air Products & Chemicals | 14,000 | 1,205,960 |
| Freeport-McMoRan Copper & Gold | 48,000 | 1,932,480 |
| Praxair | 18,000 | 1,830,060 |
| Rio Tinto, ADR | 20,000 | 1,081,200 |
| | | 6,049,700 |
| Total Common Stocks | | |
| (cost $89,966,266) | | 119,609,536 |
10
| | | |
| Other Investment—5.7% | Shares | Value ($) |
| Registered Investment Company; | | |
| Dreyfus Institutional Preferred | | |
| Plus Money Market Fund | | |
| (cost $7,336,633) | 7,336,633b | 7,336,633 |
| |
| Total Investments (cost $97,302,899) | 99.0% | 126,946,169 |
| Cash and Receivables (Net) | 1.0% | 1,257,055 |
| Net Assets | 100.0% | 128,203,224 |
| |
| ADR—American Depository Receipts |
| a | Non-income producing security. |
| b | Investment in affiliated money market mutual fund. |
| | | |
| Portfolio Summary (Unaudited)† | | |
| |
| | Value (%) | | Value (%) |
| Consumer Staples | 28.7 | Money Market Investment | 5.7 |
| Energy | 20.6 | Industrial | 4.9 |
| Information Technology | 13.9 | Materials | 4.7 |
| Consumer Discretionary | 11.2 | Financial | 3.1 |
| Health Care | 6.2 | | 99.0 |
|
| † Based on net assets. |
| See notes to financial statements. |
|
| STATEMENT OF ASSETS AND LIABILITIES |
| October 31, 2011 |
| | | | | |
| | | | Cost | Value |
| Assets ($): | | | | |
| Investments in securities—See Statement of Investments: | | | |
| Unaffiliated issuers | | | 89,966,266 | 119,609,536 |
| Affiliated issuers | | | 7,336,633 | 7,336,633 |
| Cash | | | | 217,156 |
| Receivable for shares of Capital Stock subscribed | | | 1,344,208 |
| Dividends receivable | | | | 131,262 |
| | | | | 128,638,795 |
| Liabilities ($): | | | | |
| Due to The Dreyfus Corporation and affiliates—Note 3(b) | | | 151,011 |
| Payable for investment securities purchased | | | 228,422 |
| Payable for shares of Capital Stock redeemed | | | 56,138 |
| | | | | 435,571 |
| Net Assets ($) | | | | 128,203,224 |
| Composition of Net Assets ($): | | | | |
| Paid-in capital | | | | 107,856,372 |
| Accumulated undistributed investment income—net | | | 1,119,251 |
| Accumulated net realized gain (loss) on investments | | | (10,415,669) |
| Accumulated net unrealized appreciation | | | |
| (depreciation) on investments | | | | 29,643,270 |
| Net Assets ($) | | | | 128,203,224 |
| |
| |
| Net Asset Value Per Share | | | | |
| | Class A | Class B | Class C | Class I |
| Net Assets ($) | 100,740,216 | 793,141 | 20,385,781 | 6,284,086 |
| Shares Outstanding | 5,210,198 | 42,365 | 1,110,587 | 323,953 |
| Net Asset Value Per Share ($) | 19.34 | 18.72 | 18.36 | 19.40 |
| |
| See notes to financial statements. | | | | |
12
|
| STATEMENT OF OPERATIONS |
| Year Ended October 31, 2011 |
| | |
| Investment Income ($): | |
| Income: | |
| Cash dividends (net of $62,726 foreign taxes withheld at source): | |
| Unaffiliated issuers | 3,053,993 |
| Affiliated issuers | 2,421 |
| Income from securities lending—Note 1(b) | 12,173 |
| Total Income | 3,068,587 |
| Expenses: | |
| Management fee—Note 3(a) | 1,231,320 |
| Distribution and service plan fees—Note 3(b) | 427,666 |
| Directors’ fees—Note 3(a) | 7,975 |
| Loan commitment fees—Note 2 | 1,482 |
| Total Expenses | 1,668,443 |
| Less—reduction in management fee due to undertaking—Note 3(a) | (34,647) |
| Less—Directors’ fees reimbursed by the Manager—Note 3(a) | (7,975) |
| Net Expenses | 1,625,821 |
| Investment Income—Net | 1,442,766 |
| Realized and Unrealized Gain (Loss) on Investments—Note 4 ($): | |
| Net realized gain (loss) on investments | 7,247,428 |
| Net unrealized appreciation (depreciation) on investments | 3,617,573 |
| Net Realized and Unrealized Gain (Loss) on Investments | 10,865,001 |
| Net Increase in Net Assets Resulting from Operations | 12,307,767 |
| |
| See notes to financial statements. | |
STATEMENT OF CHANGES IN NET ASSETS
| | | | |
| | Year Ended October 31, |
| | 2011 | 2010 |
| Operations ($): | | |
| Investment income—net | 1,442,766 | 1,228,520 |
| Net realized gain (loss) on investments | 7,247,428 | (1,619,386) |
| Net unrealized appreciation | | |
| (depreciation) on investments | 3,617,573 | 13,381,220 |
| Net Increase (Decrease) in Net Assets | | |
| Resulting from Operations | 12,307,767 | 12,990,354 |
| Dividends to Shareholders from ($): | | |
| Investment income—net: | | |
| Class A Shares | (1,099,328) | (1,138,917) |
| Class B Shares | (5,980) | (14,518) |
| Class C Shares | (132,062) | (233,095) |
| Class I Shares | (36,805) | (13,241) |
| Total Dividends | (1,274,175) | (1,399,771) |
| Capital Stock Transactions ($): | | |
| Net proceeds from shares sold: | | |
| Class A Shares | 29,779,524 | 17,687,206 |
| Class B Shares | 60,039 | 61,752 |
| Class C Shares | 2,542,453 | 1,416,440 |
| Class I Shares | 6,123,770 | 1,762,843 |
| Dividends reinvested: | | |
| Class A Shares | 926,744 | 930,890 |
| Class B Shares | 4,857 | 9,548 |
| Class C Shares | 83,534 | 152,875 |
| Class I Shares | 30,608 | 4,500 |
| Cost of shares redeemed: | | |
| Class A Shares | (14,867,890) | (12,430,957) |
| Class B Shares | (961,078) | (2,219,873) |
| Class C Shares | (2,910,180) | (4,516,727) |
| Class I Shares | (2,005,757) | (311,727) |
| Increase (Decrease) in Net Assets | | |
| from Capital Stock Transactions | 18,806,624 | 2,546,770 |
| Total Increase (Decrease) in Net Assets | 29,840,216 | 14,137,353 |
| Net Assets ($): | | |
| Beginning of Period | 98,363,008 | 84,225,655 |
| End of Period | 128,203,224 | 98,363,008 |
| Undistributed investment income—net | 1,119,251 | 950,660 |
14
| | | | |
| | Year Ended October 31, |
| | 2011 | 2010 |
| Capital Share Transactions: | | |
| Class Aa | | |
| Shares sold | 1,589,698 | 1,098,561 |
| Shares issued for dividends reinvested | 52,152 | 58,732 |
| Shares redeemed | (799,107) | (768,994) |
| Net Increase (Decrease) in Shares Outstanding | 842,743 | 388,299 |
| Class Ba | | |
| Shares sold | 3,307 | 3,739 |
| Shares issued for dividends reinvested | 280 | 619 |
| Shares redeemed | (52,844) | (143,047) |
| Net Increase (Decrease) in Shares Outstanding | (49,257) | (138,689) |
| Class C | | |
| Shares sold | 142,453 | 90,402 |
| Shares issued for dividends reinvested | 4,920 | 10,091 |
| Shares redeemed | (164,189) | (292,251) |
| Net Increase (Decrease) in Shares Outstanding | (16,816) | (191,758) |
| Class I | | |
| Shares sold | 323,566 | 106,216 |
| Shares issued for dividends reinvested | 1,721 | 284 |
| Shares redeemed | (103,183) | (19,085) |
| Net Increase (Decrease) in Shares Outstanding | 222,104 | 87,415 |
| |
| a | During the period ended October 31, 2011, 25,225 Class B shares representing $464,608 were automatically |
| | converted to 26,492 Class A shares and during the period ended October 31, 2010, 30,622 Class B shares |
| | representing $480,875 were automatically converted to 29,632 Class A shares. |
| See notes to financial statements. |
FINANCIAL HIGHLIGHTS
The following tables describe the performance for each share class for the fiscal periods indicated.All information (except portfolio turnover rate) reflects financial results for a single fund share.Total return shows how much your investment in the fund would have increased (or decreased) during each period, assuming you had reinvested all dividends and distributions.These figures have been derived from the fund’s financial statements.
| | | | | | | | | | |
| | | Year Ended October 31, | |
| Class A Shares | 2011 | 2010 | 2009 | 2008 | 2007 |
| Per Share Data ($): | | | | | |
| Net asset value, beginning of period | 17.47 | 15.40 | 14.35 | 20.51 | 18.44 |
| Investment Operations: | | | | | |
| Investment income—neta | .27 | .25 | .27 | .25 | .22 |
| Net realized and unrealized | | | | | |
| gain (loss) on investments | 1.85 | 2.10 | 1.05 | (6.17) | 2.08 |
| Total from Investment Operations | 2.12 | 2.35 | 1.32 | (5.92) | 2.30 |
| Distributions: | | | | | |
| Dividends from investment income—net | (.25) | (.28) | (.27) | (.24) | (.23) |
| Net asset value, end of period | 19.34 | 17.47 | 15.40 | 14.35 | 20.51 |
| Total Return (%)b | 12.13 | 15.53 | 9.53 | (29.22) | 12.58 |
| Ratios/Supplemental Data (%): | | | | | |
| Ratio of total expenses | | | | | |
| to average net assets | 1.36 | 1.36 | 1.36 | 1.36 | 1.36 |
| Ratio of net expenses | | | | | |
| to average net assets | 1.32 | 1.25 | 1.25 | 1.25 | 1.25 |
| Ratio of net investment income | | | | | |
| to average net assets | 1.42 | 1.54 | 2.04 | 1.35 | 1.13 |
| Portfolio Turnover Rate | 15.10 | 3.00 | — | 5.91 | 8.09 |
| Net Assets, end of period ($ x 1,000) | 100,740 | 76,318 | 61,270 | 60,207 | 96,507 |
| |
| a | Based on average shares outstanding at each month end. |
| b | Exclusive of sales charge. |
| See notes to financial statements. |
16
| | | | | | | | | | |
| | | Year Ended October 31, | |
| Class B Shares | 2011 | 2010 | 2009 | 2008 | 2007 |
| Per Share Data ($): | | | | | |
| Net asset value, beginning of period | 16.88 | 14.80 | 13.72 | 19.56 | 17.57 |
| Investment Operations: | | | | | |
| Investment income—neta | .13 | .12 | .17 | .11 | .08 |
| Net realized and unrealized | | | | | |
| gain (loss) on investments | 1.78 | 2.04 | .99 | (5.91) | 1.98 |
| Total from Investment Operations | 1.91 | 2.16 | 1.16 | (5.80) | 2.06 |
| Distributions: | | | | | |
| Dividends from investment income—net | (.07) | (.08) | (.08) | (.04) | (.07) |
| Net asset value, end of period | 18.72 | 16.88 | 14.80 | 13.72 | 19.56 |
| Total Return (%)b | 11.37 | 14.65 | 8.59 | (29.72) | 11.76 |
| Ratios/Supplemental Data (%): | | | | | |
| Ratio of total expenses | | | | | |
| to average net assets | 2.11 | 2.11 | 2.10 | 2.11 | 2.11 |
| Ratio of net expenses | | | | | |
| to average net assets | 2.06 | 2.00 | 2.00 | 2.00 | 2.00 |
| Ratio of net investment income | | | | | |
| to average net assets | .72 | .82 | 1.36 | .65 | .42 |
| Portfolio Turnover Rate | 15.10 | 3.00 | — | 5.91 | 8.09 |
| Net Assets, end of period ($ x 1,000) | 793 | 1,547 | 3,410 | 8,519 | 23,622 |
| |
| a | Based on average shares outstanding at each month end. |
| b | Exclusive of sales charge. |
| See notes to financial statements. |
FINANCIAL HIGHLIGHTS (continued)
| | | | | | | | | | |
| | | Year Ended October 31, | |
| Class C Shares | 2011 | 2010 | 2009 | 2008 | 2007 |
| Per Share Data ($): | | | | | |
| Net asset value, beginning of period | 16.60 | 14.65 | 13.63 | 19.48 | 17.53 |
| Investment Operations: | | | | | |
| Investment income—neta | .12 | .12 | .17 | .11 | .07 |
| Net realized and unrealized | | | | | |
| gain (loss) on investments | 1.76 | 2.01 | .99 | (5.87) | 1.98 |
| Total from Investment Operations | 1.88 | 2.13 | 1.16 | (5.76) | 2.05 |
| Distributions: | | | | | |
| Dividends from investment income—net | (.12) | (.18) | (.14) | (.09) | (.10) |
| Net asset value, end of period | 18.36 | 16.60 | 14.65 | 13.63 | 19.48 |
| Total Return (%)b | 11.38 | 14.63 | 8.68 | (29.71) | 11.73 |
| Ratios/Supplemental Data (%): | | | | | |
| Ratio of total expenses | | | | | |
| to average net assets | 2.11 | 2.11 | 2.11 | 2.11 | 2.11 |
| Ratio of net expenses | | | | | |
| to average net assets | 2.07 | 2.00 | 2.00 | 2.00 | 2.00 |
| Ratio of net investment income | | | | | |
| to average net assets | .68 | .80 | 1.29 | .61 | .39 |
| Portfolio Turnover Rate | 15.10 | 3.00 | — | 5.91 | 8.09 |
| Net Assets, end of period ($ x 1,000) | 20,386 | 18,714 | 19,323 | 20,247 | 34,961 |
| |
| a | Based on average shares outstanding at each month end. |
| b | Exclusive of sales charge. |
| See notes to financial statements. |
18
| | | | | | | | | | |
| | | Year Ended October 31, | |
| Class I Shares | 2011 | 2010 | 2009 | 2008 | 2007a |
| Per Share Data ($): | | | | | |
| Net asset value, beginning of period | 17.53 | 15.44 | 14.41 | 20.58 | 18.52 |
| Investment Operations: | | | | | |
| Investment income—netb | .30 | .28 | .30 | .28 | .20 |
| Net realized and unrealized | | | | | |
| gain (loss) on investments | 1.86 | 2.13 | 1.05 | (6.16) | 2.14 |
| Total from Investment Operations | 2.16 | 2.41 | 1.35 | (5.88) | 2.34 |
| Distributions: | | | | | |
| Dividends from investment income—net | (.29) | (.32) | (.32) | (.29) | (.28) |
| Net asset value, end of period | 19.40 | 17.53 | 15.44 | 14.41 | 20.58 |
| Total Return (%) | 12.47 | 15.81 | 9.74 | (29.99) | 12.76 |
| Ratios/Supplemental Data (%): | | | | | |
| Ratio of total expenses | | | | | |
| to average net assets | 1.11 | 1.11 | 1.12 | 1.11 | 1.12 |
| Ratio of net expenses | | | | | |
| to average net assets | 1.08 | 1.00 | 1.00 | 1.00 | 1.01 |
| Ratio of net investment income | | | | | |
| to average net assets | 1.62 | 1.72 | 2.10 | 1.57 | 1.01 |
| Portfolio Turnover Rate | 15.10 | 3.00 | — | 5.91 | 8.09 |
| Net Assets, end of period ($ x 1,000) | 6,284 | 1,785 | 223 | 10 | 12 |
| |
| a | Effective June 1, 2007, Class R shares were redesignated as Class I shares. |
| b | Based on average shares outstanding at each month end. |
| See notes to financial statements. |
NOTES TO FINANCIAL STATEMENTS
NOTE 1—Significant Accounting Policies:
Dreyfus Tax Managed Growth Fund (the “fund”) is a separate diversified series of The Dreyfus/Laurel Funds, Inc. (the “Company”), which is registered under the Investment Company Act of 1940, as amended (the “Act”), as an open-end management investment company and operates as a series company currently offering ten series, including the fund. The fund’s investment objective is to seek long-term capital appreciation consistent with minimizing realized capital gains and taxable current income.The Dreyfus Corporation (the “Manager” or “Dreyfus”), a wholly-owned subsidiary of The Bank of New York Mellon Corporation (“BNY Mellon”), serves as the fund’s investment adviser. Fayez Sarofim & Co. (“Sarofim & Co.”) serves as the fund’s sub-investment adviser.
MBSC Securities Corporation (the “Distributor”), a wholly-owned subsidiary of Dreyfus, is the distributor of the fund’s shares.The fund is authorized to issue 500 million shares of $.001 par value Capital Stock. The fund currently offers four classes of shares: Class A (200 million shares authorized), Class B (100 million shares authorized), Class C (100 million shares authorized) and Class I (100 million shares authorized). Class A, Class B and Class C shares are sold primarily to retail investors through financial intermediaries and bear a distribution fee and/or service fee. Class A shares are sold with a front-end sales charge, while Class B and Class C shares are subject to a contingent deferred sales charge (“CDSC”). Class B shares automatically convert to Class A shares after six years.The fund no longer offers Class B shares, except in connection with dividend reinvestment and permitted exchanges of Class B shares and, effective on or about March 13, 2012, all outstanding Class B shares will automatically convert to Class A shares. Class I shares are sold primarily to bank trust departments and other financial service providers (including The Bank of New York Mellon, a subsidiary of BNY Mellon and an affiliate of Dreyfus) acting on behalf of customers having a qualified trust or investment account or relationship at such
20
institution, and bear no distribution or service fees. Class I shares are offered without a front-end sales charge or CDSC. Each class of shares has identical rights and privileges, except with respect to distribution and service fees and voting rights on matters affecting a single class. Income, expenses (other than expenses attributable to a specific class), and realized and unrealized gains or losses on investments are allocated to each class of shares based on its relative net assets.
The Financial Accounting Standards Board (“FASB”) Accounting Standards Codification (“ASC”) is the exclusive reference of authoritative U.S. generally accepted accounting principles (“GAAP”) recognized by the FASB to be applied by nongovernmental entities. Rules and interpretive releases of the Securities and Exchange Commission (“SEC”) under authority of federal laws are also sources of authoritative GAAP for SEC registrants. The fund’s financial statements are prepared in accordance with GAAP, which may require the use of management estimates and assumptions.Actual results could differ from those estimates.
(a) Portfolio valuation: The fair value of a financial instrument is the amount that would be received to sell an asset or paid to transfer a liability in an orderly transaction between market participants at the measurement date (i.e. the exit price). GAAP establishes a fair value hierarchy that prioritizes the inputs of valuation techniques used to measure fair value.This hierarchy gives the highest priority to unadjusted quoted prices in active markets for identical assets or liabilities (Level 1 measurements) and the lowest priority to unobservable inputs (Level 3 measurements).
Additionally, GAAP provides guidance on determining whether the volume and activity in a market has decreased significantly and whether such a decrease in activity results in transactions that are not orderly. GAAP requires enhanced disclosures around valuation inputs and techniques used during annual and interim periods.
NOTES TO FINANCIAL STATEMENTS (continued)
Various inputs are used in determining the value of the fund’s investments relating to fair value measurements.These inputs are summarized in the three broad levels listed below:
Level 1—unadjusted quoted prices in active markets for identical investments.
Level 2—other significant observable inputs (including quoted prices for similar investments, interest rates, prepayment speeds, credit risk, etc.).
Level 3—significant unobservable inputs (including the fund’s own assumptions in determining the fair value of investments).
The inputs or methodology used for valuing securities are not necessarily an indication of the risk associated with investing in those securities.
Changes in valuation techniques may result in transfers in or out of an assigned level within the disclosure hierarchy. Valuation techniques used to value the fund’s investments are as follows:
Investments in securities are valued at the last sales price on the securities exchange or national securities market on which such securities are primarily traded. Securities listed on the National Market System for which market quotations are available are valued at the official closing price or, if there is no official closing price that day, at the last sales price. Securities not listed on an exchange or the national securities market, or securities for which there were no transactions, are valued at the average of the most recent bid and asked prices, except for open short positions, where the asked price is used for valuation purposes. Bid price is used when no asked price is available. Registered investment companies that are not traded on an exchange are valued at their net asset value.All preceding securities are categorized within Level 1 of the fair value hierarchy.
Fair valuing of securities may be determined with the assistance of a pricing service using calculations based on indices of domestic securities and other appropriate indicators, such as prices of relevant ADRs and futures contracts. Utilizing these techniques may result in transfers between Level 1 and Level 2 of the fair value hierarchy.
22
When market quotations or official closing prices are not readily available, or are determined not to reflect accurately fair value, such as when the value of a security has been significantly affected by events after the close of the exchange or market on which the security is principally traded (for example, a foreign exchange or market), but before the fund calculates its net asset value, the fund may value these investments at fair value as determined in accordance with the procedures approved by the Board of Directors. Certain factors may be considered when fair valuing investments such as: fundamental analytical data, the nature and duration of restrictions on disposition, an evaluation of the forces that influence the market in which the securities are purchased and sold, and public trading in similar securities of the issuer or comparable issuers. These securities are either categorized as Level 2 or 3 depending on the relevant inputs used.
For restricted securities where observable inputs are limited, assumptions about market activity and risk are used and are categorized within Level 3 of the fair value hierarchy.
The following is a summary of the inputs used as of October 31, 2011 in valuing the fund’s investments:
| | | | |
| | | Level 2—Other | Level 3— | |
| | Level 1— | Significant | Significant | |
| | Unadjusted | Observable | Unobservable | |
| | Quoted Prices | Inputs | Inputs | Total |
| Assets ($) | | | | |
| Investments in Securities | | | |
| Equity Securities— | | | | |
| Domestic† | 105,770,276 | — | — | 105,770,276 |
| Equity Securities— | | | | |
| Foreign† | 13,839,260 | — | — | 13,839,260 |
| Mutual Funds | 7,336,633 | — | — | 7,336,633 |
| † See Statement of Investments for additional detailed categorizations. | |
In May 2011, FASB issued Accounting Standards Update (“ASU”) No. 2011-04 “Amendments to Achieve Common Fair Value Measurement and Disclosure Requirements in GAAP and International Financial Reporting Standards (“IFRS”)” (“ASU 2011-04”). ASU 2011-04
NOTES TO FINANCIAL STATEMENTS (continued)
includes common requirements for measurement of and disclosure about fair value between GAAP and IFRS. ASU 2011-04 will require reporting entities to disclose the following information for fair value measurements categorized within Level 3 of the fair value hierarchy: quantitative information about the unobservable inputs used in the fair value measurement, the valuation processes used by the reporting entity and a narrative description of the sensitivity of the fair value measurement to changes in unobservable inputs and the interrelationships between those unobservable inputs. In addition, ASU 2011-04 will require reporting entities to make disclosures about amounts and reasons for all transfers in and out of Level 1 and Level 2 fair value measurements. The new and revised disclosures are effective for interim and annual reporting periods beginning after December 15, 2011. At this time, management is evaluating the implications of ASU 2011-04 and its impact on the financial statements.
(b) Securities transactions and investment income: Securities transactions are recorded on a trade date basis. Realized gains and losses from securities transactions are recorded on the identified cost basis. Dividend income is recognized on the ex-dividend date and interest income, including, where applicable, accretion of discount and amortization of premium on investments, is recognized on the accrual basis.
Pursuant to a securities lending agreement withThe Bank of NewYork Mellon, the fund may lend securities to qualified institutions. It is the fund’s policy that, at origination, all loans are secured by collateral of at least 102% of the value of U.S. securities loaned and 105% of the value of foreign securities loaned. Collateral equivalent to at least 100% of the market value of securities on loan is maintained at all times. Collateral is either in the form of cash, which can be invested in certain money market mutual funds managed by Dreyfus, U.S. Government and Agency securities or letters of credit.The fund is entitled to receive all income on securities loaned, in addition to income earned as a result of the lending transaction.Although each security loaned is fully collateralized, the fund bears the risk of delay in recovery of, or loss of rights
24
in, the securities loaned should a borrower fail to return the securities in a timely manner. During the period ended October 31, 2011,The Bank of NewYork Mellon earned $5,217 from lending portfolio securities, pursuant to the securities lending agreement.
(c) Affiliated issuers: Investments in other investment companies advised by Dreyfus are defined as “affiliated” in the Act.
The fund may invest in shares of certain affiliated investment companies also advised or managed by Dreyfus. Investments in affiliated investment companies for the period ended October 31, 2011 were as follows:
| | | | | | | |
| Affiliated | | | | | | | |
| Investment | Value | | | | Value | | Net |
| Company | 10/31/2010 | ($) | Purchases ($) | Sales ($) | 10/31/2011 | ($) | Assets (%) |
| Dreyfus | | | | | | | |
| Institutional | | | | | | | |
| Preferred | | | | | | | |
| Plus Money | | | | | | | |
| Market Fund | 1,039,000 | | 22,161,857 | 15,864,224 | 7,336,633 | | 5.7 |
| Dreyfus | | | | | | | |
| Institutional | | | | | | | |
| Cash | | | | | | | |
| Advantage | | | | | | | |
| Fund† | — | | 29,631,530 | 29,631,530 | — | | — |
| Total | 1,039,000 | | 51,793,387 | 45,495,754 | 7,336,633 | | 5.7 |
| |
| † On June 7, 2011, Dreyfus Institutional Cash Advantage Plus Fund was acquired by Dreyfus |
| Institutional Cash Advantage Fund, resulting in a transfer of shares. | | | |
(d) Dividends to shareholders: Dividends are recorded on the ex-dividend date. Dividends from investment income-net and dividends from net realized capital gains, if any, are normally declared and paid annually, but the fund may make distributions on a more frequent basis to comply with the distribution requirements of the Internal Revenue Code of 1986, as amended (the “Code”).To the extent that net realized capital gains can be offset by capital loss carryovers, it is the policy of the fund not to distribute such gains. Income and capital gain distributions are determined in accordance with income tax regulations, which may differ from GAAP.
NOTES TO FINANCIAL STATEMENTS (continued)
(e) Federal income taxes: It is the policy of the fund to continue to qualify as a regulated investment company, if such qualification is in the best interests of its shareholders, by complying with the applicable provisions of the Code, and to make distributions of taxable income sufficient to relieve it from substantially all federal income and excise taxes.
As of and during the period ended October 31, 2011, the fund did not have any liabilities for any uncertain tax positions.The fund recognizes interest and penalties, if any, related to uncertain tax positions as income tax expense in the Statement of Operations. During the period, the fund did not incur any interest or penalties.
Each of the tax years in the four-year period ended October 31, 2011 remains subject to examination by the Internal Revenue Service and state taxing authorities.
At October 31, 2011, the components of accumulated earnings on a tax basis were as follows: undistributed ordinary income $1,119,251, accumulated capital losses $10,415,669 and unrealized appreciation $29,643,270.
The accumulated capital loss carryover is available for federal income tax purposes to be applied against future net securities profits, if any, realized subsequent to October 31, 2011. If not applied, $7,781,638 of the carryover expires in fiscal 2012, $1,014,645 expires in fiscal 2017 and $1,619,386 expires in fiscal 2018.
Under the recently enacted Regulated Investment Company Modernization Act of 2010 (the “2010 Act”), the fund will be permitted to carry forward capital losses incurred in taxable years beginning after December 22, 2010 (“post-enactment losses”) for an unlimited period. However, the 2010 Act requires any post-enactment losses to be utilized before the utilization of losses incurred in taxable years prior to the effective date of the 2010 Act.As a result of this ordering rule, capital loss carryovers related to taxable years beginning prior to the effective date of the 2010 Act may be more likely to expire unused.
26
The tax character of distributions paid to shareholders during the fiscal periods ended October 31, 2011 and October 31, 2010 were as follows: ordinary income $1,274,175 and $1,399,771, respectively.
NOTE 2—Bank Lines of Credit:
The fund participates with other Dreyfus-managed funds in a $225 million unsecured credit facility led by Citibank, N.A. and a $300 million unsecured credit facility provided by The Bank of New York Mellon (each, a “Facility”), each to be utilized primarily for temporary or emergency purposes, including the financing of redemptions. In connection therewith, the fund has agreed to pay its pro rata portion of commitment fees for each Facility. Interest is charged to the fund based on rates determined pursuant to the terms of the respective Facility at the time of borrowing. During the period ended on October 31, 2011, the fund did not borrow under the Facilities.
NOTE 3—Investment Management Fee and Other Transactions With Affiliates:
(a) Pursuant to an investment management agreement with Dreyfus, Dreyfus provides or arranges for one or more third parties and/or affiliates to provide investment advisory, administrative, custody, fund accounting and transfer agency services to the fund. Dreyfus also directs the investments of the fund in accordance with its investment objective, policies and limitations. For these services, the fund is contractually obligated to pay Dreyfus a fee, calculated daily and paid monthly, at the annual rate of 1.10% of the value of the fund’s average daily net assets. Out of its fee, Dreyfus pays all of the expenses of the fund except brokerage fees, taxes, interest, commitment fees, Rule 12b-1 distribution fees and expenses, service fees, expenses of non-interested Directors (including counsel fees) and extraordinary expenses. In addition, Dreyfus is required to reduce its fee in an amount equal to the fund’s allocable portion of fees and expenses of the non-interested Directors
NOTES TO FINANCIAL STATEMENTS (continued)
(including counsel fees). Each Board member who is not an “interested person” of the Company (as defined in the Act) receives $60,000 per annum, plus $7,000 per joint Board meeting of the Company, Dreyfus Investment Funds,The Dreyfus/Laurel Funds Trust,The Dreyfus/Laurel Tax-Free Municipal Funds and Dreyfus Funds, Inc. (collectively, the “Board Group Open-End Funds”) attended, $2,500 for separate in-person committee meetings attended which are not held in conjunction with a regularly scheduled Board meeting and $2,000 for Board meetings and separate committee meetings attended that are conducted by telephone. The Board Group Open-End Funds also reimburse each Board member who is not an “interested person” of the Company (as defined in the Act) for travel and out-of-pocket expenses.With respect to Board meetings, the Chairman of the Board receives an additional 25% of such compensation (with the exception of reimbursable amounts).The Chair of each of the Board’s committees, unless the Chair also serves as Chair of the Board, receives $1,350 per applicable committee meeting. In the event that there is an in-person joint committee meeting or a joint telephone meeting of the Board Group Open-End Funds and Dreyfus HighYield Strategies Fund (“DHF”), a $2,500 fee is allocated between the Board Group Open-End Funds and DHF. The Company’s portion of these fees and expenses are charged and allocated to each series baed on net assets. Amounts required to be paid by the Company directly to the non-interested Directors, that would be applied to offset a portion of the management fee payable to Dreyfus, are in fact paid directly by Dreyfus to the non-interested Directors.
Effective January 1, 2012, the Board Group Open-End Funds and DHF (collectively, the “Board Group Funds”) will pay each Board member their respective allocated portions of an annual retainer of $85,000 and a fee of $10,000 for each regularly scheduled Board meeting attended ($75,000 and $8,000, respectively, in the aggregate, prior to January 1, 2012). With respect to the annual retainer and Board meetings of the Board Group Funds, the Chair of the Board will
28
receive an additional 25% of such compensation (with the exception of reimbursable amounts). Each Board member will receive $2,500 for any separate in-person committee meetings attended, which are not held in conjunction with a regularly scheduled Board meeting, such amount to be allocated among the Board Group Funds, as applicable. In the event that there is a joint telephone meeting of the Board Group Funds, a fee of $2,000 will be allocated among the applicable Board Group Funds, accordingly (prior to January 1, 2012, the fee allocated was $2,500 if the meeting included DHF).The Chair of each of the Board’s committees, unless the Chair also serves as Chair of the Board, will receive $1,500 per applicable committee meeting. Each Emeritus Board member is entitled to receive an annual retainer of one-half the amount paid as a retainer at the time the Board member became Emeritus and a per meeting attended fee of one-half the amount paid to Board members.The Board Group Funds also reimburse each Independent Board member and Emeritus Board members for travel and out-of-pocket expenses.
Dreyfus had agreed to waive a portion of the fund’s management fee, in the amount of .10% of the value of the fund’s average daily net assets until March 1, 2011.The reduction in management fee, pursuant to the undertaking, amounted to $34,647 during the period ended October 31, 2011.
Pursuant to a sub-investment advisory agreement between Dreyfus and Sarofim & Co., Dreyfus has agreed to pay Sarofim & Co. a monthly sub-investment advisory fee at the annual rate of .2175% of the value of the fund’s average daily net assets.
During the period ended October 31, 2011, the Distributor retained $10,278 from commissions earned on sales of the fund’s Class A shares and $13,251 and $1,996 from CDSCs on redemptions of the fund’s Class B and Class C shares, respectively.
NOTES TO FINANCIAL STATEMENTS (continued)
(b) Under separate Distribution Plans (the “Plans”) adopted pursuant to Rule 12b-1 under the Act, Class A shares may pay annually up to .25% of the value of its average daily net assets to compensate the Distributor for shareholder servicing activities and expenses primarily intended to result in the sale of Class A shares. Class B and Class C shares pay the Distributor for distributing their shares at an aggregate annual rate of .75% of the value of the average daily net assets of Class B and Class C shares. Class B and Class C shares are also subject to a service plan adopted pursuant to Rule 12b-1 (the “Service Plan”), under which Class B and Class C shares pay the Distributor for providing certain services to the holders of their shares a fee at the annual rate of .25% of the value of the average daily net assets of Class B and Class C shares. During the period ended October 31, 2011, Class A, Class B and Class C shares were charged $219,768, $8,651 and $147,272, respectively, pursuant to their respective Plans. During the period ended October 31, 2011, Class B and Class C shares were charged $2,884 and $49,091, respectively, pursuant to the Service Plan.
Under its terms, the Plans and Service Plan shall remain in effect from year to year, provided such continuance is approved annually by a vote of majority of those Directors who are not “interested persons” of the Company and who have no direct or indirect financial interest in the operation of or in any agreement related to the Plans or Service Plan.
The components of “Due toThe Dreyfus Corporation and affiliates” in the Statement of Assets and Liabilities consist of: management fees $113,406, Rule 12b-1 distribution plan fees $33,284 and service plan fees $4,321.
30
NOTE 4—Securities Transactions:
The aggregate amount of purchases and sales of investment securities, excluding short-term securities, during the period ended October 31, 2011, amounted to $27,810,442 and $16,506,884, respectively.
At October 31, 2011, the cost of investments for federal income tax purposes was $97,302,899; accordingly, accumulated net unrealized appreciation on investments was $29,643,270, consisting of $34,964,261 gross unrealized appreciation and $5,320,991 gross unrealized depreciation.
NOTE 5—Other Matters:
At the October 27, 2011 Board meeting, the Board of the Company approved a proposal to have shareholders consider the election of Francine J. Bovich as an additional Board member of the Company, and also consider the election of Joseph S. DiMartino and Benaree Pratt Wiley, current Board members of the Company not previously proposed to shareholders of the fund. A proxy statement was mailed, on December 1, 2011, to shareholders of record as of the close of business on November 1, 2011 asking shareholders to consider these elections at a special joint meeting of shareholders to be held on Wednesday, February 8, 2012.
|
| REPORT OF INDEPENDENT REGISTERED |
| PUBLIC ACCOUNTING FIRM |
The Board of Directors and Shareholders of The Dreyfus/Laurel Funds, Inc.
We have audited the accompanying statement of assets and liabilities of Dreyfus Tax Managed Growth Fund, a series of The Dreyfus/Laurel Funds, Inc. (the “Fund”), including the statement of investments, as of October 31, 2011, and the related statement of operations for the year then ended, the statements of changes in net assets for each of the years in the two-year period then ended, and the financial highlights for each of the years in the five-year period then ended. These financial statements and financial highlights are the responsibility of the Fund’s management. Our responsibility is to express an opinion on these financial statements and financial highlights based on our audits.
We conducted our audits in accordance with the standards of the Public Company Accounting Oversight Board (United States).Those standards require that we plan and perform the audit to obtain reasonable assurance about whether the financial statements and financial highlights are free of material misstatement. An audit includes examining, on a test basis, evidence supporting the amounts and disclosures in the financial statements. Our procedures included confirmation of securities owned as of October 31, 2011, by correspondence with the custodian and brokers or by other appropriate auditing procedures where replies from brokers were not received. An audit also includes assessing the accounting principles used and significant estimates made by management, as well as evaluating the overall financial statement presentation.We believe that our audits provide a reasonable basis for our opinion.
In our opinion, the financial statements and financial highlights referred to above present fairly, in all material respects, the financial position of Dreyfus Tax Managed Growth Fund as of October 31, 2011, the results of its operations for the year then ended, the changes in its net assets for each of the years in the two-year period then ended, and the financial highlights for each of the years in the five-year period then ended, in conformity with U.S. generally accepted accounting principles.

New York, New York
December 22, 2011
32
IMPORTANT TAX INFORMATION (Unaudited)
For federal tax purposes, the fund designates $1,274,175 as ordinary income dividends paid during the year ended October 31, 2011 as qualified dividend income in accordance with Section 854(b)(1)(B) of the Internal Revenue Code. Also, the fund designates 100% of ordinary income dividends paid during the year ended October 31, 2011 as eligible for the corporate dividends received deduction provided under Section 243 of the Internal Revenue Code in accordance with Section 854(b)(1)(A) of the Internal Revenue Code. Shareholders will receive notification in early 2012 of the percentage applicable to the preparation of their 2011 income tax returns.
OFFICERS OF THE FUND (Unaudited)
BRADLEY J. SKAPYAK, President since January 2010.
Chief Operating Officer and a director of the Manager since June 2009. From April 2003 to June 2009, Mr. Skapyak was the head of the Investment Accounting and Support Department of the Manager. He is an officer of 75 investment companies (comprised of 167 portfolios) managed by the Manager. He is 52 years old and has been an employee of the Manager since February 1988.
MICHAEL A. ROSENBERG, Vice President and Secretary since August 2005.
Assistant General Counsel of BNY Mellon, and an officer of 76 investment companies (comprised of 192 portfolios) managed by the Manager. He is 51 years old and has been an employee of the Manager since October 1991.
KIESHA ASTWOOD, Vice President and Assistant Secretary since January 2010.
Counsel of BNY Mellon, and an officer of 76 investment companies (comprised of 192 portfolios) managed by the Manager. She is 38 years old and has been an employee of the Manager since July 1995.
JAMES BITETTO, Vice President and Assistant Secretary since August 2005.
Senior Counsel of BNY Mellon and Secretary of the Manager, and an officer of 76 investment companies (comprised of 192 portfolios) managed by the Manager. He is 45 years old and has been an employee of the Manager since December 1996.
JONI LACKS CHARATAN, Vice President and Assistant Secretary since August 2005.
Senior Counsel of BNY Mellon, and an officer of 76 investment companies (comprised of 192 portfolios) managed by the Manager. She is 55 years old and has been an employee of the Manager since October 1988.
JOSEPH M. CHIOFFI, Vice President and Assistant Secretary since August 2005.
Senior Counsel of BNY Mellon, and an officer of 76 investment companies (comprised of 192 portfolios) managed by the Manager. He is 49 years old and has been an employee of the Manager since June 2000.
KATHLEEN DENICHOLAS, Vice President and Assistant Secretary since January 2010.
Senior Counsel of BNY Mellon, and an officer of 76 investment companies (comprised of 192 portfolios) managed by the Manager. She is 37 years old and has been an employee of the Manager since February 2001.
JANETTE E. FARRAGHER, Vice President and Assistant Secretary since August 2005.
Assistant General Counsel of BNY Mellon, and an officer of 76 investment companies (comprised of 192 portfolios) managed by the Manager. She is 48 years old and has been an employee of the Manager since February 1984.
JOHN B. HAMMALIAN, Vice President and Assistant Secretary since August 2005.
Managing Counsel of BNY Mellon, and an officer of 76 investment companies (comprised of 192 portfolios) managed by the Manager. He is 48 years old and has been an employee of the Manager since February 1991.
M. CRISTINA MEISER, Vice President and Assistant Secretary since January 2010.
Senior Counsel of BNY Mellon, and an officer of 76 investment companies (comprised of 192 portfolios) managed by the Manager. She is 41 years old and has been an employee of the Manager since August 2001.
36
ROBERT R. MULLERY, Vice President and Assistant Secretary since August 2005.
Managing Counsel of BNY Mellon, and an officer of 76 investment companies (comprised of 192 portfolios) managed by the Manager. He is 59 years old and has been an employee of the Manager since May 1986.
JEFF PRUSNOFSKY, Vice President and Assistant Secretary since August 2005.
Managing Counsel of BNY Mellon, and an officer of 76 investment companies (comprised of 192 portfolios) managed by the Manager. He is 46 years old and has been an employee of the Manager since October 1990.
JAMES WINDELS, Treasurer since November 2001.
Director – Mutual Fund Accounting of the Manager, and an officer of 76 investment companies (comprised of 192 portfolios) managed by the Manager. He is 53 years old and has been an employee of the Manager since April 1985.
RICHARD CASSARO, Assistant Treasurer since January 2008.
Senior Accounting Manager – Money Market and Municipal Bond Funds of the Manager, and an officer of 76 investment companies (comprised of 192 portfolios) managed by the Manager. He is 52 years old and has been an employee of the Manager since September 1982.
GAVIN C. REILLY, Assistant Treasurer since December 2005.
Tax Manager of the Investment Accounting and Support Department of the Manager, and an officer of 76 investment companies (comprised of 192 portfolios) managed by the Manager. He is 43 years old and has been an employee of the Manager since April 1991.
ROBERT ROBOL, Assistant Treasurer since December 2002.
Senior Accounting Manager – Fixed Income Funds of the Manager, and an officer of 76 investment companies (comprised of 192 portfolios) managed by the Manager. He is 47 years old and has been an employee of the Manager since October 1988.
ROBERT SALVIOLO, Assistant Treasurer since July 2007.
Senior Accounting Manager – Equity Funds of the Manager, and an officer of 76 investment companies (comprised of 192 portfolios) managed by the Manager. He is 44 years old and has been an employee of the Manager since June 1989.
ROBERT SVAGNA, Assistant Treasurer since December 2002.
Senior Accounting Manager – Equity Funds of the Manager, and an officer of 76 investment companies (comprised of 192 portfolios) managed by the Manager. He is 44 years old and has been an employee of the Manager since November 1990.
OFFICERS OF THE FUND (Unaudited) (continued)
JOSEPH W. CONNOLLY, Chief Compliance Officer since October 2004.
Chief Compliance Officer of the Manager and The Dreyfus Family of Funds (76 investment companies, comprised of 192 portfolios). From November 2001 through March 2004, Mr. Connolly was first Vice-President, Mutual Fund Servicing for Mellon Global Securities Services. In that capacity, Mr. Connolly was responsible for managing Mellon’s Custody, Fund Accounting and Fund Administration services to third-party mutual fund clients. He is 54 years old and has served in various capacities with the Manager since 1980, including manager of the firm’s Fund Accounting Department from 1997 through October 2001.
STEPHEN J. STOREN, Anti-Money Laundering Compliance Officer since May 2011.
Chief Compliance Officer of the Distributor, and the Anti-Money Laundering Compliance Officer of 72 investment companies (comprised of 188 portfolios) managed by the Manager. He is 57 years old and has been an employee of the Distributor since October 1999.
38
Save time. Save paper. View your next shareholder report online as soon as it’s available. Log into www.dreyfus.com and sign up for Dreyfus eCommunications. It’s simple and only takes a few minutes.
The views expressed in this report reflect those of the portfolio manager only through the end of the period covered and do not necessarily represent the views of Dreyfus or any other person in the Dreyfus organization. Any such views are subject to change at any time based upon market or other conditions and Dreyfus disclaims any responsibility to update such views.These views may not be relied on as investment advice and, because investment decisions for a Dreyfus fund are based on numerous factors, may not be relied on as an indication of trading intent on behalf of any Dreyfus fund.
Not FDIC-Insured • Not Bank-Guaranteed • May Lose Value
| | Contents |
| | THE FUND |
| 2 | A Letter from the Chairman and CEO |
| 3 | Discussion of Fund Performance |
| 6 | Fund Performance |
| 7 | Understanding Your Fund’s Expenses |
| 7 | Comparing Your Fund’s Expenses With Those of Other Funds |
| 8 | Statement of Investments |
| 24 | Statement of Financial Futures |
| 25 | Statement of Assets and Liabilities |
| 26 | Statement of Operations |
| 27 | Statement of Changes in Net Assets |
| 28 | Financial Highlights |
| 29 | Notes to Financial Statements |
| 41 | Report of Independent Registered Public Accounting Firm |
| 42 | Important Tax Information |
| 43 | Board Members Information |
| 45 | Officers of the Fund |
| | FOR MORE INFORMATION |
| | Back Cover |
Dreyfus BASIC
S&P 500 Stock Index Fund
The Fund

A LETTER FROM THE CHAIRMAN AND CEO
Dear Shareholder:
We present to you this annual report for Dreyfus BASIC S&P Stock Index Fund, covering the 12-month period from November 1, 2010, through October 31, 2011. For information about how the fund performed during the reporting period, as well as general market perspectives, we provide a Discussion of Fund Performance on the pages that follow.
Investors were encouraged by expectations of a more robust economic recovery into the first quarter of 2011, but sentiment subsequently deteriorated due to disappointing economic data, rising commodity prices, an escalating sovereign debt crisis in Europe and a contentious debate regarding taxes, spending and borrowing in the United States. Stocks have been sensitive to these macroeconomic developments, often regardless of underlying company fundamentals. Indeed, market declines were particularly severe during August and September after a major credit rating agency downgraded U.S. long-term debt, while October ranked as one of the best months of the past decade.
The economic outlook currently remains clouded by market turbulence and political infighting, but we believe that a continued subpar global expansion is more likely than a return to recession. Although Europe continues to struggle with a debt crisis, inflationary pressures appear to be waning in most countries as energy prices recently have retreated from their highs. In the United States, moderately low core inflation and an accommodative monetary policy could help support near-trend growth despite ongoing deleveraging activity in the private sector.To assess the potential impact of these and other developments on your investments, we encourage you, as always, to speak with your financial advisor.
Thank you for your continued confidence and support.

Jonathan R. Baum
Chairman and Chief Executive Officer
The Dreyfus Corporation
November 15, 2011
2

DISCUSSION OF FUND PERFORMANCE
For the period of November 1, 2010, through October 31, 2011, as provided by Thomas J. Durante, CFA, Karen Q.Wong, CFA and Richard A. Brown, CFA, Portfolio Managers
Fund and Market Performance Overview
For the 12-month period ended October 31, 2011, Dreyfus BASIC S&P 500 Index Fund produced a total return of 7.94%.1 In comparison, the Standard & Poor’s 500 Composite Stock Price Index (the “S&P 500 Index”), the fund’s benchmark, produced an 8.07% return for the same period.2, 3
Although U.S. stocks rallied through the first quarter of 2011 as an economic recovery appeared to gain traction, renewed macroeconomic concerns later caused the market to give back many of its previous gains. The fund produced a lower return than its benchmark.The difference in return between the fund and the S&P 500 Index was primarily the result of transaction costs and operating expenses that are not reflected in the S&P 500 Index’s results.
The Fund’s Investment Approach
The fund seeks to match the total return of the S&P 500 Index by generally investing in all 500 stocks in the S&P 500 Index in proportion to their respective weightings. Often considered a barometer for the stock market in general, the S&P 500 Index is made up of 500 widely held common stocks across 10 economic sectors. Each stock is weighted by its float-adjusted market capitalization; that is, larger companies have greater representation in the S&P 500 Index than smaller ones.
Global Economic Concerns Weighed on Equities
Gains in employment, consumer spending and corporate earnings supported a U.S. stock market rally over the first several months of the reporting period. However, the rally was interrupted in February 2011 when political unrest in the Middle East led to sharply rising crude oil prices, and again in March when catastrophic natural and nuclear disasters in Japan disrupted the global industrial supply chain. Nonetheless, investors proved resilient, and stocks rebounded quickly from these unexpected shocks.
DISCUSSION OF FUND PERFORMANCE (continued)
Investor sentiment began to deteriorate in earnest in late April when Greece appeared headed for default on its sovereign debt and pressures mounted on the banking systems of other European nations. In addition, U.S. economic data proved more disappointing than expected, and investors reacted cautiously to a contentious political debate regarding U.S. government spending and borrowing. Stocks suffered bouts of heightened volatility when newly risk-averse investors shifted their focus to industry groups that historically have held up well under uncertain economic conditions. Volatility was particularly severe in August and September, after a major credit-rating agency downgraded its assessment of long-term U.S. government debt. In contrast, the market rebounded strongly in October when some macroeconomic worries seemed to ease.
Large-Cap Stocks Produced Mixed Results
The energy and information technology sectors led the S&P 500 Index’s advance over the reporting period. In the energy sector, major integrated energy producers benefited from rising crude oil prices and improved results from their refinery operations. Energy giants Exxon Mobil and Chevron also were buoyed by increased domestic production of natural gas. Among information technology companies, resilient consumer spending helped support sales and earnings for a number of software and service companies. In addition, electronics innovator Apple continued to gain value on the success of its popular smartphone and tablet computer products, International Business Machines continued to grow its global consulting business and Intel captured market share from other semiconductor manufacturers.
The consumer discretionary sector also ranked among the market’s better performing industry groups for the reporting period. Casual dining leader McDonald’s fared well as consumers throughout the world, including Europe, opted for lower-cost restaurants. McDonald’s also did a good job of containing costs during the economic downturn. Internet retailer Amazon.com achieved strong sales growth, including greater market penetration of its Kindle e-book reader. Other winners
4
in the consumer discretionary sector included ubiquitous coffee chain Starbucks and big-box retailer Home Depot.
The financials sector proved to be the only component of the S&P 500 Index to post negative absolute returns for the reporting period, as large commercial and custodial banks lost value amid fears of contagion from Europe’s debt crisis. Indeed, Bank of America ranked at the bottom of the S&P 500 Index for the reporting period, as the company and several of its large rivals struggled with anemic loan demand, higher regulatory costs, investment write-offs and revenue shortfalls from investment banking operations. Although the industrials sector eked out a positive absolute return, its results were undermined by weakness among automobile manufacturers, most notably Ford Motor.
Index Funds Offer Diversification Benefits
As an index fund, we attempt to replicate the returns of the S&P 500 Index by closely approximating its composition. In our view, one of the greatest benefits of an index fund is that it offers a broadly diversified investment vehicle that can help investors manage risks by limiting the impact on the overall portfolio of unexpected losses in any single industry group or holding.
November 15, 2011
| |
| | Equity funds are subject generally to market, market sector, market liquidity, issuer and investment |
| | style risks, among other factors, to varying degrees, all of which are more fully described in the |
| | fund’s prospectus. |
| 1 | Total return includes reinvestment of dividends and any capital gains paid. Past performance is no |
| | guarantee of future results. Share price and investment return fluctuate such that upon redemption, |
| | fund shares may be worth more or less than their original cost. |
| 2 | SOURCE: LIPPER INC. -- Reflects reinvestment of dividends daily and, where applicable, |
| | capital gain distributions.The Standard & Poor’s 500 Composite Stock Price Index is a widely |
| | accepted, unmanaged index of U.S. stock market performance. Investors cannot invest directly in |
| | any index. |
| 3 | “Standard & Poor’s®,” “S&P®,”“Standard & Poor’s® 500” and “S&P 500®” are registered |
| | trademarks of Standard & Poor’s Financial Services LLC, and have been licensed for use on |
| | behalf of the fund.The fund is not sponsored, managed, advised, sold or promoted by Standard & |
| | Poor’s and its affiliates and Standard & Poor’s and its affiliates make no representation regarding |
| | the advisability of investing in the fund. |
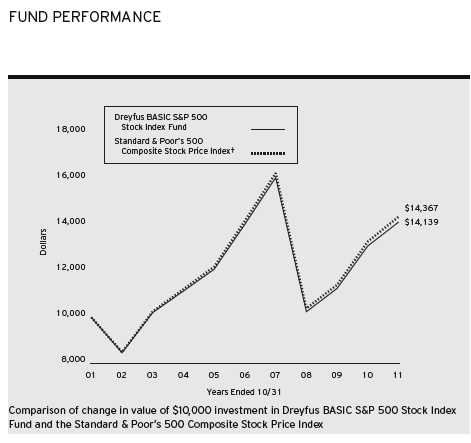
| | | | | | |
| Average Annual Total Returns as of 10/31/11 | | |
| | 1Year | 5 Years | 10 Years |
| Fund | 7.94% | 0.14% | 3.52% |
| Standard & Poor’s 500 | | | |
| Composite Stock Price Index | 8.07% | 0.25% | 3.69% |
|
| † Source: Lipper Inc. |
| Past performance is not predictive of future performance.The fund’s performance shown in the graph and table does not |
| reflect the deduction of taxes that a shareholder would pay on fund distributions or the redemption of fund shares. |
| The above graph compares a $10,000 investment made in Dreyfus BASIC S&P 500 Stock Index Fund on |
| 10/31/01 to a $10,000 investment made in the Standard & Poor’s 500 Composite Stock Price Index (the “Index”) |
| on that date.All dividends and capital gain distributions are reinvested. |
| The fund’s performance shown in the line graph above takes into account all applicable fees and expenses.The Index is a |
| widely accepted, unmanaged index of U.S. stock market performance. Unlike a mutual fund, the Index is not subject to |
| charges, fees and other expenses. Investors cannot invest directly in any index. Further information relating to fund |
| performance, including expense reimbursements, if applicable, is contained in the Financial Highlights section of the |
| prospectus and elsewhere in this report. |
6
UNDERSTANDING YOUR FUND’S EXPENSES (Unaudited)
As a mutual fund investor, you pay ongoing expenses, such as management fees and other expenses. Using the information below, you can estimate how these expenses affect your investment and compare them with the expenses of other funds.You also may pay one-time transaction expenses, including sales charges (loads) and redemption fees, which are not shown in this section and would have resulted in higher total expenses. For more information, see your fund’s prospectus or talk to your financial adviser.
Review your fund’s expenses
The table below shows the expenses you would have paid on a $1,000 investment in Dreyfus BASIC S&P 500 Stock Index Fund from May 1, 2011 to October 31, 2011. It also shows how much a $1,000 investment would be worth at the close of the period, assuming actual returns and expenses.
| | |
| Expenses and Value of a $1,000 Investment |
| assuming actual returns for the six months ended October 31, 2011 |
| |
| Expenses paid per $1,000† | $ | .97 |
| Ending value (after expenses) | $ | 928.40 |
|
| COMPARING YOUR FUND’S EXPENSES |
| WITH THOSE OF OTHER FUNDS (Unaudited) |
Using the SEC’s method to compare expenses
The Securities and Exchange Commission (SEC) has established guidelines to help investors assess fund expenses. Per these guidelines, the table below shows your fund’s expenses based on a $1,000 investment, assuming a hypothetical 5% annualized return. You can use this information to compare the ongoing expenses (but not transaction expenses or total cost) of investing in the fund with those of other funds.All mutual fund shareholder reports will provide this information to help you make this comparison. Please note that you cannot use this information to estimate your actual ending account balance and expenses paid during the period.
| | |
| Expenses and Value of a $1,000 Investment |
| assuming a hypothetical 5% annualized return for the six months ended October 31, 2011 |
| |
| Expenses paid per $1,000† | $ | 1.02 |
| Ending value (after expenses) | $ | 1,024.20 |
† Expenses are equal to the fund’s annualized expense ratio of .20%, multiplied by the average account value over the period, multiplied by 184/365 (to reflect the one-half year period).
|
| STATEMENT OF INVESTMENTS |
| October 31, 2011 |
| | | |
| Common Stocks—98.0% | Shares | Value ($) |
| Consumer Discretionary—10.1% | | |
| Abercrombie & Fitch, Cl. A | 7,856 | 584,486 |
| Amazon.com | 34,750a | 7,419,472 |
| Apollo Group, Cl. A | 11,086a | 524,922 |
| AutoNation | 4,768a,b | 185,666 |
| AutoZone | 2,778a | 898,933 |
| Bed Bath & Beyond | 23,920a | 1,479,213 |
| Best Buy | 29,509b | 774,021 |
| Big Lots | 6,967a | 262,586 |
| Cablevision Systems (NY Group), Cl. A | 21,298 | 308,182 |
| CarMax | 22,031a,b | 662,252 |
| Carnival | 44,201 | 1,556,317 |
| CBS, Cl. B | 64,167 | 1,656,150 |
| Chipotle Mexican Grill | 2,995a | 1,006,679 |
| Coach | 28,171 | 1,833,087 |
| Comcast, Cl. A | 264,467 | 6,201,751 |
| D.R. Horton | 26,451 | 294,400 |
| Darden Restaurants | 12,386b | 593,042 |
| DeVry | 5,914 | 222,840 |
| DIRECTV, Cl. A | 70,729a | 3,215,340 |
| Discovery Communications, Cl. A | 26,915a | 1,169,726 |
| Expedia | 18,453b | 484,576 |
| Family Dollar Stores | 11,264 | 660,408 |
| GameStop, Cl. A | 13,389a,b | 342,357 |
| Gannett | 22,345 | 261,213 |
| Gap | 33,328 | 629,899 |
| Genuine Parts | 14,381b | 825,901 |
| Goodyear Tire & Rubber | 23,381a | 335,751 |
| H&R Block | 28,967b | 442,905 |
| Harley-Davidson | 21,732 | 845,375 |
| Harman International Industries | 5,846 | 252,313 |
| Hasbro | 11,611 | 441,915 |
| Home Depot | 149,792 | 5,362,554 |
| International Game Technology | 29,492 | 518,764 |
| Interpublic Group of Cos. | 45,264 | 429,103 |
| J.C. Penney | 13,799b | 442,672 |
8
| | | |
| Common Stocks (continued) | Shares | Value ($) |
| Consumer Discretionary (continued) | | |
| Johnson Controls | 65,016 | 2,140,977 |
| Kohl’s | 26,136 | 1,385,469 |
| Leggett & Platt | 13,061 | 286,036 |
| Lennar, Cl. A | 13,520b | 223,621 |
| Limited Brands | 23,568 | 1,006,589 |
| Lowe’s | 120,744 | 2,538,039 |
| Macy’s | 41,036 | 1,252,829 |
| Marriott International, Cl. A | 26,533b | 835,789 |
| Mattel | 33,471 | 945,221 |
| McDonald’s | 99,148 | 9,205,892 |
| McGraw-Hill | 29,269 | 1,243,932 |
| Netflix | 5,012a | 411,385 |
| Newell Rubbermaid | 26,817 | 396,892 |
| News, Cl. A | 218,616 | 3,830,152 |
| NIKE, Cl. B | 36,300 | 3,497,505 |
| Nordstrom | 16,198 | 821,077 |
| O’Reilly Automotive | 12,917a | 982,338 |
| Omnicom Group | 27,024 | 1,202,028 |
| Priceline.com | 4,755a | 2,414,209 |
| Pulte Group | 29,094a,b | 150,707 |
| Ralph Lauren | 5,990 | 951,152 |
| Ross Stores | 11,266 | 988,366 |
| Scripps Networks Interactive, Cl. A | 8,978 | 381,385 |
| Sears Holdings | 4,131a,b | 322,962 |
| Staples | 68,586 | 1,026,047 |
| Starbucks | 71,766 | 3,038,572 |
| Starwood Hotels & | | |
| Resorts Worldwide | 18,801c | 942,118 |
| Target | 64,662 | 3,540,245 |
| Tiffany & Co. | 12,306 | 981,157 |
| Time Warner | 100,061 | 3,501,134 |
| Time Warner Cable | 31,150 | 1,983,944 |
| TJX | 36,996b | 2,180,174 |
| Urban Outfitters | 11,981a,b | 326,482 |
| VF | 8,420 | 1,163,812 |
STATEMENT OF INVESTMENTS (continued)
| | | |
| Common Stocks (continued) | Shares | Value ($) |
| Consumer Discretionary (continued) | | |
| Viacom, Cl. B | 55,024 | 2,412,802 |
| Walt Disney | 177,728 | 6,199,153 |
| Washington Post, Cl. B | 493b | 167,699 |
| Whirlpool | 6,894b | 350,284 |
| Wyndham Worldwide | 15,825 | 532,828 |
| Wynn Resorts | 7,648 | 1,015,654 |
| Yum! Brands | 44,589 | 2,388,633 |
| | | 112,290,061 |
| Consumer Staples—10.8% | | |
| Altria Group | 198,308 | 5,463,385 |
| Archer-Daniels-Midland | 65,378 | 1,892,039 |
| Avon Products | 41,405 | 756,883 |
| Beam | 14,852 | 734,134 |
| Brown-Forman, Cl. B | 9,942 | 742,966 |
| Campbell Soup | 16,952b | 563,654 |
| Clorox | 12,530 | 838,758 |
| Coca-Cola | 219,773 | 15,014,891 |
| Coca-Cola Enterprises | 31,308 | 839,681 |
| Colgate-Palmolive | 46,761 | 4,225,792 |
| ConAgra Foods | 38,528 | 975,914 |
| Constellation Brands, Cl. A | 16,689a | 337,452 |
| Costco Wholesale | 41,804 | 3,480,183 |
| CVS Caremark | 129,673 | 4,707,130 |
| Dean Foods | 16,760a | 162,907 |
| Dr. Pepper Snapple Group | 20,278 | 759,411 |
| Estee Lauder, Cl. A | 10,962 | 1,079,209 |
| General Mills | 61,148 | 2,356,032 |
| H.J. Heinz | 30,866 | 1,649,479 |
| Hershey | 14,766 | 845,058 |
| Hormel Foods | 13,526b | 398,611 |
| J.M. Smucker | 10,820 | 833,356 |
| Kellogg | 24,041 | 1,303,263 |
| Kimberly-Clark | 37,617 | 2,622,281 |
| Kraft Foods, Cl. A | 168,052 | 5,912,069 |
| Kroger | 58,220 | 1,349,540 |
| Lorillard | 13,263 | 1,467,684 |
10
| | | |
| Common Stocks (continued) | Shares | Value ($) |
| Consumer Staples (continued) | | |
| McCormick & Co. | 12,210b | 592,918 |
| Mead Johnson Nutrition | 19,616 | 1,409,410 |
| Molson Coors Brewing, Cl. B | 15,576 | 659,488 |
| PepsiCo | 151,033 | 9,507,527 |
| Philip Morris International | 168,177 | 11,750,527 |
| Procter & Gamble | 263,103 | 16,835,961 |
| Reynolds American | 32,474 | 1,256,094 |
| Safeway | 34,506b | 668,381 |
| Sara Lee | 56,273 | 1,001,659 |
| SUPERVALU | 20,377b | 163,424 |
| Sysco | 55,973 | 1,551,572 |
| Tyson Foods, Cl. A | 26,951 | 520,154 |
| Wal-Mart Stores | 168,550 | 9,560,156 |
| Walgreen | 87,615 | 2,908,818 |
| Whole Foods Market | 15,081 | 1,087,642 |
| | | 120,785,493 |
| Energy—12.0% | | |
| Alpha Natural Resources | 21,006a | 504,984 |
| Anadarko Petroleum | 47,608 | 3,737,228 |
| Apache | 36,683 | 3,654,727 |
| Baker Hughes | 41,629 | 2,414,066 |
| Cabot Oil & Gas | 9,929 | 771,682 |
| Cameron International | 23,547a | 1,157,100 |
| Chesapeake Energy | 63,033 | 1,772,488 |
| Chevron | 192,015 | 20,171,176 |
| ConocoPhillips | 131,506 | 9,159,393 |
| Consol Energy | 21,804 | 932,339 |
| Denbury Resources | 35,771a | 561,605 |
| Devon Energy | 40,500 | 2,630,475 |
| Diamond Offshore Drilling | 6,451b | 422,799 |
| El Paso | 73,822 | 1,846,288 |
| EOG Resources | 25,710 | 2,299,245 |
| EQT | 14,401 | 914,464 |
| Exxon Mobil | 465,528 | 36,353,082 |
| FMC Technologies | 23,119a | 1,036,194 |
| Halliburton | 87,542 | 3,270,569 |
STATEMENT OF INVESTMENTS (continued)
| | | |
| Common Stocks (continued) | Shares | Value ($) |
| Energy (continued) | | |
| Helmerich & Payne | 9,871b | 524,940 |
| Hess | 29,001 | 1,814,303 |
| Marathon Oil | 68,271 | 1,777,094 |
| Marathon Petroleum | 34,348 | 1,233,093 |
| Murphy Oil | 18,613 | 1,030,602 |
| Nabors Industries | 28,164a | 516,246 |
| National Oilwell Varco | 40,508 | 2,889,436 |
| Newfield Exploration | 11,979a | 482,275 |
| Noble | 24,311a | 873,737 |
| Noble Energy | 16,935 | 1,512,973 |
| Occidental Petroleum | 77,700 | 7,221,438 |
| Peabody Energy | 26,004 | 1,127,793 |
| Pioneer Natural Resources | 11,246 | 943,539 |
| QEP Resources | 15,930 | 566,312 |
| Range Resources | 15,459 | 1,064,198 |
| Rowan | 12,551a,b | 432,884 |
| Schlumberger | 129,658 | 9,525,973 |
| Southwestern Energy | 33,411a | 1,404,598 |
| Spectra Energy | 62,344 | 1,784,909 |
| Sunoco | 11,226b | 417,944 |
| Tesoro | 13,231a | 343,212 |
| Valero Energy | 54,797 | 1,348,006 |
| Williams | 56,441 | 1,699,439 |
| | | 134,144,848 |
| Financial—13.7% | | |
| ACE | 32,300 | 2,330,445 |
| Aflac | 44,857 | 2,022,602 |
| Allstate | 50,222 | 1,322,847 |
| American Express | 100,007 | 5,062,354 |
| American International Group | 41,961a | 1,036,017 |
| Ameriprise Financial | 22,332 | 1,042,458 |
| Aon | 31,717 | 1,478,647 |
| Apartment Investment & Management, Cl. A | 10,170c | 250,894 |
| Assurant | 8,962 | 345,395 |
| AvalonBay Communities | 8,879c | 1,187,034 |
| Bank of America | 968,421 | 6,614,315 |
12
| | | |
| Common Stocks (continued) | Shares | Value ($) |
| Financial (continued) | | |
| Bank of New York Mellon | 118,913 | 2,530,469 |
| BB&T | 66,847b | 1,560,209 |
| Berkshire Hathaway, Cl. B | 168,285a | 13,102,670 |
| BlackRock | 9,620 | 1,517,940 |
| Boston Properties | 13,972c | 1,383,088 |
| Capital One Financial | 43,999b | 2,008,994 |
| CBRE Group | 31,010a | 551,358 |
| Charles Schwab | 103,036 | 1,265,282 |
| Chubb | 28,053b | 1,880,954 |
| Cincinnati Financial | 16,022b | 463,677 |
| Citigroup | 279,101 | 8,816,801 |
| CME Group | 6,432 | 1,772,402 |
| Comerica | 19,700 | 503,335 |
| Discover Financial Services | 52,373 | 1,233,908 |
| E*TRADE Financial | 23,390a | 253,782 |
| Equity Residential | 28,255c | 1,658,003 |
| Federated Investors, Cl. B | 8,548b | 167,028 |
| Fifth Third Bancorp | 88,447 | 1,062,248 |
| First Horizon National | 21,903 | 153,102 |
| Franklin Resources | 13,831 | 1,474,800 |
| Genworth Financial, Cl. A | 43,345a | 276,541 |
| Goldman Sachs Group | 48,439 | 5,306,492 |
| Hartford Financial Services Group | 42,932 | 826,441 |
| HCP | 38,969b,c | 1,552,915 |
| Health Care REIT | 17,025b,c | 897,047 |
| Host Hotels & Resorts | 67,485c | 963,011 |
| Hudson City Bancorp | 46,730b | 292,063 |
| Huntington Bancshares | 76,897 | 398,326 |
| IntercontinentalExchange | 6,715a | 872,144 |
| Invesco | 44,534 | 893,797 |
| Janus Capital Group | 16,766b | 109,985 |
| JPMorgan Chase & Co. | 373,365 | 12,978,167 |
| KeyCorp | 87,135 | 615,173 |
| Kimco Realty | 39,279b,c | 686,204 |
| Legg Mason | 12,591b | 346,253 |
| Leucadia National | 18,166 | 487,394 |
STATEMENT OF INVESTMENTS (continued)
| | | |
| Common Stocks (continued) | Shares | Value ($) |
| Financial (continued) | | |
| Lincoln National | 30,567 | 582,301 |
| Loews | 29,865 | 1,185,641 |
| M&T Bank | 12,079b | 919,333 |
| Marsh & McLennan | 52,546 | 1,608,959 |
| MetLife | 101,150 | 3,556,434 |
| Moody’s | 19,237b | 682,721 |
| Morgan Stanley | 142,323 | 2,510,578 |
| NASDAQ OMX Group | 13,159a | 329,633 |
| Northern Trust | 23,277 | 942,020 |
| NYSE Euronext | 23,703 | 629,789 |
| People’s United Financial | 33,414 | 426,029 |
| Plum Creek Timber | 15,802b,c | 595,103 |
| PNC Financial Services Group | 50,401 | 2,707,038 |
| Principal Financial Group | 30,979b | 798,639 |
| Progressive | 62,804 | 1,193,904 |
| ProLogis | 43,657c | 1,299,232 |
| Prudential Financial | 46,744 | 2,533,525 |
| Public Storage | 13,420c | 1,731,851 |
| Regions Financial | 122,961 | 483,237 |
| Simon Property Group | 28,067c | 3,604,925 |
| SLM | 50,875 | 695,461 |
| State Street | 48,337 | 1,952,331 |
| SunTrust Banks | 51,643 | 1,018,916 |
| T. Rowe Price Group | 24,944 | 1,318,041 |
| Torchmark | 10,783 | 441,348 |
| Travelers | 40,141 | 2,342,227 |
| U.S. Bancorp | 184,273 | 4,715,546 |
| Unum Group | 28,531 | 680,179 |
| Ventas | 27,592c | 1,534,391 |
| Vornado Realty Trust | 17,616c | 1,458,781 |
| Wells Fargo & Co. | 505,290 | 13,092,064 |
| Weyerhaeuser | 51,859c | 932,425 |
| XL Group | 31,384 | 682,288 |
| Zions Bancorporation | 16,958b | 294,391 |
| | | 153,034,292 |
14
| | | |
| Common Stocks (continued) | Shares | Value ($) |
| Health Care—11.3% | | |
| Abbott Laboratories | 148,545 | 8,002,119 |
| Aetna | 36,424 | 1,448,218 |
| Agilent Technologies | 33,445a | 1,239,806 |
| Allergan | 29,193 | 2,455,715 |
| AmerisourceBergen | 25,202 | 1,028,242 |
| Amgen | 88,903 | 5,091,475 |
| Baxter International | 54,594 | 3,001,578 |
| Becton Dickinson & Co. | 20,977 | 1,641,031 |
| Biogen Idec | 23,149a | 2,693,618 |
| Boston Scientific | 147,027a | 865,989 |
| Bristol-Myers Squibb | 163,136 | 5,153,466 |
| C.R. Bard | 8,257 | 709,689 |
| Cardinal Health | 33,650 | 1,489,686 |
| CareFusion | 21,833a | 558,925 |
| Celgene | 44,314a | 2,872,877 |
| Cerner | 13,926a | 883,326 |
| CIGNA | 25,994 | 1,152,574 |
| Coventry Health Care | 14,545a | 462,676 |
| Covidien | 47,474 | 2,233,177 |
| DaVita | 8,685a | 607,950 |
| DENTSPLY International | 13,077b | 483,326 |
| Edwards Lifesciences | 11,050a | 833,391 |
| Eli Lilly & Co. | 97,467 | 3,621,874 |
| Express Scripts | 46,773a | 2,138,929 |
| Forest Laboratories | 27,536a | 861,877 |
| Gilead Sciences | 73,878a | 3,077,757 |
| Hospira | 16,180a | 508,861 |
| Humana | 16,178 | 1,373,350 |
| Intuitive Surgical | 3,771a | 1,636,086 |
| Johnson & Johnson | 261,835 | 16,859,556 |
| Laboratory Corp. of America Holdings | 9,656a,b | 809,656 |
| Life Technologies | 16,644a | 676,911 |
| McKesson | 23,589 | 1,923,683 |
| Medco Health Solutions | 36,934a | 2,026,199 |
| Medtronic | 102,313 | 3,554,354 |
STATEMENT OF INVESTMENTS (continued)
| | | |
| Common Stocks (continued) | Shares | Value ($) |
| Health Care (continued) | | |
| Merck & Co. | 294,930 | 10,175,085 |
| Mylan | 42,327a | 828,339 |
| Patterson | 8,749 | 275,331 |
| PerkinElmer | 11,378 | 235,183 |
| Pfizer | 747,021 | 14,387,624 |
| Quest Diagnostics | 15,173b | 846,653 |
| St. Jude Medical | 31,560 | 1,230,840 |
| Stryker | 32,013 | 1,533,743 |
| Tenet Healthcare | 41,625a | 196,886 |
| Thermo Fisher Scientific | 36,728a | 1,846,317 |
| UnitedHealth Group | 103,604 | 4,971,956 |
| Varian Medical Systems | 10,930a,b | 641,810 |
| Waters | 8,413a | 674,050 |
| Watson Pharmaceuticals | 12,186a | 818,412 |
| WellPoint | 34,537 | 2,379,599 |
| Zimmer Holdings | 18,461a,b | 971,602 |
| | | 125,991,377 |
| Industrial—10.7% | | |
| 3M | 67,936 | 5,368,303 |
| Avery Dennison | 9,802 | 260,733 |
| Boeing | 70,606 | 4,645,169 |
| C.H. Robinson Worldwide | 15,773 | 1,095,119 |
| Caterpillar | 61,617 | 5,820,342 |
| Cintas | 10,888b | 325,442 |
| CSX | 105,630 | 2,346,042 |
| Cummins | 18,820 | 1,871,273 |
| Danaher | 54,423 | 2,631,352 |
| Deere & Co. | 39,634 | 3,008,221 |
| Dover | 17,948 | 996,652 |
| Dun & Bradstreet | 4,467 | 298,664 |
| Eaton | 32,757 | 1,468,169 |
| Emerson Electric | 71,929 | 3,461,223 |
| Equifax | 11,676 | 410,411 |
| Expeditors International of Washington | 20,443 | 932,201 |
| Fastenal | 28,382b | 1,081,070 |
| FedEx | 30,234 | 2,474,048 |
16
| | | |
| Common Stocks (continued) | Shares | Value ($) |
| Industrial (continued) | | |
| Flowserve | 4,952 | 459,001 |
| Fluor | 16,242 | 923,358 |
| Ford Motor | 363,339a | 4,243,800 |
| General Dynamics | 34,650 | 2,224,184 |
| General Electric | 1,013,067 | 16,928,350 |
| Goodrich | 12,007 | 1,472,418 |
| Honeywell International | 75,302 | 3,945,825 |
| Illinois Tool Works | 47,907 | 2,329,717 |
| Ingersoll-Rand | 31,900 | 993,047 |
| Iron Mountain | 19,389b | 599,702 |
| Jacobs Engineering Group | 11,640a | 451,632 |
| Joy Global | 10,125 | 882,900 |
| L-3 Communications Holdings | 10,295 | 697,795 |
| Lockheed Martin | 26,364b | 2,001,028 |
| Masco | 32,014 | 307,334 |
| Norfolk Southern | 33,835 | 2,503,452 |
| Northrop Grumman | 26,182 | 1,512,011 |
| PACCAR | 35,095 | 1,517,508 |
| Pall | 10,788 | 552,022 |
| Parker Hannifin | 14,858 | 1,211,670 |
| Pitney Bowes | 18,302b | 372,995 |
| Precision Castparts | 13,783 | 2,248,696 |
| Quanta Services | 18,782a | 392,356 |
| R.R. Donnelley & Sons | 19,526b | 318,274 |
| Raytheon | 34,181 | 1,510,458 |
| Republic Services | 29,210 | 831,317 |
| Robert Half International | 13,148b | 347,502 |
| Rockwell Automation | 13,901b | 940,403 |
| Rockwell Collins | 14,326 | 799,821 |
| Roper Industries | 8,670 | 703,137 |
| Ryder System | 4,585 | 233,560 |
| Snap-on | 5,560 | 298,405 |
| Southwest Airlines | 72,327 | 618,396 |
| Stanley Black & Decker | 16,173 | 1,032,646 |
| Stericycle | 8,282a,b | 692,210 |
| Textron | 27,173b | 527,700 |
STATEMENT OF INVESTMENTS (continued)
| | | |
| Common Stocks (continued) | Shares | Value ($) |
| Industrial (continued) | | |
| Tyco International | 45,000 | 2,049,750 |
| Union Pacific | 46,915 | 4,671,327 |
| United Parcel Service, Cl. B | 94,275 | 6,621,876 |
| United Technologies | 87,489 | 6,822,392 |
| W.W. Grainger | 5,811 | 995,482 |
| Waste Management | 45,494b | 1,498,117 |
| Xylem | 17,726 | 473,993 |
| | | 119,252,001 |
| Information Technology—19.3% | | |
| Accenture, Cl. A | 62,132 | 3,744,074 |
| Adobe Systems | 48,462a | 1,425,267 |
| Advanced Micro Devices | 57,047a,b | 332,584 |
| Akamai Technologies | 18,433a | 496,585 |
| Altera | 30,968 | 1,174,307 |
| Amphenol, Cl. A | 16,982 | 806,475 |
| Analog Devices | 28,832 | 1,054,386 |
| Apple | 88,737a | 35,918,963 |
| Applied Materials | 126,520 | 1,558,726 |
| Autodesk | 22,525a | 779,365 |
| Automatic Data Processing | 46,894 | 2,453,963 |
| BMC Software | 16,442a | 571,524 |
| Broadcom, Cl. A | 45,772a | 1,651,911 |
| CA | 35,445 | 767,739 |
| Cisco Systems | 525,627 | 9,739,868 |
| Citrix Systems | 18,081a | 1,316,839 |
| Cognizant Technology Solutions, Cl. A | 29,169a | 2,122,045 |
| Computer Sciences | 13,702 | 431,065 |
| Compuware | 20,796a | 175,726 |
| Corning | 150,399 | 2,149,202 |
| Dell | 148,622a | 2,349,714 |
| eBay | 109,302a | 3,479,083 |
| Electronic Arts | 32,089a | 749,278 |
| EMC | 196,792a | 4,823,372 |
| F5 Networks | 7,913a | 822,556 |
| Fidelity National Information Services | 23,771 | 622,325 |
| First Solar | 5,256a,b | 261,591 |
| Fiserv | 13,353a | 786,091 |
18
| | | |
| Common Stocks (continued) | Shares | Value ($) |
| Information Technology (continued) | | |
| FLIR Systems | 14,691b | 386,373 |
| Google, Cl. A | 24,107a | 14,286,772 |
| Harris | 11,445b | 432,049 |
| Hewlett-Packard | 198,324 | 5,277,402 |
| Intel | 502,733 | 12,337,068 |
| International | | |
| Business Machines | 114,350 | 21,112,441 |
| Intuit | 29,045 | 1,558,845 |
| Jabil Circuit | 18,243 | 375,076 |
| JDS Uniphase | 20,883a | 250,596 |
| Juniper Networks | 51,244a | 1,253,941 |
| KLA-Tencor | 15,246 | 717,934 |
| Lexmark International, Cl. A | 7,518 | 238,321 |
| Linear Technology | 22,009 | 711,111 |
| LSI | 55,300a | 345,625 |
| MasterCard, Cl. A | 10,193 | 3,539,417 |
| MEMC Electronic Materials | 21,958a,b | 131,528 |
| Microchip Technology | 18,573a,b | 671,600 |
| Micron Technology | 95,874a | 535,936 |
| Microsoft | 713,693 | 19,005,645 |
| Molex | 12,446b | 307,292 |
| Monster Worldwide | 11,979a | 110,566 |
| Motorola Mobility Holdings | 25,104a | 976,044 |
| Motorola Solutions | 28,979 | 1,359,405 |
| NetApp | 35,316a | 1,446,543 |
| Novellus Systems | 6,699a,b | 231,450 |
| NVIDIA | 57,882a | 856,654 |
| Oracle | 378,103 | 12,390,435 |
| Paychex | 31,022 | 903,981 |
| QUALCOMM | 160,769 | 8,295,680 |
| Red Hat | 18,635a | 925,228 |
| SAIC | 25,700a | 319,451 |
| Salesforce.com | 12,943a,b | 1,723,619 |
| SanDisk | 22,969a | 1,163,839 |
| Symantec | 72,582a | 1,234,620 |
| TE Connectivity | 41,400 | 1,471,770 |
| Tellabs | 33,419 | 144,704 |
STATEMENT OF INVESTMENTS (continued)
| | | |
| Common Stocks (continued) | Shares | Value ($) |
| Information Technology (continued) | | |
| Teradata | 16,265a | 970,370 |
| Teradyne | 16,342a,b | 234,017 |
| Texas Instruments | 111,148 | 3,415,578 |
| Total System Services | 14,787 | 294,113 |
| VeriSign | 16,074b | 515,815 |
| Visa, Cl. A | 48,904 | 4,560,787 |
| Western Digital | 22,446a | 597,961 |
| Western Union | 58,370b | 1,019,724 |
| Xerox | 134,724 | 1,102,042 |
| Xilinx | 25,602b | 856,643 |
| Yahoo! | 120,946a | 1,891,595 |
| | | 215,052,230 |
| Materials—3.5% | | |
| Air Products & Chemicals | 20,323 | 1,750,623 |
| Airgas | 6,628 | 457,001 |
| AK Steel Holding | 10,844b | 90,331 |
| Alcoa | 102,174 | 1,099,392 |
| Allegheny Technologies | 9,716 | 450,822 |
| Ball | 15,153 | 523,839 |
| Bemis | 9,859b | 277,136 |
| CF Industries Holdings | 6,865 | 1,113,984 |
| Cliffs Natural Resources | 13,966 | 952,761 |
| Dow Chemical | 112,512 | 3,136,835 |
| E.I. du Pont de Nemours & Co. | 88,829 | 4,270,010 |
| Eastman Chemical | 13,882 | 545,424 |
| Ecolab | 22,293b | 1,200,255 |
| FMC | 6,612a,b | 521,621 |
| Freeport-McMoRan Copper & Gold | 90,613 | 3,648,079 |
| International Flavors & Fragrances | 7,897 | 478,242 |
| International Paper | 42,031 | 1,164,259 |
| MeadWestvaco | 15,819 | 441,508 |
| Monsanto | 51,277 | 3,730,402 |
| Mosaic | 26,471 | 1,550,142 |
| Newmont Mining | 47,253b | 3,157,918 |
| Nucor | 30,390 | 1,148,134 |
| Owens-Illinois | 14,761a | 296,401 |
20
| | | |
| Common Stocks (continued) | Shares | Value ($) |
| Materials (continued) | | |
| PPG Industries | 14,687 | 1,269,104 |
| Praxair | 29,109 | 2,959,512 |
| Sealed Air | 13,962 | 248,524 |
| Sherwin-Williams | 8,157 | 674,665 |
| Sigma-Aldrich | 11,748 | 769,259 |
| Titanium Metals | 7,164b | 119,997 |
| United States Steel | 12,653b | 320,880 |
| Vulcan Materials | 11,603b | 363,058 |
| | | 38,730,118 |
| Telecommunication Services—3.0% | | |
| American Tower, Cl. A | 38,010a | 2,094,351 |
| AT&T | 567,237 | 16,625,716 |
| CenturyLink | 58,906 | 2,077,026 |
| Frontier Communications | 96,003b | 600,979 |
| MetroPCS Communications | 24,326a | 206,771 |
| Sprint Nextel | 287,837a | 739,741 |
| Verizon Communications | 270,319 | 9,996,397 |
| Windstream | 49,282b | 599,762 |
| | | 32,940,743 |
| Utilities—3.6% | | |
| AES | 59,265a | 664,953 |
| Ameren | 21,901 | 698,204 |
| American Electric Power | 46,189 | 1,814,304 |
| CenterPoint Energy | 40,986 | 854,148 |
| CMS Energy | 24,728 | 514,837 |
| Consolidated Edison | 28,061 | 1,623,890 |
| Constellation Energy Group | 18,290 | 726,113 |
| Dominion Resources | 55,122 | 2,843,744 |
| DTE Energy | 16,312 | 850,018 |
| Duke Energy | 127,497b | 2,603,489 |
| Edison International | 31,304 | 1,270,942 |
| Entergy | 16,517 | 1,142,481 |
| Exelon | 63,412b | 2,814,859 |
| FirstEnergy | 40,097 | 1,802,761 |
| Integrys Energy Group | 7,680 | 406,349 |
| NextEra Energy | 40,417 | 2,279,519 |
STATEMENT OF INVESTMENTS (continued)
| | | |
| Common Stocks (continued) | Shares | Value ($) |
| Utilities (continued) | | |
| Nicor | 4,328 | 243,450 |
| NiSource | 27,288b | 602,792 |
| Northeast Utilities | 17,237 | 595,883 |
| NRG Energy | 22,467a | 481,243 |
| ONEOK | 9,766 | 742,704 |
| Pepco Holdings | 20,828b | 412,394 |
| PG&E | 38,167 | 1,637,364 |
| Pinnacle West Capital | 9,666 | 440,576 |
| PPL | 55,360 | 1,625,923 |
| Progress Energy | 28,270 | 1,472,867 |
| Public Service Enterprise Group | 48,517 | 1,635,023 |
| SCANA | 10,587b | 447,618 |
| Sempra Energy | 23,002 | 1,235,897 |
| Southern | 81,247 | 3,509,870 |
| TECO Energy | 18,734 | 347,890 |
| Wisconsin Energy | 21,156 | 686,089 |
| Xcel Energy | 46,523 | 1,202,620 |
| | | 40,230,814 |
| Total Common Stocks | | |
| (cost $915,454,079) | | 1,092,451,977 |
| | Principal | |
| Short-Term Investments—.1% | Amount ($) | Value ($) |
| U.S. Treasury Bills; | | |
| 0.02%, 3/22/12 | | |
| (cost $1,529,892) | 1,530,000d | 1,529,804 |
| |
| Other Investment—1.8% | Shares | Value ($) |
| Registered Investment Company; | | |
| Dreyfus Institutional Preferred | | |
| Plus Money Market Fund | | |
| (cost $19,954,478) | 19,954,478e | 19,954,478 |
22
| | | | |
| Investment of Cash Collateral | | |
| for Securities Loaned—3.2% | Shares | Value ($) |
| Registered Investment Company; | | |
| Dreyfus Institutional Cash Advantage Fund | | |
| (cost $35,765,124) | 35,765,124e | 35,765,124 |
| Total Investments (cost $972,703,573) | 103.1% | 1,149,701,383 |
| Liabilities, Less Cash and Receivables | (3.1%) | (34,260,608) |
| Net Assets | 100.0% | 1,115,440,775 |
|
| REIT—Real Estate Investment Trust |
| a Non-income producing security. |
| b Security, or portion thereof, on loan.At October 31, 2011, the market value of the fund’s securities on loan was |
| $34,903,924 and the market value of the collateral held by the fund was $36,610,314, consisting of cash collateral |
| of $35,765,124 and U.S. Government securities valued at $845,190. |
| c Investment in real estate investment trust. |
| d Held by a broker as collateral for open financial futures positions. |
| e Investment in affiliated money market mutual fund. |
| | | |
| Portfolio Summary (Unaudited)† | | |
| |
| | Value (%) | | Value (%) |
| Information Technology | 19.3 | Short-Term/ | |
| Financial | 13.7 | Money Market Investments | 5.1 |
| Energy | 12.0 | Utilities | 3.6 |
| Health Care | 11.3 | Materials | 3.5 |
| Consumer Staples | 10.8 | Telecommunication Services | 3.0 |
| Industrial | 10.7 | | |
| Consumer Discretionary | 10.1 | | 103.1 |
| |
| † Based on net assets. | | | |
| See notes to financial statements. | | | |
The Fund 23
|
| STATEMENT OF FINANCIAL FUTURES |
| October 31, 2011 |
| | | | | |
| | | Market Value | | Unrealized | |
| | | Covered by | | Appreciation | |
| | Contracts | Contracts ($) | Expiration | at 10/31/2011 | ($) |
| Financial Futures Long | | | | | |
| Standard & Poor’s 500 E-mini | 354 | 22,112,610 | December 2011 | 1,373,118 | |
| |
| See notes to financial statements. | | | | | |
24
|
| STATEMENT OF ASSETS AND LIABILITIES |
| October 31, 2011 |
| | | |
| | Cost | Value |
| Assets ($): | | |
| Investments in securities—See Statement of Investments (including | | |
| securities on loan, valued at $34,903,924)—Note 1(b): | | |
| Unaffiliated issuers | 916,983,971 | 1,093,981,781 |
| Affiliated issuers | 55,719,602 | 55,719,602 |
| Cash | | 317,999 |
| Dividends, interest and securities lending income receivable | | 1,253,768 |
| Receivable for investment securities sold | | 809,329 |
| Receivable for shares of Capital Stock subscribed | | 540,402 |
| | | 1,152,622,881 |
| Liabilities ($): | | |
| Due to The Dreyfus Corporation and affiliates—Note 3(a) | | 181,980 |
| Liability for securities on loan—Note 1(b) | | 35,765,124 |
| Payable for futures variation margin—Note 4 | | 566,795 |
| Payable for investment securities purchased | | 473,639 |
| Payable for shares of Capital Stock redeemed | | 194,568 |
| | | 37,182,106 |
| Net Assets ($) | | 1,115,440,775 |
| Composition of Net Assets ($): | | |
| Paid-in capital | | 979,695,575 |
| Accumulated undistributed investment income—net | | 6,244,686 |
| Accumulated net realized gain (loss) on investments | | (48,870,414) |
| Accumulated net unrealized appreciation (depreciation) | | |
| on investments (including $1,373,118 net unrealized | | |
| appreciation on financial futures) | | 178,370,928 |
| Net Assets ($) | | 1,115,440,775 |
| Shares Outstanding | | |
| (150 million shares of $.001 par value Capital Stock authorized) | | 43,323,498 |
| Net Asset Value, offering and redemption price per share ($) | | 25.75 |
| |
| See notes to financial statements. | | |
|
| STATEMENT OF OPERATIONS |
| Year Ended October 31, 2011 |
| | |
| Investment Income ($): | |
| Income: | |
| Cash dividends: | |
| Unaffiliated issuers | 21,087,012 |
| Affiliated issuers | 24,100 |
| Income from securities lending—Note 1(b) | 116,285 |
| Interest | 1,176 |
| Total Income | 21,228,573 |
| Expenses: | |
| Management fee—Note 3(a) | 2,084,126 |
| Directors’ fees—Note 3(a) | 69,400 |
| Loan commitment fees—Note 2 | 13,830 |
| Total Expenses | 2,167,356 |
| Less—Directors’ fees reimbursed by the Manager—Note 3(a) | (69,400) |
| Net Expenses | 2,097,956 |
| Investment Income—Net | 19,130,617 |
| Realized and Unrealized Gain (Loss) on Investments—Note 4 ($): | |
| Net realized gain (loss) on investments | (4,432,157) |
| Net realized gain (loss) on financial futures | 1,869,139 |
| Net Realized Gain (Loss) | (2,563,018) |
| Net unrealized appreciation (depreciation) on investments | 59,131,331 |
| Net unrealized appreciation (depreciation) on financial futures | 673,244 |
| Net Unrealized Appreciation (Depreciation) | 59,804,575 |
| Net Realized and Unrealized Gain (Loss) on Investments | 57,241,557 |
| Net Increase in Net Assets Resulting from Operations | 76,372,174 |
| |
| See notes to financial statements. | |
26
STATEMENT OF CHANGES IN NET ASSETS
| | | | |
| | Year Ended October 31, |
| | 2011 | 2010 |
| Operations ($): | | |
| Investment income—net | 19,130,617 | 16,770,506 |
| Net realized gain (loss) on investments | (2,563,018) | (10,787,084) |
| Net unrealized appreciation | | |
| (depreciation) on investments | 59,804,575 | 128,001,219 |
| Net Increase (Decrease) in Net Assets | | |
| Resulting from Operations | 76,372,174 | 133,984,641 |
| Dividends to Shareholders from ($): | | |
| Investment income—net | (18,338,879) | (16,695,148) |
| Capital Stock Transactions ($): | | |
| Net proceeds from shares sold | 312,797,098 | 194,007,574 |
| Dividends reinvested | 15,173,762 | 13,410,822 |
| Cost of shares redeemed | (194,058,972) | (256,524,610) |
| Increase (Decrease) in Net Assets | | |
| from Capital Stock Transactions | 133,911,888 | (49,106,214) |
| Total Increase (Decrease) in Net Assets | 191,945,183 | 68,183,279 |
| Net Assets ($): | | |
| Beginning of Period | 923,495,592 | 855,312,313 |
| End of Period | 1,115,440,775 | 923,495,592 |
| Undistributed investment income—net | 6,244,686 | 5,621,151 |
| Capital Share Transactions (Shares): | | |
| Shares sold | 12,211,660 | 8,503,079 |
| Shares issued for dividends reinvested | 587,759 | 591,305 |
| Shares redeemed | (7,500,634) | (11,304,258) |
| Net Increase (Decrease) in Shares Outstanding | 5,298,785 | (2,209,874) |
| |
| See notes to financial statements. | | |
FINANCIAL HIGHLIGHTS
The following table describes the performance for the fiscal periods indicated. Total return shows how much your investment in the fund would have increased (or decreased) during each period, assuming you had reinvested all dividends and distributions.These figures have been derived from the fund’s financial statements.
| | | | | | | | | | |
| | | Year Ended October 31, | |
| | 2011 | 2010 | 2009 | 2008 | 2007 |
| Per Share Data ($): | | | | | |
| Net asset value, beginning of period | 24.29 | 21.26 | 20.18 | 32.30 | 28.73 |
| Investment Operations: | | | | | |
| Investment income—neta | .48 | .43 | .44 | .56 | .55 |
| Net realized and unrealized | | | | | |
| gain (loss) on investments | 1.45 | 3.02 | 1.42 | (12.08) | 3.54 |
| Total from Investment Operations | 1.93 | 3.45 | 1.86 | (11.52) | 4.09 |
| Distributions: | | | | | |
| Dividends from investment income—net | (.47) | (.42) | (.46) | (.60) | (.52) |
| Dividends from net realized | | | | | |
| gain on investments | — | — | (.32) | — | — |
| Total Distributions | (.47) | (.42) | (.78) | (.60) | (.52) |
| Net asset value, end of period | 25.75 | 24.29 | 21.26 | 20.18 | 32.30 |
| Total Return (%) | 7.94 | 16.39 | 9.84 | (36.23) | 14.41 |
| Ratios/Supplemental Data (%): | | | | | |
| Ratio of total expenses | | | | | |
| to average net assets | .21 | .21 | .21 | .21 | .21 |
| Ratio of net expenses | | | | | |
| to average net assets | .20 | .20 | .20 | .20 | .20 |
| Ratio of net investment income | | | | | |
| to average net assets | 1.84 | 1.85 | 2.38 | 2.07 | 1.82 |
| Portfolio Turnover Rate | 2.12 | 7.64 | 4.99 | 4.84 | 8.00 |
| Net Assets, end of period | | | | | |
| ($ x 1,000) | 1,115,441 | 923,496 | 855,312 | 866,815 | 1,664,428 |
| |
| a Based on average shares outstanding at each month end. | | | | |
| See notes to financial statements. | | | | | |
28
NOTES TO FINANCIAL STATEMENTS
NOTE 1—Significant Accounting Policies:
Dreyfus BASIC S&P 500 Stock Index Fund (the “fund”) is a separate diversified series of The Dreyfus/Laurel Funds, Inc. (the “Company”), which is registered under the Investment Company Act of 1940, as amended (the “Act”), as an open-end management investment company and operates as a series company currently offering ten series including the fund.The fund’s investment objective seeks to match the total return of the Standard & Poor’s 500 Composite Stock Price Index. The Dreyfus Corporation (the “Manager” or “Dreyfus”), a wholly-owned subsidiary of The Bank of New York Mellon Corporation (“BNY Mellon”), serves as the fund’s investment adviser. MBSC Securities Corporation (the “Distributor”), a wholly-owned subsidiary of the Manager, is the distributor of the fund’s shares, which are sold to the public without a sales charge.
The Financial Accounting Standards Board (“FASB”) Accounting Standards Codification (“ASC”) is the exclusive reference of authoritative U.S. generally accepted accounting principles (“GAAP”) recognized by the FASB to be applied by nongovernmental entities. Rules and interpretive releases of the Securities and Exchange Commission (“SEC”) under authority of federal laws are also sources of authoritative GAAP for SEC registrants. The fund’s financial statements are prepared in accordance with GAAP, which may require the use of management estimates and assumptions.Actual results could differ from those estimates.
(a) Portfolio valuation: The fair value of a financial instrument is the amount that would be received to sell an asset or paid to transfer a liability in an orderly transaction between market participants at the measurement date (i.e. the exit price). GAAP establishes a fair value hierarchy that prioritizes the inputs of valuation techniques used to measure fair value.This hierarchy gives the highest priority to unadjusted quoted prices in active markets for identical assets or liabilities (Level 1 measurements) and the lowest priority to unobservable inputs (Level 3 measurements).
NOTES TO FINANCIAL STATEMENTS (continued)
Additionally, GAAP provides guidance on determining whether the volume and activity in a market has decreased significantly and whether such a decrease in activity results in transactions that are not orderly. GAAP requires enhanced disclosures around valuation inputs and techniques used during annual and interim periods.
Various inputs are used in determining the value of the fund’s investments relating to fair value measurements.These inputs are summarized in the three broad levels listed below:
Level 1—unadjusted quoted prices in active markets for identical investments.
Level 2—other significant observable inputs (including quoted prices for similar investments, interest rates, prepayment speeds, credit risk, etc.).
Level 3—significant unobservable inputs (including the fund’s own assumptions in determining the fair value of investments).
The inputs or methodology used for valuing securities are not necessarily an indication of the risk associated with investing in those securities.
Changes in valuation techniques may result in transfers in or out of an assigned level within the disclosure hierarchy. Valuation techniques used to value the fund’s investments are as follows:
Investments in securities are valued at the last sales price on the securities exchange or national securities market on which such securities are primarily traded. Securities listed on the National Market System for which market quotations are available are valued at the official closing price or, if there is no official closing price that day, at the last sales price. Securities not listed on an exchange or the national securities market, or securities for which there were no transactions, are valued at the average of the most recent bid and asked prices, except for open short positions, where the asked price is used for valuation purposes. Bid price is used when no asked price is available. Registered investment companies that are not traded on an exchange are valued at their net asset value.All preceding securities are categorized within Level 1 of the fair value hierarchy.
30
U.S. Treasury Bills are valued at the mean price between quoted bid prices and asked prices by an independent pricing service approved by the Board of Directors. These securities are generally categorized within Level 2 of the fair value hierarchy.
Fair valuing of securities may be determined with the assistance of a pricing service using calculations based on indices of domestic securities and other appropriate indicators, such as prices of relevant American Depository Receipts and futures contracts. Utilizing these techniques may result in transfers between Level 1 and Level 2 of the fair value hierarchy.
When market quotations or official closing prices are not readily available, or are determined not to reflect accurately fair value, such as when the value of a security has been significantly affected by events after the close of the exchange or market on which the security is principally traded (for example, a foreign exchange or market), but before the fund calculates its net asset value, the fund may value these investments at fair value as determined in accordance with the procedures approved by the Board of Directors. Certain factors may be considered when fair valuing investments such as: fundamental analytical data, the nature and duration of restrictions on disposition, an evaluation of the forces that influence the market in which the securities are purchased and sold, and public trading in similar securities of the issuer or comparable issuers. These securities are either categorized as Level 2 or 3 depending on the relevant inputs used.
For restricted securities where observable inputs are limited, assumptions about market activity and risk are used and are categorized within Level 3 of the fair value hierarchy.
Financial futures, which are traded on an exchange, are valued at the last sales price on the securities exchange on which such securities are primarily traded or at the last sales price on the national securities market on each business day.These securities are generally categorized within Level 1 of the fair value hierarchy.
NOTES TO FINANCIAL STATEMENTS (continued)
The following is a summary of the inputs used as of October 31, 2011 in valuing the fund’s investments:
| | | | |
| | | Level 2—Other | Level 3— | |
| | Level 1— | Significant | Significant | |
| | Unadjusted | Observable | Unobservable | |
| | Quoted Prices | Inputs | Inputs | Total |
| Assets ($) | | | | |
| Investments in Securities: | | | |
| Equity Securities— | | | | |
| Domestic† | 1,092,451,977 | — | — | 1,092,451,977 |
| Mutual Funds | 55,719,602 | — | — | 55,719,602 |
| U.S. Treasury | — | 1,529,804 | — | 1,529,804 |
| Other Financial | | | | |
| Instruments: | | | | |
| Futures†† | 1,373,118 | — | — | 1,373,118 |
| |
| † | See Statement of Investments for additional detailed categorizations. |
| †† | Amount shown represents unrealized appreciation at period end. |
In May 2011, FASB issued Accounting Standards Update (“ASU”) No. 2011-04 “Amendments to Achieve Common Fair Value Measurement and Disclosure Requirements in GAAP and International Financial Reporting Standards (“IFRS”)” (“ASU 2011-04”). ASU 2011-04 includes common requirements for measurement of and disclosure about fair value between GAAP and IFRS. ASU 2011-04 will require reporting entities to disclose the following information for fair value measurements categorized within Level 3 of the fair value hierarchy: quantitative information about the unobservable inputs used in the fair value measurement, the valuation processes used by the reporting entity and a narrative description of the sensitivity of the fair value measurement to changes in unobservable inputs and the interrelationships between those unobservable inputs. In addition, ASU 2011-04 will require reporting entities to make disclosures about amounts and reasons for all transfers in and out of Level 1 and Level 2 fair value measurements.The new and revised disclosures are effective for interim
32
and annual reporting periods beginning after December 15, 2011. At this time, management is evaluating the implications of ASU 2011-04 and its impact on the financial statements.
(b) Securities transactions and investment income: Securities transactions are recorded on a trade date basis. Realized gains and losses from securities transactions are recorded on the identified cost basis. Dividend income is recognized on the ex-dividend date and interest income, including, where applicable, accretion of discount and amortization of premium on investments, is recognized on the accrual basis.
Pursuant to a securities lending agreement withThe Bank of NewYork Mellon, a subsidiary of BNY Mellon and an affiliate of Dreyfus, the fund may lend securities to qualified institutions. It is the fund’s policy that, at origination, all loans are secured by collateral of at least 102% of the value of U.S. securities loaned and 105% of the value of foreign securities loaned. Collateral equivalent to at least 100% of the market value of securities on loan is maintained at all times. Collateral is either in the form of cash, which can be invested in certain money market mutual funds managed by the Manager, U.S. Government and Agency securities or letters of credit.The fund is entitled to receive all income on securities loaned, in addition to income earned as a result of the lending transaction. Although each security loaned is fully collateralized, the fund bears the risk of delay in recovery of, or loss of rights in, the securities loaned should a borrower fail to return the securities in a timely manner. During the period ended October 31, 2011,The Bank of NewYork Mellon earned $49,836 from lending portfolio securities, pursuant to the securities lending agreement.
(c) Affiliated issuers: Investments in other investment companies advised by Dreyfus are defined as “affiliated” in the Act.
NOTES TO FINANCIAL STATEMENTS (continued)
The fund may invest in shares of certain affiliated investment companies also advised or managed by Dreyfus. Investments in affiliated investment companies for the period ended October 31, 2011 were as follows:
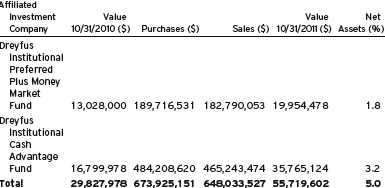
(d) Dividends to shareholders: Dividends are recorded on the ex-dividend date. Dividends from investment income-net are declared and paid on a quarterly basis. Dividends from net realized capital gains, if any, are normally declared and paid annually, but the fund may make distributions on a more frequent basis to comply with the distribution requirements of the Internal Revenue Code of 1986, as amended (the “Code”).To the extent that net realized capital gains can be offset by capital loss carryovers, it is the policy of the fund not to distribute such gains. Income and capital gain distributions are determined in accordance with income tax regulations, which may differ from GAAP.
(e) Federal income taxes: It is the policy of the fund to continue to qualify as a regulated investment company, if such qualification is in the best interests of its shareholders, by complying with the applicable provisions of the Code, and to make distributions of taxable income sufficient to relieve it from substantially all federal income and excise taxes.
As of and during the period ended October 31, 2011, the fund did not have any liabilities for any uncertain tax positions.The fund recognizes interest and penalties, if any, related to uncertain tax positions as income tax expense in the Statement of Operations. During the period, the fund did not incur any interest or penalties.
34
Each of the tax years in the four-year period ended October 31, 2011 remains subject to examination by the Internal Revenue Service and state taxing authorities.
At October 31, 2011, the components of accumulated earnings on a tax basis were as follows: undistributed ordinary income $5,984,848, accumulated capital losses $24,124,819 and unrealized appreciation $153,885,171.
The accumulated capital loss carryover is available for federal income tax purposes to be applied against future net securities profits, if any, realized subsequent to October 31, 2011. If not applied, $17,732,628 of the carryover expires in fiscal 2017, $6,259,621 expires in fiscal 2018 and $132,570 expires in fiscal 2019.
Under the recently enacted Regulated Investment Company Modernization Act of 2010 (the “2010 Act”), the fund will be permitted to carry forward capital losses incurred in taxable years beginning after December 22, 2010 (“post-enactment losses”) for an unlimited period. However, the 2010 Act requires post-enactment losses to be utilized before the utilization of losses incurred in taxable years prior to the effective date of the 2010 Act. As a result of this ordering rule, capital loss carryovers related to taxable years beginning prior to the effective date of the 2010 Act may be more likely to expire unused.
The tax character of distributions paid to shareholders during the fiscal periods ended October 31, 2011 and October 31, 2010 were as follows: ordinary income $18,338,879 and $16,695,148, respectively.
During the period ended October 31, 2011, as a result of permanent book to tax differences, primarily due to the tax treatment for real estate investment trusts, the fund decreased accumulated undistributed investment income-net by $168,203 and increased accumulated net realized gain (loss) on investments by the same amount. Net assets and net asset value per share were not affected by this reclassification.
NOTES TO FINANCIAL STATEMENTS (continued)
NOTE 2—Bank Lines of Credit:
The fund participates with other Dreyfus-managed funds in a $225 million unsecured credit facility led by Citibank, N.A. and a $300 million unsecured credit facility provided by The Bank of New York Mellon (each, a “Facility”), each to be utilized primarily for temporary or emergency purposes, including the financing of redemptions. In connection therewith, the fund has agreed to pay its pro rata portion of commitment fees for each Facility. Interest is charged to the fund based on rates determined pursuant to the terms of the respective Facility at the time of borrowing. During the period ended October 31, 2011, the fund did not borrow under the Facilities.
NOTE 3—Investment Management Fee And Other Transactions with Affiliates:
(a) Pursuant to an investment management agreement with the Manager, the Manager provides or arranges for one or more third and/or affiliated parties to provide investment advisory, administrative, custody, fund accounting and transfer agency services to the fund.The Manager also directs the investments of the fund in accordance with its investment objective, policies and limitations. For these services, the fund is contractually obligated to pay the Manager a fee, calculated daily and paid monthly, at the annual rate of .20% of the value of the fund’s average daily net assets. Out of its fee, the Manager pays all of the expenses of the fund except brokerage fees, taxes, interest, commitment fees, fees and expenses of non-interested Directors (including counsel fees) and extraordinary expenses. In addition, the Manager is required to reduce its fee in an amount equal to the fund’s allocable portion of fees and expenses of the non-interested Directors (including counsel fees). Each Board member who is not an “interested person” of the Company (as defined in the Act) receives $60,000 per annum, plus $7,000 per joint Board meeting of the Company, Dreyfus Investment Funds, The Dreyfus/Laurel Funds Trust, The Dreyfus/Laurel Tax-Free Municipal Funds and Dreyfus Funds, Inc. (collectively, the “Board Group Open-End Funds”) attended, $2,500 for separate in-person
36
committee meetings attended which are not held in conjunction with a regularly scheduled Board meeting and $2,000 for Board meetings and separate committee meetings attended that are conducted by tele-phone.The Board Group Open-End Funds also reimburse each Board member who is not an “interested person” of the Company (as defined in the Act) for travel and out-of-pocket expenses.With respect to Board meetings, the Chairman of the Board receives an additional 25% of such compensation (with the exception of reimbursable amounts).The Chair of each of the Board’s committees, unless the Chair also serves as Chair of the Board, receives $1,350 per applicable committee meeting. In the event that there is an in-person joint committee meeting or a joint telephone meeting of the Board Group Open-End Funds and Dreyfus HighYield Strategies Fund (“DHF”), a $2,500 fee is allocated between the Board Group Open-End Funds and DHF.The Company’s portion of these fees and expenses are charged and allocated to each series based on net assets.Amounts required to be paid by the Company directly to the non-interested Directors, that would be applied to offset a portion of the management fee payable to Dreyfus, are in fact paid directly by Dreyfus to the non-interested Directors.
Effective January 1, 2012, the Board Group Open-End Funds and DHF (collectively, the “Board Group Funds”) will pay each Trustee their respective allocated portions of an annual retainer of $85,000 and a fee of $10,000 for each regularly scheduled Board meeting attended ($75,000 and $8,000, respectively, in the aggregate, prior to January 1, 2012).With respect to the annual retainer and Board meetings of the Board Group Funds, the Chair of the Board will receive an additional 25% of such compensation (with the exception of reimbursable amounts). Each Trustee will receive $2,500 for any separate in-person committee meetings attended, which are not held in conjunction with a regularly scheduled Board meeting, such amount to be allocated among the Board Group Funds, as applicable. In the event that there is a joint telephone meeting of the Board Group Funds, a fee of $2,000 will be allocated among the applicable Board Group Funds, accord-
NOTES TO FINANCIAL STATEMENTS (continued)
ingly (prior to January 1, 2012, the fee allocated was $2,500 if the meeting included DHF).The Chair of each of the Board’s committees, unless the Chair also serves as Chair of the Board, will receive $1,500 per applicable committee meeting. Each Emeritus Trustee is entitled to receive an annual retainer of one-half the amount paid as a retainer at the time the Trustee became Emeritus and a per meeting attended fee of one-half the amount paid to Trustees.The Board Group Funds also reimburse each Independent Trustee and Emeritus Trustees for travel and out-of-pocket expenses.
The components of “Due to The Dreyfus Corporation and affiliates” in the Statement of Assets and Liabilities consist of: management fees $181,980.
NOTE 4—Securities Transactions:
The aggregate amount of purchases and sales of investment securities, excluding short-term securities and financial futures, during the period ended October 31, 2011, amounted to $151,744,742 and $21,704,305, respectively.
Futures Contracts: In the normal course of pursuing its investment objective, the fund is exposed to market risk, including equity price risk, as a result of changes in value of underlying financial instruments.The fund invests in financial futures contracts in order to manage its exposure to or protect against changes in the market.A futures contract represents a commitment for the future purchase or a sale of an asset at a specified date. Upon entering into such contracts, these investments require initial margin deposits with a broker, which consist of cash or cash equivalents. The amount of these deposits is determined by the exchange or Board of Trade on which the contract is traded and is subject to change. Accordingly, variation margin payments are received or made to reflect daily unrealized gains or losses which are recorded in the Statement of Operations. Futures contracts are valued daily at the last sales price established by the Board of Trade or exchange upon which they are traded. When the contracts are closed, the fund recognizes a
38
realized gain or loss. There is minimal counterparty credit risk to the fund with futures since futures are exchange traded, and the exchange’s clearinghouse guarantees the futures against default. Contracts open at October 31, 2011 are set forth in the Statement of Financial Futures.
The following summarizes the average market value of derivatives outstanding during the period ended October 31, 2011:
| |
| | Average Market Value ($) |
| Equity futures contracts | 19,685,918 |
At October 31, 2011, the cost of investments for federal income tax purposes was $995,816,212; accordingly, accumulated net unrealized appreciation on investments was $153,885,171, consisting of $315,292,279 gross unrealized appreciation and $161,407,108 gross unrealized depreciation.
NOTE 5—Other Matters:
At the October 27, 2011 Board meeting, the Board of the Company approved a proposal to have shareholders consider the election of Francine J. Bovich as an additional Board member of the Company, and also consider the election of Joseph S. DiMartino and Benaree Pratt Wiley, current Board members of the Company not previously proposed to shareholders of the fund.A proxy statement was mailed, on December 1, 2011, to shareholders of record as of the close of business on November 1, 2011 asking shareholders to consider these elections at a special joint meeting of shareholders to be held on Wednesday, February 8, 2012.
NOTE 6—Pending Legal Matters:
The fund and more than two hundred other entities have been named as defendants in two pending litigations (Deutsche Bank Trust Co., Americas et al. v. Adaly Opportunity Fund TD Secs. Inc. et al., No. 11- cv-04784, filed July 12, 2011 in the United States District Court for the Southern District of New York (“Deutsche Bank v.
The Fund 39
NOTES TO FINANCIAL STATEMENTS (continued)
Adaly”), and Niese et al. v. Alliance Bernstein L.P. et al., No. 11-cv-04538, filed July 1, 2011 in the United States District Court for the Southern District of New York) against shareholders of the Tribune Company who received payment for their shares in June or December 2007, as part of a leveraged buyout of the company (the “LBO”). Approximately one year after the LBO was concluded, the Tribune Company filed for bankruptcy.Thereafter, in approximately June 2011, certain Tribune Company creditors filed dozens of complaints in various courts throughout the country, including complaints in the two actions referred to above, alleging that the payments made to shareholders in the LBO were “fraudulent conveyances,” and that the shareholders must return the payments they received for their shares to satisfy the plaintiffs’ unpaid claims. In Deutsche Bank v. Adaly, the fund and eleven other defendants are named as shareholder defendants class representatives.
In addition, there is a case pending in United States Bankruptcy Court for the District of Delaware brought by the Unsecured Creditors Committee of the Tribune Company (The Official Committee of Unsecured Creditors of Tribune Co. v. Fitzsimons et al., Bankr. D. Del. Adv. Pro. No. 10-54010 (KJC), filed Nov. 1, 2010). In this case, the Creditors Committee seeks recovery for alleged “fraudulent conveyances” from approximately 27,000 Tribune shareholders, including the fund, in an Amended Complaint filed in December 2010.
At this early stage in the proceedings, it is not possible to assess with any reasonable certainty the probable outcomes of the pending litigations. Consequently, at this time, management is unable to estimate the possible loss or range of loss that may result.
40
|
| REPORT OF INDEPENDENT REGISTERED |
| PUBLIC ACCOUNTING FIRM |
The Board of Directors and Shareholders of The Dreyfus/Laurel Funds, Inc.
We have audited the accompanying statement of assets and liabilities of Dreyfus BASIC S&P 500 Stock Index Fund, a series of The Dreyfus/Laurel Funds, Inc. (the “Fund”), including the statement of investments and financial futures, as of October 31, 2011, and the related statement of operations for the year then ended, the statements of changes in net assets for each of the years in the two-year period then ended, and the financial highlights for each of the years in the five-year period then ended. These financial statements and financial highlights are the responsibility of the Fund’s management. Our responsibility is to express an opinion on these financial statements and financial highlights based on our audits.
We conducted our audits in accordance with the standards of the Public Company Accounting Oversight Board (United States).Those standards require that we plan and perform the audit to obtain reasonable assurance about whether the financial statements and financial highlights are free of material misstatement. An audit includes examining, on a test basis, evidence supporting the amounts and disclosures in the financial statements. Our procedures included confirmation of securities owned as of October 31, 2011, by correspondence with the custodian and brokers or by other appropriate auditing procedures where replies from brokers were not received.An audit also includes assessing the accounting principles used and significant estimates made by management, as well as evaluating the overall financial statement presentation.We believe that our audits provide a reasonable basis for our opinion.
In our opinion, the financial statements and financial highlights referred to above present fairly, in all material respects, the financial position of Dreyfus BASIC S&P 500 Stock Index Fund as of October 31, 2011, the results of its operations for the year then ended, the changes in its net assets for each of the years in the two-year period then ended, and the financial highlights for each of the years in the five-year period then ended, in conformity with U.S. generally accepted accounting principles.

New York, New York
December 22, 2011
IMPORTANT TAX INFORMATION (Unaudited)
For federal tax purposes, the fund designates the maximum amount allowable, but not less than $17,978,672 as ordinary income dividends paid during the year ended October 31, 2011 as qualified dividend income in accordance with Section 854(b)(1)(B) of the Internal Revenue Code.Also, the fund designates the maximum amount allowable but not less than 99.50% of ordinary income dividends paid during the year ended October 31, 2011 as eligible for the corporate dividends received deduction provided under Section 243 of the Internal Revenue Code in accordance with Section 854(b)(1)(A) of the Internal Revenue Code. Shareholders will receive notification in early 2012 of the percentage applicable to the preparation of their 2011 income tax returns.
42
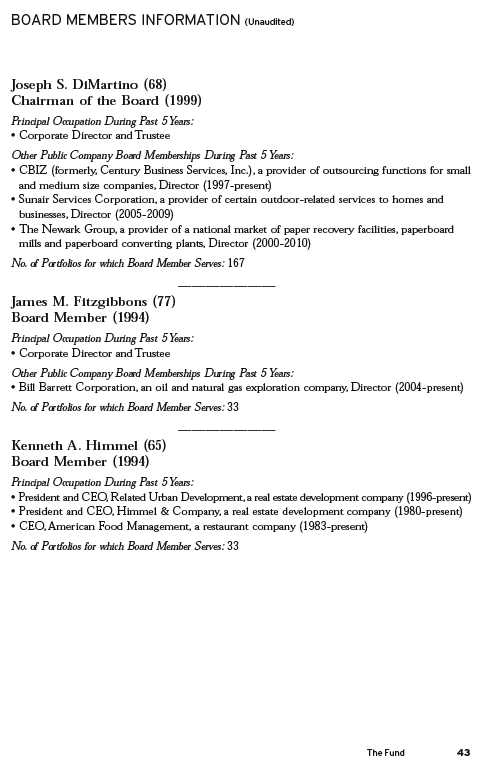

OFFICERS OF THE FUND (Unaudited)
BRADLEY J. SKAPYAK, President since January 2010.
Chief Operating Officer and a director of the Manager since June 2009. From April 2003 to June 2009, Mr. Skapyak was the head of the Investment Accounting and Support Department of the Manager. He is an officer of 75 investment companies (comprised of 167 portfolios) managed by the Manager. He is 52 years old and has been an employee of the Manager since February 1988.
MICHAEL A. ROSENBERG, Vice President and Secretary since August 2005.
Assistant General Counsel of BNY Mellon, and an officer of 76 investment companies (comprised of 192 portfolios) managed by the Manager. He is 51 years old and has been an employee of the Manager since October 1991.
KIESHA ASTWOOD, Vice President and Assistant Secretary since January 2010.
Counsel of BNY Mellon, and an officer of 76 investment companies (comprised of 192 portfolios) managed by the Manager. She is 38 years old and has been an employee of the Manager since July 1995.
JAMES BITETTO, Vice President and Assistant Secretary since August 2005.
Senior Counsel of BNY Mellon and Secretary of the Manager, and an officer of 76 investment companies (comprised of 192 portfolios) managed by the Manager. He is 45 years old and has been an employee of the Manager since December 1996.
JONI LACKS CHARATAN, Vice President and Assistant Secretary since August 2005.
Senior Counsel of BNY Mellon, and an officer of 76 investment companies (comprised of 192 portfolios) managed by the Manager. She is 55 years old and has been an employee of the Manager since October 1988.
JOSEPH M. CHIOFFI, Vice President and Assistant Secretary since August 2005.
Senior Counsel of BNY Mellon, and an officer of 76 investment companies (comprised of 192 portfolios) managed by the Manager. He is 49 years old and has been an employee of the Manager since June 2000.
KATHLEEN DENICHOLAS, Vice President and Assistant Secretary since January 2010.
Senior Counsel of BNY Mellon, and an officer of 76 investment companies (comprised of 192 portfolios) managed by the Manager. She is 37 years old and has been an employee of the Manager since February 2001.
JANETTE E. FARRAGHER, Vice President and Assistant Secretary since August 2005.
Assistant General Counsel of BNY Mellon, and an officer of 76 investment companies (comprised of 192 portfolios) managed by the Manager. She is 48 years old and has been an employee of the Manager since February 1984.
JOHN B. HAMMALIAN, Vice President and Assistant Secretary since August 2005.
Managing Counsel of BNY Mellon, and an officer of 76 investment companies (comprised of 192 portfolios) managed by the Manager. He is 48 years old and has been an employee of the Manager since February 1991.
M. CRISTINA MEISER, Vice President and Assistant Secretary since January 2010.
Senior Counsel of BNY Mellon, and an officer of 76 investment companies (comprised of 192 portfolios) managed by the Manager. She is 41 years old and has been an employee of the Manager since August 2001.
OFFICERS OF THE FUND (Unaudited) (continued)
ROBERT R. MULLERY, Vice President and Assistant Secretary since August 2005.
Managing Counsel of BNY Mellon, and an officer of 76 investment companies (comprised of 192 portfolios) managed by the Manager. He is 59 years old and has been an employee of the Manager since May 1986.
JEFF PRUSNOFSKY, Vice President and Assistant Secretary since August 2005.
Managing Counsel of BNY Mellon, and an officer of 76 investment companies (comprised of 192 portfolios) managed by the Manager. He is 46 years old and has been an employee of the Manager since October 1990.
JAMES WINDELS, Treasurer since November 2001.
Director – Mutual Fund Accounting of the Manager, and an officer of 76 investment companies (comprised of 192 portfolios) managed by the Manager. He is 53 years old and has been an employee of the Manager since April 1985.
RICHARD CASSARO, Assistant Treasurer since January 2008.
Senior Accounting Manager – Money Market and Municipal Bond Funds of the Manager, and an officer of 76 investment companies (comprised of 192 portfolios) managed by the Manager. He is 52 years old and has been an employee of the Manager since September 1982.
GAVIN C. REILLY, Assistant Treasurer since December 2005.
Tax Manager of the Investment Accounting and Support Department of the Manager, and an officer of 76 investment companies (comprised of 192 portfolios) managed by the Manager. He is 43 years old and has been an employee of the Manager since April 1991.
ROBERT ROBOL, Assistant Treasurer since December 2002.
Senior Accounting Manager – Fixed Income Funds of the Manager, and an officer of 76 investment companies (comprised of 192 portfolios) managed by the Manager. He is 47 years old and has been an employee of the Manager since October 1988.
ROBERT SALVIOLO, Assistant Treasurer since July 2007.
Senior Accounting Manager – Equity Funds of the Manager, and an officer of 76 investment companies (comprised of 192 portfolios) managed by the Manager. He is 44 years old and has been an employee of the Manager since June 1989.
ROBERT SVAGNA, Assistant Treasurer since December 2002.
Senior Accounting Manager – Equity Funds of the Manager, and an officer of 76 investment companies (comprised of 192 portfolios) managed by the Manager. He is 44 years old and has been an employee of the Manager since November 1990.
46
JOSEPH W. CONNOLLY, Chief Compliance Officer since October 2004.
Chief Compliance Officer of the Manager and The Dreyfus Family of Funds (76 investment companies, comprised of 192 portfolios). From November 2001 through March 2004, Mr. Connolly was first Vice-President, Mutual Fund Servicing for Mellon Global Securities Services. In that capacity, Mr. Connolly was responsible for managing Mellon’s Custody, Fund Accounting and Fund Administration services to third-party mutual fund clients. He is 54 years old and has served in various capacities with the Manager since 1980, including manager of the firm’s Fund Accounting Department from 1997 through October 2001.
STEPHEN J. STOREN, Anti-Money Laundering Compliance Officer since May 2011.
Chief Compliance Officer of the Distributor, and the Anti-Money Laundering Compliance Officer of 72 investment companies (comprised of 188 portfolios) managed by the Manager. He is 57 years old and has been an employee of the Distributor since October 1999.
Save time. Save paper. View your next shareholder report online as soon as it’s available. Log into www.dreyfus.com and sign up for Dreyfus eCommunications. It’s simple and only takes a few minutes.
The views expressed in this report reflect those of the portfolio manager only through the end of the period covered and do not necessarily represent the views of Dreyfus or any other person in the Dreyfus organization. Any such views are subject to change at any time based upon market or other conditions and Dreyfus disclaims any responsibility to update such views.These views may not be relied on as investment advice and, because investment decisions for a Dreyfus fund are based on numerous factors, may not be relied on as an indication of trading intent on behalf of any Dreyfus fund.
Not FDIC-Insured • Not Bank-Guaranteed • May Lose Value
| | Contents |
| | THE FUND |
| 2 | A Letter from the Chairman and CEO |
| 3 | Discussion of Fund Performance |
| 6 | Understanding Your Fund’s Expenses |
| 6 | Comparing Your Fund’s Expenses With Those of Other Funds |
| 7 | Statement of Investments |
| 9 | Statement of Assets and Liabilities |
| 10 | Statement of Operations |
| 11 | Statement of Changes in Net Assets |
| 12 | Financial Highlights |
| 14 | Notes to Financial Statements |
| 23 | Report of Independent Registered Public Accounting Firm |
| 24 | Important Tax Information |
| 25 | Board Members Information |
| 27 | Officers of the Fund |
| | FOR MORE INFORMATION |
| | Back Cover |
Dreyfus
U.S. Treasury Reserves
The Fund

A LETTER FROM THE CHAIRMAN AND CEO
Dear Shareholder:
We present to you this annual report for Dreyfus U.S.Treasury Reserves, covering the 12-month period from November 1, 2010, through October 31, 2011. For information about how the fund performed during the reporting period, as well as general market perspectives, we provide a Discussion of Fund Performance on the pages that follow.
The reporting period was mostly characterized by intensifying macroeconomic concerns amid fluctuating U.S. economic data, volatile commodity prices, the ongoing sovereign debt crisis in Europe and a contentious debate regarding taxes, spending and borrowing in the United States.Toward the end of the reporting period, in the wake of the downgrade of U.S. long-term debt over the summer, October proved to be one of the strongest months of stock market performance of the past decade.
The economic outlook currently remains clouded by market turbulence and political infighting, but we believe that a continued subpar global expansion is more likely than a return to recession. Although Europe continues to struggle with a debt crisis, inflationary pressures appear to be waning in most countries as energy prices recently have retreated from their highs. In the United States, moderately low core inflation and an accommodative monetary policy could help support near-trend growth despite ongoing deleveraging activity in the private sector.To assess the potential impact of these and other developments on your investments, as well as to assess your liquid asset allocations, we encourage you, as always, to speak with your financial advisor.
Thank you for your continued confidence and support.

Jonathan R. Baum
Chairman and Chief Executive Officer
The Dreyfus Corporation
November 15, 2011
2

DISCUSSION OF FUND PERFORMANCE
For the period of November 1, 2010, through October 31, 2011, as provided by Patricia A. Larkin, Senior Portfolio Manager
Fund and Market Performance Overview
For the 12-month period ended October 31, 2011, Dreyfus U.S. Treasury Reserves’ Investor shares produced a yield of 0.00%, and Class R shares produced a yield of 0.00%. Taking into account the effects of compounding, the fund’s Investor shares and Class R shares also produced effective yields of 0.00% and 0.00%, respectively.1
Yields of U.S. Treasury bills hovered near historically low levels throughout the reporting period as the Federal Reserve Board (the “Fed”) left short-term interest rates within a historically low range between 0% and 0.25%.
The Fund’s Investment Approach
The fund seeks a high level of current income consistent with stability of principal.As a U.S.Treasury money market fund, we attempt to provide shareholders with an investment vehicle that is made up of direct U.S. Treasury obligations with remaining maturities of 13 months or less, as well as repurchase agreements with securities dealers, which are backed by U.S. Treasuries. To pursue its goal, the fund normally invests only in direct obligations of the U.S.Treasury and in repurchase agreements secured by these obligations.
Mixed Economic Data Sparked Shifts in Market Sentiment
Although a U.S. economic recovery seemed to gain momentum over the opening months of the reporting period, economic headwinds intensified in February, when energy prices surged higher amid unrest in the Middle East, and in March when devastating natural and nuclear disasters in Japan disrupted the global industrial supply chain. Indeed, these factors helped produce an annualized U.S. GDP growth rate of just 0.4% for the first quarter of 2011.
DISCUSSION OF FUND PERFORMANCE (continued)
In late April, a European sovereign debt crisis worsened as Greece teetered on the brink of default, and a contentious debate about government spending, borrowing and taxes dominated headlines in the United States. May saw mixed economic data. While industrial production picked up, the unemployment rate climbed to 9.1% in May from 8.8% in March. The U.S. housing market continued to deteriorate, posting declines in existing home sales and housing starts.
The Fed ended its massive quantitative easing program in June, and investors were relieved when the program’s termination had relatively little immediate impact on the financial markets. Meanwhile, energy prices moderated even as manufacturing activity increased.These positive developments were largely offset by declining consumer confidence, weakness in U.S. housing markets and sluggish job creation. In fact, the unemployment rate crept higher to 9.2% in June, and it later was announced that U.S. gross domestic product grew at a sluggish 1.3% annualized rate during the second quarter of 2011.
July saw heightened turmoil in the financial markets when Greece moved closer to insolvency, and an unprecedented default on U.S. government debt loomed as the U.S. Congress continued to engage in a rancorous debate about federal budget deficits. Some of these worries came to a head in early August, when Congress passed legislation raising the U.S. debt ceiling, and Standard & Poor’s downgraded its credit rating on long-term U.S. debt securities.The rating on short-term government debt, including securities purchased by many money market funds, was unchanged. Later in the month, hurricanes, drought and wildfires inflicted additional damage on an already battered economy.
September brought more market turbulence when investors apparently believed that the U.S. economy was headed for recession. However, the data seemed to tell a somewhat different story, as the unemployment rate moderated to 9.0%, existing-home sales moved higher and evidence emerged that U.S. households had reduced their debt-service burdens to a level not seen since 1994.
Economic sentiment changed dramatically in October, when new data suggested that the U.S. economy continued to show resilience and it
4
appeared that European officials had finally agreed on measures to address the debt crisis. Meanwhile, the U.S. industrial and manufacturing sectors continued to improve, and housing starts surged to their highest level in nearly 18 months.While these developments provided no guarantee that a return to recession had been avoided, they sparked strong rebounds among investments that had been severely punished during the summer downturn. It later was announced that U.S. GDP grew at an annualized 2.0% rate during the third quarter.
Outlook Clouded by Macroeconomic Developments
Yields of U.S. Treasury bills remained near zero percent throughout the reporting period and yield differences along the market’s maturity spectrum remained relatively narrow, so it made little sense to incur the additional risks that longer-dated securities typically entail. Therefore, we maintained the fund’s weighted average maturity in a range that was roughly in line with industry averages.
Despite the glimmers of economic improvement late in the reporting period, the economic outlook remains cloudy and the Fed has signaled its intention to keep short-term interest rates near historical lows “at least through mid-2013.”Therefore, we intend to maintain the fund’s focus on liquidity.
November 15, 2011
| |
| | An investment in the fund is not insured or guaranteed by the FDIC or any other government |
| | agency.Although the fund seeks to preserve the value of your investment at $1.00 per share, it is |
| | possible to lose money by investing in the fund. |
| | Short-term corporate, asset-backed securities holdings and municipal securities holdings (as |
| | applicable), while rated in the highest rating category by one or more NRSRO (or unrated, if deemed |
| | of comparable quality by Dreyfus), involve credit and liquidity risks and risk of principal loss. |
| 1 | Effective yield is based upon dividends declared daily and reinvested monthly. Past performance is |
| | no guarantee of future results.Yields fluctuate.Yields provided reflect the absorption of certain fund |
| | expenses by The Dreyfus Corporation pursuant to an undertaking in effect that may be extended, |
| | terminated or modified at any time. Had these expenses not been absorbed, the fund’s yields |
| | would have been lower, and in some cases, 7-day yields during the reporting period would have |
| | been negative absent the expense absorption. |
UNDERSTANDING YOUR FUND’S EXPENSES (Unaudited)
As a mutual fund investor, you pay ongoing expenses, such as management fees and other expenses. Using the information below, you can estimate how these expenses affect your investment and compare them with the expenses of other funds.You also may pay one-time transaction expenses, including sales charges (loads) and redemption fees, which are not shown in this section and would have resulted in higher total expenses. For more information, see your fund’s prospectus or talk to your financial adviser.
Review your fund’s expenses
The table below shows the expenses you would have paid on a $1,000 investment in Dreyfus U.S.Treasury Reserves from May 1, 2011 to October 31, 2011. It also shows how much a $1,000 investment would be worth at the close of the period, assuming actual returns and expenses.
| | | | |
| Expenses and Value of a $1,000 Investment | | |
| assuming actual returns for the six months ended October 31, 2011 | | |
| | | Investor Shares | | Class R Shares |
| Expenses paid per $1,000† | $ | 0.40 | $ | 0.40 |
| Ending value (after expenses) | $ | 1,000.00 | $ | 1,000.00 |
|
| COMPARING YOUR FUND’S EXPENSES |
| WITH THOSE OF OTHER FUNDS (Unaudited) |
Using the SEC’s method to compare expenses
The Securities and Exchange Commission (SEC) has established guidelines to help investors assess fund expenses. Per these guidelines, the table below shows your fund’s expenses based on a $1,000 investment, assuming a hypothetical 5% annualized return. You can use this information to compare the ongoing expenses (but not transaction expenses or total cost) of investing in the fund with those of other funds.All mutual fund shareholder reports will provide this information to help you make this comparison. Please note that you cannot use this information to estimate your actual ending account balance and expenses paid during the period.
| | | | |
| Expenses and Value of a $1,000 Investment | | |
| assuming a hypothetical 5% annualized return for the six months ended October 31, 2011 |
| | | Investor Shares | | Class R Shares |
| Expenses paid per $1,000† | $ | 0.41 | $ | 0.41 |
| Ending value (after expenses) | $ | 1,024.80 | $ | 1,024.80 |
Expenses are equal to the fund’s annualized expense ratio of .08% for Investor shares and .08% for Class R shares, multiplied by the average account value over the period, multiplied by 184/365 (to reflect the one-half year period).
6
|
| STATEMENT OF INVESTMENTS |
| October 31, 2011 |
| | | |
| | Annualized | | |
| | Yield on | | |
| | Date of | Principal | |
| U.S. Treasury Bills—19.7% | Purchase (%) | Amount ($) | Value ($) |
| 3/1/12 | 0.04 | 25,000,000 | 24,996,849 |
| 4/19/12 | 0.05 | 30,000,000 | 29,992,917 |
| Total U.S. Treasury Bills | | | |
| (cost $54,989,766) | | | 54,989,766 |
| |
| U.S. Treasury Notes—25.9% | | | |
| 11/30/11 | 0.02 | 2,000,000 | 2,001,156 |
| 12/15/11 | 0.07 | 27,000,000 | 27,034,302 |
| 1/17/12 | 0.03 | 2,000,000 | 2,004,500 |
| 1/31/12 | 0.02 | 2,000,000 | 2,023,388 |
| 2/15/12 | 0.04 | 4,000,000 | 4,055,687 |
| 2/15/12 | 0.07 | 25,000,000 | 25,093,811 |
| 5/31/12 | 0.23 | 10,000,000 | 10,029,683 |
| Total U.S. Treasury Notes | | | |
| (cost $72,242,527) | | | 72,242,527 |
| |
| Repurchase Agreements—54.1% | | | |
| Goldman, Sachs & Co. | | | |
| dated 10/31/11, due 11/1/11 in the | | | |
| amount of $51,000,057 (fully collateralized | | | |
| by $45,185,200 U.S. Treasuty Inflation | | | |
| Protected Securities, 1.25%, due 7/15/20, | | | |
| value $52,020,072) | 0.04 | 51,000,000 | 51,000,000 |
| JPMorgan Chase & Co. | | | |
| dated 10/31/11, due 11/1/11 in the | | | |
| amount of $50,000,111 (fully collateralized | | | |
| by $48,640,000 U.S. Treasury Bonds, 2.75%, | | | |
| due 10/31/13, value $51,003,421) | 0.08 | 50,000,000 | 50,000,000 |
STATEMENT OF INVESTMENTS (continued)
| | | | | |
| | | Annualized | | | |
| | | Yield on | | | |
| | | Date of | Principal | | |
| Repurchase Agreements (continued) | Purchase (%) | Amount ($) | | Value ($) |
| RBS Securities, Inc. | | | | | |
| dated 10/31/11, due 11/1/11 in the | | | | | |
| amount of $50,000,111 (fully collateralized | | | | |
| by $48,220,000 U.S. Treasury Bonds, 2.13%, | | | | |
| due 11/30/14, value $51,002,934) | | 0.08 | 50,000,000 | | 50,000,000 |
| Total Repurchase Agreements | | | | | |
| (cost $151,000,000) | | | | | 151,000,000 |
| |
| Total Investments (cost $278,232,293) | | 99.7 | % | 278,232,293 |
| Cash and Receivables (Net) | | | .3 | % | 863,942 |
| Net Assets | | | 100.0 | % | 279,096,235 |
| |
| |
| |
| |
| Portfolio Summary (Unaudited)† | | | | |
| Value (%) | | | | Value (%) |
| Repurchase Agreements | 54.1 | U.S. Treasury Bills | | 19.7 |
| U.S. Treasury Notes | 25.9 | | | | 99.7 |
| |
| † Based on net assets. | | | | | |
| See notes to financial statements. | | | | | |
8
|
| STATEMENT OF ASSETS AND LIABILITIES |
| October 31, 2011 |
| | |
| | Cost | Value |
| Assets ($): | | |
| Investments in securities—See Statement of | | |
| Investments (including Repurchase | | |
| Agreements of $151,000,000)—Note 1(b) | 278,232,293 | 278,232,293 |
| Cash | | 578,712 |
| Interest receivable | | 298,327 |
| | | 279,109,332 |
| Liabilities ($): | | |
| Due to The Dreyfus Corporation and affiliates—Note 2(b) | | 13,087 |
| Dividend payable | | 10 |
| | | 13,097 |
| Net Assets ($) | | 279,096,235 |
| Composition of Net Assets ($): | | |
| Paid-in capital | | 279,091,845 |
| Accumulated net realized gain (loss) on investments | | 4,390 |
| Net Assets ($) | | 279,096,235 |
| |
| |
| Net Asset Value Per Share | | |
| | Investor Shares | Class R Shares |
| Net Assets ($) | 125,983,743 | 153,112,492 |
| Shares Outstanding | 125,981,695 | 153,110,150 |
| Net Asset Value Per Share ($) | 1.00 | 1.00 |
| |
| See notes to financial statements. | | |
|
| STATEMENT OF OPERATIONS |
| Year Ended October 31, 2011 |
| | |
| Investment Income ($): | |
| Interest Income | 408,218 |
| Expenses: | |
| Management fee—Note 2(a) | 1,697,665 |
| Distribution fees (Investor Shares)—Note 2(b) | 243,379 |
| Directors’ fees—Note 2(a) | 17,373 |
| Total Expenses | 1,958,417 |
| Less—reduction in expenses due to undertaking—Note 2(a) | (1,532,944) |
| Less—Directors’ fees reimbursed by the Manager—Note 2(a) | (17,373) |
| Net Expenses | 408,100 |
| Investment Income—Net | 118 |
| Net Realized Gain (Loss) on Investments—Note 1(b) ($) | 4,390 |
| Net Increase in Net Assets Resulting from Operations | 4,508 |
| |
| See notes to financial statements. | |
10
STATEMENT OF CHANGES IN NET ASSETS
| | | | |
| | Year Ended October 31, |
| | 2011 | 2010 |
| Operations ($): | | |
| Investment income—net | 118 | 142 |
| Net realized gain (loss) on investments | 4,390 | 1,180 |
| Net Increase (Decrease) in Net Assets | | |
| Resulting from Operations | 4,508 | 1,322 |
| Dividends to Shareholders from ($): | | |
| Investment income—net: | | |
| Investor Shares | (492) | (39) |
| Class R Shares | (806) | (103) |
| Total Dividends | (1,298) | (142) |
| Capital Stock Transactions ($1.00 per share): | | |
| Net proceeds from shares sold: | | |
| Investor Shares | 89,618,921 | 85,064,685 |
| Class R Shares | 826,165,790 | 404,688,036 |
| Dividends reinvested: | | |
| Investor Shares | 478 | 39 |
| Class R Shares | 52 | 6 |
| Cost of shares redeemed: | | |
| Investor Shares | (80,617,839) | (93,905,198) |
| Class R Shares | (869,684,318) | (608,213,306) |
| Increase (Decrease) in Net Assets | | |
| from Capital Stock Transactions | (34,516,916) | (212,365,738) |
| Total Increase (Decrease) in Net Assets | (34,513,706) | (212,364,558) |
| Net Assets ($): | | |
| Beginning of Period | 313,609,941 | 525,974,499 |
| End of Period | 279,096,235 | 313,609,941 |
| |
| See notes to financial statements. | | |
FINANCIAL HIGHLIGHTS
The following tables describe the performance for each share class for the fiscal periods indicated. All information reflects financial results for a single fund share. Total return shows how much your investment in the fund would have increased (or decreased) during each period, assuming you had reinvested all dividends and distributions.These figures have been derived from the fund’s financial statements.
| | | | | | | | | | |
| | | Year Ended October 31, | |
| Investor Shares | 2011 | 2010 | 2009 | 2008 | 2007 |
| Per Share Data ($): | | | | | |
| Net asset value, beginning of period | 1.00 | 1.00 | 1.00 | 1.00 | 1.00 |
| Investment Operations: | | | | | |
| Investment income—net | .000a | .000a | .000a | .016 | .043 |
| Distributions: | | | | | |
| Dividends from investment income—net | (.000)a | (.000)a | (.000)a | (.016) | (.043) |
| Net asset value, end of period | 1.00 | 1.00 | 1.00 | 1.00 | 1.00 |
| Total Return (%) | .00b | .00b | .01 | 1.62 | 4.41 |
| Ratios/Supplemental Data (%): | | | | | |
| Ratio of total expenses | | | | | |
| to average net assets | .71 | .71 | .73 | .72 | .71 |
| Ratio of net expenses | | | | | |
| to average net assets | .12 | .21 | .39 | .68 | .70 |
| Ratio of net investment income | | | | | |
| to average net assets | .00b | .00b | .01 | 1.51 | 4.31 |
| Net Assets, end of period ($ x 1,000) | 125,984 | 116,980 | 125,821 | 154,823 | 108,151 |
| |
| a | Amount represents less than $.001 per share. |
| b | Amount represents less than .01%. |
| See notes to financial statements. |
12
| | | | | | | | | | |
| | | Year Ended October 31, | |
| Class R Shares | 2011 | 2010 | 2009 | 2008 | 2007 |
| Per Share Data ($): | | | | | |
| Net asset value, beginning of period | 1.00 | 1.00 | 1.00 | 1.00 | 1.00 |
| Investment Operations: | | | | | |
| Investment income—net | .000a | .000a | .000a | .018 | .045 |
| Distributions: | | | | | |
| Dividends from investment income—net | (.000)a | (.000)a | (.000)a | (.018) | (.045) |
| Net asset value, end of period | 1.00 | 1.00 | 1.00 | 1.00 | 1.00 |
| Total Return (%) | .00b | .00b | .01 | 1.81 | 4.62 |
| Ratios/Supplemental Data (%): | | | | | |
| Ratio of total expenses | | | | | |
| to average net assets | .50 | .51 | .53 | .52 | .51 |
| Ratio of net expenses | | | | | |
| to average net assets | .12 | .21 | .38 | .49 | .50 |
| Ratio of net investment income | | | | | |
| to average net assets | .00b | .00b | .01 | 1.35 | 4.40 |
| Net Assets, end of period ($ x 1,000) | 153,112 | 196,629 | 400,154 | 502,085 | 63,941 |
| |
| a | Amount represents less than $.001 per share. |
| b | Amount represents less than .01%. |
| See notes to financial statements. |
NOTES TO FINANCIAL STATEMENTS
NOTE 1—Significant Accounting Policies:
Dreyfus U.S. Treasury Reserves (the “fund”) is a separate diversified series of The Dreyfus/Laurel Funds, Inc. (the “Company”), which is registered under the Investment Company Act of 1940, as amended (the “Act”), as an open-end management investment company and operates as a series company currently offering ten series including the fund.The fund’s investment objective is to seek a high level of current income consistent with stability of principal.The Dreyfus Corporation (the “Manager” or “Dreyfus”), a wholly-owned subsidiary ofThe Bank of New York Mellon Corporation (“BNY Mellon”), serves as the fund’s investment adviser.
MBSC Securities Corporation (the “Distributor”), a wholly-owned subsidiary of the Manager, is the distributor of the fund’s shares, which are sold without a sales charge.The fund is authorized to issue 1 billion shares of $.001 par value Capital Stock in each of the following classes of shares: Investor and Class R. Investor shares are sold primarily to retail investors and bear a distribution fee. Class R shares are sold primarily to bank trust departments and other financial service providers (including The Bank of New York Mellon, a subsidiary of BNY Mellon and an affiliate of Dreyfus) acting on behalf of customers having a qualified trust or investment account or relationship at such institution, and bear no distribution fee. Each class of shares has identical rights and privileges, except with respect to the distribution fee and voting rights on matters affecting a single class. Income, expenses (other than expenses attributable to a specific class), and realized and unrealized gains or losses on investments are allocated to each class of shares based on its relative net assets.
It is the fund’s policy to maintain a continuous net asset value per share of $1.00 for the fund; the fund has adopted certain investment, portfolio valuation and dividend and distribution policies to enable it to
14
do so. There is no assurance, however, that the fund will be able to maintain a stable net asset value per share of $1.00.
The Financial Accounting Standards Board (“FASB”) Accounting Standards Codification (“ASC”) is the exclusive reference of authoritative U.S. generally accepted accounting principles (“GAAP”) recognized by the FASB to be applied by nongovernmental entities. Rules and interpretive releases of the Securities and Exchange Commission (“SEC”) under authority of federal laws are also sources of authoritative GAAP for SEC registrants. The fund’s financial statements are prepared in accordance with GAAP, which may require the use of management estimates and assumptions.Actual results could differ from those estimates.
(a) Portfolio valuation: Investments in securities are valued at amortized cost in accordance with Rule 2a-7 of the Act, which has been determined by the Board of Directors to represent the fair value of the fund’s investments.
The fair value of a financial instrument is the amount that would be received to sell an asset or paid to transfer a liability in an orderly transaction between market participants at the measurement date (i.e. the exit price). GAAP establishes a fair value hierarchy that prioritizes the inputs of valuation techniques used to measure fair value.This hierarchy gives the highest priority to unadjusted quoted prices in active markets for identical assets or liabilities (Level 1 measurements) and the lowest priority to unobservable inputs (Level 3 measurements).
Additionally, GAAP provides guidance on determining whether the volume and activity in a market has decreased significantly and whether such a decrease in activity results in transactions that are not orderly. GAAP requires enhanced disclosures around valuation inputs and techniques used during annual and interim periods.
NOTES TO FINANCIAL STATEMENTS (continued)
Various inputs are used in determining the value of the fund’s investments relating to fair value measurements.These inputs are summarized in the three broad levels listed below:
Level 1—unadjusted quoted prices in active markets for identical investments.
Level 2—other significant observable inputs (including quoted prices for similar investments, interest rates, prepayment speeds, credit risk, etc.).
Level 3—significant unobservable inputs (including the fund’s own assumptions in determining the fair value of investments).
The inputs or methodology used for valuing securities are not necessarily an indication of the risk associated with investing in those securities. For example, money market securities are valued using amortized cost, in accordance with rules under the Act. Generally, amortized cost approximates the current fair value of a security, but since the value is not obtained from a quoted price in an active market, such securities are reflected within Level 2 of the fair value hierarchy.
The following is a summary of the inputs used as of October 31, 2011 in valuing the fund’s investments:
| |
| | Short-Term |
| Valuation Inputs | Investments ($)† |
| Level 1—Unadjusted Quoted Prices | — |
| Level 2—Other Significant Observable Inputs | 278,232,293 |
| Level 3—Significant Unobservable Inputs | — |
| Total | 278,232,293 |
| † See Statement of Investments for additional detailed categorizations. | |
In May 2011, FASB issued Accounting Standards Update (“ASU”) No. 2011-04 “Amendments to Achieve Common Fair Value Measurement and Disclosure Requirements in GAAP and International Financial Reporting Standards (“IFRS”)” (“ASU 2011-04”). ASU 2011-04 includes common requirements for measurement of and disclosure about fair value between GAAP and IFRS. ASU 2011-04 will require reporting entities to disclose the following information for fair value
16
measurements categorized within Level 3 of the fair value hierarchy: quantitative information about the unobservable inputs used in the fair value measurement, the valuation processes used by the reporting entity and a narrative description of the sensitivity of the fair value measurement to changes in unobservable inputs and the interrelationships between those unobservable inputs. In addition, ASU 2011-04 will require reporting entities to make disclosures about amounts and reasons for all transfers in and out of Level 1 and Level 2 fair value measurements.The new and revised disclosures are effective for interim and annual reporting periods beginning after December 15, 2011. At this time, management is evaluating the implications of ASU 2011-04 and its impact on the financial statements.
(b) Securities transactions and investment income: Securities transactions are recorded on a trade date basis. Realized gains and losses from securities transactions are recorded on the identified cost basis. Interest income, adjusted for accretion of discount and amortization of premium on investments, is earned from settlement date and recognized on the accrual basis. Cost of investments represents amortized cost.
The fund may engage in repurchase agreement transactions. Under the terms of a typical repurchase agreement, the fund, through its custodian and sub-custodian, takes possession of an underlying debt obligation subject to an obligation of the seller to repurchase, and the fund to resell, the obligation at an agreed-upon price and time, thereby determining the yield during the fund’s holding period. This arrangement results in a fixed rate of return that is not subject to market fluctuations during the fund’s holding period.The value of the collateral is at least equal, at all times, to the total amount of the repurchase obligation, including interest. In the event of a counterparty default, the fund has the right to use the collateral to offset losses incurred.There is potential loss to the fund in the event the fund is delayed or prevented from exercising its rights to dispose of the collateral securities, including the risk of a possible decline in the value of the underlying securities during the period while the fund seeks to assert its rights. The
NOTES TO FINANCIAL STATEMENTS (continued)
Manager, acting under the supervision of the Board of Directors, reviews the value of the collateral and the creditworthiness of those banks and dealers with which the fund enters into repurchase agreements to evaluate potential risks.
(c) Dividends to shareholders: It is the policy of the fund to declare dividends daily from investment income-net; such dividends are paid monthly. Dividends from net realized capital gains, if any, are normally declared and paid annually, but the fund may make distributions on a more frequent basis to comply with the distribution requirements of the Internal Revenue Code of 1986, as amended (the “Code”).To the extent that net realized capital gains can be offset by capital loss carryovers, it is the policy of the fund not to distribute such gains.
(d) Federal income taxes: It is the policy of the fund to continue to qualify as a regulated investment company, if such qualification is in the best interests of its shareholders, by complying with the applicable provisions of the Code, and to make distributions of taxable income sufficient to relieve it from substantially all federal income and excise taxes.
As of and during the period ended October 31, 2011, the fund did not have any liabilities for any uncertain tax positions.The fund recognizes interest and penalties, if any, related to uncertain tax positions as income tax expense in the Statement of Operations. During the period, the fund did not incur any interest or penalties.
Each of the tax years in the four-year period ended October 31, 2011 remains subject to examination by the Internal Revenue Service and state taxing authorities.
At October 31, 2011, the components of accumulated earnings on a tax basis were substantially the same as for financial reporting purposes.
The tax character of distributions paid to shareholders during the fiscal periods ended October 31, 2011 and October 31, 2010 were all ordinary income.
During the period ended October 31, 2011, as a result of permanent book to tax differences, primarily due to dividend reclassification, the fund increased accumulated undistributed investment income-net by
18
$1,180 and decreased accumulated net realized gain (loss) on investments by the same amount. Net assets and net asset value per share were not affected by this reclassification.
At October 31, 2011, the cost of investments for federal income tax purposes was substantially the same as the cost for financial reporting purposes (see the Statement of Investments).
NOTE 2—Investment Management Fee and Other Transactions with Affiliates:
(a) Pursuant to an investment management agreement with the Manager, the Manager provides or arranges for one or more third parties and/or affiliates to provide investment advisory, administrative, custody, fund accounting and transfer agency services to the fund. The Manager also directs the investments of the fund in accordance with its investment objective, policies and limitations. For these services, the fund is contractually obligated to pay the Manager a fee, calculated daily and paid monthly, at the annual rate of .50% of the value of the fund’s average daily net assets. Out of its fee, the Manager pays all of the expenses of the fund except brokerage fees, taxes, interest, Rule 12b-1 distribution fees, service fees and expenses, fees and expenses of non-interested Directors (including counsel fees) and extraordinary expenses. In addition, the Manager is required to reduce its fee in an amount equal to the fund’s allocable portion of fees and expenses of the non-interested Directors (including counsel fees). Each Board member who is not an “interested person” of the Company (as defined in the Act) receives $60,000 per annum, plus $7,000 per joint Board meeting of the Company, Dreyfus Investment Funds,The Dreyfus/Laurel Funds Trust, The Dreyfus/Laurel Tax-Free Municipal Funds and Dreyfus Funds, Inc. (collectively, the “Board Group Open-End Funds”) attended, $2,500 for separate in-person committee meetings attended which are not held in conjunction with a regularly scheduled Board meeting and $2,000 for Board meetings and separate committee meetings attended that are conducted by telephone. The Board Group Open-End Funds also reimburse each Board member who is not an
NOTES TO FINANCIAL STATEMENTS (continued)
“interested person” of the Company (as defined in the Act) for travel and out-of-pocket expenses. With respect to Board meetings, the Chairman of the Board receives an additional 25% of such compensation (with the exception of reimbursable amounts).The Chair of each of the Board’s committees, unless the Chair also serves as Chair of the Board, receives $1,350 per applicable committee meeting. In the event that there is an in-person joint committee meeting or a joint telephone meeting of the Board Group Open-End Funds and Dreyfus HighYield Strategies Fund (“DHF”), a $2,500 fee is allocated between the Board Group Open-End Funds and DHF. The Company’s portion of these fees and expenses are charged and allocated to each series based on net assets. Amounts required to be paid by the Company directly to the non-interested Directors, that would be applied to offset a portion of the management fee payable to the Manager, are in fact paid directly by the Manager to the non-interested Directors.
Effective January 1, 2012, the Board Group Open-End Funds and DHF (collectively, the “Board Group Funds”) will pay each Board member their respective allocated portions of an annual retainer of $85,000 and a fee of $10,000 for each regularly scheduled Board meeting attended ($75,000 and $8,000, respectively, in the aggregate, prior to January 1, 2012). With respect to the annual retainer and Board meetings of the Board Group Funds, the Chair of the Board will receive an additional 25% of such compensation (with the exception of reimbursable amounts). Each Board member will receive $2,500 for any separate in-person committee meetings attended, which are not held in conjunction with a regularly scheduled Board meeting, such amount to be allocated among the Board Group Funds, as applicable. In the event that there is a joint telephone meeting of the Board Group Funds, a fee of $2,000 will be allocated among the applicable Board Group Funds, accordingly (prior to January 1, 2012, the fee allocated was $2,500 if the meeting included DHF).The Chair of each of the Board’s committees, unless the Chair also serves as Chair of the Board, will receive $1,500 per applicable committee meeting.
20
Each Emeritus Board member is entitled to receive an annual retainer of one-half the amount paid as a retainer at the time the Board member became Emeritus and a per meeting attended fee of one-half the amount paid to Board members.The Board Group Funds also reimburse each Independent Board member and Emeritus Board members for travel and out-of-pocket expenses.
The Manager has undertaken to waive receipt of the management fee and/or reimburse operating expenses in order to facilitate a daily yield at or above certain level which may change from time to time. This undertaking is voluntary and not contractual, and may be terminated at any time.The reduction in expenses, pursuant to the undertaking, amounted to $703,501 for Investor shares and $829,443 for Class R shares during the period ended October 31, 2011.
(b) Under the Distribution Plan (the “Plan”) adopted pursuant to Rule 12b-1 under the Act, Investor shares may pay annually up to .25% (currently limited by the Company’s Board of Directors to .20%) of the value of the average daily net assets attributable to its Investor shares to compensate the Distributor for shareholder servicing activities and expenses primarily intended to result in the sale of Investor shares. During the period ended October 31, 2011, Investor shares were charged $243,379 pursuant to the Plan.
Under its terms, the Plan shall remain in effect from year to year, provided such continuance is approved annually by a vote of a majority of those Directors who are not “interested persons” of the Company and who have no direct or indirect financial interest in the operation of or in any agreement related to the Plan.
The components of “Due to The Dreyfus Corporation and affiliates” in the Statement of Assets and Liabilities consist of: management fees $140,309 and Rule 12b-1 distribution plan fees $21,413, which are offset against an expense reimbursement currently in effect in the amount of $148,635.
NOTES TO FINANCIAL STATEMENTS (continued)
NOTE 3—Other Matters:
At the October 27, 2011 Board meeting, the Board of the Company approved a proposal to have shareholders consider the election of Francine J. Bovich as an additional Board member of the Company, and also consider the election of Joseph S. DiMartino and Benaree Pratt Wiley, current Board members of the Company not previously proposed to shareholders of the fund. A proxy statement was mailed, on December 1, 2011, to shareholders of record as of the close of business on November 1, 2011 asking shareholders to consider these elections at a special joint meeting of shareholders to be held on Wednesday, February 8, 2012.
22
|
| REPORT OF INDEPENDENT REGISTERED |
| PUBLIC ACCOUNTING FIRM |
The Board of Directors and Shareholders of The Dreyfus/Laurel Funds, Inc.
We have audited the accompanying statement of assets and liabilities of Dreyfus U.S. Treasury Reserves, a series of The Dreyfus/Laurel Funds, Inc. (the “Fund”), including the statement of investments, as of October 31, 2011, and the related statement of operations for the year then ended, the statements of changes in net assets for each of the years in the two-year period then ended, and the financial highlights for each of the years in the five-year period then ended. These financial statements and financial highlights are the responsibility of the Fund’s management. Our responsibility is to express an opinion on these financial statements and financial highlights based on our audits.
We conducted our audits in accordance with the standards of the Public Company Accounting Oversight Board (United States).Those standards require that we plan and perform the audit to obtain reasonable assurance about whether the financial statements and financial highlights are free of material misstatement. An audit includes examining, on a test basis, evidence supporting the amounts and disclosures in the financial statements. Our procedures included confirmation of securities owned as of October 31, 2011, by correspondence with the custodian and brokers or by other appropriate auditing procedures where replies from brokers were not received. An audit also includes assessing the accounting principles used and significant estimates made by management, as well as evaluating the overall financial statement presentation.We believe that our audits provide a reasonable basis for our opinion.
In our opinion, the financial statements and financial highlights referred to above present fairly, in all material respects, the financial position of Dreyfus U.S.Treasury Reserves as of October 31, 2011, the results of its operations for the year then ended, the changes in its net assets for each of the years in the two-year period then ended, and the financial highlights for each of the years in the five-year period then ended, in conformity with U.S. generally accepted accounting principles.

New York, New York
December 22, 2011
IMPORTANT TAX INFORMATION (Unaudited)
For federal tax purposes the fund designates 100% as interest-related dividends in accordance with Sections 871(k)(1) and 881(e) of the Internal Revenue Code.
24

OFFICERS OF THE FUND (Unaudited)
BRADLEY J. SKAPYAK, President since January 2010.
Chief Operating Officer and a director of the Manager since June 2009. From April 2003 to June 2009, Mr. Skapyak was the head of the Investment Accounting and Support Department of the Manager. He is an officer of 75 investment companies (comprised of 167 portfolios) managed by the Manager. He is 52 years old and has been an employee of the Manager since February 1988.
MICHAEL A. ROSENBERG, Vice President and Secretary since August 2005.
Assistant General Counsel of BNY Mellon, and an officer of 76 investment companies (comprised of 192 portfolios) managed by the Manager. He is 51 years old and has been an employee of the Manager since October 1991.
KIESHA ASTWOOD, Vice President and Assistant Secretary since January 2010.
Counsel of BNY Mellon, and an officer of 76 investment companies (comprised of 192 portfolios) managed by the Manager. She is 38 years old and has been an employee of the Manager since July 1995.
JAMES BITETTO, Vice President and Assistant Secretary since August 2005.
Senior Counsel of BNY Mellon and Secretary of the Manager, and an officer of 76 investment companies (comprised of 192 portfolios) managed by the Manager. He is 45 years old and has been an employee of the Manager since December 1996.
JONI LACKS CHARATAN, Vice President and Assistant Secretary since August 2005.
Senior Counsel of BNY Mellon, and an officer of 76 investment companies (comprised of 192 portfolios) managed by the Manager. She is 55 years old and has been an employee of the Manager since October 1988.
JOSEPH M. CHIOFFI, Vice President and Assistant Secretary since August 2005.
Senior Counsel of BNY Mellon, and an officer of 76 investment companies (comprised of 192 portfolios) managed by the Manager. He is 49 years old and has been an employee of the Manager since June 2000.
KATHLEEN DENICHOLAS, Vice President and Assistant Secretary since January 2010.
Senior Counsel of BNY Mellon, and an officer of 76 investment companies (comprised of 192 portfolios) managed by the Manager. She is 37 years old and has been an employee of the Manager since February 2001.
JANETTE E. FARRAGHER, Vice President and Assistant Secretary since August 2005.
Assistant General Counsel of BNY Mellon, and an officer of 76 investment companies (comprised of 192 portfolios) managed by the Manager. She is 48 years old and has been an employee of the Manager since February 1984.
JOHN B. HAMMALIAN, Vice President and Assistant Secretary since August 2005.
Managing Counsel of BNY Mellon, and an officer of 76 investment companies (comprised of 192 portfolios) managed by the Manager. He is 48 years old and has been an employee of the Manager since February 1991.
M. CRISTINA MEISER, Vice President and Assistant Secretary since January 2010.
Senior Counsel of BNY Mellon, and an officer of 76 investment companies (comprised of 192 portfolios) managed by the Manager. She is 41 years old and has been an employee of the Manager since August 2001.
OFFICERS OF THE FUND (Unaudited) (continued)
ROBERT R. MULLERY, Vice President and Assistant Secretary since August 2005.
Managing Counsel of BNY Mellon, and an officer of 76 investment companies (comprised of 192 portfolios) managed by the Manager. He is 59 years old and has been an employee of the Manager since May 1986.
JEFF PRUSNOFSKY, Vice President and Assistant Secretary since August 2005.
Managing Counsel of BNY Mellon, and an officer of 76 investment companies (comprised of 192 portfolios) managed by the Manager. He is 46 years old and has been an employee of the Manager since October 1990.
JAMES WINDELS, Treasurer since November 2001.
Director – Mutual Fund Accounting of the Manager, and an officer of 76 investment companies (comprised of 192 portfolios) managed by the Manager. He is 53 years old and has been an employee of the Manager since April 1985.
RICHARD CASSARO, Assistant Treasurer since January 2008.
Senior Accounting Manager – Money Market and Municipal Bond Funds of the Manager, and an officer of 76 investment companies (comprised of 192 portfolios) managed by the Manager. He is 52 years old and has been an employee of the Manager since September 1982.
GAVIN C. REILLY, Assistant Treasurer since December 2005.
Tax Manager of the Investment Accounting and Support Department of the Manager, and an officer of 76 investment companies (comprised of 192 portfolios) managed by the Manager. He is 43 years old and has been an employee of the Manager since April 1991.
ROBERT ROBOL, Assistant Treasurer since December 2002.
Senior Accounting Manager – Fixed Income Funds of the Manager, and an officer of 76 investment companies (comprised of 192 portfolios) managed by the Manager. He is 47 years old and has been an employee of the Manager since October 1988.
ROBERT SALVIOLO, Assistant Treasurer since July 2007.
Senior Accounting Manager – Equity Funds of the Manager, and an officer of 76 investment companies (comprised of 192 portfolios) managed by the Manager. He is 44 years old and has been an employee of the Manager since June 1989.
ROBERT SVAGNA, Assistant Treasurer since December 2002.
Senior Accounting Manager – Equity Funds of the Manager, and an officer of 76 investment companies (comprised of 192 portfolios) managed by the Manager. He is 44 years old and has been an employee of the Manager since November 1990.
28
JOSEPH W. CONNOLLY, Chief Compliance Officer since October 2004.
Chief Compliance Officer of the Manager and The Dreyfus Family of Funds (76 investment companies, comprised of 192 portfolios). From November 2001 through March 2004, Mr. Connolly was first Vice-President, Mutual Fund Servicing for Mellon Global Securities Services. In that capacity, Mr. Connolly was responsible for managing Mellon’s Custody, Fund Accounting and Fund Administration services to third-party mutual fund clients. He is 54 years old and has served in various capacities with the Manager since 1980, including manager of the firm’s Fund Accounting Department from 1997 through October 2001.
STEPHEN J. STOREN, Anti-Money Laundering Compliance Officer since May 2011.
Chief Compliance Officer of the Distributor, and the Anti-Money Laundering Compliance Officer of 72 investment companies (comprised of 188 portfolios) managed by the Manager. He is 57 years old and has been an employee of the Distributor since October 1999.
Save time. Save paper. View your next shareholder report online as soon as it’s available. Log into www.dreyfus.com and sign up for Dreyfus eCommunications. It’s simple and only takes a few minutes.
The views expressed in this report reflect those of the portfolio manager only through the end of the period covered and do not necessarily represent the views of Dreyfus or any other person in the Dreyfus organization. Any such views are subject to change at any time based upon market or other conditions and Dreyfus disclaims any responsibility to update such views.These views may not be relied on as investment advice and, because investment decisions for a Dreyfus fund are based on numerous factors, may not be relied on as an indication of trading intent on behalf of any Dreyfus fund.
Not FDIC-Insured • Not Bank-Guaranteed • May Lose Value
| | Contents |
| | THE FUND |
| 2 | A Letter from the Chairman and CEO |
| 3 | Discussion of Fund Performance |
| 6 | Fund Performance |
| 8 | Understanding Your Fund’s Expenses |
| 8 | Comparing Your Fund’s Expenses With Those of Other Funds |
| 9 | Statement of Investments |
| 13 | Statement of Assets and Liabilities |
| 14 | Statement of Operations |
| 15 | Statement of Changes in Net Assets |
| 17 | Financial Highlights |
| 21 | Notes to Financial Statements |
| 33 | Report of Independent Registered Public Accounting Firm |
| 34 | Board Members Information |
| 36 | Officers of the Fund |
| | FOR MORE INFORMATION |
| | Back Cover |
Dreyfus
Small Cap Fund
The Fund

A LETTER FROM THE CHAIRMAN AND CEO
Dear Shareholder:
We present to you this annual report for Dreyfus Small Cap Fund, covering the 12-month period from November 1, 2010, through October 31, 2011. For information about how the fund performed during the reporting period, as well as general market perspectives, we provide a Discussion of Fund Performance on the pages that follow.
Investors were encouraged by expectations of a more robust economic recovery into the first quarter of 2011, but sentiment subsequently deteriorated due to disappointing economic data, rising commodity prices, an escalating sovereign debt crisis in Europe and a contentious debate regarding taxes, spending and borrowing in the United States. Stocks have been sensitive to these macroeconomic developments, often regardless of underlying company fundamentals. Indeed, market declines were particularly severe during August and September after a major credit rating agency downgraded U.S. long-term debt, while October ranked as one of the best months of the past decade.
The economic outlook currently remains clouded by market turbulence and political infighting, but we believe that a continued subpar global expansion is more likely than a return to recession. Although Europe continues to struggle with a debt crisis, inflationary pressures appear to be waning in most countries as energy prices recently have retreated from their highs. In the United States, moderately low core inflation and an accommodative monetary policy could help support near-trend growth despite ongoing deleveraging activity in the private sector.To assess the potential impact of these and other developments on your investments, we encourage you, as always, to speak with your financial advisor.
Thank you for your continued confidence and support.

Jonathan R. Baum
Chairman and Chief Executive Officer
The Dreyfus Corporation
November 15, 2011
2

DISCUSSION OF FUND PERFORMANCE
For the period of November 1, 2010, through October 31, 2011, as provided by David A. Daglio, Primary Portfolio Manager
Fund and Market Performance Overview
For the 12-month period ended October 31, 2011, Dreyfus Small Cap Fund’s Class A shares produced a total return of –0.49%, Class B shares returned –1.22%, Class C shares returned –1.22% and Class I shares returned –0.21%.1 In comparison, the fund’s benchmark, the Russell 2000 Index (the “Index”), produced a total return of 6.71%.2
Stocks generally rallied into the first quarter of 2011 as an economic recovery appeared to gain traction, but renewed macroeconomic concerns later caused the market to give back many of its previous gains. The fund produced lower returns than its benchmark, as skittish investors focused on expected headwinds over a short time horizon rather than adopting the longer-term view of company fundamentals favored by our investment approach.
The Fund’s Investment Approach
The fund seeks capital appreciation.To pursue this goal, the fund normally invests at least 80% of its net assets in stocks of small U.S. companies within the market capitalization range of the Russell 2000 at the time of purchase.We select stocks using a disciplined,“bottom-up” investment process that relies on proprietary fundamental research. Elements of the process include analysis of mid-cycle business prospects, estimation of the intrinsic value of the company and the identification of a revaluation trigger.The fund’s sector weightings and risk characteristics are a result of this bottom-up process and may vary from those of the benchmark at any given time.
Economic Concerns Sparked Heightened Market Volatility
Improving economic data supported investor sentiment over the first several months of the reporting period, sending stock prices higher. However, the rally was interrupted in February 2011 when political unrest in the Middle East led to sharply rising energy prices, and again in March when natural and nuclear disasters in Japan disrupted the global industrial supply chain. Nonetheless, stocks rebounded quickly from these unexpected shocks.
DISCUSSION OF FUND PERFORMANCE (continued)
In late April, investor sentiment began to deteriorate in earnest when Greece appeared headed for default on its sovereign debt, global economic data proved disappointing and a contentious debate regarding U.S. government spending and borrowing intensified. Stocks suffered heightened volatility over the summer of 2011 as newly risk-averse investors generally disregarded the long-term strengths of individual companies in favor of reacting to near-term macroeconomic develop-ments.Volatility was particularly severe in August and September, after a major credit-rating agency downgraded its assessment of long-term U.S. government debt. In contrast, the market rebounded strongly in October when some macroeconomic worries seemed to ease.
Deteriorating Investor Sentiment Dampened Fund Results
Our investment approach fell out of favor when investors proved unwilling to look beyond the next several months. As a result, stocks that we regarded favorably over a longer time horizon fared relatively poorly. For example, in the industrials sector, truck components manufacturer Meritor lost value when it announced a quarterly earnings shortfall, and air conditioning systems specialist Lennox International reduced earnings guidance due to a moribund commercial and residential construction environment. Underweighted exposure to the consumer staples and telecommunications services sectors also weighed on performance when traditionally defensive industry groups held up relatively well during the market downturn.
Weakness in these areas was offset to a degree by better results in other market sectors. In the energy sector, natural gas producers Gulfport Energy, SandRidge Energy and Cabot Oil & Gas benefited from increased production activity when commodity prices moved higher. In the consumer discretionary sector, women’s apparel maker Liz Claiborne gained value after announcing asset sales and a restructuring designed to unlock the value of its underlying brands.A relatively new holding, clothing retailer Express, posted improved same-store sales as young men and women responded favorably to the company’s fashions. In other areas, gaming company Bally Technologies advanced in anticipation of a casino equipment upgrade cycle, and rising automobile sales lifted the stock price of car dealer Group 1 Automotive.
4
Opportunities Among Attractively Valued Stocks
We remain committed to our investment approach, and we believe that investors’ focus on short-term results is likely to prove temporary. Indeed, we saw signs of a more rational market in October as investors found opportunities to purchase the stocks of fundamentally sound businesses at attractive prices.As of the reporting period’s end, we have found a number of value-oriented opportunities in the industrials sector, where capital equipment and transportation companies seem to be poised for better business conditions. We have added to the fund’s information technology holdings to take advantage of lower valuations among growing Internet and software companies.We have identified fewer opportunities in the materials sector, where moderating commodity prices could put pressure on earnings, and in the utilities sector, where few companies meet our valuation standards.
November 15, 2011
| |
| | Please note, the position in any security highlighted in italicized typeface was sold during the |
| | reporting period. |
| | Equity funds are subject generally to market, market sector, market liquidity, issuer and investment |
| | style risks, among other factors, to varying degrees, all of which are more fully described in the |
| | fund’s prospectus. |
| | Small companies carry additional risks because their earnings and revenues tend to be less predictable |
| | and their share prices more volatile than those of larger, more established companies.The shares of |
| | smaller companies tend to trade less frequently than those of larger, more established companies, which |
| | can adversely affect the pricing of these securities and the fund’s ability to sell these securities. |
| 1 | Total return includes reinvestment of dividends and any capital gains paid, and does not take into |
| | consideration the maximum initial sales charge in the case of Class A shares, or the applicable |
| | contingent deferred sales charges imposed on redemptions in the case of Class B and Class C |
| | shares. Had these charges been reflected, returns would have been lower. Past performance is no |
| | guarantee of future results. Share price and investment return fluctuate such that upon redemption, |
| | fund shares may be worth more or less than their original cost. Return figures provided reflect the |
| | absorption of certain fund expenses by The Dreyfus Corporation pursuant to an agreement in |
| | effect until March 1, 2011, at which point it was terminated. Had these expenses not been |
| | absorbed, the fund’s returns would have been lower. |
| 2 | SOURCE: LIPPER INC. — Reflects the reinvestment of dividends and, where applicable, |
| | capital gain distributions.The Russell 2000 Index is an unmanaged index of small-cap stock |
| | performance and is composed of the 2,000 smallest companies in the Russell 3000 Index.The |
| | Russell 3000 Index is composed of the 3,000 largest U.S. companies based on total market |
| | capitalization |
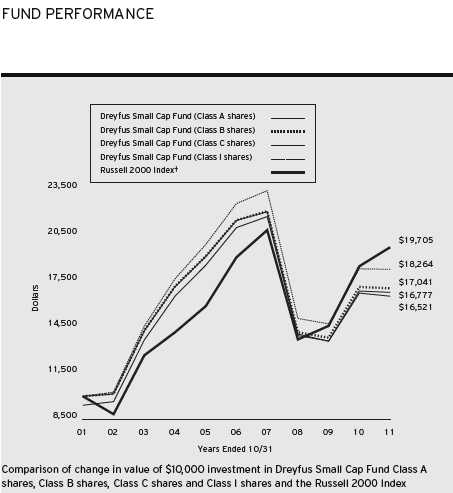
|
| † Source: Lipper Inc. |
| Past performance is not predictive of future performance. |
| The above graph compares a $10,000 investment made in each of the Class A, Class B, Class C and Class I shares of |
| Dreyfus Small Cap Fund on 10/31/01 to a $10,000 investment made in the Russell 2000 Index (the “Index”) on |
| that date.All dividends and capital gain distributions are reinvested. |
| The fund’s performance shown in the line graph above takes into account the maximum initial sales charge on Class A |
| shares and all other applicable fees and expenses on all classes. Performance for Class B shares assumes the conversion of |
| Class B shares to Class A shares at the end of the sixth year following the date of purchase.The Index is an unmanaged |
| index of small-cap stock performance and is composed of the 2,000 smallest companies in the Russell 3000 Index.The |
| Russell 3000 Index is composed of the 3,000 largest U.S. companies based on total market capitalization. Unlike a |
| mutual fund, the Index is not subject to charges, fees and other expenses. Investors cannot invest directly in any index. |
| Further information relating to fund performance, including expense reimbursements, if applicable, is contained in the |
| Financial Highlights section of the prospectus and elsewhere in this report. |
6
| | | | | | |
| Average Annual Total Returns as of 10/31/11 | | |
| |
| | 1Year | 5 Years | 10 Years |
| Class A shares | | | |
| with maximum sales charge (5.75%) | –6.19% | –5.51% | 5.31% |
| without sales charge | –0.49% | –4.38% | 5.94% |
| Class B shares | | | |
| with applicable redemption charge † | –5.17% | –5.38% | 5.48% |
| without redemption | –1.22% | –5.09% | 5.48% |
| Class C shares | | | |
| with applicable redemption charge †† | –2.21% | –5.09% | 5.15% |
| without redemption | –1.22% | –5.09% | 5.15% |
| Class I shares | –0.21% | –4.13% | 6.21% |
| Russell 2000 Index | 6.71% | 0.68% | 7.02% |
| |
| Past performance is not predictive of future performance.The fund’s performance shown in the graph and table does not |
| reflect the deduction of taxes that a shareholder would pay on fund distributions or the redemption of fund shares. |
| † | The maximum contingent deferred sales charge for Class B shares is 4%.After six years Class B shares convert to |
| | Class A shares. |
| †† | The maximum contingent deferred sales charge for Class C shares is 1% for shares redeemed within one year of the |
| | date of purchase. |
UNDERSTANDING YOUR FUND’S EXPENSES (Unaudited)
As a mutual fund investor, you pay ongoing expenses, such as management fees and other expenses. Using the information below, you can estimate how these expenses affect your investment and compare them with the expenses of other funds.You also may pay one-time transaction expenses, including sales charges (loads) and redemption fees, which are not shown in this section and would have resulted in higher total expenses. For more information, see your fund’s prospectus or talk to your financial adviser.
Review your fund’s expenses
The table below shows the expenses you would have paid on a $1,000 investment in Dreyfus Small Cap Fund from May 1, 2011 to October 31, 2011. It also shows how much a $1,000 investment would be worth at the close of the period, assuming actual returns and expenses.
| | | | | | | | |
| Expenses and Value of a $1,000 Investment | | | | | | |
| assuming actual returns for the six months ended October 31, 2011 | | | | |
| | | Class A | | Class B | | Class C | | Class I |
| Expenses paid per $1,000† | $ | 6.81 | $ | 10.21 | $ | 10.21 | $ | 5.68 |
| Ending value (after expenses) | $ | 802.40 | $ | 799.60 | $ | 799.70 | $ | 803.80 |
|
| COMPARING YOUR FUND’S EXPENSES�� |
| WITH THOSE OF OTHER FUNDS (Unaudited) |
Using the SEC’s method to compare expenses
The Securities and Exchange Commission (SEC) has established guidelines to help investors assess fund expenses. Per these guidelines, the table below shows your fund’s expenses based on a $1,000 investment, assuming a hypothetical 5% annualized return. You can use this information to compare the ongoing expenses (but not transaction expenses or total cost) of investing in the fund with those of other funds.All mutual fund shareholder reports will provide this information to help you make this comparison. Please note that you cannot use this information to estimate your actual ending account balance and expenses paid during the period.
| | | | | | | | |
| Expenses and Value of a $1,000 Investment | | | | | | |
| assuming a hypothetical 5% annualized return for the six months ended October 31, 2011 |
| | | Class A | | Class B | | Class C | | Class I |
| Expenses paid per $1,000† | $ | 7.63 | $ | 11.42 | $ | 11.42 | $ | 6.36 |
| Ending value (after expenses) | $ | 1,017.64 | $ | 1,013.86 | $ | 1,013.86 | $ | 1,018.90 |
† Expenses are equal to the fund’s annualized expense ratio of 1.50% for Class A, 2.25% for Class B, 2.25% for Class C and 1.25% for Class I, multiplied by the average account value over the period, multiplied by 184/365 (to reflect the one-half year period).
8
|
| STATEMENT OF INVESTMENTS |
| October 31, 2011 |
| | | |
| Common Stocks—98.2% | Shares | Value ($) |
| Consumer Discretionary—37.7% | | |
| American Axle & Manufacturing Holdings | 29,299a | 283,907 |
| Bally Technologies | 20,520a | 744,260 |
| Dana Holding | 86,320a,b | 1,220,565 |
| DFC Global | 42,830a | 938,833 |
| Equifax | 24,990 | 878,398 |
| Express | 56,960 | 1,286,726 |
| Group 1 Automotive | 21,390b | 974,528 |
| Guess? | 11,810 | 389,612 |
| ICF International | 43,010a | 1,005,574 |
| Kelly Services, Cl. A | 78,060 | 1,276,281 |
| Liz Claiborne | 282,531a,b | 2,263,073 |
| Meritage Homes | 78,790a | 1,398,523 |
| Meritor | 202,210a | 1,925,039 |
| Mohawk Industries | 14,210a | 748,157 |
| Saks | 162,950a,b | 1,722,382 |
| ScanSource | 51,150a | 1,777,974 |
| Shuffle Master | 53,400a | 566,574 |
| Standard-Pacific | 203,620a,b | 619,005 |
| Steelcase, Cl. A | 98,060 | 726,625 |
| Tower International | 33,190a | 408,569 |
| TrueBlue | 15,540a | 205,439 |
| Williams-Sonoma | 42,640 | 1,600,706 |
| Wright Express | 36,110a | 1,692,837 |
| | | 24,653,587 |
| Consumer Staples—.9% | | |
| Dole Food | 33,200a,b | 351,256 |
| Primo Water | 41,550b | 252,624 |
| | | 603,880 |
| Energy—4.3% | | |
| Gulfport Energy | 44,800a | 1,395,072 |
| Resolute Energy | 23,980a,b | 311,740 |
| SandRidge Energy | 141,580a,b | 1,084,503 |
| | | 2,791,315 |
STATEMENT OF INVESTMENTS (continued)
| | | |
| Common Stocks (continued) | Shares | Value ($) |
| Financial—9.8% | | |
| Arthur J. Gallagher & Co. | 24,620 | 760,758 |
| Brown & Brown | 58,430 | 1,290,134 |
| Employers Holdings | 47,560 | 771,423 |
| Jones Lang LaSalle | 19,540 | 1,262,675 |
| National Penn Bancshares | 33,370 | 260,286 |
| Nelnet, Cl. A | 14,100 | 302,868 |
| Och-Ziff Capital Management Group, Cl. A | 47,990 | 523,571 |
| Portfolio Recovery Associates | 14,360a,b | 1,007,210 |
| Starwood Property Trust | 12,700b,c | 238,633 |
| | | 6,417,558 |
| Health Care—8.8% | | |
| Align Technology | 38,960a | 897,249 |
| Durect | 94,600a | 150,414 |
| Emergent BioSolutions | 83,860a,b | 1,581,599 |
| Hanger Orthopedic Group | 85,200a | 1,479,924 |
| Onyx Pharmaceuticals | 11,700a | 478,881 |
| Sagent Pharmaceuticals | 18,570b | 474,464 |
| Salix Pharmaceuticals | 10,540a,b | 361,048 |
| United Therapeutics | 7,300a | 319,229 |
| | | 5,742,808 |
| Industrial—15.9% | | |
| Columbus McKinnon | 51,380a | 770,186 |
| Con-way | 16,630 | 490,086 |
| Endeavour International | 61,130a,b | 567,286 |
| Granite Construction | 47,300b | 1,064,250 |
| Griffon | 26,810a | 253,891 |
| Herman Miller | 31,520b | 650,888 |
| Landstar System�� | 24,930 | 1,112,626 |
| Orion Marine Group | 50,390a | 342,148 |
| Oshkosh | 46,620a | 972,493 |
| Saia | 19,730a | 263,396 |
| Sterling Construction | 24,970a | 310,877 |
| Trinity Industries | 24,790 | 676,023 |
| UTi Worldwide | 104,200 | 1,522,362 |
| Watts Water Technologies, Cl. A | 22,850 | 719,547 |
10
| | | |
| Common Stocks (continued) | Shares | Value ($) |
| Industrial (continued) | | |
| Zoltek | 87,530a,b | 634,593 |
| | | 10,350,652 |
| Information Technology—16.7% | | |
| Brocade Communications Systems | 88,980a | 389,732 |
| CSG Systems International | 57,010a | 811,822 |
| DealerTrack Holdings | 97,430a | 2,113,256 |
| Encore Wire | 33,006b | 877,299 |
| Hubbell, Cl. B | 6,020 | 359,936 |
| JDS Uniphase | 75,420a | 905,040 |
| Kenexa | 12,840a | 293,651 |
| MICROS Systems | 19,570a | 963,235 |
| Microsemi | 68,400a | 1,262,664 |
| SYKES Enterprises | 18,350a | 292,316 |
| Take-Two Interactive Software | 47,280a | 746,078 |
| Velti | 160,180a | 1,348,716 |
| Vishay Intertechnology | 49,430a | 531,373 |
| | | 10,895,118 |
| Materials—1.2% | | |
| Cytec Industries | 2,570 | 114,802 |
| Georgia Gulf | 21,980a | 397,838 |
| Omnova Solutions | 55,070a | 243,960 |
| | | 756,600 |
| Telecommunication | | |
| Services—2.9% | | |
| Cbeyond | 38,780a | 319,547 |
| GeoEye | 46,870a,b | 1,573,426 |
| | | 1,892,973 |
| Total Common Stocks | | |
| (cost $66,477,349) | | 64,104,491 |
| |
| Other Investment—1.8% | | |
| Registered Investment Company; | | |
| Dreyfus Institutional Preferred | | |
| Plus Money Market Fund | | |
| (cost $1,189,731) | 1,189,731d | 1,189,731 |
STATEMENT OF INVESTMENTS (continued)
| | | | |
| Investment of Cash Collateral | | |
| for Securities Loaned—19.4% | Shares | Value ($) |
| Registered Investment Company; | | |
| Dreyfus Institutional Cash Advantage Fund | | |
| (cost $12,676,147) | 12,676,147d | 12,676,147 |
| Total Investments (cost $80,343,227) | 119.4% | 77,970,369 |
| Liabilities, Less Cash and Receivables | (19.4%) | (12,664,404) |
| Net Assets | 100.0% | 65,305,965 |
|
| a Non-income producing security. |
| b Security, or portion thereof, on loan.At October 31, 2011, the value of the fund’s securities on loan was |
| $11,737,206 and the value of the collateral held by the fund was $12,676,147. |
| c Investment in real estate investment trust. |
| d Investment in affiliated money market mutual fund. |
| | | |
| Portfolio Summary (Unaudited)† | | |
| |
| | Value (%) | | Value (%) |
| Consumer Discretionary | 37.7 | Energy | 4.3 |
| Money Market Investments | 21.2 | Telecommunication Services | 2.9 |
| Information Technology | 16.7 | Materials | 1.2 |
| Industrial | 15.9 | Consumer Staples | .9 |
| Financial | 9.8 | | |
| Health Care | 8.8 | | 119.4 |
| |
| † Based on net assets. | | | |
| See notes to financial statements. | | | |
12
|
| STATEMENT OF ASSETS AND LIABILITIES |
| October 31, 2011 |
| | | | | |
| | | | Cost | Value |
| Assets ($): | | | | |
| Investments in securities—See Statement of Investments (including | | |
| securities on loan, valued at $11,737,206)—Note 1(b): | | | |
| Unaffiliated issuers | | | 66,477,349 | 64,104,491 |
| Affiliated issuers | | | 13,865,878 | 13,865,878 |
| Cash | | | | 11,808 |
| Receivable for investment securities sold | | | 945,635 |
| Receivable for shares of Capital Stock subscribed | | | 80,056 |
| Dividends and securities lending income receivable | | | 13,994 |
| | | | | 79,021,862 |
| Liabilities ($): | | | | |
| Due to The Dreyfus Corporation and affiliates—Note 3(b) | | | 79,018 |
| Liability for securities on loan—Note 1(b) | | | | 12,676,147 |
| Payable for investment securities purchased | | | 575,060 |
| Payable for shares of Capital Stock redeemed | | | 385,672 |
| | | | | 13,715,897 |
| Net Assets ($) | | | | 65,305,965 |
| Composition of Net Assets ($): | | | | |
| Paid-in capital | | | | 202,958,573 |
| Accumulated net realized gain (loss) on investments | | | (135,279,750) |
| Accumulated net unrealized appreciation | | | |
| (depreciation) on investments | | | | (2,372,858) |
| Net Assets ($) | | | | 65,305,965 |
| |
| |
| Net Asset Value Per Share | | | | |
| | Class A | Class B | Class C | Class I |
| Net Assets ($) | 42,980,755 | 299,152 | 6,352,947 | 15,673,111 |
| Shares Outstanding | 3,015,441 | 23,072 | 489,508 | 1,078,083 |
| Net Asset Value Per Share ($) | 14.25 | 12.97 | 12.98 | 14.54 |
| |
| See notes to financial statements. | | | | |
|
| STATEMENT OF OPERATIONS |
| Year Ended October 31, 2011 |
| | |
| Investment Income ($): | |
| Income: | |
| Cash dividends: | |
| Unaffiliated issuers | 682,904 |
| Affiliated issuers | 1,129 |
| Income from securities lending—Note 1(b) | 29,629 |
| Total Income | 713,662 |
| Expenses: | |
| Management fee—Note 3(a) | 973,175 |
| Distribution and service plan fees—Note 3(b) | 219,633 |
| Directors’ fees—Note 3(a) | 4,080 |
| Loan commitment fees—Note 2 | 1,032 |
| Interest expense—Note 2 | 342 |
| Total Expenses | 1,198,262 |
| Less—reduction in management fee due to undertaking—Note 3(a) | (56,235) |
| Less—Directors’ fees reimbursed by the Manager—Note 3(a) | (4,080) |
| Net Expenses | 1,137,947 |
| Investment (Loss)—Net | (424,285) |
| Realized and Unrealized Gain (Loss) on Investments—Note 4 ($): | |
| Net realized gain (loss) on investments | 7,700,390 |
| Net unrealized appreciation (depreciation) on investments | (6,469,033) |
| Net Realized and Unrealized Gain (Loss) on Investments | 1,231,357 |
| Net Increase in Net Assets Resulting from Operations | 807,072 |
| |
| See notes to financial statements. | |
14
STATEMENT OF CHANGES IN NET ASSETS
| | | | |
| | Year Ended October 31, |
| | 2011 | 2010 |
| Operations ($): | | |
| Investment income (loss)—net | (424,285) | 32,236 |
| Net realized gain (loss) on investments | 7,700,390 | 5,480,673 |
| Net unrealized appreciation | | |
| (depreciation) on investments | (6,469,033) | 10,144,251 |
| Net Increase (Decrease) in Net Assets | | |
| Resulting from Operations | 807,072 | 15,657,160 |
| Dividends to Shareholders from ($): | | |
| Investment income—net: | | |
| Class A Shares | — | (362,526) |
| Class B Shares | — | (6,994) |
| Class C Shares | — | (23,863) |
| Class I Shares | — | (297,922) |
| Total Dividends | — | (691,305) |
| Capital Stock Transactions ($): | | |
| Net proceeds from shares sold: | | |
| Class A Shares | 12,771,446 | 25,919,643 |
| Class B Shares | 5,159 | 3,754 |
| Class C Shares | 290,787 | 634,667 |
| Class I Shares | 4,430,844 | 5,898,069 |
| Dividends reinvested: | | |
| Class A Shares | — | 278,585 |
| Class B Shares | — | 4,818 |
| Class C Shares | — | 14,047 |
| Class I Shares | — | 280,775 |
| Cost of shares redeemed: | | |
| Class A Shares | (19,368,165) | (27,433,035) |
| Class B Shares | (2,490,066) | (2,266,857) |
| Class C Shares | (2,096,120) | (2,341,075) |
| Class I Shares | (6,389,249) | (17,704,190) |
| Increase (Decrease) in Net Assets | | |
| from Capital Stock Transactions | (12,845,364) | (16,710,799) |
| Total Increase (Decrease) in Net Assets | (12,038,292) | (1,744,944) |
| Net Assets ($): | | |
| Beginning of Period | 77,344,257 | 79,089,201 |
| End of Period | 65,305,965 | 77,344,257 |
| Undistributed investment income—net | — | 419 |
STATEMENT OF CHANGES IN NET ASSETS (continued)
| | | | |
| | Year Ended October 31, |
| | 2011 | 2010 |
| Capital Share Transactions: | | |
| Class Aa | | |
| Shares sold | 812,956 | 1,859,502 |
| Shares issued for dividends reinvested | — | 22,705 |
| Shares redeemed | (1,238,499) | (2,056,006) |
| Net Increase (Decrease) in Shares Outstanding | (425,543) | (173,799) |
| Class Ba | | |
| Shares sold | 350 | 333 |
| Shares issued for dividends reinvested | — | 425 |
| Shares redeemed | (167,801) | (190,870) |
| Net Increase (Decrease) in Shares Outstanding | (167,451) | (190,112) |
| Class C | | |
| Shares sold | 20,718 | 52,415 |
| Shares issued for dividends reinvested | — | 1,240 |
| Shares redeemed | (148,296) | (197,327) |
| Net Increase (Decrease) in Shares Outstanding | (127,578) | (143,672) |
| Class I | | |
| Shares sold | 281,819 | 440,887 |
| Shares issued for dividends reinvested | — | 22,552 |
| Shares redeemed | (401,173) | (1,354,228) |
| Net Increase (Decrease) in Shares Outstanding | (119,354) | (890,789) |
| |
| a | During the period ended October 31, 2011, 41,299 Class B shares representing $612,291 were automatically |
| | converted to 37,736 Class A shares and during the period ended October 31, 2010, 36,376 Class B shares |
| | representing $431,310 were automatically converted to 33,442 Class A shares. |
| See notes to financial statements. |
16
FINANCIAL HIGHLIGHTS
The following tables describe the performance for each share class for the fiscal periods indicated.All information (except portfolio turnover rate) reflects financial results for a single fund share.Total return shows how much your investment in the fund would have increased (or decreased) during each period, assuming you had reinvested all dividends and distributions.These figures have been derived from the fund’s financial statements.
| | | | | | | | | | |
| | | Year Ended October 31, | |
| Class A Shares | 2011 | 2010 | 2009 | 2008 | 2007 |
| Per Share Data ($): | | | | | |
| Net asset value, beginning of period | 14.32 | 11.65 | 12.09 | 22.34 | 23.55 |
| Investment Operations: | | | | | |
| Investment income (loss)—neta | (.08) | .01 | .12 | .06 | .06 |
| Net realized and unrealized | | | | | |
| gain (loss) on investments | .01 | 2.77 | (.44) | (7.11) | .72 |
| Total from Investment Operations | (.07) | 2.78 | (.32) | (7.05) | .78 |
| Distributions: | | | | | |
| Dividends from investment income—net | — | (.11) | (.12) | — | (.02) |
| Dividends from net realized | | | | | |
| gain on investments | — | — | — | (3.20) | (1.97) |
| Total Distributions | — | (.11) | (.12) | (3.20) | (1.99) |
| Net asset value, end of period | 14.25 | 14.32 | 11.65 | 12.09 | 22.34 |
| Total Return (%)b | (.49) | 23.97 | (2.56) | (35.70) | 3.42 |
| Ratios/Supplemental Data (%): | | | | | |
| Ratio of total expenses | | | | | |
| to average net assets | 1.51 | 1.50 | 1.51 | 1.51 | 1.50 |
| Ratio of net expenses | | | | | |
| to average net assets | 1.43 | 1.32 | 1.36 | 1.36 | 1.42 |
| Ratio of net investment income | | | | | |
| (loss) to average net assets | (.52) | .05 | 1.14 | .34 | .27 |
| Portfolio Turnover Rate | 93.87 | 206.27 | 97.34 | 78.10 | 66.35 |
| Net Assets, end of period ($ x 1,000) | 42,981 | 49,285 | 42,115 | 77,814 | 223,590 |
| |
| a | Based on average shares outstanding at each month end. |
| b | Exclusive of sales charge. |
| See notes to financial statements. |
FINANCIAL HIGHLIGHTS (continued)
| | | | | | | | | | |
| | | Year Ended October 31, | |
| Class B Shares | 2011 | 2010 | 2009 | 2008 | 2007 |
| Per Share Data ($): | | | | | |
| Net asset value, beginning of period | 13.13 | 10.69 | 11.05 | 20.86 | 22.25 |
| Investment Operations: | | | | | |
| Investment income (loss)—neta | (.12) | (.07) | .04 | (.06) | (.10) |
| Net realized and unrealized | | | | | |
| gain (loss) on investments | (.04) | 2.53 | (.40) | (6.55) | .68 |
| Total from Investment Operations | (.16) | 2.46 | (.36) | (6.61) | .58 |
| Distributions: | | | | | |
| Dividends from investment income—net | — | (.02) | — | — | — |
| Dividends from net realized | | | | | |
| gain on investments | — | — | — | (3.20) | (1.97) |
| Total Distributions | — | (.02) | — | (3.20) | (1.97) |
| Net asset value, end of period | 12.97 | 13.13 | 10.69 | 11.05 | 20.86 |
| Total Return (%)b | (1.22) | 23.04 | (3.26) | (36.20) | 2.65 |
| Ratios/Supplemental Data (%): | | | | | |
| Ratio of total expenses | | | | | |
| to average net assets | 2.25 | 2.26 | 2.26 | 2.26 | 2.25 |
| Ratio of net expenses | | | | | |
| to average net assets | 2.13 | 2.07 | 2.11 | 2.11 | 2.17 |
| Ratio of net investment income | | | | | |
| (loss) to average net assets | (.92) | (.61) | .38 | (.42) | (.46) |
| Portfolio Turnover Rate | 93.87 | 206.27 | 97.34 | 78.10 | 66.35 |
| Net Assets, end of period ($ x 1,000) | 299 | 2,501 | 4,068 | 6,589 | 18,876 |
| |
| a | Based on average shares outstanding at each month end. |
| b | Exclusive of sales charge. |
| See notes to financial statements. |
18
| | | | | | | | | | |
| | | Year Ended October 31, | |
| Class C Shares | 2011 | 2010 | 2009 | 2008 | 2007 |
| Per Share Data ($): | | | | | |
| Net asset value, beginning of period | 13.14 | 10.71 | 11.07 | 20.89 | 22.28 |
| Investment Operations: | | | | | |
| Investment income (loss)—neta | (.18) | (.08) | .03 | (.06) | (.10) |
| Net realized and unrealized | | | | | |
| gain (loss) on investments | .02 | 2.54 | (.39) | (6.56) | .68 |
| Total from Investment Operations | (.16) | 2.46 | (.36) | (6.62) | .58 |
| Distributions: | | | | | |
| Dividends from investment income—net | — | (.03) | — | — | — |
| Dividends from net realized | | | | | |
| gain on investments | — | — | — | (3.20) | (1.97) |
| Total Distributions | — | (.03) | — | (3.20) | (1.97) |
| Net asset value, end of period | 12.98 | 13.14 | 10.71 | 11.07 | 20.89 |
| Total Return (%)b | (1.22) | 23.15 | (3.34) | (36.19) | 2.65 |
| Ratios/Supplemental Data (%): | | | | | |
| Ratio of total expenses | | | | | |
| to average net assets | 2.26 | 2.25 | 2.26 | 2.26 | 2.25 |
| Ratio of net expenses | | | | | |
| to average net assets | 2.18 | 2.07 | 2.11 | 2.11 | 2.17 |
| Ratio of net investment income | | | | | |
| (loss) to average net assets | (1.26) | (.66) | .37 | (.43) | (.48) |
| Portfolio Turnover Rate | 93.87 | 206.27 | 97.34 | 78.10 | 66.35 |
| Net Assets, end of period ($ x 1,000) | 6,353 | 8,108 | 8,145 | 11,935 | 34,161 |
| |
| a | Based on average shares outstanding at each month end. |
| b | Exclusive of sales charge. |
| See notes to financial statements. |
FINANCIAL HIGHLIGHTS (continued)
| | | | | | | | | | |
| | | Year Ended October 31, | |
| Class I Shares | 2011 | 2010 | 2009 | 2008 | 2007a |
| Per Share Data ($): | | | | | |
| Net asset value, beginning of period | 14.57 | 11.86 | 12.33 | 22.72 | 23.92 |
| Investment Operations: | | | | | |
| Investment income (loss)—netb | (.04) | .05 | .15 | .11 | .13 |
| Net realized and unrealized | | | | | |
| gain (loss) on investments | .01 | 2.80 | (.45) | (7.26) | .72 |
| Total from Investment Operations | (.03) | 2.85 | (.30) | (7.15) | .85 |
| Distributions: | | | | | |
| Dividends from investment income—net | — | (.14) | (.17) | (.04) | (.08) |
| Dividends from net realized | | | | | |
| gain on investments | — | — | — | (3.20) | (1.97) |
| Total Distributions | — | (.14) | (.17) | (3.24) | (2.05) |
| Net asset value, end of period | 14.54 | 14.57 | 11.86 | 12.33 | 22.72 |
| Total Return (%) | (.21) | 24.37 | (2.34) | (35.57) | 3.68 |
| Ratios/Supplemental Data (%): | | | | | |
| Ratio of total expenses | | | | | |
| to average net assets | 1.26 | 1.25 | 1.26 | 1.26 | 1.25 |
| Ratio of net expenses | | | | | |
| to average net assets | 1.18 | 1.07 | 1.11 | 1.11 | 1.16 |
| Ratio of net investment income | | | | | |
| (loss) to average net assets | (.25) | .40 | 1.48 | .62 | .57 |
| Portfolio Turnover Rate | 93.87 | 206.27 | 97.34 | 78.10 | 66.35 |
| Net Assets, end of period ($ x 1,000) | 15,673 | 17,449 | 24,761 | 68,233 | 263,262 |
| |
| a | Effective June 1, 2007, Class R shares were redesignated as Class I shares. |
| b | Based on average shares outstanding at each month end. |
| See notes to financial statements. |
20
NOTES TO FINANCIAL STATEMENTS
NOTE 1—Significant Accounting Policies:
Dreyfus Small Cap Fund (the “fund”) is a separate diversified series of The Dreyfus/Laurel Funds, Inc. (the “Company”), which is registered under the Investment Company Act of 1940, as amended (the “Act”), as an open-end management investment company and operates as a series company currently offering ten series, including the fund. The fund’s investment objective is to seek capital appreciation.The Dreyfus Corporation (the “Manager” or “Dreyfus”), a wholly-owned subsidiary of The Bank of New York Mellon Corporation (“BNY Mellon”), serves as the fund’s investment adviser.
On July 29, 2010, the fund’s Board of Directors approved, effective November 30, 2010, to close the fund to new investors.
MBSC Securities Corporation (the “Distributor”), a wholly-owned subsidiary of the Manager, is the distributor of the fund’s shares. The fund is authorized to issue 600 million shares of $.001 par value shares of Capital Stock.The fund currently offers four classes of shares: Class A (300 million shares authorized), Class B (100 million shares authorized), Class C (100 million shares authorized) and Class I (100 million shares authorized). Class A, Class B and Class C shares are sold primarily to retail investors through financial intermediaries and bear a distribution fee and/or service fee. Class A shares are sold with a front end sales charge, while Class B and Class C are subject to a contingent deferred sales charge (“CDSC”). Class B shares automatically convert to Class A shares after six years.The fund no longer offers Class B shares, except in connection with dividend reinvestment and permitted exchanges of Class B shares and, effective on or about March 13, 2012, all outstanding Class B shares will automatically convert to Class A shares. Class I shares are sold primarily to bank trust departments and other financial services providers (including The Bank of New York Mellon, a subsidiary of BNY Mellon and an affiliate of Dreyfus, and its affiliates) acting on behalf of customers having a qualified or investment account or relationship at such institution, and bear no distribution or service fee. Class I shares are offered without a front-end sales charge or
NOTES TO FINANCIAL STATEMENTS (continued)
CDSC. Each class of shares has identical rights and privileges, except with respect to distribution and service fees and voting rights on matters affecting a single class. Income, expenses (other than expenses attributable to a specific class), and realized and unrealized gains or losses on investments are allocated to each class of shares based on its relative net assets.
The Financial Accounting Standards Board (“FASB”) Accounting Standards Codification (“ASC”) is the exclusive reference of authoritative U.S. generally accepted accounting principles (“GAAP”) recognized by the FASB to be applied by nongovernmental entities. Rules and interpretive releases of the Securities and Exchange Commission (“SEC”) under authority of federal laws are also sources of authoritative GAAP for SEC registrants. The fund’s financial statements are prepared in accordance with GAAP, which may require the use of management estimates and assumptions.Actual results could differ from those estimates.
(a) Portfolio valuation: The fair value of a financial instrument is the amount that would be received to sell an asset or paid to transfer a liability in an orderly transaction between market participants at the measurement date (i.e. the exit price). GAAP establishes a fair value hierarchy that prioritizes the inputs of valuation techniques used to measure fair value.This hierarchy gives the highest priority to unadjusted quoted prices in active markets for identical assets or liabilities (Level 1 measurements) and the lowest priority to unobservable inputs (Level 3 measurements).
Additionally, GAAP provides guidance on determining whether the volume and activity in a market has decreased significantly and whether such a decrease in activity results in transactions that are not orderly. GAAP requires enhanced disclosures around valuation inputs and techniques used during annual and interim periods.
22
Various inputs are used in determining the value of the fund’s investments relating to fair value measurements.These inputs are summarized in the three broad levels listed below:
Level 1—unadjusted quoted prices in active markets for identical investments.
Level 2—other significant observable inputs (including quoted prices for similar investments, interest rates, prepayment speeds, credit risk, etc.).
Level 3—significant unobservable inputs (including the fund’s own assumptions in determining the fair value of investments).
The inputs or methodology used for valuing securities are not necessarily an indication of the risk associated with investing in those securities.
Changes in valuation techniques may result in transfers in or out of an assigned level within the disclosure hierarchy. Valuation techniques used to value the fund’s investments are as follows:
Investments in securities are valued at the last sales price on the securities exchange or national securities market on which such securities are primarily traded. Securities listed on the National Market System for which market quotations are available are valued at the official closing price or, if there is no official closing price that day, at the last sales price. Securities not listed on an exchange or the national securities market, or securities for which there were no transactions, are valued at the average of the most recent bid and asked prices, except for open short positions, where the asked price is used for valuation purposes. Bid price is used when no asked price is available. Registered investment companies that are not traded on an exchange are valued at their net asset value. All preceding securities are categorized within Level 1 of the fair value hierarchy.
NOTES TO FINANCIAL STATEMENTS (continued)
Fair valuing of securities may be determined with the assistance of a pricing service using calculations based on indices of domestic securities and other appropriate indicators, such as prices of relevant American Depository Receipts and futures contracts. Utilizing these techniques may result in transfers between Level 1 and Level 2 of the fair value hierarchy.
When market quotations or official closing prices are not readily available, or are determined not to reflect accurately fair value, such as when the value of a security has been significantly affected by events after the close of the exchange or market on which the security is principally traded (for example, a foreign exchange or market), but before the fund calculates its net asset value, the fund may value these investments at fair value as determined in accordance with the procedures approved by the Board of Directors. Certain factors may be considered when fair valuing investments such as: fundamental analytical data, the nature and duration of restrictions on disposition, an evaluation of the forces that influence the market in which the securities are purchased and sold, and public trading in similar securities of the issuer or comparable issuers. These securities are either categorized as Level 2 or 3 depending on the relevant inputs used.
For restricted securities where observable inputs are limited, assumptions about market activity and risk are used and are categorized within Level 3 of the fair value hierarchy.
The following is a summary of the inputs used as of October 31, 2011 in valuing the fund’s investments:
| | | | |
| | | Level 2—Other | Level 3— | |
| | Level 1— | Significant | Significant | |
| | Unadjusted | Observable | Unobservable | |
| | Quoted Prices | Inputs | Inputs | Total |
| Assets ($) | | | | |
| Investments in Securities | | | |
| Equity Securities— | | | | |
| Domestic† | 61,233,413 | — | — | 61,233,413 |
| Equity Securities— | | | | |
| Foreign† | 2,871,078 | — | — | 2,871,078 |
| Mutual Funds | 13,865,878 | — | — | 13,865,878 |
| † See Statement of Investments for additional detailed categorizations. | |
24
In May 2011, FASB issued Accounting Standards Update (“ASU”) No. 2011-04 “Amendments to Achieve Common Fair Value Measurement and Disclosure Requirements in GAAP and International Financial Reporting Standards (“IFRS”)” (“ASU 2011-04”). ASU 2011-04 includes common requirements for measurement of and disclosure about fair value between GAAP and IFRS. ASU 2011-04 will require reporting entities to disclose the following information for fair value measurements categorized within Level 3 of the fair value hierarchy: quantitative information about the unobservable inputs used in the fair value measurement, the valuation processes used by the reporting entity and a narrative description of the sensitivity of the fair value measurement to changes in unobservable inputs and the interrelationships between those unobservable inputs. In addition, ASU 2011-04 will require reporting entities to make disclosures about amounts and reasons for all transfers in and out of Level 1 and Level 2 fair value measurements.The new and revised disclosures are effective for interim and annual reporting periods beginning after December 15, 2011. At this time, management is evaluating the implications of ASU 2011-04 and its impact on the financial statements.
(b) Securities transactions and investment income: Securities transactions are recorded on a trade date basis. Realized gains and losses from securities transactions are recorded on the identified cost basis. Dividend income is recognized on the ex-dividend date and interest income, including, where applicable, accretion of discount and amortization of premium on investments, is recognized on the accrual basis.
Pursuant to a securities lending agreement with The Bank of New York Mellon, the fund may lend securities to qualified institutions. It is the funds policy that, at origination, all loans are secured by collateral of at least 102% of the value of U.S. securities loaned and 105% of the value of foreign securities loaned. Collateral equivalent to at least 100% of the market value of securities on loan is maintained at all times. Collateral is either in the form of cash, which can be invested in certain money market mutual funds managed by the Manager, U.S.
NOTES TO FINANCIAL STATEMENTS (continued)
Government and Agency securities or letters of credit. The fund is entitled to receive all income on securities loaned, in addition to income earned as a result of the lending transaction. Although each security loaned is fully collateralized, the fund bears the risk of delay in recovery of, or loss of rights in, the securities loaned should a borrower fail to return the securities in a timely manner. During the period ended October 31, 2011, The Bank of New York Mellon earned $12,698 from lending portfolio securities, pursuant to the securities lending agreement.
(c) Affiliated issuers: Investments in other investment companies advised by Dreyfus are defined as “affiliated” in the Act.
The fund may invest in shares of certain affiliated investment companies also advised or managed by Dreyfus. Investments in affiliated investment companies for the period ended October 31, 2011 were as follows:
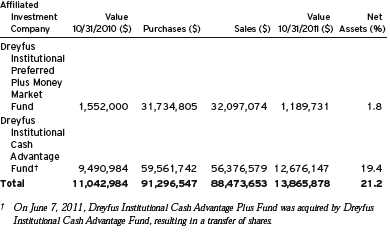
(d) Dividends to shareholders: Dividends are recorded on the ex-dividend date. Dividends from investment income-net and dividends from net realized capital gains, if any, are normally declared and paid annually, but the fund may make distributions on a more frequent basis to comply with the distribution requirements of the Internal Revenue Code of 1986, as amended (the “Code”).To the extent that net realized
26
capital gains can be offset by capital loss carryovers, it is the policy of the fund not to distribute such gains. Income and capital gain distributions are determined in accordance with income tax regulations, which may differ from GAAP.
(e) Federal income taxes: It is the policy of the fund to continue to qualify as a regulated investment company, if such qualification is in the best interests of its shareholders, by complying with the applicable provisions of the Code, and to make distributions of taxable income sufficient to relieve it from substantially all federal income and excise taxes.
As of and during the period ended October 31, 2011, the fund did not have any liabilities for any uncertain tax positions.The fund recognizes interest and penalties, if any, related to uncertain tax positions as income tax expense in the Statement of Operations. During the period, the fund did not incur any interest or penalties.
Each of the tax years in the four-year period ended October 31, 2011 remains subject to examination by the Internal Revenue Service and state taxing authorities.
At October 31, 2011, the components of accumulated earnings on a tax basis were as follows: accumulated capital losses $135,255,852 and unrealized depreciation $2,396,756.
The accumulated capital loss carryover is available for federal income tax purposes to be applied against future net securities profits, if any, realized subsequent to October 31, 2011. If not applied, $69,009,293 of the carryover expires in fiscal 2016 and $66,246,559 expires in fiscal 2017.
Under the recently enacted Regulated Investment Company Modernization Act of 2010 (the “2010 Act”), the fund will be permitted to carry forward capital losses incurred in taxable years beginning after December 22, 2010 (“post-enactment losses”) for an unlimited period. However, the 2010 Act requires any post-enactment losses to be utilized before the utilization of losses incurred in taxable years
NOTES TO FINANCIAL STATEMENTS (continued)
prior to the effective date of the 2010 Act.As a result of this ordering rule, capital loss carryovers related to taxable years beginning prior to the effective date of the 2010 Act may be more likely to expire unused.
The tax character of distributions paid to shareholders during the fiscal periods ended October 31, 2011 and October 31, 2010 were as follows: ordinary income $0 and $691,305, respectively.
During the period ended October 31, 2011, as a result of permanent book to tax differences, primarily due to the tax treatment for real estate investment trusts, limited partnerships and net operating losses, the fund increased accumulated undistributed investment income-net by $423,866, increased accumulated net realized gain (loss) on investments by $18,331 and decreased paid-in capital by $442,197. Net assets and net asset value per share were not affected by this reclassification.
NOTE 2—Bank Lines of Credit:
The fund participates with other Dreyfus-managed funds in a $225 million unsecured credit facility led by Citibank, N.A. and a $300 million unsecured credit facility provided by The Bank of New York Mellon (each, a “Facility”), each to be utilized primarily for temporary or emergency purposes, including the financing of redemptions. In connection therewith, the fund has agreed to pay its pro rata portion of commitment fees for each Facility. Interest is charged to the fund based on rates determined pursuant to the terms of the respective Facility at the time of borrowing.
The average amount of borrowings outstanding under the Facilities during the period ended October 31, 2011 was approximately $23,800, with a related weighted average annualized interest rate of 1.43%.
NOTE 3—Investment Management Fee and Other Transactions With Affiliates:
(a) Pursuant to an investment management agreement with the Manager, the Manager provides or arranges for one or more third parties and/or affiliates to provide investment advisory, administrative,
28
custody, fund accounting and transfer agency services to the fund.The Manager also directs the investments of the fund in accordance with its investment objective, policies and limitations. For these services, the fund is contractually obligated to pay the Manager a fee, calculated daily and paid monthly, at the annual rate of 1.25% of the value of the fund’s average daily net assets. Out of its fee, the Manager pays all of the expenses of the fund except brokerage fees, taxes, interest, commitment fees, Rule 12b-1 distribution fees and expenses, service fees, fees and expenses of non-interested Directors (including counsel fees) and extraordinary expenses. In addition, the Manager is required to reduce its fee in an amount equal to the fund’s allocable portion of fees and expenses of the non-interested Directors (including counsel fees). Each Board member who is not an “interested person” of the Company (as defined in the Act) receives $60,000 per annum, plus $7,000 per joint Board meeting of the Company, Dreyfus Investment Funds, The Dreyfus/Laurel Funds Trust, The Dreyfus/Laurel Tax-Free Municipal Funds and Dreyfus Funds, Inc. (collectively, the“Board Group Open-End Funds”) attended, $2,500 for separate in-person committee meetings attended which are not held in conjunction with a regularly scheduled Board meeting and $2,000 for Board meetings and separate committee meetings attended that are conducted by telephone.The Board Group Open-End Funds also reimburse each Board member who is not an “interested person” of the Company (as defined in the Act) for travel and out-of-pocket expenses. With respect to Board meetings, the Chairman of the Board receives an additional 25% of such compensation (with the exception of reimbursable amounts).The Chair of each of the Board’s committees, unless the Chair also serves as Chair of the Board, receives $1,350 per applicable committee meeting. In the event that there is an in-person joint committee meeting or a joint telephone meeting of the Board Group Open-End Funds and Dreyfus HighYield Strategies Fund (“DHF”), a $2,500 fee is allocated between the Board Group Open-End Funds and DHF. The Company’s portion of these
NOTES TO FINANCIAL STATEMENTS (continued)
fees and expenses are charged and allocated to each series based on net assets. Amounts required to be paid by the Company directly to the non-interested Directors, that would be applied to offset a portion of the management fee payable to the Manager, are in fact paid directly by the Manager to the non-interested Directors.
Effective January 1, 2012, the Board Group Open-End Funds and DHF (collectively, the “Board Group Funds”) will pay each Board member their respective allocated portions of an annual retainer of $85,000 and a fee of $10,000 for each regularly scheduled Board meeting attended ($75,000 and $8,000, respectively, in the aggregate, prior to January 1, 2012). With respect to the annual retainer and Board meetings of the Board Group Funds, the Chair of the Board will receive an additional 25% of such compensation (with the exception of reimbursable amounts). Each Board member will receive $2,500 for any separate in-person committee meetings attended, which are not held in conjunction with a regularly scheduled Board meeting, such amount to be allocated among the Board Group Funds, as applicable. In the event that there is a joint telephone meeting of the Board Group Funds, a fee of $2,000 will be allocated among the applicable Board Group Funds, accordingly (prior to January 1, 2012, the fee allocated was $2,500 if the meeting included DHF).The Chair of each of the Board’s committees, unless the Chair also serves as Chair of the Board, will receive $1,500 per applicable committee meeting. Each Emeritus Board member is entitled to receive an annual retainer of one-half the amount paid as a retainer at the time the Board member became Emeritus and a per meeting attended fee of one-half the amount paid to Board members. The Board Group Funds also reimburse each Independent Board member and Emeritus Board members for travel and out-of-pocket expenses.
The Manager had agreed from November 1, 2010 through March 1, 2011 to waive receipt of a portion of the fund’s management fee, in
30
the amount of .20% of the value of the fund’s average daily net assets. The reduction in management fee, pursuant to the undertaking, amounted to $56,235 during the period ended October 31, 2011.
During the period ended October 31, 2011, the Distributor retained $1,427 from commissions earned on sales of fund’s Class A shares and $2,214 and $1,213 from CDSCs on redemptions of the fund’s Class B and Class C shares, respectively.
(b) Under separate Distribution Plans (the “Plans”) adopted pursuant to Rule 12b-1 under the Act, Class A shares may pay annually up to .25% of the value of its average daily net assets to compensate the Distributor for shareholder servicing activities and expenses primarily intended to result in the sale of Class A shares. Class B and Class C shares pay the Distributor for distributing their shares at an aggregate annual rate of .75% of the value of the average daily net assets of Class B and Class C shares. Class B and Class C shares are also subject to a service plan adopted pursuant to Rule 12b-1 (the “Service Plan”), under which Class B and Class C shares pay the Distributor for providing certain services to the holders of their shares a fee at the annual rate of .25% of the value of the average daily net assets of Class B and Class C shares. During the period ended October 31, 2011, Class A, Class B and Class C shares were charged $126,679, $9,221, and $60,494, respectively, pursuant to their respective Plans. Class B and Class C shares were charged $3,074 and $20,165, respectively, pursuant to the Service Plan.
Under its terms, the Plans and Service Plan shall remain in effect from year to year, provided such continuance is approved annually by a vote of a majority of those directors who are not “interested persons” of the Company and who have no direct or indirect financial interest in the operation of or in any agreement related to the Plans or Service Plan.
NOTES TO FINANCIAL STATEMENTS (continued)
The components of “Due to The Dreyfus Corporation and affiliates” in the Statement of Assets and Liabilities consist of: management fees $65,049, Rule 12b-1 distribution plan fees $12,592, service plan fees $1,329 and custodian fees $48.
NOTE 4—Securities Transactions:
The aggregate amount of purchases and sales of investment securities, excluding short-term securities, during the period ended October 31, 2011, amounted to $72,068,326 and $84,398,064, respectively.
At October 31, 2011, the cost of investments for federal income tax purposes was $80,367,125; accordingly, accumulated net unrealized depreciation on investments was $2,396,756, consisting of $4,332,323 gross unrealized appreciation and $6,729,079 gross unrealized depreciation.
NOTE 5—Other Matters:
At the October 27, 2011 Board meeting, the Board of the Company approved a proposal to have shareholders consider the election of Francine J. Bovich as an additional Board member of the Company, and also consider the election of Joseph S. DiMartino and Benaree Pratt Wiley, current Board members of the Company not previously proposed to shareholders of the fund. A proxy statement was mailed, on December 1, 2011, to shareholders of record as of the close of business on November 1, 2011 asking shareholders to consider these elections at a special joint meeting of shareholders to be held on Wednesday, February 8, 2012.
32
|
| REPORT OF INDEPENDENT REGISTERED |
| PUBLIC ACCOUNTING FIRM |
The Board of Directors and Shareholders of The Dreyfus/Laurel Funds, Inc.
We have audited the accompanying statement of assets and liabilities of Dreyfus Small Cap Fund, a series ofThe Dreyfus/Laurel Funds, Inc. (the “Fund”), including the statement of investments, as of October 31, 2011, and the related statement of operations for the year then ended, the statements of changes in net assets for each of the years in the two-year period then ended, and the financial highlights for each of the years in the five-year period then ended. These financial statements and financial highlights are the responsibility of the Fund’s management. Our responsibility is to express an opinion on these financial statements and financial highlights based on our audits.
We conducted our audits in accordance with the standards of the Public Company Accounting Oversight Board (United States).Those standards require that we plan and perform the audit to obtain reasonable assurance about whether the financial statements and financial highlights are free of material misstatement. An audit includes examining, on a test basis, evidence supporting the amounts and disclosures in the financial statements. Our procedures included confirmation of securities owned as of October 31, 2011, by correspondence with the custodian and brokers or by other appropriate auditing procedures where replies from brokers were not received. An audit also includes assessing the accounting principles used and significant estimates made by management, as well as evaluating the overall financial statement presentation. We believe that our audits provide a reasonable basis for our opinion.
In our opinion, the financial statements and financial highlights referred to above present fairly, in all material respects, the financial position of Dreyfus Small Cap Fund as of October 31, 2011, the results of its operations for the year then ended, the changes in its net assets for each of the years in the two-year period then ended, and the financial highlights for each of the years in the five-year period then ended, in conformity with U.S. generally accepted accounting principles.

New York, New York
December 22, 2011
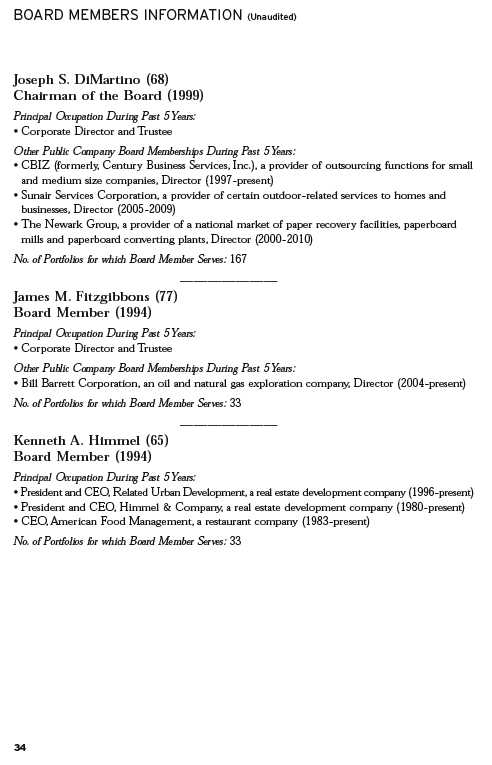
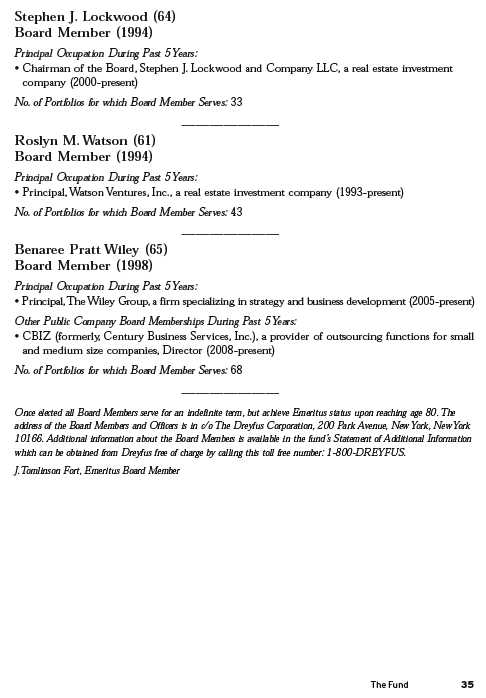
OFFICERS OF THE FUND (Unaudited)
BRADLEY J. SKAPYAK, President since January 2010.
Chief Operating Officer and a director of the Manager since June 2009. From April 2003 to June 2009, Mr. Skapyak was the head of the Investment Accounting and Support Department of the Manager. He is an officer of 75 investment companies (comprised of 167 portfolios) managed by the Manager. He is 52 years old and has been an employee of the Manager since February 1988.
MICHAEL A. ROSENBERG, Vice President and Secretary since August 2005.
Assistant General Counsel of BNY Mellon, and an officer of 76 investment companies (comprised of 192 portfolios) managed by the Manager. He is 51 years old and has been an employee of the Manager since October 1991.
KIESHA ASTWOOD, Vice President and Assistant Secretary since January 2010.
Counsel of BNY Mellon, and an officer of 76 investment companies (comprised of 192 portfolios) managed by the Manager. She is 38 years old and has been an employee of the Manager since July 1995.
JAMES BITETTO, Vice President and Assistant Secretary since August 2005.
Senior Counsel of BNY Mellon and Secretary of the Manager, and an officer of 76 investment companies (comprised of 192 portfolios) managed by the Manager. He is 45 years old and has been an employee of the Manager since December 1996.
JONI LACKS CHARATAN, Vice President and Assistant Secretary since August 2005.
Senior Counsel of BNY Mellon, and an officer of 76 investment companies (comprised of 192 portfolios) managed by the Manager. She is 55 years old and has been an employee of the Manager since October 1988.
JOSEPH M. CHIOFFI, Vice President and Assistant Secretary since August 2005.
Senior Counsel of BNY Mellon, and an officer of 76 investment companies (comprised of 192 portfolios) managed by the Manager. He is 49 years old and has been an employee of the Manager since June 2000.
KATHLEEN DENICHOLAS, Vice President and Assistant Secretary since January 2010.
Senior Counsel of BNY Mellon, and an officer of 76 investment companies (comprised of 192 portfolios) managed by the Manager. She is 37 years old and has been an employee of the Manager since February 2001.
JANETTE E. FARRAGHER, Vice President and Assistant Secretary since August 2005.
Assistant General Counsel of BNY Mellon, and an officer of 76 investment companies (comprised of 192 portfolios) managed by the Manager. She is 48 years old and has been an employee of the Manager since February 1984.
JOHN B. HAMMALIAN, Vice President and Assistant Secretary since August 2005.
Managing Counsel of BNY Mellon, and an officer of 76 investment companies (comprised of 192 portfolios) managed by the Manager. He is 48 years old and has been an employee of the Manager since February 1991.
M. CRISTINA MEISER, Vice President and Assistant Secretary since January 2010.
Senior Counsel of BNY Mellon, and an officer of 76 investment companies (comprised of 192 portfolios) managed by the Manager. She is 41 years old and has been an employee of the Manager since August 2001.
36
ROBERT R. MULLERY, Vice President and Assistant Secretary since August 2005.
Managing Counsel of BNY Mellon, and an officer of 76 investment companies (comprised of 192 portfolios) managed by the Manager. He is 59 years old and has been an employee of the Manager since May 1986.
JEFF PRUSNOFSKY, Vice President and Assistant Secretary since August 2005.
Managing Counsel of BNY Mellon, and an officer of 76 investment companies (comprised of 192 portfolios) managed by the Manager. He is 46 years old and has been an employee of the Manager since October 1990.
JAMES WINDELS, Treasurer since November 2001.
Director – Mutual Fund Accounting of the Manager, and an officer of 76 investment companies (comprised of 192 portfolios) managed by the Manager. He is 53 years old and has been an employee of the Manager since April 1985.
RICHARD CASSARO, Assistant Treasurer since January 2008.
Senior Accounting Manager – Money Market and Municipal Bond Funds of the Manager, and an officer of 76 investment companies (comprised of 192 portfolios) managed by the Manager. He is 52 years old and has been an employee of the Manager since September 1982.
GAVIN C. REILLY, Assistant Treasurer since December 2005.
Tax Manager of the Investment Accounting and Support Department of the Manager, and an officer of 76 investment companies (comprised of 192 portfolios) managed by the Manager. He is 43 years old and has been an employee of the Manager since April 1991.
ROBERT ROBOL, Assistant Treasurer since December 2002.
Senior Accounting Manager – Fixed Income Funds of the Manager, and an officer of 76 investment companies (comprised of 192 portfolios) managed by the Manager. He is 47 years old and has been an employee of the Manager since October 1988.
ROBERT SALVIOLO, Assistant Treasurer since July 2007.
Senior Accounting Manager – Equity Funds of the Manager, and an officer of 76 investment companies (comprised of 192 portfolios) managed by the Manager. He is 44 years old and has been an employee of the Manager since June 1989.
ROBERT SVAGNA, Assistant Treasurer since December 2002.
Senior Accounting Manager – Equity Funds of the Manager, and an officer of 76 investment companies (comprised of 192 portfolios) managed by the Manager. He is 44 years old and has been an employee of the Manager since November 1990.
OFFICERS OF THE FUND (Unaudited) (continued)
JOSEPH W. CONNOLLY, Chief Compliance Officer since October 2004.
Chief Compliance Officer of the Manager and The Dreyfus Family of Funds (76 investment companies, comprised of 192 portfolios). From November 2001 through March 2004, Mr. Connolly was first Vice-President, Mutual Fund Servicing for Mellon Global Securities Services. In that capacity, Mr. Connolly was responsible for managing Mellon’s Custody, Fund Accounting and Fund Administration services to third-party mutual fund clients. He is 54 years old and has served in various capacities with the Manager since 1980, including manager of the firm’s Fund Accounting Department from 1997 through October 2001.
STEPHEN J. STOREN, Anti-Money Laundering Compliance Officer since May 2011.
Chief Compliance Officer of the Distributor, and the Anti-Money Laundering Compliance Officer of 72 investment companies (comprised of 188 portfolios) managed by the Manager. He is 57 years old and has been an employee of the Distributor since October 1999.
38
Save time. Save paper. View your next shareholder report online as soon as it’s available. Log into www.dreyfus.com and sign up for Dreyfus eCommunications. It’s simple and only takes a few minutes.
The views expressed in this report reflect those of the portfolio manager only through the end of the period covered and do not necessarily represent the views of Dreyfus or any other person in the Dreyfus organization. Any such views are subject to change at any time based upon market or other conditions and Dreyfus disclaims any responsibility to update such views.These views may not be relied on as investment advice and, because investment decisions for a Dreyfus fund are based on numerous factors, may not be relied on as an indication of trading intent on behalf of any Dreyfus fund.
Not FDIC-Insured • Not Bank-Guaranteed • May Lose Value
| | Contents |
| | THE FUND |
| 2 | A Letter from the Chairman and CEO |
| 3 | Discussion of Fund Performance |
| 6 | Fund Performance |
| 8 | Understanding Your Fund’s Expenses |
| 8 | Comparing Your Fund’s Expenses With Those of Other Funds |
| 9 | Statement of Investments |
| 22 | Statement of Financial Futures |
| 23 | Statement of Options Written |
| 24 | Statement of Assets and Liabilities |
| 25 | Statement of Operations |
| 26 | Statement of Changes in Net Assets |
| 28 | Financial Highlights |
| 31 | Notes to Financial Statements |
| 54 | Report of Independent Registered Public Accounting Firm |
| 55 | Important Tax Information |
| 56 | Board Members Information |
| 58 | Officers of the Fund |
| | FOR MORE INFORMATION |
| | Back Cover |
Dreyfus
Opportunistic Fixed
Income Fund
The Fund

A LETTER FROM THE CHAIRMAN AND CEO
Dear Shareholder:
We are pleased to present this annual report for Dreyfus Opportunistic Fixed Income Fund, covering the 12-month period from November 1, 2010, through October 31, 2011. For information about how the fund performed during the reporting period, as well as general market perspectives, we provide a Discussion of Fund Performance on the pages that follow.
Investors were encouraged by expectations of a more robust economic recovery during the final months of 2010, but sentiment deteriorated sharply in 2011 due to disappointing global economic data, rising commodity prices, an escalating sovereign debt crisis in Europe and a contentious debate regarding taxes, spending and borrowing in the United States. International bond markets proved sensitive to these macroeconomic developments, as increasingly risk-averse investors flocked to traditional “safe havens,” such as U.S.Treasury securities and other high-quality developed nation sovereign debt. In contrast, bonds in emerging markets generally suffered, seemingly regardless of underlying credit fundamentals.
The economic outlook currently remains clouded by market turbulence and political infighting, but we believe that a continued subpar global expansion is more likely than a return to recession. Although Europe continues to struggle with a debt crisis, inflationary pressures appear to be waning in most countries as energy prices recently have retreated from their highs. In the United States, moderately low core inflation and an accommodative monetary policy could help support near-trend growth despite ongoing deleveraging activity in the private sector, potentially supporting a renewed rally among corporate-backed bonds.To assess the impact of these and other developments on your investments, we encourage you, as always, to speak with your financial advisor.
Thank you for your continued confidence and support.

Jonathan R. Baum
Chairman and Chief Executive Officer
The Dreyfus Corporation
November 15, 2011
2

DISCUSSION OF FUND PERFORMANCE
For the period of November 1, 2010, through October 31, 2011, as provided by David Leduc and David Horsfall, Portfolio Managers
Fund and Market Performance Overview
For the 12-month period ended October 31, 2011, Dreyfus Opportunistic Fixed Income Fund’s Class A, Class C and Class I shares produced total returns of –0.24%, –1.00% and 0.03%, respectively.1 In comparison, the fund’s benchmark, the Barclays Capital U.S.Aggregate Bond Index (the “Index”), produced a total return of 5.00% for the same period.2
Bonds produced mixed results amid heightened volatility over the reporting period as investors responded first to signs of economic strength and later to renewed economic weakness.The fund produced lower returns than its benchmark, primarily due to weakness among higher yielding market sectors over the second half of the reporting period.
The Fund’s Investment Approach
The fund seeks to maximize total return through capital appreciation and income.To pursue this goal, we typically allocate the fund’s assets across four sectors of the fixed-income market: U.S. high yield bonds rated below investment grade; U.S. government, investment grade corporate and mortgage-backed securities; foreign debt securities of developed markets; and foreign debt securities of emerging markets.
Our analysis of top down quantitative and macroeconomic factors guides the allocation of assets among market sectors, industries and positioning along the yield curve. Using fundamental analysis, we seek to identify individual securities with high current income, as well as appreciation potential, based on relative value, credit upgrade probability and extensive research into the credit history and current financial strength of the securities’ issuers.
Shifting Economic Sentiment Sparked Market Volatility
Investor sentiment turned positive over the final months of 2010 as the financial markets responded to improvements in U.S. employment, consumer spending and corporate earnings.These developments supported corporate bonds and asset-backed securities into the first quarter of 2011, but they sent prices of U.S.Treasury securities lower.
DISCUSSION OF FUND PERFORMANCE (continued)
Investors began to question the sustainability of the economic recovery in February, when political unrest in the Middle East led to sharply rising energy prices, and again in March when devastating natural and nuclear disasters in Japan disrupted the global industrial supply chain. Nonetheless, investors proved resilient, and the more economically sensitive sectors of the bond market bounced back.
Economic sentiment began to deteriorate in earnest in late April when Greece appeared headed for default on its sovereign debt, U.S. economic data proved more disappointing than expected and a contentious political debate regarding U.S. government spending and borrowing intensified.Volatility was especially severe in August and September, after Standard & Poor’s downgraded its credit rating on long-term U.S. debt securities, causing sharp declines in higher yielding bonds whileTreasury securities rallied during a “flight to quality.” In contrast, higher yielding securities that were punished in late summer rebounded in October as some macroeconomic concerns seemed to ease.
Higher Yielding Securities Dampened Relative Performance
Although the fund’s relative performance was bolstered over much of the reporting period by overweighted exposure to higher yielding market sectors, steep declines late in the reporting period caused investment-grade and high yield corporate bonds, commercial mortgage-backed securities and residential mortgage-backed securities to weigh on the fund’s relative performance for the reporting period overall. Among corporate bonds, the fund held underweighted exposure to the hard-hit financials sector, but even relatively light holdings from financial institutions proved counterproductive. In addition, U.S. dollar-denominated bonds from Argentina andVenezuela hurt relative performance.
As economic conditions deteriorated over the reporting period’s second half, we attempted to reduce risks by upgrading the fund’s overall credit quality and reducing the interest-rate sensitivity of its holdings. We found opportunities to do so among investment-grade corporate bonds with BB credit ratings and asset-backed securities backed by credit card receivables and automobile loans with maturities in the two- to three-year range. These changes helped mitigate the impact of the market decline.
In addition, the fund achieved positive results through its interest-rate strategies, as a relatively long average duration over the summer of 2011 helped the fund participate fully in the rally among U.S.Treasury
4
securities. We employed put and call options to help establish the fund’s duration posture. A short position in the euro also fared relatively well when the sovereign debt crisis caused the currency to lose value relative to the U.S. dollar.
A Cautious Investment Posture
We have maintained a generally defensive investment posture in light of current economic uncertainty, including a substantial allocation to U.S. Treasury securities and an emphasis on shorter maturities.At the same time, with little likelihood of higher short-term interest rates over the foreseeable future, we have set the fund’s average duration in a range that is modestly longer than industry averages. In our judgment, these are prudent strategies until we see signs that Europe is taking effective steps toward addressing its debt crisis and the U.S. economic outlook becomes clearer.
November 15, 2011
| |
| | Bond funds are subject generally to interest rate, credit, liquidity and market risks, to varying |
| | degrees, all of which are more fully described in the fund’s prospectus. Generally, all other factors |
| | being equal, bond prices are inversely related to interest-rate changes, and rate increases can cause |
| | price declines. |
| | High yield bonds are subject to increased credit risk and are considered speculative in terms of the |
| | issuer’s perceived ability to continue making interest payments on a timely basis and to repay |
| | principal upon maturity. |
| | The fund may use derivative instruments, such as options, futures and options on futures, forward |
| | contracts, swaps (including credit default swaps on corporate bonds and asset-backed securities), |
| | options on swaps and other credit derivatives.A small investment in derivatives could have a |
| | potentially large impact on the fund’s performance.The use of derivatives involves risks different |
| | from, or possibly greater than, the risks associated with investing directly in the underlying assets. |
| 1 | Total return includes reinvestment of dividends and any capital gains paid, and does not take into |
| | consideration the maximum initial sales charge in the case of Class A shares, or the applicable |
| | contingent deferred sales charges imposed on redemptions in the case of Class C shares. Had these |
| | charges been reflected, returns would have been lower. Past performance is no guarantee of future |
| | results. Share price, yield and investment return fluctuate such that upon redemption, fund shares |
| | may be worth more or less than their original cost. Return figures provided reflect the absorption of |
| | certain fund expenses by The Dreyfus Corporation pursuant to an agreement in effect through |
| | March 1, 2012, at which time it may be extended, modified or terminated. Had these expenses |
| | not been absorbed, the fund’s returns would have been lower. |
| 2 | SOURCE: LIPPER INC. — Reflects reinvestment of dividends and, where applicable, capital |
| | gain distributions.The Barclays Capital U.S.Aggregate Bond Index is a widely accepted, |
| | unmanaged total return index of corporate, U.S. government and U.S. government agency debt |
| | instruments, mortgage-backed securities and asset-backed securities with an average maturity of |
| | 1-10 years. Investors cannot invest directly in any index. |
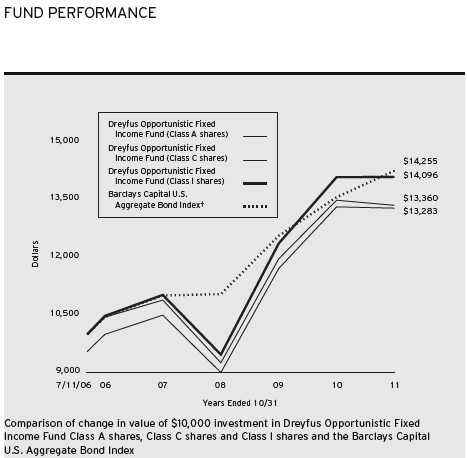
|
| † Source: Lipper Inc. |
| Past performance is not predictive of future performance. |
| The above graph compares a $10,000 investment made in Class A, Class C and Class I shares of Dreyfus |
| Opportunistic Fixed Income Fund on 7/11/06 (inception date) to a $10,000 investment made in the Barclays Capital |
| U.S.Aggregate Bond Index (the “Index”) on that date.All dividends and capital gain distributions are reinvested. |
| The fund invests primarily in fixed-income securities.The fund’s performance shown in the line graph above takes into |
| account the maximum initial sales charge on Class A shares and all other applicable fees and expenses on all classes.The |
| Index is a widely accepted, unmanaged total return index of corporate, U.S. government and U.S. government agency |
| debt instruments, mortgage-backed securities and asset-backed securities with an average maturity of 1-10 years. Unlike a |
| mutual fund, the Index is not subject to charges, fees and other expenses. Investors cannot invest directly in any index. |
| Further information relating to fund performance, including expense reimbursements, if applicable, is contained in the |
| Financial Highlights section of the prospectus and elsewhere in this report. |
6
| | | | | | | |
| Average Annual Total Returns as of 10/31/11 | | | |
| |
| | Inception | | | From |
| | Date | 1Year | 5 Years | Inception |
| Class A shares | | | | |
| with maximum sales charge (4.5%) | 7/11/06 | –4.71% | 4.88% | 5.49% |
| without sales charge | 7/11/06 | –0.24% | 5.85% | 6.41% |
| Class C shares | | | | |
| with applicable redemption charge † | 7/11/06 | –1.96% | 5.05% | 5.61% |
| without redemption | 7/11/06 | –1.00% | 5.05% | 5.61% |
| Class I shares | 7/11/06 | 0.03% | 6.12% | 6.68% |
| Barclays Capital | | | | |
| U.S. Aggregate Bond Index | 6/30/06 | 5.00% | 6.41% | 6.87%†† |
| |
| Past performance is not predictive of future performance.The fund’s performance shown in the graph and table does not |
| reflect the deduction of taxes that a shareholder would pay on fund distributions or the redemption of fund shares. |
| † | The maximum contingent deferred sales charge for Class C shares is 1% for shares redeemed within one year of the |
| | date of purchase. |
| †† | The Index date is based on the life of Class A shares. For comparative purposes, the value of the Index as of |
| | 6/30/06 is used as the beginning value on 7/11/06 (the inception date for Class A shares). |
UNDERSTANDING YOUR FUND’S EXPENSES (Unaudited)
As a mutual fund investor, you pay ongoing expenses, such as management fees and other expenses. Using the information below, you can estimate how these expenses affect your investment and compare them with the expenses of other funds.You also may pay one-time transaction expenses, including sales charges (loads) and redemption fees, which are not shown in this section and would have resulted in higher total expenses. For more information, see your fund’s prospectus or talk to your financial adviser.
Review your fund’s expenses
The table below shows the expenses you would have paid on a $1,000 investment in Dreyfus Opportunistic Fixed Income Fund from May 1, 2011 to October 31, 2011. It also shows how much a $1,000 investment would be worth at the close of the period, assuming actual returns and expenses.
| | | | | | |
| Expenses and Value of a $1,000 Investment | | | | |
| assuming actual returns for the six months ended October 31, 2011 | | |
| | | Class A | | Class C | | Class I |
| Expenses paid per $1,000† | $ | 5.46 | $ | 9.17 | $ | 4.23 |
| Ending value (after expenses) | $ | 970.20 | $ | 966.30 | $ | 972.10 |
|
| COMPARING YOUR FUND’S EXPENSES |
| WITH THOSE OF OTHER FUNDS (Unaudited) |
Using the SEC’s method to compare expenses
The Securities and Exchange Commission (SEC) has established guidelines to help investors assess fund expenses. Per these guidelines, the table below shows your fund’s expenses based on a $1,000 investment, assuming a hypothetical 5% annualized return. You can use this information to compare the ongoing expenses (but not transaction expenses or total cost) of investing in the fund with those of other funds.All mutual fund shareholder reports will provide this information to help you make this comparison. Please note that you cannot use this information to estimate your actual ending account balance and expenses paid during the period.
| | | | | | | | |
| Expenses and Value of a $1,000 Investment | | | | | | |
| assuming a hypothetical 5% annualized return for the six months ended October 31, 2011 |
| | | Class A | | | Class C | | | Class I |
| Expenses paid per $1,000† | $ | 5.60 | | $ | 9.40 | | $ | 4.33 |
| Ending value (after expenses) | $ | 1,019.66 | $ | 1,015.88 | $ | 1,020.92 |
† Expenses are equal to the fund’s annualized expense ratio of 1.10% for Class A, 1.85% for Class C and .85% for Class I, multiplied by the average account value over the period, multiplied by 184/365 (to reflect the one-half year period).
8
|
| STATEMENT OF INVESTMENTS |
| October 31, 2011 |
| | | | | |
| | Coupon | Maturity | Principal | | |
| Bonds and Notes—99.9% | Rate (%) | Date | Amount ($)a | Value ($) |
| Aerospace & Defense—1.0% | | | | | |
| L-3 Communications, | | | | | |
| Gtd. Notes, Ser. B | 6.38 | 10/15/15 | 375,000 | | 383,906 |
| Agriculture—1.3% | | | | | |
| Altria Group, | | | | | |
| Gtd. Notes | 9.70 | 11/10/18 | 235,000 | | 316,273 |
| Lorillard Tobacco, | | | | | |
| Gtd. Notes | 8.13 | 6/23/19 | 160,000 | | 193,104 |
| | | | | | 509,377 |
| Asset-Backed Certificates—.5% | | | | | |
| CIT Equipment Collateral, | | | | | |
| Ser. 2010-VT1A, Cl. D | 7.33 | 9/15/17 | 200,000 | b | 209,411 |
| Asset-Backed Ctfs./ | | | | | |
| Auto Receivables—9.1% | | | | | |
| Americredit Automobile Receivables | | | | | |
| Trust, Ser. 2011-2, Cl. C | 3.19 | 10/12/16 | 310,000 | | 311,568 |
| Americredit Automobile Receivables | | | | | |
| Trust, Ser. 2011-5, Cl. C | 3.44 | 10/8/17 | 195,000 | | 194,946 |
| AmeriCredit Automobile Receivables | | | | | |
| Trust, Ser. 2011-2, Cl. D | 4.00 | 5/8/17 | 160,000 | | 159,930 |
| Americredit Automobile Receivables | | | | | |
| Trust, Ser. 2011-3, Cl. D | 4.04 | 7/10/17 | 200,000 | | 199,051 |
| Americredit Automobile Receivables | | | | | |
| Trust, Ser. 2010-2, Cl. D | 6.24 | 6/8/16 | 370,000 | | 392,113 |
| Americredit Automobile Receivables | | | | | |
| Trust, Ser. 2010-1, Cl. D | 6.65 | 7/17/17 | 70,000 | | 74,312 |
| DT Auto Owner Trust, | | | | | |
| Ser. 2011-2A, Cl. B | 2.12 | 2/16/16 | 250,000 | b | 250,248 |
| DT Auto Owner Trust, | | | | | |
| Ser. 2011-2A, Cl. D | 4.36 | 12/15/16 | 250,000 | b | 251,478 |
| Navistar Financial Corporation | | | | | |
| Owner Trust, Ser. 2010-B, Cl. C | 4.08 | 3/19/18 | 350,000 | b | 351,953 |
| Santander Drive Auto Receivables | | | | | |
| Trust, Ser. 2010-3, Cl. B | 2.05 | 5/15/15 | 160,000 | | 159,453 |
| Santander Drive Auto Receivables | | | | | |
| Trust, Ser. 2011-4, Cl. B | 2.90 | 5/16/16 | 160,000 | | 160,468 |
| Santander Drive Auto Receivables | | | | | |
| Trust, Ser. 2010-B, Cl. C | 3.02 | 10/17/16 | 240,000 | b | 238,222 |
| Santander Drive Auto Receivables | | | | | |
| Trust, Ser. 2011-S1A, Cl. D | 3.10 | 5/15/17 | 168,826 | b | 168,134 |
STATEMENT OF INVESTMENTS (continued)
| | | | | | |
| | | Coupon | Maturity | Principal | | |
| Bonds and Notes (continued) | Rate (%) | Date | Amount ($)a | Value ($) |
| Asset-Backed Ctfs./ | | | | | | |
| Auto Receivables (continued) | | | | | | |
| Santander Drive Auto Receivables | | | | | | |
| Trust, Ser. 2011-S2A, Cl. D | | 3.35 | 6/15/17 | 157,939 | b | 156,613 |
| Santander Drive Auto Receivables | | | | | | |
| Trust, Ser. 2010-2, Cl. C | | 3.89 | 7/17/17 | 200,000 | | 204,242 |
| Santander Drive Auto Receivables | | | | | | |
| Trust, Ser. 2011-1, Cl. D | | 4.01 | 2/15/17 | 200,000 | | 199,970 |
| Smart Trust, | | | | | | |
| Ser. 2011-1USA, Cl. A3B | | 1.09 | 10/14/14 | 125,000 | b,c | 125,045 |
| | | | | | | 3,597,746 |
| Asset-Backed Ctfs./Credit Cards—.7% | | | | | |
| Citibank Omni Master Trust, | | | | | | |
| Ser. 2009-A14A, Cl. A14 | | 2.99 | 8/15/18 | 250,000 | b,c | 263,781 |
| Asset-Backed Ctfs./ | | | | | | |
| Home Equity Loans—.3% | | | | | | |
| Accredited Mortgage Loan Trust, | | | | | | |
| Ser. 2006-1, Cl. A3 | | 0.42 | 4/25/36 | 62,900 | c | 51,826 |
| Carrington Mortgage Loan Trust, | | | | | | |
| Ser. 2005-NC5, Cl. A2 | | 0.56 | 10/25/35 | 34,248 | c | 31,503 |
| Citicorp Residential Mortgage | | | | | | |
| Securities, Ser. 2006-1, Cl. A3 | | 5.71 | 7/25/36 | 22,846 | c | 22,902 |
| First Franklin Mortgage Loan Asset | | | | | |
| Backed Certificates, | | | | | | |
| Ser. 2005-FF2, Cl. M1 | | 0.64 | 3/25/35 | 11,012 | c | 10,941 |
| | | | | | | 117,172 |
| Auto & Trucks—.9% | | | | | | |
| Goodyear Tire & Rubber, | | | | | | |
| Gtd. Notes | | 10.50 | 5/15/16 | 120,000 | | 133,800 |
| Kia Motors, | | | | | | |
| Sr. Unscd. Notes | | 3.63 | 6/14/16 | 235,000 | b,d | 229,041 |
| | | | | | | 362,841 |
| Banks—10.1% | | | | | | |
| Ally Financial, | | | | | | |
| Gtd. Bonds | | 4.50 | 2/11/14 | 400,000 | | 392,000 |
| Banco Bilbao | | | | | | |
| Vizcaya Argentaria, | | | | | | |
| Covered Bonds | EUR | 3.50 | 7/26/13 | 100,000 | | 137,706 |
| Banco Bilbao | | | | | | |
| Vizcaya Argentaria, | | | | | | |
| Covered Notes | EUR | 4.13 | 1/13/14 | 100,000 | | 138,893 |
10
| | | | | | |
| | | Coupon | Maturity | Principal | | |
| Bonds and Notes (continued) | Rate (%) | Date | Amount ($)a | Value ($) |
| Banks (continued) | | | | | | |
| Capital One Financial, | | | | | | |
| Sr. Unscd. Notes | | 7.38 | 5/23/14 | 180,000 | | 201,580 |
| CIT Group, | | | | | | |
| Scd. Notes | | 5.25 | 4/1/14 | 90,000 | b | 90,000 |
| CIT Group, | | | | | | |
| Sr. Notes | | 7.00 | 5/1/17 | 65,000 | | 65,081 |
| Citigroup, | | | | | | |
| Sr. Unscd. Notes | | 1.30 | 4/1/14 | 595,000 | c | 573,319 |
| Discover Bank, | | | | | | |
| Sub. Notes | | 7.00 | 4/15/20 | 260,000 | d | 271,945 |
| Goldman Sachs Group, | | | | | | |
| Sr. Unscd. Notes | | 3.63 | 2/7/16 | 200,000 | | 198,355 |
| Lloyds TSB Bank, | | | | | | |
| Covered Bonds | EUR | 3.38 | 3/17/16 | 215,000 | | 302,877 |
| Lloyds TSB Bank, | | | | | | |
| Covered Notes | EUR | 4.00 | 9/29/20 | 60,000 | | 82,928 |
| Lloyds TSB Bank, | | | | | | |
| Bank Gtd. Notes | | 4.38 | 1/12/15 | 200,000 | b | 200,698 |
| Morgan Stanley, | | | | | | |
| Sr. Unscd. Notes | | 5.50 | 1/26/20 | 200,000 | | 197,382 |
| Morgan Stanley, | | | | | | |
| Sr. Unscd. Notes | | 5.50 | 7/28/21 | 170,000 | | 166,353 |
| Nordea Bank, | | | | | | |
| Sr. Unscd. Notes | | 2.13 | 1/14/14 | 300,000 | b | 299,887 |
| Nordea Bank, | | | | | | |
| Sub. Notes | | 4.88 | 5/13/21 | 200,000 | b | 179,810 |
| Royal Bank of Scotland, | | | | | | |
| Bank Gtd. Notes | | 3.95 | 9/21/15 | 175,000 | | 172,671 |
| Santander US Debt SA Unipersonal, | | | | | |
| Bank Gtd. Notes | | 3.72 | 1/20/15 | 155,000 | b | 144,880 |
| Societe Generale, | | | | | | |
| Sr. Unscd. Notes | | 2.50 | 1/15/14 | 205,000 | b | 196,116 |
| | | | | | | 4,012,481 |
| Building Materials—.2% | | | | | | |
| Holcim US Finance Sarl & Cie, | | | | | | |
| Gtd. Notes | | 6.00 | 12/30/19 | 75,000 | b | 80,644 |
| Commercial & Professional | | | | | | |
| Services—.4% | | | | | | |
| Aramark, | | | | | | |
| Gtd. Notes | | 8.50 | 2/1/15 | 170,000 | | 177,225 |
STATEMENT OF INVESTMENTS (continued)
| | | | | |
| | Coupon | Maturity | Principal | | |
| Bonds and Notes (continued) | Rate (%) | Date | Amount ($)a | Value ($) |
| Commercial Mortgage | | | | | |
| Pass-Through Ctfs.—9.1% | | | | | |
| American Tower Trust, | | | | | |
| Ser. 2007-1A, Cl. AFX | 5.42 | 4/15/37 | 75,000 | b | 80,151 |
| American Tower Trust, | | | | | |
| Ser. 2007-1A, Cl. F | 6.64 | 4/15/37 | 185,000 | b | 197,648 |
| Arkle Master Issuer, | | | | | |
| Ser. 2010-2A, Cl. 1A1 | 1.69 | 5/17/60 | 260,000 | b,c | 259,944 |
| Banc of America Commercial | | | | | |
| Mortgage, Ser. 2004-6, Cl. A4 | 4.63 | 12/10/42 | 100,000 | c | 105,310 |
| Banc of America Commercial | | | | | |
| Mortgage, Ser. 2004-6, Cl. A5 | 4.81 | 12/10/42 | 475,000 | | 514,467 |
| Banc of America Commercial | | | | | |
| Mortgage, Ser. 2007-4, Cl. A4 | 5.92 | 2/10/51 | 70,000 | c | 75,489 |
| Banc of America Commercial | | | | | |
| Mortgage, Ser. 2007-4, Cl. AM | 5.98 | 2/10/51 | 200,000 | c | 184,738 |
| Bear Stearns Commercial Mortgage | | | | | |
| Securities, Ser. 2007-PW17, | | | | | |
| Cl. AAB | 5.70 | 6/11/50 | 200,000 | | 214,412 |
| Bear Stearns Commercial Mortgage | | | | | |
| Securities, Ser. 2007-PW16, | | | | | |
| Cl. AAB | 5.90 | 6/11/40 | 35,000 | c | 37,722 |
| Commercial Mortgage Pass-Through | | | | | |
| Certificates, Ser. 2010-C1, Cl. D | 6.10 | 7/10/46 | 285,000 | b,c | 234,965 |
| Fosse Master Issuer, | | | | | |
| Ser. 2011-1A, Cl. A2 | 1.80 | 10/18/54 | 325,000 | b,c | 324,952 |
| GE Capital Commercial Mortgage, | | | | | |
| Ser. 2005-C2, Cl. A2 | 4.71 | 5/10/43 | 5,630 | | 5,626 |
| GE Capital Commercial Mortgage, | | | | | |
| Ser. 2004-C2, Cl. A4 | 4.89 | 3/10/40 | 150,000 | | 159,617 |
| GMAC Commercial Mortgage | | | | | |
| Securities, Ser. 2003-C3, Cl. A3 | 4.65 | 4/10/40 | 3,961 | | 4,005 |
| GS Mortgage Securities Corporation | | | | | |
| II, Ser. 2007-EOP, Cl. A3 | 1.53 | 3/6/20 | 175,000 | b,c | 173,211 |
| GS Mortgage Securities Corporation | | | | | |
| II, Ser. 2011-ALF, Cl. D | 4.21 | 2/10/21 | 80,000 | b | 75,584 |
| GS Mortgage Securities Corporation | | | | | |
| II, Ser. 2011-ALF, Cl. E | 4.95 | 2/10/21 | 100,000 | b | 94,110 |
| JPMorgan Chase Commercial Mortgage | | | | | |
| Securities, Ser. 2011-C3, Cl. C | 5.36 | 2/15/46 | 65,000 | b,c | 53,469 |
12
| | | | | | |
| | | Coupon | Maturity | Principal | | |
| Bonds and Notes (continued) | Rate (%) | Date | Amount ($)a | Value ($) |
| Commercial Mortgage | | | | | | |
| Pass-Through Ctfs. (continued) | | | | | |
| JPMorgan Chase Commercial Mortgage | | | | | |
| Securities, Ser. 2011-C4, Cl. E | 5.39 | 7/15/46 | 115,000 | b,c | 83,805 |
| MASTR Asset Securitization Trust, | | | | | |
| Ser. 2003-11, Cl. 9A5 | | 5.25 | 9/25/20 | 200,000 | | 204,899 |
| Morgan Stanley Capital I, | | | | | | |
| Ser. 2011-C1, Cl. D | | 5.26 | 9/15/47 | 200,000 | b,c | 161,940 |
| Paragon Mortgages, | | | | | | |
| Ser. 14A, Cl. A2C | | 0.45 | 9/15/39 | 229,555 | b,c | 171,481 |
| Residential Funding Mortgage | | | | | |
| Securities I, Ser. 2005-S6, Cl. A1 | 5.00 | 8/25/35 | 183,589 | | 183,857 |
| | | | | | | 3,601,402 |
| Diversified Financial | | | | | | |
| Services—5.6% | | | | | | |
| FCE Bank, | | | | | | |
| Sr. Unscd. Notes | GBP | 5.13 | 11/16/15 | 150,000 | | 240,582 |
| Ford Motor Credit, | | | | | | |
| Sr. Unscd. Notes | | 3.88 | 1/15/15 | 200,000 | | 200,247 |
| Ford Motor Credit, | | | | | | |
| Sr. Unscd. Notes | | 5.63 | 9/15/15 | 200,000 | | 212,197 |
| FUEL Trust, | | | | | | |
| Scd. Notes | | 4.21 | 10/15/22 | 200,000 | b | 200,980 |
| General Electric Capital, | | | | | | |
| Sr. Unscd. Notes | | 1.01 | 4/7/14 | 135,000 | c | 132,596 |
| Harley-Davidson Funding, | | | | | | |
| Gtd. Notes | | 5.75 | 12/15/14 | 145,000 | b | 158,166 |
| Hyundai Capital Services, | | | | | | |
| Sr. Unscd. Notes | | 4.38 | 7/27/16 | 200,000 | b | 202,893 |
| International Lease Finance, | | | | | | |
| Sr. Unscd. Notes | | 5.88 | 5/1/13 | 105,000 | | 105,000 |
| International Lease Finance, | | | | | | |
| Sr. Unscd. Notes | | 6.25 | 5/15/19 | 305,000 | | 287,523 |
| Merrill Lynch & Co., | | | | | | |
| Sr. Unscd. Bonds | | 6.88 | 4/25/18 | 100,000 | | 102,858 |
| RCI Banque, | | | | | | |
| Sr. Unscd. Notes | | 2.26 | 4/11/14 | 85,000 | b,c | 78,820 |
| SLM, | | | | | | |
| Sr. Unscd. Notes | | 5.05 | 11/14/14 | 100,000 | | 97,818 |
STATEMENT OF INVESTMENTS (continued)
| | | | | | |
| | | Coupon | Maturity | Principal | | |
| Bonds and Notes (continued) | Rate (%) | Date | Amount ($)a | Value ($) |
| Diversified Financial | | | | | | |
| Services (continued) | | | | | | |
| SLM, | | | | | | |
| Sr. Notes | | 6.25 | 1/25/16 | 200,000 | | 200,183 |
| | | | | | | 2,219,863 |
| Electric Utilities—3.9% | | | | | | |
| AES, | | | | | | |
| Sr. Unscd. Notes | | 7.38 | 7/1/21 | 200,000 | b | 215,000 |
| AES, | | | | | | |
| Sr. Unscd. Notes | | 7.75 | 3/1/14 | 185,000 | | 199,800 |
| Calpine, | | | | | | |
| Sr. Scd. Notes | | 7.88 | 1/15/23 | 195,000 | b | 206,700 |
| Duquesne Light Holdings, | | | | | | |
| Sr. Unscd. Bonds | | 5.90 | 12/1/21 | 215,000 | b | 212,581 |
| Enel Finance International, | | | | | | |
| Gtd. Bonds | | 6.25 | 9/15/17 | 100,000 | b | 103,785 |
| GenOn Energy, | | | | | | |
| Sr. Unscd. Notes | | 9.50 | 10/15/18 | 200,000 | d | 212,000 |
| NRG Energy, | | | | | | |
| Gtd. Notes | | 7.38 | 1/15/17 | 35,000 | | 36,619 |
| NRG Energy, | | | | | | |
| Gtd. Notes | | 7.63 | 5/15/19 | 200,000 | b | 201,000 |
| Puget Energy, | | | | | | |
| Sr. Scd. Notes | | 6.00 | 9/1/21 | 150,000 | | 155,335 |
| | | | | | | 1,542,820 |
| Entertainment/Gambling—.5% | | | | | |
| Penn National Gaming, | | | | | | |
| Sr. Sub. Notes | | 8.75 | 8/15/19 | 70,000 | | 75,950 |
| Wynn Las Vegas, | | | | | | |
| First Mortgage Notes | | 7.75 | 8/15/20 | 95,000 | | 104,975 |
| | | | | | | 180,925 |
| Food & Beverages—.9% | | | | | | |
| Pernod-Ricard, | | | | | | |
| Sr. Unscd. Notes | | 5.75 | 4/7/21 | 175,000 | b | 197,970 |
| Pernod-Ricard, | | | | | | |
| Sr. Unscd. Notes | EUR | 7.00 | 1/15/15 | 100,000 | | 153,127 |
| | | | | | | 351,097 |
14
| | | | | | |
| | | Coupon | Maturity | Principal | | |
| Bonds and Notes (continued) | Rate (%) | Date | Amount ($)a | Value ($) |
| Foreign/Governmental—16.1% | | | | | | |
| Argentine Government, | | | | | | |
| Sr. Unscd. Bonds, Ser. 1 | | 8.75 | 6/2/17 | 425,000 | | 400,563 |
| Brazilian Government, | | | | | | |
| Sr. Unscd. Notes | BRL | 12.50 | 1/5/16 | 300,000 | | 204,444 |
| Corp Andina De Formento, | | | | | | |
| Sr. Unscd. Notes | | 3.75 | 1/15/16 | 560,000 | | 564,723 |
| Croatian Government, | | | | | | |
| Sr. Unscd Notes | | 6.38 | 3/24/21 | 300,000 | b | 293,768 |
| Eurasian Development Bank, | | | | | | |
| Sr. Unscd. Notes | | 7.38 | 9/29/14 | 225,000 | b | 239,063 |
| Ireland Government, | | | | | | |
| Bonds | EUR | 4.00 | 1/15/14 | 580,000 | | 729,996 |
| Mexican Bonos, | | | | | | |
| Bonds, Ser. M | MXN | 6.50 | 6/10/21 | 2,815,000 | | 216,950 |
| Mexican Bonos, | | | | | | |
| Bonds, Ser. M20 | MXN | 7.50 | 6/3/27 | 2,470,000 | | 197,487 |
| Mexican Bonos, | | | | | | |
| Bonds, Ser. MI10 | MXN | 9.00 | 12/20/12 | 7,390,000 | | 582,313 |
| Mexican Government, | | | | | | |
| Sr. Unscd. Bonds | | 5.63 | 1/15/17 | 208,000 | | 238,160 |
| Peruvian Government Bond, | | | | | | |
| Sr. Unscd. Notes | PEN | 6.95 | 8/12/31 | 370,000 | | 146,179 |
| Peruvian Government Bond, | | | | | | |
| Sr. Unscd. Notes | | 7.13 | 3/30/19 | 260,000 | | 323,700 |
| Philippine Government, | | | | | | |
| Sr. Unscd. Notes | PHP | 4.95 | 1/15/21 | 9,000,000 | | 203,696 |
| Philippine Government, | | | | | | |
| Sr. Unscd. Bonds | PHP | 6.25 | 1/14/36 | 13,000,000 | | 297,217 |
| Polish Government, | | | | | | |
| Sr. Unscd. Notes | | 5.00 | 3/23/22 | 135,000 | | 133,481 |
| Republic of Indonesia, | | | | | | |
| Sr. Unscd. Notes | | 11.63 | 3/4/19 | 200,000 | b | 299,000 |
| Russian Government, | | | | | | |
| Sr. Unscd. Bonds | | 7.50 | 3/31/30 | 450,900 | c | 535,444 |
| United Kingdom Gilt, | | | | | | |
| Bonds | GBP | 4.25 | 12/7/40 | 295,000 | | 548,580 |
STATEMENT OF INVESTMENTS (continued)
| | | | | | |
| | | Coupon | Maturity | Principal | | |
| Bonds and Notes (continued) | Rate (%) | Date | Amount ($)a | Value ($) |
| Foreign/Governmental (continued) | | | | | |
| Venezuelan Government, | | | | | | |
| Sr. Unscd. Notes | | 12.75 | 8/23/22 | 235,000 | | 207,975 |
| | | | | | | 6,362,739 |
| Health Care—.9% | | | | | | |
| Biomet, | | | | | | |
| Gtd. Notes | | 10.00 | 10/15/17 | 75,000 | | 81,375 |
| HCA, | | | | | | |
| Sr. Scd. Bonds | | 7.88 | 2/15/20 | 70,000 | | 76,475 |
| Life Technologies, | | | | | | |
| Sr. Unscd. Notes | | 3.50 | 1/15/16 | 215,000 | | 216,961 |
| | | | | | | 374,811 |
| Industrial—.8% | | | | | | |
| Asciano Finance, | | | | | | |
| Gtd. Notes | | 5.00 | 4/7/18 | 200,000 | b | 212,922 |
| Bombardier, | | | | | | |
| Sr. Unscd. Notes | | 7.50 | 3/15/18 | 95,000 | b | 104,025 |
| | | | | | | 316,947 |
| Materials—.6% | | | | | | |
| Consol Energy, | | | | | | |
| Gtd. Notes | | 8.25 | 4/1/20 | 180,000 | | 198,000 |
| Ineos Group Holdings, | | | | | | |
| Gtd. Notes | EUR | 7.88 | 2/15/16 | 50,000 | b | 56,040 |
| | | | | | | 254,040 |
| Media—3.1% | | | | | | |
| CCO Holdings, | | | | | | |
| Gtd. Notes | | 7.00 | 1/15/19 | 90,000 | | 93,825 |
| CCO Holdings, | | | | | | |
| Gtd. Notes | | 7.25 | 10/30/17 | 95,000 | | 99,750 |
| CSC Holdings, | | | | | | |
| Sr. Unscd. Notes | | 6.50 | 11/15/21 | 105,000 | b | 105,000 |
| Dish DBS, | | | | | | |
| Gtd. Notes | | 6.63 | 10/1/14 | 95,000 | | 99,513 |
| Dish DBS, | | | | | | |
| Gtd. Notes | | 7.00 | 10/1/13 | 190,000 | | 201,875 |
| Kabel BW Erste Beteiligungs, | | | | | | |
| Sr. Scd. Notes | | 7.50 | 3/15/19 | 150,000 | b | 156,750 |
16
| | | | | |
| | Coupon | Maturity | Principal | | |
| Bonds and Notes (continued) | Rate (%) | Date | Amount ($)a | Value ($) |
| Media (continued) | | | | | |
| News America, | | | | | |
| Gtd. Notes | 4.50 | 2/15/21 | 435,000 | | 455,142 |
| | | | | | 1,211,855 |
| Oil & Gas—6.0% | | | | | |
| Anadarko Petroleum, | | | | | |
| Unscd. Notes | 6.20 | 3/15/40 | 300,000 | | 346,388 |
| Chesapeake Energy, | | | | | |
| Gtd. Notes | 6.63 | 8/15/20 | 255,000 | | 277,631 |
| Continental Resources, | | | | | |
| Gtd. Notes | 7.13 | 4/1/21 | 125,000 | | 135,625 |
| EQT, | | | | | |
| Sr. Unscd. Bonds | 8.13 | 6/1/19 | 65,000 | | 77,452 |
| KazMunayGaz National, | | | | | |
| Sr. Unscd. Notes | 7.00 | 5/5/20 | 335,000 | b | 368,081 |
| Marathon Petroleum, | | | | | |
| Gtd. Notes | 5.13 | 3/1/21 | 275,000 | b | 297,760 |
| Newfield Exploration, | | | | | |
| Sr. Sub. Notes | 6.88 | 2/1/20 | 190,000 | | 204,725 |
| Petroleos De Venezuela, | | | | | |
| Gtd. Notes | 5.25 | 4/12/17 | 525,000 | | 328,781 |
| Petroleos de Venezuela, | | | | | |
| Gtd. Notes | 8.50 | 11/2/17 | 150,000 | b,d | 109,125 |
| Range Resources, | | | | | |
| Gtd. Notes | 7.50 | 10/1/17 | 20,000 | | 21,450 |
| Weatherford International, | | | | | |
| Gtd. Notes | 9.88 | 3/1/39 | 150,000 | | 214,145 |
| | | | | | 2,381,163 |
| Pipelines—1.7% | | | | | |
| El Paso, | | | | | |
| Sr. Unscd. Notes | 6.50 | 9/15/20 | 55,000 | | 60,363 |
| Energy Transfer Partners, | | | | | |
| Sr. Unscd. Notes | 4.65 | 6/1/21 | 215,000 | | 213,841 |
| Kinder Morgan Energy Partners, | | | | | |
| Sr. Unscd. Notes | 6.85 | 2/15/20 | 85,000 | | 101,732 |
| Plains All American Pipeline, | | | | | |
| Gtd. Notes | 5.75 | 1/15/20 | 65,000 | | 73,366 |
STATEMENT OF INVESTMENTS (continued)
| | | | | |
| | Coupon | Maturity | Principal | | |
| Bonds and Notes (continued) | Rate (%) | Date | Amount ($)a | | Value ($) |
| Pipelines (continued) | | | | | |
| Williams Partners, | | | | | |
| Sr. Unscd. Notes | 5.25 | 3/15/20 | 200,000 | | 221,364 |
| | | | | | 670,666 |
| Property & Casualty | | | | | |
| Insurance—2.4% | | | | | |
| American International Group, | | | | | |
| Sr. Unscd. Notes | 4.25 | 9/15/14 | 270,000 | | 265,932 |
| American International Group, | | | | | |
| Sr. Unscd. Notes | 6.40 | 12/15/20 | 40,000 | | 41,966 |
| Cincinnati Financial, | | | | | |
| Sr. Unscd. Debs | 6.13 | 11/1/34 | 54,000 | | 53,993 |
| Cincinnati Financial, | | | | | |
| Sr. Unscd. Notes | 6.92 | 5/15/28 | 47,000 | | 51,203 |
| Hartford Financial Services Group, | | | | | |
| Sr. Unscd. Notes | 5.50 | 3/30/20 | 175,000 | | 179,729 |
| HUB International Holdings, | | | | | |
| Sr. Sub. Notes | 10.25 | 6/15/15 | 90,000 | b | 87,525 |
| Principal Financial Group, | | | | | |
| Gtd. Notes | 8.88 | 5/15/19 | 5,000 | | 6,344 |
| Willis North America, | | | | | |
| Gtd. Notes | 6.20 | 3/28/17 | 170,000 | | 186,403 |
| Willis North America, | | | | | |
| Gtd. Notes | 7.00 | 9/29/19 | 60,000 | | 66,719 |
| | | | | | 939,814 |
| Real Estate—2.1% | | | | | |
| Developers Diversified Realty | | | | | |
| Corp., Sr. Unscd. Notes | 4.75 | 4/15/18 | 105,000 | | 98,945 |
| Developers Diversified Realty, | | | | | |
| Sr. Unscd. Notes | 9.63 | 3/15/16 | 175,000 | | 202,408 |
| Duke Realty, | | | | | |
| Sr. Unscd. Notes | 6.75 | 3/15/20 | 95,000 | | 103,534 |
| Duke Realty, | | | | | |
| Sr. Unscd. Notes | 8.25 | 8/15/19 | 60,000 | | 70,533 |
| HCP, | | | | | |
| Sr. Unscd. Notes | 5.38 | 2/1/21 | 170,000 | | 174,913 |
| Liberty Property, | | | | | |
| Sr. Unscd. Notes | 6.63 | 10/1/17 | 150,000 | | 169,403 |
| | | | | | 819,736 |
18
| | | | | | |
| | | Coupon | Maturity | Principal | | |
| Bonds and Notes (continued) | Rate (%) | Date | Amount ($)a | Value ($) |
| Residential Mortgage | | | | | | |
| Pass-Through Ctfs.—.1% | | | | | | |
| CS First Boston | | | | | | |
| Mortgage Securities, | | | | | | |
| Ser. 2005-6, Cl. 1A2 | | 0.51 | 7/25/35 | 42,030 | c | 37,798 |
| Retail—1.5% | | | | | | |
| CVS Pass-Through Trust, | | | | | | |
| Gtd. Notes | | 5.77 | 1/31/33 | 63,875 | b | 65,258 |
| CVS Pass-Through Trust, | | | | | | |
| Pass Thru Certificates | | 7.51 | 1/10/32 | 135,442 | b | 157,647 |
| CVS Pass-Through Trust, | | | | | | |
| Pass Thru Certificates | | | | | | |
| Notes | | 8.35 | 7/10/31 | 124,841 | b | 153,279 |
| Edcon, | | | | | | |
| Sr. Scd. Notes | EUR | 9.50 | 3/1/18 | 25,000 | b | 29,490 |
| Inergy Finance, | | | | | | |
| Gtd. Notes | | 7.00 | 10/1/18 | 90,000 | | 90,900 |
| QVC, | | | | | | |
| Sr. Scd. Notes | | 7.38 | 10/15/20 | 110,000 | b | 120,450 |
| | | | | | | 617,024 |
| Telecommunications—3.0% | | | | | | |
| CC Holdings, | | | | | | |
| Sr. Scd. Notes | | 7.75 | 5/1/17 | 160,000 | b | 174,000 |
| Centurylink, | | | | | | |
| Sr. Unscd. Notes | | 5.15 | 6/15/17 | 220,000 | | 222,284 |
| Digicel Group, | | | | | | |
| Sr. Unscd. Notes | | 9.13 | 1/15/15 | 200,000 | b | 203,500 |
| Nextel Communications, | | | | | | |
| Gtd. Notes, Ser. E | | 6.88 | 10/31/13 | 106,000 | | 105,205 |
| Richland Towers Funding, | | | | | | |
| Sr. Scd. Notes | | 4.61 | 3/15/41 | 96,838 | b | 100,677 |
| Richland Towers Funding, | | | | | | |
| Sr. Scd. Notes | | 7.87 | 3/15/41 | 100,000 | b | 102,539 |
| Telefonica Emisiones, | | | | | | |
| Gtd. Notes | | 5.46 | 2/16/21 | 275,000 | | 279,218 |
| Wind Acquisition | | | | | | |
| Holdings Finance, | | | | | | |
| Sr. Scd. Notes | | 12.25 | 7/15/17 | 1 | b | 1 |
| | | | | | | 1,187,424 |
STATEMENT OF INVESTMENTS (continued)
| | | |
| | Principal | | |
| Bonds and Notes (continued) | Amount ($)a | | Value ($) |
| U.S. Government Agencies/Mortgage-Backed—.6% | | | |
| Government National Mortgage Association I: | | | |
| Ser. 2011-53 (Interest Only) | | | |
| 1.43%, 5/16/51 | 1,782,340 | c,e | 128,017 |
| Ser. 2011-77 (Interest Only) | | | |
| 1.54%, 4/16/42 | 1,293,222 | c,e | 102,034 |
| | | | 230,051 |
| U.S. Government Securities—16.5% | | | |
| U.S. Treasury Notes: | | | |
| 1.00%, 5/15/14 | 365,000 | d | 371,017 |
| 1.00%, 8/31/16 | 640,000 | d | 641,304 |
| 3.13%, 5/15/21 | 3,075,000 | d | 3,343,343 |
| 3.63%, 5/15/13 | 1,745,000 | | 1,836,286 |
| 3.88%, 5/15/18 | 300,000 | | 345,211 |
| | | | 6,537,161 |
| Total Bonds and Notes | | | |
| (cost $39,184,399) | | | 39,551,920 |
| | | |
| | Face Amount | | |
| | Covered by | | |
| Options—.1% | Contracts ($) | | Value ($) |
| Call Options—.0% | | | |
| Japanese Yen, | | | |
| December 2011 @ $83 | 2,050,000 | f | 2,076 |
| Put Options—.1% | | | |
| 5-Year USD LIBOR-BBA, | | | |
| January 2012 @ $1.60 | 3,930,000 | f | 19,392 |
| 10-Year USD LIBOR-BBA, | | | |
| November 2015 @ $ 5.81 | 1,500,000 | f | 27,662 |
| | | | 47,054 |
| Total Options | | | |
| (cost $131,238) | | | 49,130 |
| | | |
| | Principal | | |
| Short-Term Investments—1.3% | Amount ($) | | Value ($) |
| U.S. Treasury Bills; | | | |
| 0.08%, 11/17/11 | | | |
| (cost $499,981) | 500,000 | g | 499,998 |
20
| | | | |
| Investment of Cash Collateral | | |
| for Securities Loaned—2.2% | Shares | Value ($) |
| Registered Investment Company; | | |
| Dreyfus Institutional Cash Advantage Fund | | |
| (cost $855,697) | 855,697h | 855,697 |
| Total Investments (cost $40,671,315) | 103.5% | 40,956,745 |
| Liabilities, Less Cash and Receivables | (3.5%) | (1,380,612) |
| Net Assets | 100.0% | 39,576,133 |
| a | Principal amount stated in U.S. Dollars unless otherwise noted. BRL—Brazilian Real EUR—Euro GBP—British Pound MXN—Mexican New Peso PEN—Peruvian Nuevo Sol PHP—Philippines Peso |
| b | Securities exempt from registration under Rule 144A of the Securities Act of 1933.These securities may be resold in transactions exempt from registration, normally to qualified institutional buyers.At October 31, 2011, these securities were valued at $10,561,016 or 26.7% of net assets. |
| c | Variable rate security—interest rate subject to periodic change. |
| d | Security, or portion thereof, on loan.At October 31, 2011, the value of the fund’s securities on loan was $5,091,756 and the value of the collateral held by the fund was $5,327,281, consisting of cash collateral of $855,697 and U.S. |
| | Government and Agency securities valued at $4,471,584. |
| e | Notional face amount shown. |
| f | Non-income producing security. |
| g | Held by a broker as collateral for open financial futures positions. |
| h | Investment in affiliated money market mutual fund. |
| | | |
| Portfolio Summary (Unaudited)† | | |
| |
| | Value (%) | | Value (%) |
| Corporate Bonds | 46.9 | Short-Term/ | |
| Asset/Mortgage-Backed | 19.8 | Money Market Investments | 3.5 |
| U.S. Government & Agencies | 17.1 | Options Purchased | .1 |
| Foreign/Governmental | 16.1 | | 103.5 |
| |
| † Based on net assets. | | | |
| See notes to financial statements. | | | |
|
| STATEMENT OF FINANCIAL FUTURES |
| October 31, 2011 |
| | | | | | |
| | | | | Unrealized |
| | | Market Value | | Appreciation |
| | | Covered by | | (Depreciation) |
| | Contracts | Contracts ($) | Expiration | at 10/31/2011($) |
| Financial Futures Long | | | | |
| U.S. Treasury 10 Year Notes | 20 | 2,581,250 | December 2011 | 14,176 |
| Financial Futures Short | | | | |
| Long Gilt | 6 | (1,238,146) | December 2011 | (9,085) |
| U.S. Treasury 2 Year Notes | 35 | (7,709,844) | December 2011 | (5,591) |
| U.S. Treasury 5 Year Notes | 15 | (1,839,141) | December 2011 | (8,011) |
| U.S. Treasury 30 Year Bonds | 4 | (556,125) | December 2011 | 26,866 |
| U.S. Treasury Ultra 30 Year Bonds | 2 | (304,750) | December 2011 | (12,192) |
| Gross Unrealized Appreciation | | | | 41,042 |
| Gross Unrealized Depreciation | | | | (34,879) |
| |
| See notes to financial statements. | | | | |
22
|
| STATEMENT OF OPTIONS WRITTEN |
| October 31, 2011 |
| | | | |
| | Face Amount | | |
| | Covered by | | |
| | Contracts ($) | | Value ($) |
| Call Options; | | | |
| U.S. Treasury 10 Year Notes, | | | |
| December 2011 @ $128 | 19,000 | a | (31,468) |
| Put Options; | | | |
| U.S Treasury 10 Year Notes, | | | |
| December 2011 @ $128 | 19,000 | a | (27,313) |
| 5-Year USD LIBOR-BBA, | | | |
| January 2012 @ $1.75 | 7,870,000 | a | (25,725) |
| 10-Year USD LIBOR-BBA, | | | |
| November 2011 @ $4.23 | 3,600,000 | a | — |
| (premiums received $169,658) | | | (84,506) |
|
| BBA—British Bankers Association |
| LIBOR—London Interbank Bank Offered Rate |
| USD—US Dollar |
| a Non-income producing security. |
| See notes to financial statements. |
|
| STATEMENT OF ASSETS AND LIABILITIES |
| October 31, 2011 |
| | | |
| | | Cost | Value |
| Assets ($): | | | |
| Investments in securities—See Statement of Investments (including | | |
| securities on loan, valued at $5,091,756)—Note 1(c): | | |
| Unaffiliated issuers | | 39,815,618 | 40,101,048 |
| Affiliated issuers | | 855,697 | 855,697 |
| Receivable for investment securities sold | | | 1,898,125 |
| Interest and securities lending income receivable | | | 485,227 |
| Receivable from broker for swap transactions—Note 4 | | 83,310 |
| Receivable for shares of Capital Stock subscribed | | | 25,011 |
| Unrealized appreciation on forward foreign | | | |
| currency exchange contracts—Note 4 | | | 13,557 |
| Prepaid expenses | | | 25,284 |
| | | | 43,487,259 |
| Liabilities ($): | | | |
| Due to The Dreyfus Corporation and affiliates—Note 3(d) | | 34,207 |
| Cash overdraft due to Custodian | | | 46,851 |
| Payable for investment securities purchased | | | 2,312,742 |
| Liability for securities on loan—Note 1(c) | | | 855,697 |
| Payable for shares of Capital Stock redeemed | | | 329,226 |
| Outstanding options written, at value (premiums received | | |
| $169,658)—See Statement of Options Written—Note 4 | | 84,506 |
| Payable to broker from swap transactions—Note 4 | | | 83,281 |
| Unrealized depreciation on forward foreign | | | |
| currency exchange contracts—Note 4 | | | 64,633 |
| Payable for futures variation margin—Note 4 | | | 32,515 |
| Unrealized depreciation on swap contracts—Note 4 | | | 16,640 |
| Swaps premium received—Note 4 | | | 5,542 |
| Accrued expenses | | | 45,286 |
| | | | 3,911,126 |
| Net Assets ($) | | | 39,576,133 |
| Composition of Net Assets ($): | | | |
| Paid-in capital | | | 38,876,974 |
| Accumulated undistributed investment income—net | | | 311,385 |
| Accumulated net realized gain (loss) on investments | | | 78,573 |
| Accumulated net unrealized appreciation (depreciation) on investments, | |
| swap transactions, options transactions and foreign currency transactions | |
| [including $6,163 net unrealized appreciation on financial futures] | | 309,201 |
| Net Assets ($) | | | 39,576,133 |
| |
| |
| |
| Net Asset Value Per Share | | | |
| | Class A | Class C | Class I |
| Net Assets ($) | 27,735,460 | 4,746,136 | 7,094,537 |
| Shares Outstanding | 2,160,387 | 370,980 | 552,695 |
| Net Asset Value Per Share ($) | 12.84 | 12.79 | 12.84 |
| |
| See notes to financial statements. | | | |
24
|
| STATEMENT OF OPERATIONS |
| Year Ended October 31, 2011 |
| | |
| Investment Income ($): | |
| Income: | |
| Interest (net of $12,784 foreign taxes withheld at source): | 1,901,722 |
| Dividends: | |
| Unaffiliated issuers | 3,790 |
| Affiliated issuers | 1,356 |
| Income from securities lending—Note 1(c) | 2,764 |
| Total Income | 1,909,632 |
| Expenses: | |
| Management fee—Note 3(a) | 231,227 |
| Shareholder servicing costs—Note 3(d) | 114,384 |
| Auditing fees | 49,552 |
| Distribution fees—Note 3(c) | 37,781 |
| Registration fees | 35,115 |
| Prospectus and shareholders’ reports | 18,983 |
| Custodian fees—Note 3(d) | 17,992 |
| Directors’ fees and expenses—Note 3(b) | 14,084 |
| Legal fees | 12,936 |
| Loan commitment fees—Note 2 | 778 |
| Miscellaneous | 49,929 |
| Total Expenses | 582,761 |
| Less—reduction in management fee due to undertaking—Note 3(a) | (132,678) |
| Less—reduction in fees due to earnings credits—Note 3(d) | (30) |
| Net Expenses | 450,053 |
| Investment Income—Net | 1,459,579 |
| Realized and Unrealized Gain (Loss) on Investments—Note 4 ($): | |
| Net realized gain (loss) on investments and foreign currency transactions | 1,929,351 |
| Net realized gain (loss) on options transactions | 14,766 |
| Net realized gain (loss) on financial futures | (1,443,897) |
| Net realized gain (loss) on swap transactions | 3,848 |
| Net realized gain (loss) on forward foreign currency exchange contracts | (219,797) |
| Net Realized Gain (Loss) | 284,271 |
| Net unrealized appreciation (depreciation) on | |
| investments and foreign currency transactions | (1,972,700) |
| Net unrealized appreciation (depreciation) on options transactions | 11,318 |
| Net unrealized appreciation (depreciation) on financial futures | 75,183 |
| Net unrealized appreciation (depreciation) on swap transactions | (16,640) |
| Net unrealized appreciation (depreciation) on | |
| forward foreign currency exchange contracts | (54,470) |
| Net Unrealized Appreciation (Depreciation) | (1,957,309) |
| Net Realized and Unrealized Gain (Loss) on Investments | (1,673,038) |
| Net (Decrease) in Net Assets Resulting from Operations | (213,459) |
| |
| See notes to financial statements. | |
STATEMENT OF CHANGES IN NET ASSETS
| | | | |
| | Year Ended October 31, |
| | 2011 | 2010 |
| Operations ($): | | |
| Investment income—net | 1,459,579 | 1,630,219 |
| Net realized gain (loss) on investments | 284,271 | 1,330,109 |
| Net unrealized appreciation | | |
| (depreciation) on investments | (1,957,309) | 1,042,462 |
| Net Increase (Decrease) in Net Assets | | |
| Resulting from Operations | (213,459) | 4,002,790 |
| Dividends to Shareholders from ($): | | |
| Investment income—net: | | |
| Class A Shares | (1,237,654) | (1,111,849) |
| Class C Shares | (181,506) | (186,951) |
| Class I Shares | (185,893) | (51,345) |
| Total Dividends | (1,605,053) | (1,350,145) |
| Capital Stock Transactions ($): | | |
| Net proceeds from shares sold: | | |
| Class A Shares | 9,803,175 | 11,143,866 |
| Class C Shares | 1,841,829 | 2,677,726 |
| Class I Shares | 9,800,581 | 930,148 |
| Dividends reinvested: | | |
| Class A Shares | 809,349 | 930,469 |
| Class C Shares | 88,503 | 76,754 |
| Class I Shares | 114,344 | 27,982 |
| Cost of shares redeemed: | | |
| Class A Shares | (11,451,622) | (8,683,168) |
| Class C Shares | (2,253,769) | (2,909,632) |
| Class I Shares | (4,047,613) | (353,293) |
| Increase (Decrease) in Net Assets | | |
| from Capital Stock Transactions | 4,704,777 | 3,840,852 |
| Total Increase (Decrease) in Net Assets | 2,886,265 | 6,493,497 |
| Net Assets ($): | | |
| Beginning of Period | 36,689,868 | 30,196,371 |
| End of Period | 39,576,133 | 36,689,868 |
| Undistributed investment income—net | 311,385 | 315,002 |
26
| | | | |
| | Year Ended October 31, |
| | 2011 | 2010 |
| Capital Share Transactions: | | |
| Class A | | |
| Shares sold | 739,920 | 865,561 |
| Shares issued for dividends reinvested | 61,391 | 72,867 |
| Shares redeemed | (867,568) | (687,566) |
| Net Increase (Decrease) in Shares Outstanding | (66,257) | 250,862 |
| Class C | | |
| Shares sold | 139,910 | 209,707 |
| Shares issued for dividends reinvested | 6,739 | 6,009 |
| Shares redeemed | (171,061) | (227,286) |
| Net Increase (Decrease) in Shares Outstanding | (24,412) | (11,570) |
| Class I | | |
| Shares sold | 745,140 | 72,665 |
| Shares issued for dividends reinvested | 8,694 | 2,208 |
| Shares redeemed | (310,472) | (27,544) |
| Net Increase (Decrease) in Shares Outstanding | 443,362 | 47,329 |
| |
| See notes to financial statements. | | |
FINANCIAL HIGHLIGHTS
The following tables describe the performance for each share class for the fiscal periods indicated.All information (except portfolio turnover rate) reflects financial results for a single fund share.Total return shows how much your investment in the fund would have increased (or decreased) during each period, assuming you had reinvested all dividends and distributions.These figures have been derived from the fund’s financial statements.
| | | | | | | | | | |
| | | Year Ended October 31, | |
| Class A Shares | 2011 | 2010 | 2009 | 2008 | 2007 |
| Per Share Data ($): | | | | | |
| Net asset value, beginning of period | 13.44 | 12.36 | 10.06 | 12.62 | 12.95 |
| Investment Operations: | | | | | |
| Investment income—neta | .51 | .67 | .68 | .73 | .81 |
| Net realized and unrealized | | | | | |
| gain (loss) on investments | (.54) | .98 | 2.23 | (2.40) | (.19) |
| Total from Investment Operations | (.03) | 1.65 | 2.91 | (1.67) | .62 |
| Distributions: | | | | | |
| Dividends from investment income—net | (.57) | (.57) | (.61) | (.73) | (.83) |
| Dividends from net realized | | | | | |
| gain on investments | — | — | — | (.16) | (.12) |
| Total Distributions | (.57) | (.57) | (.61) | (.89) | (.95) |
| Net asset value, end of period | 12.84 | 13.44 | 12.36 | 10.06 | 12.62 |
| Total Return (%)b | (.24) | 13.67 | 30.10 | (14.21) | 4.98 |
| Ratios/Supplemental Data (%): | | | | | |
| Ratio of total expenses | | | | | |
| to average net assets | 1.44 | 1.41 | 1.53 | 1.78 | 1.74 |
| Ratio of net expenses | | | | | |
| to average net assets | 1.10 | 1.10 | 1.10 | 1.09 | 1.10 |
| Ratio of net investment income | | | | | |
| to average net assets | 3.88 | 5.27 | 6.25 | 6.24 | 6.37 |
| Portfolio Turnover Rate | 309.54c | 172.20 | 133.04c 265.85c 310.92c |
| Net Assets, end of period ($ x 1,000) | 27,735 | 29,926 | 24,420 | 18,947 | 22,200 |
| |
| a | Based on average shares outstanding at each month end. |
| b | Exclusive of sales charge. |
| c | The portfolio turnover rates excluding mortgage dollar roll transactions for the periods ended October 31, 2011, |
| | 2009, 2008 and 2007, were 303.56%, 123.39%, 178.23% and 285.25%, respectively. |
| See notes to financial statements. |
28
| | | | | | | | | | |
| | | Year Ended October 31, | |
| Class C Shares | 2011 | 2010 | 2009 | 2008 | 2007 |
| Per Share Data ($): | | | | | |
| Net asset value, beginning of period | 13.39 | 12.31 | 10.02 | 12.59 | 12.94 |
| Investment Operations: | | | | | |
| Investment income—neta | .42 | .59 | .61 | .64 | .71 |
| Net realized and unrealized | | | | | |
| gain (loss) on investments | (.55) | .96 | 2.22 | (2.41) | (.18) |
| Total from Investment Operations | (.13) | 1.55 | 2.83 | (1.77) | .53 |
| Distributions: | | | | | |
| Dividends from investment income—net | (.47) | (.47) | (.54) | (.64) | (.76) |
| Dividends from net realized | | | | | |
| gain on investments | — | — | — | (.16) | (.12) |
| Total Distributions | (.47) | (.47) | (.54) | (.80) | (.88) |
| Net asset value, end of period | 12.79 | 13.39 | 12.31 | 10.02 | 12.59 |
| Total Return (%)b | (1.00) | 12.81 | 29.19 | (14.95) | 4.26 |
| Ratios/Supplemental Data (%): | | | | | |
| Ratio of total expenses | | | | | |
| to average net assets | 2.22 | 2.20 | 2.28 | 2.62 | 2.55 |
| Ratio of net expenses | | | | | |
| to average net assets | 1.85 | 1.85 | 1.85 | 1.84 | 1.85 |
| Ratio of net investment income | | | | | |
| to average net assets | 3.15 | 4.57 | 5.57 | 5.48 | 5.55 |
| Portfolio Turnover Rate | 309.54c | 172.20 | 133.04c 265.85c 310.92c |
| Net Assets, end of period ($ x 1,000) | 4,746 | 5,295 | 5,010 | 1,430 | 982 |
| |
| a | Based on average shares outstanding at each month end. |
| b | Exclusive of sales charge. |
| c | The portfolio turnover rates excluding mortgage dollar roll transactions for the periods ended October 31, 2011, |
| | 2009, 2008 and 2007, were 303.56%, 123.39%, 178.23% and 285.25%, respectively. |
| See notes to financial statements. |
FINANCIAL HIGHLIGHTS (continued)
| | | | | | | | | | |
| | | Year Ended October 31, | |
| Class I Shares | 2011 | 2010 | 2009 | 2008 | 2007a |
| Per Share Data ($): | | | | | |
| Net asset value, beginning of period | 13.44 | 12.36 | 10.06 | 12.62 | 12.95 |
| Investment Operations: | | | | | |
| Investment income—netb | .51 | .72 | .71 | .76 | .84 |
| Net realized and unrealized | | | | | |
| gain (loss) on investments | (.50) | .96 | 2.24 | (2.41) | (.19) |
| Total from Investment Operations | .01 | 1.68 | 2.95 | (1.65) | .65 |
| Distributions: | | | | | |
| Dividends from investment income—net | (.61) | (.60) | (.65) | (.75) | (.86) |
| Dividends from net realized | | | | | |
| gain on investments | — | — | — | (.16) | (.12) |
| Total Distributions | (.61) | (.60) | (.65) | (.91) | (.98) |
| Net asset value, end of period | 12.84 | 13.44 | 12.36 | 10.06 | 12.62 |
| Total Return (%) | .03 | 13.99 | 30.50 | (14.06) | 5.22 |
| Ratios/Supplemental Data (%): | | | | | |
| Ratio of total expenses | | | | | |
| to average net assets | 1.23 | 1.16 | 1.25 | 1.54 | 1.53 |
| Ratio of net expenses | | | | | |
| to average net assets | .85 | .85 | .85 | .84 | .85 |
| Ratio of net investment income | | | | | |
| to average net assets | 3.87 | 5.54 | 6.51 | 6.49 | 6.54 |
| Portfolio Turnover Rate | 309.54c | 172.20 | 133.04c 265.85c 310.92c |
| Net Assets, end of period ($ x 1,000) | 7,095 | 1,469 | 766 | 521 | 807 |
| |
| a | Effective June 1, 2007, Class R shares were redesignated as Class I shares. |
| b | Based on average shares outstanding at each month end. |
| c | The portfolio turnover rates excluding mortgage dollar roll transactions for the periods ended October 31, 2011, |
| | 2009, 2008 and 2007, were 303.56%, 123.39%, 178.23% and 285.25%, respectively. |
| See notes to financial statements. |
30
NOTES TO FINANCIAL STATEMENTS
NOTE 1—Significant Accounting Policies:
Dreyfus Opportunistic Fixed Income Fund (the “fund”) is a separate non-diversified series of The Dreyfus/Laurel Funds, Inc. (the “Company”), which is registered under the Investment Company Act of 1940, as amended (the “Act”), as an open-end management investment company and operates as a series company currently offering ten series, including the fund. The fund’s investment objective seeks to maximize total return through capital appreciation and income. The Dreyfus Corporation (the “Manager” or “Dreyfus”), a wholly-owned subsidiary of The Bank of New York Mellon Corporation (“BNY Mellon”), serves as the fund’s investment adviser.
MBSC Securities Corporation (the “Distributor”), a wholly-owned subsidiary of the Manager, is the distributor of the fund’s shares. The fund is authorized to issue 100 million shares of $.001 par value Capital Stock in each of the following classes of shares: Class A, Class C and Class I. Class A and Class C shares are sold primarily to retail investors through financial intermediaries and bear a distribution fee and/or shareholder services fee. Class A shares are sold with a front-end sales charge, while Class C shares are subject to a contingent deferred sales charge (“CDSC”). Class I shares are sold primarily to bank trust departments and other financial service providers (includingThe Bank of New York Mellon, a subsidiary of BNY Mellon and an affiliate of Dreyfus), acting on behalf of customers having a qualified trust or investment account or relationship at such institution, and bear no distribution or shareholder services fees. Class I shares are offered without a front-end sales charge or CDSC. Other differences between the classes include the services offered to and the expenses borne by each class, the allocation of certain transfer agency costs and certain voting rights. Income, expenses (other than expenses attributable to a specific class), and realized and unrealized gains or losses on investments are allocated to each class of shares based on its relative net assets.
NOTES TO FINANCIAL STATEMENTS (continued)
As of October 31, 2011, MBC Investments Corp., an indirect subsidiary of BNY Mellon, held 316,146 Class A, 25,937 Class C and 54,150 Class I shares of the fund.
The Company accounts separately for the assets, liabilities and operations of each series. Expenses directly attributable to each series are charged to that series’ operations; expenses which are applicable to all series are allocated among them on a pro rata basis.
The Financial Accounting Standards Board (“FASB”) Accounting Standards Codification (“ASC”) is the exclusive reference of authoritative U.S. generally accepted accounting principles (“GAAP”) recognized by the FASB to be applied by nongovernmental entities. Rules and interpretive releases of the Securities and Exchange Commission (“SEC”) under authority of federal laws are also sources of authoritative GAAP for SEC registrants. The fund’s financial statements are prepared in accordance with GAAP, which may require the use of management estimates and assumptions.Actual results could differ from those estimates.
(a) Portfolio valuation: The fair value of a financial instrument is the amount that would be received to sell an asset or paid to transfer a liability in an orderly transaction between market participants at the measurement date (i.e. the exit price). GAAP establishes a fair value hierarchy that prioritizes the inputs of valuation techniques used to measure fair value.This hierarchy gives the highest priority to unadjusted quoted prices in active markets for identical assets or liabilities (Level 1 measurements) and the lowest priority to unobservable inputs (Level 3 measurements).
Additionally, GAAP provides guidance on determining whether the volume and activity in a market has decreased significantly and whether such a decrease in activity results in transactions that are not orderly. GAAP requires enhanced disclosures around valuation inputs and techniques used during annual and interim periods.
32
Various inputs are used in determining the value of the fund’s investments relating to fair value measurements.These inputs are summarized in the three broad levels listed below:
Level 1—unadjusted quoted prices in active markets for identical investments.
Level 2—other significant observable inputs (including quoted prices for similar investments, interest rates, prepayment speeds, credit risk, etc.).
Level 3—significant unobservable inputs (including the fund’s own assumptions in determining the fair value of investments).
The inputs or methodology used for valuing securities are not necessarily an indication of the risk associated with investing in those securities.
Changes in valuation techniques may result in transfers in or out of an assigned level within the disclosure hierarchy. Valuation techniques used to value the fund’s investments are as follows:
Registered investment companies that are not traded on an exchange are valued at their net asset value and are categorized within Level 1 of the fair value hierarchy.
Investments in securities excluding short-term investments (other than U.S. Treasury Bills), financial futures, options, swaps and forward foreign currency exchange contracts (“forward contracts”) are valued each business day by an independent pricing service (the “Service”) approved by the Board of Directors. Investments for which quoted bid prices are readily available and are representative of the bid side of the market in the judgment of the Service are valued at the mean between the quoted bid prices (as obtained by the Service from dealers in such securities) and asked prices (as calculated by the Service based upon its evaluation of the market for such securities). Other investments (which constitute a majority of the portfolio securities) are valued as deter-
NOTES TO FINANCIAL STATEMENTS (continued)
mined by the Service, based on methods which include consideration of: yields or prices of securities of comparable quality, coupon, maturity and type; indications as to values from dealers; and general market conditions.These securities are generally categorized within Level 2 of the fair value hierarchy.
U.S. Treasury Bills are valued at the mean price between quoted bid prices and asked prices by an independent pricing service approved by the Board of Directors. These securities are generally categorized within Level 2 of the fair value hierarchy.
When market quotations or official closing prices are not readily available, or are determined not to reflect accurately fair value, such as when the value of a security has been significantly affected by events after the close of the exchange or market on which the security is principally traded (for example, a foreign exchange or market), but before the fund calculates its net asset value, the fund may value these investments at fair value as determined in accordance with the procedures approved by the Board of Directors. Certain factors may be considered when fair valuing investments such as: fundamental analytical data, the nature and duration of restrictions on disposition, an evaluation of the forces that influence the market in which the securities are purchased and sold, and public trading in similar securities of the issuer or comparable issuers. These securities are either categorized as Level 2 or 3 depending on the relevant inputs used.
For restricted securities where observable inputs are limited, assumptions about market activity and risk are used and are categorized within Level 3 of the fair value hierarchy.
Financial futures and options, which are traded on an exchange, are valued at the last sales price on the securities exchange on which such securities are primarily traded or at the last sales price on the national securities market on each business day. These securities are generally categorized within Level 1 of the fair value hierarchy. Options traded over-the-counter are valued at the mean between the bid and asked price.These securities are generally categorized within Level 2 of the
34
fair value hierarchy. Investments in swap transactions are valued each business day by a pricing service approved by the Board of Directors. Swaps are valued by the service by using a swap pricing model which incorporates among other factors, default probabilities, recovery rates, credit curves of the underlying issuer and swap spreads on interest rates.These securities are generally categorized within Level 2 of the fair value hierarchy. Investments denominated in foreign currencies are translated to U.S. dollars at the prevailing rates of exchange. Forward contracts are valued at the forward rate.These securities are generally categorized within Level 2 of the fair value hierarchy.
The following is a summary of the inputs used as of October 31, 2011 in valuing the fund’s investments:
| | | | |
| | | Level 2—Other | Level 3— | |
| | Level 1— | Significant | Significant | |
| | Unadjusted | Observable | Unobservable | |
| | Quoted Prices | Inputs | Inputs | Total |
| Assets ($) | | | | |
| Investments in Securities: | | | |
| Asset-Backed | — | 4,188,110 | — | 4,188,110 |
| Commercial | | | | |
| Mortgage-Backed | — | 3,601,402 | — | 3,601,402 |
| Corporate Bonds† | — | 18,594,659 | — | 18,594,659 |
| Foreign Government | — | 6,362,739 | — | 6,362,739 |
| Mutual Funds | 855,697 | — | — | 855,697 |
| Residential | | | | |
| Mortgage-Backed | — | 37,798 | — | 37,798 |
| U.S. Government | | | | |
| Agencies/ | | | | |
| Mortgage-Backed | — | 230,051 | — | 230,051 |
| U.S. Treasury | — | 7,037,159 | — | 7,037,159 |
| Other Financial | | | | |
| Instruments: | | | | |
| Forward Foreign | | | | |
| Currency Exchange | | | | |
| Contracts†† | — | 13,557 | — | 13,557 |
| Futures†† | 41,042 | — | — | 41,042 |
| Options Purchased | — | 49,130 | — | 49,130 |
NOTES TO FINANCIAL STATEMENTS (continued)
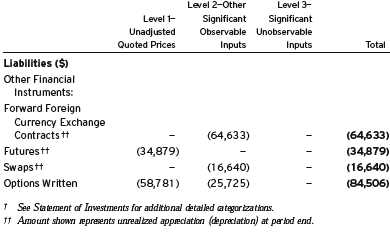
In May 2011, FASB issued Accounting Standards Update (“ASU”) No. 2011-04 “Amendments to Achieve Common FairValue Measurement and Disclosure Requirements in GAAP and International Financial Reporting Standards (“IFRS”)” (“ASU 2011-04”). ASU 2011-04 includes common requirements for measurement of and disclosure about fair value between GAAP and IFRS. ASU 2011-04 will require reporting entities to disclose the following information for fair value measurements categorized within Level 3 of the fair value hierarchy: quantitative information about the unobservable inputs used in the fair value measurement, the valuation processes used by the reporting entity and a narrative description of the sensitivity of the fair value measurement to changes in unobservable inputs and the interrelationships between those unobservable inputs. In addition, ASU 2011-04 will require reporting entities to make disclosures about amounts and reasons for all transfers in and out of Level 1 and Level 2 fair value mea-surements.The new and revised disclosures are effective for interim and annual reporting periods beginning after December 15, 2011. At this time, management is evaluating the implications of ASU 2011-04 and its impact on the financial statements.
36
(b) Foreign currency transactions: The fund does not isolate that portion of the results of operations resulting from changes in foreign exchange rates on investments from the fluctuations arising from changes in the market prices of securities held. Such fluctuations are included with the net realized and unrealized gain or loss on investments.
Net realized foreign exchange gains or losses arise from sales of foreign currencies, currency gains or losses realized on securities transactions between trade and settlement date, and the difference between the amounts of dividends, interest and foreign withholding taxes recorded on the fund’s books and the U.S. dollar equivalent of the amounts actually received or paid. Net unrealized foreign exchange gains and losses arise from changes in the value of assets and liabilities other than investments resulting from changes in exchange rates. Foreign currency gains and losses on investments are included with net realized and unrealized gain or loss on investments.
(c) Securities transactions and investment income: Securities transactions are recorded on a trade date basis. Realized gains and losses from securities transactions are recorded on the identified cost basis. Dividend income is recognized on the ex-dividend date and interest income, including, where applicable, accretion of discount and amortization of premium on investments, is recognized on the accrual basis.
Pursuant to a securities lending agreement with The Bank of New York Mellon, the fund may lend securities to qualified institutions. It is the fund’s policy that, at origination, all loans are secured by collateral of at least 102% of the value of U.S. securities loaned and 105% of the value of foreign securities loaned. Collateral equivalent to at least 100% of the market value of securities on loan is maintained at all times. Collateral is either in the form of cash, which can be invested in certain money market mutual funds managed by the Manager, U.S. Government and Agency securities or letters of credit. The fund is
NOTES TO FINANCIAL STATEMENTS (continued)
entitled to receive all income on securities loaned, in addition to income earned as a result of the lending transaction. Although each security loaned is fully collateralized, the fund bears the risk of delay in recovery of, or loss of rights in, the securities loaned should a borrower fail to return the securities in a timely manner. During the period ended October 31, 2011,The Bank of NewYork Mellon earned $1,488 from lending portfolio securities, pursuant to the securities lending agreement.
(d) Affiliated issuers: Investments in other investment companies advised by Dreyfus are defined as “affiliated” in the Act.
The fund may invest in shares of certain affiliated investment companies also advised or managed by Dreyfus. Investments in affiliated investment companies for the period ended October 31, 2011 were as follows:
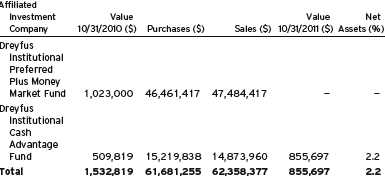
(e) Concentration of Risk:The fund invests primarily in debt securities. Failure of an issuer of the debt securities to make timely interest or principal payments, or a decline or the perception of a decline in the credit quality of a debt security, can cause the debt security’s price to fall, potentially lowering the fund’s share price. In addition, the value of debt securities may decline due to general market conditions that are not specifically related to a particular company, such as real or perceived adverse economic conditions, changes in outlook for corporate earnings, changes in interest or currency rates or adverse investor sentiment.They may also decline because of factors that affect a particular industry.
38
(f) Dividends to shareholders: Dividends are recorded on ex-dividend date. Dividends from investment income-net are declared and paid quarterly. Dividends from net realized capital gains, if any, are normally declared and paid annually, but the fund may make distributions on a more frequent basis to comply with the distribution requirements of the Internal Revenue Code of 1986, as amended (the “Code”).To the extent that net realized capital gains can be offset by capital loss carryovers, it is the policy of the fund not to distribute such gains. Income and capital gain distributions are determined in accordance with income tax regulations, which may differ from GAAP.
On October 31, 2011, the Board of Directors declared a cash dividend of $.037, $.030 and $.040 per share from undistributed investment income-net for Class A, Class C and Class I shares, respectively, payable on November 1, 2011 (ex-dividend date), to shareholders of record as of the close of business on October 31, 2011.
(g) Federal income taxes: It is the policy of the fund to continue to qualify as a regulated investment company, if such qualification is in the best interests of its shareholders, by complying with the applicable provisions of the Code, and to make distributions of taxable income sufficient to relieve it from substantially all federal income and excise taxes.
As of and during the period ended October 31, 2011, the fund did not have any liabilities for any uncertain tax positions.The fund recognizes interest and penalties, if any, related to uncertain tax positions as income tax expense in the Statement of Operations. During the period, the fund did not incur any interest or penalties.
Each of the tax years in the four-year period ended October 31, 2011 remains subject to examination by the Internal Revenue Service and state taxing authorities.
At October 31, 2011, the components of accumulated earnings on a tax basis were as follows: undistributed ordinary income $352,161, undistributed capital gains $138,014 and unrealized appreciation $208,984.
NOTES TO FINANCIAL STATEMENTS (continued)
The tax character of distributions paid to shareholders during the fiscal periods ended October 31, 2011 and October 31, 2010 were as follows: ordinary income $1,605,053 and $1,350,145, respectively.
During the period ended October 31, 2011, as a result of permanent book to tax differences, primarily due to the tax treatment for pay-downs gains and losses, foreign currency transactions, swap periodic payments and consent fees, the fund increased accumulated undistributed investment income-net by $141,857 and decreased accumulated net realized gain (loss) on investments by the same amount. Net assets and net asset value per share were not affected by this reclassification.
(h) New Accounting Pronouncement: In April 2011, FASB issued ASU No. 2011-03 “Transfers and Servicing (Topic 860) Reconsideration of Effective Control for Repurchase Agreements (“ASU 2011-03”) which relates to the accounting for repurchase agreements and similar agreements including mortgage dollar rolls, that both entitle and obligate a transferor to repurchase or redeem financial assets before their maturity. ASU 2011-03 modifies the criteria for determining effective control of transferred assets and as a result certain agreements may now be accounted for as secured borrowings.ASU 2011-03 is effective prospectively for new transfers and existing transactions that are modified in the first interim or annual period beginning on or after December 15, 2011. Management is currently evaluating the implications of this change and its impact on the financial statements.
NOTE 2—Bank Lines of Credit:
The fund participates with other Dreyfus-managed funds in a $225 million unsecured credit facility led by Citibank, N.A. and a $300 million unsecured credit facility provided by The Bank of New York Mellon (each, a “Facility”), each to be utilized primarily for temporary or emergency purposes, including the financing of redemptions. In connection therewith, the fund has agreed to pay its pro rata portion of commitment fees for each Facility. Interest is charged to the fund based
40
on rates determined pursuant to the terms of the respective Facility at the time of borrowing. During the period ended October 31, 2011, the fund did not borrow under the Facilities.
NOTE 3—Management Fee and Other Transactions with Affiliates:
(a) Pursuant to a management agreement with the Manager and the Company, the Company has agreed to pay the Manager a management fee computed at the annual rate of .60% of the value of the fund’s average daily net assets and is payable monthly.The Manager has contractually agreed to waive receipt of its fees and/or assume certain expenses of the fund, until March 1, 2012, so that fund expenses (exclusive of taxes, brokerage fees, Rule 12b-1 distribution plan fees, shareholder services fees, interest expense, commitment fees and extraordinary expenses) do not exceed an annual rate of .85% of the value of the fund’s average daily net assets. The reduction in management fee, pursuant to the undertaking, amounted to $132,678 during the period ended October 31, 2011.
(b) Each Board member who is not an “interested person” of the Company (as defined in the Act) receives $60,000 per annum, plus $7,000 per joint Board meeting of the Company,The Dreyfus/Laurel Funds, Inc., The Dreyfus/Laurel Tax-Free Municipal Funds, Dreyfus Investment Funds and Dreyfus Funds, Inc. (collectively, the “Board Group Open-End Funds”) attended, $2,500 for separate in-person committee meetings attended which are not held in conjunction with a regularly scheduled Board meeting and $2,000 for Board meetings and separate committee meetings attended that are conducted by tele-phone.The Board Group Open-End Funds also reimburse each Board member who is not an “interested person” of the Company (as defined in the Act) for travel and out-of-pocket expenses.With respect to Board meetings, the Chair of the Board receives an additional 25% of such compensation (with the exception of reimbursable amounts). The Chair of each of the Board’s committees, unless the Chair also serves as
NOTES TO FINANCIAL STATEMENTS (continued)
Chair of the Board, receives $1,350 per applicable committee meeting. In the event that there is an in-person joint committee meeting or a joint telephone meeting of the Board Group Open-End Funds and Dreyfus High Yield Strategies Fund (“DHF”), the $2,500 is allocated between the Board Group Open-End Funds and DHF. The Company’s portion of these fees and expenses are charged and allocated to each series based on net assets. Amounts required to be paid by the Company directly to the non-interested Board members, that would be applied to offset a portion of the management fee payable by certain other series of the Company to the Manager, are in fact paid directly by the Manager to the non-interested Board members.
Effective January 1, 2012, the Board Group Open-End Funds and DHF (collectively, the “Board Group Funds”) will pay each Director their respective allocated portions of an annual retainer of $85,000 and a fee of $10,000 for each regularly scheduled Board meeting attended ($75,000 and $8,000, respectively, in the aggregate, prior to January 1, 2012).With respect to the annual retainer and Board meetings of the Board Group Funds, the Chair of the Board will receive an additional 25% of such compensation (with the exception of reimbursable amounts). Each Director will receive $2,500 for any separate in-person committee meetings attended, which are not held in conjunction with a regularly scheduled Board meeting, such amount to be allocated among the Board Group Funds, as applicable. In the event that there is a joint telephone meeting of the Board Group Funds, a fee of $2,000 will be allocated among the applicable Board Group Funds, accordingly (prior to January 1, 2012, the fee allocated was $2,500 if the meeting included DHF). The Chair of each of the Board’s committees, unless the Chair also serves as Chair of the Board, will receive $1,500 per applicable committee meeting. Each Emeritus Director is entitled to receive an annual retainer of one-half the amount paid as a retainer at the time the Director became Emeritus and a per meeting attended fee of one-half the amount paid to Directors.The Board Group Funds also reimburse each Independent Director and Emeritus Directors for travel and out-of-pocket expenses.
42
During the period ended October 31, 2011, the Distributor retained $3,030 from commissions earned on sales of the fund’s Class A shares and $154 from CDSCs on redemptions of the fund’s Class C shares.
(c) Under the Distribution Plan (the “Plan”) adopted pursuant to Rule 12b-1 under the Act, Class C shares pay the Distributor for distributing its shares at an annual rate of .75% of the value of the average daily net assets of Class C shares. During the period ended October 31, 2011, Class C shares were charged $37,781, pursuant to the Plan.
(d) Under the Shareholder Services Plan, Class A and Class C shares pay the Distributor at an annual rate of .25% of the value of their average daily net assets for the provision of certain services.These services provided may include personal services relating to shareholder accounts, such as answering shareholder inquiries regarding the fund and providing reports and other information, and services related to the maintenance of shareholder accounts. The Distributor may make payments to Service Agents (a securities dealer, financial institution or other industry professional) in respect of these services. The Distributor determines the amounts to be paid to Service Agents. During the period ended October 31, 2011, Class A and Class C shares were charged $71,329 and $12,593, respectively, pursuant to the Shareholder Services Plan.
Under its terms, the Plan and Shareholder Services Plan shall remain in effect from year to year, provided such continuance is approved annually by a vote of a majority of those Directors who are not “interested persons” of the Company and who have no direct or indirect financial interest in the operation of or in any agreement related to the Plan or Shareholder Services Plan.
The fund compensates Dreyfus Transfer, Inc., a wholly-owned subsidiary of the Manager, under a transfer agency agreement for providing personnel and facilities to perform transfer agency services for the fund. During the period ended October 31, 2011, the fund was charged $8,427 pursuant to the transfer agency agreement, which is included in Shareholder servicing costs in the Statement of Operations.
NOTES TO FINANCIAL STATEMENTS (continued)
The fund has arrangements with the custodian and cash management bank whereby the fund may receive earnings credits when positive cash balances are maintained, which are used to offset custody and cash management fees. For financial reporting purposes, the fund includes net earnings credits as an expense offset in the Statement of Operations.
The fund compensates The Bank of New York Mellon under cash management agreements for performing cash management services related to fund subscriptions and redemptions. During the period ended October 31, 2011, the fund was charged $983 pursuant to the cash management agreements, which is included in Shareholder servicing costs in the Statement of Operations.These fees were partially offset by earnings credits of $30.
The fund also compensates The Bank of New York Mellon under a custody agreement for providing custodial services for the fund. During the period ended October 31, 2011, the fund was charged $17,992 pursuant to the custody agreement.
During the period ended October 31, 2011, the fund was charged $6,751 for services performed by the Chief Compliance Officer.
The components of “Due to The Dreyfus Corporation and affiliates” in the Statement of Assets and Liabilities consist of: management fees $20,137, Rule 12b-1 distribution plan fees $3,041, shareholder services plan fees $6,899, custodian fees $6,704, chief compliance officer fees $4,246 and transfer agency per account fees $1,815, which are offset against an expense reimbursement currently in effect in the amount of $8,635.
NOTE 4—Securities Transactions:
The aggregate amount of purchases and sales (including paydowns) of investment securities, excluding short-term securities, forward contracts, financial futures, options transactions and swap transactions, during the period ended October 31, 2011, amounted to $121,492,604 and $112,768,487, respectively, of which $2,168,684 in purchases and $2,175,938 in sales were from mortgage dollar roll transactions.
44
Mortgage Dollar Rolls: A mortgage dollar roll transaction involves a sale by the fund of mortgage related securities that it holds with an agreement by the fund to repurchase similar securities at an agreed upon price and date.The securities purchased will bear the same interest rate as those sold, but generally will be collateralized by pools of mortgages with different prepayment histories than those securities sold.
The following tables show the fund’s exposure to different types of market risk as it relates to the Statement of Assets and Liabilities and the Statement of Operations, respectively.
Fair value of derivative instruments as of October 31, 2011 is shown below:
| | | | |
| | Derivative | | Derivative |
| | Assets ($) | | Liabilities ($) |
| Interest rate risk1,2 | 88,096 | Interest rate risk1,3 | (119,385) |
| Foreign exchange risk2,5 | 15,633 | Foreign exchange risk6 | (64,633) |
| Credit risk | — | Credit risk4 | (16,640) |
| Gross fair value of | | | |
| derivatives contracts | 103,729 | | (200,658) |
Statement of Assets and Liabilities location:
| 1 | Includes cumulative appreciation (depreciation) on futures contracts as reported in the Statement of Financial Futures, but only the unpaid variation margin is reported in the Statement of Assets and Liabilities. |
| 2 | Options purchased are inluded in Investments in securities of Unaffiliated issuers at market value. |
| 3 | Outstanding options written, at value. |
| 4 | Unrealized depreciation on swap contracts. |
| 5 | Unrealized appreciation on forward foreign currency exchange contracts. |
| 6 | Unrealized depreciation on forward foreign currency exchange contracts. |
The effect of derivative instruments in the Statement of Operations during the period ended October 31, 2011 is shown below:
| | | | | | | | | | |
| | Amount of realized gain or (loss) on derivatives recognized in income ($) |
| | | | Forward | | |
| Underlying risk | Futures7 | Options8 | Contracts9 | Swaps10 | Total |
| Interest rate | (1,443,897) | 77,522 | — | (13,019) | (1,379,394) |
| Foreign | | | | | |
| exchange | — | (62,756) | (219,797) | — | (282,553) |
| Credit | — | — | — | 16,867 | 16,867 |
| Total | (1,443,897) | 14,766 | (219,797) | 3,848 | (1,645,080) |
NOTES TO FINANCIAL STATEMENTS (continued)
Change in unrealized appreciation or (depreciation) on derivatives recognized in income ($)
| | | | | | | | | |
| | | | Forward | | |
| Underlying risk | Futures11 | Options12 | Contracts13 | Swaps14 | Total |
| Interest rate | 75,183 | 35,417 | — | — | 110,600 |
| Foreign exchange | — | (24,099) | (54,470) | — | (78,569) |
| Credit | — | — | — | (16,640) | (16,640) |
| Total | 75,183 | 11,318 | (54,470) | (16,640) | 15,391 |
Statement of Operations location:
| 7 | Net realized gain (loss) on financial futures. |
| 8 | Net realized gain (loss) on options transactions. |
| 9 | Net realized gain (loss) on forward foreign currency exchange contracts. |
| 10 | Net realized gain (loss) on swap transactions. |
| 11 | Net unrealized appreciation (depreciation) on financial futures. |
| 12 | Net unrealized appreciation (depreciation) on options transactions. |
| 13 | Net unrealized appreciation (depreciation) on forward foreign currency exchange contracts. |
| 14 | Net unrealized appreciation (depreciation) on swap transactions. |
Futures Contracts: In the normal course of pursuing its investment objective, the fund is exposed to market risk, including interest rate risk, as a result of changes in value of underlying financial instruments.The fund invests in financial futures contracts in order to manage its exposure to or protect against changes in the market. A futures contract represents a commitment for the future purchase or a sale of an asset at a specified date. Upon entering into such contracts, these investments require initial margin deposits with a broker, which consist of cash or cash equivalents.The amount of these deposits is determined by the exchange or Board of Trade on which the contract is traded and is subject to change.Accordingly, variation margin payments are received or made to reflect daily unrealized gains or losses which are recorded in the Statement of Operations. Futures contracts are valued daily at the last sales price established by the Board of Trade or exchange upon which they are traded. When the contracts are closed, the fund recognizes a realized gain or loss. There is minimal counterparty credit risk to the fund with futures since futures are exchange traded, and the exchange’s clearinghouse guarantees the futures against default. Contracts open at October 31, 2011 are set forth in the Statement of Financial Futures.
46
Options: The fund purchases and writes (sells) put and call options to hedge against changes in interest rates, foreign currencies, or as a substitute for an investment.The fund is subject to interest rate risk and currency risk in the course of pursuing its investment objectives through its investments in options contracts. A call option gives the purchaser of the option the right (but not the obligation) to buy, and obligates the writer to sell, the underlying security or securities at the exercise price at any time during the option period, or at a specified date. Conversely, a put option gives the purchaser of the option the right (but not the obligation) to sell, and obligates the writer to buy the underlying security or securities at the exercise price at any time during the option period, or at a specified date.
As a writer of call options, the fund receives a premium at the outset and then bears the market risk of unfavorable changes in the price of the financial instrument underlying the option. Generally, the fund realizes a gain, to the extent of the premium, if the price of the underlying financial instrument decreases between the date the option is written and the date on which the option is terminated. Generally, the fund incurs a loss, if the price of the financial instrument increases between those dates.
As a writer of put options, the fund receives a premium at the outset and then bears the market risk of unfavorable changes in the price of the financial instrument underlying the option. Generally, the fund realizes a gain, to the extent of the premium, if the price of the underlying financial instrument increases between the date the option is written and the date on which the option is terminated. Generally, the fund incurs a loss, if the price of the financial instrument decreases between those dates.
As a writer of an option, the fund has no control over whether the underlying securities may be sold (call) or purchased (put) and as a result bears the market risk of an unfavorable change in the price of the security underlying the written option.There is a risk of loss from
NOTES TO FINANCIAL STATEMENTS (continued)a
a change in value of such options which may exceed the related premiums received. One risk of holding a put or a call option is that if the option is not sold or exercised prior to its expiration, it becomes worthless. However, this risk is limited to the premium paid by the fund. Upon the expiration or closing of the option transaction, a gain or loss is reported in the Statement of Operations.
The following summarizes the fund’s call/put options written during the period ended October 31, 2011:
| | | | | |
| | Face Amount | | Options Terminated | |
| | Covered by | Premiums | | Net Realized | |
| Options Written: | Contracts ($) | Received ($) | Cost ($) | Gain (Loss) ($) | |
| Contracts outstanding | | | | | |
| October 31, 2010 | 870,000 | 13,050 | | | |
| Contracts written | 33,790,000 | 662,110 | | | |
| Contracts terminated: | | | | | |
| Contracts closed | 10,609,000 | 325,311 | 368,933 | (43,622 | ) |
| Contracts expired | 12,543,000 | 180,191 | — | 180,191 | |
| Total contracts | | | | | |
| terminated | 23,152,000 | 505,502 | 368,933 | 136,569 | |
| Contracts outstanding | | | | | |
| October 31, 2011 | 11,508,000 | 169,658 | | | |
Forward Foreign Currency Exchange Contracts: The fund enters into forward contracts in order to hedge its exposure to changes in foreign currency exchange rates on its foreign portfolio holdings, to settle foreign currency transactions or as a part of its investment strategy. When executing forward contracts, the fund is obligated to buy or sell a foreign currency at a specified rate on a certain date in the future. With respect to sales of forward contracts, the fund incurs a loss if the value of the contract increases between the date the forward contract is opened and the date the forward contract is closed.The fund realizes a gain if the value of the contract decreases between those dates. With respect to purchases of forward contracts, the fund incurs a loss if the value of the contract decreases between the date the forward contract is opened and the date the forward contract is closed.The fund realizes a gain if the value of the contract increases between those dates. Any realized gain or loss which occurred during the period is reflected in the Statement of Operations.The fund is exposed to foreign currency risk as a result of changes in value of underlying financial instruments.
48
The fund is also exposed to credit risk associated with counterparty nonperformance on these forward contracts, which is typically limited to the unrealized gain on each open contract.The following summarizes open forward contracts at October 31, 2011:
| | | | | |
| | Foreign | | | Unrealized | |
| Forward Foreign Currency | Currency | | | Appreciation | |
| Exchange Contracts | Amounts | Cost ($) | Value ($) (Depreciation) ($) | |
| Purchases: | | | | | |
| Chilean Peso, | | | | | |
| Expiring 11/30/2011 | 78,080,000 | 151,054 | 158,812 | 7,758 | |
| Mexican New Peso, | | | | | |
| Expiring 11/1/2011 | 5,406,656 | 415,897 | 405,692 | (10,205 | ) |
| Mexican New Peso, | | | | | |
| Expiring 11/30/2011 | 4,990,000 | 370,731 | 373,321 | 2,590 | |
| Peruvian Nuevo Sol, | | | | | |
| Expiring 11/30/2011 | 695,000 | 254,467 | 255,995 | 1,528 | |
| South African Rand, | | | | | |
| Expiring 11/30/2011 | 1,380,000 | 171,444 | 173,125 | 1,681 | |
| Sales: | | Proceeds ($) | | | |
| British Pound, | | | | | |
| Expiring 11/30/2011 | 310,000 | 486,511 | 498,304 | (11,793 | ) |
| British Pound, | | | | | |
| Expiring 11/30/2011 | 160,000 | 254,720 | 257,189 | (2,469 | ) |
| British Pound, | | | | | |
| Expiring 11/30/2011 | 40,000 | 63,947 | 64,297 | (350 | ) |
| Chilean Peso, | | | | | |
| Expiring 11/30/2011 | 78,080,000 | 152,261 | 158,812 | (6,551 | ) |
| Euro, | | | | | |
| Expiring 11/30/2011 | 440,000 | 604,428 | 608,651 | (4,223 | ) |
| Euro, | | | | | |
| Expiring 11/30/2011 | 960,000 | 1,318,579 | 1,327,966 | (9,387 | ) |
| Euro, | | | | | |
| Expiring 11/30/2011 | 570,000 | 780,315 | 788,480 | (8,165 | ) |
| Euro, | | | | | |
| Expiring 11/30/2011 | 120,000 | 165,934 | 165,996 | (62 | ) |
| Peruvian Nuevo Sol, | | | | | |
| Expiring 11/30/2011 | 1,090,000 | 398,173 | 401,488 | (3,315 | ) |
| Philippines Peso, | | | | | |
| Expiring 11/30/2011 | 21,190,000 | 489,883 | 496,110 | (6,227 | ) |
| South African Rand, | | | | | |
| Expiring 11/30/2011 | 1,380,000 | 171,239 | 173,125 | (1,886 | ) |
| Gross Unrealized | | | | | |
| Appreciation | | | | 13,557 | |
| Gross Unrealized | | | | | |
| Depreciation | | | | (64,633 | ) |
NOTES TO FINANCIAL STATEMENTS (continued)
Swaps: The fund enters into swap agreements to exchange the interest rate on, or return generated by, one nominal instrument for the return generated by another nominal instrument.The fund enters into these agreements to hedge certain market or interest rate risks, to manage the interest rate sensitivity (sometimes called duration) of fixed income securities, to provide a substitute for purchasing or selling particular securities or to increase potential returns.
The fund accrues for the interim payments on swap contracts on a daily basis, with the net amount recorded within unrealized appreciation (depreciation) on swap contracts in the Statement of Assets and Liabilities. Once the interim payments are settled in cash, the net amount is recorded as realized gain (loss) on swaps, in addition to realized gain (loss) recorded upon the termination of swap contracts in the Statement of Operations. Upfront payments made and/or received by the fund, are recorded as an asset and/or liability in the Statement of Assets and Liabilities and are recorded as a realized gain or loss ratably over the contract’s term/event with the exception of forward starting interest rate swaps which are recorded as realized gains or losses on the termination date. Fluctuations in the value of swap contracts are recorded for financial statement purposes as unrealized appreciation or depreciation on swap transactions.
Interest Rate Swaps: Interest rate swaps involve the exchange of commitments to pay and receive interest based on a notional principal amount.The fund enters into these agreements for a variety of reasons, including to hedge certain market or interest rate risks, to manage the interest rate sensitivity (sometimes called duration) of fixed income securities, to provide a substitute for purchasing or selling particular securities or to increase potential returns.The fund may elect to pay a fixed rate and receive a floating rate, or receive a fixed rate and pay a floating rate on a notional principal amount.The net interest received or paid on interest rate swap agreements is included within unrealized appreciation (depreciation) on swap contracts in the Statement of Assets and Liabilities. Interest rate swaps are valued daily and the change, if any,
50
is recorded as an unrealized gain or loss in the Statement of Operations. When a swap contract is terminated early, the fund records a realized gain or loss equal to the difference between the current realized value and the expected cash flows.At October 31, 2011, there were no interest rate swap agreements outstanding.
Credit Default Swaps: Credit default swaps involve commitments to pay a fixed interest rate in exchange for payment if a credit event affecting a third party (the referenced company) occurs. Credit events may include a failure to pay interest or principal, bankruptcy, or restructur-ing.The fund enters into these agreements to manage its exposure to the market or certain sectors of the market, to reduce its risk exposure to defaults of corporate and sovereign issuers, or to create exposure to corporate or sovereign issuers to which it is not otherwise exposed. For those credit default swaps in which the fund is paying a fixed rate, the fund is buying credit protection on the instrument. In the event of a credit event, the fund would receive the full notional amount for the reference obligation. For those credit default swaps in which the fund is receiving a fixed rate, the fund is selling credit protection on the underlying instrument. The maximum payouts for these contracts are limited to the notional amount of each swap. Credit default swaps may involve greater risks than if the fund had invested in the reference obligation directly and are subject to general market risk, liquidity risk, counterparty risk and credit risk.
The maximum potential amount of future payments (undiscounted) that a fund as a seller of protection could be required to make under a credit default swap agreement would be an amount equal to the notional amount of the agreement which may exceed the amount of unrealized appreciation or depreciation reflected in the Statement of Assets and Liabilities. Notional amounts of all credit default swap agreements are disclosed in the following chart, which summarizes open credit default swaps on corporate issues entered into by the fund. These potential amounts would be partially offset by any recovery
NOTES TO FINANCIAL STATEMENTS (continued)
values of the respective referenced obligations, upfront payments received upon entering into the agreement, or net amounts received from the settlement of buy protection credit default swap agreements entered into by the fund for the same referenced entity or entities.The following summarizes open credit default swaps entered into by the fund at October 31, 2011:
| | | | | | | | | | | |
| | | | | (Pay) | | | | Upfront | | | |
| | | | | Receive | Implied | | | Premiums | | | |
| Reference | | Notional | | Fixed | Credit | Market | | Received | | Unrealized | |
| Obligation | | Amount ($)2 | | Rate (%) | Spread (%)3 | Value ($) | | (Paid) ($) | | Depreciation ($) | |
| Sales Contracts:1 | | | | | | | | | | | |
| Metlife Inc, 5% | | | | | | | | | | | |
| 6/15/2015 | | | | | | | | | | | |
| 6/20/2016 | † | 190,000 | a | 1.00 | 2.72 | (13,494 | ) | (3,127 | ) | (10,367 | ) |
| Prudential | | | | | | | | | | | |
| Financial, 4.50% | | | | | | | | | | | |
| 7/15/2013 | | | | | | | | | | | |
| 6/20/2016 | † | 190,000 | a | 1.00 | 2.09 | (8,688 | ) | (2,415 | ) | (6,273 | ) |
| Gross Unrealized | | | | | | | | | | | |
| Depreciation | | | | | | | | | | (16,640 | ) |
| † Expiration Date | | | | | | | | | | | |
| Counterparty: | | | | | | | | | | | |
| a | JP Morgan |
| 1 | If the fund is a seller of protection and a credit event occurs, as defined under the terms of the swap agreement, the fund will either (i) pay to the buyer of protection an amount equal to the notional amount of the swap and take delivery of the reference obligation or (ii) pay a net settlement amount in the form of cash or securities equal to the notional amount of the swap less the recovery value of the reference obligation. |
| 2 | The maximum potential amount the fund could be required to pay as a seller of credit protection or receive as a buyer of credit protection if a credit event occurs as defined under the terms of the swap agreement. |
| 3 | Implied credit spreads, represented in absolute terms, utilized in determining the market value as of the period end serve as an indicator of the current status of the payment/performance risk and represent the likelihood of risk of default for the credit derivative.The credit spread of a particular referenced entity reflects the cost of buying/selling protection and may include upfront payments required to be made to enter into the agreement.Wider credit spreads represent a deterioration of the referenced entity's credit soundness and a greater likelihood of risk of default or other credit event occurring as defined under the terms of the agreement.A credit spread identified as Defaulted indicates a credit event has occurred for the referenced entity. |
GAAP requires disclosure for (i) the nature and terms of the credit derivative, reasons for entering into the credit derivative, the events or circumstances that would require the seller to perform under the credit derivative, and the current status of the payment/performance risk of the credit derivative, (ii) the maximum potential amount of future payments (undiscounted) the seller could be required to make under the
52
credit derivative, (iii) the fair value of the credit derivative, and (iv) the nature of any recourse provisions and assets held either as collateral or by third parties.All required disclosures have been made and are incorporated within the current period as part of the Notes to the Statement of Investments and disclosures within this Note.
The following summarizes the average market value of derivatives outstanding during the period ended October 31, 2011:
| |
| | Average Market Value ($) |
| Interest rate futures contracts | 16,984,685 |
| Interest rate options contracts | 141,702 |
| Foreign currency options contracts | 14,375 |
| Forward contracts | 7,439,640 |
The following summarizes the average notional value of swap contracts outstanding during the period ended October 31, 2011:
| |
| | Average Notional Value ($) |
| Credit default swap contracts | 343,077 |
| Interest rate swap contracts | 113,846 |
At October 31, 2011, the cost of investments for federal income tax purposes was $40,677,938; accordingly, accumulated net unrealized appreciation on investments was $278,807, consisting of $749,465 gross unrealized appreciation and $470,658 gross unrealized depreciation.
NOTE 5—Other Matters:
At the October 27, 2011 Board meeting, the Board of the Company approved a proposal to have shareholders consider the election of Francine J. Bovich as an additional Board member of the Company, and also consider the election of Joseph S. DiMartino and Benaree Pratt Wiley, current Board members of the Company not previously proposed to shareholders of the fund. A proxy statement was mailed, on December 1, 2011, to shareholders of record as of the close of business on November 1, 2011 asking shareholders to consider these elections at a special joint meeting of shareholders to be held on Wednesday, February 8, 2012.
|
| REPORT OF INDEPENDENT REGISTERED |
| PUBLIC ACCOUNTING FIRM |
The Board of Directors and Shareholders of The Dreyfus/Laurel Funds, Inc.
We have audited the accompanying statement of assets and liabilities of Dreyfus Opportunistic Fixed Income Fund, a series of The Dreyfus/Laurel Funds, Inc. (the “Fund”), including the statement of investments, financial futures and options written, as of October 31, 2011, and the related statement of operations for the year then ended, the statements of changes in net assets for each of the years in the two-year period then ended, and the financial highlights for each of the years in the five-year period then ended. These financial statements and financial highlights are the responsibility of the Fund’s management. Our responsibility is to express an opinion on these financial statements and financial highlights based on our audits.
We conducted our audits in accordance with the standards of the Public Company Accounting Oversight Board (United States).Those standards require that we plan and perform the audit to obtain reasonable assurance about whether the financial statements and financial highlights are free of material misstatement. An audit includes examining, on a test basis, evidence supporting the amounts and disclosures in the financial statements. Our procedures included confirmation of securities owned as of October 31, 2011, by correspondence with the custodian and brokers or by other appropriate auditing procedures where replies from brokers were not received. An audit also includes assessing the accounting principles used and significant estimates made by management, as well as evaluating the overall financial statement presentation.We believe that our audits provide a reasonable basis for our opinion.
In our opinion, the financial statements and financial highlights referred to above present fairly, in all material respects, the financial position of Dreyfus Opportunistic Fixed Income Fund as of October 31, 2011, the results of its operations for the year then ended, the changes in its net assets for each of the years in the two-year period then ended, and the financial highlights for each of the years in the five-year period then, in conformity with U.S. generally accepted accounting principles.

New York, New York
December 22, 2011
54
IMPORTATION TAX INFORMATION (Unaudited)
For federal tax purposes the fund designates the maximum amount allowable but not less than 77.22% as interest-related dividends in accordance with Sections 871(k)(1) and 881(e) of the Internal Revenue Code.
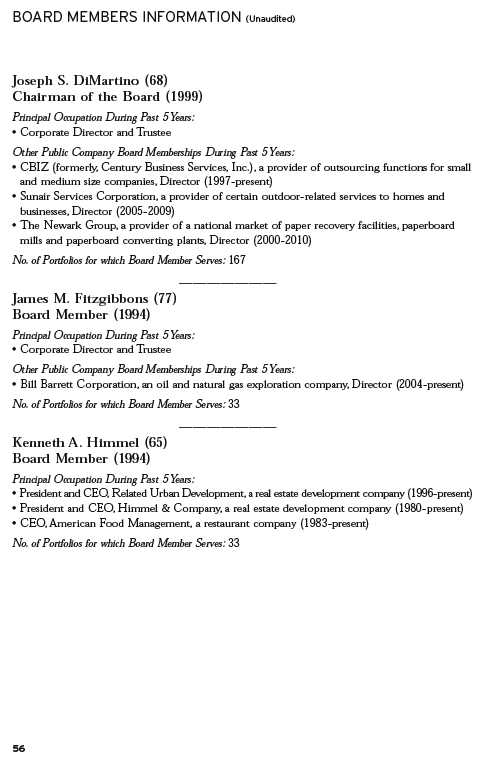
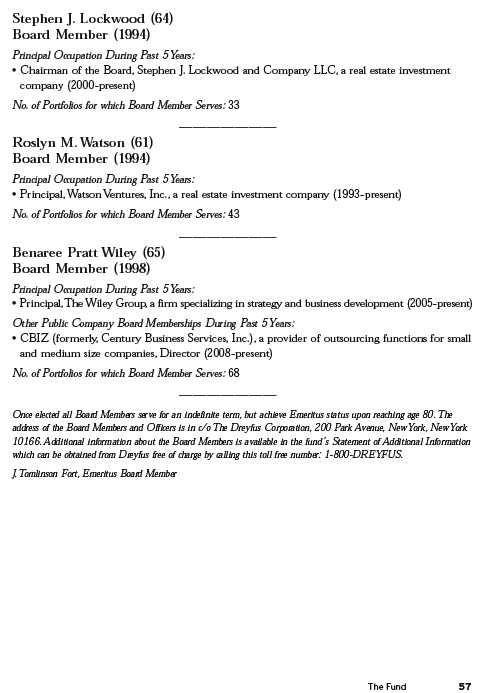
OFFICERS OF THE FUND (Unaudited)
BRADLEY J. SKAPYAK, President since January 2010.
Chief Operating Officer and a director of the Manager since June 2009. From April 2003 to June 2009, Mr. Skapyak was the head of the Investment Accounting and Support Department of the Manager. He is an officer of 75 investment companies (comprised of 167 portfolios) managed by the Manager. He is 52 years old and has been an employee of the Manager since February 1988.
MICHAEL A. ROSENBERG, Vice President and Secretary since August 2005.
Assistant General Counsel of BNY Mellon, and an officer of 76 investment companies (comprised of 192 portfolios) managed by the Manager. He is 51 years old and has been an employee of the Manager since October 1991.
KIESHA ASTWOOD, Vice President and Assistant Secretary since January 2010.
Counsel of BNY Mellon, and an officer of 76 investment companies (comprised of 192 portfolios) managed by the Manager. She is 38 years old and has been an employee of the Manager since July 1995.
JAMES BITETTO, Vice President and Assistant Secretary since August 2005.
Senior Counsel of BNY Mellon and Secretary of the Manager, and an officer of 76 investment companies (comprised of 192 portfolios) managed by the Manager. He is 45 years old and has been an employee of the Manager since December 1996.
JONI LACKS CHARATAN, Vice President and Assistant Secretary since August 2005.
Senior Counsel of BNY Mellon, and an officer of 76 investment companies (comprised of 192 portfolios) managed by the Manager. She is 55 years old and has been an employee of the Manager since October 1988.
JOSEPH M. CHIOFFI, Vice President and Assistant Secretary since August 2005.
Senior Counsel of BNY Mellon, and an officer of 76 investment companies (comprised of 192 portfolios) managed by the Manager. He is 49 years old and has been an employee of the Manager since June 2000.
KATHLEEN DENICHOLAS, Vice President and Assistant Secretary since January 2010.
Senior Counsel of BNY Mellon, and an officer of 76 investment companies (comprised of 192 portfolios) managed by the Manager. She is 37 years old and has been an employee of the Manager since February 2001.
JANETTE E. FARRAGHER, Vice President and Assistant Secretary since August 2005.
Assistant General Counsel of BNY Mellon, and an officer of 76 investment companies (comprised of 192 portfolios) managed by the Manager. She is 48 years old and has been an employee of the Manager since February 1984.
JOHN B. HAMMALIAN, Vice President and Assistant Secretary since August 2005.
Managing Counsel of BNY Mellon, and an officer of 76 investment companies (comprised of 192 portfolios) managed by the Manager. He is 48 years old and has been an employee of the Manager since February 1991.
M. CRISTINA MEISER, Vice President and Assistant Secretary since January 2010.
Senior Counsel of BNY Mellon, and an officer of 76 investment companies (comprised of 192 portfolios) managed by the Manager. She is 41 years old and has been an employee of the Manager since August 2001.
58
ROBERT R. MULLERY, Vice President and Assistant Secretary since August 2005.
Managing Counsel of BNY Mellon, and an officer of 76 investment companies (comprised of 192 portfolios) managed by the Manager. He is 59 years old and has been an employee of the Manager since May 1986.
JEFF PRUSNOFSKY, Vice President and Assistant Secretary since August 2005.
Managing Counsel of BNY Mellon, and an officer of 76 investment companies (comprised of 192 portfolios) managed by the Manager. He is 46 years old and has been an employee of the Manager since October 1990.
JAMES WINDELS, Treasurer since November 2001.
Director – Mutual Fund Accounting of the Manager, and an officer of 76 investment companies (comprised of 192 portfolios) managed by the Manager. He is 53 years old and has been an employee of the Manager since April 1985.
RICHARD CASSARO, Assistant Treasurer since January 2008.
Senior Accounting Manager – Money Market and Municipal Bond Funds of the Manager, and an officer of 76 investment companies (comprised of 192 portfolios) managed by the Manager. He is 52 years old and has been an employee of the Manager since September 1982.
GAVIN C. REILLY, Assistant Treasurer since December 2005.
Tax Manager of the Investment Accounting and Support Department of the Manager, and an officer of 76 investment companies (comprised of 192 portfolios) managed by the Manager. He is 43 years old and has been an employee of the Manager since April 1991.
ROBERT ROBOL, Assistant Treasurer since December 2002.
Senior Accounting Manager – Fixed Income Funds of the Manager, and an officer of 76 investment companies (comprised of 192 portfolios) managed by the Manager. He is 47 years old and has been an employee of the Manager since October 1988.
ROBERT SALVIOLO, Assistant Treasurer since July 2007.
Senior Accounting Manager – Equity Funds of the Manager, and an officer of 76 investment companies (comprised of 192 portfolios) managed by the Manager. He is 44 years old and has been an employee of the Manager since June 1989.
ROBERT SVAGNA, Assistant Treasurer since December 2002.
Senior Accounting Manager – Equity Funds of the Manager, and an officer of 76 investment companies (comprised of 192 portfolios) managed by the Manager. He is 44 years old and has been an employee of the Manager since November 1990.
OFFICERS OF THE FUND (Unaudited) (continued)
JOSEPH W. CONNOLLY, Chief Compliance Officer since October 2004.
Chief Compliance Officer of the Manager and The Dreyfus Family of Funds (76 investment companies, comprised of 192 portfolios). From November 2001 through March 2004, Mr. Connolly was first Vice-President, Mutual Fund Servicing for Mellon Global Securities Services. In that capacity, Mr. Connolly was responsible for managing Mellon’s Custody, Fund Accounting and Fund Administration services to third-party mutual fund clients. He is 54 years old and has served in various capacities with the Manager since 1980, including manager of the firm’s Fund Accounting Department from 1997 through October 2001.
STEPHEN J. STOREN, Anti-Money Laundering Compliance Officer since May 2011.
Chief Compliance Officer of the Distributor, and the Anti-Money Laundering Compliance Officer of 72 investment companies (comprised of 188 portfolios) managed by the Manager. He is 57 years old and has been an employee of the Distributor since October 1999.
60
Item 2. Code of Ethics.
The Registrant has adopted a code of ethics that applies to the Registrant's principal executive officer, principal financial officer, principal accounting officer or controller, or persons performing similar functions. There have been no amendments to, or waivers in connection with, the Code of Ethics during the period covered by this Report.
Item 3. Audit Committee Financial Expert.
The Registrant's Board has determined that Joseph S. DiMartino, a member of the Audit Committee of the Board, is an audit committee financial expert as defined by the Securities and Exchange Commission (the "SEC"). Mr. DiMartino is "independent" as defined by the SEC for purposes of audit committee financial expert determinations.
Item 4. Principal Accountant Fees and Services.
(a) Audit Fees. The aggregate fees billed for each of the last two fiscal years (the "Reporting Periods") for professional services rendered by the Registrant's principal accountant (the "Auditor") for the audit of the Registrant's annual financial statements or services that are normally provided by the Auditor in connection with the statutory and regulatory filings or engagements for the Reporting Periods, were $271,095 in 2010 and $ 276,510 in 2011.
(b) Audit-Related Fees. The aggregate fees billed in the Reporting Periods for assurance and related services by the Auditor that are reasonably related to the performance of the audit of the Registrant's financial statements and are not reported under paragraph (a) of this Item 4 were $32,490 in 2010 and $32,490 in 2011. These services consisted of one or more of the following: (i) agreed upon procedures related to compliance with Internal Revenue Code section 817(h), (ii) security counts required by Rule 17f-2 under the Investment Company Act of 1940, as amended, (iii) advisory services as to the accounting or disclosure treatment of Registrant transactions or events and (iv) advisory services to the accounting or disclosure treatment of the actual or potential impact to the Registrant of final or proposed rules, standards or interpretations by the Securities and Exchange Commission, the Financial Accounting Standards Boards or other regulatory or standard-setting bodies.
The aggregate fees billed in the Reporting Periods for non-audit assurance and related services by the Auditor to the Registrant's investment adviser (not including any sub-investment adviser whose role is primarily portfolio management and is subcontracted with or overseen by another investment adviser), and any entity controlling, controlled by or under common control with the investment adviser that provides ongoing services to the Registrant ("Service Affiliates"), that were reasonably related to the performance of the annual audit of the Service Affiliate, which required pre-approval by the Audit Committee were $0 in 2010 and $0 in 2011.
(c) Tax Fees. The aggregate fees billed in the Reporting Periods for professional services rendered by the Auditor for tax compliance, tax advice, and tax planning ("Tax Services") were $20,340 in 2010 and $20,340 in 2011. These services consisted of review or preparation of U.S. federal, state, local and excise tax returns. The aggregate fees billed in the Reporting Periods for Tax Services by the Auditor to Service Affiliates, which required pre-approval by the Audit Committee were $0 in 2010 and $0 in 2011.
(d) All Other Fees. The aggregate fees billed in the Reporting Periods for products and services provided by the Auditor, other than the services reported in paragraphs (a) through (c) of this Item, were $0 in 2010 and $0 in 2011.
The aggregate fees billed in the Reporting Periods for Non-Audit Services by the Auditor to Service Affiliates, other than the services reported in paragraphs (b) through (c) of this Item, which required pre-approval by the Audit Committee, were $0 in 2010 and $0 in 2011.
(e)(1) Audit Committee Pre-Approval Policies and Procedures. The Registrant's Audit Committee has established policies and procedures (the "Policy") for pre-approval (within specified fee limits) of the Auditor's engagements for non-audit services to the Registrant and Service Affiliates without specific case-by-case consideration. The pre-approved services in the Policy can include pre-approved audit services, pre-approved audit-related services, pre-approved tax services and pre-approved all other services. Pre-approval considerations include whether the proposed services are compatible with maintaining the Auditor's independence. Pre-approvals pursuant to the Policy are considered annually.
(e)(2) Note: None of the services described in paragraphs (b) through (d) of this Item 4 were approved by the Audit Committee pursuant to paragraph (c)(7)(i)(C) of Rule 2-01 of Regulation S-X.
(f) None of the hours expended on the principal accountant's engagement to audit the registrant's financial statements for the most recent fiscal year were attributed to work performed by persons other than the principal account's full-time, permanent employees.
Non-Audit Fees. The aggregate non-audit fees billed by the Auditor for services rendered to the Registrant, and rendered to Service Affiliates, for the Reporting Periods were $3,221,000 in 2010 and $12,152,586 in 2011.
Auditor Independence. The Registrant's Audit Committee has considered whether the provision of non-audit services that were rendered to Service Affiliates, which were not pre-approved (not requiring pre-approval), is compatible with maintaining the Auditor's independence.
Item 5. Audit Committee of Listed Registrants.
Not applicable.
Item 6. Investments.
(a) Not applicable.
Item 7. Disclosure of Proxy Voting Policies and Procedures for Closed-End Management Investment Companies.
Not applicable.
Item 8. �� Portfolio Managers of Closed-End Management Investment Companies.
Not applicable.
Item 9. Purchases of Equity Securities by Closed-End Management Investment Companies and Affiliated Purchasers.
Item 10. Submission of Matters to a Vote of Security Holders.
There have been no material changes to the procedures applicable to Item 10.
Item 11. Controls and Procedures.
(a) The Registrant's principal executive and principal financial officers have concluded, based on their evaluation of the Registrant's disclosure controls and procedures as of a date within 90 days of the filing date of this report, that the Registrant's disclosure controls and procedures are reasonably designed to ensure that information required to be disclosed by the Registrant on Form N-CSR is recorded, processed, summarized and reported within the required time periods and that information required to be disclosed by the Registrant in the reports that it files or submits on Form N-CSR is accumulated and communicated to the Registrant's management, including its principal executive and principal financial officers, as appropriate to allow timely decisions regarding required disclosure.
(b) There were no changes to the Registrant's internal control over financial reporting that occurred during the second fiscal quarter of the period covered by this report that have materially affected, or are reasonably likely to materially affect, the Registrant's internal control over financial reporting.
Item 12. Exhibits.
(a)(1) Code of ethics referred to in Item 2.
(a)(2) Certifications of principal executive and principal financial officers as required by Rule 30a-2(a) under the Investment Company Act of 1940.
(a)(3) Not applicable.
(b) Certification of principal executive and principal financial officers as required by Rule 30a-2(b) under the Investment Company Act of 1940.
SIGNATURES
Pursuant to the requirements of the Securities Exchange Act of 1934 and the Investment Company Act of 1940, the Registrant has duly caused this Report to be signed on its behalf by the undersigned, thereunto duly authorized.
The Dreyfus/Laurel Funds, Inc.
By: /s/ Bradley J. Skapyak |
Bradley J. Skapyak, President |
Date: | December 19, 2011 |
|
Pursuant to the requirements of the Securities Exchange Act of 1934 and the Investment Company Act of 1940, this Report has been signed below by the following persons on behalf of the Registrant and in the capacities and on the dates indicated. |
|
By: /s/ Bradley J. Skapyak |
Bradley J. Skapyak, President |
Date: | December 19, 2011 |
|
By: /s/ James Windels |
James Windels, Treasurer |
Date: | December 19, 2011 |
|
EXHIBIT INDEX
(a)(1) Code of ethics referred to in Item 2.
(a)(2) Certifications of principal executive and principal financial officers as required by Rule 30a-2(a) under the Investment Company Act of 1940. (EX-99.CERT)
(b) Certification of principal executive and principal financial officers as required by Rule 30a-2(b) under the Investment Company Act of 1940. (EX-99.906CERT)