UNITED STATES
SECURITIES AND EXCHANGE COMMISSION
Washington, D.C. 20549
FORM N-CSR
CERTIFIED SHAREHOLDER REPORT OF REGISTERED MANAGEMENT
INVESTMENT COMPANIES
Investment Company Act file number | 811- 05202 |
| |
| The Dreyfus/Laurel Funds, Inc. | |
| (Exact name of Registrant as specified in charter) | |
| | |
| c/o The Dreyfus Corporation 200 Park Avenue New York, New York 10166 | |
| (Address of principal executive offices) (Zip code) | |
| | |
| Michael A. Rosenberg, Esq. 200 Park Avenue New York, New York 10166 | |
| (Name and address of agent for service) | |
|
Registrant's telephone number, including area code: | (212) 922-6000 |
| |
Date of fiscal year end: | 8/31 | |
Date of reporting period: | 8/31/10 | |
| | | | | | |
The following Form N-CSR relates only to Dreyfus Core Equity Fund, a series of the Registrant, and does not affect the other series of the Registrant, which have a different fiscal year end and, therefore, different Form N-CSR reporting requirements. A separate Form N-CSR will be filed for those series, as appropriate.
FORM N-CSR
Item 1. Reports to Stockholders.
Save time. Save paper. View your next shareholder report online as soon as it’s available. Log into www.dreyfus.com and sign up for Dreyfus eCommunications. It’s simple and only takes a few minutes.
The views expressed in this report reflect those of the portfolio manager only through the end of the period covered and do not necessarily represent the views of Dreyfus or any other person in the Dreyfus organization. Any such views are subject to change at any time based upon market or other conditions and Dreyfus disclaims any responsibility to update such views.These views may not be relied on as investment advice and, because investment decisions for a Dreyfus fund are based on numerous factors, may not be relied on as an indication of trading intent on behalf of any Dreyfus fund.
Not FDIC-Insured • Not Bank-Guaranteed • May Lose Value
| | Contents |
| | THE FUND |
| 2 | A Letter from the Chairman and CEO |
| 3 | Discussion of Fund Performance |
| 6 | Fund Performance |
| 8 | Understanding Your Fund’s Expenses |
| 8 | Comparing Your Fund’s Expenses With Those of Other Funds |
| 9 | Statement of Investments |
| 12 | Statement of Assets and Liabilities |
| 13 | Statement of Operations |
| 14 | Statement of Changes in Net Assets |
| 16 | Financial Highlights |
| 20 | Notes to Financial Statements |
| 31 | Report of Independent Registered Public Accounting Firm |
| 32 | Important Tax Information |
| 33 | Board Members Information |
| 35 | Officers of the Fund |
| | FOR MORE INFORMATION |
| | Back Cover |
Dreyfus
Core Equity Fund
The Fund

A LETTER FROM THE CHAIRMAN AND CEO
Dear Shareholder:
We are pleased to present this annual report for Dreyfus Core Equity Fund, covering the 12-month period from September 1, 2009, through August 31, 2010.
As the summer of 2010 cooled off, so did the pace of the U.S. and global economic recoveries. Former engines of growth appeared to stall as large parts of the developed world remained indebted and burdened by weak housing markets.While some emerging markets have posted more impressive growth rates, their developing economies have not yet provided a meaningful boost to global economic activity.The result has been a subpar U.S. recovery with stubbornly high unemployment rates, low levels of consumer confidence and muted corporate investment.
Nonetheless, we do not expect a return to recessionary conditions, thanks to record low short-term interest rates and quantitative easing from the Federal Reserve Board. In addition, the corporate profit outlook continues to be positive as many U.S. companies have taken advantage of improved demand while aggressively controlling costs. Consequently, we believe stocks are now attractive relative to other asset classes due to improved valuations, healthy corporate balance sheets and better-than-expected earnings. As always, your financial advisor can help you align your investments with a slow-growth economic environment as well as your needs, goals and attitudes toward risk.
Thank you for your continued confidence and support.

Jonathan R. Baum
Chairman and Chief Executive Officer
The Dreyfus Corporation
September 15, 2010
2

DISCUSSION OF FUND PERFORMANCE
For the period from September 1, 2009, through August 31, 2010, as provided by Fayez Sarofim, Portfolio Manager of Fayez Sarofim & Co., Sub-Investment Adviser
Fund and Market Performance Overview
For the 12-month period ended August 31, 2010, Dreyfus Core Equity Fund’s Class A shares produced a total return of 6.67%, Class B shares returned 5.88%, Class C shares returned 5.88% and Class I shares returned 7.01%.1 For the same period, the fund’s benchmark, the Standard & Poor’s 500 Composite Stock Price Index (“S&P 500 Index”), produced a 4.93% total return.2 Renewed economic uncertainty generally undermined stock prices over the reporting period’s second half, partially offsetting gains achieved during the first half.The fund produced higher returns than its benchmark, primarily due to its longstanding focus on higher-quality companies as investors refocused on fundamentals in a slowing economy.
The Fund’s Investment Approach
The fund seeks long-term capital appreciation.To pursue its goal, the fund normally invests at least 80% of its assets in common stocks of U.S. and foreign companies with market capitalizations exceeding $5 billion at the time of purchase, including multinational companies.
In choosing stocks, the fund first identifies economic sectors that it believes will expand over the next three to five years or longer. Using fundamental analysis, the fund then seeks companies within these sectors that have dominant positions in their industries and that have demonstrated sustained patterns of profitability, strong balance sheets and expanding global presence and the potential to achieve predictable, above-average earnings growth. The fund is also alert to companies which it considers undervalued in terms of current earnings, assets or growth prospects.
The fund employs a“buy-and-hold” investment strategy, which generally has resulted in an annual portfolio turnover of below 15%.3 As a result, the fund invests for long-term growth rather than short-term profits.
Return to Fundamentals in a Slow-Growth Economy
From September 2009 through April 2010, strong earnings reports, rising manufacturing activity and other evidence of economic recovery
The Fund 3
DISCUSSION OF FUND PERFORMANCE (continued)
drove many stocks higher in a sustained market rally. However, investors at the time continued to focus mainly on smaller, more speculative stocks that had been severely beaten down during the recession and financial crisis. In contrast, large, well-established companies continued to lag market averages.
In early May 2010, the market’s advance was interrupted by renewed economic concerns, including a sovereign debt crisis in Europe and inflationary pressures in China. In the United States, investors became more cautious in light of persistently high levels of unemployment, ongoing troubles in housing markets and the catastrophic oil spill in the Gulf of Mexico. As a result, while many stocks lost ground, investors became increasingly selective, turning to companies that they believed could maintain earnings growth in a sluggish economy.This shift in investor sentiment benefited the kinds of blue-chip growth companies in which the fund invests.
Sector Allocations and Stock Selections Bolstered Fund Results
The fund achieved especially strong relative performance in the consumer staples sector, where overweighted exposure and strong stock selections produced favorable results among companies with a global presence, solid financial structures, ample dividends and track records of steady revenues under a variety of economic conditions. Some of the top performers exhibiting these characteristics included food giant Nestle, tobacco producers Altria Group and Philip Morris International, beverages leaders The Coca-Cola Company and PepsiCo, casual dining chain McDonald’s Corp., personal care company Estee Lauder Companies and household goods purveyor Procter & Gamble.
In the health care sector, successful stock selection, led by Danish pharmaceutical company Novo-Nordisk, also aided relative outperformance. In addition, the fund’s sector allocation strategy helped it avoid general weakness in the financials sector amid fears of economic weakness and stricter U.S. regulations.
Detractors from the fund’s performance during the reporting period included the consumer discretionary sector, where an underweight position combined with lack of exposure to automobile manufacturers prevented the fund from participating in the sector’s relative strength. Similarly, underweighted exposure to the better-performing industrials sector dampened relative performance. Finally, an overweighted posi-
4
tion in the energy sector hindered results due to economic worries and concerns surrounding the Gulf oil spill.
New positions added in the reporting period include International Business Machines (IBM) and Roche. IBM is the world’s leading supplier of technology products and services to global businesses.The company has successfully transitioned away from unattractive commodity hardware businesses to software and IT services, which feature better margins, cash flow characteristics and overall growth prospects. Roche is a Swiss-based global health care company which also owns Genentech, the world’s largest biotech company.The company offers the lowest generic exposure and one of the strongest pipelines in the pharmaceutical sector which we believe will lay the foundation for future earnings growth.
Focused on Secular Growth Opportunities
Although the U.S. and global economies have hit a rough patch, we believe a return to recession is unlikely. Slower growth in the United States and Europe is likely to be balanced by more robust growth in the emerging markets. In our view, investors are likely to continue to favor large, multinational companies with solid business fundamentals. In addition, we believe that these high quality companies, which are trading at a discount to the overall U.S. stock market, are attractively valued given their solid balance sheets and opportunities for growth.
September 15, 2010
| |
| | Equity funds are subject generally to market, market sector, market liquidity, issuer and investment |
| | style risks, among other factors, to varying degrees, all of which are more fully described in the |
| | fund’s prospectus. |
| 1 | Total return includes reinvestment of dividends and any capital gains paid, and does not take into |
| | consideration the maximum initial sales charge in the case of Class A shares, or the applicable |
| | contingent deferred sales charges imposed on redemptions in the case of Class B and Class C |
| | shares. Had these charges been reflected, returns would have been lower. Past performance is no |
| | guarantee of future results. Share price and investment return fluctuate such that upon redemption, |
| | fund shares may be worth more or less than their original cost. Return figures provided reflect the |
| | absorption of certain fund expenses by The Dreyfus Corporation, pursuant to an undertaking in |
| | effect through January 1, 2011. Had these expenses not been absorbed, the fund’s returns would |
| | have been lower. |
| 2 | SOURCE: LIPPER INC. — Reflects monthly reinvestment of dividends and, where |
| | applicable, capital gain distributions.The Standard & Poor’s 500 Composite Stock Price Index is |
| | a widely accepted, unmanaged index of U.S. stock market performance. Investors cannot invest |
| | directly in any index. |
| 3 | Portfolio turnover rates are subject to change. Portfolio turnover rates alone do not automatically |
| | result in high or low distribution levels.There can be no guarantee that the fund will generate any |
| | specific level of distributions annually. |
The Fund 5
FUND PERFORMANCE
|
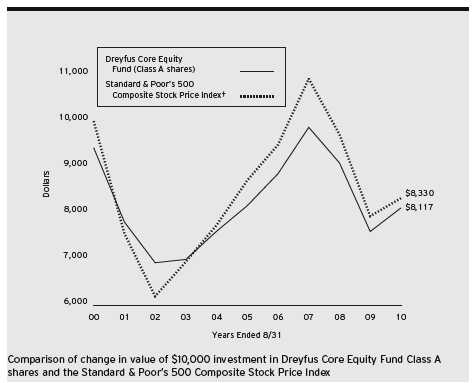
| † Source: Lipper Inc. |
| Past performance is not predictive of future performance. |
| The above graph compares a $10,000 investment made in Class A shares of Dreyfus Core Equity Fund on 8/31/00 |
| to a $10,000 investment made in the Standard & Poor’s 500 Composite Stock Price Index (the “Index”) on that date. |
| All dividends and capital gain distributions are reinvested. |
| The fund’s performance shown in the line graph takes into account the maximum initial sales charge on Class A shares |
| and all other applicable fees and expenses on all classes. Performance for Class B, Class C and Class I shares will vary |
| from the performance of Class A shares shown above due to differences in charges and expenses.The Index is a widely |
| accepted, unmanaged index of U.S. stock market performance. Unlike a mutual fund, the Index is not subject to charges, |
| fees and other expenses. Investors cannot invest directly in any index. Further information relating to fund performance, |
| including expense reimbursements, if applicable, is contained in the Financial Highlights section of the prospectus and |
| elsewhere in this report. |
6
| | | | |
| Average Annual Total Returns as of 8/31/10 | | | |
| |
| | Inception | | | |
| | Date | 1 Year | 5 Years | 10 Years |
| Class A shares | | | | |
| with maximum sales charge (5.75%) | 9/30/98 | 0.57% | –1.30% | –2.07% |
| without sales charge | 9/30/98 | 6.67% | –0.13% | –1.48% |
| Class B shares | | | | |
| with applicable redemption charge † | 4/15/02 | 1.88% | –1.28% | –1.81%†††,†††† |
| without redemption | 4/15/02 | 5.88% | –0.89% | –1.81%†††,†††† |
| Class C shares | | | | |
| with applicable redemption charge †† | 4/15/02 | 4.88% | –0.89% | –2.11%††† |
| without redemption | 4/15/02 | 5.88% | –0.89% | –2.11%††† |
| Class I shares | 4/15/02 | 7.01% | 0.14% | –1.11%††† |
| Standard & Poor’s 500 | | | | |
| Composite Stock Price Index | | 4.93% | –0.91% | –1.81% |
| |
| Past performance is not predictive of future performance.The fund’s performance shown in the graph and table does not |
| reflect the deduction of taxes that a shareholder would pay on fund distributions or the redemption of fund shares. |
| † | The maximum contingent deferred sales charge for Class B shares is 4%.After six years Class B shares convert to |
| | Class A shares. |
| †† | The maximum contingent deferred sales charge for Class C shares is 1% for shares redeemed within one year of |
| | the date of purchase. |
| ††† | The total return performance figures presented for Class B, C and I shares of the fund represent the performance of |
| | the fund’s Class A shares for periods prior to April 15, 2002 (the inception date for Class B, C and I shares), |
| | adjusted to reflect the applicable sales load for each share class. |
| †††† | Assumes the conversion of Class B shares to Class A shares at the end of the sixth year following the |
| | date of purchase. |
The Fund 7
UNDERSTANDING YOUR FUND’S EXPENSES (Unaudited)
As a mutual fund investor, you pay ongoing expenses, such as management fees and other expenses. Using the information below, you can estimate how these expenses affect your investment and compare them with the expenses of other funds.You also may pay one-time transaction expenses, including sales charges (loads) and redemption fees, which are not shown in this section and would have resulted in higher total expenses. For more information, see your fund’s prospectus or talk to your financial adviser.
Review your fund’s expenses
The table below shows the expenses you would have paid on a $1,000 investment in Dreyfus Core Equity Fund from March 1, 2010 to August 31, 2010. It also shows how much a $1,000 investment would be worth at the close of the period, assuming actual returns and expenses.
| | | | |
| Expenses and Value of a $1,000 Investment | | | |
| assuming actual returns for the six months ended August 31, 2010 | | |
| | Class A | Class B | Class C | Class I |
| Expenses paid per $1,000† | $ 6.23 | $ 9.95 | $ 9.95 | $ 4.99 |
| Ending value (after expenses) | $977.20 | $973.50 | $973.20 | $979.00 |
|
| COMPARING YOUR FUND’S EXPENSES |
| WITH THOSE OF OTHER FUNDS (Unaudited) |
Using the SEC’s method to compare expenses
The Securities and Exchange Commission (SEC) has established guidelines to help investors assess fund expenses. Per these guidelines, the table below shows your fund’s expenses based on a $1,000 investment, assuming a hypothetical 5% annualized return. You can use this information to compare the ongoing expenses (but not transaction expenses or total cost) of investing in the fund with those of other funds.All mutual fund shareholder reports will provide this information to help you make this comparison. Please note that you cannot use this information to estimate your actual ending account balance and expenses paid during the period.
| | | | |
| Expenses and Value of a $1,000 Investment | | | |
| assuming a hypothetical 5% annualized return for the six months ended August 31, 2010 |
| | Class A | Class B | Class C | Class I |
| Expenses paid per $1,000† | $ 6.36 | $ 10.16 | $ 10.16 | $ 5.09 |
| Ending value (after expenses) | $1,018.90 | $1,015.12 | $1,015.12 | $1,020.16 |
† Expenses are equal to the fund’s annualized expense ratio of 1.25% for Class A, 2.00% for Class B, 2.00% for Class C and 1.00% for Class I, multiplied by the average account value over the period, multiplied by 184/365 (to reflect the one-half year period).
8
|
| STATEMENT OF INVESTMENTS |
| August 31, 2010 |
| | |
| Common Stocks—96.9% | Shares | Value ($) |
| Consumer Discretionary—7.2% | | |
| McDonald’s | 55,000 | 4,018,300 |
| McGraw-Hill | 58,500 | 1,617,525 |
| News, Cl. A | 180,200 | 2,265,114 |
| Target | 45,000 | 2,302,200 |
| | | 10,203,139 |
| Consumer Staples—33.0% | | |
| Altria Group | 160,000 | 3,571,200 |
| Coca-Cola | 150,000 | 8,388,000 |
| Estee Lauder, Cl. A | 21,000 | 1,177,470 |
| Nestle, ADR | 150,125 | 7,738,944 |
| PepsiCo | 80,000 | 5,134,400 |
| Philip Morris International | 160,000 | 8,230,400 |
| Procter & Gamble | 102,000 | 6,086,340 |
| Wal-Mart Stores | 45,000 | 2,256,300 |
| Walgreen | 135,000 | 3,628,800 |
| Whole Foods Market | 15,000 a | 521,850 |
| | | 46,733,704 |
| Energy—18.3% | | |
| Chevron | 84,000 | 6,229,440 |
| ConocoPhillips | 60,000 | 3,145,800 |
| Exxon Mobil | 125,560 | 7,428,129 |
| Halliburton | 50,000 | 1,410,500 |
| Occidental Petroleum | 40,000 | 2,923,200 |
| Royal Dutch Shell, Cl. A, ADR | 50,000 | 2,652,500 |
| Total, ADR | 45,000 | 2,099,250 |
| | | 25,888,819 |
| Financial—5.1% | | |
| American Express | 32,500 | 1,295,775 |
| Bank of America | 95,000 | 1,182,750 |
| HSBC Holdings, ADR | 49,583 b | 2,439,484 |
| JPMorgan Chase & Co. | 63,500 | 2,308,860 |
| | | 7,226,869 |
| Health Care—10.7% | | |
| Abbott Laboratories | 70,000 | 3,453,800 |
| Becton Dickinson & Co. | 13,000 | 886,470 |
| Johnson & Johnson | 90,000 | 5,131,800 |
The Fund 9
STATEMENT OF INVESTMENTS (continued)
| | |
| Common Stocks (continued) | Shares | Value ($) |
| Health Care (continued) | | |
| Medtronic | 30,000 | 944,400 |
| Merck & Co. | 70,000 | 2,461,200 |
| Novo Nordisk, ADR | 25,000 | 2,140,500 |
| Roche Holding, ADR | 3,000 | 101,790 |
| | | 15,119,960 |
| Industrial—4.6% | | |
| Caterpillar | 27,000 | 1,759,320 |
| General Electric | 204,000 | 2,953,920 |
| United Technologies | 27,000 | 1,760,670 |
| | | 6,473,910 |
| Information Technology—15.6% | | |
| Apple | 25,000 a | 6,084,250 |
| Automatic Data Processing | 30,000 | 1,158,300 |
| Cisco Systems | 100,000 a | 2,005,000 |
| Intel | 305,000 | 5,404,600 |
| International Business Machines | 20,000 | 2,464,600 |
| Microsoft | 100,000 | 2,348,000 |
| QUALCOMM | 25,000 | 957,750 |
| Texas Instruments | 75,000 | 1,727,250 |
| | | 22,149,750 |
| Materials—2.4% | | |
| Freeport-McMoRan Copper & Gold | 15,000 | 1,079,700 |
| Praxair | 25,000 | 2,150,750 |
| Rio Tinto, ADR | 4,000 | 201,720 |
| | | 3,432,170 |
| Total Common Stocks | | |
| (cost $117,256,824) | | 137,228,321 |
| |
| Other Investment—2.8% | | |
| Registered Investment Company; | | |
| Dreyfus Institutional Preferred | | |
| Plus Money Market Fund | | |
| (cost $3,916,000) | 3,916,000 c | 3,916,000 |
10
| | |
| Investment of Cash Collateral | | |
| for Securities Loaned—1.5% | Shares | Value ($) |
| Registered Investment Company; | | |
| Dreyfus Institutional Cash | | |
| Advantage Plus Fund | | |
| (cost $2,111,200) | 2,111,200 c | 2,111,200 |
| |
| Total Investments (cost $123,284,024) | 101.2% | 143,255,521 |
| Liabilities, Less Cash and Receivables | (1.2%) | (1,729,271) |
| Net Assets | 100.0% | 141,526,250 |
|
| ADR—American Depository Receipts |
| a Non-income producing security. |
| b Security, or portion thereof, on loan.At August 31, 2010, the market value of the fund’s securities on loan was |
| $2,077,421 and the market value of the collateral held by the fund was $2,111,200. |
| c Investment in affiliated money market mutual fund. |
| | | |
| Portfolio Summary (Unaudited)† | | |
| |
| | Value (%) | | Value (%) |
| Consumer Staples | 33.0 | Financial | 5.1 |
| Energy | 18.3 | Industrial | 4.6 |
| Information Technology | 15.6 | Money Market Investments | 4.3 |
| Health Care | 10.7 | Materials | 2.4 |
| Consumer Discretionary | 7.2 | | 101.2 |
| |
| † Based on net assets. | | | |
| See notes to financial statements. | | | |
The Fund 11
|
| STATEMENT OF ASSETS AND LIABILITIES |
| August 31, 2010 |
| | | | |
| | | | Cost | Value |
| Assets ($): | | | | |
| Investments in securities—See Statement of Investments (including | | |
| securities on loan, valued at $2,077,421)—Note 1(b): | | | |
| Unaffiliated issuers | | | 117,256,824 | 137,228,321 |
| Affiliated issuers | | | 6,027,200 | 6,027,200 |
| Cash | | | | 140,453 |
| Dividends and interest receivable | | | | 443,477 |
| Receivable for shares of Capital Stock subscribed | | | 83,541 |
| | | | | 143,922,992 |
| Liabilities ($): | | | | |
| Due to The Dreyfus Corporation and affiliates—Note 3(b) | | 197,573 |
| Liability for securities on loan—Note 1(b) | | | 2,111,200 |
| Payable for shares of Capital Stock redeemed | | | 87,969 |
| | | | | 2,396,742 |
| Net Assets ($) | | | | 141,526,250 |
| Composition of Net Assets ($): | | | | |
| Paid-in capital | | | | 122,417,802 |
| Accumulated undistributed investment income—net | | | 1,491,115 |
| Accumulated net realized gain (loss) on investments | | | (2,354,164) |
| Accumulated net unrealized appreciation | | | |
| (depreciation) on investments | | | | 19,971,497 |
| Net Assets ($) | | | | 141,526,250 |
| |
| |
| Net Asset Value Per Share | | | | |
| | Class A | Class B | Class C | Class I |
| Net Assets ($) | 68,009,422 | 2,251,753 | 66,280,226 | 4,984,849 |
| Shares Outstanding | 4,966,273 | 165,699 | 4,937,173 | 356,944 |
| Net Asset Value Per Share ($) | 13.69 | 13.59 | 13.42 | 13.97 |
| |
| See notes to financial statements. | | | | |
12
|
| STATEMENT OF OPERATIONS |
| Year Ended August 31, 2010 |
| |
| Investment Income ($): | |
| Income: | |
| Cash dividends (net of $83,855 foreign taxes withheld at source): | |
| Unaffiliated issuers | 3,875,846 |
| Affiliated issuers | 3,326 |
| Income from securities lending—Note 1(b) | 14,959 |
| Total Income | 3,894,131 |
| Expenses: | |
| Management fee—Note 3(a) | 1,588,133 |
| Distribution and service fees—Note 3(b) | 885,896 |
| Directors’ fees and expenses—Note 3(a) | 10,684 |
| Loan commitment fees—Note 2 | 315 |
| Interest expense—Note 2 | 257 |
| Total Expenses | 2,485,285 |
| Less—reduction in management fee due to undertaking—Note 3(a) | (144,375) |
| Less—Directors’ fees reimbursed by the Manager—Note 3(a) | (10,684) |
| Net Expenses | 2,330,226 |
| Investment Income—Net | 1,563,905 |
| Realized and Unrealized Gain (Loss) on Investments—Note 4 ($): | |
| Net realized gain (loss) on investments | (141,169) |
| Net unrealized appreciation (depreciation) on investments | 7,278,271 |
| Net Realized and Unrealized Gain (Loss) on Investments | 7,137,102 |
| Net Increase in Net Assets Resulting from Operations | 8,701,007 |
| |
| See notes to financial statements. | |
The Fund 13
STATEMENT OF CHANGES IN NET ASSETS
| | |
| | Year Ended August 31, |
| | 2010 | 2009a |
| Operations ($): | | |
| Investment income—net | 1,563,905 | 1,863,128 |
| Net realized gain (loss) on investments | (141,169) | (874,220) |
| Net unrealized appreciation | | |
| (depreciation) on investments | 7,278,271 | (27,318,085) |
| Net Increase (Decrease) in Net Assets | | |
| Resulting from Operations | 8,701,007 | (26,329,177) |
| Dividends to Shareholders from ($): | | |
| Investment income—net: | | |
| Class A Shares | (1,076,942) | (805,844) |
| Class B Shares | (20,226) | (8,384) |
| Class C Shares | (592,640) | (271,640) |
| Class I Shares | (60,960) | (1,698) |
| Class T Shares | — | (14,028) |
| Total Dividends | (1,750,768) | (1,101,594) |
| Capital Stock Transactions ($): | | |
| Net proceeds from shares sold: | | |
| Class A Shares | 20,047,009 | 26,409,839 |
| Class B Shares | 247,493 | 579,960 |
| Class C Shares | 20,832,821 | 21,766,961 |
| Class I Shares | 5,600,643 | 744,471 |
| Class T Shares | — | 76,712 |
| Dividends reinvested: | | |
| Class A Shares | 920,299 | 616,759 |
| Class B Shares | 14,804 | 5,904 |
| Class C Shares | 270,487 | 108,921 |
| Class I Shares | 12,726 | 1,698 |
| Class T Shares | — | 10,794 |
| Cost of shares redeemed: | | |
| Class A Shares | (23,469,135) | (21,394,495) |
| Class B Shares | (5,757,767) | (11,547,362) |
| Class C Shares | (17,820,563) | (14,990,265) |
| Class I Shares | (1,299,008) | (209,088) |
| Class T Shares | — | (1,306,277) |
| Increase (Decrease) in Net Assets | | |
| from Capital Stock Transactions | (400,191) | 874,532 |
| Total Increase (Decrease) in Net Assets | 6,550,048 | (26,556,239) |
| Net Assets ($): | | |
| Beginning of Period | 134,976,202 | 161,532,441 |
| End of Period | 141,526,250 | 134,976,202 |
| Undistributed investment income—net | 1,491,115 | 1,677,978 |
14
| | |
| | Year Ended August 31, |
| | 2010 | 2009a |
| Capital Share Transactions: | | |
| Class Ab,c | | |
| Shares sold | 1,432,817 | 2,263,047 |
| Shares issued for dividends reinvested | 64,537 | 55,068 |
| Shares redeemed | (1,663,461) | (1,817,338) |
| Net Increase (Decrease) in Shares Outstanding | (166,107) | 500,777 |
| Class Bb | | |
| Shares sold | 17,443 | 50,689 |
| Shares issued for dividends reinvested | 1,040 | 530 |
| Shares redeemed | (414,813) | (977,510) |
| Net Increase (Decrease) in Shares Outstanding | (396,330) | (926,291) |
| Class C | | |
| Shares sold | 1,491,558 | 1,897,606 |
| Shares issued for dividends reinvested | 19,238 | 9,848 |
| Shares redeemed | (1,275,008) | (1,294,554) |
| Net Increase (Decrease) in Shares Outstanding | 235,788 | 612,900 |
| Class I�� | | |
| Shares sold | 389,188 | 64,426 |
| Shares issued for dividends reinvested | 876 | 149 |
| Shares redeemed | (90,231) | (16,273) |
| Net Increase (Decrease) in Shares Outstanding | 299,833 | 48,302 |
| Class Tc | | |
| Shares sold | — | 6,585 |
| Shares issued for dividends reinvested | — | 970 |
| Shares redeemed | — | (118,148) |
| Net Increase (Decrease) in Shares Outstanding | — | (110,593) |
| |
| a | Effective close of business on February 4, 2009, the fund no longer offers Class T shares. |
| b | During the period ended August 31, 2010, 99,509 Class B shares representing $1,373,959 were automatically |
| | converted to 98,696 Class A shares and during the period ended August 31, 2009, 336,666 Class B shares |
| | representing $4,029,035 were automatically converted to 332,824 Class A shares. |
| c | On the close of business on February 4, 2009, 92,591 Class T shares representing $1,000,911 were converted to |
| | 91,712 Class A shares. |
| See notes to financial statements. |
The Fund 15
FINANCIAL HIGHLIGHTS
The following tables describe the performance for each share class for the fiscal periods indicated.All information (except portfolio turnover rate) reflects financial results for a single fund share.Total return shows how much your investment in the fund would have increased (or decreased) during each period, assuming you had reinvested all dividends and distributions.These figures have been derived from the fund’s financial statements.
| | | | | |
| | | Year Ended August 31, | |
| Class A Shares | 2010 | 2009 | 2008 | 2007 | 2006 |
| Per Share Data ($): | | | | | |
| Net asset value, beginning of period | 13.03 | 15.81 | 17.56 | 15.94 | 14.81 |
| Investment Operations: | | | | | |
| Investment income—neta | .20 | .23 | .20 | .18 | .17 |
| Net realized and unrealized | | | | | |
| gain (loss) on investments | .68 | (2.84) | (1.54) | 1.63 | 1.08 |
| Total from Investment Operations | .88 | (2.61) | (1.34) | 1.81 | 1.25 |
| Distributions: | | | | | |
| Dividends from investment income—net | (.22) | (.17) | (.21) | (.19) | (.12) |
| Dividends from net realized | | | | | |
| gain on investments | — | — | (.20) | — | — |
| Total Distributions | (.22) | (.17) | (.41) | (.19) | (.12) |
| Net asset value, end of period | 13.69 | 13.03 | 15.81 | 17.56 | 15.94 |
| Total Return (%)b | 6.67 | (16.33) | (7.86) | 11.39 | 8.45 |
| Ratios/Supplemental Data (%): | | | | | |
| Ratio of total expenses | | | | | |
| to average net assets | 1.36 | 1.36 | 1.36 | 1.35 | 1.36 |
| Ratio of net expenses | | | | | |
| to average net assets | 1.25 | 1.25 | 1.25 | 1.25 | 1.30 |
| Ratio of net investment income | | | | | |
| to average net assets | 1.44 | 1.90 | 1.19 | 1.07 | 1.13 |
| Portfolio Turnover Rate | 2.09 | 6.99 | 8.27 | 5.10 | .88 |
| Net Assets, end of period ($ x 1,000) | 68,009 | 66,857 | 73,223 | 87,341 | 85,054 |
| |
| a | Based on average shares outstanding at each month end. |
| b | Exclusive of sales charge. |
| See notes to financial statements. |
16
| | | | | |
| | | Year Ended August 31, | |
| Class B Shares | 2010 | 2009 | 2008 | 2007 | 2006 |
| Per Share Data ($): | | | | | |
| Net asset value, beginning of period | 12.88 | 15.52 | 17.24 | 15.65 | 14.62 |
| Investment Operations: | | | | | |
| Investment income—neta | .09 | .13 | .07 | .05 | .06 |
| Net realized and unrealized | | | | | |
| gain (loss) on investments | .67 | (2.76) | (1.53) | 1.60 | 1.05 |
| Total from Investment Operations | .76 | (2.63) | (1.46) | 1.65 | 1.11 |
| Distributions: | | | | | |
| Dividends from investment income—net | (.05) | (.01) | (.06) | (.06) | (.08) |
| Dividends from net realized | | | | | |
| gain on investments | — | — | (.20) | — | — |
| Total Distributions | (.05) | (.01) | (.26) | (.06) | (.08) |
| Net asset value, end of period | 13.59 | 12.88 | 15.52 | 17.24 | 15.65 |
| Total Return (%)b | 5.88 | (16.96) | (8.60) | 10.56 | 7.60 |
| Ratios/Supplemental Data (%): | | | | | |
| Ratio of total expenses | | | | | |
| to average net assets | 2.11 | 2.11 | 2.11 | 2.10 | 2.11 |
| Ratio of net expenses | | | | | |
| to average net assets | 2.00 | 2.00 | 2.00 | 2.00 | 2.05 |
| Ratio of net investment income | | | | | |
| to average net assets | .65 | 1.12 | .45 | .32 | .38 |
| Portfolio Turnover Rate | 2.09 | 6.99 | 8.27 | 5.10 | .88 |
| Net Assets, end of period ($ x 1,000) | 2,252 | 7,238 | 23,104 | 36,510 | 40,222 |
| |
| a | Based on average shares outstanding at each month end. |
| b | Exclusive of sales charge. |
| See notes to financial statements. |
The Fund 17
FINANCIAL HIGHLIGHTS (continued)
| | | | | |
| | | Year Ended August 31, | |
| Class C Shares | 2010 | 2009 | 2008 | 2007 | 2006 |
| Per Share Data ($): | | | | | |
| Net asset value, beginning of period | 12.79 | 15.49 | 17.21 | 15.64 | 14.61 |
| Investment Operations: | | | | | |
| Investment income—neta | .10 | .13 | .07 | .05 | .06 |
| Net realized and unrealized | | | | | |
| gain (loss) on investments | .66 | (2.77) | (1.51) | 1.59 | 1.05 |
| Total from Investment Operations | .76 | (2.64) | (1.44) | 1.64 | 1.11 |
| Distributions: | | | | | |
| Dividends from investment income—net | (.13) | (.06) | (.08) | (.07) | (.08) |
| Dividends from net realized | | | | | |
| gain on investments | — | — | (.20) | — | — |
| Total Distributions | (.13) | (.06) | (.28) | (.07) | (.08) |
| Net asset value, end of period | 13.42 | 12.79 | 15.49 | 17.21 | 15.64 |
| Total Return (%)b | 5.88 | (16.96) | (8.59) | 10.60 | 7.60 |
| Ratios/Supplemental Data (%): | | | | | |
| Ratio of total expenses | | | | | |
| to average net assets | 2.11 | 2.11 | 2.11 | 2.10 | 2.11 |
| Ratio of net expenses | | | | | |
| to average net assets | 2.00 | 2.00 | 2.00 | 2.00 | 2.05 |
| Ratio of net investment income | | | | | |
| to average net assets | .70 | 1.15 | .45 | .32 | .38 |
| Portfolio Turnover Rate | 2.09 | 6.99 | 8.27 | 5.10 | .88 |
| Net Assets, end of period ($ x 1,000) | 66,280 | 60,123 | 63,332 | 75,646 | 64,230 |
| |
| a | Based on average shares outstanding at each month end. |
| b | Exclusive of sales charge. |
| See notes to financial statements. |
18
| | | | | |
| | | Year Ended August 31, | |
| Class I Shares | 2010 | 2009 | 2008 | 2007a | 2006 |
| Per Share Data ($): | | | | | |
| Net asset value, beginning of period | 13.28 | 16.12 | 17.90 | 16.24 | 15.06 |
| Investment Operations: | | | | | |
| Investment income—netb | .26 | .25 | .25 | .23 | .22 |
| Net realized and unrealized | | | | | |
| gain (loss) on investments | .68 | (2.88) | (1.58) | 1.66 | 1.09 |
| Total from Investment Operations | .94 | (2.63) | (1.33) | 1.89 | 1.31 |
| Distributions: | | | | | |
| Dividends from investment income—net | (.25) | (.21) | (.25) | (.23) | (.13) |
| Dividends from net realized | | | | | |
| gain on investments | — | — | (.20) | — | — |
| Total Distributions | (.25) | (.21) | (.45) | (.23) | (.13) |
| Net asset value, end of period | 13.97 | 13.28 | 16.12 | 17.90 | 16.24 |
| Total Return (%) | 7.01 | (16.11) | (7.63) | 11.69 | 8.72 |
| Ratios/Supplemental Data (%): | | | | | |
| Ratio of total expenses | | | | | |
| to average net assets | 1.12 | 1.12 | 1.11 | 1.10 | 1.11 |
| Ratio of net expenses | | | | | |
| to average net assets | 1.01 | 1.01 | 1.00 | 1.00 | 1.05 |
| Ratio of net investment income | | | | | |
| to average net assets | 1.77 | 2.09 | 1.46 | 1.33 | 1.41 |
| Portfolio Turnover Rate | 2.09 | 6.99 | 8.27 | 5.10 | .88 |
| Net Assets, end of period ($ x 1,000) | 4,985 | 758 | 142 | 125 | 122 |
| |
| a | Effective June 1, 2007, Class R shares were redesignated as Class I shares. |
| b | Based on average shares outstanding at each month end. |
| See notes to financial statements. |
The Fund 19
NOTES TO FINANCIAL STATEMENTS
NOTE 1—Significant Accounting Policies:
Dreyfus Core Equity Fund (the “fund”) is a separate diversified series of The Dreyfus/Laurel Funds, Inc. (the “Company”) which is registered under the Investment Company Act of 1940, as amended (the “Act”), as an open-end management investment company and operates as a series company currently offering ten series, including the fund. The fund’s investment objective is to seek long-term capital appreciation. The Dreyfus Corporation (the “Manager” or “Dreyfus”), a wholly-owned subsidiary of The Bank of New York Mellon Corporation (“BNY Mellon”), serves as the fund’s investment adviser. Fayez Sarofim & Co. (“Sarofim & Co.”) serves as the fund’s sub-investment adviser.
MBSC Securities Corporation (the “Distributor”), a wholly-owned subsidiary of Dreyfus, is the distributor of the fund’s shares.The fund is authorized to issue 500 million shares of $.001 par value Capital Stock. The fund currently offers four classes of shares: Class A (200 million shares authorized), Class B (100 million shares authorized), Class C (100 million shares authorized) and Class I (100 million shares authorized). Class A, Class B and Class C shares are sold primarily to retail investors through financial intermediaries and bear a distribution fee and/or service fee. Class A shares are sold with a front-end sales charge. Class B and Class C shares are subject to a contingent deferred sales charge (“CDSC”). Class B shares automatically convert to Class A shares after six years.The fund does not offer Class B shares, except in connection with dividend reinvestment and permitted ex changes of Class B shares. Class I shares are sold primarily to bank trust departments and other financial service providers, including The Bank of New York Mellon, a subsidiary of BNY Mellon and an affiliate of Dreyfus, acting on behalf of customers having a qualified trust or investment account or relationship at such institution and bear no distribution or service fees. Class I shares are offered without a front end sales charge or CDSC. Each class of shares has identical rights and privileges, except with respect to distribution and service fees and voting rights on matters affecting a single class. Income, expenses (other than expenses attributable to a specific
20
class), and realized and unrealized gains or losses on investments are allocated to each class of shares based on its relative net assets.
The Financial Accounting Standards Board (“FASB”) Accounting Standards Codification (“ASC”) has become the exclusive reference of authoritative U.S. generally accepted accounting principles (“GAAP”) recognized by the FASB to be applied by nongovernmental entities. Rules and interpretive releases of the Securities and Exchange Commission (“SEC”) under authority of federal laws are also sources of authoritative GAAP for SEC registrants. The ASC has superseded all existing non-SEC accounting and reporting standards. The fund’s financial statements are prepared in accordance with GAAP, which may require the use of management estimates and assumptions.Actual results could differ from those estimates.
(a) Portfolio valuation: Investments in securities are valued at the last sales price on the securities exchange or national securities market on which such securities are primarily traded. Securities listed on the National Market System for which market quotations are available are valued at the official closing price or, if there is no official closing price that day, at the last sales price. Securities not listed on an exchange or the national securities market, or securities for which there were no transactions, are valued at the average of the most recent bid and asked prices, except for open short positions, where the asked price is used for valuation purposes. Bid price is used when no asked price is available. Registered investment companies that are not traded on an exchange are valued at their net asset value.When market quotations or official closing prices are not readily available, or are determined not to reflect accurately fair value, such as when the value of a security has been significantly affected by events after the close of the exchange or market on which the security is principally traded (for example, a foreign exchange or market), but before the fund calculates its net asset value, the fund may value these investments at fair value as determined in accordance with the procedures approved by the Board of Directors. Fair valuing of securities may be determined with the assistance of a
The Fund 21
NOTES TO FINANCIAL STATEMENTS (continued)
pricing service using calculations based on indices of domestic securities and other appropriate indicators, such as prices of relevant ADRs and futures contracts. For other securities that are fair valued by the Board of Directors, certain factors may be considered such as: fundamental analytical data, the nature and duration of restrictions on disposition, an evaluation of the forces that influence the market in which the securities are purchased and sold, and public trading in similar securities of the issuer or comparable issuers. Financial futures are valued at the last sales price.
The fair value of a financial instrument is the amount that would be received to sell an asset or paid to transfer a liability in an orderly transaction between market participants at the measurement date (i.e. the exit price). GAAP establishes a fair value hierarchy that prioritizes the inputs of valuation techniques used to measure fair value.This hierarchy gives the highest priority to unadjusted quoted prices in active markets for identical assets or liabilities (Level 1 measurements) and the lowest priority to unobservable inputs (Level 3 measurements).
Additionally, GAAP provides guidance on determining whether the volume and activity in a market has decreased significantly and whether such a decrease in activity results in transactions that are not orderly. GAAP requires enhanced disclosures around valuation inputs and techniques used during annual and interim periods.
Various inputs are used in determining the value of the fund’s investments relating to fair value measurements.These inputs are summarized in the three broad levels listed below:
Level 1—unadjusted quoted prices in active markets for identical investments.
Level 2—other significant observable inputs (including quoted prices for similar investments, interest rates, prepayment speeds, credit risk, etc.).
Level 3—significant unobservable inputs (including the fund’s own assumptions in determining the fair value of investments).
22
The inputs or methodology used for valuing securities are not necessarily an indication of the risk associated with investing in those securities.
The following is a summary of the inputs used as of August 31, 2010 in valuing the fund’s investments:
| | | | |
| | Level 1— | Level 2—Other | Level 3— | |
| | Unadjusted | Significant | Significant | |
| | Quoted | Observable | Unobservable | |
| | Prices | Inputs | Inputs | Total |
| Assets ($) | | | | |
| Investments in Securities: | | | |
| Equity Securities— | | | | |
| Domestic† | 119,854,133 | — | — | 119,854,133 |
| Equity Securities— | | | | |
| Foreign† | 17,374,188 | — | — | 17,374,188 |
| Mutual Funds | 6,027,200 | — | — | 6,027,200 |
| † See Statement of Investments for industry classification. | | |
In January 2010, FASB issued Accounting Standards Update (“ASU”) No. 2010-06 “Improving Disclosures about FairValue Measurements”. The portions of ASU No. 2010-06 which require reporting entities to prepare new disclosures surrounding amounts and reasons for significant transfers in and out of Level 1 and Level 2 fair value measurements as well as inputs and valuation techniques used to measure fair value for both recurring and nonrecurring fair value measurements that fall in either Level 2 or Level 3 have been adopted by the fund. No significant transfers between Level 1 or Level 2 fair value measurements occurred at August 31, 2010. The remaining portion of ASU No. 2010-06 requires reporting entities to make new disclosures about information on purchases, sales, issuances and settlements on a gross basis in the reconciliation of activity in Level 3 fair value measurements.These new and revis ed disclosures are required to be implemented for fiscal years beginning after December 15, 2010. Management is currently evaluating the impact that the adoption of this remaining portion of ASU No. 2010-06 may have on the fund’s financial statement disclosures.
The Fund 23
NOTES TO FINANCIAL STATEMENTS (continued)
(b) Securities transactions and investment income: Securities transactions are recorded on a trade date basis. Realized gains and losses from securities transactions are recorded on the identified cost basis. Dividend income is recognized on the ex-dividend date and interest income, including, where applicable, accretion of discount and amortization of premium on investments is recognized on the accrual basis.
The fund has arrangements with the custodian and cash management bank whereby the fund may receive earnings credits when positive cash balances are maintained, which are used to offset custody and cash management fees. For financial reporting purposes, the fund includes net earnings credits as an expense offset in the Statement of Operations.
Pursuant to a securities lending agreement withThe Bank of NewYork Mellon, the fund may lend securities to qualified institutions. It is the fund’s policy that, at origination, all loans are secured by collateral of at least 102% of the value of U.S. securities loaned and 105% of the value of foreign securities loaned. Collateral equivalent to at least 100% of the market value of securities on loan is maintained at all times. Collateral is either in the form of cash, which can be invested in certain money market mutual funds managed by Dreyfus, U.S. Government and Agency securities or letters of credit.The fund is entitled to receive all income on securities loaned, in addition to income earned as a result of the lending transaction.Although each security loaned is fully collateralized, the fund bears the risk of delay in recovery of, or loss of rights in, the securities loaned should a borrower fail to retur n the securities in a timely manner. During the period ended August 31, 2010, The Bank of NewYork Mellon earned $6,411, from lending portfolio securities, pursuant to the securities lending agreement.
(c) Affiliated issuers: Investments in other investment companies advised by Dreyfus are defined as “affiliated” in the Act.
24
The fund may invest in shares of certain affiliated investment companies also advised or managed by Dreyfus. Investments in affiliated investment companies for the period ended August 31, 2010 were as follows:
| | | | |
| Affiliated | | | | |
| Investment | Value | | Value | Net |
| Company | 8/31/2009 ($) | Purchases ($) | Sales ($) 8/31/2010 ($) | Assets (%) |
| Dreyfus | | | | |
| Institutional | | | | |
| Preferred | | | | |
| Plus Money | | | | |
| Market | | | | |
| Fund | 3,021,000 | 19,463,000 | 18,568,000 3,916,000 | 2.8 |
| Dreyfus | | | | |
| Institutional | | | | |
| Cash | | | | |
| Advantage | | | | |
| Plus Fund | 2,515,364 | 72,974,897 | 73,379,061 2,111,200 | 1.5 |
| Total | 5,536,364 | 92,437,897 | 91,947,061 6,027,200 | 4.3 |
(d) Dividends to shareholders: Dividends are recorded on the ex-dividend date. Dividends from investment income-net and dividends from net realized capital gains, if any, are normally declared and paid annually, but the fund may make distributions on a more frequent basis to comply with the distribution requirements of the Internal Revenue Code of 1986, as amended (the “Code”).To the extent that net realized capital gains can be offset by capital loss carryovers, it is the policy of the fund not to distribute such gains. Income and capital gain distributions are determined in accordance with income tax regulations, which may differ from GAAP.
(e) Federal income taxes: It is the policy of the fund to continue to qualify as a regulated investment company, if such qualification is in the best interests of its shareholders, by complying with the applicable provisions of the Code, and to make distributions of taxable income sufficient to relieve it from substantially all federal income and excise taxes.
The Fund 25
NOTES TO FINANCIAL STATEMENTS (continued)
As of and during the period ended August 31, 2010, the fund did not have any liabilities for any uncertain tax positions.The fund recognizes interest and penalties, if any, related to uncertain tax positions as income tax expense in the Statement of Operations. During the period, the fund did not incur any interest or penalties.
Each of the tax years in the four-year period ended August 31, 2010 remains subject to examination by the Internal Revenue Service and state taxing authorities.
At August 31, 2010, the components of accumulated earnings on a tax basis were as follows: undistributed ordinary income $1,491,115, accumulated capital losses $2,212,995 and unrealized appreciation $19,971,497. In addition, the fund had $141,169 of capital losses realized after October 31, 2009, which were deferred for tax purposes to the first day of the following fiscal year.
The accumulated capital loss carryover is available for federal income tax purposes to be applied against future net securities profits, if any, realized subsequent to August 31, 2010. If not applied, the carryover expires in fiscal 2017.
The tax character of distributions paid to shareholders during the fiscal periods ended August 31, 2010 and August 31, 2009 were as follows: ordinary income $1,750,768 and $1,101,594, respectively.
NOTE 2—Bank Lines of Credit:
The fund participates with other Dreyfus-managed funds in a $225 million unsecured credit facility held by Citibank, N.A. and a $300 million unsecured credit facility provided by The Bank of New York Mellon (each, a “Facility”), each to be utilized primarily for temporary or emergency purposes, including the financing of redemptions. In connection therewith, the fund has agreed to pay its pro rata portion of commitment fees for each Facility. Interest is charged to the fund based on rates determined pursuant to the terms of the respective Facility at the time of borrowing.
26
The average amount of borrowings outstanding under the Facilities during the period ended August 31, 2010 was approximately $18,100 with a related weighted average annualized interest rate of 1.42%.
NOTE 3—Investment Management Fee, Sub-Investment Advisory Fee and Other Transactions With Affiliates:
(a) Pursuant to an Investment Management Agreement with Dreyfus, Dreyfus provides or arranges for one or more third parties and/or affiliates to provide investment advisory, administrative, custody, fund accounting and transfer agency services to the fund. Dreyfus also directs the investments of the fund in accordance with its investment objective, policies and limitations. For these services, the fund is contractually obligated to pay Dreyfus a fee, calculated daily and paid monthly, at the annual rate of 1.10% of the value of the fund’s average daily net assets. During the reporting period, Dreyfus had undertaken to waive a portion of the fund’s management fee in the amount of .10% of the fund’s average daily net assets.The undertaking is currently in place until January 1, 2011, at which time it may be term inated, changed and/or extended without notice to shareholders.The reduction in management fee, pursuant to the undertaking, amounted to $144,375 during the period ended August 31, 2010.
Pursuant to a sub-investment advisory agreement between Dreyfus and Sarofim & Co., Dreyfus pays Sarofim & Co. a monthly fee at an annual rate of .2175% of the value of the fund’s average daily net assets.
Out of its fee, Dreyfus pays all of the expenses of the fund except brokerage fees, taxes, interest, commitment fees, Rule 12b-1 distribution fees and expenses, fees and expenses of non-interested Directors (including counsel fees) and extraordinary expenses. In addition, Dreyfus is required to reduce its fee in an amount equal to the fund’s allocable portion of fees and expenses of the non-interested Directors (including counsel fees). Prior to January 1, 2010, each Board member received $45,000 per year, plus $6,000 for each joint Board meeting of the Company, The
The Fund 27
NOTES TO FINANCIAL STATEMENTS (continued)
Dreyfus/Laurel Tax-Free Municipal Funds, The Dreyfus/Laurel Funds Trust, Dreyfus Investment Funds and Dreyfus Fund, Inc. (collectively, the “Board Group Open-End Fund”) attended, $2,000 for separate in-person committee meetings attended which are not held in conjunction with a regularly scheduled Board meeting and $1,500 for Board meetings and separate committee meetings attended that were conducted by telephone. Effective January 1, 2010, the Board Group Open-End Funds will pay each Board member who is not an “interested person” of the Company (as defined in the 1940 Act) $60,000 per annum, plus $7,000 per joint Board Group Open-End Funds Board meeting attended, $2,500 for separate in-person committee meetings attended which are not held in conjunction with a regularly scheduled Board meeting and $2,000 for Board meetings and separate committee meetings attended that are conducted by telephone . The Board Group Open-End Funds also reimburse each Board member who is not an “interested person” of the Company (as defined in the 1940 Act) for travel and out-of-pocket expenses. With respect to Board meetings, the Chairman of the Board receives an additional 25% of such compensation (with the exception of reimbursable amounts).With respect to compensation committee meetings prior to January 1, 2010, the Chair of the compensation committee receives $900 per compensation committee meeting. Effective January 1, 2010, the Chair of each of the Board’s committees, unless the Chair also serves as Chair of the Board, will receive $1,350 per applicable committee meeting. In the event that there is an in-person joint committee meeting or a joint telephone meeting of the Board Group Open-End Funds and Dreyfus HighYield Strategies Fund, the $2,000 or $1,500 fee, (prior to January 1, 2010) or the $2,500 or $2,000 fee (effective January 1, 2010), is allocated between the Board Group Open-End Funds and Dreyfus HighYield Strategies Fund.The Company’s portion of these fees and expenses are charged and allocated to each series based on net assets. Amounts required to be paid by the Company directly to the non-interested Directors, that would be applied to offset a portion of the management fee payable to Dreyfus, are in fact paid directly by Dreyfus to the non-interested Directors.
28
During the period ended August 31, 2010, the Distributor retained $9,427 from commissions earned on sales of the fund’s Class A shares and $9,700 and $39,730 from CDSCs on redemptions of the fund’s Class B and Class C shares, respectively.
(b) Under separate Distribution Plans (the “Plans”) adopted pursuant to Rule 12b-1 under the Act, Class A shares may pay annually up to .25% of the value of its average daily net assets to compensate the Distributor for shareholder servicing activities and expenses primarily intended to result in the sale of Class A shares. Class B and Class C shares pay the Distributor for distributing their shares at an aggregate annual rate of .75% of the value of the average daily net assets of Class B and Class C shares. Class B and Class C shares are also subject to a service plan adopted pursuant to Rule 12b-1 (the “Service Plan”), under which Class B and Class C pay the Distributor for providing certain services to the holders of their shares a fee at the annual rate of .25% of the value of the average daily net a ssets of Class B and Class C shares. During the period ended August 31, 2010, Class A, Class B and Class C shares were charged $174,197, $33,622 and $500,152, respectively, pursuant to their respective Plans. During the period ended August 31, 2010, Class B and Class C shares were charged $11,207 and $166,718, respectively, pursuant to the Service Plan.
Under their terms, the Plans and Service Plan shall remain in effect from year to year, provided such continuance is approved annually by a vote of majority of those Directors who are not “interested persons” of the Company and who have no direct or indirect financial interest in the operation of or in any agreement related to the Plans or Service Plan.
The components of “Due to The Dreyfus Corporation and affiliates” in the Statement of Assets and Liabilities consist of: management fees $135,245, Rule 12b-1 distribution plan fees $59,638 and shareholder services plan fees $14,985, which are offset against an expense reimbursement currently in effect in the amount of $12,295.
The Fund 29
NOTES TO FINANCIAL STATEMENTS (continued)
NOTE 4—Securities Transactions:
The aggregate amount of purchases and sales of investment securities, excluding short-term securities, during the period ended August 31, 2010, amounted to $2,935,056 and $4,717,363, respectively.
The provisions of ASC Topic 815 “Derivatives and Hedging” require qualitative disclosures about objectives and strategies for using derivatives, quantitative disclosures about fair value amounts of gains and losses on derivative instruments and disclosures about credit-risk-related contingent features in derivative agreements.The fund held no derivatives during the period ended August 31, 2010. These disclosures did not impact the notes to the financial statements.
At August 31, 2010, the cost of investments for federal income tax purposes was $123,284,024; accordingly, accumulated net unrealized appreciation on investments was $19,971,497, consisting of $34,864,926 gross unrealized appreciation and $14,893,429 gross unrealized depreciation.
30
|
| REPORT OF INDEPENDENT REGISTERED |
| PUBLIC ACCOUNTING FIRM |
The Board of Directors and Shareholders of The Dreyfus/Laurel Funds, Inc.
We have audited the accompanying statement of assets and liabilities, including the statement of investments of Dreyfus Core Equity Fund (the “Fund”), a series of The Dreyfus/Laurel Funds, Inc., as of August 31, 2010, and the related statement of operations for the year then ended, the statement of changes in net assets for each of the years in the two-year period then ended, and the financial highlights for each of the years in the five-year period then ended.These financial statements and financial highlights are the responsibility of the Fund’s management. Our responsibility is to express an opinion on these financial statements and financial highlights based on our audits.
We conducted our audits in accordance with the standards of the Public Company Accounting Oversight Board (United States).Those standards require that we plan and perform the audit to obtain reasonable assurance about whether the financial statements and financial highlights are free of material misstatement. An audit includes examining, on a test basis, evidence supporting the amounts and disclosures in the financial statements. Our procedures included confirmation of securities owned as of August 31, 2010, by correspondence with the custodian. An audit also includes assessing the accounting principles used and significant estimates made by management, as well as evaluating the overall financial statement presentation.We believe that our audits provide a reasonable basis for our opinion.
In our opinion, the financial statements and financial highlights referred to above present fairly, in all material respects, the financial position of Dreyfus Core Equity Fund as of August 31, 2010, and the results of its operations for the year then ended, the changes in its net assets for each of the years in the two-year period then ended, and the financial highlights for each of the years in the five-year period then ended, in conformity with U.S. generally accepted accounting principles.

New York, New York
October 26, 2010
The Fund 31
IMPORTANT TAX INFORMATION (Unaudited)
For federal tax purposes, the fund designates the maximum amount allowable, but not less than $1,750,768 as ordinary income dividends paid during the year ended August 31, 2010 as qualified dividend income in accordance with Section 854(b)(1)(B) of the Internal Revenue Code.Also, the fund designates the maximum amount allowable but not less than 100% of ordinary income dividends paid during the year ended August 31, 2010 as eligible for the corporate dividends received deduction provided under Section 243 of the Internal Revenue Code in accordance with Section 854(b)(1)(A) of the Internal Revenue Code. Shareholders will receive notification in early 2011 of the percentage applicable to the preparation of their 2010 income tax returns.
32

OFFICERS OF THE FUND (Unaudited)
BRADLEY J. SKAPYAK, President since January 2010.
Chief Operating Officer and a director of the Manager since June 2009. From April 2003 to June 2009, Mr. Skapyak was the head of the Investment Accounting and Support Department of the Manager. He is an officer of 76 investment companies (comprised of 170 portfolios) managed by the Manager. He is 51 years old and has been an employee of the Manager since February 1988.
PHILLIP N. MAISANO, Executive Vice President since July 2007.
Chief Investment Officer,Vice Chair and a director of the Manager, and an officer of 76 investment companies (comprised of 170 portfolios) managed by the Manager. Mr. Maisano also is an officer and/or Board member of certain other investment management subsidiaries of The Bank of New York Mellon Corporation, each of which is an affiliate of the Manager. He is 63 years old and has been an employee of the Manager since November 2006. Prior to joining the Manager, Mr. Maisano served as Chairman and Chief Executive Officer of EACM Advisors, an affiliate of the Manager, since August 2004.
MICHAEL A. ROSENBERG, Vice President and Secretary since August 2005.
Assistant General Counsel of BNY Mellon, and an officer of 77 investment companies (comprised of 195 portfolios) managed by the Manager. He is 50 years old and has been an employee of the Manager since October 1991.
KIESHA ASTWOOD, Vice President and Assistant Secretary since January 2010.
Counsel of BNY Mellon, and an officer of 77 investment companies (comprised of 195 portfolios) managed by the Manager. She is 37 years old and has been an employee of the Manager since July 1995.
JAMES BITETTO, Vice President and Assistant Secretary since August 2005.
Senior Counsel of BNY Mellon and Secretary of the Manager, and an officer of 77 investment companies (comprised of 195 portfolios) managed by the Manager. He is 44 years old and has been an employee of the Manager since December 1996.
JONI LACKS CHARATAN, Vice President and Assistant Secretary since August 2005.
Senior Counsel of BNY Mellon, and an officer of 77 investment companies (comprised of 195 portfolios) managed by the Manager. She is 54 years old and has been an employee of the Manager since October 1988.
JOSEPH M. CHIOFFI, Vice President and Assistant Secretary since August 2005.
Senior Counsel of BNY Mellon, and an officer of 77 investment companies (comprised of 195 portfolios) managed by the Manager. He is 48 years old and has been an employee of the Manager since June 2000.
KATHLEEN DENICHOLAS, Vice President and Assistant Secretary since January 2010.
Senior Counsel of BNY Mellon, and an officer of 77 investment companies (comprised of 195 portfolios) managed by the Manager. She is 35 years old and has been an employee of the Manager since February 2001.
JANETTE E. FARRAGHER, Vice President and Assistant Secretary since August 2005.
Assistant General Counsel of BNY Mellon, and an officer of 77 investment companies (comprised of 195 portfolios) managed by the Manager. She is 47 years old and has been an employee of the Manager since February 1984.
The Fund 35
OFFICERS OF THE FUND (Unaudited) (continued)
JOHN B. HAMMALIAN, Vice President and Assistant Secretary since August 2005.
Managing Counsel of BNY Mellon, and an officer of 77 investment companies (comprised of 195 portfolios) managed by the Manager. He is 47 years old and has been an employee of the Manager since February 1991.
M. CRISTINA MEISER, Vice President and Assistant Secretary since January 2010.
Senior Counsel of BNY Mellon, and an officer of 77 investment companies (comprised of 195 portfolios) managed by the Manager. She is 40 years old and has been an employee of the Manager since August 2001.
ROBERT R. MULLERY, Vice President and Assistant Secretary since August 2005.
Managing Counsel of BNY Mellon, and an officer of 77 investment companies (comprised of 195 portfolios) managed by the Manager. He is 58 years old and has been an employee of the Manager since May 1986.
JEFF PRUSNOFSKY, Vice President and Assistant Secretary since August 2005.
Managing Counsel of BNY Mellon, and an officer of 77 investment companies (comprised of 195 portfolios) managed by the Manager. He is 45 years old and has been an employee of the Manager since October 1990.
JAMES WINDELS, Treasurer since November 2001.
Director – Mutual Fund Accounting of the Manager, and an officer of 77 investment companies (comprised of 195 portfolios) managed by the Manager. He is 51 years old and has been an employee of the Manager since April 1985.
RICHARD CASSARO, Assistant Treasurer since January 2008.
Senior Accounting Manager – Money Market and Municipal Bond Funds of the Manager, and an officer of 77 investment companies (comprised of 195 portfolios) managed by the Manager. He is 51 years old and has been an employee of the Manager since September 1982.
GAVIN C. REILLY, Assistant Treasurer since December 2005.
Tax Manager of the Investment Accounting and Support Department of the Manager, and an officer of 77 investment companies (comprised of 195 portfolios) managed by the Manager. He is 42 years old and has been an employee of the Manager since April 1991.
ROBERT ROBOL, Assistant Treasurer since December 2002.
Senior Accounting Manager – Fixed Income Funds of the Manager, and an officer of 77 investment companies (comprised of 195 portfolios) managed by the Manager. He is 46 years old and has been an employee of the Manager since October 1988.
ROBERT SALVIOLO, Assistant Treasurer since July 2007.
Senior Accounting Manager – Equity Funds of the Manager, and an officer of 77 investment companies (comprised of 195 portfolios) managed by the Manager. He is 43 years old and has been an employee of the Manager since June 1989.
36
ROBERT SVAGNA, Assistant Treasurer since December 2002.
Senior Accounting Manager – Equity Funds of the Manager, and an officer of 77 investment companies (comprised of 195 portfolios) managed by the Manager. He is 43 years old and has been an employee of the Manager since November 1990.
JOSEPH W. CONNOLLY, Chief Compliance Officer since October 2004.
Chief Compliance Officer of the Manager and The Dreyfus Family of Funds (77 investment companies, comprised of 195 portfolios). From November 2001 through March 2004, Mr. Connolly was first Vice-President, Mutual Fund Servicing for Mellon Global Securities Services. In that capacity, Mr. Connolly was responsible for managing Mellon’s Custody, Fund Accounting and Fund Administration services to third-party mutual fund clients. He is 53 years old and has served in various capacities with the Manager since 1980, including manager of the firm’s Fund Accounting Department from 1997 through October 2001.
NATALIA GRIBAS, Anti-Money Laundering Compliance Officer since July 2010.
Anti-Money Laundering Compliance Officer of the Distributor, and the Anti-Money Laundering Compliance Officer of 73 investment companies (comprised of 191 portfolios) managed by the Manager. She is 40 years old and has been an employee of the Distributor since September 2008.
The Fund 37
Item 2. Code of Ethics.
The Registrant has adopted a code of ethics that applies to the Registrant's principal executive officer, principal financial officer, principal accounting officer or controller, or persons performing similar functions. There have been no amendments to, or waivers in connection with, the Code of Ethics during the period covered by this Report.
Item 3. Audit Committee Financial Expert.
The Registrant's Board has determined that Joseph S. DiMartino, a member of the Audit Committee of the Board, is an audit committee financial expert as defined by the Securities and Exchange Commission (the "SEC"). Joseph S. DiMartino is "independent" as defined by the SEC for purposes of audit committee financial expert determinations.
Item 4. Principal Accountant Fees and Services.
(a) Audit Fees. The aggregate fees billed for each of the last two fiscal years (the "Reporting Periods") for professional services rendered by the Registrant's principal accountant (the "Auditor") for the audit of the Registrant's annual financial statements or services that are normally provided by the Auditor in connection with the statutory and regulatory filings or engagements for the Reporting Periods, were $28,580 in 2009 and $28,580 in 2010.
(b) Audit-Related Fees. The aggregate fees billed in the Reporting Periods for assurance and related services by the Auditor that are reasonably related to the performance of the audit of the Registrant's financial statements and are not reported under paragraph (a) of this Item 4 were $4,300 in 2009 and $4,300 in 2010. These services consisted of one or more of the following: (i) agreed upon procedures related to compliance with Internal Revenue Code section 817(h), (ii) security counts required by Rule 17f-2 under the Investment Company Act of 1940, as amended, (iii) advisory services as to the accounting or disclosure treatment of Registrant transactions or events and (iv) advisory services to the accounting or disclosure treatment of the actual or potential impact to the Registrant of final or proposed rules, standards or interpretations by the Securities and Exchange Commission, the Financial Accounting Standards Boards or other regulatory or standard-setting bodies.
The aggregate fees billed in the Reporting Periods for non-audit assurance and related services by the Auditor to the Registrant's investment adviser (not including any sub-investment adviser whose role is primarily portfolio management and is subcontracted with or overseen by another investment adviser), and any entity controlling, controlled by or under common control with the investment adviser that provides ongoing services to the Registrant ("Service Affiliates"), that were reasonably related to the performance of the annual audit of the Service Affiliate, which required pre-approval by the Audit Committee were $0 in 2009 and $0 in 2010.
(c) Tax Fees. The aggregate fees billed in the Reporting Periods for professional services rendered by the Auditor for tax compliance, tax advice, and tax planning ("Tax Services") were $2,370 in 2009 and $2,370 in 2010. These services consisted of: (i) review or preparation of U.S. federal, state, local and excise tax returns. The aggregate fees billed in the Reporting Periods for Tax Services by the Auditor to Service Affiliates, which required pre-approval by the Audit Committee were $0 in 2009 and $0 in 2010.
(d) All Other Fees. The aggregate fees billed in the Reporting Periods for products and services provided by the Auditor, other than the services reported in paragraphs (a) through (c) of this Item, were $0 in 2009 and $0 in 2010.
The aggregate fees billed in the Reporting Periods for Non-Audit Services by the Auditor to Service Affiliates, other than the services reported in paragraphs (b) through (c) of this Item, which required pre-approval by the Audit Committee, were $0 in 2009 and $0 in 2010.
(e)(1) Audit Committee Pre-Approval Policies and Procedures. The Registrant's Audit Committee has established policies and procedures (the "Policy") for pre-approval (within specified fee limits) of the Auditor's engagements for non-audit services to the Registrant and Service Affiliates without specific case-by-case consideration. The pre-approved services in the Policy can include pre-approved audit services, pre-approved audit-related services, pre-approved tax services and pre-approved all other services. Pre-approval considerations include whether the proposed services are compatible with maintaining the Auditor's independence. Pre-approvals pursuant to the Policy are considered annually.
(e)(2) Note: None of the services described in paragraphs (b) through (d) of this Item 4 were approved by the Audit Committee pursuant to paragraph (c)(7)(i)(C) of Rule 2-01 of Regulation S-X.
(f) None of the hours expended on the principal accountant's engagement to audit the registrant's financial statements for the most recent fiscal year were attributed to work performed by persons other than the principal account's full-time, permanent employees.
Non-Audit Fees. The aggregate non-audit fees billed by the Auditor for services rendered to the Registrant, and rendered to Service Affiliates, for the Reporting Periods were $3,557,000 in 2009 and $4,710,000 in 2010.
Auditor Independence. The Registrant's Audit Committee has considered whether the provision of non-audit services that were rendered to Service Affiliates, which were not pre-approved (not requiring pre-approval), is compatible with maintaining the Auditor's independence.
Item 5. Audit Committee of Listed Registrants.
Not applicable.
Item 6. Investments.
(a) Not applicable.
Item 7. Disclosure of Proxy Voting Policies and Procedures for Closed-End Management
Investment Companies.
Not applicable.
Item 8. Portfolio Managers of Closed-End Management Investment Companies.
Not applicable.
Item 9. Purchases of Equity Securities by Closed-End Management Investment Companies and
Affiliated Purchasers.
Not applicable.
Item 10. Submission of Matters to a Vote of Security Holders.
There have been no material changes to the procedures applicable to Item 10.
Item 11. Controls and Procedures.
(a) The Registrant's principal executive and principal financial officers have concluded, based on their evaluation of the Registrant's disclosure controls and procedures as of a date within 90 days of the filing date of this report, that the Registrant's disclosure controls and procedures are reasonably designed to ensure that information required to be disclosed by the Registrant on Form N-CSR is recorded, processed, summarized and reported within the required time periods and that information required to be disclosed by the Registrant in the reports that it files or submits on Form N-CSR is accumulated and communicated to the Registrant's management, including its principal executive and principal financial officers, as appropriate to allow timely decisions regarding required disclosure.
(b) There were no changes to the Registrant's internal control over financial reporting that occurred during the second fiscal quarter of the period covered by this report that have materially affected, or are reasonably likely to materially affect, the Registrant's internal control over financial reporting.
Item 12. Exhibits.
(a)(1) Code of ethics referred to in Item 2.
(a)(2) Certifications of principal executive and principal financial officers as required by Rule 30a-2(a) under the Investment Company Act of 1940.
(a)(3) Not applicable.
(b) Certification of principal executive and principal financial officers as required by Rule 30a-2(b) under the Investment Company Act of 1940.
SIGNATURES
Pursuant to the requirements of the Securities Exchange Act of 1934 and the Investment Company Act of 1940, the Registrant has duly caused this Report to be signed on its behalf by the undersigned, thereunto duly authorized.
The Dreyfus/Laurel Funds, Inc.
By: /s/ Bradley J. Skapyak |
Bradley J. Skapyak, President |
Date: October 26, 2010 |
|
Pursuant to the requirements of the Securities Exchange Act of 1934 and the Investment Company Act of 1940, this Report has been signed below by the following persons on behalf of the Registrant and in the capacities and on the dates indicated. |
|
By: /s/ Bradley J. Skapyak |
Bradley J. Skapyak, President |
Date: October 26, 2010 |
|
By: /s/ James Windels |
James Windels, Treasurer |
Date: October 26, 2010 |
|
EXHIBIT INDEX
(a)(1) Code of ethics referred to in Item 2.
(a)(2) Certifications of principal executive and principal financial officers as required by Rule 30a-2(a) under the Investment Company Act of 1940. (EX-99.CERT)
(b) Certification of principal executive and principal financial officers as required by Rule 30a-2(b) under the Investment Company Act of 1940. (EX-99.906CERT)