UNITED STATES
SECURITIES AND EXCHANGE COMMISSION
Washington, D.C. 20549
FORM N-CSR
CERTIFIED SHAREHOLDER REPORT OF REGISTERED MANAGEMENT
INVESTMENT COMPANIES
Investment Company Act file number | 811-05202 |
| |
| The Dreyfus/Laurel Funds, Inc. | |
| (Exact name of Registrant as specified in charter) | |
| | |
| c/o The Dreyfus Corporation 200 Park Avenue New York, New York 10166 | |
| (Address of principal executive offices) (Zip code) | |
| | |
| John Pak, Esq. 200 Park Avenue New York, New York 10166 | |
| (Name and address of agent for service) | |
|
Registrant's telephone number, including area code: | (212) 922-6000 |
| |
Date of fiscal year end: | 10/31 | |
Date of reporting period: | 10/31/14 | |
| | | | | | | |
The following N-CSR relates only to the Registrant’s series listed below and does not affect Dreyfus Core Equity Fund and Dreyfus Floating Rate Income Fund, each a series of the Registrant with a fiscal year end of August 31. A separate N-CSR will be filed for each series as appropriate.
Dreyfus Disciplined Stock Fund
Dreyfus Money Market Reserves
Dreyfus AMT-Free Municipal Reserves
Dreyfus Bond Market Index Fund
Dreyfus Tax Managed Growth Fund
Dreyfus BASIC S&P 500 Stock Index Fund
Dreyfus U.S. Treasury Reserves
Dreyfus Opportunistic Fixed Income Fund
Dreyfus Opportunistic Emerging Markets Debt Fund
FORM N-CSR
Item 1. Reports to Stockholders.
|
| Dreyfus Disciplined |
| Stock Fund |
ANNUAL REPORT October 31, 2014

Save time. Save paper. View your next shareholder report online as soon as it’s available. Log into www.dreyfus.com and sign up for Dreyfus eCommunications. It’s simple and only takes a few minutes.
The views expressed in this report reflect those of the portfolio manager only through the end of the period covered and do not necessarily represent the views of Dreyfus or any other person in the Dreyfus organization. Any such views are subject to change at any time based upon market or other conditions and Dreyfus disclaims any responsibility to update such views.These views may not be relied on as investment advice and, because investment decisions for a Dreyfus fund are based on numerous factors, may not be relied on as an indication of trading intent on behalf of any Dreyfus fund.
|
| Not FDIC-Insured • Not Bank-Guaranteed • May Lose Value |
| | Contents |
| | THE FUND |
| 2 | A Letter from the President |
| 3 | Discussion of Fund Performance |
| 6 | Fund Performance |
| 7 | Understanding Your Fund’s Expenses |
| 7 | Comparing Your Fund’s Expenses With Those of Other Funds |
| 8 | Statement of Investments |
| 12 | Statement of Assets and Liabilities |
| 13 | Statement of Operations |
| 14 | Statement of Changes in Net Assets |
| 15 | Financial Highlights |
| 16 | Notes to Financial Statements |
| 24 | Report of Independent Registered Public Accounting Firm |
| 25 | Important Tax Information |
| 26 | Board Members Information |
| 28 | Officers of the Fund |
| | FOR MORE INFORMATION |
| | Back Cover |
Dreyfus
Disciplined Stock Fund
The Fund
A LETTER FROM THE PRESIDENT
Dear Shareholder:
We are pleased to present this annual report for Dreyfus Disciplined Stock Fund, covering the 12-month period from November 1, 2013, through October 31, 2014. For information about how the fund performed during the reporting period, as well as general market perspectives, we provide a Discussion of Fund Performance on the pages that follow.
Despite bouts of heightened volatility stemming mainly from economic and geopolitical concerns in overseas markets, U.S. stocks gained ground over the reporting period as the domestic economy continued to rebound. As a result, several broad measures of equity market performance established new record highs. Smaller and more economically sensitive stocks generally fared well over the reporting period’s first half, but larger, better established companies rallied more strongly over the second half.
We remain cautiously optimistic regarding the U.S. stock market’s prospects. We currently expect the economy to continue to accelerate as several longstanding drags—including tight fiscal policies and private sector deleveraging—fade from the scene. Of course, a number of risks remain, including the possibilities of higher interest rates and intensifying geopolitical turmoil. As always, we encourage you to discuss our observations with your financial adviser to assess their potential impact on your investments.
Thank you for your continued confidence and support.

J. Charles Cardona
President
The Dreyfus Corporation
November 17, 2014
2
DISCUSSION OF FUND PERFORMANCE
For the reporting period of November 1, 2013, through October 31, 2014, as provided by Sean P. Fitzgibbon and John Bailer, Portfolio Managers
Fund and Market Performance Overview
For the 12-month period ended October 31, 2014, Dreyfus Disciplined Stock Fund produced a total return of 11.91%.1 In comparison, the Standard & Poor’s 500 Composite Stock Price Index (“S&P 500 Index”), the fund’s benchmark, returned 17.24% for the same period.2
Despite occasional bouts of volatility, positive U.S. economic growth and strong corporate earnings drove domestic stocks higher during the reporting period.While the fund participated in the market’s gains, relatively weak individual stock selections in several market sectors caused its returns to lag the benchmark.
The Fund’s Investment Approach
The fund seeks capital appreciation.To pursue its goal, the fund normally invests at least 80% of its net assets in stocks, with a focus on large-cap companies.The fund invests in a diversified portfolio of growth and value stocks, with sector weightings and risk characteristics generally similar to those in the S&P 500 Index. We choose stocks through a disciplined investment process that combines computer modeling techniques, fundamental analysis, and risk management. The result is a portfolio of carefully selected stocks, with overall performance determined by a large number of securities.
U.S. Economic Growth Propelled Markets Higher
Except for a weather-related contraction during the first quarter of 2014, the U.S. economy exhibited signs of steady expansion throughout the reporting period, even as growth appeared to slow in most of the rest of the world. A declining unemployment rate, restrained inflationary pressures, and strong corporate earnings bolstered investor confidence in U.S. equities, driving broad U.S. market indices to new heights and sending the S&P 500 Index well into record territory.
The Fund 3
DISCUSSION OF FUND PERFORMANCE (continued)
Health care stocks led the market higher, mainly due to striking gains in stocks of biotechnology firms developing new treatments for a wide range of conditions. Technology stocks followed closely behind, benefiting from increased enterprise spending by companies seeking to boost worker productivity through technological upgrades. High yielding utility stocks and real estate investment trusts (REITs) also outperformed the overall market as investors sought alternative sources of current income at a time when interest rates and bond yields remained near historic lows. The market’s weaker performing areas included the energy sector, where declining oil and gas prices took their toll; and the telecommunications sector, where stiff competition and other structural obstacles to growth limited gains.
Fund Performance Determined by Individual Holdings
While the fund benefited from the market’s strength, producing double digit returns during the reporting period, its performance compared to the benchmark suffered due to stock selection shortfalls in a number of industry groups. Gains proved particularly disappointing among industrial holdings, where the fund emphasized some of the more economically sensitive manufacturers, such as Owens Corning, Fluor, and Eaton, at a time when the market favored more defensive areas, such as the aerospace-and-defense and roads-and-rail industry groups. In the energy sector, where U.S. production boomed and global oil and gas prices fell, the fund’s exposure to companies with significant offshore exposure, such as Occidental Petroleum, undermined relative performance.
In the information technology sector, semiconductor maker Xilinx was hurt by slowing Chinese demand for the company’s telecommunications chips, while social networking firm Twitter trailed the market due to concerns regarding slowing user growth.The health care sector benefited from strong gains in biotechnology holdings, such as Gilead Sciences, and drug makers, such as AbbVie, but overweighted exposure to pharmaceutical giant Pfizer detracted from relative returns after the company announced plans for a potentially costly acquisition. Finally, among consumer discretionary holdings, electronics retailer Best Buy lost ground when management failed to execute on the company’s turnaround strategy, leading us to sell the fund’s position in the company.
4
On a more positive note, the fund delivered relatively strong returns in the financials sector through investments in capital markets companies—such as Ameriprise Financial and Goldman Sachs Group—that benefited from increasing corporate financing activity and rising trading volumes. Investments in other top-performing financial institutions, such as Voya Financial and The NASDAQ OMX Group, further contributed to the fund’s strong returns in the sector. Relatively good investments in the consumer staples area, such as pharmacy chain CVS Health, bolstered relative performance. Notably strong holdings in other areas included consumer electronics maker Apple and media content provider Walt Disney.
Investing in Continued U.S. Economic Growth
With the U.S. economy continuing to expand steadily, we have emphasized companies and economically sensitive industry groups that we believe are well positioned for increased corporate spending and potentially rising interest rates. As of the end of the reporting period, the fund held overweighted exposure to the financials, health care, information technology, and materials sectors. Conversely, the fund held underweighted exposure to the consumer discretionary, energy, industrials, telecommunications services, and utilities sectors.
November 17, 2014
Please note, the position in any security highlighted with italicized typeface was sold during the reporting period. Equity funds are subject generally to market, market sector, market liquidity, issuer, and investment style risks, among other factors, to varying degrees, all of which are more fully described in the fund’s prospectus.
|
| 1 Total return includes reinvestment of dividends and any capital gains paid. Past performance is no guarantee of future |
| results. Share price and investment return fluctuate such that upon redemption, fund shares may be worth more or less |
| than their original cost. |
| 2 SOURCE: LIPPER INC. — Reflects the monthly reinvestment of dividends and, where applicable, capital gain |
| distributions.The Standard & Poor’s 500 Composite Stock Price Index is a widely accepted, unmanaged index of |
| U.S. stock market performance. Investors cannot invest directly in any index. |
The Fund 5
FUND PERFORMANCE
| | | | | | |
| Average Annual Total Returns as of 10/31/14 | | | | | |
| | 1 | Year | 5 Years | | 10 Years | |
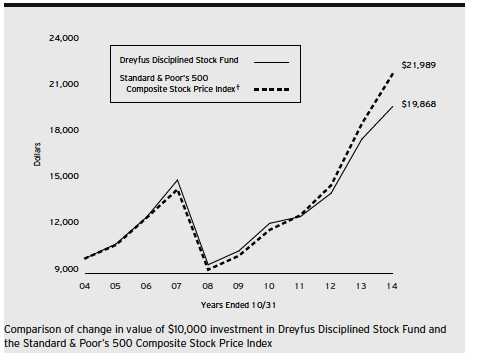
| Fund | 11.91 | % | 13.64 | % | 7.11 | % |
| Standard & Poor’s 500 | | | | | | |
| Composite Stock Price Index | 17.24 | % | 16.68 | % | 8.20 | % |
† Source: Lipper Inc.
Past performance is not predictive of future performance.The fund’s performance shown in the graph and table does not reflect the deduction of taxes that a shareholder would pay on fund distributions or the redemption of fund shares. The above graph compares a $10,000 investment made in Dreyfus Disciplined Stock Fund on 10/31/04 to a $10,000 investment made in the Standard & Poor’s 500 Composite Stock Price Index (the “Index) on that date. All dividends and capital gain distributions are reinvested.
The fund’s performance shown in the line graph above takes into account all applicable fees and expenses.The Index is a widely accepted, unmanaged index of U.S. stock market performance. Unlike a mutual fund, the Index is not subject to charges, fees and other expenses. Investors cannot invest directly in any index. Further information relating to fund performance, including expense reimbursements, if applicable, is contained in the Financial Highlights section of the prospectus and elsewhere in this report.
6
UNDERSTANDING YOUR FUND’S EXPENSES (Unaudited)
As a mutual fund investor, you pay ongoing expenses, such as management fees and other expenses. Using the information below, you can estimate how these expenses affect your investment and compare them with the expenses of other funds.You also may pay one-time transaction expenses, including sales charges (loads) and redemption fees, which are not shown in this section and would have resulted in higher total expenses. For more information, see your fund’s prospectus or talk to your financial adviser.
Review your fund’s expenses
The table below shows the expenses you would have paid on a $1,000 investment in Dreyfus Disciplined Stock Fund from May 1, 2014 to October 31, 2014. It also shows how much a $1,000 investment would be worth at the close of the period, assuming actual returns and expenses.
Expenses and Value of a $1,000 Investment
assuming actual returns for the six months ended October 31, 2014
| | |
| Expenses paid per $1,000† | $ | 5.21 |
| Ending value (after expenses) | $ | 1,065.50 |
COMPARING YOUR FUND’S EXPENSES
WITH THOSE OF OTHER FUNDS (Unaudited)
Using the SEC’s method to compare expenses
The Securities and Exchange Commission (SEC) has established guidelines to help investors assess fund expenses. Per these guidelines, the table below shows your fund’s expenses based on a $1,000 investment, assuming a hypothetical 5% annualized return. You can use this information to compare the ongoing expenses (but not transaction expenses or total cost) of investing in the fund with those of other funds. All mutual fund shareholder reports will provide this information to help you make this comparison. Please note that you cannot use this information to estimate your actual ending account balance and expenses paid during the period.
Expenses and Value of a $1,000 Investment
assuming a hypothetical 5% annualized return for the six months ended October 31, 2014
| | |
| Expenses paid per $1,000† | $ | 5.09 |
| Ending value (after expenses) | $ | 1,020.16 |
|
| † Expenses are equal to the fund’s annualized expense ratio of 1.00%, multiplied by the average account value over |
| the period, multiplied by 184/365 (to reflect the one-half year period). |
The Fund 7
STATEMENT OF INVESTMENTS
October 31, 2014
| | | |
| Common Stocks—99.3% | Shares | | Value ($) |
| Automobiles & Components—.7% | | | |
| General Motors | 126,740 | | 3,979,636 |
| Banks—10.7% | | | |
| Bank of America | 554,540 | | 9,515,906 |
| Citigroup | 212,230 | | 11,360,672 |
| JPMorgan Chase & Co. | 238,880 | | 14,447,462 |
| PNC Financial Services Group | 119,890 | | 10,357,297 |
| Regions Financial | 960,670 | | 9,539,453 |
| Wells Fargo & Co. | 150,050 | | 7,966,155 |
| | | | 63,186,945 |
| Capital Goods—6.2% | | | |
| Cummins | 50,940 | | 7,446,409 |
| Fluor | 96,500 | | 6,401,810 |
| Honeywell International | 105,710 | | 10,160,845 |
| Owens Corning | 123,550 | | 3,961,013 |
| Raytheon | 83,540 | | 8,678,135 |
| | | | 36,648,212 |
| Consumer Durables & Apparel—.9% | | | |
| PVH | 44,820 | | 5,125,167 |
| Diversified Financials—6.7% | | | |
| Ameriprise Financial | 65,370 | | 8,247,733 |
| Berkshire Hathaway, Cl. B | 68,460 | a | 9,595,354 |
| Goldman Sachs Group | 40,500 | | 7,694,595 |
| Invesco | 118,750 | | 4,805,812 |
| Voya Financial | 229,100 | | 8,992,175 |
| | | | 39,335,669 |
| Energy—8.6% | | | |
| Anadarko Petroleum | 77,510 | | 7,113,868 |
| EOG Resources | 24,860 | | 2,362,943 |
| Exxon Mobil | 98,210 | | 9,497,889 |
| Marathon Oil | 217,210 | | 7,689,234 |
| Occidental Petroleum | 185,980 | | 16,539,201 |
| Schlumberger | 77,260 | | 7,622,472 |
| | | | 50,825,607 |
| Exchange-Traded Funds—1.0% | | | |
| SPDR S&P 500 ETF Trust | 29,190 | | 5,886,455 |
| Food & Staples Retailing—2.9% | | | |
| Costco Wholesale | 36,840 | | 4,913,351 |
8
| | | |
| Common Stocks (continued) | Shares | | Value ($) |
| Food & Staples Retailing (continued) | | | |
| CVS Health | 138,560 | | 11,889,834 |
| | | | 16,803,185 |
| Food, Beverage & Tobacco—7.1% | | | |
| Archer-Daniels-Midland | 168,470 | | 7,918,090 |
| Coca-Cola Enterprises | 101,960 | | 4,419,966 |
| Molson Coors Brewing, Cl. B | 130,810 | | 9,729,648 |
| Mondelez International, Cl. A | 181,580 | | 6,402,511 |
| Philip Morris International | 148,170 | | 13,188,612 |
| | | | 41,658,827 |
| Health Care Equipment & Services—6.3% | | | |
| Cardinal Health | 75,800 | | 5,948,784 |
| McKesson | 39,200 | | 7,973,672 |
| Medtronic | 112,070 | | 7,638,691 |
| Omnicare | 88,190 | | 5,872,572 |
| UnitedHealth Group | 100,080 | | 9,508,601 |
| | | | 36,942,320 |
| Insurance—2.9% | | | |
| American International Group | 101,470 | | 5,435,748 |
| Hartford Financial Services Group | 161,530 | | 6,393,357 |
| Prudential Financial | 60,720 | | 5,376,149 |
| | | | 17,205,254 |
| Materials—4.8% | | | |
| Dow Chemical | 101,310 | | 5,004,714 |
| International Paper | 60,140 | | 3,044,287 |
| Martin Marietta Materials | 77,920 | | 9,110,406 |
| Praxair | 41,080 | | 5,175,669 |
| Vulcan Materials | 98,860 | | 6,100,651 |
| | | | 28,435,727 |
| Media—4.4% | | | |
| Omnicom Group | 139,450 | | 10,020,877 |
| Twenty-First Century Fox, Cl. A | 110,520 | | 3,810,730 |
| Walt Disney | 129,270 | | 11,812,693 |
| | | | 25,644,300 |
| Pharmaceuticals, Biotech & Life Sciences—10.6% | | | |
| AbbVie | 254,940 | | 16,178,492 |
| Amgen | 41,810 | | 6,780,746 |
| Biogen Idec | 22,090 | a | 7,092,657 |
The Fund 9
STATEMENT OF INVESTMENTS (continued)
| | | |
| Common Stocks (continued) | Shares | | Value ($) |
| Pharmaceuticals, Biotech & Life Sciences (continued) | | | |
| Gilead Sciences | 92,670 | a | 10,379,040 |
| Merck & Co. | 153,870 | | 8,915,228 |
| Pfizer | 446,224 | | 13,364,409 |
| | | | 62,710,572 |
| Retailing—1.8% | | | |
| Lowe’s | 88,466 | | 5,060,255 |
| Macy’s | 94,060 | | 5,438,549 |
| | | | 10,498,804 |
| Semiconductors & Semiconductor | | | |
| Equipment—1.8% | | | |
| Applied Materials | 255,840 | | 5,651,506 |
| Texas Instruments | 103,920 | | 5,160,667 |
| | | | 10,812,173 |
| Software & Services—10.2% | | | |
| Accenture, Cl. A | 104,000 | | 8,436,480 |
| Facebook, Cl. A | 87,940 | a | 6,594,621 |
| Google, Cl. A | 14,830 | a | 8,421,512 |
| Google, Cl. C | 14,830 | a | 8,291,156 |
| Microsoft | 187,252 | | 8,791,481 |
| salesforce.com | 147,150 | a | 9,416,128 |
| Twitter | 39,700 | | 1,646,359 |
| Visa, Cl. A | 35,050 | | 8,462,122 |
| | | | 60,059,859 |
| Technology Hardware & Equipment—10.2% | | | |
| Apple | 264,560 | | 28,572,480 |
| Cisco Systems | 585,670 | | 14,331,345 |
| EMC | 439,300 | | 12,621,089 |
| Hewlett-Packard | 122,980 | | 4,412,522 |
| | | | 59,937,436 |
| Telecommunication Services—.4% | | | |
| Windstream Holdings | 242,310 | b | 2,539,409 |
| Transportation—.5% | | | |
| Delta Air Lines | 72,760 | | 2,927,135 |
| Utilities—.6% | | | |
| Exelon | 96,660 | | 3,536,789 |
| Total Common Stocks | | | |
| (cost $475,162,162) | | | 584,699,481 |
10
| | | |
| Other Investment—.2% | Shares | | Value ($) |
| Registered Investment Company; | | | |
| Dreyfus Institutional Preferred | | | |
| Plus Money Market Fund | | | |
| (cost $1,266,457) | 1,266,457 | c | 1,266,457 |
| |
| Investment of Cash Collateral | | | |
| for Securities Loaned—.2% | | | |
| Registered Investment Company; | | | |
| Dreyfus Institutional Cash Advantage Fund | | | |
| (cost $1,195,744) | 1,195,744 | c | 1,195,744 |
| |
| Total Investments (cost $477,624,363) | 99.7 | % | 587,161,682 |
| Cash and Receivables (Net) | .3 | % | 1,750,028 |
| Net Assets | 100.0 | % | 588,911,710 |
ETF—Exchange-Traded Funds
|
| a Non-income producing security. |
| b Security, or portion thereof, on loan.At October 31 ,2014, the value of the fund’s securities on loan was |
| $1,165,711 and the value of the collateral held by the fund was $1,195,744. |
| c Investment in affiliated money market mutual fund. |
| | | |
| Portfolio Summary (Unaudited)† | | |
| |
| | Value (%) | | Value (%) |
| Banks | 10.7 | Food & Staples Retailing | 2.9 |
| Pharmaceuticals, | | Retailing | 1.8 |
| Biotech & Life Sciences | 10.6 | Semiconductors & | |
| Software & Services | 10.2 | Semiconductor Equipment | 1.8 |
| Technology Hardware & Equipment | 10.2 | Exchange-Traded Funds | 1.0 |
| Energy | 8.6 | Consumer Durables & Apparel | .9 |
| Food, Beverage & Tobacco | 7.1 | Automobiles & Components | .7 |
| Diversified Financials | 6.7 | Utilities | .6 |
| Health Care Equipment & Services | 6.3 | Transportation | .5 |
| Capital Goods | 6.2 | Telecommunication Services | .4 |
| Materials | 4.8 | Money Market Investments | .4 |
| Media | 4.4 | | |
| Insurance | 2.9 | | 99.7 |
| |
| † Based on net assets. | | | |
| See notes to financial statements. | | | |
The Fund 11
STATEMENT OF ASSETS AND LIABILITIES
October 31, 2014
| | |
| | Cost | Value |
| Assets ($): | | |
| Investments in securities—See Statement of Investments (including | | |
| securities on loan, valued at $1,165,711)—Note 1(b) : | | |
| Unaffiliated issuers | 475,162,162 | 584,699,481 |
| Affiliated issuers | 2,462,201 | 2,462,201 |
| Cash | | 19,980 |
| Receivable for investment securities sold | | 10,723,188 |
| Dividends and securities lending income receivable | | 394,719 |
| Receivable for shares of Capital Stock subscribed | | 214 |
| | | 598,299,783 |
| Liabilities ($): | | |
| Due to The Dreyfus Corporation and affiliates—Note 3(b) | | 471,207 |
| Payable for investment securities purchased | | 7,608,649 |
| Liability for securities on loan—Note 1(b) | | 1,195,744 |
| Payable for shares of Capital Stock redeemed | | 112,473 |
| | | 9,388,073 |
| Net Assets ($) | | 588,911,710 |
| Composition of Net Assets ($): | | |
| Paid-in capital | | 418,236,902 |
| Accumulated undistributed investment income—net | | 1,300,910 |
| Accumulated net realized gain (loss) on investments | | 59,836,579 |
| Accumulated net unrealized appreciation | | |
| (depreciation) on investments | | 109,537,319 |
| Net Assets ($) | | 588,911,710 |
| Shares Outstanding | | |
| (245 million shares of $.001 par value Capital Stock authorized) | | 15,651,154 |
| Net Asset Value, offering and redemption price per share ($) | | 37.63 |
| |
| See notes to financial statements. | | |
12
STATEMENT OF OPERATIONS
Year Ended October 31, 2014
| | |
| Investment Income ($): | | |
| Income: | | |
| Cash dividends: | | |
| Unaffiliated issuers | 9,661,992 | |
| Affiliated issuers | 1,574 | |
| Income from securities lending—Note 1(b) | 54,098 | |
| Total Income | 9,717,664 | |
| Expenses: | | |
| Management fee—Note 3(a) | 5,283,327 | |
| Distribution fees—Note 3(b) | 587,036 | |
| Directors’ fees—Note 3(a,c) | 39,422 | |
| Loan commitment fees—Note 2 | 5,606 | |
| Interest expense —Note 2 | 449 | |
| Total Expenses | 5,915,840 | |
| Less—Directors’ fees reimbursed by the Manager—Note 3(a) | (39,422 | ) |
| Net Expenses | 5,876,418 | |
| Investment Income—Net | 3,841,246 | |
| Realized and Unrealized Gain (Loss) on Investments—Note 4 ($): | | |
| Net realized gain (loss) on investments | 60,135,736 | |
| Net unrealized appreciation (depreciation) on investments | 1,923,059 | |
| Net Realized and Unrealized Gain (Loss) on Investments | 62,058,795 | |
| Net Increase in Net Assets Resulting from Operations | 65,900,041 | |
| |
| See notes to financial statements. | | |
The Fund 13
STATEMENT OF CHANGES IN NET ASSETS
| | | | |
| | Year Ended October 31, | |
| | 2014 | | 2013 | |
| Operations ($): | | | | |
| Investment income—net | 3,841,246 | | 4,956,965 | |
| Net realized gain (loss) on investments | 60,135,736 | | 103,987,540 | |
| Net unrealized appreciation | | | | |
| (depreciation) on investments | 1,923,059 | | 12,865,227 | |
| Net Increase (Decrease) in Net Assets | | | | |
| Resulting from Operations | 65,900,041 | | 121,809,732 | |
| Dividends to Shareholders from ($): | | | | |
| Investment income—net | (3,662,778 | ) | (5,061,683 | ) |
| Net realized gain on investments | (93,094,069 | ) | — | |
| Total Dividends | (96,756,847 | ) | (5,061,683 | ) |
| Capital Stock Transactions ($): | | | | |
| Net proceeds from shares sold | 10,292,272 | | 15,463,686 | |
| Dividends reinvested | 92,470,836 | | 4,724,966 | |
| Cost of shares redeemed | (67,019,608 | ) | (75,471,704 | ) |
| Increase (Decrease) in Net Assets | | | | |
| from Capital Stock Transactions | 35,743,500 | | (55,283,052 | ) |
| Total Increase (Decrease) in Net Assets | 4,886,694 | | 61,464,997 | |
| Net Assets ($): | | | | |
| Beginning of Period | 584,025,016 | | 522,560,019 | |
| End of Period | 588,911,710 | | 584,025,016 | |
| Undistributed investment income—net | 1,300,910 | | 1,122,442 | |
| Capital Share Transactions (Shares): | | | | |
| Shares sold | 282,183 | | 435,384 | |
| Shares issued for dividends reinvested | 2,699,912 | | 136,994 | |
| Shares redeemed | (1,846,421 | ) | (2,105,519 | ) |
| Net Increase (Decrease) in Shares Outstanding | 1,135,674 | | (1,533,141 | ) |
| |
| See notes to financial statements. | | | | |
14
FINANCIAL HIGHLIGHTS
The following table describes the performance for the fiscal periods indicated. Total return shows how much your investment in the fund would have increased (or decreased) during each period, assuming you had reinvested all dividends and distributions.These figures have been derived from the fund’s financial statements.
| | | | | | | | | | |
| | | | Year Ended October 31, | | | |
| | 2014 | | 2013 | | 2012 | | 2011 | | 2010 | |
| Per Share Data ($): | | | | | | | | | | |
| Net asset value, beginning of period | 40.23 | | 32.56 | | 29.35 | | 28.54 | | 24.51 | |
| Investment Operations: | | | | | | | | | | |
| Investment income—neta | .24 | | .32 | | .27 | | .23 | | .18 | |
| Net realized and unrealized | | | | | | | | | | |
| gain (loss) on investments | 3.86 | | 7.67 | | 3.22 | | .79 | | 4.01 | |
| Total from Investment Operations | 4.10 | | 7.99 | | 3.49 | | 1.02 | | 4.19 | |
| Distributions: | | | | | | | | | | |
| Dividends from investment income—net | (.24 | ) | (.32 | ) | (.28 | ) | (.21 | ) | (.16 | ) |
| Dividends from net realized | | | | | | | | | | |
| gain on investments | (6.46 | ) | — | | — | | — | | — | |
| Total Distributions | (6.70 | ) | (.32 | ) | (.28 | ) | (.21 | ) | (.16 | ) |
| Net asset value, end of period | 37.63 | | 40.23 | | 32.56 | | 29.35 | | 28.54 | |
| Total Return (%) | 11.91 | | 24.72 | | 11.95 | | 3.56 | | 17.13 | |
| Ratios/Supplemental Data (%): | | | | | | | | | | |
| Ratio of total expenses | | | | | | | | | | |
| to average net assets | 1.01 | | 1.01 | | 1.01 | | 1.01 | | 1.01 | |
| Ratio of net expenses | | | | | | | | | | |
| to average net assets | 1.00 | | 1.00 | | 1.00 | | 1.00 | | 1.00 | |
| Ratio of net investment income | | | | | | | | | | |
| to average net assets | .65 | | .90 | | .85 | | .76 | | .65 | |
| Portfolio Turnover Rate | 69.22 | | 118.87 | | 70.82 | | 84.19 | | 78.04 | |
| Net Assets, end of period ($ x 1,000) | 588,912 | | 584,025 | | 522,560 | | 516,493 | | 586,726 | |
| |
| a Based on average shares outstanding. | | | | | | | | | | |
| See notes to financial statements. | | | | | | | | | | |
The Fund 15
NOTES TO FINANCIAL STATEMENTS
NOTE 1—Significant Accounting Policies:
Dreyfus Disciplined Stock Fund (the “fund”) is a separate diversified series of The Dreyfus/Laurel Funds, Inc. (the “Company”), which is registered under the Investment Company Act of 1940, as amended (the “Act”), as an open-end management investment company and operates as a series company currently offering eleven series, including the fund. The fund’s investment objective is to seek capital appreciation. The Dreyfus Corporation (the “Manager” or “Dreyfus”), a wholly-owned subsidiary of The Bank of New York Mellon Corporation (“BNY Mellon”), serves as the fund’s investment adviser. MBSC Securities Corporation (the “Distributor”), a wholly-owned subsidiary of the Manager, is the distributor of the fund’s shares, which are sold to the public without a sales charge.
The Company accounts separately for the assets, liabilities and operations of each series. Expenses directly attributable to each series are charged to that series’ operations; expenses which are applicable to all series are allocated among them on a pro rata basis.
The Financial Accounting Standards Board (“FASB”) Accounting Standards Codification (“ASC”) is the exclusive reference of authoritative U.S. generally accepted accounting principles (“GAAP”) recognized by the FASB to be applied by nongovernmental entities. Rules and interpretive releases of the Securities and Exchange Commission (“SEC”) under authority of federal laws are also sources of authoritative GAAP for SEC registrants. The fund’s financial statements are prepared in accordance with GAAP, which may require the use of management estimates and assumptions. Actual results could differ from those estimates.
(a) Portfolio valuation: The fair value of a financial instrument is the amount that would be received to sell an asset or paid to transfer a liability in an orderly transaction between market participants at the measurement date (i.e., the exit price). GAAP establishes a fair value hierarchy that prioritizes the inputs of valuation techniques used to measure fair value. This hierarchy gives the highest priority to unad-
16
justed quoted prices in active markets for identical assets or liabilities (Level 1 measurements) and the lowest priority to unobservable inputs (Level 3 measurements).
Additionally, GAAP provides guidance on determining whether the volume and activity in a market has decreased significantly and whether such a decrease in activity results in transactions that are not orderly. GAAP requires enhanced disclosures around valuation inputs and techniques used during annual and interim periods.
Various inputs are used in determining the value of the fund’s investments relating to fair value measurements.These inputs are summarized in the three broad levels listed below:
Level 1—unadjusted quoted prices in active markets for identical investments.
Level 2—other significant observable inputs (including quoted prices for similar investments, interest rates, prepayment speeds, credit risk, etc.).
Level 3—significant unobservable inputs (including the fund’s own assumptions in determining the fair value of investments).
The inputs or methodology used for valuing securities are not necessarily an indication of the risk associated with investing in those securities.
Changes in valuation techniques may result in transfers in or out of an assigned level within the disclosure hierarchy. Valuation techniques used to value the fund’s investments are as follows:
Investments in securities are valued at the last sales price on the securities exchange or national securities market on which such securities are primarily traded. Securities listed on the National Market System for which market quotations are available are valued at the official closing price or, if there is no official closing price that day, at the last sales price. Securities not listed on an exchange or the national securities market, or securities for which there were no transactions, are
The Fund 17
NOTES TO FINANCIAL STATEMENTS (continued)
valued at the average of the most recent bid and asked prices, except for open short positions, where the asked price is used for valuation purposes. Bid price is used when no asked price is available. Registered investment companies that are not traded on an exchange are valued at their net asset value.All of the preceding securities are generally categorized within Level 1 of the fair value hierarchy.
Fair valuing of securities may be determined with the assistance of a pricing service using calculations based on indices of domestic securities and other appropriate indicators, such as prices of relevant American Depository Receipts and financial futures. Utilizing these techniques may result in transfers between Level 1 and Level 2 of the fair value hierarchy.
When market quotations or official closing prices are not readily available, or are determined not to reflect accurately fair value, such as when the value of a security has been significantly affected by events after the close of the exchange or market on which the security is principally traded (for example, a foreign exchange or market), but before the fund calculates its net asset value, the fund may value these investments at fair value as determined in accordance with the procedures approved by the Company’s Board of Directors (the “Board”). Certain factors may be considered when fair valuing investments such as: fundamental analytical data, the nature and duration of restrictions on disposition, an evaluation of the forces that influence the market in which the securities are purchased and sold, and public trading in similar securities of the issuer or comparable issuers. These securities are either categorized within Level 2 or 3 of the fair value hierarchy depending on the relevant inputs used.
For restricted securities where observable inputs are limited, assumptions about market activity and risk are used and are generally categorized within Level 3 of the fair value hierarchy.
18
The following is a summary of the inputs used as of October 31, 2014 in valuing the fund’s investments.
| | | | |
| | | Level 2—Other | Level 3— | |
| | Level 1— | Significant | Significant | |
| | Unadjusted | Observable | Unobservable | |
| | Quoted Prices | Inputs | Inputs | Total |
| Assets ($) | | | | |
| Investments in Securities: | | | |
| Equity Securities— | | | | |
| Domestic | | | | |
| Common Stocks† | 578,813,026 | — | — | 578,813,026 |
| Exchange-Traded | | | | |
| Funds | 5,886,455 | — | — | 5,886,455 |
| Mutual Funds | 2,462,201 | — | — | 2,462,201 |
| |
| † See Statement of Investments for additional detailed categorizations. | |
At October 31, 2014, there were no transfers between Level 1 and Level 2 of the fair value hierarchy.
(b) Securities transactions and investment income: Securities transactions are recorded on a trade date basis. Realized gains and losses from securities transactions are recorded on the identified cost basis. Dividend income is recognized on the ex-dividend date and interest income, including, where applicable, accretion of discount and amortization of premium on investments, is recognized on the accrual basis.
Pursuant to a securities lending agreement with The Bank of New York Mellon, a subsidiary of BNY Mellon and an affiliate of Dreyfus and its affiliates, the fund may lend securities to qualified institutions. It is the fund’s policy that, at origination, all loans are secured by collateral of at least 102% of the value of U.S. securities loaned and 105% of the value of foreign securities loaned. Collateral equivalent to at least 100% of the market value of securities on loan is maintained at all times. Collateral is either in the form of cash, which can be invested
The Fund 19
NOTES TO FINANCIAL STATEMENTS (continued)
in certain money market mutual funds managed by the Manager or U.S. Government and Agency securities.The fund is entitled to receive all dividends, interest and distributions on securities loaned, in addition to income earned as a result of the lending transaction. Should a borrower fail to return the securities in a timely manner, The Bank of New York Mellon is required to replace the securities for the benefit of the fund or credit the fund with the market value of the unreturned securities and is subrogated to the fund’s rights against the borrower and the collateral. During the period ended October 31, 2014, The Bank of New York Mellon earned $15,894 from lending portfolio securities, pursuant to the securities lending agreement.
(c) Affiliated issuers: Investments in other investment companies advised by Dreyfus are defined as “affiliated” under the Act. Investments in affiliated investment companies during the period ended October 31, 2014 were as follows:
| | | | | |
| Affiliated | | | | | |
| Investment | Value | | | Value | Net |
| Company | 10/31/2013($) | Purchases ($) | Sales ($) | 10/31/2014 ($) | Assets (%) |
| Dreyfus | | | | | |
| Institutional | | | | | |
| Preferred | | | | | |
| Plus Money | | | | | |
| Market Fund | 4,002,619 | 89,224,769 | 91,960,931 | 1,266,457 | .2 |
| Dreyfus | | | | | |
| Institutional | | | | | |
| Cash Advantage | | | | |
| Fund | — | 72,155,351 | 70,959,607 | 1,195,744 | .2 |
| Total | 4,002,619 | 161,380,120 | 162,920,538 | 2,462,201 | .4 |
(d) Dividends to shareholders: Dividends are recorded on the ex-dividend date. Dividends from investment income-net are normally declared and paid quarterly. Dividends from net realized capital gains, if any, are normally declared and paid annually, but the fund may make distributions on a more frequent basis to comply with the distribution requirements of the Internal Revenue Code of 1986, as amended (the “Code”). To the extent that net realized capital gains can be offset by capital loss carryovers, it is the policy of the fund not to distribute such
20
gains. Income and capital gain distributions are determined in accordance with income tax regulations, which may differ from GAAP.
(e) Federal income taxes: It is the policy of the fund to continue to qualify as a regulated investment company, if such qualification is in the best interests of its shareholders, by complying with the applicable provisions of the Code, and to make distributions of taxable income sufficient to relieve it from substantially all federal income and excise taxes.
As of and during the period ended October 31, 2014, the fund did not have any liabilities for any uncertain tax positions.The fund recognizes interest and penalties, if any, related to uncertain tax positions as income tax expense in the Statement of Operations. During the period ended October 31, 2014, the fund did not incur any interest or penalties.
Each tax year in the four-year period ended October 31, 2014 remains subject to examination by the Internal Revenue Service and state taxing authorities.
At October 31, 2014, the components of accumulated earnings on a tax basis were as follows: undistributed ordinary income $20,468,332, undistributed capital gains $40,949,888 and unrealized appreciation $109,256,588.
The tax character of distributions paid to shareholders during the fiscal periods ended October 31, 2014 and October 31, 2013 were as follows: ordinary income $4,557,893 and $5,061,683, and long-term capital gains $92,198,954 and $0, respectively.
NOTE 2—Bank Lines of Credit:
The fund participates with other Dreyfus-managed funds in a $430 million unsecured credit facility led by Citibank, N.A. and a $300 million unsecured credit facility provided by The Bank of New York Mellon (each, a “Facility”), each to be utilized primarily for temporary or emergency purposes, including the financing of redemptions. Prior
The Fund 21
NOTES TO FINANCIAL STATEMENTS (continued)
to October 8, 2014, the unsecured credit facility with Citibank, N.A. was $265 million. In connection therewith, the fund has agreed to pay its pro rata portion of commitment fees for each Facility. Interest is charged to the fund based on rates determined pursuant to the terms of the respective Facility at the time of borrowing.
The average amount of borrowings outstanding under the Facilities during the period ended October 31, 2014 was approximately $41,100 with a related weighted average annualized interest rate of 1.09%.
NOTE 3—Investment Management Fee and Other Transactions with Affiliates:
(a) Pursuant to an investment management agreement with the Manager, the Manager provides or arranges for one or more third parties and/or affiliates to provide investment advisory, administrative, custody, fund accounting and transfer agency services to the fund.The Manager also directs the investments of the fund in accordance with its investment objective, policies and limitations. For these services, the fund is contractually obligated to pay the Manager a fee, calculated daily and paid monthly, at the annual rate of .90% of the value of the fund’s average daily net assets. Out of its fee, the Manager pays all of the expenses of the fund except brokerage fees, taxes, interest expenses, commitment fees on borrowings, Distribution Plan fees, fees and expenses of non-interested Directors (including counsel fees) and extraordinary expenses. In addition, the Manager is required to reduce its fee in an amount equal to the fund’s allocable portion of fees and expenses of the non-interested Directors (including counsel fees). During the period ended October 31, 2014, fees reimbursed by the Manager amounted to $39,422.
(b) Under the Distribution Plan adopted pursuant to Rule 12b-1 under the Act, the fund may pay annually up to .10% of the value of its average daily net assets to compensate BNY Mellon and the Manager for shareholder servicing activities and the Distributor for shareholder
22
servicing activities and expenses primarily intended to result in the sale of fund shares. During the period ended October 31, 2014, the fund was charged $587,036 pursuant to the Distribution Plan.
Under its terms, the Distribution Plan shall remain in effect from year to year, provided such continuance is approved annually by a vote of a majority of those Directors who are not “interested persons” of the Company and who have no direct or indirect financial interest in the operation of or in any agreement related to the Distribution Plan.
The components of “Due to The Dreyfus Corporation and affiliates” in the Statement of Assets and Liabilities consist of: management fees $426,373 and Distribution Plan fees $48,228, which are offset against an expense reimbursement currently in effect in the amount of $3,394.
(c) Each Board member also serves as a Board member of other funds within the Dreyfus complex. Annual retainer fees and attendance fees are allocated to each fund based on net assets.
NOTE 4—Securities Transactions:
The aggregate amount of purchases and sales of investment securities, excluding short-term securities, during the period ended October 31, 2014, amounted to $405,908,477 and $464,428,040, respectively.
At October 31, 2014, the cost of investments for federal income tax purposes was $477,905,094; accordingly, accumulated net unrealized appreciation on investments was $109,256,588, consisting of $114,175,424 gross unrealized appreciation and $4,918,836 gross unrealized depreciation.
The Fund 23
REPORT OF INDEPENDENT REGISTERED
PUBLIC ACCOUNTING FIRM
The Board of Directors and Shareholders of
The Dreyfus/Laurel Funds, Inc.
We have audited the accompanying statement of assets and liabilities of Dreyfus Disciplined Stock Fund (the “Fund”), a series of The Dreyfus/Laurel Funds, Inc., including the statement of investments, as of October 31, 2014, the related statement of operations for the year then ended, the statements of changes in net assets for each of the years in the two-year period then ended, and the financial highlights for each of the years in the five-year period then ended. These financial statements and financial highlights are the responsibility of the Fund’s management. Our responsibility is to express an opinion on these financial statements and financial highlights based on our audits.
We conducted our audits in accordance with the standards of the Public Company Accounting Oversight Board (United States).Those standards require that we plan and perform the audit to obtain reasonable assurance about whether the financial statements and financial highlights are free of material misstatement. An audit includes examining, on a test basis, evidence supporting the amounts and disclosures in the financial statements. Our procedures included confirmation of securities owned as of October 31, 2014, by correspondence with the custodian and brokers or by other appropriate auditing procedures. An audit also includes assessing the accounting principles used and significant estimates made by management, as well as evaluating the overall financial statement presentation.We believe that our audits provide a reasonable basis for our opinion.
In our opinion, the financial statements and financial highlights referred to above present fairly, in all material respects, the financial position of Dreyfus Disciplined Stock Fund as of October 31, 2014, the results of its operations for the year then ended, the changes in its net assets for each of the years in the two-year period then ended, and the financial highlights for each of the years in the five-year period then ended, in conformity with U.S. generally accepted accounting principles.

New York, New York
December 30, 2014
24
IMPORTANT TAX INFORMATION (Unaudited)
For federal tax purposes, the fund reports the maximum amount allowable, but not less than $4,557,893 as ordinary income dividends paid during the year ended October 31, 2014 as qualified dividend income in accordance with Section 854(b)(1)(B) of the Internal Revenue Code.Also, the fund reports the maximum amount allowable but not less than 65.98% of ordinary income dividends paid during the year ended October 31, 2014 as eligible for the corporate dividends received deduction provided under Section 243 of the Internal Revenue Code in accordance with Section 854(b)(1)(A) of the Internal Revenue Code. Shareholders will receive notification in early 2015 of the percentage applicable to the preparation of their 2014 income tax returns. Also, the fund reports the maximum amount allowable but not less than $6.3960 per share as a capital gain dividend in accordance with Section 852(b)(3)(C) of the Internal Revenue Code. Also, the fund reports the maximum amount allowable but not less than $.0621 as a short-term capital gain dividend paid on December 12, 2013 in accordance with Sections 871(k)(2) and 881(e) of the Internal Revenue Code.
The Fund 25
BOARD MEMBERS INFORMATION (Unaudited)
INDEPENDENT BOARD MEMBERS
|
| Joseph S. DiMartino (71) |
| Chairman of the Board (1999) |
| Principal Occupation During Past 5Years: |
| • Corporate Director and Trustee (1995-present) |
| Other Public Company Board Memberships During Past 5Years: |
| • CBIZ (formerly, Century Business Services, Inc.), a provider of outsourcing functions for small |
| and medium size companies, Director (1997-present) |
| • The Newark Group, a provider of a national market of paper recovery facilities, paperboard |
| mills and paperboard converting plants, Director (2000-2010) |
| • Sunair Services Corporation, a provider of certain outdoor-related services to homes and |
| businesses, Director (2005-2009) |
| No. of Portfolios for which Board Member Serves: 144 |
| ——————— |
| Francine J. Bovich (63) |
| Board Member (2012) |
| Principal Occupation During Past 5Years: |
| • Trustee,The Bradley Trusts, private trust funds (2011-present) |
| • Managing Director, Morgan Stanley Investment Management (1993-2010) |
| Other Public Company Board Membership During Past 5Years: |
| • Annaly Capital Management, Inc., Board Member (May 2014-present) |
| No. of Portfolios for which Board Member Serves: 45 |
| ——————— |
| Kenneth A. Himmel (68) |
| Board Member (1994) |
| Principal Occupation During Past 5Years: |
| • President and CEO, Related Urban Development, a real estate development company (1996-present) |
| • President and CEO, Himmel & Company, a real estate development company (1980-present) |
| • CEO,American Food Management, a restaurant company (1983-present) |
| No. of Portfolios for which Board Member Serves: 31 |
26
|
| Stephen J. Lockwood (67) |
| Board Member (1994) |
| Principal Occupation During Past 5Years: |
| • Chairman of the Board, Stephen J. Lockwood and Company LLC, a real estate investment |
| company (2000-present) |
| No. of Portfolios for which Board Member Serves: 31 |
| ——————— |
| Roslyn M. Watson (65) |
| Board Member (1994) |
| Principal Occupation During Past 5Years: |
| • Principal,Watson Ventures, Inc., a real estate investment company (1993-present) |
| No. of Portfolios for which Board Member Serves: 69 |
| ——————— |
| Benaree Pratt Wiley (68) |
| Board Member (1998) |
| Principal Occupation During Past 5Years: |
| • Principal,TheWiley Group, a firm specializing in strategy and business development (2005-present) |
| Other Public Company Board Membership During Past 5Years: |
| • CBIZ (formerly, Century Business Services, Inc.), a provider of outsourcing functions for small |
| and medium size companies, Director (2008-present) |
| No. of Portfolios for which Board Member Serves: 69 |
| ——————— |
| Once elected all Board Members serve for an indefinite term, but achieve Emeritus status upon reaching age 80.The |
| address of the Board Members and Officers is c/o The Dreyfus Corporation, 200 Park Avenue, NewYork, NewYork |
| 10166.Additional information about the Board Members is available in the fund’s Statement of Additional Information |
| which can be obtained from Dreyfus free of charge by calling this toll free number: 1-800-DREYFUS. |
| James M. Fitzgibbons, Emeritus Board Member |
| J.Tomlinson Fort Emeritus Board Member |
The Fund 27
OFFICERS OF THE FUND (Unaudited)
BRADLEY J. SKAPYAK, President since January 2010.
Chief Operating Officer and a director of the Manager since June 2009, Chairman of Dreyfus Transfer, Inc., an affiliate of the Manager and the transfer agent of the funds, since May 2011 and Executive Vice President of the Distributor since June 2007. From April 2003 to June 2009, Mr. Skapyak was the head of the Investment Accounting and Support Department of the Manager. He is an officer of 69 investment companies (comprised of 144 portfolios) managed by the Manager. He is 55 years old and has been an employee of the Manager since February 1988.
JOHN PAK, Chief Legal Officer since March 2013.
Deputy General Counsel, Investment Management, of BNY Mellon since August 2014; Chief Legal Officer of the Manager since August 2012; from March 2005 to July 2012, Managing Director of Deutsche Bank, Deputy Global Head of Deutsche Asset Management Legal and Regional Head of Deutsche Asset Management Americas Legal. He is an officer of 70 investment companies (comprised of 169 portfolios) managed by the Manager. He is 46 years old and has been an employee of the Manager since August 2012.
JANETTE E. FARRAGHER, Vice President and Secretary since December 2011.
Assistant General Counsel of BNY Mellon, and an officer of 70 investment companies (comprised of 169 portfolios) managed by the Manager. She is 51 years old and has been an employee of the Manager since February 1984.
KIESHA ASTWOOD, Vice President and Assistant Secretary since January 2010.
Counsel of BNY Mellon, and an officer of 70 investment companies (comprised of 169 portfolios) managed by the Manager. She is 41 years old and has been an employee of the Manager since July 1995.
JAMES BITETTO, Vice President and Assistant Secretary since August 2005.
Managing Counsel of BNY Mellon and Secretary of the Manager, and an officer of 70 investment companies (comprised of 169 portfolios) managed by the Manager. He is 48 years old and has been an employee of the Manager since December 1996.
JONI LACKS CHARATAN, Vice President and Assistant Secretary since August 2005.
Managing Counsel of BNY Mellon, and an officer of 70 investment companies (comprised of 169 portfolios) managed by the Manager. She is 58 years old and has been an employee of the Manager since October 1988.
JOSEPH M. CHIOFFI, Vice President and Assistant Secretary since August 2005.
Managing Counsel of BNY Mellon, and an officer of 70 investment companies (comprised of 169 portfolios) managed by the Manager. He is 52 years old and has been an employee of the Manager since June 2000.
JOHN B. HAMMALIAN, Vice President and Assistant Secretary since August 2005.
Senior Managing Counsel of BNY Mellon, and an officer of 70 investment companies (comprised of 169 portfolios) managed by the Manager. He is 51 years old and has been an employee of the Manager since February 1991.
SARAH S. KELLEHER, Vice President and Assistant Secretary since April 2014.
Senior Counsel of BNY Mellon, and an officer of 70 investment companies (comprised of 169 portfolios) managed by the Manager; from August 2005 to March 2013, Associate General Counsel of Third Avenue Management. She is 38 years old and has been an employee of the Manager since March 2013.
28
JEFF PRUSNOFSKY, Vice President and Assistant Secretary since August 2005.
Senior Managing Counsel of BNY Mellon, and an officer of 70 investment companies (comprised of 169 portfolios) managed by the Manager. He is 49 years old and has been an employee of the Manager since October 1990.
JAMES WINDELS, Treasurer since November 2001.
Director – Mutual Fund Accounting of the Manager, and an officer of 70 investment companies (comprised of 169 portfolios) managed by the Manager. He is 56 years old and has been an employee of the Manager since April 1985.
RICHARD CASSARO, Assistant Treasurer since January 2008.
Senior Accounting Manager – Money Market and Municipal Bond Funds of the Manager, and an officer of 70 investment companies (comprised of 169 portfolios) managed by the Manager. He is 55 years old and has been an employee of the Manager since September 1982.
GAVIN C. REILLY, Assistant Treasurer since December 2005.
Tax Manager of the Investment Accounting and Support Department of the Manager, and an officer of 70 investment companies (comprised of 169 portfolios) managed by the Manager. He is 46 years old and has been an employee of the Manager since April 1991.
ROBERT S. ROBOL, Assistant Treasurer since December 2002.
Senior Accounting Manager – Fixed Income Funds of the Manager, and an officer of 70 investment companies (comprised of 169 portfolios) managed by the Manager. He is 50 years old and has been an employee of the Manager since October 1988.
ROBERT SALVIOLO, Assistant Treasurer since July 2007.
Senior Accounting Manager – Equity Funds of the Manager, and an officer of 70 investment companies (comprised of 169 portfolios) managed by the Manager. He is 47 years old and has been an employee of the Manager since June 1989.
ROBERT SVAGNA, Assistant Treasurer since December 2002.
Senior Accounting Manager – Equity Funds of the Manager, and an officer of 70 investment companies (comprised of 169 portfolios) managed by the Manager. He is 47 years old and has been an employee of the Manager since November 1990.
JOSEPH W. CONNOLLY, Chief Compliance Officer since October 2004.
Chief Compliance Officer of the Manager and The Dreyfus Family of Funds (70 investment companies, comprised of 169 portfolios). He is 57 years old and has served in various capacities with the Manager since 1980, including manager of the firm’s Fund Accounting Department from 1997 through October 2001.
MATTHEW D. CONNOLLY, Anti-Money Laundering Compliance Officer since April 2012.
Anti-Money Laundering Compliance Officer of the Distributor since October 2011; from March 2010 to September 2011, Global Head, KYC Reviews and Director of UBS Investment Bank; until March 2010, AML Compliance Officer and Senior Vice President of Citi Global Wealth Management. He is an officer of 65 investment companies (comprised of 164 portfolios) managed by the Manager. He is 42 years old and has been an employee of the Distributor since October 2011.
The Fund 29
For More Information

Telephone 1-800-DREYFUS
Mail The Dreyfus Family of Funds, 144 Glenn Curtiss Boulevard, Uniondale, NY 11556-0144
E-mail Send your request to info@dreyfus.com
Internet Information can be viewed online or downloaded at: http://www.dreyfus.com
The fund files its complete schedule of portfolio holdings with the Securities and Exchange Commission (“SEC”) for the first and third quarters of each fiscal year on Form N-Q. The fund’s Forms N-Q are available on the SEC’s website at http://www.sec.gov and may be reviewed and copied at the SEC’s Public Reference Room in Washington, DC. Information on the operation of the Public Reference Room may be obtained by calling 1-800-SEC-0330.
A description of the policies and procedures that the fund uses to determine how to vote proxies relating to portfolio securities, and information regarding how the fund voted these proxies for the most recent 12-month period ended June 30 is available at http://www.dreyfus.com and on the SEC’s website at http://www.sec.gov. The description of the policies and procedures is also available without charge, upon request, by calling 1-800-DREYFUS.

|
| Dreyfus |
| Money Market |
| Reserves |
ANNUAL REPORT October 31, 2014

Save time. Save paper. View your next shareholder report online as soon as it’s available. Log into www.dreyfus.com and sign up for Dreyfus eCommunications. It’s simple and only takes a few minutes.
The views expressed in this report reflect those of the portfolio manager only through the end of the period covered and do not necessarily represent the views of Dreyfus or any other person in the Dreyfus organization. Any such views are subject to change at any time based upon market or other conditions and Dreyfus disclaims any responsibility to update such views.These views may not be relied on as investment advice and, because investment decisions for a Dreyfus fund are based on numerous factors, may not be relied on as an indication of trading intent on behalf of any Dreyfus fund.
|
| Not FDIC-Insured • Not Bank-Guaranteed • May Lose Value |
| | Contents |
| | THE FUND |
| 2 | A Letter from the President |
| 3 | Discussion of Fund Performance |
| 6 | Understanding Your Fund’s Expenses |
| 6 | Comparing Your Fund’s Expenses With Those of Other Funds |
| 7 | Statement of Investments |
| 10 | Statement of Assets and Liabilities |
| 11 | Statement of Operations |
| 12 | Statement of Changes in Net Assets |
| 13 | Financial Highlights |
| 15 | Notes to Financial Statements |
| 21 | Report of Independent Registered Public Accounting Firm |
| 22 | Important Tax Information |
| 23 | Board Members Information |
| 25 | Officers of the Fund |
| | FOR MORE INFORMATION |
| | Back Cover |
Dreyfus
Money Market Reserves
The Fund
A LETTER FROM THE PRESIDENT
Dear Shareholder:
We are pleased to present this annual report for Dreyfus Money Market Reserves, covering the 12-month period from November 1, 2013, through October 31, 2014. For information about how the fund performed during the reporting period, as well as general market perspectives, we provide a Discussion of Fund Performance on the pages that follow.
The U.S. economy generally gained ground over the reporting period despite a weather-related economic soft patch during the first quarter of 2014.This development sparked bouts of volatility among longer term bonds, but short-term rates and yields of money market instruments remained steady, anchored near historical lows by an unchanged federal funds rate. In addition, a degree of uncertainty was removed from the money markets over the summer when the Securities Exchange Commission issued new rules governing some funds, but the immediate impact on the market was muted when regulators delayed implementation for two years.
In our view, stronger labor markets, greater manufacturing activity, rebounding housing starts, and rising household wealth portend well for the U.S. economy.While some longer term financial assets are likely to benefit from a more robust recovery, the possibility of higher inflation and rising long-term interest rates suggests that selectivity could become a more important determinant of investment success. As always, we urge you to talk regularly with your financial advisor to assess the potential impact of these and other developments on your investments.
Thank you for your continued confidence and support.

J. Charles Cardona
President
The Dreyfus Corporation
November 17, 2014
2
DISCUSSION OF FUND PERFORMANCE
For the period of November 1, 2013, through October 31, 2014, as provided by Patricia A. Larkin, Portfolio Manager
Fund and Market Performance Overview
For the 12-month period ended October 31, 2014, Dreyfus Money Market Reserves’ Investor shares produced a yield of 0.00%, and Class R shares yielded 0.00%. Taking into account the effects of compounding, the fund’s Investor shares and Class R shares produced effective yields of 0.00% and 0.00%, respectively.1
Despite stronger economic growth and low inflation over the reporting period, money market yields remained anchored by an unchanged federal funds rate between 0% and 0.25%.
The Fund’s Investment Approach
The fund seeks a high level of current income consistent with stability of principal.To pursue its goal, the fund invests in a diversified portfolio of high-quality, short-term dollar-denominated debt securities, including: securities issued or guaranteed as to principal and interest by the U.S. government or its agencies and instrumentalities; certificates of deposit, time deposits, bankers’ acceptances, and other short-term securities issued by domestic or foreign banks or thrifts or their subsidiaries or branches; repurchase agreements, including tri-party agreements; asset-backed securities; domestic and foreign commercial paper; and other short-term corporate obligations, including those with floating or variable rates of interest.
U.S. Economy Rebounded after Soft Patch
The reporting period began in the midst of a recovering U.S. economy, which in December prompted the Federal Reserve Board (the “Fed”) to begin tapering its quantitative easing program. This development helped drive yields of 10-year U.S. Treasury securities above 3%. In contrast, short-term interest rates remained unchanged. It later was announced that U.S. GDP grew at a 3.5% annualized rate over the fourth quarter of 2013 and the unemployment rate fell to 7.0% by year-end.
The Fund 3
DISCUSSION OF FUND PERFORMANCE (continued)
Long-term rates moderated in January 2014 when investors worried that global economic and political instability could derail the U.S. recovery. Yet, corporate earnings growth remained strong, the unemployment rate declined to 6.6% with the addition of 144,000 jobs, and the Fed continued to reduce quantitative easing. The economy regained strength in February when the manufacturing and service sectors posted gains. The unemployment rate ticked upward to 6.7%, but 222,000 new jobs were created. Labor markets remained robust in March with an unchanged unemployment rate and the addition of 203,000 positions. Nonetheless, U.S. GDP contracted at a 2.1% annualized rate over the first quarter, largely due to the impact of severe winter weather.
Housing markets rebounded when the weather warmed in April. 304,000 new jobs were created, and the unemployment rate fell sharply to 6.3%.The Fed again tapered quantitative easing at its April meeting. In May, nonfarm payroll employment rose by 229,000, and the unemployment rate held steady. Meanwhile, manufacturing activity accelerated and personal incomes posted a healthy gain. 267,000 jobs were created in June, and the unemployment rate dipped to 6.1%. Manufacturing activity, personal incomes, and home sales continued to grow.The U.S. economy rebounded at a robust 4.6% annualized rate during the second quarter.
The unemployment rate ticked higher to 6.2% in July, when 243,000 new jobs were created and new claims for unemployment insurance fell to their lowest level since 2006. The Fed implemented additional reductions in its bond purchasing program in June and July. August saw higher retail sales and new home sales, but new job creation fell to 180,000 even as the unemployment rate fell back to 6.1%.
In September, the economic recovery created 248,000 new jobs, and the unemployment rate fell to 5.9%, its lowest level since June 2008.The manufacturing and service sectors expanded for their 16th and 56th consecutive months, respectively. Falling energy prices helped offset rising housing and food prices, contributing to a mild inflation rate of 0.1%.The Fed again reduced quantitative easing in September.The U.S. Department of Commerce estimated that U.S. GDP grew at an annualized 3.5% rate during the third quarter.
4
Early October saw disappointing growth and deflation fears in Europe, which some believe threatened the U.S. economy. Markets bounced back over the second half of the month when U.S. economic data stayed strong, including a 5.8% unemployment rate and 214,000 new jobs. Personal incomes rose and fuel prices fell, giving consumers greater confidence and purchasing power.
Fed Remains Committed to Low Short-Term Rates
Although the Fed ended its quantitative easing program on October 31, monetary policymakers reiterated that short-term interest rates are likely to remain unchanged for “a considerable time.” In July, regulators issued changes to the rules governing prime money market funds, but the new regulations will not become effective until 2016. Therefore, the industry’s operations and asset flows have so far been relatively unaffected.
We maintained the fund’s market-neutral weighted average maturity in this environment, and we remained focused on well-established issuers with good quality and liquidity characteristics. In our view, these remain prudent strategies until we see more solid evidence that short-term interest rates are set to rise.
November 17, 2014
An investment in the fund is not insured or guaranteed by the FDIC or any other government agency. Although the fund seeks to preserve the value of your investment at $1.00 per share, it is possible to lose money by investing in the fund.
Short-term corporate, asset-backed securities holdings, and municipal securities holdings (as applicable), while rated in the highest rating category by one or more NRSROs (or unrated, if deemed of comparable quality by Dreyfus), involve credit and liquidity risks and risk of principal loss.
|
| 1 Effective yield is based upon dividends declared daily and reinvested monthly. Past performance is no guarantee of |
| future results.Yields fluctuate.Yields provided reflect the absorption of certain fund expenses by The Dreyfus |
| Corporation pursuant to an undertaking in effect that may be extended, terminated, or modified at any time. Had |
| these expenses not been absorbed, the fund’s yields would have been lower, and in some cases, 7-day yields during the |
| reporting period would have been negative absent the expense absorption. |
The Fund 5
UNDERSTANDING YOUR FUND’S EXPENSES (Unaudited)
As a mutual fund investor, you pay ongoing expenses, such as management fees and other expenses. Using the information below, you can estimate how these expenses affect your investment and compare them with the expenses of other funds.You also may pay one-time transaction expenses, including sales charges (loads) and redemption fees, which are not shown in this section and would have resulted in higher total expenses. For more information, see your fund’s prospectus or talk to your financial adviser.
Review your fund’s expenses
The table below shows the expenses you would have paid on a $1,000 investment in Dreyfus Money Market Reserves from May 1, 2014 to October 31, 2014. It also shows how much a $1,000 investment would be worth at the close of the period, assuming actual returns and expenses.
Expenses and Value of a $1,000 Investment
assuming actual returns for the six months ended October 31, 2014
| | | |
| | Investor Shares | | Class R Shares |
| Expenses paid per $1,000† | $ .76 | | $ .76 |
| Ending value (after expenses) | $ 1,000.00 | | $ 1,000.00 |
COMPARING YOUR FUND’S EXPENSES
WITH THOSE OF OTHER FUNDS (Unaudited)
Using the SEC’s method to compare expenses
The Securities and Exchange Commission (SEC) has established guidelines to help investors assess fund expenses. Per these guidelines, the table below shows your fund’s expenses based on a $1,000 investment, assuming a hypothetical 5% annualized return. You can use this information to compare the ongoing expenses (but not transaction expenses or total cost) of investing in the fund with those of other funds. All mutual fund shareholder reports will provide this information to help you make this comparison. Please note that you cannot use this information to estimate your actual ending account balance and expenses paid during the period.
Expenses and Value of a $1,000 Investment
assuming a hypothetical 5% annualized return for the six months ended October 31, 2014
| | | |
| | Investor Shares | | Class R Shares |
| Expenses paid per $1,000† | $ .77 | | $ .77 |
| Ending value (after expenses) | $ 1,024.45 | | $ 1,024.45 |
|
| † Expenses are equal to the fund’s annualized expense ratio of .15% for Investor shares and .15% for Class R shares, |
| multiplied by the average account value over the period, multiplied by 184/365 (to reflect the one-half year period). |
6
STATEMENT OF INVESTMENTS
October 31, 2014
| | | |
| | Principal | | |
| Negotiable Bank Certificates of Deposit—30.0% | Amount ($) | | Value ($) |
| Bank of Tokyo-Mitsubishi Ltd. (Yankee) | | | |
| 0.25%, 2/17/15 | 8,000,000 | | 8,000,000 |
| Citibank N.A. | | | |
| 0.20%, 11/19/14 | 5,000,000 | | 5,000,000 |
| Credit Industriel et Commercial (Yankee) | | | |
| 0.13%, 11/6/14 | 5,000,000 | | 5,000,000 |
| Mizuho Bank Ltd/NY (Yankee) | | | |
| 0.21%, 11/3/14 | 5,000,000 | | 5,000,000 |
| Norinchukin Bank/NY (Yankee) | | | |
| 0.20%, 12/4/14 | 8,000,000 | | 8,000,000 |
| Rabobank Nederland/NY (Yankee) | | | |
| 0.22%, 11/3/14 | 5,000,000 | | 5,000,000 |
| Skandinaviska Enskilda Banken NY (Yankee) | | | |
| 0.25%, 1/16/15 | 8,000,000 | | 8,000,000 |
| Standard Chartered Bank (Yankee) | | | |
| 0.20%, 12/4/14 | 5,000,000 | a | 5,000,000 |
| Toronto Dominion Bank/NY (Yankee) | | | |
| 0.22%, 11/6/14 | 5,000,000 | b | 5,000,000 |
| Wells Fargo Bank, NA | | | |
| 0.26%, 11/3/14 | 5,000,000 | b | 5,000,000 |
| Total Negotiable Bank Certificates of Deposit | | | |
| (cost $59,000,000) | | | 59,000,000 |
| |
| Commercial Paper—18.8% | | | |
| Australia and New Zealand Banking Group Ltd. | | | |
| 0.17%, 11/5/14 | 5,000,000 | a,b | 5,000,000 |
| BNP Paribas Finance Inc. | | | |
| 0.22%, 1/21/15 | 8,000,000 | | 7,996,040 |
| General Electric Capital Corp. | | | |
| 0.15%, 3/6/15 | 7,000,000 | | 6,996,354 |
| Nordea Bank AB | | | |
| 0.23%, 4/2/15 | 7,000,000 | a | 6,993,350 |
| Svenska Handelsbanken Inc | | | |
| 0.20%, 3/16/15 | 5,000,000 | a | 4,996,344 |
The Fund 7
STATEMENT OF INVESTMENTS (continued)
| | | | |
| | | Principal | | |
| | Commercial Paper (continued) | Amount ($) | | Value ($) |
| | United Overseas Bank Ltd. | | | |
| | 0.23%, 2/12/15 | 5,000,000 | a | 4,996,710 |
| | Total Commercial Paper | | | |
| | (cost $36,978,798) | | | 36,978,798 |
| |
| Asset-Backed Commercial Paper—16.3% | | | |
| | Alpine Securitization Corp. | | | |
| | 0.22%, 12/11/14 | 5,000,000 | a | 4,998,778 |
| | Antalis U.S. Funding Corp. | | | |
| | 0.16%, 11/14/14 | 8,000,000 | a | 7,999,538 |
| | Collateralized Commercial Paper II Co., LLC | | | |
| | 0.30%, 12/11/14 | 5,000,000 | a | 4,998,333 |
| | Metlife Short Term Funding LLC | | | |
| | 0.16%, 4/13/15 | 8,000,000 | a | 7,994,204 |
| | Regency Markets No. 1 LLC | | | |
| | 0.14%, 11/19/14 | 6,000,000 | a | 5,999,580 |
| | Total Asset-Backed Commercial Paper | | | |
| | (cost $31,990,433) | | | 31,990,433 |
| |
| | Time Deposits—12.2% | | | |
| | Credit Agricole (Grand Cayman) | | | |
| | 0.07%, 11/3/14 | 8,000,000 | | 8,000,000 |
| | DNB Bank (Grand Cayman) | | | |
| | 0.05%, 11/3/14 | 8,000,000 | | 8,000,000 |
| | Lloyds Bank (London) | | | |
| | 0.05%, 11/3/14 | 8,000,000 | | 8,000,000 |
| | Total Time Deposits | | | |
| | (cost $24,000,000) | | | 24,000,000 |
| |
| | Repurchase Agreements—22.4% | | | |
| | Barclays Capital, Inc. | | | |
| | 0.08%, dated 10/31/14, due 11/3/14 in the | | | |
| | amount of $24,000,160 (fully collateralized by | | | |
| | $24,505,000 U.S. Treasury Bills, | | | |
| | due 10/15/15, value $24,480,005) | 24,000,000 | | 24,000,000 |
8
| | | |
| | Principal | | |
| Repurchase Agreements (continued) | Amount ($) | | Value ($) |
| TD Securities (USA) LLC | | | |
| 0.09%, dated 10/31/14, due 11/3/14 in the | | | |
| amount of $20,000,150 (fully collateralized | | | |
| by $8,596,600 U.S. Treasury Bonds, 4.50%, | | | |
| due 5/15/38, value $11,111,456 and | | | |
| $9,035,200 U.S. Treasury Notes, 2.50%, | | | |
| due 8/15/23, value $9,288,556) | 20,000,000 | | 20,000,000 |
| Total Repurchase Agreements | | | |
| (cost $44,000,000) | | | 44,000,000 |
| |
| Total Investments (cost $195,969,231) | 99.7 | % | 195,969,231 |
| |
| Cash and Receivables (Net) | .3 | % | 570,432 |
| |
| Net Assets | 100.0 | % | 196,539,663 |
|
| a Securities exempt from registration pursuant to Rule 144A under the Securities Act of 1933.These securities may be |
| resold in transactions exempt from registration, normally to qualified institutional buyers.At October 31, 2014, these |
| securities amounted to $58,976,837 or 30.0% of net assets. |
| b Variable rate security—interest rate subject to periodic change. |
| | | |
| Portfolio Summary (Unaudited)† | | |
| |
| | Value (%) | | Value (%) |
| Banking | 57.5 | Asset-Backed/Special Purpose Entity | 4.1 |
| Repurchase Agreements | 22.4 | Finance | 3.5 |
| Asset-Backed/Banking | 5.1 | Asset-Backed/Multi-Seller Programs | 3.0 |
| Asset-Backed/Insurance | 4.1 | | 99.7 |
| |
| † Based on net assets. | | | |
| See notes to financial statements. | | | |
The Fund 9
STATEMENT OF ASSETS AND LIABILITIES
October 31, 2014
| | |
| | Cost | Value |
| Assets ($): | | |
| Investments in securities—See Statement of | | |
| Investments (including Repurchase Agreements | | |
| of $44,000,000)—Note 1(b) | 195,969,231 | 195,969,231 |
| Cash | | 566,690 |
| Interest receivable | | 28,055 |
| | | 196,563,976 |
| Liabilities ($): | | |
| Due to The Dreyfus Corporation and affiliates—Note 2(b) | | 15,814 |
| Payable for shares of Capital Stock redeemed | | 8,499 |
| | | 24,313 |
| Net Assets ($) | | 196,539,663 |
| Composition of Net Assets ($): | | |
| Paid-in capital | | 196,539,357 |
| Accumulated net realized gain (loss) on investments | | 306 |
| Net Assets ($) | | 196,539,663 |
| |
| |
| Net Asset Value Per Share | | |
| | Investor Shares | Class R Shares |
| Net Assets ($) | 150,325,942 | 46,213,721 |
| Shares Outstanding | 150,325,637 | 46,213,719 |
| Net Asset Value Per Share ($) | 1.00 | 1.00 |
| |
| See notes to financial statements. | | |
10
STATEMENT OF OPERATIONS
Year Ended October 31, 2014
| | |
| Investment Income ($): | | |
| Interest Income | 323,298 | |
| Expenses: | | |
| Management fee—Note 2(a) | 1,082,215 | |
| Distribution Plan fees (Investor Shares)—Note 2(b) | 347,278 | |
| Directors’ fees—Note 2(a,c) | 24,561 | |
| Total Expenses | 1,454,054 | |
| Less—reduction in expenses due to undertaking—Note 2(a) | (1,106,265 | ) |
| Less—Directors’ fees reimbursed by the Manager—Note 2(a) | (24,561 | ) |
| Net Expenses | 323,228 | |
| Investment Income—Net | 70 | |
| Net Realized Gain (Loss) on Investments—Note 1(b) ($) | 634 | |
| Net Increase in Net Assets Resulting from Operations | 704 | |
| |
| See notes to financial statements. | | |
The Fund 11
STATEMENT OF CHANGES IN NET ASSETS
| | | | |
| | Year Ended October 31, | |
| | 2014 | | 2013 | |
| Operations ($): | | | | |
| Investment income—net | 70 | | 74 | |
| Net realized gain (loss) on investments | 634 | | (328 | ) |
| Net Increase (Decrease) in Net Assets | | | | |
| Resulting from Operations | 704 | | (254 | ) |
| Dividends to Shareholders from ($): | | | | |
| Investment income—net: | | | | |
| Investor Shares | (55 | ) | (55 | ) |
| Class R Shares | (15 | ) | (19 | ) |
| Total Dividends | (70 | ) | (74 | ) |
| Capital Stock Transactions ($1.00 per share): | | | | |
| Net proceeds from shares sold: | | | | |
| Investor Shares | 182,967,163 | | 116,225,119 | |
| Class R Shares | 170,274,717 | | 298,961,772 | |
| Dividends reinvested: | | | | |
| Investor Shares | 55 | | 55 | |
| Class R Shares | 4 | | 4 | |
| Cost of shares redeemed: | | | | |
| Investor Shares | (210,349,839 | ) | (113,175,558 | ) |
| Class R Shares | (185,373,041 | ) | (333,057,527 | ) |
| Increase (Decrease) in Net Assets | | | | |
| from Capital Stock Transactions | (42,480,941 | ) | (31,046,135 | ) |
| Total Increase (Decrease) in Net Assets | (42,480,307 | ) | (31,046,463 | ) |
| Net Assets ($): | | | | |
| Beginning of Period | 239,019,970 | | 270,066,433 | |
| End of Period | 196,539,663 | | 239,019,970 | |
| |
| See notes to financial statements. | | | | |
12
FINANCIAL HIGHLIGHTS
The following tables describe the performance for each share class for the fiscal periods indicated. All information reflects financial results for a single fund share. Total return shows how much your investment in the fund would have increased (or decreased) during each period, assuming you had reinvested all dividends and distributions.These figures have been derived from the fund’s financial statements.
| | | | | | | | | | |
| | | | Year Ended October 31, | | | |
| Investor Shares | 2014 | | 2013 | | 2012 | | 2011 | | 2010 | |
| Per Share Data ($): | | | | | | | | | | |
| Net asset value, beginning of period | 1.00 | | 1.00 | | 1.00 | | 1.00 | | 1.00 | |
| Investment Operations: | | | | | | | | | | |
| Investment income—neta | .000 | | .000 | | .000 | | .000 | | .000 | |
| Distributions: | | | | | | | | | | |
| Dividends from | | | | | | | | | | |
| investment income—neta | (.000 | ) | (.000 | ) | (.000 | ) | (.000 | ) | (.000 | ) |
| Net asset value, end of period | 1.00 | | 1.00 | | 1.00 | | 1.00 | | 1.00 | |
| Total Return (%)b | .00 | | .00 | | .00 | | .00 | | .00 | |
| Ratios/Supplemental Data (%): | | | | | | | | | | |
| Ratio of total expenses | | | | | | | | | | |
| to average net assets | .71 | | .71 | | .71 | | .71 | | .71 | |
| Ratio of net expenses | | | | | | | | | | |
| to average net assets | .15 | | .18 | | .25 | | .24 | | .29 | |
| Ratio of net investment income | | | | | | | | | | |
| to average net assetsb | .00 | | .00 | | .00 | | .00 | | .00 | |
| Net Assets, end of period ($ x 1,000) | 150,326 | | 177,708 | | 174,659 | | 208,675 | | 328,806 | |
| |
| a | Amount represents less than $.001 per share. |
| b | Amount represents less than .01%. |
See notes to financial statements.
The Fund 13
FINANCIAL HIGHLIGHTS (continued)
| | | | | | | | | | |
| | | | Year Ended October 31, | | | |
| Class R Shares | 2014 | | 2013 | | 2012 | | 2011 | | 2010 | |
| Per Share Data ($): | | | | | | | | | | |
| Net asset value, beginning of period | 1.00 | | 1.00 | | 1.00 | | 1.00 | | 1.00 | |
| Investment Operations: | | | | | | | | | | |
| Investment income—neta | .000 | | .000 | | .000 | | .000 | | .000 | |
| Distributions: | | | | | | | | | | |
| Dividends from | | | | | | | | | | |
| investment income—neta | (.000 | ) | (.000 | ) | (.000 | ) | (.000 | ) | (.000 | ) |
| Net asset value, end of period | 1.00 | | 1.00 | | 1.00 | | 1.00 | | 1.00 | |
| Total Return (%)b | .00 | | .00 | | .00 | | .00 | | .00 | |
| Ratios/Supplemental Data (%): | | | | | | | | | | |
| Ratio of total expenses | | | | | | | | | | |
| to average net assets | .51 | | .51 | | .51 | | .51 | | .51 | |
| Ratio of net expenses | | | | | | | | | | |
| to average net assets | .15 | | .18 | | .25 | | .24 | | .29 | |
| Ratio of net investment income | | | | | | | | | | |
| to average net assetsb | .00 | | .00 | | .00 | | .00 | | .00 | |
| Net Assets, end of period ($ x 1,000) | 46,214 | | 61,312 | | 95,408 | | 80,785 | | 140,848 | |
| |
| a | Amount represents less than $.001 per share. |
| b | Amount represents less than .01%. |
See notes to financial statements.
14
NOTES TO FINANCIAL STATEMENTS
NOTE 1—Significant Accounting Policies:
Dreyfus Money Market Reserves (the “fund”) is a separate diversified series of The Dreyfus/Laurel Funds, Inc. (the “Company”), which is registered under the Investment Company Act of 1940, as amended (the “Act”), as an open-end management investment company and operates as a series company currently offering eleven series, including the fund. The fund’s investment objective is to seek a high level of current income consistent with stability of principal. The Dreyfus Corporation (the “Manager” or “Dreyfus”), a wholly-owned subsidiary of The Bank of New York Mellon Corporation (“BNY Mellon”), serves as the fund’s investment adviser.
MBSC Securities Corporation (the “Distributor”), a wholly-owned subsidiary of the Manager, is the distributor of the fund’s shares, which are sold without a sales charge.The fund is authorized to issue 2 billion shares of $.001 par value Capital Stock in each of the following classes of shares: Investor and Class R. Investor shares are sold primarily to retail investors through financial intermediaries and bear a Distribution Plan fee. Class R shares are sold primarily to bank trust departments and other financial service providers (including The Bank of New York Mellon, a subsidiary of BNY Mellon and an affiliate of Dreyfus, and its affiliates), acting on behalf of customers having a qualified trust or an investment account or relationship at such institution, and bear no Distribution Plan fee. Other differences between the classes include the services offered to and the expenses borne by each class, and certain voting rights. Income, expenses (other than expenses attributable to a specific class), and realized and unrealized gains or losses on investments are allocated to each class of shares based on its relative net assets.
It is the fund’s policy to maintain a continuous net asset value per share of $1.00; the fund has adopted certain investment, portfolio valuation and dividend and distribution policies to enable it to do so. There is no assurance, however, that the fund will be able to maintain a stable net asset value per share of $1.00.
The Fund 15
NOTES TO FINANCIAL STATEMENTS (continued)
The Company accounts separately for the assets, liabilities and operations of each series. Expenses directly attributable to each series are charged to that series’ operations; expenses which are applicable to all series are allocated among them on a pro rata basis.
The Financial Accounting Standards Board (“FASB”) Accounting Standards Codification (“ASC”) is the exclusive reference of authoritative U.S. generally accepted accounting principles (“GAAP”) recognized by the FASB to be applied by nongovernmental entities. Rules and interpretive releases of the Securities and Exchange Commission (“SEC”) under authority of federal laws are also sources of authoritative GAAP for SEC registrants. The fund’s financial statements are prepared in accordance with GAAP, which may require the use of management estimates and assumptions. Actual results could differ from those estimates.
(a) Portfolio valuation: Investments in securities are valued at amortized cost in accordance with Rule 2a-7 under the Act. If amortized cost is determined not to approximate market value, the fair value of the portfolio securities will be determined by procedures established by and under the general supervision of the Company’s Board of Directors (the “Board”).
The fair value of a financial instrument is the amount that would be received to sell an asset or paid to transfer a liability in an orderly transaction between market participants at the measurement date (i.e., the exit price). GAAP establishes a fair value hierarchy that prioritizes the inputs of valuation techniques used to measure fair value.This hierarchy gives the highest priority to unadjusted quoted prices in active markets for identical assets or liabilities (Level 1 measurements) and the lowest priority to unobservable inputs (Level 3 measurements).
Additionally, GAAP provides guidance on determining whether the volume and activity in a market has decreased significantly and whether such a decrease in activity results in transactions that are not orderly. GAAP requires enhanced disclosures around valuation inputs and techniques used during annual and interim periods.
16
Various inputs are used in determining the value of the fund’s investments relating to fair value measurements.These inputs are summarized in the three broad levels listed below:
Level 1—unadjusted quoted prices in active markets for identical investments.
Level 2—other significant observable inputs (including quoted prices for similar investments, interest rates, prepayment speeds, credit risk, etc.).
Level 3—significant unobservable inputs (including the fund’s own assumptions in determining the fair value of investments).
The inputs or methodology used for valuing securities are not necessarily an indication of the risk associated with investing in those securities. For example, money market securities are valued using amortized cost, in accordance with rules under the Act. Generally, amortized cost approximates the current fair value of a security, but since the value is not obtained from a quoted price in an active market, such securities are reflected within Level 2 of the fair value hierarchy.
The following is a summary of the inputs used as of October 31, 2014 in valuing the fund’s investments:
| |
| | Short-Term |
| Valuation Inputs | Investments ($)† |
| Level 1—Unadjusted Quoted Prices | — |
| Level 2—Other Significant Observable Inputs | 195,969,231 |
| Level 3—Significant Unobservable Inputs | — |
| Total | 195,969,231 |
| † See Statement of Investments for additional detailed categorizations. | |
At October 31, 2014, there were no transfers between Level 1 and Level 2 of the fair value hierarchy.
(b) Securities transactions and investment income: Securities transactions are recorded on a trade date basis. Interest income, adjusted for accretion of discount and amortization of premium on investments, is
The Fund 17
NOTES TO FINANCIAL STATEMENTS (continued)
earned from settlement date and is recognized on the accrual basis. Realized gains and losses from securities transactions are recorded on the identified cost basis. Cost of investments represents amortized cost.
The fund may enter into repurchase agreements with financial institutions, deemed to be creditworthy by the Manager, subject to the seller’s agreement to repurchase and the fund’s agreement to resell such securities at a mutually agreed upon price. Pursuant to the terms of the repurchase agreement, such securities must have an aggregate market value greater than or equal to the terms of the repurchase price plus accrued interest at all times. If the value of the underlying securities falls below the value of the repurchase price plus accrued interest, the fund will require the seller to deposit additional collateral by the next business day. If the request for additional collateral is not met, or the seller defaults on its repurchase obligation, the fund maintains its right to sell the underlying securities at market value and may claim any resulting loss against the seller.
(c) Dividends to shareholders: It is the policy of the fund to declare dividends daily from investment income-net. Such dividends are paid monthly. Dividends from net realized capital gains, if any, are normally declared and paid annually, but the fund may make distributions on a more frequent basis to comply with the distribution requirements of the Internal Revenue Code of 1986, as amended (the “Code”).To the extent that net realized capital gains can be offset by capital loss carryovers, it is the policy of the fund not to distribute such gains.
(d) Federal income taxes: It is the policy of the fund to continue to qualify as a regulated investment company, if such qualification is in the best interest of its shareholders, by complying with the applicable provisions of the Code, and to make distributions of taxable income sufficient to relieve it from substantially all federal income and excise taxes.
As of and during the period ended October 31, 2014, the fund did not have any liabilities for any uncertain tax positions.The fund recognizes interest and penalties, if any, related to uncertain tax positions as income tax expense in the Statement of Operations. During the period ended October 31, 2014, the fund did not incur any interest or penalties.
18
Each tax year in the four-year period ended October 31, 2014 remains subject to examination by the Internal Revenue Service and state taxing authorities.
At October 31, 2014, the components of accumulated earnings on a tax basis were substantially the same as for financial reporting purposes.
The tax character of distributions paid to shareholders during the fiscal periods ended October 31, 2014 and October 31, 2013 were all ordinary income.
At October 31, 2014, the cost of investments for federal income tax purposes was substantially the same as the cost for financial reporting purposes (see the Statement of Investments).
NOTE 2—Investment Management Fee and Other Transactions with Affiliates:
(a) Pursuant to an investment management agreement with the Manager, the Manager provides or arranges for one or more third parties and/or affiliates to provide investment advisory, administrative, custody, fund accounting and transfer agency services to the fund.The Manager also directs the investments of the fund in accordance with its investment objective, policies and limitations. For these services, the fund is contractually obligated to pay the Manager a fee, calculated daily and paid monthly, at an annual rate of .50% of the value of the fund’s average daily net assets. Out of its fee, the Manager pays all of the expenses of the fund except brokerage fees, taxes, Distribution Plan fees, fees and expenses of non-interested Directors (including counsel fees) and extraordinary expenses. In addition, the Manager is required to reduce its fee in an amount equal to the fund’s allocable portion of fees and expenses of the non-interested Directors (including counsel fees). During the period ended October 31, 2014, fees reimbursed by the Manager amounted to $24,561.
The Manager has undertaken to waive receipt of the management fee and/or reimburse operating expenses in order to facilitate a daily yield at or above a certain level which may change from time to time.This
The Fund 19
NOTES TO FINANCIAL STATEMENTS (continued)
undertaking is voluntary and not contractual, and may be terminated at any time. The reduction in expenses, pursuant to the undertaking, amounted to $1,106,265 during the period ended October 31, 2014.
(b) Under the Distribution Plan adopted pursuant to Rule 12b-1 under the Act, Investor shares may pay annually up to .25% (currently limited by the Board to .20%) of the value of the average daily net assets attributable to its Investor shares to compensate the Distributor for shareholder servicing activities and expenses primarily intended to result in the sale of Investor shares. During the period ended October 31, 2014, Investor shares were charged $347,278 pursuant to the Distribution Plan.
Under its terms, the Distribution Plan shall remain in effect from year to year, provided such continuance is approved annually by a vote of a majority of those Directors who are not “interested persons” of the Company and who have no direct or indirect financial interest in the operation of or in any agreement related to the Distribution Plan.
The components of “Due to The Dreyfus Corporation and affiliates” in the Statement of Assets and Liabilities consist of: management fees $74,131 and Distribution Plan fees $26,393, which are offset against an expense reimbursement currently in effect in the amount of $84,710.
(c) Each Board member also serves as a Board member of other funds within the Dreyfus complex. Annual retainer fees and attendance fees are allocated to each fund based on net assets.
NOTE 3—Regulatory Developments:
On July 23, 2014, the SEC adopted amendments to the rules that govern money market mutual funds. In part, the amendments will require structural changes to most types of money market funds to one extent or another; however, the SEC provided for an extended two-year transition period to comply with such structural requirements. At this time, management is evaluating the reforms adopted and the manner for implementing these reforms over time and its impact on the financial statements.
20
REPORT OF INDEPENDENT REGISTERED
PUBLIC ACCOUNTING FIRM
The Board of Directors and Shareholders of
The Dreyfus/Laurel Funds, Inc.
We have audited the accompanying statement of assets and liabilities of Dreyfus Money Market Reserves (the “Fund”), a series of The Dreyfus/Laurel Funds, Inc., including the statement of investments, as of October 31, 2014, the related statement of operations for the year then ended, the statements of changes in net assets for each of the years in the two-year period then ended, and the financial highlights for each of the years in the five-year period then ended. These financial statements and financial highlights are the responsibility of the Fund’s management. Our responsibility is to express an opinion on these financial statements and financial highlights based on our audits.
We conducted our audits in accordance with the standards of the Public Company Accounting Oversight Board (United States).Those standards require that we plan and perform the audit to obtain reasonable assurance about whether the financial statements and financial highlights are free of material misstatement. An audit includes examining, on a test basis, evidence supporting the amounts and disclosures in the financial statements. Our procedures included confirmation of securities owned as of October 31, 2014, by correspondence with the custodian and brokers or by other appropriate auditing procedures. An audit also includes assessing the accounting principles used and significant estimates made by management, as well as evaluating the overall financial statement presentation.We believe that our audits provide a reasonable basis for our opinion.
In our opinion, the financial statements and financial highlights referred to above present fairly, in all material respects, the financial position of Dreyfus Money Market Reserves as of October 31, 2014, the results of its operations for the year then ended, the changes in its net assets for each of the years in the two-year period then ended, and the financial highlights for each of the years in the five-year period then ended, in conformity with U.S. generally accepted accounting principles.

New York, New York
December 30, 2014
The Fund 21
IMPORTANT TAX INFORMATION (Unaudited)
For federal tax purposes, the fund designates the maximum amount allowable but not less than 92.69% as interest-related dividends in accordance with Sections 871(k)(1) and 881(e) of the Internal Revenue Code.
22
BOARD MEMBERS INFORMATION (Unaudited)
INDEPENDENT BOARD MEMBERS
|
| Joseph S. DiMartino (71) |
| Chairman of the Board (1999) |
| Principal Occupation During Past 5Years: |
| • Corporate Director and Trustee (1995-present) |
| Other Public Company Board Memberships During Past 5Years: |
| • CBIZ (formerly, Century Business Services, Inc.), a provider of outsourcing functions for small |
| and medium size companies, Director (1997-present) |
| • The Newark Group, a provider of a national market of paper recovery facilities, paperboard |
| mills and paperboard converting plants, Director (2000-2010) |
| • Sunair Services Corporation, a provider of certain outdoor-related services to homes and |
| businesses, Director (2005-2009) |
| No. of Portfolios for which Board Member Serves: 144 |
| ——————— |
| Francine J. Bovich (63) |
| Board Member (2012) |
| Principal Occupation During Past 5Years: |
| • Trustee,The Bradley Trusts, private trust funds (2011-present) |
| • Managing Director, Morgan Stanley Investment Management (1993-2010) |
| Other Public Company Board Membership During Past 5Years: |
| • Annaly Capital Management, Inc., Board Member (May 2014-present) |
| No. of Portfolios for which Board Member Serves: 45 |
| ——————— |
| Kenneth A. Himmel (68) |
| Board Member (1994) |
| Principal Occupation During Past 5Years: |
| • President and CEO, Related Urban Development, a real estate development company (1996-present) |
| • President and CEO, Himmel & Company, a real estate development company (1980-present) |
| • CEO,American Food Management, a restaurant company (1983-present) |
| No. of Portfolios for which Board Member Serves: 31 |
The Fund 23
BOARD MEMBERS INFORMATION (Unaudited) (continued)
INDEPENDENT BOARD MEMBERS (continued)
|
| Stephen J. Lockwood (67) |
| Board Member (1994) |
| Principal Occupation During Past 5Years: |
| • Chairman of the Board, Stephen J. Lockwood and Company LLC, a real estate investment |
| company (2000-present) |
| No. of Portfolios for which Board Member Serves: 31 |
| ——————— |
| Roslyn M. Watson (65) |
| Board Member (1994) |
| Principal Occupation During Past 5Years: |
| • Principal,Watson Ventures, Inc., a real estate investment company (1993-present) |
| No. of Portfolios for which Board Member Serves: 69 |
| ——————— |
| Benaree Pratt Wiley (68) |
| Board Member (1998) |
| Principal Occupation During Past 5Years: |
| • Principal,TheWiley Group, a firm specializing in strategy and business development (2005-present) |
| Other Public Company Board Membership During Past 5Years: |
| • CBIZ (formerly, Century Business Services, Inc.), a provider of outsourcing functions for small |
| and medium size companies, Director (2008-present) |
| No. of Portfolios for which Board Member Serves: 69 |
| ——————— |
| Once elected all Board Members serve for an indefinite term, but achieve Emeritus status upon reaching age 80.The |
| address of the Board Members and Officers is c/o The Dreyfus Corporation, 200 Park Avenue, NewYork, NewYork |
| 10166.Additional information about the Board Members is available in the fund’s Statement of Additional Information |
| which can be obtained from Dreyfus free of charge by calling this toll free number: 1-800-DREYFUS. |
| James M. Fitzgibbons, Emeritus Board Member |
| J.Tomlinson Fort, Emeritus Board Member |
24
OFFICERS OF THE FUND (Unaudited)
BRADLEY J. SKAPYAK, President since January 2010.
Chief Operating Officer and a director of the Manager since June 2009, Chairman of Dreyfus Transfer, Inc., an affiliate of the Manager and the transfer agent of the funds, since May 2011 and Executive Vice President of the Distributor since June 2007. From April 2003 to June 2009, Mr. Skapyak was the head of the Investment Accounting and Support Department of the Manager. He is an officer of 69 investment companies (comprised of 144 portfolios) managed by the Manager. He is 55 years old and has been an employee of the Manager since February 1988.
JOHN PAK, Chief Legal Officer since March 2013.
Deputy General Counsel, Investment Management, of BNY Mellon since August 2014; Chief Legal Officer of the Manager since August 2012; from March 2005 to July 2012, Managing Director of Deutsche Bank, Deputy Global Head of Deutsche Asset Management Legal and Regional Head of Deutsche Asset Management Americas Legal. He is an officer of 70 investment companies (comprised of 169 portfolios) managed by the Manager. He is 46 years old and has been an employee of the Manager since August 2012.
JANETTE E. FARRAGHER, Vice President and Secretary since December 2011.
Assistant General Counsel of BNY Mellon, and an officer of 70 investment companies (comprised of 169 portfolios) managed by the Manager. She is 51 years old and has been an employee of the Manager since February 1984.
KIESHA ASTWOOD, Vice President and Assistant Secretary since January 2010.
Counsel of BNY Mellon, and an officer of 70 investment companies (comprised of 169 portfolios) managed by the Manager. She is 41 years old and has been an employee of the Manager since July 1995.
JAMES BITETTO, Vice President and Assistant Secretary since August 2005.
Managing Counsel of BNY Mellon and Secretary of the Manager, and an officer of 70 investment companies (comprised of 169 portfolios) managed by the Manager. He is 48 years old and has been an employee of the Manager since December 1996.
JONI LACKS CHARATAN, Vice President and Assistant Secretary since August 2005.
Managing Counsel of BNY Mellon, and an officer of 70 investment companies (comprised of 169 portfolios) managed by the Manager. She is 58 years old and has been an employee of the Manager since October 1988.
JOSEPH M. CHIOFFI, Vice President and Assistant Secretary since August 2005.
Managing Counsel of BNY Mellon, and an officer of 70 investment companies (comprised of 169 portfolios) managed by the Manager. He is 52 years old and has been an employee of the Manager since June 2000.
JOHN B. HAMMALIAN, Vice President and Assistant Secretary since August 2005.
Senior Managing Counsel of BNY Mellon, and an officer of 70 investment companies (comprised of 169 portfolios) managed by the Manager. He is 51 years old and has been an employee of the Manager since February 1991.
SARAH S. KELLEHER, Vice President and Assistant Secretary since April 2014.
Senior Counsel of BNY Mellon, and an officer of 70 investment companies (comprised of 169 portfolios) managed by the Manager; from August 2005 to March 2013, Associate General Counsel of Third Avenue Management. She is 38 years old and has been an employee of the Manager since March 2013.
The Fund 25
OFFICERS OF THE FUND (Unaudited) (continued)
JEFF PRUSNOFSKY, Vice President and Assistant Secretary since August 2005.
Senior Managing Counsel of BNY Mellon, and an officer of 70 investment companies (comprised of 169 portfolios) managed by the Manager. He is 49 years old and has been an employee of the Manager since October 1990.
JAMES WINDELS, Treasurer since November 2001.
Director – Mutual Fund Accounting of the Manager, and an officer of 70 investment companies (comprised of 169 portfolios) managed by the Manager. He is 56 years old and has been an employee of the Manager since April 1985.
RICHARD CASSARO, Assistant Treasurer since January 2008.
Senior Accounting Manager – Money Market and Municipal Bond Funds of the Manager, and an officer of 70 investment companies (comprised of 169 portfolios) managed by the Manager. He is 55 years old and has been an employee of the Manager since September 1982.
GAVIN C. REILLY, Assistant Treasurer since December 2005.
Tax Manager of the Investment Accounting and Support Department of the Manager, and an officer of 70 investment companies (comprised of 169 portfolios) managed by the Manager. He is 46 years old and has been an employee of the Manager since April 1991.
ROBERT S. ROBOL, Assistant Treasurer since December 2002.
Senior Accounting Manager – Fixed Income Funds of the Manager, and an officer of 70 investment companies (comprised of 169 portfolios) managed by the Manager. He is 50 years old and has been an employee of the Manager since October 1988.
ROBERT SALVIOLO, Assistant Treasurer since July 2007.
Senior Accounting Manager – Equity Funds of the Manager, and an officer of 70 investment companies (comprised of 169 portfolios) managed by the Manager. He is 47 years old and has been an employee of the Manager since June 1989.
ROBERT SVAGNA, Assistant Treasurer since December 2002.
Senior Accounting Manager – Equity Funds of the Manager, and an officer of 70 investment companies (comprised of 169 portfolios) managed by the Manager. He is 47 years old and has been an employee of the Manager since November 1990.
JOSEPH W. CONNOLLY, Chief Compliance Officer since October 2004.
Chief Compliance Officer of the Manager and The Dreyfus Family of Funds (70 investment companies, comprised of 169 portfolios). He is 57 years old and has served in various capacities with the Manager since 1980, including manager of the firm’s Fund Accounting Department from 1997 through October 2001.
MATTHEW D. CONNOLLY, Anti-Money Laundering Compliance Officer since April 2012.
Anti-Money Laundering Compliance Officer of the Distributor since October 2011; from March 2010 to September 2011, Global Head, KYC Reviews and Director of UBS Investment Bank; until March 2010, AML Compliance Officer and Senior Vice President of Citi Global Wealth Management. He is an officer of 65 investment companies (comprised of 164 portfolios) managed by the Manager. He is 42 years old and has been an employee of the Distributor since October 2011.
26
For More Information

Telephone 1-800-DREYFUS
Mail The Dreyfus Family of Funds, 144 Glenn Curtiss Boulevard, Uniondale, NY 11556-0144
E-mail Send your request to info@dreyfus.com
Internet Information can be viewed online or downloaded at: http://www.dreyfus.com
The fund will disclose daily, on www.dreyfus.com, the fund’s complete schedule of holdings as of the end of the previous business day. The schedule of holdings will remain on the website until the fund files its Form N-Q or Form N-CSR for the period that includes the date of the posted holdings.
The fund files its complete schedule of portfolio holdings with the Securities and Exchange Commission (“SEC”) for the first and third quarters of each fiscal year on Form N-Q. The fund’s Forms N-Q are available on the SEC’s website at http://www.sec.gov and may be reviewed and copied at the SEC’s Public Reference Room in Washington, DC. Information on the operation of the Public Reference Room may be obtained by calling 1-800-SEC-0330.
Information regarding how the fund voted proxies relating to portfolio securities for the most recent 12-month period ended June 30 is available on the SEC’s website at http://www.sec.gov and without charge, upon request, by calling 1-800-DREYFUS.

|
| Dreyfus |
| AMT-Free |
| Municipal Reserves |
ANNUAL REPORT October 31, 2014

Save time. Save paper. View your next shareholder report online as soon as it’s available. Log into www.dreyfus.com and sign up for Dreyfus eCommunications. It’s simple and only takes a few minutes.
The views expressed in this report reflect those of the portfolio manager only through the end of the period covered and do not necessarily represent the views of Dreyfus or any other person in the Dreyfus organization. Any such views are subject to change at any time based upon market or other conditions and Dreyfus disclaims any responsibility to update such views.These views may not be relied on as investment advice and, because investment decisions for a Dreyfus fund are based on numerous factors, may not be relied on as an indication of trading intent on behalf of any Dreyfus fund.
|
| Not FDIC-Insured • Not Bank-Guaranteed • May Lose Value |
| | Contents |
| | THE FUND |
| 2 | A Letter from the President |
| 3 | Discussion of Fund Performance |
| 6 | Understanding Your Fund’s Expenses |
| 6 | Comparing Your Fund’s Expenses With Those of Other Funds |
| 7 | Statement of Investments |
| 21 | Statement of Assets and Liabilities |
| 22 | Statement of Operations |
| 23 | Statement of Changes in Net Assets |
| 24 | Financial Highlights |
| 28 | Notes to Financial Statements |
| 35 | Report of Independent Registered Public Accounting Firm |
| 36 | Important Tax Information |
| 37 | Board Members Information |
| 39 | Officers of the Fund |
| | FOR MORE INFORMATION |
| | Back Cover |
Dreyfus
AMT-Free
Municipal Reserves
The Fund
A LETTER FROM THE PRESIDENT
Dear Shareholder:
We are pleased to present this annual report for Dreyfus AMT-Free Municipal Reserves, covering the 12-month period from November 1, 2013, through October 31, 2014. For information about how the fund performed during the reporting period, as well as general market perspectives, we provide a Discussion of Fund Performance on the pages that follow.
The U.S. economy generally gained ground over the reporting period despite a weather-related economic soft patch during the first quarter of 2014.This development sparked bouts of volatility among longer term bonds, but short-term rates and yields of money market instruments remained steady, anchored near historical lows by an unchanged federal funds rate. In addition, a degree of uncertainty was removed from the money markets over the summer when the Securities Exchange Commission issued new rules governing some funds, but the immediate impact on the market was muted when regulators delayed implementation for two years.
In our view, stronger labor markets, greater manufacturing activity, rebounding housing starts, and rising household wealth portend well for the U.S. economy.While some longer term financial assets are likely to benefit from a more robust recovery, the possibility of higher inflation and rising long-term interest rates suggests that selectivity could become a more important determinant of investment success. As always, we urge you to talk regularly with your financial advisor to assess the potential impact of these and other developments on your investments.
Thank you for your continued confidence and support.

J. Charles Cardona
President
The Dreyfus Corporation
November 17, 2014
2
DISCUSSION OF FUND PERFORMANCE
For the period of November 1, 2013, through October 31, 2014, as provided by Bill Vasiliou, Portfolio Manager
Fund and Market Performance Overview
For the 12-month period ended October 31, 2014, Dreyfus AMT-Free Municipal Reserves’ BASIC shares produced a yield of 0.01%, Class B shares yielded 0.01%, Class R shares yielded 0.01%, and Investor shares yielded 0.01%.Taking into consideration the effects of compounding, the fund’s BASIC shares, Class B shares, Class R shares, and Investor shares produced effective yields of 0.01%, 0.01%, 0.01%, and 0.01% for the same period.1
Despite mounting evidence of a sustained U.S. economic recovery and an ongoing shift by the Federal Reserve Board (the “Fed”) to a more moderately accommodative monetary policy, the overnight federal funds rate was left unchanged near historical lows. Consequently, tax-exempt money market yields also remained low throughout the reporting period.
The Fund’s Investment Approach
The fund seeks a high level of current income, consistent with stability of principal, that is exempt from federal income tax. The fund also seeks to provide income exempt from the federal alternative minimum tax. To pursue its goal, the fund normally invests substantially all of its assets in short-term, high-quality municipal obligations that provide income exempt from federal personal income tax and the federal alternative minimum tax. Among these are municipal notes, short-term municipal bonds, tax-exempt commercial paper, and municipal leases.The fund also may invest in high-quality, short-term structured notes, which are derivative instruments whose value is tied to underlying municipal obligations.
Yields Stayed Low despite Accelerating Economic Recovery
While yields of municipal money market securities remained anchored throughout the reporting period by an unchanged federal funds rate between 0% and 0.25%, evidence of an accelerating economic recovery over the fall of 2013 and the Fed’s decision in December to begin reducing its quantitative easing program drove yields
The Fund 3
DISCUSSION OF FUND PERFORMANCE (continued)
of 10-year U.S.Treasury securities above 3% by year-end. However, unusually severe winter weather throughout much of the country caused U.S. GDP to contract at an annualized 2.1% rate during the first quarter of 2014. Investors also grew concerned about economic and political instability in the world’s emerging markets. In response, longer term bond yields fell significantly over the opening months of the reporting period.
The economic recovery got back on track in the spring, as evidenced by a 4.6% annualized GDP growth rate for the second quarter and an estimated 3.5% annualized growth rate for the third quarter.Yet, supply-and-demand dynamics continued to put downward pressure on municipal money market yields. Demand remained strong for short-term tax-exempt municipal securities, including from nontraditional buyers, such as intermediate bond funds and taxable money market funds seeking attractive tax-exempt yields compared to taxable securities with similar maturities. In contrast, individual investors seeking more competitive levels of current income focused mainly on longer term municipal bonds with higher yields. In this environment, yields of high-quality, one-year municipal notes remained low. Robust investor demand and an increasingly limited supply of new instruments also kept yields on variable rate demand notes (“VRDNs”) near historical lows.
Municipal credit quality continued to improve as most states and local governments participated in the economic recovery. Most notably, state general funds have shown consecutive quarters of growth in personal income tax and sales tax revenue, enabling most states to achieve balanced budgets.
Credit Selection Remained Paramount
Most municipal money market funds have maintained short weighted average maturities compared to historical averages due to narrow yield differences along the tax-exempt money market’s maturity range.The fund was no exception, as we continued to maintain its weighted average maturity in a position that was consistent with industry averages. Changes to the regulations governing some money market funds—which were announced in July but are not effective until 2016—also contributed to relatively cautious investment postures throughout the industry.
4
As always, well-researched credit selection remained paramount.We have continued to favor state general obligation bonds; essential service revenue bonds backed by water, sewer, and electric facilities; certain local credits with strong financial positions and stable tax bases; and health care and education issuers with stable credit characteristics.
Fed Remains Committed to Low Short-Term Rates
After a series of cuts in its monthly bond purchases over the reporting period, the Fed’s quantitative easing program ended on October 31. Nonetheless, the Fed has made clear that short-term interest rates are likely to remain near current levels “for a considerable time.” In determining how long to maintain its current target for the federal funds rate, the Fed reiterated that it will continue to monitor progress toward its objectives of full employment and a 2% inflation rate, and depending on prevailing economic conditions, it may keep rates low even after those targets are reached. Therefore, in our judgment, the prudent course continues to be an emphasis on preservation of capital and liquidity.
November 17, 2014
An investment in the fund is not insured or guaranteed by the FDIC or any other government agency. Although the fund seeks to preserve the value of your investment at $1.00 per share, it is possible to lose money by investing in the fund.
Municipal securities holdings (as applicable), while rated in the highest rating category by one or more National Recognized Statistical Rating Organizations (NRSROs) (or unrated, if deemed of comparable quality by Dreyfus), involve credit and liquidity risks and risk of principal loss.
|
| 1 Effective yield is based upon dividends declared daily and reinvested monthly. Past performance is no guarantee of |
| future results.Yields fluctuate.Yield provided reflects the absorption of certain fund expenses by The Dreyfus |
| Corporation pursuant to an undertaking in effect that may be extended, terminated, or modified at any time. Had |
| these expenses not been absorbed, fund yields would have been lower, and in some cases, 7-day yields during the |
| reporting period would have been negative absent the expense absorption. |
The Fund 5
UNDERSTANDING YOUR FUND’S EXPENSES (Unaudited)
As a mutual fund investor, you pay ongoing expenses, such as management fees and other expenses. Using the information below, you can estimate how these expenses affect your investment and compare them with the expenses of other funds.You also may pay one-time transaction expenses, including sales charges (loads) and redemption fees, which are not shown in this section and would have resulted in higher total expenses. For more information, see your fund’s prospectus or talk to your financial adviser.
Review your fund’s expenses
The table below shows the expenses you would have paid on a $1,000 investment in Dreyfus AMT-Free Municipal Reserves from May 1, 2014 to October 31, 2014. It also shows how much a $1,000 investment would be worth at the close of the period, assuming actual returns and expenses.
Expenses and Value of a $1,000 Investment
assuming actual returns for the six months ended October 31, 2014
| | | | | | | |
| | Investor Shares | | Class R Shares | | BASIC Shares | | Class B Shares |
| Expenses paid per $1,000† | $ .81 | | $ .81 | | $ .81 | | $ .81 |
| Ending value (after expenses) | $ 1,000.00 | | $ 1,000.00 | | $ 1,000.00 | | $ 1,000.00 |
COMPARING YOUR FUND’S EXPENSES
WITH THOSE OF OTHER FUNDS (Unaudited)
Using the SEC’s method to compare expenses
The Securities and Exchange Commission (SEC) has established guidelines to help investors assess fund expenses. Per these guidelines, the table below shows your fund’s expenses based on a $1,000 investment, assuming a hypothetical 5% annualized return. You can use this information to compare the ongoing expenses (but not transaction expenses or total cost) of investing in the fund with those of other funds. All mutual fund shareholder reports will provide this information to help you make this comparison. Please note that you cannot use this information to estimate your actual ending account balance and expenses paid during the period.
Expenses and Value of a $1,000 Investment
assuming a hypothetical 5% annualized return for the six months ended October 31, 2014
| | | | | | | |
| | Investor Shares | | Class R Shares | | BASIC Shares | | Class B Shares |
| Expenses paid per $1,000† | $ .82 | | $ .82 | | $ .82 | | $ .82 |
| Ending value (after expenses) | $ 1,024.40 | | $ 1,024.40 | | $ 1,024.40 | | $ 1,024.40 |
|
| † Expenses are equal to the fund’s annualized expense ratio of .16% for Investor shares, .16% for Class R shares, |
| .16% for BASIC shares and .16% for Class B shares, multiplied by the average account value over the period, |
| multiplied by 184/365 (to reflect the one-half year period). |
6
| | | | | |
| STATEMENT OF INVESTMENTS | | | | |
| October 31, 2014 | | | | | |
| |
| |
| |
| |
| Short-Term | Coupon | Maturity | Principal | | |
| Investments—100.6% | Rate (%) | Date | Amount ($) | | Value ($) |
| Alabama—5.5% | | | | | |
| Chatom Industrial Development | | | | | |
| Board, Gulf Opportunity Zone | | | | | |
| Revenue (PowerSouth Energy | | | | | |
| Cooperative Projects) (LOC; | | | | | |
| National Rural Utilities | | | | | |
| Cooperative Finance | | | | | |
| Corporation) | 0.20 | 11/7/14 | 5,000,000 | a | 5,000,000 |
| Columbia Industrial Development | | | | | |
| Board, PCR, Refunding (Alabama | | | | | |
| Power Company Project) | 0.07 | 11/3/14 | 6,150,000 | a | 6,150,000 |
| Mobile County Industrial | | | | | |
| Development Authority, Gulf | | | | | |
| Opportunity Zone Revenue (SSAB | | | | | |
| Alabama Inc.) (LOC; Swedbank) | 0.07 | 11/7/14 | 2,000,000 | a | 2,000,000 |
| Alaska—2.7% | | | | | |
| Valdez, | | | | | |
| Marine Terminal Revenue, | | | | | |
| Refunding (ExxonMobil Project) | 0.06 | 11/3/14 | 6,400,000 | a | 6,400,000 |
| Arizona—.2% | | | | | |
| Arizona Health Facilities | | | | | |
| Authority, Revenue (Community | | | | | |
| Behavioral Health Properties | | | | | |
| of Southern Arizona Project) | | | | | |
| (LOC; Wells Fargo Bank) | 0.16 | 11/7/14 | 460,000 | a | 460,000 |
| Colorado—4.8% | | | | | |
| Colorado Educational and Cultural | | | | | |
| Facilities Authority, | | | | | |
| Educational Facilities Revenue | | | | | |
| (Trinity School of Durham and | | | | | |
| Chapel Hill Project) (LOC; | | | | | |
| Branch Banking and Trust Co.) | 0.07 | 11/7/14 | 930,000 | a | 930,000 |
| Colorado Educational and Cultural | | | | | |
| Facilities Authority, Revenue, | | | | | |
| Refunding (Boulder Country Day | | | | | |
| School Project) (LOC; Wells | | | | | |
| Fargo Bank) | 0.16 | 11/7/14 | 1,340,000 | a | 1,340,000 |
| Colorado Housing and | | | | | |
| Finance Authority, | | | | | |
| Multi-Family/Project Bonds | | | | | |
| (Liquidity Facility; FHLB) | 0.06 | 11/7/14 | 1,200,000 | a | 1,200,000 |
The Fund 7
STATEMENT OF INVESTMENTS (continued)
| | | | | |
| Short-Term | Coupon | Maturity | Principal | | |
| Investments (continued) | Rate (%) | Date | Amount ($) | | Value ($) |
| Colorado (continued) | | | | | |
| Colorado Postsecondary Educational | | | | | |
| Facilities Authority, Revenue | | | | | |
| (Mullen High School Project) | | | | | |
| (LOC; Wells Fargo Bank) | 0.21 | 11/7/14 | 540,000 | a | 540,000 |
| Gateway Regional Metropolitan | | | | | |
| District, Limited Tax Improvement | | | | | |
| GO Notes, Refunding | | | | | |
| (LOC; Wells Fargo Bank) | 0.16 | 11/7/14 | 2,540,000 | a | 2,540,000 |
| Sheridan Redevelopment Agency, | | | | | |
| Tax Increment Revenue, | | | | | |
| Refunding (South Santa Fe | | | | | |
| Drive Corridor Redevelopment | | | | | |
| Project) (LOC; JPMorgan | | | | | |
| Chase Bank) | 0.08 | 11/7/14 | 4,970,000 | a | 4,970,000 |
| Connecticut—6.5% | | | | | |
| Connecticut Health and Educational | | | | | |
| Facilities Authority, Revenue | | | | | |
| (Eagle Hill School Issue) | | | | | |
| (LOC; JPMorgan Chase Bank) | 0.10 | 11/7/14 | 4,850,000 | a | 4,850,000 |
| Connecticut Health and Educational | | | | | |
| Facilities Authority, Revenue | | | | | |
| (The Children’s School Issue) | | | | | |
| (LOC; JPMorgan Chase Bank) | 0.10 | 11/7/14 | 5,270,000 | a | 5,270,000 |
| Shelton Housing Authority, | | | | | |
| Revenue (Crosby Commons | | | | | |
| Project) (LOC; M&T Trust) | 0.10 | 11/7/14 | 5,485,000 | a | 5,485,000 |
| District of Columbia—1.0% | | | | | |
| District of Columbia Water and | | | | | |
| Sewer Authority, Public | | | | | |
| Utility Subordinated Lien | | | | | |
| Revenue (Eagle Series | | | | | |
| 2013-0012) (Liquidity | | | | | |
| Facility; Citibank NA) | 0.07 | 11/7/14 | 2,500,000 | a,b,c | 2,500,000 |
| Florida—6.5% | | | | | |
| Brevard County, | | | | | |
| Revenue (Holy Trinity | | | | | |
| Episcopal Academy Project) | | | | | |
| (LOC; Wells Fargo Bank) | 0.21 | 11/7/14 | 615,000 | a | 615,000 |
8
| | | | | |
| Short-Term | Coupon | Maturity | Principal | | |
| Investments (continued) | Rate (%) | Date | Amount ($) | | Value ($) |
| Florida (continued) | | | | | |
| Collier County Industrial | | | | | |
| Development Authority, Revenue | | | | | |
| (Redlands Christian Migrant | | | | | |
| Association, Inc. Project) | | | | | |
| (LOC; Bank of America) | 0.16 | 11/7/14 | 2,945,000 | a | 2,945,000 |
| Hillsborough County, | | | | | |
| IDR (The Museum of Science & | | | | | |
| Industry and The Institute for | | | | | |
| Business & Home Safety | | | | | |
| Project) (LOC; Branch Banking | | | | | |
| and Trust Co.) | 0.07 | 11/7/14 | 1,080,000 | a | 1,080,000 |
| Hillsborough County Industrial | | | | | |
| Development Authority, Revenue | | | | | |
| (Independent Day School | | | | | |
| Project) (LOC; Bank of America) | 0.18 | 11/7/14 | 1,200,000 | a | 1,200,000 |
| Jacksonville, | | | | | |
| Educational Facilities Revenue | | | | | |
| (Edward Waters College | | | | | |
| Project) (LOC; Wells Fargo Bank) | 0.16 | 11/7/14 | 700,000 | a | 700,000 |
| Jacksonville Electric Authority, | | | | | |
| Water and Sewer System | | | | | |
| Subordinated Revenue | | | | | |
| (Liquidity Facility; State | | | | | |
| Street Bank and Trust Co.) | 0.06 | 11/7/14 | 3,350,000 | a | 3,350,000 |
| Palm Beach County, | | | | | |
| IDR (Boca Raton Jewish | | | | | |
| Community Day School, Inc. | | | | | |
| Project) (LOC; Wells Fargo Bank) | 0.16 | 11/7/14 | 1,115,000 | a | 1,115,000 |
| Sarasota County Health Facilities | | | | | |
| Authority, Health Care | | | | | |
| Facilities Revenue (Bay | | | | | |
| Village of Sarasota, Inc. | | | | | |
| Project) (LOC; Bank of America) | 0.17 | 11/7/14 | 4,600,000 | a | 4,600,000 |
| Georgia—3.4% | | | | | |
| Cobb County Development Authority, | | | | | |
| Revenue (American Heart | | | | | |
| Association, Inc. Project) | | | | | |
| (LOC; Wells Fargo Bank) | 0.16 | 11/7/14 | 725,000 | a | 725,000 |
The Fund 9
STATEMENT OF INVESTMENTS (continued)
| | | | | |
| Short-Term | Coupon | Maturity | Principal | | |
| Investments (continued) | Rate (%) | Date | Amount ($) | | Value ($) |
| Georgia (continued) | | | | | |
| Cobb County Development Authority, | | | | | |
| Revenue (Dominion Christian | | | | | |
| High School, Inc. Project) (LOC; | | | | | |
| Branch Banking and Trust Co.) | 0.08 | 11/7/14 | 2,685,000 | a | 2,685,000 |
| Douglas County Development | | | | | |
| Authority, Revenue (Colonial | | | | | |
| Hills School Property, LLC | | | | | |
| Project) (LOC; Branch Banking | | | | | |
| and Trust Co.) | 0.07 | 11/7/14 | 1,895,000 | a | 1,895,000 |
| Gwinnett County Housing Authority, | | | | | |
| MFHR, Refunding (The Greens | | | | | |
| Apartments Project) (Liquidity | | | | | |
| Facility; FNMA and LOC; FNMA) | 0.06 | 11/7/14 | 2,050,000 | a | 2,050,000 |
| Macon-Bibb County Industrial | | | | | |
| Authority, IDR (I-75 Business | | | | | |
| Park and Airport South | | | | | |
| Industrial Park Projects) | | | | | |
| (LOC; Wells Fargo Bank) | 0.16 | 11/7/14 | 895,000 | a | 895,000 |
| Illinois—4.2% | | | | | |
| Chicago Heights, | | | | | |
| Revenue (Chicago Heights | | | | | |
| Fitness, L.L.C. Project) (LOC; | | | | | |
| JPMorgan Chase Bank) | 0.15 | 11/7/14 | 700,000 | a | 700,000 |
| Illinois Educational Facilities | | | | | |
| Authority, Revenue (The | | | | | |
| Lincoln Park Society) (LOC; | | | | | |
| Citibank NA) | 0.11 | 11/7/14 | 2,700,000 | a | 2,700,000 |
| Illinois Finance Authority, | | | | | |
| Revenue (Cristo Rey Jesuit | | | | | |
| High School Project) (LOC; | | | | | |
| JPMorgan Chase Bank) | 0.14 | 11/7/14 | 1,765,000 | a | 1,765,000 |
| Illinois Finance Authority, | | | | | |
| Revenue (Holy Family | | | | | |
| Ministries Center) (LOC; | | | | | |
| PNC Bank NA) | 0.10 | 11/7/14 | 2,615,000 | a | 2,615,000 |
| Lake Villa, | | | | | |
| Revenue (The Allendale | | | | | |
| Association Project) (LOC; | | | | | |
| Wells Fargo Bank) | 0.10 | 11/7/14 | 2,480,000 | a | 2,480,000 |
10
| | | | | |
| Short-Term | Coupon | Maturity | Principal | | |
| Investments (continued) | Rate (%) | Date | Amount ($) | | Value ($) |
| Indiana—1.0% | | | | | |
| Huntington, | | | | | |
| EDR, Refunding (Huntington | | | | | |
| University Project) (LOC; | | | | | |
| Wells Fargo Bank) | 0.16 | 11/7/14 | 800,000 | a | 800,000 |
| Indiana Bond Bank, | | | | | |
| Advance Funding Program Notes | | | | | |
| (Liquidity Facility; JPMorgan | | | | | |
| Chase Bank) | 1.25 | 1/6/15 | 1,700,000 | | 1,703,063 |
| Kentucky—2.4% | | | | | |
| Jefferson County, | | | | | |
| Industrial Revenue, Refunding | | | | | |
| (Zeochem L.L.C. Project) | | | | | |
| (LOC; UBS AG) | 0.17 | 11/7/14 | 1,000,000 | a | 1,000,000 |
| Kentucky Infrastructure Authority, | | | | | |
| Wasterwater and Drinking Water | | | | | |
| Revolving Fund Revenue | 5.00 | 2/1/15 | 500,000 | | 506,045 |
| Kentucky Rural Water Finance | | | | | |
| Corporation, Public Projects | | | | | |
| Construction Notes | 1.00 | 8/1/15 | 1,700,000 | | 1,709,783 |
| Lexington Fayette Urban County | | | | | |
| Government, Industrial | | | | | |
| Building Revenue | | | | | |
| (YMCA of Central Kentucky, Inc. | | | | | |
| Project) (LOC; JPMorgan | | | | | |
| Chase Bank) | 0.05 | 11/7/14 | 2,620,000 | a | 2,620,000 |
| Louisiana—4.6% | | | | | |
| Louisiana Local Government | | | | | |
| Environmental Facilities and | | | | | |
| Community Development | | | | | |
| Authority, Revenue (Kenner | | | | | |
| Theatres, L.L.C. Project) | | | | | |
| (LOC; FHLB) | 0.07 | 11/7/14 | 3,650,000 | a | 3,650,000 |
| Louisiana Public Facilities | | | | | |
| Authority, Revenue (Air | | | | | |
| Products and Chemicals Project) | 0.05 | 11/3/14 | 4,900,000 | a | 4,900,000 |
| Louisiana Public Facilities | | | | | |
| Authority, Revenue (Air | | | | | |
| Products and Chemicals Project) | 0.07 | 11/3/14 | 2,500,000 | a | 2,500,000 |
The Fund 11
STATEMENT OF INVESTMENTS (continued)
| | | | | |
| Short-Term | Coupon | Maturity | Principal | | |
| Investments (continued) | Rate (%) | Date | Amount ($) | | Value ($) |
| Maryland—4.0% | | | | | |
| Baltimore County, | | | | | |
| Revenue, Refunding (Shade Tree | | | | | |
| Trace Apartments Facility) | | | | | |
| (LOC; M&T Trust) | 0.09 | 11/7/14 | 3,055,000 | a | 3,055,000 |
| Maryland Economic Development | | | | | |
| Corporation, EDR (Blind | | | | | |
| Industries and Services of | | | | | |
| Maryland Project) | | | | | |
| (LOC; Bank of America) | 0.16 | 11/7/14 | 5,610,000 | a | 5,610,000 |
| Washington County, | | | | | |
| EDR (Saint James School | | | | | |
| Project) (LOC; PNC Bank NA) | 0.07 | 11/7/14 | 900,000 | a | 900,000 |
| Massachusetts—.4% | | | | | |
| Massachusetts, | | | | | |
| Special Obligation Revenue, | | | | | |
| Refunding (Senior Federal | | | | | |
| Highway Grant Anticipation | | | | | |
| Note Program) | 5.00 | 6/15/15 | 855,000 | | 879,965 |
| Minnesota—3.6% | | | | | |
| Metropolitan Council | | | | | |
| (Minneapolis-Saint Paul | | | | | |
| Metropolitan Area) GO Transit | | | | | |
| Notes, Refunding | 5.00 | 2/1/15 | 250,000 | | 252,903 |
| Metropolitan Council | | | | | |
| (Minneapolis-Saint Paul | | | | | |
| Metropolitan Area) GO Waste | | | | | |
| Water Revenue | 5.00 | 3/1/15 | 400,000 | | 406,272 |
| Minneapolis, | | | | | |
| MFHR (Saint Hedwig’s Assisted | | | | | |
| Living Project) (LOC; Wells | | | | | |
| Fargo Bank) | 0.16 | 11/7/14 | 620,000 | a | 620,000 |
| Minneapolis, | | | | | |
| MFHR (Seven Corners Apartments | | | | | |
| Project) (LOC; Wells Fargo Bank) | 0.16 | 11/7/14 | 525,000 | a | 525,000 |
| Minneapolis, | | | | | |
| Nursing Home Revenue, | | | | | |
| Refunding (Catholic Eldercare | | | | | |
| Project) (LOC; Wells Fargo Bank) | 0.16 | 11/7/14 | 1,945,000 | a | 1,945,000 |
| Minnesota Rural Water Finance | | | | | |
| Authority, Public Projects | | | | | |
| Construction Notes | 1.00 | 1/1/15 | 3,300,000 | | 3,304,173 |
12
| | | | | |
| Short-Term | Coupon | Maturity | Principal | | |
| Investments (continued) | Rate (%) | Date | Amount ($) | | Value ($) |
| Minnesota (continued) | | | | | |
| Saint Paul Housing and | | | | | |
| Redevelopment Authority, | | | | | |
| Revenue (Goodwill/Easter Seals | | | | | |
| Project) (LOC; U.S. Bank NA) | 0.19 | 11/7/14 | 1,600,000 | a | 1,600,000 |
| Missouri—3.1% | | | | | |
| Kirkwood Industrial Development | | | | | |
| Authority, Revenue (Concordia | | | | | |
| Lutheran Church Community | | | | | |
| Recreational Facilities Project) | | | | | |
| (LOC; Bank of America) | 0.21 | 11/7/14 | 1,740,000 | a | 1,740,000 |
| Saint Louis Industrial Development | | | | | |
| Authority, MFHR (Hamilton | | | | | |
| Place Apartments) | | | | | |
| (LOC; FHLMC) | 0.08 | 11/7/14 | 4,635,000 | a | 4,635,000 |
| Saint Louis Parking Commission | | | | | |
| Finance Corporation, Parking | | | | | |
| Revenue (Cupples Garage | | | | | |
| Project) (LOC; Bank of America) | 0.17 | 11/7/14 | 1,125,000 | a | 1,125,000 |
| Nevada—1.4% | | | | | |
| Deutsche Bank Spears/Lifers | | | | | |
| Trust (Series DBE-668) | | | | | |
| (Clark County School District, | | | | | |
| Limited Tax Building Bonds GO) | | | | | |
| (Liquidity Facility; Deutsche | | | | | |
| Bank AG and LOC; | | | | | |
| Deutsche Bank AG) | 0.20 | 11/7/14 | 3,400,000 | a,b,c | 3,400,000 |
| New Hampshire—2.1% | | | | | |
| Merrimack County, | | | | | |
| GO Notes, TAN | 1.00 | 12/30/14 | 2,500,000 | | 2,503,037 |
| Rockingham County, | | | | | |
| GO Notes, TAN | 0.50 | 12/19/14 | 2,500,000 | | 2,501,114 |
| New Jersey—4.2% | | | | | |
| Hamilton Township, | | | | | |
| GO Notes, BAN | 1.00 | 6/3/15 | 6,621,000 | | 6,642,331 |
| Monroe Township, | | | | | |
| GO Notes, BAN | 1.00 | 2/6/15 | 2,308,000 | | 2,312,649 |
| Stafford Township, | | | | | |
| GO Notes, BAN (General | | | | | |
| Improvement and | | | | | |
| Water/Sewer Utility) | 1.00 | 5/18/15 | 1,140,000 | | 1,144,062 |
The Fund 13
STATEMENT OF INVESTMENTS (continued)
| | | | | |
| Short-Term | Coupon | Maturity | Principal | | |
| Investments (continued) | Rate (%) | Date | Amount ($) | �� | Value ($) |
| New York—7.1% | | | | | |
| Monroe County Industrial | | | | | |
| Development Agency, Civic | | | | | |
| Facility Revenue (YMCA of | | | | | |
| Greater Rochester Project) | | | | | |
| (LOC; M&T Trust) | 0.10 | 11/7/14 | 7,780,000 | a | 7,780,000 |
| New York City Industrial | | | | | |
| Development Agency, Civic | | | | | |
| Facility Revenue (Jewish | | | | | |
| Community Center on the Upper | | | | | |
| West Side, Inc. Project) ( | | | | | |
| LOC; M&T Trust) | 0.10 | 11/7/14 | 4,100,000 | a | 4,100,000 |
| South Jefferson Central School | | | | | |
| District, GO Notes, BAN | 1.00 | 6/19/15 | 3,875,000 | | 3,889,578 |
| Triborough Bridge and Tunnel | | | | | |
| Authority, General Revenue, | | | | | |
| Refunding (MTA Bridges and | | | | | |
| Tunnels) (Liquidity Facility; | | | | | |
| Landesbank Hessen-Thuringen | | | | | |
| Girozentrale) | 0.08 | 11/3/14 | 1,400,000 | a | 1,400,000 |
| North Carolina—.2% | | | | | |
| Catawba County, | | | | | |
| Recreational Facilities Lease | | | | | |
| Revenue (YMCA of Catawba | | | | | |
| Valley Project) (LOC; Wells | | | | | |
| Fargo Bank) | 0.16 | 11/7/14 | 580,000 | a | 580,000 |
| Ohio—1.3% | | | | | |
| Union Township, | | | | | |
| GO Notes, BAN (Various Purpose) | 1.00 | 9/9/15 | 3,050,000 | | 3,064,274 |
| Oklahoma—2.7% | | | | | |
| Oklahoma Turnpike Authority, | | | | | |
| Turnpike System Second Senior | | | | | |
| Revenue, Refunding (Citigroup | | | | | |
| ROCS, Series RR II R-11985) | | | | | |
| (Liquidity Facility; Citibank NA) | 0.08 | 11/7/14 | 6,000,000 | a,b,c | 6,000,000 |
| Oklahoma Water Resources Board, | | | | | |
| Revolving Fund Revenue ( | | | | | |
| Master Trust) | 4.00 | 4/1/15 | 500,000 | | 507,831 |
14
| | | | | |
| Short-Term | Coupon | Maturity | Principal | | |
| Investments (continued) | Rate (%) | Date | Amount ($) | | Value ($) |
| Pennsylvania—5.4% | | | | | |
| Deutsche Bank Spears/Lifers Trust | | | | | |
| (Series DBE-1021) | | | | | |
| (Pennsylvania Higher Education | | | | | |
| Facilities Authority, Revenue | | | | | |
| (Student Association, Inc. | | | | | |
| Student Housing Project at | | | | | |
| California University of | | | | | |
| Pennsylvania)) (Liquidity | | | | | |
| Facility; Deutsche Bank AG and | | | | | |
| LOC; Deutsche Bank AG) | 0.15 | 11/7/14 | 5,795,000 | a,b,c | 5,795,000 |
| Montgomery County Industrial | | | | | |
| Development Authority, Revenue | | | | | |
| (Big Little Associates Project) | | | | | |
| (LOC; Wells Fargo Bank) | 0.26 | 11/7/14 | 360,000 | a | 360,000 |
| Northampton County Industrial | | | | | |
| Development Authority, Revenue | | | | | |
| (Moravian Academy) (LOC; Wells | | | | | |
| Fargo Bank) | 0.13 | 11/7/14 | 800,000 | a | 800,000 |
| Pennsylvania Economic Development | | | | | |
| Financing Authority, Recovery | | | | | |
| Zone Facility Revenue (Hawley | | | | | |
| Silk Mill, LLC Project) (LOC; | | | | | |
| PNC Bank NA) | 0.13 | 11/7/14 | 900,000 | a | 900,000 |
| Philadelphia Authority for | | | | | |
| Industrial Development, | | | | | |
| Revenue (The Philadelphia | | | | | |
| Protestant Home Project) (LOC; | | | | | |
| Bank of America) | 0.13 | 11/7/14 | 1,700,000 | a | 1,700,000 |
| Tioga County Industrial | | | | | |
| Development Authority, Student | | | | | |
| Housing Revenue, BAN | | | | | |
| (Mansfield Auxiliary | | | | | |
| Corporation Student Housing | | | | | |
| Project at Mansfield | | | | | |
| University of Pennsylvania) | 1.00 | 3/13/15 | 1,000,000 | | 1,002,612 |
| York Redevelopment Authority, | | | | | |
| Revenue (LOC; M&T Trust) | 0.15 | 11/7/14 | 2,595,000 | a | 2,595,000 |
The Fund 15
STATEMENT OF INVESTMENTS (continued)
| | | | | |
| Short-Term | Coupon | Maturity | Principal | | |
| Investments (continued) | Rate (%) | Date | Amount ($) | | Value ($) |
| South Carolina—3.3% | | | | | |
| South Carolina Jobs-Economic | | | | | |
| Development Authority, EDR | | | | | |
| (Anderson Area YMCA, Inc. | | | | | |
| Project) (LOC; Branch Banking | | | | | |
| and Trust Co.) | 0.09 | 11/7/14 | 4,995,000 | a | 4,995,000 |
| South Carolina Jobs-Economic | | | | | |
| Development Authority, EDR | | | | | |
| (Carolina Children’s Home | | | | | |
| Project) (LOC; Branch Banking | | | | | |
| and Trust Co.) | 0.07 | 11/7/14 | 3,065,000 | a | 3,065,000 |
| Tennessee—.8% | | | | | |
| Cleveland Health and Educational | | | | | |
| Facilities Board, Revenue (Lee | | | | | |
| University Project) (LOC; | | | | | |
| Branch Banking and Trust Co.) | 0.06 | 11/7/14 | 2,000,000 | a | 2,000,000 |
| Texas—12.0% | | | | | |
| Atascosa County Industrial | | | | | |
| Development Corporation, PCR, | | | | | |
| Refunding (San Miguel Electric | | | | | |
| Cooperative, Inc. Project) | | | | | |
| (LOC; National Rural Utilities | | | | | |
| Cooperative Finance | | | | | |
| Corporation) | 0.10 | 11/7/14 | 9,000,000 | a | 9,000,000 |
| Brazos County Health Facilities | | | | | |
| Development Corporation, | | | | | |
| Revenue, Refunding (Burleson | | | | | |
| Saint Joseph Manor) (LOC; | | | | | |
| Wells Fargo Bank) | 0.16 | 11/7/14 | 6,500,000 | a | 6,500,000 |
| Dallas County Community College | | | | | |
| District, GO Notes | 4.00 | 2/15/15 | 490,000 | | 495,376 |
| Dallas County Community College | | | | | |
| District, GO Notes, Refunding | 4.00 | 2/15/15 | 250,000 | | 252,719 |
| Dallas Independent School | | | | | |
| District, GO Notes, Refunding | | | | | |
| (LOC; Permanent School Fund | | | | | |
| Guarantee Program) | 4.00 | 2/15/15 | 100,000 | | 101,071 |
16
| | | | | |
| Short-Term | Coupon | Maturity | Principal | | |
| Investments (continued) | Rate (%) | Date | Amount ($) | | Value ($) |
| Texas (continued) | | | | | |
| Deutsche Bank Spears/Lifers Trust | | | | | |
| (Series DBE-482) (Red River | | | | | |
| Education Financing Corporation, | | | | | |
| Higher Education Revenue | | | | | |
| (Texas Christian University Project)) | | | | | |
| (Liquidity Facility; Deutsche Bank | | | | | |
| AG and LOC; Deutsche Bank AG) | 0.17 | 11/7/14 | 3,000,000 | a,b,c | 3,000,000 |
| Harris County Cultural Education | | | | | |
| Facilities Finance Corporation, HR | | | | | |
| (Texas Children’s Hospital Project) | | | | | |
| (Citigroup ROCS, Series RR II | | | | | |
| R-11821) (Liquidity Facility; | | | | | |
| Citibank NA) | 0.10 | 11/7/14 | 5,250,000 | a,b,c | 5,250,000 |
| La Joya Independent School | | | | | |
| District, GO Notes, Refunding | | | | | |
| (LOC; Permanent School Fund | | | | | |
| Guarantee Program) | 4.50 | 2/15/15 | 500,000 | | 506,208 |
| Splendora Higher Education | | | | | |
| Facilities Corporation, | | | | | |
| Revenue (Fellowship Christian | | | | | |
| Academy Project) (LOC; | | | | | |
| Bank of America) | 0.16 | 11/7/14 | 3,100,000 | a | 3,100,000 |
| Tarrant County Cultural Education | | | | | |
| Facilities Finance Corporation, HR | | | | | |
| (Baylor Health Care System Project) | | | | | |
| (LOC; Northern Trust Company) | 0.05 | 11/7/14 | 870,000 | a | 870,000 |
| Utah—.2% | | | | | |
| Ogden City Redevelopment Agency, | | | | | |
| Tax Increment Revenue (LOC; | | | | | |
| Wells Fargo Bank) | 0.16 | 11/7/14 | 410,000 | a | 410,000 |
| Vermont—.5% | | | | | |
| Vermont Educational and Health | | | | | |
| Buildings Financing Agency, | | | �� | | |
| Revenue (Capital Asset | | | | | |
| Financing Program) | | | | | |
| (LOC; Wells Fargo Bank) | 0.10 | 11/7/14 | 1,190,000 | a | 1,190,000 |
The Fund 17
STATEMENT OF INVESTMENTS (continued)
| | | | | |
| Short-Term | Coupon | Maturity | Principal | | |
| Investments (continued) | Rate (%) | Date | Amount ($) | | Value ($) |
| Washington—1.6% | | | | | |
| Squaxin Island Tribe, | | | | | |
| Tribal Infrastructure Revenue | | | | | |
| (LOC; Bank of America) | 0.13 | 11/7/14 | 620,000 | a | 620,000 |
| Washington Housing Finance | | | | | |
| Commission, MFHR, Refunding | | | | | |
| (Lake City Senior Apartments | | | | | |
| Project) (Liquidity Facility; | | | | | |
| FHLMC and LOC; FHLMC) | 0.06 | 11/7/14 | 2,600,000 | a | 2,600,000 |
| Washington Housing Finance | | | | | |
| Commission, Nonprofit Revenue | | | | | |
| (District Council Number Five | | | | | |
| Apprenticeship and Training | | | | | |
| Trust Fund Project) (LOC; | | | | | |
| Wells Fargo Bank) | 0.16 | 11/7/14 | 470,000 | a | 470,000 |
| Washington Housing Finance | | | | | |
| Commission, Nonprofit Revenue | | | | | |
| (The Evergreen School Project) | | | | | |
| (LOC; Wells Fargo Bank) | 0.16 | 11/7/14 | 200,000 | a | 200,000 |
| Wisconsin—3.9% | | | | | |
| Oak Creek, | | | | | |
| GO Promissory Notes | 2.00 | 4/1/15 | 1,000,000 | | 1,007,350 |
| Wisconsin Health and Educational | | | | | |
| Facilities Authority, Revenue | | | | | |
| (Madison Family Medicine | | | | | |
| Residency Corporation, Inc. | | | | | |
| Project) (LOC; JPMorgan | | | | | |
| Chase Bank) | 0.15 | 11/7/14 | 2,725,000 | a | 2,725,000 |
| Wisconsin Health and Educational | | | | | |
| Facilities Authority, Revenue | | | | | |
| (Shady Lane, Inc. Project) | | | | | |
| (LOC; U.S. Bank NA) | 0.09 | 11/7/14 | 4,400,000 | a | 4,400,000 |
| Wisconsin Health and Educational | | | | | |
| Facilities Authority, Revenue | | | | | |
| (Sinsinawa Nursing, Inc. Project) | | | | | |
| (LOC; JPMorgan Chase Bank) | 0.15 | 11/7/14 | 725,000 | a | 725,000 |
18
| | | | | |
| Short-Term | Coupon | Maturity | Principal | | |
| Investments (continued) | Rate (%) | Date | Amount ($) | | Value ($) |
| Wisconsin (continued) | | | | | |
| Wisconsin Health and Educational | | | | | |
| Facilities Authority, Revenue | | | | | |
| (Valley Packaging Industries, | | | | | |
| Inc.) (LOC; JPMorgan Chase Bank) | 0.10 | 11/7/14 | 475,000 | a | 475,000 |
| Total Investments (cost $242,672,416) | | | 100.6 | % | 242,672,416 |
| Liabilities, Less Cash and Receivables | | | (.6 | %) | (1,489,377) |
| Net Assets | | | 100.0 | % | 241,183,039 |
|
| a Variable rate demand note—rate shown is the interest rate in effect at October 31, 2014. Maturity date represents |
| the next demand date, or the ultimate maturity date if earlier. |
| b Securities exempt from registration pursuant to Rule 144A under the Securities Act of 1933.These securities may be |
| resold in transactions exempt from registration, normally to qualified institutional buyers.At October 31, 2014, these |
| securities amounted to $25,945,000 or 10.8% of net assets. |
| c The fund does not directly own the municipal security indicated; the fund owns an interest in a special purpose entity |
| that, in turn, owns the underlying municipal security.The special purpose entity permits the fund to own interests in |
| underlying assets, but in a manner structured to provide certain advantages not inherent in the underlying bonds (e.g., |
| enhanced liquidity, yields linked to short-term rates). |
| | | |
| Portfolio Summary (Unaudited)† | | |
| |
| | Value (%) | | Value (%) |
| Education | 20.0 | Transportation Services | 3.5 |
| Industrial | 18.7 | County | 3.3 |
| Health Care | 13.4 | Special Tax | 2.8 |
| Housing | 11.4 | Pollution Control | 2.6 |
| Utility-Water and Sewer | 4.9 | State/Territory | 1.3 |
| City | 4.6 | Other | 10.4 |
| Utility-Electric | 3.7 | | 100.6 |
The Fund 19
STATEMENT OF INVESTMENTS (continued)
| | | |
| Summary of Abbreviations | | |
| |
| ABAG | Association of Bay Area | ACA | American Capital Access |
| | Governments | | |
| AGC | ACE Guaranty Corporation | AGIC | Asset Guaranty Insurance Company |
| AMBAC | American Municipal Bond | ARRN | Adjustable Rate |
| | Assurance Corporation | | Receipt Notes |
| BAN | Bond Anticipation Notes | BPA | Bond Purchase Agreement |
| CIFG | CDC Ixis Financial Guaranty | COP | Certificate of Participation |
| CP | Commercial Paper | DRIVERS | Derivative Inverse |
| | | | Tax-Exempt Receipts |
| EDR | Economic Development | EIR | Environmental Improvement |
| | Revenue | | Revenue |
| FGIC | Financial Guaranty | FHA | Federal Housing |
| | Insurance Company | | Administration |
| FHLB | Federal Home | FHLMC | Federal Home Loan Mortgage |
| | Loan Bank | | Corporation |
| FNMA | Federal National | GAN | Grant Anticipation Notes |
| | Mortgage Association | | |
| GIC | Guaranteed Investment | GNMA | Government National Mortgage |
| | Contract | | Association |
| GO | General Obligation | HR | Hospital Revenue |
| IDB | Industrial Development Board | IDC | Industrial Development Corporation |
| IDR | Industrial Development | LIFERS | Long Inverse Floating |
| | Revenue | | Exempt Receipts |
| LOC | Letter of Credit | LOR | Limited Obligation Revenue |
| LR | Lease Revenue | MERLOTS | Municipal Exempt Receipts |
| | | | Liquidity Option Tender |
| MFHR | Multi-Family Housing Revenue | MFMR | Multi-Family Mortgage Revenue |
| PCR | Pollution Control Revenue | PILOT | Payment in Lieu of Taxes |
| P-FLOATS | Puttable Floating Option | PUTTERS | Puttable Tax-Exempt Receipts |
| | Tax-Exempt Receipts | | |
| RAC | Revenue Anticipation Certificates | RAN | Revenue Anticipation Notes |
| RAW | Revenue Anticipation Warrants | RIB | Residual Interest Bonds |
| ROCS | Reset Options Certificates | RRR | Resources Recovery Revenue |
| SAAN | State Aid Anticipation Notes | SBPA | Standby Bond Purchase Agreement |
| SFHR | Single Family Housing Revenue | SFMR | Single Family Mortgage Revenue |
| SONYMA | State of New York | SPEARS | Short Puttable Exempt |
| | Mortgage Agency | | Adjustable Receipts |
| SWDR | Solid Waste Disposal Revenue | TAN | Tax Anticipation Notes |
| TAW | Tax Anticipation Warrants | TRAN | Tax and Revenue Anticipation Notes |
| XLCA | XL Capital Assurance | | |
| |
| See notes to financial statements. | | |
20
|
| STATEMENT OF ASSETS AND LIABILITIES |
| October 31, 2014 |
| | | | |
| | | | Cost | Value |
| Assets ($): | | | | |
| Investments in securities—See Statement of Investments | 242,672,416 | 242,672,416 |
| Interest receivable | | | | 164,908 |
| | | | | 242,837,324 |
| Liabilities ($): | | | | |
| Due to The Dreyfus Corporation and affiliates—Note 2(c) | | 24,386 |
| Cash overdraft due to Custodian | | | | 429,899 |
| Payable for investment securities purchased | | | 1,200,000 |
| | | | | 1,654,285 |
| Net Assets ($) | | | | 241,183,039 |
| Composition of Net Assets ($): | | | | |
| Paid-in capital | | | | 241,165,700 |
| Accumulated net realized gain (loss) on investments | | | 17,339 |
| Net Assets ($) | | | | 241,183,039 |
| |
| |
| Net Asset Value Per Share | | | | |
| | Investor | Class R | BASIC | Class B |
| | Shares | Shares | Shares | Shares |
| Net Assets ($) | 17,658,748 | 30,741,583 | 11,595,952 | 181,186,756 |
| Shares Outstanding | 17,657,112 | 30,739,899 | 11,595,140 | 181,175,262 |
| Net Asset Value Per Share ($) | 1.00 | 1.00 | 1.00 | 1.00 |
| See notes to financial statements. | | | | |
The Fund 21
|
| STATEMENT OF OPERATIONS |
| Year Ended October 31, 2014 |
| | |
| Investment Income ($): | | |
| Interest Income | 421,651 | |
| Expenses: | | |
| Management fee—Note 2(a) | 1,289,935 | |
| Distribution Plan fees (Investor Shares and Class B Shares)—Note 2(b) | 488,938 | |
| Shareholder servicing costs (Class B Shares)—Note 2(c) | 443,412 | |
| Directors’ fees—Note 2(a,d) | 19,726 | |
| Total Expenses | 2,242,011 | |
| Less—reduction in expenses due to undertaking—Note 2(a) | (1,800,726 | ) |
| Less—Directors’ fees reimbursed by the Manager—Note 2(a) | (19,726 | ) |
| Net Expenses | 421,559 | |
| Investment Income—Net | 92 | |
| Net Realized Gain (Loss) on Investments—Note 1(b) ($) | 17,339 | |
| Net Increase in Net Assets Resulting from Operations | 17,431 | |
| See notes to financial statements. | | |
22
STATEMENT OF CHANGES IN NET ASSETS
| | | | |
| | Year Ended October 31, | |
| | 2014 | | 2013 | |
| Operations ($): | | | | |
| Investment income—net | 92 | | 112 | |
| Net realized gain (loss) on investments | 17,339 | | 32,445 | |
| Net Increase (Decrease) in Net Assets | | | | |
| Resulting from Operations | 17,431 | | 32,557 | |
| Dividends to Shareholders from ($): | | | | |
| Investment income—net: | | | | |
| Investor Shares | (2,384 | ) | (9 | ) |
| Class R Shares | (6,464 | ) | (31 | ) |
| BASIC Shares | (1,660 | ) | — | |
| Class B Shares | (19,798 | ) | (72 | ) |
| Total Dividends | (30,306 | ) | (112 | ) |
| Capital Stock Transactions ($1.00 per share): | | | | |
| Net proceeds from shares sold: | | | | |
| Investor Shares | 70,503,067 | | 71,676,696 | |
| Class R Shares | 232,479,657 | | 216,681,901 | |
| BASIC Shares | 10,021,816 | | 16,447,341 | |
| Class B Shares | 482,346,837 | | 546,447,290 | |
| Dividends reinvested: | | | | |
| Investor Shares | 2,367 | | 9 | |
| Class R Shares | 442 | | 1 | |
| BASIC Shares | 1,653 | | — | |
| Class B Shares | 19,661 | | 72 | |
| Cost of shares redeemed: | | | | |
| Investor Shares | (76,637,703 | ) | (75,514,245 | ) |
| Class R Shares | (256,882,931 | ) | (238,638,274 | ) |
| BASIC Shares | (13,146,714 | ) | (15,745,839 | ) |
| Class B Shares | (482,958,878 | ) | (613,631,961 | ) |
| Increase (Decrease) in Net Assets | | | | |
| from Capital Stock Transactions | (34,250,726 | ) | (92,277,009 | ) |
| Total Increase (Decrease) in Net Assets | (34,263,601 | ) | (92,244,564 | ) |
| Net Assets ($): | | | | |
| Beginning of Period | 275,446,640 | | 367,691,204 | |
| End of Period | 241,183,039 | | 275,446,640 | |
| |
| See notes to financial statements. | | | | |
The Fund 23
FINANCIAL HIGHLIGHTS
The following tables describe the performance for each share class for the fiscal periods indicated. All information reflects financial results for a single fund share. Total return shows how much your investment in the fund would have increased (or decreased) during each period, assuming you had reinvested all dividends and distributions.These figures have been derived from the fund’s financial statements.
| | | | | | | | | | |
| | | | Year Ended October 31, | | | |
| Investor Shares | 2014 | | 2013 | | 2012 | | 2011 | | 2010 | |
| Per Share Data ($): | | | | | | | | | | |
| Net asset value, beginning of period | 1.00 | | 1.00 | | 1.00 | | 1.00 | | 1.00 | |
| Investment Operations: | | | | | | | | | | |
| Investment income—neta | .000 | | .000 | | .000 | | .000 | | .000 | |
| Distributions: | | | | | | | | | | |
| Dividends from | | | | | | | | | | |
| investment income—neta | (.000 | ) | (.000 | ) | (.000 | ) | (.000 | ) | (.000 | ) |
| Net asset value, end of period | 1.00 | | 1.00 | | 1.00 | | 1.00 | | 1.00 | |
| Total Return (%) | .01 | | .00 | b | .00 | b | .00 | b | .00 | b |
| Ratios/Supplemental Data (%): | | | | | | | | | | |
| Ratio of total expenses | | | | | | | | | | |
| to average net assets | .71 | | .71 | | .71 | | .71 | | .71 | |
| Ratio of net expenses | | | | | | | | | | |
| to average net assets | .16 | | .23 | | .28 | | .38 | | .45 | |
| Ratio of net investment income | | | | | | | | | | |
| to average net assetsb | .00 | | .00 | | .00 | | .00 | | .00 | |
| Net Assets, end of period ($ x 1,000) | 17,659 | | 23,792 | | 27,625 | | 30,764 | | 40,202 | |
| |
| a | Amount represents less than $.001 per share. |
| b | Amount represents less than .01%. |
See notes to financial statements.
24
| | | | | | | | | | |
| | | | Year Ended October 31, | | | |
| Class R Shares | 2014 | | 2013 | | 2012 | | 2011 | | 2010 | |
| Per Share Data ($): | | | | | | | | | | |
| Net asset value, beginning of period | 1.00 | | 1.00 | | 1.00 | | 1.00 | | 1.00 | |
| Investment Operations: | | | | | | | | | | |
| Investment income—neta | .000 | | .000 | | .000 | | .000 | | .000 | |
| Distributions: | | | | | | | | | | |
| Dividends from | | | | | | | | | | |
| investment income—neta | (.000 | ) | (.000 | ) | (.000 | ) | (.000 | ) | (.000 | ) |
| Net asset value, end of period | 1.00 | | 1.00 | | 1.00 | | 1.00 | | 1.00 | |
| Total Return (%) | .01 | | .00 | b | .00 | b | .00 | b | .01 | |
| Ratios/Supplemental Data (%): | | | | | | | | | | |
| Ratio of total expenses | | | | | | | | | | |
| to average net assets | .51 | | .51 | | .51 | | .51 | | .51 | |
| Ratio of net expenses | | | | | | | | | | |
| to average net assets | .16 | | .24 | | .29 | | .38 | | .45 | |
| Ratio of net investment income | | | | | | | | | | |
| to average net assets | .00 | b | .00 | b | .00 | b | .00 | b | .01 | |
| Net Assets, end of period ($ x 1,000) | 30,742 | | 55,149 | | 77,098 | | 48,390 | | 97,824 | |
| |
| a | Amount represents less than $.001 per share. |
| b | Amount represents less than .01%. |
See notes to financial statements.
The Fund 25
FINANCIAL HIGHLIGHTS (continued)
| | | | | | | | | | |
| | | | Year Ended October 31, | | | |
| BASIC Shares | 2014 | | 2013 | | 2012 | | 2011 | | 2010 | |
| Per Share Data ($): | | | | | | | | | | |
| Net asset value, beginning of period | 1.00 | | 1.00 | | 1.00 | | 1.00 | | 1.00 | |
| Investment Operations: | | | | | | | | | | |
| Investment income—neta | .000 | | .000 | | .000 | | .000 | | .000 | |
| Distributions: | | | | | | | | | | |
| Dividends from | | | | | | | | | | |
| investment income—neta | (.000 | ) | (.000 | ) | (.000 | ) | (.000 | ) | (.000 | ) |
| Net asset value, end of period | 1.00 | | 1.00 | | 1.00 | | 1.00 | | 1.00 | |
| Total Return (%) | .01 | | .00 | b | .00 | b | .00 | b | .01 | |
| Ratios/Supplemental Data (%): | | | | | | | | | | |
| Ratio of total expenses | | | | | | | | | | |
| to average net assets | .51 | | .51 | | .51 | | .51 | | .51 | |
| Ratio of net expenses | | | | | | | | | | |
| to average net assets | .17 | | .23 | | .28 | | .38 | | .45 | |
| Ratio of net investment income | | | | | | | | | | |
| to average net assets | .00 | b | .00 | b | .00 | b | .00 | b | .01 | |
| Net Assets, end of period ($ x 1,000) | 11,596 | | 14,720 | | 14,017 | | 26,003 | | 32,297 | |
| |
| a | Amount represents less than $.001 per share. |
| b | Amount represents less than .01%. |
See notes to financial statements.
26
| | | | | | | | | | |
| | | | Year Ended October 31, | | | |
| Class B Shares | 2014 | | 2013 | | 2012 | | 2011 | | 2010 | |
| Per Share Data ($): | | | | | | | | | | |
| Net asset value, beginning of period | 1.00 | | 1.00 | | 1.00 | | 1.00 | | 1.00 | |
| Investment Operations: | | | | | | | | | | |
| Investment income—neta | .000 | | .000 | | .000 | | .000 | | .000 | |
| Distributions: | | | | | | | | | | |
| Dividends from | | | | | | | | | | |
| investment income—neta | (.000 | ) | (.000 | ) | (.000 | ) | (.000 | ) | (.000 | ) |
| Net asset value, end of period | 1.00 | | 1.00 | | 1.00 | | 1.00 | | 1.00 | |
| Total Return (%) | .01 | | .00 | b | .00 | b | .00 | b | .00 | b |
| Ratios/Supplemental Data (%): | | | | | | | | | | |
| Ratio of total expenses | | | | | | | | | | |
| to average net assets | 1.01 | | 1.01 | | 1.01 | | 1.01 | | 1.01 | |
| Ratio of net expenses | | | | | | | | | | |
| to average net assets | .16 | | .23 | | .29 | | .37 | | .45 | |
| Ratio of net investment income | | | | | | | | | | |
| to average net assetsb | .00 | | .00 | | .00 | | .00 | | .00 | |
| Net Assets, end of period ($ x 1,000) | 181,187 | | 181,787 | | 248,951 | | 229,126 | | 227,987 | |
| |
| a | Amount represents less than $.001 per share. |
| b | Amount represents less than .01%. |
See notes to financial statements.
The Fund 27
NOTES TO FINANCIAL STATEMENTS
NOTE 1—Significant Accounting Policies:
Dreyfus AMT-Free Municipal Reserves (the “fund”) is a separate diversified series of The Dreyfus/Laurel Funds, Inc. (the “Company”), which is registered under the Investment Company Act of 1940, as amended (the “Act”), as an open-end management investment company and operates as a series company currently offering eleven series, including the fund. The fund’s investment objective is to seek a high level of current income, consistent with stability of principal, that is exempt from federal income taxes. The Dreyfus Corporation (the “Manager” or “Dreyfus”), a wholly-owned subsidiary of The Bank of New York Mellon Corporation (“BNY Mellon”), serves as the fund’s investment adviser.
MBSC Securities Corporation (the “Distributor”), a wholly-owned subsidiary of the Manager, is the distributor of the fund’s shares, which are sold without a sales charge.The fund is authorized to issue 1 billion shares of $.001 par value Capital Stock in each of the following classes of shares: Investor, Class R, BASIC and Class B. Investor shares and Class B shares are sold primarily to clients of financial institutions that have entered into selling agreements with the Distributor, and bear a Distribution Plan fee. Class B shares also bear a Shareholder Services Plan fee. BASIC shares are sold to any investor and bear no Distribution Plan or Shareholder Services Plan fees. Class R shares are sold primarily to bank trust departments and other financial service providers (including The Bank of New York Mellon, a subsidiary of BNY Mellon and an affiliate of Dreyfus, and its affiliates), acting on behalf of customers having a qualified trust or an investment account or relationship at such institution, and bear no Distribution or Shareholder Services Plan fees. Other differences between the classes include the services offered to and the expenses borne by each class, and certain voting rights. Income, expenses (other than expenses attributable to a specific class), and realized and unrealized gains or losses on investments are allocated to each class of shares based on its relative net assets.
It is the fund’s policy to maintain a continuous net asset value per share of $1.00; the fund has adopted certain investment, portfolio valuation
28
and dividend and distribution policies to enable it to do so. There is no assurance, however, that the fund will be able to maintain a stable net asset value per share of $1.00.
The Company accounts separately for the assets, liabilities and operations of each series. Expenses directly attributable to each series are charged to that series’ operations; expenses which are applicable to all series are allocated among them on a pro rata basis.
The Financial Accounting Standards Board (“FASB”) Accounting Standards Codification (“ASC”) is the exclusive reference of authoritative U.S. generally accepted accounting principles (“GAAP”) recognized by the FASB to be applied by nongovernmental entities. Rules and interpretive releases of the Securities and Exchange Commission (“SEC”) under authority of federal laws are also sources of authoritative GAAP for SEC registrants. The fund’s financial statements are prepared in accordance with GAAP, which may require the use of management estimates and assumptions. Actual results could differ from those estimates.
(a) Portfolio valuation: Investments in securities are valued at amortized cost in accordance with Rule 2a-7 under the Act. If amortized cost is determined not to approximate market value, the fair value of the portfolio securities will be determined by procedures established by and under the general supervision of the Company’s Board of Directors (the “Board”).
The fair value of a financial instrument is the amount that would be received to sell an asset or paid to transfer a liability in an orderly transaction between market participants at the measurement date (i.e., the exit price). GAAP establishes a fair value hierarchy that prioritizes the inputs of valuation techniques used to measure fair value.This hierarchy gives the highest priority to unadjusted quoted prices in active markets for identical assets or liabilities (Level 1 measurements) and the lowest priority to unobservable inputs (Level 3 measurements).
Additionally, GAAP provides guidance on determining whether the volume and activity in a market has decreased significantly and
The Fund 29
NOTES TO FINANCIAL STATEMENTS (continued)
whether such a decrease in activity results in transactions that are not orderly. GAAP requires enhanced disclosures around valuation inputs and techniques used during annual and interim periods.
Various inputs are used in determining the value of the fund’s investments relating to fair value measurements.These inputs are summarized in the three broad levels listed below:
Level 1—unadjusted quoted prices in active markets for identical investments.
Level 2—other significant observable inputs (including quoted prices for similar investments, interest rates, prepayment speeds, credit risk, etc.).
Level 3—significant unobservable inputs (including the fund’s own assumptions in determining the fair value of investments).
The inputs or methodology used for valuing securities are not necessarily an indication of the risk associated with investing in those securities. For example, money market securities are valued using amortized cost, in accordance with rules under the Act. Generally, amortized cost approximates the current fair value of a security, but since the value is not obtained from a quoted price in an active market, such securities are reflected within Level 2 of the fair value hierarchy.
The following is a summary of the inputs used as of October 31, 2014 in valuing the fund’s investments:
| | |
| | | Short-Term |
| Valuation Inputs | | Investments ($)† |
| Level 1—Unadjusted Quoted Prices | - | — |
| Level 2—Other Significant Observable Inputs | | 242,672,416 |
| Level 3—Significant Unobservable Inputs | | — |
| Total | | 242,672,416 |
| † See Statement of Investments for additional detailed categorizations. | |
At October 31, 2014, there were no transfers between Level 1 and Level 2 of the fair value hierarchy.
(b) Securities transactions and investment income: Securities transactions are recorded on a trade date basis. Interest income, adjusted for
30
accretion of discount and amortization of premium on investments, is earned from settlement date and is recognized on the accrual basis. Realized gains and losses from securities transactions are recorded on the identified cost basis. Cost of investments represents amortized cost.
(c) Dividends to shareholders: It is the policy of the fund to declare dividends daily from investment income-net. Such dividends are paid monthly. Dividends from net realized capital gains, if any, are normally declared and paid annually, but the fund may make distributions on a more frequent basis to comply with the distribution requirements of the Internal Revenue Code of 1986, as amended (the “Code”).To the extent that net realized capital gains can be offset by capital loss carryovers, it is the policy of the fund not to distribute such gains.
(d) Federal income taxes: It is the policy of the fund to continue to qualify as a regulated investment company, which can distribute tax-exempt dividends, by complying with the applicable provisions of the Code, and to make distributions of income and net realized capital gain sufficient to relieve it from substantially all federal income and excise taxes.
As of and during the period ended October 31, 2014, the fund did not have any liabilities for any uncertain tax positions.The fund recognizes interest and penalties, if any, related to uncertain tax positions as income tax expense in the Statement of Operations. During the period ended October 31, 2014, the fund did not incur any interest or penalties.
Each tax year in the four-year period ended October 31, 2014 remains subject to examination by the Internal Revenue Service and state taxing authorities.
At October 31, 2014, the components of accumulated earnings on a tax basis were substantially the same as for financial reporting purposes.
The tax character of distributions paid to shareholders during the fiscal periods ended October 31, 2014 and October 31, 2013 were as follows: tax-exempt income $92 and $112, and ordinary income $30,214 and $0, respectively.
The Fund 31
NOTES TO FINANCIAL STATEMENTS (continued)
During the period ended October 31, 2014, as a result of permanent book to tax differences, primarily due to dividend reclassification, the fund increased accumulated undistributed investment income-net by $30,214 and decreased accumulated net realized gain (loss) on investments by the same amount. Net assets and net asset value per share were not affected by this reclassification.
At October 31, 2014, the cost of investments for federal income tax purposes was substantially the same as the cost for financial reporting purposes (see the Statement of Investments).
NOTE 2—Investment Management Fee and Other Transactions with Affiliates:
(a) Pursuant to an investment management agreement with the Manager, the Manager provides or arranges for one or more third parties and/or affiliates to provide investment advisory, administrative, custody, fund accounting and transfer agency services to the fund.The Manager also directs the investments of the fund in accordance with its investment objective, policies and limitations. For these services, the fund is contractually obligated to pay the Manager a fee, calculated daily and paid monthly, at an annual rate of .50% of the value of the fund’s average daily net assets. Out of its fee, the Manager pays all of the expenses of the fund except brokerage fees, taxes, Distribution Plan fees, Shareholder Services Plan fees and expenses, fees and expenses of non-interested Directors (including counsel fees) and extraordinary expenses. In addition, the Manager is required to reduce its fee in an amount equal to the fund’s allocable portion of fees and expenses of the non-interested Directors (including counsel fees). During the period ended October 31, 2014, fees reimbursed by the Manager amounted to $19,726.
The Manager has undertaken to waive receipt of the management fee and/or reimburse operating expenses in order to facilitate a daily yield at or above a certain level which may change from time to time.This undertaking is voluntary and not contractual, and may be terminated at any time. The reduction in expenses, pursuant to the undertaking, amounted to $1,800,726 during the period ended October 31, 2014.
32
(b) Under the Distribution Plan adopted pursuant to Rule 12b-1 under the Act, Investor shares and Class B shares may pay annually up to .25% of the value of their average daily net assets (Investor shares are currently limited by the Board to .20%) attributable to Investor shares and Class B shares to compensate the Distributor for shareholder servicing activities and activities primarily intended to result in the sale of Investor shares and Class B shares. During the period ended October 31, 2014, Investor shares and Class B shares were charged $45,526 and $443,412, respectively, pursuant to the Distribution Plan.
(c) Under the Shareholder Services Plan subject to Rule 12b-1 under the Act, pursuant to which the fund pays the Distributor for the provision of certain services to the holders of its Class B shares a fee at an annual rate of .25% of the value of the fund’s average daily net assets attributable to Class B shares.The services provided may include personal services relating to shareholder accounts, such as answering shareholder inquiries regarding the fund and providing reports and other information, and services related to the maintenance of such shareholder accounts. Under the Shareholder Services Plan, the Distributor may enter into Shareholder Services Agreements (the “Agreements”) with Service Agents and make payments to Service Agents with respect to these services. During the period ended October 31, 2014, Class B shares were charged $443,412, pursuant to the Shareholder Services Plan.
The Company and the Distributor may suspend or reduce payments under the Shareholder Services Plan at any time, and payments are subject to the continuation of the Shareholder Services Plan and the Agreements described above. From time to time, the Service Agents, the Distributor and the Company may agree to voluntarily reduce the maximum fees payable under the Shareholder Services Plan.
Under its terms, the Distribution Plan and Shareholder Services Plan shall remain in effect from year to year, provided such continuance is approved annually by a vote of a majority of those Directors who are not “interested persons” of the Company and who have no direct or
The Fund 33
NOTES TO FINANCIAL STATEMENTS (continued)
indirect financial interest in the operation of or in any agreement related to the Distribution Plan and Shareholder Services Plan.
The components of “Due to The Dreyfus Corporation and affiliates” in the Statement of Assets and Liabilities consist of: management fees $102,891, Distribution Plan fees $40,632 and Shareholder Services Plan fees $37,422, which are offset against an expense reimbursement currently in effect in the amount of $156,559.
(d) Each Board member also serves as a Board member of other funds within the Dreyfus complex. Annual retainer fees and attendance fees are allocated to each fund based on net assets.
NOTE 3—Securities Transactions:
The fund is permitted to purchase or sell securities from or to certain affiliated funds under specified conditions outlined in procedures adopted by the Board. The procedures have been designed to ensure that any purchase or sale of securities by the fund from or to another fund or portfolio that are, or could be, considered an affiliate by virtue of having a common investment adviser (or affiliated investment adviser), common Directors and/or common officers, complies with Rule 17a-7 under the Act. During the period ended October 31, 2014, the fund engaged in purchases and sales of securities pursuant to Rule 17a-7 under the Act amounting to $46,470,000 and $116,865,000, respectively.
NOTE 4—Regulatory Developments:
On July 23, 2014, the SEC adopted amendments to the rules that govern money market mutual funds. In part, the amendments will require structural changes to most types of money market funds to one extent or another; however, the SEC provided for an extended two-year transition period to comply with such structural requirements. At this time, management is evaluating the reforms adopted and the manner for implementing these reforms over time and its impact on the financial statements.
34
REPORT OF INDEPENDENT REGISTERED
PUBLIC ACCOUNTING FIRM
The Board of Directors and Shareholders of The Dreyfus/Laurel Funds, Inc.
We have audited the accompanying statement of assets and liabilities of Dreyfus AMT-Free Municipal Reserves (the “Fund”), a series of The Dreyfus/Laurel Funds, Inc., including the statement of investments, as of October 31, 2014, the related statement of operations for the year then ended, the statements of changes in net assets for each of the years in the two-year period then ended, and the financial highlights for each of the years in the five-year period then ended. These financial statements and financial highlights are the responsibility of the Fund’s management. Our responsibility is to express an opinion on these financial statements and financial highlights based on our audits.
We conducted our audits in accordance with the standards of the Public Company Accounting Oversight Board (United States).Those standards require that we plan and perform the audit to obtain reasonable assurance about whether the financial statements and financial highlights are free of material misstatement. An audit includes examining, on a test basis, evidence supporting the amounts and disclosures in the financial statements. Our procedures included confirmation of securities owned as of October 31, 2014, by correspondence with the custodian and brokers or by other appropriate auditing procedures.An audit also includes assessing the accounting principles used and significant estimates made by management, as well as evaluating the overall financial statement presentation. We believe that our audits provide a reasonable basis for our opinion.
In our opinion, the financial statements and financial highlights referred to above present fairly, in all material respects, the financial position of Dreyfus AMT-Free Municipal Reserves as of October 31, 2014, the results of its operations for the year then ended, the changes in its net assets for each of the years in the two-year period then ended, and the financial highlights for each of the years in the five-year period then ended, in conformity with U.S. generally accepted accounting principles.

New York, New York
December 30, 2014
The Fund 35
IMPORTANT TAX INFORMATION (Unaudited)
In accordance with federal tax law, the fund hereby reports all the dividends paid from investment income-net during its fiscal year ended October 31, 2014 as “exempt-interest dividends” (not generally subject to regular federal income tax), except $30,214 that is being reported as an ordinary income distribution for reporting purposes. Where required by federal tax law rules, shareholders will receive notification of their portion of the fund’s tax-exempt dividends paid for the 2014 calendar year on Form 1099-DIV, which will be mailed in early 2015.
36
|
| BOARD MEMBERS INFORMATION (Unaudited) |
| INDEPENDENT BOARD MEMBERS |
|
| Joseph S. DiMartino (71) |
| Chairman of the Board (1999) |
| Principal Occupation During Past 5Years: |
| • Corporate Director and Trustee (1995-present) |
| Other Public Company Board Memberships During Past 5Years: |
| • CBIZ (formerly, Century Business Services, Inc.), a provider of outsourcing functions for small |
| and medium size companies, Director (1997-present) |
| • The Newark Group, a provider of a national market of paper recovery facilities, paperboard |
| mills and paperboard converting plants, Director (2000-2010) |
| • Sunair Services Corporation, a provider of certain outdoor-related services to homes and |
| businesses, Director (2005-2009) |
| No. of Portfolios for which Board Member Serves: 144 |
| ——————— |
| Francine J. Bovich (63) |
| Board Member (2012) |
| Principal Occupation During Past 5Years: |
| • Trustee,The Bradley Trusts, private trust funds (2011-present) |
| • Managing Director, Morgan Stanley Investment Management (1993-2010) |
| Other Public Company Board Membership During Past 5Years: |
| • Annaly Capital Management, Inc., Board Member (May 2014-present) |
| No. of Portfolios for which Board Member Serves: 45 |
| ——————— |
| Kenneth A. Himmel (68) |
| Board Member (1994) |
| Principal Occupation During Past 5Years: |
| • President and CEO, Related Urban Development, a real estate development company (1996-present) |
| • President and CEO, Himmel & Company, a real estate development company (1980-present) |
| • CEO,American Food Management, a restaurant company (1983-present) |
| No. of Portfolios for which Board Member Serves: 31 |
The Fund 37
|
| BOARD MEMBERS INFORMATION (Unaudited) (continued) |
| INDEPENDENT BOARD MEMBERS (continued) |
|
| Stephen J. Lockwood (67) |
| Board Member (1994) |
| Principal Occupation During Past 5Years: |
| • Chairman of the Board, Stephen J. Lockwood and Company LLC, a real estate investment |
| company (2000-present) |
| No. of Portfolios for which Board Member Serves: 31 |
| ——————— |
| Roslyn M. Watson (65) |
| Board Member (1994) |
| Principal Occupation During Past 5Years: |
| • Principal,Watson Ventures, Inc., a real estate investment company (1993-present) |
| No. of Portfolios for which Board Member Serves: 69 |
| ——————— |
| Benaree Pratt Wiley (68) |
| Board Member (1998) |
| Principal Occupation During Past 5Years: |
| • Principal,TheWiley Group, a firm specializing in strategy and business development (2005-present) |
| Other Public Company Board Membership During Past 5Years: |
| • CBIZ (formerly, Century Business Services, Inc.), a provider of outsourcing functions for small |
| and medium size companies, Director (2008-present) |
| No. of Portfolios for which Board Member Serves: 69 |
| ——————— |
| Once elected all Board Members serve for an indefinite term, but achieve Emeritus status upon reaching age 80.The |
| address of the Board Members and Officers is c/o The Dreyfus Corporation, 200 Park Avenue, NewYork, NewYork |
| 10166.Additional information about the Board Members is available in the fund’s Statement of Additional Information |
| which can be obtained from Dreyfus free of charge by calling this toll free number: 1-800-DREYFUS. |
| James M. Fitzgibbons, Emeritus Board Member |
| J.Tomlinson Fort, Emeritus Board Member |
38
OFFICERS OF THE FUND (Unaudited)
BRADLEY J. SKAPYAK, President since January 2010.
Chief Operating Officer and a director of the Manager since June 2009, Chairman of Dreyfus Transfer, Inc., an affiliate of the Manager and the transfer agent of the funds, since May 2011 and Executive Vice President of the Distributor since June 2007. From April 2003 to June 2009, Mr. Skapyak was the head of the Investment Accounting and Support Department of the Manager. He is an officer of 69 investment companies (comprised of 144 portfolios) managed by the Manager. He is 55 years old and has been an employee of the Manager since February 1988.
JOHN PAK, Chief Legal Officer since March 2013.
Deputy General Counsel, Investment Management, of BNY Mellon since August 2014; Chief Legal Officer of the Manager since August 2012; from March 2005 to July 2012, Managing Director of Deutsche Bank, Deputy Global Head of Deutsche Asset Management Legal and Regional Head of Deutsche Asset Management Americas Legal. He is an officer of 70 investment companies (comprised of 169 portfolios) managed by the Manager. He is 46 years old and has been an employee of the Manager since August 2012.
JANETTE E. FARRAGHER, Vice President and Secretary since December 2011.
Assistant General Counsel of BNY Mellon, and an officer of 70 investment companies (comprised of 169 portfolios) managed by the Manager. She is 51 years old and has been an employee of the Manager since February 1984.
KIESHA ASTWOOD, Vice President and Assistant Secretary since January 2010.
Counsel of BNY Mellon, and an officer of 70 investment companies (comprised of 169 portfolios) managed by the Manager. She is 41 years old and has been an employee of the Manager since July 1995.
JAMES BITETTO, Vice President and Assistant Secretary since August 2005.
Managing Counsel of BNY Mellon and Secretary of the Manager, and an officer of 70 investment companies (comprised of 169 portfolios) managed by the Manager. He is 48 years old and has been an employee of the Manager since December 1996.
JONI LACKS CHARATAN, Vice President and Assistant Secretary since August 2005.
Managing Counsel of BNY Mellon, and an officer of 70 investment companies (comprised of 169 portfolios) managed by the Manager. She is 58 years old and has been an employee of the Manager since October 1988.
JOSEPH M. CHIOFFI, Vice President and Assistant Secretary since August 2005.
Managing Counsel of BNY Mellon, and an officer of 70 investment companies (comprised of 169 portfolios) managed by the Manager. He is 52 years old and has been an employee of the Manager since June 2000.
JOHN B. HAMMALIAN, Vice President and Assistant Secretary since August 2005.
Senior Managing Counsel of BNY Mellon, and an officer of 70 investment companies (comprised of 169 portfolios) managed by the Manager. He is 51 years old and has been an employee of the Manager since February 1991.
SARAH S. KELLEHER, Vice President and Assistant Secretary since April 2014.
Senior Counsel of BNY Mellon, and an officer of 70 investment companies (comprised of 169 portfolios) managed by the Manager; from August 2005 to March 2013, Associate General Counsel of Third Avenue Management. She is 38 years old and has been an employee of the Manager since March 2013.
The Fund 39
OFFICERS OF THE FUND (Unaudited) (continued)
JEFF PRUSNOFSKY, Vice President and Assistant Secretary since August 2005.
Senior Managing Counsel of BNY Mellon, and an officer of 70 investment companies (comprised of 169 portfolios) managed by the Manager. He is 49 years old and has been an employee of the Manager since October 1990.
JAMES WINDELS, Treasurer since November 2001.
Director – Mutual Fund Accounting of the Manager, and an officer of 70 investment companies (comprised of 169 portfolios) managed by the Manager. He is 56 years old and has been an employee of the Manager since April 1985.
RICHARD CASSARO, Assistant Treasurer since January 2008.
Senior Accounting Manager – Money Market and Municipal Bond Funds of the Manager, and an officer of 70 investment companies (comprised of 169 portfolios) managed by the Manager. He is 55 years old and has been an employee of the Manager since September 1982.
GAVIN C. REILLY, Assistant Treasurer since December 2005.
Tax Manager of the Investment Accounting and Support Department of the Manager, and an officer of 70 investment companies (comprised of 169 portfolios) managed by the Manager. He is 46 years old and has been an employee of the Manager since April 1991.
ROBERT S. ROBOL, Assistant Treasurer since December 2002.
Senior Accounting Manager – Fixed Income Funds of the Manager, and an officer of 70 investment companies (comprised of 169 portfolios) managed by the Manager. He is 50 years old and has been an employee of the Manager since October 1988.
ROBERT SALVIOLO, Assistant Treasurer since July 2007.
Senior Accounting Manager – Equity Funds of the Manager, and an officer of 70 investment companies (comprised of 169 portfolios) managed by the Manager. He is 47 years old and has been an employee of the Manager since June 1989.
ROBERT SVAGNA, Assistant Treasurer since December 2002.
Senior Accounting Manager – Equity Funds of the Manager, and an officer of 70 investment companies (comprised of 169 portfolios) managed by the Manager. He is 47 years old and has been an employee of the Manager since November 1990.
JOSEPH W. CONNOLLY, Chief Compliance Officer since October 2004.
Chief Compliance Officer of the Manager and The Dreyfus Family of Funds (70 investment companies, comprised of 169 portfolios). He is 57 years old and has served in various capacities with the Manager since 1980, including manager of the firm’s Fund Accounting Department from 1997 through October 2001.
MATTHEW D. CONNOLLY, Anti-Money Laundering Compliance Officer since April 2012.
Anti-Money Laundering Compliance Officer of the Distributor since October 2011; from March 2010 to September 2011, Global Head, KYC Reviews and Director of UBS Investment Bank; until March 2010, AML Compliance Officer and Senior Vice President of Citi Global Wealth Management. He is an officer of 65 investment companies (comprised of 164 portfolios) managed by the Manager. He is 42 years old and has been an employee of the Distributor since October 2011.
40
For More Information

Telephone 1-800-DREYFUS
Mail The Dreyfus Family of Funds, 144 Glenn Curtiss Boulevard, Uniondale, NY 11556-0144 E-mail Send your request to info@dreyfus.com Internet Information can be viewed online or downloaded at: http://www.dreyfus.com
The fund will disclose daily, on www.dreyfus.com, the fund’s complete schedule of holdings as of the end of the previous business day. The schedule of holdings will remain on the website until the fund files its Form N-Q or Form N-CSR for the period that includes the date of the posted holdings.
The fund files its complete schedule of portfolio holdings with the Securities and Exchange Commission (“SEC”) for the first and third quarters of each fiscal year on Form N-Q. The fund’s Forms N-Q are available on the SEC’s website at http://www.sec.gov and may be reviewed and copied at the SEC’s Public Reference Room in Washington, DC. Information on the operation of the Public Reference Room may be obtained by calling 1-800-SEC-0330.
Information regarding how the fund voted proxies relating to portfolio securities for the most recent 12-month period ended June 30 is available on the SEC’s website at http://www.sec.gov and without charge, upon request, by calling 1-800-DREYFUS.

|
| Dreyfus |
| Bond Market |
| Index Fund |
ANNUAL REPORT October 31, 2014

Save time. Save paper. View your next shareholder report online as soon as it’s available. Log into www.dreyfus.com and sign up for Dreyfus eCommunications. It’s simple and only takes a few minutes.
The views expressed in this report reflect those of the portfolio manager only through the end of the period covered and do not necessarily represent the views of Dreyfus or any other person in the Dreyfus organization. Any such views are subject to change at any time based upon market or other conditions and Dreyfus disclaims any responsibility to update such views.These views may not be relied on as investment advice and, because investment decisions for a Dreyfus fund are based on numerous factors, may not be relied on as an indication of trading intent on behalf of any Dreyfus fund.
|
| Not FDIC-Insured • Not Bank-Guaranteed • May Lose Value |
| | Contents |
| | THE FUND |
| 2 | A Letter from the President |
| 3 | Discussion of Fund Performance |
| 6 | Fund Performance |
| 7 | Understanding Your Fund’s Expenses |
| 7 | Comparing Your Fund’s Expenses With Those of Other Funds |
| 8 | Statement of Investments |
| 70 | TBA Sale Commitments |
| 71 | Statement of Assets and Liabilities |
| 72 | Statement of Operations |
| 73 | Statement of Changes in Net Assets |
| 75 | Financial Highlights |
| 77 | Notes to Financial Statements |
| 87 | Report of Independent Registered Public Accounting Firm |
| 88 | Important Tax Information |
| 89 | Board Members Information |
| 91 | Officers of the Fund |
| | FOR MORE INFORMATION |
| | Back Cover |
Dreyfus
Bond Market Index Fund
The Fund
A LETTER FROM THE PRESIDENT
Dear Shareholder:
We are pleased to present this annual report for Dreyfus Bond Market Index Fund, covering the 12-month period from November 1, 2013, through October 31, 2014. For information about how the fund performed during the reporting period, as well as general market perspectives, we provide a Discussion of Fund Performance on the pages that follow.
Contrary to most analysts’ expectations, U.S. fixed-income securities generally gained value as long-term interest rates fell during 2014. Under most circumstances, bond yields tend to climb and prices fall during economic recoveries such as the one that prevailed over the past 12 months. However, international developments led to a surge in demand for a relatively limited supply of U.S. government securities, causing a supply-and-demand imbalance that drove yields lower and prices higher. Higher yielding sectors of the bond market also fared relatively well as credit conditions improved in the recovering U.S. economy.
We currently hold a relatively cautious view of the near- to intermediate-term prospects for fixed-income securities.The U.S. economy appears likely to continue to accelerate as several longstanding drags—including tight fiscal policies and private sector deleveraging—fade from the scene. In an improving economic environment, the Federal Reserve Board (the “Fed”) may begin to raise short-term interest rates sometime in 2015. In addition, the recent end of the Fed’s quantitative easing program has removed a degree of investor demand from the market. Therefore, we believe selectivity and a long-term perspective seem poised to become more important determinants of investment success.As always, we urge you to talk regularly with your financial advisor to assess the potential impact of our observations on your investments.
Thank you for your continued confidence and support.

J. Charles Cardona
President
The Dreyfus Corporation
November 17, 2014
2
DISCUSSION OF FUND PERFORMANCE
For the period of November 1, 2013, through October 31, 2014, as provided by Nancy G. Rogers, Portfolio Manager
Fund and Market Performance Overview
For the 12-month period ended October 31, 2014, Dreyfus Bond Market Index Fund’s Investor shares produced a total return of 3.62%, and its BASIC shares produced a total return of 3.97%.1 In comparison, the Barclays U.S.Aggregate Bond Index (the “Index”) achieved a total return of 4.14% for the same period.2
A recovering U.S. economy and rising long-term interest rates caused bond prices to fall during the final months of 2013, but renewed economic uncertainties and favorable supply-and-demand dynamics sent long-term interest rates lower and bond prices higher over the first 10 months of 2014. The difference in returns between the fund and the Index was primarily the result of transaction costs and other operating expenses that are not reflected in the Index’s results.
The Fund’s Investment Approach
The fund seeks to match the total return of the Index.To pursue this goal, the fund normally invests at least 80% of its assets in bonds that are included in the Index (or other instruments with similar characteristics). To maintain liquidity, the fund may invest up to 20% of its assets in various short-term, fixed-income securities and money market instruments.
While the fund seeks to mirror the returns of the Index, it does not hold the same number of bonds. Instead, the fund holds approximately 1,700 securities as compared to approximately 8,000 securities in the Index.The fund’s average duration—a measure of sensitivity to changing interest rates—generally remains neutral to the Index. As of October 31, 2014, the average duration of the fund was approximately 5.5 years.
Economic and Technical Factors Drove Market Performance
By the end of 2013, evidence of an accelerating economic recovery and the Federal Reserve Board (the “Fed”)’s decision to gradually reduce its quantitative easing program drove yields of 10-year U.S. Treasury securities above 3%. However, renewed global economic concerns soon caused yields to moderate, and the Fed
The Fund 3
DISCUSSION OF FUND PERFORMANCE (continued)
made clear that short-term interest rates were likely to remain near historically low levels for some time to come.The Fed’s generally dovish tone helped improve clarity in the market, reducing investor uncertainty. Meanwhile, harsh winter weather dampened domestic economic activity, causing U.S. GDP to contract at a 2.1% annualized rate over the first quarter of 2014.
In contrast, economic growth rebounded at a 4.6% annualized rate during the second quarter and an estimated 3.5% annualized rate over the third quarter. Labor markets continued to strengthen, and the Fed continued to taper its bond purchases until the program ended on October 31. Nonetheless, robust investor demand for a relatively limited supply of securities—including reduced issuance of mortgage-backed securities—kept yields low. Rates fell more sharply at the longer end of the market’s maturity spectrum, causing yield differences between short- and long-term bonds to narrow.
International developments also influenced the U.S. bond market over the reporting period. Intensifying conflicts in the Middle East, Western sanctions over Russia’s intervention into an already unstable political situation in Ukraine, political protests in Hong Kong, and the spread of Ebola in West Africa worried fixed-income investors, sparking a “flight to quality” toward traditional safe havens, including U.S. Treasury securities. Aggressively accommodative monetary policy actions from central banks in Europe and Japan also drove global investors to U.S. Treasuries, which generally provided higher yields than other high-quality sovereign bonds, such as the German bund.
Most Bond Market Sectors Produced Positive Results
The U.S. bond market benefited from strength among long-term U.S. Treasury securities in the falling interest-rate environment, which surprised many analysts who had expected long-term rates to rise as economic growth accelerated and the Fed reduced its bond purchases.Yet, higher yielding bond market sectors generally outpaced U.S. government securities when credit conditions improved and income-oriented investors resumed their reach for more competitive yields. Corporate-backed bonds produced some of the market’s highest total returns over the reporting period
4
as business conditions improved. Commercial mortgage-backed securities benefited from the same factors, as well as a change in the Index that increased its allocation to commercial mortgages and shifted its focus to larger mortgage-backed issues with strong liquidity characteristics.Asset-backed securities and residential mortgage-backed securities also added a degree of value to the overall market’s results.
Replicating the Index’s Composition
As an index fund, we attempt to match closely the returns of the Index by approximating its composition. As of October 31, 2014, approximately 68% of the fund’s assets was invested in Government and Agency securities, 25% in corporate bonds and asset-backed securities, 9% in money market investments, 5% in foreign/governmental securities and 2% in commercial mortgage-backed securities and municipal bonds. Moreover, all of the fund’s corporate securities were rated at least BBB- or better, and the fund has maintained an overall credit quality and duration posture that is closely aligned with that of the Index.
November 17, 2014
Bond funds are subject generally to interest rate, credit, liquidity, and market risks, to varying degrees, all of which are more fully described in the fund’s prospectus. Generally, all other factors being equal, bond prices are inversely related to interest-rate changes, and rate increases can cause price declines.
Indexing does not attempt to manage market volatility, use defensive strategies, or reduce the effects of any long-term periods of poor index performance.The correlation between fund and index performance may be affected by the fund’s expenses and use of sampling techniques, changes in securities markets, changes in the composition of the index, and the timing of purchases and redemptions of fund shares.
|
| 1 Total return includes reinvestment of dividends and any capital gains paid. Past performance is no guarantee of future |
| results. Share price, yield, and investment return fluctuate such that upon redemption, fund shares may be worth more |
| or less than their original cost. |
| 2 SOURCE: LIPPER INC. — Reflects reinvestment of dividends and, where applicable, capital gain distributions.The |
| Barclays U.S.Aggregate Bond Index is a widely accepted, unmanaged total return index of corporate, U.S. government |
| and U.S. government agency debt instruments, mortgage-backed securities, and asset-backed securities with an average |
| maturity of 1-10 years. Index returns do not reflect fees and expenses associated with operating a mutual fund. |
The Fund 5
FUND PERFORMANCE
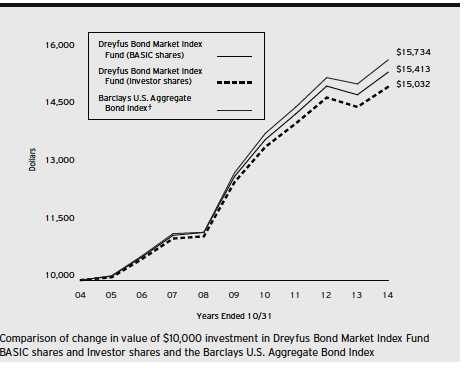
| | | | | | |
| Average Annual Total Returns as of 10/31/14 | | | | | | |
| | 1 Year | | 5 Years | | 10 Years | |
| BASIC shares | 3.97 | % | 3.95 | % | 4.42 | % |
| Investor shares | 3.62 | % | 3.67 | % | 4.16 | % |
| Barclays U.S. Aggregate Bond Index | 4.14 | % | 4.22 | % | 4.64 | % |
† Source: Lipper Inc.
Past performance is not predictive of future performance.The fund’s performance shown in the graph and table does not reflect the deduction of taxes that a shareholder would pay on fund distributions or the redemption of fund shares. The above graph compares a $10,000 investment made in each of the BASIC and Investor shares of Dreyfus Bond Market Index Fund on 10/31/04 to a $10,000 investment made in the Barclays U.S. Aggregate Bond Index (the “Index”) on that date. All dividends and capital gain distributions are reinvested.
The fund’s performance shown in the line graph above takes into account all applicable fees and expenses for BASIC and Investor shares.The Index is a widely accepted, unmanaged index of corporate, U.S. government and U.S. government agency debt instruments, mortgage-backed securities and asset-backed securities. Unlike a mutual fund, the Index is not subject to charges, fees and other expenses. Investors cannot invest directly in any index. Further information relating to fund performance, including expense reimbursements, if applicable, is contained in the Financial Highlights section of the prospectus and elsewhere in this report.
6
UNDERSTANDING YOUR FUND’S EXPENSES (Unaudited)
As a mutual fund investor, you pay ongoing expenses, such as management fees and other expenses. Using the information below, you can estimate how these expenses affect your investment and compare them with the expenses of other funds.You also may pay one-time transaction expenses, including sales charges (loads) and redemption fees, which are not shown in this section and would have resulted in higher total expenses. For more information, see your fund’s prospectus or talk to your financial adviser.
Review your fund’s expenses
The table below shows the expenses you would have paid on a $1,000 investment in Dreyfus Bond Market Index Fund from May 1, 2014 to October 31, 2014. It also shows how much a $1,000 investment would be worth at the close of the period, assuming actual returns and expenses.
Expenses and Value of a $1,000 Investment
assuming actual returns for the six months ended October 31, 2014
| | |
| | Investor Shares | BASIC Shares |
| Expenses paid per $1,000† | $2.04 | $ .76 |
| Ending value (after expenses) | $1,020.20 | $ 1,022.50 |
COMPARING YOUR FUND’S EXPENSES
WITH THOSE OF OTHER FUNDS (Unaudited)
Using the SEC’s method to compare expenses
The Securities and Exchange Commission (SEC) has established guidelines to help investors assess fund expenses. Per these guidelines, the table below shows your fund’s expenses based on a $1,000 investment, assuming a hypothetical 5% annualized return. You can use this information to compare the ongoing expenses (but not transaction expenses or total cost) of investing in the fund with those of other funds. All mutual fund shareholder reports will provide this information to help you make this comparison. Please note that you cannot use this information to estimate your actual ending account balance and expenses paid during the period.
Expenses and Value of a $1,000 Investment
assuming a hypothetical 5% annualized return for the six months ended October 31, 2014
| | |
| | Investor Shares | BASIC Shares |
| Expenses paid per $1,000† | $2.04 | $ .77 |
| Ending value (after expenses) | $1,023.19 | $ 1,024.45 |
|
| † Expenses are equal to the fund’s annualized expense ratio of .40% for Investor shares and .15% for BASIC shares, |
| multiplied by the average account value over the period, multiplied by 184/365 (to reflect the one-half year period). |
The Fund 7
|
| STATEMENT OF INVESTMENTS |
| October 31, 2014 |
| | | | | |
| | Coupon | Maturity | Principal | | |
| Bonds and Notes—100.1% | Rate (%) | Date | Amount ($) | | Value ($) |
| Asset-Backed Ctfs./ | | | | | |
| Auto Receivables—.3% | | | | | |
| Ally Auto Receivables Trust, | | | | | |
| Ser. 2012-3, Cl. A4 | 1.06 | 2/15/17 | 500,000 | | 502,688 |
| AmeriCredit Automobile Receivables | | | | | |
| Trust, Ser. 2013-5, Cl. A3 | 0.90 | 9/10/18 | 1,000,000 | | 1,001,800 |
| AmeriCredit Automobile Receivables | | | | | |
| Trust, Ser. 2014-2, Cl. A3 | 0.94 | 2/8/19 | 1,170,000 | | 1,168,148 |
| Carmax Auto Owner Trust, | | | | | |
| Ser. 2013-2, Cl. A4 | 0.84 | 11/15/18 | 650,000 | | 646,971 |
| Ford Credit Auto Owner Trust, | | | | | |
| Ser. 2012-B, Cl. A4 | 1.00 | 9/15/17 | 400,000 | | 401,669 |
| Mercedes-Benz Auto Lease Trust, | | | | | |
| Ser. 2013-A, Cl. A3 | 0.59 | 2/15/16 | 950,255 | | 950,543 |
| Santander Drive Auto Receivables | | | | | |
| Trust, Ser. 2014-3, Cl. A3 | 0.81 | 7/16/18 | 1,370,000 | | 1,370,290 |
| World Omni Auto Receivables Trust, | | | | | |
| Ser. 2013-B, Cl. A3 | 0.83 | 8/15/18 | 1,000,000 | | 1,001,361 |
| | | | | | 7,043,470 |
| Asset-Backed Ctfs./ | | | | | |
| Credit Cards—.3% | | | | | |
| Capital One Multi-Asset Execution | | | | | |
| Trust, Ser. 2007-A7, Cl. A7 | 5.75 | 7/15/20 | 565,000 | | 634,109 |
| Chase Issuance Trust, | | | | | |
| Ser. 2012-A8, Cl. A8 | 0.54 | 10/16/17 | 1,250,000 | | 1,250,787 |
| Citibank Credit Card Issuance | | | | | |
| Trust, Ser. 2013-A3, Cl. A3 | 1.11 | 7/23/18 | 1,000,000 | | 1,005,411 |
| Citibank Credit Card Issuance | | | | | |
| Trust, Ser. 2007-A8, Cl. A8 | 5.65 | 9/20/19 | 3,000,000 | | 3,368,898 |
| | | | | | 6,259,205 |
| Commercial Mortgage | | | | | |
| Pass-Through Ctfs.—1.6% | | | | | |
| Banc of America Commercial | | | | | |
| Mortgage Trust, Ser. 2007-1, | | | | | |
| Cl. A4 | 5.45 | 1/15/49 | 947,392 | | 1,022,877 |
| Banc of America Commercial | | | | | |
| Mortgage Trust, Ser. 2007-4, | | | | | |
| Cl. A4 | 5.95 | 2/10/51 | 233,809 | a | 257,313 |
8
| | | | | |
| | Coupon | Maturity | Principal | | |
| Bonds and Notes (continued) | Rate (%) | Date | Amount ($) | | Value ($) |
| Commercial Mortgage | | | | | |
| Pass-Through Ctfs. (continued) | | | | | |
| Bear Stearns Commercial Mortgage | | | | | |
| Securities Trust, | | | | | |
| Ser. 2005-PWR8, Cl. A4 | 4.67 | 6/11/41 | 221,348 | | 223,912 |
| Bear Stearns Commercial Mortgage | | | | | |
| Securities Trust, | | | | | |
| Ser. 2005-PWR9, Cl. A4A | 4.87 | 9/11/42 | 722,758 | | 737,731 |
| Bear Stearns Commercial Mortgage | | | | | |
| Securities Trust, | | | | | |
| Ser. 2006-PW14, Cl. A4 | 5.20 | 12/11/38 | 1,000,000 | | 1,071,648 |
| Bear Stearns Commercial Mortgage | | | | | |
| Securities Trust, | | | | | |
| Ser. 2005-PW10, Cl. A4 | 5.41 | 12/11/40 | 162,631 | a | 167,640 |
| Bear Stearns Commercial Mortgage | | | | | |
| Securities Trust, | | | | | |
| Ser. 2006-PW12, Cl. A4 | 5.70 | 9/11/38 | 834,907 | a | 884,850 |
| Citigroup Commercial Mortgage | | | | | |
| Trust, Ser. 2014-GC19, Cl. A2 | 2.79 | 3/10/47 | 1,250,000 | | 1,285,908 |
| Citigroup Commercial Mortgage | | | | | |
| Trust, Ser. 2006-C4, Cl. A3 | 5.78 | 3/15/49 | 198,673 | a | 209,441 |
| Citigroup Commercial Mortgage | | | | | |
| Trust, Ser. 2008-C7, Cl. A4 | 6.13 | 12/10/49 | 1,100,000 | a | 1,220,288 |
| Citigroup/Deutsche Bank Commercial | | | | | |
| Mortgage Trust, Ser. 2006-CD2, | | | | | |
| Cl. A4 | 5.30 | 1/15/46 | 85,000 | a | 88,344 |
| COBALT CMBS Commercial Mortgage | | | | | |
| Trust, Ser. 2007-C3, Cl. A4 | 5.77 | 5/15/46 | 889,584 | a | 975,721 |
| Commercial Mortgage Trust, | | | | | |
| Ser. 2014-LC15, Cl. A2 | 2.84 | 4/10/47 | 2,000,000 | | 2,061,216 |
| Commercial Mortgage Trust, | | | | | |
| Ser. 2012-CR4, Cl. A3 | 2.85 | 10/15/45 | 1,000,000 | | 991,813 |
| Commercial Mortgage Trust, | | | | | |
| Ser. 2014-CR16, Cl. A4 | 4.05 | 4/10/47 | 1,200,000 | | 1,282,085 |
| Commercial Mortgage Trust, | | | | | |
| Ser. 2013-CR11, Cl. B | 5.16 | 10/10/46 | 750,000 | a | 837,043 |
| Credit Suisse Commercial Mortgage | | | | | |
| Trust, Ser. 2006-C3, Cl. A3 | 5.81 | 6/15/38 | 1,410,764 | a | 1,485,781 |
The Fund 9
STATEMENT OF INVESTMENTS (continued)
| | | | | |
| | Coupon | Maturity | Principal | | |
| Bonds and Notes (continued) | Rate (%) | Date | Amount ($) | | Value ($) |
| Commercial Mortgage | | | | | |
| Pass-Through Ctfs. (continued) | | | | | |
| GS Mortgage Securities Trust, | | | | | |
| Ser. 2014-GC18, Cl. A3 | 3.80 | 1/10/47 | 500,000 | | 523,074 |
| GS Mortgage Securities Trust, | | | | | |
| Ser. 2007-GG10, Cl. A4 | 5.80 | 8/10/45 | 903,440 | a | 988,673 |
| J.P. Morgan Chase Commercial | | | | | |
| Mortgage Securities Trust, | | | | | |
| Ser. 2005-LDP3, Cl. A4A | 4.94 | 8/15/42 | 516,643 | a | 525,479 |
| J.P. Morgan Chase Commercial | | | | | |
| Mortgage Securities Trust, | | | | | |
| Ser. 2007-LDPX, Cl. A3 | 5.42 | 1/15/49 | 60,304 | | 65,106 |
| J.P. Morgan Chase Commercial | | | | | |
| Mortgage Securities Trust, | | | | | |
| Ser. 2007-CB18, Cl. A4 | 5.44 | 6/12/47 | 337,972 | | 363,566 |
| J.P. Morgan Chase Commercial | | | | | |
| Mortgage Securities Trust, | | | | | |
| Ser. 2006-CB14, Cl. A4 | 5.48 | 12/12/44 | 433,405 | a | 448,291 |
| J.P. Morgan Chase Commercial | | | | | |
| Mortgage Securities Trust, | | | | | |
| Ser. 2007-CB20, Cl. A4 | 5.79 | 2/12/51 | 1,000,000 | a | 1,094,136 |
| JPMBB Commercial Mortgage | | | | | |
| Securities Trust, | | | | | |
| Ser. 2013-C15, Cl. A5 | 4.13 | 11/15/45 | 500,000 | | 538,475 |
| JPMorgan Chase | | | | | |
| Commercial Mortgage | | | | | |
| Securities Trust, | | | | | |
| Ser. 2012-LC9, Cl. A5 | 2.84 | 12/15/47 | 1,000,000 | | 989,940 |
| LB-UBS Commercial Mortgage Trust, | | | | | |
| Ser. 2007-C2, Cl. A3 | 5.43 | 2/15/40 | 981,900 | | 1,063,811 |
| Merrill Lynch Mortgage Trust, | | | | | |
| Ser. 2006-C2, Cl. A4 | 5.74 | 8/12/43 | 898,725 | a | 957,700 |
| Merrill Lynch Mortgage Trust, | | | | | |
| Ser. 2007-C1, Cl. A4 | 5.84 | 6/12/50 | 1,000,000 | a | 1,097,993 |
| Merrill Lynch/Countrywide | | | | | |
| Commercial Mortgage Trust, | | | | | |
| Ser. 2007-7, Cl. A4 | 5.74 | 6/12/50 | 1,200,000 | a | 1,308,096 |
| Merrill Lynch/Countrywide | | | | | |
| Commercial Mortgage Trust, | | | | | |
| Ser. 2006-2, Cl. A4 | 6.06 | 6/12/46 | 976,905 | a | 1,034,316 |
10
| | | | | |
| | Coupon | Maturity | Principal | | |
| Bonds and Notes (continued) | Rate (%) | Date | Amount ($) | | Value ($) |
| Commercial Mortgage | | | | | |
| Pass-Through Ctfs. (continued) | | | | | |
| Morgan Stanley Bank of America | | | | | |
| Merrill Lynch Trust, | | | | | |
| Ser. 2013-C9, Cl. A1 | 0.83 | 5/15/46 | 772,664 | | 771,400 |
| Morgan Stanley Bank of America | | | | | |
| Merrill Lynch Trust, | | | | | |
| Ser. 2013-C10, Cl. A1 | 1.39 | 7/15/46 | 70,809 | | 71,331 |
| Morgan Stanley Bank of America | | | | | |
| Merrill Lynch Trust, | | | | | |
| Ser. 2013-C8, Cl. A4 | 3.13 | 12/15/48 | 1,000,000 | | 1,005,831 |
| Morgan Stanley Capital I Trust, | | | | | |
| Ser. 2007-IQ14, Cl. A4 | 5.69 | 4/15/49 | 1,300,000 | a | 1,413,050 |
| Morgan Stanley Capital I Trust, | | | | | |
| Ser. 2006-HQ9, Cl. A4 | 5.73 | 7/12/44 | 418,478 | a | 442,148 |
| UBS Commercial Mortgage Trust, | | | | | |
| Ser. 2012-C1, Cl. A3 | 3.40 | 5/10/45 | 500,000 | | 516,039 |
| UBS-Barclays Commercial Mortgage | | | | | |
| Trust, Ser. 2012-C4, Cl. A5 | 2.85 | 12/10/45 | 500,000 | | 493,907 |
| UBS-Barclays Commercial Mortgage | | | | | |
| Trust, Ser. 2012-C3, Cl. A4 | 3.09 | 8/10/49 | 500,000 | | 504,333 |
| UBS-Barclays Commercial Mortgage | | | | | |
| Trust, Ser. 2013-C6, Cl. A4 | 3.24 | 4/10/46 | 1,412,000 | | 1,428,211 |
| Wachovia Bank Commercial Mortgage | | | | | |
| Trust, Ser. 2005-C20, Cl. A7 | 5.12 | 7/15/42 | 721,703 | a | 733,936 |
| Wachovia Bank Commercial Mortgage | | | | | |
| Trust, Ser. 2006-C27, Cl. A3 | 5.77 | 7/15/45 | 2,934,312 | a | 3,094,555 |
| WF-RBS Commercial Mortgage Trust, | | | | | |
| Ser. 2013-C14, Cl. ASB | 2.98 | 6/15/46 | 1,500,000 | | 1,526,705 |
| WF-RBS Commercial Mortgage Trust, | | | | | |
| Ser. 2014-C20, Cl. A2 | 3.04 | 5/15/47 | 1,000,000 | | 1,037,761 |
| | | | | | 38,841,474 |
| Consumer Discretionary—2.5% | | | | | |
| 21st Century Fox America, | | | | | |
| Gtd. Notes | 3.70 | 9/15/24 | 750,000 | b | 763,691 |
| 21st Century Fox America, | | | | | |
| Gtd. Notes | 6.20 | 12/15/34 | 250,000 | | 312,900 |
| 21st Century Fox America, | | | | | |
| Gtd. Notes | 6.65 | 11/15/37 | 360,000 | | 466,851 |
The Fund 11
STATEMENT OF INVESTMENTS (continued)
| | | | |
| | Coupon | Maturity | Principal | |
| Bonds and Notes (continued) | Rate (%) | Date | Amount ($) | Value ($) |
| Consumer Discretionary (continued) | | | | |
| 21st Century Fox America, | | | | |
| Gtd. Notes | 7.75 | 12/1/45 | 100,000 | 147,258 |
| 21st Century Fox America, | | | | |
| Gtd. Notes | 8.25 | 8/10/18 | 150,000 | 183,920 |
| Autonation, | | | | |
| Gtd. Notes | 6.75 | 4/15/18 | 300,000 | 341,146 |
| Autozone, | | | | |
| Sr. Unscd. Notes | 1.30 | 1/13/17 | 1,000,000 | 1,003,068 |
| Bed Bath & Beyond, | | | | |
| Sr. Unscd. Notes | 3.75 | 8/1/24 | 1,000,000 | 1,005,864 |
| Carnival, | | | | |
| Gtd. Notes | 3.95 | 10/15/20 | 300,000 | 315,682 |
| CBS, | | | | |
| Gtd. Notes | 4.90 | 8/15/44 | 950,000 | 952,096 |
| CBS, | | | | |
| Gtd. Notes | 5.50 | 5/15/33 | 250,000 | 275,031 |
| CBS, | | | | |
| Gtd. Debs | 7.88 | 7/30/30 | 300,000 | 409,325 |
| Comcast, | | | | |
| Gtd. Notes | 2.85 | 1/15/23 | 300,000 | 296,854 |
| Comcast, | | | | |
| Gtd. Notes | 4.25 | 1/15/33 | 500,000 | 511,435 |
| Comcast, | | | | |
| Gtd. Bonds | 4.75 | 3/1/44 | 500,000 | 539,416 |
| Comcast, | | | | |
| Gtd. Notes | 5.70 | 7/1/19 | 1,000,000 | 1,156,267 |
| Comcast, | | | | |
| Gtd. Notes | 6.45 | 3/15/37 | 1,150,000 | 1,484,142 |
| Comcast, | | | | |
| Gtd. Bonds | 6.50 | 1/15/17 | 1,000,000 | 1,117,244 |
| Comcast Cable Communications | | | | |
| Holdings, Gtd. Notes | 9.46 | 11/15/22 | 304,000 | 436,478 |
| Costco Wholesale, | | | | |
| Sr. Unscd. Notes | 5.50 | 3/15/17 | 500,000 | 552,820 |
| CVS Health, | | | | |
| Sr. Unscd. Notes | 2.25 | 8/12/19 | 1,000,000 | 996,680 |
| CVS Health, | | | | |
| Sr. Unscd. Notes | 5.75 | 6/1/17 | 30,000 | 33,319 |
| CVS Health, | | | | |
| Sr. Unscd. Notes | 6.13 | 9/15/39 | 1,000,000 | 1,256,385 |
12
| | | | | |
| | Coupon | Maturity | Principal | | |
| Bonds and Notes (continued) | Rate (%) | Date | Amount ($) | | Value ($) |
| Consumer Discretionary (continued) | | | | | |
| Daimler Finance North America, | | | | | |
| Gtd. Notes | 8.50 | 1/18/31 | 200,000 | | 302,933 |
| DirecTV Holdings/Financing, | | | | | |
| Gtd. Notes | 3.50 | 3/1/16 | 1,500,000 | | 1,550,725 |
| DirecTV Holdings/Financing, | | | | | |
| Gtd. Notes | 6.00 | 8/15/40 | 800,000 | | 901,258 |
| Discovery Communications, | | | | | |
| Gtd. Notes | 6.35 | 6/1/40 | 700,000 | | 842,928 |
| Dollar General, | | | | | |
| Sr. Unscd. Notes | 1.88 | 4/15/18 | 1,000,000 | | 958,410 |
| Ford Motor, | | | | | |
| Sr. Unscd. Notes | 4.75 | 1/15/43 | 1,000,000 | | 1,024,227 |
| Grupo Televisa, | | | | | |
| Sr. Unscd. Notes | 5.00 | 5/13/45 | 750,000 | | 750,150 |
| Hasbro, | | | | | |
| Sr. Unscd. Notes | 3.15 | 5/15/21 | 750,000 | | 757,676 |
| Home Depot, | | | | | |
| Sr. Unscd. Notes | 5.40 | 3/1/16 | 1,050,000 | | 1,116,986 |
| Home Depot, | | | | | |
| Sr. Unscd. Notes | 5.40 | 9/15/40 | 300,000 | | 355,094 |
| Home Depot, | | | | | |
| Sr. Unscd. Notes | 5.88 | 12/16/36 | 650,000 | | 823,798 |
| Interpublic Group, | | | | | |
| Sr. Unscd. Notes | 4.20 | 4/15/24 | 500,000 | | 509,569 |
| Johnson Controls, | | | | | |
| Sr. Unscd. Notes | 5.50 | 1/15/16 | 1,300,000 | | 1,373,593 |
| Kohl’s, | | | | | |
| Sr. Unscd. Notes | 4.75 | 12/15/23 | 500,000 | | 535,653 |
| Lowe’s Cos., | | | | | |
| Sr. Unscd. Notes | 3.13 | 9/15/24 | 1,500,000 | c | 1,501,232 |
| Lowe’s Cos., | | | | | |
| Sr. Unscd. Notes | 3.88 | 9/15/23 | 500,000 | | 532,401 |
| Macy’s Retail Holdings, | | | | | |
| Gtd. Notes | 5.90 | 12/1/16 | 500,000 | | 549,247 |
| Marriott International, | | | | | |
| Sr. Unscd. Notes, Ser. N | 3.13 | 10/15/21 | 1,000,000 | | 1,001,517 |
| Mattel, | | | | | |
| Sr. Unscd. Notes | 2.35 | 5/6/19 | 500,000 | | 497,382 |
| McDonald’s, | | | | | |
| Sr. Unscd. Notes | 5.35 | 3/1/18 | 1,050,000 | | 1,177,110 |
The Fund 13
STATEMENT OF INVESTMENTS (continued)
| | | | | |
| | Coupon | Maturity | Principal | | |
| Bonds and Notes (continued) | Rate (%) | Date | Amount ($) | | Value ($) |
| Consumer Discretionary (continued) | | | | | |
| NBCUniversal Media, | | | | | |
| Gtd. Notes | 5.15 | 4/30/20 | 1,500,000 | | 1,708,898 |
| NIKE, | | | | | |
| Sr. Unscd. Notes | 2.25 | 5/1/23 | 300,000 | | 287,501 |
| NIKE, | | | | | |
| Sr. Unscd. Notes | 3.63 | 5/1/43 | 300,000 | | 289,620 |
| Nordstrom, | | | | | |
| Sr. Unscd. Bonds | 4.75 | 5/1/20 | 500,000 | | 554,343 |
| Omnicom Group, | | | | | |
| Gtd. Notes | 3.63 | 5/1/22 | 500,000 | | 513,214 |
| Pepsico, | | | | | |
| Sr. Unscd. Notes | 4.88 | 11/1/40 | 500,000 | | 549,258 |
| Philip Morris International, | | | | | |
| Sr. Unscd. Notes | 2.50 | 8/22/22 | 1,100,000 | | 1,066,849 |
| Procter & Gamble, | | | | | |
| Sr. Unscd. Notes | 5.55 | 3/5/37 | 300,000 | | 375,642 |
| QVC, | | | | | |
| Sr. Scd. Notes | 5.45 | 8/15/34 | 500,000 | b | 484,932 |
| Signet UK Finance, | | | | | |
| Gtd. Notes | 4.70 | 6/15/24 | 500,000 | | 509,466 |
| Starbucks, | | | | | |
| Sr. Unscd. Bonds | 6.25 | 8/15/17 | 750,000 | | 848,119 |
| Target, | | | | | |
| Sr. Unscd. Notes | 2.30 | 6/26/19 | 1,000,000 | | 1,006,642 |
| Target, | | | | | |
| Sr. Unscd. Notes | 5.38 | 5/1/17 | 400,000 | | 441,208 |
| Target, | | | | | |
| Sr. Unscd. Notes | 7.00 | 1/15/38 | 228,000 | | 314,627 |
| Thomson Reuters, | | | | | |
| Gtd. Notes | 6.50 | 7/15/18 | 800,000 | | 918,822 |
| Time Warner, | | | | | |
| Gtd. Notes | 4.75 | 3/29/21 | 1,500,000 | | 1,652,250 |
| Time Warner, | | | | | |
| Gtd. Notes | 7.63 | 4/15/31 | 1,100,000 | | 1,506,486 |
| Time Warner Cable, | | | | | |
| Gtd. Debs | 4.50 | 9/15/42 | 500,000 | | 494,845 |
| Time Warner Cable, | | | | | |
| Gtd. Notes | 6.55 | 5/1/37 | 350,000 | | 441,833 |
| Time Warner Cable, | | | | | |
| Gtd. Debs | 7.30 | 7/1/38 | 495,000 | | 683,253 |
14
| | | | |
| | Coupon | Maturity | Principal | |
| Bonds and Notes (continued) | Rate (%) | Date | Amount ($) | Value ($) |
| Consumer Discretionary (continued) | | | | |
| Time Warner Cable, | | | | |
| Gtd. Notes | 8.25 | 4/1/19 | 1,000,000 | 1,242,979 |
| Time Warner Cos., | | | | |
| Gtd. Debs. | 6.95 | 1/15/28 | 325,000 | 414,615 |
| Tyson Foods, | | | | |
| Gtd. Bonds | 5.15 | 8/15/44 | 500,000 | 535,923 |
| Viacom, | | | | |
| Sr. Unscd. Notes | 4.38 | 3/15/43 | 1,250,000 | 1,156,163 |
| Viacom, | | | | |
| Sr. Unscd. Notes | 6.88 | 4/30/36 | 235,000 | 296,408 |
| Wal-Mart Stores, | | | | |
| Sr. Unscd. Notes | 3.63 | 7/8/20 | 3,100,000 | 3,320,088 |
| Wal-Mart Stores, | | | | |
| Sr. Unscd. Bonds | 4.30 | 4/22/44 | 1,000,000 | 1,046,688 |
| Wal-Mart Stores, | | | | |
| Sr. Unscd. Notes | 5.25 | 9/1/35 | 600,000 | 711,358 |
| Wal-Mart Stores, | | | | |
| Sr. Unscd. Notes | 6.50 | 8/15/37 | 635,000 | 858,553 |
| Walt Disney, | | | | |
| Sr. Unscd. Notes | 3.75 | 6/1/21 | 500,000 | 538,444 |
| Walt Disney, | | | | |
| Sr. Unscd. Notes, Ser. B | 7.00 | 3/1/32 | 150,000 | 211,080 |
| WPP Finance 2010, | | | | |
| Gtd. Notes | 3.75 | 9/19/24 | 750,000 | 747,834 |
| Wyndham Worldwide, | | | | |
| Sr. Unscd. Notes | 2.50 | 3/1/18 | 500,000 | 503,312 |
| Wyndham Worldwide, | | | | |
| Sr. Unscd. Notes | 3.90 | 3/1/23 | 500,000 | 492,643 |
| Xerox, | | | | |
| Sr. Unscd. Notes | 3.80 | 5/15/24 | 500,000 | 490,974 |
| Xerox, | | | | |
| Sr. Unscd. Notes | 6.75 | 2/1/17 | 750,000 | 836,643 |
| Yale University, | | | | |
| Sr. Unscd. Notes | 2.09 | 4/15/19 | 300,000 | 303,088 |
| Yum! Brands, | | | | |
| Sr. Unscd. Notes | 6.88 | 11/15/37 | 168,000 | 213,079 |
| | | | | 60,187,441 |
| Consumer Staples—1.2% | | | | |
| Altria Group, | | | | |
| Gtd. Notes | 4.25 | 8/9/42 | 1,000,000 | 940,089 |
The Fund 15
STATEMENT OF INVESTMENTS (continued)
| | | | |
| | Coupon | Maturity | Principal | |
| Bonds and Notes (continued) | Rate (%) | Date | Amount ($) | Value ($) |
| Consumer Staples (continued) | | | | |
| Altria Group, | | | | |
| Gtd. Notes | 9.70 | 11/10/18 | 1,210,000 | 1,560,935 |
| Anheuser-Busch Cos., | | | | |
| Gtd. Notes | 5.50 | 1/15/18 | 145,000 | 161,848 |
| Anheuser-Busch Inbev Finance, | | | | |
| Gtd. Notes | 0.80 | 1/15/16 | 500,000 | 501,007 |
| Anheuser-Busch Inbev Finance, | | | | |
| Gtd. Notes | 1.13 | 1/27/17 | 1,000,000 | 1,004,029 |
| Anheuser-Busch Inbev Finance, | | | | |
| Gtd. Notes | 2.63 | 1/17/23 | 500,000 | 479,748 |
| Anheuser-Busch Inbev Finance, | | | | |
| Gtd. Notes | 3.70 | 2/1/24 | 1,000,000 | 1,031,197 |
| Anheuser-Busch Inbev Finance, | | | | |
| Gtd. Notes | 4.00 | 1/17/43 | 300,000 | 286,520 |
| Anheuser-Busch Inbev Worldwide | | | | |
| Gtd. Notes | 5.38 | 1/15/20 | 1,000,000 | 1,136,921 |
| Archer-Daniels-Midland, | | | | |
| Sr. Unscd. Notes | 5.45 | 3/15/18 | 130,000 | 146,017 |
| Coca-Cola, | | | | |
| Sr. Unscd. Notes | 3.30 | 9/1/21 | 2,000,000 | 2,100,880 |
| Coca-Cola Femsa, | | | | |
| Gtd. Bonds | 2.38 | 11/26/18 | 400,000 | 404,060 |
| Colgate-Palmolive, | | | | |
| Sr. Unscd. Notes | 2.45 | 11/15/21 | 1,500,000 | 1,491,363 |
| ConAgra Foods, | | | | |
| Sr. Unscd. Notes | 1.30 | 1/25/16 | 500,000 | 501,814 |
| ConAgra Foods, | | | | |
| Sr. Unscd. Notes | 1.90 | 1/25/18 | 500,000 | 497,921 |
| ConAgra Foods, | | | | |
| Sr. Unscd. Notes | 3.20 | 1/25/23 | 210,000 | 203,988 |
| ConAgra Foods, | | | | |
| Sr. Unscd. Notes | 4.65 | 1/25/43 | 198,000 | 196,435 |
| ConAgra Foods, | | | | |
| Sr. Unscd. Notes | 7.00 | 10/1/28 | 350,000 | 448,763 |
| Diageo Capital, | | | | |
| Gtd. Notes | 5.75 | 10/23/17 | 720,000 | 809,390 |
| Diageo Investment, | | | | |
| Gtd. Notes | 4.25 | 5/11/42 | 1,000,000 | 994,297 |
| Dr. Pepper Snapple Group, | | | | |
| Gtd. Notes | 6.82 | 5/1/18 | 200,000 | 233,070 |
16
| | | | |
| | Coupon | Maturity | Principal | |
| Bonds and Notes (continued) | Rate (%) | Date | Amount ($) | Value ($) |
| Consumer Staples (continued) | | | | |
| General Mills, | | | | |
| Sr. Unscd. Notes | 5.70 | 2/15/17 | 1,300,000 | 1,432,163 |
| Kellogg, | | | | |
| Sr. Unscd. Debs., Ser. B | 7.45 | 4/1/31 | 340,000 | 446,751 |
| Kimberly-Clark, | | | | |
| Sr. Unscd. Notes | 3.70 | 6/1/43 | 1,000,000 | 945,019 |
| Kraft Foods Group, | | | | |
| Sr. Unscd. Notes | 2.25 | 6/5/17 | 490,000 | 500,423 |
| Kraft Foods Group, | | | | |
| Sr. Unscd. Notes | 3.50 | 6/6/22 | 490,000 | 502,319 |
| Kraft Foods Group, | | | | |
| Sr. Unscd. Notes | 5.00 | 6/4/42 | 400,000 | 428,406 |
| Kroger, | | | | |
| Gtd. Notes | 7.50 | 4/1/31 | 800,000 | 1,062,317 |
| Mondelez International, | | | | |
| Sr. Unscd. Notes | 4.00 | 2/1/24 | 1,000,000 | 1,033,978 |
| Mondelez International, | | | | |
| Sr. Unscd. Notes | 6.50 | 2/9/40 | 253,000 | 323,210 |
| Pepsi Bottling Group, | | | | |
| Gtd. Notes, Ser. B | 7.00 | 3/1/29 | 800,000 | 1,098,448 |
| PepsiCo, | | | | |
| Sr. Unscd. Notes | 7.90 | 11/1/18 | 1,000,000 | 1,230,557 |
| Philip Morris International, | | | | |
| Sr. Unscd. Notes | 4.50 | 3/20/42 | 650,000 | 669,661 |
| Philip Morris International, | | | | |
| Sr. Unscd. Notes | 5.65 | 5/16/18 | 760,000 | 860,945 |
| Reynolds American, | | | | |
| Gtd. Notes | 4.85 | 9/15/23 | 650,000 | 702,187 |
| Sysco, | | | | |
| Gtd. Notes | 2.35 | 10/2/19 | 1,250,000 | 1,258,904 |
| Sysco, | | | | |
| Gtd. Notes | 5.38 | 9/21/35 | 350,000 | 405,961 |
| | | | | 28,031,541 |
| Energy—2.8% | | | | |
| Anadarko Petroleum, | | | | |
| Sr. Unscd. Notes | 3.45 | 7/15/24 | 1,000,000 | 987,781 |
| Anadarko Petroleum, | | | | |
| Sr. Unscd. Notes | 5.95 | 9/15/16 | 350,000 | 380,500 |
| Anadarko Petroleum, | | | | |
| Sr. Unscd. Notes | 6.45 | 9/15/36 | 150,000 | 185,719 |
The Fund 17
STATEMENT OF INVESTMENTS (continued)
| | | | |
| | Coupon | Maturity | Principal | |
| Bonds and Notes (continued) | Rate (%) | Date | Amount ($) | Value ($) |
| Energy (continued) | | | | |
| Apache, | | | | |
| Sr. Unscd. Notes | 4.75 | 4/15/43 | 1,000,000 | 1,005,309 |
| Apache, | | | | |
| Sr. Unscd. Notes | 6.00 | 1/15/37 | 380,000 | 444,376 |
| BP Capital Markets, | | | | |
| Gtd. Notes | 1.85 | 5/5/17 | 1,250,000 | 1,268,329 |
| BP Capital Markets, | | | | |
| Gtd. Notes | 2.50 | 11/6/22 | 800,000 | 760,663 |
| BP Capital Markets, | | | | |
| Gtd. Notes | 3.20 | 3/11/16 | 1,000,000 | 1,032,837 |
| BP Capital Markets, | | | | |
| Gtd. Notes | 3.25 | 5/6/22 | 1,200,000 | 1,205,574 |
| Buckeye Partners, | | | | |
| Sr. Unscd. Notes | 2.65 | 11/15/18 | 250,000 | 249,965 |
| Cameron International, | | | | |
| Sr. Unscd. Notes | 1.40 | 6/15/17 | 500,000 | 500,273 |
| Cameron International, | | | | |
| Sr. Unscd. Notes | 5.13 | 12/15/43 | 175,000 | 187,622 |
| Canadian Natural Resources, | | | | |
| Sr. Unscd. Notes | 6.25 | 3/15/38 | 430,000 | 522,105 |
| Cenovus Energy, | | | | |
| Sr. Unscd. Notes | 3.80 | 9/15/23 | 1,000,000 | 1,015,411 |
| Chevron, | | | | |
| Sr. Unscd. Notes | 0.89 | 6/24/16 | 500,000 | 502,754 |
| Chevron, | | | | |
| Sr. Unscd. Notes | 1.72 | 6/24/18 | 1,000,000 | 1,010,162 |
| Chevron, | | | | |
| Sr. Unscd. Notes | 3.19 | 6/24/23 | 400,000 | 408,762 |
| CNOOC Finance 2013, | | | | |
| Gtd. Notes | 1.13 | 5/9/16 | 500,000 | 500,409 |
| CNOOC Finance 2013, | | | | |
| Gtd. Notes | 3.00 | 5/9/23 | 500,000 | 475,173 |
| ConocoPhillips, | | | | |
| Gtd. Notes | 2.40 | 12/15/22 | 1,000,000 | 967,607 |
| ConocoPhillips, | | | | |
| Gtd. Notes | 6.50 | 2/1/39 | 1,000,000 | 1,330,860 |
| ConocoPhillips Holding, | | | | |
| Sr. Unscd. Notes | 6.95 | 4/15/29 | 125,000 | 169,296 |
| Continental Resources, | | | | |
| Gtd. Notes | 3.80 | 6/1/24 | 500,000 | 495,042 |
18
| | | | | |
| | Coupon | Maturity | Principal | | |
| Bonds and Notes (continued) | Rate (%) | Date | Amount ($) | | Value ($) |
| Energy (continued) | | | | | |
| Continental Resources, | | | | | |
| Gtd. Notes | 4.50 | 4/15/23 | 500,000 | | 524,639 |
| Devon Energy, | | | | | |
| Sr. Unscd. Notes | 5.60 | 7/15/41 | 650,000 | | 736,977 |
| Devon Financing, | | | | | |
| Gtd. Debs | 7.88 | 9/30/31 | 275,000 | | 384,204 |
| Enable Midstream Partners, | | | | | |
| Gtd. Notes | 5.00 | 5/15/44 | 500,000 | b | 506,544 |
| Enbridge Energy Partners, | | | | | |
| Sr. Unscd. Notes | 5.50 | 9/15/40 | 720,000 | | 768,020 |
| Encana, | | | | | |
| Sr. Unscd. Bonds | 7.20 | 11/1/31 | 625,000 | | 807,702 |
| Energy Transfer Partners, | | | | | |
| Sr. Unscd. Notes | 3.60 | 2/1/23 | 1,000,000 | c | 981,416 |
| Energy Transfer Partners, | | | | | |
| Sr. Unscd. Notes | 4.90 | 2/1/24 | 500,000 | c | 533,691 |
| Energy Transfer Partners, | | | | | |
| Sr. Unscd. Notes | 5.15 | 2/1/43 | 500,000 | | 500,296 |
| Enterprise Products Operating, | | | | | |
| Gtd. Notes | 3.35 | 3/15/23 | 600,000 | | 595,876 |
| Enterprise Products Operating, | | | | | |
| Gtd. Notes | 4.45 | 2/15/43 | 750,000 | | 731,624 |
| Enterprise Products Operating, | | | | | |
| Gtd. Bonds, Ser. L | 6.30 | 9/15/17 | 1,000,000 | | 1,138,493 |
| Exelon Generation, | | | | | |
| Sr. Unscd. Notes | 5.20 | 10/1/19 | 1,000,000 | | 1,119,799 |
| Halliburton, | | | | | |
| Sr. Unscd. Notes | 6.15 | 9/15/19 | 1,200,000 | | 1,418,222 |
| Hess, | | | | | |
| Sr. Unscd. Bonds | 7.88 | 10/1/29 | 175,000 | | 237,359 |
| Hess, | | | | | |
| Sr. Unscd. Notes | 8.13 | 2/15/19 | 1,200,000 | | 1,472,513 |
| Kerr-McGee, | | | | | |
| Gtd. Notes | 6.95 | 7/1/24 | 600,000 | | 750,978 |
| Kinder Morgan Energy Partners, | | | | | |
| Sr. Unscd. Notes | 3.50 | 9/1/23 | 500,000 | | 480,471 |
| Kinder Morgan Energy Partners, | | | | | |
| Sr. Unscd. Notes | 4.15 | 3/1/22 | 1,000,000 | | 1,023,756 |
| Kinder Morgan Energy Partners, | | | | | |
| Sr. Unscd. Notes | 5.00 | 3/1/43 | 300,000 | | 277,743 |
The Fund 19
STATEMENT OF INVESTMENTS (continued)
| | | | | |
| | Coupon | Maturity | Principal | | |
| Bonds and Notes (continued) | Rate (%) | Date | Amount ($) | | Value ($) |
| Energy (continued) | | | | | |
| Kinder Morgan Energy Partners, | | | | | |
| Sr. Unscd. Notes | 7.40 | 3/15/31 | 350,000 | | 420,030 |
| Marathon Oil, | | | | | |
| Sr. Unscd. Notes | 5.90 | 3/15/18 | 500,000 | | 565,096 |
| Marathon Oil, | | | | | |
| Sr. Unscd. Notes | 6.60 | 10/1/37 | 550,000 | | 693,296 |
| Marathon Petroleum, | | | | | |
| Sr. Unscd. Notes | 4.75 | 9/15/44 | 500,000 | c | 505,082 |
| Nabors Industries, | | | | | |
| Gtd. Notes | 2.35 | 9/15/16 | 450,000 | | 457,030 |
| Nexen Energy, | | | | | |
| Gtd. Notes | 5.88 | 3/10/35 | 125,000 | | 145,624 |
| Noble Energy, | | | | | |
| Sr. Unscd. Notes | 4.15 | 12/15/21 | 539,000 | | 575,746 |
| Noble Holding International, | | | | | |
| Gtd. Notes | 3.95 | 3/15/22 | 1,000,000 | c | 966,124 |
| Occidental Petroleum, | | | | | |
| Sr. Unscd. Notes, Ser. 1 | 4.10 | 2/1/21 | 1,700,000 | | 1,836,270 |
| ONEOK Partners, | | | | | |
| Gtd. Notes | 5.00 | 9/15/23 | 500,000 | c | 543,783 |
| ONEOK Partners, | | | | | |
| Gtd. Notes | 6.15 | 10/1/16 | 545,000 | | 594,255 |
| ONEOK Partners, | | | | | |
| Gtd. Notes | 6.85 | 10/15/37 | 60,000 | | 73,400 |
| Petrobras Global Finance, | | | | | |
| Gtd. Notes | 2.00 | 5/20/16 | 550,000 | | 549,593 |
| Petrobras Global Finance, | | | | | |
| Gtd. Notes | 3.00 | 1/15/19 | 500,000 | | 488,620 |
| Petrobras Global Finance, | | | | | |
| Gtd. Notes | 5.63 | 5/20/43 | 500,000 | | 458,635 |
| Petrobras Global Finance, | | | | | |
| Gtd. Notes | 7.25 | 3/17/44 | 500,000 | | 550,480 |
| Petrobras International Finance, | | | | | |
| Gtd. Notes | 5.38 | 1/27/21 | 2,500,000 | | 2,572,150 |
| Petrobras International Finance, | | | | | |
| Gtd. Notes | 5.88 | 3/1/18 | 625,000 | | 673,269 |
| Phillips 66, | | | | | |
| Gtd. Notes | 2.95 | 5/1/17 | 590,000 | | 613,051 |
| Pioneer Natural Resources, | | | | | |
| Sr. Unscd. Notes | 3.95 | 7/15/22 | 1,000,000 | | 1,009,643 |
20
| | | | | |
| | Coupon | Maturity | Principal | | |
| Bonds and Notes (continued) | Rate (%) | Date | Amount ($) | | Value ($) |
| Energy (continued) | | | | | |
| Plains All American Pipeline, | | | | | |
| Sr. Unscd. Notes | 3.85 | 10/15/23 | 750,000 | | 765,031 |
| Plains All American Pipeline, | | | | | |
| Sr. Unscd. Notes | 6.13 | 1/15/17 | 525,000 | | 579,481 |
| Pride International, | | | | | |
| Gtd. Notes | 6.88 | 8/15/20 | 1,000,000 | | 1,170,329 |
| Shell International Finance, | | | | | |
| Gtd. Notes | 4.30 | 9/22/19 | 1,600,000 | | 1,766,858 |
| Shell International Finance, | | | | | |
| Gtd. Notes | 6.38 | 12/15/38 | 500,000 | | 664,272 |
| Spectra Energy Capital, | | | | | |
| Gtd. Notes | 8.00 | 10/1/19 | 225,000 | | 279,167 |
| Spectra Energy Partners, | | | | | |
| Sr. Unscd. Notes | 5.95 | 9/25/43 | 400,000 | | 482,525 |
| Statoil, | | | | | |
| Gtd. Notes | 2.65 | 1/15/24 | 1,000,000 | | 962,276 |
| Statoil, | | | | | |
| Gtd. Notes | 5.25 | 4/15/19 | 1,600,000 | | 1,820,534 |
| Suncor Energy, | | | | | |
| Sr. Unscd. Notes | 6.50 | 6/15/38 | 950,000 | | 1,245,214 |
| Sunoco Logistics Partners | | | | | |
| Operations, Gtd. Notes | 3.45 | 1/15/23 | 200,000 | | 196,695 |
| Sunoco Logistics Partners | | | | | |
| Operations, Gtd. Notes | 4.95 | 1/15/43 | 200,000 | | 197,130 |
| Talisman Energy, | | | | | |
| Sr. Unscd. Notes | 6.25 | 2/1/38 | 200,000 | | 210,453 |
| Tennessee Gas Pipeline, | | | | | |
| Sr. Unscd. Debs | 7.00 | 10/15/28 | 390,000 | | 481,580 |
| Tennessee Gas Pipeline, | | | | | |
| Sr. Unscd Debs | 7.63 | 4/1/37 | 70,000 | | 89,259 |
| Total Capital, | | | | | |
| Gtd. Notes | 2.13 | 8/10/18 | 1,500,000 | | 1,525,134 |
| Total Capital, | | | | | |
| Gtd. Notes | 4.45 | 6/24/20 | 1,400,000 | | 1,560,296 |
| Total Capital International, | | | | | |
| Gtd. Notes | 2.75 | 6/19/21 | 500,000 | | 502,109 |
| Total Capital International, | | | | | |
| Gtd. Notes | 3.75 | 4/10/24 | 340,000 | c | 353,569 |
| TransCanada Pipelines, | | | | | |
| Sr. Unscd. Notes | 3.75 | 10/16/23 | 500,000 | | 511,652 |
The Fund 21
STATEMENT OF INVESTMENTS (continued)
| | | | | |
| | Coupon | Maturity | Principal | | |
| Bonds and Notes (continued) | Rate (%) | Date | Amount ($) | | Value ($) |
| Energy (continued) | | | | | |
| Trans Canada Pipelines, | | | | | |
| Sr. Unscd. Notes | 5.85 | 3/15/36 | 200,000 | | 235,715 |
| Trans Canada Pipelines, | | | | | |
| Sr. Unscd. Notes | 6.20 | 10/15/37 | 75,000 | | 91,104 |
| Trans Canada Pipelines, | | | | | |
| Sr. Unscd. Notes | 7.63 | 1/15/39 | 660,000 | | 926,828 |
| Transocean, | | | | | |
| Gtd. Notes | 7.50 | 4/15/31 | 875,000 | | 927,388 |
| Valero Energy, | | | | | |
| Gtd. Notes | 6.63 | 6/15/37 | 615,000 | | 758,476 |
| Valero Energy, | | | | | |
| Gtd. Notes | 7.50 | 4/15/32 | 170,000 | | 219,651 |
| Weatherford International, | | | | | |
| Gtd. Notes | 6.75 | 9/15/40 | 1,000,000 | | 1,159,761 |
| Williams Companies, | | | | | |
| Sr. Unscd. Notes | 4.55 | 6/24/24 | 500,000 | | 490,801 |
| Williams Partners, | | | | | |
| Sr. Unscd. Notes | 4.13 | 11/15/20 | 1,000,000 | | 1,052,939 |
| Williams Partners, | | | | | |
| Sr. Unscd. Notes | 6.30 | 4/15/40 | 800,000 | | 926,429 |
| XTO Energy, | | | | | |
| Gtd. Notes | 6.75 | 8/1/37 | 625,000 | | 902,120 |
| | | | | | 67,942,805 |
| Financial—8.1% | | | | | |
| Abbey National Treasury Service, | | | | | |
| Gtd. Notes | 3.05 | 8/23/18 | 800,000 | | 832,855 |
| Aflac, | | | | | |
| Sr. Unscd. Notes | 3.63 | 6/15/23 | 600,000 | | 609,768 |
| Air Lease, | | | | | |
| Sr. Unscd. Notes | 2.13 | 1/15/18 | 500,000 | | 495,625 |
| Air Lease, | | | | | |
| Sr. Unscd. Notes | 3.38 | 1/15/19 | 350,000 | c | 356,125 |
| Alexandria Real Estate Equities, | | | | | |
| Gtd. Notes | 2.75 | 1/15/20 | 1,000,000 | | 998,364 |
| Allstate, | | | | | |
| Sub. Notes | 5.75 | 8/15/53 | 300,000 | a | 319,687 |
| American Express Credit, | | | | | |
| Sr. Unscd. Notes | 1.55 | 9/22/17 | 500,000 | | 501,848 |
| American Express Credit, | | | | | |
| Sr. Unscd. Notes | 2.25 | 8/15/19 | 750,000 | | 750,712 |
22
| | | | | |
| | Coupon | Maturity | Principal | | |
| Bonds and Notes (continued) | Rate (%) | Date | Amount ($) | | Value ($) |
| Financial (continued) | | | | | |
| American Express, | | | | | |
| Sr. Unscd. Notes | 1.55 | 5/22/18 | 1,750,000 | | 1,727,976 |
| American Express, | | | | | |
| Sr. Unscd. Notes | 6.15 | 8/28/17 | 700,000 | | 789,274 |
| American Express, | | | | | |
| Sr. Unscd. Notes | 7.00 | 3/19/18 | 500,000 | | 583,191 |
| American Honda Finance, | | | | | |
| Sr. Unscd. Notes | 1.13 | 10/7/16 | 400,000 | | 399,431 |
| American International Group, | | | | | |
| Sr. Unscd. Notes | 4.88 | 6/1/22 | 1,400,000 | | 1,564,045 |
| American International Group, | | | | | |
| Sr. Unscd. Notes | 5.60 | 10/18/16 | 600,000 | | 651,770 |
| American International Group, | | | | | |
| Sr. Unscd. Notes | 5.85 | 1/16/18 | 1,000,000 | | 1,127,796 |
| American International Group, | | | | | |
| Sr. Unscd. Notes | 6.25 | 5/1/36 | 750,000 | | 951,269 |
| American Tower, | | | | | |
| Sr. Unscd. Notes | 3.40 | 2/15/19 | 580,000 | | 593,836 |
| AON, | | | | | |
| Gtd. Notes | 4.60 | 6/14/44 | 1,000,000 | | 1,007,963 |
| ARC Properties Operating | | | | | |
| Partnership, Gtd. Notes | 4.60 | 2/6/24 | 750,000 | c | 730,924 |
| Australia & | | | | | |
| New Zealand Banking | | | | | |
| Group of New York, | | | | | |
| Sr. Unscd. Bonds | 1.25 | 6/13/17 | 1,000,000 | | 999,526 |
| AvalonBay Communities, | | | | | |
| Sr. Unscd. Notes | 4.20 | 12/15/23 | 750,000 | | 796,465 |
| AXA, | | | | | |
| Sub. Bonds | 8.60 | 12/15/30 | 165,000 | | 222,544 |
| Bank of America, | | | | | |
| Sr. Unscd. Notes | 1.13 | 11/14/16 | 250,000 | | 249,924 |
| Bank of America, | | | | | |
| Sr. Unscd. Notes | 1.25 | 1/11/16 | 1,000,000 | | 1,004,812 |
| Bank of America, | | | | | |
| Sr. Unscd. Notes | 1.25 | 2/14/17 | 1,500,000 | | 1,502,731 |
| Bank of America, | | | | | |
| Sr. Unscd. Notes, Ser. L | 1.35 | 11/21/16 | 250,000 | | 250,350 |
| Bank of America, | | | | | |
| Sr. Unscd. Notes | 2.60 | 1/15/19 | 400,000 | | 404,068 |
The Fund 23
STATEMENT OF INVESTMENTS (continued)
| | | | | |
| | Coupon | Maturity | Principal | | |
| Bonds and Notes (continued) | Rate (%) | Date | Amount ($) | | Value ($) |
| Financial (continued) | | | | | |
| Bank of America, | | | | | |
| Sr. Unscd. Notes | 3.30 | 1/11/23 | 1,000,000 | | 992,529 |
| Bank of America, | | | | | |
| Sr. Unscd. Notes | 4.13 | 1/22/24 | 1,000,000 | | 1,041,219 |
| Bank of America, | | | | | |
| Sub. Notes | 4.20 | 8/26/24 | 800,000 | | 806,694 |
| Bank of America, | | | | | |
| Sr. Unscd. Notes | 5.00 | 1/21/44 | 500,000 | | 548,551 |
| Bank of America, | | | | | |
| Sr. Unscd. Notes | 5.63 | 10/14/16 | 575,000 | | 625,714 |
| Bank of America, | | | | | |
| Sr. Unscd. Notes | 5.63 | 7/1/20 | 800,000 | | 909,634 |
| Bank of America, | | | | | |
| Sr. Unscd. Notes | 5.65 | 5/1/18 | 965,000 | | 1,078,161 |
| Bank of America, | | | | | |
| Sub. Notes | 7.80 | 9/15/16 | 235,000 | | 261,949 |
| Bank of Montreal, | | | | | |
| Sr. Unscd. Notes | 2.50 | 1/11/17 | 1,000,000 | | 1,030,805 |
| Bank of Nova Scotia, | | | | | |
| Sr. Unscd. Notes | 1.10 | 12/13/16 | 750,000 | | 753,273 |
| Bank of Nova Scotia, | | | | | |
| Sr. Unscd. Notes | 1.30 | 7/21/17 | 1,000,000 | | 999,107 |
| Bank of Nova Scotia, | | | | | |
| Sr. Unscd. Notes | 1.38 | 7/15/16 | 1,000,000 | | 1,009,735 |
| Barclays Bank, | | | | | |
| Sr. Unscd. Notes | 6.75 | 5/22/19 | 1,300,000 | | 1,546,315 |
| BB&T, | | | | | |
| Sub. Notes | 4.90 | 6/30/17 | 150,000 | | 163,227 |
| BB&T, | | | | | |
| Sub. Notes | 5.20 | 12/23/15 | 300,000 | | 315,174 |
| Bear Stearns, | | | | | |
| Sub. Notes | 5.55 | 1/22/17 | 500,000 | | 543,979 |
| Bear Stearns, | | | | | |
| Sr. Unscd. Notes | 7.25 | 2/1/18 | 1,770,000 | | 2,059,128 |
| Berkshire Hathaway, | | | | | |
| Sr. Unscd. Notes | 2.10 | 8/14/19 | 1,000,000 | c | 1,006,631 |
| Berkshire Hathaway Finance, | | | | | |
| Gtd. Notes | 5.75 | 1/15/40 | 675,000 | | 821,623 |
| Blackrock, | | | | | |
| Sr. Unscd. Notes | 3.50 | 3/18/24 | 500,000 | | 509,206 |
24
| | | | |
| | Coupon | Maturity | Principal | |
| Bonds and Notes (continued) | Rate (%) | Date | Amount ($) | Value ($) |
| Financial (continued) | | | | |
| Blackrock, | | | | |
| Sr. Unscd. Notes, Ser. 2 | 5.00 | 12/10/19 | 500,000 | 567,828 |
| BNP Paribas, | | | | |
| Gtd. Notes | 5.00 | 1/15/21 | 1,400,000 | 1,568,077 |
| Boston Properties, | | | | |
| Sr. Unscd. Bonds | 5.63 | 11/15/20 | 1,000,000 | 1,145,548 |
| BPCE, | | | | |
| Gtd. Notes | 2.50 | 7/15/19 | 1,000,000 | 1,001,831 |
| BPCE, | | | | |
| Gtd. Notes | 4.00 | 4/15/24 | 200,000 | 207,120 |
| Branch Banking & Trust, | | | | |
| Sr. Unscd. Notes | 1.35 | 10/1/17 | 500,000 | 499,093 |
| Branch Banking & Trust, | | | | |
| Sr. Unscd. Notes | 1.45 | 10/3/16 | 750,000 | 758,214 |
| Capital One Bank USA, | | | | |
| Sr. Unscd. Notes | 1.15 | 11/21/16 | 500,000 | 499,191 |
| Capital One Bank USA, | | | | |
| Sr. Unscd. Notes | 1.20 | 2/13/17 | 750,000 | 747,179 |
| Capital One Financial, | | | | |
| Sr. Unscd. Notes | 2.45 | 4/24/19 | 1,000,000 | 1,004,000 |
| Capital One Financial, | | | | |
| Sr. Unscd. Notes | 4.75 | 7/15/21 | 730,000 | 804,839 |
| Chubb, | | | | |
| Sr. Unscd. Notes | 6.00 | 5/11/37 | 540,000 | 691,256 |
| Citigroup, | | | | |
| Sr. Unscd. Bonds | 1.30 | 11/15/16 | 400,000 | 401,077 |
| Citigroup, | | | | |
| Sr. Unscd. Notes | 3.88 | 10/25/23 | 400,000 | 412,553 |
| Citigroup, | | | | |
| Sub. Notes | 4.05 | 7/30/22 | 1,750,000 | 1,803,291 |
| Citigroup, | | | | |
| Sr. Unscd. Notes | 4.59 | 12/15/15 | 45,000 | 46,889 |
| Citigroup, | | | | |
| Sr. Unscd. Notes | 4.95 | 11/7/43 | 1,500,000 | 1,646,079 |
| Citigroup, | | | | |
| Sr. Unscd. Notes | 5.38 | 8/9/20 | 300,000 | 341,104 |
| Citigroup, | | | | |
| Sub. Notes | 5.50 | 9/13/25 | 500,000 | 555,023 |
| Citigroup, | | | | |
| Sr. Unscd. Notes | 6.13 | 11/21/17 | 2,135,000 | 2,402,037 |
The Fund 25
STATEMENT OF INVESTMENTS (continued)
| | | | | |
| | Coupon | Maturity | Principal | | |
| Bonds and Notes (continued) | Rate (%) | Date | Amount ($) | | Value ($) |
| Financial (continued) | | | | | |
| Citigroup, | | | | | |
| Sub. Notes | 6.13 | 8/25/36 | 575,000 | | 679,381 |
| Citigroup, | | | | | |
| Sr. Unscd. Notes | 6.63 | 1/15/28 | 100,000 | | 126,880 |
| Citigroup, | | | | | |
| Sr. Unscd. Notes | 8.50 | 5/22/19 | 760,000 | | 954,517 |
| CNA Financial, | | | | | |
| Sr. Unscd. Notes | 6.50 | 8/15/16 | 100,000 | | 109,376 |
| Comerica, | | | | | |
| Sub. Notes | 3.80 | 7/22/26 | 1,000,000 | | 1,002,313 |
| Commonwealth Bank of Australia, | | | | | |
| Sr. Unscd. Bonds | 1.40 | 9/8/17 | 500,000 | | 499,741 |
| Commonwealth Bank of Australia, | | | | | |
| Sr. Unscd. Notes | 2.50 | 9/20/18 | 650,000 | | 664,163 |
| Credit Suisse, | | | | | |
| Sr. Unscd. Notes | 3.63 | 9/9/24 | 500,000 | | 502,458 |
| Credit Suisse, | | | | | |
| Sr. Unscd. Notes | 4.38 | 8/5/20 | 1,000,000 | | 1,095,116 |
| Credit Suisse, | | | | | |
| Sub. Notes | 6.00 | 2/15/18 | 1,000,000 | | 1,120,050 |
| DDR, | | | | | |
| Sr. Unscd. Notes | 3.38 | 5/15/23 | 1,000,000 | | 970,352 |
| Deutsche Bank London, | | | | | |
| Sr. Unscd. Notes | 2.50 | 2/13/19 | 750,000 | c | 759,004 |
| Deutsche Bank London, | | | | | |
| Sr. Unscd. Notes | 6.00 | 9/1/17 | 845,000 | | 947,711 |
| Discover Bank, | | | | | |
| Sr. Unscd. Bonds | 2.00 | 2/21/18 | 500,000 | | 498,195 |
| Discover Bank, | | | | | |
| Sr. Unscd. Notes | 4.25 | 3/13/26 | 800,000 | | 834,428 |
| ERP Operating, | | | | | |
| Sr. Unscd. Notes | 2.38 | 7/1/19 | 1,000,000 | | 1,000,921 |
| ERP Operating, | | | | | |
| Sr. Unscd. Notes | 5.38 | 8/1/16 | 95,000 | | 102,265 |
| Fidelity National Information | | | | | |
| Services, Gtd. Notes | 2.00 | 4/15/18 | 500,000 | | 501,414 |
| Fifth Third Bancorp, | | | | | |
| Sr. Unscd. Notes | 3.50 | 3/15/22 | 1,000,000 | | 1,027,519 |
| First Republic Bank, | | | | | |
| Sr. Unscd. Notes | 2.38 | 6/17/19 | 500,000 | | 502,815 |
26
| | | | |
| | Coupon | Maturity | Principal | |
| Bonds and Notes (continued) | Rate (%) | Date | Amount ($) | Value ($) |
| Financial (continued) | | | | |
| Ford Motor Credit, | | | | |
| Sr. Unscd. Notes | 2.38 | 1/16/18 | 500,000 | 505,173 |
| Ford Motor Credit, | | | | |
| Sr. Unscd. Notes | 2.50 | 1/15/16 | 900,000 | 915,548 |
| Ford Motor Credit, | | | | |
| Sr. Unscd. Notes | 4.38 | 8/6/23 | 1,250,000 | 1,328,404 |
| Ford Motor Credit, | | | | |
| Sr. Unscd. Notes | 8.13 | 1/15/20 | 971,000 | 1,214,827 |
| General Electric Capital, | | | | |
| Sr. Unscd. Notes | 1.00 | 1/8/16 | 1,000,000 | 1,005,376 |
| General Electric Capital, | | | | |
| Sr. Unscd. Notes | 1.25 | 5/15/17 | 2,225,000 | 2,232,027 |
| General Electric Capital, | | | | |
| Sr. Unscd. Notes | 2.30 | 4/27/17 | 1,000,000 | 1,027,431 |
| General Electric Capital, | | | | |
| Sr. Unscd. Notes | 3.10 | 1/9/23 | 1,000,000 | 1,002,853 |
| General Electric Capital, | | | | |
| Sr. Unscd. Notes | 4.65 | 10/17/21 | 1,400,000 | 1,566,649 |
| General Electric Capital, | | | | |
| Sr. Unscd. Notes | 5.00 | 1/8/16 | 375,000 | 393,877 |
| General Electric Capital, | | | | |
| Sr. Unscd. Notes | 5.55 | 5/4/20 | 500,000 | 577,357 |
| General Electric Capital, | | | | |
| Sr. Unscd. Notes | 5.63 | 9/15/17 | 1,000,000 | 1,118,415 |
| General Electric Capital, | | | | |
| Sr. Unscd. Notes | 5.63 | 5/1/18 | 1,335,000 | 1,510,622 |
| General Electric Capital, | | | | |
| Sr. Unscd. Notes | 5.88 | 1/14/38 | 1,000,000 | 1,229,576 |
| General Electric Capital, | | | | |
| Sr. Unscd. Notes | 6.75 | 3/15/32 | 1,000,000 | 1,333,433 |
| Genworth Holdings, | | | | |
| Gtd. Notes | 4.90 | 8/15/23 | 1,000,000 | 1,043,055 |
| Goldman Sachs Group, | | | | |
| Sr. Unscd. Bonds | 2.55 | 10/23/19 | 1,000,000 | 994,743 |
| Goldman Sachs Group, | | | | |
| Sr. Unscd. Notes | 3.63 | 1/22/23 | 1,000,000 | 1,004,561 |
| Goldman Sachs Group, | | | | |
| Sr. Unscd. Notes | 5.38 | 3/15/20 | 1,000,000 | 1,122,107 |
| Goldman Sachs Group, | | | | |
| Sr. Unscd. Notes | 5.95 | 1/18/18 | 1,000,000 | 1,120,476 |
The Fund 27
STATEMENT OF INVESTMENTS (continued)
| | | | | |
| | Coupon | Maturity | Principal | | |
| Bonds and Notes (continued) | Rate (%) | Date | Amount ($) | | Value ($) |
| Financial (continued) | | | | | |
| Goldman Sachs Group, | | | | | |
| Sr. Unscd. Notes | 6.13 | 2/15/33 | 475,000 | | 580,146 |
| Goldman Sachs Group, | | | | | |
| Sr. Unscd. Notes | 6.15 | 4/1/18 | 680,000 | | 768,758 |
| Goldman Sachs Group, | | | | | |
| Sr. Unscd. Notes | 6.25 | 9/1/17 | 190,000 | | 213,111 |
| Goldman Sachs Group, | | | | | |
| Sr. Unscd. Notes | 6.25 | 2/1/41 | 1,000,000 | | 1,243,562 |
| Goldman Sachs Group, | | | | | |
| Sub. Notes | 6.75 | 10/1/37 | 1,500,000 | | 1,842,468 |
| Goldman Sachs Group, | | | | | |
| Sr. Unscd. Notes | 7.50 | 2/15/19 | 1,000,000 | | 1,195,154 |
| HCP, | | | | | |
| Sr. Unscd. Notes | 4.20 | 3/1/24 | 750,000 | | 767,915 |
| HCP, | | | | | |
| Sr. Unscd. Notes | 4.25 | 11/15/23 | 400,000 | | 415,613 |
| Health Care REIT, | | | | | |
| Sr. Unscd. Notes | 2.25 | 3/15/18 | 750,000 | | 759,637 |
| Health Care REIT, | | | | | |
| Sr. Unscd. Notes | 4.95 | 1/15/21 | 600,000 | | 659,438 |
| Host Hotels & Resorts, | | | | | |
| Sr. Unscd. Notes | 6.00 | 10/1/21 | 500,000 | | 573,333 |
| HSBC Finance, | | | | | |
| Sr. Unscd. Notes | 5.50 | 1/19/16 | 1,125,000 | | 1,187,943 |
| HSBC Finance Capital Trust IX, | | | | | |
| Gtd. Notes | 5.91 | 11/30/35 | 400,000 | a | 410,000 |
| HSBC Holdings, | | | | | |
| Sub. Notes | 4.25 | 3/14/24 | 500,000 | | 514,979 |
| HSBC Holdings, | | | | | |
| Sr. Unscd. Notes | 5.10 | 4/5/21 | 1,500,000 | | 1,695,202 |
| HSBC Holdings, | | | | | |
| Sub. Notes | 6.50 | 5/2/36 | 1,350,000 | | 1,694,474 |
| HSBC Holdings, | | | | | |
| Sub. Notes | 6.50 | 9/15/37 | 555,000 | | 692,626 |
| Intercontinental Exchange Group, | | | | | |
| Gtd. Notes | 4.00 | 10/15/23 | 350,000 | | 367,316 |
| Intesa Sanpaolo, | | | | | |
| Gtd. Notes | 3.13 | 1/15/16 | 500,000 | | 510,653 |
| Intesa Sanpaolo, | | | | | |
| Gtd. Bonds | 5.25 | 1/12/24 | 400,000 | | 436,334 |
28
| | | | |
| | Coupon | Maturity | Principal | |
| Bonds and Notes (continued) | Rate (%) | Date | Amount ($) | Value ($) |
| Financial (continued) | | | | |
| Invesco Finance, | | | | |
| Gtd. Notes | 4.00 | 1/30/24 | 250,000 | 261,089 |
| Jefferies Group, | | | | |
| Sr. Unscd. Notes | 5.13 | 1/20/23 | 500,000 | 530,732 |
| Jefferies Group, | | | | |
| Sr. Unscd. Debs | 6.45 | 6/8/27 | 35,000 | 39,803 |
| John Deere Capital, | | | | |
| Sr. Unscd. Notes | 1.55 | 12/15/17 | 750,000 | 751,492 |
| John Deere Capital, | | | | |
| Sr. Unscd. Notes | 3.15 | 10/15/21 | 1,900,000 | 1,947,859 |
| JPMorgan Chase & Co., | | | | |
| Sr. Unscd. Notes | 3.15 | 7/5/16 | 1,500,000 | 1,551,888 |
| JPMorgan Chase & Co., | | | | |
| Sr. Unscd. Notes | 3.20 | 1/25/23 | 1,000,000 | 993,180 |
| JPMorgan Chase & Co., | | | | |
| Sub. Notes | 3.88 | 9/10/24 | 1,000,000 | 994,703 |
| JPMorgan Chase & Co., | | | | |
| Sr. Unscd. Notes | 4.85 | 2/1/44 | 1,150,000 | 1,241,462 |
| JPMorgan Chase & Co., | | | | |
| Sr. Unscd. Notes | 6.00 | 1/15/18 | 500,000 | 563,834 |
| JPMorgan Chase & Co., | | | | |
| Sr. Unscd. Notes | 6.30 | 4/23/19 | 1,500,000 | 1,741,783 |
| JPMorgan Chase & Co., | | | | |
| Sr. Unscd. Notes | 6.40 | 5/15/38 | 650,000 | 837,582 |
| JPMorgan Chase Bank, | | | | |
| Sub. Notes | 6.00 | 10/1/17 | 150,000 | 168,101 |
| KeyBank, | | | | |
| Sub. Notes | 6.95 | 2/1/28 | 100,000 | 129,305 |
| Kimco Realty, | | | | |
| Sr. Unscd. Notes | 3.13 | 6/1/23 | 250,000 | 243,921 |
| Kimco Realty, | | | | |
| Sr. Unscd. Notes | 3.20 | 5/1/21 | 250,000 | 252,477 |
| Lazard Group, | | | | |
| Sr. Unscd. Notes | 4.25 | 11/14/20 | 250,000 | 265,355 |
| Legg Mason, | | | | |
| Sr. Unscd. Notes | 5.63 | 1/15/44 | 400,000 | 447,741 |
| Leucadia National, | | | | |
| Sr. Unscd. Notes | 6.63 | 10/23/43 | 400,000 | 416,629 |
| Lexington Realty Trust, | | | | |
| Gtd. Notes | 4.40 | 6/15/24 | 500,000 | 508,252 |
The Fund 29
STATEMENT OF INVESTMENTS (continued)
| | | | | |
| | Coupon | Maturity | Principal | | |
| Bonds and Notes (continued) | Rate (%) | Date | Amount ($) | | Value ($) |
| Financial (continued) | | | | | |
| Lincoln National, | | | | | |
| Sr. Unscd. Notes | 6.15 | 4/7/36 | 575,000 | | 702,697 |
| Lloyds Bank, | | | | | |
| Gtd. Notes | 2.35 | 9/5/19 | 500,000 | | 500,138 |
| Loews, | | | | | |
| Sr. Unscd. Notes | 2.63 | 5/15/23 | 250,000 | | 238,354 |
| Marsh & McLennan Cos., | | | | | |
| Sr. Unscd. Notes | 5.88 | 8/1/33 | 275,000 | | 330,700 |
| MasterCard, | | | | | |
| Sr. Unscd. Notes | 2.00 | 4/1/19 | 500,000 | | 499,711 |
| Merrill Lynch & Co., | | | | | |
| Sub. Notes | 6.05 | 5/16/16 | 575,000 | | 615,797 |
| Merrill Lynch & Co., | | | | | |
| Sr. Unscd. Notes | 6.40 | 8/28/17 | 1,665,000 | | 1,876,961 |
| Merrill Lynch & Co., | | | | | |
| Sr. Unscd. Notes | 6.88 | 4/25/18 | 2,640,000 | | 3,056,278 |
| Merrill Lynch & Co., | | | | | |
| Sr. Unscd. Notes | 6.88 | 11/15/18 | 150,000 | | 175,412 |
| MetLife, | | | | | |
| Sr. Unscd. Notes | 1.90 | 12/15/17 | 1,000,000 | a | 1,009,566 |
| MetLife, | | | | | |
| Sr. Unscd. Notes | 3.60 | 4/10/24 | 250,000 | c | 255,320 |
| MetLife, | | | | | |
| Sr. Unscd. Notes | 6.38 | 6/15/34 | 700,000 | | 915,893 |
| Mid-America Apartments, | | | | | |
| Sr. Unscd. Notes | 4.30 | 10/15/23 | 400,000 | | 419,078 |
| Morgan Stanley, | | | | | |
| Sr. Unscd. Notes | 1.75 | 2/25/16 | 500,000 | | 504,653 |
| Morgan Stanley, | | | | | |
| Sr. Unscd. Notes | 3.75 | 2/25/23 | 500,000 | | 507,302 |
| Morgan Stanley, | | | | | |
| Sub. Notes | 4.10 | 5/22/23 | 1,000,000 | | 1,010,418 |
| Morgan Stanley, | | | | | |
| Sr. Unscd. Notes | 5.45 | 1/9/17 | 1,100,000 | | 1,194,251 |
| Morgan Stanley, | | | | | |
| Sr. Unscd. Notes | 5.50 | 1/26/20 | 1,000,000 | | 1,128,606 |
| Morgan Stanley, | | | | | |
| Sr. Unscd. Notes | 5.75 | 10/18/16 | 875,000 | | 949,917 |
| Morgan Stanley, | | | | | |
| Sr. Unscd. Notes | 6.38 | 7/24/42 | 700,000 | | 904,602 |
30
| | | | | |
| | Coupon | Maturity | Principal | | |
| Bonds and Notes (continued) | Rate (%) | Date | Amount ($) | | Value ($) |
| Financial (continued) | | | | | |
| Morgan Stanley, | | | | | |
| Sr. Unscd. Notes | 6.63 | 4/1/18 | 1,200,000 | | 1,375,252 |
| Morgan Stanley, | | | | | |
| Sr. Unscd. Notes | 7.25 | 4/1/32 | 300,000 | | 410,104 |
| Morgan Stanley, | | | | | |
| Sr. Unscd. Notes | 7.30 | 5/13/19 | 1,300,000 | | 1,553,348 |
| Nasdaq OMX Group, | | | | | |
| Sr. Unscd. Notes | 4.25 | 6/1/24 | 500,000 | | 510,241 |
| National City, | | | | | |
| Sub. Notes | 6.88 | 5/15/19 | 600,000 | | 710,761 |
| National Retail Property, | | | | | |
| Sr. Unscd. Notes | 3.90 | 6/15/24 | 500,000 | | 506,266 |
| National Rural Utilities | | | | | |
| Cooperative Finance, Coll. | | | | | |
| Trust Bonds | 5.45 | 2/1/18 | 1,100,000 | | 1,235,775 |
| Nomura Holdings, | | | | | |
| Sr. Unscd. Notes | 6.70 | 3/4/20 | 700,000 | | 833,345 |
| Northern Trust, | | | | | |
| Sub. Notes | 3.95 | 10/30/25 | 846,000 | | 881,262 |
| Nuveen Investments, | | | | | |
| Sr. Unscd. Notes | 9.13 | 10/15/17 | 200,000 | b | 213,910 |
| Nuveen Investments, | | | | | |
| Sr. Unscd. Notes | 9.50 | 10/15/20 | 1,000,000 | b | 1,222,500 |
| Omega | | | | | |
| Healthcare Investors, | | | | | |
| Gtd. Notes | 4.50 | 1/15/25 | 300,000 | b | 295,115 |
| PartnerRe Finance, | | | | | |
| Gtd. Notes | 5.50 | 6/1/20 | 159,000 | | 179,850 |
| PNC Bank, | | | | | |
| Sr. Unscd. Notes | 1.30 | 10/3/16 | 1,250,000 | | 1,260,630 |
| PNC Bank, | | | | | |
| Sub. Notes | 3.80 | 7/25/23 | 1,000,000 | | 1,032,359 |
| PNC Funding, | | | | | |
| Gtd. Notes | 5.25 | 11/15/15 | 225,000 | | 235,382 |
| Principal Financial Group, | | | | | |
| Gtd. Notes | 6.05 | 10/15/36 | 225,000 | | 275,808 |
| ProAssurance, | | | | | |
| Sr. Unscd. Notes | 5.30 | 11/15/23 | 350,000 | | 381,285 |
| Progressive, | | | | | |
| Sr. Unscd. Notes | 4.35 | 4/25/44 | 500,000 | | 518,172 |
The Fund 31
STATEMENT OF INVESTMENTS (continued)
| | | | | |
| | Coupon | Maturity | Principal | | |
| Bonds and Notes (continued) | Rate (%) | Date | Amount ($) | | Value ($) |
| Financial (continued) | | | | | |
| Progressive, | | | | | |
| Sr. Unscd. Notes | 6.63 | 3/1/29 | 100,000 | | 132,162 |
| ProLogis, | | | | | |
| Gtd. Notes | 6.88 | 3/15/20 | 505,000 | | 596,257 |
| Prudential Financial, | | | | | |
| Sr. Unscd. Notes | 4.60 | 5/15/44 | 1,250,000 | c | 1,271,233 |
| Rabobank Nederland, | | | | | |
| Gtd. Notes | 3.38 | 1/19/17 | 2,250,000 | | 2,363,812 |
| Rabobank Nederland, | | | | | |
| Gtd. Notes | 3.95 | 11/9/22 | 1,000,000 | | 1,018,240 |
| Realty Income, | | | | | |
| Sr. Unscd. Notes | 3.88 | 7/15/24 | 500,000 | | 503,140 |
| Realty Income, | | | | | |
| Sr. Unscd. Notes | 5.95 | 9/15/16 | 100,000 | | 108,811 |
| Regency Centers, | | | | | |
| Gtd. Notes | 5.88 | 6/15/17 | 200,000 | | 221,350 |
| Reinsurance Group of America, | | | | | |
| Sr. Unscd. Notes | 4.70 | 9/15/23 | 350,000 | | 376,911 |
| Royal Bank of Canada, | | | | | |
| Sr. Unscd. Notes | 1.20 | 1/23/17 | 110,000 | | 110,332 |
| Royal Bank of Canada, | | | | | |
| Sr. Unscd. Notes | 1.25 | 6/16/17 | 500,000 | | 500,019 |
| Royal Bank of Canada, | | | | | |
| Sr. Unscd. Notes | 1.40 | 10/13/17 | 1,000,000 | | 1,000,904 |
| Royal Bank of Canada, | | | | | |
| Sr. Unscd. Notes | 2.63 | 12/15/15 | 1,000,000 | | 1,023,173 |
| Ryder System, | | | | | |
| Sr. Unscd. Notes | 2.35 | 2/26/19 | 500,000 | | 500,327 |
| Simon Property Group, | | | | | |
| Sr. Unscd. Notes | 2.20 | 2/1/19 | 500,000 | | 505,282 |
| Simon Property Group, | | | | | |
| Sr. Unscd. Notes | 6.75 | 2/1/40 | 1,000,000 | | 1,351,160 |
| State Street, | | | | | |
| Sr. Unscd. Notes | 3.70 | 11/20/23 | 250,000 | c | 259,646 |
| State Street Bank & Trust, | | | | | |
| Sub. Notes | 5.25 | 10/15/18 | 200,000 | | 223,859 |
| Sumitomo Mitsui Banking, | | | | | |
| Gtd. Notes | 0.90 | 1/18/16 | 500,000 | | 500,774 |
| Sumitomo Mitsui Banking, | | | | | |
| Gtd. Bonds | 1.35 | 7/11/17 | 500,000 | | 497,856 |
32
| | | | |
| | Coupon | Maturity | Principal | |
| Bonds and Notes (continued) | Rate (%) | Date | Amount ($) | Value ($) |
| Financial (continued) | | | | |
| Sumitomo Mitsui Banking, | | | | |
| Gtd. Notes | 1.50 | 1/18/18 | 390,000 | 385,368 |
| Sumitomo Mitsui Banking, | | | | |
| Gtd. Bonds | 3.00 | 1/18/23 | 290,000 | 288,011 |
| Sumitomo Mitsui Banking, | | | | |
| Gtd. Bonds | 3.40 | 7/11/24 | 500,000 | 508,240 |
| SunTrust Bank, | | | | |
| Sr. Unscd. Notes | 2.75 | 5/1/23 | 500,000 | 480,685 |
| SunTrust Banks, | | | | |
| Sr. Unscd. Notes | 2.35 | 11/1/18 | 500,000 | 503,639 |
| Svenska Handelsbanken, | | | | |
| Gtd. Notes | 2.25 | 6/17/19 | 1,000,000 | 1,007,243 |
| Synchrony Financial, | | | | |
| Sr. Unscd. Notes | 4.25 | 8/15/24 | 1,000,000 | 1,017,645 |
| Toronto-Dominion Bank, | | | | |
| Sr. Unscd. Bonds | 2.63 | 9/10/18 | 750,000 | 769,127 |
| Toyota Motor Credit, | | | | |
| Sr. Unscd. Notes | 1.13 | 5/16/17 | 500,000 | 499,584 |
| Toyota Motor Credit, | | | | |
| Sr. Unscd. Notes | 2.63 | 1/10/23 | 1,000,000 | 985,827 |
| Travelers Cos., | | | | |
| Sr. Unscd. Notes | 3.90 | 11/1/20 | 1,000,000 | 1,077,212 |
| Travelers Cos., | | | | |
| Sr. Unscd. Notes | 5.50 | 12/1/15 | 960,000 | 1,010,512 |
| Travelers Cos., | | | | |
| Sr. Unscd. Notes | 5.90 | 6/2/19 | 1,000,000 | 1,168,076 |
| U.S. Bancorp, | | | | |
| Sr. Unscd. Notes | 3.00 | 3/15/22 | 1,400,000 | 1,409,120 |
| U.S. Bank, | | | | |
| Sr. Unscd. Notes | 1.10 | 1/30/17 | 1,000,000 | 1,001,944 |
| UBS AG Stamford, | | | | |
| Sr. Unscd. Notes | 1.38 | 8/14/17 | 500,000 | 498,596 |
| UBS AG/Stamford, | | | | |
| Sr. Unscd. Notes | 4.88 | 8/4/20 | 293,000 | 328,800 |
| UBS AG/Stamford, | | | | |
| Sr. Unscd. Notes | 5.75 | 4/25/18 | 320,000 | 361,395 |
| UBS AG/Stamford, | | | | |
| Sub. Notes | 5.88 | 7/15/16 | 75,000 | 80,928 |
| UBS AG/Stamford, | | | | |
| Sr. Unscd. Notes | 5.88 | 12/20/17 | 442,000 | 498,231 |
The Fund 33
STATEMENT OF INVESTMENTS (continued)
| | | | | |
| | Coupon | Maturity | Principal | | |
| Bonds and Notes (continued) | Rate (%) | Date | Amount ($) | | Value ($) |
| Financial (continued) | | | | | |
| Unilever Capital, | | | | | |
| Gtd. Notes | 2.20 | 3/6/19 | 500,000 | | 508,226 |
| Unilever Capital, | | | | | |
| Gtd. Notes | 5.90 | 11/15/32 | 250,000 | | 333,096 |
| Union Bank, | | | | | |
| Sr. Unscd. Notes | 2.63 | 9/26/18 | 500,000 | | 509,676 |
| Ventas Realty, | | | | | |
| Gtd. Notes | 2.70 | 4/1/20 | 1,000,000 | | 993,333 |
| Voya Financial, | | | | | |
| Gtd. Notes | 5.50 | 7/15/22 | 750,000 | | 846,872 |
| Wachovia, | | | | | |
| Sr. Unscd. Notes | 5.75 | 6/15/17 | 1,850,000 | | 2,058,201 |
| Wachovia, | | | | | |
| Sr. Unscd. Notes | 5.75 | 2/1/18 | 1,100,000 | | 1,242,249 |
| Wachovia Bank, | | | | | |
| Sub. Notes | 6.60 | 1/15/38 | 415,000 | | 566,584 |
| Wells Fargo & Co., | | | | | |
| Sr. Unscd. Notes | 1.15 | 6/2/17 | 950,000 | | 947,635 |
| Wells Fargo & Co., | | | | | |
| Sr. Unscd. Notes | 1.50 | 1/16/18 | 500,000 | | 499,319 |
| Wells Fargo & Co., | | | | | |
| Sr. Unscd. Notes | 2.15 | 1/15/19 | 1,250,000 | | 1,256,810 |
| Wells Fargo & Co., | | | | | |
| Sub. Notes, Ser. M | 3.45 | 2/13/23 | 500,000 | | 499,806 |
| Wells Fargo & Co., | | | | | |
| Sub. Notes | 4.10 | 6/3/26 | 500,000 | c | 507,837 |
| Wells Fargo & Co., | | | | | |
| Sub. Notes | 5.38 | 11/2/43 | 500,000 | | 561,229 |
| Wells Fargo & Co., | | | | | |
| Sr. Unscd. Notes | 5.63 | 12/11/17 | 840,000 | | 942,971 |
| Wells Fargo Bank, | | | | | |
| Sub. Notes | 5.75 | 5/16/16 | 875,000 | | 939,636 |
| Westpac Banking, | | | | | |
| Sub. Notes | 4.63 | 6/1/18 | 500,000 | | 540,827 |
| Westpac Banking, | | | | | |
| Sr. Unscd. Notes | 4.88 | 11/19/19 | 700,000 | | 788,004 |
| XLIT, | | | | | |
| Gtd. Notes | 6.38 | 11/15/24 | 1,400,000 | | 1,684,649 |
| | | | | | 194,708,151 |
34
| | | | | |
| | Coupon | Maturity | Principal | | |
| Bonds and Notes (continued) | Rate (%) | Date | Amount ($) | | Value ($) |
| Foreign/Governmental—5.0% | | | | | |
| African Development Bank, | | | | | |
| Sr. Unscd. Notes | 0.75 | 10/18/16 | 330,000 | | 331,020 |
| African Development Bank, | | | | | |
| Unscd. Notes | 2.38 | 9/23/21 | 1,000,000 | | 1,013,993 |
| Asian Development Bank, | | | | | |
| Sr. Unscd. Notes | 1.88 | 10/23/18 | 1,750,000 | | 1,780,777 |
| Asian Development Bank, | | | | | |
| Sr. Unscd. Notes | 2.50 | 3/15/16 | 1,500,000 | | 1,543,452 |
| Brazilian Government, | | | | | |
| Sr. Unscd. Notes | 4.25 | 1/7/25 | 1,000,000 | | 1,017,250 |
| Brazilian Government, | | | | | |
| Sr. Unscd. Bonds | 4.88 | 1/22/21 | 500,000 | | 541,250 |
| Brazilian Government, | | | | | |
| Sr. Unscd. Bonds | 5.63 | 1/7/41 | 650,000 | c | 706,875 |
| Brazilian Government, | | | | | |
| Sr. Unscd. Notes | 5.88 | 1/15/19 | 1,000,000 | | 1,135,000 |
| Brazilian Government, | | | | | |
| Sr. Unscd. Bonds | 6.00 | 1/17/17 | 2,270,000 | | 2,491,325 |
| Brazilian Government, | | | | | |
| Sr. Unscd. Bonds | 8.88 | 4/15/24 | 250,000 | | 346,250 |
| Brazilian Government, | | | | | |
| Unscd. Bonds | 10.13 | 5/15/27 | 500,000 | | 790,000 |
| Canadian Government, | | | | | |
| Sr. Unscd. Bonds | 1.63 | 2/27/19 | 1,000,000 | | 1,003,370 |
| Colombian Government, | | | | | |
| Sr. Unscd. Bonds | 6.13 | 1/18/41 | 500,000 | | 603,750 |
| Colombian Government, | | | | | |
| Sr. Unscd. Notes | 7.38 | 3/18/19 | 2,000,000 | | 2,408,000 |
| Colombian Government, | | | | | |
| Sr. Unscd. Bonds | 8.13 | 5/21/24 | 500,000 | | 668,750 |
| Corporacion Andina de Fomento, | | | | | |
| Sr. Unscd. Notes | 8.13 | 6/4/19 | 1,000,000 | | 1,238,010 |
| Council of Europe, | | | | | |
| Sr. Unscd. Notes | 1.50 | 6/19/17 | 1,000,000 | | 1,014,791 |
| Ecopetrol, | | | | | |
| Sr. Unscd. Notes | 7.38 | 9/18/43 | 1,000,000 | | 1,230,000 |
| European Bank for Reconstruction | | | | | |
| and Development, | | | | | |
| Sr. Unscd. Notes | 1.00 | 2/16/17 | 2,000,000 | | 2,012,942 |
The Fund 35
STATEMENT OF INVESTMENTS (continued)
| | | | | |
| | Coupon | Maturity | Principal | | |
| Bonds and Notes (continued) | Rate (%) | Date | Amount ($) | | Value ($) |
| Foreign/Governmental (continued) | | | | | |
| European Bank for Reconstruction | | | | | |
| and Development, Sr. Unscd. Notes | 1.75 | 6/14/19 | 500,000 | | 502,060 |
| European Investment Bank, | | | | | |
| Sr. Unscd. Bonds | 1.00 | 8/17/17 | 1,000,000 | | 1,002,420 |
| European Investment Bank, | | | | | |
| Sr. Unscd. Notes | 1.00 | 12/15/17 | 1,000,000 | | 997,627 |
| European Investment Bank, | | | | | |
| Sr. Unscd. Notes | 1.75 | 3/15/17 | 1,250,000 | | 1,279,052 |
| European Investment Bank, | | | | | |
| Sr. Unscd. Notes | 1.75 | 6/17/19 | 500,000 | | 502,279 |
| European Investment Bank, | | | | | |
| Sr. Unscd. Notes | 1.88 | 3/15/19 | 1,000,000 | | 1,012,507 |
| European Investment Bank, | | | | | |
| Sr. Unscd. Notes | 2.25 | 3/15/16 | 2,750,000 | | 2,819,597 |
| European Investment Bank, | | | | | |
| Sr. Unscd. Notes | 2.88 | 9/15/20 | 2,000,000 | c | 2,103,256 |
| European Investment Bank, | | | | | |
| Sr. Unscd. Bonds | 5.13 | 5/30/17 | 3,700,000 | | 4,096,377 |
| Export Development Canada, | | | | | |
| Sr. Unscd. Notes | 0.63 | 12/15/16 | 500,000 | | 499,379 |
| Export Development Canada, | | | | | |
| Govt. Gtd. Bonds | 1.75 | 8/19/19 | 400,000 | | 400,908 |
| Export-Import Bank of Korea, | | | | | |
| Sr. Unscd. Bonds | 2.88 | 9/17/18 | 1,000,000 | | 1,030,711 |
| Export-Import Bank of Korea, | | | | | |
| Sr. Unscd. Notes | 4.00 | 1/14/24 | 1,500,000 | | 1,602,652 |
| Finnish Government, | | | | | |
| Sr. Unscd. Bonds | 6.95 | 2/15/26 | 25,000 | | 32,981 |
| FMS Wertmanagement, | | | | | |
| Govt. Gtd. Notes | 1.13 | 10/14/16 | 1,000,000 | | 1,009,265 |
| Inter-American Development Bank, | | | | | |
| Notes | 0.88 | 11/15/16 | 1,000,000 | | 1,005,404 |
| Inter-American Development Bank, | | | | | |
| Sr. Unscd. Notes | 1.75 | 10/15/19 | 1,000,000 | | 1,003,646 |
| Inter-American Development Bank, | | | | | |
| Sr. Unscd. Notes | 3.88 | 9/17/19 | 2,000,000 | | 2,200,740 |
| Inter-American Development Bank, | | | | | |
| Unscd. Notes | 4.25 | 9/10/18 | 540,000 | | 597,165 |
| Inter-American Development Bank, | | | | | |
| Sr. Unscd. Notes | 4.38 | 1/24/44 | 500,000 | | 581,300 |
36
| | | | |
| | Coupon | Maturity | Principal | |
| Bonds and Notes (continued) | Rate (%) | Date | Amount ($) | Value ($) |
| Foreign/Governmental (continued) | | | | |
| Inter-American Development Bank, | | | | |
| Sr. Unscd. Notes | 5.13 | 9/13/16 | 150,000 | 162,424 |
| International Bank for | | | | |
| Reconstruction and | | | | |
| Development, Unscd. Notes | 0.50 | 5/16/16 | 500,000 | 500,070 |
| International Bank for | | | | |
| Reconstruction and | | | | |
| Development, Sr. Unscd. Notes | 1.13 | 7/18/17 | 500,000 | 503,506 |
| International Bank for | | | | |
| Reconstruction and | | | | |
| Development, Sr. Unscd. Notes | 1.38 | 4/10/18 | 500,000 | 505,078 |
| International Bank for | | | | |
| Reconstruction and | | | | |
| Development, Sr. Unscd. Bonds | 1.88 | 3/15/19 | 500,000 | 508,642 |
| International Bank for | | | | |
| Reconstruction and | | | | |
| Development, Sr. Unscd. Notes | 2.13 | 3/15/16 | 2,400,000 | 2,457,295 |
| International Bank for | | | | |
| Reconstruction and | | | | |
| Development, Sr. Unscd. Notes | 5.00 | 4/1/16 | 700,000 | 745,037 |
| International Bank for | | | | |
| Reconstruction and | | | | |
| Development, Sr. Unscd. Bonds | 7.63 | 1/19/23 | 700,000 | 975,276 |
| International Finance, | | | | |
| Sr. Unscd. Notes | 0.63 | 11/15/16 | 500,000 | 499,274 |
| International Finance, | | | | |
| Sr. Unscd. Notes | 2.13 | 11/17/17 | 2,100,000 | 2,161,362 |
| Italian Government, | | | | |
| Sr. Unscd. Notes | 5.25 | 9/20/16 | 155,000 | 166,620 |
| Italian Government, | | | | |
| Sr. Unscd. Notes | 5.38 | 6/12/17 | 1,450,000 | 1,589,065 |
| Italian Government, | | | | |
| Sr. Unscd. Notes | 6.88 | 9/27/23 | 610,000 | 779,835 |
| Japan Bank for International | | | | |
| Cooperation, | | | | |
| Gov’t Gtd. Notes | 2.50 | 5/18/16 | 2,800,000 | 2,886,976 |
| KFW, | | | | |
| Gov’t Gtd. Notes | 0.50 | 7/15/16 | 1,000,000 | 1,000,094 |
| KFW, | | | | |
| Gov’t Gtd. Notes | 0.75 | 3/17/17 | 1,500,000 | 1,498,679 |
The Fund 37
STATEMENT OF INVESTMENTS (continued)
| | | | |
| | Coupon | Maturity | Principal | |
| Bonds and Notes (continued) | Rate (%) | Date | Amount ($) | Value ($) |
| Foreign/Governmental (continued) | | | | |
| KFW, | | | | |
| Gov’t Gtd. Notes | 1.75 | 10/15/19 | 1,000,000 | 1,002,085 |
| KFW, | | | | |
| Gov’t Gtd. Bonds | 4.00 | 1/27/20 | 2,500,000 | 2,771,420 |
| KFW, | | | | |
| Gov’t Gtd. Bonds | 4.50 | 7/16/18 | 3,600,000 | 4,007,941 |
| KFW, | | | | |
| Gov’t Gtd. Notes | 4.88 | 1/17/17 | 1,240,000 | 1,351,738 |
| KFW, | | | | |
| Gov’t Gtd. Notes | 4.88 | 6/17/19 | 1,000,000 | 1,143,929 |
| KFW, | | | | |
| Gov’t Gtd. Bonds | 5.13 | 3/14/16 | 625,000 | 665,742 |
| Korea Development Bank, | | | | |
| Sr. Unscd. Notes | 3.88 | 5/4/17 | 1,250,000 | 1,320,015 |
| Korea Finance, | | | | |
| Sr. Unscd. Notes | 2.88 | 8/22/18 | 500,000 | 513,359 |
| Landwirtschaftliche Rentenbank, | | | | |
| Govt. Gtd. Notes | 1.88 | 9/17/18 | 1,000,000 | 1,017,909 |
| Landwirtschaftliche Rentenbank, | | | | |
| Govt. Gtd. Bonds | 5.13 | 2/1/17 | 950,000 | 1,042,341 |
| Mexican Government, | | | | |
| Sr. Unscd. Notes | 3.63 | 3/15/22 | 500,000 | 513,750 |
| Mexican Government, | | | | |
| Sr. Unscd. Notes | 4.00 | 10/2/23 | 750,000 | 783,938 |
| Mexican Government, | | | | |
| Sr. Unscd. Notes | 5.55 | 1/21/45 | 350,000 | 398,125 |
| Mexican Government, | | | | |
| Sr. Unscd. Notes | 5.63 | 1/15/17 | 2,000,000 | 2,195,000 |
| Mexican Government, | | | | |
| Sr. Unscd. Notes | 5.95 | 3/19/19 | 1,950,000 | 2,242,500 |
| Mexican Government, | | | | |
| Sr. Unscd. Notes | 6.75 | 9/27/34 | 1,340,000 | 1,737,310 |
| OeKB, | | | | |
| Gov’t. Gtd. Notes | 1.63 | 3/12/19 | 500,000 | 499,747 |
| OeKB, | | | | |
| Govt. Gtd. Notes | 4.88 | 2/16/16 | 1,500,000 | 1,584,672 |
| Panamanian Government, | | | | |
| Sr. Unscd. Bonds | 5.20 | 1/30/20 | 200,000 | 222,000 |
| Panamanian Government, | | | | |
| Sr. Unscd. Bonds | 6.70 | 1/26/36 | 700,000 | 883,750 |
38
| | | | | |
| | Coupon | Maturity | Principal | | |
| Bonds and Notes (continued) | Rate (%) | Date | Amount ($) | | Value ($) |
| Foreign/Governmental (continued) | | | | | |
| Peruvian Government, | | | | | |
| Sr. Unscd. Bonds | 6.55 | 3/14/37 | 870,000 | c | 1,115,775 |
| Petroleos Mexicanos, | | | | | |
| Gtd. Notes | 4.88 | 1/18/24 | 1,000,000 | | 1,060,000 |
| Petroleos Mexicanos, | | | | | |
| Gtd. Bonds | 5.50 | 6/27/44 | 500,000 | | 523,750 |
| Petroleos Mexicanos, | | | | | |
| Gtd. Bonds | 5.50 | 6/27/44 | 1,000,000 | b | 1,047,500 |
| Petroleos Mexicanos, | | | | | |
| Gtd. Notes | 6.00 | 3/5/20 | 500,000 | | 569,850 |
| Petroleos Mexicanos, | | | | | |
| Gtd. Bonds | 6.63 | 6/15/35 | 1,000,000 | | 1,185,000 |
| Philippine Government, | | | | | |
| Sr. Unscd. Bonds | 5.00 | 1/13/37 | 500,000 | | 575,000 |
| Philippine Government, | | | | | |
| Sr. Unscd. Bonds | 6.50 | 1/20/20 | 400,000 | | 478,500 |
| Philippine Government, | | | | | |
| Sr. Unscd. Bonds | 9.38 | 1/18/17 | 400,000 | | 471,000 |
| Philippine Government, | | | | | |
| Sr. Unscd. Bonds | 9.50 | 2/2/30 | 800,000 | | 1,280,000 |
| Philippine Government, | | | | | |
| Sr. Unscd. Bonds | 10.63 | 3/16/25 | 800,000 | | 1,270,000 |
| Polish Government, | | | | | |
| Sr. Unscd. Notes | 5.00 | 3/23/22 | 1,400,000 | | 1,576,750 |
| Polish Government, | | | | | |
| Sr. Unscd. Notes | 6.38 | 7/15/19 | 1,450,000 | | 1,723,978 |
| Province of British Columbia | | | | | |
| Canada, Sr. Unscd. Bonds, | | | | | |
| Ser. USD2 | 6.50 | 1/15/26 | 925,000 | | 1,230,703 |
| Province of Manitoba Canada, | | | | | |
| Unscd. Debs., Ser. CB | 8.80 | 1/15/20 | 10,000 | | 13,078 |
| Province of Manitoba Canada, | | | | | |
| Unscd. Debs. | 8.88 | 9/15/21 | 450,000 | | 617,916 |
| Province of Ontario Canada, | | | | | |
| Sr. Unscd. Bonds | 4.00 | 10/7/19 | 2,300,000 | | 2,519,574 |
| Province of Ontario Canada, | | | | | |
| Sr. Unscd. Notes | 4.75 | 1/19/16 | 990,000 | | 1,042,248 |
| Province of Ontario Canada, | | | | | |
| Sr. Unscd. Notes | 4.95 | 11/28/16 | 1,000,000 | | 1,085,544 |
The Fund 39
STATEMENT OF INVESTMENTS (continued)
| | | | | |
| | Coupon | Maturity | Principal | | |
| Bonds and Notes (continued) | Rate (%) | Date | Amount ($) | | Value ($) |
| Foreign/Governmental (continued) | | | | | |
| Province of Quebec Canada, | | | | | |
| Unscd. Notes | 5.13 | 11/14/16 | 725,000 | | 789,330 |
| Province of Quebec Canada, | | | | | |
| Debs., Ser. NJ | 7.50 | 7/15/23 | 200,000 | | 269,402 |
| Province of Quebec Canada, | | | | | |
| Unscd. Notes, Ser. PD | 7.50 | 9/15/29 | 550,000 | | 800,493 |
| Republic of Korea, | | | | | |
| Sr. Unscd. Notes | 7.13 | 4/16/19 | 1,000,000 | | 1,219,400 |
| South African Government, | | | | | |
| Sr. Unscd. Notes | 4.67 | 1/17/24 | 1,000,000 | | 1,045,000 |
| South African Government, | | | | | |
| Sr. Unscd. Notes | 6.88 | 5/27/19 | 1,100,000 | | 1,269,125 |
| Swedish Export Credit, | | | | | |
| Sr. Unscd. Notes | 0.63 | 5/31/16 | 600,000 | | 601,040 |
| Swedish Export Credit, | | | | | |
| Sr. Unscd. Notes | 1.88 | 6/17/19 | 400,000 | | 402,780 |
| Turkish Government, | | | | | |
| Sr. Unscd. Notes | 3.25 | 3/23/23 | 800,000 | c | 749,320 |
| Turkish Government, | | | | | |
| Sr. Unscd. Notes | 4.88 | 4/16/43 | 1,000,000 | | 972,380 |
| Turkish Government, | | | | | |
| Unscd. Notes | 6.63 | 2/17/45 | 900,000 | | 1,082,520 |
| Turkish Government, | | | | | |
| Sr. Unscd. Notes | 7.00 | 9/26/16 | 200,000 | | 219,148 |
| Turkish Government, | | | | | |
| Sr. Unscd. Notes | 7.00 | 3/11/19 | 500,000 | | 574,600 |
| Turkish Government, | | | | | |
| Sr. Unscd. Notes | 8.00 | 2/14/34 | 600,000 | | 810,000 |
| Uruguayan Government, | | | | | |
| Sr. Unscd. Notes | 4.50 | 8/14/24 | 750,000 | | 793,125 |
| Uruguayan Government, | | | | | |
| Sr. Unscd. Bonds | 7.63 | 3/21/36 | 300,000 | | 410,250 |
| | | | | | 120,386,714 |
| Health Care—2.2% | | | | | |
| AbbVie, | | | | | |
| Sr. Unscd. Notes | 2.90 | 11/6/22 | 1,500,000 | | 1,461,721 |
| AbbVie, | | | | | |
| Sr. Unscd. Notes | 4.40 | 11/6/42 | 1,000,000 | | 991,969 |
| Actavis Funding Services, | | | | | |
| Gtd. Notes | 4.85 | 6/15/44 | 500,000 | b | 473,287 |
40
| | | | |
| | Coupon | Maturity | Principal | |
| Bonds and Notes (continued) | Rate (%) | Date | Amount ($) | Value ($) |
| Health Care (continued) | | | | |
| Aetna, | | | | |
| Sr. Unscd. Notes | 3.95 | 9/1/20 | 1,000,000 | 1,070,319 |
| Aetna, | | | | |
| Sr. Unscd. Notes | 4.75 | 3/15/44 | 500,000 | 525,436 |
| Aetna, | | | | |
| Sr. Unscd. Notes | 6.63 | 6/15/36 | 300,000 | 388,708 |
| AmerisourceBergen, | | | | |
| Sr. Unscd. Notes | 1.15 | 5/15/17 | 650,000 | 647,608 |
| Amgen, | | | | |
| Sr. Unscd. Notes | 4.10 | 6/15/21 | 2,000,000 | 2,120,018 |
| Amgen, | | | | |
| Sr. Unscd. Notes | 5.15 | 11/15/41 | 600,000 | 645,885 |
| Amgen, | | | | |
| Sr. Unscd. Notes | 5.85 | 6/1/17 | 400,000 | 444,668 |
| AstraZeneca, | | | | |
| Sr. Unscd. Notes | 6.45 | 9/15/37 | 520,000 | 686,639 |
| Baxter International, | | | | |
| Sr. Unscd. Notes | 3.20 | 6/15/23 | 400,000 | 401,903 |
| Baxter International, | | | | |
| Sr. Unscd. Notes | 6.25 | 12/1/37 | 200,000 | 260,357 |
| Becton Dickinson, | | | | |
| Sr. Unscd. Notes | 3.13 | 11/8/21 | 1,000,000 | 1,000,316 |
| Boston Scientific, | | | | |
| Sr. Unscd. Notes | 6.00 | 1/15/20 | 950,000 | 1,090,840 |
| Bristol-Myers Squibb, | | | | |
| Sr. Unscd. Notes | 5.88 | 11/15/36 | 425,000 | 529,431 |
| Cardinal Health, | | | | |
| Sr. Unscd. Notes | 1.70 | 3/15/18 | 600,000 | 597,923 |
| Cardinal Health, | | | | |
| Sr. Unscd. Notes | 3.20 | 3/15/23 | 500,000 | 494,021 |
| Cardinal Health, | | | | |
| Sr. Unscd. Notes | 4.60 | 3/15/43 | 300,000 | 310,374 |
| CareFusion, | | | | |
| Sr. Unscd. Notes | 3.88 | 5/15/24 | 650,000 | 663,754 |
| Celgene, | | | | |
| Sr. Unscd. Notes | 2.25 | 5/15/19 | 500,000 | 497,999 |
| Celgene, | | | | |
| Sr. Unscd. Notes | 4.00 | 8/15/23 | 750,000 | 784,748 |
| Cigna, | | | | |
| Sr. Unscd. Notes | 4.50 | 3/15/21 | 1,900,000 | 2,072,497 |
The Fund 41
STATEMENT OF INVESTMENTS (continued)
| | | | | |
| | Coupon | Maturity | Principal | | |
| Bonds and Notes (continued) | Rate (%) | Date | Amount ($) | | Value ($) |
| Health Care (continued) | | | | | |
| Covidien International Finance, | | | | | |
| Gtd. Notes | 6.00 | 10/15/17 | 590,000 | | 667,129 |
| Dignity Health, | | | | | |
| Unscd. Bonds | 2.64 | 11/1/19 | 1,000,000 | | 1,009,486 |
| Eli Lilly & Co., | | | | | |
| Sr. Unscd. Notes | 5.55 | 3/15/37 | 750,000 | | 909,359 |
| Eli Lilly & Co., | | | | | |
| Sr. Unscd. Notes | 7.13 | 6/1/25 | 200,000 | | 266,433 |
| Gilead Sciences, | | | | | |
| Sr. Unscd. Notes | 3.05 | 12/1/16 | 1,500,000 | | 1,562,737 |
| Gilead Sciences, | | | | | |
| Sr. Unscd. Notes | 4.50 | 4/1/21 | 1,000,000 | | 1,104,284 |
| GlaxoSmithKline Capital, | | | | | |
| Gtd. Bonds | 5.65 | 5/15/18 | 740,000 | | 839,029 |
| GlaxoSmithKline Capital, | | | | | |
| Gtd. Bonds | 6.38 | 5/15/38 | 1,000,000 | | 1,311,334 |
| Johnson & Johnson, | | | | | |
| Sr. Unscd. Debs | 4.95 | 5/15/33 | 170,000 | | 202,740 |
| Johnson & Johnson, | | | | | |
| Sr. Unscd. Notes | 5.95 | 8/15/37 | 470,000 | | 625,196 |
| Keysight Technologies, | | | | | |
| Gtd. Notes | 3.30 | 10/30/19 | 1,000,000 | b | 1,001,638 |
| McKesson, | | | | | |
| Sr. Unscd. Notes | 4.75 | 3/1/21 | 500,000 | | 555,048 |
| McKesson, | | | | | |
| Sr. Unscd. Notes | 4.88 | 3/15/44 | 500,000 | | 531,971 |
| Medco Health Solutions, | | | | | |
| Gtd. Notes | 7.13 | 3/15/18 | 1,500,000 | | 1,747,116 |
| Medtronic, | | | | | |
| Sr. Unscd. Notes | 4.63 | 3/15/44 | 1,000,000 | | 1,042,310 |
| Merck & Co., | | | | | |
| Sr. Unscd. Notes | 0.70 | 5/18/16 | 1,000,000 | | 1,002,287 |
| Merck & Co., | | | | | |
| Sr. Unscd. Notes | 1.30 | 5/18/18 | 914,000 | | 907,301 |
| Merck & Co., | | | | | |
| Gtd. Notes | 6.50 | 12/1/33 | 680,000 | a | 939,353 |
| Merck Sharp & Dohme, | | | | | |
| Gtd. Debs | 6.40 | 3/1/28 | 150,000 | | 201,239 |
| Mylan, | | | | | |
| Sr. Unscd. Notes | 1.35 | 11/29/16 | 300,000 | | 300,853 |
42
| | | | |
| | Coupon | Maturity | Principal | |
| Bonds and Notes (continued) | Rate (%) | Date | Amount ($) | Value ($) |
| Health Care (continued) | | | | |
| Mylan, | | | | |
| Sr. Unscd. Notes | 5.40 | 11/29/43 | 300,000 | 324,845 |
| Novartis Capital, | | | | |
| Gtd. Notes | 4.40 | 5/6/44 | 940,000 | 1,010,667 |
| Perrigo, | | | | |
| Gtd. Notes | 1.30 | 11/8/16 | 1,000,000 | 998,415 |
| Perrigo, | | | | |
| Gtd. Notes | 2.30 | 11/8/18 | 1,000,000 | 992,280 |
| Pfizer, | | | | |
| Sr. Unscd. Notes | 2.10 | 5/15/19 | 1,000,000 | 1,006,096 |
| Pfizer, | | | | |
| Sr. Unscd. Notes | 6.20 | 3/15/19 | 2,400,000 | 2,806,464 |
| Quest Diagnostics, | | | | |
| Sr. Unscd. Notes | 4.25 | 4/1/24 | 300,000 | 306,167 |
| Quest Diagnostics, | | | | |
| Gtd. Notes | 5.45 | 11/1/15 | 500,000 | 521,838 |
| Quest Diagnostics, | | | | |
| Gtd. Notes | 6.95 | 7/1/37 | 50,000 | 62,373 |
| Sanofi, | | | | |
| Sr. Unscd. Notes | 4.00 | 3/29/21 | 1,400,000 | 1,519,153 |
| St. Jude Medical, | | | | |
| Sr. Unscd. Notes | 3.25 | 4/15/23 | 500,000 | 498,715 |
| Stryker, | | | | |
| Sr. Unscd. Bonds | 4.38 | 5/15/44 | 500,000 | 509,483 |
| Teva Pharmaceutical Finance, | | | | |
| Gtd. Notes | 6.15 | 2/1/36 | 85,000 | 103,975 |
| Teva Pharmaceutical Finance IV, | | | | |
| Gtd. Notes | 2.25 | 3/18/20 | 500,000 | 492,422 |
| Thermo Fisher Scientific, | | | | |
| Sr. Unscd. Notes | 1.30 | 2/1/17 | 500,000 | 499,685 |
| Thermo Fisher Scientific, | | | | |
| Sr. Unscd. Notes | 5.30 | 2/1/44 | 500,000 | 565,501 |
| UnitedHealth Group, | | | | |
| Sr. Unscd. Notes | 6.88 | 2/15/38 | 810,000 | 1,114,003 |
| WellPoint, | | | | |
| Sr. Unscd. Notes | 2.30 | 7/15/18 | 750,000 | 756,800 |
| WellPoint, | | | | |
| Sr. Unscd. Notes | 3.13 | 5/15/22 | 1,700,000 | 1,685,348 |
| WellPoint, | | | | |
| Sr. Unscd. Notes | 5.88 | 6/15/17 | 65,000 | 72,336 |
The Fund 43
STATEMENT OF INVESTMENTS (continued)
| | | | | |
| | Coupon | Maturity | Principal | | |
| Bonds and Notes (continued) | Rate (%) | Date | Amount ($) | | Value ($) |
| Health Care (continued) | | | | | |
| Wyeth, | | | | | |
| Gtd. Notes | 5.95 | 4/1/37 | 200,000 | | 246,640 |
| Wyeth, | | | | | |
| Gtd. Notes | 6.50 | 2/1/34 | 200,000 | | 264,856 |
| Zoetis, | | | | | |
| Sr. Unscd. Notes | 1.15 | 2/1/16 | 500,000 | | 501,287 |
| Zoetis, | | | | | |
| Sr. Unscd. Notes | 1.88 | 2/1/18 | 500,000 | | 497,347 |
| | | | | | 52,243,960 |
| Industrial—1.5% | | | | | |
| 3M, | | | | | |
| Sr. Unscd. Notes | 5.70 | 3/15/37 | 750,000 | | 959,544 |
| Boeing, | | | | | |
| Sr. Unscd. Notes | 6.00 | 3/15/19 | 2,000,000 | | 2,325,768 |
| Burlington Northern Santa Fe, | | | | | |
| Sr. Unscd. Debs. | 4.55 | 9/1/44 | 750,000 | | 763,959 |
| Burlington Northern Santa Fe, | | | | | |
| Sr. Unscd. Debs. | 6.15 | 5/1/37 | 650,000 | | 812,941 |
| Burlington Northern Santa Fe, | | | | | |
| Sr. Unscd. Debs. | 7.00 | 12/15/25 | 100,000 | | 130,638 |
| Burlington Northern Santa Fe, | | | | | |
| Sr. Unscd. Debs. | 7.95 | 8/15/30 | 100,000 | | 140,985 |
| Canadian National Railway, | | | | | |
| Sr. Unscd. Notes | 6.71 | 7/15/36 | 950,000 | | 1,318,603 |
| Canadian National Railway, | | | | | |
| Sr. Unscd. Notes | 6.90 | 7/15/28 | 100,000 | | 134,067 |
| Canadian Pacific Railway, | | | | | |
| Sr. Unscd. Notes | 4.50 | 1/15/22 | 1,000,000 | | 1,103,533 |
| Caterpillar, | | | | | |
| Sr. Unscd. Notes | 2.60 | 6/26/22 | 2,300,000 | c | 2,255,302 |
| Caterpillar, | | | | | |
| Sr. Unscd. Notes | 4.30 | 5/15/44 | 500,000 | | 518,135 |
| Caterpillar, | | | | | |
| Sr. Unscd. Notes | 6.05 | 8/15/36 | 375,000 | | 477,389 |
| CSX, | | | | | |
| Sr. Unscd. Notes | 3.70 | 11/1/23 | 500,000 | | 520,881 |
| CSX, | | | | | |
| Sr. Unscd. Notes | 4.50 | 8/1/54 | 500,000 | | 499,461 |
| CSX, | | | | | |
| Sr. Unscd. Notes | 4.75 | 5/30/42 | 750,000 | | 793,056 |
44
| | | | |
| | Coupon | Maturity | Principal | |
| Bonds and Notes (continued) | Rate (%) | Date | Amount ($) | Value ($) |
| Industrial (continued) | | | | |
| Eaton, | | | | |
| Gtd. Notes | 1.50 | 11/2/17 | 500,000 | 499,440 |
| Eaton, | | | | |
| Gtd. Notes | 4.15 | 11/2/42 | 400,000 | 393,137 |
| Emerson Electric, | | | | |
| Sr. Unscd. Notes | 2.63 | 2/15/23 | 260,000 | 253,642 |
| FedEx, | | | | |
| Gtd. Notes | 4.00 | 1/15/24 | 750,000 | 789,798 |
| General Electric, | | | | |
| Sr. Unscd. Notes | 4.50 | 3/11/44 | 500,000 | 535,230 |
| General Electric, | | | | |
| Sr. Unscd. Notes | 5.25 | 12/6/17 | 1,000,000 | 1,113,356 |
| Honeywell International, | | | | |
| Sr. Unscd. Notes | 5.30 | 3/15/17 | 1,000,000 | 1,099,163 |
| Illinois Tool Works, | | | | |
| Sr. Unscd. Notes | 3.90 | 9/1/42 | 1,000,000 | 970,917 |
| Ingersoll-Rand Global Holding, | | | | |
| Gtd. Notes | 2.88 | 1/15/19 | 225,000 | 230,244 |
| John Deere Capital, | | | | |
| Sr. Unscd. Notes | 1.13 | 6/12/17 | 115,000 | 114,784 |
| Koninklijke Philips, | | | | |
| Sr. Unscd. Notes | 5.75 | 3/11/18 | 500,000 | 560,731 |
| L-3 Communications, | | | | |
| Gtd. Notes | 1.50 | 5/28/17 | 750,000 | 745,905 |
| L-3 Communications, | | | | |
| Gtd. Notes | 3.95 | 11/15/16 | 1,000,000 | 1,052,856 |
| Lockheed Martin, | | | | |
| Sr. Unscd. Notes | 4.07 | 12/15/42 | 1,000,000 | 980,990 |
| Lockheed Martin, | | | | |
| Sr. Unscd. Notes, Ser. B | 6.15 | 9/1/36 | 455,000 | 572,206 |
| Norfolk Southern, | | | | |
| Sr. Unscd. Bonds | 4.84 | 10/1/41 | 1,200,000 | 1,311,127 |
| Norfolk Southern, | | | | |
| Sr. Unscd. Notes | 5.59 | 5/17/25 | 2,000 | 2,357 |
| Northrop Grumman Systems, | | | | |
| Gtd. Notes | 7.75 | 2/15/31 | 500,000 | 697,834 |
| Raytheon, | | | | |
| Sr. Unscd. Debs. | 7.20 | 8/15/27 | 150,000 | 201,508 |
| Republic Services, | | | | |
| Gtd. Notes | 3.80 | 5/15/18 | 1,000,000 | 1,064,051 |
The Fund 45
STATEMENT OF INVESTMENTS (continued)
| | | | | |
| | Coupon | Maturity | Principal | | |
| Bonds and Notes (continued) | Rate (%) | Date | Amount ($) | | Value ($) |
| Industrial (continued) | | | | | |
| Republic Services, | | | | | |
| Gtd. Notes | 6.20 | 3/1/40 | 750,000 | | 943,393 |
| Union Pacific, | | | | | |
| Sr. Unscd. Notes | 2.75 | 4/15/23 | 400,000 | | 395,829 |
| Union Pacific, | | | | | |
| Sr. Unscd. Notes | 4.75 | 12/15/43 | 140,000 | | 154,349 |
| Union Pacific, | | | | | |
| Sr. Unscd. Notes | 4.82 | 2/1/44 | 325,000 | | 361,655 |
| United Airlines 2013-1 PTT, | | | | | |
| Pass Thru Certs., Ser.A | 4.30 | 8/15/25 | 1,000,000 | | 1,032,500 |
| United Airlines 2014-2 PTT, | | | | | |
| Pass Thru Certs., Ser.A | 3.75 | 9/3/26 | 300,000 | | 303,750 |
| United Parcel Service, | | | | | |
| Sr. Unscd. Notes | 3.13 | 1/15/21 | 1,600,000 | | 1,666,842 |
| United Parcel Service, | | | | | |
| Sr. Unscd. Notes | 6.20 | 1/15/38 | 425,000 | | 564,238 |
| United Parcel Service of America, | | | | | |
| Sr. Unscd. Debs. | 8.38 | 4/1/30 | 10,000 | a | 14,737 |
| United Technologies, | | | | | |
| Sr. Unscd. Notes | 3.10 | 6/1/22 | 2,100,000 | | 2,139,104 |
| United Technologies, | | | | | |
| Sr. Unscd. Notes | 5.70 | 4/15/40 | 650,000 | | 805,561 |
| United Technologies, | | | | | |
| Sr. Unscd. Notes | 6.70 | 8/1/28 | 50,000 | | 66,907 |
| United Technologies, | | | | | |
| Sr. Unscd. Debs. | 8.75 | 3/1/21 | 50,000 | | 68,115 |
| Waste Management, | | | | | |
| Gtd. Notes | 3.50 | 5/15/24 | 500,000 | | 504,161 |
| Waste Management, | | | | | |
| Gtd. Notes | 7.00 | 7/15/28 | 150,000 | | 199,630 |
| | | | | | 35,164,309 |
| Information Technology—1.1% | | | | | |
| Apple, | | | | | |
| Sr. Unscd. Notes | 0.45 | 5/3/16 | 500,000 | | 499,923 |
| Apple, | | | | | |
| Sr. Unscd. Notes | 1.00 | 5/3/18 | 500,000 | | 490,620 |
| Apple, | | | | | |
| Sr. Unscd. Notes | 1.05 | 5/5/17 | 500,000 | | 500,265 |
| Apple, | | | | | |
| Sr. Unscd. Notes | 2.40 | 5/3/23 | 500,000 | | 482,949 |
46
| | | | | |
| | Coupon | Maturity | Principal | | |
| Bonds and Notes (continued) | Rate (%) | Date | Amount ($) | | Value ($) |
| Information Technology (continued) | | | | | |
| Apple, | | | | | |
| Sr. Unscd. Notes | 2.85 | 5/6/21 | 800,000 | | 812,754 |
| Apple, | | | | | |
| Sr. Unscd. Notes | 3.45 | 5/6/24 | 500,000 | c | 514,936 |
| Apple, | | | | | |
| Sr. Unscd. Notes | 4.45 | 5/6/44 | 500,000 | | 524,471 |
| Arrow Electronics, | | | | | |
| Sr. Unscd. Notes | 3.00 | 3/1/18 | 500,000 | | 516,416 |
| Arrow Electronics, | | | | | |
| Sr. Unscd. Notes | 4.50 | 3/1/23 | 500,000 | | 517,623 |
| Baidu, | | | | | |
| Sr. Unscd. Notes | 2.75 | 6/9/19 | 750,000 | | 754,361 |
| CDK Global, | | | | | |
| Sr. Unscd. Notes | 3.30 | 10/15/19 | 1,000,000 | b | 998,466 |
| eBay, | | | | | |
| Sr. Unscd. Notes | 4.00 | 7/15/42 | 700,000 | | 602,616 |
| EMC, | | | | | |
| Sr. Unscd. Notes | 1.88 | 6/1/18 | 1,000,000 | | 994,898 |
| Fiserv, | | | | | |
| Gtd. Notes | 3.13 | 6/15/16 | 200,000 | | 206,676 |
| Fiserv, | | | | | |
| Gtd. Notes | 4.63 | 10/1/20 | 400,000 | | 436,431 |
| Google, | | | | | |
| Sr. Unscd. Notes | 3.63 | 5/19/21 | 300,000 | | 321,008 |
| Hewlett-Packard, | | | | | |
| Sr. Unscd. Notes | 3.00 | 9/15/16 | 1,000,000 | | 1,033,205 |
| Hewlett-Packard, | | | | | |
| Sr. Unscd. Notes | 5.50 | 3/1/18 | 560,000 | | 624,907 |
| Hewlett-Packard, | | | | | |
| Sr. Unscd. Notes | 6.00 | 9/15/41 | 750,000 | | 839,146 |
| Intel, | | | | | |
| Sr. Unscd. Notes | 3.30 | 10/1/21 | 2,100,000 | | 2,194,720 |
| International Business Machines, | | | | | |
| Sr. Unscd. Notes | 1.25 | 2/6/17 | 1,000,000 | | 1,006,256 |
| International Business Machines, | | | | | |
| Sr. Unscd. Notes | 5.60 | 11/30/39 | 605,000 | | 718,122 |
| International Business Machines, | | | | | |
| Sr. Unscd. Notes | 5.70 | 9/14/17 | 600,000 | | 674,578 |
| International Business Machines, | | | | | |
| Sr. Unscd. Debs. | 7.00 | 10/30/25 | 425,000 | | 564,060 |
The Fund 47
STATEMENT OF INVESTMENTS (continued)
| | | | |
| | Coupon | Maturity | Principal | |
| Bonds and Notes (continued) | Rate (%) | Date | Amount ($) | Value ($) |
| Information Technology (continued) | | | | |
| International Business Machines, | | | | |
| Sr. Unscd. Notes | 8.38 | 11/1/19 | 300,000 | 388,002 |
| Leidos Holdings, | | | | |
| Gtd. Notes, Ser. 1 | 5.95 | 12/1/40 | 700,000 | 711,951 |
| Lender Processing Service, | | | | |
| Gtd. Notes | 5.75 | 4/15/23 | 500,000 | 532,500 |
| Microsoft, | | | | |
| Sr. Unscd. Notes | 4.20 | 6/1/19 | 1,000,000 | 1,103,321 |
| Microsoft, | | | | |
| Sr. Unscd. Notes | 5.20 | 6/1/39 | 688,000 | 795,642 |
| Moody’s, | | | | |
| Sr. Unscd. Notes | 2.75 | 7/15/19 | 1,000,000 | 1,016,609 |
| Oracle, | | | | |
| Sr. Unscd. Notes | 2.80 | 7/8/21 | 600,000 | 603,003 |
| Oracle, | | | | |
| Sr. Unscd. Notes | 3.40 | 7/8/24 | 1,250,000 | 1,265,625 |
| Oracle, | | | | |
| Sr. Unscd. Notes | 5.00 | 7/8/19 | 1,200,000 | 1,351,669 |
| Oracle, | | | | |
| Sr. Unscd. Notes | 5.75 | 4/15/18 | 150,000 | 170,408 |
| Oracle, | | | | |
| Sr. Unscd. Notes | 6.50 | 4/15/38 | 500,000 | 658,292 |
| Seagate HDD, | | | | |
| Gtd. Bonds | 4.75 | 6/1/23 | 800,000 | 829,624 |
| Seagate Technology HDD, | | | | |
| Gtd. Notes | 6.80 | 10/1/16 | 125,000 | 136,250 |
| Texas Instruments, | | | | |
| Sr. Unscd. Notes | 2.75 | 3/12/21 | 400,000 | 404,723 |
| Xilinx, | | | | |
| Sr. Unscd. Notes | 3.00 | 3/15/21 | 500,000 | 502,877 |
| | | | | 27,299,903 |
| Materials—1.2% | | | | |
| Airgas, | | | | |
| Sr. Unscd. Notes | 2.38 | 2/15/20 | 500,000 | 495,119 |
| Avery Dennison, | | | | |
| Sr. Unscd. Notes | 3.35 | 4/15/23 | 1,000,000 | 984,445 |
| Barrick PD Australia Finance, | | | | |
| Gtd. Notes | 5.95 | 10/15/39 | 1,300,000 | 1,285,716 |
| BHP Billiton Finance USA, | | | | |
| Gtd. Notes | 4.13 | 2/24/42 | 500,000 | 498,313 |
48
| | | | | |
| | Coupon | Maturity | Principal | | |
| Bonds and Notes (continued) | Rate (%) | Date | Amount ($) | | Value ($) |
| Materials (continued) | | | | | |
| BHP Billiton Finance USA, | | | | | |
| Gtd. Notes | 6.50 | 4/1/19 | 1,700,000 | | 2,018,374 |
| CF Industries, | | | | | |
| Gtd. Notes | 3.45 | 6/1/23 | 500,000 | | 494,322 |
| CF Industries, | | | | | |
| Gtd. Notes | 4.95 | 6/1/43 | 500,000 | | 504,539 |
| Dow Chemical, | | | | | |
| Sr. Unscd. Notes | 4.25 | 11/15/20 | 1,250,000 | | 1,347,824 |
| Dow Chemical, | | | | | |
| Sr. Unscd. Notes | 8.55 | 5/15/19 | 1,700,000 | | 2,143,214 |
| E.I. du Pont de Nemours & Co., | | | | | |
| Sr. Unscd. Notes | 2.80 | 2/15/23 | 500,000 | | 490,187 |
| E.I. du Pont de Nemours & Co., | | | | | |
| Sr. Unscd. Notes | 4.15 | 2/15/43 | 300,000 | | 286,726 |
| E.I. du Pont de Nemours & Co., | | | | | |
| Sr. Unscd. Notes | 6.00 | 7/15/18 | 560,000 | | 642,310 |
| Freeport-McMoRan, | | | | | |
| Gtd. Notes | 3.10 | 3/15/20 | 1,500,000 | | 1,496,760 |
| Freeport-McMoRan, | | | | | |
| Gtd. Notes | 5.45 | 3/15/43 | 600,000 | | 616,045 |
| Glencore Canada, | | | | | |
| Gtd. Notes | 5.50 | 6/15/17 | 165,000 | | 179,184 |
| Goldcorp, | | | | | |
| Sr. Unscd. Notes | 3.63 | 6/9/21 | 500,000 | | 501,449 |
| International Paper, | | | | | |
| Sr. Unscd. Notes | 4.80 | 6/15/44 | 1,000,000 | | 988,189 |
| LYB International Finance, | | | | | |
| Gtd. Notes | 4.00 | 7/15/23 | 1,200,000 | | 1,246,884 |
| Methanex, | | | | | |
| Sr. Unscd. Notes | 3.25 | 12/15/19 | 465,000 | | 471,264 |
| Monsanto, | | | | | |
| Sr. Unscd. Notes | 2.13 | 7/15/19 | 1,000,000 | | 998,269 |
| Mosaic, | | | | | |
| Sr. Unscd. Notes | 4.25 | 11/15/23 | 300,000 | c | 315,270 |
| Newmont Mining, | | | | | |
| Gtd. Notes | 6.25 | 10/1/39 | 1,000,000 | | 1,001,755 |
| Owens Corning, | | | | | |
| Gtd. Notes | 7.00 | 12/1/36 | 235,000 | a | 281,921 |
| Potash Corp of Saskatchewan, | | | | | |
| Sr. Unscd. Notes | 3.63 | 3/15/24 | 500,000 | | 513,593 |
The Fund 49
STATEMENT OF INVESTMENTS (continued)
| | | | |
| | Coupon | Maturity | Principal | |
| Bonds and Notes (continued) | Rate (%) | Date | Amount ($) | Value ($) |
| Materials (continued) | | | | |
| Praxair, | | | | |
| Sr. Unscd. Notes | 2.45 | 2/15/22 | 1,000,000 | 981,941 |
| Rio Tinto Alcan, | | | | |
| Sr. Unscd. Debs. | 7.25 | 3/15/31 | 350,000 | 453,163 |
| Rio Tinto Finance USA, | | | | |
| Gtd. Notes | 3.50 | 11/2/20 | 600,000 | 623,906 |
| Rio Tinto Finance USA, | | | | |
| Gtd. Notes | 5.20 | 11/2/40 | 1,000,000 | 1,092,769 |
| Rio Tinto Finance USA, | | | | |
| Gtd. Notes | 6.50 | 7/15/18 | 20,000 | 23,233 |
| Sigma-Aldrich, | | | | |
| Sr. Unscd. Notes | 3.38 | 11/1/20 | 500,000 | 522,004 |
| Southern Copper, | | | | |
| Sr. Unscd. Notes | 5.25 | 11/8/42 | 1,000,000 | 943,420 |
| Teck Resources, | | | | |
| Gtd. Notes | 3.15 | 1/15/17 | 1,095,000 | 1,126,687 |
| Teck Resources, | | | | |
| Gtd. Notes | 4.75 | 1/15/22 | 500,000 | 508,966 |
| Vale Canada, | | | | |
| Sr. Unscd. Bonds | 7.20 | 9/15/32 | 100,000 | 113,800 |
| Vale Overseas, | | | | |
| Gtd. Notes | 4.38 | 1/11/22 | 1,200,000 | 1,224,804 |
| Vale Overseas, | | | | |
| Gtd. Notes | 6.25 | 1/23/17 | 510,000 | 559,326 |
| Vale Overseas, | | | | |
| Gtd. Notes | 6.88 | 11/21/36 | 900,000 | 1,022,157 |
| Weyerhaeuser, | | | | |
| Sr. Unscd. Notes | 7.38 | 3/15/32 | 500,000 | 654,287 |
| | | | | 29,652,135 |
| Municipal Bonds—.8% | | | | |
| Bay Area Toll Authority, | | | | |
| San Francisco Bay Area | | | | |
| Toll Bridge Revenue | | | | |
| (Build America Bonds) | 6.26 | 4/1/49 | 1,000,000 | 1,377,260 |
| Bay Area Toll Authority, | | | | |
| San Francisco Bay Area | | | | |
| Subordinate Toll Bridge | | | | |
| Revenue (Build America Bonds) | 6.79 | 4/1/30 | 695,000 | 887,432 |
| California, | | | | |
| GO (Various Purpose) | 7.50 | 4/1/34 | 1,000,000 | 1,443,050 |
50
| | | | |
| | Coupon | Maturity | Principal | |
| Bonds and Notes (continued) | Rate (%) | Date | Amount ($) | Value ($) |
| Municipal Bonds (continued) | | | | |
| California, | | | | |
| GO (Various Purpose) | 7.55 | 4/1/39 | 1,600,000 | 2,404,560 |
| California, | | | | |
| GO (Various Purpose) | 3.95 | 11/1/15 | 400,000 | 414,040 |
| Florida Hurricane Catastrophe Fund | | | | |
| Finance Corporation, Revenue | 2.11 | 7/1/18 | 500,000 | 506,965 |
| Illinois, | | | | |
| GO (Pension Funding Series) | 5.10 | 6/1/33 | 2,130,000 | 2,090,467 |
| Los Angeles Unified School | | | | |
| District, GO (Build America Bonds) | 5.75 | 7/1/34 | 1,600,000 | 1,975,472 |
| Metropolitan Transportation Authority, | | | | |
| Dedicated Tax Funds Bonds | 7.34 | 11/15/39 | 650,000 | 977,165 |
| Municipal Electric Authority of | | | | |
| Georgia, GO (Plant Vogtle | | | | |
| Units 3 and 4 Project J Bonds) | | | | |
| (Build America Bonds) | 6.64 | 4/1/57 | 1,000,000 | 1,274,090 |
| New Jersey Turnpike Authority, | | | | |
| Turnpike Revenue (Build | | | | |
| America Bonds) | 7.41 | 1/1/40 | 780,000 | 1,140,383 |
| New York City Municipal Water | | | | |
| Finance Authority, Water and | | | | |
| Sewer System Second General | | | | |
| Resolution Revenue (Build | | | | |
| America Bonds) | 5.95 | 6/15/42 | 545,000 | 711,917 |
| New York State Dormitory | | | | |
| Authority, State Personal | | | | |
| Income Tax Revenue (General | | | | |
| Purpose) (Build America Bonds) | 5.29 | 3/15/33 | 1,000,000 | 1,167,140 |
| Port Authority of New York and | | | | |
| New Jersey (Consolidated Bonds, | | | | |
| 164th Series) | 5.65 | 11/1/40 | 680,000 | 823,092 |
| Public Utilities Commission of the | | | | |
| City and County of San | | | | |
| Francisco, San Francisco Water | | | | |
| Revenue (Build America Bonds) | 6.00 | 11/1/40 | 550,000 | 694,469 |
| University of California Regents, | | | | |
| General Revenue | 1.80 | 7/1/19 | 480,000 | 478,094 |
| University of California Regents, | | | | |
| General Revenue | 4.77 | 5/15/44 | 500,000 | 526,890 |
| | | | | 18,892,486 |
The Fund 51
STATEMENT OF INVESTMENTS (continued)
| | | | | |
| | Coupon | Maturity | Principal | | |
| Bonds and Notes (continued) | Rate (%) | Date | Amount ($) | | Value ($) |
| Telecommunications—1.5% | | | | | |
| America Movil SAB de CV, | | | | | |
| Gtd. Notes | 2.38 | 9/8/16 | 1,000,000 | | 1,025,040 |
| America Movil SAB de CV, | | | | | |
| Gtd. Notes | 6.13 | 3/30/40 | 1,200,000 | | 1,446,840 |
| America Movil SAB de CV, | | | | | |
| Gtd. Notes | 6.38 | 3/1/35 | 100,000 | | 124,713 |
| American Tower, | | | | | |
| Sr. Unscd. Notes | 4.50 | 1/15/18 | 500,000 | | 534,098 |
| AT&T, | | | | | |
| Sr. Unscd. Notes | 1.70 | 6/1/17 | 1,500,000 | | 1,513,663 |
| AT&T, | | | | | |
| Sr. Unscd. Notes | 2.30 | 3/11/19 | 1,000,000 | | 1,005,828 |
| AT&T, | | | | | |
| Sr. Unscd. Notes | 3.00 | 2/15/22 | 495,000 | | 490,193 |
| AT&T, | | | | | |
| Sr. Unscd. Notes | 4.35 | 6/15/45 | 600,000 | | 562,332 |
| AT&T, | | | | | |
| Sr. Unscd. Notes | 5.35 | 9/1/40 | 1,500,000 | | 1,607,254 |
| AT&T, | | | | | |
| Sr. Unscd. Bonds | 5.50 | 2/1/18 | 950,000 | | 1,064,111 |
| AT&T, | | | | | |
| Gtd. Notes | 8.00 | 11/15/31 | 470,000 | a | 694,890 |
| British Telecommunications, | | | | | |
| Sr. Unscd. Notes | 1.25 | 2/14/17 | 250,000 | | 249,497 |
| British Telecommunications, | | | | | |
| Sr. Unscd. Notes | 5.95 | 1/15/18 | 580,000 | | 653,731 |
| British Telecommunications, | | | | | |
| Sr. Unscd. Notes | 9.63 | 12/15/30 | 175,000 | a | 276,154 |
| Cellco Partnership/Verizon | | | | | |
| Wireless Capital, Sr. Unscd. Notes | 8.50 | 11/15/18 | 376,000 | | 469,401 |
| Cisco Systems, | | | | | |
| Sr. Unscd. Notes | 4.45 | 1/15/20 | 2,000,000 | | 2,212,070 |
| Cisco Systems, | | | | | |
| Sr. Unscd. Notes | 5.50 | 2/22/16 | 500,000 | | 531,874 |
| Cisco Systems, | | | | | |
| Sr. Unscd. Notes | 5.50 | 1/15/40 | 400,000 | | 472,664 |
| Corning, | | | | | |
| Sr. Unscd. Notes | 3.70 | 11/15/23 | 400,000 | | 415,677 |
52
| | | | | |
| | Coupon | Maturity | Principal | | |
| Bonds and Notes (continued) | Rate (%) | Date | Amount ($) | | Value ($) |
| Telecommunications (continued) | | | | | |
| Deutsche Telekom International | | | | | |
| Finance, Gtd. Bonds | 8.75 | 6/15/30 | 900,000 | a | 1,309,417 |
| GTE, | | | | | |
| Gtd. Debs. | 6.94 | 4/15/28 | 100,000 | | 123,780 |
| Koninklijke KPN, | | | | | |
| Sr. Unscd. Bonds | 8.38 | 10/1/30 | 250,000 | | 349,639 |
| Motorola Solutions, | | | | | |
| Sr. Unscd. Notes | 3.50 | 9/1/21 | 1,000,000 | | 996,950 |
| Orange, | | | | | |
| Sr. Unscd. Notes | 9.00 | 3/1/31 | 945,000 | a | 1,403,666 |
| Pacific-Bell Telephone, | | | | | |
| Gtd. Debs. | 7.13 | 3/15/26 | 310,000 | | 401,534 |
| Qwest, | | | | | |
| Sr. Unscd. Debs. | 6.88 | 9/15/33 | 330,000 | | 334,224 |
| Telefonica Emisiones, | | | | | |
| Gtd. Notes | 3.19 | 4/27/18 | 1,000,000 | | 1,038,818 |
| Verizon Communications, | | | | | |
| Sr. Unscd. Notes | 1.35 | 6/9/17 | 500,000 | | 499,384 |
| Verizon Communications, | | | | | |
| Sr. Unscd. Notes | 2.00 | 11/1/16 | 600,000 | | 610,889 |
| Verizon Communications, | | | | | |
| Sr. Unscd. Notes | 2.63 | 2/21/20 | 2,395,000 | b | 2,385,135 |
| Verizon Communications, | | | | | |
| Sr. Unscd. Notes | 3.45 | 3/15/21 | 750,000 | | 766,896 |
| Verizon Communications, | | | | | |
| Sr. Unscd. Notes | 3.50 | 11/1/21 | 900,000 | | 918,773 |
| Verizon Communications, | | | | | |
| Sr. Unscd. Notes | 3.85 | 11/1/42 | 1,000,000 | | 884,699 |
| Verizon Communications, | | | | | |
| Sr. Unscd. Notes | 4.86 | 8/21/46 | 1,000,000 | b | 1,022,284 |
| Verizon Communications, | | | | | |
| Sr. Unscd. Notes | 5.15 | 9/15/23 | 1,650,000 | | 1,849,147 |
| Verizon Communications, | | | | | |
| Sr. Unscd. Notes | 5.85 | 9/15/35 | 560,000 | | 651,932 |
| Verizon Communications, | | | | | |
| Sr. Unscd. Notes | 6.55 | 9/15/43 | 1,950,000 | | 2,461,764 |
| Verizon Communications, | | | | | |
| Sr. Unscd. Notes | 7.75 | 12/1/30 | 690,000 | | 945,980 |
The Fund 53
STATEMENT OF INVESTMENTS (continued)
| | | | | |
| | Coupon | Maturity | Principal | | |
| Bonds and Notes (continued) | Rate (%) | Date | Amount ($) | | Value ($) |
| Telecommunications (continued) | | | | | |
| Vodafone Group, | | | | | |
| Sr. Unscd. Notes | 5.63 | 2/27/17 | 555,000 | | 607,485 |
| Vodafone Group, | | | | | |
| Sr. Unscd. Bonds | 6.15 | 2/27/37 | 250,000 | | 293,400 |
| Vodafone Group, | | | | | |
| Sr. Unscd. Notes | 7.88 | 2/15/30 | 125,000 | | 170,135 |
| Vodefone Group, | | | | | |
| Sr. Unscd. Notes | 1.50 | 2/19/18 | 500,000 | | 493,526 |
| | | | | | 35,869,487 |
| U.S. Government Agencies—3.8% | | | | | |
| Federal Farm Credit Bank, | | | | | |
| Bonds | 0.54 | 11/7/16 | 500,000 | | 497,947 |
| Federal Farm Credit Bank, | | | | | |
| Bonds | 5.13 | 8/25/16 | 1,200,000 | | 1,297,422 |
| Federal Home Loan Bank, | | | | | |
| Notes | 0.38 | 2/19/16 | 5,000,000 | c | 5,007,275 |
| Federal Home Loan Bank, | | | | | |
| Bonds | 0.38 | 6/24/16 | 1,500,000 | | 1,498,260 |
| Federal Home Loan Bank, | | | | | |
| Bonds | 1.25 | 2/28/18 | 570,000 | | 569,374 |
| Federal Home Loan Bank, | | | | | |
| Bonds | 1.50 | 2/28/17 | 1,500,000 | | 1,512,673 |
| Federal Home Loan Bank, | | | | | |
| Bonds | 4.75 | 12/16/16 | 1,000,000 | | 1,085,560 |
| Federal Home Loan Bank, | | | | | |
| Bonds, Ser. 1 | 4.88 | 5/17/17 | 2,000,000 | | 2,204,416 |
| Federal Home Loan Bank, | | | | | |
| Bonds | 5.00 | 11/17/17 | 2,600,000 | | 2,902,019 |
| Federal Home Loan Bank, | | | | | |
| Bonds, Ser. 656 | 5.38 | 5/18/16 | 320,000 | | 344,485 |
| Federal Home Loan Bank, | | | | | |
| Bonds | 5.50 | 7/15/36 | 480,000 | | 635,001 |
| Federal Home Loan Bank, | | | | | |
| Bonds | 5.63 | 6/11/21 | 1,200,000 | | 1,449,010 |
| Federal Home Loan Mortgage Corp. | 4.50 | 10/1/40 | 4,974,132 | d | 5,392,807 |
| Federal Home Loan Mortgage Corp. | 5.50 | 11/1/32 | 950,000 | d | 1,058,582 |
| Federal Home Loan Mortgage Corp., | | | | | |
| Notes | 0.42 | 9/18/15 | 850,000 | d | 852,003 |
| Federal Home Loan Mortgage Corp., | | | | | |
| Notes | 0.88 | 2/22/17 | 4,500,000 | d | 4,516,042 |
54
| | | | | |
| | Coupon | Maturity | Principal | | |
| Bonds and Notes (continued) | Rate (%) | Date | Amount ($) | | Value ($) |
| U.S. Government Agencies | | | | | |
| (continued) | | | | | |
| Federal Home Loan Mortgage Corp., | | | | | |
| Notes | 1.00 | 9/29/17 | 1,000,000 | d | 999,186 |
| Federal Home Loan Mortgage Corp., | | | | | |
| Notes | 1.02 | 4/30/18 | 1,050,000 | d | 1,037,799 |
| Federal Home Loan Mortgage Corp., | | | | | |
| Unscd. Notes | 1.03 | 11/28/17 | 500,000 | d | 496,627 |
| Federal Home Loan Mortgage Corp., | | | | | |
| Notes | 1.20 | 6/12/18 | 785,000 | d | 782,599 |
| Federal Home Loan Mortgage Corp., | | | | | |
| Notes | 1.25 | 10/2/19 | 2,500,000 | d | 2,439,497 |
| Federal Home Loan Mortgage Corp., | | | | | |
| Notes | 2.00 | 8/25/16 | 2,000,000 | d | 2,051,808 |
| Federal Home Loan Mortgage Corp., | | | | | |
| Notes | 2.38 | 1/13/22 | 2,600,000 | c,d | 2,618,231 |
| Federal Home Loan Mortgage Corp., | | | | | |
| Notes | 3.06 | 6/14/28 | 135,000 | d | 129,124 |
| Federal Home Loan Mortgage Corp., | | | | | |
| Notes | 3.75 | 3/27/19 | 1,600,000 | d | 1,744,307 |
| Federal Home Loan Mortgage Corp. | 4.50 | 11/1/35 | 2,700,000 | d | 2,924,860 |
| Federal Home Loan Mortgage Corp., | | | | | |
| Notes | 4.88 | 6/13/18 | 1,250,000 | c,d | 1,407,349 |
| Federal Home Loan Mortgage Corp., | | | | | |
| Notes | 5.00 | 2/16/17 | 825,000 | d | 905,749 |
| Federal Home Loan Mortgage Corp., | | | | | |
| Notes | 5.13 | 10/18/16 | 750,000 | c,d | 815,906 |
| Federal Home Loan Mortgage Corp., | | | | | |
| Notes | 5.13 | 11/17/17 | 650,000 | d | 729,030 |
| Federal Home Loan Mortgage Corp., | | | | | |
| Notes | 5.25 | 4/18/16 | 4,600,000 | d | 4,924,760 |
| Federal Home Loan Mortgage Corp., | | | | | |
| Notes | 6.25 | 7/15/32 | 1,000,000 | d | 1,411,356 |
| Federal Home Loan Mortgage Corp., | | | | | |
| Bonds | 6.75 | 9/15/29 | 400,000 | c,d | 581,322 |
| Federal National Mortgage | | | | | |
| Association, Notes | 1.88 | 9/18/18 | 2,000,000 | d | 2,034,646 |
| Federal National Mortgage | | | | | |
| Association, Notes | 1.88 | 2/19/19 | 2,000,000 | c,d | 2,026,850 |
| Federal National Mortgage | | | | | |
| Association | 3.00 | 11/13/44 | 4,400,000 | d | 4,401,031 |
The Fund 55
STATEMENT OF INVESTMENTS (continued)
| | | | | |
| | Coupon | Maturity | Principal | | |
| Bonds and Notes (continued) | Rate (%) | Date | Amount ($) | | Value ($) |
| U.S. Government Agencies | | | | | |
| (continued) | | | | | |
| Federal National Mortgage | | | | | |
| Association, Notes | 0.00 | 6/1/17 | 2,400,000 | d,e | 2,345,398 |
| Federal National Mortgage | | | | | |
| Association, Sub. Debs. | 0.00 | 10/9/19 | 2,000,000 | d,e | 1,794,996 |
| Federal National Mortgage | | | | | |
| Association, Notes | 0.38 | 12/21/15 | 2,500,000 | d | 2,504,340 |
| Federal National Mortgage | | | | | |
| Association, Notes | 0.50 | 10/22/15 | 500,000 | d | 501,627 |
| Federal National Mortgage | | | | | |
| Association, Notes | 0.52 | 2/26/16 | 750,000 | d | 750,201 |
| Federal National Mortgage | | | | | |
| Association, Notes | 0.88 | 2/8/18 | 1,500,000 | d | 1,483,522 |
| Federal National Mortgage | | | | | |
| Association, Notes | 1.00 | 12/28/17 | 750,000 | d | 746,964 |
| Federal National Mortgage | | | | | |
| Association, Notes | 1.00 | 2/15/18 | 700,000 | d | 695,517 |
| Federal National Mortgage | | | | | |
| Association, Notes, Ser. 1 | 1.00 | 4/30/18 | 1,000,000 | d | 991,382 |
| Federal National Mortgage | | | | | |
| Association, Notes | 1.13 | 3/28/18 | 415,000 | d | 412,149 |
| Federal National Mortgage | | | | | |
| Association, Notes | 1.25 | 1/30/17 | 2,000,000 | d | 2,023,682 |
| Federal National Mortgage | | | | | |
| Association, Notes | 2.63 | 9/6/24 | 1,100,000 | d | 1,097,946 |
| Federal National Mortgage | | | | | |
| Association, Notes | 5.00 | 3/15/16 | 1,240,000 | d | 1,319,291 |
| Federal National Mortgage | | | | | |
| Association, Bonds | 5.00 | 5/11/17 | 1,200,000 | d | 1,324,721 |
| Federal National Mortgage | | | | | |
| Association, Notes | 5.25 | 9/15/16 | 1,225,000 | d | 1,331,370 |
| Federal National Mortgage | | | | | |
| Association, Notes | 6.00 | 4/18/36 | 1,300,000 | d | 1,391,558 |
| Federal National Mortgage | | | | | |
| Association, Bonds | 6.25 | 5/15/29 | 1,340,000 | d | 1,834,495 |
| Federal National Mortgage | | | | | |
| Association, Notes | 6.63 | 11/15/30 | 1,000,000 | d | 1,444,203 |
| Financing Corp. (FICO), | | | | | |
| Scd. Bonds | 8.60 | 9/26/19 | 40,000 | | 52,455 |
56
| | | | | | |
| | | Coupon | Maturity | Principal | | |
| Bonds and Notes (continued) | | Rate (%) | Date | Amount ($) | | Value ($) |
| U.S. Government Agencies (continued) | | | | | | |
| Financing Corp. (FICO), | | | | | | |
| Scd. Bonds, Ser. E | | 9.65 | 11/2/18 | 510,000 | | 671,363 |
| Tennessee Valley Authority, | | | | | | |
| Notes | | 5.25 | 9/15/39 | 1,200,000 | | 1,487,507 |
| Tennessee Valley Authority, | | | | | | |
| Bonds | | 5.88 | 4/1/36 | 650,000 | | 867,042 |
| Tennessee Valley Authority, | | | | | | |
| Bonds | | 6.15 | 1/15/38 | 165,000 | | 226,415 |
| | | | | | | 92,583,057 |
| U.S. Government Agencies/ | | | | | | |
| Mortgage-Backed—29.6% | | | | | | |
| Federal Home Loan Mortgage Corp.: | | | | | | |
| 2.50 % | | | | 2,100,000 | d,f | 2,129,039 |
| 3.00 % | | | | 3,600,000 | d,f | 3,651,656 |
| 3.50 % | | | | 7,700,000 | d,f | 7,969,349 |
| 4.00 % | | | | 13,000,000 | d,f | 13,789,101 |
| 5.00 % | | | | 2,200,000 | d,f | 2,431,344 |
| 2.00%, 8/1/28—8/1/29 | | | | 1,800,000 | d | 1,785,155 |
| 2.14%, 8/1/43 | | | | 1,311,062 | a,d | 1,331,190 |
| 2.24%, 7/1/43 | | | | 485,255 | a,d | 493,507 |
| 2.45%, 10/1/43 | | | | 534,160 | a,d | 546,627 |
| 2.50%, 1/1/29—11/1/42 | | | | 10,890,859 | d | 11,072,853 |
| 3.00%, 12/1/26—1/1/43 | | | | 34,879,639 | d | 35,380,399 |
| 3.50%, 3/1/26—7/1/44 | | | | 28,101,999 | d | 29,185,964 |
| 4.00%, 11/1/14—2/1/44 | | | | 23,286,620 | d | 24,767,008 |
| 4.50%, 2/1/18—4/1/41 | | | | 14,530,103 | d | 15,701,804 |
| 5.00%, 12/1/17—1/1/40 | | | | 13,576,774 | d | 14,929,471 |
| 5.50%, 8/1/16—1/1/40 | | | | 8,226,775 | d | 9,196,302 |
| 6.00%, 5/1/16—7/1/39 | | | | 4,497,310 | d | 5,080,287 |
| 6.50%, 4/1/16—3/1/39 | | | | 2,544,703 | d | 2,901,535 |
| 7.00%, 9/1/15—7/1/37 | | | | 170,508 | d | 195,372 |
| 7.50%, 2/1/23—11/1/33 | | | | 37,311 | d | 41,514 |
| 8.00%, 2/1/17—10/1/31 | | | | 37,196 | d | 42,986 |
| 8.50%, 10/1/18—6/1/30 | | | | 1,356 | d | 1,618 |
| Ser. K714, Cl. A1 2.08%, 12/25/19 | | | | 778,914 | d | 793,778 |
| Ser. K017, Cl. A2 2.87%, 12/25/21 | | | | 750,000 | d | 769,753 |
| Ser. K032, Cl. A1 3.02%, 2/25/23 | | | | 567,451 | d | 592,144 |
| Ser. K033, Cl. A2 3.06%, 7/25/23 | | | | 1,000,000 | a,d | 1,026,548 |
| Ser. L032, Cl. A2 3.31%, 5/25/23 | | | | 1,250,000 | a,d | 1,307,318 |
| Ser. K014, Cl. A2 3.87%, 4/25/21 | | | | 1,800,000 | d | 1,957,798 |
| Ser. K012, Cl. A2 4.19%, 12/25/20 | | | | 1,284,000 | a,d | 1,418,246 |
The Fund 57
STATEMENT OF INVESTMENTS (continued)
| | | | |
| | | Principal | | |
| Bonds and Notes (continued) | | Amount ($) | | Value ($) |
| U.S. Government Agencies/ | | | | |
| Mortgage-Backed (continued) | | | | |
| Federal National Mortgage Association: | | | | |
| 2.00 % | | 1,100,000 | d,f | 1,089,945 |
| 2.50 % | | 11,200,000 | d,f | 11,363,624 |
| 3.00 % | | 4,900,000 | d,f | 5,060,573 |
| 3.50 % | | 19,000,000 | d,f | 19,692,153 |
| 4.00 % | | 25,700,000 | d,f | 27,286,087 |
| 4.50 % | | 8,300,000 | d,f | 8,996,422 |
| 5.00 % | | 2,800,000 | d,f | 3,100,781 |
| 5.50 % | | 1,450,000 | d,f | 1,619,481 |
| 2.00%, 7/1/28—9/1/29 | | 1,600,000 | d | 1,586,650 |
| 2.18%, 5/1/43 | | 546,003 | a,d | 553,123 |
| 2.50%, 7/1/27—8/1/43 | | 9,604,796 | d | 9,678,553 |
| 2.73%, 11/1/43 | | 255,862 | a,d | 262,751 |
| 2.94%, 5/1/42 | | 359,532 | a,d | 372,415 |
| 3.00%, 10/1/26—8/1/44 | | 56,211,721 | d | 56,884,213 |
| 3.04%, 12/1/41 | | 539,397 | a,d | 565,438 |
| 3.50%, 1/20/25—2/1/44 | | 43,894,318 | d | 45,699,234 |
| 4.00%, 2/1/24—5/1/42 | | 43,417,701 | d | 46,284,981 |
| 4.50%, 4/1/18—11/1/40 | | 29,808,582 | d | 32,339,868 |
| 5.00%, 11/1/17—6/1/40 | | 17,003,929 | d | 18,780,828 |
| 5.50%, 1/1/17—12/1/38 | | 12,827,393 | d | 14,317,706 |
| 6.00%, 5/1/16—11/1/38 | | 7,079,093 | d | 8,011,822 |
| 6.50%, 6/1/15—9/1/38 | | 1,834,224 | d | 2,095,794 |
| 7.00%, 6/1/15—3/1/38 | | 412,582 | d | 462,195 |
| 7.50%, 8/1/15—6/1/31 | | 77,734 | d | 87,913 |
| 8.00%, 6/1/15—8/1/30 | | 16,034 | d | 18,407 |
| 8.50%, 9/1/15—7/1/30 | | 4,821 | d | 5,011 |
| 9.00%, 10/1/30 | | 2,062 | d | 2,178 |
| Ser. 2013-M14, Cl. APT 2.51%, 4/25/23 | | 1,157,625 | a,d | 1,147,431 |
| Ser. 2014-M3, Cl. AB2 3.46%, 1/25/24 | | 800,000 | a,d | 833,459 |
| Government National Mortgage Association I: | | | | |
| 3.00 % | | 3,900,000 | f | 3,973,430 |
| 4.00 % | | 1,000,000 | f | 1,069,277 |
| 4.50 % | | 400,000 | f | 436,531 |
| 2.50%, 2/15/28 | | 1,486,496 | | 1,524,136 |
| 3.00%, 9/15/42—8/15/43 | | 1,590,225 | | 1,623,409 |
| 3.50%, 2/15/26—10/15/42 | | 4,995,321 | | 5,228,096 |
| 4.00%, 2/15/41—3/15/41 | | 6,526,081 | | 7,049,544 |
| 4.50%, 1/15/19—2/15/41 | | 10,460,021 | | 11,427,332 |
| 5.00%, 1/15/17—4/15/40 | | 13,105,510 | | 14,517,545 |
| 5.50%, 9/15/20—11/15/38 | | 4,137,675 | | 4,612,277 |
| 6.00%, 2/15/17—4/15/39 | | 4,168,245 | | 4,750,331 |
58
| | | | |
| | | Principal | | |
| Bonds and Notes (continued) | | Amount ($) | | Value ($) |
| U.S. Government Agencies/ | | | | |
| Mortgage-Backed (continued) | | | | |
| Government National Mortgage Association I (continued): | | | | |
| 6.50%, 2/15/24—2/15/39 | | 1,025,159 | | 1,196,548 |
| 7.00%, 10/15/27—8/15/32 | | 90,028 | | 102,860 |
| 7.50%, 12/15/23—11/15/30 | | 76,354 | | 85,721 |
| 8.00%, 8/15/24—3/15/32 | | 17,890 | | 21,903 |
| 8.25%, 6/15/27 | | 1,928 | | 2,230 |
| 8.50%, 10/15/26 | | 9,605 | | 11,080 |
| 9.00%, 2/15/22—2/15/23 | | 8,644 | | 8,829 |
| Government National Mortgage Association II: | | | | |
| 3.00 % | | 16,100,000 | f | 16,403,132 |
| 3.50 % | | 30,100,000 | f | 31,490,729 |
| 4.00 % | | 24,000,000 | f | 25,661,297 |
| 4.50 % | | 15,900,000 | f | 17,354,164 |
| 5.00 % | | 1,500,000 | f | 1,651,875 |
| 2.00%, 10/20/42—6/20/43 | | 1,788,490 | | 1,835,415 |
| 2.50%, 4/20/28—9/20/43 | | 1,037,698 | | 1,021,906 |
| 2.50%, 1/20/43—11/20/43 | | 1,814,689 | | 1,863,273 |
| 3.00%, 11/20/27—10/20/43 | | 13,367,606 | | 13,740,823 |
| 3.00%, 7/20/42 | | 917,289 | | 954,060 |
| 3.50%, 9/20/28—8/20/44 | | 11,101,656 | | 11,640,136 |
| 3.50%, 3/20/41—5/20/41 | | 840,917 | | 885,271 |
| 4.00%, 9/20/43—8/20/44 | | 5,993,297 | | 6,420,019 |
| 4.50%, 7/20/41—6/20/43 | | 3,759,612 | | 4,117,477 |
| 5.00%, 3/20/37—12/20/43 | | 7,607,064 | | 8,418,072 |
| 5.50%, 10/20/31—11/20/42 | | 2,568,331 | | 2,894,896 |
| 6.50%, 2/20/28 | | 827 | | 949 |
| 8.50%, 7/20/25 | | 603 | | 677 |
| Federal Home Loan Mortgage Corp.: | | | | |
| 1.94%, 8/1/37 | | 67,074 | a,d | 70,966 |
| 2.13%, 2/1/35 | | 306,537 | a,d | 326,761 |
| 2.25%, 6/1/35 | | 5,056 | a,d | 5,385 |
| 2.25%, 3/1/37 | | 71,610 | a,d | 75,992 |
| 2.38%, 4/1/33 | | 4,819 | a,d | 5,098 |
| 2.38%, 6/1/34 | | 4,321 | a,d | 4,535 |
| 2.38%, 12/1/34 | | 14,719 | a,d | 15,718 |
| 2.38%, 4/1/36 | | 128,359 | a,d | 136,763 |
| 2.40%, 6/1/36 | | 7,902 | a,d | 7,989 |
| 2.41%, 3/1/36 | | 7,315 | a,d | 7,829 |
| 2.44%, 12/1/34 | | 32,541 | a,d | 34,382 |
| 2.53%, 11/1/33 | | 4,125 | a,d | 4,423 |
| 4.58%, 8/1/34 | | 2,684 | a,d | 2,827 |
The Fund 59
STATEMENT OF INVESTMENTS (continued)
| | | |
| | Principal | | |
| Bonds and Notes (continued) | Amount ($) | | Value ($) |
| U.S. Government Agencies/ | | | |
| Mortgage-Backed (continued) | | | |
| Federal National Mortgage Association: | | | |
| 2.09%, 2/1/37 | 3,813 | a,d | 4,074 |
| 2.11%, 12/1/35 | 7,136 | a,d | 7,207 |
| 2.14%, 10/1/34 | 15,687 | a,d | 16,642 |
| 2.25%, 3/1/34 | 154,510 | a,d | 166,710 |
| 2.25%, 6/1/34 | 153,137 | a,d | 164,609 |
| 2.26%, 11/1/36 | 123,994 | a,d | 131,939 |
| 2.29%, 8/1/35 | 60,753 | a,d | 65,239 |
| 2.32%, 12/1/36 | 10,894 | a,d | 11,018 |
| 2.33%, 6/1/34 | 55,511 | a,d | 59,214 |
| 2.33%, 1/1/35 | 156,758 | a,d | 168,852 |
| 2.35%, 3/1/37 | 52,335 | a,d | 56,015 |
| 2.39%, 5/1/33 | 6,139 | a,d | 6,187 |
| 2.39%, 9/1/33 | 6,404 | a,d | 6,686 |
| 2.40%, 11/1/32 | 11,680 | a,d | 12,184 |
| 2.41%, 2/1/37 | 125,603 | a,d | 135,249 |
| 2.44%, 9/1/33 | 17,242 | a,d | 18,376 |
| 2.44%, 11/1/36 | 31,227 | a,d | 33,023 |
| 4.17%, 1/1/35 | 7,133 | a,d | 7,502 |
| 4.98%, 6/1/35 | 9,524 | a,d | 9,938 |
| 5.17%, 11/1/35 | 2,626 | a,d | 2,824 |
| | | | 714,466,108 |
| U.S. Government Securities—34.7% | | | |
| U.S. Treasury Bonds: | | | |
| 2.75%, 8/15/42 | 2,440,000 | | 2,297,221 |
| 2.75%, 11/15/42 | 2,182,000 | | 2,051,591 |
| 2.88%, 5/15/43 | 9,457,000 | | 9,105,313 |
| 3.00%, 5/15/42 | 3,500,000 | | 3,470,467 |
| 3.13%, 11/15/41 | 5,750,000 | | 5,856,915 |
| 3.13%, 2/15/42 | 20,000 | | 20,331 |
| 3.13%, 2/15/43 | 2,990,000 | | 3,025,739 |
| 3.13%, 8/15/44 | 6,655,000 | c | 6,738,187 |
| 3.38%, 5/15/44 | 9,750,000 | | 10,344,906 |
| 3.50%, 2/15/39 | 5,000,000 | | 5,455,470 |
| 3.63%, 8/15/43 | 2,885,000 | c | 3,200,772 |
| 3.63%, 2/15/44 | 5,030,000 | | 5,582,908 |
| 3.75%, 8/15/41 | 560,000 | | 638,137 |
| 3.75%, 11/15/43 | 4,995,000 | | 5,667,767 |
| 3.88%, 8/15/40 | 30,000 | c | 34,826 |
| 4.25%, 11/15/40 | 5,000,000 | | 6,156,640 |
| 4.38%, 11/15/39 | 2,212,000 | c | 2,767,075 |
| 4.38%, 5/15/41 | 1,000,000 | | 1,257,500 |
60
| | | |
| | Principal | | |
| Bonds and Notes (continued) | Amount ($) | | Value ($) |
| U.S. Government Securities (continued) | | | |
| U.S. Treasury Bonds (continued): | | | |
| 4.50%, 2/15/36 | 2,435,000 | | 3,085,983 |
| 4.50%, 5/15/38 | 625,000 | | 791,846 |
| 4.50%, 8/15/39 | 595,000 | | 756,068 |
| 4.63%, 2/15/40 | 860,000 | | 1,115,447 |
| 4.75%, 2/15/37 | 2,425,000 | | 3,177,507 |
| 4.75%, 2/15/41 | 1,300,000 | | 1,725,953 |
| 5.00%, 5/15/37 | 4,110,000 | | 5,567,122 |
| 6.25%, 5/15/30 | 7,430,000 | c | 10,810,650 |
| 6.50%, 11/15/26 | 1,200,000 | c | 1,700,063 |
| 6.63%, 2/15/27 | 780,000 | | 1,119,361 |
| 6.75%, 8/15/26 | 30,000 | c | 43,125 |
| 6.88%, 8/15/25 | 2,000,000 | | 2,855,000 |
| 7.13%, 2/15/23 | 1,920,000 | | 2,645,700 |
| 7.25%, 8/15/22 | 2,500,000 | | 3,430,470 |
| 7.50%, 11/15/16 | 4,000,000 | | 4,561,876 |
| 8.00%, 11/15/21 | 970,000 | | 1,352,847 |
| 8.13%, 5/15/21 | 1,500,000 | | 2,072,578 |
| 8.75%, 5/15/17 | 2,395,000 | | 2,876,433 |
| 8.88%, 8/15/17 | 2,725,000 | c | 3,324,925 |
| 8.88%, 2/15/19 | 1,500,000 | c | 1,966,758 |
| 9.00%, 11/15/18 | 1,840,000 | | 2,396,600 |
| 9.88%, 11/15/15 | 1,495,000 | | 1,644,267 |
| U.S. Treasury Notes: | | | |
| 0.25%, 11/30/15 | 4,015,000 | | 4,018,766 |
| 0.25%, 12/15/15 | 1,680,000 | | 1,681,443 |
| 0.25%, 12/31/15 | 3,145,000 | | 3,147,702 |
| 0.25%, 2/29/16 | 4,030,000 | | 4,031,257 |
| 0.25%, 4/15/16 | 7,120,000 | c | 7,116,105 |
| 0.25%, 5/15/16 | 7,945,000 | | 7,935,069 |
| 0.38%, 11/15/15 | 2,000,000 | | 2,004,376 |
| 0.38%, 1/15/16 | 8,720,000 | | 8,737,030 |
| 0.38%, 1/31/16 | 3,500,000 | | 3,507,109 |
| 0.38%, 2/15/16 | 7,340,000 | | 7,354,335 |
| 0.38%, 3/15/16 | 6,770,000 | | 6,780,047 |
| 0.38%, 3/31/16 | 6,000,000 | | 6,007,968 |
| 0.38%, 4/30/16 | 394,000 | | 394,400 |
| 0.38%, 5/31/16 | 3,950,000 | c | 3,953,085 |
| 0.38%, 10/31/16 | 3,995,000 | | 3,985,636 |
| 0.50%, 6/15/16 | 7,985,000 | | 8,006,208 |
| 0.50%, 6/30/16 | 3,880,000 | c | 3,889,095 |
| 0.50%, 7/31/16 | 3,800,000 | c | 3,808,014 |
| 0.50%, 8/31/16 | 6,500,000 | c | 6,509,646 |
The Fund 61
STATEMENT OF INVESTMENTS (continued)
| | | |
| | Principal | | |
| Bonds and Notes (continued) | Amount ($) | | Value ($) |
| U.S. Government Securities (continued) | | | |
| U.S. Treasury Notes (continued): | | | |
| 0.50%, 9/30/16 | 8,475,000 | c | 8,479,636 |
| 0.50%, 7/31/17 | 4,640,000 | | 4,595,048 |
| 0.63%, 7/15/16 | 2,240,000 | | 2,249,099 |
| 0.63%, 8/15/16 | 4,175,000 | | 4,190,005 |
| 0.63%, 11/15/16 | 6,765,000 | | 6,776,629 |
| 0.63%, 12/15/16 | 3,154,000 | c | 3,157,696 |
| 0.63%, 2/15/17 | 5,780,000 | | 5,777,740 |
| 0.63%, 5/31/17 | 3,500,000 | | 3,485,507 |
| 0.63%, 8/31/17 | 3,700,000 | | 3,671,673 |
| 0.63%, 9/30/17 | 5,473,000 | c | 5,425,111 |
| 0.63%, 11/30/17 | 5,040,000 | | 4,980,543 |
| 0.63%, 4/30/18 | 1,864,000 | | 1,828,176 |
| 0.75%, 1/15/17 | 3,755,000 | | 3,767,027 |
| 0.75%, 6/30/17 | 4,817,000 | | 4,808,720 |
| 0.75%, 10/31/17 | 2,220,000 | | 2,205,606 |
| 0.75%, 12/31/17 | 3,100,000 | | 3,071,179 |
| 0.75%, 2/28/18 | 6,300,000 | | 6,220,759 |
| 0.75%, 3/31/18 | 3,300,000 | | 3,254,625 |
| 0.88%, 9/15/16 | 6,690,000 | | 6,739,131 |
| 0.88%, 11/30/16 | 5,000,000 | | 5,033,595 |
| 0.88%, 12/31/16 | 6,355,000 | c | 6,391,738 |
| 0.88%, 1/31/17 | 4,320,000 | | 4,343,963 |
| 0.88%, 2/28/17 | 1,280,000 | | 1,286,500 |
| 0.88%, 4/15/17 | 3,805,000 | c | 3,821,053 |
| 0.88%, 4/30/17 | 4,500,000 | | 4,515,116 |
| 0.88%, 5/15/17 | 1,885,000 | c | 1,890,744 |
| 0.88%, 6/15/17 | 3,625,000 | c | 3,633,497 |
| 0.88%, 7/15/17 | 3,540,000 | c | 3,545,529 |
| 0.88%, 8/15/17 | 3,570,000 | | 3,571,114 |
| 0.88%, 10/15/17 | 1,350,000 | | 1,348,207 |
| 0.88%, 1/31/18 | 776,000 | | 770,786 |
| 0.88%, 7/31/19 | 1,730,000 | | 1,674,045 |
| 1.00%, 8/31/16 | 8,600,000 | | 8,686,671 |
| 1.00%, 9/30/16 | 8,001,000 | c | 8,077,882 |
| 1.00%, 10/31/16 | 2,510,000 | | 2,534,119 |
| 1.00%, 3/31/17 | 5,000,000 | c | 5,035,940 |
| 1.00%, 9/15/17 | 3,235,000 | c | 3,245,109 |
| 1.00%, 5/31/18 | 3,540,000 | | 3,512,898 |
| 1.00%, 6/30/19 | 3,000,000 | | 2,923,593 |
| 1.00%, 9/30/19 | 7,575,000 | | 7,348,932 |
| 1.00%, 11/30/19 | 1,900,000 | | 1,837,805 |
| 1.13%, 5/31/19 | 5,000,000 | | 4,907,810 |
| 1.13%, 12/31/19 | 2,800,000 | | 2,721,687 |
62
| | | |
| | Principal | | |
| Bonds and Notes (continued) | Amount ($) | | Value ($) |
| U.S. Government Securities (continued) | | | |
| U.S. Treasury Notes (continued): | | | |
| 1.13%, 3/31/20 | 4,250,000 | | 4,113,537 |
| 1.13%, 4/30/20 | 3,160,000 | | 3,053,104 |
| 1.25%, 10/31/18 | 3,168,000 | | 3,153,646 |
| 1.25%, 11/30/18 | 4,400,000 | | 4,374,907 |
| 1.25%, 1/31/19 | 2,090,000 | | 2,072,202 |
| 1.25%, 10/31/19 | 2,000,000 | | 1,963,906 |
| 1.25%, 2/29/20 | 2,000,000 | | 1,952,032 |
| 1.38%, 11/30/15 | 3,600,000 | | 3,646,123 |
| 1.38%, 6/30/18 | 2,665,000 | | 2,676,659 |
| 1.38%, 7/31/18 | 1,780,000 | | 1,786,397 |
| 1.38%, 9/30/18 | 4,068,000 | c | 4,074,037 |
| 1.38%, 11/30/18 | 1,341,000 | | 1,340,371 |
| 1.38%, 12/31/18 | 1,920,000 | | 1,915,951 |
| 1.38%, 2/28/19 | 5,998,000 | | 5,970,823 |
| 1.38%, 1/31/20 | 650,000 | | 639,285 |
| 1.38%, 5/31/20 | 2,300,000 | | 2,248,968 |
| 1.50%, 6/30/16 | 6,740,000 | | 6,863,740 |
| 1.50%, 7/31/16 | 5,000,000 | | 5,094,530 |
| 1.50%, 8/31/18 | 4,905,000 | | 4,940,257 |
| 1.50%, 12/31/18 | 2,850,000 | | 2,858,684 |
| 1.50%, 1/31/19 | 5,534,000 | c | 5,544,376 |
| 1.50%, 2/28/19 | 3,910,000 | | 3,914,278 |
| 1.50%, 3/31/19 | 3,000,000 | | 3,000,468 |
| 1.50%, 5/31/19 | 2,440,000 | | 2,435,615 |
| 1.50%, 10/31/19 | 4,820,000 | | 4,794,396 |
| 1.63%, 3/31/19 | 4,900,000 | | 4,925,264 |
| 1.63%, 4/30/19 | 7,000,000 | | 7,031,717 |
| 1.63%, 6/30/19 | 4,000,000 | c | 4,013,124 |
| 1.63%, 7/31/19 | 2,910,000 | | 2,917,275 |
| 1.63%, 8/15/22 | 1,080,000 | c | 1,040,850 |
| 1.63%, 11/15/22 | 6,180,000 | c | 5,931,836 |
| 1.75%, 5/31/16 | 3,500,000 | | 3,576,563 |
| 1.75%, 10/31/18 | 2,300,000 | | 2,333,601 |
| 1.75%, 10/31/20 | 5,540,000 | | 5,493,253 |
| 1.75%, 5/15/23 | 4,621,000 | c | 4,448,073 |
| 1.88%, 8/31/17 | 3,140,000 | | 3,226,105 |
| 1.88%, 9/30/17 | 4,590,000 | c | 4,712,998 |
| 1.88%, 10/31/17 | 5,000,000 | | 5,135,155 |
| 1.88%, 6/30/20 | 3,800,000 | | 3,814,546 |
| 2.00%, 1/31/16 | 3,025,000 | | 3,092,119 |
| 2.00%, 4/30/16 | 8,135,000 | | 8,335,837 |
| 2.00%, 7/31/20 | 4,500,000 | | 4,546,760 |
| 2.00%, 9/30/20 | 1,145,000 | | 1,153,140 |
The Fund 63
STATEMENT OF INVESTMENTS (continued)
| | | |
| | Principal | | |
| Bonds and Notes (continued) | Amount ($) | | Value ($) |
| U.S. Government Securities (continued) | | | |
| U.S. Treasury Notes (continued): | | | |
| 2.00%, 11/30/20 | 2,868,000 | c | 2,881,445 |
| 2.00%, 2/28/21 | 2,057,000 | | 2,061,338 |
| 2.00%, 5/31/21 | 6,690,000 | | 6,687,913 |
| 2.00%, 8/31/21 | 3,835,000 | | 3,826,609 |
| 2.00%, 10/31/21 | 3,995,000 | | 3,985,013 |
| 2.00%, 11/15/21 | 4,930,000 | | 4,916,906 |
| 2.00%, 2/15/22 | 1,367,000 | c | 1,360,378 |
| 2.00%, 2/15/23 | 7,915,000 | c | 7,798,744 |
| 2.13%, 12/31/15 | 3,600,000 | | 3,680,158 |
| 2.13%, 2/29/16 | 3,000,000 | | 3,075,000 |
| 2.13%, 8/31/20 | 3,190,000 | | 3,237,601 |
| 2.13%, 1/31/21 | 3,000,000 | | 3,030,936 |
| 2.13%, 6/30/21 | 2,760,000 | | 2,778,544 |
| 2.13%, 8/15/21 | 4,805,000 | | 4,835,781 |
| 2.13%, 9/30/21 | 3,475,000 | | 3,494,818 |
| 2.25%, 3/31/16 | 6,660,000 | | 6,844,189 |
| 2.25%, 11/30/17 | 5,240,000 | | 5,437,317 |
| 2.25%, 3/31/21 | 3,665,000 | | 3,725,700 |
| 2.25%, 4/30/21 | 3,675,000 | c | 3,733,282 |
| 2.25%, 7/31/21 | 3,800,000 | | 3,855,814 |
| 2.38%, 3/31/16 | 783,000 | | 805,817 |
| 2.38%, 7/31/17 | 1,320,000 | | 1,374,450 |
| 2.38%, 5/31/18 | 5,000,000 | | 5,201,170 |
| 2.38%, 6/30/18 | 2,000,000 | | 2,080,000 |
| 2.38%, 12/31/20 | 2,125,000 | | 2,180,284 |
| 2.38%, 8/15/24 | 9,035,000 | | 9,070,995 |
| 2.50%, 6/30/17 | 5,000,000 | | 5,222,265 |
| 2.50%, 8/15/23 | 7,366,000 | c | 7,517,924 |
| 2.50%, 5/15/24 | 9,060,000 | | 9,206,518 |
| 2.63%, 1/31/18 | 5,000,000 | | 5,245,310 |
| 2.63%, 8/15/20 | 6,050,000 | | 6,309,962 |
| 2.63%, 11/15/20 | 8,700,000 | | 9,058,875 |
| 2.75%, 11/30/16 | 3,700,000 | | 3,867,947 |
| 2.75%, 5/31/17 | 2,230,000 | c | 2,342,720 |
| 2.75%, 12/31/17 | 1,643,000 | c | 1,730,156 |
| 2.75%, 2/28/18 | 3,000,000 | | 3,158,907 |
| 2.75%, 2/15/19 | 4,170,000 | | 4,390,555 |
| 2.75%, 11/15/23 | 10,107,000 | c | 10,511,280 |
| 2.75%, 2/15/24 | 9,620,000 | c | 9,992,025 |
| 3.00%, 8/31/16 | 2,740,000 | | 2,866,725 |
| 3.00%, 9/30/16 | 4,560,000 | | 4,776,600 |
| 3.00%, 2/28/17 | 1,500,000 | | 1,581,093 |
| 3.13%, 10/31/16 | 5,000,000 | c | 5,258,205 |
64
| | | | | |
| | Coupon | Maturity | Principal | | |
| Bonds and Notes (continued) | Rate (%) | Date | Amount ($) | | Value ($) |
| U.S. Government Securities (continued) | | | | |
| U.S. Treasury Notes (continued): | | | | | |
| 3.13%, 1/31/17 | | | 480,000 | | 506,550 |
| 3.13%, 4/30/17 | | | 3,360,000 | | 3,558,186 |
| 3.13%, 5/15/19 | | | 5,000,000 | | 5,347,655 |
| 3.13%, 5/15/21 | | | 6,650,000 | | 7,115,500 |
| 3.25%, 5/31/16 | | | 1,083,000 | | 1,131,988 |
| 3.25%, 6/30/16 | | | 4,020,000 | | 4,210,950 |
| 3.25%, 7/31/16 | | | 4,060,000 | | 4,260,779 |
| 3.25%, 12/31/16 | | | 4,700,000 | | 4,966,946 |
| 3.38%, 11/15/19 | | | 3,130,000 | | 3,391,405 |
| 3.50%, 2/15/18 | | | 1,700,000 | | 1,831,352 |
| 3.50%, 5/15/20 | | | 4,500,000 | | 4,914,491 |
| 3.63%, 8/15/19 | | | 3,210,000 | | 3,510,687 |
| 3.63%, 2/15/20 | | | 5,430,000 | c | 5,960,696 |
| 3.63%, 2/15/21 | | | 5,000,000 | | 5,500,390 |
| 3.75%, 11/15/18 | | | 3,000,000 | c | 3,279,609 |
| 3.88%, 5/15/18 | | | 4,600,000 | | 5,028,016 |
| 4.00%, 8/15/18 | | | 2,800,000 | | 3,083,500 |
| 4.50%, 11/15/15 | | | 220,000 | | 229,831 |
| 4.50%, 2/15/16 | | | 425,000 | | 448,143 |
| 4.50%, 5/15/17 | | | 2,000,000 | | 2,187,656 |
| 4.63%, 11/15/16 | | | 3,300,000 | | 3,572,250 |
| 4.63%, 2/15/17 | | | 1,300,000 | | 1,417,304 |
| 4.75%, 8/15/17 | | | 2,387,000 | | 2,640,805 |
| 4.88%, 8/15/16 | | | 90,000 | | 97,080 |
| 5.13%, 5/15/16 | | | 1,800,000 | | 1,931,765 |
| | | | | | 838,179,189 |
| Utilities—1.9% | | | | | |
| AEP Texas Central Transition | | | | | |
| Funding, Sr. Scd. Bonds, Ser. A-4 | 5.17 | 1/1/20 | 250,000 | | 270,643 |
| AGL Capital, | | | | | |
| Gtd. Notes | 3.50 | 9/15/21 | 193,000 | | 200,440 |
| American Water Capital, | | | | | |
| Sr. Unscd. Notes | 3.85 | 3/1/24 | 250,000 | | 264,222 |
| Atmos Energy, | | | | | |
| Sr. Unscd. Notes | 4.13 | 10/15/44 | 1,000,000 | | 1,005,915 |
| Berkshire Hathaway Energy, | | | | | |
| Sr. Unscd. Notes | 5.15 | 11/15/43 | 250,000 | | 282,546 |
| Berkshire Hathaway Energy, | | | | | |
| Sr. Unscd. Bonds | 6.13 | 4/1/36 | 500,000 | | 629,636 |
| Commonwealth Edison, | | | | | |
| First Mortgage Bonds | 2.15 | 1/15/19 | 750,000 | | 755,593 |
The Fund 65
STATEMENT OF INVESTMENTS (continued)
| | | | |
| | Coupon | Maturity | Principal | |
| Bonds and Notes (continued) | Rate (%) | Date | Amount ($) | Value ($) |
| Utilities (continued) | | | | |
| Commonwealth Edison, | | | | |
| First Mortgage Bonds | 5.90 | 3/15/36 | 471,000 | 598,262 |
| Connecticut Light & Power, | | | | |
| First Mortgage Bonds | 4.30 | 4/15/44 | 500,000 | 520,017 |
| Consolidated Edison of New York, | | | | |
| Sr. Unscd. Debs., Ser. 05-A | 5.30 | 3/1/35 | 475,000 | 553,385 |
| Consolidated Edison of New York, | | | | |
| Sr. Unscd. Debs., Ser. 08-A | 5.85 | 4/1/18 | 600,000 | 683,653 |
| Consolidated Edison of New York, | | | | |
| Sr. Unscd. Debs., Ser. 06-B | 6.20 | 6/15/36 | 200,000 | 256,927 |
| Consumers Energy, | | | | |
| First Mortgage Bonds | 4.35 | 8/31/64 | 700,000 | 713,595 |
| Consumers Energy, | | | | |
| First Mortgage Bonds, Ser. P | 5.50 | 8/15/16 | 99,000 | 107,287 |
| Dominion Resources, | | | | |
| Sr. Unscd. Notes, Ser. B | 2.75 | 9/15/22 | 1,500,000 | 1,466,163 |
| Dominion Resources, | | | | |
| Sr. Unscd. Notes, Ser. E | 6.30 | 3/15/33 | 100,000 | 125,863 |
| DTE Electric, | | | | |
| Mortgage Bonds | 3.38 | 3/1/25 | 500,000 | 510,945 |
| DTE Electric, | | | | |
| Sr. Scd. Notes | 3.45 | 10/1/20 | 700,000 | 736,352 |
| Duke Energy, | | | | |
| Sr. Unscd. Notes | 3.75 | 4/15/24 | 500,000 | 519,981 |
| Duke Energy Carolinas, | | | | |
| First Mortgage Bonds | 3.90 | 6/15/21 | 800,000 | 868,610 |
| Duke Energy Carolinas, | | | | |
| First Mortgage Notes | 4.00 | 9/30/42 | 500,000 | 504,574 |
| Duke Energy Carolinas, | | | | |
| First Mortgage Bonds | 6.00 | 1/15/38 | 1,000,000 | 1,292,250 |
| Duke Energy Florida | | | | |
| First Mortgage Bonds | 6.40 | 6/15/38 | 150,000 | 203,946 |
| Empresa Nacional de Electricidad, | | | | |
| Sr. Unscd. Notes | 4.25 | 4/15/24 | 500,000 | 508,778 |
| Florida Power & Light, | | | | |
| First Mortgage Bonds | 5.63 | 4/1/34 | 1,100,000 | 1,376,313 |
| Georgia Power, | | | | |
| Sr. Unscd. Note | 4.30 | 3/15/42 | 1,300,000 | 1,340,201 |
| Hydro-Quebec, | | | | |
| Gov’t Gtd. Debs., Ser. HH | 8.50 | 12/1/29 | 1,200,000 | 1,835,176 |
66
| | | | |
| | Coupon | Maturity | Principal | |
| Bonds and Notes (continued) | Rate (%) | Date | Amount ($) | Value ($) |
| Utilities (continued) | | | | |
| Hydro-Quebec, | | | | |
| Gov’t Gtd. Debs., Ser. HK | 9.38 | 4/15/30 | 20,000 | 32,485 |
| Indiana Michigan Power, | | | | |
| Sr. Unscd. Notes | 6.05 | 3/15/37 | 800,000 | 981,320 |
| Nevada Power, | | | | |
| Mortgage Notes | 7.13 | 3/15/19 | 2,300,000 | 2,764,938 |
| NextEra Energy Capital Holdings, | | | | |
| Gtd. Debs | 2.40 | 9/15/19 | 500,000 | 501,740 |
| NiSource Finance, | | | | |
| Gtd. Notes | 6.40 | 3/15/18 | 1,700,000 | 1,944,693 |
| Oncor Electric Delivery, | | | | |
| Sr. Scd. Notes | 5.00 | 9/30/17 | 500,000 | 550,143 |
| Oncor Electric Delivery, | | | | |
| Sr. Scd. Debs. | 7.00 | 9/1/22 | 170,000 | 215,934 |
| Oncor Electric Delivery, | | | | |
| Sr. Scd. Notes | 7.00 | 5/1/32 | 250,000 | 343,492 |
| Pacific Gas & Electric, | | | | |
| Sr. Unscd. Notes | 4.75 | 2/15/44 | 500,000 | 538,508 |
| Pacific Gas & Electric, | | | | |
| Sr. Unscd. Bonds | 6.05 | 3/1/34 | 465,000 | 581,917 |
| Pacific Gas & Electric, | | | | |
| Sr. Unscd. Notes | 6.25 | 3/1/39 | 750,000 | 967,136 |
| PECO Energy, | | | | |
| First Mortgage Bonds | 4.80 | 10/15/43 | 500,000 | 567,701 |
| Pennsylvania Electric, | | | | |
| Sr. Unscd. Notes | 5.20 | 4/1/20 | 500,000 | 556,834 |
| Piedmont Natural Gas, | | | | |
| Sr. Unscd. Notes | 4.10 | 9/18/34 | 500,000 | 516,572 |
| PPL Capital Funding, | | | | |
| Gtd. Notes | 3.40 | 6/1/23 | 400,000 | 400,143 |
| PPL Capital Funding, | | | | |
| Gtd. Notes | 4.70 | 6/1/43 | 400,000 | 413,734 |
| PPL Electric Utilities, | | | | |
| First Mortgage Bonds | 4.75 | 7/15/43 | 1,000,000 | 1,109,830 |
| Progress Energy, | | | | |
| Sr. Unscd. Notes | 7.75 | 3/1/31 | 480,000 | 685,843 |
| PSEG Power, | | | | |
| Gtd. Notes | 2.45 | 11/15/18 | 180,000 | 182,047 |
| Public Service Colorado, | | | | |
| First Mortgage Bonds | 3.20 | 11/15/20 | 1,500,000 | 1,573,655 |
The Fund 67
STATEMENT OF INVESTMENTS (continued)
| | | | | |
| | Coupon | Maturity | Principal | | |
| Bonds and Notes (continued) | Rate (%) | Date | Amount ($) | | Value ($) |
| Utilities (continued) | | | | | |
| Public Service Electric & Gas, | | | | | |
| First Mortgage Notes | 3.15 | 8/15/24 | 1,200,000 | | 1,217,675 |
| Public Service Electric & Gas, | | | | | |
| Scd. Notes, Ser. D | 5.25 | 7/1/35 | 230,000 | | 276,361 |
| San Diego Gas & Electric, | | | | | |
| First Mortgage Bonds | 3.60 | 9/1/23 | 400,000 | | 421,808 |
| Sempra Energy, | | | | | |
| Sr. Unscd. Notes | 2.88 | 10/1/22 | 1,000,000 | | 982,596 |
| South Carolina Electric & Gas, | | | | | |
| First Mortgage Bonds | 4.50 | 6/1/64 | 500,000 | | 513,584 |
| South Carolina Electric & Gas, | | | | | |
| First Mortgage Bonds | 6.63 | 2/1/32 | 200,000 | | 268,362 |
| Southern California Edison, | | | | | |
| First Mortgage Bonds | 3.88 | 6/1/21 | 1,400,000 | c | 1,523,518 |
| Southern California Edison, | | | | | |
| First Mortgage Bonds, Ser. 08-A | 5.95 | 2/1/38 | 70,000 | | 90,082 |
| Southern California Edison, | | | | | |
| Sr. Unscd. Notes | 6.65 | 4/1/29 | 450,000 | | 586,859 |
| Southern California Gas, | | | | | |
| First Mortgage Bonds | 3.15 | 9/15/24 | 500,000 | | 505,498 |
| Southern California Gas, | | | | | |
| First Mortgage Bonds, Ser. HH | 5.45 | 4/15/18 | 100,000 | | 112,708 |
| Southwestern Electric Power, | | | | | |
| Sr. Unscd. Notes, Ser. F | 5.88 | 3/1/18 | 150,000 | | 168,879 |
| Tampa Electric, | | | | | |
| Sr. Unscd. Notes | 4.35 | 5/15/44 | 500,000 | | 525,213 |
| Union Electric, | | | | | |
| Sr. Scd. Notes | 6.40 | 6/15/17 | 1,000,000 | | 1,122,766 |
| Virginia Electric & Power, | | | | | |
| Sr. Unscd. Notes | 1.20 | 1/15/18 | 1,000,000 | | 992,677 |
| Virginia Electric & Power, | | | | | |
| Sr. Unscd. Notes | 4.00 | 1/15/43 | 500,000 | | 495,344 |
| Virginia Electric & Power, | | | | | |
| Sr. Unscd. Notes, Ser. A | 5.40 | 1/15/16 | 500,000 | | 529,011 |
| Wisconsin Power & Light, | | | | | |
| Sr. Unscd. Debs | 4.10 | 10/15/44 | 800,000 | | 805,437 |
| Xcel Energy, | | | | | |
| Sr. Unscd. Notes | 6.50 | 7/1/36 | 630,000 | | 837,364 |
| | | | | | 45,535,680 |
| Total Bonds and Notes | | | | | |
| (cost $2,349,886,943) | | | | | 2,413,287,115 |
68
| | | | |
| Other Investment—8.4% | Shares | | Value ($) | |
| Registered Investment Company; | | | | |
| Dreyfus Institutional Preferred | | | | |
| Plus Money Market Fund | | | | |
| (cost $202,017,347) | 202,017,347 | g | 202,017,347 | |
| |
| Investment of Cash Collateral | | | | |
| for Securities Loaned—.7% | | | | |
| Registered Investment Company; | | | | |
| Dreyfus Institutional Cash Advantage Fund | | | | |
| (cost $17,606,936) | 17,606,936 | g | 17,606,936 | |
| |
| Total Investments (cost $2,569,511,226) | 109.2 | % | 2,632,911,398 | |
| Liabilities, Less Cash and Receivables | (9.2 | %) | (221,289,528 | ) |
| Net Assets | 100.0 | % | 2,411,621,870 | |
GO—General Obligation
REIT—Real Estate Investment Trust
|
| a Variable rate security—interest rate subject to periodic change. |
| b Securities exempt from registration pursuant to Rule 144A under the Securities Act of 1933.These securities may be |
| resold in transactions exempt from registration, normally to qualified institutional buyers.At October 31, 2014, these |
| securities were valued at $10,415,002 or 0.4% of net assets. |
| c Security, or portion thereof, on loan.At October 31, 2014, the value of the fund’s securities on loan was |
| $174,932,093 and the value of the collateral held by the fund was $179,929,366, consisting of cash collateral of |
| $17,606,936 and U.S. Government & Agency securities valued at $162,322,430. |
| d The Federal Housing Finance Agency (“FHFA”) placed the Federal Home Loan Mortgage Corporation and Federal |
| National Mortgage Association into conservatorship with FHFA as the conservator.As such, the FHFA oversees the |
| continuing affairs of these companies. |
| e Security issued with a zero coupon. Income is recognized through the accretion of discount. |
| f This security is traded on a To-Be-Announced (“TBA”) basis. |
| g Investment in affiliated money market mutual fund. |
| | | |
| Portfolio Summary (Unaudited)† | | |
| |
| | Value (%) | | Value (%) |
| U.S. Government & Agencies | 68.1 | Commercial Mortgage-Backed | 1.6 |
| Corporate Bonds | 24.0 | Municipal Bonds | .8 |
| Money Market Investments | 9.1 | Asset-Backed | .6 |
| Foreign/Governmental | 5.0 | | 109.2 |
| |
| † Based on net assets. | | | |
| See notes to financial statements. | | | |
The Fund 69
| | | |
| TBA SALE COMMITMENTS | | | |
| October 31, 2014 | | | |
| |
| |
| |
| | Principal | | |
| | Amount ($) | | Value ($) |
| Federal Home Loan Mortgage Corp.: | | | |
| 4%, 11/1/29 | 300,000 | a,b | 318,070 |
| 4.50%, 11/1/18 | 800,000 | a,b | 843,500 |
| 5%, 11/19/22 | 1,500,000 | a,b | 1,581,563 |
| Total Federal Home Loan Mortgage Corp. | 2,600,000 | | 2,743,133 |
| Federal National Mortgage Association: | | | |
| 2.50%, 11/1/43 | 600,000 | a,b | 578,938 |
| 4%, 11/18/29 | 4,150,000 | a,b | 4,404,512 |
| 4.50%, 11/18/29 | 1,600,000 | a,b | 1,685,938 |
| 5%, 11/1/17 | 300,000 | a,b | 316,594 |
| 5.50%, 11/1/29 | 500,000 | a,b | 528,390 |
| Total Federal National Mortgage Association | 7,150,000 | | 7,514,372 |
| Government National Mortgage Association: | | | |
| 5%, 11/1/33 | 7,000,000 | b | 7,724,334 |
| 5.50%, 11/15/32 | 1,600,000 | b | 1,781,375 |
| Total Government | | | |
| National Mortgage Association | 8,600,000 | | 9,505,709 |
| Total TBA Sale Commitments | | | |
| (proceeds $19,746,217) | | | 19,763,214 |
|
| a The Federal Housing Finance Agency (“FHFA”) placed Federal National Mortgage Association and Federal Home |
| Loan Mortgage Corporation into conservatorship with FHFA as the conservator.As such, the FHFA oversees the |
| continuing affairs of these companies. |
| b Sold on a delayed delivery basis |
70
|
| STATEMENT OF ASSETS AND LIABILITIES |
| October 31, 2014 |
| | |
| | Cost | Value |
| Assets ($): | | |
| Investments in securities—See Statement of Investments (including | |
| securities on loan, valued at $174,932,093)—Note 1(b): | | |
| Unaffiliated issuers | 2,349,886,943 | 2,413,287,115 |
| Affiliated issuers | 219,624,283 | 219,624,283 |
| Cash | | 4,859,888 |
| Receivable for investment securities sold | | 54,679,348 |
| Receivable for TBA sale commitments | | 19,746,217 |
| Dividends, interest and securities lending income receivable | | 15,094,007 |
| Receivable for shares of Capital Stock subscribed | | 5,140,003 |
| | | 2,732,430,861 |
| Liabilities ($): | | |
| Due to The Dreyfus Corporation and affiliates—Note 3(b) | | 533,428 |
| Payable for investment securities purchased | | 160,098,825 |
| Payable for open mortgage dollar roll transactions—Note 4 | | 117,989,876 |
| TBA sales commitment, at value (proceeds $19,746,217)— | | |
| see TBA Sales Commitments—Note 4 | | 19,763,214 |
| Liability for securities on loan—Note 1(b) | | 17,606,936 |
| Payable for shares of Capital Stock redeemed | | 4,800,577 |
| Accrued expenses | | 16,135 |
| | | 320,808,991 |
| Net Assets ($) | | 2,411,621,870 |
| Composition of Net Assets ($): | | |
| Paid-in capital | | 2,328,286,038 |
| Accumulated undistributed investment income—net | | 2,329,198 |
| Accumulated net realized gain (loss) on investments | | 17,623,459 |
| Accumulated net unrealized appreciation | | |
| (depreciation) on investments | | 63,383,175 |
| Net Assets ($) | | 2,411,621,870 |
| |
| |
| Net Asset Value Per Share | | |
| | Investor Shares | BASIC Shares |
| Net Assets ($) | 1,190,993,785 | 1,220,628,085 |
| Shares Outstanding | 112,339,241 | 115,068,448 |
| Net Asset Value Per Share ($) | 10.60 | 10.61 |
| See notes to financial statements. | | |
The Fund 71
|
| STATEMENT OF OPERATIONS |
| Year Ended October 31, 2014 |
| | |
| Investment Income ($): | | |
| Income: | | |
| Interest | 56,900,875 | |
| Income from securities lending—Note 1(b) | 168,250 | |
| Dividends; | | |
| Affliated issuers | 99,708 | |
| Total Income | 57,168,833 | |
| Expenses: | | |
| Management fee—Note 3(a) | 3,271,111 | |
| Distribution Plan fees (Investor Shares)—Note 3(b) | 2,243,523 | |
| Directors’ fees—Note 3(a) | 155,430 | |
| Loan commitment fees—Note 2 | 20,305 | |
| Total Expenses | 5,690,369 | |
| Less—Directors’ fees reimbursed by the Manager—Note 3(a) | (155,430 | ) |
| Net Expenses | 5,534,939 | |
| Investment Income—Net | 51,633,894 | |
| Realized and Unrealized Gain (Loss) on Investments—Note 4 ($): | | |
| Net realized gain (loss) on investments | 22,902,556 | |
| Net unrealized appreciation (depreciation) on investments | 8,616,363 | |
| Net Realized and Unrealized Gain (Loss) on Investments | 31,518,919 | |
| Net Increase in Net Assets Resulting from Operations | 83,152,813 | |
| |
| See notes to financial statements. | | |
72
STATEMENT OF CHANGES IN NET ASSETS
| | | | |
| | Year Ended October 31, | |
| | 2014 | | 2013 | |
| Operations ($): | | | | |
| Investment income—net | 51,633,894 | | 54,387,941 | |
| Net realized gain (loss) on investments | 22,902,556 | | 36,177,404 | |
| Net unrealized appreciation | | | | |
| (depreciation) on investments | 8,616,363 | | (128,007,187 | ) |
| Net Increase (Decrease) in Net Assets | | | | |
| Resulting from Operations | 83,152,813 | | (37,441,842 | ) |
| Dividends to Shareholders from ($): | | | | |
| Investment income—net: | | | | |
| Investor Shares | (21,289,213 | ) | (25,808,556 | ) |
| BASIC Shares | (33,708,941 | ) | (36,949,929 | ) |
| Net realized gain on investments: | | | | |
| Investor Shares | (11,929,675 | ) | (2,369,554 | ) |
| BASIC Shares | (16,594,600 | ) | (3,192,239 | ) |
| Total Dividends | (83,522,429 | ) | (68,320,278 | ) |
| Capital Stock Transactions ($): | | | | |
| Net proceeds from shares sold: | | | | |
| Investor Shares | 591,861,829 | | 331,081,540 | |
| BASIC Shares | 434,531,737 | | 428,646,545 | |
| Dividends reinvested: | | | | |
| Investor Shares | 32,932,622 | | 27,685,258 | |
| BASIC Shares | 44,839,901 | | 35,691,797 | |
| Cost of shares redeemed: | | | | |
| Investor Shares | (338,025,004 | ) | (440,721,801 | ) |
| BASIC Shares | (508,208,499 | ) | (641,338,922 | ) |
| Increase (Decrease) in Net Assets | | | | |
| from Capital Stock Transactions | 257,932,586 | | (258,955,583 | ) |
| Total Increase (Decrease) in Net Assets | 257,562,970 | | (364,717,703 | ) |
| Net Assets ($): | | | | |
| Beginning of Period | 2,154,058,900 | | 2,518,776,603 | |
| End of Period | 2,411,621,870 | | 2,154,058,900 | |
| Undistributed investment income–net | 2,329,198 | | 2,011,773 | |
The Fund 73
STATEMENT OF CHANGES IN NET ASSETS (continued)
| | | | |
| | Year Ended October 31, | |
| | 2014 | | 2013 | |
| Capital Share Transactions: | | | | |
| Investor Shares | | | | |
| Shares sold | 56,139,224 | | 30,599,851 | |
| Shares issued for dividends reinvested | 3,148,438 | | 2,559,322 | |
| Shares redeemed | (32,176,189 | ) | (40,873,438 | ) |
| Net Increase (Decrease) in Shares Outstanding | 27,111,473 | | (7,714,265 | ) |
| BASIC Shares | | | | |
| Shares sold | 41,298,790 | | 39,632,326 | |
| Shares issued for dividends reinvested | 4,283,160 | | 3,298,055 | |
| Shares redeemed | (48,124,947 | ) | (59,009,178 | ) |
| Net Increase (Decrease) in Shares Outstanding | (2,542,997 | ) | (16,078,797 | ) |
| |
| See notes to financial statements. | | | | |
74
FINANCIAL HIGHLIGHTS
The following tables describe the performance for each share class for the fiscal periods indicated. All information (except portfolio turnover rate) reflects financial results for a single fund share.Total return shows how much your investment in the fund would have increased (or decreased) during each period, assuming you had reinvested all dividends and distributions.These figures have been derived from the fund’s financial statements.
| | | | | | | | | | |
| | | | Year Ended October 31, | | | |
| Investor Shares | 2014 | | 2013 | | 2012 | | 2011 | | 2010 | |
| Per Share Data ($): | | | | | | | | | | |
| Net asset value, beginning of period | 10.62 | | 11.11 | | 10.93 | | 10.80 | | 10.42 | |
| Investment Operations: | | | | | | | | | | |
| Investment income—neta | .23 | | .24 | | .30 | | .34 | | .35 | |
| Net realized and unrealized | | | | | | | | | | |
| gain (loss) on investments | .14 | | (.42 | ) | .21 | | .14 | | .39 | |
| Total from Investment Operations | .37 | | (.18 | ) | .51 | | .48 | | .74 | |
| Distributions: | | | | | | | | | | |
| Dividends from investment income—net | (.25 | ) | (.28 | ) | (.33 | ) | (.35 | ) | (.36 | ) |
| Dividends from net realized | | | | | | | | | | |
| gain on investments | (.14 | ) | (.03 | ) | — | | — | | — | |
| Total Distributions | (.39 | ) | (.31 | ) | (.33 | ) | (.35 | ) | (.36 | ) |
| Net asset value, end of period | 10.60 | | 10.62 | | 11.11 | | 10.93 | | 10.80 | |
| Total Return (%) | 3.62 | | (1.66 | ) | 4.75 | | 4.58 | | 7.28 | |
| Ratios/Supplemental Data (%): | | | | | | | | | | |
| Ratio of total expenses | | | | | | | | | | |
| to average net assets | .41 | | .41 | | .41 | | .40 | | .41 | |
| Ratio of net expenses | | | | | | | | | | |
| to average net assets | .40 | | .40 | | .40 | | .40 | | .40 | |
| Ratio of net investment income | | | | | | | | | | |
| to average net assets | 2.22 | | 2.25 | | 2.67 | | 3.24 | | 3.27 | |
| Portfolio Turnover Rate | 145.11 | b | 94.21 | b | 30.42 | | 30.02 | | 32.15 | |
| Net Assets, end of period | | | | | | | | | | |
| ($ x 1,000) | 1,190,994 | | 904,779 | | 1,032,597 | | 896,293 | | 996,131 | |
|
| a Based on average shares outstanding. |
| b The portfolio turnover rates excluding mortgage dollar roll transactions for the periods ended October 31, 2014 and |
| October 31, 2013 were 89.76% and 67.47% respectively. |
See notes to financial statements.
The Fund 75
FINANCIAL HIGHLIGHTS (continued)
| | | | | | | | | | |
| | | | Year Ended October 31, | | | |
| BASIC Shares | 2014 | | 2013 | | 2012 | | 2011 | | 2010 | |
| Per Share Data ($): | | | | | | | | | | |
| Net asset value, beginning of period | 10.62 | | 11.12 | | 10.94 | | 10.80 | | 10.42 | |
| Investment Operations: | | | | | | | | | | |
| Investment income—neta | .26 | | .27 | | .32 | | .36 | | .37 | |
| Net realized and unrealized | | | | | | | | | | |
| gain (loss) on investments | .15 | | (.43 | ) | .22 | | .16 | | .40 | |
| Total from Investment Operations | .41 | | (.16 | ) | .54 | | .52 | | .77 | |
| Distributions: | | | | | | | | | | |
| Dividends from | | | | | | | | | | |
| investment income—net | (.28 | ) | (.31 | ) | (.36 | ) | (.38 | ) | (.39 | ) |
| Dividends from net realized | | | | | | | | | | |
| gain on investments | (.14 | ) | (.03 | ) | — | | — | | — | |
| Total Distributions | (.42 | ) | (.34 | ) | (.36 | ) | (.38 | ) | (.39 | ) |
| Net asset value, end of period | 10.61 | | 10.62 | | 11.12 | | 10.94 | | 10.80 | |
| Total Return (%) | 3.97 | | (1.50 | ) | 5.01 | | 4.94 | | 7.55 | |
| Ratios/Supplemental Data (%): | | | | | | | | | | |
| Ratio of total expenses | | | | | | | | | | |
| to average net assets | .16 | | .16 | | .16 | | .15 | | .16 | |
| Ratio of net expenses | | | | | | | | | | |
| to average net assets | .15 | | .15 | | .15 | | .15 | | .15 | |
| Ratio of net investment income | | | | | | | | | | |
| to average net assets | 2.47 | | 2.50 | | 2.92 | | 3.31 | | 3.52 | |
| Portfolio Turnover Rate | 145.11 | b | 94.21 | b | 30.42 | | 30.02 | | 32.15 | |
| Net Assets, end of period | | | | | | | | | | |
| ($ x 1,000) | 1,220,628 | | 1,249,280 | | 1,486,179 | | 1,427,047 | | 1,249,324 | |
|
| a Based on average shares outstanding. |
| b The portfolio turnover rates excluding mortgage dollar roll transactions for the periods ended October 31, 2014 and |
| October 31, 2013 were 89.76% and 67.47% respectively. |
See notes to financial statements.
76
NOTES TO FINANCIAL STATEMENTS
NOTE 1—Significant Accounting Policies:
Dreyfus Bond Market Index Fund (the “fund”) is a separate diversified series of The Dreyfus/Laurel Funds, Inc. (the “Company”), which is registered under the Investment Company Act of 1940, as amended (the “Act”), as an open-end management investment company and operates as a series company currently offering eleven series, including the fund. The fund’s investment objective seeks to match the total return of the Barclays U.S. Aggregate Index.The Dreyfus Corporation (the “Manager” or “Dreyfus”), a wholly-owned subsidiary of The Bank of New York Mellon Corporation (“BNY Mellon”), serves as the fund’s investment adviser.
MBSC Securities Corporation (the “Distributor”), a wholly-owned subsidiary of the Manager, is the distributor of the fund’s shares, which are sold to the public without a sales charge.The fund is authorized to issue 500 million shares of $.001 par value Capital Stock in each of the following classes of shares: Investor and BASIC. Investor shares and BASIC shares are offered to any investor. Differences between the two classes include the services offered to and the expenses borne by each class, as well as their minimum purchase and account balance requirements. Income, expenses (other than expenses attributable to a specific class), and realized and unrealized gains or losses on investments are allocated to each class of shares based on its relative net assets.
The Company accounts separately for the assets, liabilities and operations of each series. Expenses directly attributable to each series are charged to that series’ operations; expenses which are applicable to all series are allocated among them on a pro rata basis.
The Financial Accounting Standards Board (“FASB”) Accounting Standards Codification (“ASC”) is the exclusive reference of authoritative U.S. generally accepted accounting principles (“GAAP”) recognized by the FASB to be applied by nongovernmental entities. Rules and interpretive releases of the Securities and Exchange Commission (“SEC”) under authority of federal laws are also sources of authoritative GAAP for
The Fund 77
NOTES TO FINANCIAL STATEMENTS (continued)
SEC registrants. The fund’s financial statements are prepared in accordance with GAAP, which may require the use of management estimates and assumptions. Actual results could differ from those estimates.
(a) Portfolio valuation: The fair value of a financial instrument is the amount that would be received to sell an asset or paid to transfer a liability in an orderly transaction between market participants at the measurement date (i.e., the exit price). GAAP establishes a fair value hierarchy that prioritizes the inputs of valuation techniques used to measure fair value. This hierarchy gives the highest priority to unadjusted quoted prices in active markets for identical assets or liabilities (Level 1 measurements) and the lowest priority to unobservable inputs (Level 3 measurements).
Additionally, GAAP provides guidance on determining whether the volume and activity in a market has decreased significantly and whether such a decrease in activity results in transactions that are not orderly. GAAP requires enhanced disclosures around valuation inputs and techniques used during annual and interim periods.
Various inputs are used in determining the value of the fund’s investments relating to fair value measurements.These inputs are summarized in the three broad levels listed below:
Level 1—unadjusted quoted prices in active markets for identical investments.
Level 2—other significant observable inputs (including quoted prices for similar investments, interest rates, prepayment speeds, credit risk, etc.).
Level 3—significant unobservable inputs (including the fund’s own assumptions in determining the fair value of investments).
The inputs or methodology used for valuing securities are not necessarily an indication of the risk associated with investing in those securities.
Changes in valuation techniques may result in transfers in or out of an assigned level within the disclosure hierarchy. Valuation techniques used to value the fund’s investments are as follows:
78
Registered investment companies that are not traded on an exchange are valued at their net asset value and are generally categorized within Level 1 of the fair value hierarchy.
Investments in securities, excluding short-term investments (other than U.S. Treasury Bills), are valued each business day by an independent pricing service (the “Service”) approved by the Company’s Board of Directors (the “Board”). Investments for which quoted bid prices are readily available and are representative of the bid side of the market in the judgment of the Service are valued at the mean between the quoted bid prices (as obtained by the Service from dealers in such securities) and asked prices (as calculated by the Service based upon its evaluation of the market for such securities). Other investments (which constitute a majority of the portfolio securities) are valued as determined by the Service, based on methods which include consideration of the following: yields or prices of securities of comparable quality, coupon, maturity and type; indications as to values from dealers; and general market conditions. These securities are generally categorized within Level 2 of the fair value hierarchy.
The Service’s procedures are reviewed by Dreyfus under the general supervision of the Board.
When market quotations or official closing prices are not readily available, or are determined not to reflect accurately fair value, such as when the value of a security has been significantly affected by events after the close of the exchange or market on which the security is principally traded (for example, a foreign exchange or market), but before the fund calculates its net asset value, the fund may value these investments at fair value as determined in accordance with the procedures approved by the Board. Certain factors may be considered when fair valuing investments such as: fundamental analytical data, the nature and duration of restrictions on disposition, an evaluation of the forces that influence the market in which the securities are purchased and sold, and public trading in similar securities of the issuer or comparable
The Fund 79
NOTES TO FINANCIAL STATEMENTS (continued)
issuers. These securities are either categorized within Level 2 or 3 of the fair value hierarchy depending on the relevant inputs used.
For restricted securities where observable inputs are limited, assumptions about market activity and risk are used and are generally categorized within Level 3 of the fair value hierarchy.
The following is a summary of the inputs used as of October 31, 2014 in valuing the fund's investments:
| | | | | | |
| | | Level 2—Other | | Level 3— | | |
| | Level 1— | Significant | | Significant | | |
| | Unadjusted | Observable | | Unobservable | | |
| | Quoted Prices | Inputs | | Inputs | Total | |
| Assets ($) | | | | | | |
| Investments in Securities: | | | | | |
| Asset-Backed | — | 13,302,675 | | — | 13,302,675 | |
| Commercial | | | | | | |
| Mortgage-Backed | — | 38,841,474 | | — | 38,841,474 | |
| Corporate Bonds† | — | 576,635,412 | | — | 576,635,412 | |
| Foreign Government | — | 120,386,714 | | — | 120,386,714 | |
| Municipal Bonds† | — | 18,892,486 | | — | 18,892,486 | |
| Mutual Funds | 219,624,283 | — | | — | 219,624,283 | |
| U.S. Government | | | | | | |
| Agencies/ | | | | | | |
| Mortgage-Backed | — | 807,049,165 | | — | 807,049,165 | |
| U.S. Treasury | — | 838,179,189 | | — | 838,179,189 | |
| Liabilities ($) | | | | | | |
| Other Financial | | | | | | |
| Instruments: | | | | | | |
| TBA Sales | | | | | | |
| Commitments | — | (19,763,214 | ) | — | (19,763,214 | ) |
| |
| † See Statement of Investments for additional detailed categorizations. | | |
At October 31, 2014, there were no transfers between Level 1 and Level 2 of the fair value hierarchy.
80
(b) Securities transactions and investment income: Securities transactions are recorded on a trade date basis. Realized gains and losses from securities transactions are recorded on the identified cost basis. Dividend income is recognized on the ex-dividend date and interest income, including, where applicable, accretion of discount and amortization of premium on investments, is recognized on the accrual basis.
Pursuant to a securities lending agreement with The Bank of New York Mellon, a subsidiary of BNY Mellon and an affiliate of Dreyfus, and its affiliates, the fund may lend securities to qualified institutions. It is the fund’s policy that, at origination, all loans are secured by collateral of at least 102% of the value of U.S. securities loaned and 105% of the value of foreign securities loaned. Collateral equivalent to at least 100% of the market value of securities on loan is maintained at all times. Collateral is either in the form of cash, which can be invested in certain money market mutual funds managed by the Manager or U.S. Government and Agency securities.The fund is entitled to receive all dividends, interest and distributions on securities loaned, in addition to income earned as a result of the lending transaction. Should a borrower fail to return the securities in a timely manner, The Bank of New York Mellon is required to replace the securities for the benefit of the fund or credit the fund with the market value of the unreturned securities and is subrogated to the fund’s rights against the borrower and the collateral. During the period ended October 31, 2014, The Bank of New York Mellon earned $40,451 from lending portfolio securities, pursuant to the securities lending agreement.
(c) Affiliated issuers: Investments in other investment companies advised by Dreyfus are defined as “affiliated” under the Act. Investments
The Fund 81
NOTES TO FINANCIAL STATEMENTS (continued)
in affiliated investment companies during the period ended October 31, 2014 were as follows:
| | | | | |
| Affiliated | | | | | |
| Investment | Value | | | Value | Net |
| Company | 10/31/2013 ($) | Purchases ($) | Sales ($) | 10/31/2014 ($) | Assets (%) |
| Dreyfus | | | | | |
| Institutional | | | | | |
| Preferred | | | | | |
| Plus Money | | | | | |
| Market | | | | | |
| Fund | 68,659,201 | 662,160,785 | 528,802,639 | 202,017,347 | 8.4 |
| Dreyfus | | | | | |
| Institutional | | | | | |
| Cash | | | | | |
| Advantage | | | | | |
| Fund | 9,749,007 | 113,809,570 | 105,951,641 | 17,606,936 | .7 |
| Total | 78,408,208 | 775,970,355 | 634,754,280 | 219,624,283 | 9.1 |
(d) Risk: The fund invests primarily in debt securities. Failure of an issuer of the debt securities to make timely interest or principal payments, or a decline or the perception of a decline in the credit quality of a debt security, can cause the debt security’s price to fall, potentially lowering the fund’s share price. In addition, the value of debt securities may decline due to general market conditions that are not specifically related to a particular issuer, such as real or perceived adverse economic conditions, changes in outlook for corporate earnings, changes in interest or currency rates or adverse investor sentiment. They may also decline because of factors that affect a particular industry.
(e) Dividends to shareholders: It is policy of the fund to declare dividends daily from investment income-net. Such dividends are paid monthly. Dividends from net realized capital gains, if any, are normally declared and paid annually, but the fund may make distributions on a more frequent basis to comply with the distribution requirements of the Internal Revenue Code of 1986, as amended (the “Code”).To the extent that net realized capital gains can be offset by capital loss carryovers, it is the policy of the fund not to distribute such gains. Income and capital gain distributions are determined in accordance with income tax regulations, which may differ from GAAP.
82
(f) Federal income taxes: It is the policy of the fund to continue to qualify as a regulated investment company, if such qualification is in the best interests of its shareholders, by complying with the applicable provisions of the Code, and to make distributions of taxable income sufficient to relieve it from substantially all federal income and excise taxes.
As of and during the period ended October 31, 2014, the fund did not have any liabilities for any uncertain tax positions.The fund recognizes interest and penalties, if any, related to uncertain tax positions as income tax expense in the Statement of Operations. During the period ended October 31, 2014, the fund did not incur any interest or penalties.
Each tax year in the four-year period ended October 31, 2014 remains subject to examination by the Internal Revenue Service and state taxing authorities.
At October 31, 2014, the components of accumulated earnings on a tax basis were as follows: undistributed ordinary income $8,945,301, undistributed capital gains $11,422,859 and unrealized appreciation $62,967,672.
The tax character of distributions paid to shareholders during the fiscal periods ended October 31, 2014 and October 31, 2013 were as follows: ordinary income $55,998,444 and $62,758,485, and long-term capital gains $27,523,985 and $5,561,793, respectively.
During the period ended October 31, 2014, as a result of permanent book to tax differences, primarily due to the tax treatment for paydown gains and losses on mortage backed securities, amortization of pre-minums and consent fees, the fund increased accumulated undistributed investment income-net by $3,681,685 and decreased accumulated net realized gain (loss) on investments by the same amount. Net assets and net asset value per share were not affected by this reclassification.
The Fund 83
NOTES TO FINANCIAL STATEMENTS (continued)
NOTE 2—Bank Lines of Credit:
The fund participates with other Dreyfus-managed funds in a $430 million unsecured credit facility led by Citibank, N.A. and a $300 million unsecured credit facility provided by The Bank of New York Mellon (each, a “Facility”), each to be utilized primarily for temporary or emergency purposes, including the financing of redemptions. Prior to October 8, 2014, the unsecured credit facility with Citibank, N.A. was $265 million. In connection therewith, the fund has agreed to pay its pro rata portion of commitment fees for each Facility. Interest is charged to the fund based on rates determined pursuant to the terms of the respective Facility at the time of borrowing. During the period ended October 31, 2014, the fund did not borrow under the Facilities.
NOTE 3—Investment Management Fee and Other Transactions with Affiliates:
(a) Pursuant to an investment management agreement with the Manager, the Manager provides or arranges for one or more third parties and/or affiliates to provide investment advisory, administrative, custody, fund accounting and transfer agency services to the fund.The Manager also directs the investments of the fund in accordance with its investment objective, policies and limitations. For these services, the fund is contractually obligated to pay the Manager a fee, calculated daily and paid monthly, at the annual rate of .15% of the value of the fund’s average daily net assets. Out of its fee, the Manager pays all of the expenses of the fund except brokerage fees, taxes, interest expenses, commitment fees on borrowings, Distribution Plan fees, fees and expenses of non-interested Directors (including counsel fees) and extraordinary expenses. In addition, the Manager is required to reduce its fee in an amount equal to the fund’s allocable portion of fees and expenses of the non-interested Directors (including counsel fees). During the period ended October 31, 2014, fees reimbursed by the Manager amounted to $155,430.
84
(b) Under the Distribution Plan adopted pursuant to Rule 12b-1 under the Act, Investor shares may pay annually up to .25% of the value of its average daily net assets to compensate the Distributor for shareholder servicing activities primarily intended to result in the sale of Investor shares. The BASIC shares bear no Distribution Plan fee. During the period ended October 31, 2014, Investor shares were charged $2,243,523 pursuant to the Distribution Plan.
Under its terms, the Distribution Plan shall remain in effect from year to year, provided such continuance is approved annually by a vote of majority of those Directors who are not “interested persons” of the Company and who have no direct or indirect financial interest in the operation or in any agreement related to the Distribution Plan.
The components of “Due to The Dreyfus Corporation and affiliates” in the Statement of Assets and Liabilities consist of: management fees $302,925 and Distribution Plan fees $245,218, which are offset against an expense reimbursement currently in effect in the amount of $14,715.
(c) Each Board member also serves as a Board member of other funds within the Dreyfus complex. Annual retainer fees and attendance fees are allocated to each fund based on net assets.
NOTE 4—Securities Transactions:
The aggregate amount of purchases and sales (including paydowns) of investment securities, excluding short-term securities, during the period ended October 31, 2014, amounted to $2,173,797,318 and $1,971,441,288, respectively, in addition to $1,212,351,375 in purchases and $1,215,607,205 in sales were from mortgage dollar transactions.
Mortgage Dollar Rolls: A mortgage dollar roll transaction involves a sale by the fund of mortgage related securities that it holds with an agreement by the fund to repurchase similar securities at an agreed upon
The Fund 85
NOTES TO FINANCIAL STATEMENTS (continued)
price and date.The securities purchased will bear the same interest rate as those sold, but generally will be collateralized by pools of mortgages with different prepayment histories than those securities sold.The fund accounts for mortgage dollar rolls as purchases and sales transactions.
To-Be-Announced (“TBA”) Securities: During the period ended October 31, 2014, the fund transacted in TBA securities that involved buying or selling mortgage-backed securities on a forward commitment basis. A TBA transaction typically does not designate the actual security to be delivered and only includes an approximate principal amount; however, delivered securities must meet specified terms defined by industry guidelines, including issuer, rate and current principal amount outstanding on underling mortgage pools. TBA securities subject to a forward commitment to sell at period end are included at the end of the fund’s Statement of Investments under the caption “TBA Sale Commitments.” The proceeds and value of these commitments are reflected in the fund’s Statement of Assets and Liabilities as Receivable for TBA sale commitments and TBA sale commitments, at value, respectively.
At October 31, 2014, the cost of investments for federal income tax purposes was $2,569,926,729; accordingly, accumulated net unrealized appreciation on investments was $62,984,669, consisting of $70,757,219 gross unrealized appreciation and $7,772,550 gross unrealized depreciation.
86
|
| REPORT OF INDEPENDENT REGISTERED |
| PUBLIC ACCOUNTING FIRM |
The Board of Directors and Shareholders of The Dreyfus/Laurel Funds, Inc.
We have audited the accompanying statement of assets and liabilities of Dreyfus Bond Market Index Fund (the “Fund”), a series of The Dreyfus/Laurel Funds, Inc., including the statement of investments and TBA Sale Commitments, as of October 31, 2014, the related statement of operations for the year then ended, the statements of changes in net assets for each of the years in the two-year period then ended, and the financial highlights for each of the years in the five-year period then ended. These financial statements and financial highlights are the responsibility of the Fund’s management. Our responsibility is to express an opinion on these financial statements and financial highlights based on our audits.
We conducted our audits in accordance with the standards of the Public Company Accounting Oversight Board (United States).Those standards require that we plan and perform the audit to obtain reasonable assurance about whether the financial statements and financial highlights are free of material misstatement. An audit includes examining, on a test basis, evidence supporting the amounts and disclosures in the financial statements. Our procedures included confirmation of securities owned as of October 31, 2014, by correspondence with the custodian and brokers or by other appropriate auditing procedures. An audit also includes assessing the accounting principles used and significant estimates made by management, as well as evaluating the overall financial statement presentation.We believe that our audits provide a reasonable basis for our opinion.
In our opinion, the financial statements and financial highlights referred to above present fairly, in all material respects, the financial position of Dreyfus Bond Market Index Fund as of October 31, 2014, the results of its operations for the year then ended, the changes in its net assets for each of the years in the two-year period then ended, and the financial highlights for each of the years in the five-year period then ended, in conformity with U.S. generally accepted accounting principles

New York, New York
December 30, 2014
The Fund 87
IMPORTANT TAX INFORMATION (Unaudited)
For federal tax purposes the fund reports the maximum amount allowable but not less than 89.31% as intertest-related dividends in accordance with Sections 871(k)(1) and 881(e) of the Internal Revenue Code. Also the fund reports the maximum amount allowable but not less than $.1373 per share as a capital gain dividend in accordance with Section 852(b)(3)(C) of the Internal Revenue Code. Also, the fund reports the maximum amount allowable but not less than $.0050 as a short-term capital gain dividend paid on December 20, 2013 in accordance with Sections 871(k)(2) and 881(e) of the Internal Revenue Code.
88
|
| BOARD MEMBERS INFORMATION (Unaudited) |
| INDEPENDENT BOARD MEMBERS |
|
| Joseph S. DiMartino (71) |
| Chairman of the Board (1999) |
| Principal Occupation During Past 5Years: |
| • Corporate Director and Trustee (1995-present) |
| Other Public Company Board Memberships During Past 5Years: |
| • CBIZ (formerly, Century Business Services, Inc.), a provider of outsourcing functions for small |
| and medium size companies, Director (1997-present) |
| • The Newark Group, a provider of a national market of paper recovery facilities, paperboard |
| mills and paperboard converting plants, Director (2000-2010) |
| • Sunair Services Corporation, a provider of certain outdoor-related services to homes and |
| businesses, Director (2005-2009) |
| No. of Portfolios for which Board Member Serves: 144 |
| ——————— |
| Francine J. Bovich (63) |
| Board Member (2012) |
| Principal Occupation During Past 5Years: |
| • Trustee,The Bradley Trusts, private trust funds (2011-present) |
| • Managing Director, Morgan Stanley Investment Management (1993-2010) |
| Other Public Company Board Membership During Past 5Years: |
| • Annaly Capital Management, Inc., Board Member (May 2014-present) |
| No. of Portfolios for which Board Member Serves: 45 |
| ——————— |
| Kenneth A. Himmel (68) |
| Board Member (1994) |
| Principal Occupation During Past 5Years: |
| • President and CEO, Related Urban Development, a real estate development company (1996-present) |
| • President and CEO, Himmel & Company, a real estate development company (1980-present) |
| • CEO,American Food Management, a restaurant company (1983-present) |
| No. of Portfolios for which Board Member Serves: 31 |
The Fund 89
|
| BOARD MEMBERS INFORMATION (Unaudited) (continued) |
| INDEPENDENT BOARD MEMBERS (continued) |
|
| Stephen J. Lockwood (67) |
| Board Member (1994) |
| Principal Occupation During Past 5Years: |
| • Chairman of the Board, Stephen J. Lockwood and Company LLC, a real estate investment |
| company (2000-present) |
| No. of Portfolios for which Board Member Serves: 31 |
| ——————— |
| Roslyn M. Watson (65) |
| Board Member (1994) |
| Principal Occupation During Past 5Years: |
| • Principal,Watson Ventures, Inc., a real estate investment company (1993-present) |
| No. of Portfolios for which Board Member Serves: 69 |
| ——————— |
| Benaree Pratt Wiley (68) |
| Board Member (1998) |
| Principal Occupation During Past 5Years: |
| • Principal,TheWiley Group, a firm specializing in strategy and business development (2005-present) |
| Other Public Company Board Membership During Past 5Years: |
| • CBIZ (formerly, Century Business Services, Inc.), a provider of outsourcing functions for small |
| and medium size companies, Director (2008-present) |
| No. of Portfolios for which Board Member Serves: 69 |
| ——————— |
| Once elected all Board Members serve for an indefinite term, but achieve Emeritus status upon reaching age 80.The |
| address of the Board Members and Officers is c/o The Dreyfus Corporation, 200 Park Avenue, NewYork, NewYork |
| 10166.Additional information about the Board Members is available in the fund’s Statement of Additional Information |
| which can be obtained from Dreyfus free of charge by calling this toll free number: 1-800-DREYFUS. |
| James M. Fitzgibbons, Emeritus Board Member |
| J.Tomlinson Fort, Emeritus Board Member |
90
OFFICERS OF THE FUND (Unaudited)
BRADLEY J. SKAPYAK, President since January 2010.
Chief Operating Officer and a director of the Manager since June 2009, Chairman of Dreyfus Transfer, Inc., an affiliate of the Manager and the transfer agent of the funds, since May 2011 and Executive Vice President of the Distributor since June 2007. From April 2003 to June 2009, Mr. Skapyak was the head of the Investment Accounting and Support Department of the Manager. He is an officer of 69 investment companies (comprised of 144 portfolios) managed by the Manager. He is 55 years old and has been an employee of the Manager since February 1988.
JOHN PAK, Chief Legal Officer since March 2013.
Deputy General Counsel, Investment Management, of BNY Mellon since August 2014; Chief Legal Officer of the Manager since August 2012; from March 2005 to July 2012, Managing Director of Deutsche Bank, Deputy Global Head of Deutsche Asset Management Legal and Regional Head of Deutsche Asset Management Americas Legal. He is an officer of 70 investment companies (comprised of 169 portfolios) managed by the Manager. He is 46 years old and has been an employee of the Manager since August 2012.
JANETTE E. FARRAGHER, Vice President and Secretary since December 2011.
Assistant General Counsel of BNY Mellon, and an officer of 70 investment companies (comprised of 169 portfolios) managed by the Manager. She is 51 years old and has been an employee of the Manager since February 1984.
KIESHA ASTWOOD, Vice President and Assistant Secretary since January 2010.
Counsel of BNY Mellon, and an officer of 70 investment companies (comprised of 169 portfolios) managed by the Manager. She is 41 years old and has been an employee of the Manager since July 1995.
JAMES BITETTO, Vice President and Assistant Secretary since August 2005.
Managing Counsel of BNY Mellon and Secretary of the Manager, and an officer of 70 investment companies (comprised of 169 portfolios) managed by the Manager. He is 48 years old and has been an employee of the Manager since December 1996.
JONI LACKS CHARATAN, Vice President and Assistant Secretary since August 2005.
Managing Counsel of BNY Mellon, and an officer of 70 investment companies (comprised of 169 portfolios) managed by the Manager. She is 58 years old and has been an employee of the Manager since October 1988.
JOSEPH M. CHIOFFI, Vice President and Assistant Secretary since August 2005.
Managing Counsel of BNY Mellon, and an officer of 70 investment companies (comprised of 169 portfolios) managed by the Manager. He is 52 years old and has been an employee of the Manager since June 2000.
JOHN B. HAMMALIAN, Vice President and Assistant Secretary since August 2005.
Senior Managing Counsel of BNY Mellon, and an officer of 70 investment companies (comprised of 169 portfolios) managed by the Manager. He is 51 years old and has been an employee of the Manager since February 1991.
SARAH S. KELLEHER, Vice President and Assistant Secretary since April 2014.
Senior Counsel of BNY Mellon, and an officer of 70 investment companies (comprised of 169 portfolios) managed by the Manager; from August 2005 to March 2013, Associate General Counsel of Third Avenue Management. She is 38 years old and has been an employee of the Manager since March 2013.
The Fund 91
OFFICERS OF THE FUND (Unaudited) (continued)
JEFF PRUSNOFSKY, Vice President and Assistant Secretary since August 2005.
Senior Managing Counsel of BNY Mellon, and an officer of 70 investment companies (comprised of 169 portfolios) managed by the Manager. He is 49 years old and has been an employee of the Manager since October 1990.
JAMES WINDELS, Treasurer since November 2001.
Director – Mutual Fund Accounting of the Manager, and an officer of 70 investment companies (comprised of 169 portfolios) managed by the Manager. He is 56 years old and has been an employee of the Manager since April 1985.
RICHARD CASSARO, Assistant Treasurer since January 2008.
Senior Accounting Manager – Money Market and Municipal Bond Funds of the Manager, and an officer of 70 investment companies (comprised of 169 portfolios) managed by the Manager. He is 55 years old and has been an employee of the Manager since September 1982.
GAVIN C. REILLY, Assistant Treasurer since December 2005.
Tax Manager of the Investment Accounting and Support Department of the Manager, and an officer of 70 investment companies (comprised of 169 portfolios) managed by the Manager. He is 46 years old and has been an employee of the Manager since April 1991.
ROBERT S. ROBOL, Assistant Treasurer since August 2005.
Senior Accounting Manager – Fixed Income Funds of the Manager, and an officer of 70 investment companies (comprised of 169 portfolios) managed by the Manager. He is 50 years old and has been an employee of the Manager since October 1988.
ROBERT SALVIOLO, Assistant Treasurer since July 2007.
Senior Accounting Manager – Equity Funds of the Manager, and an officer of 70 investment companies (comprised of 169 portfolios) managed by the Manager. He is 47 years old and has been an employee of the Manager since June 1989.
ROBERT SVAGNA, Assistant Treasurer since December 2002.
Senior Accounting Manager – Equity Funds of the Manager, and an officer of 70 investment companies (comprised of 169 portfolios) managed by the Manager. He is 47 years old and has been an employee of the Manager since November 1990.
JOSEPH W. CONNOLLY, Chief Compliance Officer since October 2004.
Chief Compliance Officer of the Manager and The Dreyfus Family of Funds (70 investment companies, comprised of 169 portfolios). He is 57 years old and has served in various capacities with the Manager since 1980, including manager of the firm’s Fund Accounting Department from 1997 through October 2001.
MATTHEW D. CONNOLLY, Anti-Money Laundering Compliance Officer since April 2012.
Anti-Money Laundering Compliance Officer of the Distributor since October 2011; from March 2010 to September 2011, Global Head, KYC Reviews and Director of UBS Investment Bank; until March 2010, AML Compliance Officer and Senior Vice President of Citi Global Wealth Management. He is an officer of 65 investment companies (comprised of 164 portfolios) managed by the Manager. He is 42 years old and has been an employee of the Distributor since October 2011.
92
For More Information
Telephone 1-800-DREYFUS
Mail The Dreyfus Family of Funds, 144 Glenn Curtiss Boulevard, Uniondale, NY 11556-0144 E-mail Send your request to info@dreyfus.com Internet Information can be viewed online or downloaded at: http://www.dreyfus.com
The fund files its complete schedule of portfolio holdings with the Securities and Exchange Commission (“SEC”) for the first and third quarters of each fiscal year on Form N-Q. The fund’s Forms N-Q are available on the SEC’s website at http://www.sec.gov and may be reviewed and copied at the SEC’s Public Reference Room in Washington, DC. Information on the operation of the Public Reference Room may be obtained by calling 1-800-SEC-0330.
A description of the policies and procedures that the fund uses to determine how to vote proxies relating to portfolio securities, and information regarding how the fund voted these proxies for the most recent 12-month period ended June 30 is available at http://www.dreyfus.com and on the SEC’s website at http://www.sec.gov. The description of the policies and procedures is also available without charge, upon request, by calling 1-800-DREYFUS.

|
| Dreyfus |
| Tax Managed |
| Growth Fund |
ANNUAL REPORT October 31, 2014

Save time. Save paper. View your next shareholder report online as soon as it’s available. Log into www.dreyfus.com and sign up for Dreyfus eCommunications. It’s simple and only takes a few minutes.
The views expressed in this report reflect those of the portfolio manager only through the end of the period covered and do not necessarily represent the views of Dreyfus or any other person in the Dreyfus organization. Any such views are subject to change at any time based upon market or other conditions and Dreyfus disclaims any responsibility to update such views.These views may not be relied on as investment advice and, because investment decisions for a Dreyfus fund are based on numerous factors, may not be relied on as an indication of trading intent on behalf of any Dreyfus fund.
|
| Not FDIC-Insured • Not Bank-Guaranteed • May Lose Value |
| | Contents |
| | THE FUND |
| 2 | A Letter from the President |
| 3 | Discussion of Fund Performance |
| 6 | Fund Performance |
| 8 | Understanding Your Fund’s Expenses |
| 8 | Comparing Your Fund’s Expenses With Those of Other Funds |
| 9 | Statement of Investments |
| 13 | Statement of Assets and Liabilities |
| 14 | Statement of Operations |
| 15 | Statement of Changes in Net Assets |
| 17 | Financial Highlights |
| 20 | Notes to Financial Statements |
| 30 | Report of Independent Registered Public Accounting Firm |
| 31 | Important Tax Information |
| 32 | Board Members Information |
| 34 | Officers of the Fund |
| | FOR MORE INFORMATION |
| | Back Cover |
Dreyfus
Tax Managed
Growth Fund
The Fund
A LETTER FROM THE PRESIDENT
Dear Shareholder:
We are pleased to present this annual report for Dreyfus Tax Managed Growth Fund, covering the 12-month period from November 1, 2013, through October 31, 2014. For information about how the fund performed during the reporting period, as well as general market perspectives, we provide a Discussion of Fund Performance on the pages that follow.
Despite bouts of heightened volatility stemming mainly from economic and geopolitical concerns in overseas markets, U.S. stocks gained ground over the reporting period as the domestic economy continued to rebound. As a result, several broad measures of equity market performance established new record highs. Smaller and more economically sensitive stocks generally fared well over the reporting period’s first half, but larger, better established companies rallied more strongly over the second half.
We remain cautiously optimistic regarding the U.S. stock market’s prospects. We currently expect the economy to continue to accelerate as several longstanding drags — including tight fiscal policies and private sector deleveraging — fade from the scene. Of course, a number of risks remain, including the possibilities of higher interest rates and intensifying geopolitical turmoil. As always, we encourage you to discuss our observations with your financial adviser to assess their potential impact on your investments.
Thank you for your continued confidence and support.

J. Charles Cardona
President
The Dreyfus Corporation
November 17, 2014
2
DISCUSSION OF FUND PERFORMANCE
For the period of November 1, 2013, through October 31, 2014, as provided by Fayez Sarofim, Portfolio Manager of Fayez Sarofim & Co., Sub-Investment Adviser
Fund and Market Performance Overview
For the 12-month period ended October 31, 2014, Dreyfus Tax Managed Growth Fund’s Class A shares produced a total return of 12.00%, Class C shares returned 11.16%, and Class I shares returned 12.29%.1 In comparison, the Standard & Poor’s 500 Composite Stock Price Index (“S&P 500 Index”), the fund’s benchmark, returned 17.24% for the same period.2
The S&P 500 Index reached a series of new record highs over the reporting period as the U.S. economic recovery gained momentum.The fund produced lower returns than its benchmark, primarily due to its focus on industry-leading multinationals at a time when investors predominantly favored domestically oriented companies.
The Fund’s Investment Approach
The fund invests primarily in well-established, multinational companies that we believe are well positioned to weather difficult economic climates and thrive during favorable times. We focus on purchasing large-cap, blue-chip stocks at a price we consider to be justified by a company’s fundamentals.The result is a portfolio of stocks selected for what we consider to be sustained patterns of profitability, strong balance sheets, expanding global presence, and above-average earnings growth potential. At the same time, we manage the fund in a manner cognizant of the concerns of tax-conscious investors. We typically buy and sell relatively few stocks during the course of the year, which may help reduce investors’ tax liabilities.
S&P 500 Index Reached New Record Highs
The S&P 500 Index registered a series of new highs over the reporting period even as market volatility increased.The benchmark recovered quickly after a steep sell-off in January 2014 and again after a slide in July, crossing the 2000 threshold for the first time by the end of August. The S&P 500 Index retreated again in September but rebounded to set a new record high on the last day of October.
The Fund 3
DISCUSSION OF FUND PERFORMANCE (continued)
Equities pressed higher over the reporting period even as investors began to anticipate higher short-term interest rates from the Federal Reserve Board. Investors also worried about slowing global growth, intensifying conflicts in the Middle East and Ukraine, and the Ebola crisis in West Africa.The health care and information technology sectors led the market’s advance, while the energy sector ranked among the weaker sectors due to slack global demand and a stronger U.S. dollar.
Multinationals Lagged Companies with a Domestic Focus
The fund recorded double-digit gains for the reporting period, but relative results were constrained by its focus on multinational corporations at a time when investors favored more domestically oriented companies. A substantially overweighted allocation to the consumer staples sector and weakness in key sector holdings represented the largest detractor from relative results.An above-market weighting in the lagging energy sector also penalized relative results, but this effect was mitigated to a degree by successful stock selections. However, the fund’s stock selection strategies in the health care, materials, and financials sectors proved detrimental. Individual positions detracting from performance included Whole Foods Market, International Business Machines, Target, Freeport-McMoRan, Occidental Petroleum, Diageo,ADR, and Air Products and Chemicals.
The largest factor supporting relative results was limited and selective representation in the relatively weak consumer discretionary sector. Holdings such as Walt Disney and Time Warner Cable outperformed market and sector averages. An underweighted allocation and successful stock selections in the industrials sector added value to relative performance. Lack of exposure to the telecommunications services sector also was beneficial. Individual positions making the greatest absolute contributions to returns included Apple, Altria Group, Novo Nordisk, ADR, Canadian Pacific Railway, AbbVie, Johnson & Johnson, Exxon Mobil, and Intel.
Despite lagging fund results during the reporting period, collectively companies held by the fund sustained strong financial results and enhanced long-term shareholder value through disciplined capital redeployment, dividend increases, and share repurchases.
4
Investors May Become More Selective
The combination of low interest rates, muted inflation, slow but persistent U.S. growth, and lack of attractive investment alternatives has continued to support a favorable environment for equities. However, valuations have risen, and market volatility may become more pronounced as a tighter monetary policy approaches. Consequently, we expect investors to focus more intently on company fundamentals, with a preference for companies that have the competitive advantages and financial resources to sustain earnings and dividend growth. In our judgment, the fund’s holdings of large, high-quality multinationals have the scale, financial flexibility, and management resources to manage higher costs and maintain growth as U.S. interest rates normalize. These global companies offer investors a way to benefit from improving U.S. demand while retaining diversified exposure to the substantial opportunities for market share gains abroad. Furthermore, the fund seeks to reduce risk by investing with seasoned management teams who have established records of creating value for shareholders through numerous business and market cycles.
November 17, 2014
Please note, the position in any security highlighted with italicized typeface was sold during the reporting period. Equity funds are subject generally to market, market sector, market liquidity, issuer, and investment style risks, among other factors, to varying degrees, all of which are more fully described in the fund’s prospectus.
|
| 1 Total return includes reinvestment of dividends and any capital gains paid, and does not take into consideration the |
| maximum initial sales charge in the case of Class A shares, or the applicable contingent deferred sales charge imposed |
| on redemptions in the case of Class C shares. Had these charges been reflected, returns would have been lower. Past |
| performance is no guarantee of future results. Share price and investment return fluctuate such that upon redemption, |
| fund shares may be worth more or less than their original cost. |
| 2 SOURCE: LIPPER INC. – Reflects monthly reinvestment of dividends and, where applicable, capital gain |
| distributions.The Standard & Poor’s 500 Composite Stock Price Index is a widely accepted, unmanaged index of |
| U.S. stock market performance. Investors cannot invest directly in any index. |
The Fund 5
FUND PERFORMANCE
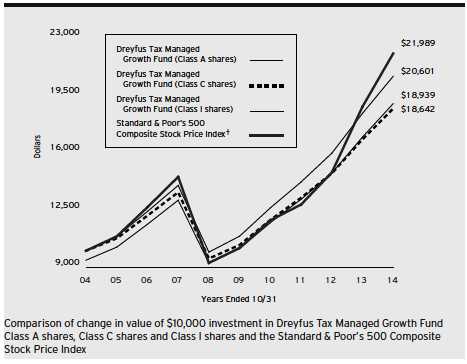
|
| † Source: Lipper Inc. |
| Past performance is not predictive of future performance. |
| The above graph compares a $10,000 investment made in each of the Class A, Class C and Class I shares of Dreyfus |
| Tax Managed Growth Fund on 10/31/04 to a $10,000 investment made in the Standard & Poor’s 500 Composite |
| Stock Price Index (the “Index”) on that date.All dividends and capital gain distributions are reinvested. |
| The fund’s performance shown in the line graph above takes into account the maximum initial sales charge on Class A |
| shares and all other applicable fees and expenses on all classes.The Index is a widely accepted, unmanaged index of U.S. |
| stock market performance. Unlike a mutual fund, the Index is not subject to charges, fees and other expenses. Investors |
| cannot invest directly in any index. Further information relating to fund performance, including expense reimbursements, |
| if applicable, is contained in the Financial Highlights section of the prospectus and elsewhere in this report. |
6
| | | | | | |
| Average Annual Total Returns as of 10/31/14 | | | | | |
| |
| | 1 | Year | 5 Years | | 10 Years | |
| Class A shares | | | | | | |
| with maximum sales charge (5.75%) | 5.56 | % | 11.99 | % | 6.59 | % |
| without sales charge | 12.00 | % | 13.32 | % | 7.23 | % |
| Class C shares | | | | | | |
| with applicable redemption charge † | 10.16 | % | 12.48 | % | 6.43 | % |
| without redemption | 11.16 | % | 12.48 | % | 6.43 | % |
| Class I shares | 12.29 | % | 13.61 | % | 7.50 | % |
| Standard & Poor’s 500 | | | | | | |
| Composite Stock Price Index | 17.24 | % | 16.68 | % | 8.20 | % |
Past performance is not predictive of future performance.The fund’s performance shown in the graph and table does not reflect the deduction of taxes that a shareholder would pay on fund distributions or the redemption of fund shares. In addition to the performance of Class A shares shown with and without a maximum sales charge, the fund’s performance shown in the table takes into account all other applicable fees and expenses on all classes.
|
| † The maximum contingent deferred sales charge for Class C shares is 1% for shares redeemed within one year of the |
| date of purchase. |
The Fund 7
UNDERSTANDING YOUR FUND’S EXPENSES (Unaudited)
As a mutual fund investor, you pay ongoing expenses, such as management fees and other expenses. Using the information below, you can estimate how these expenses affect your investment and compare them with the expenses of other funds.You also may pay one-time transaction expenses, including sales charges (loads) and redemption fees, which are not shown in this section and would have resulted in higher total expenses. For more information, see your fund’s prospectus or talk to your financial adviser.
Review your fund’s expenses
The table below shows the expenses you would have paid on a $1,000 investment in Dreyfus Tax Managed Growth Fund from May 1, 2014 to October 31, 2014. It also shows how much a $1,000 investment would be worth at the close of the period, assuming actual returns and expenses.
Expenses and Value of a $1,000 Investment
assuming actual returns for the six months ended October 31, 2014
| | | | | | |
| | | Class A | | Class C | | Class I |
| Expenses paid per $1,000† | $ | 6.96 | $ | 10.80 | $ | 5.67 |
| Ending value (after expenses) | $ | 1,044.90 | $ | 1,040.90 | $ | 1,046.40 |
COMPARING YOUR FUND’S EXPENSES
WITH THOSE OF OTHER FUNDS (Unaudited)
Using the SEC’s method to compare expenses
The Securities and Exchange Commission (SEC) has established guidelines to help investors assess fund expenses. Per these guidelines, the table below shows your fund’s expenses based on a $1,000 investment, assuming a hypothetical 5% annualized return. You can use this information to compare the ongoing expenses (but not transaction expenses or total cost) of investing in the fund with those of other funds. All mutual fund shareholder reports will provide this information to help you make this comparison. Please note that you cannot use this information to estimate your actual ending account balance and expenses paid during the period.
Expenses and Value of a $1,000 Investment
assuming a hypothetical 5% annualized return for the six months ended October 31, 2014
| | | | | | |
| | | Class A | | Class C | | Class I |
| Expenses paid per $1,000† | $ | 6.87 | $ | 10.66 | $ | 5.60 |
| Ending value (after expenses) | $ | 1,018.40 | $ | 1,014.62 | $ | 1,019.66 |
|
| † Expenses are equal to the fund’s annualized expense ratio of 1.35% for Class A, 2.10% for Class C and 1.10% |
| for Class I, multiplied by the average account value over the period, multiplied by 184/365 (to reflect the one-half |
| year period). |
8
STATEMENT OF INVESTMENTS
October 31, 2014
| | |
| Common Stocks—99.6% | Shares | Value ($) |
| Banks—1.2% | | |
| Wells Fargo & Co. | 42,700 | 2,266,943 |
| Capital Goods—2.4% | | |
| Caterpillar | 20,600 | 2,089,046 |
| United Technologies | 23,400 | 2,503,800 |
| | | 4,592,846 |
| Commercial Services & Supplies—.2% | | |
| CDK Global | 11,066 | 371,818 |
| Consumer Services—2.0% | | |
| McDonald’s | 41,150 | 3,856,990 |
| Diversified Financials—7.9% | | |
| American Express | 23,700 | 2,131,815 |
| BlackRock | 10,600 | 3,615,766 |
| Franklin Resources | 58,800 | 3,269,868 |
| JPMorgan Chase & Co. | 85,300 | 5,158,944 |
| State Street | 14,000 | 1,056,440 |
| | | 15,232,833 |
| Energy—14.9% | | |
| Chevron | 61,600 | 7,388,920 |
| ConocoPhillips | 37,800 | 2,727,270 |
| EOG Resources | 13,400 | 1,273,670 |
| Exxon Mobil | 101,912 | 9,855,909 |
| Imperial Oil | 47,400 | 2,269,512 |
| Occidental Petroleum | 59,700 | 5,309,121 |
| | | 28,824,402 |
| Food & Staples Retailing—2.3% | | |
| Walgreen | 47,400 | 3,044,028 |
| Whole Foods Market | 36,000 | 1,415,880 |
| | | 4,459,908 |
| Food, Beverage & Tobacco—21.8% | | |
| Altria Group | 109,000 | 5,269,060 |
The Fund 9
STATEMENT OF INVESTMENTS (continued)
| | | |
| Common Stocks (continued) | Shares | | Value ($) |
| Food, Beverage & Tobacco (continued) | | | |
| Coca-Cola | 225,600 | | 9,448,128 |
| Diageo, ADR | 17,100 | | 2,017,287 |
| Kraft Foods Group | 9,523 | | 536,621 |
| Mondelez International, Cl. A | 51,571 | | 1,818,393 |
| Nestle, ADR | 74,650 | | 5,474,085 |
| PepsiCo | 40,300 | | 3,875,651 |
| Philip Morris International | 122,300 | | 10,885,923 |
| SABMiller | 51,850 | | 2,928,492 |
| | | | 42,253,640 |
| Health Care Equipment & | | | |
| Services—1.6% | | | |
| Abbott Laboratories | 71,100 | | 3,099,249 |
| Household & Personal | | | |
| Products—4.8% | | | |
| Estee Lauder, Cl. A | 44,600 | | 3,353,028 |
| Procter & Gamble | 69,100 | | 6,030,357 |
| | | | 9,383,385 |
| Insurance—1.1% | | | |
| ACE | 20,000 | | 2,186,000 |
| Materials—1.3% | | | |
| Praxair | 19,500 | | 2,456,805 |
| Media—4.0% | | | |
| Comcast, Cl. A | 47,400 | | 2,623,590 |
| News Corp., Cl. A | 9,000 | a | 139,320 |
| Time Warner Cable | 2,200 | | 323,862 |
| Twenty-First Century Fox, Cl. A | 36,000 | | 1,241,280 |
| Walt Disney | 37,900 | | 3,463,302 |
| | | | 7,791,354 |
| Pharmaceuticals, Biotech & | | | |
| Life Sciences—14.2% | | | |
| AbbVie | 71,100 | | 4,512,006 |
10
| | | |
| Common Stocks (continued) | Shares | | Value ($) |
| Pharmaceuticals, Biotech & | | | |
| Life Sciences (continued) | | | |
| Celgene | 12,000 | a | 1,285,080 |
| Gilead Sciences | 20,000 | a | 2,240,000 |
| Johnson & Johnson | 62,400 | | 6,725,472 |
| Merck & Co. | 17,000 | | 984,980 |
| Novartis, ADR | 28,600 | | 2,650,934 |
| Novo Nordisk, ADR | 99,500 | | 4,495,410 |
| Roche Holding, ADR | 123,400 | | 4,542,354 |
| | | | 27,436,236 |
| Retailing—1.7% | | | |
| Wal-Mart Stores | 42,700 | | 3,256,729 |
| Semiconductors & Semiconductor | | | |
| Equipment—3.6% | | | |
| Intel | 81,600 | | 2,775,216 |
| Texas Instruments | 71,000 | | 3,525,860 |
| Xilinx | 17,100 | | 760,608 |
| | | | 7,061,684 |
| Software & Services—4.9% | | | |
| Automatic Data Processing | 33,200 | | 2,715,096 |
| International Business Machines | 26,900 | | 4,422,360 |
| Oracle | 57,500 | | 2,245,375 |
| | | | 9,382,831 |
| Technology Hardware & | | | |
| Equipment—7.7% | | | |
| Apple | 110,700 | | 11,955,600 |
| QUALCOMM | 37,500 | | 2,944,125 |
| | | | 14,899,725 |
| Transportation—2.0% | | | |
| Canadian Pacific Railway | 18,900 | | 3,925,152 |
| Total Common Stocks | | | |
| (cost $118,333,196) | | | 192,738,530 |
The Fund 11
STATEMENT OF INVESTMENTS (continued)
| | | | |
| Other Investment—.4% | Shares | | Value ($) | |
| Registered Investment Company; | | | | |
| Dreyfus Institutional Preferred | | | | |
| Plus Money Market Fund | | | | |
| (cost $801,064) | 801,064 | b | 801,064 | |
| |
| Total Investments (cost $119,134,260) | 100.0 | % | 193,539,594 | |
| Liabilities, Less Cash and Receivables | (.0 | %) | (84,025 | ) |
| Net Assets | 100.0 | % | 193,455,569 | |
| |
| ADR—American Depository Receipts | | | | |
| a Non-income producing security. | | | | |
| b Investment in affiliated money market mutual fund. | | | | |
| | | |
| Portfolio Summary (Unaudited)† | | |
| |
| | Value (%) | | Value (%) |
| Food, Beverage & Tobacco | 21.8 | Food & Staples Retailing | 2.3 |
| Energy | 14.9 | Consumer Services | 2.0 |
| Pharmaceuticals, Biotech & | | Transportation | 2.0 |
| Life Sciences | 14.2 | Retailing | 1.7 |
| Diversified Financials | 7.9 | Health Care Equipment & Services | 1.6 |
| Technology Hardware & Equipment | 7.7 | Materials | 1.3 |
| Software & Services | 4.9 | Banks | 1.2 |
| Household & Personal Products | 4.8 | Insurance | 1.1 |
| Media | 4.0 | Money Market Investment | .4 |
| Semiconductors & | | Commercial Services & Supplies | .2 |
| Semiconductor Equipment | 3.6 | | |
| Capital Goods | 2.4 | | 100.0 |
| |
| † Based on net assets. | | | |
| See notes to financial statements. | | | |
12
STATEMENT OF ASSETS AND LIABILITIES
October 31, 2014
| | |
| | Cost | Value |
| Assets ($): | | |
| Investments in securities—See Statement of Investments: | | |
| Unaffiliated issuers | 118,333,196 | 192,738,530 |
| Affiliated issuers | 801,064 | 801,064 |
| Cash | | 12,645 |
| Receivable for investment securities sold | | 43,753 |
| Dividends receivable | | 238,315 |
| | | 193,834,307 |
| Liabilities ($): | | |
| Due to The Dreyfus Corporation and affiliates—Note 3(b) | | 221,368 |
| Payable for shares of Capital Stock redeemed | | 157,370 |
| | | 378,738 |
| Net Assets ($) | | 193,455,569 |
| Composition of Net Assets ($): | | |
| Paid-in capital | | 113,696,547 |
| Accumulated undistributed investment income—net | | 563,749 |
| Accumulated net realized gain (loss) on investments | | 4,789,939 |
| Accumulated net unrealized appreciation | | |
| (depreciation) on investments | | 74,405,334 |
| Net Assets ($) | | 193,455,569 |
| | | |
| Net Asset Value Per Share | | | |
| | Class A | Class C | Class I |
| Net Assets ($) | 87,549,078 | 35,570,155 | 70,336,336 |
| Shares Outstanding | 3,284,530 | 1,405,809 | 2,632,953 |
| Net Asset Value Per Share ($) | 26.65 | 25.30 | 26.71 |
| See notes to financial statements. | | | |
The Fund 13
STATEMENT OF OPERATIONS
Year Ended October 31, 2014
| | |
| Investment Income ($): | | |
| Income: | | |
| Cash dividends (net of $126,045 foreign taxes withheld at source): | | |
| Unaffiliated issuers | 5,001,069 | |
| Affiliated issuers | 497 | |
| Income from securities lending—Note 1(c) | 7,719 | |
| Total Income | 5,009,285 | |
| Expenses: | | |
| Management fee—Note 3(a) | 2,130,571 | |
| Disbribution/Service Plan fees—Note 3(b) | 658,695 | |
| Directors’ fees—Note 3(a,c) | 14,729 | |
| Interest expenses—Note 2 | 2,047 | |
| Loan commitment fees—Note 2 | 1,858 | |
| Total Expenses | 2,807,900 | |
| Less—Directors’ fees reimbursed by the Manager—Note 3(a) | (14,729 | ) |
| Net Expenses | 2,793,171 | |
| Investment Income—Net | 2,216,114 | |
| Realized and Unrealized Gain (Loss) on Investments—Note 4 ($): | | |
| Net realized gain (loss) on investments and foreign currency transactions | 5,646,286 | |
| Net unrealized appreciation (depreciation) on investments | 13,663,583 | |
| Net Realized and Unrealized Gain (Loss) on Investments | 19,309,869 | |
| Net Increase in Net Assets Resulting from Operations | 21,525,983 | |
| See notes to financial statements. | | |
14
STATEMENT OF CHANGES IN NET ASSETS
| | | | |
| | Year Ended October 31, | |
| | 2014 | | 2013 | |
| Operations ($): | | | | |
| Investment income—net | 2,216,114 | | 2,705,201 | |
| Net realized gain (loss) on investments | 5,646,286 | | 1,681,290 | |
| Net unrealized appreciation | | | | |
| (depreciation) on investments | 13,663,583 | | 22,702,384 | |
| Net Increase (Decrease) in Net Assets | | | | |
| Resulting from Operations | 21,525,983 | | 27,088,875 | |
| Dividends to Shareholders from ($): | | | | |
| Investment income—net: | | | | |
| Class A | (1,673,385 | ) | (2,065,321 | ) |
| Class C | (210,320 | ) | (252,618 | ) |
| Class I | (393,158 | ) | (283,960 | ) |
| Total Dividends | (2,276,863 | ) | (2,601,899 | ) |
| Capital Stock Transactions ($): | | | | |
| Net proceeds from shares sold: | | | | |
| Class A | 11,671,447 | | 33,286,220 | |
| Class C | 3,667,230 | | 5,911,937 | |
| Class I | 63,932,939 | | 5,359,531 | |
| Dividends reinvested: | | | | |
| Class A | 1,503,509 | | 1,861,750 | |
| Class C | 132,504 | | 160,437 | |
| Class I | 355,412 | | 214,395 | |
| Cost of shares redeemed: | | | | |
| Class A | (85,863,612 | ) | (39,609,239 | ) |
| Class C | (5,648,728 | ) | (5,500,780 | ) |
| Class I | (10,835,103 | ) | (10,824,566 | ) |
| Increase (Decrease) in Net Assets | | | | |
| from Capital Stock Transactions | (21,084,402 | ) | (9,140,315 | ) |
| Total Increase (Decrease) in Net Assets | (1,835,282 | ) | 15,346,661 | |
| Net Assets ($): | | | | |
| Beginning of Period | 195,290,851 | | 179,944,190 | |
| End of Period | 193,455,569 | | 195,290,851 | |
| Undistributed investment income—net | 563,749 | | 624,585 | |
The Fund 15
STATEMENT OF CHANGES IN NET ASSETS (continued)
| | | | |
| | Year Ended October 31, | |
| | 2014 | | 2013 | |
| Capital Share Transactions: | | | | |
| Class Aa | | | | |
| Shares sold | 471,566 | | 1,498,038 | |
| Shares issued for dividends reinvested | 60,583 | | 83,869 | |
| Shares redeemed | (3,321,920 | ) | (1,731,695 | ) |
| Net Increase (Decrease) in Shares Outstanding | (2,789,771 | ) | (149,788 | ) |
| Class Ca | | | | |
| Shares sold | 154,387 | | 281,842 | |
| Shares issued for dividends reinvested | 5,595 | | 7,577 | |
| Shares redeemed | (235,473 | ) | (256,363 | ) |
| Net Increase (Decrease) in Shares Outstanding | (75,491 | ) | 33,056 | |
| Class I | | | | |
| Shares sold | 2,430,540 | | 241,055 | |
| Shares issued for dividends reinvested | 14,009 | | 9,665 | |
| Shares redeemed | (434,481 | ) | (483,900 | ) |
| Net Increase (Decrease) in Shares Outstanding | 2,010,068 | | (233,180 | ) |
|
| a During the period ended October 31, 2013, 25,087 Class C shares representing $560,943 were exchanged for |
| 23,890 Class A shares. |
See notes to financial statements.
16
FINANCIAL HIGHLIGHTS
The following tables describe the performance for each share class for the fiscal periods indicated. All information (except portfolio turnover rate) reflects financial results for a single fund share.Total return shows how much your investment in the fund would have increased (or decreased) during each period, assuming you had reinvested all dividends and distributions.These figures have been derived from the fund’s financial statements.
| | | | | | | | | | |
| | | | Year Ended October 31, | | | |
| Class A Shares | 2014 | | 2013 | | 2012 | | 2011 | | 2010 | |
| Per Share Data ($): | | | | | | | | | | |
| Net asset value, beginning of period | 24.09 | | 21.27 | | 19.34 | | 17.47 | | 15.40 | |
| Investment Operations: | | | | | | | | | | |
| Investment income—neta | .33 | | .34 | | .27 | | .27 | | .25 | |
| Net realized and unrealized | | | | | | | | | | |
| gain (loss) on investments | 2.54 | | 2.80 | | 2.03 | | 1.85 | | 2.10 | |
| Total from Investment Operations | 2.87 | | 3.14 | | 2.30 | | 2.12 | | 2.35 | |
| Distributions: | | | | | | | | | | |
| Dividends from investment income—net | (.31 | ) | (.32 | ) | (.37 | ) | (.25 | ) | (.28 | ) |
| Net asset value, end of period | 26.65 | | 24.09 | | 21.27 | | 19.34 | | 17.47 | |
| Total Return (%)b | 12.00 | | 14.91 | | 12.10 | | 12.13 | | 15.53 | |
| Ratios/Supplemental Data (%): | | | | | | | | | | |
| Ratio of total expenses | | | | | | | | | | |
| to average net assets | 1.36 | | 1.36 | | 1.36 | | 1.36 | | 1.36 | |
| Ratio of net expenses | | | | | | | | | | |
| to average net assets | 1.35 | | 1.35 | | 1.35 | | 1.32 | | 1.25 | |
| Ratio of net investment income | | | | | | | | | | |
| to average net assets | 1.30 | | 1.49 | | 1.28 | | 1.42 | | 1.54 | |
| Portfolio Turnover Rate | 2.44 | | 6.47 | | 11.15 | | 15.10 | | 3.00 | |
| Net Assets, end of period ($ x 1,000) | 87,549 | | 146,333 | | 132,387 | | 100,740 | | 76,318 | |
| |
| a | Based on average shares outstanding. |
| b | Exclusive of sales charge. |
See notes to financial statements.
The Fund 17
FINANCIAL HIGHLIGHTS (continued)
| | | | | | | | | | |
| | | | Year Ended October 31, | | | |
| Class C Shares | 2014 | | 2013 | | 2012 | | 2011 | | 2010 | |
| Per Share Data ($): | | | | | | | | | | |
| Net asset value, beginning of period | 22.90 | | 20.23 | | 18.36 | | 16.60 | | 14.65 | |
| Investment Operations: | | | | | | | | | | |
| Investment income—neta | .12 | | .16 | | .10 | | .12 | | .12 | |
| Net realized and unrealized | | | | | | | | | | |
| gain (loss) on investments | 2.42 | | 2.68 | | 1.94 | | 1.76 | | 2.01 | |
| Total from Investment Operations | 2.54 | | 2.84 | | 2.04 | | 1.88 | | 2.13 | |
| Distributions: | | | | | | | | | | |
| Dividends from investment income—net | (.14 | ) | (.17 | ) | (.17 | ) | (.12 | ) | (.18 | ) |
| Net asset value, end of period | 25.30 | | 22.90 | | 20.23 | | 18.36 | | 16.60 | |
| Total Return (%)b | 11.16 | | 14.11 | | 11.19 | | 11.38 | | 14.63 | |
| Ratios/Supplemental Data (%): | | | | | | | | | | |
| Ratio of total expenses | | | | | | | | | | |
| to average net assets | 2.11 | | 2.11 | | 2.11 | | 2.11 | | 2.11 | |
| Ratio of net expenses | | | | | | | | | | |
| to average net assets | 2.10 | | 2.10 | | 2.10 | | 2.07 | | 2.00 | |
| Ratio of net investment income | | | | | | | | | | |
| to average net assets | .48 | | .75 | | .51 | | .68 | | .80 | |
| Portfolio Turnover Rate | 2.44 | | 6.47 | | 11.15 | | 15.10 | | 3.00 | |
| Net Assets, end of period ($ x 1,000) | 35,570 | | 33,915 | | 29,304 | | 20,386 | | 18,714 | |
| |
| a | Based on average shares outstanding. |
| b | Exclusive of sales charge. |
See notes to financial statements.
18
| | | | | | | | | | |
| | | | Year Ended October 31, | | | |
| Class I Shares | 2014 | | 2013 | | 2012 | | 2011 | | 2010 | |
| Per Share Data ($): | | | | | | | | | | |
| Net asset value, beginning of period | 24.15 | | 21.32 | | 19.40 | | 17.53 | | 15.44 | |
| Investment Operations: | | | | | | | | | | |
| Investment income—neta | .32 | | .40 | | .32 | | .30 | | .28 | |
| Net realized and unrealized | | | | | | | | | | |
| gain (loss) on investments | 2.62 | | 2.81 | | 2.04 | | 1.86 | | 2.13 | |
| Total from Investment Operations | 2.94 | | 3.21 | | 2.36 | | 2.16 | | 2.41 | |
| Distributions: | | | | | | | | | | |
| Dividends from investment income—net | (.38 | ) | (.38 | ) | (.44 | ) | (.29 | ) | (.32 | ) |
| Net asset value, end of period | 26.71 | | 24.15 | | 21.32 | | 19.40 | | 17.53 | |
| Total Return (%) | 12.29 | | 15.21 | | 12.33 | | 12.47 | | 15.81 | |
| Ratios/Supplemental Data (%): | | | | | | | | | | |
| Ratio of total expenses | | | | | | | | | | |
| to average net assets | 1.11 | | 1.11 | | 1.11 | | 1.11 | | 1.11 | |
| Ratio of net expenses | | | | | | | | | | |
| to average net assets | 1.10 | | 1.10 | | 1.10 | | 1.08 | | 1.00 | |
| Ratio of net investment income | | | | | | | | | | |
| to average net assets | 1.24 | | 1.78 | | 1.51 | | 1.62 | | 1.72 | |
| Portfolio Turnover Rate | 2.44 | | 6.47 | | 11.15 | | 15.10 | | 3.00 | |
| Net Assets, end of period ($ x 1,000) | 70,336 | | 15,043 | | 18,253 | | 6,284 | | 1,785 | |
| a Based on average shares outstanding. | | | | | | | | | | |
| See notes to financial statements. | | | | | | | | | | |
The Fund 19
NOTES TO FINANCIAL STATEMENTS
NOTE 1—Significant Accounting Policies:
Dreyfus Tax Managed Growth Fund (the “fund”) is a separate diversified series of The Dreyfus/Laurel Funds, Inc. (the “Company”), which is registered under the Investment Company Act of 1940, as amended (the “Act”), as an open-end management investment company and operates as a series company currently offering eleven series, including the fund. The fund’s investment objective is to seek long-term capital appreciation consistent with minimizing realized capital gains and taxable current income. The Dreyfus Corporation (the “Manager” or “Dreyfus”), a wholly-owned subsidiary of The Bank of New York Mellon Corporation (“BNY Mellon”), serves as the fund’s investment adviser. Fayez Sarofim & Co. (“Sarofim & Co.”) serves as the fund’s sub-investment adviser.
MBSC Securities Corporation (the “Distributor”), a wholly-owned subsidiary of Dreyfus, is the distributor of the fund’s shares. The fund is authorized to issue 500 million shares of $.001 par value Capital Stock. The fund currently offers three classes of shares: Class A (300 million shares authorized), Class C (100 million shares authorized) and Class I (100 million shares authorized). Class A and Class C shares are sold primarily to retail investors through financial intermediaries and bear Distribution and/or Service Plan fees. Class A shares generally are subject to a sales charge imposed at the time of purchase. Class C shares are subject to a contingent deferred sales charge (“CDSC”) imposed on Class C shares redeemed within one year of purchase. Class I shares are sold primarily to bank trust departments and other financial service providers (including The Bank of New York Mellon, a subsidiary of BNY Mellon and an affiliate of Dreyfus, and its affiliates), acting on behalf of customers having a qualified trust or an investment account or relationship at such institution, and bear no Distribution or Service Plan fees. Class I shares are offered without a front-end sales charge or CDSC. Other differences between the classes include the services offered to and the expenses borne by each class, the allocation of certain transfer agency costs, and certain voting
20
rights. Income, expenses (other than expenses attributable to a specific class), and realized and unrealized gains or losses on investments are allocated to each class of shares based on its relative net assets.
The Company accounts separately for the assets, liabilities and operations of each series. Expenses directly attributable to each series are charged to that series’ operations; expenses which are applicable to all series are allocated among them on a pro rata basis.
The Financial Accounting Standards Board (“FASB”) Accounting Standards Codification (“ASC”) is the exclusive reference of authoritative U.S. generally accepted accounting principles (“GAAP”) recognized by the FASB to be applied by nongovernmental entities. Rules and interpretive releases of the Securities and Exchange Commission (“SEC”) under authority of federal laws are also sources of authoritative GAAP for SEC registrants.The fund’s financial statements are prepared in accordance with GAAP, which may require the use of management estimates and assumptions. Actual results could differ from those estimates.
(a) Portfolio valuation: The fair value of a financial instrument is the amount that would be received to sell an asset or paid to transfer a liability in an orderly transaction between market participants at the measurement date (i.e., the exit price). GAAP establishes a fair value hierarchy that prioritizes the inputs of valuation techniques used to measure fair value. This hierarchy gives the highest priority to unadjusted quoted prices in active markets for identical assets or liabilities (Level 1 measurements) and the lowest priority to unobservable inputs (Level 3 measurements).
Additionally, GAAP provides guidance on determining whether the volume and activity in a market has decreased significantly and whether such a decrease in activity results in transactions that are not orderly. GAAP requires enhanced disclosures around valuation inputs and techniques used during annual and interim periods.
The Fund 21
NOTES TO FINANCIAL STATEMENTS (continued)
Various inputs are used in determining the value of the fund’s investments relating to fair value measurements.These inputs are summarized in the three broad levels listed below:
Level 1—unadjusted quoted prices in active markets for identical investments.
Level 2—other significant observable inputs (including quoted prices for similar investments, interest rates, prepayment speeds, credit risk, etc.).
Level 3—significant unobservable inputs (including the fund’s own assumptions in determining the fair value of investments).
The inputs or methodology used for valuing securities are not necessarily an indication of the risk associated with investing in those securities.
Changes in valuation techniques may result in transfers in or out of an assigned level within the disclosure hierarchy. Valuation techniques used to value the fund’s investments are as follows:
Investments in securities are valued at the last sales price on the securities exchange or national securities market on which such securities are primarily traded. Securities listed on the National Market System for which market quotations are available are valued at the official closing price or, if there is no official closing price that day, at the last sales price. Securities not listed on an exchange or the national securities market, or securities for which there were no transactions, are valued at the average of the most recent bid and asked prices, except for open short positions, where the asked price is used for valuation purposes. Bid price is used when no asked price is available. Registered investment companies that are not traded on an exchange are valued at their net asset value.All of the preceding securities are generally categorized within Level 1 of the fair value hierarchy.
Fair valuing of securities may be determined with the assistance of a pricing service using calculations based on indices of domestic securities and other appropriate indicators, such as prices of relevant ADRs and financial futures. Utilizing these techniques may result in transfers between Level 1 and Level 2 of the fair value hierarchy.
22
When market quotations or official closing prices are not readily available, or are determined not to reflect accurately fair value, such as when the value of a security has been significantly affected by events after the close of the exchange or market on which the security is principally traded (for example, a foreign exchange or market), but before the fund calculates its net asset value, the fund may value these investments at fair value as determined in accordance with the procedures approved by the Company’s Board of Directors (the “Board”). Certain factors may be considered when fair valuing investments such as: fundamental analytical data, the nature and duration of restrictions on disposition, an evaluation of the forces that influence the market in which the securities are purchased and sold, and public trading in similar securities of the issuer or comparable issuers.These securities are either categorized within Level 2 or 3 of the fair value hierarchy depending on the relevant inputs used.
For restricted securities where observable inputs are limited, assumptions about market activity and risk are used and are generally categorized within Level 3 of the fair value hierarchy.
Investments denominated in foreign currencies are translated to U.S. dollars at the prevailing rates of exchange.
The following is a summary of the inputs used as of October 31, 2014 in valuing the fund’s investments:
| | | | | |
| | | Level 2—Other | | Level 3— | |
| | Level 1— | Significant | | Significant | |
| | Unadjusted | Observable | | Unobservable | |
| | Quoted Prices | Inputs | | Inputs | Total |
| Assets ($) | | | | | |
| Investments in Securities: | | | | |
| Equity Securities— | | | | | |
| Domestic | | | | | |
| Common Stocks† | 164,435,304 | — | | — | 164,435,304 |
| Equity Securities— | | | | | |
| Foreign | | | | | |
| Common Stocks† | 25,374,734 | 2,928,492 | †† | — | 28,303,226 |
| Mutual Funds | 801,064 | — | | — | 801,064 |
| |
| † | See Statement of Investments for additional detailed categorizations. |
| †† | Securities classified within Level 2 at period end as the values were determined pursuant to the |
| | fund’s fair valuation procedures. See note above for additional information. |
The Fund 23
NOTES TO FINANCIAL STATEMENTS (continued)
At October 31, 2013, no exchange traded foreign equity securities were classified within Level 2 of the fair value hierarchy.
(b) Foreign currency transactions: The fund does not isolate that portion of the results of operations resulting from changes in foreign exchange rates on investments from the fluctuations arising from changes in the market prices of securities held. Such fluctuations are included with the net realized and unrealized gain or loss on investments.
Net realized foreign exchange gains or losses arise from sales of foreign currencies, currency gains or losses realized on securities transactions between trade and settlement date, and the difference between the amounts of dividends, interest and foreign withholding taxes recorded on the fund’s books and the U.S. dollar equivalent of the amounts actually received or paid. Net unrealized foreign exchange gains and losses arise from changes in the value of assets and liabilities other than investments resulting from changes in exchange rates. Foreign currency gains and losses on foreign currency transactions are also included with net realized and unrealized gain or loss on investments.
(c) Securities transactions and investment income: Securities transactions are recorded on a trade date basis. Realized gains and losses from securities transactions are recorded on the identified cost basis. Dividend income is recognized on the ex-dividend date and interest income, including, where applicable, accretion of discount and amortization of premium on investments, is recognized on the accrual basis.
Pursuant to a securities lending agreement with The Bank of New York Mellon, the fund may lend securities to qualified institutions. It is the fund’s policy that, at origination, all loans are secured by collateral of at least 102% of the value of U.S. securities loaned and 105% of the value of foreign securities loaned. Collateral equivalent to at least 100% of the market value of securities on loan is maintained at all times. Collateral is either in the form of cash, which can be invested in certain money market mutual funds managed by the Dreyfus or U.S. Government and Agency securities.The fund is entitled to receive all dividends, interest and distributions on securities loaned, in addition to
24
income earned as a result of the lending transaction. Should a borrower fail to return the securities in a timely manner, The Bank of New York Mellon is required to replace the securities for the benefit of the fund or credit the fund with the market value of the unreturned securities and is subrogated to the fund’s rights against the borrower and the collateral. During the period ended October 31, 2014, The Bank of NewYork Mellon earned $1,605 from lending portfolio securities, pursuant to the securities lending agreement.
(d) Affiliated issuers: Investments in other investment companies advised by Dreyfus are defined as “affiliated” under the Act. Investments in affiliated investment companies during the period ended October 31, 2014 were as follows:
| | | | | |
| Affiliated | | | | | |
| Investment | Value | | | Value | Net |
| Company | 10/31/2013 ($) | Purchases ($) | Sales ($) | 10/31/2014 ($) | Assets (%) |
| Dreyfus | | | | | |
| Institutional | | | | | |
| Preferred | | | | | |
| Plus Money | | | | | |
| Market Fund | 647,085 | 16,384,144 | 16,230,165 | 801,064 | .4 |
| Dreyfus | | | | | |
| Institutional | | | | | |
| Cash | | | | | |
| Advantage | | | | | |
| Fund | 1,456,960 | 19,644,377 | 21,101,337 | — | — |
| Total | 2,104,045 | 36,028,521 | 37,331,502 | 801,064 | .4 |
(e) Dividends to shareholders: Dividends are recorded on the ex-dividend date. Dividends from investment income-net are normally declared and paid quarterly. Dividends from net realized capital gains, if any, are normally declared and paid annually, but the fund may make distributions on a more frequent basis to comply with the distribution requirements of the Internal Revenue Code of 1986, as amended (the “Code”). To the extent that net realized capital gains can be offset by capital loss carryovers, it is the policy of the fund not to distribute such gains. Income and capital gain distributions are determined in accordance with income tax regulations, which may differ from GAAP.
The Fund 25
NOTES TO FINANCIAL STATEMENTS (continued)
(f) Federal income taxes: It is the policy of the fund to continue to qualify as a regulated investment company, if such qualification is in the best interests of its shareholders, by complying with the applicable provisions of the Code, and to make distributions of taxable income sufficient to relieve it from substantially all federal income and excise taxes.
As of and during the period ended October 31, 2014, the fund did not have any liabilities for any uncertain tax positions.The fund recognizes interest and penalties, if any, related to uncertain tax positions as income tax expense in the Statement of Operations. During the period ended October 31, 2014, the fund did not incur any interest or penalties.
Each tax year in the four-year period ended October 31, 2014 remains subject to examination by the Internal Revenue Service and state taxing authorities.
At October 31, 2014, the components of accumulated earnings on a tax basis were as follows: undistributed ordinary income $563,749, undistributed capital gains $4,789,939 and unrealized appreciation $74,405,334.
The tax character of distributions paid to shareholders during the fiscal periods ended October 31, 2014 and October 31, 2013 were as follows: ordinary income $2,276,863 and $2,601,899, respectively.
During the period ended October 31, 2014, as a result of permanent book to tax differences, primarily due to the tax treatment for foreign currency gains and losses, the fund decreased accumulated undistributed investment income-net by $87 and increased accumulated net realized gain (loss) on investments by the same amount. Net assets and net asset value per share were not affected by this reclassification.
NOTE 2—Bank Lines of Credit:
The fund participates with other Dreyfus-managed funds in a $430 million unsecured credit facility led by Citibank, N.A. and a $300 million unsecured credit facility provided by The Bank of New York Mellon (each, a “Facility”), each to be utilized primarily for temporary or emergency purposes, including the financing of redemptions. Prior to
26
October 8, 2014, the unsecured credit facility with Citibank, N.A. was $265 million. In connection therewith, the fund has agreed to pay its pro rata portion of commitment fees for each Facility. Interest is charged to the fund based on rates determined pursuant to the terms of the respective Facility at the time of borrowing. During the period ended December 31, 2014, the fund did not borrow under the Facilities.
The average amount of borrowings outstanding under the Facilities during the period ended October 31, 2014 was approximately $185,800 with a related weighted average annualized interest rate of 1.10%.
NOTE 3—Investment Management Fee, Sub-Investment Advisory Fee and Other Transactions with Affiliates:
(a) Pursuant to an investment management agreement with Dreyfus, Dreyfus provides or arranges for one or more third parties and/or affiliates to provide investment advisory, administrative, custody, fund accounting and transfer agency services to the fund. Dreyfus also directs the investments of the fund in accordance with its investment objective, policies and limitations. For these services, the fund is contractually obligated to pay Dreyfus a fee, calculated daily and paid monthly, at the annual rate of 1.10% of the value of the fund’s average daily net assets. Out of its fee, Dreyfus pays all of the expenses of the fund except brokerage fees, taxes, interest expenses, commitment fees on borrowings, Distribution Plan and Service Plan fees, fees and expenses of non-interested Directors (including counsel fees) and extraordinary expenses. In addition, Dreyfus is required to reduce its fee in an amount equal to the fund’s allocable portion of fees and expenses of the non-interested Directors (including counsel fees). During the period ended October 31, 2014, fees reimbursed by Dreyfus amounted to $14,729.
Pursuant to a sub-investment advisory agreement between Dreyfus and Sarofim & Co., Dreyfus pays Sarofim & Co. a monthly fee at an annual rate of .2175% of the value of the fund’s average daily net assets.
The Fund 27
NOTES TO FINANCIAL STATEMENTS (continued)
During the period ended October 31, 2014, the Distributor retained $4,901 from commissions earned on sales of the fund’s Class A shares and $3,892 from CDSCs on redemptions of the fund’s class C shares.
(b) Under separate Distribution Plans adopted pursuant to Rule 12b-1 (the “Distribution Plans”) under the Act, Class A shares may pay annually up to .25% of the value of its average daily net assets to compensate the Distributor for shareholder servicing activities and expenses primarily intended to result in the sale of Class A shares. Class C shares pay the Distributor for distributing its shares at an aggregate annual rate of .75% of the value of its average daily net assets. Class C shares are also subject to a service plan adopted pursuant to Rule 12b-1 (the “Service Plan”), under which Class C shares pay the Distributor for providing certain services to the holders of their shares a fee at the annual rate of .25% of the value of the average daily net assets of Class C shares. During the period ended October 31, 2014, Class A and Class C shares were charged $311,260 and $260,576, respectively, pursuant to their Distribution Plans. During the period ended October 31, 2014, Class C shares were charged $86,859, pursuant to the Service Plan.
Under its terms, the Distribution Plans and Service Plan shall remain in effect from year to year, provided such continuance is approved annually by a vote of majority of those Directors who are not “interested persons” of the Company and who have no direct or indirect financial interest in the operation of or in any agreement related to the Distribution Plans or Service Plan.
The components of “Due to The Dreyfus Corporation and affiliates” in the Statement of Assets and Liabilities consist of: management fees $174,913, Distribution Plans fees $40,059 and Service Plan fees $7,323, which are offset against an expense reimbursement currently in effect in the amount of $927.
(c) Each Board member also serves as a Board member of other funds within the Dreyfus complex. Annual retainer fees and attendance fees are allocated to each fund based on net assets.
28
NOTE 4—Securities Transactions:
The aggregate amount of purchases and sales of investment securities, excluding short-term securities, during the period ended October 31, 2014, amounted to $4,738,020 and $35,985,745, respectively.
At October 31, 2014, the cost of investments for federal income tax purposes was $119,134,260; accordingly, accumulated net unrealized appreciation on investments was $74,405,334, consisting of $74,726,852 gross unrealized appreciation and $321,518 gross unrealized depreciation.
The Fund 29
REPORT OF INDEPENDENT REGISTERED
PUBLIC ACCOUNTING FIRM
The Board of Directors and Shareholders of
The Dreyfus/Laurel Funds, Inc.
We have audited the accompanying statement of assets and liabilities of Dreyfus Tax Managed Growth Fund (the “Fund”), a series of The Dreyfus/Laurel Funds, Inc., including the statement of investments, as of October 31, 2014, the related statement of operations for the year then ended, the statements of changes in net assets for each of the years in the two-year period then ended, and the financial highlights for each of the years in the five-year period then ended. These financial statements and financial highlights are the responsibility of the Fund’s management. Our responsibility is to express an opinion on these financial statements and financial highlights based on our audits.
We conducted our audits in accordance with the standards of the Public Company Accounting Oversight Board (United States). Those standards require that we plan and perform the audit to obtain reasonable assurance about whether the financial statements and financial highlights are free of material misstatement. An audit includes examining, on a test basis, evidence supporting the amounts and disclosures in the financial statements. Our procedures included confirmation of securities owned as of October 31, 2014, by correspondence with the custodian. An audit also includes assessing the accounting principles used and significant estimates made by management, as well as evaluating the overall financial statement presentation. We believe that our audits provide a reasonable basis for our opinion.
In our opinion, the financial statements and financial highlights referred to above present fairly, in all material respects, the financial position of Dreyfus Tax Managed Growth Fund as of October 31, 2014, the results of its operations for the year then ended, the changes in its net assets for each of the years in the two-year period then ended, and the financial highlights for each of the years in the five-year period then ended, in conformity with U.S. generally accepted accounting principles.

New York, New York
December 30, 2014
30
IMPORTANT TAX INFORMATION (Unaudited)
For federal tax purposes, the fund reports the maximum amount allowable, but not less than $2,276,863 as ordinary income dividends paid during the year ended October 31, 2014 as qualified dividend income in accordance with Section 854(b)(1)(B) of the Internal Revenue Code.Also, the fund reports the maximum amount allowable but not less than 100% of ordinary income dividends paid during the year ended October 31, 2014 as eligible for the corporate dividends received deduction provided under Section 243 of the Internal Revenue Code in accordance with Section 854(b)(1)(A) of the Internal Revenue Code. Shareholders will receive notification in early 2015 of the percentage applicable to the preparation of their 2014 income tax returns.
The Fund 31
BOARD MEMBERS INFORMATION (Unaudited)
INDEPENDENT BOARD MEMBERS
|
| Joseph S. DiMartino (71) |
| Chairman of the Board (1999) |
| Principal Occupation During Past 5Years: |
| • Corporate Director and Trustee (1995-present) |
| Other Public Company Board Memberships During Past 5Years: |
| • CBIZ (formerly, Century Business Services, Inc.), a provider of outsourcing functions for small |
| and medium size companies, Director (1997-present) |
| • The Newark Group, a provider of a national market of paper recovery facilities, paperboard |
| mills and paperboard converting plants, Director (2000-2010) |
| • Sunair Services Corporation, a provider of certain outdoor-related services to homes and |
| businesses, Director (2005-2009) |
| No. of Portfolios for which Board Member Serves: 144 |
| ——————— |
| Francine J. Bovich (63) |
| Board Member (2012) |
| Principal Occupation During Past 5Years: |
| • Trustee,The Bradley Trusts, private trust funds (2011-present) |
| • Managing Director, Morgan Stanley Investment Management (1993-2010) |
| Other Public Company Board Membership During Past 5Years: |
| • Annaly Capital Management, Inc., Board Member (May 2014-present) |
| No. of Portfolios for which Board Member Serves: 45 |
| ——————— |
| Kenneth A. Himmel (68) |
| Board Member (1994) |
| Principal Occupation During Past 5Years: |
| • President and CEO, Related Urban Development, a real estate development company (1996-present) |
| • President and CEO, Himmel & Company, a real estate development company (1980-present) |
| • CEO,American Food Management, a restaurant company (1983-present) |
| No. of Portfolios for which Board Member Serves: 31 |
32
|
| Stephen J. Lockwood (67) |
| Board Member (1994) |
| Principal Occupation During Past 5Years: |
| • Chairman of the Board, Stephen J. Lockwood and Company LLC, a real estate investment |
| company (2000-present) |
| No. of Portfolios for which Board Member Serves: 31 |
| ——————— |
| Roslyn M. Watson (65) |
| Board Member (1994) |
| Principal Occupation During Past 5Years: |
| • Principal,Watson Ventures, Inc., a real estate investment company (1993-present) |
| No. of Portfolios for which Board Member Serves: 69 |
| ——————— |
| Benaree Pratt Wiley (68) |
| Board Member (1998) |
| Principal Occupation During Past 5Years: |
| • Principal,TheWiley Group, a firm specializing in strategy and business development (2005-present) |
| Other Public Company Board Membership During Past 5Years: |
| • CBIZ (formerly, Century Business Services, Inc.), a provider of outsourcing functions for small |
| and medium size companies, Director (2008-present) |
| No. of Portfolios for which Board Member Serves: 69 |
| ——————— |
| Once elected all Board Members serve for an indefinite term, but achieve Emeritus status upon reaching age 80.The |
| address of the Board Members and Officers is c/o The Dreyfus Corporation, 200 Park Avenue, NewYork, NewYork |
| 10166.Additional information about the Board Members is available in the fund’s Statement of Additional Information |
| which can be obtained from Dreyfus free of charge by calling this toll free number: 1-800-DREYFUS. |
| James M. Fitzgibbons, Emeritus Board Member |
| J.Tomlinson Fort, Emeritus Board Member |
The Fund 33
OFFICERS OF THE FUND (Unaudited)
BRADLEY J. SKAPYAK, President since January 2010.
Chief Operating Officer and a director of the Manager since June 2009, Chairman of Dreyfus Transfer, Inc., an affiliate of the Manager and the transfer agent of the funds, since May 2011 and Executive Vice President of the Distributor since June 2007. From April 2003 to June 2009, Mr. Skapyak was the head of the Investment Accounting and Support Department of the Manager. He is an officer of 69 investment companies (comprised of 144 portfolios) managed by the Manager. He is 55 years old and has been an employee of the Manager since February 1988.
JOHN PAK, Chief Legal Officer since March 2013.
Deputy General Counsel, Investment Management, of BNY Mellon since August 2014; Chief Legal Officer of the Manager since August 2012; from March 2005 to July 2012, Managing Director of Deutsche Bank, Deputy Global Head of Deutsche Asset Management Legal and Regional Head of Deutsche Asset Management Americas Legal. He is an officer of 70 investment companies (comprised of 169 portfolios) managed by the Manager. He is 46 years old and has been an employee of the Manager since August 2012.
JANETTE E. FARRAGHER, Vice President and Secretary since December 2011.
Assistant General Counsel of BNY Mellon, and an officer of 70 investment companies (comprised of 169 portfolios) managed by the Manager. She is 51 years old and has been an employee of the Manager since February 1984.
KIESHA ASTWOOD, Vice President and Assistant Secretary since January 2010.
Counsel of BNY Mellon, and an officer of 70 investment companies (comprised of 169 portfolios) managed by the Manager. She is 41 years old and has been an employee of the Manager since July 1995.
JAMES BITETTO, Vice President and Assistant Secretary since August 2005.
Managing Counsel of BNY Mellon and Secretary of the Manager, and an officer of 70 investment companies (comprised of 169 portfolios) managed by the Manager. He is 48 years old and has been an employee of the Manager since December 1996.
JONI LACKS CHARATAN, Vice President and Assistant Secretary since August 2005.
Managing Counsel of BNY Mellon, and an officer of 70 investment companies (comprised of 169 portfolios) managed by the Manager. She is 58 years old and has been an employee of the Manager since October 1988.
JOSEPH M. CHIOFFI, Vice President and Assistant Secretary since August 2005.
Managing Counsel of BNY Mellon, and an officer of 70 investment companies (comprised of 169 portfolios) managed by the Manager. He is 52 years old and has been an employee of the Manager since June 2000.
JOHN B. HAMMALIAN, Vice President and Assistant Secretary since August 2005.
Senior Managing Counsel of BNY Mellon, and an officer of 70 investment companies (comprised of 169 portfolios) managed by the Manager. He is 51 years old and has been an employee of the Manager since February 1991.
SARAH S. KELLEHER, Vice President and Assistant Secretary since April 2014.
Senior Counsel of BNY Mellon, and an officer of 70 investment companies (comprised of 169 portfolios) managed by the Manager; from August 2005 to March 2013, Associate General Counsel of Third Avenue Management. She is 38 years old and has been an employee of the Manager since March 2013.
34
JEFF PRUSNOFSKY, Vice President and Assistant Secretary since August 2005.
Senior Managing Counsel of BNY Mellon, and an officer of 70 investment companies (comprised of 169 portfolios) managed by the Manager. He is 49 years old and has been an employee of the Manager since October 1990.
JAMES WINDELS, Treasurer since November 2001.
Director – Mutual Fund Accounting of the Manager, and an officer of 70 investment companies (comprised of 169 portfolios) managed by the Manager. He is 56 years old and has been an employee of the Manager since April 1985.
RICHARD CASSARO, Assistant Treasurer since January 2008.
Senior Accounting Manager – Money Market and Municipal Bond Funds of the Manager, and an officer of 70 investment companies (comprised of 169 portfolios) managed by the Manager. He is 55 years old and has been an employee of the Manager since September 1982.
GAVIN C. REILLY, Assistant Treasurer since December 2005.
Tax Manager of the Investment Accounting and Support Department of the Manager, and an officer of 70 investment companies (comprised of 169 portfolios) managed by the Manager. He is 46 years old and has been an employee of the Manager since April 1991.
ROBERT S. ROBOL, Assistant Treasurer since December 2002.
Senior Accounting Manager – Fixed Income Funds of the Manager, and an officer of 70 investment companies (comprised of 169 portfolios) managed by the Manager. He is 50 years old and has been an employee of the Manager since October 1988.
ROBERT SALVIOLO, Assistant Treasurer since July 2007.
Senior Accounting Manager – Equity Funds of the Manager, and an officer of 70 investment companies (comprised of 169 portfolios) managed by the Manager. He is 47 years old and has been an employee of the Manager since June 1989.
ROBERT SVAGNA, Assistant Treasurer since December 2002.
Senior Accounting Manager – Equity Funds of the Manager, and an officer of 70 investment companies (comprised of 169 portfolios) managed by the Manager. He is 47 years old and has been an employee of the Manager since November 1990.
JOSEPH W. CONNOLLY, Chief Compliance Officer since October 2004.
Chief Compliance Officer of the Manager and The Dreyfus Family of Funds (70 investment companies, comprised of 169 portfolios).
He is 57 years old and has served in various capacities with the Manager since 1980, including manager of the firm’s Fund Accounting Department from 1997 through October 2001.
MATTHEW D. CONNOLLY, Anti-Money Laundering Compliance Officer since April 2012.
Anti-Money Laundering Compliance Officer of the Distributor since October 2011; from March 2010 to September 2011, Global Head, KYC Reviews and Director of UBS Investment Bank; until March 2010, AML Compliance Officer and Senior Vice President of Citi Global Wealth Management. He is an officer of 65 investment companies (comprised of 164 portfolios) managed by the Manager. He is 42 years old and has been an employee of the Distributor since October 2011.
The Fund 35
For More Information

Telephone Call your financial representative or 1-800-DREYFUS
Mail The Dreyfus Family of Funds, 144 Glenn Curtiss Boulevard, Uniondale, NY 11556-0144
The fund files its complete schedule of portfolio holdings with the Securities and Exchange Commission (“SEC”) for the first and third quarters of each fiscal year on Form N-Q. The fund’s Forms N-Q are available on the SEC’s website at http://www.sec.gov and may be reviewed and copied at the SEC’s Public Reference Room in Washington, DC. Information on the operation of the Public Reference Room may be obtained by calling 1-800-SEC-0330.
A description of the policies and procedures that the fund uses to determine how to vote proxies relating to portfolio securities, and information regarding how the fund voted these proxies for the most recent 12-month period ended June 30 is available at http://www.dreyfus.com and on the SEC’s website at http://www.sec.gov. The description of the policies and procedures is also available without charge, upon request, by calling 1-800-DREYFUS.

|
| Dreyfus |
| BASIC S&P 500 |
| Stock Index Fund |
ANNUAL REPORT October 31, 2014

Save time. Save paper. View your next shareholder report online as soon as it’s available. Log into www.dreyfus.com and sign up for Dreyfus eCommunications. It’s simple and only takes a few minutes.
The views expressed in this report reflect those of the portfolio manager only through the end of the period covered and do not necessarily represent the views of Dreyfus or any other person in the Dreyfus organization. Any such views are subject to change at any time based upon market or other conditions and Dreyfus disclaims any responsibility to update such views.These views may not be relied on as investment advice and, because investment decisions for a Dreyfus fund are based on numerous factors, may not be relied on as an indication of trading intent on behalf of any Dreyfus fund.
|
| Not FDIC-Insured • Not Bank-Guaranteed • May Lose Value |
| | Contents |
| | THE FUND |
| 2 | A Letter from the President |
| 3 | Discussion of Fund Performance |
| 6 | Fund Performance |
| 7 | Understanding Your Fund’s Expenses |
| 7 | Comparing Your Fund’s Expenses With Those of Other Funds |
| 8 | Statement of Investments |
| 25 | Statement of Financial Futures |
| 26 | Statement of Assets and Liabilities |
| 27 | Statement of Operations |
| 28 | Statement of Changes in Net Assets |
| 29 | Financial Highlights |
| 30 | Notes to Financial Statements |
| 43 | Report of Independent Registered Public Accounting Firm |
| 44 | Important Tax Information |
| 45 | Board Members Information |
| 47 | Officers of the Fund |
| | FOR MORE INFORMATION |
| | Back Cover |
Dreyfus BASIC
S&P 500 Stock Index Fund
The Fund
A LETTER FROM THE PRESIDENT
Dear Shareholder:
We are pleased to present this annual report for Dreyfus BASIC S&P 500 Stock Index Fund, covering the 12-month period from November 1, 2013, through October 31, 2014. For information about how the fund performed during the reporting period, as well as general market perspectives, we provide a Discussion of Fund Performance on the pages that follow.
Despite bouts of heightened volatility stemming mainly from economic and geopolitical concerns in overseas markets, U.S. stocks gained ground over the reporting period as the domestic economy continued to rebound. As a result, several broad measures of equity market performance established new record highs. Smaller and more economically sensitive stocks generally fared well over the reporting period’s first half, but larger, better established companies rallied more strongly over the second half.
We remain cautiously optimistic regarding the U.S. stock market’s prospects. We currently expect the economy to continue to accelerate as several longstanding drags—including tight fiscal policies and private sector deleveraging—fade from the scene. Of course, a number of risks remain, including the possibilities of higher interest rates and intensifying geopolitical turmoil. As always, we encourage you to discuss our observations with your financial adviser to assess their potential impact on your investments.
Thank you for your continued confidence and support.

J. Charles Cardona
President
The Dreyfus Corporation
November 17, 2014
2
DISCUSSION OF FUND PERFORMANCE
For the period of November 1, 2013, through October 31, 2014, as provided by Thomas J. Durante, CFA, Karen Q.Wong, CFA, and Richard A. Brown, CFA, Portfolio Managers
Fund and Market Performance Overview
For the 12-month period ended October 31, 2014, Dreyfus BASIC S&P 500 Stock Index Fund produced a total return of 17.03%.1 In comparison, the Standard & Poor’s® 500 Composite Stock Price Index (“S&P 500 Index”), the fund’s benchmark, returned 17.24% for the same period.2,3
Despite bouts of occasional volatility, sustained improvement in U.S. economic conditions generally helped support stock market gains for the reporting period overall. The difference in returns between the fund and the S&P 500 Index was primarily the result of transaction costs and operating expenses that are not reflected in the S&P 500 Index’s results.
The Fund’s Investment Approach
The fund seeks to match the total return of the S&P 500 Index by generally investing in all 500 stocks in the S&P 500 Index in proportion to their respective weightings. Often considered a barometer for the stock market in general, the S&P 500 Index is made up of 500 widely held common stocks across 10 economic sectors. Each stock is weighted by its float-adjusted market capitalization; that is, larger companies have greater representation in the S&P 500 Index than smaller ones.
The fund employed futures contracts during the reporting period in its efforts to replicate the returns of the S&P 500 Index.
Stocks Climbed Despite Bouts of Volatility
The S&P 500 Index gained value over the final months of 2013 amid a falling unemployment rate and intensifying manufacturing activity. The Federal Reserve Board (the “Fed”) appeared to confirm the economic recovery’s sustainability in December, when it began to back gradually away from its quantitative easing program. Stocks gave up some of their previous gains in January when concerns arose regarding economic and political instability in the emerging markets. In addition,
The Fund 3
DISCUSSION OF FUND PERFORMANCE (continued)
U.S. GDP contracted at a surprising annualized 2.1% rate over the first quarter of 2014 due to the dampening effects of severe winter weather on corporate spending, housing market activity, and export activity.
U.S. stocks soon rebounded strongly, climbing to a series of new highs through the end of June as investors responded positively to expectations that the Fed would keep short-term interest rates low even as various economic indicators improved steadily. In fact, the U.S. economy rebounded at a robust 4.6% annualized rate during the second quarter of the year.
The market encountered renewed volatility in July and September, when disappointing economic growth in Europe, China, and Japan sparked concerns that a weak global economy might derail the U.S. expansion. However, strong corporate earnings and solid economic data—including an estimated 3.5% annualized GDP growth rate for the third quarter of 2014—drove the S&P 500 Index to a new record high on the last day of the reporting period.
In this environment, growth stocks generally produced higher returns than their more value-oriented counterparts, and large-cap stocks significantly outpaced small- and midcap stocks.
Technology and Health Care Stocks Led Market’s Advance
All 10 of the economic segments represented in the S&P 500 Index posted positive absolute returns over the reporting period. Results were especially robust in the information technology sector, in large part due to robust gains by industry leaders Apple, Microsoft, and Google. In addition, enterprise spending began to increase in the recovering economy, bolstering results for companies that produce efficiency and productivity enhancements for businesses. Finally, some technology companies have established or raised their dividends, attracting income-oriented investors.
In the health care sector, large pharmaceutical developers and biotechnology companies reported strong sales growth in the emerging markets. The health care sector also benefited from an aging population of U.S. consumers, which has driven Medicare spending higher. Among financial companies, retail-oriented banks fared well as mortgage lending volumes grew in response to rising refinancing activity. Real estate investment trusts gained value amid greater demand from income-oriented investors seeking competitive yields in a low interest-rate environment.
4
On the other hand, the telecommunications services sector lagged market averages due to intensifying competition from alternative providers of telephone and cable television services. In the energy sector, relative strength among large, integrated oil-and-gas producers was offset by weaker results from offshore drillers and other service providers in an environment of falling oil prices. Finally, the materials sector was hurt by declining iron ore and coal prices due to slowing demand from China and a switch by many U.S. electric utilities to lower cost natural gas.
Replicating the Performance of the S&P 500 Index
Although we do not actively manage the fund’s investments in response to macroeconomic trends, it is worth noting that the U.S. economic recovery appears to remain on track. As always, we have continued to monitor the factors considered by the fund’s investment model in light of current market conditions.
November 17, 2014
Equity funds are subject generally to market, market sector, market liquidity, issuer, and investment style risks, among other factors, to varying degrees, all of which are more fully described in the fund’s prospectus.
|
| 1 Total return includes reinvestment of dividends and any capital gains paid. Past performance is no guarantee of future |
| results. Share price and investment return fluctuate such that upon redemption, fund shares may be worth more or less |
| than their original cost. |
| 2 SOURCE: LIPPER INC. — Reflects reinvestment of dividends and, where applicable, capital gain distributions. |
| The Standard & Poor’s 500 Composite Stock Price Index is a widely accepted, unmanaged index of U.S. stock |
| market performance. Investors cannot invest directly in any index. |
| 3 “Standard & Poor’s®,” “S&P®,”“Standard & Poor’s® 500,” and “S&P 500®” are registered trademarks of |
| Standard & Poor’s Financial Services LLC, and have been licensed for use on behalf of the fund.The fund is not |
| sponsored, managed, advised, sold, or promoted by Standard & Poor’s and its affiliates, and Standard & Poor’s and |
| its affiliates make no representation regarding the advisability of investing in the fund. |
The Fund 5
FUND PERFORMANCE
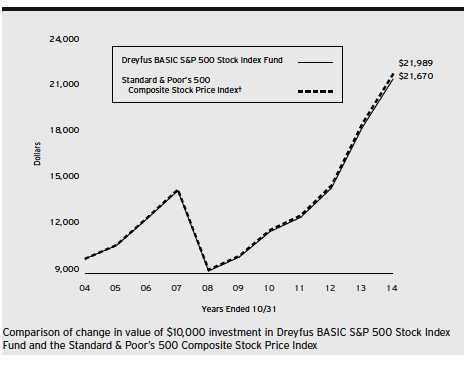
| | | | | | |
| Average Annual Total Returns as of 10/31/14 | | | | | |
| | 1 | Year | 5 Years | | 10 Years | |
| Fund | 17.03 | % | 16.51 | % | 8.04 | % |
| Standard & Poor’s 500 | | | | | | |
| Composite Stock Price Index | 17.24 | % | 16.68 | % | 8.20 | % |
† Source: Lipper Inc.
Past performance is not predictive of future performance.The fund’s performance shown in the graph and table does not reflect the deduction of taxes that a shareholder would pay on fund distributions or the redemption of fund shares. The above graph compares a $10,000 investment made in Dreyfus BASIC S&P 500 Stock Index Fund on 10/31/04 to a $10,000 investment made in the Standard & Poor’s 500 Composite Stock Price Index (the “Index”) on that date. All dividends and capital gain distributions are reinvested.
The fund’s performance shown in the line graph above takes into account all applicable fees and expenses.The Index is a widely accepted, unmanaged index of U.S. stock market performance. Unlike a mutual fund, the Index is not subject to charges, fees and other expenses. Investors cannot invest directly in any index. Further information relating to fund performance, including expense reimbursements, if applicable, is contained in the Financial Highlights section of the prospectus and elsewhere in this report.
6
UNDERSTANDING YOUR FUND’S EXPENSES (Unaudited)
As a mutual fund investor, you pay ongoing expenses, such as management fees and other expenses. Using the information below, you can estimate how these expenses affect your investment and compare them with the expenses of other funds.You also may pay one-time transaction expenses, including sales charges (loads) and redemption fees, which are not shown in this section and would have resulted in higher total expenses. For more information, see your fund’s prospectus or talk to your financial adviser.
Review your fund’s expenses
The table below shows the expenses you would have paid on a $1,000 investment in Dreyfus BASIC S&P 500 Stock Index Fund from May 1, 2014 to October 31, 2014. It also shows how much a $1,000 investment would be worth at the close of the period, assuming actual returns and expenses.
Expenses and Value of a $1,000 Investment
assuming actual returns for the six months ended October 31, 2014
| | |
| Expenses paid per $1,000† | $ | 1.05 |
| Ending value (after expenses) | $ | 1,081.00 |
COMPARING YOUR FUND’S EXPENSES
WITH THOSE OF OTHER FUNDS (Unaudited)
Using the SEC’s method to compare expenses
The Securities and Exchange Commission (SEC) has established guidelines to help investors assess fund expenses. Per these guidelines, the table below shows your fund’s expenses based on a $1,000 investment, assuming a hypothetical 5% annualized return. You can use this information to compare the ongoing expenses (but not transaction expenses or total cost) of investing in the fund with those of other funds. All mutual fund shareholder reports will provide this information to help you make this comparison. Please note that you cannot use this information to estimate your actual ending account balance and expenses paid during the period.
Expenses and Value of a $1,000 Investment
assuming a hypothetical 5% annualized return for the six months ended October 31, 2014
| | |
| Expenses paid per $1,000† | $ | 1.02 |
| Ending value (after expenses) | $ | 1,024.20 |
|
| † Expenses are equal to the fund’s annualized expense ratio of .20%, multiplied by the average account value over the |
| period, multiplied by 184/365 (to reflect the one-half year period). |
The Fund 7
STATEMENT OF INVESTMENTS
October 31, 2014
| | | |
| Common Stocks—96.2% | Shares | | Value ($) |
| Automobiles & Components—1.0% | | | |
| BorgWarner | 26,182 | | 1,492,898 |
| Delphi Automotive | 34,915 | | 2,408,437 |
| Ford Motor | 452,624 | | 6,377,472 |
| General Motors | 157,146 | | 4,934,384 |
| Goodyear Tire & Rubber | 32,138 | | 778,704 |
| Harley-Davidson | 25,544 | | 1,678,241 |
| Johnson Controls | 77,262 | | 3,650,629 |
| | | | 21,320,765 |
| Banks—5.8% | | | |
| Bank of America | 1,227,915 | | 21,071,021 |
| BB&T | 82,552 | | 3,127,070 |
| Citigroup | 354,255 | | 18,963,270 |
| Comerica | 21,253 | | 1,014,618 |
| Fifth Third Bancorp | 97,432 | | 1,947,666 |
| Hudson City Bancorp | 51,163 | | 493,723 |
| Huntington Bancshares | 99,384 | | 984,895 |
| JPMorgan Chase & Co. | 438,717 | | 26,533,604 |
| KeyCorp | 106,762 | | 1,409,258 |
| M&T Bank | 15,010 | | 1,833,922 |
| People’s United Financial | 38,682 | a | 565,531 |
| PNC Financial Services Group | 63,026 | | 5,444,816 |
| Regions Financial | 163,480 | | 1,623,356 |
| SunTrust Banks | 62,518 | | 2,446,955 |
| U.S. Bancorp | 210,223 | | 8,955,500 |
| Wells Fargo & Co. | 554,168 | | 29,420,779 |
| Zions Bancorporation | 23,623 | | 684,358 |
| | | | 126,520,342 |
| Capital Goods—7.3% | | | |
| 3M | 75,530 | | 11,614,248 |
| Allegion | 10,503 | | 557,604 |
| AMETEK | 27,933 | | 1,456,706 |
| Boeing | 78,340 | | 9,785,449 |
| Caterpillar | 72,857 | | 7,388,428 |
| Cummins | 19,988 | | 2,921,846 |
8
| | | |
| Common Stocks (continued) | Shares | | Value ($) |
| Capital Goods (continued) | | | |
| Danaher | 71,077 | | 5,714,591 |
| Deere & Co. | 41,847 | a | 3,579,592 |
| Dover | 19,802 | | 1,573,071 |
| Eaton | 55,583 | | 3,801,321 |
| Emerson Electric | 81,400 | | 5,214,484 |
| Fastenal | 31,215 | a | 1,374,709 |
| Flowserve | 16,604 | | 1,128,906 |
| Fluor | 18,783 | | 1,246,064 |
| General Dynamics | 37,067 | | 5,180,484 |
| General Electric | 1,169,416 | | 30,182,627 |
| Honeywell International | 90,741 | | 8,722,025 |
| Illinois Tool Works | 42,612 | | 3,879,823 |
| Ingersoll-Rand | 30,094 | | 1,884,486 |
| Jacobs Engineering Group | 14,751 | b | 699,935 |
| Joy Global | 11,763 | | 619,087 |
| L-3 Communications Holdings | 10,391 | | 1,262,091 |
| Lockheed Martin | 31,355 | | 5,975,322 |
| Masco | 41,354 | | 912,683 |
| Northrop Grumman | 24,279 | | 3,349,531 |
| PACCAR | 40,533 | | 2,647,616 |
| Pall | 12,492 | | 1,142,019 |
| Parker Hannifin | 17,155 | | 2,179,200 |
| Pentair | 23,342 | | 1,565,081 |
| Precision Castparts | 16,877 | | 3,724,754 |
| Quanta Services | 24,319 | b | 828,792 |
| Raytheon | 36,598 | | 3,801,800 |
| Rockwell Automation | 16,061 | | 1,804,453 |
| Rockwell Collins | 16,474 | | 1,386,287 |
| Roper Industries | 11,378 | | 1,801,137 |
| Snap-on | 6,450 | | 852,303 |
| Stanley Black & Decker | 18,513 | | 1,733,557 |
| Textron | 31,427 | | 1,305,163 |
| United Rentals | 11,072 | b | 1,218,584 |
| United Technologies | 99,201 | | 10,614,507 |
The Fund 9
STATEMENT OF INVESTMENTS (continued)
| | | |
| Common Stocks (continued) | Shares | | Value ($) |
| Capital Goods (continued) | | | |
| W.W. Grainger | 7,014 | | 1,731,055 |
| Xylem | 20,565 | | 747,743 |
| | | | 159,109,164 |
| Commercial & Professional Services—.6% | | | |
| ADT | 20,551 | a | 736,548 |
| Cintas | 11,317 | | 828,857 |
| Dun & Bradstreet | 4,420 | | 542,820 |
| Equifax | 13,517 | | 1,023,778 |
| Nielsen | 35,327 | | 1,501,044 |
| Pitney Bowes | 23,609 | | 584,087 |
| Republic Services | 31,242 | | 1,199,693 |
| Robert Half International | 16,978 | | 930,055 |
| Stericycle | 9,598 | b | 1,209,348 |
| Tyco International | 52,900 | | 2,270,997 |
| Waste Management | 50,432 | | 2,465,620 |
| | | | 13,292,847 |
| Consumer Durables & Apparel—1.3% | | | |
| Coach | 32,534 | a | 1,118,519 |
| D.R. Horton | 38,612 | | 879,967 |
| Fossil Group | 5,898 | b | 599,591 |
| Garmin | 14,202 | a | 787,927 |
| Harman International Industries | 8,158 | | 875,680 |
| Hasbro | 13,386 | | 770,097 |
| Leggett & Platt | 16,485 | a | 649,179 |
| Lennar, Cl. A | 20,402 | a | 878,918 |
| Mattel | 39,838 | | 1,237,767 |
| Michael Kors Holdings | 23,810 | b | 1,871,228 |
| Mohawk Industries | 6,980 | b | 991,439 |
| Newell Rubbermaid | 33,795 | | 1,126,387 |
| NIKE, Cl. B | 82,190 | | 7,641,204 |
| PulteGroup | 39,604 | | 760,001 |
| PVH | 9,342 | | 1,068,258 |
| Ralph Lauren | 6,847 | | 1,128,659 |
| Under Armour, Cl. A | 18,664 | b | 1,223,985 |
| VF | 40,278 | | 2,726,015 |
10
| | | |
| Common Stocks (continued) | Shares | | Value ($) |
| Consumer Durables & Apparel (continued) | | | |
| Whirlpool | 8,878 | | 1,527,460 |
| | | | 27,862,281 |
| Consumer Services—1.6% | | | |
| Carnival | 52,499 | | 2,107,835 |
| Chipotle Mexican Grill | 3,602 | b | 2,298,076 |
| Darden Restaurants | 14,356 | a | 743,354 |
| H&R Block | 33,186 | | 1,072,240 |
| Marriott International, Cl. A | 26,319 | | 1,993,664 |
| McDonald’s | 115,022 | | 10,781,012 |
| Starbucks | 87,107 | | 6,581,805 |
| Starwood Hotels & Resorts Worldwide | 22,644 | c | 1,735,889 |
| Wyndham Worldwide | 15,389 | | 1,195,264 |
| Wynn Resorts | 9,199 | | 1,747,902 |
| Yum! Brands | 51,404 | | 3,692,349 |
| | | | 33,949,390 |
| Diversified Financials—5.0% | | | |
| Affiliated Managers Group | 6,439 | b | 1,286,448 |
| American Express | 105,007 | | 9,445,380 |
| Ameriprise Financial | 21,857 | | 2,757,698 |
| Bank of New York Mellon | 132,992 | | 5,149,450 |
| Berkshire Hathaway, Cl. B | 212,559 | b | 29,792,269 |
| BlackRock | 14,552 | | 4,963,833 |
| Capital One Financial | 65,525 | | 5,423,504 |
| Charles Schwab | 133,859 | | 3,837,738 |
| CME Group | 36,433 | | 3,053,450 |
| Discover Financial Services | 53,925 | | 3,439,337 |
| E*TRADE Financial | 33,417 | b | 745,199 |
| Franklin Resources | 46,018 | | 2,559,061 |
| Goldman Sachs Group | 47,818 | | 9,084,942 |
| IntercontinentalExchange Group | 13,267 | | 2,763,383 |
| Invesco | 51,403 | | 2,080,279 |
| Legg Mason | 12,298 | | 639,496 |
| Leucadia National | 36,187 | | 860,527 |
| McGraw-Hill Financial | 31,588 | | 2,858,082 |
| Moody’s | 22,239 | | 2,206,776 |
The Fund 11
STATEMENT OF INVESTMENTS (continued)
| | | |
| Common Stocks (continued) | Shares | | Value ($) |
| Diversified Financials (continued) | | | |
| Morgan Stanley | 178,423 | | 6,235,884 |
| NASDAQ OMX Group | 15,006 | | 649,160 |
| Navient | 49,719 | | 983,442 |
| Northern Trust | 25,357 | | 1,681,169 |
| State Street | 50,236 | | 3,790,809 |
| T. Rowe Price Group | 30,631 | | 2,514,499 |
| | | | 108,801,815 |
| Energy—8.8% | | | |
| Anadarko Petroleum | 58,505 | | 5,369,589 |
| Apache | 45,055 | | 3,478,246 |
| Baker Hughes | 50,847 | | 2,692,857 |
| Cabot Oil & Gas | 48,831 | | 1,518,644 |
| Cameron International | 23,944 | b | 1,425,865 |
| Chesapeake Energy | 60,375 | | 1,339,117 |
| Chevron | 221,791 | | 26,603,830 |
| Cimarex Energy | 10,048 | | 1,142,156 |
| ConocoPhillips | 143,161 | | 10,329,066 |
| CONSOL Energy | 26,797 | | 986,130 |
| Denbury Resources | 44,157 | | 547,547 |
| Devon Energy | 44,704 | | 2,682,240 |
| Diamond Offshore Drilling | 8,243 | a | 310,844 |
| Ensco, Cl. A | 26,575 | | 1,078,679 |
| EOG Resources | 63,728 | | 6,057,346 |
| EQT | 17,343 | | 1,630,936 |
| Exxon Mobil | 497,455 | | 48,108,873 |
| FMC Technologies | 26,767 | b | 1,500,023 |
| Halliburton | 98,818 | | 5,448,825 |
| Helmerich & Payne | 12,276 | | 1,065,802 |
| Hess | 30,867 | | 2,617,830 |
| Kinder Morgan | 77,757 | a | 3,009,196 |
| Marathon Oil | 79,007 | | 2,796,848 |
| Marathon Petroleum | 33,755 | | 3,068,330 |
| Murphy Oil | 20,093 | | 1,072,765 |
| Nabors Industries | 32,564 | | 581,267 |
| National Oilwell Varco | 50,162 | | 3,643,768 |
| Newfield Exploration | 15,288 | b | 498,542 |
12
| | | |
| Common Stocks (continued) | Shares | | Value ($) |
| Energy (continued) | | | |
| Noble | 29,478 | | 616,680 |
| Noble Energy | 41,267 | | 2,378,217 |
| Occidental Petroleum | 90,945 | | 8,087,739 |
| ONEOK | 24,045 | | 1,417,212 |
| Phillips 66 | 65,213 | | 5,119,221 |
| Pioneer Natural Resources | 16,466 | | 3,113,062 |
| QEP Resources | 20,410 | | 511,679 |
| Range Resources | 19,661 | | 1,344,812 |
| Schlumberger | 151,209 | | 14,918,280 |
| Southwestern Energy | 40,335 | b | 1,311,291 |
| Spectra Energy | 77,164 | | 3,019,427 |
| Tesoro | 15,351 | | 1,096,215 |
| Transocean | 38,718 | a | 1,154,958 |
| Valero Energy | 61,951 | | 3,103,126 |
| Williams | 78,735 | | 4,370,580 |
| | | | 192,167,660 |
| Food & Staples Retailing—2.2% | | | |
| Costco Wholesale | 51,067 | | 6,810,806 |
| CVS Health | 135,106 | | 11,593,446 |
| Kroger | 57,142 | | 3,183,381 |
| Safeway | 27,748 | | 967,295 |
| Sysco | 68,446 | | 2,637,909 |
| Wal-Mart Stores | 184,284 | | 14,055,341 |
| Walgreen | 102,383 | | 6,575,036 |
| Whole Foods Market | 43,009 | | 1,691,544 |
| | | | 47,514,758 |
| Food, Beverage & Tobacco—5.1% | | | |
| Altria Group | 231,332 | | 11,182,589 |
| Archer-Daniels-Midland | 75,502 | | 3,548,594 |
| Brown-Forman, Cl. B | 18,761 | | 1,738,582 |
| Campbell Soup | 19,683 | a | 869,398 |
| Coca-Cola | 460,108 | | 19,269,323 |
| Coca-Cola Enterprises | 26,406 | | 1,144,700 |
| ConAgra Foods | 49,096 | | 1,686,448 |
| Constellation Brands, Cl. A | 19,138 | b | 1,751,893 |
| Dr. Pepper Snapple Group | 23,036 | | 1,595,243 |
The Fund 13
STATEMENT OF INVESTMENTS (continued)
| | | |
| Common Stocks (continued) | Shares | | Value ($) |
| Food, Beverage & Tobacco (continued) | | | |
| General Mills | 71,800 | | 3,730,728 |
| Hershey | 17,077 | | 1,637,855 |
| Hormel Foods | 15,603 | | 841,158 |
| J.M. Smucker | 12,123 | | 1,260,792 |
| Kellogg | 29,721 | | 1,900,955 |
| Keurig Green Mountain | 14,231 | | 2,159,554 |
| Kraft Foods Group | 69,249 | | 3,902,181 |
| Lorillard | 42,191 | | 2,594,746 |
| McCormick & Co. | 15,207 | | 1,075,439 |
| Mead Johnson Nutrition | 23,407 | | 2,324,549 |
| Molson Coors Brewing, Cl. B | 17,979 | | 1,337,278 |
| Mondelez International, Cl. A | 197,945 | | 6,979,541 |
| Monster Beverage | 16,754 | b | 1,690,144 |
| PepsiCo | 175,773 | | 16,904,089 |
| Philip Morris International | 182,215 | | 16,218,957 |
| Reynolds American | 36,263 | | 2,281,305 |
| Tyson Foods, Cl. A | 34,128 | | 1,377,065 |
| | | | 111,003,106 |
| Health Care Equipment & Services—4.3% | | | |
| Abbott Laboratories | 175,448 | | 7,647,778 |
| Aetna | 41,747 | | 3,444,545 |
| AmerisourceBergen | 24,916 | | 2,128,076 |
| Baxter International | 62,938 | | 4,414,471 |
| Becton Dickinson & Co. | 22,220 | | 2,859,714 |
| Boston Scientific | 152,615 | b | 2,026,727 |
| C.R. Bard | 9,004 | | 1,476,386 |
| Cardinal Health | 39,403 | | 3,092,347 |
| CareFusion | 23,720 | b | 1,360,816 |
| Cerner | 35,379 | b | 2,240,906 |
| Cigna | 30,812 | | 3,067,951 |
| Covidien | 52,457 | | 4,849,125 |
| DaVita HealthCare Partners | 20,723 | b | 1,617,845 |
| DENTSPLY International | 16,594 | | 842,477 |
| Edwards Lifesciences | 12,518 | b | 1,513,677 |
| Express Scripts Holding | 87,067 | b | 6,688,487 |
| Humana | 17,944 | | 2,491,524 |
| Intuitive Surgical | 4,200 | b | 2,082,360 |
14
| | | |
| Common Stocks (continued) | Shares | | Value ($) |
| Health Care Equipment & Services (continued) | | | |
| Laboratory Corporation of America Holdings | 10,432 | b | 1,140,113 |
| McKesson | 26,887 | | 5,469,085 |
| Medtronic | 114,313 | | 7,791,574 |
| Patterson | 10,060 | | 433,687 |
| Quest Diagnostics | 16,831 | | 1,068,095 |
| St. Jude Medical | 33,749 | | 2,165,673 |
| Stryker | 34,227 | | 2,995,889 |
| Tenet Healthcare | 12,016 | b | 673,497 |
| UnitedHealth Group | 113,370 | | 10,771,284 |
| Universal Health Services, Cl. B | 10,532 | | 1,092,274 |
| Varian Medical Systems | 12,627 | b | 1,062,183 |
| WellPoint | 32,018 | | 4,056,360 |
| Zimmer Holdings | 19,914 | | 2,215,233 |
| | | | 94,780,159 |
| Household & Personal Products—2.0% | | | |
| Avon Products | 50,005 | | 520,052 |
| Clorox | 15,180 | | 1,510,410 |
| Colgate-Palmolive | 100,159 | | 6,698,634 |
| Estee Lauder, Cl. A | 26,366 | | 1,982,196 |
| Kimberly-Clark | 43,997 | | 5,027,537 |
| Procter & Gamble | 315,560 | | 27,538,921 |
| | | | 43,277,750 |
| Insurance—2.7% | | | |
| ACE | 39,000 | | 4,262,700 |
| Aflac | 53,026 | | 3,167,243 |
| Allstate | 50,728 | | 3,289,711 |
| American International Group | 166,489 | | 8,918,816 |
| Aon | 33,908 | | 2,916,088 |
| Assurant | 9,041 | | 616,777 |
| Chubb | 28,609 | | 2,842,590 |
| Cincinnati Financial | 16,945 | | 855,214 |
| Genworth Financial, Cl. A | 56,876 | b | 795,695 |
| Hartford Financial Services Group | 52,578 | | 2,081,037 |
| Lincoln National | 31,313 | | 1,714,700 |
| Loews | 36,061 | | 1,572,260 |
| Marsh & McLennan | 64,079 | | 3,483,975 |
| MetLife | 130,487 | | 7,077,615 |
The Fund 15
STATEMENT OF INVESTMENTS (continued)
| | | |
| Common Stocks (continued) | Shares | | Value ($) |
| Insurance (continued) | | | |
| Principal Financial Group | 31,477 | | 1,648,450 |
| Progressive | 64,826 | | 1,712,055 |
| Prudential Financial | 53,422 | | 4,729,984 |
| Torchmark | 15,535 | | 822,734 |
| Travelers | 39,595 | | 3,991,176 |
| Unum Group | 30,491 | | 1,020,229 |
| XL Group | 31,854 | | 1,079,214 |
| | | | 58,598,263 |
| Materials—3.2% | | | |
| Air Products & Chemicals | 22,452 | | 3,023,386 |
| Airgas | 7,667 | | 855,177 |
| Alcoa | 136,575 | | 2,288,997 |
| Allegheny Technologies | 12,257 | | 402,642 |
| Avery Dennison | 11,354 | | 531,935 |
| Ball | 16,407 | | 1,057,103 |
| Bemis | 11,439 | | 440,058 |
| CF Industries Holdings | 5,805 | | 1,509,300 |
| Dow Chemical | 131,302 | | 6,486,319 |
| E.I. du Pont de Nemours & Co. | 107,662 | | 7,444,827 |
| Eastman Chemical | 17,901 | | 1,446,043 |
| Ecolab | 31,333 | | 3,485,170 |
| FMC | 16,191 | | 928,554 |
| Freeport-McMoRan | 119,405 | | 3,403,042 |
| International Flavors & Fragrances | 9,146 | | 906,826 |
| International Paper | 49,857 | | 2,523,761 |
| LyondellBasell Industries, Cl. A | 49,578 | | 4,542,832 |
| Martin Marietta Materials | 7,077 | | 827,443 |
| MeadWestvaco | 20,051 | | 885,653 |
| Monsanto | 60,803 | | 6,994,777 |
| Mosaic | 37,851 | | 1,677,178 |
| Newmont Mining | 57,318 | | 1,075,286 |
| Nucor | 36,518 | | 1,974,163 |
| Owens-Illinois | 19,059 | b | 491,150 |
| PPG Industries | 16,117 | | 3,282,872 |
| Praxair | 34,154 | | 4,303,062 |
| Sealed Air | 24,699 | | 895,339 |
16
| | | |
| Common Stocks (continued) | Shares | | Value ($) |
| Materials (continued) | | | |
| Sherwin-Williams | 9,992 | | 2,293,764 |
| Sigma-Aldrich | 13,598 | | 1,848,104 |
| Vulcan Materials | 14,876 | | 917,998 |
| | | | 68,742,761 |
| Media—3.4% | | | |
| Cablevision Systems (NY Group), Cl. A | 24,574 | a | 457,568 |
| CBS, Cl. B | 57,156 | | 3,098,998 |
| Comcast, Cl. A | 302,242 | | 16,729,095 |
| DIRECTV | 58,531 | b | 5,079,905 |
| Discovery Communications, Cl. A | 17,599 | b | 622,125 |
| Discovery Communications, Cl. C | 31,805 | b | 1,112,857 |
| Gannett | 25,883 | | 815,314 |
| Interpublic Group of Companies | 47,908 | | 928,936 |
| News Corp., Cl. A | 57,512 | b | 890,286 |
| Omnicom Group | 30,113 | | 2,163,920 |
| Scripps Networks Interactive, Cl. A | 12,617 | | 974,537 |
| Time Warner | 99,846 | | 7,934,762 |
| Time Warner Cable | 32,612 | | 4,800,813 |
| Twenty-First Century Fox, Cl. A | 219,789 | | 7,578,325 |
| Viacom, Cl. B | 44,450 | | 3,230,626 |
| Walt Disney | 184,306 | | 16,841,882 |
| | | | 73,259,949 |
| Pharmaceuticals, Biotech & | | | |
| Life Sciences—9.4% | | | |
| AbbVie | 185,421 | | 11,766,817 |
| Actavis | 30,840 | b | 7,486,102 |
| Agilent Technologies | 38,231 | | 2,113,410 |
| Alexion Pharmaceuticals | 22,973 | b | 4,396,113 |
| Allergan | 34,697 | | 6,594,512 |
| Amgen | 88,279 | | 14,317,088 |
| Biogen Idec | 27,660 | b | 8,881,073 |
| Bristol-Myers Squibb | 193,240 | | 11,244,636 |
| Celgene | 93,530 | b | 10,016,128 |
| Eli Lilly & Co. | 114,999 | | 7,627,884 |
| Gilead Sciences | 176,373 | b | 19,753,776 |
| Hospira | 18,712 | b | 1,004,834 |
The Fund 17
STATEMENT OF INVESTMENTS (continued)
| | | |
| Common Stocks (continued) | Shares | | Value ($) |
| Pharmaceuticals, Biotech & | | | |
| Life Sciences (continued) | | | |
| Johnson & Johnson | 328,919 | | 35,450,890 |
| Mallinckrodt | 13,185 | b | 1,215,393 |
| Merck & Co. | 336,586 | | 19,501,793 |
| Mylan | 43,366 | b | 2,322,249 |
| PerkinElmer | 13,117 | | 569,540 |
| Perrigo Company | 15,362 | | 2,480,195 |
| Pfizer | 739,517 | | 22,148,534 |
| Regeneron Pharmaceuticals | 8,631 | b | 3,398,197 |
| Thermo Fisher Scientific | 46,518 | | 5,469,121 |
| Vertex Pharmaceuticals | 27,377 | b | 3,083,745 |
| Waters | 10,293 | b | 1,140,464 |
| Zoetis | 57,750 | | 2,145,990 |
| | | | 204,128,484 |
| Real Estate—2.3% | | | |
| American Tower | 46,142 | c | 4,498,845 |
| Apartment Investment & Management, Cl. A | 16,870 | c | 603,777 |
| AvalonBay Communities | 15,285 | c | 2,382,014 |
| Boston Properties | 17,377 | c | 2,202,535 |
| CBRE Group, Cl. A | 32,069 | b | 1,026,208 |
| Crown Castle International | 38,919 | | 3,040,352 |
| Equity Residential | 42,148 | c | 2,931,815 |
| Essex Property Trust | 7,144 | c | 1,441,373 |
| General Growth Properties | 73,051 | c | 1,892,751 |
| HCP | 52,226 | a | 2,296,377 |
| Health Care | 37,765 | c | 2,685,469 |
| Host Hotels & Resorts | 85,832 | c | 2,000,744 |
| Iron Mountain | 19,028 | | 686,340 |
| Kimco Realty | 45,518 | c | 1,135,674 |
| Macerich | 15,798 | c | 1,113,759 |
| Plum Creek Timber | 20,430 | c | 837,834 |
| Prologis | 57,409 | c | 2,391,085 |
| Public Storage | 16,898 | c | 3,114,977 |
| Simon Property Group | 36,497 | c | 6,540,627 |
| Ventas | 33,516 | c | 2,296,181 |
| Vornado Realty Trust | 20,225 | c | 2,214,233 |
18
| | | |
| Common Stocks (continued) | Shares | | Value ($) |
| Real Estate (continued) | | | |
| Weyerhaeuser | 61,653 | c | 2,087,571 |
| | | | 49,420,541 |
| Retailing—4.0% | | | |
| Amazon.com | 44,173 | b | 13,493,085 |
| AutoNation | 9,106 | b | 521,410 |
| AutoZone | 3,807 | a,b | 2,107,251 |
| Bed Bath & Beyond | 23,916 | b | 1,610,503 |
| Best Buy | 33,808 | | 1,154,205 |
| CarMax | 25,507 | b | 1,426,096 |
| Dollar General | 34,794 | b | 2,180,540 |
| Dollar Tree | 24,071 | b | 1,457,980 |
| Expedia | 11,603 | | 985,907 |
| Family Dollar Stores | 11,248 | | 880,606 |
| GameStop, Cl. A | 13,527 | a | 578,415 |
| Gap | 30,452 | | 1,153,826 |
| Genuine Parts | 17,752 | | 1,723,364 |
| Home Depot | 157,065 | | 15,316,979 |
| Kohl’s | 23,608 | | 1,280,026 |
| L Brands | 28,286 | | 2,039,986 |
| Lowe’s | 115,173 | | 6,587,896 |
| Macy’s | 42,152 | | 2,437,229 |
| Netflix | 6,946 | b | 2,728,180 |
| Nordstrom | 16,692 | | 1,212,006 |
| O’Reilly Automotive | 12,388 | b | 2,178,801 |
| PetSmart | 12,468 | | 902,060 |
| Priceline Group | 6,114 | b | 7,374,768 |
| Ross Stores | 25,032 | | 2,020,583 |
| Staples | 79,020 | a | 1,001,974 |
| Target | 72,931 | | 4,508,594 |
| The TJX Companies | 81,774 | | 5,177,930 |
| Tiffany & Co. | 12,728 | | 1,223,415 |
| Tractor Supply | 16,137 | | 1,181,551 |
| TripAdvisor | 12,649 | b | 1,121,460 |
| Urban Outfitters | 11,892 | b | 361,041 |
| | | | 87,927,667 |
The Fund 19
STATEMENT OF INVESTMENTS (continued)
| | | |
| Common Stocks (continued) | Shares | | Value ($) |
| Semiconductors & Semiconductor | | | |
| Equipment—2.3% | | | |
| Altera | 37,148 | | 1,276,777 |
| Analog Devices | 35,944 | | 1,783,541 |
| Applied Materials | 140,621 | | 3,106,318 |
| Avago Technologies | 28,959 | | 2,497,714 |
| Broadcom, Cl. A | 63,508 | | 2,659,715 |
| First Solar | 8,752 | a,b | 515,493 |
| Intel | 577,469 | | 19,639,721 |
| KLA-Tencor | 18,590 | | 1,471,398 |
| Lam Research | 18,798 | | 1,463,612 |
| Linear Technology | 26,881 | | 1,151,582 |
| Microchip Technology | 22,728 | a | 979,804 |
| Micron Technology | 124,796 | b | 4,129,500 |
| NVIDIA | 60,224 | | 1,176,777 |
| Texas Instruments | 124,553 | | 6,185,302 |
| Xilinx | 31,010 | | 1,379,325 |
| | | | 49,416,579 |
| Software & Services—10.0% | | | |
| Accenture, Cl. A | 73,509 | | 5,963,050 |
| Adobe Systems | 55,088 | b | 3,862,771 |
| Akamai Technologies | 21,182 | b | 1,277,275 |
| Alliance Data Systems | 6,472 | b | 1,833,841 |
| Autodesk | 25,990 | b | 1,495,465 |
| Automatic Data Processing | 56,165 | | 4,593,174 |
| CA | 37,214 | | 1,081,439 |
| Citrix Systems | 19,316 | b | 1,240,667 |
| Cognizant Technology Solutions, Cl. A | 70,538 | b | 3,445,781 |
| Computer Sciences | 16,993 | | 1,026,377 |
| eBay | 131,773 | b | 6,918,082 |
| Electronic Arts | 36,859 | b | 1,510,113 |
| Facebook, Cl. A | 242,821 | b | 18,209,147 |
| Fidelity National Information Services | 33,448 | | 1,953,029 |
| Fiserv | 29,650 | b | 2,060,082 |
| Google, Cl. A | 33,034 | b | 18,759,018 |
| Google, Cl. C | 33,034 | b | 18,468,649 |
| International Business Machines | 108,308 | | 17,805,835 |
20
| | | |
| Common Stocks (continued) | Shares | | Value ($) |
| Software & Services (continued) | | | |
| Intuit | 32,950 | | 2,899,929 |
| MasterCard, Cl. A | 114,878 | | 9,621,033 |
| Microsoft | 960,018 | | 45,072,845 |
| Oracle | 380,082 | | 14,842,202 |
| Paychex | 37,598 | a | 1,764,850 |
| Red Hat | 22,460 | b | 1,323,343 |
| salesforce.com | 67,109 | b | 4,294,305 |
| Symantec | 80,345 | | 1,994,163 |
| Teradata | 19,616 | b | 830,149 |
| Total System Services | 19,165 | | 647,585 |
| VeriSign | 13,222 | a,b | 790,147 |
| Visa, Cl. A | 57,464 | | 13,873,534 |
| Western Union | 65,633 | | 1,113,136 |
| Xerox | 127,930 | | 1,698,910 |
| Yahoo! | 109,112 | b | 5,024,608 |
| | | | 217,294,534 |
| Technology Hardware & Equipment—6.5% | | | |
| Amphenol, Cl. A | 36,890 | | 1,865,896 |
| Apple | 698,493 | | 75,437,244 |
| Cisco Systems | 594,833 | | 14,555,564 |
| Corning | 151,919 | | 3,103,705 |
| EMC | 238,726 | | 6,858,598 |
| F5 Networks | 9,134 | b | 1,123,299 |
| FLIR Systems | 16,956 | | 568,535 |
| Harris | 13,174 | | 916,910 |
| Hewlett-Packard | 218,417 | | 7,836,802 |
| Jabil Circuit | 21,071 | | 441,437 |
| Juniper Networks | 47,175 | | 993,977 |
| Motorola Solutions | 26,325 | | 1,697,963 |
| NetApp | 38,646 | | 1,654,049 |
| QUALCOMM | 195,482 | | 15,347,292 |
| SanDisk | 26,129 | | 2,459,784 |
| Seagate Technology | 38,170 | | 2,398,221 |
| TE Connectivity | 47,634 | | 2,911,866 |
| Western Digital | 25,641 | | 2,522,305 |
| | | | 142,693,447 |
The Fund 21
STATEMENT OF INVESTMENTS (continued)
| | | |
| Common Stocks (continued) | Shares | | Value ($) |
| Telecommunication Services—2.3% | | | |
| AT&T | 605,091 | a | 21,081,370 |
| CenturyLink | 67,295 | | 2,791,397 |
| Frontier Communications | 111,275 | a | 727,738 |
| Verizon Communications | 482,928 | | 24,267,132 |
| Windstream Holdings | 65,076 | a | 681,996 |
| | | | 49,549,633 |
| Transportation—2.1% | | | |
| C.H. Robinson Worldwide | 17,205 | | 1,190,758 |
| CSX | 116,653 | | 4,156,346 |
| Delta Air Lines | 97,570 | | 3,925,241 |
| Expeditors International of Washington | 23,656 | | 1,009,165 |
| FedEx | 31,006 | | 5,190,404 |
| Kansas City Southern | 12,665 | | 1,555,135 |
| Norfolk Southern | 35,723 | | 3,952,393 |
| Ryder System | 5,982 | | 529,228 |
| Southwest Airlines | 80,949 | | 2,791,122 |
| Union Pacific | 104,695 | | 12,191,733 |
| United Parcel Service, Cl. B | 82,662 | | 8,672,070 |
| | | | 45,163,595 |
| Utilities—3.0% | | | |
| AES | 73,314 | | 1,031,528 |
| AGL Resources | 12,961 | | 698,728 |
| Ameren | 27,032 | | 1,144,535 |
| American Electric Power | 56,056 | | 3,270,307 |
| CenterPoint Energy | 49,893 | | 1,224,873 |
| CMS Energy | 30,633 | | 1,000,780 |
| Consolidated Edison | 33,270 | | 2,107,987 |
| Dominion Resources | 67,093 | | 4,783,731 |
| DTE Energy | 19,843 | | 1,630,301 |
| Duke Energy | 82,468 | | 6,774,746 |
| Edison International | 37,517 | | 2,347,814 |
| Entergy | 20,912 | | 1,757,026 |
| Exelon | 99,569 | | 3,643,230 |
22
| | | | |
| | Common Stocks (continued) | Shares | | Value ($) |
| | Utilities (continued) | | | |
| | FirstEnergy | 48,386 | | 1,806,733 |
| | Integrys Energy Group | 8,881 | | 645,471 |
| | NextEra Energy | 50,562 | | 5,067,324 |
| | NiSource | 35,675 | | 1,500,491 |
| | Northeast Utilities | 36,837 | | 1,817,906 |
| | NRG Energy | 39,307 | | 1,178,424 |
| | Pepco Holdings | 29,252 | | 799,750 |
| | PG&E | 54,178 | | 2,726,237 |
| | Pinnacle West Capital | 12,185 | | 749,012 |
| | PPL | 77,429 | | 2,709,241 |
| | Public Service Enterprise Group | 58,230 | | 2,405,481 |
| | SCANA | 16,081 | | 882,686 |
| | Sempra Energy | 26,944 | | 2,963,840 |
| | Southern | 103,868 | | 4,815,320 |
| | TECO Energy | 24,882 | | 487,936 |
| | Wisconsin Energy | 26,441 | a | 1,313,060 |
| | Xcel Energy | 58,516 | | 1,958,531 |
| | | | | 65,243,029 |
| | Total Common Stocks | | | |
| | (cost $1,170,812,444) | | | 2,091,038,519 |
| | | Principal | | |
| Short-Term Investments—.2% | Amount ($) | | Value ($) |
| | U.S. Treasury Bills: | | | |
| | 0.01%, 12/11/14 | 3,090,000 | d | 3,089,985 |
| | 0.02%, 3/12/15 | 800,000 | d | 799,900 |
| | Total Short-Term Investments | | | |
| | (cost $3,889,920) | | | 3,889,885 |
| |
| | Other Investment—3.4% | Shares | | Value ($) |
| | Registered Investment Company; | | | |
| | Dreyfus Institutional Preferred | | | |
| | Plus Money Market Fund | | | |
| | (cost $73,331,726) | 73,331,726 | e | 73,331,726 |
The Fund 23
STATEMENT OF INVESTMENTS (continued)
| | | | |
| Investment of Cash Collateral | | | | |
| for Securities Loaned—.5% | Shares | | Value ($) | |
| Registered Investment Company; | | | | |
| Dreyfus Institutional Cash Advantage Fund | | | | |
| (cost $11,208,670) | 11,208,670 | e | 11,208,670 | |
| Total Investments (cost $1,259,242,760) | 100.3 | % | 2,179,468,800 | |
| Liabilities, Less Cash and Receivables | (.3 | %) | (5,625,911 | ) |
| Net Assets | 100.0 | % | 2,173,842,889 | |
|
| a Security, or portion thereof, on loan.At October 31, 2014, the value of the fund’s securities on loan was |
| $34,898,972 and the value of the collateral held by the fund was $35,290,733, consisting of cash collateral of |
| $11,208,670 and U.S. Government & Agency securities valued at $24,082,063. |
| b Non-income producing security. |
| c Investment in real estate investment trust. |
| d Held by or on behalf of a counterparty for open financial futures contracts. |
| e Investment in affiliated money market mutual fund. |
| | | |
| Portfolio Summary (Unaudited)† | | |
| |
| | Value (%) | | Value (%) |
| Software & Services | 10.0 | Utilities | 3.0 |
| Pharmaceuticals, | | Insurance | 2.7 |
| Biotech & Life Sciences | 9.4 | Real Estate | 2.3 |
| Energy | 8.8 | Semiconductors & | |
| Capital Goods | 7.3 | Semiconductor Equipment | 2.3 |
| Technology Hardware & Equipment | 6.5 | Telecommunication Services | 2.3 |
| Banks | 5.8 | Food & Staples Retailing | 2.2 |
| Food, Beverage & Tobacco | 5.1 | Transportation | 2.1 |
| Diversified Financials | 5.0 | Household & Personal Products | 2.0 |
| Health Care Equipment & Services | 4.3 | Consumer Services | 1.6 |
| Short-Term/ | | Consumer Durables & Apparel | 1.3 |
| Money Market Investments | 4.1 | Automobiles & Components | 1.0 |
| Retailing | 4.0 | Commercial & Professional Services | .6 |
| Media | 3.4 | | |
| Materials | 3.2 | | 100.3 |
| |
| † Based on net assets. | | | |
| See notes to financial statements. | | | |
24
STATEMENT OF FINANCIAL FUTURES
October 31, 2014
| | | | | |
| | | Market Value | | Unrealized | |
| | | Covered by | | Appreciation | |
| | Contracts | Contracts ($) | Expiration | at 10/31/2014 | ($) |
| Financial Futures Long | | | | | |
| Standard & Poor’s 500 E-mini | 801 | 80,556,570 | December 2014 | 1,508,474 | |
| |
| See notes to financial statements. | | | | | |
The Fund 25
STATEMENT OF ASSETS AND LIABILITIES
October 31, 2014
| | | |
| | Cost | Value | |
| Assets ($): | | | |
| Investments in securities—See Statement of Investments (including | | | |
| securities on loan, valued at $34,898,972)—Note 1(b): | | | |
| Unaffiliated issuers | 1,174,702,364 | 2,094,928,404 | |
| Affiliated issuers | 84,540,396 | 84,540,396 | |
| Cash | | 1,878,565 | |
| Receivable for shares of Capital Stock subscribed | | 2,167,977 | |
| Dividends and securities lending income receivable | | 2,089,555 | |
| Receivable for futures variation margin—Note 4 | | 913,140 | |
| Other receivable | | 17,813 | |
| | | 2,186,535,850 | |
| Liabilities ($): | | | |
| Due to The Dreyfus Corporation and affiliates—Note 3(a) | | 340,971 | |
| Liability for securities on loan—Note 1(b) | | 11,208,670 | |
| Payable for shares of Capital Stock redeemed | | 1,142,320 | |
| Accrued expenses | | 1,000 | |
| | | 12,692,961 | |
| Net Assets ($) | | 2,173,842,889 | |
| Composition of Net Assets ($): | | | |
| Paid-in capital | | 1,266,850,196 | |
| Accumulated undistributed investment income—net | | 11,340,729 | |
| Accumulated net realized gain (loss) on investments | | (26,082,550 | ) |
| Accumulated net unrealized appreciation (depreciation) | | | |
| on investments (including $1,508,474 net unrealized | | | |
| appreciation on financial futures) | | 921,734,514 | |
| Net Assets ($) | | 2,173,842,889 | |
| Shares Outstanding | | | |
| (150 millon shares of $.001 par value Capital Stock authorized) | | 52,300,072 | |
| Net Asset Value, offering and redemption price per share ($) | | 41.56 | |
| |
| See notes to financial statements. | | | |
26
STATEMENT OF OPERATIONS
Year Ended October 31, 2014
| | |
| Investment Income ($): | | |
| Income: | | |
| Cash dividends (net of $4,217 foreign taxes withheld at source): | | |
| Unaffiliated issuers | 40,566,614 | |
| Affiliated issuers | 33,490 | |
| Income from securities lending—Note 1(b) | 68,353 | |
| Interest | 660 | |
| Total Income | 40,669,117 | |
| Expenses: | | |
| Management fee—Note 3(a) | 4,051,026 | |
| Directors’ fees—Note 3(a,b) | 162,476 | |
| Loan commitment fees—Note 2 | 19,345 | |
| Interest expense—Note 2 | 158 | |
| Total Expenses | 4,233,005 | |
| Less—Directors’ fees reimbursed by the Manager—Note 3(a) | (162,476 | ) |
| Net Expenses | 4,070,529 | |
| Investment Income—Net | 36,598,588 | |
| Realized and Unrealized Gain (Loss) on Investments—Note 4 ($): | | |
| Net realized gain (loss) on investments | (11,011,087 | ) |
| Net realized gain (loss) on financial futures | 8,524,770 | |
| Net Realized Gain (Loss) | (2,486,317 | ) |
| Net unrealized appreciation (depreciation) on investments | 284,565,600 | |
| Net unrealized appreciation (depreciation) on financial futures | (334,044 | ) |
| Net Unrealized Appreciation (Depreciation) | 284,231,556 | |
| Net Realized and Unrealized Gain (Loss) on Investments | 281,745,239 | |
| Net Increase in Net Assets Resulting from Operations | 318,343,827 | |
| |
| See notes to financial statements. | | |
The Fund 27
STATEMENT OF CHANGES IN NET ASSETS
| | | | |
| | Year Ended October 31, | |
| | 2014 | | 2013 | |
| Operations ($): | | | | |
| Investment income—net | 36,598,588 | | 31,717,838 | |
| Net realized gain (loss) on investments | (2,486,317 | ) | 8,894,098 | |
| Net unrealized appreciation | | | | |
| (depreciation) on investments | 284,231,556 | | 332,071,802 | |
| Net Increase (Decrease) in Net Assets | | | | |
| Resulting from Operations | 318,343,827 | | 372,683,738 | |
| Dividends to Shareholders from ($): | | | | |
| Investment income—net | (35,006,286 | ) | (29,508,079 | ) |
| Net realized gain on investments | (1,397,376 | ) | — | |
| Total Dividends | (36,403,662 | ) | (29,508,079 | ) |
| Capital Stock Transactions ($): | | | | |
| Net proceeds from shares sold | 453,083,463 | | 580,773,076 | |
| Dividends reinvested | 28,442,126 | | 24,806,123 | |
| Cost of shares redeemed | (458,453,852 | ) | (449,157,920 | ) |
| Increase (Decrease) in Net Assets | | | | |
| from Capital Stock Transactions | 23,071,737 | | 156,421,279 | |
| Total Increase (Decrease) in Net Assets | 305,011,902 | | 499,596,938 | |
| Net Assets ($): | | | | |
| Beginning of Period | 1,868,830,987 | | 1,369,234,049 | |
| End of Period | 2,173,842,889 | | 1,868,830,987 | |
| Undistributed investment income—net | 11,340,729 | | 10,191,133 | |
| Capital Share Transactions (Shares): | | | | |
| Shares sold | 11,780,839 | | 17,725,183 | |
| Shares issued for dividends reinvested | 747,402 | | 795,878 | |
| Shares redeemed | (11,890,511 | ) | (13,980,478 | ) |
| Net Increase (Decrease) in Shares Outstanding | 637,730 | | 4,540,583 | |
| See notes to financial statements. | | | | |
28
FINANCIAL HIGHLIGHTS
The following table describes the performance for the fiscal periods indicated. Total return shows how much your investment in the fund would have increased (or decreased) during each period, assuming you had reinvested all dividends and distributions.These figures have been derived from the fund’s financial statements.
| | | | | | | | | | |
| | | | Year Ended October 31, | | | |
| | 2014 | | 2013 | | 2012 | | 2011 | | 2010 | |
| Per Share Data ($): | | | | | | | | | | |
| Net asset value, | | | | | | | | | | |
| beginning of period | 36.17 | | 29.06 | | 25.75 | | 24.29 | | 21.26 | |
| Investment Operations: | | | | | | | | | | |
| Investment income—neta | .70 | | .65 | | .55 | | .48 | | .43 | |
| Net realized and unrealized | | | | | | | | | | |
| gain (loss) on investments | 5.39 | | 7.08 | | 3.27 | | 1.45 | | 3.02 | |
| Total from Investment Operations | 6.09 | | 7.73 | | 3.82 | | 1.93 | | 3.45 | |
| Distributions: | | | | | | | | | | |
| Dividends from | | | | | | | | | | |
| investment income—net | (.67 | ) | (.62 | ) | (.51 | ) | (.47 | ) | (.42 | ) |
| Dividends from net realized | | | | | | | | | | |
| gain on investments | (.03 | ) | — | | — | | — | | — | |
| Total Distributions | (.70 | ) | (.62 | ) | (.51 | ) | (.47 | ) | (.42 | ) |
| Net asset value, end of period | 41.56 | | 36.17 | | 29.06 | | 25.75 | | 24.29 | |
| Total Return (%) | 17.03 | | 26.96 | | 15.00 | | 7.94 | | 16.39 | |
| Ratios/Supplemental Data (%): | | | | | | | | | | |
| Ratio of total expenses | | | | | | | | | | |
| to average net assets | .21 | | .21 | | .21 | | .21 | | .21 | |
| Ratio of net expenses | | | | | | | | | | |
| to average net assets | .20 | | .20 | | .20 | | .20 | | .20 | |
| Ratio of net investment income | | | | | | | | | | |
| to average net assets | 1.81 | | 2.01 | | 1.97 | | 1.84 | | 1.85 | |
| Portfolio Turnover Rate | 5.41 | | 3.45 | | 3.28 | | 2.12 | | 7.64 | |
| Net Assets, end of period | | | | | | | | | | |
| ($ x 1,000) | 2,173,843 | | 1,868,831 | | 1,369,234 | | 1,115,441 | | 923,496 | |
| |
| a Based on average shares outstanding. | | | | | | | | | | |
| See notes to financial statements. | | | | | | | | | | |
The Fund 29
NOTES TO FINANCIAL STATEMENTS
NOTE 1—Significant Accounting Policies:
Dreyfus BASIC S&P 500 Stock Index Fund (the “fund”) is a separate diversified series of The Dreyfus/Laurel Funds, Inc. (the “Company”), which is registered under the Investment Company Act of 1940, as amended (the “Act”), as an open-end management investment company and operates as a series company currently offering eleven series including the fund.The fund’s investment objective seeks to match the total return of the Standard & Poor’s 500® Composite Stock Price Index. The Dreyfus Corporation (the “Manager” or “Dreyfus”), a wholly-owned subsidiary of The Bank of New York Mellon Corporation (“BNY Mellon”), serves as the fund’s investment adviser. MBSC Securities Corporation (the “Distributor”), a wholly-owned subsidiary of the Manager, is the distributor of the fund’s shares, which are sold to the public without a sales charge.
The Company accounts separately for the assets, liabilities and operations of each series. Expenses directly attributable to each series are charged to that series’ operations; expenses which are applicable to all series are allocated among them on a pro rata basis.
The Financial Accounting Standards Board (“FASB”) Accounting Standards Codification (“ASC”) is the exclusive reference of authoritative U.S. generally accepted accounting principles (“GAAP”) recognized by the FASB to be applied by nongovernmental entities. Rules and interpretive releases of the Securities and Exchange Commission (“SEC”) under authority of federal laws are also sources of authoritative GAAP for SEC registrants. The fund’s financial statements are prepared in accordance with GAAP, which may require the use of management estimates and assumptions. Actual results could differ from those estimates.
(a) Portfolio valuation: The fair value of a financial instrument is the amount that would be received to sell an asset or paid to transfer a liability in an orderly transaction between market participants at the measurement date (i.e., the exit price). GAAP establishes a fair value hierarchy that prioritizes the inputs of valuation techniques used to measure fair value. This hierarchy gives the highest priority to unad-
30
justed quoted prices in active markets for identical assets or liabilities (Level 1 measurements) and the lowest priority to unobservable inputs (Level 3 measurements).
Additionally, GAAP provides guidance on determining whether the volume and activity in a market has decreased significantly and whether such a decrease in activity results in transactions that are not orderly. GAAP requires enhanced disclosures around valuation inputs and techniques used during annual and interim periods.
Various inputs are used in determining the value of the fund’s investments relating to fair value measurements.These inputs are summarized in the three broad levels listed below:
Level 1—unadjusted quoted prices in active markets for identical investments.
Level 2—other significant observable inputs (including quoted prices for similar investments, interest rates, prepayment speeds, credit risk, etc.).
Level 3—significant unobservable inputs (including the fund’s own assumptions in determining the fair value of investments).
The inputs or methodology used for valuing securities are not necessarily an indication of the risk associated with investing in those securities.
Changes in valuation techniques may result in transfers in or out of an assigned level within the disclosure hierarchy. Valuation techniques used to value the fund’s investments are as follows:
Investments in securities are valued at the last sales price on the securities exchange or national securities market on which such securities are primarily traded. Securities listed on the National Market System for which market quotations are available are valued at the official closing price or, if there is no official closing price that day, at the last sales price. Securities not listed on an exchange or the national securities market, or securities for which there were no transactions, are valued at the average of the most recent bid and asked prices, except
The Fund 31
NOTES TO FINANCIAL STATEMENTS (continued)
for open short positions, where the asked price is used for valuation purposes. Bid price is used when no asked price is available. Registered investment companies that are not traded on an exchange are valued at their net asset value.All of the preceding securities are generally categorized within Level 1 of the fair value hierarchy.
U.S. Treasury Bills are valued at the mean price between quoted bid prices and asked prices by an independent pricing service (the “Service”) approved by the Company’s Board of Directors (the “Board”).These securities are generally categorized within Level 2 of the fair value hierarchy.
The Service’s procedures are reviewed by Dreyfus under the general supervision of the Board.
Fair valuing of securities may be determined with the assistance of a pricing service using calculations based on indices of domestic securities and other appropriate indicators, such as prices of relevant American Depository Receipts and financial futures. Utilizing these techniques may result in transfers between Level 1 and Level 2 of the fair value hierarchy.
When market quotations or official closing prices are not readily available, or are determined not to reflect accurately fair value, such as when the value of a security has been significantly affected by events after the close of the exchange or market on which the security is principally traded (for example, a foreign exchange or market), but before the fund calculates its net asset value, the fund may value these investments at fair value as determined in accordance with the procedures approved by the Board. Certain factors may be considered when fair valuing investments such as: fundamental analytical data, the nature and duration of restrictions on disposition, an evaluation of the forces that influence the market in which the securities are purchased and sold, and public trading in similar securities of the issuer or comparable
32
issuers. These securities are either categorized within Level 2 or 3 of the fair value hierarchy depending on the relevant inputs used.
For restricted securities where observable inputs are limited, assumptions about market activity and risk are used and are generally categorized within Level 3 of the fair value hierarchy.
Financial futures, which are traded on an exchange, are valued at the last sales price on the securities exchange on which such securities are primarily traded or at the last sales price on the national securities market on each business day and are generally categorized within Level 1 of the fair value hierarchy.
The following is a summary of the inputs used as of October 31, 2014 in valuing the fund's investments:
| | | | |
| | | Level 2—Other | Level 3— | |
| | Level 1— | Significant | Significant | |
| | Unadjusted | Observable | Unobservable | |
| | Quoted Prices | Inputs | Inputs | Total |
| Assets ($) | | | | |
| Investments in Securities: | | | |
| Equity Securities— | | | | |
| Domestic | | | | |
| Common | | | | |
| Stocks† | 2,085,590,898 | — | — | 2,085,590,898 |
| Equity Securities— | | | | |
| Foreign | | | | |
| Common Stocks† | 5,447,621 | — | — | 5,447,621 |
| Mutual Funds | 84,540,396 | — | — | 84,540,396 |
| U.S. Treasury | — | 3,889,885 | — | 3,889,885 |
| Other Financial | | | | |
| Instruments: | | | | |
| Financial Futures†† | 1,508,474 | — | — | 1,508,474 |
| |
| † | See Statement of Investments for additional detailed categorizations. |
| †† | Amount shown represents unrealized appreciation at period end. |
The Fund 33
NOTES TO FINANCIAL STATEMENTS (continued)
At October 31, 2014, there were no transfers between Level 1 and Level 2 of the fair value hierarchy.
(b) Securities transactions and investment income: Securities transactions are recorded on a trade date basis. Realized gains and losses from securities transactions are recorded on the identified cost basis. Dividend income is recognized on the ex-dividend date and interest income, including, where applicable, accretion of discount and amortization of premium on investments, is recognized on the accrual basis.
Pursuant to a securities lending agreement with The Bank of New York Mellon, a subsidiary of BNY Mellon and an affiliate of Dreyfus, and its affiliates, the fund may lend securities to qualified institutions. It is the fund’s policy that, at origination, all loans are secured by collateral of at least 102% of the value of U.S. securities loaned and 105% of the value of foreign securities loaned. Collateral equivalent to at least 100% of the market value of securities on loan is maintained at all times. Collateral is either in the form of cash, which can be invested in certain money market mutual funds managed by the Manager or U.S. Government and Agency securities.The fund is entitled to receive all dividends, interest and distributions on securities loaned, in addition to income earned as a result of the lending transaction. Should a borrower fail to return the securities in a timely manner,The Bank of New York Mellon is required to replace the securities for the benefit of the fund or credit the fund with the market value of the unreturned securities and is subrogated to the fund’s rights against the borrower and the collateral. During the period ended October 31, 2014, The Bank of New York Mellon earned $15,776 from lending portfolio securities, pursuant to the securities lending agreement.
(c) Affiliated issuers: Investments in other investment companies advised by Dreyfus are defined as “affiliated” under the Act. Investments
34
in affiliated investment companies during the period ended October 31, 2014 were as follows:
| | | | | |
| Affiliated | | | | | |
| Investment | Value | | | Value | Net |
| Company | 10/31/2013($) | Purchases ($) | Sales ($) | 10/31/2014 ($) | Assets (%) |
| Dreyfus | | | | | |
| Institutional | | | | | |
| Preferred | | | | | |
| Plus Money | | | | | |
| Market | | | | | |
| Fund | 51,700,177 | 241,237,152 | 219,605,603 | 73,331,726 | 3.4 |
| Dreyfus | | | | | |
| Institutional | | | | | |
| Cash | | | | | |
| Advantage | | | | | |
| Fund | 6,186,032 | 107,188,026 | 102,165,388 | 11,208,670 | .5 |
| Total | 57,886,209 | 348,425,178 | 321,770,991 | 84,540,396 | 3.9 |
(d) Dividends to shareholders: Dividends are recorded on the ex-dividend date. Dividends from investment income-net are normally declared and paid quarterly. Dividends from net realized capital gains, if any, are normally declared and paid annually, but the fund may make distributions on a more frequent basis to comply with the distribution requirements of the Internal Revenue Code of 1986, as amended (the “Code”). To the extent that net realized capital gains can be offset by capital loss carryovers, it is the policy of the fund not to distribute such gains. Income and capital gain distributions are determined in accordance with income tax regulations, which may differ from GAAP.
(e) Federal income taxes: It is the policy of the fund to continue to qualify as a regulated investment company, if such qualification is in the best interests of its shareholders, by complying with the applicable provisions of the Code, and to make distributions of taxable income sufficient to relieve it from substantially all federal income and excise taxes.
The Fund 35
NOTES TO FINANCIAL STATEMENTS (continued)
As of and during the period ended October 31, 2014, the fund did not have any liabilities for any uncertain tax positions.The fund recognizes interest and penalties, if any, related to uncertain tax positions as income tax expense in the Statement of Operations. During the period ended October 31, 2014, the fund did not incur any interest or penalties.
Each tax year in the four-year period ended October 31, 2014 remains subject to examination by the Internal Revenue Service and state taxing authorities.
At October 31, 2014, the components of accumulated earnings on a tax basis were as follows: undistributed ordinary income $11,037,117, accumulated capital losses $944,781 and unrealized appreciation $896,900,357.
Under the Regulated Investment Company Modernization Act of 2010 (the “2010 Act”), the fund is permitted to carry forward capital losses incurred in taxable years beginning after December 22, 2010 (“post-enactment losses”) for an unlimited period. Furthermore, post-enactment capital loss carryovers retain their character as either short-term or long-term capital losses rather than short-term as they were under previous statute.
The accumulated capital loss carryover is available for federal income tax purposes to be applied against future net realized capital gains, if any, realized subsequent to October 31, 2014. The fund has $944,781 of post-enactment long-term capital losses which can be carried forward for an unlimited period.
The tax character of distributions paid to shareholders during the fiscal periods ended October 31, 2014 and October 31, 2013 were as follows: ordinary income $35,009,329 and $29,508,079, and long-term capital gains $1,394,333 and $0, respectively.
During the period ended October 31, 2014, as a result of permanent book to tax differences, primarily due to the tax treatment for real estate investment trusts and dividend reclassification, the fund decreased
36
accumulated undistributed investment income-net by $442,706 and increased accumulated net realized gain (loss) on investments by the same amount. Net assets and net asset value per share were not affected by this reclassification.
NOTE 2—Bank Lines of Credit:
The fund participates with other Dreyfus-managed funds in a $430 million unsecured credit facility led by Citibank, N.A. and a $300 million unsecured credit facility provided by The Bank of New York Mellon (each, a “Facility”), each to be utilized primarily for temporary or emergency purposes, including the financing of redemptions. Prior to October 8, 2014, the unsecured credit facility with Citibank, N.A. was $265 million. In connection therewith, the fund has agreed to pay its pro rata portion of commitment fees for each Facility. Interest is charged to the fund based on rates determined pursuant to the terms of the respective Facility at the time of borrowing.
The average amount of borrowings outstanding under the Facilities during the period ended October 31, 2014 was approximately $14,500 with a related weighted average annualized interest rate of 1.09%.
NOTE 3—Investment Management Fee And Other Transactions with Affiliates:
(a) Pursuant to an investment management agreement with the Manager, the Manager provides or arranges for one or more third parties and/or affiliates to provide investment advisory, administrative, custody, fund accounting and transfer agency services to the fund.The Manager also directs the investments of the fund in accordance with its investment objective, policies and limitations. For these services, the fund is contractually obligated to pay the Manager a fee, calculated daily and paid monthly, at an annual rate of .20% of the value of the fund’s average daily net assets. Out of its fee, the Manager pays all of the expenses of the fund except brokerage fees, taxes, interest expenses,
The Fund 37
NOTES TO FINANCIAL STATEMENTS (continued)
commitment fees on borrowings, fees and expenses of non-interested Directors (including counsel fees) and extraordinary expenses. In addition, the Manager is required to reduce its fee in an amount equal to the fund’s allocable portion of fees and expenses of the non-interested Directors (including counsel fees). During the period ended October 31, 2014, fees reimbursed by the Manager amounted to $162,476.
The components of “Due to The Dreyfus Corporation and affiliates” in the Statement of Assets and Liabilities consist of: management fees $352,694, which are offset against an expense reimbursement currently in effect in the amount of $11,723.
(b) Each Board member also serves as a Board member of other funds within the Dreyfus complex. Annual retainer fees and attendance fees are allocated to each fund based on net assets.
NOTE 4—Securities Transactions:
The aggregate amount of purchases and sales of investment securities, excluding short-term securities and financial futures, during the period ended October 31, 2014, amounted to $114,063,890 and $107,407,188, respectively.
Derivatives: A derivative is a financial instrument whose performance is derived from the performance of another asset. Each type of derivative instrument that was held by the fund during the period ended October 31, 2014 is discussed below.
Financial Futures: In the normal course of pursuing its investment objective, the fund is exposed to market risk, including equity price risk as a result of changes in value of underlying financial instruments. The fund invests in financial futures in order to manage its exposure to or protect against changes in the market. A financial futures contract represents a commitment for the future purchase or a sale of an asset at a specified date. Upon entering into such contracts, these investments require initial margin deposits with a counterparty, which consist of cash or cash equiv-
38
alents. The amount of these deposits is determined by the exchange or Board of Trade on which the contract is traded and is subject to change. Accordingly, variation margin payments are received or made to reflect daily unrealized gains or losses which are recorded in the Statement of Operations.When the contracts are closed, the fund recognizes a realized gain or loss which is reflected in the Statement of Operations. There is minimal counterparty credit risk to the fund with financial futures since they are exchange traded, and the exchange guarantees the financial futures against default. Financial futures open at October 31, 2014 are set forth in the Statement of Financial Futures.
The following summarizes the average market value of derivatives outstanding during the period ended October 31, 2014:
| |
| | Average Market Value ($) |
| Equity financial futures | 48,264,782 |
At October 31, 2014, the cost of investments for federal income tax purposes was $1,282,568,443; accordingly, accumulated net unrealized appreciation on investments was $896,900,357, consisting of $945,399,301 gross unrealized appreciation and $48,498,944 gross unrealized depreciation.
NOTE 5—Pending Legal Matters:
The fund and many other entities have been named as defendants in numerous pending litigations as a result of their participation in the leveraged buyout transaction (“LBO”) of the Tribune Company (“Tribune”).The cases allege that Tribune took on billions of dollars of debt in the LBO to purchase its own stock from shareholders at $34 per share.The LBO was closed in a two-step transaction with shares being repurchased by Tribune in a tender offer in June 2007 and in a go-private merger in December 2007. In 2008, approximately one year after the LBO was concluded,Tribune filed for bankruptcy protection under Chapter 11. Thereafter, in approximately June 2011, certain Tribune
The Fund 39
NOTES TO FINANCIAL STATEMENTS (continued)
creditors filed dozens of complaints in various courts throughout the country alleging that the payments made to shareholders in the LBO were “fraudulent conveyances” under state and/or federal law, and that the shareholders must return the payments they received for their shares to satisfy the plaintiffs’ unpaid claims. These cases have been consolidated for coordinated pre-trial proceedings in a multi-district litigation in the United States District Court for the Southern District of New York titled In re Tribune Company Fraudulent Conveyance Litigation
(S.D.N.Y. Nos. 11-md-2296 and 12-mc-2296 (RJS) (“Tribune MDL”)). On March 27, 2013, the Tribune MDL was reassigned from Judge William H. Pauley to Judge Richard J. Sullivan. No explanation was given for the reassignment.
In addition, there was a case pending in United States Bankruptcy Court for the District of Delaware brought by the Unsecured Creditors Committee of the Tribune Company that has since been transferred to the Tribune MDL (formerly The Official Committee of Unsecured Creditors of Tribune Co. v. FitzSimons, et al., Bankr. D. Del.Adv. Pro. No. 10-54010 (KJC)) (“FitzSimons case”).The case was originally filed on November 1, 2010. In a Fourth Amended Complaint filed in November 2012, among other claims, the Creditors Committee sought recovery under the Bankruptcy Code for alleged “fraudulent conveyances” from more than 5,000 Tribune shareholders (“Shareholder Defendants”), including the fund, and a defendants’ class of all shareholders who tendered their Tribune stock in the LBO and received cash in exchange. There were 35 other counts in the Fourth Amended Complaint that did not relate to claims against Shareholder Defendants, but instead were brought against parties directly involved in approval or execution of the leveraged buyout. On January 10, 2013, pursuant to the Tribune bankruptcy plan, Mark S. Kirchner, as Litigation Trustee for the Tribune Litigation Trust, became the successor plaintiff to the Creditors Committee in this case. The case is now proceeding as: Mark S. Kirchner, as Litigation Trustee for the Tribune Litigation Trust v. FitzSimons, et al., S.D.N.Y. No. 12-cv-2652 (RJS). On
40
August 1, 2013, the plaintiff filed a Fifth Amended Complaint with the Court. The Fifth Amended Complaint contains more detailed allegations regarding the steps Tribune took in consideration and execution of the LBO, but does not change the legal basis for the claim previously alleged against the Shareholder Defendants.
On November 6, 2012, a motion to dismiss was filed in the Tribune MDL. Oral argument on the motion to dismiss was held on May 23, 2013. On September 23, 2013 Judge Sullivan granted the motion to dismiss on standing grounds, after rejecting defendants’ preemption arguments. By granting the motion, Judge Sullivan dismissed nearly 50 cases in the Tribune MDL, including all cases with Deutsche Bank Trust Company Americas or William A. Niese as the lead plaintiff.The fund was a defendant in at least one of the dismissed cases.The motion had no effect on the FitzSimons case, which had been stayed.
On September 30, 2013, plaintiffs appealed the motion to dismiss decision to the U.S. Court of Appeals for the Second Circuit. On October 28, 2013, certain defendants cross-appealed from Judge Sullivan’s decision, seeking review of the arguments that Judge Sullivan rejected in his decision. Briefing on the appeal and cross appeal was completed in April 2014. Oral argument before the Second Circuit took place on November 5, 2014.
On November 11, 2013, Judge Sullivan entered Master Case Order No. 4 in the Tribune MDL. Master Case Order No. 4 addressed numerous procedural and administrative tasks for the cases that remain in the Tribune MDL, including the FitzSimons case. Pursuant to Master Case Order No. 4, the parties – through their executive committees and liaison counsel – attempted to negotiate a protocol for motions to dismiss and other procedural issues, and submitted rival proposals to the Court. On April 24, 2014 the Court entered an order setting a schedule for the first motions to dismiss in the FitzSimons case. Pursuant to that schedule, a “global” motion to dismiss the fraud-
The Fund 41
NOTES TO FINANCIAL STATEMENTS (continued)
ulent transfer claim asserted against the Shareholder Defendants, which applies equally to all Shareholder Defendants including the fund, was filed on May 23, 2014. Plaintiffs’ response brief was filed on June 23, 2014, and the reply brief was filed on July 3, 2014. No date for oral argument has been scheduled. The Court also preserved Shareholder Defendants’ rights to file nineteen motions to dismiss enumerated in their proposal and motions pursuant to Rules 12(b)(2)-(5) of the Federal Rules of Civil Procedure. If these various motions are necessary after the Court decides the global motion to dismiss, the Court will set further guidelines and briefing schedules.
As of November 30, 2014, no answers to the Fifth Amended Complaint in the FitzSimons case may be filed.
At this stage in the proceedings, it is not possible to assess with any reasonable certainty the probable outcomes of the pending litigations. Consequently, at this time, management is unable to estimate the possible loss that may result.
42
REPORT OF INDEPENDENT REGISTERED
PUBLIC ACCOUNTING FIRM
The Board of Directors and Shareholders of
The Dreyfus/Laurel Funds, Inc.
We have audited the accompanying statement of assets and liabilities of Dreyfus BASIC S&P 500 Stock Index Fund (the “Fund”), a series of The Dreyfus/Laurel Funds, Inc., including the statements of investments and financial futures, as of October 31, 2014, and the related statement of operations for the year then ended, the statements of changes in net assets for each of the years in the two-year period then ended, and the financial highlights for each of the years in the five-year period then ended.These financial statements and financial highlights are the responsibility of the Fund’s management. Our responsibility is to express an opinion on these financial statements and financial highlights based on our audits.
We conducted our audits in accordance with the standards of the Public Company Accounting Oversight Board (United States).Those standards require that we plan and perform the audit to obtain reasonable assurance about whether the financial statements and financial highlights are free of material misstatement. An audit includes examining, on a test basis, evidence supporting the amounts and disclosures in the financial statements. Our procedures included confirmation of securities owned as of October 31, 2014, by correspondence with the custodian and brokers or by other appropriate auditing procedures. An audit also includes assessing the accounting principles used and significant estimates made by management, as well as evaluating the overall financial statement presentation.We believe that our audits provide a reasonable basis for our opinion.
In our opinion, the financial statements and financial highlights referred to above present fairly, in all material respects, the financial position of Dreyfus BASIC S&P 500 Stock Index Fund as of October 31, 2014, the results of its operations for the year then ended, the changes in its net assets for each of the years in the two-year period then ended, and the financial highlights for each of the years in the five-year period then ended, in conformity with U.S. generally accepted accounting principles.

New York, New York
December 30, 2014
The Fund 43
IMPORTANT TAX INFORMATION (Unaudited)
For federal tax purposes, the fund reports the maximum amount allowable, but not less than $35,009,329 as ordinary income dividends paid during the year ended October 31, 2014 as qualified dividend income in accordance with Section 854(b)(1)(B) of the Internal Revenue Code. Also, the fund reports the maximum amount allowable but not less than 100% of ordinary income dividends paid during the year ended October 31, 2014 as eligible for the corporate dividends received deduction provided under Section 243 of the Internal Revenue Code in accordance with Section 854(b)(1)(A) of the Internal Revenue Code. Shareholders will receive notification in early 2015 of the percentage applicable to the preparation of their 2014 income tax returns. Also, the fund reports the maximum amount allowable but not less than $.0264 per share as a capital gain dividend in accordance with Section 852(b)(3)(C) of the Internal Revenue Code.
44
BOARD MEMBERS INFORMATION (Unaudited)
INDEPENDENT BOARD MEMBERS
|
| Joseph S. DiMartino (71) |
| Chairman of the Board (1999) |
| Principal Occupation During Past 5Years: |
| • Corporate Director and Trustee (1995-present) |
| Other Public Company Board Memberships During Past 5Years: |
| • CBIZ (formerly, Century Business Services, Inc.), a provider of outsourcing functions for small |
| and medium size companies, Director (1997-present) |
| • The Newark Group, a provider of a national market of paper recovery facilities, paperboard |
| mills and paperboard converting plants, Director (2000-2010) |
| • Sunair Services Corporation, a provider of certain outdoor-related services to homes and |
| businesses, Director (2005-2009) |
| No. of Portfolios for which Board Member Serves: 144 |
| ——————— |
| Francine J. Bovich (63) |
| Board Member (2012) |
| Principal Occupation During Past 5Years: |
| • Trustee,The Bradley Trusts, private trust funds (2011-present) |
| • Managing Director, Morgan Stanley Investment Management (1993-2010) |
| Other Public Company Board Membership During Past 5Years: |
| • Annaly Capital Management, Inc., Board Member (May 2014-present) |
| No. of Portfolios for which Board Member Serves: 45 |
| ——————— |
| Kenneth A. Himmel (68) |
| Board Member (1994) |
| Principal Occupation During Past 5Years: |
| • President and CEO, Related Urban Development, a real estate development company (1996-present) |
| • President and CEO, Himmel & Company, a real estate development company (1980-present) |
| • CEO,American Food Management, a restaurant company (1983-present) |
| No. of Portfolios for which Board Member Serves: 31 |
The Fund 45
BOARD MEMBERS INFORMATION (Unaudited) (continued)
INDEPENDENT BOARD MEMBERS (continued)
|
| Stephen J. Lockwood (67) |
| Board Member (1994) |
| Principal Occupation During Past 5Years: |
| • Chairman of the Board, Stephen J. Lockwood and Company LLC, a real estate investment |
| company (2000-present) |
| No. of Portfolios for which Board Member Serves: 31 |
| ——————— |
| Roslyn M. Watson (65) |
| Board Member (1994) |
| Principal Occupation During Past 5Years: |
| • Principal,Watson Ventures, Inc., a real estate investment company (1993-present) |
| No. of Portfolios for which Board Member Serves: 69 |
| ——————— |
| Benaree Pratt Wiley (68) |
| Board Member (1998) |
| Principal Occupation During Past 5Years: |
| • Principal,TheWiley Group, a firm specializing in strategy and business development (2005-present) |
| Other Public Company Board Membership During Past 5Years: |
| • CBIZ (formerly, Century Business Services, Inc.), a provider of outsourcing functions for small |
| and medium size companies, Director (2008-present) |
| No. of Portfolios for which Board Member Serves: 69 |
| ——————— |
| Once elected all Board Members serve for an indefinite term, but achieve Emeritus status upon reaching age 80.The |
| address of the Board Members and Officers is c/o The Dreyfus Corporation, 200 Park Avenue, NewYork, NewYork |
| 10166.Additional information about the Board Members is available in the fund’s Statement of Additional Information |
| which can be obtained from Dreyfus free of charge by calling this toll free number: 1-800-DREYFUS. |
| James M. Fitzgibbons, Emeritus Board Member |
| J.Tomlinson Fort, Emeritus Board Member |
46
OFFICERS OF THE FUND (Unaudited)
BRADLEY J. SKAPYAK, President since January 2010.
Chief Operating Officer and a director of the Manager since June 2009, Chairman of Dreyfus Transfer, Inc., an affiliate of the Manager and the transfer agent of the funds, since May 2011 and Executive Vice President of the Distributor since June 2007. From April 2003 to June 2009, Mr. Skapyak was the head of the Investment Accounting and Support Department of the Manager. He is an officer of 69 investment companies (comprised of 144 portfolios) managed by the Manager. He is 55 years old and has been an employee of the Manager since February 1988.
JOHN PAK, Chief Legal Officer since March 2013.
Deputy General Counsel, Investment Management, of BNY Mellon since August 2014; Chief Legal Officer of the Manager since August 2012; from March 2005 to July 2012, Managing Director of Deutsche Bank, Deputy Global Head of Deutsche Asset Management Legal and Regional Head of Deutsche Asset Management Americas Legal. He is an officer of 70 investment companies (comprised of 169 portfolios) managed by the Manager. He is 46 years old and has been an employee of the Manager since August 2012.
JANETTE E. FARRAGHER, Vice President and Secretary since December 2011.
Assistant General Counsel of BNY Mellon, and an officer of 70 investment companies (comprised of 169 portfolios) managed by the Manager. She is 51 years old and has been an employee of the Manager since February 1984.
KIESHA ASTWOOD, Vice President and Assistant Secretary since January 2010.
Counsel of BNY Mellon, and an officer of 70 investment companies (comprised of 169 portfolios) managed by the Manager. She is 41 years old and has been an employee of the Manager since July 1995.
JAMES BITETTO, Vice President and Assistant Secretary since August 2005.
Managing Counsel of BNY Mellon and Secretary of the Manager, and an officer of 70 investment companies (comprised of 169 portfolios) managed by the Manager. He is 48 years old and has been an employee of the Manager since December 1996.
JONI LACKS CHARATAN, Vice President and Assistant Secretary since August 2005.
Managing Counsel of BNY Mellon, and an officer of 70 investment companies (comprised of 169 portfolios) managed by the Manager. She is 58 years old and has been an employee of the Manager since October 1988.
JOSEPH M. CHIOFFI, Vice President and Assistant Secretary since August 2005.
Managing Counsel of BNY Mellon, and an officer of 70 investment companies (comprised of 169 portfolios) managed by the Manager. He is 52 years old and has been an employee of the Manager since June 2000.
JOHN B. HAMMALIAN, Vice President and Assistant Secretary since August 2005.
Senior Managing Counsel of BNY Mellon, and an officer of 70 investment companies (comprised of 169 portfolios) managed by the Manager. He is 51 years old and has been an employee of the Manager since February 1991.
SARAH S. KELLEHER, Vice President and Assistant Secretary since April 2014.
Senior Counsel of BNY Mellon, and an officer of 70 investment companies (comprised of 169 portfolios) managed by the Manager; from August 2005 to March 2013, Associate General Counsel of Third Avenue Management. She is 38 years old and has been an employee of the Manager since March 2013.
The Fund 47
OFFICERS OF THE FUND (Unaudited)(continued)
JEFF PRUSNOFSKY, Vice President and ROBERT SALVIOLO, Assistant Treasurer Assistant Secretary since August 2005. since July 2007.
Senior Managing Counsel of BNY Mellon, Senior Accounting Manager – Equity Funds of and an officer of 70 investment companies the Manager, and an officer of 70 investment (comprised of 169 portfolios) managed by the companies (comprised of 169 portfolios) Manager. He is 49 years old and has been an managed by the Manager. He is 47 years old employee of the Manager since October 1990. and has been an employee of the Manager since June 1989.
JAMES WINDELS, Treasurer since
November 2001. ROBERT SVAGNA, Assistant Treasurer since December 2002.
Director – Mutual Fund Accounting of the
Manager, and an officer of 70 investment Senior Accounting Manager – Equity Funds of companies (comprised of 169 portfolios) the Manager, and an officer of 70 investment managed by the Manager. He is 56 years old companies (comprised of 169 portfolios) and has been an employee of the Manager managed by the Manager. He is 47 years old since April 1985. and has been an employee of the Manager since November 1990.
RICHARD CASSARO, Assistant Treasurer since January 2008. JOSEPH W. CONNOLLY, Chief Compliance Officer since October 2004.
Senior Accounting Manager – Money Market and Municipal Bond Funds of the Manager, Chief Compliance Officer of the Manager and and an officer of 70 investment companies The Dreyfus Family of Funds (70 investment (comprised of 169 portfolios) managed by companies, comprised of 169 portfolios). He is he Manager. He is 55 years old and has 57 years old and has served in various been an employee of the Manager since capacities with the Manager since 1980, September 1982. including manager of the firm’s Fund Accounting Department from 1997 through
GAVIN C. REILLY, Assistant Treasurer
October 2001. since December 2005.
MATTHEW D. CONNOLLY, Anti-Money
Tax Manager of the Investment Accounting
Laundering Compliance Officer since and Support Department of the Manager, and
April 2012. an officer of 70 investment companies
(comprised of 169 portfolios) managed by the Anti-Money Laundering Compliance Officer Manager. He is 46 years old and has been an of the Distributor since October 2011; from employee of the Manager since April 1991. March 2010 to September 2011, Global Head, KYC Reviews and Director of UBS
ROBERT S. ROBOL, Assistant Treasurer
Investment Bank; until March 2010, AML since December 2002.
Compliance Officer and Senior Vice President Senior Accounting Manager – Fixed Income of Citi Global Wealth Management. He is an Funds of the Manager, and an officer of 70 officer of 65 investment companies (comprised investment companies (comprised of 169 of 164 portfolios) managed by the Manager. portfolios) managed by the Manager. He is 50 He is 42 years old and has been an employee years old and has been an employee of the of the Distributor since October 2011. Manager since October 1988.
48
For More Information
|
| Telephone 1-800-DREYFUS |
| Mail The Dreyfus Family of Funds, 144 Glenn Curtiss Boulevard, Uniondale, NY 11556-0144 |
| E-mail Send your request to info@dreyfus.com |
| Internet Information can be viewed online or downloaded at: http://www.dreyfus.com |
The fund files its complete schedule of portfolio holdings with the Securities and Exchange Commission (“SEC”) for the first and third quarters of each fiscal year on Form N-Q. The fund’s Forms N-Q are available on the SEC’s website at http://www.sec.gov and may be reviewed and copied at the SEC’s Public Reference Room in Washington, DC. Information on the operation of the Public Reference Room may be obtained by calling 1-800-SEC-0330.
A description of the policies and procedures that the fund uses to determine how to vote proxies relating to portfolio securities, and information regarding how the fund voted these proxies for the most recent 12-month period ended June 30 is available at http://www.dreyfus.com and on the SEC’s website at http://www.sec.gov. The description of the policies and procedures is also available without charge, upon request, by calling 1-800-DREYFUS.

|
| Dreyfus |
| U.S. Treasury |
| Reserves |
ANNUAL REPORT October 31, 2014

Save time. Save paper. View your next shareholder report online as soon as it’s available. Log into www.dreyfus.com and sign up for Dreyfus eCommunications. It’s simple and only takes a few minutes.
The views expressed in this report reflect those of the portfolio manager only through the end of the period covered and do not necessarily represent the views of Dreyfus or any other person in the Dreyfus organization. Any such views are subject to change at any time based upon market or other conditions and Dreyfus disclaims any responsibility to update such views.These views may not be relied on as investment advice and, because investment decisions for a Dreyfus fund are based on numerous factors, may not be relied on as an indication of trading intent on behalf of any Dreyfus fund.
|
| Not FDIC-Insured • Not Bank-Guaranteed • May Lose Value |
| | Contents |
| | THE FUND |
| 2 | A Letter from the President |
| 3 | Discussion of Fund Performance |
| 6 | Understanding Your Fund’s Expenses |
| 6 | Comparing Your Fund’s Expenses With Those of Other Funds |
| 7 | Statement of Investments |
| 9 | Statement of Assets and Liabilities |
| 10 | Statement of Operations |
| 11 | Statement of Changes in Net Assets |
| 12 | Financial Highlights |
| 14 | Notes to Financial Statements |
| 20 | Report of Independent Registered Public Accounting Firm |
| 21 | Important Tax Information |
| 22 | Board Members Information |
| 24 | Officers of the Fund |
| | FOR MORE INFORMATION |
| | Back Cover |
Dreyfus
U.S. Treasury Reserves
The Fund
A LETTER FROM THE PRESIDENT
Dear Shareholder:
We are pleased to present this annual report for Dreyfus U.S. Treasury Reserves, covering the 12-month period from November 1, 2013, through October 31, 2014. For information about how the fund performed during the reporting period, as well as general market perspectives, we provide a Discussion of Fund Performance on the pages that follow.
The U.S. economy generally gained ground over the reporting period despite a weather-related economic soft patch during the first quarter of 2014.This development sparked bouts of volatility among longer term bonds, but short-term rates and yields of money market instruments remained steady, anchored near historical lows by an unchanged federal funds rate. In addition, a degree of uncertainty was removed from the money markets over the summer when the Securities Exchange Commission issued new rules governing some funds, but the immediate impact on the market was muted when regulators delayed implementation for two years.
In our view, stronger labor markets, greater manufacturing activity, rebounding housing starts, and rising household wealth portend well for the U.S. economy. While some longer term financial assets are likely to benefit from a more robust recovery, the possibility of higher inflation and rising long-term interest rates suggests that selectivity could become a more important determinant of investment success. As always, we urge you to talk regularly with your financial advisor to assess the potential impact of these and other developments on your investments.
Thank you for your continued confidence and support.

J. Charles Cardona
President
The Dreyfus Corporation
November 17, 2014
2
DISCUSSION OF FUND PERFORMANCE
For the period of November 1, 2013, through October 31, 2014, as provided by Patricia A. Larkin, Portfolio Manager
Fund and Market Performance Overview
For the 12-month period ended October 31, 2014, Dreyfus U.S.Treasury Reserves’ Investor shares produced a yield of 0.00%, and Class R shares yielded 0.00%.Taking into account the effects of compounding, the fund’s Investor shares and Class R shares produced effective yields of 0.00% and 0.00%, respectively.1
Despite stronger economic growth and low inflation over the reporting period, money market yields remained anchored by an unchanged federal funds rate between 0% and 0.25%.
The Fund’s Investment Approach
The fund seeks a high level of current income consistent with stability of principal. As a U.S.Treasury money market fund, we attempt to provide shareholders with an investment vehicle that is made up of direct U.S.Treasury obligations with remaining maturities of 13 months or less, as well as repurchase agreements with securities dealers, which are backed by U.S. Treasuries. To pursue its goal, the fund normally invests only in direct obligations of the U.S.Treasury and in repurchase agreements secured by these obligations.
U.S. Economy Rebounded after Soft Patch
The reporting period began in the midst of a recovering U.S. economy, which in December 2013 prompted the Federal Reserve Board (the “Fed”) to begin tapering its quantitative easing program. This development helped drive yields of 10-year U.S. Treasury securities above 3%. In contrast, short-term interest rates remained anchored near historically low levels by an unchanged federal funds rate. It later was announced that U.S. GDP grew at a 3.5% annualized rate over the fourth quarter of 2013 and the unemployment rate fell to 7.0% by year-end.
The Fund 3
DISCUSSION OF FUND PERFORMANCE (continued)
Long-term rates moderated in January 2014 when investors worried that global economic and political instability could derail the U.S. recovery.Yet, corporate earnings growth remained strong, the unemployment rate declined to 6.6% with the addition of 144,000 jobs, and the Fed continued to reduce quantitative easing.The economy regained strength in February when the manufacturing and service sectors posted gains.The unemployment rate ticked upward to 6.7%, but 222,000 new jobs were created. Labor markets remained robust in March with an unchanged unemployment rate and the addition of 203,000 positions. Nonetheless, U.S. GDP contracted at a 2.1% annualized rate over the first quarter, largely due to the impact of severe winter weather.
Housing markets rebounded when the weather warmed in April, 304,000 new jobs were created, and the unemployment rate fell sharply to 6.3%.The Fed again tapered quantitative easing at its April meeting. In May, nonfarm payroll employment rose by 229,000, and the unemployment rate held steady. Meanwhile, manufacturing activity accelerated and personal incomes posted a healthy gain. 267,000 jobs were created in June, and the unemployment rate dipped to 6.1%. Manufacturing activity, personal incomes, and home sales continued to grow.The U.S. economy rebounded at a robust 4.6% annualized rate during the second quarter.
The unemployment rate ticked higher to 6.2% in July, when 243,000 new jobs were created and new claims for unemployment insurance fell to their lowest level since 2006. The Fed implemented additional reductions in its bond purchasing program in June and July. August saw higher retail sales and new home sales, but new job creation fell to 180,000 even as the unemployment rate fell back to 6.1%.
In September, the economic recovery created 248,000 new jobs, and the unemployment rate fell to 5.9%, its lowest level since June 2008. The manufacturing and service sectors expanded for their 16th and 56th consecutive months, respectively. Falling energy prices helped offset rising housing and food prices, contributing to a mild inflation rate of 0.1%.The Fed again reduced quantitative easing in September.The U.S. Department of Commerce estimated that U.S. GDP grew at an annualized 3.5% rate during the third quarter.
4
In early October, investors reacted negatively to disappointing growth and deflation fears in Europe, which some believe threatened the U.S. economy. Markets bounced back over the second half of the month when U.S. economic data stayed strong, including a 5.8% unemployment rate and 214,000 new jobs. Personal incomes rose and fuel prices fell, giving consumers greater confidence and purchasing power.
Fed Remains Committed to Low Short-Term Rates
Although the Fed ended its quantitative easing program on October 31, monetary policymakers reiterated that short-term interest rates are likely to remain unchanged for “a considerable time.” In July, regulators issued changes to the rules governing prime money market funds, but the new regulations will not become effective until 2016.Therefore, the industry’s operations and asset flows have so far been relatively unaffected.
We have maintained the fund’s market-neutral weighted average maturity, and we have remained focused on U.S.Treasury obligations with good liquidity characteristics. In our view, these remain prudent strategies until we see more solid evidence that short-term interest rates are set to rise.
November 17, 2014
An investment in the fund is not insured or guaranteed by the FDIC or any other government agency. Although the fund seeks to preserve the value of your investment at $1.00 per share, it is possible to lose money by investing in the fund.
|
| 1 Effective yield is based upon dividends declared daily and reinvested monthly. Past performance is no guarantee of |
| future results.Yields fluctuate.Yields provided reflect the absorption of certain fund expenses by The Dreyfus |
| Corporation pursuant to an undertaking in effect that may be extended, terminated, or modified at any time. Had |
| these expenses not been absorbed, the fund’s yields would have been lower, and in some cases, 7-day yields during the |
| reporting period would have been negative absent the expense absorption. |
The Fund 5
UNDERSTANDING YOUR FUND’S EXPENSES (Unaudited)
As a mutual fund investor, you pay ongoing expenses, such as management fees and other expenses. Using the information below, you can estimate how these expenses affect your investment and compare them with the expenses of other funds.You also may pay one-time transaction expenses, including sales charges (loads) and redemption fees, which are not shown in this section and would have resulted in higher total expenses. For more information, see your fund’s prospectus or talk to your financial adviser.
Review your fund’s expenses
The table below shows the expenses you would have paid on a $1,000 investment in Dreyfus U.S.Treasury Reserves from May 1, 2014 to October 31, 2014. It also shows how much a $1,000 investment would be worth at the close of the period, assuming actual returns and expenses.
Expenses and Value of a $1,000 Investment
assuming actual returns for the six months ended October 31, 2014
| | | |
| | Investor Shares | | Class R Shares |
| Expenses paid per $1,000† | $.25 | | $.25 |
| Ending value (after expenses) | $1,000.00 | | $ 1,000.00 |
COMPARING YOUR FUND’S EXPENSES
WITH THOSE OF OTHER FUNDS (Unaudited)
Using the SEC’s method to compare expenses
The Securities and Exchange Commission (SEC) has established guidelines to help investors assess fund expenses. Per these guidelines, the table below shows your fund’s expenses based on a $1,000 investment, assuming a hypothetical 5% annualized return. You can use this information to compare the ongoing expenses (but not transaction expenses or total cost) of investing in the fund with those of other funds. All mutual fund shareholder reports will provide this information to help you make this comparison. Please note that you cannot use this information to estimate your actual ending account balance and expenses paid during the period.
Expenses and Value of a $1,000 Investment
assuming a hypothetical 5% annualized return for the six months ended October 31, 2014
| | | |
| | Investor Shares | | Class R Shares |
| Expenses paid per $1,000† | $ .26 | | $ .26 |
| Ending value (after expenses) | $ 1,024.95 | | $ 1,024.95 |
|
| † Expenses are equal to the fund’s annualized expense ratio of .05% for Investor shares and .05% for Class R shares, |
| multiplied by the average account value over the period, multiplied by 184/365 (to reflect the one-half year period). |
6
STATEMENT OF INVESTMENTS
October 31, 2014
| | | |
| | Annualized | | |
| | Yield on | | |
| | Date of | Principal | |
| U.S. Treasury Bills—11.0% | Purchase (%) | Amount ($) | Value ($) |
| 1/29/15 | | | |
| (cost $49,993,202) | 0.06 | 50,000,000 | 49,993,202 |
| |
| |
| U.S. Treasury Notes—11.1% | | | |
| 1/31/15 | | | |
| (cost $50,274,834) | 0.04 | 50,000,000 | 50,274,834 |
| |
| |
| Repurchase Agreements—77.7% | | | |
| BNP Paribas | | | |
| dated 10/31/14, due 11/3/14 in the | | | |
| amount of $75,000,688 (fully collateralized | | | |
| by $53,449,200 U.S. Treasury Inflation | | | |
| Protected Securities, 2.38%, | | | |
| due 1/15/27, value $76,500,064) | 0.11 | 75,000,000 | 75,000,000 |
| Citigroup Global Markets Holdings Inc. | | | |
| dated 10/31/14, due 11/3/14 in the | | | |
| amount of $90,000,750 (fully | | | |
| collateralized by $43,984,400 | | | |
| U.S. Treasury Bonds, 6.38%, | | | |
| due 8/15/27, value $63,144,400 | | | |
| and $28,718,500 U.S. Treasury Notes, | | | |
| 0.38%, due 10/31/16, | | | |
| value $28,655,606) | 0.10 | 90,000,000 | 90,000,000 |
| Goldman, Sachs & Co. | | | |
| dated 10/31/14, due 11/3/14 in | | | |
| the amount of $48,000,120 (fully | | | |
| collateralized by $39,092,200 | | | |
| U.S. Treasury Inflation Protected | | | |
| Securities, 1.88%, due 7/15/15, | | | |
| value $48,960,026) | 0.03 | 48,000,000 | 48,000,000 |
The Fund 7
STATEMENT OF INVESTMENTS (continued)
| | | | |
| | Annualized | | | |
| | Yield on | | | |
| | Date of | Principal | | |
| Repurchase Agreements (continued) | Purchase (%) | Amount ($) | | Value ($) |
| HSBC USA Inc. | | | | |
| dated 10/31/14, due 11/3/14 in | | | | |
| the amount of $65,000,433 (fully | | | | |
| collateralized by $50,035,000 | | | | |
| U.S. Treasury Bonds, 4.75%, | | | | |
| due 2/15/37, value $66,304,817) | 0.08 | 65,000,000 | | 65,000,000 |
| JPMorgan Chase & Co. | | | | |
| dated 10/31/14, due 11/3/14 in | | | | |
| the amount of $75,000,625 (fully | | | | |
| collateralized by $78,395,000 | | | | |
| U.S. Treasury Inflation Protected | | | | |
| Securities, 0.13%, due 7/15/24, | | | | |
| value $76,501,778) | 0.10 | 75,000,000 | | 75,000,000 |
| Total Repurchase Agreements | | | | |
| (cost $353,000,000) | | | | 353,000,000 |
| |
| Total Investments (cost $453,268,036) | | 99.8 | % | 453,268,036 |
| |
| Cash and Receivables (Net) | | .2 | % | 864,436 |
| |
| Net Assets | | 100.0 | % | 454,132,472 |
| | | |
| Portfolio Summary (Unaudited)† | | |
| | Value (%) | | Value (%) |
| Repurchase Agreements | 77.7 | U.S. Treasury Bills | 11.0 |
| U.S. Treasury Notes | 11.1 | | 99.8 |
|
| † Based on net assets. |
| See notes to financial statements. |
8
STATEMENT OF ASSETS AND LIABILITIES
October 31, 2014
| | |
| | Cost | Value |
| Assets ($): | | |
| Investments in securities—See Statement of | | |
| Investments (including Repurchase Agreements | | |
| of $353,000,000)—Note 1(b) | 453,268,036 | 453,268,036 |
| Cash | | 588,471 |
| Interest receivable | | 283,966 |
| | | 454,140,473 |
| Liabilities ($): | | |
| Due to The Dreyfus Corporation and affiliates—Note 2(b) | | 8,001 |
| Net Assets ($) | | 454,132,472 |
| Composition of Net Assets ($): | | |
| Paid-in capital | | 454,131,360 |
| Accumulated net realized gain (loss) on investments | | 1,112 |
| Net Assets ($) | | 454,132,472 |
| |
| |
| Net Asset Value Per Share | | |
| | Investor Shares | Class R Shares |
| Net Assets ($) | 122,536,721 | 331,595,751 |
| Shares Outstanding | 122,535,997 | 331,595,363 |
| Net Asset Value Per Share ($) | 1.00 | 1.00 |
| |
| See notes to financial statements. | | |
The Fund 9
STATEMENT OF OPERATIONS
Year Ended October 31, 2014
| | |
| Investment Income ($): | | |
| Interest Income | 162,824 | |
| Expenses: | | |
| Management fee—Note 2(a) | 1,626,971 | |
| Distribution Plan fees (Investor Shares)—Note 2(b) | 286,082 | |
| Directors’ fees—Note 2(a,c) | 34,161 | |
| Total Expenses | 1,947,214 | |
| Less—reduction in expenses due to undertaking—Note 2(a) | (1,750,346 | ) |
| Less—Directors’ fees reimbursed by the Manager—Note 2(a) | (34,161 | ) |
| Net Expenses | 162,707 | |
| Investment Income—Net | 117 | |
| Net Realized Gain (Loss) on Investments—Note 1(b) ($) | 1,112 | |
| Net Increase in Net Assets Resulting from Operations | 1,229 | |
| |
| See notes to financial statements. | | |
10
STATEMENT OF CHANGES IN NET ASSETS
| | | | |
| | Year Ended October 31, | |
| | 2014 | | 2013 | |
| Operations ($): | | | | |
| Investment income—net | 117 | | 126 | |
| Net realized gain (loss) on investments | 1,112 | | — | |
| Net Increase (Decrease) in Net Assets | | | | |
| Resulting from Operations | 1,229 | | 126 | |
| Dividends to Shareholders from ($): | | | | |
| Investment income—net: | | | | |
| Investor Shares | (51 | ) | (48 | ) |
| Class R Shares | (66 | ) | (78 | ) |
| Total Dividends | (117 | ) | (126 | ) |
| Capital Stock Transactions ($1.00 per share): | | | | |
| Net proceeds from shares sold: | | | | |
| Investor Shares | 88,084,148 | | 135,319,858 | |
| Class R Shares | 524,399,309 | | 362,758,319 | |
| Dividends reinvested: | | | | |
| Investor Shares | 51 | | 48 | |
| Cost of shares redeemed: | | | | |
| Investor Shares | (121,394,764 | ) | (101,501,793 | ) |
| Class R Shares | (379,459,480 | ) | (390,493,559 | ) |
| Increase (Decrease) in Net Assets | | | | |
| from Capital Stock Transactions | 111,629,264 | | 6,082,873 | |
| Total Increase (Decrease) in Net Assets | 111,630,376 | | 6,082,873 | |
| Net Assets ($): | | | | |
| Beginning of Period | 342,502,096 | | 336,419,223 | |
| End of Period | 454,132,472 | | 342,502,096 | |
| |
| See notes to financial statements. | | | | |
The Fund 11
FINANCIAL HIGHLIGHTS
The following tables describe the performance for each share class for the fiscal periods indicated. All information reflects financial results for a single fund share. Total return shows how much your investment in the fund would have increased (or decreased) during each period, assuming you had reinvested all dividends and distributions.These figures have been derived from the fund’s financial statements.
| | | | | | | | | | |
| | | | Year Ended October 31, | | | |
| Investor Shares | 2014 | | 2013 | | 2012 | | 2011 | | 2010 | |
| Per Share Data ($): | | | | | | | | | | |
| Net asset value, beginning of period | 1.00 | | 1.00 | | 1.00 | | 1.00 | | 1.00 | |
| Investment Operations: | | | | | | | | | | |
| Investment income—neta | .000 | | .000 | | .000 | | .000 | | .000 | |
| Distributions: | | | | | | | | | | |
| Dividends from | | | | | | | | | | |
| investment income—neta | (.000 | ) | (.000 | ) | (.000 | ) | (.000 | ) | (.000 | ) |
| Net asset value, end of period | 1.00 | | 1.00 | | 1.00 | | 1.00 | | 1.00 | |
| Total Return (%)b | .00 | | .00 | | .00 | | .00 | | .00 | |
| Ratios/Supplemental Data (%): | | | | | | | | | | |
| Ratio of total expenses | | | | | | | | | | |
| to average net assets | .71 | | .71 | | .71 | | .71 | | .71 | |
| Ratio of net expenses | | | | | | | | | | |
| to average net assets | .05 | | .09 | | .10 | | .12 | | .21 | |
| Ratio of net investment income | | | | | | | | | | |
| to average net assetsb | .00 | | .00 | | .00 | | .00 | | .00 | |
| Net Assets, end of period ($ x 1,000) | 122,537 | | 155,847 | | 122,029 | | 125,984 | | 116,980 | |
| |
| a | Amount represents less than $.001 per share. |
| b | Amount represents less than .01%. |
See notes to financial statements.
12
| | | | | | | | | | |
| | | | Year Ended October 31, | | | |
| Class R Shares | 2014 | | 2013 | | 2012 | | 2011 | | 2010 | |
| Per Share Data ($): | | | | | | | | | | |
| Net asset value, beginning of period | 1.00 | | 1.00 | | 1.00 | | 1.00 | | 1.00 | |
| Investment Operations: | | | | | | | | | | |
| Investment income—neta | .000 | | .000 | | .000 | | .000 | | .000 | |
| Distributions: | | | | | | | | | | |
| Dividends from | | | | | | | | | | |
| investment income—neta | (.000 | ) | (.000 | ) | (.000 | ) | (.000 | ) | (.000 | ) |
| Net asset value, end of period | 1.00 | | 1.00 | | 1.00 | | 1.00 | | 1.00 | |
| Total Return (%)b | .00 | | .00 | | .00 | | .00 | | .00 | |
| Ratios/Supplemental Data (%): | | | | | | | | | | |
| Ratio of total expenses | | | | | | | | | | |
| to average net assets | .51 | | .51 | | .51 | | .50 | | .51 | |
| Ratio of net expenses | | | | | | | | | | |
| to average net assets | .05 | | .09 | | .11 | | .12 | | .21 | |
| Ratio of net investment income | | | | | | | | | | |
| to average net assetsb | .00 | | .00 | | .00 | | .00 | | .00 | |
| Net Assets, end of period ($ x 1,000) | 331,596 | | 186,655 | | 214,391 | | 153,112 | | 196,629 | |
| |
| a | Amount represents less than $.001 per share. |
| b | Amount represents less than .01%. |
See notes to financial statements.
The Fund 13
NOTES TO FINANCIAL STATEMENTS
NOTE 1—Significant Accounting Policies:
Dreyfus U.S. Treasury Reserves (the “fund”) is a separate diversified series of The Dreyfus/Laurel Funds, Inc. (the “Company”), which is registered under the Investment Company Act of 1940, as amended (the “Act”), as an open-end management investment company and operates as a series company currently offering eleven series, including the fund. The fund’s investment objective is to seek a high level of current income consistent with stability of principal. The Dreyfus Corporation (the “Manager” or “Dreyfus”), a wholly-owned subsidiary of The Bank of New York Mellon Corporation (“BNY Mellon”), serves as the fund’s investment adviser.
MBSC Securities Corporation (the “Distributor”), a wholly-owned subsidiary of the Manager, is the distributor of the fund’s shares, which are sold without a sales charge.The fund is authorized to issue 1 billion shares of $.001 par value Capital Stock in each of the following classes of shares: Investor and Class R. Investor shares are sold primarily to retail investors through financial intermediaries and bear a Distribution Plan fee. Class R shares are sold primarily to bank trust departments and other financial service providers (including The Bank of NewYork Mellon, a subsidiary of BNY Mellon and an affiliate of Dreyfus, and its affiliates), acting on behalf of customers having a qualified trust or an investment account or relationship at such institution, and bear no Distribution Plan fee. Other differences between the classes include the services offered to and the expenses borne by each class, and certain voting rights. Income, expenses (other than expenses attributable to a specific class), and realized and unrealized gains or losses on investments are allocated to each class of shares based on its relative net assets.
It is the fund’s policy to maintain a continuous net asset value per share of $1.00; the fund has adopted certain investment, portfolio valuation and dividend and distribution policies to enable it to do so. There is no assurance, however, that the fund will be able to maintain a stable net asset value per share of $1.00.
14
The Company accounts separately for the assets, liabilities and operations of each series. Expenses directly attributable to each series are charged to that series’ operations; expenses which are applicable to all series are allocated among them on a pro rata basis.
The Financial Accounting Standards Board (“FASB”) Accounting Standards Codification (“ASC”) is the exclusive reference of authoritative U.S. generally accepted accounting principles (“GAAP”) recognized by the FASB to be applied by nongovernmental entities. Rules and interpretive releases of the Securities and Exchange Commission (“SEC”) under authority of federal laws are also sources of authoritative GAAP for SEC registrants. The fund’s financial statements are prepared in accordance with GAAP, which may require the use of management estimates and assumptions. Actual results could differ from those estimates.
(a) Portfolio valuation: Investments in securities are valued at amortized cost in accordance with Rule 2a-7 under the Act. If amortized cost is determined not to approximate market value, the fair value of the portfolio securities will be determined by procedures established by and under the general supervision of the Company’s Board of Directors (the “Board”).
The fair value of a financial instrument is the amount that would be received to sell an asset or paid to transfer a liability in an orderly transaction between market participants at the measurement date (i.e., the exit price). GAAP establishes a fair value hierarchy that prioritizes the inputs of valuation techniques used to measure fair value.This hierarchy gives the highest priority to unadjusted quoted prices in active markets for identical assets or liabilities (Level 1 measurements) and the lowest priority to unobservable inputs (Level 3 measurements).
Additionally, GAAP provides guidance on determining whether the volume and activity in a market has decreased significantly and whether such a decrease in activity results in transactions that are not
The Fund 15
NOTES TO FINANCIAL STATEMENTS (continued)
orderly. GAAP requires enhanced disclosures around valuation inputs and techniques used during annual and interim periods.
Various inputs are used in determining the value of the fund’s investments relating to fair value measurements.These inputs are summarized in the three broad levels listed below:
Level 1—unadjusted quoted prices in active markets for identical investments.
Level 2—other significant observable inputs (including quoted prices for similar investments, interest rates, prepayment speeds, credit risk, etc.).
Level 3—significant unobservable inputs (including the fund’s own assumptions in determining the fair value of investments).
The inputs or methodology used for valuing securities are not necessarily an indication of the risk associated with investing in those securities. For example, money market securities are valued using amortized cost, in accordance with rules under the Act. Generally, amortized cost approximates the current fair value of a security, but since the value is not obtained from a quoted price in an active market, such securities are reflected within Level 2 of the fair value hierarchy.
The following is a summary of the inputs used as of October 31, 2014 in valuing the fund’s investments:
| |
| | Short-Term |
| Valuation Inputs | Investments ($)† |
| Level 1—Unadjusted Quoted Prices | — |
| Level 2—Other Significant Observable Inputs | 453,268,036 |
| Level 3—Significant Unobservable Inputs | — |
| Total | 453,268,036 |
| † See Statement of Investments for additional detailed categorizations. | |
At October 31, 2014, there were no transfers between Level 1 and Level 2 of the fair value hierarchy.
(b) Securities transactions and investment income: Securities transactions are recorded on a trade date basis. Interest income, adjusted for accretion of discount and amortization of premium on investments, is
16
earned from settlement date and is recognized on the accrual basis. Realized gains and losses from securities transactions are recorded on the identified cost basis. Cost of investments represents amortized cost.
The fund may enter into repurchase agreements with financial institutions, deemed to be creditworthy by the Manager, subject to the seller’s agreement to repurchase and the fund’s agreement to resell such securities at a mutually agreed upon price. Pursuant to the terms of the repurchase agreement, such securities must have an aggregate market value greater than or equal to the terms of the repurchase price plus accrued interest at all times. If the value of the underlying securities falls below the value of the repurchase price plus accrued interest, the fund will require the seller to deposit additional collateral by the next business day. If the request for additional collateral is not met, or the seller defaults on its repurchase obligation, the fund maintains its right to sell the underlying securities at market value and may claim any resulting loss against the seller.
(c) Dividends to shareholders: It is the policy of the fund to declare dividends daily from investment income-net. Such dividends are paid monthly. Dividends from net realized capital gains, if any, are normally declared and paid annually, but the fund may make distributions on a more frequent basis to comply with the distribution requirements of the Internal Revenue Code of 1986, as amended (the “Code”).To the extent that net realized capital gains can be offset by capital loss carryovers, it is the policy of the fund not to distribute such gains.
(d) Federal income taxes: It is the policy of the fund to continue to qualify as a regulated investment company, if such qualification is in the best interest of its shareholders, by complying with the applicable provisions of the Code, and to make distributions of taxable income sufficient to relieve it from substantially all federal income and excise taxes.
As of and during the period ended October 31, 2014, the fund did not have any liabilities for any uncertain tax positions.The fund recognizes interest and penalties, if any, related to uncertain tax positions as income
The Fund 17
NOTES TO FINANCIAL STATEMENTS (continued)
tax expense in the Statement of Operations. During the period ended October 31, 2014, the fund did not incur any interest or penalties.
Each tax year in the four-year period ended October 31, 2014 remains subject to examination by the Internal Revenue Service and state taxing authorities.
At October 31, 2014, the components of accumulated earnings on a tax basis were substantially the same as for financial reporting purposes.
The tax character of distributions paid to shareholders during the fiscal periods ended October 31, 2014 and October 31, 2013 were all ordinary income.
At October 31, 2014, the cost of investments for federal income tax purposes was substantially the same as the cost for financial reporting purposes (see the Statement of Investments).
NOTE 2—Investment Management Fee and Other Transactions with Affiliates:
(a) Pursuant to an investment management agreement with the Manager, the Manager provides or arranges for one or more third parties and/or affiliates to provide investment advisory, administrative, custody, fund accounting and transfer agency services to the fund.The Manager also directs the investments of the fund in accordance with its investment objective, policies and limitations. For these services, the fund is contractually obligated to pay the Manager a fee, calculated daily and paid monthly, at the annual rate of .50% of the value of the fund’s average daily net assets. Out of its fee, the Manager pays all of the expenses of the fund except brokerage fees, taxes, Distribution Plan fees, fees and expenses of non-interested Directors (including counsel fees) and extraordinary expenses. In addition, the Manager is required to reduce its fee in an amount equal to the fund’s allocable portion of fees and expenses of the non-interested Directors (including counsel fees). During the period ended October 31, 2014, fees reimbursed by the Manager amounted to $34,161.
The Manager has undertaken to waive receipt of the management fee and/or reimburse operating expenses in order to facilitate a daily yield
18
at or above a certain level which may change from time to time.This undertaking is voluntary and not contractual, and may be terminated at any time. The reduction in expenses, pursuant to the undertaking, amounted to $1,750,346 during the period ended October 31, 2014.
(b) Under the Distribution Plan adopted pursuant to Rule 12b-1 under the Act, Investor shares may pay annually up to .25% (currently limited by the Board to .20%) of the value of the average daily net assets attributable to its Investor shares to compensate the Distributor for shareholder servicing activities and expenses primarily intended to result in the sale of Investor shares. During the period ended October 31, 2014, Investor shares were charged $286,082 pursuant to the Distribution Plan.
Under its terms, the Distribution Plan shall remain in effect from year to year, provided such continuance is approved annually by a vote of a majority of those Directors who are not “interested persons” of the Company and who have no direct or indirect financial interest in the operation of or in any agreement related to the Distribution Plan.
The components of “Due to The Dreyfus Corporation and affiliates” in the Statement of Assets and Liabilities consist of: management fees $188,100 and Distribution Plan fees $20,901, which are offset against an expense reimbursement currently in effect in the amount of $201,000.
(c) Each Board member also serves as a Board member of other funds within the Dreyfus complex. Annual retainer fees and attendance fees are allocated to each fund based on net assets.
NOTE 3—Regulatory Developments:
On July 23, 2014, the SEC adopted amendments to the rules that govern money market mutual funds. In part, the amendments will require structural changes to most types of money market funds to one extent or another; however, the SEC provided for an extended two-year transition period to comply with such structural requirements. At this time, management is evaluating the reforms adopted and the manner for implementing these reforms over time and its impact on the financial statements.
The Fund 19
REPORT OF INDEPENDENT REGISTERED
PUBLIC ACCOUNTING FIRM
The Board of Directors and Shareholders of
The Dreyfus/Laurel Funds, Inc.
We have audited the accompanying statement of assets and liabilities of Dreyfus U.S. Treasury Reserves (the “Fund”), a series of The Dreyfus/Laurel Funds, Inc., including the statement of investments, as of October 31, 2014, the related statement of operations for the year then ended, the statements of changes in net assets for each of the years in the two-year period then ended, and the financial highlights for each of the years in the five-year period then ended. These financial statements and financial highlights are the responsibility of the Fund’s management. Our responsibility is to express an opinion on these financial statements and financial highlights based on our audits.
We conducted our audits in accordance with the standards of the Public Company Accounting Oversight Board (United States).Those standards require that we plan and perform the audit to obtain reasonable assurance about whether the financial statements and financial highlights are free of material misstatement. An audit includes examining, on a test basis, evidence supporting the amounts and disclosures in the financial statements. Our procedures included confirmation of securities owned as of October 31, 2014, by correspondence with the custodian and brokers or by other appropriate auditing procedures.An audit also includes assessing the accounting principles used and significant estimates made by management, as well as evaluating the overall financial statement presentation. We believe that our audits provide a reasonable basis for our opinion.
In our opinion, the financial statements and financial highlights referred to above present fairly, in all material respects, the financial position of Dreyfus U.S.Treasury Reserves as of October 31, 2014, the results of its operations for the year then ended, the changes in its net assets for each of the years in the two-year period then ended, and the financial highlights for each of the years in the five-year period then ended, in conformity with U.S. generally accepted accounting principles.

New York, New York
December 30, 2014
20
IMPORTANT TAX INFORMATION (Unaudited)
For federal tax purposes, the fund designates the maximum amount allowable but not less than 100% as interest-related dividends in accordance with Sections 871(k)(1) and 881(e) of the Internal Revenue Code.
The Fund 21
BOARD MEMBERS INFORMATION (Unaudited)
INDEPENDENT BOARD MEMBERS
|
| Joseph S. DiMartino (71) |
| Chairman of the Board (1999) |
| Principal Occupation During Past 5Years: |
| • Corporate Director and Trustee (1995-present) |
| Other Public Company Board Memberships During Past 5Years: |
| • CBIZ (formerly, Century Business Services, Inc.), a provider of outsourcing functions for small |
| and medium size companies, Director (1997-present) |
| • The Newark Group, a provider of a national market of paper recovery facilities, paperboard |
| mills and paperboard converting plants, Director (2000-2010) |
| • Sunair Services Corporation, a provider of certain outdoor-related services to homes and |
| businesses, Director (2005-2009) |
| No. of Portfolios for which Board Member Serves: 144 |
| ——————— |
| Francine J. Bovich (63) |
| Board Member (2012) |
| Principal Occupation During Past 5Years: |
| • Trustee,The Bradley Trusts, private trust funds (2011-present) |
| • Managing Director, Morgan Stanley Investment Management (1993-2010) |
| Other Public Company Board Membership During Past 5Years: |
| • Annaly Capital Management, Inc., Board Member (May 2014-present) |
| No. of Portfolios for which Board Member Serves: 45 |
| ——————— |
| Kenneth A. Himmel (68) |
| Board Member (1994) |
| Principal Occupation During Past 5Years: |
| • President and CEO, Related Urban Development, a real estate development company (1996-present) |
| • President and CEO, Himmel & Company, a real estate development company (1980-present) |
| • CEO,American Food Management, a restaurant company (1983-present) |
| No. of Portfolios for which Board Member Serves: 31 |
22
|
| Stephen J. Lockwood (67) |
| Board Member (1994) |
| Principal Occupation During Past 5Years: |
| • Chairman of the Board, Stephen J. Lockwood and Company LLC, a real estate investment |
| company (2000-present) |
| No. of Portfolios for which Board Member Serves: 31 |
| ——————— |
| Roslyn M. Watson (65) |
| Board Member (1994) |
| Principal Occupation During Past 5Years: |
| • Principal,Watson Ventures, Inc., a real estate investment company (1993-present) |
| No. of Portfolios for which Board Member Serves: 69 |
| ——————— |
| Benaree Pratt Wiley (68) |
| Board Member (1998) |
| Principal Occupation During Past 5Years: |
| • Principal,TheWiley Group, a firm specializing in strategy and business development (2005-present) |
| Other Public Company Board Membership During Past 5Years: |
| • CBIZ (formerly, Century Business Services, Inc.), a provider of outsourcing functions for small |
| and medium size companies, Director (2008-present) |
| No. of Portfolios for which Board Member Serves: 69 |
| ——————— |
| Once elected all Board Members serve for an indefinite term, but achieve Emeritus status upon reaching age 80.The |
| address of the Board Members and Officers is c/o The Dreyfus Corporation, 200 Park Avenue, NewYork, NewYork |
| 10166.Additional information about the Board Members is available in the fund’s Statement of Additional Information |
| which can be obtained from Dreyfus free of charge by calling this toll free number: 1-800-DREYFUS. |
| James M. Fitzgibbons, Emeritus Board Member |
| J.Tomlinson Fort, Emeritus Board Member |
The Fund 23
OFFICERS OF THE FUND (Unaudited)
BRADLEY J. SKAPYAK, President since January 2010.
Chief Operating Officer and a director of the Manager since June 2009, Chairman of Dreyfus Transfer, Inc., an affiliate of the Manager and the transfer agent of the funds, since May 2011 and Executive Vice President of the Distributor since June 2007. From April 2003 to June 2009, Mr. Skapyak was the head of the Investment Accounting and Support Department of the Manager. He is an officer of 69 investment companies (comprised of 144 portfolios) managed by the Manager. He is 55 years old and has been an employee of the Manager since February 1988.
JOHN PAK, Chief Legal Officer since March 2013.
Deputy General Counsel, Investment Management, of BNY Mellon since August 2014; Chief Legal Officer of the Manager since August 2012; from March 2005 to July 2012, Managing Director of Deutsche Bank, Deputy Global Head of Deutsche Asset Management Legal and Regional Head of Deutsche Asset Management Americas Legal. He is an officer of 70 investment companies (comprised of 169 portfolios) managed by the Manager. He is 46 years old and has been an employee of the Manager since August 2012.
JANETTE E. FARRAGHER, Vice President and Secretary since December 2011.
Assistant General Counsel of BNY Mellon, and an officer of 70 investment companies (comprised of 169 portfolios) managed by the Manager. She is 51 years old and has been an employee of the Manager since February 1984.
KIESHA ASTWOOD, Vice President and Assistant Secretary since January 2010.
Counsel of BNY Mellon, and an officer of 70 investment companies (comprised of 169 portfolios) managed by the Manager. She is 41 years old and has been an employee of the Manager since July 1995.
JAMES BITETTO, Vice President and Assistant Secretary since August 2005.
Managing Counsel of BNY Mellon and Secretary of the Manager, and an officer of 70 investment companies (comprised of 169 portfolios) managed by the Manager. He is 48 years old and has been an employee of the Manager since December 1996.
JONI LACKS CHARATAN, Vice President and Assistant Secretary since August 2005.
Managing Counsel of BNY Mellon, and an officer of 70 investment companies (comprised of 169 portfolios) managed by the Manager. She is 58 years old and has been an employee of the Manager since October 1988.
JOSEPH M. CHIOFFI, Vice President and Assistant Secretary since August 2005.
Managing Counsel of BNY Mellon, and an officer of 70 investment companies (comprised of 169 portfolios) managed by the Manager. He is 52 years old and has been an employee of the Manager since June 2000.
JOHN B. HAMMALIAN, Vice President and Assistant Secretary since August 2005.
Senior Managing Counsel of BNY Mellon, and an officer of 70 investment companies (comprised of 169 portfolios) managed by the Manager. He is 51 years old and has been an employee of the Manager since February 1991.
SARAH S. KELLEHER, Vice President and Assistant Secretary since April 2014.
Senior Counsel of BNY Mellon, and an officer of 70 investment companies (comprised of 169 portfolios) managed by the Manager; from August 2005 to March 2013, Associate General Counsel of Third Avenue Management. She is 38 years old and has been an employee of the Manager since March 2013.
24
JEFF PRUSNOFSKY, Vice President and Assistant Secretary since August 2005.
Senior Managing Counsel of BNY Mellon, and an officer of 70 investment companies (comprised of 169 portfolios) managed by the Manager. He is 49 years old and has been an employee of the Manager since October 1990.
JAMES WINDELS, Treasurer since November 2001.
Director – Mutual Fund Accounting of the Manager, and an officer of 70 investment companies (comprised of 169 portfolios) managed by the Manager. He is 56 years old and has been an employee of the Manager since April 1985.
RICHARD CASSARO, Assistant Treasurer since January 2008.
Senior Accounting Manager – Money Market and Municipal Bond Funds of the Manager, and an officer of 70 investment companies (comprised of 169 portfolios) managed by the Manager. He is 55 years old and has been an employee of the Manager since September 1982.
GAVIN C. REILLY, Assistant Treasurer since December 2005.
Tax Manager of the Investment Accounting and Support Department of the Manager, and an officer of 70 investment companies (comprised of 169 portfolios) managed by the Manager. He is 46 years old and has been an employee of the Manager since April 1991.
ROBERT S. ROBOL, Assistant Treasurer since December 2002.
Senior Accounting Manager – Fixed Income Funds of the Manager, and an officer of 70 investment companies (comprised of 169 portfolios) managed by the Manager. He is 50 years old and has been an employee of the Manager since October 1988.
ROBERT SALVIOLO, Assistant Treasurer since July 2007.
Senior Accounting Manager – Equity Funds of the Manager, and an officer of 70 investment companies (comprised of 169 portfolios) managed by the Manager. He is 47 years old and has been an employee of the Manager since June 1989.
ROBERT SVAGNA, Assistant Treasurer since December 2002.
Senior Accounting Manager – Equity Funds of the Manager, and an officer of 70 investment companies (comprised of 169 portfolios) managed by the Manager. He is 47 years old and has been an employee of the Manager since November 1990.
JOSEPH W. CONNOLLY, Chief Compliance Officer since October 2004.
Chief Compliance Officer of the Manager and The Dreyfus Family of Funds (70 investment companies, comprised of 169 portfolios). He is 57 years old and has served in various capacities with the Manager since 1980, including manager of the firm’s Fund Accounting Department from 1997 through October 2001.
MATTHEW D. CONNOLLY, Anti-Money Laundering Compliance Officer since April 2012.
Anti-Money Laundering Compliance Officer of the Distributor since October 2011; from March 2010 to September 2011, Global Head, KYC Reviews and Director of UBS Investment Bank; until March 2010, AML Compliance Officer and Senior Vice President of Citi Global Wealth Management. He is an officer of 65 investment companies (comprised of 164 portfolios) managed by the Manager. He is 42 years old and has been an employee of the Distributor since October 2011.
The Fund 25
For More Information
Telephone 1-800-DREYFUS
Mail The Dreyfus Family of Funds, 144 Glenn Curtiss Boulevard, Uniondale, NY 11556-0144
E-mail Send your request to info@dreyfus.com
Internet Information can be viewed online or downloaded at: http://www.dreyfus.com
The fund will disclose daily, on www.dreyfus.com, the fund’s complete schedule of holdings as of the end of the previous business day. The schedule of holdings will remain on the website until the fund files its Form N-Q or Form N-CSR for the period that includes the date of the posted holdings.
The fund files its complete schedule of portfolio holdings with the Securities and Exchange Commission (“SEC”) for the first and third quarters of each fiscal year on Form N-Q. The fund’s Forms N-Q are available on the SEC’s website at http://www.sec.gov and may be reviewed and copied at the SEC’s Public Reference Room in Washington, DC. Information on the operation of the Public Reference Room may be obtained by calling 1-800-SEC-0330.
Information regarding how the fund voted proxies relating to portfolio securities for the most recent 12-month period ended June 30 is available on the SEC’s website at http://www.sec.gov and without charge, upon request, by calling 1-800-DREYFUS.

|
| Dreyfus |
| Opportunistic Fixed |
| Income Fund |
ANNUAL REPORT October 31, 2014

Save time. Save paper. View your next shareholder report online as soon as it’s available. Log into www.dreyfus.com and sign up for Dreyfus eCommunications. It’s simple and only takes a few minutes.
The views expressed in this report reflect those of the portfolio manager only through the end of the period covered and do not necessarily represent the views of Dreyfus or any other person in the Dreyfus organization. Any such views are subject to change at any time based upon market or other conditions and Dreyfus disclaims any responsibility to update such views.These views may not be relied on as investment advice and, because investment decisions for a Dreyfus fund are based on numerous factors, may not be relied on as an indication of trading intent on behalf of any Dreyfus fund.
|
| Not FDIC-Insured • Not Bank-Guaranteed • May Lose Value |
| | Contents |
| | THE FUND |
| 2 | A Letter from the President |
| 3 | Discussion of Fund Performance |
| 6 | Fund Performance |
| 8 | Understanding Your Fund’s Expenses |
| 8 | Comparing Your Fund’s Expenses With Those of Other Funds |
| 9 | Statement of Investments |
| 25 | Statement of Financial Futures |
| 26 | Statement of Options Written |
| 27 | Statement of Assets and Liabilities |
| 28 | Statement of Operations |
| 29 | Statement of Changes in Net Assets |
| 31 | Financial Highlights |
| 35 | Notes to Financial Statements |
| 61 | Report of Independent Registered Public Accounting Firm |
| 62 | Important Tax Information |
| 63 | Board Members Information |
| 65 | Officers of the Fund |
| | FOR MORE INFORMATION |
| | Back Cover |
Dreyfus
Opportunistic Fixed
Income Fund
The Fund
A LETTER FROM THE PRESIDENT
Dear Shareholder:
We are pleased to present this annual report for Dreyfus Opportunistic Fixed Income Fund, covering the 12-month period from November 1, 2013, through October 31, 2014. For information about how the fund performed during the reporting period, as well as general market perspectives, we provide a Discussion of Fund Performance on the pages that follow.
Municipal bonds generally gained ground for the reporting period overall despite bouts of heightened volatility during the final months of 2013, when a more moderately accommodative monetary policy and accelerating economic growth caused long-term interest rates to rise. Long-term interest rates moderated early in 2014 due to geopolitical and economic concerns, driving prices of long-term securities higher, and favorable supply-and-demand dynamics helped keep yields low when economic growth resumed. Meanwhile, improving economic fundamentals enabled many states and municipalities to shore up their fiscal conditions.
While we remain cautiously optimistic regarding the municipal bond market’s prospects, we believe that selectivity is likely to become more important to investment success. Long-term rates could rise if, as we anticipate, the economy continues to accelerate and inflationary pressures rise. On the other hand, intensifying geopolitical turmoil and other factors could dampen the potentially adverse effects of a stronger domestic economic recovery, and rising investor demand for tax-advantaged investments may continue to support municipal bond prices.As always, we encourage you to discuss our observations with your financial adviser to assess their potential impact on your investments.
Thank you for your continued confidence and support.

J. Charles Cardona
President
The Dreyfus Corporation
November 17, 2014
2
DISCUSSION OF FUND PERFORMANCE
For the period of November 1, 2013, through October 31, 2014, as provided by David Leduc, CFA, and David Horsfall, CFA, Portfolio Managers
Fund and Market Performance Overview
For the 12-month period ended October 31, 2014, Dreyfus Opportunistic Fixed Income Fund’s Class A shares produced a total return of 3.77%, Class C shares returned 3.02%, Class I shares returned 4.06%, and Class Y shares returned 4.13%.1 In comparison, the Citibank 30-day Treasury Bill Index (the “Index”) achieved a total return of 0.03% for the same period.2
A recovering U.S. economy and rising long-term interest rates caused bond prices to fall during the final months of 2013, but renewed economic uncertainties and supply-and-demand dynamics sent long-term interest rates lower and bond prices higher over the first 10 months of 2014.
The Fund’s Investment Approach
The fund seeks to maximize total return through capital appreciation and income. To pursue its goal, we typically allocate the fund’s assets across four sectors of the fixed-income market: U.S. high yield bonds rated below investment grade; U.S. government, investment grade corporate and mortgage-backed securities; foreign debt securities of developed markets; and foreign debt securities of emerging markets.
Our analysis of top-down quantitative and macroeconomic factors guides the allocation of assets among market sectors, industries, and positioning along the yield curve. Using fundamental analysis, we seek to identify individual securities with high current income, as well as appreciation potential, based on relative value, credit upgrade probability, and extensive research into the credit history and current financial strength of the securities’ issuers.
Economic and Technical Factors Drove Market Performance
By the end of 2013, evidence of an accelerating economic recovery and the Federal Reserve Board (the “Fed”)’s decision to gradually reduce its quantitative easing program drove yields of 10-year U.S. Treasury securities above 3%. However, renewed global economic concerns soon caused yields to moderate, and the Fed made clear that short-term interest rates were likely to remain near historically low
The Fund 3
DISCUSSION OF FUND PERFORMANCE (continued)
levels. Meanwhile, harsh winter weather dampened domestic economic activity: U.S. GDP contracted at a 2.1% annualized rate over the first quarter of 2014.
In contrast, economic growth rebounded at a 4.6% annualized rate during the second quarter and an estimated 3.5% annualized rate over the third quarter. Labor markets continued to strengthen, and the Fed continued to taper its bond purchases until the program ended on October 31. Nonetheless, robust investor demand for a relatively limited supply of securities kept yields low. Rates fell more sharply at the longer end of the market’s maturity spectrum, causing yield differences between short- and long-term bonds to narrow.
Higher yielding bond market sectors, such as lower rated corporate-backed bonds, commercial mortgage-backed securities, and asset-backed securities, generally outperformed U.S. government securities when credit conditions improved and income-oriented investors resumed their reach for more competitive yields.
Higher Yielding Sectors Buoyed Fund Results
Long exposure to commercial mortgage-backed securities and asset-backed securities helped boost relative performance over the reporting period. We focused mainly on securities with maturities in the three- to five-year range.The fund also held profitable positions in sovereign bonds from Portugal, Italy, and Spain, which rebounded from previously depressed levels. In addition, the fund benefited over the first half of the reporting period from a focus on corporate bonds, including high yield and, to a lesser extent, investment-grade securities.
An emphasis on the U.S. dollar, and commensurately light exposure to the Australian dollar, New Zealand dollar, and Japanese yen, helped support relative results over the reporting period’s second half. Finally, some of the fund’s opportunistic, issuer-specific security selections fared particularly well, including bonds issued by a Venezuelan oil company, the Commonwealth of Puerto Rico, and a U.K.-based bank.
Our interest rate strategies produced more mildly positive results.Although the fund generally proved well positioned for narrowing yield differences along the market’s maturity range, an overall short position in U.S. interest rates offset those gains.
At times during the reporting period, we employed currency forward contracts to hedge currency exposures, interest-rate futures to establish the fund’s duration positioning, options to protect against unexpected market turbulence, and credit default swaps to manage credit risks.
4
Strategies for an Improving Economic Environment
The U.S. economic recovery is back on track, but the end of quantitative easing has injected a degree of uncertainty into the bond market. Overseas economies are struggling, and major central banks are prepared to continue to reduce short-term interest rates.These developments suggest to us that a “flight to quality” may continue to drive investors to fixed-income investments in the United States.
In this environment, we believe that investors will continue to favor higher yielding market sectors. Therefore, we have maintained ample exposure to commercial mortgages, asset-backed securities and corporate bonds. We also have maintained positions in bonds from Australia, New Zealand, and the emerging markets. In our judgment, these are prudent strategies for today’s changing market environment.
November 17, 2014
Bond funds are subject generally to interest rate, credit, liquidity, and market risks, to varying degrees, all of which are more fully described in the fund’s prospectus. Generally, all other factors being equal, bond prices are inversely related to interest-rate changes, and rate increases can cause price declines.
High yield bonds are subject to increased credit risk and are considered speculative in terms of the issuer’s perceived ability to continue making interest payments on a timely basis and to repay principal upon maturity.
Foreign bonds are subject to special risks including exposure to currency fluctuations, changing political and economic conditions, and potentially less liquidity.These risks are generally greater with emerging market countries than with more economically and politically established foreign countries.
Investments in foreign currencies are subject to the risk that those currencies will decline in value relative to the U.S. dollar, or, in the case of hedged positions, that the U.S. dollar will decline relative to the currency being hedged. Currency rates in foreign countries may fluctuate significantly over short periods of time. A decline in the value of foreign currencies relative to the U.S. dollar will reduce the value of securities held by the fund and denominated in those currencies.The use of leverage may magnify the fund’s gains or losses. For derivatives with a leveraging component, adverse changes in the value or level of the underlying asset can result in a loss that is much greater than the original investment in the derivative.
The fund may use derivative instruments, such as options, futures and options on futures, forward contracts, swaps (including credit default swaps on corporate bonds and asset-backed securities), options on swaps, and other credit derivatives. A small investment in derivatives could have a potentially large impact on the fund’s performance.The use of derivatives involves risks different from, or possibly greater than, the risks associated with investing directly in the underlying assets.
|
| 1 Total return includes reinvestment of dividends and any capital gains paid, and does not take into consideration the |
| maximum initial sales charge in the case of Class A shares, or the applicable contingent deferred sales charge imposed |
| on redemptions in the case of Class C shares. Had these charges been reflected, returns would have been lower. Past |
| performance is no guarantee of future results. Class I and ClassY shares are not subject to any initial or deferred sales |
| changes. Share price, yield, and investment return fluctuate such that upon redemption, fund shares may be worth |
| more or less than their original cost. Return figures provided reflect the absorption of certain fund expenses by the |
| Dreyfus Corporation pursuant to an agreement in effect through March 1, 2015, at which time it may be extended, |
| modified or terminated. Had these expenses not been absorbed, the fund’s returns would have been lower. |
| 2 SOURCE: LIPPER, INC. - U.S.Treasury Bill Indices.These indices measure return equivalents of yield averages |
| that are not marked to market. For example, the U.S. 1-Month and 3-Month Treasury Bill Indices consist of the last |
| one-month and three-month Treasury bill month-end rates, respectively. Returns for these indices are calculated on a |
| monthly basis only. |
The Fund 5
FUND PERFORMANCE
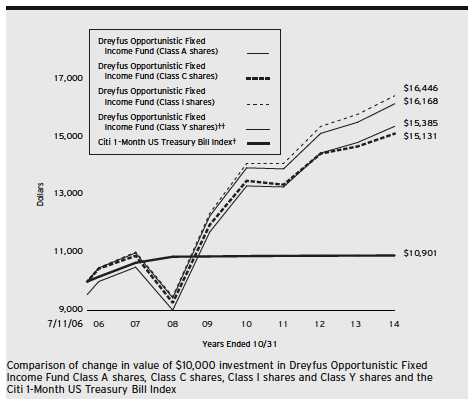
| |
| † | Source: Lipper Inc. |
| †† | The total return figures presented for ClassY shares of the fund reflect the performance of the fund’s Class A shares |
| | for the period prior to 7/1/13 (the inception date for ClassY shares), not reflecting the applicable sales charges for |
| | Class A shares. |
Past performance is not predictive of future performance.
The above graph compares a $10,000 investment made in each of the Class A, Class C, Class I and Class Y shares of Dreyfus Opportunistic Fixed Income Fund on 7/11/06 (inception date) to a $10,000 investment made in the Citi 1-Month US Treasury Bill Index (the “Index”) on that date. All dividends and capital gain distributions are reinvested. The fund invests primarily in fixed-income securities.The fund’s performance shown in the line graph above takes into account the maximum initial sales charge on Class A shares and all other applicable fees and expenses on all classes.The Index is a market value-weighted index of public obligations of the U.S.Treasury with maturities of 30 days. Unlike a mutual fund, the Index is not subject to charges, fees and other expenses. Investors cannot invest directly in any index. Further information relating to fund performance, including expense reimbursements, if applicable, is contained in the Financial Highlights section of the prospectus and elsewhere in this report.
6
| | | | | | | |
| Average Annual Total Returns as of 10/31/14 | | | | | | |
| | Inception | | | | | From | |
| | Date | 1 | Year | 5 Years | | Inception | |
| Class A shares | | | | | | | |
| with maximum sales charge (4.5%) | 7/11/06 | –0.92 | % | 4.64 | % | 5.32 | % |
| without sales charge | 7/11/06 | 3.77 | % | 5.61 | % | 5.91 | % |
| Class C shares | | | | | | | |
| with applicable redemption charge † | 7/11/06 | 2.02 | % | 4.81 | % | 5.11 | % |
| without redemption | 7/11/06 | 3.02 | % | 4.81 | % | 5.11 | % |
| Class I shares | 7/11/06 | 4.06 | % | 5.87 | % | 6.17 | % |
| Class Y shares | 7/1/13 | 4.13 | % | 5.68 | %†† | 5.95 | %†† |
| Citi 1-Month US Treasury Bill Index | 6/30/06 | 0.03 | % | 0.06 | % | 1.04 | %††† |
Past performance is not predictive of future performance.The fund’s performance shown in the graph and table does not reflect the deduction of taxes that a shareholder would pay on fund distributions or the redemption of fund shares. In addition to the performance of Class A shares shown with and without a maximum sales charge, the fund’s performance shown in the table takes into account all other applicable fees and expenses on all classes.
| |
| † | The maximum contingent deferred sales charge for Class C shares is 1% for shares redeemed within one year of |
| | the date of purchase. |
| †† | The total return performance figures presented for ClassY shares of the fund reflect the performance of the fund’s |
| | Class A shares for the period prior to 7/1/13 (the inception date for ClassY shares), not reflecting the applicable |
| | sales charges for Class A shares. |
| ††† | For comparative purposes, the value of the Index as of 6/30/06 is used as the beginning value on 7/11/06. |
The Fund 7
UNDERSTANDING YOUR FUND’S EXPENSES (Unaudited)
As a mutual fund investor, you pay ongoing expenses, such as management fees and other expenses. Using the information below, you can estimate how these expenses affect your investment and compare them with the expenses of other funds.You also may pay one-time transaction expenses, including sales charges (loads) and redemption fees, which are not shown in this section and would have resulted in higher total expenses. For more information, see your fund’s prospectus or talk to your financial adviser.
Review your fund’s expenses
The table below shows the expenses you would have paid on a $1,000 investment in Dreyfus Opportunistic Fixed Income Fund from May 1, 2014 to October 31, 2014. It also shows how much a $1,000 investment would be worth at the close of the period, assuming actual returns and expenses.
Expenses and Value of a $1,000 Investment
assuming actual returns for the six months ended October 31, 2014
| | | | | | | | |
| | | Class A | | Class C | | Class I | | Class Y |
| Expenses paid per $1,000† | $ | 4.64 | $ | 8.46 | $ | 3.48 | $ | 3.03 |
| Ending value (after expenses) | $ | 1,002.30 | $ | 998.70 | $ | 1,003.20 | $ | 1,003.40 |
COMPARING YOUR FUND’S EXPENSES
WITH THOSE OF OTHER FUNDS (Unaudited)
Using the SEC’s method to compare expenses
The Securities and Exchange Commission (SEC) has established guidelines to help investors assess fund expenses. Per these guidelines, the table below shows your fund’s expenses based on a $1,000 investment, assuming a hypothetical 5% annualized return. You can use this information to compare the ongoing expenses (but not transaction expenses or total cost) of investing in the fund with those of other funds. All mutual fund shareholder reports will provide this information to help you make this comparison. Please note that you cannot use this information to estimate your actual ending account balance and expenses paid during the period.
Expenses and Value of a $1,000 Investment
assuming a hypothetical 5% annualized return for the six months ended October 31, 2014
| | | | | | | | |
| | | Class A | | Class C | | Class I | | Class Y |
| Expenses paid per $1,000† | $ | 4.69 | $ | 8.54 | $ | 3.52 | $ | 3.06 |
| Ending value (after expenses) | $ | 1,020.57 | $ | 1,016.74 | $ | 1,021.73 | $ | 1,022.18 |
|
| † Expenses are equal to the fund’s annualized expense ratio of .92% for Class A, 1.68% for Class C, .69% for |
| Class I and .60% for ClassY, multiplied by the average account value over the period, multiplied by 184/365 (to |
| reflect the one-half year period). |
8
STATEMENT OF INVESTMENTS
October 31, 2014
| | | | | |
| | Coupon | Maturity | Principal | | |
| Bonds and Notes—95.7% | Rate (%) | Date | Amount ($) | a | Value ($) |
| Asset—Backed Certificates—1.7% | | | | | |
| Dell Equipment Finance Trust, | | | | | |
| Ser. 2014-1, Cl. D | 2.68 | 6/22/20 | 2,077,000 | b | 2,084,222 |
| OneMain Financial Issuance Trust, | | | | | |
| Ser. 2014-1A, Cl. B | 3.24 | 6/18/24 | 4,000,000 | b | 3,991,840 |
| Springleaf Funding Trust, | | | | | |
| Ser. 2013-BA, Cl. A | 3.92 | 1/16/23 | 2,710,000 | b | 2,768,102 |
| Trafigura Securitisation Finance, | | | | | |
| Ser. 2014-1A, Cl. B | 2.40 | 10/15/21 | 1,560,000 | b,c | 1,560,000 |
| | | | | | 10,404,164 |
| Asset-Backed Ctfs./ | | | | | |
| Auto Receivables—7.2% | | | | | |
| Ally Master Owner Trust, | | | | | |
| Ser. 2012-3, Cl. D | 2.50 | 6/15/17 | 235,000 | b,c | 236,292 |
| Ally Master Owner Trust, | | | | | |
| Ser. 2012-1, Cl. D | 3.12 | 2/15/17 | 165,000 | b | 165,910 |
| American Credit Acceptance | | | | | |
| Receivables Trust, | | | | | |
| Ser. 2014-2, Cl. B | 2.26 | 3/10/20 | 580,000 | b | 581,302 |
| AmeriCredit Automobile Receivables | | | | | |
| Trust, Ser. 2014-2, Cl. D | 2.57 | 7/8/20 | 3,155,000 | | 3,129,916 |
| AmeriCredit Automobile Receivables | | | | | |
| Trust, Ser. 2013-3, Cl. D | 3.00 | 7/8/19 | 700,000 | | 713,973 |
| Americredit Automobile Receivables | | | | | |
| Trust, Ser. 2014-3, Cl. D | 3.13 | 10/8/20 | 1,915,000 | | 1,938,265 |
| AmeriCredit Automobile Receivables | | | | | |
| Trust, Ser. 2012-5, Cl. E | 3.29 | 5/8/20 | 250,000 | b | 252,449 |
| Capital Auto Receivables Asset | | | | | |
| Trust, Ser. 2013-1, Cl. D | 2.19 | 9/20/21 | 2,000,000 | | 2,003,621 |
| Capital Auto Receivables Asset | | | | | |
| Trust, Ser. 2014-2, Cl. D | 2.81 | 8/20/19 | 185,000 | | 185,368 |
| DT Auto Owner Trust, | | | | | |
| Ser. 2014-2A, Cl. C | 2.46 | 1/15/20 | 955,000 | b | 956,303 |
| DT Auto Owner Trust, | | | | | |
| Ser. 2013-1A, Cl. D | 3.74 | 5/15/20 | 1,085,000 | b | 1,100,231 |
| DT Auto Owner Trust, | | | | | |
| Ser. 2014-1A, Cl. D | 3.98 | 1/15/21 | 5,245,000 | b | 5,316,280 |
| DT Auto Owner Trust, | | | | | |
| Ser. 2013-2A, Cl. D | 4.18 | 6/15/20 | 2,575,000 | b | 2,647,811 |
The Fund 9
STATEMENT OF INVESTMENTS (continued)
| | | | | |
| | Coupon | Maturity | Principal | | |
| Bonds and Notes (continued) | Rate (%) | Date | Amount ($) | a | Value ($) |
| Asset-Backed Ctfs./ | | | | | |
| Auto Receivables (continued) | | | | | |
| Exeter Automobile Receivables | | | | | |
| Trust, Ser. 2014-1A, Cl. B | 2.42 | 1/15/19 | 715,000 | b | 715,401 |
| Exeter Automobile Receivables | | | | | |
| Trust, Ser. 2013-1A, Cl. C | 3.52 | 2/15/19 | 3,680,000 | b | 3,694,253 |
| Exeter Automobile Receivables | | | | | |
| Trust, Ser. 2013-2A, Cl. C | 4.35 | 1/15/19 | 2,350,000 | b | 2,389,869 |
| Ford Credit Floorplan | | | | | |
| Master Owner Trust, | | | | | |
| Ser. 2013-1, Cl. D | 1.82 | 1/15/18 | 300,000 | | 302,215 |
| Hyundai Auto Receivables Trust, | | | | | |
| Ser. 2014-B, Cl. D | 2.51 | 12/15/20 | 1,400,000 | | 1,403,992 |
| Prestige Auto Receivables Trust, | | | | | |
| Ser. 2013-1A, Cl. D | 3.04 | 7/15/20 | 2,350,000 | b | 2,381,738 |
| Santander Drive Auto Receivables | | | | | |
| Trust, Ser. 2013-3, Cl. C | 1.81 | 4/15/19 | 850,000 | | 850,276 |
| Santander Drive Auto Receivables | | | | | |
| Trust, Ser. 2013-5, Cl. C | 2.25 | 6/17/19 | 575,000 | | 579,201 |
| Santander Drive Auto Receivables | | | | | |
| Trust, Ser. 2013-3, Cl. D | 2.42 | 4/15/19 | 605,000 | | 608,293 |
| Santander Drive Auto Receivables | | | | | |
| Trust, Ser. 2014-3, Cl. D | 2.65 | 8/17/20 | 4,650,000 | | 4,652,695 |
| Santander Drive Auto Receivables | | | | | |
| Trust, Ser. 2014-1, Cl. D | 2.91 | 4/15/20 | 1,225,000 | | 1,237,335 |
| Santander Drive Auto Receivables | | | | | |
| Trust, Ser. 2014-4, Cl. D | 3.10 | 11/16/20 | 2,970,000 | | 2,992,977 |
| Santander Drive Auto Receivables | | | | | |
| Trust, Ser. 2013-4, Cl. D | 3.92 | 1/15/20 | 235,000 | | 244,991 |
| Westlake Automobile Receivables | | | | | |
| Trust, Ser. 2014-2A, Cl. D | 2.86 | 7/15/21 | 1,875,000 | b | 1,879,001 |
| | | | | | 43,159,958 |
| Asset-Backed Ctfs./ | | | | | |
| Home Equity Loans—5.8% | | | | | |
| ACE Securities Corp. | | | | | |
| Home Equity Loan Trust, | | | | | |
| Ser. 2006-ASP3, Cl. A2C | 0.30 | 6/25/36 | 754,216 | c | 699,644 |
10
| | | | | |
| | Coupon | Maturity | Principal | | |
| Bonds and Notes (continued) | Rate (%) | Date | Amount ($) | a | Value ($) |
| Asset-Backed Ctfs./ | | | | | |
| Home Equity Loans (continued) | | | | | |
| ACE Securities Corp. Home Equity | | | | | |
| Loan Trust, Ser. 2006-HE2, | | | | | |
| Cl. A2C | 0.31 | 5/25/36 | 1,085,058 | c | 955,967 |
| ACE Securities Corp. Home Equity | | | | | |
| Loan Trust, Ser. 2004-HE4, | | | | | |
| Cl. M2 | 1.13 | 12/25/34 | 362,001 | c | 354,082 |
| Argent Securities Trust, | | | | | |
| Ser. 2006-M1, Cl. A2B | 0.24 | 7/25/36 | 10,322,148 | c | 4,416,197 |
| Asset Backed Funding Certificates | | | | | |
| Trust, Ser. 2006-OPT3, Cl. A3B | 0.31 | 11/25/36 | 314,253 | c | 169,582 |
| Asset Backed Funding Certificates | | | | | |
| Trust, Ser. 2007-NC1, Cl. A1 | 0.37 | 5/25/37 | 6,615,464 | b,c | 6,367,301 |
| Bear Stearns Asset Backed | | | | | |
| Securities, Ser. 2004-FR2, Cl. M3 | 1.95 | 6/25/34 | 711,842 | c | 687,510 |
| Carrington Mortgage Loan Trust, | | | | | |
| Ser. 2006-NC2, Cl. A2 | 0.24 | 6/25/36 | 505,888 | c | 498,627 |
| Citicorp Residential Mortgage | | | | | |
| Securities Trust, Ser. 2006-1, | | | | | |
| Cl. A4 | 5.94 | 7/25/36 | 215,956 | c | 227,245 |
| Colony American Homes, | | | | | |
| Ser. 2014-1A, Cl. E | 3.05 | 5/17/31 | 1,100,000 | b,c | 1,040,615 |
| First Franklin Mortgage Loan Trust | | | | | |
| Asset Backed Certificates, | | | | | |
| Ser. 2006-FF7, Cl. 2A3 | 0.30 | 5/25/36 | 809,454 | c | 676,081 |
| First Franklin Mortgage Loan Trust | | | | | |
| Asset Backed Certificates, | | | | | |
| Ser. 2006-FF5, Cl. 2A3 | 0.31 | 4/25/36 | 3,498,130 | c | 2,876,295 |
| GSAMP Trust, | | | | | |
| Ser. 2007-HE1, Cl. A2B | 0.25 | 3/25/47 | 1,268,938 | c | 1,253,337 |
| Home Equity Asset Trust, | | | | | |
| Ser. 2004-7, Cl. M2 | 1.14 | 1/25/35 | 262,468 | c | 252,678 |
| HSI Asset Securitization Corp. | | | | | |
| Trust, Ser. 2007-WF1, Cl. 2A3 | 0.32 | 5/25/37 | 3,242,881 | c | 3,149,716 |
| JP Morgan Mortgage Acquisition | | | | | |
| Corp., Ser. 2006-FRE2, Cl. A3 | 0.33 | 2/25/36 | 179,855 | c | 177,251 |
The Fund 11
STATEMENT OF INVESTMENTS (continued)
| | | | | |
| | Coupon | Maturity | Principal | | |
| Bonds and Notes (continued) | Rate (%) | Date | Amount ($) | a | Value ($) |
| Asset-Backed Ctfs./ | | | | | |
| Home Equity Loans (continued) | | | | | |
| JP Morgan Mortgage Acquisition | | | | | |
| Corp., Ser. 2006-FRE1, Cl. A3 | 0.34 | 5/25/35 | 341,749 | c | 336,630 |
| JP Morgan Mortgage Acquisition | | | | | |
| Trust, Ser. 2007-CH5, Cl. A3 | 0.26 | 5/25/37 | 1,210,407 | c | 1,180,864 |
| JP Morgan Mortgage Acquisition | | | | | |
| Trust, Ser. 2007-CH1, Cl. AF6 | 5.50 | 11/25/36 | 1,213,999 | c | 1,227,585 |
| Long Beach Mortgage Loan Trust, | | | | | |
| Ser. 2004-1, Cl. M2 | 0.98 | 2/25/34 | 45,633 | c | 44,141 |
| MASTR Asset Backed Securities | | | | | |
| Trust, Ser. 2006-HE2, Cl. A3 | 0.30 | 6/25/36 | 1,297,247 | c | 716,419 |
| MASTR Asset Backed Securities | | | | | |
| Trust, Ser. 2006-AM2, Cl. A3 | 0.32 | 6/25/36 | 1,460,447 | c | 1,215,820 |
| Morgan Stanley ABS Capital I | | | | | |
| Trust, Ser. 2006-NC4, Cl. A2C | 0.30 | 6/25/36 | 565,216 | c | 533,569 |
| Morgan Stanley Home Equity Loan | | | | | |
| Trust, Ser. 2006-3, Cl. A3 | 0.31 | 4/25/36 | 544,080 | c | 423,949 |
| Nationstar Home Equity Loan Trust, | | | | | |
| Ser. 2007-A, Cl. AV3 | 0.30 | 3/25/37 | 124,963 | c | 120,120 |
| New Century Home Equity Loan | | | | | |
| Trust, Ser. 2006-1, Cl. A2B | 0.33 | 5/25/36 | 1,436,906 | c | 1,023,220 |
| NovaStar Mortgage Funding Trust, | | | | | |
| Ser. 2006-4, Cl. A2D | 0.40 | 9/25/36 | 943,812 | c | 558,141 |
| Residential Asset Mortgage | | | | | |
| Products Trust, Ser. 2007-RZ1, | | | | | |
| Cl. A2 | 0.31 | 2/25/37 | 1,352,607 | c | 1,231,370 |
| Residential Asset Securities Corp. | | | | | |
| Trust, Ser. 2007-KS4, | | | | | |
| Cl. A2 | 0.33 | 5/25/37 | 1,155,051 | c | 1,150,102 |
| Securitized Asset Backed | | | | | |
| Receivables Trust, | | | | | |
| Ser. 2005-FR3, Cl. M1 | 0.86 | 4/25/35 | 285,360 | c | 282,650 |
| Structured Asset Securities Corp., | | | | | |
| Ser. 2002-BC1, Cl. M2 | 3.60 | 8/25/32 | 1,087,411 | c | 1,032,972 |
| | | | | | 34,879,680 |
| Casinos—.5% | | | | | |
| Pinnacle Entertainment, | | | | | |
| Gtd. Notes | 7.50 | 4/15/21 | 2,750,000 | | 2,949,375 |
12
| | | | | |
| | Coupon | Maturity | Principal | | |
| Bonds and Notes (continued) | Rate (%) | Date | Amount ($) | a | Value ($) |
| Commercial Mortgage | | | | | |
| Pass-Through Ctfs.—9.8% | | | | | |
| A10 Term Asset Financing, | | | | | |
| Ser. 2013-2, Cl. A | 2.62 | 11/15/27 | 897,283 | b | 904,992 |
| Banc of America Commercial | | | | | |
| Mortgage Trust, | | | | | |
| Ser. 2007-2, Cl. AJ | 5.62 | 4/10/49 | 5,930,000 | c | 5,911,169 |
| Bear Stearns Commercial Mortgage | | | | | |
| Securities Trust, | | | | | |
| Ser. 2006-PW14, Cl. AJ | 5.27 | 12/11/38 | 4,433,000 | | 4,498,777 |
| Bear Stearns Commercial Mortgage | | | | | |
| Securities Trust, | | | | | |
| Ser. 2005-PW10, Cl. AJ | 5.44 | 12/11/40 | 525,000 | c | 518,438 |
| Bear Stearns Commercial Mortgage | | | | | |
| Securities Trust, | | | | | |
| Ser. 2007-PW16, Cl. AJ | 5.71 | 6/11/40 | 2,510,000 | c | 2,573,891 |
| Bear Stearns Commercial Mortgage | | | | | |
| Securities Trust, | | | | | |
| Ser. 2007-PW17, Cl. AJ | 5.89 | 6/11/50 | 1,725,000 | c | 1,752,699 |
| Bear Stearns Commercial Mortgage | | | | | |
| Securities Trust, | | | | | |
| Ser. 2007-PW18, Cl. AJ | 6.15 | 6/11/50 | 1,025,000 | c | 999,410 |
| Citigroup Commercial Mortgage | | | | | |
| Trust, Ser. 2013-375P, Cl. E | 3.52 | 5/10/35 | 200,000 | b,c | 178,949 |
| Citigroup Commercial Mortgage | | | | | |
| Trust, Ser. 2007-C6, Cl. AJ | 5.71 | 12/10/49 | 1,090,000 | c | 1,056,762 |
| Commercial Mortgage Trust, | | | | | |
| Ser. 2006-C8, Cl. AJ | 5.38 | 12/10/46 | 5,840,000 | | 5,892,575 |
| Credit Suisse Mortgage Trust, | | | | | |
| Ser 2014-USA, Cl. E | 4.37 | 9/15/37 | 2,835,000 | b | 2,569,193 |
| JP Morgan Chase Commercial | | | | | |
| Mortgage Securities Trust, | | | | | |
| Ser. 2014-INN, Cl. E | 3.75 | 6/15/29 | 3,375,000 | b,c | 3,357,572 |
| JP Morgan Chase Commercial | | | | | |
| Mortgage Securities Trust, | | | | | |
| Ser. 2006-CB17, Cl. AM | 5.46 | 12/12/43 | 730,000 | | 762,044 |
| JP Morgan Chase Commercial | | | | | |
| Mortgage Securities Trust, | | | | | |
| Ser. 2007-LDPX, Cl. AM | 5.46 | 1/15/49 | 4,175,000 | c | 4,391,589 |
The Fund 13
STATEMENT OF INVESTMENTS (continued)
| | | | | |
| | Coupon | Maturity | Principal | | |
| Bonds and Notes (continued) | Rate (%) | Date | Amount ($) | a | Value ($) |
| Commercial Mortgage | | | | | |
| Pass-Through Ctfs. (continued) | | | | | |
| JP Morgan Chase Commercial | | | | | |
| Mortgage Securities Trust, | | | | | |
| Ser. 2007-LD12, Cl. AJ | 6.00 | 2/15/51 | 6,405,000 | c | 6,580,750 |
| Merrill Lynch Mortgage Trust, | | | | | |
| Ser. 2006-C1, Cl. AJ | 5.67 | 5/12/39 | 2,740,000 | c | 2,761,032 |
| ML-CFC Commercial Mortgage Trust, | | | | | |
| Ser. 2006-4, Cl. AJ | 5.24 | 12/12/49 | 2,600,000 | | 2,622,299 |
| ML-CFC Commercial Mortgage Trust, | | | | | |
| Ser. 2007-9, Cl. AJ | 6.19 | 9/12/49 | 1,310,000 | c | 1,293,742 |
| Wachovia Bank Commercial Mortgage | | | | | |
| Trust, Ser. 2006-C29, Cl. AJ | 5.37 | 11/15/48 | 1,440,000 | c | 1,435,673 |
| Wachovia Bank Commercial Mortgage | | | | | |
| Trust, Ser. 2006-C24, Cl. AJ | 5.66 | 3/15/45 | 4,175,000 | c | 4,286,621 |
| Wachovia Bank Commercial Mortgage | | | | | |
| Trust, Ser. 2007-C32, Cl. AJ | 5.72 | 6/15/49 | 3,950,000 | c | 4,051,884 |
| | | | | | 58,400,061 |
| Consumer Discretionary—3.1% | | | | | |
| Anna, | | | | | |
| Sr. Unscd. Notes | 7.75 | 10/1/22 | 2,175,000 | b | 2,221,219 |
| British Sky Broadcasting Group, | | | | | |
| Gtd. Notes | 3.75 | 9/16/24 | 2,675,000 | b | 2,689,199 |
| CCOH Safari, | | | | | |
| Gtd. Bonds | 5.50 | 12/1/22 | 650,000 | | 655,687 |
| Clear Channel Worldwide Holdings, | | | | | |
| Gtd. Notes, Ser. B | 7.63 | 3/15/20 | 1,820,000 | d | 1,945,125 |
| DISH DBS, | | | | | |
| Gtd. Notes | 6.75 | 6/1/21 | 2,000,000 | | 2,225,000 |
| iHeartCommunications, | | | | | |
| Sr. Scd. Notes | 9.00 | 3/1/21 | 2,175,000 | | 2,183,156 |
| JC Penney, | | | | | |
| Gtd. Bonds | 8.13 | 10/1/19 | 850,000 | d | 820,250 |
| Neiman Marcus Group, | | | | | |
| Gtd. Notes | 8.00 | 10/15/21 | 2,175,000 | b | 2,330,917 |
| Numericable Group, | | | | | |
| Sr. Scd. Bonds | 6.00 | 5/15/22 | 800,000 | b | 819,000 |
| Numericable Group, | | | | | |
| Sr. Scd. Bonds | 6.25 | 5/15/24 | 350,000 | b | 360,500 |
14
| | | | | |
| | Coupon | Maturity | Principal | | |
| Bonds and Notes (continued) | Rate (%) | Date | Amount ($) | a | Value ($) |
| Consumer Discretionary | | | | | |
| (continued) | | | | | |
| Sinclair Television Group, | | | | | |
| Gtd. Notes | 5.38 | 4/1/21 | 1,484,000 | | 1,495,130 |
| Time Warner Cable, | | | | | |
| Gtd. Notes | 5.50 | 9/1/41 | 900,000 | | 1,020,190 |
| | | | | | 18,765,373 |
| Consumer Staples—1.2% | | | | | |
| Dollar General, | | | | | |
| Sr. Unscd. Notes | 3.25 | 4/15/23 | 2,220,000 | | 1,997,003 |
| Grupo Bimbo, | | | | | |
| Gtd. Notes | 3.88 | 6/27/24 | 1,925,000 | b | 1,920,765 |
| HJ Heinz, | | | | | |
| Term B-2 Loan | 3.50 | 6/5/20 | 994,962 | c | 990,719 |
| Minerva Luxembourg, | | | | | |
| Gtd. Notes | 7.75 | 1/31/23 | 2,400,000 | b | 2,514,000 |
| | | | | | 7,422,487 |
| Energy—5.9% | | | | | |
| Antero Resources Finance, | | | | | |
| Gtd. Notes | 6.00 | 12/1/20 | 2,750,000 | | 2,873,750 |
| California Resources, | | | | | |
| Gtd. Notes | 6.00 | 11/15/24 | 640,000 | b | 654,400 |
| Cimarex Energy, | | | | | |
| Gtd. Notes | 5.88 | 5/1/22 | 1,055,000 | | 1,139,400 |
| Freeport-McMoran Oil & Gas, | | | | | |
| Gtd. Notes | 6.88 | 2/15/23 | 6,501,000 | | 7,368,493 |
| Halcon Resources, | | | | | |
| Gtd. Notes | 8.88 | 5/15/21 | 2,175,000 | d | 1,794,375 |
| Kinder Morgan, | | | | | |
| Sr. Unscd. Notes | 7.80 | 8/1/31 | 2,325,000 | | 2,871,375 |
| Kinder Morgan Energy Partners, | | | | | |
| Sr. Unscd. Notes | 5.40 | 9/1/44 | 2,470,000 | | 2,428,363 |
| Marathon Petroleum, | | | | | |
| Sr. Unscd. Notes | 4.75 | 9/15/44 | 1,175,000 | d | 1,186,943 |
| MEG Energy, | | | | | |
| Gtd. Notes | 6.50 | 3/15/21 | 308,000 | b | 306,460 |
| NRG Energy, | | | | | |
| Gtd. Notes | 6.25 | 7/15/22 | 2,850,000 | | 2,999,625 |
The Fund 15
STATEMENT OF INVESTMENTS (continued)
| | | | | | |
| | | Coupon | Maturity | Principal | | |
| Bonds and Notes (continued) | Rate (%) | Date | Amount ($) | a | Value ($) |
| Energy (continued) | | | | | | |
| Pacific Rubiales Energy, | | | | | | |
| Gtd. Notes | | 5.38 | 1/26/19 | 2,925,000 | b,d | 2,939,625 |
| Range Resources, | | | | | | |
| Gtd. Notes | | 5.00 | 3/15/23 | 1,255,000 | | 1,317,750 |
| Sanchez Energy, | | | | | | |
| Gtd. Notes | | 6.13 | 1/15/23 | 1,500,000 | b | 1,432,500 |
| Templar Energy, | | | | | | |
| Second Lien Term Loan | | 8.50 | 11/25/20 | 6,154,833 | c | 5,590,127 |
| Unit, | | | | | | |
| Gtd. Notes | | 6.63 | 5/15/21 | 520,000 | | 521,300 |
| | | | | | | 35,424,486 |
| Financial—14.6% | | | | | | |
| AerCap Ireland Capital, | | | | | | |
| Sr. Unscd. Notes | | 5.00 | 10/1/21 | 1,350,000 | b | 1,407,375 |
| Allianz Finance II, | | | | | | |
| Gtd. Notes | EUR | 5.75 | 7/8/41 | 1,500,000 | c | 2,228,746 |
| Ally Financial, | | | | | | |
| Gtd. Notes | | 8.00 | 11/1/31 | 2,950,000 | | 3,761,250 |
| American International Group, | | | | | | |
| Jr. Sub. Debs., Ser. A3 | EUR | 4.88 | 3/15/67 | 5,250,000 | c | 6,901,402 |
| AXA, | | | | | | |
| Jr. Sub. Notes | EUR | 5.78 | 7/29/49 | 3,895,000 | c | 5,173,874 |
| Bank of America, | | | | | | |
| Sub. Notes | | 4.25 | 10/22/26 | 2,900,000 | | 2,885,184 |
| Bank of America, | | | | | | |
| Sub. Notes | | 6.11 | 1/29/37 | 2,125,000 | | 2,494,531 |
| Barclays Bank, | | | | | | |
| Jr. Sub. Notes | EUR | 4.88 | 12/29/49 | 12,570,000 | c,d | 15,437,035 |
| Credit Suisse Group, | | | | | | |
| Sub. Notes | | 6.50 | 8/8/23 | 1,600,000 | b | 1,768,000 |
| General Electric Capital, | | | | | | |
| Sub. Debs. | | 6.38 | 11/15/67 | 4,900,000 | c | 5,243,000 |
| Genworth Holdings, | | | | | | |
| Gtd. Notes | | 7.70 | 6/15/20 | 2,465,000 | | 2,966,073 |
| Hockey Merger Sub 2, | | | | | | |
| Sr. Unscd. Notes | | 7.88 | 10/1/21 | 2,690,000 | b | 2,817,775 |
| HSBC Holdings, | | | | | | |
| Jr. Sub. Bonds | | 5.63 | 12/29/49 | 2,110,000 | c,d | 2,146,925 |
| Hub Holdings, | | | | | | |
| Sr. Unscd. Notes | | 8.88 | 7/15/19 | 1,425,000 | b | 1,421,437 |
16
| | | | | | |
| | | Coupon | Maturity | Principal | | |
| Bonds and Notes (continued) | Rate (%) | Date | Amount ($) | a | Value ($) |
| Financial (continued) | | | | | | |
| Icahn Enterprises, | | | | | | |
| Gtd. Notes | | 5.88 | 2/1/22 | 2,155,000 | | 2,225,037 |
| International Lease Finance, | | | | | | |
| Sr. Unscd. Notes | | 8.25 | 12/15/20 | 1,190,000 | | 1,430,975 |
| Intesa Sanpaolo, | | | | | | |
| Sub. Notes | | 5.02 | 6/26/24 | 4,300,000 | b | 4,210,379 |
| Intesa Sanpaolo, | | | | | | |
| Gtd. Bonds | | 5.25 | 1/12/24 | 2,000,000 | | 2,181,668 |
| Liberty Mutual Group, | | | | | | |
| Gtd. Bonds | | 4.85 | 8/1/44 | 2,200,000 | b | 2,211,770 |
| Lloyds Banking Group, | | | | | | |
| Sub. Notes | | 4.50 | 11/4/24 | 3,075,000 | | 3,083,619 |
| Lloyds Banking Group, | | | | | | |
| Jr. Sub. Bonds | | 7.50 | 4/30/49 | 2,373,000 | c,d | 2,473,852 |
| Morgan Stanley, | | | | | | |
| Sub. Notes | | 4.35 | 9/8/26 | 1,260,000 | | 1,265,163 |
| Royal Bank of Scotland, | | | | | | |
| Sub. Notes | | 9.50 | 3/16/22 | 1,960,000 | c | 2,244,269 |
| Royal Bank of Scotland Group, | | | | | | |
| Sub. Notes | | 6.00 | 12/19/23 | 4,015,000 | | 4,328,865 |
| ZFS Finance (USA) Trust V, | | | | | | |
| Jr. Sub. Cap. Secs | | 6.50 | 5/9/67 | 4,867,000 | b,c | 5,256,360 |
| | | | | | | 87,564,564 |
| Foreign/Governmental—29.0% | | | | | | |
| Argentine Government, | | | | | | |
| Sr. Unscd. Bonds (Principal Only) | 0.00 | 12/15/35 | 3,525,000 | | 270,544 |
| Argentine Government, | | | | | | |
| Bonds, Ser. X | | 7.00 | 4/17/17 | 140,000 | | 124,950 |
| Argentine Government, | | | | | | |
| Sr. Unscd. Notes, Ser. NY | | 8.28 | 12/31/33 | 1,600,000 | | 1,995,157 |
| Argentine Government, | | | | | | |
| Sr. Unscd. Notes | | 11.75 | 10/5/15 | 3,675,000 | | 3,537,188 |
| Australian Government, | | | | | | |
| Sr. Unscd. Bonds, Ser. 143 | AUD | 2.75 | 10/21/19 | 28,700,000 | | 25,176,499 |
| Australian Government, | | | | | | |
| Sr. Unscd. Bonds, Ser. 137 | AUD | 2.75 | 4/21/24 | 19,000,000 | | 15,999,035 |
| Brazilian Government, | | | | | | |
| Bonds, Ser. B | BRL | 6.00 | 8/15/18 | 1,000,000 | e | 1,022,551 |
| Brazilian Government, | | | | | | |
| Sr. Notes, Ser. F | BRL | 10.00 | 1/1/17 | 74,050,000 | | 29,612,081 |
The Fund 17
STATEMENT OF INVESTMENTS (continued)
| | | | | | |
| | | Coupon | Maturity | Principal | | |
| Bonds and Notes (continued) | Rate (%) | Date | Amount ($) | a | Value ($) |
| Foreign/Governmental | | | | | | |
| (continued) | | | | | | |
| Brazilian Government, | | | | | | |
| Notes, Ser. F | BRL | 10.00 | 1/1/23 | 8,500,000 | | 3,188,551 |
| Caixa Economica Federal, | | | | | | |
| Sr. Unscd. Notes | | 4.25 | 5/13/19 | 5,200,000 | b | 5,257,200 |
| Colombian Government, | | | | | | |
| Bonds, Ser. B | COP | 10.00 | 7/24/24 | 25,650,000,000 | | 15,485,619 |
| Comision Federal de Electricidad, | | | | | |
| Sr. Unscd. Notes | | 4.88 | 1/15/24 | 3,135,000 | b | 3,315,263 |
| Eurasian Development Bank, | | | | | | |
| Sr. Unscd. Notes | | 5.00 | 9/26/20 | 1,340,000 | b | 1,358,144 |
| Kazakhstan Government, | | | | | | |
| Sr. Unscd. Notes | | 4.88 | 10/14/44 | 1,400,000 | b | 1,354,500 |
| Mexican Government, | | | | | | |
| Bonds, Ser. M 10 | MXN | 7.75 | 12/14/17 | 118,320,000 | | 9,661,528 |
| Mexican Government, | | | | | | |
| Bonds, Ser. M 20 | MXN | 10.00 | 12/5/24 | 54,300,000 | | 5,281,208 |
| New Zealand Government, | | | | | | |
| Sr. Unscd. Bonds, Ser. 420 | NZD | 3.00 | 4/15/20 | 20,050,000 | | 14,980,571 |
| Polish Government, | | | | | | |
| Bonds, Ser. 0725 | PLN | 3.25 | 7/25/25 | 35,130,000 | | 11,129,567 |
| Russian Government, | | | | | | |
| Bonds, Ser. 6203 | RUB | 6.90 | 8/3/16 | 250,000,000 | | 5,539,476 |
| Spanish Government, | | | | | | |
| Bonds | EUR | 2.75 | 4/30/19 | 14,150,000 | | 19,156,290 |
| | | | | | | 173,445,922 |
| Health Care—1.7% | | | | | | |
| Biomet, | | | | | | |
| Gtd. Notes | | 6.50 | 8/1/20 | 1,955,000 | | 2,096,737 |
| CHS/Community Health System, | | | | | | |
| Gtd. Notes | | 6.88 | 2/1/22 | 2,625,000 | | 2,838,281 |
| DaVita HealthCare Partners, | | | | | | |
| Gtd. Notes | | 5.13 | 7/15/24 | 1,325,000 | d | 1,353,984 |
| Fresenius Medical Care II, | | | | | | |
| Gtd. Notes | | 4.13 | 10/15/20 | 1,200,000 | b | 1,209,750 |
| Fresenius Medical Care II, | | | | | | |
| Gtd. Notes | | 4.75 | 10/15/24 | 875,000 | b | 882,109 |
| Tenet Healthcare, | | | | | | |
| Sr. Unscd. Notes | | 8.13 | 4/1/22 | 970,000 | | 1,114,287 |
18
| | | | | |
| | Coupon | Maturity | Principal | | |
| Bonds and Notes (continued) | Rate (%) | Date | Amount ($) | a | Value ($) |
| Health Care (continued) | | | | | |
| Valeant Pharmaceuticals | | | | | |
| International, | | | | | |
| Term D2 Loan | 3.75 | 2/13/19 | 714,269 | c | 709,804 |
| | | | | | 10,204,952 |
| Industrial—1.9% | | | | | |
| Abengoa Finance, | | | | | |
| Gtd. Notes | 7.75 | 2/1/20 | 2,680,000 | b | 2,814,000 |
| AECOM Technology, | | | | | |
| Gtd. Notes | 5.88 | 10/15/24 | 1,710,000 | b | 1,812,600 |
| Algeco Scotsman Global Finance, | | | | | |
| Sr. Scd. Notes | 8.50 | 10/15/18 | 1,000,000 | b | 1,045,000 |
| Algeco Scotsman Global Finance, | | | | | |
| Gtd. Notes | 10.75 | 10/15/19 | 1,125,000 | b | 1,113,750 |
| Ashtead Capital, | | | | | |
| Scd. Notes | 5.63 | 10/1/24 | 1,425,000 | b | 1,489,125 |
| Schaeffler Holding Finance, | | | | | |
| Sr. Scd. Notes | 6.75 | 11/15/22 | 1,985,000 | b | 2,118,987 |
| Schaeffler Holding Finance, | | | | | |
| Sr. Scd. Notes | 6.88 | 8/15/18 | 709,000 | b | 746,222 |
| | | | | | 11,139,684 |
| Information Technology—.3% | | | | | |
| First Data, | | | | | |
| Gtd. Notes | 11.75 | 8/15/21 | 1,542,000 | | 1,815,705 |
| Materials—2.0% | | | | | |
| ABC Supply, | | | | | |
| Term B Loan | 3.50 | 4/16/20 | 1,591,960 | c | 1,560,789 |
| Ardagh Packaging Finance, | | | | | |
| Sr. Scd. Notes | 3.23 | 12/15/19 | 1,315,000 | b,c | 1,291,988 |
| Ardagh Packaging Finance, | | | | | |
| Gtd. Notes | 6.75 | 1/31/21 | 1,725,000 | b,d | 1,768,125 |
| Axalta Coating, | | | | | |
| Term B Loan | 4.00 | 2/1/20 | 784,703 | c | 773,753 |
| Beverage Packaging Holdings, | | | | | |
| Gtd. Notes | 6.00 | 6/15/17 | 2,806,000 | b | 2,806,000 |
| BWAY Holding, | | | | | |
| Sr. Unscd. Notes | 9.13 | 8/15/21 | 2,175,000 | b | 2,267,438 |
| Fortescue Metals Group, | | | | | |
| Term B Loan | 3.75 | 6/30/19 | 820,854 | c | 802,479 |
The Fund 19
STATEMENT OF INVESTMENTS (continued)
| | | | | |
| | Coupon | Maturity | Principal | | |
| Bonds and Notes (continued) | Rate (%) | Date | Amount ($) | a | Value ($) |
| Materials (continued) | | | | | |
| TMK OAO, | | | | | |
| Sr. Unscd. Notes | 7.75 | 1/27/18 | 550,000 | d | 554,813 |
| | | | | | 11,825,385 |
| Municipal Bonds—.4% | | | | | |
| Chattanooga-Hamilton County | | | | | |
| Hospital Authority, HR | | | | | |
| (Erlanger Medical Center) | | | | | |
| (Insured; National Public | | | | | |
| Finance Guarantee Corp.) | 0.38 | 10/1/27 | 1,625,000 | c | 1,448,281 |
| Puerto Rico Commonwealth | | | | | |
| Aqueduct and Sewer Authority, | | | | | |
| Senior Lien Revenue | 5.25 | 7/1/42 | 1,490,000 | | 1,021,470 |
| | | | | | 2,469,751 |
| Residential Mortgage | | | | | |
| Pass-Through Ctfs.—2.0% | | | | | |
| Bear Stearns ALT-A Trust, | | | | | |
| Ser. 2005-4, Cl. 24A1 | 2.49 | 5/25/35 | 1,657,420 | c | 1,632,587 |
| Countrywide Alternative Loan | | | | | |
| Trust, Ser. 2004-4CB, Cl. 1A5 | 5.50 | 4/25/34 | 126,502 | | 131,161 |
| Countrywide Alternative Loan | | | | | |
| Trust, Ser. 2004-18CB, Cl. 4A1 | 5.50 | 9/25/34 | 298,913 | | 302,700 |
| CS First Boston Commercial | | | | | |
| Mortgage Trust, Ser. 2005-8, | | | | | |
| Cl. 9A4 | 5.50 | 9/25/35 | 921,415 | | 853,659 |
| Federal National Mortgage | | | | | |
| Association Connecticut Avenue | | | | | |
| Securities, Ser. 2014-C02, Cl. 1M2 | 2.75 | 5/25/24 | 3,640,000 | c,f | 3,236,133 |
| Residential Funding Mortgage | | | | | |
| Securities Trust, | | | | | |
| Ser. 2005-S9, Cl. A9 | 5.50 | 12/25/35 | 904,229 | | 895,425 |
| Structured Adjustable Rate | | | | | |
| Mortgage Loan Trust, | | | | | |
| Ser. 2005-17, Cl. 4A3 | 4.81 | 8/25/35 | 1,279,215 | c | 1,259,732 |
| Structured Asset Securities Corp. | | | | | |
| Mortgage Pass-through | | | | | |
| Certificates, Ser. 2004-11XS, | | | | | |
| Cl. 1A5A | 6.25 | 6/25/34 | 180,000 | c | 185,936 |
| WaMu Mortgage Pass-Through | | | | | |
| Certificates Trust, | | | | | |
| Ser. 2006-AR16, Cl. 2A1 | 2.05 | 12/25/36 | 3,003,752 | c | 2,611,021 |
20
| | | | | | |
| | | Coupon | Maturity | Principal | | |
| Bonds and Notes (continued) | Rate (%) | Date | Amount ($) | a | Value ($) |
| Residential Mortgage | | | | | | |
| Pass-Through Ctfs. (continued) | | | | | |
| Wells Fargo Mortgage Backed | | | | | |
| Securities Trust, | | | | | | |
| Ser. 2005-AR12, Cl. 2A11 | 2.62 | 6/25/35 | 923,663 | c | 918,072 |
| | | | | | | 12,026,426 |
| Telecommunication Services—6.0% | | | | | |
| Alcatel-Lucent USA, | | | | | | |
| Sr. Unscd. Debs | | 6.45 | 3/15/29 | 3,825,000 | | 3,700,688 |
| Altice, | | | | | | |
| Sr. Scd. Notes | | 7.75 | 5/15/22 | 2,640,000 | b | 2,778,600 |
| CommScope, | | | | | | |
| Gtd. Notes | | 5.50 | 6/15/24 | 2,175,000 | b | 2,210,344 |
| Digicel, | | | | | | |
| Sr. Unscd. Notes | | 6.00 | 4/15/21 | 2,850,000 | b | 2,885,625 |
| Digicel Group, | | | | | | |
| Sr. Unscd. Notes | | 8.25 | 9/30/20 | 4,225,000 | b | 4,436,250 |
| Frontier Communications, | | | | | | |
| Sr. Unscd. Notes | | 8.75 | 4/15/22 | 1,165,000 | | 1,351,400 |
| Intelsat Jackson Holding, | | | | | | |
| Gtd. Notes | | 7.50 | 4/1/21 | 1,535,000 | | 1,667,394 |
| Intelsat Jackson Holdings, | | | | | | |
| Gtd. Notes | | 7.25 | 4/1/19 | 1,035,000 | | 1,090,631 |
| Intelsat Luxembourg, | | | | | | |
| Gtd. Bonds | | 7.75 | 6/1/21 | 3,750,000 | d | 3,932,813 |
| T-Mobile USA, | | | | | | |
| Gtd. Notes | | 6.00 | 3/1/23 | 1,115,000 | | 1,151,238 |
| T-Mobile USA, | | | | | | |
| Gtd. Notes | | 6.13 | 1/15/22 | 775,000 | | 806,000 |
| T-Mobile USA, | | | | | | |
| Gtd. Notes | | 6.38 | 3/1/25 | 790,000 | | 813,700 |
| T-Mobile USA, | | | | | | |
| Gtd. Notes | | 6.50 | 1/15/24 | 1,355,000 | d | 1,422,750 |
| Virgin Media Secured Finance, | | | | | |
| Sr. Scd. Notes | GBP | 6.00 | 4/15/21 | 1,470,000 | b | 2,469,361 |
| West, | | | | | | |
| Gtd. Notes | | 5.38 | 7/15/22 | 3,550,000 | b | 3,452,375 |
| Wind Acquisition Finance, | | | | | | |
| Gtd. Notes | | 7.38 | 4/23/21 | 1,575,000 | b | 1,543,500 |
| | | | | | | 35,712,669 |
The Fund 21
STATEMENT OF INVESTMENTS (continued)
| | | | | | |
| | Coupon | Maturity | Principal | | | |
| Bonds and Notes (continued) | Rate (%) | Date | Amount ($) | a | | Value ($) |
| U.S. Government | | | | | | |
| Agency/ | | | | | | |
| Mortgage-Backed—.4% | | | | | | |
| Government National | | | | | | |
| Mortgage Association I | | | | | | |
| Ser. 2011-53 (Interest Only) | | | | | | |
| 0.59%, 5/16/51 | | | 1,050,075 | c,g | | 42,180 |
| Ser. 2012-125 (Interest Only) | | | | | | |
| 0.86%, 2/16/53 | | | 29,298,853 | c,g | | 2,060,383 |
| Ser. 2011-77 (Interest Only) | | | | | | |
| 1.07%, 4/16/42 | | | 786,653 | c,g | | 37,375 |
| | | | | | | 2,139,938 |
| U.S. Government | | | | | | |
| Securities—1.0% | | | | | | |
| U.S. Treasury Bonds | | | | | | |
| 3.13%, 8/15/44 | | | 5,770,000 | d | | 5,842,125 |
| Utilities—1.2% | | | | | | |
| AES, | | | | | | |
| Sr. Unscd. Notes | 7.38 | 7/1/21 | 3,680,000 | | | 4,217,048 |
| CCOH Safari, | | | | | | |
| Gtd. Bonds | 5.75 | 12/1/24 | 1,725,000 | | | 1,739,016 |
| Dynegy Finance I/II, | | | | | | |
| Sr. Scd. Notes | 6.75 | 11/1/19 | 450,000 | b | | 466,313 |
| Dynegy Finance I/II, | | | | | | |
| Sr. Scd. Notes | 7.38 | 11/1/22 | 720,000 | b | | 762,300 |
| Dynegy Finance I/II, | | | | | | |
| Sr. Scd. Notes | 7.63 | 11/1/24 | 175,000 | b | | 185,719 |
| | | | | | | 7,370,396 |
| Total Bonds and Notes | | | | | | |
| (cost $579,452,687) | | | | | | 572,963,101 |
| |
| | | | Face Amount | | | |
| | | | Covered by | | | |
| Options Purchased—.3% | | | Contracts ($) | | | Value ($) |
| Call Options—.0% | | | | | | |
| South African Rand, | | | | | | |
| February 2015 @ $11.099 | | | 4,000,000 | | | 104,848 |
22
| | | | |
| | | Face Amount | | |
| | | Covered by | | |
| | Options Purchased (continued) | Contracts ($) | | Value ($) |
| | Put Options—.3% | | | |
| | 2-Year USD LIBOR-BBA, | | | |
| | March 2015 @ $1.14 | 222,300,000 | | 295,214 |
| | 10-Year USD LIBOR-BBA, | | | |
| | November 2015 @ $ 5.80 | 1,500,000 | | 73 |
| | 30-Year USD LIBOR-BBA, | | | |
| | November 2014 @ $3.13 | 13,100,000 | | 61,174 |
| | Eurodollar, | | | |
| | March 2015 @ $97.50 | 5,100,000 | | 420,750 |
| | U.S. Treasury 10 Year Notes, | | | |
| | November 2014 @ $125 | 544,000 | | 76,500 |
| | U.S. Treasury 10 Year Notes, | | | |
| | December 2014 @ $125.50 | 236,000 | | 217,563 |
| | U.S. Treasury 10 Year Notes, | | | |
| | December 2014 @ $126 | 236,000 | | 276,563 |
| | U.S. Treasury 10 Year Notes, | | | |
| | December 2014 @ $126.50 | 449,000 | | 666,484 |
| | U.S. Treasury Long Bonds, | | | |
| | November 2014 @ $140 | 58,000 | | 36,250 |
| | | | | 2,050,571 |
| | Total Options Purchased | | | |
| | (cost $3,216,994) | | | 2,155,419 |
| | | Principal | | |
| Short-Term Investments—.8% | Amount ($) | | Value ($) |
| | U.S. Treasury Bills: | | | |
| | 0.02%, 11/13/14 | 3,455,000 | h | 3,454,997 |
| | 0.02%, 2/19/15 | 1,350,000 | | 1,349,939 |
| | Total Short-Term Investments | | | |
| | (cost $4,804,907) | | | 4,804,936 |
| |
| | Other Investment—.9% | Shares | | Value ($) |
| | Registered Investment Company; | | | |
| | Dreyfus Institutional Preferred Plus Money Market Fund | | | |
| | (cost $5,172,509) | 5,172,509 | i | 5,172,509 |
The Fund 23
STATEMENT OF INVESTMENTS (continued)
| | | | |
| Investment of Cash Collateral | | | | |
| for Securities Loaned—3.7% | Shares | | Value ($) | |
| Registered Investment Company; | | | | |
| Dreyfus Institutional Cash Advantage Fund | | | | |
| (cost $21,907,460) | 21,907,460 | i | 21,907,460 | |
| Total Investments (cost $614,554,557) | 101.4 | % | 607,003,425 | |
| Liabilities, Less Cash and Receivables | (1.4 | %) | (8,235,585 | ) |
| Net Assets | 100.0 | % | 598,767,840 | |
BBA—British Bankers Association
LIBOR—London Interbank Offered Rate
USD—US Dollar
|
| a Principal amount stated in U.S. Dollars unless otherwise noted. |
| AUD—Australian Dollar |
| BRL—Brazilian Real |
| COP—Colombian Peso |
| EUR—Euro |
| GBP—British Pound |
| MXN—Mexican New Peso |
| NZD—New Zealand Dollar |
| PLN—Polish Zloty |
| RUB—Russian Ruble |
| b Securities exempt from registration pursuant to Rule 144A under the Securities Act of 1933.These securities may be |
| resold in transactions exempt from registration, normally to qualified institutional buyers.At October 31, 2014, these |
| securities were valued at $138,261,895 or 23.1% of net assets. |
| c Variable rate security—interest rate subject to periodic change. |
| d Security, or portion thereof, on loan.At October 31, 2014, the value of the fund’s securities on loan was |
| $37,789,245 and the value of the collateral held by the fund was $39,443,753, consisting of cash collateral of |
| $21,907,460 and U.S. Government & Agency securities valued at $17,536,293. |
| e Principal amount for accrual purposes is periodically adjusted based on changes in the Brazilian Consumer Price Index. |
| f The Federal Housing Finance Agency (“FHFA”) placed the Federal Home Loan Mortgage Corporation and Federal |
| National Mortgage Association into conservatorship with FHFA as the conservator.As such, the FHFA oversees the |
| continuing affairs of these companies. |
| g Notional face amount shown. |
| h Held by or on behalf of a counterparty for open financial futures contracts. |
| i Investment in affiliated money market mutual fund. |
| | | |
| Portfolio Summary (Unaudited)† | | |
| |
| Value (%) | | Value (%) |
| Corporate Bonds | 38.4 | U.S. Government and | |
| Foreign/Governmental | 29.0 | Agency/Mortgage-Backed | 1.4 |
| Asset-Backed | 14.7 | Municipal Bonds | .4 |
| Commercial Mortgage-Backed | 9.8 | Options Purchased | .3 |
| Short-Term/Money Market Investments | 5.4 | | |
| Residental Mortgage-Backed | 2.0 | | 101.4 |
| |
| † Based on net assets. | | | |
| See notes to financial statements. | | | |
24
STATEMENT OF FINANCIAL FUTURES
October 31, 2014
| | | | | | |
| | | | | | Unrealized | |
| | | Market Value | | | Appreciation | |
| | | Covered by | | | (Depreciation) | |
| Contracts | Contracts ($) | | Expiration | at 10/31/2014 | ($) |
| Financial Futures Long | | | | | | |
| Australian 10 Year Bonds | 205 | 22,151,506 | | December 2014 | 116,621 | |
| U.S. Treasury 5 Year Notes | 296 | 35,350,725 | | December 2014 | (416,290 | ) |
| U.S. Treasury Ultra Long Bonds | 109 | 17,092,563 | | December 2014 | (93,709 | ) |
| Financial Futures Short | | | | | | |
| U.S. Treasury 2 Year Notes | 708 | (155,450,250 | ) | December 2014 | (149,555 | ) |
| U.S. Treasury 10 Year Notes | 55 | (6,949,766 | ) | December 2014 | 7,880 | |
| U.S. Treasury Long Bonds | 72 | (10,158,750 | ) | December 2014 | (157,217 | ) |
| Gross Unrealized Appreciation | | | | | 124,501 | |
| Gross Unrealized Depreciation | | | | | (816,771 | ) |
| |
| See notes to financial statements. | | | | | | |
The Fund 25
STATEMENT OF OPTIONS WRITTEN
October 31, 2014
| | | |
| | Face Amount | | |
| | Covered by | | |
| | Contracts ($) | Value ($) | |
| Call Options: | | | |
| U.S. Treasury 10 Year Notes, | | | |
| December 2014 @ $128 | 236,000 | (59,000 | ) |
| U.S. Treasury 10 Year Notes, | | | |
| December 2014 @ $128.50 | 449,000 | (84,187 | ) |
| Put Options: | | | |
| 5-Year USD LIBOR BBA, | | | |
| March 2015 @ $2.19 | 92,600,000 | (386,059 | ) |
| Eurodollar, | | | |
| March 2015 @ $97.25 | 5,100,000 | (216,750 | ) |
| U.S. Treasury 10 Year Notes, | | | |
| December 2014 @ $124.50 | 236,000 | (125,375 | ) |
| U.S. Treasury 10 Year Notes, | | | |
| December 2014 @ $125 | 921,000 | (647,578 | ) |
| Total Options Written | | | |
| (premiums received $2,082,863) | | (1,518,949 | ) |
| |
| BBA—British Bankers Association | | | |
| LIBOR—London Interbank Offered Rate | | | |
| USD—U.S. Dollar | | | |
| See notes to financial statements. | | | |
26
STATEMENT OF ASSETS AND LIABILITIES
October 31, 2014
| | | |
| | Cost | Value | |
| |
| Assets ($): | | | |
| Investments in securities—See Statement of Investments (including | | | |
| securities on loan, valued at $37,789,245)—Note 1(c): | | | |
| Unaffiliated issuers | 587,474,588 | 579,923,456 | |
| Affiliated issuers | 27,079,969 | 27,079,969 | |
| Cash | | 5,155,568 | |
| Cash denominated in foreign currencies | 791,231 | 785,854 | |
| Receivable for investment securities sold | | 5,752,894 | |
| Dividends, interest and securities lending income receivable | | 5,627,229 | |
| Receivable for shares of Capital Stock subscribed | | 5,345,370 | |
| Swap collateral—Note 4 | | 3,957,416 | |
| Unrealized appreciation on forward foreign | | | |
| currency exchange contracts—Note 4 | | 3,413,287 | |
| Unrealized appreciation on swap agreements—Note 4 | | 1,055,039 | |
| Receivable for futures variation margin—Note 4 | | 68,603 | |
| Receivable for swap variation margin—Note 4 | | 386,698 | |
| Prepaid expenses | | 33,564 | |
| | | 638,584,947 | |
| Liabilities ($): | | | |
| Due to The Dreyfus Corporation and affiliates—Note 3(c) | | 367,311 | |
| Liability for securities on loan—Note 1(c) | | 21,907,460 | |
| Payable for investment securities purchased | | 12,795,436 | |
| Outstanding options written, at value (premiums received | | | |
| $2,082,863)—See Statement of Options Written—Note 4 | | 1,518,949 | |
| Payable for shares of Capital Stock redeemed | | 1,139,280 | |
| Unrealized depreciation on forward foreign | | | |
| currency exchange contracts—Note 4 | | 947,939 | |
| Unrealized depreciation on swap agreements—Note 4 | | 512,004 | |
| Swaps premium received—Note 4 | | 472,325 | |
| Accrued expenses | | 156,403 | |
| | | 39,817,107 | |
| Net Assets ($) | | 598,767,840 | |
| Composition of Net Assets ($): | | | |
| Paid-in capital | | 599,206,427 | |
| Accumulated undistributed investment income—net | | 10,239,528 | |
| Accumulated net realized gain (loss) on investments | | (1,927,881 | ) |
| Accumulated net unrealized appreciation (depreciation) on investments, options | | |
| transactions, swap transactions and foreign currency transactions [including | | |
| ($692,270) net unrealized depreciation on financial futures and ($4,029,552) | | |
| net unrealized depreciation on centrally cleared swap transactions] | (8,750,234 | ) |
| Net Assets ($) | | 598,767,840 | |
| | | | |
| Net Asset Value Per Share | | | | |
| | Class A | Class C | Class I | Class Y |
| Net Assets ($) | 184,505,814 | 58,623,094 | 349,914,586 | 5,724,346 |
| Shares Outstanding | 13,888,110 | 4,428,510 | 26,349,962 | 431,170 |
| Net Asset Value Per Share ($) | 13.29 | 13.24 | 13.28 | 13.28 |
| See notes to financial statements. | | | | |
The Fund 27
STATEMENT OF OPERATIONS
Year Ended October 31, 2014
| | |
| Investment Income ($): | | |
| Income: | | |
| Interest | 13,003,064 | |
| Dividends: | | |
| Unaffiliated issuers | 102,591 | |
| Affiliated issuers | 11,055 | |
| Income from securities lending—Note 1(c) | 41,800 | |
| Total Income | 13,158,510 | |
| Expenses: | | |
| Management fee—Note 3(a) | 1,640,912 | |
| Shareholder servicing costs—Note 3(c) | 612,730 | |
| Distribution fees—Note 3(b) | 239,942 | |
| Registration fees | 122,291 | |
| Custodian fees—Note 3(c) | 100,940 | |
| Professional fees | 75,643 | |
| Prospectus and shareholders’ reports | 35,207 | |
| Directors’ fees and expenses—Note 3(d) | 27,205 | |
| Loan commitment fees—Note 2 | 3,382 | |
| Miscellaneous | 54,708 | |
| Total Expenses | 2,912,960 | |
| Less—reduction in expenses due to undertaking—Note 3(a) | (69,215 | ) |
| Less—reduction in fees due to earnings credits—Note 3(c) | (28 | ) |
| Net Expenses | 2,843,717 | |
| Investment Income—Net | 10,314,793 | |
| Realized and Unrealized Gain (Loss) on Investments—Note 4 ($): | | |
| Net realized gain (loss) on investments and foreign currency transactions | 1,037,376 | |
| Net realized gain (loss) on options transactions | 669,796 | |
| Net realized gain (loss) on financial futures | (2,714,771 | ) |
| Net realized gain (loss) on swap transactions | (4,226,524 | ) |
| Net realized gain (loss) on forward foreign currency exchange contracts | 9,937,695 | |
| Net Realized Gain (Loss) | 4,703,572 | |
| Net unrealized appreciation (depreciation) on | | |
| investments and foreign currency transactions | (8,583,143 | ) |
| Net unrealized appreciation (depreciation) on options transactions | (261,539 | ) |
| Net unrealized appreciation (depreciation) on financial futures | (50,804 | ) |
| Net unrealized appreciation (depreciation) on swap transactions | (2,300,234 | ) |
| Net unrealized appreciation (depreciation) on | | |
| forward foreign currency exchange contracts | 1,835,126 | |
| Net Unrealized Appreciation (Depreciation) | (9,360,594 | ) |
| Net Realized and Unrealized Gain (Loss) on Investments | (4,657,022 | ) |
| Net Increase in Net Assets Resulting from Operations | 5,657,771 | |
| |
| See notes to financial statements. | | |
28
STATEMENT OF CHANGES IN NET ASSETS
| | | | |
| | Year Ended October 31, | |
| | 2014 | | 2013 | a |
| Operations ($): | | | | |
| Investment income—net | 10,314,793 | | 1,879,452 | |
| Net realized gain (loss) on investments | 4,703,572 | | (756,715 | ) |
| Net unrealized appreciation | | | | |
| (depreciation) on investments | (9,360,594 | ) | (598,236 | ) |
| Net Increase (Decrease) in Net Assets | | | | |
| Resulting from Operations | 5,657,771 | | 524,501 | |
| Dividends to Shareholders from ($): | | | | |
| Investment income—net: | | | | |
| Class A | (2,776,837 | ) | (884,818 | ) |
| Class C | (428,450 | ) | (115,882 | ) |
| Class I | (3,205,118 | ) | (456,933 | ) |
| Class Y | (44,825 | ) | (4 | ) |
| Net realized gain on investments: | | | | |
| Class A | — | | (516,249 | ) |
| Class C | — | | (92,019 | ) |
| Class I | — | | (190,453 | ) |
| Total Dividends | (6,455,230 | ) | (2,256,358 | ) |
| Capital Stock Transactions ($): | | | | |
| Net proceeds from shares sold: | | | | |
| Class A | 167,123,694 | | 73,376,806 | |
| Class C | 48,170,319 | | 15,344,672 | |
| Class I | 342,775,789 | | 60,557,738 | |
| Class Y | 5,748,119 | | 1,000 | |
| Dividends reinvested: | | | | |
| Class A | 2,213,251 | | 1,215,069 | |
| Class C | 269,135 | | 129,298 | |
| Class I | 1,769,442 | | 461,447 | |
| Class Y | 40,136 | | — | |
| Cost of shares redeemed: | | | | |
| Class A | (71,523,550 | ) | (12,747,712 | ) |
| Class C | (6,019,894 | ) | (3,223,861 | ) |
| Class I | (50,209,616 | ) | (11,608,270 | ) |
| Class Y | (1,893 | ) | — | |
| Increase (Decrease) in Net Assets | | | | |
| from Capital Stock Transactions | 440,354,932 | | 123,506,187 | |
| Total Increase (Decrease) in Net Assets | 439,557,473 | | 121,774,330 | |
| Net Assets ($): | | | | |
| Beginning of Period | 159,210,367 | | 37,436,037 | |
| End of Period | 598,767,840 | | 159,210,367 | |
| Undistributed (distributions in excess of) | | | | |
| investment income—net | 10,239,528 | | (410,057 | ) |
The Fund 29
STATEMENT OF CHANGES IN NET ASSETS (continued)
| | | | |
| | Year Ended October 31, | |
| | 2014 | | 2013 | a |
| Capital Share Transactions: | | | | |
| Class Ab | | | | |
| Shares sold | 12,519,432 | | 5,573,735 | |
| Shares issued for dividends reinvested | 166,121 | | 91,775 | |
| Shares redeemed | (5,351,645 | ) | (967,001 | ) |
| Net Increase (Decrease) in Shares Outstanding | 7,333,908 | | 4,698,509 | |
| Class Cb | | | | |
| Shares sold | 3,607,867 | | 1,169,452 | |
| Shares issued for dividends reinvested | 20,233 | | 9,791 | |
| Shares redeemed | (454,167 | ) | (245,331 | ) |
| Net Increase (Decrease) in Shares Outstanding | 3,173,933 | | 933,912 | |
| Class Ic | | | | |
| Shares sold | 25,614,464 | | 4,594,684 | |
| Shares issued for dividends reinvested | 132,473 | | 34,887 | |
| Shares redeemed | (3,767,211 | ) | (881,917 | ) |
| Net Increase (Decrease) in Shares Outstanding | 21,979,726 | | 3,747,654 | |
| Class Yc | | | | |
| Shares sold | 428,240 | | 76.51 | |
| Shares issued for dividends reinvested | 2,995 | | — | |
| Shares redeemed | (142 | ) | — | |
| Net Increase (Decrease) in Shares Outstanding | 431,093 | | 76.51 | |
|
| a Effective July 1, 2013, the fund commenced offering ClassY shares. |
| b During the period ended October 31, 2013, 1,897 Class C shares representing $25,779 were exchanged for 1,893 |
| Class A shares. |
| c During the period ended October 31, 2014, 344,609 Class I shares representing $4,641,890 were exchanged for |
| 344,866 ClassY shares. |
See notes to financial statements.
30
FINANCIAL HIGHLIGHTS
The following tables describe the performance for each share class for the fiscal periods indicated. All information (except portfolio turnover rate) reflects financial results for a single fund share.Total return shows how much your investment in the fund would have increased (or decreased) during each period, assuming you had reinvested all dividends and distributions.These figures have been derived from the fund’s financial statements.
| | | | | | | | | | |
| | | | Year Ended October 31, | | | |
| Class A Shares | 2014 | | 2013 | | 2012 | | 2011 | | 2010 | |
| Per Share Data ($): | | | | | | | | | | |
| Net asset value, beginning of period | 13.08 | | 13.38 | | 12.84 | | 13.44 | | 12.36 | |
| Investment Operations: | | | | | | | | | | |
| Investment income—neta | .43 | | .36 | | .46 | | .51 | | .67 | |
| Net realized and unrealized | | | | | | | | | | |
| gain (loss) on investments | .06 | | (.02 | ) | .64 | | (.54 | ) | .98 | |
| Total from Investment Operations | .49 | | .34 | | 1.10 | | (.03 | ) | 1.65 | |
| Distributions: | | | | | | | | | | |
| Dividends from investment income—net | (.28 | ) | (.37 | ) | (.51 | ) | (.57 | ) | (.57 | ) |
| Dividends from net realized | | | | | | | | | | |
| gain on investments | — | | (.27 | ) | (.05 | ) | — | | — | |
| Total Distributions | (.28 | ) | (.64 | ) | (.56 | ) | (.57 | ) | (.57 | ) |
| Net asset value, end of period | 13.29 | | 13.08 | | 13.38 | | 12.84 | | 13.44 | |
| Total Return (%)b | 3.77 | | 2.54 | | 8.85 | | (.24 | ) | 13.67 | |
| Ratios/Supplemental Data (%): | | | | | | | | | | |
| Ratio of total expenses | | | | | | | | | | |
| to average net assets | .98 | | 1.23 | | 1.51 | | 1.44 | | 1.41 | |
| Ratio of net expenses | | | | | | | | | | |
| to average net assets | .97 | | 1.10 | | 1.10 | | 1.10 | | 1.10 | |
| Ratio of net investment income | | | | | | | | | | |
| to average net assets | 3.25 | | 2.78 | | 3.58 | | 3.88 | | 5.27 | |
| Portfolio Turnover Rate | 230.83 | | 304.46 | | 267.60 | | 309.54 | c | 172.20 | |
| Net Assets, end of period ($ x 1,000) | 184,506 | | 85,719 | | 24,830 | | 27,735 | | 29,926 | |
|
| a Based on average shares outstanding. |
| b Exclusive of sales charge. |
| c The portfolio turnover rate excluding mortgage dollar roll transactions for the period ended October 31, 2011 |
| was 303.56%. |
See notes to financial statements.
The Fund 31
FINANCIAL HIGHLIGHTS (continued)
| | | | | | | | | | |
| | | | Year Ended October 31, | | | |
| Class C Shares | 2014 | | 2013 | | 2012 | | 2011 | | 2010 | |
| Per Share Data ($): | | | | | | | | | | |
| Net asset value, beginning of period | 13.03 | | 13.34 | | 12.79 | | 13.39 | | 12.31 | |
| Investment Operations: | | | | | | | | | | |
| Investment income—neta | .33 | | .25 | | .36 | | .42 | | .59 | |
| Net realized and unrealized | | | | | | | | | | |
| gain (loss) on investments | .06 | | (.02 | ) | .64 | | (.55 | ) | .96 | |
| Total from Investment Operations | .39 | | .23 | | 1.00 | | (.13 | ) | 1.55 | |
| Distributions: | | | | | | | | | | |
| Dividends from investment income—net | (.18 | ) | (.27 | ) | (.40 | ) | (.47 | ) | (.47 | ) |
| Dividends from net realized | | | | | | | | | | |
| gain on investments | — | | (.27 | ) | (.05 | ) | — | | — | |
| Total Distributions | (.18 | ) | (.54 | ) | (.45 | ) | (.47 | ) | (.47 | ) |
| Net asset value, end of period | 13.24 | | 13.03 | | 13.34 | | 12.79 | | 13.39 | |
| Total Return (%)b | 3.02 | | 1.72 | | 8.08 | | (1.00 | ) | 12.81 | |
| Ratios/Supplemental Data (%): | | | | | | | | | | |
| Ratio of total expenses | | | | | | | | | | |
| to average net assets | 1.72 | | 2.01 | | 2.30 | | 2.22 | | 2.20 | |
| Ratio of net expenses | | | | | | | | | | |
| to average net assets | 1.70 | | 1.85 | | 1.85 | | 1.85 | | 1.85 | |
| Ratio of net investment income | | | | | | | | | | |
| to average net assets | 2.52 | | 1.98 | | 2.84 | | 3.15 | | 4.57 | |
| Portfolio Turnover Rate | 230.83 | | 304.46 | | 267.60 | | 309.54 | c | 172.20 | |
| Net Assets, end of period ($ x 1,000) | 58,623 | | 16,352 | | 4,277 | | 4,746 | | 5,295 | |
|
| a Based on average shares outstanding. |
| b Exclusive of sales charge. |
| c The portfolio turnover rate excluding mortgage dollar roll transactions for the period ended October 31, 2011 |
| was 303.56%. |
See notes to financial statements.
32
| | | | | | | | | | |
| | | | Year Ended October 31, | | | |
| Class I Shares | 2014 | | 2013 | | 2012 | | 2011 | | 2010 | |
| Per Share Data ($): | | | | | | | | | | |
| Net asset value, beginning of period | 13.07 | | 13.38 | | 12.84 | | 13.44 | | 12.36 | |
| Investment Operations: | | | | | | | | | | |
| Investment income—neta | .46 | | .36 | | .49 | | .51 | | .72 | |
| Net realized and unrealized | | | | | | | | | | |
| gain (loss) on investments | .07 | | — | | .64 | | (.50 | ) | .96 | |
| Total from Investment Operations | .53 | | .36 | | 1.13 | | .01 | | 1.68 | |
| Distributions: | | | | | | | | | | |
| Dividends from investment income—net | (.32 | ) | (.40 | ) | (.54 | ) | (.61 | ) | (.60 | ) |
| Dividends from net realized | | | | | | | | | | |
| gain on investments | — | | (.27 | ) | (.05 | ) | — | | — | |
| Total Distributions | (.32 | ) | (.67 | ) | (.59 | ) | (.61 | ) | (.60 | ) |
| Net asset value, end of period | 13.28 | | 13.07 | | 13.38 | | 12.84 | | 13.44 | |
| Total Return (%) | 4.06 | | 2.74 | | 9.13 | | .03 | | 13.99 | |
| Ratios/Supplemental Data (%): | | | | | | | | | | |
| Ratio of total expenses | | | | | | | | | | |
| to average net assets | .72 | | .96 | | 1.20 | | 1.23 | | 1.16 | |
| Ratio of net expenses | | | | | | | | | | |
| to average net assets | .69 | | .85 | | .85 | | .85 | | .85 | |
| Ratio of net investment income | | | | | | | | | | |
| to average net assets | 3.53 | | 2.91 | | 3.83 | | 3.87 | | 5.54 | |
| Portfolio Turnover Rate | 230.83 | | 304.46 | | 267.60 | | 309.54 | b | 172.20 | |
| Net Assets, end of period ($ x 1,000) | 349,915 | | 57,138 | | 8,329 | | 7,095 | | 1,469 | |
|
| a Based on average shares outstanding. |
| b The portfolio turnover rate excluding mortgage dollar roll transactions for the period ended October 31, 2011 |
| was 303.56%. |
See notes to financial statements.
The Fund 33
FINANCIAL HIGHLIGHTS (continued)
| | | | |
| | Year Ended October 31, | |
| Class Y Shares | 2014 | | 2013 | a |
| Per Share Data ($): | | | | |
| Net asset value, beginning of period | 13.07 | | 13.07 | |
| Investment Operations: | | | | |
| Investment income—netb | .47 | | .13 | |
| Net realized and unrealized | | | | |
| gain (loss) on investments | .07 | | (.07 | ) |
| Total from Investment Operations | .54 | | .06 | |
| Distributions: | | | | |
| Dividends from investment income—net | (.33 | ) | (.06 | ) |
| Net asset value, end of period | 13.28 | | 13.07 | |
| Total Return (%) | 4.13 | | .42 | c |
| Ratios/Supplemental Data (%): | | | | |
| Ratio of total expenses to average net assets | .61 | | .85 | d |
| Ratio of net expenses to average net assets | .60 | | .85 | d |
| Ratio of net investment income | | | | |
| to average net assets | 3.61 | | 2.88 | d |
| Portfolio Turnover Rate | 230.83 | | 304.46 | |
| Net Assets, end of period ($ x 1,000) | 5,724 | | 1 | |
| |
| a | From July 1, 2013 (commencement of initial offering) to October 31, 2013. |
| b | Based on average shares outstanding. |
| c | Not annualized. |
| d | Annualized. |
See notes to financial statements.
34
NOTES TO FINANCIAL STATEMENTS
NOTE 1—Significant Accounting Policies:
Dreyfus Opportunistic Fixed Income Fund (the “fund”) is a separate non-diversified series of The Dreyfus/Laurel Funds, Inc. (the “Company”), which is registered under the Investment Company Act of 1940, as amended (the “Act”), as an open-end management investment company and operates as a series company currently offering eleven series, including the fund.The fund’s investment objective seeks to maximize total return through capital appreciation and income.The Dreyfus Corporation (the “Manager” or “Dreyfus”), a wholly-owned subsidiary of The Bank of New York Mellon Corporation (“BNY Mellon”), serves as the fund’s investment adviser.
MBSC Securities Corporation (the “Distributor”), a wholly-owned subsidiary of the Manager, is the distributor of the fund’s shares. The fund is authorized to issue 100 million shares of $.001 par value Capital Stock in each of the following classes of shares: Class A, Class C, Class I and Class Y. Class A and Class C shares are sold primarily to retail investors through financial intermediaries and bear Distribution and/or Shareholder Services Plan fees. Class A shares generally are subject to a sales charge imposed at the time of purchase. Class C shares are subject to a contingent deferred sales charge (“CDSC”) imposed on Class C shares redeemed within one year of purchase. Class I shares are sold primarily to bank trust departments and other financial service providers (including The Bank of NewYork Mellon, a subsidiary of BNY Mellon and an affiliate of Dreyfus, and its affiliates), acting on behalf of customers having a qualified trust or an investment account or relationship at such institution, and bear no Distribution or Shareholder Services Plan fees. ClassY shares are sold at net asset value per share generally to institutional investors and bear no Distribution or Shareholder Services Plan fees. Class I and ClassY shares are offered without a front-end sales charge or CDSC. Other differences between the classes include the services offered to and the expenses borne by each class, the allocation
The Fund 35
NOTES TO FINANCIAL STATEMENTS (continued)
of certain transfer agency costs, and certain voting rights. Income, expenses (other than expenses attributable to a specific class), and realized and unrealized gains or losses on investments are allocated to each class of shares based on its relative net assets.
The Company accounts separately for the assets, liabilities and operations of each series. Expenses directly attributable to each series are charged to that series’ operations; expenses which are applicable to all series are allocated among them on a pro rata basis.
The Financial Accounting Standards Board (“FASB”) Accounting Standards Codification (“ASC”) is the exclusive reference of authoritative U.S. generally accepted accounting principles (“GAAP”) recognized by the FASB to be applied by nongovernmental entities. Rules and interpretive releases of the Securities and Exchange Commission (“SEC”) under authority of federal laws are also sources of authoritative GAAP for SEC registrants. The fund’s financial statements are prepared in accordance with GAAP, which may require the use of management estimates and assumptions. Actual results could differ from those estimates.
(a) Portfolio valuation: The fair value of a financial instrument is the amount that would be received to sell an asset or paid to transfer a liability in an orderly transaction between market participants at the measurement date (i.e., the exit price). GAAP establishes a fair value hierarchy that prioritizes the inputs of valuation techniques used to measure fair value. This hierarchy gives the highest priority to unadjusted quoted prices in active markets for identical assets or liabilities (Level 1 measurements) and the lowest priority to unobservable inputs (Level 3 measurements).
Additionally, GAAP provides guidance on determining whether the volume and activity in a market has decreased significantly and whether such a decrease in activity results in transactions that are not orderly. GAAP requires enhanced disclosures around valuation inputs and techniques used during annual and interim periods.
36
Various inputs are used in determining the value of the fund’s investments relating to fair value measurements.These inputs are summarized in the three broad levels listed below:
Level 1—unadjusted quoted prices in active markets for identical investments.
Level 2—other significant observable inputs (including quoted prices for similar investments, interest rates, prepayment speeds, credit risk, etc.).
Level 3—significant unobservable inputs (including the fund’s own assumptions in determining the fair value of investments).
The inputs or methodology used for valuing securities are not necessarily an indication of the risk associated with investing in those securities.
Changes in valuation techniques may result in transfers in or out of an assigned level within the disclosure hierarchy. Valuation techniques used to value the fund’s investments are as follows:
Registered investment companies that are not traded on an exchange are valued at their net asset value and are generally categorized within Level 1 of the fair value hierarchy.
Investments in securities, excluding short-term investments (other than U.S. Treasury Bills), financial futures, options and forward foreign currency exchange contracts (“forward contracts”) are valued each business day by an independent pricing service (the “Service”) approved by the Company’s Board of Directors (the “Board”). Investments for which quoted bid prices are readily available and are representative of the bid side of the market in the judgment of the Service are valued at the mean between the quoted bid prices (as obtained by the Service from dealers in such securities) and asked prices (as calculated by the Service based upon its evaluation of the market for such securities). Other investments (which constitute a majority of the portfolio securities) are valued as determined by the Service, based on methods which include consid-
The Fund 37
NOTES TO FINANCIAL STATEMENTS (continued)
eration of the following: yields or prices of securities of comparable quality, coupon, maturity and type; indications as to values from dealers; and general market conditions.These securities are generally categorized within Level 2 of the fair value hierarchy.
U.S. Treasury Bills are valued at the mean price between quoted bid prices and asked prices by the Service. These securities are generally categorized within Level 2 of the fair value hierarchy.
The Service’s procedures are reviewed by Dreyfus under the general supervision of the Board.
When market quotations or official closing prices are not readily available, or are determined not to reflect accurately fair value, such as when the value of a security has been significantly affected by events after the close of the exchange or market on which the security is principally traded (for example, a foreign exchange or market), but before the fund calculates its net asset value, the fund may value these investments at fair value as determined in accordance with the procedures approved by the Board. Certain factors may be considered when fair valuing investments such as: fundamental analytical data, the nature and duration of restrictions on disposition, an evaluation of the forces that influence the market in which the securities are purchased and sold, and public trading in similar securities of the issuer or comparable issuers. These securities are either categorized within Level 2 or 3 of the fair value hierarchy depending on the relevant inputs used.
For restricted securities where observable inputs are limited, assumptions about market activity and risk are used and are generally categorized within Level 3 of the fair value hierarchy.
Investments denominated in foreign currencies are translated to U.S. dollars at the prevailing rates of exchange.
Financial futures and options, which are traded on an exchange, are valued at the last sales price on the securities exchange on which such securities are primarily traded or at the last sales price on the national securities market on each business day and are generally categorized within Level 1 of the fair value hierarchy. Options traded over-the-
38
counter (“OTC”) are valued at the mean between the bid and asked price and are generally categorized within Level 2 of the fair value hierarchy. Investments in swap transactions are valued each business day by the Service. Swaps are valued by the Service by using a swap pricing model which incorporates among other factors, default probabilities, recovery rates, credit curves of the underlying issuer and swap spreads on interest rates and are generally categorized within Level 2 of the fair value hierarchy. Forward contracts are valued at the forward rate and are generally categorized within Level 2 of the fair value hierarchy.
The following is a summary of the inputs used as of October 31, 2014 in valuing the fund’s investments:
| | | | |
| | | Level 2—Other | Level 3— | |
| | Level 1— | Significant | Significant | |
| | Unadjusted | Observable | Unobservable | |
| | Quoted Prices | Inputs | Inputs | Total |
| Assets ($) | | | | |
| Investments in Securities: | | | |
| Asset-Backed | — | 88,443,802 | — | 88,443,802 |
| Commercial | | | | |
| Mortgage-Backed | — | 58,400,061 | — | 58,400,061 |
| Corporate Bonds† | — | 230,195,076 | — | 230,195,076 |
| Foreign Government | — | 173,445,922 | — | 173,445,922 |
| Municipal Bonds† | — | 2,469,751 | — | 2,469,751 |
| Mutual Funds | 27,079,969 | — | — | 27,079,969 |
| Residential | | | | |
| Mortgage-Backed | — | 12,026,426 | — | 12,026,426 |
| U.S. Government | | | | |
| Agency/ | | | | |
| Mortgage-Backed | — | 2,139,938 | — | 2,139,938 |
| U.S. Treasury | — | 10,647,061 | — | 10,647,061 |
| Other Financial | | | | |
| Instruments: | | | | |
| Financial Futures†† | 124,501 | — | — | 124,501 |
| Forward Foreign | | | | |
| Currency Exchange | | | | |
| Contracts†† | — | 3,413,287 | — | 3,413,287 |
| Options Purchased | 1,694,110 | 461,309 | — | 2,155,419 |
| Swaps†† | — | 1,055,039 | — | 1,055,039 |
The Fund 39
NOTES TO FINANCIAL STATEMENTS (continued)
| | | | | | | |
| | | | Level 2—Other | | Level 3— | | |
| | Level 1— | | Significant | | Significant | | |
| | Unadjusted | | Observable | | Unobservable | | |
| | Quoted Prices | | Inputs | | Inputs | Total | |
| Liabilities ($) | | | | | | | |
| Other Financial | | | | | | | |
| Instruments: | | | | | | | |
| Financial Futures†† | (816,771 | ) | — | | — | (816,771 | ) |
| Forward Foreign | | | | | | | |
| Currency Exchange | | | | | | | |
| Contracts†† | — | | (947,939 | ) | — | (947,939 | ) |
| Swaps†† | — | | (4,541,556 | ) | — | (4,541,556 | ) |
| Options Written | (1,132,890 | ) | (386,059 | ) | — | (1,518,949 | ) |
| |
| † | See Statement of Investments for additional detailed categorizations. |
| †† | Amount shown represents unrealized appreciation (depreciation) at period end. |
At October 31, 2014, there were no transfers between Level 1 and Level 2 of the fair value hierarchy.
(b) Foreign currency transactions: The fund does not isolate that portion of the results of operations resulting from changes in foreign exchange rates on investments from the fluctuations arising from changes in the market prices of securities held. Such fluctuations are included with the net realized and unrealized gain or loss on investments.
Net realized foreign exchange gains or losses arise from sales of foreign currencies, currency gains or losses realized on securities transactions between trade and settlement date, and the difference between the amounts of dividends, interest and foreign withholding taxes recorded on the fund’s books and the U.S. dollar equivalent of the amounts actually received or paid. Net unrealized foreign exchange gains and losses arise from changes in the value of assets and liabilities other than investments resulting from changes in exchange rates. Foreign currency gains and losses on foreign currency transactions are also included with net realized and unrealized gain or loss on investments.
(c) Securities transactions and investment income: Securities transactions are recorded on a trade date basis. Realized gains and losses from securities transactions are recorded on the identified cost basis. Dividend income is recognized on the ex-dividend date and interest
40
income, including, where applicable, accretion of discount and amortization of premium on investments, is recognized on the accrual basis.
Pursuant to a securities lending agreement with The Bank of New York Mellon, the fund may lend securities to qualified institutions. It is the fund’s policy that, at origination, all loans are secured by collateral of at least 102% of the value of U.S. securities loaned and 105% of the value of foreign securities loaned. Collateral equivalent to at least 100% of the market value of securities on loan is maintained at all times. Collateral is either in the form of cash, which can be invested in certain money market mutual funds managed by the Manager or U.S. Government and Agency securities.The fund is entitled to receive all dividends, interest and distributions on securities loaned, in addition to income earned as a result of the lending transaction. Should a borrower fail to return the securities in a timely manner, The Bank of New York Mellon is required to replace the securities for the benefit of the fund or credit the fund with the market value of the unreturned securities and is subrogated to the fund’s rights against the borrower and the collateral. During the period ended October 31, 2014, The Bank of NewYork Mellon earned $9,848 from lending portfolio securities, pursuant to the securities lending agreement.
(d) Affiliated issuers: Investments in other investment companies advised by Dreyfus are defined as “affiliated” under the Act. Investments in affiliated investment companies during the period ended October 31, 2014 were as follows:
| | | | | |
| Affiliated | | | | | |
| Investment | Value | | | Value | Net |
| Company | 10/31/2013 ($) | Purchases ($) | Sales ($) | 10/31/2014 ($) | Assets (%) |
| Dreyfus | | | | | |
| Institutional | | | | | |
| Preferred | | | | | |
| Plus Money | | | | | |
| Market Fund | 4,895,124 | 449,641,925 | 449,364,540 | 5,172,509 | .9 |
| Dreyfus | | | | | |
| Institutional | | | | | |
| Cash Advantage | | | | |
| Fund | 5,268,753 | 114,546,511 | 97,907,804 | 21,907,460 | 3.7 |
| Total | 10,163,877 | 564,188,436 | 547,272,344 | 27,079,969 | 4.6 |
The Fund 41
NOTES TO FINANCIAL STATEMENTS (continued)
(e) Risk: The fund invests primarily in debt securities. Failure of an issuer of the debt securities to make timely interest or principal payments, or a decline or the perception of a decline in the credit quality of a debt security, can cause the debt security’s price to fall, potentially lowering the fund’s share price. In addition, the value of debt securities may decline due to general market conditions that are not specifically related to a particular issuer, such as real or perceived adverse economic conditions, changes in outlook for corporate earnings, changes in interest or currency rates or adverse investor sentiment. They may also decline because of factors that affect a particular industry.
(f) Dividends to shareholders: Dividends are recorded on the ex-dividend date. Dividends from investment income-net are normally declared and paid on a monthly basis. Dividends from net realized capital gains, if any, are normally declared and paid annually, but the fund may make distributions on a more frequent basis to comply with the distribution requirements of the Internal Revenue Code of 1986, as amended (the “Code”).To the extent that net realized capital gains can be offset by capital loss carryovers, it is the policy of the fund not to distribute such gains. Income and capital gain distributions are determined in accordance with income tax regulations, which may differ from GAAP.
On October 31, 2014, the Board declared a cash dividend of $.026, $.017 $.029 and $.029 per share from undistributed investment income-net for Class A, Class C, Class I and ClassY shares, respectively, payable on November 3, 2014 (ex-dividend date), to shareholders of record as of the close of business on October 31, 2014.
(g) Federal income taxes: It is the policy of the fund to continue to qualify as a regulated investment company, if such qualification is in the best interests of its shareholders, by complying with the applicable provisions of the Code, and to make distributions of taxable income sufficient to relieve it from substantially all federal income and excise taxes.
As of and during the period ended October 31, 2014, the fund did not have any liabilities for any uncertain tax positions.The fund recognizes interest and penalties, if any, related to uncertain tax positions as income
42
tax expense in the Statement of Operations. During the period ended October 31, 2014, the fund did not incur any interest or penalties.
Each tax year in the four-year period ended October 31, 2014 remains subject to examination by the Internal Revenue Service and state taxing authorities.
At October 31, 2014, the components of accumulated earnings on a tax basis were as follows: undistributed ordinary income $12,967,360, accumulated capital losses $2,737,072 and unrealized depreciation $10,668,875.
Under the Regulated Investment Company Modernization Act of 2010 (the “2010 Act”), the fund is permitted to carry forward capital losses incurred in taxable years beginning after December 22, 2010 (“post-enactment losses”) for an unlimited period. Furthermore, post-enactment capital loss carryovers retain their character as either short-term or long-term capital losses rather than short-term as they were under previous statute.
The accumulated capital loss carryover is available for federal income tax purposes to be applied against future net realized capital gains, if any, realized subsequent to October 31, 2014. The fund has $766,980 of post-enactment short-term capital losses and $1,970,092 of post-enactment long-term capital losses which can be carried forward for an unlimited period.
The tax character of distributions paid to shareholders during the fiscal year ended October 31, 2014 and October 31, 2013 were as follows: ordinary income $6,455,230 and $2,173,863, and long-term capital gains $0 and $82,495, respectively.
During the period ended October 31, 2014, as a result of permanent book to tax differences, primarily due to the tax treatment for pay-down gain and losses, foreign currency transactions, swap periodic payments and consent fees, the fund increased accumulated undistributed investment income-net by $6,790,022, decreased accumulated
The Fund 43
NOTES TO FINANCIAL STATEMENTS (continued)
net realized gain (loss) on investments by $6,787,522 and decreased paid-in capital by $2,500. Net assets and net asset value per share were not affected by this reclassification.
NOTE 2—Bank Lines of Credit:
The fund participates with other Dreyfus-managed funds in a $430 million unsecured credit facility led by Citibank, N.A. and a $300 million unsecured credit facility provided by The Bank of New York Mellon (each, a “Facility”), each to be utilized primarily for temporary or emergency purposes, including the financing of redemptions. Prior to October 8, 2014, the unsecured credit facility with Citibank, N.A. was $265 million. In connection therewith, the fund has agreed to pay its pro rata portion of commitment fees for each Facility. Interest is charged to the fund based on rates determined pursuant to the terms of the respective Facility at the time of borrowing. During the period ended October 31, 2014, the fund did not borrow under the Facilities.
NOTE 3—Management Fee and Other Transactions with Affiliates:
(a) Prior to April 1, 2014, pursuant to a management agreement with the Manager, the management fee was computed at the annual rate of .60% of the value of the fund’s average daily net assets and was payable monthly. Effective April 1, 2014, the Board approved the reduction in management fee to an annual rate of .50% of the value of the fund’s average daily net assets. The Manager had contractually agreed, from November 1, 2013 through March 31, 2014 to waive receipt of its fees and/or assume the direct expenses of the fund, so that the expenses of none of the classes (excluding Rule 12b-1 Distribution Plan fees, Shareholder Services Plan fees, taxes, interest expense, brokerage commissions, commitment fees on borrowings and extraordinary expenses) exceeded .85% of the value of the fund’s average daily net assets. The Manager has contractually agreed, from April 1, 2014 through March 1, 2015, to waive receipt of its fees and/or assume the direct expenses of the fund, so that the expenses of Class A, C, I and Y
44
shares (excluding certain expenses as described above) do not exceed .65%, .65%, .65% and .60% of the value of the respective class’ average daily net assets. The reduction in expenses, pursuant to the undertakings, amounted to $69,215 during the period ended October 31, 2014.
During the period ended October 31, 2014, the Distributor retained $28,943 from commissions earned on sales of the fund’s Class A shares and $5,729 from CDSCs on redemptions of the fund’s Class C shares.
(b) Under the Distribution Plan adopted pursuant to Rule 12b-1 under the Act, Class C shares pay the Distributor for distributing its shares at an annual rate of .75% of the value of its average daily net assets. During the period ended October 31, 2014, Class C shares were charged $239,942 pursuant to the Distribution Plan.
(c) Under the Shareholder Services Plan, Class A and Class C shares pay the Distributor at an annual rate of .25% of the value of their average daily net assets for the provision of certain services. The services provided may include personal services relating to shareholder accounts, such as answering shareholder inquiries regarding the fund and providing reports and other information, and services related to the maintenance of shareholder accounts. The Distributor may make payments to Service Agents (securities dealers, financial institutions or other industry professionals) with respect to these services. The Distributor determines the amounts to be paid to Service Agents. During the period ended October 31, 2014, Class A and Class C shares were charged $334,545 and $79,981, respectively, pursuant to the Shareholder Services Plan.
Under its terms, the Distribution Plan and Shareholder Services Plan shall remain in effect from year to year, provided such continuance is approved annually by a vote of a majority of those Directors who are not “interested persons” of the Company and who have no direct or indirect financial interest in the operation of or in any agreement related to the Distribution Plan or Shareholder Services Plan.
The Fund 45
NOTES TO FINANCIAL STATEMENTS (continued)
The fund has arrangements with the transfer agent and the custodian whereby the fund may receive earnings credits when positive cash balances are maintained, which are used to offset transfer agency and custody fees. For financial reporting purposes, the fund includes net earnings credits as an expense offset in the Statement of Operations.
The fund compensates Dreyfus Transfer, Inc., a wholly-owned subsidiary of the Manager, under a transfer agency agreement for providing transfer agency and cash management services for the fund.The majority of transfer agency fees are comprised of amounts paid on a per account basis, while cash management fees are related to fund subscriptions and redemptions. During the period ended October 31, 2014, the fund was charged $8,709 for transfer agency services and $421 for cash management services.These fees are included in Shareholder servicing costs in the Statement of Operations. Cash management fees were partially offset by earnings credits of $28.
The fund compensates The Bank of NewYork Mellon under a custody agreement for providing custodial services for the fund.These fees are determined based on net assets, geographic region and transaction activity. During the period ended October 31, 2014, the fund was charged $100,940 pursuant to the custody agreement.
During the period ended October 31, 2014, the fund was charged $8,015 for services performed by the Chief Compliance Officer and his staff.
The components of “Due to The Dreyfus Corporation and affiliates” in the Statement of Assets and Liabilities consist of: management fees $242,876, Distribution Plan fees $36,591, Shareholder Services Plan fees $49,841, custodian fees $50,969, Chief Compliance Officer fees $617 and transfer agency fees $1,404, which are offset against an expense reimbursement currently in effect in the amount of $14,987.
(d) Each Board member also serves as a Board member of other funds within the Dreyfus complex. Annual retainer fees and attendance fees are allocated to each fund based on net assets.
46
NOTE 4—Securities Transactions:
The aggregate amount of purchases and sales (including paydowns) of investment securities, excluding short-term securities, forward contracts, financial futures, options transactions and swap transactions, during the period ended October 31, 2014, amounted to $1,110,031,076 and $680,799,403, respectively.
Derivatives: A derivative is a financial instrument whose performance is derived from the performance of another asset. Each type of derivative instrument that was held by the fund during the period ended October 31, 2014 is discussed below.
Master Netting Arrangements: The fund enters into International Swaps and Derivatives Association, Inc. Master Agreements or similar agreements (collectively,“Master Agreements”) with its OTC derivative contract counterparties in order to, among other things, reduce its credit risk to counterparties. Master Agreements include provisions for general obligations, representations, collateral and events of default or termination. Under a Master Agreement, the fund may offset with the counterparty certain derivative financial instrument’s payables and/or receivables with collateral held and/or posted and create one single net payment in the event of default or termination.
Financial Futures: In the normal course of pursuing its investment objective, the fund is exposed to market risk, including interest rate risk, as a result of changes in value of underlying financial instruments.The fund invests in financial futures in order to manage its exposure to or protect against changes in the market. A financial futures contract represents a commitment for the future purchase or a sale of an asset at a specified date. Upon entering into such contracts, these investments require initial margin deposits with a counterparty, which consist of cash or cash equivalents.The amount of these deposits is determined by the exchange or Board of Trade on which the contract is traded and is
The Fund 47
NOTES TO FINANCIAL STATEMENTS (continued)
subject to change. Accordingly, variation margin payments are received or made to reflect daily unrealized gains or losses which are recorded in the Statement of Operations.When the contracts are closed, the fund recognizes a realized gain or loss which is reflected in the Statement of Operations.There is minimal counterparty credit risk to the fund with financial futures since they are exchange traded, and the exchange guarantees the financial futures against default. Financial futures open at October 31, 2014 are set forth in the Statement of Financial Futures.
Options Transactions: The fund purchases and writes (sells) put and call options to hedge against changes in interest rates and foreign currencies, or as a substitute for an investment.The fund is subject to market risk, interest rate risk and currency risk in the course of pursuing its investment objectives through its investments in options contracts. A call option gives the purchaser of the option the right (but not the obligation) to buy, and obligates the writer to sell, the underlying financial instrument at the exercise price at any time during the option period, or at a specified date. Conversely, a put option gives the purchaser of the option the right (but not the obligation) to sell, and obligates the writer to buy the underlying financial instrument at the exercise price at any time during the option period, or at a specified date.
As a writer of call options, the fund receives a premium at the outset and then bears the market risk of unfavorable changes in the price of the financial instrument underlying the option. Generally, the fund realizes a gain, to the extent of the premium, if the price of the underlying financial instrument decreases between the date the option is written and the date on which the option is terminated. Generally, the fund incurs a loss if the price of the financial instrument increases between those dates.
As a writer of put options, the fund receives a premium at the outset and then bears the market risk of unfavorable changes in the price of the financial instrument underlying the option. Generally, the fund realizes a gain, to the extent of the premium, if the price of the underlying financial instrument increases between the date the option is
48
written and the date on which the option is terminated. Generally, the fund incurs a loss if the price of the financial instrument decreases between those dates.
As a writer of an option, the fund has no control over whether the underlying financial instrument may be sold (call) or purchased (put) and as a result bears the market risk of an unfavorable change in the price of the financial instrument underlying the written option.There is a risk of loss from a change in value of such options which may exceed the related premiums received.This risk is mitigated by Master Agreements between the fund and the counterparty.The Statement of Operations reflects any unrealized gains or losses which occurred during the period as well as any realized gains or losses which occurred upon the expiration or closing of the option transaction.
The following summarizes the fund’s call/put options written during the period ended October 31, 2014:
| | | | |
| | Face Amount | | Options Terminated |
| | Covered by | Premiums | | Net Realized |
| Options Written: | Contracts ($) | Received ($) | Cost ($) | Gain ($) |
| Contracts outstanding | | | | |
| October 31, 2013 | 22,716,000 | 429,250 | | |
| Contracts written | 216,440,000 | 4,438,416 | | |
| Contracts terminated: | | | | |
| Contracts closed | 55,316,000 | 1,759,365 | 1,673,391 | 85,974 |
| Contracts expired | 84,298,000 | 1,025,438 | — | 1,025,438 |
| Total contracts | | | | |
| terminated | 139,614,000 | 2,784,803 | 1,673,391 | 1,111,412 |
| Contracts outstanding | | | | |
| October 31, 2014 | 99,542,000 | 2,082,863 | | |
Forward Foreign Currency Exchange Contracts: The fund enters into forward contracts in order to hedge its exposure to changes in foreign currency exchange rates on its foreign portfolio holdings, to settle foreign currency transactions or as a part of its investment strat-egy.When executing forward contracts, the fund is obligated to buy or sell a foreign currency at a specified rate on a certain date in the future. With respect to sales of forward contracts, the fund incurs a loss if the value of the contract increases between the date the forward contract
The Fund 49
NOTES TO FINANCIAL STATEMENTS (continued)
is opened and the date the forward contract is closed.The fund realizes a gain if the value of the contract decreases between those dates.With respect to purchases of forward contracts, the fund incurs a loss if the value of the contract decreases between the date the forward contract is opened and the date the forward contract is closed.The fund realizes a gain if the value of the contract increases between those dates. Any realized or unrealized gains or losses which occurred during the period are reflected in the Statement of Operations. The fund is exposed to foreign currency risk as a result of changes in value of underlying financial instruments. The fund is also exposed to credit risk associated with counterparty nonperformance on these forward contracts, which is generally limited to the unrealized gain on each open contract. This risk is mitigated by Master Agreements between the fund and the counterparty. The following summarizes open forward contracts at October 31, 2014.
| | | | | | | |
| | | | Foreign | | | Unrealized | |
| Forward Foreign Currency | Currency | | | Appreciation | |
| Exchange Contracts | | | Amounts | Cost ($) | Value ($) | (Depreciation) ($) | |
| Purchases: | | | | | | | |
| Brazilian Real, | | | | | | | |
| Expiring | | | | | | | |
| 12/2/2014a | | | 14,065,000 | 5,556,479 | 5,621,053 | 64,574 | |
| Chilean Peso, | | | | | | | |
| Expiring | | | | | | | |
| 11/28/2014b | | 3,278,950,000 | 5,606,145 | 5,683,055 | 76,910 | |
| Indian Rupee, | | | | | | | |
| Expiring: | | | | | | | |
| 11/28/2014b | | | 498,240,000 | 8,096,527 | 8,066,790 | (29,737 | ) |
| 11/28/2014c | | | 528,530,000 | 8,559,190 | 8,557,202 | (1,988 | ) |
| 1/30/2015d | | | 362,140,000 | 5,821,251 | 5,783,065 | (38,186 | ) |
| 1/30/2015e | | | 416,775,000 | 6,698,589 | 6,655,539 | (43,050 | ) |
| Malaysian Ringgit, | | | | | | | |
| Expiring | | | | | | | |
| 11/28/2014b | | | 9,455,000 | 2,877,928�� | 2,868,404 | (9,524 | ) |
| Norwegian Krone, | | | | | | | |
| Expiring | | | | | | | |
| 11/28/2014f | | | 157,830,000 | 23,816,494 | 23,377,187 | (439,307 | ) |
| Taiwan New Dollar, | | | | | | | |
| Expiring | | | | | | | |
| 11/28/2014b | | | 90,265,000 | 2,974,233 | 2,968,362 | (5,871 | ) |
| Sales: | | | | Proceeds ($) | | | |
| Australian Dollar, | | | | | | | |
| Expiring | | | | | | | |
| 11/28/2014f | | | 60,325,000 | 53,540,850 | 52,983,239 | 557,611 | |
50
| | | | | | | |
| | | | Foreign | | | Unrealized | |
| Forward Foreign Currency | Currency | | | Appreciation | |
| Exchange Contracts | | | Amounts | Proceeds ($) | Value ($) | (Depreciation) ($) | |
| Sales (continued): | | | | | | | |
| Brazilian Real, | | | | | | | |
| Expiring | | | | | | | |
| 12/2/2014b | | | 76,445,000 | 30,207,057 | 30,551,115 | (344,058 | ) |
| British Pound, | | | | | | | |
| Expiring | | | | | | | |
| 11/28/2014c | | | 1,535,000 | 2,479,984 | 2,454,977 | 25,007 | |
| Colombian Peso, | | | | | | | |
| Expiring | | | | | | | |
| 11/28/2014b | | 33,429,240,000 | 16,251,454 | 16,191,409 | 60,045 | |
| Euro, | | | | | | | |
| Expiring | | | | | | | |
| 11/28/2014f | | | 48,955,000 | 62,360,518 | 61,358,751 | 1,001,767 | |
| Japanese Yen, | | | | | | | |
| Expiring | | | | | | | |
| 11/28/2014f | | 1,909,420,000 | 17,686,947 | 17,002,629 | 684,318 | |
| Mexican New Peso, | | | | | | | |
| Expiring | | | | | | | |
| 11/28/2014e | | | 209,715,000 | 15,529,268 | 15,546,454 | (17,186 | ) |
| New Zealand Dollar, | | | | | | | |
| Expiring | | | | | | | |
| 11/28/2014b | | | 34,855,000 | 27,536,844 | 27,096,020 | 440,824 | |
| Polish Zloty, | | | | | | | |
| Expiring: | | | | | | | |
| 11/28/2014b | | | 21,035,000 | 6,312,362 | 6,235,299 | 77,063 | |
| 11/28/2014e | | | 15,220,000 | 4,567,279 | 4,511,588 | 55,691 | |
| Russian Ruble, | | | | | | | |
| Expiring | | | | | | | |
| 11/28/2014c | | | 243,190,000 | 5,711,367 | 5,608,635 | 102,732 | |
| South Korean Won, | | | | | | | |
| Expiring: | | | | | | | |
| 11/28/2014b | | 10,709,185,000 | 10,157,932 | 10,009,084 | 148,848 | |
| 11/28/2014d | | 4,441,065,000 | 4,131,703 | 4,150,735 | (19,032 | ) |
| Swedish Krona, | | | | | | | |
| Expiring | | | | | | | |
| 11/28/2014f | | | 181,845,000 | 24,745,698 | 24,627,801 | 117,897 | |
| Gross Unrealized | | | | | | | |
| Appreciation | | | | | | 3,413,287 | |
| Gross Unrealized | | | | | | | |
| Depreciation | | | | | | (947,939 | ) |
Counterparties:
| |
| a | Morgan Stanley Capital Services |
| b | Citigroup |
| c | Credit Suisse |
| d | Barclays Bank |
| e | JP Morgan Chase Bank |
| f | Goldman Sachs International |
The Fund 51
NOTES TO FINANCIAL STATEMENTS (continued)
Swap Transactions: The fund enters into swap agreements to exchange the interest rate on, or return generated by, one nominal instrument for the return generated by another nominal instrument. Swap agreements are privately negotiated in the OTC market or centrally cleared. The fund enters into these agreements to hedge certain market or interest rate risks, to manage the interest rate sensitivity (sometimes called duration) of fixed income securities, to provide a substitute for purchasing or selling particular securities or to increase potential returns.
For OTC swaps, the fund accrues for the interim payments on a daily basis, with the net amount recorded within unrealized appreciation (depreciation) on swap agreements in the Statement of Assets and Liabilities. Once the interim payments are settled in cash, the net amount is recorded as a realized gain (loss) on swaps, in addition to realized gain (loss) recorded upon the termination of swap transactions in the Statement of Operations. Upfront payments made and/or received by the fund, are recorded as an asset and/or liability in the Statement of Assets and Liabilities and are recorded as a realized gain or loss ratably over the agreement’s term/event with the exception of forward starting interest rate swaps which are recorded as realized gains or losses on the termination date.
Upon entering into centrally cleared swap agreements, an initial margin deposit is required with a counterparty, which consists of cash or cash equivalents. The amount of these deposits is determined by the exchange on which the agreement is traded and is subject to change. The change in valuation of centrally cleared swaps is recorded as a receivable or payable for variation margin in the Statement of Assets and Liabilities. Payments received from (paid to) the counterparty, including upon termination, are recorded as realized gain (loss) in the Statement of Operations.
Fluctuations in the value of swap agreements are recorded for financial statement purposes as unrealized appreciation or depreciation on swap transactions.
52
Interest Rate Swaps: Interest rate swaps involve the exchange of commitments to pay and receive interest based on a notional principal amount.The fund may elect to pay a fixed rate and receive a floating rate, or receive a fixed rate and pay a floating rate on a notional principal amount. The net interest received or paid on interest rate swap agreements is included within realized gain (loss) on swap transactions in the Statement of Operations. Interest rate swap agreements are subject to general market risk, liquidity risk, counterparty risk and interest rate risk.
For OTC swaps, the fund’s maximum risk of loss from counterparty risk is the discounted value of the cash flows to be received from the counterparty over the agreement’s remaining life, to the extent that the amount is positive. This risk is mitigated by Master Agreements between the fund and the counterparty and the posting of collateral, if any, by the counterparty to the fund to cover the fund’s exposure to the counterparty.There is minimal counterparty risk to the fund with centrally cleared swaps since they are exchange traded and the exchange guarantees these swap against default. The following summarizes open interest rate swaps entered into by the fund at October 31, 2014:
| | | | | | | |
| OTC—Interest Rate Swaps | | | | | | |
| | | | | | | Unrealized | |
| Notional | Currency/ | | (Pay) Receive | | | Appreciation | |
| Amount ($) | Floating Rate | Counterparties | Fixed Rate (%) | | Expiration | (Depreciation) ($) | |
| |
| 94,900,000 | MXN—28 Day | Deutsche | 6.74 | | 1/2/2024 | 370,829 | |
| | Libor | | | | | | |
| 244,400,000 | MXN—28 Day | J.P. Morgan | (4.74 | ) | 1/10/2017 | (283,379 | ) |
| | Libor | Chase | | | | | |
| 16,900,000 | MXN—28 Day | Deutsche | 6.47 | | 4/23/2024 | 38,689 | |
| | Libor | | | | | | |
| 33,600,000 | MXN—28 Day | Deutsche | (4.67 | ) | 5/2/2017 | (30,395 | ) |
| | Libor | | | | | | |
| 72,500,000 | MXN—28 Day | Citigroup | 6.11 | | 7/29/2024 | 12,044 | |
| | Libor | | | | | | |
| 202,000,000 | MXN—28 Day | Citigroup | (4.31 | ) | 8/7/2017 | (8,882 | ) |
| | Libor | | | | | | |
| 71,400,000 | MXN—28 Day | Deutsche | 6.30 | | 9/24/2024 | 80,797 | |
| | Libor | | | | | | |
| 199,500,000 | MXN—28 Day | Deutsche | (4.55 | ) | 10/3/2017 | (83,347 | ) |
| | Libor | | | | | | |
The Fund 53
NOTES TO FINANCIAL STATEMENTS (continued)
| | | | | | | | |
| OTC—Interest Rate Swaps (continued) | | | | | |
| | | | | | | | Unrealized | |
| Notional | | Currency/ | | (Pay) Receive | | Appreciation | |
| Amount ($) | | Floating Rate | Counterparties | Fixed Rate (%) | Expiration | (Depreciation) ($) | |
| |
| 14,000,000 | | NZD—3 Month | Deutsche | 4.32 | | 10/9/2019 | 87,207 | |
| | | Libor | | | | | | |
| 44,000,000 | | NZD—3 Month | Deutsche | 4.13 | | 10/13/2017 | 144,534 | |
| | | Libor | | | | | | |
| 10,700,000 | | NZD—3 Month | Deutsche | 4.42 | | 8/1/2019 | 117,390 | |
| | | Libor | | | | | | |
| 150,000,000 | | USD—1 YEAR | Deutsche | (1.13 | ) | 10/22/2015 | (106,001 | ) |
| | | US CPI Urban | | | | | | |
| | | Consumers NSA | | | | | | |
| Gross Unrealized | | | | | | |
| Appreciation | | | | | 851,490 | |
| Gross Unrealized | | | | | | |
| Depreciation | | | | | (512,004 | ) |
| |
| |
| Centrally Cleared Interest Rate Swaps | | | | | |
| |
| Notional | | Currency/ (Pay) Receive | | | Clearing | Unrealized | |
| Amount ($) | | Floating Rate Fixed Rate (%) | | Expiration | | House | (Depreciation) ($) | |
| |
| 33,000,000 | a | USD— | (2.31) 3/13/2021 | | Chicago | (655,621 | ) |
| | | 3 Month | | | | Mercantile | | |
| | | Libor | | | | Exchange | | |
| 38,000,000 | b | USD— | (2.82) 4/1/2024 | | Chicago | (1,374,485 | ) |
| | | 3 Month | | | | Mercantile | | |
| | | Libor | | | | Exchange | | |
| 75,000,000 | b | USD— | (1.81) 7/11/2019 | | Chicago | (875,207 | ) |
| | | 3 Month | | | | Mercantile | | |
| | | Libor | | | | Exchange | | |
| 16,300,000 | c | USD— | (2.67) 9/29/2024 | | Chicago | (329,356 | ) |
| | | 3 Month | | | | Mercantile | | |
| | | Libor | | | | Exchange | | |
| 63,400,000 | a | USD— | (0.66) 8/21/2016 | | Chicago | (91,983 | ) |
| | | 3 Month | | | | Mercantile | | |
| | | Libor | | | | Exchange | | |
| 66,000,000 | c | USD— | (1.82) 7/31/2019 | | Chicago | (702,900 | ) |
| | | 3 Month | | | | Mercantile | | |
| | | Libor | | | | Exchange | | |
| Gross Unrealized | | | | | | |
| Depreciation | | | | | (4,029,552 | ) |
| |
| Counterparties: |
| a | JP Morgan Chase Bank |
| b | Goldman Sachs International |
| c | Deutsche Bank |
| LIBOR—London Interbank Offer |
| MXN—Mexican New Peso |
| NZD—New Zealand Dollar |
| USD—U.S. Dollar |
54
Credit Default Swaps: Credit default swaps involve commitments to pay a fixed interest rate in exchange for payment if a credit event affecting a third party (the referenced obligation or index) occurs. Credit events may include a failure to pay interest or principal, bankruptcy, or restructuring. The fund enters into these agreements to manage its exposure to the market or certain sectors of the market, to reduce its risk exposure to defaults of corporate and sovereign issuers, or to create exposure to corporate or sovereign issuers to which it is not otherwise exposed. For those credit default swaps in which the fund is paying a fixed rate, the fund is buying credit protection on the instrument. In the event of a credit event, the fund would receive the full notional amount for the reference obligation. For those credit default swaps in which the fund is receiving a fixed rate, the fund is selling credit protection on the underlying instrument.The maximum payouts for these agreements are limited to the notional amount of each swap. Credit default swaps may involve greater risks than if the fund had invested in the reference obligation directly and are subject to general market risk, liquidity risk, counterparty risk and credit risk. This risk is mitigated by Master Agreements between the fund and the counterparty and the posting of collateral, if any, by the counterparty to the fund to cover the fund’s exposure to the counterparty.
The maximum potential amount of future payments (undiscounted) that a fund as a seller of protection could be required to make under a credit default swap agreement would be an amount equal to the notional amount of the agreement which may exceed the amount of unrealized appreciation or depreciation reflected in the Statement of Assets and Liabilities. Notional amounts of all credit default swap agreements are disclosed in the following chart, which summarizes open credit default swaps on index issues entered into by the fund. These potential amounts would be partially offset by any recovery values of the respective referenced obligations, underlying securities comprising the referenced index, upfront payments received upon entering into the
The Fund 55
NOTES TO FINANCIAL STATEMENTS (continued)
agreement, or net amounts received from the settlement of buy protection credit default swap agreements entered into by the fund for the same referenced entity or entities.The following summarizes open credit default swaps entered into by the fund at October 31, 2014:
OTC—Credit Default Swaps
| | | | | | |
| | | (Pay) | | | Upfront | |
| | | Receive | Implied | | Premiums | |
| Reference | Notional | Fixed | Credit | Market | Received | Unrealized |
| Obligation ($) | Amount ($)2 | Rate(%) | Spread (%)3 | Value ($) | (Paid) ($) | Appreciation ($) |
| | | | | | |
| Sales Contract:1 | | | | | | |
| Markit CMBX.NA. | | | | | | |
| BBB Series 7 | | | | | | |
| 1/17/2047† | 14,450,000a | 3.00 | 330.13 | (268,776) | 472,325 | 203,549 |
|
| † Expiration Date |
| Counterparty: |
| |
| a | Deutsche Bank |
| 1 | If the fund is a seller of protection and a credit event occurs, as defined under the terms of the |
| | swap agreement, the fund will either (i) pay to the buyer of protection an amount equal to the |
| | notional amount of the swap and take delivery of the reference obligation or (ii) pay a net |
| | settlement amount in the form of cash or securities equal to the notional amount of the swap less |
| | the recovery value of the reference obligation. |
| 2 | The maximum potential amount the fund could be required to pay as a seller of credit protection |
| | or receive as a buyer of credit protection if a credit event occurs as defined under the terms of the |
| | swap agreement. |
| 3 | Implied credit spreads, represented in absolute terms, utilized in determining the market value as of |
| | the period end serve as an indicator of the current status of the payment/performance risk and |
| | represent the likelihood of risk of default for the credit derivative.The credit spread of a particular |
| | referenced entity reflects the cost of buying/selling protection and may include upfront payments |
| | required to be made to enter into the agreement.Wider credit spreads represent a deterioration of the |
| | referenced entity's credit soundness and a greater likelihood of risk of default or other credit event |
| | occurring as defined under the terms of the agreement.A credit spread identified as “Defaulted” |
| | indicates a credit event has occurred for the referenced entity. Credit spreads are unaudited. |
GAAP requires disclosure for (i) the nature and terms of the credit derivative, reasons for entering into the credit derivative, the events or circumstances that would require the seller to perform under the credit derivative, and the current status of the payment/performance risk of the credit derivative, (ii) the maximum potential amount of future payments (undiscounted) the seller could be required to make under the credit derivative, (iii) the fair value of the credit derivative, and (iv) the nature of any recourse provisions and assets held either as
56
collateral or by third parties. All required disclosures have been made and are incorporated within the current period as part of the Notes to the Statement of Investments and disclosures within this Note.
The following tables show the fund’s exposure to different types of market risk as it relates to the Statement of Assets and Liabilities and the Statement of Operations, respectively.
Fair value of derivative instruments as of October 31, 2014 is shown below:
| | | | |
| | Derivative | | Derivative | |
| | Assets ($) | | Liabilities ($) | |
| Interest rate risk1,2,3 | 3,026,562 | Interest rate risk1,3,4 | (6,877,276 | ) |
| Foreign exchange risk2,5 | 3,518,135 | Foreign exchange risk4,6 | (947,939 | ) |
| Credit risk3 | 203,549 | Credit risk | — | |
| Gross fair value of | | | | |
| derivatives contracts | 6,748,246 | | (7,825,215 | ) |
Statement of Assets and Liabilities location:
| |
| 1 | Includes cumulative appreciation (depreciation) on financial futures as reported in the Statement of |
| | Financial Futures, but only the unpaid variation margin is reported in the Statement of Assets |
| | and Liabilities. |
| 2 | Options purchased are included in Investments in securities—Unaffiliated issuers, at value. |
| 3 | Includes cumulative appreciation (depreciation) on swap agreements as reported in the swap tables in |
| | Note 4. Unrealized appreciation (depreciation) on OTC swap agreements and only unpaid variation |
| | margin on cleared swap agreements, are reported in the Statement fo Assets and Liabilities. |
| 4 | Outstanding options written, at value. |
| 5 | Unrealized appreciation on forward foreign currency exchange contracts. |
| 6 | Unrealized depreciation on forward foreign currency exchange contracts. |
The effective of derivative instruments in the Statement of Operation during the period ended October 31, 2014 is shown below:
| | | | | | | |
| Amount of realized gain (loss) on derivatives recognized in income ($) |
|
| | Financial | | Options | | Forward | Swap | |
| Underlying risk | Futures7 | | Transactions8 | | Contracts9 | Transactions10 | Total |
| Interest rate | (2,714,771 | ) | 846,762 | | — | (3,068,771) | (4,936,780) |
| Foreign | | | | | | | |
| exchange | — | | (176,966 | ) | 9,937,695 | — | 9,760,729 |
| Credit | — | | — | | — | (1,157,753) | (1,157,753) |
| Total | (2,714,771 | ) | 669,796 | | 9,937,695 | (4,226,524) | 3,666,196 |
The Fund 57
NOTES TO FINANCIAL STATEMENTS (continued)
Change in unrealized appreciation (depreciation) on derivatives recognized in income ($)
| | | | | | | |
| | Financial | | Options | | Forward | Swap | |
| Underlying risk | Futures11 | | Transactions12 | | Contracts13 | Transactions14 | Total |
| Interest rate | (50,804 | ) | (355,638 | ) | — | (2,597,497) | (3,003,939) |
| Foreign | | | | | | | |
| exchange | — | | 94,099 | | 1,835,126 | — | 1,929,225 |
| Credit | — | | — | | — | 297,263 | 297,263 |
| Total | (50,804 | ) | (261,539) | | 1,835,126 | (2,300,234) | (777,451) |
Statement of Operations location:
| |
| 7 | Net realized gain (loss) on financial futures. |
| 8 | Net realized gain (loss) on options transactions. |
| 9 | Net realized gain (loss) on forward foreign currency exchange contracts. |
| 10 Net realized gain (loss) on swap transactions. |
| 11 Net unrealized appreciation (depreciation) on financial futures. |
| 12 Net unrealized appreciation (depreciation) on options transactions. |
| 13 Net unrealized appreciation (depreciation) on forward foreign currency exchange contracts. |
| 14 Net unrealized appreciation (depreciation) on swap transactions. |
The provisions of ASC Topic 210 “Disclosures about Offsetting Assets and Liabilities” require disclosure on the offsetting of financial assets and liabilities. These disclosures are required for certain investments, including derivative financial instruments subject to Master Agreements which are eligible for offsetting in the Statement of Assets and Liabilities and require the fund to disclose both gross and net information with respect to such investments. For financial reporting purposes, the fund does not offset derivative assets and derivative liabilities that are subject to Master Agreements in the Statement of Assets and Liabilities.
At October 31, 2014, derivative assets and liabilities (by type) on a gross basis are as follows:
| | | | |
| Derivative Financial Instruments: | Assets ($) | | Liabilities ($) | |
| Financial futures | 124,501 | | (816,771 | ) |
| Options | 2,155,419 | | (1,518,949 | ) |
| Forward contracts | 3,413,287 | | (947,939 | ) |
| Swaps | 1,055,039 | | (4,541,556 | ) |
| Total gross amount of derivative assets | | | | |
| and liabilities in the Statement of | | | | |
| Assets and Liabilities | 6,748,246 | | (7,825,215 | ) |
| Derivatives not subject to | | | | |
| Master Agreements | (1,946,423 | ) | 5,981,201 | |
| Total gross amount of assets and | | | | |
| liabilities subject to Master Agreements | 4,801,823 | | (1,844,014 | ) |
58
The following tables present derivative assets and liabilities net of amounts available for offsetting under Master Agreements and net of related collateral received or pledged, if any, as of October 31, 2014:†
| | | | | | | | |
| | | | Financial | | | | | |
| | | | Instruments | | | | | |
| | | | and | | | | | |
| | | | Derivatives | | | | | |
| | Gross Amount of | | Available | | Collateral | | Net Amount of | |
| Counterparties | Assets ($)1 | | for Offset ($) | | Received ($)2 | | Assets ($) | |
| Citigroup | 815,734 | | (398,072 | ) | (417,662 | ) | — | |
| Deutsche Bank | 1,042,995 | | (219,743 | ) | (290,000 | ) | 533,252 | |
| Goldman Sachs | | | | | | | | |
| International | 2,761,655 | | (825,366 | ) | (291,000 | ) | 1,645,289 | |
| JP Morgan Chase Bank | 116,865 | | (116,865 | ) | — | | — | |
| Morgan Stanley | 64,574 | | — | | — | | 64,574 | |
| Total | 4,801,823 | | (1,560,046 | ) | (998,662 | ) | 2,243,115 | |
| |
| | | | Financial | | | | | |
| | | | Instruments | | | | | |
| | | | and | | | | | |
| | | | Derivatives | | | | | |
| | Gross Amount of | | Available | | Collateral | | Net Amount of | |
| Counterparties | Liabilities ($)1 | | for Offset ($) | | Pledged ($)2 | | Liabilities ($) | |
| Barclays Bank | (57,218 | ) | — | | — | | (57,218 | ) |
| Citigroup | (398,072 | ) | 398,072 | | — | | — | |
| Deutsche Bank | (219,743 | ) | 219,743 | | — | | — | |
| Goldman Sachs | | | | | | | | |
| International | (825,366 | ) | 825,366 | | — | | — | |
| JP Morgan Chase Bank | (343,615 | ) | 116,865 | | 30,000 | | (196,750 | ) |
| Total | (1,844,014 | ) | 1,560,046 | | 30,000 | | (253,968 | ) |
| |
| 1 | Absent a default event or early termination, OTC derivative assets and liabilities are presented at |
| | gross amounts and are not offset in the Statement of Assets and Liabilities. |
| 2 | In some instances, the actual collateral received and/or pledged may be more than the amount |
| | shown due to overcollateralization. |
| † | See Statement of Investments for detailed information regarding collateral held for open financial |
| | futures contracts. |
The following summarizes the average market value of derivatives outstanding during the period ended October 31, 2014:
| |
| | Average Market Value ($) |
| Interest rate financial futures | 113,135,681 |
| Interest rate options contracts | 1,078,156 |
| Foreign currency options contracts | 150,416 |
| Forward contracts | 160,530,248 |
The Fund 59
NOTES TO FINANCIAL STATEMENTS (continued)
The following summarizes the average notional value of swap agreements outstanding during the period ended October 31, 2014:
| |
| | Average Notional Value ($) |
| Interest rate swap agreements | 266,100,971 |
| Credit default swap agreements | 30,195,884 |
At December 31, 2014, the cost of investments for federal income tax purposes was $615,797,686; accordingly, accumulated net unrealized depreciation on investments was $8,794,261, consisting of $4,489,839 gross unrealized appreciation and $13,284,100 gross unrealized depreciation.
60
REPORT OF INDEPENDENT REGISTERED
PUBLIC ACCOUNTING FIRM
The Board of Directors and Shareholders of
The Dreyfus/Laurel Funds, Inc.
We have audited the accompanying statement of assets and liabilities of Dreyfus Opportunistic Fixed Income Fund (the “Fund”), a series of The Dreyfus/Laurel Funds, Inc., including the statement of investments, financial futures and options written, as of October 31, 2014, the related statement of operations for the year then ended, the statements of changes in net assets for each of the years in the two-year period then ended, and the financial highlights for each of the years or period in the five-year period then ended. These financial statements and financial highlights are the responsibility of the Fund’s management. Our responsibility is to express an opinion on these financial statements and financial highlights based on our audits.
We conducted our audits in accordance with the standards of the Public Company Accounting Oversight Board (United States).Those standards require that we plan and perform the audit to obtain reasonable assurance about whether the financial statements and financial highlights are free of material misstatement. An audit includes examining, on a test basis, evidence supporting the amounts and disclosures in the financial statements. Our procedures included confirmation of securities owned as of October 31, 2014, by correspondence with the custodian and brokers or by other appropriate auditing procedures. An audit also includes assessing the accounting principles used and significant estimates made by management, as well as evaluating the overall financial statement presentation.We believe that our audits provide a reasonable basis for our opinion.
In our opinion, the financial statements and financial highlights referred to above present fairly, in all material respects, the financial position of Dreyfus Opportunistic Fixed Income Fund as of October 31, 2014, the results of its operations for the year then ended, the changes in its net assets for each of the years in the two-year period then ended, and the financial highlights for each of the years or period in the five-year period then ended, in conformity with U.S. generally accepted accounting principles.

New York, New York
December 30, 2014
The Fund 61
IMPORTANT TAX INFORMATION (Unaudited)
For federal tax purposes, the fund designates the maximum amount allowable but not less than 50.67% as interest-related dividends in accordance with Sections 871(k)(1) and 881(e) of the Internal Revenue Code.
62
BOARD MEMBERS INFORMATION (Unaudited)
INDEPENDENT BOARD MEMBERS
|
| Joseph S. DiMartino (71) |
| Chairman of the Board (1999) |
| Principal Occupation During Past 5Years: |
| • Corporate Director and Trustee (1995-present) |
| Other Public Company Board Memberships During Past 5Years: |
| • CBIZ (formerly, Century Business Services, Inc.), a provider of outsourcing functions for small |
| and medium size companies, Director (1997-present) |
| • The Newark Group, a provider of a national market of paper recovery facilities, paperboard |
| mills and paperboard converting plants, Director (2000-2010) |
| • Sunair Services Corporation, a provider of certain outdoor-related services to homes and |
| businesses, Director (2005-2009) |
| No. of Portfolios for which Board Member Serves: 144 |
| ——————— |
| Francine J. Bovich (63) |
| Board Member (2012) |
| Principal Occupation During Past 5Years: |
| • Trustee,The Bradley Trusts, private trust funds (2011-present) |
| • Managing Director, Morgan Stanley Investment Management (1993-2010) |
| Other Public Company Board Membership During Past 5Years: |
| • Annaly Capital Management, Inc., Board Member (May 2014-present) |
| No. of Portfolios for which Board Member Serves: 45 |
| ——————— |
| Kenneth A. Himmel (68) |
| Board Member (1994) |
| Principal Occupation During Past 5Years: |
| • President and CEO, Related Urban Development, a real estate development company (1996-present) |
| • President and CEO, Himmel & Company, a real estate development company (1980-present) |
| • CEO,American Food Management, a restaurant company (1983-present) |
| No. of Portfolios for which Board Member Serves: 31 |
The Fund 63
BOARD MEMBERS INFORMATION (Unaudited) (continued)
INDEPENDENT BOARD MEMBERS (continued)
|
| Stephen J. Lockwood (67) |
| Board Member (1994) |
| Principal Occupation During Past 5Years: |
| • Chairman of the Board, Stephen J. Lockwood and Company LLC, a real estate |
| investment company (2000-present) |
| No. of Portfolios for which Board Member Serves: 31 |
| ——————— |
| Roslyn M. Watson (65) |
| Board Member (1994) |
| Principal Occupation During Past 5Years: |
| • Principal,Watson Ventures, Inc., a real estate investment company (1993-present) |
| No. of Portfolios for which Board Member Serves: 69 |
| ——————— |
| Benaree Pratt Wiley (68) |
| Board Member (1998) |
| Principal Occupation During Past 5Years: |
| • Principal,TheWiley Group, a firm specializing in strategy and business development (2005-present) |
| Other Public Company Board Membership During Past 5Years: |
| • CBIZ (formerly, Century Business Services, Inc.), a provider of outsourcing functions for small |
| and medium size companies, Director (2008-present) |
| No. of Portfolios for which Board Member Serves: 69 |
| ——————— |
| Once elected all Board Members serve for an indefinite term, but achieve Emeritus status upon reaching age 80.The |
| address of the Board Members and Officers is c/o The Dreyfus Corporation, 200 Park Avenue, NewYork, NewYork |
| 10166.Additional information about the Board Members is available in the fund’s Statement of Additional Information |
| which can be obtained from Dreyfus free of charge by calling this toll free number: 1-800-DREYFUS. |
| James M. Fitzgibbons, Emeritus Board Member |
| J.Tomlinson Fort, Emeritus Board Member |
64
OFFICERS OF THE FUND (Unaudited)
BRADLEY J. SKAPYAK, President since January 2010.
Chief Operating Officer and a director of the Manager since June 2009, Chairman of Dreyfus Transfer, Inc., an affiliate of the Manager and the transfer agent of the funds, since May 2011 and Executive Vice President of the Distributor since June 2007. From April 2003 to June 2009, Mr. Skapyak was the head of the Investment Accounting and Support Department of the Manager. He is an officer of 69 investment companies (comprised of 144 portfolios) managed by the Manager. He is 55 years old and has been an employee of the Manager since February 1988.
JOHN PAK, Chief Legal Officer since March 2013.
Deputy General Counsel, Investment Management, of BNY Mellon since August 2014; Chief Legal Officer of the Manager since August 2012; from March 2005 to July 2012, Managing Director of Deutsche Bank, Deputy Global Head of Deutsche Asset Management Legal and Regional Head of Deutsche Asset Management Americas Legal. He is an officer of 70 investment companies (comprised of 169 portfolios) managed by the Manager. He is 46 years old and has been an employee of the Manager since August 2012.
JANETTE E. FARRAGHER, Vice President and Secretary since December 2011.
Assistant General Counsel of BNY Mellon, and an officer of 70 investment companies (comprised of 169 portfolios) managed by the Manager. She is 51 years old and has been an employee of the Manager since February 1984.
KIESHA ASTWOOD, Vice President and Assistant Secretary since January 2010.
Counsel of BNY Mellon, and an officer of 70 investment companies (comprised of 169 portfolios) managed by the Manager. She is 41 years old and has been an employee of the Manager since July 1995.
JAMES BITETTO, Vice President and Assistant Secretary since August 2005.
Managing Counsel of BNY Mellon and Secretary of the Manager, and an officer of 70 investment companies (comprised of 169 portfolios) managed by the Manager. He is 48 years old and has been an employee of the Manager since December 1996.
JONI LACKS CHARATAN, Vice President and Assistant Secretary since August 2005.
Managing Counsel of BNY Mellon, and an officer of 70 investment companies (comprised of 169 portfolios) managed by the Manager. She is 58 years old and has been an employee of the Manager since October 1988.
JOSEPH M. CHIOFFI, Vice President and Assistant Secretary since August 2005.
Managing Counsel of BNY Mellon, and an officer of 70 investment companies (comprised of 169 portfolios) managed by the Manager. He is 52 years old and has been an employee of the Manager since June 2000.
JOHN B. HAMMALIAN, Vice President and Assistant Secretary since August 2005.
Senior Managing Counsel of BNY Mellon, and an officer of 70 investment companies (comprised of 169 portfolios) managed by the Manager. He is 51 years old and has been an employee of the Manager since February 1991.
SARAH S. KELLEHER, Vice President and Assistant Secretary since April 2014.
Senior Counsel of BNY Mellon, and an officer of 70 investment companies (comprised of 169 portfolios) managed by the Manager; from August 2005 to March 2013, Associate General Counsel of Third Avenue Management. She is 38 years old and has been an employee of the Manager since March 2013.
The Fund 65
OFFICERS OF THE FUND (Unaudited) (continued)
JEFF PRUSNOFSKY, Vice President and Assistant Secretary since August 2005.
Senior Managing Counsel of BNY Mellon, and an officer of 70 investment companies (comprised of 169 portfolios) managed by the Manager. He is 49 years old and has been an employee of the Manager since October 1990.
JAMES WINDELS, Treasurer since November 2001.
Director – Mutual Fund Accounting of the Manager, and an officer of 70 investment companies (comprised of 169 portfolios) managed by the Manager. He is 56 years old and has been an employee of the Manager since April 1985.
RICHARD CASSARO, Assistant Treasurer since January 2008.
Senior Accounting Manager – Money Market and Municipal Bond Funds of the Manager, and an officer of 70 investment companies (comprised of 169 portfolios) managed by the Manager. He is 55 years old and has been an employee of the Manager since September 1982.
GAVIN C. REILLY, Assistant Treasurer since December 2005.
Tax Manager of the Investment Accounting and Support Department of the Manager, and an officer of 70 investment companies (comprised of 169 portfolios) managed by the Manager. He is 46 years old and has been an employee of the Manager since April 1991.
ROBERT S. ROBOL, Assistant Treasurer since August 2005.
Senior Accounting Manager – Fixed Income Funds of the Manager, and an officer of 70 investment companies (comprised of 169 portfolios) managed by the Manager. He is 50 years old and has been an employee of the Manager since October 1988.
ROBERT SALVIOLO, Assistant Treasurer since July 2007.
Senior Accounting Manager – Equity Funds of the Manager, and an officer of 70 investment companies (comprised of 169 portfolios) managed by the Manager. He is 47 years old and has been an employee of the Manager since June 1989.
ROBERT SVAGNA, Assistant Treasurer since December 2002.
Senior Accounting Manager – Equity Funds of the Manager, and an officer of 70 investment companies (comprised of 169 portfolios) managed by the Manager. He is 47 years old and has been an employee of the Manager since November 1990.
JOSEPH W. CONNOLLY, Chief Compliance Officer since October 2004.
Chief Compliance Officer of the Manager and The Dreyfus Family of Funds (70 investment companies, comprised of 169 portfolios). He is 57 years old and has served in various capacities with the Manager since 1980, including manager of the firm’s Fund Accounting Department from 1997 through October 2001.
MATTHEW D. CONNOLLY, Anti-Money Laundering Compliance Officer since April 2012.
Anti-Money Laundering Compliance Officer of the Distributor since October 2011; from March 2010 to September 2011, Global Head, KYC Reviews and Director of UBS Investment Bank; until March 2010, AML Compliance Officer and Senior Vice President of Citi Global Wealth Management. He is an officer of 65 investment companies (comprised of 164 portfolios) managed by the Manager. He is 42 years old and has been an employee of the Distributor since October 2011.
66
For More Information
Telephone Call your financial representative or 1-800-DREYFUS
Mail The Dreyfus Family of Funds, 144 Glenn Curtiss Boulevard, Uniondale, NY 11556-0144
The fund files its complete schedule of portfolio holdings with the Securities and Exchange Commission (“SEC”) for the first and third quarters of each fiscal year on Form N-Q. The fund’s Forms N-Q are available on the SEC’s website at http://www.sec.gov and may be reviewed and copied at the SEC’s Public Reference Room in Washington, DC. Information on the operation of the Public Reference Room may be obtained by calling 1-800-SEC-0330.
A description of the policies and procedures that the fund uses to determine how to vote proxies relating to portfolio securities, and information regarding how the fund voted these proxies for the most recent 12-month period ended June 30 is available at http://www.dreyfus.com and on the SEC’s website at http://www.sec.gov. The description of the policies and procedures is also available without charge, upon request, by calling 1-800-DREYFUS.

|
| Dreyfus |
| Opportunistic Emerging |
| Markets Debt Fund |
ANNUAL REPORT October 31, 2014

Save time. Save paper. View your next shareholder report online as soon as it’s available. Log into www.dreyfus.com and sign up for Dreyfus eCommunications. It’s simple and only takes a few minutes.
The views expressed in this report reflect those of the portfolio manager only through the end of the period covered and do not necessarily represent the views of Dreyfus or any other person in the Dreyfus organization. Any such views are subject to change at any time based upon market or other conditions and Dreyfus disclaims any responsibility to update such views.These views may not be relied on as investment advice and, because investment decisions for a Dreyfus fund are based on numerous factors, may not be relied on as an indication of trading intent on behalf of any Dreyfus fund.
|
| Not FDIC-Insured • Not Bank-Guaranteed • May Lose Value |
| | Contents |
| | THE FUND |
| 2 | A Letter from the President |
| 3 | Discussion of Fund Performance |
| 6 | Fund Performance |
| 8 | Understanding Your Fund’s Expenses |
| 8 | Comparing Your Fund’s Expenses With Those of Other Funds |
| 9 | Statement of Investments |
| 16 | Statement of Financial Futures |
| 16 | Statement of Options Written |
| 17 | Statement of Assets and Liabilities |
| 18 | Statement of Operations |
| 19 | Statement of Changes in Net Assets |
| 21 | Financial Highlights |
| 25 | Notes to Financial Statements |
| 49 | Report of Independent Registered Public Accounting Firm |
| 50 | Important Tax Information |
| 51 | Board Members Information |
| 53 | Officers of the Fund |
| | FOR MORE INFORMATION |
| | Back Cover |
Dreyfus
Opportunistic Emerging
Markets Debt Fund
The Fund
A LETTER FROM THE PRESIDENT
Dear Shareholder:
We are pleased to present this annual report for Dreyfus Opportunistic Emerging Markets Debt Fund, covering the 12-month period from November 1, 2013, through October 31, 2014. For information about how the fund performed during the reporting period, as well as general market perspectives, we provide a Discussion of Fund Performance on the pages that follow.
Fixed-income securities in international markets generally benefited over the past year from aggressively accommodative monetary policies throughout much of the world as some major central banks reduced short-term interest rates in an effort to fight deflationary pressures and stimulate greater economic growth. Although these actions led to bond market rallies in a number of countries, the positive effects of a declining interest-rate environment were more than fully offset by adverse currency exchange movements.The euro, yen, and other major currencies generally lost value against a strengthening U.S. dollar, undermining unhedged investment returns for U.S. residents.
We believe the outlook for international bonds currently appears to be mixed. On one hand, central banks have signaled their willingness to reduce interest rates further and adopt other measures to support their local economies, which could help drive bond yields lower and prices higher. On the other hand, bonds in some markets have reached higher valuations, and they could be vulnerable to any new evidence that credit conditions may be deteriorating. Consequently, selectivity and a long-term perspective seem poised to become more important determinants of investment success. As always, we urge you to talk regularly with your financial advisor to assess the potential impact of these and other developments on your investments.
Thank you for your continued confidence and support.

J. Charles Cardona
President
The Dreyfus Corporation
November 17, 2014
2
DISCUSSION OF FUND PERFORMANCE
For the period of November 1, 2013, through October 31, 2014, as provided by Alexander Kozhemiakin and Javier Murcio, Primary Portfolio Managers
Fund and Market Performance Overview
For the 12-month period ended October 31, 2014, Dreyfus Opportunistic Emerging Markets Debt Fund’s Class A shares produced a total return of 1.36%, Class C shares returned 0.52%, Class I shares returned 1.61%, and Class Y shares returned 1.58%.1 In comparison, the JP Morgan Emerging Markets Bond Global Index (the “Index”), the fund’s benchmark, produced a 7.20% total return. A composite index composed of 50% Emerging Markets local currency bonds (JP Morgan Global Bond Index –Emerging Markets Global Diversified Index), 25% U.S. dollar-denominated sovereign and quasi-sovereign bonds (JP Morgan Emerging Markets Bond Index Global) and 25% U.S. dollar-denominated corporate bonds (JP Morgan Corporate Emerging Markets Bond Index Diversified) produced a 2.31% total return for the same period.2 As the fund invests opportunistically across the full range of emerging market fixed income securities, we believe the composite benchmark more accurately reflects the market sectors in which the fund invests.
Emerging market bonds produced strong results in local currency terms over the reporting period, but returns for U.S. residents were dampened significantly by a strengthening U.S. dollar. The fund outperformed its composite benchmark on a gross of fee basis, largely due to favorable bond and currency selections in Latin America, as well as in Hungary and Nigeria.
The Fund’s Investment Approach
The fund seeks to maximize total return. To pursue its goal, the fund normally invests at least 80% of its net assets in debt instruments of emerging market issuers, and in derivative instruments that provide investment exposure to such securities. Bonds and debt instruments of emerging market issuers include those issued by corporations, governments, central banks, or supranational organizations.The fund’s investments may be denominated in U.S. dollars, European euros, Japanese yen, or the local currency of issue.
Our investment process uses in-depth fundamental country, issuer, and currency analysis disciplined by proprietary quantitative valuation models. A “top down” analysis of macroeconomic, financial, and political variables guides country, issuer, and currency allocation.We look for shifts in country fundamentals and consider the risk-adjusted attractiveness of currency, issuer, and duration returns for each country. Using these inputs, we seek to identify the best opportunities on a risk-adjusted basis across emerging market debt instruments, currencies, and local interest rates.
The Fund 3
DISCUSSION OF FUND PERFORMANCE (continued)
Emerging Markets Showed Signs of Rebound
A variety of headwinds during the reporting period’s first few months undermined investor confidence in developing nations. Of particular concern was the outlook for less supportive monetary policy in the US as the Federal Reserve moved to end quantitative easing. Growth forecasts were cut for several emerging markets, including Brazil, Turkey, and China. Russian markets began to suffer from the country’s involvement in the ongoing crisis in Ukraine. Emerging Market fundamentals remained intact, nonetheless, and investor sentiment began to improve. In March of 2014 investors began returning to the asset class.
Challenges continued through the period, as conflicts intensified in the Middle East, sanctions were imposed on Russia, economic data from Europe disappointed and investors were whipsawed by volatile polling ahead of Brazil’s presidential elections. Nevertheless, investor sentiment continued to improve amid continued economic growth in the United States - a key export market for developing nations – and the slower than expected increase in U.S. Treasury yields. India was also a bright spot, with new, pro-business leadership reporting improving trade balances and a strengthening currency, while investors were also optimistic about the new Indonesian government.
In this environment, many of the world’s central banks continued to adopt accommodative monetary policies. Bond prices generally climbed as interest rates fell and, with some notable exceptions, inflationary pressures remained low. However, a strengthening U.S. dollar effectively offset international markets’ gains for U.S. investors.
Latin American Bonds and Currencies Buoyed Fund Results
The fund’s relative performance was supported during the reporting period by overweighted exposure to local currency-denominated bonds in Brazil, where the country’s central bank took steps to address accelerating inflation.The fund’s holdings of U.S. Dollar bonds issued by Brazilian companies also did well. An overweight position in Colombian local currency bonds also proved beneficial as foreign investors recognized the country’s solid economic fundamentals. In Mexico, an emphasis on the peso, U.S. dollar bonds, corporate-backed bonds, and quasi-sovereign bonds fared well. The fund also benefited from underweighted exposure to the Turkish lira as a large current account deficit discouraged foreign investment in that country.The overweight Nigerian local currency bonds and Hungarian holdings that were focused on U.S. Dollar bonds also contributed to the fund’s relative performance.
On a more negative note, the fund’s bond and currency holdings in Russia were hurt by falling oil prices and broadening Western sanctions.We maintained relatively light exposure to Thai bonds, which held up well despite political turmoil. Likewise, the fund held underweighted exposure to Turkish bonds, which rebounded from previous weakness despite unfavorable fundamentals.
4
The fund employed forward contracts on U.S. Treasuries and currency markets to establish some of its strategies during the reporting period.
Investing in Areas of Growth
As the global economy recovers and monetary policies increasingly diverge over the months ahead, we expect investors to focus more on underlying fundamentals than liquidity factors.This development should favor bonds and currencies of fundamentally strong countries with sound fiscal and monetary policies. Therefore, we have maintained overweighted exposure to U.S. dollar- and local currency bonds in Colombia, Brazil, Mexica, and Panama, but we have found fewer opportunities in Turkey, Malaysia, and Thailand. The fund also ended the reporting period with overweighted exposure to the Mexican peso, Brazilian real, Colombian peso, and Indian rupee, and underweighted positions in the Nigerian naira,Turkish lira,Thai baht, South African rand, and Korean won.
November 17, 2014
Bond funds are subject generally to interest rate, credit, liquidity, and market risks, to varying degrees, all of which are more fully described in the fund’s prospectus. Generally, all other factors being equal, bond prices are inversely related to interest-rate changes, and rate increases can cause price declines.
Foreign bonds are subject to special risks including exposure to currency fluctuations, changing political and economic conditions, and potentially less liquidity. Investments in foreign currencies are subject to the risk that those currencies will decline in value relative to the U.S. dollar. Foreign currencies are also subject to risks caused by inflation, interest rates, budget deficits and low savings rate, political factors, and government control.The fixed income securities of issuers located in emerging markets can be more volatile and less liquid than those of issuers in more mature economies and emerging markets generally have less diverse and less mature economic structures and less stable political systems than those of developed countries.The securities of issuers located or doing substantial business in emerging markets are often subject to rapid and large changes in price.
The fund may use derivative instruments, such as options, futures, and options on futures, forward contracts, swaps (including credit default swaps on corporate bonds and asset-backed securities), options on swaps, and other credit derivatives. A small investment in derivatives could have a potentially large impact on the fund’s performance.
|
| 1 Total return includes reinvestment of dividends and any capital gains paid, and does not take into consideration the |
| maximum initial sales charge in the case of Class A shares, or the applicable contingent deferred sales charge imposed |
| on redemptions in the case of Class C shares. Had these charges been reflected, returns would have been lower. Past |
| performance is no guarantee of future results. Share price and investment return fluctuate such that upon redemption, |
| fund shares may be worth more or less than their original cost. Return figures provided reflect the absorption of certain |
| fund expenses by The Dreyfus Corporation pursuant to an agreement in effect until March 1, 2015. Had these |
| expenses not been absorbed, the fund’s returns would have been lower. |
| 2 SOURCE: FACTSET - JP Morgan Emerging Markets Global Bond Index tracks total returns for United States |
| Dollar denominated debt instruments issued by emerging market sovereign and quasi-sovereign entities: Brady bonds, |
| loans, and Eurobonds. JP Morgan Government Bond Index – Emerging Markets Global Diversified Index is a |
| comprehensive global local emerging markets index, and consists of regularly traded, liquid fixed rate, domestic currency |
| government bonds to which international investors can gain exposure. JPMorgan Corporate Emerging Markets Bond |
| Index Diversified (“CEMBI Diversified”) is a uniquely weighted version of the Corporate Emerging Markets Bond |
| Index (“CEMBI”) that limits the weights of those index countries with larger corporate debt stocks by only including |
| a specified portion of these countries’ eligible current face amounts of debt outstanding.The countries covered in the |
| CEMBI Diversified are identical to those covered by the CEMBI. It is not possible to invest directly in any |
| unmanaged Index. |
The Fund 5
FUND PERFORMANCE

|
| † Source: FactSet |
| Past performance is not predictive of future performance. |
| The above graph compares a $10,000 investment made in each of the Class A, Class C, Class I and ClassY shares of |
| Dreyfus Opportunistic Emerging Markets Debt Fund on 6/17/13 (inception date) to a $10,000 investment made on |
| that date in each of the following: JP Morgan Government Bond Index - Emerging Markets Global Diversified Index |
| (“JP Morgan GBI-EM Global Diversified Index”); JP Morgan Emerging Markets Bond Index Global (“JP Morgan |
| EMBI Global”); JP Morgan Corporate Emerging Markets Bond Index Diversified (“JP Morgan CEMBI |
| Diversified”); and an unmanaged hybrid index composed of 50% JP Morgan GBI-EM Global Diversified Index, 25% |
| JP Morgan EMBI Global and 25% JP Morgan CEMBI Diversified (the “Hybrid Index”).All dividends and capital |
| gain distributions are reinvested. |
| The fund’s performance shown in the line graph above takes into account the maximum initial sales charge on Class A |
| shares and all other applicable fees and expenses on all classes. JP Morgan GBI-EM Global Diversified Index is a |
| comprehensive global local emerging markets index, and consists of regularly traded, liquid fixed rate, domestic currency |
| government bonds to which international investors can gain exposure. JP Morgan EMBI Global tracks total returns for |
| United States Dollar denominated debt instruments issued by emerging market sovereign and quasi-sovereign entities: |
| Brady bonds, loans, and Eurobonds. JPMorgan CEMBI Diversified is a uniquely weighted version of the Corporate |
| Emerging Markets Bond Index (“CEMBI”) that limits the weights of those index countries with larger corporate debt |
| stocks by only including a specified portion of these countries’ eligible current face amounts of debt outstanding.The |
| countries covered in JP Morgan CEMBI Diversified are identical to those covered by the CEMBI. It is not possible to |
| invest directly in an unmanaged index. Unlike a mutual fund, each Index is not subject to charges, fees and other |
| expenses. Further information relating to fund expenses, including expense reimbursements, if applicable, is contained in |
| the Fees and Expenses section of the prospectus and elsewhere in this report. |
6
| | | | | |
| Average Annual Total Returns as of 10/31/14 | | | | | |
| | Inception | | | From | |
| | Date | 1 | Year | Inception | |
| Class A shares | | | | | |
| with maximum sales charge (4.50%) | 6/17/13 | –3.19 | % | –3.63 | % |
| without sales charge | 6/17/13 | 1.36 | % | 0.91 | % |
| Class C shares | | | | | |
| with applicable redemption charge † | 6/17/13 | –0.44 | % | –0.20 | % |
| without redemption | 6/17/13 | 0.52 | % | –0.20 | % |
| Class I shares | 6/17/13 | 1.61 | % | 1.23 | % |
| Class Y shares | 6/17/13 | 1.58 | % | 1.21 | % |
| JP Morgan Emerging Markets | | | | | |
| Bond Index Global EMBI | 6/30/13 | 7.20 | % | 8.15 | %†† |
| JP Morgan Corporate Emerging Markets | | | | | |
| Bond Index Diversified CEMBI | 6/30/13 | 7.63 | % | 8.60 | %†† |
| JP Morgan GBI-EM Global Diversified Index | 6/30/13 | -2.68 | % | –0.33 | %†† |
| Hybrid Index | 6/30/13 | 2.31 | % | 3.99 | %†† |
Past performance is not predictive of future performance.The fund’s performance shown in the graph and table does not reflect the deduction of taxes that a shareholder would pay on fund distributions or the redemption of fund shares. In addition to the performance of Class A shares shown with and without a maximum sales charge, the fund’s performance shown in the table takes into account all other applicable fees and expenses on all classes.
| |
| † | The maximum contingent deferred sales charge for Class C shares is 1% for shares redeemed within one year of the |
| | date of purchase. |
| †† | For comparative purposes, the value of the Index as of 6/30/13 is used as the beginning value on 6/17/13. |
The Fund 7
UNDERSTANDING YOUR FUND’S EXPENSES (Unaudited)
As a mutual fund investor, you pay ongoing expenses, such as management fees and other expenses. Using the information below, you can estimate how these expenses affect your investment and compare them with the expenses of other funds.You also may pay one-time transaction expenses, including sales charges (loads) and redemption fees, which are not shown in this section and would have resulted in higher total expenses. For more information, see your fund’s prospectus or talk to your financial adviser.
Review your fund’s expenses
The table below shows the expenses you would have paid on a $1,000 investment in Dreyfus Opportunistic Emerging Markets Debt Fund from May 1, 2014 to October 31, 2014. It also shows how much a $1,000 investment would be worth at the close of the period, assuming actual returns and expenses.
Expenses and Value of a $1,000 Investment
assuming actual returns for the six months ended October 31, 2014
| | | | | | | | |
| | | Class A | | Class C | | Class I | | Class Y |
| Expenses paid per $1,000† | $ | 6.33 | $ | 10.10 | $ | 5.07 | $ | 5.06 |
| Ending value (after expenses) | $ | 1,008.10 | $ | 1,003.50 | $ | 1,009.50 | $ | 1,009.10 |
COMPARING YOUR FUND’S EXPENSES
WITH THOSE OF OTHER FUNDS (Unaudited)
Using the SEC’s method to compare expenses
The Securities and Exchange Commission (SEC) has established guidelines to help investors assess fund expenses. Per these guidelines, the table below shows your fund’s expenses based on a $1,000 investment, assuming a hypothetical 5% annualized return. You can use this information to compare the ongoing expenses (but not transaction expenses or total cost) of investing in the fund with those of other funds. All mutual fund shareholder reports will provide this information to help you make this comparison. Please note that you cannot use this information to estimate your actual ending account balance and expenses paid during the period.
Expenses and Value of a $1,000 Investment
assuming a hypothetical 5% annualized return for the six months ended October 31, 2014
| | | | | | | | |
| | | Class A | | Class C | | Class I | | Class Y |
| Expenses paid per $1,000† | $ | 6.36 | $ | 10.16 | $ | 5.09 | $ | 5.09 |
| Ending value (after expenses) | $ | 1,018.90 | $ | 1,015.12 | $ | 1,020.16 | $ | 1,020.16 |
|
| † Expenses are equal to the fund’s annualized expense ratio of 1.25% for Class A, 2.00% for Class C, 1.00% for |
| Class I and 1.00 for ClassY, multiplied by the average account value over the period, multiplied by 184/365 (to |
| reflect the one-half year period). |
8
STATEMENT OF INVESTMENTS
October 31, 2014
| | | | | | |
| | | Coupon | Maturity | Principal | | |
| Bonds and Notes—96.1% | | Rate (%) | Date | Amount ($)a | Value ($) |
| Argentina—.5% | | | | | | |
| Argentine Government, | | | | | | |
| Sr. Unscd. Notes | | 11.75 | 10/5/15 | 100,000 | | 96,250 |
| Brazil—13.8% | | | | | | |
| Braskem Finance, | | | | | | |
| Gtd. Bonds | | 6.45 | 2/3/24 | 200,000 | | 212,650 |
| Brazilian Government, | | | | | | |
| Treasury Bills | BRL | 0.00 | 4/1/15 | 100,000 | b | 38,562 |
| Brazilian Government, | | | | | | |
| Sr. Notes, Ser. F | BRL | 10.00 | 1/1/17 | 930,000 | | 371,901 |
| Brazilian Government, | | | | | | |
| Notes, Ser. F | BRL | 10.00 | 1/1/23 | 2,050,000 | | 769,004 |
| BRF, | | | | | | |
| Sr. Unscd. Notes | | 4.75 | 5/22/24 | 200,000 | c | 200,750 |
| Minerva Luxembourg, | | | | | | |
| Gtd. Notes | | 7.75 | 1/31/23 | 400,000 | | 419,000 |
| Odebrecht Finance, | | | | | | |
| Gtd. Notes | | 7.13 | 6/26/42 | 200,000 | | 210,900 |
| Oi, | | | | | | |
| Sr. Unscd. Notes | | 5.75 | 2/10/22 | 210,000 | | 200,550 |
| QGOG Constellation, | | | | | | |
| Gtd. Notes | | 6.25 | 11/9/19 | 200,000 | | 197,500 |
| | | | | | | 2,620,817 |
| Chile—4.3% | | | | | | |
| Corpbanca, | | | | | | |
| Sr. Unscd. Bonds | | 3.88 | 9/22/19 | 200,000 | c | 202,034 |
| Empresa Nacional del Petroleo, | | | | | | |
| Sr. Unscd. Notes | | 4.38 | 10/30/24 | 200,000 | c | 198,801 |
| ENTEL Chile, | | | | | | |
| Sr. Unscd. Notes | | 4.75 | 8/1/26 | 200,000 | c | 203,426 |
| Tanner Servicios Financieros, | | | | | | |
| Sr. Unscd. Notes | | 4.38 | 3/13/18 | 200,000 | | 203,469 |
| | | | | | | 807,730 |
| China—3.3% | | | | | | |
| China Cinda Finance, | | | | | | |
| Gtd. Notes | | 5.63 | 5/14/24 | 210,000 | c | 220,559 |
| Country Garden Holdings, | | | | | | |
| Gtd. Bonds | | 7.25 | 4/4/21 | 200,000 | c | 198,000 |
| Kaisa Group Holdings, | | | | | | |
| Gtd. Notes | | 8.88 | 3/19/18 | 200,000 | | 203,000 |
| | | | | | | 621,559 |
The Fund 9
STATEMENT OF INVESTMENTS (continued)
| | | | | | |
| | | Coupon | Maturity | Principal | | |
| Bonds and Notes (continued) | Rate (%) | Date | Amount ($)a | Value ($) |
| Colombia—9.1% | | | | | | |
| Colombian Government, | | | | | | |
| Bonds, Ser. B | COP | 10.00 | 7/24/24 | 784,400,000 | | 473,564 |
| Emgesa, | | | | | | |
| Sr. Unscd. Notes | COP | 8.75 | 1/25/21 | 153,000,000 | | 80,318 |
| Empresas Publicas | | | | | | |
| de Medellin, | | | | | | |
| Sr. Unscd. Notes | COP | 7.63 | 9/10/24 | 170,000,000 | c | 82,939 |
| Empresas Publicas | | | | | | |
| de Medellin, | | | | | | |
| Sr. Unscd. Notes | COP | 8.38 | 2/1/21 | 1,022,000,000 | | 532,731 |
| Findeter, | | | | | | |
| Sr. Unscd. Notes | COP | 7.88 | 8/12/24 | 335,000,000 | c | 166,548 |
| Pacific Rubiales Energy, | | | | | | |
| Gtd. Notes | | 5.63 | 1/19/25 | 400,000 | c | 381,380 |
| | | | | | | 1,717,480 |
| Curacao—1.0% | | | | | | |
| SUAM Finance, | | | | | | |
| Gtd. Notes | | 4.88 | 4/17/24 | 175,000 | c | 179,812 |
| Hungary—2.3% | | | | | | |
| Hungarian Development Bank, | | | | | | |
| Govt. Gtd. Notes | | 6.25 | 10/21/20 | 200,000 | c | 221,500 |
| Hungarian Export-Import Bank, | | | | | | |
| Govt. Gtd. Bonds | | 4.00 | 1/30/20 | 200,000 | c | 199,500 |
| Hungarian Government, | | | | | | |
| Bonds, Ser. 23/A | HUF | 6.00 | 11/24/23 | 4,600,000 | | 21,775 |
| | | | | | | 442,775 |
| India—2.6% | | | | | | |
| Bharti Airtel International, | | | | | | |
| Gtd. Bonds | | 5.35 | 5/20/24 | 200,000 | | 215,936 |
| Rolta Americas, | | | | | | |
| Gtd. Bonds | | 8.88 | 7/24/19 | 280,000 | c | 281,400 |
| | | | | | | 497,336 |
| Indonesia—5.2% | | | | | | |
| Indo Energy Finance, | | | | | | |
| Sr. Scd. Notes | | 7.00 | 5/7/18 | 200,000 | | 192,088 |
| Indonesian Government, | | | | | | |
| Sr. Unscd. Bonds, | | | | | | |
| Ser. FR64 | IDR | 6.13 | 5/15/28 | 2,730,000,000 | | 183,886 |
10
| | | | | | |
| | | Coupon | Maturity | Principal | | |
| Bonds and Notes (continued) | Rate (%) | Date | Amount ($)a | Value ($) |
| Indonesia (continued) | | | | | | |
| Indonesian Government, | | | | | | |
| Sr. Unscd. Bonds, | | | | | | |
| Ser. FR55 | IDR | 7.38 | 9/15/16 | 63,000,000 | | 5,200 |
| Indonesian Government, | | | | | | |
| Sr. Unscd. Bonds | | 7.75 | 1/17/38 | 100,000 | | 132,125 |
| Indonesian Government, | | | | | | |
| Sr. Unscd. Bonds, | | | | | | |
| Ser. FR68 | IDR | 8.38 | 3/15/34 | 2,000,000,000 | | 165,117 |
| Indonesian Government, | | | | | | |
| Sr. Unscd. Bonds, | | | | | | |
| Ser. FR71 | IDR | 9.00 | 3/15/29 | 1,472,000,000 | | 128,403 |
| Indonesian Government, | | | | | | |
| Sr. Unscd. Bonds, | | | | | | |
| Ser. FR27 | IDR | 9.50 | 6/15/15 | 2,107,000,000 | | 177,242 |
| | | | | | | 984,061 |
| Ivory Coast—1.0% | | | | | | |
| Ivory Coast Government, | | | | | | |
| Sr. Unscd. Notes | | 5.38 | 7/23/24 | 200,000 | | 193,540 |
| Jamaica—1.1% | | | | | | |
| Digicel Group, | | | | | | |
| Sr. Unscd. Notes | | 7.13 | 4/1/22 | 200,000 | | 201,500 |
| Kazakhstan—2.2% | | | | | | |
| Kazakhstan Government, | | | | | | |
| Sr. Unscd. Notes | | 4.88 | 10/14/44 | 200,000 | c | 193,500 |
| Kazakhstan Temir Zholy Finance, | | | | | |
| Gtd. Notes | | 6.95 | 7/10/42 | 200,000 | | 223,500 |
| | | | | | | 417,000 |
| Kenya—1.1% | | | | | | |
| Kenyan Government, | | | | | | |
| Notes | | 6.88 | 6/24/24 | 200,000 | | 213,750 |
| Macau—1.0% | | | | | | |
| MCE Finance, | | | | | | |
| Gtd. Notes | | 5.00 | 2/15/21 | 200,000 | | 198,000 |
| Mexico—14.7% | | | | | | |
| American Movil, | | | | | | |
| Gtd. Notes | MXN | 8.46 | 12/18/36 | 2,600,000 | | 190,952 |
| CEMEX Espana, | | | | | | |
| Sr. Scd. Notes | | 9.88 | 4/30/19 | 300,000 | d | 336,060 |
The Fund 11
STATEMENT OF INVESTMENTS (continued)
| | | | | | |
| | | Coupon | Maturity | Principal | | |
| Bonds and Notes (continued) | Rate (%) | Date | Amount ($)a | Value ($) |
| Mexico (continued) | | | | | | |
| Comision Federal de Electricidad, | | | | | |
| Sr. Unscd. Notes | | 5.75 | 2/14/42 | 200,000 | | 212,500 |
| Metalsa, | | | | | | |
| Gtd. Notes | | 4.90 | 4/24/23 | 235,000 | | 226,775 |
| Mexican Government, | | | | | | |
| Bonds, Ser. S | MXN | 4.00 | 11/15/40 | 225,000 | | 95,611 |
| Mexican Government, | | | | | | |
| Bonds, Ser. M | MXN | 6.50 | 6/9/22 | 405,000 | | 31,558 |
| Mexican Government, | | | | | | |
| Bonds, Ser. M 20 | MXN | 10.00 | 12/5/24 | 2,000,000 | | 194,520 |
| Mexican Government, | | | | | | |
| Bonds, Ser. M 30 | MXN | 10.00 | 11/20/36 | 2,102,000 | | 214,517 |
| Mexichem, | | | | | | |
| Gtd. Notes | | 5.88 | 9/17/44 | 200,000 | c | 202,000 |
| Petroleos Mexicanos, | | | | | | |
| Gtd. Notes | | 4.25 | 1/15/25 | 80,000 | c | 81,184 |
| Petroleos Mexicanos, | | | | | | |
| Gtd. Notes | MXN | 7.19 | 9/12/24 | 1,440,000 | | 108,624 |
| Petroleos Mexicanos, | | | | | | |
| Gtd. Notes | MXN | 7.19 | 9/12/24 | 5,055,000 | c | 381,314 |
| Red de Carreteras | | | | | | |
| de Occidente, | | | | | | |
| Sr. Scd. Notes | MXN | 9.00 | 6/10/28 | 2,700,000 | | 193,299 |
| Southern Copper, | | | | | | |
| Sr. Unscd. Notes | | 7.50 | 7/27/35 | 100,000 | | 119,348 |
| Tenedora Nemak, | | | | | | |
| Sr. Unscd. Notes | | 5.50 | 2/28/23 | 200,000 | | 208,940 |
| | | | | | | 2,797,202 |
| Morocco—1.1% | | | | | | |
| OCP, | | | | | | |
| Sr. Unscd. Notes | | 5.63 | 4/25/24 | 200,000 | | 210,290 |
| Panama—1.1% | | | | | | |
| Panamanian Government, | | | | | | |
| Sr. Unscd. Bonds, Ser. A | | 5.63 | 7/25/22 | 180,000 | | 199,976 |
| Peru—1.2% | | | | | | |
| BBVA Banco Continental, | | | | | | |
| Sub. Notes | | 5.25 | 9/22/29 | 120,000 | c,d | 121,680 |
| Peruvian Government, | | | | | | |
| Bonds | PEN | 6.85 | 2/12/42 | 185,000 | | 65,629 |
12
| | | | | | |
| | | Coupon | Maturity | Principal | | |
| Bonds and Notes (continued) | Rate (%) | Date | Amount ($)a | Value ($) |
| Peru (continued) | | | | | | |
| Peruvian Government, | | | | | | |
| Unscd. Bonds | PEN | 6.90 | 8/12/37 | 85,000 | | 30,681 |
| | | | | | | 217,990 |
| Philippines—1.1% | | | | | | |
| Petron, | | | | | | |
| Sub. Bonds | | 7.50 | 2/6/49 | 200,000 | d | 213,000 |
| Poland—1.1% | | | | | | |
| Polish Government, | | | | | | |
| Bonds, Ser. 0922 | PLN | 5.75 | 9/23/22 | 585,000 | | 215,857 |
| Russia—8.2% | | | | | | |
| AHML Finance, | | | | | | |
| Unscd. Notes | RUB | 7.75 | 2/13/18 | 5,000,000 | | 104,487 |
| Gazprom, | | | | | | |
| Sr. Unscd. Bonds | | 6.00 | 11/27/23 | 200,000 | c | 194,500 |
| RusHydro, | | | | | | |
| Sr. Unscd. Notes | RUB | 7.88 | 10/28/15 | 14,700,000 | | 329,212 |
| Russian Agricultural Bank, | | | | | | |
| Sr. Unscd. Notes | | 5.30 | 12/27/17 | 200,000 | | 195,500 |
| Russian Agricultural Bank, | | | | | | |
| Sr. Unscd. Notes | | 7.75 | 5/29/18 | 100,000 | | 104,601 |
| Russian Agricultural Bank, | | | | | | |
| Sr. Unscd. Notes | RUB | 8.63 | 2/17/17 | 5,900,000 | | 126,171 |
| Russian Government, | | | | | | |
| Bonds, Ser. 6212 | RUB | 7.05 | 1/19/28 | 1,455,000 | | 27,114 |
| Vnesheconombank, | | | | | | |
| Sr. Unscd. Notes | | 6.03 | 7/5/22 | 200,000 | | 195,250 |
| Vnesheconombank, | | | | | | |
| Sr. Unscd. Notes | | 6.80 | 11/22/25 | 275,000 | | 274,656 |
| | | | | | | 1,551,491 |
| South Africa—5.7% | | | | | | |
| South African Government, | | | | | | |
| Bonds, Ser. R213 | ZAR | 7.00 | 2/28/31 | 4,330,000 | | 346,103 |
| South African Government, | | | | | | |
| Bonds, Ser. 2023 | ZAR | 7.75 | 2/28/23 | 275,000 | | 25,053 |
| South African Government, | | | | | | |
| Bonds, Ser. R186 | ZAR | 10.50 | 12/21/26 | 4,690,000 | | 511,010 |
| Transnet, | | | | | | |
| Sr. Unscd. Notes | ZAR | 9.50 | 5/13/21 | 2,200,000 | c | 201,726 |
| | | | | | | 1,083,892 |
The Fund 13
STATEMENT OF INVESTMENTS (continued)
| | | | | | | |
| | | Coupon | Maturity | Principal | | | |
| Bonds and Notes (continued) | Rate (%) | Date | Amount ($)a | | Value ($) |
| Sri Lanka—2.2% | | | | | | | |
| Bank of Ceylon, | | | | | | | |
| Sr. Unscd. Bonds | | 5.33 | 4/16/18 | 200,000 | | | 205,000 |
| Sri Lankan Government, | | | | | | | |
| Sr. Unscd. Bonds | | 5.13 | 4/11/19 | 200,000 | c | | 206,760 |
| | | | | | | | 411,760 |
| Thailand—1.5% | | | | | | | |
| Thai Government, | | | | | | | |
| Sr. Unscd. Bonds, Ser. ILB | THB | 1.20 | 7/14/21 | 8,800,000 | e | | 279,573 |
| Turkey—4.4% | | | | | | | |
| Export Credit Bank of Turkey, | | | | | | | |
| Sr. Unscd. Notes | | 5.88 | 4/24/19 | 200,000 | | | 213,410 |
| Turk Telekomunikasyon, | | | | | | | |
| Sr. Unscd. Notes | | 4.88 | 6/19/24 | 200,000 | c | | 199,008 |
| Turkish Government, | | | | | | | |
| Bonds, Ser. 5Y | TRY | 6.30 | 2/14/18 | 465,000 | | | 198,435 |
| Turkish Government, | | | | | | | |
| Bonds | TRY | 8.80 | 9/27/23 | 50,000 | | | 22,889 |
| Turkiye Vakiflar Bankasi, | | | | | | | |
| Sr. Unscd. Notes | | 5.00 | 10/31/18 | 200,000 | c | | 205,000 |
| | | | | | | | 838,742 |
| Uruguay—1.6% | | | | | | | |
| Uruguayan Government, | | | | | | | |
| Sr. Unscd. Bonds | UYU | 5.00 | 9/14/18 | 3,766,000 | | | 308,558 |
| Venezuela—3.7% | | | | | | | |
| Petroleos de Venezuela, | | | | | | | |
| Gtd. Notes | | 5.50 | 4/12/37 | 195,000 | | | 91,650 |
| Petroleos de Venezuela, | | | | | | | |
| Gtd. Notes | | 8.50 | 11/2/17 | 805,000 | | | 611,719 |
| | | | | | | | 703,369 |
| Total Bonds and Notes | | | | | | | |
| (cost $18,871,052) | | | | | | | 18,223,310 |
| |
| Short-Term Investments—.1% | | | | | | |
| U.S. Treasury Bills; | | | | | | | |
| 0.04%, 11/13/14 | | | | | | | |
| (cost $25,000) | | | | 25,000 | f | 25,000 |
14
| | | |
| Other Investment—.2% | Shares | | Value ($) |
| Registered Investment Company; | | | |
| Dreyfus Institutional Preferred | | | |
| Plus Money Market Fund | | | |
| (cost $30,000) | 30,000 | g | 30,000 |
| Total Investments (cost $18,926,052) | 96.4 | % | 18,278,310 |
| Cash and Receivables (Net) | 3.6 | % | 691,136 |
| Net Assets | 100.0 | % | 18,969,446 |
|
| a Principal amount stated in U.S. Dollars unless otherwise noted. |
| BRL—Brazilian Real |
| COP—Colombian Peso |
| HUF—Hungarian Forint |
| IDR—Indonesian Rupiah |
| MXN—Mexican New Peso |
| PEN—Peruvian New Sol |
| PLN—Polish Zloty |
| RUB—Russian Ruble |
| THB—Thai Baht |
| TRY—Turkish Lira |
| UYU—Uruguayan Peso |
| ZAR—South African Rand |
| b Security issued with a zero coupon. Income is recognized through the accretion of discount. |
| c Securities exempt from registration pursuant to Rule 144A under the Securities Act of 1933.These securities may be |
| resold in transactions exempt from registration, normally to qualified institutional buyers.At October 31, 2014, these |
| securities were valued at $4,723,321 or 24.9% of net assets. |
| d Variable rate security—interest rate subject to periodic change. |
| e Principal amount for accrual purposes is periodically adjusted based on changes in the Thai Consumer Price Index. |
| f Held by or on behalf of a counterparty for open financial futures contracts. |
| g Investment in affiliated money market mutual fund. |
| | | |
| Portfolio Summary (Unaudited)† | | |
| | Value (%) | Value (%) |
| Foreign/Governmental | 60.3 | Short-Term/Money Market Investments | .3 |
| Corporate Bonds | 35.8 | | 96.4 |
| † Based on net assets. | | | |
| See notes to financial statements. | | | |
The Fund 15
STATEMENT OF FINANCIAL FUTURES
October 31, 2014
| | | | | | |
| | | Market Value | | | Unrealized | |
| | | Covered by | | | (Depreciation) | |
| | Contracts | Contracts ($) | | Expiration | at 10/31/2014 | ($) |
| Financial Futures Short | | | | | | |
| U.S. Treasury 10 Year Notes | 10 | (1,263,594 | ) | December 2014 | (7,323 | ) |
| |
| See notes to financial statements. | | | | | | |
STATEMENT OF OPTIONS WRITTEN
October 31, 2014
| | | |
| | Face Amount | | |
| | Covered by | | |
| | Contracts ($) | Value ($) | |
| Call Options: | | | |
| Brazilian Real, | | | |
| November 2014 @ BRL 2.4 | | | |
| (premiums received $2,901) | 190,000 | (938 | ) |
| |
| BRL—Brazilian Real | | | |
| See notes to financial statements. | | | |
16
STATEMENT OF ASSETS AND LIABILITIES
October 31, 2014
| | | |
| | Cost | Value | |
| Assets ($): | | | |
| Investments in securities—See Statement of Investments: | | | |
| Unaffiliated issuers | 18,896,052 | 18,248,310 | |
| Affiliated issuers | 30,000 | 30,000 | |
| Cash denominated in foreign currencies | 16,291 | 16,347 | |
| Receivable for investment securities sold | | 423,502 | |
| Dividends and interest receivable | | 304,068 | |
| Unrealized appreciation on forward foreign | | | |
| currency exchange contracts—Note 4 | | 31,212 | |
| Receivable from broker for swap transactions—Note 4 | | 3,990 | |
| Receivable for futures variation margin—Note 4 | | 2,656 | |
| Unrealized appreciation on swap agreements—Note 4 | | 220 | |
| Prepaid expenses | | 18,944 | |
| | | 19,079,249 | |
| Liabilities ($): | | | |
| Due to The Dreyfus Corporation and affiliates—Note 3(c) | | 12,190 | |
| Cash overdraft due to Custodian | | 15,859 | |
| Unrealized depreciation on forward foreign | | | |
| currency exchange contracts—Note 4 | | 24,972 | |
| Payable for investment securities purchased | | 5,079 | |
| Swap premium received—Note 4 | | 4,391 | |
| Outstanding options written, at value (premiums | | | |
| received $2,901)—See Statement of Options Written—Note 4 | | 938 | |
| Accrued expenses | | 46,374 | |
| | | 109,803 | |
| Net Assets ($) | | 18,969,446 | |
| Composition of Net Assets ($): | | | |
| Paid-in capital | | 20,039,193 | |
| Accumulated undistributed investment income—net | | 107,892 | |
| Accumulated net realized gain (loss) on investments | | (526,616 | ) |
| Accumulated net unrealized appreciation (depreciation) on investments, | | |
| options transactions, swap transactions and foreign currency transactions | | |
| [including ($7,323) net unrealized (depreciation) on financial futures] | (651,023 | ) |
| Net Assets ($) | | 18,969,446 | |
| | | | |
| Net Asset Value Per Share | | | | |
| | Class A | Class C | Class I | Class Y |
| Net Assets ($) | 9,482,082 | 17,100 | 9,469,291 | 973.28 |
| Shares Outstanding | 801,867 | 1,449 | 800,530 | 82.37 |
| Net Asset Value Per Share ($) | 11.83 | 11.80 | 11.83 | 11.82 |
| See notes to financial statements. | | | | |
The Fund 17
STATEMENT OF OPERATIONS
Year Ended October 31, 2014
| | |
| Investment Income ($): | | |
| Income: | | |
| Interest (net of $5,544 foreign taxes withheld at source) | 1,201,069 | |
| Dividends; | | |
| Affiliated issuers | 649 | |
| Total Income | 1,201,718 | |
| Expenses: | | |
| Management fee—Note 3(a) | 144,884 | |
| Professional fees | 94,152 | |
| Registration fees | 71,463 | |
| Shareholder servicing costs—Note 3(c) | 24,648 | |
| Custodian fees—Note 3(c) | 22,375 | |
| Prospectus and shareholders’ reports | 8,374 | |
| Directors’ fees and expenses—Note 3(d) | 1,320 | |
| Loan commitment fees—Note 2 | 178 | |
| Distribution fees—Note 3(b) | 107 | |
| Miscellaneous | 28,619 | |
| Total Expenses | 396,120 | |
| Less—reduction in expenses due to undertaking—Note 3(a) | (178,472 | ) |
| Less—reduction in fees due to earnings credits—Note 3(c) | (1 | ) |
| Net Expenses | 217,647 | |
| Investment Income—Net | 984,071 | |
| Realized and Unrealized Gain (Loss) on Investments—Note 4 ($): | | |
| Net realized gain (loss) on investments and foreign currency transactions | (167,802 | ) |
| Net realized gain (loss) on options transactions | 1,150 | |
| Net realized gain (loss) on financial futures | (36,524 | ) |
| Net realized gain (loss) on swap transactions | (10,363 | ) |
| Net realized gain (loss) on forward | | |
| foreign currency exchange contracts | (96,179 | ) |
| Net Realized Gain (Loss) | (309,718 | ) |
| Net unrealized appreciation (depreciation) on | | |
| investments and foreign currency transactions | (409,936 | ) |
| Net unrealized appreciation (depreciation) on options transactions | 1,359 | |
| Net unrealized appreciation (depreciation) on financial futures | (7,323 | ) |
| Net unrealized appreciation (depreciation) on swap transactions | 4,353 | |
| Net unrealized appreciation (depreciation) on | | |
| forward foreign currency exchange contracts | 7,940 | |
| Net Unrealized Appreciation (Depreciation) | (403,607 | ) |
| Net Realized and Unrealized Gain (Loss) on Investments | (713,325 | ) |
| Net Increase in Net Assets Resulting from Operations | 270,746 | |
| |
| See notes to financial statements. | | |
18
STATEMENT OF CHANGES IN NET ASSETS
| | | | |
| | Year Ended October 31, | |
| | 2014 | | 2013 | a,b |
| Operations ($): | | | | |
| Investment income—net | 984,071 | | 221,705 | |
| Net realized gain (loss) on investments | (309,718 | ) | (55,394 | ) |
| Net unrealized appreciation | | | | |
| (depreciation) on investments | (403,607 | ) | (247,416 | ) |
| Net Increase (Decrease) in Net Assets | | | | |
| Resulting from Operations | 270,746 | | (81,105 | ) |
| Dividends to Shareholders from ($): | | | | |
| Investment income—net: | | | | |
| Class A | (529,013 | ) | (89,741 | ) |
| Class C | (665 | ) | (71 | ) |
| Class I | (551,724 | ) | (95,952 | ) |
| Class Y | (57 | ) | (10 | ) |
| Total Dividends | (1,081,459 | ) | (185,774 | ) |
| Capital Stock Transactions ($): | | | | |
| Net proceeds from shares sold: | | | | |
| Class A | 5,887 | | 10,015,000 | |
| Class C | 7,487 | | 10,000 | |
| Class I | 11,000 | | 9,995,000 | |
| Class Y | — | | 1,000 | |
| Dividends reinvested: | | | | |
| Class A | 1,277 | | 185 | |
| Class C | 202 | | — | |
| Increase (Decrease) in Net Assets | | | | |
| from Capital Stock Transactions | 25,853 | | 20,021,185 | |
| Total Increase (Decrease) in Net Assets | (784,860 | ) | 19,754,306 | |
| Net Assets ($): | | | | |
| Beginning of Period | 19,754,306 | | — | |
| End of Period | 18,969,446 | | 19,754,306 | |
| Undistributed investment income—net | 107,892 | | 125,478 | |
The Fund 19
STATEMENT OF CHANGES IN NET ASSETS (continued)
| | | |
| | Year Ended October 31, | |
| | 2014 | 2013 | a,b |
| Capital Share Transactions: | | | |
| Class A | | | |
| Shares sold | 492 | 801,252 | |
| Shares issued for dividends reinvested | 107 | 16 | |
| Net Increase (Decrease) in Shares Outstanding | 599 | 801,268 | |
| Class C | | | |
| Shares sold | 632 | 800 | |
| Shares issued for dividends reinvested | 17 | — | |
| Net Increase (Decrease) in Shares Outstanding | 649 | 800 | |
| Class I | | | |
| Shares sold | 930 | 799,600 | |
| Class Y | | | |
| Shares sold | — | 82.37 | |
| |
| a | From June 17, 2013 (commencement of operations) to October 31, 2013. |
| b | Effective July 1, 2013, the fund commenced offering ClassY shares. |
See notes to financial statements.
20
FINANCIAL HIGHLIGHTS
The following table describes the performance for each share class for the fiscal period indicated. All information (except portfolio turnover rate) reflects financial results for a single fund share.Total return shows how much your investment in the fund would have increased (or decreased) during each period, assuming you had reinvested all dividends and distributions.These figures have been derived from the fund’s financial statements.
| | | | |
| | Year Ended October 31, | |
| Class A Shares | 2014 | | 2013 | a |
| Per Share Data ($): | | | | |
| Net asset value, beginning of period | 12.33 | | 12.50 | |
| Investment Operations: | | | | |
| Investment income—netb | .60 | | .13 | |
| Net realized and unrealized | | | | |
| gain (loss) on investments | (.44 | ) | (.19 | ) |
| Total from Investment Operations | .16 | | (.06 | ) |
| Distributions: | | | | |
| Dividends from investment income—net | (.66 | ) | (.11 | ) |
| Net asset value, end of period | 11.83 | | 12.33 | |
| Total Return (%)c | 1.36 | | (.44 | )d |
| Ratios/Supplemental Data (%): | | | | |
| Ratio of total expenses to average net assets | 2.18 | | 2.92 | e |
| Ratio of net expenses to average net assets | 1.25 | | 1.25 | e |
| Ratio of net investment income | | | | |
| to average net assets | 4.97 | | 2.92 | e |
| Portfolio Turnover Rate | 131.87 | | 46.60 | d |
| Net Assets, end of period ($ x 1,000) | 9,482 | | 9,881 | |
| |
| a | From June 17, 2013 (commencement of operations) to October 31, 2013. |
| b | Based on average shares outstanding. |
| c | Exclusive of sales charge. |
| d | Not annualized. |
| e | Annualized. |
See notes to financial statements.
The Fund 21
FINANCIAL HIGHLIGHTS (continued)
| | | | |
| | Year Ended October 31, | |
| Class C Shares | 2014 | | 2013 | a |
| Per Share Data ($): | | | | |
| Net asset value, beginning of period | 12.32 | | 12.50 | |
| Investment Operations: | | | | |
| Investment income—netb | .51 | | .10 | |
| Net realized and unrealized | | | | |
| gain (loss) on investments | (.45 | ) | (.19 | ) |
| Total from Investment Operations | .06 | | (.09 | ) |
| Distributions: | | | | |
| Dividends from investment income—net | (.58 | ) | (.09 | ) |
| Net asset value, end of period | 11.80 | | 12.32 | |
| Total Return (%)c | .52 | | (.71 | )d |
| Ratios/Supplemental Data (%): | | | | |
| Ratio of total expenses to average net assets | 3.74 | | 4.64 | e |
| Ratio of net expenses to average net assets | 2.00 | | 2.00 | e |
| Ratio of net investment income | | | | |
| to average net assets | 4.19 | | 2.17 | e |
| Portfolio Turnover Rate | 131.87 | | 46.60 | d |
| Net Assets, end of period ($ x 1,000) | 17 | | 10 | |
| |
| a | From June 17, 2013 (commencement of operations) to October 31, 2013. |
| b | Based on average shares outstanding. |
| c | Exclusive of sales charge. |
| d | Not annualized. |
| e | Annualized. |
See notes to financial statements.
22
| | | | |
| | Year Ended October 31, | |
| Class I Shares | 2014 | | 2013 | a |
| Per Share Data ($): | | | | |
| Net asset value, beginning of period | 12.33 | | 12.50 | |
| Investment Operations: | | | | |
| Investment income—netb | .63 | | .14 | |
| Net realized and unrealized | | | | |
| gain (loss) on investments | (.44 | ) | (.19 | ) |
| Total from Investment Operations | .19 | | (.05 | ) |
| Distributions: | | | | |
| Dividends from investment income—net | (.69 | ) | (.12 | ) |
| Net asset value, end of period | 11.83 | | 12.33 | |
| Total Return (%) | 1.61 | | (.38 | )c |
| Ratios/Supplemental Data (%): | | | | |
| Ratio of total expenses to average net assets | 1.92 | | 2.67 | d |
| Ratio of net expenses to average net assets | 1.00 | | 1.00 | d |
| Ratio of net investment income | | | | |
| to average net assets | 5.22 | | 3.17 | d |
| Portfolio Turnover Rate | 131.87 | | 46.60 | c |
| Net Assets, end of period ($ x 1,000) | 9,469 | | 9,863 | |
| |
| a | From June 17, 2013 (commencement of operations) to October 31, 2013. |
| b | Based on average shares outstanding. |
| c | Not annualized. |
| d | Annualized. |
See notes to financial statements.
The Fund 23
FINANCIAL HIGHLIGHTS (continued)
| | | | |
| | Year Ended October 31, | |
| Class Y Shares | 2014 | | 2013 | a |
| Per Share Data ($): | | | | |
| Net asset value, beginning of period | 12.33 | | 12.13 | |
| Investment Operations: | | | | |
| Investment income—netb | .63 | | .13 | |
| Net realized and unrealized | | | | |
| gain (loss) on investments | (.44 | ) | .19 | |
| Total from Investment Operations | .19 | | .32 | |
| Distributions: | | | | |
| Dividends from investment income—net | (.70 | ) | (.12 | ) |
| Net asset value, end of period | 11.82 | | 12.33 | |
| Total Return (%) | 1.58 | | 2.59 | c |
| Ratios/Supplemental Data (%): | | | | |
| Ratio of total expenses to average net assets | 1.92 | | 2.34 | d |
| Ratio of net expenses to average net assets | 1.00 | | 1.00 | d |
| Ratio of net investment income | | | | |
| (loss) to average net assets | 5.22 | | 3.27 | d |
| Portfolio Turnover Rate | 131.87 | | 46.60 | c |
| Net Assets, end of period ($ x 1,000) | 1 | | 1 | |
| |
| a | From July 1, 2013 (commencement of initial offering) to October 31, 2013. |
| b | Based on average shares outstanding. |
| c | Not annualized. |
| d Annualized. |
See notes to financial statements.
24
NOTES TO FINANCIAL STATEMENTS
NOTE 1—Significant Accounting Policies:
Dreyfus Opportunistic Emerging Markets Debt Fund (the “fund”) is a separate non-diversified series of The Dreyfus/Laurel Funds, Inc. (the “Company”), which is registered under the Investment Company Act of 1940, as amended (the “Act”), as an open-end management investment company and operates as a series company currently offering eleven series, including the fund.The fund’s investment objective seeks to maximize total return.The Dreyfus Corporation (the “Manager” or “Dreyfus”), a wholly-owned subsidiary of The Bank of New York Mellon Corporation (“BNY Mellon”), serves as the fund’s investment adviser. Standish Mellon Asset Management Company LLC (“Standish”), a wholly-owned subsidiary of BNY Mellon and an affiliate of Dreyfus, serves as the fund’s sub-investment adviser.
MBSC Securities Corporation (the “Distributor”), a wholly-owned subsidiary of Dreyfus, is the distributor of the fund’s shares.The fund is authorized to issue 100 million shares of $.001 par value Capital Stock in each of the following classes of shares: Class A, Class C, Class I and Class Y. Class A and Class C shares are sold primarily to retail investors through financial intermediaries and bear Distribution and/or Shareholder Services Plan fees. Class A shares generally are subject to a sales charge imposed at the time of purchase. Class C shares are subject to a contingent deferred sales charge (“CDSC”) imposed on Class C shares redeemed within one year of purchase. Class I shares are sold primarily to bank trust departments and other financial service providers (including The Bank of NewYork Mellon, a subsidiary of BNY Mellon and an affiliate of Dreyfus, and its affiliates), acting on behalf of customers having a qualified trust or investment account or relationship at such institution, and bear no Distribution or Shareholder Services Plan fees. ClassY shares are sold at net asset value per share generally to institutional investors and bear no Distribution or Shareholder Services Plan fees. Class I and ClassY shares are offered without a front-end sales charge or CDSC. Other differences between the classes include the services offered to and the expenses borne by each class, the allocation of certain transfer agency costs, and certain voting rights. Income,
The Fund 25
NOTES TO FINANCIAL STATEMENTS (continued)
expenses (other than expenses attributable to a specific class), and realized and unrealized gains or losses on investments are allocated to each class of shares based on its relative net assets.
As of October 31, 2014, MBC Investments Corp., an indirect subsidiary of BNY Mellon, held 799,600 of Class A, 800 of Class C, 799,600 of Class I shares and all of the outstanding Class Y shares of the fund.
The Company accounts separately for the assets, liabilities and operations of each series. Expenses directly attributable to each series are charged to that series’ operations; expenses which are applicable to all series are allocated among them on a pro rata basis.
The Financial Accounting Standards Board (“FASB”) Accounting Standards Codification (“ASC”) is the exclusive reference of authoritative U.S. generally accepted accounting principles (“GAAP”) recognized by the FASB to be applied by nongovernmental entities. Rules and interpretive releases of the Securities and Exchange Commission (“SEC”) under authority of federal laws are also sources of authoritative GAAP for SEC registrants. The fund’s financial statements are prepared in accordance with GAAP, which may require the use of management estimates and assumptions. Actual results could differ from those estimates.
(a) Portfolio valuation: The fair value of a financial instrument is the amount that would be received to sell an asset or paid to transfer a liability in an orderly transaction between market participants at the measurement date (i.e., the exit price). GAAP establishes a fair value hierarchy that prioritizes the inputs of valuation techniques used to measure fair value. This hierarchy gives the highest priority to unadjusted quoted prices in active markets for identical assets or liabilities (Level 1 measurements) and the lowest priority to unobservable inputs (Level 3 measurements).
Additionally, GAAP provides guidance on determining whether the volume and activity in a market has decreased significantly and whether such a decrease in activity results in transactions that are not orderly. GAAP requires enhanced disclosures around valuation inputs and techniques used during annual and interim periods.
26
Various inputs are used in determining the value of the fund’s investments relating to fair value measurements.These inputs are summarized in the three broad levels listed below:
Level 1—unadjusted quoted prices in active markets for identical investments.
Level 2—other significant observable inputs (including quoted prices for similar investments, interest rates, prepayment speeds, credit risk, etc.).
Level 3—significant unobservable inputs (including the fund’s own assumptions in determining the fair value of investments).
The inputs or methodology used for valuing securities are not necessarily an indication of the risk associated with investing in those securities.
Changes in valuation techniques may result in transfers in or out of an assigned level within the disclosure hierarchy. Valuation techniques used to value the fund’s investments are as follows:
Registered investment companies that are not traded on an exchange are valued at their net asset value and are generally categorized within Level 1 of the fair value hierarchy.
Investments in securities, excluding short-term investments (other than U.S.Treasury Bills), financial futures, options and forward foreign currency exchange contracts (“forward contracts”) are valued each business day by an independent pricing service (the “Service”) approved by the Company’s Board of Directors (the “Board”). Investments for which quoted bid prices are readily available and are representative of the bid side of the market in the judgment of the Service are valued at the mean between the quoted bid prices (as obtained by the Service from dealers in such securities) and asked prices (as calculated by the Service based upon its evaluation of the market for such securities). Other investments (which constitute a majority of the portfolio securities) are valued as determined by the Service, based on methods which include consideration of the following: yields or prices of securities of comparable quality, coupon,
The Fund 27
NOTES TO FINANCIAL STATEMENTS (continued)
maturity and type; indications as to values from dealers; and general market conditions. These securities are generally categorized within Level 2 of the fair value hierarchy.
U.S. Treasury Bills are valued at the mean price between quoted bid prices and asked prices by the Service. These securities are generally categorized within Level 2 of the fair value hierarchy.
The Service’s procedures are reviewed by Dreyfus under the general supervision of the Board.
When market quotations or official closing prices are not readily available, or are determined not to reflect accurately fair value, such as when the value of a security has been significantly affected by events after the close of the exchange or market on which the security is principally traded (for example, a foreign exchange or market), but before the fund calculates its net asset value, the fund may value these investments at fair value as determined in accordance with the procedures approved by the Board. Certain factors may be considered when fair valuing investments such as: fundamental analytical data, the nature and duration of restrictions on disposition, an evaluation of the forces that influence the market in which the securities are purchased and sold, and public trading in similar securities of the issuer or comparable issuers. These securities are either categorized within Level 2 or 3 of the fair value hierarchy depending on the relevant inputs used.
For restricted securities where observable inputs are limited, assumptions about market activity and risk are used and are generally categorized within Level 3 of the fair value hierarchy.
Investments denominated in foreign currencies are translated to U.S. dollars at the prevailing rates of exchange.
Financial futures and options, which are traded on an exchange, are valued at the last sales price on the securities exchange on which such securities are primarily traded or at the last sales price on the national securities market on each business day and are generally categorized within Level 1 of the fair value hierarchy. Options traded over-the-
28
counter (“OTC”) are valued at the mean between the bid and asked price and are generally categorized within Level 2 of the fair value hierarchy. Investments in swap transactions are valued each business day by the Service. Swaps are valued by the Service by using a swap pricing model which incorporates among other factors, default probabilities, recovery rates, credit curves of the underlying issuer and swap spreads on interest rates and are generally categorized within Level 2 of the fair value hierarchy. Forward contracts are valued at the forward rate and are generally categorized within Level 2 of the fair value hierarchy.
The following is a summary of the inputs used as of October 31, 2014 in valuing the fund’s investments:
| | | | | | | |
| | | | Level 2—Other | | Level 3— | | |
| | Level 1— | | Significant | | Significant | | |
| | Unadjusted | | Observable | | Unobservable | | |
| | Quoted Prices | | Inputs | | Inputs | Total | |
| Assets ($) | | | | | | | |
| Investments in Securities: | | | | | | |
| Corporate Bonds† | — | | 6,784,882 | | — | 6,784,882 | |
| Foreign Government | — | | 11,438,428 | | — | 11,438,428 | |
| Mutual Funds | 30,000 | | — | | — | 30,000 | |
| U.S. Treasury | — | | 25,000 | | — | 25,000 | |
| Other Financial | | | | | | | |
| Instruments: | | | | | | | |
| Forward Foreign | | | | | | | |
| Currency Exchange | | | | | | | |
| Contracts†† | — | | 31,212 | | — | 31,212 | |
| Swaps†† | — | | 220 | | — | 220 | |
| Liabilities ($) | | | | | | | |
| Other Financial | | | | | | | |
| Instruments: | | | | | | | |
| Financial Futures†† | (7,323 | ) | — | | — | (7,323 | ) |
| Forward Foreign | | | | | | | |
| Currency Exchange | | | | | | | |
| Contracts†† | — | | (24,972 | ) | — | (24,972 | ) |
| Options Written | — | | (938 | ) | — | (938 | ) |
|
| † See Statement of Investments for additional detailed categorizations. |
| †† Amount shown represents unrealized appreciation (depreciation) at period end. |
The Fund 29
NOTES TO FINANCIAL STATEMENTS (continued)
At October 31, 2014, there were no transfers between Level 1 and Level 2 of the fair value hierarchy.
(b) Foreign currency transactions: The fund does not isolate that portion of the results of operations resulting from changes in foreign exchange rates on investments from the fluctuations arising from changes in the market prices of securities held. Such fluctuations are included with the net realized and unrealized gain or loss on investments.
Net realized foreign exchange gains or losses arise from sales of foreign currencies, currency gains or losses realized on securities transactions between trade and settlement date, and the difference between the amounts of dividends, interest and foreign withholding taxes recorded on the fund’s books and the U.S. dollar equivalent of the amounts actually received or paid. Net unrealized foreign exchange gains and losses arise from changes in the value of assets and liabilities other than investments resulting from changes in exchange rates. Foreign currency gains and losses on foreign currency transactions are also included with net realized and unrealized gain or loss on investments.
(c) Securities transactions and investment income: Securities transactions are recorded on a trade date basis. Realized gains and losses from securities transactions are recorded on the identified cost basis. Dividend income is recognized on the ex-dividend date and interest income, including, where applicable, accretion of discount and amortization of premium on investments, is recognized on the accrual basis.
(d) Affiliated issuers: Investments in other investment companies advised by Dreyfus are defined as “affiliated” under the Act. Investments in affiliated investment companies during the period ended October 31, 2014 were as follows:
| | | | | | | |
| Affiliated | | | | | | | |
| Investment | Value | | | | Value | | Net |
| Company | 10/31/2013 | ($) | Purchases ($) | Sales ($) | 10/31/2014 | ($) | Assets (%) |
| Dreyfus | | | | | | | |
| Institutional | | | | | | | |
| Preferred | | | | | | | |
| Plus Money | | | | | | | |
| Market Fund | 160,000 | | 14,268,000 | 14,398,000 | 30,000 | | .2 |
30
(e) Risk: The fund invests primarily in debt securities. Failure of an issuer of the debt securities to make timely interest or principal payments, or a decline or the perception of a decline in the credit quality of a debt security, can cause the debt security’s price to fall, potentially lowering the fund’s share price. In addition, the value of debt securities may decline due to general market conditions that are not specifically related to a particular issuer, such as real or perceived adverse economic conditions, changes in outlook for corporate earnings, changes in interest or currency rates or adverse investor sentiment. They may also decline because of factors that affect a particular industry or country.
Investing in foreign markets may involve special risks and considerations not typically associated with investing in the U.S. These risks include revaluation of currencies, high rates of inflation, repatriation restrictions on income and capital, and adverse political and economic developments. Moreover, securities issued in these markets may be less liquid, subject to government ownership controls and delayed settlements, and their prices may be more volatile than those of comparable securities in the U.S.
(f) Dividends to shareholders: Dividends are recorded on ex-dividend date. Dividends from investment income-net are normally declared and paid quarterly. Dividends from net realized capital gains, if any, are normally declared and paid annually, but the fund may make distributions on a more frequent basis to comply with the distribution requirements of the Internal Revenue Code of 1986, as amended (the “Code”). To the extent that net realized capital gains can be offset by capital loss carryovers, it is the policy of the fund not to distribute such gains. Income and capital gain distributions are determined in accordance with income tax regulations, which may differ from GAAP.
(g) Federal income taxes: It is the policy of the fund to continue to qualify as a regulated investment company, if such qualification is in the best interests of its shareholders, by complying with the applicable provisions of the Code, and to make distributions of taxable income sufficient to relieve it from substantially all federal income and excise taxes.
The Fund 31
NOTES TO FINANCIAL STATEMENTS (continued)
As of and during the period ended October 31, 2014, the fund did not have any liabilities for any uncertain tax positions.The fund recognizes interest and penalties, if any, related to uncertain tax positions as income tax expense in the Statement of Operations. During the period ended October 31, 2014, the fund did not incur any interest or penalties.
Each tax year in the two-year period ended October 31, 2014 remains subject to examination by the Internal Revenue Service and state taxing authorities.
At October 31, 2014, the components of accumulated earnings on a tax basis were as follows: undistributed ordinary income $184,022, accumulated capital losses $494,922 and unrealized depreciation $758,847.
The accumulated capital loss carryover is available for federal income tax purposes to be applied against future net realized capital gains, if any, realized subsequent to October 31, 2014. The fund has $311,034 of post-enactment short-term capital losses and $183,888 of post-enactment long-term capital losses which can be carried forward for an unlimited period.
The tax character of distributions paid to shareholders during the fiscal periods ended October 31, 2014 and October 31, 2013 were as follows: ordinary income $1,081,459 and $185,774, respectively.
During the period ended October 31, 2014, as a result of permanent book to tax differences, primarily due to the tax treatment for amortization adjustments, foreign currency transactions, swap periodic payments and foreign Consumer Price Index adjustments, the fund increased accumulated undistributed investment income-net by $79,802 and decreased accumulated net realized gain (loss) on investments by the same amount. Net assets and net asset value per share were not affected by this reclassification.
NOTE 2—Bank Lines of Credit:
The fund participates with other Dreyfus-managed funds in a $430 million unsecured credit facility led by Citibank, N.A. and a $300 million unsecured credit facility provided by The Bank of New York
32
Mellon, a subsidiary of BNY Mellon and an affiliate of Dreyfus (each, a “Facility”), each to be utilized primarily for temporary or emergency purposes, including the financing of redemptions. Prior to October 8, 2014, the unsecured credit facility with Citibank, N.A. was $265 million. In connection therewith, the fund has agreed to pay its pro rata portion of commitment fees for each Facility. Interest is charged to the fund based on rates determined pursuant to the terms of the respective Facility at the time of borrowing. During the period ended October 31, 2014, the fund did not borrow under the Facilities.
NOTE 3—Management Fee, Sub-Investment Advisory Fee and Other Transactions with Affiliates:
(a) Pursuant to a management agreement with Dreyfus, the management fee is computed at the annual rate of .75% of the value of the fund’s average daily net assets and is payable monthly. Dreyfus has contractually agreed, from November 1, 2013 through March 1, 2015, to waive receipt of its fees and/or assume the direct expenses of the fund, so that the expenses of none of the classes (excluding Rule 12b-1 Distribution Plan fees, Shareholder Services Plan fees, taxes, interest expense, brokerage commissions, commitment fees on borrowings and extraordinary expenses) exceed 1.00% of the value of the average daily net assets. The reduction in expenses, pursuant to the undertaking, amounted to $178,472 during the period ended October 31, 2014.
Pursuant to a sub-investment advisory agreement between Dreyfus and Standish, Standish serves as the fund’s sub-investment adviser responsible for the day-to–day management of a porttion of the fund’s portfolio. Dreyfus pays the sub-investment adviser a monthly fee at an annual percentage of the value of the fund’s average daily net assets. Dreyfus has obtained an exemptive order from the SEC, upon which the fund may rely, to use a manager of managers approach that permits Dreyfus, subject to certain conditions and approval by the Board, to enter into and materially amend sub-investment advisory agreements with one or more sub-investment advisers who are either unaffiliated with Dreyfus or are
The Fund 33
NOTES TO FINANCIAL STATEMENTS (continued)
whollyowned subsidiaries (as defined under the Act) of Dreyfus’ ultimate parent company, BNY Mellon, without obtaining shareholder approval. The order also relieves the fund from disclosing the sub-investment advisory fee paid by Dreyfus to an unaffiliated sub-investment adviser in documents filed with the SEC and provided to shareholders. In addition, pursuant to the order, it is not necessary to disclose the sub-investment advisory fee payable by Dreyfus separately to a sub-investment adviser that is a wholly-owned subsidiary of BNY Mellon in documents filed with the SEC and provided to shareholders; such fees are to be aggregated with fees payable to Dreyfus. Dreyfus has ultimate responsibility (subject to oversight by the Board) to supervise any sub-investment adviser and recommend the hiring, termination, and replacement of any sub-investment adviser to the Board.
(b) Under the Distribution Plan adopted pursuant to Rule 12b-1 under the Act, Class C shares pay the Distributor for distributing its shares at an annual rate of .75% of the value of the average daily net assets. During the period ended October 31, 2014, Class C shares were charged $107 pursuant to the Distribution Plan.
(c) Under the Shareholder Services Plan, Class A and Class C shares pay the Distributor at an annual rate of .25% of the value of their average daily net assets for the provision of certain services.These services provided may include personal services relating to shareholder accounts, such as answering shareholder inquiries regarding the fund and providing reports and other information, and services related to the maintenance of shareholder accounts.The Distributor may make payments to Service Agents (securities dealers, financial institutions or other industry professionals) with respect to these services.The Distributor determines the amounts to be paid to Service Agents. During the period ended October 31, 2014, Class A and Class C shares were charged $24,152 and $35, respectively, pursuant to the Shareholder Services Plan.
Under its terms, the Distribution Plan and Shareholder Services Plan shall remain in effect from year to year, provided such continuance is approved annually by a vote of a majority of those Directors who are not “interested persons” of the Company and who have no direct or
34
indirect financial interest in the operation of or in any agreement related to the Distribution Plan or Shareholder Services Plan.
The fund has arrangements with the transfer agent and the custodian whereby the fund may receive earnings credits when positive cash balances are maintained, which are used to offset transfer agency and custody fees. For financial reporting purposes, the fund includes net earnings credits as an expense offset in the Statement of Operations.
The fund compensates Dreyfus Transfer, Inc., a wholly-owned subsidiary of Dreyfus, under a transfer agency agreement for providing transfer agency and cash management services for the fund. The majority of transfer agency fees are comprised of amounts paid on a per account basis, while cash management fees are related to fund subscriptions and redemptions. During the period ended October 31, 2014, the fund was charged $44 for transfer agency services and $11 for cash management services. These fees are included in Shareholder servicing costs in the Statement of Operations. Cash management fees were partially offset by earnings credit of $1.
The fund compensates The Bank of NewYork Mellon under a custody agreement for providing custodial services for the fund.These fees are determined based on net assets, geographic region and transaction activity. During the period ended October 31, 2014, the fund was charged $22,375 pursuant to the custody agreement.
During the period ended October 31, 2014, the fund was charged $8,015 for services performed by the Chief Compliance Officer and his staff.
The components of “Due to The Dreyfus Corporation and affiliates” in the Statement of Assets and Liabilities consist of: management fees $12,039, Distribution Plan fees $11, Shareholder Services Plan fees $2,010, custodian fees $9,408, Chief Compliance Officer fees $617 and transfer agency fees $44, which are offset against an expense reimbursement currently in effect in the amount of $11,939.
The Fund 35
NOTES TO FINANCIAL STATEMENTS (continued)
(d) Each Board member also serves as a Board member of other funds within the Dreyfus complex. Annual retainer fees and attendance fees are allocated to each fund based on net assets.
(e) A 2% redemption fee is charged and retained by the fund on certain shares redeemed within sixty days following the date of issuance subject to certain exceptions, including redemptions made through the use of the fund’s exchange privilege. During the period ended October 31, 2014, there were no redemption fees charged and retained by the fund.
NOTE 4—Securities Transactions:
The aggregate amount of purchases and sales of investment securities, excluding short-term securities, financial futures, options transactions, forward contracts and swap transactions, during the period ended October 31, 2014, amounted to $24,223,829 and $23,769,167, respectively.
Derivatives: A derivative is a financial instrument whose performance is derived from the performance of another asset. Each type of derivative instrument that was held by the fund during the period ended October 31, 2014 is discussed below.
Master Netting Arrangements: The fund enters into International Swaps and Derivatives Association, Inc. Master Agreements or similar agreements (collectively, “Master Agreements”) with its OTC derivative contract counterparties in order to, among other things, reduce its credit risk to counterparties. Master Agreements include provisions for general obligations, representations, collateral and events of default or termination. Under a Master Agreement, the fund may offset with the counterparty certain derivative financial instrument’s payables and/or receivables with collateral held and/or posted and create one single net payment in the event of default or termination.
Financial Futures: In the normal course of pursuing its investment objective, the fund is exposed to market risk, including interest rate risk as a result of changes in value of underlying financial instruments.
36
The fund invests in financial futures in order to manage its exposure to or protect against changes in the market.A financial futures contract represents a commitment for the future purchase or a sale of an asset at a specified date. Upon entering into such contracts, these investments require initial margin deposits with a counterparty, which consist of cash or cash equivalents.The amount of these deposits is determined by the exchange or Board of Trade on which the contract is traded and is subject to change. Accordingly, variation margin payments are received or made to reflect daily unrealized gains or losses which are recorded in the Statement of Operations. When the contracts are closed, the fund recognizes a realized gain or loss which is reflected in the Statement of Operations. There is minimal counter-party credit risk to the fund with financial futures since they are exchange traded, and the exchange guarantees the financial futures against default. Financial futures open at October 31, 2014 are set forth in the Statement of Financial Futures.
Options Transactions: The fund purchases and writes (sells) put and call options to hedge against changes in foreign currencies or as a substitute for an investment. The fund is subject to market risk and currency risk in the course of pursuing its investment objectives through its investments in options contracts. A call option gives the purchaser of the option the right (but not the obligation) to buy, and obligates the writer to sell, the underlying financial instrument at the exercise price at any time during the option period, or at a specified date. Conversely, a put option gives the purchaser of the option the right (but not the obligation) to sell, and obligates the writer to buy the underlying financial instrument at the exercise price at any time during the option period, or at a specified date.
As a writer of call options, the fund receives a premium at the outset and then bears the market risk of unfavorable changes in the price of the financial instrument underlying the option. Generally, the fund realizes a gain, to the extent of the premium, if the price of the underlying financial instrument decreases between the date the option is
The Fund 37
NOTES TO FINANCIAL STATEMENTS (continued)
written and the date on which the option is terminated. Generally, the fund incurs a loss if the price of the financial instrument increases between those dates.
As a writer of put options, the fund receives a premium at the outset and then bears the market risk of unfavorable changes in the price of the financial instrument underlying the option. Generally, the fund realizes a gain, to the extent of the premium, if the price of the underlying financial instrument increases between the date the option is written and the date on which the option is terminated. Generally, the fund incurs a loss if the price of the financial instrument decreases between those dates.
As a writer of an option, the fund has no control over whether the underlying financial instrument may be sold (call) or purchased (put) and as a result bears the market risk of an unfavorable change in the price of the financial instrument underlying the written option.There is a risk of loss from a change in value of such options which may exceed the related premiums received.This risk is mitigated by Master Agreements between the fund and the counterparty.The Statement of Operations reflects any unrealized gains or losses which occurred during the period as well as any realized gains or losses which occurred upon the expiration or closing of the option transaction.
The following summarizes the fund’s call/put options written during the period ended October 31, 2014:
| | | | | |
| | Face Amount | | Options Terminated | |
| | Covered by | Premiums | | Net Realized | |
| Options Written: | Contracts ($) | Received ($) | Cost ($) | Gain (Loss) ($) | |
| Contracts outstanding | | | | | |
| October 31, 2013 | 2,500,000 | 2,215 | | | |
| Contracts written | 570,000 | 9,012 | | | |
| Contracts terminated: | | | | | |
| Contracts closed | 380,000 | 6,111 | 7,177 | (1,066 | ) |
| Contracts expired | 2,500,000 | 2,215 | — | 2,215 | |
| Total contracts terminated | 2,880,000 | 8,326 | 7,177 | 1,149 | |
| Contracts Outstanding | | | | | |
| October 31, 2014 | 190,000 | 2,901 | | | |
38
Forward Foreign Currency Exchange Contracts: The fund enters into forward contracts in order to hedge its exposure to changes in foreign currency exchange rates on its foreign portfolio holdings, to settle foreign currency transactions or as a part of its investment strat-egy.When executing forward contracts, the fund is obligated to buy or sell a foreign currency at a specified rate on a certain date in the future. With respect to sales of forward contracts, the fund incurs a loss if the value of the contract increases between the date the forward contract is opened and the date the forward contract is closed.The fund realizes a gain if the value of the contract decreases between those dates.With respect to purchases of forward contracts, the fund incurs a loss if the value of the contract decreases between the date the forward contract is opened and the date the forward contract is closed.The fund realizes a gain if the value of the contract increases between those dates. Any realized or unrealized gains or losses which occurred during the period are reflected in the Statement of Operations. The fund is exposed to foreign currency risk as a result of changes in value of underlying financial instruments. The fund is also exposed to credit risk associated with counterparty nonperformance on these forward contracts, which is generally limited to the unrealized gain on each open contract. This risk is mitigated by Master Agreements between the fund and the counterparty. The following summarizes open forward contracts at October 31, 2014:
| | | | | | |
| | | Foreign | | | Unrealized | |
| Forward Foreign Currency | | Currency | | | Appreciation | |
| Exchange Contracts | | Amounts | Cost ($) | Value ($) | (Depreciation) ($) | |
| Purchases: | | | | | | |
| Brazilian Real, | | | | | | |
| Expiring: | | | | | | |
| 12/2/2014a | | 395,000 | 156,083 | 157,861 | 1,778 | |
| 12/2/2014b | | 350,000 | 142,712 | 139,877 | (2,835 | ) |
| Chilean Peso, | | | | | | |
| Expiring | | | | | | |
| 11/28/2014a | | 232,090,000 | 396,813 | 402,257 | 5,444 | |
| Euro, | | | | | | |
| Expiring | | | | | | |
| 11/28/2014c | | 150,000 | 191,507 | 188,005 | (3,502 | ) |
The Fund 39
NOTES TO FINANCIAL STATEMENTS (continued)
| | | | | | |
| | | Foreign | | | Unrealized | |
| Forward Foreign Currency | | Currency | | | Appreciation | |
| Exchange Contracts | | Amounts | Cost ($) | Value ($) | (Depreciation) ($) | |
| Purchases (continued): | | | | | | |
| Hungarian Forint, | | | | | | |
| Expiring | | | | | | |
| 11/28/2014b | | 31,530,000 | 129,457 | 128,143 | (1,314 | ) |
| Indian Rupee, | | | | | | |
| Expiring: | | | | | | |
| 11/28/2014a | | 23,340,000 | 379,281 | 377,888 | (1,393 | ) |
| 11/28/2014d | | 11,600,000 | 186,841 | 187,811 | 970 | |
| 11/28/2014e | | 11,575,000 | 187,116 | 187,406 | 290 | |
| Indonesian Rupiah, | | | | | | |
| Expiring | | | | | | |
| 11/28/2014f | | 686,730,000 | 57,108 | 56,564 | (544 | ) |
| Malaysian Ringgit, | | | | | | |
| Expiring | | | | | | |
| 11/28/2014a | | 3,350,000 | 1,019,678 | 1,016,303 | (3,375 | ) |
| Peruvian New Sol, | | | | | | |
| Expiring | | | | | | |
| 11/28/2014g | | 640,000 | 218,244 | 218,226 | (18 | ) |
| Philippines Peso, | | | | | | |
| Expiring | | | | | | |
| 11/28/2014d | | 2,170,000 | 48,389 | 48,310 | (79 | ) |
| Polish Zloty, | | | | | | |
| Expiring: | | | | | | |
| 11/28/2014d | | 525,000 | 157,546 | 155,623 | (1,923 | ) |
| 11/28/2014e | | 855,000 | 256,571 | 253,443 | (3,128 | ) |
| 11/28/2014g | | 1,425,000 | 427,584 | 422,406 | (5,178 | ) |
| Russian Ruble, | | | | | | |
| Expiring | | | | | | |
| 11/28/2014f | | 650,000 | 15,265 | 14,990 | (275 | ) |
| Taiwan New Dollar, | | | | | | |
| Expiring | | | | | | |
| 11/28/2014a | | 5,750,000 | 189,463 | 189,089 | (374 | ) |
| Thai Baht, | | | | | | |
| Expiring: | | | | | | |
| 11/28/2014d | | 930,000 | 28,737 | 28,517 | (220 | ) |
| 11/28/2014e | | 950,000 | 29,359 | 29,131 | (228 | ) |
| Turkish Lira, | | | | | | |
| Expiring | | | | | | |
| 11/28/2014e | | 400,000 | 177,685 | 178,812 | 1,127 | |
| Sales: | | | Proceeds ($) | | | |
| Colombian Peso, | | | | | | |
| Expiring | | | | | | |
| 11/28/2014a | | 1,321,670,000 | 642,523 | 640,149 | 2,374 | |
| Mexican New Peso, | | | | | | |
| Expiring | | | | | | |
| 11/28/2014e | | 1,230,000 | 91,081 | 91,182 | (101 | ) |
40
| | | | | | |
| | | Foreign | | | Unrealized | |
| Forward Foreign Currency | | Currency | | | Appreciation | |
| Exchange Contracts | | Amounts | Proceeds ($) | Value ($) | (Depreciation) ($) | |
| Sales (continued): | | | | | | |
| Peruvian New Sol, | | | | | | |
| Expiring: | | | | | | |
| 11/28/2014a | | 120,000 | 41,060 | 40,917 | 143 | |
| 11/28/2014e | | 675,000 | 233,201 | 230,160 | 3,041 | |
| Romanian Leu, | | | | | | |
| Expiring | | | | | | |
| 11/26/2014e | | 570,000 | 162,855 | 161,812 | 1,043 | |
| Singapore Dollar, | | | | | | |
| Expiring | | | | | | |
| 11/28/2014d | | 240,000 | 188,551 | 186,785 | 1,766 | |
| South African Rand, | | | | | | |
| Expiring | | | | | | |
| 11/28/2014a | | 8,645,000 | 787,818 | 780,194 | 7,624 | |
| South Korean Won, | | | | | | |
| Expiring | | | | | | |
| 11/28/2014a | | 403,770,000 | 382,986 | 377,374 | 5,612 | |
| Taiwan New Dollar, | | | | | | |
| Expiring | | | | | | |
| 11/28/2014e | | 5,750,000 | 188,603 | 189,088 | (485 | ) |
| Gross Unrealized | | | | | | |
| Appreciation | | | | | 31,212 | |
| Gross Unrealized | | | | | | |
| Depreciation | | | | | (24,972 | ) |
Counterparties:
| |
| a | Citigroup |
| b | Morgan Stanley Capital Services |
| c | Goldman Sachs International |
| d | Barclays Bank |
| e | JP Morgan Chase Bank |
| f | Credit Suisse |
| g | Deutsche Bank |
Swap Transactions: The fund enters into swap agreements to exchange the interest rate on, or return generated by, one nominal instrument for the return generated by another nominal instrument. Swap agreements are privately negotiated in the OTC market or centrally cleared. The fund enters into these agreements to hedge certain market or interest rate risks, to manage the interest rate sensitivity (sometimes called duration) of fixed income securities, to provide a substitute for purchasing or selling particular securities or to increase potential returns.
The Fund 41
NOTES TO FINANCIAL STATEMENTS (continued)
For OTC swaps, the fund accrues for the interim payments on a daily basis, with the net amount recorded within unrealized appreciation (depreciation) on swap agreements in the Statement of Assets and Liabilities. Once the interim payments are settled in cash, the net amount is recorded as a realized gain (loss) on swaps, in addition to realized gain (loss) recorded upon the termination of swap transactions in the Statement of Operations. Upfront payments made and/or received by the fund, are recorded as an asset and/or liability in the Statement of Assets and Liabilities and are recorded as a realized gain or loss ratably over the agreement’s term/event with the exception of forward starting interest rate swaps which are recorded as realized gains or losses on the termination date.
Fluctuations in the value of swap agreements are recorded for financial statement purposes as unrealized appreciation or depreciation on swap transactions.
Interest Rate Swaps: Interest rate swaps involve the exchange of commitments to pay and receive interest based on a notional principal amount. The fund may elect to pay a fixed rate and receive a floating rate, or receive a fixed rate and pay a floating rate on a notional principal amount. The net interest received or paid on interest rate swap agreements is included within realized gain (loss) on swap transactions in the Statement of Operations. Interest rate swap agreements are subject to general market risk, liquidity risk, counterparty risk and interest rate risk. At October 31, 2014, there were no interest rate swap agreements outstanding.
Credit Default Swaps: Credit default swaps involve commitments to pay a fixed interest rate in exchange for payment if a credit event affecting a third party (the referenced obligation) occurs. Credit events may include a failure to pay interest or principal, bankruptcy, or
42
restructuring. The fund enters into these agreements to manage its exposure to the market or certain sectors of the market, to reduce its risk exposure to defaults of corporate and sovereign issuers, or to create exposure to corporate or sovereign issuers to which it is not otherwise exposed. For those credit default swaps in which the fund is paying a fixed rate, the fund is buying credit protection on the instrument. In the event of a credit event, the fund would receive the full notional amount for the reference obligation. For those credit default swaps in which the fund is receiving a fixed rate, the fund is selling credit protection on the underlying instrument. The maximum pay-outs for these agreements are limited to the notional amount of each swap. Credit default swaps may involve greater risks than if the fund had invested in the reference obligation directly and are subject to general market risk, liquidity risk, counterparty risk and credit risk. This risk is mitigated by Master Agreements between the fund and the counterparty and the posting of collateral, if any, by the counterparty to the fund to cover the fund’s exposure to the counterparty.
The maximum potential amount of future payments (undiscounted) that a fund as a seller of protection could be required to make under a credit default swap agreement would be an amount equal to the notional amount of the agreement which may exceed the amount of unrealized appreciation or depreciation reflected in the Statement of Assets and Liabilities. Notional amounts of all credit default swap agreements are disclosed in the following chart, which summarizes open credit default swaps on sovereign issues entered into by the fund. These potential amounts would be partially offset by any recovery values of the respective referenced obligations, upfront payments received upon entering into the agreement, or net amounts received from the settlement of buy protection credit default swap agreements entered
The Fund 43
NOTES TO FINANCIAL STATEMENTS (continued)
into by the fund for the same referenced entity or entities.The following summarizes open credit default swaps entered into by the fund at October 31, 2014:
OTC—Credit Default Swaps
| | | | | | |
| | | (Pay) | | | | |
| | | Receive | Implied | | Upfront | |
| Reference | Notional | Fixed | Credit | Market | Premiums | Unrealized |
| Obligation ($) | Amount ($)2 | Rate(%) | Spread (%)3 | Value ($) | Received ($) | Appreciation ($) |
| | | | | | |
| Sales Contracts:1 | | | | | | |
| Russian Federation, | | | | | | |
| 7.5%, 3/31/2030, | | | | | | |
| 12/20/2015† | 400,000a | 1.00 | 2.0172 | (4,171) | (4,391) | 220 |
† Expiration Date
Counterparty:
| |
| a | JP Morgan Chase Bank |
| 1 | If the fund is a seller of protection and a credit event occurs, as defined under the terms of the swap |
| | agreement, the fund will either (i) pay to the buyer of protection an amount equal to the notional |
| | amount of the swap and take delivery of the reference obligation or (ii) pay a net settlement |
| | amount in the form of cash or securities equal to the notional amount of the swap less the recovery |
| | value of the reference obligation. |
| 2 | The maximum potential amount the fund could be required to pay as a seller of credit protection |
| | or receive as a buyer of credit protection if a credit event occurs as defined under the terms of the |
| | swap agreement. |
| 3 | Implied credit spreads, represented in absolute terms, utilized in determining the market value as of |
| | the period end serve as an indicator of the current status of the payment/performance risk and |
| | represent the likelihood of risk of default for the credit derivative.The credit spread of a particular |
| | referenced entity reflects the cost of buying/selling protection and may include upfront payments |
| | required to be made to enter into the agreement.Wider credit spreads represent a deterioration of the |
| | referenced entity's credit soundness and a greater likelihood of risk of default or other credit event |
| | occurring as defined under the terms of the agreement.A credit spread identified as “Defaulted” |
| | indicates a credit event has occurred for the referenced entity. Credit spreads are unaudited. |
GAAP requires disclosure for (i) the nature and terms of the credit derivative, reasons for entering into the credit derivative, the events or circumstances that would require the seller to perform under the credit derivative, and the current status of the payment/performance risk of the credit derivative, (ii) the maximum potential amount of future payments (undiscounted) the seller could be required to make under the credit derivative, (iii) the fair value of the credit derivative,
44
and (iv) the nature of any recourse provisions and assets held either as collateral or by third parties. All required disclosures have been made and are incorporated within the current period as part of the Notes to the Statement of Investments and disclosures within this Note.
The following tables show the fund’s exposure to different types of market risk as it relates to the Statement of Assets and Liabilities and the Statement of Operations, respectively.
Fair value of derivative instruments as of October 31, 2014 is shown below:
| | | | |
| | Derivative | | Derivative | |
| | Assets ($) | | Liabilities ($) | |
| Foreign exchange risk1 | 31,212 | Foreign exchange risk2,3 | (25,910 | ) |
| Credit risk4 | 220 | Interest rate risk5 | (7,323 | ) |
| Gross fair value of | | | | |
| derivatives contracts | 31,432 | | (33,233 | ) |
Statement of Assets and Liabilities location:
| |
| 1 | Unrealized appreciation on forward foreign currency exchange contracts. |
| 2 | Unrealized depreciation on forward foreign currency exchange contracts. |
| 3 | Outstanding options written, at value. |
| 4 | Unrealized appreciation on swap agrements. |
| 5 | Includes cumulative appreciation (depreciation) on financial futures as reported in the Statement |
| | of Financial Futures, but only the unpaid variation margin is reported in the Statement of Assets |
| | and Liabilities. |
The effect of derivative instruments in the Statement of Operations during the period ended October 31, 2014 is shown below:
| | | | | | | | | |
| Amount of realized gain (loss) on derivatives recognized in income ($) |
|
| | Financial | | Options | Forward | | Swap | | | |
| Underlying risk | Futures6 | | Transactions7 | Contracts8 | | Transactions9 | | Total | |
| Interest rate | (36,524 | ) | — | — | | (6,447 | ) | (42,971 | ) |
| Foreign exchange | — | | 1,150 | (96,179 | ) | — | | (95,029 | ) |
| Credit | — | | — | — | | (3,916 | ) | (3,916 | ) |
| Total | (36,524 | ) | 1,150 | (96,179 | ) | (10,363 | ) | (141,916 | ) |
The Fund 45
NOTES TO FINANCIAL STATEMENTS (continued)
Change in unrealized appreciation (depreciation) on derivatives recognized in income ($)
| | | | | | | |
| | Financial | | Options | Forward | Swap | | |
| Underlying risk | Futures10 | Transactions11 | Contracts12 | Transactions13 | Total | |
| Interest rate | (7,323 | ) | — | — | 4,133 | (3,190 | ) |
| Foreign exchange | — | | 1,359 | 7,940 | — | 9,299 | |
| Credit | — | | — | — | 220 | 220 | |
| Total | (7,323 | ) | 1,359 | 7,940 | 4,353 | 6,329 | |
Statement of Operations location:
| |
| 6 | Net realized gain (loss) on financial futures. |
| 7 | Net realized gain (loss) on options transactions. |
| 8 | Net realized gain (loss) on forward foreign currency exchange contracts. |
| 9 | Net realized gain (loss) on swap transactions. |
| 10 Net unrealized appreciation (depreciation) on financial futures. |
| 11 Net unrealized appreciation (depreciation) on options transactions. |
| 12 Net unrealized appreciation (depreciation) on forward foreign currency exchange contracts. |
| 13 Net unrealized appreciation (depreciation) on swap transactions. |
The provisions of ASC Topic 210 “Disclosures about Offsetting Assets and Liabilities” require disclosure on the offsetting of financial assets and liabilities. These disclosures are required for certain investments, including derivative financial instruments subject to Master Agreements which are eligible for offsetting in the Statement of Assets and Liabilities and require the fund to disclose both gross and net information with respect to such investments. For financial reporting purposes, the fund does not offset derivative assets and derivative liabilities that are subject to Master Agreements in the Statement of Assets and Liabilities.
At October 31, 2014, derivative assets and liabilities (by type) on a gross basis are as follows:
| | | |
| Derivative Financial Instruments: | Assets ($) | Liabilities ($) | |
| Financial futures | — | (7,323 | ) |
| Options | — | (938 | ) |
| Forward contracts | 31,212 | (24,972 | ) |
| Swaps | 220 | — | |
| Total gross amount of derivative assets | | | |
| and liabilities in the Statement of | | | |
| Assets and Liabilities | 31,432 | (33,233 | ) |
| Derivatives not subject to | | | |
| Master Agreements | — | 8,142 | |
| Total gross amount of assets and liabilities | | | |
| subject to Master Agreements | 31,432 | (25,091 | ) |
46
The following tables present derivative assets and liabilities net of amounts available for offsetting under Master Agreements and net of related collateral received or pledged, if any, as of October 31, 2014:†
| | | | | | | |
| | | | Financial | | | | |
| | | | Instruments | | | | |
| | | | and | | | | |
| | | | Derivatives | | | | |
| | Gross Amount of | | Available | | Collateral | Net Amount of | |
| Counterparties | Assets ($)1 | | for Offset ($) | | Received ($) | Assets ($) | |
| Barclays Bank | 2,736 | | (2,222 | ) | — | 514 | |
| Citigroup | 22,975 | | (5,142 | ) | — | 17,833 | |
| JP Morgan Chase Bank | 5,721 | | (4,880 | ) | — | 841 | |
| Total | 31,432 | | (12,244 | ) | — | 19,188 | |
| |
| | | | Financial | | | | |
| | | | Instruments | | | | |
| | | | and | | | | |
| | | | Derivatives | | | | |
| | Gross Amount of | | Available | | Collateral | Net Amount of | |
| Counterparties | Liabilities ($)1 | | for Offset ($) | | Pledged ($) | Liabilities ($) | |
| Barclays Bank | (2,222 | ) | 2,222 | | — | — | |
| Citigroup | (5,142 | ) | 5,142 | | — | — | |
| Deutsche Bank | (5,196 | ) | — | | — | (5,196 | ) |
| Goldman Sachs | | | | | | | |
| International | (3,502 | ) | — | | — | (3,502 | ) |
| JP Morgan Chase Bank | (4,880 | ) | 4,880 | | — | — | |
| Morgan Stanley | | | | | | | |
| Capital Services | (4,149 | ) | — | | — | (4,149 | ) |
| Total | (25,091 | ) | 12,244 | | — | (12,847 | ) |
| |
| 1 | Absent a default event or early termination, OTC derivative assets and liabilities are presented at |
| | gross amounts and are not offset in the Statement of Assets and Liabilities. |
| † | See Statement of Investments for detailed information regarding collateral held for open financial |
| | futures contracts. |
The following summarizes the average market value of derivatives outstanding during the period ended October 31, 2014:
| |
| | Average Market Value ($) |
| Interest rate financial futures | 961,502 |
| Foreign currency options contracts | 672 |
| Forward contracts | 4,993,820 |
The Fund 47
NOTES TO FINANCIAL STATEMENTS (continued)
The following summarizes the average notional value of swap agreements outstanding during the period ended October 31, 2014:
| |
| | Average Notional Value ($) |
| Interest rate swap agreements | 229,446 |
| Credit default swap agreements | 30,769 |
At October 31, 2014, the cost of investments for federal income tax purposes was $19,041,147; accordingly, accumulated net unrealized depreciation on investments was $762,837, consisting of $188,441 gross unrealized appreciation and $951,278 gross unrealized depreciation.
48
REPORT OF INDEPENDENT REGISTERED
PUBLIC ACCOUNTING FIRM
The Board of Directors and Shareholders of
The Dreyfus/Laurel Funds, Inc.
We have audited the accompanying statement of assets and liabilities of Dreyfus Opportunistic Emerging Markets Debt Fund (the “Fund”), a series of The Dreyfus/Laurel Funds, Inc., including the statements of investments, financial futures and options written, as of October 31, 2014, and the related statement of operations for the year then ended, and the statement of changes in net assets and the financial highlights for each of the years or periods in the two-year period then ended.These financial statements and financial highlights are the responsibility of the Fund’s management. Our responsibility is to express an opinion on these financial statements and financial highlights based on our audits.
We conducted our audits in accordance with the standards of the Public Company Accounting Oversight Board (United States).Those standards require that we plan and perform the audit to obtain reasonable assurance about whether the financial statements and financial highlights are free of material misstatement. An audit includes examining, on a test basis, evidence supporting the amounts and disclosures in the financial statements. Our procedures included confirmation of securities owned as of October 31, 2014, by correspondence with the custodian and brokers or by other appropriate auditing procedures. An audit also includes assessing the accounting principles used and significant estimates made by management, as well as evaluating the overall financial statement presentation.We believe that our audits provide a reasonable basis for our opinion.
In our opinion, the financial statements and financial highlights referred to above present fairly, in all material respects, the financial position of Dreyfus Opportunistic Emerging Markets Debt Fund as of October 31, 2014, and the results of its operations for the year then ended, and the changes in its net assets and the financial highlights for each of the years or periods in the two-year period then ended, in conformity with U.S. generally accepted accounting principles.

New York, New York
December 30, 2014
The Fund 49
IMPORTANT TAX INFORMATION (Unaudited)
For federal tax purposes the fund designates the maximum amount allowable but not less than 2.50% as interest-related dividends in accordance with Sections 871(k)(1) and 881(e) of the Internal Revenue Code.
50
BOARD MEMBERS INFORMATION (Unaudited)
INDEPENDENT BOARD MEMBERS
|
| Joseph S. DiMartino (71) |
| Chairman of the Board (1999) |
| Principal Occupation During Past 5Years: |
| • Corporate Director and Trustee (1995-present) |
| Other Public Company Board Memberships During Past 5Years: |
| • CBIZ (formerly, Century Business Services, Inc.), a provider of outsourcing functions for small |
| and medium size companies, Director (1997-present) |
| • The Newark Group, a provider of a national market of paper recovery facilities, paperboard |
| mills and paperboard converting plants, Director (2000-2010) |
| • Sunair Services Corporation, a provider of certain outdoor-related services to homes and busi- |
| nesses, Director (2005-2009) |
| No. of Portfolios for which Board Member Serves: 144 |
| ——————— |
| Francine J. Bovich (63) |
| Board Member (2012) |
| Principal Occupation During Past 5Years: |
| • Trustee,The Bradley Trusts, private trust funds (2011-present) |
| • Managing Director, Morgan Stanley Investment Management (1993-2010) |
| Other Public Company Board Membership During Past 5Years: |
| • Annaly Capital Management, Inc., Board Member (May 2014-present) |
| No. of Portfolios for which Board Member Serves: 45 |
| ——————— |
| Kenneth A. Himmel (68) |
| Board Member (1994) |
| Principal Occupation During Past 5Years: |
| • President and CEO, Related Urban Development, a real estate development company (1996-present) |
| • President and CEO, Himmel & Company, a real estate development company (1980-present) |
| • CEO,American Food Management, a restaurant company (1983-present) |
| No. of Portfolios for which Board Member Serves: 31 |
The Fund 51
BOARD MEMBERS INFORMATION (Unaudited) (continued)
INDEPENDENT BOARD MEMBERS (continued)
|
| Stephen J. Lockwood (67) |
| Board Member (1994) |
| Principal Occupation During Past 5Years: |
| • Chairman of the Board, Stephen J. Lockwood and Company LLC, a real estate investment |
| company (2000-present) |
| No. of Portfolios for which Board Member Serves: 31 |
| ——————— |
| Roslyn M. Watson (65) |
| Board Member (1994) |
| Principal Occupation During Past 5Years: |
| • Principal,Watson Ventures, Inc., a real estate investment company (1993-present) |
| No. of Portfolios for which Board Member Serves: 69 |
| ——————— |
| Benaree Pratt Wiley (68) |
| Board Member (1998) |
| Principal Occupation During Past 5Years: |
| • Principal,TheWiley Group, a firm specializing in strategy and business development (2005-present) |
| Other Public Company Board Membership During Past 5Years: |
| • CBIZ (formerly, Century Business Services, Inc.), a provider of outsourcing functions for small |
| and medium size companies, Director (2008-present) |
| No. of Portfolios for which Board Member Serves: 69 |
| ——————— |
| Once elected all Board Members serve for an indefinite term, but achieve Emeritus status upon reaching age 80.The |
| address of the Board Members and Officers is c/o The Dreyfus Corporation, 200 Park Avenue, NewYork, NewYork |
| 10166.Additional information about the Board Members is available in the fund’s Statement of Additional Information |
| which can be obtained from Dreyfus free of charge by calling this toll free number: 1-800-DREYFUS. |
| James M. Fitzgibbons, Emeritus Board Member |
| J.Tomlinson Fort, Emeritus Board Member |
52
OFFICERS OF THE FUND (Unaudited)
BRADLEY J. SKAPYAK, President since January 2010.
Chief Operating Officer and a director of the Manager since June 2009, Chairman of Dreyfus Transfer, Inc., an affiliate of the Manager and the transfer agent of the funds, since May 2011 and Executive Vice President of the Distributor since June 2007. From April 2003 to June 2009, Mr. Skapyak was the head of the Investment Accounting and Support Department of the Manager. He is an officer of 69 investment companies (comprised of 144 portfolios) managed by the Manager. He is 55 years old and has been an employee of the Manager since February 1988.
JOHN PAK, Chief Legal Officer since March 2013.
Deputy General Counsel, Investment Management, of BNY Mellon since August 2014; Chief Legal Officer of the Manager since August 2012; from March 2005 to July 2012, Managing Director of Deutsche Bank, Deputy Global Head of Deutsche Asset Management Legal and Regional Head of Deutsche Asset Management Americas Legal. He is an officer of 70 investment companies (comprised of 169 portfolios) managed by the Manager. He is 46 years old and has been an employee of the Manager since August 2012.
JANETTE E. FARRAGHER, Vice President and Secretary since December 2011.
Assistant General Counsel of BNY Mellon, and an officer of 70 investment companies (comprised of 169 portfolios) managed by the Manager. She is 51 years old and has been an employee of the Manager since February 1984.
KIESHA ASTWOOD, Vice President and Assistant Secretary since January 2010.
Counsel of BNY Mellon, and an officer of 70 investment companies (comprised of 169 portfolios) managed by the Manager. She is 41 years old and has been an employee of the Manager since July 1995.
JAMES BITETTO, Vice President and Assistant Secretary since August 2005.
Managing Counsel of BNY Mellon and Secretary of the Manager, and an officer of 70 investment companies (comprised of 169 portfolios) managed by the Manager. He is 48 years old and has been an employee of the Manager since December 1996.
JONI LACKS CHARATAN, Vice President and Assistant Secretary since August 2005.
Managing Counsel of BNY Mellon, and an officer of 70 investment companies (comprised of 169 portfolios) managed by the Manager. She is 58 years old and has been an employee of the Manager since October 1988.
JOSEPH M. CHIOFFI, Vice President and Assistant Secretary since August 2005.
Managing Counsel of BNY Mellon, and an officer of 70 investment companies (comprised of 169 portfolios) managed by the Manager. He is 52 years old and has been an employee of the Manager since June 2000.
JOHN B. HAMMALIAN, Vice President and Assistant Secretary since August 2005.
Senior Managing Counsel of BNY Mellon, and an officer of 70 investment companies (comprised of 169 portfolios) managed by the Manager. He is 51 years old and has been an employee of the Manager since February 1991.
SARAH S. KELLEHER, Vice President and Assistant Secretary since April 2014.
Senior Counsel of BNY Mellon, and an officer of 70 investment companies (comprised of 169 portfolios) managed by the Manager; from August 2005 to March 2013, Associate General Counsel of Third Avenue Management. She is 38 years old and has been an employee of the Manager since March 2013.
The Fund 53
OFFICERS OF THE FUND (Unaudited) (continued)
JEFF PRUSNOFSKY, Vice President and Assistant Secretary since August 2005.
Senior Managing Counsel of BNY Mellon, and an officer of 70 investment companies (comprised of 169 portfolios) managed by the Manager. He is 49 years old and has been an employee of the Manager since October 1990.
JAMES WINDELS, Treasurer since November 2001.
Director – Mutual Fund Accounting of the Manager, and an officer of 70 investment companies (comprised of 169 portfolios) managed by the Manager. He is 56 years old and has been an employee of the Manager since April 1985.
RICHARD CASSARO, Assistant Treasurer since January 2008.
Senior Accounting Manager – Money Market and Municipal Bond Funds of the Manager, and an officer of 70 investment companies (comprised of 169 portfolios) managed by the Manager. He is 55 years old and has been an employee of the Manager since September 1982.
GAVIN C. REILLY, Assistant Treasurer since December 2005.
Tax Manager of the Investment Accounting and Support Department of the Manager, and an officer of 70 investment companies (comprised of 169 portfolios) managed by the Manager. He is 46 years old and has been an employee of the Manager since April 1991.
ROBERT S. ROBOL, Assistant Treasurer since August 2005.
Senior Accounting Manager – Fixed Income Funds of the Manager, and an officer of 70 investment companies (comprised of 169 portfolios) managed by the Manager. He is 50 years old and has been an employee of the Manager since October 1988.
ROBERT SALVIOLO, Assistant Treasurer since July 2007.
Senior Accounting Manager – Equity Funds of the Manager, and an officer of 70 investment companies (comprised of 169 portfolios) managed by the Manager. He is 47 years old and has been an employee of the Manager since June 1989.
ROBERT SVAGNA, Assistant Treasurer since December 2002.
Senior Accounting Manager – Equity Funds of the Manager, and an officer of 70 investment companies (comprised of 169 portfolios) managed by the Manager. He is 47 years old and has been an employee of the Manager since November 1990.
JOSEPH W. CONNOLLY, Chief Compliance Officer since October 2004.
Chief Compliance Officer of the Manager and The Dreyfus Family of Funds (70 investment companies, comprised of 169 portfolios). He is 57 years old and has served in various capacities with the Manager since 1980, including manager of the firm’s Fund Accounting Department from 1997 through October 2001.
MATTHEW D. CONNOLLY, Anti-Money Laundering Compliance Officer since April 2012.
Anti-Money Laundering Compliance Officer of the Distributor since October 2011; from March 2010 to September 2011, Global Head, KYC Reviews and Director of UBS Investment Bank; until March 2010, AML Compliance Officer and Senior Vice President of Citi Global Wealth Management. He is an officer of 65 investment companies (comprised of 164 portfolios) managed by the Manager. He is 42 years old and has been an employee of the Distributor since October 2011.
54
For More Information

|
| Telephone Call your financial representative or 1-800-DREYFUS |
| Mail The Dreyfus Family of Funds, 144 Glenn Curtiss Boulevard, Uniondale, NY 11556-0144 |
The fund files its complete schedule of portfolio holdings with the Securities and Exchange Commission (“SEC”) for the first and third quarters of each fiscal year on Form N-Q. The fund's Forms N-Q are available on the SEC’s website at http://www.sec.gov and may be reviewed and copied at the SEC’s Public Reference Room in Washington, DC. Information on the operation of the Public Reference Room may be obtained by calling 1-800-SEC-0330.
Information regarding how the fund voted proxies relating to portfolio securities for the most recent 12-month period ended June 30 is available on the SEC’s website at http://www.sec.gov and without charge, upon request, by calling 1-800-DREYFUS.

Item 2. Code of Ethics.
The Registrant has adopted a code of ethics that applies to the Registrant's principal executive officer, principal financial officer, principal accounting officer or controller, or persons performing similar functions. There have been no amendments to, or waivers in connection with, the Code of Ethics during the period covered by this Report.
Item 3. Audit Committee Financial Expert.
The Registrant's Board has determined that Joseph S. DiMartino, a member of the Audit Committee of the Board, is an audit committee financial expert as defined by the Securities and Exchange Commission (the "SEC"). Mr. DiMartino is "independent" as defined by the SEC for purposes of audit committee financial expert determinations.
Item 4. Principal Accountant Fees and Services.
(a) Audit Fees. The aggregate fees billed for each of the last two fiscal years (the "Reporting Periods") for professional services rendered by the Registrant's principal accountant (the "Auditor") for the audit of the Registrant's annual financial statements or services that are normally provided by the Auditor in connection with the statutory and regulatory filings or engagements for the Reporting Periods, were $297,425 in 2013and $302,840 in 2014.
(b) Audit-Related Fees. The aggregate fees billed in the Reporting Periods for assurance and related services by the Auditor that are reasonably related to the performance of the audit of the Registrant's financial statements and are not reported under paragraph (a) of this Item 4 were $29,350 in 2013 and $34,020 in 2014. These services consisted of one or more of the following: (i) agreed upon procedures related to compliance with Internal Revenue Code section 817(h), (ii) security counts required by Rule 17f-2 under the Investment Company Act of 1940, as amended, (iii) advisory services as to the accounting or disclosure treatment of Registrant transactions or events and (iv) advisory services to the accounting or disclosure treatment of the actual or potential impact to the Registrant of final or proposed rules, standards or interpretations by the Securities and Exchange Commission, the Financial Accounting Standards Boards or other regulatory or standard-setting bodies.
The aggregate fees billed in the Reporting Periods for non-audit assurance and related services by the Auditor to the Registrant's investment adviser (not including any sub-investment adviser whose role is primarily portfolio management and is subcontracted with or overseen by another investment adviser), and any entity controlling, controlled by or under common control with the investment adviser that provides ongoing services to the Registrant ("Service Affiliates"), that were reasonably related to the performance of the annual audit of the Service Affiliate, which required pre-approval by the Audit Committee were $0 in 2013 and $0 in 2014.
(c) Tax Fees. The aggregate fees billed in the Reporting Periods for professional services rendered by the Auditor for tax compliance, tax advice, and tax planning ("Tax Services") were $18,800 in 2013 and $21,600 in 2014. These services consisted of the review or preparation of U.S. federal, state, local and excise tax returns. The aggregate fees billed in the Reporting Periods for Tax Services by the Auditor to Service Affiliates, which required pre-approval by the Audit Committee were $0 in 2013 and $0 in 2014.
(d) All Other Fees. The aggregate fees billed in the Reporting Periods for products and services provided by the Auditor, other than the services reported in paragraphs (a) through (c) of this Item, were $0 in 2013 and $0 in 2014.
The aggregate fees billed in the Reporting Periods for Non-Audit Services by the Auditor to Service Affiliates, other than the services reported in paragraphs (b) through (c) of this Item, which required pre-approval by the Audit Committee, were $0 in 2013 and $0 in 2014.
(e)(1) Audit Committee Pre-Approval Policies and Procedures. The Registrant's Audit Committee has established policies and procedures (the "Policy") for pre-approval (within specified fee limits) of the Auditor's engagements for non-audit services to the Registrant and Service Affiliates without specific case-by-case consideration. The pre-approved services in the Policy can include pre-approved audit services, pre-approved audit-related services, pre-approved tax services and pre-approved all other services. Pre-approval considerations include whether the proposed services are compatible with maintaining the Auditor's independence. Pre-approvals pursuant to the Policy are considered annually.
(e)(2) Note: None of the services described in paragraphs (b) through (d) of this Item 4 were approved by the Audit Committee pursuant to paragraph (c)(7)(i)(C) of Rule 2-01 of Regulation S-X.
(f) None of the hours expended on the principal accountant's engagement to audit the registrant's financial statements for the most recent fiscal year were attributed to work performed by persons other than the principal account's full-time, permanent employees.
Non-Audit Fees. The aggregate non-audit fees billed by the Auditor for services rendered to the Registrant, and rendered to Service Affiliates, for the Reporting Periods were $13,945,381 in 2013 and $15,598,229 in 2014.
Auditor Independence. The Registrant's Audit Committee has considered whether the provision of non-audit services that were rendered to Service Affiliates, which were not pre-approved (not requiring pre-approval), is compatible with maintaining the Auditor's independence.
Item 5. Audit Committee of Listed Registrants.
Not applicable.
Item 6. Investments.
(a) Not applicable.
Item 7. Disclosure of Proxy Voting Policies and Procedures for Closed-End Management Investment Companies.
Not applicable.
Item 8. Portfolio Managers of Closed-End Management Investment Companies.
Not applicable.
Item 9. Purchases of Equity Securities by Closed-End Management Investment Companies and Affiliated Purchasers.
Not applicable.
Item 10. Submission of Matters to a Vote of Security Holders.
There have been no material changes to the procedures applicable to Item 10.
Item 11. Controls and Procedures.
(a) The Registrant's principal executive and principal financial officers have concluded, based on their evaluation of the Registrant's disclosure controls and procedures as of a date within 90 days of the filing date of this report, that the Registrant's disclosure controls and procedures are reasonably designed to ensure that information required to be disclosed by the Registrant on Form N-CSR is recorded, processed, summarized and reported within the required time periods and that information required to be disclosed by the Registrant in the reports that it files or submits on Form N-CSR is accumulated and communicated to the Registrant's management, including its principal executive and principal financial officers, as appropriate to allow timely decisions regarding required disclosure.
(b) There were no changes to the Registrant's internal control over financial reporting that occurred during the second fiscal quarter of the period covered by this report that have materially affected, or are reasonably likely to materially affect, the Registrant's internal control over financial reporting.
Item 12. Exhibits.
(a)(1) Code of ethics referred to in Item 2.
(a)(2) Certifications of principal executive and principal financial officers as required by Rule 30a-2(a) under the Investment Company Act of 1940.
(a)(3) Not applicable.
(b) Certification of principal executive and principal financial officers as required by Rule 30a-2(b) under the Investment Company Act of 1940.
SIGNATURES
Pursuant to the requirements of the Securities Exchange Act of 1934 and the Investment Company Act of 1940, the Registrant has duly caused this Report to be signed on its behalf by the undersigned, thereunto duly authorized.
The Dreyfus/Laurel Funds, Inc.
By: /s/ Bradley J. Skapyak
Bradley J. Skapyak,
President
Date: December 18, 2014
Pursuant to the requirements of the Securities Exchange Act of 1934 and the Investment Company Act of 1940, this Report has been signed below by the following persons on behalf of the Registrant and in the capacities and on the dates indicated.
By: /s/ Bradley J. Skapyak
Bradley J. Skapyak,
President
Date: December 18, 2014
By: /s/ James Windels
James Windels,
Treasurer
Date: December 18, 2014
EXHIBIT INDEX
(a)(1) Code of ethics referred to in Item 2.
(a)(2) Certifications of principal executive and principal financial officers as required by Rule 30a-2(a) under the Investment Company Act of 1940. (EX-99.CERT)
(b) Certification of principal executive and principal financial officers as required by Rule 30a-2(b) under the Investment Company Act of 1940. (EX-99.906CERT)