UNITED STATES
SECURITIES AND EXCHANGE COMMISSION
Washington, D.C. 20549
FORM N-CSR
CERTIFIED SHAREHOLDER REPORT OF REGISTERED MANAGEMENT
INVESTMENT COMPANIES
Investment Company Act file number | 811-05202 | |||||
|
| |||||
| The Dreyfus/Laurel Funds, Inc. |
| ||||
| (Exact name of Registrant as specified in charter) |
| ||||
|
|
| ||||
|
c/o The Dreyfus Corporation 200 Park Avenue New York, New York 10166 |
| ||||
| (Address of principal executive offices) (Zip code) |
| ||||
|
|
| ||||
| Bennett A. MacDougall, Esq. 200 Park Avenue New York, New York 10166 |
| ||||
| (Name and address of agent for service) |
| ||||
| ||||||
Registrant's telephone number, including area code: | (212) 922-6400 | |||||
|
| |||||
Date of fiscal year end:
| 08/31 |
| ||||
Date of reporting period: | 08/31/2017
|
| ||||
The following N-CSR relates only to the Registrant's series listed below and does not relate to any series of the Registrant with a different fiscal year end and, therefore, different N-CSR reporting requirements. A separate N-CSR will be filed for any series with a different fiscal year end, as appropriate.
Dreyfus Core Equity Fund
Dreyfus Floating Rate Income Fund
FORM N-CSR
Item 1. Reports to Stockholders.
Dreyfus Core Equity Fund
| ANNUAL REPORT |

|

Save time. Save paper. View your next shareholder report online as soon as it’s available. Log into www.dreyfus.com and sign up for Dreyfus eCommunications. It’s simple and only takes a few minutes. |
The views expressed in this report reflect those of the portfolio manager(s) only through the end of the period covered and do not necessarily represent the views of Dreyfus or any other person in the Dreyfus organization. Any such views are subject to change at any time based upon market or other conditions and Dreyfus disclaims any responsibility to update such views. These views may not be relied on as investment advice and, because investment decisions for a Dreyfus fund are based on numerous factors, may not be relied on as an indication of trading intent on behalf of any Dreyfus fund. |
Not FDIC-Insured • Not Bank-Guaranteed • May Lose Value |
Contents
THE FUND
With Those of Other Funds | |
in Affiliated Issuers | |
Public Accounting Firm | |
the Fund’s Investment | |
Management Agreement | |
FOR MORE INFORMATION
Back Cover
| The Fund |
A LETTER FROM THE CEO OF DREYFUS
Dear Shareholder:
We are pleased to present this annual report for Dreyfus Core Equity Fund, covering the 12-month period from September 1, 2016 through August 31, 2017. For information about how the fund performed during the reporting period, as well as general market perspectives, we provide a Discussion of Fund Performance on the pages that follow.
Stocks set a series of new record highs and bonds produced mixed results over the past year in response to changing economic and political conditions. Financial markets during the final months of 2016 were dominated by the election of a new U.S. presidential administration. Equities surged higher in anticipation of more business-friendly regulatory, tax, and fiscal policies, but high-quality bonds generally lost value due to expectations of rising interest rates and accelerating inflation in a stronger economy. Despite a series of short-term interest-rate hikes, bonds recovered over the first eight months of 2017 when it became clearer that major tax and fiscal reforms would take time and political capital to enact. Stocks continued to rally, led by large growth-oriented companies, as corporate earnings grew and global economic conditions improved.
The markets’ recent strong performance has been supported by solid underlying fundamentals. While we currently expect these favorable conditions to persist, we remain watchful for economic and political developments that could derail the rallies. As always, we encourage you to discuss the risks and opportunities of today’s investment environment with your financial advisor.
Thank you for your continued confidence and support.
Sincerely,

Mark D. Santero
Chief Executive Officer
The Dreyfus Corporation
September 15, 2017
2
DISCUSSION OF FUND PERFORMANCE
For the period from September 1, 2016 through August 31, 2017, as provided by portfolio manager Fayez Sarofim of Fayez Sarofim & Co., Sub-Investment Adviser
Market and Fund Performance Overview
For the 12-month period ended August 31, 2017, Dreyfus Core Equity Fund’s Class A shares produced a total return of 16.89%, Class C shares returned 16.09%, and Class I shares returned 17.01%.1 In comparison, the S&P 500® Index (the “Index”), the fund’s benchmark, produced a total return of 16.22% for the same period.2
Large-cap stocks gained ground amid better-than-expected corporate earnings and improving global economic prospects. Our sector allocation and security selection strategies in the information technology, consumer discretionary, and health care sectors helped the fund’s relative performance against the benchmark.
The Fund’s Investment Approach
The fund seeks long-term capital appreciation. To pursue its goal, the fund normally invests at least 80% of its net assets in common stocks. The fund focuses on “blue-chip” companies with market capitalizations exceeding $5 billion at the time of purchase, including multinational companies.
In choosing stocks, the fund first identifies economic sectors that it believes will expand over the next three to five years or longer. Using fundamental analysis, the fund then seeks companies within these sectors that have dominant positions in their industries and that have demonstrated sustained patterns of profitability, strong balance sheets, and expanding global presence and the potential to achieve predictable, above-average earnings growth. The fund is also alert to companies that it considers undervalued in terms of current earnings, assets, or growth prospects.
The fund may also invest in securities of foreign companies in the form of U.S.-dollar-denominated American depositary receipts (ADRs).
The fund employs a “buy-and-hold” investment strategy, which generally has resulted in an annual portfolio turnover of below 15%.3
Rising Corporate Earnings Drove Markets Higher
The Index pressed higher over the reporting period as global growth improved and market volatility moderated. Economically sensitive market sectors and more domestically oriented businesses led the market’s advance in late 2016, buoyed by rising inflation expectations and a stronger U.S. dollar. These trends reversed in early 2017 as investors gravitated towards higher-quality companies while the dollar drifted lower, and stocks with higher international exposure outpaced their more U.S.-oriented peers over the first eight months of 2017. Market uncertainty resurfaced in the spring and summer due to a lack of progress on legislative issues and the possibility of balance-sheet unwinding by the Federal Reserve Board later in the year, but stronger-than-expected corporate earnings helped limit adverse market reactions. The information technology, financials, and industrials sectors were the strongest sectors of the Index for the reporting period. The energy and telecommunication services sectors were the only two segments of the Index to register declines.
3
DISCUSSION OF FUND PERFORMANCE (continued)
Selection and Allocation Strategies Supported Fund Results
Overweighted and selectively focused representation in the information technology sector was the largest contributor to relative performance, with overweight positions in Apple and Facebook producing the largest positive effects. Positioning within the consumer discretionary sector, which included the avoidance of retail stocks, proved beneficial, as did a lack of exposure to the interest rate-sensitive telecommunication services and real estate sectors. Security selections among health care stocks also added value, including strong returns from Intuitive Surgical and UnitedHealth Group. The largest positive contributors to the fund’s relative performance over the reporting period included Apple, Facebook, Philip Morris International, Microsoft, and JPMorgan Chase.
Factors that penalized relative results included an emphasis on the industrials sector, particularly within the aerospace and railroad industries. In the financials sector, lack of exposure to certain banks, insurance companies, and capital markets firms hampered results compared to the Index, but an overweighted allocation to the sector overall provided an ameliorative effect. Conversely, an above-market allocation to the energy sector proved detrimental. This impact, however, was mitigated by an emphasis on the major integrated oil companies within the sector. The largest detractors from returns were Occidental Petroleum, Exxon Mobil, Gilead Sciences, Novo Nordisk, and NIKE.
Focusing on Industry Leaders
Against a backdrop of structurally slower economic growth and rising uncertainty, investors have homed in on companies with strong fundamental characteristics that are capable of delivering consistent returns through diverse market conditions. The fund’s long-practiced investment strategy focuses on such companies, including large, high-quality multinationals with best-in-class business models, entrenched market positions, and highly stable revenue streams. These industry leaders have the scale and financial discipline to sustain earnings growth in a rising interest-rate environment, which we believe will have increasing appeal as central banks ease off the monetary accelerator. Furthermore, healthy balance sheets and ample free cash flows better enable these companies to maintain and grow their dividends as the cost of capital rises, offering the prospect of greater total returns over time.
September 15, 2017
1 Total return includes reinvestment of dividends and any capital gains paid, and does not take into consideration the maximum initial sales charge in the case of Class A shares, or the applicable contingent deferred sales charge imposed on redemptions in the case of Class C shares. Had these charges been reflected, returns would have been lower. Past performance is no guarantee of future results. Share price and investment return fluctuate such that upon redemption, fund shares may be worth more or less than their original cost.
2 Source: Lipper Inc. — The S&P 500® Index is widely regarded as the best single gauge of large-cap U.S. equities. The index includes 500 leading companies and captures approximately 80% coverage of available market capitalization. Investors cannot invest directly in any index.
3 Portfolio turnover rates are subject to change. Portfolio turnover rates alone do not automatically result in high or low distribution levels. There can be no guarantee that the fund will generate any specific level of distributions annually.
Please note: the position in any security highlighted with italicized typeface was sold during the reporting period.
Equities are subject generally to market, market sector, market liquidity, issuer, and investment style risks, among other factors, to varying degrees, all of which are more fully described in the fund’s prospectus.
4
FUND PERFORMANCE
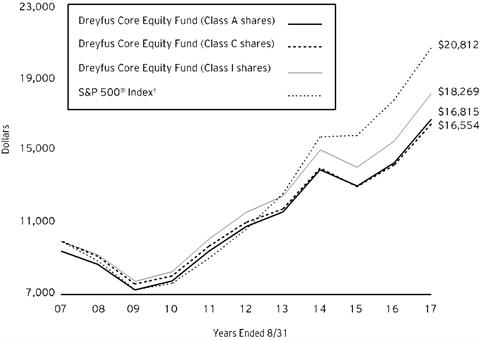
Comparison of change in value of $10,000 investment in Dreyfus Core Equity Fund Class A shares, Class C shares and Class I shares and the S&P 500® Index (the “Index”)
† Source: Lipper Inc.
Past performance is not predictive of future performance.
The above graph compares a $10,000 investment made in each of the Class A, Class C and Class I shares of Dreyfus Core Equity Fund on 8/31/07 to a $10,000 investment made in the Index on that date. All dividends and capital gain distributions are reinvested.
The fund’s performance shown in the line graph above takes into account the maximum initial sales charge on Class A shares and all other applicable fees and expenses on all classes. The Index is widely regarded as the best single gauge of large-cap U.S. equities. The index includes 500 leading companies and captures approximately 80% coverage of available market capitalization. Unlike a mutual fund, the Index is not subject to charges, fees and other expenses. Investors cannot invest directly in any index. Further information relating to fund performance, including expense reimbursements, if applicable, is contained in the Financial Highlights section of the prospectus and elsewhere in this report.
5
FUND PERFORMANCE (continued)
Average Annual Total Returns as of 8/31/17 | |||
| 1 Year | 5 Years | 10 Years |
Class A shares | |||
with maximum sales charge (5.75%) | 10.18% | 7.94% | 5.33% |
without sales charge | 16.89% | 9.23% | 5.96% |
Class C shares | |||
with applicable redemption charge† | 15.09% | 8.44% | 5.17% |
without redemption | 16.09% | 8.44% | 5.17% |
Class I shares | 17.01% | 9.47% | 6.21% |
S&P 500® Index | 16.22% | 14.33% | 7.60% |
† The maximum contingent deferred sales charge for Class C shares is 1% for shares redeemed within one year of the date of purchase.
The performance data quoted represents past performance, which is no guarantee of future results. Share price and investment return fluctuate and an investor’s shares may be worth more or less than original cost upon redemption. Current performance may be lower or higher than the performance quoted. Go to Dreyfus.com for the fund’s most recent month-end returns.
The fund’s performance shown in the graph and table does not reflect the deduction of taxes that a shareholder would pay on fund distributions or the redemption of fund shares. In addition to the performance of Class A shares shown with and without a maximum sales charge, the fund’s performance shown in the table takes into account all other applicable fees and expenses on all classes.
6
UNDERSTANDING YOUR FUND’S EXPENSES (Unaudited)
As a mutual fund investor, you pay ongoing expenses, such as management fees and other expenses. Using the information below, you can estimate how these expenses affect your investment and compare them with the expenses of other funds. You also may pay one-time transaction expenses, including sales charges (loads) and redemption fees, which are not shown in this section and would have resulted in higher total expenses. For more information, see your fund’s prospectus or talk to your financial adviser.
Review your fund’s expenses
The table below shows the expenses you would have paid on a $1,000 investment in Dreyfus Core Equity Fund from March 1, 2017 to August 31, 2017. It also shows how much a $1,000 investment would be worth at the close of the period, assuming actual returns and expenses.
Expenses and Value of a $1,000 Investment | |||||||||||||
assuming actual returns for the six months ended August 31, 2017 | |||||||||||||
|
|
|
| Class A | Class C | Class I | |||||||
Expenses paid per $1,000† |
| $7.11 | $11.03 | $5.79 | |||||||||
Ending value (after expenses) |
| $1,088.40 | $1,084.70 | $1,090.00 | |||||||||
COMPARING YOUR FUND’S EXPENSES
WITH THOSE OF OTHER FUNDS (Unaudited)
Using the SEC’s method to compare expenses
The Securities and Exchange Commission (SEC) has established guidelines to help investors assess fund expenses. Per these guidelines, the table below shows your fund’s expenses based on a $1,000 investment, assuming a hypothetical 5% annualized return. You can use this information to compare the ongoing expenses (but not transaction expenses or total cost) of investing in the fund with those of other funds. All mutual fund shareholder reports will provide this information to help you make this comparison. Please note that you cannot use this information to estimate your actual ending account balance and expenses paid during the period.
Expenses and Value of a $1,000 Investment | |||||||
assuming a hypothetical 5% annualized return for the six months ended August 31, 2017 | |||||||
Class A | Class C | Class I | |||||
Expenses paid per $1,000† | $6.87 | $10.66 | $5.60 | ||||
Ending value (after expenses) | $1,018.40 | $1,014.62 | $1,019.66 | ||||
† Expenses are equal to the fund’s annualized expense ratio of 1.35% for Class A, 2.10% for Class C and 1.10% for Class I, multiplied by the average account value over the period, multiplied by 184/365 (to reflect the one-half year period).
7
STATEMENT OF INVESTMENTS
August 31, 2017
Description | Shares | Value ($) | |||||
Common Stocks - 98.4% | |||||||
Banks - 4.6% | |||||||
JPMorgan Chase & Co. | 62,550 | 5,685,169 | |||||
Wells Fargo & Co. | 49,650 | 2,535,626 | |||||
8,220,795 | |||||||
Capital Goods - 1.1% | |||||||
United Technologies | 16,425 | 1,966,401 | |||||
Consumer Durables & Apparel - 1.2% | |||||||
NIKE, Cl. B | 41,720 | 2,203,233 | |||||
Consumer Services - 1.5% | |||||||
McDonald's | 17,275 | 2,763,482 | |||||
Diversified Financials - 8.5% | |||||||
American Express | 35,150 | 3,026,415 | |||||
BlackRock | 10,950 | 4,588,159 | |||||
Intercontinental Exchange | 39,800 | 2,573,866 | |||||
S&P Global | 16,800 | 2,592,744 | |||||
State Street | 27,750 | 2,566,598 | |||||
15,347,782 | |||||||
Energy - 7.2% | |||||||
Chevron | 40,475 | 4,355,919 | |||||
ConocoPhillips | 44,975 | 1,963,608 | |||||
Exxon Mobil | 64,260 | 4,904,966 | |||||
Occidental Petroleum | 28,725 | 1,714,883 | |||||
12,939,376 | |||||||
Food & Staples Retailing - 1.1% | |||||||
Walgreens Boots Alliance | 25,300 | 2,061,950 | |||||
Food, Beverage & Tobacco - 19.4% | |||||||
Altria Group | 91,025 | 5,770,985 | |||||
Anheuser-Busch InBev, ADR | 14,100 | 1,669,017 | |||||
Coca-Cola | 114,250 | 5,204,087 | |||||
Constellation Brands, Cl. A | 9,650 | 1,930,965 | |||||
Nestle, ADR | 53,455 | 4,530,846 | |||||
PepsiCo | 31,000 | 3,587,630 | |||||
Philip Morris International | 104,325 | 12,198,722 | |||||
34,892,252 | |||||||
Health Care Equipment & Services - 3.6% | |||||||
Abbott Laboratories | 53,000 | 2,699,820 | |||||
Intuitive Surgical | 1,500 | a | 1,507,005 | ||||
8
Description | Shares | Value ($) | |||||
Common Stocks - 98.4% (continued) | |||||||
Health Care Equipment & Services - 3.6% (continued) | |||||||
UnitedHealth Group | 11,700 | 2,327,130 | |||||
6,533,955 | |||||||
Household & Personal Products - 3.5% | |||||||
Estee Lauder, Cl. A | 38,325 | 4,100,392 | |||||
Procter & Gamble | 22,825 | 2,106,063 | |||||
6,206,455 | |||||||
Insurance - 3.0% | |||||||
Chubb | 38,200 | 5,402,244 | |||||
Materials - 1.6% | |||||||
Praxair | 21,275 | 2,798,513 | |||||
Media - 5.6% | |||||||
Comcast, Cl. A | 118,350 | 4,806,193 | |||||
Twenty-First Century Fox, Cl. A | 63,325 | 1,747,137 | |||||
Walt Disney | 35,000 | 3,542,000 | |||||
10,095,330 | |||||||
Pharmaceuticals, Biotechnology & Life Sciences - 6.2% | |||||||
AbbVie | 37,650 | 2,835,045 | |||||
Celgene | 12,775 | a | 1,774,831 | ||||
Novo Nordisk, ADR | 67,775 | 3,227,446 | |||||
Roche Holding, ADR | 101,525 | 3,223,419 | |||||
11,060,741 | |||||||
Semiconductors & Semiconductor Equipment - 4.4% | |||||||
ASML Holding | 16,925 | 2,645,547 | |||||
Texas Instruments | 63,675 | 5,273,563 | |||||
7,919,110 | |||||||
Software & Services - 16.9% | |||||||
Alphabet, Cl. C | 6,780 | a | 6,368,657 | ||||
Automatic Data Processing | 9,260 | 985,912 | |||||
Facebook, Cl. A | 55,050 | a | 9,466,948 | ||||
Microsoft | 109,880 | 8,215,728 | |||||
VeriSign | 5,525 | a | 573,219 | ||||
Visa, Cl. A | 46,200 | b | 4,782,624 | ||||
30,393,088 | |||||||
Technology Hardware & Equipment - 6.0% | |||||||
Apple | 65,300 | 10,709,200 | |||||
Transportation - 3.0% | |||||||
Canadian Pacific Railway | 18,025 | 2,804,690 | |||||
9
STATEMENT OF INVESTMENTS (continued)
Description | Shares | Value ($) | |||||
Common Stocks - 98.4% (continued) | |||||||
Transportation - 3.0% (continued) | |||||||
Union Pacific | 24,425 | 2,571,953 | |||||
5,376,643 | |||||||
Total Common Stocks (cost $80,934,706) | 176,890,550 | ||||||
Other Investment - .5% | |||||||
Registered Investment Company; | |||||||
Dreyfus Institutional Preferred Government Plus Money Market Fund | 901,337 | c | 901,337 | ||||
Total Investments (cost $81,836,043) | 98.9% | 177,791,887 | |||||
Cash and Receivables (Net) | 1.1% | 1,973,083 | |||||
Net Assets | 100.0% | 179,764,970 | |||||
ADR—American Depository Receipt
aNon-income producing security.
bSecurity, or portion thereof, on loan. At August 31, 2017, the value of the fund’s securities on loan was $4,734,798 and the value of the collateral held by the fund was $4,839,382, consisting of U.S. Government & Agency securities.
cInvestment in affiliated money market mutual fund.
10
Portfolio Summary (Unaudited) † | Value (%) |
Food, Beverage & Tobacco | 19.4 |
Software & Services | 16.9 |
Diversified Financials | 8.5 |
Energy | 7.2 |
Pharmaceuticals, Biotechnology & Life Sciences | 6.2 |
Technology Hardware & Equipment | 6.0 |
Media | 5.6 |
Banks | 4.6 |
Semiconductors & Semiconductor Equipment | 4.4 |
Health Care Equipment & Services | 3.6 |
Household & Personal Products | 3.5 |
Insurance | 3.0 |
Transportation | 3.0 |
Materials | 1.6 |
Consumer Services | 1.5 |
Consumer Durables & Apparel | 1.2 |
Food & Staples Retailing | 1.1 |
Capital Goods | 1.1 |
Money Market Investment | .5 |
98.9 |
† Based on net assets.
See notes to financial statements.
11
STATEMENT OF INVESTMENTS IN AFFILIATED ISSUERS (Unaudited)
Registered Investment Companies | Value | Purchases ($) | Sales ($) | Value | Net | Dividends/ |
Dreyfus Institutional Cash | 443,916 | 9,217,731 | 9,661,647 | - | - | - |
Dreyfus Institutional Preferred Government Plus Money Market Fund | 1,782,566 | 36,565,557 | 37,446,786 | 901,337 | .5 | 9,956 |
Dreyfus Institutional Preferred Government Money Market Fund, Institutional Shares | - | 36,098,741 | 36,098,741 | - | - | - |
Total | 2,226,482 | 81,882,029 | 83,207,174 | 901,337 | .5 | 9,956 |
See notes to financial statements.
12
STATEMENT OF ASSETS AND LIABILITIES
August 31, 2017
|
|
|
|
|
|
|
|
|
| Cost |
| Value |
|
Assets ($): |
|
|
|
| ||
Investments in securities—See Statement of Investments |
|
|
|
| ||
Unaffiliated issuers |
| 80,934,706 |
| 176,890,550 |
| |
Affiliated issuers |
| 901,337 |
| 901,337 |
| |
Receivable for investment securities sold |
|
|
|
| 1,915,481 |
|
Dividends and securities lending income receivable |
|
|
|
| 429,328 |
|
Receivable for shares of Common Stock subscribed |
|
|
|
| 8,604 |
|
|
|
|
|
| 180,145,300 |
|
Liabilities ($): |
|
|
|
| ||
Due to The Dreyfus Corporation and affiliates—Note 3(b) |
|
|
|
| 235,424 |
|
Cash overdraft due to Custodian |
|
|
|
| 60,094 |
|
Payable for shares of Common Stock redeemed |
|
|
|
| 81,638 |
|
Accrued expenses |
|
|
|
| 3,174 |
|
|
|
|
|
| 380,330 |
|
Net Assets ($) |
|
| 179,764,970 |
| ||
Composition of Net Assets ($): |
|
|
|
| ||
Paid-in capital |
|
|
|
| 59,066,862 |
|
Accumulated undistributed investment income—net |
|
|
|
| 131,937 |
|
Accumulated net realized gain (loss) on investments |
|
|
|
| 24,610,327 |
|
Accumulated net unrealized appreciation (depreciation) |
|
|
|
| 95,955,844 |
|
Net Assets ($) |
|
| 179,764,970 |
| ||
Net Asset Value Per Share | Class A | Class C | Class I |
|
Net Assets ($) | 78,096,451 | 62,499,643 | 39,168,876 |
|
Shares Outstanding | 4,071,376 | 3,345,672 | 1,984,868 |
|
Net Asset Value Per Share ($) | 19.18 | 18.68 | 19.73 |
|
See notes to financial statements. |
13
STATEMENT OF OPERATIONS
Year Ended August 31, 2017
|
|
|
|
|
|
|
|
|
|
|
|
|
|
Investment Income ($): |
|
|
|
| ||
Income: |
|
|
|
| ||
Cash dividends (net of $67,251 foreign taxes withheld at source): |
|
|
|
| ||
Unaffiliated issuers |
|
| 4,173,487 |
| ||
Affiliated issuers |
|
| 9,956 |
| ||
Income from securities lending—Note 1(b) |
|
| 7,966 |
| ||
Total Income |
|
| 4,191,409 |
| ||
Expenses: |
|
|
|
| ||
Management fee—Note 3(a) |
|
| 2,056,842 |
| ||
Distribution/Service Plan fees—Note 3(b) |
|
| 938,271 |
| ||
Directors’ fees—Note 3(a,c) |
|
| 16,535 |
| ||
Loan commitment fees—Note 2 |
|
| 4,218 |
| ||
Total Expenses |
|
| 3,015,866 |
| ||
Less—Directors’ fees reimbursed by Dreyfus—Note 3(a) |
|
| (16,535) |
| ||
Net Expenses |
|
| 2,999,331 |
| ||
Investment Income—Net |
|
| 1,192,078 |
| ||
Realized and Unrealized Gain (Loss) on Investments—Note 4 ($): |
|
| ||||
Net realized gain (loss) on investments | 27,845,577 |
| ||||
Net unrealized appreciation (depreciation) on investments |
|
| (1,087,266) |
| ||
Net Realized and Unrealized Gain (Loss) on Investments |
|
| 26,758,311 |
| ||
Net Increase in Net Assets Resulting from Operations |
| 27,950,389 |
| |||
See notes to financial statements. | ||||||
14
STATEMENT OF CHANGES IN NET ASSETS
|
|
|
| Year Ended August 31, | |||||
|
|
|
| 2017 |
|
|
| 2016 |
|
Operations ($): |
|
|
|
|
|
|
|
| |
Investment income—net |
|
| 1,192,078 |
|
|
| 1,937,045 |
| |
Net realized gain (loss) on investments |
| 27,845,577 |
|
|
| 22,650,297 |
| ||
Net unrealized appreciation (depreciation) |
| (1,087,266) |
|
|
| (3,156,643) |
| ||
Net Increase (Decrease) in Net Assets | 27,950,389 |
|
|
| 21,430,699 |
| |||
Distributions to Shareholders from ($): |
|
|
|
|
|
|
|
| |
Investment income—net: |
|
|
|
|
|
|
|
| |
Class A |
|
| (706,371) |
|
|
| (1,039,120) |
| |
Class C |
|
| (150,621) |
|
|
| (496,651) |
| |
Class I |
|
| (447,314) |
|
|
| (703,687) |
| |
Net realized gain on investments: |
|
|
|
|
|
|
|
| |
Class A |
|
| (9,198,709) |
|
|
| (12,546,421) |
| |
Class C |
|
| (10,379,880) |
|
|
| (15,041,329) |
| |
Class I |
|
| (4,672,850) |
|
|
| (7,217,544) |
| |
Total Distributions |
|
| (25,555,745) |
|
|
| (37,044,752) |
| |
Capital Stock Transactions ($): |
|
|
|
|
|
|
|
| |
Net proceeds from shares sold: |
|
|
|
|
|
|
|
| |
Class A |
|
| 10,434,931 |
|
|
| 5,260,014 |
| |
Class C |
|
| 6,915,147 |
|
|
| 9,379,891 |
| |
Class I |
|
| 16,736,502 |
|
|
| 10,172,399 |
| |
Distributions reinvested: |
|
|
|
|
|
|
|
| |
Class A |
|
| 7,922,268 |
|
|
| 10,842,835 |
| |
Class C |
|
| 5,148,751 |
|
|
| 7,299,775 |
| |
Class I |
|
| 3,286,416 |
|
|
| 5,340,089 |
| |
Cost of shares redeemed: |
|
|
|
|
|
|
|
| |
Class A |
|
| (18,308,853) |
|
|
| (23,575,399) |
| |
Class C |
|
| (39,067,988) |
|
|
| (29,047,892) |
| |
Class I |
|
| (21,741,390) |
|
|
| (28,808,451) |
| |
Increase (Decrease) in Net Assets | (28,674,216) |
|
|
| (33,136,739) |
| |||
Total Increase (Decrease) in Net Assets | (26,279,572) |
|
|
| (48,750,792) |
| |||
Net Assets ($): |
|
|
|
|
|
|
|
| |
Beginning of Period |
|
| 206,044,542 |
|
|
| 254,795,334 |
| |
End of Period |
|
| 179,764,970 |
|
|
| 206,044,542 |
| |
Undistributed investment income—net | 131,937 |
|
|
| 244,165 |
| |||
Capital Share Transactions (Shares): |
|
|
|
|
|
|
|
| |
Class A |
|
|
|
|
|
|
|
| |
Shares sold |
|
| 572,555 |
|
|
| 278,971 |
| |
Shares issued for distributions reinvested |
|
| 486,015 |
|
|
| 585,911 |
| |
Shares redeemed |
|
| (1,021,107) |
|
|
| (1,259,246) |
| |
Net Increase (Decrease) in Shares Outstanding | 37,463 |
|
|
| (394,364) |
| |||
Class C |
|
|
|
|
|
|
|
| |
Shares sold |
|
| 428,604 |
|
|
| 518,402 |
| |
Shares issued for distributions reinvested |
|
| 325,581 |
|
|
| 403,745 |
| |
Shares redeemed |
|
| (2,209,753) |
|
|
| (1,576,547) |
| |
Net Increase (Decrease) in Shares Outstanding | (1,455,568) |
|
|
| (654,400) |
| |||
Class I |
|
|
|
|
|
|
|
| |
Shares sold |
|
| 912,389 |
|
|
| 534,340 |
| |
Shares issued for distributions reinvested |
|
| 195,856 |
|
|
| 281,471 |
| |
Shares redeemed |
|
| (1,184,343) |
|
|
| (1,494,359) |
| |
Net Increase (Decrease) in Shares Outstanding | (76,098) |
|
|
| (678,548) |
| |||
See notes to financial statements. | |||||||||
15
FINANCIAL HIGHLIGHTS
The following tables describe the performance for each share class for the fiscal periods indicated. All information (except portfolio turnover rate) reflects financial results for a single fund share. Total return shows how much your investment in the fund would have increased (or decreased) during each period, assuming you had reinvested all dividends and distributions. These figures have been derived from the fund’s financial statements.
Year Ended August 31, | |||||||||||
Class A Shares | 2017 | 2016 | 2015 | 2014 | 2013 | ||||||
Per Share Data ($): | |||||||||||
Net asset value, beginning of period | 19.01 | 20.27 | 23.04 | 19.66 | 18.54 | ||||||
Investment Operations: | |||||||||||
Investment income—neta | .16 | .21 | .26 | .26 | .30 | ||||||
Net realized and unrealized | 2.58 | 1.71 | (1.67) | 3.67 | 1.09 | ||||||
Total from Investment Operations | 2.74 | 1.92 | (1.41) | 3.93 | 1.39 | ||||||
Distributions: | |||||||||||
Dividends from | (.18) | (.24) | (.26) | (.29) | (.27) | ||||||
Dividends from net realized | (2.39) | (2.94) | (1.10) | (.26) | - | ||||||
Total Distributions | (2.57) | (3.18) | (1.36) | (.55) | (.27) | ||||||
Net asset value, end of period | 19.18 | 19.01 | 20.27 | 23.04 | 19.66 | ||||||
Total Return (%)b | 16.89 | 10.07 | (6.60) | 20.28 | 7.57 | ||||||
Ratios/Supplemental Data (%): | |||||||||||
Ratio of total expenses | 1.36 | 1.36 | 1.36 | 1.36 | 1.36 | ||||||
Ratio of net expenses | 1.35 | 1.35 | 1.35 | 1.35 | 1.35 | ||||||
Ratio of net investment income | .88 | 1.13 | 1.18 | 1.21 | 1.53 | ||||||
Portfolio Turnover Rate | 2.89 | 4.06 | 10.31 | .62 | 7.63 | ||||||
Net Assets, end of period ($ x 1,000) | 78,096 | 76,704 | 89,744 | 131,033 | 176,742 | ||||||
a Based on average shares outstanding.
b Exclusive of sales charge.
See notes to financial statements.
16
Year Ended August 31, | ||||||||||
Class C Shares | 2017 | 2016 | 2015 | 2014 | 2013 | |||||
Per Share Data ($): | ||||||||||
Net asset value, beginning of period | 18.56 | 19.85 | 22.58 | 19.28 | 18.19 | |||||
Investment Operations: | ||||||||||
Investment income—neta | .03 | .07 | .09 | .10 | .15 | |||||
Net realized and unrealized | 2.51 | 1.68 | (1.63) | 3.59 | 1.08 | |||||
Total from Investment Operations | 2.54 | 1.75 | (1.54) | 3.69 | 1.23 | |||||
Distributions: | ||||||||||
Dividends from | (.03) | (.10) | (.09) | (.13) | (.14) | |||||
Dividends from net realized | (2.39) | (2.94) | (1.10) | (.26) | - | |||||
Total Distributions | (2.42) | (3.04) | (1.19) | (.39) | (.14) | |||||
Net asset value, end of period | 18.68 | 18.56 | 19.85 | 22.58 | 19.28 | |||||
Total Return (%)b | 16.09 | 9.27 | (7.31) | 19.35 | 6.83 | |||||
Ratios/Supplemental Data (%): | ||||||||||
Ratio of total expenses | 2.11 | 2.11 | 2.11 | 2.11 | 2.11 | |||||
Ratio of net expenses | 2.10 | 2.10 | 2.10 | 2.10 | 2.10 | |||||
Ratio of net investment income | .14 | .38 | .43 | .46 | .78 | |||||
Portfolio Turnover Rate | 2.89 | 4.06 | 10.31 | .62 | 7.63 | |||||
Net Assets, end of period ($ x 1,000) | 62,500 | 89,127 | 108,287 | 140,690 | 147,544 | |||||
a Based on average shares outstanding.
b Exclusive of sales charge.
See notes to financial statements.
17
FINANCIAL HIGHLIGHTS (continued)
Year Ended August 31, | ||||||||||
Class I Shares | 2017 | 2016 | 2015 | 2014 | 2013 | |||||
Per Share Data ($): | ||||||||||
Net asset value, beginning of period | 19.51 | 20.72 | 23.53 | 20.07 | 18.92 | |||||
Investment Operations: | ||||||||||
Investment income—neta | .21 | .27 | .33 | .32 | .35 | |||||
Net realized and unrealized | 2.62 | 1.75 | (1.72) | 3.74 | 1.12 | |||||
Total from Investment Operations | 2.83 | 2.02 | (1.39) | 4.06 | 1.47 | |||||
Distributions: | ||||||||||
Dividends from | (.22) | (.29) | (.32) | (.34) | (.32) | |||||
Dividends from net realized | (2.39) | (2.94) | (1.10) | (.26) | - | |||||
Total Distributions | (2.61) | (3.23) | (1.42) | (.60) | (.32) | |||||
Net asset value, end of period | 19.73 | 19.51 | 20.72 | 23.53 | 20.07 | |||||
Total Return (%) | 17.01 | 10.39 | (6.39) | 20.56 | 7.83 | |||||
Ratios/Supplemental Data (%): | ||||||||||
Ratio of total expenses | 1.11 | 1.11 | 1.11 | 1.11 | 1.11 | |||||
Ratio of net expenses | 1.10 | 1.10 | 1.10 | 1.10 | 1.10 | |||||
Ratio of net investment income | 1.14 | 1.38 | 1.43 | 1.45 | 1.78 | |||||
Portfolio Turnover Rate | 2.89 | 4.06 | 10.31 | .62 | 7.63 | |||||
Net Assets, end of period ($ x 1,000) | 39,169 | 40,213 | 56,764 | 83,389 | 73,915 | |||||
a Based on average shares outstanding.
See notes to financial statements.
18
NOTES TO FINANCIAL STATEMENTS
NOTE 1—Significant Accounting Policies:
Dreyfus Core Equity Fund (the “fund”) is a separate diversified series of The Dreyfus/Laurel Funds, Inc. (the “Company”), which is registered under the Investment Company Act of 1940, as amended (the “Act”), as an open-end management investment company and operates as a series company currently offering nine series, including the fund. The fund’s investment objective is to seek long-term capital appreciation. The Dreyfus Corporation (the “Manager” or “Dreyfus”), a wholly-owned subsidiary of The Bank of New York Mellon Corporation (“BNY Mellon”), serves as the fund’s investment adviser. Fayez Sarofim & Co. (“Sarofim & Co.”), serves as the fund’s sub-investment adviser.
Effective March 31, 2017, the fund authorized the issuance of Class T shares, but, as of the date of this report, the fund did not offer Class T shares for purchase. The fund authorized 100 million Class T shares which resulted in the fund’s total authorized shares increasing from 500 million to 600 million.
MBSC Securities Corporation (the “Distributor”), a wholly-owned subsidiary of Dreyfus, is the distributor of the fund’s shares. The fund is authorized to issue 600 million shares of $.001 par value Common Stock. The fund currently has authorized four classes of shares: Class A (300 million shares authorized), Class C (100 million shares authorized), Class I (100 million shares authorized) and Class T (100 million shares authorized). Class A, Class C and Class T shares are sold primarily to retail investors through financial intermediaries and bear Distribution fees and/or Service Plan fees. Class A and Class T shares generally are subject to a sales charge imposed at the time of purchase. Class C shares are subject to a contingent deferred sales charge (“CDSC”) imposed on Class C shares redeemed within one year of purchase. Class I shares are sold primarily to bank trust departments and other financial service providers (including The Bank of New York Mellon, a subsidiary of BNY Mellon and an affiliate of Dreyfus, and its affiliates), acting on behalf of customers having a qualified trust or an investment account or relationship at such institution, and bear no Distribution or Service Plan fees. Class I shares are offered without a front-end sales charge or CDSC. Other differences between the classes include the services offered to and the expenses borne by each class, and certain voting rights. Income, expenses (other than expenses attributable to a specific class), and realized and unrealized gains or losses on investments are allocated to each class of shares based on its relative net assets.
19
NOTES TO FINANCIAL STATEMENTS (continued)
The Company accounts separately for the assets, liabilities and operations of each series. Expenses directly attributable to each series are charged to that series’ operations; expenses which are applicable to all series are allocated among them on a pro rata basis.
The Financial Accounting Standards Board (“FASB”) Accounting Standards Codification is the exclusive reference of authoritative U.S. generally accepted accounting principles (“GAAP”) recognized by the FASB to be applied by nongovernmental entities. Rules and interpretive releases of the Securities and Exchange Commission (“SEC”) under authority of federal laws are also sources of authoritative GAAP for SEC registrants. The fund’s financial statements are prepared in accordance with GAAP, which may require the use of management estimates and assumptions. Actual results could differ from those estimates.
(a) Portfolio valuation: The fair value of a financial instrument is the amount that would be received to sell an asset or paid to transfer a liability in an orderly transaction between market participants at the measurement date (i.e., the exit price). GAAP establishes a fair value hierarchy that prioritizes the inputs of valuation techniques used to measure fair value. This hierarchy gives the highest priority to unadjusted quoted prices in active markets for identical assets or liabilities (Level 1 measurements) and the lowest priority to unobservable inputs (Level 3 measurements).
Additionally, GAAP provides guidance on determining whether the volume and activity in a market has decreased significantly and whether such a decrease in activity results in transactions that are not orderly. GAAP requires enhanced disclosures around valuation inputs and techniques used during annual and interim periods.
Various inputs are used in determining the value of the fund’s investments relating to fair value measurements. These inputs are summarized in the three broad levels listed below:
Level 1—unadjusted quoted prices in active markets for identical investments.
Level 2—other significant observable inputs (including quoted prices for similar investments, interest rates, prepayment speeds, credit risk, etc.).
Level 3—significant unobservable inputs (including the fund’s own assumptions in determining the fair value of investments).
The inputs or methodology used for valuing securities are not necessarily an indication of the risk associated with investing in those securities.
20
Changes in valuation techniques may result in transfers in or out of an assigned level within the disclosure hierarchy. Valuation techniques used to value the fund’s investments are as follows:
Investments in securities are valued at the last sales price on the securities exchange or national securities market on which such securities are primarily traded. Securities listed on the National Market System for which market quotations are available are valued at the official closing price or, if there is no official closing price that day, at the last sales price. For open short positions, asked prices are used for valuation purposes. Bid price is used when no asked price is available. Registered investment companies that are not traded on an exchange are valued at their net asset value. All of the preceding securities are generally categorized within Level 1 of the fair value hierarchy.
Securities not listed on an exchange or the national securities market, or securities for which there were no transactions, are valued at the average of the most recent bid and asked prices. These securities are generally categorized within Level 2 of the fair value hierarchy.
Fair valuing of securities may be determined with the assistance of a pricing service using calculations based on indices of domestic securities and other appropriate indicators, such as prices of relevant ADRs and futures. Utilizing these techniques may result in transfers between Level 1 and Level 2 of the fair value hierarchy.
When market quotations or official closing prices are not readily available, or are determined not to reflect accurately fair value, such as when the value of a security has been significantly affected by events after the close of the exchange or market on which the security is principally traded (for example, a foreign exchange or market), but before the fund calculates its net asset value, the fund may value these investments at fair value as determined in accordance with the procedures approved by the Company’s Board of Directors (the “Board”). Certain factors may be considered when fair valuing investments such as: fundamental analytical data, the nature and duration of restrictions on disposition, an evaluation of the forces that influence the market in which the securities are purchased and sold, and public trading in similar securities of the issuer or comparable issuers. These securities are either categorized within Level 2 or 3 of the fair value hierarchy depending on the relevant inputs used.
For restricted securities where observable inputs are limited, assumptions about market activity and risk are used and are generally categorized within Level 3 of the fair value hierarchy.
21
NOTES TO FINANCIAL STATEMENTS (continued)
The following is a summary of the inputs used as of August 31, 2017 in valuing the fund’s investments:
Level 1 – Unadjusted | Level 2 - Other Significant Observable | Level 3 -Significant Unobservable Inputs | Total | |
Assets ($) | ||||
Investments in Securities: | ||||
Equity Securities - Domestic Common Stocks† | 158,789,585 | - | - | 158,789,585 |
Equity Securities - Foreign Common Stocks† | 18,100,965 | - | - | 18,100,965 |
Registered Investment Company | 901,337 | - | - | 901,337 |
† See Statement of Investments for additional detailed categorizations.
At August 31, 2017, there were no transfers between levels of the fair value hierarchy.
(b) Securities transactions and investment income: Securities transactions are recorded on a trade date basis. Realized gains and losses from securities transactions are recorded on the identified cost basis. Dividend income is recognized on the ex-dividend date and interest income, including, where applicable, accretion of discount and amortization of premium on investments, is recognized on the accrual basis.
Pursuant to a securities lending agreement with The Bank of New York Mellon, the fund may lend securities to qualified institutions. It is the fund’s policy that, at origination, all loans are secured by collateral of at least 102% of the value of U.S. securities loaned and 105% of the value of foreign securities loaned. Collateral equivalent to at least 100% of the market value of securities on loan is maintained at all times. Collateral is either in the form of cash, which can be invested in certain money market mutual funds managed by Dreyfus, or U.S. Government and Agency securities. The fund is entitled to receive all dividends, interest and distributions on securities loaned, in addition to income earned as a result of the lending transaction. Should a borrower fail to return the securities in a timely manner, The Bank of New York Mellon is required to replace the securities for the benefit of the fund or credit the fund with the market value of the unreturned securities and is subrogated to the fund’s rights
22
against the borrower and the collateral. Additionally, the contractual maturity of security lending transactions are on an overnight and continuous basis. During the period ended August 31, 2017, The Bank of New York Mellon earned $1,532 from lending portfolio securities, pursuant to the securities lending agreement.
(c) Affiliated issuers: Investments in other investment companies advised by Dreyfus are defined as “affiliated” under the Act.
(d) Dividends and distributions to shareholders: Dividends and distributions are recorded on the ex-dividend date. Dividends from investment income-net are normally declared and paid quarterly. Dividends from net realized capital gains, if any, are normally declared and paid annually, but the fund may make distributions on a more frequent basis to comply with the distribution requirements of the Internal Revenue Code of 1986, as amended (the “Code”). To the extent that net realized capital gains can be offset by capital loss carryovers, it is the policy of the fund not to distribute such gains. Income and capital gain distributions are determined in accordance with income tax regulations, which may differ from GAAP.
(e) Federal income taxes: It is the policy of the fund to continue to qualify as a regulated investment company, if such qualification is in the best interests of its shareholders, by complying with the applicable provisions of the Code, and to make distributions of taxable income sufficient to relieve it from substantially all federal income and excise taxes.
As of and during the period ended August 31, 2017, the fund did not have any liabilities for any uncertain tax positions. The fund recognizes interest and penalties, if any, related to uncertain tax positions as income tax expense in the Statement of Operations. During the period ended August 31, 2017, the fund did not incur any interest or penalties.
Each tax year in the four-year period ended August 31, 2017 remains subject to examination by the Internal Revenue Service and state taxing authorities.
At August 31, 2017, the components of accumulated earnings on a tax basis were as follows: undistributed ordinary income $273,526, undistributed capital gains $24,469,907 and unrealized appreciation $95,954,675.
The tax character of distributions paid to shareholders during the fiscal periods ended August 31, 2017 and August 31, 2016 were as follows: ordinary income $1,330,685 and $2,318,695, and long-term capital gains $24,225,060 and $34,726,057, respectively.
23
NOTES TO FINANCIAL STATEMENTS (continued)
NOTE 2—Bank Lines of Credit:
The fund participates with other Dreyfus-managed funds in an $810 million unsecured credit facility led by Citibank, N.A. and a $300 million unsecured credit facility provided by The Bank of New York Mellon (each, a “Facility”), each to be utilized primarily for temporary or emergency purposes, including the financing of redemptions. Prior to October 5, 2016, the unsecured credit facility with Citibank, N.A. was $555 million. In connection therewith, the fund has agreed to pay its pro rata portion of commitment fees for each Facility. Interest is charged to the fund based on rates determined pursuant to the terms of the respective Facility at the time of borrowing. During the period ended August 31, 2017, the fund did not borrow under the Facilities.
NOTE 3—Investment Management Fee, Sub-Investment Advisory Fee and Other Transactions with Affiliates:
(a) Pursuant to an investment management agreement with Dreyfus, Dreyfus provides or arranges for one or more third parties and/or affiliates to provide investment management, administrative, custody, fund accounting and transfer agency services to the fund. Dreyfus also directs the investments of the fund in accordance with its investment objective, policies and limitations. For these services, the fund is contractually obligated to pay Dreyfus a fee, calculated daily and paid monthly, at the annual rate of 1.10% of the value of the fund’s average daily net assets. Out of its fee, Dreyfus pays all of the expenses of the fund except brokerage fees, taxes, interest expenses, commitment fees on borrowings, Distribution Plan fees and Service Plan fees, fees and expenses of the non-interested Directors (including counsel fees) and extraordinary expenses. In addition, Dreyfus is required to reduce its fee in an amount equal to the fund’s allocable portion of fees and expenses of the non-interested Directors (including counsel fees). During the period ended August 31, 2017, fees reimbursed by Dreyfus amount to $16,535.
Pursuant to a sub-investment advisory agreement between Dreyfus and Sarofim & Co., Dreyfus pays Sarofim & Co. a monthly fee at an annual rate of .2175% of the value of the fund’s average daily net assets.
During the period ended August 31, 2017, the Distributor retained $3,016 from commissions earned on sales of the fund’s Class A shares and $168 from CDSCs on redemption of the fund’s Class C shares.
(b) Under the Distribution Plans adopted pursuant to Rule 12b-1 (the “Distribution Plans”) under the Act, Class A shares pay annually up to .25% of the value of its average daily net assets to compensate the Distributor for shareholder servicing activities and expenses primarily
24
intended to result in the sale of Class A shares. Class C shares pay the Distributor for distributing its shares at an aggregate annual rate of .75% of the value of the average daily net assets of Class C shares. Class C shares are also subject to a service plan adopted pursuant to Rule 12b-1 (the “Service Plan”), under which Class C shares pay the Distributor for providing certain services to the holders of their shares, a fee at an annual rate of .25% of the value of the average daily net assets of Class C shares. During the period ended August 31, 2017, Class A and Class C shares were charged $184,494 and $565,333, respectively, pursuant to their Distribution Plans. During the period ended August 31, 2017, Class C shares were charged $188,444 pursuant to the Service Plan.
Under its terms, the Distribution Plans and Service Plan shall remain in effect from year to year, provided such continuance is approved annually by a vote of a majority of those Directors who are not “interested persons” of the Company and who have no direct or indirect financial interest in the operation of or in any agreement related to the Distribution Plans or Service Plan.
The components of “Due to The Dreyfus Corporation and affiliates” in the Statement of Assets and Liabilities consist of: management fees $168,213, Distribution Plans fees $56,556 and Service Plan fees $13,351, which are offset against an expense reimbursement currently in effect in the amount of $2,696.
(c) Each Board member also serves as a Board member of other funds within the Dreyfus complex. Annual retainer fees and attendance fees are allocated to each fund based on net assets.
NOTE 4—Securities Transactions:
The aggregate amount of purchases and sales of investment securities, excluding short-term securities, during the period ended August 31, 2017, amounted to $5,333,178 and $59,504,197, respectively.
At August 31, 2017, the cost of investments for federal income tax purposes was $81,837,212; accordingly, accumulated net unrealized appreciation on investments was $95,954,675, consisting of $96,395,940 gross unrealized appreciation and $441,265 gross unrealized depreciation.
25
REPORT OF INDEPENDENT REGISTERED
PUBLIC ACCOUNTING FIRM
The Board of Directors and Shareholders
The Dreyfus/Laurel Funds Inc.
We have audited the accompanying statement of assets and liabilities of Dreyfus Core Equity Fund (the “Fund”), a series of The Dreyfus/Laurel Funds, Inc., including the statements of investments and investments in affiliated issuers, as of August 31, 2017, and the related statement of operations for the year then ended, the statements of changes in net assets for each of the years in the two-year period then ended, and the financial highlights for each of the years in the five-year period then ended. These financial statements and financial highlights are the responsibility of the Fund’s management. Our responsibility is to express an opinion on these financial statements and financial highlights based on our audits.
We conducted our audits in accordance with the standards of the Public Company Accounting Oversight Board (United States). Those standards require that we plan and perform the audit to obtain reasonable assurance about whether the financial statements and financial highlights are free of material misstatement. An audit includes examining, on a test basis, evidence supporting the amounts and disclosures in the financial statements. Our procedures included confirmation of securities owned as of August 31, 2017, by correspondence with the custodian and brokers or by other appropriate auditing procedures. An audit also includes assessing the accounting principles used and significant estimates made by management, as well as evaluating the overall financial statement presentation. We believe that our audits provide a reasonable basis for our opinion.
In our opinion, the financial statements and financial highlights referred to above present fairly, in all material respects, the financial position of Dreyfus Core Equity Fund as of August 31, 2017, the results of its operations for the year then ended, the changes in its net assets for each of the years in the two-year period then ended, and the financial highlights for each of the years in the five-year period then ended, in conformity with U.S. generally accepted accounting principles.

New York, New York
October 27, 2017
26
IMPORTANT TAX INFORMATION (Unaudited)
For federal tax purposes, the fund reports the maximum amount allowable but not less than 100% of ordinary income dividends paid during the fiscal year ended August 31, 2017 as eligible for the corporate dividends received deduction provided under Section 243 of the Internal Revenue Code in accordance with Section 854(b)(1)(A) of the Internal Revenue Code. Also, the fund reports the maximum amount allowable but not less than $1,330,685 as ordinary income dividends paid during the fiscal year ended August 31, 2017 as qualified dividend income in accordance with Section 854(b)(1)(B) of the Internal Revenue Code. Shareholders will receive notification in early 2018 of the percentage applicable to the preparation of their 2017 income tax returns. Also, the fund reports the maximum amount allowable but not less than $2.3877 per share as a capital gain dividend paid on December 1, 2016 in accordance with Section 852(b)(3)(C) of the Internal Revenue Code. Also, the fund reports the maximum amount allowable but not less than $.0026 as a short-term capital gain dividend paid on December 1, 2016 in accordance with Sections 871(k)(2) and 881(e) of the Internal Revenue Code.
27
INFORMATION ABOUT THE RENEWAL OF THE FUND’S INVESTMENT MANAGEMENT AGREEMENT (Unaudited)
At a meeting of the fund’s Board of Directors held on July 26-27, 2017, the Board considered the renewal of the fund’s Investment Management Agreement, pursuant to which Dreyfus provides the fund with investment advisory and administrative services (the “Agreement”), and the Sub-Investment Advisory Agreement (together, the “Agreements”), pursuant to which Fayez Sarofim & Co. (the “Subadviser”) provides day-to-day management of the fund’s investments. The Board members, none of whom are “interested persons” (as defined in the Investment Company Act of 1940, as amended) of the fund, were assisted in their review by independent legal counsel and met with counsel in executive session separate from representatives of Dreyfus and the Subadviser. In considering the renewal of the Agreements, the Board considered all factors that it believed to be relevant, including those discussed below. The Board did not identify any one factor as dispositive, and each Board member may have attributed different weights to the factors considered.
Analysis of Nature, Extent, and Quality of Services Provided to the Fund. The Board considered information provided to them at the meeting and in previous presentations from Dreyfus representatives regarding the nature, extent, and quality of the services provided to funds in the Dreyfus fund complex. Dreyfus provided the number of open accounts in the fund, the fund’s asset size and the allocation of fund assets among distribution channels. Dreyfus also had previously provided information regarding the diverse intermediary relationships and distribution channels of funds in the Dreyfus fund complex (such as retail direct or intermediary, in which intermediaries typically are paid by the fund and/or Dreyfus) and Dreyfus’ corresponding need for broad, deep, and diverse resources to be able to provide ongoing shareholder services to each intermediary or distribution channel, as applicable to the fund.
The Board also considered research support available to, and portfolio management capabilities of, the fund’s portfolio management personnel and that Dreyfus also provides oversight of day-to-day fund operations, including fund accounting and administration and assistance in meeting legal and regulatory requirements. The Board also considered Dreyfus’ extensive administrative, accounting, and compliance infrastructures, as well as Dreyfus’ supervisory activities over the Subadviser. The Board also considered portfolio management’s brokerage policies and practices (including policies and practices regarding soft dollars) and the standards applied in seeking best execution.
Comparative Analysis of the Fund’s Performance and Management Fee and Expense Ratio. The Board reviewed reports prepared by Broadridge Financial Solutions, Inc. (“Broadridge”), an independent provider of investment company data, which included information comparing (1) the fund’s performance with the performance of a group of comparable funds (the “Performance Group”) and with a broader group of funds (the “Performance Universe”), all for various periods ended June 30, 2017, and (2) the fund’s actual and contractual management fees and total expenses with those of a group of comparable funds (the “Expense Group”) and with a broader group of funds (the “Expense Universe”), the information for which was derived in part from fund financial
28
statements available to Broadridge as of the date of its analysis. Dreyfus previously had furnished the Board with a description of the methodology Broadridge used to select the Performance Group and Performance Universe and the Expense Group and Expense Universe.
Dreyfus representatives stated that the usefulness of performance comparisons may be affected by a number of factors, including different investment limitations that may be applicable to the fund and comparison funds. The Board discussed with representatives of Dreyfus and/or the Sub-Adviser the results of the comparisons and noted that the fund’s total return performance was below the Performance Group median, and above the Performance Universe. Representatives of Dreyfus and the Subadviser stated that the fund’s recent performance had improved, noting that the fund’s total return performance for the three- and six- month periods ended June 30, 2017 ranked in the first quartile in the fund’s Broadridge category. Dreyfus also provided a comparison of the fund’s calendar year total returns to the returns of the fund’s benchmark index.
The Board also reviewed the range of actual and contractual management fees and total expenses of the Expense Group and Expense Universe funds and discussed the results of the comparisons. Taking into account the fund’s “unitary” fee structure, the Board took into consideration that the fund’s contractual management fee was above the Expense Group median and the fund’s actual management fee and the fund’s total expenses were above the Expense Group and Expense Universe medians. The Board also considered that the fund appeared to be the only unitary fee fund in the Expense Group.
Dreyfus representatives reviewed with the Board the management or investment advisory fees (1) paid by funds advised or administered by Dreyfus that are in the same Broadridge category as the fund and (2) paid to Dreyfus or the Subadviser or its affiliates for advising any separate accounts and/or other types of client portfolios that are considered to have similar investment strategies and policies as the fund (the “Similar Clients”), and explained the nature of the Similar Clients. They discussed differences in fees paid and the relationship of the fees paid in light of any differences in the services provided and other relevant factors, noting the fund’s “unitary” fee structure. The Board considered the relevance of the fee information provided for the Similar Clients to evaluate the appropriateness of the fund’s management fee.
The Board considered the fee to the Subadviser in relation to the fee paid to Dreyfus by the fund and the respective services provided by the Subadviser and Dreyfus. The Board also took into consideration that the Subadviser’s fee is paid by Dreyfus (out of its fee from the fund) and not by the fund.
Analysis of Profitability and Economies of Scale. Dreyfus representatives reviewed the expenses allocated and profit received by Dreyfus and its affiliates and the resulting profitability percentage for managing the fund and the aggregate profitability percentage to Dreyfus and its affiliates for managing the funds in the Dreyfus fund complex, and the method used to determine the expenses and profit. The Board concluded that the profitability results were not unreasonable, given the services rendered and service levels
29
INFORMATION ABOUT THE RENEWAL OF THE FUND’S INVESTMENT MANAGEMENT AGREEMENT (Unaudited) (continued)
provided by Dreyfus. The Board also had been provided with information prepared by an independent consulting firm regarding Dreyfus’ approach to allocating costs to, and determining the profitability of, individual funds and the entire Dreyfus fund complex. The consulting firm also had analyzed where any economies of scale might emerge in connection with the management of a fund.
The Board considered on the advice of its counsel the profitability analysis (1) as part of its evaluation of whether the fees under the Agreements, considered in relation to the mix of services provided by Dreyfus and the Subadviser, including the nature, extent and quality of such services, supported the renewal of the Agreements and (2) in light of the relevant circumstances for the fund and the extent to which economies of scale would be realized if the fund grows and whether fee levels reflect these economies of scale for the benefit of fund shareholders. Since Dreyfus, and not the fund, pays the Subadviser pursuant to the Sub-Investment Advisory Agreement, the Board did not consider the Subadviser’s profitability to be relevant to its deliberations. Dreyfus representatives noted that a discussion of economies of scale is predicated on a fund having achieved a substantial size with increasing assets and that, if a fund’s assets had been stable or decreasing, the possibility that Dreyfus may have realized any economies of scale would be less. Dreyfus representatives also noted that, as a result of shared and allocated costs among funds in the Dreyfus fund complex, the extent of economies of scale could depend substantially on the level of assets in the complex as a whole, so that increases and decreases in complex-wide assets can affect potential economies of scale in a manner that is disproportionate to, or even in the opposite direction from, changes in the fund’s asset level. The Board also considered potential benefits to Dreyfus and the Subadviser from acting as investment adviser and sub-investment adviser, respectively, and noted the soft dollar arrangements in effect for trading the fund’s investments.
At the conclusion of these discussions, the Board agreed that it had been furnished with sufficient information to make an informed business decision with respect to the renewal of the Agreements. Based on the discussions and considerations as described above, the Board concluded and determined as follows.
· The Board concluded that the nature, extent and quality of the services provided by Dreyfus and the Subadviser are adequate and appropriate.
· The Board considered the fund’s improved total return performance, accepting as contributing to the better performance the analytical tools introduced by Dreyfus and applied by the Subadviser.
· The Board concluded that the fees paid to Dreyfus and the Subadviser continued to be appropriate under the circumstances and in light of the factors and the totality of the services provided as discussed above, subject to review no later than the next renewal consideration.
· The Board determined that the economies of scale which may accrue to Dreyfus and its affiliates in connection with the management of the fund had
30
been adequately considered by Dreyfus in connection with the fee rate charged to the fund pursuant to the Agreement and that, to the extent in the future it were determined that material economies of scale had not been shared with the fund, the Board would seek to have those economies of scale shared with the fund.
In evaluating the Agreements, the Board considered these conclusions and determinations and also relied on its previous knowledge, gained through meetings and other interactions with Dreyfus and its affiliates and the Subadviser, of Dreyfus and the Subadviser and the services provided to the fund by Dreyfus and the Subadviser. The Board also relied on information received on a routine and regular basis throughout the year relating to the operations of the fund and the investment management and other services provided under the Agreements, including information on the investment performance of the fund in comparison to similar mutual funds and benchmark performance indices; general market outlook as applicable to the fund; and compliance reports. In addition, the Board’s consideration of the contractual fee arrangements for this fund had the benefit of a number of years of reviews of the Agreements for the fund, or substantially similar agreements for other Dreyfus funds that the Board oversees, during which lengthy discussions took place between the Board and Dreyfus representatives. Certain aspects of the arrangements may receive greater scrutiny in some years than in others, and the Board’s conclusions may be based, in part, on their consideration of the fund’s arrangements, or substantially similar arrangements for other Dreyfus funds that the Board oversees, in prior years. The Board determined to renew the Agreements through April 4, 2018.
31
BOARD MEMBERS INFORMATION (Unaudited)
INDEPENDENT BOARD MEMBERS
Chairman of the Board (1999)
Principal Occupation During Past 5 Years:
· Corporate Director and Trustee (1995-present)
Other Public Company Board Memberships During Past 5 Years:
· CBIZ (formerly, Century Business Services, Inc.), a provider of outsourcing functions for small and medium size companies, Director (1997-present)
No. of Portfolios for which Board Member Serves: 130
———————
Francine J. Bovich (66)
Board Member (1994)
Principal Occupation During Past 5 Years:
· Trustee, The Bradley Trusts, private trust funds (2011-present)
Other Public Company Board Memberships During Past 5 Years:
· Annaly Capital Management, Inc., Board Member (May 2014-present)
No. of Portfolios for which Board Member Serves: 76
———————
Kenneth A. Himmel (71)
Board Member (1994)
Principal Occupation During Past 5 Years:
· Managing Partner, Gulf Related, an international real estate development company (2010-present)
· President and CEO, Related Urban Development, a real estate development company (1996-present)
· President and CEO, Himmel & Company, a real estate development company (1980-present)
· CEO, American Food Management, a restaurant company (1983-present)
No. of Portfolios for which Board Member Serves: 28
———————
32
Stephen J. Lockwood (70)
Board Member (1994)
Principal Occupation During Past 5 Years:
· Chairman of the Board, Stephen J. Lockwood and Company LLC, a real estate investment company (2000-present)
No. of Portfolios for which Board Member Serves: 28
———————
Roslyn M. Watson (67)
Board Member (1994)
Principal Occupation During Past 5 Years:
· Principal, Watson Ventures, Inc., a real estate investment company (1993-present)
No. of Portfolios for which Board Member Serves: 62
———————
Benaree Pratt Wiley (71)
Board Member (1998)
Principal Occupation During Past 5 Years:
· Principal, The Wiley Group, a firm specializing in strategy and business development (2005-present)
Other Public Company Board Memberships During Past 5 Years:
· CBIZ (formerly, Century Business Services, Inc.), a provider of outsourcing functions for small and medium size companies, Director (2008-present)
No. of Portfolios for which Board Member Serves: 83
———————
Once elected all Board Members serve for an indefinite term, but achieve Emeritus status upon reaching age 80. The address of the Board Members and Officers is c/o The Dreyfus Corporation, 200 Park Avenue, New York, New York 10166. Additional information about the Board Members is available in the fund’s Statement of Additional Information which can be obtained from Dreyfus free of charge by calling this toll free number: 1-800-DREYFUS.
James M. Fitzgibbons, Emeritus Board Member
J. Tomlinson Fort, Emeritus Board Member
33
OFFICERS OF THE FUND (Unaudited)
BRADLEY J. SKAPYAK, President since January 2010.
Chief Operating Officer and a director of the Manager since June 2009, Chairman of Dreyfus Transfer, Inc., an affiliate of the Manager and the transfer agent of the funds, since May 2011 and Chief Executive Officer of MBSC Securities Corporation since August 2016. He is an officer of 63 investment companies (comprised of 130 portfolios) managed by the Manager. He is 58 years old and has been an employee of the Manager since February 1988.
BENNETT A. MACDOUGALL, Chief Legal Officer since October 2015.
Chief Legal Officer of the Manager and Associate General Counsel and Managing Director of BNY Mellon since June 2015; from June 2005 to June 2015, he served in various capacities with Deutsche Bank – Asset & Wealth Management Division, including as Director and Associate General Counsel, and Chief Legal Officer of Deutsche Investment Management Americas Inc. from June 2012 to May 2015. He is an officer of 64 investment companies (comprised of 155 portfolios) managed by the Manager. He is 45 years old and has been an employee of the Manager since June 2015.
JANETTE E. FARRAGHER, Vice President and Secretary since December 2011.
Associate General Counsel of BNY Mellon, and an officer of 64 investment companies (comprised of 155 portfolios) managed by the Manager. She is 54 years old and has been an employee of the Manager since February 1984.
JAMES BITETTO, Vice President and Assistant Secretary since August 2005.
Managing Counsel of BNY Mellon and Secretary of the Manager, and an officer of 64 investment companies (comprised of 155 portfolios) managed by the Manager. He is 51 years old and has been an employee of the Manager since December 1996.
JOSEPH M. CHIOFFI, Vice President and Assistant Secretary since August 2005.
Managing Counsel of BNY Mellon, and an officer of 64 investment companies (comprised of 155 portfolios) managed by the Manager. He is 55 years old and has been an employee of the Manager since June 2000.
MAUREEN E. KANE, Vice President and Assistant Secretary since April 2015.
Managing Counsel of BNY Mellon since July 2014; from October 2004 until July 2014, General Counsel, and from May 2009 until July 2014, Chief Compliance Officer of Century Capital Management. She is an officer of 64 investment companies (comprised of 155 portfolios) managed by the Manager. She is 55 years old and has been an employee of the Manager since July 2014.
SARAH S. KELLEHER, Vice President and Assistant Secretary since April 2014.
Senior Counsel of BNY Mellon since March 2013, from August 2005 to March 2013, Associate General Counsel of Third Avenue Management. She is an officer of 64 investment companies (comprised of 155 portfolios) managed by the Manager. She is 41 years old and has been an employee of the Manager since March 2013.
JEFF PRUSNOFSKY, Vice President and Assistant Secretary since August 2005.
Senior Managing Counsel of BNY Mellon, and an officer of 64 investment companies (comprised of 155 portfolios) managed by the Manager. He is 52 years old and has been an employee of the Manager since October 1990.
NATALYA ZELENSKY, Vice President and Assistant Secretary since March 2017.
Counsel and Vice President of BNY Mellon since May 2016; Attorney at Wildermuth Endowment Strategy Fund/Wildermuth Advisory, LLC from November 2015 until May 2016; Assistant General Counsel at RCS Advisory Services from July 2014 until November 2015; Associate at Sutherland, Asbill & Brennan from January 2013 until January 2014; Associate at K&L Gates from October 2011 until January 2013. She is an officer of 64 investment companies (comprised of 155 portfolios) managed by Dreyfus. She is 32 years old and has been an employee of the Manager since May 2016.
JAMES WINDELS, Treasurer since November 2001.
Director – Mutual Fund Accounting of the Manager, and an officer of 64 investment companies (comprised of 155 portfolios) managed by the Manager. He is 58 years old and has been an employee of the Manager since April 1985.
34
RICHARD CASSARO, Assistant Treasurer since January 2008.
Senior Accounting Manager – Money Market and Municipal Bond Funds of the Manager, and an officer of 64 investment companies (comprised of 155 portfolios) managed by the Manager. He is 58 years old and has been an employee of the Manager since September 1982.
GAVIN C. REILLY, Assistant Treasurer since December 2005.
Tax Manager of the Investment Accounting and Support Department of the Manager, and an officer of 64 investment companies (comprised of 155 portfolios) managed by the Manager. He is 49 years old and has been an employee of the Manager since April 1991.
ROBERT S. ROBOL, Assistant Treasurer since August 2005.
Senior Accounting Manager – Dreyfus Financial Reporting of the Manager, and an officer of 64 investment companies (comprised of 155 portfolios) managed by the Manager. He is 53 years old and has been an employee of the Manager since October 1988.
ROBERT SALVIOLO, Assistant Treasurer since July 2007.
Senior Accounting Manager – Equity Funds of the Manager, and an officer of 64 investment companies (comprised of 155 portfolios) managed by the Manager. He is 50 years old and has been an employee of the Manager since June 1989.
ROBERT SVAGNA, Assistant Treasurer since August 2005.
Senior Accounting Manager – Fixed Income and Equity Funds of the Manager, and an officer of 64 investment companies (comprised of 155 portfolios) managed by the Manager. He is 50 years old and has been an employee of the Manager since November 1990.
JOSEPH W. CONNOLLY, Chief Compliance Officer since October 2004.
Chief Compliance Officer of the Manager and The Dreyfus Family of Funds (64 investment companies, comprised of 155 portfolios). He is 60 years old and has served in various capacities with the Manager since 1980, including manager of the firm’s Fund Accounting Department from 1997 through October 2001.
CARIDAD M. CAROSELLA, Anti-Money Laundering Compliance Officer since January 2016.
Anti-Money Laundering Compliance Officer of the Dreyfus Family of Funds and BNY Mellon Funds Trust since January 2016; from May 2015 to December 2015, Interim Anti-Money Laundering Compliance Officer of the Dreyfus Family of Funds and BNY Mellon Funds Trust and the Distributor; from January 2012 to May 2015, AML Surveillance Officer of the Distributor and from 2007 to December 2011, Financial Processing Manager of the Distributor. She is an officer of 59 investment companies (comprised of 150 portfolios) managed by the Manager. She is 49 years old and has been an employee of the Distributor since 1997.
35
NOTES
36
NOTES
37
Dreyfus Core Equity Fund
200 Park Avenue
New York, NY 10166
Manager
The Dreyfus Corporation
200 Park Avenue
New York, NY 10166
Sub-Investment Adviser
Fayez Sarofim & Co.
Two Houston Center
Suite 2907
Houston, TX 77010
Custodian
The Bank of New York Mellon
225 Liberty Street
New York, NY 10286
Transfer Agent &
Dividend Disbursing Agent
Dreyfus Transfer, Inc.
200 Park Avenue
New York, NY 10166
Distributor
MBSC Securities Corporation
200 Park Avenue
New York, NY 10166
Ticker Symbols: | Class A: DLTSX Class C: DPECX Class I: DPERX |
Telephone Call your financial representative or 1-800-DREYFUS
Mail The Dreyfus Family of Funds, 144 Glenn Curtiss Boulevard, Uniondale, NY 11556-0144
E-mail Send your request to info@dreyfus.com
Internet Information can be viewed online or downloaded at www.dreyfus.com
The fund files its complete schedule of portfolio holdings with the Securities and Exchange Commission (“SEC”) for the first and third quarters of each fiscal year on Form N-Q. The fund’s Forms N-Q are available on the SEC’s website at www.sec.gov and may be reviewed and copied at the SEC’s Public Reference Room in Washington, D.C. (phone 1-800-SEC-0330 for information).
A description of the policies and procedures that the fund uses to determine how to vote proxies relating to portfolio securities and information regarding how the fund voted these proxies for the most recent 12-month period ended June 30 is available at www.dreyfus.com and on the SEC’s website at www.sec.gov and without charge, upon request, by calling 1-800-DREYFUS.
© 2017 MBSC Securities Corporation |
|

Dreyfus Floating Rate Income Fund
| ANNUAL REPORT |

|

Save time. Save paper. View your next shareholder report online as soon as it’s available. Log into www.dreyfus.com and sign up for Dreyfus eCommunications. It’s simple and only takes a few minutes. |
The views expressed in this report reflect those of the portfolio manager(s) only through the end of the period covered and do not necessarily represent the views of Dreyfus or any other person in the Dreyfus organization. Any such views are subject to change at any time based upon market or other conditions and Dreyfus disclaims any responsibility to update such views. These views may not be relied on as investment advice and, because investment decisions for a Dreyfus fund are based on numerous factors, may not be relied on as an indication of trading intent on behalf of any Dreyfus fund. |
Not FDIC-Insured • Not Bank-Guaranteed • May Lose Value |
Contents
THE FUND
With Those of Other Funds | |
in Affiliated Issuers | |
Currency Exchange Contracts | |
Public Accounting Firm | |
FOR MORE INFORMATION
Back Cover
| The Fund |
A LETTER FROM THE CEO OF DREYFUS
Dear Shareholder:
We are pleased to present this annual report for Dreyfus Floating Rate Income Fund, covering the 12-month period from September 1, 2016 through August 31, 2017. For information about how the fund performed during the reporting period, as well as general market perspectives, we provide a Discussion of Fund Performance on the pages that follow.
Stocks set a series of new record highs and bonds produced mixed results over the past year in response to changing economic and political conditions. Financial markets during the final months of 2016 were dominated by the election of a new U.S. presidential administration. Equities surged higher in anticipation of more business-friendly regulatory, tax, and fiscal policies, but high-quality bonds generally lost value due to expectations of rising interest rates and accelerating inflation in a stronger economy. Despite a series of short-term interest-rate hikes, bonds recovered over the first eight months of 2017 when it became clearer that major tax and fiscal reforms would take time and political capital to enact. Stocks continued to rally, led by large growth-oriented companies, as corporate earnings grew and global economic conditions improved.
The markets’ recent strong performance has been supported by solid underlying fundamentals. While we currently expect these favorable conditions to persist, we remain watchful for economic and political developments that could derail the rallies. As always, we encourage you to discuss the risks and opportunities of today’s investment environment with your financial advisor.
Thank you for your continued confidence and support.
Sincerely,

Mark D. Santero
Chief Executive Officer
The Dreyfus Corporation
September 15, 2017
2
DISCUSSION OF FUND PERFORMANCE
For the period from September 1, 2016 through August 31, 2017, as provided by the fund’s primary portfolio managers, Kevin Cronk and Chris Barris of Alcentra NY, LLC, Sub-Investment Adviser
Market and Fund Performance Overview
For the 12-month period ended August 31, 2017, Dreyfus Floating Rate Income Fund’s Class A shares produced a total return of 4.14%, Class C shares returned 3.38%, Class I shares returned 4.47%, and Class Y shares returned 4.51%.1 The fund’s benchmark, The S&P/LSTA U.S. Leveraged Loan Index (the “Index”), produced a total return of 5.80% for the same period.2
Floating-rate loans produced solidly positive total returns amid expectations of rising interest rates, stronger economic growth, and improving business conditions. The fund underperformed the Index, primarily due to its cautious loan allocation strategy early in the reporting period.
As of May 24, 2017, Kevin Cronk became a co-primary portfolio manager for the fund.
The Fund’s Investment Approach
The fund seeks high current income. To pursue its goal, the fund normally invests at least 80% of its net assets, plus any borrowings for investment purposes, in floating-rate loans and other floating-rate securities. These investments effectively should enable the fund to achieve a floating rate of income. The fund currently intends to invest principally in floating-rate loans and other floating-rate securities of U.S. issuers, but may invest up to 30% of its net assets in securities of foreign issuers.
We buy and sell securities through a value-oriented, bottom-up research process that incorporates a macroeconomic overlay. We use fundamental credit analysis to identify favorable and unfavorable risk/reward opportunities across sectors, industries, and structures while seeking to mitigate credit risk. Fundamental analysis is complemented by our macroeconomic outlook as it relates to observed default trends, performance drivers, and capital market liquidity. We seek to mitigate credit risk through a disciplined approach to credit investment selection and evaluation.
Economic and Political Developments Drove Loan Markets
Longer-term interest rates rose sharply in the weeks following the U.S. presidential election in November 2016, causing yields of floating-rate notes to reset at higher levels. Rates increased in response to expectations that a new presidential administration’s more business-friendly regulatory, tax, and fiscal policies would boost U.S. economic growth and inflationary pressures. In addition, the Federal Reserve Board (the “Fed”) implemented a long-awaited increase in short-term interest rates in December 2016.
Meanwhile, evidence of stronger global economic growth in overseas markets prompted a gradual move among central banks away from the aggressively accommodative monetary policies of the past few years. In the United States, short-term interest rates continued to rise when the Fed implemented two more increases in the overnight federal funds rate over the first half of 2017. In contrast, long-term U.S. interest rates moderated, giving back some, but not all, of the post-election spike when inflationary pressures remained muted and investors came to realize that some government policy reforms were far from certain. Meanwhile, corporate-backed instruments, including floating-rate loans, generally continued to benefit in an environment of rising corporate earnings.
3
DISCUSSION OF FUND PERFORMANCE (continued)
Allocation Strategy Dampened Relative Results
The fund’s performance compared to the Index was constrained by its relatively conservative loan allocation strategy in the final months of 2016, when we maintained underweighted exposure to lower-rated notes. We were especially cautious with regard to loans to energy producers and metals-and-mining companies that had been hurt by volatile swings in commodity prices. However, many of these loans rebounded from previously depressed levels later in the reporting period. More recently, the fund struggled to a degree with relatively heavy exposure to loans to health care companies and credit selection shortfalls among homebuilders.
As the outlook for the U.S. economy improved, we increased the fund’s allocation to energy and materials producers, which helped boost the fund’s relative performance over the second half of the reporting period. The fund further benefited from underweighted exposure and strong credit selections among retailers, many of which faced intensifying competition from online sellers. Overweighted exposure to service providers and chemical producers also proved beneficial, as did the fund’s holdings of high yield corporate bonds.
Positioned for Continued Economic Growth
The U.S. economy has continued to expand, and many analysts expect slow-to-moderate growth to persist over the months ahead. Inflationary pressures may increase in this environment, and most analysts anticipate additional short-term interest-rate hikes and balance-sheet normalization from the Fed as it moves toward a less stimulative monetary policy. On the other hand, we believe that technical conditions in the leveraged loan market remain favorable due to generally robust investor demand stemming from expectations of rising interest rates.
Therefore, we have adopted a generally constructive investment posture. In light of improved underlying business fundamentals for many corporate borrowers, we have increased the fund’s holdings of higher-yielding B-rated loans and reduced its holdings of BB-rated loans. We also have maintained the fund’s positions in high yield bonds for liquidity purposes. In our judgment, these are prudent strategies as market conditions evolve.
September 15, 2017
1 Total return includes reinvestment of dividends and any capital gains paid, and does not take into consideration the maximum initial sales charge in the case of Class A shares, or the applicable contingent deferred sales charge imposed on redemptions in the case of Class C shares. Had these charges been reflected, returns would have been lower. Past performance is no guarantee of future results. Share price, yield, and investment return fluctuate such that upon redemption, fund shares may be worth more or less than their original cost. The fund’s returns reflect the absorption of certain fund expenses by the fund’s investment adviser pursuant to an agreement in effect through January 1, 2018, at which time it may be extended, terminated, or modified. Had these expenses not been absorbed, the fund’s returns would have been lower.
2 Source: Lipper Inc. – The S&P/LSTA U.S. Leveraged Loan Index is a market value-weighted index designed to measure the performance of the U.S. leveraged loan market based upon market weightings, spreads and interest payments. Investors cannot invest directly in any index.
Floating-rate loans are subject generally to interest-rate, credit, liquidity, and market risks, to varying degrees, all of which are more fully described in the fund’s prospectus.
The risks of an investment in a collateralized loan obligation (CLO) depend largely on the type of the collateral and the tranche of the CLO in which the fund invests. CLO tranches can experience substantial losses due to actual defaults, increased sensitivity to defaults due to collateral default, market anticipation of defaults, as well as aversion to CLO securities as an asset class.
The fund may use derivative instruments, such as options, futures, options on futures, forward contracts, and swaps. A small investment in derivatives could have a potentially large impact on the fund’s performance. The use of derivatives involves risks different from, or possibly greater than, the risks associated with investing directly in the underlying assets.
High yield bonds are subject to increased credit risk and are considered speculative in terms of the issuer’s perceived ability to continue making interest payments on a timely basis and to repay principal upon maturity.
4
FUND PERFORMANCE

Comparison of change in value of $10,000 investment in Dreyfus Floating Rate Income Fund Class A shares, Class C shares, Class I shares and Class Y shares and the S&P/LSTA U.S. Leveraged Loan Index (the “Index”)
† Source: Lipper Inc.
Past performance is not predictive of future performance.
The above graph compares a $10,000 investment made in each of the Class A, Class C, Class I and Class Y shares of Dreyfus Floating Rate Income Fund on 9/27/13 (inception date) to a $10,000 investment made in the Index. All dividends and capital gain distributions are reinvested.
The fund’s performance shown in the line graph above takes into account the maximum initial sales charge on Class A shares and all other applicable fees and expenses on all classes. The Index is a market value-weighted index designed to measure the performance of the U.S. leveraged loan market based upon market weightings, spreads and interest payments. Unlike a mutual fund, the Index is not subject to charges, fees and other expenses. Investors cannot invest directly in any index. Further information relating to fund performance, including expense reimbursements, if applicable, is contained in the Financial Highlights section of the prospectus and elsewhere in this report.
5
FUND PERFORMANCE (continued)
Average Annual Total Returns as of 8/31/17 | ||||
| Inception Date | 1 Year | From | |
Class A shares | ||||
with maximum sales charge (2.50%) | 9/27/13 | 1.54% | 2.15% | |
without sales charge | 9/27/13 | 4.14% | 2.80% | |
Class C shares | ||||
with applicable redemption charge† | 9/27/13 | 2.38% | 2.03% | |
without redemption | 9/27/13 | 3.38% | 2.03% | |
Class I shares | 9/27/13 | 4.47% | 3.08% | |
Class Y shares | 9/27/13 | 4.51% | 3.10% | |
S&P/LSTA U.S. Leveraged Loan Index | 9/30/13 | 5.80% | 3.85%†† | |
† The maximum contingent deferred sales charge for Class C shares is 1% for shares redeemed within one year of the date of purchase.
†† For comparative purposes, the value of the Index on 9/30/13 is used as the beginning value on 9/27/13.
The performance data quoted represents past performance, which is no guarantee of future results. Share price and investment return fluctuate and an investor’s shares may be worth more or less than original cost upon redemption. Current performance may be lower or higher than the performance quoted. Go to Dreyfus.com for the fund’s most recent month-end returns.
The fund’s performance shown in the graph and table does not reflect the deduction of taxes that a shareholder would pay on fund distributions or the redemption of fund shares. In addition to the performance of Class A shares shown with and without a maximum sales charge, the fund’s performance shown in the table takes into account all other applicable fees and expenses on all classes.
6
UNDERSTANDING YOUR FUND’S EXPENSES (Unaudited)
As a mutual fund investor, you pay ongoing expenses, such as management fees and other expenses. Using the information below, you can estimate how these expenses affect your investment and compare them with the expenses of other funds. You also may pay one-time transaction expenses, including sales charges (loads) and redemption fees, which are not shown in this section and would have resulted in higher total expenses. For more information, see your fund’s prospectus or talk to your financial adviser.
Review your fund’s expenses
The table below shows the expenses you would have paid on a $1,000 investment in Dreyfus Floating Rate Income Fund from March 1, 2017 to August 31, 2017. It also shows how much a $1,000 investment would be worth at the close of the period, assuming actual returns and expenses.
Expenses and Value of a $1,000 Investment | |||||||||||
assuming actual returns for the six months ended August 31, 2017 | |||||||||||
|
|
|
| Class A | Class C | Class I | Class Y | ||||
Expenses paid per $1,000† |
| $5.07 | $8.96 | $3.91 | $3.71 | ||||||
Ending value (after expenses) |
| $1,012.20 | $1,008.30 | $1,013.80 | $1,013.90 | ||||||
COMPARING YOUR FUND’S EXPENSES
WITH THOSE OF OTHER FUNDS (Unaudited)
Using the SEC’s method to compare expenses
The Securities and Exchange Commission (SEC) has established guidelines to help investors assess fund expenses. Per these guidelines, the table below shows your fund’s expenses based on a $1,000 investment, assuming a hypothetical 5% annualized return. You can use this information to compare the ongoing expenses (but not transaction expenses or total cost) of investing in the fund with those of other funds. All mutual fund shareholder reports will provide this information to help you make this comparison. Please note that you cannot use this information to estimate your actual ending account balance and expenses paid during the period.
Expenses and Value of a $1,000 Investment | |||||||||||
assuming a hypothetical 5% annualized return for the six months ended August 31, 2017 | |||||||||||
|
|
| Class A | Class C | Class I | Class Y | |||||
Expenses paid per $1,000† | $5.09 | $9.00 | $3.92 | $3.72 | |||||||
Ending value (after expenses) | $1,020.16 | $1,016.28 | $1,021.32 | $1,021.53 | |||||||
† Expenses are equal to the fund’s annualized expense ratio of 1.00% for Class A, 1.77% for Class C, .77% for Class I and .73% for Class Y, multiplied by the average account value over the period, multiplied by 184/365 (to reflect the one-half year period).
7
STATEMENT OF INVESTMENTS
August 31, 2017
Description | Coupon | Maturity Date | Principal | a | Value ($) | ||||
Bonds and Notes - 8.0% | |||||||||
Automotive - .7% | |||||||||
Federal Mogul, | EUR | 4.88 | 4/15/24 | 3,600,000 | b | 4,232,899 | |||
IHO Verwaltungs, | 4.13 | 9/15/21 | 2,000,000 | c | 2,032,500 | ||||
6,265,399 | |||||||||
Building & Development - .2% | |||||||||
William Lyon Homes, | 5.88 | 1/31/25 | 2,000,000 | 2,060,000 | |||||
Cable & Satellite Television - 1.1% | |||||||||
Altice Financing, | 6.63 | 2/15/23 | 2,550,000 | c | 2,703,000 | ||||
Cablevision Systems, | 7.75 | 4/15/18 | 1,200,000 | 1,239,000 | |||||
GLP Capital, | 4.88 | 11/1/20 | 1,200,000 | 1,272,000 | |||||
Numericable-SFR, | 6.00 | 5/15/22 | 4,825,000 | c | 5,072,281 | ||||
10,286,281 | |||||||||
Chemicals & Plastics - .6% | |||||||||
ARD Finance, | 7.13 | 9/15/23 | 3,000,000 | 3,187,500 | |||||
Chemours, | 7.00 | 5/15/25 | 2,000,000 | 2,215,000 | |||||
5,402,500 | |||||||||
Collateralized Loan Obligations - 1.0% | |||||||||
Arrowpoint, | 5.66 | 4/18/27 | 2,000,000 | b,c | 2,026,135 | ||||
Highbridge Loan Management, | 7.40 | 5/5/27 | 1,000,000 | b,c | 1,000,598 | ||||
Neuberger Berman, | 6.11 | 4/20/27 | 1,500,000 | b,c | 1,514,121 | ||||
Octagon Investment Partners 27, | 8.26 | 7/15/27 | 750,000 | b,c | 757,548 | ||||
Sound Point Clo XII, | 7.56 | 10/20/28 | 2,000,000 | b,c | 2,007,388 | ||||
York, | 6.60 | 1/22/27 | 1,500,000 | b,c | 1,444,665 | ||||
8,750,455 | |||||||||
Electronics & Electrical Equipment - .3% | |||||||||
Diamond 1 Finance, | 4.42 | 6/15/21 | 2,200,000 | c | 2,320,243 | ||||
Financial Intermediaries - 1.0% | |||||||||
Ladder Capital Finance Holdings, | 5.25 | 3/15/22 | 2,475,000 | c | 2,555,437 | ||||
Quicken Loans, | 5.75 | 5/1/25 | 2,000,000 | c | 2,105,000 | ||||
VHF Parent, | 6.75 | 6/15/22 | 4,250,000 | c | 4,420,000 | ||||
9,080,437 | |||||||||
8
Description | Coupon | Maturity Date | Principal | a | Value ($) | ||||
Bonds and Notes - 8.0% (continued) | |||||||||
Health Care - .3% | |||||||||
HCA, | 3.75 | 3/15/19 | 375,000 | 382,500 | |||||
Valeant Pharmaceuticals International, | 6.75 | 8/15/21 | 1,300,000 | c | 1,251,250 | ||||
Valeant Pharmaceuticals International, | 6.50 | 3/15/22 | 800,000 | c | 841,000 | ||||
2,474,750 | |||||||||
Lodging & Casinos - .7% | |||||||||
International Game Technology, | 6.50 | 2/15/25 | 2,000,000 | c | 2,255,000 | ||||
MGM Resorts International, | 6.63 | 12/15/21 | 1,000,000 | 1,125,000 | |||||
Scientific Games International, | 10.00 | 12/1/22 | 3,000,000 | 3,348,750 | |||||
6,728,750 | |||||||||
Oil & Gas - .4% | |||||||||
CVR Refining/Coffeyville Finance, | 6.50 | 11/1/22 | 1,860,000 | 1,892,550 | |||||
Extraction Oil & Gas, | 7.38 | 5/15/24 | 2,225,000 | c | 2,247,250 | ||||
4,139,800 | |||||||||
Publishing - .3% | |||||||||
Sirius XM Radio, | 3.88 | 8/1/22 | 3,000,000 | c | 3,067,500 | ||||
Radio & Television - .5% | |||||||||
DISH DBS, | 5.13 | 5/1/20 | 4,000,000 | 4,220,000 | |||||
Telecommunications - .9% | |||||||||
Sprint, | 7.88 | 9/15/23 | 5,200,000 | 5,954,676 | |||||
Sprint Capital, | 6.88 | 11/15/28 | 1,800,000 | 1,984,500 | |||||
7,939,176 | |||||||||
Total Bonds and Notes | 72,735,291 | ||||||||
Floating Rate Loan Interests - 84.3% | |||||||||
Aerospace & Defense - 1.3% | |||||||||
American Airlines, | 3.77 | 12/9/23 | 1,727,500 | b | 1,734,790 | ||||
Engility, | 4.06 | 8/4/20 | 300,625 | b | 302,286 | ||||
Engility, | 4.56 | 8/4/23 | 313,787 | b | 316,664 | ||||
SI Organization, | 6.02 | 11/23/19 | 1,428,689 | b | 1,438,961 | ||||
TransDigm, | 4.30 | 6/9/23 | 6,703,573 | b | 6,722,645 | ||||
9
STATEMENT OF INVESTMENTS (continued)
Description | Coupon | Maturity Date | Principal Amount ($) | a | Value ($) | ||||
Floating Rate Loan Interests - 84.3% (continued) | |||||||||
Aerospace & Defense - 1.3% (continued) | |||||||||
US Security Associates Holdings, | 5.31 | 6/21/23 | 1,538,375 | b | 1,549,921 | ||||
12,065,267 | |||||||||
Automotive - 3.6% | |||||||||
American Tire Distributors, | 5.55 | 9/24/21 | 4,877,899 | b | 4,922,874 | ||||
CH Hold Corp, | 4.31 | 2/1/24 | 226,705 | b | 228,026 | ||||
CH Hold Corp, | 8.56 | 1/26/22 | 175,000 | b | 179,375 | ||||
Dealer Tire, | 5.06 | 12/22/21 | 1,462,697 | b | 1,479,152 | ||||
FPC Holdings, | 5.31 | 11/19/19 | 3,812,478 | b | 3,767,986 | ||||
FPC Holdings, | 9.32 | 5/19/20 | 1,309,719 | b | 1,250,782 | ||||
Gates Global, | 4.56 | 4/1/24 | 5,071,497 | b | 5,096,855 | ||||
Innovative XCessories & Services, | 6.07 | 11/23/22 | 4,039,875 | b | 4,095,423 | ||||
Lumileds Holding, | 5.50 | 3/15/24 | 5,600,000 | b | 5,647,264 | ||||
TI Group Automotive Systems, | 4.06 | 6/30/22 | 3,512,748 | b | 3,524,446 | ||||
US Farathane, | 5.31 | 12/23/21 | 2,383,944 | b | 2,404,803 | ||||
32,596,986 | |||||||||
Building & Development - 3.0% | |||||||||
American Builders & Contractors Supply Co., | 3.81 | 10/31/23 | 648,375 | b | 650,434 | ||||
Beacon Roofing Supply, | 4.02 | 10/1/22 | 1,984,848 | b | 1,994,366 | ||||
C.H.I. Overhead Doors, | 4.57 | 7/29/22 | 3,428,526 | b | 3,426,400 | ||||
Capital Automotive, | 7.29 | 3/21/25 | 2,431,943 | b | 2,467,669 | ||||
Capital Automotive, | 4.29 | 3/21/24 | 4,612,752 | b | 4,645,710 | ||||
Foncia Groupe, | EUR | 4.25 | 9/7/23 | 1,482,447 | b | 1,777,324 | |||
Forterra Finance, | 4.31 | 10/25/23 | 3,156,728 | b | 2,651,667 | ||||
GEO Group, | 3.55 | 3/15/24 | 1,047,375 | b | 1,050,868 | ||||
Jeld-Wen, | 4.32 | 7/1/22 | 2,109,510 | b | 2,125,331 | ||||
Quikrete Holdings, | 4.07 | 11/3/23 | 2,189,000 | b | 2,181,207 | ||||
10
Description | Coupon | Maturity Date | Principal Amount ($) | a | Value ($) | ||||
Floating Rate Loan Interests - 84.3% (continued) | |||||||||
Building & Development - 3.0% (continued) | |||||||||
SRS Distribution, | 4.55 | 8/25/22 | 3,270,457 | b | 3,286,809 | ||||
Ventia Deco, | 4.80 | 5/21/22 | 999,159 | b | 1,004,155 | ||||
27,261,940 | |||||||||
Business Equipment & Services - 10.0% | |||||||||
AlixPartners, | 4.30 | 3/28/24 | 3,145,062 | b | 3,166,244 | ||||
Allied Universal Holdco, | 5.06 | 7/28/22 | 3,070,000 | b,d | 3,070,000 | ||||
Allied Universal Holdco, | 5.06 | 7/28/22 | 3,880,567 | b | 3,885,903 | ||||
Almonde, | 4.74 | 4/26/24 | 3,500,000 | b | 3,521,507 | ||||
Almonde, | EUR | 4.25 | 4/26/24 | 1,000,000 | b | 1,207,007 | |||
Almonde, | 8.52 | 4/28/25 | 2,662,500 | b | 2,719,078 | ||||
Americold Realty Operating Partnership, | 5.06 | 12/1/22 | 617,125 | b | 625,225 | ||||
Ascend Learning, | 4.55 | 7/29/24 | 4,375,000 | b | 4,405,078 | ||||
ATS Consolidated, | 5.82 | 5/24/24 | 2,625,000 | b | 2,644,687 | ||||
BMC Software Finance, | 5.30 | 9/10/22 | 6,001,253 | b | 6,034,200 | ||||
Camelot Finance, | 4.80 | 10/3/23 | 992,513 | b | 998,716 | ||||
Cast & Crew Entertainment Services, | 4.81 | 8/12/22 | 643,492 | b | 647,111 | ||||
CH Hold Corp, | 4.31 | 2/1/24 | 21,212 | b | 21,336 | ||||
Constellis Holdings, | 6.31 | 4/18/24 | 5,350,000 | b | 5,319,906 | ||||
DTZ US Borrower, | 4.50 | 11/4/21 | 2,431,573 | b | 2,439,829 | ||||
Electro Rent Corporation, | 6.31 | 1/23/24 | 3,009,875 | b | 3,043,736 | ||||
GCA Services Group, | 6.05 | 2/22/23 | 2,928,062 | b | 2,942,703 | ||||
Genesys Telecommunications Laboratories, | 5.06 | 12/1/23 | 5,395,684 | b | 5,435,180 | ||||
Hyland Software, | 4.57 | 7/1/22 | 3,067,937 | b | 3,100,059 | ||||
11
STATEMENT OF INVESTMENTS (continued)
Description | Coupon | Maturity Date | Principal Amount ($) | a | Value ($) | ||||
Floating Rate Loan Interests - 84.3% (continued) | |||||||||
Business Equipment & Services - 10.0% (continued) | |||||||||
Hyland Software, | 8.30 | 5/31/25 | 1,000,000 | b | 1,021,250 | ||||
Kronos, | 4.81 | 11/1/23 | 3,432,772 | b | 3,466,567 | ||||
Mitchell International, | 4.79 | 10/1/20 | 3,035,905 | b | 3,050,326 | ||||
Mitchell International, | 8.80 | 10/11/21 | 500,000 | b | 505,625 | ||||
PGX Holdings, | 6.05 | 9/24/20 | 2,792,338 | b | 2,800,198 | ||||
Pike, | 4.99 | 3/1/24 | 2,743,125 | b | 2,773,999 | ||||
Press Ganey Holdings, | 8.48 | 9/30/24 | 600,000 | b | 614,250 | ||||
Press Ganey Holdings, | 4.56 | 9/29/23 | 2,238,750 | b | 2,251,343 | ||||
Prime Security Services Borrower, | 4.05 | 5/2/22 | 3,633,394 | b | 3,656,393 | ||||
Primeline Utility Services, | 6.81 | 11/14/22 | 4,272,539 | b | 4,272,539 | ||||
SAI Global CIS, | 5.80 | 12/6/23 | 472,625 | b | 479,714 | ||||
ServiceMaster Company, | 3.81 | 11/3/23 | 2,388,000 | b | 2,394,567 | ||||
TKC Holdings, | 5.56 | 1/31/23 | 4,623,412 | b | 4,648,703 | ||||
TKC Holdings, | 9.32 | 1/31/24 | 1,575,000 | b | 1,582,088 | ||||
Travel Leaders Group, | 5.81 | 1/25/24 | 698,250 | b | 705,233 | ||||
UOS, | 6.80 | 4/7/23 | 900,000 | b | 920,255 | ||||
USIC Holdings, | 4.77 | 12/8/23 | 597,000 | b | 600,236 | ||||
90,970,791 | |||||||||
Cable & Satellite Television - 3.3% | |||||||||
Atlantic Broadband, | 3.65 | 8/9/24 | 4,600,000 | b | 4,577,414 | ||||
Charter Communications Operating, | 3.31 | 7/1/20 | 1,964,207 | b | 1,972,310 | ||||
Charter Communications Operating, | 3.29 | 8/24/21 | 493,750 | b | 495,851 | ||||
Charter Communications Operating, | 3.54 | 1/15/24 | 1,012,188 | b | 1,018,018 | ||||
CSC Holdings, | 3.52 | 7/15/25 | 1,243,758 | b | 1,237,931 | ||||
12
Description | Coupon | Maturity Date | Principal Amount ($) | a | Value ($) | ||||
Floating Rate Loan Interests - 84.3% (continued) | |||||||||
Cable & Satellite Television - 3.3% (continued) | |||||||||
Mediacom Illinois, | 3.56 | 1/19/24 | 2,094,750 | b | 2,104,344 | ||||
Radiate Holdco, | 4.31 | 12/9/23 | 4,438,875 | b | 4,387,384 | ||||
SFR Group, | 4.56 | 1/14/25 | 5,455,134 | b | 5,483,392 | ||||
Virgin Media Finance, | 4.04 | 1/31/25 | 2,300,000 | b | 2,307,820 | ||||
WideOpenWest Finance, | 4.56 | 8/18/23 | 6,425,000 | b | 6,422,591 | ||||
30,007,055 | |||||||||
Chemicals & Plastics - 6.2% | |||||||||
AgroFresh, | 6.06 | 7/31/21 | 1,915,789 | b | 1,908,605 | ||||
Allnex, | 5.00 | 6/2/23 | 2,520,750 | b | 2,530,203 | ||||
Allnex, | 5.00 | 4/17/23 | 1,899,109 | b | 1,906,230 | ||||
Berry Plastics, | 3.56 | 10/1/22 | 3,487,844 | b | 3,493,738 | ||||
Chemours, | 3.80 | 3/12/22 | 1,953,027 | b | 1,961,572 | ||||
Colouroz Midco, | 8.25 | 9/5/22 | 673,301 | b | 659,272 | ||||
Cyanco Intermediate, | 5.81 | 5/1/20 | 2,055,925 | b | 2,064,919 | ||||
Duke Finance, | 5.56 | 2/21/24 | 5,615,451 | b | 5,654,057 | ||||
Huntsman International, | 4.31 | 4/1/23 | 663,084 | b | 667,434 | ||||
Ineos Styrolution US Holding, | 4.05 | 3/29/24 | 932,001 | b | 936,666 | ||||
KIK Custom Products, | 5.81 | 8/26/22 | 3,500,000 | b | 3,534,650 | ||||
Kraton Polymers, | 5.31 | 1/6/22 | 1,026,677 | b | 1,037,483 | ||||
Macdermid, | 4.82 | 6/7/20 | 1,339,210 | b | 1,350,513 | ||||
Methanol Holdings, | 4.80 | 6/16/22 | 3,134,010 | b | 3,157,515 | ||||
Omnova Solutions, | 5.57 | 8/17/23 | 6,351,779 | b | 6,415,296 | ||||
Orion Engineered Carbons, | EUR | 3.75 | 7/25/21 | 726,827 | b | 876,770 | |||
Road Infrastructure Investment Holdings, | 4.81 | 6/9/23 | 2,853,438 | b | 2,870,672 | ||||
Solenis International, | 4.56 | 7/31/21 | 503,183 | b | 505,384 | ||||
Solenis International, | EUR | 4.50 | 7/2/21 | 1,458,750 | b | 1,760,444 | |||
13
STATEMENT OF INVESTMENTS (continued)
Description | Coupon | Maturity Date | Principal Amount ($) | a | Value ($) | ||||
Floating Rate Loan Interests - 84.3% (continued) | |||||||||
Chemicals & Plastics - 6.2% (continued) | |||||||||
Solenis International, | 8.06 | 7/2/22 | 2,250,000 | b | 2,259,844 | ||||
Trinseo Materials Operating, | 4.56 | 11/5/21 | 2,210,526 | b | 2,217,898 | ||||
Tronox Pigments, | 4.81 | 3/19/20 | 2,603,561 | b | 2,611,906 | ||||
Univar USA, | 4.06 | 7/1/22 | 4,086,097 | b | 4,099,520 | ||||
Venator Materials, | 4.31 | 6/28/24 | 2,300,000 | b | 2,315,099 | ||||
56,795,690 | |||||||||
Clothing/Textiles - .8% | |||||||||
ABG Intermediate Holdings 2, | 5.31 | 5/27/21 | 3,468,769 | b | 3,494,785 | ||||
Oak Parent, | 5.81 | 10/26/23 | 2,254,177 | b | 2,231,635 | ||||
Varsity Brands, | 5.00 | 12/10/21 | 1,803,750 | b | 1,817,278 | ||||
7,543,698 | |||||||||
Conglomerates - .1% | |||||||||
Columbus McKinnon Corporation, | 4.00 | 1/19/24 | 591,836 | b | 595,165 | ||||
Containers & Glass Products - 2.7% | |||||||||
BWAY Corp, | 4.55 | 4/3/24 | 5,650,000 | b | 5,663,673 | ||||
Dunn Paper, | 5.75 | 9/28/22 | 756,848 | b | 766,308 | ||||
Fort Dearborn Holding Company , | 5.00 | 10/6/23 | 2,271,375 | b | 2,288,410 | ||||
Kloeckner Pentaplast of America, | EUR | 4.75 | 6/29/22 | 5,586,881 | b | 6,564,629 | |||
Reynolds Group Holdings, | 4.31 | 2/4/23 | 5,025,388 | b | 5,035,716 | ||||
TricorBraun Holdings, | 5.07 | 11/30/23 | 422,940 | b,d | 426,746 | ||||
TricorBraun Holdings, | 5.07 | 11/29/23 | 4,208,248 | b | 4,246,123 | ||||
24,991,605 | |||||||||
Cosmetics/Toiletries - .6% | |||||||||
Prestige Brands, | 4.06 | 1/20/24 | 3,124,982 | b | 3,135,717 | ||||
Revlon Consumer Products, | 4.82 | 7/21/23 | 2,807,748 | b | 2,528,475 | ||||
5,664,192 | |||||||||
Ecological Services & Equipment - 1.2% | |||||||||
Advanced Disposal Services, | 4.06 | 11/10/23 | 2,494,552 | b | 2,510,342 | ||||
EnergySolutions, | 6.06 | 5/22/20 | 2,566,685 | b | 2,614,810 | ||||
14
Description | Coupon | Maturity Date | Principal Amount ($) | a | Value ($) | ||||
Floating Rate Loan Interests - 84.3% (continued) | |||||||||
Ecological Services & Equipment - 1.2% (continued) | |||||||||
GFL Environmental, | 4.05 | 9/27/23 | 1,811,313 | b | 1,820,749 | ||||
Granite Acquisition, | 8.52 | 10/14/22 | 500,000 | b | 502,085 | ||||
Granite Acquisition, | 5.27 | 10/15/21 | 3,644,068 | b | 3,677,083 | ||||
Granite Acquisition, | 5.27 | 10/15/21 | 164,382 | b | 165,872 | ||||
11,290,941 | |||||||||
Electronics & Electrical Equipment - 4.7% | |||||||||
Avast Software, | 4.25 | 9/30/23 | 5,540,379 | b | 5,581,932 | ||||
Colorado Buyer, | 8.57 | 3/14/25 | 2,775,000 | b | 2,823,562 | ||||
Compuware, | 9.52 | 12/9/22 | 344,816 | b | 349,990 | ||||
Compuware Corporation, | 5.56 | 12/15/21 | 4,485,490 | b | 4,541,559 | ||||
Dell International, | 3.82 | 9/7/23 | 7,195,716 | b | 7,234,357 | ||||
Oberthur Technologies Of America, | 4.70 | 12/15/23 | 623,438 | b | 615,903 | ||||
ON Semiconductor, | 3.55 | 3/31/23 | 500,179 | b | 502,508 | ||||
Rackspace Hosting, | 4.29 | 11/3/23 | 2,867,813 | b | 2,876,473 | ||||
Rocket Software, | 5.55 | 10/11/23 | 3,275,250 | b | 3,316,191 | ||||
Rocket Software, | 10.80 | 10/11/24 | 575,000 | b | 577,156 | ||||
RP Crown Parent, | 4.80 | 9/22/23 | 7,611,401 | b | 7,682,111 | ||||
Sophia, | 4.56 | 9/30/22 | 2,790,076 | b | 2,790,940 | ||||
Vantiv, | 3.80 | 6/11/21 | 597,000 | b | 599,487 | ||||
West Corporation, | 3.78 | 6/17/23 | 2,376,045 | b | 2,379,015 | ||||
West Corporation, | 3.78 | 6/17/21 | 990,019 | b | 991,415 | ||||
42,862,599 | |||||||||
Equipment Leasing - .5% | |||||||||
Neff Rentals, | 7.57 | 5/21/21 | 3,316,236 | b | 3,331,424 | ||||
North American Lifting Holdings, | 5.82 | 11/26/20 | 1,496,129 | b | 1,403,870 | ||||
4,735,294 | |||||||||
15
STATEMENT OF INVESTMENTS (continued)
Description | Coupon | Maturity Date | Principal Amount ($) | a | Value ($) | ||||
Floating Rate Loan Interests - 84.3% (continued) | |||||||||
Financial Intermediaries - 6.2% | |||||||||
Alliant Holdings I, | 4.56 | 7/27/22 | 4,979,718 | b | 4,985,943 | ||||
Armor Holding II, | 5.79 | 6/26/20 | 4,004,686 | b | 4,032,218 | ||||
Avolon TLB Borrower 1, | 4.05 | 1/20/22 | 3,885,710 | b | 3,902,108 | ||||
Citco Funding, | 4.30 | 3/23/22 | 3,192,000 | b | 3,227,910 | ||||
First Data Corp, | 3.50 | 7/8/22 | 3,633,245 | b | 3,634,008 | ||||
First Data Corp, | 3.81 | 4/26/24 | 3,905,550 | b | 3,912,053 | ||||
Fortress, | 2.65 | 6/10/22 | 1,225,000 | b | 1,237,709 | ||||
Harland Clarke Holdings, | 7.31 | 12/31/19 | 1,321,299 | b | 1,330,878 | ||||
Harland Clarke Holdings, | 6.82 | 2/4/22 | 4,893,241 | b | 4,922,820 | ||||
HUB International, | 4.56 | 9/18/20 | 6,784,891 | b | 6,819,799 | ||||
Ion Trading Finance, | 4.32 | 6/10/21 | 1,035,387 | b | 1,031,934 | ||||
Ion Trading Finance, | 4.00 | 6/10/21 | 1,209,570 | b | 1,456,510 | ||||
Sedgwick Claims Management Services, | 4.07 | 2/11/21 | 1,653,635 | b | 1,657,918 | ||||
Sedgwick Claims Management Services, | 7.07 | 2/11/22 | 1,250,000 | b | 1,259,375 | ||||
Sedgwick Claims Management Services, | 7.05 | 2/28/22 | 1,000,000 | b | 1,005,000 | ||||
Sedgwick Claims Management Services, | 4.54 | 2/28/21 | 1,064,250 | b | 1,068,507 | ||||
SS&C European Holdings Sarl, | 3.57 | 7/8/22 | 37,491 | b | 37,699 | ||||
SS&C Technologies, | 3.57 | 7/8/22 | 718,879 | b | 722,858 | ||||
Tempo Acquisition, | 4.31 | 4/19/24 | 1,950,000 | b | 1,958,775 | ||||
USI, | 4.32 | 4/5/24 | 4,150,000 | b | 4,134,873 | ||||
York Risk Services Holding, | 5.05 | 10/1/21 | 4,117,716 | b | 4,070,095 | ||||
56,408,990 | |||||||||
Food & Drug Retail - .6% | |||||||||
Albertson's, | 4.05 | 8/25/21 | 1,378,180 | b | 1,341,507 | ||||
Albertson's, | 4.30 | 6/22/23 | 3,590,628 | b | 3,500,108 | ||||
16
Description | Coupon | Maturity Date | Principal Amount ($) | a | Value ($) | ||||
Floating Rate Loan Interests - 84.3% (continued) | |||||||||
Food & Drug Retail - .6% (continued) | |||||||||
BJ's Wholesale Club, | 5.06 | 1/26/24 | 448,875 | b | 434,046 | ||||
5,275,661 | |||||||||
Food Products - 1.6% | |||||||||
Alphabet Holding Co., | 4.81 | 9/15/24 | 3,800,000 | b | 3,779,822 | ||||
Alphabet Holding Co., | 9.06 | 9/15/25 | 1,600,000 | b | 1,594,672 | ||||
Atkins Nutritionals Holdings, | 5.31 | 6/21/24 | 2,400,000 | b | 2,421,000 | ||||
Del Monte Foods, | 8.56 | 7/26/21 | 1,000,000 | b | 591,665 | ||||
Hostess Brands, | 3.81 | 8/3/22 | 1,234,406 | b | 1,239,498 | ||||
JBS USA, | 3.28 | 10/30/22 | 1,548,020 | b | 1,532,540 | ||||
Nature's Bounty, | 4.81 | 5/5/23 | 2,376,060 | b | 2,381,632 | ||||
Weight Watchers International, | 4.55 | 4/2/20 | 899,625 | b | 881,795 | ||||
14,422,624 | |||||||||
Food Service - .7% | |||||||||
Advantage Sales & Marketing, | 4.56 | 7/21/21 | 5,758,821 | b | 5,557,982 | ||||
Advantage Sales & Marketing, | 7.82 | 7/21/22 | 818,708 | b | 755,004 | ||||
6,312,986 | |||||||||
Health Care - 6.5% | |||||||||
Air Medical Group Holdings, | 5.31 | 4/28/22 | 3,450,000 | b | 3,404,287 | ||||
Air Medical Group Holdings, | 4.55 | 4/28/22 | 3,275,870 | b | 3,189,190 | ||||
Air Methods, | 4.81 | 4/12/24 | 4,548,409 | b | 4,437,542 | ||||
Auris Luxembourg III, | 4.32 | 1/17/22 | 1,466,325 | b | 1,470,915 | ||||
Catalent Pharma Solutions, | 4.07 | 5/7/21 | 1,682,821 | b | 1,694,214 | ||||
Change Healthcare Holdings, | 4.07 | 2/3/24 | 3,042,375 | b | 3,046,558 | ||||
CHG Healthcare Services, | 4.56 | 6/7/23 | 2,147,813 | b | 2,167,723 | ||||
HCA, | 3.56 | 2/15/24 | 995,006 | b | 1,001,051 | ||||
Immucor, | 6.31 | 6/25/21 | 1,725,000 | b | 1,751,953 | ||||
Jaguar Holding Co II, | 4.07 | 8/18/22 | 5,992,854 | b | 6,016,556 | ||||
17
STATEMENT OF INVESTMENTS (continued)
Description | Coupon | Maturity Date | Principal Amount ($) | a | Value ($) | ||||
Floating Rate Loan Interests - 84.3% (continued) | |||||||||
Health Care - 6.5% (continued) | |||||||||
Mallinckrodt International Finance, | 4.07 | 9/24/24 | 3,275,297 | b | 3,284,255 | ||||
MPH Acquisition Holdings, | 4.32 | 5/25/23 | 2,443,014 | b | 2,456,499 | ||||
NVA Holdings, | 8.32 | 8/14/22 | 275,000 | b | 277,750 | ||||
NVA Holdings, | 4.82 | 8/14/21 | 156,656 | b | 157,635 | ||||
Onex Carestream Finance, | 5.32 | 6/7/19 | 298,826 | b | 299,013 | ||||
Parexel, | 4.27 | 8/9/24 | 4,550,000 | b | 4,566,494 | ||||
Surgery Partners, | 4.25 | 6/20/24 | 3,685,000 | b | 3,658,118 | ||||
Team Health Holdings, | 3.75 | 1/12/24 | 1,645,875 | b | 1,629,416 | ||||
Tecomet, | 4.75 | 4/18/24 | 4,407,223 | b | 4,436,156 | ||||
UIC Merger Sub, | 4.56 | 8/28/24 | 4,090,000 | b | 4,098,957 | ||||
Valeant Pharmaceuticals International, | 6.04 | 3/11/22 | 6,500,827 | b | 6,619,012 | ||||
59,663,294 | |||||||||
Home Furnishing - .3% | |||||||||
Comfort Holding, | 6.06 | 2/2/24 | 2,743,125 | b | 2,557,964 | ||||
Industrial Equipment - 3.3% | |||||||||
AI Mistral, | 4.00 | 1/27/24 | 3,167,062 | b | 3,149,248 | ||||
Duravant, | 8.25 | 7/25/25 | 192,021 | b | 193,701 | ||||
Dynacast International, | 4.80 | 1/28/22 | 4,081,984 | b | 4,096,026 | ||||
Engineered Machinery Holdings, | 4.56 | 7/25/24 | 204,204 | b | 204,395 | ||||
Engineered Machinery Holdings, | 4.56 | 7/25/24 | 1,570,796 | b | 1,572,273 | ||||
Engineered Machinery Holdings, | 8.56 | 7/25/25 | 1,612,979 | b | 1,627,092 | ||||
Filtration Group, | 4.55 | 11/13/20 | 3,596,088 | b | 3,618,114 | ||||
Gardner Denver, | 4.56 | 7/23/20 | 1,676,563 | b | 1,678,039 | ||||
Hayward Industries, | 4.81 | 7/18/24 | 3,125,000 | b | 3,145,516 | ||||
18
Description | Coupon | Maturity Date | Principal Amount ($) | a | Value ($) | ||||
Floating Rate Loan Interests - 84.3% (continued) | |||||||||
Industrial Equipment - 3.3% (continued) | |||||||||
Lineage Logistics, | 4.81 | 3/31/21 | 4,247,234 | b | 4,261,186 | ||||
Navios Maritime Partners, | 6.00 | 9/4/20 | 2,073,750 | b | 2,071,158 | ||||
Navios Maritime Partners, | 5.77 | 6/15/20 | 1,271,644 | b | 1,271,644 | ||||
Penn Engineering & Manufacturing, | 4.05 | 6/13/24 | 1,950,000 | b | 1,957,615 | ||||
XPO Logistics, | 3.57 | 11/1/21 | 1,806,286 | b | 1,811,380 | ||||
30,657,387 | |||||||||
Leisure Goods/Activities/Movies - 3.6% | |||||||||
Alpha Topco, | 4.56 | 7/30/21 | 5,080,132 | b | 5,119,275 | ||||
Centerplate, | 5.07 | 11/27/19 | 3,735,875 | b | 3,745,215 | ||||
ClubCorp Club Operations, | 4.06 | 12/15/22 | 2,518,088 | b | 2,508,016 | ||||
Cyan Blue Holdco 3, | GBP | 5.77 | 7/26/24 | 1,000,000 | b | 1,303,198 | |||
Deluxe Entertainment Services Group, | 6.81 | 2/25/20 | 3,312,429 | b | 3,324,850 | ||||
Lions Gate Entertainment, | 3.77 | 10/13/23 | 3,558,047 | b | 3,592,880 | ||||
NPC International, | 4.81 | 3/29/24 | 2,925,000 | b | 2,946,937 | ||||
Sabre GLBL, | 4.07 | 2/16/24 | 4,294,705 | b | 4,316,866 | ||||
Technicolor, | 3.95 | 12/6/23 | 2,388,000 | b | 2,385,015 | ||||
William Morris Endeavor Entertainment, | 4.57 | 3/19/21 | 3,705,986 | b | 3,730,538 | ||||
32,972,790 | |||||||||
Lodging & Casinos - 2.2% | |||||||||
American Casino & Entertainment Properties, | 4.56 | 7/7/22 | 590,169 | b | 592,017 | ||||
Boyd Gaming, | 3.80 | 9/15/23 | 1,125,788 | b | 1,129,526 | ||||
Eldorado Resorts, | 3.56 | 3/15/24 | 3,092,250 | b | 3,082,587 | ||||
Greektown Holdings, | 4.32 | 3/21/24 | 3,600,000 | b | 3,601,692 | ||||
MGM Growth Properties, | 3.56 | 4/7/23 | 385,125 | b | 386,463 | ||||
Scientific Games International, | 4.56 | 8/14/24 | 7,650,000 | b | 7,721,260 | ||||
Station Casinos, | 3.81 | 5/25/23 | 358,751 | b | 358,943 | ||||
19
STATEMENT OF INVESTMENTS (continued)
Description | Coupon | Maturity Date | Principal Amount ($) | a | Value ($) | ||||
Floating Rate Loan Interests - 84.3% (continued) | |||||||||
Lodging & Casinos - 2.2% (continued) | |||||||||
Travelport Finance Luxembourg Sarl, | 4.06 | 9/2/21 | 2,854,226 | b | 2,854,683 | ||||
19,727,171 | |||||||||
Nonferrous Metals/Minerals - 1.3% | |||||||||
Big River Steel, | 6.00 | 8/15/23 | 3,571,471 | b | 3,625,043 | ||||
Global Brass and Copper, | 4.50 | 6/16/23 | 918,063 | b | 926,096 | ||||
Oxbow Carbon, | 8.31 | 1/18/20 | 1,600,000 | b | 1,607,000 | ||||
Oxbow Carbon, | 4.81 | 1/19/20 | 1,940,438 | b | 1,959,852 | ||||
Peabody Energy, | 5.80 | 2/8/22 | 3,631,293 | b | 3,668,514 | ||||
11,786,505 | |||||||||
Oil & Gas - 1.7% | |||||||||
BCP Raptor, | 5.57 | 6/7/24 | 3,450,000 | b | 3,483,051 | ||||
Brand Energy & Infrastructure Services, | 5.54 | 6/14/24 | 6,325,000 | b | 6,353,115 | ||||
California Resources, | 11.38 | 12/31/21 | 2,000,000 | b | 2,126,660 | ||||
Gavilan Resources, | 7.32 | 2/24/24 | 4,115,000 | b | 3,898,962 | ||||
15,861,788 | |||||||||
Publishing - 1.9% | |||||||||
Information Resources, | 5.49 | 12/20/23 | 478,800 | b | 483,289 | ||||
Information Resources, | 9.49 | 12/20/24 | 1,295,000 | b | 1,297,428 | ||||
Polyconcept North America Holdings, | 6.57 | 8/10/23 | 1,865,900 | b | 1,877,562 | ||||
Pre-Paid Legal Services, | 6.55 | 7/1/19 | 1,322,666 | b | 1,334,649 | ||||
Redtop Acquisitions, | EUR | 4.75 | 12/22/20 | 1,000,000 | b | 1,194,805 | |||
SESAC Holdco II, | 4.57 | 2/13/24 | 2,992,500 | b | 2,992,500 | ||||
Springer Science+Business Media, | EUR | 3.75 | 8/14/20 | 2,977,538 | b | 3,556,885 | |||
Trader Corporation, | 4.54 | 9/28/23 | 4,821,250 | b | 4,824,263 | ||||
17,561,381 | |||||||||
20
Description | Coupon | Maturity Date | Principal Amount ($) | a | Value ($) | ||||
Floating Rate Loan Interests - 84.3% (continued) | |||||||||
Radio & Television - 3.9% | |||||||||
AVSC Holding, | 4.81 | 4/25/24 | 4,071,437 | b | 4,086,705 | ||||
CBS Radio, | 4.81 | 10/6/23 | 675,495 | b | 680,845 | ||||
Creative Artists Agency, | 4.82 | 2/10/24 | 6,171,992 | b | 6,219,579 | ||||
Global Eagle Entertainment, | 8.30 | 12/22/22 | 3,527,812 | b | 3,427,270 | ||||
Gray Television, | 3.80 | 2/2/24 | 1,741,250 | b | 1,747,127 | ||||
ION Media Networks, | 4.32 | 12/18/20 | 6,150,000 | b | 6,173,062 | ||||
Mission Broadcasting, | 4.31 | 9/26/23 | 113,060 | b | 113,413 | ||||
MTL Publishing, | 3.81 | 8/21/23 | 2,400,386 | b | 2,409,735 | ||||
Nexstar Broadcasting, | 4.31 | 9/26/23 | 1,268,780 | b | 1,272,745 | ||||
Sinclair Television, | 3.55 | 1/3/24 | 758,450 | b | 760,464 | ||||
Townsquare Media, | 4.31 | 4/1/22 | 1,955,367 | b | 1,962,700 | ||||
Tribune Media Company, | 4.31 | 1/26/24 | 3,120,981 | b | 3,133,340 | ||||
Univision Communications, | 4.02 | 3/15/24 | 3,558,892 | b | 3,536,097 | ||||
35,523,082 | |||||||||
Retailers - 3.7% | |||||||||
Bass Pro Group, | 6.02 | 5/15/18 | 500,000 | b | 502,190 | ||||
Bass Pro Group, | 6.27 | 11/5/23 | 2,356,000 | b | 2,241,157 | ||||
CWGS Group, | 5.02 | 11/3/23 | 5,124,250 | b | 5,170,163 | ||||
Dollar Tree, | 4.25 | 3/9/22 | 2,500,000 | 2,536,462 | |||||
Floor & Decor Outlets of America, | 4.80 | 9/30/23 | 471,080 | b | 472,847 | ||||
Harbor Freight Tools USA, | 4.56 | 8/16/23 | 1,473,750 | b | 1,481,583 | ||||
Leslie's Poolmart, | 5.07 | 8/9/23 | 4,190,352 | b | 4,198,649 | ||||
LSF9 Atlantis Holdings, | 7.31 | 4/21/23 | 3,065,000 | b | 3,083,513 | ||||
PetSmart, | 4.30 | 3/11/22 | 1,838,238 | b | 1,627,420 | ||||
Serta Simmons Bedding, | 4.81 | 10/20/23 | 3,283,500 | b | 3,200,592 | ||||
21
STATEMENT OF INVESTMENTS (continued)
Description | Coupon | Maturity Date | Principal Amount ($) | a | Value ($) | ||||
Floating Rate Loan Interests - 84.3% (continued) | |||||||||
Retailers - 3.7% (continued) | |||||||||
Serta Simmons Bedding, | 9.31 | 10/21/24 | 2,183,467 | b | 2,122,068 | ||||
Staples, | 5.30 | 8/15/24 | 6,900,000 | b | 6,874,125 | ||||
33,510,769 | |||||||||
Surface Transport - 1.2% | |||||||||
Commercial Barge Line Company, | 10.07 | 11/6/20 | 1,078,125 | b | 863,848 | ||||
IBC Capital, | 5.02 | 8/5/21 | 2,939,943 | b | 2,919,128 | ||||
IBC Capital, | 8.27 | 9/9/22 | 1,570,000 | b | 1,499,350 | ||||
Kenan Advantage, | 4.31 | 7/22/22 | 633,190 | b | 633,981 | ||||
Kenan Advantage, | 4.27 | 7/22/22 | 2,082,971 | b | 2,085,575 | ||||
Omnitracs, | 5.07 | 10/29/20 | 656,013 | b | 660,661 | ||||
OSG Bulk Ships, | 5.56 | 7/22/19 | 1,581,001 | b | 1,517,761 | ||||
PODS, | 4.56 | 2/2/22 | 592,400 | b | 597,092 | ||||
10,777,396 | |||||||||
Telecommunications - 4.8% | |||||||||
Asurion, | 4.06 | 8/4/22 | 1,457,137 | b | 1,463,061 | ||||
Asurion, | 4.31 | 11/3/23 | 4,331,339 | b | 4,355,356 | ||||
Asurion, | 7.31 | 7/14/25 | 9,485,000 | b | 9,712,261 | ||||
Avaya, | 8.81 | 1/23/18 | 1,675,000 | b | 1,707,101 | ||||
CCC Information Services, | 4.31 | 3/31/24 | 1,500,000 | b | 1,500,000 | ||||
Cincinnati Bell, | 4.32 | 9/10/20 | 1,564,466 | b | 1,567,986 | ||||
Consolidated Communications, | 4.30 | 9/29/23 | 3,706,625 | b | 3,649,284 | ||||
Digicel International Finance, | 5.07 | 5/10/24 | 800,000 | b | 809,144 | ||||
Equinix, | EUR | 3.25 | 12/7/23 | 1,496,250 | b | 1,789,000 | |||
Global Tel*Link Corp, | 5.06 | 5/23/20 | 3,525,000 | b | 3,558,487 | ||||
22
Description | Coupon | Maturity Date | Principal Amount ($) | a | Value ($) | ||||
Floating Rate Loan Interests - 84.3% (continued) | |||||||||
Telecommunications - 4.8% (continued) | |||||||||
IPC, | 5.81 | 8/6/21 | 1,459,666 | b | 1,392,156 | ||||
Level 3 Financing, | 3.57 | 2/17/24 | 2,865,000 | b | 2,868,352 | ||||
Masergy Holdings, | 5.07 | 12/15/23 | 497,500 | b | 501,853 | ||||
Masergy Holdings, | 9.77 | 12/14/24 | 1,425,000 | b | 1,442,813 | ||||
Sprint Communications, | 3.81 | 1/31/24 | 2,771,055 | b | 2,775,752 | ||||
Transaction Network Services, | 5.32 | 2/15/20 | 119,175 | b | 120,039 | ||||
Transaction Network Services, | 9.31 | 8/14/20 | 2,124,021 | b | 2,128,004 | ||||
Zayo Group, | 3.56 | 1/19/24 | 2,216,384 | b | 2,221,725 | ||||
43,562,374 | |||||||||
Utilities - 2.8% | |||||||||
Calpine, | 4.04 | 5/20/22 | 1,470,000 | b | 1,467,582 | ||||
Calpine, | 4.04 | 1/15/23 | 246,250 | b | 246,000 | ||||
Dayton Power & Light, | 4.57 | 8/19/22 | 582,075 | b | 590,323 | ||||
Dynegy, | 4.56 | 6/27/23 | 1,656,047 | b | 1,661,064 | ||||
Helix Gen Funding, | 5.07 | 3/9/24 | 6,108,582 | b | 6,176,601 | ||||
Murray Energy, | 8.55 | 4/9/20 | 6,573,276 | b | 6,034,497 | ||||
TEX Operations Company, | 4.06 | 8/4/23 | 546,093 | b | 546,926 | ||||
TEX Operations Company, | 4.06 | 8/4/23 | 2,382,435 | b | 2,386,068 | ||||
TPF II Power, | 5.30 | 9/29/21 | 6,586,989 | b | 6,609,615 | ||||
25,718,676 | |||||||||
Total Floating Rate Loan Interests | 769,682,061 | ||||||||
Description | Shares | Value ($) | |||||||
Common Stocks - 1.0% | |||||||||
Exchange-Traded Funds - 1.0% | |||||||||
PowerShares Senior Loan Portfolio | 389,000 | 9,001,460 | |||||||
23
STATEMENT OF INVESTMENTS (continued)
Description | Shares | Value ($) | |||||||
Other Investment - 10.3% | |||||||||
Registered Investment Company; | |||||||||
Dreyfus Institutional Preferred Government Plus Money Market Fund | 94,487,366 | e | 94,487,366 | ||||||
Total Investments (cost $943,338,043) | 103.6% | 945,906,178 | |||||||
Liabilities, Less Cash and Receivables | (3.6%) | (33,116,530) | |||||||
Net Assets | 100.0% | 912,789,648 | |||||||
ETF—Exchange-Traded Fund
EURIBOR—Euro Interbank Offered Rate
LIBOR—London Interbank Offered Rate
PRIME—Prime Lending Rate
EUR—Euro
GBP—British Pound
a Amount stated in U.S. Dollars unless otherwise noted above.
b Variable rate security—rate shown is the interest rate in effect at period end.
c Security exempt from registration pursuant to Rule 144A under the Securities Act of 1933. These securities may be resold in transactions exempt from registration, normally to qualified institutional buyers. At August 31, 2017, these securities were valued at $39,620,916 or 4.34% of net assets.
d Investment, or portion of investment, represents an unfunded floating note loan interest outstanding.
e Investment in affiliated money market mutual fund.
Portfolio Summary (Unaudited) † | Value (%) |
Bank Loans | 84.3 |
Money Market Investment | 10.3 |
Corporate Bonds | 7.0 |
Common Stocks | 1.0 |
Asset-Backed | 1.0 |
103.6 |
† Based on net assets.
See notes to financial statements.
24
STATEMENT OF INVESTMENTS IN AFFILIATED ISSUERS
Registered Investment Company | Value | Purchases ($) | Sales ($) | Value | Net | Dividends/ |
Dreyfus Institutional Preferred Government Plus Money Market Fund | 61,721,980 | 445,571,164 | 412,805,778 | 94,487,366 | 10.3 | 560,753 |
See notes to financial statements.
25
STATEMENT OF FORWARD FOREIGN CURRENCY EXCHANGE CONTRACTS August 31, 2017
Counterparty/ Purchased | Purchased Currency | Currency | Sold | Settlement Date | Unrealized (Depreciation)($) |
Credit Suisse International | |||||
United States Dollar | 25,282,675 | Euro | 21,393,000 | 9/15/17 | (204,782) |
Gross Unrealized Depreciation | (204,782) | ||||
See notes to financial statements.
26
STATEMENT OF ASSETS AND LIABILITIES
August 31, 2017
|
|
|
|
|
|
|
|
|
| Cost |
| Value |
|
Assets ($): |
|
|
|
| ||
Investments in securities—See Statement of Investments: |
|
|
|
| ||
Unaffiliated issuers |
| 848,850,677 |
| 851,418,812 |
| |
Affiliated issuers |
| 94,487,366 |
| 94,487,366 |
| |
Cash |
|
|
|
| 4,574,725 |
|
Cash denominated in foreign currency |
|
| 15,863 |
| 16,250 |
|
Receivable for investment securities sold |
|
|
|
| 9,840,385 |
|
Dividends and interest receivable |
|
|
|
| 4,249,293 |
|
Receivable for shares of Common Stock subscribed |
|
|
|
| 1,689,780 |
|
Cash collateral held by broker—Note 4 |
|
|
|
| 300,000 |
|
Prepaid expenses |
|
|
|
| 52,521 |
|
|
|
|
|
| 966,629,132 |
|
Liabilities ($): |
|
|
|
| ||
Due to The Dreyfus Corporation and affiliates—Note 3(c) |
|
|
|
| 511,893 |
|
Payable for investment securities purchased |
|
|
|
| 52,717,711 |
|
Unrealized depreciation on forward foreign |
|
|
|
| 204,782 |
|
Payable for shares of Common Stock redeemed |
|
|
|
| 179,251 |
|
Accrued expenses |
|
|
|
| 225,847 |
|
|
|
|
|
| 53,839,484 |
|
Net Assets ($) |
|
| 912,789,648 |
| ||
Composition of Net Assets ($): |
|
|
|
| ||
Paid-in capital |
|
|
|
| 935,096,603 |
|
Accumulated undistributed investment income—net |
|
|
|
| 1,778,815 |
|
Accumulated net realized gain (loss) on investments |
|
|
|
| (26,462,423) |
|
Accumulated net unrealized appreciation (depreciation) |
|
|
| 2,376,653 |
| |
Net Assets ($) |
|
| 912,789,648 |
| ||
Net Asset Value Per Share | Class A | Class C | Class I | Class Y |
|
Net Assets ($) | 14,483,099 | 2,652,174 | 18,491,800 | 877,162,575 |
|
Shares Outstanding | 1,193,722 | 218,999 | 1,526,879 | 72,524,413 |
|
Net Asset Value Per Share ($) | 12.13 | 12.11 | 12.11 | 12.09 |
|
See notes to financial statements. |
27
STATEMENT OF OPERATIONS
Year Ended August 31, 2017
|
|
|
|
|
|
|
|
|
|
|
|
|
|
Investment Income ($): |
|
|
|
| ||
Income: |
|
|
|
| ||
Interest |
|
| 32,472,428 |
| ||
Dividends: |
|
|
|
| ||
Unaffiliated issuers |
|
| 218,286 |
| ||
Affiliated issuers |
|
| 560,753 |
| ||
Total Income |
|
| 33,251,467 |
| ||
Expenses: |
|
|
|
| ||
Management fee—Note 3(a) |
|
| 4,651,137 |
| ||
Registration fees |
|
| 117,359 |
| ||
Professional fees |
|
| 107,324 |
| ||
Directors’ fees and expenses—Note 3(d) |
|
| 72,537 |
| ||
Shareholder servicing costs—Note 3(c) |
|
| 61,046 |
| ||
Prospectus and shareholders’ reports |
|
| 24,327 |
| ||
Distribution fees—Note 3(b) |
|
| 21,295 |
| ||
Loan commitment fees—Note 2 |
|
| 13,854 |
| ||
Custodian fees—Note 3(c) |
|
| 9,800 |
| ||
Miscellaneous |
|
| 276,617 |
| ||
Total Expenses |
|
| 5,355,296 |
| ||
Less—reduction in expenses due to undertaking—Note 3(a) |
|
| (4,552) |
| ||
Less—reduction in fees due to earnings credits—Note 3(c) |
|
| (4,133) |
| ||
Net Expenses |
|
| 5,346,611 |
| ||
Investment Income—Net |
|
| 27,904,856 |
| ||
Realized and Unrealized Gain (Loss) on Investments—Note 4 ($): |
|
| ||||
Net realized gain (loss) on investments and foreign currency transactions | (2,503,787) |
| ||||
Net realized gain (loss) on forward foreign currency exchange contracts | (740,770) |
| ||||
Net Realized Gain (Loss) |
|
| (3,244,557) |
| ||
Net unrealized appreciation (depreciation) on investments |
|
| 4,190,025 |
| ||
Net unrealized appreciation (depreciation) on |
|
| (213,269) |
| ||
Net Unrealized Appreciation (Depreciation) |
|
| 3,976,756 |
| ||
Net Realized and Unrealized Gain (Loss) on Investments |
|
| 732,199 |
| ||
Net Increase in Net Assets Resulting from Operations |
| 28,637,055 |
| |||
See notes to financial statements. | ||||||
28
STATEMENT OF CHANGES IN NET ASSETS
|
|
|
| Year Ended August 31, | |||||
|
|
|
| 2017 |
|
|
| 2016 |
|
Operations ($): |
|
|
|
|
|
|
|
| |
Investment income—net |
|
| 27,904,856 |
|
|
| 20,328,817 |
| |
Net realized gain (loss) on investments |
| (3,244,557) |
|
|
| (19,145,146) |
| ||
Net unrealized appreciation (depreciation) |
| 3,976,756 |
|
|
| 9,635,237 |
| ||
Net Increase (Decrease) in Net Assets | 28,637,055 |
|
|
| 10,818,908 |
| |||
Distributions to Shareholders from ($): |
|
|
|
|
|
|
|
| |
Investment income—net: |
|
|
|
|
|
|
|
| |
Class A |
|
| (439,124) |
|
|
| (296,459) |
| |
Class C |
|
| (76,376) |
|
|
| (50,252) |
| |
Class I |
|
| (779,372) |
|
|
| (449,533) |
| |
Class Y |
|
| (25,202,771) |
|
|
| (20,561,835) |
| |
Total Distributions |
|
| (26,497,643) |
|
|
| (21,358,079) |
| |
Capital Stock Transactions ($): |
|
|
|
|
|
|
|
| |
Net proceeds from shares sold: |
|
|
|
|
|
|
|
| |
Class A |
|
| 12,313,342 |
|
|
| 1,781,327 |
| |
Class C |
|
| 1,469,121 |
|
|
| 2,104,044 |
| |
Class I |
|
| 48,823,802 |
|
|
| 17,270,859 |
| |
Class Y |
|
| 469,824,657 |
|
|
| 128,060,167 |
| |
Distributions reinvested: |
|
|
|
|
|
|
|
| |
Class A |
|
| 418,239 |
|
|
| 284,561 |
| |
Class C |
|
| 73,719 |
|
|
| 47,028 |
| |
Class I |
|
| 661,698 |
|
|
| 256,498 |
| |
Class Y |
|
| 9,010,491 |
|
|
| 8,384,636 |
| |
Cost of shares redeemed: |
|
|
|
|
|
|
|
| |
Class A |
|
| (5,523,110) |
|
|
| (2,500,994) |
| |
Class C |
|
| (856,786) |
|
|
| (1,004,639) |
| |
Class I |
|
| (43,917,071) |
|
|
| (14,612,027) |
| |
Class Y |
|
| (85,234,090) |
|
|
| (135,458,915) |
| |
Increase (Decrease) in Net Assets | 407,064,012 |
|
|
| 4,612,545 |
| |||
Total Increase (Decrease) in Net Assets | 409,203,424 |
|
|
| (5,926,626) |
| |||
Net Assets ($): |
|
|
|
|
|
|
|
| |
Beginning of Period |
|
| 503,586,224 |
|
|
| 509,512,850 |
| |
End of Period |
|
| 912,789,648 |
|
|
| 503,586,224 |
| |
Undistributed investment income—net | 1,778,815 |
|
|
| 1,817,829 |
| |||
29
STATEMENT OF CHANGES IN NET ASSETS (continued)
|
|
|
| Year Ended August 31, | |||||
|
|
|
| 2017 |
|
|
| 2016 |
|
Capital Share Transactions (Shares): |
|
|
|
|
|
|
|
| |
Class A |
|
|
|
|
|
|
|
| |
Shares sold |
|
| 1,016,419 |
|
|
| 149,914 |
| |
Shares issued for distributions reinvested |
|
| 34,514 |
|
|
| 23,952 |
| |
Shares redeemed |
|
| (454,952) |
|
|
| (212,586) |
| |
Net Increase (Decrease) in Shares Outstanding | 595,981 |
|
|
| (38,720) |
| |||
Class C |
|
|
|
|
|
|
|
| |
Shares sold |
|
| 121,518 |
|
|
| 177,894 |
| |
Shares issued for distributions reinvested |
|
| 6,094 |
|
|
| 3,982 |
| |
Shares redeemed |
|
| (70,735) |
|
|
| (85,164) |
| |
Net Increase (Decrease) in Shares Outstanding | 56,877 |
|
|
| 96,712 |
| |||
Class Ia |
|
|
|
|
|
|
|
| |
Shares sold |
|
| 4,030,579 |
|
|
| 1,451,443 |
| |
Shares issued for distributions reinvested |
|
| 54,699 |
|
|
| 21,622 |
| |
Shares redeemed |
|
| (3,624,840) |
|
|
| (1,235,985) |
| |
Net Increase (Decrease) in Shares Outstanding | 460,438 |
|
|
| 237,080 |
| |||
Class Ya |
|
|
|
|
|
|
|
| |
Shares sold |
|
| 38,800,687 |
|
|
| 10,777,628 |
| |
Shares issued for distributions reinvested |
|
| 746,227 |
|
|
| 707,357 |
| |
Shares redeemed |
|
| (7,048,673) |
|
|
| (11,435,254) |
| |
Net Increase (Decrease) in Shares Outstanding | 32,498,241 |
|
|
| 49,731 |
| |||
a During the period ended August 31, 2017, 871,441 Class Y shares representing $10,544,135 were exchanged for 870,512 Class I shares and during the period ended August 31, 2016, 151,852 Class Y shares representing $1,799,364 were exchanged for 151,720 Class I shares. | |||||||||
See notes to financial statements. | |||||||||
30
FINANCIAL HIGHLIGHTS
The following tables describe the performance for each share class for the fiscal periods indicated. All information (except portfolio turnover rate) reflects financial results for a single fund share. Total return shows how much your investment in the fund would have increased (or decreased) during each period, assuming you had reinvested all dividends and distributions. These figures have been derived from the fund’s financial statements.
Year Ended August 31, | ||||||
Class A Shares | 2017 | 2016 | 2015 | 2014a | ||
Per Share Data ($): | ||||||
Net asset value, beginning of period | 12.06 | 12.29 | 12.64 | 12.50 | ||
Investment Operations: | ||||||
Investment income—net b | .44 | .47 | .48 | .38 | ||
Net realized and unrealized | .05 | (.21) | (.33) | .05 | ||
Total from Investment Operations | .49 | .26 | .15 | .43 | ||
Distributions: | ||||||
Dividends from investment income—net | (.42) | (.49) | (.48) | (.29) | ||
Dividends from net realized gain on investments | - | - | (.02) | - | ||
Total Distributions | (.42) | (.49) | (.50) | (.29) | ||
Net asset value, end of period | 12.13 | 12.06 | 12.29 | 12.64 | ||
Total Return (%)c | 4.14 | 2.23 | 1.28 | 3.39d | ||
Ratios/Supplemental Data (%): | ||||||
Ratio of total expenses to average net assets | 1.02 | 1.04 | 1.04 | 1.13e | ||
Ratio of net expenses to average net assets | 1.02 | 1.04 | 1.04 | 1.03e | ||
Ratio of net investment income | 3.61 | 3.98 | 3.88 | 3.17e | ||
Portfolio Turnover Rate | 97.82 | 66.45 | 76.63 | 51.30d | ||
Net Assets, end of period ($ x 1,000) | 14,483 | 7,210 | 7,824 | 4,402 | ||
a From September 27, 2013 (commencement of operations) to August 31, 2014.
b Based on average shares outstanding.
c Exclusive of sales charge.
d Not annualized.
e Annualized.
See notes to financial statements.
31
FINANCIAL HIGHLIGHTS (continued)
Year Ended August 31, | ||||||
Class C Shares | 2017 | 2016 | 2015 | 2014a | ||
Per Share Data ($): | ||||||
Net asset value, beginning of period | 12.04 | 12.28 | 12.63 | 12.50 | ||
Investment Operations: | ||||||
Investment income—netb | .35 | .38 | .39 | .28 | ||
Net realized and unrealized | .05 | (.22) | (.33) | .06 | ||
Total from Investment Operations | .40 | .16 | .06 | .34 | ||
Distributions: | ||||||
Dividends from investment income—net | (.33) | (.40) | (.39) | (.21) | ||
Dividends from net realized gain on investments | - | - | (.02) | - | ||
Total Distributions | (.33) | (.40) | (.41) | (.21) | ||
Net asset value, end of period | 12.11 | 12.04 | 12.28 | 12.63 | ||
Total Return (%)c | 3.38 | 1.43 | .47 | 2.73d | ||
Ratios/Supplemental Data (%): | ||||||
Ratio of total expenses to average net assets | 1.81 | 1.84 | 1.84 | 1.98e | ||
Ratio of net expenses to average net assets | 1.78 | 1.80 | 1.80 | 1.80e | ||
Ratio of net investment income | 2.85 | 3.22 | 3.11 | 2.40e | ||
Portfolio Turnover Rate | 97.82 | 66.45 | 76.63 | 51.30d | ||
Net Assets, end of period ($ x 1,000) | 2,652 | 1,952 | 803 | 475 | ||
a From September 27, 2013 (commencement of operations) to August 31, 2014.
b Based on average shares outstanding.
c Exclusive of sales charge.
d Not annualized.
e Annualized.
See notes to financial statements.
32
Year Ended August 31, | ||||
Class I Shares | 2017 | 2016 | 2015 | 2014a |
Per Share Data ($): | ||||
Net asset value, beginning of period | 12.05 | 12.28 | 12.62 | 12.50 |
Investment Operations: | ||||
Investment income—netb | .47 | .50 | .56 | .43 |
Net realized and unrealized | .05 | (.20) | (.36) | .01 |
Total from Investment Operations | .52 | .30 | .20 | .44 |
Distributions: | ||||
Dividends from investment income—net | (.46) | (.53) | (.52) | (.32) |
Dividends from net realized gain on investments | - | - | (.02) | - |
Total Distributions | (.46) | (.53) | (.54) | (.32) |
Net asset value, end of period | 12.11 | 12.05 | 12.28 | 12.62 |
Total Return (%) | 4.47 | 2.49 | 1.58 | 3.59c |
Ratios/Supplemental Data (%): | ||||
Ratio of total expenses to average net assets | .80 | .81 | .77 | .85d |
Ratio of net expenses to average net assets | .78 | .80 | .77 | .79d |
Ratio of net investment income | 3.87 | 4.22 | 4.19 | 3.40d |
Portfolio Turnover Rate | 97.82 | 66.45 | 76.63 | 51.30c |
Net Assets, end of period ($ x 1,000) | 18,492 | 12,845 | 10,187 | 6,876 |
a From September 27, 2013 (commencement of operations) to August 31, 2014.
b Based on average shares outstanding.
c Not annualized.
d Annualized.
See notes to financial statements.
33
FINANCIAL HIGHLIGHTS (continued)
Year Ended August 31, | ||||
Class Y Shares | 2017 | 2016 | 2015 | 2014a |
Per Share Data ($): | ||||
Net asset value, beginning of period | 12.03 | 12.27 | 12.63 | 12.50 |
Investment Operations: | ||||
Investment income—netb | .47 | .51 | .51 | .36 |
Net realized and unrealized | .05 | (.22) | (.32) | .09 |
Total from Investment Operations | .52 | .29 | (.19) | .45 |
Distributions: | ||||
Dividends from investment income—net | (.46) | (.53) | (.53) | (.32) |
Dividends from net realized gain on investments | - | - | (.02) | - |
Total Distributions | (.46) | (.53) | (.55) | (.32) |
Net asset value, end of period | 12.09 | 12.03 | 12.27 | 12.63 |
Total Return (%) | 4.51 | 2.54 | 1.56 | 3.59c |
Ratios/Supplemental Data (%): | ||||
Ratio of total expenses to average net assets | .74 | .76 | .75 | .86d |
Ratio of net expenses to average net assets | .74 | .76 | .75 | .79d |
Ratio of net investment income | 3.91 | 4.27 | 4.14 | 3.41d |
Portfolio Turnover Rate | 97.82 | 66.45 | 76.63 | 51.30c |
Net Assets, end of period ($ x 1,000) | 877,163 | 481,579 | 490,699 | 519,996 |
a From September 27, 2013 (commencement of operations) to August 31, 2014.
b Based on average shares outstanding.
c Not annualized.
d Annualized.
See notes to financial statements.
34
NOTES TO FINANCIAL STATEMENTS
NOTE 1—Significant Accounting Policies:
Dreyfus Floating Rate Income Fund (the “fund”) is a separate non-diversified series of The Dreyfus/Laurel Funds, Inc. (the “Company”), which is registered under the Investment Company Act of 1940, as amended (the “Act”), as an open-end management investment company and operates as a series company currently offering nine series, including the fund. The fund’s investment objective is to seek high current income. The Dreyfus Corporation (the “Manager” or “Dreyfus”), a wholly-owned subsidiary of The Bank of New York Mellon Corporation (“BNY Mellon”), serves as the fund’s investment adviser. Alcentra NY, LLC (“Alcentra”), a wholly-owned subsidiary of BNY Mellon and an affiliate of Dreyfus, serves as the fund’s sub-investment adviser.
Effective March 31, 2017, the fund authorized the issuance of Class T shares, but, as of the date of this report, the fund did not offer Class T shares for purchase. The fund authorized 100 million Class T shares which resulted in the fund’s total authorized shares increasing from 400 million to 500 million.
MBSC Securities Corporation (the “Distributor”), a wholly-owned subsidiary of Dreyfus, is the distributor of the fund’s shares. The fund is authorized to issue 100 million shares of $.001 par value Common Stock in each of the following classes of shares: Class A, Class C, Class I, Class T and Class Y. Class A, Class C and Class T shares are sold primarily to retail investors through financial intermediaries and bear Distribution and/or Shareholder Services Plan fees. Class A and Class T shares generally are subject to a sales charge imposed at the time of purchase. Class C shares are subject to a contingent deferred sales charge (“CDSC”) imposed on Class C shares redeemed within one year of purchase. Class I shares are sold primarily to bank trust departments and other financial service providers (including The Bank of New York Mellon, a subsidiary of BNY Mellon and an affiliate of Dreyfus, and its affiliates), acting on behalf of customers having a qualified trust or an investment account or relationship at such institution, and bear no Distribution or Shareholder Services Plan fees. Class Y shares are sold at net asset value per share generally to institutional investors, and bear no Distribution or Shareholder Services Plan fees. Class I and Class Y shares are offered without a front-end sales charge or CDSC. Other differences between the classes include the services offered to and the expenses borne by each class, the allocation of certain transfer agency costs, and certain voting rights. Income, expenses (other than expenses attributable to a specific class), and realized and unrealized gains or losses on investments are allocated to each class of shares based on its relative net assets.
35
NOTES TO FINANCIAL STATEMENTS (continued)
The Company accounts separately for the assets, liabilities and operations of each series. Expenses directly attributable to each series are charged to that series’ operations; expenses which are applicable to all series are allocated among them on a pro rata basis.
The Financial Accounting Standards Board (“FASB”) Accounting Standards Codification is the exclusive reference of authoritative U.S. generally accepted accounting principles (“GAAP”) recognized by the FASB to be applied by nongovernmental entities. Rules and interpretive releases of the Securities and Exchange Commission (“SEC”) under authority of federal laws are also sources of authoritative GAAP for SEC registrants. The fund’s financial statements are prepared in accordance with GAAP, which may require the use of management estimates and assumptions. Actual results could differ from those estimates.
(a) Portfolio valuation: The fair value of a financial instrument is the amount that would be received to sell an asset or paid to transfer a liability in an orderly transaction between market participants at the measurement date (i.e., the exit price). GAAP establishes a fair value hierarchy that prioritizes the inputs of valuation techniques used to measure fair value. This hierarchy gives the highest priority to unadjusted quoted prices in active markets for identical assets or liabilities (Level 1 measurements) and the lowest priority to unobservable inputs (Level 3 measurements).
Additionally, GAAP provides guidance on determining whether the volume and activity in a market has decreased significantly and whether such a decrease in activity results in transactions that are not orderly. GAAP requires enhanced disclosures around valuation inputs and techniques used during annual and interim periods.
Various inputs are used in determining the value of the fund’s investments relating to fair value measurements. These inputs are summarized in the three broad levels listed below:
Level 1—unadjusted quoted prices in active markets for identical investments.
Level 2—other significant observable inputs (including quoted prices for similar investments, interest rates, prepayment speeds, credit risk, etc.).
Level 3—significant unobservable inputs (including the fund’s own assumptions in determining the fair value of investments).
The inputs or methodology used for valuing securities are not necessarily an indication of the risk associated with investing in those securities.
36
Changes in valuation techniques may result in transfers in or out of an assigned level within the disclosure hierarchy. Valuation techniques used to value the fund’s investments are as follows:
Investments in debt securities, floating rate loan interests and other securities, excluding short-term investments (other than U.S. Treasury Bills), and forward foreign currency exchange contracts (“forward contracts”) are valued each business day by an independent pricing service (the “Service”) approved by the Company’s Board of Directors (the “Board”). Investments for which quoted bid prices are readily available and are representative of the bid side of the market in the judgment of the Service are valued at the mean between the quoted bid prices (as obtained by the Service from dealers in such securities) and asked prices (as calculated by the Service based upon its evaluation of the market for such securities). Other investments (which constitute a majority of the portfolio securities) are valued as determined by the Service, based on methods which include consideration of the following: yields or prices of securities of comparable quality, coupon, maturity and type; indications as to values from dealers; and general market conditions. These securities are generally categorized within Level 2 of the fair value hierarchy.
Investments in equity securities are valued at the last sales price on the securities exchange or national securities market on which such securities are primarily traded. Securities listed on the National Market System for which market quotations are available are valued at the official closing price or, if there is no official closing price that day, at the last sales price. For open short positions, asked prices are used for valuation purposes. Bid price is used when no asked price is available. Registered investment companies that are not traded on an exchange are valued at their net asset value. All of the preceding securities are generally categorized within Level 1 of the fair value hierarchy.
Securities not listed on an exchange or the national securities market, or securities for which there were no transactions, are valued at the average of the most recent bid and asked prices. These securities are generally categorized within Level 2 of the fair value hierarchy.
The Service is engaged under the general supervision of the Board.
Fair valuing of securities may be determined with the assistance of a pricing service using calculations based on indices of domestic securities and other appropriate indicators, such as prices of relevant American Depository Receipts and futures. Utilizing these techniques may result in transfers between Level 1 and Level 2 of the fair value hierarchy.
37
NOTES TO FINANCIAL STATEMENTS (continued)
When market quotations or official closing prices are not readily available, or are determined not to reflect accurately fair value, such as when the value of a security has been significantly affected by events after the close of the exchange or market on which the security is principally traded (for example, a foreign exchange or market), but before the fund calculates its net asset value, the fund may value these investments at fair value as determined in accordance with the procedures approved by the Board. Certain factors may be considered when fair valuing investments such as: fundamental analytical data, the nature and duration of restrictions on disposition, an evaluation of the forces that influence the market in which the securities are purchased and sold, and public trading in similar securities of the issuer or comparable issuers. These securities are either categorized within Level 2 or 3 of the fair value hierarchy depending on the relevant inputs used.
For restricted securities where observable inputs are limited, assumptions about market activity and risk are used and are generally categorized within Level 3 of the fair value hierarchy.
Investments denominated in foreign currencies are translated to U.S. dollars at the prevailing rates of exchange.
Forward contracts are valued at the forward rate and are generally categorized within Level 2 of the fair value hierarchy.
The following is a summary of the inputs used as of August 31, 2017 in valuing the fund’s investments:
Level 1 - Unadjusted Quoted Prices | Level 2 - Other Significant Observable Inputs | Level 3 -Significant Unobservable Inputs | Total | |
Assets ($) | ||||
Investments in Securities: | ||||
Collateralized Loan Obligations | - | 8,750,455 | - | 8,750,455 |
Corporate Bonds† | - | 63,984,836 | - | 63,984,836 |
Exchange-Traded Funds | 9,001,460 | - | - | 9,001,460 |
Floating Rate Loan Interests† | - | 769,682,061 | - | 769,682,061 |
Registered Investment Company | 94,487,366 | - | - | 94,487,366 |
Liabilities ($) | ||||
Other Financial Instruments: | ||||
Forward Foreign Currency Exchange Contracts†† | - | (204,782) | - | (204,782) |
† See Statement of Investments for additional detailed categorizations.
†† Amount shown represents unrealized appreciation at period end.
38
At August 31, 2017, there were no transfers between levels of the fair value hierarchy.
The following is a reconciliation of Level 3 assets for which significant unobservable inputs were used to determine fair value:
|
Floating Rate Loan Interests ($) | |
Balance as of 8/31/2016 | 3,399,819 | |
Realized gain (loss) | (108,031) | |
Change in unrealized appreciation (depreciation) | 121,557 | |
Purchases/issuances | 9,034 | |
Sales/dispositions | 3,422,379 | |
Transfers into Level 3 | - | |
Transfers out of Level 3 | - | |
Balance as of 8/31/2017 | - | |
The amount of total gains (losses) for the period | - | |
(b) Foreign currency transactions: The fund does not isolate that portion of the results of operations resulting from changes in foreign exchange rates on investments from the fluctuations arising from changes in the market prices of securities held. Such fluctuations are included with the net realized and unrealized gain or loss on investments.
Net realized foreign exchange gains or losses arise from sales of foreign currencies, currency gains or losses realized on securities transactions between trade and settlement date, and the difference between the amounts of dividends, interest and foreign withholding taxes recorded on the fund’s books and the U.S. dollar equivalent of the amounts actually received or paid. Net unrealized foreign exchange gains and losses arise from changes in the value of assets and liabilities other than investments resulting from changes in exchange rates. Foreign currency gains and losses on foreign currency transactions are also included with net realized and unrealized gain or loss on investments.
(c) Securities transactions and investment income: Securities transactions are recorded on a trade date basis. Realized gains and losses from securities transactions are recorded on the identified cost basis. Dividend income is recognized on the ex-dividend date and interest income, including, where applicable, accretion of discount and amortization of premium on investments, is recognized on the accrual basis.
39
NOTES TO FINANCIAL STATEMENTS (continued)
(d) Affiliated issuers: Investments in other investment companies advised by Dreyfus are defined as “affiliated” under the Act.
(e) Risk: The fund invests in floating rate loan interests. The floating rate loans in which the fund invests typically are below investment grade securities, and inherently speculative. In the event of the bankruptcy of a borrower, the fund could experience delays or limitations imposed by insolvency laws with respect to its ability to realize the benefits of any collateral securing the borrower’s loan.
The fund invests primarily in debt securities. Failure of an issuer of the debt securities to make timely interest or principal payments, or a decline or the perception of a decline in the credit quality of a debt security, can cause the debt security’s price to fall, potentially lowering the fund’s share price. In addition, the value of debt securities may decline due to general market conditions that are not specifically related to a particular issuer, such as real or perceived adverse economic conditions, changes in outlook for corporate earnings, changes in interest or currency rates or adverse investor sentiment. They may also decline because of factors that affect a particular industry.
(f) Dividends and distributions to shareholders: Dividends and distributions are recorded on the ex-dividend date. Dividends from investment income-net are normally declared and paid on a monthly basis. Dividends from net realized capital gains, if any, are normally declared and paid annually, but the fund may make distributions on a more frequent basis to comply with the distribution requirements of the Internal Revenue Code of 1986, as amended (the “Code”). To the extent that net realized capital gains can be offset by capital loss carryovers, it is the policy of the fund not to distribute such gains. Income and capital gain distributions are determined in accordance with income tax regulations, which may differ from GAAP.
On August 31, 2017, the Board declared a cash dividend of $.041, $.033, $.044 and $.044 per share from undistributed investment income-net for Class A, Class C, Class I and Class Y shares, respectively, payable on September 1, 2017 (ex-dividend date), to shareholders of record as of the close of business on August 31, 2017.
(g) Federal income taxes: It is the policy of the fund to continue to qualify as a regulated investment company, if such qualification is in the best interests of its shareholders, by complying with the applicable provisions of the Code, and to make distributions of taxable income sufficient to relieve it from substantially all federal income and excise taxes.
40
As of and during the period ended August 31, 2017, the fund did not have any liabilities for any uncertain tax positions. The fund recognizes interest and penalties, if any, related to uncertain tax positions as income tax expense in the Statement of Operations. During the period ended August 31, 2017, the fund did not incur any interest or penalties.
Each tax year in the four-year period ended August 31, 2017 remains subject to examination by the Internal Revenue Service and state taxing authorities.
At August 31, 2017, the components of accumulated earnings on a tax basis were as follows: undistributed ordinary income $1,574,033, accumulated capital losses $25,823,619 and unrealized appreciation $1,942,631.
Under the Regulated Investment Company Modernization Act of 2010, the fund is permitted to carry forward capital losses for an unlimited period. Furthermore, capital loss carryovers retain their character as either short-term or long-term capital losses.
The accumulated capital loss carryover is available for federal income tax purposes to be applied against future net realized capital gains, if any, realized subsequent to August 31, 2017. The fund has $6,015,820 of short-term capital losses and $19,807,799 of long-term capital losses which can be carried forward for an unlimited period.
The tax character of distributions paid to shareholders during the fiscal periods ended August 31, 2017 and August 31, 2016 were as follows: ordinary income $26,497,643 and $21,358,079, respectively.
During the period ended August 31, 2017, as a result of permanent book to tax differences, primarily due to the tax treatment for amortization adjustments, foreign currency transactions, paydown gains and losses and consent fees, the fund decreased accumulated undistributed investment income-net by $1,446,227 and increased accumulated net realized gain (loss) on investments by the same amount. Net assets and net asset value per share were not affected by this reclassification.
NOTE 2—Bank Lines of Credit:
The fund participates with other Dreyfus-managed funds in an $810 million unsecured credit facility led by Citibank, N.A. and a $300 million unsecured credit facility provided by The Bank of New York Mellon (each, a “Facility”), each to be utilized primarily for temporary or emergency purposes, including the financing of redemptions. Prior to October 5, 2016, the unsecured credit facility with Citibank, N.A. was $555 million. In connection therewith, the fund has agreed to pay its pro rata portion of
41
NOTES TO FINANCIAL STATEMENTS (continued)
commitment fees for each Facility. Interest is charged to the fund based on rates determined pursuant to the terms of the respective Facility at the time of borrowing. During the period ended August 31, 2017, the fund did not borrow under the Facilities.
NOTE 3—Management Fee, Sub-Investment Advisory Fee and Other Transactions with Affiliates:
(a) Pursuant to a management agreement with Dreyfus, the management fee is computed at the annual rate of .65% of the value of the fund’s average daily net assets and is payable monthly. Dreyfus had contractually agreed, from September 1, 2016 through April 20, 2017, to waive receipt of its fees and/or assume the direct expenses of the fund, so that the expenses of none of the classes (excluding Rule 12b-1 Distribution Plan fees, Shareholder Services Plan fees, taxes, interest expense, brokerage commissions, commitment fees on borrowings and extraordinary expenses) exceeded .80% of the value of the fund’s average daily net assets. Dreyfus has also contractually agreed, from April 21, 2017 through January 1, 2018, to waive receipt of its fees and/or assume the direct expenses of the fund, so that the annual fund expenses of none of the classes (excluding certain expenses as described above) exceed .75% of the value of the fund’s average daily net assets. The reduction in expenses, pursuant to the undertaking, amounted to $4,552 during the period ended August 31, 2017.
Pursuant to a sub-investment advisory agreement between Dreyfus and Alcentra, Alcentra serves as the fund’s sub-investment adviser responsible for the day-to-day management of the fund’s portfolio. Dreyfus pays the sub-investment adviser a monthly fee at an annual percentage of the value of the fund’s average daily net assets. Dreyfus has obtained an exemptive order from the SEC (the “Order”), upon which the fund may rely, to use a manager of managers approach that permits Dreyfus, subject to certain conditions and approval by the Board, to enter into and materially amend sub-investment advisory agreements with one or more sub-investment advisers who are either unaffiliated with Dreyfus or are wholly-owned subsidiaries (as defined under the Act) of Dreyfus’ ultimate parent company, BNY Mellon, without obtaining shareholder approval. The Order also allows the fund to disclose the sub-investment advisory fee paid by Dreyfus to any unaffiliated sub-investment adviser in the aggregate with other unaffiliated sub-investment advisers in documents filed with the SEC and provided to shareholders. In addition, pursuant to the Order, it is not necessary to disclose the sub-investment advisory fee payable by Dreyfus separately to a sub-investment adviser that is a wholly-owned subsidiary of BNY Mellon in documents filed with the SEC and provided to
42
shareholders; such fees are to be aggregated with fees payable to Dreyfus. Dreyfus has ultimate responsibility (subject to oversight by the Board) to supervise any sub-investment adviser and recommend the hiring, termination, and replacement of any sub-investment adviser to the Board.
During the period ended August 31, 2017, the Distributor retained $749 from commissions earned on sales of the fund’s Class A shares.
(b) Under the Distribution Plan adopted pursuant to Rule 12b-1 under the Act, Class C shares pay the Distributor for distributing its shares at an annual rate of .75% of the value of its average daily net assets. During the period ended August 31, 2017, Class C shares were charged $21,295 pursuant to the Distribution Plan.
(c) Under the Shareholder Services Plan, Class A and Class C shares pay the Distributor at an annual rate of .25% of the value of their average daily net assets for the provision of certain services. The services provided may include personal services relating to shareholder accounts, such as answering shareholder inquiries regarding the fund and providing reports and other information, and services related to the maintenance of shareholder accounts. The Distributor may make payments to Service Agents (securities dealers, financial institutions or other industry professionals) with respect to these services. The Distributor determines the amounts to be paid to Service Agents. During the period ended August 31, 2017, Class A and Class C shares were charged $32,537 and $7,098, respectively, pursuant to the Shareholder Services Plan.
Under its terms, the Distribution Plan and Shareholder Services Plan shall remain in effect from year to year, provided such continuance is approved annually by a vote of a majority of those Directors who are not “interested persons” of the Company and who have no direct or indirect financial interest in the operation of or in any agreement related to the Distribution Plan or Shareholder Services Plan.
The fund has arrangements with the transfer agent and the custodian whereby the fund may receive earnings credits when positive cash balances are maintained, which are used to offset transfer agency and custody fees. For financial reporting purposes, the fund includes net earnings credits as an expense offset in the Statement of Operations.
The fund compensates Dreyfus Transfer, Inc., a wholly-owned subsidiary of Dreyfus, under a transfer agency agreement for providing transfer agency and cash management services for the fund. The majority of transfer agency fees are comprised of amounts paid on a per account basis, while cash management fees are related to fund subscriptions and redemptions. During the period ended August 31, 2017, the fund was
43
NOTES TO FINANCIAL STATEMENTS (continued)
charged $7,852 for transfer agency services and $207 for cash management services. These fees are included in Shareholder servicing costs in the Statement of Operations. Cash management fees were offset by earnings credits of $207.
The fund compensates The Bank of New York Mellon under a custody agreement for providing custodial services for the fund. These fees are determined based on net assets, geographic region and transaction activity. During the period ended August 31, 2017, the fund was charged $9,800 pursuant to the custody agreement. These fees were partially offset by earnings credits of $3,926.
During the period ended August 31, 2017, the fund was charged $11,281 for services performed by the Chief Compliance Officer and his staff.
The components of “Due to The Dreyfus Corporation and affiliates” in the Statement of Assets and Liabilities consist of: management fees $499,746, Distribution Plan fees $1,831, Shareholder Services Plan fees $3,685, custodian fees $2,319, Chief Compliance Officer fees $4,670 and transfer agency fees $740, which are offset against an expense reimbursement currently in effect in the amount of $1,098.
(d) Each Board member also serves as a Board member of other funds within the Dreyfus complex. Annual retainer fees and attendance fees are allocated to each fund based on net assets.
NOTE 4—Securities Transactions:
The aggregate amount of purchases and sales (including paydowns) of investment securities, excluding short-term securities and forward contracts, during the period ended August 31, 2017, amounted to $1,035,635,968 and $661,333,322, respectively.
Floating Rate Loan Interests: Floating rate instruments are loans and other securities with interest rates that adjust or “float” periodically. Floating rate loans are made by banks and other financial institutions to their corporate clients. The rates of interest on the loans adjust periodically by reference to a base lending rate, such as the London Interbank Offered Rate (“LIBOR”) plus a premium or credit spread. Floating rate loans reset on periodic set dates, typically 30 to 90 days, but not to exceed one year. The fund may invest in multiple series or tranches of a loan. A different series or tranche may have varying terms and carry different associated risks.
The fund may enter into certain credit agreements all or a portion of which may be unfunded. The fund is obligated to fund these commitments at the borrower’s discretion. The commitments are disclosed in the
44
accompanying Statement of Investments. At August 31, 2017, the fund had sufficient cash and/or securities to cover these commitments.
Derivatives: A derivative is a financial instrument whose performance is derived from the performance of another asset. The fund enters into International Swaps and Derivatives Association, Inc. Master Agreements or similar agreements (collectively, “Master Agreements”) with its over-the-counter (“OTC”) derivative contract counterparties in order to, among other things, reduce its credit risk to counterparties. Master Agreements include provisions for general obligations, representations, collateral and events of default or termination. Under a Master Agreement, the fund may offset with the counterparty certain derivative financial instrument’s payables and/or receivables with collateral held and/or posted and create one single net payment in the event of default or termination.
Each type of derivative instrument that was held by the fund during the period ended August 31, 2017 is discussed below.
Forward Foreign Currency Exchange Contracts: The fund enters into forward contracts in order to hedge its exposure to changes in foreign currency exchange rates on its foreign portfolio holdings, to settle foreign currency transactions or as a part of its investment strategy. When executing forward contracts, the fund is obligated to buy or sell a foreign currency at a specified rate on a certain date in the future. With respect to sales of forward contracts, the fund incurs a loss if the value of the contract increases between the date the forward contract is opened and the date the forward contract is closed. The fund realizes a gain if the value of the contract decreases between those dates. With respect to purchases of forward contracts, the fund incurs a loss if the value of the contract decreases between the date the forward contract is opened and the date the forward contract is closed. The fund realizes a gain if the value of the contract increases between those dates. Any realized or unrealized gains or losses which occurred during the period are reflected in the Statement of Operations. The fund is exposed to foreign currency risk as a result of changes in value of underlying financial instruments. The fund is also exposed to credit risk associated with counterparty nonperformance on these forward contracts, which is generally limited to the unrealized gain on each open contract. This risk may be mitigated by Master Agreements, if any, between the fund and the counterparty and the posting of collateral, if any, by the counterparty to the fund to cover the fund’s exposure to the counterparty. Forward contracts open at August 31, 2017 are set forth in the Statement of Forward Foreign Currency Exchange Contracts.
45
NOTES TO FINANCIAL STATEMENTS (continued)
The following summarizes the average market value of derivatives outstanding during the period ended August 31, 2017:
|
| Average Market Value ($) |
Forward contracts | 18,836,300 | |
At August 31, 2017, the cost of investments inclusive of derivative contracts for federal income tax purposes was $943,976,847; accordingly, accumulated net unrealized appreciation on investments inclusive of derivative contracts was $1,724,549, consisting of $7,115,044 gross unrealized appreciation and $5,390,495 gross unrealized depreciation.
46
REPORT OF INDEPENDENT REGISTERED
PUBLIC ACCOUNTING FIRM
The Board of Directors and Shareholders
The Dreyfus/Laurel Funds, Inc.
We have audited the accompanying statement of assets and liabilities of Dreyfus Floating Rate Income Fund (the “Fund”), a series of The Dreyfus/Laurel Funds, Inc., including the statements of investments, investments in affiliated issuers, and foreign currency exchange contracts, as of August 31, 2017, and the related statement of operations for the year then ended, the statements of changes in net assets for each of the years in the two-year period then ended, and the financial highlights for each of the years or periods in the four-year period then ended. These financial statements and financial highlights are the responsibility of the Fund’s management. Our responsibility is to express an opinion on these financial statements and financial highlights based on our audits.
We conducted our audits in accordance with the standards of the Public Company Accounting Oversight Board (United States). Those standards require that we plan and perform the audit to obtain reasonable assurance about whether the financial statements and financial highlights are free of material misstatement. An audit includes examining, on a test basis, evidence supporting the amounts and disclosures in the financial statements. Our procedures included confirmation of securities owned as of August 31, 2017, by correspondence with the custodian and brokers or by other appropriate auditing procedures. An audit also includes assessing the accounting principles used and significant estimates made by management, as well as evaluating the overall financial statement presentation. We believe that our audits provide a reasonable basis for our opinion.
In our opinion, the financial statements and financial highlights referred to above present fairly, in all material respects, the financial position of Dreyfus Floating Rate Income Fund as of August 31, 2017, and the results of its operations for the year then ended, the changes in its net assets for each of the years in the two-year period then ended, and the financial highlights for each of the years or periods in the four-year period then ended, in conformity with U.S. generally accepted accounting principles.

New York, New York
October 27, 2017
47
IMPORTANT TAX INFORMATION (Unaudited)
For federal tax purposes the fund designates the maximum amount allowable but not less than 83.59% as interest-related dividends in accordance with Sections 871(k)(1) and 881(e) of the Internal Revenue Code. Where required by federal tax law rules, shareholders will receive notification of their portion of the fund’s taxable ordinary dividends and capital gains distributions paid for the 2017 calendar year on Form 1099-DIV which will be mailed in early 2018.
48
BOARD MEMBERS INFORMATION (Unaudited)
INDEPENDENT BOARD MEMBERS
Chairman of the Board (1999)
Principal Occupation During Past 5 Years:
· Corporate Director and Trustee (1995-present)
Other Public Company Board Memberships During Past 5 Years:
· CBIZ (formerly, Century Business Services, Inc.), a provider of outsourcing functions for small and medium size companies, Director (1997-present)
No. of Portfolios for which Board Member Serves: 130
———————
Francine J. Bovich (66)
Board Member (2012)
Principal Occupation During Past 5 Years:
· Trustee, The Bradley Trusts, private trust funds (2011-present)
Other Public Company Board Memberships During Past 5 Years:
· Annaly Capital Management, Inc., Board Member (May 2014-present)
No. of Portfolios for which Board Member Serves: 76
———————
Kenneth A. Himmel (71)
Board Member (1994)
Principal Occupation During Past 5 Years:
· Managing Partner, Gulf Related, an international real estate development company (2010-present)
· President and CEO, Related Urban Development, a real estate development company (1996-present)
· President and CEO, Himmel & Company, a real estate development company (1980-present)
· CEO, American Food Management, a restaurant company (1983-present)
No. of Portfolios for which Board Member Serves: 28
———————
49
BOARD MEMBERS INFORMATION (Unaudited) (continued)
INDEPENDENT BOARD MEMBERS (continued)
Stephen J. Lockwood (70)
Board Member (1994)
Principal Occupation During Past 5 Years:
· Chairman of the Board, Stephen J. Lockwood and Company LLC, a real estate investment company (2000-present)
No. of Portfolios for which Board Member Serves: 28
———————
Roslyn M. Watson (67)
Board Member (2015)
Principal Occupation During Past 5 Years:
· Principal, Watson Ventures, Inc., a real estate investment company (1993-present)
No. of Portfolios for which Board Member Serves: 62
———————
Benaree Pratt Wiley (71)
Board Member (1998)
Principal Occupation During Past 5 Years:
· Principal, The Wiley Group, a firm specializing in strategy and business development (2005-present)
Other Public Company Board Memberships During Past 5 Years:
· CBIZ (formerly, Century Business Services, Inc.), a provider of outsourcing functions for small and medium size companies, Director (2008-present)
No. of Portfolios for which Board Member Serves: 83
———————
Once elected all Board Members serve for an indefinite term, but achieve Emeritus status upon reaching age 80. The address of the Board Members and Officers is c/o The Dreyfus Corporation, 200 Park Avenue, New York, New York 10166. Additional information about the Board Members is available in the fund’s Statement of Additional Information which can be obtained from Dreyfus free of charge by calling this toll free number: 1-800-DREYFUS.
J. Tomlinson Fort, Emeritus Board Member
50
OFFICERS OF THE FUND (Unaudited)
BRADLEY J. SKAPYAK, President since January 2010.
Chief Operating Officer and a director of the Manager since June 2009, Chairman of Dreyfus Transfer, Inc., an affiliate of the Manager and the transfer agent of the funds, since May 2011 and Chief Executive Officer of MBSC Securities Corporation since August 2016. He is an officer of 63 investment companies (comprised of 130 portfolios) managed by the Manager. He is 58 years old and has been an employee of the Manager since February 1988.
BENNETT A. MACDOUGALL, Chief Legal Officer since October 2015.
Chief Legal Officer of the Manager and Associate General Counsel and Managing Director of BNY Mellon since June 2015; from June 2005 to June 2015, he served in various capacities with Deutsche Bank – Asset & Wealth Management Division, including as Director and Associate General Counsel, and Chief Legal Officer of Deutsche Investment Management Americas Inc. from June 2012 to May 2015. He is an officer of 64 investment companies (comprised of 155 portfolios) managed by the Manager. He is 45 years old and has been an employee of the Manager since June 2015.
JANETTE E. FARRAGHER, Vice President and Secretary since December 2011.
Associate General Counsel of BNY Mellon, and an officer of 64 investment companies (comprised of 155 portfolios) managed by the Manager. She is 54 years old and has been an employee of the Manager since February 1984.
JAMES BITETTO, Vice President and Assistant Secretary since August 2005.
Managing Counsel of BNY Mellon and Secretary of the Manager, and an officer of 64 investment companies (comprised of 155 portfolios) managed by the Manager. He is 51 years old and has been an employee of the Manager since December 1996.
JOSEPH M. CHIOFFI, Vice President and Assistant Secretary since August 2005.
Managing Counsel of BNY Mellon, and an officer of 64 investment companies (comprised of 155 portfolios) managed by the Manager. He is 55 years old and has been an employee of the Manager since June 2000.
MAUREEN E. KANE, Vice President and Assistant Secretary since April 2015.
Managing Counsel of BNY Mellon since July 2014; from October 2004 until July 2014, General Counsel, and from May 2009 until July 2014, Chief Compliance Officer of Century Capital Management. She is an officer of 64 investment companies (comprised of 155 portfolios) managed by the Manager. She is 55 years old and has been an employee of the Manager since July 2014.
SARAH S. KELLEHER, Vice President and Assistant Secretary since April 2014.
Senior Counsel of BNY Mellon since March 2013, from August 2005 to March 2013, Associate General Counsel of Third Avenue Management. She is an officer of 64 investment companies (comprised of 155 portfolios) managed by the Manager. She is 41 years old and has been an employee of the Manager since March 2013.
JEFF PRUSNOFSKY, Vice President and Assistant Secretary since August 2005.
Senior Managing Counsel of BNY Mellon, and an officer of 64 investment companies (comprised of 155 portfolios) managed by the Manager. He is 52 years old and has been an employee of the Manager since October 1990.
NATALYA ZELENSKY, Vice President and Assistant Secretary since March 2017.
Counsel and Vice President of BNY Mellon since May 2016; Attorney at Wildermuth Endowment Strategy Fund/Wildermuth Advisory, LLC from November 2015 until May 2016; Assistant General Counsel at RCS Advisory Services from July 2014 until November 2015; Associate at Sutherland, Asbill & Brennan from January 2013 until January 2014; Associate at K&L Gates from October 2011 until January 2013. She is an officer of 64 investment companies (comprised of 155 portfolios) managed by Dreyfus. She is 32 years old and has been an employee of the Manager since May 2016.
JAMES WINDELS, Treasurer since November 2001.
Director – Mutual Fund Accounting of the Manager, and an officer of 64 investment companies (comprised of 155 portfolios) managed by the Manager. He is 58 years old and has been an employee of the Manager since April 1985.
51
OFFICERS OF THE FUND (Unaudited) (continued)
RICHARD CASSARO, Assistant Treasurer since January 2008.
Senior Accounting Manager – Money Market and Municipal Bond Funds of the Manager, and an officer of 64 investment companies (comprised of 155 portfolios) managed by the Manager. He is 58 years old and has been an employee of the Manager since September 1982.
GAVIN C. REILLY, Assistant Treasurer since December 2005.
Tax Manager of the Investment Accounting and Support Department of the Manager, and an officer of 64 investment companies (comprised of 155 portfolios) managed by the Manager. He is 49 years old and has been an employee of the Manager since April 1991.
ROBERT S. ROBOL, Assistant Treasurer since August 2003.
Senior Accounting Manager – Dreyfus Financial Reporting of the Manager, and an officer of 64 investment companies (comprised of 155 portfolios) managed by the Manager. He is 53 years old and has been an employee of the Manager since October 1988.
ROBERT SALVIOLO, Assistant Treasurer since July 2007.
Senior Accounting Manager – Equity Funds of the Manager, and an officer of 64 investment companies (comprised of 155 portfolios) managed by the Manager. He is 50 years old and has been an employee of the Manager since June 1989.
ROBERT SVAGNA, Assistant Treasurer since August 2005.
Senior Accounting Manager – Fixed Income and Equity Funds of the Manager, and an officer of 64 investment companies (comprised of 155 portfolios) managed by the Manager. He is 50 years old and has been an employee of the Manager since November 1990.
JOSEPH W. CONNOLLY, Chief Compliance Officer since October 2004.
Chief Compliance Officer of the Manager and The Dreyfus Family of Funds (64 investment companies, comprised of 155 portfolios). He is 60 years old and has served in various capacities with the Manager since 1980, including manager of the firm’s Fund Accounting Department from 1997 through October 2001.
CARIDAD M. CAROSELLA, Anti-Money Laundering Compliance Officer since January 2016.
Anti-Money Laundering Compliance Officer of the Dreyfus Family of Funds and BNY Mellon Funds Trust since January 2016; from May 2015 to December 2015, Interim Anti-Money Laundering Compliance Officer of the Dreyfus Family of Funds and BNY Mellon Funds Trust and the Distributor; from January 2012 to May 2015, AML Surveillance Officer of the Distributor and from 2007 to December 2011, Financial Processing Manager of the Distributor. She is an officer of 59 investment companies (comprised of 150 portfolios) managed by the Manager. She is 49 years old and has been an employee of the Distributor since 1997.
52
NOTES
53
Dreyfus Floating Rate Income Fund
200 Park Avenue
New York, NY 10166
Manager
The Dreyfus Corporation
200 Park Avenue
New York, NY 10166
Sub-Investment Adviser
Alcentra NY, LLC
200 Park Avenue
New York, NY 10166
Custodian
The Bank of New York Mellon
225 Liberty Street
New York, NY 10286
Transfer Agent &
Dividend Disbursing Agent
Dreyfus Transfer, Inc.
200 Park Avenue
New York, NY 10166
Distributor
MBSC Securities Corporation
200 Park Avenue
New York, NY 10166
Ticker Symbols: | Class A: DFLAX Class C: DFLCX Class I: DFLIX Class Y: DFLYX |
Telephone Call your financial representative or 1-800-DREYFUS
Mail The Dreyfus Family of Funds, 144 Glenn Curtiss Boulevard, Uniondale, NY 11556-0144
E-mail Send your request to info@dreyfus.com
Internet Information can be viewed online or downloaded at www.dreyfus.com
The fund files its complete schedule of portfolio holdings with the Securities and Exchange Commission (“SEC”) for the first and third quarters of each fiscal year on Form N-Q. The fund’s Forms N-Q are available on the SEC’s website at www.sec.gov and may be reviewed and copied at the SEC’s Public Reference Room in Washington, D.C. (phone 1-800-SEC-0330 for information).
A description of the policies and procedures that the fund uses to determine how to vote proxies relating to portfolio securities and information regarding how the fund voted these proxies for the most recent 12-month period ended June 30 is available at www.dreyfus.com and on the SEC’s website at www.sec.gov and without charge, upon request, by calling 1-800-DREYFUS.
© 2017 MBSC Securities Corporation |
|

Item 2. Code of Ethics.
The Registrant has adopted a code of ethics that applies to the Registrant's principal executive officer, principal financial officer, principal accounting officer or controller, or persons performing similar functions. There have been no amendments to, or waivers in connection with, the Code of Ethics during the period covered by this Report.
Item 3. Audit Committee Financial Expert.
The Registrant's Board has determined that Joseph S. DiMartino, a member of the Audit Committee of the Board, is an audit committee financial expert as defined by the Securities and Exchange Commission (the "SEC"). Joseph S. DiMartino is "independent" as defined by the SEC for purposes of audit committee financial expert determinations.
Item 4. Principal Accountant Fees and Services.
(a) Audit Fees. The aggregate fees billed for each of the last two fiscal years (the "Reporting Periods") for professional services rendered by the Registrant's principal accountant (the "Auditor") for the audit of the Registrant's annual financial statements or services that are normally provided by the Auditor in connection with the statutory and regulatory filings or engagements for the Reporting Periods, were $87,100 in 2016 and $89,310 in 2017.
(b) Audit-Related Fees. The aggregate fees billed in the Reporting Periods for assurance and related services by the Auditor that are reasonably related to the performance of the audit of the Registrant's financial statements and are not reported under paragraph (a) of this Item 4 were $10,100 in 2016 and $10,405 in 2017. These services consisted of one or more of the following: (i) agreed upon procedures related to compliance with Internal Revenue Code section 817(h), (ii) security counts required by Rule 17f-2 under the Investment Company Act of 1940, as amended, (iii) advisory services as to the accounting or disclosure treatment of Registrant transactions or events and (iv) advisory services to the accounting or disclosure treatment of the actual or potential impact to the Registrant of final or proposed rules, standards or interpretations by the Securities and Exchange Commission, the Financial Accounting Standards Boards or other regulatory or standard-setting bodies.
The aggregate fees billed in the Reporting Periods for non-audit assurance and related services by the Auditor to the Registrant's investment adviser (not including any sub-investment adviser whose role is primarily portfolio management and is subcontracted with or overseen by another investment adviser), and any entity controlling, controlled by or under common control with the investment adviser that provides ongoing services to the Registrant ("Service Affiliates"), that were reasonably related to the performance of the annual audit of the Service Affiliate, which required pre-approval by the Audit Committee were $0 in 2016 and $0 in 2017.
(c) Tax Fees. The aggregate fees billed in the Reporting Periods for professional services rendered by the Auditor for tax compliance, tax advice, and tax planning ("Tax Services") were $5,600 in 2016 and $5,800 in 2017. These services consisted of: (i) review or preparation of U.S. federal, state, local and excise tax returns. The aggregate fees billed in the Reporting Periods for Tax Services by the Auditor to Service Affiliates, which required pre-approval by the Audit Committee were $0 in 2016 and $0 in 2017.
(d) All Other Fees. The aggregate fees billed in the Reporting Periods for products and services provided by the Auditor, other than the services reported in paragraphs (a) through (c) of this Item, were $0 in 2016 and $0 in 2017.
The aggregate fees billed in the Reporting Periods for Non-Audit Services by the Auditor to Service Affiliates, other than the services reported in paragraphs (b) through (c) of this Item, which required pre-approval by the Audit Committee, were $0 in 2016 and $0 in 2017.
(e)(1) Audit Committee Pre-Approval Policies and Procedures. The Registrant's Audit Committee has established policies and procedures (the "Policy") for pre-approval (within specified fee limits) of the Auditor's engagements for non-audit services to the Registrant and Service Affiliates without specific case-by-case consideration. The pre-approved services in the Policy can include pre-approved audit services, pre-approved audit-related services, pre-approved tax services and pre-approved all other services. Pre-approval considerations include whether the proposed services are compatible with maintaining the Auditor's independence. Pre-approvals pursuant to the Policy are considered annually.
(e)(2) Note. None of the services described in paragraphs (b) through (d) of this Item 4 were approved by the Audit Committee pursuant to paragraph (c)(7)(i)(C) of Rule 2-01 of Regulation S-X.
(f) None of the hours expended on the principal accountant's engagement to audit the registrant's financial statements for the most recent fiscal year were attributed to work performed by persons other than the principal account's full-time, permanent employees.
Non-Audit Fees. The aggregate non-audit fees billed by the Auditor for services rendered to the Registrant, and rendered to Service Affiliates, for the Reporting Periods were $19,018,000 in 2016 and $20,552,000 in 2017.
Auditor Independence. The Registrant's Audit Committee has considered whether the provision of non-audit services that were rendered to Service Affiliates, which were not pre-approved (not requiring pre-approval), is compatible with maintaining the Auditor's independence.
Item 5. Audit Committee of Listed Registrants.
Not applicable.
Item 6. Investments.
(a) Not applicable.
Item 7. Disclosure of Proxy Voting Policies and Procedures for Closed-End Management Investment Companies.
Not applicable.
Item 8. Portfolio Managers of Closed-End Management Investment Companies.
Not applicable.
Item 9. Purchases of Equity Securities by Closed-End Management Investment Companies and Affiliated Purchasers.
Not applicable.
Item 10. Submission of Matters to a Vote of Security Holders.
There have been no material changes to the procedures applicable to Item 10.
Item 11. Controls and Procedures.
(a) The Registrant's principal executive and principal financial officers have concluded, based on their evaluation of the Registrant's disclosure controls and procedures as of a date within 90 days of the filing date of this report, that the Registrant's disclosure controls and procedures are reasonably designed to ensure that information required to be disclosed by the Registrant on Form N-CSR is recorded, processed, summarized and reported within the required time periods and that information required to be disclosed by the Registrant in the reports that it files or submits on Form N-CSR is accumulated and communicated to the Registrant's management, including its principal executive and principal financial officers, as appropriate to allow timely decisions regarding required disclosure.
(b) There were no changes to the Registrant's internal control over financial reporting that occurred during the second fiscal quarter of the period covered by this report that have materially affected, or are reasonably likely to materially affect, the Registrant's internal control over financial reporting.
Item 12. Exhibits.
(a)(1) Code of ethics referred to in Item 2.
(a)(2) Certifications of principal executive and principal financial officers as required by Rule 30a-2(a) under the Investment Company Act of 1940.
(a)(3) Not applicable.
(b) Certification of principal executive and principal financial officers as required by Rule 30a-2(b) under the Investment Company Act of 1940.
SIGNATURES
Pursuant to the requirements of the Securities Exchange Act of 1934 and the Investment Company Act of 1940, the Registrant has duly caused this Report to be signed on its behalf by the undersigned, thereunto duly authorized.
The Dreyfus/Laurel Funds, Inc.
By: /s/ Bradley J. Skapyak
Bradley J. Skapyak
President
Date: October 27, 2017
Pursuant to the requirements of the Securities Exchange Act of 1934 and the Investment Company Act of 1940, this Report has been signed below by the following persons on behalf of the Registrant and in the capacities and on the dates indicated.
By: /s/ Bradley J. Skapyak
Bradley J. Skapyak
President
Date: October 27, 2017
By: /s/ James Windels
James Windels
Treasurer
Date: October 27, 2017
EXHIBIT INDEX
(a)(1) Code of ethics referred to in Item 2.
(a)(2) Certifications of principal executive and principal financial officers as required by Rule 30a-2(a) under the Investment Company Act of 1940. (EX-99.CERT)
(b) Certification of principal executive and principal financial officers as required by Rule 30a-2(b) under the Investment Company Act of 1940. (EX-99.906CERT)