UNITED STATES
SECURITIES AND EXCHANGE COMMISSION
Washington, D.C. 20549
FORM N-CSR
CERTIFIED SHAREHOLDER REPORT OF REGISTERED MANAGEMENT
INVESTMENT COMPANIES
Investment Company Act file number | 811-05202 |
| |
| The Dreyfus/Laurel Funds, Inc. | |
| (Exact name of Registrant as specified in charter) | |
| | |
| c/o The Dreyfus Corporation 200 Park Avenue New York, New York 10166 | |
| (Address of principal executive offices) (Zip code) | |
| | |
| Bennett A. MacDougall, Esq. 200 Park Avenue New York, New York 10166 | |
| (Name and address of agent for service) | |
|
Registrant's telephone number, including area code: | (212) 922-6400 |
| |
Date of fiscal year end: | 10/31 | |
Date of reporting period: | 10/31/17 | |
| | | | | | | |
The following N-CSR relates only to the Registrant's series listed below and does not relate to any series of the Registrant with a different fiscal year end and, therefore, different N-CSR reporting requirements. A separate N-CSR will be filed for any series with a different fiscal year end, as appropriate.
- Dreyfus Bond Market Index Fund
- Dreyfus Disciplined Stock Fund
- Dreyfus Institutional S&P 500 Stock Index Fund
- Dreyfus Opportunistic Fixed Income Fund
- Dreyfus Tax Managed Growth Fund
FORM N-CSR
Item 1. Reports to Stockholders.
Dreyfus Bond Market Index Fund
| | | |

| | ANNUAL REPORT
October 31, 2017 |
| |
Save time. Save paper. View your next shareholder report online as soon as it’s available. Log into www.dreyfus.com and sign up for Dreyfus eCommunications. It’s simple and only takes a few minutes. |
| |
The views expressed in this report reflect those of the portfolio manager(s) only through the end of the period covered and do not necessarily represent the views of Dreyfus or any other person in the Dreyfus organization. Any such views are subject to change at any time based upon market or other conditions and Dreyfus disclaims any responsibility to update such views. These views may not be relied on as investment advice and, because investment decisions for a Dreyfus fund are based on numerous factors, may not be relied on as an indication of trading intent on behalf of any Dreyfus fund. |
| |
Not FDIC-Insured • Not Bank-Guaranteed • May Lose Value |
Contents
THE FUND
FOR MORE INFORMATION
Back Cover
| | | | |
| |
Dreyfus Bond Market Index Fund
| | The Fund |
A LETTER FROM THE CEO OF DREYFUS
Dear Shareholder:
We are pleased to present this annual report for Dreyfus Bond Market Index Fund, covering the 12-month period from November 1, 2016 through October 31, 2017. For information about how the fund performed during the reporting period, as well as general market perspectives, we provide a Discussion of Fund Performance on the pages that follow.
Stocks set a series of new record highs and bonds produced mixed results over the past year in response to changing economic and political conditions. Financial markets at the start of the reporting period were dominated by the election of a new U.S. presidential administration. Equities and corporate-backed bonds surged higher in anticipation of more business-friendly regulatory, tax, and fiscal policies, but high-quality bonds generally lost value due to expectations of rising interest rates and accelerating inflation in a stronger economy. Despite a series of short-term interest-rate hikes, bonds recovered their previous losses over the first 10 months of 2017 when it became clearer that pro-growth legislation would take time and political capital to enact. U.S. and international stocks continued to rally as corporate earnings grew and global economic conditions improved.
The markets’ recent strong performance has been supported by solid underlying fundamentals. While we currently expect these favorable conditions to persist, we remain watchful for economic and political developments that could derail the markets. As always, we encourage you to discuss the risks and opportunities of today’s investment environment with your financial advisor.
Thank you for your continued confidence and support.
Sincerely,

Mark D. Santero
Chief Executive Officer
The Dreyfus Corporation
November 15, 2017
2
DISCUSSION OF FUND PERFORMANCE
For the period from November 1, 2016 through October 31, 2017, as provided by Nancy G. Rogers, CFA, Paul Benson, CFA, and Stephanie Shu, CFA, Portfolio Managers
Market and Fund Performance Overview
For the 12-month period ended October 31, 2017, Dreyfus Bond Market Index Fund’s Class I shares produced a total return of 0.64%, and its Investor shares produced a total return of 0.39%.1 In comparison, the Bloomberg Barclays U.S. Aggregate Bond Index (the “Index”) achieved a total return of 0.90% for the same period.2
U.S. bonds produced modestly positive total returns over the reporting period, on average, when moderating long-term interest rates and muted inflation offset earlier market weakness stemming from expectations of greater economic growth. The difference in returns between the fund and the Index was primarily the result of operating expenses that are not reflected in the Index’s results.
The Fund’s Investment Approach
The fund seeks to match the total return of the Index. To pursue this goal, the fund normally invests at least 80% of its assets in bonds that are included in the Index (or other instruments with similar characteristics). To maintain liquidity, the fund may invest up to 20% of its assets in various short-term, fixed-income securities and money market instruments.
The fund’s investments are selected by a “sampling” process, which is a statistical process used to select bonds so that the fund has investment characteristics that closely approximate those of the Index. By using this sampling process, the fund typically will not invest in all of the securities in the Index.
Economic and Political Developments Drove Bond Markets
Longer-term interest rates rose sharply in the weeks following the U.S. presidential election in November 2016, causing prices of U.S. government securities to decline. Rates moved higher in response to expectations that a new presidential administration’s more business-friendly regulatory, tax, and fiscal policies would boost U.S. economic growth and inflationary pressures. In addition, the Federal Reserve Board (the “Fed”) implemented a long-awaited increase in short-term interest rates in December 2016.
In 2017, evidence of stronger economic growth in domestic and overseas markets prompted a gradual move among central banks away from the aggressively accommodative monetary policies of the past few years. In the United States, short-term interest rates continued to rise when the Fed implemented two more increases in the overnight federal funds rate and, toward the end of the reporting period, began to unwind its balance sheet through sales of U.S. government securities. In contrast, long-term U.S. interest rates moderated over much of 2017, giving back some, but not all, of the post-election spike when inflationary pressures remained muted and investors came to realize that some government policy reforms were far from certain.
Higher-Yielding Market Sectors Fared Best
In this environment, high-quality U.S. government securities lost value when long-term interest rates spiked in post-election trading. However, longer-term bond yields later moderated, enabling U.S. Treasury securities with maturities of 10 years or more to recoup a significant portion of their previous losses. Short-term U.S. government bonds with maturities between 1 and 10 years also lost a degree of value as yield differences narrowed along the market’s maturity spectrum.
3
DISCUSSION OF FUND PERFORMANCE (continued)
In contrast, corporate-backed bonds produced consistently strong returns amid growing earnings and upbeat business sentiment. Corporate bond prices also were supported by investors seeking competitive levels of current income, and the resulting robust demand more than compensated for increased bond issuance from businesses seeking to raise capital or refinance existing debt in advance of interest-rate hikes and potential tax reform legislation.
Mortgage-backed securities produced generally flat returns over the reporting period, as the benefits of their yield advantage over U.S. Treasury securities were offset by concerns regarding a glut of supply stemming from the Fed’s asset sales. Commercial mortgage-backed securities fared better, supported by steady economic growth and investor demand for higher-yielding securities.
The Index underwent some changes in April 2017 that, in our judgment, could lead to a more investable universe. Requirements for the amount outstanding for each bond issue were increased and hybrid mortgage-backed securities were removed as Index components, resulting in the elimination of hundreds of relatively thinly traded bonds.
Replicating the Index’s Composition
As an index fund, we attempt to match closely the returns of the Index by approximating its composition. Still, it is worth noting that most analysts expect additional short-term interest-rate hikes from the Fed, which may constrain total returns from U.S. government securities. However, corporate securities currently appear likely to continue to benefit from economic growth.
As of October 31, 2017, approximately 28.0% of the fund’s assets was invested in mortgage-backed securities, 1.9% in commercial mortgage-backed securities, 31.5% in credit bonds and asset-backed securities, and 38.5% in U.S. Treasury and agency securities. Moreover, all of the fund’s corporate securities were rated at least BBB- or better, and the fund has maintained an overall credit quality that is closely aligned with that of the Index.
November 15, 2017
1 Total return includes reinvestment of dividends and any capital gains paid. Past performance is no guarantee of future results. Share price, yield, and investment return fluctuate such that upon redemption, fund shares may be worth more or less than their original cost.
2 Source: Lipper Inc. — The Bloomberg Barclays U.S. Aggregate Bond Index is a broad-based flagship benchmark that measures the investment-grade, U.S. dollar-denominated, fixed-rate taxable bond market. The index includes Treasuries, government-related and corporate securities, MBS (agency fixed-rate and hybrid ARM pass-throughs), ABS and CMBS (agency and nonagency). Investors cannot invest directly in any index.
Bonds are subject generally to interest-rate, credit, liquidity, and market risks, to varying degrees, all of which are more fully described in the fund’s prospectus. Generally, all other factors being equal, bond prices are inversely related to interest-rate changes, and rate increases can cause price declines.
Indexing does not attempt to manage market volatility, use defensive strategies, or reduce the effects of any long-term periods of poor index performance. The correlation between fund and index performance may be affected by the fund’s expenses and use of sampling techniques, changes in securities markets, changes in the composition of the index, and the timing of purchases and redemptions of fund shares.
4
FUND PERFORMANCE
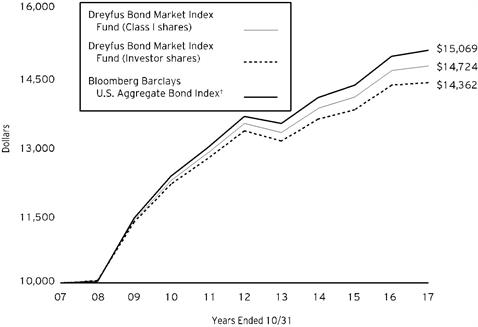
Comparison of change in value of $10,000 investment in Dreyfus Bond Market Index Fund Investor shares and Class I shares and the Bloomberg Barclays U.S. Aggregate Bond Index (the “Index”)
† Source: Lipper Inc.
Past performance is not predictive of future performance.
The above graph compares a $10,000 investment made in each of the Investor and Class I shares of Dreyfus Bond Market Index Fund on 10/31/07 to a $10,000 investment made in the Index on that date. All dividends and capital gain distributions are reinvested.
The fund’s performance shown in the line graph above takes into account all applicable fees and expenses for Class I and Investor shares. The Index is a broad-based flagship benchmark that measures the investment-grade, U.S. dollar-denominated, fixed-rate taxable bond market. The Index includes Treasuries, government-related and corporate securities, MBS (agency fixed-rate and hybrid ARM pass-throughs), ABS and CMBS (agency and nonagency). Unlike a mutual fund, the Index is not subject to charges, fees and other expenses. Investors cannot invest directly in any index. Further information relating to fund performance, including expense reimbursements, if applicable, is contained in the Financial Highlights section of the prospectus and elsewhere in this report.
5
FUND PERFORMANCE (continued)
| | | | |
Average Annual Total Returns as of 10/31/17 |
| 1 Year | 5 Years | 10 Years |
Class I shares | 0.64% | 1.78% | 3.95% |
Investor shares | 0.39% | 1.53% | 3.69% |
Bloomberg Barclays U.S. Aggregate Bond Index | 0.90% | 2.04% | 4.19% |
The performance data quoted represents past performance, which is no guarantee of future results. Share price and investment return fluctuate and an investor’s shares may be worth more or less than original cost upon redemption. Current performance may be lower or higher than the performance quoted. Go to Dreyfus.com for the fund’s most recent month-end returns.
The fund’s performance shown in the graph and table does not reflect the deduction of taxes that a shareholder would pay on fund distributions or the redemption of fund shares.
6
UNDERSTANDING YOUR FUND’S EXPENSES (Unaudited)
As a mutual fund investor, you pay ongoing expenses, such as management fees and other expenses. Using the information below, you can estimate how these expenses affect your investment and compare them with the expenses of other funds. You also may pay one-time transaction expenses, including sales charges (loads) and redemption fees, which are not shown in this section and would have resulted in higher total expenses. For more information, see your fund’s prospectus or talk to your financial adviser.
Review your fund’s expenses
The table below shows the expenses you would have paid on a $1,000 investment in Dreyfus Bond Market Index Fund from May 1, 2017 to October 31, 2017. It also shows how much a $1,000 investment would be worth at the close of the period, assuming actual returns and expenses.
| | | | | | | | |
Expenses and Value of a $1,000 Investment | | |
assuming actual returns for the six months ended October 31, 2017 | |
| | | | Investor Shares | Class I |
Expenses paid per $1,000† | | | $2.03 | | $.76 |
Ending value (after expenses) | | | $1,013.20 | | $1,015.50 |
COMPARING YOUR FUND’S EXPENSES
WITH THOSE OF OTHER FUNDS (Unaudited)
Using the SEC’s method to compare expenses
The Securities and Exchange Commission (“SEC”) has established guidelines to help investors assess fund expenses. Per these guidelines, the table below shows your fund’s expenses based on a $1,000 investment, assuming a hypothetical 5% annualized return. You can use this information to compare the ongoing expenses (but not transaction expenses or total cost) of investing in the fund with those of other funds. All mutual fund shareholder reports will provide this information to help you make this comparison. Please note that you cannot use this information to estimate your actual ending account balance and expenses paid during the period.
| | | | | | | | |
Expenses and Value of a $1,000 Investment | | |
assuming a hypothetical 5% annualized return for the six months ended October 31, 2017 |
| | | | Investor Shares | Class I |
Expenses paid per $1,000† | | | $2.04 | | $.77 |
Ending value (after expenses) | | | $1,023.19 | | $1,024.45 |
† Expenses are equal to the fund’s annualized expense ratio of .40% for Investor shares and .15% for Class I shares, multiplied by the average account value over the period, multiplied by 184/365 (to reflect the one-half year period).
7
STATEMENT OF INVESTMENTS
October 31, 2017
| | | | | | | | | | |
| |
Description | Coupon
Rate (%) | | Maturity
Date | | Principal
Amount ($) | | Value ($) | |
Bonds and Notes - 100.5% | | | | | |
Asset-Backed Ctfs./Auto Receivables - .2% | | | | | |
Ally Auto Receivables Trust,
Ser. 2015-2, Cl. A4 | | 1.84 | | 6/15/20 | | 1,000,000 | | 1,000,887 | |
Ford Credit Auto Owner Trust,
Ser. 2016-B, Cl. A3 | | 1.33 | | 10/15/20 | | 1,000,000 | | 996,751 | |
Toyota Auto Receivables Owner Trust,
Ser. 2016-C, Cl. A4 | | 1.32 | | 11/15/21 | | 1,000,000 | | 988,403 | |
| | 2,986,041 | |
Asset-Backed Ctfs./Credit Cards - .3% | | | | | |
Capital One Multi-Asset Execution Trust,
Ser. 2017-A4, Cl. A4 | | 1.99 | | 7/17/23 | | 500,000 | | 500,364 | |
Chase Issuance Trust,
Ser. 2016-A2, Cl. A | | 1.37 | | 6/15/21 | | 1,000,000 | | 993,172 | |
Chase Issuance Trust,
Ser. 2017-A4, Cl. A4 | | 1.84 | | 4/15/22 | | 1,000,000 | | 997,910 | |
Citibank Credit Card Issuance Trust,
Ser. 2014-A5, Cl. A5 | | 2.68 | | 6/7/23 | | 1,000,000 | | 1,018,627 | |
Discover Card Execution Note Trust,
Ser. 2017-A2, Cl. A2 | | 2.39 | | 7/15/24 | | 1,250,000 | | 1,259,756 | |
| | 4,769,829 | |
Commercial Mortgage Pass-Through Ctfs. - 1.3% | | | | | |
CFCRE Commercial Mortgage Trust,
Ser. 2017-C8, Cl. A4 | | 3.57 | | 6/15/50 | | 500,000 | | 517,122 | |
Citigroup Commercial Mortgage Trust,
Ser. 2014-GC23, Cl. A4 | | 3.62 | | 7/10/47 | | 1,000,000 | | 1,050,599 | |
Commercial Mortgage Trust,
Ser. 2013-CR11, Cl. B | | 5.33 | | 10/10/46 | | 750,000 | | 815,569 | |
Commercial Mortgage Trust,
Ser. 2014-CR16, Cl. A4 | | 4.05 | | 4/10/47 | | 1,200,000 | | 1,285,564 | |
Commercial Mortgage Trust,
Ser. 2016-CR28, Cl. A4 | | 3.76 | | 2/10/49 | | 1,035,000 | | 1,095,646 | |
GS Mortgage Securities Trust,
Ser. 2014-GC18, Cl. A3 | | 3.80 | | 1/10/47 | | 500,000 | | 529,310 | |
GS Mortgage Securities Trust,
Ser. 2015-GC28, Cl. AAB | | 3.21 | | 2/10/48 | | 750,000 | | 773,039 | |
J.P. Morgan Chase Commercial Mortgage Securities Corp.,
Ser. 2012-LC9, Cl. A5 | | 2.84 | | 12/15/47 | | 1,000,000 | | 1,015,206 | |
JPMBB Commercial Mortgage Securities Trust,
Ser. 2013-C15, Cl. A5 | | 4.13 | | 11/15/45 | | 500,000 | | 537,926 | |
JPMBB Commercial Mortgage Securities Trust,
Ser. 2014-C24, Cl. A5 | | 3.64 | | 11/15/47 | | 725,000 | | 758,561 | |
8
| | | | | | | | | | |
| |
Description | Coupon
Rate (%) | | Maturity
Date | | Principal
Amount ($) | | Value ($) | |
Bonds and Notes - 100.5% (continued) | | | | | |
Commercial Mortgage Pass-Through Ctfs. - 1.3% (continued) | | | | | |
JPMBB Commercial Mortgage Securities Trust,
Ser. 2015-C33, Cl. A4 | | 3.77 | | 12/15/48 | | 2,000,000 | | 2,108,422 | |
Morgan Stanley Bank of America Merrill Lynch Trust,
Ser. 2015-C20, Cl. A4 | | 3.25 | | 2/15/48 | | 1,175,000 | | 1,200,918 | |
Morgan Stanley Capital I Trust,
Ser. 2012-C4, Cl. AS | | 3.77 | | 3/15/45 | | 720,000 | | 744,968 | |
SG Commercial Mortgage Securities Trust,
Ser. 2016-C5, Cl. A4 | | 3.06 | | 10/10/48 | | 2,000,000 | | 1,994,943 | |
UBS-Barclays Commercial Mortgage Trust,
Ser. 2012-C3, Cl. A4 | | 3.09 | | 8/10/49 | | 500,000 | | 513,775 | |
UBS-Barclays Commercial Mortgage Trust,
Ser. 2013-C6, Cl. A4 | | 3.24 | | 4/10/46 | | 1,412,000 | | 1,455,292 | |
WF-RBS Commercial Mortgage Trust,
Ser. 2013-C14, Cl. ASB | | 2.98 | | 6/15/46 | | 500,000 | | 508,747 | |
WF-RBS Commercial Mortgage Trust,
Ser. 2014-C20, Cl. A2 | | 3.04 | | 5/15/47 | | 1,000,000 | | 1,013,554 | |
| | 17,919,161 | |
Consumer Discretionary - 2.7% | | | | | |
21st Century Fox America,
Gtd. Debs. | | 7.75 | | 12/1/45 | | 100,000 | | 152,300 | |
21st Century Fox America,
Gtd. Notes | | 6.20 | | 12/15/34 | | 250,000 | | 311,090 | |
21st Century Fox America,
Gtd. Notes, Ser. WI | | 3.70 | | 9/15/24 | | 400,000 | | 417,217 | |
Alibaba Group Holding,
Gtd. Notes | | 3.13 | | 11/28/21 | | 290,000 | | 296,178 | |
Alibaba Group Holding,
Gtd. Notes | | 3.60 | | 11/28/24 | | 300,000 | a | 311,008 | |
Amazon.com,
Sr. Unscd. Notes | | 2.60 | | 12/5/19 | | 500,000 | | 508,500 | |
Amazon.com,
Sr. Unscd. Notes | | 2.40 | | 2/22/23 | | 210,000 | b | 208,775 | |
Amazon.com,
Sr. Unscd. Notes | | 3.15 | | 8/22/27 | | 650,000 | b | 655,184 | |
Amazon.com,
Sr. Unscd. Notes | | 3.88 | | 8/22/37 | | 210,000 | b | 217,834 | |
Amazon.com,
Sr. Unscd. Notes | | 4.25 | | 8/22/57 | | 390,000 | b | 411,234 | |
AutoZone,
Sr. Unscd. Notes | | 3.13 | | 4/21/26 | | 500,000 | | 488,087 | |
Bed Bath & Beyond,
Sr. Unscd. Notes | | 3.75 | | 8/1/24 | | 500,000 | a | 497,152 | |
9
STATEMENT OF INVESTMENTS (continued)
| | | | | | | | | | |
| |
Description | Coupon
Rate (%) | | Maturity
Date | | Principal
Amount ($) | | Value ($) | |
Bonds and Notes - 100.5% (continued) | | | | | |
Consumer Discretionary - 2.7% (continued) | | | | | |
BorgWarner,
Sr. Unscd. Notes | | 3.38 | | 3/15/25 | | 500,000 | | 503,820 | |
California Institute of Technology,
Unscd. Bonds | | 4.32 | | 8/1/45 | | 110,000 | | 124,249 | |
Carnival,
Gtd. Notes | | 3.95 | | 10/15/20 | | 300,000 | | 314,854 | |
CBS,
Gtd. Debs. | | 7.88 | | 7/30/30 | | 300,000 | | 412,206 | |
CBS,
Gtd. Notes | | 4.90 | | 8/15/44 | | 240,000 | | 253,268 | |
Charter Communications Operating,
Sr. Scd. Notes | | 4.91 | | 7/23/25 | | 910,000 | | 969,538 | |
Charter Communications Operating,
Sr. Scd. Notes | | 6.48 | | 10/23/45 | | 500,000 | | 578,424 | |
Colgate-Palmolive,
Sr. Unscd. Notes | | 2.45 | | 11/15/21 | | 500,000 | | 503,490 | |
Comcast,
Gtd. Bonds | | 4.75 | | 3/1/44 | | 500,000 | | 556,795 | |
Comcast,
Gtd. Bonds | | 4.00 | | 8/15/47 | | 60,000 | | 60,453 | |
Comcast,
Gtd. Notes | | 5.70 | | 7/1/19 | | 500,000 | | 530,658 | |
Comcast,
Gtd. Notes | | 2.85 | | 1/15/23 | | 300,000 | | 304,477 | |
Comcast,
Gtd. Notes | | 2.75 | | 3/1/23 | | 100,000 | | 101,108 | |
Comcast,
Gtd. Notes | | 3.38 | | 8/15/25 | | 730,000 | | 749,563 | |
Comcast,
Gtd. Notes | | 4.25 | | 1/15/33 | | 500,000 | | 539,260 | |
Comcast,
Gtd. Notes | | 6.45 | | 3/15/37 | | 650,000 | | 869,006 | |
Comcast Cable Communications Holdings,
Gtd. Notes | | 9.46 | | 11/15/22 | | 304,000 | | 403,651 | |
Costco Wholesale,
Sr. Unscd. Bonds | | 2.30 | | 5/18/22 | | 170,000 | | 170,144 | |
Costco Wholesale,
Sr. Unscd. Notes | | 2.25 | | 2/15/22 | | 500,000 | | 499,263 | |
Costco Wholesale,
Sr. Unscd. Notes | | 3.00 | | 5/18/27 | | 100,000 | | 100,430 | |
CVS Health,
Sr. Unscd. Bonds | | 2.25 | | 8/12/19 | | 500,000 | | 501,023 | |
CVS Health,
Sr. Unscd. Notes | | 2.88 | | 6/1/26 | | 400,000 | | 381,668 | |
CVS Health,
Sr. Unscd. Notes | | 5.13 | | 7/20/45 | | 480,000 | | 538,040 | |
10
| | | | | | | | | | |
| |
Description | Coupon
Rate (%) | | Maturity
Date | | Principal
Amount ($) | | Value ($) | |
Bonds and Notes - 100.5% (continued) | | | | | |
Consumer Discretionary - 2.7% (continued) | | | | | |
Delphi Automotive,
Gtd. Notes | | 4.25 | | 1/15/26 | | 400,000 | | 426,554 | |
Discovery Communications,
Gtd. Notes | | 3.95 | | 3/20/28 | | 500,000 | | 496,917 | |
Discovery Communications,
Gtd. Notes | | 5.00 | | 9/20/37 | | 500,000 | | 513,428 | |
Discovery Communications,
Gtd. Notes | | 5.20 | | 9/20/47 | | 300,000 | | 306,744 | |
Ford Motor,
Sr. Unscd. Bonds | | 6.63 | | 10/1/28 | | 400,000 | | 485,738 | |
Ford Motor,
Sr. Unscd. Notes | | 5.29 | | 12/8/46 | | 160,000 | a | 170,024 | |
General Motors,
Sr. Unscd. Notes | | 4.20 | | 10/1/27 | | 180,000 | | 183,686 | |
General Motors,
Sr. Unscd. Notes | | 5.15 | | 4/1/38 | | 90,000 | | 93,841 | |
General Motors,
Sr. Unscd. Notes | | 5.20 | | 4/1/45 | | 340,000 | | 348,896 | |
Grupo Televisa,
Sr. Unscd. Notes | | 5.00 | | 5/13/45 | | 400,000 | | 401,012 | |
Hasbro,
Sr. Unscd. Notes | | 3.15 | | 5/15/21 | | 450,000 | | 458,001 | |
Home Depot,
Sr. Unscd. Notes | | 2.00 | | 4/1/21 | | 300,000 | | 299,502 | |
Home Depot,
Sr. Unscd. Notes | | 5.88 | | 12/16/36 | | 300,000 | | 396,561 | |
Home Depot,
Sr. Unscd. Notes | | 4.88 | | 2/15/44 | | 500,000 | | 586,540 | |
Interpublic Group,
Sr. Unscd. Notes | | 4.20 | | 4/15/24 | | 500,000 | | 524,948 | |
Kohl's,
Sr. Unscd. Notes | | 4.75 | | 12/15/23 | | 250,000 | | 260,442 | |
Lowe's Cos.,
Sr. Unscd. Notes | | 3.13 | | 9/15/24 | | 500,000 | | 512,372 | |
Lowe's Cos.,
Sr. Unscd. Notes | | 4.38 | | 9/15/45 | | 250,000 | | 270,077 | |
Lowe's Cos.,
Sr. Unscd. Notes | | 4.05 | | 5/3/47 | | 120,000 | | 123,983 | |
Macy's Retail Holdings,
Gtd. Debs. | | 6.90 | | 4/1/29 | | 350,000 | | 370,264 | |
Marriott International,
Sr. Unscd. Notes | | 3.13 | | 10/15/21 | | 600,000 | | 611,666 | |
Mattel,
Sr. Unscd. Notes | | 2.35 | | 5/6/19 | | 500,000 | | 492,430 | |
McDonald's,
Sr. Unscd. Notes | | 2.75 | | 12/9/20 | | 300,000 | | 306,134 | |
11
STATEMENT OF INVESTMENTS (continued)
| | | | | | | | | | |
| |
Description | Coupon
Rate (%) | | Maturity
Date | | Principal
Amount ($) | | Value ($) | |
Bonds and Notes - 100.5% (continued) | | | | | |
Consumer Discretionary - 2.7% (continued) | | | | | |
McDonald's,
Sr. Unscd. Notes | | 4.88 | | 12/9/45 | | 465,000 | | 530,875 | |
Newell Brands,
Sr. Unscd. Notes | | 5.50 | | 4/1/46 | | 350,000 | | 416,093 | |
NIKE,
Sr. Unscd. Notes | | 2.25 | | 5/1/23 | | 300,000 | | 300,923 | |
NIKE,
Sr. Unscd. Notes | | 3.63 | | 5/1/43 | | 300,000 | | 294,405 | |
Nordstrom,
Sr. Unscd. Bonds | | 4.75 | | 5/1/20 | | 500,000 | | 524,187 | |
Omnicom Group,
Gtd. Notes | | 3.63 | | 5/1/22 | | 500,000 | | 521,876 | |
Philip Morris International,
Sr. Unscd. Notes | | 2.50 | | 8/22/22 | | 600,000 | | 599,888 | |
President & Fellows of Harvard College,
Unscd. Bonds | | 3.15 | | 7/15/46 | | 750,000 | | 716,560 | |
Procter & Gamble,
Sr. Unscd. Notes | | 5.55 | | 3/5/37 | | 29,000 | | 38,220 | |
QVC,
Sr. Scd. Notes | | 5.45 | | 8/15/34 | | 250,000 | | 249,498 | |
Rice University,
Unscd. Bonds | | 3.57 | | 5/15/45 | | 250,000 | | 249,629 | |
Stanley Black & Decker,
Gtd. Notes | | 3.40 | | 12/1/21 | | 400,000 | | 414,345 | |
Starbucks,
Sr. Unscd. Notes | | 4.30 | | 6/15/45 | | 250,000 | | 271,399 | |
Target,
Sr. Unscd. Notes | | 2.30 | | 6/26/19 | | 250,000 | | 252,379 | |
Target,
Sr. Unscd. Notes | | 2.50 | | 4/15/26 | | 400,000 | a | 384,824 | |
Target,
Sr. Unscd. Notes | | 3.90 | | 11/15/47 | | 50,000 | | 49,388 | |
Thomson Reuters,
Sr. Unscd. Notes | | 3.95 | | 9/30/21 | | 300,000 | | 312,338 | |
Time Warner,
Gtd. Notes | | 4.75 | | 3/29/21 | | 500,000 | | 536,331 | |
Time Warner,
Gtd. Notes | | 7.63 | | 4/15/31 | | 300,000 | | 407,663 | |
Time Warner,
Gtd. Notes | | 4.85 | | 7/15/45 | | 300,000 | | 299,894 | |
Time Warner Cable,
Gtd. Debs. | | 6.55 | | 5/1/37 | | 350,000 | | 412,094 | |
Time Warner Cable,
Gtd. Debs. | | 4.50 | | 9/15/42 | | 500,000 | | 461,790 | |
Time Warner Cable,
Gtd. Notes | | 8.25 | | 4/1/19 | | 500,000 | | 541,819 | |
12
| | | | | | | | | | |
| |
Description | Coupon
Rate (%) | | Maturity
Date | | Principal
Amount ($) | | Value ($) | |
Bonds and Notes - 100.5% (continued) | | | | | |
Consumer Discretionary - 2.7% (continued) | | | | | |
University of Southern California,
Sr. Unscd. Notes | | 5.25 | | 2/15/41 | | 40,000 | | 49,116 | |
Viacom,
Sr. Unscd. Notes | | 4.38 | | 3/15/43 | | 400,000 | | 340,566 | |
Walgreens Boots Alliance,
Gtd. Notes | | 3.30 | | 11/18/21 | | 400,000 | | 411,026 | |
Walgreens Boots Alliance,
Gtd. Notes | | 4.50 | | 11/18/34 | | 400,000 | | 412,589 | |
Wal-Mart Stores,
Sr. Unscd. Notes | | 1.75 | | 10/9/19 | | 300,000 | | 299,972 | |
Wal-Mart Stores,
Sr. Unscd. Notes | | 3.63 | | 7/8/20 | | 1,000,000 | | 1,045,075 | |
Wal-Mart Stores,
Sr. Unscd. Notes | | 2.35 | | 12/15/22 | | 300,000 | | 299,544 | |
Wal-Mart Stores,
Sr. Unscd. Notes | | 3.63 | | 12/15/47 | | 300,000 | | 306,060 | |
Walt Disney,
Sr. Unscd. Notes | | 2.30 | | 2/12/21 | | 500,000 | | 504,303 | |
Walt Disney,
Sr. Unscd. Notes | | 3.00 | | 2/13/26 | | 500,000 | | 505,500 | |
Walt Disney,
Sr. Unscd. Notes, Ser. B | | 7.00 | | 3/1/32 | | 150,000 | | 209,537 | |
WPP Finance 2010,
Gtd. Notes | | 3.75 | | 9/19/24 | | 350,000 | | 359,525 | |
Wyndham Worldwide,
Sr. Unscd. Notes | | 3.90 | | 3/1/23 | | 250,000 | | 249,579 | |
Xerox,
Sr. Unscd. Notes | | 3.80 | | 5/15/24 | | 500,000 | a | 495,440 | |
| | 37,353,957 | |
Consumer Staples - 1.5% | | | | | |
Altria Group,
Gtd. Notes | | 2.85 | | 8/9/22 | | 500,000 | | 506,950 | |
Altria Group,
Gtd. Notes | | 4.25 | | 8/9/42 | | 500,000 | | 515,814 | |
Anheuser-Busch InBev Finance,
Gtd. Notes | | 1.90 | | 2/1/19 | | 390,000 | | 390,508 | |
Anheuser-Busch InBev Finance,
Gtd. Notes | | 2.65 | | 2/1/21 | | 1,049,063 | | 1,062,678 | |
Anheuser-Busch InBev Finance,
Gtd. Notes | | 2.63 | | 1/17/23 | | 500,000 | | 501,580 | |
Anheuser-Busch InBev Finance,
Gtd. Notes | | 3.70 | | 2/1/24 | | 1,000,000 | | 1,048,388 | |
Anheuser-Busch InBev Finance,
Gtd. Notes | | 3.65 | | 2/1/26 | | 615,000 | | 635,602 | |
Anheuser-Busch InBev Finance,
Gtd. Notes | | 4.70 | | 2/1/36 | | 590,000 | | 650,729 | |
13
STATEMENT OF INVESTMENTS (continued)
| | | | | | | | | | |
| |
Description | Coupon
Rate (%) | | Maturity
Date | | Principal
Amount ($) | | Value ($) | |
Bonds and Notes - 100.5% (continued) | | | | | |
Consumer Staples - 1.5% (continued) | | | | | |
Anheuser-Busch InBev Finance,
Gtd. Notes | | 4.00 | | 1/17/43 | | 700,000 | | 701,353 | |
BAT Capital,
Gtd. Notes | | 2.76 | | 8/15/22 | | 350,000 | b | 350,653 | |
BAT Capital,
Gtd. Notes | | 3.22 | | 8/15/24 | | 310,000 | b | 312,479 | |
BAT Capital,
Gtd. Notes | | 3.56 | | 8/15/27 | | 310,000 | b | 311,371 | |
BAT Capital,
Gtd. Notes | | 4.39 | | 8/15/37 | | 180,000 | b | 186,603 | |
BAT Capital,
Gtd. Notes | | 4.54 | | 8/15/47 | | 180,000 | b | 184,274 | |
Campbell Soup,
Sr. Unscd. Notes | | 3.30 | | 3/19/25 | | 400,000 | | 405,019 | |
Church & Dwight Co.,
Sr. Unscd. Notes | | 3.95 | | 8/1/47 | | 300,000 | | 296,756 | |
Clorox,
Sr. Unscd. Notes | | 3.80 | | 11/15/21 | | 200,000 | | 210,032 | |
Coca-Cola,
Sr. Unscd. Notes | | 3.30 | | 9/1/21 | | 750,000 | | 784,000 | |
Coca-Cola Femsa,
Gtd. Bonds | | 2.38 | | 11/26/18 | | 250,000 | | 250,920 | |
Conagra Brands,
Sr. Unscd. Notes | | 3.20 | | 1/25/23 | | 165,000 | | 168,596 | |
Diageo Investment,
Gtd. Notes | | 4.25 | | 5/11/42 | | 250,000 | | 269,808 | |
General Mills,
Sr. Unscd. Notes | �� | 5.40 | | 6/15/40 | | 500,000 | | 587,055 | |
JM Smucker,
Gtd. Notes | | 2.50 | | 3/15/20 | | 500,000 | | 504,121 | |
Kellogg,
Sr. Unscd. Notes | | 4.15 | | 11/15/19 | | 400,000 | | 416,997 | |
Kellogg,
Sr. Unscd. Notes | | 2.65 | | 12/1/23 | | 300,000 | | 298,030 | |
Kraft Heinz Foods,
Gtd. Notes | | 2.80 | | 7/2/20 | | 390,000 | | 395,201 | |
Kraft Heinz Foods,
Gtd. Notes | | 3.50 | | 6/6/22 | | 490,000 | | 506,710 | |
Kraft Heinz Foods,
Gtd. Notes | | 6.75 | | 3/15/32 | | 525,000 | b | 668,137 | |
Kraft Heinz Foods,
Gtd. Notes | | 4.38 | | 6/1/46 | | 400,000 | | 391,874 | |
Kroger,
Gtd. Notes | | 7.50 | | 4/1/31 | | 400,000 | | 528,334 | |
Kroger,
Sr. Unscd. Notes | | 3.30 | | 1/15/21 | | 300,000 | | 307,773 | |
14
| | | | | | | | | | |
| |
Description | Coupon
Rate (%) | | Maturity
Date | | Principal
Amount ($) | | Value ($) | |
Bonds and Notes - 100.5% (continued) | | | | | |
Consumer Staples - 1.5% (continued) | | | | | |
Kroger,
Sr. Unscd. Notes | | 3.70 | | 8/1/27 | | 300,000 | | 298,760 | |
Molson Coors Brewing,
Gtd. Notes | | 2.10 | | 7/15/21 | | 500,000 | | 494,895 | |
Molson Coors Brewing,
Gtd. Notes | | 4.20 | | 7/15/46 | | 150,000 | | 148,542 | |
PepsiCo,
Sr. Unscd. Notes | | 2.15 | | 10/14/20 | | 810,000 | | 815,505 | |
PepsiCo,
Sr. Unscd. Notes | | 3.50 | | 7/17/25 | | 500,000 | | 523,589 | |
PepsiCo,
Sr. Unscd. Notes | | 4.88 | | 11/1/40 | | 500,000 | | 582,656 | |
PepsiCo,
Sr. Unscd. Notes | | 4.45 | | 4/14/46 | | 210,000 | | 234,527 | |
Philip Morris International,
Sr. Unscd. Notes | | 4.50 | | 3/20/42 | | 650,000 | | 709,166 | |
Procter & Gamble,
Sr. Unscd. Notes | | 2.30 | | 2/6/22 | | 500,000 | | 501,126 | |
Reynolds American,
Gtd. Notes | | 5.70 | | 8/15/35 | | 240,000 | | 283,938 | |
Sysco,
Gtd. Notes | | 5.38 | | 9/21/35 | | 350,000 | | 410,415 | |
Tyson Foods,
Gtd. Bonds | | 5.15 | | 8/15/44 | | 250,000 | | 287,345 | |
Unilever Capital,
Gtd. Notes | | 2.20 | | 3/6/19 | | 500,000 | | 502,703 | |
Unilever Capital,
Gtd. Notes | | 2.90 | | 5/5/27 | | 500,000 | | 497,015 | |
Unilever Capital,
Gtd. Notes | | 5.90 | | 11/15/32 | | 250,000 | | 329,012 | |
| | 20,967,539 | |
Energy - 2.5% | | | | | |
Anadarko Petroleum,
Sr. Unscd. Notes | | 6.45 | | 9/15/36 | | 150,000 | | 182,565 | |
Anadarko Petroleum,
Sr. Unscd. Notes | | 6.60 | | 3/15/46 | | 250,000 | | 316,991 | |
Apache,
Sr. Unscd. Notes | | 6.00 | | 1/15/37 | | 380,000 | | 450,031 | |
Baker Hughes,
Sr. Unscd. Notes, Ser. WI | | 3.20 | | 8/15/21 | | 382,000 | | 393,636 | |
BP Capital Markets,
Gtd. Notes | | 3.25 | | 5/6/22 | | 700,000 | | 724,723 | |
BP Capital Markets,
Gtd. Notes | | 2.50 | | 11/6/22 | | 800,000 | | 798,304 | |
BP Capital Markets,
Gtd. Notes | | 3.28 | | 9/19/27 | | 110,000 | | 110,795 | |
15
STATEMENT OF INVESTMENTS (continued)
| | | | | | | | | | |
| |
Description | Coupon
Rate (%) | | Maturity
Date | | Principal
Amount ($) | | Value ($) | |
Bonds and Notes - 100.5% (continued) | | | | | |
Energy - 2.5% (continued) | | | | | |
Buckeye Partners,
Sr. Unscd. Notes | | 2.65 | | 11/15/18 | | 250,000 | | 251,618 | |
Canadian Natural Resources,
Sr. Unscd. Notes | | 3.90 | | 2/1/25 | | 250,000 | | 258,472 | |
Canadian Natural Resources,
Sr. Unscd. Notes | | 6.25 | | 3/15/38 | | 430,000 | | 532,931 | |
Chevron,
Sr. Unscd. Notes | | 2.42 | | 11/17/20 | | 640,000 | | 647,382 | |
Chevron,
Sr. Unscd. Notes | | 3.33 | | 11/17/25 | | 165,000 | | 171,281 | |
Chevron,
Sr. Unscd. Notes | | 2.95 | | 5/16/26 | | 295,000 | | 296,172 | |
CNOOC Finance 2013,
Gtd. Notes | | 3.00 | | 5/9/23 | | 500,000 | | 503,070 | |
Columbia Pipeline Group,
Gtd. Notes | | 3.30 | | 6/1/20 | | 500,000 | | 512,395 | |
Concho Resources,
Gtd. Notes | | 4.88 | | 10/1/47 | | 60,000 | | 63,891 | |
ConocoPhillips,
Gtd. Notes | | 2.20 | | 5/15/20 | | 500,000 | a | 501,467 | |
ConocoPhillips,
Gtd. Notes | | 4.95 | | 3/15/26 | | 500,000 | | 568,854 | |
ConocoPhillips,
Gtd. Notes | | 5.95 | | 3/15/46 | | 500,000 | | 667,731 | |
ConocoPhillips Holding,
Sr. Unscd. Notes | | 6.95 | | 4/15/29 | | 125,000 | | 163,735 | |
Devon Energy,
Sr. Unscd. Notes | | 5.85 | | 12/15/25 | | 71,000 | | 82,035 | |
Devon Energy,
Sr. Unscd. Notes | | 5.60 | | 7/15/41 | | 300,000 | | 338,310 | |
Enable Midstream Partners,
Sr. Unscd. Notes | | 5.00 | | 5/15/44 | | 250,000 | b | 248,074 | |
Enbridge Energy Partners,
Sr. Unscd. Notes | | 5.88 | | 10/15/25 | | 250,000 | | 286,658 | |
Enbridge Energy Partners,
Sr. Unscd. Notes | | 5.50 | | 9/15/40 | | 370,000 | | 399,247 | |
Energy Transfer,
Sr. Unscd. Notes | | 3.60 | | 2/1/23 | | 500,000 | | 510,178 | |
Energy Transfer,
Sr. Unscd. Notes | | 5.15 | | 2/1/43 | | 500,000 | | 490,753 | |
EnLink Midstream Partners,
Sr. Unscd. Notes | | 4.85 | | 7/15/26 | | 350,000 | | 369,291 | |
Enterprise Products Operating,
Gtd. Notes | | 3.35 | | 3/15/23 | | 600,000 | | 618,767 | |
Enterprise Products Operating,
Gtd. Notes | | 3.70 | | 2/15/26 | | 200,000 | | 206,691 | |
16
| | | | | | | | | | |
| |
Description | Coupon
Rate (%) | | Maturity
Date | | Principal
Amount ($) | | Value ($) | |
Bonds and Notes - 100.5% (continued) | | | | | |
Energy - 2.5% (continued) | | | | | |
Enterprise Products Operating,
Gtd. Notes | | 4.90 | | 5/15/46 | | 500,000 | | 552,550 | |
EOG Resources,
Sr. Unscd. Notes | | 3.90 | | 4/1/35 | | 400,000 | | 403,377 | |
Exxon Mobil,
Sr. Unscd. Notes | | 1.71 | | 3/1/19 | | 565,000 | | 565,571 | |
Exxon Mobil,
Sr. Unscd. Notes | | 2.22 | | 3/1/21 | | 500,000 | | 503,407 | |
Exxon Mobil,
Sr. Unscd. Notes | | 4.11 | | 3/1/46 | | 500,000 | | 545,490 | |
Halliburton,
Sr. Unscd. Bonds | | 3.80 | | 11/15/25 | | 415,000 | | 431,477 | |
Hess,
Sr. Unscd. Bonds | | 5.60 | | 2/15/41 | | 250,000 | | 262,253 | |
Hess,
Sr. Unscd. Notes | | 4.30 | | 4/1/27 | | 250,000 | | 252,252 | |
HollyFrontier,
Sr. Unscd. Bonds | | 5.88 | | 4/1/26 | | 480,000 | | 533,410 | |
Kerr-McGee,
Gtd. Notes | | 6.95 | | 7/1/24 | | 300,000 | | 357,438 | |
Kinder Morgan,
Gtd. Notes | | 5.30 | | 12/1/34 | | 500,000 | | 537,127 | |
Kinder Morgan Energy Partners,
Gtd. Notes | | 5.00 | | 10/1/21 | | 300,000 | | 323,461 | |
Kinder Morgan Energy Partners,
Gtd. Notes | | 3.50 | | 9/1/23 | | 500,000 | | 508,484 | |
Kinder Morgan Energy Partners,
Gtd. Notes | | 7.40 | | 3/15/31 | | 350,000 | | 432,681 | |
Kinder Morgan Energy Partners,
Gtd. Notes | | 5.00 | | 3/1/43 | | 300,000 | | 301,953 | |
Marathon Oil,
Sr. Unscd. Notes | | 6.60 | | 10/1/37 | | 300,000 | | 354,893 | |
Marathon Petroleum,
Sr. Unscd. Notes | | 4.75 | | 9/15/44 | | 500,000 | | 509,826 | |
MPLX,
Sr. Unscd. Notes | | 4.88 | | 12/1/24 | | 500,000 | | 544,544 | |
MPLX,
Sr. Unscd. Notes | | 5.20 | | 3/1/47 | | 130,000 | | 139,620 | |
Nexen Energy,
Gtd. Notes | | 5.88 | | 3/10/35 | | 125,000 | | 152,566 | |
Noble Energy,
Sr. Unscd. Notes | | 4.15 | | 12/15/21 | | 539,000 | | 569,025 | |
Noble Energy,
Sr. Unscd. Notes | | 3.90 | | 11/15/24 | | 500,000 | | 516,277 | |
Occidental Petroleum,
Sr. Unscd. Bonds | | 3.00 | | 2/15/27 | | 300,000 | | 299,818 | |
17
STATEMENT OF INVESTMENTS (continued)
| | | | | | | | | | |
| |
Description | Coupon
Rate (%) | | Maturity
Date | | Principal
Amount ($) | | Value ($) | |
Bonds and Notes - 100.5% (continued) | | | | | |
Energy - 2.5% (continued) | | | | | |
Occidental Petroleum,
Sr. Unscd. Notes | | 4.10 | | 2/15/47 | | 310,000 | | 323,570 | |
Occidental Petroleum,
Sr. Unscd. Notes, Ser. 1 | | 4.10 | | 2/1/21 | | 400,000 | | 422,502 | |
ONEOK,
Gtd. Notes | | 4.00 | | 7/13/27 | | 300,000 | | 305,861 | |
ONEOK Partners,
Gtd. Notes | | 5.00 | | 9/15/23 | | 500,000 | | 545,109 | |
ONEOK Partners,
Gtd. Notes | | 6.85 | | 10/15/37 | | 60,000 | | 75,115 | |
Phillips 66,
Gtd. Notes | | 4.88 | | 11/15/44 | | 202,000 | | 224,439 | |
Pioneer Natural Resources,
Sr. Unscd. Notes | | 3.95 | | 7/15/22 | | 500,000 | | 524,309 | |
Plains All American Pipeline,
Sr. Unscd. Notes | | 3.85 | | 10/15/23 | | 300,000 | | 301,790 | |
Plains All American Pipeline,
Sr. Unscd. Notes | | 4.90 | | 2/15/45 | | 250,000 | | 237,962 | |
Regency Energy Partners,
Gtd. Notes | | 4.50 | | 11/1/23 | | 750,000 | | 787,709 | |
Sabine Pass Liquefaction,
Sr. Scd. Notes | | 5.00 | | 3/15/27 | | 600,000 | | 645,957 | |
Sabine Pass Liquefaction,
Sr. Unscd. Notes | | 5.63 | | 4/15/23 | | 300,000 | b | 333,536 | |
Shell International Finance,
Gtd. Notes | | 4.30 | | 9/22/19 | | 850,000 | | 884,995 | |
Shell International Finance,
Gtd. Notes | | 1.88 | | 5/10/21 | | 485,000 | | 481,464 | |
Shell International Finance,
Gtd. Notes | | 3.25 | | 5/11/25 | | 560,000 | | 576,676 | |
Shell International Finance,
Gtd. Notes | | 2.88 | | 5/10/26 | | 185,000 | | 184,186 | |
Shell International Finance,
Gtd. Notes | | 4.13 | | 5/11/35 | | 260,000 | | 279,041 | |
Shell International Finance,
Gtd. Notes | | 3.75 | | 9/12/46 | | 500,000 | | 493,432 | |
Spectra Energy Partners,
Sr. Unscd. Notes | | 5.95 | | 9/25/43 | | 200,000 | | 243,060 | |
Statoil,
Gtd. Notes | | 5.25 | | 4/15/19 | | 600,000 | | 628,700 | |
Statoil,
Gtd. Notes | | 2.65 | | 1/15/24 | | 500,000 | | 498,126 | |
Suncor Energy,
Sr. Unscd. Notes | | 6.50 | | 6/15/38 | | 300,000 | | 399,342 | |
Sunoco Logistics Partners Operations,
Gtd. Notes | | 3.45 | | 1/15/23 | | 200,000 | | 202,350 | |
18
| | | | | | | | | | |
| |
Description | Coupon
Rate (%) | | Maturity
Date | | Principal
Amount ($) | | Value ($) | |
Bonds and Notes - 100.5% (continued) | | | | | |
Energy - 2.5% (continued) | | | | | |
Sunoco Logistics Partners Operations,
Gtd. Notes | | 4.95 | | 1/15/43 | | 200,000 | | 187,896 | |
Sunoco Logistics Partners Operations,
Gtd. Notes | | 5.40 | | 10/1/47 | | 110,000 | | 111,861 | |
Tennessee Gas Pipeline,
Gtd. Debs. | | 7.63 | | 4/1/37 | | 70,000 | | 89,053 | |
Total Capital,
Gtd. Notes | | 4.45 | | 6/24/20 | | 450,000 | | 478,970 | |
Total Capital International,
Gtd. Notes | | 3.75 | | 4/10/24 | | 340,000 | | 360,980 | |
TransCanada Pipelines,
Sr. Unscd. Notes | | 3.75 | | 10/16/23 | | 500,000 | | 528,980 | |
TransCanada Pipelines,
Sr. Unscd. Notes | | 6.20 | | 10/15/37 | | 75,000 | | 98,978 | |
TransCanada Pipelines,
Sr. Unscd. Notes | | 7.63 | | 1/15/39 | | 300,000 | | 449,913 | |
Valero Energy,
Gtd. Notes | | 7.50 | | 4/15/32 | | 170,000 | | 229,148 | |
Valero Energy,
Sr. Unscd. Notes | | 6.63 | | 6/15/37 | | 315,000 | | 405,334 | |
Williams Partners,
Sr. Unscd. Notes | | 4.13 | | 11/15/20 | | 500,000 | | 521,927 | |
Williams Partners,
Sr. Unscd. Notes | | 4.00 | | 9/15/25 | | 100,000 | | 103,443 | |
Williams Partners,
Sr. Unscd. Notes | | 3.75 | | 6/15/27 | | 150,000 | | 150,778 | |
Williams Partners,
Sr. Unscd. Notes | | 6.30 | | 4/15/40 | | 400,000 | | 487,993 | |
| | 35,068,033 | |
Financials - 8.2% | | | | | |
AerCap Ireland Capital,
Gtd. Notes | | 3.95 | | 2/1/22 | | 500,000 | | 521,796 | |
AerCap Ireland Capital,
Gtd. Notes | | 3.50 | | 5/26/22 | | 500,000 | | 514,206 | |
Affiliated Managers Group,
Sr. Unscd. Notes | | 3.50 | | 8/1/25 | | 250,000 | | 252,241 | |
Aflac,
Sr. Unscd. Notes | | 3.63 | | 6/15/23 | | 600,000 | | 629,948 | |
Air Lease,
Sr. Unscd. Notes | | 3.38 | | 1/15/19 | | 350,000 | | 355,606 | |
Air Lease,
Sr. Unscd. Notes | | 3.75 | | 2/1/22 | | 100,000 | | 104,537 | |
Allstate,
Sub. Debs., 3 Month LIBOR + 2.94% | | 5.75 | | 8/15/53 | | 300,000 | c | 328,500 | |
American Express,
Sub. Notes | | 3.63 | | 12/5/24 | | 500,000 | | 516,903 | |
19
STATEMENT OF INVESTMENTS (continued)
| | | | | | | | | | |
| |
Description | Coupon
Rate (%) | | Maturity
Date | | Principal
Amount ($) | | Value ($) | |
Bonds and Notes - 100.5% (continued) | | | | | |
Financials - 8.2% (continued) | | | | | |
American Express Credit,
Sr. Unscd. Notes | | 2.25 | | 8/15/19 | | 750,000 | | 754,356 | |
American Honda Finance,
Sr. Unscd. Bonds | | 2.15 | | 3/13/20 | | 750,000 | | 752,690 | |
American International Group,
Sr. Unscd. Notes | | 2.30 | | 7/16/19 | | 500,000 | | 502,401 | |
American International Group,
Sr. Unscd. Notes | | 4.88 | | 6/1/22 | | 400,000 | | 438,352 | |
American International Group,
Sr. Unscd. Notes | | 3.88 | | 1/15/35 | | 500,000 | | 496,194 | |
Aon,
Gtd. Notes | | 4.60 | | 6/14/44 | | 500,000 | | 544,535 | |
Ares Capital,
Sr. Unscd. Notes | | 3.50 | | 2/10/23 | | 630,000 | | 624,926 | |
Australia & New Zealand Banking Group,
Sr. Unscd. Bonds | | 1.60 | | 7/15/19 | | 500,000 | | 497,365 | |
Australia & New Zealand Banking Group,
Sr. Unscd. Notes | | 2.30 | | 6/1/21 | | 350,000 | | 348,732 | |
AXA,
Sub. Bonds | | 8.60 | | 12/15/30 | | 165,000 | | 238,013 | |
Bank of America,
Sr. Unscd. Bonds | | 2.63 | | 4/19/21 | | 610,000 | | 613,376 | |
Bank of America,
Sr. Unscd. Notes | | 6.88 | | 11/15/18 | | 150,000 | | 157,628 | |
Bank of America,
Sr. Unscd. Notes | | 5.63 | | 7/1/20 | | 800,000 | | 868,273 | |
Bank of America,
Sr. Unscd. Notes | | 3.30 | | 1/11/23 | | 1,000,000 | | 1,024,930 | |
Bank of America,
Sr. Unscd. Notes | | 4.13 | | 1/22/24 | | 500,000 | | 533,009 | |
Bank of America,
Sr. Unscd. Notes | | 3.50 | | 4/19/26 | | 1,030,000 | | 1,050,340 | |
Bank of America,
Sr. Unscd. Notes | | 5.00 | | 1/21/44 | | 500,000 | | 579,472 | |
Bank of America,
Sr. Unscd. Notes, 3 Month LIBOR + .66% | | 2.37 | | 7/21/21 | | 500,000 | c | 499,968 | |
Bank of America,
Sr. Unscd. Notes, 3 Month LIBOR + 1.58% | | 3.82 | | 1/20/28 | | 310,000 | c | 319,538 | |
Bank of America,
Sr. Unscd. Notes, 3 Month LIBOR + 1.81% | | 4.24 | | 4/24/38 | | 160,000 | c | 169,976 | |
Bank of America,
Sr. Unscd. Notes, Ser. L | | 2.60 | | 1/15/19 | | 400,000 | | 402,729 | |
Bank of America,
Sub. Notes, Ser. L | | 3.95 | | 4/21/25 | | 900,000 | | 928,923 | |
20
| | | | | | | | | | |
| |
Description | Coupon
Rate (%) | | Maturity
Date | | Principal
Amount ($) | | Value ($) | |
Bonds and Notes - 100.5% (continued) | | | | | |
Financials - 8.2% (continued) | | | | | |
Bank of Nova Scotia,
Sr. Unscd. Notes | | 2.80 | | 7/21/21 | | 600,000 | | 609,531 | |
Bank of Nova Scotia,
Sub. Notes | | 4.50 | | 12/16/25 | | 500,000 | | 527,615 | |
Barclays,
Sr. Unscd. Notes | | 3.20 | | 8/10/21 | | 500,000 | | 507,054 | |
Barclays,
Sr. Unscd. Notes | | 4.38 | | 1/12/26 | | 200,000 | | 209,959 | |
Barclays,
Sr. Unscd. Notes | | 4.34 | | 1/10/28 | | 200,000 | | 208,019 | |
Barclays Bank,
Sub. Notes | | 5.14 | | 10/14/20 | | 500,000 | | 534,427 | |
BB&T,
Sr. Unscd. Notes | | 2.45 | | 1/15/20 | | 1,000,000 | | 1,009,410 | |
Berkshire Hathaway,
Sr. Unscd. Notes | | 2.10 | | 8/14/19 | | 500,000 | | 503,304 | |
Berkshire Hathaway,
Sr. Unscd. Notes | | 2.75 | | 3/15/23 | | 500,000 | | 507,261 | |
Berkshire Hathaway,
Sr. Unscd. Notes | | 3.13 | | 3/15/26 | | 500,000 | | 506,660 | |
BlackRock,
Sr. Unscd. Notes | | 3.50 | | 3/18/24 | | 250,000 | | 261,339 | |
BlackRock,
Sr. Unscd. Notes, Ser. 2 | | 5.00 | | 12/10/19 | | 250,000 | | 266,087 | |
BNP Paribas,
Gtd. Notes | | 2.40 | | 12/12/18 | | 500,000 | | 503,730 | |
BNP Paribas,
Gtd. Notes | | 5.00 | | 1/15/21 | | 500,000 | | 541,840 | |
BPCE,
Gtd. Notes | | 2.50 | | 7/15/19 | | 1,000,000 | | 1,009,330 | |
BPCE,
Gtd. Notes | | 4.00 | | 4/15/24 | | 200,000 | | 212,570 | |
Brookfield Asset Management,
Sr. Unscd. Notes | | 4.00 | | 1/15/25 | | 250,000 | | 257,458 | |
Capital One Financial,
Sr. Unscd. Notes | | 2.45 | | 4/24/19 | | 500,000 | | 502,856 | |
Capital One Financial,
Sr. Unscd. Notes | | 4.75 | | 7/15/21 | | 730,000 | | 787,419 | |
Capital One Financial,
Sub. Notes | | 3.75 | | 7/28/26 | | 750,000 | | 747,147 | |
Chubb,
Sr. Unscd. Notes | | 6.00 | | 5/11/37 | | 540,000 | | 710,614 | |
Chubb INA Holdings,
Gtd. Notes | | 3.35 | | 5/15/24 | | 250,000 | | 258,726 | |
Citigroup,
Sr. Unscd. Bonds, 3 Month LIBOR + 1.84% | | 4.28 | | 4/24/48 | | 80,000 | c | 84,803 | |
21
STATEMENT OF INVESTMENTS (continued)
| | | | | | | | | | |
| |
Description | Coupon
Rate (%) | | Maturity
Date | | Principal
Amount ($) | | Value ($) | |
Bonds and Notes - 100.5% (continued) | | | | | |
Financials - 8.2% (continued) | | | | | |
Citigroup,
Sr. Unscd. Notes | | 2.40 | | 2/18/20 | | 250,000 | | 251,385 | |
Citigroup,
Sr. Unscd. Notes | | 2.65 | | 10/26/20 | | 1,250,000 | | 1,262,518 | |
Citigroup,
Sr. Unscd. Notes | | 2.90 | | 12/8/21 | | 500,000 | | 506,008 | |
Citigroup,
Sr. Unscd. Notes | | 3.75 | | 6/16/24 | | 500,000 | | 521,068 | |
Citigroup,
Sr. Unscd. Notes | | 6.63 | | 1/15/28 | | 100,000 | | 124,247 | |
Citigroup,
Sr. Unscd. Notes | | 5.88 | | 1/30/42 | | 400,000 | | 515,483 | |
Citigroup,
Sr. Unscd. Notes | | 4.65 | | 7/30/45 | | 350,000 | | 391,456 | |
Citigroup,
Sr. Unscd. Notes, 3 Month LIBOR + .95% | | 2.88 | | 7/24/23 | | 500,000 | c | 500,025 | |
Citigroup,
Sr. Unscd. Notes, 3 Month LIBOR + 1.39% | | 3.67 | | 7/24/28 | | 500,000 | c | 506,696 | |
Citigroup,
Sub. Notes | | 4.05 | | 7/30/22 | | 250,000 | | 262,950 | |
Citigroup,
Sub. Notes | | 5.50 | | 9/13/25 | | 500,000 | | 565,177 | |
Citizens Bank,
Sr. Unscd. Notes | | 2.45 | | 12/4/19 | | 500,000 | | 503,273 | |
CME Group,
Sr. Unscd. Notes | | 3.00 | | 3/15/25 | | 250,000 | | 254,759 | |
Cooperatieve Rabobank,
Gtd. Notes | | 2.50 | | 1/19/21 | | 400,000 | | 404,149 | |
Cooperatieve Rabobank,
Gtd. Notes | | 3.95 | | 11/9/22 | | 1,000,000 | | 1,055,813 | |
Credit Suisse,
Sr. Unscd. Notes | | 4.38 | | 8/5/20 | | 1,000,000 | | 1,057,501 | |
Credit Suisse,
Sr. Unscd. Notes | | 3.63 | | 9/9/24 | | 500,000 | | 521,016 | |
Credit Suisse Group Funding,
Gtd. Notes | | 3.75 | | 3/26/25 | | 1,000,000 | | 1,028,635 | |
Credit Suisse Group Funding,
Gtd. Notes | | 4.88 | | 5/15/45 | | 280,000 | | 315,362 | |
Deutsche Bank,
Sr. Unscd. Notes | | 4.25 | | 10/14/21 | | 290,000 | | 303,868 | |
Deutsche Bank London,
Sr. Unscd. Notes | | 2.50 | | 2/13/19 | | 500,000 | | 502,452 | |
Discover Bank,
Sr. Unscd. Notes | | 4.25 | | 3/13/26 | | 400,000 | | 417,663 | |
Discover Bank,
Sr. Unscd. Notes | | 3.45 | | 7/27/26 | | 500,000 | | 493,939 | |
22
| | | | | | | | | | |
| |
Description | Coupon
Rate (%) | | Maturity
Date | | Principal
Amount ($) | | Value ($) | |
Bonds and Notes - 100.5% (continued) | | | | | |
Financials - 8.2% (continued) | | | | | |
Fidelity National Information Services,
Sr. Unscd. Notes | | 3.63 | | 10/15/20 | | 450,000 | | 467,159 | |
Fifth Third Bancorp,
Sr. Unscd. Notes | | 3.50 | | 3/15/22 | | 600,000 | | 622,311 | |
First American Financial,
Sr. Unscd. Notes | | 4.60 | | 11/15/24 | | 500,000 | | 513,523 | |
First Republic Bank,
Sr. Unscd. Bonds | | 2.38 | | 6/17/19 | | 500,000 | | 502,007 | |
First Tennessee Bank,
Sr. Unscd. Notes | | 2.95 | | 12/1/19 | | 500,000 | | 505,668 | |
Fiserv,
Gtd. Notes | | 4.63 | | 10/1/20 | | 400,000 | | 425,320 | |
Ford Motor Credit,
Sr. Unscd. Notes | | 8.13 | | 1/15/20 | | 571,000 | | 640,204 | |
Ford Motor Credit,
Sr. Unscd. Notes | | 3.20 | | 1/15/21 | | 750,000 | | 767,453 | |
Ford Motor Credit,
Sr. Unscd. Notes | | 3.34 | | 3/18/21 | | 500,000 | | 513,686 | |
Ford Motor Credit,
Sr. Unscd. Notes | | 4.38 | | 8/6/23 | | 400,000 | | 424,062 | |
GE Capital International Funding,
Gtd. Notes | | 4.42 | | 11/15/35 | | 1,000,000 | | 1,071,810 | |
General Electric,
Gtd. Bonds | | 2.20 | | 1/9/20 | | 500,000 | | 502,614 | |
General Electric,
Gtd. Notes | | 4.65 | | 10/17/21 | | 650,000 | | 709,774 | |
General Motors Financial,
Gtd. Notes | | 2.35 | | 10/4/19 | | 500,000 | | 502,048 | |
General Motors Financial,
Gtd. Notes | | 3.20 | | 7/13/20 | | 500,000 | | 511,458 | |
General Motors Financial,
Gtd. Notes | | 4.30 | | 7/13/25 | | 500,000 | | 518,955 | |
Goldman Sachs Group,
Sr. Unscd. Notes | | 2.55 | | 10/23/19 | | 1,000,000 | | 1,008,134 | |
Goldman Sachs Group,
Sr. Unscd. Notes | | 2.60 | | 4/23/20 | | 500,000 | | 503,822 | |
Goldman Sachs Group,
Sr. Unscd. Notes | | 2.75 | | 9/15/20 | | 1,000,000 | | 1,011,217 | |
Goldman Sachs Group,
Sr. Unscd. Notes | | 2.35 | | 11/15/21 | | 500,000 | | 495,425 | |
Goldman Sachs Group,
Sr. Unscd. Notes | | 3.63 | | 1/22/23 | | 500,000 | | 517,687 | |
Goldman Sachs Group,
Sr. Unscd. Notes | | 3.75 | | 5/22/25 | | 1,000,000 | | 1,032,273 | |
Goldman Sachs Group,
Sr. Unscd. Notes | | 3.85 | | 1/26/27 | | 730,000 | | 747,661 | |
23
STATEMENT OF INVESTMENTS (continued)
| | | | | | | | | | |
| |
Description | Coupon
Rate (%) | | Maturity
Date | | Principal
Amount ($) | | Value ($) | |
Bonds and Notes - 100.5% (continued) | | | | | |
Financials - 8.2% (continued) | | | | | |
Goldman Sachs Group,
Sr. Unscd. Notes | | 6.25 | | 2/1/41 | | 700,000 | | 927,962 | |
Goldman Sachs Group,
Sub. Notes | | 4.25 | | 10/21/25 | | 130,000 | | 136,098 | |
Goldman Sachs Group,
Sub. Notes | | 6.75 | | 10/1/37 | | 1,000,000 | | 1,323,191 | |
HSBC Holdings,
Sr. Unscd. Notes | | 3.40 | | 3/8/21 | | 600,000 | | 619,409 | |
HSBC Holdings,
Sr. Unscd. Notes | | 5.10 | | 4/5/21 | | 750,000 | | 815,527 | |
HSBC Holdings,
Sr. Unscd. Notes | | 3.90 | | 5/25/26 | | 295,000 | | 308,471 | |
HSBC Holdings,
Sub. Notes | | 4.25 | | 3/14/24 | | 500,000 | | 526,192 | |
HSBC Holdings,
Sub. Notes | | 6.50 | | 5/2/36 | | 850,000 | | 1,106,523 | |
HSBC Holdings,
Sub. Notes | | 6.50 | | 9/15/37 | | 555,000 | | 731,930 | |
Industrial & Commercial Bank of China,
Sr. Unscd. Notes | | 2.91 | | 11/13/20 | | 750,000 | | 754,039 | |
Industrial & Commercial Bank of China,
Sr. Unscd. Notes | | 2.45 | | 10/20/21 | | 500,000 | | 494,416 | |
ING Groep,
Sr. Unscd. Notes | | 3.15 | | 3/29/22 | | 300,000 | | 306,285 | |
Intercontinental Exchange,
Gtd. Notes | | 4.00 | | 10/15/23 | | 350,000 | | 377,428 | |
Intesa Sanpaolo,
Gtd. Bonds | | 5.25 | | 1/12/24 | | 400,000 | | 440,941 | |
Invesco Finance,
Gtd. Notes | | 4.00 | | 1/30/24 | | 250,000 | | 264,678 | |
Jefferies Group,
Sr. Unscd. Debs. | | 6.45 | | 6/8/27 | | 35,000 | | 41,009 | |
Jefferies Group,
Sr. Unscd. Notes | | 5.13 | | 1/20/23 | | 500,000 | | 544,840 | |
John Deere Capital,
Sr. Unscd. Notes | | 1.25 | | 10/9/19 | | 500,000 | | 494,058 | |
John Deere Capital,
Sr. Unscd. Notes | | 3.15 | | 10/15/21 | | 650,000 | | 672,574 | |
John Deere Capital,
Sr. Unscd. Notes | | 2.80 | | 3/6/23 | | 500,000 | | 507,235 | |
JPMorgan Chase & Co.,
Sr. Unscd. Notes | | 2.25 | | 1/23/20 | | 1,000,000 | | 1,005,013 | |
JPMorgan Chase & Co.,
Sr. Unscd. Notes | | 4.25 | | 10/15/20 | | 500,000 | | 528,855 | |
JPMorgan Chase & Co.,
Sr. Unscd. Notes | | 2.40 | | 6/7/21 | | 1,240,000 | | 1,242,563 | |
24
| | | | | | | | | | |
| |
Description | Coupon
Rate (%) | | Maturity
Date | | Principal
Amount ($) | | Value ($) | |
Bonds and Notes - 100.5% (continued) | | | | | |
Financials - 8.2% (continued) | | | | | |
JPMorgan Chase & Co.,
Sr. Unscd. Notes | | 3.20 | | 1/25/23 | | 1,000,000 | | 1,023,744 | |
JPMorgan Chase & Co.,
Sr. Unscd. Notes | | 3.30 | | 4/1/26 | | 500,000 | | 504,342 | |
JPMorgan Chase & Co.,
Sr. Unscd. Notes | | 6.40 | | 5/15/38 | | 650,000 | | 875,580 | |
JPMorgan Chase & Co.,
Sr. Unscd. Notes, 3 Month LIBOR + .94% | | 2.78 | | 4/25/23 | | 300,000 | c | 301,201 | |
JPMorgan Chase & Co.,
Sr. Unscd. Notes, 3 Month LIBOR + 1.58% | | 4.26 | | 2/22/48 | | 400,000 | c | 423,178 | |
JPMorgan Chase & Co.,
Sub. Notes | | 3.88 | | 9/10/24 | | 500,000 | | 522,337 | |
JPMorgan Chase & Co.,
Sub. Notes | | 4.13 | | 12/15/26 | | 500,000 | | 524,448 | |
JPMorgan Chase Bank,
Sr. Unscd. Bonds | | 1.65 | | 9/23/19 | | 500,000 | | 498,305 | |
KeyBank,
Sr. Unscd. Notes | | 3.30 | | 6/1/25 | | 400,000 | | 408,007 | |
KeyBank,
Sub. Notes | | 6.95 | | 2/1/28 | | 100,000 | | 126,498 | |
Lazard Group,
Sr. Unscd. Notes | | 4.25 | | 11/14/20 | | 250,000 | | 264,221 | |
Legg Mason,
Sr. Unscd. Notes | | 5.63 | | 1/15/44 | | 200,000 | | 219,280 | |
Lincoln National,
Sr. Unscd. Notes | | 3.63 | | 12/12/26 | | 500,000 | | 509,876 | |
Lincoln National,
Sr. Unscd. Notes | | 6.15 | | 4/7/36 | | 39,000 | | 48,322 | |
Llyods Banking Group,
Sub. Notes | | 4.58 | | 12/10/25 | | 820,000 | | 866,221 | |
Loews,
Sr. Unscd. Notes | | 2.63 | | 5/15/23 | | 250,000 | | 250,298 | |
Manufacturers & Traders Trust Co.,
Sr. Unscd. Notes | | 2.10 | | 2/6/20 | | 500,000 | | 500,746 | |
Marsh & McLennan Cos.,
Sr. Unscd. Notes | | 2.35 | | 3/6/20 | | 250,000 | | 251,129 | |
Marsh & McLennan Cos.,
Sr. Unscd. Notes | | 5.88 | | 8/1/33 | | 275,000 | | 342,401 | |
Mastercard,
Sr. Unscd. Notes | | 2.00 | | 4/1/19 | | 500,000 | | 502,137 | |
MetLife,
Sr. Unscd. Notes | | 3.60 | | 4/10/24 | | 250,000 | | 262,918 | |
MetLife,
Sr. Unscd. Notes | | 6.38 | | 6/15/34 | | 350,000 | | 463,260 | |
MetLife,
Sr. Unscd. Notes | | 4.05 | | 3/1/45 | | 400,000 | | 409,962 | |
25
STATEMENT OF INVESTMENTS (continued)
| | | | | | | | | | |
| |
Description | Coupon
Rate (%) | | Maturity
Date | | Principal
Amount ($) | | Value ($) | |
Bonds and Notes - 100.5% (continued) | | | | | |
Financials - 8.2% (continued) | | | | | |
Mitsubishi UFJ Financial Group,
Sr. Unscd. Notes | | 3.00 | | 2/22/22 | | 500,000 | | 508,291 | |
Mitsubishi UFJ Financial Group,
Sr. Unscd. Notes | | 3.68 | | 2/22/27 | | 500,000 | | 516,707 | |
Mizuho Financial Group,
Sr. Unscd. Bonds | | 2.27 | | 9/13/21 | | 500,000 | | 492,678 | |
Mizuho Financial Group,
Sr. Unscd. Bonds | | 2.84 | | 9/13/26 | | 500,000 | | 484,144 | |
Morgan Stanley,
Sr. Unscd. Notes | | 7.30 | | 5/13/19 | | 1,300,000 | | 1,401,288 | |
Morgan Stanley,
Sr. Unscd. Notes | | 5.50 | | 1/26/20 | | 1,000,000 | | 1,071,942 | |
Morgan Stanley,
Sr. Unscd. Notes | | 3.75 | | 2/25/23 | | 500,000 | | 522,984 | |
Morgan Stanley,
Sr. Unscd. Notes | | 4.00 | | 7/23/25 | | 500,000 | | 526,289 | |
Morgan Stanley,
Sr. Unscd. Notes | | 3.63 | | 1/20/27 | | 380,000 | | 387,364 | |
Morgan Stanley,
Sr. Unscd. Notes | | 7.25 | | 4/1/32 | | 300,000 | | 413,424 | |
Morgan Stanley,
Sr. Unscd. Notes | | 4.38 | | 1/22/47 | | 500,000 | | 533,511 | |
Morgan Stanley,
Sub. Notes | | 4.10 | | 5/22/23 | | 500,000 | | 526,949 | |
Morgan Stanley,
Sub. Notes | | 3.95 | | 4/23/27 | | 500,000 | | 510,714 | |
Nasdaq,
Sr. Unscd. Notes | | 4.25 | | 6/1/24 | | 250,000 | | 266,081 | |
National Australia Bank,
Sr. Unscd. Bonds | | 2.50 | | 7/12/26 | | 500,000 | | 477,150 | |
National Australia Bank,
Sr. Unscd. Notes | | 2.63 | | 7/23/20 | | 260,000 | | 263,315 | |
National City,
Sub. Notes | | 6.88 | | 5/15/19 | | 600,000 | | 643,592 | |
Nomura Holdings,
Sr. Unscd. Notes | | 6.70 | | 3/4/20 | | 350,000 | | 384,090 | |
Northern Trust,
Sub. Notes | | 3.95 | | 10/30/25 | | 846,000 | | 903,170 | |
PartnerRe Finance,
Gtd. Notes | | 5.50 | | 6/1/20 | | 159,000 | | 170,866 | |
PNC Bank,
Sr. Unscd. Notes | | 2.60 | | 7/21/20 | | 500,000 | | 506,202 | |
PNC Bank,
Sr. Unscd. Notes | | 2.63 | | 2/17/22 | | 500,000 | | 504,955 | |
PNC Bank,
Sub. Notes | | 3.80 | | 7/25/23 | | 500,000 | | 526,585 | |
26
| | | | | | | | | | |
| |
Description | Coupon
Rate (%) | | Maturity
Date | | Principal
Amount ($)
| | Value ($) | |
Bonds and Notes - 100.5% (continued) | | | | | |
Financials - 8.2% (continued) | | | | | |
Progressive,
Sr. Unscd. Notes | | 6.63 | | 3/1/29 | | 100,000 | | 128,340 | |
Progressive,
Sr. Unscd. Notes | | 4.35 | | 4/25/44 | | 250,000 | | 274,576 | |
Progressive,
Sr. Unscd. Notes | | 4.13 | | 4/15/47 | | 70,000 | | 74,065 | |
Prudential Financial,
Jr. Sub. Notes, 3 Month LIBOR + 3.04% | | 5.20 | | 3/15/44 | | 550,000 | c | 587,152 | |
Prudential Financial,
Sr. Unscd. Notes | | 4.60 | | 5/15/44 | | 400,000 | | 445,302 | |
Reinsurance Group of America,
Sr. Unscd. Notes | | 4.70 | | 9/15/23 | | 350,000 | | 379,127 | |
Royal Bank of Canada,
Sr. Unscd. Bonds | | 2.15 | | 3/6/20 | | 750,000 | | 751,961 | |
Royal Bank of Canada,
Sr. Unscd. Notes | | 2.00 | | 12/10/18 | | 500,000 | | 501,316 | |
Royal Bank of Scotland Group,
Sr. Unscd. Notes | | 4.80 | | 4/5/26 | | 500,000 | | 539,401 | |
Santander UK,
Sr. Unscd. Notes | | 2.38 | | 3/16/20 | | 750,000 | | 756,290 | |
Santander UK Group Holdings,
Sr. Unscd. Notes | | 2.88 | | 10/16/20 | | 500,000 | | 506,633 | |
Skandinaviska Enskilda,
Sr. Unscd. Bonds | | 1.50 | | 9/13/19 | | 500,000 | | 495,926 | |
Skandinaviska Enskilda,
Sr. Unscd. Notes | | 1.88 | | 9/13/21 | | 250,000 | | 245,804 | |
State Street,
Sr. Unscd. Notes | | 2.55 | | 8/18/20 | | 310,000 | | 315,699 | |
State Street,
Sr. Unscd. Notes | | 3.70 | | 11/20/23 | | 250,000 | | 266,891 | |
State Street,
Sr. Unscd. Notes | | 3.55 | | 8/18/25 | | 290,000 | | 302,847 | |
Sumitomo Mitsui Banking,
Gtd. Bonds | | 3.00 | | 1/18/23 | | 290,000 | | 292,704 | |
Sumitomo Mitsui Financial Group,
Sr. Unscd. Notes | | 3.78 | | 3/9/26 | | 500,000 | | 518,543 | |
Sumitomo Mitsui Financial Group,
Sr. Unscd. Notes | | 3.45 | | 1/11/27 | | 160,000 | | 162,056 | |
SunTrust Bank,
Sr. Unscd. Notes | | 2.35 | | 11/1/18 | | 500,000 | | 502,504 | |
SunTrust Bank,
Sr. Unscd. Notes | | 2.75 | | 5/1/23 | | 500,000 | | 498,331 | |
Svenska Handelsbanken,
Gtd. Notes | | 2.25 | | 6/17/19 | | 500,000 | | 502,995 | |
Synchrony Financial,
Sr. Unscd. Notes | | 4.25 | | 8/15/24 | | 500,000 | | 521,067 | |
27
STATEMENT OF INVESTMENTS (continued)
| | | | | | | | | | |
| |
Description | Coupon
Rate (%) | | Maturity
Date | | Principal
Amount ($) | | Value ($) | |
Bonds and Notes - 100.5% (continued) | | | | | |
Financials - 8.2% (continued) | | | | | |
TD Ameritrade Holding,
Sr. Unscd. Notes | | 2.95 | | 4/1/22 | | 500,000 | | 509,989 | |
Toronto-Dominion Bank,
Sr. Unscd. Notes | | 2.50 | | 12/14/20 | | 500,000 | | 505,254 | |
Toyota Motor Credit,
Sr. Unscd. Bonds | | 1.70 | | 2/19/19 | | 500,000 | | 499,676 | |
Toyota Motor Credit,
Sr. Unscd. Notes | | 2.15 | | 3/12/20 | | 500,000 | | 502,548 | |
Toyota Motor Credit,
Sr. Unscd. Notes | | 2.63 | | 1/10/23 | | 1,000,000 | a | 1,012,219 | |
Travelers Cos.,
Sr. Unscd. Notes | | 3.90 | | 11/1/20 | | 500,000 | | 524,782 | |
Trinity Acquisition,
Gtd. Notes | | 3.50 | | 9/15/21 | | 500,000 | | 509,852 | |
U.S. Bancorp,
Sr. Unscd. Notes | | 3.00 | | 3/15/22 | | 900,000 | | 925,458 | |
Visa,
Sr. Unscd. Notes | | 2.20 | | 12/14/20 | | 400,000 | | 402,928 | |
Visa,
Sr. Unscd. Notes | | 4.15 | | 12/14/35 | | 270,000 | | 295,184 | |
Visa,
Sr. Unscd. Notes | | 4.30 | | 12/14/45 | | 200,000 | | 221,844 | |
Visa,
Sr. Unscd. Notes | | 3.65 | | 9/15/47 | | 55,000 | | 54,701 | |
Wells Fargo & Co.,
Sr. Unscd. Notes | | 2.15 | | 1/15/19 | | 1,250,000 | | 1,254,248 | |
Wells Fargo & Co.,
Sr. Unscd. Notes | | 2.10 | | 7/26/21 | | 620,000 | | 612,904 | |
Wells Fargo & Co.,
Sr. Unscd. Notes | | 3.07 | | 1/24/23 | | 470,000 | | 476,492 | |
Wells Fargo & Co.,
Sr. Unscd. Notes | | 3.55 | | 9/29/25 | | 500,000 | | 513,685 | |
Wells Fargo & Co.,
Sr. Unscd. Notes | | 3.00 | | 4/22/26 | | 1,000,000 | | 981,765 | |
Wells Fargo & Co.,
Sub. Notes | | 4.10 | | 6/3/26 | | 500,000 | | 521,079 | |
Wells Fargo & Co.,
Sub. Notes | | 4.65 | | 11/4/44 | | 1,000,000 | | 1,075,801 | |
Wells Fargo & Co.,
Sub. Notes, Ser. M | | 3.45 | | 2/13/23 | | 500,000 | | 513,772 | |
Wells Fargo Bank,
Sr. Unscd. Notes | | 2.15 | | 12/6/19 | | 500,000 | | 501,894 | |
Westpac Banking,
Sr. Unscd. Notes | | 2.60 | | 11/23/20 | | 1,000,000 | | 1,012,425 | |
Westpac Banking,
Sr. Unscd. Notes | | 2.85 | | 5/13/26 | | 200,000 | | 196,105 | |
28
| | | | | | | | | | |
| |
Description | Coupon
Rate (%) | | Maturity
Date | | Principal
Amount ($) | | Value ($) | |
Bonds and Notes - 100.5% (continued) | | | | | |
Financials - 8.2% (continued) | | | | | |
XLIT,
Gtd. Notes | | 6.38 | | 11/15/24 | | 700,000 | | 820,612 | |
| | 114,441,022 | |
Foreign/Governmental - 4.3% | | | | | |
African Development Bank,
Sr. Unscd. Notes | | 1.38 | | 2/12/20 | | 500,000 | | 495,586 | |
African Development Bank,
Sr. Unscd. Notes | | 2.38 | | 9/23/21 | | 500,000 | a | 506,691 | |
AID-Israel,
Gtd. Bonds | | 5.50 | | 9/18/23 | | 450,000 | | 531,431 | |
Asian Development Bank,
Sr. Unscd. Notes | | 1.88 | | 4/12/19 | | 1,000,000 | | 1,003,071 | |
Asian Development Bank,
Sr. Unscd. Notes | | 1.75 | | 6/8/21 | | 500,000 | | 496,042 | |
Asian Development Bank,
Sr. Unscd. Notes | | 1.75 | | 9/13/22 | | 295,000 | | 289,755 | |
Asian Development Bank,
Sr. Unscd. Notes | | 2.00 | | 1/22/25 | | 1,000,000 | | 975,579 | |
Chilean Government,
Sr. Unscd. Notes | | 3.13 | | 3/27/25 | | 500,000 | | 515,000 | |
Colombian Government,
Sr. Unscd. Bonds | | 5.00 | | 6/15/45 | | 500,000 | | 515,625 | |
Colombian Government,
Sr. Unscd. Notes | | 7.38 | | 3/18/19 | | 500,000 | | 536,250 | |
Colombian Government,
Sr. Unscd. Notes | | 3.88 | | 4/25/27 | | 500,000 | | 503,875 | |
Corporacion Andina de Fomento,
Sr. Unscd. Notes | | 8.13 | | 6/4/19 | | 500,000 | | 547,570 | |
Council of Europe Development Bank,
Sr. Unscd. Notes | | 1.75 | | 11/14/19 | | 500,000 | a | 499,680 | |
Development Bank of Japan,
Sr. Unscd. Notes | | 2.00 | | 10/19/21 | | 500,000 | | 492,047 | |
Ecopetrol,
Sr. Unscd. Notes | | 7.38 | | 9/18/43 | | 300,000 | | 349,140 | |
European Bank for Reconstruction and Development,
Sr. Unscd. Bonds | | 1.75 | | 11/26/19 | | 1,000,000 | | 999,078 | |
European Bank for Reconstruction and Development,
Sr. Unscd. Notes | | 1.75 | | 6/14/19 | | 500,000 | | 500,084 | |
European Investment Bank,
Sr. Unscd. Bonds | | 2.88 | | 9/15/20 | | 1,000,000 | | 1,027,791 | |
European Investment Bank,
Sr. Unscd. Notes | | 1.25 | | 5/15/19 | | 560,000 | | 556,307 | |
European Investment Bank,
Sr. Unscd. Notes | | 1.75 | | 6/17/19 | | 1,500,000 | | 1,501,707 | |
29
STATEMENT OF INVESTMENTS (continued)
| | | | | | | | | | |
| |
Description | Coupon
Rate (%) | | Maturity
Date | | Principal
Amount ($) | | Value ($) | |
Bonds and Notes - 100.5% (continued) | | | | | |
Foreign/Governmental - 4.3% (continued) | | | | | |
European Investment Bank,
Sr. Unscd. Notes | | 2.00 | | 3/15/21 | | 1,000,000 | | 1,001,343 | |
European Investment Bank,
Sr. Unscd. Notes | | 2.25 | | 3/15/22 | | 500,000 | a | 503,224 | |
European Investment Bank,
Sr. Unscd. Notes | | 1.88 | | 2/10/25 | | 1,000,000 | | 965,429 | |
European Investment Bank,
Sr. Unscd. Notes | | 2.38 | | 5/24/27 | | 500,000 | | 494,140 | |
Export Development Canada,
Sr. Unscd. Bonds | | 1.75 | | 8/19/19 | | 400,000 | | 400,252 | |
Export-Import Bank of Korea,
Sr. Unscd. Notes | | 1.88 | | 10/21/21 | | 500,000 | | 483,371 | |
Export-Import Bank of Korea,
Sr. Unscd. Notes | | 4.00 | | 1/14/24 | | 500,000 | | 526,968 | |
Finnish Government,
Sr. Unscd. Bonds | | 6.95 | | 2/15/26 | | 25,000 | | 31,817 | |
FMS Wertmanagement,
Gov't Gtd. Notes | | 1.75 | | 3/17/20 | | 750,000 | | 748,798 | |
Hungarian Government,
Sr. Unscd. Notes | | 6.38 | | 3/29/21 | | 500,000 | | 560,070 | |
Hungarian Government,
Sr. Unscd. Notes | | 7.63 | | 3/29/41 | | 500,000 | | 772,375 | |
Inter-American Development Bank,
Sr. Unscd. Notes | | 3.88 | | 9/17/19 | | 1,000,000 | | 1,039,468 | |
Inter-American Development Bank,
Sr. Unscd. Notes | | 2.13 | | 1/18/22 | | 370,000 | | 370,995 | |
Inter-American Development Bank,
Sr. Unscd. Notes | | 2.13 | | 1/15/25 | | 1,000,000 | | 984,402 | |
Inter-American Development Bank,
Unscd. Notes | | 1.63 | | 5/12/20 | | 400,000 | | 398,372 | |
International Bank for Reconstruction and Development,
Sr. Unscd. Bonds | | 7.63 | | 1/19/23 | | 700,000 | | 886,180 | |
International Bank for Reconstruction and Development,
Sr. Unscd. Notes | | 1.88 | | 3/15/19 | | 500,000 | | 501,707 | |
International Bank for Reconstruction and Development,
Sr. Unscd. Notes | | 1.88 | | 10/7/19 | | 500,000 | | 501,484 | |
International Bank for Reconstruction and Development,
Sr. Unscd. Notes | | 1.38 | | 9/20/21 | | 430,000 | | 420,201 | |
International Bank for Reconstruction and Development,
Sr. Unscd. Notes | | 1.75 | | 4/19/23 | | 500,000 | | 488,097 | |
30
| | | | | | | | | | |
| |
Description | Coupon
Rate (%) | | Maturity
Date | | Principal
Amount ($) | | Value ($) | |
Bonds and Notes - 100.5% (continued) | | | | | |
Foreign/Governmental - 4.3% (continued) | | | | | |
International Bank for Reconstruction and Development,
Sr. Unscd. Notes | | 2.50 | | 7/29/25 | | 1,000,000 | | 1,004,695 | |
International Bank for Reconstruction and Development,
Unscd. Notes | | 2.00 | | 1/26/22 | | 620,000 | | 618,330 | |
International Finance,
Sr. Unscd. Bonds | | 1.63 | | 7/16/20 | | 200,000 | | 198,974 | |
Italian Government,
Sr. Unscd. Notes | | 6.88 | | 9/27/23 | | 750,000 | | 895,612 | |
Japan Bank for International Cooperation,
Gtd. Bonds | | 1.88 | | 7/21/26 | | 500,000 | | 470,879 | |
Japan Bank for International Cooperation,
Gtd. Notes | | 1.88 | | 4/20/21 | | 490,000 | | 483,289 | |
Japan Bank for International Cooperation,
Gtd. Notes | | 2.75 | | 1/21/26 | | 1,500,000 | | 1,504,330 | |
KFW,
Gov't Gtd. Bonds | | 4.00 | | 1/27/20 | | 1,000,000 | | 1,048,227 | |
KFW,
Gov't Gtd. Bonds | | 2.13 | | 6/15/22 | | 320,000 | | 320,088 | |
KFW,
Gov't Gtd. Bonds | | 0.00 | | 6/29/37 | | 250,000 | d | 140,184 | |
KFW,
Gov't Gtd. Notes | | 4.88 | | 6/17/19 | | 1,000,000 | | 1,050,210 | |
KFW,
Gov't Gtd. Notes | | 1.25 | | 9/30/19 | | 650,000 | | 643,996 | |
KFW,
Gov't Gtd. Notes | | 1.63 | | 3/15/21 | | 1,900,000 | | 1,879,510 | |
KFW,
Gov't Gtd. Notes | | 1.50 | | 6/15/21 | | 765,000 | a | 751,551 | |
KFW,
Gov't Gtd. Notes | | 2.13 | | 3/7/22 | | 620,000 | | 620,666 | |
KFW,
Gov't Gtd. Notes | | 2.00 | | 5/2/25 | | 1,100,000 | a | 1,070,031 | |
Korea Development Bank,
Sr. Unscd. Notes | | 2.75 | | 3/19/23 | | 300,000 | | 297,671 | |
Landwirtschaftliche Rentenbank,
Gov't Gtd. Notes | | 2.38 | | 6/10/25 | | 500,000 | | 498,569 | |
Mexican Government,
Sr. Unscd. Notes | | 3.63 | | 3/15/22 | | 500,000 | | 522,000 | |
Mexican Government,
Sr. Unscd. Notes | | 3.60 | | 1/30/25 | | 250,000 | | 253,750 | |
Mexican Government,
Sr. Unscd. Notes | | 4.15 | | 3/28/27 | | 345,000 | a | 359,059 | |
Mexican Government,
Sr. Unscd. Notes | | 5.55 | | 1/21/45 | | 850,000 | | 953,062 | |
31
STATEMENT OF INVESTMENTS (continued)
| | | | | | | | | | |
| |
Description | Coupon
Rate (%) | | Maturity
Date | | Principal
Amount ($) | | Value ($) | |
Bonds and Notes - 100.5% (continued) | | | | | |
Foreign/Governmental - 4.3% (continued) | | | | | |
Mexican Government,
Sr. Unscd. Notes | | 4.60 | | 1/23/46 | | 1,000,000 | | 978,238 | |
OeKB,
Gov't Gtd. Notes | | 1.63 | | 3/12/19 | | 500,000 | | 499,540 | |
OeKB,
Gov't Gtd. Notes | | 1.50 | | 10/21/20 | | 500,000 | | 493,744 | |
Panamanian Government,
Sr. Unscd. Bonds | | 5.20 | | 1/30/20 | | 200,000 | | 215,000 | |
Panamanian Government,
Sr. Unscd. Bonds | | 6.70 | | 1/26/36 | | 400,000 | | 530,000 | |
Peruvian Government,
Sr. Unscd. Bonds | | 7.35 | | 7/21/25 | | 500,000 | | 655,250 | |
Peruvian Government,
Sr. Unscd. Bonds | | 6.55 | | 3/14/37 | | 370,000 | | 499,500 | |
Petroleos Mexicanos,
Gtd. Bonds | | 6.63 | | 6/15/35 | | 500,000 | | 529,875 | |
Petroleos Mexicanos,
Gtd. Bonds | | 5.50 | | 6/27/44 | | 500,000 | | 452,950 | |
Petroleos Mexicanos,
Gtd. Notes | | 6.00 | | 3/5/20 | | 500,000 | | 533,875 | |
Petroleos Mexicanos,
Gtd. Notes | | 4.88 | | 1/18/24 | | 500,000 | | 513,600 | |
Petroleos Mexicanos,
Gtd. Notes | | 6.50 | | 3/13/27 | | 190,000 | b | 207,604 | |
Petroleos Mexicanos,
Gtd. Notes | | 6.50 | | 3/13/27 | | 380,000 | b | 415,207 | |
Petroleos Mexicanos,
Gtd. Notes | | 5.63 | | 1/23/46 | | 750,000 | | 685,500 | |
Petroleos Mexicanos,
Gtd. Notes | | 6.75 | | 9/21/47 | | 250,000 | b | 258,300 | |
Philippine Government,
Sr. Unscd. Bonds | | 10.63 | | 3/16/25 | | 800,000 | | 1,220,620 | |
Philippine Government,
Sr. Unscd. Bonds | | 5.00 | | 1/13/37 | | 500,000 | | 591,869 | |
Philippine Government,
Sr. Unscd. Bonds | | 3.70 | | 2/2/42 | | 400,000 | | 399,305 | |
Polish Government,
Sr. Unscd. Notes | | 6.38 | | 7/15/19 | | 950,000 | | 1,022,943 | |
Polish Government,
Sr. Unscd. Notes | | 5.00 | | 3/23/22 | | 650,000 | | 715,786 | |
Province of Alberta Canada,
Sr. Unscd. Notes | | 1.90 | | 12/6/19 | | 1,000,000 | | 998,385 | |
Province of British Columbia Canada,
Sr. Unscd. Bonds, Ser. USD2 | | 6.50 | | 1/15/26 | | 925,000 | | 1,156,836 | |
Province of Manitoba Canada,
Unscd. Debs. | | 8.88 | | 9/15/21 | | 450,000 | | 553,442 | |
32
| | | | | | | | | | |
| |
Description | Coupon
Rate (%) | | Maturity Date | | Principal Amount ($) | | Value ($) | |
Bonds and Notes - 100.5% (continued) | | | | | |
Foreign/Governmental - 4.3% (continued) | | | | | |
Province of Ontario Canada,
Sr. Unscd. Bonds | | 4.00 | | 10/7/19 | | 1,550,000 | | 1,610,819 | |
Province of Quebec Canada,
Bonds, Ser. NJ | | 7.50 | | 7/15/23 | | 200,000 | | 249,525 | |
Province of Quebec Canada,
Sr. Unscd. Debs., Ser. PD | | 7.50 | | 9/15/29 | | 550,000 | | 785,912 | |
Republic of Korea,
Sr. Unscd. Notes | | 7.13 | | 4/16/19 | | 500,000 | | 535,730 | |
Swedish Export Credit,
Sr. Unscd. Notes | | 1.88 | | 6/17/19 | | 400,000 | | 400,564 | |
Uruguayan Government,
Sr. Unscd. Bonds | | 7.63 | | 3/21/36 | | 300,000 | | 425,250 | |
Uruguayan Government,
Sr. Unscd. Notes | | 4.50 | | 8/14/24 | | 750,000 | a | 824,250 | |
| | 59,465,104 | |
Health Care - 2.6% | | | | | |
Abbott Laboratories,
Sr. Unscd. Notes | | 2.90 | | 11/30/21 | | 600,000 | | 609,845 | |
Abbott Laboratories,
Sr. Unscd. Notes | | 3.25 | | 4/15/23 | | 500,000 | | 511,349 | |
Abbott Laboratories,
Sr. Unscd. Notes | | 3.75 | | 11/30/26 | | 540,000 | | 558,014 | |
Abbott Laboratories,
Sr. Unscd. Notes | | 4.90 | | 11/30/46 | | 250,000 | | 281,196 | |
AbbVie,
Sr. Unscd. Notes | | 2.90 | | 11/6/22 | | 1,000,000 | | 1,011,556 | |
AbbVie,
Sr. Unscd. Notes | | 3.60 | | 5/14/25 | | 170,000 | | 175,021 | |
AbbVie,
Sr. Unscd. Notes | | 4.30 | | 5/14/36 | | 235,000 | | 247,100 | |
AbbVie,
Sr. Unscd. Notes | | 4.45 | | 5/14/46 | | 330,000 | | 348,293 | |
Aetna,
Sr. Unscd. Notes | | 6.63 | | 6/15/36 | | 300,000 | | 396,616 | |
Aetna,
Sr. Unscd. Notes | | 4.75 | | 3/15/44 | | 250,000 | | 271,627 | |
Allergan Funding,
Gtd. Notes | | 3.00 | | 3/12/20 | | 795,000 | | 807,414 | |
Allergan Funding,
Gtd. Notes | | 4.75 | | 3/15/45 | | 400,000 | | 423,936 | |
Allergan Funding,
Sr. Unscd. Notes | | 3.80 | | 3/15/25 | | 500,000 | | 512,547 | |
Amgen,
Sr. Unscd. Notes | | 4.10 | | 6/15/21 | | 500,000 | | 526,853 | |
Amgen,
Sr. Unscd. Notes | | 2.60 | | 8/19/26 | | 1,000,000 | | 958,534 | |
33
STATEMENT OF INVESTMENTS (continued)
| | | | | | | | | | |
| |
Description | Coupon
Rate (%) | | Maturity
Date | | Principal
Amount ($) | | Value ($) | |
Bonds and Notes - 100.5% (continued) | | | | | |
Health Care - 2.6% (continued) | | | | | |
Amgen,
Sr. Unscd. Notes | | 4.66 | | 6/15/51 | | 671,000 | | 728,513 | |
Anthem,
Sr. Unscd. Notes | | 3.30 | | 1/15/23 | | 500,000 | | 513,385 | |
AstraZeneca,
Sr. Unscd. Notes | | 2.38 | | 11/16/20 | | 350,000 | | 351,688 | |
AstraZeneca,
Sr. Unscd. Notes | | 3.38 | | 11/16/25 | | 285,000 | | 290,545 | |
AstraZeneca,
Sr. Unscd. Notes | | 4.38 | | 11/16/45 | | 205,000 | | 221,801 | |
Baxalta,
Gtd. Notes | | 5.25 | | 6/23/45 | | 350,000 | | 402,994 | |
Baxalta,
Sr. Unscd. Notes | | 2.88 | | 6/23/20 | | 240,000 | | 243,584 | |
Becton Dickinson,
Sr. Unscd. Notes | | 3.13 | | 11/8/21 | | 500,000 | | 511,005 | |
Becton Dickinson,
Sr. Unscd. Notes | | 3.73 | | 12/15/24 | | 386,000 | | 397,276 | |
Biogen,
Sr. Unscd. Notes | | 4.05 | | 9/15/25 | | 500,000 | | 531,952 | |
Boston Scientific,
Sr. Unscd. Notes | | 6.00 | | 1/15/20 | | 500,000 | | 540,017 | |
Bristol-Myers Squibb,
Sr. Unscd. Notes | | 2.00 | | 8/1/22 | | 750,000 | | 741,874 | |
Cardinal Health,
Sr. Unscd. Notes | | 3.20 | | 3/15/23 | | 300,000 | | 304,330 | |
Cardinal Health,
Sr. Unscd. Notes | | 4.60 | | 3/15/43 | | 300,000 | | 305,735 | |
Celgene,
Sr. Unscd. Notes | | 2.25 | | 5/15/19 | | 500,000 | | 502,029 | |
Celgene,
Sr. Unscd. Notes | | 3.88 | | 8/15/25 | | 190,000 | | 197,857 | |
Celgene,
Sr. Unscd. Notes | | 5.00 | | 8/15/45 | | 450,000 | | 496,774 | |
Cigna,
Sr. Unscd. Notes | | 4.50 | | 3/15/21 | | 650,000 | | 689,621 | |
Cigna,
Sr. Unscd. Notes | | 3.88 | | 10/15/47 | | 75,000 | | 72,522 | |
Cleveland Clinic Foundation,
Unscd. Bonds | | 4.86 | | 1/1/2114 | | 350,000 | | 383,574 | |
Danaher,
Sr. Unscd. Notes | | 4.38 | | 9/15/45 | | 250,000 | | 276,220 | |
Dignity Health,
Scd. Bonds | | 2.64 | | 11/1/19 | | 300,000 | | 302,030 | |
Dignity Health,
Scd. Bonds | | 5.27 | | 11/1/64 | | 304,000 | | 315,266 | |
34
| | | | | | | | | | |
| |
Description | Coupon
Rate (%) | | Maturity
Date | | Principal
Amount ($) | | Value ($) | |
Bonds and Notes - 100.5% (continued) | | | | | |
Health Care - 2.6% (continued) | | | | | |
Eli Lilly & Co.,
Sr. Unscd. Notes | | 3.10 | | 5/15/27 | | 500,000 | | 505,558 | |
Eli Lilly & Co.,
Sr. Unscd. Notes | | 5.55 | | 3/15/37 | | 200,000 | | 252,931 | |
Express Scripts Holding,
Gtd. Notes | | 3.40 | | 3/1/27 | | 500,000 | | 492,057 | |
Express Scripts Holding,
Gtd. Notes | | 4.80 | | 7/15/46 | | 250,000 | | 260,542 | |
Gilead Sciences,
Sr. Unscd. Notes | | 4.50 | | 4/1/21 | | 500,000 | | 537,342 | |
Gilead Sciences,
Sr. Unscd. Notes | | 4.60 | | 9/1/35 | | 190,000 | | 211,710 | |
Gilead Sciences,
Sr. Unscd. Notes | | 4.80 | | 4/1/44 | | 500,000 | | 560,504 | |
Gilead Sciences,
Sr. Unscd. Notes | | 4.15 | | 3/1/47 | | 220,000 | | 225,768 | |
GlaxoSmithKline Capital,
Gtd. Notes | | 2.85 | | 5/8/22 | | 500,000 | | 511,490 | |
GlaxoSmithKline Capital,
Gtd. Notes | | 2.80 | | 3/18/23 | | 300,000 | | 304,666 | |
Humana,
Sr. Unscd. Notes | | 3.85 | | 10/1/24 | | 500,000 | | 520,818 | |
Johnson & Johnson,
Sr. Unscd. Debs. | | 4.95 | | 5/15/33 | | 170,000 | | 204,273 | |
Johnson & Johnson,
Sr. Unscd. Notes | | 1.65 | | 3/1/21 | | 525,000 | | 519,856 | |
Johnson & Johnson,
Sr. Unscd. Notes | | 2.45 | | 3/1/26 | | 380,000 | | 372,741 | |
Johnson & Johnson,
Sr. Unscd. Notes | | 3.75 | | 3/3/47 | | 350,000 | | 371,125 | |
Kaiser Foundation Hospitals,
Gtd. Notes | | 3.15 | | 5/1/27 | | 500,000 | | 504,802 | |
Laboratory Corporation of America Holdings,
Sr. Unscd. Notes | | 4.00 | | 11/1/23 | | 400,000 | | 420,178 | |
McKesson,
Sr. Unscd. Notes | | 4.75 | | 3/1/21 | | 500,000 | | 537,115 | |
Medtronic,
Gtd. Notes | | 3.50 | | 3/15/25 | | 1,050,000 | | 1,091,319 | |
Medtronic,
Gtd. Notes | | 4.63 | | 3/15/44 | | 600,000 | | 675,324 | |
Memorial Sloan-Kettering Cancer Center,
Sr. Unscd. Notes | | 4.20 | | 7/1/55 | | 200,000 | | 211,046 | |
Merck & Co.,
Gtd. Notes | | 6.50 | | 12/1/33 | | 680,000 | | 910,876 | |
Merck & Co.,
Sr. Unscd. Notes | | 2.75 | | 2/10/25 | | 500,000 | | 500,562 | |
35
STATEMENT OF INVESTMENTS (continued)
| | | | | | | | | | |
| |
Description | Coupon
Rate (%) | | Maturity
Date | | Principal
Amount ($) | | Value ($) | |
Bonds and Notes - 100.5% (continued) | | | | | |
Health Care - 2.6% (continued) | | | | | |
Mylan,
Gtd. Notes | | 3.15 | | 6/15/21 | | 430,000 | | 435,193 | |
Mylan,
Gtd. Notes | | 5.40 | | 11/29/43 | | 300,000 | | 329,493 | |
Northwell Healthcare,
Scd. Notes | | 3.98 | | 11/1/46 | | 250,000 | | 239,216 | |
Novartis Capital,
Gtd. Notes | | 4.40 | | 5/6/44 | | 340,000 | | 386,818 | |
Perrigo Finance Unlimited,
Gtd. Notes | | 4.38 | | 3/15/26 | | 200,000 | | 208,523 | |
Pfizer,
Sr. Unscd. Notes | | 2.10 | | 5/15/19 | | 250,000 | | 251,482 | |
Pfizer,
Sr. Unscd. Notes | | 1.95 | | 6/3/21 | | 355,000 | | 353,827 | |
Pfizer,
Sr. Unscd. Notes | | 2.75 | | 6/3/26 | | 470,000 | | 467,286 | |
Pfizer,
Sr. Unscd. Notes | | 3.00 | | 12/15/26 | | 250,000 | | 252,537 | |
Pfizer,
Sr. Unscd. Notes | | 4.13 | | 12/15/46 | | 300,000 | | 323,078 | |
Providence St. Joseph Health Obligated Group,
Unscd. Notes, Ser. I | | 3.74 | | 10/1/47 | | 250,000 | | 241,678 | |
Quest Diagnostics,
Sr. Unscd. Notes | | 3.50 | | 3/30/25 | | 500,000 | | 511,853 | |
Sanofi,
Sr. Unscd. Notes | | 4.00 | | 3/29/21 | | 550,000 | | 582,105 | |
Stryker,
Sr. Unscd. Bonds | | 4.38 | | 5/15/44 | | 250,000 | | 264,362 | |
Stryker,
Sr. Unscd. Notes | | 3.50 | | 3/15/26 | | 250,000 | | 258,347 | |
Teva Pharmaceutical Finance,
Gtd. Notes | | 6.15 | | 2/1/36 | | 5,000 | a | 5,146 | |
Teva Pharmaceutical Finance IV,
Gtd. Notes | | 2.25 | | 3/18/20 | | 500,000 | | 489,796 | |
Teva Pharmaceutical Finance Netherlands III,
Gtd. Notes | | 3.15 | | 10/1/26 | | 500,000 | a | 443,900 | |
Teva Pharmaceutical Finance Netherlands III,
Gtd. Notes | | 4.10 | | 10/1/46 | | 250,000 | | 199,605 | |
Thermo Fisher Scientific,
Sr. Unscd. Notes | | 5.30 | | 2/1/44 | | 250,000 | | 297,730 | |
Trinity Health,
Scd. Bonds | | 4.13 | | 12/1/45 | | 400,000 | | 410,971 | |
UnitedHealth Group,
Sr. Unscd. Notes | | 2.88 | | 12/15/21 | | 350,000 | | 358,140 | |
36
| | | | | | | | | | |
| |
Description | Coupon
Rate (%) | | Maturity
Date | | Principal
Amount ($) | | Value ($) | |
Bonds and Notes - 100.5% (continued) | | | | | |
Health Care - 2.6% (continued) | | | | | |
UnitedHealth Group,
Sr. Unscd. Notes | | 3.75 | | 7/15/25 | | 330,000 | | 349,404 | |
UnitedHealth Group,
Sr. Unscd. Notes | | 6.88 | | 2/15/38 | | 410,000 | | 590,010 | |
UnitedHealth Group,
Sr. Unscd. Notes | | 4.75 | | 7/15/45 | | 280,000 | | 324,592 | |
UnitedHealth Group,
Sr. Unscd. Notes | | 3.75 | | 10/15/47 | | 70,000 | | 68,758 | |
Wyeth,
Gtd. Notes | | 6.50 | | 2/1/34 | | 200,000 | | 270,481 | |
Zimmer Biomet Holdings,
Sr. Unscd. Notes | | 3.55 | | 4/1/25 | | 250,000 | | 254,721 | |
| | 36,832,148 | |
Industrials - 1.7% | | | | | |
3M,
Sr. Unscd. Notes | | 2.25 | | 9/19/26 | | 500,000 | | 477,608 | |
Allegion US Holding Co.,
Gtd. Notes | | 3.20 | | 10/1/24 | | 400,000 | | 401,824 | |
American Airlines 16-1 AA PTT,
Scd. Notes | | 3.58 | | 7/15/29 | | 518,618 | | 535,240 | |
Boeing,
Sr. Unscd. Notes | | 6.00 | | 3/15/19 | | 600,000 | | 635,760 | |
Burlington Northern Santa Fe,
Sr. Unscd. Debs. | | 7.00 | | 12/15/25 | | 100,000 | | 127,533 | |
Burlington Northern Santa Fe,
Sr. Unscd. Debs. | | 6.15 | | 5/1/37 | | 650,000 | | 860,855 | |
Burlington Northern Santa Fe,
Sr. Unscd. Debs. | | 4.55 | | 9/1/44 | | 300,000 | | 338,285 | |
Burlington Northern Santa Fe,
Sr. Unscd. Notes | | 3.05 | | 3/15/22 | | 200,000 | | 206,078 | |
Canadian Pacific Railway,
Sr. Unscd. Notes | | 6.13 | | 5/15/45 | | 220,000 | | 286,151 | |
Caterpillar,
Sr. Unscd. Bonds | | 6.05 | | 8/15/36 | | 237,000 | | 309,398 | |
Caterpillar,
Sr. Unscd. Notes | | 2.60 | | 6/26/22 | | 800,000 | | 805,780 | |
Caterpillar,
Sr. Unscd. Notes | | 4.30 | | 5/15/44 | | 500,000 | a | 557,582 | |
CSX,
Sr. Unscd. Notes | | 3.70 | | 11/1/23 | | 500,000 | | 524,818 | |
CSX,
Sr. Unscd. Notes | | 4.50 | | 8/1/54 | | 500,000 | | 517,717 | |
Eaton,
Gtd. Notes | | 4.15 | | 11/2/42 | | 400,000 | | 406,718 | |
Ecolab,
Sr. Unscd. Notes | | 4.35 | | 12/8/21 | | 200,000 | | 215,509 | |
37
STATEMENT OF INVESTMENTS (continued)
| | | | | | | | | | |
| |
Description | Coupon
Rate (%) | | Maturity
Date | | Principal
Amount ($) | | Value ($) | |
Bonds and Notes - 100.5% (continued) | | | | | |
Industrials - 1.7% (continued) | | | | | |
Ecolab,
Sr. Unscd. Notes | | 2.70 | | 11/1/26 | | 500,000 | | 483,837 | |
Emerson Electric,
Sr. Unscd. Notes | | 2.63 | | 2/15/23 | | 260,000 | | 260,492 | |
FedEx,
Gtd. Notes | | 4.00 | | 1/15/24 | | 250,000 | | 268,199 | |
FedEx,
Gtd. Notes | | 4.75 | | 11/15/45 | | 400,000 | | 437,579 | |
Fortive,
Sr. Unscd. Notes | | 2.35 | | 6/15/21 | | 250,000 | | 248,770 | |
General Electric,
Sr. Unscd. Notes | | 4.50 | | 3/11/44 | | 500,000 | | 547,970 | |
Illinois Tool Works,
Sr. Unscd. Notes | | 3.90 | | 9/1/42 | | 500,000 | | 520,930 | |
Ingersoll-Rand Global Holding,
Gtd. Notes | | 2.88 | | 1/15/19 | | 225,000 | | 227,314 | |
Johnson Controls International,
Sr. Unscd. Notes | | 5.13 | | 9/14/45 | | 100,000 | | 115,315 | |
Kansas City Southern,
Gtd. Notes | | 4.95 | | 8/15/45 | | 300,000 | | 336,846 | |
Keysight Technologies,
Gtd. Notes | | 3.30 | | 10/30/19 | | 500,000 | | 506,823 | |
Lockheed Martin,
Sr. Unscd. Bonds | | 3.60 | | 3/1/35 | | 500,000 | | 498,469 | |
Lockheed Martin,
Sr. Unscd. Notes | | 2.50 | | 11/23/20 | | 420,000 | | 425,552 | |
Lockheed Martin,
Sr. Unscd. Notes | | 3.55 | | 1/15/26 | | 235,000 | | 244,845 | |
Lockheed Martin,
Sr. Unscd. Notes | | 4.07 | | 12/15/42 | | 500,000 | | 515,010 | |
Norfolk Southern,
Sr. Unscd. Bonds, Ser. WI | | 4.84 | | 10/1/41 | | 350,000 | | 398,177 | |
Norfolk Southern,
Sr. Unscd. Notes | | 3.85 | | 1/15/24 | | 300,000 | | 317,677 | |
Northrop Grumman,
Sr. Unscd. Notes | | 3.50 | | 3/15/21 | | 500,000 | | 520,269 | |
Northrop Grumman,
Sr. Unscd. Notes | | 2.55 | | 10/15/22 | | 210,000 | | 210,483 | |
Northrop Grumman,
Sr. Unscd. Notes | | 4.03 | | 10/15/47 | | 160,000 | | 164,927 | |
Northrop Grumman Systems,
Gtd. Notes | | 7.75 | | 2/15/31 | | 500,000 | | 708,870 | |
Raytheon,
Sr. Unscd. Debs. | | 7.20 | | 8/15/27 | | 150,000 | | 201,725 | |
Republic Services,
Sr. Unscd. Notes | | 5.25 | | 11/15/21 | | 500,000 | | 552,280 | |
38
| | | | | | | | | | |
| |
Description | Coupon
Rate (%) | | Maturity
Date | | Principal
Amount ($) | | Value ($) | |
Bonds and Notes - 100.5% (continued) | | | | | |
Industrials - 1.7% (continued) | | | | | |
Rockwell Automation,
Sr. Unscd. Notes | | 2.05 | | 3/1/20 | | 500,000 | | 499,836 | |
Roper Technologies,
Sr. Unscd. Notes | | 3.80 | | 12/15/26 | | 500,000 | | 518,988 | |
S&P Global,
Gtd. Notes | | 4.40 | | 2/15/26 | | 230,000 | | 248,919 | |
Stanford Unversity,
Unscd. Bonds | | 3.65 | | 5/1/48 | | 30,000 | | 31,282 | |
Textron,
Sr. Unscd. Notes | | 4.00 | | 3/15/26 | | 500,000 | | 523,523 | |
Total System Services,
Sr. Unscd. Notes | | 4.80 | | 4/1/26 | | 500,000 | | 544,615 | |
Union Pacific,
Sr. Unscd. Notes | | 2.75 | | 4/15/23 | | 400,000 | | 403,181 | |
Union Pacific,
Sr. Unscd. Notes | | 4.82 | | 2/1/44 | | 325,000 | | 380,056 | |
United Airlines 2013-1 PTT,
Pass Thru Certs., Ser.A | | 4.30 | | 2/15/27 | | 852,323 | | 908,619 | |
United Parcel Service,
Sr. Unscd. Notes | | 3.13 | | 1/15/21 | | 500,000 | | 516,978 | |
United Technologies,
Sr. Unscd. Notes | | 2.30 | | 5/4/22 | | 400,000 | | 397,228 | |
United Technologies,
Sr. Unscd. Notes | | 3.10 | | 6/1/22 | | 600,000 | | 616,075 | |
United Technologies,
Sr. Unscd. Notes | | 3.13 | | 5/4/27 | | 110,000 | | 110,241 | |
United Technologies,
Sr. Unscd. Notes | | 6.70 | | 8/1/28 | | 50,000 | | 64,870 | |
United Technologies,
Sr. Unscd. Notes | | 5.70 | | 4/15/40 | | 300,000 | | 376,493 | |
United Technologies,
Sr. Unscd. Notes | | 4.50 | | 6/1/42 | | 380,000 | | 414,475 | |
Waste Management,
Gtd. Notes | | 3.50 | | 5/15/24 | | 500,000 | | 519,354 | |
Xylem,
Sr. Unscd. Notes | | 4.88 | | 10/1/21 | | 21,000 | | 22,833 | |
Xylem,
Sr. Unscd. Notes | | 4.38 | | 11/1/46 | | 250,000 | | 261,422 | |
| | 23,278,203 | |
Information Technology - 1.8% | | | | | |
Adobe Systems,
Sr. Unscd. Notes | | 3.25 | | 2/1/25 | | 500,000 | | 513,021 | |
Alphabet,
Sr. Unscd. Notes | | 3.63 | | 5/19/21 | | 300,000 | | 315,527 | |
Alphabet,
Sr. Unscd. Notes | | 2.00 | | 8/15/26 | | 300,000 | | 282,338 | |
39
STATEMENT OF INVESTMENTS (continued)
| | | | | | | | | | |
| |
Description | Coupon
Rate (%) | | Maturity
Date | | Principal
Amount ($) | | Value ($) | |
Bonds and Notes - 100.5% (continued) | | | | | |
Information Technology - 1.8% (continued) | | | | | |
Apple,
Sr. Unscd. Notes | | 1.90 | | 2/7/20 | | 300,000 | | 300,479 | |
Apple,
Sr. Unscd. Notes | | 2.00 | | 5/6/20 | | 510,000 | | 511,630 | |
Apple,
Sr. Unscd. Notes | | 2.50 | | 2/9/22 | | 300,000 | | 303,266 | |
Apple,
Sr. Unscd. Notes | | 2.30 | | 5/11/22 | | 210,000 | | 210,182 | |
Apple,
Sr. Unscd. Notes | | 3.45 | | 5/6/24 | | 500,000 | | 522,086 | |
Apple,
Sr. Unscd. Notes | | 3.20 | | 5/13/25 | | 925,000 | | 948,957 | |
Apple,
Sr. Unscd. Notes | | 3.35 | | 2/9/27 | | 500,000 | | 513,702 | |
Apple,
Sr. Unscd. Notes | | 3.20 | | 5/11/27 | | 200,000 | | 203,289 | |
Apple,
Sr. Unscd. Notes | | 4.45 | | 5/6/44 | | 500,000 | | 556,007 | |
Apple,
Sr. Unscd. Notes | | 4.25 | | 2/9/47 | | 300,000 | | 322,247 | |
Apple,
Sr. Unscd. Notes | | 3.75 | | 9/12/47 | | 75,000 | | 74,689 | |
Applied Materials,
Sr. Unscd. Notes | | 3.90 | | 10/1/25 | | 500,000 | | 536,740 | |
Arrow Electronics,
Sr. Unscd. Notes | | 4.50 | | 3/1/23 | | 500,000 | | 532,769 | |
Autodesk,
Sr. Unscd. Notes | | 4.38 | | 6/15/25 | | 250,000 | | 267,412 | |
Baidu,
Sr. Unscd. Notes | | 2.75 | | 6/9/19 | | 750,000 | | 758,110 | |
Broadcom,
Gtd. Notes | | 3.00 | | 1/15/22 | | 760,000 | b | 770,013 | |
Broadcom,
Gtd. Notes | | 3.88 | | 1/15/27 | | 300,000 | b | 309,209 | |
Broadcom,
Gtd. Notes | | 3.50 | | 1/15/28 | | 110,000 | b | 109,637 | |
Dell International,
Sr. Scd. Notes | | 3.48 | | 6/1/19 | | 420,000 | b | 427,658 | |
Dell International,
Sr. Scd. Notes | | 6.02 | | 6/15/26 | | 450,000 | b | 503,170 | |
Dell International,
Sr. Scd. Notes | | 8.35 | | 7/15/46 | | 260,000 | b | 337,794 | |
eBay,
Sr. Unscd. Notes | | 4.00 | | 7/15/42 | | 350,000 | | 321,601 | |
Fidelity National Information Services,
Sr. Unscd. Bonds | | 3.00 | | 8/15/26 | | 500,000 | | 486,073 | |
40
| | | | | | | | | | |
| |
Description | Coupon
Rate (%) | | Maturity
Date | | Principal
Amount ($) | | Value ($) | |
Bonds and Notes - 100.5% (continued) | | | | | |
Information Technology - 1.8% (continued) | | | | | |
Harris,
Sr. Unscd. Notes | | 5.05 | | 4/27/45 | | 350,000 | | 405,877 | |
Hewlett Packard Enterprise,
Sr. Unscd. Notes | | 4.90 | | 10/15/25 | | 500,000 | b | 532,447 | |
HP,
Sr. Unscd. Notes | | 4.38 | | 9/15/21 | | 250,000 | | 265,567 | |
HP,
Sr. Unscd. Notes | | 6.00 | | 9/15/41 | | 200,000 | | 218,166 | |
Intel,
Sr. Unscd. Notes | | 3.30 | | 10/1/21 | | 850,000 | | 887,175 | |
Intel,
Sr. Unscd. Notes | | 3.10 | | 7/29/22 | | 300,000 | | 311,445 | |
Intel,
Sr. Unscd. Notes | | 3.15 | | 5/11/27 | | 110,000 | | 111,808 | |
Intel,
Sr. Unscd. Notes | | 4.10 | | 5/19/46 | | 500,000 | | 530,082 | |
Intel,
Sr. Unscd. Notes | | 4.10 | | 5/11/47 | | 80,000 | | 84,859 | |
International Business Machines,
Sr. Unscd. Notes | | 8.38 | | 11/1/19 | | 300,000 | | 338,222 | |
International Business Machines,
Sr. Unscd. Notes | | 3.45 | | 2/19/26 | | 230,000 | | 237,885 | |
International Business Machines,
Sr. Unscd. Notes | | 5.60 | | 11/30/39 | | 605,000 | | 761,185 | |
Microsoft,
Sr. Unscd. Notes | | 4.20 | | 6/1/19 | | 500,000 | | 519,576 | |
Microsoft,
Sr. Unscd. Notes | | 1.55 | | 8/8/21 | | 575,000 | | 563,763 | |
Microsoft,
Sr. Unscd. Notes | | 4.10 | | 2/6/37 | | 480,000 | | 526,510 | |
Microsoft,
Sr. Unscd. Notes | | 5.20 | | 6/1/39 | | 688,000 | | 848,300 | |
Microsoft,
Sr. Unscd. Notes | | 3.75 | | 2/12/45 | | 1,000,000 | | 1,015,792 | |
Microsoft,
Sr. Unscd. Notes | | 4.45 | | 11/3/45 | | 411,000 | | 467,051 | |
Microsoft,
Sr. Unscd. Notes | | 4.75 | | 11/3/55 | | 135,000 | | 158,625 | |
Microsoft,
Sr. Unscd. Notes | | 4.50 | | 2/6/57 | | 160,000 | | 180,520 | |
Moody's,
Sr. Unscd. Notes | | 2.75 | | 7/15/19 | | 500,000 | | 505,725 | |
NVIDIA,
Sr. Unscd. Notes | | 2.20 | | 9/16/21 | | 500,000 | | 499,384 | |
Oracle,
Sr. Unscd. Notes | | 5.00 | | 7/8/19 | | 450,000 | | 474,322 | |
41
STATEMENT OF INVESTMENTS (continued)
| | | | | | | | | | |
| |
Description | Coupon
Rate (%) | | Maturity
Date | | Principal
Amount ($) | | Value ($) | |
Bonds and Notes - 100.5% (continued) | | | | | |
Information Technology - 1.8% (continued) | | | | | |
Oracle,
Sr. Unscd. Notes | | 2.50 | | 10/15/22 | | 500,000 | | 502,783 | |
Oracle,
Sr. Unscd. Notes | | 3.40 | | 7/8/24 | | 500,000 | | 523,921 | |
Oracle,
Sr. Unscd. Notes | | 3.90 | | 5/15/35 | | 480,000 | | 504,002 | |
Oracle,
Sr. Unscd. Notes | | 3.85 | | 7/15/36 | | 500,000 | | 523,289 | |
Oracle,
Sr. Unscd. Notes | | 4.38 | | 5/15/55 | | 280,000 | | 303,887 | |
Qualcomm,
Sr. Unscd. Notes | | 2.25 | | 5/20/20 | | 500,000 | | 502,701 | |
Qualcomm,
Sr. Unscd. Notes | | 3.25 | | 5/20/27 | | 210,000 | | 209,966 | |
Qualcomm,
Sr. Unscd. Notes | | 4.65 | | 5/20/35 | | 140,000 | | 152,948 | |
Qualcomm,
Sr. Unscd. Notes | | 4.80 | | 5/20/45 | | 210,000 | | 228,361 | |
Qualcomm,
Sr. Unscd. Notes | | 4.30 | | 5/20/47 | | 120,000 | | 121,466 | |
Seagate HDD,
Gtd. Bonds | | 4.75 | | 6/1/23 | | 400,000 | | 411,750 | |
Xilinx,
Sr. Unscd. Notes | | 3.00 | | 3/15/21 | | 500,000 | | 508,899 | |
| | 25,875,865 | |
Materials - .8% | | | | | |
Agrium,
Sr. Unscd. Debs. | | 5.25 | | 1/15/45 | | 500,000 | | 579,106 | |
Barrick PD Australia Finance,
Gtd. Notes | | 5.95 | | 10/15/39 | | 400,000 | | 502,801 | |
BHP Billiton Finance USA,
Gtd. Notes | | 4.13 | | 2/24/42 | | 500,000 | | 529,256 | |
Celanese US Holdings,
Gtd. Notes | | 4.63 | | 11/15/22 | | 350,000 | | 377,038 | |
Dow Chemical,
Sr. Unscd. Notes | | 4.25 | | 11/15/20 | | 775,000 | | 813,518 | |
E.I. du Pont de Nemours & Co.,
Sr. Unscd. Notes | | 2.80 | | 2/15/23 | | 500,000 | | 504,673 | |
E.I. du Pont de Nemours & Co.,
Sr. Unscd. Notes | | 4.15 | | 2/15/43 | | 300,000 | | 308,046 | |
Eastman Chemical,
Sr. Unscd. Notes | | 3.80 | | 3/15/25 | | 378,000 | | 394,461 | |
Goldcorp,
Sr. Unscd. Notes | | 3.63 | | 6/9/21 | | 500,000 | | 518,400 | |
International Paper,
Sr. Unscd. Notes | | 3.65 | | 6/15/24 | | 400,000 | | 418,028 | |
42
| | | | | | | | | | |
| |
Description | Coupon
Rate (%) | | Maturity
Date | | Principal
Amount ($) | | Value ($) | |
Bonds and Notes - 100.5% (continued) | | | | | |
Materials - .8% (continued) | | | | | |
International Paper,
Sr. Unscd. Notes | | 4.40 | | 8/15/47 | | 500,000 | | 518,678 | |
LYB International Finance,
Gtd. Notes | | 4.00 | | 7/15/23 | | 350,000 | | 369,308 | |
Methanex,
Sr. Unscd. Notes | | 3.25 | | 12/15/19 | | 465,000 | | 469,870 | |
Monsanto,
Sr. Unscd. Notes | | 2.13 | | 7/15/19 | | 500,000 | | 500,562 | |
Mosaic,
Sr. Unscd. Notes | | 4.25 | | 11/15/23 | | 300,000 | a | 313,861 | |
Newmont Mining,
Gtd. Notes | | 6.25 | | 10/1/39 | | 126,000 | | 160,491 | |
Nucor,
Sr. Unscd. Notes | | 6.40 | | 12/1/37 | | 200,000 | | 260,809 | |
Owens Corning,
Gtd. Notes | | 7.00 | | 12/1/36 | | 137,000 | b | 179,443 | |
Potash Corporation of Saskatchewan,
Sr. Unscd. Bonds | | 3.63 | | 3/15/24 | | 500,000 | | 514,761 | |
Praxair,
Sr. Unscd. Notes | | 2.45 | | 2/15/22 | | 600,000 | | 604,775 | |
Rio Tinto Alcan,
Sr. Unscd. Debs. | | 7.25 | | 3/15/31 | | 350,000 | | 464,188 | |
Sherwin-Williams,
Sr. Unscd. Notes | | 4.50 | | 6/1/47 | | 100,000 | | 106,483 | |
Southern Copper,
Sr. Unscd. Notes | | 5.25 | | 11/8/42 | | 500,000 | | 544,423 | |
Vale Canada,
Sr. Unscd. Bonds | | 7.20 | | 9/15/32 | | 100,000 | | 112,750 | |
Vale Overseas,
Gtd. Notes | | 6.88 | | 11/21/36 | | 550,000 | | 661,650 | |
| | 10,727,379 | |
Municipal Bonds - .6% | | | | | |
American Municipal Power Inc.,
Combined Hydroelectic Projects Revenue (Build America Bonds) | | 8.08 | | 2/15/50 | | 100,000 | | 167,783 | |
Bay Area Toll Authority,
San Francisco Bay Area Toll Bridge Revenue (Build America Bonds) | | 6.26 | | 4/1/49 | | 300,000 | | 438,477 | |
California,
GO (Various Purpose) | | 7.50 | | 4/1/34 | | 500,000 | | 732,970 | |
California,
GO (Various Purpose) | | 7.55 | | 4/1/39 | | 600,000 | | 927,300 | |
Illinois,
GO (Pension Funding Series) | | 5.10 | | 6/1/33 | | 1,130,000 | | 1,141,334 | |
Los Angeles Unified School District,
GO (Build America Bonds) | | 5.75 | | 7/1/34 | | 350,000 | | 449,565 | |
43
STATEMENT OF INVESTMENTS (continued)
| | | | | | | | | | |
| |
Description | Coupon
Rate (%) | | Maturity
Date | | Principal
Amount ($) | | Value ($) | |
Bonds and Notes - 100.5% (continued) | | | | | |
Municipal Bonds - .6% (continued) | | | | | |
Metropolitan Transportation Authority,
Dedicated Tax Funds Bonds | | 7.34 | | 11/15/39 | | 300,000 | | 459,828 | |
Municipal Electric Authority of Georgia,
GO (Plant Vogtle Units 3 and 4 Project J Bonds) (Build America Bonds) | | 6.64 | | 4/1/57 | | 350,000 | | 444,360 | |
New Jersey Economic Development Authority,
State Pension Funding Bonds (Insured; National Public Finance Guarantee Corp.) | | 7.43 | | 2/15/29 | | 500,000 | | 622,360 | |
New Jersey Turnpike Authority,
Turnpike Revenue (Build America Bonds) | | 7.41 | | 1/1/40 | | 400,000 | | 610,076 | |
New York City Municipal Water Finance Authority,
Water and Sewer System Second General Resolution Revenue (Build America Bonds) | | 5.95 | | 6/15/42 | | 345,000 | | 471,401 | |
Ohio State University,
General Receipts Bonds (Multiyear Debt Issuance Program) | | 3.80 | | 12/1/46 | | 500,000 | | 513,255 | |
Port Authority of New York and New Jersey,
(Consolidated Bonds, 192nd Series) | | 4.81 | | 10/15/65 | | 300,000 | | 355,455 | |
San Diego County Water Authority Financing Agency,
Water Revenue (Build America Bonds) | | 6.14 | | 5/1/49 | | 300,000 | | 417,627 | |
State of Connecticut,
GO (Teachers' Retirement Fund) | | 5.85 | | 3/15/32 | | 200,000 | | 242,696 | |
| | 7,994,487 | |
Real Estate - .9% | | | | | |
Alexandria Real Estate Equities,
Gtd. Notes | | 2.75 | | 1/15/20 | | 500,000 | | 503,927 | |
American Tower,
Sr. Unscd. Notes | | 3.40 | | 2/15/19 | | 580,000 | | 590,062 | |
AvalonBay Communities,
Sr. Unscd. Notes | | 4.20 | | 12/15/23 | | 400,000 | | 430,282 | |
Boston Properties,
Sr. Unscd. Bonds | | 5.63 | | 11/15/20 | | 700,000 | | 763,376 | |
CBL & Associates,
Gtd. Notes | | 5.25 | | 12/1/23 | | 200,000 | a | 201,184 | |
Crown Castle International,
Sr. Unscd. Notes | | 3.20 | | 9/1/24 | | 270,000 | | 268,680 | |
Crown Castle International,
Sr. Unscd. Notes | | 3.70 | | 6/15/26 | | 430,000 | | 432,002 | |
Daimler Finance North America,
Gtd. Notes | | 8.50 | | 1/18/31 | | 200,000 | | 299,250 | |
44
| | | | | | | | | | |
| |
Description | Coupon
Rate (%) | | Maturity
Date | | Principal
Amount ($) | | Value ($) | |
Bonds and Notes - 100.5% (continued) | | | | | |
Real Estate - .9% (continued) | | | | | |
DDR,
Sr. Unscd. Notes | | 3.38 | | 5/15/23 | | 500,000 | | 495,982 | |
Duke Realty,
Sr. Unscd. Notes | | 3.75 | | 12/1/24 | | 400,000 | | 415,086 | |
ERP Operating,
Sr. Unscd. Notes | | 2.38 | | 7/1/19 | | 500,000 | | 503,791 | |
Federal Realty Investment Trust,
Sr. Unscd. Notes | | 4.50 | | 12/1/44 | | 200,000 | | 212,439 | |
HCP,
Sr. Unscd. Notes | | 4.25 | | 11/15/23 | | 400,000 | | 424,164 | |
HCP,
Sr. Unscd. Notes | | 6.75 | | 2/1/41 | | 300,000 | | 393,908 | |
Host Hotels & Resorts,
Sr. Unscd. Notes | | 6.00 | | 10/1/21 | | 500,000 | | 555,801 | |
Kimco Realty,
Sr. Unscd. Notes | | 3.20 | | 5/1/21 | | 250,000 | | 255,837 | |
Kimco Realty,
Sr. Unscd. Notes | | 3.13 | | 6/1/23 | | 250,000 | | 251,635 | |
Mid-America Apartments,
Sr. Unscd. Notes | | 4.30 | | 10/15/23 | | 400,000 | | 424,288 | |
National Retail Properties,
Sr. Unscd. Notes | | 3.90 | | 6/15/24 | | 500,000 | | 515,585 | |
Realty Income,
Sr. Unscd. Notes | | 3.88 | | 7/15/24 | | 500,000 | | 515,629 | |
Simon Property Group,
Sr. Unscd. Notes | | 2.50 | | 7/15/21 | | 750,000 | | 754,307 | |
Simon Property Group,
Sr. Unscd. Notes | | 6.75 | | 2/1/40 | | 150,000 | | 208,727 | |
Ventas Realty,
Gtd. Notes | | 2.70 | | 4/1/20 | | 1,000,000 | | 1,009,176 | |
Weingarten Realty Investors,
Sr. Unscd. Notes | | 3.38 | | 10/15/22 | | 250,000 | | 254,128 | |
Welltower,
Sr. Unscd. Notes | | 4.95 | | 1/15/21 | | 600,000 | | 643,435 | |
Weyerhaeuser,
Sr. Unscd. Debs. | | 7.38 | | 3/15/32 | | 500,000 | | 696,819 | |
| | 12,019,500 | |
Telecommunications - 1.5% | | | | | |
America Movil,
Gtd. Notes | | 6.38 | | 3/1/35 | | 100,000 | | 125,572 | |
America Movil,
Gtd. Notes | | 6.13 | | 3/30/40 | | 350,000 | | 436,297 | |
AT&T,
Gtd. Notes | | 8.00 | | 11/15/31 | | 249,000 | b | 352,150 | |
AT&T,
Sr. Unscd. Bonds | | 2.80 | | 2/17/21 | | 490,000 | | 497,352 | |
45
STATEMENT OF INVESTMENTS (continued)
| | | | | | | | | | |
| |
Description | Coupon
Rate (%) | | Maturity
Date | | Principal
Amount ($) | | Value ($) | |
Bonds and Notes - 100.5% (continued) | | | | | |
Telecommunications - 1.5% (continued) | | | | | |
AT&T,
Sr. Unscd. Notes | | 2.30 | | 3/11/19 | | 1,000,000 | | 1,004,378 | |
AT&T,
Sr. Unscd. Notes | | 3.00 | | 2/15/22 | | 495,000 | | 501,137 | |
AT&T,
Sr. Unscd. Notes | | 3.00 | | 6/30/22 | | 500,000 | | 506,488 | |
AT&T,
Sr. Unscd. Notes | | 2.85 | | 2/14/23 | | 500,000 | | 497,115 | |
AT&T,
Sr. Unscd. Notes | | 3.40 | | 8/14/24 | | 300,000 | | 300,418 | |
AT&T,
Sr. Unscd. Notes | | 3.90 | | 8/14/27 | | 500,000 | | 498,720 | |
AT&T,
Sr. Unscd. Notes | | 4.50 | | 5/15/35 | | 500,000 | | 488,552 | |
AT&T,
Sr. Unscd. Notes | | 4.90 | | 8/14/37 | | 500,000 | | 501,327 | |
AT&T,
Sr. Unscd. Notes | | 6.00 | | 8/15/40 | | 800,000 | | 891,540 | |
AT&T,
Sr. Unscd. Notes | | 5.35 | | 9/1/40 | | 75,000 | | 78,145 | |
AT&T,
Sr. Unscd. Notes | | 4.75 | | 5/15/46 | | 500,000 | | 472,844 | |
AT&T,
Sr. Unscd. Notes | | 4.50 | | 3/9/48 | | 341,000 | | 310,173 | |
AT&T,
Sr. Unscd. Notes | | 5.15 | | 2/14/50 | | 300,000 | | 296,967 | |
AT&T,
Sr. Unscd. Notes | | 5.70 | | 3/1/57 | | 360,000 | | 381,447 | |
AT&T,
Sr. Unscd. Notes | | 5.30 | | 8/14/58 | | 300,000 | | 298,067 | |
British Telecommunications,
Sr. Unscd. Notes | | 8.63 | | 12/15/30 | | 175,000 | | 264,959 | |
Cisco Systems,
Sr. Unscd. Notes | | 4.45 | | 1/15/20 | | 500,000 | | 527,656 | |
Cisco Systems,
Sr. Unscd. Notes | | 2.95 | | 2/28/26 | | 500,000 | | 503,880 | |
Cisco Systems,
Sr. Unscd. Notes | | 2.50 | | 9/20/26 | | 500,000 | | 486,807 | |
Cisco Systems,
Sr. Unscd. Notes | | 5.50 | | 1/15/40 | | 250,000 | | 322,226 | |
Deutsche Telekom International Finance,
Gtd. Bonds | | 8.25 | | 6/15/30 | | 300,000 | | 441,436 | |
Juniper Networks,
Sr. Unscd. Notes | | 4.35 | | 6/15/25 | | 200,000 | a | 210,035 | |
Koninklijke KPN,
Sr. Unscd. Bonds | | 8.38 | | 10/1/30 | | 250,000 | | 345,124 | |
46
| | | | | | | | | | |
| |
Description | Coupon
Rate (%) | | Maturity
Date | | Principal
Amount ($) | | Value ($) | |
Bonds and Notes - 100.5% (continued) | | | | | |
Telecommunications - 1.5% (continued) | | | | | |
Motorola Solutions,
Sr. Unscd. Notes | | 3.50 | | 9/1/21 | | 500,000 | | 512,439 | |
Orange,
Sr. Unscd. Notes | | 8.50 | | 3/1/31 | | 300,000 | b | 455,614 | |
Qwest,
Sr. Unscd. Debs. | | 6.88 | | 9/15/33 | | 275,000 | | 270,672 | |
Rogers Communications,
Gtd. Notes | | 7.50 | | 8/15/38 | | 125,000 | | 177,787 | |
Telefonica Emisiones,
Gtd. Notes | | 7.05 | | 6/20/36 | | 250,000 | | 334,295 | |
Telefonica Emisiones,
Gtd. Notes | | 5.21 | | 3/8/47 | | 300,000 | | 331,384 | |
Verizon Communications,
Sr. Unscd. Bonds | | 5.25 | | 3/16/37 | | 365,000 | | 398,579 | |
Verizon Communications,
Sr. Unscd. Notes | | 1.75 | | 8/15/21 | | 1,000,000 | | 978,479 | |
Verizon Communications,
Sr. Unscd. Notes | | 5.15 | | 9/15/23 | | 1,650,000 | | 1,851,286 | |
Verizon Communications,
Sr. Unscd. Notes | | 3.38 | | 2/15/25 | | 787,000 | b | 792,988 | |
Verizon Communications,
Sr. Unscd. Notes | | 4.50 | | 8/10/33 | | 220,000 | | 227,248 | |
Verizon Communications,
Sr. Unscd. Notes | | 3.85 | | 11/1/42 | | 500,000 | | 441,736 | |
Verizon Communications,
Sr. Unscd. Notes | | 4.86 | | 8/21/46 | | 750,000 | | 759,175 | |
Verizon Communications,
Sr. Unscd. Notes | | 5.01 | | 4/15/49 | | 330,000 | | 337,955 | |
Verizon Communications,
Sr. Unscd. Notes | | 5.01 | | 8/21/54 | | 90,000 | | 90,315 | |
Verizon Communications,
Sr. Unscd. Notes | | 4.67 | | 3/15/55 | | 500,000 | | 476,828 | |
Vodafone Group,
Sr. Unscd. Bonds | | 6.15 | | 2/27/37 | | 250,000 | | 308,649 | |
Vodafone Group,
Sr. Unscd. Notes | | 7.88 | | 2/15/30 | | 125,000 | | 171,354 | |
| | 20,457,595 | |
U.S. Government Agencies - 2.0% | | | | | |
Federal Home Loan Bank,
Bonds | | 1.75 | | 12/14/18 | | 2,000,000 | | 2,003,822 | |
Federal Home Loan Bank,
Bonds | | 1.13 | | 6/21/19 | | 500,000 | | 496,372 | |
Federal Home Loan Bank,
Bonds | | 0.88 | | 8/5/19 | | 1,000,000 | | 987,026 | |
Federal Home Loan Bank,
Bonds | | 4.13 | | 3/13/20 | | 1,000,000 | | 1,055,976 | |
47
STATEMENT OF INVESTMENTS (continued)
| | | | | | | | | | |
| |
Description | Coupon
Rate (%) | | Maturity
Date | | Principal
Amount ($) | | Value ($) | |
Bonds and Notes - 100.5% (continued) | | | | | |
U.S. Government Agencies - 2.0% (continued) | | | | | |
Federal Home Loan Bank,
Bonds | | 5.63 | | 6/11/21 | | 1,200,000 | | 1,357,090 | |
Federal Home Loan Bank,
Bonds | | 5.50 | | 7/15/36 | | 480,000 | | 650,923 | |
Federal Home Loan Mortgage Corp.,
Multifamily Structured Pass Through Certificates Ser. K039, Cl. A2 | | 3.30 | | 7/25/24 | | 1,000,000 | e | 1,048,424 | |
Federal Home Loan Mortgage Corp.,
Multifamily Structured Pass Through Certificates Ser. K047, Cl. A | | 3.33 | | 5/25/25 | | 1,500,000 | e | 1,573,412 | |
Federal Home Loan Mortgage Corp.,
Multifamily Structured Pass Through Certificates Ser. K056, Cl. A2 | | 2.53 | | 5/25/26 | | 1,300,000 | e | 1,281,578 | |
Federal Home Loan Mortgage Corp.,
Notes | | 3.75 | | 3/27/19 | | 1,600,000 | e | 1,648,672 | |
Federal Home Loan Mortgage Corp.,
Notes | | 1.25 | | 10/2/19 | | 2,500,000 | e | 2,481,820 | |
Federal Home Loan Mortgage Corp.,
Notes | | 6.25 | | 7/15/32 | | 1,000,000 | e | 1,409,804 | |
Federal Home Loan Mortgage Corp.,
Unscd. Notes | | 0.95 | | 1/30/19 | | 225,000 | e | 223,135 | |
Federal National Mortgage Association,
Notes | | 0.88 | | 12/27/17 | | 700,000 | e | 699,768 | |
Federal National Mortgage Association,
Notes | | 1.25 | | 2/26/19 | | 1,000,000 | e | 994,955 | |
Federal National Mortgage Association,
Notes | | 1.13 | | 7/26/19 | | 900,000 | e | 892,145 | |
Federal National Mortgage Association,
Notes | | 0.88 | | 8/2/19 | | 500,000 | e | 493,589 | |
Federal National Mortgage Association,
Notes | | 1.75 | | 11/26/19 | | 1,500,000 | e | 1,502,427 | |
Federal National Mortgage Association,
Notes | | 1.70 | | 1/27/20 | | 600,000 | e | 597,634 | |
Federal National Mortgage Association,
Notes | | 1.25 | | 8/17/21 | | 500,000 | e | 488,162 | |
Federal National Mortgage Association,
Notes | | 6.25 | | 5/15/29 | | 540,000 | e | 727,284 | |
Federal National Mortgage Association,
Notes | | 6.63 | | 11/15/30 | | 1,000,000 | e | 1,420,160 | |
Federal National Mortgage Association,
Notes | | 5.50 | | 4/1/34 | | 30,957 | e | 34,206 | |
Federal National Mortgage Association,
Notes | | 7.00 | | 7/1/37 | | 18,978 | e | 21,173 | |
Federal National Mortgage Association,
Notes. Ser.1 | | 1.00 | | 4/30/18 | | 1,000,000 | e | 997,942 | |
Federal National Mortgage Association,
Ser. 2013-M14, Cl. APT | | 2.60 | | 4/25/23 | | 947,193 | e | 950,338 | |
48
| | | | | | | | | | |
| |
Description | Coupon
Rate (%) | | Maturity
Date | | Principal
Amount ($) | | Value ($) | |
Bonds and Notes - 100.5% (continued) | | | | | |
U.S. Government Agencies - 2.0% (continued) | | | | | |
Financing (FICO),
Scd. Bonds | | 8.60 | | 9/26/19 | | 40,000 | | 45,113 | |
Financing (FICO),
Scd. Bonds, Ser. E | | 9.65 | | 11/2/18 | | 610,000 | | 659,558 | |
Tennessee Valley Authority,
Sr. Unscd. Bonds | | 6.15 | | 1/15/38 | | 165,000 | | 236,921 | |
Tennessee Valley Authority,
Sr. Unscd. Bonds | | 5.25 | | 9/15/39 | | 1,200,000 | a | 1,579,277 | |
| | 28,558,706 | |
U.S. Government Agencies Mortgage-Backed - 29.1% | | | | | |
Federal Home Loan Mortgage Corp. | | | |
2.00% | | | 100,000 | e,f | 98,000 | |
2.50% | | | 1,425,000 | e,f | 1,430,790 | |
3.00% | | | 8,225,000 | e,f | 8,247,933 | |
3.50% | | | 12,050,000 | e,f | 12,386,710 | |
4.00% | | | 3,225,000 | e,f | 3,383,821 | |
2.00%, 8/1/28-1/1/29 | | | 700,353 | e | 689,677 | |
2.08%, 12/25/19 | | | 247,602 | e | 248,095 | |
2.50%, 10/1/27-2/1/47 | | | 7,964,595 | e | 8,001,487 | |
2.87%, 12/25/21 | | | 850,000 | e | 870,303 | |
3.00%, 9/1/21-1/1/47 | | | 25,029,633 | e | 25,299,634 | |
3.02%, 2/25/23 | | | 406,343 | e | 416,244 | |
3.06%, 12/25/24 | | | 648,000 | e | 670,021 | |
3.38%, 8/1/34, 1 Yr T Note Constant + 2.25% | | | 1,417 | c,e | 1,495 | |
3.50%, 1/1/21-4/1/47 | | | 19,369,769 | e | 19,994,958 | |
4.00%, 5/1/18-5/1/47 | | | 14,517,959 | e | 15,277,373 | |
4.50%, 4/1/18-4/1/47 | | | 6,930,685 | e | 7,412,482 | |
5.00%, 11/1/18-11/1/39 | | | 3,918,033 | e | 4,237,906 | |
5.50%, 10/1/20-1/1/40 | | | 1,853,841 | e | 2,052,951 | |
6.00%, 6/1/22-7/1/39 | | | 1,090,757 | e | 1,234,131 | |
6.50%, 3/1/19-11/1/37 | | | 287,479 | e | 319,953 | |
7.00%, 6/1/21-7/1/37 | | | 112,539 | e | 125,299 | |
7.50%, 2/1/23-11/1/33 | | | 23,078 | e | 25,324 | |
8.00%, 7/1/20-10/1/31 | | | 13,315 | e | 15,104 | |
8.50%, 6/1/30 | | | 438 | e | 512 | |
Federal National Mortgage Association | | | |
2.50% | | | 4,125,000 | e,f | 4,142,419 | |
3.00% | | | 8,975,000 | e,f | 8,997,510 | |
3.50% | | | 19,200,000 | e,f | 19,732,261 | |
4.00% | | | 8,150,000 | e,f | 8,551,773 | |
2.00%, 7/1/28-3/1/32 | | | 1,407,083 | e | 1,389,959 | |
2.50%, 7/1/27-2/1/47 | | | 8,531,493 | e | 8,558,566 | |
49
STATEMENT OF INVESTMENTS (continued)
| | | | | | | | | |
| |
Description | Coupon
Rate (%) | | Maturity
Date | | Principal
Amount ($) | | Value ($) | |
Bonds and Notes - 100.5% (continued) | | | | | |
U.S. Government Agencies Mortgage-Backed - 29.1% (continued) | | | | | |
3.00%, 10/1/26-5/1/47 | | | 40,971,395 | e | 41,412,168 | |
3.34%, 11/1/35, 1 Yr LIBOR + .18% | | | 88 | c,e | 92 | |
3.50%, 8/1/25-12/1/46 | | | 29,598,523 | e | 30,557,833 | |
3.66%, 11/25/20 | | | 788,401 | e | 809,065 | |
3.72%, 6/1/35, 1 Yr LIBOR + .18% | | | 222 | c,e | 225 | |
4.00%, 2/1/24-4/1/47 | | | 24,913,729 | e | 26,220,485 | |
4.50%, 4/1/18-12/1/46 | | | 11,723,768 | e | 12,566,684 | |
5.00%, 11/1/17-1/1/44 | | | 5,059,294 | e | 5,486,433 | |
5.50%, 11/1/17-2/1/42 | | | 3,202,809 | e | 3,543,779 | |
6.00%, 1/1/23-11/1/38 | | | 1,721,480 | e | 1,946,770 | |
6.50%, 10/1/21-12/1/37 | | | 529,922 | e | 594,030 | |
7.00%, 8/1/23-3/1/38 | | | 145,546 | e | 164,404 | |
7.50%, 4/1/26-6/1/31 | | | 33,259 | e | 36,325 | |
8.00%, 3/1/22-8/1/30 | | | 8,493 | e | 9,381 | |
8.50%, 7/1/30 | | | 267 | e | 314 | |
9.00%, 10/1/30 | | | 1,870 | e | 1,942 | |
Government National Mortgage Association I | | | |
2.50%, 2/15/28-3/15/43 | | | 478,397 | | 475,776 | |
3.00%, 9/15/42-8/15/45 | | | 1,907,424 | | 1,935,156 | |
3.50%, 2/15/26-8/15/45 | | | 1,728,921 | | 1,800,157 | |
4.00%, 2/15/41-9/15/45 | | | 2,196,979 | | 2,329,429 | |
4.50%, 1/15/19-2/15/41 | | | 2,376,132 | | 2,537,762 | |
5.00%, 7/15/33-4/15/40 | | | 3,222,450 | | 3,520,253 | |
5.50%, 9/15/20-11/15/38 | | | 1,189,972 | | 1,328,090 | |
6.00%, 1/15/29-9/15/38 | | | 608,888 | | 688,006 | |
6.50%, 2/15/24-8/15/38 | | | 238,489 | | 272,790 | |
7.00%, 10/15/27-8/15/32 | | | 53,226 | | 59,775 | |
7.50%, 12/15/23-11/15/30 | | | 44,160 | | 45,842 | |
8.00%, 8/15/24-3/15/32 | | | 11,927 | | 14,114 | |
8.25%, 6/15/27 | | | 1,084 | | 1,171 | |
8.50%, 10/15/26 | | | 7,556 | | 8,313 | |
9.00%, 2/15/22-2/15/23 | | | 5,703 | | 5,749 | |
Government National Mortgage Association II | | | |
3.00% | | | 23,850,000 | f | 24,129,491 | |
3.50% | | | 29,225,000 | f | 30,314,109 | |
4.00% | | | 8,700,000 | f | 9,135,041 | |
4.50% | | | 600,000 | f | 635,883 | |
2.50%, 3/20/27-3/20/47 | | | 1,347,795 | | 1,334,711 | |
3.00%, 11/20/27-1/20/47 | | | 7,525,913 | | 7,673,211 | |
3.50%, 9/20/28-8/20/46 | | | 12,303,280 | | 12,801,886 | |
4.00%, 9/20/43-2/20/47 | | | 8,570,648 | | 9,057,973 | |
4.50%, 7/20/41-1/20/46 | | | 4,852,828 | | 5,169,243 | |
50
| | | | | | | | | | |
| |
Description | Coupon
Rate (%) | | Maturity
Date | | Principal
Amount ($) | | Value ($) | |
Bonds and Notes - 100.5% (continued) | | | | | |
U.S. Government Agencies Mortgage-Backed - 29.1% (continued) | | | | | |
5.00%, 1/20/39-10/20/45 | | | 2,618,800 | | 2,825,538 | |
5.50%, 10/20/31-10/20/44 | | | 1,374,918 | | 1,512,766 | |
6.50%, 2/20/28 | | | 497 | | 572 | |
8.50%, 7/20/25 | | | 254 | | 276 | |
| | 406,775,704 | |
U.S. Government Securities - 36.6% | | | | | |
U.S. Treasury Bonds | | 8.88 | | 2/15/19 | | 720,000 | | 788,272 | |
U.S. Treasury Bonds | | 8.75 | | 8/15/20 | | 470,000 | | 560,585 | |
U.S. Treasury Bonds | | 8.13 | | 5/15/21 | | 190,000 | a | 231,229 | |
U.S. Treasury Bonds | | 7.25 | | 8/15/22 | | 500,000 | a | 620,059 | |
U.S. Treasury Bonds | | 6.25 | | 8/15/23 | | 2,000,000 | | 2,453,008 | |
U.S. Treasury Bonds | | 7.50 | | 11/15/24 | | 1,610,000 | | 2,166,519 | |
U.S. Treasury Bonds | | 6.88 | | 8/15/25 | | 1,000,000 | a | 1,331,699 | |
U.S. Treasury Bonds | | 5.50 | | 8/15/28 | | 1,000,000 | | 1,296,758 | |
U.S. Treasury Bonds | | 5.25 | | 11/15/28 | | 1,350,000 | a | 1,724,704 | |
U.S. Treasury Bonds | | 5.38 | | 2/15/31 | | 1,340,000 | a | 1,785,864 | |
U.S. Treasury Bonds | | 4.75 | | 2/15/37 | | 870,000 | | 1,150,099 | |
U.S. Treasury Bonds | | 5.00 | | 5/15/37 | | 1,470,000 | | 2,000,549 | |
U.S. Treasury Bonds | | 4.38 | | 2/15/38 | | 335,000 | | 423,965 | |
U.S. Treasury Bonds | | 4.50 | | 5/15/38 | | 1,920,000 | | 2,470,650 | |
U.S. Treasury Bonds | | 3.50 | | 2/15/39 | | 780,000 | | 878,155 | |
U.S. Treasury Bonds | | 4.63 | | 2/15/40 | | 780,000 | a | 1,023,095 | |
U.S. Treasury Bonds | | 3.88 | | 8/15/40 | | 1,160,000 | | 1,375,212 | |
U.S. Treasury Bonds | | 4.75 | | 2/15/41 | | 2,530,000 | | 3,386,889 | |
U.S. Treasury Bonds | | 3.75 | | 8/15/41 | | 1,900,000 | | 2,214,131 | |
U.S. Treasury Bonds | | 3.13 | | 2/15/42 | | 4,000,000 | | 4,217,969 | |
U.S. Treasury Bonds | | 2.75 | | 8/15/42 | | 1,270,000 | | 1,251,471 | |
U.S. Treasury Bonds | | 2.75 | | 11/15/42 | | 2,182,000 | | 2,147,778 | |
U.S. Treasury Bonds | | 3.13 | | 2/15/43 | | 1,170,000 | | 1,230,442 | |
U.S. Treasury Bonds | | 2.88 | | 5/15/43 | | 3,057,000 | a | 3,072,106 | |
U.S. Treasury Bonds | | 3.63 | | 8/15/43 | | 3,535,000 | | 4,042,604 | |
U.S. Treasury Bonds | | 3.75 | | 11/15/43 | | 2,025,000 | | 2,365,216 | |
U.S. Treasury Bonds | | 3.63 | | 2/15/44 | | 3,070,000 | | 3,515,270 | |
U.S. Treasury Bonds | | 3.38 | | 5/15/44 | | 4,490,000 | | 4,931,809 | |
U.S. Treasury Bonds | | 3.13 | | 8/15/44 | | 3,275,000 | | 3,442,844 | |
U.S. Treasury Bonds | | 3.00 | | 11/15/44 | | 3,760,000 | | 3,861,197 | |
U.S. Treasury Bonds | | 2.50 | | 2/15/45 | | 3,605,000 | | 3,351,946 | |
U.S. Treasury Bonds | | 3.00 | | 5/15/45 | | 3,740,000 | | 3,836,860 | |
U.S. Treasury Bonds | | 2.88 | | 8/15/45 | | 4,720,000 | | 4,724,056 | |
U.S. Treasury Bonds | | 2.50 | | 2/15/46 | | 700,000 | | 648,621 | |
U.S. Treasury Bonds | | 2.50 | | 5/15/46 | | 4,040,000 | | 3,739,527 | |
U.S. Treasury Bonds | | 2.25 | | 8/15/46 | | 4,075,000 | a | 3,570,243 | |
51
STATEMENT OF INVESTMENTS (continued)
| | | | | | | | | | |
| |
Description | Coupon
Rate (%) | | Maturity
Date | | Principal
Amount ($) | | Value ($) | |
Bonds and Notes - 100.5% (continued) | | | | | |
U.S. Government Securities - 36.6% (continued) | | | | | |
U.S. Treasury Bonds | | 2.88 | | 11/15/46 | | 3,000,000 | | 2,998,301 | |
U.S. Treasury Bonds | | 3.00 | | 2/15/47 | | 950,000 | | 973,175 | |
U.S. Treasury Bonds | | 3.00 | | 5/15/47 | | 2,685,000 | a | 2,750,499 | |
U.S. Treasury Bonds | | 2.75 | | 8/15/47 | | 2,865,000 | | 2,791,249 | |
U.S. Treasury Notes | | 1.25 | | 11/15/18 | | 3,976,000 | | 3,966,060 | |
U.S. Treasury Notes | | 3.75 | | 11/15/18 | | 2,570,000 | | 2,629,130 | |
U.S. Treasury Notes | | 1.00 | | 11/30/18 | | 3,230,000 | a | 3,213,156 | |
U.S. Treasury Notes | | 1.25 | | 11/30/18 | | 3,000,000 | a | 2,992,207 | |
U.S. Treasury Notes | | 1.38 | | 11/30/18 | | 942,000 | | 940,841 | |
U.S. Treasury Notes | | 1.25 | | 12/31/18 | | 3,230,000 | a | 3,220,789 | |
U.S. Treasury Notes | | 1.38 | | 12/31/18 | | 3,730,000 | | 3,724,390 | |
U.S. Treasury Notes | | 1.13 | | 1/31/19 | | 3,240,000 | a | 3,224,686 | |
U.S. Treasury Notes | | 1.25 | | 1/31/19 | | 2,090,000 | | 2,083,550 | |
U.S. Treasury Notes | | 1.50 | | 1/31/19 | | 2,000,000 | | 1,999,688 | |
U.S. Treasury Notes | | 2.75 | | 2/15/19 | | 4,170,000 | a | 4,235,401 | |
U.S. Treasury Notes | | 1.38 | | 2/28/19 | | 3,068,000 | | 3,062,307 | |
U.S. Treasury Notes | | 1.50 | | 2/28/19 | | 3,910,000 | | 3,908,702 | |
U.S. Treasury Notes | | 1.25 | | 3/31/19 | | 2,730,000 | | 2,719,496 | |
U.S. Treasury Notes | | 1.63 | | 3/31/19 | | 4,200,000 | | 4,205,824 | |
U.S. Treasury Notes | | 1.25 | | 4/30/19 | | 2,725,000 | | 2,713,397 | |
U.S. Treasury Notes | | 1.63 | | 4/30/19 | | 1,500,000 | | 1,501,934 | |
U.S. Treasury Notes | | 1.25 | | 5/31/19 | | 2,085,000 | a | 2,075,308 | |
U.S. Treasury Notes | | 1.50 | | 5/31/19 | | 4,155,000 | a | 4,151,592 | |
U.S. Treasury Notes | | 1.25 | | 6/30/19 | | 2,090,000 | a | 2,079,305 | |
U.S. Treasury Notes | | 1.63 | | 6/30/19 | | 1,300,000 | | 1,301,143 | |
U.S. Treasury Notes | | 0.75 | | 7/15/19 | | 2,445,000 | a | 2,411,620 | |
U.S. Treasury Notes | | 1.38 | | 7/31/19 | | 1,965,000 | a | 1,958,437 | |
U.S. Treasury Notes | | 1.63 | | 7/31/19 | | 1,100,000 | a | 1,100,945 | |
U.S. Treasury Notes | | 0.75 | | 8/15/19 | | 2,450,000 | a | 2,414,733 | |
U.S. Treasury Notes | | 3.63 | | 8/15/19 | | 1,900,000 | | 1,968,727 | |
U.S. Treasury Notes | | 1.00 | | 8/31/19 | | 2,010,000 | a | 1,988,958 | |
U.S. Treasury Notes | | 1.25 | | 8/31/19 | | 1,890,000 | | 1,878,593 | |
U.S. Treasury Notes | | 1.63 | | 8/31/19 | | 1,400,000 | a | 1,400,793 | |
U.S. Treasury Notes | | 1.38 | | 9/30/19 | | 1,905,000 | | 1,897,186 | |
U.S. Treasury Notes | | 1.75 | | 9/30/19 | | 3,190,000 | | 3,199,159 | |
U.S. Treasury Notes | | 1.00 | | 10/15/19 | | 4,100,000 | | 4,053,235 | |
U.S. Treasury Notes | | 1.25 | | 10/31/19 | | 1,000,000 | | 993,066 | |
U.S. Treasury Notes | | 1.50 | | 10/31/19 | | 4,450,000 | a | 4,441,309 | |
U.S. Treasury Notes | | 3.38 | | 11/15/19 | | 2,440,000 | a | 2,526,067 | |
U.S. Treasury Notes | | 1.50 | | 11/30/19 | | 2,465,000 | | 2,458,741 | |
U.S. Treasury Notes | | 1.13 | | 12/31/19 | | 2,990,000 | a | 2,958,406 | |
U.S. Treasury Notes | | 1.63 | | 12/31/19 | | 4,960,000 | | 4,959,515 | |
U.S. Treasury Notes | | 1.38 | | 1/15/20 | | 1,500,000 | | 1,491,445 | |
52
| | | | | | | | | | |
| |
Description | Coupon
Rate (%) | | Maturity
Date | | Principal
Amount ($) | | Value ($) | |
Bonds and Notes - 100.5% (continued) | | | | | |
U.S. Government Securities - 36.6% (continued) | | | | | |
U.S. Treasury Notes | | 1.25 | | 1/31/20 | | 5,255,000 | | 5,209,532 | |
U.S. Treasury Notes | | 1.38 | | 2/15/20 | | 2,020,000 | a | 2,007,493 | |
U.S. Treasury Notes | | 3.63 | | 2/15/20 | | 1,400,000 | | 1,462,316 | |
U.S. Treasury Notes | | 1.38 | | 2/29/20 | | 3,525,000 | a | 3,502,005 | |
U.S. Treasury Notes | | 1.63 | | 3/15/20 | | 3,020,000 | | 3,017,051 | |
U.S. Treasury Notes | | 1.38 | | 3/31/20 | | 995,000 | a | 988,023 | |
U.S. Treasury Notes | | 1.50 | | 4/15/20 | | 1,895,000 | | 1,886,709 | |
U.S. Treasury Notes | | 1.38 | | 4/30/20 | | 2,525,000 | | 2,506,062 | |
U.S. Treasury Notes | | 1.50 | | 5/15/20 | | 1,925,000 | a | 1,916,127 | |
U.S. Treasury Notes | | 3.50 | | 5/15/20 | | 3,770,000 | a | 3,941,049 | |
U.S. Treasury Notes | | 1.38 | | 5/31/20 | | 1,175,000 | a | 1,165,820 | |
U.S. Treasury Notes | | 1.50 | | 5/31/20 | | 3,110,000 | | 3,094,875 | |
U.S. Treasury Notes | | 1.50 | | 6/15/20 | | 1,930,000 | a | 1,920,388 | |
U.S. Treasury Notes | | 1.63 | | 6/30/20 | | 3,835,000 | | 3,827,060 | |
U.S. Treasury Notes | | 1.88 | | 6/30/20 | | 2,330,000 | | 2,340,649 | |
U.S. Treasury Notes | | 1.50 | | 7/15/20 | | 1,815,000 | | 1,805,003 | |
U.S. Treasury Notes | | 1.63 | | 7/31/20 | | 3,410,000 | a | 3,402,074 | |
U.S. Treasury Notes | | 2.00 | | 7/31/20 | | 3,360,000 | | 3,385,791 | |
U.S. Treasury Notes | | 1.50 | | 8/15/20 | | 1,745,000 | | 1,734,946 | |
U.S. Treasury Notes | | 2.63 | | 8/15/20 | | 5,000,000 | | 5,123,242 | |
U.S. Treasury Notes | | 1.38 | | 8/31/20 | | 600,000 | a | 594,293 | |
U.S. Treasury Notes | | 2.13 | | 8/31/20 | | 3,190,000 | | 3,225,202 | |
U.S. Treasury Notes | | 1.38 | | 9/15/20 | | 1,755,000 | a | 1,738,410 | |
U.S. Treasury Notes | | 1.38 | | 9/30/20 | | 3,095,000 | | 3,063,506 | |
U.S. Treasury Notes | | 2.00 | | 9/30/20 | | 1,745,000 | | 1,758,360 | |
U.S. Treasury Notes | | 1.63 | | 10/15/20 | | 1,675,000 | | 1,670,191 | |
U.S. Treasury Notes | | 1.38 | | 10/31/20 | | 2,525,000 | | 2,497,531 | |
U.S. Treasury Notes | | 2.63 | | 11/15/20 | | 1,700,000 | | 1,743,795 | |
U.S. Treasury Notes | | 1.63 | | 11/30/20 | | 2,525,000 | | 2,514,495 | |
U.S. Treasury Notes | | 2.00 | | 11/30/20 | | 2,868,000 | | 2,888,502 | |
U.S. Treasury Notes | | 1.75 | | 12/31/20 | | 4,355,000 | a | 4,351,002 | |
U.S. Treasury Notes | | 2.38 | | 12/31/20 | | 3,000,000 | | 3,055,078 | |
U.S. Treasury Notes | | 1.38 | | 1/31/21 | | 3,000,000 | | 2,960,332 | |
U.S. Treasury Notes | | 3.63 | | 2/15/21 | | 3,100,000 | | 3,281,580 | |
U.S. Treasury Notes | | 1.13 | | 2/28/21 | | 2,500,000 | | 2,444,971 | |
U.S. Treasury Notes | | 1.25 | | 3/31/21 | | 3,390,000 | | 3,326,769 | |
U.S. Treasury Notes | | 2.25 | | 3/31/21 | | 1,430,000 | | 1,450,417 | |
U.S. Treasury Notes | | 1.38 | | 4/30/21 | | 2,000,000 | | 1,969,336 | |
U.S. Treasury Notes | | 2.25 | | 4/30/21 | | 3,260,000 | | 3,306,353 | |
U.S. Treasury Notes | | 3.13 | | 5/15/21 | | 2,700,000 | | 2,820,076 | |
U.S. Treasury Notes | | 1.38 | | 5/31/21 | | 4,900,000 | | 4,820,949 | |
U.S. Treasury Notes | | 2.00 | | 5/31/21 | | 2,525,000 | | 2,538,858 | |
U.S. Treasury Notes | | 1.13 | | 7/31/21 | | 2,455,000 | | 2,389,549 | |
53
STATEMENT OF INVESTMENTS (continued)
| | | | | | | | | | |
| |
Description | Coupon
Rate (%) | | Maturity
Date | | Principal
Amount ($) | | Value ($) | |
Bonds and Notes - 100.5% (continued) | | | | | |
U.S. Government Securities - 36.6% (continued) | | | | | |
U.S. Treasury Notes | | 2.25 | | 7/31/21 | | 3,100,000 | a | 3,142,504 | |
U.S. Treasury Notes | | 2.13 | | 8/15/21 | | 2,925,000 | | 2,952,593 | |
U.S. Treasury Notes | | 1.13 | | 8/31/21 | | 3,450,000 | | 3,354,451 | |
U.S. Treasury Notes | | 1.13 | | 9/30/21 | | 3,000,000 | a | 2,913,400 | |
U.S. Treasury Notes | | 2.13 | | 9/30/21 | | 3,400,000 | | 3,430,016 | |
U.S. Treasury Notes | | 1.25 | | 10/31/21 | | 1,695,000 | | 1,652,923 | |
U.S. Treasury Notes | | 2.00 | | 10/31/21 | | 2,285,000 | | 2,293,970 | |
U.S. Treasury Notes | | 2.00 | | 11/15/21 | | 680,000 | | 682,975 | |
U.S. Treasury Notes | | 1.75 | | 11/30/21 | | 3,130,000 | | 3,110,193 | |
U.S. Treasury Notes | | 1.88 | | 11/30/21 | | 3,300,000 | a | 3,297,035 | |
U.S. Treasury Notes | | 2.00 | | 12/31/21 | | 1,875,000 | | 1,880,530 | |
U.S. Treasury Notes | | 2.13 | | 12/31/21 | | 1,265,000 | a | 1,275,229 | |
U.S. Treasury Notes | | 1.88 | | 1/31/22 | | 1,000,000 | | 997,383 | |
U.S. Treasury Notes | | 2.00 | | 2/15/22 | | 1,300,000 | | 1,303,986 | |
U.S. Treasury Notes | | 1.88 | | 2/28/22 | | 2,500,000 | | 2,492,627 | |
U.S. Treasury Notes | | 1.75 | | 3/31/22 | | 3,770,000 | | 3,736,571 | |
U.S. Treasury Notes | | 1.88 | | 3/31/22 | | 4,480,000 | | 4,463,550 | |
U.S. Treasury Notes | | 1.88 | | 4/30/22 | | 3,635,000 | | 3,619,168 | |
U.S. Treasury Notes | | 1.75 | | 5/31/22 | | 2,525,000 | | 2,499,997 | |
U.S. Treasury Notes | | 1.75 | | 6/30/22 | | 3,800,000 | | 3,759,328 | |
U.S. Treasury Notes | | 2.13 | | 6/30/22 | | 2,500,000 | | 2,514,648 | |
U.S. Treasury Notes | | 1.88 | | 7/31/22 | | 4,500,000 | | 4,473,633 | |
U.S. Treasury Notes | | 2.00 | | 7/31/22 | | 5,000,000 | a | 5,000,390 | |
U.S. Treasury Notes | | 1.63 | | 8/15/22 | | 55,000 | a | 54,090 | |
U.S. Treasury Notes | | 1.63 | | 8/31/22 | | 3,835,000 | | 3,767,663 | |
U.S. Treasury Notes | | 1.88 | | 8/31/22 | | 1,000,000 | a | 993,633 | |
U.S. Treasury Notes | | 1.75 | | 9/30/22 | | 4,215,000 | | 4,161,324 | |
U.S. Treasury Notes | | 1.88 | | 9/30/22 | | 2,490,000 | | 2,473,659 | |
U.S. Treasury Notes | | 1.88 | | 10/31/22 | | 1,910,000 | | 1,896,123 | |
U.S. Treasury Notes | | 2.00 | | 10/31/22 | | 50,000 | | 49,966 | |
U.S. Treasury Notes | | 1.63 | | 11/15/22 | | 65,000 | | 63,770 | |
U.S. Treasury Notes | | 2.00 | | 11/30/22 | | 4,490,000 | | 4,482,984 | |
U.S. Treasury Notes | | 2.13 | | 12/31/22 | | 5,000,000 | | 5,018,847 | |
U.S. Treasury Notes | | 1.75 | | 1/31/23 | | 3,700,000 | | 3,642,549 | |
U.S. Treasury Notes | | 2.00 | | 2/15/23 | | 3,715,000 | | 3,703,028 | |
U.S. Treasury Notes | | 1.63 | | 4/30/23 | | 2,500,000 | | 2,439,599 | |
U.S. Treasury Notes | | 1.75 | | 5/15/23 | | 3,710,000 | | 3,643,336 | |
U.S. Treasury Notes | | 2.50 | | 8/15/23 | | 2,000,000 | a | 2,042,539 | |
U.S. Treasury Notes | | 1.38 | | 9/30/23 | | 3,000,000 | a | 2,873,908 | |
U.S. Treasury Notes | | 1.63 | | 10/31/23 | | 1,400,000 | | 1,359,887 | |
U.S. Treasury Notes | | 2.75 | | 11/15/23 | | 4,585,000 | | 4,744,759 | |
U.S. Treasury Notes | | 2.13 | | 11/30/23 | | 3,500,000 | | 3,496,924 | |
U.S. Treasury Notes | | 2.25 | | 12/31/23 | | 1,490,000 | | 1,498,003 | |
54
| | | | | | | | | | |
| |
Description | Coupon
Rate (%) | | Maturity
Date | | Principal
Amount ($) | | Value ($) | |
Bonds and Notes - 100.5% (continued) | | | | | |
U.S. Government Securities - 36.6% (continued) | | | | | |
U.S. Treasury Notes | | 2.25 | | 1/31/24 | | 1,065,000 | | 1,069,971 | |
U.S. Treasury Notes | | 2.75 | | 2/15/24 | | 2,780,000 | | 2,874,477 | |
U.S. Treasury Notes | | 2.13 | | 2/29/24 | | 2,010,000 | | 2,003,915 | |
U.S. Treasury Notes | | 2.13 | | 3/31/24 | | 2,940,000 | | 2,929,032 | |
U.S. Treasury Notes | | 2.00 | | 4/30/24 | | 1,960,000 | a | 1,937,299 | |
U.S. Treasury Notes | | 2.50 | | 5/15/24 | | 2,290,000 | | 2,332,356 | |
U.S. Treasury Notes | | 2.00 | | 5/31/24 | | 2,245,000 | | 2,217,551 | |
U.S. Treasury Notes | | 2.00 | | 6/30/24 | | 2,255,000 | | 2,226,064 | |
U.S. Treasury Notes | | 2.13 | | 7/31/24 | | 2,120,000 | | 2,108,365 | |
U.S. Treasury Notes | | 2.38 | | 8/15/24 | | 1,655,000 | | 1,671,453 | |
U.S. Treasury Notes | | 1.88 | | 8/31/24 | | 2,035,000 | a | 1,991,041 | |
U.S. Treasury Notes | | 2.13 | | 9/30/24 | | 1,000,000 | | 993,613 | |
U.S. Treasury Notes | | 2.25 | | 10/31/24 | | 1,950,000 | | 1,952,590 | |
U.S. Treasury Notes | | 2.25 | | 11/15/24 | | 4,015,000 | | 4,018,450 | |
U.S. Treasury Notes | | 2.00 | | 2/15/25 | | 4,560,000 | | 4,480,823 | |
U.S. Treasury Notes | | 2.13 | | 5/15/25 | | 2,800,000 | | 2,771,617 | |
U.S. Treasury Notes | | 2.00 | | 8/15/25 | | 7,880,000 | | 7,717,321 | |
U.S. Treasury Notes | | 2.25 | | 11/15/25 | | 7,000,000 | | 6,973,066 | |
U.S. Treasury Notes | | 1.63 | | 2/15/26 | | 5,000,000 | | 4,738,183 | |
U.S. Treasury Notes | | 1.63 | | 5/15/26 | | 3,880,000 | | 3,667,737 | |
U.S. Treasury Notes | | 1.50 | | 8/15/26 | | 3,865,000 | | 3,607,134 | |
U.S. Treasury Notes | | 2.00 | | 11/15/26 | | 5,230,000 | | 5,079,944 | |
U.S. Treasury Notes | | 2.25 | | 2/15/27 | | 5,350,000 | | 5,298,485 | |
U.S. Treasury Notes | | 2.38 | | 5/15/27 | | 6,305,000 | a | 6,308,079 | |
U.S. Treasury Notes | | 2.25 | | 8/15/27 | | 3,525,000 | a | 3,486,377 | |
| | 511,748,870 | |
Utilities - 1.9% | | | | | |
AEP Texas Central Transition Funding II,
Sr. Scd. Bonds, Ser. A-4 | | 5.17 | | 1/1/20 | | 40,024 | | 40,258 | |
Alabama Power,
Sr. Unscd. Notes | | 3.75 | | 3/1/45 | | 500,000 | | 509,924 | |
American Water Capital,
Sr. Unscd. Notes | | 3.85 | | 3/1/24 | | 250,000 | | 264,690 | |
American Water Capital,
Sr. Unscd. Notes | | 3.75 | | 9/1/47 | | 110,000 | | 111,205 | |
Atmos Energy,
Sr. Unscd. Notes | | 4.13 | | 10/15/44 | | 700,000 | | 744,182 | |
Berkshire Hathaway Energy,
Sr. Unscd. Bonds | | 6.13 | | 4/1/36 | | 500,000 | | 656,365 | |
Berkshire Hathaway Energy,
Sr. Unscd. Notes | | 5.15 | | 11/15/43 | | 250,000 | | 297,294 | |
Commonwealth Edison,
First Mortgage Bonds | | 2.15 | | 1/15/19 | | 750,000 | | 752,662 | |
55
STATEMENT OF INVESTMENTS (continued)
| | | | | | | | | | |
| |
Description | Coupon
Rate (%) | | Maturity
Date | | Principal
Amount ($) | | Value ($) | |
Bonds and Notes - 100.5% (continued) | | | | | |
Utilities - 1.9% (continued) | | | | | |
Commonwealth Edison,
First Mortgage Bonds | | 5.90 | | 3/15/36 | | 471,000 | | 607,797 | |
Consolidated Edison of New York,
Sr. Unscd. Debs., Ser. 06-B | | 6.20 | | 6/15/36 | | 200,000 | | 263,862 | |
Consolidated Edison of New York,
Sr. Unscd. Notes | | 4.30 | | 12/1/56 | | 450,000 | | 485,301 | |
Dominion Energy,
Sr. Unscd. Notes | | 4.05 | | 9/15/42 | | 400,000 | | 402,279 | |
Dominion Energy,
Sr. Unscd. Notes, Ser. B | | 2.75 | | 9/15/22 | | 500,000 | | 501,913 | |
Dominion Energy,
Sr. Unscd. Notes, Ser. E | | 6.30 | | 3/15/33 | | 100,000 | | 125,801 | |
DTE Electric,
Mortgage Bonds | | 3.38 | | 3/1/25 | | 500,000 | | 515,668 | |
DTE Electric,
Sr. Scd. Notes | | 3.45 | | 10/1/20 | | 350,000 | | 363,165 | |
Duke Energy,
Sr. Unscd. Notes | | 3.75 | | 4/15/24 | | 500,000 | | 523,469 | |
Duke Energy Carolinas,
First Mortgage Bonds | | 3.90 | | 6/15/21 | | 400,000 | | 421,683 | |
Duke Energy Carolinas,
First Mortgage Bonds | | 4.00 | | 9/30/42 | | 250,000 | | 263,704 | |
Duke Energy Florida,
First Mortgage Bonds | | 6.40 | | 6/15/38 | | 150,000 | | 207,017 | |
Duke Energy Florida,
First Mortgage Bonds | | 3.40 | | 10/1/46 | | 300,000 | | 286,559 | |
Emera US Finance,
Gtd. Notes | | 4.75 | | 6/15/46 | | 250,000 | | 271,473 | |
Enel Generacion Chile,
Sr. Unscd. Notes | | 4.25 | | 4/15/24 | | 500,000 | | 528,822 | |
Exelon Generation,
Sr. Unscd. Notes | | 5.20 | | 10/1/19 | | 500,000 | | 528,696 | |
Exelon Generation,
Sr. Unscd. Notes | | 6.25 | | 10/1/39 | | 400,000 | | 454,224 | |
FirstEnergy,
Sr. Unscd. Notes | | 4.85 | | 7/15/47 | | 150,000 | | 162,237 | |
Florida Power & Light Co.,
First Mortgage Bonds | | 4.05 | | 10/1/44 | | 400,000 | | 434,563 | |
Georgia Power,
Sr. Unscd. Notes | | 3.25 | | 4/1/26 | | 500,000 | | 501,417 | |
Georgia Power,
Sr. Unscd. Notes | | 3.25 | | 3/30/27 | | 1,000,000 | | 1,004,699 | |
Hydro-Quebec,
Gov't Gtd. Debs., Ser. HH | | 8.50 | | 12/1/29 | | 400,000 | | 595,835 | |
Hydro-Quebec,
Gov't Gtd. Debs., Ser. HK | | 9.38 | | 4/15/30 | | 20,000 | | 31,555 | |
56
| | | | | | | | | | |
| |
Description | Coupon
Rate (%) | | Maturity
Date | | Principal
Amount ($) | | Value ($) | |
Bonds and Notes - 100.5% (continued) | | | | | |
Utilities - 1.9% (continued) | | | | | |
Indiana Michigan Power,
Sr. Unscd. Notes | | 6.05 | | 3/15/37 | | 300,000 | | 382,717 | |
Interstate Power & Light,
Sr. Unscd. Debs. | | 3.70 | | 9/15/46 | | 300,000 | | 291,139 | |
Nevada Power,
Mortgage Notes | | 7.13 | | 3/15/19 | | 550,000 | | 587,907 | |
Nevada Power,
Mortgage Notes, Ser. R | | 6.75 | | 7/1/37 | | 400,000 | | 554,946 | |
NextEra Energy Capital Holdings,
Gtd. Debs. | | 2.40 | | 9/15/19 | | 500,000 | | 502,955 | |
Oncor Electric Delivery,
Sr. Scd. Debs. | | 7.00 | | 9/1/22 | | 170,000 | | 203,415 | |
Oncor Electric Delivery,
Sr. Scd. Notes | | 7.00 | | 5/1/32 | | 250,000 | | 346,862 | |
Pacific Gas & Electric,
Sr. Unscd. Bonds | | 6.05 | | 3/1/34 | | 465,000 | | 579,527 | |
Pacific Gas & Electric,
Sr. Unscd. Notes | | 6.25 | | 3/1/39 | | 400,000 | | 522,712 | |
Pacific Gas & Electric,
Sr. Unscd. Notes | | 4.75 | | 2/15/44 | | 500,000 | | 561,759 | |
PPL Capital Funding,
Gtd. Notes | | 3.40 | | 6/1/23 | | 400,000 | | 412,344 | |
PPL Electric Utilities,
First Mortgage Bonds | | 4.75 | | 7/15/43 | | 500,000 | | 577,201 | |
Progress Energy,
Sr. Unscd. Notes | | 7.75 | | 3/1/31 | | 480,000 | | 676,609 | |
Public Service Company of Colorado,
First Mortgage Bonds | | 3.20 | | 11/15/20 | | 750,000 | | 772,180 | |
San Diego Gas & Electric,
First Mortgage Bonds, Ser. NNN | | 3.60 | | 9/1/23 | | 400,000 | | 420,528 | |
Sempra Energy,
Sr. Unscd. Notes | | 2.88 | | 10/1/22 | | 1,000,000 | | 1,009,372 | |
South Carolina Electric & Gas,
First Mortgage Bonds | | 6.63 | | 2/1/32 | | 200,000 | | 252,761 | |
South Carolina Electric & Gas,
First Mortgage Bonds | | 4.50 | | 6/1/64 | | 250,000 | | 249,367 | |
Southern,
Sr. Unscd. Notes | | 1.85 | | 7/1/19 | | 350,000 | | 349,449 | |
Southern,
Sr. Unscd. Notes | | 2.35 | | 7/1/21 | | 640,000 | | 637,118 | |
Southern California Edison,
First Mortgage Bonds | | 3.88 | | 6/1/21 | | 400,000 | | 422,023 | |
Southern California Edison,
First Mortgage Notes, Ser. 08-A | | 5.95 | | 2/1/38 | | 70,000 | | 92,392 | |
Southern California Edison,
Sr. Unscd. Notes | | 6.65 | | 4/1/29 | | 450,000 | | 583,725 | |
57
STATEMENT OF INVESTMENTS (continued)
| | | | | | | | | | |
| |
Description | Coupon
Rate (%) | | Maturity
Date | | Principal
Amount ($) | | Value ($) | |
Bonds and Notes - 100.5% (continued) | | | | | |
Utilities - 1.9% (continued) | | | | | |
Southern California Gas,
First Mortgage Bonds | | 3.15 | | 9/15/24 | | 500,000 | | 511,648 | |
Southern Co. Gas Capital,
Gtd. Notes | | 3.50 | | 9/15/21 | | 193,000 | | 199,309 | |
Southwestern Public Service,
First Mortgage Bonds | | 3.40 | | 8/15/46 | | 350,000 | | 331,871 | |
Tampa Electric,
Sr. Unscd. Notes | | 4.35 | | 5/15/44 | | 250,000 | | 265,268 | |
Toledo Edison,
Sr. Scd. Notes | | 6.15 | | 5/15/37 | | 200,000 | | 253,895 | |
Virginia Electric & Power,
Sr. Unscd. Notes | | 4.00 | | 1/15/43 | | 500,000 | | 523,926 | |
Washington Gas Light Co.,
Sr. Unscd. Notes | | 3.80 | | 9/15/46 | | 500,000 | | 502,855 | |
WEC Energy Group,
Sr. Unscd. Bonds | | 3.55 | | 6/15/25 | | 140,000 | | 144,879 | |
Xcel Energy,
Sr. Unscd. Notes | | 6.50 | | 7/1/36 | | 200,000 | | 267,599 | |
| | 26,848,577 | |
Total Bonds and Notes
(cost $1,384,527,387) | | 1,404,087,720 | |
Description | | | | | Shares | | Value ($) | |
Other Investment - 9.2% | | | | | |
Registered Investment Company; | | | | | |
Dreyfus Institutional Preferred Government Plus Money Market Fund
(cost $128,121,390) | | | | | | 128,121,390 | g | 128,121,390 | |
58
| | | | | | | | | | |
| |
Description | | | | | Shares | | Value ($) | |
Investment of Cash Collateral for Securities Loaned - .8% | | | | | |
Registered Investment Company; | | | | | |
Dreyfus Institutional Preferred Government Money Market Fund, Institutional Shares
(cost $10,441,693) | | | | | | 10,441,693 | g | 10,441,693 | |
Total Investments (cost $1,523,090,470) | | 110.5% | 1,542,650,803 | |
Liabilities, Less Cash and Receivables | | (10.5%) | (146,103,491) | |
Net Assets | | 100.0% | 1,396,547,312 | |
GO—General Obligation
LIBOR—London Interbank Offered Rate
REIT—Real Estate Investment Trust
a Security, or portion thereof, on loan. At October 31, 2017, the value of the fund’s securities on loan was $111,908,986 and the value of the collateral held by the fund was $120,377,499, consisting of cash collateral of $10,441,693 and U.S. Government & Agency securities valued at $109,935,806.
b Security exempt from registration pursuant to Rule 144A under the Securities Act of 1933. These securities may be resold in transactions exempt from registration, normally to qualified institutional buyers. At October 31, 2017, these securities were valued at $9,739,388 or .7% of net assets.
c Variable rate security—rate shown is the interest rate in effect at period end.
d Security issued with a zero coupon. Income is recognized through the accretion of discount.
e The Federal Housing Finance Agency (“FHFA”) placed the Federal Home Loan Mortgage Corporation and Federal National Mortgage Association into conservatorship with FHFA as the conservator. As such, the FHFA oversees the continuing affairs of these companies.
f Purchased on a forward commitment basis.
g Investment in affiliated money market mutual fund.
| | |
Portfolio Summary (Unaudited) † | Value (%) |
U.S. Government & Agencies | 67.8 |
Corporate Bonds | 26.1 |
Money Market Investments | 10.0 |
Foreign/Governmental | 4.2 |
Commercial Mortgage-Backed | 1.3 |
Municipal Bonds | .6 |
Asset-Backed | .5 |
| | 110.5 |
† Based on net assets.
See notes to financial statements.
59
Statement of TBA Sale Commitments
October 31, 2017
| | | | | | | | | | | |
| |
Bonds and Notes-.9% | | Coupon Rate (%) | | Maturity Date | | Principal Amount ($) | | Value ($) | |
Federal Home Loan Mortgage Corp.-.2% | | | | | |
Federal Home Loan Mortgage Corp. | | 5.00 | | 11/19/22 | | 625,000 | a,b | 635,718 | |
Federal Home Loan Mortgage Corp. | | 4.50 | | 11/1/18 | | 600,000 | a,b | 610,945 | |
Federal Home Loan Mortgage Corp. | | 5.00 | | 11/1/38 | | 500,000 | a,b | 540,873 | |
Federal Home Loan Mortgage Corp. | | 5.50 | | 12/1/47 | | 100,000 | a,b | 109,863 | |
Federal Home Loan Mortgage Corp. | | 4.50 | | 11/1/47 | | 100,000 | a,b | 106,809 | |
| | 2,004,208 | |
Federal National Mortgage Association-.3% | | | | | |
Federal National Mortgage Association | | 4.00 | | 11/18/29 | | 2,050,000 | a,b | 2,117,346 | |
Federal National Mortgage Association | | 4.50 | | 11/18/29 | | 1,025,000 | a,b | 1,041,456 | |
Federal National Mortgage Association | | 5.50 | | 11/1/29 | | 200,000 | a,b | 202,023 | |
Federal National Mortgage Association | | 5.00 | | 11/1/17 | | 300,000 | a,b | 304,441 | |
Federal National Mortgage Association | | 4.50 | | 11/12/45 | | 125,000 | a,b | 133,628 | |
Federal National Mortgage Association | | 5.00 | | 11/13/44 | | 600,000 | a,b | 651,609 | |
Federal National Mortgage Association | | 2.50 | | 11/1/47 | | 100,000 | a,b | 96,512 | |
Federal National Mortgage Association | | 3.50 | | 11/1/32 | | 200,000 | a,b | 207,742 | |
| | 4,754,757 | |
Government National Mortgage Association-.4% | | | | | |
Government National Mortgage Association | | 5.00 | | 11/1/33 | | 2,000,000 | b | 2,168,281 | |
Government National Mortgage Association | | 5.50 | | 11/15/32 | | 1,100,000 | b | 1,217,374 | |
Government National Mortgage Association | | 5.00 | | 11/1/47 | | 800,000 | b | 859,063 | |
Government National Mortgage Association | | 5.50 | | 11/1/47 | | 700,000 | b | 760,037 | |
Government National Mortgage Association | | 3.00 | | 11/1/47 | | 150,000 | b | 151,749 | |
| | 5,156,504 | |
Total Sale Commitments (proceeds $11,921,859) | | 11,915,469 | |
a The Federal Housing Finance Agency (“FHFA”) placed the Federal Home Loan Mortgage Corporation and Federal National Mortgage Association into conservatorship with FHFA as the conservator. As such, the FHFA oversees the continuing affairs of these companies.
b Sold on a delayed delivery basis.
See notes to financial statements.
60
STATEMENT OF INVESTMENTS IN AFFILIATED ISSUERS
| | | | | | | |
Registered Investment Companies | Value
10/31/16($) | Purchases($) | Sales ($) | Value
10/31/17($) | Net
Assets(%) | Dividends/
Distributions($) |
Dreyfus Institutional Preferred Government Plus Money Market Fund | 190,298,652 | 874,702,763 | 936,880,025 | 128,121,390 | 9.2 | 1,062,848 |
Dreyfus Institutional Preferred Government Money Market Fund, Institutional Shares | 18,933,078 | 108,980,658 | 117,472,043 | 10,441,693 | .8 | – |
Total | 209,231,730 | 983,683,421 | 1,054,352,068 | 138,563,083 | 10.0 | 1,062,848 |
See notes to financial statements.
61
STATEMENT OF ASSETS AND LIABILITIES
October 31, 2017
| | | | | | | |
| | | | | | |
| | | Cost | | Value | |
Assets ($): | | | | |
Investments in securities—See Statement of Investments
(including securities on loan, valued at $111,908,986)—Note 1(b): | | | |
Unaffiliated issuers | 1,384,527,387 | | 1,404,087,720 | |
Affiliated issuers | | 138,563,083 | | 138,563,083 | |
Cash | | | | | 1,259,798 | |
Receivable for investment securities sold | | 13,185,088 | |
Receivable for TBA sale commitments—Note 4 | | 11,921,859 | |
Dividends, interest and securities lending income receivable | | 8,435,480 | |
Receivable for shares of Common Stock subscribed | | 942,786 | |
| | | | | 1,578,395,814 | |
Liabilities ($): | | | | |
Due to The Dreyfus Corporation and affiliates—Note 3(b) | | | | | 276,767 | |
Payable for open mortgage dollar roll transactions—Note 4 | | 118,134,095 | |
Payable for investment securities purchased | | 32,378,241 | |
TBA sale commitments, at value (proceeds $11,921,859)—Note 4 | | 11,915,469 | |
Liability for securities on loan—Note 1(b) | | 10,441,693 | |
Payable for shares of Common Stock redeemed | | 8,676,543 | |
Accrued expenses | | | | | 25,694 | |
| | | | | 181,848,502 | |
Net Assets ($) | | | 1,396,547,312 | |
Composition of Net Assets ($): | | | | |
Paid-in capital | | | | | 1,383,692,819 | |
Accumulated undistributed investment income—net | | 1,302,389 | |
Accumulated net realized gain (loss) on investments | | | | | (8,014,619) | |
Accumulated net unrealized appreciation (depreciation)
on investments | | | | 19,566,723 | |
Net Assets ($) | | | 1,396,547,312 | |
| | | | |
Net Asset Value Per Share | Investor Shares | Class I | |
Net Assets ($) | 497,586,405 | 898,960,907 | |
Shares Outstanding | 48,151,711 | 86,977,565 | |
Net Asset Value Per Share ($) | 10.33 | 10.34 | |
| | | | |
See notes to financial statements. | | | |
62
STATEMENT OF OPERATIONS
Year Ended October 31, 2017
| | | | | | | |
| | | | | | |
| | | | | | |
Investment Income ($): | | | | |
Income: | | | | |
Interest | | | 43,714,058 | |
Dividends from affiliated issuers | | | 1,062,848 | |
Income from securities lending—Note 1(b) | | | 166,109 | |
Total Income | | | 44,943,015 | |
Expenses: | | | | |
Management fee—Note 3(a) | | | 2,784,887 | |
Distribution fees—Note 3(b) | | | 1,839,483 | |
Directors’ fees—Note 3(a,c) | | | 138,704 | |
Loan commitment fees—Note 2 | | | 42,841 | |
Total Expenses | | | 4,805,915 | |
Less—Directors’ fees reimbursed by Dreyfus—Note 3(a) | | | (138,704) | |
Net Expenses | | | 4,667,211 | |
Investment Income—Net | | | 40,275,804 | |
Realized and Unrealized Gain (Loss) on Investments—Note 4 ($): | | |
Net realized gain (loss) on investments | (3,397,769) | |
Net unrealized appreciation (depreciation) on investments | | | (45,222,806) | |
Net Realized and Unrealized Gain (Loss) on Investments | | | (48,620,575) | |
Net (Decrease) in Net Assets Resulting from Operations | | (8,344,771) | |
| | | | | | | |
See notes to financial statements. | | | | | |
63
STATEMENT OF CHANGES IN NET ASSETS
| | | | | | | | | | |
| | | | Year Ended October 31, |
| | | | 2017 | | 2016 | a |
Operations ($): | | | | | | | | |
Investment income—net | | | 40,275,804 | | | | 52,078,457 | |
Net realized gain (loss) on investments | | (3,397,769) | | | | 16,298,644 | |
Net unrealized appreciation (depreciation)
on investments | | (45,222,806) | | | | 28,649,215 | |
Net Increase (Decrease) in Net Assets
Resulting from Operations | (8,344,771) | | | | 97,026,316 | |
Distributions to Shareholders from ($): | |
Investment income—net: | | | | | | | | |
Investor Shares | | | (16,088,193) | | | | (23,232,715) | |
Class I | | | (27,387,856) | | | | (33,615,027) | |
Net realized gain on investments: | | | | | | | | |
Investor Shares | | | (5,093,715) | | | | (4,856,602) | |
Class I | | | (6,434,648) | | | | (6,768,417) | |
Total Distributions | | | (55,004,412) | | | | (68,472,761) | |
Capital Stock Transactions ($): | |
Net proceeds from shares sold: | | | | | | | | |
Investor Shares | | | 214,786,858 | | | | 373,379,996 | |
Class I | | | 508,333,922 | | | | 508,202,158 | |
Distributions reinvested: | | | | | | | | |
Investor Shares | | | 20,970,958 | | | | 27,873,008 | |
Class I | | | 29,825,623 | | | | 35,904,493 | |
Cost of shares redeemed: | | | | | | | | |
Investor Shares | | | (820,290,943) | | | | (343,621,877) | |
Class I | | | (925,346,555) | | | | (696,109,115) | |
Increase (Decrease) in Net Assets
from Capital Stock Transactions | (971,720,137) | | | | (94,371,337) | |
Total Increase (Decrease) in Net Assets | (1,035,069,320) | | | | (65,817,782) | |
Net Assets ($): | |
Beginning of Period | | | 2,431,616,632 | | | | 2,497,434,414 | |
End of Period | | | 1,396,547,312 | | | | 2,431,616,632 | |
Undistributed investment income—net | 1,302,389 | | | | 3,005,153 | |
Capital Share Transactions (Shares): | |
Investor Shares | | | | | | | | |
Shares sold | | | 20,840,081 | | | | 35,446,695 | |
Shares issued for distributions reinvested | | | 2,043,464 | | | | 2,652,454 | |
Shares redeemed | | | (79,720,111) | | | | (32,639,437) | |
Net Increase (Decrease) in Shares Outstanding | (56,836,566) | | | | 5,459,712 | |
Class I | | | | | | | | |
Shares sold | | | 49,324,881 | | | | 48,201,043 | |
Shares issued for distributions reinvested | | | 2,900,716 | | | | 3,417,402 | |
Shares redeemed | | | (90,223,852) | | | | (66,008,601) | |
Net Increase (Decrease) in Shares Outstanding | (37,998,255) | | | | (14,390,156) | |
| | | | | | | | | | |
a On August 31, 2016, the fund redesignated BASIC shares as Class I shares. | |
See notes to financial statements.
| | | | | | | | |
64
FINANCIAL HIGHLIGHTS
The following tables describe the performance for each share class for the fiscal periods indicated. All information (except portfolio turnover rate) reflects financial results for a single fund share. Total return shows how much your investment in the fund would have increased (or decreased) during each period, assuming you had reinvested all dividends and distributions. These figures have been derived from the fund’s financial statements.
| | | | | | | | | | | |
| | | |
| | | | |
Investor Shares | | | Year Ended October 31, |
| | | 2017 | 2016 | 2015 | 2014 | 2013 |
Per Share Data ($): | | | | | | | |
Net asset value, beginning of period | | | 10.57 | 10.45 | 10.60 | 10.62 | 11.11 |
Investment Operations: | | | | | | | |
Investment income—neta | | | .20 | .21 | .21 | .23 | .24 |
Net realized and unrealized
gain (loss) on investments | | | (.16) | .19 | (.05) | .14 | (.42) |
Total from Investment Operations | | | .04 | .40 | .16 | .37 | (.18) |
Distributions: | | | | | | | |
Dividends from
investment income—net | | | (.23) | (.23) | (.23) | (.25) | (.28) |
Dividends from net realized
gain on investments | | | (.05) | (.05) | (.08) | (.14) | (.03) |
Total Distributions | | | (.28) | (.28) | (.31) | (.39) | (.31) |
Net asset value, end of period | | | 10.33 | 10.57 | 10.45 | 10.60 | 10.62 |
Total Return (%) | | | .39 | 3.85 | 1.54 | 3.62 | (1.66) |
Ratios/Supplemental Data (%): | | | | | | | |
Ratio of total expenses
to average net assets | | | .41 | .41 | .41 | .41 | .41 |
Ratio of net expenses
to average net assets | | | .40 | .40 | .40 | .40 | .40 |
Ratio of net investment income
to average net assets | | | 2.01 | 1.97 | 2.00 | 2.22 | 2.25 |
Portfolio Turnover Rateb | | | 179.26 | 144.83 | 150.80 | 145.11 | 94.21 |
Net Assets, end of period ($ x 1,000) | | | 497,586 | 1,109,787 | 1,040,129 | 1,190,994 | 904,779 |
a Based on average shares outstanding.
b The portfolio turnover rates excluding mortgage dollar roll transactions for the periods ended October 31, 2017, 2016, 2015, 2014 and 2013 were 103.99%, 95.05%, 79.15%, 89.76% and 67.47%, respectively.
See notes to financial statements.
65
FINANCIAL HIGHLIGHTS (continued)
| | | | | | | | | | |
| | | |
| | | | |
Class I Shares | | | Year Ended October 31, |
| | | 2017 | 2016a | 2015 | 2014 | 2013 |
Per Share Data ($): | | | | | | | |
Net asset value, beginning of period | | | 10.58 | 10.46 | 10.61 | 10.62 | 11.12 |
Investment Operations: | | | | | | | |
Investment income—netb | | | .23 | .23 | .24 | .26 | .27 |
Net realized and unrealized
gain (loss) on investments | | | (.17) | .20 | (.06) | .15 | (.43) |
Total from Investment Operations | | | .06 | .43 | .18 | .41 | (.16) |
Distributions: | | | | | | | |
Dividends from
investment income—net | | | (.25) | (.26) | (.25) | (.28) | (.31) |
Dividends from net realized
gain on investments | | | (.05) | (.05) | (.08) | (.14) | (.03) |
Total Distributions | | | (.30) | (.31) | (.33) | (.42) | (.34) |
Net asset value, end of period | | | 10.34 | 10.58 | 10.46 | 10.61 | 10.62 |
Total Return (%) | | | .64 | 4.11 | 1.79 | 3.97 | (1.50) |
Ratios/Supplemental Data (%): | | | | | | | |
Ratio of total expenses
to average net assets | | | .16 | .16 | .16 | .16 | .16 |
Ratio of net expenses
to average net assets | | | .15 | .15 | .15 | .15 | .15 |
Ratio of net investment income
to average net assets | | | 2.27 | 2.23 | 2.24 | 2.47 | 2.50 |
Portfolio Turnover Ratec | | | 179.26 | 144.83 | 150.80 | 145.11 | 94.21 |
Net Assets, end of period ($ x 1,000) | | | 898,961 | 1,321,830 | 1,457,305 | 1,220,628 | 1,249,280 |
a On August 31, 2016, the fund redesignated BASIC shares as Class I shares.
b Based on average shares outstanding.
c The portfolio turnover rates excluding mortgage dollar roll transactions for the periods ended October 31, 2017, 2016, 2015, 2014 and 2013 were 103.99%, 95.05%, 79.15%, 89.76% and 67.47%, respectively.
See notes to financial statements.
66
NOTES TO FINANCIAL STATEMENTS
NOTE 1—Significant Accounting Policies:
Dreyfus Bond Market Index Fund (the “fund”) is a separate diversified series of The Dreyfus/Laurel Funds, Inc. (the “Company”), which is registered under the Investment Company Act of 1940, as amended (the “Act”), as an open-end management investment company and operates as a series company currently offering eight series, including the fund. The fund’s investment objective is to seek to match the total return of the Bloomberg Barclays U.S. Aggregate Bond Index. The Dreyfus Corporation (the “Manager” or “Dreyfus”), a wholly-owned subsidiary of The Bank of New York Mellon Corporation (“BNY Mellon”), serves as the fund’s investment adviser.
MBSC Securities Corporation (the “Distributor”), a wholly-owned subsidiary of Dreyfus, is the distributor of the fund’s shares, which are sold to the public without a sales charge. The fund is authorized to issue 500 million shares of $.001 par value Common Stock in each of the following classes of shares: Investor and Class I. Investor shares are sold primarily to retail investors through financial intermediaries and bear Distribution Plan fees. Class I shares are sold primarily to bank trust departments and other financial service providers (including The Bank of New York Mellon, a subsidiary of BNY Mellon and an affiliate of Dreyfus, and its affiliates), acting on behalf of customers having a qualified trust or an investment account or relationship at such institution, and bear no Distribution Plan fees. Differences between the two classes include the services offered to and the expenses borne by each class, as well as their minimum purchase and account balance requirements. Income, expenses (other than expenses attributable to a specific class), and realized and unrealized gains or losses on investments are allocated to each class of shares based on its relative net assets.
The Company accounts separately for the assets, liabilities and operations of each series. Expenses directly attributable to each series are charged to that series’ operations; expenses which are applicable to all series are allocated among them on a pro rata basis.
The Financial Accounting Standards Board (“FASB”) Accounting Standards Codification is the exclusive reference of authoritative U.S. generally accepted accounting principles (“GAAP”) recognized by the FASB to be applied by nongovernmental entities. Rules and interpretive releases of the Securities and Exchange Commission (“SEC”) under authority of federal laws are also sources of authoritative GAAP for SEC registrants. The fund’s financial statements are prepared in accordance with
67
NOTES TO FINANCIAL STATEMENTS (continued)
GAAP, which may require the use of management estimates and assumptions. Actual results could differ from those estimates.
(a) Portfolio valuation: The fair value of a financial instrument is the amount that would be received to sell an asset or paid to transfer a liability in an orderly transaction between market participants at the measurement date (i.e., the exit price). GAAP establishes a fair value hierarchy that prioritizes the inputs of valuation techniques used to measure fair value. This hierarchy gives the highest priority to unadjusted quoted prices in active markets for identical assets or liabilities (Level 1 measurements) and the lowest priority to unobservable inputs (Level 3 measurements).
Additionally, GAAP provides guidance on determining whether the volume and activity in a market has decreased significantly and whether such a decrease in activity results in transactions that are not orderly. GAAP requires enhanced disclosures around valuation inputs and techniques used during annual and interim periods.
Various inputs are used in determining the value of the fund’s investments relating to fair value measurements. These inputs are summarized in the three broad levels listed below:
Level 1—unadjusted quoted prices in active markets for identical investments.
Level 2—other significant observable inputs (including quoted prices for similar investments, interest rates, prepayment speeds, credit risk, etc.).
Level 3—significant unobservable inputs (including the fund’s own assumptions in determining the fair value of investments).
The inputs or methodology used for valuing securities are not necessarily an indication of the risk associated with investing in those securities.
Changes in valuation techniques may result in transfers in or out of an assigned level within the disclosure hierarchy. Valuation techniques used to value the fund’s investments are as follows:
Registered investment companies that are not traded on an exchange are valued at their net asset value and are generally categorized within Level 1 of the fair value hierarchy.
Investments in securities, excluding short-term investments (other than U.S. Treasury Bills), are valued each business day by an independent pricing service (the “Service”) approved by the Company’s Board of Directors (the “Board”). Investments for which quoted bid prices are readily available and are representative of the bid side of the market in the
68
judgment of the Service are valued at the mean between the quoted bid prices (as obtained by the Service from dealers in such securities) and asked prices (as calculated by the Service based upon its evaluation of the market for such securities). Other investments (which constitute a majority of the portfolio securities) are valued as determined by the Service, based on methods which include consideration of the following: yields or prices of securities of comparable quality, coupon, maturity and type; indications as to values from dealers; and general market conditions. These securities are generally categorized within Level 2 of the fair value hierarchy.
The Service is engaged under the general supervision of the Board.
When market quotations or official closing prices are not readily available, or are determined to not accurately reflect fair value, such as when the value of a security has been significantly affected by events after the close of the exchange or market on which the security is principally traded (for example, a foreign exchange or market), but before the fund calculates its net asset value, the fund may value these investments at fair value as determined in accordance with the procedures approved by the Board. Certain factors may be considered when fair valuing investments such as: fundamental analytical data, the nature and duration of restrictions on disposition, an evaluation of the forces that influence the market in which the securities are purchased and sold, and public trading in similar securities of the issuer or comparable issuers. These securities are either categorized within Level 2 or 3 of the fair value hierarchy depending on the relevant inputs used.
For restricted securities where observable inputs are limited, assumptions about market activity and risk are used and are generally categorized within Level 3 of the fair value hierarchy.
The following is a summary of the inputs used as of October 31, 2017 in valuing the fund’s investments:
69
NOTES TO FINANCIAL STATEMENTS (continued)
| | | | | |
| Level 1 - Unadjusted Quoted Prices | Level 2 - Other Significant Observable Inputs | Level 3 -Significant Unobservable Inputs | Total |
Assets ($) | | | | |
Investments in Securities: | | | | |
Asset-Backed | - | 7,755,870 | - | 7,755,870 |
Commercial Mortgage-Backed | - | 17,919,161 | - | 17,919,161 |
Corporate Bonds† | - | 363,869,818 | - | 363,869,818 |
Foreign Government | - | 59,465,104 | - | 59,465,104 |
Municipal Bonds† | - | 7,994,487 | - | 7,994,487 |
Registered Investment Companies | 138,563,083 | - | - | 138,563,083 |
U.S. Government Agencies/
Mortgage-Backed | - | 435,334,410 | - | 435,334,410 |
U.S. Treasury | - | 511,748,870 | - | 511,748,870 |
Liabilities ($) | | | | |
Other Financial Instruments: | | | | |
TBA Sales Commitments | - | (11,915,469) | - | (11,915,469) |
† See Statement of Investments for additional detailed categorizations.
At October 31, 2017, there were no transfers between levels of the fair value hierarchy. It is the fund’s policy to recognize transfers between levels at the end of the reporting period.
(b) Securities transactions and investment income: Securities transactions are recorded on a trade date basis. Realized gains and losses from securities transactions are recorded on the identified cost basis. Dividend income is recognized on the ex-dividend date and interest income, including, where applicable, accretion of discount and amortization of premium on investments, is recognized on the accrual basis.
Pursuant to a securities lending agreement with The Bank of New York Mellon, the fund may lend securities to qualified institutions. It is the fund’s policy that, at origination, all loans are secured by collateral of at least 102% of the value of U.S. securities loaned and 105% of the value of foreign securities loaned. Collateral equivalent to at least 100% of the market value of securities on loan is maintained at all times. Collateral is either in the form of cash, which can be invested in certain money market mutual funds managed by Dreyfus, or U.S. Government and Agency securities. The fund is entitled to receive all dividends, interest and distributions on securities loaned, in addition to income earned as a result of the lending transaction. Should a borrower fail to return the securities in
70
a timely manner, The Bank of New York Mellon is required to replace the securities for the benefit of the fund or credit the fund with the market value of the unreturned securities and is subrogated to the fund’s rights against the borrower and the collateral. Additionally, the contractual maturity of security lending transactions are on an overnight and continuous basis. During the period ended October 31, 2017, The Bank of New York Mellon earned $32,949 from lending portfolio securities, pursuant to the securities lending agreement.
(c) Affiliated issuers: Investments in other investment companies advised by Dreyfus are defined as “affiliated” under the Act.
(d) Risk: The fund invests primarily in debt securities. Failure of an issuer of the debt securities to make timely interest or principal payments, or a decline or the perception of a decline in the credit quality of a debt security, can cause the debt security’s price to fall, potentially lowering the fund’s share price. In addition, the value of debt securities may decline due to general market conditions that are not specifically related to a particular issuer, such as real or perceived adverse economic conditions, changes in outlook for corporate earnings, changes in interest or currency rates or adverse investor sentiment. Such values may also decline because of factors that affect a particular industry.
(e) Dividends and distributions to shareholders: It is the policy of the fund to declare dividends daily from investment income-net. Such dividends are paid monthly. Dividends from net realized capital gains, if any, are normally declared and paid annually, but the fund may make distributions on a more frequent basis to comply with the distribution requirements of the Internal Revenue Code of 1986, as amended (the “Code”). To the extent that net realized capital gains can be offset by capital loss carryovers, it is the policy of the fund not to distribute such gains. Income and capital gain distributions are determined in accordance with income tax regulations, which may differ from GAAP.
(f) Federal income taxes: It is the policy of the fund to continue to qualify as a regulated investment company, if such qualification is in the best interests of its shareholders, by complying with the applicable provisions of the Code, and to make distributions of taxable income sufficient to relieve it from substantially all federal income and excise taxes.
As of and during the period ended October 31, 2017, the fund did not have any liabilities for any uncertain tax positions. The fund recognizes interest and penalties, if any, related to uncertain tax positions as income tax expense in the Statement of Operations. During the period ended October 31, 2017, the fund did not incur any interest or penalties.
71
NOTES TO FINANCIAL STATEMENTS (continued)
Each tax year in the four-year period ended October 31, 2017 remains subject to examination by the Internal Revenue Service and state taxing authorities.
At October 31, 2017, the components of accumulated earnings on a tax basis were as follows: undistributed ordinary income $1,302,389, accumulated capital losses $4,958,001 and unrealized appreciation $16,510,105.
Under the Regulated Investment Company Modernization Act of 2010, the fund is permitted to carry forward capital losses for an unlimited period. Furthermore, capital loss carryovers retain their character as either short-term or long-term capital losses.
The accumulated capital loss carryover is available for federal income tax purposes to be applied against future net realized capital gains, if any, realized subsequent to October 31, 2017. The funds has $4,958,001 of short-term capital losses which can be carried forward for an unlimited period.
The tax character of distributions paid to shareholders during the fiscal periods ended October 31, 2017 and October 31, 2016 were as follows: ordinary income $50,195,532 and $66,839,102, and long-term capital gains $4,808,880 and $1,633,659, respectively.
During the period ended October 31, 2017, as a result of permanent book to tax differences, primarily due to the tax treatment for paydown gains and losses on mortgage backed securities, amortization of premiums and consent fees, the fund increased accumulated undistributed investment income-net by $1,497,481 and decreased accumulated net realized gain (loss) on investments by the same amount. Net assets and net asset value per share were not affected by this reclassification.
NOTE 2—Bank Lines of Credit:
The fund participates with other Dreyfus-managed funds in an $830 million unsecured credit facility led by Citibank, N.A. and a $300 million unsecured credit facility provided by The Bank of New York Mellon (each, a “Facility”), each to be utilized primarily for temporary or emergency purposes, including the financing of redemptions. Prior to October 4, 2017, the unsecured credit facility with Citibank, N.A. was $810 million. In connection therewith, the fund has agreed to pay its pro rata portion of commitment fees for each Facility. Interest is charged to the fund based on rates determined pursuant to the terms of the respective Facility at the time of borrowing. During the period ended October 31, 2017, the fund did not borrow under the Facilities.
72
NOTE 3—Investment Management Fee and Other Transactions with Affiliates:
(a) Pursuant to an investment management agreement with Dreyfus, Dreyfus provides or arranges for one or more third parties and/or affiliates to provide investment advisory, administrative, custody, fund accounting and transfer agency services to the fund. Dreyfus also directs the investments of the fund in accordance with its investment objective, policies and limitations. For these services, the fund is contractually obligated to pay Dreyfus a fee, calculated daily and paid monthly, at the annual rate of .15% of the value of the fund’s average daily net assets. Out of its fee Dreyfus pays all of the expenses of the fund except brokerage fees, taxes, interest expenses, commitment fees on borrowings, Distribution Plan fees, fees and expenses of non-interested Directors (including counsel fees) and extraordinary expenses. In addition, Dreyfus is required to reduce its fee in an amount equal to the fund’s allocable portion of fees and expenses of the non-interested Directors (including counsel fees). During the period ended October 31, 2017, fees reimbursed by Dreyfus amounted to $138,704.
(b) Under the Distribution Plan adopted pursuant to Rule 12b-1 under the Act, Investor shares may pay annually up to .25% of the value of its average daily net assets to compensate the Distributor for shareholder servicing activities primarily intended to result in the sale of Investor shares. During the period ended October 31, 2017, Investor shares were charged $1,839,483 pursuant to the Distribution Plan.
Under its terms, the Distribution Plan shall remain in effect from year to year, provided such continuance is approved annually by a vote of a majority of those Directors who are not “interested persons” of the Company and who have no direct or indirect financial interest in the operation of or in any agreement related to the Distribution Plan.
The components of “Due to The Dreyfus Corporation and affiliates” in the Statement of Assets and Liabilities consist of: management fees $178,921 and Distribution Plan fees $106,300, which are offset against an expense reimbursement currently in effect in the amount of $8,454.
(c) Each Board member also serves as a Board member of other funds within the Dreyfus complex. Annual retainer fees and attendance fees are allocated to each fund based on net assets.
NOTE 4—Securities Transactions:
The aggregate amount of purchases and sales (including paydowns) of investment securities, excluding short-term securities, during the period
73
NOTES TO FINANCIAL STATEMENTS (continued)
ended October 31, 2017, amounted to $3,368,482,872 and $4,335,116,346, respectively, of which $1,414,364,372 in purchases and $1,416,655,459 in sales were from mortgage dollar transactions.
Mortgage Dollar Rolls: A mortgage dollar roll transaction involves a sale by the fund of mortgage related securities that it holds with an agreement by the fund to repurchase similar securities at an agreed upon price and date. The securities purchased will bear the same interest rate as those sold, but generally will be collateralized by pools of mortgages with different prepayment histories than those securities sold. The fund accounts for mortgage dollar rolls as purchases and sales transactions.
To-Be-Announced (“TBA”) Securities: During the period ended October 31, 2017, the fund transacted in TBA securities that involved buying or selling mortgage-backed securities on a forward commitment basis. A TBA transaction typically does not designate the actual security to be delivered and only includes an approximate principal amount; however, delivered securities must meet specified terms defined by industry guidelines, including issuer, rate and current principal amount outstanding on underling mortgage pools. TBA securities subject to a forward commitment to sell at period end are included at the end of the fund’s Statement of Investments under the caption “Statement of TBA Sale Commitments.” The proceeds and value of these commitments are reflected in the fund’s Statement of Assets and Liabilities as Receivable for TBA sale commitments and TBA sale commitments, at value, respectively.
At October 31, 2017, the cost of investments for federal income tax purposes was $1,526,147,088; accordingly, accumulated net unrealized appreciation on investments was $16,503,715, consisting of $27,029,730 gross unrealized appreciation and $10,526,015 gross unrealized depreciation.
74
REPORT OF INDEPENDENT REGISTERED
PUBLIC ACCOUNTING FIRM
The Board of Directors and Shareholders of
The Dreyfus/Laurel Funds, Inc.
We have audited the accompanying statement of assets and liabilities of Dreyfus Bond Market Index Fund (the “Fund”), a series of The Dreyfus/Laurel Funds, Inc., including the statements of investments, investments in affiliated issuers and TBA Sale Commitments, as of October 31, 2017, and the related statement of operations for the year then ended, the statements of changes in net assets for each of the years in the two-year period then ended, and the financial highlights for each of the years in the five-year period then ended. These financial statements and financial highlights are the responsibility of the Fund’s management. Our responsibility is to express an opinion on these financial statements and financial highlights based on our audits.
We conducted our audits in accordance with the standards of the Public Company Accounting Oversight Board (United States). Those standards require that we plan and perform the audit to obtain reasonable assurance about whether the financial statements and financial highlights are free of material misstatement. An audit includes examining, on a test basis, evidence supporting the amounts and disclosures in the financial statements. Our procedures included confirmation of securities owned as of October 31, 2017, by correspondence with the custodian and brokers or by other appropriate auditing procedures. An audit also includes assessing the accounting principles used and significant estimates made by management, as well as evaluating the overall financial statement presentation. We believe that our audits provide a reasonable basis for our opinion.
In our opinion, the financial statements and financial highlights referred to above present fairly, in all material respects, the financial position of Dreyfus Bond Market Index Fund as of October 31, 2017, and the results of its operations for the year then ended, the changes in its net assets for each of the years in the two-year period then ended, and the financial highlights for each of the years in the five-year period then ended, in conformity with U.S. generally accepted accounting principles.

New York, New York
December 22, 2017
75
IMPORTANT TAX INFORMATION (Unaudited)
For federal tax purposes, the fund reports the maximum amount allowable but not less than 89.25% as interest-related dividends in accordance with Sections 871(k)(1) and 881(e) of the Internal Revenue Code. Also, the fund reports the maximum amount allowable but not less than $.0210 per share as a capital gain dividend in accordance with Section 852(b)(3)(C) of the Internal Revenue Code. Also, the fund reports the maximum amount allowable but not less than $.0292 as a short-term capital gain dividend paid on December 20, 2016 in accordance with Sections 871(k)(2) and 881(e) of the Internal Revenue Code.
76
BOARD MEMBERS INFORMATION (Unaudited)
INDEPENDENT BOARD MEMBERS
Joseph S. DiMartino (74)
Chairman of the Board (1999)
Principal Occupation During Past 5 Years:
· Corporate Director and Trustee (1995-present)
Other Public Company Board Memberships During Past 5 Years:
· CBIZ (formerly, Century Business Services, Inc.), a provider of outsourcing functions for small and medium size companies, Director (1997-present)
No. of Portfolios for which Board Member Serves: 126
———————
Francine J. Bovich (66)
Board Member (2012)
Principal Occupation During Past 5 Years:
· Trustee, The Bradley Trusts, private trust funds (2011-present)
Other Public Company Board Memberships During Past 5 Years:
· Annaly Capital Management, Inc., Board Member (May 2014-present)
No. of Portfolios for which Board Member Serves: 74
———————
Kenneth A. Himmel (71)
Board Member (1994)
Principal Occupation During Past 5 Years:
· Managing Partner, Gulf Related, an international real estate development company (2010-present)
· President and CEO, Related Urban Development, a real estate development company (1996-present)
· President and CEO, Himmel & Company, a real estate development company (1980-present)
· CEO, American Food Management, a restaurant company (1983-present)
No. of Portfolios for which Board Member Serves: 28
———————
77
BOARD MEMBERS INFORMATION (Unaudited) (continued)
INDEPENDENT BOARD MEMBERS (continued)
Stephen J. Lockwood (70)
Board Member (1994)
Principal Occupation During Past 5 Years:
· Chairman of the Board, Stephen J. Lockwood and Company LLC, a real estate investment company (2000-present)
No. of Portfolios for which Board Member Serves: 28
———————
Roslyn M. Watson (68)
Board Member (1994)
Principal Occupation During Past 5 Years:
· Principal, Watson Ventures, Inc., a real estate investment company (1993-present)
No. of Portfolios for which Board Member Serves: 60
———————
Benaree Pratt Wiley (71)
Board Member (1998)
Principal Occupation During Past 5 Years:
· Principal, The Wiley Group, a firm specializing in strategy and business development (2005-present)
Other Public Company Board Memberships During Past 5 Years:
· CBIZ (formerly, Century Business Services, Inc.), a provider of outsourcing functions for small and medium size companies, Director (2008-present)
No. of Portfolios for which Board Member Serves: 81
———————
Once elected all Board Members serve for an indefinite term, but achieve Emeritus status upon reaching age 80. The address of the Board Members and Officers is c/o The Dreyfus Corporation, 200 Park Avenue, New York, New York 10166. Additional information about the Board Members is available in the fund’s Statement of additional Information which can be obtained from Dreyfus free of charge by calling this toll free number: 1-800-DREYFUS
James M. Fitzgibbons, Emeritus Board Member
J. Tomlinson Fort, Emeritus Board Member
78
OFFICERS OF THE FUND (Unaudited)
BRADLEY J. SKAPYAK, President since January 2010.
Chief Operating Officer and a director of the Manager since June 2009, Chairman of Dreyfus Transfer, Inc., an affiliate of the Manager and the transfer agent of the funds, since May 2011 and Chief Executive Officer of MBSC Securities Corporation since August 2016. He is an officer of 62 investment companies (comprised of 126 portfolios) managed by the Manager. He is 58 years old and has been an employee of the Manager since February 1988.
BENNETT A. MACDOUGALL, Chief Legal Officer since October 2015.
Chief Legal Officer of the Manager and Associate General Counsel and Managing Director of BNY Mellon since June 2015; from June 2005 to June 2015, he served in various capacities with Deutsche Bank – Asset & Wealth Management Division, including as Director and Associate General Counsel, and Chief Legal Officer of Deutsche Investment Management Americas Inc. from June 2012 to May 2015. He is an officer of 63 investment companies (comprised of 151 portfolios) managed by the Manager. He is 46 years old and has been an employee of the Manager since June 2015.
JANETTE E. FARRAGHER, Vice President and Secretary since December 2011.
Associate General Counsel of BNY Mellon, and an officer of 63 investment companies (comprised of 151 portfolios) managed by the Manager. She is 54 years old and has been an employee of the Manager since February 1984.
JAMES BITETTO, Vice President and Assistant Secretary since August 2005.
Managing Counsel of BNY Mellon and Secretary of the Manager, and an officer of 63 investment companies (comprised of 151 portfolios) managed by the Manager. He is 51 years old and has been an employee of the Manager since December 1996.
JOSEPH M. CHIOFFI, Vice President and Assistant Secretary since August 2005.
Managing Counsel of BNY Mellon, and an officer of 63 investment companies (comprised of 151 portfolios) managed by the Manager. He is 55 years old and has been an employee of the Manager since June 2000.
MAUREEN E. KANE, Vice President and Assistant Secretary since April 2015.
Managing Counsel of BNY Mellon since July 2014; from October 2004 until July 2014, General Counsel, and from May 2009 until July 2014, Chief Compliance Officer of Century Capital Management. She is an officer of 63 investment companies (comprised of 151 portfolios) managed by the Manager. She is 55 years old and has been an employee of the Manager since July 2014.
SARAH S. KELLEHER, Vice President and Assistant Secretary since April 2014.
Senior Counsel of BNY Mellon since March 2013, from August 2005 to March 2013, Associate General Counsel of Third Avenue Management. She is an officer of 63 investment companies (comprised of 151 portfolios) managed by the Manager. She is 42 years old and has been an employee of the Manager since March 2013.
JEFF PRUSNOFSKY, Vice President and Assistant Secretary since August 2005.
Senior Managing Counsel of BNY Mellon, and an officer of 63 investment companies (comprised of 151 portfolios) managed by the Manager. He is 52 years old and has been an employee of the Manager since October 1990.
NATALYA ZELENSKY, Vice President and Assistant Secretary since March 2017.
Counsel and Vice President of BNY Mellon since May 2016; Attorney at Wildermuth Endowment Strategy Fund/Wildermuth Advisory, LLC from November 2015 until May 2016; Assistant General Counsel at RCS Advisory Services from July 2014 until November 2015; Associate at Sutherland, Asbill & Brennan from January 2013 until January 2014; Associate at K&L Gates from October 2011 until January 2013. She is an officer of 63 investment companies (comprised of 151 portfolios) managed by Dreyfus. She is 32 years old and has been an employee of the Manager since May 2016.
JAMES WINDELS, Treasurer since November 2001.
Director – Mutual Fund Accounting of the Manager, and an officer of 63 investment companies (comprised of 151 portfolios) managed by the Manager. He is 59 years old and has been an employee of the Manager since April 1985.
79
OFFICERS OF THE FUND (Unaudited) (continued)
RICHARD CASSARO, Assistant Treasurer since January 2008.
Senior Accounting Manager – Money Market and Municipal Bond Funds of the Manager, and an officer of 63 investment companies (comprised of 151 portfolios) managed by the Manager. He is 58 years old and has been an employee of the Manager since September 1982.
GAVIN C. REILLY, Assistant Treasurer since December 2005.
Tax Manager of the Investment Accounting and Support Department of the Manager, and an officer of 63 investment companies (comprised of 151 portfolios) managed by the Manager. He is 49 years old and has been an employee of the Manager since April 1991.
ROBERT S. ROBOL, Assistant Treasurer since August 2005.
Senior Accounting Manager – Dreyfus Financial Reporting of the Manager, and an officer of 63 investment companies (comprised of 151 portfolios) managed by the Manager. He is 53 years old and has been an employee of the Manager since October 1988.
ROBERT SALVIOLO, Assistant Treasurer since July 2007.
Senior Accounting Manager – Equity Funds of the Manager, and an officer of 63 investment companies (comprised of 151 portfolios) managed by the Manager. He is 50 years old and has been an employee of the Manager since June 1989.
ROBERT SVAGNA, Assistant Treasurer since December 2002.
Senior Accounting Manager – Fixed Income and Equity Funds of the Manager, and an officer of 63 investment companies (comprised of 151 portfolios) managed by the Manager. He is 50 years old and has been an employee of the Manager since November 1990.
JOSEPH W. CONNOLLY, Chief Compliance Officer since October 2004.
Chief Compliance Officer of the Manager and The Dreyfus Family of Funds (63 investment companies, comprised of 151 portfolios). He is 60 years old and has served in various capacities with the Manager since 1980, including manager of the firm’s Fund Accounting Department from 1997 through October 2001.
CARIDAD M. CAROSELLA, Anti-Money Laundering Compliance Officer since January 2016.
Anti-Money Laundering Compliance Officer of the Dreyfus Family of Funds and BNY Mellon Funds Trust since January 2016; from May 2015 to December 2015, Interim Anti-Money Laundering Compliance Officer of the Dreyfus Family of Funds and BNY Mellon Funds Trust and the Distributor; from January 2012 to May 2015, AML Surveillance Officer of the Distributor and from 2007 to December 2011, Financial Processing Manager of the Distributor. She is an officer of 57 investment companies (comprised of 145 portfolios) managed by the Manager. She is 49 years old and has been an employee of the Distributor since 1997.
80
NOTES
81
Dreyfus Bond Market Index Fund
200 Park Avenue
New York, NY 10166
Manager
The Dreyfus Corporation
200 Park Avenue
New York, NY 10166
Custodian
The Bank of New York Mellon
225 Liberty Street
New York, NY 10286
Transfer Agent &
Dividend Disbursing Agent
Dreyfus Transfer, Inc.
200 Park Avenue
New York, NY 10166
Distributor
MBSC Securities Corporation
200 Park Avenue
New York, NY 10166
| | |
Ticker Symbols: | Investor: DBMIX Class I: DBIRX |
Telephone Call your financial representative or 1-800-DREYFUS
Mail The Dreyfus Family of Funds, 144 Glenn Curtiss Boulevard, Uniondale, NY 11556-0144
E-mail Send your request to info@dreyfus.com
Internet Information can be viewed online or downloaded at www.dreyfus.com
The fund files its complete schedule of portfolio holdings with the Securities and Exchange Commission (“SEC”) for the first and third quarters of each fiscal year on Form N-Q. The fund’s Forms N-Q are available on the SEC’s website at www.sec.gov and may be reviewed and copied at the SEC’s Public Reference Room in Washington, D.C. (phone 1-800-SEC-0330 for information).
A description of the policies and procedures that the fund uses to determine how to vote proxies relating to portfolio securities and information regarding how the fund voted these proxies for the most recent 12-month period ended June 30 is available at www.dreyfus.com and on the SEC’s website at www.sec.gov and without charge, upon request, by calling 1-800-DREYFUS.
| | |
© 2017 MBSC Securities Corporation
0310AR1017 | 
|
Dreyfus Disciplined Stock Fund
| | | |

| | ANNUAL REPORT
October 31, 2017 |
| |
Save time. Save paper. View your next shareholder report online as soon as it’s available. Log into www.dreyfus.com and sign up for Dreyfus eCommunications. It’s simple and only takes a few minutes. |
| |
The views expressed in this report reflect those of the portfolio manager(s) only through the end of the period covered and do not necessarily represent the views of Dreyfus or any other person in the Dreyfus organization. Any such views are subject to change at any time based upon market or other conditions and Dreyfus disclaims any responsibility to update such views. These views may not be relied on as investment advice and, because investment decisions for a Dreyfus fund are based on numerous factors, may not be relied on as an indication of trading intent on behalf of any Dreyfus fund. |
| |
Not FDIC-Insured • Not Bank-Guaranteed • May Lose Value |
Contents
THE FUND
FOR MORE INFORMATION
Back Cover
| | | | |
| |
Dreyfus Disciplined Stock Fund
| | The Fund |
A LETTER FROM THE CEO OF DREYFUS
Dear Shareholder:
We are pleased to present this annual report for Dreyfus Disciplined Stock Fund, covering the 12-month period from November 1, 2016 through October 31, 2017. For information about how the fund performed during the reporting period, as well as general market perspectives, we provide a Discussion of Fund Performance on the pages that follow.
Stocks set a series of new record highs and bonds produced mixed results over the past year in response to changing economic and political conditions. Financial markets at the start of the reporting period were dominated by the election of a new U.S. presidential administration. Equities and corporate-backed bonds surged higher in anticipation of more business-friendly regulatory, tax, and fiscal policies, but high-quality bonds generally lost value due to expectations of rising interest rates and accelerating inflation in a stronger economy. Despite a series of short-term interest-rate hikes, bonds recovered their previous losses over the first 10 months of 2017 when it became clearer that pro-growth legislation would take time and political capital to enact. U.S. and international stocks continued to rally as corporate earnings grew and global economic conditions improved.
The markets’ recent strong performance has been supported by solid underlying fundamentals. While we currently expect these favorable conditions to persist, we remain watchful for economic and political developments that could derail the markets. As always, we encourage you to discuss the risks and opportunities of today’s investment environment with your financial advisor.
Thank you for your continued confidence and support.
Sincerely,

Mark D. Santero
Chief Executive Officer
The Dreyfus Corporation
November 15, 2017
2
DISCUSSION OF FUND PERFORMANCE
For the period from November 1, 2016 through October 31, 2017, as provided by George E. DeFina and John C. Bailer, Portfolio Managers
Market and Fund Performance Overview
For the 12-month period ended October 31, 2017, Dreyfus Disciplined Stock Fund produced a total return of 20.84%.1 In comparison, the S&P 500® Index (the “Index”), the fund’s benchmark, returned 23.61% for the same period.2
U.S. stocks rose amid improving economic growth prospects and positive investor sentiment in anticipation of business-friendly government reforms. The fund lagged its benchmark, primarily due to disappointing security selections in the consumer discretionary, health care, real estate, telecommunication services, and consumer staples sectors.
The Fund’s Investment Approach
The fund seeks capital appreciation. To pursue its goal, the fund normally invests at least 80% of its net assets in stocks, with a focus on large-cap companies.
The fund invests in a diversified portfolio of growth and value stocks, with sector weightings and risk characteristics generally similar to those in the Index. We choose stocks through a disciplined investment process that combines computer modeling techniques, fundamental analysis, and risk management. The fund’s investment process is designed to provide investors with investment exposure to sector weightings and risk characteristics generally similar to those of the Index.
We use a proprietary computer model to identify and rank stocks within an industry or sector, based on several characteristics, including: Value, or how a stock is priced relative to its perceived intrinsic worth; Growth, in this case the sustainability or growth or earnings; and Financial Profile, which measures the financial health of the company. The model screens each stock for relative attractiveness within its economic sector and industry and, based on fundamental analysis, we generally select the most attractive of the higher-ranked securities, drawing on a variety of sources, including internal as well as Wall Street research, and company management.
Economic Growth and Investor Sentiment Bolstered Stocks
The unexpected result of the 2016 presidential election energized equity markets as investors began to anticipate lower corporate taxes, reduced regulatory constraints on business, and increased infrastructure spending. Although concerns arose in the spring of 2017 regarding the new presidential administration’s ability to implement its business-friendly policy proposals, encouraging economic data—including a declining unemployment rate—continued to support investor confidence, driving broad stock market indices to a series of new highs throughout 2017.
Most market sectors benefited from the market’s broad rise, led by some of the more growth-oriented, economically sensitive market segments. The information technology sector produced especially sharp gains, followed by the materials, utilities, and financials sectors, which modestly outperformed the overall market. Telecommunication services stocks lost ground due to heightened competitive pressures and the perceived risks of rising interest rates. Energy stocks also dipped, particularly during the first half of the reporting period, in response to declining oil and gas prices.
Some Stock Selections Dampened Relative Performance
While the fund participated in most of the Index’s gains, relative returns suffered due to a few disappointing stock selections. In the consumer discretionary area, advertising agency Omnicom and cable television company Comcast both faced intensifying concerns regarding Internet-based competition, while automobile components maker Goodyear Tire & Rubber reported weaker-than-expected sales. In the health care sector, biotechnology firm Celgene declined sharply after reporting
3
DISCUSSION OF FUND PERFORMANCE (continued)
disappointing sales, and pharmaceutical developer Merck & Co. lost value when a promising experimental drug failed in clinical trials.
While the fund benefited from underweighted exposure to the real estate sector, individual holdings of real estate investment trusts (REITs), such as Uniti Group, underperformed market averages due to credit-related pressures. In the telecommunication services sector, overweighted exposure to industry giant AT&T at a time of stiff competition detracted from relative results. Among consumer staples holdings, several food and beverage companies—including Molson Coors Brewing, Kellogg, and Conagra Brands—came under pressure from weak demand and concerns that the entry of Internet retailing giant Amazon.com into the grocery market could undercut industry margins. Other disappointing holdings included oil and gas producer Occidental Petroleum and cosmetics retailer Ulta Beauty.
On a more positive note, the fund enhanced relative returns with favorable stock selections in the financials sector, which generally benefited from improving economic conditions and rising equity markets. Leading performers included banks, such as SunTrust Banks, JPMorgan Chase, and Bank of America; capital markets firms, such as Goldman Sachs and Charles Schwab; insurers, such as Prudential Financial; and diversified financials organizations, such as Voya Financial. Overweighted exposure to the materials sector bolstered performance, as did the fund’s investment in Packaging Corporation of America. Other notably strong performers included payment processor Square.
Investing in an Expanding Economy
Despite the damage caused by recent hurricanes along the Atlantic and Gulf coasts, the U.S. economy has continued to show signs of steady expansion, and a wide range of companies has reported better-than-expected quarterly earnings. We believe that further gains are likely to be supported by pro-growth government policies and positive global macroeconomic developments. We have positioned the fund to benefit from these developments by focusing on attractively valued companies with strong cyclical growth prospects. As of the end of the reporting period, the fund held overweighted exposure to the financials sector, particularly those companies leveraged to a strengthening U.S. economy and industry deregulation. Other areas of emphasis include the materials, energy, and information technology sectors. In contrast, the fund held comparatively little exposure to the consumer staples, consumer discretionary, health care, real estate, and utilities sectors.
November 15, 2017
1 Total return includes reinvestment of dividends and any capital gains paid. Past performance is no guarantee of future results. Share price and investment return fluctuate such that upon redemption, fund shares may be worth more or less than their original cost.
2 Source: Lipper Inc. — The S&P 500® Index is widely regarded as the best single gauge of large-cap U.S. equities. The index includes 500 leading companies and captures approximately 80% coverage of available market capitalization. Investors cannot invest directly in any index.
Please note: the position in any security highlighted with italicized typeface was sold during the reporting period.
Equities are subject generally to market, market sector, market liquidity, issuer and investment style risks, among other factors, to varying degrees, all of which are more fully described in the fund’s prospectus.
4
FUND PERFORMANCE

Comparison of change in value of $10,000 investment in Dreyfus Disciplined Stock Fund and the S&P 500® Index (the “Index”)
† Source: Lipper Inc.
Past performance is not predictive of future performance.
The above graph compares a $10,000 investment made in Dreyfus Disciplined Stock Fund on 10/31/07 to a $10,000 investment made in the Index on that date. All dividends and capital gain distributions are reinvested.
The fund’s performance shown in the line graph above takes into account all applicable fees and expenses. The Index is widely regarded as the best single gauge of large-cap U.S. equities. The Index includes 500 leading companies and captures approximately 80% coverage of available market capitalization. Unlike a mutual fund, the Index is not subject to charges, fees and other expenses. Investors cannot invest directly in any index. Further information relating to fund performance, including expense reimbursements, if applicable, is contained in the Financial Highlights section of the prospectus and elsewhere in this report.
| | | | |
Average Annual Total Returns as of 10/31/17 | |
| 1 Year | 5 Years | 10 Years |
Fund | 20.84% | 13.15% | 5.75% |
S&P 500® Index | 23.61% | 15.17% | 7.51% |
The performance data quoted represents past performance, which is no guarantee of future results. Share price and investment return fluctuate and an investor’s shares may be worth more or less than original cost upon redemption. Current performance may be lower or higher than the performance quoted. Go to Dreyfus.com for the fund’s most recent month-end returns.
The fund’s performance shown in the graph and table does not reflect the deduction of taxes that a shareholder would pay on fund distributions or the redemption of fund shares.
5
UNDERSTANDING YOUR FUND’S EXPENSES (Unaudited)
As a mutual fund investor, you pay ongoing expenses, such as management fees and other expenses. Using the information below, you can estimate how these expenses affect your investment and compare them with the expenses of other funds. You also may pay one-time transaction expenses, including sales charges (loads) and redemption fees, which are not shown in this section and would have resulted in higher total expenses. For more information, see your fund’s prospectus or talk to your financial adviser.
Review your fund’s expenses
The table below shows the expenses you would have paid on a $1,000 investment in Dreyfus Disciplined Stock Fund from May 1, 2017 to October 31, 2017. It also shows how much a $1,000 investment would be worth at the close of the period, assuming actual returns and expenses.
| | | | | | | | | | |
Expenses and Value of a $1,000 Investment |
assuming actual returns for the six months ended October 31, 2017 | | |
| | | | | | | | | |
Expenses paid per $1,000† | | | | $5.20 | | | |
Ending value (after expenses) | | | | $1,064.60 | | | |
COMPARING YOUR FUND’S EXPENSES
WITH THOSE OF OTHER FUNDS (Unaudited)
Using the SEC’s method to compare expenses
The Securities and Exchange Commission (“SEC”) has established guidelines to help investors assess fund expenses. Per these guidelines, the table below shows your fund’s expenses based on a $1,000 investment, assuming a hypothetical 5% annualized return. You can use this information to compare the ongoing expenses (but not transaction expenses or total cost) of investing in the fund with those of other funds. All mutual fund shareholder reports will provide this information to help you make this comparison. Please note that you cannot use this information to estimate your actual ending account balance and expenses paid during the period.
| | | | | | | | | | | |
Expenses and Value of a $1,000 Investment |
assuming a hypothetical 5% annualized return for the six months ended October 31, 2017 |
| | | | | | | | | |
Expenses paid per $1,000† | | | | $5.09 | | | |
Ending value (after expenses) | | | | $1,020.16 | | | |
† Expenses are equal to the fund’s annualized expense ratio of 1.00%, multiplied by the average account value over the period, multiplied by 184/365 (to reflect the one-half year period).
6
STATEMENT OF INVESTMENTS
October 31, 2017
| | | | | | | | |
| |
Description | | | | Shares | | Value ($) | |
Common Stocks - 97.9% | | | | | |
Automobiles & Components - 1.0% | | | | | |
Goodyear Tire & Rubber | | | | 197,268 | | 6,034,428 | |
Banks - 10.3% | | | | | |
Bank of America | | | | 449,423 | | 12,309,696 | |
Citigroup | | | | 224,620 | | 16,509,570 | |
JPMorgan Chase & Co. | | | | 261,610 | | 26,320,582 | |
SunTrust Banks | | | | 104,149 | | 6,270,811 | |
| | | | | 61,410,659 | |
Capital Goods - 8.4% | | | | | |
Honeywell International | | | | 62,882 | | 9,065,069 | |
L3 Technologies | | | | 36,981 | | 6,922,104 | |
Quanta Services | | | | 243,677 | a | 9,193,933 | |
Raytheon | | | | 62,386 | | 11,241,957 | |
United Technologies | | | | 114,040 | | 13,657,430 | |
| | | | | 50,080,493 | |
Consumer Durables & Apparel - .5% | | | | | |
Newell Brands | | | | 78,771 | | 3,212,281 | |
Consumer Services - .7% | | | | | |
Las Vegas Sands | | | | 70,472 | | 4,466,515 | |
Diversified Financials - 8.1% | | | | | |
American Express | | | | 70,511 | | 6,735,211 | |
Ameriprise Financial | | | | 32,416 | | 5,074,401 | |
Berkshire Hathaway, Cl. B | | | | 60,171 | a | 11,248,367 | |
Goldman Sachs Group | | | | 32,742 | | 7,939,280 | |
Synchrony Financial | | | | 264,056 | | 8,613,507 | |
Voya Financial | | | | 213,958 | | 8,592,553 | |
| | | | | 48,203,319 | |
Energy - 6.6% | | | | | |
EOG Resources | | | | 84,586 | | 8,447,604 | |
Occidental Petroleum | | | | 283,918 | | 18,332,585 | |
Phillips 66 | | | | 79,820 | | 7,270,006 | |
Schlumberger | | | | 90,020 | | 5,761,280 | |
| | | | | 39,811,475 | |
Food & Staples Retailing - 1.4% | | | | | |
Costco Wholesale | | | | 51,572 | | 8,307,218 | |
Food, Beverage & Tobacco - 3.3% | | | | | |
Conagra Brands | | | | 176,851 | | 6,041,230 | |
Kellogg | | | | 128,604 | b | 8,041,608 | |
PepsiCo | | | | 53,579 | | 5,906,013 | |
| | | | | 19,988,851 | |
Health Care Equipment & Services - 3.8% | | | | | |
Aetna | | | | 57,266 | | 9,736,938 | |
7
STATEMENT OF INVESTMENTS (continued)
| | | | | | | | |
| |
Description | | | | Shares | | Value ($) | |
Common Stocks - 97.9% (continued) | | | | | |
Health Care Equipment & Services - 3.8% (continued) | | | | | |
AmerisourceBergen | | | | 53,747 | | 4,135,832 | |
UnitedHealth Group | | | | 42,470 | | 8,928,043 | |
| | | | | 22,800,813 | |
Insurance - 3.2% | | | | | |
American International Group | | | | 78,255 | | 5,056,056 | |
Hartford Financial Services Group | | | | 87,684 | | 4,827,004 | |
Prudential Financial | | | | 81,815 | | 9,037,285 | |
| | | | | 18,920,345 | |
Materials - 4.7% | | | | | |
DowDuPont | | | | 124,690 | | 9,016,334 | |
Newmont Mining | | | | 174,878 | | 6,323,588 | |
Packaging Corporation of America | | | | 50,841 | | 5,911,283 | |
Vulcan Materials | | | | 55,390 | | 6,743,733 | |
| | | | | 27,994,938 | |
Media - 2.5% | | | | | |
Comcast, Cl. A | | | | 206,037 | | 7,423,513 | |
Omnicom Group | | | | 108,620 | | 7,298,178 | |
| | | | | 14,721,691 | |
Pharmaceuticals, Biotechnology & Life Sciences - 7.6% | | | | | |
Biogen | | | | 11,718 | a | 3,652,032 | |
Celgene | | | | 68,255 | a | 6,891,707 | |
Gilead Sciences | | | | 55,956 | | 4,194,462 | |
Johnson & Johnson | | | | 128,296 | | 17,885,745 | |
Merck & Co. | | | | 54,571 | | 3,006,316 | |
Pfizer | | | | 287,676 | | 10,085,921 | |
| | | | | 45,716,183 | |
Real Estate - 1.3% | | | | | |
Lamar Advertising, Cl. A | | | | 67,337 | b,c | 4,743,218 | |
Uniti Group | | | | 182,742 | b,c | 3,197,985 | |
| | | | | 7,941,203 | |
Retailing - 4.3% | | | | | |
Amazon.com | | | | 12,075 | a | 13,346,256 | |
Home Depot | | | | 40,731 | | 6,752,385 | |
Priceline Group | | | | 3,071 | a | 5,871,629 | |
| | | | | 25,970,270 | |
Semiconductors & Semiconductor Equipment - 3.1% | | | | | |
Microchip Technology | | | | 49,615 | b | 4,703,502 | |
Texas Instruments | | | | 146,004 | | 14,117,127 | |
| | | | | 18,820,629 | |
Software & Services - 13.2% | | | | | |
Alphabet, Cl. C | | | | 24,283 | a | 24,687,069 | |
Facebook, Cl. A | | | | 78,191 | a | 14,079,071 | |
First Data, Cl. A | | | | 319,468 | a | 5,689,725 | |
8
| | | | | | | | |
| |
Description | | | | Shares | | Value ($) | |
Common Stocks - 97.9% (continued) | | | | | |
Software & Services - 13.2% (continued) | | | | | |
Fortinet | | | | 101,188 | a | 3,987,819 | |
Oracle | | | | 209,425 | | 10,659,733 | |
PayPal Holdings | | | | 63,791 | a | 4,628,675 | |
Splunk | | | | 51,953 | a | 3,496,437 | |
Square, Cl. A | | | | 188,183 | a | 6,998,526 | |
Teradata | | | | 137,730 | a,b | 4,607,069 | |
| | | | | 78,834,124 | |
Technology Hardware & Equipment - 7.9% | | | | | |
Apple | | | | 175,910 | | 29,735,826 | |
Cisco Systems | | | | 510,330 | | 17,427,770 | |
| | | | | 47,163,596 | |
Telecommunication Services - 2.8% | | | | | |
AT&T | | | | 491,588 | | 16,541,936 | |
Transportation - 1.0% | | | | | |
Delta Air Lines | | | | 114,788 | | 5,742,844 | |
Utilities - 2.2% | | | | | |
FirstEnergy | | | | 278,769 | | 9,185,439 | |
NRG Yield, Cl. C | | | | 219,097 | b | 4,075,204 | |
| | | | | 13,260,643 | |
Total Common Stocks (cost $454,868,043) | | | | 585,944,454 | |
| | | | | | | | |
Other Investment - 1.6% | | | | | |
Registered Investment Company; | | | | | |
Dreyfus Institutional Preferred Government Plus Money Market Fund
(cost $9,300,069) | | | | 9,300,069 | d | 9,300,069 | |
| | | | | | | | |
Investment of Cash Collateral for Securities Loaned - 1.2% | | | | | |
Registered Investment Company; | | | | | |
Dreyfus Institutional Preferred Government Money Market Fund, Institutional Shares
(cost $7,357,140) | | | | 7,357,140 | d | 7,357,140 | |
Total Investments (cost $471,525,252) | | 100.7% | | 602,601,663 | |
Liabilities, Less Cash and Receivables | | (.7%) | | (4,416,418) | |
Net Assets | | 100.0% | | 598,185,245 | |
aNon-income producing security.
bSecurity, or portion thereof, on loan. At October 31, 2017, the value of the fund’s securities on loan was $18,937,868 and the value of the collateral held by the fund was $21,542,823, consisting of cash collateral of $7,357,140 and U.S. Government & Agency securities valued at $14,185,683.
cInvestment in real estate investment trust.
dInvestment in affiliated money market mutual fund.
9
STATEMENT OF INVESTMENTS (continued)
| | |
Portfolio Summary (Unaudited) † | Value (%) |
Software & Services | 13.2 |
Banks | 10.3 |
Capital Goods | 8.4 |
Diversified Financials | 8.1 |
Technology Hardware & Equipment | 7.9 |
Pharmaceuticals, Biotech & Life Sciences | 7.6 |
Energy | 6.6 |
Materials | 4.7 |
Retailing | 4.3 |
Health Care Equipment & Services | 3.8 |
Food, Beverage & Tobacco | 3.3 |
Insurance | 3.2 |
Semiconductors & Semiconductor Equipment | 3.1 |
Money Market Investments | 2.8 |
Telecommunication Services | 2.8 |
Media | 2.5 |
Utilities | 2.2 |
Food & Staples Retailing | 1.4 |
Real Estate | 1.3 |
Automobiles & Components | 1.0 |
Transportation | 1.0 |
Consumer Services | .7 |
Consumer Durables & Apparel | .5 |
| | 100.7 |
† Based on net assets.
See notes to financial statements.
10
STATEMENT OF INVESTMENTS IN AFFILIATED ISSUERS
| | | | | | | |
Registered Investment Companies | Value
10/31/16 ($) | Purchases ($) | Sales ($) | Value
10/31/17 ($) | Net
Assets (%) | Dividends/
Distributions ($) |
Dreyfus Institutional Preferred Government Money Market Fund, Institutional Shares | 2,736,804 | 86,567,097 | 81,946,761 | 7,357,140 | 1.2 | — |
Dreyfus Institutional Preferred Government Plus Money Market Fund | 3,059,135 | 112,766,439 | 106,525,505 | 9,300,069 | 1.6 | 24,088 |
Total | 5,795,939 | 199,333,536 | 188,472,266 | 16,657,209 | 2.8 | 24,088 |
11
STATEMENT OF ASSETS AND LIABILITIES
October 31, 2017
| | | | | | | | | | | |
| | | | | | |
| | | Cost | | Value | |
Assets ($): | | | | |
Investments in securities—See Statement of Investments
(including securities on loan, valued at $18,937,868)—Note 1(b): | | | |
Unaffiliated issuers | 454,868,043 | | 585,944,454 | |
Affiliated issuers | | 16,657,209 | | 16,657,209 | |
Cash | | | | | 29,213 | |
Receivable for investment securities sold | | 5,720,982 | |
Dividends and securities lending income receivable | | 477,488 | |
Receivable for shares of Common Stock subscribed | | 20,215 | |
| | | | | 608,849,561 | |
Liabilities ($): | | | | |
Due to The Dreyfus Corporation and affiliates—Note 3(b) | | | | | 504,069 | |
Liability for securities on loan—Note 1(b) | | 7,357,140 | |
Payable for investment securities purchased | | 2,644,470 | |
Payable for shares of Common Stock redeemed | | 157,890 | |
Accrued expenses | | | | | 747 | |
| | | | | 10,664,316 | |
Net Assets ($) | | | 598,185,245 | |
Composition of Net Assets ($): | | | | |
Paid-in capital | | | | | 411,019,396 | |
Accumulated undistributed investment income—net | | 1,887,354 | |
Accumulated net realized gain (loss) on investments | | | | | 54,202,084 | |
Accumulated net unrealized appreciation (depreciation)
on investments | | | | 131,076,411 | |
Net Assets ($) | | | 598,185,245 | |
Shares Outstanding | | |
(245 million shares of $.001 par value Common Stock authorized) | 15,621,776 | |
Net Asset Value Per Share ($) | | 38.29 | |
| | | | | |
See notes to financial statements. | | | | |
12
STATEMENT OF OPERATIONS
Year Ended October 31, 2017
| | | | | | | |
| | | | | | |
| | | | | | |
Investment Income ($): | | | | |
Income: | | | | |
Cash dividends: | |
Unaffiliated issuers | | | 11,792,644 | |
Affiliated issuers | | | 24,088 | |
Income from securities lending—Note 1(b) | | | 30,761 | |
Total Income | | | 11,847,493 | |
Expenses: | | | | |
Management fee—Note 3(a) | | | 5,282,819 | |
Distribution fees—Note 3(b) | | | 586,980 | |
Directors’ fees—Note 3(a,c) | | | 42,458 | |
Loan commitment fees—Note 2 | | | 18,665 | |
Interest expense—Note 2 | | | 237 | |
Total Expenses | | | 5,931,159 | |
Less—Directors’ fees reimbursed by Dreyfus—Note 3(a) | | | (42,458) | |
Net Expenses | | | 5,888,701 | |
Investment Income—Net | | | 5,958,792 | |
Realized and Unrealized Gain (Loss) on Investments—Note 4 ($): | | |
Net realized gain (loss) on investments | 54,974,431 | |
Net unrealized appreciation (depreciation) on investments | | | 48,226,593 | |
Net Realized and Unrealized Gain (Loss) on Investments | | | 103,201,024 | |
Net Increase in Net Assets Resulting from Operations | | 109,159,816 | |
| | | | | | | |
See notes to financial statements. | | | | | |
13
STATEMENT OF CHANGES IN NET ASSETS
| | | | | | | | | | |
| | | | Year Ended October 31, |
| | | | 2017 | | 2016 | |
Operations ($): | | | | | | | | |
Investment income—net | | | 5,958,792 | | | | 6,156,644 | |
Net realized gain (loss) on investments | | 54,974,431 | | | | 11,166,719 | |
Net unrealized appreciation (depreciation)
on investments | | 48,226,593 | | | | (1,023,994) | |
Net Increase (Decrease) in Net Assets
Resulting from Operations | 109,159,816 | | | | 16,299,369 | |
Distributions to Shareholders from ($): | |
Investment income—net | | | (5,851,063) | | | | (5,991,812) | |
Net realized gain on investments | | | (11,449,855) | | | | (57,360,591) | |
Total Distributions | | | (17,300,918) | | | | (63,352,403) | |
Capital Stock Transactions ($): | |
Net proceeds from shares sold | | | 19,011,992 | | | | 17,742,585 | |
Distributions reinvested | | | 16,576,319 | | | | 60,883,553 | |
Cost of shares redeemed | | | (67,559,365) | | | | (58,239,800) | |
Increase (Decrease) in Net Assets
from Capital Stock Transactions | (31,971,054) | | | | 20,386,338 | |
Total Increase (Decrease) in Net Assets | 59,887,844 | | | | (26,666,696) | |
Net Assets ($): | |
Beginning of Period | | | 538,297,401 | | | | 564,964,097 | |
End of Period | | | 598,185,245 | | | | 538,297,401 | |
Undistributed investment income—net | 1,887,354 | | | | 1,884,205 | |
Capital Share Transactions (Shares): | |
Shares sold | | | 538,395 | | | | 556,573 | |
Shares issued for distributions reinvested | | | 488,454 | | | | 1,919,268 | |
Shares redeemed | | | (1,877,034) | | | | (1,813,693) | |
Net Increase (Decrease) in Shares Outstanding | (850,185) | | | | 662,148 | |
| | | | | | | | | | |
See notes to financial statements. | | | | | | | | |
14
FINANCIAL HIGHLIGHTS
The following table describes the performance for the fiscal periods indicated. Total return shows how much your investment in the fund would have increased (or decreased) during each period, assuming you had reinvested all dividends and distributions. These figures have been derived from the fund’s financial statements.
| | | | | | | | | | | |
| | | | | |
| | |
| | Year Ended October 31, |
| | 2017 | 2016 | 2015 | 2014 | 2013 |
Per Share Data ($): | | | | | | |
Net asset value, beginning of period | | 32.68 | 35.74 | 37.63 | 40.23 | 32.56 |
Investment Operations: | | | | | | |
Investment income—neta | | .37 | .37 | .32 | .24 | .32 |
Net realized and unrealized
gain (loss) on investments | | 6.30 | .60 | 1.96 | 3.86 | 7.67 |
Total from Investment Operations | | 6.67 | .97 | 2.28 | 4.10 | 7.99 |
Distributions: | | | | | | |
Dividends from
investment income—net | | (.36) | (.37) | (.30) | (.24) | (.32) |
Dividends from net realized
gain on investments | | (.70) | (3.66) | (3.87) | (6.46) | – |
Total Distributions | | (1.06) | (4.03) | (4.17) | (6.70) | (.32) |
Net asset value, end of period | | 38.29 | 32.68 | 35.74 | 37.63 | 40.23 |
Total Return (%) | | 20.84 | 3.15 | 6.62 | 11.91 | 24.72 |
Ratios/Supplemental Data (%): |
Ratio of total expenses
to average net assets | | 1.01 | 1.01 | 1.01 | 1.01 | 1.01 |
Ratio of net expenses
to average net assets | | 1.00 | 1.00 | 1.00 | 1.00 | 1.00 |
Ratio of net investment income
to average net assets | | 1.02 | 1.15 | .90 | .65 | .90 |
Portfolio Turnover Rate | | 55.38 | 49.27 | 65.96 | 69.22 | 118.87 |
Net Assets, end of period ($ x 1,000) | | 598,185 | 538,297 | 564,964 | 588,912 | 584,025 |
a Based on average shares outstanding.
See notes to financial statements.
15
NOTES TO FINANCIAL STATEMENTS
NOTE 1—Significant Accounting Policies:
Dreyfus Disciplined Stock Fund (the “fund”) is a separate diversified series of The Dreyfus/Laurel Funds, Inc. (the “Company”), which is registered under the Investment Company Act of 1940, as amended (the “Act”), as an open-end management investment company and operates as a series company currently offering eight series, including the fund. The fund’s investment objective is to seek capital appreciation. The Dreyfus Corporation (the “Manager” or “Dreyfus”), a wholly-owned subsidiary of The Bank of New York Mellon Corporation (“BNY Mellon”), serves as the fund’s investment adviser. MBSC Securities Corporation (the “Distributor”), a wholly-owned subsidiary of Dreyfus, is the distributor of the fund’s shares, which are sold to the public without a sales charge.
The Company accounts separately for the assets, liabilities and operations of each series. Expenses directly attributable to each series are charged to that series’ operations; expenses which are applicable to all series are allocated among them on a pro rata basis.
The Financial Accounting Standards Board (“FASB”) Accounting Standards Codification is the exclusive reference of authoritative U.S. generally accepted accounting principles (“GAAP”) recognized by the FASB to be applied by nongovernmental entities. Rules and interpretive releases of the Securities and Exchange Commission (“SEC”) under authority of federal laws are also sources of authoritative GAAP for SEC registrants. The fund’s financial statements are prepared in accordance with GAAP, which may require the use of management estimates and assumptions. Actual results could differ from those estimates.
(a) Portfolio valuation: The fair value of a financial instrument is the amount that would be received to sell an asset or paid to transfer a liability in an orderly transaction between market participants at the measurement date (i.e., the exit price). GAAP establishes a fair value hierarchy that prioritizes the inputs of valuation techniques used to measure fair value. This hierarchy gives the highest priority to unadjusted quoted prices in active markets for identical assets or liabilities (Level 1 measurements) and the lowest priority to unobservable inputs (Level 3 measurements).
Additionally, GAAP provides guidance on determining whether the volume and activity in a market has decreased significantly and whether such a decrease in activity results in transactions that are not orderly. GAAP requires enhanced disclosures around valuation inputs and techniques used during annual and interim periods.
16
Various inputs are used in determining the value of the fund’s investments relating to fair value measurements. These inputs are summarized in the three broad levels listed below:
Level 1—unadjusted quoted prices in active markets for identical investments.
Level 2—other significant observable inputs (including quoted prices for similar investments, interest rates, prepayment speeds, credit risk, etc.).
Level 3—significant unobservable inputs (including the fund’s own assumptions in determining the fair value of investments).
The inputs or methodology used for valuing securities are not necessarily an indication of the risk associated with investing in those securities.
Changes in valuation techniques may result in transfers in or out of an assigned level within the disclosure hierarchy. Valuation techniques used to value the fund’s investments are as follows:
Investments in securities are valued at the last sales price on the securities exchange or national securities market on which such securities are primarily traded. Securities listed on the National Market System for which market quotations are available are valued at the official closing price or, if there is no official closing price that day, at the last sales price. For open short positions, asked prices are used for valuation purposes. Bid price is used when no asked price is available. Registered investment companies that are not traded on an exchange are valued at their net asset value. All of the preceding securities are generally categorized within Level 1 of the fair value hierarchy.
Securities not listed on an exchange or the national securities market, or securities for which there were no transactions, are valued at the average of the most recent bid and asked prices. These securities are generally categorized within Level 2 of the fair value hierarchy.
Fair valuing of securities may be determined with the assistance of a pricing service using calculations based on indices of domestic securities and other appropriate indicators, such as prices of relevant American Depository Receipts and futures. Utilizing these techniques may result in transfers between Level 1 and Level 2 of the fair value hierarchy.
When market quotations or official closing prices are not readily available, or are determined to not accurately reflect fair value, such as when the value of a security has been significantly affected by events after the close of the exchange or market on which the security is principally traded (for
17
NOTES TO FINANCIAL STATEMENTS (continued)
example, a foreign exchange or market), but before the fund calculates its net asset value, the fund may value these investments at fair value as determined in accordance with the procedures approved by the Company’s Board of Directors (the “Board”). Certain factors may be considered when fair valuing investments such as: fundamental analytical data, the nature and duration of restrictions on disposition, an evaluation of the forces that influence the market in which the securities are purchased and sold, and public trading in similar securities of the issuer or comparable issuers. These securities are either categorized within Level 2 or 3 of the fair value hierarchy depending on the relevant inputs used.
For restricted securities where observable inputs are limited, assumptions about market activity and risk are used and are generally categorized within Level 3 of the fair value hierarchy.
The following is a summary of the inputs used as of October 31, 2017 in valuing the fund’s investments:
| | | | | |
| | Level 1 - Unadjusted Quoted Prices | Level 2 - Other Significant Observable Inputs | Level 3 - Significant Unobservable Inputs | Total |
Assets ($) | | | | |
Investments in Securities: | | |
Equity Securities—
Domestic
Common Stocks† | 585,944,454 | – | – | 585,944,454 |
Registered
Investment
Companies | 16,657,209 | – | – | 16,657,209 |
† See Statement of Investments for additional detailed categorizations.
At October 31, 2017, there were no transfers between levels of the fair value hierarchy. It is the fund’s policy to recognize transfers between levels at the end of the reporting period.
(b) Securities transactions and investment income: Securities transactions are recorded on a trade date basis. Realized gains and losses from securities transactions are recorded on the identified cost basis. Dividend income is recognized on the ex-dividend date and interest income, including, where applicable, accretion of discount and amortization of premium on investments, is recognized on the accrual basis.
Pursuant to a securities lending agreement with The Bank of New York Mellon, a subsidiary of BNY Mellon and an affiliate of Dreyfus, and its affiliates, the fund may lend securities to qualified institutions. It is the fund’s policy that, at origination, all loans are secured by collateral of at
18
least 102% of the value of U.S. securities loaned and 105% of the value of foreign securities loaned. Collateral equivalent to at least 100% of the market value of securities on loan is maintained at all times. Collateral is either in the form of cash, which can be invested in certain money market mutual funds managed by Dreyfus, or U.S. Government and Agency securities. The fund is entitled to receive all dividends, interest and distributions on securities loaned, in addition to income earned as a result of the lending transaction. Should a borrower fail to return the securities in a timely manner, The Bank of New York Mellon is required to replace the securities for the benefit of the fund or credit the fund with the market value of the unreturned securities and is subrogated to the fund’s rights against the borrower and the collateral. Additionally, the contractual maturity of security lending transactions are on an overnight and continuous basis. During the period ended October 31, 2017, The Bank of New York Mellon earned $5,714 from lending portfolio securities, pursuant to the securities lending agreement.
(c) Affiliated issuers: Investments in other investment companies advised by Dreyfus are defined as “affiliated” under the Act.
(d) Dividends and distributions to shareholders: Dividends and distributions are recorded on the ex-dividend date. Dividends from investment income-net are normally declared and paid quarterly. Dividends from net realized capital gains, if any, are normally declared and paid annually, but the fund may make distributions on a more frequent basis to comply with the distribution requirements of the Internal Revenue Code of 1986, as amended (the “Code”). To the extent that net realized capital gains can be offset by capital loss carryovers, it is the policy of the fund not to distribute such gains. Income and capital gain distributions are determined in accordance with income tax regulations, which may differ from GAAP.
(e) Federal income taxes: It is the policy of the fund to continue to qualify as a regulated investment company, if such qualification is in the best interests of its shareholders, by complying with the applicable provisions of the Code, and to make distributions of taxable income sufficient to relieve it from substantially all federal income and excise taxes.
As of and during the period ended October 31, 2017, the fund did not have any liabilities for any uncertain tax positions. The fund recognizes interest and penalties, if any, related to uncertain tax positions as income tax expense in the Statement of Operations. During the period ended October 31, 2017, the fund did not incur any interest or penalties.
19
NOTES TO FINANCIAL STATEMENTS (continued)
Each tax year in the four-year period ended October 31, 2017 remains subject to examination by the Internal Revenue Service and state taxing authorities.
At October 31, 2017, the components of accumulated earnings on a tax basis were as follows: undistributed ordinary income $13,037,140, undistributed capital gains $43,727,529 and unrealized appreciation $130,401,180.
The tax character of distributions paid to shareholders during the fiscal periods ended October 31, 2017 and October 31, 2016 were as follows: ordinary income $5,851,063 and $6,037,227, and long-term capital gains $11,449,855 and $57,315,176, respectively.
During the period ended October 31, 2017, as a result of permanent book to tax differences, primarily due to the tax treatment for real estate investment trusts, the fund decreased accumulated undistributed investment income-net by $104,580 and increased accumulated net realized gain (loss) on investments by the same amount. Net assets and net asset value per share were not affected by this reclassification.
NOTE 2—Bank Lines of Credit:
The fund participates with other Dreyfus-managed funds in an $830 million unsecured credit facility led by Citibank, N.A. and a $300 million unsecured credit facility provided by The Bank of New York Mellon (each, a “Facility”), each to be utilized primarily for temporary or emergency purposes, including the financing of redemptions. Prior to October 4, 2017, the unsecured credit facility with Citibank, N.A. was $810 million. In connection therewith, the fund has agreed to pay its pro rata portion of commitment fees for each Facility. Interest is charged to the fund based on rates determined pursuant to the terms of the respective Facility at the time of borrowing.
The average amount of borrowings outstanding under the Facilities during the period ended October 31, 2017 was approximately $11,200 with a related weighted average annualized interest rate of 2.12%.
NOTE 3—Investment Management Fee and Other Transactions with Affiliates:
(a) Pursuant to an investment management agreement with Dreyfus, Dreyfus provides or arranges for one or more third parties and/or affiliates to provide investment advisory, administrative, custody, fund accounting and transfer agency services to the fund. Dreyfus also directs the investments of the fund in accordance with its investment objective, policies and limitations. For these services, the fund is contractually
20
obligated to pay Dreyfus a fee, calculated daily and paid monthly, at the annual rate of .90% of the value of the fund’s average daily net assets. Out of its fee, Dreyfus pays all of the expenses of the fund except brokerage fees, taxes, interest expenses, commitment fees on borrowings, Distribution Plan fees, fees and expenses of non-interested Directors (including counsel fees) and extraordinary expenses. In addition, Dreyfus is required to reduce its fee in an amount equal to the fund’s allocable portion of fees and expenses of the non-interested Directors (including counsel fees). During the period ended October 31, 2017, fees reimbursed by Dreyfus amounted to $42,458.
(b) Under the Distribution Plan adopted pursuant to Rule 12b-1 under the Act, the fund may pay annually up to .10% of the value of its average daily net assets to compensate BNY Mellon and Dreyfus for shareholder servicing activities and the Distributor for shareholder servicing activities and expenses primarily intended to result in the sale of fund shares. During the period ended October 31, 2017, the fund was charged $586,980 pursuant to the Distribution Plan.
Under its terms, the Distribution Plan shall remain in effect from year to year, provided such continuance is approved annually by a vote of a majority of those Directors who are not “interested persons” of the Company and who have no direct or indirect financial interest in the operation of or in any agreement related to the Distribution Plan.
The components of “Due to The Dreyfus Corporation and affiliates” in the Statement of Assets and Liabilities consist of: management fees $457,039 and Distribution Plan fees $50,782, which are offset against an expense reimbursement currently in effect in the amount of $3,752.
(c) Each Board member also serves as a Board member of other funds within the Dreyfus complex. Annual retainer fees and attendance fees are allocated to each fund based on net assets.
NOTE 4—Securities Transactions:
The aggregate amount of purchases and sales of investment securities, excluding short-term securities, during the period ended October 31, 2017, amounted to $321,312,200 and $371,512,585, respectively.
At October 31, 2017, the cost of investments for federal income tax purposes was $472,200,483; accordingly, accumulated net unrealized appreciation on investments was $130,401,180, consisting of $137,546,658 gross unrealized appreciation and $7,145,478 gross unrealized depreciation.
21
REPORT OF INDEPENDENT REGISTERED
PUBLIC ACCOUNTING FIRM
The Board of Directors and Shareholders of
The Dreyfus/Laurel Funds, Inc.
We have audited the accompanying statement of assets and liabilities of Dreyfus Disciplined Stock Fund (the “Fund”), a series of The Dreyfus/Laurel Funds, Inc., including the statements of investments and investments in affiliated issuers, as of October 31, 2017, and the related statement of operations for the year then ended, the statements of changes in net assets for each of the years in the two-year period then ended, and the financial highlights for each of the years in the five-year period then ended. These financial statements and financial highlights are the responsibility of the Fund’s management. Our responsibility is to express an opinion on these financial statements and financial highlights based on our audits.
We conducted our audits in accordance with the standards of the Public Company Accounting Oversight Board (United States). Those standards require that we plan and perform the audit to obtain reasonable assurance about whether the financial statements and financial highlights are free of material misstatement. An audit includes examining, on a test basis, evidence supporting the amounts and disclosures in the financial statements. Our procedures included confirmation of securities owned as of October 31, 2017, by correspondence with the custodian and brokers or by other appropriate auditing procedures. An audit also includes assessing the accounting principles used and significant estimates made by management, as well as evaluating the overall financial statement presentation. We believe that our audits provide a reasonable basis for our opinion.
In our opinion, the financial statements and financial highlights referred to above present fairly, in all material respects, the financial position of Dreyfus Disciplined Stock Fund as of October 31, 2017, and the results of its operations for the year then ended, the changes in its net assets for each of the years in the two-year period then ended, and the financial highlights for each of the years in the five-year period then ended, in conformity with U.S. generally accepted accounting principles.

New York, New York
December 22, 2017
22
IMPORTANT TAX INFORMATION (Unaudited)
For federal tax purposes, the fund reports the maximum amount allowable, but not less than $5,851,063 as ordinary income dividends paid during the year ended October 31, 2017 as qualified dividend income in accordance with Section 854(b)(1)(B) of the Internal Revenue Code. Also, the fund reports the maximum amount allowable but not less than 78.52% of ordinary income dividends paid during the year ended October 31, 2017 as eligible for the corporate dividends received deduction provided under Section 243 of the Internal Revenue Code in accordance with Section 854(b)(1)(A) of the Internal Revenue Code. Shareholders will receive notification in early 2018 of the percentage applicable to the preparation of their 2017 income tax returns. Also, the fund reports the maximum amount allowable but not less than $.6968 per share as a capital gain dividend in accordance with Section 852(b)(3)(C) of the Internal Revenue Code.
23
BOARD MEMBERS INFORMATION (Unaudited)
INDEPENDENT BOARD MEMBERS
Joseph S. DiMartino (74)
Chairman of the Board (1999)
Principal Occupation During Past 5 Years:
· Corporate Director and Trustee (1995-present)
Other Public Company Board Memberships During Past 5 Years:
· CBIZ (formerly, Century Business Services, Inc.), a provider of outsourcing functions for small and medium size companies, Director (1997-present)
No. of Portfolios for which Board Member Serves: 126
———————
Francine J. Bovich (66)
Board Member (2012)
Principal Occupation During Past 5 Years:
· Trustee, The Bradley Trusts, private trust funds (2011-present)
Other Public Company Board Memberships During Past 5 Years:
· Annaly Capital Management, Inc., Board Member (May 2014-present)
No. of Portfolios for which Board Member Serves: 74
———————
Kenneth A. Himmel (71)
Board Member (1994)
Principal Occupation During Past 5 Years:
· Managing Partner, Gulf Related, an international real estate development company (2010-present)
· President and CEO, Related Urban Development, a real estate development company (1996-present)
· President and CEO, Himmel & Company, a real estate development company (1980-present)
· CEO, American Food Management, a restaurant company (1983-present)
No. of Portfolios for which Board Member Serves: 28
———————
24
Stephen J. Lockwood (70)
Board Member (1994)
Principal Occupation During Past 5 Years:
· Chairman of the Board, Stephen J. Lockwood and Company LLC, a real estate investment company (2000-present)
No. of Portfolios for which Board Member Serves: 28
———————
Roslyn M. Watson (68)
Board Member (1994)
Principal Occupation During Past 5 Years:
· Principal, Watson Ventures, Inc., a real estate investment company (1993-present)
No. of Portfolios for which Board Member Serves: 60
———————
Benaree Pratt Wiley (71)
Board Member (1998)
Principal Occupation During Past 5 Years:
· Principal, The Wiley Group, a firm specializing in strategy and business development (2005-present)
Other Public Company Board Memberships During Past 5 Years:
· CBIZ (formerly, Century Business Services, Inc.), a provider of outsourcing functions for small and medium size companies, Director (2008-present)
No. of Portfolios for which Board Member Serves: 81
———————
Once elected all Board Members serve for an indefinite term, but achieve Emeritus status upon reaching age 80. The address of the Board Members and Officers is c/o The Dreyfus Corporation, 200 Park Avenue, New York, New York 10166. Additional information about the Board Members is available in the fund’s Statement of Additional Information which can be obtained from Dreyfus free of charge by calling this toll free number: 1-800-DREYFUS.
James M. Fitzgibbons, Emeritus Board Member
J. Tomlinson Fort Emeritus Board Member
25
OFFICERS OF THE FUND (Unaudited)
BRADLEY J. SKAPYAK, President since January 2010.
Chief Operating Officer and a director of the Manager since June 2009, Chairman of Dreyfus Transfer, Inc., an affiliate of the Manager and the transfer agent of the funds, since May 2011 and Chief Executive Officer of MBSC Securities Corporation since August 2016. He is an officer of 62 investment companies (comprised of 126 portfolios) managed by the Manager. He is 58 years old and has been an employee of the Manager since February 1988.
BENNETT A. MACDOUGALL, Chief Legal Officer since October 2015.
Chief Legal Officer of the Manager and Associate General Counsel and Managing Director of BNY Mellon since June 2015; from June 2005 to June 2015, he served in various capacities with Deutsche Bank – Asset & Wealth Management Division, including as Director and Associate General Counsel, and Chief Legal Officer of Deutsche Investment Management Americas Inc. from June 2012 to May 2015. He is an officer of 63 investment companies (comprised of 151 portfolios) managed by the Manager. He is 46 years old and has been an employee of the Manager since June 2015.
JANETTE E. FARRAGHER, Vice President and Secretary since December 2011.
Associate General Counsel of BNY Mellon, and an officer of 63 investment companies (comprised of 151 portfolios) managed by the Manager. She is 54 years old and has been an employee of the Manager since February 1984.
JAMES BITETTO, Vice President and Assistant Secretary since August 2005.
Managing Counsel of BNY Mellon and Secretary of the Manager, and an officer of 63 investment companies (comprised of 151 portfolios) managed by the Manager. He is 51 years old and has been an employee of the Manager since December 1996.
JOSEPH M. CHIOFFI, Vice President and Assistant Secretary since August 2005.
Managing Counsel of BNY Mellon, and an officer of 63 investment companies (comprised of 151 portfolios) managed by the Manager. He is 55 years old and has been an employee of the Manager since June 2000.
MAUREEN E. KANE, Vice President and Assistant Secretary since April 2015.
Managing Counsel of BNY Mellon since July 2014; from October 2004 until July 2014, General Counsel, and from May 2009 until July 2014, Chief Compliance Officer of Century Capital Management. She is an officer of 63 investment companies (comprised of 151 portfolios) managed by the Manager. She is 55 years old and has been an employee of the Manager since July 2014.
SARAH S. KELLEHER, Vice President and Assistant Secretary since April 2014.
Senior Counsel of BNY Mellon since March 2013, from August 2005 to March 2013, Associate General Counsel of Third Avenue Management. She is an officer of 63 investment companies (comprised of 151 portfolios) managed by the Manager. She is 42 years old and has been an employee of the Manager since March 2013.
JEFF PRUSNOFSKY, Vice President and Assistant Secretary since August 2005.
Senior Managing Counsel of BNY Mellon, and an officer of 63 investment companies (comprised of 151 portfolios) managed by the Manager. He is 52 years old and has been an employee of the Manager since October 1990.
NATALYA ZELENSKY, Vice President and Assistant Secretary since March 2017.
Counsel and Vice President of BNY Mellon since May 2016; Attorney at Wildermuth Endowment Strategy Fund/Wildermuth Advisory, LLC from November 2015 until May 2016; Assistant General Counsel at RCS Advisory Services from July 2014 until November 2015; Associate at Sutherland, Asbill & Brennan from January 2013 until January 2014; Associate at K&L Gates from October 2011 until January 2013. She is an officer of 63 investment companies (comprised of 151 portfolios) managed by Dreyfus. She is 32 years old and has been an employee of the Manager since May 2016.
JAMES WINDELS, Treasurer since November 2001.
Director – Mutual Fund Accounting of the Manager, and an officer of 63 investment companies (comprised of 151 portfolios) managed by the Manager. He is 59 years old and has been an employee of the Manager since April 1985.
26
RICHARD CASSARO, Assistant Treasurer since January 2008.
Senior Accounting Manager – Money Market and Municipal Bond Funds of the Manager, and an officer of 63 investment companies (comprised of 151 portfolios) managed by the Manager. He is 58 years old and has been an employee of the Manager since September 1982.
GAVIN C. REILLY, Assistant Treasurer since December 2005.
Tax Manager of the Investment Accounting and Support Department of the Manager, and an officer of 63 investment companies (comprised of 151 portfolios) managed by the Manager. He is 49 years old and has been an employee of the Manager since April 1991.
ROBERT S. ROBOL, Assistant Treasurer since December 2002.
Senior Accounting Manager – Dreyfus Financial Reporting of the Manager, and an officer of 63 investment companies (comprised of 151 portfolios) managed by the Manager. He is 53 years old and has been an employee of the Manager since October 1988.
ROBERT SALVIOLO, Assistant Treasurer since July 2007.
Senior Accounting Manager – Equity Funds of the Manager, and an officer of 63 investment companies (comprised of 151 portfolios) managed by the Manager. He is 50 years old and has been an employee of the Manager since June 1989.
ROBERT SVAGNA, Assistant Treasurer since December 2002.
Senior Accounting Manager – Fixed Income and Equity Funds of the Manager, and an officer of 63 investment companies (comprised of 151 portfolios) managed by the Manager. He is 50 years old and has been an employee of the Manager since November 1990.
JOSEPH W. CONNOLLY, Chief Compliance Officer since October 2004.
Chief Compliance Officer of the Manager and The Dreyfus Family of Funds (63 investment companies, comprised of 151 portfolios). He is 60 years old and has served in various capacities with the Manager since 1980, including manager of the firm’s Fund Accounting Department from 1997 through October 2001.
CARIDAD M. CAROSELLA, Anti-Money Laundering Compliance Officer since January 2016.
Anti-Money Laundering Compliance Officer of the Dreyfus Family of Funds and BNY Mellon Funds Trust since January 2016; from May 2015 to December 2015, Interim Anti-Money Laundering Compliance Officer of the Dreyfus Family of Funds and BNY Mellon Funds Trust and the Distributor; from January 2012 to May 2015, AML Surveillance Officer of the Distributor and from 2007 to December 2011, Financial Processing Manager of the Distributor. She is an officer of 57 investment companies (comprised of 145 portfolios) managed by the Manager. She is 49 years old and has been an employee of the Distributor since 1997.
27
NOTES
28
NOTES
29
Dreyfus Disciplined Stock Fund
200 Park Avenue
New York, NY 10166
Manager
The Dreyfus Corporation
200 Park Avenue
New York, NY 10166
Custodian
The Bank of New York Mellon
225 Liberty Street
New York, NY 10286
Transfer Agent &
Dividend Disbursing Agent
Dreyfus Transfer, Inc.
200 Park Avenue
New York, NY 10166
Distributor
MBSC Securities Corporation
200 Park Avenue
New York, NY 10166
Telephone Call your financial representative or 1-800-DREYFUS
Mail The Dreyfus Family of Funds, 144 Glenn Curtiss Boulevard, Uniondale, NY 11556-0144
E-mail Send your request to info@dreyfus.com
Internet Information can be viewed online or downloaded at www.dreyfus.com
The fund files its complete schedule of portfolio holdings with the Securities and Exchange Commission (“SEC”) for the first and third quarters of each fiscal year on Form N-Q. The fund’s Forms N-Q are available on the SEC’s website at www.sec.gov and may be reviewed and copied at the SEC’s Public Reference Room in Washington, D.C. (phone 1-800-SEC-0330 for information).
A description of the policies and procedures that the fund uses to determine how to vote proxies relating to portfolio securities and information regarding how the fund voted these proxies for the most recent 12-month period ended June 30 is available at www.dreyfus.com and on the SEC’s website at www.sec.gov and without charge, upon request, by calling 1-800-DREYFUS.
| | |
© 2017 MBSC Securities Corporation
0728AR1017 | 
|
Dreyfus Institutional S&P 500 Stock Index Fund
| | | |

| | ANNUAL REPORT
October 31, 2017 |
| |
Save time. Save paper. View your next shareholder report online as soon as it’s available. Log into www.dreyfus.com and sign up for Dreyfus eCommunications. It’s simple and only takes a few minutes. |
| |
The views expressed in this report reflect those of the portfolio manager(s) only through the end of the period covered and do not necessarily represent the views of Dreyfus or any other person in the Dreyfus organization. Any such views are subject to change at any time based upon market or other conditions and Dreyfus disclaims any responsibility to update such views. These views may not be relied on as investment advice and, because investment decisions for a Dreyfus fund are based on numerous factors, may not be relied on as an indication of trading intent on behalf of any Dreyfus fund. |
| |
Not FDIC-Insured • Not Bank-Guaranteed • May Lose Value |
Contents
THE FUND
FOR MORE INFORMATION
Back Cover
| | | | |
| |
Dreyfus Institutional S&P 500 Stock Index Fund
| | The Fund |
A LETTER FROM THE CEO OF DREYFUS
Dear Shareholder:
We are pleased to present this annual report for Dreyfus Institutional S&P 500 Stock Index Fund, covering the 12-month period from November 1, 2016 through October 31, 2017. For information about how the fund performed during the reporting period, as well as general market perspectives, we provide a Discussion of Fund Performance on the pages that follow.
Stocks set a series of new record highs and bonds produced mixed results over the past year in response to changing economic and political conditions. Financial markets at the start of the reporting period were dominated by the election of a new U.S. presidential administration. Equities and corporate-backed bonds surged higher in anticipation of more business-friendly regulatory, tax, and fiscal policies, but high-quality bonds generally lost value due to expectations of rising interest rates and accelerating inflation in a stronger economy. Despite a series of short-term interest-rate hikes, bonds recovered their previous losses over the first 10 months of 2017 when it became clearer that pro-growth legislation would take time and political capital to enact. U.S. and international stocks continued to rally as corporate earnings grew and global economic conditions improved.
The markets’ recent strong performance has been supported by solid underlying fundamentals. While we currently expect these favorable conditions to persist, we remain watchful for economic and political developments that could derail the markets. As always, we encourage you to discuss the risks and opportunities of today’s investment environment with your financial advisor.
Thank you for your continued confidence and support.
Sincerely,

Mark D. Santero
Chief Executive Officer
The Dreyfus Corporation
November 15, 2017
2
DISCUSSION OF FUND PERFORMANCE
For the period from November 1, 2016 through October 31, 2017, as provided by Thomas J. Durante, CFA, Karen Q. Wong, CFA, and Richard A. Brown, CFA, Portfolio Managers
Market and Fund Performance Overview
For the 12-month period ended October 31, 2017, Dreyfus Institutional S&P 500 Index Fund produced a total return of 23.42%.1 In comparison, the S&P 500® Index (the “Index”), the fund’s benchmark, returned 23.61% for the same period.2,3
Large-cap stocks gained ground amid better-than-expected corporate earnings, improving global economic prospects, and expectations of more stimulative U.S. government policies. The difference in returns between the fund and the Index was primarily the result of transaction costs and operating expenses that are not reflected in the Index’s results.
The Fund’s Investment Approach
The fund seeks to match the total return of the Index by generally investing at least 95% of its total assets in common stocks included in the Index. To replicate index performance, the fund’s portfolio managers use a passive management approach and generally purchase all of the securities comprising the Index (though, at times, the fund may invest in a representative sample of the Index). Because the fund has expenses, performance will tend to be slightly lower than that of the Index. The fund attempts to have a correlation between its performance and that of the Index of at least .95, before expenses. A correlation of 1.00 would mean that the fund and the Index were perfectly correlated.
The Index is an unmanaged index of 500 common stocks chosen to reflect the industries of the U.S. economy and is often considered a proxy for the stock market in general.
Rising Corporate Earnings Drove Markets Higher
Equity markets were reenergized in late 2016 when investors began to anticipate more robust economic growth stemming from lower corporate taxes, reduced regulatory constraints on business, and increased infrastructure spending from a new presidential administration. In early 2017, better-than-expected corporate earnings and encouraging global economic developments drove the Index to a series of new highs. While concerns about the new presidential administration’s ability to implement its business-friendly policy proposals slowed the market’s advance in the spring, most broad measures of stock market performance quickly erased those losses and reached new all-time highs over the summer and into the fall.
The market’s advance was supported throughout the reporting period by measured, well-telegraphed shifts in monetary policy from the Federal Reserve Board (the “Fed”). Although rising interest rates historically have tended to undermine investor sentiment toward stocks, the Fed’s gradual approach to withdrawing economic stimulus—including three short-term interest-rate hikes and the start of balance-sheet reduction—was received calmly by investors, who focused on rising corporate earnings and improving business conditions.
Technology Stocks Led the Market’s Advance
The Index’s robust results over the reporting period were largely driven by earnings growth in the information technology sector. Ongoing trends in favor of cloud computing, e-commerce, digital advertising, and mobile communications helped support revenues and earnings for a variety of large technology companies, most notably industry leaders such as Apple, Amazon.com, Facebook, Microsoft, and Alphabet (the parent of Google). Some of these industry giants moved
3
DISCUSSION OF FUND PERFORMANCE (continued)
into new lines of business, disrupting other areas, such as retail sales. Technological innovations also generated robust demand for semiconductor companies, which further benefited from renewed pricing power in a consolidating industry.
The financials sector also produced impressive results. Higher short-term interest rates helped banks and capital market firms expand their lending margins and currency-trading revenues. Deregulation of the financials sector helped boost profits further, and the previous cost-cutting efforts of many financial institutions positioned them well for the 2017 upturn.
Despite uncertainty surrounding government efforts to repeal and replace the Affordable Care Act, the health care sector posted strong gains over the reporting period. Indeed, Congress’s inability to repeal Obamacare helped support the outlook for a number of hospital operators and insurers. Moreover, concerns waned regarding government intervention to control drug costs, removing an impediment to gains among large biotechnology firms and pharmaceutical developers. Finally, the industry has been successful in obtaining regulatory approval of a record number of new drugs so far in 2017, further bolstering their prospects in the eyes of investors. Very large drug companies with diversified revenue sources fared especially well.
Only the telecommunication services sector posted negative absolute returns over the reporting period. Comprised of just four companies, the Index’s telecommunications components confronted challenges presented by “cord cutting” when more customers disconnected landlines and replaced cable television with Internet-based entertainment services. The energy sector posted a mildly positive return, as low oil prices early in the reporting period, reduced production volumes, and heavy debt burdens weighed on drilling equipment and oil service providers.
Replicating the Performance of the Index
Although we do not actively manage the fund’s investments in response to macroeconomic trends, it is worth noting that the U.S. and global economic recoveries appear to have gained momentum, and corporate earnings have continued to exceed many analysts’ expectations. However, the market’s currently constructive conditions could be undermined by unexpected political and economic developments. As always, we have continued to monitor the factors considered by the fund’s investment model in light of current market conditions.
November 15, 2017
¹ Total return includes reinvestment of dividends and any capital gains paid. Past performance is no guarantee of future results. Share price and investment return fluctuate such that upon redemption, fund shares may be worth more or less than their original cost.
² Source: Lipper Inc. — The S&P 500® Index is widely regarded as the best single gauge of large-cap U.S. equities. The index includes 500 leading companies and captures approximately 80% coverage of available market capitalization. Investors cannot invest directly in any index.
³ “Standard & Poor’s®,” “S&P®,” “Standard & Poor’s® 500,” and “S&P 500®” are registered trademarks of Standard & Poor’s Financial Services LLC, and have been licensed for use on behalf of the fund. The fund is not sponsored, managed, advised, sold, or promoted by Standard & Poor’s and its affiliates, and Standard & Poor’s and its affiliates make no representation regarding the advisability of investing in the fund.
Equities are subject generally to market, market sector, market liquidity, issuer, and investment style risks, among other factors, to varying degrees, all of which are more fully described in the fund’s prospectus.
4
FUND PERFORMANCE
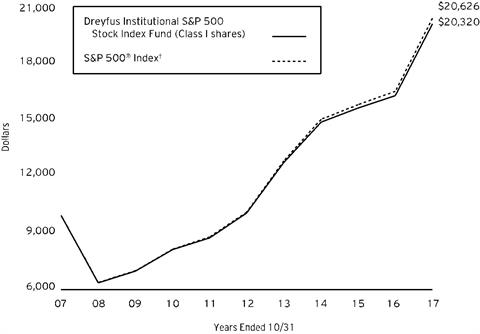
Comparison of change in value of $10,000 investment in Dreyfus Institutional S&P 500 Stock Index Fund Class I shares and the S&P 500® Index (the “Index”)
† Source: Lipper Inc.
Past performance is not predictive of future performance.
The above graph compares a $10,000 investment made in the Class I shares of Dreyfus Institutional S&P 500 Stock Index Fund on 10/31/07 to a $10,000 investment made in the Index on that date. All dividends and capital gain distributions are reinvested.
The fund’s performance shown in the line graph above takes into account all applicable fees and expenses. The Index is widely regarded as the best single gauge of large-cap U.S. equities. The Index includes 500 leading companies and captures approximately 80% coverage of available market capitalization. Unlike a mutual fund, the Index is not subject to charges, fees and other expenses. Investors cannot invest directly in any index. Further information relating to fund performance, including expense reimbursements, if applicable, is contained in the Financial Highlights section of the prospectus and elsewhere in this report.
| | | | |
Average Annual Total Returns as of 10/31/17 | |
| 1 Year | 5 Years | 10 Years |
Fund | 23.42% | 14.96% | 7.35% |
S&P 500® Index | 23.61% | 15.17% | 7.51% |
The performance data quoted represents past performance, which is no guarantee of future results. Share price and investment return fluctuate and an investor’s shares may be worth more or less than original cost upon redemption. Current performance may be lower or higher than the performance quoted. Go to Dreyfus.com for the fund’s most recent month-end returns.
The fund’s performance shown in the graph and table does not reflect the deduction of taxes that a shareholder would pay on fund distributions or the redemption of fund shares.
5
UNDERSTANDING YOUR FUND’S EXPENSES (Unaudited)
As a mutual fund investor, you pay ongoing expenses, such as management fees and other expenses. Using the information below, you can estimate how these expenses affect your investment and compare them with the expenses of other funds. You also may pay one-time transaction expenses, including sales charges (loads) and redemption fees, which are not shown in this section and would have resulted in higher total expenses. For more information, see your fund’s prospectus or talk to your financial adviser.
Review your fund’s expenses
The table below shows the expenses you would have paid on a $1,000 investment in Dreyfus Institutional S&P 500 Stock Index Fund from May 1, 2017 to October 31, 2017. It also shows how much a $1,000 investment would be worth at the close of the period, assuming actual returns and expenses.
| | | | | | | | | | | | | | | |
Expenses and Value of a $1,000 Investment | | |
assuming actual returns for the six months ended October 31, 2017 |
| | | | | | | | | |
Expenses paid per $1,000† | | | | | | $1.05 | | | | |
Ending value (after expenses) | | | | | | $1,090.00 | | | | |
COMPARING YOUR FUND’S EXPENSES
WITH THOSE OF OTHER FUNDS (Unaudited)
Using the SEC’s method to compare expenses
The Securities and Exchange Commission (“SEC”) has established guidelines to help investors assess fund expenses. Per these guidelines, the table below shows your fund’s expenses based on a $1,000 investment, assuming a hypothetical 5% annualized return. You can use this information to compare the ongoing expenses (but not transaction expenses or total cost) of investing in the fund with those of other funds. All mutual fund shareholder reports will provide this information to help you make this comparison. Please note that you cannot use this information to estimate your actual ending account balance and expenses paid during the period.
| | | | | | | | | | | | | | | | |
Expenses and Value of a $1,000 Investment | | | |
assuming a hypothetical 5% annualized return for the six months ended October 31, 2017 |
| | | | | | | | | | |
Expenses paid per $1,000† | | | | | | | $1.02 | | | | |
Ending value (after expenses) | | | | | | | $1,024.20 | | | | |
† Expenses are equal to the fund’s annualized expense ratio of .20%, multiplied by the average account value over the period, multiplied by 184/365 (to reflect the one-half year period).
6
STATEMENT OF INVESTMENTS
October 31, 2017
| | | | | | | | |
| |
Description | | | | Shares | | Value ($) | |
Common Stocks - 99.2% | | | | | |
Automobiles & Components - .7% | | | | | |
BorgWarner | | | | 24,741 | | 1,304,346 | |
Delphi Automotive | | | | 31,350 | | 3,115,563 | |
Ford Motor | | | | 459,004 | | 5,631,979 | |
General Motors | | | | 154,705 | | 6,649,221 | |
Goodyear Tire & Rubber | | | | 30,580 | | 935,442 | |
Harley-Davidson | | | | 20,228 | | 957,594 | |
| | | | | 18,594,145 | |
Banks - 6.5% | | | | | |
Bank of America | | | | 1,154,977 | | 31,634,820 | |
BB&T | | | | 94,374 | | 4,646,976 | |
Citigroup | | | | 320,603 | | 23,564,320 | |
Citizens Financial Group | | | | 59,927 | | 2,277,825 | |
Comerica | | | | 20,522 | | 1,612,414 | |
Fifth Third Bancorp | | | | 88,440 | | 2,555,916 | |
Huntington Bancshares | | | | 126,675 | | 1,748,115 | |
JPMorgan Chase & Co. | | | | 414,103 | | 41,662,903 | |
KeyCorp | | | | 126,664 | | 2,311,618 | |
M&T Bank | | | | 18,116 | | 3,021,205 | |
People's United Financial | | | | 39,915 | | 744,814 | |
PNC Financial Services Group | | | | 56,396 | | 7,714,409 | |
Regions Financial | | | | 144,206 | | 2,232,309 | |
SunTrust Banks | | | | 57,517 | | 3,463,099 | |
U.S. Bancorp | | | | 186,976 | | 10,167,755 | |
Wells Fargo & Co. | | | | 525,479 | | 29,500,391 | |
Zions Bancorporation | | | | 24,489 | | 1,137,759 | |
| | | | | 169,996,648 | |
Capital Goods - 7.3% | | | | | |
3M | | | | 70,271 | | 16,175,681 | |
A.O. Smith | | | | 17,309 | | 1,024,693 | |
Acuity Brands | | | | 5,158 | | 862,418 | |
Allegion | | | | 10,915 | | 910,202 | |
AMETEK | | | | 27,980 | | 1,888,370 | |
Arconic | | | | 46,112 | | 1,158,333 | |
Boeing | | | | 65,382 | | 16,867,248 | |
Caterpillar | | | | 69,374 | | 9,420,989 | |
Cummins | | | | 18,448 | | 3,263,082 | |
Deere & Co. | | | | 37,199 | | 4,943,003 | |
Dover | | | | 17,812 | | 1,700,868 | |
Eaton | | | | 52,637 | | 4,212,013 | |
Emerson Electric | | | | 75,634 | | 4,875,368 | |
Fastenal | | | | 33,976 | | 1,595,853 | |
7
STATEMENT OF INVESTMENTS (continued)
| | | | | | | | |
| |
Description | | | | Shares | | Value ($) | |
Common Stocks - 99.2% (continued) | | | | | |
Capital Goods - 7.3% (continued) | | | | | |
Flowserve | | | | 15,568 | | 686,082 | |
Fluor | | | | 16,313 | | 702,927 | |
Fortive | | | | 35,434 | | 2,560,461 | |
Fortune Brands Home & Security | | | | 17,913 | | 1,183,333 | |
General Dynamics | | | | 32,790 | | 6,655,714 | |
General Electric | | | | 1,018,368 | | 20,530,299 | |
Honeywell International | | | | 89,549 | | 12,909,384 | |
Illinois Tool Works | | | | 36,466 | | 5,707,658 | |
Ingersoll-Rand | | | | 29,794 | | 2,639,748 | |
Jacobs Engineering Group | | | | 13,540 | | 788,163 | |
Johnson Controls International | | | | 109,595 | | 4,536,137 | |
L3 Technologies | | | | 8,749 | | 1,637,638 | |
Lockheed Martin | | | | 29,318 | | 9,034,635 | |
Masco | | | | 37,360 | | 1,487,675 | |
Northrop Grumman | | | | 20,705 | | 6,118,949 | |
PACCAR | | | | 40,477 | | 2,903,415 | |
Parker-Hannifin | | | | 15,904 | | 2,904,229 | |
Pentair | | | | 20,191 | | 1,422,658 | |
Quanta Services | | | | 18,757 | a | 707,702 | |
Raytheon | | | | 34,219 | | 6,166,264 | |
Rockwell Automation | | | | 14,851 | | 2,982,378 | |
Rockwell Collins | | | | 19,028 | | 2,580,197 | |
Roper Technologies | | | | 11,983 | | 3,093,651 | |
Snap-on | | | | 6,697 | | 1,056,653 | |
Stanley Black & Decker | | | | 17,596 | | 2,842,634 | |
Textron | | | | 30,596 | | 1,613,633 | |
TransDigm Group | | | | 5,682 | | 1,576,755 | |
United Rentals | | | | 10,489 | a | 1,483,984 | |
United Technologies | | | | 88,076 | | 10,547,982 | |
W.W. Grainger | | | | 6,314 | | 1,248,278 | |
Xylem | | | | 21,337 | | 1,419,551 | |
| | | | | 190,626,888 | |
Commercial & Professional Services - .6% | | | | | |
Cintas | | | | 9,629 | | 1,435,106 | |
Equifax | | | | 14,036 | | 1,523,327 | |
IHS Markit | | | | 42,035 | a | 1,791,111 | |
Nielsen Holdings | | | | 38,439 | | 1,424,934 | |
Republic Services | | | | 26,636 | | 1,733,205 | |
Robert Half International | | | | 15,886 | | 822,418 | |
Stericycle | | | | 9,959 | a | 705,595 | |
Verisk Analytics | | | | 18,576 | a | 1,579,889 | |
Waste Management | | | | 47,065 | | 3,867,331 | |
| | | | | 14,882,916 | |
8
| | | | | | | | |
| |
Description | | | | Shares | | Value ($) | |
Common Stocks - 99.2% (continued) | | | | | |
Consumer Durables & Apparel - 1.1% | | | | | |
D.R. Horton | | | | 39,678 | | 1,754,164 | |
Garmin | | | | 12,681 | | 717,871 | |
Hanesbrands | | | | 42,437 | | 954,833 | |
Hasbro | | | | 12,834 | | 1,188,300 | |
Leggett & Platt | | | | 15,369 | | 726,339 | |
Lennar, Cl. A | | | | 23,655 | | 1,316,874 | |
Mattel | | | | 41,279 | | 582,859 | |
Michael Kors Holdings | | | | 18,080 | a | 882,485 | |
Mohawk Industries | | | | 7,448 | a | 1,949,588 | |
Newell Brands | | | | 56,780 | | 2,315,488 | |
NIKE, Cl. B | | | | 154,655 | | 8,504,478 | |
PulteGroup | | | | 33,981 | | 1,027,246 | |
PVH | | | | 9,698 | | 1,229,803 | |
Ralph Lauren | | | | 6,213 | | 555,629 | |
Tapestry | | | | 33,701 | | 1,380,056 | |
Under Armour, Cl. A | | | | 21,071 | a | 263,809 | |
Under Armour, Cl. C | | | | 21,223 | a | 244,701 | |
VF | | | | 37,820 | | 2,634,163 | |
Whirlpool | | | | 8,572 | | 1,405,208 | |
| | | | | 29,633,894 | |
Consumer Services - 1.9% | | | | | |
Carnival | | | | 48,127 | | 3,195,152 | |
Chipotle Mexican Grill | | | | 2,980 | a | 810,262 | |
Darden Restaurants | | | | 14,684 | | 1,208,053 | |
H&R Block | | | | 24,623 | | 609,173 | |
Hilton Worldwide Holdings | | | | 24,084 | | 1,740,792 | |
Marriott International, Cl. A | | | | 37,005 | | 4,421,357 | |
McDonald's | | | | 95,304 | | 15,907,191 | |
MGM Resorts International | | | | 60,362 | | 1,892,349 | |
Norwegian Cruise Line Holdings | | | | 20,912 | a | 1,165,844 | |
Royal Caribbean Cruises | | | | 20,061 | | 2,482,950 | |
Starbucks | | | | 170,460 | | 9,348,026 | |
Wyndham Worldwide | | | | 12,415 | | 1,326,543 | |
Wynn Resorts | | | | 9,545 | | 1,407,792 | |
Yum! Brands | | | | 40,347 | | 3,003,834 | |
| | | | | 48,519,318 | |
Diversified Financials - 5.4% | | | | | |
Affiliated Managers Group | | | | 6,317 | | 1,178,121 | |
American Express | | | | 86,492 | | 8,261,716 | |
Ameriprise Financial | | | | 17,710 | | 2,772,323 | |
Bank of New York Mellon | | | | 121,883 | | 6,270,880 | |
Berkshire Hathaway, Cl. B | | | | 225,830 | a | 42,216,660 | |
BlackRock | | | | 14,522 | | 6,837,393 | |
9
STATEMENT OF INVESTMENTS (continued)
| | | | | | | | | | | | |
| |
Description | | | | Shares | | Value ($) | |
Common Stocks - 99.2% (continued) | | | | | |
Diversified Financials - 5.4% (continued) | | | | | |
Capital One Financial | | | | 56,438 | | 5,202,455 | |
Cboe Global Markets | | | | 13,022 | | 1,472,267 | |
Charles Schwab | | | | 142,192 | | 6,375,889 | |
CME Group | | | | 39,872 | | 5,469,242 | |
Discover Financial Services | | | | 43,917 | | 2,921,798 | |
E*TRADE Financial | | | | 33,068 | a | 1,441,434 | |
Franklin Resources | | | | 40,655 | | 1,712,795 | |
Goldman Sachs Group | | | | 42,384 | | 10,277,272 | |
Intercontinental Exchange | | | | 69,004 | | 4,561,164 | |
Invesco | | | | 46,517 | | 1,664,843 | |
Leucadia National | | | | 37,542 | | 949,813 | |
Moody's | | | | 20,056 | | 2,856,175 | |
Morgan Stanley | | | | 166,467 | | 8,323,350 | |
Nasdaq | | | | 13,757 | | 999,446 | |
Navient | | | | 34,765 | | 433,172 | |
Northern Trust | | | | 25,141 | | 2,351,186 | |
Raymond James Financial | | | | 14,966 | | 1,268,817 | |
S&P Global | | | | 30,556 | | 4,781,097 | |
State Street | | | | 43,776 | | 4,027,392 | |
Synchrony Financial | | | | 88,227 | | 2,877,965 | |
T. Rowe Price Group | | | | 28,518 | | 2,649,322 | |
| | | | | 140,153,987 | |
Energy - 5.9% | | | | | |
Anadarko Petroleum | | | | 65,274 | | 3,222,577 | |
Andeavor | | | | 17,725 | | 1,883,104 | |
Apache | | | | 45,144 | | 1,867,607 | |
Baker Hughes | | | | 49,477 | | 1,555,062 | |
Cabot Oil & Gas | | | | 53,938 | | 1,494,083 | |
Chesapeake Energy | | | | 86,337 | a | 336,714 | |
Chevron | | | | 222,599 | | 25,796,998 | |
Cimarex Energy | | | | 11,163 | | 1,305,290 | |
Concho Resources | | | | 17,042 | a | 2,287,207 | |
ConocoPhillips | | | | 143,255 | | 7,327,493 | |
Devon Energy | | | | 62,028 | | 2,288,833 | |
EOG Resources | | | | 67,285 | | 6,719,753 | |
EQT | | | | 20,360 | | 1,273,314 | |
Exxon Mobil | | | | 498,043 | | 41,511,884 | |
Halliburton | | | | 101,480 | | 4,337,255 | |
Helmerich & Payne | | | | 12,737 | | 691,746 | |
Hess | | | | 31,152 | | 1,375,672 | |
Kinder Morgan | | | | 225,819 | | 4,089,582 | |
Marathon Oil | | | | 99,178 | | 1,410,311 | |
Marathon Petroleum | | | | 61,160 | | 3,653,698 | |
10
| | | | | | | | |
| |
Description | | | | Shares | | Value ($) | |
Common Stocks - 99.2% (continued) | | | | | |
Energy - 5.9% (continued) | | | | | |
National Oilwell Varco | | | | 45,195 | | 1,545,217 | |
Newfield Exploration | | | | 23,294 | a | 717,222 | |
Noble Energy | | | | 56,716 | | 1,580,675 | |
Occidental Petroleum | | | | 89,746 | | 5,794,899 | |
ONEOK | | | | 44,654 | | 2,423,373 | |
Phillips 66 | | | | 51,519 | | 4,692,351 | |
Pioneer Natural Resources | | | | 19,985 | | 2,991,155 | |
Range Resources | | | | 21,926 | | 397,080 | |
Schlumberger | | | | 162,608 | | 10,406,912 | |
TechnipFMC | | | | 54,447 | | 1,491,303 | |
Valero Energy | | | | 52,053 | | 4,106,461 | |
Williams Cos. | | | | 96,559 | | 2,751,931 | |
| | | | | 153,326,762 | |
Food & Staples Retailing - 1.7% | | | | | |
Costco Wholesale | | | | 51,415 | | 8,281,928 | |
CVS Health | | | | 119,606 | | 8,196,599 | |
Kroger | | | | 105,890 | | 2,191,923 | |
Sysco | | | | 57,271 | | 3,185,413 | |
Walgreens Boots Alliance | | | | 107,597 | | 7,130,453 | |
Wal-Mart Stores | | | | 172,231 | | 15,037,489 | |
| | | | | 44,023,805 | |
Food, Beverage & Tobacco - 4.5% | | | | | |
Altria Group | | | | 225,691 | | 14,493,876 | |
Archer-Daniels-Midland | | | | 67,276 | | 2,749,570 | |
Brown-Forman, Cl. B | | | | 22,709 | | 1,294,867 | |
Campbell Soup | | | | 22,592 | | 1,070,183 | |
Coca-Cola | | | | 451,488 | | 20,759,418 | |
Conagra Brands | | | | 47,747 | | 1,631,038 | |
Constellation Brands, Cl. A | | | | 20,335 | | 4,455,195 | |
Dr Pepper Snapple Group | | | | 22,203 | | 1,901,909 | |
General Mills | | | | 67,870 | | 3,523,810 | |
Hershey | | | | 16,754 | | 1,778,940 | |
Hormel Foods | | | | 32,350 | | 1,008,026 | |
J.M. Smucker | | | | 13,260 | | 1,406,223 | |
Kellogg | | | | 29,440 | | 1,840,883 | |
Kraft Heinz | | | | 70,028 | | 5,415,265 | |
McCormick & Co. | | | | 13,623 | | 1,355,897 | |
Molson Coors Brewing, Cl. B | | | | 21,789 | | 1,762,076 | |
Mondelez International, Cl. A | | | | 178,585 | | 7,398,777 | |
Monster Beverage | | | | 48,509 | a | 2,810,126 | |
PepsiCo | | | | 167,407 | | 18,453,274 | |
Philip Morris International | | | | 182,429 | | 19,089,371 | |
11
STATEMENT OF INVESTMENTS (continued)
| | | | | | | | | |
| |
Description | | | | Shares | | Value ($) | |
Common Stocks - 99.2% (continued) | | | | | |
Food, Beverage & Tobacco - 4.5% (continued) | | | | | |
Tyson Foods, Cl. A | | | | 34,037 | | 2,481,638 | |
| | | | | 116,680,362 | |
Health Care Equipment & Services - 5.6% | | | | | |
Abbott Laboratories | | | | 203,799 | | 11,052,020 | |
Aetna | | | | 38,906 | | 6,615,187 | |
Align Technology | | | | 8,879 | a | 2,121,903 | |
AmerisourceBergen | | | | 19,105 | | 1,470,130 | |
Anthem | | | | 30,952 | | 6,475,468 | |
Baxter International | | | | 58,635 | | 3,780,198 | |
Becton Dickinson & Co. | | | | 26,443 | | 5,517,861 | |
Boston Scientific | | | | 160,683 | a | 4,521,620 | |
C.R. Bard | | | | 8,479 | | 2,773,227 | |
Cardinal Health | | | | 36,798 | | 2,277,796 | |
Centene | | | | 20,024 | a | 1,875,648 | |
Cerner | | | | 36,822 | a | 2,486,221 | |
Cigna | | | | 29,663 | | 5,850,137 | |
Cooper | | | | 5,674 | | 1,363,235 | |
Danaher | | | | 71,435 | | 6,591,307 | |
DaVita | | | | 18,380 | a | 1,116,401 | |
Dentsply Sirona | | | | 26,496 | | 1,618,111 | |
Edwards Lifesciences | | | | 24,479 | a | 2,502,488 | |
Envision Healthcare | | | | 13,638 | a | 580,979 | |
Express Scripts Holding | | | | 68,075 | a | 4,172,317 | |
HCA Healthcare | | | | 34,102 | a | 2,579,816 | |
Henry Schein | | | | 18,683 | a | 1,468,484 | |
Hologic | | | | 32,196 | a | 1,218,619 | |
Humana | | | | 17,036 | | 4,350,143 | |
IDEXX Laboratories | | | | 10,480 | a | 1,741,462 | |
Intuitive Surgical | | | | 12,996 | a | 4,878,179 | |
Laboratory Corporation of America Holdings | | | | 12,108 | a | 1,861,121 | |
McKesson | | | | 24,796 | | 3,418,872 | |
Medtronic | | | | 159,366 | | 12,832,150 | |
Patterson | | | | 10,426 | | 385,762 | |
Quest Diagnostics | | | | 15,773 | | 1,479,192 | |
ResMed | | | | 16,702 | | 1,405,974 | |
Stryker | | | | 37,596 | | 5,822,493 | |
UnitedHealth Group | | | | 113,605 | | 23,882,043 | |
Universal Health Services, Cl. B | | | | 10,917 | | 1,121,176 | |
Varian Medical Systems | | | | 11,186 | a | 1,165,469 | |
Zimmer Biomet Holdings | | | | 23,614 | | 2,871,935 | |
| | | | | 147,245,144 | |
12
| | | | | | | | | |
| |
Description | | | | Shares | | Value ($) | |
Common Stocks - 99.2% (continued) | | | | | |
Household & Personal Products - 1.7% | | | | | |
Church & Dwight | | | | 30,756 | | 1,389,249 | |
Clorox | | | | 15,112 | | 1,912,121 | |
Colgate-Palmolive | | | | 103,499 | | 7,291,505 | |
Coty, Cl. A | | | | 56,145 | | 864,633 | |
Estee Lauder, Cl. A | | | | 26,255 | | 2,935,572 | |
Kimberly-Clark | | | | 41,698 | | 4,691,442 | |
Procter & Gamble | | | | 300,596 | | 25,953,459 | |
| | | | | 45,037,981 | |
Insurance - 2.7% | | | | | |
Aflac | | | | 47,410 | | 3,977,225 | |
Allstate | | | | 42,963 | | 4,032,507 | |
American International Group | | | | 105,829 | | 6,837,612 | |
Aon | | | | 29,979 | | 4,299,888 | |
Arthur J. Gallagher & Co. | | | | 20,757 | | 1,314,541 | |
Assurant | | | | 6,253 | | 629,364 | |
Brighthouse Financial | | | | 11,604 | | 721,537 | |
Chubb | | | | 54,554 | | 8,227,834 | |
Cincinnati Financial | | | | 17,569 | | 1,232,817 | |
Everest Re Group | | | | 4,827 | | 1,146,171 | |
Hartford Financial Services Group | | | | 44,373 | | 2,442,734 | |
Lincoln National | | | | 26,681 | | 2,021,886 | |
Loews | | | | 32,725 | | 1,620,215 | |
Marsh & McLennan | | | | 61,285 | | 4,959,795 | |
MetLife | | | | 125,187 | | 6,707,519 | |
Principal Financial Group | | | | 30,645 | | 2,017,973 | |
Progressive | | | | 68,469 | | 3,331,017 | |
Prudential Financial | | | | 50,683 | | 5,598,444 | |
Torchmark | | | | 13,145 | | 1,105,889 | |
Travelers | | | | 32,525 | | 4,307,936 | |
Unum Group | | | | 26,506 | | 1,379,372 | |
Willis Towers Watson | | | | 15,676 | | 2,525,090 | |
XL Group | | | | 31,053 | | 1,256,715 | |
| | | | | 71,694,081 | |
Materials - 3.0% | | | | | |
Air Products & Chemicals | | | | 25,206 | | 4,018,593 | |
Albemarle | | | | 13,320 | | 1,876,655 | |
Avery Dennison | | | | 10,332 | | 1,096,948 | |
Ball | | | | 40,680 | | 1,746,392 | |
CF Industries Holdings | | | | 26,623 | | 1,011,142 | |
DowDuPont | | | | 272,803 | | 19,726,385 | |
Eastman Chemical | | | | 17,362 | | 1,576,643 | |
Ecolab | | | | 30,384 | | 3,969,973 | |
FMC | | | | 15,415 | | 1,431,437 | |
13
STATEMENT OF INVESTMENTS (continued)
| | | | | | | | | |
| |
Description | | | | Shares | | Value ($) | |
Common Stocks - 99.2% (continued) | | | | | |
Materials - 3.0% (continued) | | | | | |
Freeport-McMoRan | | | | 158,924 | a | 2,221,758 | |
International Flavors & Fragrances | | | | 9,492 | | 1,399,311 | |
International Paper | | | | 48,026 | | 2,750,449 | |
LyondellBasell Industries, Cl. A | | | | 38,270 | | 3,962,093 | |
Martin Marietta Materials | | | | 7,216 | | 1,564,790 | |
Monsanto | | | | 51,351 | | 6,218,606 | |
Mosaic | | | | 41,220 | | 920,855 | |
Newmont Mining | | | | 62,305 | | 2,252,949 | |
Nucor | | | | 37,871 | | 2,190,080 | |
Packaging Corporation of America | | | | 11,090 | | 1,289,434 | |
PPG Industries | | | | 30,289 | | 3,520,793 | |
Praxair | | | | 33,542 | | 4,901,157 | |
Sealed Air | | | | 22,145 | | 979,473 | |
Sherwin-Williams | | | | 9,464 | | 3,739,700 | |
Vulcan Materials | | | | 15,434 | | 1,879,089 | |
WestRock | | | | 28,538 | | 1,750,220 | |
| | | | | 77,994,925 | |
Media - 2.6% | | | | | |
CBS, Cl. B | | | | 43,866 | | 2,461,760 | |
Charter Communications, Cl. A | | | | 23,724 | a | 7,927,849 | |
Comcast, Cl. A | | | | 553,185 | | 19,931,256 | |
Discovery Communications, Cl. A | | | | 18,226 | a | 344,107 | |
Discovery Communications, Cl. C | | | | 27,357 | a | 487,228 | |
DISH Network, Cl. A | | | | 26,473 | a | 1,284,999 | |
Interpublic Group of Companies | | | | 45,164 | | 869,407 | |
News Corp., Cl. A | | | | 45,011 | | 614,850 | |
News Corp., Cl. B | | | | 11,872 | | 165,021 | |
Omnicom Group | | | | 27,950 | | 1,877,960 | |
Scripps Networks Interactive, Cl. A | | | | 10,551 | | 878,687 | |
Time Warner | | | | 91,073 | | 8,951,565 | |
Twenty-First Century Fox, Cl. A | | | | 123,125 | | 3,219,719 | |
Twenty-First Century Fox, Cl. B | | | | 52,066 | | 1,325,080 | |
Viacom, Cl. B | | | | 41,224 | | 990,613 | |
Walt Disney | | | | 180,825 | | 17,686,493 | |
| | | | | 69,016,594 | |
Pharmaceuticals, Biotechnology & Life Sciences - 8.3% | | | | | |
AbbVie | | | | 187,169 | | 16,892,002 | |
Agilent Technologies | | | | 37,082 | | 2,522,688 | |
Alexion Pharmaceuticals | | | | 26,360 | a | 3,154,238 | |
Allergan | | | | 39,196 | | 6,946,707 | |
Amgen | | | | 85,835 | | 15,040,009 | |
Biogen | | | | 24,880 | a | 7,754,101 | |
Bristol-Myers Squibb | | | | 193,886 | | 11,955,011 | |
14
| | | | | | | | | |
| |
Description | | | | Shares | | Value ($) | |
Common Stocks - 99.2% (continued) | | | | | |
Pharmaceuticals, Biotechnology & Life Sciences - 8.3% (continued) | | | | | |
Celgene | | | | 91,709 | a | 9,259,858 | |
Eli Lilly & Co. | | | | 113,758 | | 9,321,331 | |
Gilead Sciences | | | | 153,420 | | 11,500,363 | |
Illumina | | | | 17,317 | a | 3,553,275 | |
Incyte | | | | 20,484 | a | 2,319,813 | |
Johnson & Johnson | | | | 315,632 | | 44,002,257 | |
Merck & Co. | | | | 321,753 | | 17,725,373 | |
Mettler-Toledo International | | | | 3,031 | a | 2,069,052 | |
Mylan | | | | 61,933 | a | 2,211,627 | |
PerkinElmer | | | | 13,589 | | 982,756 | |
Perrigo | | | | 16,235 | | 1,314,873 | |
Pfizer | | | | 701,214 | | 24,584,563 | |
Quintiles IMS Holdings | | | | 17,612 | a | 1,903,857 | |
Regeneron Pharmaceuticals | | | | 8,933 | a | 3,596,604 | |
Thermo Fisher Scientific | | | | 46,891 | | 9,088,883 | |
Vertex Pharmaceuticals | | | | 29,408 | a | 4,300,332 | |
Waters | | | | 9,107 | a | 1,785,427 | |
Zoetis | | | | 57,903 | | 3,695,369 | |
| | | | | 217,480,369 | |
Real Estate - 2.9% | | | | | |
Alexandria Real Estate Equities | | | | 10,606 | b | 1,314,720 | |
American Tower | | | | 50,025 | b | 7,187,092 | |
Apartment Investment & Management, Cl. A | | | | 17,503 | b | 769,782 | |
AvalonBay Communities | | | | 16,273 | b | 2,950,783 | |
Boston Properties | | | | 18,205 | b | 2,206,082 | |
CBRE Group, Cl. A | | | | 35,079 | a,b | 1,379,306 | |
Crown Castle International | | | | 47,317 | b | 5,066,704 | |
Digital Realty Trust | | | | 23,383 | b | 2,769,483 | |
Duke Realty | | | | 41,806 | b | 1,190,635 | |
Equinix | | | | 9,110 | b | 4,222,485 | |
Equity Residential | | | | 43,309 | b | 2,912,963 | |
Essex Property Trust | | | | 7,762 | b | 2,036,982 | |
Extra Space Storage | | | | 14,470 | b | 1,180,607 | |
Federal Realty Investment Trust | | | | 8,139 | b | 980,912 | |
GGP | | | | 73,026 | b | 1,421,086 | |
HCP | | | | 55,243 | b | 1,427,479 | |
Host Hotels & Resorts | | | | 88,029 | b | 1,721,847 | |
Iron Mountain | | | | 30,755 | b | 1,230,200 | |
Kimco Realty | | | | 49,962 | b | 907,310 | |
Macerich | | | | 12,973 | b | 708,326 | |
Mid-America Apartment Communities | | | | 13,222 | b | 1,353,272 | |
15
STATEMENT OF INVESTMENTS (continued)
| | | | | | | | | |
| |
Description | | | | Shares | | Value ($) | |
Common Stocks - 99.2% (continued) | | | | | |
Real Estate - 2.9% (continued) | | | | | |
Prologis | | | | 62,509 | b | 4,036,831 | |
Public Storage | | | | 17,263 | b | 3,577,757 | |
Realty Income | | | | 31,650 | b | 1,698,655 | |
Regency Centers | | | | 17,064 | b | 1,050,289 | |
SBA Communications | | | | 14,248 | a,b | 2,239,501 | |
Simon Property Group | | | | 36,769 | b | 5,711,329 | |
SL Green Realty | | | | 12,009 | b | 1,149,021 | |
UDR | | | | 30,697 | b | 1,190,737 | |
Ventas | | | | 41,449 | b | 2,600,925 | |
Vornado Realty Trust | | | | 19,724 | b | 1,476,539 | |
Welltower | | | | 42,266 | b | 2,830,131 | |
Weyerhaeuser | | | | 89,218 | b | 3,203,818 | |
| | | | | 75,703,589 | |
Retailing - 5.4% | | | | | |
Advance Auto Parts | | | | 8,575 | | 700,921 | |
Amazon.com | | | | 46,838 | a | 51,769,105 | |
AutoZone | | | | 3,377 | a | 1,990,741 | |
Best Buy | | | | 31,561 | | 1,766,785 | |
CarMax | | | | 21,677 | a | 1,627,943 | |
Dollar General | | | | 29,890 | | 2,416,308 | |
Dollar Tree | | | | 27,650 | a | 2,523,062 | |
Expedia | | | | 14,192 | | 1,769,175 | |
Foot Locker | | | | 16,184 | | 486,815 | |
Gap | | | | 24,092 | | 626,151 | |
Genuine Parts | | | | 17,382 | | 1,533,614 | |
Home Depot | | | | 138,769 | | 23,005,125 | |
Kohl's | | | | 20,288 | | 847,227 | |
L Brands | | | | 28,761 | | 1,237,873 | |
LKQ | | | | 36,170 | a | 1,363,247 | |
Lowe's | | | | 99,454 | | 7,951,347 | |
Macy's | | | | 36,645 | | 687,460 | |
Netflix | | | | 50,398 | a | 9,899,679 | |
Nordstrom | | | | 14,416 | | 571,594 | |
O'Reilly Automotive | | | | 10,404 | a | 2,194,724 | |
Priceline Group | | | | 5,767 | a | 11,026,273 | |
Ross Stores | | | | 45,868 | | 2,912,159 | |
Signet Jewelers | | | | 7,733 | | 507,053 | |
Target | | | | 65,744 | | 3,881,526 | |
The TJX Companies | | | | 74,925 | | 5,229,765 | |
Tiffany & Co. | | | | 12,078 | | 1,130,742 | |
Tractor Supply | | | | 15,783 | | 951,084 | |
TripAdvisor | | | | 13,142 | a | 492,825 | |
16
| | | | | | | | | |
| |
Description | | | | Shares | | Value ($) | |
Common Stocks - 99.2% (continued) | | | | | |
Retailing - 5.4% (continued) | | | | | |
Ulta Beauty | | | | 6,713 | a | 1,354,616 | |
| | | | | 142,454,939 | |
Semiconductors & Semiconductor Equipment - 4.0% | | | | | |
Advanced Micro Devices | | | | 93,481 | a | 1,026,889 | |
Analog Devices | | | | 43,018 | | 3,927,543 | |
Applied Materials | | | | 125,212 | | 7,065,713 | |
Broadcom | | | | 47,696 | | 12,587,451 | |
Intel | | | | 553,910 | | 25,197,366 | |
KLA-Tencor | | | | 17,863 | | 1,945,102 | |
Lam Research | | | | 18,955 | | 3,953,444 | |
Microchip Technology | | | | 26,894 | | 2,549,551 | |
Micron Technology | | | | 129,877 | a | 5,754,850 | |
NVIDIA | | | | 70,442 | | 14,568,110 | |
Qorvo | | | | 15,298 | a | 1,159,741 | |
QUALCOMM | | | | 172,576 | | 8,803,102 | |
Skyworks Solutions | | | | 22,270 | | 2,535,662 | |
Texas Instruments | | | | 116,547 | | 11,268,929 | |
Xilinx | | | | 30,277 | | 2,231,112 | |
| | | | | 104,574,565 | |
Software & Services - 14.4% | | | | | |
Accenture, Cl. A | | | | 72,957 | | 10,386,159 | |
Activision Blizzard | | | | 87,846 | | 5,753,035 | |
Adobe Systems | | | | 57,829 | a | 10,129,328 | |
Akamai Technologies | | | | 20,955 | a | 1,094,899 | |
Alliance Data Systems | | | | 5,763 | | 1,289,356 | |
Alphabet, Cl. A | | | | 34,967 | a | 36,122,310 | |
Alphabet, Cl. C | | | | 35,435 | a | 36,024,638 | |
ANSYS | | | | 10,049 | a | 1,373,799 | |
Autodesk | | | | 25,355 | a | 3,168,361 | |
Automatic Data Processing | | | | 52,911 | | 6,151,433 | |
CA | | | | 37,025 | | 1,198,869 | |
Cadence Design Systems | | | | 32,937 | a | 1,421,561 | |
Citrix Systems | | | | 17,076 | a | 1,410,648 | |
Cognizant Technology Solutions, Cl. A | | | | 69,485 | | 5,257,930 | |
CSRA | | | | 18,875 | | 603,811 | |
DXC Technology | | | | 33,100 | | 3,029,312 | |
eBay | | | | 118,883 | a | 4,474,756 | |
Electronic Arts | | | | 36,002 | a | 4,305,839 | |
Facebook, Cl. A | | | | 278,543 | a | 50,154,453 | |
Fidelity National Information Services | | | | 38,749 | | 3,594,357 | |
Fiserv | | | | 25,401 | a | 3,287,651 | |
Gartner | | | | 10,551 | a | 1,322,146 | |
Global Payments | | | | 18,153 | | 1,887,004 | |
17
STATEMENT OF INVESTMENTS (continued)
| | | | | | | | | | |
| |
Description | | | | Shares | | Value ($) | |
Common Stocks - 99.2% (continued) | | | | | |
Software & Services - 14.4% (continued) | | | | | |
International Business Machines | | | | 101,743 | | 15,674,527 | |
Intuit | | | | 28,347 | | 4,280,964 | |
Mastercard, Cl. A | | | | 109,843 | | 16,341,343 | |
Microsoft | | | | 906,517 | | 75,404,084 | |
Oracle | | | | 354,714 | | 18,054,943 | |
Paychex | | | | 37,940 | | 2,420,193 | |
PayPal Holdings | | | | 132,540 | a | 9,617,102 | |
Red Hat | | | | 20,609 | a | 2,490,185 | |
salesforce.com | | | | 80,035 | a | 8,190,782 | |
Symantec | | | | 73,404 | | 2,385,630 | |
Synopsys | | | | 17,484 | a | 1,512,716 | |
Total System Services | | | | 19,870 | | 1,431,633 | |
VeriSign | | | | 10,209 | a | 1,097,672 | |
Visa, Cl. A | | | | 215,238 | | 23,671,875 | |
Western Union | | | | 55,170 | | 1,095,676 | |
| | | | | 377,110,980 | |
Technology Hardware & Equipment - 5.9% | | | | | |
Amphenol, Cl. A | | | | 36,487 | | 3,174,369 | |
Apple | | | | 607,670 | | 102,720,537 | |
Cisco Systems | | | | 587,442 | | 20,061,144 | |
Corning | | | | 106,456 | | 3,333,137 | |
F5 Networks | | | | 7,462 | a | 904,917 | |
FLIR Systems | | | | 14,984 | | 701,551 | |
Harris | | | | 14,479 | | 2,017,214 | |
Hewlett Packard Enterprise | | | | 192,608 | | 2,681,103 | |
HP | | | | 197,894 | | 4,264,616 | |
Juniper Networks | | | | 44,791 | | 1,112,161 | |
Motorola Solutions | | | | 19,603 | | 1,774,856 | |
NetApp | | | | 31,966 | | 1,419,930 | |
Seagate Technology | | | | 35,489 | | 1,312,028 | |
TE Connectivity | | | | 41,234 | | 3,751,057 | |
Western Digital | | | | 34,529 | | 3,082,404 | |
Xerox | | | | 23,773 | | 720,560 | |
| | | | | 153,031,584 | |
Telecommunication Services - 1.9% | | | | | |
AT&T | | | | 722,367 | | 24,307,650 | |
CenturyLink | | | | 113,737 | | 2,159,866 | |
Verizon Communications | | | | 479,321 | | 22,945,096 | |
| | | | | 49,412,612 | |
Transportation - 2.1% | | | | | |
Alaska Air Group | | | | 14,446 | | 953,869 | |
American Airlines Group | | | | 51,714 | | 2,421,249 | |
C.H. Robinson Worldwide | | | | 16,672 | | 1,309,252 | |
18
| | | | | | | | | | |
| |
Description | | | | Shares | | Value ($) | |
Common Stocks - 99.2% (continued) | | | | | |
Transportation - 2.1% (continued) | | | | | |
CSX | | | | 107,564 | | 5,424,453 | |
Delta Air Lines | | | | 79,070 | | 3,955,872 | |
Expeditors International of Washington | | | | 20,427 | | 1,192,528 | |
FedEx | | | | 28,706 | | 6,482,102 | |
J.B. Hunt Transport Services | | | | 9,851 | | 1,048,048 | |
Kansas City Southern | | | | 13,137 | | 1,369,138 | |
Norfolk Southern | | | | 33,986 | | 4,466,440 | |
Southwest Airlines | | | | 65,376 | | 3,521,151 | |
Union Pacific | | | | 94,224 | | 10,910,197 | |
United Continental Holdings | | | | 30,713 | a | 1,796,096 | |
United Parcel Service, Cl. B | | | | 80,319 | | 9,439,892 | |
| | | | | 54,290,287 | |
Utilities - 3.1% | | | | | |
AES | | | | 76,099 | | 808,932 | |
Alliant Energy | | | | 26,925 | | 1,164,776 | |
Ameren | | | | 28,640 | | 1,775,394 | |
American Electric Power | | | | 57,824 | | 4,302,684 | |
American Water Works | | | | 21,031 | | 1,845,681 | |
CenterPoint Energy | | | | 51,722 | | 1,529,937 | |
CMS Energy | | | | 32,918 | | 1,592,244 | |
Consolidated Edison | | | | 35,966 | | 3,094,874 | |
Dominion Energy | | | | 75,297 | | 6,109,599 | |
DTE Energy | | | | 21,480 | | 2,372,681 | |
Duke Energy | | | | 81,828 | | 7,226,231 | |
Edison International | | | | 38,843 | | 3,105,498 | |
Entergy | | | | 21,149 | | 1,824,313 | |
Eversource Energy | | | | 37,912 | | 2,374,808 | |
Exelon | | | | 112,352 | | 4,517,674 | |
FirstEnergy | | | | 50,138 | | 1,652,047 | |
NextEra Energy | | | | 54,766 | | 8,492,564 | |
NiSource | | | | 36,736 | | 968,728 | |
NRG Energy | | | | 35,826 | | 895,650 | |
PG&E | | | | 60,136 | | 3,474,057 | |
Pinnacle West Capital | | | | 12,656 | | 1,110,058 | |
PPL | | | | 79,352 | | 2,980,461 | |
Public Service Enterprise Group | | | | 60,376 | | 2,970,499 | |
SCANA | | | | 16,687 | | 719,877 | |
Sempra Energy | | | | 29,327 | | 3,445,922 | |
Southern | | | | 115,930 | | 6,051,546 | |
WEC Energy Group | | | | 37,709 | | 2,541,210 | |
19
STATEMENT OF INVESTMENTS (continued)
| | | | | | | | | | | | | |
| |
Description | | | | Shares | | Value ($) | |
Common Stocks - 99.2% (continued) | | | | | |
Utilities - 3.1% (continued) | | | | | |
Xcel Energy | | | | 60,563 | | 2,999,080 | |
| | | | | 81,947,025 | |
Total Common Stocks (cost $1,152,496,232) | | | | 2,593,433,400 | |
| | | | | Principal Amount ($) | | | |
Short-Term Investments - .0% | | | | | |
U.S. Treasury Bills | | | | | |
1.02%, 12/7/17
(cost $889,094) | | | | 890,000 | c | 889,128 | |
| | | | | | | | |
Other Investment - .7% | | | | | |
Registered Investment Company; | | | | | |
Dreyfus Institutional Preferred Government Plus Money Market Fund
(cost $17,561,479) | | | | 17,561,479 | d | 17,561,479 | |
Total Investments (cost $1,170,946,805) | | 99.9% | | 2,611,884,007 | |
Cash and Receivables (Net) | | .1% | | 3,212,159 | |
Net Assets | | 100.0% | | 2,615,096,166 | |
aNon-income producing security.
bInvestment in real estate investment trust.
cHeld by or on behalf of a counterparty for open futures contracts.
dInvestment in affiliated money market mutual fund.
| | |
Portfolio Summary (Unaudited) † | Value (%) |
Software & Services | 14.4 |
Pharmaceuticals, Biotechnology & Life Sciences | 8.3 |
Capital Goods | 7.3 |
Banks | 6.5 |
Energy | 5.9 |
Technology Hardware & Equipment | 5.9 |
Health Care Equipment & Services | 5.6 |
Retailing | 5.4 |
Diversified Financials | 5.4 |
Food, Beverage & Tobacco | 4.5 |
Semiconductors & Semiconductor Equipment | 4.0 |
Utilities | 3.1 |
Materials | 3.0 |
Real Estate | 2.9 |
Insurance | 2.7 |
Media | 2.6 |
Transportation | 2.1 |
Telecommunication Services | 1.9 |
Consumer Services | 1.9 |
Household & Personal Products | 1.7 |
20
| | |
Portfolio Summary (Unaudited) † | Value (%) |
Food & Staples Retailing | 1.7 |
Consumer Durables & Apparel | 1.1 |
Automobiles & Components | .7 |
Short-Term/Money Market Investments | .7 |
Commercial & Professional Services | .6 |
| | 99.9 |
† Based on net assets.
See notes to financial statements.
21
STATEMENT OF INVESTMENTS IN AFFILIATED ISSUERS
| | | | | | | |
Registered Investment Company | Value
10/31/16 ($) | Purchases ($) | Sales ($) | Value
10/31/17 ($) | Net
Assets (%) | Dividends/
Distributions ($) |
Dreyfus Institutional Preferred Government Plus Money Market Fund | 32,928,263 | 315,158,073 | 330,524,857 | 17,561,479 | .7 | 174,581 |
Dreyfus Institutional Preferred Money Market Fund, Institutional Shares | 6,877,364 | 84,401,425 | 91,278,789 | - | - | - |
Total | 39,805,627 | 399,559,498 | 421,803,646 | 17,561,479 | .7 | 174,581 |
See notes to financial statements.
22
STATEMENT OF FUTURES
October 31, 2017
| | | | | | | |
Description | Number of
Contracts | Expiration | Notional
Value ($) | Value ($) | Unrealized Appreciation ($) | |
Futures Long | | |
Standard & Poor's 500 E-mini | 164 | 12/2017 | 20,582,807 | 21,096,140 | 513,333 | |
Gross Unrealized Appreciation | | 513,333 | |
See notes to financial statements.
23
STATEMENT OF ASSETS AND LIABILITIES
October 31, 2017
| | | | | | | | | | | |
| | | | | | |
| | | Cost | | Value | |
Assets ($): | | | | |
Investments in securities—See Statement of Investments: | | | |
Unaffiliated issuers | 1,153,385,326 | | 2,594,322,528 | |
Affiliated issuers | | 17,561,479 | | 17,561,479 | |
Cash | | | | | 1,574,928 | |
Dividends receivable | | 2,188,152 | |
Receivable for shares of Common Stock subscribed | | 476,967 | |
Receivable for futures variation margin—Note 4 | | 35,656 | |
Other assets | | | | | 37,197 | |
| | | | | 2,616,196,907 | |
Liabilities ($): | | | | |
Due to The Dreyfus Corporation—Note 3(b) | | | | | 426,875 | |
Payable for shares of Common Stock redeemed | | 669,866 | |
Accrued expenses | | | | | 4,000 | |
| | | | | 1,100,741 | |
Net Assets ($) | | | 2,615,096,166 | |
Composition of Net Assets ($): | | | | |
Paid-in capital | | | | | 1,160,291,573 | |
Accumulated undistributed investment income—net | | 14,342,889 | |
Accumulated net realized gain (loss) on investments | | | | | (988,831) | |
Accumulated net unrealized appreciation (depreciation)
on investments (including $513,333 net unrealized
appreciation on futures) | | | | 1,441,450,535 | |
Net Assets ($) | | | 2,615,096,166 | |
Shares Outstanding | | |
(150 million shares of $.001 par value Common Stock authorized) | 50,061,395 | |
Net Asset Value Per Share ($) | | 52.24 | |
| | | | | |
See notes to financial statements. | | | | |
24
STATEMENT OF OPERATIONS
Year Ended October 31, 2017
| | | | | | | |
| | | | | | |
| | | | | | |
Investment Income ($): | | | | |
Income: | | | | |
Cash dividends: | |
Unaffiliated issuers | | | 50,275,676 | |
Affiliated issuers | | | 174,581 | |
Income from securities lending—Note 1(b) | | | 34,483 | |
Interest | | | 10,269 | |
Total Income | | | 50,495,009 | |
Expenses: | | | | |
Management fee—Note 3(a) | | | 4,928,050 | |
Directors’ fees—Note 3(a,c) | | | 190,913 | |
Loan commitment fees—Note 2 | | | 55,082 | |
Interest expense—Note 2 | | | 5,714 | |
Total Expenses | | | 5,179,759 | |
Less—Directors’ fees reimbursed by Dreyfus—Note 3(a) | | | (190,913) | |
Net Expenses | | | 4,988,846 | |
Investment Income—Net | | | 45,506,163 | |
Realized and Unrealized Gain (Loss) on Investments—Note 4 ($): | | |
Net realized gain (loss) on investments | 16,850,381 | |
Net realized gain (loss) on futures | 6,354,553 | |
Net Realized Gain (Loss) | | | 23,204,934 | |
Net unrealized appreciation (depreciation) on investments | | | 441,595,468 | |
Net unrealized appreciation (depreciation) on futures | | | 890,959 | |
Net Unrealized Appreciation (Depreciation) | | | 442,486,427 | |
Net Realized and Unrealized Gain (Loss) on Investments | | | 465,691,361 | |
Net Increase in Net Assets Resulting from Operations | | 511,197,524 | |
| | | | | | | |
See notes to financial statements. | | | | | |
25
STATEMENT OF CHANGES IN NET ASSETS
| | | | | | | | | | |
| | | | Year Ended October 31, |
| | | | 2017 | | 2016 | |
Operations ($): | | | | | | | | |
Investment income—net | | | 45,506,163 | | | | 43,557,265 | |
Net realized gain (loss) on investments | | 23,204,934 | | | | 26,124,045 | |
Net unrealized appreciation (depreciation)
on investments | | 442,486,427 | | | | 23,590,222 | |
Net Increase (Decrease) in Net Assets
Resulting from Operations | 511,197,524 | | | | 93,271,532 | |
Distributions to Shareholders from ($): | |
Investment income—net | | | (43,692,370) | | | | (41,839,246) | |
Net realized gain on investments | | | (23,419,581) | | | | (14,285,634) | |
Total Distributions | | | (67,111,951) | | | | (56,124,880) | |
Capital Stock Transactions ($): | |
Net proceeds from shares sold | | | 441,670,667 | | | | 492,946,022 | |
Distributions reinvested | | | 47,592,208 | | | | 42,091,827 | |
Cost of shares redeemed | | | (544,641,017) | | | | (501,560,260) | |
Increase (Decrease) in Net Assets
from Capital Stock Transactions | (55,378,142) | | | | 33,477,589 | |
Total Increase (Decrease) in Net Assets | 388,707,431 | | | | 70,624,241 | |
Net Assets ($): | |
Beginning of Period | | | 2,226,388,735 | | | | 2,155,764,494 | |
End of Period | | | 2,615,096,166 | | | | 2,226,388,735 | |
Undistributed investment income—net | 14,342,889 | | | | 13,201,194 | |
Capital Share Transactions (Shares): | |
Shares sold | | | 9,282,187 | | | | 11,632,406 | |
Shares issued for distributions reinvested | | | 1,034,299 | | | | 985,354 | |
Shares redeemed | | | (11,363,268) | | | | (11,794,982) | |
Net Increase (Decrease) in Shares Outstanding | (1,046,782) | | | | 822,778 | |
| | | | | | | | | | |
See notes to financial statements. | | | | | | | | |
26
FINANCIAL HIGHLIGHTS
The following table describes the performance for the fiscal periods indicated. Total return shows how much your investment in the fund would have increased (or decreased) during each period, assuming you had reinvested all dividends and distributions. These figures have been derived from the fund’s financial statements.
| | | | | | | | | |
| | | |
Year Ended October 31, |
| | | 2017 | 2016 | 2015 | 2014 | 2013 |
Per Share Data ($): | | | | | | |
Net asset value,
beginning of period | | 43.56 | 42.87 | 41.56 | 36.17 | 29.06 |
Investment Operations: | | | | | | |
Investment income—neta | | .89 | .86 | .80 | .70 | .65 |
Net realized and unrealized
gain (loss) on investments | | 9.12 | .94 | 1.28 | 5.39 | 7.08 |
Total from Investment Operations | | 10.01 | 1.80 | 2.08 | 6.09 | 7.73 |
Distributions: | | | | | | |
Dividends from investment
income—net | | (.86) | (.83) | (.77) | (.67) | (.62) |
Dividends from net realized
gain on investments | | (.47) | (.28) | - | (.03) | - |
Total Distributions | | (1.33) | (1.11) | (.77) | (.70) | (.62) |
Net asset value, end of period | | 52.24 | 43.56 | 42.87 | 41.56 | 36.17 |
Total Return (%) | | 23.42 | 4.28 | 5.02 | 17.03 | 26.96 |
Ratios/Supplemental Data (%): | | | | | |
Ratio of total expenses to
average net assets | | .21 | .21 | .21 | .21 | .21 |
Ratio of net expenses to
average net assets | | .20 | .20 | .20 | .20 | .20 |
Ratio of net investment income
to average net assets | | 1.85 | 2.02 | 1.88 | 1.81 | 2.01 |
Portfolio Turnover Rate | | 6.00 | 5.11 | 8.71 | 5.41 | 3.45 |
Net Assets,
end of period ($ x 1,000) | | 2,615,096 | 2,226,389 | 2,155,764 | 2,173,843 | 1,868,831 |
a Based on average shares outstanding.
See notes to financial statements.
27
NOTES TO FINANCIAL STATEMENTS
NOTE 1—Significant Accounting Policies:
Dreyfus Institutional S&P 500 Stock Index Fund (the “fund”) is a separate diversified series of The Dreyfus/Laurel Funds, Inc. (the “Company”), which is registered under the Investment Company Act of 1940, as amended (the “Act”), as an open-end management investment company and operates as a series company currently offering eight series, including the fund. The fund’s investment objective is to seek to match the total return of the Standard & Poor’s 500® Composite Stock Price Index. The Dreyfus Corporation (the “Manager” or “Dreyfus”), a wholly-owned subsidiary of The Bank of New York Mellon Corporation (“BNY Mellon”), serves as the fund’s investment adviser. MBSC Securities Corporation (the “Distributor”), a wholly-owned subsidiary of Dreyfus, is the distributor of the fund’s shares.
Class I shares are sold primarily to bank trust departments and other financial service providers (including The Bank of New York Mellon, a subsidiary of BNY Mellon and an affiliate of Dreyfus, and its affiliates), acting on behalf of customers having a qualified trust or an investment account or relationship at such institution, and bear no Distribution or Shareholder Service Plan fees. Class I shares are offered without a front-end sales charge or a contingent deferred sales charge.
The Company accounts separately for the assets, liabilities and operations of each series. Expenses directly attributable to each series are charged to that series’ operations; expenses which are applicable to all series are allocated among them on a pro rata basis.
The Financial Accounting Standards Board (“FASB”) Accounting Standards Codification is the exclusive reference of authoritative U.S. generally accepted accounting principles (“GAAP”) recognized by the FASB to be applied by nongovernmental entities. Rules and interpretive releases of the Securities and Exchange Commission (“SEC”) under authority of federal laws are also sources of authoritative GAAP for SEC registrants. The fund’s financial statements are prepared in accordance with GAAP, which may require the use of management estimates and assumptions. Actual results could differ from those estimates.
(a) Portfolio valuation: The fair value of a financial instrument is the amount that would be received to sell an asset or paid to transfer a liability in an orderly transaction between market participants at the measurement date (i.e., the exit price). GAAP establishes a fair value hierarchy that prioritizes the inputs of valuation techniques used to measure fair value. This hierarchy gives the highest priority to unadjusted quoted prices in
28
active markets for identical assets or liabilities (Level 1 measurements) and the lowest priority to unobservable inputs (Level 3 measurements).
Additionally, GAAP provides guidance on determining whether the volume and activity in a market has decreased significantly and whether such a decrease in activity results in transactions that are not orderly. GAAP requires enhanced disclosures around valuation inputs and techniques used during annual and interim periods.
Various inputs are used in determining the value of the fund’s investments relating to fair value measurements. These inputs are summarized in the three broad levels listed below:
Level 1—unadjusted quoted prices in active markets for identical investments.
Level 2—other significant observable inputs (including quoted prices for similar investments, interest rates, prepayment speeds, credit risk, etc.).
Level 3—significant unobservable inputs (including the fund’s own assumptions in determining the fair value of investments).
The inputs or methodology used for valuing securities are not necessarily an indication of the risk associated with investing in those securities.
Changes in valuation techniques may result in transfers in or out of an assigned level within the disclosure hierarchy. Valuation techniques used to value the fund’s investments are as follows:
Investments in securities are valued at the last sales price on the securities exchange or national securities market on which such securities are primarily traded. Securities listed on the National Market System for which market quotations are available are valued at the official closing price or, if there is no official closing price that day, at the last sales price. For open short positions, asked prices are used for valuation purposes. Bid price is used when no asked price is available. Registered investment companies that are not traded on an exchange are valued at their net asset value. All of the preceding securities are generally categorized within Level 1 of the fair value hierarchy.
Securities not listed on an exchange or the national securities market, or securities for which there were no transactions, are valued at the average of the most recent bid and asked prices. U.S. Treasury Bills are valued at the mean price between quoted bid prices and asked prices by an independent pricing service (the “Service”) approved by the Board. These securities are generally categorized within Level 2 of the fair value hierarchy.
29
NOTES TO FINANCIAL STATEMENTS (continued)
The Service is engaged under the general supervision of the Board.
Fair valuing of securities may be determined with the assistance of a pricing service using calculations based on indices of domestic securities and other appropriate indicators, such as prices of relevant American Depository Receipts and futures. Utilizing these techniques may result in transfers between Level 1 and Level 2 of the fair value hierarchy.
When market quotations or official closing prices are not readily available, or are determined to not accurately reflect fair value, such as when the value of a security has been significantly affected by events after the close of the exchange or market on which the security is principally traded (for example, a foreign exchange or market), but before the fund calculates its net asset value, the fund may value these investments at fair value as determined in accordance with the procedures approved by the Board. Certain factors may be considered when fair valuing investments such as: fundamental analytical data, the nature and duration of restrictions on disposition, an evaluation of the forces that influence the market in which the securities are purchased and sold, and public trading in similar securities of the issuer or comparable issuers. These securities are either categorized within Level 2 or 3 of the fair value hierarchy depending on the relevant inputs used.
For restricted securities where observable inputs are limited, assumptions about market activity and risk are used and are generally categorized within Level 3 of the fair value hierarchy.
Futures, which are traded on an exchange, are valued at the last sales price on the securities exchange on which such securities are primarily traded or at the last sales price on the national securities market on each business day and are generally categorized within Level 1 of the fair value hierarchy.
The following is a summary of the inputs used as of October 31, 2017 in valuing the fund’s investments:
| | | | | |
| | Level 1 - Unadjusted Quoted Prices | Level 2 - Other Significant Observable Inputs | Level 3 -Significant Unobservable Inputs | Total |
Assets ($) | | | | |
Investments in Securities: | | |
Equity Securities—Domestic Common Stocks† | 2,573,648,907 | - | - | 2,573,648,907 |
Equity Securities—Foreign Common Stocks† | 19,784,493 | - | - | 19,784,493 |
30
| | | | | |
| | Level 1 - Unadjusted Quoted Prices | Level 2 - Other Significant Observable Inputs | Level 3 -Significant Unobservable Inputs | Total |
Registered Investment Company | 17,561,479 | - | - | 17,561,479 |
U.S. Treasury | - | 889,128 | - | 889,128 |
Other Financial Instruments: | | | |
Futures†† | 513,333 | - | - | 513,333 |
† See Statement of Investments for additional detailed categorizations.
†† Amount shown represents unrealized appreciation at period end.
At October 31, 2017, there were no transfers between levels of the fair value hierarchy. It is the fund’s policy to recognize transfers between levels at the end of the reporting period.
(b) Securities transactions and investment income: Securities transactions are recorded on a trade date basis. Realized gains and losses from securities transactions are recorded on the identified cost basis. Dividend income is recognized on the ex-dividend date and interest income, including, where applicable, accretion of discount and amortization of premium on investments, is recognized on the accrual basis.
Pursuant to a securities lending agreement with The Bank of New York Mellon, the fund may lend securities to qualified institutions. It is the fund’s policy that, at origination, all loans are secured by collateral of at least 102% of the value of U.S. securities loaned and 105% of the value of foreign securities loaned. Collateral equivalent to at least 100% of the market value of securities on loan is maintained at all times. Collateral is either in the form of cash, which can be invested in certain money market mutual funds managed by Dreyfus, or U.S. Government and Agency securities. The fund is entitled to receive all dividends, interest and distributions on securities loaned, in addition to income earned as a result of the lending transaction. Should a borrower fail to return the securities in a timely manner, The Bank of New York Mellon is required to replace the securities for the benefit of the fund or credit the fund with the market value of the unreturned securities and is subrogated to the fund’s rights against the borrower and the collateral. Additionally, the contractual maturity of security lending transactions are on an overnight and continuous basis. During the period ended October 31, 2017, The Bank of New York Mellon earned $7,486 from lending portfolio securities, pursuant to the securities lending agreement.
(c) Affiliated issuers: Investments in other investment companies advised by Dreyfus are defined as “affiliated” under the Act.
31
NOTES TO FINANCIAL STATEMENTS (continued)
(d) Dividends and distributions to shareholders: Dividends and distributions are recorded on the ex-dividend date. Dividends from investment income-net are normally declared and paid quarterly. Dividends from net realized capital gains, if any, are normally declared and paid annually, but the fund may make distributions on a more frequent basis to comply with the distribution requirements of the Internal Revenue Code of 1986, as amended (the “Code”). To the extent that net realized capital gains can be offset by capital loss carryovers, it is the policy of the fund not to distribute such gains. Income and capital gain distributions are determined in accordance with income tax regulations, which may differ from GAAP.
(e) Federal income taxes: It is the policy of the fund to continue to qualify as a regulated investment company, if such qualification is in the best interests of its shareholders, by complying with the applicable provisions of the Code, and to make distributions of taxable income sufficient to relieve it from substantially all federal income and excise taxes.
As of and during the period ended October 31, 2017, the fund did not have any liabilities for any uncertain tax positions. The fund recognizes interest and penalties, if any, related to uncertain tax positions as income tax expense in the Statement of Operations. During the period ended October 31, 2017, the fund did not incur any interest or penalties.
Each tax year in the four-year period ended October 31, 2017 remains subject to examination by the Internal Revenue Service and state taxing authorities.
At October 31, 2017, the components of accumulated earnings on a tax basis were as follows: undistributed ordinary income $19,003,648, undistributed capital gains $17,500,008 and unrealized appreciation $1,418,300,937.
The tax character of distributions paid to shareholders during the fiscal periods ended October 31, 2017 and October 31, 2016 were as follows: ordinary income $45,171,712 and $44,021,942, and long-term capital gains $21,940,239 and $12,102,938, respectively.
During the period ended October 31, 2017, as a result of permanent book to tax differences, primarily due to the tax treatment for real estate investment trusts, the fund decreased accumulated undistributed investment income-net by $672,098 and increased accumulated net realized gain (loss) on investments by the same amount. Net assets and net asset value per share were not affected by this reclassification.
32
NOTE 2—Bank Lines of Credit:
The fund participates with other Dreyfus-managed funds in an $830 million unsecured credit facility led by Citibank, N.A. and a $300 million unsecured credit facility provided by The Bank of New York Mellon (each, a “Facility”), each to be utilized primarily for temporary or emergency purposes, including the financing of redemptions. Prior to October 4, 2017, the unsecured credit facility with Citibank, N.A. was $810 million. In connection therewith, the fund has agreed to pay its pro rata portion of commitment fees for each Facility. Interest is charged to the fund based on rates determined pursuant to the terms of the respective Facility at the time of borrowing.
The average amount of borrowings outstanding under the facilities during the period ended October 31, 2017 was approximately $351,000 with a related weighted average annualized interest rate of 1.63%.
NOTE 3—Investment Management Fee and Other Transactions with Affiliates:
(a) Pursuant to an investment management agreement with Dreyfus, Dreyfus provides or arranges for one or more third parties and/or affiliates to provide investment advisory, administrative, custody, fund accounting and transfer agency services to the fund. Dreyfus also directs the investments of the fund in accordance with its investment objective, policies and limitations. For these services, the fund is contractually obligated to pay Dreyfus a fee, calculated daily and paid monthly, at an annual rate of .20% of the value of the fund’s average daily net assets. Out of its fee, Dreyfus pays all of the expenses of the fund except brokerage fees, taxes, interest expense, commitment fees on borrowings, fees and expenses of non-interested Directors (including counsel fees) and extraordinary expenses. In addition, Dreyfus is required to reduce its fee in an amount equal to the fund’s allocable portion of fees and expenses of the non-interested Directors (including counsel fees). During the period ended October 31, 2017, fees reimbursed by Dreyfus amounted to $190,913.
(b) The components of “Due to The Dreyfus Corporation” in the Statement of Assets and Liabilities consist of: management fees $442,581, which are offset against an expense reimbursement currently in effect in the amount of $15,706.
(c) Each Board member also serves as a Board member of other funds within the Dreyfus complex. Annual retainer fees and attendance fees are allocated to each fund based on net assets.
33
NOTES TO FINANCIAL STATEMENTS (continued)
NOTE 4—Securities Transactions:
The aggregate amount of purchases and sales of investment securities, excluding short-term securities and financial futures, during the period ended October 31, 2017, amounted to $145,660,106 and $198,592,764, respectively.
Derivatives: A derivative is a financial instrument whose performance is derived from the performance of another asset. Each type of derivative instrument that was held by the fund during the period ended October 31, 2017 is discussed below.
Futures: In the normal course of pursuing its investment objective, the fund is exposed to market risk, including equity price risk, as a result of changes in value of underlying financial instruments. The fund invests in futures in order to manage its exposure to or protect against changes in the market. A futures contract represents a commitment for the future purchase or a sale of an asset at a specified date. Upon entering into such contracts, these investments require initial margin deposits with a counterparty, which consist of cash or cash equivalents. The amount of these deposits is determined by the exchange or Board of Trade on which the contract is traded and is subject to change. Accordingly, variation margin payments are received or made to reflect daily unrealized gains or losses which are recorded in the Statement of Operations. When the contracts are closed, the fund recognizes a realized gain or loss which is reflected in the Statement of Operations. There is minimal counterparty credit risk to the fund with futures since they are exchange traded, and the exchange guarantees the futures against default. Futures open at October 31, 2017 are set forth in the Statement of Futures.
The following summarizes the average market value of derivatives outstanding during the period ended October 31, 2017:
| | | |
| | Average Market Value ($) |
Equity futures | | 32,529,037 |
| | | |
At October 31, 2017, the cost of investments for federal income tax purposes was $1,193,583,070; accordingly, accumulated net unrealized appreciation on investments inclusive of derivative contracts was $1,418,300,937, consisting of $1,471,293,338 gross unrealized appreciation and $52,992,401 gross unrealized depreciation.
NOTE 5—Pending Legal Matters:
The fund and many other entities have been named as defendants in numerous pending litigations as a result of their participation in the
34
leveraged buyout transaction (“LBO”) of the Tribune Company (“Tribune”). The cases allege that Tribune took on billions of dollars of debt in the LBO to purchase its own stock from shareholders at $34 per share. The LBO was executed in a two-step transaction: shares were repurchased by Tribune in a tender offer in June 2007 and then in a go-private merger in December 2007. In 2008, approximately one year after the LBO was concluded, Tribune filed for bankruptcy protection under Chapter 11. Thereafter, in approximately June 2011, certain Tribune creditors filed dozens of complaints in various courts throughout the country alleging that the payments made to shareholders in the LBO were “fraudulent conveyances” under state and/or federal law, and that the shareholders must return the payments they received for their shares to satisfy the plaintiffs’ unpaid claims. These cases were consolidated for coordinated pre-trial proceedings in a multi-district litigation in the United States District Court for the Southern District of New York titled In re Tribune Company Fraudulent Conveyance Litigation (S.D.N.Y. Nos. 11-md-2296 and 12-mc-2296 (RJS) (“Tribune MDL”)).
In addition, there was a case pending in United States Bankruptcy Court for the District of Delaware brought by the Unsecured Creditors Committee of the Tribune Company that has since been transferred to the Tribune MDL (formerly The Official Committee of Unsecured Creditors of Tribune Co. v. FitzSimons, et al., Bankr. D. Del. Adv. Pro. No. 10-54010 (KJC)) (“FitzSimons case”). The case was originally filed on November 1, 2010. In a Fourth Amended Complaint filed in November 2012, among other claims, the Creditors Committee sought recovery under the Bankruptcy Code for alleged “fraudulent conveyances” from more than 5,000 Tribune shareholders (“Shareholder Defendants”), including the fund, and a defendants’ class of all shareholders who tendered their Tribune stock in the LBO and received cash in exchange. There were 35 other counts in the Fourth Amended Complaint that did not relate to claims against Shareholder Defendants, but instead were brought against parties directly involved in approval or execution of the leveraged buyout. On January 10, 2013, pursuant to the Tribune bankruptcy plan, Mark S. Kirchner, as Litigation Trustee for the Tribune Litigation Trust, became the successor plaintiff to the Creditors Committee in this case. The case is now proceeding as: Mark S. Kirchner, as Litigation Trustee for the Tribune Litigation Trust v. FitzSimons, et al., S.D.N.Y. No. 12-cv-2652 (RJS). On August 1, 2013, the plaintiff filed a Fifth Amended Complaint with the Court. The Fifth Amended Complaint contains more detailed allegations regarding the steps Tribune took in consideration and execution of the LBO, but did not change the legal basis for the claim previously alleged against the Shareholder Defendants.
35
NOTES TO FINANCIAL STATEMENTS (continued)
On November 6, 2012, a motion to dismiss was filed in the Tribune MDL that applied to most, but not all, of the cases in the Tribune MDL. On September 23, 2013 Judge Sullivan granted the motion to dismiss on standing grounds, after rejecting defendants’ preemption arguments. By granting the motion, Judge Sullivan dismissed nearly 50 cases in the Tribune MDL. The fund was a defendant in at least one of the dismissed cases. The motion had no effect on the FitzSimons case, which had been stayed.
On September 30, 2013, plaintiffs appealed the motion to dismiss decision to the U.S. Court of Appeals for the Second Circuit. On October 28, 2013, certain defendants cross-appealed from Judge Sullivan’s decision, seeking review of the arguments that Judge Sullivan rejected in his decision. On March 29, 2016, the Second Circuit issued its decision on the appeal and cross-appeal. A panel of three judges unanimously affirmed the dismissal on the ground that the plaintiffs’ claims were preempted by section 546(e) of the Bankruptcy Code. On April 12, 2016, the plaintiffs/appellants filed a petition with the Second Circuit requesting rehearing of the appeal by the same panel of judges and/or rehearing en banc by all judges on the Second Circuit. On July 22, 2016, the Second Circuit denied both requests for rehearing. On September 9, 2016, Plaintiffs filed a petition for certiorari with the U.S. Supreme Court. A brief in opposition to the petition was filed on behalf of defendants on October 24, 2016. Plaintiffs filed a reply brief on November 4, 2016. As of December 6, 2017, the Supreme Court had not ruled on the petition.
In the FitzSimons case, a “global” motion to dismiss the fraudulent transfer claim asserted against the Shareholder Defendants, which applies equally to all Shareholder Defendants including the fund, was filed on May 23, 2014 and briefing was completed in July 2014. On January 9, 2017, Judge Sullivan entered an order granting the “global” motion and dismissing the claim against all the Shareholder Defendants. On February 2, 2017, the plaintiff filed a request to seek leave to appeal with the court. On February 23, 2017, the Court entered an order stating that it would permit the Plaintiff to make an interlocutory appeal of the dismissal of the claim, but only after the Court decided other pending motions to dismiss that do not involve the Shareholder Defendants. As of December 6, 2017, the Court had not decided those other motions.
At this stage in the proceedings, it is not possible to assess with any reasonable certainty the probable outcomes of the pending litigations. Consequently, at this time, management is unable to estimate the possible loss that may result.
36
REPORT OF INDEPENDENT REGISTERED
PUBLIC ACCOUNTING FIRM
The Board of Directors and Shareholders of
The Dreyfus/Laurel Funds, Inc.
We have audited the accompanying statement of assets and liabilities of Dreyfus Institutional S&P 500 Stock Index Fund (the “Fund”), a series of The Dreyfus/Laurel Funds, Inc., including the statements of investments, investments in affiliated issuers, and futures, as of October 31, 2017, and the related statement of operations for the year then ended, the statements of changes in net assets for each of the years in the two-year period then ended, and the financial highlights for each of the years in the five-year period then ended. These financial statements and financial highlights are the responsibility of the Fund’s management. Our responsibility is to express an opinion on these financial statements and financial highlights based on our audits.
We conducted our audits in accordance with the standards of the Public Company Accounting Oversight Board (United States). Those standards require that we plan and perform the audit to obtain reasonable assurance about whether the financial statements and financial highlights are free of material misstatement. An audit includes examining, on a test basis, evidence supporting the amounts and disclosures in the financial statements. Our procedures included confirmation of securities owned as of October 31, 2017, by correspondence with the custodian and brokers or by other appropriate auditing procedures. An audit also includes assessing the accounting principles used and significant estimates made by management, as well as evaluating the overall financial statement presentation. We believe that our audits provide a reasonable basis for our opinion.
In our opinion, the financial statements and financial highlights referred to above present fairly, in all material respects, the financial position of Dreyfus Institutional S&P 500 Stock Index Fund as of October 31, 2017, and the results of its operations for the year then ended, the changes in its net assets for each of the years in the two-year period then ended, and the financial highlights for each of the years in the five-year period then ended, in conformity with U.S. generally accepted accounting principles.

New York, New York
December 22, 2017
37
IMPORTANT TAX INFORMATION (Unaudited)
For federal tax purposes, the fund reports the maximum amount allowable, but not less than $45,171,712 as ordinary income dividends paid during the year ended October 31, 2017 as qualified dividend income in accordance with Section 854(b)(1)(B) of the Internal Revenue Code. Also, the fund reports the maximum amount allowable but not less than 98.00% of ordinary income dividends paid during the year ended October 31, 2017 as eligible for the corporate dividends received deduction provided under Section 243 of the Internal Revenue Code in accordance with Section 854(b)(1)(A) of the Internal Revenue Code. Shareholders will receive notification in early 2018 of the percentage applicable to the preparation of their 2017 income tax returns. Also the fund reports the maximum amount allowable but not less than $.4390 per share as a capital gain dividend in accordance with Section 852(b)(3)(C) of the Internal Revenue Code. Also, the fund reports the maximum amount allowable but not less than $.0296 as a short-term capital gain dividend paid on December 28, 2016 in accordance with Sections 871(k)(2) and 881(e) of the Internal Revenue Code.
38
BOARD MEMBERS INFORMATION (Unaudited)
INDEPENDENT BOARD MEMBERS
Joseph S. DiMartino (74)
Chairman of the Board (1999)
Principal Occupation During Past 5 Years:
· Corporate Director and Trustee (1995-present)
Other Public Company Board Memberships During Past 5 Years:
· CBIZ (formerly, Century Business Services, Inc.), a provider of outsourcing functions for small and medium size companies, Director (1997-present)
No. of Portfolios for which Board Member Serves: 126
———————
Francine J. Bovich (66)
Board Member (2012)
Principal Occupation During Past 5 Years:
· Trustee, The Bradley Trusts, private trust funds (2011-present)
Other Public Company Board Memberships During Past 5 Years:
· Annaly Capital Management, Inc., Board Member (May 2014-present)
No. of Portfolios for which Board Member Serves: 74
———————
Kenneth A. Himmel (71)
Board Member (1994)
Principal Occupation During Past 5 Years:
· Managing Partner, Gulf Related, an international real estate development company (2010-present)
· President and CEO, Related Urban Development, a real estate development company (1996-present)
· President and CEO, Himmel & Company, a real estate development company (1980-present)
· CEO, American Food Management, a restaurant company (1983-present)
No. of Portfolios for which Board Member Serves: 28
———————
39
BOARD MEMBERS INFORMATION (Unaudited) (continued)
INDEPENDENT BOARD MEMBERS (continued)
Stephen J. Lockwood (70)
Board Member (1994)
Principal Occupation During Past 5 Years:
· Chairman of the Board, Stephen J. Lockwood and Company LLC, a real estate investment company (2000-present)
No. of Portfolios for which Board Member Serves: 28
———————
Roslyn M. Watson (68)
Board Member (1994)
Principal Occupation During Past 5 Years:
· Principal, Watson Ventures, Inc., a real estate investment company (1993-present)
No. of Portfolios for which Board Member Serves: 60
———————
Benaree Pratt Wiley (71)
Board Member (1998)
Principal Occupation During Past 5 Years:
· Principal, The Wiley Group, a firm specializing in strategy and business development (2005-present)
Other Public Company Board Memberships During Past 5 Years:
· CBIZ (formerly, Century Business Services, Inc.), a provider of outsourcing functions for small and medium size companies, Director (2008-present)
No. of Portfolios for which Board Member Serves: 81
———————
Once elected all Board Members serve for an indefinite term, but achieve Emeritus status upon reaching age 80. The address of the Board Members and Officers is c/o The Dreyfus Corporation, 200 Park Avenue, New York, New York 10166. Additional information about the Board Members is available in the fund’s Statement of Additional Information which can be obtained from Dreyfus free of charge by calling this toll free number: 1-800-DREYFUS.
James M. Fitzgibbons, Emeritus Board Member
J. Tomlinson Fort, Emeritus Board Member
40
OFFICERS OF THE FUND (Unaudited)
BRADLEY J. SKAPYAK, President since January 2010.
Chief Operating Officer and a director of the Manager since June 2009, Chairman of Dreyfus Transfer, Inc., an affiliate of the Manager and the transfer agent of the funds, since May 2011 and Chief Executive Officer of MBSC Securities Corporation since August 2016. He is an officer of 62 investment companies (comprised of 126 portfolios) managed by the Manager. He is 58 years old and has been an employee of the Manager since February 1988.
BENNETT A. MACDOUGALL, Chief Legal Officer since October 2015.
Chief Legal Officer of the Manager and Associate General Counsel and Managing Director of BNY Mellon since June 2015; from June 2005 to June 2015, he served in various capacities with Deutsche Bank – Asset & Wealth Management Division, including as Director and Associate General Counsel, and Chief Legal Officer of Deutsche Investment Management Americas Inc. from June 2012 to May 2015. He is an officer of 63 investment companies (comprised of 151 portfolios) managed by the Manager. He is 46 years old and has been an employee of the Manager since June 2015.
JANETTE E. FARRAGHER, Vice President and Secretary since December 2011.
Associate General Counsel of BNY Mellon, and an officer of 63 investment companies (comprised of 151 portfolios) managed by the Manager. She is 54 years old and has been an employee of the Manager since February 1984.
JAMES BITETTO, Vice President and Assistant Secretary since August 2005.
Managing Counsel of BNY Mellon and Secretary of the Manager, and an officer of 63 investment companies (comprised of 151 portfolios) managed by the Manager. He is 51 years old and has been an employee of the Manager since December 1996.
JOSEPH M. CHIOFFI, Vice President and Assistant Secretary since August 2005.
Managing Counsel of BNY Mellon, and an officer of 63 investment companies (comprised of 151 portfolios) managed by the Manager. He is 55 years old and has been an employee of the Manager since June 2000.
MAUREEN E. KANE, Vice President and Assistant Secretary since April 2015.
Managing Counsel of BNY Mellon since July 2014; from October 2004 until July 2014, General Counsel, and from May 2009 until July 2014, Chief Compliance Officer of Century Capital Management. She is an officer of 63 investment companies (comprised of 151 portfolios) managed by the Manager. She is 55 years old and has been an employee of the Manager since July 2014.
SARAH S. KELLEHER, Vice President and Assistant Secretary since April 2014.
Senior Counsel of BNY Mellon since March 2013, from August 2005 to March 2013, Associate General Counsel of Third Avenue Management. She is an officer of 63 investment companies (comprised of 151 portfolios) managed by the Manager. She is 42 years old and has been an employee of the Manager since March 2013.
JEFF PRUSNOFSKY, Vice President and Assistant Secretary since August 2005.
Senior Managing Counsel of BNY Mellon, and an officer of 63 investment companies (comprised of 151 portfolios) managed by the Manager. He is 52 years old and has been an employee of the Manager since October 1990.
NATALYA ZELENSKY, Vice President and Assistant Secretary since March 2017.
Counsel and Vice President of BNY Mellon since May 2016; Attorney at Wildermuth Endowment Strategy Fund/Wildermuth Advisory, LLC from November 2015 until May 2016; Assistant General Counsel at RCS Advisory Services from July 2014 until November 2015; Associate at Sutherland, Asbill & Brennan from January 2013 until January 2014; Associate at K&L Gates from October 2011 until January 2013. She is an officer of 63 investment companies (comprised of 151 portfolios) managed by Dreyfus. She is 32 years old and has been an employee of the Manager since May 2016.
JAMES WINDELS, Treasurer since November 2001.
Director – Mutual Fund Accounting of the Manager, and an officer of 63 investment companies (comprised of 151 portfolios) managed by the Manager. He is 59 years old and has been an employee of the Manager since April 1985.
41
OFFICERS OF THE FUND (Unaudited) (continued)
RICHARD CASSARO, Assistant Treasurer since January 2008.
Senior Accounting Manager – Money Market and Municipal Bond Funds of the Manager, and an officer of 63 investment companies (comprised of 151 portfolios) managed by the Manager. He is 58 years old and has been an employee of the Manager since September 1982.
GAVIN C. REILLY, Assistant Treasurer since December 2005.
Tax Manager of the Investment Accounting and Support Department of the Manager, and an officer of 63 investment companies (comprised of 151 portfolios) managed by the Manager. He is 49 years old and has been an employee of the Manager since April 1991.
ROBERT S. ROBOL, Assistant Treasurer since December 2002.
Senior Accounting Manager – Dreyfus Financial Reporting of the Manager, and an officer of 63 investment companies (comprised of 151 portfolios) managed by the Manager. He is 53 years old and has been an employee of the Manager since October 1988.
ROBERT SALVIOLO, Assistant Treasurer since July 2007.
Senior Accounting Manager – Equity Funds of the Manager, and an officer of 63 investment companies (comprised of 151 portfolios) managed by the Manager. He is 50 years old and has been an employee of the Manager since June 1989.
ROBERT SVAGNA, Assistant Treasurer since December 2002.
Senior Accounting Manager – Fixed Income and Equity Funds of the Manager, and an officer of 63 investment companies (comprised of 151 portfolios) managed by the Manager. He is 50 years old and has been an employee of the Manager since November 1990.
JOSEPH W. CONNOLLY, Chief Compliance Officer since October 2004.
Chief Compliance Officer of the Manager and The Dreyfus Family of Funds (63 investment companies, comprised of 151 portfolios). He is 60 years old and has served in various capacities with the Manager since 1980, including manager of the firm’s Fund Accounting Department from 1997 through October 2001.
CARIDAD M. CAROSELLA, Anti-Money Laundering Compliance Officer since January 2016.
Anti-Money Laundering Compliance Officer of the Dreyfus Family of Funds and BNY Mellon Funds Trust since January 2016; from May 2015 to December 2015, Interim Anti-Money Laundering Compliance Officer of the Dreyfus Family of Funds and BNY Mellon Funds Trust and the Distributor; from January 2012 to May 2015, AML Surveillance Officer of the Distributor and from 2007 to December 2011, Financial Processing Manager of the Distributor. She is an officer of 57 investment companies (comprised of 145 portfolios) managed by the Manager. She is 49 years old and has been an employee of the Distributor since 1997.
42
NOTES
43
NOTES
44
NOTES
45
Dreyfus Institutional S&P 500 Stock Index Fund
200 Park Avenue
New York, NY 10166
Manager
The Dreyfus Corporation
200 Park Avenue
New York, NY 10166
Custodian
The Bank of New York Mellon
225 Liberty Street
New York, NY 10286
Transfer Agent &
Dividend Disbursing Agent
Dreyfus Transfer, Inc.
200 Park Avenue
New York, NY 10166
Distributor
MBSC Securities Corporation
200 Park Avenue
New York, NY 10166
Telephone Call your financial representative or 1-800-DREYFUS
Mail The Dreyfus Family of Funds, 144 Glenn Curtiss Boulevard, Uniondale, NY 11556-0144
E-mail Send your request to info@dreyfus.com
Internet Information can be viewed online or downloaded at www.dreyfus.com
The fund files its complete schedule of portfolio holdings with the Securities and Exchange Commission (“SEC”) for the first and third quarters of each fiscal year on Form N-Q. The fund’s Forms N-Q are available on the SEC’s website at www.sec.gov and may be reviewed and copied at the SEC’s Public Reference Room in Washington, D.C. (phone 1-800-SEC-0330 for information).
A description of the policies and procedures that the fund uses to determine how to vote proxies relating to portfolio securities and information regarding how the fund voted these proxies for the most recent 12-month period ended June 30 is available at www.dreyfus.com and on the SEC’s website at www.sec.gov and without charge, upon request, by calling 1-800-DREYFUS.
| | |
© 2017 MBSC Securities Corporation
0713AR1017 | 
|
Dreyfus Opportunistic Fixed Income Fund
| | | |

| | ANNUAL REPORT
October 31, 2017 |
| |
Save time. Save paper. View your next shareholder report online as soon as it’s available. Log into www.dreyfus.com and sign up for Dreyfus eCommunications. It’s simple and only takes a few minutes. |
| |
The views expressed in this report reflect those of the portfolio manager(s) only through the end of the period covered and do not necessarily represent the views of Dreyfus or any other person in the Dreyfus organization. Any such views are subject to change at any time based upon market or other conditions and Dreyfus disclaims any responsibility to update such views. These views may not be relied on as investment advice and, because investment decisions for a Dreyfus fund are based on numerous factors, may not be relied on as an indication of trading intent on behalf of any Dreyfus fund. |
| |
Not FDIC-Insured • Not Bank-Guaranteed • May Lose Value |
Contents
THE FUND
FOR MORE INFORMATION
Back Cover
| | | | |
| |
Dreyfus Opportunistic Fixed Income Fund
| | The Fund |
A LETTER FROM THE CEO OF DREYFUS
Dear Shareholder:
We are pleased to present this annual report for Dreyfus Opportunistic Fixed Income Fund, covering the 12-month period from November 1, 2016 through October 31, 2017. For information about how the fund performed during the reporting period, as well as general market perspectives, we provide a Discussion of Fund Performance on the pages that follow.
Stocks set a series of new record highs and bonds produced mixed results over the past year in response to changing economic and political conditions. Financial markets at the start of the reporting period were dominated by the election of a new U.S. presidential administration. Equities and corporate-backed bonds surged higher in anticipation of more business-friendly regulatory, tax, and fiscal policies, but high-quality bonds generally lost value due to expectations of rising interest rates and accelerating inflation in a stronger economy. Despite a series of short-term interest-rate hikes, bonds recovered their previous losses over the first 10 months of 2017 when it became clearer that pro-growth legislation would take time and political capital to enact. U.S. and international stocks continued to rally as corporate earnings grew and global economic conditions improved.
The markets’ recent strong performance has been supported by solid underlying fundamentals. While we currently expect these favorable conditions to persist, we remain watchful for economic and political developments that could derail the markets. As always, we encourage you to discuss the risks and opportunities of today’s investment environment with your financial advisor.
Thank you for your continued confidence and support.
Sincerely,

Mark D. Santero
Chief Executive Officer
The Dreyfus Corporation
November 15, 2017
2
DISCUSSION OF FUND PERFORMANCE
For the period from November 1, 2016 through October 31, 2017, as provided by David Leduc, CFA and Brendan Murphy, CFA, Portfolio Managers
Market and Fund Performance Overview
For the 12-month period ended October 31, 2017, Dreyfus Opportunistic Fixed Income Fund’s Class A shares produced a total return of 6.12%, Class C shares returned 5.34%, Class I shares returned 6.31%, and Class Y shares returned 6.33%.1 In comparison, the Citi One-Month U.S. Treasury Bill Index (the “Index”) achieved a total return of 0.67% for the same period.2
Fixed-income securities across a variety of regional markets produced solidly positive total returns over the reporting period when moderating long-term interest rates and muted inflation offset earlier market weakness stemming from expectations of greater economic growth. The fund outperformed the Index, primarily due to its exposure to higher-yielding bond market sectors.
The Fund’s Investment Approach
The fund seeks to maximize total return through capital appreciation and income. To pursue its goal, we typically allocate the fund’s assets across four sectors of the fixed-income market: U.S. high yield bonds rated below investment grade; U.S. government, investment-grade corporate, mortgage- and asset-backed securities; foreign debt securities of developed markets; and foreign debt securities of emerging markets.
The fund is managed using a blend of macroeconomic, quantitative and fundamental analysis. Through security selection and tactical allocation across fixed-income asset classes and sectors, countries and currencies, we seek to construct a portfolio comprised of the best opportunities to produce absolute returns with low correlation with, and less volatility than, major markets over the long term.
Economic and Political Developments Drove Bond Markets
Longer-term interest rates rose sharply in the weeks following the U.S. presidential election in November 2016, causing prices of U.S. government securities to decline. Rates moved higher in response to expectations that a new presidential administration’s more business-friendly regulatory, tax, and fiscal policies would boost U.S. economic growth and inflationary pressures. In addition, the Federal Reserve Board (the “Fed”) implemented a long-awaited increase in short-term interest rates in December 2016.
In 2017, evidence of stronger global economic growth in overseas markets prompted a gradual move among central banks away from the aggressively accommodative monetary policies of the past few years. In the United States, short-term interest rates continued to rise when the Fed implemented two more increases in the overnight federal funds rate over the first 10 months of the year. In contrast, long-term U.S. interest rates moderated, giving back some, but not all, of the post-election spike when inflationary pressures remained muted and investors came to realize that some government policy reforms were far from certain. Meanwhile, corporate-backed bonds continued to produce robust returns in an environment of growing corporate earnings.
3
DISCUSSION OF FUND PERFORMANCE (continued)
Allocation Strategy Bolstered Fund Results
The fund’s performance benefited over the reporting period from our sector allocation strategy. Most notably, exposure to investment-grade corporate bonds, asset-backed securities, high yield securities, and emerging-market debt helped the fund participate in their higher yields and the benefits of narrowing yield differences along the market’s credit-quality spectrum. The fund’s performance was further enhanced by our country allocation strategy, in which investments in bonds and currencies in Portugal, Mexico, Argentina, and Brazil fared especially well. Positions in the emerging markets also gained value as commodity prices stabilized, protectionism fears waned, and the U.S. dollar weakened against most other currencies.
In most markets, we maintained the fund’s average duration in a range that was slightly shorter than bond market averages. This positioning helped cushion the negative impact of rising long-term interest rates over the final weeks of 2016, but it mildly constrained the benefits of moderating rates in 2017.
Disappointments proved to be relatively mild during the reporting period. Most notably, the fund’s holdings of inflation-linked bonds in the United States, New Zealand, and Japan lagged other bond market sectors in the low-inflation environment. Despite their recent relative weakness, we believe that inflation-linked securities have become more attractively valued and can provide valuable portfolio protection against unexpected accelerations of inflation.
At times during the reporting period, the fund employed option contracts, futures contracts, and forward contracts to manage its interest-rate and currency exposures.
Positioned for Continued Economic Growth
The global economy has continued to expand, and many analysts expect moderate growth to persist over the months ahead. Inflationary pressures may increase in this environment, and most analysts anticipate additional short-term interest-rate hikes and balance-sheet normalization from the Fed and other central banks as they move gradually toward less stimulative monetary policies.
Therefore, we have retained a generally defensive investment posture, including relatively low durations in markets where interest rates seem poised to rise, such as the Eurozone and the United Kingdom. On the other hand, we have maintained the fund’s emphasis on
4
higher-yielding bond market sectors, including corporate- and asset-backed securities, that could continue to benefit from improving global business conditions.
November 15, 2017
1 Total return includes reinvestment of dividends and any capital gains paid, and does not take into consideration the maximum initial sales charge in the case of Class A shares, or the applicable contingent deferred sales charge imposed on redemptions in the case of Class C shares. Had these charges been reflected, returns would have been lower. Class I and Class Y shares are not subject to any initial or deferred sales charges. Share price, yield, and investment return fluctuate such that upon redemption, fund shares may be worth more or less than their original cost. Return figures provided reflect the absorption of certain fund expenses by The Dreyfus Corporation pursuant to an agreement in effect through March 1, 2018, at which time it may be extended, modified, or terminated. Past performance is no guarantee of future results.
² Source: Lipper Inc. — The Citi One-Month U.S. Treasury Bill Index consists of the last one-month Treasury bill month-end rates. The Citi One-Month U.S. Treasury Bill Index measures return equivalents of yield averages. The instruments are not marked to market. Investors cannot invest directly in any index.
Bonds are subject generally to interest-rate, credit, liquidity, and market risks, to varying degrees, all of which are more fully described in the fund’s prospectus. Generally, all other factors being equal, bond prices are inversely related to interest-rate changes, and rate increases can cause price declines.
High yield bonds are subject to increased credit risk and are considered speculative in terms of the issuer’s perceived ability to continue making interest payments on a timely basis and to repay principal upon maturity.
Foreign bonds are subject to special risks, including exposure to currency fluctuations, changing political and economic conditions, and potentially less liquidity. These risks are generally greater with emerging market countries than with more economically and politically established foreign countries.
Investments in foreign currencies are subject to the risk that those currencies will decline in value relative to the U.S. dollar, or, in the case of hedged positions, that the U.S. dollar will decline relative to the currency being hedged. Currency rates in foreign countries may fluctuate significantly over short periods of time. A decline in the value of foreign currencies relative to the U.S. dollar will reduce the value of securities held by the fund and denominated in those currencies. The use of leverage may magnify the fund’s gains or losses. For derivatives with a leveraging component, adverse changes in the value or level of the underlying asset can result in a loss that is much greater than the original investment in the derivative.
The fund may use derivative instruments, such as options, futures, options on futures, forward contracts, swaps (including credit default swaps on corporate bonds and asset-backed securities), options on swaps, and other credit derivatives. A small investment in derivatives could have a potentially large impact on the fund’s performance. The use of derivatives involves risks different from, or possibly greater than, the risks associated with investing directly in the underlying assets.
5
FUND PERFORMANCE

Comparison of change in value of $10,000 investment in Dreyfus Opportunistic Fixed Income Fund Class A shares, Class C shares, Class I shares and Class Y shares and the Citi One-Month U.S. Treasury Bill Index (the “Index”)
† Source: Lipper Inc.
†† The total return figures presented for Class Y shares of the fund reflect the performance of the fund’s Class A shares for the period prior to 7/1/13 (the inception date for Class Y shares), not reflecting the applicable sales charges for Class A shares.
Past performance is not predictive of future performance.
The above graph compares a $10,000 investment made in each of the Class A, Class C, Class I and Class Y shares of Dreyfus Opportunistic fixed Income Fund on 10/31/07 to a $10,000 investment made in the Index on that date. All dividends and capital gain distributions are reinvested.
The fund’s performance shown in the line graph above takes into account the maximum initial sales charge on Class A shares and all other applicable fees and expenses on all classes. The Index consists of the last one-month Treasury bill month-end rates. The Index measures returns equivalent of yield averages. The instruments are not marked to market. Unlike a mutual fund, the Index is not subject to charges, fees and other expenses. Investors cannot invest directly in any index. Further information relating to fund performance, including expense reimbursements, if applicable, is contained in the Financial Highlights section of the prospectus and elsewhere in this report.
6
| | | | | | | |
Average Annual Total Returns as of 10/31/17 | | |
| Inception
Date | 1 Year | 5 Years | | 10 Years |
Class A shares | | | | |
with maximum sales charge (4.5%) | 7/11/06 | 1.36% | 0.14% | | 3.33% | |
without sales charge | 7/11/06 | 6.12% | 1.07% | | 3.81% | |
Class C shares | | | | |
with applicable redemption charge † | 7/11/06 | 4.34% | 0.32% | | 3.03% | |
without redemption | 7/11/06 | 5.34% | 0.32% | | 3.03% | |
Class I shares | 7/11/06 | 6.31% | 1.32% | | 4.07% | |
Class Y shares | 7/1/13 | 6.33% | 1.32% | †† | 3.94% | †† |
Citi One-Month U.S. Treasury Bill Index | | 0.67% | 0.18% | | 0.32% | |
† The maximum contingent deferred sales charge for Class C shares is 1% for shares redeemed within one year of the date of purchase.
†† The total return performance figures presented for Class Y shares of the fund reflect the performance of the fund’s Class A shares for the period prior to 7/1/13 (the inception date for Class Y shares), not reflecting the applicable sales charges for Class A shares.
The performance data quoted represents past performance, which is no guarantee of future results. Share price and investment return fluctuate and an investor’s shares may be worth more or less than original cost upon redemption. Current performance may be lower or higher than the performance quoted. Go to Dreyfus.com for the fund’s most recent month-end returns.
The fund’s performance shown in the graph and table does not reflect the deduction of taxes that a shareholder would pay on fund distributions or the redemption of fund shares. In addition to the performance of Class A shares shown with and without a maximum sales charge, the fund’s performance shown in the table takes into account all other applicable fees and expenses on all classes.
7
UNDERSTANDING YOUR FUND’S EXPENSES (Unaudited)
As a mutual fund investor, you pay ongoing expenses, such as management fees and other expenses. Using the information below, you can estimate how these expenses affect your investment and compare them with the expenses of other funds. You also may pay one-time transaction expenses, including sales charges (loads) and redemption fees, which are not shown in this section and would have resulted in higher total expenses. For more information, see your fund’s prospectus or talk to your financial adviser.
Review your fund’s expenses
The table below shows the expenses you would have paid on a $1,000 investment in Dreyfus Opportunistic Fixed Income Fund from May 1, 2017 to October 31, 2017. It also shows how much a $1,000 investment would be worth at the close of the period, assuming actual returns and expenses.
| | | | | | | | | | | | |
Expenses and Value of a $1,000 Investment | | |
assuming actual returns for the six months ended October 31, 2017 |
| | | | | | | | |
| | | | Class A | Class C | Class I | Class Y |
Expenses paid per $1,000† | | $4.59 | | $8.39 | | $3.31 | | $3.31 |
Ending value (after expenses) | | $1,021.70 | | $1,018.00 | | $1,022.20 | | $1,022.30 |
COMPARING YOUR FUND’S EXPENSES
WITH THOSE OF OTHER FUNDS (Unaudited)
Using the SEC’s method to compare expenses
The Securities and Exchange Commission (“SEC”) has established guidelines to help investors assess fund expenses. Per these guidelines, the table below shows your fund’s expenses based on a $1,000 investment, assuming a hypothetical 5% annualized return. You can use this information to compare the ongoing expenses (but not transaction expenses or total cost) of investing in the fund with those of other funds. All mutual fund shareholder reports will provide this information to help you make this comparison. Please note that you cannot use this information to estimate your actual ending account balance and expenses paid during the period.
| | | | | | | | | | | | |
Expenses and Value of a $1,000 Investment | | |
assuming a hypothetical 5% annualized return for the six months ended October 31, 2017 |
| | | | | | | | |
| | | | Class A | Class C | Class I | Class Y |
Expenses paid per $1,000† | | $4.58 | | $8.39 | | $3.31 | | $3.31 |
Ending value (after expenses) | | $1,020.67 | | $1,016.89 | | $1,021.93 | | $1,021.93 |
† Expenses are equal to the fund’s annualized expense ratio of .90% for Class A, 1.65% for Class C, .65% for Class I and .65% for Class Y, multiplied by the average account value over the period, multiplied by 184/365 (to reflect the one-half year period).
8
STATEMENT OF INVESTMENTS
October 31, 2017
| | | | | | | | | | |
| |
Description | Coupon
Rate (%) | | Maturity Date | | Principal
Amount ($) | a | Value ($) | |
Bonds and Notes - 93.3% | | | | | |
Asset-Backed Certificates - 7.2% | | | | | |
American Homes 4 Rent Trust,
Ser. 2014-SFR3, Cl. A | | 3.68 | | 12/17/36 | | 142,335 | b | 148,502 | |
American Homes 4 Rent Trust,
Ser. 2015-SFR3, Cl. E | | 5.64 | | 4/17/52 | | 425,000 | b | 461,946 | |
CIT Equipment Collateral,
Ser. 2014-VT1, Cl. C | | 2.65 | | 2/20/20 | | 1,475,000 | b | 1,479,636 | |
CLUB Credit Trust,
Ser. 2017-P1, Cl. A | | 2.42 | | 9/15/23 | | 350,000 | b | 350,328 | |
Conn Funding II,
Ser. 2017-A Cl. A | | 2.73 | | 5/15/20 | | 206,856 | b | 206,930 | |
Consumer Loan Underlying Bond Credit Trust,
Ser. 2017-NP1, Cl. A | | 2.39 | | 4/17/23 | | 123,042 | b | 123,118 | |
Consumer Loan Underlying Bond Credit Trust,
Ser. 2017-NP1, Cl. B | | 3.17 | | 4/17/23 | | 425,000 | b | 426,337 | |
Dell Equipment Finance Trust,
Ser. 2016-1, Cl. D | | 3.24 | | 7/22/22 | | 925,000 | b | 934,554 | |
Dell Equipment Finance Trust,
Ser. 2017-2, Cl. B | | 2.47 | | 10/24/22 | | 100,000 | b | 99,998 | |
Marlette Funding Trust,
Ser. 2016-1A, Cl. A | | 3.06 | | 1/17/23 | | 177,540 | b | 178,138 | |
Marlette Funding Trust,
Ser. 2017-1A, Cl. A | | 2.83 | | 3/15/24 | | 111,588 | b | 112,007 | |
Prosper Marketplace Issuance Trust,
Ser. 2017-1A, Cl. A | | 2.56 | | 6/15/23 | | 202,287 | b | 203,030 | |
Prosper Marketplace Issuance Trust,
Ser. 2017-3A, Cl. A | | 2.36 | | 11/15/23 | | 525,000 | b | 525,705 | |
RAAC Series Trust,
Ser. 2006-SP4, Cl. M1, 1 Month LIBOR + 0.34% | | 1.58 | | 11/25/36 | | 600,000 | c | 590,986 | |
Sofi Consumer Loan Program Trust,
Ser. 2017-1, Cl. A | | 3.28 | | 1/26/26 | | 560,572 | b | 567,584 | |
Springleaf Funding Trust,
Ser. 2015-AA, Cl. B | | 3.62 | | 11/15/24 | | 700,000 | b | 705,498 | |
Springleaf Funding Trust,
Ser. 2016-AA, Cl. B | | 3.80 | | 11/15/29 | | 800,000 | b | 810,468 | |
Starwood Waypoint Homes Trust,
Ser. 2017-1, Cl. A, 1 Month LIBOR + 0.95% | | 2.19 | | 1/17/35 | | 647,634 | b,c | 650,108 | |
| | 8,574,873 | |
Asset-Backed Ctfs./Auto Receivables - 1.6% | | | | | |
Canadian Pacer Auto Receivables Trust,
Ser. 2017-1A, Cl. A4 | | 2.29 | | 1/19/22 | | 250,000 | b | 249,649 | |
9
STATEMENT OF INVESTMENTS (continued)
| | | | | | | | | | |
| |
Description | Coupon
Rate (%) | | Maturity
Date | | Principal
Amount ($) | a | Value ($) | |
Bonds and Notes - 93.3% (continued) | | | | | |
Asset-Backed Ctfs./Auto Receivables - 1.6% (continued) | | | | | |
Drive Auto Receivables Trust,
Ser. 2016-CA, Cl. D | | 4.18 | | 3/15/24 | | 500,000 | b | 515,355 | |
Drive Auto Receivables Trust,
Ser. 2017-3, Cl. C | | 2.80 | | 7/15/22 | | 250,000 | | 250,879 | |
Ford Auto Securitization Trust,
Ser. 2017-RA5, Cl. A3 | CAD | 2.38 | | 3/15/23 | | 350,000 | b | 272,328 | |
GMF Canada Leasing Trust,
Ser. 2017-1 | CAD | 2.47 | | 9/20/22 | | 250,000 | b | 194,936 | |
GO Financial Auto Securitization Trust,
Ser. 2015-1, Cl. B | | 3.59 | | 10/15/20 | | 126,448 | b | 126,441 | |
OSCAR US Funding Trust,
Ser. 2017-2A, Cl. A3 | | 2.45 | | 12/10/21 | | 130,000 | b | 130,040 | |
OSCAR US Funding Trust,
Ser. 2017-2A, Cl. A4 | | 2.76 | | 12/10/24 | | 150,000 | b | 150,009 | |
| | 1,889,637 | |
Asset-Backed Ctfs./Home Equity Loans - 4.6% | | | | | |
Carrington Mortgage Loan Trust,
Ser. 2006-NC5, Cl. A2, 1 Month LIBOR + 0.11% | | 1.35 | | 1/25/37 | | 2,980,742 | c | 2,799,260 | |
Countrywide Asset-Backed Certificates,
Ser. 2004-1, Cl. M5, 1 Month LIBOR + 1.58% | | 2.81 | | 1/25/34 | | 1,487,579 | c | 1,472,625 | |
JP Morgan Mortgage Acquisition Trust,
Ser. 2007-CH1, Cl. AF6, 3 Month LIBOR + 2.00% | | 4.96 | | 11/25/36 | | 282,434 | c | 282,839 | |
Morgan Stanley ABS Capital I Trust,
Ser. 2006-NC4, Cl. A2C, 1 Month LIBOR + 0.15% | | 1.39 | | 6/25/36 | | 188,700 | c | 171,442 | |
Structured Asset Securities Corp.,
Ser. 2002-BC1, Cl. M2, 1 Month LIBOR + 3.45% | | 4.69 | | 8/25/32 | | 770,439 | c | 766,724 | |
| | 5,492,890 | |
Asset-Backed Ctfs./Student Loans - .2% | | | | | |
SMB Private Education Loan Trust,
Ser. 2016-B, Cl. A1, 1 Month LIBOR + .65% | | 1.89 | | 11/15/23 | | 211,600 | b,c | 211,914 | |
Casinos - .7% | | | | | |
International Game Technology,
Sr. Scd. Notes | | 6.25 | | 2/15/22 | | 400,000 | b | 441,880 | |
Scientific Games International,
Gtd. Notes | | 10.00 | | 12/1/22 | | 385,000 | | 426,869 | |
| | 868,749 | |
Commercial Mortgage Pass-Through Ctfs. - 1.6% | | | | | |
Bear Stearns Commercial Mortgage Securities Trust,
Ser. 2006-PWR14, Cl. AJ | | 5.27 | | 12/11/38 | | 251,214 | | 251,077 | |
10
| | | | | | | | | | |
| |
Description | Coupon
Rate (%) | | Maturity
Date | | Principal
Amount ($) | a | Value ($) | |
Bonds and Notes - 93.3% (continued) | | | | | |
Commercial Mortgage Pass-Through Ctfs. - 1.6% (continued) | | | | | |
Bear Stearns Commercial Mortgage Securities Trust,
Ser. 2007-PWR17, Cl. AJ (Interest Only) | | 5.93 | | 6/11/50 | | 65,612 | | 65,735 | |
Cobalt CMBS Commercial Mortgage Trust,
Ser. 2007-C3, Cl. AJ, (Interest Only) | | 5.84 | | 5/15/46 | | 191,952 | | 195,342 | |
COMM Mortgage Trust,
Ser. 2017-DLTA, Cl. A, 1 Month LIBOR + 0.85% | | 2.09 | | 8/15/32 | | 450,000 | b,c | 451,203 | |
GE Capital Commercial Mortgage Corporation Trust,
Ser. 2005-C4, Cl. AJ (Interest Only) | | 5.92 | | 11/10/45 | | 278,435 | | 284,472 | |
Hyatt Hotel Portfolio Trust,
Ser. 2017-HYT2, Cl. B, 1 Month LIBOR + 0.96% | | 2.20 | | 8/9/20 | | 625,000 | b,c | 623,211 | |
| | 1,871,040 | |
Consumer Discretionary - 1.3% | | | | | |
AMC Networks,
Gtd. Notes | | 5.00 | | 4/1/24 | | 160,000 | | 163,300 | |
AMC Networks,
Gtd. Notes | | 4.75 | | 8/1/25 | | 55,000 | | 55,068 | |
Charter Communication,
Sr. Scd. Notes | | 5.38 | | 5/1/47 | | 250,000 | b | 253,848 | |
Cox Communications,
Sr. Unscd. Notes | | 3.35 | | 9/15/26 | | 250,000 | b | 245,869 | |
GLP Capital,
Gtd. Notes | | 5.38 | | 4/15/26 | | 255,000 | | 276,675 | |
Nemak,
Sr. Unscd. Bonds | EUR | 3.25 | | 3/15/24 | | 475,000 | b | 571,563 | |
| | 1,566,323 | |
Consumer Staples - .8% | | | | | |
Kraft Heinz Foods,
Gtd. Notes | EUR | 2.25 | | 5/25/28 | | 605,000 | | 735,356 | |
Kraft Heinz Foods,
Scd. Notes | | 4.88 | | 2/15/25 | | 220,000 | b | 235,424 | |
| | 970,780 | |
Energy - 7.6% | | | | | |
Cenovus Energy,
Sr. Unscd. Notes | | 4.25 | | 4/15/27 | | 250,000 | b,d | 251,309 | |
Cheniere Corpus Christi Holdings,
Sr. Scd. Notes | | 5.13 | | 6/30/27 | | 400,000 | b | 413,500 | |
Cheniere Energy Partners,
Gtd. Notes | | 5.25 | | 10/1/25 | | 250,000 | b | 258,125 | |
Concho Resources,
Gtd. Notes | | 3.75 | | 10/1/27 | | 150,000 | | 151,739 | |
Concho Resources,
Gtd. Notes | | 4.88 | | 10/1/47 | | 50,000 | | 53,242 | |
11
STATEMENT OF INVESTMENTS (continued)
| | | | | | | | | | |
| |
Description | Coupon
Rate (%) | | Maturity
Date | | Principal
Amount ($) | a | Value ($) | |
Bonds and Notes - 93.3% (continued) | | | | | |
Energy - 7.6% (continued) | | | | | |
Continental Resources,
Gtd. Notes | | 3.80 | | 6/1/24 | | 475,000 | d | 463,719 | |
Diamondback Energy,
Notes | | 4.75 | | 11/1/24 | | 225,000 | | 230,063 | |
Enbridge,
Unscd. Sub. Notes, 3 Month LIBOR + 4.17% | | 5.50 | | 7/15/77 | | 325,000 | c | 335,563 | |
Energy Transfer Partners,
Sr. Unscd. Notes | | 4.75 | | 1/15/26 | | 155,000 | | 163,387 | |
Energy Transfer Partners,
Sr. Unscd. Notes | | 4.20 | | 4/15/27 | | 100,000 | | 101,356 | |
EQT,
Sr. Unscd. Notes | | 3.00 | | 10/1/22 | | 95,000 | | 94,734 | |
EQT,
Sr. Unscd. Notes | | 3.90 | | 10/1/27 | | 485,000 | | 484,100 | |
Kinder Morgan,
Gtd. Notes | | 4.30 | | 6/1/25 | | 100,000 | | 105,155 | |
Kinder Morgan,
Gtd. Notes | | 5.55 | | 6/1/45 | | 150,000 | | 163,515 | |
Lukoil International Finance,
Gtd. Notes | | 6.13 | | 11/9/20 | | 300,000 | | 326,516 | |
Lukoil International Finance,
Gtd. Notes | | 4.75 | | 11/2/26 | | 650,000 | b | 684,185 | |
NGPL PipeCo,
Sr. Unscd. Notes | | 4.38 | | 8/15/22 | | 40,000 | b | 41,250 | |
NRG Energy,
Gtd. Notes | | 6.25 | | 7/15/22 | | 425,000 | | 448,375 | |
Occidental Petroleum,
Sr. Unscd. Notes | | 3.00 | | 2/15/27 | | 425,000 | | 424,742 | |
Petrobras Global Finance,
Gtd. Notes | | 6.13 | | 1/17/22 | | 270,000 | | 292,545 | |
Petrobras Global Finance,
Gtd. Notes | | 5.30 | | 1/27/25 | | 1,060,000 | b | 1,064,770 | |
Petrobras Global Finance,
Gtd. Notes | | 7.38 | | 1/17/27 | | 300,000 | | 333,600 | |
Petrobras Global Finance,
Gtd. Notes | | 7.25 | | 3/17/44 | | 430,000 | | 452,037 | |
Petroleos Mexicanos,
Gtd. Notes | | 6.50 | | 3/13/27 | | 675,000 | b | 737,539 | |
Sinopec Group Overseas Development,
Gtd. Notes | | 2.50 | | 9/13/22 | | 700,000 | b | 690,655 | |
Sunoco Logistics Partners Operations,
Gtd. Notes | | 4.00 | | 10/1/27 | | 225,000 | | 224,225 | |
Sunoco Logistics Partners Operations,
Gtd. Notes | | 5.40 | | 10/1/47 | | 75,000 | | 76,269 | |
| | 9,066,215 | |
12
| | | | | | | | | | |
| |
Description | Coupon
Rate (%) | | Maturity
Date | | Principal
Amount ($) | a | Value ($) | |
Bonds and Notes - 93.3% (continued) | | | | | |
Financials - 9.0% | | | | | |
AerCap Ireland Capital,
Gtd. Notes | | 4.63 | | 10/30/20 | | 600,000 | | 637,643 | |
AerCap Ireland Capital,
Gtd. Notes | | 5.00 | | 10/1/21 | | 425,000 | | 459,767 | |
Allianz Finance II,
Gtd. Notes, 3 Month EURIBOR + 3.34% | EUR | 5.75 | | 7/8/41 | | 1,000,000 | c | 1,382,092 | |
Bank of America,
Sub. Notes | | 4.25 | | 10/22/26 | | 325,000 | | 341,826 | |
Barclays,
Jr. Sub. Bonds, 3 Month LIBOR + 6.77% | | 7.88 | | 3/15/22 | | 600,000 | c | 670,252 | |
Barclays,
Sub. Notes | | 5.20 | | 5/12/26 | | 575,000 | | 617,770 | |
Citigroup,
Sub. Notes | | 4.30 | | 11/20/26 | | 325,000 | | 340,935 | |
Credit Suisse Group,
Sr. Unscd. Notes | | 4.28 | | 1/9/28 | | 525,000 | b | 547,900 | |
Goldman Sachs Group,
Sr. Unscd. Notes | | 3.50 | | 11/16/26 | | 475,000 | | 476,503 | |
HSBC Holdings,
Sub. Notes | | 4.38 | | 11/23/26 | | 350,000 | | 368,733 | |
Intesa Sanpaolo,
Gtd. Bonds | | 5.25 | | 1/12/24 | | 350,000 | | 385,823 | |
Lloyds Banking Group,
Gtd. Notes | | 3.10 | | 7/6/21 | | 225,000 | | 229,245 | |
Lloyds Banking Group,
Sr. Unscd. Notes | | 3.75 | | 1/11/27 | | 275,000 | | 279,710 | |
Morgan Stanley,
Sub. Notes | | 3.95 | | 4/23/27 | | 425,000 | | 434,107 | |
Prudential Financial,
Jr. Sub. Notes, 3 Month LIBOR + 2.38% | | 4.50 | | 9/15/47 | | 500,000 | c | 506,562 | |
Royal Bank of Scotland Group,
Jr. Sub. Notes, 3 Month LIBOR + 7.60% | | 8.63 | | 8/15/21 | | 625,000 | c | 709,312 | |
Royal Bank of Scotland Group,
Sr. Unscd. Notes | | 3.88 | | 9/12/23 | | 1,100,000 | | 1,129,436 | |
Santander UK Group Holdings,
Sr. Unscd. Notes | | 3.57 | | 1/10/23 | | 375,000 | | 383,627 | |
Wells Fargo & Co.,
Sr. Unscd. Notes | | 3.00 | | 4/22/26 | | 320,000 | | 314,165 | |
Wells Fargo & Co.,
Sub. Notes | | 4.30 | | 7/22/27 | | 215,000 | | 227,353 | |
WPC Eurobond,
Gtd. Bonds | EUR | 2.25 | | 7/19/24 | | 325,000 | | 400,624 | |
| | 10,843,385 | |
Foreign/Governmental - 39.7% | | | | | |
Abu Dhabi Government,
Sr. Unscd. Notes | | 3.13 | | 10/11/27 | | 200,000 | b | 197,633 | |
13
STATEMENT OF INVESTMENTS (continued)
| | | | | | | | | | |
| |
Description | Coupon
Rate (%) | | Maturity
Date | | Principal
Amount ($) | a | Value ($) | |
Bonds and Notes - 93.3% (continued) | | | | | |
Foreign/Governmental - 39.7% (continued) | | | | | |
Abu Dhabi Government,
Sr. Unscd. Notes | | 4.13 | | 10/11/47 | | 525,000 | b | 521,131 | |
Argentina POM Politica Monetaria,
Unscd. Bonds, Argentine 7-Day Reference Rate | ARS | 6.26 | | 6/21/20 | | 1,305,000 | c | 78,202 | |
Argentine Government,
Sr. Unscd. Bonds | | 6.88 | | 1/26/27 | | 1,300,000 | d | 1,419,600 | |
Argentine Government,
Sr. Unscd. Notes | ARS | 5.83 | | 12/31/33 | | 5,060,000 | e | 2,129,631 | |
Argentine Government,
Sr. Unscd. Notes | | 8.28 | | 12/31/33 | | 475,000 | | 782,033 | |
Argentine Government,
Unscd. Bonds | ARS | 21.20 | | 9/19/18 | | 45,900,000 | | 2,557,914 | |
Argentine Government,
Unscd. Bonds, 3 Month BADLAR + 3.83% | ARS | 6.04 | | 5/31/22 | | 6,000,000 | c | 348,269 | |
Asian Development Bank,
Sr. Unscd. Notes | NZD | 3.50 | | 5/30/24 | | 550,000 | | 381,151 | |
Chilean Government,
Bonds | CLP | 4.50 | | 3/1/21 | | 855,000,000 | | 1,378,787 | |
City of Buenos Aires Argentina,
Unscd. Bonds, Ser. 22, 3 Month BADLAR + 3.25% | ARS | 5.72 | | 3/29/24 | | 12,100,000 | c | 676,985 | |
Colombian Government,
Bonds, Ser. B | COP | 10.00 | | 7/24/24 | | 3,046,000,000 | | 1,200,710 | |
Egyptian Government,
Sr. Unscd. Notes | | 8.50 | | 1/31/47 | | 200,000 | b | 226,627 | |
Ghanaian Government,
Sr. Unscd. Bonds | | 8.13 | | 1/18/26 | | 550,000 | | 598,381 | |
International Bank for Reconstruction & Development,
Sr. Unscd. Notes | NZD | 3.50 | | 1/22/21 | | 1,575,000 | | 1,107,047 | |
International Finance,
Sr. Unscd. Notes | INR | 6.30 | | 11/25/24 | | 17,590,000 | | 275,921 | |
Italy Buoni Poliennali Del Tesoro,
Sr. Unscd. Bonds | EUR | 2.70 | | 3/1/47 | | 1,125,000 | b | 1,240,581 | |
Ivory Coast Government,
Sr. Unscd. Bonds | EUR | 5.13 | | 6/15/25 | | 125,000 | b | 154,245 | |
Ivory Coast Government,
Sr. Unscd. Bonds | | 6.13 | | 6/15/33 | | 200,000 | b | 197,968 | |
Japanese Government,
Sr. Unscd. Bonds, Ser. 21 | JPY | 0.10 | | 3/10/26 | | 490,000,000 | | 4,539,062 | |
Japanese Government,
Sr. Unscd. Bonds, Ser. 22 | JPY | 0.10 | | 3/10/27 | | 286,200,000 | | 2,665,536 | |
Japanese Government,
Sr. Unscd. Bonds, Ser. 348 | JPY | 0.10 | | 9/20/27 | | 54,250,000 | | 478,845 | |
14
| | | | | | | | | | |
| |
Description | Coupon
Rate (%) | | Maturity
Date | | Principal
Amount ($) | a | Value ($) | |
Bonds and Notes - 93.3% (continued) | | | | | |
Foreign/Governmental - 39.7% (continued) | | | | | |
Kuwaiti Government,
Sr. Unscd. Notes | | 3.50 | | 3/20/27 | | 650,000 | b | 664,609 | |
Mexican Government,
Bonds, Ser. M | MXN | 8.00 | | 11/7/47 | | 17,190,000 | | 942,407 | |
New Zealand Government,
Sr. Unscd. Bonds, Ser. 0925 | NZD | 2.06 | | 9/20/25 | | 5,275,000 | f | 3,935,467 | |
Portuguese Government,
Sr. Unscd. Bonds | EUR | 2.88 | | 7/21/26 | | 1,450,000 | b | 1,825,060 | |
Portuguese Government,
Sr. Unscd. Bonds | EUR | 4.13 | | 4/14/27 | | 1,900,000 | b | 2,601,664 | |
Province of Argentina,
Sr. Unscd. Notes | | 5.75 | | 6/15/19 | | 450,000 | b | 466,875 | |
Province of Argentina,
Sr. Unscd. Notes | | 9.13 | | 3/16/24 | | 455,000 | b | 531,212 | |
Provincia de Cordoba,
Sr. Unscd. Notes | | 7.45 | | 9/1/24 | | 375,000 | b | 413,771 | |
Russian Government,
Bonds, Ser. 6212 | RUB | 7.05 | | 1/19/28 | | 118,500,000 | | 1,967,519 | |
Saudi Government,
Sr. Unscd. Notes | | 3.63 | | 3/4/28 | | 625,000 | b | 621,094 | |
Senegalese Government,
Unscd. Notes | | 6.25 | | 5/23/33 | | 375,000 | b | 388,744 | |
South African Government,
Bonds, Ser. 2048 | ZAR | 8.75 | | 2/28/48 | | 20,300,000 | | 1,251,270 | |
South African Government,
Bonds, Ser. R186 | ZAR | 10.50 | | 12/21/26 | | 23,000,000 | | 1,763,893 | |
Spanish Government,
Sr. Unscd. Bonds | EUR | 2.90 | | 10/31/46 | | 1,850,000 | b | 2,226,719 | |
Sri Lankan Government,
Sr. Unscd. Bonds | | 5.75 | | 1/18/22 | | 475,000 | b | 504,743 | |
Sri Lankan Government,
Sr. Unscd. Notes | | 6.20 | | 5/11/27 | | 200,000 | b | 212,930 | |
Turkish Government,
Sr. Unscd. Notes | | 5.75 | | 5/11/47 | | 200,000 | | 191,050 | |
Turkish Government,
Unscd. Bonds | TRY | 2.00 | | 9/18/24 | | 4,100,000 | | 1,316,694 | |
Turkish Government,
Unscd. Bonds | TRY | 11.00 | | 2/24/27 | | 4,275,000 | | 1,095,359 | |
Ukrainian Government,
Sr. Unscd. Notes | | 7.38 | | 9/25/32 | | 625,000 | b | 617,404 | |
Ukrainian Government,
Sr. Unscd. Notes | | 0.00 | | 5/31/40 | | 400,000 | g | 229,451 | |
Uruguayan Government,
Sr. Unscd. Bonds | UYU | 9.88 | | 6/20/22 | | 9,340,000 | b | 341,781 | |
Uruguayan Government,
Sr. Unscd. Bonds | UYU | 8.50 | | 3/15/28 | | 11,200,000 | b | 390,062 | |
| | 47,656,037 | |
15
STATEMENT OF INVESTMENTS (continued)
| | | | | | | | | | |
| |
Description | Coupon
Rate (%) | | Maturity
Date | | Principal
Amount ($) | a | Value ($) | |
Bonds and Notes - 93.3% (continued) | | | | | |
Health Care - 1.3% | | | | | |
Abbott Laboratories,
Sr. Unscd. Notes | | 3.75 | | 11/30/26 | | 175,000 | | 180,838 | |
AbbVie,
Sr. Unscd. Bonds | EUR | 1.38 | | 5/17/24 | | 525,000 | | 632,388 | |
HCA,
Sr. Scd. Notes | | 5.50 | | 6/15/47 | | 190,000 | | 193,800 | |
Mylan,
Gtd. Notes | | 2.50 | | 6/7/19 | | 275,000 | | 275,906 | |
Tenet Healthcare,
Sr. Unscd. Notes | | 6.75 | | 6/15/23 | | 275,000 | d | 259,188 | |
| | 1,542,120 | |
Industrials - 1.2% | | | | | |
Mexico City Airport Trust,
Sr. Scd. Bonds | | 5.50 | | 7/31/47 | | 250,000 | b,d | 248,875 | |
Mexico City Airport Trust,
Sr. Scd. Notes | | 4.25 | | 10/31/26 | | 675,000 | b | 692,719 | |
United Rentals North America,
Gtd. Notes | | 5.50 | | 7/15/25 | | 275,000 | | 294,938 | |
United Rentals North America,
Gtd. Notes | | 4.88 | | 1/15/28 | | 235,000 | | 236,763 | |
| | 1,473,295 | |
Information Technology - 1.8% | | | | | |
Amazon.com,
Sr. Unscd. Notes | | 3.15 | | 8/22/27 | | 525,000 | b | 529,187 | |
Dell International,
Sr. Scd. Notes | | 3.48 | | 6/1/19 | | 675,000 | b | 687,307 | |
First Data,
Gtd. Notes | | 7.00 | | 12/1/23 | | 325,000 | b | 348,569 | |
Infor US,
Gtd. Notes | | 6.50 | | 5/15/22 | | 440,000 | | 461,912 | |
Zayo Group,
Gtd. Notes | | 5.75 | | 1/15/27 | | 180,000 | b | 190,125 | |
| | 2,217,100 | |
Materials - 1.3% | | | | | |
Bway Holding,
Sr. Scd. Notes | | 5.50 | | 4/15/24 | | 358,000 | b | 373,663 | |
Equate Petrochemical,
Gtd. Notes | | 3.00 | | 3/3/22 | | 300,000 | b | 297,450 | |
Glencore Funding,
Gtd. Notes | | 3.00 | | 10/27/22 | | 175,000 | b | 175,343 | |
INEOS Finance,
Notes | EUR | 2.13 | | 11/15/25 | | 175,000 | b | 204,363 | |
MMC Norilsk Nickel,
Sr. Unscd. Notes | | 4.10 | | 4/11/23 | | 500,000 | b | 504,322 | |
| | 1,555,141 | |
16
| | | | | | | | | | |
| |
Description | Coupon
Rate (%) | | Maturity
Date | | Principal
Amount ($) | a | Value ($) | |
Bonds and Notes - 93.3% (continued) | | | | | |
Municipal Bonds - 1.1% | | | | | |
Georgetown University,
GO (Insured; National Public Finance Guarantee Corp.), Auction-Based | | 2.18 | | 4/1/29 | | 1,400,000 | h | 1,326,164 | |
Real Estate - .5% | | | | | |
Digital Euro Finco,
Gtd. Bonds | EUR | 2.63 | | 4/15/24 | | 300,000 | | 378,968 | |
Healthcare Trust of America Holdings,
Gtd. Notes | | 2.95 | | 7/1/22 | | 250,000 | | 251,718 | |
| | 630,686 | |
Residential Mortgage Pass-Through Ctfs. - .2% | | | | | |
Impac Secured Assets Trust,
Ser. 2006-2, Cl. 2A1 , 1 Month LIBOR + 0.35% | | 1.59 | | 8/25/36 | | 276,778 | c | 271,859 | |
Telecommunications - 1.9% | | | | | |
Digicel Group,
Sr. Unscd. Notes | | 8.25 | | 9/30/20 | | 402,000 | b | 398,985 | |
Sprint,
Gtd. Notes | | 7.88 | | 9/15/23 | | 325,000 | | 364,000 | |
Sprint Communications,
Sr. Unscd. Notes | | 7.00 | | 8/15/20 | | 325,000 | | 351,813 | |
Sprint Spectrum,
Sr. Scd. Notes | | 3.36 | | 9/20/21 | | 450,000 | b | 457,650 | |
T-Mobile USA,
Gtd. Notes | | 6.63 | | 4/1/23 | | 450,000 | | 473,625 | |
Verizon Communications,
Sr. Unscd. Notes | | 4.13 | | 3/16/27 | | 200,000 | | 209,120 | |
| | 2,255,193 | |
U.S. Government Agencies Mortgage-Backed - 1.3% | | | | | |
Government National Mortgage Association,
Ser. 2011-53 (Interest Only) | | 0.46 | | 5/16/51 | | 348,148 | i | 9,693 | |
Government National Mortgage Association,
Ser. 2011-77 (Interest Only) | | 0.62 | | 4/16/42 | | 62,020 | i | 3,091 | |
Government National Mortgage Association,
Ser. 2012-125 (Interest Only) | | 0.41 | | 2/16/53 | | 20,002,772 | i | 622,324 | |
Government National Mortgage Association,
Ser. 2012-84, Cl. SG, -1 Month LIBOR + 6.10% | | 4.86 | | 7/20/42 | | 1,031,108 | c,i | 218,793 | |
Government National Mortgage Association,
Ser. 2015-105 Cl. CI (Interest Only) | | 3.50 | | 3/20/39 | | 2,160,874 | i | 207,128 | |
Government National Mortgage Association,
Ser. 2015-16, Cl. IL (Interest Only) | | 4.00 | | 3/20/42 | | 827,880 | i | 97,807 | |
17
STATEMENT OF INVESTMENTS (continued)
| | | | | | | | | | |
| |
Description | Coupon
Rate (%) | | Maturity
Date | | Principal
Amount ($) | a | Value ($) | |
Bonds and Notes - 93.3% (continued) | | | | | |
U.S. Government Agencies Mortgage-Backed - 1.3% (continued) | | | | | |
Government National Mortgage Association,
Ser. 2015-162, Cl. IM, -1 Month LIBOR + 6.20% | | 4.96 | | 11/20/45 | | 1,790,653 | c,i | 399,845 | |
| | 1,558,681 | |
U.S. Government Securities - 7.3% | | | | | |
U. S. Treasury Notes | | 1.63 | | 8/31/22 | | 1,825,000 | | 1,792,956 | |
U.S. Treasury Inflation Protected Securities,
Bonds | | 0.88 | | 2/15/47 | | 2,288,250 | j | 2,261,541 | |
U.S. Treasury Inflation Protected Securities,
Notes | | 0.63 | | 1/15/26 | | 4,623,481 | j | 4,682,446 | |
| | 8,736,943 | |
Utilities - 1.1% | | | | | |
Dominion Energy,
Jr. Sub. Notes | | 2.58 | | 7/1/20 | | 500,000 | | 502,951 | |
EDP Finance,
Sr. Unscd. Notes | | 3.63 | | 7/15/24 | | 325,000 | b | 330,142 | |
KazTransGas JSC,
Gtd. Notes | | 4.38 | | 9/26/27 | | 550,000 | b | 544,456 | |
| | 1,377,549 | |
Total Bonds and Notes
(cost $109,363,727) | | 111,956,574 | |
| | | | | | | | | |
Floating Rate Loan Interests - 2.1% | | | | | |
Consumer Discretionary - 1.1% | | | | | |
Hilton Worldwide Finance,
Series B-2 Term Loan, 3 Month LIBOR + 2.00% | | 3.32 | | 10/25/23 | | 405,789 | c | 408,988 | |
Univar USA,
Tranche B-2 Term Loan, 3 Month LIBOR + 2.75% | | 4.11 | | 7/1/22 | | 900,683 | c | 906,632 | |
| | 1,315,620 | |
Health Care - 1.0% | | | | | |
Catalent Pharma Solutions,
Dollar Term Loan, 3 Month LIBOR + 2.25% | | 4.07 | | 5/20/21 | | 810,541 | c | 818,963 | |
Onex Carestream Finance,
First Lien Term Loan, 3 Month LIBOR + 4.00% | | 5.32 | | 6/7/19 | | 377,124 | c | 378,444 | |
| | 1,197,407 | |
Total Floating Rate Loan Interests
(cost $2,498,720) | | 2,513,027 | |
18
| | | | | | | | | | |
| |
Description /Number of Contracts/Counterparty | Exercise
Price | | Expiration Date | | Notional Amount ($) | | Value ($) | |
Options Purchased - .2% | | | | | |
Call Options - .1% | | | | | |
10 Year Interest Rate Swaption,
Contracts 6,700 Citigroup | | 2.10 | | 4/2018 | | 6,700,000 | | 40,171 | |
Japanese Yen,
Contracts 2,475 Barclays Bank | | 111.00 | | 1/2018 | | 2,475,000 | | 66,862 | |
Norwegian Krone Cross Currency,
Contracts 9,700 Goldman Sachs International | SEK | 1.04 | | 1/2018 | | 9,700,000 | | 5,555 | |
| | 112,588 | |
Put Options - .1% | | | | | |
British Pound Cross Currency,
Contracts 1,100 JP Morgan Chase Bank | EUR | 0.89 | | 2/2018 | | 1,100,000 | | 26,516 | |
Japanese Yen,
Contracts 2,475 Barclays Bank | | 111.00 | | 1/2018 | | 2,475,000 | | 17,256 | |
Japanese Yen,
Contracts 1,200 Goldman Sachs International | | 113.40 | | 1/2018 | | 1,200,000 | | 19,981 | |
Japanese Yen,
Contracts 2,100 Citigroup | | 110.15 | | 11/2017 | | 2,100,000 | | 0 | |
Japanese Yen Cross Currency,
Contracts 3,050 JP Morgan Chase Bank | CAD | 86.00 | | 1/2018 | | 3,050,000 | | 17,236 | |
| | 80,989 | |
Total Options Purchased
(cost $239,373) | | 193,577 | |
Description | Yield at
Date of
Purchase (%) | | Maturity Date | | Principal Amount ($) | | Value ($) | |
Short-Term Investments - .8% | | | | | |
U.S. Treasury Bills
(cost $961,431) | | 1.11 | | 3/1/18 | | 965,000 | k | 961,263 | |
| | | | | | Shares | | Value ($) | |
Other Investment - 1.7% | | | | | |
Registered Investment Company; | | | | | |
Dreyfus Institutional Preferred Government Plus Money Market Fund
(cost $2,015,282) | | | | | | 2,015,282 | l | 2,015,282 | |
19
STATEMENT OF INVESTMENTS (continued)
| | | | | | | | | | |
| |
Description | | | | | Shares | | Value ($) | |
Investment of Cash Collateral for Securities Loaned - 2.3% | | | | | |
Registered Investment Company; | | | | | |
Dreyfus Institutional Preferred Government Money Market Fund, Institutional Shares
(cost $2,730,750) | | | | | | 2,730,750 | l | 2,730,750 | |
Total Investments (cost $117,809,283) | | 100.4% | 120,370,473 | |
Liabilities, Less Cash and Receivables | | (0.4%) | (421,763) | |
Net Assets | | 100.0% | 119,948,710 | |
BADLAR—Buenos Aires Interbank Offer Rate
EURIBOR—Euro Interbank Offered Rate
GDP—Gross Domestic Product
GO—General Obligation
LIBOR—London Interbank Offered Rate
ARS—Argentine Peso
CAD—Canadian Dollar
CLP—Chilean Peso
COP—Colombian Peso
EUR—Euro
INR—Indian Rupee
JPY—Japanese Yen
MXN—Mexican Peso
NZD—New Zealand Dollar
RUB—Russian Ruble
SEK—Swedish Krona
TRY—Turkish Lira
UYU—Uruguayan Peso
ZAR—South African Rand
a Amount stated in U.S. Dollars unless otherwise noted above.
b Security exempt from registration pursuant to Rule 144A under the Securities Act of 1933. These securities may be resold in transactions exempt from registration, normally to qualified institutional buyers. At October 31, 2017, these securities were valued at $37,674,799 or 31.41% of net assets.
c Variable rate security—rate shown is the interest rate in effect at period end.
d Security, or portion thereof, on loan. At October 31, 2017, the value of the fund’s securities on loan was $2,642,691 and the value of the collateral held by the fund was $2,730,750.
e Principal amount for accrual purposes is periodically adjusted based on changes in the Argentine Consumer Price Index.
f Principal amount for accrual purposes is periodically adjusted based on changes in the New Zealand Consumer Price Index.
g Zero coupon until a specified date at which time the stated coupon rate becomes effective until maturity.
h Auction Rate Security—interest rate is reset periodically under an auction process that is conducted by an auction agent. Rate shown is the interest rate in effect at period end.
i Notional face amount shown.
j Principal amount for accrual purposes is periodically adjusted based on changes in the Consumer Price Index.
k Held by a counterparty for open futures contracts.
l Investment in affiliated money market mutual fund.
20
| | |
Portfolio Summary (Unaudited) † | Value (%) |
Foreign/Governmental | 39.7 |
Corporate Bonds | 28.5 |
Asset-Backed | 13.6 |
U.S. Government & Agencies | 7.3 |
Short-Term/Money Market Investments | 4.8 |
Floating Rate Loan Interests | 2.1 |
Commercial Mortgage-Backed | 1.6 |
U.S. Government and Agency/Mortgage-Backed | 1.3 |
Municipal Bonds | 1.1 |
Residential Mortgage-Backed | .2 |
Options Purchased | .2 |
| | 100.4 |
† Based on net assets.
See notes to financial statements.
21
STATEMENT OF INVESTMENTS IN AFFILIATED ISSUERS
| | | | | | | |
Registered Investment Companies | Value
10/31/16 ($) | Purchases ($) | Sales ($) | Value
10/31/17 ($) | Net
Assets (%) | Dividends/
Distributions ($) |
Dreyfus Institutional Preferred Government Money Market Fund, Institutional Shares | 4,500,090 | 39,045,157 | 40,814,497 | 2,730,750 | 2.3 | — |
Dreyfus Institutional Preferred Government Plus Money Market Fund | 3,268,038 | 91,600,828 | 92,853,584 | 2,015,282 | 1.7 | 14,788 |
Total | 7,768,128 | 130,645,985 | 133,668,081 | 4,746,032 | 4.0 | 14,788 |
See note to financial statements.
22
STATEMENT OF FUTURES
October 31, 2017
| | | | | | | |
Description | Number of
Contracts | Expiration | Notional
Value ($) | Value ($) | Unrealized Appreciation (Depreciation) ($) | |
Futures Long | | |
Euro-BTP Italian Government Bond | 8 | 12/2017 | 1,297,431 | 1,300,811 | 3,380 | |
U.S. Treasury 5 Year Notes | 19 | 12/2017 | 2,245,978 | 2,226,563 | (19,415) | |
Futures Short | | |
Canadian 10 Year Bond | 62 | 12/2017 | (6,509,083) | (6,604,651) | (95,568) | |
Euro 30 Year Bond | 24 | 12/2017 | (4,666,449) | (4,644,115) | 22,334 | |
Euro-Bond | 106 | 12/2017 | (20,025,911) | (20,095,401) | (69,490) | |
Long Gilt | 68 | 12/2017 | (11,206,212) | (11,228,720) | (22,508) | |
U.S. Treasury 10 Year Notes | 43 | 12/2017 | (5,388,571) | (5,372,313) | 16,258 | |
U.S. Treasury Long Bond | 6 | 12/2017 | (929,771) | (914,813) | 14,958 | |
Gross Unrealized Appreciation | | 56,930 | |
Gross Unrealized Depreciation | | (206,981) | |
See notes to financial statements.
23
STATEMENT OF OPTIONS WRITTEN
October 31, 2017
| | | | | | | |
Description/ Expiration Date/ Exercise Price | Counterparty | Number of Contracts | Notional Amount ($) | a | Value ($) | |
Call Options: | | | | | | |
British Pound Cross Currency
February 2018 @ GBP 0.96 | JP Morgan Chase Bank | 1,100 | 1,100,000 | EUR | (1,205) | |
Japanese Yen Cross Currency
January 2018 @ JPY 92 | JP Morgan Chase Bank | 3,050 | 3,050,000 | CAD | (3,877) | |
Put Options: | | | | | | |
Norwegian Krone Cross Currency
January 2018 @ NOK 1 | Goldman Sachs International | 9,700 | 9,700,000 | SEK | (4,834) | |
Total Options Written (premiums received $33,126) | | | | | (9,916) | |
a Notional amount stated in U.S. Dollars unless otherwise indicated.
CAD—Canadian Dollar
EUR—Euro
SEK—Swedish Krona
See notes to financial statements.
24
STATEMENT OF FORWARD FOREIGN CURRENCY EXCHANGE CONTRACTS October 31, 2017
| | | | | | |
Counterparty/ Purchased
Currency | Purchased Currency
Amounts | Currency
Sold | Sold
Currency
Amounts | Settlement Date | Unrealized Appreciation (Depreciation)($) |
Citigroup | | | |
Colombian Peso | 3,641,370,000 | United States Dollar | 1,237,202 | 11/14/17 | (41,835) |
Indonesian Rupiah | 51,038,250,000 | United States Dollar | 3,809,653 | 11/13/17 | (50,495) |
Norwegian Krone | 19,645,000 | United States Dollar | 2,461,154 | 11/30/17 | (54,298) |
Swedish Krona | 30,045,000 | United States Dollar | 3,667,312 | 11/30/17 | (72,320) |
United States Dollar | 1,391,035 | Brazilian Real | 4,390,000 | 12/4/17 | 55,140 |
United States Dollar | 3,226,735 | Euro | 2,760,000 | 11/30/17 | 6,424 |
United States Dollar | 2,450,347 | Hungarian Forint | 649,065,000 | 11/13/17 | 20,944 |
United States Dollar | 280,624 | Indian Rupee | 18,310,000 | 11/13/17 | (1,569) |
United States Dollar | 1,284,452 | Philippine Peso | 65,780,000 | 11/13/17 | 11,395 |
Goldman Sachs International | | | |
Peruvian New Sol | 6,480,000 | United States Dollar | 1,985,598 | 1/10/18 | 1,047 |
United States Dollar | 3,088,143 | Canadian Dollar | 3,955,000 | 11/30/17 | 21,729 |
United States Dollar | 1,336,451 | Colombian Peso | 4,000,000,000 | 11/14/17 | 23,356 |
United States Dollar | 3,326,659 | Euro | 2,845,000 | 11/30/17 | 7,171 |
United States Dollar | 1,136,685 | Mexican New Peso | 20,470,000 | 11/13/17 | 71,479 |
United States Dollar | 3,467,424 | South African Rand | 46,270,000 | 11/13/17 | 202,625 |
HSBC | | | |
United States Dollar | 250,166 | Australian Dollar | 325,000 | 11/30/17 | 1,509 |
United States Dollar | 5,693,551 | Euro | 4,870,000 | 11/30/17 | 11,335 |
United States Dollar | 4,948,298 | Japanese Yen | 557,040,000 | 11/30/17 | 42,890 |
United States Dollar | 5,465,602 | New Zealand Dollar | 7,930,000 | 11/30/17 | 42,267 |
United States Dollar | 538,435 | Philippine Peso | 27,570,000 | 11/13/17 | 4,866 |
JP Morgan Chase Bank | | | |
Brazilian Real | 4,390,000 | United States Dollar | 1,334,897 | 12/4/17 | 998 |
25
STATEMENT OF FORWARD FOREIGN CURRENCY EXCHANGE CONTRACTS (continued)
| | | | | | |
Counterparty/ Purchased
Currency | Purchased Currency
Amounts | Currency
Sold | Sold
Currency
Amounts | Settlement Date | Unrealized Appreciation (Depreciation)($) |
JP Morgan Chase Bank (continued) |
Euro | 512,915 | United States Dollar | 597,406 | 11/2/17 | 62 |
Polish Zloty | 8,875,000 | United States Dollar | 2,426,424 | 11/13/17 | 11,709 |
Singapore Dollar | 2,380,000 | United States Dollar | 1,749,627 | 11/13/17 | (3,507) |
United States Dollar | 6,289,797 | Euro | 5,380,000 | 11/30/17 | 12,524 |
United States Dollar | 2,637,038 | South Korean Won | 3,000,000,000 | 11/13/17 | (40,861) |
United States Dollar | 598,451 | Polish Zloty | 2,185,160 | 11/2/17 | (1,876) |
United States Dollar | 271,195 | Polish Zloty | 986,065 | 11/3/17 | 294 |
United States Dollar | 776,116 | Russian Ruble | 46,775,000 | 11/13/17 | (21,959) |
United States Dollar | 4,868,193 | Taiwan Dollar | 148,000,000 | 11/13/17 | (41,836) |
UBS | | | |
Euro | 175,000 | United States Dollar | 206,711 | 11/3/17 | (2,862) |
United States Dollar | 5,908,037 | Euro | 5,050,000 | 11/30/17 | 15,801 |
United States Dollar | 2,176,136 | South African Rand | 29,865,000 | 11/13/17 | 68,869 |
Gross Unrealized Appreciation | | | 634,434 |
Gross Unrealized Depreciation | | | (333,418) |
See notes to financial statements.
26
STATEMENT OF SWAP AGREEMENTS
October 31, 2017
| | | | | |
Centrally Cleared Interest Rate Swaps | |
Notional
Amount($)† | Currency/
Floating Rate | (Pay) Receive
Fixed Rate (%) | Expiration | Unrealized Appreciation (Depreciation) ($) |
11,300,000 | CAD - 3 Month Canadian Bankers Acceptances | 1.25 | 6/21/2019 | (60,621) |
13,400,000 | USD - 3 Month LIBOR | 1.89 | 4/19/2022 | (86,845) |
172,000,000 | JPY - 6 Month LIBOR | (0.63) | 3/29/2046 | 123,674 |
22,000,000 | SEK - 3 Month Stockholm Interbank Offered Rate | (0.44) | 7/18/2022 | (20,223) |
7,300,000 | EUR - 6 Month EURIBOR | 0.13 | 3/6/2022 | 21,465 |
4,200,000 | USD - 3 Month LIBOR | (1.80) | 9/28/2046 | 700,917 |
3,900,000 | USD - 3 Month LIBOR | (2.59) | 10/20/2047 | (69) |
66,100,000 | SEK - 3 Month Stockholm Interbank Offered Rate | (0.46) | 7/19/2022 | (68,223) |
144,400,000 | JPY - 6 Month LIBOR | (0.62) | 4/4/2046 | 105,757 |
33,300,000 | CAD - 3 Month Canadian Bankers Acceptances | 1.25 | 6/20/2019 | (176,015) |
22,000,000 | SEK - 3 Month Stockholm Interbank Offered Rate | (0.42) | 7/20/2022 | (18,306) |
Gross Unrealized Appreciation | 951,813 |
Gross Unrealized Depreciation | (430,302) |
CAD—Canadian Dollar
EUR—Euro
EURIBOR—Euro Interbank Offered Rate
JPY—Japanese Yen
LIBOR—London Interbank Offered Rate
SEK—Swedish Krona
USD—United States Dollar
† Clearing House-Chicago Mercantile Exchange or LCH (Clearing)
See notes to financial statements.
27
STATEMENT OF ASSETS AND LIABILITIES
October 31, 2017
| | | | | | | |
| | | | | | |
| | | Cost | | Value | |
Assets ($): | | | | |
Investments in securities—See Statement of Investments
(including securities on loan, valued at $2,642,691)—Note 1(c): | | | |
Unaffiliated issuers | 113,073,981 | | 115,624,441 | |
Affiliated issuers | | 4,746,032 | | 4,746,032 | |
Cash | | | | | 1,756,788 | |
Cash denominated in foreign currency | | | 535,039 | | 518,269 | |
Dividends, interest and securities lending income receivable | | 1,025,390 | |
Receivable for investment securities sold | | 973,529 | |
Cash collateral held by broker—Note 4 | | 771,308 | |
Unrealized appreciation on forward foreign
currency exchange contracts—Note 4 | | 634,434 | |
Receivable for shares of Common Stock subscribed | | 47,434 | |
Prepaid expenses | | | | | 28,221 | |
| | | | | 126,125,846 | |
Liabilities ($): | | | | |
Due to The Dreyfus Corporation and affiliates—Note 3(c) | | | | | 71,273 | |
Liability for securities on loan—Note 1(c) | | 2,730,750 | |
Payable for investment securities purchased | | 2,720,308 | |
Unrealized depreciation on forward foreign
currency exchange contracts—Note 4 | | 333,418 | |
Payable for shares of Common Stock redeemed | | 146,315 | |
Payable for swap variation margin—Note 4 | | 67,398 | |
Payable for futures variation margin—Note 4 | | 14,062 | |
Outstanding options written, at value
(premiums received $33,126)—Note 4 | | 9,916 | |
Accrued expenses | | | | | 83,696 | |
| | | | | 6,177,136 | |
Net Assets ($) | | | 119,948,710 | |
Composition of Net Assets ($): | | | | |
Paid-in capital | | | | | 229,039,227 | |
Accumulated undistributed investment income—net | | 1,209,716 | |
Accumulated net realized gain (loss) on investments | | | | | (113,545,168) | |
Accumulated net unrealized appreciation (depreciation)
on investments, options transactions and foreign currency
transactions [including ($150,051) net unrealized
(depreciation) on futures and $521,511
net unrealized appreciation on centrally cleared swap
agreements] | | | | 3,244,935 | |
Net Assets ($) | | | 119,948,710 | |
| | | | | | |
Net Asset Value Per Share | Class A | Class C | Class I | Class Y | |
Net Assets ($) | 34,063,498 | 17,726,931 | 59,899,834 | 8,258,447 | |
Shares Outstanding | 2,921,305 | 1,527,391 | 5,136,584 | 708,929 | |
Net Asset Value Per Share ($) | 11.66 | 11.61 | 11.66 | 11.65 | |
| | | | | | |
See notes to financial statements. | | | | | |
28
STATEMENT OF OPERATIONS
Year Ended October 31, 2017
| | | | | | | |
| | | | | | |
| | | | | | |
Investment Income ($): | | | | |
Income: | | | | |
Interest (net of $44,235 foreign taxes withheld at source) | | | 5,971,024 | |
Dividends from affiliated issuers | | | 14,788 | |
Income from securities lending—Note 1(c) | | | 12,960 | |
Total Income | | | 5,998,772 | |
Expenses: | | | | |
Management fee—Note 3(a) | | | 712,332 | |
Shareholder servicing costs—Note 3(c) | | | 252,314 | |
Distribution fees—Note 3(b) | | | 167,498 | |
Professional fees | | | 83,806 | |
Registration fees | | | 62,895 | |
Custodian fees—Note 3(c) | | | 35,409 | |
Prospectus and shareholders’ reports | | | 17,695 | |
Directors’ fees and expenses—Note 3(d) | | | 10,857 | |
Loan commitment fees—Note 2 | | | 3,045 | |
Miscellaneous | | | 56,162 | |
Total Expenses | | | 1,402,013 | |
Less—reduction in expenses due to undertaking—Note 3(a) | | | (143,866) | |
Less—reduction in fees due to earnings credits—Note 3(c) | | | (1,537) | |
Net Expenses | | | 1,256,610 | |
Investment Income—Net | | | 4,742,162 | |
Realized and Unrealized Gain (Loss) on Investments—Note 4 ($): | | |
Net realized gain (loss) on investments and foreign currency transactions | 597,902 | |
Net realized gain (loss) on options transactions | 141,644 | |
Net realized gain (loss) on futures | (362,405) | |
Net realized gain (loss) on swap agreements | 1,298,509 | |
Net realized gain (loss) on forward foreign currency exchange contracts | (412,763) | |
Net Realized Gain (Loss) | | | 1,262,887 | |
Net unrealized appreciation (depreciation) on investments
and foreign currency transactions | | | 2,309,445 | |
Net unrealized appreciation (depreciation) on options transactions | (170,197) | |
Net unrealized appreciation (depreciation) on futures | | | (473,775) | |
Net unrealized appreciation (depreciation) on swap agreements | | | 295,943 | |
Net unrealized appreciation (depreciation) on
forward foreign currency exchange contracts | | | 509,249 | |
Net Unrealized Appreciation (Depreciation) | | | 2,470,665 | |
Net Realized and Unrealized Gain (Loss) on Investments | | | 3,733,552 | |
Net Increase in Net Assets Resulting from Operations | | 8,475,714 | |
| | | | | | | |
See notes to financial statements. | | | | | |
29
STATEMENT OF CHANGES IN NET ASSETS
| | | | | | | | | | |
| | | | Year Ended October 31, |
| | | | 2017 | | 2016 | |
Operations ($): | | | | | | | | |
Investment income—net | | | 4,742,162 | | | | 14,219,216 | |
Net realized gain (loss) on investments | | 1,262,887 | | | | (70,605,662) | |
Net unrealized appreciation (depreciation)
on investments | | 2,470,665 | | | | 26,316,964 | |
Net Increase (Decrease) in Net Assets
Resulting from Operations | 8,475,714 | | | | (30,069,482) | |
Distributions to Shareholders from ($): | |
Investment income—net: | | | | | | | | |
Class A | | | (1,411,659) | | | | (7,867,924) | |
Class C | | | (537,957) | | | | (2,127,890) | |
Class I | | | (1,933,465) | | | | (11,105,023) | |
Class Y | | | (400,900) | | | | (4,278,333) | |
Total Distributions | | | (4,283,981) | | | | (25,379,170) | |
Capital Stock Transactions ($): | |
Net proceeds from shares sold: | | | | | | | | |
Class A | | | 17,899,314 | | | | 14,680,816 | |
Class C | | | 1,455,402 | | | | 4,419,689 | |
Class I | | | 33,508,987 | | | | 40,014,799 | |
Class Y | | | 2,198,141 | | | | 24,633,042 | |
Distributions reinvested: | | | | | | | | |
Class A | | | 1,011,561 | | | | 7,341,575 | |
Class C | | | 342,149 | | | | 1,393,228 | |
Class I | | | 1,521,175 | | | | 7,614,858 | |
Class Y | | | 61,238 | | | | 1,310,065 | |
Cost of shares redeemed: | | | | | | | | |
Class A | | | (36,216,385) | | | | (149,824,700) | |
Class C | | | (14,986,773) | | | | (34,941,773) | |
Class I | | | (58,287,629) | | | | (262,120,087) | |
Class Y | | | (12,831,503) | | | | (86,506,835) | |
Increase (Decrease) in Net Assets
from Capital Stock Transactions | (64,324,323) | | | | (431,985,323) | |
Total Increase (Decrease) in Net Assets | (60,132,590) | | | | (487,433,975) | |
Net Assets ($): | |
Beginning of Period | | | 180,081,300 | | | | 667,515,275 | |
End of Period | | | 119,948,710 | | | | 180,081,300 | |
Undistributed investment income—net | 1,209,716 | | | | 1,612,468 | |
30
| | | | | | | | | | |
| | | | Year Ended October 31, |
| | | | 2017 | | 2016 | |
Capital Share Transactions (Shares): | |
Class A | | | | | | | | |
Shares sold | | | 1,589,908 | | | | 1,270,069 | |
Shares issued for distributions reinvested | | | 90,100 | | | | 636,499 | |
Shares redeemed | | | (3,203,159) | | | | (13,351,996) | |
Net Increase (Decrease) in Shares Outstanding | (1,523,151) | | | | (11,445,428) | |
Class C | | | | | | | | |
Shares sold | | | 128,414 | | | | 388,360 | |
Shares issued for distributions reinvested | | | 30,608 | | | | 120,809 | |
Shares redeemed | | | (1,322,648) | | | | (3,080,043) | |
Net Increase (Decrease) in Shares Outstanding | (1,163,626) | | | | (2,570,874) | |
Class Ia | | | | | | | | |
Shares sold | | | 2,953,668 | | | | 3,519,031 | |
Shares issued for distributions reinvested | | | 135,350 | | | | 660,346 | |
Shares redeemed | | | (5,133,780) | | | | (23,013,738) | |
Net Increase (Decrease) in Shares Outstanding | (2,044,762) | | | | (18,834,361) | |
Class Ya | | | | | | | | |
Shares sold | | | 195,034 | | | | 2,148,051 | |
Shares issued for distributions reinvested | | | 5,455 | | | | 114,118 | |
Shares redeemed | | | (1,135,006) | | | | (7,713,475) | |
Net Increase (Decrease) in Shares Outstanding | (934,517) | | | | (5,451,306) | |
| | | | | | | | | | |
a During the period ended October 31, 2016, 27,695 Class Y shares representing $306,230 were exchanged for 27,671 Class I shares. | |
See notes to financial statements.
| | | | | | | | |
31
FINANCIAL HIGHLIGHTS
The following tables describe the performance for each share class for the fiscal periods indicated. All information (except portfolio turnover rate) reflects financial results for a single fund share. Total return shows how much your investment in the fund would have increased (or decreased) during each period, assuming you had reinvested all dividends and distributions. These figures have been derived from the fund’s financial statements.
| | | | | | | | | | | |
| | | | | |
| | |
| | Year Ended October 31, |
Class A Shares | | 2017 | 2016 | 2015 | 2014 | 2013 |
Per Share Data ($): | | | | | | |
Net asset value, beginning of period | | 11.29 | 12.31 | 13.29 | 13.08 | 13.38 |
Investment Operations: | | | | | | |
Investment income—neta | | .37 | .41 | .48 | .43 | .36 |
Net realized and unrealized
gain (loss) on investments | | .31 | (.87) | (.85) | .06 | (.02) |
Total from Investment Operations | | .68 | (.46) | (.37) | .49 | .34 |
Distributions: | | | | | | |
Dividends from
investment income—net | | (.31) | (.56) | (.61) | (.28) | (.37) |
Dividends from net realized
gain on investments | | — | — | — | — | (.27) |
Total Distributions | | (.31) | (.56) | (.61) | (.28) | (.64) |
Net asset value, end of period | | 11.66 | 11.29 | 12.31 | 13.29 | 13.08 |
Total Return (%)b | | 6.12 | (3.80) | (2.93) | 3.77 | 2.54 |
Ratios/Supplemental Data (%): | | | | | | |
Ratio of total expenses
to average net assets | | .99 | .90 | .89 | .98 | 1.23 |
Ratio of net expenses
to average net assets | | .90 | .90 | .89 | .97 | 1.10 |
Ratio of net investment income
to average net assets | | 3.27 | 3.64 | 3.70 | 3.25 | 2.78 |
Portfolio Turnover Rate | | 85.23 | 158.94 | 182.35 | 230.83 | 304.46 |
Net Assets, end of period ($ x 1,000) | | 34,063 | 50,191 | 195,629 | 184,506 | 85,719 |
a Based on average shares outstanding.
b Exclusive of sales charge.
See notes to financial statements.
32
| | | | | | | | | |
| | | | | |
| | |
| | Year Ended October 31, |
Class C Shares | | 2017 | 2016 | 2015 | 2014 | 2013 |
Per Share Data ($): | | | | | | |
Net asset value, beginning of period | | 11.26 | 12.27 | 13.24 | 13.03 | 13.34 |
Investment Operations: | | | | | | |
Investment income—neta | | .29 | .32 | .38 | .33 | .25 |
Net realized and unrealized
gain (loss) on investments | | .30 | (.86) | (.85) | .06 | (.02) |
Total from Investment Operations | | .59 | (.54) | (.47) | .39 | .23 |
Distributions: | | | | | | |
Dividends from
investment income—net | | (.24) | (.47) | (.50) | (.18) | (.27) |
Dividends from net realized
gain on investments | | — | — | — | — | (.27) |
Total Distributions | | (.24) | (.47) | (.50) | (.18) | (.54) |
Net asset value, end of period | | 11.61 | 11.26 | 12.27 | 13.24 | 13.03 |
Total Return (%)b | | 5.34 | (4.46) | (3.66) | 3.02 | 1.72 |
Ratios/Supplemental Data (%): | | | | | | |
Ratio of total expenses
to average net assets | | 1.78 | 1.67 | 1.65 | 1.72 | 2.01 |
Ratio of net expenses
to average net assets | | 1.65 | 1.65 | 1.65 | 1.70 | 1.85 |
Ratio of net investment income
to average net assets | | 2.55 | 2.89 | 2.94 | 2.52 | 1.98 |
Portfolio Turnover Rate | | 85.23 | 158.94 | 182.35 | 230.83 | 304.46 |
Net Assets, end of period ($ x 1,000) | | 17,727 | 30,300 | 64,587 | 58,623 | 16,352 |
a Based on average shares outstanding.
b Exclusive of sales charge.
See notes to financial statements.
33
FINANCIAL HIGHLIGHTS (continued)
| | | | | | | | | | | |
| | | | | |
| | |
| | Year Ended October 31, |
Class I Shares | | 2017 | 2016 | 2015 | 2014 | 2013 |
Per Share Data ($): | | | | | | |
Net asset value, beginning of period | | 11.29 | 12.30 | 13.28 | 13.07 | 13.38 |
Investment Operations: | | | | | | |
Investment income—neta | | .41 | .44 | .52 | .46 | .36 |
Net realized and unrealized
gain (loss) on investments | | .29 | (.87) | (.85) | .07 | — |
Total from Investment Operations | | .70 | (.43) | (.33) | .53 | .36 |
Distributions: | | | | | | |
Dividends from
investment income—net | | (.33) | (.58) | (.65) | (.32) | (.40) |
Dividends from net realized
gain on investments | | — | — | — | — | (.27) |
Total Distributions | | (.33) | (.58) | (.65) | (.32) | (.67) |
Net asset value, end of period | | 11.66 | 11.29 | 12.30 | 13.28 | 13.07 |
Total Return (%) | | 6.31 | (3.48) | (2.65) | 4.06 | 2.74 |
Ratios/Supplemental Data (%): | | | | | | |
Ratio of total expenses
to average net assets | | .76 | .64 | .63 | .72 | .96 |
Ratio of net expenses
to average net assets | | .65 | .64 | .63 | .69 | .85 |
Ratio of net investment income
to average net assets | | 3.60 | 3.90 | 3.96 | 3.53 | 2.91 |
Portfolio Turnover Rate | | 85.23 | 158.94 | 182.35 | 230.83 | 304.46 |
Net Assets, end of period ($ x 1,000) | | 59,900 | 81,056 | 320,031 | 349,915 | 57,138 |
a Based on average shares outstanding.
See notes to financial statements.
34
| | | | | | | |
| | |
| | | | |
| | | Year Ended October 31, |
Class Y Shares | | 2017 | 2016 | 2015 | 2014 | 2013a |
Per Share Data ($): | | | | | | |
Net asset value, beginning of period | | 11.28 | 12.30 | 13.28 | 13.07 | 13.07 |
Investment Operations: | | | | | | |
Investment income—netb | | .39 | .46 | .50 | .47 | .13 |
Net realized and unrealized
gain (loss) on investments | | .31 | (.89) | (.83) | .07 | (.07) |
Total from Investment Operations | | .70 | (.43) | (.33) | .54 | .06 |
Distributions: | | | | | | |
Dividends from investment income—net | | (.33) | (.59) | (.65) | (.33) | (.06) |
Net asset value, end of period | | 11.65 | 11.28 | 12.30 | 13.28 | 13.07 |
Total Return (%) | | 6.33 | (3.47) | (2.59) | 4.13 | .42c |
Ratios/Supplemental Data (%): | | | | | | |
Ratio of total expenses to average net assets | | .69 | .58 | .58 | .61 | .85d |
Ratio of net expenses to average net assets | | .65 | .58 | .58 | .60 | .85d |
Ratio of net investment income
to average net assets | | 3.52 | 3.96 | 4.00 | 3.61 | 2.88d |
Portfolio Turnover Rate | | 85.23 | 158.94 | 182.35 | 230.83 | 304.46 |
Net Assets, end of period ($ x 1,000) | | 8,258 | 18,534 | 87,269 | 5,724 | 1 |
a From July 1, 2013 (commencement of initial offering) to October 31, 2013.
b Based on average shares outstanding.
c Not annualized.
d Annualized.
See notes to financial statements.
35
NOTES TO FINANCIAL STATEMENTS
NOTE 1—Significant Accounting Policies:
Dreyfus Opportunistic Fixed Income Fund (the “fund”) is a separate non-diversified series of The Dreyfus/Laurel Funds, Inc. (the “Company”), which is registered under the Investment Company Act of 1940, as amended (the “Act”), as an open-end management investment company and operates as a series company currently offering eight series, including the fund. The fund’s investment objective is to seek to maximize total return through capital appreciation and income. The Dreyfus Corporation (the “Manager” or “Dreyfus”), a wholly-owned subsidiary of The Bank of New York Mellon Corporation (“BNY Mellon”), serves as the fund’s investment adviser.
Effective March 31, 2017, the fund authorized the issuance of Class T shares, but, as of the date of this report, the fund did not offer Class T shares for purchase. The fund authorized 100 million Class T shares which resulted in the fund's total authorized shares increasing from 400 million to 500 million.
MBSC Securities Corporation (the “Distributor”), a wholly-owned subsidiary of Dreyfus, is the distributor of the fund’s shares. The fund is authorized to issue 100 million shares of $.001 par value Common Stock in each of the following classes of shares: Class A, Class C, Class I, Class T and Class Y. Class A, Class C and Class T shares are sold primarily to retail investors through financial intermediaries and bear Distribution and/or Shareholder Services Plan fees. Class A and Class T shares generally are subject to a sales charge imposed at the time of purchase. Class C shares are subject to a contingent deferred sales charge (“CDSC”) imposed on Class C shares redeemed within one year of purchase. Class I shares are sold primarily to bank trust departments and other financial service providers (including The Bank of New York Mellon, a subsidiary of BNY Mellon and an affiliate of Dreyfus, and its affiliates), acting on behalf of customers having a qualified trust or an investment account or relationship at such institution, and bear no Distribution or Shareholder Services Plan fees. Class Y shares are sold at net asset value per share generally to institutional investors, and bear no Distribution or Shareholder Services Plan fees. Class I and Class Y shares are offered without a front-end sales charge or CDSC. Other differences between the classes include the services offered to and the expenses borne by each class, the allocation of certain transfer agency costs, and certain voting rights. Income, expenses (other than expenses attributable to a specific class), and realized and unrealized gains or losses on investments are allocated to each class of shares based on its relative net assets.
36
The Company accounts separately for the assets, liabilities and operations of each series. Expenses directly attributable to each series are charged to that series’ operations; expenses which are applicable to all series are allocated among them on a pro rata basis.
The Financial Accounting Standards Board (“FASB”) Accounting Standards Codification (“ASC”) is the exclusive reference of authoritative U.S. generally accepted accounting principles (“GAAP”) recognized by the FASB to be applied by nongovernmental entities. Rules and interpretive releases of the Securities and Exchange Commission (“SEC”) under authority of federal laws are also sources of authoritative GAAP for SEC registrants. The fund’s financial statements are prepared in accordance with GAAP, which may require the use of management estimates and assumptions. Actual results could differ from those estimates.
(a) Portfolio valuation: The fair value of a financial instrument is the amount that would be received to sell an asset or paid to transfer a liability in an orderly transaction between market participants at the measurement date (i.e., the exit price). GAAP establishes a fair value hierarchy that prioritizes the inputs of valuation techniques used to measure fair value. This hierarchy gives the highest priority to unadjusted quoted prices in active markets for identical assets or liabilities (Level 1 measurements) and the lowest priority to unobservable inputs (Level 3 measurements).
Additionally, GAAP provides guidance on determining whether the volume and activity in a market has decreased significantly and whether such a decrease in activity results in transactions that are not orderly. GAAP requires enhanced disclosures around valuation inputs and techniques used during annual and interim periods.
Various inputs are used in determining the value of the fund’s investments relating to fair value measurements. These inputs are summarized in the three broad levels listed below:
Level 1—unadjusted quoted prices in active markets for identical investments.
Level 2—other significant observable inputs (including quoted prices for similar investments, interest rates, prepayment speeds, credit risk, etc.).
Level 3—significant unobservable inputs (including the fund’s own assumptions in determining the fair value of investments).
The inputs or methodology used for valuing securities are not necessarily an indication of the risk associated with investing in those securities.
37
NOTES TO FINANCIAL STATEMENTS (continued)
Changes in valuation techniques may result in transfers in or out of an assigned level within the disclosure hierarchy. Valuation techniques used to value the fund’s investments are as follows:
Registered investment companies that are not traded on an exchange are valued at their net asset value and are generally categorized within Level 1 of the fair value hierarchy.
Investments in securities, floating rate loan interests and other securities, excluding short-term investments (other than U.S. Treasury Bills), futures, options and forward foreign currency exchange contracts (“forward contracts”) are valued each business day by an independent pricing service (the “Service”) approved by the Company’s Board of Directors (the “Board”). Investments for which quoted bid prices are readily available and are representative of the bid side of the market in the judgment of the Service are valued at the mean between the quoted bid prices (as obtained by the Service from dealers in such securities) and asked prices (as calculated by the Service based upon its evaluation of the market for such securities). Other investments (which constitute a majority of the portfolio securities) are valued as determined by the Service, based on methods which include consideration of the following: yields or prices of securities of comparable quality, coupon, maturity and type; indications as to values from dealers; and general market conditions. These securities are generally categorized within Level 2 of the fair value hierarchy.
U.S. Treasury Bills are valued at the mean price between quoted bid prices and asked prices by the Service. These securities are generally categorized within Level 2 of the fair value hierarchy.
The Service is engaged under the general supervision of the Board.
When market quotations or official closing prices are not readily available, or are determined to not accurately reflect fair value, such as when the value of a security has been significantly affected by events after the close of the exchange or market on which the security is principally traded (for example, a foreign exchange or market), but before the fund calculates its net asset value, the fund may value these investments at fair value as determined in accordance with the procedures approved by the Board. Certain factors may be considered when fair valuing investments such as: fundamental analytical data, the nature and duration of restrictions on disposition, an evaluation of the forces that influence the market in which the securities are purchased and sold, and public trading in similar securities of the issuer or comparable issuers. These securities are either categorized within Level 2 or 3 of the fair value hierarchy depending on the relevant inputs used.
38
For restricted securities where observable inputs are limited, assumptions about market activity and risk are used and are generally categorized within Level 3 of the fair value hierarchy.
Investments denominated in foreign currencies are translated to U.S. dollars at the prevailing rates of exchange.
Futures and options, which are traded on an exchange, are valued at the last sales price on the securities exchange on which such securities are primarily traded or at the last sales price on the national securities market on each business day and are generally categorized within Level 1 of the fair value hierarchy. Options traded over-the-counter (“OTC”) are valued at the mean between the bid and asked price and are generally categorized within Level 2 of the fair value hierarchy. Investments in swap agreements are valued each business day by the Service. Swaps are valued by the Service by using a swap pricing model which incorporates among other factors, default probabilities, recovery rates, credit curves of the underlying issuer and swap spreads on interest rates and are generally categorized within Level 2 of the fair value hierarchy. Forward contracts are valued at the forward rate and are generally categorized within Level 2 of the fair value hierarchy.
The following is a summary of the inputs used as of October 31, 2017 in valuing the fund’s investments:
| | | | | |
| Level 1 - Unadjusted Quoted Prices | Level 2 - Other Significant Observable Inputs | Level 3 -Significant Unobservable Inputs | Total |
Assets ($) | | | | |
Investments in Securities: | | | | |
Asset-Backed | — | 16,169,314 | — | 16,169,314 |
Commercial
Mortgage-Backed | — | 1,871,040 | — | 1,871,040 |
Corporate Bonds† | — | 34,366,536 | — | 34,366,536 |
Floating Rate
Loan Interests† | — | 2,513,027 | — | 2,513,027 |
Foreign Government | — | 47,656,037 | — | 47,656,037 |
Municipal Bonds† | — | 1,326,164 | — | 1,326,164 |
Registered
Investment Companies | 4,746,032 | — | — | 4,746,032 |
Residential
Mortgage-Backed | — | 271,859 | — | 271,859 |
U.S. Government
Agencies/Mortgage-
Backed | — | 1,558,681 | — | 1,558,681 |
39
NOTES TO FINANCIAL STATEMENTS (continued)
| | | | | | |
| Level 1 - Unadjusted Quoted Prices | Level 2 - Other Significant Observable Inputs | Level 3 -Significant Unobservable Inputs | Total |
U.S. Treasury | — | 9,698,206 | — | 9,698,206 |
Other Financial Instruments: | | | |
Futures†† | 56,930 | — | — | 56,930 |
Forward Foreign
Currency Exchange
Contracts†† | — | 634,434 | — | 634,434 |
Options Purchased | — | 193,577 | — | 193,577 |
Swaps†† | — | 951,813 | — | 951,813 |
Liabilities ($) | | | | |
Other Financial Instruments: | | | |
Futures†† | (206,981) | — | — | (206,981) |
Forward Foreign
Currency Exchange
Contracts†† | — | (333,418) | — | (333,418) |
Options Written | — | (9,916) | — | (9,916) |
Swaps†† | — | (430,302) | — | (430,302) |
† See Statement of Investments for additional detailed categorizations.
†† Amount shown represents unrealized appreciation (depreciation) at period end.
At October 31, 2017, there were no transfers between levels of the fair value hierarchy. It is the fund’s policy to recognize transfers between levels at the end of the reporting period.
(b) Foreign currency transactions: The fund does not isolate that portion of the results of operations resulting from changes in foreign exchange rates on investments from the fluctuations arising from changes in the market prices of securities held. Such fluctuations are included with the net realized and unrealized gain or loss on investments.
Net realized foreign exchange gains or losses arise from sales of foreign currencies, currency gains or losses realized on securities transactions between trade and settlement date, and the difference between the amounts of dividends, interest and foreign withholding taxes recorded on the fund’s books and the U.S. dollar equivalent of the amounts actually received or paid. Net unrealized foreign exchange gains and losses arise from changes in the value of assets and liabilities other than investments resulting from changes in exchange rates. Foreign currency gains and losses on foreign currency transactions are also included with net realized and unrealized gain or loss on investments.
(c) Securities transactions and investment income: Securities transactions are recorded on a trade date basis. Realized gains and losses from securities transactions are recorded on the identified cost basis.
40
Dividend income is recognized on the ex-dividend date and interest income, including, where applicable, accretion of discount and amortization of premium on investments, is recognized on the accrual basis.
Pursuant to a securities lending agreement with The Bank of New York Mellon, the fund may lend securities to qualified institutions. It is the fund’s policy that, at origination, all loans are secured by collateral of at least 102% of the value of U.S. securities loaned and 105% of the value of foreign securities loaned. Collateral equivalent to at least 100% of the market value of securities on loan is maintained at all times. Collateral is either in the form of cash, which can be invested in certain money market mutual funds managed by Dreyfus, or U.S. Government and Agency securities. The fund is entitled to receive all dividends, interest and distributions on securities loaned, in addition to income earned as a result of the lending transaction. Should a borrower fail to return the securities in a timely manner, The Bank of New York Mellon is required to replace the securities for the benefit of the fund or credit the fund with the market value of the unreturned securities and is subrogated to the fund’s rights against the borrower and the collateral. Additionally, the contractual maturity of security lending transactions are on an overnight and continuous basis. During the period ended October 31, 2017, The Bank of New York Mellon earned $2,584 from lending portfolio securities, pursuant to the securities lending agreement.
(d) Affiliated issuers: Investments in other investment companies advised by Dreyfus are defined as “affiliated” under the Act.
(e) Risk: The fund invests primarily in debt securities. Failure of an issuer of the debt securities to make timely interest or principal payments, or a decline or the perception of a decline in the credit quality of a debt security, can cause the debt security’s price to fall, potentially lowering the fund’s share price. In addition, the value of debt securities may decline due to general market conditions that are not specifically related to a particular issuer, such as real or perceived adverse economic conditions, changes in outlook for corporate earnings, changes in interest or currency rates or adverse investor sentiment. Such values may also decline because of factors that affect a particular industry.
The fund invests in floating rate loan interests. The floating rate loans in which the fund invests typically are below investment grade securities, and inherently speculative. In the event of the bankruptcy of a borrower, the fund could experience delays or limitations imposed by insolvency laws with respect to its ability to realize the benefits of any collateral securing the borrower’s loan.
41
NOTES TO FINANCIAL STATEMENTS (continued)
(f) Dividends and distributions to shareholders: Dividends and distributions are recorded on the ex-dividend date. Dividends from investment income-net are normally declared and paid on a monthly basis. Dividends from net realized capital gains, if any, are normally declared and paid annually, but the fund may make distributions on a more frequent basis to comply with the distribution requirements of the Internal Revenue Code of 1986, as amended (the “Code”). To the extent that net realized capital gains can be offset by capital loss carryovers, it is the policy of the fund not to distribute such gains. Income and capital gain distributions are determined in accordance with income tax regulations, which may differ from GAAP.
On October 31, 2017, the Board declared a cash dividend of $.031, $.025, $.033 and $.033 per share from undistributed investment income-net for Class A, Class C, Class I and Class Y shares, respectively, payable on November 1, 2017 (ex-dividend date), to shareholders of record as of the close of business on October 31, 2017.
(g) Federal income taxes: It is the policy of the fund to continue to qualify as a regulated investment company, if such qualification is in the best interests of its shareholders, by complying with the applicable provisions of the Code, and to make distributions of taxable income sufficient to relieve it from substantially all federal income and excise taxes.
As of and during the period ended October 31, 2017, the fund did not have any liabilities for any uncertain tax positions. The fund recognizes interest and penalties, if any, related to uncertain tax positions as income tax expense in the Statement of Operations. During the period ended October 31, 2017, the fund did not incur any interest or penalties.
Each tax year in the four-year period ended October 31, 2017 remains subject to examination by the Internal Revenue Service and state taxing authorities.
At October 31, 2017, the components of accumulated earnings on a tax basis were as follows: undistributed ordinary income $2,490,746, accumulated capital losses $113,735,125 and unrealized appreciation $2,153,862.
Under the Regulated Investment Company Modernization Act of 2010, the fund is permitted to carry forward capital losses for an unlimited period. Furthermore, capital loss carryovers retain their character as either short-term or long-term capital losses.
The accumulated capital loss carryover is available for federal income tax purposes to be applied against future net realized capital gains, if any,
42
realized subsequent to October 31, 2017. The fund has $72,975,945 short-term capital losses and $40,759,180 of long-term capital losses which can be carried forward for an unlimited period.
The tax character of distributions paid to shareholders during the fiscal periods ended October 31, 2017 and October 31, 2016 were as follows: ordinary income $4,283,981 and $25,379,170 , respectively.
During the period ended October 31, 2017, as a result of permanent book to tax differences, primarily due to the tax treatment for paydown gains and losses, foreign currency transactions and swap periodic payments, the fund decreased accumulated undistributed investment income-net by $860,933 and increased accumulated net realized gain (loss) on investments by the same amount. Net assets and net asset value per share were not affected by this reclassification.
NOTE 2—Bank Lines of Credit:
The fund participates with other Dreyfus-managed funds in an $830 million unsecured credit facility led by Citibank, N.A. and a $300 million unsecured credit facility provided by The Bank of New York Mellon (each, a “Facility”), each to be utilized primarily for temporary or emergency purposes, including the financing of redemptions. Prior to October 4, 2017, the unsecured credit facility with Citibank, N.A. was $810 million. In connection therewith, the fund has agreed to pay its pro rata portion of commitment fees for each Facility. Interest is charged to the fund based on rates determined pursuant to the terms of the respective Facility at the time of borrowing. During the period ended October 31, 2017, the fund did not borrow under the Facilities.
NOTE 3—Management Fee and Other Transactions with Affiliates:
(a) Pursuant to a management agreement with Dreyfus, the management fee is computed at the annual rate of .50% of the value of the fund’s average daily net assets and is payable monthly. Dreyfus has contractually agreed, from November 1, 2016 through March 1, 2018, to waive receipt of its fees and/or assume the expenses of the fund, so that the expenses of Class A, C, I and Y shares (excluding Rule 12b-1 Distribution Plan fees, Shareholder Services Plan fees, taxes, interest expense, brokerage commissions, commitment fees on borrowings and extraordinary expenses) do not exceed .65% of the value of the fund’s average daily net assets. The reduction in expenses, pursuant to the undertaking, amounted to $143,866 during the period ended October 31, 2017.
43
NOTES TO FINANCIAL STATEMENTS (continued)
During the period ended October 31, 2017, the Distributor retained $146 from commissions earned on sales of the fund’s Class A shares and $446 from CDSCs on redemptions of the fund’s Class C shares.
(b) Under the Distribution Plan adopted pursuant to Rule 12b-1 under the Act, Class C shares pay the Distributor for distributing its shares at an annual rate of .75% of the value of its average daily net assets. During the period ended October 31, 2017, Class C shares were charged $167,498 pursuant to the Distribution Plan.
(c) Under the Shareholder Services Plan, Class A and Class C shares pay the Distributor at an annual rate of .25% of the value of their average daily net assets for the provision of certain services. The services provided may include personal services relating to shareholder accounts, such as answering shareholder inquiries regarding the fund and providing reports and other information, and services related to the maintenance of shareholder accounts. The Distributor may make payments to Service Agents (securities dealers, financial institutions or other industry professionals) with respect to these services. The Distributor determines the amounts to be paid to Service Agents. During the period ended October 31, 2017, Class A and Class C shares were charged $104,937 and $55,833, respectively, pursuant to the Shareholder Services Plan.
Under its terms, the Distribution Plan and Shareholder Services Plan shall remain in effect from year to year, provided such continuance is approved annually by a vote of a majority of those Directors who are not “interested persons” of the Company and who have no direct or indirect financial interest in the operation of or in any agreement related to the Distribution Plan or Shareholder Services Plan.
The fund has arrangements with the transfer agent and the custodian whereby the fund may receive earnings credits when positive cash balances are maintained, which are used to offset transfer agency and custody fees. For financial reporting purposes, the fund includes net earnings credits as an expense offset in the Statement of Operations.
The fund compensates Dreyfus Transfer, Inc., a wholly-owned subsidiary of Dreyfus, under a transfer agency agreement for providing transfer agency and cash management services for the fund. The majority of transfer agency fees are comprised of amounts paid on a per account basis, while cash management fees are related to fund subscriptions and redemptions. During the period ended October 31, 2017, the fund was charged $10,367 for transfer agency services and $604 for cash management services. These fees are included in Shareholder servicing
44
costs in the Statement of Operations. Cash management fees were offset by earnings credits of $604.
The fund compensates The Bank of New York Mellon under a custody agreement for providing custodial services for the fund. These fees are determined based on net assets, geographic region and transaction activity. During the period ended October 31, 2017, the fund was charged $35,409 pursuant to the custody agreement. These fees were partially offset by earnings credits of $933.
During the period ended October 31, 2017, the fund was charged $11,224 for services performed by the Chief Compliance Officer and his staff.
The components of “Due to The Dreyfus Corporation and affiliates” in the Statement of Assets and Liabilities consist of: management fees $51,566, Distribution Plan fees $11,461, Shareholder Services Plan fees $11,043, custodian fees $7,793, Chief Compliance Officer fees $6,538 and transfer agency fees $1,302, which are offset against an expense reimbursement currently in effect in the amount of $18,430.
(d) Each Board member also serves as a Board member of other funds within the Dreyfus complex. Annual retainer fees and attendance fees are allocated to each fund based on net assets.
NOTE 4—Securities Transactions:
The aggregate amount of purchases and sales (including paydowns) of investment securities, excluding short-term securities, futures, options transactions, forward contracts and swap agreements during the period ended October 31, 2017, amounted to $116,626,598 and $178,234,211, respectively.
Floating Rate Loan Interests: Floating rate instruments are loans and other securities with interest rates that adjust or “float” periodically. Floating rate loans are made by banks and other financial institutions to their corporate clients. The rates of interest on the loans adjust periodically by reference to a base lending rate, such as the London Interbank Offered Rate (“LIBOR”) plus a premium or credit spread. Floating rate loans reset on periodic set dates, typically 30 to 90 days, but not to exceed one year. The fund may invest in multiple series or tranches of a loan. A different series or tranche may have varying terms and carry different associated risks.
Derivatives: A derivative is a financial instrument whose performance is derived from the performance of another asset. The fund enters into International Swaps and Derivatives Association, Inc. Master Agreements or similar agreements (collectively, “Master Agreements”) with its OTC
45
NOTES TO FINANCIAL STATEMENTS (continued)
derivative contract counterparties in order to, among other things, reduce its credit risk to counterparties. Master Agreements include provisions for general obligations, representations, collateral and events of default or termination. Under a Master Agreement, the fund may offset with the counterparty certain derivative financial instrument’s payables and/or receivables with collateral held and/or posted and create one single net payment in the event of default or termination.
Each type of derivative instrument that was held by the fund during the period ended October 31, 2017 is discussed below.
Futures: In the normal course of pursuing its investment objective, the fund is exposed to market risk, including interest rate risk, as a result of changes in value of underlying financial instruments. The fund invests in futures in order to manage its exposure to or protect against changes in the market. A futures contract represents a commitment for the future purchase or a sale of an asset at a specified date. Upon entering into such contracts, these investments require initial margin deposits with a counterparty, which consist of cash or cash equivalents. The amount of these deposits is determined by the exchange or Board of Trade on which the contract is traded and is subject to change. Accordingly, variation margin payments are received or made to reflect daily unrealized gains or losses which are recorded in the Statement of Operations. When the contracts are closed, the fund recognizes a realized gain or loss which is reflected in the Statement of Operations. There is minimal counterparty credit risk to the fund with futures since they are exchange traded, and the exchange guarantees the futures against default. Futures open at October 31, 2017 are set forth in the Statement of Futures.
Options Transactions: The fund purchases and writes (sells) put and call options to hedge against changes in the values of interest rates and foreign currencies, or as a substitute for an investment. The fund is subject to market risk, interest rate risk and currency risk in the course of pursuing its investment objectives through its investments in options contracts. A call option gives the purchaser of the option the right (but not the obligation) to buy, and obligates the writer to sell, the underlying financial instrument at the exercise price at any time during the option period, or at a specified date. Conversely, a put option gives the purchaser of the option the right (but not the obligation) to sell, and obligates the writer to buy the underlying financial instrument at the exercise price at any time during the option period, or at a specified date.
As a writer of call options, the fund receives a premium at the outset and then bears the market risk of unfavorable changes in the price of the financial instrument underlying the option. Generally, the fund realizes a
46
gain, to the extent of the premium, if the price of the underlying financial instrument decreases between the date the option is written and the date on which the option is terminated. Generally, the fund incurs a loss if the price of the financial instrument increases between those dates.
As a writer of put options, the fund receives a premium at the outset and then bears the market risk of unfavorable changes in the price of the financial instrument underlying the option. Generally, the fund realizes a gain, to the extent of the premium, if the price of the underlying financial instrument increases between the date the option is written and the date on which the option is terminated. Generally, the fund incurs a loss if the price of the financial instrument decreases between those dates.
As a writer of an option, the fund has no control over whether the underlying financial instrument may be sold (call) or purchased (put) and as a result bears the market risk of an unfavorable change in the price of the financial instrument underlying the written option. There is a risk of loss from a change in value of such options which may exceed the related premiums received. This risk is mitigated by Master Agreements between the fund and the counterparty and the posting of collateral, if any, by the counterparty to the fund to cover the fund’s exposure to the counterparty. The Statement of Operations reflects any unrealized gains or losses which occurred during the period as well as any realized gains or losses which occurred upon the expiration or closing of the option transaction. Options written open at October 31, 2017 are set forth in Statement of Options Written.
Forward Foreign Currency Exchange Contracts: The fund enters into forward contracts in order to hedge its exposure to changes in foreign currency exchange rates on its foreign portfolio holdings, to settle foreign currency transactions or as a part of its investment strategy. When executing forward contracts, the fund is obligated to buy or sell a foreign currency at a specified rate on a certain date in the future. With respect to sales of forward contracts, the fund incurs a loss if the value of the contract increases between the date the forward contract is opened and the date the forward contract is closed. The fund realizes a gain if the value of the contract decreases between those dates. With respect to purchases of forward contracts, the fund incurs a loss if the value of the contract decreases between the date the forward contract is opened and the date the forward contract is closed. The fund realizes a gain if the value of the contract increases between those dates. Any realized or unrealized gains or losses which occurred during the period are reflected in the Statement of Operations. The fund is exposed to foreign currency risk as a result of changes in value of underlying financial instruments. The fund is also
47
NOTES TO FINANCIAL STATEMENTS (continued)
exposed to credit risk associated with counterparty nonperformance on these forward contracts, which is generally limited to the unrealized gain on each open contract. This risk may be mitigated by Master Agreements, if any, between the fund and the counterparty and the posting of collateral, if any, by the counterparty to the fund to cover the fund’s exposure to the counterparty. Forward contracts open at October 31, 2017 are set forth in the Statement of Forward Foreign Currency Exchange Contracts.
Swap Agreements: The fund enters into swap agreements to exchange the interest rate on, or return generated by, one nominal instrument for the return generated by another nominal instrument. Swap agreements are privately negotiated in the OTC market or centrally cleared. The fund enters into these agreements to hedge certain market or interest rate risks, to manage the interest rate sensitivity (sometimes called duration) of fixed income securities, to provide a substitute for purchasing or selling particular securities or to increase potential returns.
For OTC swaps, the fund accrues for interim payments on a daily basis, with the net amount recorded within unrealized appreciation (depreciation) on swap agreements in the Statement of Assets and Liabilities. Once the interim payments are settled in cash, the net amount is recorded as a realized gain (loss) on swaps, in addition to realized gain (loss) recorded upon the termination of swap agreements in the Statement of Operations. Upfront payments made and/or received by the fund, are recorded as an asset and/or liability in the Statement of Assets and Liabilities and are recorded as a realized gain or loss ratably over the agreement’s term/event with the exception of forward starting interest rate swaps which are recorded as realized gains or losses on the termination date.
Upon entering into centrally cleared swap agreements, an initial margin deposit is required with a counterparty, which consists of cash or cash equivalents. The amount of these deposits is determined by the exchange on which the agreement is traded and is subject to change. The change in valuation of centrally cleared swaps is recorded as a receivable or payable for variation margin in the Statement of Assets and Liabilities. Payments received from (paid to) the counterparty, including upon termination, are recorded as realized gain (loss) in the Statement of Operations.
Fluctuations in the value of swap agreements are recorded for financial statement purposes as unrealized appreciation or depreciation on swap agreements.
Interest Rate Swaps: Interest rate swaps involve the exchange of commitments to pay and receive interest based on a notional principal amount. The fund may elect to pay a fixed rate and receive a floating rate,
48
or receive a fixed rate and pay a floating rate on a notional principal amount. The net interest received or paid on interest rate swap agreements is included within realized gain (loss) on swap agreements in the Statement of Operations. Interest rate swap agreements are subject to general market risk, liquidity risk, counterparty risk and interest rate risk.
For OTC swaps, the fund’s maximum risk of loss from counterparty risk is the discounted value of the cash flows to be received from the counterparty over the agreement’s remaining life, to the extent that the amount is positive. This risk may be mitigated by Master Agreements, if any, between the fund and the counterparty and the posting of collateral, if any, by the counterparty to the fund to cover the fund’s exposure to the counterparty. There is minimal counterparty risk to the fund with centrally cleared swaps since they are settled through an exchange and the exchange guarantees these swap against default. Interest rate swaps open at October 31, 2017 are set forth in the Statement of Swap Agreements.
Credit Default Swaps: Credit default swaps involve commitments to pay a fixed interest rate in exchange for payment if a credit event affecting a third party (the referenced obligation or index) occurs. Credit events may include a failure to pay interest or principal, bankruptcy, or restructuring. The fund enters into these agreements to manage its exposure to the market or certain sectors of the market, to reduce its risk exposure to defaults of corporate and sovereign issuers, or to create exposure to corporate or sovereign issuers to which it is not otherwise exposed. For those credit default swaps in which the fund is paying a fixed rate, the fund is buying credit protection on the instrument. In the event of a credit event, the fund would receive the full notional amount for the reference obligation. For those credit default swaps in which the fund is receiving a fixed rate, the fund is selling credit protection on the underlying instrument. The maximum payouts for these agreements are limited to the notional amount of each swap. Credit default swaps may involve greater risks than if the fund had invested in the reference obligation directly and are subject to general market risk, liquidity risk, counterparty risk and credit risk. This risk may be mitigated by Master Agreements, if any, between the fund and the counterparty and the posting of collateral, if any, by the counterparty to the fund to cover the fund’s exposure to the counterparty. At October 31, 2017, there were no credit default swap agreements outstanding.
The following tables show the fund’s exposure to different types of market risk as it relates to the Statement of Assets and Liabilities and the Statement of Operations, respectively.
49
NOTES TO FINANCIAL STATEMENTS (continued)
Fair value of derivative instruments as of October 31, 2017 is shown below:
The effect of derivative instruments in the Statement of Operations during the period ended October 31, 2017 is shown below:
| | | | | | | | | | | |
Amount of realized gain (loss) on derivatives recognized in income ($) | |
Underlying
risk | Futures | 1 | Options
Transactions | 2 | Forward
Contracts | 3 | Swap
Agreements | 4 | Total | |
Interest
rate | (362,405) | | 225,206 | | - | | 1,321,729 | | 1,184,530 | |
Foreign
exchange | - | | (83,562) | | (412,763) | | - | | (496,325) | |
Credit | - | | - | | - | | (23,220) | | (23,220) | |
Total | (362,405) | | 141,644 | | (412,763) | | 1,298,509 | | 664,985 | |
| | | | | | | | | | | |
50
| | | | | | | | | | | | |
Change in unrealized appreciation (depreciation)
on derivatives recognized in income ($) | |
Underlying
risk | Futures | 5 | Options
Transactions | 6 | Forward
Contracts | 7 | Swap
Agreements | 8 | Total | |
Interest
rate | (473,775) | | (49,827) | | - | | 295,943 | | (227,659) | |
Foreign
exchange | - | | (120,370) | | 509,249 | | - | | 388,879 | |
Total | (473,775) | | (170,197) | | 509,249 | | 295,943 | | 161,220 | |
| | | | | | | | | | | | |
Statement of Operations location: | |
1 Net realized gain (loss) on futures. | | |
2 Net realized gain (loss) on options transactions. |
3 Net realized gain (loss) on forward foreign currency exchange contracts. | | |
4 Net realized gain (loss) on swap agreements. | | |
5 Net unrealized appreciation (depreciation) on futures. | | |
6 Net unrealized appreciation (depreciation) on options transactions. | | |
7 Net unrealized appreciation (depreciation) on forward foreign currency exchange contracts. | |
8 Net unrealized appreciation (depreciation) on swap agreements. | | |
The provisions of ASC Topic 210 “Disclosures about Offsetting Assets and Liabilities” require disclosure on the offsetting of financial assets and liabilities. These disclosures are required for certain investments, including derivative financial instruments subject to Master Agreements which are eligible for offsetting in the Statement of Assets and Liabilities and require the fund to disclose both gross and net information with respect to such investments. For financial reporting purposes, the fund does not offset derivative assets and derivative liabilities that are subject to Master Agreements in the Statement of Assets and Liabilities.
At October 31, 2017, derivative assets and liabilities (by type) on a gross basis are as follows:
| | | | | | |
Derivative Financial Instruments: | | Assets ($) | | Liabilities ($) | |
Futures | | 56,930 | | (206,981) | |
Options | | 193,577 | | (9,916) | |
Forward contracts | | 634,434 | | (333,418) | |
Swaps | | 951,813 | | (430,302) | |
Total gross amount of derivative | | | | | |
assets and liabilities in the | | | | | |
Statement of Assets and Liabilities | | 1,836,754 | | (980,617) | |
Derivatives not subject to | | | | | |
Master Agreements | | (1,008,743) | | 637,283 | |
Total gross amount of assets | | | | | |
and liabilities subject to | | | | | |
Master Agreements | | 828,011 | | (343,334) | |
51
NOTES TO FINANCIAL STATEMENTS (continued)
The following tables present derivative assets and liabilities net of amounts available for offsetting under Master Agreements and net of related collateral received or pledged, if any, as of October 31, 2017:†
| | | | | | | |
| | | | Financial | | | |
| | | | Instruments | | | |
| | | | and Derivatives | | | |
| | Gross Amount of | | Available | Collateral | | Net Amount of |
Counterparty | Assets ($) | 1 | for Offset ($) | Received ($) | 2 | Assets ($) |
Barclays Bank | 84,118 | | - | - | | 84,118 |
Citigroup | 134,074 | | (134,074) | - | | - |
Goldman Sachs
International | 352,943 | | (4,834) | (348,109) | | - |
HSBC | 102,867 | | - | - | | 102,867 |
JP Morgan
Chase Bank | 69,339 | | (69,339) | - | | - |
UBS | 84,670 | | (2,862) | - | | 81,808 |
Total | 828,011 | | (211,109) | (348,109) | | 268,793 |
| | | | | | | |
| | | | Financial | | | |
| | | | Instruments | | | |
| | | | and Derivatives | | | |
| | Gross Amount of | | Available | Collateral | | Net Amount of |
Counterparty | Liabilities ($) | 1 | for Offset ($) | Pledged ($) | 2 | Liabilities ($) |
Citigroup | (220,517) | | 134,074 | - | | (86,443) |
Goldman Sachs
International | (4,834) | | 4,834 | - | | - |
JP Morgan
Chase Bank | (115,121) | | 69,339 | - | | (45,782) |
UBS | (2,862) | | 2,862 | - | | - |
Total | (343,334) | | 211,109 | - | | (132,225) |
| | | | | | | |
1 Absent a default event or early termination, OTC derivative assets and liabilities are presented at gross amounts and are not offset in the Statement of Assets and Liabilities. |
2 In some instances, the actual collateral received and/or pledged may be more than the amount shown due to over collateralization. |
† See Statement of Investments for detailed information regarding collateral held for open futures contracts. |
The following summarizes the average market value of derivatives outstanding during the period ended October 31, 2017:
| | | |
| | Average Market Value ($) |
Interest rate futures | | 110,055,250 |
Interest rate options contracts | | 72,391 |
Foreign currency options contracts | | 198,660 |
Forward contracts | | 109,635,693 |
| | | |
52
The following summarizes the average notional value of swap agreements outstanding during the period ended October 31, 2017:
| | | |
| | Average Notional Value ($) |
Interest rate swap agreements | | 44,031,713 |
Credit default swap agreements | | 246,797 |
| | | |
At October 31, 2017, the cost of investments for federal income tax purposes was $118,068,304; accordingly, accumulated net unrealized appreciation on investments inclusive of derivative contracts was $2,622,260, consisting of $5,509,395 gross unrealized appreciation and $2,887,135 gross unrealized depreciation.
53
REPORT OF INDEPENDENT REGISTERED
PUBLIC ACCOUNTING FIRM
The Board of Directors and Shareholders
The Dreyfus/Laurel Funds, Inc.
We have audited the accompanying statement of assets and liabilities of Dreyfus Opportunistic Fixed Income Fund (the “Fund”), a series of The Dreyfus/Laurel Funds, Inc., including the statements of investments, investments in affiliated issuers, futures, options written, forward foreign currency exchange contracts and swap agreements, as of October 31, 2017, and the related statement of operations for the year then ended, the statements of changes in net assets for each of the years in the two-year period then ended, and the financial highlights for each of the years or period in the five-year period then ended. These financial statements and financial highlights are the responsibility of the Fund’s management. Our responsibility is to express an opinion on these financial statements and financial highlights based on our audits.
We conducted our audits in accordance with the standards of the Public Company Accounting Oversight Board (United States). Those standards require that we plan and perform the audit to obtain reasonable assurance about whether the financial statements and financial highlights are free of material misstatement. An audit includes examining, on a test basis, evidence supporting the amounts and disclosures in the financial statements. Our procedures included confirmation of securities owned as of October 31, 2017, by correspondence with the custodian and brokers or by other appropriate auditing procedures. An audit also includes assessing the accounting principles used and significant estimates made by management, as well as evaluating the overall financial statement presentation. We believe that our audits provide a reasonable basis for our opinion.
In our opinion, the financial statements and financial highlights referred to above present fairly, in all material respects, the financial position of Dreyfus Opportunistic Fixed Income Fund as of October 31, 2017, and the results of its operations for the year then ended, the changes in its net assets for each of the years in the two-year period then ended, and the financial highlights for each of the years or period in the five-year period then ended, in conformity with U.S. generally accepted accounting principles.

New York, New York
December 22, 2017
54
IMPORTANT TAX INFORMATION (Unaudited)
For federal tax purposes the fund designates the maximum amount allowable but not less than 37.44% as interest-related dividends in accordance with Sections 871(k)(1) and 881(e) of the Internal Revenue Code.
55
INFORMATION ABOUT THE RENEWAL OF THE FUND’S MANAGEMENT AGREEMENT (Unaudited)
At a meeting of the fund’s Board of Directors held on July 26-27, 2017, the Board considered the renewal of the fund’s Management Agreement, pursuant to which Dreyfus provides the fund with investment advisory and administrative services (the “Agreement”). The Board members, none of whom are “interested persons” (as defined in the Investment Company Act of 1940, as amended) of the fund, were assisted in their review by independent legal counsel and met with counsel in executive session separate from Dreyfus representatives. In considering the renewal of the Agreement, the Board considered all factors that it believed to be relevant, including those discussed below. The Board did not identify any one factor as dispositive, and each Board member may have attributed different weights to the factors considered.
Analysis of Nature, Extent, and Quality of Services Provided to the Fund. The Board considered information provided to them at the meeting and in previous presentations from Dreyfus representatives regarding the nature, extent, and quality of the services provided to funds in the Dreyfus fund complex. Dreyfus provided the number of open accounts in the fund, the fund’s asset size and the allocation of fund assets among distribution channels. Dreyfus also had previously provided information regarding the diverse intermediary relationships and distribution channels of funds in the Dreyfus fund complex (such as retail direct or intermediary, in which intermediaries typically are paid by the fund and/or Dreyfus) and Dreyfus’ corresponding need for broad, deep, and diverse resources to be able to provide ongoing shareholder services to each intermediary or distribution channel, as applicable to the fund.
The Board also considered research support available to, and portfolio management capabilities of, the fund’s portfolio management personnel and that Dreyfus also provides oversight of day-to-day fund operations, including fund accounting and administration and assistance in meeting legal and regulatory requirements. The Board also considered Dreyfus’ extensive administrative, accounting, and compliance infrastructures.
Comparative Analysis of the Fund’s Performance and Management Fee and Expense Ratio. The Board reviewed reports prepared by Broadridge Financial Solutions, Inc. (“Broadridge”), an independent provider of investment company data, which included information comparing (1) the fund’s performance with the performance of a group of comparable funds (the “Performance Group”) and with a broader group of funds (the “Performance Universe”), all for various periods ended June 30, 2017, and (2) the fund’s actual and contractual management fees and total expenses with those of a group of comparable funds (the “Expense Group”) and with a broader group of funds (the “Expense Universe”), the information for which was derived in part from fund financial statements available to Broadridge as of the date of its analysis. Dreyfus previously had furnished the Board with a description of the methodology Broadridge used to select the Performance Group and Performance Universe and the Expense Group and Expense Universe.
Dreyfus representatives stated that the usefulness of performance comparisons may be affected by a number of factors, including different investment limitations that may be
56
applicable to the fund and comparison funds. The Board discussed with representatives of Dreyfus and/or its affiliates the results of the comparisons and considered that the fund’s total return performance was below the Performance Group and Performance Universe medians the various periods, except for the one- and ten-year periods when the fund’s performance was above the Performance Group and Performance Universe medians. The Board also considered that the fund’s yield performance was at or above the Performance Group median in five of the ten one-year periods ended June 30th and was at or above the Performance Universe median eight of the ten one-year periods ended June 30th. Dreyfus also provided a comparison of the fund’s calendar year total returns to the returns of the fund’s benchmark index showing that the fund’s return was higher than the return of the index in six of the ten years shown.
Representatives of Dreyfus and its affiliates discussed and expressed confidence in the investment approach notwithstanding the fund’s total return performance. They also reminded the Board of the addition of Brendan Murphy as a primary portfolio manager to the fund in August 2016 and additional steps taken by Dreyfus and its affiliates in an effort to improve fund performance. Representatives of Dreyfus stated that the fund’s recent performance had improved, noting that the fund’s total return performance for the three- and six- month periods ended June 30, 2017 ranked in the second and first quartile, respectively, of the fund’s Lipper category.
The Board also reviewed the range of actual and contractual management fees and total expenses of the Expense Group and Expense Universe funds and discussed the results of the comparisons. The Board considered that the fund’s contractual management fee was below the Expense Group median and the fund’s actual management fee and expense ratio were below the Expense Group and Expense Universe medians.
Dreyfus representatives stated that Dreyfus had contractually agreed until March 1, 2018, to waive receipt of its fees and/or assume the expenses of the fund, so that annual direct fund operating expenses of its Class A, C, I and Y shares (excluding Rule 12b-1 fees, shareholder services fees, taxes, interest, brokerage commissions, commitment fees on borrowings and extraordinary expenses) do not exceed 0.65% of the fund’s average daily net assets.
Dreyfus representatives reviewed with the Board the management or investment advisory fees (1) paid by funds advised or administered by Dreyfus that are in the same Broadridge category as the fund and (2) paid to Dreyfus or the Dreyfus-affiliated primary employer of the fund’s primary portfolio manager(s) for advising any separate accounts and/or other types of client portfolios that are considered to have similar investment strategies and policies as the fund (the “Similar Clients”), and explained the nature of the Similar Clients. They discussed differences in fees paid and the relationship of the fees paid in light of any differences in the services provided and other relevant factors. The Board considered the relevance of the fee information provided for the Similar Clients to evaluate the appropriateness of the fund’s management fee.
Analysis of Profitability and Economies of Scale. Dreyfus representatives reviewed the expenses allocated and profit received by Dreyfus and its affiliates and the resulting
57
INFORMATION ABOUT THE RENEWAL OF THE FUND’S MANAGEMENT AGREEMENT (Unaudited) (continued)
profitability percentage for managing the fund and the aggregate profitability percentage to Dreyfus and its affiliates for managing the funds in the Dreyfus fund complex, and the method used to determine the expenses and profit. The Board concluded that the profitability results were not unreasonable, given the services rendered and service levels provided by Dreyfus. The Board also had been provided with information prepared by an independent consulting firm regarding Dreyfus’ approach to allocating costs to, and determining the profitability of, individual funds and the entire Dreyfus fund complex. The consulting firm also had analyzed where any economies of scale might emerge in connection with the management of a fund.
The Board considered, on the advice of its counsel, the profitability analysis (1) as part of its evaluation of whether the fees under the Agreement, considered in relation to the mix of services provided by Dreyfus, including the nature, extent and quality of such services, supported the renewal of the Agreement and (2) in light of the relevant circumstances for the fund and the extent to which economies of scale would be realized if the fund grows and whether fee levels reflect these economies of scale for the benefit of fund shareholders. Dreyfus representatives stated that a discussion of economies of scale is predicated on a fund having achieved a substantial size with increasing assets and that, if a fund’s assets had been stable or decreasing, the possibility that Dreyfus may have realized any economies of scale would be less. Dreyfus representatives also stated that, as a result of shared and allocated costs among funds in the Dreyfus fund complex, the extent of economies of scale could depend substantially on the level of assets in the complex as a whole, so that increases and decreases in complex-wide assets can affect potential economies of scale in a manner that is disproportionate to, or even in the opposite direction from, changes in the fund’s asset level. The Board also considered potential benefits to Dreyfus from acting as investment adviser and took into consideration that there were no soft dollar arrangements in effect for trading the fund’s investments.
At the conclusion of these discussions, the Board agreed that it had been furnished with sufficient information to make an informed business decision with respect to the renewal of the Agreement. Based on the discussions and considerations as described above, the Board concluded and determined as follows.
· The Board concluded that the nature, extent and quality of the services provided by Dreyfus are adequate and appropriate.
· The Board considered the fund’s improved total return performance.
· The Board concluded that the fee paid to Dreyfus continued to be appropriate under the circumstances and in light of the factors and the totality of the services provided as discussed above, subject to review no later than the next renewal consideration.
· The Board determined that the economies of scale which may accrue to Dreyfus and its affiliates in connection with the management of the fund had been adequately considered by Dreyfus in connection with the fee rate charged
58
to the fund pursuant to the Agreement and that, to the extent in the future it were determined that material economies of scale had not been shared with the fund, the Board would seek to have those economies of scale shared with the fund.
In evaluating the Agreement, the Board considered these conclusions and determinations and also relied on its previous knowledge, gained through meetings and other interactions with Dreyfus and its affiliates, of Dreyfus and the services provided to the fund by Dreyfus. The Board also relied on information received on a routine and regular basis throughout the year relating to the operations of the fund and the investment management and other services provided under the Agreement, including information on the investment performance of the fund in comparison to similar mutual funds and benchmark performance indices; general market outlook as applicable to the fund; and compliance reports. In addition, the Board’s consideration of the contractual fee arrangements for this fund had the benefit of a number of years of reviews of the Agreement for the fund, or substantially similar agreements for other Dreyfus funds that the Board oversees, during which lengthy discussions took place between the Board and Dreyfus representatives. Certain aspects of the arrangements may receive greater scrutiny in some years than in others, and the Board’s conclusions may be based, in part, on their consideration of the fund’s arrangements, or similar arrangements for other Dreyfus funds that the Board oversees, in prior years. The Board determined to renew the Agreement through April 4, 2018.
59
BOARD MEMBERS INFORMATION (Unaudited)
INDEPENDENT BOARD MEMBERS
Joseph S. DiMartino (74)
Chairman of the Board (1999)
Principal Occupation During Past 5 Years:
· Corporate Director and Trustee (1995-present)
Other Public Company Board Memberships During Past 5 Years:
· CBIZ (formerly, Century Business Services, Inc.), a provider of outsourcing functions for small and medium size companies, Director (1997-present)
No. of Portfolios for which Board Member Serves: 126
———————
Francine J. Bovich (66)
Board Member (2012)
Principal Occupation During Past 5 Years:
· Trustee, The Bradley Trusts, private trust funds (2011-present)
Other Public Company Board Memberships During Past 5 Years:
· Annaly Capital Management, Inc., Board Member (May 2014-present)
No. of Portfolios for which Board Member Serves: 74
———————
Kenneth A. Himmel (71)
Board Member (1994)
Principal Occupation During Past 5 Years:
· Managing Partner, Gulf Related, an international real estate development company (2010-present)
· President and CEO, Related Urban Development, a real estate development company (1996-present)
· President and CEO, Himmel & Company, a real estate development company (1980-present)
· CEO, American Food Management, a restaurant company (1983-present)
No. of Portfolios for which Board Member Serves: 28
———————
60
Stephen J. Lockwood (70)
Board Member (1994)
Principal Occupation During Past 5 Years:
· Chairman of the Board, Stephen J. Lockwood and Company LLC, a real estate investment company (2000-present)
No. of Portfolios for which Board Member Serves: 28
———————
Roslyn M. Watson (68)
Board Member (1994)
Principal Occupation During Past 5 Years:
· Principal, Watson Ventures, Inc., a real estate investment company (1993-present)
No. of Portfolios for which Board Member Serves: 60
———————
Benaree Pratt Wiley (71)
Board Member (1998)
Principal Occupation During Past 5 Years:
· Principal, The Wiley Group, a firm specializing in strategy and business development (2005-present)
Other Public Company Board Memberships During Past 5 Years:
· CBIZ (formerly, Century Business Services, Inc.), a provider of outsourcing functions for small and medium size companies, Director (2008-present)
No. of Portfolios for which Board Member Serves: 81
———————
Once elected all Board Members serve for an indefinite term, but achieve Emeritus status upon reaching age 80. The address of the Board Members and Officers is c/o The Dreyfus Corporation, 200 Park Avenue, New York, New York 10166. Additional information about the Board Members is available in the fund’s Statement of Additional Information which can be obtained from Dreyfus free of charge by calling this toll free number: 1-800-DREYFUS.
James M. Fitzgibbons, Emeritus Board Member
J. Tomlinson Fort, Emeritus Board Member
61
OFFICERS OF THE FUND (Unaudited)
BRADLEY J. SKAPYAK, President since January 2010.
Chief Operating Officer and a director of the Manager since June 2009, Chairman of Dreyfus Transfer, Inc., an affiliate of the Manager and the transfer agent of the funds, since May 2011 and Chief Executive Officer of MBSC Securities Corporation since August 2016. He is an officer of 62 investment companies (comprised of 126 portfolios) managed by the Manager. He is 58 years old and has been an employee of the Manager since February 1988.
BENNETT A. MACDOUGALL, Chief Legal Officer since October 2015.
Chief Legal Officer of the Manager and Associate General Counsel and Managing Director of BNY Mellon since June 2015; from June 2005 to June 2015, he served in various capacities with Deutsche Bank – Asset & Wealth Management Division, including as Director and Associate General Counsel, and Chief Legal Officer of Deutsche Investment Management Americas Inc. from June 2012 to May 2015. He is an officer of 63 investment companies (comprised of 151 portfolios) managed by the Manager. He is 46 years old and has been an employee of the Manager since June 2015.
JANETTE E. FARRAGHER, Vice President and Secretary since December 2011.
Associate General Counsel of BNY Mellon, and an officer of 63 investment companies (comprised of 151 portfolios) managed by the Manager. She is 54 years old and has been an employee of the Manager since February 1984.
JAMES BITETTO, Vice President and Assistant Secretary since August 2005.
Managing Counsel of BNY Mellon and Secretary of the Manager, and an officer of 63 investment companies (comprised of 151 portfolios) managed by the Manager. He is 51 years old and has been an employee of the Manager since December 1996.
JOSEPH M. CHIOFFI, Vice President and Assistant Secretary since August 2005.
Managing Counsel of BNY Mellon, and an officer of 63 investment companies (comprised of 151 portfolios) managed by the Manager. He is 55 years old and has been an employee of the Manager since June 2000.
MAUREEN E. KANE, Vice President and Assistant Secretary since April 2015.
Managing Counsel of BNY Mellon since July 2014; from October 2004 until July 2014, General Counsel, and from May 2009 until July 2014, Chief Compliance Officer of Century Capital Management. She is an officer of 63 investment companies (comprised of 151 portfolios) managed by the Manager. She is 55 years old and has been an employee of the Manager since July 2014.
SARAH S. KELLEHER, Vice President and Assistant Secretary since April 2014.
Senior Counsel of BNY Mellon since March 2013, from August 2005 to March 2013, Associate General Counsel of Third Avenue Management. She is an officer of 63 investment companies (comprised of 151 portfolios) managed by the Manager. She is 42 years old and has been an employee of the Manager since March 2013.
JEFF PRUSNOFSKY, Vice President and Assistant Secretary since August 2005.
Senior Managing Counsel of BNY Mellon, and an officer of 63 investment companies (comprised of 151 portfolios) managed by the Manager. He is 52 years old and has been an employee of the Manager since October 1990.
NATALYA ZELENSKY, Vice President and Assistant Secretary since March 2017.
Counsel and Vice President of BNY Mellon since May 2016; Attorney at Wildermuth Endowment Strategy Fund/Wildermuth Advisory, LLC from November 2015 until May 2016; Assistant General Counsel at RCS Advisory Services from July 2014 until November 2015; Associate at Sutherland, Asbill & Brennan from January 2013 until January 2014; Associate at K&L Gates from October 2011 until January 2013. She is an officer of 63 investment companies (comprised of 151 portfolios) managed by Dreyfus. She is 32 years old and has been an employee of the Manager since May 2016.
JAMES WINDELS, Treasurer since November 2001.
Director – Mutual Fund Accounting of the Manager, and an officer of 63 investment companies (comprised of 151 portfolios) managed by the Manager. He is 59 years old and has been an employee of the Manager since April 1985.
62
RICHARD CASSARO, Assistant Treasurer since January 2008.
Senior Accounting Manager – Money Market and Municipal Bond Funds of the Manager, and an officer of 63 investment companies (comprised of 151 portfolios) managed by the Manager. He is 58 years old and has been an employee of the Manager since September 1982.
GAVIN C. REILLY, Assistant Treasurer since December 2005.
Tax Manager of the Investment Accounting and Support Department of the Manager, and an officer of 63 investment companies (comprised of 151 portfolios) managed by the Manager. He is 49 years old and has been an employee of the Manager since April 1991.
ROBERT S. ROBOL, Assistant Treasurer since August 2005.
Senior Accounting Manager – Dreyfus Financial Reporting of the Manager, and an officer of 63 investment companies (comprised of 151 portfolios) managed by the Manager. He is 53 years old and has been an employee of the Manager since October 1988.
ROBERT SALVIOLO, Assistant Treasurer since July 2007.
Senior Accounting Manager – Equity Funds of the Manager, and an officer of 63 investment companies (comprised of 151 portfolios) managed by the Manager. He is 50 years old and has been an employee of the Manager since June 1989.
ROBERT SVAGNA, Assistant Treasurer since December 2002.
Senior Accounting Manager – Fixed Income and Equity Funds of the Manager, and an officer of 63 investment companies (comprised of 151 portfolios) managed by the Manager. He is 50 years old and has been an employee of the Manager since November 1990.
JOSEPH W. CONNOLLY, Chief Compliance Officer since October 2004.
Chief Compliance Officer of the Manager and The Dreyfus Family of Funds (63 investment companies, comprised of 151 portfolios). He is 60 years old and has served in various capacities with the Manager since 1980, including manager of the firm’s Fund Accounting Department from 1997 through October 2001.
CARIDAD M. CAROSELLA, Anti-Money Laundering Compliance Officer since January 2016.
Anti-Money Laundering Compliance Officer of the Dreyfus Family of Funds and BNY Mellon Funds Trust since January 2016; from May 2015 to December 2015, Interim Anti-Money Laundering Compliance Officer of the Dreyfus Family of Funds and BNY Mellon Funds Trust and the Distributor; from January 2012 to May 2015, AML Surveillance Officer of the Distributor and from 2007 to December 2011, Financial Processing Manager of the Distributor. She is an officer of 57 investment companies (comprised of 145 portfolios) managed by the Manager. She is 49 years old and has been an employee of the Distributor since 1997.
63
NOTES
64
NOTES
65
Dreyfus Opportunistic Fixed Income Fund
200 Park Avenue
New York, NY 10166
Manager
The Dreyfus Corporation
200 Park Avenue
New York, NY 10166
Custodian
The Bank of New York Mellon
225 Liberty Street
New York, NY 10286
Transfer Agent &
Dividend Disbursing Agent
Dreyfus Transfer, Inc.
200 Park Avenue
New York, NY 10166
Distributor
MBSC Securities Corporation
200 Park Avenue
New York, NY 10166
| | |
Ticker Symbols: | Class A: DSTAX Class C: DSTCX �� Class I: DSTRX Class Y: DSTYX |
Telephone Call your financial representative or 1-800-DREYFUS
Mail The Dreyfus Family of Funds, 144 Glenn Curtiss Boulevard, Uniondale, NY 11556-0144
E-mail Send your request to info@dreyfus.com
Internet Information can be viewed online or downloaded at www.dreyfus.com
The fund files its complete schedule of portfolio holdings with the Securities and Exchange Commission (“SEC”) for the first and third quarters of each fiscal year on Form N-Q. The fund’s Forms N-Q are available on the SEC’s website at www.sec.gov and may be reviewed and copied at the SEC’s Public Reference Room in Washington, D.C. (phone 1-800-SEC-0330 for information).
A description of the policies and procedures that the fund uses to determine how to vote proxies relating to portfolio securities and information regarding how the fund voted these proxies for the most recent 12-month period ended June 30 is available at www.dreyfus.com and on the SEC’s website at www.sec.gov and without charge, upon request, by calling 1-800-DREYFUS.
| | |
© 2017 MBSC Securities Corporation
6148AR1017 | 
|
Dreyfus Tax Managed Growth Fund
| | | |

| | ANNUAL REPORT
October 31, 2017 |
| |
Save time. Save paper. View your next shareholder report online as soon as it’s available. Log into www.dreyfus.com and sign up for Dreyfus eCommunications. It’s simple and only takes a few minutes. |
| |
The views expressed in this report reflect those of the portfolio manager(s) only through the end of the period covered and do not necessarily represent the views of Dreyfus or any other person in the Dreyfus organization. Any such views are subject to change at any time based upon market or other conditions and Dreyfus disclaims any responsibility to update such views. These views may not be relied on as investment advice and, because investment decisions for a Dreyfus fund are based on numerous factors, may not be relied on as an indication of trading intent on behalf of any Dreyfus fund. |
| |
Not FDIC-Insured • Not Bank-Guaranteed • May Lose Value |
Contents
THE FUND
FOR MORE INFORMATION
Back Cover
| | | | |
| |
Dreyfus Tax Managed Growth Fund
| | The Fund |
A LETTER FROM THE CEO OF DREYFUS
Dear Shareholder:
We are pleased to present this annual report for Dreyfus Tax Managed Growth Fund, covering the 12-month period from November 1, 2016 through October 31, 2017. For information about how the fund performed during the reporting period, as well as general market perspectives, we provide a Discussion of Fund Performance on the pages that follow.
Stocks set a series of new record highs and bonds produced mixed results over the past year in response to changing economic and political conditions. Financial markets at the start of the reporting period were dominated by the election of a new U.S. presidential administration. Equities and corporate-backed bonds surged higher in anticipation of more business-friendly regulatory, tax, and fiscal policies, but high-quality bonds generally lost value due to expectations of rising interest rates and accelerating inflation in a stronger economy. Despite a series of short-term interest-rate hikes, bonds recovered their previous losses over the first 10 months of 2017 when it became clearer that pro-growth legislation would take time and political capital to enact. U.S. and international stocks continued to rally as corporate earnings grew and global economic conditions improved.
The markets’ recent strong performance has been supported by solid underlying fundamentals. While we currently expect these favorable conditions to persist, we remain watchful for economic and political developments that could derail the markets. As always, we encourage you to discuss the risks and opportunities of today’s investment environment with your financial advisor.
Thank you for your continued confidence and support.
Sincerely,

Mark D. Santero
Chief Executive Officer
The Dreyfus Corporation
November 15, 2017
2
DISCUSSION OF FUND PERFORMANCE
For the period from November 1, 2016 through October 31, 2017, as provided by portfolio manager Fayez Sarofim of Fayez Sarofim & Co., Sub-Investment Adviser
Market and Fund Performance Overview
For the 12-month period ended October 31, 2017, Dreyfus Tax Managed Growth Fund’s Class A shares produced a total return of 23.55%, Class C shares returned 22.58%, and Class I shares returned 23.80%.1 In comparison, the S&P 500® Index (the “Index”), the fund’s benchmark, returned 23.61% for the same period.2
Equities advanced strongly over the reporting period amid business-friendly political developments, rising corporate earnings, and expectations of greater global economic growth. The fund produced returns that were roughly in line with the Index.
The Fund’s Investment Approach
The fund seeks long-term capital appreciation consistent with minimizing realized capital gains. To pursue this goal, we normally invest at least 80% of net assets, plus any borrowings for investment purposes, in common stocks and employ a tax-managed strategy, which is an approach to managing a fund that seeks to minimize capital gains tax liabilities.
We focus on purchasing large-cap, blue-chip stocks at a price we consider to be justified by a company’s fundamentals. The result is a portfolio of stocks selected for what we consider to be sustained patterns of profitability, strong balance sheets, expanding global presence, and above-average earnings growth potential. At the same time, we manage the fund in a manner cognizant of the concerns of tax-conscious investors. We typically buy and sell relatively few stocks during the course of the year, which may help reduce investors’ tax liabilities.
Economic and Political Developments Drove Markets Higher
The Index delivered impressive performance over the reporting period, setting a series of new highs as strengthening global economic growth and upbeat earnings reports lifted stock prices. Volatility declined and remained below historical averages through most of the reporting period despite halting progress on tax reform legislation, allegations of Russian election interference, and escalating tensions with North Korea. Meanwhile, the Federal Reserve Board (the “Fed”) implemented three short-term interest-rate hikes, while signs of economic momentum in the Eurozone and Japan fed speculation of moves towards monetary policy normalization in those economies. The stock market’s advance was primarily driven by gains in the information technology sector stemming from impressive revenue and earnings reports from some of the industry group’s largest companies. The telecommunication services sector was the weakest segment of the Index for the reporting period and the only market sector to post negative absolute returns.
Fund Participated Fully in Market’s Gains
The fund produced returns that were roughly in line with the Index over the reporting period. Overweighted exposure and favorable security selections in the information technology sector were the most significantly positive contributors to the fund’s relative performance. Overweighted positions in Apple and semiconductor equipment maker ASML Holding proved particularly advantageous. Stock selections in the health care sector
3
DISCUSSION OF FUND PERFORMANCE (continued)
augmented relative results, with notable strength in pharmaceutical developer AbbVie, insurer UnitedHealth Group, and diabetes specialist Novo Nordisk. An underweighted position in the consumer discretionary sector also added value relative to the Index, as did the strategic avoidance of stocks in the telecommunication services, utilities, and real estate sectors. The largest positive contributors to the fund’s relative return, reflecting both performance and weighting, included Apple, Facebook, JPMorgan Chase & Co., Microsoft, and AbbVie.
These strong performers were undercut by a relatively heavy allocation to the lagging consumer staples sector, although favorable stock selections within the sector helped reduce the drag on relative results. In the financials sector, not owning several of the banks with outsized gains was an impediment. Positioning in the industrials sector was also detrimental due to disappointing security selections in the aerospace-and-defense industry as well as lack of exposure to machinery producers. The greatest detractors from the fund’s returns were Walgreens Boots Alliance, Occidental Petroleum, Gilead Sciences, Twenty-First Century Fox, and Whole Foods Market.
Positioned for Monetary Policy Normalization
Within the context of moderate global growth and strong earnings, central banks appear set to shape the final chapter of an unusually calm year for equity markets. In the near term, given the economy’s firm underlying momentum, gradual policy normalization should have a limited impact on the market. However, with the Fed’s initiation of a balance-sheet reduction program in October and the European Central Bank contemplating a tapering of its asset purchases, tighter global liquidity conditions could make 2018 more challenging.
In this environment, we expect investors to focus more intently on the profit fundamentals of large, high-quality, multinational companies with best-in-class business models, entrenched market positions, and highly stable revenue streams. We believe that these industry leaders have the scale and financial flexibility to sustain earnings growth while continuing to invest prudently for the future. Furthermore, in our judgment, their established records of returning capital to shareholders in the form of dividends and share repurchases provide the potential for more consistent returns across business cycles.
November 15, 2017
1 Total return includes reinvestment of dividends and any capital gains paid, and does not take into consideration the maximum initial sales charge in the case of Class A shares or the applicable contingent deferred sales charge imposed on redemptions in the case of Class C shares. Had these charges been reflected, returns would have been lower. Past performance is no guarantee of future results. Share price and investment return fluctuate such that upon redemption, fund shares may be worth more or less than their original cost.
2 Source: Lipper Inc. — The S&P 500® Index is widely regarded as the best single gauge of large-cap U.S. equities. The index includes 500 leading companies and captures approximately 80% coverage of available market capitalization. Investors cannot invest directly in any index.
Please note: the position in any security highlighted with italicized typeface was sold during the reporting period.
Equities are subject generally to market, market sector, market liquidity, issuer, and investment style risks, among other factors, to varying degrees, all of which are more fully described in the fund’s prospectus.
4
FUND PERFORMANCE

Comparison of change in value of $10,000 investment in Dreyfus Tax Managed Growth Fund Class A shares, Class C shares and Class I shares and the S&P 500® Index (the “Index”)
† Source: Lipper Inc.
Past performance is not predictive of future performance.
The above graph compares a $10,000 investment made in each of the Class A, Class C and Class I shares of Dreyfus Tax Managed Growth Fund on 10/31/07 to a $10,000 investment made in the Index on that date. All dividends and capital gain distributions are reinvested.
The fund’s performance shown in the line graph above takes into account the maximum initial sales charge on Class A shares and all other applicable fees and expenses on all classes. The Index is widely regarded as the best single gauge of large-cap U.S. equities. The Index includes 500 leading companies and captures approximately 80% coverage of available market capitalization. Unlike a mutual fund, the Index is not subject to charges, fees and other expenses. Investors cannot invest directly in any index. Further information relating to fund performance, including expense reimbursements, if applicable, is contained in the Financial Highlights section of the prospectus and elsewhere in this report.
5
FUND PERFORMANCE (continued)
| | | | |
Average Annual Total Returns as of 10/31/17 |
| | 1 Year | 5 Years | 10 Years |
Class A shares | | | |
with maximum sales charge (5.75%) | 16.44% | 8.40% | 5.36% |
without sales charge | 23.55% | 9.69% | 5.98% |
Class C shares | | | |
with applicable redemption charge † | 21.58% | 8.88% | 5.19% |
without redemption | 22.58% | 8.88% | 5.19% |
Class I shares | 23.80% | 9.96% | 6.25% |
S&P 500® Index | 23.61% | 15.17% | 7.51% |
† The maximum contingent deferred sales charge for Class C shares is 1% for shares redeemed within one year of the date of purchase.
The performance data quoted represents past performance, which is no guarantee of future results. Share price and investment return fluctuate and an investor’s shares may be worth more or less than original cost upon redemption. Current performance may be lower or higher than the performance quoted. Go to Dreyfus.com for the fund’s most recent month-end returns.
The fund’s performance shown in the graph and table does not reflect the deduction of taxes that a shareholder would pay on fund distributions or the redemption of fund shares. In addition to the performance of Class A shares shown with and without a maximum sales charge, the fund’s performance shown in the table takes into account all other applicable fees and expenses on all classes.
6
UNDERSTANDING YOUR FUND’S EXPENSES (Unaudited)
As a mutual fund investor, you pay ongoing expenses, such as management fees and other expenses. Using the information below, you can estimate how these expenses affect your investment and compare them with the expenses of other funds. You also may pay one-time transaction expenses, including sales charges (loads) and redemption fees, which are not shown in this section and would have resulted in higher total expenses. For more information, see your fund’s prospectus or talk to your financial adviser.
Review your fund’s expenses
The table below shows the expenses you would have paid on a $1,000 investment in Dreyfus Tax Managed Growth Fund from May 1, 2017 to October 31, 2017. It also shows how much a $1,000 investment would be worth at the close of the period, assuming actual returns and expenses.
| | | | | | | | | | | | | |
Expenses and Value of a $1,000 Investment | | |
assuming actual returns for the six months ended October 31, 2017 |
| | | | Class A | Class C | Class I | |
Expenses paid per $1,000† | | $7.13 | | $11.07 | | $5.81 | |
Ending value (after expenses) | | $1,096.10 | | $1,091.70 | | $1,097.30 | |
COMPARING YOUR FUND’S EXPENSES
WITH THOSE OF OTHER FUNDS (Unaudited)
Using the SEC’s method to compare expenses
The Securities and Exchange Commission (“SEC”) has established guidelines to help investors assess fund expenses. Per these guidelines, the table below shows your fund’s expenses based on a $1,000 investment, assuming a hypothetical 5% annualized return. You can use this information to compare the ongoing expenses (but not transaction expenses or total cost) of investing in the fund with those of other funds. All mutual fund shareholder reports will provide this information to help you make this comparison. Please note that you cannot use this information to estimate your actual ending account balance and expenses paid during the period.
| | | | | | | | | | | | | | |
Expenses and Value of a $1,000 Investment | | |
assuming a hypothetical 5% annualized return for the six months ended October 31, 2017 |
| | | | Class A | Class C | Class I | |
Expenses paid per $1,000† | | $6.87 | | $10.66 | | $5.60 | |
Ending value (after expenses) | | $1,018.40 | | $1,014.62 | | $1,019.66 | |
† Expenses are equal to the fund’s annualized expense ratio of 1.35% for Class A, 2.10% for Class C and 1.10% for Class I, multiplied by the average account value over the period, multiplied by 184/365 (to reflect the one-half year period).
7
STATEMENT OF INVESTMENTS
October 31, 2017
| | | | | | | | |
| |
Description | | | | Shares | | Value ($) | |
Common Stocks - 97.9% | | | | | |
Banks - 4.9% | | | | | |
JPMorgan Chase & Co. | | | | 64,300 | | 6,469,223 | |
Wells Fargo & Co. | | | | 40,600 | | 2,279,284 | |
| | | | | 8,748,507 | |
Capital Goods - 1.5% | | | | | |
United Technologies | | | | 21,900 | | 2,622,744 | |
Consumer Durables & Apparel - 1.1% | | | | | |
NIKE, Cl. B | | | | 33,660 | | 1,850,963 | |
Consumer Services - 2.2% | | | | | |
McDonald's | | | | 22,750 | | 3,797,203 | |
Diversified Financials - 6.9% | | | | | |
American Express | | | | 29,300 | | 2,798,736 | |
BlackRock | | | | 9,600 | | 4,519,968 | |
Intercontinental Exchange | | | | 34,000 | | 2,247,400 | |
State Street | | | | 29,300 | | 2,695,600 | |
| | | | | 12,261,704 | |
Energy - 7.2% | | | | | |
Chevron | | | | 44,800 | | 5,191,872 | |
ConocoPhillips | | | | 37,700 | | 1,928,355 | |
Exxon Mobil | | | | 67,012 | | 5,585,450 | |
| | | | | 12,705,677 | |
Food & Staples Retailing - 1.1% | | | | | |
Walgreens Boots Alliance | | | | 30,400 | | 2,014,608 | |
Food, Beverage & Tobacco - 18.7% | | | | | |
Altria Group | | | | 88,800 | | 5,702,736 | |
Anheuser-Busch InBev, ADR | | | | 7,200 | | 884,016 | |
Coca-Cola | | | | 113,500 | | 5,218,730 | |
Constellation Brands, Cl. A | | | | 5,800 | | 1,270,722 | |
Nestle, ADR | | | | 60,150 | | 5,066,435 | |
PepsiCo | | | | 35,100 | | 3,869,073 | |
Philip Morris International | | | | 106,500 | | 11,144,160 | |
| | | | | 33,155,872 | |
Health Care Equipment & Services - 3.2% | | | | | |
Abbott Laboratories | | | | 58,100 | | 3,150,763 | |
UnitedHealth Group | | | | 12,200 | | 2,564,684 | |
| | | | | 5,715,447 | |
Household & Personal Products - 3.8% | | | | | |
Estee Lauder, Cl. A | | | | 38,900 | | 4,349,409 | |
Procter & Gamble | | | | 28,400 | | 2,452,056 | |
| | | | | 6,801,465 | |
Insurance - 2.8% | | | | | |
Chubb | | | | 33,100 | | 4,992,142 | |
8
| | | | | | | | |
| |
Description | | | | Shares | | Value ($) | |
Common Stocks - 97.9% (continued) | | | | | |
Materials - 2.1% | | | | | |
Air Products & Chemicals | | | | 5,000 | | 797,150 | |
Praxair | | | | 19,300 | | 2,820,116 | |
| | | | | 3,617,266 | |
Media - 5.0% | | | | | |
Comcast, Cl. A | | | | 106,800 | | 3,848,004 | |
Twenty-First Century Fox, Cl. A | | | | 32,550 | | 851,183 | |
Twenty-First Century Fox, Cl. B | | | | 30,000 | | 763,500 | |
Walt Disney | | | | 34,800 | | 3,403,788 | |
| | | | | 8,866,475 | |
Pharmaceuticals, Biotechnology & Life Sciences - 7.0% | | | | | |
AbbVie | | | | 45,700 | | 4,124,425 | |
Novartis, ADR | | | | 24,900 | | 2,056,242 | |
Novo Nordisk, ADR | | | | 65,175 | | 3,245,063 | |
Roche Holding, ADR | | | | 101,800 | | 2,943,547 | |
| | | | | 12,369,277 | |
Semiconductors & Semiconductor Equipment - 5.0% | | | | | |
ASML Holding | | | | 16,100 | | 2,910,075 | |
Texas Instruments | | | | 61,900 | | 5,985,111 | |
| | | | | 8,895,186 | |
Software & Services - 16.8% | | | | | |
Alphabet, Cl. C | | | | 6,718 | a | 6,829,788 | |
Automatic Data Processing | | | | 8,640 | | 1,004,486 | |
Facebook, Cl. A | | | | 51,900 | a | 9,345,114 | |
Microsoft | | | | 99,045 | | 8,238,563 | |
Visa, Cl. A | | | | 39,500 | b | 4,344,210 | |
| | | | | 29,762,161 | |
Technology Hardware & Equipment - 6.9% | | | | | |
Apple | | | | 72,700 | | 12,289,208 | |
Transportation - 1.7% | | | | | |
Canadian Pacific Railway | | | | 16,900 | | 2,931,136 | |
Total Common Stocks (cost $85,676,847) | | | | 173,397,041 | |
9
STATEMENT OF INVESTMENTS (continued)
| | | | | | | | |
| |
Description | | | | Shares | | Value ($) | |
Other Investment - 2.3% | | | | | |
Registered Investment Company; | | | | | |
Dreyfus Institutional Preferred Government Plus Money Market Fund
(cost $4,000,306) | | | | 4,000,306 | c | 4,000,306 | |
Total Investments (cost $89,677,153) | | 100.2% | | 177,397,347 | |
Liabilities, Less Cash and Receivables | | (.2%) | | (281,881) | |
Net Assets | | 100.0% | | 177,115,466 | |
ADR—American Depository Receipt
aNon-income producing security.
bSecurity, or portion thereof, on loan. At October 31, 2017, the value of the fund’s securities on loan was $4,300,768 and the value of the collateral held by the fund was $4,389,357, consisting of U.S. Government & Agency securities.
cInvestment in affiliated money market mutual fund.
| | |
Portfolio Summary (Unaudited) † | Value (%) |
Food, Beverage & Tobacco | 18.7 |
Software & Services | 16.8 |
Energy | 7.2 |
Pharmaceuticals, Biotechnology & Life Sciences | 7.0 |
Technology Hardware & Equipment | 6.9 |
Diversified Financials | 6.9 |
Semiconductors & Semiconductor Equipment | 5.0 |
Media | 5.0 |
Banks | 4.9 |
Household & Personal Products | 3.8 |
Health Care Equipment & Services | 3.2 |
Insurance | 2.8 |
Money Market Investment | 2.3 |
Consumer Services | 2.2 |
Materials | 2.1 |
Transportation | 1.7 |
Capital Goods | 1.5 |
Food & Staples Retailing | 1.1 |
Consumer Durables & Apparel | 1.1 |
| | 100.2 |
† Based on net assets.
See notes to financial statements.
10
STATEMENT OF INVESTMENTS IN AFFILIATED ISSUERS
| | | | | | | |
Registered Investment Companies | Value
10/31/16($) | Purchases($) | Sales ($) | Value
10/31/17($) | Net
Assets(%) | Dividends/
Distributions($) |
Dreyfus Institutional Preferred Government Money Market Fund, Institutional Shares | 2,374,649 | 23,227,395 | 25,602,044 | – | – | – |
Dreyfus Institutional Preferred Government Plus Money Market Fund | 1,095,290 | 16,809,355 | 13,904,339 | 4,000,306 | 2.3 | 8,341 |
Total | 3,469,939 | 40,036,750 | 39,506,383 | 4,000,306 | 2.3 | 8,341 |
See notes to financial statements.
11
STATEMENT OF ASSETS AND LIABILITIES
October 31, 2017
| | | | | | | |
| | | | | | |
| | | Cost | | Value | |
Assets ($): | | | | |
Investments in securities—See Statement of Investments
(including securities on loan, valued at $4,300,768)—Note 1(b): | | | |
Unaffiliated issuers | 85,676,847 | | 173,397,041 | |
Affiliated issuers | | 4,000,306 | | 4,000,306 | |
Dividends and securities lending income receivable | | | | | 221,769 | |
Receivable for shares of Common Stock subscribed | | | | | 36,425 | |
| | | | | 177,655,541 | |
Liabilities ($): | | | | |
Due to The Dreyfus Corporation and affiliates—Note 3(b) | | | | | 198,909 | |
Cash overdraft due to Custodian | | | | | 48,659 | |
Payable for shares of Common Stock redeemed | | | | | 292,507 | |
| | | | | 540,075 | |
Net Assets ($) | | | 177,115,466 | |
Composition of Net Assets ($): | | | | |
Paid-in capital | | | | | 80,872,223 | |
Accumulated undistributed investment income—net | | 350,709 | |
Accumulated net realized gain (loss) on investments | | | | | 8,172,340 | |
Accumulated net unrealized appreciation (depreciation)
on investments | | | | 87,720,194 | |
Net Assets ($) | | | 177,115,466 | |
| | | | | |
Net Asset Value Per Share | Class A | Class C | Class I | |
Net Assets ($) | 70,072,804 | 23,992,665 | 83,049,997 | |
Shares Outstanding | 2,380,472 | 863,905 | 2,814,870 | |
Net Asset Value Per Share ($) | 29.44 | 27.77 | 29.50 | |
| | | | | |
See notes to financial statements. | | | | |
12
STATEMENT OF OPERATIONS
Year Ended October 31, 2017
| | | | | | | |
| | | | | | |
| | | | | | |
Investment Income ($): | | | | |
Income: | | | | |
Cash dividends (net of $70,662 foreign taxes withheld at source): | |
Unaffiliated issuers | | | 3,856,898 | |
Affiliated issuers | | | 8,341 | |
Income from securities lending—Note 1(b) | | | 6,867 | |
Total Income | | | 3,872,106 | |
Expenses: | | | | |
Management fee—Note 3(a) | | | 1,886,364 | |
Distribution/Service Plan fees—Note 3(b) | | | 421,951 | |
Directors’ fees—Note 3(a,c) | | | 13,103 | |
Loan commitment fees—Note 2 | | | 3,825 | |
Interest expense—Note 2 | | | 1,023 | |
Total Expenses | | | 2,326,266 | |
Less—Directors’ fees reimbursed by Dreyfus—Note 3(a) | | | (13,103) | |
Net Expenses | | | 2,313,163 | |
Investment Income—Net | | | 1,558,943 | |
Realized and Unrealized Gain (Loss) on Investments—Note 4 ($): | | |
Net realized gain (loss) on investments | 8,173,220 | |
Net unrealized appreciation (depreciation) on investments | | | 26,427,794 | |
Net Realized and Unrealized Gain (Loss) on Investments | | | 34,601,014 | |
Net Increase in Net Assets Resulting from Operations | | 36,159,957 | |
| | | | | | | |
See notes to financial statements. | | | | | |
13
STATEMENT OF CHANGES IN NET ASSETS
| | | | | | | | | | |
| | | | Year Ended October 31, |
| | | | 2017 | | 2016 | |
Operations ($): | | | | | | | | |
Investment income—net | | | 1,558,943 | | | | 1,808,005 | |
Net realized gain (loss) on investments | | 8,173,220 | | | | 85,000 | |
Net unrealized appreciation (depreciation)
on investments | | 26,427,794 | | | | (536,607) | |
Net Increase (Decrease) in Net Assets
Resulting from Operations | 36,159,957 | | | | 1,356,398 | |
Distributions to Shareholders from ($): | |
Investment income—net: | | | | | | | | |
Class A | | | (588,152) | | | | (772,282) | |
Class C | | | (51,422) | | | | (134,489) | |
Class I | | | (935,814) | | | | (1,046,226) | |
Net realized gain on investments: | | | | | | | | |
Class A | | | (30,689) | | | | (3,668,452) | |
Class C | | | (13,475) | | | | (1,741,189) | |
Class I | | | (41,193) | | | | (3,710,408) | |
Total Distributions | | | (1,660,745) | | | | (11,073,046) | |
Capital Stock Transactions ($): | |
Net proceeds from shares sold: | | | | | | | | |
Class A | | | 5,551,428 | | | | 2,613,634 | |
Class C | | | 708,201 | | | | 1,298,056 | |
Class I | | | 19,586,701 | | | | 25,810,589 | |
Distributions reinvested: | | | | | | | | |
Class A | | | 534,952 | | | | 3,871,060 | |
Class C | | | 46,697 | | | | 1,181,162 | |
Class I | | | 955,233 | | | | 4,625,280 | |
Cost of shares redeemed: | | | | | | | | |
Class A | | | (12,210,846) | | | | (13,429,914) | |
Class C | | | (8,254,619) | | | | (6,336,157) | |
Class I | | | (36,942,445) | | | | (15,393,577) | |
Increase (Decrease) in Net Assets
from Capital Stock Transactions | (30,024,698) | | | | 4,240,133 | |
Total Increase (Decrease) in Net Assets | 4,474,514 | | | | (5,476,515) | |
Net Assets ($): | |
Beginning of Period | | | 172,640,952 | | | | 178,117,467 | |
End of Period | | | 177,115,466 | | | | 172,640,952 | |
Undistributed investment income—net | 350,709 | | | | 367,154 | |
14
| | | | | | | | | | |
| | | | Year Ended October 31, |
| | | | 2017 | | 2016 | |
Capital Share Transactions (Shares): | |
Class Aa | | | | | | | | |
Shares sold | | | 204,325 | | | | 111,007 | |
Shares issued for distributions reinvested | | | 20,948 | | | | 159,939 | |
Shares redeemed | | | (462,518) | | | | (557,027) | |
Net Increase (Decrease) in Shares Outstanding | (237,245) | | | | (286,081) | |
Class C | | | | | | | | |
Shares sold | | | 29,392 | | | | 58,096 | |
Shares issued for distributions reinvested | | | 1,961 | | | | 51,614 | |
Shares redeemed | | | (322,871) | | | | (288,136) | |
Net Increase (Decrease) in Shares Outstanding | (291,518) | | | | (178,426) | |
Class Ia | | | | | | | | |
Shares sold | | | 744,127 | | | | 1,103,899 | |
Shares issued for distributions reinvested | | | 37,497 | | | | 190,731 | |
Shares redeemed | | | (1,425,690) | | | | (642,877) | |
Net Increase (Decrease) in Shares Outstanding | (644,066) | | | | 651,753 | |
| | | | | | | | | | |
a During the period ended October 31, 2017, 988 Class A shares representing $26,189 were exchanged for 986 Class I shares. | |
See notes to financial statements.
| | | | | | | | |
15
FINANCIAL HIGHLIGHTS
The following tables describe the performance for each share class for the fiscal periods indicated. All information (except portfolio turnover rate) reflects financial results for a single fund share. Total return shows how much your investment in the fund would have increased (or decreased) during each period, assuming you had reinvested all dividends and distributions. These figures have been derived from the fund’s financial statements.
| | | | | | | |
| | | | |
| | | |
Class A Shares | | Year Ended October 31, |
| | 2017 | 2016 | 2015 | 2014 | 2013 |
Per Share Data ($): | | | | | | |
Net asset value, beginning of period | | 24.06 | 25.52 | 26.65 | 24.09 | 21.27 |
Investment Operations: | | | | | | |
Investment income—neta | | .24 | .26 | .31 | .33 | .34 |
Net realized and unrealized
gain (loss) on investments | | 5.39 | (.12) | (.47) | 2.54 | 2.80 |
Total from Investment Operations | | 5.63 | .14 | (.16) | 2.87 | 3.14 |
Distributions: | | | | | | |
Dividends from
investment income—net | | (.24) | (.28) | (.31) | (.31) | (.32) |
Dividends from net realized
gain on investments | | (.01) | (1.32) | (.66) | - | - |
Total Distributions | | (.25) | (1.60) | (.97) | (.31) | (.32) |
Net asset value, end of period | | 29.44 | 24.06 | 25.52 | 26.65 | 24.09 |
Total Return (%)b | | 23.55 | .54 | (.65) | 12.00 | 14.91 |
Ratios/Supplemental Data (%): | | | | | | |
Ratio of total expenses
to average net assets | | 1.36 | 1.36 | 1.36 | 1.36 | 1.36 |
Ratio of net expenses
to average net assets | | 1.35 | 1.35 | 1.35 | 1.35 | 1.35 |
Ratio of net investment income
to average net assets | | .91 | 1.07 | 1.20 | 1.30 | 1.49 |
Portfolio Turnover Rate | | 1.14 | 10.84 | 11.02 | 2.44 | 6.47 |
Net Assets, end of period ($ x 1,000) | | 70,073 | 62,985 | 74,091 | 87,549 | 146,333 |
a Based on average shares outstanding.
b Exclusive of sales charge.
See notes to financial statements.
16
| | | | | | | | | |
| | | | |
| | | |
Class C Shares | | Year Ended October 31, |
| | 2017 | 2016 | 2015 | 2014 | 2013 |
Per Share Data ($): | | | | | | |
Net asset value, beginning of period | | 22.71 | 24.17 | 25.30 | 22.90 | 20.23 |
Investment Operations: | | | | | | |
Investment income—neta | | .05 | .07 | .11 | .12 | .16 |
Net realized and unrealized
gain (loss) on investments | | 5.07 | (.10) | (.45) | 2.42 | 2.68 |
Total from Investment Operations | | 5.12 | (.03) | (.34) | 2.54 | 2.84 |
Distributions: | | | | | | |
Dividends from
investment income—net | | (.05) | (.11) | (.13) | (.14) | (.17) |
Dividends from net realized
gain on investments | | (.01) | (1.32) | (.66) | - | - |
Total Distributions | | (.06) | (1.43) | (.79) | (.14) | (.17) |
Net asset value, end of period | | 27.77 | 22.71 | 24.17 | 25.30 | 22.90 |
Total Return (%)b | | 22.58 | (.18) | (1.42) | 11.16 | 14.11 |
Ratios/Supplemental Data (%): | | | | | | |
Ratio of total expenses
to average net assets | | 2.11 | 2.11 | 2.11 | 2.11 | 2.11 |
Ratio of net expenses
to average net assets | | 2.10 | 2.10 | 2.10 | 2.10 | 2.10 |
Ratio of net investment income
to average net assets | | .19 | .32 | .45 | .48 | .75 |
Portfolio Turnover Rate | | 1.14 | 10.84 | 11.02 | 2.44 | 6.47 |
Net Assets, end of period ($ x 1,000) | | 23,993 | 26,237 | 32,241 | 35,570 | 33,915 |
a Based on average shares outstanding.
b Exclusive of sales charge.
See notes to financial statements.
17
FINANCIAL HIGHLIGHTS (continued)
| | | | | | | | | | |
| | | | | | | |
| | | |
Class I Shares | | Year Ended October 31, |
| | 2017 | 2016 | 2015 | 2014 | 2013 |
Per Share Data ($): | | | | | | |
Net asset value, beginning of period | | 24.12 | 25.57 | 26.71 | 24.15 | 21.32 |
Investment Operations: | | | | | | |
Investment income—neta | | .30 | .31 | .37 | .32 | .40 |
Net realized and unrealized
gain (loss) on investments | | 5.39 | (.10) | (.47) | 2.62 | 2.81 |
Total from Investment Operations | | 5.69 | .21 | (.10) | 2.94 | 3.21 |
Distributions: | | | | | | |
Dividends from
investment income—net | | (.30) | (.34) | (.38) | (.38) | (.38) |
Dividends from net realized
gain on investments | | (.01) | (1.32) | (.66) | - | - |
Total Distributions | | (.31) | (1.66) | (1.04) | (.38) | (.38) |
Net asset value, end of period | | 29.50 | 24.12 | 25.57 | 26.71 | 24.15 |
Total Return (%) | | 23.80 | .83 | (.43) | 12.29 | 15.21 |
Ratios/Supplemental Data (%): | | | | | | |
Ratio of total expenses
to average net assets | | 1.11 | 1.11 | 1.11 | 1.11 | 1.11 |
Ratio of net expenses
to average net assets | | 1.10 | 1.10 | 1.10 | 1.10 | 1.10 |
Ratio of net investment income
to average net assets | | 1.14 | 1.30 | 1.44 | 1.24 | 1.78 |
Portfolio Turnover Rate | | 1.14 | 10.84 | 11.02 | 2.44 | 6.47 |
Net Assets, end of period ($ x 1,000) | | 83,050 | 83,419 | 71,785 | 70,336 | 15,043 |
a Based on average shares outstanding.
See notes to financial statements.
18
NOTES TO FINANCIAL STATEMENTS
NOTE 1—Significant Accounting Policies:
Dreyfus Tax Managed Growth Fund (the “fund”) is a separate diversified series of The Dreyfus/Laurel Funds, Inc. (the “Company”), which is registered under the Investment Company Act of 1940, as amended (the “Act”), as an open-end management investment company and operates as a series company currently offering eight series, including the fund. The fund’s investment objective is to seek long-term capital appreciation consistent with minimizing realized capital gains. The Dreyfus Corporation (the “Manager” or “Dreyfus”), a wholly-owned subsidiary of The Bank of New York Mellon Corporation (“BNY Mellon”), serves as the fund’s investment adviser. Fayez Sarofim & Co. (“Sarofim & Co.”), serves as the fund’s sub-investment adviser.
Effective March 31, 2017, the fund authorized the issuance of Class T shares, but, as of the date of this report, the fund did not offer Class T shares for purchase. The fund authorized 100 million Class T shares which resulted in the fund’s total authorized shares increasing from 500 million to 600 million.
MBSC Securities Corporation (the “Distributor”), a wholly-owned subsidiary of Dreyfus, is the distributor of the fund’s shares. The fund is authorized to issue 600 million shares of $.001 par value Common Stock. The fund currently has authorized four classes of shares: Class A (300 million shares authorized), Class C (100 million shares authorized), Class I (100 million shares authorized) and Class T (100 million shares authorized). Class A, Class C and Class T shares are sold primarily to retail investors through financial intermediaries and bear Distribution fees and/or Service Plan fees. Class A and Class T shares generally are subject to a sales charge imposed at the time of purchase. Class C shares are subject to a contingent deferred sales charge (“CDSC”) imposed on Class C shares redeemed within one year of purchase. Class I shares are sold primarily to bank trust departments and other financial service providers (including The Bank of New York Mellon, a subsidiary of BNY Mellon and an affiliate of Dreyfus, and its affiliates), acting on behalf of customers having a qualified trust or an investment account or relationship at such institution, and bear no Distribution or Service Plan fees. Class I shares are offered without a front-end sales charge or CDSC. Other differences between the classes include the services offered to and the expenses borne by each class, and certain voting rights. Income, expenses (other than expenses attributable to a specific class), and realized and unrealized gains
19
NOTES TO FINANCIAL STATEMENTS (continued)
or losses on investments are allocated to each class of shares based on its relative net assets.
The Company accounts separately for the assets, liabilities and operations of each series. Expenses directly attributable to each series are charged to that series’ operations; expenses which are applicable to all series are allocated among them on a pro rata basis.
The Financial Accounting Standards Board (“FASB”) Accounting Standards Codification is the exclusive reference of authoritative U.S. generally accepted accounting principles (“GAAP”) recognized by the FASB to be applied by nongovernmental entities. Rules and interpretive releases of the Securities and Exchange Commission (“SEC”) under authority of federal laws are also sources of authoritative GAAP for SEC registrants. The fund’s financial statements are prepared in accordance with GAAP, which may require the use of management estimates and assumptions. Actual results could differ from those estimates.
(a) Portfolio valuation: The fair value of a financial instrument is the amount that would be received to sell an asset or paid to transfer a liability in an orderly transaction between market participants at the measurement date (i.e., the exit price). GAAP establishes a fair value hierarchy that prioritizes the inputs of valuation techniques used to measure fair value. This hierarchy gives the highest priority to unadjusted quoted prices in active markets for identical assets or liabilities (Level 1 measurements) and the lowest priority to unobservable inputs (Level 3 measurements).
Additionally, GAAP provides guidance on determining whether the volume and activity in a market has decreased significantly and whether such a decrease in activity results in transactions that are not orderly. GAAP requires enhanced disclosures around valuation inputs and techniques used during annual and interim periods.
Various inputs are used in determining the value of the fund’s investments relating to fair value measurements. These inputs are summarized in the three broad levels listed below:
Level 1—unadjusted quoted prices in active markets for identical investments.
Level 2—other significant observable inputs (including quoted prices for similar investments, interest rates, prepayment speeds, credit risk, etc.).
Level 3—significant unobservable inputs (including the fund’s own assumptions in determining the fair value of investments).
20
The inputs or methodology used for valuing securities are not necessarily an indication of the risk associated with investing in those securities.
Changes in valuation techniques may result in transfers in or out of an assigned level within the disclosure hierarchy. Valuation techniques used to value the fund’s investments are as follows:
Investments in securities are valued at the last sales price on the securities exchange or national securities market on which such securities are primarily traded. Securities listed on the National Market System for which market quotations are available are valued at the official closing price or, if there is no official closing price that day, at the last sales price. For open short positions, asked prices are used for valuation purposes. Bid price is used when no asked price is available. Registered investment companies that are not traded on an exchange are valued at their net asset value. All of the preceding securities are generally categorized within Level 1 of the fair value hierarchy.
Securities not listed on an exchange or the national securities market, or securities for which there were no transactions, are valued at the average of the most recent bid and asked prices. These securities are generally categorized within Level 2 of the fair value hierarchy.
Fair valuing of securities may be determined with the assistance of a pricing service using calculations based on indices of domestic securities and other appropriate indicators, such as prices of relevant ADRs and futures. Utilizing these techniques may result in transfers between Level 1 and Level 2 of the fair value hierarchy.
When market quotations or official closing prices are not readily available, or are determined to not accurately reflect fair value, such as when the value of a security has been significantly affected by events after the close of the exchange or market on which the security is principally traded (for example, a foreign exchange or market), but before the fund calculates its net asset value, the fund may value these investments at fair value as determined in accordance with the procedures approved by the Company’s Board of Directors (the “Board”). Certain factors may be considered when fair valuing investments such as: fundamental analytical data, the nature and duration of restrictions on disposition, an evaluation of the forces that influence the market in which the securities are purchased and sold, and public trading in similar securities of the issuer or comparable issuers. These securities are either categorized within Level 2 or 3 of the fair value hierarchy depending on the relevant inputs used.
21
NOTES TO FINANCIAL STATEMENTS (continued)
For restricted securities where observable inputs are limited, assumptions about market activity and risk are used and are generally categorized within Level 3 of the fair value hierarchy.
The following is a summary of the inputs used as of October 31, 2017 in valuing the fund’s investments:
| | | | | |
| | Level 1 - Unadjusted Quoted Prices | Level 2 - Other Significant Observable
Inputs | Level 3 -Significant Unobservable Inputs | Total |
Assets ($) | | | |
Investments in Securities: | | | |
Equity Securities - Domestic Common Stocks† | 153,360,528 | - | - | 153,360,528 |
Equity Securities - Foreign Common Stocks† | 20,036,513 | - | - | 20,036,513 |
Registered Investment Company | 4,000,306 | - | - | 4,000,306 |
† See Statement of Investments for additional detailed categorizations.
At October 31, 2017, there were no transfers between levels of the fair value hierarchy. It is the fund’s policy to recognize transfers between levels at the end of the reporting period.
(b) Securities transactions and investment income: Securities transactions are recorded on a trade date basis. Realized gains and losses from securities transactions are recorded on the identified cost basis. Dividend income is recognized on the ex-dividend date and interest income, including, where applicable, accretion of discount and amortization of premium on investments, is recognized on the accrual basis.
Pursuant to a securities lending agreement with The Bank of New York Mellon, the fund may lend securities to qualified institutions. It is the fund’s policy that, at origination, all loans are secured by collateral of at least 102% of the value of U.S. securities loaned and 105% of the value of foreign securities loaned. Collateral equivalent to at least 100% of the market value of securities on loan is maintained at all times. Collateral is either in the form of cash, which can be invested in certain money market mutual funds managed by Dreyfus, or U.S. Government and Agency securities. The fund is entitled to receive all dividends, interest and distributions on securities loaned, in addition to income earned as a result
22
of the lending transaction. Should a borrower fail to return the securities in a timely manner, The Bank of New York Mellon is required to replace the securities for the benefit of the fund or credit the fund with the market value of the unreturned securities and is subrogated to the fund’s rights against the borrower and the collateral. Additionally, the contractual maturity of security lending transactions are on an overnight and continuous basis. During the period ended October 31, 2017, The Bank of New York Mellon earned $1,359 from lending portfolio securities, pursuant to the securities lending agreement.
(c) Affiliated issuers: Investments in other investment companies advised by Dreyfus are defined as “affiliated” under the Act.
(d) Dividends and distributions to shareholders: Dividends and distributions are recorded on the ex-dividend date. Dividends from investment income-net are normally declared and paid quarterly. Dividends from net realized capital gains, if any, are normally declared and paid annually, but the fund may make distributions on a more frequent basis to comply with the distribution requirements of the Internal Revenue Code of 1986, as amended (the “Code”). To the extent that net realized capital gains can be offset by capital loss carryovers, it is the policy of the fund not to distribute such gains. Income and capital gain distributions are determined in accordance with income tax regulations, which may differ from GAAP.
(e) Federal income taxes: It is the policy of the fund to continue to qualify as a regulated investment company, if such qualification is in the best interests of its shareholders, by complying with the applicable provisions of the Code, and to make distributions of taxable income sufficient to relieve it from substantially all federal income and excise taxes.
As of and during the period ended October 31, 2017, the fund did not have any liabilities for any uncertain tax positions. The fund recognizes interest and penalties, if any, related to uncertain tax positions as income tax expense in the Statement of Operations. During the period ended October 31, 2017, the fund did not incur any interest or penalties.
Each tax year in the four-year period ended October 31, 2017 remains subject to examination by the Internal Revenue Service and state taxing authorities.
At October 31, 2017, the components of accumulated earnings on a tax basis were as follows: undistributed ordinary income $570,831, undistributed capital gains $7,952,218 and unrealized appreciation $87,720,194.
23
NOTES TO FINANCIAL STATEMENTS (continued)
The tax character of distributions paid to shareholders during the fiscal periods ended October 31, 2017 and October 31, 2016 were as follows: ordinary income $1,575,388 and $2,059,640, and long-term capital gains $85,357 and $9,013,406, respectively.
NOTE 2—Bank Lines of Credit:
The fund participates with other Dreyfus-managed funds in an $830 million unsecured credit facility led by Citibank, N.A. and a $300 million unsecured credit facility provided by The Bank of New York Mellon (each, a “Facility”), each to be utilized primarily for temporary or emergency purposes, including the financing of redemptions. Prior to October 4, 2017, the unsecured credit facility with Citibank, N.A. was $810 million. In connection therewith, the fund has agreed to pay its pro rata portion of commitment fees for each Facility. Interest is charged to the fund based on rates determined pursuant to the terms of the respective Facility at the time of borrowing.
The average amount of borrowings outstanding under the Facilities during the period ended October 31, 2017, was approximately $62,200 with a related weighted average annualized interest rate of 1.65%.
NOTE 3—Investment Management Fee, Sub-Investment Advisory Fee and Other Transactions with Affiliates:
(a) Pursuant to an investment management agreement with Dreyfus, Dreyfus provides or arranges for one or more third parties and/or affiliates to provide investment management, administrative, custody, fund accounting and transfer agency services to the fund. Dreyfus also directs the investments of the fund in accordance with its investment objective, policies and limitations. For these services, the fund is contractually obligated to pay Dreyfus a fee, calculated daily and paid monthly, at the annual rate of 1.10% of the value of the fund’s average daily net assets. Out of its fee, Dreyfus pays all of the expenses of the fund except brokerage fees, taxes, interest expenses, commitment fees on borrowings, Distribution Plan fees and Service Plan fees, fees and expenses of the non-interested Directors (including counsel fees) and extraordinary expenses. In addition, Dreyfus is required to reduce its fee in an amount equal to the fund’s allocable portion of fees and expenses of the non-interested Directors (including counsel fees). During the period ended October 31, 2017, fees reimbursed by Dreyfus amount to $13,103.
Pursuant to a sub-investment advisory agreement between Dreyfus and Sarofim & Co., Dreyfus pays Sarofim & Co. a monthly fee at an annual rate of .2175% of the value of the fund’s average daily net assets.
24
During the period ended October 31, 2017, the Distributor retained $3,514 from commissions earned on sales of the fund’s Class A share and $251 from CDSCs on redemptions of the fund’s Class C shares.
(b) Under the Distribution Plans adopted pursuant to Rule 12b-1 (the “Distribution Plans”) under the Act, Class A shares pay annually up to .25% of the value of its average daily net assets to compensate the Distributor for shareholder servicing activities and expenses primarily intended to result in the sale of Class A shares. Class C shares pay the Distributor for distributing its shares at an aggregate annual rate of .75% of the value of the average daily net assets of Class C shares. Class C shares are also subject to a service plan adopted pursuant to Rule 12b-1 (the “Service Plan”), under which Class C shares pay the Distributor for providing certain services to the holders of their shares, a fee at an annual rate of .25% of the value of the average daily net assets of Class C shares. During the period ended October 31, 2017, Class A and Class C shares were charged $164,887 and $192,798, respectively, pursuant to their Distribution Plans. During the period ended October 31, 2017, Class C shares were charged $64,266 pursuant to the Service Plan.
Under its terms, the Distribution Plans and Service Plan shall remain in effect from year to year, provided such continuance is approved annually by a vote of a majority of those Directors who are not “interested persons” of the Company and who have no direct or indirect financial interest in the operation of or in any agreement related to the Distribution Plans or Service Plan.
The components of “Due to The Dreyfus Corporation and affiliates” in the Statement of Assets and Liabilities consist of: management fees $164,870, Distribution Plans fees $30,210 and Service Plan fees $5,117, which are offset against an expense reimbursement currently in effect in the amount of $1,288.
(c) Each Board member also serves as a Board member of other funds within the Dreyfus complex. Annual retainer fees and attendance fees are allocated to each fund based on net assets.
NOTE 4—Securities Transactions:
The aggregate amount of purchases and sales of investment securities, excluding short-term securities, during the period ended October 31, 2017, amounted to $1,938,198 and $34,713,112, respectively.
At October 31, 2017, the cost of investments for federal income tax purposes was $89,677,153; accordingly, accumulated net unrealized
25
NOTES TO FINANCIAL STATEMENTS (continued)
appreciation on investments was $87,720,194, consisting of $88,086,261 gross unrealized appreciation and $366,067 gross unrealized depreciation.
26
REPORT OF INDEPENDENT REGISTERED
PUBLIC ACCOUNTING FIRM
The Board of Directors and Shareholders of
The Dreyfus/Laurel Funds, Inc.
We have audited the accompanying statement of assets and liabilities of Dreyfus Tax Managed Growth Fund (the “Fund”), a series of The Dreyfus/Laurel Funds, Inc., including the statements of investments and investments in affiliated issuers, as of October 31, 2017, and the related statement of operations for the year then ended, the statements of changes in net assets for each of the years in the two-year period then ended, and the financial highlights for each of the years in the five-year period then ended. These financial statements and financial highlights are the responsibility of the Fund’s management. Our responsibility is to express an opinion on these financial statements and financial highlights based on our audits.
We conducted our audits in accordance with the standards of the Public Company Accounting Oversight Board (United States). Those standards require that we plan and perform the audit to obtain reasonable assurance about whether the financial statements and financial highlights are free of material misstatement. An audit includes examining, on a test basis, evidence supporting the amounts and disclosures in the financial statements. Our procedures included confirmation of securities owned as of October 31, 2017, by correspondence with the custodian and brokers or by other appropriate auditing procedures. An audit also includes assessing the accounting principles used and significant estimates made by management, as well as evaluating the overall financial statement presentation. We believe that our audits provide a reasonable basis for our opinion.
In our opinion, the financial statements and financial highlights referred to above present fairly, in all material respects, the financial position of Dreyfus Tax Managed Growth Fund as of October 31, 2017, and the results of its operations for the year then ended, the changes in its net assets for each of the years in the two-year period then ended, and the financial highlights for each of the years in the five-year period then ended, in conformity with U.S. generally accepted accounting principles.

New York, New York
December 22, 2017
27
IMPORTANT TAX INFORMATION (Unaudited)
For federal tax purposes, the fund reports the maximum amount allowable, but not less than $1,575,388 as ordinary income dividends paid during the year ended October 31, 2017 as qualified dividend income in accordance with Section 854(b)(1)(B) of the Internal Revenue Code. Also, the fund reports the maximum amount allowable but not less than 100% of ordinary income dividends paid during the year ended October 31, 2017 as eligible for the corporate dividends received deduction provided under Section 243 of the Internal Revenue Code in accordance with Section 854(b)(1)(A) of the Internal Revenue Code. Shareholders will receive notification in early 2018 of the percentage applicable to the preparation of their 2017 income tax returns. Also, the fund reports the maximum amount allowable but not less than $.0118 per share as a capital gain dividend in accordance with Section 852(b)(3)(C) of the Internal Revenue Code.
28
INFORMATION ABOUT THE RENEWAL OF THE FUND'S INVESTMENT MANAGEMENT AND SUB-INVESTMENT ADVISORY AGREEMENTS (Unaudited)
At a meeting of the fund’s Board of Directors held on July 26-27, 2017, the Board considered the renewal of the fund’s Investment Management Agreement, pursuant to which Dreyfus provides the fund with investment advisory and administrative services (the “Agreement”), and the Sub-Investment Advisory Agreement (together, the “Agreements”), pursuant to which Fayez Sarofim & Co. (the “Subadviser”) provides day-to-day management of the fund’s investments. The Board members, none of whom are “interested persons” (as defined in the Investment Company Act of 1940, as amended) of the fund, were assisted in their review by independent legal counsel and met with counsel in executive session separate from representatives of Dreyfus and the Subadviser. In considering the renewal of the Agreements, the Board considered all factors that it believed to be relevant, including those discussed below. The Board did not identify any one factor as dispositive, and each Board member may have attributed different weights to the factors considered.
Analysis of Nature, Extent, and Quality of Services Provided to the Fund. The Board considered information provided to them at the meeting and in previous presentations from Dreyfus representatives regarding the nature, extent, and quality of the services provided to funds in the Dreyfus fund complex. Dreyfus provided the number of open accounts in the fund, the fund’s asset size and the allocation of fund assets among distribution channels. Dreyfus also had previously provided information regarding the diverse intermediary relationships and distribution channels of funds in the Dreyfus fund complex (such as retail direct or intermediary, in which intermediaries typically are paid by the fund and/or Dreyfus) and Dreyfus’ corresponding need for broad, deep, and diverse resources to be able to provide ongoing shareholder services to each intermediary or distribution channel, as applicable to the fund.
The Board also considered research support available to, and portfolio management capabilities of, the fund’s portfolio management personnel and that Dreyfus also provides oversight of day-to-day fund operations, including fund accounting and administration and assistance in meeting legal and regulatory requirements. The Board also considered Dreyfus’ extensive administrative, accounting, and compliance infrastructures, as well as Dreyfus’ supervisory activities over the Subadviser. The Board also considered portfolio management’s brokerage policies and practices (including policies and practices regarding soft dollars) and the standards applied in seeking best execution.
Comparative Analysis of the Fund’s Performance and Management Fee and Expense Ratio. The Board reviewed reports prepared by Broadridge Financial Solutions, Inc. (“Broadridge”), an independent provider of investment company data, which included information comparing (1) the fund’s performance with the performance of a group of comparable funds (the “Performance Group”) and with a broader group of funds (the “Performance Universe”), all for various periods ended June 30, 2017, and (2) the fund’s actual and contractual management fees and total expenses with those of a group of comparable funds (the “Expense Group”) and with a broader group of funds (the
29
INFORMATION ABOUT THE RENEWAL OF THE FUND'S INVESTMENT MANAGEMENT AND SUB-INVESTMENT ADVISORY AGREEMENTS (Unaudited) (continued)
“Expense Universe”), the information for which was derived in part from fund financial statements available to Broadridge as of the date of its analysis. Dreyfus previously had furnished the Board with a description of the methodology Broadridge used to select the Performance Group and Performance Universe and the Expense Group and Expense Universe.
Dreyfus representatives stated that the usefulness of performance comparisons may be affected by a number of factors, including different investment limitations that may be applicable to the fund and comparison funds. The Board discussed with representatives of Dreyfus, its affiliates and/or the Subadviser the results of the comparisons and considered that the fund’s total return performance was below the Performance Group and Performance Universe medians. Representatives of Dreyfus and the Subadviser stated that the fund’s recent performance had improved, noting that the fund’s total return performance for the three- and six- month periods ended June 30, 2017 ranked in the first quartile in the fund’s Broadridge category. Dreyfus also provided a comparison of the fund’s calendar year total returns to the returns of the fund’s benchmark index showing that the fund’s return was higher than the return of the index in four of the ten years shown.
The Board also reviewed the range of actual and contractual management fees and total expenses of the Expense Group and Expense Universe funds and discussed the results of the comparisons. Taking into account the fund’s “unitary” fee structure, the Board took into consideration that the fund’s contractual management fee was above the Expense Group median and the fund’s actual management fee and total expense ratio were above the Expense Group and Expense Universe medians.
Dreyfus representatives reviewed with the Board the management or investment advisory fees (1) paid by funds advised or administered by Dreyfus that are in the same Broadridge category as the fund and (2) paid to Dreyfus or the Subadviser or its affiliates for advising any separate accounts and/or other types of client portfolios that are considered to have similar investment strategies and policies as the fund (the “Similar Clients”), and explained the nature of the Similar Clients. They discussed differences in fees paid and the relationship of the fees paid in light of any differences in the services provided and other relevant factors, noting the fund’s “unitary” fee structure. The Board considered the relevance of the fee information provided for the Similar Clients to evaluate the appropriateness of the fund’s management fee.
The Board considered the fee to the Subadviser in relation to the fee paid to Dreyfus by the fund and the respective services provided by the Subadviser and Dreyfus. The Board also took into consideration that the Subadviser’s fee is paid by Dreyfus (out of its fee from the fund) and not by the fund.
Analysis of Profitability and Economies of Scale. Dreyfus representatives reviewed the expenses allocated and profit received by Dreyfus and its affiliates and the resulting profitability percentage for managing the fund and the aggregate profitability percentage to Dreyfus and its affiliates for managing the funds in the Dreyfus fund complex, and the method used to determine the expenses and profit. The Board concluded that the
30
profitability results were not unreasonable, given the services rendered and service levels provided by Dreyfus. The Board also had been provided with information prepared by an independent consulting firm regarding Dreyfus’ approach to allocating costs to, and determining the profitability of, individual funds and the entire Dreyfus fund complex. The consulting firm also had analyzed where any economies of scale might emerge in connection with the management of a fund.
The Board considered on the advice of its counsel the profitability analysis (1) as part of its evaluation of whether the fees under the Agreements, considered in relation to the mix of services provided by Dreyfus and the Subadviser, including the nature, extent and quality of such services, supported the renewal of the Agreements and (2) in light of the relevant circumstances for the fund and the extent to which economies of scale would be realized if the fund grows and whether fee levels reflect these economies of scale for the benefit of fund shareholders. Since Dreyfus, and not the fund, pays the Subadviser pursuant to the Sub-Investment Advisory Agreement, the Board did not consider the Subadviser’s profitability to be relevant to its deliberations. Dreyfus representatives stated that a discussion of economies of scale is predicated on a fund having achieved a substantial size with increasing assets and that, if a fund’s assets had been stable or decreasing, the possibility that Dreyfus may have realized any economies of scale would be less. Dreyfus representatives also stated that, as a result of shared and allocated costs among funds in the Dreyfus fund complex, the extent of economies of scale could depend substantially on the level of assets in the complex as a whole, so that increases and decreases in complex-wide assets can affect potential economies of scale in a manner that is disproportionate to, or even in the opposite direction from, changes in the fund’s asset level. The Board also considered potential benefits to Dreyfus and the Subadviser from acting as investment adviser and sub-investment adviser, respectively, and took into consideration the soft dollar arrangements in effect for trading the fund’s investments.
At the conclusion of these discussions, the Board agreed that it had been furnished with sufficient information to make an informed business decision with respect to the renewal of the Agreements. Based on the discussions and considerations as described above, the Board concluded and determined as follows.
· The Board concluded that the nature, extent and quality of the services provided by Dreyfus and the Subadviser are adequate and appropriate.
· The Board considered the fund’s improved total return performance, accepting as contributing to the better performance the analytical tools introduced by Dreyfus and applied by the Subadviser.
· The Board concluded that the fees paid to Dreyfus and the Subadviser continued to be appropriate under the circumstances and in light of the factors and the totality of the services provided as discussed above, subject to review no later than the next renewal consideration.
31
INFORMATION ABOUT THE RENEWAL OF THE FUND'S INVESTMENT MANAGEMENT AND SUB-INVESTMENT ADVISORY AGREEMENTS (Unaudited) (continued)
· The Board determined that the economies of scale which may accrue to Dreyfus and its affiliates in connection with the management of the fund had been adequately considered by Dreyfus in connection with the fee rate charged to the fund pursuant to the Agreement and that, to the extent in the future it were determined that material economies of scale had not been shared with the fund, the Board would seek to have those economies of scale shared with the fund.
In evaluating the Agreements, the Board considered these conclusions and determinations and also relied on its previous knowledge, gained through meetings and other interactions with Dreyfus and its affiliates and the Subadviser, of Dreyfus and the Subadviser and the services provided to the fund by Dreyfus and the Subadviser. The Board also relied on information received on a routine and regular basis throughout the year relating to the operations of the fund and the investment management and other services provided under the Agreements, including information on the investment performance of the fund in comparison to similar mutual funds and benchmark performance indices; general market outlook as applicable to the fund; and compliance reports. In addition, the Board’s consideration of the contractual fee arrangements for this fund had the benefit of a number of years of reviews of the Agreements for the fund, or substantially similar agreements for other Dreyfus funds that the Board oversees, during which lengthy discussions took place between the Board and Dreyfus representatives. Certain aspects of the arrangements may receive greater scrutiny in some years than in others, and the Board’s conclusions may be based, in part, on their consideration of the fund’s arrangements, or substantially similar arrangements for other Dreyfus funds that the Board oversees, in prior years. The Board determined to renew the Agreements through April 4, 2018.
32
BOARD MEMBERS INFORMATION (Unaudited)
INDEPENDENT BOARD MEMBERS
Joseph S. DiMartino (74)
Chairman of the Board (1999)
Principal Occupation During Past 5 Years:
· Corporate Director and Trustee (1995-present)
Other Public Company Board Memberships During Past 5 Years:
· CBIZ (formerly, Century Business Services, Inc.), a provider of outsourcing functions for small and medium size companies, Director (1997-present)
No. of Portfolios for which Board Member Serves: 126
———————
Francine J. Bovich (66)
Board Member (2012)
Principal Occupation During Past 5 Years:
· Trustee, The Bradley Trusts, private trust funds (2011-present)
Other Public Company Board Memberships During Past 5 Years:
· Annaly Capital Management, Inc., Board Member (May 2014-present)
No. of Portfolios for which Board Member Serves: 74
———————
Kenneth A. Himmel (71)
Board Member (1994)
Principal Occupation During Past 5 Years:
· Managing Partner, Gulf Related, an international real estate development company (2010-present)
· President and CEO, Related Urban Development, a real estate development company (1996-present)
· President and CEO, Himmel & Company, a real estate development company (1980-present)
· CEO, American Food Management, a restaurant company (1983-present)
No. of Portfolios for which Board Member Serves: 28
———————
33
BOARD MEMBERS INFORMATION (Unaudited) (continued)
INDEPENDENT BOARD MEMBERS (continued)
Stephen J. Lockwood (70)
Board Member (1994)
Principal Occupation During Past 5 Years:
· Chairman of the Board, Stephen J. Lockwood and Company LLC, a real estate investment company (2000-present)
No. of Portfolios for which Board Member Serves: 28
———————
Roslyn M. Watson (68)
Board Member (1994)
Principal Occupation During Past 5 Years:
· Principal, Watson Ventures, Inc., a real estate investment company (1993-present)
No. of Portfolios for which Board Member Serves: 60
———————
Benaree Pratt Wiley (71)
Board Member (1998)
Principal Occupation During Past 5 Years:
· Principal, The Wiley Group, a firm specializing in strategy and business development (2005-present)
Other Public Company Board Memberships During Past 5 Years:
· CBIZ (formerly, Century Business Services, Inc.), a provider of outsourcing functions for small and medium size companies, Director (2008-present)
No. of Portfolios for which Board Member Serves: 81
———————
Once elected all Board Members serve for an indefinite term, but achieve Emeritus status upon reaching age 80. The address of the Board Members and Officers is c/o The Dreyfus Corporation, 200 Park Avenue, New York, New York 10166. Additional information about the Board Members is available in the fund’s Statement of Additional Information which can be obtained from Dreyfus free of charge by calling this toll free number: 1-800-DREYFUS.
James M. Fitzgibbons, Emeritus Board Member
J. Tomlinson Fort, Emeritus Board Member
34
OFFICERS OF THE FUND (Unaudited)
BRADLEY J. SKAPYAK, President since January 2010.
Chief Operating Officer and a director of the Manager since June 2009, Chairman of Dreyfus Transfer, Inc., an affiliate of the Manager and the transfer agent of the funds, since May 2011 and Chief Executive Officer of MBSC Securities Corporation since August 2016. He is an officer of 62 investment companies (comprised of 126 portfolios) managed by the Manager. He is 58 years old and has been an employee of the Manager since February 1988.
BENNETT A. MACDOUGALL, Chief Legal Officer since October 2015.
Chief Legal Officer of the Manager and Associate General Counsel and Managing Director of BNY Mellon since June 2015; from June 2005 to June 2015, he served in various capacities with Deutsche Bank – Asset & Wealth Management Division, including as Director and Associate General Counsel, and Chief Legal Officer of Deutsche Investment Management Americas Inc. from June 2012 to May 2015. He is an officer of 63 investment companies (comprised of 151 portfolios) managed by the Manager. He is 46 years old and has been an employee of the Manager since June 2015.
JANETTE E. FARRAGHER, Vice President and Secretary since December 2011.
Associate General Counsel of BNY Mellon, and an officer of 63 investment companies (comprised of 151 portfolios) managed by the Manager. She is 54 years old and has been an employee of the Manager since February 1984.
JAMES BITETTO, Vice President and Assistant Secretary since August 2005.
Managing Counsel of BNY Mellon and Secretary of the Manager, and an officer of 63 investment companies (comprised of 151 portfolios) managed by the Manager. He is 51 years old and has been an employee of the Manager since December 1996.
JOSEPH M. CHIOFFI, Vice President and Assistant Secretary since August 2005.
Managing Counsel of BNY Mellon, and an officer of 63 investment companies (comprised of 151 portfolios) managed by the Manager. He is 55 years old and has been an employee of the Manager since June 2000.
MAUREEN E. KANE, Vice President and Assistant Secretary since April 2015.
Managing Counsel of BNY Mellon since July 2014; from October 2004 until July 2014, General Counsel, and from May 2009 until July 2014, Chief Compliance Officer of Century Capital Management. She is an officer of 63 investment companies (comprised of 151 portfolios) managed by the Manager. She is 55 years old and has been an employee of the Manager since July 2014.
SARAH S. KELLEHER, Vice President and Assistant Secretary since April 2014.
Senior Counsel of BNY Mellon since March 2013, from August 2005 to March 2013, Associate General Counsel of Third Avenue Management. She is an officer of 63 investment companies (comprised of 151 portfolios) managed by the Manager. She is 42 years old and has been an employee of the Manager since March 2013.
JEFF PRUSNOFSKY, Vice President and Assistant Secretary since August 2005.
Senior Managing Counsel of BNY Mellon, and an officer of 63 investment companies (comprised of 151 portfolios) managed by the Manager. He is 52 years old and has been an employee of the Manager since October 1990.
NATALYA ZELENSKY, Vice President and Assistant Secretary since March 2017.
Counsel and Vice President of BNY Mellon since May 2016; Attorney at Wildermuth Endowment Strategy Fund/Wildermuth Advisory, LLC from November 2015 until May 2016; Assistant General Counsel at RCS Advisory Services from July 2014 until November 2015; Associate at Sutherland, Asbill & Brennan from January 2013 until January 2014; Associate at K&L Gates from October 2011 until January 2013. She is an officer of 63 investment companies (comprised of 151 portfolios) managed by Dreyfus. She is 32 years old and has been an employee of the Manager since May 2016.
JAMES WINDELS, Treasurer since November 2001.
Director – Mutual Fund Accounting of the Manager, and an officer of 63 investment companies (comprised of 151 portfolios) managed by the Manager. He is 59 years old and has been an employee of the Manager since April 1985.
35
OFFICERS OF THE FUND (Unaudited) (continued)
RICHARD CASSARO, Assistant Treasurer since January 2008.
Senior Accounting Manager – Money Market and Municipal Bond Funds of the Manager, and an officer of 63 investment companies (comprised of 151 portfolios) managed by the Manager. He is 58 years old and has been an employee of the Manager since September 1982.
GAVIN C. REILLY, Assistant Treasurer since December 2005.
Tax Manager of the Investment Accounting and Support Department of the Manager, and an officer of 63 investment companies (comprised of 151 portfolios) managed by the Manager. He is 49 years old and has been an employee of the Manager since April 1991.
ROBERT S. ROBOL, Assistant Treasurer since December 2002.
Senior Accounting Manager – Dreyfus Financial Reporting of the Manager, and an officer of 63 investment companies (comprised of 151 portfolios) managed by the Manager. He is 53 years old and has been an employee of the Manager since October 1988.
ROBERT SALVIOLO, Assistant Treasurer since July 2007.
Senior Accounting Manager – Equity Funds of the Manager, and an officer of 63 investment companies (comprised of 151 portfolios) managed by the Manager. He is 50 years old and has been an employee of the Manager since June 1989.
ROBERT SVAGNA, Assistant Treasurer since December 2002.
Senior Accounting Manager – Fixed Income and Equity Funds of the Manager, and an officer of 63 investment companies (comprised of 151 portfolios) managed by the Manager. He is 50 years old and has been an employee of the Manager since November 1990.
JOSEPH W. CONNOLLY, Chief Compliance Officer since October 2004.
Chief Compliance Officer of the Manager and The Dreyfus Family of Funds (63 investment companies, comprised of 151 portfolios). He is 60 years old and has served in various capacities with the Manager since 1980, including manager of the firm’s Fund Accounting Department from 1997 through October 2001.
CARIDAD M. CAROSELLA, Anti-Money Laundering Compliance Officer since January 2016.
Anti-Money Laundering Compliance Officer of the Dreyfus Family of Funds and BNY Mellon Funds Trust since January 2016; from May 2015 to December 2015, Interim Anti-Money Laundering Compliance Officer of the Dreyfus Family of Funds and BNY Mellon Funds Trust and the Distributor; from January 2012 to May 2015, AML Surveillance Officer of the Distributor and from 2007 to December 2011, Financial Processing Manager of the Distributor. She is an officer of 57 investment companies (comprised of 145 portfolios) managed by the Manager. She is 49 years old and has been an employee of the Distributor since 1997.
36
NOTES
37
Dreyfus Tax Managed Growth Fund
200 Park Avenue
New York, NY 10166
Investment Adviser
The Dreyfus Corporation
200 Park Avenue
New York, NY 10166
Sub-Investment Adviser
Fayez Sarofim & Co.
Two Houston Center
Suite 2907
909 Fannin Street
Houston, TX 77010
Custodian
The Bank of New York Mellon
225 Liberty Street
New York, NY 10286
Transfer Agent &
Dividend Disbursing Agent
Dreyfus Transfer, Inc.
200 Park Avenue
New York, NY 10166
Distributor
MBSC Securities Corporation
200 Park Avenue
New York, NY 10166
| | |
Ticker Symbols: | Class A: DTMGX Class C: DPTAX Class I: DPTRX |
Telephone Call your financial representative or 1-800-DREYFUS
Mail The Dreyfus Family of Funds, 144 Glenn Curtiss Boulevard, Uniondale, NY 11556-0144
E-mail Send your request to info@dreyfus.com
Internet Information can be viewed online or downloaded at www.dreyfus.com
The fund files its complete schedule of portfolio holdings with the Securities and Exchange Commission (“SEC”) for the first and third quarters of each fiscal year on Form N-Q. The fund’s Forms N-Q are available on the SEC’s website at www.sec.gov and may be reviewed and copied at the SEC’s Public Reference Room in Washington, D.C. (phone 1-800-SEC-0330 for information).
A description of the policies and procedures that the fund uses to determine how to vote proxies relating to portfolio securities and information regarding how the fund voted these proxies for the most recent 12-month period ended June 30 is available at www.dreyfus.com and on the SEC’s website at www.sec.gov and without charge, upon request, by calling 1-800-DREYFUS.
| | |
© 2017 MBSC Securities Corporation
0149AR1017 | 
|
Item 2. Code of Ethics.
The Registrant has adopted a code of ethics that applies to the Registrant's principal executive officer, principal financial officer, principal accounting officer or controller, or persons performing similar functions. There have been no amendments to, or waivers in connection with, the Code of Ethics during the period covered by this Report.
Item 3. Audit Committee Financial Expert.
The Registrant's Board has determined that Joseph S. DiMartino, a member of the Audit Committee of the Board, is an audit committee financial expert as defined by the Securities and Exchange Commission (the "SEC"). Joseph S. DiMartino is "independent" as defined by the SEC for purposes of audit committee financial expert determinations.
Item 4. Principal Accountant Fees and Services.
(a) Audit Fees. The aggregate fees billed for each of the last two fiscal years (the "Reporting Periods") for professional services rendered by the Registrant's principal accountant (the "Auditor") for the audit of the Registrant's annual financial statements or services that are normally provided by the Auditor in connection with the statutory and regulatory filings or engagements for the Reporting Periods, were $183,500 in 2016 and $188,274 in 2017.
(b) Audit-Related Fees. The aggregate fees billed in the Reporting Periods for assurance and related services by the Auditor that are reasonably related to the performance of the audit of the Registrant's financial statements and are not reported under paragraph (a) of this Item 4 were $24,800 in 2016 and $25,540 in 2017. These services consisted of one or more of the following: (i) agreed upon procedures related to compliance with Internal Revenue Code section 817(h), (ii) security counts required by Rule 17f-2 under the Investment Company Act of 1940, as amended, (iii) advisory services as to the accounting or disclosure treatment of Registrant transactions or events and (iv) advisory services to the accounting or disclosure treatment of the actual or potential impact to the Registrant of final or proposed rules, standards or interpretations by the Securities and Exchange Commission, the Financial Accounting Standards Boards or other regulatory or standard-setting bodies.
The aggregate fees billed in the Reporting Periods for non-audit assurance and related services by the Auditor to the Registrant's investment adviser (not including any sub-investment adviser whose role is primarily portfolio management and is subcontracted with or overseen by another investment adviser), and any entity controlling, controlled by or under common control with the investment adviser that provides ongoing services to the Registrant ("Service Affiliates"), that were reasonably related to the performance of the annual audit of the Service Affiliate, which required pre-approval by the Audit Committee were $0 in 2016 and $0 in 2017.
(c) Tax Fees. The aggregate fees billed in the Reporting Periods for professional services rendered by the Auditor for tax compliance, tax advice, and tax planning ("Tax Services") were $12,500 in 2016 and $13,000 in 2017. These services consisted of review or preparation of U.S. federal, state, local and excise tax returns. The aggregate fees billed in the Reporting Periods for Tax Services by the Auditor to Service Affiliates, which required pre-approval by the Audit Committee were $0 in 2016 and $ 0 in 2017.
(d) All Other Fees. The aggregate fees billed in the Reporting Periods for products and services provided by the Auditor, other than the services reported in paragraphs (a) through (c) of this Item, were $0 in 2016 and $0 in 2017.
The aggregate fees billed in the Reporting Periods for Non-Audit Services by the Auditor to Service Affiliates, other than the services reported in paragraphs (b) through (c) of this Item, which required pre-approval by the Audit Committee, were $0 in 2016 and $0 in 2017.
(e)(1) Audit Committee Pre-Approval Policies and Procedures. The Registrant's Audit Committee has established policies and procedures (the "Policy") for pre-approval (within specified fee limits) of the Auditor's engagements for non-audit services to the Registrant and Service Affiliates without specific case-by-case consideration. The pre-approved services in the Policy can include pre-approved audit services, pre-approved audit-related services, pre-approved tax services and pre-approved all other services. Pre-approval considerations include whether the proposed services are compatible with maintaining the Auditor's independence. Pre-approvals pursuant to the Policy are considered annually.
(e)(2) Note. None of the services described in paragraphs (b) through (d) of this Item 4 were approved by the Audit Committee pursuant to paragraph (c)(7)(i)(C) of Rule 2-01 of Regulation S-X.
(f) None of the hours expended on the principal accountant's engagement to audit the registrant's financial statements for the most recent fiscal year were attributed to work performed by persons other than the principal account's full-time, permanent employees.
Non-Audit Fees. The aggregate non-audit fees billed by the Auditor for services rendered to the Registrant, and rendered to Service Affiliates, for the Reporting Periods were $19,426,000 in 2016 and $20,070,000 in 2017.
Auditor Independence. The Registrant's Audit Committee has considered whether the provision of non-audit services that were rendered to Service Affiliates, which were not pre-approved (not requiring pre-approval), is compatible with maintaining the Auditor's independence.
Item 5. Audit Committee of Listed Registrants.
Not applicable.
Item 6. Investments.
(a) Not applicable.
Item 7. Disclosure of Proxy Voting Policies and Procedures for Closed-End Management Investment Companies.
Not applicable.
Item 8. Portfolio Managers of Closed-End Management Investment Companies.
Not applicable.
Item 9. Purchases of Equity Securities by Closed-End Management Investment Companies and Affiliated Purchasers.
Not applicable.
Item 10. Submission of Matters to a Vote of Security Holders.
There have been no material changes to the procedures applicable to Item 10.
Item 11. Controls and Procedures.
(a) The Registrant's principal executive and principal financial officers have concluded, based on their evaluation of the Registrant's disclosure controls and procedures as of a date within 90 days of the filing date of this report, that the Registrant's disclosure controls and procedures are reasonably designed to ensure that information required to be disclosed by the Registrant on Form N-CSR is recorded, processed, summarized and reported within the required time periods and that information required to be disclosed by the Registrant in the reports that it files or submits on Form N-CSR is accumulated and communicated to the Registrant's management, including its principal executive and principal financial officers, as appropriate to allow timely decisions regarding required disclosure.
(b) There were no changes to the Registrant's internal control over financial reporting that occurred during the second fiscal quarter of the period covered by this report that have materially affected, or are reasonably likely to materially affect, the Registrant's internal control over financial reporting.
Item 12. Exhibits.
(a)(1) Code of ethics referred to in Item 2.
(a)(2) Certifications of principal executive and principal financial officers as required by Rule 30a-2(a) under the Investment Company Act of 1940.
(a)(3) Not applicable.
(b) Certification of principal executive and principal financial officers as required by Rule 30a-2(b) under the Investment Company Act of 1940.
SIGNATURES
Pursuant to the requirements of the Securities Exchange Act of 1934 and the Investment Company Act of 1940, the Registrant has duly caused this Report to be signed on its behalf by the undersigned, thereunto duly authorized.
The Dreyfus/Laurel Funds, Inc.
By: /s/ Bradley J. Skapyak
Bradley J. Skapyak
President
Date: December 21, 2017
Pursuant to the requirements of the Securities Exchange Act of 1934 and the Investment Company Act of 1940, this Report has been signed below by the following persons on behalf of the Registrant and in the capacities and on the dates indicated.
By: /s/ Bradley J. Skapyak
Bradley J. Skapyak
President
Date: December 21, 2017
By: /s/ James Windels
James Windels
Treasurer
Date: December 21, 2017
EXHIBIT INDEX
(a)(1) Code of ethics referred to in Item 2.
(a)(2) Certifications of principal executive and principal financial officers as required by Rule 30a-2(a) under the Investment Company Act of 1940. (EX-99.CERT)
(b) Certification of principal executive and principal financial officers as required by Rule 30a-2(b) under the Investment Company Act of 1940. (EX-99.906CERT)